Embed Size (px)
Citation preview

Tribofysische interpretatie van wrijving en slijtagevoor kunststoffen op verschillende schaalgrootte
Tribophysical Interpretation of Scaling Effectsin Friction and Wear for Polymers
Pieter Samyn
Promotoren: prof. dr. ir. P. De Baets, prof. dr. ir. G. SchoukensProefschrift ingediend tot het behalen van de graad van Doctor in de Ingenieurswetenschappen: Materiaalkunde
Vakgroep Mechanische Constructie en ProductieVoorzitter: prof. dr. ir. J. DegrieckFaculteit IngenieurswetenschappenAcademiejaar 2006 - 2007

ISBN 978-90-8578-134-9 NUR 971, 978 Wettelijk depot: D/2007/10.500/8 De auteur geeft de toelating dit doctoraatswerk voor consultatie beschikbaar te stellen, en delen ervan te kopiëren uitsluitend voor persoonlijk gebruik. Elk ander gebruik valt onder de beperkingen van het auteursrecht, in het bijzonder met betrekking tot de verplichting uitdrukkelijk de bron te vermelden bij het aanhalen van de resultaten van dit werk. The author gives the authorization to consult and to copy parts of this work for personal use only. Any other use is limited by the Laws of Copyright. Permission to reproduce any material contained in this work should be obtained from the author. Copyright © Pieter Samyn Gent, February 2007

Promotors: prof. dr. ir. Patrick De Baets Ghent University Faculty of Engineering Department of Mechanical Construction and Production (IR04) prof. dr. ir. Gustaaf Schoukens Ghent University Faculty of Engineering Department of Textiles (IR11) Examination Committee: prof. dr. Paul Kiekens (chairman) prof. dr. ir. Wim De Waele (secretary) prof. dr. ir. Patrick De Baets prof. dr. ir. Gustaaf Schoukens prof. dr. Nicholas D Spencer prof. dr. ir. Dick Schipper prof. dr. ir. Geraldine Heynderickx prof. dr. Filip Du Prez prof. dr. Francis Verpoort
Ghent University Ghent University Ghent University Ghent University ETH Zürich (CH) Twente University (NL) Ghent University Ghent University Ghent University
Research Institute: Ghent University Department Mechanical Construction and Production Laboratory Soete Sint-Pietersnieuwstraat 41 B-9000 Gent Belgium Tel. +32 9 264 33 08 Fax. +32 9 264 32 95 Mail to [email protected]


It bubbles in my workshop, searching is a lovely job
The patterns I draw, are formulas of laws of nature
… Science is Art!
Dirk Brossé Karel V Oratorium


(i)
Acknowledgements.
This work was performed under supervision of prof. dr. ir. Patrick De Baets and prof. dr. ir. Gustaaf Schoukens. I like to express my gratitude to my promotors for the freedom and opportunities they have given during my PhD study at Ghent University, Laboratory Soete. Tribology is a multidisciplinary science with many aspects. Therefore, I appreciate the collaboration with other laboratories involved in polymer characterisation:
• Thank you drs. Jeroen Van Craenenbroeck and prof. dr. Francis Verpoort for the many Raman spectra that you recorded (Ghent University, Laboratory of Organometallics and Catalysis),
• Thank you prof. dr. Isabel Van Driessche for thermo-analytical measurements (Ghent University, Department of Inorganic and Physical Chemistry),
• Thank you dr. ir. Karen De Clerck and Lieve Van Landuyt for DSC-measurements (Ghent University, Department of Textiles),
• Thank you ing. Wim Van Daele for SEM microscopy (Ghent University, Cel Corrosion),
• Thank you prof. dr. ir. Wim Van Paepegem and prof. dr. ir. Joris Degrieck for your help with composite characterisation,
• Thank you ing. Tommy de Ghein for full-scale static tests of polymer elements (Ghent University, Laboratory Magnel) under supervision of prof. dr. ir. Luc Taerwe,
• Thank you ing. Michel De Waele, ing. Andries Vandevyver (Belgian Institute for Welding) for optical microscopy,
• Thank you ir. Karen Vercammen at VITO (Flemisch Institute for Technological Research) and dr. ir. Karel Van Acker for surface contact angle measurements.
Parts of my research were possible through co-operation with industrial partners. I would like to acknowledge them sincerely for delivering test materials and for agreeing to report test results:
• Mr. Freddy De Bruyne from Quadrant EPP (Tielt, Belgium) delivered thermoplastic test materials,
• Mr. Koen Peeters and Mr. Philippe Cantillon from Dupont de Nemours (Mechelen, Belgium) delivered different polyimide grades,
• The Nederlandse Rijkswaterstaat, especially ing. J.S. Leendertz and ing. E. Suister, involved our laboratory in the redesign of the Maeslant storm surge barrier. The experiences with practical design were an additional value for my PhD research. I express also my appreciation to ir. Ludo Van Schepdael (Solico BV, Oosterhout, The Netherlands) for results of numerical simulations.

(ii) I am deeply grateful to prof. N.D. Spencer and prof. P. Smith offering me possibilities for a short stay as a visiting student at ETH, Zürich in September 2006. It was an unforgettable experience and real motivation for further scientific research. The members of the examination committee spent a lot of time reading this work, but their comments were very useful and they offered plenty of suggestions to be considered for further research. Parts of this research were financially sponsored by the Fund for Scientific Research of the Flemish Community (FWO G.0295.01) and the Research Fund of Ghent University (BOF 01109098). But most of all, my parents and family supported and encouraged me throughout the course of this PhD study. The interest of friends after weekly concert band rehearsals and relaxing moments I found among them stimulated me to finish this work.
Thank you all once again,
Pieter Gent, February 2007

(iii)
Summary.
Polymers are used in dry sliding applications such as bearings, due to self-lubricating ability. Most experimental work from literature on friction and wear mechanisms focuses on mechanical effects causing transfer and results from small-scale testing. Friction and wear of polymers are mainly influenced by visco-elastic deformation and sliding temperature while also depending on the test configuration. In present work, tribophysical or tribochemical effects on worn polymer surfaces and polymer debris after sliding against steel are investigated on micro-scale explaining transitions in tribological performance. Extrapolations of friction and wear data from small-scale testing towards large-scale testing are discussed in relation to polymer structures and wear debris mobility depending on the contact area size. Sliding applications at either high-temperature (100 to 260°C) or high-load (8 to 150 MPa) conditions are covered in this work, using high-performance polymers such as sintered or thermoplastic polyimide, or engineering polymers such as polyamide, polyoxymethylene, polyethylene terephthalate and polyethylene. Experimental techniques are presented in a first part of this work. Small-scale sliding tests are done on a standard cylinder-on-plate configuration and large-scale sliding is done on flat-on-flat configurations, showing acceptable statistical variation and inter-laboratorial repeatability. An analytical model to calculate the maximum polymer sur-face temperature T* during sliding is introduced and verified. A change from integrated flash temperature concept to bulk temperature concept should be considered at high loads, agreeing to a transition in visco-elastic polymer deformation. Raman spectro-scopy and thermo-analytical polymer analysis are used to characterise wear products. The importance of wear debris interactions forming transfer is demonstrated like this. Micro-scale to small-scale relations in friction and wear for polyimides are investigated in the second part of this work. Sintered polyimides show high friction and wear under atmospheric conditions, which are mechanically controlled by brittleness at high loads. A transition to low friction and stable wear manifests above 180°C, related to chemical effects such as hydrolysis at low temperature and imidisation at high temperature. Molecular orientation for semi-thermosetting polyimide is mainly concentrated on side groups at low load and on the backbone structure at high load. Imidisation corresponds to a transition from transverse orientation into axial orientation. Transfer of sintered polyimides is often island-like and depends on either humidity or counterface type being steel or diamond-like carbon coatings. Coefficients of friction on different counterfaces are classified according to surface energy measurements, while the wear rates depend on the production of abrasive third bodies during sliding. Thermoplastic polyimides show thermo-mechanically controlled sliding and homogeneous transfer depending on normal load and sliding velocity. Chemical modifications and degradation are noted at high temperatures. Molecular orientation for thermoplastic polyimide is mainly located on the backbone structure. The efficiency of graphite additives for sintered polyimide causing smooth sliding is restricted to specific sliding conditions.

(iv) Polytetrafluouroethylene additives for thermoplastic polyimide provide smooth sliding over the entire testing interval. Small-scale to large-scale testing correlations for engineering polymers are discussed in the third part of this work. The most common parameter to characterise tribological data for polymers is the contact pressure x sliding velocity (pv-value), but its use seems restricted to a single testing scale. Four experimental models comparing small-scale and large-scale tribological data are evaluated with a single or two mechanical parameters. The most extensive is a macroscopic geometry model considering the influence of thermal effects, sample geometry and contact conditions. Coefficients of friction for pure polyacetals are in agreement for both testing scales. Correlating friction for pure polyamide should consider the effect of crystallisation. Extrapolation of wear rates is not possible due to transitions between mild wear, softening and melting and need specific large-scale testing. Friction and wear data for solid lubricated or internally oil lubricated polymers are more difficult to extrapolate due to interactions of lubricant supply with softening, melting and deformation of the polymer bulk as presently investigated for different polyamide grades. Differences depending on the testing scale are attributed to limited debris mobility within large contact areas, promoting homogeneous film formation on either the counterface or the polymer surface. High-temperature sliding tests on small-scale are not representative for high-load tests on large-scale. Different polymer structures are observed after high-load and high-temperature sliding: orientation concentrates in either a crystalline phase (high temperature) or a rigid amorphous phase (high load). Mainly post-polymerisation of debris improves the homogeneity of the transfer film for polyesters, while crystallisation causes coherent but unfavourable transfer. The influences of recoverable or permanent creep were illustrated from static loading tests and agree to transitions in sliding performance. Large-scale to full-scale extrapolation is illustrated in the fourth part of this work by a case study on the redesign of a ball-joint incorporating polymer pads as bearing elements (Dutch Ministry of Transport, Water Management and Public Works). Representative large-scale test conditions are determined from a global analysis of the ball-joint construction. The local stresses and deformation for a constrained polymer pad are analysed from a numerical model (Solico BV). Functioning of polymers above yield strength provides stable sliding but it requires dimensional stabilisation with an epoxy composite reinforcing ring. Shear failure observed after full-scale static and dynamic testing is avoided by optimisation of the geometry and processing parameters. A representative failure criterion for strength of reinforcing composite rings can be scaled from full-scale testing to small-scale short-beam-shear testing. General conclusions are made in the fifth part of this work, relating the effect of variations in polymer structure to sliding properties and giving an overview of the demonstrated sliding mechanisms. Further research should be directed on either fundamental knowledge on the effect of polymer structure on nano-scale or either applied research on a quantitative classification of wear debris or in-situ measurements.

(v)
Samenvatting.
Kunststoffen functioneren onder droge wrijving en worden gebruikt in lagers omwille van hun zelfsmerende eigenschappen. De meeste literatuurgegevens omtrent wrijving en slijtagemechanismen zijn gericht op mechanische effecten die de overdracht van kunststof naar het tegenloopvlak beschrijven. Bovendien gebeurt experimenteel onder-zoek meestal op kleinschalige testopstellingen. Het wrijvings- en slijtagegedrag van kunststoffen is echter sterk afhankelijk van het visco-elastische gedrag, de glijtempe-ratuur en de testconfiguratie. Het voorliggend werk beschrijft de fysische en chemische effecten die optreden gedurende het glijden van kunststoffen tegen staal, door karakte-risatie van gesleten kunststofoppervlakken en slijtagepartikels. Overgangen in wrijving en/of slijtageverloop kunnen zo beter verklaard worden. Kleinschalige testresultaten worden daarna vergeleken met grootschalige proeven en verschillen worden verklaard door o.a. het ontwikkelen van andere materiaalstructuren of de invloed van de grootte van het contactoppervlak op de beweeglijkheid van slijtagepartikels. Glijtoepassingen onder hoge temperatuur (100 tot 260°C) of hoge contactdruk (8 tot 150 MPa) worden in dit werk besproken. Daarvoor worden testen uitgevoerd met hoogwaardige kunststoffen zoals gesinterd of thermoplastisch polyimide, of technische kunststoffen zoals polyamide, polyoxymethyleen, polyethyleen tereftalaat en polyethyleen. Een eerste deel van dit werk presenteert de experimentele technieken. Kleinschalige glijtesten worden uitgevoerd met een cilinder-op-plaat opstelling en grootschalige testen worden uitgevoerd met een plaat-op-plaat configuratie. De statistische spreiding en herhaalbaarheid van de testen zijn aanvaardbaar. De maximale glijtemperatuur T* aan het kunststofoppervlak kan berekend worden met een analytisch model dat wordt geïntroduceerd en geverifieerd. Het gebruikte model is gebaseerd op een integratie van piektemperaturen maar is niet geldig bij hoge drukken. In het laatste geval worden de berekende bulktemperaturen belangrijk, in overeenstemming met visco-elastische vervorming. Raman spectroscopie and thermo-analytische analyses worden gebruikt om slijtageprodukten te karakteriseren. Het belang van interacties tussen slijtagepartikels om een coherente film te vormen op het tegenloopvlak is aldus aangetoond. Een tweede deel van dit werk toont relaties tussen microschaal en kleinschalige glij-testen voor polyimides. Gesinterde polyimides vertonen hoge wrijving en slijtage onder atmosferische omstandigheden, mechanisch gecontroleerd door brosheid onder hoge belastingen. Een overgang naar lage wrijving en stabiele slijtagesnelheden komt voor boven 180°C omwille van chemische effecten zoals hydrolyse bij lage temperatuur en imidisatie bij hoge temperatuur. De oriëntatie van moleculaire ketens voor semi-thermohardend polyimide gebeurt vooral ter hoogte van de functionele zijgroepen bij lage belasting and in de hoofdketen bij hoge belasting. Imidisatie veroorzaakt een over-gang van transversale naar axiale oriëntatie. De materiaaloverdracht van gesinterd polyimide naar koolstofstaal is niet homogeen en gebeurt onder de vorm van afzonder-

(vi) lijke eilandjes. Dit gedrag hangt af van de relatieve vochtigheid of de keuze van het tegenmateriaal (vb. staalsoort of diamantachtige deklaag). De wrijvingscoëfficiënten voor polyimide in contact met verschillende tegenloopvlaken verhogen met de oppervlakte-energie, terwijl slijtagesnelheden beïnvloed worden door gegenereerde abrasieve deeltjes. Wrijving en slijtage voor thermoplastische polyimides zijn thermo-mechanisch gecontroleerd door de normaalbelasting en de glijsnelheid. Chemische veranderingen en degradatie gebeuren op hoge temperatuur. Moleculaire oriëntatie van thermoplastisch polyimide gebeurt hoofdzakelijk in de hoofdketens. Toevoegingen van grafiet als intern smeermiddel voor gesinterd polyimide is slechts efficiënt onder speci-fieke glijvoorwaarden. Additieven van polytetrafluoroethyleen voor thermoplastisch polyimide zijn gunstig over het volledige testinterval voor vermindering van wrijving en slijtagesnelheden. Een derde deel van dit werk beschrijft verbanden tussen klein- en grootschalige test-resultaten. Tribologische data voor kunststoffen worden veelal gekarakteriseerd door het product van contactdruk en glijsnelheid (pv-parameter), maar die parameter blijkt beperkt voor een enkele testopstelling. Kleinschalige en grootschalige proeven worden vergeleken aan de hand van vier experimentele modellen die een enkele of twee mechanische testparameters beschrijven. Het meest uitgebreid is een macroscopisch extrapolatiemodel dat de invloed van temperatuurseffecten, monstergeometrie en contactvoorwaarden omvat. Wrijvingscoëfficiënten voor ongevuld polyacetal stemmen overeen op klein- en grootschalige testen. Relaties voor polyamides hangen sterk af van het optreden van kristallisatie. Slijtagesnelheden kunnen moeilijk geëxtrapoleerd worden over verschillende testopstellingen heen als gevolg van overgangen tussen milde slijtage, verweking en smelten: specifieke grootschalige testen zijn hiervoor nuttig. Voor kunststoffen met interne vaste smeermiddelen of olie zijn er moeilijk verbanden te vinden tussen klein- en grootschalige testen door interactie van smeermechanismen met verweking, smelten of vervorming van de bulk kunststof. Verschillen in het tribologische gedrag naargelang de testschaal zijn een gevolg van de ophoping van slijtagepartikels in grootschalige contactoppervlakken, zodat een homogene film op zowel het tegenoppervlak of het kunststofoppervlak zich gemakkelijker vormt. Kleinschalige testen op hoge temperatuur zijn niet representatief voor grootschalige testen onder hoge contactdruk. De veranderingen in microstructuur van kunststoffen is immers verschillend: ofwel gebeurt de oriëntatie in een kristallijne fase (hoge temperatuur) ofwel gebeurt die in een georiënteerde amorfe fase (hoge druk). Polymerisatie van polyester slijtagepartikels bevordert de homogeniteit van de overdrachtsfilm, terwijl kristallisatie aanleiding heeft tot een coherente maar ruwere film. De invloeden van omkeerbare of permanente vervormingen zijn aangetoond door statische drukproeven en zijn in overeenstemming met overgangen in glijgedrag. In een vierde deel van dit werk wordt aangetoond hoe grootschalige laboratorium-proeven gerelateerd worden met een werkelijke toepassing. Er wordt hiervoor een gevallenstudie gebruikt over het herontwerp van de glijvlakken in een bolscharnier, waarbij kunststofelementen als glij- en draagvlak dienen (Nederlandse Rijkswaterstaat). Representatieve testvoorwaarden worden afgeleid uit een globale analyse van de constructie. De lokale spanningen en vervormingen in een verstevigd kunststofelement worden geanalyseerd door interpretatie van numerieke simulaties (Solico BV). Het functioneren van kunststofelementen onder belastingen boven de vloeigrens levert stabiele glijeigenschappen, maar het vereist dimensionele stabilisatie door een verstevigingsring van epoxy composiet. Na het testen van kunststofelementen op volle

(vii) schaalgrootte onder statische en dynamische belastingen ontstaan er afschuivingsbreuken in de composietring, die vermeden worden door aangepast ontwerp en betere controle van de procesvoorwaarden. Een representatief schadecriterium voor de sterkte van de verstevigingsringen kan verschaald worden van een test op volle schaalgrootte naar kleinschalige testen. De algemene besluiten van dit werk zijn samengebracht in een vijfde deel. De veranderingen in microstructuur van kunststoffen gedurende het glijden wordt gerelateerd tot het wrijvings- en slijtagegedrag. Er wordt een overzicht gegeven van de glijmechanismen die vaak specifiek zijn voor een bepaalde kunststof. Verder onderzoek naar de glijeigenschappen van kunststoffen moet gericht zijn op fundamentele kennis over het effect van polymeerstructuren op nanoschaal of kan eerder toegepast onderzoek zijn naar ofwel een kwantitatieve beschrijving van slijtagepartikels of het ontwikkelen van in-situ meetprocedures.

(viii)

List of contents (ix)
Doctoral Thesis.
List of Contents.
Chapter 1. An introduction to polymer tribology 1.1. Tribological polymers 1.2. State-of-the-art on polymer friction and wear
1.2.1. Fundamentals of friction 1.2.2. Fundamentals of wear 1.2.3. Self lubricating properties and polymer structure 1.2.4. Theoretical influence of sliding parameters
1.2.4.1. Effect of normal load 1.2.4.2. Effect of sliding velocity 1.2.4.3. Effect of temperature
1.2.5. Friction and wear results reported in literature 1.3. Applications and challenges
1.3.1. High temperature sliding 1.3.2. High load sliding
1.4. Conclusions Chapter 2. Goals and Methodology of this work 2.1. Micro-scale and small-scale phenomena 2.2. Small-scale to large-scale extrapolation 2.3. Large-scale testing to full-scale design Chapter 3. Test materials 3.1. Overview 3.2. Engineering polymers 3.2.1. Polyamides (PA) 3.2.2. Polyoxymethylene homopolymer (POM-H) 3.2.3. Polyethyleneterephtalate (PET)
3.2.4. Ultra-high molecular weight polyethylene (UHMWPE) and carbon fiber/epoxy composite (CFR-E) reinforcing ring
3.3. High performance polymers 3.3.1. Polyimide synthesis 3.3.2. Sintered polyimides (SP) 3.3.3. Thermoplastic polyimides (TP)
3.4. Counterface types
PART 1. INTRODUCTION AND EXPERIMENTAL CONDITIONS
233456689
1012121314
202122
242828293031
3232353738

List of contents (x) 3.4.1. Physical properties of counterfaces 3.4.2. Steel counterface types 3.4.3. Diamond-like carbon coated counterfaces
3.5. Conclusions
Chapter 4. Tribotesting and Analysis 4.1. Introduction 4.2. Small-scale friction and wear testing 4.2.1. Small-scale testing device 4.2.2. Small-scale test conditions 4.2.3. Preliminary test: statistical analysis and influence of test geometry 4.3. Large-scale friction and wear testing 4.3.1. Large-scale testing device 4.3.2. Large-scale test conditions 4.3.3. Preliminary evaluation 4.4. Contact conditions 4.4.1. Contact geometries 4.4.2. Counterface roughness conditions 4.5. Surface temperature 4.5.1. Bulk temperature 4.5.1.1. Experimental bulk temperature measurements 4.5.1.2. Theoretical bulk temperature rise 4.5.1.3. Evaluation of experimental and theoretical bulk temperature 4.5.2. Maximum polymer surface temperature T*
4.5.3. Asperity flash temperature Tf 4.6. Wear Analysing Techniques 4.6.1. On-line and off-line wear measurement 4.6.2. Post-mortem microscopy 4.6.3. Post-mortem thermo-analytical analysis 4.6.3.1. Differential Scanning Calorimetry 4.6.3.2. Differential Thermal Analysis / ThermoGravimetric Analysis 4.6.4. Post-mortem Fourier Transform Raman Spectroscopy 4.7. Conclusions
Chapter 5. Polyimides under atmospheric conditions: influence of normal load,
sliding velocity, test environment and composition 5.1. Introduction 5.2. Sliding of pure and filled sintered polyimides under atmospheric conditions 5.2.1. Static creep and deformation 5.2.2. Friction results under standard atmosphere
5.2.2.1. Influence of sliding velocity on friction 5.2.2.2. Influence of normal load on friction
PART 2. SMALL-SCALE SLIDING OF HIGH-PERFORMANCE POLYIMIDES
39 39 42 46
52 53 53 54 54
59 59 60 61 62 62 67 70 71 71 73 77
79 80 82 82 83 83 84 85
86 88
949596979899

List of contents (xi) 5.2.3. Wear results under standard atmosphere
5.2.3.1. Influence of sliding velocity and normal load on wear 5.2.3.2. Influence of creep and deformation on wear
5.2.4. Counterface and transfer evaluation 5.3. Sliding of pure and filled thermoplastic polyimides under atmospheric conditions 5.3.1. Static loading 5.3.2. Friction results under standard atmosphere 5.3.3. Wear and deformation under standard atmosphere 5.3.4. Counterface and transfer evaluation 5.4. Discussions on the influence of test conditions 5.4.1. Influence of pv-factor and spontaneous frictional heating 5.4.2. Influence of relative humidity 5.5. Conclusions Chapter 6. Thermal influences on tribology and micro structure of polyimides 6.1. Introduction 6.2. Thermal transitions in friction and wear of unfilled polyimide 6.2.1. Sintered and thermoplastic polyimide at mild load conditions (50 N) 6.2.2. Sintered polyimide at high load conditions (100 to 200 N) 6.3. Bulk temperature and maximum polymer surface temperature T* 6.4. Efficiency of fillers at high temperature 6.4.1. Graphite additives for sintered polyimide 6.4.2. Thermoplastic additives (PTFE) for thermoplastic polyimide 6.5. Microscopic surface evaluation 6.5.1. Polyimide transfer films on steel surfaces
6.5.1.1. Transfer for pure sintered and thermoplastic polyimides at high temperature
6.5.1.2. Optical microscopy of transfer for filled polyimides 6.5.2. Sliding surfaces of sintered and thermoplastic polyimide 6.5.2.1. Pure sintered and thermoplastic sliding surfaces 6.5.2.2. Sliding surfaces of graphite and PTFE filled polyimide 6.6. Thermo-analytical analysis of polyimide wear debris 6.6.1. Thermal stability and transition temperatures of bulk material 6.6.2. Thermo-analytical analysis of sintered wear debris 6.6.3. Thermo-analytical analysis of thermoplastic wear debris 6.6.4. Thermo-analytical Mass Spectroscopy (MS) of sintered wear debris 6.7. Tribophysical analysis of polyimide wear surfaces 6.7.1. Raman spectroscopy and characterisation of bulk material 6.7.2. Raman spectroscopy of worn sintered polyimide surfaces 6.7.2.1. Relation between polyimide and polyamide-acid characteristic groups 6.7.2.2. Relation between polyimide characteristic groups 6.7.3. Raman spectroscopy of worn thermoplastic polyimides 6.8. Discussion on thermal effects 6.8.1. Effect of fillers at high temperature 6.8.2. Parallelism between temperature and humidity 6.9. Conclusions
101 103 104 106 112
112 113 115 117 120 120 124 128
132 133 133 136 138 139 139 142 143 143 143
146 148 148 149 151 151 154 156 160 163 163 167 168
170 174 179 179 180 181

List of contents (xii) Chapter 7. Counterface effects on friction, wear and transfer of polyimide 7.1. Introduction 7.2. Tribological test results 7.2.1. Friction results 7.2.1.1. Friction of polyimide against steel counterfaces 7.2.1.2. Friction of polyimide against diamond-like carbon coatings 7.2.2. Wear results 7.2.2.1. Wear of polyimide against steel counterfaces 7.2.2.2. Wear of polyimide against diamond-like carbon coatings 7.2.3. Summary of experimental friction and wear against different counterfaces 7.3. Surface characterisation 7.3.1. Contact angle measurements and surface energy 7.3.2. Thermal conductivity and maximum polymer surface temperature T* 7.3.3. Transfer evaluation 7.3.4. Roughness measurements of steel and coatings after sliding 7.3.5. Polymer surface microscopy and wear debris morphology 7.4. Discussion on counterface effects influencing tribological performance 7.4.1. Friction mechanisms
7.4.1.1. Friction mechanisms sliding against diamond-like carbon coated counterfaces
7.4.1.2. Friction mechanisms sliding against steel type counterfaces 7.4.2. Wear mechanisms 7.4.2.1. Wear mechanisms sliding against diamond-like carbon coated counterfaces 7.4.2.2. Wear mechanisms sliding against steel type counterfaces 7.4.3. Influence of test environment and polyimide composition 7.5. Conclusions
Chapter 8. Polyamides: Influence of internal lubricants, crystalline structure and
scaling during small-scale and large-scale tribotesting 8.1. Introduction 8.2. Frictional stability and effect of contact conditions at running-in 8.2.1. Meso-scale flat-on-flat testing 8.2.2. Small-scale cylinder-on-plate testing 8.2.3. Large-scale flat-on-flat testing 8.2.4. Discussion on running-in effects for polyamides at different testing scales
8.2.4.1. Influence of deformation and contact situation at running-in 8.2.4.2. Influence of internal lubricant type at running-in
PART 3. SCALING EFFECTS FOR SLIDING OF ENGINEERING POLYMERS
186 188 188 188 190
191 192 193
194
196 196 199 202 206 209 212 212 212
213 214 214
214 215 216
220221221223223226
226
228

List of contents (xiii) 8.3. Friction and wear of pure and filled polyamides at steady-state 8.3.1. Small-scale sliding at steady-state
8.3.1.1. Small-scale sliding stability for pure polyamides 8.3.1.2. Small-scale sliding stability for internally lubricated polyamides
8.3.2. Large-scale sliding in overload prevented by internal lubrication 8.3.2.1. Large-scale sliding stability for pure polyamides in overload 8.3.2.2. Large-scale sliding stability for internally lubricated polyamides in overload
8.3.3. Large-scale sliding in overload prevented by low counterface roughness 8.4. Thermal effects and transfer for polyamides 8.4.1. Discussion on softening and melting of pure polyamides
8.4.1.1. Frictional heating for pure polyamides on small-scale tests 8.4.1.2. Explicit counterface heating for pure polyamides on small-scale tests 8.4.1.3. Frictional heating for pure polyamides on large-scale tests
8.4.2. Discussion on softening and melting of oil filled polyamides 8.4.2.1. Frictional heating for oil lubricated polyamides on small-scale tests 8.4.2.2. Frictional heating for oil lubricated polyamides on large-scale tests
8.4.3. Discussion on softening of solid-lubricant filled polyamides 8.4.3.1. Frictional heating for solid lubricated polyamides on small-scale tests 8.4.3.2. Frictional heating for solid lubricated polyamides on large-scale tests
8.5. Structural effects: DTA-TGA and Raman spectroscopy for pure polyamides with different catalyst 8.5.1. Thermo-analytical analysis of pure cast polyamides: influence of catalyst 8.5.2. Raman spectroscopy of pure cast polyamides: influence of catalyst
8.5.2.1. Raman characterisation of crystalline features in polyamide bulk material 8.5.2.2. Raman characterisation of worn polyamide surfaces
8.6. Extrapolation from small-scale to large-scale testing 8.6.1. Frictional behaviour of pure polyamides 8.6.2. Wear behaviour of pure polyamides 8.6.3. High temperature versus high load sliding 8.7. Conclusions Chapter 9. Polyacetals: Evaluation of scaling phenomena 9.1. Introduction 9.2. Friction of polyoxymethylene homopolymer 9.2.1. Running-in and static friction at large-scale and small-scale sliding 9.2.2. Steady-state friction at large-scale and small-scale sliding
229230232233
233234
234
236
238238238
239
241
244244
246
248248
249
251
251
252252
254257257258260263
270 271 271 273

List of contents (xiv) 9.3. Wear of polyoxymethylene homopolymer 9.3.1. Small-scale wear rates 9.3.2. Large-scale wear rates 9.4. Microscopic surface evaluation 9.4.1. Polymer surfaces 9.4.2. Polymer transfer 9.5. Discussion and characterisation 9.5.1. Evaluation and verification of temperature models 9.5.2. Creep and deformation 9.5.3. Wear mechanisms and transitions 9.5.4. Tribophysical analysis
9.5.4.1. Thermo-analytical analysis of polymer sliding surfaces (DSC) 9.5.4.2. Thermo-analytical analysis of wear debris (DTA-TGA) 9.5.4.3. Raman spectroscopy of polymer sliding surfaces and wear debris
9.6. Extrapolation from small-scale to large-scale testing 9.6.1. Single-mechanical-parameter model
9.6.1.1. Friction as a function of normal load or contact pressure 9.6.1.2. Wear as a function of normal load
9.6.2. Two-mechanical-parameter model 9.6.2.1. Friction as a function of normal load and sliding velocity 9.6.2.2. Wear as a function of normal load and sliding velocity 9.6.2.3. Wear as a function of normal load, sliding velocity and coefficient of friction
9.6.3. Pv temperature-limit model 9.6.4. Macroscopic geometry model
9.6.4.1. Definition of a scaling parameter 9.6.4.2. Scaling of friction 9.6.4.3. Scaling of wear
9.7. Conclusions Chapter 10. Polyesters: Evaluation of scaling phenomena by microstructural changes
and polymerisation of small-scale and large-scale surfaces 10.1. Introduction 10.2. Small-scale and large-scale friction and wear 10.2.1. Small-scale friction and wear of PET and PET/PTFE
10.2.1.1. Influence of normal load, sliding velocity on small-scale
10.2.1.2. Influence of controlled temperature on small-scale 10.2.2. Large-scale friction and wear of PET and PET/PTFE
10.2.2.1. Running-in friction: influence of lubricant and counterface type on large-sale 10.2.2.2. Steady-state friction and temperatures on large-scale 10.2.2.3. Steady-state wear and deformation on large-scale
10.3. Extrapolation from small-scale to large-scale testing 10.3.1. Single-mechanical-parameter model 10.3.2. Two-mechanical-parameter model
276276277278278281283283285289290290
292295
296296296298299299
300300
301302303304305305
310310311311
313314314
315317319319320

List of contents (xv) 10.3.3. Macroscopic geometry model 10.4. Analysis of sliding surfaces 10.4.1. Polymer transfer
10.4.1.1. Small-scale transfer films of PET and PET/PTFE 10.4.1.2. Large-scale transfer films of PET and PET/PTFE
10.4.2. Worn polymer surfaces 10.5. Tribophysical Analysis 10.5.1. Raman spectroscopy of polymer surfaces
10.5.1.1. Lubricant deposition 10.5.1.2. Orientation and conformational changes
10.5.2. Thermo-analytical analysis of the wear debris 10.6. Conclusions
Chapter 11. Design of high-loaded polymer bearing elements in a functional ball-joint. 11.1. Global analysis of bearing elements for a ball-joint 11.1.1. Design problem and modification 11.1.2. Analysis of an elastic bearing interlayer 11.2. Experimental large-scale testing of bearing elements 11.2.1. Full-scale static compression and creep tests
11.2.1.1. Test program 11.2.1.2. Stress versus strain characteristics in full-scale compression test 11.2.1.3. Creep in full-scale compression test 11.2.1.4. Recovery and permanent deformation
11.2.2. Large-scale dynamic sliding tests 11.2.2.1. Test program 11.2.2.2. Influence of normal load and counterface type 11.2.2.3. Influence of preload and perpendicular wear path 11.2.2.4. Influence of external grease lubricant
11.3. Local analysis of constrained bearing elements 11.3.1. Preliminary study on different pad geometries by two-dimensional FEM-simulation at low load
11.3.1.1. Short-time loading (static deformation) 11.3.1.2. Long-time loading (creep deformation)
11.3.2. Local design analysis by three-dimensional FEM-simulation at high load
11.3.2.1. Influence of counterface geometry: contact model 11.3.2.2. A transition in elasticity modulus at high loads for constrained polymer pads
11.4. Creep reinforcement design with a composite ring 11.4.1. Full-scale fracture phenomena
11.4.1.1. Observations of full-scale failure 11.4.1.2. Full-scale stress analysis
11.4.2. Small-scale verification
PART 4. DESIGN STUDY FOR HIGH-LOADED BEARING ELEMENTS
321322322322325328330331332334340343
348 348 350 352 352 352 353
354 355 357 357 358 359 359 361 361
361 363 363
364 365
368 369 369 370 371

List of contents (xvi) 11.4.2.1. Short-beam-shear (SBS) tests 11.4.2.2. Uniaxial compression (UC) tests
11.4.3. Discussion 11.4.3.1. Interpretation of various testing scales 11.4.3.2. Optimisation of composite geometry and production parameters
11.5. Practical implementation 11.6. Conclusions
Chapter 12. General conclusions and recommendations 12.1. General Conclusions 12.1.1. Contribution of this work to polymer tribology 12.1.2. Analysis methods used in this work 12.1.3. Relations between different testing scales
12.1.3.1. Micro-scale to small-scale 12.1.3.2. Small-scale to large-scale 12.1.3.3. Large-scale to full-scale
12.2. Recommendations for further research 12.2.1. Fundamental research 12.2.2. Applied research and implementation Curriculum Vitae
PART 5. CONCLUSIONS AND FURTHER RESEARCH
371 373 376 376 376
378 379
382 382 382 383 384 387 387 388 388 390
393

List of contents (xvii)
List of symbols and abbreviations. °C a A A′ Å A/D Aavg
Aeff
AH AISI Al2O3 Amax
a.m.u. ASTM at % a.u. b c C c’, c” ca. CFR-E cm Cr d DC DIN DLC DLN DSC DTA e E E E′ EDX EN Fdyn
Fl FN
Fr
degree celcius thermal diffusivity apparent contact area real contact area Angström analogue / digital average area factor effective cross section static Hertz contact area American Institute for Steel and Iron alumina maximum area factor atomic mass unit American Standard for Testing Materials atomic percentage arbitrary units semi contact width specific heat capacity complex heat capacity complex specific heat capacity circa carbon-fiber reinforced epoxy centimeter chromium measuring distance direct current German Standard diamond-like carbon diamond-like nanocomposite differential scanning calorimetry differential thermal analysis elongation (at break) elasticity or Younng’s modulus percentage of relative error equivalent modulus of elasticity energy dispersive x-ray analysis European normalisation dynamic friction force friction force at left-hand side normal load friction force at right-hand side
FS
Fstat FT Fy, Fz G GPa h H HA HB HDPE HDT HRC HV Hz I ILSS J / kJ k, k1, k2, k3 K K keV kg kN kV ℓ L l2,f LCP Lmin LVDT m m m M-DSC Mg mN Mn Mn
critical normal load (seizure) static friction force Fourier transform force components geometrical factor gigapascal (109 Pa) hour(s) enthalpy high-alloy Brinell hardness high density polyethylene heat deflection temperature Rockwell C hardness Vickers hardness Hertz intensity interlaminar shear strength joule / kilojoule thermal conductivity constant Kelvin kilo-electronvolt kilogram kilonewton kilovolt semi contact length sample length equivalent heat diffusion distance liquid crystalline polymer minimum sample length linear displacement transducer coefficient mass meter modulated differential scanning calorimetry magnesium millinewton manganese number-average molecular weight

List of contents (xviii) Mo MoS2 MPa MS Mw
mm n n N N Na Ni NiP nm O ODA p Pa PA PA 6 PAA PA-CVD PA-Na PA-Mg PAo1 PAo2 PAs1 PAs2 Pc PC Pe PE PEEK PET pH, avg
pH, max PI PMDA PMMA Pnc Pno POM POM-C POM-H PP PPS PS PTFE pv PVC q Q
molybdenium molybdenium disulphide megapascal mass spectrometry weight-average molecular weight millimeter coefficient number of tests (statistical) Newton nitrogen sodium nickel nickel phosphate nanometer oxygen oxydianyline contact pressure Pascal polyamide polyamide 6 polyamic acid plasma assisted chemical vapour deposition polyamide sodium catalysed polyamide magnesium catalysed polyamide oil-filled homogeneous polyamide oil-filled in holed polyamide solid-lubricant filled polyamide solid-lubricant filled probability for structural collapse polycarbonate Peclet polyethylene polyetheretherketone polyethylene terephthalate average Hertz contact pressure maximum Hertz contact pressure polyimide pyromellitic dianhydride polymethylmethacrylate probability for not closing probability for not opening polyoxymethylene polyoxymethylene copolymer polyoxymethylene homopolyer polypropylene polyphenylenesulphide polystyrene polytetrafluoroethylene contact pressure x sliding velocity polyvinylchloride heat flux (W/m2) total energy input (W)
R2 ra
r1, r2 R′ R, R1, R2 Ra Re RH Rm Rp Rt Rv Rz s S SBS SEM Si SP SP-1 SP-2 t T* T1, T2 Tb Tc
Tcc Tenv Tf Tg TGA Thydrat Tm TP TP-1 TP-2 Trex
UC UHMWPE UK v V vol % w W wt% XPS
statistical significance asperity radius heat partitioning coefficients equivalent radius radius of polymer cylinder average roughness yield strength relative humidity tensile strength maximum peak height roughness peak-to-valley roughness maximum valley depth to mean-line roughness mean roughness depth sliding stroke standard deviation short-beam-shear scanning electron microscopy silicon sintered polyimide sintered polyimide pure sintered polyimide graphite-filled time maximum polymer surface temperature sample dimensions (UC-test) bulktemperature crystallisation temperature cold crystallisation temperature environmental temperature flash temperature glass transition temperature thermogravimetric analysis hydration temperature melting temperature thermoplastic polyimide thermoplastic polyimide pure thermoplastic polyimide PTFE-filled recrystallisation temperature uniaxial compression ultra-high molecular weight polyethylene United Kingdom sliding velocity Volt volumetric percentage (volumetric) wear rate Watt weight percentage X-ray photon spectroscopy

List of contents (xix) z Zn
α α, β, γ δΗ
ε ε0 ∆g
∆g0
∆hv
∆hm
∆Hm
∆hc
∆ht
∆hv,corr
∆l ∆R ∆Ra
∆Rt
∆Τavg
∆Τmax ∆Τb, steel ∆Τb, polymer ∆Τf
γd γp η λc µ µ0 µd µd,max µd,min
µG;d µL;s1;d
µL;sn;d µs1
µsn,max
depth beneath contact surface zinc
statistical significance level crystalline phases (polyamide) relative approach or Hertz deformation creep strain initial strain weight loss mean weight loss on-line vertical displacement post-mortem diameter reduction (micrometer measurement) melting enthalpy creep thermal expansion corrected vertical displacement vertical indentation radius difference change in average roughness change in peak-to-valley roughness average temperature rise maximum temperature rise steel bulk temperature rise polymer bulk temperature rise flash temperature rise dispersive surface energy polar surface energy viscosity cut-off length coefficient of friction mean coefficient of friction dynamic coefficient of friction maximum dynamic coefficient of friction minimum dynamic coefficient of friction global design coefficient of friction local design coefficient of static friction at initial start local design coefficient of static friction at steady-state static coefficient of friction at initial start static coefficient of friction at steady-state (max value)
µsn,min µs
µm ρ σ, σXX, σYY, σZZ σmax θ χm τmax
τXY ν ϕX, ϕY, ϕΖ Ω
static coefficient of friction at steady-state (min value) static coefficient of friction micrometer density stress and stress components maximum compressive stress (UC-test) contact angle modelling or design factor maximum shear stress radial-tangential shear stress Poisson coefficient rotation angles electrical resistance (Ohm)
Greek symbols

List of contents (xx)

1
Chapter 1.
An Introduction to Polymer Tribology.
Goals
• To introduce thermoplastic polymers frequently used in tribology • To describe theoretical concepts on friction, deformation and adhesion of
polymers • To describe theoretical concepts on wear for polymers
• To describe the origin and effects of a polymer transfer film in relation to the
polymer structure
• To review theorectical influences of normal load and sliding velocity
• To determine the main influencing parameters on sliding performance
• To select new application areas for polymer tribology
Methodology
• Literature review
Wear of Materials, 2003, Washington (USA)

Chapter 1. An introduction to polymer tribology 2 1.1. Tribological polymers Besides corrosion and fatigue, friction and wear are the main reasons for damage of machine elements such as guiding systems, gears, journal bearings, shafts, ball- bearings, etc… The sliding properties between two bodies are generally favoured by an oil or grease film. However, the design of an appropriate lubricating system is often difficult and lubricants degrade under severe working conditions of high load, low sliding velocities and high temperatures. Lubricant failure then leads to catastrophic damage of the entire construction through cold-welding spots. Moreover, oils and greases are likely avoided for hygienic and/or ecological reasons. Over the past twenty years, interest has increased in replacing metal parts by self-lubricating polymer parts with stable friction, low wear and additional damping charac-teristics, excluding external lubricants. Thermosetting epoxies do not soften and are mainly used in combination with additives and fiber reinforcement for good sliding pro-perties. Thermoplastics are prone to softening and tribologists often classify them into three groups, according to Figure 1.1: the ‘smooth molecular profiles’ such as ultra-high molecular weight polyethylene (UHMWPE), the commodities or engineering polymers such as polyamides (PA), polyacetals (POM) or polyethylene terephthalate (PET) and amorphous polymers such as polymethylmetacrylate (PMMA). During sliding, approxi-mately 90 % of the mechanical energy input converts into heat and results in a surface temperature rise. The application range of engineering polymers is therefore limited to relatively low sliding velocities and low loads, due to low thermal stability and creep. High-performance polymers such as polyimides (PI), polyetheretherketone (PEEK) or polyphenylenesulphide (PPS) are needed to resist high loads and temperatures. Their sliding properties can be altered by adding solid lubricants with lamellar structure such as, e.g., graphite, polytetrafluoroethylene (PTFE) or molybdeniumdisulfide (MoS2), allowing for easy shear and sometimes better thermal conductivity of the polymer bulk. Additives should be carefully selected: it is known that PTFE possibly deteriorates the sliding properties of PEEK [1.1] and should be added in narrowly defined percentages.
Figure 1.1 Classification of tribological polymers
Performance
Advanced Engineering Plastics
Engineering Plastics
Standard Plastics
Hot water or steam resistant Thermoformable Transparent/Translucent
General Purpose Structural Thermoformable Bondable
Non-critical, Low Stress Applications (Bondable, Formable)
Imidized Materials Extreme Service Environments HighTemperature High Purity Chemical Resistance
Superior Chemical Resistance Good Wear Resistance
Common Bearing and Wear materials Good Chemical Resistance
Non-critical, Low Stress Applications Good Chemical Resistance

Chapter 1. An introduction to polymer tribology 3 1.2. State-of-the art on polymer friction and wear 1.2.1. Fundamentals of friction Polymers are visco-elastic materials, meaning that they are subjected to elastic (imme-diate) and viscous (time-dependent) deformation upon loading. Their sliding properties are different from other materials used in dry sliding as, e.g., aluminium bronzes. Lancaster [1.2], Hutchings [1.3] and Tewari et al. [1.4] reported that the friction of poly-mers is attributed to two main mechanisms: deformation and adhesion. The deformation mechanism involves dissipation of energy in the contact area. The adhesion component results from breaking bonds between the polymer and the mating surface. Both contributions to friction control the transfer of forces between the polymer sliding part and its counterface and result in micro-structural changes at the sliding interface. The deformation forces arise from hysteresis losses [1.5] in the polymer. Two types of deformation can occur during sliding: firstly, microscopic interactions that account for plastic deformation and displacement of interlocking surface asperities, and secondly, the macroscopic interactions that arise from ploughing induced by surface asperities especially when the surfaces are of different hardness [1.6]. For metals the asperities flow plastically: a detailed study by Tabor [1.7] indicated that the mean pressure that metals can withstand during localized plastic deformation depends little on the shape and size of the contact being deformed, so that friction can be regarded as a material’s con-stant. Polymers have lower elasticity or Young’s moduli compared to steel, implying neither purely plastic nor purely elastic deformation, but intermediate over a wide range of loads. Under reciprocating sliding, the polymer is subjected to cyclic compressive and tensile loads, resulting in the time-dependent dissipation of frictional energy. The adhesion component of friction arises from rupture of attractive forces between two contact bodies. When two surfaces are brought into contact, surface forces of attraction and repulsion act between the atoms or molecules of both approaching surfaces, neutralizing each other at some equilibrium separation. Due to these forces, bonds are formed between the contacting surfaces and junctions develop on the real contact spots. The simple model of junction formation has been proposed by Bowden and Tabor [1.8]. Depending on the intermolecular bonding energy, dispersive forces, dipole-dipole inter-action and hydrogen bonds exist for the majority of polymers. The formation, growth and fracture of interfacial junctions are generally influenced by the nature of surfaces (roughness), surface chemistry (chemical composition, surface energy, additives) and stresses in the surface layers (residual and external static or dynamic). The molecular kinetics at the sliding interface were modelled in the work of Bartenev and Lavrentev [1.9], based on Brownian motions and the formation of junctions that is controlled by the activation energy, vibration frequencies and jump probability of an atom or molecule into a certain direction towards the counterface. The reaction of polymer molecules on sinusoidal adhesive forces exerted by the counterface is described by models of Prandtl [1.10]. Other forces such as electrostatic interactions, capillary action and interdiffusion can play a role in adhesion of some specific systems, although their importance and strength is less important than the chemical van der Waals forces [1.11]. The mechanics of adhesion were reviewed by Johnson [1.12] for elastic and visco-elastic solids, introducing the ‘work of adhesion’, i.e. the work to separate a unit area of the interface, in combination to the deformation at asperity scale.

Chapter 1. An introduction to polymer tribology 4 1.2.2. Fundamentals of wear In order for a polymer body to function as a sliding element, it must support the dynamic stresses induced by the applied load and the tangential friction stresses. If not, it will wear rapidly through plastic deformation or brittle fracture, causing catastrophic failure in some cases. In other cases, the polymer wears rapidly only during a short running-in time until the contact area increases to the point where the polymer supports lower dynamic stress and steady-state conditions with mild wear conditions establish. Czichos [1.13] generally defined wear as material loss mainly depending on the mechanical interaction between two contact bodies, while Kragelskii et al. [1.14] stressed mainly the progressive degradation under repeated loading (fatigue) for rubbers. According to Briscoe [1.15], wear processes are classified as ‘interfacial’ or ‘cohesive’ phenomena, depending on the depth beneath the sliding interface over which they govern. Cohesive wear includes mechanisms that involve the dissipation of frictional energy and its resultant damage in relatively large volumes adjacent to the interface (e.g. abrasion and fatigue). The extent of the affected surface zone is defined by the contact geometry and contact stresses generated in the surface, although having a thickness in the order of the microscopic contact length. Cohesive wear rates are mainly controlled by the cohesive strength and toughness of the bulk polymer. The interfacial wear processes involve the dissipation of frictional energy in much thinner surface regions at larger energy densities (e.g. adhesive wear and chemical processes). It is influenced by the physical or chemical surface properties, which may be significantly different from bulk properties due to high deformation rates and high local temperatures. In practice, however, different wear mechanisms overlap and change as a function of counterface roughness and elasticity modulus of the polymer. For polymers, adhesion is a dominant wear mechanism that is possibly preceded by fatigue and followed by abrasion. Adhesive wear results from shear of the contact junctions between a polymer and its counterface and is characterised by material transfer from the one to the other rubbing surface. If the interfacial bond is stronger than the cohesive forces within the polymer bulk, then bulk material is fractured and polymer transfer takes place. The interfacial junctions together with fracture products and the highly deformed surface layer where shear deformation is concentrated, is generally referred to as a ‘third body’ or more specifically called a ‘transfer layer’ by Bahadur [1.16]. Depending on the ratio of adhe-sive to cohesive forces, shear takes place either within the shear layer of the polymer, either in the transfer layer on the counterface or between both. The transfer layer mostly adheres strongly to the counterface and wear proceeds as material transfer from the poly-mer bulk into the transfer layer. For situations where the transfer layer has low cohesive strength, the film delaminates and adheres to both sliding components. In a strict sense, adhesive polymer wear only occurs when the transfer layer breaks up in particles that are removed from the contact interface as separate wear debris. Abrasive polymer wear occurs through plastic deformation by the indentation of hard counterface asperities (two-body abrasion) or separate particles in the sliding interface (three-body abrasion), resulting in material removal through a combination of ploughing and cutting effects. Its surface aspect is characterised by the formation of longitudinal grooves and debris particles frequently appear as fine cutting chips. Those abrasive mechanisms will not be intently simulated in present work and appropriate literature is referenced for more details [1.17 to 1.19].

Chapter 1. An introduction to polymer tribology 5 1.2.3. Self lubricating properties and polymer structure To understand the lubricating action of polymers, one word on the molecular structure should be said. Consisting of very large molecules with carbon atoms as the main component in their backbone, polymers tend to grow into long chains that can have a molecular weight Mn of several millions depending on the polymerisation conditions. The length and composition of the chain determine the mechanical properties. Thermo-plastics lack cross-links between the long-chain molecules, while thermosettings are highly cross-linked. Depending on their ordering, the molecules either form an amor-phous (isotropic) phase or a crystalline (ordered) phase. The most widely accepted model for the crystalline phase is the folded chain structure: it is based on the fact that complex molecular aggregates, called spherulites, exist through the entire bulk of the solid polymer. The amorphous phase contains a mixture of randomly oriented chains and extended chains serving as links between various folded crystalline domains. If the distance between the folds is larger than 200 nm, the crystal is then designated as an “extended chain crystal”. When no folds are present, it is called a “fully extended chain crystal”. Full crystallisation is however rarely obtained: the structure of a semi-crystal-line polymer with different physical phases is schematically shown in Figure 1.2.
Figure 1.2 Schematic representation of a semi-crystalline polymer structure It appears that an extended chain structure at the surface is often preferred for low friction and wear. Two models for chain unfolding by mechanical deformation have been proposed: (i) by visco-elastic deformation, the chains simply unfold in the direction of the applied force, (ii) by shearing deformation, the chains gradually become tilted by twisting and slipping and orient along the direction of the force. Macromolecules of amorphous polymers (polymethylmetacrylate (PMMA), polystyrene (PS)) are immobile at ambient temperature, leading to brittleness and lower tendency for smooth material transfer. Hence, they wear as polymer flakes originating from crack pro-pagation under friction-induced stresses and usually form inhomogeneous transfer films with low coherence (‘fragmented transfer’). On the other hand, the molecular structure of semi-crystalline polymers is stretched and oriented into the direction of easy shear when used in the rubbery state, i.e. above the glass transition temperature Tg, tending to large material transfer. Macromolecules of thermoplastics become mobile at higher
Folded chain crystals Amorphous oriented chains
Isotropic amorphous phase
Entanglements
Amorphous oriented chains

Chapter 1. An introduction to polymer tribology 6 temperature and it can be expected that material wear occurs by ductile mechanisms. Either a relatively thick and little oriented film of ca. 0.1 to 1.0 µm (‘lumpy transfer’) develops or a very thin and oriented film with thickness of ca. 10 to 50 nm forms (‘smooth transfer’), depending on the molecular composition and/or symmetry. Lumpy transfer generally develops for polymers with low ductility as, e.g., polypropylene (PP) or polyamides (PA), as molecules fracture before they are completely oriented. Thin and continuous transfer films or glazes are the most efficient for stable sliding and have only been observed in a restricted range of sliding conditions for high density polyethylene (HDPE), ultra-high molecular weight polyethylene (UHMWPE), polytetrafluoro-ethylene (PTFE) and polyoxymethylene (POM), or what have been termed smooth molecular profiles polymers with high ductility. Large plastic deformation theoretically induces thicker transfer films with higher deformation and vibrations in the interface. Transfer film removal occurs most likely through cracking or delamination. Polymer molecules in the transfer film are mainly oriented along the sliding direction with conse-quently small strength in the transverse direction. The maximum film thickness at steady-state is limited by adhesive attraction to the counterface and it may loose coherence through chemical degradation, such as chain rupture, or thermal degradation, such as softening or melting. Abrasive film removal is evident in case hard fillers are embedded in the polymer bulk. The resulting debris particle size is mainly determined by the interfacial residence time rather than it depends on the external load or sliding velocity parameters: particles are small (about 3 µm) when immediately evacuated after shear and gradually grow to 10 µm when circulating between the roughness asperities at the interface [1.20]. This behaviour is in contrast to metals, where particles generally become smaller after longer residence time. 1.2.4. Theoretical influence of sliding parameters Friction and wear properties are not intrinsic material’s characteristics, but strongly depend on the entire test system, especially normal loads and sliding velocities. In this paragraph, the latter effects are considered theoretically in parallel to the visco-elastic behaviour of the polymer molecules. In macromolecular systems, stresses result in relatively small deformation forces and extremely high elongation without fracture through time-dependent orientation and relaxation of the molecules. In practice, however, the increase in normal load will affect the tribological performance through an increase in real contact area and in combination with the sliding velocity, the surface temperature mainly influences the polymer sliding properties. 1.2.4.1. Effect of normal load It is generally accepted that the friction force is proportional to the applied normal load (the first law of friction). Experiments of various researchers have however shown that this law is only valid for some polymers tested under specific conditions of low loads and low surface roughness (Table 1.1). Thus, the friction coefficient remains practically constant in the 10 to 100 N load ranges when, e.g., a steel ball of radius 6.35 mm slides over PTFE, PMMA, PVC and PE [1.21, 1.22]. Outside this load range, on the left and right, the proportionality between friction force and applied load breaks down. It was shown that for moderate loads of 0.02 to 1 N the friction coefficient decreases with

Chapter 1. An introduction to polymer tribology 7 Table 1.1. Theoretical effect of load on friction coefficient
Table 1.2. Theoretical effect of sliding velocity on friction coefficient
Author(s) Materials and load Graphical representation Bowers, Clinton and Zisman [1.21] Shooter and Thomas [1.22]
2 to 15 N, steel-polymer (PTFE, PVC, PE) 10 to 40 N, steel-polymer (PTFE, PE, PMMA, PC)
Rees [1.23] 0.02 to 1 N, steel-polymer (PTFE, PE, PA)
Schallamach [1.24] Theory, steel-rubber
Shooter and Tabor [1.25] 10 to 100 N, steel-polymer (PTFE, PE, PMMA, PVC, PA)
Kragelskii [1.26] Theory, steel-rubber
Author(s) Materials and sliding velocity Graphical representation
Shooter and Thomas [1.22] 10-4 to 10-2 m/s, steel-polymer (PTFE, PE, PMMA, PC)
White [1.27] 10-3 to 0.1 m/s, steel-polymer (PTFE, PA)
Flom and Porile [1.28] Schallamach [1.24]
10-2 to 2 m/s, steel-polymer (PTFE) Theory, steel-rubber
Milz and Sargent [1.29] 4.10-2 to 2 m/s, polymer-polymer (PA, PC)
Fort [1.30] 10-7 to 0.1 m/s, steel-polymer (PTFE)
µ
FN µ
FN
µ
FN µ
FN µ
FN
µ
v µ
v µ
v µ
v µ
v

Chapter 1. An introduction to polymer tribology 8 increasing the load [1.23]. Such behaviour is explained by the influence of contact pressure and a gradual increase of the real contact area through elastic deformation of the surface asperities. It is of interest that a similar trend is characteristic for rubbers that typically deform elastically, as theoretically demonstrated by Schallamach [1.24]. The latter indicates the influence of visco-elastic deformation of polymers and rubbers on friction properties, in contrast to metals that mainly flow plastically. On the other side of the proportionality range, the theoretical increase in coefficient of friction for polymers at high loads is often explained by plastic deformation of asperities in contact [1.25]. Friction of rubbers as a function of load generally varies in a manner that was described by Kragelskii [1.26]: the coefficient of friction goes through a minimum that corres-ponds to the transition from elastic into plastic contact. In practice, however, the increase of friction with load is only limited to a combination of low loads and low sliding velocities, not influenced by thermal effects and material transfer. Wear rates increase linearly with sliding distance and normal load (Archard’s law, determined for metals). A critical load exists, however, above which catastrophic failure occurs by high contact stresses exceeding the polymer compressive strength. Based on experimental evidence, this happens for loads higher than a 1/3 factor of the hardness. 1.2.4.2. Effect of sliding velocity It is agreed that the friction force is theoretically independent of the sliding velocity. This statement is approximately valid when the contact temperature does not vary significantly and when the relaxation behaviour of the interface does not change. Speed-independent friction was demonstrated within a limited range of velocities (10-4 to 10-2 m/s) for PTFE, PE, PMMA and PS as in Table 1.2 [1.22]. More complex relationships are most often observed through to the visco-elastic behaviour of polymers. For low velocities, the polymer molecules are progressively stretched in parallel to the imposed sliding motion and viscous resistance in the contact zone increases with increasing velo-city. Therefore, friction slightly increases at low velocities [1.27, 1.28, 1.24]. For high velocities, the molecular polymer chains react stiffer and elastic behaviour becomes prevalent. As a result, the friction force either depends only slightly on the velocity or it decreases with sliding velocity [1.29]. In addition, the duration of contact shortens and the contact area size decreases at high sliding velocities, with a further decrease in the friction force. For intermediate velocities, all the above factors are in competition and a maximum appears in the friction force versus sliding velocity curve with a position depending on the relaxation properties of the polymer [1.30]. For a combination of low sliding velocity and high contact pressures, abnormally viscous flow is often observed for PTFE [1.28], which leads to a sharp rise of viscosity due to velocity increase. Molecular-kinetic considerations also lead to the same dependency [1.9]. It should be recognized that the above relationships depend essentially on the contact temperature. When tests are done near the glass transition temperature, the sliding velocity has a more pronounced effect on friction, whereas at lower temperature friction hardly depends on the sliding velocity due to immobility of the polymer chains. The wear rate is generally characterized by a critical sliding velocity that is the limit between mild and severe wear. Theoretically, polymer molecules do not follow the sliding motion and do not orient along the sliding direction at high sliding velocities. The polymer reacts therefore more brittle and degrades as separate wear debris particles.

Chapter 1. An introduction to polymer tribology 9 1.2.4.3. Effect of temperature Heat generation results from the deformation of material in the real contact spots. Some processes with molecular mechanisms relating to the transformation of mechanical energy into heat happen through plastic deformation, hysteresis, dispersion and viscous flow. Another source of heat is attributed to origination and breakdown of adhesive bonds. These processes are most probably energetically non-equivalent and the energy difference causes the generation or absorption of heat. The resulting distribution of temperature at the contact surface depends on the sliding velocity, normal load, rough-ness, contact geometry and thermal properties of the contact bodies. The frictional heating importantly influences polymer contacts as they have low thermal conductivity. Mechanical properties of a polymer depend strongly on temperature, with a transition from the glassy state (with high strength, high stiffness) into the rubbery state (with lower strength and lower stiffness) above the glass transition temperature. At low temperatures, only small segments of the polymer chains are mobile, while they gain vibrational and rotational freedom at higher temperatures allowing for orientation and transfer to the counterface. Therefore, it is difficult to correlate friction and wear properties of a certain polymer to its mechanical properties. It is mainly near transition temperatures of the polymer structure that the molecular relaxation changes and causes either discontinuities in the tribological behaviour as illustrated for thermoplastics by Lancaster [1.31] or a maximum friction and wear value as illustrated for PE by Uetz and Wiedemeyer [1.32]. As the friction force depends per definition on the product of real contact area and shear strength, the influence of temperature on friction is ambiguous as weakening both causes an increase in the real contact area and a decrease in mechanical strength. Wear rates generally increase near the melting temperature, although they can be lower in the rubbery state compared to the glassy state due to higher toughness. Besides variations in molecular relaxation and structural changes, also irreversible che-mical reactions manifest at high temperatures that cause degradation and finally melting [1.33]. The chemical reactivity at the polymer surface possibly becomes so high that physico-chemical interactions between the sliding surfaces or between the sliding surface and the environment are the origin for specific interfacial bonds. Some reactions are controlled by radical formation. Rhee et al. [1.34] reported that the friction and wear processes at high temperatures are rather controlled by pyrolysis. Thermal and oxidative reactions cause degraded wear particles to incorporate in the transfer film and change its stability. The debris particles created at low temperatures often show stronger cohesion than debris that is partially degraded through formation at high temperatures. On the other hand, non-softened debris particles often do not cohere strongly. The limiting factor in sliding of polymers is clearly the surface temperature, depending on the applied normal load (contact pressure p) and sliding velocity v amongst others. A limiting pv-value is often determined as a technical selection criterion [1.35], as the generated heat is proportional to the product of the coefficient of friction µ, contact pressure p and sliding velocity v. It is important to note that the use of pv-limits is strongly connected to the test configuration. It represents an amount of energy dissipated per unit surface area and serves as a transition between mild and severe wear conditions at steady-state. From previous discussion it follows that an increase in load affects the sliding properties in a different way than an increase in sliding velocity and the pv-limit is only an indicative and not a unique parameter.

Chapter 1. An introduction to polymer tribology 10 1.2.5. Friction and wear results reported in literature From previous considerations, it reveals that tribological studies are on the edge between materials science, surface chemistry and mechanics. Due to the large number of influen-cing parameters, a single universal wear model does not exist and only empirical expres-sions that are valid on one side of a wear transition can be used. One of the earliest and most frequently cited relationships for sliding wear of metals is the Archard equation, stating that the wear volume is proportional to the normal load and the sliding distance. Most information is however hidden in the use of a wear factor k that depends on the type of wear and that should be determined experimentally for a given material. Other wear equations by Ratner et al. [1.36], Lewis [1.37], Rhee [1.38], Lancaster [1.39], Atkinson et al. [1.40], Eiss et al. [1.41], Dowson et al. [1.42] have related the wear volume to the operating variables such as load or contact pressure, sliding velocity and sliding length or duration through a wear constant or a wear coefficient. Other models also include properties such as counterface hardness, asperity height, shear strength of the polymer, etc... Kar and Bahadur [1.43] introduced a non-linear wear equation in 1974, considering explicitly each of the experimental values that appeared to influence the wear process, and defined four dimensionless parameters for which the exponents should be determined experimentally. This model was however based on adhesive wear of polyoxymethylene (POM) and difficult to apply for other polymers. Visanawath et al. [1.44] expanded the equation by including the effects of the counterface roughness and evaluated it for various polymers, including the modulus of elasticity, surface energy and thermal conductivity as material parameters. Scarce, inadequate or incomparable wear data and unclear definitions of wear factors are at the origin of many open questions and doubts in design, which should be solved by engineering practice and best guesses. Literature data on wear rates, even more than those concerning friction, are either very general and difficult to apply for a specific design situation or either too specific in a way they cannot be extrapolated to the case of interest. Friction and wear data show large scatter, each determined by different authors under various wear modes with different sliding conditions. General reference literature with wear coefficients for various materials can be found e.g. in The Tribology Hand- book [1.45] or Fatigue and Tribological Properties of Plastics and Elastomers [1.46]. Table 1.3. Illustration of the variation in literature data on friction and wear rates for UHMWPE
Friction coefficient
Specific wear rate (10-6 mm3/Nm) Test conditions Ref.
0.30 0.20
10 3
Bloc-on-ring, dry steel, 100 N, 0.4 m/s Bloc-on-ring, dry steel, 500 N, 0.4 m/s
[1.47]
0.30 21 Pin-on-disc, dry steel, 1 MPa, 1 m/s [1.48]
0.10 0.20
1.5 0.8
Pin-on-disc, dry stainless steel, 1 MPa (75 N), 0.5 m/s Pin-on-disc, dry stainless steel, 2.5 MPa (188 N), 0.5 m/s
[1.49]
0.20 0.13 0.22
1.0 to 1.6 2.2 0.25
Pin-on-disc, dry Co-Cr, 0.3 MPa, 0.001 m/s Pin-on-disc, dry steel, 0.3 MPa, 0.001 m/s Pin-on-disc, dry stainless steel, 0.3 MPa, 0.001 m/s
[1.50]
0.13 0.23 Pin-on-disc, dry Al2O3, 3 MPa, 0.02 m/s [1.51]

Chapter 1. An introduction to polymer tribology 11 Scatter on wear and friction data found in literature for, e.g., ultra-high molecular weight polyethylene (UHMWPE) is listed in Table 1.3. There have been numerous investiga-tions that explore the influence of test conditions, contact geometry, counterface roughness and test environment on the friction and wear behaviour of polymers. Following summary has not the meaning to be complete, but illustrates the wide variation on available test data. Many literature studies give a general classification of different polymer compositions, based on specifically designed selection tests. Zsidai et al. [1.52] compared dry friction and wear of polyamides, polyesters and polyacetals under reciprocating sliding in line contacts, reporting best performance of the latter two materials. Franklin [1.53] also included PTFE-filled polyacetal and UHMWPE under reciprocating conditions and found lowest wear for UHMPWE. The mutual overlap coefficient (i.e. the ratio between the contact area of pin and area of the wear track) for reciprocating sliding was intro-duced by Abarou et al. [1.54], showing a central zone on the counterface with transfer only for small overlap coefficients and no transfer for large overlap coefficients. In the limit of very small sliding strokes, fretting wear of polymers was studied by Higham et al. [1.55]. Pin-on-disc tests with a continuously rotating motion were done by Vaziri et al. [1.56] on polyethylene, polyacetal, polyvinylchloride and polymethylmetacrylate, indicating low friction for polyethylene and large variations in friction during sliding time mainly for polyacetal. Also Unal et al. [1.57] used a pin-on-disc apparatus with continuous rotating sliding against stainless steel counterfaces. Tanaka et al. [1.58] slid PTFE and polyethylenes against glass plates to investigate the transfer. While PTFE belongs to the most investigated material with low friction due to its layer structure, it cannot withstand high loads and it is nowadays used as internal lubricant into stronger polymer matrices. Later, the influence of water lubrication on transfer was examined [1.59]. Mens et al. [1.60] compared the sliding of polyacetal, polyethylene terephthalate, polyamide, polyetheretherketone in environments of air and water. Friction and wear experiments at very low temperature (77 K) were done by Gradt et al. [1.61]. Polymers for use in food industries were tested under sugar environment by Seabra et al. [1.62]. The tribological characteristics of high-performance materials as PEEK were investigated by Briscoe et al. [1.63] and Hanchi et al. [1.64] in pure form, or by Stuart [1.65], Zhang et al. [1.66] and Lu et al. [1.67] in filled form. It was found that mainly the spherulite size of the crystallites and the hardness of PEEK play an important role in friction performance. Based on experimental results obtained in a series of studies, Stolarski [1.68] presented a comprehensive discussion on the tribological performance of PEEK. An important observation emerging from his work is that, regardless of the con-tact configuration, the wear rate for PEEK (7.4 10-3 mm3/m) is smaller than polyamide (10.10-3 mm3/m), but higher than polyacetal (1.0 10-3 mm3/m). Another interesting finding is that lubrication of PEEK sliding contacts is not very effective and produces effects detrimental to the polymer’s performance. Other research papers dealing with specific friction and wear mechanisms for polymers used in present work will be referenced in later chapters. The influence of sliding parameters was studied, e.g., by Santner et al. [1.69], Brentnall and Lancaster [1.70] and Clerico [1.71] observing that the coefficient of friction for polymers decreases with the increase in load, while Shiao et al. [1.72] and Yamaguchi [1.73] or Ludema et al. [1.74] showed higher friction with the increase in load. The behaviour at low speed and low normal load was studied by Unal et al. [1.75] reporting an increase in friction with normal load. Watanabe et al. [1.76], Tanaka et al. [1.77] and

Chapter 1. An introduction to polymer tribology 12 Bahadur et al. [1.78] reported that tribology of polyamide and polyethylene is much affected by normal load, sliding velocity and temperature. Wang and Li [1.79] reported that the sliding velocity exerts greater influence on sliding wear than load does. Some researchers [1.80-1.81] have looked to the effect of counterface roughness and obtained mixed results. Usually, as the counterface was made smoother, the wear rate of the polymer was found to decrease. Two exceptions were the work of Swikert et al. [1.82] and Dowson et al. [1.83], showing that there is an optimum surface roughness with mini-mum wear for UHMWPE. Experiments on the influence of steel counterface roughness on sliding of unfilled polyacetal were done by Sekiguchi et al. [1.84]. It was found that the friction coefficient decreases for higher initial steel roughness and a minimum friction occurred at optimum roughness values. On the other hand, a change in roughness of the polymer pin did not affect the friction coefficients as much. Hooke et al. [1.85] and Lawrence et al. [1.86] reported that the coefficient of friction and the wear rates can be reduced by selection of a good material combination and appropriate fillers. More fundamental research on the effect of different fillers (e.g. solid lubricants as PTFE, mica, MoS2, or inorganic compounds as oxides, sulphides, fluori-des, or metal powders as Al, Cu, Ag) was done by, e.g., Bahadur and Gong [1.87], Bijwe et al. [1.88], Jain and Bahadur [1.89] or Tanaka [1.90] and many others. 1.3. Applications and challenges Due to chemical inertness and self-lubrication, thermoplastics are used for low to medium loaded tribological purposes, such as seals [1.91], gears [1.92], bearings [1.93], brakes and clutches [1.94], transmission belts [1.95], rollers [1.96], artificial joints [1.97], grinding mills [1.98], engines [1.99] and office automation machinery [1.100]. The sliding applications of plastics and rubbers were summarised Uchiyama [1.101]. Nowadays, polymers should also fit high-demanding sliding systems under extremely high temperature or high load. The tribological properties of polymers are improved by the formation of molecular superstructures in the bulk polymer or by addition of fillers or copolymers. High-performance polymers ensure longer life-expectance and reliability under severe working conditions of either high load or high sliding velocities or high temperature. Polyimides (PI), polyphenylenesulphide (PPS), polyetheretherketone (PEEK) or liquid crystalline polymers (LCP) are believed to fit demands of modern tribological systems due to their strength, load-carrying capacity and thermal resistance. Present work will focus firstly on extremely high temperature sliding conditions and secondly on extremely high load conditions, using either polyimides as small parts at high temperatures or thermoplastic engineering polymers in large constructional parts loaded above the material’s yield strength. 1.3.1. High temperature sliding Polyimides were introduced in the eighties mainly for space applications and films were previously tested under vacuum [1.102], in contact with cooling agents [1.103] or under fretting conditions [1.104]. A breakthrough of polyimides in the latest decennia is due to better control of the production processes on industrial scale. They are recently applied as small and complex parts in daily life, such as automotive devices (fuel system,

Chapter 1. An introduction to polymer tribology 13 transmissions), or in textile, food, pharmaceutical, glass or metal manufacturing and electronic industries. They serve as replacements for chrome-plated piston rings in jet engines, seal rings or niche applications such as high temperature or highly loaded bearings, gears, rollers, in aerospace, chemical industry and nuclear industry. An example of polyimide bushings or thrust plugs used in an electrical motor is shown in Figure 1.3. Using high performance polymers allows for miniaturisation of the bearing length as higher loads and temperatures can be withstood. The flexible shaping processes for polymers allow, e.g., for ‘flanged’ designs able to take a combination of both radial and axial loads, excluding the need of an additional washer [1.105].
Figure 1.3 Application of high-performance polymers in high-temperature sliding [1.106] 1.3.2. High load sliding Off-shore constructions often operate under specific conditions of high load and low sliding velocities. Oil lubricants and greases often fail at high contact pressures as they are squeezed out of the contact interface. Also lubricating thin films (e.g. MoS2 spray coatings) applied to the counterface are removed through wear at high loads. In combi-nation with low sliding velocities, hydrodynamic oil lubrication is not promoted. Seizing of lubricated steel contacts or aluminium bronzes is illustrated in Figure 1.4 after laboratory testing at 60 MPa, 0.005 m/s. To support moving parts in huge constructions as e.g. sea-lock doors or train boggies, roller bearings cannot be used because of their large dimensions and insufficient bearing capacity. Moreover, external oil circuits make the construction complex and enhance exploitation costs, while maintenance and inspection of the lubricated parts are difficult due to low accessibility. Only at some easily replaceable positions, as e.g. guiding rails for bridge positioning systems, external grease lubricants formulated with high-pressure additives are exceptionally tolerated to lower friction. Dry running journal bearings with self-lubricating ability are common alternatives and are nowadays used in off-shore constructions as bearing material. They are designed to fulfil requirements of low friction and/or high wear lifetime under certain type of load
Polyimide bearing
Polyimide thrust plug

Chapter 1. An introduction to polymer tribology 14 (horizontal and/or vertical forces) and movement (linear or rotating). Engineering polymers are used as guidance rails or positioning systems in telescoping cranes (Figure 1.5a), requiring smooth sliding and precise motion control in combination with low wear. Polymer wear pads are applied as sliding elements for the positioning of bridge decks (Figure 1.5b), requiring stable friction while wear is not a main issue as the pads are easily replaced. A design study incorporating polymer bearing elements in an extre-mely high loaded ball-joint will be detailed in the final part of this work. All those appli-cations are typically characterised by high contact pressures, low sliding velocities and need specific design. In order to distribute the contact stresses more equally over the soft polymer elements, large contact surfaces (> 10000 mm2) are applied, which influence e.g. wear debris circulation in the sliding interface and possible transfer film formation.
Figure 1.4 Seizing during steel/steel sliding or aluminium-bronze/steel sliding at 60 MPa, 5 mm/s [1.107]
(a) (b)
Figure 1.5 Application of thermoplastic engineering polymers in high-load / low sliding velocity systems,
(a) crane guidance: load 40 MPa, sliding velocity 0.005 mm/s (Nylatron, Quadrant EPP) [1.108], (b) bridge positioning system: load 90 MPa, sliding velocity 0.005 m/s (Pertuy Constructions) [1.109]
10 mm
polymer pads
polymer guideway

Chapter 1. An introduction to polymer tribology 15
1.4. Conclusions A widespread interest in polymers for sliding applications grew in the mid-20th century due to their self-lubricating ability. The tribological performance of polymers strongly differs from metals due to visco-elastic deformation and dependency on contact temperature:
• Visco-elastic deformation in polymer/steel contacts happens on macro- and micro-scale from partial dissipation of frictional energy. While metal contacts mainly flow plastically, polymers exhibit time-dependent deformation upon loading manifesting as creep and molecular relaxation. Therefore, the contact conditions depend strongly on the contact pressure and sliding velocity. It interferes with the sliding properties mainly through increase in real contact area with time and molecular orientation.
• Polymers have low thermal conductivity and the mechanical properties of thermoplastics progressively weaken by transitions at high temperature from the glassy state into softening and melting.
Polymer friction has two contributions: (i) deformation, depending on mechanical inter- action at the surface asperities and hysteresis in the polymer bulk, and (ii) adhesion, depending on interfacial bonding at the surface. Tribological studies are therefore on the edge of mechanical science, chemistry and material’s science. Early literature studies are mainly based on the approach of sliding mechanisms by mechanical interaction. However, the effect of temperature and transitions in polymer structure on the tribolo-gical properties should be better evaluated. The relation between creep and sliding properties should be taken into account, as it affects the contact conditions. Polymer wear is essentially an adhesive mechanism for low elasticity modulus and low counterface roughness, possibly initiated by fatigue and followed by abrasion. Polymer transfer film formation controls the sliding properties and its morphology depends on the polymer type. Lumpy transfer (low ductility) should be avoided, while a smooth and continuous transfer (high ductility) is preferred for stable sliding. However, variations in sliding parameters are not always clearly related to transitions in transfer morphology, while transfer formation does not necessarily promote low friction and low wear simultaneously. Theoretical influences of normal load and sliding velocities, based on the visco-elastic response of the polymer, are only obtained under specific sliding conditions in practice. The polymer surface temperature seems a decisive factor for tribological performance. Available literature data are very divergent and only valid under specific test conditions and test configurations, making it difficult to compare and/or extrapolate data. Consistent experimental work under a broad range of sliding parameters is needed. Present working range for polymers in sliding applications is limited to low loads and low temperatures. It should be extended towards high temperature sliding or high load/low sliding velocity to cover new applications. For the first category, high-performance plastics are preferred (polyimides), and for the second category, engineering thermoplastics are preferred (polyamides, polyacetal, polyester and polyethylene with eventual internal lubricants).

Chapter 1. An introduction to polymer tribology 16 References [1.1] Friedrich K, Wu JS. Polymer composites with high wear resistance, in: Encyclopedia of Composite
Materials Vol 4, Lee SH (ed.), VCH press (New York), 1991, 225-279, ISBN 0-4711-8760-7 [1.2] Lancaster JK. Dry bearings: a survey of materials and factors affecting their performance, Tribol Internat
6 (1973), 219-252 [1.3] Hutchings IM. Tribology: Friction and Wear of Engineering Materials, Edward Arnold (London), 1992,
ISBN 0-8493-7764-1 [1.4] Tewari US, Sharma SK, Vasudevan P. Polymer tribology, Rev Macromol Chem Phys 29 (1989), 1-38 [1.5] Staverman AJ. Inleiding in de fysica van macromoleculen, Delftse Uitgevers Maatschappij (Delft), 1981,
ISBN 90-6562-010-9 [1.6] Ludema KC, Tabor D. The friction and visco-elastic properties of polymeric solids, Wear 9 (1966), 329-
348 [1.7] Tabor D. Interactions between surfaces: adhesion and friction, in: Surface physics of materials, Blakely
JM (ed.), Academic Press (New York), 1980 [1.8] Bowden FP, Tabor D. Friction and lubrication of solids, Clarendon press (Oxford), 1964, ISBN 0-1985-
0777-1 [1.9] Bartenev GM, Lavrentev VV. Friction and Wear of Polymers, Elsevier (Amsterdam), 1981, ISBN 0-
4444-2000-2 [1.10] Prandtl L. Ein Gedankenmodell zur kinetischen Theorie der festen Korper, Z Angew Math Mech 8
(1928), 85-106, summarised in: Uetz H, Wiedemeyer J. Tribologie der Polymere [1.11] Garbassi F, Morra M, Occhiello E. Polymer surfaces, Wiley and Sons (Chichester), 1998, ISBN 0-4719-
7100-6 [1.12] Johnson KL, Greenwood JA. An adhesion map for the contact of elastic spheres. J Colloid Interf Sci 192
(1997), 326-333 [1.13] Czichos H. Polymer wear and its control. In: Lee LH, ACS Symp Series (1985), 287-293 [1.14] Kragelskii IV, Dobychen MN, Kombolov VS. Friction and wear calculation methods, Pergamon
(Oxford), 1982, ISBN 0-0802-5461-6 [1.15] Briscoe BJ. Wear of polymers: An essay on fundamental aspects, Tribol Internat 14 (1981), 231-243 [1.16] Bahadur S. The development of transfer layers and their role in polymer tribology, Wear 245 (2000), 92-
99 [1.17] Cortellucci R, Heim CJ, Koshy TD. Abrasion of plastics, Wear 47 (1978), 397-405 [1.18] Briscoe BJ, Evans PD, Pelillo E, Sinha SK. Scratching maps for polymers, Wear 200 (1996), 137-147 [1.19] De Pellegrin DV, Stachowiak GW. Evaluating the role of particle distribution and shape in two-body
abrasion by statistical simulation, Tribol Internat 37 (2004), 255-270 [1.20] Fusaro RL. Evaluation of Several Polymer Materials for use as solid lubricants in Space, ASLE Tribol
Trans 31 (1988), 174-181 [1.21] Bowers RC, Clinton WC, Zisman WA. Frictional behaviour of polyethylene, polytetrafluoroethylene,
and halogenated derivates, Lubrication Eng 9 (1953), 204-209 [1.22] Shooter K, Thomas RH. Frictional properties of some plastics, Research 2 (1952), 533-539 [1.23] Rees BL. Static friction of bulk polymers over a temperature range, Research 10 (1957), 331-338 [1.24] Schallamach A. The load dependence of rubber friction, Proc Phys Soc B 65 (1952), 658-661 [1.25] Shooter K, Tabor D. The frictional properties of plastics, Proc R Soc B 65 (1952), 661 [1.26] Kragelskii I. Friction and wear, Pergamon Press (Elmsford), 1982, ISBN 0-0802-5461-6 [1.27] White NS. Small oil-free bearings, J Res Nat Bur Stand 57 (1956), 185-189 [1.28] Flom DG, Porile NT. Effect of temperature and high-speed sliding on the friction of teflon on teflon,
Nature 175 (1955), 682-685 [1.29] Milz WC, Sargent LE. Frictional characteristics of plastics, Lubrication Eng 11 (1955), 313-317 [1.30] Fort T. Adsorption and boundary friction of polymer surfaces, J Phys Chem 66 (1962), 1136-1143 [1.31] Lancaster JK. Estimation of the limiting pv relationships for thermoplastic bearing materials, Tribology
4 (1971), 82 [1.32] Uetz H, Wiedmeyer J. Tribologie der Polymere, Carl Hanser Verlag (Munchen), 1985, ISBN 3-4461-
4050-6 [1.33] Zhu J, Schweigen W. Pronounced temperature/time behaviour in plastic/metal sliding pairs under dry
friction, KU Kunststoffe plast Europe 91 (2001), 55-56 [1.34] Rhee SH, Ludema KC. Mechanisms of formation of polymeric transfer films, Wear 2 (1958), 231-240 [1.35] Yamaguchi Y, Kasshiwagi K. The limiting Pressure-Velocity (PV) of plastics under unlubricated
sliding, Pol Eng Sci 22 (1982), 248-53 [1.36] Ratner SB, Farberova II, Radyukevich OV, Lure EG. Correlation between the wear resistance of
plastics and other mechanical properties, Soviet Plast 7 (1964), 37-40 [1.37] Lewis RB. Predicting the wear of sliding plastic surfaces, Mech Eng 86 (1964), 32-35 [1.38] Rhee SK. Wear equation for polymers sliding against metal surfaces, Wear 16 (1970), 431-445

Chapter 1. An introduction to polymer tribology 17 [1.39] Lancaster JK. Relationships between the wear of polymers and their mechanical properties, Proc Inst
Mech Eng 183 (1968), 98-106 [1.40] Atkinson JR, Brown KJ, Dowson D. Wear of UHMWPE, Trans. ASME, J Lubr Technol 100 (1978),
208-218 [1.41] Eiss NS, Wood KC, Herold JA, Smyth KA. Model for the transfer of polymer to rough hard surfaces,
Trans ASME, J Lubr Technol 101 (1979) 212-219 [1.42] Dowson D, Taheri S, Wallbridge NC. Proceedings 6th international conf on Wear of Materials, 1987 [1.43] Kar MK, Bahadur S. The wear equation for unfilled and filled polyoxymethylene, Wear 30 (1974), 337-
348 [1.44] Viswanath N, Bellow DG. Development of an equation for the wear of polymers, Wear 181-183 (1995),
42-49 [1.45] Booser ER. Tribology Data Handbook, CRC press (Boca Roaton), 1997, ISBN 0-8493-3904-4 [1.46] Plastics Design Library, Fatigue and tribological properties of plastics and elastomers, PDL (New York),
1995, ISBN 1-884207-15-4 [1.47] Guofang G, Huayong Y, Xin F. Tribological properties of kaolin filled UHMWPE composites in
unlubricated conditions, Wear 256 (2004) 88-94 [1.48] Unal H, Mimaroglu A. Friction and wear behaviour of unfilled engineering plastics, Materials design 24
(2003), 183-187 [1.49] Liu CZ, Wu JQ, Li JQ, Ren LQ, Tong J, Arnell AD. Tribological behaviours of PA/UHMWPE blend
under dry and lubricating conditions, Wear 260 (2005), 109-115 [1.50] Plastics Design Library, Fatigue and tribological properties of plastics and elastomers, PDL (New York),
1995, ISBN 1-884207-15-4 [1.51] Xiong D, Ge S. Friction and wear properties of UHMWPE/Al2O3 ceramic under different lubricating
conditions, Wear 250 (2001), 242-245 [1.52] Zsidai L, De Baets P, Samyn P, Kalacska G, Van Peteghem AP, Van Parys F. The tribological
behaviour of engineering plastics during sliding friction investigated with small-scale specimens, Wear 253 (2002), 673-688
[1.53] Franklin SE. Wear experiments with selected engineering polymers and polymer composites under dry reciprocating sliding conditions, Wear 251 (2000), 1591-1598
[1.54] Abarou S, Play D, Kennedy FE. Wear transitions of self-lubricating composites used in dry oscillating applications, ASLE Tribol Trans 30 (1986), 269-281
[1.55] Higham PA, Stott FH, Bethune B. The influence of polymer composition on the wear of the metal surface during fretting of steel on polymer, Wear 47 (1978), 71-80
[1.56] Vaziri M, Stott FH, Spurr RT. Studies of the friction of polymeric materials, Wear 122 (1988), 313-327 [1.57] Unal H, Sen U, Mimaroglu A. Dry sliding wear characteristics of some industrial polymers against steel
counterface, Tribol Internat 37 (2000), 727-732 [1.58] Tanaka K, Miyata T. Studies on the friction and transfer of semi-crystalline polymers, Wear 41 (1977),
383-398 [1.59] Tanaka K. Transfer of semicrystalline polymers sliding against smooth steel surface, Wear 27 (1982),
183-199 [1.60] Mens JWM, de Gee AWJ. Friction and wear behaviour of 18 polymers in contact with steel in
environments of air and water, Wear 149 (1991), 255-268 [1.61] Gradt T, Schneider T, Hübner W. Friction and wear at low temperatures, Int J Hydrogen Energy 23
(1998), 397-403 [1.62] Seabra LC, Baptista AM. Tribological behaviour of food grade polymers sliding against stainless steel
in dry sliding with sugar, Wear 253 (2002), 394-402 [1.63] Briscoe BJ, Stuart BH, Sebastian S. The failure of PEEK in high speed contacts, Wear 162-164 (1993),
407-417 [1.64] Hanchi J, Eiss NS. Tribological behaviour of polyetheretherketone, a thermotropic liquid crystalline
polymer under dry sliding conditions at elevated temperatures, Wear 200 (1996), 105-121 [1.65] Stuart BH. Tribological studies of poly(ether ether ketone) blends, Tribol Internat 31 (1998), 647-651 [1.66] Zhang Z, Breidt C, Chang L, Friedrich K. Wear of PEEK composites related to their mechanical
performances, Tribol Internat 37 (2004), 271-277 [1.67] Lu ZP, Friedrich K. On the sliding friction and wear of PEEK and its composites, Wear 181-183 (1995),
624-631 [1.68] Stolarski TA. Tribology of polyetheretherketone, Wear 158 (1992), 71-78 [1.69] Santner E, Czichos H. Tribology of polymers, Tribol Internat 22 (1989), 103-109 [1.70] Brentall AB, Lancaster JK. The friction and wear behaviour of a composite dry-bearing liner sliding
against itself. Proceedings of the Wear of Materials Congress, ASME (1989), 596-603 [1.71] Clerico M. A study of the friction and wear of nylon against metal, Wear 13 (1969), 183-197 [1.72] Shiao SJ, Wang TZ. Dry self-lubricating composites, Composites B 27 (1996), 459-465 [1.73] Yamaguchi Y. Tribology of plastic materials, Elsevier (Amsterdam), 1990, ISBN 0-4448-7445-3

Chapter 1. An introduction to polymer tribology 18 [1.74] Ludema KC, Tabor D. The friction and visco-elastic properties of polymeric solids, Wear 9 (1966), 329-
348 [1.75] Unal H, Mimaroglu A. Influence of test conditions on the tribological properties of polymers, Industrial
Lub Techn 55 (2003), 178-183 [1.76] Wanatabe M. The friction and wear properties of nylon, Wear 110 (1968), 379-388 [1.77] Tanaka K, Uchiyama Y. Friction, wear and surface melting of crystalline polymers, in: Advances in
polymer friction and wear, Vol. 5B, Lee LH (ed.), Plenum press (New York), 1974, 499-531, ISBN 0-3063-6492-1
[1.78] Bahadur S, Tabor D. Role of fillers in the friction and wear behaviour of high density polyethylene, in: ACS Symposium Series, Lee LH (ed.), 1985, 253-268
[1.79] Wang YQ, Li J. Sliding wear behaviour and mechanisms of ultra-high molecular weight polyethylene, Mater Sci Eng A 266 (1999), 155-160
[1.80] Hollander AD, Lancaster JK. An application of topographical analysis to the wear of polymers, Wear 25 (1973), 155-170
[1.81] Fusaro RL. Counterface effects on tribological properties of polyimide composites, Lubr Eng 42 (1986), 668-676
[1.82] Swikert MA, Johnson RL. Simulated studies of wear and friction in total hip prosthesis components with various ball sizes and surface finishes, NASA TN-D-8174 (1976)
[1.83] Dowson D, Challen JM, Holmes K, Atkinson JR. The influence of counterface roughness on the wear rate of polyethylene, Proceedings 3rd Leeds-Lyon Conference, Leeds, 1976, 99-102
[1.84] Sekiguchi I, Yamaguchi Y, Katsu Y, Kamoshida H, Suzuki T. Study on plastic composites for brake shoes, ASLE Tribol Trans 4 (1983), 17-22
[1.85] Hooke CJ, Kukureka SN, Liao P, Rao M, Chen YK. The friction and wear of polymers in non-conformal contacts, Wear 200 (1996), 83-94
[1.86] Lawrence CC, Stolarski TA. Rolling contact wear of polymers: a preliminary study, Wear 132 (1989), 83-91
[1.87] Bahadur S., Gong D. The action of fillers in the modification of the tribological behaviour of polymers, Wear 158 (1992), 41-59
[1.88] Bijwe J, Logani C, Tewari US. Influence of fillers and fiber reinforcement on abrasive wear resistance of some polymeric composites, Wear 138 (1990), 77-92
[1.89] Jain VK, Bahadur S. Material transfer in polymer-polymer sliding, Wear 46 (1974), 177-88 [1.90] Tanaka K. Effects of various fillers on the friction and wear of PTFE-based composites, in: Friction and
wear of polymer composites, Friedrich K (ed.), Elsevier (Amsterdam), 1986, ISBN 0-4444-2524-1 [1.91] Rivkim M, Kholodenko A. Mechanical seal with elastomeric rotating elements, Rubber Chem Technol
67 (1994), 62-75 [1.92] Mao K, Hooke CJ, Walton D. The wear behaviour of polymer gears, J Synth Lubr 4 (1995), 337-345 [1.93] Flom DG. Survey of aerospace requirements for bearings and lubricants, Lubr Eng 22 (1966), 415-423 [1.94] Lnoue M. Application of polymers to breaks and clutches, Japanese J Tribol 37 (1992), 759-766 [1.95] Hoshiro T. Application of polymers to transmission belts, Japanese J Tribol 37 (1992), 775-782 [1.96] Kon S. Application of polymers to rollers, Japanese J Tribol 37 (1992), 767-774 [1.97] Shen C, Dumbleton JH. The evaluation of polyimide and poly(amide-imide) as joint replacement
materials, Wear 40 (1976), 351-360 [1.98] Marklund G, Eriksson KB. Abrasion: rubber beats metal, Eur Rubber J 171 (1989), 24-25 [1.99] Ecklund R. Polymer and composite use in gas turbine engines, Flight-Vehicle Materials Structures 2
(1994), 385-394 [1.100] Suzuki K, Morita M. Application of polymers to office automation machinery, Japanese J Tribol 37
(1992), 797-804 [1.101] Uchiyama Y. Survey of polymer tribology, Japanese J Tribol 37 (1992), 657-665 [1.102] Fusaro RL. Evaluation of several polymer materials for use as solid lubricants is space, Tribol Trans
31 (1988), 174-181 [1.103] Sheiretov T, Van Glabbeek W, Cusano C. Evaluation of the tribological properties of polyimide and
poy(amide-imide) polymers in a refrigerant environment, Tribol Trans 38 (1995), 914-922 [1.104] Iwabuchi A, Hori K, Sugawara Y. Effects of temperature and ambient pressure on fretting properties of
polyimide, Wear 125 (1988), 67-81 [1.105] Dupont. Vespel: High performance polyimide parts and shapes, design handbook, 1995 [1.106] Dupont. Engineering polymers for electric motors, promotional brochure, 1998 [1.107] Samyn P, De Baets P. Determination of loading capacity for seizing of steel and hardened steel sliding
pairs under dry and lubricated conditions, test report Laboratory Soete V3/05/0516 [1.108] Samyn P, De Baets P. Comparative study on the friction and wear behaviour of different types internal
lubricated cast nylons sliding against steel on a large-scale tribotester, test report Laboratory Soete V3/04/0317
[1.109] Samyn P, De Baets P. Etude du frottement des différents couples de matériaux appliquées aux ponts poussés avec un test à grandes dimensions, test report Laboratory Soete V3/03/0530

19
Chapter 2.
Goals and Methodology of This Work.
Goals
This work aims to investigate the tribological behaviour of polymers on micro-scale, small-scale, large-scale and full-scale, leading to better insight and relations in the factors that influence friction and wear:
• Micro-scale to small-scale: relating transitions in small-scale friction and wear to variations in polymer structure by using appropriate characteri-sation techniques will help to explain friction and wear mechanisms
• Small-scale to large-scale: comparing friction and wear results on small-
scale and large-scale laboratory test equipment will provide accurate design information
• Large-scale to full-scale: integrating tribological tests and static compres-
sion tests in a design study of heavily loaded polymer bearing elements will illustrate validity of large-scale tests and practical implementation
Methodology
• Experimental work: small-scale sliding tests, large-scale sliding tests • Analysis of wear products: Raman spectroscopy of worn polymer surfaces,
thermo-analytical analysis of wear debris, surface energy measurements, microscopy
• Calculations and modelling: temperatures, stresses (Solico BV)
Matrib, 2005, Vela Luka (Croatia)

Chapter 2. Goals and methodology of this work 20 2.1. Micro-scale and small-scale phenomena The sliding performance of polymers is determined by their micro-scale structure. High-performance polymers show high mechanical strength and good thermal stability, lack-ing softening at high temperatures. Only small secondary transition temperatures occur before melting, with minor influence on the sliding characteristics. Polyimides (PI) are presently tested as they perform highest thermal resistance among others and are a flexible polymer family with either thermoplastic or semi-thermosetting properties. For practical use of polyimides under atmospheric sliding conditions, transitions in the friction and/or wear curves should be clearly detected and related to changes in transfer, as it received relatively little attention in literature compared to, e.g., PEEK. Although the generation of friction and wear data is primarily important for practical application of sliding elements in industrial environment, this work aims to investigate more fundamentally the micro-structural changes at the polymer interface induced by friction. Knowledge on the variations in the polymer structure can lead to insights in the tribophysical or tribochemical phenomena and interference between mechanical and thermal effects. As frequently used for yarn shrinkage or film orientation studies but almost not in polymer tribology, Raman spectroscopy is presently applied on the slid surfaces giving quantitative and qualitative information about the chemical nature (structural units or additives), conformational order (trans-gauche molecular isomerism), state of order (amorphous, crystalline) and orientation (alignment of polymer chain and side groups) of molecules. Other information is obtained from thermo-analytical analysis of the wear debris particles. Due to the joint action of repeated loading and high temperature, the wear debris undergoes physical and chemical reactions since its genera-tion. As a result, the properties of those small particles would not be identical to those of the bulk material and are characteristic for the wear process. Small-scale tribological experiments are done as they are a flexible tool for investigating the effect of different sliding parameters: normal load, sliding velocity, relative humidity and surface conditions. Most attention will be given to the effect of the contact tempera-ture. In contrast to traditional pin-on-disc test set-ups, a contra formal cylinder-on-plate contact is presently applied with initial line contact to obtain high contact pressure and promote transfer at running-in. Sliding wear tests are done on different commercially available polyimide grades, in order to explore the effect of fillers and processing para-meters: pure and graphite-filled sintered polyimdes (SP) are tested besides pure and PTFE-filled thermoplastic polyimides (TP). As the sliding performance depends on both the wear specimen and the counterface type, low carbon steel, high-alloy steel, stainless steel and diamond-like carbon coatings will be applied as counterface.
Following research partners are sincerely acknowledged: • Dupont de Nemours (Mechelen, Belgium) providing different polyimide grades, • Bekaert Dymonics (Zulte, Belgium) and VITO (Mol, Belgium) delivering
diamond-like carbon coatings and performing surface energy measurements, • Ghent University, Laboratory of Organometallics and Catalysis, Department of
Inorganic and Physical Chemistry, performing thermo-analytical and Raman spectroscopic measurements,
• Ghent University, Department of Textiles, doing thermo-analytical analysis.

Chapter 2. Goals and methodology of this work 21 2.2. Small-scale to large-scale extrapolation Tribological data on polymer/steel sliding in literature are most common obtained from laboratory pin-on-disc, bloc-on-ring or flat-on-flat tests with standardised sample geome-tries, providing fundamental information about friction and wear mechanisms. These methods, however, are only useful for a general classification of various materials, and result in important errors when extrapolated towards the real working environment. In order to make a correct material selection for heavily loaded sliding systems with large contact areas, the consultancy of tribological literature or technical data based on small-scale tests is often not satisfying, since the layout of a tribological system and its test parameters have a strong influence on the material’s performance. Real criteria for mate-rial selection in a given application require the tribological characterisation of polymer parts under conditions that are closely related to its practical functionality. Appropriate tribological data are often missing due to the lack of coherent research and experimental facilities for performing friction and wear tests on large-scale test specimens. This work aims to compare the friction and wear behaviour during large-scale flat-on-flat and small-scale cylinder-on-plate tests, introducing a macroscopic geometrical scaling parameter in an attempt to match both steady-state sliding conditions. Special attention will be given to the sliding stability during the running-in period under high contact pressures. It should be verified if large-scale tests at extremely high load conditions can be equivalent with small-scale tests at high temperature or high sliding velocities. Different transitions in friction and wear tendencies on both testing scales are related to either softening and/or melting characteristics of the polymer surface, further analysed by Raman spectroscopy and thermo-analytical analysis. As such, it will be verified if various mechanical and thermal parameters applied to each of the testing scales affect the polymer structure in a different way and possibly explain the variation in test results. Under high-load sliding, however, not only the surface characteristics but also the integrity of the polymer bulk properties becomes important, mainly determined by its load carrying capacity. The contributions of creep and visco-elastic deformation eventually influence the contact conditions and it should be verified whether weakening or degradation in bulk properties during large-scale tests causes alterations in friction and wear mechanisms on macro- and microscale. In present work, large-scale sliding experiments are done on polymer pads with large contact area at low sliding velocity and loads between 8 to 150 MPa, well above the polymer yield strength. The sliding behaviour of thermoplastics under optimum working conditions and failure modes in overload conditions will be investigated. Engineering polymers such as polyamides (PA), polyacetals (POM) and polyethylene terephthalates (PET) and some of their composites are selected in parallel to economic costs and possi-bilities for practical application in bearing elements for, e.g., off-shore constructions.
Following research partners are sincerely acknowledged: • Quadrant Engineering Plastic Products (Tielt, Belgium) providing test speci-
mens, • Terraglobus Ltd. (Budapest, Hungary) delivering test materials, • Pertuy Constructions (Maxeville, France), Busak and Shamban (Dion-Valmont,
Belgium) allowing to present test results.

Chapter 2. Goals and methodology of this work 22 2.3. Large-scale testing to full-scale design The incorporation of polymer sliding pads in a real bearing construction does not only require good tribological characteristics, but as they often form an integrated part of the entire construction, good static strength and dimensional stability should be ensured. While plastic flow of the sliding surface seems favourable for low coefficients of fric-tion, polymers are nowadays mostly used under low contact pressures. Under high loads, creep and deformation during loading and unloading should be controlled and the design of polymer bearings does not only deal with sliding behaviour (dynamic properties), but also with its long-term strength and dimensional stability (static properties). Sliding elements are mainly designed as functional components and permanent deformation after creep and recovery results in, e.g., an increase of clearance between the sliding surfaces with implications on the functionality, possibly leading to failure. Reinforcing systems for polymer materials should therefore be considered, consisting of high-strength materials such as carbon fibre/epoxy reinforced composites (CFR-E) that carry the imposed loads and minimise creep. A protection from flooding of lowlands surrounding harbour areas without restrictions for water traffic consists of a movable storm surge barrier as the Maeslantkering near Rotterdam, The Netherlands. It has a curved wall that is connected to a pivot element (ball-joint) by steel trusses. A critical point in the construction is the rotating ball-joint that controls the movement of the retaining wall into the river. It was firstly designed with a sliding film of solid lubricants, but failed due to details as, e.g., shape tolerances that are difficult to scale into laboratorial tests. A solution is found by incorporating reinforced ultra-high molecular weight polyethylene (UHMWPE) bearing elements that exhibit good dimensional stability and low friction. Also thermosetting polyester resins with polyester fabric reinforcement were tested. The application of an elastic bearing layer however changes the functional characteristics. In this work, a global design study is presented on the bearing capacity and sliding behaviour of the modified ball-joint for different loading histories during operation. From a local analysis of the polymer bearing elements, the strength and deformation is verified by means of finite element modelling. Much attention is given to the design and strength of a reinforcing ring consisting of a carbon fibre/epoxy composite, for which small-scale selection tests were developed. The static and dynamic strength of full-scale bearing elements is experimentally investigated with large-scale test set-ups and the reliability is verified by two on-the-field operations.
Following research partners are sincerely acknowledged: • Dutch Ministry of Transport, Water Management and Public Works, Civil
Engineering Division (Nederlandse Rijkswaterstaat, Zoetermeer, The Netherlands) for being involved in the redesign of the Maeslant storm surge barrier (Rotterdam, The Netherlands),
• Solico BV, Solutions in Composites (Everdenberg, The Netherlands) for finite element calculations,
• Stuttgart University, Materialprüfüngsanstalt (Vaihingen, Germany) allowing to present test results,
• Ghent University, Laboratory Magnel for large-scale static tests and Laboratory Soete, Mechanics of Materials and Structures for composite material tests.

23
Chapter 3.
Test Materials.
Goals Selection and characterisation of polymer wear materials:
• Suitable compositions for semi-crystalline thermoplastics and high-performance polymers: chemical composition and fillers
• Influence of processing method and parameters on structure and mecha-
nical properties • Polymerisation and identification of intermediate products that can form
during degradation • Ease of processing in relation to thermal stability or crystallisation,
possibility for manufacturing large sections and/or small sliding parts
• Identification of fracture surfaces with brittle and/or ductile behaviour
Selection and characterisation of counterface materials:
• Steel grades • Diamond-like carbon and silicon-doped diamond-like carbon coatings
Methodology
• Literature review, manufacturer’s catalogues
• Experimental work: evaluation of fracture surfaces, SEM images
Antec, Annual Technical Conference of the Society for Plastic Engineers, 2005, Boston (USA)

Chapter 3. Test materials 24 3.1. Overview A selection of polymers is made in relation to common tribological practice. Referring to Figure 1.1, amorphous materials generally produce high friction and low wear resistance due to brittleness at room temperature, i.e. below the glass transition temperature Tg (e.g. polystyrene (PS), Tg = 90°C), and when used above the glass transition temperature, they loose strength very soon. Polycarbonate (PC) is an exception in this respect due to a sec-ondary transition in the glassy state below room temperature providing better toughness, but it is not considered due to unstable sliding and formation of thick transfer films [3.1]. It is mainly used for good abrasive or scratch resistance due to high impact strength [3.2]. Amorphous polymers such as polyphenylene sulphide (PPS) form thick transfer films with unallowably high wear rates [3.3]. Semi-crystalline polymers have better me-chanical properties, good ductility and fatigue resistance to be used as sliding material. Engineering polymers with a combination of good strength and processing characteris-tics (casting, extrusion) are included as test materials. Polyethylene (PE) and polypropy-lene (PP) are not applied, as they have low strength and are mainly used as films. Ultra-high molecular weight polyethylene (UHMWPE) will be used in a design study. Poly-amides (PA) are selected due to appropriate (but limited) tensile strength and often good impact strength. Thermal and mechanical properties of pure and internally lubricated polyamides are summarised in Table 3.1, including pure cast polyamides with either sodium (PA-Na) or magnesium (PA-Mg) catalysts, two internally oil-filled grades (PAo1, PAo2) and two solid-lubricant filled polyamides (PAs1, PAs2). Thermal and mechanical properties of polyoxymethylene homopolymer (POM-H) and polyethylene terephthalate under pure conditions (PET) or with PTFE fillers (PET/PTFE) are given in Table 3.2. Their selection is based on better dimensional stability than PA due to high crystallinity and/or stiffening action of aromatic molecular groups. However, sensitivity to brittle fracture at notch and stress concentrations can restrict the applicability of PET. Mentioned thermoplastics can be produced as large parts at economic price (2 to 4 €/kg). High-performance polymers retain good mechanical strength at high temperatures. Poly-imides (PI) are used with better thermal stability than, e.g., polyetheretherketone (PEEK) that softens above Tg = 160 °C. Characteristics of sintered polyimides under pure (SP-1) or graphite-filled form (SP-2) and thermoplastic polyimides under pure (TP-1) or PTFE-filled form (TP-2) are given in Table 3.3. It are expensive materials (15 to 20 €/kg) and most likely applied as small parts, where thermal energy input is concentrated. Among listed mechanical properties, the Young’s modulus is characteristic for the adhesional friction component, since it is correlated with the chain flexibility [3.4]. The deformation ability is determined by tensile stress and strain, since their product is proportional to the work of rupture or the material’s toughness. The temperature region in which a polymer can be used, is limited at low as well as at high side. Brittleness is found with semi-crystalline polymers when used below the glass-rubber transition Tg, loosing the rubbery nature and transition into the glassy state of the amorphous phase. The theoretical glass transition temperature Tg for semi-crystalline polymers is below room temperature (-50°C for PA, -30°C for POM-H), explaining good properties at environmental temperature. A secondary transition temperature however manifests for polyamides, polyacetals and thermoplastic polyesters. The Heat Deflection Temperature (HDT) indicates softening under load and is measured from bending standard test bars at constant load with increasing temperature, until certain deflection or collapse is attained.

Chapter 3. Test materials 25 Table 3.1. Mechanical and thermal properties of polyamide grades [3.5, 3.6]
Property Units PA-Na1 PA-Mg2 PAo13 PAo24 PAs15 PAs26
Specific gravity g/cm3 1.15 1.15 1.135 1.135 1.14 1.11
Water absorption water 24 h @ 23°C air equilibrium 23°C / 50% RH
% %
0.65
2.20
0.67 2.20
0.66 2.20
0.66 2.20
0.59 2.20
0.61 2.20
Thermal properties
Melting temperature °C 220 220 220 220 220 216
Secondary transition temperature °C 50 50 50 50 50 50
Heat deflection temperature at 1.8 MPa °C 80 75 75 75 75 70
Max. service temperature short term (1 h) long term (20000 h)
°C °C
170 90
170 90
165 90
165 90
165 90
160 90
Thermal conductivity W/(mK) 0.29 0.29 0.28 0.28 0.29 0.30
Specific heat capacity J/(gK) 2.01 2.01 2.01 2.01 2.01 2.01
Thermal diffusivity 10-7 m2/s 1.25 1.25 1.22 1.22 1.26 1.34
Coefficient of linear thermal expansion µm/mK 90 90 90 90 95 100
Mechanical properties
Modulus of elasticity MPa 1700 1500 1450 1600 1500 1450
Tensile stress at yield MPa 55 75 45 50 50 40
Tensile stress at break MPa _ _ _ _ _ _
Tensile strain at break dry saturated in air
% %
25 > 50
30 > 50
20 > 50
22 > 50
25 > 50
10 > 50
Compressive stress at 1 % strain 2 % strain 5 % strain 10 % strain (compress. strength)
MPa MPa MPa MPa
26 51 95 103
23 42 82 95
22 43 79 93
22
43 79 93
23 44 81 97
21 40 67 69
Creep stress in tension to produce 1 % strain in 1000 h
MPa
10
10
8
8
8
7
Charpy impact strength unnotched notched
kJ/m2 kJ/m2
No break
3.5
No break
4.5
No break
4
No break
4
No break
4
No break
3.5
Rockwell Hardness - M 88 M 83 M 82 M 85 M 81 M 59
Shear strength MPa 76 70 64 64 69 60
Commercial names: 1Ertalon 6 PLA (Quadrant EPP), 2Teramid (Terraglobus), 3Ertalon LFX (Quadrant EPP), 4Unirim (Quadrant EPP), 5Nylatron NSM (Quadrant EPP), 6Nylatron 703 XL (Quadrant EPP)

Chapter 3. Test materials 26 Table 3.2. Mechanical and thermal properties of engineering thermoplastics [3.5, 3.7]
Property Units POM-C7 POM-H8 PET9 PET/PTFE10 UHMWPE11
Specific gravity g/cm3 1.41 1.43 1.39 1.44 0.93
Water absorption water 24 h @ 23°C air equilibrium 23°C / 50% RH
% %
0.24 0.20
0.21 0.20
0.07 0.25
0.06 0.23
0.02 0.01
Thermal properties
Melting temperature °C 165 175 255 255 133
Secondary transition temperature °C 90 90 70 70 80
Heat deflection temperature at 1.8 MPa °C 105 110 75 75 42
Max. service temperature short term (1 h) long term (20000 h)
°C °C
140 95
150 90
160 100
160 100
120 80
Thermal conductivity W/(mK) 0.33 0.33 0.30 0.30 0.41
Specific heat capacity J/(gK) 1.50 1.50 1.25 1.25 1.84
Thermal diffusivity 10-7 m2/s 1.56 1.54 1.78 1.72
Coefficient of linear thermal expansion µm/mK 125 110 80 85 200
Mechanical properties
Modulus of elasticity MPa 3100 3600 3700 3450 720
Tensile stress at yield MPa 68 78 90 85 20
Tensile stress at break MPa _ _ _ _ _
Tensile strain at break dry saturated in air
% %
35 35
35 35
15 15
7 7
300 300
Compressive stress at 1 % strain 2 % strain 5 % strain 10 % strain (compress. strength)
MPa MPa MPa MPa
19 35 67 103
22 40 75
110
26 51 100 115
24 47 95 105
4.5 8 14 -
Creep stress in tension to produce 1 % strain in 1000 h
MPa
13
15
26
23
5
Charpy impact strength unnotched notched
kJ/m2 kJ/m2
> 150 7
> 200 10
> 50 2
> 30 3
No break
> 220
Rockwell Hardness - M 84 M 88 M 96 M 94 R 52
Shear strength MPa 55 62 55 59 _
Commercial names: 7Ertacetal C (Quadrant EPP): not explicitly tested but added as reference, 8Ertacetal H (Quadrant EPP), 9Ertalyte (Quadrant EPP), 10Ertalyte TX (Quadrant EPP), 11GUR 4120 (Ticona)

Chapter 3. Test materials 27 Table 3.3. Mechanical and thermal properties of polyimides [3.8]
Property Units SP-112 SP-213 TP-114 TP-215
Specific gravity g/cm3 1.34 1.42 1.33 1.44
Water absorption water 24 h @ 23°C air equilibrium 23°C / 50% RH
% %
0.22 1.00
0.19 0.80
0.34 1.10
0.34 1.10
Thermal properties
Melting temperature °C None None 388 388
Secondary transition temperature °C None None 250 250
Heat deflection temperature at 1.8 MPa °C 360 360 238 230
Max. service temperature short term (1 h) long term (20000 h)
°C °C
500 300
500 300
300 230
300 220
Thermal conductivity W/(mK) 0.30 0.46 0.17 0.17
Specific heat capacity J/(gK) 1.13 1.13 1.01 1.01
Thermal diffusivity 10-7 m2/s 1.98 1.87 1.27 1.16
Coefficient of linear thermal expansion µm/mK 50 41 50 57
Mechanical properties
Modulus of elasticity MPa 2480 3170 2760 2400
Tensile stress at yield MPa No No 94 72
Tensile stress at break MPa 72 62 118 96
Tensile strain at break saturated in air
%
7.5
5.5
90
6.0
Compressive stress at 1 % strain 2 % strain 10 % strain (compress. strength)
MPa MPa MPa
24 46 112
23 43 104
25 - 122
25 - 122
Creep stress in tension to produce 1 % strain in 1000 h
MPa
Charpy impact strength unnotched notched
kJ/m2 kJ/m2
7.5 3.5
3.2
4
No break
9
No break
10
Rockwell Hardness - M 100 M 90 M 95 M 93
Shear strength MPa 90 77 83 86
Commercial names: 12Vespel SP-1 (DuPont de Nemours), 13Vespel SP-21 (DuPont de Nemours), 14Vespel TP- 8054 (DuPont de Nemours), 15Vespel TP-8929 (DuPont de Nemours)

Chapter 3. Test materials 28 3.2. Engineering polymers 3.2.1. Polyamides (PA) Nylons cover a wide range of properties and applications due to flexibility in formula-tion and processing. The synthesis of nylon 6 (PA 6) by anionic polymerisation invol-ving ring opening of caprolactam (Figure 3.1) has been extensively investigated because of its high yield and very high reaction rate [3.9, 3.10]. Different processing methods as extrusion or injection moulding are available for design of machine elements. Most standard extruded stock is generally made from nylon 6/6, since it was introduced in 1946. The extrusion and moulding processes simply reshape a pre-polymerised resin, however leading to high internal stresses and inconsistent density across the shape. The effect of various injection moulding parameters on the tribological behaviour of nylon 6/6 was investigated by Apichartpattanasiri et al. [3.11].
Figure 3.1 Molecular unit for polyamide 6 Low pressure monomer casting of polyamide 6 is often cheaper to produce large parts with near-net-shape geometry, large cross-sections and free of voids. Nylon casting differs from injection moulding or extrusion in producing a shape by polymerisation of molten lactam monomers right in the heated mould under low (atmospheric) injection pressures and at process temperatures below the polyamide melting point. Characteris-tics of the polymerizing reaction during casting, such as initiation and propagation mechanisms, have been discovered with addition of e.g. sodium as an activator, diiso-cyanates as a chain initiator and sodium (PA-Na) or magnesium (PA-Mg) as a catalyst from liquid steams [3.12, 3.13]. Mg catalysts result in lower Young’s modulus and better toughness compared to Na-catalysed polyamides. Heat stabilisers and plasticizers can be added to improve the impact resistance, while reducing tensile and compressive stresses. The build-up of electrical charge is generally avoided by incorporation of graphite or carbon black [3.14]. Polymerisation in the mould produces material with higher molecular weight and crystallinity, favourable for better dimensional stability, higher compressive and tensile strength and higher Young’s modulus than achieved by extrusion or moulding, although the melting point of cast nylons (220°C) is somewhat lower than for extruded nylons (225°C). A range of polyamide grades with proprietary solid (wax) additives or oil-impregnated nylons was developed by Quadrant EPP. Test samples are machined from the bulk of cast elements, in order to avoid edge effects causing inhomogeneities. According to Kang et al. [3.15], who investigated the influence of lubricant content on friction, wear and mechanical properties, the dispersion of oils becomes inhomogeneous in nylon for contents above 8 wt %. As shown from optical microscopy in Figure 3.2a, the PAo1 morphology has a uniform dispersion of synthetic oil and as revealed from Figure 3.2b,
Caprolactam Polycaprolactam (polyamide 6 (PA6))

Chapter 3. Test materials 29 the oil lubricant for PAo2 is added into separate holes on the surface. Regarding possibi-lities for scaling the sliding surface, the PAo2 surface texture is not appropriate to be small-scale tested, as the lubricating holes are randomly distributed over the sliding surface and small surface areas do not representatively include the surface properties. A micrograph of unworn PAs1 morphology with homogeneous thermoplastic lubricants or wax (mixture of MoS2 and PTFE) is shown in Figure 3.2c. PAs1 has lower wax content than PAs2, but the content for both grades is below 10 wt %, as the solidification time abruptly increases and the polymerisation reaction does not complete for higher additive concentrations. For either solid or oil-lubricated cast polyamides, the Young’s modulus is lower compared to unfilled polyamides. The heat deflection temperature significantly decreases as internal lubricants are added, while the melting temperature remains constant at 220°C for the oil-filled polyamide grades and is slightly lower for PAs2. (a) (b) (c)
Figure 3.2 Surface morphology of internal oil lubricated and solid lubricated cast polyamide grades, (a) PAo1 with homogeneous oil lubricant, (b) PAo2 with oil in lubricating holes,
(c) PAs1 with solid thermoplastic lubricant (MoS2 (1) and PTFE (2)) 3.2.2. Polyoxymethylene homopolymer (POM-H) Polyoxymethylene, or simply acetal, is a polyether from formaldehyde (H2C=O) known since 1925. The first thermally stable polymers of formaldehyde were prepared in 1960. The polymer reverts to its monomer on heating to 120°C, since the linear carbon-oxygen bonds in the main chain are not thermally stable. Commercial products should therefore further react with acetic anhydride to cap the hydroxyl end groups of the polymer chains with acetate groups [3.16]. It is polymerised by an anionic mechanism in presence of inert solvent at atmospheric pressure and low temperatures (50 to 70°C), where the solvent is liquid. The polymer is insoluble in the reaction mixture and is continuously
(1)
(2) 1 mm

Chapter 3. Test materials 30 removed as a slurry. Depending on the chain structure, both homopolymer (POM-H) and copolymer (POM-C) grades are available to fit different requirements. The random addition of ethylene oxide as a comonomer in POM-C provides higher chain flexibility, higher toughness and thermo-oxidative stability but reduces strength and stiffness. The POM-H homopolymers on the other hand have better mechanical properties over a long time and a wide range of temperatures. The simple molecular configuration of an acetal homopolymer (Figure 3.3a) with linear CH2O-bonds allows a very stable crystalline structure (up to 75% [3.17]) leading to high heat resistance, high modulus of elasticity, high strength and superior creep resistance. The crystallinity manifests itself in local macromolecular arrangements of lamellar-like aggregates, so-called sphereolites [3.18]. Because it absorbs little moisture compared to polyamides, acetal resins show very good dimensional stability with variable humidity. Processing temperatures are between 190 to 230°C. In this work, the POM-H cylinders for small-scale testing are machined from the centre of an extruded bar, excluding molecular alignment effects at the surface after processing. The POM-H plates for large-scale tests are machined from extruded blocks. 3.2.3. Polyethylene terephthalate (PET) Polyethylene terephthalate is a saturated polyester and known from the use as a textile fiber, like nylon, or as biaxially oriented film in soda bottles [3.19], although with different molecular weight. Aromatic polyesters have linear molecules of ester groups (COO) linked with p-phenylene groups (benzene ring) and ethylene groups (CH2CH2) as shown in Figure 3.3b. PET is a polycondensation product of terephthalic acid and ethylene glycol, although it is industrially more likely produced by transesterification at 270 to 285°C of dimethyl terephthalate as a prepolymerisation product. It has however long crystallisation times with maximum 60 % crystalline content, while the industrial crystallinity is between 30 to 50 %. Pellets are likely processed by extrusion due to their high viscosity: a standard extrusion temperature profile is 200 – 280 – 270 °C through the melt pumping stage. Internal solid lubricants as PTFE (Teflon®) are homogeneously dispersed into the polymer bulk. Research towards an optimum filler content was made by Bahadur et al. [3.20], indicating a working range for PTFE in PET between 10 to 15 wt%. The exact composition is however own to industrial property. The beneficial effect of PTFE on low friction has generally been reported by e.g. Tanaka et al. [3.21], Briscoe [3.22], Lancaster [3.23] and Gong et al. [3.24] and results from its lamellar structure with low shear strength leading to easy formation of a transfer film. In this work, test samples of PET and PET/PTFE are machined from the centre of extruded bars or blocks. (a) (b)
Figure 3.3 Molecular units for thermoplastics, (a) Polyoxymethylene homopolymer (POM-H), (b) Polyethylene terephthalate (PET)

Chapter 3. Test materials 31 3.2.4. Ultra-high molecular weight polyethylene (UHMWPE) and carbon fiber/
epoxy composite (CFR-E) reinforcing ring Polyethylenes are linear thermoplastics with a repeating unit (- CH2 ) X consisting of ethylene as monomers. The most important values characterising the polyethylene properties are density and molecular weight: mechanical properties such as yield stress and rigidity depend particularly on density, while toughness (notched impact strength), wear resistance, heat deflection temperature and resistance to cracking all depend on molecular weight. Typical high density polyethylene (HDPE) resins have average molecular weights Mw = 100000 to 200000 g/mol. High-molecular weight polyethylene (HMWPE) resins with Mw = 200000 to 500000 g/mol have improved environmental stress cracking resistance, impact and tensile strength and long-term strength retention. It is used for pipes, films and large blow-moulded containers and still processable by usual techniques. Ultra-high molecular weight polyethylene (UHMWPE) has, according to ASTM D 4020, molecular weights Mw above 3.106 g/mol. Therefore, it has exceptional abrasion and impact resistance compared to any other thermoplastic in combination with low friction and resistance to fatigue. Despites UHMWPE is a linear polyethylene, it has low density as ordering mechanisms like crystallisation are restricted: crystallinity of UHMWPE is typically about 45 to 50 %. Presently used UHMWPE grade has an average molecular weight of Mw = 5.106 g/mol, according to measurements of intrinsic viscosity η = 2100 ml/g done by Ticona [3.7] and conversion by means of the Mark-Houwink equation Mw = K. [η]α with experimental parameters K = 5.37.104 and α = 1.5 respectively. Because of its extremely high molecular weight, it cannot be readily shaped by thermoplastic melt-processing techni-ques such as injection moulding or extrusion. The long-chain molecules do not melt or flow like other thermoplastics: a block of UHWMPE heated well above the crystalline melting point does not change in shape, but only change in appearance from opaque to clear indicating the disappearance of crystalline structure. Therefore, it is compression moulded into blocks, precision parts or bearing pads. Although it has superior sliding properties, the stiffness and yield strength of UHMWPE are very low compared to other thermoplastics (Table 3.2). The maximum permissible surface pressure for dynamic applications is 10 to 15 MPa and, therefore, UHMWPE is until now only used for low loaded sliding parts (e.g. knee prostheses). Deformation at high load can be limited by a composite carbon fiber/epoxy (CFR-E) ring as reinfor-cement around central bulk polymer parts. A CFR-E ring is made of unidirectional carbon fiber Toray T700 12K (1.8 g/cm3) and epoxy Bakelite EPR-LB20 HXS resin with EPH 960 hardener (1.090 g/cm3). A filament winding process over a steel mandrel with fixed radius and winding angle 90° is applied to manufacture composite tubes that are afterwards machined into separate rings. The composite ring is transversally isotropic as it is only fiber reinforced in the hoop winding direction. Its thermal properties are deter-mined from a DSC-test with Tg > 95°C. The curing times and temperatures were strictly controlled at 16 hours room temperature, 8 to 10 hours at 60°C and 8 to 10 hours at 120°C with a temperature rise of 15°C/hour. The resulting tensile stress in fiber direction is 2450 MPa [3.25]. However, carbon fiber reinforcements often deteriorate the sliding behaviour of bulk polymers and cause abrasive wear [3.26, 3.27], mainly for longitudinal and transverse fiber orientations relatively to the counterface. Therefore, a geometry for hybrid UHMWPE pads with ‘embedded’ CFR-E ring should be developed as detailed in Chapter 11 of this work (see Figure 11.2).

Chapter 3. Test materials 32 3.3. High-performance polymers Polyimides (PI) are a family of high-performance materials with extremely high mecha-nical strength and thermal stability up to 310°C (long term) or 450°C (short term), having an imide unit either as linear or cyclic form and strong aromatic groups. Conven-tional polyimides are chemically cross-linked thermosettings or pseudo-thermoplastic re-sins that undergo a cross-linking reaction during processing, resulting in a network struc-ture that cannot be reformed. Although the cross-linked structure produces high chemical and thermal resistance, polyimides have inferior mouldability because they are insoluble and infusible. Polyimides lack a clear glass transition temperature and have extremely high melting temperatures. To obtain a moulded product, it was necessary to use a sinter-ing process. As such, it is however difficult to make products having a complex shape. Products should either be direct formed in the sintering mould or those with a more complex shape should be machined from a block inducing high costs and material loss. Polyimides with a well-defined glass transition and melting temperature and appropriate viscosity are needed for injection or extrusion moulding [3.28]. Polyetherimides are amorphous materials with a glass transition temperature Tg = 215°C and have insuffi- cient thermal stability. Thermoplastic polyimides are semi-crystalline and have a glass transition temperature Tg = 250°C reflected in a heat deflection temperature of 238°C. A moulding cycle of about 30 to 60 seconds however produces low crystallinity due to slow crystallisation [3.29]. Further crystallisation after moulding is obtained by a heat treatment that increases the heat deflection temperature onto 260°C. Also better control of the molecular termination reaction possibly increases the thermal stability. 3.3.1. Polyimide Synthesis The most widely used synthetic route for preparation of polyimides, as pioneered at DuPont de Nemours, is a two step method to cope with the infusibility and insolubility of aromatic polyimides. In a first step, polyamic acid is produced from a step-growth polymerisation between an aromatic tetracarboxylic dianhydride and an aromatic diamine (Figure 3.4). The conversion of the polyamic acid into the polyimide is done by intramolecular condensation (Figure 3.5). The final polyimide molecular weight distri-bution will be affected by the imidisation method. Due to limited solubility of the precursor, the molecular weight is low compared to other thermoplastics (Mw = 10000 to 250000 g/mol, Mn = 13000 to 55000) with a polydispersity index 2.0 to 5.0 [3.30].
Figure 3.4 Formation of polyamic acid (PAA) as a precursor for polyimide
+ PMDA ODA

Chapter 3. Test materials 33
Figure 3.5 Molecular unit for sintered polyimide SP-1 (pure) and SP-2 (graphite-filled) In the first step, soluble polyamic acid (PAA) is prepared from pyromellitic dianhydride (PMDA) and 4,4’ diamino diphenyl ether or oxydianyline (ODA). The reaction happens in a dry polar aprotic solvent near or below room temperature. The reaction mechanism involves the nucleophilic attack of the amino group and the carbonyl carbon of the anhydride, followed by the opening of the anhydride ring to form an amic acid group. In this equilibrium reaction, the forward reaction is often much faster than the reverse reaction. The acetylation reaction of amine is an exothermic reaction and is therefore favoured by high monomer concentrations and low temperatures (max 50°C) to form high molecular weight polyamic acid. High temperatures are also avoided as complete cyclisation would cause the polyamic acid to be insoluble in the reactive medium. The reactivity of the monomers is an important factor governing the rate of amic acid formation and stability. It is expected that the nucleophilicity of the amino nitrogen atom within the diamine part and the electrophilicity of the carbonyl group of the dianhydride control this process. However, the structure of the diamines seems to influence the rate of the acetylation reaction more than the variation in dianhydride, as the electron concentration around the diamine is denser. More details on the effects of reactivity of both the diamine and dianhydride parts are given by Dunson [3.31]. In the second step, dehydration can be done chemically or as a bulk thermal imidisation: • Thermal cyclisation is most commonly applied and involves gradual heating of the
PAA at 250 to 350°C for 3 to 5 hours, depending on the stability of the polymer, in air or an inert atmosphere. An inert atmosphere tends to minimize thermal oxidation. The events occurring during heating include evolution of the solvent and dehydrative cycloimidisation. Removal of water produced from the condensation reaction is important, as the presence of water can degrade the polyimide by hydrolysis. Water removal can be difficult for thick structures. Because of this reason, thermal bulk imidisation is particularly effective for the preparation of thin materials such as films, coatings, fibers and powders because it allows the diffusion of by-products and solvent without forming bristles and voids. A typical multi-stage heating schedule includes a one-hour resident time at 100°C, followed by a relatively rapid temperature rise (20°C/min) to 200°C and 300°C, each kept constant for one hour. Palmese and Gillham demonstrated that a stepwise imidi-sation scheme aids in the formation of linear species [3.32]. Repeated steps of steadily increasing isothermal hold temperatures minimise side reactions that result in cross-linking. The majority of the solvent is slowly driven off in the first stage, while imidi-sation essentially occurs in the second stage, where the curing stress is reasonable [3.33]. Such a heating cycle allows a conversion of PAA into PI of about 92 to 99%, and is considered to be the maximum that can be achieved via thermal imidisation.

Chapter 3. Test materials 34 Further heating at 300°C or higher does not result in complete conversion because of the so-called ‘kinetic interruption’ effect [3.34]. The hydrolytically unstable residual amic acid units occur as defect sizes. Their presence at concentrations of 1 to 8 % in the final polyimide product notably reduces the hydrolytic stability, most likely for rigid polyimide structures for which full imidisation is the most difficult to achieve. Another important consideration of thermal imidisation is the occurrence of side reactions. A partially reversible decrease in molecular weight in the early stage of imidisation was observed as a result of the depolymerisation reaction. This effect has been monitored by e.g. Laius et al. [3.35] on insoluble PI, by both changes in mecha-nical properties during imidisation and by spectroscopic studies from the temporary appearance of an anhydride carbonyl absorption band between 100 to 250°C. Evidence of this effect was later verified by Young et al. [3.36], measuring the mole-cular weight of the PI at different stages of thermal imidisation. The molecular weight gradually regained at high temperature.
The side reactions associated with thermal imidisation can also lead to some cross-linking [3.37]. Linear, high molecular weight polyimides are usually desired, while intermolecular imidisation effectively creates a cross-link, which in high concen-tration can form a polymeric network (i.e. the formation of an imide bond from an amide part and carboxylic acid part that are on adjacent polymer chains). Hermans and Streef [3.38] studied the bulk imidisation of polyimides based on hexamethylene diamine and pyromellitic dianhydride and noted brittle, obviously cross-linked products. A proposed reaction mechanism for imidisation assumed that a side reaction which forms an amide will occur along with imide formation. This side reaction could lead to branching and is promoted by a slight excess of basic groups and suppressed by a slight excess of acid groups. Saini et al. [3.39] monitored amine terminated imide compounds by spectroscopy during heating. The appearance of a C=N absorption band confirmed that imide-imine conversion was occurring, which was predicted by a proposed cross-link reaction mechanism involving the attack of terminal amino groups into imide carbonyl groups, with the resulting formation of imine. A recent study by Schulze et al. [3.40], however, showed that the imine bond formation is only significant when small amine terminated species are present. The probability of imine formation decreased with the polymer chain length.
• Chemical imidisation is done at low temperature (20 to 80°C) in solution utilizing a
chemical dehydrating agent (e.g. anhydrides) in conjunction with a basic catalyst (e.g. amines) to promote ring closure reactions. Increasing the temperature from 20 to 100°C decreased the reaction time from 15 to 2 hours to achieve complete imidisa-tion [3.41]. Incomplete imidisation is often a disadvantage for the chemical technique and will yield a material that is not completely stable: the imidisation reaction will continue upon further processing. The water produced during polycondensation will lead to voids in the material and could hydrolytically degrade the polyimide. Possible formation of an intermediate isoimide can produce a more flexible polymer backbone, thereby reducing the viscosity, however, it has tendency to disappear at higher temperatures and therefore increases the viscosity.
In contrast to thermal imidisation, the chemical pathway occurs without the depoly-merisation reaction and the polymer has constant molecular weight. It is however less attractive for commercial applications due to the process complexity and cost.

Chapter 3. Test materials 35 3.3.2. Sintered polyimides (SP) The PMDA-ODA polyimide (Figure 3.5) has a secondary transition temperature of approximately 385°C and a theoretical melting point of 595°C. Therefore, it does not flow significantly at temperatures below its melting point and decomposes thermally before reaching this temperature. Other techniques than melt processing were developed. A sintering process was patented by DuPont de Nemours in 1955 [3.42] for preparing Vespel, whereby particulate polyimide powder is introduced into a mould and heated during compaction, comparable to powder metallurgy techniques. Polyimide resins with initial grain size diameter of 10 to 20 µm are pre-compacted into 100 µm grains for beneficial flow in the sintering mould. Sintering happens under pressures of 500 to 2000 bar at a temperature of about 300°C for 10 minutes [3.43]. A small amount of PTFE lubricant (< 0.2 %) is added into the mould allowing for evacuation of the pieces from the mould, although it does not influence further properties due to the very small quanti-ty and removal after a pre-sintering step. The exact parameters of the subsequent sinter-ing phases are however own to industrial proprietary. Samples for present research are obtained from a ‘direct forming’ sintering process, meaning that the final geometry of small cylindrical parts are produced right into the mould without additional machining. Polyimide compounds of SP-1 samples consist of pure PMDA-ODA powders or SP-2 samples consist of PMDA-ODA powders with 15 wt% graphite powder additives. After sintering, the polyimides are characterised by lack of glass transition, secondary transiti-ons or melting temperature. Therefore, sintered polyimides act as thermosetting poly-mers and are referred to as ‘pseudo-thermosetting’ polymer grades. According to manu-facturers data [3.44], sintered polyimide samples have a very low crystalline content, based on an x-ray diffraction analysis method. The original amorphous SP resin has an imide content of 40 %, although it becomes higher (90 %) after sintering. The unworn surface of sintered polymer cylinders SP-1 (Figure 3.6) that will be used for sliding, is uneven with cracks due to the sintering process and accumulation of internal stresses.
Figure 3.6 Unworn sliding surface of sintered polyimide SP-1 cylinders The SP-1 and SP-2 bulk structures are characterised by the fracture aspects shown on SEM images in Table 3.4. Notched cylindrical samples are cooled in nitrogen to approx-imately -40°C and fractured as shown in Figure 3.7, according to ASTM E399. The ori-ginal sintered structure of fine powders with diameter of approximately 10 µm is visible on the surfaces. The fine wedge-like particles in between the polymer matrix as seen for SP-2, refer to the graphite fillers. The onset of chevron lines near the notch is slightly observed for sintered polyimides, while the entire fracture aspect is rather brittle.

Chapter 3. Test materials 36
5 mm
F
1
2
3
15 mm
(a) (b)
Figure 3.7 Fracture of polyimide samples according to ASTM E399, (a) notched sample, (b) fracture surface with zone (1) near the notch, zone (2) in the centre, zone (3) near the edge
Table 3.4. Fracture aspects of sintered polyimide: pure SP-1 and 15 wt% graphite-filled SP-2
SP-1 SP-2
Nea
r th
e no
tch
(zon
e 1)
Cen
tre
of fr
actu
re (z
one
2)
Nea
r th
e ed
ge (z
one
3)

Chapter 3. Test materials 37 3.3.3. Thermoplastic polyimides (TP) If the polyimide is a linear thermoplastic polymer, melt processing may be a reasonable method. Recent advances included synthesis of polyimides with flexible chain linkages in the polymer backbone, having a suitable melt viscosity for conventional melt process-ing. The thermoplastic polyimides (TP) used in present investigation are industrial products obtained by reacting pyromellitic dianhydride with 4,4’-bis(3-amino-phenoxy) biphenyl to give a polyamic acid precursor that is cyclodehydrated (Figure 3.8). The ether links in the polymer backbone allow for higher flexibility. TP powders have a weight-averaged molecular weight Mw = 25000 to 27000 g/mol and polydispersity index 2.9. Different grades of thermoplastic polyimide are patented by Mitsui Toatsu chemi-cals, Inc, Tokyo, Japan [3.45].
Figure 3.8 Molecular unit for thermoplastic polyimide TP-1 (pure) and TP-2 (PTFE-filled)
The TP samples are injection moulded parts: cylinder temperatures range between 380 to 410°C (typically 390°C) at 21 MPa moulding pressure with 100 to 200 rpm screw speeds. However, thermoplastic polyimides generally crystallise rather slowly from the melt and a moulded product obtained by a general moulding cycle of about 30 to 60 seconds is amorphous. Present TP grade is one of the only semi-crystalline polyimides successful in achieving reasonable crystallinity on industrial scale. Different DSC-scans were studied by Ratta [3.46] on both high molecular and low molecular weight versions after quenching from the melting phase. After repeated heating, both versions show stability of the melting point at 388°C and it was found that isothermal crystallisation at temperatures below 350°C was successful in inducing crystallinity. The lower molecular weight version seems to have slower crystallisation kinetics from the melt. To improve the heat resistance, mechanical properties and sliding characteristics of a moulded product, present samples were industrially heat-treated at 280°C for 10 hours. The thermal stability of TP samples was studied by Li et al. [3.47], showing no degradation up to 550°C in air. A first stage of the thermal degradation is de-etherification, hydra-tation and hydrogen abstraction with subsequent cross-linking between the residual aromatic carbons. The second stage includes attack of the p-biphenylene carbons. SEM images with the fracture aspect of notched samples from pure TP-1 and 20 wt % PTFE-filled TP-2, prepared according to Figure 3.7, are shown in Table 3.5, both near the notch (zone 1) and near the sample edges (zone 3). The aspect in the centre (zone 2) is similar to what is observed near the notch (zone 1). There are clear transitions of the fracture modes through the bulk of the polyimide, starting with chevron lines and shear fracture near the notch. The flow lines smoothen towards the edge of the sample, where a zone of brittle fracture initiates and propagates again in a ductile mode towards the sample border. This transition follows from the accumulation of surface stresses during the moulding process of thermoplastic samples. The thermoplastic PTFE fillers added to TP-2 are spherulite-like and seem to form a separate phase in the bulk. They are easily

Chapter 3. Test materials 38 detached from the bulk (necessary for good lubrication) and are visible on the surface with consequent holes in the matrix. Fillers slightly weaken the bulk polyimide as also observed in the mechanical properties in Table 3.3. Table 3.5. Fracture aspects of thermoplastic polyimide: pure TP-1 and 20 wt% PTFE-filled TP-2 TP-1 TP-2
Nea
r th
e no
tch
(zon
e 1)
Nea
r th
e ed
ge (z
one
3)
3.4. Counterface types The main purpose of this work is to study the sliding behaviour of polymers in contact with steel type counterfaces. Only in Chapter 7 the effect of different coatings (DLC, DLN) applied to a steel substrate is evaluated for the sliding behaviour of polyimides. The coating deposition is shortly described in this paragraph, but we refer to Chapter 7 for detailed information and literature references on its tribological benefits. Polymer/polymer sliding contacts are not considered in this work, as limitations regar-ding intensive thermal heating and strong adhesion between materials with similar composition have detrimental effects on sliding. Vaziri et al. [3.48] compared polymer/ polymer and polymer/steel sliding on, e.g., POM-H or PA 6, concluding that the wear rates for like-on-like sliding pairs are significantly higher than with steel counterfaces. Rymuza et al. [3.49] tested miniature polymer/polymer journal bearings of POM-C and

Chapter 3. Test materials 39 PA 6, although intended to be used at low contact pressures. At a certain load, there is a very rapid increase in wear mainly due to thermal effects. Also the loading capacity of a polymer/polymer system is below what is aimed for present large-scale constructions. 3.4.1. Physical properties of counterfaces The properties of steel and coated steel counterfaces applied in present work are given in Table 3.6 and discussed in next paragraphs in relation to their composition. Table 3.6. Physical properties of different steel counterfaces and coatings
* micro Vickers hardness at 0.5 N normal load, HV0.5, ** indentation depth < 300 nm 3.4.2. Steel counterface types High alloy steel (HA-steel) is used as a reference counterface on both small-scale and large-scale tests, corresponding to DIN 1.2738 (40 CrMnMo846, no EN classification) with a yield strength Re = 765 N/mm2 and a tensile strength Rm = 900 to 1100 N/mm2. It is used because of its high hardness of 330 HV (≈ 320 HB ≈ 34 HRC) measured on the sliding surface (laboratory measurement) and it is specifically fitted for general mechanical engineering and tool manufacturing, especially for large sizes over 400 mm thickness. Because of the Ni-addition there is hardly any hardness decrease in the centre of large sections, which makes them favourable to be used in large bearing sections. It is practically applied as mould steel in unhardened conditions for, e.g., polymer extrusion dies. A SEM image with detailed surface conditions is shown in Figure 3.9a for a roughness value Ra = 0.05 µm. The surface is nominally flat with some surface grooves parallel to the sliding direction resulting from its preparation by grinding and polishing. An EDX analysis of unworn HA-steel surfaces (Figure 3.9b) indicates Cr, Si, Mn, Ni and Mo as alloying elements.
Grade Density (g/cm3)
Micro Hardness (GPa)*
Elasticity modulus
(GPa)
Thermal stability
(°C)
Coating thickness
(µm)
Friction against
steel
Wear rate against steel
(10-15 m3/Nm)
Thermal conductivity
(W/mK)
Composition in wt% : C ≤ 0.17, Si = 0.03 – 0.20, Mn = 0.20 – 0.50, P ≤0.04, S ≤ 0.04 St 37-2N
7.80 3 210 200 - 0.70 > 50 46
Composition in wt% : C = 0.43, Si = 0.30, Mn = 1.50, Cr = 2.00, Mo = 0.20, Ni = 1.10 HA
7.85 5 210 200 - 0.70 > 50 33
Composition in wt% : C < 0.03, Si = 1.00, Mn = 2.00, Mo = 2.0-3.0, Ni= 10.0 – 14.0, Cr = 16- 18 316L
7.90 2 210 200 - 0.60 4 – 15 15
Composition : a-C:H DLC
1.80 to 2.10 20 to 30** 160 300 1.2 0.10 to
0.20 5 – 10 Cf. infra
Composition : a-C:H / a-Si:O DLN
2.10 13 to 17** 130 400 1.5 0.05 to 0.10 20 – 40 Cf. infra

Chapter 3. Test materials 40 (a) (b)
Figure 3.9 Characterisation of high alloy steel (HA-steel, Ra = 0.05 µm after polishing), (a) SEM image, (b) EDX analysis
Low carbon steels (DIN St 37-2N) have a composition that is in accordance to EN 1.0116, with a yield strength Re = 235 N/mm2 and a tensile strength Rm = 380 N/mm2. Laboratory measurements of hardness on the sliding surface yield HB = 140 N/mm2. It is used as a representative steel grade for common construction steel qualities. A SEM image of the sliding surface with average roughness Ra = 0.20 µm (after grinding) and Ra = 0.05 µm (after polishing) and is shown in Figures 3.10a and 3.10b, with some roughness grooves parallel to the sliding direction. The EDX spectrum of a polished surface, shown in Figure 3.10c, indicates the presence of Si on the sliding surface, although it is not an alloying element in low carbon steel. It originates from the grinding and subsequent polishing operations of the sliding surface with abrasive silicon carbide (SiC) paper. Before sliding, the surfaces should be intensively rinsed by pouring water to remove impurities and afterwards it should be cleaned with a universal rinsing agent and acetone. It was experimentally verified that the Si peaks then disappeared from the spectrum. The peak at 7 keV represents a sum peak of the FeK and FeL lines.
MoL
Energy (keV)
Inte
nsity
(cou
nts)

Chapter 3. Test materials 41
Impurity after polishing against SiC paper
Energy (keV)
Inte
nsity
(cou
nts)
(a) (b) (c)
Figure 3.10 Characterisation of low carbon steel (St 37-2N), (a) SEM image for Ra = 0.20 µm after
grinding, (b) SEM image for Ra = 0.05 µm after polishing, (c) EDX analysis of polished surface
The composition of austenitic stainless steel AISI 316L is in accordance with DIN 1.4404 or EN 1.0088, having a yield strength Re = 290 N/mm2 and tensile strength Rm = 580 N/mm2. It is preferred above other stainless steel types due to better weldability. The surface hardness within the sliding stroke was measured at HB = 175 N/mm2. A SEM image and an EDX spectrum of the sliding surface are shown in Figure 3.11a and 3.11b.

Chapter 3. Test materials 42 (a) (b)
Figure 3.11 Characterisation of stainless steel (316L, Ra = 0.05 µm after polishing), (a) SEM image, (b) EDX analysis
3.4.3. Diamond-like carbon coated counterfaces Hydrogenated amorphous carbon coatings (a-C:H) consist basically of an amorphous network of cross-linked carbon atoms with a combination of sp2 (graphitic-like) or sp3 (diamond-like) hybridisation. The surface hardness is determined by the content of sp3 bonded carbon and the hydrogen content, offering high wear resistance, whereas the sp2 bonding induces the graphite-like behaviour with low coefficient of friction. A cross-section of a diamond-like carbon (DLC) coating on top of a steel substrate is shown in Figure 3.12. The HA-steel grade is presently used as substrate, which is ultra-sonically rinsed and argon plasma etched before a coating is applied by plasma assisted chemical vapour deposition (PA-CVD) [3.50]. According to Jiaren Jiang et al. [3.51], substrates with higher yield strength are desirable to improve the load-carrying capacity of the coating. Plasma-assisted deposition of DLC films can be performed by using either solid phase or vapour phase carbon sources. With the substrate temperature below 200°C, gaseous acetylene is presently used in combination with electron emission from a heated filament and a high-frequency or pulsed DC voltage on the steel substrate
MnK
Energy (keV)
Inte
nsity
(cou
nts)

Chapter 3. Test materials 43 (150 to 1000 V). The working pressure can be varied between 10-3 and 10-1 mbar. An argon carrier stream is used for higher deposition rates. The substrate is bombarded by various ionized hydrocarbon molecules, neutrals, and inert ions (Ar+) with ion energies typically below 1 keV. It is the impact of the ions on the growing film that induces the sp3 bonding [3.52]. The adhesion between the coating and substrate is typically verified by a scratch test with Rockwell C indentor, where a critical load of 30 N is attained without delamination. The DLC coating (black colour) has a hydrogen content of 30 at% and a thickness of 1.2 µm in combination with a silicon interlayer of 10 nm for better adhesion. The major drawbacks of these films are their low toughness, high internal stresses impeding good adhesion and thermal degradation above 300°C due to graphitisation of DLC (i.e. conversion of sp3 to sp2) [3.53].
Figure 3.12 Cross-section of deposited diamond-like carbon (DLC) coating on HA-steel substrates with Si interlayer
By alloying the amorphous carbon coating with transition metals or elements such as silicon, oxygen, fluorine or nitrogen its physical properties can be controlled [3.54, 3.55]. The incorporation of Si or Si-O containing diamond-like films and details on their structure have received much attention [3.56]. The silicon-doped diamond-like nano-composite (DLN) coatings are obtained by using an energetic Ar+ ion beam and a com-bination of acetylene/SiH4 as vapour-deposited precursors. A negative bias voltage is applied on the substrate. Deposition of metal-containing DLC by applying negative bias has positive impact on the film properties compared to that of neutral or positive bias [3.57]. The DLN coating has a thickness of 1.5 µm and it contains 15 at% silicon and 7 at% oxygen with a hydrogen content between 20 and 35 at%. The Si:O content can even-tually be changed by variation of the type of siloxane precursor. Its atomic structure con-sists of graphitic-like (a-C:H) and quartz-like (a-Si:O) random interpenetrating networks, both respectively stabilised by hydrogen and oxygen. The bonding state of C and Si atoms was investigated from XPS measurements by Neerinck et al. [3.58], indicating only very small Si-C contributions and leading to the conclusion that both networks are independent. Moreover, no x-ray detectable crystallinity was present in the as-deposited DLN films. The amorphous structure is schematically shown in Figure 3.13.

Chapter 3. Test materials 44 Robertson et al. [3.59] reviewed x-ray spectra to investigate the coordination and chemical environment around Si in Si-DLC and described a model for the Si-DLC struc-ture. The incorporation of silicon causes an overall sp2 hybridisation with a lattice struc-ture distortion, attributed to the disruption of the carbon network [3.60] and disappear-ance of the long-range translation symmetry through formation of some local Si-C and Si-O-C bonds [3.61]. This structure was confirmed from Raman measurements by Yang et al. [3.62], indicating an intensification of disordered graphitic absorption peaks that are related to sp2 bonded clusters in amorphous carbon. Those clusters appear as small graphite microcrystallites with finite size. Due to these microstructural changes, Si-doped DLN has lower hardness and wear resistance compared to DLC. The Si or Si-O modified coatings were extensively studied by, e.g., Zajickova et al. [3.63] and it was found by Meneve et al. [3.64] that internal compressive stresses are below 1 GPa, which is advantageous for better adhesion on various substrates, both hard and soft ones. It was found by Masahito et al. [3.65] that the internal stress was reduced below 1 GPa with a SiH4 flow ratio of 36.4% by formation of Si-H bonds, while Vassell et al. [3.66] identi-fied little changes in other mechanical properties, such as elasticity. Adhesion between a DLN coating and steel substrates is verified by a scratch test with Rockwell C indentor, with a critical load of typically 40 N without delamination at the track edges [3.58].
Figure 3.13 Schematic representation of a diamond-like nanocomposite (DLN) coating microstructure
Furthermore, the thermal stability of silicon-doped DLN is superior to pure DLC as the graphitisation process is retarded. Venkatraman et al. [3.67] studied the thermal beha-viour of doped amorphous carbon films by annealing at various temperatures and defined the stability by a variation in mechanical properties (15 % loss in hardness). Annealing at intermediate temperatures lead to an increase in disordered amorphous graphitic structure until a critical point, where a phase transformation from a disordered diamond-like structure into an ordered graphitic structure takes place. Graphitisation then leads to loss in coating hardness and wear resistance. In air environment and atmospheric pressure, this transition occurs at 400°C while it is postponed to 600°C for coatings annealed argon. The coating thickness decreased above 500°C in air due to
C
H
Si
O
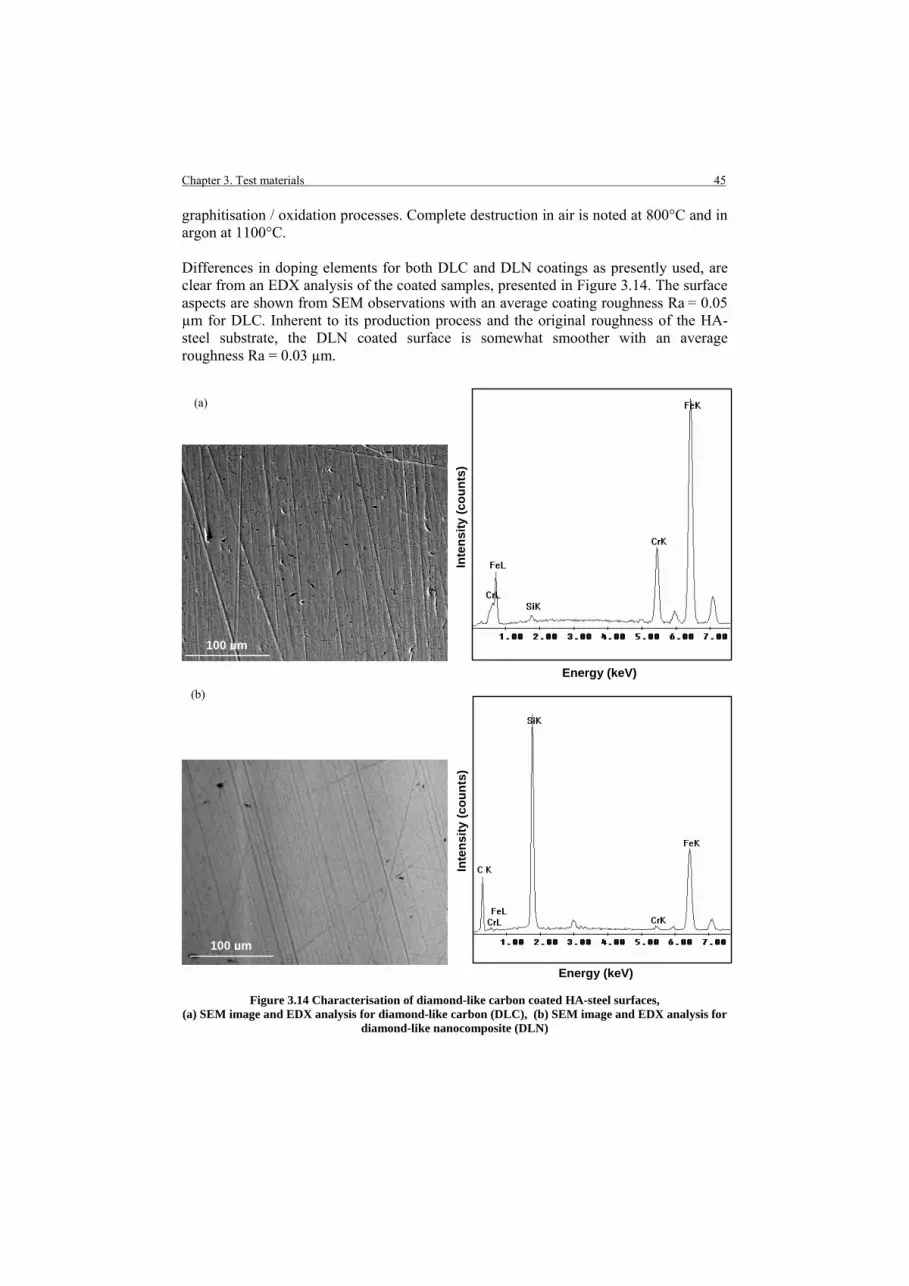
Chapter 3. Test materials 45 graphitisation / oxidation processes. Complete destruction in air is noted at 800°C and in argon at 1100°C. Differences in doping elements for both DLC and DLN coatings as presently used, are clear from an EDX analysis of the coated samples, presented in Figure 3.14. The surface aspects are shown from SEM observations with an average coating roughness Ra = 0.05 µm for DLC. Inherent to its production process and the original roughness of the HA-steel substrate, the DLN coated surface is somewhat smoother with an average roughness Ra = 0.03 µm. (a) (b)
Figure 3.14 Characterisation of diamond-like carbon coated HA-steel surfaces, (a) SEM image and EDX analysis for diamond-like carbon (DLC), (b) SEM image and EDX analysis for
diamond-like nanocomposite (DLN)
100 µm
Energy (keV)
Inte
nsity
(cou
nts)
100 µm
Energy (keV)
Inte
nsity
(cou
nts)

Chapter 3. Test materials 46 3.5. Conclusions From literature review, amorphous polymers are not suitable for tribological purposes due to low strength and brittleness, resulting in lumpy transfer films and unstable sliding. Semi-crystalline thermoplastics are preferred with eventually internal lubricants in limited percentages, interfering with polymerisation or homogenisation. Cast polyamide 6 (PA) can be flexibly shaped in large cross sections by low pressure / low temperature monomer casting, favourable for large-scale tribotests. Cast polyamides have better mechanical properties but slightly lower melting temperatures compared to extruded polyamides. The use of either sodium or magnesium catalysts influences its mechanical properties. Internal oil lubricants are added at max 8 wt% in homogeneous dispersion or in lubricating holes on the surface. Solid lubricants (mixture of MoS2 and PTFE) are homogeneously added for max 10 wt% during casting. Polyoxymethylene homopolymer or polyacetal (POM-H) is a linear thermoplastic with very stable crystalline structure and consequently higher mechanical strength than its copolymer grade (POM-C). It is less sensitive to moisture compared to polyamides, but it has low thermal stability. Test samples are manufactured by extrusion. Polyethylene terephthalate (PET) is an aromatic thermoplastic with better mechanical strength and thermal stability compared to linear structures. It has however lower crystallinity compared to polyacetals and is more sensitive to brittle fracture at notch and stress concentrations. PTFE is homogeneously added for approx 10 to 15 wt%. Samples are processed by extrusion. Ultra-high molecular weight polyethylene (UHMWPE) mechanical and sliding proper-ties are mainly determined by its extremely high molecular weight, providing extremely high wear resistance and low friction. Processing by injection moulding or extrusion is not possible, but large parts can be made from compression moulding. It has however low stiffness and yield strength and should be reinforced by, e.g., a carbon fiber/epoxy composite ring made by hoop winding. Polyimides (PI) are high-performance materials with extremely high mechanical strength and thermal stability up to 310°C (long term) or 450°C (short term). Therefore, it is not melt-processable and should be shaped by sintering. The original imide powders were made by thermal cyclisation of the intermediate polyamic acid, however important side-reactions may occur during processing and the material is sensitive to hydration. Some authors reported about reversible depolymerisation reactions during imidisation in a certain temperature interval. ODA-PMDA polyimide has an amorphous structure and graphite can be added at 15 wt% during sintering. Thermoplastic polyimides have a more flexible molecular composition and with very strict control of the processing para-meters or thermal treatment, it can be partially crystallized. PTFE is added for 20 wt% during injection moulding. Thermal degradation consists of de-etherification, hydration and hydrogen abstraction with subsequent cross-linking between the residual aromatic carbons. The fracture aspect of sintered polyimides is brittle and homogeneous over the entire cross section. The fracture aspect of thermoplastic polyimides is mainly ductile, with an initiation of brittle fracture near the edges that becomes ductile again.
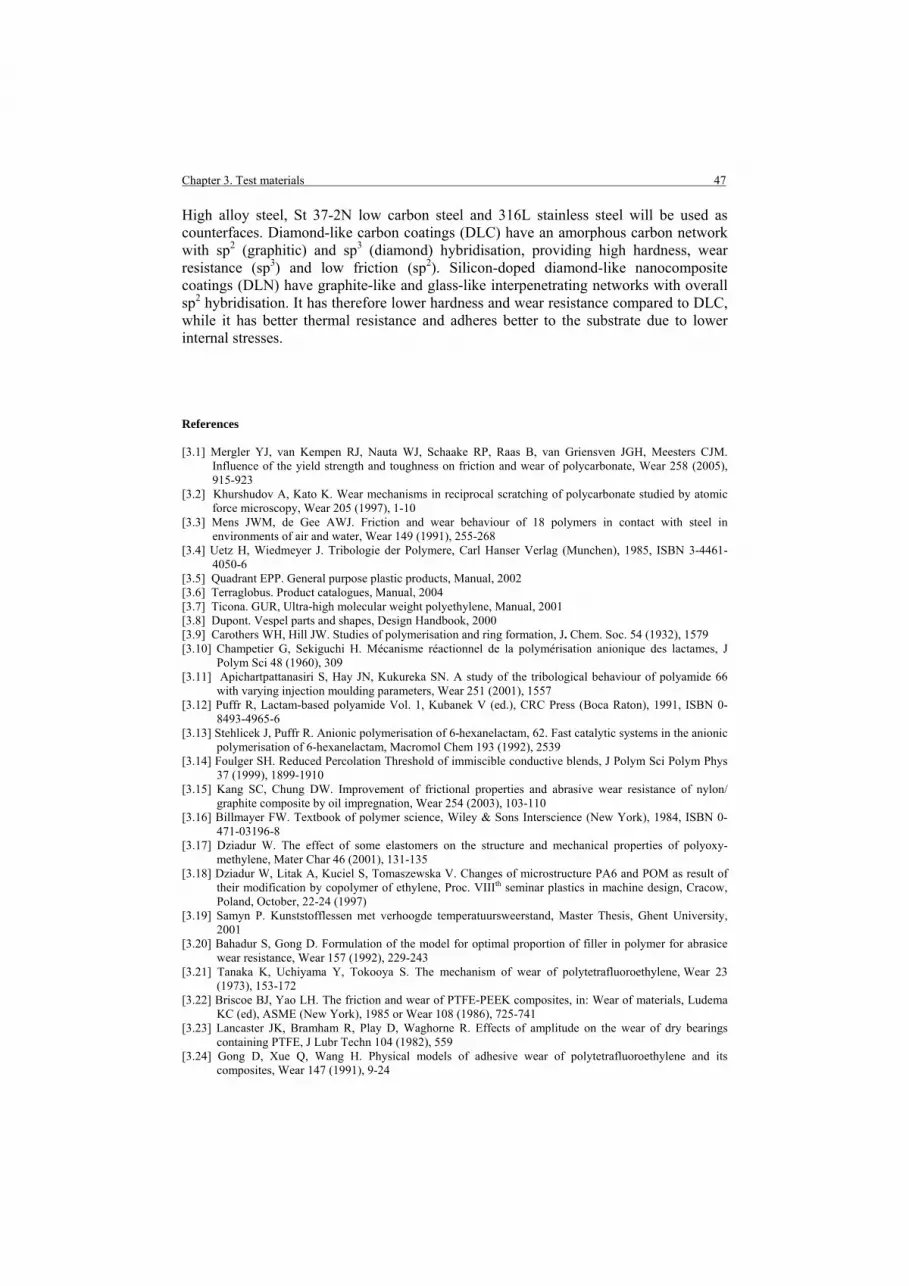
Chapter 3. Test materials 47 High alloy steel, St 37-2N low carbon steel and 316L stainless steel will be used as counterfaces. Diamond-like carbon coatings (DLC) have an amorphous carbon network with sp2 (graphitic) and sp3 (diamond) hybridisation, providing high hardness, wear resistance (sp3) and low friction (sp2). Silicon-doped diamond-like nanocomposite coatings (DLN) have graphite-like and glass-like interpenetrating networks with overall sp2 hybridisation. It has therefore lower hardness and wear resistance compared to DLC, while it has better thermal resistance and adheres better to the substrate due to lower internal stresses. References [3.1] Mergler YJ, van Kempen RJ, Nauta WJ, Schaake RP, Raas B, van Griensven JGH, Meesters CJM.
Influence of the yield strength and toughness on friction and wear of polycarbonate, Wear 258 (2005), 915-923
[3.2] Khurshudov A, Kato K. Wear mechanisms in reciprocal scratching of polycarbonate studied by atomic force microscopy, Wear 205 (1997), 1-10
[3.3] Mens JWM, de Gee AWJ. Friction and wear behaviour of 18 polymers in contact with steel in environments of air and water, Wear 149 (1991), 255-268
[3.4] Uetz H, Wiedmeyer J. Tribologie der Polymere, Carl Hanser Verlag (Munchen), 1985, ISBN 3-4461-4050-6
[3.5] Quadrant EPP. General purpose plastic products, Manual, 2002 [3.6] Terraglobus. Product catalogues, Manual, 2004 [3.7] Ticona. GUR, Ultra-high molecular weight polyethylene, Manual, 2001 [3.8] Dupont. Vespel parts and shapes, Design Handbook, 2000 [3.9] Carothers WH, Hill JW. Studies of polymerisation and ring formation, J. Chem. Soc. 54 (1932), 1579 [3.10] Champetier G, Sekiguchi H. Mécanisme réactionnel de la polymérisation anionique des lactames, J
Polym Sci 48 (1960), 309 [3.11] Apichartpattanasiri S, Hay JN, Kukureka SN. A study of the tribological behaviour of polyamide 66
with varying injection moulding parameters, Wear 251 (2001), 1557 [3.12] Puffr R, Lactam-based polyamide Vol. 1, Kubanek V (ed.), CRC Press (Boca Raton), 1991, ISBN 0-
8493-4965-6 [3.13] Stehlicek J, Puffr R. Anionic polymerisation of 6-hexanelactam, 62. Fast catalytic systems in the anionic
polymerisation of 6-hexanelactam, Macromol Chem 193 (1992), 2539 [3.14] Foulger SH. Reduced Percolation Threshold of immiscible conductive blends, J Polym Sci Polym Phys
37 (1999), 1899-1910 [3.15] Kang SC, Chung DW. Improvement of frictional properties and abrasive wear resistance of nylon/
graphite composite by oil impregnation, Wear 254 (2003), 103-110 [3.16] Billmayer FW. Textbook of polymer science, Wiley & Sons Interscience (New York), 1984, ISBN 0-
471-03196-8 [3.17] Dziadur W. The effect of some elastomers on the structure and mechanical properties of polyoxy-
methylene, Mater Char 46 (2001), 131-135 [3.18] Dziadur W, Litak A, Kuciel S, Tomaszewska V. Changes of microstructure PA6 and POM as result of
their modification by copolymer of ethylene, Proc. VIIIth seminar plastics in machine design, Cracow, Poland, October, 22-24 (1997)
[3.19] Samyn P. Kunststofflessen met verhoogde temperatuursweerstand, Master Thesis, Ghent University, 2001
[3.20] Bahadur S, Gong D. Formulation of the model for optimal proportion of filler in polymer for abrasice wear resistance, Wear 157 (1992), 229-243
[3.21] Tanaka K, Uchiyama Y, Tokooya S. The mechanism of wear of polytetrafluoroethylene, Wear 23 (1973), 153-172
[3.22] Briscoe BJ, Yao LH. The friction and wear of PTFE-PEEK composites, in: Wear of materials, Ludema KC (ed), ASME (New York), 1985 or Wear 108 (1986), 725-741
[3.23] Lancaster JK, Bramham R, Play D, Waghorne R. Effects of amplitude on the wear of dry bearings containing PTFE, J Lubr Techn 104 (1982), 559
[3.24] Gong D, Xue Q, Wang H. Physical models of adhesive wear of polytetrafluoroethylene and its composites, Wear 147 (1991), 9-24

Chapter 3. Test materials 48 [3.25] Van Paepegem W, Van Schepdael L, Degrieck J, Samyn P, De Baets P, Suister E, Leendertz,J.S. Fast
characterisation of carbon/epoxy rings for use in the ball-joints of the Maeslant storm surge barrier, Comp Struct, in press (2006)
[3.26] McGee AC, Dharan CKH, Finnie I. Abrasive wear of graphite fiber-reinforced polymer composite materials, Wear 114 (1987), 97-107
[3.27] Shim HH, Kwon OK. Effects of fiber orientation and humidity on friction and wear properties of graphite fiber composites, Wear 157 (1992), 141-149
[3.28] Esaki S. Aurum thermoplastic polyimides. Advanced materials and processes 5 (1995), 37-38 [3.29] Kuroki T, Sakata Y, Okumura T, Shibuya A. Crystalline polyimide for melt moulding with satisfactory
thermal stability, US Patent 6,458,912 B1 (2002) [3.30] Kiekens P. Supervezels, Master Course, Ghent University, 2000 [3.31] Dunson DL. Synthesis and characterisation of thermosetting polyimide oligomers for microelectronics
packaging, Dissertation Virginia Polytechnic Institute, 2000 [3.32] Palmese GR, Gillham JK. Time temperature transformation cure diagrams – relationships between Tg
and the time of cure for a polyamic acid polyimide system, J Appl Pol Sci 34 (1987), 1925-1939 [3.33] Volksen W. Condensation polyimides: synthesis, solution behaviour and imidisation characteristics,
Adv Polym Sci 117 (1994), 111-164 [3.34] Harris FW. Polyimides: Chapter 1, Wilson D, Stenzenberger HD, Hergenrother PM (eds.), Chapman
and Hall (New York), 1990, ISBN 0-4120-2181-1 [3.35] Laius LA, Tsapovetskii MI. Polyimides: Synthesis, Characterisation and Applications, K. L. Mittal
(ed.), Plenum Press (New York), 1984, ISBN 0-3064-1670-0 [3.36] Young PR, Davis JR, Chang AC, Richardson JN. Characterisation of a thermally imidized soluble
polyimide film, J Polym Sci A 28 (1990), 3107-3122 [3.37] Snyder RW, Thomson B, Bartges B, Czerniwski D, Painter PC. FTIR studies of polyimides, thermal
curing, Macromolecules 22 (1989), 4166-4172 [3.38] Hermans PH, Streef JW. Curing studies of a polyimide precursor, Die Makromol Chemie 74 (1964),
133-144 [3.39] Saini AK, Carlin CM, Patterson HH. Confirmation of the presence of imine bonds in thermally cured
polyimide, J Polym Sci A 31 (1993), 2751-2758 [3.40] Schulze T, Saini AK, Labreque D, Patterson HH. Curing studies of new polyimide model compounds
with molecular weights of about 100 g/mol, J Macromol Sci A 34 (1997), 1535-1552 [3.41] Riderick WR. The isomerism of N-substituted maleimides, J Am Chem Soc 79 (1957), 1710-1712 [3.42] Manwiller CH. Poly(metha-phenylene isophtalamide) moulding compositions, US Patent 4,243,574
(1980) [3.43] Zhuang H. Synthesis and characterisation of aryl phosphine oxide containing thermoplastic polyimides
and thermosetting polyimides with controlled reactivity, dissertation Virginia Polytechnic Institute and State University, 1998
[3.44] Spiegelman PP, Donald CA, Waughtal RE. Super tough polyimide, Aerospace Engineering 1987, 16-22 [3.45] Tamai M, Kawashima S, Sonobe Y, Ohta M, Oikawa H, Yamahuchi T. Polyimide and heat resistant
adhesive consisting of polyimide, Japanese Patent 62-068817 (1987) [3.46] Ratta V. Crystallisation, morphology, thermal stability and adhesive properties of novel high performan-
ce semi-crystalline polyimides, dissertation Virginia Polytechnic University, 1999 [3.47] Li XG, Huang MR, Bai H, Yang YL. Thermogravimetry of thermoplastic polyimide powders under four
different atmospheres, Macromol Mater Eng 286 (2001), 421-428 [3.48] Vaziri M, Spurr RT, Stott FH. An investigation of the wear of polymeric materials, Wear 122 (1988),
329-342 [3.49] Rymuza Z. Adhesion and wear in miniature plastic bearings, Wear 142 (1991), 185-193 [3.50] Tanaka A, Mizuhara K, Umeda K, Ko MW, Kim SY, Lee SH. Effects of environments on friction and
wear of DLC-films produced by PACVD technique. First World Tribology Congress (1997), 506 [3.51] Jiang J, Arnell RD, Tong J. The effect of substrate properties on tribological behaviour of composite
DLC coatings, Tribol Internat 30 (1997), 613-625 [3.52] Yang WJ, Choa YH, Sekino T. Thermal stability evaluation of diamond-like nanocomposite coating,
Thin Solid Films 434 (2003), 49-54 [3.53] Gangopadhyay A, Willermet PA, Tamor MA, Vassell WC. Amorphous hydrogenated carbon films for
tribological applications, Tribol Internat 30 (1997), 9-18 [3.54] Donnet C. Recent progress on the tribology of doped diamond-like and carbon alloy coatings: A review,
Surf Coat Tech 100-101 (1998), 180-186 [3.55] Dorfman VF. Diamond-like nanocomposites (DLN), Thin Solid Films 212 (1992), 267-273 [3.56] He XM, Walter KC, Nastesi M, Lee ST, Fung MK. Investigation of Si-doped diamond-like carbon films
synthesized by plasma immersion ion processing, J Vac Sci Techn A 18 (2000), 2143-2148 [3.57] Sharma R, Panwar OS, Kumar S, Sarangi D, Goullet A, Dixit N, Bhattacharyya R. Effect of substrate
bias on SE, XPS and XAES studies of diamond-like carbon films deposited by saddle field fast atom beam source, Appl Surf Sci 220 (2003), 313-320

Chapter 3. Test materials 49 [3.58] Neerinck D, Persoone R, Sercu M, Goel A, Kester D, Bray D. Diamond-like nanocomposite coatings for
tribological applications, Diamond and Related Materials 7 (1998), 468-471 [3.59] Robertson J. Diamond-like amorphous carbon, Mat Sc Eng R 37 No. 4-6 (2002), 129-281 [3.60] Lee S, Kim D, Rhee S, Oh S, Lee K. Structure and optical properties of Si incorporated diamond-like
carbon films deposited by r.f. plasma-assisted chemical vapor deposition, Thin Solid Films, 341 (1999), 68-72
[3.61] Laidini N, Speranza G, Calliari L, Micheli V, Anderle M. Chemical and microstructural characterisation of silicon-containing carbon films, E-MRS Spring Meeting (2002), Symposium C
[3.62] Yang W, Choa Y, Sekino T, Shim K, Niihara K, Auch K. Tribological evaluation of Si-O containing diamond-like carbon films, Surf Coat Tech 162 (2003), 183-188
[3.63] Zajickova L, Burcikova V, Pecina V, Mackova A, Janca J. Correlation between SiOx content and properties of DLC: SiOx films prepared by PECVD, Surf Coat Tech 174 (2003), 281-285
[3.64] Meneve J, Dekempeneer E, Smeets J. a-Si1-xCx:H films and their possibilities and limitations for tribological applications, Diamond Films Technology 4 (1994), 23
[3.65] Masahito B, Hasegawa T. Internal stress reduction by incorporation of silicon in diamond-like carbon films, Surf Coat Tech 162 (2002), 1-5
[3.66] Vassell WC, Gangopadhyay AK, Potter J, Tamor MA, Rokosz MJ. Characterisation of silicon-stabilized amorphous hydrogenated carbon, J Mater Eng Perform 6 (1997), 426-432
[3.67] Venkatraman C, Brodbeck C, Lei R. Tribological properties of diamond-like nanocomposite coatings at high temperatures, Surf Coat Tech 115 (1999), 215-221

Chapter 3. Test materials 50

51
Chapter 4.
Tribotesting and Analysis.
Goals
• Description of small-scale and large-scale test equipment and test conditions
• Verification of statistical repeatability of friction and wear results
• Analysis of flat-on-flat and cylinder-on-plate contact conditions on
macroscopic level (changing contact geometry during running-in) and microscopic level (influence of counterface roughness)
• Definition and significance of a maximum polymer temperature T*
under reciprocating sliding
• Theoretical overview of characterisation techniques for polymer wear products (debris + surfaces) and possibilities to apply
Methodology
• Preliminary small-scale and large-scale tribotests
• Temperature measurements and calculations
Condition monitoring, 2005, Cambridge (UK)

Chapter 4. Tribotesting and Analysis 52 4.1. Introduction In conventional tribotesting, small-scale tests are preferred due to their cost- and time-effectiveness with easy handling of test specimens (apparent contact area 1 to 102 mm2). An appropriate test set-up can be selected according to ASTM and some DIN standards for each wear mode. The National Physics Laboratory (UK) identified worldwide more than 400 test methods with either scientific or industrial interest [4.1]. Under adhesive conditions either pin-on-disc (ASTM G99) or pin-on-plate (ASTM G133) is used in con-tinuous or reciprocating motion. Block-on-ring (ASTM G88) tests are applied for line contact as occurring in gears. Also small component tests are available to simulate strong conformal contacts (Figure 4.1). Test conditions should simulate the real working envi-ronment as close as possible, including the micro- and macrostructure of material sliding couples, contact geometries, contact pressures, type of sliding motion, stiffness, etc. (a) Pin-on-disc (b) Block-on-ring (c) Pin-on-plate (d) Ring-on-ring (e) Bush-on-shaft (f) Piston-on-cylinder
Figure 4.1 Conventional small-scale tribotesters for adhesive wear conditions
Most reliable testing of machine components involves the real tribosystem, however, it is often not possible due to practical obstructions. A scheme for scaling tribological research was provided by Czichos [4.2], going from ‘field tests’ on original aggregates over large-scale simulation tests on real components to ‘laboratory tests’ on artificial samples with simple geometry and modelling. He mainly stressed the importance of running-in conditions. For each test system, an equivalent input of mechanical and thermal energy should be provided. This rule seems however too general, mainly for polymers, because possible transitions in wear mechanisms can change mild conditions into severe or overload damage. Moreover, the contact area size may influence transfer film formation. Tests performed on a large-scale tribotester are classified as Category III testing according to Czichos, including specimens as used in practice. Large-scale wear samples (apparent contact area 104 to 105 mm2) allow for reducing the effect of stress concentrations near the sample edges due to a high ratio of bulk to edge material and are more representative for debris mobility into the sliding interface. To our experience, also sliding instabilities manifest more frequently on large-scale testing while they are hidden on small-scale. As such, the ‘real wear lifetime’ of polymer components can be deter-mined more accurately within conditions near to practice. However, it requires large dimensions, weight, stiffness and manipulation of test pieces becomes more difficult.

Chapter 4. Tribotesting and Analysis 53 4.2. Small-scale friction and wear testing 4.2.1. Small-scale testing device The small-scale cylinder-on-plate tester used for present studies is schematically shown in Figure 4.2. It is a universal PLINT TE 77 High Frequency tribotester for dry recipro-cating sliding between a moving polymer cylinder and a fixed counterface plate. A line contact is chosen for easy alignment of the sliding pair and high contact pressures at running-in: it will promote transfer controlling steady-state sliding. The initial contact geometry is contra formal with a contact area continuously growing as wear proceeds, called an ‘increasing contact area’ type of wear. The polymer cylinder (diameter 5 mm x width 15 mm) is mounted into a reciprocating moving arm by means of a clamp and aligning mechanism, preventing it from rolling during the test so that pure sliding is guaranteed. The oscillating motion of the arm is provided through an eccentric transmission, which converts the continuous rotational motion of a DC electromotor into a linear movement and is used for adjustment of the sliding stroke. The normal load is manually applied through a spring and lever system that pulls down a transverse bridge structure over the polymer specimen. Contact between the moving arm and the bridge structure is made by a roller bearing. The stationary steel counterface (58 mm x 38 mm x 4 mm) is fixed onto a plate holder that is connected to the base plate by means of four leaf springs with high stiffness in vertical direction and appropriate flexibility in horizontal direction. The counterface can be heated by four Vulstar heat cartridges (200 W, 400 Ω), continuously PID-controlled.
Figure 4.2 Small-scale reciprocating cylinder-on-plate tribotester
A piezo-electrical force transducer (range +/- 500 N, resolution 0.001 N) in contact with the stationary steel plate measures the horizontal friction force that the polymer speci-men exerts on the counterface. The normal load is measured by a load cell connected to the spring and lever system. A contactless inductive displacement transducer is positi-oned on top of the transverse bridge, measuring its displacement as the combined effect of wear and deformation of the polymer samples during sliding. Sliding temperatures are measured by a DIN 43710 K-type (nickel-chromium/nickel-aluminium) thermocouple positioned on top of the counterface at 10 mm from the end of the sliding stroke.
Displacement transducer
Reciprocating arm
Transverse bridge
Force transducer
Moving polymer cylinder
Stationary counterface plate
Clamping mechanism
Thermocouple

Chapter 4. Tribotesting and Analysis 54 4.2.2. Small-scale test conditions Test conditions for small-scale tribotests are summarised in Table 4.1. The range for normal loads is 10 to 250 N, the sliding frequency range is 2,5 to 50 Hz and the sliding stroke can be varied between 0,1 to 15 mm. A selection of normal loads and sliding velocities includes both normal functioning and overload conditions for polymer elements. The sliding stroke is fixed at 15 mm as changing the eccentric mechanism could cause alignment problems and minimising the stroke would induce fretting. The test environment is surrounded by a climate box that is connected to an external climate conditioner. According to ASTM F732-98 “Reciprocating Pin-on-flat wear tests”, tests are done at controlled atmosphere of 23°C temperature and 60 % relative humidity. Counterfaces are rinsed with water and acetone and the polymer surface is cleaned with acetone after mounting in the test rig. Good alignment between the polymer sample and its counterface is ensured by applying a small preload (20 N) before tight fixation of the clamping mechanism. No external oil or grease lubricants are applied. Table 4.1. Small-scale test conditions
Test parameter Unit Small-scale reciprocating cylinder-on-plate test
Normal load N 50, 100, 150, 200
Sliding stroke mm 15
Total sliding distance m 15000
Sliding frequency Hz 10, 20, 30, 40
Sliding velocity m/s 0.3, 0.6, 0.9, 1.2
Counterface temperature °C no heating, 60, 80, 100, 120, 140, 180, 220, 260
Ambient temperature °C 23 ± 2 (controlled standard atmosphere)
Relative humidity % 60 ± 2 (controlled standard atmosphere)
4.2.3. Preliminary test: statistical analysis and influence of test geometry The friction force is continuously measured as a function of the reciprocating sliding motion as shown in Figure 4.3 for five subsequent sliding cycles, with either a positive or negative value depending on the sliding direction. One sliding cycle (i.e. a double sliding stroke) contains 50 sample values, independent of the sliding velocity. This means that for a 10 Hz sliding test, where 100 sliding cycles take 10 seconds, the sample frequency is 500 Hz or the intermediate sampling time is 2 ms. For each 100 sliding cycles, however, only 5 are selected as shown in Figure 4.3 to calculate the friction force and the 95 following cycles are ignored. Within a single sliding stroke, the static friction force Fstat occurs at restart after reversal of the sliding direction and is calculated according to Formula (4.1). The dynamic friction force Fdyn occurs in the centre of the sliding stroke and is calculated as a root-mean-square value of the force transducer sig-nal according to Formula (4.2), as the signal is often not centred around the zero value.

Chapter 4. Tribotesting and Analysis 55
-40
-30
-20
-10
0
10
20
30
40
0 50 100 150 200 250
Sample number
Fric
tion
forc
e (N
)
Fstat,min
Fstat,max
(4.1)
(4.2)
Figure 4.3 Sampling of the friction force over five reciprocating sliding cycles for SP-1, 50 N, 0.3 m/s
on a small-scale cylinder-on-plate test against HA-steel The static and dynamic coefficient of friction are calculated as the ratio of friction force and applied normal load FN, resulting in µs = Fstat/FN and µd = Fdyn/FN. The evolution of the dynamic coefficient of friction µd as a function of the sliding distance is plotted in Figure 4.4a for sliding tests on sintered polyimide SP-1 at 50 N, 0.3 m/s. Test results for polymer cylinders with fixed diameter 5 mm and width 2b either 12 or 15 mm are illustrated. Future tests in this work will always be done on 15 mm cylinders, because of better alignment and larger available wear track to be analysed for transfer. For estimating the statistical repeatability of the small-scale test results, five tests are done on 15 mm cylinders with identical load and sliding velocity. Coefficients of friction measured on 12 mm cylinders are systematically lower than friction measured on 15 mm cylinders under identical normal load, caused by the higher contact pressures on small cylinders. The second test on 12 mm samples provides lower friction, likely attributed to a lower counterface roughness. The 12 mm tests were done on the same counterface with intermediate polishing, reducing the initial counterface roughness Ra = 0.05 µm to Ra = 0.02 µm. More details on roughness effects are further analysed (Chapter 7). For the statistical 15 mm tests, freshly machined counterfaces with identical roughness are used for each test and there is reasonable accordance between measurements: during running-in, there is some higher friction due to Hertz contact conditions, and during steady-state, friction attains a nearly constant value. The curves slightly deviate towards the end of the test possibly due to random interaction with wear debris particles in the interface. No coherent transfer film for present test conditions on HA-steel was observed and the friction curve mainly indicates mechanical interactions.
2max,min, statstat
stat
FFF
+=
( )∫=T
dyn dttFT
F0
2)(1
0 T

Chapter 4. Tribotesting and Analysis 56 The on-line measurements of vertical displacement are given in Figure 4.4b for 12 mm and 15 mm cylinders. The final vertical displacement for 12 mm samples is higher due to a higher contact pressure. The second test with lowest roughness Ra = 0.02 µm causes highest wear, as explained in Chapter 7 (see Figure 7.5). The statistical 15 mm tests show good correspondence for the final vertical displacement value, however most scat-ter occurs during running-in due to deformation of the Hertz line contact. A statistically high or low friction does not necessarily correlate to a statistically high or low wear. (a) (b)
Figure 4.4 Preliminary statistical analysis of small-scale sliding measurements for SP-1, 50 N, 0.3m/s on HA-steel, cylinders with width 2b = 15 mm (tests 1-5) or 2b = 12 mm (tests 6 with Ra = 0.05 µm, test 7
with Ra = 0.02 µm) against HA-steel, (a) friction, (b) wear
0
0.1
0.2
0.3
0.4
0.5
0.6
0.7
0.8
0 2000 4000 6000 8000 10000 12000 14000 16000
Sliding distance (m)
Dyn
amic
coe
ffic
ient
of f
rictio
n
(1-5)
(6) (7)
0
100
200
300
400
500
600
700
0 2000 4000 6000 8000 10000 12000 14000 16000
Sliding distance (m)
Vert
ical
dis
plac
emen
t (µm
)
(7)
(6)
(1-5)

Chapter 4. Tribotesting and Analysis 57 The repeatability of test results for friction and wear on 15 mm cylindrical samples of SP-1 is analysed in Table 4.2. Wear is determined from weight measurements (analytical balance, 0.0001 g) and dimensional measurements (micrometer, 0.01 mm) both imme-diately and one week after testing, allowing for recovery and homogenisation at atmos-pheric temperature and humidity. As a measuring protocol for future data, weight and diameter reduction will be measured one week after testing to allow for equilibration. Table 4.2. Statistical analysis for small-scale tests on cylinders with 2b = 15 mm, SP-1 at 50 N, 0.3 m/s
Weight loss (g)
Diameter reduction (mm) Test
number Coefficient of friction
Vertical displace-
ment (µm) immediately
after testing one week
after testing immediately after testing
one week after testing
1 0.50 472 0.0155 0.0152 0.42 0.42
2 0.51 510 0.0156 0.0156 0.46 0.45
3 0.48 550 0.0185 0.0179 0.51 0.51
4 0.52 518 0.0176 0.0173 0.49 0.48
5 0.55 493 0.0161 0.0160 0.45 0.45
Mean value 0.51 509 - 0.0164 - 0.46
Standard deviation 0.026 29.1 - 0.001 - 0.038
Max range 0.07 78 - 0.0027 - 0.10
Relative error around the average
± 7 % ± 8 % - ± 8 % - ± 12 %
Tribological test results typically show larger variation than intrinsic material properties such as mechanical strength, stiffness, thermal properties or electrical properties and are difficult to control. The variation in experimental values does not only depend on the statistical variation in properties of both contact materials, but it is mainly dependent on the test rig design. The contact and eventual material transfer between both sliding materials happens at some local roughness peaks changing in number and dimensions during sliding. The local contact conditions, however, strongly change with the surface finish of the test samples: close control on the composition, structure, shape and surface conditions is indispensable for good repeatability. The polymer structure is strongly defined by its processing parameters, however as all samples presently used originate from industrial processes, this is considered as a minor influence. Particularly for polymer/steel mating pairs, the heat generation through the frictional process influences the sliding behaviour and depends on the local friction conditions, while any variation in friction coefficient causes a variation in temperature. A second reason for scatter in test results, and to our experience the most important, is the unreliable functioning of each part on the test rig. Most critical parts as the roller bearing in contact with the transverse bridge structure and the spring and lever system for loading the transverse bridge (Figure 4.1) should be regularly replaced. It is our experience that with good maintenance of the

Chapter 4. Tribotesting and Analysis 58 test rig, the steel surface conditions become the second most crucial influence. Prepara-tion according to ASTM G115-98 should be followed, including ultrasonic rinsing, poli-shing and degreasing. The final polishing step is done with grooves parallel to the sliding direction. As a variation of 10 to 15 % or even higher on experimental values is often observed [4.3], present data for SP-1 are “reasonably acceptable”. The relative error on friction coefficients seems somewhat lower than on wear values, as the latter are additionally influenced by creep and deformation. Thermoplastics showed somewhat higher statistical variations (± 10 % on friction to ± 16 % on wear). Klaffke [4.4] found for steel/steel pairings a scatter of ± 6.3 % on friction and a scatter of ± 30 % for wear. For a normal distribution of the experimental values, the mean value can be statistically tested on its significance by means of the ‘t-test’ [4.5]. Assuming that the standard deviation of the distribution is not a priori known, the confidence interval is given by Formula (4.3),
(4.3) with µ0 the mean value calculated from experiments, tn-1, 1-α/2 the t-value for n = 5 tests and a significance level α (tabulated) and S the standard deviation calculated from ex-periments. The 95 % and 90 % confidence intervals for on-line mean coefficient of fric-tion µ0 and off-line mean weight loss ∆g0 are given in Table 4.3. It means that 95 %, res-pectively 90 %, of the test results measured for SP-1 at 50 N, 0.3 m/s is within the given interval. Table 4.3. Confidence intervals for experimental friction and weight loss on small-scale tests
Parameter 95 % confidence interval 90 % confidence interval
Coefficient of friction µ0 ± 0.032 µ0 ± 0.025
Weight loss ∆g0 ± 0.0014 ∆g0 ± 0.0011
From the calculated mean value µ0 and standard deviation S for the measurements of friction coefficients (Table 4.2), the number of tests required for a respective 10 %, 6 %, 5 % and 1 % relative error can be calculated according to Formula (4.4) [4.6],
(4.4) with n the number of measurements, tα,ν the t-value for confidence level α = 0.05 and ν = 5-1 = 4 degrees of freedom (tabulated), S the standard deviation, µ0 the average value and E the percentage of relative error. For a relative error of 10 % the number of experiments n should be 1, for a relative error of 6 % the number of experiments n should be 3, for a relative error of 5 % the number of experiments n should be 5 and for relative error of 1 %, the number of experiments n should be 118. From the effectively available time, each test result in future work will be averaged from three repeated tests.
2
0
, 100⎟⎟⎠
⎞⎜⎜⎝
⎛⋅=
ESt
nµ
να
nStX
nSt nn 2/1,1002/1,10 αα µµ −−−− +≤≤−

Chapter 4. Tribotesting and Analysis 59 4.3. Large-scale friction and wear testing
4.3.1. Large-scale testing device The tribotester for high-load testing of large specimens available at Laboratory Soete, is schematically illustrated in Figure 4.5. Two identical sliding couples positioned on top and bottom of the machine (each consisting of a polymer specimen measuring 150 x 150 x 20 mm3 and a counterface plate sizing 410 x 200 x 20 mm3) are tested simultaneously in a flat-on-flat reciprocating motion. The stationary polymer specimens are fixed in rectangular specimen holders, inserted into a horizontally rigid frame. The counterface plates are positioned on both sides of the central sliding block, taken out of the machine during preparation. The polymer specimens and counterface plates are pressed against each other by a normal force, exerted by the jack in the vertical column. The central sliding block provides the reciprocating motion and is driven by two horizontal jacks on the left and on the right. Depending on the sliding direction, one of the jacks provides a counter pressure to obtain a higher rigidity of the machine. The sliding velocity is controlled by a hydraulic circuit and is almost constant over the sliding stroke, except near the edges where the sliding direction reverses.
Figure 4.5 Large-scale reciprocating flat-on-flat tribotester, (1) polymer sample, (2) steel counterface, (3) horizontal jacks, (4) vertical jack, (5) thermocouple
During sliding, the horizontal and vertical forces are measured with dynamometers placed between the jacks and the central block. The horizontal displacement of the cen-tral sliding block is followed with a linear displacement transducer (LVDT, not shown). The wear of the polymer specimens is continuously measured as the vertical displace-ment of the polymer samples towards their counterfaces by means of two displacement transducers that are in contact with the counterfaces: as wear progresses, the distance between the polymer samples and the counterfaces decreases. The sliding temperatures are continuously measured on the counterface side with a K-type thermocouple at a measuring depth d = 20 mm beneath the contact surface, i.e. at the interface between the counterface plate and the central sliding block.
(4)
(3) (3)
(2)
(2)
(1)
(1)
(5)
(5)

Chapter 4. Tribotesting and Analysis 60 4.3.2. Large-scale test conditions The large-scale test parameters are presented in Table 4.4. The maximum normal load FN is 6500 kN and horizontal forces Fl and Fr at the left and right side are limited to 2500 kN, making it possible to test materials with a coefficient of friction of 0.2 at maxi-mum normal load. Sliding tests are done at different contact pressures, both below and above the polymer yield strength for investigating the effects of overload. A series of tests on polyamides (PA) is done at lower contact pressures than used for the more rigid thermoplastics (PET/PTFE, POM-H), due to early softening and unstable sliding. Only one sliding velocity of 5 mm/s can be applied, but it is low in accordance to practical bearing applications in heavily loaded sliding systems. One test runs over approximately 168 hours (7 days) to determine the material’s wear lifetime. If overload or sliding instabilities occur, tests are stopped prematurely. Short-time tests over 10 sliding cycles (4.6 m) are performed for investigation of the sliding stability at running-in. In some tests, the effect of external lubricant (high-pressure lubricant grades with addi-tives) can be investigated by brushing oils or greases on the counterfaces before sliding. The sliding block is continuously cooled by a water flow through the centre of the block and the initial counterface temperature is 15°C. If not cooled, the temperature rises very fast and overload during large-scale tests happens more easily. Both counterfaces and polymer samples are cleaned with acetone before testing and they are preloaded with a small normal load (90 kN) for better alignment. Large-scale test results are averaged from two test runs. The statistical variation is ± 7% for coefficients of friction and ± 15 % for wear rates from weight loss, although the latter depend on either top or bottom positions (see Chapter 9, 10). From inter-laboratorial testing (Chapter 11), there is good agreement in coefficients of friction within the statistical variation. Table 4.4. Large-scale test conditions
Test parameter Unit Large-scale reciprocating flat-on-flat test
Normal load kN
225, 450, 675, 900 (polyamides working range)
190, 380, 560, 1260, 3380 (rigid thermoplastics working and
overload range)
Contact pressure MPa
10, 20, 30, 40 (polyamides working range)
8, 16, 25, 55, 150 (rigid thermoplastics working and
overload range)
Sliding stroke mm 230
Sliding velocity m/s 0.005
Counterface temperature °C no heating
Ambient temperature °C 23 ± 2 (measured, but not controlled)
Relative humidity % 40 to 60 (measured, but not controlled)
Short-time test Long-time test
Total sliding distance m 4.6
2500 to 3000 depending on overload

Chapter 4. Tribotesting and Analysis 61 4.3.3. Preliminary evaluation Two measuring protocols are used, either (i) sampling full sliding cycles or (ii) sampling an average value per sliding cycle. The evolution of the coefficient of friction over five full sliding cycles is illustrated in Figure 4.6 for polyamide PAo2 at 20 MPa. A sample rate of 38.5 Hz is applied for ten data channels, each measuring a force, displacement or temperature. As only one A/D convertor with multiplexer is used, both horizontal forces Fl and Fr at the left and right side of the sliding block and the normal load FN are sampled at 3.85 Hz. The sample time between two trigger events is 250 ms, being the lowest time available on present configuration but allowing for the representation of signals with good accuracy at low sliding velocity. As one sliding cycle takes approximately 92 seconds, there are sampled approximately 354 points within one sliding cycle. The coefficient of friction is calculated from the friction forces according to formula (4.5),
(4.5)
with Fl the horizontal force at the left and Fr the horizontal force at the right of the central sliding block, FN the normal force and the factor 1/2 resulting from the couple of sliding pairs that is tested simultaneously. The modulus is introduced because of negative forces occurring on reversal of the sliding direction. Both static and dynamic friction coefficients are determined from a friction-displacement curve as illustrated in Figure 4.6. The initial peak in friction at the beginning of the reciprocating motion is called the static friction at start (µs1), but static friction occurs also at each reversal of the sliding motion, with a maximum value µsn,max and a minimum value µsn,min. The dynamic coefficients of friction in the centre of the sliding stroke are indicated by a maximum value µd, max and a minimum value µd, min.
Figure 4.6 Sampling of the coefficient of friction over five reciprocating sliding cycles for PAo2, 20 MPa, 0.005 m/s on a large-scale flat-on-flat test against HA-steel:
indication of sliding direction and characteristic friction values
N
rl
FFF −
=21µ
-0.25
-0.20
-0.15
-0.10
-0.05
0.00
0.05
0.10
0.15
0.20
0.25
-150 -100 -50 0 50 100 150
Sliding distance (mm)
Coe
ffic
ient
of f
rictio
n
µs1 µsn,max µsn,min
µd,max µd,min
start
stop
1 2 3 to 5

Chapter 4. Tribotesting and Analysis 62 Sampling the average dynamic friction force over one cycle during the entire sliding distance of 2500 to 3000 m is done by generating a trigger event at the centre of the sliding stroke and measuring 50 samples at a sample frequency of 3.85 Hz. Those samples are averaged to calculate the dynamic friction force according to formula (4.5). Vertical displacement of the top and bottom large-scale samples is measured on-line and samples are triggered simultaneously to the average dynamic friction force. It will be compared to off-line thickness reduction (micrometer, 0.01 mm) and weight measure-ments (analytical balance, 0.01 g). While on-line measurements are strongly influenced by deformations of the polymer sample under creep (enhancing the wear signal) or ther-mal expansion (counteracting the wear signal), the real wear or material loss is determi-ned by the difference in weight of the polymer sample before and after testing. Analysis of real wear and deformation will be considered in future tests. 4.4. Contact conditions 4.4.1. Contact geometries For large-scale tests, the macroscopic or apparent contact area A remains flat during wear of the polymer sample, providing a constant contact pressure during sliding. In case of overload the contact area increases due to creep as material flows out of the sample holders. However, this part of the contact surface does not carry any load and the contact pressure remains restricted to the initial macroscopic contact area. On a microscopic scale, however, real contact between two mating bodies is only made at the roughness peaks on their surface. Under static load conditions, the magnitude of the real contact area A′ depends on the hardness, the stiffness and the roughness parameters of the mating surfaces and the number of contact zones varies as a function of time due to creep and adhesion until a regime situation establishes where local stress concentrations are minimised. The evolution in time and saturation of the real contact area was studied by Tabor [4.7]. For intermediate surface roughness and contact pressures which are “sufficiently low” (depending on material Young’s modulus, hardness and roughness) to neglect interaction of the individual microasperities, the real contact area A′ is only a fraction of the apparent contact area A and rises proportionally to the applied normal load FN for both elastic and plastic deformation. According to the generalised Archard model [4.8], a proportionality rule (A′ ~ FN) results from the formation of new contact points with increase in load because of purely plastic deformation. However, when the individual contact spots are supposed to interact, the real contact area increases less than proportionally with the normal load (A′ ~ FN
2/3). This behaviour was examined by Hertz and is related to the increase in size of existing contact zones, while the number of contacts remains constant [4.9] because of purely elastic deformation. The deformation of polyamide was investigated by Pascoe and Tabor [4.10], showing intermediate coefficients m for the proportionality A′ ~ (FN)m with m between 2.5/3 and 2.7/3 as an indication that the deformation is neither plastic nor elastic under low load. Holm [4.11] introduced the idea that although the overall stresses are in the elastic range the local stresses at the contact spots are much higher so that the elastic limit will be exceeded and the contact will yield plastically. The assumption that low load contacts are per definition elastic and high load contacts are per definition plastic is not completely true, as also the roughness texture should be considered. One may expect that for very rough

Chapter 4. Tribotesting and Analysis 63
FN
2 ℓ
2b
2 ℓ
2b
R1
R2
Rectangular contact Body 1
Body 2
z
x
surfaces there will be plastic flow, while contact on very smooth surfaces will be entirely elastic. A generalised plasticity index was therefore proposed by Greenwood and Williamson [4.12], depending on the mechanical strength of the contact body and the distribution of the surface roughness profile. It is clear that nearly all deformation is located in the softest contact body. In present situation of very high contact pressures approaching the hardness (or yield strength) of the soft polymer sample in combination with long loading times and smooth counterfaces (Ra ≤ 0.2 µm), the real contact area approaches the apparent contact area. An increase in normal load then no longer enlarges the real contact area, but increases the real contact pressure. With a constant contact surface of 150 mm x 150 mm = 22500 mm2 for all test samples, the applied normal load FN is converted into contact pressures p, according to p = FN/A. The small-scale cylinder-on-plate macroscopic contact changes during sliding from a contra formal into a conformal situation. The initial line contact can be described by the analytical formulas developed by Hertz, based on the theory of elasticity [4.13]. A general model for line contact between two elastic cylinders is illustrated in Figure 4.7, where the radius of the second contact body (R2) is taken infinite in case of a cylinder-on-plate configuration. The Hertz theory (1881) allows to calculate the contact geome-try, contact pressures and elastic deformation when a static normal load FN is applied between two elastic bodies apparently contacting at a single point. The contact area and contact pressure depend on whether the contact bodies are convex or concave and whether it are hard or soft bodies. In the calculations, the material properties of both elastic solids are represented by an equivalent modulus of elasticity E′ according to formula (4.6) with Poisson coefficients ν1 = 0.4 for polymers and ν2 = 0.3 for steel counterfaces, and Young’s moduli E1 for polymer and E2 = 210 GPa for steel respectively. The reduced radius of curvature R′ is given in formula (4.7). A polymer cylinder pressed against a flat steel plate will produce a plane rectangular contact area AH with width 2b and length 2ℓ, calculated from formula (4.8) to (4.10). The large difference in elasticity causes all deformation to be concentrated in the polymer sample.
Equivalent modulus of elasticity E′:
⎥⎦
⎤⎢⎣
⎡ −+
−=
2
22
1
21 11
21
'1
EEEνν
Reduced radius R′:
21
11'
1RRR
+=
Geometry: 2b = 15 mm
''4
EbRFN
π=l
Contact area AH = 4 b ℓ
Figure 4.7 General Hertz line contact situation (R2 = ∞ for cylinder-on-plate contact) [4.14]
(4.6) (4.7)
(4.8)
(4.9) (4.10)

Chapter 4. Tribotesting and Analysis 64 Under a normal load FN, the contact pressure at the interface is parabolically distributed according to formula (4.11) with a maximum value pH,max on the centre line where the load is applied and an average value pH,avg from formulas (4.12) and (4.13).
(4.11)
(4.12)
(4.13) The elastic indentation of the polymer cylinder can be estimated from the relative approach δΗ between polymer and steel according to formula (4.14).
(4.14)
As an illustration for sintered polyimide grades SP-1 and SP-2 and for thermoplastic polyimide grades TP-1 and TP-2 with different Young’s moduli respectively, the Hertz deformation and contact pressures are calculated in Table 4.5 and Table 4.6. Table 4.5. Small-scale cylinder-on-plate contact conditions from Hertz theory for sintered polyimide
Pure sintered polyimide (SP-1) Graphite-filled sintered polyimide (SP-2) Normal load (N) pH,max
(MPa) pH,avg
(MPa) AH
(mm2) δΗ
(µm)
pH,max
(MPa) pH,avg
(MPa) AH
(mm2) δΗ
(µm)
50 34 27 1.82 3.32 39 30 1.60 2.66
100 49 39 2.58 6.13 55 43 2.29 4.94
150 60 47 3.17 8.85 68 53 2.81 7.07
200 70 55 3.66 11.3
78 61 3.24 9.10
Pure thermoplastic polyimide (TP-1) PTFE-filled thermoplastic polyimide (TP-2) Normal load (N) pH,max
(MPa) pH,avg
(MPa) AH
(mm2) δΗ
(µm)
pH,max
(MPa) pH,avg
(MPa) AH
(mm2) δΗ
(µm)
50 36 29 1.73 3.02 34 27 1.86 3.42
100 52 41 2.45 5.59 48 38 2.63 6.32
150 64 50 3.00 8.00 59 46 3.22 9.04
200 73 58 3.47 10.3
68 53 3.72 11.6
max,,
max,
2
max,
44
1
HN
avgH
NH
HH
pb
Fp
bF
p
xpp
ππ
==
=
⎟⎠⎞
⎜⎝⎛−=
l
l
l
⎥⎦
⎤⎢⎣
⎡⎟⎠⎞
⎜⎝⎛ −
−=
214ln1 1
1
21
l
REb
FNH
νπ
δ
Table 4.6. Small-scale cylinder-on-plate contact conditions from Hertz theory for thermoplastic polyimide

Chapter 4. Tribotesting and Analysis 65 With ongoing small-scale sliding, the macroscopic contact area at steady-state is circum-scribed by a narrow rectangle that progressively grows through wear. A geometrical relation between contact pressure p and wear depth ∆h is given by Formula (4.15) for a cylindrical polymer specimen with radius R1 (2.5 mm) tested under normal load FN,
(4.15) with A the macroscopic or apparent contact area, b the half-width of wear track (7.5 mm) and ℓ semi-length in the sliding direction, geometrically calculated from the wear depth ∆h. Due to the increase of contact area during wear, the initial contact pressure decreases while running a small-scale test. According to Formula (4.15) the contact pressure levels off with ongoing wear towards a steady-state situation with nearly constant contact pressure. The evolution of the contact pressure and the contact area as a function of the wear depth is plotted in Figure 4.8 for normal loads of 50, 100, 150 and 200 N. The average steady-state contact pressure on the macrocontact falls down to 1 to 3 MPa depending on the normal load. Its value at the end of the sliding test is calculated from measurement of diameter reduction (see Table 4.2). This contact pressure is further considered to determine the pv (contact pressure x sliding velocity) sliding conditions.
Figure 4.8 Evolution of contact pressure for different normal loads and contact area with wear depth for small-scale cylinder-on-plate tests at 50, 100, 150 and 200 N normal load
The influence of changing contact conditions on friction and wear of sintered polyimide is illustrated in Figure 4.9. Sliding against high alloy (HA) steel, there is hardly noted a transfer film, as such that the sliding conditions are minor affected by a third body in the interface and variation in friction and/or wear mainly depends on the variation in contact conditions. There is clearly distinguished a limit between running-in and steady-state
21
21 )(422 hRRb
FbF
AF
p NNN
∆−−===
l
0
5
10
15
20
25
30
35
40
45
50
0 100 200 300 400 500 600 700 800 900 1000 1100 1200
Wear depth ∆h (µm)
Con
tact
pre
ssur
e (M
Pa)
0
10
20
30
40
50
60
70
80
Mac
rosc
opic
con
tact
are
a (m
m2 )
200
150 N 100 N
50 N Mac
rosc
opic
con
tact
are
a A
(mm
2 )

Chapter 4. Tribotesting and Analysis 66
1000
· µ
0
100
200
300
400
500
600
700
800
900
1000
0 2000 4000 6000 8000 10000 12000 14000 16000
Sliding distance (m)
Wea
r dep
th (µ
m)
1000
µ
Running- in
Steady-state
friction
wear
Vert
ical
dis
plac
emen
t (µm
)
1000
·µ
wear, with a transition at about 2500 m sliding distance. Running-in is characterised by high and unstable friction with high wear rates (i.e. high slope of the wear curve), mainly attributed to the line contact situation with high contact pressures. After starting the sliding test, there is about 10 to 20 µm immediate vertical displacement due to deforma-tion and wear of the line contact. Steady-state conditions with stable friction and lower wear rates establish after 250 µm wear depth. Referring to the variation of contact pressures with wear depth from Figure 4.8, this vertical displacement corresponds to a stabilisation in contact pressure at about 4 MPa. Present transition is thus mainly the effect of a change from contra formal line contact into conformal contact. In cases where polymer transfer interferes with the sliding contact, this transition was less clear and lower friction during running-in was noted as illustrated in future tests. Figure 4.9 Determination of running-in and steady-state conditions for friction and wear parallel to the
variation in contact conditions for tests on SP-1, 100 N 0.3 m/s against HA-steel
The characteristics of a line contact during the running-in process were studied by Horng et al. [4.15] for steel/steel pairings. It was experienced that the contact length 2ℓ rapidly increases at the initial stage of wear, no matter how large the normal load is, favouring low steady-state wear. The inaccuracy in contact area growth is, however, nearly 300 % compared to calculations from the Hertz theory. The effect of counterface roughness on the increase in contact length is inferior to the effect of normal load on contact length. During the line contact running-in, also the real contact area increases, but it reaches a stable value at the early middle stage of the running-in process. Also the influence of a temperature rise during running-in, approximately 40°C at FN = 200 N and µ = 0.10, was considered as inferior. The increase in contact during running-in seems to happen three times faster compared to steady-state. The running-in process and deforma-tion of a line contact associated to a drop in contact pressure favourably controls the steady-state tribological properties. For polymer samples, the running-in features are also influenced by the morphology of the sliding surface (e.g. Figure 3.6) and stress concen-trations near the surface own to its production process.

Chapter 4. Tribotesting and Analysis 67 4.4.2. Counterface roughness conditions The surface topography at micro level has important influence on the friction and wear properties, as it determines the contact conditions. Being softer than the steel counterface the polymer surface is less critical in this respect: roughness asperities deform or wear easily. The steel topography continuously changes during sliding as some roughness peaks are possibly flattened through abrasive wear or debris accumulates between the peaks. Possibly a directional roughness establishes relatively to the sliding direction un-der the action of, e.g., fillers. The detachment of steel particles and incorporation into the polymer surface reign the wear mechanism. The initial counterface roughness is how-ever important for the running-in behaviour and influences further sliding, acting as a boundary condition for the wear debris motion and possible formation of a transfer film. Present counterfaces are characterised prior to testing and after testing by a two-dimensional roughness profile z(x) illustrated in Figure 4.10 for ground and polished HA-steel. The height parameters determined from this profile are the centre-line-average or Ra value (formula 4.16), and the maximum peak-to-valley height value Rt. The Ra value is the most commonly used parameter in engineering practice, representing the arithmetical roughness average over the total sample length L. The effect of a single spurious, non-typical peak or valley (e.g. scratch) is averaged out and has only a small effect on the final value. One of the main disadvantages of this parameter is that it can give identical values for surfaces with very different profiles. Since it is directly related to the area enclosed by the surface profile around the mean line, any redistribution of peaks has no effect on its value. A second parameter Rt is therefore also used, represen-ting the extreme height over the entire profile. The highest asperities on the steel surface have importance in dry contacts because damage may be caused to the polymer body by penetration of few high asperities. Many other parameters can be calculated, although they are not further used in this work: the mean roughness depth Rz is the mean value of single roughness depths over n consecutive sampling lengths Lmin (formula 4.17), Rp is the maximum peak height relatively to the mean, and Rv is the maximum valley depth relatively to the mean. They are more frequently used for expressing the retention of oil.
(4.16)
(4.17) The profilometry measuring protocol is taken form the DIN 4768 standard, performed on a 2D universal PERTHEN 5 SP equipment, or ISO 4287, done on a 3D-Surfascan, with a diamond tip scanning over the surface. Depending on the average roughness Ra, the minimum sample length Lmin = 1.25 mm and the cut-off length λc = 0.25 mm for 0.02 µm < Ra < 0.1 µm , while Lmin = 4.8 mm and λc = 0.8 µm for 0.1 µm < Ra < 2 µm. The total sample length L is divided in n sample lengths Lmin. Roughness profiles are measured perpendicular to the sliding direction, unless stated otherwise. A normalised surface profile with Ra = 0.20 µm, Rt = 3.7 µm or Ra = 0.05 µm, Rt = 0.8 µm and is illustrated in Figure 4.10a and 4.10b. A detail of some surface asperities with
∫=L
dxxzL
Ra0
)(1
∑=
=n
iizR
nRz
1,
1

Chapter 4. Tribotesting and Analysis 68 an indication of their radius ra is shown in Figure 4.10c for the smoothest counterface. Normalisation is done as such that the waviness is filtered and the mean profile line is parallel to the 0 µm reference height. The position of the mean line depends on equilibration of the ‘material volumes’ above and beneath this line.
(a) (b) (c)
Figure 4.10 Normalised roughness profiles for HA-steel measured perpendicular to the sliding direction, (a) ground Ra = 0.20 µm, (b) polished Ra = 0.05 µm, (c) detail for polished Ra = 0.05 µm
0
1
2
3
4
5
Rou
ghne
ss h
eigh
t (µm
)
2 4 6 8 10 12 14 Sample length (mm)
0
1
2
3
4
5
Rou
ghne
ss h
eigh
t (µm
)
2 4 6 8 10 12 14 Sample length (mm)
5.40 5.50 5.60 5.70 5.80 5.90 6.00 Sample length (mm)
- 0.15
- 0.10
- 0.05
0.00
0.05
0.15
0.10
Rou
ghne
ss h
eigh
t (µm
)
Rv
Rt Rp
ra = 1094.17 µm
ra = 1374.63 µmra = 536.17 µm
ra = 545.25 µm
ra = 147.53 µm
ra = 501.59 µm
Rzi

Chapter 4. Tribotesting and Analysis 69 Theoretically the coefficient of friction and wear rate change with initial counterface roughness as illustrated in Figure 4.11a and 4.11b, according to Erhard et al. [4.16]. During sliding however, the contact conditions may change. He used the Rv value considering the local contact and deformation of the polymer over a single asperity peak. In relation to common information on bearing surfaces we prefer using the average roughness parameter Ra. As a rule of thumb and from experimental experience, it can be approximated that Rv ≈ 10 Ra for polished steel surfaces. A grey zone in Figure 4.11 indicates present working range. The coefficient of friction drops at low roughness towards a minimum value and it further increases as a result from the transition between two sliding mechanisms: i.e. the adhesion component that is important at low roughness and decreases for high roughness and the deformation component that is low in contact with smooth counterfaces and becomes high for rough counterfaces. Wear rates often increase continuously at higher roughness due to a combined effect of abrasion and fatigue. The lack of a transition in wear rates at low roughness can possibly be related to the effect of transfer film formation, which is promoted at low roughness but has a rather lumpy morphology and act as an abrasive due to little mechanical locking points on the counterface [4.17]. Smooth transfer is also inhibited at very high roughness and does not protect against wear. Wear debris was mainly observed on top of the roughness peaks rather than in the valleys [4.18]. The counterface roughness for small-scale tests of polyimides is chosen at Ra = 0.05 µm because Tewari and Bijwe [4.19] reported that polyimides are not suitable for abrasive wear applications, while the incorporation of fillers even deteriorates the abrasive wear resistance. This results from the Lancaster-Ratner equation [4.20] indicating that abra-sive wear rate is proportional to a toughness parameter 1/(Rm.e) with Rm the ultimate ten-sile strength and e the elongation at break: sintered polyimides are rather brittle, mainly due to low elongation, and easily fracture. Due to the huge difference in hardness bet-ween steel and polymer contact bodies, small abrasive action of some metallic protru-sions remains even at low roughness. Roughness parameters for large-scale testing and comparative small-scale testing of thermoplastics are chosen at Ra = 0.20 µm in parallel to industrial surface finishing of bearing elements. Counterfaces are ground and after-wards polished with GRID 600 abrasive SiC paper towards the required roughness. (a)
0.2
0.3
0.4
0.5
0.6
1 2 3 4 5 Counterface roughness Rv (µm)
Coe
ffici
ent o
f fric
tion
PI
PA
PET
POM
HDPE
PTFE

Chapter 4. Tribotesting and Analysis 70 (b)
Figure 4.11 Theoretical relation between counterface roughness and
(a) polymer friction, (b) polymer wear, with an indication of present working range [4.21] 4.5. Surface temperature The mechanical energy input from friction force and sliding velocity is transformed into internal energy or heat, which causes the temperature of the sliding bodies to increase. The mechanisms and exact location for this energy dissipation are not exactly known. Some investigators as Landman et al. [4.22] contend that these processes occur by atomic-scale interactions in the top surface layer while, e.g., Rigney et al. [4.23] believe that most energy dissipation or frictional heating originates from plastic deformation in the bulk solid beneath the contact region. For polymers, it is mainly the visco-elastic hysteresis loss resulting in heating of the sliding interface. Experimental work by Kennedy [4.24] has shown that at least 95 % of the energy dissipation happens within the top 5 to 10 µm of the contact bodies. The energy dissipation is theoretically concentrated within the real contact area and in absence of lubricant, heat is conducted into the two members through small contact spots. The temperature distribution at the sliding interface thus depends on the contact geometry, the coefficient of friction, the sliding parameters, the thermal material properties and the roughness conditions. As the real contact surface A′ is only a small fraction of the apparent contact area A, the local energy density is reasonably high. For low contact stress situations, asperity interaction results in numerous temperature flashes [4.25] over areas of a few microns, possibly causing local flow or melting. For high-stress situations, the real area of contact A′ is close to the apparent area of contact A and essentially a single contact occurs during sliding, levelling the local flash temperatures. Also if one of the sliding members is compliant, in casu a polymer, the local temperature rise is smaller than for, e.g., metal or ceramic contacts where flash temperatures of 700°C can occur. The real area of polymer contacts increases through creep and
1 2 0.50 3 0.25 4 5
0.10 0.25
0.50
1
2
0.75
3
4
Counterface roughness Rv (µm)
Wea
r rat
e (µ
m/k
m)
HDPE PTFE
POM
PET
PA PI
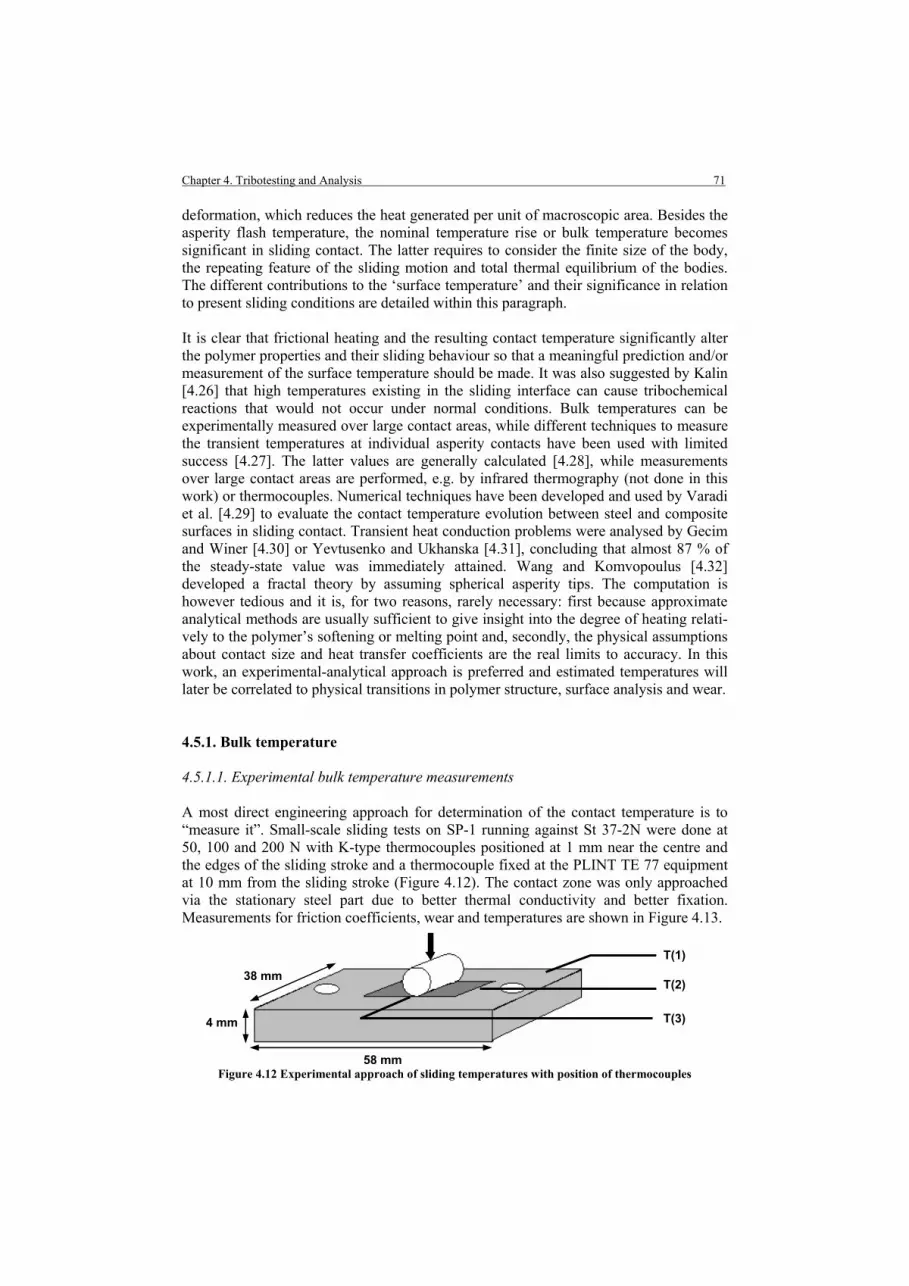
Chapter 4. Tribotesting and Analysis 71 deformation, which reduces the heat generated per unit of macroscopic area. Besides the asperity flash temperature, the nominal temperature rise or bulk temperature becomes significant in sliding contact. The latter requires to consider the finite size of the body, the repeating feature of the sliding motion and total thermal equilibrium of the bodies. The different contributions to the ‘surface temperature’ and their significance in relation to present sliding conditions are detailed within this paragraph. It is clear that frictional heating and the resulting contact temperature significantly alter the polymer properties and their sliding behaviour so that a meaningful prediction and/or measurement of the surface temperature should be made. It was also suggested by Kalin [4.26] that high temperatures existing in the sliding interface can cause tribochemical reactions that would not occur under normal conditions. Bulk temperatures can be experimentally measured over large contact areas, while different techniques to measure the transient temperatures at individual asperity contacts have been used with limited success [4.27]. The latter values are generally calculated [4.28], while measurements over large contact areas are performed, e.g. by infrared thermography (not done in this work) or thermocouples. Numerical techniques have been developed and used by Varadi et al. [4.29] to evaluate the contact temperature evolution between steel and composite surfaces in sliding contact. Transient heat conduction problems were analysed by Gecim and Winer [4.30] or Yevtusenko and Ukhanska [4.31], concluding that almost 87 % of the steady-state value was immediately attained. Wang and Komvopoulus [4.32] developed a fractal theory by assuming spherical asperity tips. The computation is however tedious and it is, for two reasons, rarely necessary: first because approximate analytical methods are usually sufficient to give insight into the degree of heating relati-vely to the polymer’s softening or melting point and, secondly, the physical assumptions about contact size and heat transfer coefficients are the real limits to accuracy. In this work, an experimental-analytical approach is preferred and estimated temperatures will later be correlated to physical transitions in polymer structure, surface analysis and wear. 4.5.1. Bulk temperature 4.5.1.1. Experimental bulk temperature measurements A most direct engineering approach for determination of the contact temperature is to “measure it”. Small-scale sliding tests on SP-1 running against St 37-2N were done at 50, 100 and 200 N with K-type thermocouples positioned at 1 mm near the centre and the edges of the sliding stroke and a thermocouple fixed at the PLINT TE 77 equipment at 10 mm from the sliding stroke (Figure 4.12). The contact zone was only approached via the stationary steel part due to better thermal conductivity and better fixation. Measurements for friction coefficients, wear and temperatures are shown in Figure 4.13.
Figure 4.12 Experimental approach of sliding temperatures with position of thermocouples
4 mm
T(1)
T(2)
T(3)
38 mm
58 mm

Chapter 4. Tribotesting and Analysis 72 Experimental values for T(2) and T(3) are identical, although rising more rapidly than T(1) and closely following the variations in friction. After a transient behaviour during running-in, they stabilise. The steady-state temperatures will be compared to analytical calculations of the maximum polymer surface temperature T* from paragraph 4.5.2. Figure 4.13 On-line friction, vertical displacement and temperature evolution for SP-1 against St 37-2N at (a) 50 N, 0.3 m/s, (b) 100 N, 0.3 m/s, (c) 200 N, 0.3 m/s: temperatures T(1) and T(2) = T(3) measured
according to Figure 4.12 and T* analytically calculated according to next paragraph 4.5.2
0
0.1
0.2
0.3
0.4
0.5
0.6
0.7
0 2000 4000 6000 8000 10000 12000 14000 16000
Sliding distance (m)
Coe
ffic
ient
of f
rictio
n
0
50
100
150
200
250
300
350
400
450
Vert
ical
dis
plac
emen
t (µm
)
0102030405060708090
100
0 2000 4000 6000 8000 10000 12000 14000 16000
Sliding distance (m)
Tem
pera
ture
(°C
)
0
0.1
0.2
0.3
0.4
0.5
0.6
0.7
0 2000 4000 6000 8000 10000 12000 14000 16000
Sliding distance (m)
Coe
ffic
ient
of f
rictio
n
0
100
200
300
400
500
600
700
800
Vert
ical
dis
plac
emen
t (µm
)
0
0.1
0.2
0.3
0.4
0.5
0.6
0.7
0 2000 4000 6000 8000 10000 12000 14000 16000
Coefficient of friction
Coe
ffic
ient
of f
rictio
n
0
200
400
600
800
1000
1200
1400
1600
Vert
ical
dis
plac
emen
t (µm
)
0
20
40
60
80
100
120
140
0 2000 4000 6000 8000 10000 12000 14000 16000
Sliding distance (m)
Tem
pera
ture
(°C
)
020406080
100120140160180200
0 2000 4000 6000 8000 10000 12000 14000 16000
Sliding distance (m)
Tem
pera
ture
(°C
)
(b)
(c)
(a)
T*
T*
T*
T(1)
T(2)
T(1)
T(2)
T(1)
T(2)
µ
∆h
µ
∆h
µ
∆h
Sliding distance (m)

Chapter 4. Tribotesting and Analysis 73 4.5.1.2. Theoretical bulk temperature rise For two-body sliding, the rate of total energy Q (J/s = W) dissipated in the contact is determined by the friction force and the relative sliding velocity. The generated frictional heat flux q (W/m2) per unit of macroscopic contact area A, or specific frictional heat, is given by formula (4.18),
q = µ p v (4.18) with µ the coefficient of friction, p the contact pressure and v the sliding velocity. The contact pressure in flat-on-flat tests remains constant as a function of sliding time, while it progressively lowers towards steady-state conditions for cylinder-on-plate tests. The heat flows into both solids, partitioned between them in a way that depends on their thermal properties. In all analysis, it is assumed that the heat transfer occurs by unidirec-tional conduction, while convection and radiation effects are inferior. A portion r1q of the total heat will flow into the polymer and a portion r2q = (1 - r1)q of the heat will flow into the metal counterface, according to Formula (4.19). However, in contacts with low thermal conductivity of the polymer specimen (k1,polymer << k2,steel), the heat input goes for 99 % into the metal counterface so that partition of heat can presently be neglected.
1
,1
,21 1
−
⎥⎥⎦
⎤
⎢⎢⎣
⎡+=
polymer
steel
kk
r (4.19)
Evaluation of the surface temperature is basically a heat transfer problem. For a comple-te overview of thermal analysis and available analytical models, we refer to common handbooks [4.33], while only some results useful for present work are detailed. Most surface temperature analysis has been based on the pioneering work of Blok in 1937 [4.34] and further developments of Jaeger in 1942 [4.35], both of whom used heat source models. The closed-form solution for the temperature distribution due to a point source at the surface of a semi-infinite solid was used to develop the solution for a distributed heat flux within a path of the contact surface. Those studies assumed that the heat pulse is generated at a mathematical boundary acting for sufficiently long time, and the heat flux q is dissipated into a single isolated region of the surface (single asperity contact). The same restrictions apply to Archard’s work [4.36], who considered circular sources and simplified the theoretical formulation for both slowly and rapidly moving contacts. Studying the transient temperature distributions near the heat source, refinements to the theory were outlined by Carslaw and Jaeger [4.37]. Kuhlman-Wilsdorf (1987) [4.38] used similar techniques to develop an approximate solution for a single source at inter-mediate velocities (in between the slow and fast conditions of Archard’s solution). Ashby et al. [4.39] considered bulk temperatures for either pin-on-disc or four-ball confi-gurations, taking into account the entire test environment as a heat sink. Analytical solutions for estimating the bulk temperature rise as discussed below, are the result of the integration (in space and time) of the temperature flashes that occur in the real contact asperities due to a single heat source on either a stationary or a moving body. Formulas expressing the temperature rise ∆Tmax govern over apparent contact area A with a geometry given in Figure 4.14 and represent a homogeneous temperature.

Chapter 4. Tribotesting and Analysis 74
Figure 4.14 Geometry for temperature models [4.14] The following assumptions are made in common temperature analysis [4.14]:
• thermal properties of the contacting bodies are independent of temperature, • a single area of contact is regarded as a plane source of heat, • frictional heat is uniformly generated and uniformly distributed through the
contact spots, • all heat produced is unidirectionally conducted into the contacting bodies, • the coefficient of friction has attained some steady-state value.
a) Stationary heat source on stationary body: For an infinite band heat source - ℓ < x < ℓ, - ∝ < y < + ∝ with constant heat supply q and zero or very small velocity, a homogeneous distribution of the heat flux over the real contact area is considered as a collection of continuous point heat sources. The temperature distribution is integrated over the surface of a semi-infinite counterbody and for large times (steady-state conditions), the maximum rise in bulk temperature ∆Tmax approaches a steady-state value given by formula (4.20),
πkqT l2
max =∆ (4.20)
with k the thermal conductivity. Other solutions for various heat flux distributions and source shapes have been found by Yovanovich et al. [4.40]. For stationary conditions, the temperature rise for a band heat source equals the solution for square sources. b) Stationary or low speed rectangular heat source (LOEWEN AND SHAW): The temperature solution for rectangular heat sources (2ℓ x 2b) with - ℓ < x < ℓ and - b < y < + b was studied by Loewen and Shaw [4.41]. Applying for stationary or low sliding velocity bodies, the maximum temperature ∆Tmax (at the tailing edge x = - ℓ) and average temperature ∆Tavg on the sliding surface are given by Formula (4.21),
(4.21) kqAT
kqAT avgavg
ll=∆=∆ maxmax
Heat source in origin at t = 0
Time t ago
y
x
z

Chapter 4. Tribotesting and Analysis 75 with Amax and Aavg the area factors and k the thermal conductivity. The model results from an analytical approach. Depending on the geometry of the rectangular contact, the area factors are plotted in Figure 4.15 as a function of the aspect ratio of the surface area (b/ℓ). Note that for a square heat source (b/ℓ = 1), Amax = 1.12 and Aavg = 0.95.
Figure 4.15 Loewen and Shaw area factors for stationary rectangular heat source (2ℓ x 2b) [4.41] c) General expression for semi-infinite moving heat-source (BLOK, TIAN-KENNEDY): The analysis of moving heat sources is based upon the assumption that one of the contacts can be modelled as a stationary heat source and the other as a fast moving heat source. The problem of a moving heat source on a stationary body is equivalent to the problem of a stationary heat source on a moving body. The important concept is that there is relative motion between the source of heat and the body into which the heat flows (conductive diffusion). Considering a band heat source of intensity q travelling over a half-space, the maximum temperature rise ∆Tmax on the surface is given by formu-la (4.22) developed by Blok (1937), assuming that all heat flows into the half-space,
ckvpµ
cktqT
ρπρπl222max ==∆ (4.22)
with t the time for which the source has been over the point concerned (t = 2ℓ / v), k the thermal conductivity, ρ the density, c the specific heat of the half-space and v the sliding velocity. Several authors have used Blok’s solution for various configurations and boundary conditions (e.g. Archard [4.42], Ling and Pu [4.43] and Harpavat [4.44]), giving some experimental confirmations of the temperature concept. This model is one-dimensional and considers the heat flow only in the direction normal to the surface. However, the model may be applied to any plain shaped contact at moderate to high Peclet numbers, as the transverse flow of heat is negligible compared to the flow normal to the surface. This has been clearly shown by Blahey [4.45]. Blok’s result applies to
0.0
0.5
1.0
1.5
2.0
2.5
3.0
1 3 5 7 9 11 13 15 17
Aspect ratio b/ℓ
Are
a fa
ctor
A
Aspect ratio b/ℓ
Are
a fa
ctor
A
Amax Aavg

Chapter 4. Tribotesting and Analysis 76 steady-state conditions, while the transient temperature rise was numerically verified by Mc Ettles [4.46], showing that after ten sliding cycles 80 % of the steady-state Blok temperature was attained. In many problems, the assumption of a ‘fast’ moving heat source may not be valid and the analysis overestimates the temperature. The results depend much on the dimension-less Peclet number, given in formula (4.23) for isotropic bodies,
(4.23) with v the sliding velocity, ℓ the semi-length in sliding direction and a the thermal diffusivity (a = k/(ρ c)). The Peclet number may be interpreted as a measure of the rela-tive thermal penetration depth. The latter is small for Pe → ∝ implying a one-dimensi-onal heat flow since the spreading of the heat over the half-space is negligible. If Pe → 0 the spreading of heat into the substrate may be significant. A steady-state heat conduc-tion solution can be used if Pe < 0.5. According to formula (4.23), a sliding contact problem is mostly considered as ‘slow’ if either the sliding velocity is low or the thermal diffusivity is high. The ‘fast’ sliding assumption is valid for Pe > 5. For different values of Pe, a closed-form expression for the maximum temperature rise ∆Tmax is not easily found by analytical solutions and should be approximated by formulas (4.24) to (4.26) according to Greenwood (1991) [4.47] or Tian and Kennedy (1995) [4.48]. A uniform band source of heat acting over - ℓ < x < ℓ, - ∝ < y < + ∝ is assumed with a one-dimensional heat conduction in a half-space.
Pe < 0.1 : (4.24) Pe > 10 : (4.25)
All Pe : (4.26) It is noted from the Tian-Kennedy model that for a constant heat input q the maximum surface temperature decreases as the sliding velocity (or Pe) increases, due to the nature of heat transfer. The material entering the heat source at the leading edge (x = ℓ) has a finite heat capacity and thermal diffusivity, so a finite time is required to absorb the heat that causes an increase in its temperature. As the body’s velocity is higher, there is less time spent beneath the heat source by a given volume of material, and thus the temperature rise of the material will be smaller. At low sliding velocities the temperature distribution is almost symmetrical about the centre x = 0, according to which would be expected for a stationary heat source, while at high sliding velocities, the temperature distribution is highly asymmetrical with the maximum temperature rise at the tailing edge. The Peclet number is 970 < Pe < 1680 for small-scale tests, while it is Pe = 1250 for large-scale tests.
avPe2l
=
πkqT l2
max =∆
PekqTπl2
max =∆
)1(2
max PekqT
+=∆
πl

Chapter 4. Tribotesting and Analysis 77 d) General expression for rectangular or square moving heat sources (JAEGER): Based on the previous Blok theory, Jaeger [4.35] did some experimental verifications for heat sources of different shape. At high sliding velocities, the solution is in fact similar to this for a band source as the side flow can be neglected, while the heat distribution at low sliding velocities should be considered non-uniform. Solutions are obtained for rectangular (or square) heat sources sliding on a semi-infinite body and are based on graphical results as no closed-form analytical solution of the heat conduction equation is obtained. Formula (4.27) is suggested for the maximum temperature rise ∆Tmax from experimental work for a rectangular or square heat source with - ℓ < x < ℓ,
(4.27) with a the thermal diffusivity and k the thermal conductivity. This model is developed for a moving heat source and assumes that heat conduction into a half space through the contact asperities is one-dimensional, not considering a spatial temperature distribution. 4.5.1.3. Evaluation of experimental and theoretical bulk temperature The experimental sliding temperatures and theoretical calculations are compared for small-scale tests on SP-1 at 50 to 200 N normal load and 0.3 m/s sliding velocity against St 37-2N steel over 15000 m. The test results for an average coefficient of friction and final wear depth ∆h from micrometer measurements are summarised in Table 4.7. Table 4.7. Experimental test results for SP-1 at 50 to 200 N, 0.3 m/s at steady-state against St 37-2N
Parameter 50 N 100 N 150 N 200 N
Coefficient of friction - 0.46 0.44 0.40 0.38
Wear depth ∆h mm 0.36 0.60 1.00 1.30
Contact length 2ℓ mm 2.56 3.28 4.05 4.44
Contact pressure p MPa 1.30 2.02 2.47 3.00
Aspect ratio b/ℓ - 5.85 4.57 3.70 3.37
Area factor Amax and Aavg - 1.98 and 2.15 1.74 and 1.99 1.62 and 1.82 1.60 and 1.86
* Temperature T(1) °C 31 35 43 52
* Temperature T(2) °C 43 56 68 88
* positions for temperature measurements T(1) and T(2) are indicated in Figure 4.12
a) Stationary heat source models: The theoretical bulk temperatures Tb are calculated as Tb = ∆Tmax + 23°C, with the temperature rise ∆Tmax discussed in previous paragraph superimposed to the initial
kvpµ
vaT l13.1max =∆

Chapter 4. Tribotesting and Analysis 78 counterface temperature. Considering a stationary polymer and/or steel sample, the maximum temperature at either the polymer surface or the steel surface is calculated in Table 4.8, with k1,polymer = 0.30 W/mK and k2,steel = 46 W/mK. The general formulation (4.20) and the formula (4.21) for a rectangular heat source b/ℓ according to Loewen and Shaw are applied. The dimensions and aspect ratio for the rec-tangular source are calculated for conditions at the end of the test in previous Table 4.7. The stationary temperature on the polyimide surface has no physical meaning for present sliding tests and is only illustrative. For the steel surfaces, it is worth noting the differ-ence in temperature of an infinite band source and a rectangular geometry, as the latter has higher heat concentration. The Loewen and Shaw model for Tavg corresponds well to the experimental long-range temperature T(1) measured on the steel surface (Table 4.7). Table 4.8. Theoretical surface temperatures for SP-1 at 50 to 200 N, 0.3 m/s stationary heat source model
Sliding body as stationary heat source 50 N 100 N 150 N 200 N
General formulation (formula 4.20)
Polyimide SP-1 surface *
Steel St 37-2N surface
886 °C
28 °C
1667 °C
33 °C
2280 °C
38 °C
2878 °C
43 °C
Rectangular heat source (formula 4.21)
Polyimide SP-1 surface * Tavg
Tmax
Steel St 37-2N surface Tavg
Tmax
1515 °C
1645 °C
29 °C
30 °C
2536 °C
2900 °C
36 °C
39 °C
3241 °C
3641 °C
43 °C
46 °C
4049 °C
4706 °C
51 °C
55 °C
* only illustrative, no physical meaning in relation to present sliding tests b) Moving heat source models: The theoretical bulk temperatures Tb are calculated from the temperature rise ∆T accor-ding to models of Blok, Tian-Kennedy and Jaeger, superimposed to the initial counter-face temperature, i.e. Tb = ∆T + 23°C. Those calculations are evaluated in Table 4.9. The value for the Peclet number is calculated for a moving polyimide specimen, with a dimension ℓ resulting from the wear depth at end-of-test conditions. For present small-scale sliding geometries with polyimide samples, the Blok formula (4.22) has changed into formula (4.28) and the Jaeger formula (4.27) translates into formula (4.29). SMALL-SCALE BLOK-MODEL: l21016.9 4
max pµT −=∆ (4.28)
SMALL-SCALE JAEGER-MODEL: lb
vFµT N4
max 102.4 −=∆ (4.29)
Due to high Peclet-numbers, the Blok and Tian-Kennedy models give equal results. For a rectangular sliding source, the temperatures are somewhat lower than for band sources.

Chapter 4. Tribotesting and Analysis 79 Table 4.9. Theoretical surface temperatures for SP-1 at 50 to 200 N, 0.3 m/s moving heat source model
Polyimide body as moving heat source 50 N 100 N 150 N 200 N
Peclet number Pe (formula 4.23) 970 1242 1534 1681
Blok or Tian-Kennedy model 50°C 69°C 80°C 92°C
Jaeger model 43°C 56°C 64°C 73°C
4.5.2. Maximum polymer surface temperature T* Following questions rise: “Which temperature rise should be taken into account for determination of the homogeneous polymer surface temperature during reciprocating sliding ?” and “What is the significance of the temperature rise to evoke variations in the polymer sliding behaviour?” If a single concentrated heat source does not repeat the same sliding path over the contact surface and if the counterface body is very large, all heat generated at a contact spot is transferred into the three-dimensional heat sink and the counterface bulk temperature levels out without any significant nominal bulk temperature rise. The contact temperature in that case can be found from the work done by Blok. However, if the heat source passes repeatedly over the same point on the surface, there still exists a nominal counterface bulk temperature rise before the next sliding step regenerates heat at the same contact spot. The frictional heat generated during one sliding pass needs some time to flow away from the contact area and the bulk temperature does not completely level out. The temperature conditions of the counterface for the second sliding stroke seem different compared to the first sliding stroke and an extra surface temperature rise relatively to the initial bulk temperature should be taken into account. The maximum steady-state temperature T* at the polymer surface during reciprocating sliding has three contributions, being (i) the environmental temperature Tenv or initial bulk temperature, (ii) the temperature rise ∆Tb,steel due to progressive heating of the steel counterface during reciprocating sliding and (iii) the temperature ∆Tb,polymer created through heat that is generated on the polymer surface during each new sliding event, making its surface temperature higher than the nominal steel counterface temperature. The summation of the environmental temperature Tenv and the temperature rise of the steel counterface ∆Tb,steel is considered as a ‘nominal bulk temperature’ or the ‘actual steel surface temperature’, or from formula (4.30):
T* = Tenv + ∆Tb,steel + ∆Tb,polymer (4.30) An appropriate expression for each temperature component can be selected from the available theoretical models and should be verified against the experiments from Table 4.7. For a rectangular testing geometry and considering whether the contact partner is moving or stationary, the Loewen and Shaw temperature model (formula (4.21)) can be applied for the ∆Tb,steel component and the Jaeger temperature model (formula (4.29))

Chapter 4. Tribotesting and Analysis 80 can be used for the ∆Tb,polymer component. As such, the rectangular testing geometry 2b x 2ℓ is taken into account with the aspect ratio b/ℓ being important for the heat flow distri-bution over the steel plate (long-range) while the aspect ratio is not considered for the polymer surface temperature as a polymer surface fraction in the sliding interface does not ‘feel’ its environmental geometry (short-range). Verification of the experimental values against the maximum polymer surface tempera-ture T* is done in Figure 4.16 for steady-state conditions. The theoretical Loewen-Shaw model agrees to the long-range bulk temperatures measured with the thermocouple T(1), fixed to the PLINT TE 77 testing device. This temperature component is interpreted as the ‘nominal bulk temperature’ or the ‘actual steel surface temperature’. The maximum polymer surface temperature T* could not be measured experimentally, but calculations show that it is slightly higher than the experimental temperature T(2). Measurements are done on the steel surface immediately near the sliding stroke, being likely that the real polymer surface temperature within the contact interface is about 10 to 15 °C higher.
Figure 4.16 Evaluation of experimental (closed dots) and calculated (open dots) temperatures,
maximum polymer surface temperature T* (), Loewen and Shaw bulktemperatures Tb,max and Tb,min (, ∆), experimental temperature T(1) (♦), experimental temperature T(2) ()
4.5.3. Asperity flash temperature Tf The temperatures considered in previous paragraph govern homogeneously over the sliding surface. The heat however enters the surface through local contact asperities on the real contact surface A′, which is much smaller than the macroscopic contact surface A, so that the temperature is much higher at the contacts themselves. An expression for the steel asperity flash temperature rise ∆Tf is given by Ashby et al. [4.49] in formula (4.31), considering that the thermal conductivity k2,steel >> k1,polymer . Local asperity contact is estimated from a roughness profile as shown in Figure 4.10c. Measuring a steel asperity radius ra, a real contact area A′ can be calculated from formula (4.32), with the simplified assumption that the asperity radius equals the contact radius. The equivalent heat diffusion distance l2,f depends on the size of the asperities
0
20
40
60
80
100
120
0 5 10 15 20 25 30
µ FN v (N.m/s)
Tem
pera
ture
(°C
)
T*
Tb,max Tb,min

Chapter 4. Tribotesting and Analysis 81 (4.31)
relatively to the macroscopic contact size radius R1 and on whether a heat flow is transient or steady. Its value is approximated by formula (4.33) for low normal load FN < FS and by formula (4.34) at high normal load FN > FS with FS a critical normal load or seizure load, i.e. the load at which A′ becomes equal to A. For polyimides, this normal load is determined from an experimental static measurement of the stress-strain characteristic under present contact situation, showing a critical load of 100 N (see Figure 5.1). At loads below 100 N, mainly visco-elastic deformation occurs resulting in higher asperity flash temperatures, while plastic deformation happens at higher loads. 2' arA π= (4.32)
LOW NORMAL LOAD FN < FS ⎪⎭
⎪⎬⎫
⎪⎩
⎪⎨⎧
+⎟⎟⎠
⎞⎜⎜⎝
⎛⎟⎟⎠
⎞⎜⎜⎝
⎛−= 11
2
2
12
as
Naf r
RFF
rl π (4.33)
HIGH NORMAL LOAD FN > FS af rl22π
= (4.34)
For an average steel asperity radius ra = 800 µm estimated from Figure 4.10c, the asperity flash temperature rise can be calculated. It is clear that for smaller asperity radii, the flash temperature rises higher. An indication of calculated asperity flash temperatures Tf = Tenv + ∆Tb,steel + ∆Tf is given in Table 4.10 together with the maximum polymer surface temperature T* for polyimide SP-1 slid at different normal loads and sliding velocities. Asperity flash temperatures cannot be measured experimentally. Although flash temperatures are higher than the maximum polymer surface temperature, they only govern over very short times (10-5 sec [4.28]) and their location continuously changes during sliding, not representing a homogeneous temperature. Table 4.10. Calculations of maximum polymer surface temperature T* (°C) and asperity flash tempera-tures Tf (°C) for SP-1 sliding against St 37-2N at different normal load and sliding velocity
50 N 100 N 150 N 200 N Sliding parameter T* Tf
T* Tf
T* Tf
T* Tf
0.3 m/s 50 162 72 140 87 184 105 230
0.6 m/s 61 259 91 227 125 350 147 418
0.9 m/s 67 323 106 318 146 455 184 584
1.2 m/s 86 480
116 359
159 542
192 800
steel
fN
ff
Nf k
lA
vµF
lk
lkA
vµFT,2
,2
2
2
1
1 '1
'≈
⎥⎥⎥⎥
⎦
⎤
⎢⎢⎢⎢
⎣
⎡
+=∆

Chapter 4. Tribotesting and Analysis 82 4.6. Wear Analysing Techniques 4.6.1. On-line and off-line wear measurement
Figure 4.17 Evaluation of wear volumes from on-line vertical displacement ∆hv (), off-line diameter reduction by micrometer measurement ∆hm (∆), and off-line weight by balance measurement ∆g (♦)
for SP-1 at 50 N, 0.3 m/s against HA-steel Wear measurements during a stepwise sliding test, with intermediate off-line examina-tion of wear depths ∆hm after various sliding distances, are presented in Figure 4.17. The wear volumes are calculated from the weight measurements ∆g and from the wear depths ∆h according to formula (4.35), for a cylinder with radius R and width 2b.
(4.35) The wear volumes from weight measurements increase linearly with sliding distance and can be extrapolated towards the origin, showing a constant volumetric wear rate and no transition during sliding of SP-1 against HA-steel at 50 N, 0.3 m/s as a transfer film does not form for present sliding conditions. The wear volumes calculated from on-line vertical displacement ∆hv are the highest and do not follow a linear increase over the entire sliding distance: they indicate higher deformation at running-in while levelling off after 2000 m sliding. Due to the visco-elastic nature and creep of polyimides during sli-ding, the on-line vertical displacement ∆hv is strongly influenced by deformation of the Hertz line contact. A part of the deformation is recovered immediately after unloading as represented by the lower value of ∆hm. One week after testing, also most part of this de-formation is recovered and there exists agreement between weight and dimensional mea-surements without significant permanent deformation for SP-1 at 50 N (see Chapter 5).
⎟⎟
⎠
⎞
⎜⎜
⎝
⎛∆−−∆−−
∆−−− 2222
12 )()()(
sin2 hRRhRR
hRRRb
0
5
10
15
20
25
30
0 2000 4000 6000 8000 10000 12000 14000 16000
Sliding distance (m)
Wea
r vol
ume
(mm
3 )

Chapter 4. Tribotesting and Analysis 83 4.6.2. Post-mortem microscopy The tribological phenomena on polymer surfaces can be interpreted at different scales from macro to atomic level, each clarifying mechanisms and leading to specific conclu-sions. In relation to the practical application of dry sliding elements, the macro level is preferred while some correlations to the molecular structure should be made for justi-fying or explaining the observed tendencies. The molecular scale is the limit of present work, to be studied by spectroscopy, while atomic force microscopy [4.50] and tribo-emission [4.51] should be further studied on atomic scale within the nanotribology field. The visual observation of wear scars, depositions on polymer and steel surfaces or wear debris is the most important tool for evaluation of the severity of wear. A Carl-Zeiss optical stereomicroscope with magnification x 15 to x 150 is used, equipped with digital camera. Visible details are mostly acceptable for the examination of transfer morphology and polymer wear (resolution in the order of 2000 Ǻ, i.e. about half the wavelength of the incident light beam), although the major disadvantage is the limited in-focus depth of field, varying inversely with increased magnification. However, many of the tribological processes occur on a scale for which optical microscopy remains probably the best and most flexible instrument to use for a first evaluation [4.52]. Scanning electron microscopy (SEM) is done on a Philips XL 30 ESAM with a LaB6 electron gun filament, operating in ‘wet-mode’. A narrow beam of primary electrons, accelerated through a field of 25 kV, is scanned across the specimen surface, creating secondary electrons, backscattered electrons and x-ray photons emitted from the surface. An image is created by collecting the emitted secondary electrons in a charged collector and amplifying this current so as to provide a signal used to modulate the intensity of an electron beam in a cathode ray tube that is scanned synchronously with the primary beam. The magnification is varied without the need of re-focussing and is controlled by changing the scan area on the specimen while keeping the area of scan on the cathode ray tube constant. A good physical interpretation of wear surfaces is made at x 500 to x 1500 magnifications. Small spot sizes are obtained through a system of lenses, providing a resolution in the order of 100 Ǻ. The micrograph contrast is related to the relative slopes of roughness, determining the direction in which the secondary electrons are emitted, as such that surface topography becomes visible. Due to the almost infinite depth of field, there is no need for successive re-focussing on the top and bottom features being observed. The surface composition is analysed from x-ray detection by an energy dispersive spectrometer (EDX). 4.6.3. Post-mortem thermo-analytical analysis Polymers undergo structural changes through the combined effect of shear and tempera-ture. The transitions between glass and rubbery phase occur at specific temperatures and crystallisation during sliding affects the melting behaviour. Also degradation mecha-nisms as melting, oxidation and pyrolisis take place and further control the sliding stability, possibly leading to severe wear. A study of the mechanophysical and -chemical reactions at the sliding interface is necessary for understanding the changes in polymer structure during sliding and has drawn the attention of some investigators [4.53, 4.54]. Thermo-analytical methods common to polymer science are used for monitoring phase transitions and chemical reactions of polymer structures as a function of temperature.

Chapter 4. Tribotesting and Analysis 84 4.6.3.1. Differential Scanning Calorimetry Calorimetric measurements are done on a Universal TA instruments 2920 Modulated DSC equipment under nitrogen atmosphere. Polymer test samples are approximately 6 mg. The temperature and heat flow scales were calibrated at the same heating rate with indium (Tm = 165°C) and benzophenone (Tm = 48°C) standards. Samples are heated from room temperature to a maximum temperature at a scanning rate of 10°C/min. In a traditional Differential Scanning Calorimeter (DSC) [4.55] the difference in heat flow to a polymer sample and an empty reference aluminium pan at the same tempera-ture is recorded as a function of temperature. The temperature of both the sample and reference is increased at a constant rate, while heat is supplied by two resistance heater elements separately connected to each sample. When the polymer sample undergoes a thermal transition, the power to the heaters is adjusted to maintain its temperature. The independent parameter is the temperature that is programmed as a linear function of the time. Feedback loops control the heat supply to the polymer sample and reference so that the temperature profile is closely followed. Since the DSC cell is at constant pressure, the change in heat flow is equivalent to enthalpy changes, or given in formula (4.36):
(4.36)
(4.37) Here dq/dt is the heat flow rate measured in mcal/sec. The difference in heat flow rate or difference in enthalpy change rate ∆ dH/dt between the sample and the reference according to formula (4.37) is plotted in a thermograph and is either positive for an en-dothermic process or negative for an exothermic process. As the time-scale t is coupled to the temperature scale T according to dT/dt, also ∆ dH/dT is more frequently plotted in a thermograph, being equivalent to the heat capacity Cp from formula (4.38):
(4.38) Since the heat flux increases with the applied temperature rate dT/dt, higher heating rates lead to more sensitive thermal spectra. On the other hand, high heating rates result in lower resolution of the temperature of transition and can have consequences for transi-tions that display kinetic features. This method is frequently used for determination of glass transitions, melting temperatures or heat capacities, although it is less sensitive to secondary transitions as occurring in, e.g., sintered polyimides. Temperature Modulated Differential Scanning Calorimetry (M-DSC) [4.56] is used when the sample is subjected to a modulated temperature profile, with a periodic (sinusoidal) heating rate superimposed to the linear heating rate. The measured heat flow in response to this temperature program is also periodic due to the immediately high heating rates implied by the periodic signal. Certain effects such as changes in the
dtdH
dtdq
p
=⎟⎠⎞
⎜⎝⎛
referencesample dtdH
dtdH
dtdH
⎟⎠⎞
⎜⎝⎛−⎟
⎠⎞
⎜⎝⎛=∆
dTdt
dtdH
dTdHCp ==

Chapter 4. Tribotesting and Analysis 85 specific heat capacity can follow the applied heating rate (”reversing” phenomena), whereas other effects such as crystallisation cannot (“irreversible” phenomena). The periodic heat flow signal q is therefore the superposition of an in-phase heat flow component and a component that is out of phase with the heating rate. Schawe [4.57] has proposed that the data obtained using a periodic temperature profile may be best interpreted in terms of a complex heat capacity Cp* = C’ – iC”, where the C’ component originates from the component of heat flow which is in-phase with the temperature modulation and the C” component out of phase arises from enthalpy dissipation processes. The response to the linear temperature part (DSC) yields the total heat capacity while the response to the modulated temperature part (M-DSC) yields the complex specific heat capacity cp* [4.58], according to Formula (4.39):
(4.39)
4.6.3.2. Differential Thermal Analysis / ThermoGravimetric Analysis Simultaneous Differential Thermal Analysis (DTA) and Thermogravimetric Analysis (TGA) is done on a Stanton Redcroft 1500 Thermobalance for polymer bulk material and wear debris particles. The initial polymer sample weight is about 17 mg unworn polymer material and 3 mg polymer wear debris. Measurements are conducted in either air or nitrogen atmosphere during two subsequent heating cycles between room temperature and a maximum temperature, depending on the polymer in case (e.g. 300°C for polyamide or 700°C for polyimide). A constant heating rate of 10°C/min is applied. Calibration was done by running a thermogram on an empty Al2O3 crucible. In Differential Thermal Analysis (DTA) [4.59], the polymer sample and an inert Al2O3 ceramic reference, undergoing no structural transitions in the temperature range of inter-est, are heated at the same rate, i.e. with a constant heat flux. The temperature difference between the polymer sample and the reference is measured and plotted as a function of the polymer sample temperature. If the polymer sample undergoes a thermal transition such as a glass transition and melting (endothermic) or crystallisation (exothermic), a difference in temperature is observed: by convention, the exothermic reaction is register-ed as an upwards peak and the endothermic reaction is a downwards peak in the thermo-graph. In contrast to Differential Scanning Calorimetry (DSC), a single heater element is used for both samples and the resulting sample temperature is a dependent parameter. Quantitative analysis from DTA is more complicated compared to DSC (estimations of enthalpies are generally not accurate), although it is presently preferred for analysis of wear debris that could not be analysed by DSC through high degradation and mass loss under heating, damaging the DSC sample cells. Using Thermogravimetric Analysis (TGA) [4.60], decomposition during heating is studied from a sensitive balance that follows the weight changes as a function of the polymer sample temperature. The technique can characterise materials that exhibit weight loss or gain due to decomposition, oxidation or (de)hydratation. The instrument is coupled to a mass spectrometer (MS) for analysis of the gaseous decomposition products. Mass spectroscopy is done under inert argon atmosphere.
⎟⎠⎞
⎜⎝⎛=
dTdH
mc p
1*

Chapter 4. Tribotesting and Analysis 86 4.6.4. Post-mortem Fourier Transform Raman Spectroscopy The polymer surfaces before and after sliding are characterised by Raman spectroscopy [4.61]. Unlike infrared spectroscopy being an absorption process, Raman spectroscopy is a scattering process where molecular vibrations shift the wavelength of a laser beam striking a sample and results in sharp, well-resolved bands. This shifted light, called Raman scatter, is collected in a spectrum and can be used for qualitative and quantitative analysis of functional groups based on the intensity and wavelength position. The main strength of Raman spectroscopy is its short-time and flexible sampling by using appropriate probes coupled with optical fibers, both delivering the laser light and collecting the scattered light from the sample [4.62]. Present measurements are performed on a Brucker FT spectrometer Equinox 55S (Brucker Optik, Ettlingen, Germany), equipped with a Raman module FRA 106 fitted to a nitrogen cooled (77 K) germanium high sensitivity detector D418-T. The applied laser wavelength during the experiments is the 1064 nm line from a Diode Laser Pumped Nd3+:YAG laser. A stable laser light with relatively high wavelength is chosen as it reduces fluorescence and heating of the sample. The 1064 nm line corresponds to the frequency of light emitted by the atoms in the laser crystal. All spectra have a resolution of 3 cm-1 between wavenumbers 0 and 3500 cm-1, using a non-focused laser beam with a power of 70 mW (surface area approx. 3 mm2). Each spectrum is collected as an average of 250 scans, so that the selected parameters result in an optimum noise/intensity ratio for all spectra. Large-scale sliding surfaces are analysed at ten different places revealing small variations in the spectra depending on the location. For small-scale surfaces, intensities are averaged from three scans. The dispersion of the spectrum over the total sliding surface is small. A quantitative interpretation of the spectra is made using the baseline theory for correction of individual spectra. Normalised or relative intensities should be used to compensate for any change in experimental conditions such as excitation intensity or sample positioning. There is ± 2% variation in relative intensities. The phenomenon of inelastic light scattering or inelastic collisions between photons and molecules, known as Raman radiation, was first documented by the Indian scientists Raman and Krishnan (1928) [4.63]. When a surface is irradiated with monochromatic light, most of the scattered energy comprises radiation of the incident frequency (elastic or Rayleigh scattering). When energy is transferred from the incident photon to the molecule, light of lower energy (higher wavelength) will be scattered from the molecular centres, known as inelastic Stokes scattering. When energy is transferred from the molecule to the photon, light of higher energy (lower wavelength) will be scattered by the sample, known as inelastic anti-Stokes scattering. At room temperature, most polymer molecules are in the energetic ground state and they do not have sufficient thermal energy to overcome the energetic barrier to move into the first excited state. For this reason, Stokes scattering is more favourable than anti-Stokes scattering. Also, anti-Stokes scattering from the higher excited molecular modes is unlikely. A Raman spectrum is collected by plotting the intensity of the scattered light as a function of the energy shift or Raman shift expressed in units of inverse wavelengths or wavenumbers, cm-1. The frequency spectrum of the scattered light in a Fourier transform (FT) Raman module is obtained with a Michelson interferometer, in contrast to the grating technique used in a dispersive Raman module. The latter technique uses typically 785, 633 or 532 nm beams as excitation bands (often polarised light) and a

Chapter 4. Tribotesting and Analysis 87 silicon detector. In the dispersive technique [4.64], the scattered light is analysed by subsequently focussing wavelength by wavelength on the detector trough a system of lenses and prisms. In FT-Raman spectroscopy [4.65], the entire wavelength spectrum is captured at once and discriminated into its wavelength components by a Fourier trans-form. This operation is done by a computer displaying the Raman spectrum. The detec-tor is positioned orthogonal to the incident light beam to observe only the scattered light. The difference in frequency between the scattered light and the incident beam corresponds to the vibrational and rotational energy states of the molecule. For large molecules, most Raman scattered light is due to changes in vibrational energy modes, while rotational modes are lower in energy and occur around three orders of magnitude slower than vibrational modes. Whether net energy absorption or emission is seen, depends on the population of the energy levels within a molecule. Quantitative analysis is based on the intensity of the Raman scattered light being proportional to the concentration. Qualitative analysis is based on the wavelength shifts being different for a wide range of molecular vibrations. The possibilities for molecular vibration and related Raman frequency are determined by the masses of the atoms (composition), their equilibrium spatial arrangement, their relative displacements during a vibration and the bond forces. For vibrational modes causing a frequency shift by Raman scattering, it should induce a change in the polarizability of the molecule, which depends on its orientation [4.66]. This is the selection rule for Raman spectroscopy in contrast to infrared spectroscopy, where the permanent dipole moment of the molecule should change during a vibrational cycle to be active in the infrared spectrum. Any event that changes the equilibrium order, the composition, the orientation or the mutual forces between molecules (e.g. intermolecular interactions) can change the frequency and intensity of a spectral Raman band. Hence, vibrational spectroscopy is strongly sensitive to the physical and chemical macromolecular structure. Different parts of the same molecule tend to be strongly coupled, so changing a single atom or orientation of a molecular segment can perturb many of its vibrations. This means that a subtle structural change can have large impact on the resulting spectrum, with the advantage that Raman spectra provide a fingerprint for a given molecule and its confor-mation. It is however not obvious to predict the numbers of bands to be expected in a spectrum for any molecule. The technique should rather be used as a relative evaluation tool in comparing different molecular structures before and after sliding. With respect to technical viability, characterisation methods monitoring structural changes in a thin layer activated by wear should have (i) a sensitivity adequate to distinguish the surface structure from the bulk, (ii) a detection depth equivalent to the surface layer thickness to study the structure of interest, and (iii) a signal-to-noise ratio high enough to avoid possible interference originating from foreign matter adhering to the wear surface. Laser Raman spectroscopy seems to be feasible as scattered photons originate from about 5 to 10 µm depth beneath the sample surface. This range typically includes the zone of the polymer that is affected by sliding and rising bulk and flash temperatures. Other techniques as, e.g., x-ray photoelectron spectroscopy (XPS) have detection depths of several nanometers. A study on the influence of detection depths relatively to the observed phenomena was made by Li et al. [4.67], indicating e.g. prevalent chain scission and consequently oxidation on the worn surface, while branching and cross-linking in the subsurface was observed own to the propagation of radicals beyond a critical load that allows for higher mobility of molecular segments.

Chapter 4. Tribotesting and Analysis 88 4.7. Conclusions The study of friction and wear properties is mainly an experimental science due to the large number of influencing factors and test geometries. Most tests are done in relation to a specific application and only few testing standards are available. Present test con-ditions for small-scale cylinder-on-plate and large-scale flat-on-flat tribotests include a broad range of normal loads and sliding velocities. Preliminary statistical analysis shows a variation ± 7 % on coefficients of friction, ± 8 % on wear rates from weight loss and ± 12 % on wear rates from diameter reduction for small-scale tests, or ± 7% on coefficients of friction and ± 15 % on wear rates from weight loss for large-scale tests. Compared to other tribological literature, these are acceptable limits. During small-scale testing, there is a transition from an initial Hertz line contact into a more conformal contact. A line contact is intentionally chosen for high contact pressures at running-in, which is important to induce eventual transfer and control steady-state sliding. The geometry influences the friction and wear behaviour, with a running-in period over 250 µm wear depth that is characterised by high friction and wear. This wear depth corresponds to levelling of the contact pressure. The initial counterface roughness is selected within an optimum working range mentioned in literature and according to practical application: the average steel roughness Ra = 0.05 µm is applied for polyimides and Ra = 0.20 µm is used for thermoplastics on both small-scale and large-scale testing. A model to calculate the maximum polymer surface temperature T* was evaluated from a combination of experimental measurements and literature models. Under reciprocating sliding, the temperature T* has three contributions, i.e. the environmental temperature, the nominal steel bulk temperature and the polymer surface temperature. The nominal steel bulk temperature corresponds to progressive heating of the steel bulk and is calculated from the Loewen and Shaw model, agreeing to measurements with a thermo-couple distanced at 10 mm from the sliding stroke. The polymer surface temperature results from additional heating at the polymer surface during each sliding motion and is estimated from the Jaeger model. The Jaeger model used to calculate T* considers the integrated effect of flash temperatures. The calculated maximum polymer surface tem-perature T* is 10 to 15°C higher than measurements with a thermocouple placed imme-diately near the sliding stroke, but it is physically not possible to measure temperatures in the contact itself. Measured and calculated values represent homogeneous surface temperatures, acting over the entire polymer surface. Their effect causing changes in polymer structure will be discussed throughout this work. The single asperity flash tem-peratures are not further considered as they govern very locally and during short times. Those temperatures can be calculated, but strongly depend on the steel asperity radius. Raman spectroscopy is able to illustrate variations in chemical and physical state of the molecules at the polymer surface (e.g. composition, orientation, conformation) with a detection depth of 5 to 10 µm agreeing to the zone that is affected by frictional heating. Thermo-analytical techniques as Differential Scanning Calorimetry (DSC) are applied for studying changes in polymer structure (e.g. crystallinity) before and after sliding. However, it only applies to polymer specimens that are not thermally degraded during sliding, as high mass loss through degradation would damage the measuring cell. Therefore, differential thermal analysis (DTA) and thermo-gravimetric analysis (TGA) are better suited to characterise the wear debris. Worn surfaces are visualised by optical microscopy and scanning electron microscopy.

Chapter 4. Tribotesting and Analysis 89 References [4.1] Neale MJ, Gee M. Guide to wear problems and testing for industry, Professional Engineering Publishing
Limited, St. Edmundsbury Press Ltd (Suffolk), 2000 [4.2] Czichos H. Polymer wear and its control, in: ACS Symp Series, Lee LH (ed.), 1985, 287-93 [4.3] Lhymn C. Analysis of wear statistics for polymer composites, Wear 114 (1987), 223-239 [4.4] Klaffke D. On the repeatability of friction and wear results and on the influence of humidity in oscillating
sliding tests of steel-steel pairings, Wear 189 (1995), 117-121 [4.5] Taerwe L. Waarschijnlijkheidsrekening en statistiek, Batchelor Course, Ghent University, 1998 [4.6] Quintelier J, Gallens J. Tribologisch gedrag van UHMWPE voor knieprothesen, Master Thesis, Ghent
University, 2002 [4.7] Tabor D. Friction, adhesion and boundary lubrication of polymers, in: Advances in polymer friction and
wear, Lee LH (ed.), Plenum press (New York), 1974 [4.8] Archard JF. Surface topography and tribology, Tribology 7 (1974), 213-220 [4.9] Yamaguchi Y. Tribology of plastic materials, Elsevier (Amsterdam), 1990, ISBN 0-4448-7445-3 [4.10] Pascoe MW, Tabor D. The friction and deformation of polymers, Proc R Soc London A 235 (1955),
210-224 [4.11] Holm R. Contacts handbook, Springer (Berlin), 1958, ISBN 3-5400-3875-2 [4.12] Greenwood JA, Williamson JBP. Contact of nominally flat surfaces, Proc R Soc London A 295 (1966),
300-319 [4.13] Hamrock BJ, Jacobson BO, Schmid SR. Fundamentals of machine elements, WCB/McGraw-Hill
Higher Education (Boston), 1999, ISBN 0-07-228933-3 [4.14] Stachowiak GW, Batchelor AW. Engineering tribology, Butterworth-Heinemann (Boston), 2001, ISBN
0-7506-7304-4 [4.15] Horng JH, Len ML, Lee JS. The contact characteristics of rough surfaces in line contact during running-
in process, Wear 253 (2002), 899-913 [4.16] Erhard G. Sliding friction behaviour of polymer-polymer material combination, Wear 84 (1983), 167-
181 [4.17] Uetz H, Wiedmeyer J. Tribologie der Polymere, Carl Hanser Verlag (Munchen), 1985, ISBN 3-4461-
4050-6 [4.18] Ovaert TC, Ramachandra S. The effect of controlled counterface topography on polymer transfer and
wear, Int J Machine Tools and Manufacture, 35 (1995), 311-316 [4.19] Tewari US, Bijwe J. On the abrasive wear of some polyimides and their composites, Tribol Internat 24
(1991), 247-254 [4.20] Lancaster JK. Abrasive wear of polymers, Wear 14 (1969), 219-223 [4.21] Erhard G, Strickle F. Gleitelemente aus thermoplastischen Kunststoffen. Kunststoffe 6 (1972), 2 [4.22] Landman U, Luedtke WD, Ringer EM. Molecular dynamics simulation of adhesive contact formation
and friction, in: Fundamentals of Friction: macroscopic and microscopic processes, Singer IL, Pollock HM (eds.), Kluwer Academic Publishers (Dordrecht), 1992, ISBN 0-7923-1912-5, 463
[4.23] Rigney DA, Hirth JP. Plastic deformation and sliding friction of metals, Wear 53 (1979), 345-370 [4.24] Kennedy FE. Single-pass rub phenomena-Analysis and Experiment, ASME J Lubrication Technology
104 (1982), 582-588 [4.25] Blok H. The flash temperature concept, Wear 6 (1963), 483-494 [4.26] Kalin M. Influence of flash temperatures on the Tribological behaviour in low-speed sliding: A review,
Mater Sc Eng A 375 (2004), 390-397 [4.27] Hooke CJ, Mao K, Walton D, Breeds AR, Kukureka SN. Measurement and prediction of the surface
temperature in polymer gears and its relationship to gear wear, Tribol Trans 115 (1993), 119-124 [4.28] Matysiak SJ, Yevtushenko AA, Ivanyk EG. Contact temperature and wear of composite friction
elements during braking, Int J Heat and Mass Transfer 45 (2002), 193-199 [4.29] Varadi K, Neder Z, Friedrich K, Flöck J. Numerical and finite element contact temperature analysis of
real composite-steel surfaces in sliding contact, Tribol Internat 31 (1998), 669-686 [4.30] Gecim B, Winer WO. Transient temperatures in the vicinity of an asperity contact, J Tribol 107 (1985),
333-342 [4.31] Yevtusenko A, Ukhanska O. Non-stationary temperature field of discrete sliding contact of elastic
bodies, Wear 176 (1994), 19-23 [4.32] Wang S, Komvopoulos K. A fractal theory of the interfacial temperature distribution in the slow sliding
regime, J Tribol 116 (1994), 812-823 [4.33] Bhushan B. Modern tribology handbook, CRC Press (Boca Raton), 2001, ISBN 0-8493-8403-6 [4.34] Blok H. Theoretical study of temperature rise at surfaces of actual contact under oiliness lubricating
conditions, Proc General Discussion Inst Mech Eng London 222-235 (1937) [4.35] Jaeger CJ. Moving sources of heat and the temperature at sliding contacts, Proc Roy Soc NSW 76
(1942), 1107-1121 [4.36] Archard JF. The temperature of rubbing surfaces, Wear 2 (1958), 438-455

Chapter 4. Tribotesting and Analysis 90 [4.37] Carslaw HS, Jaeger JC. Conduction of heat in solids, Clarendon Press (Oxford), 1959, ISBN 0-1985-
3368-3 [4.38] Kuhlmann-Wilsdorf D. Temperatures at interfacial contact spots: dependence on velocity and on role
reversal of two materials in sliding contact, J Tribol, 109 (1987), 321-329 [4.39] Ashby MF, Abulawi J, Kong HS. Temperature maps for frictional heating in dry sliding, Tribol Trans
34 (1991), 577-587 [4.40] Yovanovich MM, Negus KJ. Transient temperature rise at surface due to arbitrary contacts on half-
spaces, Trans Canadian Soc Mech Eng 13 (1989), 1-9 [4.41] Bhushan B. Principles and Applications of tribology, Wiley-Interscience (New York), 1999, ISBN 0-
471-59407-5 [4.42] Archard JF, Rowntree RA. The temperature of rubbing bodies, Wear 128 (1988), 1-17 [4.43] Ling FF, Pu SL. Probable interface temperatures of solids in sliding contact, Wear 7 (1968), 23-34 [4.44] Harpavat G. Frictional heating of a uniform finite thickness material rubbing against an elastomer, in:
Polymer Science and Technology, 5A, Lee LH (ed.), 1974, 205-219 [4.45] Blahey AG. The elastohydrodynamic lubrication of elliptical contacts with thermal effects, Dissertation
University of Waterloo, 1985 [4.46] Mc Ettles CM. Polymer and elastomer friction in the thermal control regime, ASLE Trans 30 (1987),
149-159 [4.47] Greenwood JA. An interpolation formula for flash temperatures, Wear 150 (1991), 153-158 [4.48] Tian X, Kennedy FE. Maximum and average flash temperatures in sliding contacts, J Tribol 116 (1994),
411-418 [4.49] Ashby MF, Abulawi J, Kong H. Background reading: Frictional heating at dry sliding surfaces,
Cambridge press (Cambridge), 1992, paperback [4.50] Gibson CT, Watson GS, Mapledoram LD, Kondo H, Myhra S. Characterisation of organic thin films by
atomic force microscopy, Appl Surf Sci 144-145 (1999), 618-622 [4.51] Kajdas CK. Importance of triboemission process for tribochemical reaction, Tribol Internat 38 (2005),
337-353 [4.52] Quinn TFJ. Physical analysis for tribology, Cambridge University Press (Cambridge), 1991, ISBN 0-
5213-2602-8 [4.53] Sharf TW, Singer IL. Monitoring transfer films and friction instabilities with in situ Raman tribometry,
Tribol Let 14 (2003), 3-8 [4.54] Bark LS. Polymer changes during friction material performance, Wear 41 (1977), 309-314 [4.55] Schacht E. Polymeermaterialen, Master Course, Ghent University, 1999 [4.56] Androsch R, Wunderlich B. Temperature-modulated DSC using higher harmonics of the Fourier
transform, Thermochim Acta 333 (1999), 27-32 [4.57] Schawe JEK. A comparison of different evaluations methods in modulated temperature DSC,
Thermochim Acta 260 (1995), 1-16 [4.58] Kanari K, Ozawa T. Errors and correction in complex heat capacity measurements by temperature
modulated DSC, Thermochim Acta 399 (2003), 189-201 [4.59] Bhadesia HKDH. Thermal Analysis Techniques, Course in Materials Science, University of Cambridge [4.60] Billmayer FW. Textbook of polymer science, Wiley & Sons Interscience (New York), 1984, ISBN 0-
471-03196-8 [4.61] Vankeirsbilck T, Vercauteren A, Baeyens W, Van der Weken G, Verpoort F, Remon JP. Application of
Raman spectroscopy in pharmaceutical analysis, Trends Anal Chem 21 (2002), 869-877 [4.62] Lewis IR. Handbook of Raman spectroscopy, Edwards HGM (ed.), Marcel Dekker (New York), 2001,
ISBN 0-8247-0557-2 [4.63] Raman CV, Krishnan KS. A new type of secondary radiation, Nature 121 (1928), 501-502 [4.64] Lewis ML, Lewis IR, Griffiths PR. Evaluation of a dispersive spectrometer with a Ge array detector and
a 1064 nm laser for the study of explosives, Vibrat Spectr 38 (2005), 11-16 [4.65] Hendra PJ, Jones C, Warnes G. Fourier transform Raman spectroscopy: instrumentation and chemical
applications, Ellis Horwood (Chichester), 1991, ISBN 0-1332-7032-7 [4.66] Op de Beek J. Analytische chemie, Master Course, Ghent University, 2000 [4.67] Li TQ, Zhang MQ, Song L, Zeng HM. Friction induced mechanochemical and mechanophysical
changes in high performance semicrystalline polymer, Polymer 40 (1999), 4451-4458

Chapter 4. Tribotesting and Analysis 91 Appendix to Chapter 4
Technical Specifications for small-scale PLINT TE 77 tribotester Electromotor type Type: Bull electric Ltd, speed range 150 to 3000 rev/min d.c. with thyristor controller (Eurotherm Drives, 220 V) and tachogenerator feedback (Moore & Read) ensures stable oscillating frequency (2.5 to 50 Hz, resolution < 5%) Electrical supply by Single phase, ac, 16 A, field 210 V power 0.55 kW Normal load measurement Type: Futek load cell L2357 capacity 50 lb = 222 N resolution ± 0.1 % = 0.02 N Charge amplifier Data Track 243-1-R Friction force measurement Type: Force transducer Kistler, Type 9203 range +500 N (tension) to -500 N (compression) resolution 0.001 N Charge amplifier Kistler, Type 5007 Temperature measurement and control Type: Code K to BS4937 Part 4, ANSI Type K and DIN 43710 nickel chromium/nickel-aluminium
range -270 to 1370°C resolution 0.1°C: -220 to 1370°C resolution 0.025°C: -20 to 1150°C
Temperature controller-indicator Gulton West 2050, PID controller Maximum heating range 350°C Vertical displacement transducer Type: Bentley-Nevada max range 3 mm (-5 V to +5 V), linear range 1.2 mm resolution 0.005 mm Climate Conditioner Type: Weiss Technik SB 111 300 temperature measurement and humidity measurement Dicon SM resolution 0,1°C and 0,1 % RH

Chapter 4. Tribotesting and Analysis 92 Appendix to Chapter 4
Technical Specifications for large-scale tribotester
Normal load measurement Type: Roltran-Novatech F209-Z (0 to 750 tons, only compressive load) resolution ± 0.02 % = 0.15 tons
non-linearity 0,3 % full-scale hysteresis 0,2 % full-scale repeatability 0,1 % full-scale accuracy class C3
Friction force measurement Type: Roltran-Novatech F205-Z (0 to 250 tons, only compressive load) resolution ± 0.02 % = 0.15 tons
non-linearity 0,5 % full-scale hysteresis 0,5 % full-scale repeatability 0,05 % full-scale accuracy class C3
Temperature measurement Type: Code K to BS4937 Part 4, ANSI Type K and DIN 43710 nickel chromium/nickel-aluminium
range -270 to 1370°C resolution 0.1°C: -220 to 1370°C resolution 0.025°C: -20 to 1150°C
Vertical displacement transducers Type: SONY DG-810 linear range 0 to 10 mm (- 5 V to 5 V) resolution ± 0.001 mm
measuring feeler: carbide ball dustproof bellows protection

93
Chapter 5.
Polyimides under atmospheric conditions: influence of normal load, sliding velocity,
test environment and composition.
Goals
• Determination of transitions in friction and wear and mechanical overload as a function of normal load and sliding velocity for different polyimide types, and possibility to use a uniform representation (pv-value)
• Influence of sintered and thermoplastic polyimide compositions with graphite
fillers and PTFE fillers on stabilisation of friction and/or wear
• Influence of atmospheric test conditions on friction and wear, related to change in transfer and efficiency of graphite fillers
• Microscopic characterisation of wear mechanisms and overload: sliding
surfaces and wear debris
• Correlation between overload conditions under sliding to static deformation
• Correction of on-line wear measurements for creep and thermal expansion and correlation to off-line wear measurements
Methodology
• Small-scale tribotesting, microscopic analysis, roughness measurements, temperature calculations, creep measurements
High performance plastics conference, 2005, Vienna (Austria)

Chapter 5. Polyimides under atmospheric conditions 94 5.1. Introduction on the influence of polyimide composition
and environmental atmosphere on sliding properties Due to the high cost, polyimides (PI) were originally used for space applications. They replaced oils or greases that could not be used because of evaporation and contamination of nearby surfaces. The earliest work on polyimides by Buckley [5.1] therefore focussed on the sliding behaviour of polyimides in 10-9 to 10-10 Torr vacuum, reporting that friction and wear behaviour of polyimide sliding against stainless steel was superior to polytetrafluoroethylene (PTFE). Low friction and wear depended on the transfer of a thin polyimide film to the counterface. Solid lubricants were added to improve transfer, showing that addition of 30 wt% copper favourably reduces friction and minimises wear rates, while both friction and wear increased when graphite is added in vacuum atmos-phere. Molybdenium disulphide remarkably reduced both friction and wear in vacuum. Pioneering research on tribology of polyimide films and bulk material was done by Fusaro [5.2] at the NASA Lewis Research Center. Mainly the effect of sliding velocity, normal load, temperature and test specimen geometry was investigated in vacuum (10-3 to 10-6 Torr) or argon environments, using a pin-on-disc test set-up with steel pin and rotating polyimide film at 2.7 m/s and 9.8 N. Nine different polyimides and composites containing solid lubricants or fibers were studied, but the exact compositions were not reported. He could generally conclude that linear thermoplastics had higher wear rates than thermosetting polyimides. As no transfer film developed for thermoplastic polyimi-des, but rather fine wear debris was generated, wear of thermoplastics was suggested to occur through fatigue rather than adhesion. The investigated polyimides were classified in two groups according to their tribological properties and wear track morphology: (i) low-friction / high-wear materials, with smooth sliding surfaces covered by powdery agglomerated particles and transfer films to the pin being thin and plastically flown, and (ii) high-friction / low-wear materials, with rough-looking surfaces covered by fine wear particles not agglomerating on the wear track, but forming thick transfer films to the pin that did not shear easily and lack plastic deformation. It follows from previous research that smooth sliding in vacuum with low friction and wear is caused by a beneficial transfer film developing on the counterface. Transfer was attributed to plastification ability of the polyimide surface in absence of water vapour. Under atmospheric conditions, however, it can be predicted that water molecules restrict the formation of a transfer film and cause a transition from low to high friction and wear, before achieving an acceptable steady-state friction regime. Water molecules possibly act as anti-plasticizers restricting the molecular mobility (relaxation) and orientation under sliding [5.3]. The surface then acts brittle and the secondary transition temperature artificially increases. Atmospheric influences therefore closely relate to thermal influen-ces. The impediments on molecular orientation during sliding were however not clearly demonstrated in literature, but are further detailed in this work (Chapter 6). Flexible chain configurations with high toughness have positive effects on the wear rates of polyimide films, as demonstrated by Chitsaz-Zadeh et al. [5.4] who artificially changed the diamine groups into structures with different elasticity modulus. Jones et al. [5.5] varied the dianhydride groups and found similar trends: (i) the lowest wear rates were observed for the most flexible chains with relatively low secondary transition temperature, and (ii) the friction slightly decreased for flexible chain structures.

Chapter 5. Polyimides under atmospheric conditions 95 The effect of other environments such as cooling liquids was investigated by Sheiretov et al. [5.6], indicating no chemical degradation and no strong effect of refrigerants on friction and wear behaviour of polyimides, as they are resistant to most common sol-vents and chemicals. Mainly the fillers influenced the sliding behaviour at different at-mospheric conditions: organics either improved or deteriorated the wear rates compared to dry atmospheric sliding. Shen and Dumbleton [5.7] reported on galling mechanisms and three-body abrasive wear under moist conditions while good performance under dry sliding was noted. This was attributed to low cohesion of filled sintered polyimides and stress-cracking: dislodgement on the polyimide wear surface was likely observed at the site of graphite fibers, as the polyimide may change size in contact with moisture while graphite does not. Also Bayer et al. [5.8] observed subsurface voids in thermoplastic films due to stress concentrations, lowering the coefficient of friction and wear rates. In this chapter, tribological behaviour of sintered and thermoplastic polyimides is tested under atmospheric conditions for various normal loads and sliding velocities, since there is increasing interest in the material’s use for terrestrial highly loaded situations (e.g. Hertz contacts). A consistent overview of the friction and wear properties of sintered materials and their composites over a broad range of sliding velocities and normal loads has however rarely been found in literature, compared to the wear mechanisms of thermoplastics. Only Iwabuchi et al. [5.9] reported on the fretting properties of pure sintered polyimides against stainless steel, observing plate-like transfer particles and surface cracks that lead to increasing friction with sliding time. Friedrich [5.10] compared the sliding behaviour of Vespel (DuPont, USA) and Sintimid compositions (Sintimid, Austria is a polyimide-amide copolymer), illustrating the effect of sintering conditions and additives needed for superior sliding under mild conditions. Better insight in the sliding behaviour correlated to the loading capacity, surface texture and unstable transfer under certain conditions is still needed for application of sintered products. The influence of fillers as graphite is often dubious, whether improving or deteriorating the sliding properties of bulk polymers. The efficiency of graphite lubricants depends on the moisture content and water molecules are needed to allow for easy shear of the graphite structure consisting of parallel planes with low shear strength. This effect contradicts to previously noted detrimental effect of water absorbed to the polyimide surface and will be discussed in Chapters 5 and 6. In presence of fiber reinforcements, the fiber-matrix adhesion was generally poor and the wear resistance of the polyimide matrix decreased (mainly above 200°C), as observed by Tewari et al. [5.11]. In combina-tion with solid lubricants such as PTFE or graphite, sliding properties further deteriora-ted [5.11, 5.12]. Fiber reinforcements are therefore not considered in present tests.
5.2. Sliding of pure and filled sintered polyimides under atmospheric conditions
In this paragraph, test results on small-scale sliding of pure SP-1 and graphite-filled SP-2 at 50, 100, 150, 200 N and 0.3, 0.6, 0.9, 1.2 m/s against HA-steel counterfaces are presented. The environmental standard atmosphere is 23°C, 60 % RH (Table 4.1). It will be demonstrated that friction and wear behaviour of SP-1 is mainly influenced by normal load (mechanical overload and brittleness). Therefore, a transition at high load sliding is compared to static compression tests. The efficiency of graphite fillers in reducing fric-tion and wear mainly improves at high sliding velocities. Transfer films are platelet-like.

Chapter 5. Polyimides under atmospheric conditions 96
0
2
4
6
8
10
12
14
16
18
20
0 2 4 6 8 10 12 14 16 18 20 22 24
Time (h)
Vert
ical
dis
plac
emen
t (µm
)
50 N
100 N
150 N
200 N (c)
0
20
40
60
80
100
120
140
160
180
200
0 50 100 150 200 250Vertical displacement (µm)
Nor
mal
load
FN (N
)
(a)
Transition point 100 N
5.2.1. Static creep and deformation The compressive deformation of SP-1 in line contact is illustrated by a loading and un-loading diagram in Figure 5.1a. The maximum Hertz contact pressures pH, max are calcu-lated from the normal loads 50, 100, 150, 200 N (Table 4.5) and plotted in Figure 5.2b. The behaviour is compared to a compression test according to ASTM D695 [3.8] with flat contact geometry (grey line). Creep measurements for SP-1 in line contact, similar to the sliding contact configuration, are shown in Figure 5.1c during 24 hours loading.
Figure 5.1 Experimental determination of static loading behaviour for SP-1 in Hertz line contact, (a) compressive load / displacement curve for line contact, (b) contact pressure / displacement curve for
line and flat contact, (c) creep for line contact A transition between visco-elastic and plastic deformation occurs at 48 MPa, according to the ASTM compression test. A transition in slope of the normal load versus vertical displacement for a line contact occurs at 100 N, corresponding to pH,max = 49 MPa. Sintered SP-1 shows a critical load of 100 to 150 N that will be reflected in sliding tests. Creep measurements confirm that the 50, 100 N deformation is 9 to 10 µm (24 hours), while significantly higher deformation of 13 to 18 µm happens at 150, 200 N. Each creep test was repeated two times with a statistical variation of ± 1 µm. Recovery tests indicated nearly complete recuperation of the deformation at 50 to 100 N immediately after unloading, while it took about 48 h for complete recovery after 150 to 200 N loads.
Hertz
loading
unloading
0
10
20
30
40
50
60
70
80
0 50 100 150 200 250
Vertical displacement (µm)
Con
tact
pre
ssur
e (M
Pa)
(b)
Hertz
ASTM
pH, max
Transition point 100 N

Chapter 5. Polyimides under atmospheric conditions 97 The experimental vertical displacement during loading of polyimide cylinders is up to a factor 10 larger than the estimated Hertz elastic deformation (Table 4.5). Polymers, however, behave rather visco-elastically under load depending on the loading time and effective stress situation in the polymer bulk. The state of stress beneath the contact surface is illustrated in Figure 5.2 at 50 N (pH,max = 34 MPa), according to calculations from [5.13]. The principal stresses along the z-axis parallel to the line of loading symmetry are represented. The maximum shear stress attains τmax = 0.33 pH,max at a depth of z = 0.78 ℓ. The maximum Von Mises stresses in the subsurface attain 19 MPa at 50 N, 26 MPa at 100 N, 32 MPa at 150 N and 37 MPa at 200 N normal load. Figure 5.2 Calculated stress situation in a polymer cylinder with diameter 5 mm and width 2b = 15 mm
statically loaded in a Hertz line contact at 50 N normal load (pH,max = 24 MPa) 5.2.2. Friction results under standard atmosphere The evolution of dynamic friction coefficients with sliding distance is illustrated in Figure 5.3 for SP-1 (pure) and SP-2 (graphite-filled) polyimides. Steady-state values are summarised in Tables 5.1 and 5.2. Observations on the influences of graphite additives, normal load and sliding velocity are discussed below. Comparing both sintered polyimide grades, graphite additives are favourable for lower friction over nearly the entire testing range (except low velocity, high loads) because of their lubricating action and transfer film formation. Friction is high for SP-1 under stan-dard atmospheric conditions, as no or unfavourable polymer transfer was observed. Due to mechanical overload, some tests were stopped prematurely. Differences between pure and filled grades become more pronounced at higher loads and/or sliding velocity by improved transfer of SP-2. The regime values of friction for SP-2 are however less stable compared to SP-1, reflecting larger bulk inhomogeneities with dispersed graphite pow-der within the matrix. Therefore, the transfer film is supposed to be build up of graphite layers with low shear strength as reported by Langlade et al. [5.14], while the debris particles consist of both polyimide and graphite. It is clear that an increase in load and/or sliding velocity has other effects on friction: there is a general tendency of decrease in friction with increase in velocity, while an increase in friction often occurs at high loads. The transition into steady-state sliding happens more rapidly at high loads or velocities.
4
3
2
-35 -30 -25 -20 -15 -10 -5 0 5 10 15 20 25 30 35
Contact with steel surface
Poly
mer
bul
k cy
linde
r
σZZ σyy
σXX
Von Mises stress τmax
Dep
th b
enea
th c
onta
ct s
urfa
ce z
(mm
)
Stress (MPa)
10-1
10-2
10-3
10-4

Chapter 5. Polyimides under atmospheric conditions 98
0
0.1
0.2
0.3
0.4
0.5
0.6
0.7
0 2000 4000 6000 8000 10000 12000 14000 16000
Sliding distance (m)
Coe
ffic
ient
of f
rictio
n
0
0.1
0.2
0.3
0.4
0.5
0.6
0.7
0 2000 4000 6000 8000 10000 12000 14000 16000
Sliding distance (m)
Coe
ffic
ient
of f
rictio
n
0.3 m/s
0.6 m/s 1.2 m/s
0.3 m/s
0.6 m/s
1.2 m/s
(a) (b)
Figure 5.3 Evolution of coefficients of friction as a function of sliding distance for (a) SP-1 and (b) SP-2, at 100 N, 0.3 to 1.2 m/s against HA-steel
5.2.2.1 Influence of sliding velocity on friction For pure SP-1, friction either (i) decreases with sliding velocity at low loads (50 to 150 N), or (ii) linearly increases with sliding velocity at higher loads (200 N) related to mechanical overload. At high sliding velocities, friction may stabilise at a value independent of any further increase in sliding velocity, in contrast to the behaviour of most thermoplastics. High friction (µ = 0.40 to 0.50) is often observed for bulk polyimides at low sliding velocity (v < 0.5 m/s), according to Bozet et al. [5.15], while polyimide films have coefficients of friction of about 0.20 to 0.30 [5.16]. The evolution of friction at high sliding velocities is, however, often dubious:
• A theoretical model by Uetz et al. [5.18] considers the deformation of visco-elastic material and interaction with the counterfaces asperities. It states that the real contact area decreases by impeded chain relaxation and higher stiffness at high sliding veloci-ties. Therefore, the polymer surface does not follow the roughness asperities fluently and friction lowers. This trend applies to SP-1 at low loads / low sliding velocities.
• A theoretical model of Matsubara [5.17] considers orientation of molecules at the sliding surface. It predicts higher friction at high sliding velocities because the poly-mer chains react stiffer and disfavour a conducive surface texture. This trend applies to SP-1 at high loads / high sliding velocities as molecular mobility is limited.
• Practical experience learns that frictional heating often interferes with polymer chain mobility and lower friction. For semi-thermosetting SP-1, however, a transition to low friction will only happen for polymer surface temperatures T* > 180°C (Chapter 6), while present temperatures under free frictional heating are lower (see paragraph 5.4).
It is concluded that mechanical shear interactions prevail over thermal effects for SP-1. For graphite-filled SP-2, high sliding velocities cause a monotonous decrease in coeffi-cients of friction at any load, more pronounced than for SP-1. The decreasing trend becomes stronger at higher normal loads. Possibly higher wear rates then contribute to larger exposure of graphite lubricant in the sliding interface and influence friction more favourably. Related to the low friction, temperature rise becomes less important for SP-2 compared to SP-1 (calculations are given later) and cannot be solely responsible for the

Chapter 5. Polyimides under atmospheric conditions 99 Table 5.1. Coefficients of friction for pure sintered polyimide SP-1
50 N 100 N 150 N 200 N
0.3 m/s 0.51 0.47 0.45 0.41
0.6 m/s 0.41 0.41* 0.42* 0.44*
0.9 m/s 0.37 0.38* 0.40* 0.48*
1.2 m/s 0.40 0.38* 0.40* 0.48* * short test (< 15000 m sliding distance) due to overload Table 5.2. Coefficients of friction for graphite-filled sintered polyimide SP-2
50 N 100 N 150 N 200 N
0.3 m/s 0.40 0.42 0.45 0.46
0.6 m/s 0.35 0.32 0.24 0.25
0.9 m/s 0.38 0.26 0.18 0.15
1.2 m/s 0.32 0.20 0.15 0.12
decrease in friction. On the other hand, formation of a graphite transfer film mainly determines friction. At higher sliding velocities, shear between the graphite layers occurs more readily and they perform lower friction resistance. 5.2.2.2. Influence of normal load on friction The coefficients of friction for SP-1 either (i) decrease monotonously with normal load at low sliding velocities, or (ii) increase with normal load at 0.6 to 1.2 m/s sliding velocities. The friction at high load / high sliding velocity conditions does not depend on sliding velocities (0.9 to 1.2 m/s) and is solely determined by the normal load. This be-haviour is related to lack of softening for semi-thermosetting SP-1 under present sliding conditions, consequently hindering favourable transfer film formation. The frictional behaviour at high load depends on the intrinsic strength or weakness of the sintered structure and mechanical overload happens due to brittle fracture. Semi-thermosetting sintered SP-1 behaves clearly different from thermoplastics. The general law of friction Ffriction = µ FN with constant µ as a function of normal load FN cannot be stated for polymers, since their contact surface deforms visco-elastically under load. Therefore, the variation in friction coefficients with load for thermoplastics often follows the equation µ = K·FN
(n-1), where K and n are constants with 2/3 < n < 1, depending on the amount of interaction between elastic and plastic deformation. Models for thermally controlled friction [5.19] indicate a reduction in friction at higher loads, according to µ = K·FN
-0.33 for microscopically “partial” contact (i.e. local elastic contact at the asperities) to µ = K·FN
-1 for “full” contact (i.e. when the real contact area A′ approaches the macroscopic contact area A through plastic deformation). These relations originate from the definition of friction coefficients and elastic contact theories. For semi-thermosetting SP-1, the decrease in friction with normal load at 0.3 m/s is smaller than expected from previous equations. The friction coefficients decrease linear rather than following previous power-law (an extrapolated value according to µ = K·FN
-n yields coefficient of friction at 200 N of µ = 0.32 for n = 0.33, or µ = 0.13 for n = 1).

Chapter 5. Polyimides under atmospheric conditions 100 An important transition with increasing friction manifests from 100 to 150 N normal loads, corresponding to the transition zone noticed in compressive deformation tests (Figure 5.1). This transition agrees to visual variation in debris morphology (Figure 5.4): (i) being fine and spherulite-like at 50 to 100 N (mild sliding regime), while (ii) having an agglomerated structure for 150 to 200 N tests (mechanical overload). The latter morphology indicates formation of large particles through brittle fracture at some weak sintered interfaces, while other interfaces within the agglomerated particle have better strength. Also complete stress-cracking of some samples after 200 N sliding indicate brittleness. The lack of softening and no favourable transfer for SP-1 under present test conditions makes the frictional behaviour strongly dependent on the sintering process and initial polyimide properties, having among the highest shear strength and brittleness, according to Table 3.2. It is concluded that the performance of SP-1 above 150 N is limited by brittleness and mechanical overload. (a) (b)
Figure 5.4 Wear debris morphology for SP-1 sliding at (a) 50 to 100 N indicating mild sliding,
(b) 150 to 200 N indicating brittleness and overload with unstable friction The coefficients of friction for SP-2 either (i) increase with normal load at low sliding velocities, or (ii) decrease with normal load at 0.6 to 1.2 m/s sliding velocities. These trends are reversed in relation to SP-1 and relate to the amount of lubricant (fillers) in the interface. It is assumed and visually observed that the sliding behaviour of graphite-filled polyimides is controlled by the formation and the quality of a graphite transfer film. From Table 3.3, it reveals that sintered polyimide with graphite additives have lower strength. The influence of the intrinsic mechanical strength mainly manifests at low sliding velocities (0.3 m/s) with a continuous increase in friction. This mechanical overload was also reflected in high wear rates and lumpy transfer. The influence of a transfer film prevails at high sliding velocities (0.6 to 0.9 m/s) as it becomes more homogeneous and is favoured by shear. The strong reduction in friction coefficients, mainly at high sliding velocity and high normal loads, can be related to the combination of (i) the brittleness of the polyimide structure resulting in high lubricant supply, and (ii) the shear stresses favouring homogenisation of polyimide and graphite debris. Both actions result in the formation of a mixed graphite/polyimide transfer film. For each of the test parameters, graphite was exposed as fine powder (Figure 5.5). No large agglomerated particles were observed as the friction (and shear stresses in the polyimide bulk) are lower with less stress concentrations at the sintered interfaces.
1 mm

Chapter 5. Polyimides under atmospheric conditions 101 (a) (b)
Figure 5.5 Graphite/polyimide wear debris morphology for SP-2 after sliding at (a) 50 N, (b) 200 N
5.2.3. Wear results under standard atmosphere The on-line vertical displacement as a function of sliding distance is plotted in Figure 5.6 for SP-1 and SP-2 polyimides at some sliding conditions. Average volumetric wear rates (mm3/m) over the entire test course are summarised in Tables 5.3 and 5.4, compa-ring both weight and dimensional (micrometer) measurements. Since contact pressures continuously change during sliding, specific wear rates mm3/Nm are not considered. For filled SP-2, wear rates are only 10 to 20 % of the values for pure SP-1. The influences of graphite additives, normal load and sliding velocity are discussed below. A discrimina-tion between real wear (i.e. material loss) and deformation will be made. Differences in wear behaviour for pure and filled sintered polyimide are importantly reflected in the wear versus sliding distance curve. For pure SP-1, volumetric wear rates remain constant over the entire sliding distance with hardly any difference in running-in and steady-state (Figure 4.17). Only for the highest loads and velocities, a slight transition to lower steady-state wear rates becomes clearer. The change in wear depth evolution between running-in and steady state conditions related to the Hertz line contact was mentioned earlier in this work (Figure 4.9). For graphite-filled SP-2, the curves of either volumetric wear or wear depth versus sliding distance have two different slopes with a clear separation between running-in and steady-state sliding: a transition results from graphite transfer after certain sliding time, causing a constant wear depth during steady-state. However, there is no stabilisation of the wear curve for the most severe testing parameters (100 N - 1.2 m/s; 150 N - 0.6 to 1.2 m/s and 200 N - 0.6 to 1.2 m/s), reflecting overload conditions. A graphite transfer film builds-up gradually to support the implied load, but strength is limited due to its lamellar structure [5.20].
polyimide
graphite
polyimide graphite
1 mm

Chapter 5. Polyimides under atmospheric conditions 102 (a) (b)
Figure 5.6 On-line vertical displacement as a function of sliding distance for (a) SP-1 and (b) SP-2, at 100 N, 0.3 to 1.2 m/s against HA-steel
Table 5.3. Wear rates for pure sintered polyimide SP-1 (10-4 mm3/m) from weight and (dimensional) measurements
50 N 100 N 150 N 200 N
0.3 m/s 7.76 (7.73) 19.5 (19.1) 31.7 (31.0) 50.9 (52.0)
0.6 m/s 12.3 (12.0) 36.5 (36.8)* 59.7 (57.0)* 100 (102)*
0.9 m/s 13.5 (13.3) 34.8 (33.8)* 65.0 (66.2)* 126 (128)*
1.2 m/s 18.2 (18.6) 33.9 (32.4)* 68.9 (68.2)* 137 (158)* * short test (< 15000 m sliding distance) due to overload Table 5.4. Wear rates for graphite-filled sintered polyimide SP-2 (10-4 mm3/m) from weight and (dimen-sional) measurements
50 N 100 N 150 N 200 N
0.3 m/s 0.60 (0.58) 4.72 (4.93) 12.8 (14.2) 16.5 (18.6)
0.6 m/s 2.61 (2.68) 7.22 (7.20) 11.0 (11.2) 9.40 (9.17)
0.9 m/s 9.90 (10.3) 11.5 (12.2) 10.2 (10.3) 9.40 (9.15)
1.2 m/s 9.12 (9.43) 12.1 (15.3) 10.5 (10.3) 9.42 (9.23)
0
200
400
600
800
1000
1200
1400
0 2000 4000 6000 8000 10000 12000 14000 16000
Sliding distance (m)
Vert
ical
dis
plac
emen
t (µm
)
0.3 m/s
1.2 m/s 0.9 m/s 0.6 m/s
0
200
400
600
800
1000
1200
1400
0 2000 4000 6000 8000 10000 12000 14000 16000
Sliding distance (m)
Vert
ical
dis
plac
emen
t (µm
)
0.3 m/s
1.2 m/s
0.9 m/s
0.6 m/s
SP-1, 0.3 m/s

Chapter 5. Polyimides under atmospheric conditions 103 The running-in evolution of on-line vertical displacement for SP-1 and SP-2 (Figure 5.6b) matches for both curves, as the initial wear conditions for either bulk or filled materials are identical. It is only after some sliding time that a graphite transfer film develops and stabilises wear for SP-2. It is also noticed that stabilisation and formation of a transfer film with wear protecting capacity needs longer sliding time when the test conditions become more severe, i.e. either for increasing sliding velocity or normal load. The steady-state stabilisation in on-line vertical displacement for SP-2 is more pronoun-ced as a function of sliding velocities than as a function of normal loads. The lubricating mechanism of graphite is based on ‘easy shear’ planes, depending on horizontal shear stresses parallel to the sliding direction rather than depending on normal loads. 5.2.3.1. Influence of sliding velocity and normal load on wear Sliding velocities have smaller effects on the real wear rates (or material loss) for SP-1 than loads have, in parallel to the tendencies in friction. An increase in sliding velocity may somewhat increase the chain stiffness and enhance the brittleness of the sliding surface, consequently being prone to fracture and easier formation of wear debris particles. The wear rates for SP-2 at high sliding velocities completely stabilise or even diminish slightly for the highest sliding velocity due to the lubricating action of the graphite film through shear improving at higher sliding velocities.
(a) (b)
Figure 5.7 Influence of normal load on volumetric wear rates of (a) SP-1, and (b) SP-2, 0.3 m/s, x 0.6 m/s, 0.9 m/s, ∆ 1.2 m/s
Normal loads influence the wear rates of SP-1 severely since gradually higher wear rates occur at higher loads. Figure 5.7 reveals a critical normal load of 100 to 150 N due to mechanical overload, in parallel to the transition into brittle fracture noticed for friction and the transition in compressive deformation (Figure 5.1). According to Lancaster [5.21], a transition to severe wear at high loads is attributed to limited strength and/or large plastic deformation of polymers. For SP-2, no mechanical overload conditions were noticed, but two relations with normal load are distinguished:
0
2
4
6
8
10
12
14
16
18
0 50 100 150 200 250
Normal load (N)
Wea
r rat
e (1
0-4
mm
3 /m)
0
20
40
60
80
100
120
140
160
0 50 100 150 200 250
Normal load (N)
Wea
r rat
e (1
0-4m
m3 /m
)

Chapter 5. Polyimides under atmospheric conditions 104
0
200
400
600
800
1000
1200
1400
1600
1800
0 2000 4000 6000 8000 10000 12000 14000 16000
Sliding distance (m)
Vert
ical
dis
plac
emen
t (µm
) 200 N, 0.9 m/s 150 N,
0.9 m/s
200 N, 0.3 m/s
150 N, 0.3 m/s
100 N, 0.3 m/s
50 N, 0.3 m/s
(i) at high sliding velocities, wear rates stabilise at 0.0010 to 0.0012 mm3/m without overload, reflecting the beneficial action of graphite in parallel to decreasing friction, or
(ii) at low sliding velocities, wear rates progressively grow with normal loads in parallel to increasing friction (Table 5.2). At 150 N, the wear rates increase discontinuously at 0.3 m/s, while they stabilise at 0.6 m/s. A transition in wear rates between 100 to 150 N is noticed for SP-2 and refers to the mechanical overload situation for pure SP-1. It indicates that the bulk properties of pure sintered polyimide – although inferiorly – influences the behaviour of its composites. The beneficial sliding characteristics of a mixed graphite/polyimide transfer film fully appear at 0.6 m/s, 150 N, as large produc-tion of polyimide debris is expected from overload of pure SP-1 and mix-up with the graphite transferred particles to improve strength of the lubricating film. One important conclusion in visually comparing the wear mechanisms of SP-1 and SP-2 is the transition into brittle fracture and formation of agglomerated wear debris particles for SP-1 at high loads, while lacking for SP-2 under identical normal loads and sliding velocities. The frictional forces for pure SP-1 are higher than those for graphite-filled SP-2 and cause higher shear stresses on the SP-1 subsurface, leading to stress concentra-tions near the sintered grain boundaries and possible fracture of the weakest boundaries. Shear stress concentrations can be assumed as an origin for failure, as also noted from the parallel layers on the fracture aspects of notched sintered polyimides (Table 3.4). High friction of sintered polyimides seems well-coupled to high wear rates and overload. 5.2.3.2. Influence of creep and deformation on wear The wear rates calculated from post-mortem weight measurements and diameter reduc-tion ∆hm (micrometer) at the end of the test (Table 5.3) are in reasonably good agree-ment. It indicates that permanent deformation of polyimides under sliding and loading is limited. Compared to on-line measurements of vertical displacement ∆hv (Figure 5.8), however, deformation by creep ∆hc and thermal expansion ∆ht should be taken into account. This is illustrated in Figure 5.8 or Tables 5.5 and 5.6 for SP-1 at 50 to 200 N.
Figure 5.8 On-line vertical displacement as a function of sliding distance for SP-1 at 50 to 200 N, 0.3 m/s to 0.9 m/s against HA-steel (1.2 m/s not considered due to frequent overload)

Chapter 5. Polyimides under atmospheric conditions 105 Table 5.5. Evaluation of wear and deformation for SP-1 sliding at 0.3 m/s against HA-steel
0.3 m/s 50 N 100 N 150 N 200 N
Post-mortem wear depth ∆hm
On-line wear depth ∆hv
T*
Thermal expansion ∆ht
Creep ∆hc
(µm)
(µm)
(°C)
(µm)
(µm)
450
472
57
9
7
820
862
81
15
8
1050
1264
104
21
10
1550
1773
117
23
16
Corrected on-line wear depth (µm) 474 869 1275 1780
Recovered visco-elastic deformation one week after test
(µm)
(%)
24
5
49
6
225
17
230
13
On-line wear rates
Running-in**
Steady-state
Average
(10-4 mm3/m)
(10-4 mm3/m)
(10-4 mm3/m)
13
5
9
24
12
18
46
16
31
60
34
47
** running-in over approximately first 1500 m, *** short tests due to overload, T* maximum polymer surface temperature (Chapter 4) Table 5.6. Evaluation of wear and deformation for SP-1 sliding at 0.9 m/s against HA-steel
0.9 m/s 50 N 100 N 150 N 200 N
Post-mortem wear depth ∆hm
On-line wear depth ∆hv
T*
Thermal expansion ∆ht
Creep ∆hc
(µm)
(µm)
(°C)
(µm)
(µm)
550
585
77
14
7
910***
922
136
29
8
920***
1103
198
45
10
1040***
1240
303
70
16
Corrected on-line wear depth (µm) 592 943*** 1138*** 1294***
Recovered visco-elastic deformation one week after test
(µm)
(%)
42
7
33
5
218
19
254
19
On-line wear rates
Running-in**
Steady-state
Average
(10-4 mm3/m)
(10-4 mm3/m)
(10-4 mm3/m)
24
11
17
51
16
34
85
32
59
156
152
154
** running-in over approximately first 1500 m, *** short tests due to overload, T* maximum polymer surface temperature (Chapter 4)
For all test parameters, the on-line vertical displacement ∆hv is higher than the post-mortem diameter reduction ∆hm from micrometer measurements. Even when corrected for thermal expansion and creep, the corrected on-line wear depth ∆hv,corr = ∆hv – ∆hc + ∆ht remains higher than the post-mortem wear ∆hm. The difference between on-line and post-mortem evaluation indicates the part of visco-elastic deformation that is recovered

Chapter 5. Polyimides under atmospheric conditions 106 during one week under stress free conditions. Longer recovery time did not reveal fur-ther changes (see also Table 4.2). The percentage of recovered deformation depends on the normal load conditions, being 5 to 6 % after sliding at 50 to 100 N or 13 to 17 % after sliding at 150 to 200 N. Only one characteristic test is represented in Tables 5.5 and 5.6, but statistical analysis for the 0.3 m/s tests shows a variation ± 2 % on the recovered visco-elastic deformation. Again, the transition between low load and high load as noticed in friction and wear behaviour manifests also in visco-elastic properties. The small recovery at low loads during one week indicates small accumulation of visco-elastic deformation after sliding and most deformation was recovered immediately at unloading. At high loads, however, less deformation was immediately recovered and a large percentage was recovered one week after testing. The recovery for high-velocity tests at overload is somewhat larger as the stored energy and hysteresis, both influenced by normal loads and sliding velocity, was higher than for low-velocity tests. Comparing the on-line wear rates calculated from the vertical displacement ∆hv at running-in and steady-state (Tables 5.5 and 5.6), most deformation is concentrated in the running-in period during sliding in a Hertz line contact. The difference between deformation and real wear or material loss during running-in was previously mentioned (Figure 4.17). The average dimensional wear rates from on-line vertical displacement (Table 5.5, 5.6) and post-mortem measurements (Table 5.3) are in good agreement. Under overload conditions, however, the deformation becomes predominant in the overall test evaluation as sliding times and steady-state conditions shorten. 5.2.4. Counterface and transfer evaluation
50 N 0.6 m/s 50 N 1.2 m/s
Figure 5.9 General overview of HA-steel counterface after sliding with SP-1 at 50 N and
various sliding velocity The sliding behaviour of smooth surfaces is mainly governed by adhesion and conse-quent formation of an interlayer with low shear strength, either consisting of a lubricant or transfer film. Early theories [5.21] state that the formation of a thin film is favourable for lowering the counterface roughness and therefore lowers friction and wear. For poly-mers, however, often a reverse trend is observed and the tribological performance depends on the morphology of a polymer transfer film. It reverses polymer/steel contacts
1 mm

Chapter 5. Polyimides under atmospheric conditions 107 into (local) polymer/polymer contact with variations in adhesion and/or deformation. Fusaro [5.22] reported about different transfer film features for polyimides affecting the sliding properties in a different way: he noted separate platelets, thin and continuous, thick and lumpy or thick and rigid films. A qualitative interpretation of polyimide trans-fer films is presently made by optical microscopy. Figure 5.9 gives an overview of the entire sliding area on HA-steel (15 mm x 15 mm, sliding direction = horizontal). It reveals no coherent transfer film after sliding at 50 N but sometimes different features in the centre and at the borders of the sliding stroke for 0.6 to 1.2 m/s sliding velocities. A continuous polyimide transfer film was never formed after sliding tests on HA-steel at 23°C and 60 % RH atmospheric conditions, only ‘platelet-like’ transfer was observed.
50 N 0.3 m/s 100 N 0.3 m/s
150 N 0.3 m/s 200 N 0.3 m/s
Figure 5.10 Transfer evaluation on HA-steel after sliding with SP-1 at 0.3 m/s and various normal loads
Polymer transfer for SP-1 on HA-steel is detailed as a function of normal load (Figure 5.10). At 50 to 100 N, no depositions are observed in the centre of the sliding stroke while very thin polymer flakes are seen near the borders. It is obvious that particles are more easily squeezed within the sliding interface near the borders of the sliding stroke, where the direction of the sliding motion reverses. This island type of transfer with fine particles suggests that particles detach from the polyimide bulk and deposit without conglomeration in the interface. As demonstrated in Chapter 7, this behaviour strongly depends on the counterface properties. Also at 150 to 200 N, very few depositions are
1 mm

Chapter 5. Polyimides under atmospheric conditions 108 seen in the centre of the sliding stroke, but significantly larger ‘bullet-like’ particles deposit near the borders due to previously noted mechanical overload and brittle fracture. This is correlated to the debris morphology (Figure 5.4). In cases that transfer lacks or island transfer occurs, abrasive grooves on the HA-steel surface are observed with some fine wear debris particles accumulated at the slip ends.
50 N 0.3 m/s 50 N 0.6 m/s
50 N 0.9 m/s 50 N 1.2 m/s
Figure 5.11 Transfer evaluation on HA-steel after sliding with SP-1 at 50 N and various sliding velocities Polymer transfer for SP-1 on HA-steel is detailed as a function of sliding velocity (Figure 5.11). Coherent transfer lacks and only separate particles deposit near the roughness grooves. In contrast to ‘bullet-like’ particles at high-load, debris becomes smooth and is mechanically sheared along the sliding direction. This shearing morpho-logy is more pronounced at higher sliding velocities, but shear does not cause interaction between the debris to form a thin and continuous layer. The transferred particles at 50 N, 1.2 m/s are smaller compared to high-load sliding because the polyimide strength is not exceeded and brittle fracture does not occur. There is lower tendency for formation of abrasive grooves under high sliding velocity compared to high loads. The transfer film type under atmospheric conditions is different from the continuously thin layers observed in vacuum sliding [5.2], having its effect on sliding instabilities with relatively high friction and wear: the lack of transfer at 50 N, 0.3 m/s corresponds to
1 mm

Chapter 5. Polyimides under atmospheric conditions 109 high friction and the large island like particles cause high wear rates. Through the high strength and hardness of sintered polyimide, the latter particles can act as an abrasive third body. Small oriented particles evenly distributed over the sliding stroke, e.g. at 50 N, 0.9 m/s, are the most favourable for low friction and the same conclusion yields, e.g., after sliding on stainless steels. Physical background on the formation or absence of a transfer film is given in relation to adhesion on various counterface types (Chapter 7). The interaction between transfer particles and the counterface is illustrated on SEM images in Figure 5.12. Polyimide is not preferentially deposited into random roughness grooves, but it occurs over the entire sliding area. It shows that mechanical interlocking is not the single wear type but adhesive interaction with the counterface is important (Chapter 7). Separate polyimide particles do not interact with each other. It shows that thermal effects (Chapter 6) then do not govern and mechanical interaction prevails.
(a) (b)
Figure 5.12 SEM evaluation of transfer near some random roughness grooves on HA-steel after sliding with SP-1 at 100 N, 0.3 m/s
Transfer for SP-2 on HA-steel is evaluated in Figure 5.13. The graphite additives can form a thin lubricating film under sliding conditions where the pure sintered polyimide bulk is not able to do so, causing low friction and wear. At low sliding velocities, however, the graphite additives seem not efficient as the coefficient of friction and wear rate monotonously increase as a function of normal load. This is understood as the transfer films look rough and they are not easily sheared into thin and continuous layers. Lumpy transfer particles have irregular edges perpendicular to the sliding direction, causing deformation and abrasion to the polyimide surface. Mainly for combinations of low sliding velocities and high normal loads, the films are very rough and additionally influenced by mechanical overload and brittleness of the polyimide bulk material. The highest wear rates occur therefore at 200 N, 0.3 m/s. At high sliding velocities, the graphite is more beneficially oriented in small strokes parallel to the sliding direction causing smooth sliding. The film consists of a polyimide/graphite mixture that covers nearly the entire sliding area. Shear seems important to enhance the transfer film proper-ties. For combinations of high normal loads and high sliding velocities, a mixed transfer film homogeneously covers the sliding strokes and causes stable wear and friction A 3D-topographic scan in Figure 5.14 illustrates different transfer for pure SP-1 and gra-phite-filled SP-2. The graphite film is reasonably thick (8 µm) and more homogeneous
Abrasive groove formed during sliding

Chapter 5. Polyimides under atmospheric conditions 110
50 N 0.3 m/s
100 N 0.3 m/s 50 N 0.6 m/s
150 N 0.3 m/s 50 N 0.9 m/s
200 N 0.3 m/s 50 N 1.2 m/s
Figure 5.13 Transfer evaluation on HA-steel after sliding with SP-2 at various normal loads and
sliding velocities
1 mm
1 mm
Full
slid
ing
stro
ke
detail

Chapter 5. Polyimides under atmospheric conditions 111
Figure 5.14 Topographic scans of HA-steel with transfer after sliding at 50 N, 1.2 m/s, (a) pure polyimide SP-1, (b) graphite-filled polyimide SP-2 (arrows indicate sliding direction)
in contrast to the separate flake-like depositions for pure polyimide (2 to 4 µm). Further smoothening of the films will be achieved during high temperature sliding. Topogra-phical scans across the sliding stroke (Figure 5.15) better quantify the deposited polymer flakes (see *), being approximately 2 µm high in the centre of the sliding stroke to 8 µm near the borders of the sliding stroke. The abrasive grooves (see ↓) in the HA-steel surface formed during sliding are approximately 3 µm deep.
(a)
(b)
Figure 5.15 Normalised roughness profiles measured perpendicular to the sliding direction on HA-steel
after sliding at 50 N, 0.3 m/s with details of SP-1 depositions or abrasive grooves, (a) at the centre of the sliding stroke, (b) near the borders of the sliding stroke
0 1 2
3 4 5
Rou
ghne
ss h
eigh
t (µm
)
2 4 6 8 10 12 14 Sample length (mm)
6
0 1 2 3 4 5
Rou
ghne
ss h
eigh
t (µm
)
2 4 6 8 10 12 14 Sample length (mm)
6 7 8
9 10
* ** * * * * * * *↓ ↓ ↓ ↓
*
*
*
* *
**
↓↓ ↓↓
Ra = 0.14 µm Rt = 5.31 µm
Ra = 0.18 µm Rt = 9.87 µm
(a) (b)
Vertical scale 0 to 5 µm
Vertical scale 0 to 10 µm

Chapter 5. Polyimides under atmospheric conditions 112 5.3. Sliding of pure and filled thermoplastic polyimides
under atmospheric conditions Test results for thermoplastic polyimides, pure TP-1 and PTFE-filled TP-2, are obtained under identical conditions of sintered polyimides at 50, 100, 150, 200 N and 0.3, 0.6, 0.9, 1.2 m/s against HA-steel counterfaces. The atmosphere is controlled at 23°C, 60 % RH (Table 4.1). It is clear that thermal softening and plastification control sliding processes and allow for homogeneous transfer. As a result, the influence of both normal loads and sliding velocities is important. Thermoplastic fillers reduce friction, wear and overload. 5.3.1. Static creep and deformation The compressive deformation and creep of TP-1 cylinders measured during loading the Hertz line contact is shown in Figure 5.16. The deformation of a TP-1 sample is lower compared to a SP-1 sample during immediate loading, indicating higher stiffness of thermoplastic polyimides and good loading capacity according to properties in Table 3.3. (a) (b)
Figure 5.16 Experimental determination of static loading behaviour for TP-1 in Hertz line contact,
(a) compressive load / displacement curve for line contact, (b) creep for line contact
0
2
4
6
8
10
12
14
16
18
20
0 2 4 6 8 10 12 14 16 18 20 22 24
Time (h)
Vert
ical
dis
plac
emen
t (µm
)
50 N
100 N
150 N
200 N
0
20
40
60
80
100
120
140
160
180
200
0 50 100 150 200 250
Vertical displacement (µm)
Nor
mal
load
FN (k
N)
SP-1 Hertz
TP-1 Hertz

Chapter 5. Polyimides under atmospheric conditions 113
0
0.1
0.2
0.3
0.4
0.5
0.6
0.7
0 2000 4000 6000 8000 10000 12000 14000 16000
Sliding distance (m)
Coe
ffic
ient
of f
rictio
n
50 N
150 N
100 N
200 N
0
0.1
0.2
0.3
0.4
0.5
0.6
0.7
0 2000 4000 6000 8000 10000 12000 14000 16000
Sliding distance (m)
Coe
ffic
ient
of f
rictio
n
50 N
150 N
100 N
200 N
The subsequent creep during 24 hours loading is larger for TP-1 than for SP-1, indica-ting that thermoplastics have more important visco-elastic flow. There is a statistical variation of ± 2 µm on the final creep value. The recovery measured immediately after loading is smaller for thermoplastics, while the 24 hours recovery under stress free conditions is higher compared to sintered polyimides. A transition towards higher creep is noticed at 150 to 200 N, rather than at 100 to 150 N as for sintered polyimides. 5.3.2. Friction results under standard atmosphere Some measurements for coefficients of friction of pure TP-1 and PTFE-filled TP-2 are illustrated in Figure 5.17, while the steady-state values are summarised in Tables 5.7 and 5.8 as a function of normal loads and sliding velocities. The effects of both sliding parameters are discussed below and compared to the behaviour of sintered polyimides. The evolution of friction with sliding distance for TP-1 is more stable, mainly during the running-in period, in contrast to semi-thermosetting SP-1. Sliding instabilities attributed to a change from line contact into more conformal contact are minimised by plastifica-tion or softening and immediate formation of a transfer film on the counterface, as visu-ally noticed for TP-1. Also for this reason, the coefficient of friction continuously decreases as a function of sliding distance when the transfer film gains progressively better lubricating properties by softening (thermal effects have stronger influence on the thermoplastic polyimide compared to sintered polyimides as further detailed). Overload happens at 200 N as the loading capacity of the transfer film fails and friction increases in respect to a 150 N test. This agrees with the transition in creep behaviour noted in Figure 5.16b. Additives of PTFE in thermoplastic polyimide TP-2 are more efficient in reducing friction than graphite additives do for sintered polyimide SP-2. The soft and thermoplastic characteristics of PTFE relatively to graphite can be responsible for this, in combination with differences in semi-thermosetting versus thermoplastic matrix pro-perties. At low normal loads, however, the PTFE fillers result in unstable friction: there is continuous formation and removal of particles from the interface because the amount of generated debris and wear rates are too small to form a stable and homogeneous layer. At higher loads, friction for TP-2 becomes smooth for all contact pressures.
(a) (b)
Figure 5.17 Evolution of coefficients of friction as a function of sliding distance for (a) TP-1 and (b) TP-2, at 0.3 m/s, 50 to 200 N against HA-steel

Chapter 5. Polyimides under atmospheric conditions 114 The coefficients of friction for thermoplastic polyimide TP-1 clearly depend on both the normal load and sliding velocity, contrasting to sintered polyimide SP-1. Each of them causes a decrease in friction if no overload occurs (i.e. below 200 N, Table 5.7). Under mild sliding conditions, thermoplastic TP-1 has lower coefficients of friction compared to semi-thermosetting SP-1. The strong dependency on normal loads is expressed by the power law of friction µ = K·FN
-n with an exponent n = 0.22 (R2 = 0.97) for TP-1 and an exponent n = 0.14 (R2 = 0.93) for SP-1. The decrease in coefficient of friction with sliding velocity is more pronounced for thermoplastics than for semi-thermosetting polyimides due to thermal effects and visco-elastic properties: TP-1 has higher polymer chain mobility and better ability for alignment of the molecular chains. For the highest sliding velocities, however, overload occurs more rapidly for TP-1 (Table 5.7) compared to SP-1, as it is stronger determined by the pv-value and thermal energy input than it was for sintered polyimide (see also paragraph 5.4). The coefficients of friction and overload situations for TP-2 are favourably reduced in respect to pure TP-1. Thermoplastic PTFE is efficient for smooth transfer film formation with consequently low friction and less frictional heating. Overload only happens for the most severe sliding conditions, in parallel to the loading capacity of the thermoplastic bulk polymer. Friction for TP-2 is lower than for SP-2 at each couple of test parameters, reflecting good compatibility between the thermoplastic filler and matrix. Table 5.7. Coefficients of friction for pure thermoplastic polyimide TP-1
50 N 100 N 150 N 200 N
0.3 m/s 0.48 0.40 0.38 0.40*
0.6 m/s 0.38 0.42 0.40* 0.43*
0.9 m/s 0.33 0.46* - -
1.2 m/s 0.30* - - - * short test (< 15000 m sliding distance) due to overload, - not tested due to overload Table 5.8. Coefficients of friction for PTFE-filled thermoplastic polyimide TP-2
50 N 100 N 150 N 200 N
0.3 m/s 0.30 0.22 0.21 0.20
0.6 m/s 0.24 0.22 0.19 0.19
0.9 m/s 0.20 0.19 0.16 0.15*
1.2 m/s 0.18 0.14 0.12* - * short test (< 15000 m sliding distance) due to overload, - not tested due to overload Debris morphology for thermoplastic polyimide TP-1 (Figure 5.18) gradually changes from finely dispersed separate particles at 50 N towards conglomerated debris at 150 N and largely worn polyimide flakes at 200 N. Mixed polyimide/PTFE debris for TP-2 only consists of finely dispersed particles. The rather dark-yellow colour of 150 N debris compared to 50 N debris indicates thermal and/or chemical interactions during sliding, while conglomeration did not happen for SP-1. Further analysis by thermo-analytical methods will be made (Chapter 6). The smooth particles at 200 N show plastic deforma-tion and shear in the sliding interface. Plastification and thermal effects cause overload of thermoplastic polyimides, rather than brittleness governing for sintered polyimides.

Chapter 5. Polyimides under atmospheric conditions 115
(a) (b) (c)
Figure 5.18 Wear debris morphology for TP-1 at 0.3 m/s, (a) 50 N, (b) 150 N, (c) 200 N 5.3.3. Wear and deformation under standard atmosphere On-line vertical displacement measurements for thermoplastic polyimide TP-1 and TP-2 are shown in Figure 5.19. The wear rates for thermoplastic TP-1 and TP-2 polyimides from weight and dimensional measurements are given in Tables 5.9 and 5.10. Deforma-tion will become more important for thermoplastic than sintered polyimides, while PTFE is more favourable than graphite to lower wear rates under mild sliding conditions. A clear difference in running-in sliding for sintered and thermoplastic polyimides is noticed. Agreeing to visual observation and stabilisation of running-in friction, a transfer film for thermoplastic polyimide develops already during the first sliding sequences, in contrast to sintered polyimide. The wear curve for thermoplastic polyimides has there-fore a low slope at running-in changing towards steady-state wear rates after some sliding distance. This transition in slope was also observed for other thermoplastics such as polyamide (Chapter 8), however, only at 50 N as more important deformation manifested on the initial Hertz contact at 100 to 200 N. For polyimides, the running-in period with low wear disappears and changes into an immediate rise in vertical displace-ment at 200 N, because of important deformation and overload. Thermoplastic PTFE lowers the final wear depth more significantly than graphite fillers cause to sintered polyimide, but complete stabilisation as a function of sliding distance as seen for graphite does not happen. Local irregularities in the 50 N vertical displacement curve happen over ± 5 µm according to the build-up and removal of transferred flakes also seen on the variation in friction (Figure 5.17b). Also the 200 N overload during running-in is visible for TP-2, in parallel to observations for TP-1. Dimensional and weight measurements show surprisingly better agreement at high normal loads and high sliding velocities compared to mild loading conditions. It indicates that, rather than load, mainly the loading time is important for deformation of thermoplastic samples, as it is the longest at 0.3 m/s tests and the shortest for 1.2 m/s tests or at overload conditions. The evolution of wear rates for TP-1 with normal load and sliding velocity agrees with general trends for unfilled thermoplastics, increasing with both normal load and sliding velocity until a critical value is attained that depends on the sliding temperature (see paragraph 5.4). The wear rates of PTFE-filled TP-2 are the lowest of all polyimide types considered. However, the interaction between fa-vourable transfer of PTFE and loading capacity becomes more complicated and the wear rate at 100 N, 0.3 m/s is significantly higher compared to 150 N, 0.3 m/s.
1 mm

Chapter 5. Polyimides under atmospheric conditions 116 (a) (b)
Figure 5.19 On-line vertical displacement as a function of sliding distance for (a) TP-1 and (b) TP-2 at measured at 0.3 m/s and 50 to 200 N normal loads against HA-steel
Table 5.9. Wear rates for pure thermoplastic polyimide TP-1 (10-4 mm3/m) from weight and (dimensional) measurements
50 N 100 N 150 N 200 N
0.3 m/s 2.4 (2.7) 25.3 (26.2) 27.8 (30.3) 18.3 (18.6)*
0.6 m/s 12.4 (13.4) 20.2 (20.5) 165 (164)* 666 (757)*
0.9 m/s 15.3 (15.6) 201 (200)* - -
1.2 m/s 144 (147)* - - - * short test (< 15000 m sliding distance) due to overload, - not tested due to overload Table 5.10. Wear rates for PTFE-filled thermoplastic polyimide TP-2 (10-4 mm3/m) from weight and (dimensional) measurements
50 N 100 N 150 N 200 N
0.3 m/s 0.46 (0.50) 1.72 (1.91) 0.65 (0.81) 1.01 (1.10)
0.6 m/s 0.46 (0.50) 2.21 (2.87) 3.92 (5.42) 7.61 (8.50)
0.9 m/s 0.46 (0.50) 4.53 (4.43) 7.81 (7.95) 20.3 (20.5)*
1.2 m/s 1.50 (1.65) 7.63 (5.45) 10.3 (10.1)* - * short test (< 15000 m sliding distance) due to overload, - not tested due to overload Post-mortem and on-line wear measurements for TP-1 are compared in Table 5.11. The on-line vertical displacement ∆hv is corrected for thermal expansion ∆ht and creep ∆hc in analogy to what was done for SP-1 in Table 5.5. The difference between on-line and post-mortem measurements is larger for TP compared to SP, because thermoplastics are more prone to visco-elastic deformation. Also the recovered deformation during one week in unloaded conditions is the highest for thermoplastic polyimide TP-1. The statistical variation in recovery is about ± 5 %. The wear rates calculated from vertical displacement ∆hv indicate a low running-in value (in contrast to sintered SP-1), as such that the post-mortem diameter reduction nearly totally corresponds to the on-line regime wear rates. However, the transition towards overload at 200 N causes a different trend in running-in and steady-state wear rates.
0
200
400
600
800
1000
1200
1400
1600
0 2000 4000 6000 8000 10000 12000 14000 16000
Sliding distance (m)
Vert
ical
dis
plac
emen
t (µm
)
50 N
100 N
150 N
200 N
0
50
100
150
200
250
300
350
400
0 2000 4000 6000 8000 10000 12000 14000 16000
Sliding distance (m)
Vert
ical
dis
plac
emen
t (µm
)
50 N
100 N
150 N 200 N

Chapter 5. Polyimides under atmospheric conditions 117 Table 5.11. Evaluation of wear and deformation for TP-1 sliding at 0.3 m/s against HA-steel
0.3 m/s 50 N 100 N 150 N 200 N
Post-mortem wear depth ∆hm
On-line wear depth ∆hv
T*
Thermal expansion ∆ht
Creep ∆hc
(µm)
(µm)
(°C)
(µm)
(µm)
190
292
75
11
8
950
1271
85
13
10
1050
1465
110
18
12
750
1280
149
27
19
Corrected on-line wear depth (µm) 295 1274 1471 1288
Recovered visco-elastic deformation one week after test
(µm)
(%)
105
36
324
25
421
28
538
41
On-line wear rates
Running-in**
Steady-state
Average
(10-4 mm3/m)
(10-4 mm3/m)
(10-4 mm3/m)
2.3
2.6
2.5
6.3
25.8
16.1
11.4
29.8
20.6
47.3
10.2
28.7
** running-in over approximately first 1500 m, T* maximum polymer surface temperature (Chapter 4)
5.3.4. Counterface and transfer evaluation Optical microscopy of the transfer films for TP-1 and TP-2 is detailed in Figure 5.20 for overload conditions, revealing smooth flake-like depositions that are thermally softened and plastified. They resemble the morphology of wear debris particles from Figure 5.18. The wear mechanisms at overload therefore consist in easy removal of the transfer film particles from the sliding interface. The transfer films shown in Figures 5.21 and 5.22 for normal working conditions cover smoothly the entire sliding area: films are homogeneous and have only some separate polyimide flakes for the mildest sliding conditions, which smoothen at high loads and/or sliding velocities. These coherent films correspond to stable sliding. The TP-2 film looks thinner and becomes more homogeneous as a function of normal loads and/or sliding velocities. There is some tendency for thin film formation at higher sliding velocities and somewhat thicker films at higher normal loads through plastification.
(a) (b)
Figure 5.20 Transfer on HA-steel at overload for (a) TP-1, 100 N, 0.9 m/s, (b) TP-2, 200 N, 0.9 m/s
1 mm

Chapter 5. Polyimides under atmospheric conditions 118
50 N 0.3 m/s
100 N 0.3 m/s 50 N 0.6 m/s
150 N 0.3 m/s 50 N 0.9 m/s
200 N 0.3 m/s 50 N 1.2 m/s
Figure 5.21 Transfer evaluation on HA-steel after sliding with TP-1 at various normal loads and
sliding velocities
Full
slid
ing
stro
ke
detail
1 mm
1 mm

Chapter 5. Polyimides under atmospheric conditions 119
50 N 0.3 m/s
100 N 0.3 m/s 50 N 0.6 m/s
150 N 0.3 m/s 50 N 0.9 m/s
200 N 0.3 m/s 50 N 1.2 m/s
Figure 5.22 Transfer evaluation on HA-steel after sliding with TP-2 at various normal loads and
sliding velocities
Full
slid
ing
stro
ke
detail
1 mm
1 mm

Chapter 5. Polyimides under atmospheric conditions 120
5.4. Discussions on the influence of test conditions The influences of normal loads and sliding velocities on friction and wear properties of polyimides were presented in previous paragraphs. However, their synergistic effect results in an increase in sliding temperature that possibly controls the sliding mecha-nisms. The combined effect of normal load (more exactly, the contact pressure p) and sliding velocity v is expressed as a pv-value allowing to determine the favourable working range and overload conditions. A second parameter influencing the tribological properties of polyimides and additives is the relative humidity. All of the small-scale tests done in this work are performed at standard atmosphere, i.e. 23°C and 60 % relative humidity (RH). Only in this paragraph comparative tests at lower relative humidity, i.e. 23°C and 40 % RH, are run as it was noted in the introduction to this Chapter 5 that a change in transfer behaviour occurred when changing vacuum conditions into 40 % relative humidity. 5.4.1. Influence of pv-factor and spontaneous frictional heating Small-scale test results for sintered polyimide SP-1, SP-2 and thermoplastic polyimide TP-1, TP-2 are plotted against the regime pv-value in Figures 5.23 to 5.26. The contact pressure is geometrically calculated from the wear depth ∆hm at the end of the test. The trend lines for coefficients of friction µ, wear rates w and maximum polymer surface temperature T* indicate general tendencies for tribological properties with eventual transitions. However, it also demonstrates that the pv-value is not a unique parameter! An increase in sliding velocity is not ever equivalent to an increase in normal load, each with a specific influence on polymer chain orientation or plastification (Chapter 1), causing some scatter in the graphs or even very different trends. Deviations from the general trend lines mainly happen at low loads (50 N) for SP-1, TP-1 and TP-2, while manifesting at low velocities (0.3 m/s) for SP-2. It is clear that normal loads relate to the loading capacity and brittleness of polyimides, while sliding velocity is more important for shear properties of the graphite transfer film of SP-2. Pure sintered polyimides SP-1 (Figure 5.23) have an initial regime of decreasing friction due to normal load - sliding velocity effects at 0.5 MPa.m/s < pv < 1.5 MPa.m/s. These sliding conditions are mainly mechanically controlled by shear. The coefficient of friction stabilises at 1.5 MPa.m/s < pv < 3 MPa.m/s independently of any further increa-se in sliding velocity or normal load, as the polymer act as a thermosetting and is not fur-ther influenced by chain orientation. Possibilities for polymer chain orientation induced by friction are chemically controlled (Chapter 6). The transition into stable friction happens at T* = 175°C. Overload in friction at severe sliding conditions determines a limiting pv-value = 3 MPa.m/s with temperatures T* > 260°C. The wear rates are mainly determined by the applied normal load, because of brittleness. Graphite-filled sintered polyimides SP-2 (Figure 5.24) have no overload in friction or wear, in present pv-range. Lewis [5.23] noted a pv-limit of 12 MPa.m/s for SP-2 in air from pin-on-disc tests. However, a transition in friction with change in slope and maxi-mum value is presently noted at 3 MPa.m/s, corresponding to the pv-limit causing over-load for pure SP-1. This transition coincides with a change in transfer morphology that is graphite-based at low pv, while smooth and mixed graphite/polyimide-based at high pv.

Chapter 5. Polyimides under atmospheric conditions 121
0
0.1
0.2
0.3
0.4
0.5
0.6
0 1 2 3 4
Regime pv (MPa.m/s)
Coe
ffici
ent o
f fric
tion
0
50
100
150
200
250
300
350
400
Wea
r rat
e (1
0-4 m
m3 /m
)
Tem
pera
ture
T* (
°C)
Low loads (50 N)
50 N
100 N
150 N
200 N
High loads (100 to 200 N)
Low loads (50 N) R2 = 0.94
Figure 5.23 Influence of regime pv-value on friction µ (), wear rates w (♦) and maximum polymer surface temperature T* () for SP-1 sliding at 23°C, 60 % standard atmosphere against HA-steel
Figure 5.24 Influence of regime pv-value on friction µ (), wear rates w (♦) and maximum polymer surface temperature T* () for SP-2 sliding at 23°C, 60 % standard atmosphere against HA-steel
0
0.1
0.2
0.3
0.4
0.5
0.6
0 1 2 3 4 5 6
Regime pv (MPa.m/s)
Coe
ffici
ent o
f fric
tion
-10
10
30
50
70
90
110
130
150
Wea
r rat
e (1
0-4 m
m3 /m
)
Tem
pera
ture
T* (
°C)
Low velocities (0.3 m/s)
Transition point

Chapter 5. Polyimides under atmospheric conditions 122
0
0.1
0.2
0.3
0.4
0.5
0.6
0 0.5 1 1.5 2
Regime pv (MPa.m/s)
Coe
ffici
ent o
f fric
tion
0
50
100
150
200
250
300
350
400
Wea
r rat
e (1
0-4 m
m3 /m
)
Tem
pera
ture
T* (
°C)
Low loads (50 N)
0
0.1
0.2
0.3
0.4
0.5
0.6
0 0.5 1 1.5 2 2.5 3 3.5
Regime pv (MPa.m/s)
Coe
ffici
ent o
f fric
tion
-10
10
30
50
70
90
110
130
150
Wea
r rat
e (1
0-4 m
m3 /m
) T
empe
ratu
re T
* (°C
)
Figure 5.25 Influence of regime pv-value on friction µ (), wear rates w (♦) and maximum polymer surface temperature T* () for TP-1 sliding at 23°C, 60 % standard atmosphere against HA-steel
Figure 5.26 Influence of regime pv-value on friction µ (), wear rates w (♦) and maximum polymer surface temperature T* () for TP-2 sliding at 23°C, 60 % standard atmosphere against HA-steel
Low loads (50 N)
R2 = 0.97
R2 = 0.90

Chapter 5. Polyimides under atmospheric conditions 123 The transition in friction for SP-2 coincides with stabilisation in maximum polymer surface temperature T* = 115°C. Comparing the transition into stable friction at 1.5 MPa.m/s for SP-1 and at 3 MPa.m/s for SP-2, shows a maximum polymer surface temperature T* = 175°C for SP-1 and T* = 115°C for SP-2. The temperature ratio 175°C / 115°C = 1.52 agrees approximately to the ratio of polyimide heat conductivities 0.46 (W/mK) / 0.30 (W/mK) = 1.53. Therefore, not only the thermal characteristics of the steel counterface are important, but also the polymer composition influences frictional heating at steady-state. This effect is obviously explained by heat conduction through polymer transfer particles in the interface, having lower thermal conductivity. For pure polyimides, polyimide films only develop at high loads and high sliding velocities. The stabilisation in friction for SP-1 at pv = 1.5 MPa.m/s corresponds to the formation of a platelet-transfer film (Figure 5.10), while no film developed at low pv-levels. The stabilisation in friction for SP-2 at pv = 3 MPa.m/s corresponds to the forma- tion of a mixed graphite-polyimide film (Figure 5.13), mainly controlled by mechanical shear. The graphite additives do not only lower the coefficient of friction but they also improve the thermal conductivity of the polymer depositions: these two effects lower the maximum polymer surface temperature T* and improve the sliding performance of a polymer component. According to McEttles et al. [5.24] the transition towards stable friction for thermoplastics was denoted as ‘thermally controlled sliding’. For semi-thermosetting polyimides, this sliding regime with constant friction at high load / high sliding velocity is mechanically controlled by shear, while wear rates are mainly influenced by normal load and brittleness. Pure thermoplastic polyimides TP-1 (Figure 5.25) have a pv-limit of 1.15 MPa.m/s for present test configuration, corresponding to a maximum polymer surface temperature T* = 175°C. At low pv-values, friction continuously decreases and wear rates slightly increase as typically noted for thermoplastic polymers with progressive formation of a polymer transfer film. Low normal loads, however, cause a different tendency with lower wear rates and lower temperatures T*. Overload in both friction and wear is mainly thermally controlled by softening and plastification effects. The maximum polymer surface temperature at overload T* = 175°C is in the same range as where sintered polyimides perform stable sliding. It agrees to a change from smooth into lumpy transfer for TP-1 (Figure 5.20). Thermoplastics soften and do not support the implied mechanical loading at high temperatures, whereas the structure of sintered polyimides is not sensitive to softening and overload is determined by mechanical loading. Teflon® (PTFE)-filled thermoplastic polyimides TP-2 (Figure 5.26) show transitions in friction and wear at a pv-value of 2.2 MPa.m/s (T* = 120°C) and 3 MPa.m/s (T* = 140°C). The region in between has nearly constant or slightly decreasing friction while the wear rates smoothly increase. The plateau in stable friction and slightly increasing wear is controlled by mixed PTFE-polyimide transfer. In parallel to paragraph 6.4.2 (Chapter 6), the transition at 120°C corresponds to thermally controlled sliding of PTFE. The real overload and loose of strength happen at pv = 3 MPa.m/s. This pv-limit agrees to overload for SP-1. At low normal loads, a different behaviour is noted with somewhat higher friction and complete stabilisation in wear rates. It is concluded that the pv-diagrams for polyimides are efficient for indicating different sliding regimes and transitions in friction and/or wear behaviour. However, different actions of either increase in normal load or increase in sliding velocity should be considered.

Chapter 5. Polyimides under atmospheric conditions 124
0.30
0.35
0.40
0.45
0.50
0.55
0 50 100 150 200 250
Normal load FN (N)
Coe
ffici
ent o
f fric
tion
(iii)
(iv)
(i)
(ii)
0
0.1
0.2
0.3
0.4
0.5
0.6
0.7
0.8
0 2000 4000 6000 8000 10000 12000 14000 16000
Sliding distance (m)
Coe
ffici
ent o
f fric
tion
(i) (ii)
(iii)
(iv)
Normal load FN (N) Sliding distance (m)
Coe
ffici
ent o
f fric
tion
Coe
ffici
ent o
f fric
tion
0
100
200
300
400
500
600
0 2000 4000 6000 8000 10000 12000 14000 16000
Sliding distance (m)
Vert
ical
dis
plac
emen
t (µm
)
(iii)
(iv)
(i) (ii)
Sliding distance (m)
Vert
ical
dis
plac
emen
t (µm
)
0
10
20
30
40
50
60
70
0 50 100 150 200 250
Normal load FN (N)
Wea
r rat
e (1
0-4 m
m3 /m
)
(iii)
(iv)
(i)
(ii)
Normal load FN (N)
Wea
r rat
e (1
0-4 m
m3 /m
)
5.4.2. Influence of relative humidity The atmosphere surrounding the sliding contact was conditioned at 23°C, 40 % RH to compare friction and wear results for sintered polyimides SP-1 and SP-2 with a standard atmosphere of 23°C, 60 % RH. The sliding velocity was fixed at 0.3 m/s and normal loads are 50 to 100 N. Low sliding velocities are chosen because variations in sliding and transfer are expected to be most pronounced at mild sliding conditions. Test results will be discussed in relation to mechanisms known in literature for polyimide and gra-phite. The interaction graphite-polyimide-humidity has however never been described. The environmental atmosphere influences importantly the evolutions in friction and vertical displacement with sliding distance (Figure 5.27). Friction for SP-1 at high humidity (60 % RH) has a maximum at running-in and stabilises with ongoing sliding distance, while at lower humidity (40 % RH) the friction at running-in is more stable and progressively decreases at longer sliding time. For SP-2, a transition in friction is noted after 8000 m at 60 % RH and after 2000 m at 40 % RH. Instabilities in SP-2 friction at 40 % RH indicate the interaction with interfacial transfer particles. (a) (b) (c) (d)
Figure 5.27 Test results comparing sliding behaviour of SP-1 (i, ii) and of SP-2 (iii, iv) at 0.3 m/s against HA-steel under relative humidity of 60 % RH (i, iii) and 40 % RH (ii, iv), (a) friction as a function of sliding distance at 50 N, (b) friction as a function of normal load,
(c) on-line wear depth as a function of sliding distance at 50 N, (d) wear rate as a function of normal load

Chapter 5. Polyimides under atmospheric conditions 125 The on-line wear depths for SP-1 at 50 N are not significantly influenced by the test environment, only some scatter in the wear depth curve at 40% RH is due to periodical formation and removal of polymer particles from the interface. Lower wear for SP-2 at 40 % RH compared to 60 % RH is more clearly noted. Friction and wear observations for both SP-1 and SP-2 indicate that a transfer film develops easier at 40 % RH tests than for 60 % RH tests. Micrographs of transfer on HA-steel counterfaces (Figure 5.28) show that transfer has favourably developed at 50 N, 0.3 m/s as a combined smooth-lumpy film for SP-1 at 40 % RH (while no transfer at 60 % RH, Figure 5.10) and a thin viscous polyimide/graphite film for SP-2 (while solely graphite-based at 60 % RH, Figure 5.13). (a) (b)
Figure 5.28 Transfer evaluation on HA-steel after sliding under 40 % RH atmosphere at 50 N, 0.3 m/s (a) SP-1, (b) SP-2
For pure SP-1 at 40 % RH, coefficients of friction and wear rates are listed in Table 5.12 for various normal loads and sliding velocities. Lower friction is noted at low relative humidity (40 % RH) compared to moist air (60 % RH, Table 5.1) for each sliding velocity, corresponding to the formation of a transfer film that is more easily sheared and oriented at higher sliding velocity. Also as a function of normal loads, the friction is lower in dry compared to moist air, but indicates overload at 150 to 200 N. The wear rates at 40 % RH are higher compared to 60 % RH for all test conditions. From literature [5.3], the effects of humidity on polyimide are related to absorption of water molecules at the sliding surface and formation of hydrogen bonds between the carbonyl groups in adjacent molecular chains, constraining the chain mobility and preventing orientation. At high humidity, therefore, transfer lacks and friction increases. Through these cross-links, however, the surface structure also gains mechanical strength with lower wear rates and lower tendency for overload at high humidity. It is concluded for pure sintered polyimide that this surface strengthening effect dominates at high humidity. Slight weakening of the bulk polymer through water absorption is inferior [5.25] and hydrolysis reduces brittleness revealed by smoother surfaces. At low humi-dity, transfer establishes and another reason for high wear rates is found in the abrasive action of the smooth-lumpy transfer film. Overload conditions at 150 to 200 N at low humidity cause unstable friction. An increase in wear rates for sintered polyimides at low humidity is in contrast to literature data on thermoplastic polyimides [5.3], reporting smooth transfer and progressively lower wear as the moisture content in air decreases.
1 mm
graphite
PI+graphite

Chapter 5. Polyimides under atmospheric conditions 126 Table 5.12. Coefficients of friction µ and volumetric wear rates w (10-4 mm3/m) determined from weight measurements for pure sintered polyimide SP-1 at 40 % relative humidity
50 N 100 N 150 N 200 N
µ w
µ w
µ w
µ w
0.3 m/s 0.39 8.0 0.45 20.3 0.53 64.7* 0.49 58.6*
0.6 m/s 0.37 17.2
0.9 m/s 0.33 32.3
1.2 m/s 0.35 19.6
Not included in tests
* short test (< 15000 m sliding distance) due to overload The transfer film morphology for pure SP-1 is clearly affected by relative humidity. The lack of transfer at 60 % RH and easy transfer at 40 % RH agrees with findings for thermoplastic polyimides by Jia et al. [5.26], who tested explicitly in dry and water environments. The worn polyimide surface under dry sliding was characterised by severe plastic deformation and micro cracking, while a large amount of transferred debris particles was observed on the counterpart. The worn polyimide surfaces after sliding at high humidity were smoother and no signs of transfer were noted. In other words, water inhibited the transfer of polyimide to the metal counterface. On the contrary, Kang et al. [5.27] observed an increase in wear rates of polyimide coatings under fretting conditions at high humidity compared to dry humidity, however more likely attributed to the formation of abrasive iron oxide debris. Earlier investigations by Fusaro [5.2] on thermoplastic polyimides reveals a friction coefficient µ = 0.60 during a 50 % RH test, dropping to µ = 0.10 in a 0.13 Pa vacuum or µ = 0.05 in a 0.00013 Pa vacuum while wear rates progressively lowered under more severe vacuum conditions. These differen-ces were also ascribed to water vapour concentration. Table 5.13. Coefficients of friction µ and volumetric wear rates w (10-4 mm3/m) determined from weight measurements for pure sintered polyimide SP-2 at 40 % relative humidity
50 N 100 N 150 N 200 N
µ w
µ w
µ w
µ w
0.3 m/s 0.34 0.40 0.37 1.68 0.53 4.30 0.43 6.15
0.6 m/s 0.31 1.62
0.9 m/s 0.41 8.26
1.2 m/s 0.29 7.51
Not included in tests
For graphite-filled SP-2 at 40 % RH, coefficients of friction and wear rates are given in Table 5.13 for different normal loads and sliding velocities. Contrasting to pure SP-1, the SP-2 presents both lower friction coefficients and lower wear rates at low relative humidity (40 % RH) compared to high relative humidity (60 % RH, Table 5.3) for all normal loads and sliding velocities.

Chapter 5. Polyimides under atmospheric conditions 127 From literature, the lubricating action of graphite depends strongly on the test conditions and interaction with the test environment. Despite its lamellar crystalline structure, it is generally accepted that graphite has no intrinsic lubricating properties. Fillers successfully used in one typical sliding condition may not perform equally in another. Since the work of Savage [5.28], it is known that the shear resistance along the graphitic basal planes becomes low only in presence of moisture or other vapours suitable to adsorb on the graphite surface. In contrast, under dry conditions the shear resistance is high and the associated increase in friction coefficient is often ascribed to the presence of dangling bonds with high chemical reactivity, leading to an increase in adhesive surface interaction [5.29]. Graphite does therefore not function well under vacuum conditions. Low friction may result from the complete desactivation of dangling bonds, e.g. through chemical reaction with available molecules from the environment. In ambient atmosphere, those bonds are rapidly desactivated by chemisorption of water and result in low friction. Desactivation of dangling bonds may also be created from reaction with wear debris. Hence, the mechanism by which water is influencing the shear resistance is still not fully clear. Referring to Lancaster [5.30], low friction for graphitic materials prevails as long as the fraction of the graphitic surface area covered by the adsorbents remains larger than a critical value. Possible transitions from low to high friction often occurs abruptly and have been associated to vapour desorption. However, referring to Gardos [5.31] the adsorbed vapours do not necessarily play the role of boundary lubricants, but rather modify the electronic orbitals within the graphite and thus the shear resistance. The general believe of low friction for graphite at high humidity atmosphere does not agree with present test results on graphite-filled polyimide SP-2, performing low friction at 40 % RH and high friction at 60 % RH. So far, very few papers are found in literature focussing on sliding applications of sintered polyimide filled with graphite flakes. Most polyimide composites studied include graphite fibre reinforcements and/or PTFE and/or MoS2 fillers [5.32]. Only Xian et al. [5.33] investigated the effect of percentage graphite flakes and the effect of temperature for polyetherimide. For pure graphite, higher friction at high humidity was recently observed in certain sliding conditions of low sliding velocities by Brendlé et al. [5.34, 5.35], modelling the tribo-reactions of moisture at the sliding surface of graphite as a triboreactor. He concluded that the real amount of water entering and consumed in the contact depends not only on the relative humidity but also on the sliding temperature and sliding velocity, responsible for the initiation of chain reactions by, e.g. particle detachment. A hypothesis is drawn from previous literature mechanisms in relation to present test results. For graphite-filled sintered polyimides the fraction of graphite is only 15 wt% and it can be estimated that the polyimide bulk properties are most important. At low humidity, the improved transfer of polyimide is beneficial for the formation of a mixed graphite-polyimide transfer film with good sliding properties. At low humidity, also the theoretical presence of dangling bonds on graphitic surfaces makes them chemically reactive and may also stimulate interaction with polyimide debris for more homogeneous transfer.

Chapter 5. Polyimides under atmospheric conditions 128 5.5. Conclusions The influence of 50 to 200 N normal loads, 0.3 to 1.2 m/s sliding velocities and 40 or 60 % RH on the friction and wear of different polyimide compositions was investigated and microscopically compared to the transfer films and shape of wear debris particles. Sliding temperatures result from free frictional heating and are calculated. Sintered polyimide behaves as a semi-thermosetting: friction and wear under atmos-pheric conditions are mainly mechanically controlled.
• For pure sintered polyimide, coefficients of friction are relatively high (0.51 to 0.38) and mainly depend on normal loads. At mild load conditions, friction decreases linearly but it is less dependent on normal load than expected from power-law models known for thermoplastics. At high load conditions, friction increases: a transition towards high friction happens at 100 to 150 N related to mechanical overload and brittleness. This critical load manifests during static deformation tests, sliding tests, recovery tests after sliding and debris or transfer morphology. As a function of high sliding velocities, friction stabilises independently of any fur-ther increase in sliding velocity. Thermal softening does not happen while mechani-cal shear and visco-elastic properties control sliding mechanisms. A regime of decreasing friction is limited to pv < 1.5 MPa.m/s (T* < 175°C) due to mechanical normal load - sliding velocity effects. The coefficient of friction stabilises for 1.5 MPa.m/s < pv < 3 MPa.m/s (175°C < T* < 260°C) due to chemical effects (Chapter 6). Wear rates are mainly determined by normal load and are independent of sliding velocity: adhesive/abrasive wear happens at 50 to 100 N while mechanical overload and brittleness govern at 150 to 200 N. No transfer happens under mild sliding conditions, while platelet-like transfer of separate debris particles happens own to brittleness at high loads/high sliding velocities. Most favourable transfer for low friction consists of small oriented particles evenly distributed over the sliding stroke at low loads/high sliding velocities. At low humidity (40 % RH), friction is low and wear rates are high, while a smooth-lumpy transfer film develops easily.
• For graphite-filled sintered polyimide, coefficients of friction are low (0.45 to 0.12) and depend mainly on sliding velocity. Higher sliding velocities cause a decrease in friction coefficients in parallel to homogenisation of the transfer films. For the lowest sliding velocities, however, graphite is not efficient and there is noticed an increase in friction as a function of normal loads: the transfer films look rough and are mainly graphite-based. The noted relation with sliding velocity agrees with shear mechanisms of layered graphite structure. Graphite additives are most favourable at high sliding velocities/high normal loads strongly reducing coefficients of friction and preventing mechanical overload or brittle fracture confirmed by debris morpho-logy. The shear forces on graphite-filled polyimide are lower compared to pure polyimide and it is assumed that mainly shear action cause failure at weak sintered grain boundaries. Stabilisation in friction coefficients happens for pv > 3 MPa.m/s (corresponding to stabilisation of T* = 115°C) with formation of a mixed graphite-polyimide transfer film, mainly controlled by mechanical shear. The wear rates unfavourably increase at low sliding velocities, but completely stabilise at mild to high sliding velocities and mild to high normal loads. At low humidity (40 % RH), lower friction and lower wear is measured due to a thin polyimide/graphite transfer film. Reaction of graphite dangling bonds with wear debris is likely at low humidity.

Chapter 5. Polyimides under atmospheric conditions 129 For thermoplastic polyimides, thermal softening and plastification control sliding processes and allow for homogeneous transfer.
• For pure thermoplastic polyimides, both normal loads and sliding velocities cause a progressive decrease in friction until thermo-mechanical overload happens at pv = 1.15 MPa.m/s (T* = 150°C). The overload temperature is in the same range as where sintered polyimides perform stable sliding. Power-law models for friction as a function of normal load are more closely followed compared to sintered poly-imides. The wear rate of thermoplastic polyimide at lowest load, lowest sliding velocity is below that for sintered polyimide, but it rises very soon at mild sliding conditions due to softening. Stable sliding corresponds to smooth transfer, which already forms at running-in and minimises the effects of a line contact. Thermo-mechanical overload corresponds to lumpy transfer. The debris morphology is gradually influenced by thermal action and/or chemical interaction, plastic deforma-tion and shear. Visco-elastic deformation under mild conditions is more severe for thermoplastic than for sintered polyimide: the loading time is mainly important.
• For PTFE-filled thermoplastic polyimides, both normal loads and sliding velocities influence sliding properties as such that friction decreases and wear increases. It provides lowest wear rates among all polyimide grades at low to mild normal loads and low to mild sliding velocities, while it is prone to thermo-mechanical overload only for combinations of highest normal load and highest sliding velocity. A regime with thermally controlled sliding establishes at 2.2 MPa.m/s < pv < 3 MPa.m/s (120°C < T* < 140°C). There is a tendency for smooth transfer film formation at increasing sliding velocities and somewhat thicker films at increasing normal loads through plastification of thermoplastic polyimide bulk and thermoplastic filler.
The pv-diagrams for polyimides are efficient for indicating different sliding regimes and transitions in friction and/or wear behaviour. However, different actions of either increase in normal load or increase in sliding velocity should be considered. References [5.1] Buckley DH. Friction and wear characteristics of polyimide and filled polyimide compositions in
vacuum, NASA TN D 3261, Washington D.C., 1966 [5.2] Fusaro RL. Friction and wear life properties of polyimide thin films, NASA TN D 6914, Washington
D.C., 1972 [5.3] Fusaro RL. Effect of atmosphere and temperature on wear, friction and transfer of polyimide films, ASLE
Trans 21 (1978), 125-133 [5.4] Chitsaz-Zadeh MR, Eiss NS. Friction and wear of polyimide thin films, Wear 110 (1986), 359-368 [5.5] Jones JW, Eiss NS. Chemical structure effect on polyimide thin films, in: Polymer wear and its control,
Lee LH (ed.), American Chemical Society (Washington), 1985, ISBN 0-8412-0932-4 [5.6] Sheiretov T, Van Glabbeek W, Cusano C. Evaluation of the tribological properties of polyimide and
poy(amide-imide) polymers in a refrigerant environment, Tribol Trans 38 (1995), 914-922 [5.7] Shen C, Dumbleton JH. The evaluation of polyimide and poly(amide-imide) as joint replacement
materials, Wear 40 (1976), 351-360 [5.8] Bayer RG, Sacher E. The effect of voids on the sliding friction of polyimide film, Wear 37 (1976), 15-20 [5.9] Iwabuchi A, Hori K, Sugawara Y. Effects of temperature and ambient pressure on fretting properties of
polyimide, Wear 125 (1988), 67-81 [5.10] Friedrich K. Sliding wear performance of different polyimide formulations, Tribol Internat 22 (1989),
25-31

Chapter 5. Polyimides under atmospheric conditions 130 [5.11] Tewari US, Bijwe J. On the abrasive wear of some polyimides and their composites, Tribol Internat 24
(1991), 247-254 [5.12] Tewari US, Bijwe J, Vasudevan P. Friction and wear studies of a short glass-fibre- reinforced polyether-
imide composite, Wear 132 (1989), 247-264 [5.13] Bhushan B. Modern tribology handbook, Vol. I, CRC Press (Boca Raton), 2001, ISBN 0-8493-8403-6 [5.14] Langlade C, Fayeulle S, Olier R. New insights into adhesion and lubricating properties of graphite-based
transfer films, Wear 172 (1994), 85-92 [5.15] Bozet JL, Gras R. Tribological behaviour of fluorinated resins and polyimide resins sliding over a
metallic surface in liquid nitrogen, 5th European Space Mechanisms and Tribology Symposium, ESA SP-334, 1993, 29-33
[5.16] Fusaro RL. Self-lubricating polymer composites and polymer transfer film lubrication for space applications, Tribol Internat 23 (1990), 105-121
[5.17] Matsubara M. The frictional properties of polymers, in: Friction and Wear of Polymers, Bartenev GM, Lavrentev VV (ed), Elsevier (Amsterdam), 1981, ISBN 0-4444-2000-2
[5.18] Uetz H, Wiedmeyer J. Tribologie der Polymere, Carl Hanser Verlag (Munchen), 1985, ISBN 3-4461-4050-6
[5.19] Yamaguchi Y. Tribology of plastic materials, Elsevier (Amsterdam), 1990, ISBN 0-4448-7445-3 [5.20] Bahadur S, Gong D. Formulation of the model for optimal proportion of filler in polymer for abrasive
wear resistance, Wear 157 (1992), 229-243 [5.21] Lancaster JK. Basic mechanism of friction and wear of polymers, Plast Polym 41 (1973), 297-305 [5.22] Fusaro RL. Evaluation of several polymer materials for use as solid lubricants in space, Tribol Trans 31
(1988), 174-181 [5.23] Lewis RB. Wear of polyimide resin, Proceedings 24th ASLE Annual Meeting (1969), 177-180 [5.24] McEttles CM. Polymer and elastomer friction in the thermal control regime. ASLE Trans 30 (1987),
149-159 [5.25] Bertrand PA, Carre DJ. Oil exchange between ball bearings and porous polyimide ball bearing retainers,
Tribol Trans 40 (1997), 294-302 [5.26] Jia JH, Zhou HD, Gao SQ, Chen JM. A comparative investigation of the friction and wear behaviour of
polyimide composites under dry sliding and water-lubricated condition, Mat Sc Eng A 356 (2003), 48-53
[5.27] Kang C, Eiss NS. Fretting of polyimide coatings: structure and moisture effects, Wear 181-183 (1995), 94-100
[5.28] Savage RH. Graphite lubrication, J Appl Phys 19 (1948), 1-10 [5.29] Lancaster JK. Transition in the friction and wear of carbons and graphites sliding against themselves,
ASLE Trans 18 (1975), 187-201 [5.30] Lancaster JK, Pritchard JR. Influence of environment and pressure on the transition to dusting wear of
graphite, J Appl Phys D 14 (1981), 747-762 [5.31] Gardos M. The problem-solving role of basic science in solid lubrication, in: World tribology congress:
New directions in tribology, Hutchings IM (ed.), Mechanical Engineering Publications (London), 1997, ISBN 1-8605-8109-9
[5.32] Bijwe J, Indumathi J. Influence of fibres and solid lubricants on low amplitude oscillating wear of polyetherimide composites, Wear 257 (2004), 562-572
[5.33] Xian G, Zhang Z. Sliding wear of polyetherimide matrix composites: influence of graphite flakes, Wear 258 (2005), 783-788
[5.34] Brendlé M, Stempflé P. Triboreactions of graphite with moisture – a new model of triboreactor for integrating friction and wear, Wear 254 (2003), 818-826
[5.35] Brendlé M, Fatkin J, Gilmore R. Mechanisms of graphite transfer on steel as studied by image analysis, Tribol Trans 33 (1990), 471-480

131
Chapter 6.
Thermal influences on tribology and micro structure of polyimides.
Goals
• Explaining transitions in friction and wear for sintered and thermoplastic polyimides between 60 to 260°C
• Performance of graphite fillers and thermoplastic PTFE fillers at 60 to 260°C
• Characterisation of sliding mechanisms for sintered polyimide (chemical
effects: hydrolysis and imidisation) • Characterisation of sliding mechanisms for thermoplastics (chemical and
thermal effects: hydrolysis, imidisation and degradation)
• Detailed study on molecular reorganisation at the sliding interface Methodology
• Small-scale tribotesting, microscopic analysis, temperature calculations • Thermo-analytical analysis of wear debris (DTA, TGA, MS) • Raman spectroscopy of polyimide sliding surfaces
Nordtrib, 2006, Helsingor (Denmark)

Chapter 6. Thermal influences on tribology and micro structure of polyimides 132 6.1. Introduction From sliding experiments with free frictional heating in previous Chapter 5, coefficients of friction for sintered polyimides at mild pv-conditions are high (µ = 0.50 to 0.37 for SP-1, or µ = 0.40 to 0.20 for SP-2) and have no advantage over thermoplastics such as unfilled polyacetal (µ = 0.30 to 0.40) or PTFE-filled polyethylene terephthalate (µ = 0.20 to 0.30). Also brittleness governs for polyimides, while the wear rates for filled thermoplastics under mild loading conditions are lower up to a factor 5. The practical application range of technical polymers is, however, limited because of their thermal stability. Frictional heating and/or additional external heat sources cause weakening and melting of thermoplastics that result in loose of mechanical strength and loading capacity. Therefore, the main benefits of polyimide sliding parts should be situated in high temperature sliding applications. Some authors observed a transition to low friction for polyimides “somewhere” in the 100 to 200°C temperature range. According to Fusaro [6.1], low friction was related to a transition into mild wear regimes, while others [6.2] only observed a wear transition without significant change in friction. From Table 6.1, the transition tem-perature between severe to mild wear strongly depends on the atmospheric conditions: transitions happen at lower temperature when the atmosphere has lower water vapour content. Low friction and wear at high temperatures are most prominent under dry and inert atmospheres, while the transition is less clear or postponed to higher temperatures in humid air. This behaviour manifests clearly for semi-crystalline polyimides, while it is reported to be less significant for amorphous polyimides [6.1]. Table 6.1. Literature data on transitions in friction and wear for polyimides with not further defined composition [6.1]
Atmosphere Transition from high to low wear
Transition from high to low friction
Inert atmosphere (argon, <20ppm H2O) 40°C 25 to 100°C
Dry atmosphere (<20ppm H2O) 25 to 100°C 25 to 100°C
Humid atmosphere (10000ppm H2O) 100 to 200°C 100 to 200°C
Transitions in friction and/or wear are noticed over a broad temperature range, but the reasons for it and correlations with the polymer chain conformation were not illustrated. The orientation of highly aromatic polyimide structures is more difficult than linear structures, because only specific functional groups or side-chains are mobile and reorient without overall alignment of the molecular backbone. Also for this reason, homogeneous transfer films develop difficultly. The presence of water molecules in moist air can restrict the polymer chain mobility by formation of hydrogen bonds, which become more likely under atmospheric conditions compared to vacuum. A close examination of worn polyimide surfaces by Raman spectroscopy [6.3], thermo-analytical analysis of wear debris and microscopic observations are done in this Chapter 6 in order to provide new insights on tribophysical processes induced by sliding of polyimide surfaces.

Chapter 6. Thermal influences on tribology and micro structure of polyimides 133 6.2. Thermal transitions in friction and wear of unfilled
polyimides High sliding temperatures are created by resistance heating of HA-steel counterfaces at 60 to 260°C, referred to as bulk temperatures. Unfilled sintered polyimides SP-1 are slid at 50 to 200 N, 0.3 m/s and thermoplastic polyimides TP-1 are only tested at 50 N, 0.3 m/s due to more rapid overload. The atmosphere is 23°C, 60 % RH. 6.2.1. Sintered and thermoplastic polyimide at mild load conditions (50 N) The evolution of friction with sliding distance for SP-1 and TP-1 is shown in Figure 6.1a and 6.1b at different bulk temperatures. The corresponding on-line vertical displace-ment curves are given in Figure 6.1c and 6.1d. A summary for coefficients of friction and wear rates for SP-1 and TP-1 is presented in Figures 6.2 and 6.3. The observed trends are discussed below and hypothesis about the mechanisms behind are made.
Figure 6.1 On-line measurements for friction and vertical displacement at 50 N, 0.3 m/s and bulk temperatures between 60 to 260°C for (a, c) SP-1 and (b, d) TP-1
(a)
(c) (d)
0
200
400
600
800
1000
1200
1400
1600
1800
0 2000 4000 6000 8000 10000 12000 14000 16000
Sliding distance (m)
Vert
ical
dis
plac
emen
t (µm
)
220°C
100°C
180°C
140°C
no 120°C
80°C 60°C
0
100
200300
400
500
600
700800
900
1000
0 2000 4000 6000 8000 10000 12000 14000 16000
Sliding distance (m)
Vert
ical
dis
plac
emen
t (µm
)
60°C
100°C
140°C
220°C
180°C
no 80°C
260°C
0
0.1
0.2
0.3
0.4
0.5
0.6
0.7
0.8
0 2000 4000 6000 8000 10000 12000 14000 16000
Sliding distance (m)
Coe
ffic
ient
of f
rictio
n
60 to 80°C 100°C
140°C
220°C
180°C
no heating 120°C
0
0.1
0.2
0.3
0.4
0.5
0.6
0.7
0.8
0 2000 4000 6000 8000 10000 12000 14000 16000
Sliding distance (m)
Coe
ffic
ient
of f
rictio
n
180°C 60°C 100°C
140°C
220°C
260°C
no heating
(b)

Chapter 6. Thermal influences on tribology and micro structure of polyimides 134
0
0.1
0.2
0.3
0.4
0.5
0.6
0.7
0.8
0.9
0 50 100 150 200 250 300
Bulk temperature (°C)
Coe
ffic
ient
of f
rictio
n
Bulk temperature (°C)
hydrolysis
partial imidisation
melting
0
0.1
0.2
0.3
0.4
0.5
0.6
0.7
0 50 100 150 200 250 300
Bulktemperature (°C)
Coe
ffic
ient
of f
rictio
n
Bulk temperature (°C)
hydrolysis partial imidisation
0
20
40
60
80
100
120
140
160
180
200
0 50 100 150 200 250 300
Bulk temperature (°C)
Wea
r rat
e (1
0-4 m
m3 /m
)
Bulk temperature (°C)
(a) (b)
Figure 6.2 Overview of friction at 50 N, 0.3 m/s as a function of bulk temperature for (a) SP-1 and (b) TP-1, after 30 m (x), 100 m () and 15000 m or end-of-test ()
Figure 6.3 Overview of wear rates at 50 N, 0.3 m/s as a function of bulk temperature for
SP-1 () and TP-1 () Running-in periods for friction (Figure 6.1a) shorten at high temperatures. An initial peak with high friction during sliding at 50 N against HA-steel was previously related to the Hertz line contact. This peak now diminishes through interaction with polyimide transfer at high temperatures. Also Tanaka et al. [6.4] observed a peak value for running-in friction during unidirectional sliding. In contrast, friction and wear tests performed by Chitsaz-Zadeh et al. [6.5] on a pin-on-disc configuration (conformal contact) showed an initial period of low friction, which was terminated by a rise in friction and simultaneous appearance of wear debris. This behaviour is typically observed in present tests at 180°C bulk temperatures for SP-1 (Figure 6.1a) and corresponds to a running-in period characteristic for transfer film formation. Average coefficients of friction for SP-1 (Figure 6.2a) have two regimes depending on the bulk temperature, with a clear transition at 180°C. The initial friction after 30 m sliding is constant at 0.60 until it abruptly decreases for bulk temperatures above 180°C.

Chapter 6. Thermal influences on tribology and micro structure of polyimides 135 High steady-state friction (µdyn = 0.37 to 0.50) occurs at bulk temperatures below 180°C and low steady-state friction (µdyn = 0.20 to 0.27) establishes at higher temperatures. Also the evolution of friction as a function of sliding distance after 30, 100 and 15000 m changes with bulk temperatures: friction progressively lowers for 60 to 140°C, while it slightly rises between 30 to 100 m for 180, 220 and 260°C. The latter agrees to the formation of a transfer film during running-in. This film becomes progressively homogeneous and enhances self-lubricating properties towards the end of the tests at 220 to 260°C, while it does not completely homogenise at the 180°C transition temperature. Maximum steady-state friction manifests after 2000 m sliding at 180°C in parallel to molecular transitions demonstrated in paragraphs 6.6 and 6.7. Steady-state friction at 220 to 260°C decreases as a function of sliding distance and becomes irregular through interaction with the transfer film. Present transitions as a function of temperature are in contrast to findings of Iwabuchi et al. [6.6] investigating SP-1 under fretting. Slightly higher friction was observed above 200°C, but this trend diminished near the end of the sliding test into low friction (µdyn = 0.3) that is constant over the full temperature range. The wear debris during fretting easily circulates in the interface, permitting transfer to an opposing surface even at low temperatures and causing less frictional transitions, in contrast to present reciprocating sliding. For unidirectional sliding, Tanaka et al. [6.7] found higher steady-state friction above 200°C (µ = 0.6) owing to unfavourable transfer and limited wear debris compaction, in contrast to present reciprocating sliding. Average coefficients of friction for TP-1 (Figure 6.2b) perform small variations as a function of sliding distance, but steady-state values are somewhat higher compared to SP-1. Friction rises at 100 to 120°C and decreases at 120 to 180°C bulk temperatures, in parallel to molecular transitions demonstrated in paragraphs 6.6 and 6.7. The transition to low friction happens at lower bulk temperatures and is more pronounced than for SP-1. A maximum coefficient of friction within the transition zone is not observed for TP-1 as it was for SP-1, due to thermoplastic properties and smooth transfer for TP-1. Thermoplastics are prone to overload and unstable friction at 180 to 260°C because of thermal effects and loss of mechanical strength. The wear rates for SP-1 (Figure 6.3) are correlated to frictional transitions: a maximum value of 34.10-4 mm3/m at 180°C agrees to the peak in coefficient of friction. Higher temperatures cause stabilisation of wear rates in parallel to low friction. The low wear rates at 140°C do not correspond to any frictional transitions, but they are related to micro-structural changes with lubricating effect in paragraphs 6.6 and 6.7. Temperatures between 60 to 100°C provide slightly increasing wear rates as they are outside the transition range and mainly mechanically influenced. The highest on-line vertical displacement is recorded at 180°C (Figure 6.1c), while lower and less uniform on-line measurements occur at 220 to 260°C with a separation between high running-in wear and low steady-state wear. Small perturbations result from interactions with wear debris and repetitive transfer film formation and removal. The wear volumes from dimensional and weight measurements are compared in Table 6.2, indicating best agreement at 180 to 220°C through the protective action of transfer with lower shear stresses and deformation. Deformation by overload happens at 260°C. The wear rates for TP-1 (Figure 6.3) are lower than for SP-1 at temperatures below 120°C, in contrast to Cong et al. [6.8] who found permanently higher wear rates with increasing temperature for thermoplastic polyimides. A transition in wear for TP-1 at 120 to 180°C correlates to a regime with decreasing friction, while overload conditions

Chapter 6. Thermal influences on tribology and micro structure of polyimides 136 Table 6.2. Wear volumes (mm3) for SP-1 and TP-1 after sliding at 60 to 260°C bulk temperatures and 50 N, 0.3 m/s compared from weight and dimensional measurements
Wear volume SP-1 (mm3) Wear volume TP-1 (mm3) Bulk temperature weight dimensional difference
weight dimensional Difference
60 °C 15.8 16.4 4 % 10.9 11.4 6 %
80 °C 17.6 19.4 10 % 11.8 12.2 4 %
100 °C 18.4 20.4 10 % 14.3 13.2 - 7 %
140 °C 10.9 11.7 7 % 51.3* 47.2 - 8 %
180 °C 21.1 22.1 5 % 58.9* 55.0 - 7 %
220 °C 19.1 20.2 5 % 47.8* 49.0 3 %
260 °C 20.1 21.9 9 %
50.6* 75.2 50 % * shorter sliding distance (< 15000 m) due to overload
in wear (melting) agree with suddenly high friction at 180 to 260°C. In contrast, Tewari et al. [6.9] observed rather non-correlated peaks in steady-state friction and wear: while the friction transition occurred at 150°C, the wear transition happened at 200°C. Discontinuous increases in on-line vertical displacement at 140°C (Figure 6.1d) represent interaction with flake-like debris. Dimensional and weight measurements indicate higher wear volumes calculated from weight at 100 to 180°C, as the polymer density possibly changes through crystallisation, observed as an opaque colour of the sliding surface. Some hypothesis for friction and wear transitions can be made from literature. As decomposition of sintered polyimide is expected to occur only at 500 to 700°C and softening lacks [6.10, 6.11], other theories than thermal decomposition should be respon-sible. Matsubara et al. [6.12] explained peak values as an interaction between abrasive action and chemical changes of the polyimide. Tanaka et al. [6.7] related peak values to transfer film formation, which could reduce wear. Fusaro [6.1] generally attributed transitions to better polymer chain mobility and orientation effects at the surface, leading to a texture conducive to easy shear. Such a texture could generally be produced by an extended chain molecular structure with orientation parallel to the sliding direction. However, softening mechanisms are not likely for sintered polyimides. In parallel to changes in relative humidity discussed in Chapter 5, bulk temperatures at 100 to 260°C are also able to cause chemical changes by creating or destroying hydrogen bonds. These hypotheses will be verified in next paragraphs 6.6 and 6.7. Bill [6.13] reported, however, that wear of polyimide in moist air was larger than in dry air without change in friction. 6.2.2. Sintered polyimide at high load conditions (100 to 200 N) Tests with controlled bulk temperatures between 60 to 260°C were done on SP-1 at 100, 150 and 200 N with 0.3 m/s to ensure the repeatability of transitions. From the decrease in friction at each normal load, it will be concluded that transitions are mainly thermally activated. Secondly, it is verified whether overload is enhanced or postponed at high temperature while sintered polyimides revealed a critical load of 100 to 150 N related to brittleness under free frictional heating. Test results for average friction after different sliding distances are given in Figure 6.4 and wear rates are plotted in Figure 6.5 as a function of bulk temperature and normal loads.

Chapter 6. Thermal influences on tribology and micro structure of polyimides 137
0
0.1
0.2
0.3
0.4
0.5
0.6
0.7
0 50 100 150 200 250 300
Bulk temperature (°C)
Coe
ffici
ent o
f fric
tion
(a) (b) (c)
Figure 6.4 Overview of friction for SP-1 as a function of bulk temperature at 0.3 m/s for different normal loads, (a) 100 N, (b) 150 N, (c) 200 N, after 30 m (x), 100 m () and 15000 m or end-of-test ()
Figure 6.5 Overview of wear rates for SP-1 as a function of bulk temperature and normal loads at 0.3 m/s, (a) influence of temperature, (b) influence of normal load
The transition to low friction manifests at each normal load. The critical 180°C bulk temperature only manifests at 100 N, while the transition is more gradual at high normal loads and initiates at 140°C bulk temperatures. Wear rates at 100 to 150 N behave similar to those at 50 N and have a minimum at 140°C. Overloads at 220 to 260°C,
0
20
40
60
80
100
120
140
160
0 50 100 150 200 250
Normal load (N)
Wea
r rat
e (1
0-4 m
m3 /m
)
260 °C
220 °C
180 °C 140 °C
60 to 100°C
0
20
40
60
80
100
120
140
160
0 50 100 150 200 250 300
Bulk temperature (°C)
Wea
r rat
e (1
0-4 m
m3 /m
)
100 N
150 N
200 N
(a) (b)
0
0.1
0.2
0.3
0.4
0.5
0.6
0.7
0 50 100 150 200 250 300
Bulk temperature (°C)
Coe
ffici
ent o
f fric
tion
0
0.1
0.2
0.3
0.4
0.5
0.6
0.7
0 50 100 150 200 250 300
Bulk temperature (°C)
Coe
ffici
ent o
f fric
tion

Chapter 6. Thermal influences on tribology and micro structure of polyimides 138 however, do not stabilise wear rates at 100 to 150 N (Figure 6.5a), as it was observed at 50 N. Overload at 200 N is even noticed at low temperatures: the monotonously increasing wear rates at 200 N have different slopes at 60 to 100°C, 100 to 180°C and 180 to 260°C. The characteristic normal load at 100 to 150 N noticed under free frictional heating (Figure 5.7) is less prominent and slightly increases towards 150 N at high temperatures (Figure 6.5b). Brittleness is thus not only influenced by static defor-mation of the Hertz line contact but depends on transfer formation at high temperatures. 6.3. Bulk temperature and maximum polymer surface
temperature T* Besides the bulk temperature applied to the steel counterfaces, the dissipated frictional energy causes higher maximum polymer surface temperatures T* calculated from Jaeger’s theory, detailed in Chapter 4. The temperature T* is given in Table 6.3 for each bulk temperature applied to SP-1 and TP-1 at 50 N, 0.3 m/s, together with the semi-contact length ℓ (mm) and the dissipated frictional energy q (J/s). Sometimes high friction and high contact stresses during running-in (Hertz line contact) results in high maximum polymer surface temperatures T* over a short sliding time (approxi-mately 30 m). It levels towards a steady-state temperature T* in parallel to decreasing contact pressures (Figure 4.13). The temperatures for TP-1 are higher than for SP-1 under identical sliding conditions, taking into account both higher friction and lower thermal conductivity for TP-1. Table 6.3. Maximum polymer surface temperature T* (°C) for SP-1 and TP-1 sliding at 60 to 260°C bulk temperatures and 50 N, 0.3 m/s
SP-1 TP-1 running-
in steady-state running-in steady-state
Applied
bulk temperature
T* (°C) ℓ (mm) q (J/s) T* (°C)
T* (°C) ℓ (mm) q (J/s) T* (°C)
60 °C 150 1.58 6.3 77 150 1.32 6.8 80
80 °C 154 1.76 6.1 96 177 1.20 6.8 98
100 °C 165 1.73 6.0 115 190 1.45 7.5 120
140 °C 177 1.48 5.4 152 232* 2.03 7.2 182
180 °C 275 1.80 6.8 196 298* 2.17 4.9 192
220 °C 323 1.93 4.1 230 350* 2.10 10.1 244
260 °C 352 1.86 3.0 267
398* 1.10 11.2 292 * shorter test due to overload (< 15000 m)
The maximum temperature T* = 352°C during running-in for SP-1 remains below the short-time maximum exposure temperature of 500°C and the maximum steady-state temperature T* = 267°C is below the reported long-time exposure limit of 300°C, implying no thermal overload. The maximum temperature during running-in for TP-1 approaches the heat deflection temperature (238°C) at 140°C bulk temperatures and the long-term service temperature of 220°C is exceeded at 220 to 260°C bulk temperatures.
Chapter 6. Thermal influences on tribology and micro structure of polyimides 139 Related to the transition temperatures in friction and wear for SP-1 at 50 N, 0.3 m/s, the maximum polymer surface temperatures T* = 177°C during running-in and T* = 152°C during steady-state do not cause any lower friction (bulk temperature 140°C), while transitions were observed for T* = 196°C at steady-state (bulk temperature 180°C). The transition in wear for TP-1 noted at 140°C bulk temperature corresponds to a short-time temperature T* = 232°C near the heat-deflection temperature and loose in mechanical strength, while also the steady-state temperature T* is above the 180°C transition noted for SP-1. It is clear that softening during running-in is critical to cause a transition in wear and melting during running-in is critical for overload of thermoplastics. Running-in temperatures are more significant for thermoplastics than for semi-thermosettings. Table 6.4. Maximum polymer surface temperature T* (°C) for SP-1 sliding at 60 to 260°C bulk tempera-tures and 100 to 200 N, 0.3 m/s
SP-1 at steady-state
100 N 150 N 200 N
Applied
bulk temperature
ℓ (mm) q (J/s) T* (°C) ℓ (mm) q (J/s) T* (°C) ℓ (mm) q (J/s) T* (°C)
100 °C 1.93 11.6 127 2.28 20.3 143 2.27 27.0 158
140 °C 1.73 11.1 167 1.31 20.3 197 2.28 28.2 202
180 °C 2.04 11.3 205 1.87 18.0 222 2.24 21.6 227
220 °C 2.32 7.8 237 2.60 12.2 244 2.28 18.1 259
260 °C 2.24 8.1 278 2.14 11.3 290 2.19 16.2 300* * shorter test due to overload (< 15000 m)
Related to the transition temperatures in friction and wear for SP-1 at 100 to 200 N, 0.3 m/s, the maximum polymer surface temperatures are presented in Table 6.4. Thermal overload with T* > 300°C only happens at 200 N, 260°C. A transition in friction at 100 N corresponds to T* > 180°C (bulk temperature 180°C) in parallel to the 50 N tests. The decrease in friction at 150 to 200 N happens already at bulk temperatures of 140°C, corresponding to a maximum polymer surface temperature T* > 180°C. The transition temperatures T* = 180°C causing decreasing friction also agree with the previously noted temperature range causing constant friction during sliding with free frictional heating (Figure 5.23). It is concluded that the transitions in tribological behaviour for polyimides are thermally activated. The temperature T* = 180°C is critical for both sintered and thermoplastic polyimides and will be further related to their micro structure. 6.4. Efficiency of fillers at high temperature 6.4.1. Graphite additives for sintered polyimide On-line friction and wear measurements for SP-2 at 60 to 260°C, 50 to 200 N and 0.3 m/s are presented in Figure 6.6 and a summary of average friction and wear rates is given in Figure 6.7, compared to SP-1. Graphite fillers cause high friction and unstable sliding at 60 to 100°C bulk temperatures and a transition to lower friction occurs at 100°C under 50 N. The high friction regimes at low temperature manifest over a smaller

Chapter 6. Thermal influences on tribology and micro structure of polyimides 140
(a) (b)
(c) (d)
Figure 6.6 On-line measurements for friction and vertical displacement for SP-2 at high temperatures,
(a, b) 50 N, 0.3 m/s, (c, d) 150 N, 0.3 m/s Table 6.5. Maximum polymer surface temperature T* (°C) for SP-2 sliding at 60 to 260°C bulk tempe-ratures and 50 to 200 N, 0.3 m/s
T* for SP-2 at steady-state (°C) Applied bulk
temperature 50 N 100 N 150 N 200 N
60 °C 88 113 122 102
80 °C 115 118 116 126
100 °C 138 128 130 136
140 °C 152 155 159 165
180 °C 190 187 190 193
220 °C 225 226 228 233
260 °C 264 265 268 270
0
0.1
0.2
0.3
0.4
0.5
0.6
0.7
0.8
0 2000 4000 6000 8000 10000 12000 14000 16000
Sliding distance (m)
Coe
ffic
ient
of f
rictio
n
0
50
100
150
200
250
300
350
400
0 2000 4000 6000 8000 10000 12000 14000 16000
Sliding distance (m)
Vert
ical
dis
plac
emen
t (µm
)
60°C
80°C
100°C
140°C
180°C
260°C 220°C 60°C
80°C
100°C
140°C 180°C
260°C
220°C
0
0.1
0.2
0.3
0.4
0.5
0.6
0.7
0.8
0 2000 4000 6000 8000 10000 12000 14000 16000
Sliding distance (m)
Coe
ffic
ient
of f
rictio
n
0
100
200
300
400
500
600
0 2000 4000 6000 8000 10000 12000 14000 16000
Sliding distance (m)
Vert
ical
dis
plac
emen
t (µm
)
80°C
60°C
100°C 120°C 140°C
180 to 260°C
60°C
80°C
100°C
140°C
180°C
220°C 260°C 120°C

Chapter 6. Thermal influences on tribology and micro structure of polyimides 141
0
0.1
0.2
0.3
0.4
0.5
0.6
0.7
0.8
0 50 100 150 200 250 300
Bulk temperature (°C)
Coe
ffic
ient
of f
rictio
n
0
2
4
6
8
10
12
14
16
18
0 50 100 150 200 250 300
Bulk temperature (°C)
Wea
r rat
e (1
0-4 m
m3 /m
)
0
0.1
0.2
0.3
0.4
0.5
0.6
0.7
0.8
0 50 100 150 200 250 300
Bulk temperature (°C)
Coe
ffic
ient
of f
rictio
n
SP-1
SP-2
0
5
10
15
20
25
30
35
0 50 100 150 200 250 300
Bulk temperature (°C)
Wea
r rat
e (1
0-4 m
m3 /m
)
SP-1
SP-2
(a) (b)
(c) (d)
Figure 6.7 Overview of friction and wear rates for SP-2 as a function of bulk temperature at various normal loads, (a,b) influence of graphite additives at 50 N, 0.3 m/s comparing SP-1 () and SP-2 (),
(c, d) influence of normal loads for SP-2 at 50 N (), 100 N (♦), 150 N (∆) and 200 N (x), 0.3 m/s temperature interval at higher normal loads (only for 60°C at 150 N) and completely disappear at 200 N. Besides the transition in friction at the low temperature side in presence of graphite, also the transition at 180°C corresponding to the original polyimide structure remains visible, causing a friction regime nearly constant as a function of temperature and normal load. The maximum polymer surface temperatures T* (Table 6.5) are lower for SP-2 than for SP-1 through better thermal conductivity of graphite fillers. The critical temperature T* = 180°C is not attained at 140°C bulk temperatures, but manifests at 180°C bulk temperatures. It is concluded that graphite controls high friction at 60 to 100°C. On-line vertical displacements show that high friction regimes at low temperature correspond to stable wear depths. The wear rates of graphite-filled SP-2 progressively increase at 60 to 100°C (Figure 6.7b and 6.7d) and have minimum values at 140°C bulk temperature at 150 to 200 N. Both observations reflect similarities to pure SP-1 (Figure 6.5a). Graphite fillers favourably protect against overload wear over the entire tempera-ture region, while SP-1 showed overload wear over the entire 200 N load range.

Chapter 6. Thermal influences on tribology and micro structure of polyimides 142
0
0.1
0.2
0.3
0.4
0.5
0.6
0.7
0.8
0 100 200 300 400
Bulk temperature (°C)
Coe
ffic
ient
of f
rictio
n
TP-1
TP-2 PTFE [6.14]
6.4.2. Thermoplastic additives (PTFE) for thermoplastic polyimide The role of PTFE added to thermoplastic polyimide is illustrated in Figure 6.8. Con-trasting to graphite, thermoplastic fillers effectively reduce both friction and wear over the entire temperature region. Some transitions in tribological properties at high temperature remain, however, determined by the properties of unfilled TP-1 polyimide. Teflon® or PTFE has good thermal resistance to 400°C with a minimum coefficient of friction at 120°C, according to Pleskachevsky et al. [6.14]. Thermal fluctuations in fric-tion of PTFE were reported: coefficients of friction decrease from 0.20 to 0.13 only between 60 and 120°C and increase at higher temperatures. Efficient lubrication is only attained in a self-regulating temperature range, where a lamellar transfer layer possesses an optimum correlation between bearing capacity and rheological properties. From this knowledge, there is very good agreement with present frictional tendencies of TP-2, being in between the values for pure TP-1 and pure PTFE. The friction for TP-2 at 60 to 80°C is parallel to the tendencies of TP-1, while decreasing above 100°C bulk temperatures through thermally controlled sliding of the PTFE additives. Calculations show that the 100°C bulk temperature corresponds to T* = 118°C maximum polymer surface temperatures, which is close to the onset of thermally controlled sliding for PTFE (120°C). A minimum friction for TP-2 at 180°C bulk temperature is determined by the properties of pure polyimide, corresponding to a temperature T* = 153°C and T* = 190°C at 140°C and 180°C bulk temperatures respectively. Extrapolation of the frictional regime for both TP-1 and TP-2 shows zero friction at the glass transition temperature Tg = 250°C. Crystallisation and degradation interfere with friction, however, with instabilities above the 230°C heat deflection temperature. Wear rates of TP-2 decrease at 100°C bulk temperature (T* = 118°C) in parallel to friction with permanent increasing wear at higher temperatures, as expected for thermoplastics at thermally controlled sliding. The transition temperature T* = 120°C also manifested for TP-2 during sliding under atmospheric conditions in Figure 5.26.
(a) (b) Figure 6.8 Friction and wear rates for TP-2 as a function of bulk temperature at 50 N, 0.3 m/s compared
to TP-1, (a) influence of PTFE on friction, (b) influence of PTFE on wear rates
0.1
1
10
100
1000
0 50 100 150 200 250 300
Bulk temperature (°C)
TP-2
TP-1
Wea
r rat
e (1
0-4 m
m3 /m
)

Chapter 6. Thermal influences on tribology and micro structure of polyimides 143
6.5. Microscopic surface evaluation 6.5.1. Polyimide transfer films on steel surfaces 6.5.1.1. Transfer for pure sintered and thermoplastic polyimides at high temperature The HA-steel counterfaces after high temperature sliding are evaluated by optical microscopy. Different morphologies of the polyimide transfer film with sintered or thermoplastic properties are illustrated in Figure 6.9. For SP-1, the transitions in friction and wear as a function of temperature correspond to transfer film formation, which is rather determined by chemical interaction of wear debris. For TP-1, the transfer morphology is rather determined by softening and melting with more homogeneous, but unstable transfer films. The effects of high loads and high temperatures on film homogeneity for SP-1 are presented in Figure 6.10. Sintered SP-1 revealed no evidence of polymer transfer during sliding under atmospheric conditions at 50 N, 0.3 m/s (Figure 5.10). Also no coherent transfer films develop for T* < 180°C. From Figure 6.10, only small separate wear debris particles collect into the steel roughness grooves at 100°C (A) and separately smoothened particles occur at 140°C (B). Polymer material is not drawn out of the surface and does not orient easily, agreeing with a general lack of softening and high stiffness at low temperatures. A more coherent transfer film only develops at T* > 180°C, indicating partial molecular reorga-nisation at the polymer surface and transferred wear debris (C). The transfer consists of particles smoothened over the entire sliding surface and large patches of powdery material drawn into plate-like sheets parallel to the sliding direction (D). Theoretically, the latter morphology occurs at high temperatures through weakening, which allows for plastification of the transfer film and wear debris particles. For present sintered poly-imides, however, thermal softening is less certain and it are mainly chemical modifica- tions of the polyimide structure such as hydrolysis and imidisation that hinder or promote transfer (paragraph 6.6 and 6.7). The formation of a transfer layer agrees to the noted transition from high to low friction and separation between high running-in and low steady-state wear. While transfer is favourable for low friction, thick films (E) mani-festing at T* > 260°C cause sliding instabilities (Figure 6.1a). Those irregularities result from subsequent detachment of transferred polymer parts, removal from the contact zone and local formation of a new film. This conclusion is also based on large wear debris particles found at the borders of the sliding stroke for 260°C tests (Figure 6.20). The transfer film gains homogeneity at high temperatures and it becomes thinner at high loads (Figure 6.10), but an entirely smoothened and completely homogeneous film is never observed. The brittle nature and lacking thermal softening of sintered polyimides prevent easy elongation of the polymer chains. At 100 N and 220°C, the polyimide film is drawn into striations parallel to the sliding direction but it does not cover the complete sliding area. At 200 N, the film looses bearing capacity causing overload. The SEM microscopy in Figure 6.11 confirms that the transfer for SP-1 is disconti- nuous over the entire temperature region. There are only separate particles seen at 140°C bulk temperatures. There are oriented depositions seen above 180°C and it is detailed by SEM microscopy that they consist of separate particles that adhere to each other and to the steel surface. It suggests that wear debris particles in the sliding interface conglomerate and chemically interact with each other (imidisation) at high temperature, resulting in transfer with better strength.

Chapter 6. Thermal influences on tribology and micro structure of polyimides 144
SP-1 (50 N, 0.3 m/s) TP-1 (50 N, 0.3 m/s) 10
0°C
140°
C
180°
C
220°
C
260°
C
Figure 6.9 Optical microscopy of transfer films for SP-1 and TP-1 on HA-steel, influence of bulk temperature between 100 to 260°C for sliding at 50 N, 0.3 m/s
A
BB
C
D
E
F
G
G
H
H
1 mm

Chapter 6. Thermal influences on tribology and micro structure of polyimides 145
SP-1 (100 N, 0.3 m/s) SP-1 (150 N, 0.3 m/s) SP-1 (200 N, 0.3 m/s)
220°
C
260°
C
Figure 6.10 Optical microscopy of transfer films for SP-1 on HA-steel,
influence of normal load between 100 to 200 N for sliding at 220 and 260°C bulk temperatures, 0.3 m/s
SP-1 140°C SP-1 180°C
SP-1 220°C SP-1 260°C
Figure 6.11 SEM microscopy of transfer films for SP-1 on HA-steel,
influence of temperature between 140 to 260°C for sliding at fixed normal load 50 N, 0.3 m/s
1 mm

Chapter 6. Thermal influences on tribology and micro structure of polyimides 146 Thermoplastic TP-1 (Figure 6.9) reveals three film types depending on the applied bulk temperature: thin and smooth films between 60 to 120°C (F, adhesive shear), patchy films for 140 to 180°C transition temperatures (G, softening and crystallisation) and thick films at highest bulk temperatures (H, melting). Patchy films correspond to a tran-sition in wear rates and low friction at 140 to 180°C, because the shear interface benefi-cially displaces into the polymer bulk that progressively softens and attains lower cohe-sive strength than the polyimide-metal interface. Thick films correspond to melting and unstable removal of material from the polyimide surface with high friction and wear. The three categories of transfer morphology indicate that the maximum polymer surface temperature T* at running-in, which is higher for a short-time than the steady-state tem-perature, is more important to cause softening or melting thermoplastics than for sintered polyimides and thermal polyimide properties determine the final transfer morphology. Energy dispersive spectroscopic analysis (EDX) on transferred parts of sintered polyimide indicates that the transfer areas are enriched with carbon, nitrogen and oxygen. Detection shows that all constitutional polyimide elements are transferred to the HA-steel counterface and degradation before transfer is unlikely. 6.5.1.2. Optical microscopy of transfer for filled polyimides Incorporation of graphite (SP-2) or PTFE (TP-2) in transfer films generally allows for low shear resistance. It is illustrated below that, however, proper functioning of graphite depends on good mixture with the polyimide debris and PTFE forms more homogeneous and thinner films through its thermoplastic properties. Transfer films for SP-2 (Figure 6.12) have two components, indicated as polyimide (PI) or graphite (G). Pure graphite depositions are noted at 60 to 100°C, inhomogeneously distributed over the sliding area and mostly accumulating into the roughness grooves. The coarse graphite flakes restrict direct polymer/steel contact and have a smooth top surface along the sliding direction (related to its planar structure) allowing for low wear rates. Uneven thickness and rough edges perpendicular to the sliding direction causes, however, unstable and high friction. The transfer at 180 to 260°C consists of a mixed graphite/polyimide film, which is smoother and mainly important for lower friction in contrast to low temperatures. Graphite incorporation causes stabilisation of wear rates at a lower value relatively to pure SP-1 due to better loading capacity. The role of PTFE added to TP-2 is favourable for smooth transfer over the entire sliding stroke with a thin film of PTFE and some polyimide flakes on top of it at 60 to 100°C. At 140 to 180°C, overload with patchy polyimide flakes is avoided but softening of thermoplastic polyimides still influences the transfer film morphology with polyimide striations parallel to the sliding direction. It is only for the highest bulk temperatures that the polyimide and PTFE completely mix into a homogeneous film. This film is thinner for TP-2 compared to TP-1 because polyimide melting is disfavoured by low friction. Summarising, the development of a thin and discontinuous transfer film for SP-1 is favourable for lowering friction and stabilising wear rates at T* > 180°C, while a thin and smooth film observed for TP-1 corresponds to higher friction and lower wear rates. Thick transfer for TP-1 represent unstable sliding and high wear rates, while additives of PTFE in TP-2 are favourable for thin transfer films with lower friction and stable sliding.

Chapter 6. Thermal influences on tribology and micro structure of polyimides 147
SP-2 (50 N, 0.3 m/s) TP-2 (50 N, 0.3 m/s) 10
0°C
140°
C
180°
C
220°
C
260°
C
Figure 6.12 Optical microscopy of transfer films for SP-2 and TP-2 on HA-steel,
influence of temperature between 100 to 260°C for sliding at fixed normal load 50 N, 0.3 m/s
PI
G
G
G PI
PI
PI
PI + G
PI + G
PI + PTFE
PI + PTFE
PI + PTFE
PTFE
PTFE
PTFE
1 mm

Chapter 6. Thermal influences on tribology and micro structure of polyimides 148 6.5.2. Sliding surfaces of sintered and thermoplastic polyimide 6.5.2.1. Pure sintered and thermoplastic sliding surfaces The sintered SP-1 sliding surfaces (Figure 6.13) show two regimes depending on the sliding temperature: (i) overall smooth surfaces occur at 100 to 180°C with some shear zones and polymer flakes torn out the surface, suggesting pure adhesive wear, and (ii) deformation and black spots occur at 180 to 260°C, suggesting abrasive interactions and chemical modifications. Abrasive grooves on the surfaces are most likely caused by sliding over polyimide particles transferred into a platelet-like transfer film. This is visually ascertained by comparing locations of transfer on the steel surface and locations of the grooves. Local degradation occurs as black spots but it does not affect the loading capacity as the sintered polyimide has thermal stability up to 500°C (short-time) or 300°C (long-time). Confirmed by later spectroscopy, local degradation is related to a monomer fraction of polyamic acid that has not imidised (Figure 6.34).
SP-1 100°C SP-1 180°C
SP-1 220°C SP-1 260°C
Figure 6.13 Optical microscopy of worn polyimide SP-1 surfaces at high temperature, 50 N, 0.3 m/s
The thermoplastic TP-1 sliding surfaces are compared to sintered SP-1 by SEM evalua-tion (Figure 6.14). Thermoplastic sliding surfaces show three regimes as they are stronger influenced by a combination of chemical and thermal influences: (i) adhesive wear happens at 100 to 120°C with slight thermal softening at 120°C (T* = 228°C), (ii) irregular surfaces are noted at 120 to 180°C and correspond to a change in surface colour from originally transparent brown to opaque yellow that indicates chemical modifi-cations (imidisation), and (iii) melting happens at 260°C and smoothens the surface.
1 mm

Chapter 6. Thermal influences on tribology and micro structure of polyimides 149 SP-1 TP-1
120°
C
180°
C
260°
C
Figure 6.14 SEM microscopy of worn sintered polyimide SP-1 and thermoplastic polyimide TP-1
surfaces after sliding at high temperature, 50 N, 0.3 m/s 6.5.2.2. Sliding surfaces of graphite and PTFE filled polyimide The graphite depositions on SP-2 sliding surfaces (Figure 6.15) show different features depending on the sliding temperature: (i) graphite depositions are not homogeneously distributed at 60 to 100°C and have a shiny aspect, corresponding to high and unstable friction; abrasive grooves near the depositions occur through ploughing interaction with transferred graphite particles, and (ii) smooth surfaces with dull aspect and graphite depositions oriented along the sliding direction occur at high temperatures; abrasive grooves disappear progressively until a smooth surface is observed at 260°C. The PTFE depositions on TP-2 sliding surfaces (Figure 6.16) become progressively more homogeneously distributed. They soften and mix-up with a softened polyimide surface layer to form a smooth surface characteristic for adhesive wear.
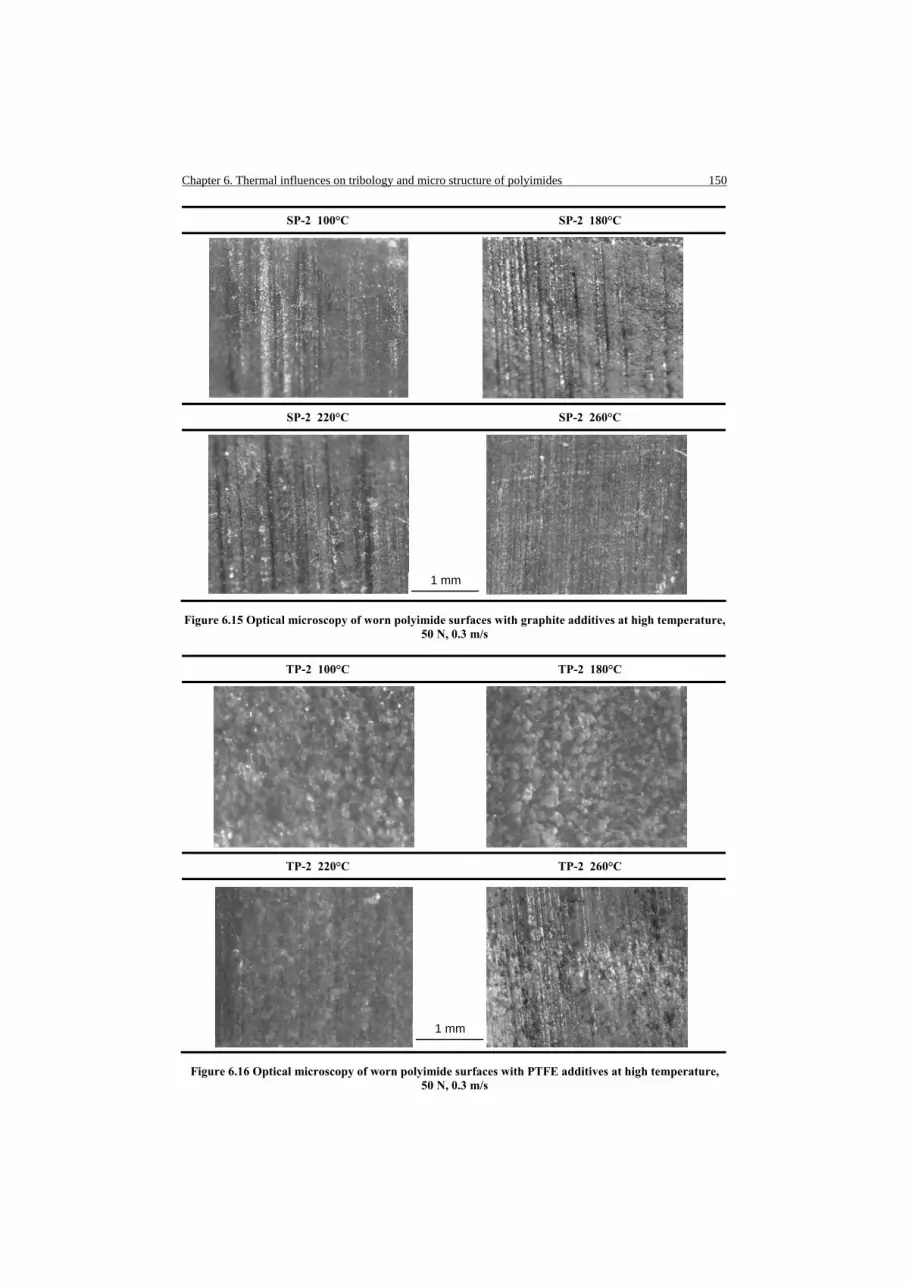
Chapter 6. Thermal influences on tribology and micro structure of polyimides 150
SP-2 100°C SP-2 180°C
SP-2 220°C SP-2 260°C
Figure 6.15 Optical microscopy of worn polyimide surfaces with graphite additives at high temperature,
50 N, 0.3 m/s
TP-2 100°C TP-2 180°C
TP-2 220°C TP-2 260°C
Figure 6.16 Optical microscopy of worn polyimide surfaces with PTFE additives at high temperature,
50 N, 0.3 m/s
1 mm
1 mm

Chapter 6. Thermal influences on tribology and micro structure of polyimides 151
0
10
20
30
40
50
60
70
80
90
100
0 100 200 300 400 500 600 700 800
Temperature (°C)
0
5
10
15
20
25
SP-1, N2
TP-1, air
SP-1, air
TP-1, air
98.0
98.5
99.0
99.5
100.0
0 100 200 300 400 500 600
SP-1
TP-1
SP-1, air
air180°C
dw/dT
Temperature (°C)
Res
idua
l wei
ght (
%)
Wei
ght-l
oss
rate
dw
/dT
(%/°C
) 380°C
6.6. Thermo-analytical analysis of polyimide wear debris A critical transition temperature T* = 180°C was noted in previous paragraphs leading to low friction and transfer for sintered polyimide. Transitions for thermoplastic polyimides occurred already at T* = 120 to 140°C. The transition manifested at different normal loads and it was concluded that these phenomena are mainly thermally activated. In this paragraph, the thermal stability of unworn polyimides is investigated in order to relate tribological transitions to intrinsic polymer temperatures. It will be illustrated that the polyimide is thermally stable to 600°C, while dehydration happens at 180°C. Transitions in sliding behaviour are thus mainly chemically induced. Also the thermal stability of wear debris is investigated in order to show that imidisation happens during sliding. 6.6.1. Thermal stability and transition temperatures of bulk material Implicit in the designation ‘high-temperature’ or ‘thermostable’ polymers are two basic criteria: (i) thermo-chemical stability – the ability to withstand oxidation at high temperatures in air, (ii) thermo-physical stability – the ability to retain substantial strength and modulus at elevated temperature depending on softening and melting. Thermogravimetric (TGA) measurements for unworn SP-1 and TP-1 in nitrogen or air atmosphere are plotted in Figure 6.17. Comparing the onset temperature of thermal degradation shows higher thermal stability of SP-1 in air (592°C) compared to nitrogen (550°C). The sample looses weight more gradually during heating in air, but the final residue is smaller than in nitrogen. This is attributed to oxidative degradation in air.
Figure 6.17 Thermogravimetric analysis (TGA) for unworn SP-1 and TP-1 in air and nitrogen atmosphere, recording weight loss and weight-loss rate as a function of heating temperature

Chapter 6. Thermal influences on tribology and micro structure of polyimides 152 Also Marinovic-Cincovic et al. [6.15] or Li et al. [6.16] found similar behaviour for thermoplastic polyimides, which is in contrast to the degradation behaviour of most other polymers. For polyimides, oxidation reactions result in the formation of cross-links during heating. The temperature with maximum degradation rate in air is 578°C for thermoplastic and 592°C for sintered polyimides. The decomposition interval for sintered structures is broader compared to thermoplastics, because the sintering process is a thermal treatment inducing a variety in molecular structures. A small change in slope at 380°C for SP-1 weight-loss curves corresponds to the melting temperature of TP-1. It indicates the influence of a small fraction original non-sintered polyimide. In the 200 to 400°C temperature region, the SP-1 weight lowers slightly while being constant for TP-1. The total weight loss at 450°C is 0.2 % for SP-1 and 0.7 % for TP-1 samples. Most important for tribological performance is the 1 % weight loss at 100 to 200°C with maximum weight-loss rate at 180°C, agreeing to the transitions in sliding properties. The weight-loss happens more gradual for SP-1 at 100 to 400°C temperatures compared to TP-1. This transition was recorded both in air and nitrogen atmospheres, indicating that oxidation is not a responsible mechanism. From a differential thermal analysis (DTA) in Figure 6.18, the transition at 180°C is related to a minimum in the heat flow curve for both SP-1 and TP-1, indicating an endotherm dehydration reaction. It implies an imidisation reaction associated with the absorption of heat. It is known from literature [6.17] that dehydration processes are generally found to spread over large temperature intervals, resulting in broad weight-loss step, in contrast to a secondary or melting transition. The dehydration reaction is reversible as it occurs both during a first and a second heating cycle through desorption of water molecules. The corresponding weight loss is higher for TP-1 than for SP-1, as the equilibrium percentage of absorbed water is larger for TP-1 (Table 3.4). Sintered polyimides SP-1 have no further transitions below the decomposition point of 578°C. Only a small change at 380 to 400°C is noted in parallel to the minor peak in weight loss rate (Figure 6.17) during a first heating cycle. It disappears in a second
(a) (b)
Figure 6.18 Differential thermal analysis (DTA) for two subsequent heating cycles (1) and (2) for polyimide bulk material, (a) SP-1, (b) TP-1
-8
-6
-4
-2
0
2
4
6
8
0 100 200 300 400 500 600 700
Temperature (°C)
Hea
t flo
w (µ
V)
-8
-7
-6
-5
-4
-3
-2
-1
0
0 100 200 300 400 500
Temperature (°C)
Hea
t flo
w (µ
V)
Tg
Tc
Tm
Trex
1
2
2 1

Chapter 6. Thermal influences on tribology and micro structure of polyimides 153 heating cycle, because the first heating step to 450°C further homogenised the sintered material. Thermoplastic polyimides TP-1 have clear and well-resolved transition temperatures: the glass transition Tg = 249.6°C, an exotherm crystallisation peak Tc = 302.8°C and a melting peak Tm = 387°C. During cooling, recrystallisation happens at Trex = 236°C. For a second heating step, the shift in crystallisation peak Tc = 330°C indicates improved crystalline zones. Present analysis indicates that a sintering process masks the transition temperatures, while a thermal cycle of heating in the DTA cell influences the transition temperatures for thermoplastic polyimides. In relation to previous sliding tests, frictional heating influences the thermoplastic structure while it has little influence on the sintered structure that is only sensitive to dehydration. Although DSC is commonly used to identify transition temperatures, it did not give clear results for SP-1. This problem arises from the high thermal stability of sintered poly-imides. Thermoplastic polyimides were already studied in literature by DSC [6.18] and give similar results to DTA (Figure 6.18b). Temperature modulated DSC (Chapter 4) is presently applied to SP-1, recording the specific complex heat capacity as the response to a periodical heating profile (Figure 6.19). A slight variation in slope is noted at the 180°C transition temperature. The sinusoidal heating regime is able to evoke thermal transitions that are not detectable by linear heating. Those transitions include not only the glass temperature Tg characteristic for increase in mobility of the molecular backbone and drop in mechanical properties, but rather illustrate secondary transitions where only relatively small parts or side groups locally gain rotational and/or vibrational freedom.
Figure 6.19 Temperature modulated differential scanning calorimetry (M-DSC) for SP-1 Transition temperatures in friction and wear for sintered SP-1 cannot be correlated to a traditional polymer glass transition Tg. Rather secondary transitions result in local reorientation of side groups in the polyimide structure and are further studied by Raman spectroscopy in next paragraph. Secondary transitions are also responsible for higher molecular mobility and explain the polyimide transfer to the steel counterface. The polymer stiffness remains constrained and is determined by the aromatic structures in the main molecular chain. It is significant that present transition did not manifest during tensile testing from manufacturer’s data [6.10], which is not further researched in this work. One hypothesis is that molecular shear is the prime deformation mode during sliding and depends strongly on the interference between orientation and hydration.
Temperature (°C) 0 100 200 300 400
0
0.5
1.0
1.5
2.0
2.5
C
ompl
ex C
p* (J
/gK
)

Chapter 6. Thermal influences on tribology and micro structure of polyimides 154 6.6.2. Thermo-analytical analysis of sintered wear debris
100°C 180°C
220°C 260°C
Figure 6.20 Optical microscopy of sintered polyimide SP-1 wear debris after sliding at
high temperature, 50 N, 0.3 m/s
It was reported in literature that the colour of thermoplastic polyimide wear debris varied with increasing temperature and became very dark near wear peaks [6.19], indicating that thermal decomposition was the main degradation mechanism. Comparing the maximum polymer surface temperatures T* and degradation region of 500 to 700°C for sintered polyimide reveals, however, that transitions are not caused by thermal degradation but rather by chemical and/or physical changes in structure. The morphology of sintered SP-1 debris (Figure 6.20) shows small particles after sliding at 100°C (characteristic for adhesive wear, Figure 6.13), conglomerated smooth particles above 180°C (characteristic for chemical reaction in the interface) and some debris with original sintered structure at 260°C (characteristic for overload). The change in morphology between low temperatures and high temperatures explains the maximum in wear rates at 180°C, since the transferred particles might act as an abrasive, with large chemically modified particles more harmful than small ones acting as an abrasive. Thermo-analytical DTA/TGA analysis of the wear debris particles is made to identify changes in thermal stability, weight loss and position of the endotherm peak (Figure 6.21, Table 6.6). Measurements will indicate that debris particles imidised in the inter-face during the frictional process at T* > 180°C. Two subsequent heating cycles from 23 to 450°C and 23 to 590°C at 20°C/min are applied, showing less variation between them compared to original polyimide, through homogenisation under frictional heating.
1 mm

Chapter 6. Thermal influences on tribology and micro structure of polyimides 155
Figure 6.21 Differential thermal analysis (DTA) of SP-1 wear debris after sliding at 60 to 260°C and different normal loads (a) 50 N, 0.3 m/s, (b) 200 N, 0.3 m/s
(note that the curves are shifted over a constant µV-value for better presentation)
-14
-12
-10
-8
-6
-4
-2
0
0 100 200 300 400 500 600Temperature (°C)
Hea
t flo
w (µ
V)
-8
-7
-6
-5
-4
-3
-2
-1
0
0 100 200 300 400 500 600Temperature (°C)
Hea
t flo
w (µ
V)(a)
(b)
260°C
180°C 100°C
80°C
60°C
260°C
180°C
100°C 60°C
unworn
unworn
220°C

Chapter 6. Thermal influences on tribology and micro structure of polyimides 156 No significant thermal degradation of the SP-1 wear debris is noted: the debris weight loss for each sliding temperature is restricted to 2 % during the first heating cycle. The weight loss during the second heating cycle is higher and solely concentrated at 450 to 590°C. The endotherm peak temperature or dehydration temperature Thydrat (maximum dehydration intensity) is determined from fitting curves in Figure 6.21 and it shifts towards higher temperatures for wear debris relatively to the unworn SP-1. The dehydration reaction of wear products depends on sliding temperature and normal loads: there is a general trend that the dehydration temperature increases for high sliding temperatures while this trend is stronger for high normal loads; at low loads, however, a critical bulk temperature of 180°C must be exceeded to increase the dehydration temperature. The upward shift in dehydration temperature of wear debris indicates chemical changes after sliding, such as imidisation, that cause a delay in dehydration. After formation of polyimide networks modified by sliding, higher temperatures or activation energy is needed for dehydration. Nevertheless, this process remains reversible during subsequent heating-cooling-heating cycles. According to Nagai et al. [6.20] it is known that polyimides are sensitive to water absorption, but its relation to polyimide structures that are modified by wear was not yet illustrated. Table 6.6. TGA weight loss and DTA endotherm peak position of SP-1 wear debris after sliding at 50 and 200 N, 0.3 m/s at high temperature
50 N 200 N
Weight loss (%)
Weight loss (%) Bulk
temperature (°C)
1st heating* 2nd heating*
Thydrat (°C)
1st heating* 2nd heating*
Thydrat (°C)
original 0.72 ± 0.02 13 ± 0.05 182 ± 0.2 0.72 13 182
60°C 0.64 16 204 1.45 32 200
100°C 1.51 18 199 1.82 32 220
180°C 1.59 18 192 0.94 31 222
220°C 1.15 18 197 0.23 30 228
260°C 1.20 18 200
0.20 30 230 * First heating between 23 to 430°C, second heating between 23 to 590°C
6.6.3. Thermo-analytical analysis of thermoplastic wear debris The variations in the structure of thermoplastic polyimide wear debris are more impor-tant than for sintered polyimides and can be well-correlated to different transitions in friction and wear. It mainly indicates thermal changes in the amorphous phase through crystallisation and/or cross-linking. The shift in dehydration temperature at 180°C as noted for sintered polyimides is less clear for thermoplastics through interference with complex phase changes. Thermal modifications have the upperhand for thermoplastics. Thermo-analytical DTA measurements of TP-1 debris under similar conditions to SP-1 are presented in Figure 6.22, during a first heating step (23 to 450°C) and a second heating step (23 to 590°C) at 20°C/min. The morphology of debris particles is shown in Figure 6.23 and corresponding TGA curves are given in Figure 6.24.

Chapter 6. Thermal influences on tribology and micro structure of polyimides 157 The original TP-1 has clear transition temperatures, but they smoothen for debris. Chemical reactions progressively change the thermoplastic polyimide structure into the properties of sintered polyimides that lack transitions and/or melting. Both sintering and/or sliding are thus considered as a ‘thermal treatment’ altering the polymer structure. The first heating step in DTA (Figure 6.22a) shows that the glass transition temperature Tg increases or finally disappears when it becomes smoothened over a broad interval from 230 to 280°C. The glass transition temperature Tg is representative for linear molecular structures in an amorphous ordering and shifting or disappearance therefore indicates that the amorphous zone is affected by cross-linking into the formation of a more stable and ordered structure after sliding at high temperature. This evolution is also reflected in the disappearance of a crystallisation peak Tc: it indicates that most polyimide has a crystalline form when attaining this heating temperature and confirms that the amorphous polyimide has changed into a crystalline structure under sliding. The melting exotherm Tm decreases in intensity and its maximum value increases from 387°C (unworn) to 391°C (after sliding at 140 to 180°C) in parallel to the formation of a crystalline structure and strongly cross-linked structures with higher melting point. The recrystallisation peak during cooling disappears by lacking crystal nucleation in the modified amorphous phase. The conclusion that the amorphous phase modifies under sliding agrees to visual observations that debris particles change from transparent to opaque yellow colour (Figure 6.23). Debris becomes brittle (and consequently acting more abrasive) after sliding in parallel to the behaviour of sintered polyimides. The second heating step in DTA (Figure 6.22b) reveals that the structural modifications of the amorphous phase are partially reversible after a first heating step. The amorphous glass transition temperature slightly manifests again at Tg = 249.6°C. This observation suggests that the crystalline structure established after sliding has degraded during thermal stabilisation at 400 to 430°C (2 minutes) after the first heating step. It is therefore concluded that the maximum polymer surface temperature T* during sliding was lower than the maximum temperature of 430°C during heating in the first thermo-analytical analysis, which agrees to calculations in Table 6.3. The transition zones in tribological properties of TP-1 (Figure 6.2b) are compared to wear debris evaluation and parallel transitions in thermo-analytical analysis are found:
• After sliding at 100 to 120°C (increasing friction), a fraction of dark coloured particles is visually observed (Figure 6.23, see B) indicating chemical degradation by hydrolysis. This is confirmed by TGA analysis that shows lowest thermal stability for 120°C wear debris (Figure 6.24).
• After sliding at 120 to 180°C (decreasing friction), a fraction of flake-like particles is visually observed (Figure 6.23, see C) indicating an increase in polyimide strength by imidisation. This is confirmed by TGA analysis that shows high thermal stability of those particles (Figure 6.24). The DTA analysis (Figure 6.22b) also indicates crystallisation or cross-linking of debris particles after 120 to 180°C sliding tests, although at lower temperature relatively to unworn TP.
• After sliding at 220 to 260°C (increasing friction), a fraction of rolled debris is visually observed (Figure 6.23, see D) indicating melting. As those particles are rapidly removed out of the sliding surface, TGA analysis show high thermal stability.

Chapter 6. Thermal influences on tribology and micro structure of polyimides 158
Figure 6.22 Differential thermal analysis (DTA) of TP-1 wear debris after sliding at 60 to 260°C and 50 N normal loads, (a) first DTA heating cycle, (b) second DTA heating cycle
(note that the curves are shifted over a constant µV-value for better presentation)
-16
-14
-12
-10
-8
-6
-4
-2
0
0 100 200 300 400 500
Temperature (°C)
Hea
t flo
w (µ
V)
-16
-14
-12
-10
-8
-6
-4
-2
0
0 100 200 300 400 500 600
Temperature (°C)
Hea
t flo
w (µ
V)
(a)
(b)
unworn
< 100°C 120°C 140°C
180°C 220°C
260°C
unworn
< 100°C
120°C 140°C
180°C
220°C 260°C
Tg
Tc
Tm
Tg
Tc
Tm

Chapter 6. Thermal influences on tribology and micro structure of polyimides 159
< 100°C
120°C
140 to 180°C
260°C
Figure 6.23 Optical microscopy of TP-1 wear debris after sliding at
high temperature, 50 N, 0.3 m/s
B
B
1 mm1 mm
C
D

Chapter 6. Thermal influences on tribology and micro structure of polyimides 160
Figure 6.24 Thermogravimetric (TGA) analysis of TP-1 wear debris after sliding at 60 to 260°C over a
heating cycle 1, cooling cycle 2, heating cycle 3 6.6.4. Thermo-analytical Mass Spectroscopy (MS) of sintered wear debris The emission of gaseous species during thermal decomposition SP-1 wear debris is analysed with a mass spectrometer coupled to DTA/TGA measurements. One single heating step from 23 to 600°C at 20°C/min is applied, using argon carrier stream. It will demonstrate that the instrumentation is sensitive to detect water volatilisation (only 1% weight loss) and confirms that the endothermic reaction at 180°C is surely related to dehydration. Other degradation products are characterised and have lower intensity, which further decreases when the sliding temperature was higher. Some spectra for SP-1 debris after sliding at 50 N, 0.3 m/s and 100, 180, 260°C, are given in Figures 6.25 to 6.27. Spectra represent the volatilisation intensity for a specific emission product as a function of the heating temperature. Each decomposition product is characterised by its atomic mass unit (a.m.u.) and intensities are related to the ion current (A) in the mass detector (scaled to sample weight), which is proportional to the concentration of decomposition product in the carrier stream. The totality of gaseous degradation products is represented by the carbon fraction (a.m.u. = 12, Figure 6.25) originating from CO2 or CO decomposing in the spectrometer. The intensities have a nearly constant baseline towards the decomposition point in parallel to Figure 6.17, showing that the 1 % weight drop at 100 to 200°C is not directly related to thermal decomposition. The highest carbonisation intensity is found for wear debris after a 180°C sliding test in parallel to highest weight loss in Table 6.6. It indica-tes that structures worn above 180°C become stable through imidisation during sliding. Most important decomposition fraction for tribological performance is the production of water (a.m.u. = 18, Figure 6.26). Water volatilisation occurs at 180 to 200°C heating temperatures as a peak intensity for the debris samples after 100°C sliding or a maxi-mum intensity for debris samples after 180 and 260°C sliding. Water volatilisation at 200 to 600°C heating temperatures depends on the sliding temperatures, showing:
70
75
80
85
90
95
100
105
0 100 200 300 400 500 600
Temperature (°C)
Res
idua
l wei
ght (
%)
220 to 260°C
140 to 180°C
< 100°C 120°C
Temperature (°C)
Res
idua
l wei
ght (
%)
1
2 3

Chapter 6. Thermal influences on tribology and micro structure of polyimides 161
0 100 200 300 400 500 600
Temperature (°C)
5.8 10-9
5.7 10-9
5.6 10-9
5.5 10-9
5.4 10-9
5.3 10-9
5.2 10-9
6.0 10-10
5.0 10-10
4.0 10-10
3.0 10-10
2.0 10-10
1.0 10-10
0.0 100
Inte
nsity
a.m
.u. =
18
(wat
er)
Inte
nsity
a.m
.u. =
16
(oxy
gen)
0 100 200 300 400 500 600
Temperature (°C)
6.9 10-9
6.8 10-9
6.7 10-9
6.6 10-9
6.5 10-9
6.4 10-9
6.3 10-9
6.2 10-9
1.29 10-8
1.27 10-8
1.25 10-8
1.23 10-8
1.21 10-8
1.19 10-8
Inte
nsity
a.m
.u. =
18
(wat
er)
for 1
80°C
deb
ris
Inte
nsity
a.m
.u. =
18
(wat
er)
for 2
60°C
deb
ris
600Temperature (°C)
Temperature (°C)
(a) (b)
Figure 6.26 Mass spectroscopy for dehydration of polyimide wear debris related to water fraction (a.m.u. = 18) and oxygen fraction (a.m.u. = 16) for (a) 100°C debris, (b) 180°C (♦) and 260°C (∆) debris
0 100 200 300 400 500 600 700
Temperature (°C)
1.8 10-11
Inte
nsity
a.m
.u. =
12
(car
bon)
1.6 10-11
1.4 10-11
1.2 10-11
1.0 10-11
8 10-12
6 10-12
4 10-12
2 10-12
0 100
Temperature (°C)
Figure 6.25 Mass spectroscopy for degradation of polyimide wear debris related to carbon fraction (a.m.u. = 12) for 100°C wear debris, ♦ 180°C wear debris, ∆ 260°C wear debris

Chapter 6. Thermal influences on tribology and micro structure of polyimides 162
0 100 200 300 400 500 600
Temperature (°C)Temperature (°C)
5.0 10-11
4.0 10-11
3.0 10-11
2.0 10-11
1.0 10-11
0.0 100 Inte
nsity
a.m
.u. =
30
(nitr
ogen
mon
oxid
e)
Figure 6.27 Mass spectroscopy for degradation of polyimide wear debris related to nitrogen monoxide
fraction (a.m.u. = 30) for 100°C wear debris, ♦ 180°C wear debris, ∆ 260°C wear debris (i) a constant or increasing tendency of water volatilisation for 100°C debris indicating progressive imidisation during heating, and (ii) a decreasing trend for 180 to 260°C wear debris indicating that debris is more inert by imidisation during sliding. The peak in water emission for high temperature wear debris broadens (Figure 6.26b) through variations in structure (and molecular weight) after wear. Water volatilisation agrees to the previously noted shift of dehydration temperature Thydrat in DTA thermographs, rising for debris after 180 to 260°C sliding (Table 6.6). A second small peak in a.m.u. = 18 intensities for debris after 100°C sliding occurs at 380°C and corresponds to small weight loss noted in Figure 6.17. The oxygen intensity (a.m.u. = 16) is plotted over the intensities of water volatilisation in Figure 6.26a and confirms that dehydration or water condensation is responsible for the noted endothermic reaction at 180°C. Argon carrier stream was used for present analysis in order to detect the nitrogen-related decomposition species. The nitrogen N2 fraction (a.m.u. = 28) cannot be observed in the spectrum because it overlaps with carbon-monoxide CO fraction (a.m.u. = 28) and higher spectral compositions (a.m.u. > 40) were not recorded. The nitrogen-monoxide NO fraction (a.m.u. = 30, Figure 6.27) has similar features to nitrogen N fraction (a.m.u. = 14). It is firstly stressed that the concentration of released nitrogen is a factor 10-2 to 10-3 smaller than water concentrations. The decomposition of polyimide wear debris into nitrogen monoxide is postponed and finally disappears with increasing sliding temperatures through formation of a strong imide structure after sliding. According to Ozawa et al. [6.21], the nitrogen-monoxide decomposition for polyimides is spread over a relatively long interval because it is a multiple-step process. Air carrier stream was used for a preliminary analysis of decomposition products and did not reveal changes as clear as in argon, because the gasses to be detected were elements of the air carrier stream. The combustion of wear debris in oxidative atmosphere resulted in a higher carbon fraction (a.m.u. = 12) than in inert argon atmosphere, with intensities of 4.10-11 at 100°C heating temperature, rising at 6.10-14/°C in air compared to 2.10-15/°C in inert argon (Figure 6.25).

Chapter 6. Thermal influences on tribology and micro structure of polyimides 163 6.7. Tribophysical analysis of polyimide wear surfaces According to Fusaro [6.22], the differences in friction and wear mechanisms for poly-imide at low and high temperature were generally attributed to higher polymer chain mobility. In previous paragraphs, it was shown that transitions are mainly related to chemical effects (dehydration) for sintered polyimides, while they are also governed by thermal effects (softening and crystallisation) for thermoplastic polyimides. In this paragraph, the friction-induced orientation and reorganisation of polyimide molecules or specific functional groups are detailed by means of Raman spectroscopy on worn sintered and thermoplastic surfaces. The hydrolysis reaction will be related to conversion of polyimide into its monomer precursors. The formation of an imide structure above 180°C will be related to structural reorganisation of C=O, C-N-C and C-O-C groups. 6.7.1. Raman spectroscopy and characterisation of bulk material Most Raman characterisation of polyimide in literature was done on thermoplastic films after low-force cloth rubbing [6.23]. Aligned polyimide layers are used to realise uniform and unidirectional liquid crystal (LC) orientation, which is essential for liquid crystal display (LCD) technology. The Raman technique has not been applied on semi-thermosetting or thermoplastic bulk polyimide so far for correlating transitions in friction and/or wear at 60 to 260°C to variations in molecular structure. First, reference spectra for unworn SP-1 and TP-1 polyimide (Figure 6.28) are charac-terised in relation to the molecular structures and influences of a sintering process. Also a scan of degraded SP-1 residue after thermo-analytical measurements at 400°C is made to indicate spectral changes (600°C residue did not give a signal through black colour).
Figure 6.28 Reference Raman spectra for (i) unworn TP-1, (ii) unworn SP-1 and (iii) degraded SP-1
0 5001000150020002500 3000 3500
Wavenumber (cm-1)
0.01
0.
02
0.03
0.
04
0.05
In
tens
ity (
a.u.
)
(i)
(ii)
(iii) 1599
.87

Chapter 6. Thermal influences on tribology and micro structure of polyimides 164 From literature [6.24], the Raman absorption bands can be assigned to fully cured PI (polyimide) and PAA (polyamic acid) as precursor or end-groups (Table 6.7). Raman absorption bands were identified during the imidisation process, where amide-related (PAA) bands disappear and imide-related (PI) bands correspondingly appear with heating temperature. In more detail, the respective bands for carboxylic acid and amide II at 1330 cm-1 and 1565 cm-1 gradually diminish and finally disappear at 250°C. Conversely, the imide peaks at 1395 cm-1 and 1786 cm-1 begin to appear during polymerisation at 80°C and enhance when the temperature increases to 250°C. As such, positive and negative cross-peaks could be determined by Yu et al. [6.25], investigating the ring closing process: it was concluded that during thermal imidisation the imide-related modes changed prior to the amide or carboxylic mode. Most typical bands for polyimide are the imide I (C=O stretch), imide II (C-N-C axial vibration stretch) and imide III (C-N-C transverse vibration stretch). Other bands for PAA and PI behave in the same manner as those of PAA and PI, respectively. Walsh et al. [6.26] made a more theoretical study on the flexibility of different bonds in the polyimide PMDA-ODA structure as a function of activation energies. It is valuable to investigate the changes of relative band intensities for monitoring decomposition (relationship between amide/imide bands) or orientation (relationship between imide bands) after sliding. The shoulder peak at 1613 cm-1 is assigned to aromatic imide groups and will therefore be used in this work as a reference peak for variations in the imide-related bands. Table 6.7. Characterisation of Raman absorption peaks for polyimide [6.25]
Raman absorption band
(cm-1) Poly(amic acid) PAA precursor Fully cured polyimide (PI)
753 Aromatic ring in dianhydride part
881 O-C=O or O=C-N (amide I)
1124 C-N-C transverse vibration (imide III)
1247 NH bend + CH stretch (amide III)
1330 Symmetric stretch of carboxylic acid
1394 C-N-C axial vibration (imide II)
1565 NH bend + CH stretch (amide II)
1601 Ring vibration of carboxylic acid
1613 Aromatic ring stretch in dianhydride part
1662 Carbonyl stretch (amide I)
1685 Asymmetric carboxylate stretch
1724 C=O stretch of free carboxylic acid
1728 C-CO-C asymmetric stretch (imide I)
1788 C-CO-C symmetric stretch (imide I)
3070 Aromatic C-H bend
Comparing a spectrum for SP-1 and TP-1 unworn samples (Figure 6.29), indicates significant changes in the polyimide structure through sintering or molecular composition, suggested by additional peaks and small shifts in TP-1 absorption bands:

Chapter 6. Thermal influences on tribology and micro structure of polyimides 165
Figure 6.29 Detailed variations in Raman spectra between TP-1 and SP-1 polyimide (unworn samples)
• The imide I and II bands change after sintering, with the imide I band at 1791 cm-1
(TP-1) shifting down to 1786 cm-1 (SP-1) and the imide II band at 1384 cm-1 (TP-1) shifting up to 1397 cm-1 (SP-1). A similar downward shift from 1791.52 cm-1 to 1789.90 cm-1 or upward shift from 1384.50 cm-1 to 1387.90 cm-1 was measured for unworn TP-1 relatively to TP-1 worn at 260°C: it shows similar modifications of the imide structure that is thermally affected by either sintering or sliding. The imide I band (1786 cm-1) was used by Yu et al. [6.25] to evaluate polymer-isation reactions and growth in polyimide chain length. Stuart [6.27] attributed a decrease in C=O stretching mode frequency at 1790 cm-1 to higher crystallinity or ordering, corresponding to present observations. During sintering, further imidisa-tion is indicated by rising intensity of the imide I band relatively to carboxylic acid from I (1791) / I (1601) = 1.21 (TP-1) to I (1791) / I (1601) = 2.17 (SP-1). The upward shift of the imide II band (1384 cm-1) agrees to disappearance of carbo-xylic acid in the CONH amide groups (mainly C-N stretch) located at 1350 cm-1. In this respect, the shoulder at the low wavenumber side of the imide II band in TP-1 weakens for SP-1 and the intensity for imide II / imide I increases from 0.54 (TP-1) to 1.00 (SP-1). In fully cured polyimide, the imide II band is located at 1400 cm-1.
• The imide III band has very low intensity for unworn TP-1 (and it will further
decrease after sliding), which results from the semi-crystalline structure for TP-1: a transverse orientation of C-N-C bonds is not favourably oriented for incorporation into a crystalline structure, while it fits in the amorphous SP-1 structure.
• A band at 1513 cm-1 grows after sintering and corresponds to aromatic C=C or C=N
stretching modes, which are normally found to be weak in thermoplastic polyimide according to Constantini et al. [6.28]. Two bands near the aromatic 1513 cm-1 band are related to amide precursor and decrease after sintering (they will further de-crease after sliding), i.e. the amide C-N band (amide II) at 1565 cm-1 and the amide N-H band at 1454 cm-1. Their lower intensities indicate imidisation after sintering.
1800 1900
Wavenumber (cm-1)
1700 1600 1500 1400 1300 1200 1100 1000
1786
.25
1612
.37
1601
.03
1513
.74
1397
.35
1124
.83
1791
.52
1611
.56
1384
.50
1287
.76
1175
.34
1006
.00
inte
nsity
(a.u
.)
SP-1
TP-1
1203
.32
1107
.39
1203
.24
1166
.76
1272
.83
amid
e C
=O
amid
e I
imid
e I
arom
atic
im
ide
carb
oxyl
ic
acid
arom
atic
am
ide
II C
-N
amid
e N
-H
imid
e II
amid
e C
ON
H
C-O
-C
amid
e III
imid
e III

Chapter 6. Thermal influences on tribology and micro structure of polyimides 166 • The TP-1 band at 1287 cm-1 is less intense for SP-1 compared to TP-1 and is related
to stretching of the C-O-C ether links. The latter structures are numerous in the molecular configuration of thermoplastic polyimide, serving chain flexibility. The band position of ether links agrees with, e.g., PEEK spectra. Also the intensification of a 726 cm-1 band for TP-1 is due to C-O-C ether links [6.29].
• An absorption band for TP-1 at 1006 cm-1 indicates stretching vibrations in
phenylene-phenylene (C6H6 – C6H6) bridge structures that are more prominent in the TP-1 structure than in the SP-1 structure.
• To the best of available literature [6.30], the 1203 cm-1 peak is an aromatic band
related to skeletal C-C stretch. The 1166 cm-1 band represents the asymmetric phenyl C6H6 group. According to Ishida et al. [6.31] the peak at 1163 cm-1 in the amorphous phase shifted to 1164 cm-1 in the crystalline polyimide spectrum. This upward shift is presently clear in amorphous SP-1 relatively to crystalline TP-1.
• The lower frequency spectrum for polyimides was scarcely studied in literature. It is
presently noted that the 773 cm-1, 753 cm-1 and 702 cm-1 bands gain intensity after sintering (see later, e.g. Figure 6.44) as they are presumably related to aromatic ring vibrations. The high frequency spectrum after sintering reveals (i) presence of cyano-aromatic species (2227 cm-1), and (ii) disappearance of C-H aromatic bending (3073 cm-1) through cross-linking.
Degradation of SP-1 after heating at 400°C is illustrated by the spectrum in Figure 6.28 and micrographs in Figure 6.30. Raman spectroscopy does not reveal D (disordered) and G (graphitic) carbon bands at 1365 cm-1 and 1520 to 1555 cm-1, in contrast to Lippert et al. [6.32] after carbonisation. Also Raimondi et al. [6.33] studied carbonisation of poly-imide after laser irradiation and found only two local polycrystalline carbon bands in the spectrum. Presently, the imide-related bands remain in the spectrum and carbonisation is not revealed. There are only indications of destabilisation in the dianhydride part by lowering of the 1601 cm-1 absorption peak towards 1599 cm-1 and broadening at the 1620 cm-1 side (see inset Figure 6.28). It will be clear from next analysis on worn poly-imide surfaces that none of the surfaces degraded into carbon bands.
(a) (b)
Figure 6.30 Degradation and carbonisation of SP-1 after heating in a hot-air oven for 1 hour at (a) 400°C, (b) 600°C
1 mm

Chapter 6. Thermal influences on tribology and micro structure of polyimides 167 6.7.2. Raman spectroscopy of worn sintered polyimide surfaces The variation in relative intensity of some Raman bands will be followed as a function of the applied bulk temperature during sliding, illustrating hydrolysis and imidisation. It was mentioned by Ge et al. [6.34] that FT-Raman spectra of thick polyimide films are not strongly affected by rubbing because of sensitivity lack, but present study reveals some clear changes that can be related to tribological performance. The Raman spectra of SP-1 surfaces slid at, e.g., 100 N, 0.3 m/s, 60 to 260°C and 200 N, 0.3 m/s, 100 to 260°C are shown in Figure 6.31. Spectra for 50 and 150 N sliding tests were also made.
(a)
(b)
Figure 6.31 Raman spectra of worn SP-1 surfaces after sliding at different bulk temperatures and (a) 100 N normal load, 0.3 m/s, (b) 200 N normal load, 0.3 m/s
1900 1800 1700 1600 1500 1200 1300 1400 1000 1100
Wavenumber (cm-1)
Inte
nsity
(a.u
.)
Wavenumber (cm-1) 1000 1100 1200 1300 1400 1500 1600 1700 1800 1900
60°C
100°C
180°C
220°C
260°C
imid
e I
imid
e II
imid
e III
C-O
-C
arom
atic
imid
e
carb
oxyl
ic a
cid
Inte
nsity
(a.u
.)
180°C
220°C
260°C
100°C

Chapter 6. Thermal influences on tribology and micro structure of polyimides 168
1600
1602
1604
1606
1608
1610
1612
1614
1616
0 50 100 150 200 250 300
Bulk temperature (°C)
Wav
enum
ber (
cm-1)
200 N
50 N
1.00
1.05
1.10
1.15
1.20
1.25
1.30
0 50 100 150 200 250 300
Bulk temperature (°C)
Rel
ativ
e in
tens
ity
imid
e I (
1612
) / c
arbo
xylic
aci
d I (
1061
)
50 N 100 N
200 N
hydrolysis
imidisation
6.7.2.1. Relation between polyimide and polyamide-acid characteristic groups The sensitivity of the polyimide (PI) structure to hydrolysis was demonstrated by thermal analysis. However, what effects have water absorption to the polyimide structure and what is its relation to sliding? The two hypothesis for structural changes are: (i) the reversion of PI into PAA caused by ring-opening reactions, or (ii) the formation of cross-links between adjacent molecules. The relation between imide structure and hydrolysed carboxylic acid structure is illustrated by comparing the 1612 cm-1 and 1601 cm-1 band, respectively (Figure 6.32). For a constant 1601 cm-1 position, there is a downward shift in the 1612 cm-1 wave-number at 100 to 140°C at different normal loads. The lower frequencies represent deterioration of the imide structure, partially changing into polyamic acid that is charac-terised by the 1601 cm-1 band. Enhancement of the imide structure through ring-closing of carboxylic acid is given by an upward shift of 1612 cm-1 and establishes at 180 to 200°C. Hydrolysis at 100 to 140°C is also reflected in the relative intensity I (1612) / I (1601), with a maximum in hydrolysis and minimum in imidisation reactions at 140°C for each normal load. Dehydration happens most intensively at 180°C irres-pective of the 50 to 150 N normal loads, represented by a maximum 1612 cm-1 band. (a) (b)
Figure 6.32 Raman analysis of imide aromatic band (1612 cm-1) and carboxylic acid band (1601 cm-1) for SP-1, (a) wavenumber position, (b) relative intensity
Wav
enum
ber (
cm-1
)

Chapter 6. Thermal influences on tribology and micro structure of polyimides 169
1.4
1.6
1.8
2.0
2.2
2.4
0 50 100 150 200 250 300
Bulk temperature (°C)
I (17
88) /
I (1
601)
2
2.1
2.2
2.3
2.4
2.5
2.6
2.7
0 50 100 150 200 250 300
Bulk temperature (°C)
I (13
95) /
I (1
601)
50 N
100 N
200 N
100 N
50 N
200 N
At 50 to 100 N loads, the imide content during sliding at temperatures above 180°C slightly increases. At higher loads, however, the maximum intensity of imidisation is limited in a very small temperature range around 180°C and degradation happens at 200 to 260°C. Degradation is limited at 100 N while it happens earlier at 200 N, given from decreasing wavenumber position and lowering imide intensity. The maximum polymer surface temperature T* = 227°C for a 200 N sliding test at 180°C indicates chemical degradation. The 1612 cm-1 band only represents the aromatic imide part, but also characteristic C=O imide groups (1788 cm-1) and C-N-C imide groups (1395 cm-1) show similar trends relatively to the carboxylic acid structure (Figure 6.33). The 1788 cm-1 position shifts down from 1787.12 cm-1 (60°C) to 1785.19 cm-1 (140°C) and it shifts up from 1789.12 cm-1 (180°C) to 1791.11 cm-1 (260°C) at 50 N normal loads. The minimum imide I intensity through hydrolysis at 140°C is more pronounced for the 1788 cm-1 band than observed for the aromatic imide ring at 1612 cm-1, as mainly the C=O groups with high polarity are affected through hydrolysis. Imidisation starts at 180°C and shows clearer evolutions at 180 to 260°C by additional orientation of the functional C=O polyimide groups (see next paragraph). The C-N-C imide bonds relatively to the carboxylic acid indicate identical decreasing and increasing tendencies. The minimum in the curve has shifted, however, from 140 to 180°C as the C-N-C structures are not directly hydrolysed. Hydrolysis is mainly affecting the C=O bonds and aromatic imide rings. At high loads, other reactions happen to the C=O and C-N-C structures with a decreasing intensity of imide-related bonds. According to Li et al. [6.35], a drop in C=O was also found for PEEK in the high load region and not in the low load region, correlated to bond rupture and radical formation by higher mechanical energy input.
(a) (b)
Figure 6.33 Raman analysis of imide bands (1788, 1395 cm-1) and carboxylic acid band (1601 cm-1) for SP-1, (a) imide I (C=O) relative intensity, (b) imide II (C-N-C) relative intensity
Figure 6.34 demonstrates that black spots on the polyimide SP-1 surface after sliding at 260°C (see e.g. Figure 6.13) correspond to degradation of carboxylic acid groups. Although the imide structure is thermally stable without significant degradation below 592°C, a part of the hydrolysed polyamic acid degrades at 180 to 260°C before it reconverted into imide during sliding at those sliding temperatures.

Chapter 6. Thermal influences on tribology and micro structure of polyimides 170
Figure 6.34 Chemical degradation (black spots) on the polyimide surface through hydrolysis at 50 N
According to Ge et al. [6.34], soft rubbing of polyimide films on a rotating drum wrapped with velvet progressively enhances the 1612 cm-1 vibration mode. It agrees to present work at mild sliding conditions (bulk temperature below 100°C), but disconti-nuities over a broad rang of sliding parameters better relate to the observed tribological transitions. They effectively demonstrate the importance of hydrolysis of polyimides at high temperatures. The maximum intensity of hydrolysis at 140°C relates to minimum wear rates at 50 N sliding. The COOH acid groups act as a lubricant to the polyimide surface but the hydrolysed structure prevents transfer film formation because of limita-tions in strength. Another theory is that the high polarity of C=O groups is neutralised by hydrolysis and minimises adhesive interaction with the counterface, preventing adhesion of wear debris. At 180°C, the COOH groups recombine through intramolecular conden-sation and strength increases by imide formation that allows for better transfer. This reaction also happens to separate debris particles, suggested by the SEM microscopies described in Figure 6.11. The imide reaction at 180°C causes a discontinuity with maxi-mum friction, but it is beneficial for lower friction and stable wear at high temperature. 6.7.2.2. Relation between polyimide characteristic groups The intensities of imide-related absorption bands relatively to the aromatic imide structure indicate the relative (re-)orientation of functional groups within the polyimide. • The orientation of the C=O side-groups relatively to the aromatic imide ring is given
by the intensities of 1788 cm-1 and 1612 cm-1 bands (Figure 6.35a). The imide I band intensifies as a function of bulk temperatures and 50 N. The C=O group becomes progressively stretched through shear stresses and minor heating of the sliding surface, determining the polymer chain mobility. Fukuhara et al. [6.36] investigated the thermally activated structural changes in polyetherimide by internal friction and also concluded that relaxation induced important C=O motions. How-ever, the relative intensity remains constant at 140 to 180°C sliding temperatures because the previously detailed hydrolysis reactions restrict the molecular mobility in this temperature range. At low loads, the polymer side-groups are more easily oriented compared to the molecular backbone. This orientation is constrained at 100
1500 1600 1700
Wavenumber (cm-1)
inte
nsity
(a.u
.)
260°C
220°C
180°C
140°C
100°C
1800 1700 1600 Wavenumber (cm-1)
220°C
260°C
Car
boxy
lic a
cid
1 mm

Chapter 6. Thermal influences on tribology and micro structure of polyimides 171 to 200 N normal loads (decreasing trend and lower intensity), where only at 260°C the molecular movement allows for reorientation of C=O parts. At high loads, chemical reactions such as radical formation near the C=O parts, according to Li et al. [6.35], rule over physical reorientation by high mechanical energy input.
A shoulder band at lower intensity (1780 cm-1) develops for bulk temperatures above 180°C (Figure 6.35b). According to Ishida et al. [6.37], high packing densities in an imidised part of the polymer matrix can cause electronic interactions between polar groups of different segments, thereby changing the delocation of the π electrons in the C=O group and hence the absorption frequency. This packing densification agrees to present imidisation reactions above 180°C.
(a) (b)
Figure 6.35 Raman analysis of the imide I band (1788 cm-1, C=O functional groups) for SP-1, (a) relative intensity, (b) absorption peak at different temperatures, 50 N
• The orientation of the C-N-C backbone structure relatively to the aromatic imide ring is given by the intensities of 1124 cm-1 and 1612 cm-1 bands (Figure 6.36a). The imide III band at 1124 cm-1 represents the C-N-C transverse orientation and progressively increases at higher sliding temperatures and higher normal loads. This structural evolution happens more gradually compared to the C=O groups, because the C-N-C bonds are not directly influenced or constrained by additional hydrolysis reactions. The imide II vibration at 1395 cm-1 represents the axial C-N-C vibration mode and shows a different trend at high temperatures. The difference between C-N-C transverse and axial vibration is given by the intensity ratio of the 1124 cm-1 and 1395 cm-1 bands (Figure 6.36b). It shows that the transverse vibration decreases at high temperatures in favour of the axial vibration, indicated by a maximum relative intensity at 180°C. It is concluded that the axial C-N-C structure is promoted by shear stresses and fits better in the imidised structure that develops under sliding. A reorientation of C-N-C at 180°C agrees with the observed transition in friction and maximum in wear rates. It is related to the endotherm reac-tion in the polyimide bulk, as dehydration allows for additional rotational freedom of the molecular chains. Orientation is concentrated on C=O groups at low load (50 N, Figure 6.35), while it is concentrated on C-N-C at high load (200 N, Figure 6.36).
1.2
1.3
1.4
1.5
1.6
1.7
1.8
1.9
2.0
2.1
0 50 100 150 200 250 300
Bulk temperature (°C)
I (17
88) /
I (1
612)
100 N
200 N
50 N
Wavenumber (cm-1) 1700 1800 1900
140°C
180°C
100°C
220°C
60°C
inte
nsity
(a.u
.)
1780

Chapter 6. Thermal influences on tribology and micro structure of polyimides 172
1300 1200 1100
100°C
140°C
180°C
220°C
Wavenumber (cm-1)
1272
cm
-1
inte
nsity
(a.u
.)
0.10
0.12
0.14
0.16
0.18
0.20
0.22
0.24
0.26
0.28
0.30
0 50 100 150 200 250 300
Bulk temperature (°C)
I (12
72) /
I (1
612)
50 N
100 N
200 N
0.32
0.34
0.36
0.38
0.40
0.42
0.44
0.46
0 50 100 150 200 250 300
Bulk temperature (°C)
I (11
24) /
I (1
395)
50 N
100 N
200 N
0.6
0.7
0.8
0.9
1.0
1.1
0 50 100 150 200 250 300
Bulk temperature (°C)
I (11
24) /
I (1
612)
50 N
100 N
200 N
(a) (b)
Figure 6.36 Raman analysis of the imide II band (1385 cm-1, C-N-C axial) and imide III band (1124 cm-1, C-N-C transverse), (a) imide III to imide aromatic relative intensity, (b) imide II / imide III intensity
• The orientation of the C-O-C backbone structure relatively to the aromatic imide ring is given by the intensities of 1272 cm-1 and 1612 cm-1 bands (Figure 6.37). Ge et al. [6.34] attributed a band near 1290 cm-1 to general phenylene-phenylene bridge stretching, containing an oxygen atom in present PMDA-ODA polyimide. Also Sakamoto et al. [6.38] reported explicitly that this band corresponds to a C-O-C structure in polyimide. These assignments are more likely than assumptions of Lippert et al. [6.32], who attributed the 1272 cm-1 band to degradation products after laser ablation of thermoplastic polyimide. The relative intensities of 1272 cm-1 and 1612 cm-1 bands for 50 to 200 N sliding tests show similar trends as a function of sliding temperature. The C-O-C intensity above 180°C decreases, showing that higher molecular chain mobility above the transition temperature allows for tilting of the ether structure. It is interesting to note that extrapolation of the decreasing
(a) (b)
Figure 6.37 Raman analysis of the C-O-C ether bands at 1272 cm-1 for SP-1, (a) relative intensity, (b) absorption peak at different temperatures, 50 N
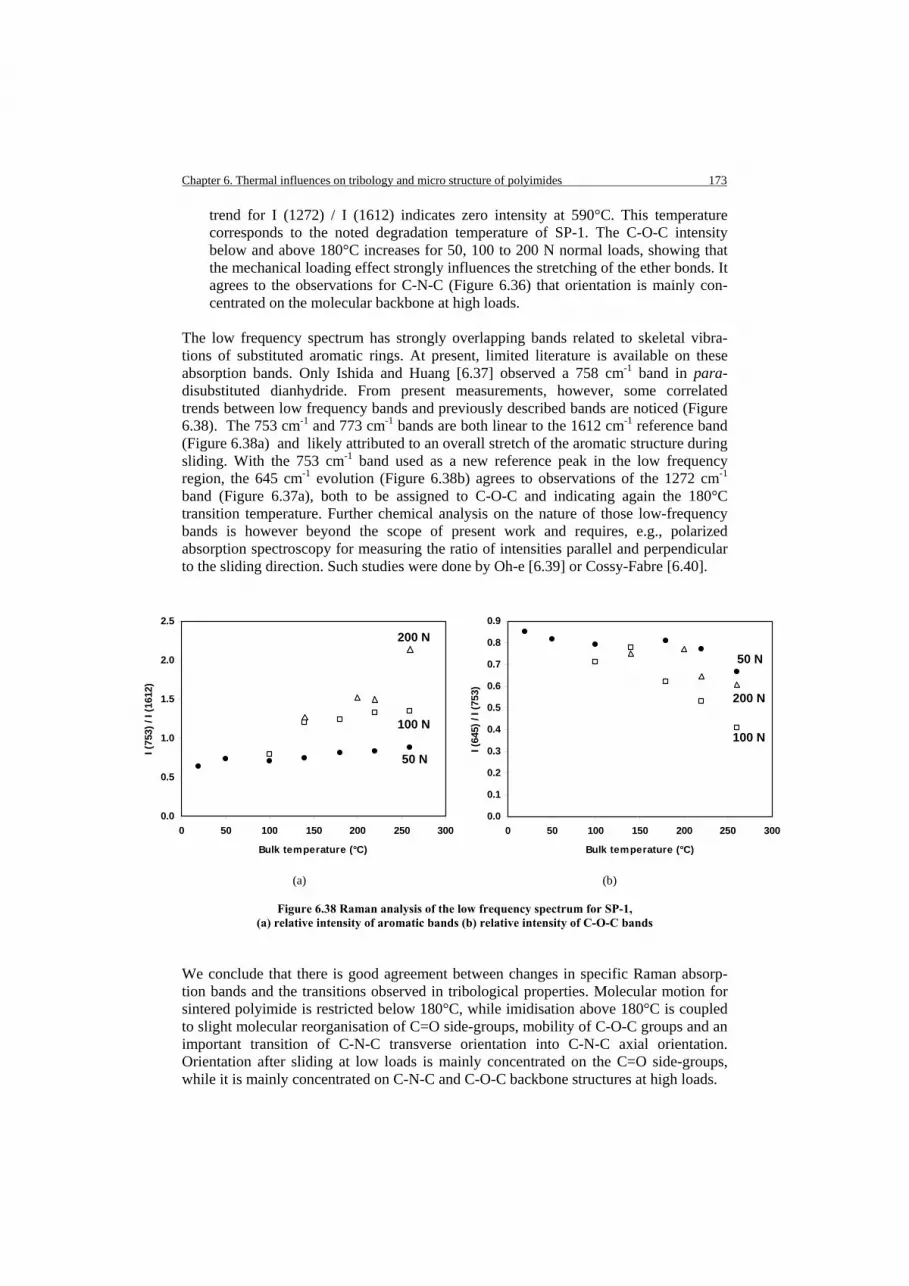
Chapter 6. Thermal influences on tribology and micro structure of polyimides 173
trend for I (1272) / I (1612) indicates zero intensity at 590°C. This temperature corresponds to the noted degradation temperature of SP-1. The C-O-C intensity below and above 180°C increases for 50, 100 to 200 N normal loads, showing that the mechanical loading effect strongly influences the stretching of the ether bonds. It agrees to the observations for C-N-C (Figure 6.36) that orientation is mainly con-centrated on the molecular backbone at high loads.
The low frequency spectrum has strongly overlapping bands related to skeletal vibra-tions of substituted aromatic rings. At present, limited literature is available on these absorption bands. Only Ishida and Huang [6.37] observed a 758 cm-1 band in para-disubstituted dianhydride. From present measurements, however, some correlated trends between low frequency bands and previously described bands are noticed (Figure 6.38). The 753 cm-1 and 773 cm-1 bands are both linear to the 1612 cm-1 reference band (Figure 6.38a) and likely attributed to an overall stretch of the aromatic structure during sliding. With the 753 cm-1 band used as a new reference peak in the low frequency region, the 645 cm-1 evolution (Figure 6.38b) agrees to observations of the 1272 cm-1 band (Figure 6.37a), both to be assigned to C-O-C and indicating again the 180°C transition temperature. Further chemical analysis on the nature of those low-frequency bands is however beyond the scope of present work and requires, e.g., polarized absorption spectroscopy for measuring the ratio of intensities parallel and perpendicular to the sliding direction. Such studies were done by Oh-e [6.39] or Cossy-Fabre [6.40]. ²
(a) (b)
Figure 6.38 Raman analysis of the low frequency spectrum for SP-1, (a) relative intensity of aromatic bands (b) relative intensity of C-O-C bands
We conclude that there is good agreement between changes in specific Raman absorp-tion bands and the transitions observed in tribological properties. Molecular motion for sintered polyimide is restricted below 180°C, while imidisation above 180°C is coupled to slight molecular reorganisation of C=O side-groups, mobility of C-O-C groups and an important transition of C-N-C transverse orientation into C-N-C axial orientation. Orientation after sliding at low loads is mainly concentrated on the C=O side-groups, while it is mainly concentrated on C-N-C and C-O-C backbone structures at high loads.
0.0
0.5
1.0
1.5
2.0
2.5
0 50 100 150 200 250 300
Bulk temperature (°C)
I (75
3) /
I (16
12)
0.0
0.1
0.2
0.3
0.4
0.5
0.6
0.7
0.8
0.9
0 50 100 150 200 250 300
Bulk temperature (°C)
I (64
5) /
I (75
3)
50 N
100 N
200 N
50 N
100 N
200 N

Chapter 6. Thermal influences on tribology and micro structure of polyimides 174 6.7.3. Raman spectroscopy of worn thermoplastic polyimides The Raman spectra of TP-1 surfaces slid at 50 N, 0.3 m/s, 60 to 260°C are shown in Figure 6.39. Also TP-2 surfaces were analysed after sliding under similar conditions and show identical bands. Most significant differences in the spectra for sintered and thermoplastic polyimide wear surfaces are found at 1612 cm-1 bands, disappearing above 180°C sliding temperatures for TP-1 and above 220°C sliding temperatures for TP-2. It will be demonstrated that TP-1 surfaces suffer thermal degradation besides hydrolysis.
Figure 6.39 Raman spectra for worn TP-1 surfaces after sliding at different bulk temperatures and (a) 100 N normal load, 0.3 m/s, (b) 200 N normal load, 0.3 m/s
The positions and relative intensities of the 1612 cm-1 and 1601 cm-1 band (Figure 6.40) indicate that the imide part for thermoplastic polyimide TP-1 degraded more severely under sliding compared to sintered polyimide SP-1: (i) TP-1 reverses into polyamic acid by hydrolysis at 100 to 120°C through chemical degradation (while hydrolysis for SP-1 happened at 100 to 180°C), and (ii) TP-1 finally decomposes at 180 to 260°C through additional thermal degradation (while imidisation happened for SP-1 at 180 to 260°C). There is good agreement between the noted transitions in friction (Figure 6.2), the wear debris morphology (paragraph 6.6.3) and present Raman measurements (Figure 6.40b) for thermoplastic polyimide: (i) the hydrolysis at 100 to 120°C agrees to increasing friction and chemical degradation of debris noted by change in colour, and (ii) the intermediate imidisation at 140 to 180°C was reflected in decreasing friction with flake-like transfer. The imidisation reaction does not favour thin transfer, as it strengthens the polymer surface with consequently large wear debris particles. Also compared to SP-1 polyimide with higher imidisation degree (note that I (1612) / I (1601) = 1.17 for SP-1 and 1.05 for TP-1), transfer happened more difficultly.
Wavenumber (cm-1) 1000 1100 1200 1300 1400 1500 1600 1700 1800 1900
60°C
100°C
180°C
220°C
260°C
Inte
nsity
(a.u
.)
1791
1612
1601
1521
1488
1451
1384
1286
1201
1174
1006

Chapter 6. Thermal influences on tribology and micro structure of polyimides 175
0.8
0.9
1.0
1.1
1.2
0 50 100 150 200 250 300
Bulk temperature (°C)
imidisation
hydrolysis
degradation
Rel
ativ
e in
tens
ity
I (16
12) i
mid
e / I
(160
1) c
arbo
xylic
aci
d
Figure 6.40 Raman analysis of imide aromatic band (1612 cm-1) and carboxylic acid band (1601 cm-1)
for TP-1 () and TP-2 () at 50 N, 0.3 m/s, (a) wavenumber position, (b) relative intensity
Thermal degradation for TP-1 at 180 to 260°C agrees to melting with unstable friction and thick transfer. Thermal decomposition results in the reversion of polyimide into its monomers. The formation of CONH amide groups is confirmed by a shoulder developing around 1350 cm-1 at 220 and 260°C. The extrapolation of relative intensities I (1612) / I (1601) towards zero intensity learns that imide completely disappears at 590°C, corresponding to the decomposition temperature of TP-1 from TGA. It is obvious that the decomposition for TP-2 is somewhat retarded due to lower friction compared to TP-1. Depolymerisation of aromatic structures for TP-1 weakens strength and results in high wear. Thermal decomposition lacks for SP-1 that further imidises during sliding. Some information on polyimide degradation is available in literature, but there are no universally accepted mechanisms. Cella et al. [6.41] showed that presence of water or oxygen rapidly accelerates the degradation of thermoplastic polyimides. Atmospheric moisture is, however, not the only source of water for hydrolytic degradation. Water also arises from several sources such as cyclisation of amic acids, condensation of unreacted amine with acid or anhydride groups and condensation of unreacted amines with imide links. Hydrolytic degradation results generally in chain scission and weight loss. For this reason, Kuroki [6.42] reported difficulties in crystallisation of polyimides below 260°C, which is also observed in present sliding tests on thermoplastic polyimides.
1600
1602
1604
1606
1608
1610
1612
0 50 100 150 200 250 300
Bulk temperature (°C)
Wav
enum
ber (
cm-1)
Wav
enum
ber (
cm-1
)
(a)
(b)

Chapter 6. Thermal influences on tribology and micro structure of polyimides 176 The relative intensities of imide-related absorption bands for TP-1 indicate the following trends: • The C=O stretching mode or imide I (Figure 6.41a) for TP-1 varies stronger
than for SP-1. The Raman shifts do not develop continuously, but they decrease mainly above 180°C in parallel to a transition in friction and wear regime. After sliding, the TP-1 structure evolutes towards the SP-1 structure and extrapolation shows that it becomes equal for a sample hypothetically slid at 400 to 450°C. When TP-1 is heated under a static load at 400°C in a hot air-oven, the position of the C=O band decreases relatively to the original material due to crystallisation. However, the intensities measured from combined mechanical-thermal actions are lower and indicate additional orientation effects. The decrease in relative intensity for C=O (Figure 6.41b) after sliding of TP-1 is opposed to the increase in intensity after sliding of SP-1. It suggests different effects of shear stresses on stretching of the side groups. The molecular repeat unit for SP-1 is more compact and it has therefore high shear resistance with low probability of orientation in the main polymer chain; orientation mainly concentrates on the side groups. Flexible TP-1 molecular chains allow for higher orientation in the molecular backbone. The TP-2 has similar variations in both wavenumbers and relative intensities compared to TP-1, indicating good repeatability of the Raman spectros-copy technique. The lower intensities for TP-2 compared to TP-1 relate to the lower friction forces on TP-2 surfaces.
(a) (b)
Figure 6.41 Raman analysis of the imide I band (1788 cm-1, C=O functional groups) for TP-1 () and TP-2 () at 50 N, 0.3 m/s, (a) peak position, (b) relative intensity
• The C-N-C axial stretch or imide II (1384 cm-1) enhances after sliding at 100 to 180°C, while it lowers at high sliding temperatures due to degradation (Figure 6.42). The imide III transverse C-N-C stretch (1108 cm-1) has very low intensity for the unworn samples and further decreases after sliding. It shows that the transverse orientation does not fit in the semi-crystalline structure of thermoplastic polyimides, while the crystalline structure further develops under shear at 140 to 180°C.
1785
1786
1787
1788
1789
1790
1791
1792
0 50 100 150 200 250 300 350 400
Bulk temperature (°C)
Wav
enum
ber (
cm-1)
0.7
0.8
0.9
1.0
1.1
0 50 100 150 200 250 300
Bulk temperature (°C)
I (17
90) /
I (1
612)
SP-1 reference
static heating
TP
dynamic

Chapter 6. Thermal influences on tribology and micro structure of polyimides 177
0.00
0.02
0.04
0.06
0.08
0.10
0.12
0 50 100 150 200 250 300
Bulk temperature (°C)
I (11
08) /
I (1
612)
0
0.1
0.2
0.3
0.40.5
0.6
0.7
0.8
0.9
0 50 100 150 200 250 300
Bulk temperature (°C)
I (13
84) /
I (1
612)
(a) (b)
(c)
Figure 6.42 Raman analysis of the imide II band (1385 cm-1, C-N-C axial) and imide III band (1108 cm-1,
C-N-C transverse) for TP-1 () and TP-2 () at 50 N, 0.3 m/s, (a) imide II to imide aromatic relative intensity, (b) imide III to imide aromatic relative intensity, (c) peak position
The disappearance of C-N-C axial stretching at 180°C and lack of C-N-C transverse stretching for TP-1 are important differences compared to the structural changes for SP-1, where a transverse-into-axial transition happens at 180°C.
• The C-O-C stretching clearly increases after sliding relatively to unworn samples
(Figure 6.43a). It is more pronounced for TP-1 compared to TP-2 in parallel to the higher sliding forces acting on unfilled TP-1 surfaces. For sintered polyimides SP-1 it was mainly the normal load that affected the intensity of the C-O-C band at 100 to 180°C (Figure 6.37), while for thermoplastic polyimides also the sliding tem-perature importantly contributes to higher band intensities. This effect agrees to the better chain flexibility and thermoplastic properties. Also the 1006 cm-1 band relates to a flexible phenylene-phenylene bridge structure and show similar trends to the 1287 cm-1 band (Figure 6.43a).
From a strong variation in C-O-C stretch (Figure 6.43) and slight variation in C=O stretch for thermoplastic polyimides, it is concluded that molecular orientation during sliding at 50 N is mainly located in the molecular backbone rather than on side groups, in contrast to sintered polyimide.
1382
1384
1386
1388
1390
1392
1394
1396
1398
1400
0 50 100 150 200 250 300
Bulk temperature (°C)
Wav
enum
ber (
cm-1)
SP-1
Wav
enum
ber (
cm-1
)

Chapter 6. Thermal influences on tribology and micro structure of polyimides 178 (a) (b)
Figure 6.43 Raman analysis of the ether and phenylene-phenylene bridge bands for TP-1 () and TP-2 () at 50 N, 0.3 m/s, (a) relative intensity for C-O-C stretch (1287 cm-1),
(b) relative intensity for phenylene-phenylene stretch (1006 cm-1)
The low frequency spectrum for SP-1 (unworn), TP-1 (worn at 80 and 260°C) and TP-2 (worn at 80 and 260°C) is depicted in Figure 6.44. Its features are difficult to correlate. From our experience with PTFE-filled thermoplastic polyester (Figure 10.20), a band around 732 cm-1 could be assigned to PTFE surface depositions. This band does not clearly manifest for unworn TP-2 through overlap with imide-related bands. Also after sliding no clear signal for PTFE depositions on the TP-2 surface are detected by Raman spectroscopy. Two bands at 750 and 700 cm-1 slightly develop after sliding of thermo-plastic polyimide, indicating an evolution of the thermoplastic towards the sintered polyimide structure.
Figure 6.44 Low frequency spectrum for unworn SP-1, worn TP-1 and worn TP-2 at 50 N, 0.3 m/s
0.50
0.55
0.60
0.65
0.70
0.75
0 50 100 150 200 250 300
Bulk temperature (°C)
I (12
87) /
I (1
612)
0.60
0.65
0.70
0.75
0.80
0.85
0 50 100 150 200 250 300
Bulk temperature (°C)
I (10
06) /
I (1
612)
1000 900 800 700 600 Wavenumber (cm-1)
SP-1, unworn
TP-1, 80°C
TP-1, 260°C
TP-2, 80°C
TP-2, 260°C
inte
nsity
(a.u
.)
853.
98
825.
94
803.
27
773.
54
753.
29
724.
74
702.
54
661.
61
645.
48
780
722
629
845
750
700

Chapter 6. Thermal influences on tribology and micro structure of polyimides 179 6.8. Discussion on thermal effects 6.8.1. Effect of fillers at high temperature PTFE fillers for TP-2 beneficially lower friction and wear at 80 to 260°C due to their thermoplastic properties. Graphite fillers for SP-2 cause various transitions in friction depending on the applied bulk temperature, with high and unstable friction at 60 to 100°C. Graphite fillers also performed higher friction at high humidity compared to low humidity. Different wear debris morphologies characterise the friction zones as a function of temperature (Figure 6.45): (i) coarse sheet-like debris is found at 60 to 100°C (high friction), (ii) fine debris occurs at 140 to 180°C (decreasing friction), and (iii) graphite incorporates in a poly-imide film at 180 to 260°C (low friction and smooth sliding). A similar transition in graphite morphology was found by Brendlé et al. [6.43] for sliding of graphite in humid air (coarse debris) or dry air (fine powders), represented in Figure 6.46. (a) (b) (c) Figure 6.45 Graphite debris morphology after sliding SP-2 at 50 N, 0.3 m/s and different temperatures,
(a) sheet-like at 60 to 100°C, (b) powdery at 100 to 180°C, (c) homogenous film above 180°C Raman spectroscopy could not be used on black SP-2 surfaces. Referring to Figure 6.32 for SP-1, hydrolysis happens to pure sintered polyimide at 100 to 180°C, while the reactivity is limited at lower temperatures. Present debris morphology corresponds to the “triboreactor principle” of Brendlé et al. [6.43]: (i) hydrolysis at 100 to 180°C can be associated to a reaction of polyimide with environmental water, causing a ‘dry’ atmosphere in the sliding interface and powdery debris, while (ii) water remains in the environment through lack of hydrolysis at 60 to 100°C, causing a ‘humid’ atmosphere and coarse debris. Depending on the level of moisture, the mechanical response of graphite is either one between a preferential cleavage along the basal planes (Figure 6.46b, moist) or the embrittlement into nanosized particles (Figure 6.46c, dry). The cleavage is associated with relatively high humidity and low shear stresses. In contrast, the fragmentation into nanoparticles is associated with dry conditions and shear stresses exceeding the tensile strength of the sheets. Referring to other papers [4.44] the mecha-nism of fragmentation is similar to unidirectional tensile cracking of thin brittle films. From the above correlation, the overall behaviour of a polyimide tribocontact seems not only determined by environmental humidity, but triboreactions such as hydrolysis that is demonstrated in previous paragraphs, are very important in controlling the real water supply in the sliding interface.

Chapter 6. Thermal influences on tribology and micro structure of polyimides 180
Pin-on-disc
tribometer with discrete agglomera-
tes of transferred material
inlet
Generation of debris with decreasing size
depending on amount of absorbed
water q outlet
Actual coexistence of debris with large particles near inlet
and small near outlet
High relative
humidity
Sheet-like
Medium relative
humidity
Mixed
Dry
Powdery
Figure 6.46 Triboreactions of graphite with moisture according to Brendlé et al. [6.43],
(a) triboreactor principle with consumption of absorbed water in interface, (b) particle detachment through cleavage in humid conditions, (c) particle detachment through fragmentation in dry conditions 6.8.2. Parallelism between temperature and humidity Comparing friction at various humidity, SP-1 has high friction at high relative humidity and low friction at low relative humidity (Table 5.12). In a similar way, it was demonstrated that SP-1 has high friction at low temperatures while it lowers above a critical temperature. Friction tendencies at high temperature are thus similar to low humidity. Absence of water at low humidity resulted in easier transfer film formation, while transfer was inhibited in presence of water. In an opposite way, wear rates for SP-1 stabilise at high temperatures (at least at low loads) while wear rates increase at low humidity. It indicates the influence of additional chemical effects that manifest at high temperatures such as imidisation, improving the strength of the transfer film. According to Raman spectroscopy, the polyimide structure at low temperature is mainly influenced by hydrolysis and is therefore similar to what happens to the polyimide structure at high humidity.
(b) cleavage (moist)
(c) brittle fracture (dry)
H2O absorption
Prismatic surface
Basal plane

Chapter 6. Thermal influences on tribology and micro structure of polyimides 181 6.9. Conclusions The friction and wear evolution of sintered and thermoplastic polyimides was investiga-ted for controlled bulk temperatures between 60 to 260°C. Transitions in friction regimes correlate to transitions in wear regimes. Differences in tribological properties are successfully related to thermo-analytical analysis and mass spectroscopy of the wear debris particles and Raman spectroscopy of the worn polyimide surfaces. Pure sintered polyimides show two sliding regimes that are related to chemical effects:
• At 100 to 180°C, friction is high and wear rates increase with a discontinuous minimum at 140°C. The trends are representative at different normal loads. No transfer film is detected on the steel counterfaces and the polymer surfaces are adhesively worn. Debris particles consist of separately fine powders that do not interact. Raman spectroscopy confirms that hydration causes the reversion of polyimide into poly(amic) acid precursor. A maximum hydrolysis intensity at 140°C relates to minimum wear rates with acid groups acting as a lubricant. The hydrolysed structure does not form a transfer film, because low interaction between the wear debris products results in limited strength. It is demonstrated that the molecular mobility is restricted by hydrolysis.
• At 180 to 260°C, friction lowers and wear rates stabilise at mild loads with a maxi-mum wear rate at 180°C in agreement to maximum friction. Wear rates increase at high loads, but brittleness is somewhat postponed to 150 N at high temperatures. A discontinuous platelet transfer film develops for T* > 180°C, drawn parallel to the sliding direction. The polymer surfaces show some abrasive traces and chemical degradation of a precursor fraction. Debris particles conglomerate and form platelet-like sheets, while thermo-analytical TGA/DTA analysis confirmed that they have imidised in the sliding interface. The importance of interfacial reaction to create coherent transfer particles is clearly demonstrated. This imidisation is illustrated by mass spectrometry revealing that the debris becomes more inert when the maximum polymer surface temperature T* > 180°C. According to Raman spectroscopy, the imidised structure that forms during sliding is characterised by reorientation of the C-N-C imide bonds from transverse into axial conformation. Also the C=O and C-O-C groups become more flexible and reorient in the imide structure. Depending on the normal loads, reorientation is mainly concentrated on the C=O side-groups at low loads, while it is concentrated on the C-N-C and C-O-C backbone structures at high loads.
Pure thermoplastic polyimides show three sliding regimes that are related to a combination of chemical and thermal effects:
• At 100 to 120°C, friction increases and is somewhat higher compared to sintered polyimides. Wear rates, in contrast, are lower compared to sintered polyimides. A thin transfer film develops by shear and the polymer surfaces show adhesive wear below 120°C. Thermal softening is slightly observed at 120°C: the maximum polymer surface temperature T* > Tg at running-in seems important for this. Dark debris particles were chemically degraded by hydrolysis as confirmed by thermo-analytical measurements. Raman measurements indicate higher mobility of the polymer chains at low temperatures compared to sintered polyimides. From variations in C=O, C-O-C and C-N-C stretch, it is concluded that molecular

Chapter 6. Thermal influences on tribology and micro structure of polyimides 182 orientation during sliding at low loads is mainly located in the molecular backbone rather than on side groups.
• At 120 to 180°C, friction decreases and a transition to high wear rates happens. A patchy-like transfer film develops and the polymer surfaces become irregular and opaque through softening and chemical modification. Large flake-like particles are formed and TGA/DTA analysis confirms that they have a crystalline or cross-linked structure. Wear debris particles become brittle and act as an abrasive. From Raman spectroscopy, C-N-C axial stretching enhanced as an indication for crystallisation.
• At 180 to 260°C, friction increases and overload wear results from melting. A thick transfer film develops and the polymer surface smoothens. Roll-like debris is visually observed as an indication for melting. Debris has high thermal stability as it is rapidly removed from the sliding interface. Raman measurements indicate thermal decomposition (depolymerisation) of aromatic structures into amide mono-mers on the polyimide surface, weakening strength and resulting in high wear.
Graphite additives cause high friction and low wear rates for sintered polyimides at 60 to 100°C, corresponding to coarse wear debris particles and thick graphite transfer inhomogeneously distributed over the sliding area. The temperature regime with high friction becomes narrower when normal loads increase. Decreasing friction at 140 to 180°C corresponds to fine wear debris. Low friction occurs at 180 to 260°C and proper functioning of graphite depends on good mixture with the polyimide debris for smooth transfer. It is explained in parallel to a literature model that the debris morphology depends on humidity and water supply in the sliding interface, which is also controlled by hydrolysis of the polyimide. Thermoplastic PTFE additives cause lower friction and wear for thermoplastic polyimi-des over the entire temperature range:
• At 100 to 180°C, friction decreases with onset of thermally controlled sliding of PTFE at T* = 120°C. The effect of hydrolysis of the polyimide bulk material causing higher friction at 100 to 120°C is covered. Wear rates drop discontinuously at 100°C, corresponding to the onset of thermally controlled sliding of PTFE. Smooth transfer is observed over the entire sliding stroke and polymer surfaces show adhesive wear and shear. The film does not completely mix when polyimide does not soften. Raman spectroscopy indicates lower intensity for C=O stretching in parallel to lower shear forces acting on the surface compared to pure thermoplastic polyimides. Also C-O-C stretching intensities increase more progressively. Similar C-N-C intensities suggest that both pure and PTFE-filled thermoplastics crystallises during sliding.
• At 180 to 260°C, friction increases through softening of the thermoplastic polyimide but overload wear is limited as no melting is observed. The polyimide and PTFE mix into a more homogeneous film through softening of the polyimide bulk material compared to low temperature. Raman spectroscopy indicates slightly better thermal stability of PTFE-filled thermoplastic polyimide at 220°C compared to pure thermoplastic polyimide.

Chapter 6. Thermal influences on tribology and micro structure of polyimides 183 References [6.1] Fusaro RL. Effect of atmosphere and temperature on wear, friction and transfer of polyimide films, ASLE
Trans 21 (1978), 125-133 [6.2] Lewis RB. Wear of polyimide resin, Proceedings 24th ASLE Annual Meeting (1969), 177-180 [6.3] Scharf TW, Singer IL. Monitoring transfer films and friction instabilities with in-situ Raman tribometry,
Tribol Letters 14 (2003), 3-8 [6.4] Tanaka K, Ueda S, Friction and wear of polyimide composites, J Jpn Soc Lubr Eng 26 (1980), 62 [6.5] Chitsaz-Zadeh MR, Eiss NS. Friction and wear of polyimide thin films, Wear 110 (1986), 359-368 [6.6] Iwabuchi A, Hori K, Sugawara Y. Effects of temperature and ambient pressure on fretting properties of
polyimide, Wear 125 (1988), 67-81 [6.7] Tanaka K, Yamada Y. Tribology of fibre-reinforced polyimides, in: Polymer wear and its control, ACS
Symp Series, Lee LH (ed.), American Chemical Society, Washingthon DC, 287 (1985), 103-128, ISBN 0-8412-0932-4
[6.8] Cong PH, Li TS, Liu XJ, Zhang XS, Xue QJ. Effect of temperature on the friction and wear properties of a cross-linked and a linear polyimide, Acta Pol Sinica 5 (1998), 556-561
[6.9] Tewari US, Bijwe J. Tribological Behaviour of Polyimides, in: Polyimides: fundamentals and applications, Marcel Dekker (ed), Marcel Dekker Inc (New York), 1996, 533-583, ISBN 0-8246-9466-4
[6.10] Dupont. Vespel parts and shapes, Design Handbook (2000) [6.11] Pozdnyakov AO, Kudryavtsev VV, Friedrich K. Sliding wear of polyimide-C60 composite coatings,
Wear 254 (2003), 501-513 [6.12] Matsubara K, Watanabe M, Karasawa M. Frictional properties of irradiated polymers at elevated
temperatures, J Jap Soc Lubr Eng 14 (1969), 99-103 [6.13] Bill RC. Selected fretting-wear-resistant coatings for Ti-6%Al-4%V alloy, Wear 106 (1985), 283-290 [6.14] Pleskachevsky Yu M, Smurugov VA. Thermal fluctuations at PTFE friction and transfer, Wear 209
(1997), 123-127 [6.15] Marinovic-Cincovic MM, Babic D, Jovanovic R, Popov-Pergal K, Pergal M. Thermal, oxidative and
radiation stability of polyimides, Polym Degrad Stab 81 (2003), 387-392 [6.16] Li XG, Huang MR, Bai H, Yang YL. Thermogravimetry of thermoplastic polyimide powders under four
different atmospheres, Macromol Mater Eng 286 (2001), 421-428 [6.17] Prabhumirashi LS, Khoje JK. TGA and DTA studies on complexes of chloride, nitrate, sulphate, acetate
and oxalate, Thermochim acta 383 (2002), 109-118 [6.18] Ratta V. Crystallisation, morphology, thermal stability and adhesive properties of novel high perfor-
mance semi-crystalline polyimides, dissertation Virginia Polytechnic University, 1999 [6.19] Tewari US, Bijwe J. Tribological Behaviour of Polyimides, in: Polyimides: fundamentals and
applications, Marcel Dekker (ed), Marcel Dekker Inc (New York), 1996, 533-583, ISBN 0-8246-9466-4 [6.20] Nagai N, Hironaka T, Imai T, Harada T, Nishimura M, Mimori R, Ishida H. Study of interaction
between polyimide and Cu under a high humidity condition, Appl Surf Sci 171 (2001), 101-105 [6.21] Ozawa T, Arii T, Kishi A. Thermogravimetry and evolved gas analysis of polyimide, Thermochim Acta
352-353 (2000), 177-180 [6.22] Fusaro RL. Friction and wear life properties of polyimide thin films, NASA Report TN D-6914 (1972) [6.23] Park SH, Durning CJ. A mechanistic picture of the effects of rubbing on polyimide surfaces and liquid
crystal pretilt angles, J Appl Phys 83 (1998), 1270-1280 [6.24] Evans A. Evaluating polymer cure using Raman spectroscopy (2002), www.eaglabs.com [6.25] Yu KH, Yoo YH, Rhee JM, Lee MH, Yu SC. Two-dimensional Raman correlation spectroscopy of the
pathway for thermal imidisation of Poly(amic acid), Bull Korean Chem Soc 24 (2003), 357-362 [6.26] Walsh TR, Harkins CG, Sutton AP. A theoretical study of polyimide flexibility, J Chem Phys 112
(2000), 4402-4412 [6.27] Stuart BH. The application of Raman spectroscopy to the tribology of polymers, Tribol Internat 31
(1998), 687-693 [6.28] Constantini JM, Couvreur F, Salvetat JP, Bouffard S. Micro-Raman study of the carbonisation of
polyimide induced by swift heavy ion irradiations, Nucl Instr Meth Phys B 194 (2002), 132-140 [6.29] http://www.jobinyvon.com/usadivisions/Raman/applications/bands.pdf [6.30] Ge J, Li C, Xue G, Mann IK, Zhang D, Wang SY, Harris FW, Cheng ZD, Hong SC, Zhuang X, Shen
YR. Rubbing-induced molecular reorientation on an alignment surface of an aromatic polyimide containing cyanobiphenyl side chains, J Amer Chem Soc 123 (2001), 5768-5776
[6.31] Ishida H, Huang MT. Molecular level study of the crystallisation of a thermoplastic polyimide by infrared spectroscopy, J Pol Sci Pol Phys 32 (1994), 2271
[6.32] Lippert T, Ortelli E, Panitz JC, Raimondi F, Wambach J, Wokaun A. Imaging-XPS/Raman investigation on the carbonisation of polyimide after irradiation at 308 nm, J Appl Phys A 69 (1999), 651-654
[6.33] Raimondi F, Abolhassani S, Brutsch R, Geiger F, Lippert T, Wambach J, Wei J, Wokaun A. Quantification of polyimide carbonisation after laser ablation, J Appl Phys 88 (2000), 3659-3666
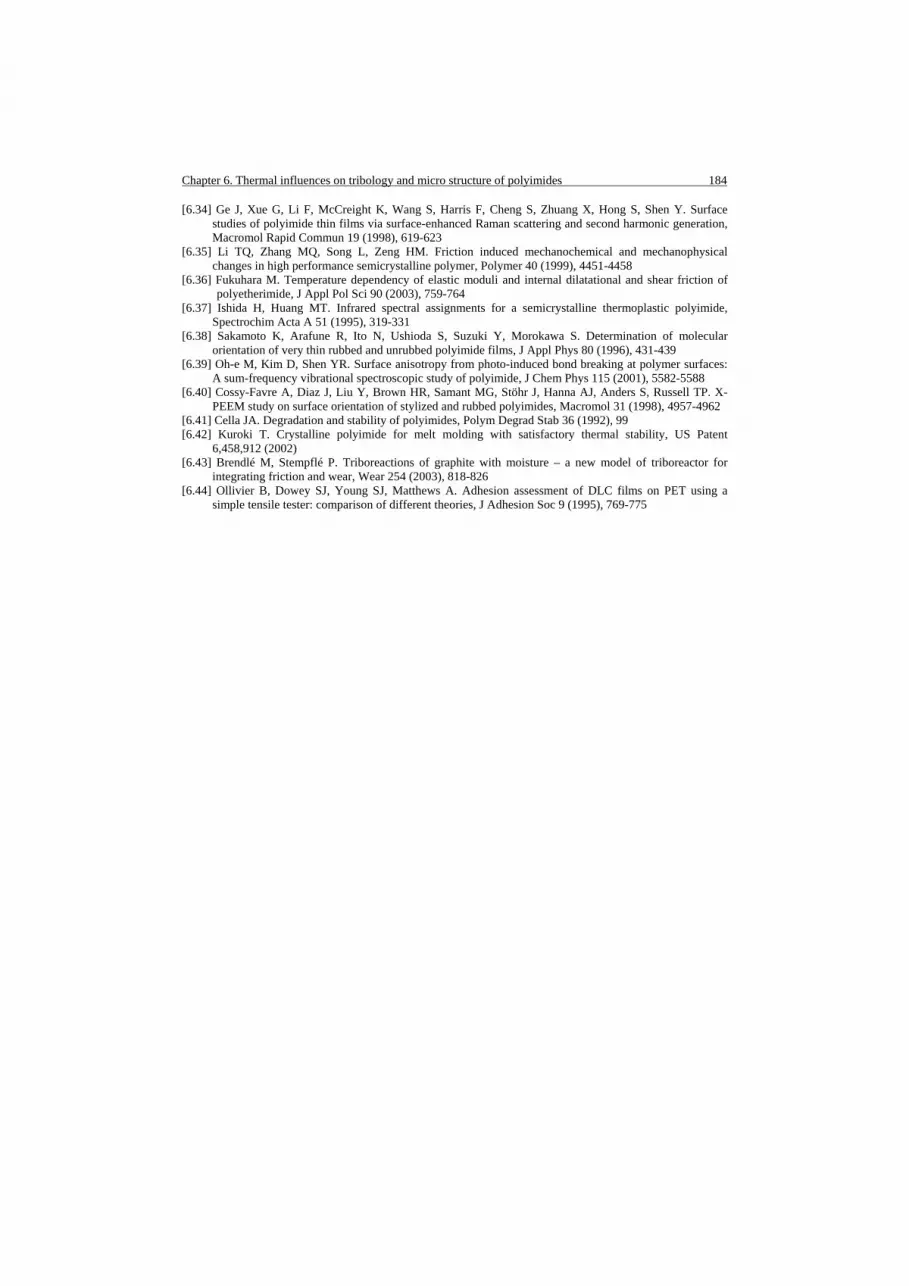
Chapter 6. Thermal influences on tribology and micro structure of polyimides 184 [6.34] Ge J, Xue G, Li F, McCreight K, Wang S, Harris F, Cheng S, Zhuang X, Hong S, Shen Y. Surface
studies of polyimide thin films via surface-enhanced Raman scattering and second harmonic generation, Macromol Rapid Commun 19 (1998), 619-623
[6.35] Li TQ, Zhang MQ, Song L, Zeng HM. Friction induced mechanochemical and mechanophysical changes in high performance semicrystalline polymer, Polymer 40 (1999), 4451-4458
[6.36] Fukuhara M. Temperature dependency of elastic moduli and internal dilatational and shear friction of polyetherimide, J Appl Pol Sci 90 (2003), 759-764
[6.37] Ishida H, Huang MT. Infrared spectral assignments for a semicrystalline thermoplastic polyimide, Spectrochim Acta A 51 (1995), 319-331
[6.38] Sakamoto K, Arafune R, Ito N, Ushioda S, Suzuki Y, Morokawa S. Determination of molecular orientation of very thin rubbed and unrubbed polyimide films, J Appl Phys 80 (1996), 431-439
[6.39] Oh-e M, Kim D, Shen YR. Surface anisotropy from photo-induced bond breaking at polymer surfaces: A sum-frequency vibrational spectroscopic study of polyimide, J Chem Phys 115 (2001), 5582-5588
[6.40] Cossy-Favre A, Diaz J, Liu Y, Brown HR, Samant MG, Stöhr J, Hanna AJ, Anders S, Russell TP. X-PEEM study on surface orientation of stylized and rubbed polyimides, Macromol 31 (1998), 4957-4962
[6.41] Cella JA. Degradation and stability of polyimides, Polym Degrad Stab 36 (1992), 99 [6.42] Kuroki T. Crystalline polyimide for melt molding with satisfactory thermal stability, US Patent
6,458,912 (2002) [6.43] Brendlé M, Stempflé P. Triboreactions of graphite with moisture – a new model of triboreactor for
integrating friction and wear, Wear 254 (2003), 818-826 [6.44] Ollivier B, Dowey SJ, Young SJ, Matthews A. Adhesion assessment of DLC films on PET using a
simple tensile tester: comparison of different theories, J Adhesion Soc 9 (1995), 769-775

185
Chapter 7.
Counterface effects on friction, wear and transfer of polyimide.
Goals
• Influence of counterface type on transfer behaviour of polyimide • Evaluation of the performance of diamond-like coatings in combination with
polyimide • Relative classification of different steel and coated steel counterfaces according
to friction and wear
• Study of physical parameters that characterise the counterface and influence tribology: surface energy, structural compatibility and thermal influences
Methodology
• Small-scale tribotesting, roughness measurements, microscopy • Contact angle measurements
Balkantrib, 2005, Kragujevac (Serbia)

Chapter 7. Counterface effects on friction, wear and transfer of polyimide 186 7.1. Introduction The performance of relatively soft polymers sliding against hard counterfaces is deter-mined by transfer ability and build-up of a polymer film, as discussed by Bahadur [7.1]. The efficiency in reducing friction and wear does not only depend on the molecular polymer structure but also on the counterface type [7.2] and properties such as composi-tion, roughness, hardness and thermal conductivity. As the roughness profile acts as a boundary condition for wear debris flow, it controls the transfer film stability. Fusaro [7.3] studied the effect of different counterface types on friction of graphite-fiber reinforced polyimides, including cobalt-based alloys, nickel-based alloys, glass, ferritic stainless steels, austenitic stainless steels and carbon steel counterfaces. Differences in friction and wear were, however, most likely attributed to variations in counterface roughness (Ra = 0.006 to 0.12 µm), inherent to the surface preparation process. No clear study is attributed to different counterface compositions and interfacial interactions. Cobalt-based alloys perform lowest friction and wear and nickel-based counterfaces have highest friction and wear, corresponding to respectively smooth and thick transfer. Metallic protrusions on the polished nickel surface cause local transfer and back-transfer. Steel surfaces cause intermediate friction and wear due to platelet-like transfer that partially flows into a homogeneous film. Ultra-smooth borosilicate glass results in very low friction and wear with a transfer film thickness below 0.4 µm. Bronze or copper does not cause transfer, indicating that the counterface composition influences the trans-fer rate [7.4]. According to Play [7.5], who studied the effects of initial counterface topo-graphy on polyimide composite wear rates, not only the average surface roughness but the distribution of 13 independent roughness variables should be used to relate coun-terface roughness and tribological performance. Friction is generally minimised for an optimum roughness, while Jain and Bahadur [7.7] found an increase at higher asperity radii. Wear rates usually decrease for smoother counterfaces, although studies by Dow-son et al. [7.6] indicated wear rate minima for UHMWPE at Ra = 0.11 µm. The wear rates decrease for higher asperity radii because sliding stresses in the polymer surface become weaker and require more revolutions for wear debris formation (fatigue-wear). During the past decades, surface properties have been tailored by ceramic or diamond-like carbon (DLC) coatings for controlling corrosion of the metallic part. The composition of thin and hard DLC coatings was discussed in Chapter 3, while the tribo-logical benefits are summarised below. Holmberg et al. [7.8] reviewed fundamentals of coating tribology. Soft polymer/coating contacts were studied by Santner and Czichos [7.9] sliding polyamide against steel and aluminium discs coated with Al2O3 or NiP, or Benabdallah [7.10] sliding polyacetal against galvanised and epoxy coated steel. The need for hard coatings or advanced surface treatments used in moulding and extrusion dies was described by e.g. Heinze [7.11]. Most studies principally focussed on the wear behaviour of polymer/coating contacts (and mainly contact with polymer melts), but frictional properties were less discussed. Thin hard coatings such as DLC have been further investigated for tribological [7.12], automotive [7.13] and medical [7.14] applications since the eighties. They offer high surface hardness, low friction and high wear resistance in combination with good elasticity allowing for plastic and elastic deformation. They have benefits in reducing stick-slip in contact with metals and the high surface hardness, determined by the content of sp3 bonded carbon and the hydrogen content, offers high wear resistance. They also protect the metal sliding counterparts from excessive wear by the build-up of a graphitic layer as proved by micro-Raman analysis by Ronkainen et al. [7.15]. This self-lubricating process depends on humidity

Chapter 7. Counterface effects on friction, wear and transfer of polyimide 187 and temperature, as studied by Liu et al. [7.16] or Sanchez-Lopez et al. [7.17]. The low friction of DLC is explained by interfacial sliding between the worn coating and its transfer film [7.18] or by the extreme smoothness of the surface [7.19]. These tendencies were proved by Yoon et al. [7.20] in metal contact sliding. The influence of humidity, as shown by Jiang et al. [7.21], indicates lower coating wear at high humidity due to a reduction in surface energy by adsorption of water at the dangling carbon bonds on the edge-faces of sp2 carbon clusters. Also according to Yang et al. [7.22] the coefficient of friction of DLC is lower in air compared to vacuum sliding. Some authors found an increase in friction at higher relative humidity [7.23, 7.24] while also oxygen has been found to increase the friction coefficient of DLC. On the other hand, Voevodin et al. [7.25] showed an opposite effect with decreasing friction after a certain number of sliding cycles when the relative humidity increased to 80 % RH. In inert environments, including dry nitrogen and vacuum, friction coefficients can reach either ultra-low values (< 0.01) or extremely high (> 0.5) values. Donnet et al. [7.26] demonstrated that this behaviour can be controlled by the hydrogen content of the film. Knowledge about polymers sliding against hard coatings is scarce. The joint work with Zsidai et al. [7.27] at St. Stephen University, Department of Mechanical Engineering, Gödöllõ (Hungary), was preliminary to present work. It revealed that friction of poly-mers sliding against diamond-like nanocomposite (DLN) coatings is not necessarily lower compared to steel (Figure 7.1): the coating was favourable in reducing friction for some rigid polymers (polyacetal, polyethylene terephthalate), while high friction occur-red for polyamide/DLC compared to polyamide/steel. Large scatter in friction and wear rates occurred, as melting of thermoplastics was the real limit for coating applications.
(a) (b)
Figure 7.1 Preliminary study on the influence of DLN coating on friction and wear of polymers (Pin-on-disc tests at 35 N, 0.5 m/s on DLN coating ( ) and HA-steel ( ) [7.27])
The wear of UHMWPE/DLC joints was evaluated by Sheeja et al. [7.28] and Tiainen [7.29], reporting either a decrease or no significant differences in wear of UHMWPE sliding on coated and uncoated steel. Material selection for biotribology obviously focuses on wear studies, while little is known about frictional performance of polymer/ coating contacts. The friction and wear mechanisms of two high-performance materials, sintered polyimides SP-1 and DLC or DLN, separately sliding against steel grades are known from previous literature. However, their mutual sliding has not been studied yet.
0.0
0.5
1.0
1.5
2.0
2.5
3.0
3.5
PET-PTFE POM-H PAo1 PA-Na PA-Mg
Coe
ffic
ient
of f
rictio
n
0.000
0.002
0.004
0.006
0.008
0.010
0.012
PET-PTFE POM-H PAo1 PA-Na PA-Mg
Wea
r dep
th (m
m)

Chapter 7. Counterface effects on friction, wear and transfer of polyimide 188 As polyimides are chemically inert and thermally resistant, also the counterface should withstand severe sliding conditions. Coated counterfaces yield possibilities to be used in self-lubricating applications under agressive conditions. In order to correlate the effect of counterface properties such as composition, surface energy, adhesion, roughness and hardness systematically to friction and wear mechanisms of sintered polyimides SP-1, four counterface types are investigated in this Chapter 7: low carbon steel (St 37-2N), high-alloy steel (HA-steel), stainless steel (316L), diamond-like carbon (DLC) and Si-doped diamond-like nanocomposite (DLN). Small-scale testing is the most appropriate test environment due to restrictions in fabrication process and high cost of coatings. 7.2. Tribological test results The small-scale test parameters are varied with either fixed normal load (50 N) and 0.3 to 1.2 m/s sliding velocities, or fixed sliding velocity (0.3 m/s) and 50 to 200 N normal loads. Pure sintered polyimide SP-1 is used as wear samples. Friction and wear rates show a consistent classification for different counterfaces and coatings are not ever effi-cient (overload). Hardness and initial roughness are not the main controlling parameters. 7.2.1. Friction results The coefficients of friction for SP-1 sliding against various uncoated and coated steels are shown in Figure 7.2 as a function of sliding distance. Stable friction is characterised by a stabilisation or smooth decrease with ongoing sliding time and results from progres-sive polymer transfer and conversion of the initial counter formal contact into conformal contact. It is known from Horng et al. [7.30] that mainly the contact area growth affects tribological performance. Pleskachevsky et al. [7.31] stated that the formation of a trans-fer film during running-in has most significant effect on friction and further controls steady-state sliding. This can be seen, e.g., in the frictional evolution on HA-steel or 316L counterfaces, either lacking transfer with unstable running-in for HA-steel or for-ming a more coherent transfer with stable running-in for 316L. Unstable sliding is noted for DLC coatings at each test parameter, while DLN coatings offer stable sliding under mild sliding conditions. The coefficients of friction at the end of test for HA-steel (Ra = 0.05 µm), smooth St 37-2N (Ra = 0.05 µm), rough St 37-2N (Ra = 0.20 µm) and 316L (Ra = 0.05 µm) together with DLC and DLN coatings are given in Tables 7.1 and 7.2. 7.2.1.1. Friction of polyimide against steel counterfaces The relative classification of decreasing friction for SP-1 against HA-steel, rough St 37-2N and smooth St 37-2N steel is consistent at each sliding velocity, showing good repro-ducibility of the cylinder-on-plate sliding tests. Also as a function of increasing normal loads there is consistency that HA-steel causes highest friction, while a transition during sliding on smooth steel happens at 150 to 200 N due to overload. Stainless steel 316L causes permanently lowest friction amongst steel counterfaces. The hardness effect is discussed in comparing HA-steel (high hardness), smooth St 37-2N (medium hardness) and 316L (low hardness). For smooth metal surfaces, friction between soft surfaces is higher compared to hard surfaces as adhesion increases

Chapter 7. Counterface effects on friction, wear and transfer of polyimide 189
0.1
0.2
0.3
0.4
0.5
0.6
0.7
0.8
0.9
1
0 2000 4000 6000 8000 10000 12000 14000 16000
Sliding distance (m)
Coe
ffic
ient
of f
rictio
n
0.1
0.2
0.3
0.4
0.5
0.6
0.7
0.8
0.9
1
0 2000 4000 6000 8000 10000 12000 14000 16000
Sliding distance (m)
Fric
tion
coef
ficie
nt
(a) (b)
(c) (d)
Figure 7.2 Friction of sintered polyimide SP-1 as a function of sliding distance against different counterfaces at 50 N and various sliding velocities, (a) 0.3 m/s, (b) 0.6 m/s, (c) 0.9 m/s, (d) 1.2 m/s,
(i) HA-steel, (ii) rough St 37-2N steel, (iii) smooth St 37-2N steel, (iv) 316L, (v) DLN, (vi) DLC for soft contact bodies [7.32]. For polymers in contact with steels, however, this trend does not rule and counterface hardness is not a decisive factor. The relative difference in hardness between different steel counterfaces and polymers is insignificant for friction. The roughness effect is discussed in comparing rough St 37-2N (Ra = 0.20 µm) and smooth St 37-2N (Ra = 0.05 µm) counterfaces: rough steels result in highest friction. There are few references on the effect of counterface roughness on friction of sintered polyimides, but an optimum surface roughness for low friction generally establishes at about Ra = 0.25 µm for thermoplastic polyimides (Figure 4.11), according to Uetz and Wiedemeyer [7.32]. Graphite-filled polyimides as examined by Sheiretov et al. [7.33] show that friction decreases for higher counterface roughness, in contrast to present observations for unfilled SP-1. The relation between initial counterface roughness and friction is, however, not always clear due to transfer and gradual change in roughness during the wear process [7.34]. Surfaces with similar roughness Ra = 0.05 µm (HA-steel, smooth St 37-2N, 316L) cause different friction and shows that not only the topography but also the steel composition influences the frictional behaviour. Whilst friction stabili-ses on HA-steel or low carbon steel, it progressively diminishes as a function of sliding distance for stainless steels. Surfaces are therefore further characterised in paragraph 7.3.
(i) (i)
(v)
(v)
(vi)(vi)
(ii) (iii)
(iv)
(ii)(iii)(iv)
0.1
0.2
0.3
0.4
0.5
0.6
0.7
0.8
0.9
1
0 2000 4000 6000 8000 10000 12000 14000 16000
Sliding distance (m)
Coe
ffic
ient
of f
rictio
n
0.1
0.2
0.3
0.4
0.5
0.6
0.7
0.8
0.9
1
0 2000 4000 6000 8000 10000 12000 14000 16000
Sliding distance (m)
Coe
ffic
ient
of f
rictio
n
(i)
(i) (v)
(v)
(ii)(iii)(iv)
(vi)(vi)
(ii) (iii) (iv)

Chapter 7. Counterface effects on friction, wear and transfer of polyimide 190 Table 7.1. Coefficients of friction for SP-1 as a function of sliding velocity, sliding against different counterfaces at fixed normal load 50 N
Counterface type 0.3 m/s 0.6 m/s 0.9 m/s 1.2 m/s
HA-steel 0.51 0.41 0.37 0.40
St 37-2N rough 0.46 0.39 0.33 0.38
St 37-2N smooth 0.43 0.35 0.31 0.33
316L 0.41 0.33 0.30 0.15
DLN 0.40 0.32 0.29 0.45
DLC 0.61 0.55 0.70* 0.80* * Test prematurely stopped after 4500 m due to overload Table 7.2. Coefficients of friction for SP-1 as a function of normal load, sliding against different counterfaces at fixed sliding velocity 0.3 m/s
Counterface type 50 N 100 N 150 N 200 N
HA-steel 0.51 0.47 0.45 0.41
St 37-2N rough 0.46 0.44 0.40 0.38
St 37-2N smooth 0.43 0.42 0.42 0.40
316L 0.41 0.39 0.35 0.29
DLN 0.40 0.35 0.49 0.51
DLC 0.61 0.70* 0.70* 0.65* * Test prematurely stopped after 4500 m due to overload 7.2.1.2. Friction of polyimide against diamond-like carbon coatings Against DLC coated steel, friction for polyimide SP-1 is higher than sliding against uncoated steel and it strongly fluctuates with sliding distance, although steel and DLC coatings have the same smooth roughness (Ra = 0.05 µm). Unstable interaction between polyimide and coated counterfaces correlates to wear of the DLC coating and final breakthrough. Therefore, friction suddenly drops near the end of the tests at 0.9 and 1.2 m/s, preceded by strong vibrations. Overload as a function of normal load at 100 N happens more rapidly than overload as a function of sliding velocity, depending on the loadability of the coating and polyimide. In contrast, benefits of DLC for low friction of some thermoplastics under mild sliding conditions were demonstrated by De Baets et al. [7.35], investigating coating applications on extrusion dies: POM-C shows lower fric-tion against DLC compared to polished steel grades, but on the other hand DLC coatings increase friction for PVC relatively to steel counterfaces. Studies by Platon et al. [7.36] for hip joint prostheses indicate low friction of UHMWPE/(stainless steel+DLC) com-pared to UHMWPE/stainless steel, but with high fluctuations. Also substrate properties are important, as UHMWPE/(titanium alloy+DLC) sliding pairs result in high friction. Against DLN coated steel, friction for polyimide SP-1 is lower than sliding against uncoated or DLC coated steel at 0.3 to 0.9 m/s, but it is less stable compared to steel. At 1.2 m/s sliding velocities, a significant increase in friction against DLN counterfaces is noticed, tending towards friction on DLC counterfaces where overload situations cause coating failure. Identical overload situations occur at 150 N normal loads.

Chapter 7. Counterface effects on friction, wear and transfer of polyimide 191 Compared to sliding of engineering polymers against DLN [7.27], the polyimide/DLN couple performs reasonably well with lower friction than polyamide/DLN and more stable friction than POM-H/DLN or internal oil-lubricated polyamide/DLN. However, PET+PTFE/DLN shows lowest and most stable friction due to benefits of the PTFE internal lubricants allowing for transfer. Friction on DLN-coatings is lower than on hard DLC in parallel to the hardness relation observed for steel counterfaces and it confirms that other surface characteristics than hardness interfere with friction. 7.2.2. Wear results The on-line vertical displacement for SP-1 cylinders sliding against different counter-faces is given in Figure 7.3, representing the combined wear of polymer and counter-face. The post-mortem diameter reductions ∆hm and volumetric wear rates from weight loss are given in Tables 7.3 to 7.4 for various normal loads and sliding velocities.
0
100
200
300
400
500
600
0 2000 4000 6000 8000 10000 12000 14000 16000
Sliding distance (m)
Vert
ical
dis
plac
emen
t (µm
)
0
200
400
600
800
1000
1200
0 2000 4000 6000 8000 10000 12000 14000 16000
Sliding distance (m)
Vert
ical
dis
plac
emen
t (µm
)
0
200
400
600
800
1000
1200
0 2000 4000 6000 8000 10000 12000 14000 16000
Sliding distance (m)
Vert
ical
dis
plac
emen
t (µm
)
0
200
400
600
800
1000
1200
0 2000 4000 6000 8000 10000 12000 14000 16000
Sliding distance (m)
Vert
ical
dis
plac
emen
t (µm
)
(a) (b)
(c) (d)
(i)
(ii)
(iii)
(iii)(ii)
(iv)(i)
(v) (vi)
(vi) (v)
(iv)
(vi)
(vi)
(v) (v)
(iv)
(i) (i) (iii)(ii) (ii)
(iii)(iv)
Figure 7.3 On-line vertical displacement of sintered polyimide SP-1 as a function of sliding distance against different counterfaces at 50 N and various sliding velocities, (a) 0.3 m/s, (b) 0.6 m/s, (c) 0.9 m/s, (d) 1.2 m/s,
(i) HA-steel, (ii) rough St 37-2N steel, (iii) smooth St 37-2N steel, (iv) 316L, (v) DLN, (vi) DLC

Chapter 7. Counterface effects on friction, wear and transfer of polyimide 192 Table 7.3. Diameter reduction ∆hm (mm) and wear rates w (10-4 mm3/m) for SP-1 as a function of sliding velocity, sliding against different counterfaces at fixed normal load 50 N
0.3 m/s 0.6 m/s 0.9 m/s 1.2 m/s Counterface type
∆hm w
∆hm w
∆hm w
∆hm w
HA-steel 0.43 7.7 0.53 12.3 0.55 13.5 0.75 18.2
St 37-2N rough 0.30 6.3 0.43 9.7 0.50 11.8 0.45 12.5
St 37-2N smooth 0.38 7.2 0.47 11.0 0.53 12.3 0.60 15.2
316L 0.45 9.1 0.58 12.7 0.60 14.4 0.33 5.0
DLN 0.44 9.2 0.57 13.0 0.62 16.0 0.63 17.3
DLC 0.46 10.0
0.65 18.1
0.26 10.0*
0.15 5.3* * Test prematurely stopped after 4500 m due to overload Table 7.4. Diameter reduction ∆hm (mm) and wear rates w (10-4 mm3/m) for SP-1 as a function of normal load, sliding against different counterfaces at fixed sliding velocity 0.3 m/s
50 N 100 N 150 N 200 N Counterface type
∆hm w
∆hm w
∆hm w
∆hm w
HA-steel 0.43 7.7 0.82 19.5 1.05 31.7 1.55 50.9
St 37-2N rough 0.30 6.3 0.55 14.2 0.95 28.5 1.20 42.1
St 37-2N smooth 0.38 7.2 0.57 14.8 1.00 30.7 1.10 66.0
316L 0.45 9.1 0.87 23.3 1.13 34.2 1.55 50.7
DLN 0.44 9.2 0.53 22.2 1.02 29.8 1.15 39.3
DLC 0.46 10.0
0.30 7.2*
0.70 18.4*
0.28 6.4* * Test prematurely stopped after 4500 m due to overload The vertical displacement and wear rates for SP-1 show a consistent classification for different counterfaces according to (vi) DLC > (v) DLN > (i) HA-steel > (iii) smooth St 37-2N > (ii) rough St 37-2N. The position of on-line SP-1 measurements against 316L varies due to possible transitions during sliding and interactions with polymer transfer. 7.2.2.1. Wear of polyimide against steel counterfaces The relative classification of wear rates for SP-1 against HA-steel and St 37-2N is representative for each sliding velocity and normal load, with the highest wear for HA-steel and the lowest wear for rough St 37-2N steel counterfaces. Stainless steels provide constantly higher wear rates of polyimide (while friction was lowest) compared to low carbon steel or HA-steel, except in overload situations at 200 N or 1.2 m/s. The influence of roughness is illustrated from smooth St 37-2N (Ra = 0.05 µm) and rough St 37-2N (Ra = 0.20 µm) counterfaces. In contrast to tendencies for thermoplastics (Figure 4.11), smooth counterfaces cause higher wear than rough counterfaces for SP-1. For thermoplastic polymers as, e.g., polyethylene or polyamide, there is a general trend for higher wear rates against rough counterfaces or there is a critical surface roughness with a transition from mild to severe wear. However, the transfer film type (Figure 7.16)

Chapter 7. Counterface effects on friction, wear and transfer of polyimide 193
0
200
400
600
800
1000
1200
1400
1600
1800
0 2000 4000 6000 8000 10000 12000 14000 16000
Sliding distance (m)
Vert
ical
dis
plac
emen
t (µm
)
(i)
(i)
(i) (ii)
(ii)
(ii) 50 N
200 N
100 N
Sliding distance (m)
Vert
ical
dis
plac
emen
t (µm
)
Figure 7.4 Detailed comparison of on-line vertical displacement as a function of sliding distance for SP-1
sliding at 0.3 m/s and at different normal loads against (i) HA-steel and (ii) smooth St 37-2N steel importantly interferes with the initial counterface roughness and controls the wear. The effect of transfer film formation is clearly reflected in the vertical displacement charac-teristic (Figure 7.4). Some details for running-in wear on smooth St 37-2N steel and HA-steel (Ra = 0.05 µm) indicate that the running-in wear for polyimide is identical in sliding against both smooth counterface types, while starting to differentiate after certain sliding time. This is attributed to beneficial transfer film formation on low carbon St 37-2N steel and lack of homogeneous transfer on HA-steel (Figures 5.16, 5.17). 7.2.2.2. Wear of polyimide against diamond-like carbon coatings The DLC coatings cause higher polyimide wear than steel at 0.3 and 0.6 m/s. Lower polyimide wear is calculated for the sliding tests at 0.9 and 1.2 m/s, however, being not representative as the tests were stopped prematurely due to coating wear (Figure 5.17, 5.18). A sudden increase in vertical displacement after 7000 m at 0.9 m/s and after 3800 m at 1.2 m/s superimposed on the polyimide wear indicates coating failure. DLC is removed after shorter sliding distance when the sliding velocity is higher, corresponding to the friction instabilities as previously discussed. The wear of polymers such as UHMWPE was found to be lower in contact with DLC [7.37], up to about seven times against coated compared to uncoated stainless steel, according to Firkins et al. [7.38]. Xu et al. [7.39] also found that DLC coatings improve wear behaviour of UHMWPE, but Saikko et al. [7.40] noted no significant differences. Most wear tests in literature were done with water or bovine serum lubricants, while differences in protein adsorption strongly altered the tribology. Also the hydrogen content in DLC, deposition method or substrates can be a reason for contradicting results. The DLN coatings reduce the polyimide wear rates relatively to DLC, but they remain slightly higher or equal wear rates on HA-steel. The wear rates for polyimide against DLC coatings with high hardness are higher than against DLN coatings, in parallel to high wear rates against hard HA-steel compared to soft St 37-2N steel. However, this is not a general trend as 316L with low hardness compared to HA-steel causes higher wear.

Chapter 7. Counterface effects on friction, wear and transfer of polyimide 194
0.2
0.3
0.4
0.5
0.6
0.7
0.8
0 0.2 0.4 0.6 0.8 1 1.2 1.4
Sliding velocity (m/s)
Coe
ffic
ient
of f
rictio
n
(i)
(vi)
(v)
(ii) (iii)
(iv)
Sliding velocity (m/s)
Coe
ffici
ent o
f fric
tion
6
8
10
12
14
16
18
20
22
0 0.2 0.4 0.6 0.8 1 1.2 1.4
Sliding velocity (m/s)
Wea
r rat
e (1
0-4
mm
3 /m)
(i)(vi)
(v)
(ii)
(iii) (iv)
Sliding velocity (m/s)
Wea
r rat
e (1
0-4 m
m3 /m
)
7.2.3. Summary of experimental friction and wear against different counterfaces An overview in Figure 7.5 for coefficients of friction and wear rates indicates that low friction on DLN, stainless steel 316L or smooth St 37-2N does not necessarily imply the lowest wear rates. Stainless steels 316L provide low friction, but high wear rates. It suggests different physical surface interactions and importance of transfer film morphologies to be analysed in paragraph 7.3.3.
(a) (b)
Figure 7.5 Summary of coefficients of friction and wear rates of SP-1 sliding against different counter-faces, (i) HA-steel, (ii) rough St 37-2N steel, (iii) smooth St 37-2N steel, (iv) 316L, (v) DLN, (vi) DLC
The influence of the pv-value in sliding on different steel counterfaces is represented: • For smooth St 37-2N steel, the performance of SP-1 over a broad test range of
normal loads (50 to 200 N) and sliding velocities (0.3 to 1.2 m/s), including both regime and overload conditions, is given in Figure 7.6. Tendencies in friction are significantly different when comparing smooth St 37-2N steel (Figure 7.6) and HA-steel (Figure 5.23) counterfaces. While friction stabilises for HA-steels, it progress-ively lowers on St 37-2N steel and mainly overload conditions at the pv-limit 3 MPa.m/s are reduced. Although the wear rates remain determined by the normal loads, there is a small reduction in wear rates for the most severe sliding conditions. Both phenomena are related to the development of a more favourable transfer film on low carbon steel St 37-2N compared to HA-steel (Figures 7.15, 7.16).
• For 316L stainless steel, only a limited number of tests is available but significant
differences are even found at low to mild regime pv-values (Figure 7.7). Coeffi-cients of friction decrease significantly at 0.5 MPa.m/s < pv < 1.5 MPa.m/s in parallel to strongly rising maximum polymer surface temperatures T*. The critical temperature T* = 180°C (Chapter 6) is attained at pv = 1.5 MPa.m/s and contribu-tes to a very low coefficient of friction, while sliding becomes chemically control-led. For pv < 1.5 MPa.m/s, mechanical and physical effects rather than temperature and chemical reactions cause low friction. Therefore, physical parameters such as surface energy are investigated in next paragraph 7.3.1. High temperatures on stain-less steels are beneficially influenced by lower thermal conductivity compared to HA-steel and low carbon steel St 37-2N, also investigated in next paragraph 7.3.2.

Chapter 7. Counterface effects on friction, wear and transfer of polyimide 195
Figure 7.6 Influence of regime pv-value on friction µ (), wear rates w (♦) and maximum polymer
surface temperature T* () for SP-1 sliding at 23°C, 60 % standard atmosphere against smooth St 37-2N
Figure 7.7 Influence of regime pv-value on friction µ (), wear rates w (♦) and maximum polymer surface temperature T* () for SP-1 sliding at 23°C, 60 % standard atmosphere against 316L
0
0.1
0.2
0.3
0.4
0.5
0.6
0 1 2 3 40
50
100
150
200
250
R2 = 0.92
200 N
150 N
100 N 50 N
Regime pv (MPa.m/s)
Coe
ffici
ento
ffric
tion
Wea
r rat
e (1
0-4 m
m3 /m
)
Tem
pera
ture
T* (
°C)
0
0.1
0.2
0.3
0.4
0.5
0.6
0 1 2 3 40
50
100
150
200
250
43
Regime pv (MPa.m/s)
Coe
ffici
ento
ffric
tion
Wea
rrat
e(1
0-4m
m3 /m
)Te
mpe
ratu
reT*
(°C
)
50 N
100 N
150 N
200 N
R2 = 0.87
Higher pv-values not included in present tests

Chapter 7. Counterface effects on friction, wear and transfer of polyimide 196 7.3. Surface characterisation 7.3.1. Contact angle measurements and surface energy Dynamic contact angle measurements on the counterfaces are performed by sessile drop tests, using water and diiodomethane (CH2I2) liquids. A relation between surface energies (work of adhesion) and coefficients of friction will be demonstrated. A Dataphysics system (Figure 7.8) allows determining a polar and dispersive surface energy component, γp and γd respectively. The counterfaces are mechanically ground (Ra = 0.20 µm), polished (Ra = 0.05 µm) and cleaned with acetone similar to those used in sliding tests, as surface cleanliness and preparation influence the measurements.
Figure 7.8 Test set-up for contact angle measurements (VITO, Mol, Belgium),
(a) general view with sample positioning system, (b) detail of drop deposition, (c) drops on HA-steel The drop geometry is recorded for 20 seconds with 40 measurements per drop and each water or diiodomethane drop test is repeated on three locations to ensure the statistical validity. The drop geometry is fitted according to the Laplace-Young method and ana-lysed with the Owens-Wendt [7.41] theory for low energy surfaces. Reference values are chosen from Ström et al. [7.42] for surface energies of water (γd = 21.80 mN/m and γp = 51.00 mN/m) and from Janczuk et al. [7.43] for surface energies of diiodomethane (γd = 50.42 mN/m and γp = 0.38 mN/m). From the contact angle measurements, significant differences in polar and total surface energies are calculated, while the dispersive energies are nearly identical (γd = 34.5 mN/m) for each counterface type. The experimental error in determination of surface energies is between 2 to 3 %. During the drop test, contact angles slightly decrease towards steady-state values that are obtained after 3 seconds (Figure 7.9). The contact angles are more stable for DLC and DLN than for St 37-2N because of possible oxidation of the steel surfaces or contamina-tion (especially on rough surfaces). The mechanical surface preparation and roughness influence the surface energies (Figure 7.10), which are higher for polished steel St 37-2N
Camera
WaterDiiodomethane
Sample
Needle
Camera
WaterDiiodomethane
Sample
Needle
water CH2I2
58 mm
(b)
(c)
(a)

Chapter 7. Counterface effects on friction, wear and transfer of polyimide 197
0
10
20
30
40
50
60
70
Rough St 37-2N
SmoothSt 37-2N
HA-steel DLC DLN 316L SP-1
Surf
ace
ener
gy (m
N/m
)
polar
dispersive
(a)
(b) (c)
Figure 7.9 Contact angle measurements as a function of measuring time for different counterfaces, (a) Laplace-Young fitting of droplets, (b) contact angles for steels, (c) contact angles for coatings
(i) HA-steel, (ii) rough St 37-2N steel, (iii) smooth St 37-2N steel, (iv) 316L, (v) DLN, (vi) DLC
Figure 7.10 Surface energies for different steel counterface types and polyimide SP-1
compared to ground steel St 37-2N. A higher polar component and decrease in water contact angle due to better wetting indicate that smooth polished surfaces become more hydrophilic. These effects were also experienced by Lugscheider et al. [7.44] and are attributed to high internal stresses induced during grinding in a surface layer of 1 to 2.5 µm thick. High mechanical loads and crushing of cutting material lead to a stress gradient from the surface to the bulk. This layer was removed after polishing of smooth steel. Steel surface energies are also influenced by the chemical composition as alloying
θ
(ii) (vi) (v)
40
45
50
55
60
65
70
75
80
85
0 50 100 150 200 250
Measurement number
Con
tact
ang
le (°
)
38
43
48
53
58
63
68
73
78
0 50 100 150 200 250
Measurement number
Con
tact
ang
le (°
) (v)
(vi)
(iv)
(i)
(iii)
(ii)
Water droplets Water droplets
CH2I2 droplets CH2I2 droplets
γlv
γsv γsl

Chapter 7. Counterface effects on friction, wear and transfer of polyimide 198
0
0.1
0.2
0.3
0.4
0.5
0.6
0.7
0.8
0.9
1
62 64 66 68 70 72 74 76 78
Work of adhesion (mN/m)
Coe
ffic
ient
of f
rictio
n
DLN
316L
DLC
R
ough
St
37-2
N
Smoo
th
St37
-2N
HA
ste
el
elements (Mo, Cr, Mn, Ni) in HA-steel cause higher surface polarity and total surface energy through their chemical activity. The polar shares of HA-steel imply strong dipole interactions with higher bonding energy than dispersion forces. One can expect high polar energy leading to better coating adhesion, which makes HA-steel favourable as coating substrate. The surface energy of 316L stainless steel is lower than St 37-2N and HA-steel and is mainly influenced by the Mo content in the surface oxide coat. Diamond-like carbon coatings have lower surface energy than HA-steel and St 37-2N with identical roughness. Amorphous carbon networks have chemical analogues with polymer materials consisting of C-C structures, and show therefore low surface energy depending on the shielding of carbon atoms by hydrogen. As a three-dimensional hydrogen stabilised carbon structure (a-C:H) is needed for high wear resistance, it implies higher structural order and higher surface energy than, e.g., PTFE with linear carbon-fluorine chains. The effect of alloying elements on the surface energy of a-C:H was tested by Grischke et al. [7.45], reporting that the surface energy of amorphous diamond-like carbon coatings increased from 41 mN/m for pure a-C:H towards 52 mN/m with oxygen addition, but it decreased to 19 to 24 mN/m with silicon or fluorine additions. Our measurements show an identical trend, but the absolute values are differ-ent because of variations in coating deposition techniques and the mathematical fitting methods used. Lower surface energy and reduced adhesion for DLN compared to DLC is likely attributed to prohibited carbon network formation in presence of silicon (DLN). This can be understood in relation to publications of Laidini et al. [7.46] about the chemical and micro structural characterisation of silicon-containing carbon films. Other literature [7.47] also indicates lower surface energies of DLN (35 mN/m) compared to steel (40 mN/m), but the polar and dispersive components were not yet determined.
Figure 7.11 Relation between work of adhesion and coefficients of friction for SP-1 at ♦ 0.3 m/s, 0.6 m/s, 0.9 m/s (1.2 m/s is not indicated due to overload) against different counterfaces
According to the general Dupré equation, the work of adhesion WA in contacts between, e.g., polyimide SP-1 and respective counterfaces X is calculated from Formula (7.1)
Xp
SPp
Xd
SPdAW γγγγ 22 += (7.1)

Chapter 7. Counterface effects on friction, wear and transfer of polyimide 199 As suggested by Chaudhurry [7.48], a solid of higher surface energy generally has higher friction than one of lower surface energy. Plotting the coefficients of friction against either the counterface surface energy or the work of adhesion (Figure 7.11) shows that previous rule is valid for DLN, 316L, smooth St 37-2N and HA-steel counter-faces. Differences in friction between smooth and rough steel are obviously not explained by the surface energy, as the friction coefficient contains both an adhesive and a deformation component with the latter dominating for rough St 37-2N counterfaces. Therefore, the relation between surface energy and friction should only be considered for equal counterface roughness (Ra = 0.05 µm). Despite low initial roughness, DLC pre-sents relatively higher friction than expected from its surface energy as coating removal (Figure 7.17) and increasing roughness contribute to unstable sliding and deformation. 7.3.2. Thermal conductivity and maximum polymer surface temperature T* The effects of frictional heating are evaluated by calculating bulk temperatures Tb accor-ding to Loewen and Shaw and maximum polymer surface temperatures T* according to Jaeger’s equation (Chapter 4). The thermal stability of polyimides is determined by ther-mo-oxidative degradation at 600°C (Chapter 6), while it depends on graphitisation for DLC at 300°C and DLN at 400°C (Chapter 3). It is concluded that thermal effects are not fully responsible to explain counterface effects for polyimide under mild sliding conditions, while thermal degradation is important for coatings under severe conditions. Calculated temperatures are plotted as a function of sliding velocities (Figure 7.12) or normal loads (Figure 7.13). The maximum polymer surface temperatures T* are below 100 to 120°C for sliding against steel counterfaces under most severe conditions of 50 N, 1.2 m/s or 200 N, 0.3 m/s, while they rise higher for sliding against coatings at the same conditions, due to the lower thermal conductivity of coatings. Important transitions in friction and wear of polyimides occur at T* = 180°C, as studied in previous Chapter 6. From these findings, thermal effects cannot explain the differences in sliding of SP-1 against HA-steel, St 37-2N and 316L counterfaces under present test conditions.
(a) (b)
Figure 7.12 Bulk temperatures Tb (full lines) and maximum polymer surface temperatures T* (dotted lines) for SP-1 at 50 N normal load and 0.3 m/s to 1.2 m/s sliding velocities,
(i) HA-steel, (ii) rough St 37-2N steel, (iii) smooth St 37-2N steel, (iv) 316L, (v) DLN, (vi) DLC
0
10
20
30
40
50
60
70
80
90
100
0 0.2 0.4 0.6 0.8 1 1.2 1.4
Sliding velocity (m/s)
Tem
pera
ture
(°C
)
(i)
(i) (iv)
(iv) (iii)
(iii)
(ii)
(ii)
0
100
200
300
400
500
600
700
800
900
1000
0 0.2 0.4 0.6 0.8 1 1.2 1.4
Sliding velocity (m/s)
Tem
pera
ture
(°C
)
(vi)
(v)
SP-1 transition
SP-1 max
DLN failure DLC failure
Tem
pera
ture
(°C
)
Tem
pera
ture
(°C
)
Sliding velocity (m/s) Sliding velocity (m/s)

Chapter 7. Counterface effects on friction, wear and transfer of polyimide 200
(a) (b)
Figure 7.13 Bulk temperatures Tb (full lines) and maximum polymer surface temperatures T* (dotted lines) for SP-1 at 0.3 m/s sliding velocity and 50 N to 200 N normal loads,
(i) HA-steel, (ii) rough St 37-2N steel, (iii) smooth St 37-2N steel, (iv) 316L, (v) DLN, (vi) DLC
Moreover, higher temperatures against HA-steel compared to St 37-2N would imply lower friction for HA-steel counterfaces, which is not observed. The high temperatures on DLC are not favourable since they exceed the thermal stability of the coating and lead to its delamination. High temperatures for DLN only contribute partially to lower friction: although the SP-1 transition temperature of 180°C is not exceeded at 50 N, 0.3 m/s to 0.6 m/s, friction of SP-1 sliding against DLN coatings is lower than against steel for the same sliding parameters. Temperatures seem rather important for the coating stability as the thermal endurance limit (see Table 3.6) is exceeded at 50 N, 1.2 m/s. The thermal conductivity of different counterfaces is an important factor, ranging between 33 W/mK for HA-steel to 46 W/mK for St 37-2N steel. Thermal conductivities for DLC were numerously discussed in literature and widely vary in values, depending on the measuring method, deposition conditions and substrate properties. Measure- ments on thin films are not obviously performed and generally give lower conductivities than for bulk materials. Ruiz et al. [7.49] measured by a scanning thermal microscope a conductivity of 76 W/mK for DLN deposited on silicon. Muzychka et al. [7.50] develop-ed an analytical model for multilayered coatings similar to present metal/Si-interface/ DLC coating, and calculated an average conductivity of 3.66 W/mK. The latter value is used for calculations in Figures 7.12 and 7.13, as it corresponds to work of Morath et al. [7.51] considering the thermal interlayer resistance of a silicon/DLC interface. A qualitative verification of thermal conductivity for DLN coatings deposited on HA-steel was done by Zsidai et al. [7.27] and indicates lower surface conductivity of DLN compared to HA-steel. The experiment is demonstrated in Figure 7.14. A constant heat input is realised with an electronically controlled hot air jet (Leister Electron, max 3060 W), while the resulting surface temperatures T(1) and T(2) are measured on top of the surface in points 1 and 2 at a given distance D = 26,6 mm. The temperature evolution in both points is registered as a function of time, qualifying the differences in heat flow on both HA-steel and DLN-coated surfaces. Two experiments were performed on each sur-face with different heat input (high input Whigh and low input Wlow). A constant heat le-vel was applied during a time needed to establish a given maximum temperature rise in point 2, i.e. T(2),max. The temperature rise T(2),max is identical for HA-steel or DLN.
0
20
40
60
80
100
120
140
0 50 100 150 200 250
Normal load (N)
Tem
pera
ture
(°C
)
(iv)
(iv)
(i) (ii) (iii)
(ii)
(i) (iii)
Tem
pera
ture
(°C
)
Normal load (N)
0100
200300
400500600
700800
9001000
0 50 100 150 200 250
Normal load (N)
(vi)
(v)
Tem
pera
ture
(°C
)
Normal load (N)
SP-1 transition
SP-1 max
DLN failure DLC failure

Chapter 7. Counterface effects on friction, wear and transfer of polyimide 201 Temperature profile on HA-steel Temperature profile on DLN
Hig
h he
at in
put W
high
Low
hea
t inp
ut W
low
Figure 7.14 Experimental verification of temperatures evolutions on HA-steel and DLN surfaces for an
artificially applied constant heat input Whigh and Wlow [7.27] The heat input is stopped after attaining T(2),max = 97°C in case of Whigh and T(2),max = 63°C in case of Wlow, with each temperature attained in a time t97,DLN and t97,steel or t63,DLN and t63,steel. For DLN, it was observed that the surface temperature T(2) near the heating source rises more rapidly and reaches its maximum value T(2),max after a shor-ter time t97,DLN compared to t97,steel on the HA-steel. The difference between temperatures T(2) and T(1) in the measuring points 1 and 2 is higher on DLN than in case of the HA-steel surface. Both observations indicate lower thermal conductivity for DLN coatings.
DISC SPECIMEN(STEEL OR DLN)
HEAT GENERATOR
MASK
THERMOMETERS
T max
T(2)T(1)
D = 26.6 mm Te
mpe
ratu
re ri
se (°
C)
Time (s)
Tem
pera
ture
rise
(°C
)
Time (s)
Tem
pera
ture
rise
(°C
)
Time (s)
Tem
pera
ture
rise
(°C
)
Time (s)

Chapter 7. Counterface effects on friction, wear and transfer of polyimide 202 7.3.3. Transfer evaluation Although both polymers and DLC coatings develop a transfer film, the macroscopic polyimide transfer is more important than the microscopic graphitisation of DLC coat-ings located at the roughness peaks. Therefore, properties of the polyimide transfer film will govern the tribological performance. The transfer behaviour generally depends on the counterface type as reported by Chen et al. [7.52] for, e.g., polyamides. Transfer of SP-1 on steel counterfaces is analysed by optical microscopy as a function of sliding velocities (Figure 7.15) or normal loads (Figure 7.16), often with different features in the centre of the sliding stroke compared to the borders of it. In this paragraph, transfer film morphologies are examined while they are related to friction and wear in paragraph 7.4. For HA-steel, no polymer transfer is observed at low sliding velocities and low normal loads. Only few polyimide (A) particles deposit on top of the surface and into the rough-ness grooves at higher velocities. The lack of transfer film formation is an indication for high friction, mainly with high peak values during running-in due to line contact. Also at high normal loads, the transfer is platelet-like and abrasive grooves parallel to the sliding direction are often observed on the steel. As discussed by, e.g., Jintang et al. [7.53] com-plex chemical reactions between polymer, transfer and metal occur at the frictional interface depending on the counterface composition. The adhesion between the metal surface and the transfer film is determined by the formation of, e.g., organo-metallics, while other researchers [7.54] recently described the hypothetical formation of a “n-p-n semiconductor” structure at the sliding interface. They suggested that the impetus for coherent transfer could be the formation of “p-n junctions” that are favoured by incor-poration of foreign atoms. Another hypothesis is that reactive Cr, Ni, Mo or Mn sites on HA-steel are sensitive to tribo-chemical oxidation and alter eventual bonding between the polymer transfer film and the metal surface. As demonstrated by Flint et al. [7.55] the nature of the oxide coat is mainly influenced by the Mo content and affects adhesion. For rough St 37-2N steel, heavy transfer is localised near the roughness grooves and at low sliding velocities (B) and it becomes progressively smoother with sliding velocity or normal loads, indicating that mechanical interlocking of wear debris particles in combi-nation with a rough surface profile adds to smooth transfer. A completely homogeneous transfer film (C) is observed at high sliding velocities due to mechanical shear. Separate platelets (D) are incorporated at high normal loads, indicating previously mentioned mechanical overload by brittleness (Chapter 5). For smooth St 37-2N steel, coarse island-like transfer (E) occurs near the borders of the sliding stroke and no transfer film in the centre of the sliding stroke was observed at 0.3 m/s. It progressively gains homogeneity at higher sliding velocities, indicating that mechanical shear is prevailing until the film becomes thinner (F) at 0.9 m/s and covers the entire sliding area. For 316L stainless steel, thin platelet-like polyimide particles are seen over the entire sliding area. This type of film resembles the film on smooth St 37-2N, but transferred polymer particles are finer (G) and homogeneously dispersed over the sliding area. Also at higher sliding velocities, the transfer becomes smoother through mechanical shear. Abrasive wear marks (H) on stainless steel are more important than previously noted on HA-steels, indicating that the oxide coat is less wear-resistant than other steel types. Wear marks are observed both at high normal load and at high sliding velocity. Also on large-scale tests (Chapter 10), stainless steels were severely damaged by abrasive wear after sliding with thermoplastic polymers.

Chapter 7. Counterface effects on friction, wear and transfer of polyimide 203
0.3 m/s 0.9 m/s
HA
-ste
el
Rou
gh S
t 37-
2N
Smoo
th S
t 37-
2N
316L
stai
nles
s ste
el
Figure 7.15 Optical microscopy of polyimide SP-1 transfer on different steel counterfaces at 50 N
normal load and various sliding velocities
A
B
E F
G
H1 mm
C

Chapter 7. Counterface effects on friction, wear and transfer of polyimide 204
100 N 200 N
HA
-ste
el
Rou
gh S
t 37-
2N
Smoo
th S
t 37-
2N
316L
stai
nles
s ste
el
Figure 7.16 Optical microscopy of polyimide SP-1 transfer on different steel counterfaces at 0.3 m/s
sliding velocity and various normal loads
A
D
C
E
E
H
G
1 mm
C
D

Chapter 7. Counterface effects on friction, wear and transfer of polyimide 205 Transfer on DLN coatings (Figure 7.17, as a function of sliding velocities, and Figure 7.18, as a function of normal loads) consists of an island-like film covering the entire sliding area and looks similar as for 316L stainless steel. For both counterface types, the morphology corresponds to low friction, but high wear. Transfer particles origins from mechanical shear. The polyimide flakes on DLN are thinner and smoother (I), while also the surface fraction covered by polyimide is larger compared to steel and DLC. The debris, however, is not removed from the interface (no separate debris was observed during running-in) due to interaction of debris with the coating, in contrast to steel counterfaces. This contributes to more homogeneous transfer film formation over the entire sliding area. Separate polyimide flakes coalesce at higher sliding velocities into continuous shearing bands parallel to the sliding direction (J), indicating thermal effects (T* > 180°C) that enhance interaction between debris. Due to thermal effects, also the surface coverage becomes larger at 200 N normal loads (O). Near the reversals of the stroke, large island-like particles are sheared as the debris mobility is limited at the borders and debris is not readily removed from the sliding interface: the particles remain in the contact interface during reversal of the sliding motion, while they are more readily removed in the centre of the stroke. Some very slight grooves in the DLN coating appear at intermediate loads of 100 N (N), while more severe abrasion (P) is noticed at 200 N. This is related to thermal degradation of the coating (T* > 400°C). It is observed that detached coating particles circulate in the sliding interface as abrasive third bodies (see paragraph 7.3.5).
0.3 m/s 0.9 m/s
DL
N c
oatin
g
DL
C c
oatin
g
Figure 7.17 Optical microscopy of polyimide SP-1 transfer on diamond-like carbon coatings at 50 N
normal load and various sliding velocities
I
J
K
M
L
1 mm

Chapter 7. Counterface effects on friction, wear and transfer of polyimide 206 Transfer on DLC coatings (Figure 7.17, as a function of sliding velocities and Figure 7.18, as a function of normal loads) shows coarse transfer particles (K) homogeneously distributed over the entire sliding area. Surface striations on DLC represent partial coating removal at 50 N to 100 N, 0.3 m/s (L) and entire coating removal at 150 to 200 N, 0.3 m/s (M) or 50 N, 0.9 to 1.2 m/s. High temperatures contribute to thermal coating degradation, observed as brown colour (L and M). Also for soft coatings, Benabdallah [7.10] noticed that coatings were easily removed after sliding against polymers. For present hard coatings, concentration of Hertz stresses beneath the sliding surface is important for coating delamination. The adhesion between coating and substrate is important for the coating performance and improves when the relative difference in hardness and internal stresses between coating and substrate decrease. Therefore, one can suppose that the adhesion on HA-steel substrates is better for DLN coatings being relatively softer compared to hard DLC coatings.
100 N 200 N
DL
N c
oatin
g
DL
C c
oatin
g
Figure 7.18 Optical microscopy of polyimide SP-1 transfer on diamond-like carbon coatings at 0.3 m/s
sliding velocity and various normal loads 7.3.4. Roughness measurements of steel and coatings after sliding The change in counterface roughness ∆Ra and ∆Rt for steels and coatings before and after sliding is given in Figure 7.19, either increasing (positive) or decreasing (negative) as a combination of polymer transfer and counterface wear. The roughness profiles in Figure 7.20 for steels and Figure 7.21 for coatings are measured perpendicular to the
N O
P
P
L
L
K
M
1 mm

Chapter 7. Counterface effects on friction, wear and transfer of polyimide 207
(a) (b)
Figure 7.19 Change in counterface roughness parameters before and after sliding, (a) centre-line average roughness Ra (µm), (b) peak-to-valley height Rt.
The four bars for each counterface type represent 0.3, 0.6, 0.9, 1.2 m/s at 50 N normal load
sliding direction. It will be concluded for DLC coatings that abrasive grooves affect the coating/substrate interface, while small grooves are detected on DLN, 316L or HA-steel. For HA-steel, no change in roughness is observed at low sliding velocities in agreement with lacking polymer transfer. Progressively higher roughness after 0.9 to 1.2 m/s sliding tests indicates that the HA-steel is slightly worn by abrasive grooves parallel to the sliding direction, as noticed on the HA-steel profile. The origin of those abrasive grooves is found in the detachment of steel particles by Hertz contact stresses and circulation as third body abrasives in the sliding interface (see paragraph 7.3.5). A different trend is observed for other counterfaces, showing progressively smaller changes in roughness at higher sliding velocities, due to the interaction between counterface wear and transfer. The increase in roughness of smooth steel counterfaces is mainly attributed to inhomogeneous film formation, becoming smoother and increasingly covering the sliding area at higher sliding velocities. This is indicated by a decrease in Ra and negative Rt values at 1.2 m/s, finally representing smooth and homogeneous transfer. The profile of smooth St 37-2N shows that transfer material (on top of the surface) accumulates mainly near the grooves. This is different to what was seen on SEM images for HA-steel (Figure 5.12) with separate polyimide flakes over the entire surface, as adhesion in the latter case is more important.
-0.2
-0.1
0
0.1
0.2
0.3
0.4
0.5
Del
ta R
a
-3
-2
-1
0
1
2
3
4
5
Del
ta R
tHA-steel Rough
St 37-2N Smooth St 37-2N 316L
DLC DLN
HA-steel Rough St 37-2N
Smooth St 37-2N
316L
DLC DLN
No film, grooves
Thick film
Unhomo- geneous
Platelets, grooves
∆R
a (µ
m)
∆R
t (µm
)

Chapter 7. Counterface effects on friction, wear and transfer of polyimide 208
Roughness profile after sliding
HA
-ste
el
Rou
gh S
t 37-
2N
Smoo
th S
t 37-
2N
31
6L st
ainl
ess s
teel
Figure 7.20 Roughness profile of different steel counterfaces after sliding with polyimides SP-1
Rough steel counterfaces decrease in roughness by formation of a thick polymer transfer film that completely masks the original steel topography. The initial grooves are filled with polymer over the entire surface and a smooth film establishes. Stainless steels count numerous small abrasive grooves through abrasive wear, caused by detachment of steel particles and circulation as third body abrasives in the sliding interface. These grooves are more numerously for stainless steels compared to HA-steels. Therefore, the rough-ness of stainless steels significantly increases after sliding. Abrasive grooves were also observed in contact of stainless steel with large-scale polyethylene terephthalate / poly-tetrafluoroethylene (PET/PTFE) samples (Chapter 10). The brittleness and hardness of a passivating oxide film on the surface of stainless steel contribute to detachment of steel particles by wear (paragraph 7.3.5). The DLC-coating presents a large increase in Ra due to coating wear through a combination of thermal degradation and abrasive third bodies. An increase in roughness
1 µm
1 cm
1 µm
1 cm
1 µm
1 cm
1 µm
1 cm

Chapter 7. Counterface effects on friction, wear and transfer of polyimide 209
Roughness profile after sliding
D
LN
coa
ting
DL
C c
oatin
g
Figure 7.21 Roughness profile of diamond-like carbon coatings after sliding with polyimides SP-1 is the most prominent for the 0.6 m/s test, because transfer particles likely deposit near the abrasive grooves of the worn coating. The profile also shows depositions in the centre of the surface around craters caused by abrasion. It is very important to see that the groove depth on DLC attains maximum 5 µm, which is larger than the coating thickness and indicates failure near the coating/substrate interface! This agrees to previous micrographs where the steel substrate becomes visible at the most severe sliding conditions. Also the increase in surface roughness of DLN is attributed to abrasive grooves, although they remain smaller than the coating thickness. Lower inter-nal stresses own to the coating process cause the grooves not growing along the coating/ substrate interface and delamination of the DLN coating over a large area is not observed, in contrast to DLC. Although polyimide specimens are softer than steels and coatings, they cause hard coun-terfaces being abrasively worn. Third body abrasive wear particles are created by detach-ment from steel or coating surfaces through wear and stress concentrations at the counterface asperities or subsurface Hertz stresses. 7.3.5. Polymer surface microscopy and wear debris morphology The polyimide SP-1 surfaces and wear debris particles after sliding against different counterfaces are evaluated by optical microscopy. It will be concluded that sometimes the polymer surface has abrasive grooves and detached counterface particles most likely circulate in the sliding interface as third body abrasives. The wear debris morphology de-pends on the counterface type and is conglomerated after sliding against coatings.
1 µm
1 cm
2.5
µm 1 cm
grooves 5 µm

Chapter 7. Counterface effects on friction, wear and transfer of polyimide 210
HA-steel Smooth St 37-2N Rough St 37-2N
DLC coating DLN coating
Figure 7.22 Surface morphology of sintered polyimides SP-1 after sliding against different counterfaces
by optical microscopy The polyimide wear surfaces are shown in Figure 7.22 after sliding at 50 N, 0.9 m/s with different counterfaces. Smooth polyimide surfaces are observed after sliding against St 37-2N as an indication of adhesive wear. Abrasive grooves in the polyimide surface are observed after sliding against HA-steel, 316L stainless steel, DLN and DLC. These agree with the cases for which also abrasive grooves in the counterface were observed. After optical microscopy, SEM microscopy and EDX analysis there were no indications of transferred steel particles on the surface of sintered polyimides. Steel or coating parti-cles are observed in the collected wear debris (Figure 7.23). It suggests that counterface particles, detached by Hertz stresses or thermal degradation, circulate free in the sliding interface and cause abrasive wear to both the polyimide surface and the counterface. Abrasive grooves in the polyimide surface are caused when sliding over hard third
(a) (b)
Figure 7.23 Wear debris (a) mixed polyimide/steel particles, and (b) mixed polyimide/coating particles.
1 mm
316L DLC

Chapter 7. Counterface effects on friction, wear and transfer of polyimide 211 bodies in the interface. If steel particles embed in the polyimide surface, they should protect the soft surface and cause no grooves along the sliding direction. It is in contrast to observations of thermoplastic PET/PTFE (Figure 10.17), where detached stainless steel particles embed in the soft polymer surface. Tewari et al. [7.56] detected transfer of metallic particles on thermoplastic polyimide surfaces and abrasive counterface wear. Le Moigne et al. [7.57] found that graphite-fiber reinforced polyimides caused detachment of steel counterface particles and incorporation in the polyimide surface. Sintered poly-imides have semi-thermosetting properties with high hardness and stiffness that are not likely for embedment, in contrast to thermoplastics. Also small polyimide contact areas promote evacuation of third bodies in contrast to debris accumulation for large areas. Wear particles at 50 N, 0.9 m/s (Figure 7.24) are small and wedge-like after sliding against steels. For HA-steel, uniformly small particles are easily ejected from the sliding interface and do not form a transfer film. For smooth St 37-2N steel, large debris consist of agglomerated polyimide particles with the original sintered structure. It agrees with the surface energies of steel grades and the brittle structure of sintered polyimide, that (i) high work of adhesion and high friction for polyimide/HA-steel lead to strong shear forces at the polyimide surface with consequently small particles, and (ii) the lower shear forces for polyimide/St 37-2N steel only allow for detachment along weak sintered boundaries with consequently large agglomerated particles. The wear debris after sliding against DLC and DLN consist of large sheet-like particles. Their specific structure confirms the hypothesis that wear debris is formed by transfer particles conglomerating in the interface through adhesion and heating. This assumption is made because no separate wear debris was observed during running-in, indicating that particles initially remain in the interface. The dynamics and partition of wear particles between the transfer film and loose debris was discussed by Jacko et al. [7.58], depending on the ratio of cohesive and adhesive forces.
HA-steel Smooth St 37-2N Rough St 37-2N
DLC coating DLN coating
Figure 7.24 Wear debris morphology of SP-1 after sliding against different counterfaces at 50 N, 0.9 m/s
1 mm

Chapter 7. Counterface effects on friction, wear and transfer of polyimide 212 7.4. Discussion on counterface effects influencing tribologi-
cal performance Differences in friction and wear mechanisms of polyimide/steel or polyimide/coating pairs are summarised in Table 7.5 and explained below in relation to counterface characterisation. The calculated maximum polymer surface temperature T* reveals that the 180°C critical temperature (Chapter 6) is not is exceeded for steel counterfaces and coatings under low sliding velocity. Moreover, the thermal stability of polyimides is higher than for DLC or DLN, so that thermal degradation does not cause polyimide failure but rather explains the observed coating wear. As adhesion is the main mecha-nism for low roughness surfaces (Ra = 0.05 µm) during initial sliding, physical interac-tions should be considered in explaining present counterface effects. During ongoing sliding, however, transfer and wear debris behaviour rule friction and wear. Table 7.5. Summary of observed friction and wear mechanisms of sintered polyimide SP-1 sliding against different counterfaces under normal sliding conditions (no overload)
Counterface type Friction Wear Surface energy Transfer Counterface wear
HA-steel 2 4 1 No transfer (or very local) Slight abrasive wear
St 37-2N rough 3 6 3 Thick overall film No wear
St 37-2N smooth 4 5 2 Thin platelet-like film No wear
316L 5 3 5 Thin flakes (island-like) Heavy abrasive wear
DLN coating 6 2 6 Thin flakes (island-like) No wear, minor grooves
DLC coating 1 1 4 Coarse flakes (island-like) Severe delamination numbers represent ranking from 1 (high) to 6 (low) 7.4.1. Friction mechanisms 7.4.1.1. Friction mechanisms sliding against diamond-like carbon coated counterfaces The lowest friction for SP-1 is observed for DLN counterfaces (not considering overload). This is in agreement with low surface energy and low work of adhesion, implying small interactions and mutual bonding during running-in. During steady-state, the polyimide wear debris particles show high structural compatibility with DLN (the amorphous coating and polyimide structure basically consist of a carbon-carbon net-work, Figures 3.13 and 7.25) causing high mutual interaction and deposition of transfer particles over the entire counterface area. Transfer formation therefore happens even at low sliding velocities, where thermal transitions do not influence reactions between separate debris particles. The debris particles remain for several sliding periods attached to the counterface and agglomerate into larger particles with local conversion of poly-imide/coating into smooth polyimide/polyimide sliding, reducing friction. However, the adhesion of debris decreases as transfer particles grow and especially large particles are submitted to high shear until they detach and establish a thin island-like transfer film. Although its structural compatibility, there is no homogeneous transfer own to brittleness

Chapter 7. Counterface effects on friction, wear and transfer of polyimide 213
Figure 7.25 Structural compatibility between carbon-like coatings and polymers [7.59], (a = amorphous, ta = tetrahedral amorphous, C = carbon film, C:H = hydrogenated carbon film)
of sintered polyimides and own to the balance between cohesive and adhesive forces localised on the transfer particles. At higher sliding velocities, additional smoothening and orientation of the particles transferred to DLN happen through mechanical shear and temperature rise, being insufficient to cause interactions between debris particles at mild sliding conditions (e.g., 0.3 to 0.6 m/s). Also amorphous DLC coatings have high structural compatibility with polyimide, but the high internal stresses contribute to high surface energy. The latter implies high interactions and adhesive forces during initial sliding. As the surface polarity of DLC is higher compared to DLN, the build-up of large particle transfer is favoured: the higher adhesive forces relatively to cohesive forces allow for attachment of particles to the counterface over long sliding times. Therefore, large transfer particles grow during sliding and cause unstable rather than smooth sliding. Moreover, the extremely high friction for DLC enhances coating removal, increasing the counterface roughness and generating abrasive third bodies in the sliding interface. Recurrent processes of coating removal and high friction lead to unstable sliding. 7.4.1.2. Friction mechanisms sliding against steel type counterfaces The lowest friction for SP-1 among steel counterfaces is noticed for 316L stainless steels, in parallel to low surface energy. A thin platelet-like film is most favourable for low friction rather than thick films. A similar thin film with small oriented particles occurred in Figure 5.11 and yielded also low friction. The highest friction occurs for HA-steel in parallel to high surface energy, lack of transfer at low sliding velocities or very local transfer at higher sliding velocities. The lack of coherent particle transfer in the centre of the steel sliding stroke represents the low structural compatibility between polyimide and steel counterfaces in contrast to amorphous diamond-like coatings. Therefore, the wear debris is easily removed from the steel contact area instead of structural adhering to the counterface as it was observed for
C sp2 H
C sp3
Glassy carbon
a-C
ta-C
ta-C:H
a-C:H
Poly mers No films
Graphitic carbon
Diamond carbon

Chapter 7. Counterface effects on friction, wear and transfer of polyimide 214 amorphous coatings. General models for smooth sliding surfaces suggest, however, higher friction in contacts between soft sliding bodies compared to hard bodies. In relation to present HA-steel counterfaces, it reveals that the high surface energy and interaction with alloying elements are more important to increase friction than the expected decrease in friction from its hardness. The DLN coatings are harder than HA-steel and cause low friction indicating that hardness is no unique parameter in controlling friction of sintered polyimides. For St 37-2 N, it is obvious that higher roughness results in higher friction due to the deformation component of friction. Also the formation of a thick transfer film on rough steel counterfaces is not conducive to low friction. The gradual build-up of a thick transfer film likely results from presence of mechanical anchor points for attachment of wear debris. For smooth steel surfaces, this mechanical interaction decreases and transfer is governed by purely adhesive interaction. A platelet film is therefore observed with some similarities to 316L, while transferred particles are some coarser for St 37-2N due to its higher surface energy. Friction of smooth St 37-2N is thus in between rough St 37-2N and stainless steel 316L. 7.4.2. Wear mechanisms Wear measurements indicate that a combination of smooth counterfaces and/or low friction and/or low work of adhesion does not necessarily result in low wear for polyimide SP-1. Different wear mechanisms such as adhesion, abrasion and fatigue interact. They depend on the relative compatibility of the contact bodies, transfer film formation and the type of wear debris in the sliding interface. The lack of abrasive wear resistance for sintered polyimides, however, makes each origin of abrasion contributing to high wear rates and disfavouring the generally good adhesive wear resistance. While wear is initially expected on the softest sliding body, also coating wear is attributed to Hertz contact stresses localised beneath the sliding interface and thermal degradation. 7.4.2.1. Wear mechanisms sliding against diamond-like carbon coated counterfaces Polyimide SP-1 wear rates increase through severe coating wear, causing (i) production of third body abrasive coating particles (most important origin for abrasive wear grooves in the polyimide surface), and (ii) an increase in counterface roughness. Also the inhomogeneous platelet polyimide particles with relatively high hardness and stiffness compared to thermoplastics as, e.g., polyethylene or polyamides, may act as abrasives for the polyimide surface. As the work of adhesion between polyimide and DLN is the lowest of all sliding pairs, adhesive wear mechanisms are minor. 7.4.2.2. Wear mechanisms sliding against steel type counterfaces Polyimide SP-1 wear rates on rough steel St 37-2N are lower than for smooth counterfaces, contradictorily to the expected abrasive action of the roughness asperities. The formation of a thick transfer film on rough surfaces masks contact with the steel counterface and provides smooth polyimide/polyimide contact, subjected to favourable adhesive wear but high friction. From Figure 7.22, a smooth polyimide surface illustrates protection by a thick transfer film. In contrast, the platelets or thin transfer films

Chapter 7. Counterface effects on friction, wear and transfer of polyimide 215 observed on smooth steel counterfaces increase the abrasive action of the counterface and do not remove the steel roughness profile. They rather induce slight grooves on the polyimide surface, shown in Figure 7.22. The counterface wear of 316L and HA-steel causes steel particles as third body abrasives in the interface leading to abrasive wear. Also inhomogeneous transfer particles may increase abrasiveness. 7.4.3. Influence of test environment and polyimide composition The combined effect of polyimide composition, counterface type and relative humidity on friction and wear is presented in Table 7.6. Sliding tests are done on SP-1 and SP-2 at 100 N, 0.3 m/s and either 60 or 40 % relative humidity. The influence of humidity for SP-1 and SP-2 sliding against HA-steel was previously explained in paragraph 5.4.2. The relation to DLN coatings is discussed below: • For SP-1, the trend of lower friction and higher wear at 40 % RH relatively to 60 %
RH is similar for HA-steel or DLN counterfaces. This behaviour was in Chapter 5 related to the adsorption of water molecules that restricts the molecular movement (higher friction) and enhances the strength between adjacent molecular chains by cross-links (lower wear). When changing HA-steel into DLN coatings, the decrease in friction and increase in wear for SP-1 at low humidity is maintained. The favourable action of DLN in lowering friction even enhances at 40 % RH (friction only decreases with 25 % from 0.47 to 0.35 at 60 % RH while friction decreases with 55 % from 0.45 to 0.20 at 40 % RH). According to Gangopadhyay et al. [7.60] or Yang et al. [7.22], the friction coefficient of diamond-like carbon coatings in unlubricated sliding against metals or ceramics increases at high atmospheric humidity. These intrinsic coating effects are thus also reflected in contact with polyimide. According to Jiang et al. [7.61], also coating wear decreased at high humidity through adsorption of water at the dangling carbon bonds.
• For SP-2, the relations for friction and wear as a function of relative humidity are
similar for HA-steel and DLN, and were discussed in Chapter 5. Both lower friction and lower wear rates occur at low humidity. However, friction of the SP-2/DLN couple is higher compared to the SP-1/DLN couple. This is presumably explained through the high structural compatibility between graphite fillers and DLN, which imply cohesive forces over the interface. Further investigation on this topic was not done within this work, as dark graphitic surfaces could not easily be analysed by Raman spectroscopy. Other techniques should be applied in future.
Table 7.6. Influence of relative humidity and counterface on tribological properties of SP-1 and SP-2 at 100 N, 0.3m/s: friction coefficients and wear rates w (10-4 mm3/m)
SP-1 SP-2
HA-steel DLN coating HA-steel DLN coating Relative humidity
µ w
µ w
µ w
µ w
60 % 0.47 19.5 0.35 22.2 0.42 4.72 0.40 4.42
40 % 0.45 20.3
0.20 24.3
0.37 1.62
0.28 3.26

Chapter 7. Counterface effects on friction, wear and transfer of polyimide 216 7.5. Conclusions Sintered polyimide was slid against high-alloy (HA) steel, carbon steel (St 37-2N) with rough and smooth finish, stainless steel (316L) and two types of diamond-like carbon coatings: DLC and Si-doped nanocomposite coatings (DLN). For steel and coated steel surfaces with identical low roughness (Ra = 0.05 µm), differences in friction mechanisms for sintered polyimide are related to surface energies and transfer behaviour. Wear mechanisms are influenced by third body abrasives. There is no unique relationship between counterface hardness and friction or wear for sintered polyimides. The calculated maximum polymer surface temperatures T* reveal that not only the polyimide transition temperatures can explain differences in friction and wear. The surface energy and structural compatibility between polyimide and amorphous carbon coatings are controlling parameters at running-in, while transfer morphology is important at steady-state: • The coefficient of friction for counterfaces with low roughness increases with work
of adhesion for DLN coating < 316L stainless steel < smooth St 37-2N < HA-steel. This trend does not apply for DLC coatings with unstable friction and coating wear.
• The wear of polyimide sliding against counterfaces with low roughness increases for smooth St 37-2N < HA-steel < 316L stainless steel < DLN coating < DLC coating. Smooth polyimide surfaces sliding on smooth St 37-2N indicate mainly adhesive wear. Slight abrasive wear of polyimide is governed by third body particles that detach from the counterface during sliding against DLC, DLN, 316L and HA-steel. Counterface wear originates from concentrations of Hertz stresses and thermal coating degradation. According to roughness measurements, failure of DLC happens above 100 N or 0.9 m/s at the interface between substrate and coating, while limited failure of DLN above 150 N or 1.2 m/s happens only within the coating. Counterface particles are not embedded in the sintered polyimide surface.
• Transfer and wear debris interaction rules friction at steady-state. Lowest friction on DLN corresponds to an island-like transfer film with thin flakes covering the entire sliding area. Structural compatibility between polyimide and amorphous carbon coatings ensures that debris is not ejected from the sliding interface but conglome-rates during sliding. Transfer on DLC also happens by conglomeration, but it is coarse due to higher surface energy. A thin platelet-like transfer film is also noticed on 316L stainless steels, conducive to low friction. Smooth St 37-2N lacks transfer in the centre and shows flake-like transfer only near the borders. Highest friction on HA-steel corresponds to lack of transfer film or very local transfer particles, as most wear debris is very small and completely washed out of the contact interface. Low structural compatibility between polyimide and steel disfavours transfer.
For steel surfaces St 37-2N with high roughness (Ra = 0.20 µm), the surface energy is lower compared to smooth steel. Higher friction and lower wear of polyimides is mea-sured on rough compared to smooth steel St 37-2N. The coefficient of friction changes in a reverse trend than estimated from work of adhesion as an indication that the defor-mation component of friction becomes more important. A thick transfer film forms by mechanical interlocking of polyimide debris on rough steel surfaces and it becomes completely smooth in combination with mechanical shear. A continuous thick film masks the original roughness and ensures adhesive wear. No or coarse transfer occurs on

Chapter 7. Counterface effects on friction, wear and transfer of polyimide 217 smooth steel, suggesting lack of mechanical interaction. At low environmental humidity, friction of pure sintered polyimide on HA-steel and DLN coatings decrease while wear rates increase. The favourable action of DLN in lowering friction enhances at low humidity. References [7.1] Bahadur S. Development of transfer layers and their role in polymer tribology, Wear 245 (2000), 92-99 [7.2] Schwartz CJ, Bahadur S. Studies on the tribological behavior and transfer film–counterface bond strength for polyphenylene sulfide filled with nanoscale alumina particles, Wear 237 (2000), 261-273 [7.3] Fusaro RL. Counterface effects on the Tribological properties of polyimide composites, Lubr Eng 42 (1989), 668-676 [7.4] Ramos MD. Theoretical study of metal-polyimide interfacial properties, Vacuum 64 (2002), 255-260 [7.5] Play DF. Counterface roughness effect on the dry steady state wear of self-lubricating polyimide composites, J Tribol 106 (1984), 177-184 [7.6] Dowson D, Challen JM, Holmes K, Atkinson JR. The influence of counterface roughness on the wear rate of polyethylene, Proceedings 3rd Leeds-Lyon Conference, Leeds, 1976, 99-102 [7.7] Jain VK, Bahadur S. Material transfer in polymer-polymer sliding, Wear 46 (1978), 177-188 [7.8] Holmberg K, Matthews A, Ronkainen H. Coatings tribology – contact mechanisms and surface design. Tribol Internat 31 (1998), 107-120 [7.9] Santner E, Czichos H. Tribology of polymers, Tribol Internat 22 (1989), 103-109 [7.10] Benabdallah H. Friction and wear of blended polyoxymethylene sliding against coated steel plates, Wear 254 (2000), 1239-1246 [7.11] Heinze M. Wear resistance of hard coatings in plastics processing, Surf Coat Tech 105 (1998), 38-44 [7.12] Robertson J. Diamond-like amorphous carbon, Mat Sc Eng R 37 (2002), 129-281 [7.13] Gählin R, Larsson M, Hedenqvist P. ME-C:H coatings in motor vehicles. Wear 249 (2001), 302-309 [7.14] Hauert R. An overview on the tribological behaviour of diamond-like carbon in technical and medical applications. Tribol Internat 37 (2004), 991-1003 [7.15] Ronkainen H, Varjus S, Koskinen J, Holmberg K. Differentiating the Tribological performance of hydrogenated and gydrogen-free DLC coatings, Wear 249 (2001), 260-266 [7.16] Liu Y, Erdemir A, Meletis EI. A study of the wear mechanism of diamond-like carbon films, Surf Coat Tech 82 (1996), 48-56 [7.17] Sanchez-Lopez JC, Erdemir A, Donnet C, Rojas TC. Friction-induced structural transformations of diamond-like carbon coatings under various atmospheres, Surf Coat Tech 163-164 (2003), 444-450 [7.18] Scharf TW, Singer IL. Role of third bodies in friction behavior of diamond-like nanocomposite coatings studied by in situ tribometry, Tribol Trans 45 (2002), 363-371 [7.19] Donnet C. Tribology of solid lubricant coatings, Condensed Mater News 4/6 (1995), 9-24 [7.20] Yoon E, Kong H, Lee K. Tribological behaviour of diamond-like carbon films under various environments, Wear 217 (1998), 262-270 [7.21] Jiang J, Arnell RD, Tong J. The effect of substrate properties on tribological behaviour of composite DLC coatings, Tribol Internat 30 (1997), 613-625 [7.22] Yang SH, Kong H, Lee KW, Park S, Kim DE. Effect of environment on the tribological behaviour of Si-incorporated diamond-like carbon films, Wear 252 (2002), 70-79 [7.23] Le Huu T, Zaidi H, Paulmier D, Voumard P. Transformation of sp3 to sp2 sites of diamond like carbon coatings during friction in vacuum and water vapour environment, Thin Sol Film 290-291 (1996), 126-130 [7.24] Donnet C, Le Mongne T, Ponsonnet L. The respective role of oxygen and water vapor on the tribology of hydrogenated diamond-like carbon coatings, Tribol Letters 4 (1998), 259-265 [7.25] Voevodin AA, Phelps AW, Zabinski JS, Donley MS. Friction induced phase transformation of pulsed laser deposited diamond-like carbon, Diamond Relat Mater 5 (1996), 1264-1269 [7.26] Donnet C, Grill A. Friction control of diamond-like carbon coatings, Surf Coat Tech 94-95 (1997), 456-462 [7.27] Zsidai L, Samyn P, Vercammen K, Van Acker K, Kozma M, Kalacska G, De Baets P. Friction and thermal effects of engineering plastics sliding against Steel and DLN-coated surfaces, Tribol Letters 17 (2004), 269-288 [7.28] Sheeja D, Tay BK, Shi X, Lau SP, Nung LN. Mechanical and tribological characterization of diamond-like carbon coatings on orthopedic materials, Diamond Relat Mater 10 (2001), 1043-1048 [7.29] Tiainen VM. Amorphous carbon as a bio-mechanical coating - mechanical properties and biological applications, Diamond Relat Mater 10 (2001), 153-160

Chapter 7. Counterface effects on friction, wear and transfer of polyimide 218 [7.30] Horng JH, Len ML, Lee JS. The contact characteristics of rough surfaces in line contact during running-in process, Wear 253 (2002), 899-913 [7.31] Pleskachevsky YM, Smurugov VA. Thermal fluctuations at PTFE friction, Wear 209 (1997), 123-127 [7.32] Uetz H, Wiedmeyer J. Tribologie der Polymere, Carl Hanser Verlag (Munchen), 1985, ISBN 3-4461-4050-6 [7.33] Sheiretov T, Van Glabbeek W, Cusano C. Evaluation of the tribological properties of polyimide and poy(amide-imide) polymers in a refrigerant environment, Tribol Trans 38 (1995), 914-922 [7.34] Bijwe J, Tewari US, Vasudevan P. Friction and wear studies of a short glass-fiber-reinforced polyetherimide composite, Wear 132 (1989), 247-264 [7.35] De Baets P, Deckers P, Van Parys F, Vercammen K. Tribological behaviour of diamond-like carbon coatings applied on polymer extrusion dies, Proceedings 2nd World Tribology Congress, Vienna, 2001 [7.36] Platon F, Fournier P, Rouxel S. Tribological behaviour of DLC coatings compared to different materials used in hip joint prostheses, Wear 250 (2001), 227-236 [7.37] Onate JI, Comin M, Braceras I, Garcia A, Viviente JL, Brizuela M. Wear reduction effect on ultra-high- molecular-weight polyethylene by application of hard coatings and ion implantation on cobalt chromium alloy, as measured in a knee wear simulation machine, Surf Coat Tech 142-144 (2001), 1056-1062 [7.38] Firkins P, Hailey JL, Fisher J, Lettington AH, Butter R. Wear of UHMWPE against damaged and undamaged stainless steel and DLC-coated counterfaces, J Mater Sci Mater Med 9 (1998), 597-601 [7.39] Xu T, Pruitt J. Diamond-Like Carbon Coatings for Orthopedic Applications: An Evaluation of Tribological Performance, J Mater Sci Mater Med 10 (1999), 83-90 [7.40] Saikko V, Ahlroos T, Calonius O, Keränen J. Wear simulation of total hip prostheses with polyethylene against CoCr, alumina and diamond-like carbon, Biomaterials 22 (2001), 1507-1514 [7.41] Owens DK, Wendt RC. Estimation of surface free energy of polymers, J Appl Polym Sci 13 (1969), 1741-1746 [7.42] Ström G, Fredriksson M, Klason T. Interfacial tension and surface hydrophilicity in systems of solid polymers in contact with aqueous solutions, J Colloid Interfacial Sci 123 (1988), 324-338 [7.43] Janczuk B, Bialopiotrowicz T, Wieslaw W. The components of surface tension of liquids and their usefulness in determinations of surface free energy of solids, J Colloid Interface Sci 127 (1989), 59-66 [7.44] Lugscheider E, Bobzin K. The influence on surface free energy of PVD-coatings, Surf Coat Tech 142-144 (2001), 755-760 [7.45] Grischke M, Hieke A, Morgenweck F, Dimigen H. Variation of the wettability of DLC-coatings by network modification using silicon and oxygen, Diamond Relat Mater 7 (1998), 454-458 [7.46] Laidini N, Speranza G, Calliari L, Micheli V, Anderle M. Chemical and microstructural characterisation of silicon-containing carbon films, Proceedings E-MRS Spring Meeting, 2002 [7.47] Neerinck D, Persoone P, Sercu M, Goel A, Kester D, Bray D. Diamond-like nanocomposite coatings for tribological applications, Diamond Relat Mater 7 (1998), 468-471 [7.48] Chaudhury MK. Interfacial interaction between low-energy surfaces, Mat Sc Eng R 16 (1996), 97-159 [7.49] Ruiz F, Sun WD, Pollak FH, Venkatraman C. Determination of the thermal conductivity of diamond-like nanocomposite films using a scanning thermal microscope, Appl Phys Lett 73 (1998), 1802-1804 [7.50] Muzychka YS, Sridhar MR, Yovanovich MM. Thermal spreading resistance in multilayered contacts: applications in thermal contact resistance, J Thermophysics and Heat Transfer 13 (1999), 489-494 [7.51] Morath CJ, Maris HJ, Coumo JJ. Picosecond optical studies of amorphous diamond and DLC: thermal conductivity and longitudinal sound velocity, J Appl Physics 76 (1994), 2636-2640 [7.52] Chen YK, Modi OP, Mhay AS, Chrysanthou A, O’Sullivan JM. The effect of different metallic counterface materials and different surface treatments on the wear and friction of polyamide 66 and its composite in rolling-sliding contact, Wear 255 (2003), 714-721 [7.53] Jintang G. Tribochemical effects in formation of polymer transfer film, Wear 245 (2000), 100-106 [7.54] Wang CB, Yan MF, Wang Y. The influence of metal surface composition on the tribological properties of filled PTFE/steel couples, Tribol Internat 37 (2004), 645-650 [7.55] Flint SH, Brooks JD, Bremer PJ. Properties of the stainless steel substrate, influencing the adhesion of thermo-resistant streptococci, J Food Eng 43 (2000), 235-242 [7.56] Tewari US, Bijwe J. Tribological Behaviour of Polyimides, in: Polyimides: fundamentals and applications, Marcel Dekker (ed), Marcel Dekker Inc (New York), 1996, 533-583, ISBN 0-8246-9466-4 [7.57] Le Moigne L, Bozet JL. Influences physico-chimiques sur le comportement tribologique des resines polyimide, Materiaux et Techniques 5-6 (1995), 43-48 [7.58] Jacko MG, Tsang PHS, Rhee SK. Wear debris compaction and friction film formation of polymer composites, Wear 11 (1989), 23-38 [7.59] Donnet C, Erdemir A. Tribology of diamond-like carbon films: an overview and future directions, Proceedings International Tribology Conference ITC, Kobe, Symposium: Tribology of DLC coatings, 2005 [7.60] Gangopadhyay AK, Vassell WC, Tamor MA, Willermet PA. Tribological behaviour of amorphous hydrogenated carbon films on silicon, ASME J Tribol 116 (1994), 454-462 [7.61] Jiang J, Zhang S, Arnell RD. The effect of relative humidity on wear of a diamond-like carbon coating, Surf Coat Techn 167 (2003), 221-225

219
Chapter 8.
Polyamides: Influence of internal lubricants,
crystalline structure and scaling for small-scale and large-scale tribotesting.
Goals
• Relation between frictional stability and deformation at running-in on different testing scales
• Influence of the testing scale on the efficiency of internal oil lubricant and
internal solid lubricant at running-in and steady-state
• Relation between sliding stability, transitions in softening and/or melting, polymer surface aspects and transfer film morphology.
• Influence of sodium catalysts and magnesium catalysts on the sliding stability
and crystalline structure, transformation of crystalline structures during sliding
• Extrapolation between small-scale and large-scale friction and wear Methodology
• Meso-scale testing, small-scale testing, large-scale testing, microscopic analysis, static deformation measurements
• Temperature calculations, thermo-analytical measurements, Raman
spectroscopy
International Tribology Conference, 2005, Kobe, Japan

Chapter 8. Polyamides: Influence of internal lubricants, crystalline structure and scaling 220 8.1. Introduction Numerous work has been published on the behaviour of polyamides under dry sliding, as it is an attractive industrial polymer for engineering applications since the 60’s [8.1,8.2]. More recently, Gao [8.3] tested pure polyamides (PA) sliding against austenitic stainless steels with coefficients of friction around 0.7, being outside the range of any meaningful technical application. Therefore, different PA composites with either polytetrafluoro-ethylene (PTFE) [8.4] or ultra-high molecular weight polyethylene (UHMWPE) [8.5-8.7] were developed. Palabiyik [8.8] used different blends of polyamide 6 (PA 6) and high density polyethylene (HDPE) resulting in a friction drop from 0.81 to 0.17 for a 40% HDPE blend. Tiny UHMWPE particles disperse evenly in the matrix and serve as “filler reinforced composites”. A strong bond between UHMWPE and PA resulted in a uniform and thin transfer film that acts as a lubricant for low friction and wear. It is known from Kang et al. [8.9] that also lubricant-impregnated cast nylons provide lower friction in combination with chromium-alloy AISI 52100 steel. Rajesh et al. [8.10] studied polyamide 11 (PA11) composites with different metallic powders and glass fibers, showing lower friction and better wear resistance when copper and bronzes are added. Copper compounds were also studied by Bahadur et al. [8.11]. Wang et al. [8.12] investigated the effect of fillers and short carbon fibers in nylon 1010. Thermoplastics are favourably used in highly loaded sliding applications with large sliding areas, high loads and low sliding velocities. When loaded above the polymer’s yield strength, extremely low coefficients of friction under steady-state can be obtained. A preliminary study of large-scale tests on polyamide/carbon steel pairs at high loads and low sliding velocities was done by Van de Velde et al. [8.13], however, concluding that pure PA6 always produces severe stick-slip with vibrations and reduced life-time through brittle fracture. One reason for unstable sliding is high static friction and a nega-tive slope of the friction versus sliding velocity characteristic. In practice, the sliding distance for a polymer bearing element is often limited and many start/stop events occur. The running-in behaviour of various materials should thus be thoroughly known from a reliable estimation of the in-situ behaviour. For high precision instruments such as teles-copes, high positioning accuracy is also needed. Another problem is the generation of frictional heat that should be controlled by minimising the dynamic coefficient of fric-tion. Therefore, a range of cast polyamides with solid wax additives or oil-impregnation was developed, proprietary to Quadrant EPP. The build-up of electrical charge is gener-ally solved by incorporating graphite or carbon black, since it forms microdomains with a partially agglomerated structure that contributes to lower resistivity [8.14]. Present research focuses on a comparative study of different polyamide types on either meso-scale, small-scale or large-scale tribotesters. As such, an extremely broad range of contact pressures, sliding velocities and contact geometries is covered, extending avail-able literature. The effect of different internal lubricants on sliding stability is investiga-ted. Simulation tests at high load conditions are made for better estimation of wear resistance and loading capacities at contact pressures and pv-values beyond common literature data. Possibilities for extrapolation are evaluated and will help the design engi-neer to estimate a correct value of friction depending on the effective contact situation. The running-in friction is related to variations in contact conditions, while the steady-state sliding is also influenced by transfer film formation and frictional heating. In this respect, it is utmost important to consider the differences in degradation by softening and/or melting and how they influence the sliding stability and polyamide structure.

Chapter 8. Polyamides: Influence of internal lubricants, crystalline structure and scaling 221 8.2. Frictional stability and effect of contact conditions at
running-in Pure polyamide (PA-Na, PA-Mg), solid lubricated polyamide (PAs2) and oil filled polyamide with homogeneous dispersion (PAo1) or separate lubricating holes (PAo2) is tested on meso-scale (flat-on-flat), small-scale (cylinder-on-plate) and large-scale (flat-on-flat). It will be illustrated that mainly the contact deformation and lubricant deposi-tion is important at running-in. The efficiency of lubricants depends on the testing scale. 8.2.1. Meso-scale flat-on-flat testing A unidirectional meso-scale flat-on-flat tribotester (Figure 8.1) has a circular steel coun-terface with diameter 60 mm that is used as a moving specimen and driven in a smooth and linear motion by a DC motor. A stationary rectangular polymer plate (30 mm parallel to sliding direction x 20 mm perpendicular to sliding direction) with thickness 1.5 mm is placed on top of the metal part. A normal load is applied on the polymer by dead weights. The polymer specimen is connected to the load cell with two thin metallic wires, monitoring the friction force. The normal loads vary between 1.15 and 5.16 N (0.0018 to 0.0086 MPa) and the sliding velocity is low between 0.12 and 20 mm/s. Extremely low loads are applied in order to simulate nearly elastic flat-on-flat contact.
Figure 8.1 Meso-scale flat-on-flat tribotester On-line friction measurements over a unidirectional sliding stroke are illustrated in Figure 8.2 for PA-Na sliding against steel St 37-2 N with roughness Ra = 1.6 µm. At higher roughness (Ra = 4 µm), unstable sliding manifested: stick-slip phenomena occur-red at low sliding velocity and a quasi-harmonic oscillation happened at relatively high sliding velocity. Depending on the normal loads and sliding velocities (Table 8.1), the coefficients of friction show a reproducible trend for each material at meso-scale testing. The most prominent relation is that both static and dynamic coefficients of friction decrease at higher normal loads, irrespective of the polyamide grade or sliding velocity. The variation of dynamic coefficient of friction with sliding velocities is less uniform: in general, µd decreases at higher sliding velocity, but this trend possibly reverses at 8 to 20 mm/s due to limitations of the test equipment and these values are not further used.
DC motor
Stationary polymer
Moving steel counterface
Metallic wire
Dead weights

Chapter 8. Polyamides: Influence of internal lubricants, crystalline structure and scaling 222
Figure 8.2 Meso-scale friction during running-in over one sliding stroke for PA-Na at (a) 1.15 N and 0.12 m/s, (b) 3.15 N and 0.125 mm/s, (c) 1.15 N and 0.50 mm/s
Table 8.1 Meso-scale test results for static (µs) and dynamic (µd) coefficients of friction for different polyamide grades (statistical variation ± 0.005)
Contact pressure (MPa) 0.0018 MPa 0.0052 MPa 0.0086 MPa
Sliding velocity (mm/s)
µs1 µd
µs1 µd
µs1 µd
PA-N
a
0.12 0.5 2.0 8.0
0.45 0.45 0.52 0.50
0.40 0.39 0.38 0.35
0.35 0.35 0.40 0.42
0.30 0.30 0.29 0.29
0.30 0.35 0.35 0.40
0.28 0.27 0.26 0.25
PA-M
g 0.12 0.5 2.0 8.0
0.26 0.30 0.32 0.35
0.23 0.22 0.22 0.20
0.25 0.26 0.28 0.28
0.21 0.19 0.19 0.20
0.22 0.25 0.27 0.26
0.19 0.18 0.18 0.19
PAo1
0.12 0.5 2.0 8.0
0.30 0.32 0.35 0.37
0.25 0.24 0.22 0.22
0.25 0.27 0.30 0.32
0.22 0.22 0.20 0.21
0.23 0.24 0.28 0.30
0.20 0.18 0.19 0.19
PAs2
0.12
0.5 2.0 8.0
0.27 0.35 0.37 0.47
0.26 0.26 0.26 0.25
0.30 0.32 0.37 0.42
0.25 0.25 0.24 0.23
0.29 0.30 0.36 0.40
0.25 0.25 0.24 0.23
0
2
3
4
5
6
70.7
0.6
0.5
0.4
0.3
0.2
0.1
0
Coe
ffici
ent o
f fric
tion
2 4 6 8 10 12 14Time (ms) x 104
(a) 0.7
0.6
0.5
0.4
0.3
0.2
0.1
0
Coe
ffici
ent o
f fric
tion
2 4 6 8 10 12 14 Time (ms) x 104
(b)
0.7
0.6
0.5
0.4
0.3
0.2
0.1
0
Coe
ffici
ent o
f fric
tion
2 4 6 8 10 12Time (ms) x 104
(c)
premotion sliding motion
µs1
µd

Chapter 8. Polyamides: Influence of internal lubricants, crystalline structure and scaling 223 8.2.2. Small-scale cylinder-on-plate testing A small-scale cylinder-on-plate tribotester (Figure 4.2) is used to simulate a Hertz line contact between a moving polymer cylinder (diameter 6 mm x width 12 mm) and a fixed steel counterface plate (Ra = 1.6 µm). A Hertz contact is presently chosen for simulation of high contact pressures and variation in visco-elastic deformation on small-scale tests. Normal loads between 50 and 200 N are applied (pH,max = 31 to 63 MPa, pH,avg = 23 to 47 MPa) for a fixed sliding velocity of 0.3 m/s. Friction plots for ten reciprocating sliding strokes at running-in are given in Figure 8.3. The general trend observed from meso-scale flat-on-flat tests, i.e. a decreasing coeffi-cient of friction at higher normal loads, is not uniquely transferred to small-scale cylinder-on-plate tests due to differences in contact conditions and possible overloads:
• For pure PA-Na and PA-Mg, the initially high Hertz contact pressures causes an overload situation, responsible for very high static friction and/or unstable sliding: (i) for PA-Na, the load effect with decreasing friction at higher normal loads only governs between 50 and 100 N, while overload at 150 to 200 N is found; (ii) for PA-Mg, the load effect with decreasing friction at higher normal loads is not observed. Smooth sliding only happens at 50 N with low static friction (and lower friction compared to PA-Na), but overload occurs at 100 to 200 N with progressive-ly increasing friction. A soft polyamide structure expressed by low mechanical strength is favourable for low friction compared to PA-Na at mild load conditions.
• For PAo1 and PAs2, no overload happens and the trend observed on meso-scale and small-scale testing is similar, with decreasing friction at high normal loads.
8.2.3. Large-scale flat-on-flat testing A large-scale flat-on-flat tribotester (Figure 4.5) is needed to investigate the effect of extremely large contact areas and overload conditions above the yield stress, related to practical application of polyamides as bearing material. Normal loads between 250 and 900 kN (10 to 40 MPa) are applied with 5 mm/s sliding velocity. Friction plots for ten reciprocating sliding strokes at running-in are presented in Figure 8.4. The effect of running-in on frictional evolutions can be most clearly followed during the first sliding cycle and is more prominent than observed on small-scale tests: PA-Na, PAo1 and PAs2 possess identical friction at onset of sliding (µs1 = 0.15) as internal lubri-cant has no influence at initial contact, while pure polyamide/steel contact establishes with prevailing bulk properties. Nevertheless, friction differentiates at ongoing sliding: • For pure polyamides PA-Na, running-in is unfavourable with continuously increas-
ing friction after contact with deposited polyamide. In contrast, PA-Mg is a softer than PA-Na causing lower static and dynamic friction that immediately stabilises.
• For solid lubricated polyamides (PAs2), friction completely stabilises after one single sliding stroke. For PAs2, e.g., friction is high during the first half-stroke (0 to +120 mm), it lowers during return over the same half-stroke (+120 to 0 mm) and it rises again during the third half-stroke (0 to -120 mm) that was not previously slid. After the first sliding sequence, friction becomes low and stable over the entire sliding stroke. This effect is attributed to the high effectiveness of internal lubricants

Chapter 8. Polyamides: Influence of internal lubricants, crystalline structure and scaling 224
(b) (c) (d)
Figure 8.3 Small-scale friction during running-in over ten sliding cycles at 50 N (full black line), 100 N (full grey line) and 200 N (dotted black line) for (a) PA-Na, (b) PA-Mg, (c) PAo1, (d) PAs2
-1.0
-0.8
-0.6
-0.4
-0.2
0.0
0.2
0.4
0.6
0.8
1.0
0 0.1 0.2 0.3 0.4 0.5 0.6 0.7 0.8 0.9 1
T ime (s)
-1.0
-0.8
-0.6
-0.4
-0.2
0.0
0.2
0.4
0.6
0.8
1.0
0 0.1 0.2 0.3 0.4 0.5 0.6 0.7 0.8 0.9 1
T ime (s)
-1.0
-0.8
-0.6
-0.4
-0.2
0.0
0.2
0.4
0.6
0.8
1.0
0 0.1 0.2 0.3 0.4 0.5 0.6 0.7 0.8 0.9 1
T ime (s)
-1.0
-0.8
-0.6
-0.4
-0.2
0.0
0.2
0.4
0.6
0.8
1.0
0 0.1 0.2 0.3 0.4 0.5 0.6 0.7 0.8 0.9 1
T ime (s)
Coe
ffici
ent o
f fric
tion
Coe
ffici
ent o
f fric
tion
Coe
ffici
ent o
f fric
tion
Coe
ffici
ent o
f fric
tion
Time (s)
Time (s)
Time (s)
Time (s)
(a)

Chapter 8. Polyamides: Influence of internal lubricants, crystalline structure and scaling 225
in combination with large contact area. It allows for high supply and transfer rate of internal solid lubricants because the wear debris mobility in a ‘closed’ large-scale interface is limited in contrast to an ‘open’ contact interface for small-scale Hertz contacts (see also Chapter 10). In general, running-in is a combination between smoothening the counterface roughness [8.15], possibly small molecular alignment [8.16] and polymer transfer [8.17], which seems the most effective for large-scale testing due to wear debris entrapment.
• For oil lubricated polyamide, there is an influence of either a homogeneous oil dis-persion (PAo1) or oil added into separate holes into the sliding surface (PAo2). The latter surface morphology cannot representatively be scaled down and is thus only large-scale tested. For PAo1, friction in the first sliding stroke is lower than pure PA-Na and stabilises more frequently than PAs2, possibly due to low surface energy and adhesion (Table 9.2). Progressive oil deposits mix with polyamide debris and lower friction in respect to pure PA-Na. At high load, however, PAo1 has higher friction than other lubricants because continuous oil migration to the sliding interface is hindered by deformation that possibly blocks diffusion of homogene-ously dispersed oil. For PAo2, the original polyamide properties have larger influence and stick-slip is not completely excluded at low loads. To obtain low friction, a polymer matrix with homogeneous oil dispersion is most favourable at low loads, while oil lubricating holes are more favourable at high loads.
(a) (b)
(c) (d)
-0.4
-0.3
-0.2
-0.1
0
0.1
0.2
0.3
0.4
-150 -100 -50 0 50 100 150
Sliding distance (mm)
Coe
ffic
ient
of f
rictio
n
-0.2
-0.15
-0.1
-0.05
0
0.05
0.1
0.15
0.2
-150 -100 -50 0 50 100 150
Sliding distance (mm)
-0.2
-0.15
-0.1
-0.05
0
0.05
0.1
0.15
0.2
-150 -100 -50 0 50 100 150
Sliding distance (mm)
Coe
ffic
ient
of f
rictio
n
-0.15
-0.1
-0.05
0
0.05
0.1
0.15
0.2
-150 -100 -50 0 50 100 150
Sliding distance (mm)
Sliding distance (mm) Sliding distance (mm)
Sliding distance (mm) Sliding distance (mm)
Coe
ffici
ent o
f fric
tion
Coe
ffici
ent o
f fric
tion
Coe
ffici
ent o
f fric
tion
Coe
ffici
ent o
f fric
tion
µs1
µd
µsn

Chapter 8. Polyamides: Influence of internal lubricants, crystalline structure and scaling 226
0
0.1
0.2
0.3
0.4
0.5
0.6
0.7
0.0001 0.001 0.01 0.1 1 10 100 1000 10000 100000
pv-value (MPa.m/s)
Coe
ffici
ent o
f fric
tion
Meso-scale Large-scale Small-scale
(e)
Figure 8.4 Large-scale friction during running-in over ten sliding cycles at 10 MPa for (a) PA-Na, (b) PA-Mg, (c) PAo1, (d) Pas2, (e) PAo2
8.2.4. Discussion on running-in effects for polyamides at different testing scales Dynamic coefficients of friction for different polyamides will be compared at meso-scale, small-scale and large-scale as a function of pv-value (running-in contact pressure). Present data contains a significant extension of literature data, usually reporting small-scale test results. However, the coefficient of friction is not only determined by the mechanical pv sliding conditions. It will be demonstr ated that friction is also influenced by visco-elastic deformation and efficiency of lubricant disposal in the sliding interface. 8.2.4.1. Influence of deformation and contact situation at running-in Dynamic friction for pure PA-Na and PA-Mg is summarised in Figure 8.5. The statistical variation at running-in is smaller than noticed in previous Chapters for steady-state sliding and depends mainly on good alignment, ensured by small preloading.
Figure 8.5 Coefficient of friction of pure polyamides during running-in at different testing scales (black dots = PA-Na, open dots = PA-Mg)
-0.25
-0.2
-0.15
-0.1
-0.05
0
0.05
0.1
0.15
0.2
0.25
0.3
-150 -100 -50 0 50 100 150C
oeff
icie
nt o
f fric
tion
Coe
ffici
ent o
f fric
tion
Sliding distance (mm)

Chapter 8. Polyamides: Influence of internal lubricants, crystalline structure and scaling 227
0
10
20
30
40
50
60
0 0.5 1 1.5 2
Vertical compression (mm)
Con
tact
pre
ssur
e (M
Pa)
0
10
20
30
40
50
60
70
0 1 2 3 4 5
Vertical compression (mm)
Con
tact
pre
ssur
e (M
Pa)
Vertical displacement (mm) Vertical displacement (mm)
PA-Na
PA-Mg
PA-Mg
PA-Na
Transition point 20 MPa
Transition point 10 MPa
Transition point 45 MPa
Transition point 30 MPa
There is good agreement in the relative classification of pure polyamide grades on each testing scale: PA-Na has higher friction than PA-Mg likely attributed to differences in mechanical material properties (surface energies were similar [8.26]). The lower Young’s modulus and clear tendency of plastification for PA-Mg contribute to initial deformation. Higher tensile strength and strain at break for PA-Mg makes it more ductile than PA-Na with consequently low friction. For overload conditions in Hertz line contact, however, dynamic friction of PA-Na and PA-Mg becomes equal. Static friction µs1 disappears by changing PA-Na into PA-Mg at small-scale and large-scale test at low loads, while this information was not included in the meso-scale flat-on-flat testing. As a function of normal loads, it is not sure that high contact pressures provide low friction for polyamide. It is known for polyamides at low speeds and low loads that the coefficient of friction decreases gradually with increasing load [8.18]. Others found a maximum coefficient of friction at certain load [8.2]. Present work concludes that the coefficient of friction for pure polyamides either decreases or increases, depending on local deformation of the flat-on-flat (large-scale) or line (small-scale) contact situation. Pure PA-Na shows a transition on small-scale from decreasing to increasing friction at 100 to 150 N. Pure PA-Mg shows a transition on small-scale to increasing friction at 50 to 100 N. Both pure polyamides also perform increasing friction during large-scale tests, indicating different sliding regimes compared to meso-scale tests. While sliding over one single stroke, however, no transfer or thermal effects can explain differences in sliding behaviour. Also the counterface roughness is equal for each testing scale. Differences should be mainly related to intrinsic material properties (stiffness, hardness, strength) or mechanical sliding parameters (pv-value).
(a) (b)
Figure 8.6 Experimental determination of static loading behaviour for different polyamide grades on various contact geometries, (a) large-scale flat-on-flat contact, (b) small-scale Hertz contact
( PA-Na, + PA-Mg, PAo1, x PAo2, ∆ PAs1)
Small-scale cylinder-on-plate and large-scale flat-on-flat contact geometries cause different deformation of the contact surface, as verified by static indentation measure-ments (Figure 8.6). The relative classification of various polyamide grades, with PA-Na highest stiffness and PA-Mg lowest stiffness, is identical for each testing scale, while deformation in a Hertz line contact is much larger and consequently weaker than for a

Chapter 8. Polyamides: Influence of internal lubricants, crystalline structure and scaling 228 flat-on-flat contact. In the latter case, constraint of the sample holder manifests when loaded above 20 MPa for PA-Na and 10 MPa for PA-Mg and causes an increase in stiffness. The initial clearance between the polymer sample and the sample holder disappears through permanent (plastic) deformation of the polymer sample. Expansion of the polymer sample into its holder is limited and leads to a hydrostatic stress (Chapter 11). For a Hertz line contact, plastic deformation is observed from 45 MPa on for PA-Na (100 N) and from 30 MPa on for PA-Mg (50 N). Static deformation of internally lubricated polyamides is similar to PA-Na, as the latter serves as bulk polymer. The limit between visco-elastic and plastic deformation noticed in macroscopic defor-mation corresponds well to noticed transitions in frictional behaviour, as a function of normal loads:
• For a Hertz contact, the decrease in friction for PA-Na at 50 to 100 N is within the elastic region, while it increases at 100 to 200 N according to plastic deformation. Continuously increasing friction for PA-Mg at 50 to 200 N corresponds to plastic deformation over the entire load region.
• For flat-on-flat testing, the decrease in friction for PA-Na and PA-Mg on meso-scale at 1.15 to 5.16 N corresponds to elastic deformation under extremely low loads. The onset of plastic deformation at either 20 MPa for PA-Na or 10 MPa for PA-Mg on large-scale tests corresponds to a transition from decreasing to increasing friction.
Previous relationship observed for macroscale deformation was verified by Adams on microscale [8.1], who explained the elastic-plastic transition by local deformations near roughness asperities. For apparent contact pressures that are sufficiently low to neglect the interaction of the individual contact spots, the real contact area is proportional to the normal load [8.20-8.21]. For higher apparent contact pressures the real contact area increases less then proportional with the load. It seems from present work that the contact situation is also influenced by macro-parameters as sample geometry, contact type and reinforcing action of a specimen holder, inducing specific stress conditions. A careful selection of tribotester for simulation of a specific issue should be made and extrapolation should take into account those specific transitions in contact situation. 8.2.4.2. Influence of internal lubricant type at running-in Dynamic friction for internally lubricated PAo1 and PAs2 is summarised in Figure 8.7. In contrast to pure polyamides, the relative classification of oil or solid lubricants in lowering friction is not unique and their efficiency strongly depends on the testing scale.
• Solid lubricants for PAs2 result in lowest friction on small-scale and large-scale while they cause intermediate friction on meso-scale. The efficiency of solid lubricants was not demonstrated on meso-scale due to low contact pressures. Plastification of thermoplastic fillers (PTFE) under high load is favourable for low friction as observed on small-scale and large-scale tests, with good loading capacity.
• Homogeneous oil lubricants for PAo1 cause lowest friction on meso-scale and intermediate friction on small-scale and large-scale. The limited efficiency of oil lubricant on large-scale and small-scale tests is mainly attributed to oil supply mechanisms at the sliding interface. At high loads, deformation of the contact surface acts as an obstruction for internal diffusion of the lubricating oil towards the

Chapter 8. Polyamides: Influence of internal lubricants, crystalline structure and scaling 229
Figure 8.7 Coefficient of friction of internally lubricated polyamides during running-in at different
testing scales (black dots = PAs2, open dots = PAo1)
sliding interface. At low loads, the diffusion paths such as pores in the polymer structure are not blocked and allow fluent lubrication. At extremely high loads, however, the interaction between plastification of the polymer bulk and oil lubricant results in mixed transfer and favourably reduces friction again at 30 to 40 MPa.
Nevertheless, coefficients of friction at running-in of filled polyamide grades are clearly lower compared to pure polyamides on each testing scale. The initial contact is mainly governed by adhesion. Lowering friction is largely due to the fact that silicone oil decreases the surface energy and mainly the polarity of polymers (total surface energy 46 mN/m for PA-Na or PA-Mg (similar) and 37 mN/m for PAo1) and also thermoplastic lubricants lower surface energy as e.g. PTFE (e.g. 20 mN/m for PTFE and < 1 mN/m polar component). Adhesive forces are therefore lower than for pure polyamides, which is responsible for reducing the difference in static and dynamic coefficient of friction. As a result, stick-slip was not observed during running-in of filled polyamides. The contact surface area of solid lubricated polyamides also influences the friction, as it determines the amount of lubricant in contact with the steel.
8.3. Friction and wear of pure and filled polyamides at steady-state
At running-in level, only deformation and intrinsic polymer properties are important. During longer sliding times, polymer transfer and frictional heating will change the sli-ding conditions and interfere with sliding stability. Transitions in friction and wear for pure and internally lubricated polyamides are studied on small-scale and large-scale test samples. Meso-scale tests are not further considered as they were designed for unidi-rectional motion. There is agreement in efficiency of sodium and magnesium catalysts at small-scale and large-scale. The efficiency of internal oil and solid lubricants for stable sliding depends strongly on the testing scale. Overload situations happen on small-scale and large-scale tests, when either friction forces exceed the test rig capacity and become unstable or lubricant actions are exhausted. Transfer is proved in next paragraph 8.4.
0.00
0.05
0.10
0.15
0.20
0.25
0.30
0.0001 0.001 0.01 0.1 1 10 100 1000 10000 100000
pv-value (MPa.m/s)
Coe
ffici
ent o
f fric
tion
Meso-scale Large-scale Small-scale

Chapter 8. Polyamides: Influence of internal lubricants, crystalline structure and scaling 230
0
0.1
0.2
0.3
0.4
0.5
0.6
0.7
0.8
0.9
1
0 1000 2000 3000 4000 5000 6000
100 N 50 N
150 N 200 N
Sliding distance (m)
Coe
ffici
ent o
f fric
tion
0
100
200
300
400
500
600
700
800
900
1000
0 1000 2000 3000 4000 5000 6000
50 N
100 N
150 N
200 N
Sliding distance (m)
Vert
ical
dis
plac
emen
t (µm
)
0
0.1
0.2
0.3
0.4
0.5
0.6
0.7
0.8
0.9
1
0 1000 2000 3000 4000 5000 6000
50 N100 N
150 N 200 N
Sliding distance (m)
Coe
ffici
ent o
f fric
tion
0
100
200
300
400
500
600
700
800
900
1000
0 1000 2000 3000 4000 5000 6000
50 N
100 N
150 N, 200 N
Sliding distance (m)
Vert
ical
dis
plac
emen
t (µm
)
8.3.1. Small-scale sliding at steady-state Small-scale friction and wear measurements for pure PA-Na and PA-Mg are shown in Figure 8.8, while given for oil filled PAo1 and solid lubricant filled PAs2 in Figure 8.9. The wear rates from weight ∆g and dimensional changes ∆hm after testing are presented in Table 8.2. The contribution of creep to height reduction is evaluation from weight loss and diameter reduction, i.e. at 100 N: 4 % for PA-Na, 9 % for PA-Mg, 2 % for PAo1 and 1 % for PAs2, or at 150 N: 18 % for PA-Na, 24 % for PA-Mg, 19 % for PAo1 and 2 % for PAs2. It reflects the weakness of pure PA-Mg relatively to PA-Na. Some general differences are noted in friction and wear at low and high loads for each polyamide type (Figures 8.8 and 8.9): (i) the 50 N test shows huge fluctuations in friction and often high wear rates originating from unstable sliding, (ii) the 100 N test is within a transition phase from unstable to more stable sliding, and (iii) the 150 to 200 N tests often cause stabilisation in friction and wear with a nearly similar behaviour. At high loads, there is reasonable agreement between on-line and post-mortem wear depths due to permanent deformation while on-line vertical displacement at 50 N is larger than ∆hm in Table 8.2 due to recovered elastic deformation.
(a) (b)
(c) (d)
Figure 8.8 Small-scale friction and wear tests at steady-state under different normal loads and 0.3 m/s for (a), (b) pure PA-Na, (c), (d) pure PA-Mg

Chapter 8. Polyamides: Influence of internal lubricants, crystalline structure and scaling 231
0
0.1
0.2
0.3
0 1000 2000 3000 4000 5000 6000
50 N
100 N 150 N 200 N
Sliding distance (m)
Coe
ffici
ent o
f fric
tion
0
10
20
30
40
50
60
70
80
90
100
0 1000 2000 3000 4000 5000 6000
50 N
100 N 150 N
200 N
Sliding distance (m)
Vert
ical
dis
plac
emen
t (µm
)
Table 8.2. Small-scale weight loss (∆g, 10-4 g), diameter reduction (∆hm, mm) and volumetric wear rates from weight loss (w, 10-4 mm3/m) for different polyamide grades during steady-state sliding
50 N 100 N 150 N 200 N
∆g ∆hm w ∆g ∆hm w ∆g ∆hm w ∆g ∆hm w
PA-Na 236 0.72 34.2 40 0.20 5.5 28 0.18 4.1 31 0.23 4.5
PA-Mg 78 0.27 11.3 46 0.25 6.8 39 0.23 5.6 77 0.40 11.2
PAo1 64 0.25 9.4 260 0.70 38.2 58 0.30 8.5 60 0.30 8.8
PAs2 1 0.02 0.2 3 0.03 0.5 5 0.05 0.8 5 0.07 0.8
(a) (b)
(c) (d)
Figure 8.9 Small-scale friction and wear tests at steady-state under different normal loads and 0.3 m/s for (a), (b) oil filled PAo1, (c), (d) solid lubricated PAs2
The evolutions in steady-state friction and wear for pure and internally lubricated poly-amides do not always follow smooth trends at small-scale. Instabilities are often obser-ved depending on softening, melting or lubricant efficiency. These effects are described below in relation to polymer transfer and deformation. The polymer transfer films will be detailed in next paragraphs and discussed in relation to sliding temperatures T*.
0
0.1
0.2
0.3
0.4
0.5
0.6
0.7
0.8
0.9
1
0 1000 2000 3000 4000 5000 6000
50 N, 100 N
200 N
150 N
Sliding distance (m)
Coe
ffici
ent o
f fric
tion
0
100
200
300
400
500
600
700
800
900
1000
0 1000 2000 3000 4000 5000 6000
50 N
150N, 200 N
100 N
Sliding distance (m)
Vert
ical
dis
plac
emen
t (µm
)

Chapter 8. Polyamides: Influence of internal lubricants, crystalline structure and scaling 232 8.3.1.1. Small-scale sliding stability for pure polyamides Friction of pure polyamides is not only very high for dry sliding applications, it is also unstable depending on the used catalyst (sodium PA-Na is brittle and unstable, magne-sium PA-Mg is ductile and stable at low load). No peak for running-in friction is observed in contrast to polyimides (Chapter 4 and 5) due to interference with transfer and deformation of soft polyamides at running-in.
• PA-Na has high and unstable friction at 50 N with almost no transfer film on the steel counterface own to brittleness. Compared to sintered polyimides, also not developing a transfer film at 50 N, friction of polyamide remains high through low mechanical strength and high deformation. Sliding instabilities near the end of the 50 N test result from polymer/steel contact and separate polymer flakes that do not soften or do not form a homogeneous film. Continuous polymer transfer was observed at 100 N, reflected in the evolution of friction: fluctuations during the first 3000 m correspond to unstable formation and removal of a polymer film while friction stabilises after a transfer film definitely establishes at steady-state. At 150 to 200 N, polymer transfer forms immediately and causes constant friction independent of any higher load. Stick-slip noise was observed at the end of the 100 N test and during the entire 150 or 200 N tests due to gradual transitions from polymer/steel in polymer/polymer contact.
• PA-Mg has low and smooth friction at 50 N and a homogeneous transfer film develops, own to better ductility than PA-Na. At 100 to 200 N, however, this trend reverses with high friction for PA-Mg own to lower thermal stability and weak mechanical strength of PA-Mg (paragraph 8.5) causing easy overload. These observations are most important differences in friction for either sodium or magnesium catalysts and will be confirmed by large-scale tests.
Wear for pure polyamides can be understood in parallel with the friction mechanisms. Also on-line vertical displacement for PA-Na and PA-Mg shows different trends.
• At low load (50 N), the wear rate of soft PA-Mg is below PA-Na through efficient transfer of PA-Mg. On-line vertical displacements indicate that the wear resistance strongly depends on the first 500 m of sliding. The running-in wear curve has lower slope for PA-Mg compared to PA-Na and indicates formation of a PA-Mg transfer film. There is a change in slope at steady-state, either lowering for PA-Na after 1000 m (onset of unstable friction and transfer), either increasing for PA-Mg after 2500 m sliding (onset of stable friction and overload). Those observations confirm that the wear mechanisms are linked to the friction phenomena.
• At intermediate load (100 N), the wear rates are lower than at 50 N for both PA-Na and PA-Mg in parallel to smoother transfer and more stable sliding.
• At high loads (150 to 200 N), wear rates stabilise for PA-Na or indicate overload for PA-Mg. Stabilisation for PA-Na is reflected in similar increases of wear depth at steady-state for 150 to 200 N. Overload is most prominent for soft PA-Mg and concentrated during running-in: it shows mainly the effect of initial deformation and creep or polymer transfer. It is seen from post-mortem dimensional measurements ∆hm that the final diameter reduction at 150 N is 0.18 mm (PA-Na) and 0.23 mm (PA-Mg) respectively. This is in good agreement with the on-line vertical displace-ment ∆hv, suggesting small influence of creep and mainly influence of transfer.

Chapter 8. Polyamides: Influence of internal lubricants, crystalline structure and scaling 233 8.3.1.2. Small-scale sliding stability for internally lubricated polyamides Oil filled polyamide PAo1 shows a transition to high friction after 2500 m (50 N), 1500 m (100 N) or 1000 m (150 N). At low loads (50 N), the lubricant remains partially functional because the high friction regime remains below the friction of pure PA-Na. At intermediate loads (100 N), the lubricant completely fails because the high friction regime becomes exactly similar to pure PA-Na. High loads (150 to 200 N) cause a sec-ond transition to low and stable friction due to homogeneous oil/polyamide mixed trans-fer. The wear rates of PAo1 are below PA-Na only at 50 N while higher wear at 100 to 200 N indicate overload, as the mechanical properties of oil filled polyamide composites are weaker than pure polyamides. The wear evolution closely follows the variation in coefficients of friction and sharply increases when the efficiency of oil lubricant fails. Solid lubricated polyamide PAs2 performs no abrupt transitions in friction as a function of sliding distance. Friction progressively decreases at higher normal loads, while it becomes nearly load-independent at the test end. The efficiency of solid lubricants improves at high normal loads when friction stabilises over shorter sliding times. The wear rates for solid lubricated polyamides are significantly lower than for oil lubricated polyamides and they follow a trend of higher wear at higher normal load. Some very small irregularities in friction or vertical displacement are attributed to interaction with transfer particles in the interface that possibly build-up and remove. 8.3.2. Large-scale sliding in overload prevented by internal lubrication Serving as material selection tests for real bearing design in offshore constructions (Norway), small-scale tests are not fully representative. Large-scale tests should be used and were done in cooperation with Quadrant EPP to verify if transitions in friction and wear of polyamides are similar to small-scale tests. Due to different contact area size and stiffness of the test geometry, however, sliding instabilities and stick-slip occur more frequently during large-scale tests. Heavy vibrations in the large-scale tribotester strongly reduce life-time of the polymer element, e.g., by brittle fracture near the borders of the tests specimens. This information was not included in small-scale tests. Overload conditions due to unstable sliding, high load or inefficient lubrication are detected and linked to unfavourable transfer or frictional heating (paragraph 8.4):
• In this paragraph 8.3.2 it is evaluated whether unstable sliding of pure polyamides can be reduced by incorporation of internal lubricants. Relatively high counterface roughness Ra = 1.6 µm is applied in parallel to practical steel surface finishes.
• In next paragraph 8.3.3 the effect of lower steel counterface roughness Ra = 0.20 µm on improving sliding stability of pure polyamides will be evaluated.
Large-scale friction and on-line vertical displacement measurements at 10, 20, 30 and 40 MPa on pure, oil-lubricated and solid-lubricated polyamide grades are presented in Figure 8.10. A logarithmic plot inserted in Figure 8.10b details running-in wear at 10 MPa. The contact pressure was subsequently changed after approx. 100 m sliding distance. The large-scale and/or overload wear rates calculated from weight and thick-ness reduction (immediate after test and one week after testing, allowing for recovery) are summarised in Table 8.3. As the weight was not measured in between changing contact pressures, the volumetric wear rates represent an “equivalent” value.

Chapter 8. Polyamides: Influence of internal lubricants, crystalline structure and scaling 234 (a) (b)
Figure 8.10 Large-scale friction and wear tests on different pure and internally lubricated polyamides for counterface roughness Ra = 1.6 µm, (a) coefficient of friction, (b) vertical displacement
Table 8.3. Large-scale weight loss (∆g, g), thickness reduction (∆hm, mm) and volumetric wear rates (mm3/m), immediately after testing (1) and after one week recovery (2)
Equivalent wear rate (mm3/m)
Thickness reduction ∆hm (mm) dimensional
Weight re- duction ∆g
(g) (1) (2) weight
(1) (2)
PA-Na* - 5.10 - 0.25 - 0.20 41.1 52.1 41.6
PA-Mg** - 7.08 - 0.55 - 0.51 28.5 57.3 53.2
PAo1 - 8.56 - 0.62 - 0.50 17.4 32.3 26.1
PAo2 - 0.64 - 0.14 - 0.04 1.31 7.29 2.08
PAs1 - 0.24 - 0.05 - 0.03 0.49 2.61 1.56
PAs2 - 0.08 - 0.12 - 0.07 0.17 6.25 3.65 *only worn at 10 MPa **only worn at 10 and 20 MPa
0
100
200
300
400
500
600
700
0 50 100 150 200 250 300 350 400 450
1
10
100
0 50 100
PA-Na
PA-Mg
PAo1 PAo2
PAs1, PAs2
PAo1
PAo2PAs1 PAs2
Sliding distance (m)
Vert
ical
dis
plac
emen
t (µm
)
PA-Na
0.00
0.05
0.10
0.15
0.20
0.25
0.30
0.35
0.40
0 50 100 150 200 250 300 350 400 450
PA-Na
PA-Mg
PAo1PAo2
PAs2 PAs1
Sliding distance (m)
Coe
ffici
ent o
f fric
tion
10 MPa 20 MPa 30 MPa 40 MPa

Chapter 8. Polyamides: Influence of internal lubricants, crystalline structure and scaling 235 8.3.2.1. Large-scale sliding stability for pure polyamides in overload Sliding instabilities for pure PA-Na manifest more clearly on large-scale tests compared to small-scale tests, while PA-Mg performs stable friction and wear at low loads in parallel to small-scale tests:
• Pure PA-Na has lower friction compared to small-scale tests, while it produces very loud noise at 10 MPa indicating severe stick-slip. Similar instabilities are noted for pure PET (Chapter 10) and relate to brittleness of the polymer (see Tables 3.1, 3.2: low elongation at break and Charpy impact strength). Low friction on large-scale relates to a more homogeneous contact pressure distribution at running-in and debris entrapment in sliding interfaces at steady-state. Transfer film formation is promoted for large-scale sliding and is noticed by a decrease in friction after 30 m running-in. However, own to the brittleness and high polar surface energy of both transfer film and polymer surface, stick-slip motion intensifies (rise in static friction from µs1 = 0.26 to µs,n = 0.33). Friction increases at higher normal loads due to overload, brit-tleness and unfavourable transfer, contradicting small-scale tests and the expected law of decreasing friction at high contact pressure [8.22]. The test was stopped prematurely as the horizontal power supply of the tribotester was exceeded.
Extremely high wear rates manifest for PA-Na at 10 MPa, also reflected in the volumetric wear rate (Table 8.3). Brittleness causes easy fracture of the polymer surface and lumpy transfer. Pure polyamides PA-Na have good compliancy, as the dimensional measurements after recovery correspond well to weight measurements. However, it has to be mentioned that the creep of the sample at 10 MPa is restricted compared to the other samples that were loaded to 40 MPa.
• Pure PA-Mg has low and stable friction at 10 MPa, in parallel to small-scale tests under mildest load, while friction increases for ongoing sliding towards overload at 30 MPa. The catastrophic stick-slip is postponed from 10 to 20 MPa.
The wear depth for PA-Mg at 10 MPa remains below 1 µm during running-in. Low running-in wear agrees with small-scale wear at 50 or 100 N and smooth transfer in contrast to PA-Na. Also steady-state wear rates are lower for PA-Mg than PA-Na at mild loads. The contribution of creep, calculated from difference in weight and thickness reduction, is 50 µm or 20 % for PA-Na and 280 µm or 50 % for PA-Mg. Higher ductility (and thus possibility for energy absorption) of PA-Mg compared to PA-Na is reflected in deformation and is favourable for stable sliding at mild load.
8.3.2.2. Large-scale sliding stability for internally lubricated polyamides in overload Important transitions are found in friction of homogeneous oil filled polyamides (PAo1) with also stick-slip at high loads. Oil lubricant added into separate holes (PAo2) more effectively reduces friction and prevents unstable sliding. Solid lubricants provide lowest friction and wear (mainly at low load) that is completely stable over the entire test time.
• PAo1 has lower friction than PA-Na and behaves different from small-scale tests, with either regimes of in- or decreasing friction. Unstable sliding happens at 10 MPa with progressively increasing friction accompanied by stick-slip noise, before decreasing to stable friction for the second period at 10 to 20 MPa. The increase in friction resembles the evolution from small-scale tests at 150 to 200 N, but occurring after shorter sliding time on large-scale tests. It suggests inter-

Chapter 8. Polyamides: Influence of internal lubricants, crystalline structure and scaling 236 ference between oil supply and deformation, depending on softening and transfer film morphology (paragraph 8.4). Sliding instabilities at 30 MPa occur again with intensification of the stick-slip noise through melting. When the surface was additionally cooled, stable sliding is observed at 40 MPa. Overload correlates clearly to melting. The steady-state wear rates for PAo1 are below PA-Na, but the wear depth evolution during running-in at 10 MPa is nearly parallel to PA-Na; it is only shifted in time and indicates that low friction initially induces low wear.
• PAo2 shows no overload and gradually lower friction at higher contact pressure. During running-in, friction slightly increases in parallel to an increase in wear depth over 7 µm, being similar for PA-Na and PAo2. It represents a time needed for lubricant release. The steady-state wear rates over the entire testing time become much lower than PAo1. The dimensional stability for homogeneous oil filled PAo1 differs from that with lubricant holes PAo2. The contribution of creep is 280 µm or 45 % for PAo1 and 114 µm or 80 % for PAo2. There is mainly plastic deformation and low recovery (19%) for PAo1 while very high recovery (72 %) for PAo2.
• PAs1 and PAs2 have a running-in with decreasing friction through immediate release of solid lubricant. The running-in time shortens for PAs2 as it has larger amounts of lubricant. The solid lubricants provide low wear rates, stabilizing at 6 µm after a 15 m running-in period. At longer sliding times, the wear rates are stronger influenced by the solid lubricant type. However, the PAs2 samples are prone to large deformation (> 80 % creep), explained by weaker mechanical properties of solid lubricated polyamides with higher lubricant content than PAs1. Good friction and wear properties are therefore a compromise between solid lubricant additives and reduction in mechanical strength or stiffness.
External grease lubricants with high pressure additives were applied to the steel counter-face during sliding of PAs1. They did not significantly influence friction as most grease is rapidly squeezed out of the contact area. The equivalent wear rates increased to 1.22 mm3/m compared to 0.49 mm3/m in dry sliding through lack of coherent transfer film and possibly chemical degradation of polyamide surfaces. 8.3.3. Large-scale sliding in overload prevented by low counterface roughness Overload and unstable sliding for pure PA-Na at Ra = 1.6 µm was ascribed to brittleness. The sliding stability became worse for higher counterface roughness at 20 MPa: friction increases from µd = 0.30 (Ra = 1.6 µm) to µd = 0.60 (Ra = 4 µm) with more severe stick-slip [8.23]. The higher deformation component of friction at Ra = 4 µm is clearly not favoured by brittleness. Rather adhesive sliding conditions (Ra = 0.20 µm) are evaluated in this paragraph. The build-up of polymer transfer then depends less on mechanical in-teraction with the counterface topography, but intrinsic polyamide properties, softening and melting prevail. It is concluded that friction at Ra = 0.20 µm becomes higher through interaction with a transfer film, but stick-slip reduces in respect to Ra = 1.6 µm. Friction for pure polyamides PA-Na and PA-Mg sliding at 8 to 150 MPa are shown in Figure 8.11 as a function of logarithmic sliding distance for detailing running-in. Extre-mely low friction is observed for the first 10 m until softening and melting mechanisms interfere with the transfer behaviour. Friction increases over long sliding times by inter- action with more continuous transfer compared to high counterface roughness. A pro-gressive decrease friction at high loads (agreeing to thermoplastic behaviour) occurs

Chapter 8. Polyamides: Influence of internal lubricants, crystalline structure and scaling 237
(a) (b)
Figure 8.11 Large-scale friction test on pure polyamides at 8 to 150 MPa for counterface roughness Ra = 0.20 µm, (a) PA-Na, (b) PA-Mg
more clearly for pure polyamides at low than at high counterface roughness. This trend was not clearly noted in Figure 8.10 (Ra = 1.6 µm) due to instabilities, stick-slip and prevailing deformation mechanisms. Adhesive sliding of pure polyamides against low roughness counterfaces is more stable compared to high counterface roughness and brittle fracture of specimens does not occur. However, friction remains high in contact with a polyamide transfer film due to high polar surface energy component. Transitions in frictional tendencies and transfer of polyamides will further be related to thermal effects, such as softening and melting (paragraph 8.4). Wear rates for top and bottom polyamide specimens (Table 8.4) depend on the relative position of wear samples and counterfaces. It is likely that bottom sliding pairs (with steel counterface above polymer sample) show higher wear rates than top sliding pairs (with steel counterface beneath polymer sample) because wear debris does not accu-mulate easily into a transfer film on the counterface for the bottom specimens. This trend possibly reverses under overload conditions, as also creep becomes more important. Table 8.4. Large-scale volumetric wear rates weight loss (wg, mm3/m) and thickness reduction (wt, mm3/m) with indication of the percentage creep deformation (%) under overload conditions
Steady-state volumetric wear rates (mm3/m)
top specimen bottom specimen average Polymer Contact pressure [MPa] wg wt wg wt wg wt
Specific wear rate
(10-6 mm3/Nm)
Creep
%
8 1.4 1.7 1.7 2.1 1.6 1.9 8 15
16 8.8 10.6 9.2 11.2 9.0 10.9 24 17
25 9.0 11.4 9.4 11.5 9.2 11.5 16 20 PA-Na
55 56.0 67.0 46.0 58.7 51.0 63.0
40
20
8 0.7 0.7 0.9 1.1 0.8 0.9 4 11
16 11.9 11.8 13.0 15.0 12.0 14.2 32 15
25 72.0 77.0 67.2 94.0 70.0 88.0 125 21 PA-Mg
55 206 260 187 251 198 256 157
25
0
0.1
0.2
0.3
0.4
0.5
0.6
1 10 100 1000 10000
8 MPa 16 MPa
25 MPa
55 MPa
Coe
ffici
ent o
f fric
tion
Sliding distance (m)
0
0.1
0.2
0.3
0.4
0.5
0.6
1 10 100 1000 10000
8 MPa
16 MPa
25 MPa
55 MPa
150 MPa
Coe
ffici
ent o
f fric
tion
Sliding distance (m)

Chapter 8. Polyamides: Influence of internal lubricants, crystalline structure and scaling 238
8.4. Thermal effects and transfer for polyamides Sliding stability will be discussed in relation to thermal conditions (softening/melting), polymer surface aspects and transfer film morphology. Therefore, the evolution of maximum polymer surface temperature T* is calculated over the entire tests run. It is concluded that softening and melting mechanisms depend on the catalyst type: softening deteriorates sliding stability of PA-Na, while it is favourable for PA-Mg. Supply of oil lubricant on small-scale tests cannot be directly related to polyamide transition tempera-tures as deformation prevails. Oil release for large-scale samples relates better to soften-ing and melting mechanisms. Solid lubricants cause sliding in the softening regime. 8.4.1. Discussion on softening and melting of pure polyamides 8.4.1.1. Frictional heating for pure polyamides on small-scale tests Referring to small-scale tests on PA-Na and PA-Mg (Figure 8.8), the temperature T* is calculated in Figure 8.12. Microscopic observations of the polymer surfaces and transfer are shown in Figure 8.13. The thermal conditions relate to sliding stability, as below:
(a) (b) Figure 8.12 Calculation of maximum polymer surface temperature T* during small-scale sliding of pure
polyamides at 0.3 m/s, (a) PA-Na, (b) PA-Mg For PA-Na at 50 N, the temperature rises to T* = 105°C over only a short running-in time and finally decreases below the glass transition temperature to T* 76°C < Tg,. Softening is limited and consequently a huge amount of wear debris does not compact into a film. Brittleness at T* < Tg explains sliding instabilities and lack of homogeneous transfer. There is mainly mechanical interaction. For PA-Na at 100 N, the temperature rises to T* = 180°C and attains T* = 134°C at the end of the test, indicating continuous softening with the formation of a partly coherent transfer film. Friction does not completely stabilise when the film is not molten, while wear rates are favourably lowered. This mechanism is according to Lancaster [8.24] attributed to decreasing interaction between polymer sample and counterface roughness. For PA-Na at 150 to 200 N, the temperature T* = 250°C after short running-in causes melting and very smooth transfer, which stabilises both friction and wear. As T* at the end of the sliding test is 173°C, the initially molten film remains softened with good adhesion to the counterface and better friction properties.
0
50
100
150
200
250
300
0 1000 2000 3000 4000 5000 6000
Sliding distance (m)
Max
imum
pol
ymer
tem
pera
ture
T* (
°C)
0
50
100
150
200
250
300
0 1000 2000 3000 4000 5000 6000
Sliding distance (m)
Max
imum
pol
ymer
tem
pera
ture
T* (
°C)
50 N
100 N
150 N
50 N
100 N
150 N
Tg Tg
Tm Tm

Chapter 8. Polyamides: Influence of internal lubricants, crystalline structure and scaling 239
100 N 150 N
PA-N
a
(a) (b)
(a) (b)
PA-M
g
(a) (b)
(a) (b)
Figure 8.13 Optical microscopy of worn surfaces of pure polyamide and transfer film after small-scale
sliding at 0.3 m/s, (a) polymer surface, (b) polymer transfer film on steel surface
For PA-Mg at 50 N, the temperature T* = 114°C at running-in and T* = 85°C at steady-state are higher than for PA-Na and the softening regime is maintained over the entire sliding test. Favourable transfer is even observed for a 50 N test with T* > Tg. For PA-Mg at 100 N, the temperature T* = 180 to 138°C shows that softening rather than melting mechanisms control the sliding of PA-Mg. A stable transfer film without brittle fracture forms in contrast to softened PA-Na films. Friction and wear of PA-Mg is controlled by stable softened transfer film formation even at low load. For PA-Mg at 150 to 200 N, molten transfer is observed at temperatures T* > 200°C. The film becomes too weak and looses its loading capacity, resulting in high wear rates. It is concluded that softening mechanisms for PA-Na and PA-Mg are different: softening favourably stabilises friction in case of PA-Mg while it is unfavourable for PA-Na. Stable friction for PA-Na requires a film that is first molten and finally softened. 8.4.1.2. Explicit counterface heating for pure polyamides on small-scale tests For PA-Na, the thermal influences on sliding stability are explicitly studied by small-scale sliding test at 50 N, 0.3 m/s on steel counterfaces heated at Tb = 40 to 180°C bulk temperatures. Degradation by softening or melting is simulated and it is experienced if low friction similar to large-scale tests (e.g. µ= 0.2, Figure 8.11) can be obtained. Coefficients of friction and calculated maximum polymer surface temperatures T* are given in Figure 8.14 with wear rates presented in Table 8.5. Microscopy of the worn polyamide surfaces and transfer films is shown in Figure 8.15. The coefficient of friction increases at Tb = 40 to 60°C and decreases at Tb = 80 to 180°C. The wear rates gradually decreases between 40 and 100°C in parallel to the effect of 50 to 150 N normal load (Table 8.2). Friction and temperatures T* at Tb = 40°C
1 mm

Chapter 8. Polyamides: Influence of internal lubricants, crystalline structure and scaling 240
(a) (b)
Figure 8.14 Friction and maximum polymer surface temperature T* for small-scale sliding of PA-Na at 50 N, with controlled bulk temperatures between 40 and 180°C
are nearly similar to the 50 N test without temperature control (Figure 8.8a) and similar instabilities are observed at the end of the test:
• For Tb = 40°C, the temperature T* = 103°C over a running-in distance allows for softening, while it drops to T* = 78°C < Tg with consequent rubber into glassy tran-sition. A thick and brittle transfer film develops as it was not molten and contributes to unstable sliding. Also for Tb = 60°C, the temperature T* equals the softening temperature during running-in with consequent thick transfer resulting in unstable sliding and increasing friction. The latter causes a rise in temperature T* = 135°C, but it remains below the melting point over the entire test run. The polymer surface only shows grooves as slight deformation by softening. Observations confirm that friction for PA-Na is unstable when only softening happens without melting.
• For Tb = 80 to 140°C, the temperature T* > Tm during initial sliding attains the melting temperature and surfaces remain softened over the entire sliding test. This is reflected in a thin molten film on the steel surface and molten particles on the polyamide surface. However, high wear rates are observed for PA-Na at bulk temperatures above 140°C due to melting. Observations confirm that friction for PA-Na is lower and more stable when melting occurs at running-in and permanent softening is favourable for a further decrease in friction with sliding time.
Table 8.5. Weight loss (∆g), diameter reduction (∆hm), volumetric wear rates (w) and average dynamic friction µd for small-scale tests at controlled bulk temperature of PA-Na, 50 N, 0.3 m/s
Bulk temperature Tb (°C)
∆g (10-4 g)
∆hm (mm)
w (10-4 mm3/m) µd
40°C
60°C
80°C
100°C
140°C
180°C
20
27
12
9
55
75
0.09
0.10
0.08
0.05
0.17
0.25
2.9
1.9
1.7
1.3
8.2
11
0.65
0.80
0.63
0.56
0.46
0.19
0
50
100
150
200
250
300
0 1000 2000 3000 4000 5000 6000
Sliding distance (m)M
axim
um p
olym
er te
mpe
ratu
re T
* (°C
)
0.00.10.20.30.40.5
0.60.70.80.91.0
0 1000 2000 3000 4000 5000 6000
Sliding distance (m)
Coe
ffici
ent o
f fric
tion
180°C 140°C
80°C
60°C 40°C
180°C 140°C
80°C
60°C 40°C
Tg
Tm

Chapter 8. Polyamides: Influence of internal lubricants, crystalline structure and scaling 241
0
50
100
150
200
250
300
1 10 100 1000 10000
Sliding distance (m)
Max
imum
pol
ymer
tem
pera
ture
T* (
°C)
0
50
100
150
200
250
300
1 10 100 1000 10000
Sliding distance (m)
Max
imum
pol
ymer
tem
pera
ture
T* (
°C)
Bulktemperature at 8 MPa Bulktemperature at 8 MPa
8 MPa
16 MPa
25 MPa 55 MPa
8 MPa
16 MPa 25 MPa 55 MPa
150 MPa
° ° ° ° °
60°C 80°C 140 to 180°C
Figure 8.15 Optical microscopy of polyamide PA-Na surfaces (top) and transfer film (under) after small-
scale sliding at controlled bulk temperatures of 60°C, 80°C and 140 to 180°C 8.4.1.3. Frictional heating for pure polyamides on large-scale tests Referring to large-scale tests for PA-Na and PA-Mg at 8 to 150 MPa (Figure 8.11), the temperatures T* are calculated in Figure 8.16 as a function of the sliding distance. Note (°) that extremely high temperatures T* are limited by plastic deformation and melting enthalpy, as further detailed. Figures 8.17 and 8.18 show microscopic observations of the polyamide sliding surfaces. Relations between frictional stability, glassy-rubber or rubber-melting transitions and surface aspects are discussed below. In next paragraph 8.5 the importance of crystalline structures for PA-Na and PA-Mg will be demonstrated.
(a) (b) Figure 8.16 Calculation of maximum polymer surface temperature T* during large-scale sliding of pure polyamides at 0.005 m/s, (a) PA-Na, (b) PA-Mg (° plastic deformation, see critical note paragraph 8.6.3)
1 mm
Tg
Tm
Tg
Tm

Chapter 8. Polyamides: Influence of internal lubricants, crystalline structure and scaling 242
(a) (b) (c) (d)
Figure 8.17 Optical microscopy of polyamide PA-Na surfaces after large-scale sliding at different normal loads, (a) 8 MPa, (b) 16 MPa, (c) 25 MPa, (d) 55 MPa
(a) (b) (c) (d)
Figure 8.18 Optical microscopy of polyamide PA-Mg surfaces after large-scale sliding at different normal loads, (a) 8 MPa, (b) 16 MPa, (c) 25 MPa, (d) 55 MPa
Important differences in the softening behaviour of PA-Na and PA-Mg are noted during large-scale sliding in agreement to softening trends at small-scale (paragraph 8.4.1.1):
• For PA-Na at 8 to 16 MPa, the temperature T* = 46 to 72°C < Tg at running-in is low because of low friction and low normal load. The polyamide is brittle below the glass transition temperature and there is an increase in running-in friction from µd = 0.10 to 0.13 at higher contact pressures (Figure 8.11) explained by lacking
1 mm
1 mm

Chapter 8. Polyamides: Influence of internal lubricants, crystalline structure and scaling 243 softening and plastification. Similar to small-scale tests, deformation and brittleness at T* < Tg is unfavourable for friction. At steady-state, the temperature Tg < T* < Tm indicates a transition from glassy into rubbery phase with higher sliding resistance. The melting temperature Tm is not attained during steady-state at 8 to 16 MPa (only at the end of the test due to instabilities and overload). Visual inspection of the worn polymer surfaces (Figure 8.17) confirms that no melting spots are observed, correlating to the temperature calculations. Large-scale tests indicate that softening of PA-Na is unfavourable and leads to unstable increase in steady-state friction due to contact with non-molten polyamide wear debris. Softened polyamide wear debris does not allow for coherent transfer (Figure 8.19a) and causes unstable sliding with fluctuations in friction and loud noise (stick-slip).
It agrees to small-scale tests that softening of PA-Na deteriorates friction stability. Striations or yielding marks are clearly observed on the 8 and 16 MPa polyamide surfaces (Figure 8.17), being most prominent at low contact pressures due to softening and somewhat masked at 16 MPa by the short melting period at the end of the sliding test. Those characteristic wavy patterns manifest more intensively at large-scale tests compared to small-scale tests. They were also observed in abrasive sliding of rubbers by Tomoaki Iwai et al. [8.25] at Kanazawa University (Japan), further investigating its nature. This observation most importantly indicates that the polyamide surface is in a rubber-like phase and softening mechanisms prevail over melting at low loads.
• For PA-Na at 25 to 55 MPa, the temperature T* = 85 to 110°C > Tg at running-in is favourable for softening and decreases running-in friction from µd = 0.13 to 0.05 at higher contact pressure (Figure 8.11). An increase in friction from running-in to steady-state for Tg < T* < Tm agrees to the formation of a softened transfer film that reverses polyamide/steel into polyamide/polyamide contact with high adhesion. Adhesive forces for polyamides are mainly important for increasing friction due to high surface energy (polarity) [8.26] compared to other polymers. At steady-state, the temperature T* > Tm causes melting as confirmed by melting craters and irregular deformation of the molten polyamide surfaces (Figure 8.17). Large-scale sliding tests indicate that melting of PA-Na is necessary to improve the sliding stability as steady-state friction at 25 to 55 MPa is stable compared to 8 to 16 MPa.
It agrees to small-scale tests that melting of PA-Na is required for improving friction stability. Softening wear is characterised by flake-like, non-coherent transfer particles onto the counterface at low load, while melting wear is characterised by a more coherent film at high load. After cooling the transfer film at high contact pressures, it was very brittle and peels off the counterface, not able to carry the load. The deposition of inhomogeneous polymer particles is also reflected in an increase in counterface roughness after sliding. This thick transfer is called by Bahadur [8.27] the ‘normal sliding behaviour’ of nylons due to brittleness.
• For PA-Mg at 8 MPa, the temperature T* = 46°C < Tg at running-in is similar to
PA-Na with µd = 0.13. At steady-state, softening for PA-Mg with T* > Tg occurs after 25 m sliding distance while friction for PA-Mg progressively increases and remains below PA-Na. Softening mechanisms for PA-Mg are different from PA-Na as visually observed on the polymer surface (Figure 8.18). Small softened particles parallel to the sliding direction are seen without stick-slip marks, as expected from stable friction and better wear resistance relatively to PA-Na. Softening and better sliding stability for PA-Mg at low loads is similar to small-scale tests.

Chapter 8. Polyamides: Influence of internal lubricants, crystalline structure and scaling 244
(a) (b)
(c) (d)
Figure 8.19 Transfer of pure polyamides in the softening and melting regime, (a) PA-Na at 8 MPa, (b) PA-Na at 55 MPa, (c) PA-Mg at 8 MPa, (d) PA-Mg at 55 MPa
A thin polymer transfer film of separate particles adheres to the counterface. Some brown colour is observed, indicating possible degradation as the TGA analysis reflect lower thermal stability for PA-Mg (paragraph 8.5). Nevertheless, softening for PA-Mg does not cause unstable sliding in contrast to PA-Na. As demonstrated in next paragraph, different behaviour of PA-Mg and PA-Na is related to differences in crystalline structure. Progressive increase in friction of PA-Mg is explained through combination of (i) weakening mechanical strength, enhancing the ploughing component of friction, and (ii) adhesive effects in contact with polymer transfer. The differences in softening of PA-Na and PA-Mg also influence wear rates (Table 8.4), having a similar trend to friction: PA-Mg shows lower wear at 8 MPa relatively to PA-Na, according to the classification on small-scale tests.
• For PA-Mg at 16 to 25 MPa, running-in friction monotonously decreases at higher loads by a normal load effect, independently of the T* being below or above the glass transition temperature, in contrast to PA-Na. It indicates that PA-Mg is more ductile and not disfavoured by brittleness, in parallel to its crystalline structure (paragraph 8.5). Melting during steady-state sliding at 16 to 55 MPa results in flake-like polymer transfer and a friction behaviour nearly similar or worse than PA-Na, controlled by polyamide/polyamide adhesion and overload by melting.
8.4.2. Discussion on softening and melting of oil filled polyamides 8.4.2.1. Frictional heating for oil lubricated polyamides on small-scale tests Referring to small-scale tests on PAo1 (Figure 8.9), the temperatures T* are calculated in Figure 8.20 as a function of sliding distance. Transfer behaviour after small-scale sliding is illustrated in Figures 8.20 and 8.21.
1 mm

Chapter 8. Polyamides: Influence of internal lubricants, crystalline structure and scaling 245
Figure 8.20 Calculation of maximum polymer surface temperature T* during small-scale sliding of oil filled polyamides PAo1 at 0.3 m/s
100 N 150 N
PAo1
(a) (b)
(a) (b)
Figure 8.21 Optical microscopy of worn surfaces of oil-lubricated polyamide and transfer film after
small-scale sliding, (a) polymer surface, (b) polymer transfer film on steel surface Internal oil additives cause lower friction and wear compared to pure polyamides, but important transitions over the sliding distance occur. The transition to high friction for oil-lubricated PAo1 happens at T* = 90°C for 50 N loads, at T* = 110°C for 100 N loads and at T* = 180°C for 150 N loads. While transitions in friction and/or wear for pure polyamides correlated to intrinsic polyamide transition temperatures, there is no exact correlation to polyamide bulk transition temperatures for oil filled PAo1: rather a time-load related mechanism is supposed to interfere with originally low friction. The lubricating action depends on oil exposure from the polymer bulk into the sliding interface and the behaviour of oil lubricant (mixed with polymer transfer) in the sliding interface. Stable sliding requires a permanent oil supply to the interface. Means of lubricant supply were studied by Marchetti et al. [8.28] and are attributed to “static” effects through pores in the matrix (migration, capillary effects caused by the surface roughness and Maragoni effects due to temperature gradients) and “dynamic” effects (reciprocating sliding). Thermal effects in oil extraction were demonstrated by using a sintered porous polyimide reservoir with good thermal resistance and the extraction rate improved during heating at 35 to 100°C. Yabe et al. [8.29] studied the oil discharge rate from compression moulded and injection moulded polyethylene at different temperatures
0
50
100
150
200
250
300
0 1000 2000 3000 4000 5000 6000
Sliding distance (m)
Max
imum
pol
ymer
tem
pera
ture
T* (
°C)
50 N
100 N
150 N
Tg
1 mm

Chapter 8. Polyamides: Influence of internal lubricants, crystalline structure and scaling 246 between 60°C and 80°C, noting higher discharge rates with rising temperature. Some variations in friction were measured for a test on a bearing and rail over 434 hours at 0.01 m/s, 40°C. The effect of lubricant content and contact stress on friction for cast nylons was studied by Kang et al. [8.9], but the sliding time was limited to ten minutes at 0.06 m/s and 0.083 MPa contact stress. Low friction (0.08 to 0.12) was noted in this case without considering transitions as a function of sliding time and temperatures. Polyamide bulk materials through which oil migrates are softer compared to, e.g., sinter-ed porous reservoirs and any polymer matrix deformation interferes with oil supply to the interface. Deformation may favourably squeeze lubricant out of the bulk at running-in (Figure 8.7), but blocks migration paths during softening at steady-state (Figure 8.9):
• For PAo1 at 50 N, low temperatures T* = 77°C do not promote thermal migration and oil is mechanically squeezed out of the polymer bulk. When oil at the surface becomes exhausted, there is a sudden increase in friction and wear, promoting fresh lubricant exhibited at the surface and lowering of friction. These processes repeat until T* = Tg causes softening and migration paths are blocked by deformation of the polyamide bulk. The sliding situation is then comparable to pure PA-Na with lumpy transfer.
• For PAo1 at 100 to 150 N, the running-in wear of PAo1 is significantly lower and suggests that previous recurrent processes are less likely. At running-in, oil is supplied by mechanical squeezing and temperatures T* = 120 to 180°C may promo-te thermal oil migration. It allows for combined transfer of polyamide and oil with low running-in friction. At steady-state, however, cooling to T* = 110°C causes solidification and restricts further lubrication at 100 N. It is visually noted that the transfer film contains separate softened polyamide flakes and limited amount of oil. High temperatures T* = 180°C at 150 N are maintained over a longer sliding times and causes mixed polyamide/oil transfer with low friction and stable wear.
8.4.2.2. Frictional heating for oil lubricated polyamides on large-scale tests Referring to the large-scale tests on oil filled PAo1 and PAo2 (Figure 8.10), the steady-state temperatures T* at 10 to 40 MPa contact pressures are calculated in Table 8.6 (compared to pure polyamide in overload). The transfer and polymer surface morpho-logies of PAo1 and PAo2 presented in Figure 8.22. Stable sliding of PAo2 compared to PAo1 is related to sliding temperatures and oil supply as follows: Table 8.6. Calculation of bulk temperatures (°C) and maximum polymer surface temperatures (°C) for large-scale tests on oil-lubricated polyamide at different contact pressures, compared to pure polyamides
10 MPa 20 MPa 30 MPa 40 MPa
Tb T* Tb T* Tb T* Tb T*
PA-Na 58 194 96 387 - - - -
PA-Mg 41 99 79 258 111 389 - -
PAo1 51 162 58 194 65 230 62 216
PAo2 40 92 53 144 59 166 62 179

Chapter 8. Polyamides: Influence of internal lubricants, crystalline structure and scaling 247
10 MPa 40 MPa
PAo1
(a) (b)
(a) (b)
PAo2
(a) (b)
(a) (b)
Figure 8.22 Optical microscopy of worn surfaces of oil-lubricated polyamide and transfer film after
large-scale sliding, (a) polymer surface, (b) polymer transfer film on steel surface • For PAo1 with homogeneous oil lubricant, the polyamide surface is covered with a
thick and viscous film controlled by softening and lubricant supply at 10 MPa (T* = 162°C), or controlled by melting and polyamide bulk properties at 30 to 40 MPa (T* = 230 to 216°C). Continuous or lumpy transfer is enhanced in contrast to pure PA-Na showing no or flake-like transfer. Sliding instabilities at 10 and 30 MPa correspond to softening and melting respectively:
- Softening at 10 to 20 MPa results in a continuous thick transfer film because coherence between softened wear debris enhances by oil lubricant. An increase in friction at 10 MPa is caused by thermal softening and low running-in wear with limited supply of fresh lubricant. Friction stability improves at 20 MPa by thermal softening and higher wear rates. Fresh lubricant supply in the sliding interface is necessary when oil is exhausted over a certain depth in the matrix and depends on wear.
- Melting at 30 MPa causes lumpy transfer of a polyamide/oil mixture. The migration paths of oil are blocked by melting and high friction is controlled by the polyamide bulk. Also for pure PA-Na, melting contributes to lumpy transfer and high adhesive forces in a polyamide/polyamide contact. The PAo1 surfaces are less deformed than pure polyamides, however, by a lubricating film on the polyamide surface that provides low friction and shear. Thick transfer films with molten polyamide and oil are brittle and show cracks through degradation similar to pure PA-Na. The contact surfaces at 40 MPa were additionally cooled to re-establish stable sliding under softening conditions (T* = 216°C) with lower friction and wear rates.
Homogeneous oil lubrication is most favourable in the softening regime.
1 mm

Chapter 8. Polyamides: Influence of internal lubricants, crystalline structure and scaling 248
The homogeneous oil lubrication mechanisms for large sliding samples are better related to surface softening and/or melting of the polyamide bulk compared to small sliding areas, as the entire polymer surface has enlarged possibility for homogeneous oil supply while stresses are more homogeneously distributed over the contact area. • For PAo2 with oil in lubricating holes, softening mechanisms occur at 10 to 40 MPa
(T* = 92 to 179°C) and melting does not happen. A continuous thick transfer film develops, which is homogeneous and coherent at low loads but becomes brittle at high loads with fractures near the borders as also seen for pure PA-Na. No lumpy transfer occurs because melting does not happen. In contrast to PAo1, no continuous film on the polyamide surface develops but only island-like polyamide flakes are separately deposited on the polyamide surface and plasticized parallel to the sliding direction. The lubricating holes are not worn and do not cause preferential accumu-lation of polymer debris.
The lubrication mechanisms of oil in surface holes (PAo2) are more efficient to stabilise sliding. The lubricant is immediately in contact with the sliding interface and exposure does not depend on running-in wear. Therefore, friction and sliding temperatures remain low and melting does not happen. Also deformation through softening and/or melting is minimised and if any, the migration paths for oil through macroscopic holes are larger compared to the microscopic migration of oil through pores in the polyamide bulk. 8.4.3. Discussion on softening of solid-lubricant filled polyamides The lowest and most stable friction and wear is obtained for solid lubricant filled polyamides (PAs1 or PAs2) on small-scale and large-scale tests. It is also known for other polymers that PTFE-fillers reduce both friction and wear [8.30]. The addition of MoS2 to polymers also lowers friction, but it is less discussed [8.31]. 8.4.3.1. Frictional heating for solid lubricated polyamides on small-scale tests Referring to the small-scale tests on solid lubricated PAs2 (Figure 8.9), the temperatures T* are given in Table 8.7. The steel and polymer surfaces are shown in Figure 8.23.
• For PAs2 at 50 N, running-in friction rises from 0.20 to 0.25 through small amounts of lubricant in the sliding interface, because the wear rates are very low and softening does not happen at T* < Tg. No homogeneous transfer was consequently observed but only single particles lower friction after 2000 m. Also the polyamide surface shows irregular, non-softened particles of PTFE (light brown colour).
• For PAs2 at 100 N, running-in wear is somewhat higher and enhances lubricant supply improving the transfer film for lower friction. The film homogenises mainly by mechanical shear at T* < Tg, but it remains reasonably thick.
• For PAs2 at 150 to 200 N, progressive softening at Tg < T* < Tm makes transfer films smoother and it stabilises both friction and wear (regime wear in Figure 8.9d is nearly parallel and absolute values mainly depend on deformation). Thin transfer films are attributed combined polyamide/lubricant transfer and progressive softening of the polyamide. Combined with the low shear resistance of thermo-

Chapter 8. Polyamides: Influence of internal lubricants, crystalline structure and scaling 249
(i) running-in, (ii) steady-state
100 N 150 N
PAs2
(a) (b)
(a) (b)
Figure 8.23 Optical microscopy of worn surfaces of solid-lubricated polyamide and transfer film after
small-scale sliding, (a) polymer surface, (b) polymer transfer film on steel surface
plastic solid lubricants, a homogeneous film is promoted at high load. Irregularities in wear depth evolution at 200 N are attributed to partial removal of thick film fragments that were observed as large flakes near the borders of the sliding stroke. 8.4.3.2. Frictional heating for solid lubricated polyamides on large-scale tests Referring to the large-scale tests on solid lubricated PAs1 with low lubricant amount and PAs2 with high lubricant amount (Figure 8.9), the temperatures T* are given in Table 8.8. The temperatures T* < Tm reveal that large-scale tests only cause softening without melting, similar to small-scale tests. The main differences in transfer and polymer surface aspects (Figure 8.24) between large-scale and small-scale behaviour are thus attributed to mechanical effects, such as wear debris circulation in the interface. The polyamide bulk properties are less dominant by plastification and softening of additives. • For PAs1, softened island-like polyamide flakes deposit and are smoothened in the
direction of sliding, allowing for immediate low friction even at low contact pressures and limitation of frictional heating. Depositions become more homogene-ous by softening at high loads. The transfer film is preferentially deposited into the original roughness grooves and progressive softening at high loads makes it more coherent. When the steel surfaces are cooled after testing, the transfer film still adheres well to the steel surface and does not peel off indicating low brittleness.
Solid lubricants are favourable for finely dispersed polymer depositions on the polymer surface, while flake-like or completely viscous depositions were observed for oil lubricated PAo1 or PAo2, contributing to higher friction resistance.
50 N 100 N 150 N 200 N
Tb T* Tb T* Tb T* Tb T*
PAs2 r.i. (i) s.s.(ii) 30 61
46 37 80 74 43 103
95 46 120 105
1 mm
Table 8.7. Calculation of bulk temperatures (°C) and maximum polymer surface temperatures (°C) for small-scale tests on solid-lubricated polyamide at different normal loads

Chapter 8. Polyamides: Influence of internal lubricants, crystalline structure and scaling 250 Table 8.8. Calculation of bulk temperatures (°C) and maximum polymer surface temperatures (°C) for large-scale tests on solid-lubricated polyamide at different contact pressures
• For PAs2, a more continuous sliding film forms on the polyamide surface even at
low load and it plasticizes completely at higher loads. Some abrasive traces parallel to the sliding direction are observed, however, as higher additive volumes decrease the mechanical properties (especially lower elasticity modulus and hardness). Also the transfer film is very thin and only determined by the lubricant additives.
The sliding stability of internally oil and solid lubricated polyamidess is detailed in Figure 8.25. A large-scale test at 20 MPa is stopped and restarted after 50 m (3 hours):
• Oil filled polyamide shows additional running-in after mid-time restart with more pronounced stick-slip. This is attributed to intermediate solidifying of the transfer film that becomes brittle under cooling to T* < Tg (see Figure 8.22). When sliding proceeds, the deposited film softens again and provides similar lubrication as before.
• Solid lubricated polyamide shows no additional running-in after restart because the thin transfer film is more stable and does not suffer brittleness. Stop/restart events can be performed. However, separately softened wear debris particles may contribu-te to small irregularities observed as peaks in the coefficient of friction.
10 MPa 40 MPa
PAs1
(a) (b)
(a) (b)
PAs2
(a) (b)
(a) (b)
Figure 8.24 Optical microscopy of worn surfaces of solid-lubricated polyamide and transfer film after
large-scale sliding, (a) polymer surface, (b) polymer transfer film on steel surface
10 MPa 20 MPa 30 MPa 40 MPa
Tb T* Tb T* Tb T* Tb T*
PAs1 38 83 40 97 49 127 53 144
PAs2 35 71 40 92 49 127 58 162
1 mm

Chapter 8. Polyamides: Influence of internal lubricants, crystalline structure and scaling 251
0
0.01
0.02
0.03
0.04
0.05
0.06
0.07
0.08
0.09
0.1
0 20 40 60 80 100 120
Sliding distance (m)
Coe
ffici
ent o
f fric
tion
PAo1 or PAo2
PAs1 or PAs2
Figure 8.25 Detail of the stability in coefficient of friction for oil filled (PAo2) and solid-lubricant filled (PAs1 or PAs2) polyamides during a stop/restart sequence after 50 m sliding at 20 MPa
8.5. Structural effects: DTA-TGA and Raman spectroscopy for pure polyamides with different catalyst
It was demonstrated on small-scale and large-scale tests that different softening and/or melting mechanisms strongly influence friction of pure polyamides. For PA-Na, the combination of softening and transition into the glassy state is detrimental for sliding stability. A transfer film formed by continuous softening also provides high friction. Melting during initial sliding is necessary for stabilisation in both friction and wear, and eventual softening of a molten film near the end of the test then not deteriorates sliding stability. For PA-Mg, in contrast, softening at low loads is favourable for coherent trans-fer and more stable sliding than PA-Na. It will be shown that PA-Na is α-crystalline with high strength, thermal stability and brittleness, while PA-Mg is γ-crystalline with low thermal stability and better ductility. A γ into α transformation is noted after sliding. 8.5.1. Thermo-analytical analysis of pure cast polyamides: influence of catalyst TGA and DTA measurements are shown in Figure 8.26 for PA-Na, PA-Mg and PAo1.
91
92
93
94
95
96
97
98
99
100
101
0 50 100 150 200 250 300 350
Temperature (°C)
TGA
- M
ass
(%)
-20
-15
-10
-5
0
DTA
- m
Volt
(V)
(i)
(ii)
(iii)
Figure 8.26 Thermo-analytical analysis (DTA-TGA) of polyamide grades, (i) PA-Na, (ii) PA-Mg, (iii) PAo1

Chapter 8. Polyamides: Influence of internal lubricants, crystalline structure and scaling 252 The TGA measurements show decreasing weight for each polyamide grade above Tg to final weight loss of 3% (PA-Na), 4% (PAo1) and 6% (PA-Mg). Degradation of PA-Mg is more significant than for PA-Na and happens even at low temperature. Softening starts at 88°C for PA-Mg and at 95°C for both PA-Na and PAo1, indicating lower thermal stability of PA-Mg. The somewhat higher weight loss of PAo1 compared to PA-Na is attributed to thermally activated oil discharge, starting at 60 to 80°C according to Yabe et al. [8.29]. For a 70 wt% oil-impregnated material, they found 2 wt% immediate discharge rate and 8 to 10 wt% discharge rate after 10000 hours. Marchetti et al. [8.28] found 3 to 4 wt% loss in polyimides during migration experiments of oil under static conditions during 4 days at 60°C. The DTA measurements show a melting temperature Tm = 220°C for PA-Na and PAo1, and Tm = 215°C for PA-Mg. The latter has a broad peak with onset at 187°C indicating lower thermal stability. A narrow melting peak with onset at 195°C coincides for PA-Na and PAo1. Good agreement in thermal stability for PAo1 and PA-Na is found as PA-Na is used as bulk material for oil filled polyamide composites. 8.5.2. Raman spectroscopy of pure cast polyamides: influence of catalyst 8.5.2.1. Raman characterisation of crystalline features in polyamide bulk material Raman spectra of unworn PA-Na, PA-Mg and oil filled PAo1 are shown in Figure 8.27. Measurements are averaged over three points on the polyamide surfaces. The frequency range of interest is 1000 to 1700 cm-1 (Figure 8.27a) and 900 to 1000 cm-1 (Figure 8.27b). Bands at higher wavenumbers (2700 to 3300 cm-1) represent CH2 and N-H vibra-tions and are not further considered. Differences in spectra indicate α crystalline struc-tures for PA-Na and γ crystalline structures for PA-Mg, with properties given below: (a) (b)
Figure 8.27 Reference Raman spectrum for unworn polyamide (i) PA-Na, (ii) PA-Mg and (iii) PAo1, (a) 1000 to 1700 cm-1 wavenumbers, (b) detail of 900 to 1000 cm-1 wavenumbers
1000 900 800
Wavenumber (cm-1)
(ii)
(i)
(iii
0.00
3 0.
005
0.00
4 0.
006
0.00
7
962
932
1000 1100 1300 1200 1400 1500 1600 1700
Wavenumber (cm-1)
0.00
5 0.
010
0.02
0 0.
015
0.02
5
Inte
nsity
(a.u
.)
(i)
(ii)
(iii)
1636
1280
13
08
1444
1127
1079
10
63
amid
e I
amid
e III
C-C
pla
nar s
tretc
h
C-C
non
-pla
nar s
tretc
h
CH
2 w
aggi
ng
non-
plan
ar c
ryst
allin
e
amid
e II
CO
-NH
in p
lane

Chapter 8. Polyamides: Influence of internal lubricants, crystalline structure and scaling 253 The Raman spectra are characterised according to Ferreiro et al. [8.32] or Schmidt et al. [8.33]. Some bands are assigned to functional polyamide groups and variations in crystalline structure:
• Spectra for unworn PA-Na and PAo1 are in good agreement and show reproduci-bility of the Raman measurements.
• Spectra for PA-Na and PA-Mg are different. The amide I (C=O) band at 1636 cm-1 is similar for each polyamide grade, but the amide III (N-H bending and C-N stretching) band at 1280 cm-1 has a lower intensity for PA-Mg. Variations in PA-Mg and PA-Na bands are most clear at 962 and 1079 cm-1: their positions shift from 1079.58 cm-1 (PA-Na) up to 1079.96 cm-1 (PA-Mg) and from 932.42 cm-1 (PA-Na) down to 932.31 cm-1 (PA-Mg) for a constant amide I band position at 1613.39 cm-1. Present variations agree to different crystalline structures having an ordered phase in PA-Na and a less ordered phase in PA-Mg.
Three crystalline structures of PA 6 are widely described in literature [8.34-8.35], i.e. the monoclinic α, the pseudo-hexagonal β and the monoclinic γ. The α and γ crystalline structures have been well characterised by x-rays and FTIR analysis [8.36]. Based on reference Raman spectra for each structural composition, the band at 1127 cm-1 charac-terises a planar band representative for fully extended chains with the amide groups in the same plane as the methylene groups: it is only present in the α crystalline form according to Holmes et al. [8.37]. The band at 1079 cm-1 is characteristic for a twisted or non-planar configuration: Arimoto et al. [8.38] showed that the amide group in the γ structure is rotated 67° away from the main chain. Hydrogen bonds occur between paral-lel chains and the interchain distance for the γ form is higher than for the α form [8.39]. The β structure is a mesomorphous phase obtained from quenching molten polymer. Cast polyamide samples are a mixture of different crystalline phases, but some bands indicate that the γ structure prevails in the PA-Mg samples and the α structure is pre-dominant in the PA-Na samples:
• Obvious evidence for γ crystalline structures is found in the 1079 cm-1 band: it is clearly resolved with high intensity for PA-Mg while it is a shoulder band for PA-Na. Obvious evidence for α crystalline structures is found in the 1127 cm-1 planar crystalline band: it is more prominent for PA-Na, with a relative intensity ratio of the bands I1079 / I1127 = 0.50 for PA-Mg and I1079 / I1127 = 0.42 for PA-Na. According to Rodriguez-Cabello [8.40] both 1444 cm-1 and 1636 cm-1 bands are used as inter-nal reference bands, and lower intensity I1127 / I1444 with a nearly constant ratio I1444 / I1636 for PA-Mg relatively to PA-Na confirms the different crystalline structure.
Some bands shift significantly to a lower wavenumber in the γ structure relatively to the α structure [8.32]. This is presently also observed – although not as strongly as revealed on pure α or γ PA 6 –, e.g., from 1127.79 cm-1 (PA-Na) to 1127.54 cm-1 (PA-Mg), as attributed to the different positions of the C-C amorphous stretch. Another upward shift is noted from 1063.67 cm-1 (PA-Na) to 1063.90 cm-1 (PA-Mg). Both down- and upward shifts direct towards the 1079 cm-1 band and represent a non-planar γ crystalline structure.
• Minor indications of a prevailing γ structure for PA-Mg are observed in agreement with Jakes et al. [8.41] and Vansanhan et al. [8.42]. A supplementary band at 962 cm-1 and a shoulder band at 1234 cm-1 for PA-Mg was also observed for γ PA 6

Chapter 8. Polyamides: Influence of internal lubricants, crystalline structure and scaling 254 films. The 1308 cm-1 band has a relative intensity I1308/I1281 = 1.15 for PA-Mg agreeing with a γ spectrum compared to I1308/I1281 = 1.09 for PA-Na [8.38].
In case of PA-Na, the intensity I1079 / I1127 = 0.42 is in good correspondence with a reference spectrum of α polyamide. From a reference spectrum of pure γ polyamide, the estimated content γ polyamide in PA-Mg is 15 to 20 %. Thermal stability for α and γ crystalline structures was discussed by Penel-Peirron et al. [8.43] and agrees to present experience. In literature, pure α and γ crystalline PA 6 were analysed by DSC with a melting peak Tm = 220°C for α crystals or Tm = 215°C for γ crystals. The lower melting point of PA-Mg from present TGA-DTA (Figure 8.26) agrees with Raman measurements that indicate γ structures for PA-Mg and α structures for PA-Na. The γ phase is thermally stable up to 200°C without transition into another crystalline form [8.44]. This corresponds to the onset of the melting peak of PA-Mg in DTA as noted in Figure 8.26. According to patent literature [8.45], it is very likely that different catalytic processes induce a different crystalline structure. This was also men-tioned in publications of Penel-Peirron et al. [8.43-8.45] using a nucleating agent to pre-pare intentionally γ structured polyamides. Other possibility for γ crystallisation is short processing time: rapid cooling after casting and low crystallisation temperatures promote γ PA 6, while slow cooling and high crystallisation temperatures lead to α PA 6 [8.46]. Mechanical properties and differences in ductility for α and γ crystalline structures were discussed in literature under tensile testing [8.47], while it is presently demonstrated that they also influence sliding behaviour. Polyamide samples in the mesomorphic β form are more ductile than in the predominant α form, while the γ crystalline form has lower yield stress and higher ductility compared to the brittle α crystals. Also Bessell et al. [8.48] and Bell et al. [8.49] showed that low crystallinity improves the PA 6 ductility. The internal damping factor tan δ for α and γ phase polyamides [8.43] indicates higher chain mobility for the γ polyamide in the temperature range 40 to 80°C. Also Ito et al. [8.50] reported that polyamide films coextruded in the solid state in the temperature range 100 to 180°C have better ductility in the γ form than in the α form. Plasticity for PA 6 is basically governed by crystal slip parallel to the hydrogen bonded sheet structure, i.e. without rupture of the H bonds [8.51]. It seems mainly influenced by the higher intersheet distance of γ PA 6 crystals and consequently lower critical shear stresses. As observed by AFM [8.32], plastic deformation occurs through nucleation and propagation of the shear bands in the amorphous phase. Related to present sliding tests, the ductility of PA-Mg attributed to a prevailing γ phase compared to PA-Na clearly manifests as lower wear rates at 50 N (small-scale) or 8 MPa (large-scale) for PA-Mg compared to PA-Na with formation of a transfer film. 8.5.2.2. Raman characterisation of worn polyamide surfaces The mechanical and thermal cycle during sliding possibly affects the crystalline polymer structure. Strain induced γ to α transitions above 120°C has been noticed during tensile testing [8.44], but it is not clear whether this process is mainly stress and/or thermal activated. According to Miyasaka et al. [8.52] the γ phase is mechanically reasonably stable and transformation into α is limited, not providing higher mechanical strength upon heating. After sliding, weak γ into α transition will be demonstrated below.

Chapter 8. Polyamides: Influence of internal lubricants, crystalline structure and scaling 255 The γ into α transformation after small-scale and large-scale sliding tests is studied from spectra of worn PA-Na and PA-Mg samples (Figure 8.28). The relative intensities of I1079 / I1127 and I1063 / I1127 bands before and after sliding are given in Table 8.9 as a
Figure 8.28 Raman spectra of worn polyamide surfaces after large-scale sliding (8 and 55 MPa) and small-scale sliding (150 N), (i) PA-Na, (ii) PA-Mg
Table 8.9. Relative intensities of some Raman bands before and after sliding
Crystalline structures Amide I / Amide III
I1079 / I1127 I1063 / I1127 I1636 / I1280 Tribological
test conditions
PA-Na PA-Mg
PA-Na PA-Mg
PA-Na PA-Mg
Unworn 0.42 0.50 0.54 0.53 1.61 1.71
Small-scale test 50 N 100 N 150 N
50 N, 140°C
0.43 0.40 0.39 0.39
0.48 0.46 0.46 0.43
0.51 0.51 0.50 0.48
0.52 0.50 0.50 0.50
1.73 1.72 1.73 1.74
1.73 1.72 1.73 1.74
Large-scale test 8 MPa 25 MPa 55 MPa
0.42 0.42 0.42
0.50 0.48 0.47
0.48 0.47 0.47
0.51 0.50 0.48
1.67 1.72 1.77
1.70 1.72 1.74
(i), 8 MPa (i), 55 MPa
(ii), 8 MPa
(ii), 55 MPa
(ii), 150 N (i), 150 N
1000 1100 1300 1200 1400 1500 1600 1700
Wavenumber (cm-1)
0.00
5 0.
010
0.02
0 0.
015
0.02
5
Inte
nsity
(a.u
.)
1079
1127
1063
1280
1636

Chapter 8. Polyamides: Influence of internal lubricants, crystalline structure and scaling 256
1127.51127.61127.71127.81127.91128.01128.11128.21128.3
Testconditions
Wav
enum
ber (
cm-1)
unworn
large-scale small-scale
8 M
Pa
25 M
Pa
55 M
Pa
50 N
100
N
150
N
140°
C
1063.21063.31063.41063.5
1063.61063.71063.81063.91064.0
Testconditions
Wav
enum
ber (
cm-1)
unworn
large-scale small-scale
8 M
Pa
25 M
Pa
55 M
Pa
50 N
100
N
150
N
140°
C
function of sliding parameters and the position of the 1127 cm-1 and 1063 cm-1 band is plotted in Figure 8.29a and 8.29b. A slight conversion of γ into α structure after sliding of PA-Mg can be concluded from following observations:
• The γ - related intensity I1079 / I1127 decreases from 0.50 to 0.47 (large-scale) or 0.46 (small-scale) and evolutes to PA-Na with low I1079 / I1127 intensity and α structure. The γ into α transition for PA-Mg is most pronounced for small-scale tests, favoured by high sliding velocities and better orientation. Also 140°C temperatures promote the γ into α transition. The intensities for PA-Na are lower and less affected by sliding because it has already an α structure that is more stable.
• The wavenumbers shift from 1127.54 to 1128 cm-1 (large-scale) or 1128.18 cm-1 (small-scale) for PA-Mg and from 1063.70 cm-1 to 1063.46 cm-1 (Figure 8.29). With the central 1079 cm-1 band representing γ PA 6, both up- and downward shifts are asymmetric and directed away from 1079 cm-1 by weakening of its intensity. Transitions are most evident after small-scale tests and for PA-Mg.
Variations in the amide I band (C=O stretching vibration, 1636 cm-1) to the amide III band (N-H bending and C-N stretching, 1280 cm-1) depend on large-scale or small-scale testing (Table 8.9). Reorientation after small-scale testing is nearly similar for each sliding parameter, while it develops more progressively during large-scale testing when structures develop more gradually. Also a shoulder band near the amide I band disap-pears after sliding PA-Na while it remains existing after sliding PA-Mg: Raman spectra studied by Stuart [8.53] at high temperatures indicated an increase in C=O stretching frequency due to crystallisation and loosening intermolecular hydrogen-bonding. (a) (b)
Figure 8.29 Variation in wavenumber position of bands that flank the 1079 cm-1 band (γ structure), (a) upward shift of 1128 cm-1 band, (b) downward shift of 1063 cm-1 band, for PA-Na, PA-Mg
Wav
enum
ber (
cm-1
) W
aven
umbe
r (cm
-1)

Chapter 8. Polyamides: Influence of internal lubricants, crystalline structure and scaling 257 8.6. Extrapolation from small-scale to large-scale testing 8.6.1. Frictional behaviour of pure polyamides (a) (b)
Figure 8.30 Scaling of friction and maximum polymer surface temperature T* for (a) PA-Na, (b) PA-Mg, small-scale friction, small-scale T*, large-scale friction, ∆ large-scale T*
Coefficients of friction from small-scale and large-scale tests of pure polyamides are compared in Figure 8.30. They are plotted as a function of a scaling parameter given in Formula (8.1), with p the contact pressure, v the sliding velocity, Pe the Peclet number and G a geometrical factor. The origin of this parameter relates to the thermal heat input and dissipation on large-scale and small-scale tests and will be discussed in Chapter 9. GPevpparameterScaling = (8.1)
0
0.1
0.2
0.3
0.4
0.5
0.6
0.7
0.8
0 10 20 30 40 50 60 70
Scaling parameter
Coe
ffici
ent o
f fric
tion
0
50
100
150
200
250
300
350
400
Max
imum
pol
ymer
tem
pera
ture
T* (
°C)
cf note § 8.6.3
y = 1.1812x-0.3663
R2 = 0.9619
0
0.1
0.2
0.3
0.4
0.5
0.6
0.7
0.8
0 10 20 30 40 50 60 70
Scaling parameter
Coe
ffici
ent o
f fric
tion
0
50
100
150
200
250
300
350
400
Max
imum
pol
ymer
tem
pera
ture
T* (
°C)
y = 3.1228x-0.6333
R2 = 0.9919
cf note § 8.6.3

Chapter 8. Polyamides: Influence of internal lubricants, crystalline structure and scaling 258 The scaling parameter was defined from experimental best-fit and relates physically to the maximum polymer surface temperature T*. The temperatures T* increase linearly and match for small-scale and large-scale tests under mild conditions. A change in temperature extrapolation is noted above the polyamide melting point Tm = 220°C. This transition is further explained in paragraph 8.6.3. Possibilities for extrapolation depend on the polymer type and thermal conditions:
• For PA-Na, friction fits on small-scale and large-scale tests with extrapolation according to a power-law. The coefficient of friction decreases for small-scale tests at 50°C < T* < 150°C and it further decreases on large-scale tests with T* > 220°C. Coefficients of friction µ = 0.5 remain constant, however, between 140 and 180°C.
According to thermal effects and transfer (paragraph 8.4), unfavourable softening (with constant friction) and necessarily melting (with decreasing friction) for stable friction is reflected. According to structural effects (paragraph 8.5), the α-crystalline form is brittle and further develops during sliding mainly at 140 to 180°C.
• For PA-Mg, friction shows two trends on small-scale and large-scale tests: the coefficient of friction increases both on small-scale and large-scale tests for 100°C < T* < 220°C, while it decreases at T* > 220°C, allowing for extrapolation only in this region.
According to thermal effects and transfer (paragraph 8.4), softening was favourable at low loads by good ductility. According structural effects (paragraph 8.5), how-ever, a γ-crystalline form transforms into α-crystalline form during sliding typically at 120 to 200°C that agree to an increase in friction.
For present scaling parameter, the trend line for PA-Na has an exponent -0.36 (R2 = 0.96) and is in agreement with general power-law models of Yamaguchi [8.22], assuming coefficients of friction µ proportional to p-1/3 in the elastic deformation range. The trend line for PA-Mg has an exponent near -2/3 (R2 = 0.99) and indicates higher influence of visco-elastic deformation and softening in parallel to the noted ductility of PA-Mg and interference with crystallisation mechanisms. Extrapolation of friction for internally lubricated polyamides PAo1, PAs1 or PAs2 is difficult due to differences in transfer and specific transitions in lubrication mecha-nisms interfering with softening and/or melting (paragraph 8.4). Moreover, exposure of lubricant in the sliding interface and wear debris mobility are different on large-scale compared to small-scale testing and mainly control steady-state sliding performance. 8.6.2. Wear behaviour of pure polyamides Specific wear rates from small-scale and large-scale tests on pure polyamides are compared in Figure 8.31. For PA-Na, different trends for wear rates on small-scale and large-scale tests do not easily correlate, because softening and/or melting, transfer, unstable sliding and overload depend on the test geometry. PA-Mg shows better correlation between small-scale and large-scale sliding in agreement with thermal transitions. Transformation of γ into α crystalline structures and melting is reflected in small-scale and large-scale wear rates. The small-scale wear rate at most severe sliding conditions agrees to large-scale wear rates at mildest conditions.

Chapter 8. Polyamides: Influence of internal lubricants, crystalline structure and scaling 259 (a) (b)
Figure 8.31 Scaling of specific wear rates for (a) PA-Na, (b) PA-Mg, small-scale, large-scale
Figure 8.32 summarises the specific wear rates as a function of initial material properties (Rm = tensile strength, e = elongation at break) for pure and internally lubricated polyamides. The wear rates are related to the maximum polymer surface temperature T* for better correspondence between small-scale and large-scale sliding. General conclu-sions from this representation are not made. The graph only illustrates some trends and differences between large-scale and small-scale wear rates, as the exact properties gradually change with sliding temperature and weakening.
• Decreasing wear with higher ductility governs for PA-Na and PA-Mg agreeing on large-scale and small-scale testing at low loads (A). The higher toughness of PA-Mg relatively to PA-Na is beneficial for better wear resistance with the formation of a coherent transfer film in a small working range. At higher loads, this trend is reversed by overload, melting and transfer and no further conclusion are made from Figure 8.31 as other mechanisms control original sliding properties.
• Increasing wear with higher ductility governs for filled polyamide grades (B), indicating that other wear mechanisms govern and transfer film formation is an important interfering factor. Considering the effect of testing scales on wear of PAs2, it is clearly shown that deposition of solid lubricants is more favourable at large-scale testing for lower wear, while lubricating mechanisms depend on time-load-temperature related overload conditions and for PAo1.
0 10 20 30 40 50 60 70
Scaling parameter
10-3
10-4
10-5
10-6
crystalli- sation
melting
Spec
ific
wea
r rat
e (m
m3 /N
m)
0 10 20 30 40 50 60 70
Scaling parameter
10-3
10-4
10-5
10-6
Spec
ific
wea
r rat
e (m
m3 /N
m)

Chapter 8. Polyamides: Influence of internal lubricants, crystalline structure and scaling 260
Figure 8.32 Relation between original mechanical parameters and specific wear rates for large-scale testing () and small-scale testing (open dots) of different polyamide grades
8.6.3. High temperature versus high load sliding For PA-Na, small-scale sliding tests 50 N normal load and controlled bulk temperatures 40 to 180°C (Table 8.5) are compared to large-scale tests at 8 to 55 MPa (Figure 8.33). The bulk temperatures are converted into maximum polymer surface temperatures T*, according to Formulas (4.30), (4.29) and (4.21). Most important agreement between small-scale and large-scale tests is found during softening. The softening sliding regime allows to draw conclusions, while it is clear that the melting regime represents unstable friction and wear by overload.
• In the softening regime 100°C < T* < 220°C, the coefficients of friction and specific wear rates for PA-Na fit between small-scale and large-scale tests and show better agreement compared to Figure 8.31a. It indicates the temperature T* is a main con-trolling parameter for polyamides as far as softening is considered. Sliding stability in this temperature regime is a compromise between crystallisation and softening until the bulk becomes too weak and looses loading capacity.
• Melting at T* > 220°C during small-scale tests causes overload and a coefficient of friction µ = 0.19. Melting conditions on small-scale tests do not immediately correspond to large-scale tests conditions at onset of melting. At higher contact pressures similar coefficients of friction µ = 0.19 are obtained on large-scale tests. Extrapolation towards the melting regime is critical, however, considering change in physical polymer properties.
0 5 10 15 20 25 30
Rm x e (N/mm2)
10-9
10-8
10-7
10-6 Sp
ecifi
c w
ear r
ate
/ Tem
pera
ture
( m
m 3
/ N m
°C )
PA
s2
PA
o1
PA
-Na
PA
-Mg
50 N
100 N
150 N
200 N
A
B

Chapter 8. Polyamides: Influence of internal lubricants, crystalline structure and scaling 261
Figure 8.33 Scaling of friction and specific wear rates between small-scale and large-scale testing, as a function of maximum polymer surface temperature T*
small-scale friction, small-scale wear, large-scale friction, large-scale wear Critical note on the used temperature models: Maximum polymer surface temperatures T* were obtained from the same temperature model for both softening and melting conditions. However, the mechanical properties of polyamide change during loading and deformations on either macro- or micro-scale cause variations in the contact conditions. Also thermal properties change above the melting point. Two corrections should thus preliminary be considered, for (i) the influ-ence of deformation and contact conditions, and (ii) the influence of melting enthalpy. (i) Influence of deformation The maximum polymer surface temperature T* plotted in Figure 8.33 was calculated from the Jaeger temperature model (Formulas 4.29, 4.30) that considers a homogeneous polymer temperature as a result of integrated temperature flashes over contact asperities. Deformation of the contact surface, however, enlarges the real contact area and levels the temperature flashes. The temperature rise at the polymer surface should then be con-sidered as a bulk temperature not resulting from temperature flashes, but resulting from the dissipation of frictional energy over the entire contact surface. Therefore, the Loewen and Shaw bulk temperature model should rather be used to calculate the temperature rise under melting conditions. Both Jaeger or Loewen and Shaw temperature models are evaluated at T* > Tm (Figure 8.34). Extrapolation of temperatures in the melting zone is made from the softening temperature regime, where the Jaeger model is used:
• When the Jaeger model is extrapolated, the correlation R2 = 0.93 is small and the estimated temperatures are too high.
• When the Loewen and Shaw model is extrapolated, the correlation R2 = 0.97 is better, but a modified thermal conductivity coefficient (k = 23 W/mK) is used that takes polymer transfer into account.
0
0.1
0.2
0.3
0.4
0.5
0.6
0.7
0.8
0.9
0 100 200 300 400 500
Maximum polymer temperature T* (°C)
Coe
ffic
ient
of f
rictio
n
0.0E+00
5.0E-06
1.0E-05
1.5E-05
2.0E-05
2.5E-05
3.0E-05
3.5E-05
4.0E-05
Spec
ific
wea
r rat
e (m
m3 /N
m)
4 10-5
3 10-5
2 10-5
1 10-5
0
Spec
ific
wea
r rat
e (m
m3 /N
m)
Softening Melting
Maximum polymer surface temperature T* (°C)
Coe
ffici
ent o
f fric
tion

Chapter 8. Polyamides: Influence of internal lubricants, crystalline structure and scaling 262
Figure 8.34 Scaling of friction as a function of the maximum polymer surface temperature T* calculated
from Jaeger model over entire temperature range or Loewen and Shaw model in the melting temperature range, small-scale friction, large-scale friction
Table 8.10. Critical review of maximum polymer surface temperatures T* calculated from Jaeger and Loewen and Shaw models on large-scale sliding (compare to Figure 8.16)
The Jaeger or Loewen and Shaw models for estimating temperatures T* on large-scale tests are reviewed in Table 8.10. There is reasonable agreement between both models at low loads, while the extremely high temperatures resulting from the Jaeger model at high loads are lowered by the Loewen and Shaw model. The limit between application of one or the other model is situated around the melting point, also coinciding with the limit between elastic and plastic deformation at 20 MPa (Figure 8.6a). This note preliminary indicates that the Jaeger model is not suited for extrapolation towards large-scale testing under high plastic deformation. The contact conditions change in respect to small-scale tests or large-scale tests at low load. Further discussion and evidence on extrapolation and transitions in temperature models for large-scale tests are presented in next Chapter 9 on polyacetal or Chapter 10 on polyethylene tereph-thalate. It will be confirmed that the limit between recoverable and permanent visco-elastic deformation determines whether an integrated flash temperature model (Jaeger) or a bulk temperature model (Loewen and Shaw) is applicable.
PA-Na PA-Mg
T* (°C) T* (°C) Contact pressure
(MPa)
Tb (°C) Jaeger Loewen
Tb (°C)
Jaeger Loewen
8 52 158 146 44 150 104
16 71 220 220 74 250 220
25 80 349 270 86 349 265
55 136 471 390
124 471 370
Maximum polymer surface temperature T* (°C)
Coe
ffici
ent o
f fric
tion
y = 0.888e-0.003x
R2 = 0.9258
y = 1.1849e-0.0047x
R2 = 0.9737
0
0.1
0.2
0.3
0.4
0.5
0.6
0.7
0.8
0.9
0 100 200 300 400 500
Melting
Jaeger model
Loewen model
Jaeger model
Softening

Chapter 8. Polyamides: Influence of internal lubricants, crystalline structure and scaling 263 (ii) Influence of melting enthalpy The transition from softening to melting of the polymer surface is an endotherm reaction associated with energy consumption. Part of the frictional energy is used for melting polymer substance rather than for increasing the maximum polymer surface temperature T*. The melting enthalpy (J/g) represents the energy amount used for melting a unit of polymer material. Endotherm reactions somewhat lower the temperature T* in the melting regime or cause a retardation before the sliding temperature further increases. The melting enthalpy for PA-Mg is 80 J/g and the energy production during friction is 760 J/s at 16 MPa, 840 J/s at 25 MPa and 1400 J/s at 55 MPa. It is estimated from calculations for large-scale testing of PA-Mg at 16 MPa that melting of the worn polymer takes about 400 s, assuming that the heat flow partitions between the steel and the polymer bulk according to the ratio’s of thermal conductivities. The melting enthalpy affects the temperature in the melting regime, but it does not influence frictional heating during softening and, consequently, the detection limit whether the melting temperature is exceeded or not. The latter temperatures T* can be successfully calculated from previ-ous temperature models as demonstrated in previous paragraphs of this Chapter 8.
8.7. Conclusions Friction and wear rates of different polyamide grades are studied on a flat-on-flat meso-scale tester at extremely low loads, a small-scale cylinder-on-plate tester at 50 to 200 N, 0.3 m/s and a large-scale configuration with 22500 mm2 contact area at 8 to 150 MPa, 0.005 m/s. The spectrum of test conditions is much broader compared to available lit-erature. Pure polyamides with sodium (PA-Na) or magnesium (PA-Mg) catalysts, inter-nally oil lubricated polyamide with homogeneous oil dispersion (PAo1) or lubricating holes in the surface (PAo2) and solid lubricated polyamide (PAs1, PAs2) are evaluated. During running-in, the influence of visco-elastic deformation and efficiency of internal lubricant depending on the testing scale is demonstrated. No unique extrapolation can be made for different testing scales. Not only pv sliding parameters determine tribological behaviour of polymers. The contact size is mainly important for supply and accumu-lation of solid lubricants because wear debris mobility is limited for large contact areas:
• For pure polyamide grades, coefficients of friction of PA-Na are higher than PA-Mg on each testing scale, indicating the effect of intrinsic material properties. A transition from decreasing friction to increasing friction at high loads coincides with a transition in visco-elastic deformation. The latter depends on the test geome-try and is determined from in-situ stress-strain characteristics on either small-scale test set-ups (45 MPa for PA-Na, 30 MPa for PA-Mg) or large-scale test set-ups (20 MPa for PA-Na, 10 MPa for PA-Mg). Coefficients of friction monotonously decrease for meso-scale tests and no transition was found due to elastic deformation.
• For filled polyamide grades, oil lubricants provide the lowest friction on meso-scale testing while solid lubricants are the most efficient on small-scale and large-scale testing. A reduction in adhesive forces compared to pure polyamides most likely explains the stabilisation in running-in, which is superior for solid lubricants compa-red to oil lubricant:

Chapter 8. Polyamides: Influence of internal lubricants, crystalline structure and scaling 264
- Oil lubricant is favourably squeezed out of the polymer bulk by small defor-mation, but diffusion paths are blocked at high loads. At low loads, a polymer matrix with homogeneous oil dispersion is preferred, while at high loads oil lubricating holes in the sliding surface are more favourable.
- Solid lubricants are not efficient on meso-scale compared to small-scale due to lack of plastification and they are more efficient on large-scale compared to small-scale due to debris entrapment.
During steady-state, the influence of transfer and thermal effects is demonstrated. Maximum polymer surface temperatures T* are calculated and differences between softening and/or melting agree with visual observations of the sliding surfaces:
• Pure PA-Na has unstable friction and high wear rates on small-scale and large-scale testing due to brittleness. Softening mechanisms only result in the formation of a brittle film and melting is necessary for stabilisation in friction and wear. Observations are confirmed by explicit heating of the counterface. On large-scale samples, softening results in heavy stick-slip with a wavy-like pattern on polyamide surfaces that is more pronounced than for small-scale tests. Due to high polarity, however, friction remains unacceptably high and unstable for dry sliding in contact with a polyamide transfer film.
• Pure PA-Mg shows low friction and wear compared to PA-Na at low loads on either small-scale or large-scale tests due to better ductility. Softening mechanisms for PA-Mg are more favourable compared to PA-Na and results in a smooth and thin transfer film. At high loads, PA-Mg suffers deformation and overload because it is weaker and has lower thermal stability compared to PA-Na.
• Homogeneously oil lubricated PAo1 is prone to important transitions in friction and wear during sliding and it does not completely remove stick-slip. At small-scale tests, lubricant failure is most pronounced at intermediate loads (100 N). The lubri-cation mechanism is not clearly related to a softening or melting temperature, indi-cating that oil supply depends on a combination of load, wear, deformation, tempe-rature and time. On large-scale tests, sliding instabilities with increasing friction are better related to either softening or melting: a continuous thick transfer film deve-lops under softening and a lumpy film establishes under melting. Stop/restart actions are not favourable through intermediate solidification of the transfer film.
• Oil lubricant added into holes on the surface provides more stable and lower friction. Melting is not observed and a brittle transfer film develops by softening, which is unfavourable during stop/restart motions.
• Solid lubricants are most favourable for low friction and wear without abrupt transi-tions. However, a compromise should be attained between low friction/low wear by solid lubrication and creep deformation by decrease in mechanical strength. Transfer films are thin and form by mechanical shear, while they become more homogeneous under softening. Melting is presently not observed. Stop/restart events can be fluent-ly done. External grease lubricants are not efficient and even increase wear rates.
The influence of counterface roughness for PA-Na and PA-Mg indicates lowest friction for Ra = 1.6 µm and higher friction at Ra = 4 µm or Ra = 0.20 µm. At low roughness, the tendency of stick-slip or overload reduces and the relation of decreasing friction at higher contact pressure is more clear.

Chapter 8. Polyamides: Influence of internal lubricants, crystalline structure and scaling 265 The influence of softening and crystallisation mechanisms for PA-Na and PA-Mg is investigated by thermal analysis and Raman spectroscopy:
• Sodium catalysts (PA-Na) promote α crystalline polyamide that further develops under sliding, mainly at 140 to 180°C reflected in constant friction and decrease in wear.
• Magnesium catalysts (PA-Mg) promote γ crystalline polyamide with lower thermal resistance and better ductility than α crystalline polyamide. After sliding, the γ structure slightly reverts into an α structure, most likely at 120 to 180°C reflected in an increase in friction and decrease in wear.
Extrapolation for coefficients of friction can be made according to a power-law model as a function of a macroscopic scaling parameter for PA-Na. Similar extrapolation only applies in a limited interval for PA-Mg in parallel to the noted γ into α crystallisation. A higher power-law exponent for PA-Mg indicates more influence of visco-elastic deformation and ductility. Extrapolation of wear rates for PA-Na cannot be done due to overload, while it applies in a limited interval for PA-Mg in parallel to the noted γ into α crystallisation and softening. References [8.1] Adams N. Friction and deformation of nylons, J Appl Polym Sci 7 (1963), 2075-2103 [8.2] Watanabe M, Karasawa M, Matsubara K. The frictional properties of nylon, Wear 12 (1968), 185-191 [8.3] Gao J, Mao S, Liu J, Feng D. Tribochemical effects of some polymers/stainless steel, Wear 212 (1997),
238-243 [8.4] Lehmann D. New PTFE polyamide compounds, Designed monomers and polymers 5 (2001), 317-324 [8.5] Liu CZ, Ren LQ, Tong J, Joyce TJ, Green SM, Arnell RD. Statistical wear analysis of PA-6/UHMWPE
alloy, UHMWPE and PA-6, Wear 251 (2001), 1557-1566 [8.6] Liu CZ, Wu JQ, Li JQ, Ren LQ, Tong J, Arnell AD. Tribological behaviours of PA/UHMWPE blend
under dry and lubricated condition, Wear 260 (2006), 109-115 [8.7] Yelle H, Benabdallah H, Richards H. Friction and wear of polyethylene-nylon blends, Wear 149 (1991),
341-352 [8.8] Palabiyik M, Bahadur S, Mechanical and tribological properties of polyamide 6 and high density
polyethylene polyblends with and without compatibilizer, Wear 246 (2000), 149-158 [8.9] Kang SC, Chung DW. Improvement of frictional properties and abrasive wear resistance of
nylon/graphite composite by oil impregnation, Wear 254 (2003), 103-110 [8.10] Rajesh J, Bijwe J. Influence of fillers on the low amplitude oscillating wear behaviour of polyamide 11,
Wear 256 (2004), 1-8 [8.11] Bahadur S, Gong D, Anderegg JW. The role of copper compounds as fillers in transfer film formation
and wear of nylon, Wear 154 (1992), 207-223 [8.12] Wang J, Gua M, Songhaob B, Gec S. Investigation of the influence of MoS2 filler on the Tribological
properties of carbon fiber reinforced nylon 1010 composites, Wear 255 (2003), 774-779 [8.13] Van de Velde F, De Baets P. The friction and wear behaviour of polyamide 6 sliding against steel at low
velocity under very high contact pressure, Wear 209 (1997), 106-114 [8.14] Foulger SH. Reduced Percolation Threshold of immiscible conductive blends, J Polym Sci Polym Phys
37 (1999), 1899-1910 [8.15] Jain VK, Bahadur S. Surface topography changes in polymer-metal sliding, ASME Trans 102 (1980),
520-525 [8.16] Horng JH, Len ML, Lee JS. The contact characteristics of rough surfaces in line contact during running-
in process, Wear 253 (2002), 899-913 [8.17] Jain VK, Bahadur S. Material transfer in polymer-polymer sliding, Wear 46 (1978), 177-188 [8.18] Pascoe MW, Tabor D. The friction and deformation of polymers, Proc Roy Soc London A235 (1955),
210-24

Chapter 8. Polyamides: Influence of internal lubricants, crystalline structure and scaling 266 [8.19] Bowden FP, Tabor D. Friction and lubrication of solids, Clarendon press (Oxford), 1964, ISBN 0-1985-
0777-1 [8.20] Archard JF. Elastic deformation and the laws of friction, Proc Roy Soc London A243 (1957), 190-205 [8.21] Greenwood JA, Williamson JBP. Contact of nominally flat surfaces, Proc Roy Soc London A295
(1966), 300-319 [8.22] Yamaguchi Y. Tribology of plastic materials, Elsevier (Amsterdam), 1990, ISBN 0-4448-7445-3 [8.23] De Baets P, Ost W, Samyn P, Schoukens G, Van Parys F. The friction and wear of different polymers
under high load conditions, J Synth Lubr 19 (2002), 109-118 [8.24] Lancaster JK. Geometrical effects on wear of polymers and carbons, J Lubr Techn 97 (1975), 187-194 [8.25] Iwai T, Uchiyama Y, Shimosaka K, Takase K. Study on the formation of periodic ridges in the rubber
surface by friction and wear monitoring, Wear 259 (2005), 669-675 [8.26] Zsidai L, De Baets P, Samyn P, Kalacska G, Van Peteghem AP, Van Parys F. The tribological
behaviour of engineering plastics during sliding friction investigated with small-scale specimens, Wear 253 (2002), 673-688
[8.27] Bahadur S. The development of transfer layers and their role in polymer tribology, Wear 245 (2000), 92-99
[8.28] Marchetti M, Meurisse HM, Vergne P, Sicre J, Durand M. Analysis of oil supply phenomena by sintered porous reservoirs, Tribol Letters 10 (2003), 163-170
[8.29] Yabe T, Takajo T, Kato S, Ueki F. Lubricant-supplying properties and durability of oil-impregnated polymers, Tribol Trans 43 (2000), 453-458
[8.30] Tanaka K, Uchiyama Y, Tokooya S. The mechanism of wear of polytetrafluoroethylene, Wear 23 (1973), 153-172
[8.31] Bijwe J, Logani CM, Tewari US. Influence of fillers and fibre reinforcement on abrasive wear resistance of some polymeric composites, Wear 138 (1990), 77-92
[8.32] Ferreiro V, Depecker C, Laureyns J, Coulon G. Structures and morphologies of cast and plastically strained polyamide 6 films as evidenced by confocal Raman microspectroscopy and atomic force microscopy, Polymer 45 (2004), 6013-6026
[8.33] Schmidt R, Fernandez MR, Pastor JM, Roda J. Study of the conformations of poly(e-caprolactam) and poly (e-caprolactam)-polybutadiene block copolymers by FTIR spectroscopy with photoacoustic detection and by micro-Raman confocal spectroscopy, Polymer 38 (1997), 2067-2075
[8.34] Murthy NS. A discussion of the structural-changes in nylon-6 and comments on Salem and Weigmann paper, Polym Commun 32 (1991), 301-305
[8.35] Rotter G, Ishida H. FTIR separation of nylon-6 chain conformations: Clarification of the mesomorphous and γ-crystalline phases, J Polym Sci B30 (1992), 489-495
[8.36] Lin L, Argon AS. Rate Mechanism of Plasticity in the Crystalline Component of Semicrystalline Nylon 6, Macromolecules 27 (1994), 6903-6914
[8.37] Holmes DR, Bunn CW, Smith DJ. The crystal structure of polcapro-amide: nylon 6, J Polym Sci 17 (1955), 159-172
[8.38] Arimoto H, Ishibashi M, Hirai M, Chatani Y. Crystal structure of the γ-form of nylon 6, J Polym Sci A3 (1965), 317
[8.39] Galeski A, Argon AS, Cohen RE. Deconvolution of x-ray diffraction data to elucidate plastic deformation mechanisms in the uniaxial extension of bulk nylon 6, Macromolecules 24 (1991), 3945-3952
[8.40] Rodriguez-Cabello JC, Alonso M, Diez MI, Caballero MI, Herguedas MM. Structural investigation of the poly(pentapeptide) of elastin, poly(GVGVP)n in the solid state, Macromol Chem Phys 200 (1999), 1831-1838
[8.41] Jakes J, Krimm S. Normal coordinate analyses of molecules with the amide group, Spectrochim Acta A27 (1971), 35-63
[8.42] Vansanthan N, Salem DR. FTIR spectroscopic characterization of structural changes in polyamide-6 fibers during annealing and drawing, J Polym Sci B39 (2001), 536-547
[8.43] Penel-Pierron L, Depecker C, Seguela R, Lefebvre JM. Structural and mechanical behaviour of nylon 6 films part I, identification and stability of the crystalline phases, J Polym Sci B39 (2001), 484-495
[8.44] Penel-Pierron L, Seguela R, Lefebvre JM, Miri V, Depecker C, Jutigny M, Pabiot J. Structural and mechanical behaviour of nylon 6 films part II, uniaxial and biaxial drawing, J Polym Sci B39 (2001), 1224-1236
[8.45] Maxfield MR, Christiani BR, Sanjeeva NM, Tuller H. Nanocomposites of gamma phase polymers containing inorganic particulate material, US Patent 5,385,776 (1995)
[8.46] Debowska M, Piglowski J, Slusarczyk C, Schmidt P, Rudzinska J, Suzuki T, Yu R, Binias W. Is positron annihilation in polyamide 6 affected by morphology, Fibres and Textiles 13 (2005), 64-68
[8.47] Ramirez JMH, Colomban P, Bunsell A. Micro-Raman study of the fatigue fracture and tensile behaviour of polyamide fibres, J Raman Spectrosc 35 (2004), 1063-1072
[8.48] Bessell TJ, Hull D, Shortall JB. Effect of polymerization conditions and crystallinity on mechanical properties and fracture of spherulitic nylon-6, J Mater Sci 10 (1975), 1127-1136

Chapter 8. Polyamides: Influence of internal lubricants, crystalline structure and scaling 267 [8.49] Bell JP, Dumbleton JH. Relation between melting behavior and physical structure in polymers, J Polym
Sci B7 (1969), 1033-1057 [8.50] Ito M, Mizuochi K, Kanamoto T. Effects of crystalline forms on the deformation behaviour of nylon-6,
Polymer 39 (1998), 4593-4598 [8.51] Lin L, Argon AS. Deformation resistance in oriented nylon 6, Macromolecules 25 (1992), 4011-4024 [8.52] Miyasaka K, Ishikawa K. Effects of temperature and water on the crystalline transition of nylon 6
caused by stretching in the chain direction, J Polym Sci Polym Phys 6 (1968), 1317-1329 [8.53] Stuart BH. The application of Raman spectroscopy to the tribology of polymers, Tribol Internat 31
(1998), 687-693 [8.54] Uetz H, Wiedmeyer J. Tribologie der Polymere, Carl Hanser Verlag (Munchen), 1985, ISBN 3-4461-
4050-6

Chapter 8. Polyamides: Influence of internal lubricants, crystalline structure and scaling 268

269
Chapter 9.
Polyacetals: Evaluation of scaling phenomena.
Goals
• Friction stability for large-scale and small-scale tests at running-in and
(dis)agreement of steady-state friction to known literature models
• Transitions and overload in wear for small-scale and large-scale testing • Evaluation of prevailing temperature model (Loewen and Shaw – bulk tempe-
rature model or Jaeger – integrated flash temperature model) for high load conditions, in relation to deformation characteristics
• Verification of maximum polymer surface temperature T* and prevailing
temperature model by analysis of wear debris and sliding surfaces • Selection of appropriate scaling parameters (macroscopic) and extrapolation
of friction and wear between small-scale and large-scale tests
Methodology
• Small-scale testing, large-scale testing, microscopic analysis, roughness measurements, creep measurements
• Temperature calculations, thermo-analytical measurements, Raman
spectroscopy
Wear of Materials, 2005, San Diego (USA)
Chapter 9. Polyacetals: Evaluation of scaling phenomena 270 9.1. Introduction Both homo- and copolymer acetal grades are used in tribotechnique for close-toleranced sliding parts. Polyoxymethylene homopolymer (POM-H) is employed for joint replace-ments because of its biocompatibility [9.1]. Shen and Dumbleton reported superior performance of pure POM-H [9.2] and filled POM-H [9.3] over UHMWPE for total hip prostheses due to high strength, hardness and creep resistance. Acetals are also applied in industry for bearings, gearwheels and housing parts. Breeds et al. [9.4] studied non-conformal gear contacts and concluded that life-time of POM-H is limited by wear at low torques while the maximum permissible surface temperature is a limiting factor at high loads. Kukureka et al. [9.5] studied polyacetal in dry contact with polymer/polymer sliding couples. Failure mechanisms were attributed to mechanical fatigue with surface pitting and flaking rather than to adhesion. A transition to severe wear at high Hertz contact stresses was very sensitive to changes in surface temperature. The wear of polymer/polymer pairs does however not correspond to polymer/steel contacts. A relative ranking of different engineering polymers sliding on steel was obtained from preliminary work [9.6] on small-scale tests, revealing superior performance of POM-H compared to other engineering polymers. Other literature [9.7] confirms the benefits of unfilled POM under dry running against steel in air. The basic failure mechanisms were described by Clerico [9.8] and attributed to subsurface deformation with crack initiation and propagation parallel to the surface. Deformation of the crystalline regions and an energy-dissipating crystalline-amorphous transition caused by the normal and shear forces at the sliding contact were observed. Engel et al. [9.9] studied the impact of POM-H discs in dry and lubricated conditions and reported about the brittle failure of polyacetals, in parallel to Palanivelu et al. [9.10]. This explains observations by Odi-Owei et al. [9.11], using a tribotester with compensation for thermal effects: he reported lack of coherent transfer for unfilled POM-H. Brittleness could be overcome by blending with polyurethane. Other composites were investigated by Kurokawa et al. [9.12] showing that only POM/PTFE obviously made a transfer film on an aluminum disk and compositions with silicon carbide or calcium developed an extremely thin film. The lifetime and tribological performance of a sliding element strongly depends on its geometrical conformation. Endo et al. [9.13] therefore studied convex and flat POM-H pins sliding against flat steel or polymer discs, concluding that it is irrelevant to compare two geometries. It was found that friction for a curved polymer pin sliding on steel is nearly independent of normal loads, while it is lower and slightly decreases with normal load for flat polymer pins. The differences in wear of the pins are not remarkable. There is recent interest to use POM-H for highly loaded constructions, relying on its acceptable creep rate. The operating conditions for POM-H as bearing material are limi-ted to maximum pressures of 70 MPa under static and 50 MPa under dynamic loading; pv-limits of 0.16 MPa m/s under dry sliding are reported [9.14]. Problems to be expected are limitations in the thermal stability and degradation of POM-H, because it has lower melting point than polyamides. The extrapolation of temperature models as preliminary evaluated for polyamides should be further evidenced. This is done by relating melting and crystallisation behaviour of worn surfaces and wear debris to its tribological perfor-mance under extremely high load. A second problem is the influence of deformation and creep. Friction and wear mechanisms under softening conditions are scarcely known at present. A third problem is the influence of contact area that influences debris mobility.

Chapter 9. Polyacetals: Evaluation of scaling phenomena 271 9.2. Friction of polyoxymethylene homopolymer Friction for large-scale tests at 8 to 150 MPa and 0.005 m/s is compared to small-scale cylinder-on-plate tests at 50 to 200 N, 0.3 to 1.2 m/s. It is concluded that plastic defor-mation above 16 MPa is favourable to reduce static friction at running-in. Large-scale friction at steady-state is lower than small-scale friction and disagrees literature models. 9.2.1. Running-in and static friction at large-scale and small-scale sliding
(a) (b)
Figure 9.1 Large-scale friction during the first ten sliding strokes at running-in, (a) 8 MPa, (b) 55 MPa A short-time large-scale test of ten sliding cycles with stroke 230 mm (each cycle 460 mm) is done at 8 to 150 MPa contact pressures. The coefficient of friction is plotted as a function of the horizontal displacement of the central sliding block in Figure 9.1 and characteristics for static and dynamic friction are given in Table 9.1. The static friction at the initial start and reversals of the sliding direction is indicated by µs1 and µsn,max or µsn,min respectively. The latter values indicate a variation of the static coefficient of friction between a maximum and a minimum value depending on the number of sliding cycles. Dynamic friction µd,max or µd,min is measured at the centre of the stroke. For large-scale tests at low loads, some scatter on the coefficient of friction is noted although smoothening near the end of the sliding test: it represents initial interaction with the steel counterface roughness. At high loads above the polymer yield strength, scatter is limited or disappears completely as visco-elastic deformation of the polymer surface allows better compatibility with the counterface roughness. Some higher µs1 compared to µd is noticed for 8 to 16 MPa while µs1 lowers and equals µd,max at 25 to 150 MPa. The variation of static friction during running-in is more dependent on normal load than the dynamic friction does: µs > µd at 8.33 MPa while µs ≈ µd at 150 MPa. Static friction for dry sliding is generally higher than dynamic friction, while it becomes equal or lower than dynamic friction only in presence of lubricants or PTFE. Present high load tests show, however, that also plastic deformation of thermoplastic surfaces is favourable for stable sliding. POM-H is not prone to stick-slip in contrast to, e.g., polyamides showing unstable sliding and frictional instabilities at high loads. The differ-
-0.15
-0.1
-0.05
0
0.05
0.1
0.15
-150 -100 -50 0 50 100 150
µs1 µsn
µd
Sliding distance (mm)
Coe
ffici
ent o
f fric
tion
-0.15
-0.1
-0.05
0
0.05
0.1
0.15
-150 -100 -50 0 50 100 150
µs1 µsn µd
Sliding distance (mm)
Coe
ffici
ent o
f fric
tion
1 2
3 - 10

Chapter 9. Polyacetals: Evaluation of scaling phenomena 272 Table 9.1. Static and dynamic coefficients of friction for POM-H at running-in for large-scale sliding
Static friction Dynamic friction Contact pressure (MPa) µs1 µsn, min µsn, max
µd, min µd, max
T* at running-in
(°C)
8
16
25
55
150
0.11
0.09
0.08
0.07
0.06
0.08
0.08
0.07
0.06
0.06
0.09
0.09
0.08
0.07
0.07
0.08
0.08
0.07
0.06
0.06
0.09
0.08
0.08
0.07
0.06
30
38
43
61
78
Table 9.2. Total surface energy with polar and dispersive energy component for different thermoplastics (measurements according to paragraph 7.3)
POM-H PAo1 PA-Na
Polar surface energy mN/m 6.1 6.9 11.2
Dispersive surface energy mN/m 36.0 30.7 34.4
Total surface energy mN/m 42.1 ± 0.5 37.6 ± 0.5 45.6 ± 0.5
ence in Young’s modulus (being higher for POM-H compared to polyamide), or elonga-tion at break (being higher for POM-H compared to polyamide) are two mechanical properties influencing better sliding stability as the polymer becomes more ductile. Running-in contact is also influenced by adhesion, expressed by the surface energy (Table 9.2). The lower surface energy (and mainly polar energy component) of POM-H favourably reduces adhesion and friction, but this rule does not govern uniquely: e.g., oil-filled polyamide PAo1 has lower surface energy than PA-Na but static friction µs1 and µsn is still high (Figure 8.4c). Also stated for polyamides, temperature effects during running-in (first sliding stroke) do not strongly influence the frictional behaviour. The maximum polymer surface temperatures T* for POM-H at running-in vary between 30 to 78°C (Table 9.1), remaining below the glass transition temperature Tg = 90°C. For small-scale tests, the friction force is plotted in Figure 9.2 over ten reciprocating strokes of 15 mm. Static and dynamic friction is compared in Table 9.3 for different normal loads and sliding velocities. Static friction clearly decreases at high normal loads in parallel to dynamic friction, but there is no clear evolution of static friction with sliding velocity. The lack in uniform variation of static friction with sliding velocity was also mentioned for polyamides on meso-scale tests. The possible causes for stick-slip of POM-H clearly decrease for small-scale tests at high loads and this trend is further established for large-scale tests at high loads/low sliding velocities with a ratio µs(n)/µd = 1.3 to 1. The reduction in large-scale static friction may be enhanced by smaller effects of stress concentrations on the edges of large-scale test samples, owing to the more favourable edge to contact area ratio. Yamaguchi [9.15] measured static coefficients of friction for polyacetal/steel at 0.1 to 0.5 N normal loads and found a constant value µs1 = 0.3 independent of the normal load: the static friction was not affected as much as the dynamic coefficient of friction by conditions of normal load and velocity. However, a clear evolution in static friction with test parameters is presently observed at high loads.

Chapter 9. Polyacetals: Evaluation of scaling phenomena 273
Figure 9.2 Small-scale friction during the first ten sliding strokes at running-in, POM-H, 50 N, 0.3 m/s
Table 9.3. Static and dynamic friction for POM-H at running-in for small-scale sliding
v = 0.3 m/s v = 0.6 m/s V = 0.9 m/s v = 1.2 m/s FN (N) µsn µsn/µd µsn µsn/µd µsn µsn/µd µsn µsn/µd 50 1.30 1.62 0.64 1.36 0.70 1.42 0.76 1.68
100 1.20 1.50 0.52 1.24 0.60 1.36 0.53 1.43
150 0.82 1.26 0.46 1.21 0.46 1.27 0.46 1.39
200 0.76 1.24 0.49 1.36 0.41 1.24 0.41 1.24
9.2.2. Steady-state friction at large-scale and small-scale sliding The coefficients of friction for POM-H as a function of the sliding distance are given in Figure 9.3a for large-scale tests and in Figure 9.3b for some small-scale tests. Dynamic friction at steady-state is summarised in Table 9.4 and will be discussed as a function of sliding distance, normal loads and sliding velocities for both test geometries. As a function of sliding distance, both large-scale and small-scale tests show similar increase in friction that should indicate polymer transfer. For small-scale tests, however, only a very thin polymer transfer film was observed. The increase in friction is thus rather related to softening of the polymer surface causing deeper indentation of the counterface asperities and consequently a higher deformation component of friction. The increase in steady-state friction during sliding was explained by Mergler et al. [9.16] for POM-C, resulting from polymer transfer onto stainless steel. However, this transition seems to occur more difficultly for POM-H: friction of POM-H rises after 300 m at 3 MPa.m/s (steady-state) while transitions occur more rapidly when load and/or sliding velocity becomes more severe. Friction of POM-C rises already at 150 m sliding at 0.075 MPa m/s [9.16]. The insert of an ethylene copolymer in the molecular structure enhances chain flexibility, reflected in lower tensile strength and Young’s modulus. Stretching and transfer of POM-C then occurs more readily, leading to a transition with higher friction. Steady-state friction is more rapidly attained during large-scale sliding own to transfer. For small-scale tests, the time to establish steady-state friction shortens at higher load and/or sliding velocity until overload at 200 N occurs.
0 5 0 10 0 15 0 2 0 0 2 5 0
S l b
0
50
-50
Sample number
Fric
tion
forc
e (N
)

Chapter 9. Polyacetals: Evaluation of scaling phenomena 274
0.00
0.05
0.10
0.15
0.20
0.25
0.30
0.35
0 500 1000 1500 2000 2500 3000 3500
Coe
ffic
ient
of f
rictio
n
Sliding distance (m)
8 MPa16 MPa
25 MPa
55 MPa
150 MPa
0
0.10.2
0.30.4
0.50.6
0.70.8
0.9
0 2000 4000 6000 8000 10000 12000 14000 16000
Coe
ffic
ient
of f
rictio
n
50 N 0.3 m/s
100 N 0.3 m/s
50 N 0.6 m/s
100 N 0.6 m/s
200 N 0.6 m/s
Sliding distance (m)
(a) (b)
Figure 9.3 On-line friction measurements for POM-H at different sliding conditions, (a) large-scale tests, (b) small-scale tests
Table 9.4. Dynamic coefficients of friction for large-scale and small-scale tests
Large-scale tests Small-scale tests under controlled atmosphere
P (MPa)
FN (kN) µd Sliding velocity
8 190 0.28
FN (N)
v = 0.3 m/s v = 0.6 m/s v = 0.9 m/s v = 1.2 m/s
16 380 0.26 50 0.82 0.47 0.41 0.45
25 560 0.23 100 0.75 0.42 0.41 0.37
55 1260 0.15 150 0.65 0.38 0.36 0.33
150 3440 0.06 200 0.60 0.36 0.34 0.33
Large-scale tests at low contact pressures (8 MPa) show fluctuations in steady-state friction that disappear at higher loads. They mainly result from difficulties in maintain-ing a constant normal load by the hydraulic system at small loads and irregular transfer. A further transition in steady-state friction occurs after certain sliding distance for 16 and 55 MPa as it also appears for small-scale tests under certain conditions. For large-scale tests at 150 MPa, running in effects shorten and disappear as a result of immediate softening and there is no further increase in steady-state friction. Average values for steady-state dynamic coefficients of friction (Table 9.4) are discussed below and compared to literature. Large-scale friction is lower than small-scale friction and monotoneously decreases with higher contact pressure. Small-scale friction decreases with normal load and sliding velocity, being characteristic for thermoplastics: • The relation of friction with normal load (Figure 9.4a) is described by literature
models for small-scale tests. The general law of friction Ffriction = µ FN with constant µ as a function of FN is not true for polymers due to visco-elastic deformation. Therefore, the coefficients of friction follow the equation µ = K·FN
(n-1), where K and

Chapter 9. Polyacetals: Evaluation of scaling phenomena 275 n are constants with 2/3 < n < 1, depending on the interaction between elastic and plastic deformation. Models for thermally controlled friction are µ = K·FN
-0.25 for partial contact to µ = K·FN
-1 for full contact. In contrast, Unal et al. [9.17] found a linear increase of µ with FN for POM at low loads. Present small-scale tests indicate that µ decreases with FN for n = 0.72 ± 0.05 and K = 1.56 ± 0.44. According to Clerico [9.3] rubbing polyacetal over steel in an Amsler configuration (contra-rotating disc), the characteristic law with n = 0.75 is closely followed between 200 and 600 N. For large-scale tests, however, previous equation does not apply and the coefficient of friction depends more strongly on normal loads. The decrease in friction in case of large-scale tests fits better to an exponential law: µ = 0.3 exp (-5.10-7 FN) with R2 = 0.99. The discrepancy between both models results from higher deformations at large-scale testing compared to small-scale testing, changing the contact conditions as later referred to on microscale (paragraph 9.5.2). The different frictional behaviour as a function of load indicates the influence of the testing scale.
(a) (b)
Figure 9.4 Comparison of small-scale friction for POM-H on a cylinder-on-plate test to literature data, (a) model as a function of normal load for ♦ 0.3 m/s, 0.6 m/s, 0.9 m/s and ◊ 1.2 m/s,
(b) model as a function of sliding velocity for ♦ 50 N, 100 N, 150 N, ◊ 200 N
• The relation of friction with sliding velocity (Figure 9.4b) indicates that higher
sliding velocities on small-scale tests reduce the coefficient of friction and this tendency is the strongest at low FN.v values. The influence of sliding velocity on polymer friction results from interaction between visco-elasticity and temperature rise. Contrasting to previous results on semi-thermosetting polyimides (Table 5.1), the effect of temperature becomes more important for POM-H. A model of Matsubara [9.18] based on the visco-elastic behaviour and orientation of molecular chains predicts high friction at high sliding velocities because of enhanced chain stiffness. For POM-H these trends were recorded by Benabdallah [9.19] only at low normal loads of 10 N (initial contact pressure 8 MPa) between 0.05 and 0.3 m/s. Also other work by Odi-Owei et al. [9.11] or Vaziri et al. [9.20] shows an increase in friction until a critical velocity of 0.3 m/s is attained. Earlier work by Tanaka [9.21] revealed an initial increase in friction at low speeds, dropping off as speed increases. The decreasing friction at present velocities (0.3 to 1.2 m/s) suggests that frictional heating undoubtedly induce lower friction as the polymer softens and molecular mobility increases (T* > 90°C, see Figure 9.10). Friction stabilises under
y = 2.0212x-0.2261
R2 = 0.9666
y = 1.1247x-0.238
R2 = 0.9561
0
0.1
0.2
0.3
0.4
0.5
0.6
0.7
0.8
0.9
0 50 100 150 200 250
Coe
ffici
ent o
f fric
tion
Normal load (N)
0
0.1
0.2
0.3
0.4
0.5
0.6
0.7
0.8
0.9
0 0.2 0.4 0.6 0.8 1 1.2 1.4
Coe
ffici
ent o
f fric
tion
Trendline according to [9.20]
Sliding velocity (m/s)

Chapter 9. Polyacetals: Evaluation of scaling phenomena 276 the most severe sliding conditions, (200 N, 1.2 m/s). It is ascertained that only for those conditions the melting temperature is exceeded (T* > 175°C, see Figure 9.10).
The influence of the counterface roughness on large-scale friction was studied [9.23] at 55 MPa with a counterface roughness of Ra = 4 µm, providing µd = 0.20 at steady-state, compared to µd = 0.15 at present roughness Ra = 0.20 µm. The higher friction at higher surface roughness accords to small-scale experiments on POM-C of Odi-Owei [9.11], where randomly prepared counterfaces with higher average roughness Ra shows 30 % higher friction, but Zsidai et al. [9.24] found hardly any variation in friction of POM-H with roughness at 100 to 200 N cylinder-on-plate tests. 9.3. Wear of polyoxymethylene homopolymer The volumetric wear rates calculated from weight loss and thickness or diameter reduc-tion are presented in Table 9.5 for large-scale and small-scale tests. The data pertain to the wear rates over the whole test period including running-in and steady-state. On-line wear measurements are discussed and corrected in paragraph 9.5.2. Small-scale wear rates cover a broad range with a transition from mild wear to severe wear. Large-scale wear rates are higher than small-scale wear rates and depend on the position of polymer wear sample relatively to steel counterface. Transitions are illustrated in next paragraphs. Table 9.5. Wear rates for small-scale and large-scale testing of POM-H from weight loss and (dimensio-nal diameter reduction)
Large-scale wear rates (mm3/m) Small-scale wear rates (10-5 mm3/m)
P (MPa)
FN (kN) v = 0.005 m/s
8 190 0.57 (0.63)
FN (N) v = 0.3 m/s v = 0.6 m/s v = 0.9 m/s v = 1.2 m/s
16 380 1.26 (1.25) 50 2.8 (4.8) 3.3 (12) 5.2 (27) 11.2 (47)
25 560 1.34 (1.41) 100 10 (18) 53 (58) 48 (50) 1386* (1650)
55 1260 2.75 (3.72) 150 18 (40) 91 (113) 1244* (1261) 5940* (6810)
150 3440 3.53 (38.7)
200 40 (58) 157* (204) 2777* (4457) 6600* (8930)
* indicates an overload situation and is tested over lower sliding distance
9.3.1. Small-scale wear rates On-line vertical displacement indicates gradually increasing wear with sliding distance for mild conditions, while there is a change to severe wear during the test at highest FN.v sliding conditions, characterised by sudden increase in vertical displacement. Small-scale wear rates are between 10-5 to 0.1 mm3/m and increase with normal load and/or sliding velocity. The apparent wear rates from dimensional change indicate visco-elastic deformation. The increase in wear rates with normal load is in agreement with

Chapter 9. Polyacetals: Evaluation of scaling phenomena 277 generally accepted trends. In its most elementary form wear would be predicted as nearly independent of the sliding velocity as observed for sintered polyimides (Table 5.3), unless the influence of temperature becomes large enough to cause a change in wear mechanism. In the lower velocity range from 0.1 to 0.3 m/s, Odi-Owei [9.11] and Yama-guchi [9.15] found decreasing wear rates with increasing velocity for POM. At higher sliding velocities, Yamaguchi [9.15] found increasing wear rates with sliding velocity. Wear rates are stable at low sliding velocities (v < 0.6 m/s) and at higher sliding veloci-ties a critical load is observed with a transition from mild wear (w < 10-3 mm3/m) to se-vere wear (w > 10-2 mm3/m). The latter is characterised by the formation of shear lips at the borders perpendicular to the sliding direction (Figure 9.5). The critical load decreas-es for higher sliding velocities due to thermal effects (softening). Under mild conditions, the wear rates are strongly influenced by normal load, while the sliding velocities have a more important effect under severe conditions as thermal effects become important. Most available literature on wear of POM-H [9.25, 9.26] was obtained from pin-on-disc tests (conformal contact) with POM pins loaded against a rotating steel disc and wear rates are typically 2.10-6 to 4.10-6 mm3/Nm. Clerico [9.8] found wear rates between 10-7 to 10-6 mm3/Nm. Present cylinder-on-plate tests give wear coefficients of 6.10-7 to 4.10-4
mm3/Nm. The large variation in specific wear rates compared to literature follows from non-conformal Hertz contacts with high contact pressures applied to simulate overload. 9.3.2. Large-scale wear rates The volumetric wear rates of large-scale tests are 0.5 to 3.5 mm3/m, averaged between the top and bottom polymer specimens (Table 9.6). For the 8 to 25 MPa test, there is good agreement between weight and dimensional measurements, while there is a signify-cant contribution of permanent creep deformation at 55 to 150 MPa. The bottom polymer plate has generally higher wear rates than the top specimen, due to (i) the (minor) influence of an additional load (10 kN) of the central sliding block acting on the bottom polymer test specimen, and (ii) mainly the relative positioning of the polymer test samples to their counterface and the debris motion into the contact zones is different for both positions. The specific wear rates for large-scale sliding tests are nearly constant for 8 to 16 MPa and decrease at higher contact pressures through the action of surface plastification and transfer films developing more importantly at high loads. Table 9.6. Large-scale wear rates for top and bottom positioned specimens and repeatability from weight loss and dimensional measurements (between brackets)
p (MPa)
FN (kN)
Top specimen wear rate (mm3/m)
Bottom specimen wear rate (mm3/m)
Average wear rate (mm3/m)
Specific wear rate (10-6 mm3/Nm)
0.32 (0.41) 0.82 (0.85) 0.57 (0.63) 3.0 8 190
0.55 (0.60) 0.74 (0.80) 0.65 (0.70) 3.4
16 380 0.98 (1.00) 1.52 (1.58) 1.26 (1.25) 3.3
25 560 1.15 (1.20) 1.55 (1.62) 1.34 (1.41) 2.4
55 1260 1.32 (2.47) 4.18 (4.97) 2.75 (3.72) 2.1
150 3440 3.44 (28.0) 3.64 (49.3) 3.53 (38.7) 1.0

Chapter 9. Polyacetals: Evaluation of scaling phenomena 278 9.4. Microscopic surface evaluation 9.4.1. Polymer surfaces Optical microscopy of the POM-H surfaces after small-scale sliding (Figure 9.5) indica-tes transitions between mild adhesive/abrasive wear and softening. The POM-H surfaces after large-scale sliding (Figure 9.6) illustrate transitions between softening and melting. For small-scale tests, mild wear is characterised by adhesive/abrasive interaction with wear grooves (A) parallel to the sliding direction. They result from indentation of counterface asperities with high hardness into the soft polymer surface with lower hardness. Under severe wear conditions, softened surface zones with glossy appearance and irregular shape occur (B). When the mechanical strength of the polymer cylinder weakens, it is sheared more easily. The cylindrical samples then form shear lips (C) at the edges of the contact area due to stress concentrations within small-scale samples and plastification. Such behaviour was also observed by Subramanian during small-scale testing of non-polymeric materials [9.27]. A detail of the wear lip indicates that the polymer is sheared into parallel zones through the action of horizontal frictional forces.
Mild wear mode Severe wear mode
FN = 50 N, v = 0.3 m/s
FN = 100 N, v = 0.9 m/s
Polymer lip formation at edges perpendicular to sliding direction
shear lip FN = 200 N, v = 1.2 m/s polymer surface
Figure 9.5 Optical microscopy of worn POM-H surfaces after small-scale testing,
illustrating different wear modes
1 mm
1 mm 1 mm
1 mm
A B
B
C

Chapter 9. Polyacetals: Evaluation of scaling phenomena 279
Mild wear mode
FN = 190 kN, p = 8 MPa, v = 0.005 m/s
FN = 380 kN, p = 16 MPa, v = 0.005 m/s
FN = 560 kN, p = 25 MPa, v = 0.005 m/s
FN = 1260 kN, p = 55 MPa, v = 0.005 m/s
Severe wear mode and degradation
FN = 3440 kN, p = 150 MPa, v = 0.005 m/s FN = 3440 kN, p = 150 MPa, v = 0.005 m/s
Figure 9.6 Optical microscopy of worn POM-H surfaces after large-scale testing,
illustrating different wear modes
5 mm
1 mm
5 mm
5 mm 5 mm
5 mm

Chapter 9. Polyacetals: Evaluation of scaling phenomena 280
Severe wear (200 N, 1.2 m/s)
Ra = 0.60 µm
Ra > 10 µm
-100 µm
+50 µm
Shear lips occur at FN.v > 90 N.m/s or (pv)regime > 1.5 MPa.m/s. The regime contact pres-sures are geometrically calculated from the wear depth (paragraph 4.4.1). A similar sur-face flow was reported by Tanaka et al. [9.21] for polypropylene and nylon or by Odi-Owei et al. [9.11] for polyoxymethylene at FN.v > 62 N.m/s. The latter study was only done at constant low contact pressures (2.5 MPa) and sliding velocities 0.1 to 1 m/s, whi-le no indication of a surface temperature was given. Pitting or mechanical fatigue in the mild wear mode or cracks normal to the sliding direction in the severe wear mode were not found, contrasting to reports of Kukureka et al. [9.28] in rolling-sliding of polyacetal. For large-scale tests, softened polymer flakes are noticed on the surfaces slid at 8 to 55 MPa. At low loads, they occur mainly at the edges of the specimen while they cover the entire sample area at 55 MPa. Degradation of the polymer surface is noticed at 150 MPa or (pv)regime > 0.75 MPa.m/s, characterised by the formation of a molten polymer film that is brittle after cooling. Large-scale test specimens show no shear lips due to more homogeneous contact stresses and reduced edge effects as the ratio between edge and bulk material is lower. Plastification at 150 MPa manifests as flow of the polymer bulk out of the sample holder.
Figure 9.7 Different wear modes of POM-H surfaces illustrated by topographical scans
Small-scale wear samples
Large-scale wear samples
FN = 190 kN, p = 8 MPa
Ra = 1.50 µm
+10 µm
-20 µm
FN = 1260 kN, p = 55 MPa
Ra = 3.25 µm
-60 µm
+15 µm
Ra = 0.30 µm
+20 µm
-20 µm
Mild wear (50 N, 0.9 m/s)

Chapter 9. Polyacetals: Evaluation of scaling phenomena 281 The polymer surface topography is studied by a three-dimensional scan to reveal depositions or specific surface flow patterns (Figure 9.7). It is recorded on a Surfascan (Hommel Somicromic, France) with a diamond tip running over the surface at 0.3 mm/s The scans are filtered by a high-pass B-spline to study microgeometries. This filter sepa-rates waviness from roughness by removing low frequency wavelength components with cut-off wavelengths chosen according to ISO 3274 and ISO 11526. The mild and severe wear on small-scale samples is differentiated by the depth of dama-ge beneath the surface. Small-scale samples worn at mild conditions have a smooth sur-face (adhesive wear) and some grooves parallel to the sliding direction with approxima-tely 5 µm depth (abrasive wear). Only adhesive/abrasive interfacial wear is thus obser-ved: this type of wear mechanism is typical for polymers when not thermally influenced. Under severe wear conditions the surface has a rather ductile aspect with polymer particles torn out of the surface and maximum groove depth of 120 µm, characteristic for cohesive wear. According to Shen et al. [9.3] particles are detached from the surface through shear and delamination, which is favoured by progressive weakening of the polymer structure. No evidence of a smooth film deposited on the small-scale polyacetal surfaces is observed through lack of melting. Large-scale surfaces slid at 8 MPa have a regular pattern of abrasive grooves with sharp peaks, while they are irregular shaped with rather wavy patterns at higher loads. In the centre of the 55 MPa wear surface, also a smoothened zone is noted through softening and permanent plastic deformation. 9.4.2. Polymer transfer The transfer behaviour of polyacetals is not fully understood: some experimental eviden-ce by Franklin et al. [9.29] indicated the presence of a polymer film while it was not noticed by Odi-Owei et al. [9.11]. Detection of POM-H transfer on small-scale tests may, however, be difficult through its extremely low thickness. This is due to the simple molecular profile and symmetrical conformation that allows for easy shear along the sli-ding direction. Mergler et al. [9.16] stated that transfer of POM-C is initiated by mecha-nical interlocking of the metal asperities into the polymer and transfer increases the coefficient of friction, as its thickness is insufficient to prevent ploughing interactions. Small-scale tests (Figure 9.8) show accumulation of wear debris and lack of transfer under mild wear conditions, while there is limited evidence of transferred polymer in the severe wear mode for FN.v > 90 N.m/s. Under the latter conditions, less debris accumulated at the borders of the sliding stroke, which is an indication that it either adheres to the polymer sliding surface or to the steel surface. However, no completely homogeneous transfer is observed as the debris particles do not compact through lack of interaction during softening or melting. Large-scale tests (Figure 9.9) show clearer evidence of a homogeneous transfer film from 8 MPa on, becoming thicker at higher normal loads. The white zones on the sliding stroke of 25 to 55 MPa tests represent separately transferred polymer flakes originating from progressive softening of the polymer surface and tearing. Transfer becomes extremely large at 150 MPa through melting. A transfer film develops more easily on large-scale tests at each contact pressure under softening conditions similar to small-scale tests. It indicates that wear debris particles are difficultly ejected from sliding interface and interact. The role of the wear debris and compaction into a film depends on the test configuration and will be thermo-analytically examined (paragraph 9.5.4).

Chapter 9. Polyacetals: Evaluation of scaling phenomena 282
Mild wear mode Severe wear mode
FN = 100 N, v = 0.6 m/s
FN = 100 N, v = 0.9 m/s
Figure 9.8 Transfer of POM-H on HA-steel counterfaces for small-scale tests
8 MPa 16 MPa 55 MPa 150 MPa
original 8 MPa 55 MPa 150 MPa
Figure 9.9 Transfer of POM-H on HA-steel counterfaces for large-scale tests at different contact
pressures (top) and roughness profile of transferred polymer flakes (bottom)
Softened particles
Smoothened and more
homogeneous
Molten substance
5 µm
1 mm 1 mm
1 mm
HA
-ste
el
HA
-ste
el
HA
-ste
el
HA
-ste
el

Chapter 9. Polyacetals: Evaluation of scaling phenomena 283 9.5. Discussion and characterisation In an attempt to correlate sliding temperatures to the visual aspect of the polymer sur-face and change from mild into severe wear, the maximum polymer surface temperature T* will be estimated from available models. It will be concluded that a bulk temperature concept prevails at high load/low sliding velocity while an integrated flash temperature concept prevails at low load/high sliding velocity conditions (paragraph 9.5.1). The degree to which the polymer is plastically deformed will determine whether an integra-ed flash temperature or a bulk temperature calculation is more appropriate (paragraph 9.5.2). As such, the transitions in wear mechanisms from mild wear to softening (small-scale) and from softening to melting (large-scale) are correlated (paragraph 9.5.3). Ther-mo-analytical analysis indicating crystallisation or degradation, is finally used to confirm that maximum polymer temperatures T* lead to softening or melting (paragraph 9.5.4). The thermal stability of POM-H is determined from a TGA-measurement, indicating a melting peak Tm = 175°C and no thermal degradation up to 200°C. Mass loss at higher temperatures indicates thermo-oxidative degradation reactions. Mechanical degradation of POM-H is characterised by a glass transition temperature Tg = 90°C according to ASTM D 648 and a heat-deflection temperature of 110°C according to ISO 75 [9.10]. 9.5.1. Evaluation and verification of temperature models The available temperature models were defined in formulas (4.21) and (4.29). However, it was preliminary noted for polyamides in paragraph 8.6.3 that each model is not appli-cable over the entire interval of experimental sliding parameters. • The bulk temperature Tb is calculated according to Formula (9.1) by Loewen and
Shaw, with an average geometry factor Aavg depending on the ratio b/ℓ and the thermal conductivity of the steel counterface k1 = 46 W/mK:
(9.1)
• The maximum polymer surface temperature T* at the polymer surface is calculated according Formula (9.2) by Jaeger, taking into account the thermal conductivity k2 = 0.33 W/mK at the polymer surface:
(9.2)
For small-scale tests, the calculated bulk temperatures Tb and maximum polymer temperatures T* are plotted as a function of the frictional power in Figure 9.10 and com-pared to experimental measurements. The bulk temperatures were experimentally veri-fied with a K-type thermocouple positioned on the steel counterface near the sliding stroke. There is good agreement between the calculated bulk temperatures and experi-mental measurements at steady-state (no steady-state conditions were achieved for the highest FN.v because the test was stopped prematurely by overload, see Table 9.5). The maximum polymer temperature T* rises above the glass transition temperature Tg for sliding conditions µ.FN.v > 30 N.m/s (corresponding to FN.v > 90 N.m/s) and it attains
bN T
bvµF
T += −
l
4102.4*
envavgb Tk
µpvAT +=1
. l

Chapter 9. Polyacetals: Evaluation of scaling phenomena 284
Figure 9.10 Temperatures for small-scale sliding tests: experimentally measured bulktemperature (), calculated bulk temperature Tb (), calculated maximum polymer temperature T* ()
the melting temperature Tm for the most severe sliding conditions. Small-scale tests at low normal loads and low sliding velocities are below the softening point. Small-scale tests at intermediate loads or sliding velocities are in the softening regime 90°C < T* < 175°C. Only the most severe sliding conditions with FN = 200 N and v = 1.2 m/s (T* = 180°C) exceed the POM-H melting temperature. There is good correspondence between maximum polymer temperatures T* and visual observations of the small-scale polymer surfaces (Figure 9.5) that suggest only softening and no degradation by melting. For large-scale tests, the calculated bulk temperatures Tb and maximum polymer surface temperatures T* are evaluated in Table 9.7. The bulk temperatures were experimentally verified with a K-type thermocouple positioned at 20 mm beneath the sliding surface and corrected by a linear conductive law ∆T = µpvd / k1 for heat input µpv and a measuring depth d = 20 mm. There is agreement between experimentally corrected and calculated bulk temperatures at 8 to 25 MPa, but errors occur at the highest normal loads.
Table 9.7. Evaluation of different temperature models for large-scale sliding tests
Experimental temperatures (°C) Calculated temperatures (°C)
T* Contact pressure (MPa)
Measured bulk
temperature ∆T
Corrected bulk
temperature
Tb
Jaeger Loewen and Shaw
8 25 7 32 25 93 53
16 34 13 47 47 167 95
25 40 18 58 62 213 104
55 49 25 74 89 302 150
150**
51 27 78
97 328 200 ** only 300 m sliding distance due to overload
µ FN v (N. m/s)
20 40 60 80 100 0 0
20
40
180
200 Te
mpe
ratu
re (°
C)
60
80
100
120
140
160
No steady-state temperatures
Tg
Tm

Chapter 9. Polyacetals: Evaluation of scaling phenomena 285 The maximum polymer surface temperatures T*, according to Jaeger, rise immediately above the glass transition and indicate softening at 8 MPa, while they rise extremely high and suggest local melting at 16 MPa (T* = 170°C) or degradation at 25 MPa (T* = 200°C). This calculation does not agree with visual observations of the polymer surfaces, indicating that an integrated flash temperature model applicable for small-scale tests cannot be used at high load sliding conditions. The original flash temperature concept introduced by Blok [9.30] is based on single-asperity contacts, where the heat conducted into the sliding bodies is concentrated at the roughness asperities. For low contact stress situations, asperity interaction results in numerous temperature flashes over areas of a few microns, causing local flow or melting [9.32]. Therefore, the local temperature in sliding of hard materials, e.g. ceramics, easily rises to 700°C under normal sliding conditions [9.31]. The solution used by Jaeger (paragraph 4.5.1.2.d) is based on an extension of Blok’s theory and it represents a homogeneous surface temperature that considers the integration of generated tempe-rature flashes in space and time. Polymers, however, are more compliant than metals or ceramics and for a high-stress situation, the real area of contact A′ is close to the apparent area of contact A with essentially a multi-asperity contact. The real contact area enlarges through deformation, reducing the heat generated per unit of apparent area. Therefore, the temperature distribution resulting from bulk heating prevails at high load / low sliding velocity conditions while the temperature distribution originating from flash temperatures prevails at low load / high sliding velocity. The bulk temperature concept according to Loewen and Shaw is evaluated in Table 9.7 for the maximum polymer temperature T* at high load conditions, as it considers heat dissipation over the apparent area of contact A (that equals the real area of contact after plastification at high loads). Calculating bulk temperatures for large-scale tests, however, a polymer transfer film should be taken into account, which results in a drop of the thermal conductivity of the steel bulk towards k3 = 23 W/(mK). The bulk temperature model shows better agreement with visual observations of the polymer surfaces: it indicates no melting at 8 to 55 MPa while melting and degradation occur at 150 MPa. At low loads, however, the Jaeger model still provides the best results, as softening of the polymer surfaces with softened polymer flakes was observed at 8 MPa. The degree to which the polymer is plastically deformed determines whether an integra-ted flash or a bulk temperature model is more appropriate. It is also clear from the calcu-lated specific wear rates (Table 9.6) that POM-H behaves different at 8 MPa (where the integrated flash temperature model prevails) opposed to 25, 55 and 150 MPa (where the bulk temperature model prevails), while the 16 MPa contact pressure is within a transi-tion zone. A relation with visco-elastic deformation is discussed in next paragraph. 9.5.2. Creep and deformation The deformation of large-scale and small-scale samples is experimentally verified during static loading and creep. Test results are used to determine whether the applicability of an integrated flash temperature model (low load) or bulk temperature model (high load) can be related to purely elastic deformation (recovered creep) or visco-elastic deforma-tion (permanent creep) of the polymer sample. Creep results are moreover used to cor-rect on-line measurements of vertical displacement, dividing into wear and deformation.

Chapter 9. Polyacetals: Evaluation of scaling phenomena 286
Figure 9.11 Deformation of POM-H test samples during static loading on (a) standard ASTM , (b) small-scale Hertz contact, (c) large-scale constrained contact
The deformation of large-scale samples statically loaded at 8 to 55 MPa is verified in Figure 9.11. It is compared to compressive deformation of the small-scale Hertz contact at pH, max and an ASTM D695 test on cylinders with flat contact geometry (similar to Fig-ure 5.1). An increase in stiffness of large-scale samples is noted by the constraining action of the sample holder, causing a transition from bulk modulus into apparent modulus (Chapter 11). The latter depends strongly on the test geometry and is determined experi-mentally: the bulk modulus of 2200 MPa at 0 to 10 MPa compressive stress changes into an apparent modulus of 4300 MPa at high compressive stresses. It is concluded that deformation is mainly elastic below 10 MPa, progressively changing into visco-elastic. The clearance between polymer specimen and sample holder lowers at high load and constraint of the sample holder then induces a hydrostatic stress situation. For large-scale samples, long-term creep and thermal deformation is studied from on-line measurements of vertical displacement and post-mortem wear evaluation. The vertical displacement measured during sliding is compared with creep and thermal expansion due to frictional heating of the polymer sample. Figure 9.12 shows the plots as a function of the sliding distance for contact pressures at 8 to 55 MPa: • The on-line vertical displacement ∆hv is favoured by creep (both wear and creep
reduce the sample thickness) and opposed by thermal expansion (wear and thermal effects respectively reduces and increases the sample thickness). Most influences appear during running-in. Irregularities at steady-state sliding noticed for the 25 MPa curve are attributed to the interaction with polymer flakes transferred to the counterface. This is confirmed by visual observation and a topographical scan of the steel surface. Depositions are removed after certain sliding time and form a smooth transfer film and do not influence the final ∆hv value. For other contact pressures, the transfer film is more homogeneous without significant influence on ∆hv.
• The thermal expansion ∆ht is calculated from bulk temperatures according to Jaeger
or Loewen and Shaw, and a linear coefficient of expansion 100.10-6 m/mK. • The creep ∆hc is measured during a 166 hours static loading test at 8, 16, 25 and 55
MPa or 16 hours at 150 MPa. Normal loads are applied at 30 MPa/min. Statistical variation on two creep tests (4 samples) is ±1 µm at low load to ±4 µm at high load.
0
10
20
30
40
50
60
0 1 2 3 4Compressive strain (%)
Com
pres
sive
str
ess
(MPa
)
(a) (b) (c)

Chapter 9. Polyacetals: Evaluation of scaling phenomena 287
-50
-25
0
25
50
75
100
125
0 500 1000 1500 2000 2500 3000 3500
Sliding distance (m)
Vert
ical
dis
plac
emen
t (µm
)
-100
-50
0
50
100
150
200
0 500 1000 1500 2000 2500 3000 3500
Sliding distance (m)
Vert
ical
dis
plac
emen
t (µm
)
∆hv
∆hv
∆hc ∆hc
−∆ht −∆ht
∆hv + ∆ht ∆hv + ∆ht
-150
-100
-50
0
50
100
150
200
0 500 1000 1500 2000 2500 3000 3500
Sliding distance (m)
Vert
ical
dis
plac
emen
t (µm
)
-200
-100
0
100
200
300
400
500
0 500 1000 1500 2000 2500 3000 3500
Sliding distance (m)
Vert
ical
dis
plac
emen
t (µm
)
∆hv ∆hv
∆hc
∆hc
−∆ht −∆ht
∆hv + ∆ht ∆hv + ∆ht
(a) (b) (c) (d) Figure 9.12 On-line measurements of creep ∆hc, thermal deformation ∆ht and vertical displacement ∆hv
for large-scale tests at (a) 8 MPa, (b) 16 MPa, (c) 25 MPa, (d) 55 MPa
Table 9.8. Creep, deformation and wear for large-scale tests from post-mortem measurements ∆hm and on-line measurements ∆hv
Post-mortem evaluation On-line measurement
Thickness reduction ∆hm (µm)
Contact pressure (MPa)
Weight loss
(g) (1) (2)
Total vertical displacement
∆hv (µm)
Creep
∆hc (µm)
Thermal expansion
∆ht (µm)
Steady-state wear rate from vertical
displacement (mm3/m)
8 2.4 110 90 74 20 39 0.66
16 4.6 145 143 60 35 80 1.01
25 5.4 168 168 62 50 107 1.22
55 11.2 475 473 328 70 150 3.68
150*
1.52 872 861 700 100 148 33.0 (1) immediately after testing, (2) one week after testing, * only 300 m sliding distance due to overload, no regime

Chapter 9. Polyacetals: Evaluation of scaling phenomena 288 For large-scale tests, characteristic values from the above analysis are given in Table 9.8 with also the post-mortem thickness reduction ∆hm measured by micrometer immedia-tely and one week after sliding. Corrections to the on-line vertical displacement ∆hv for creep and thermal deformation are made for being in correspondence to the post-mortem measurements ∆hm, as follows: • At 8 MPa sliding test, the post-mortem ∆hm measurement equals the on-line vertical
displacement ∆hv corrected for thermal expansion ∆ht, or: ∆hm = 110 µm and ∆hv + ∆ht = 74 + 39 = 113 µm (error 2.5 %), while ∆hm = 90 µm after recovery equals ∆hv + ∆ht – ∆hc = 74 + 39 – 20 = 93 µm (error 3%). The on-line vertical displacement after recovery should be corrected for thermal expansion and creep. The long-term creep of 20 µm is thus entirely recovered after one week at zero stress.
• At 16 to 55 MPa sliding tests, the post-mortem ∆hm measurements equal the on-
line vertical displacement ∆hv when only thermal expansion ∆ht is taken into account, or at 16 MPa: ∆hm = 143 µm and ∆hv + ∆ht = 60 + 80 = 140 µm (error 2 %), or at 25 MPa: ∆hm = 168 µm and ∆hv + ∆ht = 62 + 107 = 169 µm (error 1 %), or at 55 MPa: ∆hm = 473 µm and ∆hv + ∆ht = 328 + 150 = 478 µm (error 2 %). It indicates that the long-term creep is not recovered after one week at zero stress. The situation at 150 MPa does not represent steady-state conditions and is not considered.
It is concluded that there is a significant difference between 8 MPa and 16 to 55 MPa large-scale tests: creep is recovered after sliding at 8 MPa, while creep remains as permanent deformation at 16 to 55 MPa. It indicates that the long-term deformation at 8 MPa is elastic while it is visco-elastic to plastic at higher contact pressures. This obser-vation is in agreement with the transition from a bulk modulus into an apparent modulus above 10 MPa (Figure 9.11), indicating visco-elastic deformation at higher contact pressure. The limit between elastic and plastic deformation also influences the microscopic contact conditions [9.33], generally expressed by the plasticity index [9.34]. Under elastic conditions at 8 MPa, the theory of single asperity contact prevails: the real contact area is smaller than the apparent contact area, resulting in a maximum polymer temperature T* = 93°C that originates from integration of temperature flashes at the contact asperities (Table 9.7). Due to permanent deformation of the large-scale contact surface above 10 MPa, the real contact area approaches the apparent contact area and the integrated flash temperature model is not realistic. The maximum polymer temperatures T* = 95 to 200°C calculated from dissipation of energy over the entire contact surface are the most significant for 16 to 150 MPa large-scale tests and they agree with visual observations of the sliding surfaces. For small-scale tests, the on-line vertical displacement, creep and thermal expansion are evaluated in Figure 9.13 for a test at 200 N. They are compared to the post-mortem diameter reduction ∆hm = 360 µm (immediately after testing) and ∆hm = 320 µm (one week after testing). The vertical displacement curve ∆hv should be corrected for thermal expansion ∆ht and creep ∆hc, i.e. ∆hv + ∆ht - ∆hc = 360 + 25 – 50 = 335 µm (error 4 %). Most of the creep is thus recovered after small-scale sliding and creep deformation is essentially elastic in parallel to the large-scale test at 8 MPa. Therefore, the integrated flash temperature model according to Jaeger can be applied to calculate the maximum polymer temperature T* for small-scale tests to 200 N.

Chapter 9. Polyacetals: Evaluation of scaling phenomena 289
-50
0
50
100
150
200
250
300
350
400
450
0 2000 4000 6000 8000 10000 12000 14000 16000
Sliding distance (m)
Vert
ical
dis
plac
emen
t (µm
)∆hv
∆hc
−∆ht
∆hv + ∆ht
∆hv + ∆ht – ∆hc
Figure 9.13 On-line measurements of creep ∆hc, thermal deformation ∆ht and vertical displacement ∆hv
for small-scale tests at 200 N, 0.3 m/s 9.5.3. Wear mechanisms and transitions A transition from mild wear (adhesive/abrasive) to severe wear (polymer lip formation) on small-scale tests is associated with maximum polymer temperatures T* above 90°C, being the glass transition temperature for POM-H. The latter temperature corresponds to the peak of the alpha molecular relaxation and implies a significant decrease in elastic modulus, as found by McCrum et al. [9.35]. Similar changes in mild to severe wear were observed by other authors, but transitions were mostly related to melting of POM-H at 175°C [9.36]. However, it is presently demonstrated that both bulk and maximum poly-mer surface temperatures are below the melting point. Degradation and weakening mechanisms occur however over a broad temperature range between the softening and melting temperature with a gradual decrease in mechanical strength, leading to the wear transitions. According to McEttles [9.37] an upper-bound frictional temperature that implies transitions in friction and/or wear mechanisms must be that surface temperature above which the material cannot remain in contact as it is easily removed by shear. Gradual softening depends on the load and is likely happens below the crystalline melting point. Rhee and Ludema [9.38] mentioned that severe wear with very thin transfer film formation, as presently observed on small-scale tests, is mainly attributed to softening and tearing out of polymer particles instead of melting. Overload conditions on small-scale tests are associated with the formation of shear lips due to softening and stress concentrations in the polymer cylinder, rising to 50 MPa at 150 N load. A transition from mild wear (softening) to severe wear (melting) on large-scale tests occurs for maximum polymer surface temperatures T* above 200°C. Softening was an indication of overload on small-scale tests, but polymer wear during large-scale testing stabilises in the softening regime at 90 to 175°C most likely due to a better stress distribution over the sliding area and formation of a softened transfer film. A transition to melting provides extremely low coefficients of friction, but the removal of molten polymer causes high wear rates.

Chapter 9. Polyacetals: Evaluation of scaling phenomena 290 9.5.4. Tribophysical analysis Microstructural change of worn polymer surfaces and wear debris is verified by thermo-analytical DSC, DTA, TGA measurements and Raman spectroscopy. Variations in melt-ing behaviour indicate that no crystallisation happens at 8 MPa, resulting in degradation. Crystallisation is demonstrated for 16 to 55 MPa debris. Debris at low contact pressures have long resident times in the sliding interface, while it is immediately expelled at 150 MPa. Degradation is confirmed by transition of C-O-C into –CH3 molecular structure. 9.5.4.1. Thermo-analytical analysis of polymer sliding surfaces (DSC) DSC-scans are shown in Figure 9.14 for (a) the original polymer, (b) large-scale worn surfaces at 16 to 55 MPa also representative for small-scale polymer lips, and (c) large-scale molten surfaces at 150 MPa. The thermographs are shifted over a fixed value of heat flow for clear presentation. The first heating cycle (1) at 10°C/min between 23 to 220°C gives information on the polymer structure after sliding. Samples are kept for 2 min at 220°C to erase the thermal history and subsequently cooled at 10°C/min to 23°C recording the dynamic crystallisation behaviour. A second heating step (2) from 23 to 220°C at 10°C/min allows assessing the melting characteristics after thermal crystallisa-tion. The values for melting temperatures Tm, crystallisation temperatures Tcc and the respective enthalpies ∆Hm (melting) and ∆Hcc (crystallisation) are given in Table 9.9.
Figure 9.14 Differential scanning calorimetric analysis (DSC) of unworn and worn POM-H surfaces, (a) unworn, (b) large-scale softened surface and small-scale polymer lip, (c) large-scale molten surface
• Unworn material (curve a) has a single melting endotherm Tm1 = 178°C and a heat
of fusion value of 168 J/g, which reflects 51.5 % crystallinity (heat of fusion for 100 % crystalline POM is 326.3 J/g [9.39]). The cooling curve shows that crystalli-
50 100 150 200 250 -15
-10
-5
0
5
10
15
Heating temperature (°C)
Hea
t Flo
w (W
/g)
Tcc
Tm
1 2
2
2
1
1
(a)
(b)
(c)
Exo up

Chapter 9. Polyacetals: Evaluation of scaling phenomena 291
First heating (1) Cooling Second heating (2)
Tm1 (°C) ∆Hm1 (J/g)
Tcc (°C) ∆Hcc (J/g)
Tm2 (°C) ∆Hm2 (J/g) Weight
loss
(a) 178 168 148 155 177 156 9 %
(b) 183 153 150 140 179 140 9 %
(c)
173 1450
147 30
170 30
80 %
sation starts at 150°C and stops at 135°C. The melting temperature of a second heating step Tm2 is identical to the first heating step and the ∆Hm2 is identical to the thermal crystallisation endotherm, indicating homogeneous crystallisation. From thermogravimetric measurements, polyacetal shows no thermal degradation up to 200°C and mass losses at higher temperature indicate thermo-oxidative degradation reactions. The 9 % weight loss presently measured (by weighing samples before and after DSC) is thus concentrated within 200 to 220°C heating temperatures.
• Large-scale surfaces worn at 16 to 55 MPa (curve b) have a broader melting region with two overlapping endotherms Tm1 at 178 and 183°C in the first heating cycle. The first melting temperature corresponds to unworn polymer, while a more intense peak at higher temperature indicates melting of a crystalline fraction with better ordering and/or higher molecular weight, which has formed during sliding. Broadening of the melting region generally characterises a large size distribution of oriented structures developing during sliding. An upward shift in melting tempera-ture Tm1 has typically been observed after stretching of polyamide or polyethylene terephthalate films [9.40] and is attributed to a transition from folded molecular chains into stretched chains with perfection of the crystalline structure. The total heat of fusion ∆Hm1 diminishes relatively to unworn POM-H, indicating that a fraction of crystals formed during sliding does not melt in this temperature region. The peak temperature of the crystallisation exotherm Tcc increased relatively to the original material, indicating that crystallisation occurs easily during cooling, possi-bly explained by simple initiation in presence of some crystalline nuclei that were not molten. The crystallisation enthalpy however decreased and, according to Ever-aert et al. [9.41], this is ascribed to the lower amount of material involved in the crystallisation process as presently explained by a crystalline fraction that did not melt during the first heating step. For the second heating cycle, the melting tempera-ture Tm2 slightly increased relatively to unworn polymer, showing that the evolution into a more perfect crystalline structure is irreversible. A similar thermograph was recorded for small-scale wear lips, showing that both the wear lip and the large-scale samples are prone to softening and crystallisation rather than melting.
• Large-scale surfaces worn at 150 MPa with a molten film (curve c) shows a broad
melting interval with lower melting temperature Tm1 due to degradation and lower molecular weight, explained by pyrolysis of the surface during sliding. Also chain scission is a possible wear mechanism, resulting in a large variation of polymer chain lengths [9.42]. The crystallisation peak Tcc occurs at a higher degree of undercooling while also the enthalpy ∆Hcc decreases, being related to the impossible formation of crystals in the highly degraded structure with distorted crystals.
Table 9.9. Differential scanning calorimetric (DSC) analysis of unworn and worn POM-H surfaces

Chapter 9. Polyacetals: Evaluation of scaling phenomena 292 Thermal analysis of POM-H sliding surfaces confirms the differences in wear regimes between softening (both on small-scale and large-scale) and melting (large-scale). It is useful to verify the calculated sliding temperatures T*. From the temperature Tcc for unworn POM-H, thermal crystallisation is favoured at 120 to 150°C. This temperature region agrees to the maximum polymer surface temperatures T* for small-scale tests, indicating that crystallisation is induced during sliding. As small-scale surfaces show no visual degradation, surface temperatures higher than 200°C are not likely. Also for large-scale surfaces, the lack of degradation and eventual crystallisation at 16 to 55 MPa justify calculations for T* between 95 and 150°C. Surface temperatures above 200°C are not likely for large-scale sliding tests at 8 to 55 MPa, while degradation at 150 MPa is in agreement with calculated bulk temperature of 200°C. These observations evidence the validity of a bulk temperature model at high contact pressures. 9.5.4.2. Thermo-analytical analysis of wear debris (DTA-TGA) Different wear debris morphologies after large-scale testing (Figure 9.15) show dark platelet-like particles at 8 to 16 MPa, white scale-like particles at 25 to 55 MPa and white fiber-like particles at 150 MPa. Most degradation of wear debris visually occurs at low contact pressures noticed as brown colour. Also smaller debris size is observed at 8 to 16 MPa compared to 25 to 55 MPa. Debris produced at 8 to 150 MPa is analysed with thermogravimetry (TGA) in Figure 9.16, representing weight loss and differential weight loss dm/dT during a single heating step between 23 and 220°C. Unworn POM-H is thermally stable to 220°C, where thermo-oxidative degradation results in 1% weight loss. The wear debris has lower thermal stability with one or two decomposition steps. The onset temperature of weight loss (Figure 9.16a) decreases for debris produced at lower contact pressures, i.e., 73°C at 55 MPa, 70°C at 25 MPa, 65°C at 16 MPa and 60°C at 8 MPa. (a) (b)
(c) (d)
Figure 9.15 Wear debris morphology after large-scale testing at (a) 8 MPa, (b) 16 MPa, (c) 25 to 55 MPa, (d) 150 MPa
1 mm

Chapter 9. Polyacetals: Evaluation of scaling phenomena 293
0
10
20
30
40
50
60
70
80
90
100
0 50 100 150 200
Temperature (°C)
Wei
ght l
oss
(%)
-4
-3
-2
-1
0
50 100 150 200
Temperature (°C)dm
/dT
(a.u
.)
8 16
25
55
150
unworn
150
55
8
16 25
*
* *
*
**
**
** Wei
ght l
oss
(%)
dm /
dT (a
.u.)
Temperature (°C) Temperature (°C)
(a) (b)
Figure 9.16 Thermogravimetric analysis (TGA) of wear debris produced during large-scale sliding at different contact pressures (MPa), (a) weight loss, (b) differential weight loss
The differential weight curve dm/dT (Figure 9.16b) indicates that the wear debris pro-duced at high contact pressures has best thermal stability, while debris produced at low contact pressures has a single or multiple decomposition reactions. The differential ther-mal analysis (DTA) in Figure 9.17 represents a first heating, cooling and second heating sequence at 20°C/min. The wear debris has lower melting temperatures Tm with broad melting region and variation in recrystallisation temperature Tcc relatively to unworn polymer. Following conclusions relate to the behaviour of debris in the interface: • Debris produced at 8 MPa thermally decomposes completely at 171°C in one single
step, agreeing with visual observations of dark platelet particles. The degradation temperature is below the crystalline melting temperature Tm = 178°C and shows that crystallisation did not happen during sliding, as only T* = 93°C. Thermo-oxidative degradation of non-crystallised zones during sliding also manifests in broadening of the melting peak only below the melting temperature. Recrystallisation peaks Tcc during cooling disappear as no crystals form in degraded polymer. While sliding temperatures are low, most degradation is found at lowest contact pressures: it indicates that the debris at 8 MPa has long resident times within the sliding interface without crystallisation. These particles are easily sheared in a completely covering and smooth transfer film.
• Debris produced at 16 to 55 MPa has two decomposition steps: (*) one at a fixed
temperature of 171°C and (**) a second step that progressively lowers in temperatu-re for debris produced at lower contact pressures. The first step coincides with a fraction thermo-oxidative degraded amorphous material similar to 8 MPa debris and the second step agrees to a crystalline fraction that has formed during sliding. Both fractions degraded and crystallised polymer are also reflected in broadening of the melting peak at both low-temperature and high-temperature side of the original melting temperature. Crystallisation improves at higher contact pressures. Also dur-ing second reheating (Figure 9.17c), the melting peaks gradually increase in inten-sity and temperature with higher contact pressure. From the calculated temperatures T* = 120 to 150°C, crystallisation occurs that is beneficial for coherent transfer without degradation resulting in formation of larger debris particles.

Chapter 9. Polyacetals: Evaluation of scaling phenomena 294
-40
-35
-30
-25
-20
-15
-10
-5
050 70 90 110 130 150 170 190 210 230
Temperature (°C)
DTA
(a.u
.)
unworn
8 16
25
55
150 Exo up
Hea
t flo
w (m
V)
Temperature (°C)
-20
-15
-10
-5
050 70 90 110 130 150 170 190 210 230
Temperature (°C)
DTA
(a.u
.)
unworn
8
16 25 55
150
Exo up
-15
-10
-5
0
5
10
50 70 90 110 130 150 170 190 210 230
Temperature (°C)
DTA
(a.u
.)
unworn
8
25 55
150
16
Exo up
Hea
t flo
w (m
V)
Temperature (°C)
(a)
(b) (c)
Figure 9.17 Differential thermal analysis (DTA) of POM-H wear debris after large-scale sliding at 8 to 150 MPa, (a) melting at first heating step, (b) recrystallisation, (c) melting at second heating step
(note that the curves are shifted over a constant mV-value for better presentation) • Debris produced at 150 MPa is thermally stable to 200°C, nearly identical to
unworn POM-H. This corresponds to the white appearance of fiber-like debris. The single melting peak of unworn polymer is best reflected in 150 MPa debris. Despite high temperatures (T* = 200°C), lack of degradation indicates that debris is imme-diately expelled from the interface during sliding at high contact pressures and it shows a structure similar to unworn POM-H. There is no reaction between the debris is the interface, resulting in a thick polymer transfer film (Figure 9.9).
Hea
t flo
w (m
V)
Temperature (°C)
Tm1
Tcc
Tm2

Chapter 9. Polyacetals: Evaluation of scaling phenomena 295 9.5.4.3. Raman spectroscopy of polymer sliding surfaces and wear debris
Figure 9.18 Details from the Raman spectra of (a) original POM-H (magnified x2), (b) worn surface at 55 MPa, (c) worn surface at 150 MPa, (d) wear debris at 8 MPa
Two details from Raman spectra of the sliding surfaces and wear debris particles are shown in Figure 9.18 and compared to the unworn POM-H, showing structural changes and/or degradation mechanisms. Characteristic bands for aliphatic ethers as POM-H are a symmetric C-O-C stretch at 930 cm-1 and O-CH3 , O-CH2 deformations at 1480 cm-1 (assigned to end groups of the polymer chain). The relative intensity I1480 / I930 for ether bands changes from 0.45 in the unworn sample towards 0.41 for worn surfaces (16 to 55 MPa) and 0.51 for the wear debris (8 MPa). Different physico-chemical reactions are: • The lower intensity for worn surfaces suggests a transition from O-CH3 into C-O-C,
or an increase in chain length attributed to further polymerisation during sliding. • The higher intensity for wear debris suggests a degradation of ether C-O-C links due
to chain scission and radical reactions into CH3 end groups during sliding. Raman spectra agree with thermo-analytical data of 8 MPa debris, indicating degradation.
The high frequency region at 2880 to 2980 cm-1 corresponds to CH2 stretching motions. The relative intensity I2980 / I2880 equals 1.51 for unworn samples and it lowers to 1.38 or 1.20 for surfaces worn at respectively 55 or 150 MPa, while it equals 1.50 for the wear debris. Furlani et al. [9.43] assigned the highest frequency band to asymmetric stretching and the lower band to symmetric stretching. The latter configuration is clearly favoured through the action of shear forces under sliding. Bands only present in unworn POM-H are: 1100 cm-1 (assigned to hydroxyl (OH) end groups of the polymer chains), 1300 to 1400 cm-1 (assigned to CH, CH2) and 2800 cm-1 (assigned to the CHO group in aliphatic aldehydes originating from the formaldehyde monomers). The disappearance of the OH and CHO related bands suggests further polymerisation during sliding and/or the thermal stabilisation of the polymer chains by acetylation of the hydroxyl end groups, in agreement with thermo-analytical analysis.
Wavenumber (cm-1) 800 1000 120014001600
x 2
(a)
(b)
(c)
(d)
Wavenumber (cm-1) 24002800 3200
x 2
(a)
(b)
(d)
(c)
Inte
nsity
(a.u
.)
930
1480

Chapter 9. Polyacetals: Evaluation of scaling phenomena 296 9.6. Extrapolation from small-scale to large-scale testing Friction and wear was discussed for small-scale and large-scale tests separately. If how-ever a correlation between test configurations exists, extrapolations could provide more accurate design information. Due to the large number of parameters influencing the tribological behaviour, extrapolation is presently studied from an experimental best-fit with parameters that relate to mechanical loading, thermal heating, contact conditions and geometry. Four models are evaluated, based on (i) one single mechanical parameter (normal load), (ii) two mechanical parameters (normal load and sliding velocity), (iii) the contact pressure-sliding velocity model (temperature limit), (iv) macroscopic geometry model. The latter model is most extensive and considers thermal effects, sample geome-try and contact conditions. Values for friction and wear relate to steady-state conditions. 9.6.1. Single-mechanical-parameter model 9.6.1.1. Friction as a function of normal load or contact pressure
Figure 9.19 Relation between friction force and normal load over the entire testing interval for small-scale () and large-scale ()
A summary of friction data at small-scale and large-scale level for POM-H is shown in Figure 9.19 by plotting the friction force as a function of the applied normal loads. This method for extrapolation was used by, e.g., Drees et al. [9.44], investigating the friction of thin coatings on three length scales under reciprocating sliding. Extrapolation was possible for coatings in a limited normal load range, without considering transitions. Note that logarithmic scales are used and that this method is, however, not very sensitive to local variations in friction. Calculating the coefficients of friction from the trendline yields a relationship µ = 0.78 FN
-0.12 that should be valid for any value of FN, however only with R2 = 0.60 over the entire testing range. It is clear that a uniform equation is not valid to be applied for polymers: elastic/plastic deformation and thermal transitions should be distinguished. The extrapolation in Figure 9.19 cannot be applied to polymers!
y = 0.7851x0.8832
R2 = 0.9907
106
105
104
103
102
101
100
Fric
tion
forc
e F f
(N)
101 100 102 103 104 105 106 107 Normal load FN (N)
Small-scale
Large-scale

Chapter 9. Polyacetals: Evaluation of scaling phenomena 297
Figure 9.20 Relation between coefficient of friction and normal load for small-scale () and large-scale ()
The variation in coefficients of friction with normal load for small-scale and large-scale tests is illustrated in Figure 9.20. Small-scale tests show high coefficients of friction at low sliding velocities (0.3 m/s) compared to high sliding velocities (0.6 m/s to 1.2 m/s) to be further discussed: sliding velocities mainly influence the maximum polymer surface temperature T* and explain two different regimes. Regarding the dependence of the coefficient of friction on normal loads, both small-scale regimes show a power-law model of friction µ = K.FN
-0.19 to µ = K.FN-0.23 as an indication of elastic deformation
with the power parameter n close to 1/3. This is in agreement with on-line creep and recovery measurements after small-scale testing (paragraph 9.5.2) showing that entire creep was recovered after small-scale loading. Large-scale coefficients of friction at 16 to 150 MPa strongly depend on normal loads according to µ = K.FN
-0.68 with the power parameter n close to 2/3 due to visco-elastic to plastic deformation. The 8 to 16 MPa coefficients of friction at large-scale are in the elastic deformation regime.
Figure 9.21 Relation between coefficients of friction and steady-state contact pressure for small-scale () and large-scale ()
y = 1774.9x-0.6779
R2 = 0.9639
y = 0.9394x-0.1904
R2 = 0.7702
y = 2.0212x-0.2261
R2 = 0.9666
0
0.1
0.2
0.3
0.4
0.5
0.6
0.7
0.8
0.9C
oeffi
cien
t of f
rictio
n
R2 = 0.9702
Small-scale v > 0.3 m/s
Small-scale v = 0.3 m/s
Large-scale
101 100 102 103 104 105 106 107 Normal load FN (N)
0
0.1
0.2
0.3
0.4
0.5
0.6
0.7
0.8
0.9
Coe
ffici
ent o
f fric
tion
Small-scale v = 0.3 m/s
Large-scale
Small-scale v > 0.3 m/s
101 100 102 103
Contact pressure p (MPa)

Chapter 9. Polyacetals: Evaluation of scaling phenomena 298 No extrapolation from small-scale to large-scale friction can be made as a function of normal loads, as it mainly indicates the discrepancy between either elastic or plastic deformation. A forward prediction (calculated) of the small-scale trend lines yields similar friction to large-scale tests at 150 MPa. In the latter case, the polymer is molten and it is not influenced by the difference between either elastic or plastic deformation as governing in the softening regime. Friction is related to steady-state contact pressure in Figure 9.21, with the macroscopic contact pressure calculated over the apparent contact area. Extrapolation of friction can be made between the small-scale tests at low sliding velocities and large-scale tests at 8 MPa as the contact is elastic. Plastic deformation at 16 to 150 MPa, however, cannot be predicted from small-scale tests and causes a different trend for coefficients of friction. 9.6.1.2. Wear as a function of normal load Predictive methods for wear have been developed by Kar and Bahadur (1974) [9.45], Jain and Bahadur (1980) [9.46] and Kragelskii (1982) [9.47]. Those models considered experimental variables influencing the wear process, but the applicability seems to be restricted to a single wear mode as, e.g., adhesive or fatigue wear. Extrapolations from one to another wear mode were impossible. Visanawath (1995) [9.48] proposed a non-linear wear equation with an exponent for each of the operating parameters to be determined experimentally. The effect of load on small-scale and large-scale wear is examined in Figure 9.22. The data from each testing scale fits on a straight line but different relations are found depending on the test geometry and normal load range. Small-scale test results show an exponential parameter of 1.80 that is close to the value obtained by Visanawath [9.48], who tested on a pin-on-disc machine (also in a load range between 1.8 < log FN < 2.2). It illustrates the independence of his wear equation on the test-rig design and sliding velocity. Extrapolations as a function of normal load from small-scale to large-scale wear seem not possible as large-scale results fit on a lower slope of 0.43.
Figure 9.22 Extrapolation from small-scale to large-scale wear volumes as a function of normal load FN according to Visanawath [9.48]
y = 1.79x - 2.58y = 1.79x - 3.11y = 1.82x - 2.73
y = 0.43x + 1.15
-1
0
1
2
3
4
5
0 1 2 3 4 5 6 7
Small-scale Large-scale
(, v = 0.9 m/s) (, v = 0.6 m/s) (∆, v = 0.3 m/s)
log
wea
r vol
ume
(mm
3 )
log FN (N)
R2 = 0.95
R2 = 0.95

Chapter 9. Polyacetals: Evaluation of scaling phenomena 299 9.6.2. Two-mechanical-parameter model 9.6.2.1. Friction as a function of normal load and sliding velocity
Figure 9.23 Extrapolation from small-scale () to large-scale () coefficients of friction and maximum polymer temperature T* as a function of mechanical power (normal load x sliding velocity)
The effect of mechanical power on friction for small-scale and large-scale tests is evaluated in Figure 9.23. For possible extrapolation, both the normal load and sliding velocity are taken into account as it relates to the heat production and the maximum polymer surface temperature T*. Moreover, an appropriate extrapolation model is useful when it contains test parameters that are known a priori, rather than considering parameters that result from the performed test (e.g., steady-state contact pressure for small-scale tests, Figure 9.21). From a plot of the coefficient of friction against the product of applied normal load FN and sliding velocity v, the linear decreasing trend of friction with FN.v on small-scale tests is continued with an identical slope towards large-scale friction. For properly ex-plaining transitions in frictional behaviour, the maximum polymer temperature T* cor-responding to a given FN.v combination is plotted in dashed lines. Transitions in friction occur from T* = 90°C on for small-scale tests. This temperature corresponds to the heat deflection temperature as determined by Palanivelu [9.10] according to ASTM D 648. At lower temperatures, the coefficient of friction depends more strongly on sliding velocity and normal load than at higher temperatures, where friction mechanisms are generally governed by softening. Extrapolations do only apply when the small-scale test and large-scale test conditions provide a coefficient of friction under what is called “thermally con-trolled conditions” according to McEttles et al. [9.37], i.e. softening. Extrapolations do not apply for the highest FN.v since the combined effect of load and temperature then causes overload and melting on large-scale tests with extremely low friction through sliding on a “liquid” polymer film. These conditions did not occur on small-scale.
0
0.1
0.2
0.3
0.4
0.5
0.6
0.7
0.8
0.9
Coe
ffici
ent o
f fric
tion
0
20
40
60
80
100
120
140
160
180
200
Max
imum
pol
ymer
tem
pera
ture
T* (
°C)
Large-scale Small-scale
T*
Softening Melting
101 100 102 103 104 105 FN.v (N.m/s)
R2 = 0.88R2 = 0.93 C
oeffi
cien
t of f
rictio
n
T*

Chapter 9. Polyacetals: Evaluation of scaling phenomena 300 9.6.2.2. Wear as a function of normal load and sliding velocity
Figure 9.24 Extrapolation from small-scale to large-scale volumetric wear rates as a function of mechanical power, from weight measurements (♦) and dimensional measurements ()
The volumetric wear rates are plotted as a function of mechanical power in Figure 9.24 for both small-scale and large-scale tests. The wear rates determined from weight or dimensional measurements show an identical trend, except at melting conditions where weight measurements under-estimate the wear by adherence of a molten polymer film. The small-scale volumetric wear rate under the most severe test conditions and the large-scale volumetric wear rate under the mildest normal load become in the same range. Transitions in wear rates are associated with the average maximum polymer temperature T* = 90°C or T* = 175°C (Table 9.7). In contrast to friction, the wear rates cannot be linearly extrapolated as a function of the FN.v parameters as transitions between different wear mechanisms should be considered (see also paragraph 9.5.3). 9.6.2.3. Wear as a function of normal load, sliding velocity and coefficient of friction Extrapolation of volumetric wear rates is more difficult than extrapolation of coefficients of friction, mainly due to transitions from pure adhesive/abrasive wear to softening (small-scale) and from softening to melting (large-scale). Due to strong influences of frictional heating, the frictional power µ.FN.v can be considered as extrapolation para-meter (Figure 9.25) that is directly related to the maximum polymer temperature T* by definition. However, there remain different slopes between small-scale and large-scale wear rates that should be further related also to the sample geometry. It is clear that wear volumes calculated from weight or dimensional measurements are more sensitive to the cylindrical or the rectangular polymer shape than coefficients of friction are. The specific wear rates of small-scale test samples are not representative for specific wear rates of large-scale test samples and they are not directly related to each other by frictional heating. Sample geometry and wear debris mobility influence also wear rates.
10-5
10-4
10-3
10-2
10-1
100
101
102
Wea
r rat
e (m
m3 /m
)
Softening Melting Mild wear
Large-scale
Small-scale
101 100 102 103 104 105 FN.v (N.m/s)

Chapter 9. Polyacetals: Evaluation of scaling phenomena 301 (a) (b) Figure 9.25 (a) Ratio of volumetric wear rates to coefficients of friction (mm3/m), and (b) specific wear
rates (mm3/Nm) as a function of normal load, sliding velocity and coefficient of friction for small-scale () and large-scale () testing
9.6.3. Pv temperature-limit model The most common parameter to characterise polymer friction and wear is the pv-value (contact pressure x sliding velocity). It has been shown in this work that it describes the frictional transitions for different polyimide types during small-scale sliding (Chapter 5). Comparing small-scale and large-scale testing for polyacetal, a broad range of regime pv-values is covered, from 0.84 MPa.m/s < pv < 3.51 MPa.m/s for small-scale tests to 0.04 MPa.m/s < pv < 0.75 MPa.m/s for large-scale tests. The coefficients of friction, maximum polymer temperatures T* and wear rates are plotted in Figure 9.26a and 9.26b as a function of the regime pv-value: • For small-scale tests, the maximum polymer temperature T* fits linearly to the pv-
value with R2 = 0.90. It shows that the pv-value better relates to frictional heating than the FN.v value (Figure 9.23), as the latter fits non-linearly with R2 = 0.88. A transition in friction and wear regime is noted for POM-H during small-scale testing at pv = 1.5 MPa.m/s, corresponding to a maximum polymer temperature T* = 90°C. This is in agreement with the transition into softening and shear-lip forma-tion as noted in previous discussions.
• For large-scale tests, the maximum polymer temperatures T* fit to the pv-values
according to a linear relation with R2 = 0.95. The large-scale coefficients of friction decrease with higher pv-value and the wear rates increase at higher pv-values, but friction nor wear rates can be directly related to the small-scale test conditions.
It is concluded that the pv temperature-limit model is useful to characterise friction, temperature and wear transitions within a single testing scale, but extrapolation is not possible. Similar representations are obtained when tribological data is plotted as a func-tion of the µpv-parameter. It is clear that present model only considers the generation of frictional heat and does not account for the dissipation of energy within the sliding contact. The latter strongly depends on the test geometry and the test conditions.
102
101
100
10-1
10-2
10-3
10-4
10-5 100 101 102 103 104 105
FN.v (N.m/s)
Wea
r rat
e / C
oeffi
cien
t of f
rictio
n (m
m3 /m
)
µ.FN.v (N.m/s) 100 101 102 103 104
10-7
10-6
10-5
10-4
10-3
Spec
ific
wea
r rat
e (m
m3 /N
m)
Small-scale
Small-scaleLarge-scale
Large-scale
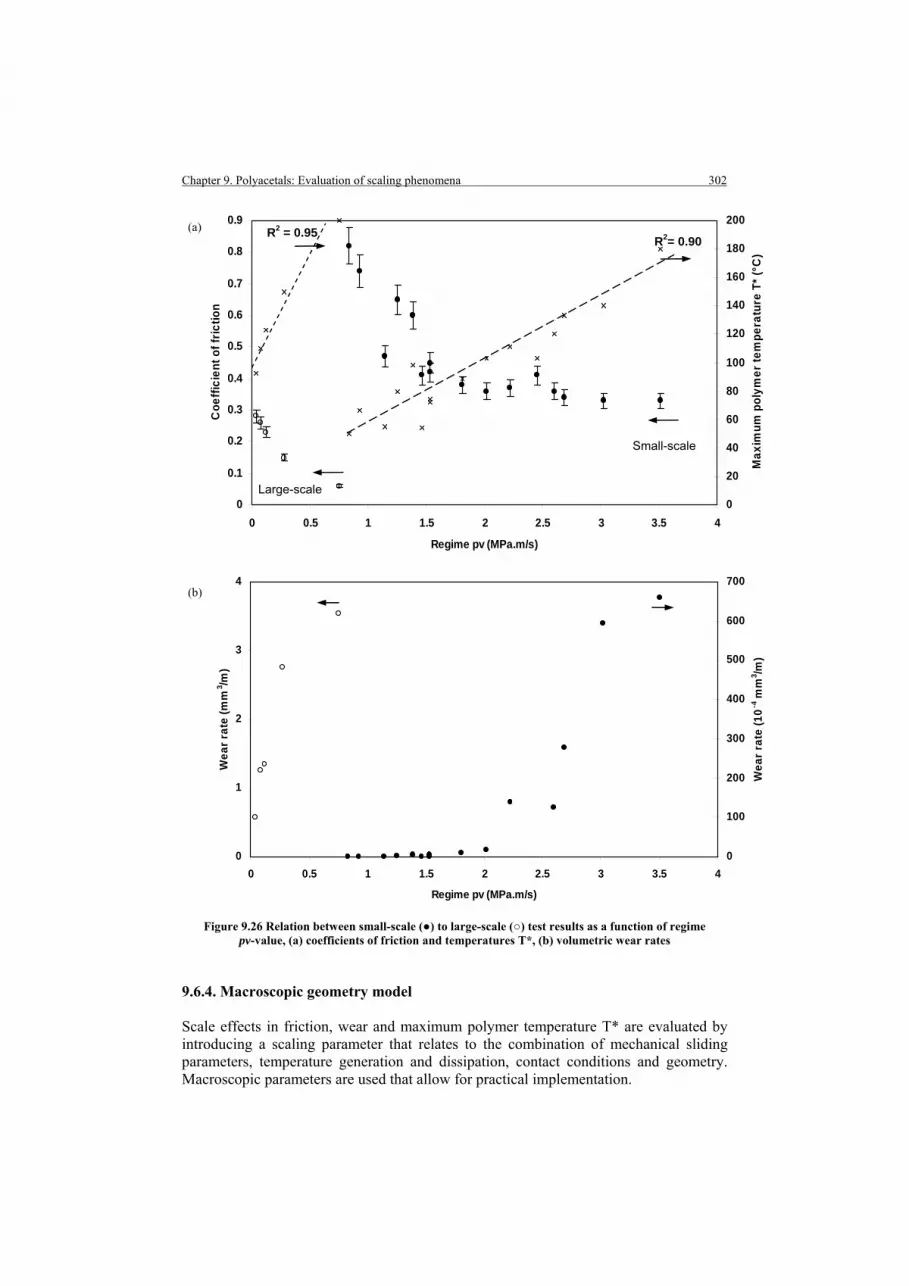
Chapter 9. Polyacetals: Evaluation of scaling phenomena 302
0
1
2
3
4
0 0.5 1 1.5 2 2.5 3 3.5 4
Regime pv (MPa.m/s)
Wea
r rat
e (m
m3 /m
)
0
100
200
300
400
500
600
700
Wea
r rat
e (1
0-4 m
m3 /m
)
0
0.1
0.2
0.3
0.4
0.5
0.6
0.7
0.8
0.9
0 0.5 1 1.5 2 2.5 3 3.5 4
Regime pv (MPa.m/s)
Coe
ffici
ent o
f fric
tion
0
20
40
60
80
100
120
140
160
180
200
Max
imum
pol
ymer
tem
pera
ture
T* (
°C)
R2= 0.90 R2 = 0.95
Small-scale
Large-scale
(a) (b)
Figure 9.26 Relation between small-scale () to large-scale () test results as a function of regime
pv-value, (a) coefficients of friction and temperatures T*, (b) volumetric wear rates 9.6.4. Macroscopic geometry model Scale effects in friction, wear and maximum polymer temperature T* are evaluated by introducing a scaling parameter that relates to the combination of mechanical sliding parameters, temperature generation and dissipation, contact conditions and geometry. Macroscopic parameters are used that allow for practical implementation.

Chapter 9. Polyacetals: Evaluation of scaling phenomena 303 9.6.4.1. Definition of a scaling parameter A scaling factor is empirically defined to match the maximum polymer temperatures T* on small-scale and large-scale sliding. Physical parameters should consider the thermal energy input (depending on the pv-value) and the dissipation of energy (depending on the test geometry and the heat sink). A macroscopic geometry parameter G and the Peclet number Pe are therefore introduced, as also used by Friedrich et al. [9.49] for numerical simulation of the sliding contact temperature: • The macroscopic geometry parameter G = 2 ℓ b / s (ℓ+b) is a dimensionless factor,
depending on the ratio of contact area 2ℓ x 2b to contact contour 2ℓ + 2b and the sliding stroke s. It is clear that large contact areas promote the accumulation of heat in the sliding interface with consequently high temperature rises, while small con-tours and sliding strokes also promote higher interface temperatures.
• The Peclet number Pe = v.ℓ/2a is a dimensionless factor, which is constant for
large-scale sliding (Pe = 1220) and variable for small-scale sliding (580 < Pe < 8800). Both sliding conditions range in the high-speed category with Pe > 10.
The maximum polymer temperature T* is plotted in Figure 9.27 as a function of scaling
factors or .
(a) (b) Figure 9.27 Relation between scaling factors and maximum polymer temperature T* for small-scale () and large-scale () testing, (a) discrepancy between testing scales, (b) agreement between testing scales
Best correlation between small-scale and large-scale temperatures T* is found in Figure 9.27b. Other combinations of scaling factors did not result in any correlation with overlapping temperatures for small-scale and large-scale tests. The temperatures T* are fitted by a linear trend over the 60 to 175°C temperature region, with R2 = 0.93. It is however not possible to extrapolate towards the melting temperature range, as the physi-cal polymer characteristics change. Present experimental model indicates that tempera-ture depends on pv (dimensions W/m2) related to heat generation, and G (ℓ/a)1/2
(dimensions (m/s)-1/2) related to heat dissipation. The proportionality of temperature rise
GPepv GvPep
R2 = 0.93
GvPep
y = 1.893x + 58.979R2 = 0.9121
0
50
100
150
200
250
0 50 100 150 200
GPepv
0
50
100
150
200
250
0 20 40 60 80 100
Max
imum
pol
ymer
tem
pera
ture
T* (
°C)
Max
imum
pol
ymer
tem
pera
ture
T* (
°C)

Chapter 9. Polyacetals: Evaluation of scaling phenomena 304 to W/m2 . (m/s)-1/2 finds some evidence in recent work of Bhushan and Nosonowsky [9.50], studying scaling effects of friction, wear and temperature between nano- and microscale. They considered the scale dependence of contact sizes, adhesion and defor-mation components of friction by using a fractal theory. In traditional statistical analysis, the real limit of detection is the distance at which two points on a contact surface have just reached the condition to be regarded as independent. A fractal approach considers a magnified image of a surface profile similar to the original profile. When an asperity comes into contact with another under sliding, it is considered that the real area of con-tact starts to grow, it is maximum when both asperities are above each other and it starts to get smaller when both asperities move away from each other. From numerical calcula-tions for adhesion contact, with heat generation from a constant heat source q (W/m2) and heat flow perpendicular to the sliding surface, the maximum temperature rise was found proportional to (m/s)-1/2 illustrated by formula (9.3) for Pe > 10, with ρc = volu-metric specific heat, v = sliding velocity, ℓ = contact length and a = thermal diffusivity:
2/1
2/1295.0v
qToravqvcT ∝⎟
⎠⎞
⎜⎝⎛=
lρ (9.3)
9.6.4.2. Scaling of friction The small-scale and large-scale coefficients of friction are plotted in Figure 9.28a as a function of the empirical scaling factor. Although maximum polymer temperatures T* are identical, large-scale coefficients of friction are lower than small-scale values. One hypothetical reason for differences is found in previous discussions, noting that small-scale tests are mainly under elastic conditions while large-scale tests behave under plastic conditions for 16 to 150 MPa. When a correction factor for plastic deformation is applied to the large-scale coefficients of friction (Figure 9.28b), they agree to small-scale test results. The limit between elastic and plastic deformation represents a critical contact pressure po = 16 MPa (Figure 9.11). Grouping both thermal and contact conditions in experimental parameters allows agreement between coefficients of friction. (a) (b)
Figure 9.28 Relation between small-scale () and large-scale () friction as a function of a macroscopic scaling factor, (a) coefficients of friction (b) corrected coefficients of friction for contact deformation
0
0.1
0.2
0.3
0.4
0.5
0.6
0.7
0.8
0.9
0 50 100 150 200
GvPep
Small-scale
Large-scale
Coe
ffici
ent o
f fric
tion
GvPep
0
0.1
0.2
0.3
0.4
0.5
0.6
0.7
0.8
0.9
0 50 100 150 200
Coe
ffici
ent o
f fric
tion
*

Chapter 9. Polyacetals: Evaluation of scaling phenomena 305 9.6.4.3. Scaling of wear The small-scale and large-scale wear rates are plotted in Figure 9.29 as a function of the empirical scaling factor. Wear rates are also related to coefficients of friction as it relates more directly to the frictional energy input. Under mild conditions, small-scale and large-scale wear rates agree, but softening on small-scale tests causes overload conditions while favourable transfer during large-scale testing causes stabilisation in specific wear rates. Wear rates are more prone to the testing scale than friction, possibly caused by the different sample geometry.
Figure 9.29 Relation between small-scale () and large-scale () wear rates as a function of a macroscopic scaling factor
9.7. Conclusions Friction and wear rates of polyoxymethylene homopolymer are studied on a flat-on-flat configuration with 22500 mm2 contact area at 8 to 150 MPa contact pressure, 0.005 m/s (large-scale tests) and they are compared to cylinder-on-plate tests at 50 to 200 N normal loads, 0.3 to 1.2 m/s (small-scale tests): • Coefficients of friction from large-scale tests are lower than those from small-scale
tests and cannot be predicted from normal loads according to known power-law models. Plastification at high load favourably reduces static and dynamic friction.
• Wear rates on small-scale tests cover a broad range with a transition from
adhesive/abrasive wear to softening. Large-scale wear rates are higher than small-scale wear rates and show transitions from softening to melting. While softening causes overload and shear lips on small-scale tests at FN.v > 90 N.m/s (T* > 90°C), it is favourable for the stabilisation of wear rates on large-scale tests. The edge effects and stress concentrations for small-scale test samples seem not representative for large-scale sliding conditions during softening.
• Transfer film formation is clearer on large-scale tests compared to small-scale tests.
10-2
10-3
10-4
10-5
10-6
10-7 Spec
ific
wea
r rat
e / C
oeffi
cien
t of f
rictio
n
(mm
3 /Nm
)
GvPep0 50 100 150 200
Small-scale
Large-scale

Chapter 9. Polyacetals: Evaluation of scaling phenomena 306 Transitions in wear mechanisms can be related to thermal effects, evaluated from a bulk temperature model (Loewen and Shaw) and an integrated flash temperature model (Jaeger). For small-scale tests, the calculated temperatures T* = 60 to 180°C agree with visual observations that do not reveal melting. Only softening happens on small-scale tests and shear lip formation mainly manifests when the softening temperature is exceeded. For large-scale tests, the calculated temperature T* = 93°C corresponds to visual softening on the polymer surface only at the lowest contact pressure (8 MPa). The bulk temperatures between 95 and 200°C prevail at higher normal loads and indicate a transition from softening to melting at 150 MPa. The change from an integrated flash temperature concept into a bulk temperature concept above 16 MPa is further related to deformation of the polymer surface by creep measurements. Large-scale polymer samples show elastic creep (totally recovered) at the lowest contact pressure, while permanent creep happens at higher loads. Elastic creep is measured for small-scale tests and corresponds to the integrated flash temperature concept that does not indicate melting for small-scale tests. The on-line wear curves are corrected for dimensional changes resulting from creep and thermal expansion. Corrected on-line measurements agree with post-mortem thickness reduction measurements (error 1 to 3%). Thermal expansion of the polymer sample is calculated from the prevailing temperature model. The polymer surface temperatures T* leading to softening on either small-scale or large-scale sliding tests are confirmed by thermo-analytical analysis. It indicates that crystallisation happens during sliding and, therefore, the sliding temperatures should range typically between 120 and 150°C. This temperature range corresponds to calculations according to either an integrated flash or a bulk temperature model. Degradation is noticed during large-scale tests at the highest contact pressure (150 MPa) and is attributed to thermo-oxidative reactions at 200°C. Present study emphasizes the importance of wear debris in the sliding interface, being responsible for transfer film formation. At low loads, debris does not crystallise and strongly degrades: it indicates long resident time and formation of a smooth transfer film. Degradation is confirmed by Raman spectroscopy from a transition of C-O-C into -CH3 molecular structures, suggesting chain scission and radical reactions during sliding. At intermediate loads, debris is prone to crystallisation and it forms coherent transfer films. At high loads, debris is similar to unworn material and it suggests immediate removal from the sliding interface. Extrapolation for coefficients of friction can be made as a function of mechanical power (normal load FN x sliding velocity v), but local transitions between adhesive/abrasive sliding, softening and melting should be taken into account: linear extrapolation is only possible in the softening regime. Extrapolation for coefficients of friction can be made as a function of a macroscopic scaling parameter, including a geometry factor G, the Peclet number Pe and a correction factor to coefficients of friction for visco-elastic deforma-tion. The scaling parameter was experimentally determined as such that the maximum polymer surface temperature T* on small-scale and large-scale is similar. Extrapolation of volumetric or specific wear rates is not possible, because softening on small-scale tests causes overload while softening on large-scale tests is favourable for coherent transfer and stabilisation in specific wear rates.

Chapter 9. Polyacetals: Evaluation of scaling phenomena 307 References [9.1] Ohlin A, Linder L. Biocompatibility of polyoxymethylene in bone, Biomaterials 14 (1993), 285-289 [9.2] Shen C, Dumbleton JH. The friction and wear behaviour of polyoxymethylene in connection with joint
replacement, Wear 38 (1976), 291-303 [9.3] Shen C, Dumbleton JH. The wear of a polytetrafluoroethylene-filled polyoxymethylene composite in
connection with joint replacement, Wear 40 (1976), 371-382 [9.4] Breeds AR, Kukureka SN, Mao K, Walton D, Hooke CJ. Wear behaviour of acetal gear pairs, Wear 166
(1993), 85-91 [9.5] Kukureka SN, Chen YK, Hooke CJ, Liao P. The wear mechanisms of acetal in unlubricated rolling-
sliding contact, Wear 185 (1995), 1-8 [9.6] Zsidai L, De Baets P, Samyn P, Kalacska G, Van Peteghem AP, Van Parys F. The tribological behaviour
of engineering plastics during sliding friction investigated with small-scale specimens, Wear 253 (2002), 673-688
[9.7] Ziemianski K, Capanidis D. The mechanism of dry friction of polyoxymethylene against steel, Wear 82 (1982), 317-332
[9.8] Clerico M. Tribological behaviour of polyacetals, Wear 64 (1980), 259-272 [9.9] Engel PA, Zhao Z. Impact of delrin disc: lubricated and dry contacts, Wear 193 (1996), 114-125 [9.10] Palanivelu K, Balakrishnan S, Rengasamy P. Thermoplastic polyurethane toughened polyacetal blends,
Polymer Test 19 (2000), 75-83 [9.11] Odi-Owei S, Schipper DJ. Tribological behaviour of unfilled and composite polyoxymethylene, Wear
148 (1991), 363-376 [9.12] Kurokawa M, Uchiyama Y, Iwai T, Nagai S. Tribological properties of polyoxymethylene composites
against aluminum, ASME J Tribol 125 (2003), 661-669 [9.13] Endo H, Marui E. Effect of the specimen geometry on wear-combination of polyacetal and carbon steel
for machine structures, Wear 258 (2005), 1525-1530 [9.14] Quadrant EPP. General purpose plastic products, manual 2002 [9.15] Yamaguchi Y. Tribology of plastic materials, Elsevier (Amsterdam), 1990, ISBN 0-4448-7445-3 [9.16] Mergler YP, Schaake RP, Huis in ‘t Veld AJ. Material transfer of POM in sliding contact, Wear 256
(2004), 294-301 [9.17] Unal H, Mimaroglu A. Influence of test conditions on the tribological properties of polymers, Ind Lubr
Techn 55 (2003), 178-183 [9.18] Bartenev GM, Lavrentev VV. Friction and wear of polymers, Elsevier (Amsterdam), 1981, ISBN 0-
4444-2000-2 [9.19] Benabdallah H. Friction and wear of blended polyoxymethylene sliding against coated steel plates, Wear
254 (2003), 1239-1246 [9.20] Vaziri M, Stott FH, Spurr RT. Studies of the friction of polymeric materials, Wear 122 (1988), 313-327 [9.21] Tanaka K, Uchiyama Y. Friction, wear and surface melting of crystalline polymers, in: Advances in
polymer friction and wear, Vol. 5B, Lee LH (ed.), Plenum press (New York), 1974, 499-531, ISBN 0-3063-6492-1
[9.22] Uetz H, Wiedemeyer J. Tribologie der Polymere, Carl Hanser Verlag München Wien (1985), ISBN 3-446-14050-6
[9.23] De Baets P, Ost W, Samyn P, Schoukens G, Van Parys F. The friction and wear of different polymers under high load conditions, J Synth Lubr 19-2 (2002), 109-118
[9.24] Zsidai L, De Baets P, Samyn P, Kalacska G, Van Peteghem AP, Van Parys F. The tribological behaviour of engineering plastics during sliding friction investigated with small-scale specimens, Wear 253 (2002), 673-688
[9.25] Mens JWM, de Gee AWJ. Friction and wear behaviour of 18 polymers in contact with steel in environments of air and water, Wear 149 (1991), 255-268
[9.26] Franklin SE. Wear experiments with selected engineering polymers and polymer composites under dry reciprocating sliding conditions, Wear 251 (2001), 1591-1598
[9.27] Subramanian C. Wear lip formation during dry sliding, Wear 126 (1988), 57-67 [9.28] Kukureka SN, Chen YK, Hooke CJ, Liao P. The wear mechanisms of acetal in unlubricated rolling-
sliding contact, Wear 185 (1995), 1-8 [9.29] Frankin SE, de Kraker A. Investigation of counterface surface topography effects on the wear and
transfer behaviour of a POM-20% PTFE composite, Wear 255 (2003), 766-773 [9.30] Blok H. The flash temperature concept, Wear 6 (1963), 483-494 [9.31] Kalin M. Influence of flash temperatures on the Tribological behaviour in low-speed sliding: a review,
Materials Science Engineering A375 (2004), 390-397 [9.32] Abdel-Aal HA. A remark on the flash-temperature concept, Int Comm Heat Mass Transfer 24 (1997),
241-250 [9.33] Greenwood JA, Williamson JBP. Contact of nominally flat surfaces, Proceedings Inst Mech Eng, 1966,
300-319

Chapter 9. Polyacetals: Evaluation of scaling phenomena 308 [9.34] Hutchings IM. Tribology: Friction and Wear of Engineering Materials, Edward Arnold (London), 1992,
ISBN 0-8493-7764-1 [9.35] McCrum NG, Read BE, Williams G. Anelastic and dielectris effects in polymeric solids, Dover
Publications (New York), 1967, 541, ISBN 0-4866-6752-9 [9.36] Hooke CJ, Kukureka SN, Liao P, Rao M, Chen YK. The friction and wear of polymers in non-
conformal contacts, Wear 200 (1996), 83-94 [9.37] McEttles CM. Polymer and elastomer friction in the thermal control regime, ASLE Trans 30 (1987),
149-159 [9.38] Rhee SH, Ludema KC. Mechanisms of formation of polymeric transfer film, Wear 46 (1978), 231-240 [9.39] Zhao R. Melt blowing polyoxymethylene copolymer, INJ Summer (2005), 19-24 [9.40] Fakirov S, Fisher EW, Hoffman R, Schmidt GF. Structure and properties of polyethylene(terephtalate)
crystallized by annealing in the highly oriented state, Polymer 18 (1977), 1121-1125 [9.41] Everaert V, Groeninckx G, Aerts L. Fractionated crystallization in immiscible POM(PS/PPE) blends,
Polymer 41 (2000), 1409-1428 [9.42] Hasegawa S, Takeshita H, Yoshii F, Sasaki T, Makuuchi K, Nishimoto S. Thermal degradation
behaviour of gamma-irradiated acetyloxy end-capped poly(oxymethylene), Polymer 41 (2000), 111-120 [9.43] Furlani M, Ferry A, Franke A, Jacobsson P. Time resolved luminescence and vibrational spectroscopic
studies on complexes of polyethylene oxide oligomers, Solid State Ionics 113-115 (1998), 129-138 [9.44] Drees D, Celis JP, Achanta S. Friction of thin coatings on three length scales under reciprocating
sliding, Surf Coat Tech 188-189 (2004), 511-518 [9.45] Kar MK, Bahadur S. The wear equation for unfilled and filled polyoxymethylene, Wear 30 (1974), 337-
348 [9.46] Jain VK, Bahadur S. Development of a wear equation for polymer-metal sliding in terms of fatigue and
topography of the sliding surface, Wear 60 (1980), 237-248 [9.47] Kragelskii IV, Dobychen MN, Kombolov VS. Friction and wear calculation methods, Pergamon
(Oxford), 1982, ISBN 0-0802-5461-6 [9.48] Visanawath N, Bellow DG. Development of an equation for the wear of polymers, Wear 181-183
(1995), 42-49 [9.49] Friedrich K, Flöck J, Váradi K, Neder Z. Numerical and finite element contact and thermal analysis of
real composite-steel surfaces in sliding contact, Wear 225-229 (1999), 368-379 [9.50] Bhushan B, Nosonovsky M. Scale effects in dry and wet friction, wear and interface temperature,
Nanotechnology 15 (2004), 749-761

309
Chapter 10.
Polyesters: Evaluation of scaling phenomena by
microstructural changes and polymerisation of small-scale and large-scale surfaces.
Goals
• Extrapolation of friction and wear between small-scale and large-scale tests according to scaling factors
• Disagreement between high-temperature sliding on small-scale tests and high-
load sliding on large-scale tests • Efficiency of lubricant deposition on small-scale and large-scale contact area
• Importance of contact area size on accumulation of wear debris and detach-
ment of stainless steel asperities • Determination of tribophysical and tribochemical modifications: transitions
between amorphous phase, rigid amorphous phase (amorphous stretching) and crystalline phase
• Effect of post-polymerisation during sliding
Methodology
• Small-scale testing, large-scale testing, microscopic analysis, roughness measurements, , creep measurements
• Temperature calculations, thermo-analytical measurements, Raman
spectroscopy
IV International Conference on Tribochemistry, 2005, Cracow (Poland)

Chapter 10. Polyesters: Evaluation of scaling phenomena 310 10.1. Introduction Polyethylene terephthalate or PET is a semi-crystalline thermoplastic with high dimen-sional stability and good chemical resistance. Nowadays it is most widely used as biaxially oriented film in soda bottles or as thermally sprayed coating for surface protection against corrosion and wear. The wear behaviour of unlubricated PET coatings in three conditions (as moulded, thermally sprayed and quenched after thermal spraying) has been investigated by Branco et al. [10.1] using a small-scale pin-on-disc tester. Beake et al. [10.2] studied the frictional and adhesive properties of commercial films. For a better understanding of the molecular processes leading to surface degradation of PET films, they used atomic force microscopy experiments to describe the surface deformation during a tip-induced wear process. While polyamides or polyethylene are most commonly used for wear applications, they should be replaced by polyesters for obtaining higher temperature and fatigue resistance because of the stiffening action of the aromatic phenylene group. However, the sensitivity to brittle fracture due to notch and stress concentrations can restrict its applicability [10.3]. The favourable use of PET in dry sliding was recently demonstrated by Neogi et al. [10.4] on small-scale tests, who found gradually decreasing wear rates and lower friction when PET was added to polypropylene while the limit of moderate wear increased to higher contact stresses. For internally lubricated polymers, the role of debris in the sliding interface is important as lubricants should favourably incorporate in a transfer film that easily shears along the sliding direction. The large-scale contact geometry is rather ‘closed’ compared to a small-scale ‘open’ contact and the role of the wear debris is supposed to be different in each of the test configurations. Depending on the resident times and motion of the wear debris in the contact interface, a polymer transfer film develops on the steel counterface and interferes with the sliding stability. The dynamics of wear debris compaction on small-scale tests was discussed by Jacko et al. [10.5], determining for the transfer film thickness and amount of lost wear debris. On the other hand, small-scale tests can possibly be accelerated by influencing the sliding temperature. It should therefore be verified if high temperature sliding can compensate for high contact pressure sliding. A study of the variations in polymer structure on molecular scale will lead to additional insights in the tribophysical or tribochemical phenomena at small-scale and large-scale interfaces with interference between mechanical and thermal effects. Friction and wear rate data for PET and PET/PTFE are summarised, while interpretation is focussed on conformational changes of the polymer structure and polymerisation during sliding.
10.2. Small-scale and large-scale friction and wear Pure PET and PET/PTFE is tested on small-scale cylinder-on-plate tests at 50 to 200 N, 0.3 to 1.2 m/s and large-scale flast-on-flat tests at 8 to 150 MPa, 0.005 m/s. It is conclu-ded that pure PET shows unstable sliding above its glass transition temperature Tg on small-scale tests. Heavy stick-slip also occurs during large-scale running-in sliding due to brittleness of PET. PTFE-fillers favourably stabilise and reduce friction. An increase in bulk sliding temperature on small-scale tests is not able to simulate large-scale tests. Similar to POM-H, a transition between integrated flash temperature model or bulk tem-perature model for calculating T* agrees with static deformation and either recoverable or permanent visco-elastic deformation. The relative position of polymer and counter-face is very important for wear protection in presence of internal lubricants.

Chapter 10. Polyesters: Evaluation of scaling phenomena 311 10.2.1. Small-scale friction and wear of PET and PET/PTFE 10.2.1.1. Influence of normal load, sliding velocity on small-scale Small-scale coefficients of friction at steady-state and wear rates from weight measure-ments are given for PET (Table 10.1) and PET/PTFE (Table 10.2) as a function of nor-mal load and sliding velocity. The maximum polymer surface temperatures T* are calcu-lated and plotted against the regime pv-value for PET (Figure 10.1a) and PET/PTFE (Figure 10.1b), indicating that transitions in friction and wear are correlated to T*. Table 10.1 Dynamic coefficients of friction and wear rates for small-scale tests on PET
Coefficient of friction Wear rates (10-5 mm3/m) FN (N) 0.3 m/s 0.6 m/s 0.9 m/s 1.2 m/s
0.3 m/s 0.6 m/s 0.9 m/s 1.2 m/s
50 0.28 0.54 0.56 0.98 3 7 40 217
100 0.30 0.96 0.80* 0.60* 16 570 overload overload
150 0.35 0.85* 0.60* 0.60* 80 1600* overload overload
200 0.70 0.80* 0.52* 0.60*
200 3300* overload overload * test stopped prematurely due to overload Table 10.2 Dynamic coefficients of friction and wear rates for small-scale tests on PET /PTFE
Coefficient of friction Wear rates (10-5 mm3/m) FN (N) 0.3 m/s 0.6 m/s 0.9 m/s 1.2 m/s
0.3 m/s 0.6 m/s 0.9 m/s 1.2 m/s
50 0.31 0.27 0.28 0.23 10 12 22 21
100 0.27 0.23 0.23 0.52 19 26 35 93
150 0.28 0.35 0.40 0.37 22 48 131 149
200 0.19 0.47 0.28* 0.31*
28 113 137* 377* * test stopped prematurely due to overload For pure polyesters PET, stable sliding only occurs at 50 N, 0.3 m/s. Unstable sliding happens over the entire test region with increasing friction when either normal loads or sliding velocities increase. The pv-limit of 1 MPa.m/s corresponds to maximum poly-mer surface temperatures T* > 75°C, exceeding the polymer glass transition temperature Tg. Whilst softening was favourable for lowering friction in case of POM-H (Figure 9.23), it causes overload and unstable sliding for PET. This is due to the more complex aromatic structure of PET compared to a linear structure of POM-H: softening of PET induces various structural changes in the amorphous phase (see paragraph 10.5.1) resulting in unstable sliding. The melting point of PET is higher compared to POM-H, indicating a broad softening range with important influence on tribological properties. Both the softening temperature Tg = 75°C and melting temperature Tm = 255°C are clearly reflected in a frictional peak (Figure 10.1a) due to molecular rearrangements. For filled polyesters PET/PTFE, it is clear that addition of PTFE favourably controls frictional stability and postpones the softening regime. For POM-H, those fillers were not considered due to stable sliding in the softening regime. The pv-limit for filled polyesters PET/PTFE is 2.3 MPa.m/s and it is also determined by the maximum poly-

Chapter 10. Polyesters: Evaluation of scaling phenomena 312
0
0.1
0.2
0.3
0.4
0.5
0.6
0 0.5 1 1.5 2 2.5 3 3.5
Regime pv (MPa.m/s)
Coe
ffic
ient
of f
rictio
n
0
50
100
150
200
250
300
350
400
Wea
r rat
e (1
0-5 m
m3 /m
) T
empe
ratu
re T
* (°C
)
Regime pv (MPa.m/s)
Coe
ffici
ent o
f fric
tion
Wea
r rat
e (1
0-5 m
m3 /m
)
Tem
pera
ture
T* (
°C)
0
0.1
0.2
0.3
0.4
0.5
0.6
0.7
0.8
0.9
1
0 0.5 1 1.5 2 2.5 3 3.5
Regime pv (MPa.m/s)
Coe
ffici
ent o
f fric
tion
0
100
200
300
400
500
600
700
Wea
r rat
e (1
0-5 m
m3 /m
)
Tem
pera
ture
T* (
°C)
overload
Regime pv (MPa.m/s)
Coe
ffici
ent o
f fric
tion
Wea
r rat
e (1
0-5 m
m3 /m
)
Tem
pera
ture
T* (
°C)
(a) (b) Figure 10.1 Influence of regime pv-value on friction (), wear rates w (♦) and maximum polymer surface
temperatures T* () for small-scale testing of (a) PET, (b) PET/PTFE mer surface temperature T* > 75°C. With increasing normal load and sliding velocity, the coefficients of friction are expected to decrease according to the theories of chain orientation. This trend is presently only observed under mild sliding conditions and attributed to mechanical interaction. Combinations of high sliding velocities and high loads cause, however, a transition to high and unstable friction through softening and melting of the polymer surface. This allows for molecular transitions and indentation

Chapter 10. Polyesters: Evaluation of scaling phenomena 313
0
0.1
0.2
0.3
0.4
0.5
0.6
0 50 100 150 200 250
Bulk temperature (°C)
Coe
ffici
ent o
f fric
tion
1
10
100
1000
10000
Wea
r rat
e (1
0-5 m
m3 /m
)
Maximum polymer surface temperature T* (°C)
85 90 168153 208 265
102
103
104
10
of the steel counterface asperities with increasing friction from 0.25 (T* < Tg) to 0.50 (T* > Tg). The transition in friction due to softening of PET/PTFE is similar to PET, but postponed by PTFE. A second transition into overload happens at pv = 3.1 MPa.m/s (T* > 255°C), exceeding the melting temperature. Wear rates increase at high load or sliding velocity, but they increase somewhat less as a function of sliding velocities. High sliding speed favourably affects the nature of the transfer layer. It mainly consists of PTFE with shear planes orienting at high sliding velocity. The loading capacity of PTFE is, however, limited. The main benefit of PTFE fillers is thus a reduction in friction and hence, lowering the maximum polymer temperatures T*. The PTFE fillers are not fully effective under mildest sliding conditions, as the intrinsic polymer properties are then important: pure PET has better mechanical strength (modulus of elasticity and tensile strength) promoting lower friction and wear. Also the amount of wear debris at low load/low sliding velocity is too little for homogeneous transfer with lubricating particles. 10.2.1.2. Influence of controlled temperature on small-scale The counterface bulk temperature was artificially controlled at 60, 80, 120, 140, 180 and 200°C for mild load conditions (50 N, 0.3 m/s) in order to verify the thermal transitions in friction and wear. It is used to investigate whether high temperatures on small-scale tests can compensate for high load conditions on large-scale tests, having low coeffici-ents of friction between µ = 0.10 to 0.04 (Table 10.3). Friction and wear rates at high temperature are presented in Figure 10.2 together with the calculated temperature T*. There is a region with low coefficients of friction between µ = 0.15 to 0.10, noted at T* = 85 to 90°C, while softening also leads to unstable sliding at higher temperatures. This confirms the transitions noted under free frictional heating (Figure 10.1). An increase in sliding temperature above the softening point or melting point is not able to simulate low friction on a small-scale tester as it was obtained during large-scale tests.
Figure 10.2 Influence of controlled bulk temperatures applied to small-scale tests at 50 N, 0.3 m/s on friction (♦) and wear rates () of PET/PTFE

Chapter 10. Polyesters: Evaluation of scaling phenomena 314 10.2.2. Large-scale friction and wear of PET and PET/PTFE 10.2.2.1. Running-in friction: influence of lubricant and counterface type on large-scale The coefficients of friction during running-in for PET and PET/PTFE at 8 MPa are illustrated in Figure 10.3 for the first ten sliding cycles. Static and dynamic coefficients of friction are given in Table 10.3, during running-in for pure PET and PET/PTFE sliding against HA-steel and stainless steel 316L at different contact pressures. Pure PET shows unstable friction continuously increasing with incremental sliding dis-tance when sliding against steel. Sliding is not stable because of heavy stick-slip, not on-ly at the start or reversal of the sliding motion but over the entire sliding stroke, observed as irregularities on the friction-displacement characteristics. It agrees to small-scale tests that sliding deteriorates for T* > Tg (T* = 80°C at 8 MPa). The loud noise produced during sliding forced the tests to be stopped prematurely at high contact pressures (55 MPa, only 1 sliding cycle). Compared to POM-H, aromatic structures provide higher strength and lower tensile strain at break to PET: brittleness of PET is a likely reason for unstable sliding. Friction increases at high contact pressures and finally exceeds the horizontal power of the test rig at 150 MPa. The observed tendency contrasts with general models for polymer sliding predicting lower friction at high normal loads. (a) (b)
Figure 10.3 Running-in friction during large-scale sliding over first ten sliding cycles at 8 MPa for (a) PET, (b) PET/PTFE against HA-steel
Table 10.3. Large-scale static and dynamic coefficients of friction during running-in of PET and PET/ PTFE at different contact pressures against HA-steel and stainless steel 316L
PET against
HA-steel
PET against 316L
PET/PTFE against
HA-steel
PET/PTFE against 316L
Contact pressure
(MPa) µsn, max µd, min µsn, max µd, min µsn, max µd, min µsn, max µd, min
8 0.16 0.14 0.09 0.10 0.12 0.10 0.10 0.09
16 0.21 0.18 0.09 0.09 0.10 0.09 0.09 0.08
25 0.19 0.21 0.09 0.08 0.08 0.07 0.07 0.06
55 0.20 0.23 0.07 0.07 0.06 0.06 0.06 0.05
150 overload 0.05 0.04 0.04 0.04 0.03 0.03
-0.2
-0.15
-0.1
-0.05
0
0.05
0.1
0.15
0.2
-150 -100 -50 0 50 100 150
µsn,max
µd, min
Sliding distance (mm)
Coe
ffici
ent o
f fric
tion
-0.2
-0.15
-0.1
-0.05
0
0.05
0.1
0.15
0.2
-150 -100 -50 0 50 100 150
Sliding distance (mm)
Coe
ffici
ent o
f fric
tion
1 2
3 - 10
1
2 - 10

Chapter 10. Polyesters: Evaluation of scaling phenomena 315
0.00
0.02
0.04
0.06
0.08
0.10
0.12
0.14
0.16
0.18
0.20
0 1000 2000 3000 4000
Sliding distance (m)
Coe
ffic
ient
of f
rictio
n
8 MPa
16 MPa
25 MPa
55 MPa
150 MPa
Pure PET, however, shows smooth sliding against stainless steel 316L and lower friction that stabilises after two sliding cycles. Friction decreases at higher contact pressures. Low friction on 316L compared to HA-steel was also noticed for small-scale sliding tests of sintered polyimide (Chapter 7), indicating the importance of counterface properties. When the counterface roughness was increased from Ra = 0.20 µm to Ra = 0.40 µm, friction for pure PET at 25 MPa further increased to 0.30 and destabilised. It agrees to brittleness of PET which disfavours the deformation component of friction. Filled PET/PTFE has lower and more stable friction in dry sliding against both HA-steel and stainless steel 316L. The static and dynamic friction becomes equal in presence of PTFE, excluding stick-slip. Comparing the coefficients of friction of PET/PTFE in dry sliding against HA-steel and stainless steel 316L reveals that friction is lower in the latter case. Although the thermal conductivity of stainless steel is lower than for HA-steel, it is calculated that the maximum polymer temperatures T* in both cases are situated in the softening regime (Table 10.4). The major variations in friction between HA-steel and 316L stainless steel are visually related to better adherence of polymer debris to the polymer surface and formation of a smooth polymer film on the polymer surface (Figure 10.17), rather than adherence of polymer debris to the stainless steel surface. Differences are thus likely explained by surface energies, being lower for 316L stainless steel than for HA-steel. It agrees to previous observations that polyimides sliding against stainless steel provide lower friction (Chapter 7). 10.2.2.2. Steady-state friction and temperatures on large-scale The coefficients of friction over 166 h sliding of PET/PTFE against HA-steel are given in Figure 10.4a. Pure PET is not further considered due to overloads, while further investigations mainly focus on the beneficial effect and behaviour of PTFE internal lubricants on HA-steel and stainless steel 316L. (a) (b)
Figure 10.4 Steady-state friction of PET/PTFE for large-scale tests at 8 to 150 MPa,
(a) coefficient of friction for HA-steel as a function of sliding distance (entire testing time), (b) steady-state coefficient of friction for different counterfaces
Counterface type p
(MPa) HA-steel 316L
8 0.18 ± 0.01
16 0.11 Not tested
25 0.08 0.07
55 0.04 0.03
150 0.03 Not tested
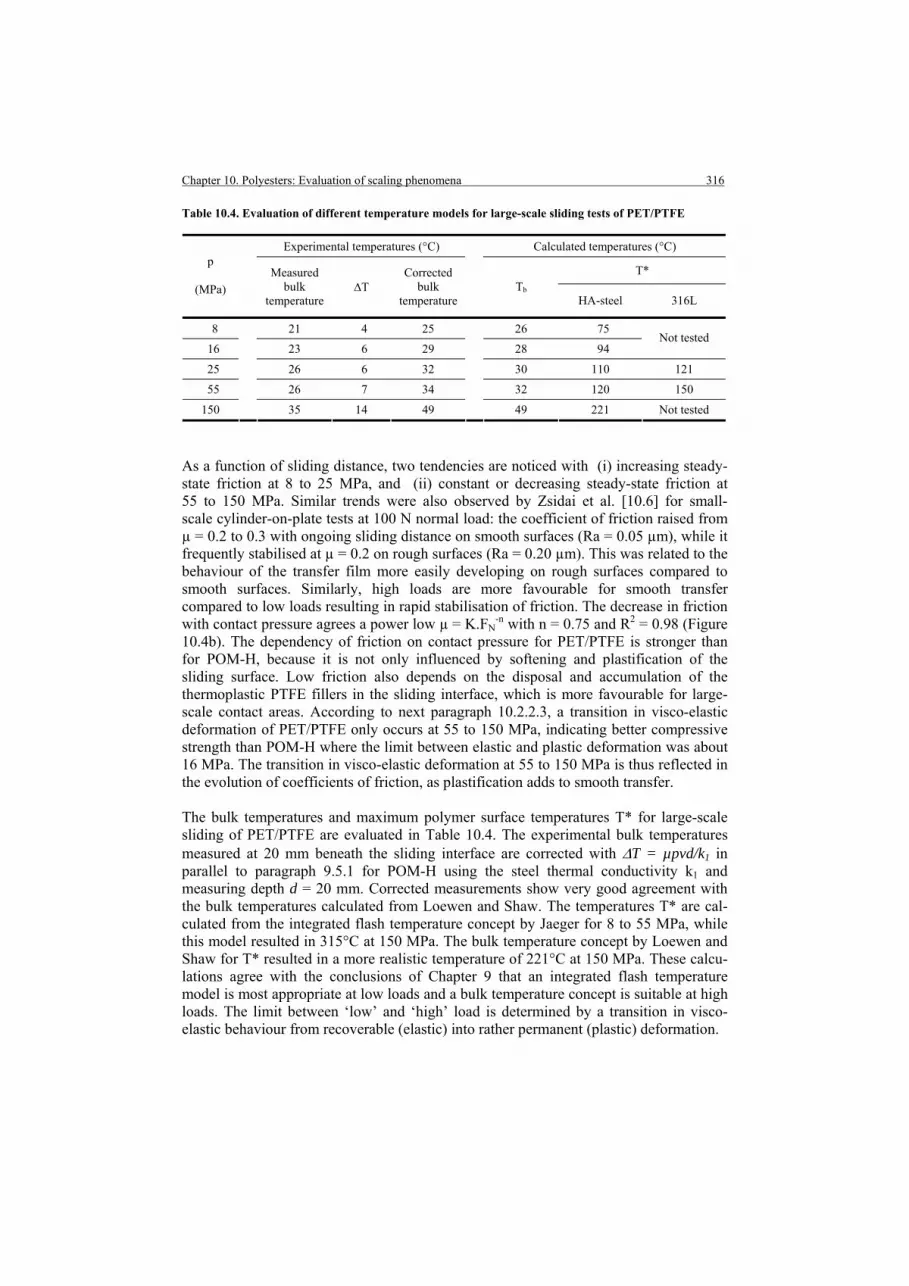
Chapter 10. Polyesters: Evaluation of scaling phenomena 316 Table 10.4. Evaluation of different temperature models for large-scale sliding tests of PET/PTFE
Experimental temperatures (°C) Calculated temperatures (°C)
T* p
(MPa) Measured
bulk temperature
∆T Corrected
bulk temperature
Tb
HA-steel 316L
8 21 4 25 26 75
16 23 6 29 28 94 Not tested
25 26 6 32 30 110 121
55 26 7 34 32 120 150
150
35 14 49
49 221 Not tested
As a function of sliding distance, two tendencies are noticed with (i) increasing steady- state friction at 8 to 25 MPa, and (ii) constant or decreasing steady-state friction at 55 to 150 MPa. Similar trends were also observed by Zsidai et al. [10.6] for small- scale cylinder-on-plate tests at 100 N normal load: the coefficient of friction raised from µ = 0.2 to 0.3 with ongoing sliding distance on smooth surfaces (Ra = 0.05 µm), while it frequently stabilised at µ = 0.2 on rough surfaces (Ra = 0.20 µm). This was related to the behaviour of the transfer film more easily developing on rough surfaces compared to smooth surfaces. Similarly, high loads are more favourable for smooth transfer compared to low loads resulting in rapid stabilisation of friction. The decrease in friction with contact pressure agrees a power low µ = K.FN
-n with n = 0.75 and R2 = 0.98 (Figure 10.4b). The dependency of friction on contact pressure for PET/PTFE is stronger than for POM-H, because it is not only influenced by softening and plastification of the sliding surface. Low friction also depends on the disposal and accumulation of the thermoplastic PTFE fillers in the sliding interface, which is more favourable for large-scale contact areas. According to next paragraph 10.2.2.3, a transition in visco-elastic deformation of PET/PTFE only occurs at 55 to 150 MPa, indicating better compressive strength than POM-H where the limit between elastic and plastic deformation was about 16 MPa. The transition in visco-elastic deformation at 55 to 150 MPa is thus reflected in the evolution of coefficients of friction, as plastification adds to smooth transfer. The bulk temperatures and maximum polymer surface temperatures T* for large-scale sliding of PET/PTFE are evaluated in Table 10.4. The experimental bulk temperatures measured at 20 mm beneath the sliding interface are corrected with ∆T = µpvd/k1 in parallel to paragraph 9.5.1 for POM-H using the steel thermal conductivity k1 and measuring depth d = 20 mm. Corrected measurements show very good agreement with the bulk temperatures calculated from Loewen and Shaw. The temperatures T* are cal-culated from the integrated flash temperature concept by Jaeger for 8 to 55 MPa, while this model resulted in 315°C at 150 MPa. The bulk temperature concept by Loewen and Shaw for T* resulted in a more realistic temperature of 221°C at 150 MPa. These calcu-lations agree with the conclusions of Chapter 9 that an integrated flash temperature model is most appropriate at low loads and a bulk temperature concept is suitable at high loads. The limit between ‘low’ and ‘high’ load is determined by a transition in visco-elastic behaviour from recoverable (elastic) into rather permanent (plastic) deformation.

Chapter 10. Polyesters: Evaluation of scaling phenomena 317 10.2.2.3. Steady-state wear and deformation on large-scale Prior to dynamic sliding tests, the dimensional stability of constrained PET/PTFE samples is determined under static loading, measuring the vertical indentation as displa-cement between the polymer samples and the steel counterfaces. Normal loads are ap-plied according to 8, 16, 25, 55 and 150 MPa contact pressures at 30 MPa/min. Imme-diately after the required load level is attained, the initial elastic indentation is recorded and compared to the theoretical normal deformation of PET/PTFE calculated from the Table 10.5. Deformation of large-scale PET/PTFE samples under static loading
Normal deformation (µm) Creep (µm)
top bottom p
(MPa) top bottom calculated24 h 166 h 24 h 166 h
Recovered
deformation
8 57 45 48 1 1 0 0 97 ± 2 %
16 92 79 97 2 1 1 0 97 ± 2 %
25 155 144 145 4 2 4 4 96 ± 2 %
55 282 281 319 13 3 11 4 95 ± 2 %
150 666 691 870 60 10 63 10 84 ± 2 %
modulus of elasticity E = 3450 MPa (Table 10.5): for a contact pressure p, the indenta-tion or normal deformation ∆l = p/Ε · 20 mm. Creep is measured after 24 hours and 166 hours constant loading. Statistical variation on creep measurements is ±1 µm at low load to ± 3 µm at high load. The creep ∆hc for pure PET at 25 MPa is 7 µm and very similar to values of PET/PTFE. Recovery of the normal deformation is measured after one week at zero stress, differentiating either recoverable or permanent deformation. Following information is drawn from deformation behaviour of constrained PET/PTFE: • At 8 to 55 MPa, the experimental elastic indentation is in good agreement with
calculated values (error 6%), showing that the reinforcing action of the sample holder has limited effect. The > 95 % recovery of deformation after loading at 8 to 55 MPa shows that the material is then mainly loaded under recoverable visco-elastic deformation. The difference in deformation between top and bottom samples is attributed to machining tolerances (± 0.5 mm) on the sample and sample holder.
• At 55 to 150 MPa, the experimental normal deformation is smaller than the
calculated normal deformation, due to clamping of the polymer samples into the sample holders. The retaining action of the sample holder restricts the lateral deformation of the entire polymer bulk, concentrating the deformation of the poly-mer samples in the free neck 5 mm outside the holder. The stiffness of the polymer at 55 to 150 MPa is higher than estimated from the E modulus measured under free deformation: the bulk-modulus for PET/PTFE at 150 MP a contact pressures is 5000 MPa. The total creep after 166 h loading is very small for PET/PTFE, reflecting its good dimensional stability. The average creep rate under steady-state equals 0.024 µm/h at 55 MPa and 0.070 µm/h at 150 MPa, or 1% compressive strain occurs after 8000 h loading at 55 MPa and after 2000 h loading at 150 MPa, while being under plastic conditions.

Chapter 10. Polyesters: Evaluation of scaling phenomena 318 In previous Chapter 9, it was found that the transition between visco-elastic to plastic deformation for POM-H was important in considering either the integrated flash temperature concept or the bulk temperature concept for calculating the maximum polymer surface temperatures T*. This conclusion is also confirmed for PET/PTFE, because the integrated flash temperature concept (Jaeger) yields for 8 to 55 MPa, while the bulk temperature concept (Loewen and Shaw) is used at 150 MPa in Table 10.4. The wear rates for top and bottom large-scale samples are between 0.14 and 1.54 mm3/m (Table 10.6) with a statistical variation of 15% on average wear rates. There is agreement between weight and dimensional measurements for 8 to 55 MPa tests. In contrast to POM-H, however, the bottom sample does not show higher wear rates than the top sample for each contact pressure: bottom samples have lower wear rates than the top samples at 25 to 150 MPa. This relates to the influence of deposited PTFE debris and formation of a polymer film on top of the polymer surface positioned at the bottom (Fig-ure 10.15). The specific wear rates for bottom samples decrease monotonously between 8 to 150 MPa: 1.10-6, 0.82.10-6, 0.73.10-6, 0.58.10-6, 0.24.10-6 mm3/Nm (specific wear rates in Table 10.6 are averaged). For the top samples, debris accumulates on the steel counterface and forms a protective film only on the steel and not on the polymer surface. It results in larger variation of wear rates. The relative positioning of sample and coun-terface is thus very important for wear protection, mainly if internal lubricants are used. The wear rates for PET/PTFE sliding against stainless steel 316L are given in Table 10.7 and indicate higher wear rates compared to HA-steel counterfaces. This observation is in parallel to small-scale tests on polyimide SP-1 sliding against different steel counterfaces (Chapter 7), as stainless steel 316L provided highest polyimide wear rates and lowest friction, comparing different steel-type counterfaces. Table 10.6. Large-scale wear rates for PET/PTFE specimens on top and bottom and repeatability from weight loss and dimensional measurements (between brackets) after sliding against HA-steel
p (MPa)
FN (kN)
Top specimen wear rate (mm3/m)
Bottom specimen wear rate (mm3/m)
Average wear rate (mm3/m)
Specific wear rate (10-6 mm3/Nm)
0.14 (0.15) 0.14 (0.19) 0.14 (0.16) 0.7 8 190
0.17 (0.17) 0.19 (0.20) 0.18 (0.19) 0.8
16 380 0.25 (0.28) 0.31 (0.41) 0.28 (0.34) 0.8
25 560 0.60 (0.75) 0.41 (0.63) 0.50 (0.69) 0.9
55 1260 0.92 (1.11) 0.73 (0.98) 0.83 (1.04) 0.6
150 3440 2.26 (2.91) 0.82 (1.14) 1.54 (2.02) 0.4
Table 10.7. Large-scale wear rates for PET/PTFE specimens on top and bottom from weight loss and dimensional measurements (between brackets) after sliding against 316L
p (MPa)
FN (kN)
Top specimen wear rate (mm3/m)
Bottom specimen wear rate (mm3/m)
Average wear rate (mm3/m)
Specific wear rate (10-6 mm3/Nm)
25 560 0.79 (0.83) 0.72 (0.76) 0.76 (0.80) 1.3
55 1260 1.15 (1.37) 1.02 (1.30) 1.09 (1.34) 0.9

Chapter 10. Polyesters: Evaluation of scaling phenomena 319
0
0.1
0.2
0.3
0.4
0.5
0.6
0.7
0.8
0.9
1 10 100 1000
Contact pressure p (MPa)
Coe
ffici
ent o
f fri
ctio
n
Small-scale v < 0.6 m/s
Large-scale
Small-scale v > 0.6 m/s
10.3. Extrapolation from small-scale to large-scale testing Three extrapolation models as presented in Chapter 9 for POM-H are now evaluated for PET/PTFE to verify influences of thermal effects and elastic/plastic deformation. A rela-tion as a function of contact pressure on small-scale and large-scale fits better for PET/ PTFE compared to POM-H due to elastic contact on both testing scales. A single extra-polation in the softening regime is not possible as friction on large-scale tests remains lower compared to small-scale tests. It indicates the favourable effect of wear debris and internal lubricants with limited mobility within large contact interfaces. 10.3.1. Single-mechanical-parameter model
Figure 10.5 Relation between coefficients of friction and steady-state contact pressure for small-scale () and large-scale ()
The coefficients of friction for PET/PTFE are plotted against the macroscopic or apparent contact pressure at steady-state for small-scale and large-scale tests in Figure 10.5. There is a good relation in the linear decreasing trend of coefficients of friction between both small-scale tests v < 0.6 m/s and large-scale tests. Present relation for PET/PTFE is better than previous relations for POM-H (compare Figure 10.5 to Figure 9.21) and it clearly demonstrates that both small-scale test conditions and large-scale test conditions for PET/PTFE at 8 to 55 MPa are under elastic conditions (see recovered visco-elastic deformation in Table 10.5). Only the contact conditions at 150 MPa change into plastic deformation. It was noticed for POM-H that small-scale contact conditions were rather elastic, while large-scale contact conditions changed from elastic into plastic at 16 MPa. Therefore, linear extrapolation as a function of contact pressure for POM-H was only valid between small-scale tests and a 8 MPa large-scale test. Present relations clearly indicate the influence of visco-elastic contact conditions on the evolution of coefficient of friction at high contact pressures. The change from recovera-ble visco-elastic deformation into permanent visco-elastic deformation is an important limit for extrapolation. This limit was experimentally determined and also agrees to the change in models for calculations of maximum polymer surface temperatures T*.
R2= 0.90

Chapter 10. Polyesters: Evaluation of scaling phenomena 320 10.3.2. Two-mechanical-parameter model Small-scale and large-scale coefficients of friction are plotted as a function of mecha-nical power (normal load x sliding velocity) in Figure 10.6a. As friction for PET/PTFE is lower compared to POM-H, similar thermal conditions below the glass transition tempe-rature are attained during either small-scale at mild conditions or large-scale testing at 8 MPa. It is in contrast to POM-H, for which only a softening regime established during large-scale testing. Due to the differences in thermal regime, extrapolation should be (a)
(b)
Figure 10.6 Extrapolation from small-scale to large-scale friction, maximum polymer temperature T*
and wear as a function of mechanical power (normal load x sliding velocity), (a) coefficient of friction on small-scale () and large-scale () with maximum polymer temperature T*,
(b) wear rate from weight (♦) and dimensional () measurements
0
0.1
0.2
0.3
0.4
0.5
0.6
0.7
0.8
0.9
Coe
ffici
ent o
f fric
tion
0
20
40
60
80
100
120
140
160
180
200
Max
imum
pol
ymer
tem
pera
ture
T* (
°C)
Softening Softening
T* R2 = 0.91
T*
Melting
101 102 100 103 104 105 FN.v (N.m/s)
Coe
ffici
ent o
f fric
tion
Max
imum
pol
ymer
sur
face
tem
pera
ture
T* (
°C)
10010-5
101 102 103 104 105
10-4
10-3
10-2
10-1
100
101
102
FN.v (N.m/s)
Wea
r rat
e (m
m3 /m
)
Small-scale
Large-scale

Chapter 10. Polyesters: Evaluation of scaling phenomena 321 differentiated: (i) for mild adhesive sliding (T* < Tg), the coefficients of friction can be linearly extrapolated between small-scale and large-scale tests (i.e. a power-law relation in logarithmic scale), and (ii) for sliding under softening conditions (T* > Tg), linear extrapolation cannot be made in contrast to observations for POM-H. As the PET/PTFE behaves elastically on both small-scale and large-scale tests up to 55 MPa (paragraph 10.2.2.3), elastic/plastic deformation cannot be responsible for different fric-tion tendencies under softening conditions. The different trends in coefficients of friction are then mainly caused by the efficiency of internal lubricants on large contact areas and formation of a transfer film: lubricants remain within the sliding interface for ‘closed’ flat-on-flat geometries and beneficially form a transfer film, while they are easily remo-ved towards the edges of the sliding stroke for an ‘open’ cylinder-on-plate geometry. Small-scale and large-scale volumetric wear rates are plotted as a function of mechanical power in Figure 10.6b and cannot be easily compared due to transitions in wear behaviour and efficiency of polymer film formation on either the polymer surface or the steel counterface. Also specific wear rates have different trends on each testing scale. 10.3.3. Macroscopic geometry model The scaling factor that was experimentally determined for POM-H, can also be applied to small-scale and large-scale tests of PET/PTFE. The maximum polymer surface temperatures T* for both testing scales are fitted by a linear trend over 60 to 220°C, with R2 = 0.92 (Figure 10.7a). The large-scale tests at 55 to 150 MPa fit less to this linear trend, as very low friction occurs at 55 MPa by a PTFE film lowering the gene-rated heat and maximum polymer temperature T*. A lubricating polymer film on the polymer surface was also observed at 150 MPa, altering the physical polymer proper-ties. Extrapolation behind the melting point is not possible as also noted for POM-H. Coefficients of friction that are corrected with a factor for deformation (Figure 10.7b) show agreement between small-scale and large-scale values for a limited number of (a) (b)
Figure 10.7 Relation between small-scale () and large-scale () sliding as a function of a macroscopic
scaling factor, (a) maximum polymer surface temperature T*, (b) corrected friction coefficients for contact deformation
GvPep
y = 3.1141x + 32.299R2 = 0.9227
0
50
100
150
200
250
0 50 100 150 200
Max
imum
pol
ymer
tem
pera
ture
T* (
°C)
GvPep
Coe
ffici
ent o
f fric
tion
*
0
0.1
0.2
0.3
0.4
0.5
0.6
0.7
0.8
0.9
0 50 100 150 200
Small-scale
Large-scale

Chapter 10. Polyesters: Evaluation of scaling phenomena 322
0 50 100 150 200
10-2
10-3
10-4
10-5
10-6
10-7 Spec
ific
wea
r rat
e / C
oeffi
cien
t of f
rictio
n
(mm
3 /Nm
)
GvPep
Large-scale Small-scale
Figure 10.8 Relation between the ration of specific wear rates to coefficients of friction as a function of a macroscopic scaling factor on small-scale () and large-scale () tests
sliding parameters: the coefficient of friction at 8 MPa large-scale testing coincides with small-scale coefficients of friction while it becomes lower on large-scale tests at high load. The agreement between small-scale and large-scale coefficients of friction for unfilled POM-H was better. However, other effects than deformation and/or temperature favourably promote low friction during large-scale testing at high loads for PET/PTFE. The wear debris mobility is important and it is limited for large contact areas compared to small ones, enhancing transfer film formation. Specific wear rates related to the coefficient of friction overlap slightly for small-scale and large-scale tests at 8 to 55 MPa (Figure 10.8). When not related to the coefficients of friction, there was no overlap neither for volumetric neither for specific wear rates. The wear rates are scaled to identical thermal conditions and identical elastic deformation of the samples, but large-scale and small-scale wear rates are obtained on different sample sizes. The specific wear rates (not related to the coefficients of friction) vary between 2.10-6 to 10.10-6 mm3/Nm for small-scale tests and between 7.10-7 to 4.10-7 mm3/Nm for large-scale tests, indicating that large-scale tests provide lower specific wear rates over the entire testing interval due to PTFE film formation.
10.4. Analysis of sliding surfaces 10.4.1. Polymer transfer 10.4.1.1. Small-scale transfer films of PET and PET/PTFE Transfer of PET and PET/PTFE on HA-steel after small-scale sliding at various normal loads and sliding velocities is shown in Figure 10.9 and Figure 10.10 with an indication of the different components (A = PET, B = PTFE, C = steel). Different features are observed, mainly depending on the calculated maximum polymer temperature T*. It seems that thick transfer films above the softening temperature are mainly determined by brittle properties of PET, while PTFE beneficially induces a thin film at T* < Tg. additi-onal plastification and debris entrapment at high loads and large contact areas allows for thin and smooth films with ultra-low friction. Transfer on stainless steels is different.

Chapter 10. Polyesters: Evaluation of scaling phenomena 323
PET, T* < Tg PET, Tg < T* < Tm PET, T* > Tm
FN = 50 N, v = 0.3 m/s
FN = 150 N, v = 0.3 m/s
FN = 200 N, v = 0.6 m/s
FN = 50 N, v = 0.6 m/s
FN = 100 N, v = 0.6 m/s
FN = 100 N, v = 1.2 m/s
Figure 10.9 Optical microscopy of PET transfer on HA-steel after small-scale testing at different normal
loads and sliding velocities: mild wear (T* < Tg), softening (Tg < T* < Tm) and melting (T* > Tm)
PET/PTFE, T* < Tg PET/PTFE, Tg < T* < Tm PET/PTFE, T* > Tm
FN = 50 N, v = 0.6 m/s
FN = 150 N, v = 0.9 m/s
FN = 150 N, v = 0.6 m/s
FN = 200 N, v = 0.9 m/s
FN = 200 N, v = 1.2 m/s
Figure 10.10 Optical microscopy of PET/PTFE transfer on HA-steel after small-scale testing at different normal loads and sliding velocities: mild wear (T* < Tg), softening (Tg < T* < Tm) and melting (T* > Tm)
A
A+B
A
A+B
A+B
A+B
C
C
A+B
C
C
C
C
C
C
C
A
A
A
A
1 mm
1 mm

Chapter 10. Polyesters: Evaluation of scaling phenomena 324
PET/PTFE, T* < Tg PET/PTFE, Tg < T* < Tm PET/PTFE, T* > Tm
FN = 50 N, v = 0.3 m/s, Tb = 60°C
² FN = 50 N, v = 0.3 m/s, Tb = 140°C
FN = 50 N, v = 0.3 m/s, Tb = 220°C.
Figure 10.11 Optical and SEM microscopy of PET/PTFE transfer on HA-steel after small-scale testing
at 50 N, 0.3 m/s for different applied bulk temperatures between 60 and 220°C For pure PET, separate polymer flakes are observed at T* < Tg originating from mechanical interaction. The particles become stretched along the sliding direction through high shear stresses at high sliding velocities, however, they do not form a smooth film as softening lacks. Mainly high normal loads induce softening: soften- ed transfer films have large thickness as brittleness of pure PET results in tearing of large polymer flakes and difficult orientation along the sliding direction. Sliding marks perpendicular to the sliding direction indicate sliding instabilities. They manifest mainly at high normal load rather than at high sliding speed, as instabilities are closely rela- ted overload and mechanical strength of the polymer. The shearing action at high sliding velocities causes a thicker transfer film with patchy polymer particles. No transfer occurs in the melting zone as the test was stopped prematurely and molten polymer particles detach from the polymer cylinder. There is good agreement between the different transfer types, temperatures T* and transitions in friction (Figure 10.1). For PET/PTFE, the lubricant is beneficial below the glass transition temperature of PET to provide a continuous transfer layer covering the entire counterface, opposed to pure PET. The film becomes thinner at high normal load or sliding velocity. It seems therefore that the lubricating action of PTFE is mainly though mechanical shear, allowing for easy orientation along the sliding direction. Thermal effects of PTFE enhancing transfer are less likely and only expected at T* > 120°C (paragraph 6.4.2).
FN = 50 N, v = 0.3 m/s, Tb = 140°C
A+B
A+B
C A
A+B
1 mm 1 mm 1 mm
FN = 50 N, v = 0.3 m/s, Tb = 220°C

Chapter 10. Polyesters: Evaluation of scaling phenomena 325 Under softening conditions, however, the properties of aromatic PET prevail with discontinuous and thick transfer films in parallel to high friction. Large polymer flakes (mainly PET) are noted above the melting temperature. These trends are confirmed by similar transfer types when the bulk temperature is controlled at 50 N, 0.3 m/s (Figure 10.11): low and stable friction for T* < Tg agrees with continuous transfer, high and un-stable friction for Tg < T* < Tm agrees with discontinuous transfer and overload happens at T* > Tm. It is clear that the frictional properties and transfer of PET/PTFE are mainly determined by transition temperatures of the bulk polymer PET, as it is a thermoplastic. 10.4.1.2. Large-scale transfer films of PET and PET/PTFE The PET transfer on HA-steel after large-scale testing is non-uniformly distributed over the sliding area as flake-like particles (Figure 10.12). Transfer films are always thick and discontinuous (lumpy transfer) with debris progressively growing around a fixed nucleus or containing agglomerated softened polymer: once a polymer particle is deposited, it acts as mechanical anchor point for future debris. Flake-like transfer reduces the performance by vibrations within the sliding interface and it contributes to stick-slip. At 8 MPa (T* ≈ Tg), a very thin polymer transfer establishes after 10 sliding cycles, show-ing the influence of debris entrapment for large polymer surface areas in contrast to small-scale tests with uneven transfer below Tg (Figure 10.9). Film formation, however, deteriorates friction that continuously grows with sliding time. Due to brittleness of PET compared to POM-H (mainly low elongation) no continuously oriented film exists. Separate flakes are torn out the surface at 16 to 25 MPa (Tg < T* < Tm) and sheared within the interface. Softening does not favourably cause smooth transfer and the parti-cles show striations similar to small-scale tests due to stick-slip. At 55 MPa (T* > Tm) some shear marks are observed on the polymer flakes. The transfer at 55 MPa undergoes melting and large particles are more ductile than the fractured debris at 25 MPa. (a) (b) (c) (d)
Figure 10.12 Optical microscopy of PET transfer after large-scale sliding against HA-steel at (a) 8 MPa, (b) 16 MPa, (c) 25 MPa, (d) 55 MPa
1 mm

Chapter 10. Polyesters: Evaluation of scaling phenomena 326
Steel roughness profile after sliding HA-steel surface
Roughness before sliding (µm) Roughness after sliding (µm)
8 M
Pa
Ra = 0.18 Rt = 2.15 Ra = 0.11 Rt = 1.58
16 M
Pa
Ra = 0.17 Rt = 2.20 Ra = 0.12 Rt = 1.57 25
MPa
Ra = 0.23 Rt = 2.58 Ra = 0.20 Rt = 2.18
55 M
Pa
Ra = 0.21 Rt = 2.75 Ra = 0.29 Rt = 3.28
150
MPa
Ra = 0.17 Rt = 2.05 Ra = 0.23 Rt =2.75
Figure 10.13 Optical microscopy and roughness profile of HA-steel surfaces after large-scale sliding of
PET/PTFE at different contact pressures
A+B
A+B
C
A
A+B
B
A
A+B
B
A+B
A
A
1000 µm
1000 µm
1000 µm
1000 µm
1000 µm
5µm
5µm
2.5 µm
2.5 µm
1 mm
2.5µm

Chapter 10. Polyesters: Evaluation of scaling phenomena 327 The PET/PTFE transfer on HA-steel after large-scale testing at 8 to 150 MPa is shown in Figure 10.13. The transfer film has a smooth overall-PTFE film (brown colour), locally mixed with softened PET particles (white colour). Although softening does not happen at 8 MPa, a transfer film develops locally in presence of PTFE. This kind of very smooth transfer at T* < Tg was also noted for small-scale tests below the glass transition temperature of PET and is attributed to mechanical shear of PTFE lubricants. For T* > Tg (16 to 55 MPa) the transfer becomes less homogeneous with separate depositions of both softened PET (white flakes) and PTFE (smooth brown film). This explains the increase in specific wear rates from 0.75 10-6 mm3/Nm at 8 MPa to 0.9 10-6 mm3/Nm at 16 to 25 MPa in Table 10.6. In contrast to small-scale tests, softening phenomena on large-scale tests does not cause unstable friction because the film additionally plasticizes at high contact pressures. The transfer films at 55 to 150 MPa are more homogeneous and coherent compared to lower contact pressures: this type of transfer is favourable for low specific wear rates and low friction that immediately stabilises. The average roughness of HA-steel uniformly decreases after sliding at low loads, representing the formation of a film that is mainly deposited into the original roughness valleys. As the roughness peaks are not covered, they still provide local polymer/steel contact with high friction. A small increase in roughness at 55 to 150 MPa indicates that polymer transfer becomes more coherent. The latter implies that the PET/PTFE film on the steel counterface is in contact with the polymer sample over the entire sliding area, corresponding to frequent stabilisation in friction (Figure 10.4) at 55 to 150 MPa. However, from the calculated temperatures, it is clear that the melting temperature at 55 MPa is not exceeded and melting cannot contribute to homogenisation in transfer. Tribo-chemical reactions occur. (a) (b) (c) (d) (e)
Figure 10.14 Optical microscopy and roughness profile of 316L after large-scale sliding of PET/PTFE at (a) 25 MPa, macrophoto, (b) 25 MPa, (c) 55 MPa, (d) roughness before sliding at 25 MPa,
(e) roughness after sliding at 25 MPa and removing transfer film
Ra = 0.20 µm Rt = 2.25 µm Ra = 0.16 µm Rt = 1.75 µm
groove
2.5 µm
2.5 µm 1000 µm
1000 µm
1 mm
5 mm

Chapter 10. Polyesters: Evaluation of scaling phenomena 328 As illustrated in paragraph 10.6.2, it is mainly post-polymerisation of wear debris in the sliding interface that improves the coherence of the transfer film at 55 to 150 MPa. This polymerisation typically happens at 120 to 200°C, certainly over long times as applied during present sliding, and agrees with temperatures T* calculated in Table 10.4. The PET/PTFE depositions on stainless steel after large-scale testing at 25 and 55 MPa are shown in Figure 10.14. The transfer types are different compared to HA-steel, with rather platelet depositions on stainless steel while a continuous film developed on HA-steel. Discontinuous transfer and lower friction on stainless steel compared to HA-steel was also noted earlier for small-scale tests of polyimides (Chapter 7). It was related to the low surface energy (especially lower polar component) of stainless steel and lower adhesion. The film can be easily removed after sliding, measuring the changes in steel surface roughness. Despites higher temperatures T* on stainless steel (Table 10.4), softening does not favour film homogeneity and it indicates that adhesion effects are pre-dominant for PET/PTFE. The stainless steel surfaces also have severe abrasive wear marks like grooves parallel to the sliding direction. It is noted from the steel roughness profiles that the top asperities of the steel counterface are removed. These steel particles are incorporated in the PET/PTFE sliding surface and act abrasively (see Figure 10.17). Detachment is likely explained by brittleness of the oxide surface layer of 316L stainless steels, while HA-steel asperities did not detach. 10.4.2. Worn polymer surfaces Large-scale PET surfaces slid against HA-steel show wear grooves parallel to the sliding direction (abrasive action), surface pits (fracture) and shearing bands perpendicular to the sliding direction (Figure 10.15). On small-scale pin-on-disc tests, Branco et al. [10.1] found that abrasion and plastic deformation was the main failure mode of pure PET. The PET surfaces are brittle and, however, they do show fracture rather than large plastic deformation. At low loads, the polymer surface is smooth with some abrasive wear grooves. Chevron marks perpendicular to the sliding direction are observed on the polymer surfaces at 16 to 25 MPa, indicating a stick-slip process and brittleness [10.7]. Some separately detached flakes are on top of the surface. The surface pits at 55 to 150 MPa indicate severe cohesive wear. The wear process in polymers is a combination of adhesive and cohesive failures leading to debris detachment. When the latter is prevailing, the interfacial bond between the polymer and the transferred film is stronger than the strength within the polymer bulk, as frequently observed [10.8].
(a) (b) (c)
Figure 10.15 Optical microscopy of large-scale PET surfaces after sliding against HA-steel at (a) 8 MPa, (b) 16 to 25 MPa, (c) 55 to 150 MPa
1 mm

Chapter 10. Polyesters: Evaluation of scaling phenomena 329 (a) (b) (c) (d) (e) (f) (g) (h)
Figure 10.16 Optical microscopy of large-scale PET/PTFE surfaces after sliding against HA-steel at
(a) 8 MPa, (b) 16 MPa, (c) 25 MPa, (d) 55 MPa, (e) 150 MPa, and roughness profiles of PET/PTFE surfaces after sliding against steel at (f) 8 MPa, (g) 25 MPa, (h) 55 MPa
Large-scale PET/PTFE surfaces slid against HA-steel (Figure 10.16) have brown depositions resulting from PTFE fillers that are delivered from the polymer bulk as debris. The type of depositions depends strongly on the contact pressure. At 8 MPa separate particles are only locally sheared into relatively thick bands parallel to the sliding direction. The lack of softening and surface plastification at 8 MPa does not
2.5 µm 1000 µm
PTFE
PTFE deformation
groo
ve
groo
ve
groo
ve
2.5 µm 1000 µm
PTFE
2.5 µm 1000 µm
PTFE PTFE PTFE
groo
ve
groo
ve
groo
ve
1 mm

Chapter 10. Polyesters: Evaluation of scaling phenomena 330 allow for a favourable thin film over the entire polymer surface. From 16 to 25 MPa on, the polymer surface softens (glossy appearance with irregular shape) and separate poly-mer flakes are torn out of the bulk. The PTFE depositions become thinner and spread over a larger area of the sliding surface. This PTFE layer completely plasticizes and mixes with molten PET at 150 MPa, loosing its load-carrying capacity with local destruction. While the polymer surface progressively softens, the indentation of the counterface asperities causes plastic deformation with abrasive grooves parallel to the sliding direction. The roughness profiles of the polymer surfaces indicate wear grooves as a combination of abrasive wear and plastic deformation. Surface deformation increases at high loads with more grooves becoming deeper. Deformation manifests as polymer extrusion next to the grooves. The PTFE depositions do not preferentially deposit into the roughness grooves, but occur on top of the polymer surface asperities. (a) (d) (b) (e) (c) Figure 10.17 Optical microscopy of large-scale PET surfaces after sliding against 316L at (a) 25 MPa, or
PET/PTFE surfaces after sliding against 316L at (b) 25 MPa, (c) 55 MPa, (d) 150 MPa, with (e) EDX-analysis of PET/PTFE surface after sliding against HA-steel or 316L
Large-scale PET and PET/PTFE surfaces slid against 316L stainless steel (Figure 10.17) have a grey film that is softened. EDX analysis and microscopic photographs reveal that Fe particles are embedded in the polymer surface. The transfer of steel particles towards the softer polymer surface is ascertained by levelling off the roughness peaks on stainless steel surfaces after sliding (Figure 10.13). The oxide film on the stainless steel surface is affected by sliding and detached wear particles incorporating in the soft
1 mm
C K
C K
Fe K
O K
F K
O K
F K1 2 3 4 5 6 7 8 9 10 11 12 13
1 2 3 4 5 6 7 8 9
Energy (eV)
Inte
nsity
(cou
nts)
PET/PTFE slid on HA-steel
PET/PTFE slid on 316L
1 mm
1 mm

Chapter 10. Polyesters: Evaluation of scaling phenomena 331 polymer surface further act as abrasives. A small abrasive crater is only observed around the steel particles (Figure 10.17d), while no abrasive grooves along the sliding direction are found on the polymer surface. This confirms that steel particles are incorporated in the soft polymer surface. It is in contrast to small-scale sliding tests on polyimide, where steel particles remained in the interface as third body elements. This type of reverse transfer was also mentioned by Ludema [10.9]. Tribochemical effects of polymer/stain-less steel sliding couples are further discussed by Gao et al. [10.10]. The small-scale polymer surfaces (Figure 10.18) after sliding on HA-steel show no separate PTFE depositions and no film is formed on the polymer surfaces. It confirms the different role of debris particles on large-scale or small-scale sliding areas. Small-scale polymer surfaces are smooth after sliding in the softening temperature zone, in agreement with surface aspects after sliding at different pv-levels. Surface melting is observed for the sliding test at 50 N, 0.3 m/s with controlled bulk temperature Tb = 200°C and confirm previous calculation of the maximum polymer temperature T* = 265°C. Similar melting phenomena were observed at 200 N, 1.2 m/s (T* = 250°C). (a) (b) (c)
Figure 10.18 Optical microscopy of small-scale PET/PTFE surfaces after sliding at 50 N, 0.3 m/s and (a) Tb = 60°C, T* = 85°C, (b) Tb = 140°C, T* = 153°C, (c) Tb = 200°C, T* = 265°C
10.5. Tribophysical Analysis Raman spectroscopy on small-scale and large-scale worn PET and PET/PTFE surfaces indicates differences in lubricant deposition, either increasing or decreasing after sliding. Conformational changes (trans/gauche orientation) after small-scale sliding are mainly concentrated in the formation of a crystalline phase, while a rigid amorphous phase de-velops after large-scale sliding. A transition from rigid amorphous into crystalline phase is clearly reflected in a transition of wear rates. Differential thermal analysis (DTA) on wear debris confirms modification of the amorphous phase at 8 to 16 MPa, crystallisa-tion at 25 MPa and a combination of post-polymerisation and crystallisation at high load. 10.5.1. Raman spectroscopy of polymer surfaces A reference Raman spectrum for unworn PET/PTFE is shown in Figure 10.19. Each spectrum for unworn or worn samples is averaged over ten locations on the sliding area. Raman spectroscopy of PET was reviewed by Maddams [10.11], assigning different Raman-active bands to molecular vibrations: some bands are due to the backbone molecular bonds (e.g. benzene ring vibration) and others are attributed to the side groups
1 mm

Chapter 10. Polyesters: Evaluation of scaling phenomena 332 (e.g. C=O stretching). Most of the bands in a polyester spectrum are stress-sensitive, as frequently studied during preparation or thermal treatment of oriented films [10.12]. Bands assigned to the aromatic structure at 702 cm-1, 795 cm-1 or 1613 cm-1 can be used as internal reference bands.
Figure 10.19 Reference Raman spectrum for PET/PTFE with band assignments
10.5.1.1. Lubricant deposition A SEM image of the large-scale PET/PTFE surfaces (Figure 10.20) shows the morpho-logy of deposited lubricant and polymer. It has separate flakes at low contact pressures that progressively build up and form a continuous film at high contact pressures. Raman spectra between 500 to 1500 cm-1 wavenumbers of unworn and worn PET and PET/PTFE surfaces (Figure 10.21) indicate PTFE lubricant by a band at 732 cm-1 not appearing in spectra of pure PET. Compared to the neighbouring band at 702 cm-1, representing the aromatic structure, the variation in relative intensity I732/I702 for large-scale and small-scale sliding conditions is given in Figure 10.22.
• For large-scale samples (Figure 10.22a), the 732 cm-1 intensity increases with normal load from 0.23 to 0.27, according to a sliding film of mixed PTFE/polyester debris developing on the polymer surface. The discontinuity at 16 MPa is in relation to conformational changes discussed in next paragraph. A higher intensity I732/I701 is noted after sliding against stainless steel as it was reported in Figure 10.20d that a more continuous and viscous polymer film has formed on the polymer surface.
• For small-scale samples slid at 80 and 180°C bulk temperature (Figure 10.22b), the 732 cm-1 band decreases from 0.23 to 0.15 as no sliding film was observed and lubricant is removed, resulting in higher friction compared to large-scale tests. An increase in band intensity at Tb = 200°C is noted, tending to the unworn intensity due to overload and melting. Under free frictional heating, the relative intensity I732/I702 remains constant at 0.21 as a function of normal load for 0.3 m/s and the intensity further decreases to 0.19 as a function of sliding velocities.
Wavenumber (cm-1)
Inte
nsity
(a.
u.)
3500 3000 2000 2500 1500 1000 500 0
0.00
2 0.
004
0.00
6 0.
008
3080
29
65
2908
1727
1613
1284
11
86
1094
996
732
632
794
702
orie
ntat
ion
ethy
lene
gly
col
C=O
arom
atic
O-C
=O s
tretc
h
crys
talli
ne or
ient
atio
n et
hyle
ne g
lyco
l P
TFE
arom
atic
857
0

Chapter 10. Polyesters: Evaluation of scaling phenomena 333 (a) (b) (c) (d) (c) (d)
Figure 10.20 SEM microscopy of PTFE lubricant film on large-scale PET/PTFE samples slid against
HA-steel at (a) 8 MPa, (b) 25 MPa, (c) 150 MPa and stainless steel at (d) 150 MPa Differences between large-scale and small-scale tests with either smooth or no sliding film on the polymer surface are clearly demonstrated by present Raman spectroscopy. They are likely attributed to the contact area size and debris motions that are restricted in flat-on-flat sliding, while it is easily removed towards the outer ends of the sliding strokes for a small-scale cylinder-on-plate sliding configuration.
Figure 10.21 Detail of Raman spectra of unworn and worn PET and PET/PTFE at different contact pressures after large-scale testing
500 10001500 Wavenumber (cm-1)
Inte
nsity
(a.u
.)
PET
unworn
worn
PET/PTFE
unworn worn (MPa)
8
16
25
55
150
732
702

Chapter 10. Polyesters: Evaluation of scaling phenomena 334
0.60
0.61
0.62
0.63
0.64
0.65
0 50 100 150 200 250
Bulk temperature (°C)
I (17
26) /
I (1
613)
0.60
0.61
0.62
0.63
0.64
0.65
0 50 100 150 200 250
Normal load (N)
I (17
26) /
I (1
613)
Bulk temperature (°C) Normal load (N)
0.10
0.15
0.20
0.25
0.30
1 10 100 1000
Contact pressure (MPa)
I (73
2) /
I (70
2)
0.10
0.15
0.20
0.25
0.30
0 50 100 150 200 250
Bulk temperature (°C)
I (73
2) /
I (70
2)
Contact pressure (MPa) Bulk temperature (°C)
(a) (b)
Figure 10.22 Raman analysis of the PTFE absorption band (732 cm-1) for PET/PTFE, after (a) large-scale testing against HA-steel (), stainless steel (), (b) small-scale testing against HA-steel () 10.5.1.2. Orientation and conformational changes A band attributed to stretching of the C=O side-groups in PET and PET/PTFE is at 1726 cm-1. Its intensity relatively to the 1613 cm-1 aromatic band is examined for small-scale tests as a function of normal load and sliding velocity (Figure 10.23a) and as a function of temperature (Figure 10.23b). Large-scale intensities are shown in Figure 10.24. Comparing large-scale to small-scale C=O orientation indicates that the band is sensitive to sliding conditions. Mainly the sliding velocity is important to cause stretching at small-scale, which is enhanced at higher temperatures.
• Small-scale intensities of C=O stretching increase when either sliding velocity or normal load is higher, while an increase in sliding velocity has more influence on orientation compared to an increase in normal load. At 200 N, 1.2 m/s, the intensity drops by overload and melting. Also as a function of sliding temperature, the C=O intensity increases until melting happens at T* = 265°C for the highest bulk temperature.
(a) (b) Figure 10.23 Raman analysis of the C=O absorption band (1726 cm-1) for PET/PTFE, small-scale testing at (a) normal loads for 0.3 m/s, 0.9 m/s, 1.2 m/s, (b) controlled bulk temperature at 50 N, 0.3m/s

Chapter 10. Polyesters: Evaluation of scaling phenomena 335
c
0.56
0.58
0.60
0.62
0.64
1 10 100 1000
Contact pressure (MPa)
I (17
26) /
I (1
613)
x
Contact pressure (MPa)
Figure 10.24 Raman analysis of the C=O absorption band (1726 cm-1) for PET/PTFE after large-scale testing at different contact pressures against HA-steel () or stainless steel () compared to PET (x)
• Large-scale intensities of the C=O stretching frequency behave different and decrea-se as a function of higher contact pressures, likely related to the low friction (and thus shear) forces acting on the PET/PTFE surfaces. The intensity at 150 MPa does not depend strongly on the counterface type (in contrast to the polymer film forma-tion), but pure PET has higher C=O intensity in parallel to the high friction force.
The overall orientation of the polymer backbone is characterised by either a trans (stret-ched) or gauche (coiled) orientation of the ethylene glycol linkages. Both conformations of the polyester molecules are illustrated in Figure 10.25 and are characterised by speci-fic absorption bands at 998 cm-1 (trans) and 857 cm-1 (gauche). Their intensities are given relatively to an aromatic band at 795 cm-1 that is insensitive to the orientation. Also the bands at 2908 cm-1 and 2960 cm-1 are assigned to trans and gauche isomers respectively [10.13]. The positions of some bands are detailed in Figure 10.26 and the relative intensities after large-scale and small-scale testing as a function of contact pres-sure or bulk temperature are given in Figure 10.27. The intensity for trans bands after small-scale and large-scale sliding increases and the gauche bands accordingly decrease (a) (b)
Figure 10.25 Conformational arrangement of the polyethylene terephthalate molecules,
(a) all-trans or 180° orientation (c = 18.6 Å), (b) gauche-trans or 60° orientation (c = 23.6 Å)
Carbon
Oxygen

Chapter 10. Polyesters: Evaluation of scaling phenomena 336
Figure 10.26 Details of Raman spectra for PET/PTFE after large-scale sliding at 8 and 55 MPa and small-scale sliding at controlled bulk temperatures 80 and 180°C
Figure 10.27 Relative intensities of Raman bands related to trans (998 cm-1) and gauche (857 cm-1)
conformations for PET/PTFE after (a, b) large-scale testing, and (c, d) small-scale testing
Wavenumber (cm-1)
3000 2500 3500
180°C
80°C
55 MPa
8 MPa
Wavenumber (cm-1)
Inte
nsity
(a.u
.)
1000 1500 500
80°C
180°C
8 MPa
55 MPa
0.50
0.55
0.60
0.65
0.70
0.75
0.80
0 50 100 150 200 250
Bulk temperature (°C)
I (99
8) /
I (79
5)
3.00
3.20
3.40
3.60
3.80
4.00
0 50 100 150 200 250
Bulk temperature (°C)
I (85
7) /
I (79
5)
(c)
(c)
0.50
0.55
0.60
0.65
0.70
0.75
0.80
1 10 100 1000
Contact pressure (MPa)
I (99
8) /
I (79
5)
3.00
3.20
3.40
3.60
3.80
4.00
1 10 100 1000
Contact pressure (MPa)
I (85
7) /
I (79
5)
(a)
(b)
PET
PET/PTFEStainless steel
x
Contact pressure (MPa)
Contact pressure (MPa)
Bulk temperature (°C)
Bulk temperature (°C)

Chapter 10. Polyesters: Evaluation of scaling phenomena 337 in intensity, indicating that the 998 and 857 cm-1 or 2908 and 2960 cm-1 are complimen-tary. For large-scale tests, the discontinuity in structural transformations at 16 MPa is explained below (Figure 10.28). The polymer composition and counterface type influence orientation (see at 150 MPa): as the frictional forces are higher for sliding pure PET (µ = 0.25) compared to PET/PTFE (µ = 0.05), higher trans orientation is induced. Under the same conditions with stainless steel counterfaces, the friction is lower (µ = 0.03) and therefore lower trans orientation is measured. Similar trends are observed for the 2908 and 2960 cm-1 bands with the 3080 cm-1 band used as internal reference.
The quantitative trans and gauche isomer contents are calculated from the relative intensities I998/I795, I857/I795 and I2908/I3080, I2960/I3080 (Table 10.8). Since only two confor-mational isomers are possible in PET, a two-phase conformational model can be consi-dered similar to the model proposed for annealed PET by Swierenga et al. [10.14]. For complimentary Raman bands, the relationships (10.1) and (10.2) should hold:
1795
8572
795
9981 =⎟⎟
⎠
⎞⎜⎜⎝
⎛+⎟⎟
⎠
⎞⎜⎜⎝
⎛II
pII
p (10.1) 13080
29604
3080
29083 =⎟⎟
⎠
⎞⎜⎜⎝
⎛+⎟⎟
⎠
⎞⎜⎜⎝
⎛IIp
IIp (10.2)
where p1 and p2 or p3 and p4 are the band weights determined from linear regression. Good correlation is found in least square fitting of the relative intensities for 996 and 857 cm-1 (R2 = 0.98 to 0.99) revealing the adequacy of the model, while the correlation is somewhat lower for the 2908 and 2960 cm-1 bands (R2 = 0.90 to 0.95). The trans confor-mation after small-scale tests calculated from 996 and 857 cm-1 intensities, increases from 40 to 48 % and is larger than after large-scale tests increasing from 36 to 40 %. It agrees to lower friction forces on large-scale polymer surfaces that lower shear stresses induce less surface orientation. The trans content within the worn surface layer calculated from 2908 and 2960 cm-1 bands is higher and increases from 54 to 59 % on small-scale and from 49 % to 59 % on large-scale. Table 10.8. Isomer content calculated from linear regression on I998/I795, I857/I795 and I2908/I3080, I2960/I3080
isomer content from 998, 857 cm-1 isomer content from 2908, 2960 cm-1
trans (%) gauche (%)
trans (%) gauche (%)
unworn 33 67 49 51
8 MPa 36 64 56 44 16 MPa 29 68 60 40 25 MPa 38 62 58 42 55 MPa 40 60 59 41 La
rge-
scal
e
150 MPa 39 61 54 46
60°C 40 60 50 50 80°C 43 57 52 48
120°C 44 56 53 47 140°C 46 54 54 46 180°C 48 52 56 44 Sm
all-s
cale
200°C 41 59 53 47

Chapter 10. Polyesters: Evaluation of scaling phenomena 338
0%
10%
20%
30%
40%
50%
60%
70%
0 20 40 60 80 100 120 140 160
Contact pressure (MPa)
Isom
er c
onte
nt
(i)
(ii)
(iii)
(iv)
Contact pressure (MPa)
0%
10%
20%
30%
40%
50%
60%
70%
0 20 40 60 80 100 120 140 160 180 200 220
Bulk temperature (°C)
Isom
er c
onte
nt
(i)
(ii)
(iii)
(iv)
Bulk temperature (°C)
Isom
er c
onte
nt
From these calculations and according to [10.13], it is concluded that stressed PET contains three physical phases: a crystalline, an amorphous and a rigid amorphous phase, respectively containing trans isomers in a three-dimensional order, gauche iso-mers in random orientation and oriented trans isomers with a two-dimensional degree of order. When stress is applied to macromolecular semi-crystalline networks, an increase in trans conformation is mainly favoured in the latter phase as it is an intermediate phase in the amorphous to crystalline transition. From the differences in trans isomer represented by Raman bands at 998 cm-1 and 2908 cm-1, the evolution of the respective phases is calculated as a function of normal load (large-scale tests, Figure 10.28a) or sliding temperature (small-scale tests, Figure 10.28b). (a) (b)
Figure 10.28 Isomer distribution after sliding of PET/PTFE as a function of
(a) contact pressure on large-scale sliding, (b) bulk temperature on small-scale sliding: (i) crystalline trans, (ii) rigid amorphous trans, (iii) total trans, and (iv) gauche
Isom
er c
onte
nt

Chapter 10. Polyesters: Evaluation of scaling phenomena 339 Tribophysical reactions are correlated to a transition from gauche to trans conformation, being different on small-scale and large-scale surfaces. With almost an identical percent-tage total trans conformation, the orientation during small-scale sliding is mainly concentrated in the formation of a crystalline phase, while a rigid amorphous phase develops at large-scale sliding. The formation of a rigid amorphous phase will be related to tribological behaviour on large-scale testing, with a high slope of wear rates when a rigid amorphous phase develops and lowering slope in wear rates when crystallisation happens: • For large-scale tests, a stress-induced transition from rigid amorphous phase into
crystalline phase happens above 25 MPa (T* = 110°C). There is a drop in crystalline phase in favour of rigid amorphous phase at 16 MPa, as also noted in discontinuities in the crystalline absorption band at 1094 cm-1 (Figure 10.29a). Studying the uniaxial stretching behaviour of PET films, Rodriguez-Cabello et al. [10.15] also measured a decrease in oriented isomer content at 70 to 90°C, especially at low stretching speed causing para-crystallisation. Gupta et al. [10.16] studied this compacted structure by X-ray and density analysis, showing that it consists of a distorted crystal structure with poor longitudinal and transverse order. Defects in the crystalline phase may be attributed to stresses acting on it, which originate from the rigid amorphous phase. Also the significant decrease in intensity of the C=O band at 16 MPa (Figure 10.24) suggests that the side group is subjected to high stresses, ma-king them to tilt. The re-orientation of C=O is also reflected in a progressive shift of the related absorption band from 1726.62 cm-1 to 1726.72 cm-1. Further evidence on stretching of the C=O groups, mainly located in the amorphous phase, is given by Ellis et al. [10.17]. Compared to the large-scale friction and wear measurements, the decrease in rigid amorphous phase and increase in crystallinity between 25 MPa to 150 MPa corresponds to a change in slope of the wear rate versus contact pressure curve (Figure 10.30). The transition from rigid amorphous into crystalline phase is favourable to lower the slope of the wear rate curve.
• For small-scale tests, the permanent increase in crystalline content (Figures 10.28b,
10.29b) is consistent with low wear rates, while local transitions in wear rates are also correlated to the amount of rigid amorphous phase (Figures 10.2, 10.28b):
• (a) (b) Figure 10.29 Raman analysis of absorption band related to crystalline phase (1094 cm-1) for PET/PTFE,
(a) large-scale tests at different contact pressures, (b) small-scale tests at different bulk temperatures
1.20
1.25
1.30
1.35
1.40
1.45
0 50 100 150 200 250
Bulk temperature (°C)
I (10
94) /
I (1
613)
1.20
1.25
1.30
1.35
1.40
1.45
1 10 100 1000
Contact pressure (MPa)
I (10
94) /
I (1
613)
PET
PET/PTFEStainless steel
x
Contact pressure (MPa) Bulk temperature (°C)

Chapter 10. Polyesters: Evaluation of scaling phenomena 340
Figure 10.30 Change of wear rate slope in parallel to crystallisation above 16 MPa on large-scale tests, (♦ friction, wear rate, maximum polymer temperature T*)
(i) low wear rates at 80 to 120°C agree to lowering rigid amorphous phase, and (ii) an increase in wear rates at 140°C agrees to a slightly increasing orientation of the rigid amorphous phase. The transition from rigid amorphous phase into crystalline phase is strongest at Tb = 180°C (T* = 208°C) and provides stable wear rates. Melting of the crystalline phase at Tb = 200°C (T* = 265°C) finally produces rigid amorphous phase again and high wear through overload.
10.5.2. Thermo-analytical analysis of the wear debris Thermographs from differential thermal analysis (DTA) of PET/PTFE debris after large-scale testing at 8 to 150 MPa are presented in Figure 10.31. A first heating step to 260°C, a cooling step and a second heating step to 300°C is applied at 20°C/min. The experimental conditions were similar to measurements on debris of POM-H (Figure 9.17). Simultaneous thermogravimetric analysis (TGA) indicates a weight loss for the debris after heating of: 4% at 8 MPa, 3.6 % at 16 MPa, 2.8 % at 25 MPa, 2.3 % at 55 MPa and no mass loss after sliding at 150 MPa. The kinetics of decomposition of polyesters were analysed by El-Wahab [10.18]. It is similar to observations for POM-H that PET/PTFE debris produced at highest contact pressures has best thermal stability. This indicates clear structural changes during sliding. Following conclusions relate to the behaviour of debris in the interface: • The 8 to 16 MPa tests cause a clear increase in glass transition temperature Tg of the
debris (Figure 10.31a) as the amorphous zone is affected by stretching during sliding. This is in perfect agreement with the formation of a rigid amorphous phase noted from Raman spectroscopy (Figure 10.28a). The melting point Tm for 8 and 16 MPa debris is constant at 255°C, similar to unworn PET/PTFE, indicating that there is limited variation in crystallisation during sliding at 8 to 16 MPa. Mainly orienta-
0.00
0.02
0.04
0.06
0.08
0.10
0.12
0.14
0.16
0.18
0.20
0 0.2 0.4 0.6 0.8
pv-value (MPa.m/s)
Coe
ffici
ent o
f fric
tion
0
50
100
150
200
250
pv-value (MPa.m/s)
Coe
ffici
ent o
f fric
tion
Wea
r rat
e (1
0-3 m
m3 /m
)
Tem
pera
ture
T* (
°C)
R2 = 0.99

Chapter 10. Polyesters: Evaluation of scaling phenomena 341
-12
-10
-8
-6
-4
-2
00 50 100 150 200 250 300
Hea
t flo
w (µ
V)
-12
-10
-8
-6
-4
-2
00 50 100 150 200 250 300
mVo
lt
-12
-10
-8
-6
-4
-2
00 50 100 150 200 250 300
mVo
lt
8 16 25 55 150
8 16 25 55 150
8
16
25 55 150
Temperature (°C) H
eat f
low
(mV)
H
eat f
low
(mV)
H
eat f
low
(mV)
Temperature (°C)
Temperature (°C)
(a) (b) (c) Figure 10.31 Differential thermal analysis (DTA) of PET/PTFE wear debris after large-scale testing at 8 to 150 MPa, (a) melting at first heating step, (b) recrystallisation, (c) melting at second heating step
(note that the curves are shifted over a constant mV-value for better presentation)
Tg
Tm
Tcc

Chapter 10. Polyesters: Evaluation of scaling phenomena 342
tion in the amorphous phase is important. The recrystallisation peak Tcc (Figure 10.31b) increases for 8 to 16 MPa debris, as the formation of crystals happens more easily (i.e., a smaller degree of undercooling) from an oriented rigid amorphous structure.
• The debris at 25 MPa has a lower glass transition temperature Tg compared to 8 to 16 MPa, showing that the amorphous phase is less stretched in agreement to Raman spectroscopy (Figure 10.31a). The melting peak Tm = 257°C enlarges and broadens at 25 MPa compared to 8 to 16 MPa debris, resulting from crystallisation under sliding. The highest melting enthalpy ∆Hm = 51.13 J/g is measured for 25 MPa debris (compared to ∆Hm = 41 J/g at 8 to 16 MPa, and ∆Hm = 46 J/g at 55 to 150 MPa). Crystallisation was reflected in the transfer film morphology of Figure 10.13 with large white particles representing crystallised PET. Crystallisation of wear debris in the sliding interface is favourable for more coherent transfer, but somewhat less smooth transfer (see Ra-value, Figure 10.13). The strength of crystallised material is higher which makes it less ductile; therefore, particles are difficultly drawn out of the surface and they align into thicker transfer films.
• The debris at 55 to 150 MPa has only very slight or even no glass transition
temperature because the amorphous phase crystallises in combination with post-polymerisation. This is in perfect agreement with the formation of a crystalline phase noted from Raman analysis. Also the melting temperature increases to 259°C as an indication of improved crystalline structures. The lower melting enthalpy ∆Hm, however, indicates that crystallisation is not prevailing and it is concurring with post-polymerisation. The recrystallisation peak Tcc shifts to higher degree of under-cooling and broadens, which is indicative for a post-polymerisation reaction of PET debris under sliding. Through this polymerisation reaction, the polymer chain lengths increase and crystallisation is more difficult.
Further transesterification of reactive polyester chain ends depends mainly on time/ temperature and causes higher molecular weights. Hence, polymerisation during sliding improves the mechanical properties of the polyester, which is reflected in a more cohe-rent transfer film with good ductility and no fracture at high contact pressures. The transfer film after post-polymerisation at 55 to 150 MPa is more ductile compared to the transfer film at 25 MPa after crystallisation. It indicates the importance of chemical reactions between different debris particles in the interface to form a transfer film with good sliding characteristics. This polymerisation reaction for PET typically happens at 120 to 170°C and certainly needs long time [10.19]. Present thermo-analytical investiga-tion of wear debris confirms previously calculated maximum polymer surface tempera-tures T* (Table 10.4) for 55 to 150 MPa, being in the range T* = 120 to 221°C to cause polymerisation, while maximum polymer temperatures T* = 75 to 94°C at 8 to 16 MPa are below 120°C and do not cause polymerisation, nor crystallisation. On the contrary, the amorphous phase is then modified. The maximum polymer temperature T* = 110°C at 25 MPa is favourable for crystallisation, but not for post-polymerisation. Differences in sliding behaviour of polyesters at high contact pressures depend thus strongly on transfer film formation through the entrapment of wear debris in the interface. The transfer homogeneity is mainly determined by the maximum polymer temperature T* and a combination of crystallisation and/or polymerisation during sliding, according to Figures 10.28, 10.30 and 10.31.

Chapter 10. Polyesters: Evaluation of scaling phenomena 343 10.6. Conclusions Pure polyethylene terephthalate (PET) and polytetrafluoroethylene-filled (PET/PTFE) was tested on a flat-on-flat configuration with 22500 mm2 contact area at 8 to 150 MPa contact pressure, 0.005 m/s (large-scale tests) and they are compared to cylinder-on-plate tests at 50 to 200 N normal loads, 0.3 to 1.2 m/s (small-scale tests): The tribological performance of pure PET is determined by unstable sliding and brittle-ness above the glass transition temperature Tg on both small-scale and large-scale tests:
• Coefficients of friction for PET are only stable on small-scale at mildest sliding con-ditions (T* < Tg) while they are prone to heavy stick-slip at T* > Tg. Both transitions Tg and melting Tm are reflected in a frictional peak. The tendency of increasing friction contrasts with models predicting lower friction at high normal loads.
• Wear rates on small-scale show overload in the softening regime above 1 MPa.m/s.
• Transfer types agree with the transitions in friction depending on temperature, being flake-like (T* < Tg), thick and unstable (Tg < T* < Tm) or not transferring (Tm < T*). Large-scale transfer consists of particles sheared into a thin film at T* ≈ Tg influenced by debris entrapment for large sliding areas. Separate flakes exist at T* > Tg as the original brittle material properties prevail over entrapment.
Softening of aromatic structures (PET) is associated with more complex molecular tran-sitions compared to linear structures (POM-H) and results in brittleness, characterised by fracture and surface pits on the worn polymer surface. From Raman analysis, high fric-tion induces large orientation and crystallisation for PET compared to PET/PTFE. The improved tribological performance of PTFE-filled PET on small-scale tests is main-ly due to coherent transfer and mechanical shear of PTFE, lowering friction and postpo-ning the softening regime. On large-scale tests, depositions of debris are important:
• Coefficients of friction for PET/PTFE are stable at T* < Tg but they are determined by instabilities of the PET bulk polymer on small-scale tests at T* > Tg. Lower friction on large-scale tests occurs, even in the softening regime. The variation of friction with contact pressure for PET/PTFE is stronger than for POM-H, because it is not only influenced by softening and plastification, but also by debris entrapment.
• Wear rate transitions on small-scale accompany a friction transition at 2.3 MPa.m/s due to softening. For large-scale tests, the relative position of polymer and counter-face is very important for wear protection in presence of internal lubricants. The specific wear rates decrease at high loads by deposition of a mixed polymer/lubri-cant film on the polymer surface.
• Transfer on small-scale at Tg < T* is beneficially influenced by PTFE providing a thin and smooth film, while it becomes thicker by softening of PET at T* > Tg. The film morphology on large-scale tests is stongly determined by wear debris inter-action, such as: (i) orientation at 8 to 16 MPa (formation rigid amorphous phase) providing thin and smooth films, (ii) crystallisation at 25 MPa providing less smooth transfer with some PET flakes, and (iii) post-polymerisation at 55 to 150 MPa providing a coherent film with low-friction properties.

Chapter 10. Polyesters: Evaluation of scaling phenomena 344 Extrapolation models introduced in Chapter 9 were evaluated for PET/PTFE:
• Coefficients of friction can be extrapolated as a function of contact pressure between small-scale tests at low sliding velocity and large-scale tests. Static defor-mation and creep tests indicate that PET/PTFE has recoverable visco-elastic defor-mation at 8 to 55 MPa, while deformation is permanent at 55 to 150 MPa. Deforma-tion conditions on small-scale and large-scale are similar. Extrapolation as a func-tion of a macrosopic scaling factor, considering similar temperatures T* and correc-tions for deformation, provides lower coefficients of friction for PET/PTFE due to formation of a lubricating film on the polymer surface during large-scale tests.
• Volumetric wear rates and specific wear rates on large-scale testing are lower than extrapolated from small-scale tests.
• High temperatures on small-scale cannot compensate for high loads on large-scale. Counterface effects manifest in sliding against 316L stainless steel as lower friction and higher wear rates compared to HA-steel. Detachment of steel particles and incorporation in the large-scale polymer surfaces are noticed. The contact area size influences deposition of PTFE lubricants and formation of a film on the polymer surface for large-scale surfaces while lacking for small-scale surfaces. Stainless steel particles incorporate in the polymer surface for large-scale surfaces while they acted as third body abrasives on small-scale (Chapter 7). Debris mobility is mainly important for filled polymers. Different microstructural changes were noticed after large-scale and small-scale sliding. The importance of crystallisation and polymerisation is demonstrated and emphasized:
• Debris deposition on large-scale polyester surfaces is clearly demonstrated by Raman spectroscopy.
• Lower orientation is noted after sliding on stainless steel in parallel to lower friction.
• The total amount of orientation on small-scale and large-scale samples is similar (50 to 50 %), but it is unevenly distributed in either a crystalline phase (small-scale) or a rigid amorphous phase (large-scale):
o For small-scale tests, there is a permanent transition of rigid amorphous into crystalline phase. A discontinuity with increase in rigid amorphous orientation at 140°C agrees with higher wear rates.
o For large-scale tests, orientation at 8 to 16 MPa is concentrated in a rigid amorphous phase. There is a transition from rigid amorphous phase into crystalline phase happens above 25 MPa (T* = 120°C), agreeing to change into lower wear rates slope.
Thermo-analytical wear debris evaluation confirms amorphous stretching at 8 to 16 MPa, crystallisation at 25 MPa and post-polymerisation at 55 to 150 MPa. Crystallisation causes coherent but unfavourable transfer, while polymerisation is beneficial for homogeneity, strength and ductility.

Chapter 10. Polyesters: Evaluation of scaling phenomena 345 References [10.1] Branco JRT, Campos SV. Wear behaviour of thermally sprayed PET, Surf Coat Tech 120-121 (1999),
476-481 [10.2] Beake BD, Leggett GJ, Shipway PH. Nanotribology of biaxially oriented poly(ethylene terephthalate)
film, Polymer 42 (2001), 7025-7031 [10.3] McCrum NG, Buckley CP, Bucknall CB. Principles of polymer engineering, Oxford Science
Publication (Oxford), 1988, ISBN 0-1985-6155-5 [10.4] Neogi S, Hashmi SAR, Chand H. Role of PET in improving wear properties of PP in dry sliding
condition, Bull Mater Sci 26 (2003), 579-584 [10.5] Jacko MG, Tsang PHS, Rhee SK. Wear debris compaction and friction film formation of polymer
composites, Wear 113 (1989), 23-38 [10.6] Zsidai L, De Baets P, Samyn P, Kalacska G, Van Peteghem AP, Van Parys F. The tribological
behaviour of engineering plastics during sliding friction investigated with small-scale specimens, Wear 253 (2002), 673-688
[10.7] Lloyd AIG, Noel REJ. The effect of counterface surface roughness on the wear of UHMWPE in water and oil-in-water emulsion, Tribol Internat 21 (1988), 83-88
[10.8] Hutchings IM. Tribology: Friction and Wear of Engineering Materials, Edward Arnold (London), 1992, ISBN 0-8493-7764-1
[10.9] Ludema KC. Sliding and adhesive wear, in: Friction, Lubrication and Wear Technology, ASM Handbook Vol. 18, Blau PJ (ed.), 1992, 236, ISBN 0-8717-0380-7
[10.10] Gao J, Mao S, Liu J, Feng D. Tribochemical effects of some polymers/stainless steel, Wear 212 (1997), 238-243
[10.11] Maddams WF. A review of Fourier transform Raman spectroscopic studies on polymers, Spectrochim Acta 256 (1995), 271-280
[10.12] Samyn P. Kunststofflessen met verhoogde temperatuursweerstand, Master thesis, Ghent University, 2001
[10.13] Schoukens G, De Clerck K. Thermal analysis and Raman spectroscopic studies of crystallisation in poly(ethylene2,6- naphtalate), Polymer 46 (2005), 845-857
[10.14] Swierenga H, De Weijer AP, Buydens LMC. Robust calibration model for on-line and off-line prediction of poly(ethylene terephthalate) yarn shrinkage by Raman spectroscopy, J Chemometrics 13 (1999), 237-249
[10.15] Rodriguez-Cabello JC, Merino JC, Quintanilla L, Pastor JM. Deformation-induced conformational changes in stretched samples of amorphous polyethyleneterephtalate, J Appl Polym Sci 62 (1996), 1953-1964
[10.16] Gupta VB, Radhakrishnan J, Sett SK. Interaction between thermal shrinkage and crystallization in axially oriented poly(ethylene terephthalate) fibres and films, Polymer 34 (1993), 3814-3822
[10.17] Ellis G, Marco C, Del Pino J, Lorente J, Gomez MA, Fatou JG. Analysis of the influence of chemical structure and thermal history on thermotropic liquid crystal polyesters by infrared and Raman spectroscopy, Vibr Spectroscopy 9 (1995), 49-56
[10.18] El-Wahab MA. Thermal decomposition kinetics of some new unsaturated polyesters, Thermochim Acta 256 (1995), 271-280
[10.19] Buchner S, Wiswe D, Zachmann HG. Kinetics of crystallization and melting behaviour of poly (ethylene naphthalene-2,6-dicarboxylate), Polymer 30 (1989), 480-488

Chapter 10. Polyesters: Evaluation of scaling phenomena 346

347
Chapter 11.
Design of high-loaded polymer bearing elements in a functional ball-joint.
Goals
• Illustrating the relation between large-scale testing, full-scale testing, practical design (Nederlandse Rijkswaterstaat) and finite element calculations (Solico BV)
• Determination of representative large-scale test conditions from the global
analysis of the real construction
• Verification of large-scale test results by inter-laboratorial testing
• Translation of experimental large-scale dynamic and static test results to the real construction and verification of local strength for a single bearing element
• Analysis of stresses and deformation for constrained polymer elements
• Analysis of a composite ring as creep reinforcement:
- relation between full-scale testing and small-scale testing - scaling of a representative selection criterion for strength
Methodology
• Full-scale testing, Large-scale static and dynamic testing, Small-scale material testing
• Interpretation of finite element calculations (Solico BV)
The Maeslantkering in The Nieuwe Waterweg, Rotterdam (The Netherlands)

Chapter 11. Design of high-loaded polymer bearing elements 348 11.1. Global analysis of bearing elements for a ball-joint 11.1.1. Design problem and modification A flexible protection from flooding lowlands around harbour areas consists of a mov-able storm surge barrier, such as the Maeslantkering near Rotterdam. It has two curved steel walls that are floated from the banks into the river if an expected storm level exceeds 3.20 m above datum. The retaining walls are connected by triangular steel trusses to a pivot or ball-joint (Figure 11.1) that provides the rotating motion. The functionality, wear and design modifications of the ball-joint with diameter 10 m and 680 tons weight are described below in order to draw representative test conditions. The ball-joint kernel has a rectangular box structure with four webs connected to the steel trusses. The front bearing (sea-side) and back bearing (river-side) have convex sca-les of cast steel (St 52.3) in contact with a concave chairs of cast iron. The bottom bear-ing contains a convex ring structure with eight concave supports. With a tolerance on the convex and concave parts of ± 1.0 mm, the convex parts have a diameter of 10.0 m and the concave parts have a diameter of 10.04 m, or ∆R = 20 mm. The ball scales slide over the bottom and back chairs through deformation and rotation of the retaining walls, transmitting respectively vertical and horizontal loads to the anchor block that introduces them into the foundation. During the “out of service” phase the ball-joint is supported by hydraulic jacks, which are permanently under pressure in order to avoid damage by fretting of the contact surfaces. The convex parts can be lifted for maintenance.
Figure 11.1 Ball-joint in the Maeslant storm surge barrier, modified with holes for containing hybrid UHMWPE polymer pads as bearing elements
The ball-joint rotates at 0.033 rad/min during operation. It has a floating angle ϕZ = 57°, an angle ϕY = - 2.86 to + 0.72° during submersion or lifting and a maximum variation ϕX = - 0.61 to + 0.61° through the action of wind and waves. The load during floating is introduced through the bottom bearing with a resultant vertical force Fz = 42.106 N. After submersion, the resultant bearing force turns into a more horizontal direction with
z
x y
Back-chair Back-scale
Front-scale
Front-chair
Segmented ball-joint
Bottom chair
Ring bearing

Chapter 11. Design of high-loaded polymer bearing elements 349 a maximum of 275.106 N under full positive hydraulic head (compressive load from sea side onto the bearing) caused by hydraulic forces. Additional effects of waves counts for a resulting force 4.106 N, wind forces are 6.5 106 N (mainly Fy) and current during floating amounts for 15.106 N. The design value for the resultant bearing force is Fx = 350.106 N. This load is carried by the back bearing. A situation with negative hydraulic head (high water level at the riverside causing tensile forces on the bearing) possibly occurs after a storm with a horizontal force Fx = -50 106 N acting on the front bearing. The convex and concave ball-joint surfaces were originally (1991) covered with a 10 µm thick layer that is a mixture of MoS2 and PTFE resin. An additional layer of PTFE-spray was applied to overcome static friction at running-in. After several sliding steps the coating was removed from the contact surfaces and severe wear marks as cold welding spots occurred by adhesive steel/steel contact. An international research team with the Dutch Ministry of Transport, Water Management and Public Works (Nederlandse Rijks-waterstaat), The Bouwcombinatie Maeslantkering (the original contractor), Solico (Solu-tions in Composites), Materialprüfungsanstalt der Universität Stuttgart (MPA) and Ghent University was involved to make the structure functional within the period 2002 - 2004.
The modified design finished in 2004 contains (i) a zinc-alkyd phosphate primer coating on the convex steel ball surfaces protecting against corrosion, and (ii) 468 polymer bear-ing elements or ‘pads’ incorporated in holes machined into the concave surfaces [11.1]: • A first design of ‘free’ polyester/polyester composite pads bolted on the concave sur-
faces was studied. Forces are transferred from the convexes to the concaves and the foundations of the structure through friction between the bottom surface of the com-posite pads and the concave steel surface. The coefficient of friction on the top sur-face of the pad in contact with the convex cast steel should imperatively be lower than the coefficient of friction on the bottom surface in contact with the concave cast iron. This might be possible by introducing a solid lubricant on the top sliding surface and increasing the roughness of the bottom sliding surface. The elasticity of ‘free’ poly-mer pads is favourable for local deformation and little sensitive to manufacturing tole-rances. However, large deformation of the top lubricated layer and catastrophic wear of the primer coating on the convex surface was experienced during sliding tests.
• The final design has constrained hybrid UHMWPE pads (Figure 11.2) incorporated
into holes machined on the concave back, bottom and front chairs of the ball-joint. The pad has a nominal diameter of 249.50 mm and a thickness of 40 mm while the holes have a diameter of 250 mm and 32 mm depth. It means that the polymer has a free surface of 8 mm above the concave chair structures in contact with the convex steel counterface. The pad is dimensionally stabilised by a carbon fiber/epoxy (CFR-E) reinforcing ring. A polymer lip on top of the ring protects against direct contact between the convex and the carbon ring that would lead to unacceptable wear [11.2]. An optimum thickness and diameter of the polymer lip was determined by large-scale static and dynamic testing, requiring stable plastic deformation. The pads have dimples on the sliding surface to contain eventual lubricant, but low friction under dry sliding will be demonstrated. In contrast to ‘free’ bearing elements, two issues should be further analysed: (i) the tolerances on diameter and thickness of the polymer pads and machined holes determine local deformation and stiffness, and (ii) forces between convex and concave surfaces are transferred through the walls of the machined holes and strength of the concave steel structure should be verified.

Chapter 11. Design of high-loaded polymer bearing elements 350
Figure 11.2 Hybrid UHMWPE pad or bearing element, (a) top view, (b) exploded view, (c) assembly 11.1.2. Analysis of an elastic bearing interlayer The contact pressures on a continuous elastic bearing interlayer were studied by Neder-landse Rijkswaterstaat, using a 4-D finite element simulation (variations of load in space and time). Influences of interlayer thickness and stiffness on maximum contact stresses are presented in Table 1.11. Variable thickness d = 19, 15, 10 mm (corresponding to ∆R = 1, 5, 10 mm), elasticity E = 100, 1000, 10000 MPa and hypothetic coefficient of fric-tion µ = 0.15 or 0.25 are applied. Contact pressures on the front bearing are inferior and not further considered. Only for the bottom bearing, ∆R and E influence the contact pres-sures significantly, while variations in elasticity between 1000 to 10000 MPa almost do not influence the contact stresses. An interlayer thickness ∆R = 8 to 10 mm is applied, based on calculations and application (lower ∆R causes contact between convex and concave, estimated from imperfections). Calculations with higher coefficients of friction indicate only a slight variation in contact stresses, while the global strength of the struc-ture is not exceeded. When only the bottom bearing is loaded during floating, coeffi-cients of friction up to 0.50 are allowed without exceeding the constructional strength, because the full bearing capacity is then not used. The loading histories with contact pressure distribution over front, bottom and back bearings are detailed in ref. [11.3]. Table 11.1. Global FEM analysis for contact pressure on the elastic bearing interlayer with variation in thickness, friction and elasticity
Loading history First stroke Steady-state sliding
Elasticity-modulus (MPa) 103 to 104 102 103 104
∆R (mm) 10 5 1 5 10 5
Coefficient of friction (-) 0.25 0.15 0.15 0.15 0.15 0.25 0.15
Total available bearing
area
(m2)
Back-bearing 7 36 36 34 32 31 34 22.67
Bottom-bearing 18 23 25 32 33 34 31 2.08
Contact pressure (MPa) Front-bearing 5 22 21 22 20 21 20 10.62
Ø 237 ± 0.1
Ø 209 ± 0.1
Ø 249.5 ± 0.1
Ø 249.5 ± 0.1
Ø 237 ± 0.1
1.5±
0.1
Dimples (Ø4) on UHMWPE sliding surface
Rubber ring (Ø5) for positioning
into holder
Reinforcing carbon ring
(a) (b)
(c)

Chapter 11. Design of high-loaded polymer bearing elements 351
Table 11.2. Local contact pressures for a single polymer pad in the back and bottom concave surfaces of the ball-joint (front bearing is inferior)
Design factor
Back bearing
Bottom bearing
Comments
Global contact pressure MPa 31 34 Homogeneous bearing layer
Loading factor - 2.61 2.53 Discrete pad distribution
Factor difference in local stiffness - 1.22 1.23 Non-uniform contact pressure
over bearing surface
Local deformation mm 2.70 2.80 Vertical indentation due to total contact pressure (experimental)
Extra deformation mm 0.56 0.72 Imperfect geometrical tolerances on pad and hole
Additional contact pressure MPa
48
57
Implied by deformation (experimental)
Total contact pressure MPa
147 163 Local working conditions for a polymer pad
The maximum contact pressure on a single hybrid UHMWPE pad is calculated in Table 11.2 from (i) the global contact pressures over a full bearing area with ∆R = 8 to 10 mm, (ii) the distribution of discrete pads instead of a continuous bearing interlayer, and (iii) the local deformation of pads implied by their tolerances. Local supports at the back of the concave surfaces cause a variation in stiffness and locally increase contact pressu-res. Applying stress intensity factors for local effects, the design contact pressure for each polymer pad is 150 MPa. Compared to an infinitely stiff MoS2 lubricant layer, an elastic bearing interlayer causes a homogeneous distribution of the contact stresses and single polymer pads favourably bear local variations in stiffness or dimensional toleran-ces. Redistribution of the contact stresses prevents failure over large areas, when the ma-terial has high bearing capacity and ductility for local plastic deformation. The levelling of stress concentrations allows for better simulations and representative test conditions. During rotation of the ball under normal load and zero friction (µ = 0), only slip occurs: there is a translation of the resultant force into a new centric point while its direction remains parallel to the original direction. In case of friction (µ > 0), a combination of rolling and slip occurs: the direction of the resultant force varies and the relative position of the bearing surfaces changes through rolling of the convex into the concave. The evolution of the resultant bearing force over the concave surfaces for a complete loading history was simulated [11.3]. It is concluded that both the magnitude and the specific position on the bearing surface of the resulting force is influenced by friction. The eccentricity of the bearing force causes a frictional moment on the ball-joint that attains a critical maximum value more rapidly for small ∆R. The reaction of the ball-joint on rotations is thus more sensitive and it acts more ‘nervous’: the rotation of the convex surface into the concave surface is intense and the resultant force attains its extreme positions more rapidly. Some constructional elements are higher loaded in the modified design of an elastic bearing layer with finite thickness compared to the original thin MoS2 coating. For given maximum coefficient of friction µ = 0.25 and ∆R = 10 mm, the resultant bearing force remains within the constructional strength. Calculations are detailed in a global analysis in ref. [11.3].

Chapter 11. Design of high-loaded polymer bearing elements 352 Present ball-joint redesign is a unique design for application of polymer pads at extre-mely high loads. Common contact stresses applied on UHMWPE are 10 to 20 MPa, but there is no consensus regarding the true yield strength or maximum design load of polyethylene above which the material is deleteriously overloaded. Collier et al. [11.4] cited a 21 MPa tensile yield strength for polyethylene, while Buechel et al. [11.5] used a 32 MPa compressive yield strength and a damage threshold of 5 MPa. Bartel et al. [11.6] used a 12.7 MPa yield strength, while Hayes et al. [11.7] used 14 to 15 MPa. Bristol et al. [11.8] also found that the maximum contact stresses in several non-conformal designs are much larger than the tensile or compressive yield strength of the polymer and rise towards 30 or 40 MPa with 80 % of the total contact area that is typically overloaded. A damage threshold of 10 MPa was calculated according to the fatigue strength. 11.2. Experimental large-scale testing of bearing elements The static strength, stiffness, friction and wear of a hybrid UHMWPE pad and a convex counterface with Zn-phosphate primer coating are large-scale tested to verify their bea-ring capacity. Test results will be used as input for numerical simulations (paragraph 11.3). Main principles are given below and details on selection tests for different pad geometries are given in [11.9, 11.10]. Each test was done three times, as more data im-proves the reliability of a test result but it has no better significance for the storm surge barrier [11.1]. Statistical variation on experiments will be covered by design factors. 11.2.1. Full-scale static compression and creep tests 11.2.1.1. Test program Hybrid UHMWPE pads (diameters 249.37 mm, 249.50 mm, 249.55 mm, thickness 40 mm) are constraint in a sample holder with diameter 250 mm and loaded at 30 MPa/min against a convex counterface (radius 5000 mm) to 30, 60, 90, 120 and 150 MPa. A vertical hydraulic press is used (Amsler 10000 kN, Figure 11.3). Each contact pressure is applied for 2 hours (short-time test) and the 150 MPa working condition for 24 hours (long-time creep test). The recovery was measured for 12 hours after load removal.
Figure 11.3 Test set-up for static compression and creep, (a) constraint bearing element in sample
holder, (b) hydraulic press Amsler 10000 kN (Ghent University, Laboratory Magnel)
(a) (b)
(2) Ball counterface Radius 5000 mm
(1)
LVDT
Polymer pad
Sample holder

Chapter 11. Design of high-loaded polymer bearing elements 353 11.2.1.2. Stress versus strain characteristics in full-scale compression test The engineering and true stress-strain curves for full-scale constrained hybrid UHMWPE pads are shown in Figure 11.4. They are compared to test data of Kurtz et al. [11.11]. Kurtz performed small-scale compressive tests on the yielding, plastic flow and fracture of UHMWPE at low contact stresses (< 30 MPa) using unreinforced cylindrical samples of 10 mm diameter and 15 mm length. One conclusion of his work was that the true stress-strain curve is similar under tensile and compressive stress up to e = 0.12. Effects of constraint and contact with a convex counterface are presently noticed.
Figure 11.4 Stress-strain characteristics for full-scale constrained hybrid UHMWPE pads, (a) engineering strain and influence of pad diameter, (b) true strain and influence of initial deformation The initial point contact between the convex and the polymer pad causes local stresses (paragraph 11.3.2) that are not dimensionally stabilised by the CFR-E ring, because of the initial clearance between the bulk UHMWPE and its ring. A low stiffness is therefore noticed for initial contact and a 100 kN normal load (2 MPa) results in 0.70 mm axial compression (ε = 1.75 or e = 0.018). Compared to the true stress-strain curve by Kurtz et al [11.11], this region corresponds to the elastic zone of UHMWPE with a linear stress-strain relation. At higher contact pressures and/or strain, the polymer element is fully constrained by the CFR-E ring and sample holder. There is a linear increase in strain with stress at e = 0.02 to 0.04 until further increasing in stiffness at higher deformation. The true strain e = 0.04 corresponds to the onset of plastic deformation at 21 MPa yield strength [11.11]. A non-linear relation is observed through progressive indentation of the convex counterface below 50 MPa. At higher loads, the stiffness attains 3879 kN/mm at 120 MPa to 4910 kN/mm at 150 MPa (27 % increase), corresponding to an apparent modulus of 4200 to 5000 MPa and Poisson coefficient ν = 0.47. The effect of clearances on the deformation of a hybrid UHMWPE pad was extensively discussed in ref. [11.9]. The total deformation at 150 MPa for pads with small diameter is higher compared to pads with large diameter due to differences in constraining action of the steel sample holder, while the final stiffness (kN/mm) does not vary significantly in agreement with the constraining mechanism by plastic deformation. During a second
0
20
40
60
80
100
120
140
160
0 1 2 3 4 5 6 7 8 9 10
Engineering strain ε (%)
Con
tact
pre
ssur
e (M
Pa)
Con
tact
pre
ssur
e (M
Pa)
Engineering strain ε
diam 249.37 mm
diam 249.50 mm
diam 249.55 mm
0
20
40
60
80
100
120
140
160
0 0.02 0.04 0.06 0.08 0.1 0.12
True strain e
Con
tact
pre
ssur
e (M
Pa)
True strain e
Con
tact
pre
ssur
e (M
Pa)
diam 249.50 mm
Kurtz et al. [11.11]
Engineering strain ε = ∆h/40 (%) True strain e = - ln (1 – ∆h/40)
(a) (b)

Chapter 11. Design of high-loaded polymer bearing elements 354 loading step, the stress-strain curves are more homogeneous and the initial clearance has no longer importance [11.9]. The stiffness at low load increases significantly compared to the first loading step and axial compression is low by constraint of the polymer pads. 11.2.1.3. Creep in full-scale compression test Creep measurements during 24 hours loading are given in Figure 11.5a for constrained hybrid UMHWPE pads and free polyester/polyester pads with diameter 249.50 mm. Creep of hybrid UHMWPE pads is limited to 0.15 mm at 150 MPa during the first loading step. For polyester/polyester pads [11.12], the total creep is between 0.10 and 0.55 mm with two regimes: creep is low at 30 to 60 MPa and it becomes higher at 90 to 150 MPa. Figure 11.5 Creep deformation for bearing elements, (a) constrained hybrid UHMWPE pads (full lines)
and free polyester/polyester pads (dotted lines), (b) creep for constrained and free bearing elements Creep deformation is mostly described by a power law verified by, e.g., Scott and Zureick [11.13] for time-dependent deformation of thermoplastics. The simplest form of the power law is written in Formula (11.1),
ntmt += 0)( εε (11.1)
where ε(t) = total time-dependent creep strain, ε0 = stress-dependent and temperature-dependent initial elastic strain, t = time after loading and the parameters m and n empirical constants to be determined from a double logarithmic plot. Creep of a free polyester/polyester pad is in agreement with previous equation. The constraining action of a steel sample holder, however, causes lower deformation. This is adequately demon-strated on a plot with logarithmic time and linear creep strain (Figure 11.5b), indicating lower deformation of constrained hybrid UHMWPE pads under different contact pressures, according to Formula (11.2):
tlogmt += 0)( εε (11.2)
30 MPa*
75 MPa*
150 MPa**
60 MPa**
90, 120 MPa**
0.01 0.1 1 10 100 Time (h)
0.5
0.4
0.3
0.2
0.1
0
Cre
ep s
trai
n ε
(%)
0 2 4 6 8 10 12 14 16 18 20 22 24
0.6
0.5
0.4
0.3
0.2
0.1
0
Time (h)
Axi
al c
ompr
essi
on (m
m)
< 90 MPa
120 MPa
150 MPa
150 MPa
120 MPa
90 MPa
60 MPa
(a) (b)
free constrained
* first loading step ** multiple loading steps

Chapter 11. Design of high-loaded polymer bearing elements 355 Different loading histories on constrained UHMWPE pads are compared in Figure 11.5b for (i) a two-hours creep test at 30 MPa, (ii) stepwise loading at 30, 60, 90, 120 and 150 MPa during two hours, (iii) one verification test for 168 hours loading at 75 MPa. It is concluded that the steady-state creep strain rate for constrained elements is nearly independent of the normal load. The deformation is similar for 90 to 150 MPa, even after multiple loading. This is an important issue in respect to the practical implementation and life-time use of the bearing elements in the ball-joint. Variable deformation is con-centrated within the first loading period at low loads. High initial deformation is obser-ved at 30 MPa as clearances are not yet eliminated by initial visco-elastic deformation; the creep is further controlled by constraint after 45 min loading. The initial deformation step is somewhat reduced at 75 MPa as the immediate elastic deformation during loading is higher; therefore, steady-state creep is attained after shorter loading time at high load. 11.2.1.4. Recovery and permanent deformation The dimensional recovery and permanent deformation after 24 hours creep at 150 MPa is given in Table 11.3 for bearing elements with constrained or free radial expansion:
• For constrained hybrid UHMWPE or polyester/polyester pads, the permanent axial compression is 0.74 mm (UHMWPE) or 1.20 mm (polyester/polyester). The total axial compression after creep at 150 MPa is nearly similar for both materials, but the integrated area under the stress-strain curve is significantly larger for polyester/ polyester pads through deformation hysteresis. This suggests high permanent axial compression of polyester/polyester pads and shear fracture of the weak PTFE-lubri-cated top surface. In contrast, hybrid UHMWPE pads have rather elastic properties and dimensional stability through the reinforcing CFR-E ring.
• For free polyester/polyester pads, high radial expansion of the bulk is noticed in parallel to small-scale creep tests done by Van Paepegem et al. [11.14].
Related to the ball-joint, the polymer bearing surface should be at least 4 mm above the steel surface to avoid contact between convex and concave surfaces. Almost no wear of the UHMWPE surface is noticed (paragraph 11.2.2) and mainly visco-elastic indentation or creep determines the dimensional stability. After unloading and recovery, the perma-nent flow of the surface diameter is 0.5 % and the permanent axial compression is 0.7 %. For a nominal pad diameter 249.50 mm, the maximum indentation after 24 hours creep at 150 MPa is 3.85 mm + 0.15 mm = 4 mm with a remaining bearing layer thickness of 8 mm – 4 mm = 4 mm. The total vertical indentation after a life-time creep test (6 days) at 75 MPa is 1.69 to 1.99 mm, implying a bearing layer thickness 6.0 and 6.3 mm. Table 11.3. Summary of axial compression at 150 MPa (δ150), creep for 24 h at 150 MPa, recovery and permanent deformation of different polymer bearing elements
Recovery (mm) Polymer bearing element type δ150
(mm)
Creep at 150 MPa
(mm) immediate 12 h
Permanent deformation
(mm)
Constrained hybrid UHMWPE pad 3.85 0.15 2.60 0.63 0.70 to 0.74
Constrained polyester/polyester pad 2.85 0.54 2.35 0.37 0.80 to 1.20
Free polyester/polyester pad 6.85 2.35 4.86 1.10 2.38
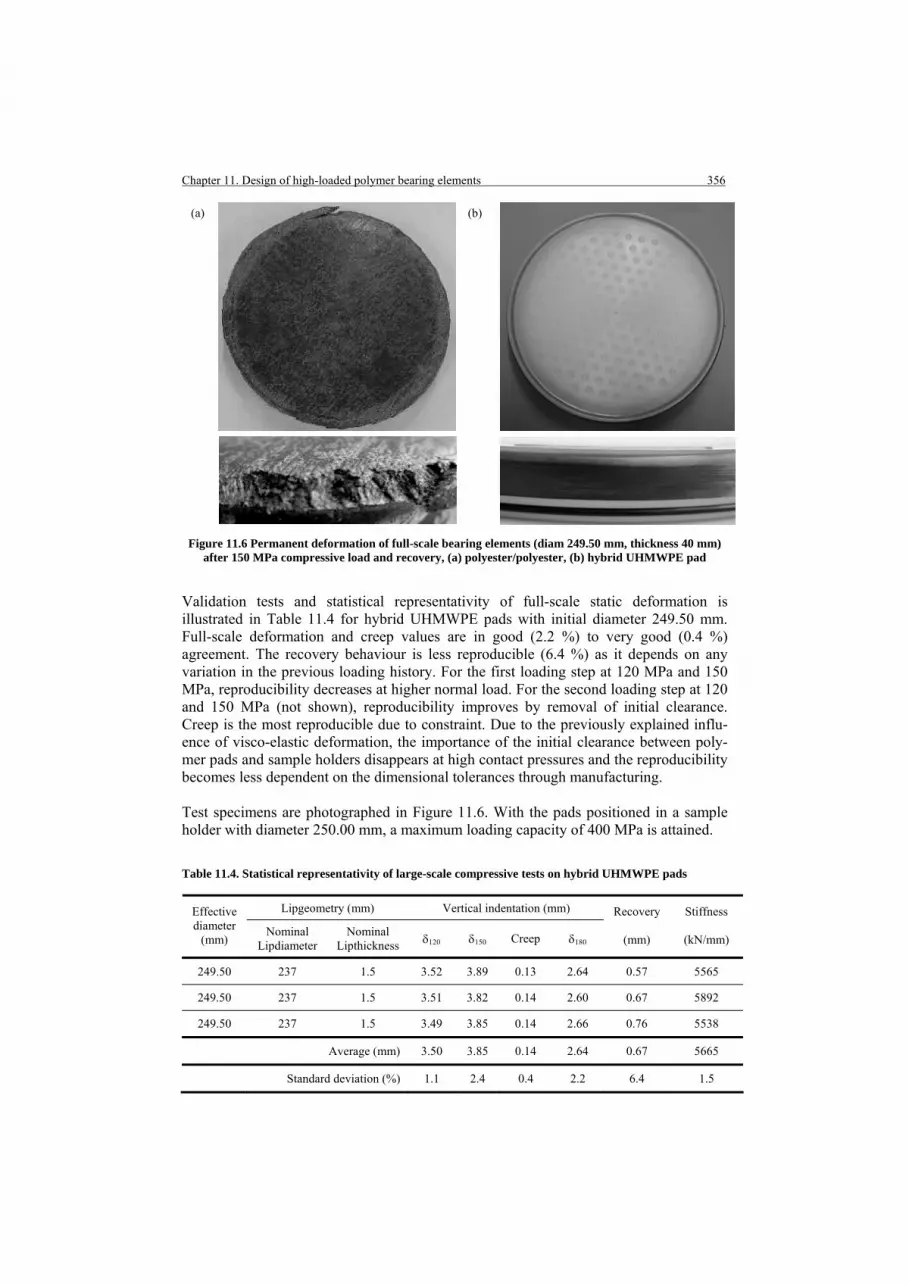
Chapter 11. Design of high-loaded polymer bearing elements 356 (a) (b)
Figure 11.6 Permanent deformation of full-scale bearing elements (diam 249.50 mm, thickness 40 mm)
after 150 MPa compressive load and recovery, (a) polyester/polyester, (b) hybrid UHMWPE pad Validation tests and statistical representativity of full-scale static deformation is illustrated in Table 11.4 for hybrid UHMWPE pads with initial diameter 249.50 mm. Full-scale deformation and creep values are in good (2.2 %) to very good (0.4 %) agreement. The recovery behaviour is less reproducible (6.4 %) as it depends on any variation in the previous loading history. For the first loading step at 120 MPa and 150 MPa, reproducibility decreases at higher normal load. For the second loading step at 120 and 150 MPa (not shown), reproducibility improves by removal of initial clearance. Creep is the most reproducible due to constraint. Due to the previously explained influ-ence of visco-elastic deformation, the importance of the initial clearance between poly-mer pads and sample holders disappears at high contact pressures and the reproducibility becomes less dependent on the dimensional tolerances through manufacturing. Test specimens are photographed in Figure 11.6. With the pads positioned in a sample holder with diameter 250.00 mm, a maximum loading capacity of 400 MPa is attained. Table 11.4. Statistical representativity of large-scale compressive tests on hybrid UHMWPE pads
Lipgeometry (mm) Vertical indentation (mm) Effective diameter
(mm) Nominal
Lipdiameter Nominal
Lipthickness δ120 δ150 Creep δ180
Recovery
(mm)
Stiffness
(kN/mm)
249.50 237 1.5 3.52 3.89 0.13 2.64 0.57 5565
249.50 237 1.5 3.51 3.82 0.14 2.60 0.67 5892
249.50 237 1.5 3.49 3.85 0.14 2.66 0.76 5538
Average (mm) 3.50 3.85 0.14 2.64 0.67 5665
Standard deviation (%) 1.1 2.4 0.4 2.2 6.4 1.5

Chapter 11. Design of high-loaded polymer bearing elements 357 11.2.2. Large-scale dynamic sliding tests 11.2.2.1. Test program Hybrid UHMWPE pads with diameter 175 mm (scale 1:1.43), 60 mm (scale 1:4.2) and 150 mm (scale 1:1.7) are tested on tribotesters at Ghent University (Figure 11.7a) and Stuttgart University (Figure 11.7b) with different loading capacity. Both equipments allow for comparing inter-laboratorial repeatability. The Ghent University tribotester was detailed in Chapter 4. Sliding tests are done at 15, 30, 60, 90, 120 and 150 MPa with 0.005 m/s sliding velocity. With a sliding stroke of 240 mm, the total sliding distance comprises ten sliding cycles (one cycle is a double stroke) or 4.8 m at each contact pressure. The counterfaces are either steel with Ra = 1.12 µm or a soft Zn-phosphate primer coating (alkyd-resin based, density 1.4 kg/l, 47 vol % solids) with Ra = 1.29 µm sprayed on sandblasted steel surfaces with Ra = 3 µm: the average coating thickness in wet conditions is 175 µm and 40 µm to 80 µm in dry conditions (drying time 1 hour, curing time 1 week). MoS2 coatings were tested in com-bination with polyester/polyester composite pads: although being favourable for impreg-nation of the top lubricating surface, it is removed after a single sliding step [11.12].
(a) (b)
Figure 11.7 Test set-up for dynamic testing, (a) Ghent University, (b) Stuttgart University tribotesters The Stuttgart University test equipment has lower loading capacity, while it is used for detailing running-in sliding. Sliding tests are mainly done when highest friction occurs, i.e. at 15 to 30 MPa, 0.005 m/s. The friction forces are measured accurately when the actuator is driven by a spindle and the roller bearings have low and calibrated friction. The initial adhesion between the polymer pad and the zinc-phosphate coating was con-sidered for different application methods (spraying, brushing and rolling with or without polishing). The effects of static pre-load and creep at 75 MPa are investigated for static and dynamic coefficients of friction. The influence of three intermediate wear paths (each 100 m at 75 MPa) perpendicular to the motion of the friction test is investigated. Functioning of the ball-joint implies a multidirectional movement of the sliding surfaces. The final design aims a total wear path of 300 m for the ball sliding over the pads without loosing functionality, implying that the storm surge should function without additional maintenance for 5 years. The sliding distance is calculated from ball rotations during one test closure every year and one closure for a two-hydraulic head storm.
thermo couple
polymer pad
counterface

Chapter 11. Design of high-loaded polymer bearing elements 358 11.2.2.2. Influence of normal load and counterface type Coefficients of friction are given in Table 11.5 for a hybrid UHMWPE pad (Ø 175 mm) sliding against steel and sprayed Zn-phosphate coating at 15 to 150 MPa, without static preload. Steel counterfaces are included as polymer/steel contact possibly occurs after the coating has worn. The initial static friction µs1 is higher than static friction at subse-quent reversals of the sliding direction, own to the original steel or coating roughness and application method for Zn-phosphate coatings. Different coating applications mainly influence static friction [11.10]: brushed or sprayed and polished coatings cause lower static friction than rolled coatings, while it has minor influences on the dynamic friction. The stabilisation time of dynamic friction with sliding distance is longer on Zn-phos-phate coatings compared to steel due to progressive smoothening of the soft coating. After several sliding cycles, the soft Zn-phosphate coating becomes smoothened with nearly identical friction results for all application methods. Sprayed coatings with controllable thickness are finally preferred for the ball protection: the coating thickness ranges between 37 µm and 66 µm with average thickness of 51 µm after complete curing. Similar tests were done on thermosetting polyester/polyester composites [11.12], but higher friction and different wear mechanisms without composite softening occurred. Table 11.5. Coefficients of friction for hybrid UHMWPE pads sliding against steel and Zn-coated counterfaces at 15 to 150 MPa over ten sliding strokes
Steel counterface Zn-coated counterface
static friction dynamic friction static friction dynamic friction P
(MPa) µs1 µs,min µs,max µd,min µd,max µs1 µs,min µs,max µd,min µd,max
15 0.12 0.11 0.12 0.10 0.11 0.10 0.11 0.12 0.08 0.09
30 0.10 0.10 0.11 0.09 0.10 0.10 0.08 0.09 0.07 0.08
60 0.08 0.07 0.08 0.06 0.07 0.05 0.06 0.07 0.04 0.04
90 0.06 0.05 0.06 0.05 0.05 0.04 0.05 0.05 0.03(5) 0.03(5)
120 0.05 0.05 0.05 0.04 0.04 0.03(5) 0.04 0.04 0.03 0.03
150 0.04 0.04 0.04 0.03(5) 0.03(5) 0.03 0.02(5) 0.03 0.02(5) 0.02(5)
The Zn-phosphate coating adheres well to the steel substrate (Figure 11.8). The aspect of the coating changes from coarse grained (mat grey colour) to fine grained (glossy grey colour) after sliding. From roughness profiles at 150 MPa [11.10] it is concluded that the coating roughness asperities flattened, while the waviness still remains after sliding. Contact should be avoided between carbon fibers from the reinforcing CFR-E ring and the Zn-phosphate coating. They cause small cracks and wear marks to the coating as microscopically observed after sliding at 30 MPa, when the carbon ring was not yet fully covered by a polymer lip. Those cracks, however, disappear at 150 MPa sliding as the coating seems to have limited self-repairing capability, due to local plastification. Further research on the nature of those cracks and eventual relations to the coating drying time was not done, but it was noticed from static compression tests that longer curing times improve coating adhesion. If no polymer lip was applied, coating wear is observed after direct contact with the CFR-E ring at 150 MPa and the coefficient of friction increases to µs1= 0.11 and µd = 0.07.

Chapter 11. Design of high-loaded polymer bearing elements 359
(b) (a) (c)
Figure 11.8 Zinc-phosphate coating, (a) macrophoto after 150 MPa sliding with stick-marks and print of
polymer pad undulations, and optical microscopy of (b) original coating, (c) 150 MPa slid coating 11.2.2.3. Influence of preload and perpendicular wear path After static preload of 75 MPa prior to sliding, the initial static coefficient of friction becomes µs1 = 0.21 at 15 MPa or µs1 = 0.14 at 75 MPa. Static friction is significantly higher than in previous sliding tests from Table 11.5, while dynamic friction is lower af-ter preload. High friction at start µs1 is attributed to bonding (adhesion) of the polymer surface to the soft Zn-phosphate coating and plastic deformation, while lower dynamic friction either results from the height reduction of the surface asperities by creep or from compaction and orientation of the crystalline lamellae structure of polyethylene [11.15]. Intermediate wear motion perpendicular to the friction test shows increasing friction with ongoing perpendicular sliding to µd,min = 0.16 at 15 MPa, µd,min = 0.11 at 30 MPa or µd,min = 0.05 at 150 MPa compared to Table 11.5. The effect of a cross-path motion on wear of UHMWPE was described by Turell et al. [11.16] for small-scale samples and explained by orientation of the molecular chains. Previous studies showed that motion in the perpendicular sliding path leads to mainly plastic deformation and molecular orientation, whereas motion in the sliding test direction leads to material removal by intermolecular splitting. Present large-scale tests do however not reveal excess wear compared to single reciprocating motion. Multi-directional motions were simulated on small-scale by e.g. Wang et al. [11.17] and explained by the energy dissipation in each of the sliding directions. 11.2.2.4. Influence of external grease lubricant Lubricating dimples are foreseen on the top surface of the hybrid UHMWPE pad. Exter-nal grease is not favourable in lowering friction at 150 MPa as it is squeezed out of the interface and similar low friction of µd,min = 0.02(5) is attained at working conditions. After sliding, visco-elastic deformation around the dimples is recovered. Due to easy manufacturing by moulding, dimples are maintained in the final design as they do not influence sliding and serve as eventual traps for dust [11.18].
1 mm
1 mm
1 mm

Chapter 11. Design of high-loaded polymer bearing elements 360 Validation tests and evaluations of statistical representativity for dynamic sliding for hybrid UHMWPE pads are given in Table 11.6, comparing tests at Ghent University and Stuttgart University. For sliding conditions of 30 MPa without preload, the largest devi-ation occurs in static friction at start µs1. Other friction values show max ± 6% variation. Table 11.6. Evaluation of statistical significance of large-scale sliding tests on hybrid UHMWPE pads with different diameter compared on Ghent University and Stuttgart University tribotesters
Zn-coated counterface
static friction dynamic friction Test rig equipment and contact pressure (MPa)
µs1 µs,min µs,max µd,min µd,max
Ghent University tribotester 30 MPa no preload
30 MPa ”
30 MPa ”
0.10
0.09
0.11
0.08
0.08
0.08
0.09
0.09
0.10
0.07
0.07
0.07
0.08
0.08
0.09
diam
175
mm
150 MPa no preload
150 MPa ”
150 MPa ”
0.03
0.03(5)
0.03
0.02(5)
0.02(5)
0.02(5)
0.03
0.03
0.03
0.02
0.02(5)
0.02
0.02(5)
0.02(5)
0.02(5)
diam
150
mm
Stuttgart University tribotester 30 MPa no preload
30 MPa preloaded
30 MPa with 100 m wear path
30 MPa with 200 m wear path
30 MPa with 300 m wear path
0.14
0.21
0.09
0.10
0.11
0.08
0.06
0.10
0.11
0.12
0.09
0.08
0.10
0.11
0.12
0.08
0.04
0.08
0.10
0.11
0.08
0.05
0.09
0.10
0.11
A design coefficient of friction for the ball-joint was determined, using a modelling factor χm = 1.25 on the experimental friction after an intermediate wear path of 300 m: • The global design criterion for friction does not assume that each pad is simulta-
neously subjected to maximum static friction, but roll and slip motion of the ball-joint causes 80 % of the pads to slide dynamically and 20 % of the pads to break from the ball counterface and overcome static friction. The global design coefficient of friction µG;d is estimated from Formula (11.3):
)20.080.0( 1max,; sdmdG µ+= µχµ = 0.22 (11.3)
• The local design coefficient of friction considers the maximum friction force on one single hybrid UHMWPE pad during the first sliding stroke (Formula 11.4) and subsequent sliding strokes (Formula 11.5):
1,1; smdsL µχµ = = 0.26 (11.4) max,,; smdsnL µχµ = = 0.21 (11.5) Design coefficients of friction show that global values are below the design limit of µG;d < 0.25. Present solution fits the strength requirements of the steel structure. The UHMWPE/Zn-coating contact has a considerably long running-in phase, however, with high initial static friction. The contact stresses at the back, front and bottom chairs during floating are lower than steady-state contact and higher friction is then tolerated.

Chapter 11. Design of high-loaded polymer bearing elements 361 11.3. Local analysis of constrained bearing elements In a first part, the stress distribution and deformation at the sliding surface or in the polymer bulk are evaluated for a constrained polymer pad. In a second part, contact with a convex counterface and influence of CFR-E ring at high load are considered.
11.3.1. Preliminary study on different pad geometries by two-dimensional FEM-
simulation at low load A preliminary two-dimensional finite element model is used to calculate stresses and deformation on a single constrained bearing element (Solico BV, EMRC-NISA software). Normal loads are applied along the Z-axis by a flat counterface and radial direction appears along the X-axis. In present simulation, a constrained bearing element with homogeneous elastic properties (no CFR-E ring) is used to study the stability of the free top surface and the influence of the fixation method during short-time and long-time loading. It is concluded that a hydrostatic stress situation governs in the polymer bulk, while stress concentrations at the top surface are different and cause plastic deformation. Those stresses are important for hybrid UHMWPE pads causing extrusion (cold-flow) of the polymer lip, while they are detrimental for polyester/polyester pads causing failure. The pad geometry affects the deformation behaviour mainly at 10 to 50 MPa. At higher loads, the constraining action of the steel sample holder determines an apparent modulus and ensures stability with representative creep (Figure 11.5). Deformation at 10, 30 and 50 MPa is therefore detailed for short-term (i.e. immediate or ‘elastic’ deformation) and long-term (i.e. ‘visco-elastic deformation’ or creep) loading, with following parameters: • The pad thickness t = 17, 34, 51 mm and diameter D = 150, 225, 300 mm, • The Young’s modulus E = 750, 1000 and 3000 MPa, • Two fixation methods of the pads are applied: (i) tight fitting in the steel sample
holder with given tolerances (Type I), and (ii) grooves in the polymer part containing a rubber O-ring (Type II) for axial fixation.
11.3.1.1. Short-time loading (static deformation) The axial compression, radial expansion and Von Mises stress in a constrained bearing element are illustrated in Figure 11.9 for two fixation types. For short-time deformation, the axial compression increases for thicker pads, while a change in pad diameter has small influence on the axial compression due to radial constraint. Details about modelling can be found in [11.19] with different stresses in the bulk or surface: • In the polymer bulk, a complex stress situation occurs with Von Mises stresses of 10
to 18 MPa at 30 to 50 MPa loading. The polymer bulk is under elastic conditions with a Von Mises stress below the yield strength. Stresses in the polymer bulk are lower than estimated contact pressures from normal loads. The constraint by perfect fitting between a polymer pad and the steel holder implies a hydrostatic stress con-dition. This stress state most likely acts near the walls, where the Von Mises stress is lower than in the polymer bulk for a Type I pad. Stress concentrations near the grooves for a Type II pad indicate that the yield strength is locally exceeded at 30 to 50 MPa loading, but they have no influence on the short-time loading characteristic.

291
Type I pad with free top surface and fitting tolerances (p = 50 MPa) Type II pad with polymer grooves (p = 30 MPa)
Composite pad RR23
11
Von Mises stress (MPa)
Z-displacement (mm)
Z-displacement (mm)
Effective stress (MPa)
X-displacement (mm)
Composite pad
3
Z-displacement (mm)
X-displacement (mm)
Von Mises stress (MPa)
Figure 11.9 Illustration of finite element analysis for stresses and deformation of constrained polymer pads during short-time loading at p = 50 or 30 MPa (Solico BV)
Chapter 11. D
esign of high loaded polymer bearing elem
ents 362

Chapter 11. Design of high loaded polymer bearing elements 363 • Near the polymer sliding surface, which is not constrained by the sample holder, the
calculated Von Mises stress on a Type I pad is 32 MPa at 50 MPa loading. It exceeds the yield strength and explains either the deformation for polyester/ polyester pads or cold-flow in the UHMWPE polymer lip to protect the CFR-E ring. A radial displacement at the free top surface of 0.08 mm at 30 MPa to 0.17 mm at 50 MPa was calculated. Regular flow of the polymer lip was seen during immediate loading (short-time) without long-term visco-elastic deformation of the bulk.
11.3.1.2. Long-time loading (creep deformation) During long-time deformation, creep causes (i) self-stabilising extrusion at the top sur-face, and (ii) yielding near the fixation grooves. These effects are completely detailed in ref. [11.19] with simulations and main conclusions for both effects are given below: • At the top polymer surface, radial deformation is simulated as viscous polymer flow
between the CFR-E ring and counterface. This is equivalent to polymer extrusion through a small ‘die’ geometry with length L and height H. At constant normal load, the extrusion rate diminishes with loading time as the extrusion length L increases, the height H decreases and the local pressure p decreases by increasing contact area: the extrusion of the polymer lip stabilises in time through decreasing extrusion rate. The simulations for lubricated contact (friction µ < 0.05) and unlubricated sliding (friction µ = 0.10 to 0.15) show that extrusion rate is lower in the latter case.
• In the polymer bulk, the variation in fixation grooves radii with loading time is also
simulated by polymer extrusion through a gap with appropriate geometry. At con-stant normal load, the deformation of grooves is relatively slower than the extrusion on top of the CFR-E ring, due to higher stress concentrations in latter case and hy-drostatic stresses in the polymer bulk. After recovery at 50 MPa, permanent defor-mation near the groove accounts for 0.50 mm non-reversible axial compression.
The axial compression of a constrained polymer pad consists of a short-term (elastic) and a long-term component (creep). Mainly the latter is influenced by pad geometry and extrusion of the polymer lip at the top surface. The total creep depends on the elasticity modulus and pad geometry: for reasons of low creep the pad diameter should be chosen as large as possible [11.19]. Present parametric study in combination with practical considerations resulted in the nominal pad diameter of 250 mm. 11.3.2. Local design analysis by three-dimensional FEM-simulation at high load A three-dimensional finite element model is used to simulate the contact between a flat polymer and a convex counterface (radius 5000 mm). The action of a reinforcing CFR-E ring is detailed as a load transferring element between the polymer and the steel holder. It is concluded that full contact occurs above 50 MPa with important stress concentra-tions near the polymer lip. Due to constraint at high loads, there is a transition from bulk modulus into apparent modulus that is determined by the test geometry. For present model (Figure 11.10), a normal load is applied in the centre of the polymer pad parallel to the Z-axis (axial direction) and friction effects are additionally simulated

Chapter 11. Design of high loaded polymer bearing elements 364
Figure 11.10 Three-dimensional finite element model for a constrained hybrid UHMWPE pad
(Solico BV)
by applying a shear force in X direction. Nodes on the bottom of the holder are vertically fixed and horizontally free, assuming that no forces are transmitted. On the radial edge, the size of contact elements is smaller to simulate the contact between the CFR-E ring and the steel holder. The steel part is modelled as pure elastic material. The build-up of a hydrostatic pressure under loading is simulated by avoiding extrusion of the poly-ethylene bulk modulus in the extrusion gap. Therefore, the polyethylene lip is modeled as purely elastic without visco-elastic or time-dependent properties (paragraph 11.3.1). 11.3.2.1. Influence of counterface geometry: contact model A convex counterface causes an inhomogeneous distribution of the contact pressure over the polymer surface. Hertz theories for point contact cannot be applied, as they assume an infinite small and continuous contact surface in contrast to present situation of a facetted convex surface in contact with multiple bearing elements. The contact diameter between a convex counterface and a hybrid UHMWPE pad with a CFR-E ring during short-time loading at 0 to 50 MPa is calculated in Figure 11.11a as a function of the apparent contact pressure. The latter is calculated for a nominal pad diameter and represents an average contact pressure on the bottom of the sample holder. The contact pressure on the polymer surface over the pad radius is plotted in Figure 11.11b. The contact starts from a point contact and mainly increases under elastic deformation (p < 20 MPa). In this load range, also a complex stress-strain characteristic was experienced in parallel to the variation in contact geometry (Figure 11.4). At 30 MPa, the real contact pressure becomes higher near the borders of the polymer pad, implied by the CFR-E ring. This is favourable for extrusion of the polymer lip as soon as the steel counterface makes contact with the CFR-E ring. At lower loads, extrusion is not necessary as no direct contact happens between the CFR-E ring and counterface. Full contact occurs above 50 MPa and both the apparent and real contact pressure become similar. This transition was also noticed in experimental compression tests (Figure 11.4).
y
z
x
Symmetrical plane

Chapter 11. Design of high loaded polymer bearing elements 365 (a) (b)
Figure 11.11 Contact between a hybrid UHMWPE pad and a convex steel counterface, (a) evolution of the contact diameter with applied contact pressure, (b) contact pressure over contact
area between polymer pad and convex counterface for different applied normal pressures (Solico BV)
The normal stress σZZ over the cross-section (thickness) of a hybrid UHMWPE pad is plotted in Figure 11.12 at 2 to 50 MPa apparent contact pressures. At low contact pressures (2 MPa), the normal stress strongly varies over the pad radius attaining σZZ = 12 MPa in the centre of the pad. At intermediate contact pressures (16 MPa), the yield strength is locally exceeded with σZZ = -30.5 MPa in the centre of the pad. At high contact pressures (50 MPa), full contact occurs and the normal stress σZZ = -60 MPa becomes more homogeneous. It is important to note a positive normal stress near the polymer lip and the CFR-E ring influencing the deformation and extrusion of the polymer lip. Compared to the stress distribution near the polymer sliding surface in Figure 11.9 at 50 MPa, differences are attributed to the effect of a convex counterface. 11.3.2.2. A transition in elasticity modulus at high loads for constrained polymer pads Experimental compression tests and simulations confirm that plasticity of a hybrid UHMWPE pad occurs above 50 MPa. The initial clearance between the polymer pad and steel sample holder then disappears by deformation and total constraint. The deformation of the polymer pad is affected by a hydrostatic stress state and stiffness increases to approximately 5000 kN/mm for both hybrid UHMWPE and polyester/polyester pads.
Contact radius of hybrid UHMWPE pad (mm)
Con
tact
pre
ssur
e (M
Pa)
10
20
30
40
50
60
70
0 50 75 100 125 25
0.2 MPa
2 MPa 6 MPa
14 MPa
22 MPa 33 MPa
40 MPa
50 MPa p =
60 0 10 20 30 40 50
50
0
100
150
200
250
Apparent contact pressure (MPa)
Con
tact
diam
eter
(mm
)

Chapter 11. Design of high loaded polymer bearing elements 366
σZZ (MPa)
σZZ (MPa)
σZZ (MPa)
σZZ (MPa)
(a) (b) (c) (d)
Figure 11.12 Distribution of normal stresses σZZ with evolution of the contact between a convex steel counterface and hybrid UHMWPE pad under low loads, (a) 100 kN or 2 MPa, (b) 800 kN or 16 MPa,
(c) 1700 kN or 35 MPa, (d) 2500 kN or 51 MPa (Solico BV) The stiffness of constrained polymer pads at high loads is not only determined by intrinsic material’s properties, but depends on constraint of the sample holder. Therefore, also the test geometry has important influence. An apparent modulus or a bulk-modulus rather than the Young’s modulus should be used, depending on the normal load relatively to the yield stress: the stiffness at low loads is determined by a bulk modulus while it turns into an apparent modulus at high loads. For isotropic structures, a compressive bulk modulus can be calculated from the Young’s modulus E and Poisson coefficient ν (Formula 11.6):

Chapter 11. Design of high loaded polymer bearing elements 367
0
20
40
60
80
100
120
140
160
0 1 2 3 4 5 6 7 8 9 10
Compressive strain ε (%)
Apparent modulus
Bulk modulus
Yield point
(a)
(b) (c)
Compressive strain ε (%)
Con
tact
pre
ssur
e (M
Pa)
)(Emodulus bulk
ν213 −= (11.6)
For constrained orthotropic structures (i.e. three perpendicular planes of symmetry), however, no unique formula is available and a simulation was made for different materials [11.19]: (i) for soft materials with E = 750 MPa, the bulk modulus is 1250 MPa and apparent modulus is 1600 MPa, (ii) for materials with intermediate stiffness E = 1000 MPa, the bulk modulus is 1650 MPa and apparent modulus is 2100 MPa, for materials with high stiffness E = 3000 MPa, the apparent modulus rises to 5500 MPa. The geometrical influence on the stress-strain characteristics of a constrained composite pad with zero initial clearance is calculated in Figure 11.13, for a bulk polymer with Young’s modulus E = 1000 MPa and yield strength 60 MPa (representative for polyester/polyester) or 20 MPa (representative for UHMWPE). Two conditions are compared: curve (a) is for a constrained polymer pad with free top surface and flat counterface (Type I pad), or curves (b, c) are for constrained polymer pads with additional CFR-E ring for stabilisation of the top surface and convex counterface. A difference in stiffness at low loads is attributed to the reinforcing CFR-E ring and a tri-linear characteristic is used for local analysis of a pad. For simulation of the strength of the global steel structure, a bi-linear function can be used. These curves agree with the observed experimental deformation of a hybrid UHMWPE polymer pad during a second loading step, i.e. with perfect fitting and zero clearance. Compared to experimental data during the first loading step of a hybrid UHMWPE pad (Figure 11.4), the initial clearance in the latter case influences the deformation at low loads, but this zone is eliminated during a second loading step. A similar increase in stiffness is experimentally noted. The effectiveness of a reinforcing ring in obtaining a high apparent modulus is demonstrated and important for the global stiffness. As illustrated in paragraph 11.1.2, the latter determines the functionality of the ball-joint and deformation of local polymer pads contributes to higher contact pressures.
Figure 11.13 Transition from apparent modulus to bulk modulus for constrained bearing elements depending on the loading geometry, (a) Type I pad with free top surface for intermediate Young’s modulus E = 1000 MPa, (b) hybrid UHMWPE pad with reinforcing CFR-E ring (local analysis),
(c) hybrid UHMWPE pad with reinforcing CFR-E ring (global analysis)

Chapter 11. Design of high loaded polymer bearing elements 368 Present deformation model confirms experimental data that was obtained in previous Chapters. Static compression tests of unreinforced bulk polymer samples on large-scale tests revealed a transition in visco-elastic deformation through constraint of the sample holder for polyamides (Chapter 8), polyacetals (Chapter 9) or polyesters (Chapter 10). The transition for the unreinforced thermoplastics was somewhat lower than for present reinforced hybrid UHMWPE pad, representing additional constraint of a CFR-E ring. It was demonstrated, moreover, that a transition in deformation coincides with a transi-tion in temperature model for calculating the maximum polymer surface temperature T*. For present hybrid UHMWPE discs, the temperatures rise to T* = 56°C at 15 MPa, T* = 90°C at 60 MPa, T* = 120°C at 120 MPa and T* = 130°C at 150 MPa. The melting is not observed and deformation of the polymer lip clearly is governed by visco-elastic deformation. For polyester/polyester, the temperature rise to T* = 160°C at 150 MPa. 11.4. Creep reinforcement design with a composite ring The dimensional stability of thermoplastics at high loads should be ensured by a reinfor-cing carbon fiber/epoxy (CFR-E) ring, but full-scale tests reveal fracture of those rings. Interpretation of finite element analysis (Solico BV) shows that shear fracture is caused by radial-axial shear stresses. These stresses are scaled towards representative small-scale short-beam shear (SBS) and unidirectional compression (UC) tests on CFR-E ring segments. Failure is avoided by modifying the ring geometry and production process. 11.4.1. Full-scale fracture phenomena 11.4.1.1. Observations of full-scale failure The CFR-E rings after static and/or dynamic testing at 150 MPa show circumferential splitting of the carbon fibers in the zone above the machined edge (Figure 11.14). The CFR-E ring is made by a hoop winding process with a composition detailed in Chapter 3 (paragraph 3.2.4). Splitting along the hoop winding direction was identically observed by Liu et al. [11.20] for E-glass fiber/epoxy composites and is characteristic for 90° winding angles. Failure was then attributed to interlaminar delamination and could be reduced by filament winding of hybrid composites [11.20]. The fracture of different CFR-E ring cross-sections was investigated with straight edges, inclined edges with variable angle and round edges (Figure 11.15). Shear failure initiates at the machined edge or near the top of the ring and propagates through the bulk at 30 to 45° directions, possibly dividing into multiple cracks. A specific curvature radius R = 1 to 4 mm is required for the machined edges, while fine cracks are observed. As no transverse cracks are observed, however, the structural integrity and strength of the CFR-E ring under full load is not affected and ensures retaining of the central polyethylene part. The permanent radial deformation of the CFR-E ring is 0.07 to 0.17 mm [11.19], showing that it bears large deformation implied by high tangential and radial stresses. Catastrophic failure in radial direction due to fiber fracture is not observed, but shear failure causes detrimental contact between loose carbon fibers and the sliding counter-face with unstable lip deformation, high wear and high friction.

Chapter 11. Design of high loaded polymer bearing elements 369
Figure 11.14 Side-view on fracture of CFR-E rings after full-scale loading at 150 MPa (I = initiation)
Straight edge Inclined edge Round edge
Figure 11.15 Cross-section of different CFR-E ring geometries and failure after large-scale testing
Cracking is reduced in the final design with round edges, but some fine crack initiation is still observed without propagation towards the top surface of the ring. In 50 % of the tests on round edged CFR-E reinforcing rings no cracks were observed. Based on the typical crack direction, internal delamination of the CFR-E composite due to concentrated shear forces is most likely and is further analysed by stress modelling. Nevertheless, cracks did not completely disappear after reducing stress concentrations by applying round edges instead of straight or inclined ones. As a particular case, also one static compression test on a straight edged CFR-E ring to 150 MPa did not reveal damage. It is therefore concluded that additional to stress concentrations, also the com-posite composition should be controlled within narrow tolerances (paragraph 11.4.3).
UHMWPE Polymer lip Circumferential splitting of carbon fibers
machined edge
I I I
1.5 ± 0.1
R3
R5
R1
5 ±
0.1
7
± 0
.1
24.
5 ±
0.1
4 ± 0.14.
7 ±
0.1
7.4
± 0.
1
24.2
± 0
.1
R5
R4
66° R3
5 ± 0.1
4.6
± 0.
1
5.6
± 0.
1
24 ±
0.1
R5.7
R5
R3
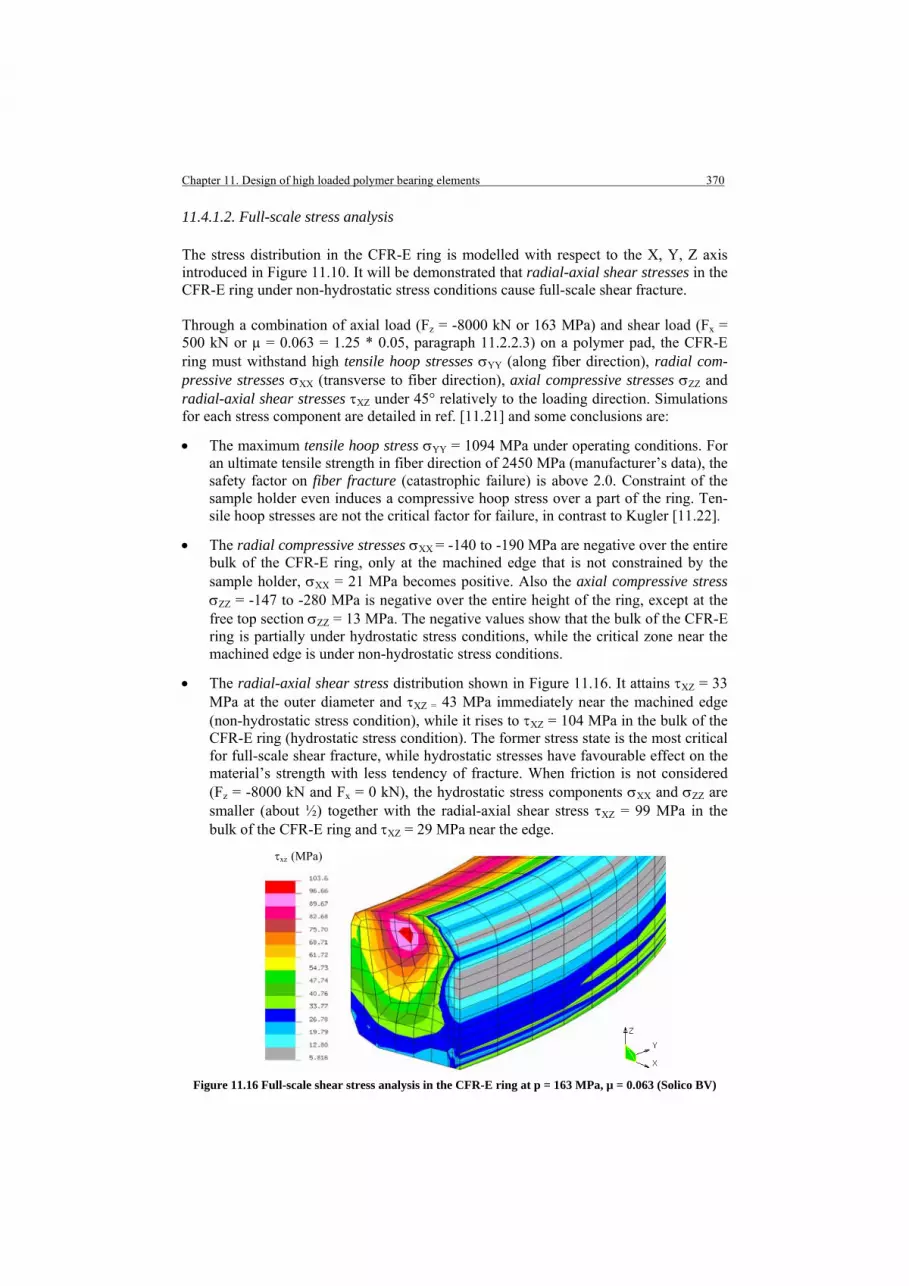
Chapter 11. Design of high loaded polymer bearing elements 370 11.4.1.2. Full-scale stress analysis The stress distribution in the CFR-E ring is modelled with respect to the X, Y, Z axis introduced in Figure 11.10. It will be demonstrated that radial-axial shear stresses in the CFR-E ring under non-hydrostatic stress conditions cause full-scale shear fracture. Through a combination of axial load (Fz = -8000 kN or 163 MPa) and shear load (Fx = 500 kN or µ = 0.063 = 1.25 * 0.05, paragraph 11.2.2.3) on a polymer pad, the CFR-E ring must withstand high tensile hoop stresses σYY (along fiber direction), radial com-pressive stresses σXX (transverse to fiber direction), axial compressive stresses σZZ and radial-axial shear stresses τXZ under 45° relatively to the loading direction. Simulations for each stress component are detailed in ref. [11.21] and some conclusions are:
• The maximum tensile hoop stress σYY = 1094 MPa under operating conditions. For an ultimate tensile strength in fiber direction of 2450 MPa (manufacturer’s data), the safety factor on fiber fracture (catastrophic failure) is above 2.0. Constraint of the sample holder even induces a compressive hoop stress over a part of the ring. Ten-sile hoop stresses are not the critical factor for failure, in contrast to Kugler [11.22].
• The radial compressive stresses σXX = -140 to -190 MPa are negative over the entire bulk of the CFR-E ring, only at the machined edge that is not constrained by the sample holder, σXX = 21 MPa becomes positive. Also the axial compressive stress σZZ = -147 to -280 MPa is negative over the entire height of the ring, except at the free top section σZZ = 13 MPa. The negative values show that the bulk of the CFR-E ring is partially under hydrostatic stress conditions, while the critical zone near the machined edge is under non-hydrostatic stress conditions.
• The radial-axial shear stress distribution shown in Figure 11.16. It attains τXZ = 33 MPa at the outer diameter and τXZ = 43 MPa immediately near the machined edge (non-hydrostatic stress condition), while it rises to τXZ = 104 MPa in the bulk of the CFR-E ring (hydrostatic stress condition). The former stress state is the most critical for full-scale shear fracture, while hydrostatic stresses have favourable effect on the material’s strength with less tendency of fracture. When friction is not considered (Fz = -8000 kN and Fx = 0 kN), the hydrostatic stress components σXX and σZZ are smaller (about ½) together with the radial-axial shear stress τXZ = 99 MPa in the bulk of the CFR-E ring and τXZ = 29 MPa near the edge.
Figure 11.16 Full-scale shear stress analysis in the CFR-E ring at p = 163 MPa, µ = 0.063 (Solico BV)
τxz (MPa)

Chapter 11. Design of high loaded polymer bearing elements 371 11.4.2. Small-scale verification A critical radial-axial shear stress causes CFR-E ring failure in full-scale tests. This stress, acting in a section of the CFR-E ring under non-hydrostatic conditions, should be representatively simulated in a selection criterion on small-scale short-beam-shear (SBS) or uniaxial compression (UC) tests. Finite element analysis was used to verify if small-scale shear stress failure criterions can be formulated under non-hydrostatic stresses similar to full-scale tests. The influence of sample geometry and loading conditions was preliminary studied [11.23]. Some principles and final test results are detailed below. 11.4.2.1. Short-beam-shear (SBS) tests
Figure 11.17 Short-beam-shear (SBS) test for small-scale qualification of CFR-E rings,
(a) experimental test set-up (b) front-view on a SBS test with real ring geometry Small-scale short-beam-shear (SBS) tests are done on CFR-E ring segments according to Figure 11.17a to determine the interlaminar shear strength τ (ILSS) from formula (11.7), for a normal load FN at failure, w the width and t the thickness of the segment:
wtFN
43
=τ (11.7)
The normal load is applied along the X-axis, the Y-axis is parallel to the fiber orientation and the Z-axis represents the sample thickness. Consequently, σXX corresponds to the ra-dial compressive stress in full-scale tests, σYY is the tensile hoop stress and σZZ corres-ponds to the axial compressive stress. The radial-tangential shear stress τXY or ILSS is a representative stress for qualification of the full-scale radial-axial shear stress τXZ. Rings with different cross-section geometries and similar production quality were loaded (test procedure detailed in [11.23]): (i) ring geometries according to ASTM D 2344 standards (thickness 6 mm, width 24 mm, span 24 mm) with cylindrical supports, (ii) rectangular section rings (thickness 15 mm, width 17 mm, span 80 mm) with flat supports, (iii) rectangular section rings (thickness 20 mm, width 30 mm, span 80 mm) with flat supports and (iv) finished or machined section rings (thickness 20 mm, width 24 mm, span 80 mm, cross-section 472 mm2) with flat supports (Figure 11.17b).
R 5
Span 80
93
Machined edge
R 104.5
x z
y
FN
(a) (b)
w

Chapter 11. Design of high loaded polymer bearing elements 372
0
5
10
15
20
25
30
35
40
0.0 0.5 1.0 1.5 2.0 2.5 3.0
Displacement (mm)
Nor
mal
forc
e (k
N)
(i)
(ii)
(iii) (iv)
Nor
mal
load
(kN
)
Figure 11.18 Normal load versus displacement characteristic for different CFR-E ring geometries loaded
in a small-scale SBS test (numbers (i) to (iv) refer to text and geometries in Figure 11.19)
Figure 11.19 Failure mode of CFR-E rings with different cross section after SBS test
Some normal load versus displacement curves are plotted in Figure 11.18, indicating statistical representativity of test results for each configuration. The ILSS for each beam geometry is calculated from formula (11.7) using the experimental normal load at failure (i.e. the maximum load in Figure 11.18) and the cross-sectional area of the beam, which is accurately measured with a profilometer. The ILSS or radial-tangential shear stress τXY for each test geometry is (i) 67 to 69 MPa (12.7 to 12.8 kN) on ASTM standard geometries with cylindrical supports, (ii) 51 to 54 MPa (32.7 to 34.6 kN) on small rectangular section rings, (iii) 39 to 42 MPa on large rectangular section rings, and (iv) 48 to 50 MPa (30.5 to 31.1 kN) on real CFR-E ring geometries. A fit-to-purpose test on real CFR-E ring geometries is clearly required to evaluate the composite strength. Standardised methods overestimate the strength because they do not account for stress concentrations introduced on machined section rings. By comparing either convex or concave loaded beams [11.23], the radial-tangential stress τXY is 1.4 times higher for concave than for convex geometries: small-scale loading of a convex geometry is preferred because it is more conservative to determine a critical shear strength. Convex geometries have higher stresses in the bulk of the CFR-E ring with symmetrical stress distribution. Figure 11.19 shows that CFR-E beams failed by interlaminar shear and additional fracture near the machined edge is observed for the test (iv) specimen.
(ii)
(iii)
(iv) (i)
x
z

Chapter 11. Design of high loaded polymer bearing elements 373 Stress analysis of a SBS-loaded beam was done by 3D finite element calculations [11.21, 11.23], showing that a hydrostatic stress condition occurs near the flat loading supports (σXX = -20 MPa, σYY = -240 MPa, σZZ = -25 MPa). Non-hydrostatic stress conditions similar to full-scale tests are observed in the centre of a beam. The latter are most critical and can be used as a representative stress situation for full-scale failure. The distribution of σXX (radial compressive stress) and τXY (radial-tangential shear stress) is illustrated in Figure 11.20 for a small-scale beam loaded at 27 kN normal load. The shear stress in the centre of the beam is τXY = 43 MPa and corresponds to the value of 33 MPa found in full-scale modelling with a safety factor of 1.3 (Figure 11.16) immediately near the machined edge. For small-scale testing, there is a sharp variation in radial-tangential shear stress τXY = 0 to 30 MPa over the machined edge. The shear stress distribution is not symmetrically with respect to a vertical plane cut nor through the entire sample thickness due to local stress concentrations near the machined edges. It is shown that those stress distributions influence the measured strength in present ‘Maeslant-test’.
(a) (b)
Figure 11.20 Small-scale stress analysis for a SBS test on a CFR-E beam at 27 kN normal load, (a) radial compressive stress, (b) radial-tangential shear stress 43 MPa in centre (Solico BV)
11.4.2.2. Uniaxial compression (UC) tests Small-scale uniaxial compression (UC) tests are done with CFR-E specimens centred between two circular plates and loaded at 0.9 mm/min (Figure 11.21a). As the original CFR-E ring section is difficult for interpretation, segments with a square cross section and curved length are machined from the bulk of the CFR-E ring (Figure 11.21b, 11.21c). This is a time-consuming operation with extremely high cost and, however, only a limited number of UC tests were performed. Tests allow to determine the radial-axial shear strength τXZ (perpendicular to fiber orientation), according to ASTM D695-77. The compressive strength is calculated from formula (11.8):
eff
N
AF
=maxσ (11.8)
τXY (MPa) σXX (MPa) Loading support
Normal load

Chapter 11. Design of high loaded polymer bearing elements 374 (a)
Figure 11.21 Uniaxial compression (UC) test for small-scale qualification of CFR-E rings, (a) experimental test set-up (b) top view on a UC test sample, (c) cut of UC test sample from CFR-E ring
where FN is the normal load at failure, Aeff is the effective surface area calculated from values T1 (16.4 mm < T1 < 18.2 mm), T2 (15.2 mm < T2 < 16.5 mm) and R1 = 14.5 mm. Small variations in geometry are attributed to the difficult machining operations. The sample thickness is 17 mm. The nominal contact surface area is 204.36 mm2. The maximum compressive force varies for different CFR-E ring geometries shown in Figure 11.15, ranging from 17 kN (initial straight edged ring geometry) to 20 kN (incli-ned edge geometry) and 44 kN (final round edge geometry), corresponding to σmax = 90, 104 and 144 MPa respectively. The variation of compressive strength on three separate segments from one ring was 12, 6 and 1.3 % respectively. It does not represent differences in ring geometry, but the influence of different composite qualities. The fracture aspect after failure at maximum load (Figure 11.22) is similar to the radial-axial shear mode failure observed after full-scale testing, with crack propagation under nearly 45° to 60° shear angles. No transverse cracks resulting from buckling were observed.
Figure 11.22 Failure mode of CFR-E rings with different initial geometry after small-scale UC test with different compressive strength, (a) straight edged (90 MPa), (b) inclined edged (104 MPa), (c)
round edged (144 MPa)
R 1
04.5
R 1
24
R 1
09.5
Outer ring geometry removed
R1
R 1
24.5
17
R 109.5
R 124
x
y R1
T1T2
(b) Top view (c) Front view
(a) (b) (c)
z
x

Chapter 11. Design of high loaded polymer bearing elements 375
σXX (MPa) τXZ (MPa)
Stress concentrations in a UC test and an estimation of radial-axial shear strength τXZ from experimental σmax requires FEM analysis [11.21]. Friction between the sample and the compression plate is modelled with fixed nodes on the top surface, resulting in very high stresses appearing at the corners of the specimen in contact with the upper compression plate. The influence of the compression plate roughness was incorporated in the frictional conditions. Hydrostatic stress conditions occur near the corners with compressive stresses σXX = -146 MPa, σYY = -147 MPa and σZZ = -280 MPa (Figure 11.23a). In the centre of the specimen, the compressive stresses σXX and σYY nearly disappear or become slightly positive while only an overall axial compressive stress σZZ = -98 MPa occurs at 20 kN normal load. Most important for shear failure on small-scale UC tests are the maximum radial-axial shear stresses τXZ under 45° relative to the loading direction (Figure 11.23b). Under hydrostatic conditions near the corners of the sample, high shear stresses τXZ = 107 MPa occur. They serve as initiation for fracture as experimentally observed near the edges of the cubic samples and propagation under 60°. While CFR-E bulk material is presently loaded, stress concentrations at the machined edge have no influence. In the central zone, τXZ = 46 MPa corresponds to half the measured compressive stress σmax = 98 MPa. The critical radial-axial shear stress τXZ can be estimated from the load at failure in a UC test and is representative for the parts of the CFR-E ring under non-hydrostatic stress, being most critical for full-scale fracture. (a) (b)
Figure 11.23 Small-scale stress analysis for a UC-test on a CFR-E beam at 20 kN normal load, (a) radial compressive stress, (b) radial-tangential shear stress 46 MPa in centre (Solico BV)
The friction between the CFR-E sample and the steel plate importantly influences the creation of a hydrostatic (near the corners) and non-hydrostatic (in the centre) stress condition in UC tests. When assuming sliding contact (zero friction) between the CFR-E and the steel plate, there are nearly homogeneous compressive stresses σXX = 0 to -1 MPa and σYY = 0 to -1 MPa in the entire bulk with a constant axial compressive stress σZZ = -98 MPa. Consequently, the radial-axial shear stress τXZ is constant over the entire CFR-E bulk and is not useful in a predictive failure criterion for a CFR-E segment. The real coefficient of friction of the CFR-E ring segment in contact with a steel plate origins from a full-scale sliding test on bearing elements without polymer lip and direct contact between CFR-E ring and its counterface [11.2]. At 150 MPa, µs1 = 0.11 (static coefficient of friction) and µd,min = 0.07 (dynamic coefficient of friction), which is significantly higher than friction of UHMWPE surfaces from Table 11.5.
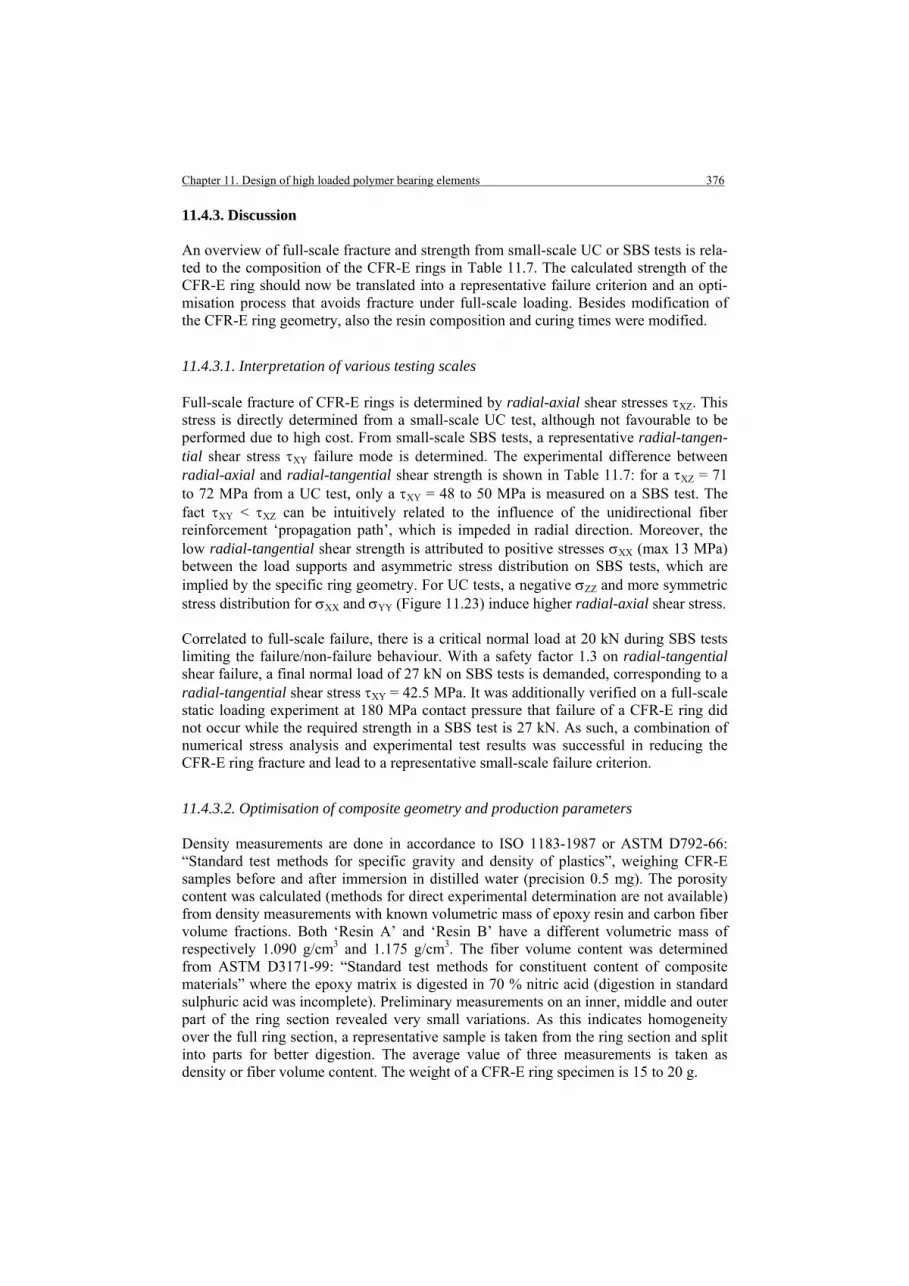
Chapter 11. Design of high loaded polymer bearing elements 376 11.4.3. Discussion An overview of full-scale fracture and strength from small-scale UC or SBS tests is rela-ted to the composition of the CFR-E rings in Table 11.7. The calculated strength of the CFR-E ring should now be translated into a representative failure criterion and an opti-misation process that avoids fracture under full-scale loading. Besides modification of the CFR-E ring geometry, also the resin composition and curing times were modified. 11.4.3.1. Interpretation of various testing scales Full-scale fracture of CFR-E rings is determined by radial-axial shear stresses τXZ. This stress is directly determined from a small-scale UC test, although not favourable to be performed due to high cost. From small-scale SBS tests, a representative radial-tangen-tial shear stress τXY failure mode is determined. The experimental difference between radial-axial and radial-tangential shear strength is shown in Table 11.7: for a τXZ = 71 to 72 MPa from a UC test, only a τXY = 48 to 50 MPa is measured on a SBS test. The fact τXY < τXZ can be intuitively related to the influence of the unidirectional fiber reinforcement ‘propagation path’, which is impeded in radial direction. Moreover, the low radial-tangential shear strength is attributed to positive stresses σXX (max 13 MPa) between the load supports and asymmetric stress distribution on SBS tests, which are implied by the specific ring geometry. For UC tests, a negative σZZ and more symmetric stress distribution for σXX and σYY (Figure 11.23) induce higher radial-axial shear stress. Correlated to full-scale failure, there is a critical normal load at 20 kN during SBS tests limiting the failure/non-failure behaviour. With a safety factor 1.3 on radial-tangential shear failure, a final normal load of 27 kN on SBS tests is demanded, corresponding to a radial-tangential shear stress τXY = 42.5 MPa. It was additionally verified on a full-scale static loading experiment at 180 MPa contact pressure that failure of a CFR-E ring did not occur while the required strength in a SBS test is 27 kN. As such, a combination of numerical stress analysis and experimental test results was successful in reducing the CFR-E ring fracture and lead to a representative small-scale failure criterion. 11.4.3.2. Optimisation of composite geometry and production parameters Density measurements are done in accordance to ISO 1183-1987 or ASTM D792-66: “Standard test methods for specific gravity and density of plastics”, weighing CFR-E samples before and after immersion in distilled water (precision 0.5 mg). The porosity content was calculated (methods for direct experimental determination are not available) from density measurements with known volumetric mass of epoxy resin and carbon fiber volume fractions. Both ‘Resin A’ and ‘Resin B’ have a different volumetric mass of respectively 1.090 g/cm3 and 1.175 g/cm3. The fiber volume content was determined from ASTM D3171-99: “Standard test methods for constituent content of composite materials” where the epoxy matrix is digested in 70 % nitric acid (digestion in standard sulphuric acid was incomplete). Preliminary measurements on an inner, middle and outer part of the ring section revealed very small variations. As this indicates homogeneity over the full ring section, a representative sample is taken from the ring section and split into parts for better digestion. The average value of three measurements is taken as density or fiber volume content. The weight of a CFR-E ring specimen is 15 to 20 g.

Chapter 11. Design of high loaded polymer bearing elements 377 Table 11.7. Evaluation of full-scale fracture, small-scale shear stress τXZ (radial-axial) from UC tests or small-scale shear stress τXY (radial-tangential) from SBS tests and composite composition
UC-test strength SBS-test strength Composition CFR-E ring geometry
Full-scale
fracture at 150 MPa
σmax (MPa)
τXZ (MPa)
FN, max (kN)
τXY (MPa)
Density (g/cm3)
Fiber (%)
Porosity (%)
Resin (%)
Resin A
Yes 86
43
17 26 1.537 69 3.5 27.5
Resin A
Yes 104
52
18 28 1.546 67 1.9 31.1
Prototype I Resin A
Yes (50 %)
No
(50 %)
not performed*
20 31 1.542 66 1.5 32.5
Prototype II Resin A
No
not performed*
29 47 1.534 60 1.4 38.6
30 49 1.591 64 1.5 34.5
Prototype I Resin B
No 144
72
31 52 1.574 64 0.4 35.6
* only limited tests due to expensive cost and difficult sample preparation
Fiber percentages should be 58 to 64 %, with porosities below 2.5 % and epoxy resin content above 34.5 % [11.1]. Higher fiber and lower resin contents lead to failure as stress concentrations accumulate in the matrix and thus lower transverse shear strength: it could be visually observed from the CFR-E rings that the fractured rings with original composition have a ‘dry’ aspect relatively to the ‘wet’ aspect of the unfailed rings. According to Costa et al. [11.24] CFR-E composites have typical higher void contents compared to other resins for the same manufacturing procedure (5.6 to 1.5 %) and ILSS between 55 and 71 MPa for fabric laminates.
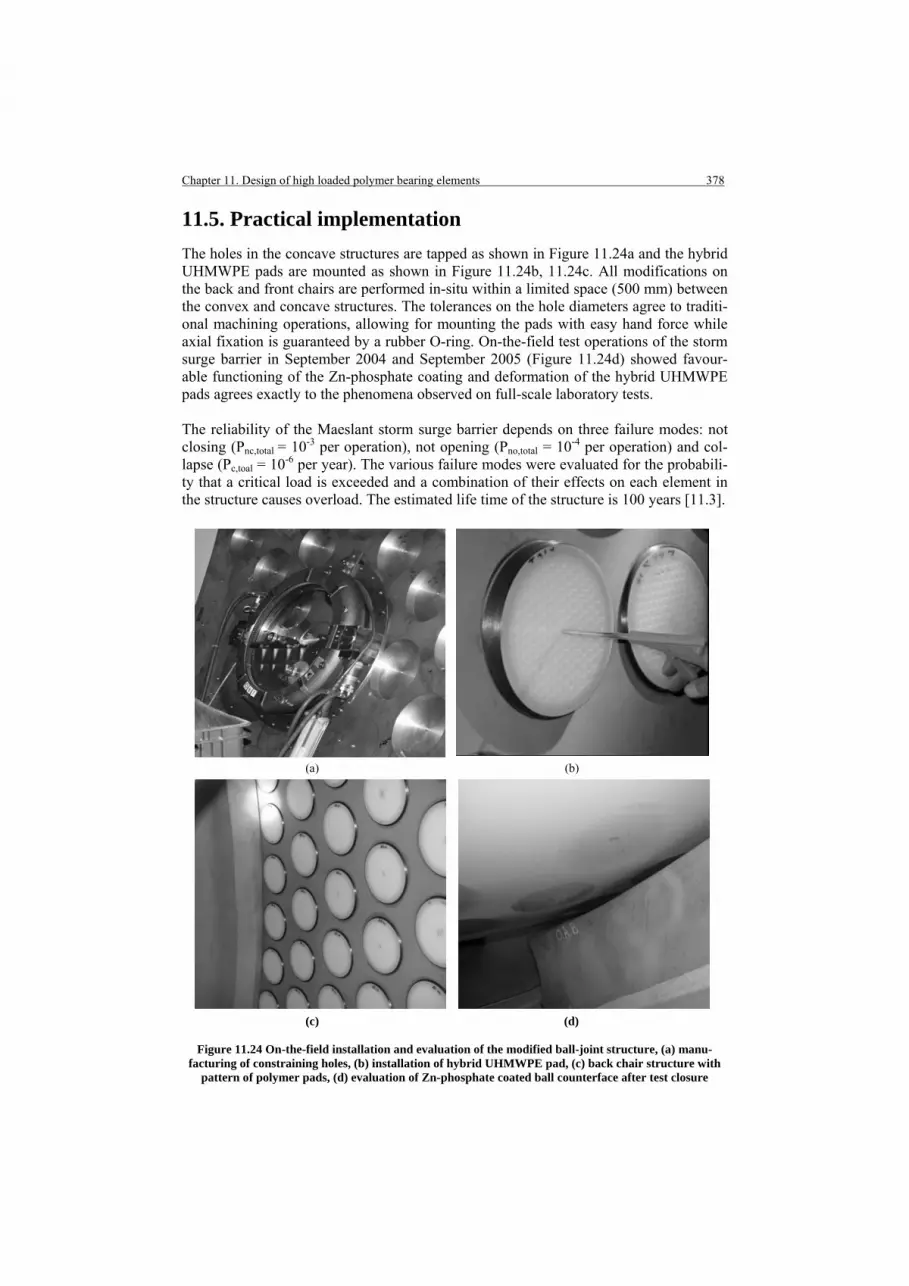
Chapter 11. Design of high loaded polymer bearing elements 378 11.5. Practical implementation The holes in the concave structures are tapped as shown in Figure 11.24a and the hybrid UHMWPE pads are mounted as shown in Figure 11.24b, 11.24c. All modifications on the back and front chairs are performed in-situ within a limited space (500 mm) between the convex and concave structures. The tolerances on the hole diameters agree to traditi-onal machining operations, allowing for mounting the pads with easy hand force while axial fixation is guaranteed by a rubber O-ring. On-the-field test operations of the storm surge barrier in September 2004 and September 2005 (Figure 11.24d) showed favour-able functioning of the Zn-phosphate coating and deformation of the hybrid UHMWPE pads agrees exactly to the phenomena observed on full-scale laboratory tests. The reliability of the Maeslant storm surge barrier depends on three failure modes: not closing (Pnc,total = 10-3 per operation), not opening (Pno,total = 10-4 per operation) and col-lapse (Pc,toal = 10-6 per year). The various failure modes were evaluated for the probabili-ty that a critical load is exceeded and a combination of their effects on each element in the structure causes overload. The estimated life time of the structure is 100 years [11.3].
(a) (b)
(c) (d)
Figure 11.24 On-the-field installation and evaluation of the modified ball-joint structure, (a) manu-facturing of constraining holes, (b) installation of hybrid UHMWPE pad, (c) back chair structure with
pattern of polymer pads, (d) evaluation of Zn-phosphate coated ball counterface after test closure

Chapter 11. Design of high loaded polymer bearing elements 379 11.6. Conclusions Off-shore constructions such as a storm surge barrier protect lowlands against flooding, but its flexibility depends on the functioning of a ball-joint construction. For a maximum transmitted bearing load of 350.106 N, the sliding surfaces of the joint were initially covered with a thin lubricating film. The film provides low friction, but failure of the film leads to delamination and cold-welding. Standard small-scale laboratory tests were not able to simulate the sliding conditions of the bearing surfaces. From global analysis of the bal-joint, test conditions for large-scale testing were determi-ned. The force on an elastic bearing interlayer changes with lower elasticity, higher friction and higher thickness. Through the combined rolling/slip behaviour of the convex surface in contact with concave supports, the bearing force attains extreme positions more rapidly and loads on the construction increase. Single hybrid UHMWPE pads reinforced with a carbon fiber/epoxy (CFR-E) ring were introduced as bearing material. The maximum contact pressure of 150 MPa for a single element depends on the distribu-tion of the pads with nominal diameter 250 mm and local deformation: different design factors were added as a stress intensity factor. An optimum bearing layer thickness of 8 mm translates into pads with thickness 40 mm constrained into 32 mm deep holes. Full-scale experiments on static strength and large-scale experiments on dynamic strength of hybrid UHMWPE pads and polyester/polyester composite pads were done against steel and Zn-phosphate coated counterfaces. Contact between the CFR-E ring and the counterface is avoided by plastic flow of a polymer lip. For homogeneous deformation, the pad diameters should be narrow toleranced and the lip geometry should be carefully selected from sliding and creep tests. Instabilities are attributed to curling after extrusion of polyethylene between the carbon ring and the convex counterface and recovery. The maximum compressive strength of a constrained bearing element is 400 MPa, while sprayed coatings adhere well to the counterface. Static deformation, creep and recovery tests show good statistical representativity and dynamic sliding tests show agreement after inter-laboratorial tests. The dynamic coefficient of friction is very low, i.e. 0.02(5) at 150 MPa by plastic deformation of the surface. Most critical static coeffi-cient of friction occurs after preload and intermediate wear paths. The global design coefficient of friction is 0.22 and a local design coefficient of friction 0.26 is tolerated. Local analysis of constrained polymer elements indicates a bulk modulus at low loads that gradually increases to an apparent modulus at high loads. The bulk of polymer elements is under hydrostatic stress, being different from the free sliding surface. Fracture of the CFR-E ring was observed after full-scale loading of a hybrid UHMWPE pad to 150 MPa, initiating near the machined edge. From finite element analysis, a non-hydrostatic stress state occurs in this zone with radial-axial shear stresses of 33 MPa. In the bulk of the ring, hydrostatic stresses allow for higher shear stresses up to 104 MPa. The former non-hydrostatic stress state is the most critical for failure and a small-scale design criterion was defined for qualifying the composite shear strength under similar stress conditions than full-scale tests. A failure criterion for radial-tangential shear stress is determined from a short-beam-shear test on the real ring geometry. Also uniaxial com-pression tests were considered to determine the radial-axial shear strength. The radial-tangential shear strength is lower than the radial-axial shear strength, as additional stress concentrations implied by the real ring geometry should be taken into account. An

Chapter 11. Design of high loaded polymer bearing elements 380 increase in shear strength of the ring was achieved by changing the edge geometry and control of the production process lowering fiber (< 64 %) and porosity (< 2.5 %) content. References [11.1] Leendertz JS, Van Schepdael L, Van Paepegem W, Samyn P, De Baets P, Degrieck J. Änderungen der
Gelenklagerkonstruktion des Sturmflutsperrwerks bei Rotterdam, Stahlbau 75 (2006), 45-54 [11.2] Samyn P, De Baets P, Van Paepegem W, Van Schepdael L, Suister E, Leendertz JS. Design of a
carbon/epoxy reinforcing ring reducing creep of UHMWPE in high-loaded sliding contacts, Proceedings 8th Internat Conf on Tribology, Veszprem (Hungary), 2004, 89-96
[11.3] Samyn P, Van Paepegem W, Leendertz JS, Suister E, Van Schepdael L, Degrieck J, De Baets P. Global analysis and constructional aspects in the redesign of bearing elements for a movable storm surge barrier, Eng Struct, submitted (2006)
[11.4] Collier JP, Mayor MB, McNamara JL. Analysis of the failure of 122 polyethylene inserts from uncemented tibial knee components, Clin Orthop Rel Res 273 (1991), 232-242
[11.5] Buechel FF, Pappas MJ, Makris G. Evaluation of contact stress in metal-backed patellar replacements, Clin Orthop Rel Res 273 (1991), 190-197
[11.6] Bartel DL, Bicknell VL, Wright TM. The effect of conformity, thickness and material stresses in UHMWPE components for total joint replacement, J Bone Joint Surg A68 (1986), 1041-1051
[11.7] Hayes WC, Lathi VK, Takeuchi TY. Patello-femoral contact pressures exceed the compressive yield strength of UHMWPE in total knee replacements, Transactions 39th ORS Conference, 1993, 421
[11.8] Bristol RE, Fitzpatrick DC, Brown TD, Callaghan JJ. Non-uniformity of contact stress in total knee arthrosplasty, Clinical Biomechanics 11, 2 (1996) 75-80.
[11.9] Samyn P, Van Schepdael L, Leendertz JS, Van Paepegem W, De Baets P, Degrieck J. Deformation of reinforced polymer bearing elements on full-scale compressive strength and creep tests under yielding conditions, Polym Test 25 (2006), 230-245
[11.10] Samyn P, Van Schepdael L, Leendertz JS, Gerber A, Van Paepegem W, De Baets P, Degrieck J. Large-scale friction and wear tests on a hybrid UHMWPE-pad / Primer Coating combination used as bearing element in an extremely high-loaded ball-joint, Tribol Internat 39 (2006), 796-811
[11.11] Kurtz SM, Pruitt L, Jewett CW, Crawford RP, Crane DJ, Edidin AA. The yielding, plastic flow and fracture of UHMWPE used in total joint replacements, Biomaterials 19 (1998), 1989-2003.
[11.12] Samyn P, Van Paepegem W, Leendertz JS, Gerber A, Van Schepdael L, Degrieck J, De Baets P. Large-scale evaluation of constrained bearing elements made of thermosetting polyester resin and polyester fabric reinforcement, J Tribol, in press (2006)
[11.13] Scott DW, Zureick AH. Compression creep of pultruded E-Glass/vinylester composite, Composites Sci Technol 58 (1998), 1361-1369
[11.14] Van Paepegem W, Van Schepdael L, Degrieck J, Samyn P, De Baets P, Suister E, Leendertz JS. Characterisation of composites for use in the ball-joints of the Maeslant storm surge barrier, ASCE J Compos Constr, submitted (2006)
[11.15] Lee KY, Pienkowski D. Reduction in the initial wear of UHMWPE after compressive creep deformation, Wear 203-204 (1997), 375-379.
[11.16] Turell M, Wang A, Bellare A. Quantification of the effect of cross-path motion on the wear rate of UHMWPE, Wear 255 (2003), 1034-1039.
[11.17] Wang A. A unified theory of wear for UHMWPE in multidirectional sliding, Wear 248 (2001), 38-47 [11.18] Nishimura I, Yuhta T, Ikubo K, Shimooka T, Murabayashi S, Mitamura Y. Modification of the
frictional surfaces if artificial joints, ASAIO Journal 65 (1993), 762-766 [11.19] Samyn P, Van Schepdael L, Leendertz JS, Gerber A, Van Paepegem W, Degrieck J, De Baets P. Full-
scale analysis of deformation and stress distribution for constrained bearing elements under compressive yielding conditions, Materials Design, submitted (2006)
[11.20] Liu HS, Liao WC, Tseng L, Lee WH, Sawada Y. Compression strength of pre-damaged concrete cylinders reinforced by non-adhesive filament wound composites, Composites A35 (2004), 281-292
[11.21] Samyn P, Van Schepdael L, Van Paepegem W, Leendertz JS, Suister E, De Baets P, Degrieck J. Fracture assesment of carbon fiber/epoxy reinforced rings through a combination of full-scale testing, small-scale testing and stress modelling, Appl Comp Mater 13 (2006), 57-85
[11.22] Kugler D, Moon TG. A technique for compression testing of composite rings, Composites A33 (2002), 507-514
[11.23] Samyn P, Van Schepdael L, Leendertz JS, Van Paepegem W, De Baets P, Degrieck J. Short-beam-shear testing of carbon fiber/epoxy ring segments with variable cross-sectional geometry as a representative selection criterion for full-scale delamination, ASTM J Test Eval, in press (2006)
[11.24] Costa ML, de Almeida SFM, Rezende MC. The influence of porosity on the interlaminar shear strength of carbon/epoxy and carbon/bismaleimide fabric laminates, Composites Sci Technol 61 (2001), 2101-2108

381
Chapter 12.
General conclusions and Recommendations.
Goals
• This work contributes to polymer tribology by relating transitions in sliding performance to changes in polymer structure
• New analysis techniques that were rarely applied to polymer wear products are
introduced and successfully demonstrate variations in polymer structure after sliding
• Friction and wear mechanisms for sintered and thermoplastic polymers are
detailed
• Some extrapolations between small-scale and large-scale testing can be made, however, it is difficult to predict the large-scale sliding performance for internally lubricated polymers
• Large-scale testing is successfully related to full-scale sliding performance • Further tribological research should focus on explaining friction and wear
mechanisms down to the nanolevel scale
ETH Hönggerberg, Laboratory for Surface Science and Technolog, Laboratory for Polymer Technology with sincere acknowledgements to prof. N.D. Spencer and prof. P. Smith for hospitality.
Visiting student September 2006, Zürich (Switzerland)

Chapter 12. General conclusions and recommendations 382 12.1. General Conclusions 12.1.1. Contribution of this work to polymer tribology This work describes both practically and fundamentally friction and wear mechanisms for (i) high-performance polymers at high temperature, and (ii) engineering polymers at high loads under dry sliding. This work aims to relate tribological phenomena on micro-scale, small-scale, large-scale and full-scale. Different tribotesters (meso-scale flat-on-flat, small-scale cylinder-on-plate and large-scale flat-on-flat) and analysis methods (optical and electron microscopy, Raman spectroscopy, thermo-analytical analysis, roughness measurements, contact angle measurements, interpretation of numerical calculations (Solico BV)) are used. This work is both complimentary and extending to available literature data on polymer tribology:
• Traditional literature focuses mainly on mechanical interaction between polymers sliding elements and counterfaces, while present work focuses on tribophysical changes of the polymer structure induced by friction.
• Most literature focuses on small-scale testing, while the working range of sliding pa-rameters is significantly extended in present work to extremely high load conditions (above yield strength) and low sliding velocity. These allow for new applications.
High-performance and engineering polymers are tested as available from industrial production: sintered polyimide, thermoplastic polyimide, polyamide with sodium or magnesium catalyst, polyacetal or polyoxymethylene homopolymer, polyester or polyethylene terephthalate and ultra-high molecular weight polyethylene. Internal lubricants are tested in combination with some bulk polymers available from industrial production: graphite powders for sintered polyimide, PTFE for thermoplastic polyimide and polyesters, oil-lubricants and solid lubricants for polyamide. Proper functioning of internal lubricants is restricted to specific operating conditions and depends on the testing scale, as detailed in this work. Sliding parameters are varied as follows: testing scale, normal load, sliding velocity, counterface temperature, relative humidity, counterface type (high alloy steel, low carbon steel, stainless steel or diamond-like nanocomposite coating). 12.1.2. Analysis methods used in this work Tribotesting on small-scale tests (contact area 10 to 50 mm2) and large-scale tests (contact area 22500 mm2) shows acceptable statistical variation and inter-laboratorial repeatability. Clear trends as a function of normal load and temperature are revealed for semi-thermosetting polyimide, while various thermoplastics are influenced by normal load, sliding velocity and temperature. Clear trends as a function of counterface type (steel grades or diamond-like carbon coatings) are observed. On-line wear curves can be corrected for creep and thermal expansion to be in agreement with post-mortem wear measurements. Variations in tribological properties are related to differences in visco-elastic deformation by measuring static deformation and creep on the tribotester.

Chapter 12. General conclusions and recommendations 383 The maximum polymer surface temperature T* during reciprocating sliding can be calculated from a combination of available models, superimposing a steel bulk tempera- ture and an integrated flash temperature model. A change from integrated flash tempe-rature to bulk temperature model at high loads corresponds to a transition in visco-elastic deformation. The significance of the temperature T* is successfully illustrated through-out this work by relating those temperatures to transitions in friction and/or wear regime and to specific polymer transition temperatures (i.e. either glass transition temperature, crystallisation temperature, dehydration temperature or melting temperature). Raman spectra of worn polymer surfaces show variations in polymer structure agreeing with transitions in friction and wear behaviour. Different mechanisms interfering with sliding are illustrated, such as polymerisation or depolymerisation reactions, degradation reactions, crystallisation, orientation of side-groups, orientation of polymer backbone, orientation of a rigid amorphous phase, conformational changes and deposition of internal solid lubricant. Orientation for semi-thermosetting polyimide is mainly concen-trated on side groups at low load and on the molecular backbone at high load. Orientation for thermoplastic polyimide is located on the molecular backbone at low loads. Crystallisation from γ into α structures is noted for polyamides. Orientation and crystallisation for polyesters is sensitive to internal lubricants and applied counterface type: high friction causes higher molecular orientation. Thermogravimetric measurements (TGA) of wear debris indicate that polymerisation or crystallisation under sliding improves the thermostability while depolymerisation or long resident times in the sliding interface deteriorates the thermostability of amorphous wear debris. Thermo-analytical mass spectroscopy of the wear debris is sensitive to detect decomposition products and confirms hydrolysis and imidisation reactions for polyimide. Differential thermal analysis (DTA) of wear debris shows variations in polymer structure that are in agreement to transitions in sliding behaviour. Hydrolysis and imidisation are reflected in the thermographs for sintered polyimide, crystallisation or cross-linking is observed for thermoplastic polyimides, differences in crystalline structure are observed for polyamides, and polyesters are sensitive to post-polyconden-sation during sliding causing more stable transfer. Surface energy measurements on polymer and counterface surfaces are useful for classification of coefficients of friction for polyimide sliding on different counterfaces according to the calculated work of adhesion. An interpretation of finite element simulations for stresses (Solico BV, Nederlandse Rijkswaterstaat) is useful for determination of specific large-scale test conditions scaled from an entire construction. It is also used to determine the stress conditions in con-strained bearing elements and reinforcing composite structures. 12.1.3. Relations between different testing scales Differences between mechanical interaction, thermal influences and chemical reaction in the sliding interface are demonstrated. Generally, reaction between polymer debris or structural changes to the polymer surface are very important to form a transfer film that further improves or deteriorates sliding properties. Such reactions were in general hypothetically assumed in literature, but they are more specifically demonstrated in this work. Polymerisation reactions such as imidisation or post-polycondensation improve

Chapter 12. General conclusions and recommendations 384 homogeneous transfer film properties, while crystallisation often causes unstable sliding. A general overview of small-scale sliding mechanisms identified in this work is given in Table 12.1. Sliding mechanisms for large-scale tests are summarised in Table 12.2. Some friction and wear mechanisms are very specific for a given polymer structure and the relation to friction and wear evolutions or transfer behaviour is detailed separately in the Conclusions part of each Chapter in this work. 12.1.3.1. Micro-scale to small-scale Micro-scale observations are evidenced by maximum polymer surface temperatures T* and characterisation of surfaces and/or debris. Structural changes correspond to transi-tions in sliding performance and eventual sliding instabilities. Most important sliding mechanisms are: • Mechanical shear for sintered polyimides causes a slight decrease in friction and
increase in wear rates as a function of normal load, or constant friction and wear rates as a function of sliding velocity. Brittleness for sintered polyimides causes increase in friction and overload in wear. Mechanical shear for graphite-filled polyimides causes unstable sliding at low velocities while low friction and constant wear rates happen at high velocities.
• Hydrolysis for sintered polyimides restricts transfer below 180°C, resulting in high
friction. A maximum in hydrolysis intensity at 140°C corresponds to minimum wear rates. Imidisation for polyimides above 180°C causes transfer with low friction and stable wear rates at mild load conditions. Graphite additives often cause unstable sliding below 100°C; hydrolysis at 100 to 140°C controls interfacial humidity and improves the lubricating performance of graphite; graphite additives are most favourable in combination with imidisation of polyimide bulk material.
• Hydrolysis for thermoplastic polyimide at 100 to 120°C causes high friction and
relatively low wear. Imidisation and crystallisation at 120 to 180°C causes decreasing friction and higher wear rates. Melting at 180 to 260°C causes unstable friction and wear. Thermal sliding properties of PTFE controls smooth friction and wear for filled thermoplastic polyimide.
• Softening and crystallisation for pure polyamide cause unstable sliding for a brittle
α crystalline structure. The combination of melting and softening is required for stable sliding. A ductile γ crystalline structure is more favourable for stable sliding and low friction at low loads, but a γ into α transition during sliding leads to increase in friction and reduction in wear. Melting of weak γ crystalline structures causes more frequent overload.
• Softening and crystallisation for pure polyesters cause unstable sliding and brittle
failure due to structural changes in the amorphous phase, while this tendency is reduced by addition of PTFE. The lower friction in presence of PTFE postpones the softening range.
• Softening and crystallisation for polyacetal cause stable sliding and low friction but
often overload in wear depending on stress concentrations.

377 C
hapter 12. General conclusions and recom
mendations 385
Table 12.1. Predominant friction and wear mechanisms on small-scale testing, explicitly demonstrated in this work
Normal load (N) * Sliding velocity (m/s) Bulktemperature (°C)
50 100 150 200 0.3 0.6 0.9 1.2 100 120 140 180 220 260
Sintered polyimide Mechanical Shear Brittleness Mechanical shear and Visco-elasticity Hydrolysis Imidisation
Sintered polyimide + graphite
Mechanical Shear Mechanical Shear Hydrolysis Imidisation
Thermoplastic polyimide
Thermo-mechanical Softening Thermo-
mechanical Softening Hydrolysis Crystallisation and imidisation Melting
Thermoplastic polyimide + PTFE
Thermo-mechanical (PTFE) Thermo-mechanical (PTFE) Thermo-mechanical (PTFE-controlled) Melting
PA-Na Brittle + Crystallisation Melting Softening and brittleness α crystallisation Melting
PA-Mg Ductile + Crystallisation Melting Softening γ into α crystallisation Melting
PA homogeneous- ly oil lubricated Mechanical + Softening Melting
PA solid lubricated Mechanical Shear Softening
Not tested
Not tested
POM-H Mechanical (mild adhesive/abrasive) Softening, shear lips Mechanical (mild
adhesive/abrasive) Softening, shear lips Softening Melting
PET Mild Softening and Brittleness Melting Mild Softening and
Brittleness Melting Not tested
PET/PTFE Thermo-mechanical (PTFE) Softening M Thermo-mechanical (PTFE) Softening M Softening Crystallisation Melting
UHMWPE Not tested
* Normal loads are applied to a Hertz contact with variable contact pressure of approximately 27 to 55 MPa at running-in towards 5 to 2 MPa at steady-state

Chapter 12. General conclusions and recommendations 378 Table 12.2. Predominant friction and wear mechanisms on large-scale testing, explicitly demonstrated in this work
Contact pressure (MPa)
8 16 25 55 150
PA-Na Softening and brittleness α crystallisation Melting Overload
PA-Mg Softening and ductility γ into α crystallisation γ into α crystallisation Melting Overload
PA homogeneously oil lubricated
Softening and limited oil supply
Softening and larger oil supply
Melting (stable if cooled)
PA oil lubricated in surface holes Softening and plastification* (brittle if cooled)
PA solid lubricated Mechanical Shear Softening and plastification*
Not tested
POM-H Softening and recovered deformation
Thermal decomposition of amorphous phase
Softening and permanent deformation
Crystallisation
Melting and thermo-oxidative degradation
PET Softening and brittleness Melting Overload
Mechanical Softening and recoverable deformation Softening and permanent deformation
PET/PTFE Orientation of rigid amorphous phase Crystallisation Post-polycondensation and Crystallisation
UHMWPE Mechanical Softening and plastification*
* Softening refers to thermal effects (T* > Tg), plastification refers to load effects in constrained polymer bulk elements above yield strength
Chapter 12. G
eneral concluasions and recomm
endations
386

Chapter 12. General conclusions and recommendations 387 12.1.3.2. Small-scale to large-scale A macroscopic scaling parameter is defined for relating maximum polymer surface temperatures T* and coefficients of friction on small-scale and large-scale testing. For polyacetal, there is good agreement in coefficients of friction after correction for deformation. There is a transition from adhesive/abrasive sliding to softening on small-scale testing and a transition from softening to melting on large-scale testing. For polyamides, extrapolations for friction should consider the effects of crystallisation during sliding. For filled polyethylene terephthalate, extrapolation for friction is difficult due to the effect of internal lubricants. Volumetric wear rates cannot be uniquely extrapolated over the entire testing range and need specific large-scale testing. High-temperature sliding tests on small-scale are not representative for high-load tests on large-scale. Different polymer structures are observed after sliding: orientation con-centrates in a crystalline phase (high temperature) or rigid amorphous phase (high load). Important effects of wear debris mobility are noted, being restricted for large sliding areas and promoting film formation on either the counterface or on the polymer surface. Counterface particles incorporate in large-scale thermoplastic surfaces while they act as third body abrasives during small-scale testing. The relative position of polymer surface relatively to the counterface is important for efficiency of debris. Overloads in small-scale testing often occur due to softening of polyacetal, while soften-ing was favourable for stabilising friction and wear on large-scale testing. Homogene-ous stress distributions and limited edge effects on large-scale tests favour stable sliding. Thermoplastics can be favourably used at loads above yield strength with (very) low friction and acceptable wear rates. The influences of recoverable or permanent creep were illustrated for polyacetals, polyesters and ultra-high molecular weight polyethylene. 12.1.3.3. Large-scale to full-scale A case study illustrates that large-scale static and dynamic tests on constrained polymer bearing elements favourably simulate the real working conditions in, e.g., a highly loaded ball-joint. Analysis of a global construction allows defining representative testing conditions. Forces on a continuous elastic bearing layer depend on elasticity, coefficient of friction and thickness. Discrete polymer pads are introduced as sliding elements. The reliability of large-scale testing is verified by an on-the-field test operation. The stress situation in constrained polymer elements is analysed by numerical analysis, indicating an increase from bulk modulus at low loads to an apparent modulus at high loads by constraint of the reinforcing composite ring and sample holder. The constrained polymer bulk is under hydrostatic stress, being different from the free sliding surface. The design of reinforcing composite rings preventing creep and deformation is illustra-ted. Shear failure observed after full-scale static and dynamic testing is avoided by optimisation of the geometry and processing parameters. A representative failure criterion for strength of reinforcing composite rings can be scaled from full-scale testing to small-scale short-beam-shear testing by numerical analysis.

Chapter 12. General conclusions and recommendations 388 12.2. Recommendations for further research 12.2.1. Fundamental research
Figure 12.1 Preliminary contact-mode AFM-analysis of polyimide SP-1 surfaces after sliding at 50 N, 0.3 m/s, 180°C (with thanks to prof. N.D. Spencer and Dr. S. Lee, ETH Zürich)
Sliding direction
Sca
nnin
g di
rect
ion

Chapter 12. General conclusions and recommendations 389 • Atomic Force Microscopy (AFM) is capable of investigating surfaces on a nano-
scale to atomic scale resolution. The AFM relies on a scanning technique with laser beam deflection to produce very high-resolution images of sample surfaces. Ultrasmall forces (less than 1 nN) are present between the AFM tip mounted on a flexible cantilever and a sample surface. In the contact mode, simultaneous measu-rements of surface roughness and friction force can be made. In the tapping mode, the cantilever oscillates vertically at a drive frequency close to its resonance frequency. As the tip approaches the surface, the vibrational characteristics of the cantilever oscillation change due to the tip-sample interaction. As such, information on local height (amplitude-images) and stiffness (phase-images) can be obtained. A preliminary study on AFM measurements in contact mode on SP-1 surfaces is presented in Figure 12.1 on micro-scale and in Figure 12.2 on nanoscale. The sig-nals from height measurements, deflection measurements and friction measure-ments (trace and retrace) indicate differences in polyimide topography and/or com-position and show, e.g., the effect of imidised zones that occur along the sliding direction (Figure 12.1) or molecular arrangements (Figure 12.2). Further interpret-tation of AFM will be important to investigate the effect of local polymer com-position, polymerisation, crystallisation and orientation. It will be mainly useful to reveal the effect of internal lubricant distribution.
Figure 12.2 Preliminary contact-mode AFM-analysis of polyimide SP-1 surfaces after sliding at 50 N, 0.3 m/s, 260°C
• Other surface characterising techniques such as SIMS (Secundary Ion Mass
Spectrometry) or XPS (X-ray photoelectron Spectroscopy) will provide additional information on the atomic bonding states and on the surface chemistry of worn samples (e.g. chemical surface mapping).
• Polymers tested in present work originate from industrial processes. Variations in
molecular weight and/or molecular weight distribution on the tribological properties should be further investigated on laboratory scale. Nano-scale characterisation will also be useful to this purpose in order to characterised different molecular arrange-ments.
2.5
0 0 nm
2.5
Scanning direction
Slid
ing
dire
ctio
n

Chapter 12. General conclusions and recommendations 390 12.2.2. Applied research and implementation • The importance of wear debris interaction was demonstrated in this work. Besides
thermal modifications of wear debris, also the morphology contains information about the wear processes. Most wear debris characterisation up to present is based on visual observations and comparison according to known classifications that are available in electronic libraries. A more quantitative and automated rather than qualitative description of wear debris morphologies is needed [12.1].
Fourier spectra and morphological pattern spectra can be used to extract parameters that relate to the size and shape of wear debris particles. The Fourier transform is based on the greyscale periodicity of a microscopic wear debris image, which is a scale for the wear debris size. This method lacks, however, the ability to incorporate information about the wear debris shape. Mathematical morphology allows to deter-mine a structural element that is related to the debris morphology. The construction of a morphological spectrum with an indication of the wear debris size distribution is preliminary illustrated in Figure 12.3. A spectrum of the debris size is constructed by eliminating particles from the original microscopic photograph by means of scanning the image with a filter element of certain shape.
(a) (b)
(c)
(d)
Figure 12.3 Preliminary analysis of wear debris morphology spectrum for SP-1 debris (a) original greyscale image, (b) eliminated zones after increasing the size of the structural element to
999 pixels or to (c) 9999 pixels (with thanks to Alessandro Ledda, Telin, Ghent University)
1 9999 Pixel size of filer element
Num
ber e
limin
ated
pix
els
1 999 Pixel size of filer element
Num
ber e
limin
ated
pix
els

Chapter 12. General conclusions and recommendations 391
A complete spectrum is constructed by progressively increasing the size (pixel number) of the filter element. The structure element chosen in present illustration has an elliptical form with progressively increasing diameter for eliminating wear debris particles from the image. The stepwise elimination of wear debris particles is shown in Figures 12.3a to 12.3d. From the original wear debris image in Figure 12.3a a replica is made in Figure 12.3b, corrected for background for detachment of linked particle objects. The pictures in Figure 12.3c and Figure 12.3d show the elliptical zones where elements has been removed after increasing the pixel size of the filter element from 999 pixels towards 9999 pixels. Finally, all the wear particles were removed from the image and a morphological pattern spectrum is created. Further research will be firstly directed towards an optimisation of the mathematical techniques for plotting wear debris spectra, strongly depending on the shape of the filter element. In advance, different mathematical operations should be performed on microscopic wear debris images such as background corrections and corrections for linked particles. These have an influence the final spectrum. To shorten the calculation times, an original image should eventually be divided into subimages. Some available algorithms at present apply to greyscale images and they should be extended to incorporate multi-colour information. It is clearly illustrated in present work that a change in wear debris colour indicates a transition in sliding mechanism. Further research will secondly focus on the extraction of spectral parameters such as mean object size, entropy (quantification of the shape complexity), shapiness (quantification of the resemblance of the wear debris shape to the filter element shape) and maximum pixel size should be defined from mathematical spectra. In a final step, the spectral parameters should be correlated to tribological performance.
• Measurement techniques used in this work were post-mortem evaluations. The wear processes could be more closely followed if in situ measurements are available.
• It remains difficult to match friction and wear properties with mechanical properties
of the polymer in order to construct wear maps. The main problem is that the mechanical material properties at the sliding surface are different compared to the bulk properties and continuously change during sliding by thermal and/or mechanical processes. A first step to get better insight in the relation between tribological properties and the change in mechanical properties are DMTA (Dynamic Mechanical Thermal Analysis) tests, measuring the variation in mechanical properties as a function of temperature. It should be taken into account, however, that shear loading is the main deformation mode during sliding and possibly causes different interactions compared to tensile loading.
References [12.1] Ledda A. Mathematical morphology in image processing, PhD Thesis, Ghent University, 2007

Chapter 12. General conclusions and recommendations 392

393
Curriculum Vitae
Personal
Pieter Samyn Aardbeienstraat 5 8800 Roeselare Belgium Born Roeselare (Belgium), 16th February 1978 Native language: Dutch Second languages: English, French Contact: mobile +32 476 288 302 e-mail : [email protected]
Education 1992 – 1996: Koninklijk Atheneum Kortrijk, Science-Mathematics (great distinction, first prizes math, physics, chemistry) 1996 – 1998: Ghent University (Belgium), Bachelor Engineering Sciences 1998 – 2001: Ghent University (Belgium), Master Materials Science and Engineering (great distinction) Master Thesis: Plastic bottles with high thermostability Promotor : Prof. G. Schoukens Working Experience 2001 – present: Ghent University, Laboratory Soete, Department Mechanical construction and Production, Prof. P. De Baets Sint-Pietersnieuwstraat 41 B-9000 Gent (Belgium) Research Assistant Research area: Tribology of Polymers and Polymer Composites: scaling of friction and wear data, tribophysical polymer surface analysis Promotors: Prof. P. De Baets, Prof. G. Schoukens 09/2006 : ETH (Eidgenössische Technische Hochschule), Hönggerberg, Zürich
Laboratory for Surface Science and Technology, Prof. N.D. Spencer Laboratory for Polymer Technology, Prof. P. Smith Wolfgang-Pauli Strasse 10 CH-8093 Zürich (Switzerland) Visiting student Research area: Advanced surface characterisation by Atomic Force Microscopy
Varia 2001: First Sidmar-prize (Arcelor, Zelzate, Belgium) for Master Thesis 2006: Biography selected for Marquis Who’s who in Engineering and Science 2006-2007
Update 15/01/07

394
Scientific work A1 - Publications with international review committee with SCI-classification [1] L. Zsidai, P. De Baets, P. Samyn, G. Kalacska, A.P. Van Peteghem, F. Van Parys, “The
tribological behaviour of engineering plastics during sliding friction investigated with small-scale specimens”, Wear, Vol. 253 No. 5-6 (2002), 673-688, SCI=1.404
[2] P. Samyn, P. De Baets, G. Schoukens and B. Hendrickx, “Tribological Behavior of Pure and
Graphite-Filled Polyimides under Atmospheric Conditions”, Polymer Engineering and Science, Vol. 43 No. 8 (2003), 1477-1487, SCI = 1.076
[3] G. Schoukens, P. Samyn, S. Maddens, T. Van Audenaerde, “Shrinkage behavior after the heat setting of biaxially stretched poly(ethylene 2,6-Naphthalate) films and bottles”, Journal of Applied Polymer Science, Vol. 87 No. 9 (2003), 1462-1473, SCI = 1.072
[4] L. Zsidai, P. Samyn, K. Vercammen, K. Van Acker, M. Kozma, G. Kalacska, P. De Baets, “Friction and thermal effects of engineering plastics sliding against Steel and DLN-coated surfaces”, Tribology Letters, Vol.17 No. 2 (2004), 269-288, SCI = 1.187
[5] P. Samyn, P. De Baets, “Determination of friction and wear of engineering polymers by means of large-scale specimen testing”, Materials Science Forum, Vol. 475-479 (2005), 1077-1082, SCI = 0.399
[6] P. Samyn, J. Quintelier, W. Ost, P. De Baets, G. Schoukens, “Sliding behaviour of pure polyester and polyester-PTFE filled bulkcomposites in overload conditions”, Polymer Testing, Vol. 24 No.11 (2005), 588-603, SCI = 1.390
[7] P. Samyn, P. De Baets, “Friction and wear of acetal: a matter of scale”, Wear, Vol. 259 No. 1-6
(2005), 697-702, SCI = 1.404
[8] P. Samyn, P. De Baets, “Friction of polyoxymethylene homopolymer in highly loaded applications extrapolated from small-scale testing”, Tribology Letters, Vol. 19 No. 3 (2005), 177-189, SCI = 1.187
[9] P. Samyn, J. Quintelier, P. De Baets, G. Schoukens, “Characterisation of polyimides under high
temperature sliding”, Materials Letters, Vol. 59 No.22 (2005), 2850-2857, SCI = 1.299
[10] P. Samyn, P. De Baets, G. Schoukens, A.P. Van Peteghem, “Large-scale tests on friction and wear of engineering polymers for material selection in highly loaded sliding systems”, Materials & Design, Vol. 27 No.7 (2006), 535-555, SCI = 0.785
[11] P. Samyn, G. Schoukens, J. Quintelier, P. De Baets, “Friction, wear and material transfer of
sintered polyimides sliding against various steel and diamond-like carbon coated surfaces”, Tribology International, Vol. 39 No. 6 (2006), 575-589, SCI = 1.026
[12] P. Samyn, P. De Baets, J. Van Craenenbroeck, F. Verpoort, G. Schoukens, “Thermal transitions
in polyimide transfer under sliding against steel investigated by Raman spectroscopy and thermal analysis”, Journal of Applied Polymer Science, Vol. 101 No. 3 (2006), 1407-1425, SCI = 1.072
[13] P. Samyn, L. Van Schepdael, J.S. Leendertz, A. Gerber, W. Van Paepegem, P. De Baets, J. Degrieck, “Large-scale friction and wear tests on a hybrid UHMWPE-pad / Primer Coating combination used as bearing element in an extremely high-loaded ball-joint”, Tribology International (invited), Vol. 39 No.8 (2006), 796-811, SCI = 1.026
[14] P. Samyn, L. Van Schepdael, J.S. Leendertz, W. Van Paepegem, P. De Baets, J. Degrieck, “Deformation of reinforced polymer bearing elements on full-scale compressive strength and creep tests under yielding conditions”, Polymer Testing, Vol. 25 No. 2 (2006), 230-245, SCI = 1.390
[15] P. Samyn, L. Van Schepdael, W. Van Paepegem, J.S. Leendertz, E. Suister, P. De Baets, J.
Degrieck, “Fracture assesment of carbon fibre / epoxy reinforced rings through a combination of full-scale testing, small-scale testing and stress modelling”, Applied Composite Materials, Vol. 13 No. 2 (2006), 507-85, SCI = 0.841

395 [16] J. Quintelier, P. Samyn, P. De Baets, T. Tuzolana, W. Van Paepegem, F. Van den Abeele, J.
Vermeulen, “Wear behaviour of carbon fiber reinforced Poly(phenylene sulfide)”, Polymer Composites, Vol. 27 No. 1 (2006), 92-98, SCI = 0.628
[17] P. Samyn, J. Van Craenenbroeck, J. Quintelier, G. Schoukens, P. De Baets, “Friction induced
conformational changes on large-scale and small-scale polyester sliding surfaces”, Surface and Interface Analysis, Vol. 38 No. 4 (2006), 868-872, SCI = 0.981
[18] P. Samyn, G. Schoukens, I. Van Driessche, J. Van Craenenbroeck, F. Verpoort, P. De Baets,
“Softening and melting mechanisms of polyamides interfering with sliding stability under adhesive conditions”, Polymer, Vol. 47 No. 14 (2006), 5050-5065, SCI = 2.849
[19] J. Quintelier, P. Samyn, P. De Baets, “On the SEM features of glass-polyester composite
system subjected to dry sliding wear”, Wear, Vol. 261 No. 7-8 (2006), 703-714, SCI = 1.404 [20] P. Samyn, “Tribophysical phenomena on polyester sliding surfaces evaluated by spectroscopic
and thermal analysis”, Tribology Letters, Vol. 24 No. 3 (2006), 229-235, SCI = 1.187 [21] P. Samyn, W. Van Paepegem, J.S. Leendertz, A. Gerber, L. Van Schepdael, J. Degrieck, P. De
Baets, “Large-scale evaluation of constrained bearing elements made of thermosetting poly-ester resin and polyester fabric reinforcement”, Journal of Tribology, Vol. 128 (2006), 681-696, SCI = 0.682
[22] J. Quintelier, P. Samyn, P. De Baets, L. De Doncker, D. Van Hemelrijck, H. Sol, “Influence of re-
adhesion on the wear and friction of glass fibre reinforced polyester composites”, Journal of Adhesion, Vol. 82 No. 11 (2006), 1033-1060, SCI = 1.128
[23] W. Van Paepegem, L. Van Schepdael, J. Degrieck, P. Samyn, P. De Baets, E. Suister, J.S.
Leendertz,J.S, “Fast characterization of carbon/epoxy rings for use in the ball-joints of the Maeslant storm surge barrier”, Composite Structures, Vol. 78 No. 3 (2007), 359-367, SCI = 0.953
[24] P. Samyn, J. Vancraenenbroeck, F. Verpoort, P. De Baets, “Post-mortem Raman spectroscopy
explaining friction and wear behaviour of sintered polyimide at high temperature”, Journal of Materials Engineering and Performance, Vol. 15 No. 6 (2007), 750-757, SCI = 0.378
[25] P. Samyn, P. De Baets, G. Schoukens, J. Quintelier, “Wear transitions and stability of
polyoxymethylene homopolymer in highly loaded applications compared to small-scale testing”, Tribology International, Vol. 40 No. 5 (2007), 819-833, SCI = 1.026
accepted journal papers (A1):
[26] W. Van Paepegem, L. Van Schepdael, J. Degrieck, P. Samyn, P. De Baets, E. Suister, J.S. Leendertz, “Characterization of composites for use in the ball-joints of the Maeslant storm surge barrier”, accepted Polymer Composites, SCI = 0.628
[27] P. Samyn, L. Van Schepdael, J.S. Leendertz, W. Van Paepegem, P. De Baets, J. Degrieck,
“Short-beam-shear testing of carbon fibre / epoxy ring segments with variable cross-sectional geometry as a representative selection criterion for full-scale delamination”, accepted ASTM Journal of Testing and Evaluation, SCI = 0.252
[28] P. Samyn, L. Van Schepdael, J.S. Leendertz, A. Gerber, W. Van Paepegem, J. Degrieck, P. De
Baets, “Full-scale analysis of deformation and stress distribution for constrained bearing elements under compressive yielding conditions”, accepted Materials & Design, SCI = 0.785
[29] P. Samyn, J. Quintelier, G. Schoukens, P. De Baets, “The sliding behaviour of sintered and
thermoplastic polyimides investigated by thermal and raman spectroscopic measurements”, accepted Wear, SCI = 1.404
[30] P. Samyn, P. De Baets, G. Schoukens, “A review on friction and wear properties of sintered and
thermoplastic polyimides”, accepted Macromolecular Materials and Engineering (invited review paper), SCI = 1.400

396 [31] P. Samyn, G. Schoukens, I. Van Driessche, P. De Baets, “Friction, wear and transfer of pure
and internal lubricated cast polyamides at various testing scales”, accepted Wear, SCI = 1.404 [32] P. Samyn, W. Van Paepegem, J.S. Leendertz, E. Suister, L. Van Schepdael, J. Degrieck, P. De
Baets, “Global analysis and constructional aspects in the redesign of bearing elements for a movable storm surge barrier”, accepted Engineering Structures, SCI = 0.625
submitted journal papers (A1):
[33] L. Van Schepdael, H. Leendertz, W. Van Paepegem, P. Samyn, P. De Baets, J. Degrieck, “Carbon fibre reinforced pad design for the modification of the ball bearing of the storm surge barrier near Rotterdam (NL)”, submitted to Composites Science and Technology, 15/10/2005
[34] P. Samyn, I. Van Driessche, G. Schoukens, P. De Baets, “Thermal and spectroscopic analysis
of large-scale worn polyoxy-methylene surfaces and its wear debris”, submitted to Materials Chemistry and Physics, 17/01/2006
A2 - Publications with international review committee not included in SCI-classification [1] P. De Baets, W. Ost, P. Samyn, G. Schoukens, F. Van Parys, “The friction and wear of different
polymers under high load conditions”, Journal Synthetic Lubrication 19-2 (2002), 109-118 [2] P. De Baets, C. Dekoninck, P. Samyn, W. Ost, “Tribological research at Ghent University”,
European Journal of Mechanical Engineering 47-2 (2002), 122-124 [3] J.S. Leendertz, L. Van Schepdael, W. Van Paepegem, P. Samyn, P. De Baets, J. Degrieck,
“Änderungen der Gelenklagerkonstruktion des Sturmflutsperrwerks bei Rotterdam”, Stahlbau, Vol. 75 No. 1 (2006), pp 45-54
[4] P. Samyn, W. Van Paepegem, P. De Baets, J. Degrieck, L. Van Schepdael, A. Gerber, E.
Suister, J.S. Leendertz, “Experimental study of the friction and wear behaviour of a polymer disc/primer coating combination used in ball-joints by means of large-scale testing”, Tribotest, Vol. 12 No. 2 (2006), 119-131 (invited)
[5] P. Samyn, J. Van Craenenbroeck, F. Verpoort, P. De Baets, “The use of post-mortem Raman
spectroscopy in explaining friction and wear behaviour of sintered polyimide at high temperature”, Tribotest, Vol. 12 No. 3 (2006), 223-236
[6] P. Samyn, “Large-scale specimen testing on friction and wear of pure and internal lubricated
polyamides”, Tribotest, Vol. 12 No. 3 (2006), 237-256 (invited) submitted journal papers (A2): [7] P. Samyn, P. De Baets, R. Kerestes, L. Zsidai, G. Kalacska, E. Kislinder, M. Kozma, “Influence of
cylinder-on-plate or bloc-on-ring sliding configurations on friction and wear of pure and filled engineering polymers”, submitted to Tribotest, 01/07/06
C1 - International Conference Proceedings with oral presentation [1] L. Zsidai, E. Kislinder, P. De Baets, M. Kozma, G. Kalacska, P. Samyn, “Tribological properties of
PA, POM, PETP polymers by different tribological systems”, Intertribo 2002, 14-17 October 2002, The high tatras, Stara Lasna (Slovak Republic), pp. 255-257
[2] A. Ledda, J. Quintelier, P. Samyn, P. De Baets, W. Philips, “Quantitative Image Analysis with
Mathematical Morphology”, Proceedings of ProRISC. 2003, 26-27 Nov 2003, Veldhoven (The Netherlands), pp. 399-406

397 [3] A. Ledda, P. Samyn, J. Quintelier, P. De Baets, W. Philips, “Polymer analysis with mathematical
morphology”, SPS IEEE Benelux signal processing symposium, 14-16 April 2004, Hilvaren-beek (The Netherlands), pp. 87-92
[4] P. Samyn, P. De Baets, A. Ledda, “Tribological characterisation of polyimides under atmospheric
conditions at high temperature” 8th international conference on tribology, 1-4 June 2004, Veszprem (Hungary), pp. 43-50
[5] P. Samyn, P. De Baets, W. Van Paepegem, L. Van Schepdael, E. Suister, J.S. Leendertz,
“Design of a carbon/epoxy reinforcing ring reducing creep of UHMWPE in high-loaded sliding contacts”, 8th international conference on tribology, 1-4 June 2004, Veszprem (Hungary), pp. 89-96
[6] J. Quintelier, P. Samyn, W. Ost, P. De Baets, T. De Baets, “The influence of scratched steel
counterface on friction and wear lifetime of UHMWPE”, 8th international conference on tribology, 1-4 June 2004, Veszprem (Hungary), pp. 69-76
[7] P. Samyn, P. De Baets, A. Gerber, J.S. Leendertz, “Experimental study of the friction and wear
behaviour of a polymer disc/primer coating combination used in ball-joints by means of large-scale testing”, 4th AIMETA International Tribology Conference, 14-17 September 2004, Rome (Italy), pp. 145-152
[8] P. Samyn, P. De Baets, “Determination of friction and wear of engineering polymers by means of
large-scale specimen testing” 5th Pacific RIM International Conference on Advanced Materials and Processing (PRICM-5), 2-5 Nov 2004, Beijing (China), Part 2, 1077-1082 – invited paper
Chairman symposium B, composite materials, Friday 5th November 2004, 8u30-12u00 [9] P. Samyn, P. De Baets, G. Schoukens, J. Quintelier, “The use of polyimides in high temperature
sliding applications”, High performance plastics, 5-6 Apr 2005, Vienna (Austria), Paper 10 [10] P. Samyn, P. De Baets, “Friction and wear of acetals: a matter of scale”, 15th International
Conference on Wear of Materials, 28 Apr-1 May 2005, San Diego (USA), Paper 09.B.2 [11] P. Samyn, P. De Baets, J. Van Craenenbroeck, F. Verpoort, G. Schoukens, “Orientation of
polyimide sliding surfaces studied by Raman spectroscopy”, ANTEC 2005 (Annual Technical Conference of the Society of Plastic Engineers), 1-4 May 2005, Boston (USA), p. 29 (Proceedings on CD)
[12] P. Samyn, J. Quintelier, G. Schoukens, F. De Bruyne, P. De Baets, “Friction and wear
properties of pure and teflon-filled polyesters determined on a Large-scale tribotester”, SAMPE 2005, 1-5 May 2005, Long Beach (USA), p. 20 (Proceedings on CD)
[13] J. Quintelier, P. Samyn, P. De Baets, J. Degrieck, “Thin film formation and deformation at fibre
reinforced composites”, SAMPE 2005, 1-5 May 2005, Long Beach (USA), p. 15 (Proceedings on CD)
[14] P. Samyn, P. De Baets, F. De Bruyne, “Large-Scale Specimen Testing on Friction and wear of
Pure and Internal Lubricated Polyamides”, ITC 2006, Kobe, (Japan) 30 May – 2 June 2005, p. 376
[15] P. Samyn, J. Quintelier, G. Schoukens, P. De Baets, “Sliding properties of polyimide against
various steel and DLC-coated counterfaces”, Balkantrib 2005, 15-18 June 2005, Kragujevac (Serbia), pp. 506-515
Chairman session Tribology in Machine Elements, Friday 18th June 2005, 9u00-10u30 [16] J. Quintelier, P. Samyn, P. De Baets, J. Degrieck, “Wear of steel against carbon fibre reinforced
PPS”, Balkantrib 2005, 15-18 June 2005, Kragujevac (Serbia), pp.324-329 [17] P. Samyn, J. Quintelier, P. De Baets, “Comparative study of friction and wear behaviour of
internal lubricated cast nylons on a large-scale tribotester”, Matrib 2005, 23-25 June 2005, Vela Luka (Croatia), p. 201-207 (Proceedings on CD)

398 [18] J. Quintelier, P. Samyn, P. De Baets, “Frictional behaviour of glass fibre reinforced polymer
composites”, Matrib 2005, 23-25 June 2005, Vela Luka (Croatia), p. 189-194 (Proceedings on CD)
[19] P. Samyn, P. De Baets, “Ad hoc design of sliding elements against wear”, II Congresso Ibérico
de Tribologia (IBERTRIB 2005) e 9as Jornadas Portuguesas de Tribologia, 16 - 17 June 2005, Guimaraes (Portugal) – plenary lecture
[20] P. Samyn, A. Ledda, J. Quintelier, P. De Baets, “Image processing techniques for charac-
teristaction of polymer wear debris” , Condition Monitoring 2005, 18-21 July 2005, Cambridge (UK), p. 423-432
[21] J. Quintelier, P. Samyn, P. De Baets, J. Degrieck, "Wear and frictional behaviour of pultruded
profiles on pin-on-disc test apparatus", Condition Monitoring 2005, 18-21 July 2005, Cambridge (UK), p. 491-495
[22] P. Samyn, J. Quintelier, P. De Baets, J. Van Craenenbroek, F. Verpoort, G. Schoukens,
“Orientation and degradation of polymer sliding surfaces evaluated by Raman spectroscopy”, WTC III (3rd World Tribology Congress), 12-16 Sept 2005, Washington (USA), Proceedings on CD
[23] J. Quintelier, P. Samyn, P. De Baets, J. Degrieck, “Tribological behaviour of GFR composites”,
WTC III (3rd World Tribology Congress 2005), 12-16 Sept 2005, Washington (USA), Proceedings on CD
[24] P. Samyn, J. Van Craenenbroeck, J. Quintelier, G. Schoukens, P. De Baets, “Friction-induced
conformational changes on large-scale and small-scale polyester sliding surfaces”, European Conference on Applications of Surface and Interface Analysis (ECASIA ‘05), 25-30 Sept 2005, Vienna (Austria), p. 71
[25] J. Quintelier, P. Samyn, P. De Baets, “The influence of the subsurface on the frictional
behaviour of glass fibre reinforced composites”, European Conference on Applications of Surface and Interface Analysis (ECASIA ‘05), 25-30 Sept 2005, Vienna (Austria), p. 121
[26] P. Samyn, G. Schoukens, I. Van Driessche, P. De Baets “Tribophysical phenomena on polymer
sliding surfaces evaluated by spectroscopic and thermal analysis”, IV International Conference on Tribochemistry, 3-5 Oct 2005, Cracow (Poland), p. 21
[27] P. Samyn, T. Tuzolana, J. Quintelier, P. De Baets ”Friction and wear evaluation of internal
lubricated polyamides at various testing scales. Part I. Sliding stability during running-in”, Society for Tribologists and Lubrication Engineers (STLE) Annual Meeting Spring 2006, 7-11 May 2006, Calgary (Canada), Proceedings on CD
[28] P. Samyn, J. Quintelier, G. Schoukens, P. De Baets, “The sliding behaviour of sintered and
thermoplastic polyimides investigated by thermal and Raman spectroscopic measurements”, Nordtrib 2006, 7-9 June 2006, Helsingor (Denmark), Proceedings on CD
[29] J. Quintelier, P. Samyn, P. De Baets, “The 45 degrees of Fibre Orientation and its Influence on
the Frictional Behaviour of Composites”, Nordtrib 2006, 7-9 June 2006, Helsingor (Denmark), Proceedings on CD
[30] J. Degrieck, W. Van Paepegem, L. Van Schepdael, P. Samyn, P. De Baets, E. Suister, J.S.
Leendertz, “Characterization of composites for the maeslant storm surge barrier”, 16th European Conference on Fracture (ECF 16), 3-7 July 2006, Alexandropolis (Greece), Proceedings on CD (invited presentation)
[31] W. Van Paepegem, L. Van Schepdael, P. Samyn, J.S. Leendertz, P. De Baets, J. Degrieck,
“Reliable small-scale qualification tests for carbon/epoxy rings in the Maeslant storm surge barrier”, 12th European Conference on Composite Materials (ECCM-12), 29 Aug – 1 Sept 2006, Biarritz (France), Proceedings on CD

399 [32] P. Samyn, P. De Baets, “Comparative study on the sliding behaviour of thermoplastic and
sintered polyimides”, Intertribo 2006, 11-13 October 2006, The High Tatras, Stara Lesna (Slovak Republic), p. 20-23
C1 - International Conference Proceedings with poster presentation [1] P. Samyn, P. De Baets, “Large-scale tribotesting of Engineering polymers”, 14th International
Conference on Wear of Materials, 30 March – 3 Apr 2003, Washington (USA) [2] J. Quintelier, P. Samyn, P. De Baets, J. Degrieck, “Friction and wear of glass fibre reinforced
polyester composites”, 15th International Conference on Wear of Materials, 28 Apr – 1 May 2005, San Diego (USA)
[3] P. Samyn, W. Van Paepegem, P. De Baets, J. Degrieck, J.S. Leendertz, E. Suister, L. Van
Schepdael, “Integrated design of highly loaded sliding surfaces of a huge ball-joint”, WTC III (3rd World Tribology Congress), Washington (USA), 12-16 Sept 2005, Proceedings on CD
[4] P. Samyn, T. Iwai, P. De Baets, “Effect of polyamide crystalline structure on sliding stability in the
rubbery phase”, Asiatrib 2006, Kanazawa (Japan), 10-17 Oct 2006, Proceedings on CD
National poster presentations and Workshops [1] P. De Baets, F. Van Parys, P. Samyn, W. Ost, “Large-scale tribotesting of polymers”, Workshop
BWTS, 30 Nov 2001, Tribology of Self-lubricating Polymers, Ghent (Belgium) [2] P. Samyn, P. De Baets, G. Schoukens, “Tribological behaviour of Polyimides”, 2nd PhD
symposium FTW, 12 Dec 2001, Proceedings on CD [3] G. Schoukens, P. Samyn, S. Maddens, “The use of plastic beverage bottles at high temperatures
and recycling of beverage bottles”, Workshop 15 Dec 2001, Ghent (Belgium) [4] P. Samyn, P. De Baets, G. Schoukens, “Tribological behaviour of Polyimides”, 4th PhD
symposium FTW, Gent, 03 Dec 2003, Proceedings on CD [5] P. Samyn, P. De Baets, G. Schoukens, “Polymer tribology under high-load conditions”, 5th PhD
symposium FTW, 1 Dec 2004, Gent (Belgium), Proceedings on CD [6] P. Samyn, J. Quintelier, G. Schoukens, I. Van Driessche, P. De Baets, ”Spectroscopic
characterization of sintered and thermoplastic polyimides under sliding”, 6th PhD symposium Firw, Gent (Belgium)
Articles in book volumes
[1] P. De Baets, K. Bonny, J. Quintelier, P. Samyn, “Handboek Constructiematerialen en Corrosiebescherming, Afl. 19 (2004), 2. Theoretische achtergrond – 2.5.2 Slijtage”, Kluwer Techniek en Kwaliteit (België), pp. 37-120
[2] P. Samyn, J. Quintelier, P. De Baets, “Tribological evaluation of polymers and polymer
composites: from phenomenological modelling towards practical application” Recent Research Developments in Applied Polymer Science (invited), Vol. 3 (2006)
Reviewer for international journals Wear (6), Tribology Letters (2), Surface and Coating Technology (3), Surface and Interface Analysis (1), Macromolecular materials and engineering (1)

400
Industrial projects and reports [1] Study of friction and wear of Nylatron NSM immersed in sea-water on large-scale test rig,
V3/02/0814 [2] Etude du frottement et de l’usure de l’ERTALYTE TX et du CESTILITE ASTL avec un test à
grandes dimensions, V3/03/0314 [3] Evaluatie van de slijtage van zuigers van de dieselinjectiepomp van de motoren van een
Emmerbaggermolen B3, V3/03/0410 [4] Evaluatie van de slijtage van zuigers van de dieselinjectiepomp van de motoren van een
Emmerbaggermolen B3, Appendix V3/03/0410 [5] Project SVKW, verbeteren scharnierconstructie: Kruip- en terugveringsgedrag van UHMWPE en
ORKOT, V3/03/0525 [6] Project SVKW, verbeteren scharnierconstructie: Drukproeven op een ORKOT-schijf, V3/03/0526 [7] Etude du frottement des différents couples de matériaux appliquées aux ponts poussés avec un
test à grandes dimensions, V3/03/0530 [8] Project SVKW, verbeteren scharnierconstructie:Kruip- en terugveringsgedrag van Multiglide,
vergeleken met Orkot, V3/03/0602 [9] Project SVKW, verbeteren scharnierconstructie:Kruip- en terugveringsgedrag van UHMWPE-
klikschijven met lip, V3/03/0623 [10] Project SVKW, verbeteren scharnierconstructie:Wrijving van de koppels UHMWPE-staal en
ORKOT-staal, V3/03/1010 [11] Project SVKW, verbeteren scharnierconstructie: Invloed van een cyclische belasting op het
vervormings- en kruipgedrag van een Vrije ORKOT-schijf met grote diameter, V3/03/1012 [12] Project SKKW, verbeteren scharnierconstructie: Invloed van een cyclische belasting op het
vervormings- en kruipgedrag van een Vrije ORKOT-schijf met kleine diameter, V3/03/1013 [13] Project SVKW, verbeteren scharnierconstructie: Plaatsvastheid van een Vrije ORKOT-schijf
gedurende een grootschalige wrijvingstest, V3/03/1016 [14] Project SVKW, verbeteren scharnierconstructie: Verificatieproeven voor de bepaling van wrijving
en afschuifkracht van UHMWPE-klikschijven met verschillende lipvormen, V3/03/1018 [15] Project SVKW, verbeteren scharnierconstructie: Verificatieproeven voor de bepaling van het
kruip- en terugveringsgedrag van UHMWPE-klikschijven, V3/03/1020 [16] Project SVKW, verbeteren scharnierconstructie: Evaluatie van UHMWPE-klikschijven met
aanpassing van het ontwerp van de koolstofring, V3/03/1022 [17] Project SVKW, verbeteren scharnierconstructie: Experimentele studie van het lokale gedrag van
polymeerschijven ter verbetering van het bolscharnier in de stormvloedkering Maeslantkering, V3/04/0115
[18] Comparative study on the friction and wear behaviour of different types internal lubricated cast nylons sliding against steel on a large-scale tribotester, V3/04/0317
[19] Determination of friction and wear of ORKOT TLM Marine under lubricated conditions on a large-scale tribotester, V3/04/0429
[20] Project SVKW, verbeteren scharnierconstructie: Verificatieproeven op UHMWPE klikschijven bij oplevering van zuid en noord, V3/04/0802
[21] Project SVKW, verbeteren scharnierconstructie: Langeduur kruipproeven op UHMWPE-klikschijven tegen Hempaquick coating i.v.m. het buiten bedrijf stellen van de vijzeloptie in parkeerstand, V3/04/0827
[22] Project SVKW, verbeteren scharnierconstructie: Verificatieproeven op UHMWPE klikschijven bij oplevering van noordelijk bolscharnier, V3/04/0901
[23] Comparative study on the friction and wear behaviour of different types internal lubricated cast nylons sliding against steel on a large-scale tribotester (part 2), V3/04/1009
[24] Friction and wear of RD 304 cast nylon under dry and lubricated conditions on a large-scale tribotester, V3/04/1012
[25] Friction and wear of Aluminium-bronze under lubricated conditions and high load by means of a large-scale tribotester, V3/04/1021
[26] Determination of loading capacity for seizing of steel and hardened steel sliding pairs under dry and lubricated conditions (FRIEX-project), V3/05/0516
[27] Friction and wear of Nylatron RD 609 and Polyamide black cast nylon under dry conditions on a large-scale tribotester, V3/06/0420
[28] Large-scale tribological test on Nylatron 703 XL with curved contact surfaces, V3/06/0522 [29] Schade-evaluatie van scharnierpunten in de constructie van een drijvende bok en aanbeveling-
en, V3/06/1213

401

402


