Embed Size (px)
Citation preview
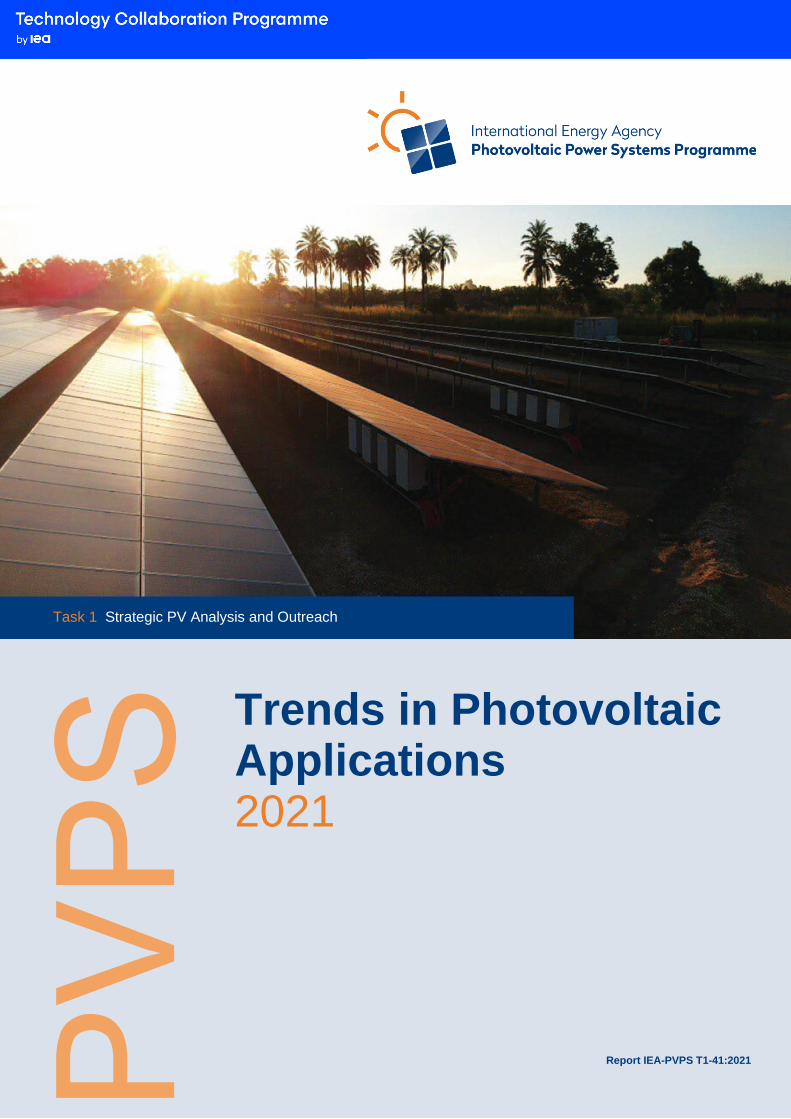
Trends in Photovoltaic Applications 2021
PVPS
Report IEA-PVPS T1-41:2021
Task 1 Strategic PV Analysis and Outreach

AUTHORS
Main Authors: Gaëtan Masson (Becquerel Institute), Izumi Kaizuka (RTS Corporation). Analysis: Izumi Kaizuka (RTS Corporation), E. Bosch, G. Masson (Becquerel Institute), Johan Lindahl (Becquerel Institute Sweden), Eddy Blokken (SERIS). Data: IEA PVPS Reporting Countries, Becquerel Institute (BE), RTS Corporation (JP) and Arnulf Jaeger-Waldau (EU-JRC), For the non-IEA PVPS countries UNEF (ES). For the other European Union countries: EU-JRC. For floating PV data: SERIS (SG). For the non-IEA PVPS countries: BSW, UNEF. Editor: G. Masson, IEA PVPS Task 1 Operating Agent. Design: Onehemisphere, Sweden, [email protected]
DISCLAIMER
The IEA PVPS TCP is organised under the auspices of the International Energy Agency (IEA) but is functionally and legally autonomous. Views, findings and publications of the IEA PVPS TCP do not necessarily represent the views or policies of the IEA Secretariat or its individual member countries Data for non-IEA PVPS countries are provided by official contacts or experts in the relevant countries. Data are valid at the date of publication and should be considered as estimates in several countries due to the publication date.
COVER IMAGE
Manono, RDC. © Enerdeal
ISBN 978-3-907281-28-4: Trends in Photovoltaic Applications 2021.
‘Tasks,’ that may be research projects or activity areas. This
report has been prepared under Task 1, which deals with market
and industry analysis, strategic research and facilitates the
exchange and dissemination of information arising from the
overall IEA PVPS Programme.
The IEA PVPS participating countries are Australia, Austria,
Belgium, Canada, Chile, China, Denmark, Finland, France,
Germany, Israel, Italy, Japan, Korea, Malaysia, Mexico, Morocco,
the Netherlands, Norway, Portugal, South Africa, Spain, Sweden,
Switzerland, Thailand, Turkey, and the United States of America.
The European Commission, Solar Power Europe, the Smart
Electric Power Alliance (SEPA), the Solar Energy Industries
Association and the Copper Alliance are also members.
Visit us at: www.iea-pvps.org
The International Energy Agency (IEA), founded in 1974, is an autonomous body within the framework of the Organization for Economic Cooperation and Development (OECD). The Technology Collaboration Programme (TCP) was created with a belief that the future of energy security and sustainability starts with global collaboration. The programme is made up of thousands of experts across government, academia, and industry dedicated to advancing common research and the application of specific energy technologies.
The IEA Photovoltaic Power Systems Programme (IEA PVPS) is
one of the TCP’s within the IEA and was established in 1993. The
mission of the programme is to “enhance the international
collaborative efforts which facilitate the role of photovoltaic solar
energy as a cornerstone in the transition to sustainable energy
systems.” In order to achieve this, the Programme’s participants
have undertaken a variety of joint research projects in PV power
systems applications. The overall programme is headed by an
Executive Committee, comprised of one delegate from each
country or organisation member, which designates distinct
WHAT IS IEA PVPS TCP?

IEA PVPS TRENDS IN PHOTOVOLTAIC APPLICATIONS 2021 / 3
IEA PVPS TRENDS 2021 IN PHOTOVOLTAIC APPLICATIONS
system prices varies, depending on the willingness of the relevant
national PV industry to provide data. This report presents the
results of the 25th international survey. It provides an overview of
PV power systems applications, markets and production in the
reporting countries and elsewhere at the end of 2020 and
analyses trends in the implementation of PV power systems
between 1992 and 2020. Key data for this publication were drawn
mostly from national survey reports and information summaries,
which were supplied by representatives from each of the
reporting countries. Information from the countries outside IEA
PVPS are drawn from a variety of sources and, while every
attempt is made to ensure their accuracy, the validity of some of
these data cannot be assured with the same level of confidence as
for IEA PVPS member countries.
The Trends report’s objective is to present and interpret developments in the PV power systems market and the evolving applications for these products within this market. These trends are analysed in the context of the business, policy and nontechnical environment in the reporting countries.
This report is prepared to assist those who are responsible for
developing the strategies of businesses and public authorities, and
to support the development of medium-term plans for electricity
utilities and other providers of energy services. It also provides
guidance to government officials responsible for setting energy
policy and preparing national energy plans. The scope of the
report is limited to PV applications with a rated power of 40 W or
more. National data supplied are as accurate as possible at the
time of publication. Data accuracy on production levels and
REPORT SCOPE AND OBJECTIVES
This report has been prepared under the supervision by Task 1 participants. A special thanks to all of them. The report authors also
gratefully acknowledge special support of Eddy Blokken from SERIS.
ACKNOWLEDGEMENT
IEA PVPS TRENDS 2021 IN PHOTOVOLTAIC APPLICATIONS
IEA PVPS TRENDS IN PHOTOVOLTAIC APPLICATIONS 2021 / 4
VIPV is becoming a market reality. PV is expected to develop
everywhere it makes economic sense: from infrastructure to
fields, from water to roads, roofs to façades, in deserts and urban
areas, on cars, buses, trucks and planes. This evolution has been
followed by the IEA PVPS program for years with Task 15
focusing on BIPV and Task 17 exploring VIPV for instance.
Such developments are visible in market and industry numbers:
year after year, the order of magnitude of installations and industrial
capacities is increasing and is now in the multi-hundreds of GW
range. Market levels are increasing on all continents: from
GW-scale market number is increasing as well as the number of
countries importing PV for a burgeoning local market: 6 GW have
been installed in 2020 in the 150 countries not reporting officially PV
installations. This number is rising fast and has almost doubled
compared to the last year. This reflects the health of the PV
fundamentals and especially its scalability and competitiveness and
will lead to further major levels of deployment in the coming years.
In summary, 2020 was a special year due to the COVID-19
pandemic and its trade and industrial disruptions. But PV
continued its development and reaches now all continents. In
2021, the pace accelerated, together with major value chain
issues that reflect the growing share of PV in the energy but also
the materials sector. The more PV develops, the more it will
impact all the value chains it depends on.
This reflects the general belief in this industry that the solar PV era
is just about to begin. And the need for continuing researching
how to properly integrate PV into the energy sector at large.
From a niche market for space and off-grid applications two decades
ago, PV is now a key tool to fight climate change and electrify the
world: based on the installed capacity at the end of 2020,
CO2 savings resulting PV existing installations reached
860 million tonnes of CO2, a record-breaking level. More will be
needed but the IEA PVPS program is proud of continuing supporting
one of the key options to decarbonize the entire energy sector.
2020 achieved unprecedented levels of PV installations globally. With 145 GWdc installed in 2020, this was again a record-breaking year, despite the pandemic. And more is expected in 2021. This remarkable result comes from years of fine-tuning of policies, upgraded business models and improved competitiveness of PV systems.
In 2021, for the first time, the IEA recognised “solar is the new king
of energy markets” offering “some of the lowest cost of energy we
have ever seen”. The record levels achieved in terms of prices of
electricity, position PV as the leading renewable energy for
decarbonization of the energy sector. Its potential now spans
through building heating and cooling, transport and industrial
applications. It remains difficult to extrapolate the tremendous
potential of a source of electricity which has become so
competitive. In 2020, the pandemic hasn’t stopped PV
development. It is even more complicated to estimate whether it
has even reduced its global deployment. In 2021, supply chain
difficulties could reduce the global market growth, but the narrative
remains the same: PV is developing fast, on all continents.
This report highlights the key trends in PV development and the
ever-changing policy landscape. The more PV develops and
captures a greater share of power generation, new challenges arise.
The latest example is the rise of energy communities that trigger
new questions about grid management, grid costs, and how to
price a fair use of the grid by distributed embedded producers and
consumers. Many questions that pre-existed, but didn’t impact
much the ecosystem, now are facing a new reality of higher PV
penetration. Net-metering that used to be the simplest way to
support PV development on buildings, is now being replaced
progressively by self-consumption policies. And this is just one
example out of many.
The diversity of applications is increasing fast: floating PV has
reached 3 GW of total capacity, BIPV is growing, agricultural PV is
experiencing a major push from several key PVPS countries and
FOREWORD
Gaëtan Masson Chairman IEA PVPS Programme
Daniel Mugnier Chairman IEA PVPS Programme

IEA PVPS TRENDS IN PHOTOVOLTAIC APPLICATIONS 2021 / 5
IEA PVPS TRENDS 2021 IN PHOTOVOLTAIC APPLICATIONS
FOREWORD 4 1. INTRODUCTION TO THE CONCEPTS AND METHODOLOGY 7
PV TECHNOLOGY 7 PV APPLICATIONS AND MARKET SEGMENTS 8 METHODOLOGY FOR THE MAIN PV MARKET DEVELOPMENT INDICATORS 9
2. PV MARKET DEVELOPMENT TRENDS 10
THE GLOBAL PV INSTALLED CAPACITY 10 PV MARKET SEGMENTS 17 EMERGING PV MARKET SEGMENTS 20 PV DEVELOPMENT PER REGION 23 THE AMERICAS 24 ASIA-PACIFIC 24 EUROPE 26 MIDDLE EAST AND AFRICA 28
3. POLICY FRAMEWORK 31
PV MARKET DRIVERS 32 THE SUPPORT SCHEMES 34 FINANCING OF SUPPORT SCHEMES 38 SOFT COSTS 38 OWNERSHIP OF PV PLANTS 39 GRID INTEGRATION 39 SUSTAINABLE BUILDING REQUIREMENTS & BIPV 40 ELECTRICITY STORAGE 41
4. TRENDS IN THE PV INDUSTRY 42
THE UPSTREAM PV SECTOR 42 THE DOWNSTREAM SECTOR 51
5. SOCIETAL IMPLICATIONS OF PV 53
VALUE FOR THE ECONOMY 53 EMPLOYMENT IN PV 57 PV FOR SOCIAL POLICIES 58 CLIMATE CHANGE MITIGATION 59
6. COMPETITIVENESS OF PV ELECTRICITY IN 2020 61
MODULE PRICES 61 SYSTEM PRICES 64 COST OF PV ELECTRICITY 66
7. PV IN THE ENERGY SECTOR 70
PV ELECTRICITY PRODUCTION 70 PV PENETRATION 71 PV INTEGRATION AND SECTOR COUPLING 73
ANNEXES 75
LIST OF FIGURES 78
LIST OF TABLES 79
TABLE OF CONTENTS

IEA PVPS TRENDS IN PHOTOVOLTAIC APPLICATIONS 2021 / 6
TRENDS IN PHOTOVOLTAIC APPLICATIONS // 2021PHOTOVOLTAIC POWER SYSTEMS PROGRAMME WWW.IEA-PVPS.ORG
SOURCE IEA PVPS AND OTHERS
42 COUNTRIES REACHED AT LEAST
1 GWpIN 2020
Share of PV in the global electricitiy demand in 2020
4 %
TOTAL BUSINESS VALUE IN PV SECTOR IN 2020
$160 BILLION
PV CONTRIBUTION TO ELECTRICITY DEMAND
19 COUNTRIES INSTALLED AT LEAST
1 GWpIN 2020
CLIMATE CHANGE IMPACTS
GLOBAL PVCAPACITY END OF 2020
ANNUAL INSTALLED CAPACITY IN 2020 (GW)145GW
622GW
767GW(2020)
GLOBAL PV CAPACITYEND OF 2019 (GW)
>800 W
1 W
PV penetration (W/capita)
PV PENETRATION PER CAPITA IN 2020
YEARLY PV INSTALLATION, PV PRODUCTION AND PRODUCTION CAPACITY 2010 - 2020
0
50
100
150
200
250
300
350
GW
2010 2011 2012 2013 2014 2015 2016 2017 2018 2019 2020
Total production capacityTotal productionPV installations
PV MARKETS IN 2020
TOP5 CHINA
VIETNAMUSA
JAPAN
EU
PV POWER PER CAPITA
1. AUSTRALIA (810 Wp)
2. GERMANY (648 Wp)
3. JAPAN (571 Wp)
48,0 GW
11,1 GW19,7 GW
8,7 GW
19,8 GW
millions of tons of CO2 saving every year,
860

IEA PVPS TRENDS IN PHOTOVOLTAIC APPLICATIONS 2021 / 7
years, over 85% of the c-Si share. Multicrystalline silicon (mc-Si) cells, also called polycrystalline, are formed with multicrystalline wafers, manufactured from a cast solidification process. They are still in production due to their lower production prices. Nevertheless, they are less efficient, with average conversion efficiency around 18%-21% in mass production (single-junction).
Thin-film cells are formed by depositing extremely thin layers of photovoltaic semiconductor materials onto a backing material such as glass, stainless steel or plastic. III-V compound semiconductor PV cells are formed using materials such as Gallium Arsenide (GaAs) on Germanium (Ge) substrates and have high conversion efficiencies from 25% up to 30% (not concentrated). Due to their high cost, they are typically used in concentrated PV (CPV) systems with tracking systems or for space applications. Thin-film modules used to have lower conversion efficiencies than basic crystalline silicon technologies, but this has changed in recent years. They are potentially less expensive to manufacture than crystalline cells thanks to the reduced number of manufacturing steps from raw materials to modules, and to reduced energy demand. Thin-film materials commercially used are cadmium telluride (CdTe), and copper-indium-(gallium)-diselenide (CIGS and CIS). Amorphous (a-Si) and micromorph silicon (μ-Si) used to have a significant market share but failed to follow both the price of crystalline silicon cells and the efficiency increase of other thin film technologies.
Organic thin-film PV (OPV) cells use dye or organic semiconductors as the light-harvesting active layer. This technology has created increasing interest and research over the last few years and is currently the fastest-advancing solar technology. Despite the low production costs, stable products are
Photovoltaic (PV) devices convert light directly into electricity and should not be confused with other solar technologies such as concentrated solar power (CSP) or solar thermal for heating and cooling. The key components of a PV power system are various types of photovoltaic cells (often called solar cells) interconnected and encapsulated to form a photovoltaic module (the commercial product), the mounting structure for the module or array, the inverter (essential for grid-connected systems and required for most off-grid systems), the storage battery and charge controller (for off-grid systems but also increasingly for grid-connected ones).
CELLS, MODULES AND SYSTEMS
Photovoltaic cells represent the smallest unit in a photovoltaic power producing device. Wafer sizes, and thus cell sizes have progressively increased, as it is commonly considered by industrial actors as an easy way to improve cell and modules wattage. Nowadays, wafer sizes range from 156,75 x 156,75 square mm (named M2) up to 210 x 210 square mm (named M12). To this date, there is no standard in the wafer size. Nevertheless, M10 wafers (182 x 182 square mm) and M12 have gained a lot of traction in the last year. In general, cells can be classified as either wafer-based crystalline silicon c-Si (mono- and multi-crystalline), compound semiconductor (thin-film), or organic.
Currently, c-Si technologies account for more than 95% of the overall cell production. Monocrystalline PV cells, formed with wafers manufactured using a single crystal growth method, feature commercial efficiencies between 20% and 25% (single-junction). They have gained the biggest market share in recent
PV TECHNOLOGY
one INTRODUCTION TO THE CONCEPTS AND METHODOLOGY
© IOC/dam Mork

can be assembled in way that they fill multiple functions usually devoted to conventional building envelope solutions.
Bifacial PV modules collect light on both sides of the panel. When mounted on a surface which albedo reflects enough light, the energy production increase is estimated to a maximum of 15% with structure, and possibly up to 30-35% with a single-axis system. Bifacial modules have a growing competitive advantage despite higher overall installation costs. Indeed, recent competitive projects in desert areas boosted the market confidence in bifacial PV performance and production lines are increasingly moving towards bifacial modules. The additional factors affecting bifacial performance into their models are also better understood and integrated in the downstream industry. Bifacial PV panels have gained traction again in 2021 and are expected to take growing market shares in the coming years for utility-scale applications.
Floating PV systems are mounted on a structure that floats on a water surface and can be associated with existing grid connections for instance in the case of dam vicinity. The development of floating PV on man-made water areas is a solution to land scarcity in high population density areas and can be combined with hydropower.
Agricultural PV combine crops and energy production on the same site. The sharing of light between these two types of production potentially allows a higher crop yield, depending on the climate and the selection of the crop variety and can even be mutually beneficial in some cases, as the water which evaporates from the crops can contribute to a reduction of PV modules operating temperature.
PV thermal hybrid solar installations (PVT) combine a solar module with a solar thermal collector, thereby converting sunlight into electricity and capturing the remaining waste heat from the PV module to produce hot water or feed the central heating system. It also allows to reduce the operating temperature of the modules, which benefits the global performances of the system.
VIPV or vehicle integrated PV. The integration of highly efficient solar cells into the shell of the vehicles allow for emissions reductions in the mobility sector. The solar cell technological developments allow to meet both aesthetic expectations for car design and technical requirements such as lightweight and resistance to load. VAPV relates to the use of PV modules on vehicles without integration.
Various Solar Home Sytems (SHS) or pico PV systems have experienced significant development in the last few years, combining the use of efficient lights (mostly LEDs) with charge controllers and batteries. With a small PV panel of only a few watts, essential services can be provided, such as lighting, phone charging and powering a radio or a small computer. Expandable versions of solar pico PV systems have entered the market and enable starting with a small kit and adding extra loads later. They are mainly used for off-grid basic electrification, mainly in developing countries.
not yet available for the market, nevertheless development and demonstration activities are underway. Tandem cells based on perovskites are researched as well, with either a crystalline silicon base or a thin film base and could hit the market sooner than pure perovskites products. In 2021, perovskite solar cell achieved 28.0% efficiencies in silicon-based tandem and 23.26% efficiencies in CIGS-based tandems.
Photovoltaic modules are typically rated from 290 W to 600 W, depending on the technology and the size. Specialized products for building integrated PV systems (BIPV) exist, sometimes with higher nominal power due to their larger sizes. Crystalline silicon modules consist of individual PV cells connected and encapsulated between a transparent front, usually glass, and a backing material, usually plastic or glass. Thin-film modules encapsulate PV cells formed into a single substrate, in a flexible or fixed module, with transparent plastic or glass as the front material. Their efficiency ranges between 9% (OPV), 10% (a-Si), 17% (CIGS and CIS), 19% (CdTe), 25% GaAs (non-concentrated) and above 40% for some CPV modules .
A PV system consists of one or several PV modules, connected to either an electricity network (grid-connected PV) or to a series of loads (off-grid). It comprises various electric devices aiming at adapting the electricity output of the module(s) to the standards of the network or the load: inverters, charge controllers or batteries.
A wide range of mounting structures has been developed especially for BIPV; including PV facades, sloped and flat roof mountings, integrated (opaque or semi-transparent) glass-glass modules and PV tiles.
Single or two-axis tracking systems have recently become more and more attractive for ground-mounted systems, particularly for PV utilization in countries with a high share of direct irradiation. By using such systems, the energy yield can typically be increased by 10-20% for single axis trackers and 20-30% for double axis trackers compared with fixed systems.
When considering distributed PV systems, it is necessary to distinguish BAPV (building applied photovoltaics) and BIPV (buildings integrated photovoltaics) systems. BAPV refers to PV systems installed on an existing building while BIPV imposes to replace conventional building materials by some which include PV cells. Amongst BIPV solutions, PV tiles, or PV shingles, are typically small, rectangular solar panels that can be installed alongside conventional tiles or slates using a traditional racking system used for this type of building product. BIPV products can take various shapes, colours and be manufactured using various materials, although a vast majority use glass on both sides. They
CHAPTER 1 INTRODUCTION TO THE CONCEPTS AND METHODOLOGY
PV APPLICATIONS AND MARKET SEGMENTS
PV TECHNOLOGY / CONTINUED
1 Source: https://www.nrel.gov/pv/module-efficiency.html
IEA PVPS TRENDS IN PHOTOVOLTAIC APPLICATIONS 2021 / 8
CHAPTER 1 INTRODUCTION TO THE CONCEPTS AND METHODOLOGY
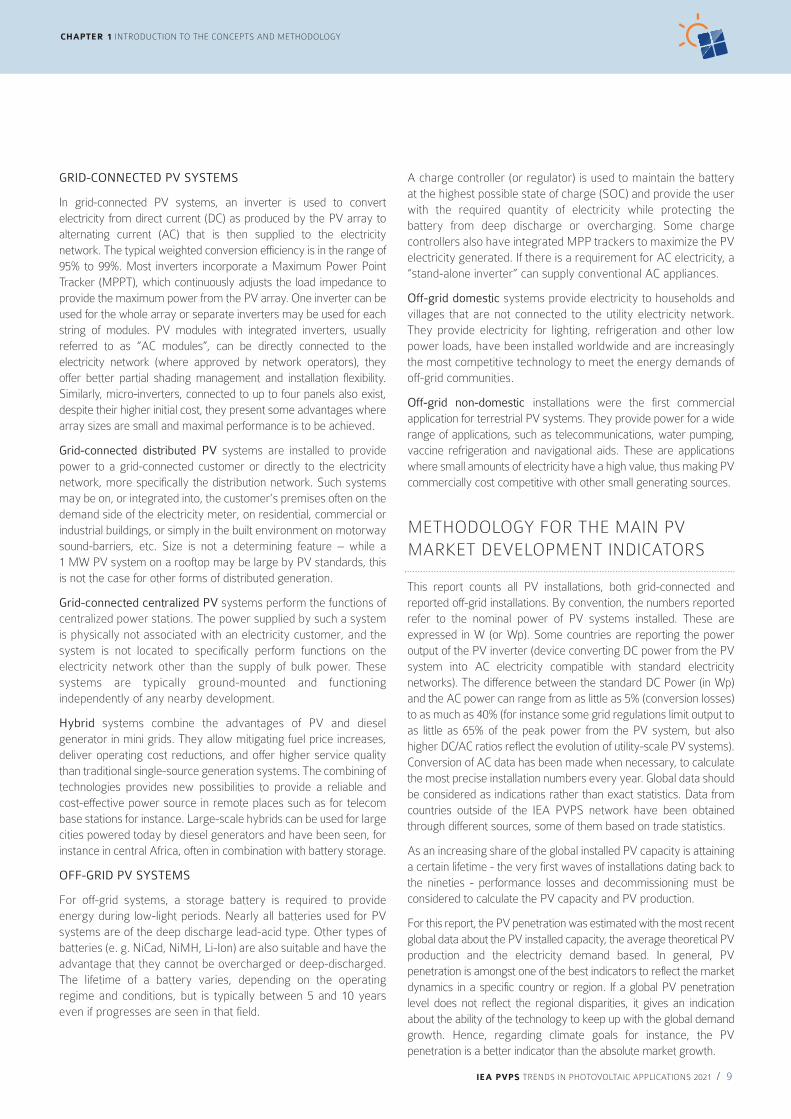
GRID-CONNECTED PV SYSTEMS
In grid-connected PV systems, an inverter is used to convert electricity from direct current (DC) as produced by the PV array to alternating current (AC) that is then supplied to the electricity network. The typical weighted conversion efficiency is in the range of 95% to 99%. Most inverters incorporate a Maximum Power Point Tracker (MPPT), which continuously adjusts the load impedance to provide the maximum power from the PV array. One inverter can be used for the whole array or separate inverters may be used for each string of modules. PV modules with integrated inverters, usually referred to as “AC modules”, can be directly connected to the electricity network (where approved by network operators), they offer better partial shading management and installation flexibility. Similarly, micro-inverters, connected to up to four panels also exist, despite their higher initial cost, they present some advantages where array sizes are small and maximal performance is to be achieved.
Grid-connected distributed PV systems are installed to provide power to a grid-connected customer or directly to the electricity network, more specifically the distribution network. Such systems may be on, or integrated into, the customer’s premises often on the demand side of the electricity meter, on residential, commercial or industrial buildings, or simply in the built environment on motorway sound-barriers, etc. Size is not a determining feature – while a 1 MW PV system on a rooftop may be large by PV standards, this is not the case for other forms of distributed generation.
Grid-connected centralized PV systems perform the functions of centralized power stations. The power supplied by such a system is physically not associated with an electricity customer, and the system is not located to specifically perform functions on the electricity network other than the supply of bulk power. These systems are typically ground-mounted and functioning independently of any nearby development.
Hybrid systems combine the advantages of PV and diesel generator in mini grids. They allow mitigating fuel price increases, deliver operating cost reductions, and offer higher service quality than traditional single-source generation systems. The combining of technologies provides new possibilities to provide a reliable and cost-effective power source in remote places such as for telecom base stations for instance. Large-scale hybrids can be used for large cities powered today by diesel generators and have been seen, for instance in central Africa, often in combination with battery storage.
OFF-GRID PV SYSTEMS
For off-grid systems, a storage battery is required to provide energy during low-light periods. Nearly all batteries used for PV systems are of the deep discharge lead-acid type. Other types of batteries (e. g. NiCad, NiMH, Li-Ion) are also suitable and have the advantage that they cannot be overcharged or deep-discharged. The lifetime of a battery varies, depending on the operating regime and conditions, but is typically between 5 and 10 years even if progresses are seen in that field.
A charge controller (or regulator) is used to maintain the battery at the highest possible state of charge (SOC) and provide the user with the required quantity of electricity while protecting the battery from deep discharge or overcharging. Some charge controllers also have integrated MPP trackers to maximize the PV electricity generated. If there is a requirement for AC electricity, a “stand-alone inverter” can supply conventional AC appliances.
Off-grid domestic systems provide electricity to households and villages that are not connected to the utility electricity network. They provide electricity for lighting, refrigeration and other low power loads, have been installed worldwide and are increasingly the most competitive technology to meet the energy demands of off-grid communities.
Off-grid non-domestic installations were the first commercial application for terrestrial PV systems. They provide power for a wide range of applications, such as telecommunications, water pumping, vaccine refrigeration and navigational aids. These are applications where small amounts of electricity have a high value, thus making PV commercially cost competitive with other small generating sources.
This report counts all PV installations, both grid-connected and reported off-grid installations. By convention, the numbers reported refer to the nominal power of PV systems installed. These are expressed in W (or Wp). Some countries are reporting the power output of the PV inverter (device converting DC power from the PV system into AC electricity compatible with standard electricity networks). The difference between the standard DC Power (in Wp) and the AC power can range from as little as 5% (conversion losses) to as much as 40% (for instance some grid regulations limit output to as little as 65% of the peak power from the PV system, but also higher DC/AC ratios reflect the evolution of utility-scale PV systems). Conversion of AC data has been made when necessary, to calculate the most precise installation numbers every year. Global data should be considered as indications rather than exact statistics. Data from countries outside of the IEA PVPS network have been obtained through different sources, some of them based on trade statistics.
As an increasing share of the global installed PV capacity is attaining a certain lifetime - the very first waves of installations dating back to the nineties - performance losses and decommissioning must be considered to calculate the PV capacity and PV production.
For this report, the PV penetration was estimated with the most recent global data about the PV installed capacity, the average theoretical PV production and the electricity demand based. In general, PV penetration is amongst one of the best indicators to reflect the market dynamics in a specific country or region. If a global PV penetration level does not reflect the regional disparities, it gives an indication about the ability of the technology to keep up with the global demand growth. Hence, regarding climate goals for instance, the PV penetration is a better indicator than the absolute market growth.
METHODOLOGY FOR THE MAIN PV MARKET DEVELOPMENT INDICATORS
IEA PVPS TRENDS IN PHOTOVOLTAIC APPLICATIONS 2021 / 9

IEA PVPS TRENDS IN PHOTOVOLTAIC APPLICATIONS 2021 / 10
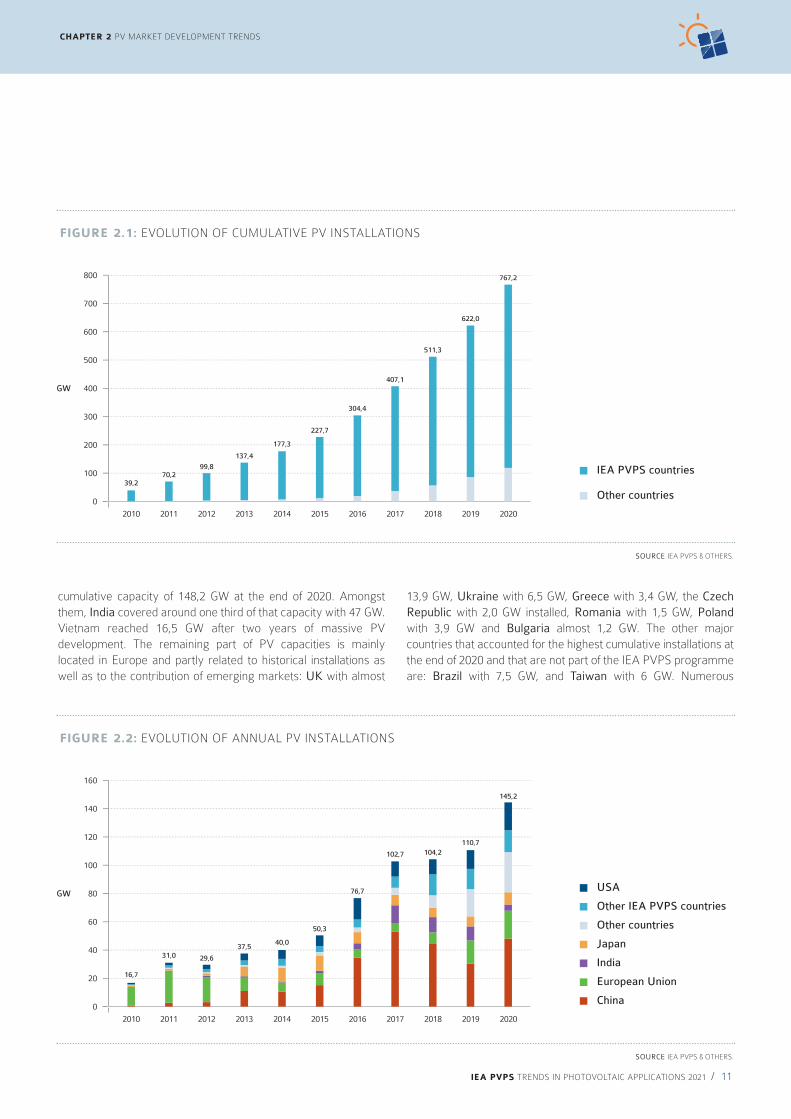
At the end of 2020, the global PV installed capacity represented 767 GW of cumulative PV installations.
Presently it appears that 145 GW represented the minimum capacity installed during 2020 with a reasonably firm level of certainty. This level is the highest ever recorded for PV installations, despite the pandemic related perturbations which might have delayed market development in some countries. The real impact of the pandemic is difficult to estimate, since the delays observed in the first part of the year were sometimes compensated in the second part. It seems reasonable that some projects might have been delayed.
The group of IEA PVPS countries represented 107,7 GW of the total installed capacity. The IEA PVPS participating countries in 2020 are Australia, Austria, Belgium, Canada, Chile, China, Denmark, Finland, France, Germany, Israel, Italy, Japan, Korea, Malaysia, Mexico, Morocco, the Netherlands, Norway, Portugal, South Africa, Spain, Sweden, Switzerland, Thailand, Turkey, and the United States of America.
The other key markets that have been considered and which are not part of the IEA PVPS Programme, represented a total
Since the early beginnings of the PV market development, over 767 GW of PV plants have been installed globally, of which around 70% has been installed over the last five years. Over the years, a growing number of markets started to contribute to global PV installations, and the year 2020 closed with a record number of new countries installing significant PV numbers.
A large majority of PV installations are grid-connected and include an inverter which converts the variable direct current (DC) output of solar modules into alternating current (AC) to be injected into the electrical grid. PV installation data is reported in DC by default in this report (see also Chapter 1). When countries are reporting officially in AC, this report converts in DC to maintain coherency. When official reporting is in AC, announced capacities are mentioned as MWac or MWdc in this report. By default, MW implies capacities mentioned in DC.
For more information on registering PV installations, download the IEA PVPS report on registering PV installations published recently.
two PV MARKET DEVELOPMENT TRENDS
THE GLOBAL PV INSTALLED CAPACITY
Download the “Data Model for PV Systems” report:
��
�
�
�
�
�
�
�
�
�
�
�
�
�
�
�
�
�
� �
�
�
�
�
�
�
�
�
�
�
������������� ������������������������������������������� �������������������������������������������������������� �������������������������
�����
��
��
�
������ !�" � ��#$%$&"'$()')'�
���������� ���������������������� ��������������������������� ���������� ����� !�
Floating PV Plants in France © AKUO
Global PV installed capacity (GW)
+30% YoY growth
IEA PVPS TRENDS IN PHOTOVOLTAIC APPLICATIONS 2021 / 11
CHAPTER 2 PV MARKET DEVELOPMENT TRENDS
13,9 GW, Ukraine with 6,5 GW, Greece with 3,4 GW, the Czech Republic with 2,0 GW installed, Romania with 1,5 GW, Poland with 3,9 GW and Bulgaria almost 1,2 GW. The other major countries that accounted for the highest cumulative installations at the end of 2020 and that are not part of the IEA PVPS programme are: Brazil with 7,5 GW, and Taiwan with 6 GW. Numerous
cumulative capacity of 148,2 GW at the end of 2020. Amongst them, India covered around one third of that capacity with 47 GW. Vietnam reached 16,5 GW after two years of massive PV development. The remaining part of PV capacities is mainly located in Europe and partly related to historical installations as well as to the contribution of emerging markets: UK with almost
SOURCE IEA PVPS & OTHERS.
FIGURE 2.1: EVOLUTION OF CUMULATIVE PV INSTALLATIONS
0
GW
20112010 2012 2013 2014 2015 2016 2017 2018 2019 2020
39,270,2
99,8
137,4
177,3
227,7
304,4
407,1
511,3
622,0
767,2
IEA PVPS countries
Other countries
100
200
300
400
500
600
700
800
70 2770 2
177 377 31
6 22276767
SOURCE IEA PVPS & OTHERS.
FIGURE 2.2: EVOLUTION OF ANNUAL PV INSTALLATIONS
0
20
40
60
80
100
120
140
160
GW
Japan
USA
Other countries
Other IEA PVPS countries
China
India
European Union
20112010 2012 2013 2014 2015 2016 2017 2018 2019 2020
16,7
31,0 29,6
37,540,0
50,3
76,7
102,7 104,2110,7
145,2
IEA PVPS TRENDS IN PHOTOVOLTAIC APPLICATIONS 2021 / 12
CHAPTER 2 PV MARKET DEVELOPMENT TRENDS
EVOLUTION OF PV ANNUAL INSTALLATIONS
The IEA PVPS countries installed at least 107 GW in 2020. While they are more difficult to track with a high level of certainty, installations in non-IEA PVPS countries contributed an estimated amount of 38 GW. The noteworthy trend of 2020 is the growth of the global PV market despite the pandemic which could have delayed market development in some countries. As in 2019, the rise of emerging markets contributed to this market growth in 2020.
For the eighth year in a row, China was in first place and installed more than 48 GW in 2020, according to China’s National Energy Administration; an installation level that equated and overpassed the levels reached in the country in 2017 and 2018. The total installed capacity in China reached 253,6 GW, and by that the country kept its market leader position in terms of total installed capacity. The Chinese market represented 33% of the global installation in 2020.
countries all over the world have started to deploy PV but few have yet reached a significant development level in terms of cumulative installed capacity outside the ones mentioned above. New developments occurred in Africa (Egypt, South Africa) and in the Middle East (UAE) which led to GW-scale installation levels: 4,2 in South Africa, 2,8 in the UAE and 3,1 in Egypt for instance.
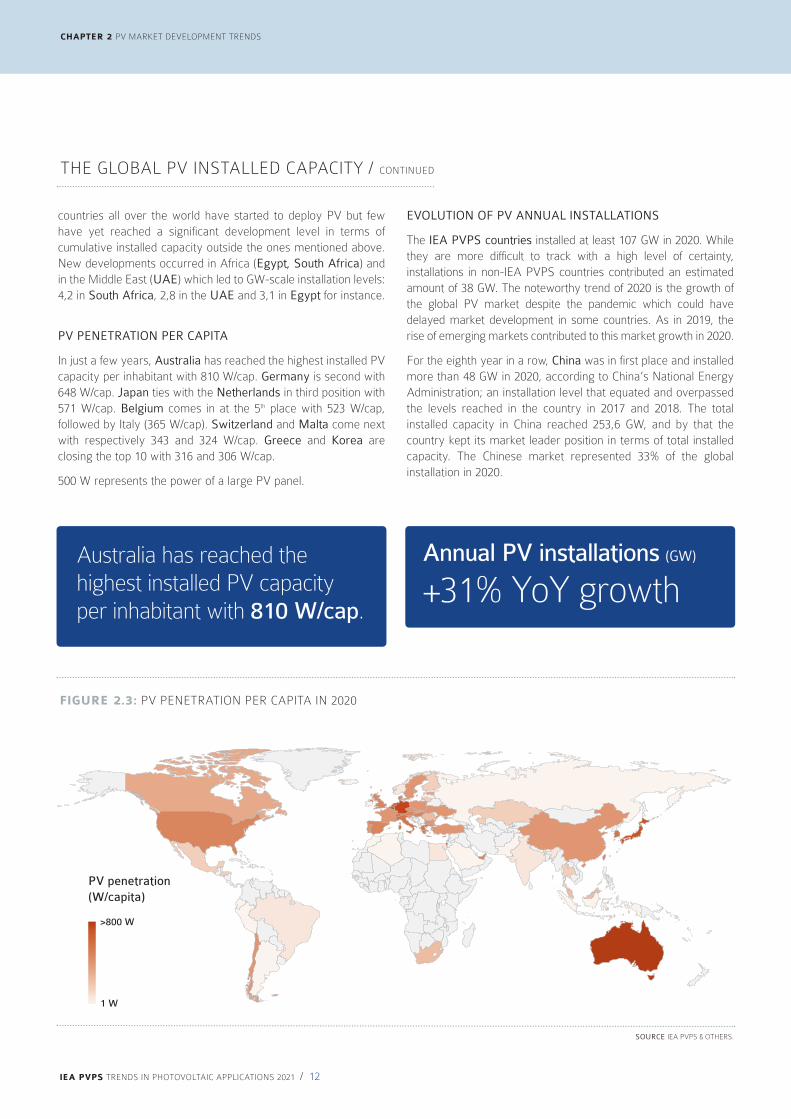
PV PENETRATION PER CAPITA
In just a few years, Australia has reached the highest installed PV capacity per inhabitant with 810 W/cap. Germany is second with 648 W/cap. Japan ties with the Netherlands in third position with 571 W/cap. Belgium comes in at the 5th place with 523 W/cap, followed by Italy (365 W/cap). Switzerland and Malta come next with respectively 343 and 324 W/cap. Greece and Korea are closing the top 10 with 316 and 306 W/cap.
500 W represents the power of a large PV panel.
THE GLOBAL PV INSTALLED CAPACITY / CONTINUED
SOURCE IEA PVPS & OTHERS.
FIGURE 2.3: PV PENETRATION PER CAPITA IN 2020
>800 W
1 W
PV penetration (W/capita)
Australia has reached the highest installed PV capacity per inhabitant with 810 W/cap.
Annual PV installations (GW)
+31% YoY growth

IEA PVPS TRENDS IN PHOTOVOLTAIC APPLICATIONS 2021 / 13
CHAPTER 2 PV MARKET DEVELOPMENT TRENDS
Second was the European Union which experienced growth for the third year in a row with 19,8 GW, coming closer to the 23,2 GW recorded in 2011. Germany (4,9 GW), the Netherlands (3 GW) and Spain (3,5 GW) were the key markets this year, followed by Poland, France, Belgium, and several others.
Third was United States with 19,7 GW installed, a significant growth compared to 2018 and 2019, marking 2020 the largest single year increase in installations in the U.S. Both the utility sector installations and the residential market increased over 2019 installation levels. At the end of 2020, the U.S. reached 95 GW of cumulative installed capacity.
Vietnam was in fourth place with 11,1 GW installed, out of which a large part was installed as distributed PV plants. For the second year in a row, while levels reached in two years are important, the country’s appetite for PV has led to high development levels which highlight both the need for market control and positively, the ability to rapidly deploy massive PV capacities.
The market in Japan is rather stable as the installations slightly increased to 8,7 GW in 2020, which is still below the record level of 10,8 GW in 2015.
Together, these five leading individual or block of countries represented around 75% of all installations recorded in 2020, a level comparable to the 73% in 2018 but higher than 2019. In terms of
cumulative installed capacity, these countries represent 75% of the global capacity. This shows that the global PV market concentration is again increasing, with new markets contributing proportionally less to global installation numbers than established ones.
Behind the top 5, India installed 4,4 GW. The official number has been recalculated based on official AC data using IEA PVPS assumptions on AC-DC ratio. The cumulative installed capacity is 47 GWdc at the end of 2020.
Australia installed 4,5 GW in 2020, slightly below the 4,9 GW of 2019: a tremendous level given the country’s population. For several years the country has been experiencing a boom in utility-scale applications together with a robust demand for distributed PV systems. The total installed PV capacity reached 20,8 GW at the end of 2020.
Korea installed 4,1 GW in 2020, the highest level of installations ever in the country, with an important share of utility-scale plants. Korea is one key industrial actor in the PV sector, with several key players such as Hanwha.
Brazil’s position in the top 10 countries for PV installations comes from 2,9 GW installed in 2020, also the highest ever level for the country. After years of limited PV market development, Brazil appears now as one of the key global players, with a potential much higher than the level reached until now.
SOURCE IEA PVPS & OTHERS.
FIGURE 2.4: EVOLUTION OF MARKET SHARE OF TOP COUNTRIES
0
20
40
60
80
100
%
2011 2012 2013 2014 2015 2016 2017 2018 2019 2020
Top 5 Global PV Markets1st Global PV Market Top 10 Global PV Markets
31%27%
29%27%
30%
45%
51%
42%
26%
33%
77%
68%72%
77% 78%
83%84%
73%
57%
64%
91%
84% 86% 88% 88%89% 91%
86%
75%77%

CHAPTER 2 PV MARKET DEVELOPMENT TRENDS
IEA PVPS TRENDS IN PHOTOVOLTAIC APPLICATIONS 2021 / 14
In the tenth position comes Taiwan where PV installations finally advanced in 2020 after some years of slow development. In total around 1,7 GW were installed.
Together, these 10 markets cover around 85% of the 2020 annual world market, a sign that the growth of the global PV market has been driven by a limited number of countries again, however less than in previous years as the remaining markets are starting to contribute more significantly. Market concentration has been fuelling fears for the market’s stability in the past, if one of the top three or top five markets would experience a slowdown. As shown in Figure 2.4, the market concentration steadily decreased in 2019 before growing again in 2020, mostly due to the growth of the Chinese PV
market. However, as new markets are starting to emerge, the versatility of the global PV market minus China reduces, and therefore the risks. However, the size of the Chinese PV market continues to shape the evolution of the PV market as a whole. As we have seen in 2019, the global growth was limited due to the decline of the first market, which almost wiped out the global growth, while in 2020, China’s installations maximized the global growth.
The level of installation required to enter the top 10 (country wise) have increased steadily since 2014: from 843 MW to 1,5 GW in 2018, and around 3 GW in 2019 and 2020. This reflects the global growth trend of the solar PV market, but also its variations from one year to another.
THE GLOBAL PV INSTALLED CAPACITY / CONTINUED
SOURCE IEA PVPS & OTHERS.
RANKING 2011 2012 2013 2014 2015 2016 2017 2018 2019 2020
1. ITALY GERMANY CHINA CHINA CHINA CHINA CHINA CHINA CHINA CHINA
2. GERMANY ITALY JAPAN JAPAN JAPAN USA INDIA INDIA USA USA
3. CHINA CHINA USA USA USA JAPAN USA USA INDIA VIETNAM
4. USA USA GERMANY UK UK INDIA JAPAN JAPAN JAPAN JAPAN
5. FRANCE JAPAN ITALY GERMANY INDIA UK TURKEY AUSTRALIA VIETNAM GERMANY
6. JAPAN FRANCE UK SOUTH AFRICA GERMANY GERMANY GERMANY TURKEY AUSTRALIA AUSTRALIA
7. BELGIUM AUSTRALIA ROMANIA FRANCE KOREA THAILAND KOREA GERMANY SPAIN INDIA
8. UK INDIA INDIA KOREA AUSTRALIA KOREA AUSTRALIA MEXICO GERMANY KOREA
9. AUSTRALIA GREECE GREECE AUSTRALIA FRANCE AUSTRALIA BRAZIL KOREA UKRAINE SPAIN
10. GREECE BULGARIA AUSTRALIA INDIA CANADA TURKEY UK NETHERLANDS KOREA NETHERLANDS
RANKING EU 1. 1. 2. 3. 3. 4. 5. 4. 2. 2.
MARKET LEVEL TO ACCESS THE TOP 10
426 MW 843 MW 792 MW 779 MW 675 MW 818 MW 944 MW 1 621 MW 3 130 MW 3 036 MW
TABLE 2.1: EVOLUTION OF TOP 10 PV MARKETS
The debate whether considering the European Union as one
entity or a collection of markets is an editorial choice of the writers.
Considering the European PV Markets separately, Germany
would rank fifth, Spain ninth and the Netherlands tenth. This
doesn’t change the general conclusions of this chapter; the ten
first countries would cover 77% of the global PV market.
As detailed above, the IEA PVPS choice consists in reporting DC
capacities. An estimate of AC capacities would put the market
around 106 GW in 2020. This number (in the same way as the
DC number) is an approximation of the reality and represents an
estimated value of the maximum power that all PV systems
globally could generate instantaneously, assuming they would
all produce at the same time. This number is indicative and
should in no case be used for energy production calculation.

IEA PVPS TRENDS IN PHOTOVOLTAIC APPLICATIONS 2021 / 15
CHAPTER 2 PV MARKET DEVELOPMENT TRENDS
Other countries experienced a significant development of PV in 2020, with part of them having reached the top ten in previous years such as Vietnam, Brazil, and the Netherlands. Others that installed several GW in the last years, sometimes in the top 10 countries, didn’t succeed in maintaining the level of installations high enough to stay in the rankings: Mexico, Turkey, France and many other countries.
For the second time, Egypt appears in the GW-scale markets in 2020. It added 1,5 GWdc of solar PV capacity in 2020 mainly thanks to a new park of utility-scale PV plants. In the UAE, almost 1 GW came online in 2020 through large-scale tenders, amongst the most competitive globally. Self-consumption polices didn’t contribute much but could represent a complementary driver in the near future. Mexico’s annual installations reached 1,6 GWdc in 2020, in a complex policy environment, which might put the brakes on its market in the coming years, but 2020 installations in these three countries were significantly smaller.
Other countries reached significant installation levels in 2020: Around 2,6 GW of PV installations were added in Poland in 2020, mostly as small distributed installations. Around 1,7 GW of mostly distributed PV was installed in Taiwan in 2020. Turkey installed around 950 GWdc of solar PV in 2020. Belgium installed 1,1 GW in 2020, the highest level ever for that country.
Other countries that installed significant amounts of PV but below the GW, are France (0,97 GW), Malaysia with almost 900 MW, Chile (790 MW), Italy (785 MW), or Israel (590 MW).
The total installed capacity in most countries takes decommissioning of PV plants into account. While such numbers remain relatively limited for the time being, they start to impact at a very low level, which can lead to discrepancies in national statistics of several IEA PVPS countries. Off-grid numbers are difficult to track and most numbers are estimates. Changes (including repowering) and decommissioning are higher for these applications than in other segments and can lead to number glitches. In this report, global annual installations and the cumulative capacity are computed based on a variety of sources and could, despites all efforts, differ from other publications.
.
SOURCE IEA PVPS & OTHERS.
FIGURE 2.5: GLOBAL PV MARKET IN 2020
VIETNAM, 7,7%
INDIA, 3,0%
GERMANY, 3,4%
SPAIN, 2,4%
NETHERLANDS, 2,1%
OTHER COUNTRIES,22,8%
145,2 GW
CHINA, 33,2%
USA, 13,6%
AUSTRALIA, 3,1%
JAPAN, 6,0%
SOUTH KOREA, 2,8%
SOURCE IEA PVPS & OTHERS.
FIGURE 2.6: CUMULATIVE PV CAPACITY END 2020
JAPAN, 9,4%
ITALY, 2,8%
GERMANY, 7,0%
AUSTRALIA, 2,7%
UK, 1,8%
SOUTH KOREA, 2,1%VIETNAM, 2,1%
OTHER COUNTRIES,20,3%
767,2GW
INDIA, 6,2%
CHINA, 33,1%
USA, 12,5%
CHAPTER 2 PV MARKET DEVELOPMENT TRENDS
IEA PVPS TRENDS IN PHOTOVOLTAIC APPLICATIONS 2021 / 16
THE GLOBAL PV INSTALLED CAPACITY / CONTINUED
SOURCE IEA PVPS & OTHERS.
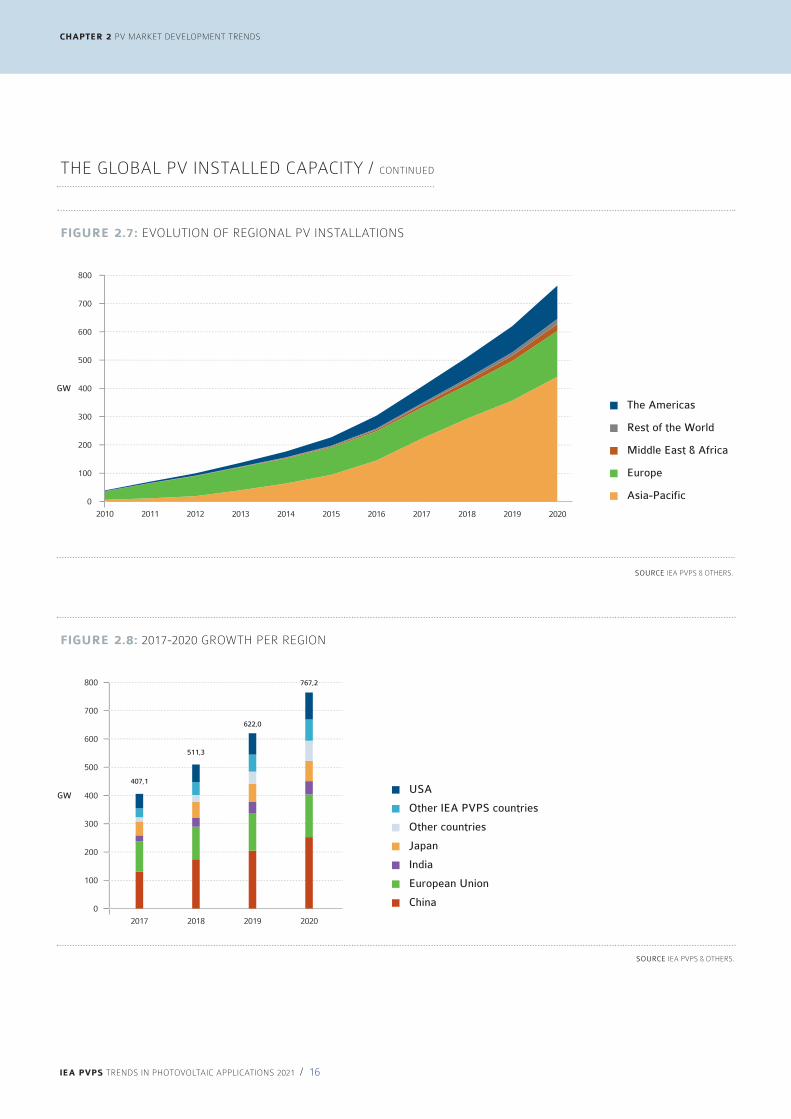
FIGURE 2.8: 2017-2020 GROWTH PER REGION
0
100
200
300
400
500
600
700
800
GW
Japan
USA
Other countries
Other IEA PVPS countries
China
India
European Union
20182017 2019 2020
407,1
511,3
622,0
767,2
SOURCE IEA PVPS & OTHERS.
FIGURE 2.7: EVOLUTION OF REGIONAL PV INSTALLATIONS
0
100
200
300
400
500
600
700
800
GW
2010 2011 2012 2013 2014 2015 2016 2017 2018 2019 2020
Rest of the World
Middle East & Africa
Asia-Pacific
The Americas
Europe
IEA PVPS TRENDS IN PHOTOVOLTAIC APPLICATIONS 2021 / 17
countries are proposing tendering processes to select the most competitive projects, which trigger a significant decline in the value of the electricity from PV systems and enlarge horizons for PV development. Merchant PV, where PV electricity is directly sold to electricity markets or (C-)PPAs, where it is directly sold to (corporate) consumers is experiencing growth in numerous countries, but this market driver remains limited so far.
One of the key trends of 2020 is the wider development of utility-scale plants with the sole revenues of electricity sales (on wholesale electricity markets or from private customers). Such development is mostly independent from financial incentives and therefore policy decisions, which makes its potential virtually unlimited. Limitations are already seen due to grid congestion in some places: this has modified the tendering approaches which might lead to bidding at the lowest possible cost to secure a grid connection. This has been seen in Portugal for instance.
New utility-scale PV plants are increasingly using trackers to maximise production and in parallel, the use of bifacial PV modules increases relatively fast as well. The addition of storage systems also becomes a trend in some countries, either pushed by specific rules in tenders or by the willingness to better serve the wholesale and grid services markets. In 2020, utility-scale plants amounted to 89 GW globally and the total installed capacity for all of these applications amounted to 453 GW; or 61 % of the 2020 market and 59 % of the cumulative installed capacity.
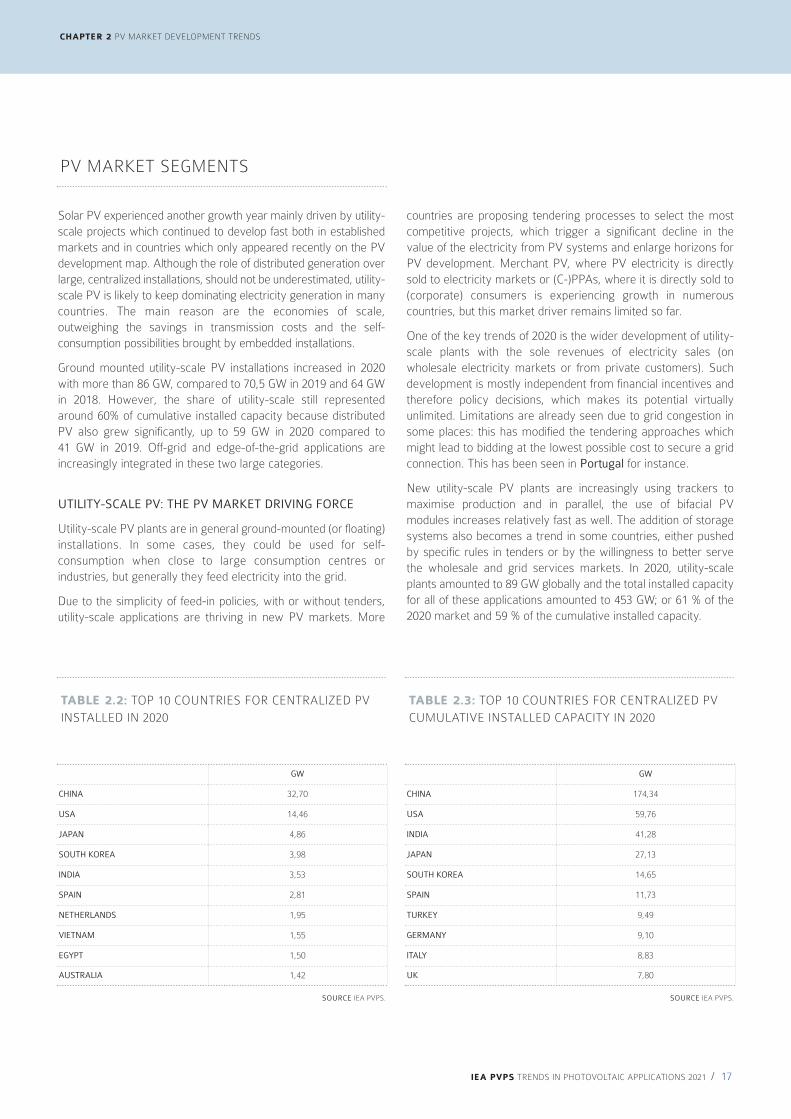
Solar PV experienced another growth year mainly driven by utility-scale projects which continued to develop fast both in established markets and in countries which only appeared recently on the PV development map. Although the role of distributed generation over large, centralized installations, should not be underestimated, utility-scale PV is likely to keep dominating electricity generation in many countries. The main reason are the economies of scale, outweighing the savings in transmission costs and the self-consumption possibilities brought by embedded installations.
Ground mounted utility-scale PV installations increased in 2020 with more than 86 GW, compared to 70,5 GW in 2019 and 64 GW in 2018. However, the share of utility-scale still represented around 60% of cumulative installed capacity because distributed PV also grew significantly, up to 59 GW in 2020 compared to 41 GW in 2019. Off-grid and edge-of-the-grid applications are increasingly integrated in these two large categories.
UTILITY-SCALE PV: THE PV MARKET DRIVING FORCE
Utility-scale PV plants are in general ground-mounted (or floating) installations. In some cases, they could be used for self-consumption when close to large consumption centres or industries, but generally they feed electricity into the grid.
Due to the simplicity of feed-in policies, with or without tenders, utility-scale applications are thriving in new PV markets. More
PV MARKET SEGMENTS
TABLE 2.2: TOP 10 COUNTRIES FOR CENTRALIZED PV
INSTALLED IN 2020
SOURCE IEA PVPS.
GW
CHINA 32,70
USA 14,46
JAPAN 4,86
SOUTH KOREA 3,98
INDIA 3,53
SPAIN 2,81
NETHERLANDS 1,95
VIETNAM 1,55
EGYPT 1,50
AUSTRALIA 1,42
TABLE 2.3: TOP 10 COUNTRIES FOR CENTRALIZED PV
CUMULATIVE INSTALLED CAPACITY IN 2020
SOURCE IEA PVPS.
GW
CHINA 174,34
USA 59,76
INDIA 41,28
JAPAN 27,13
SOUTH KOREA 14,65
SPAIN 11,73
TURKEY 9,49
GERMANY 9,10
ITALY 8,83
UK 7,80
CHAPTER 2 PV MARKET DEVELOPMENT TRENDS

CHAPTER 2 PV MARKET DEVELOPMENT TRENDS
IEA PVPS TRENDS IN PHOTOVOLTAIC APPLICATIONS 2021 / 18
PROSUMERS, EMPOWERING CONSUMERS
Prosumers are consumers producing part of their own electricity consumption.
Historically driven by simple financial incentives such as net-metering, prosumers segments increasingly develop thanks to various schemes based on the concept of self-consumption. Indeed, the new generation of solar schemes are often making the distinction between the electricity consumed and the electricity injected into the grid, thereby incentivizing self-consumption.
An important factor in the success of self-consumption schemes is the retail electricity price which is still being maintained artificially low in some countries. Subsidies for fossil fuels are still a reality and reduce the attractiveness of solar PV installations, also in market segments involving self-consumption. Conversely, the PV market tends to grow quickly when electricity prices increase. Overall, the main trend goes in the direction of self-consuming PV electricity in most of countries, often with adequate regulations offering a value for the excess electricity. This can be done with a FiT, a feed-in-premium added to the spot market price or more complex net-billing. Unfortunately, the move towards pure self-consumption schemes can create temporary market slowdowns, especially if the transition is abrupt. However, if the market conditions are favourable and the market regains confidence, self-consumption can become a market driver.
The distributed market has been oscillating around 16-19 GW from 2011 to 2016, until China succeeded in developing its own distributed market: it allowed the distributed PV market to grow significantly to more than 36 GW globally in 2017 to 49 GW in 2020.
Several countries promote collective and distributed self-consumption as a new model for residential and commercial electricity customers. This model allows different consumers located in the same building or private area (collective self-consumption), or in the same geographical area which requires to use the public grid (distributed or virtual self-consumption), to share the self-generated electricity; thereby unlocking access to self-consumption for a wide range of consumers. Such regulation, if well implemented, will allow development of new business models for prosumers, creating jobs and local added value while reducing the price of electricity for consumers and energy communities. These models of production could also positively impact grid integration of PV systems by enhancing adequacy between production and demand. In the case of “virtual (or distributed) self-consumption”, the prosumers are not grouped behind a meter. We will call “virtual (or distributed) self-consumption”, the case where production and consumption can be compensated at a certain distance, while paying a fair share to cover the grid costs.
PV MARKET SEGMENTS / CONTINUED
SOURCE IEA PVPS & OTHERS.
FIGURE 2.9: CENTRALIZED PV INSTALLED CAPACITY
PER REGION 2020
0
10
20
30
40
50
60
GW
Asia Pacific Europe Middle East
and Africa
The Americas
SOURCE IEA PVPS & OTHERS.
FIGURE 2.10: CENTRALIZED PV CUMULATIVE
INSTALLED CAPACITY PER REGION 2020
0
50
100
150
200
250
300
GW
Asia Pacific Europe Middle East
and Africa
The Americas

IEA PVPS TRENDS IN PHOTOVOLTAIC APPLICATIONS 2021 / 19
CHAPTER 2 PV MARKET DEVELOPMENT TRENDS
SOURCE IEA PVPS & OTHERS.
FIGURE 2.11: DISTRIBUTED PV INSTALLED CAPACITY
PER REGION 2020
0
5
10
15
20
25
30
35
40
GW
Asia Pacific Europe Middle East
and Africa
The Americas
SOURCE IEA PVPS & OTHERS.
FIGURE 2.12: DISTRIBUTED PV CUMULATIVE
INSTALLED CAPACITY PER REGION 2020
0
20
40
60
80
100
120
140
160
180
GW
Asia Pacific Europe Middle East
and Africa
The Americas
TABLE 2.4: TOP 10 COUNTRIES FOR DISTRIBUTED PV
INSTALLED IN 2020
SOURCE IEA PVPS.
GW
CHINA 15,50
VIETNAM 9,58
USA 5,27
JAPAN 3,82
GERMANY 3,69
AUSTRALIA 3,06
BRAZIL 2,26
NETHERLANDS 1,09
BELGIUM 1,03
INDIA 0,86
TABLE 2.5: TOP 10 COUNTRIES FOR DISTRIBUTED
CUMULATIVE PV INSTALLED CAPACITY IN 2020
SOURCE IEA PVPS.
GW
CHINA 78,94
GERMANY 44,81
JAPAN 44,56
USA 35,73
AUSTRALIA 13,31
ITALY 12,82
VIETNAM 9,96
FRANCE 6,31
INDIA 6,07
BELGIUM 5,86

contributed to the utility-scale market, distributed PV also increased significantly in 2020, with around 59 GW installed; with 15,5 GW from China alone. Remarkably, the distributed segment took off in the Middle East due to adequate policies in Israel and Jordan.
Globally, centralized PV continued to represent 60% of the market in 2020, mainly driven by China, the USA, and emerging PV markets. In the same trend as in previous years, 2020 saw again some new records in terms of PV electricity prices through extremely competitive tenders. Although renewed competitive tenders
CHAPTER 2 PV MARKET DEVELOPMENT TRENDS
IEA PVPS TRENDS IN PHOTOVOLTAIC APPLICATIONS 2021 / 20
EMERGING PV MARKET SEGMENTS
SOURCE IEA PVPS & OTHERS.
FIGURE 2.13: ANNUAL SHARE OF CENTRALIZED AND DISTRIBUTED GRID-CONNECTED INSTALLATIONS 2010 - 2020
0
%
2018 2019 20202010 2011 2012 2013 2014 2015 2016 2017
Grid-connected centralized
Grid-connected distributed
20
40
60
80
100
SOURCE IEA PVPS & OTHERS.
FIGURE 2.14: CUMULATIVE SHARE OF GRID CONNECTED PV INSTALLATIONS 2010 - 2020
0
%
2018 2019 20202010 2011 2012 2013 2014 2015 2016 2017
Grid-connected centralized
Grid-connected distributed
20
40
60
80
100

IEA PVPS TRENDS IN PHOTOVOLTAIC APPLICATIONS 2021 / 21
CHAPTER 2 PV MARKET DEVELOPMENT TRENDS
based solar systems face either competing uses with industrial, or agricultural activities or may not be economically viable due to high cost of land. This is also why Japan was one of the early adopters of Floating PV and still has the highest number of FPV projects (~200). Floating PV is even possible in city states such as Singapore, which inaugurated a 60 MWp FPV plant in June 2021 and has called for a study for another 140 MWp. The highest installed FPV capacity to-date is deployed in China (a total of 1,3 GWp) where developers largely took advantage of water bodies that were created when former coal mines filled-up with ground water. These so-called subsidence areas are almost ideal as they are considered as unstable territories (hence not suitable for industrial or agricultural activities) and often have little bioactivities (leading to minimal environmental impacts).
Another great opportunity for Floating Solar is the combination with existing hydropower dams. This even more so when conjointly operating the solar and hydro power generation (rather than pure co-location of the FPV plant on the reservoir). Apart from the diurnal cycle (i.e., generating solar power during the day and saving water for hydropower generation at night), there is also a possible seasonal benefit in areas with dry and wet seasons. Depending on the turbines and their reaction times, it is also possible to buffer some of the short-term variability from solar (due to could movements) and hence use the reservoirs as a “giant battery”. Many of the announced Floating Solar projects are on hydropower reservoirs, for example in Thailand (3,5 GWp), South Korea (2,1 GWp) and Laos (1,2 GWp).
With the exception of the European market which incentivized residential segments from the start, initially most of the major PV developments in emerging PV markets are coming from utility-scale PV. This evolution had different causes. Utility-scale PV requires developers and financing institutions to set up plants in a relatively short time. This option allows the start of using PV electricity in a country faster than what distributed PV requires. Moreover, tenders are making PV electricity even more attractive in some regions. However, both trends are compatible as some policies were implemented recently in emerging markets to incentivize rooftop installations and tenders for rooftop installations are being organized in several historical markets.
FLOATING PV: A GROWING MARKET SEGMENT
The installed capacity of Floating PV (FPV) systems worldwide has surpassed 3 GWp in 2021, with 688 MWp added in 2020 alone (see Fig. 2.15), according to data from the Solar Energy Research Institute of Singapore (SERIS) at the National University of Singapore (NUS). SERIS maintains a global database of close to 700 projects in operation and more than 300 projects under planning, development, or construction.
Apart from some installations in Europe, especially in the Netherlands, France, and the UK, Floating Solar is so far mostly located in Asia with more than 85% deployed in East and South-East Asia. In densely populated areas the proximity of water bodies to load centres is often an advantage. Traditional land-
SOURCE IEA PVPS & OTHERS.
FIGURE 2.15: EVOLUTION OF FLOATING PV INSTALLED CAPACITY FROM 2013 TO Q3 2021
0 0
Cum
ulat
ive
inst
alle
d ca
paci
ty (
MW
p D
C)
Annual installed capacity (M
Wp D
C)
20142013 2015 2016 2017 2018 2019 2020 2021
4 5
61
102
417
721
589
688
434
Annual installed capacity
Cumulative installed capacity500100
200
300
400
500
600
700
800
1 000
1 500
2 000
2 500
3 000
3 500
6 1172
174
591
1 312
1 901
2 589
3 023

BIPV: WAITING FOR THE START
The BIPV market remains a niche which can only be estimated properly with difficulty. With multiple business models, different incentives, all kinds of buildings or infrastructures (including roads) From tiles and shingles for residential roofs to glass curtain walls and more exotic façade elements, BIPV covers different segments with different technologies. Depending on the definition considered, the BIPV market ranged from 300 MW to 400 MW per year in Europe and probably reached 1 GW globally, while the difference between custom-made elements and traditional glass-glass modules can be difficult to assess. In that respect, simplified BIPV, using conventional PV modules with dedicated mounting structures, experienced positive developments in numerous EU countries in 2020. The market is also split between some industrial products such as prefabricated tiles (found in the USA and some European countries for instance), to custom-made architectural products fabricated on demand.
OFF-GRID MARKET DEVELOPMENT
Numbers for off-grid applications are generally not tracked with the same level of accuracy as grid-connected applications. The off-grid and edge-of-the-grid market can hardly be compared to the grid-connected market because the rapid deployment of grid-connected PV dwarfed the off-grid market. Nevertheless, off-grid applications are developing more rapidly than in the past, mainly thanks to rural electrification programs essentially in Asia and Africa but also in Latin America.
In some countries in Asia and in Africa, off-grid systems with back-up represent an alternative to bringing the grid into remote areas. Two types of off-grid systems can be distinguished:
• Mini-grids, also termed as isolated grids, involve small-scale electricity generation with a capacity between 10 kW and 10 MW. This grid uses one or more renewable energy sources (solar, hydro, wind, biomass) to generate electricity and serves a limited number of consumers in isolation from national electricity transmission network. Back-up power can be batteries and/or diesel generators.
• Stand-alone systems, for instance solar home systems (SHS) that are not connected to a central power distribution system and supply power for individual appliances, households or small (production) business. Batteries are also used to extend the duration of energy use.
This trend is specific to countries that have enough solar resources throughout the year to make a PV system viable. In such countries, PV has been deployed to power off-grid cities and villages or for agricultural purposes such as water pumping installations.
Another area of increasing interest are near-shore and off-shore marine floating PV projects. Such projects will see additional challenges but also almost endless opportunities. The challenges are the much more demanding environments, where tidal currents, richer marine life, wind, waves and the presence of salt water all need to be considered. But the opportunities in near-shore areas alone are enormous: significant unused space can be activated for energy harvesting close to load centres in coastal settlements and harbours. Going further off-shore aggravates the challenges and cost but still has possible applications, especially for powering oil & gas platforms or for utilising the vast ocean spaces between the towers in off-shore wind farms. In those cases, the FPV project would take advantage of the existing transmission infrastructure and also of the fact that solar and wind generation are often complementary in their resource availability. The first such testbeds are being set up in the Netherlands and Belgium.
In terms of floating structures, the vast majority of the FPV installations in operation use HDPE plastic floats, for which Ciel & Terre and Sungrow together have more than 50% market share. There is an increasing number of players, however, which follow different designs, ranging from a combination of floats and metal structures (e.g. Zimmermann) to membranes that are held in place by large plastic rings (e.g. Ocean Sun). For off-shore applications, more robust designs are being test-bedded, for example by Oceans of Energy or SolarDuck.
AGRI-PV: DUAL USE WHICH IS EXPECTED TO EMERGE FAST
The development of PV on agricultural land exists from the beginning of utility-scale PV but, in some cases, crops have been replaced by photovoltaics and thus the use of the land has mostly shifted towards electricity production. Agri-PV proposes a different perspective with the possibility to use PV as an additional source of revenues for farmers, complementing their agricultural business. By positioning PV systems above the crops or plants, the system can allow raising different kinds of crops with a reduced solar insulation, allowing a better development in sunny regions, and possibly new business models, such as recovery of damaged crops for instance, or different crops which would not have been profitable in some regions. This dual use imposes a different kind of PV systems, which can in some case change their position, from horizontal to vertical and allow either maximum PV production or maximum crop production depending on the weather conditions. Defining Agri-PV could be difficult and most existing plants on agricultural land could hardly be qualified as such. We will define Agri-PV in general as a PV plant which allows a combined land use, for agriculture and for PV plants, without putting the emphasis completely on the PV plant. In 2020 and 2021, an increasing number of countries either started to clearly define Agri-PV (in Germany for instance) or constrained it waiting for further regulations.
CHAPTER 2 PV MARKET DEVELOPMENT TRENDS
IEA PVPS TRENDS IN PHOTOVOLTAIC APPLICATIONS 2021 / 22
EMERGING PV MARKET SEGMENTS / CONTINUED
IEA PVPS TRENDS IN PHOTOVOLTAIC APPLICATIONS 2021 / 23
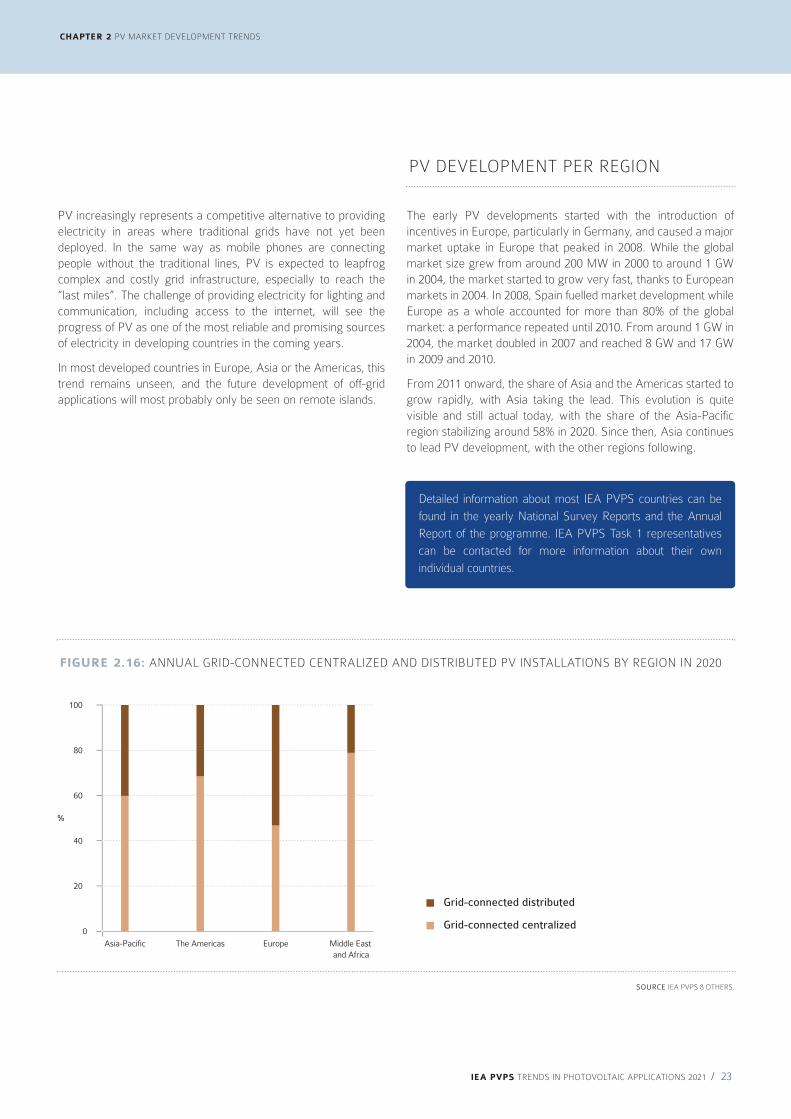
The early PV developments started with the introduction of incentives in Europe, particularly in Germany, and caused a major market uptake in Europe that peaked in 2008. While the global market size grew from around 200 MW in 2000 to around 1 GW in 2004, the market started to grow very fast, thanks to European markets in 2004. In 2008, Spain fuelled market development while Europe as a whole accounted for more than 80% of the global market: a performance repeated until 2010. From around 1 GW in 2004, the market doubled in 2007 and reached 8 GW and 17 GW in 2009 and 2010.
From 2011 onward, the share of Asia and the Americas started to grow rapidly, with Asia taking the lead. This evolution is quite visible and still actual today, with the share of the Asia-Pacific region stabilizing around 58% in 2020. Since then, Asia continues to lead PV development, with the other regions following.
PV increasingly represents a competitive alternative to providing electricity in areas where traditional grids have not yet been deployed. In the same way as mobile phones are connecting people without the traditional lines, PV is expected to leapfrog complex and costly grid infrastructure, especially to reach the “last miles”. The challenge of providing electricity for lighting and communication, including access to the internet, will see the progress of PV as one of the most reliable and promising sources of electricity in developing countries in the coming years.
In most developed countries in Europe, Asia or the Americas, this trend remains unseen, and the future development of off-grid applications will most probably only be seen on remote islands.
PV DEVELOPMENT PER REGION
Detailed information about most IEA PVPS countries can be
found in the yearly National Survey Reports and the Annual
Report of the programme. IEA PVPS Task 1 representatives
can be contacted for more information about their own
individual countries.
SOURCE IEA PVPS & OTHERS.
FIGURE 2.16: ANNUAL GRID-CONNECTED CENTRALIZED AND DISTRIBUTED PV INSTALLATIONS BY REGION IN 2020
0
%
Grid-connected centralized
Grid-connected distributed
20
40
60
80
100
Asia-Pacific EuropeThe Americas Middle East
and Africa
CHAPTER 2 PV MARKET DEVELOPMENT TRENDS
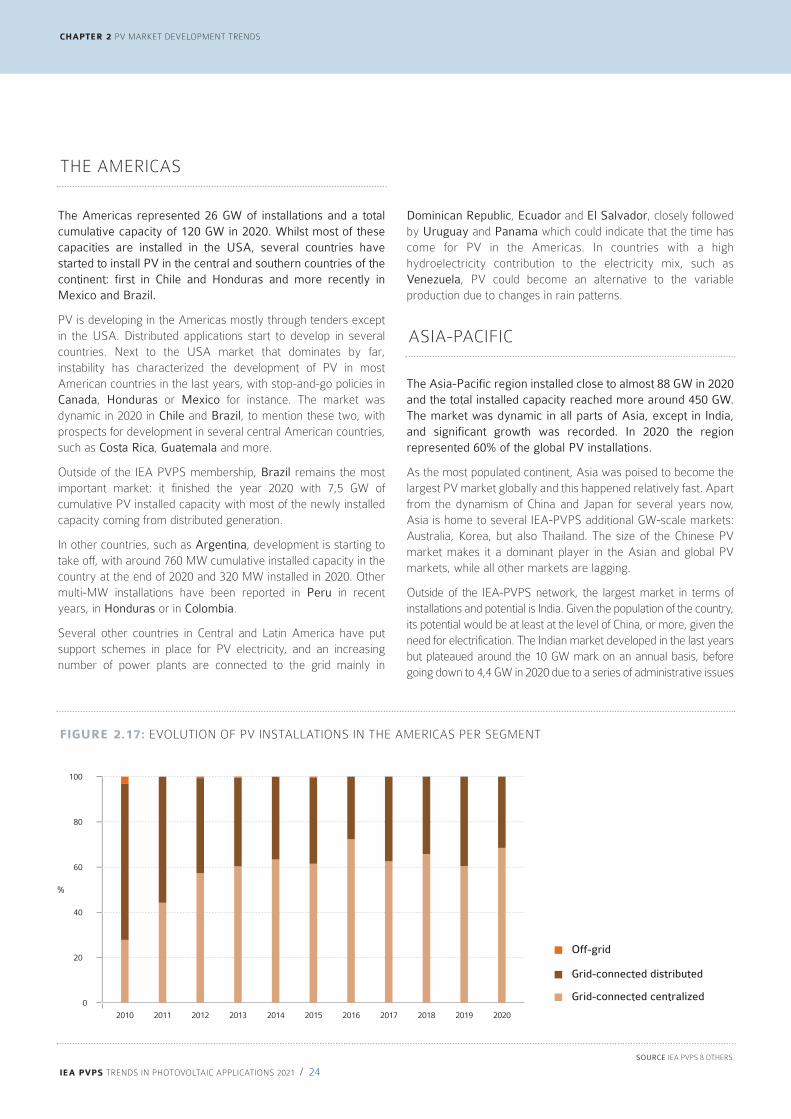
The Americas represented 26 GW of installations and a total cumulative capacity of 120 GW in 2020. Whilst most of these capacities are installed in the USA, several countries have started to install PV in the central and southern countries of the continent: first in Chile and Honduras and more recently in Mexico and Brazil.
PV is developing in the Americas mostly through tenders except in the USA. Distributed applications start to develop in several countries. Next to the USA market that dominates by far, instability has characterized the development of PV in most American countries in the last years, with stop-and-go policies in Canada, Honduras or Mexico for instance. The market was dynamic in 2020 in Chile and Brazil, to mention these two, with prospects for development in several central American countries, such as Costa Rica, Guatemala and more.
Outside of the IEA PVPS membership, Brazil remains the most important market: it finished the year 2020 with 7,5 GW of cumulative PV installed capacity with most of the newly installed capacity coming from distributed generation.
In other countries, such as Argentina, development is starting to take off, with around 760 MW cumulative installed capacity in the country at the end of 2020 and 320 MW installed in 2020. Other multi-MW installations have been reported in Peru in recent years, in Honduras or in Colombia.
Several other countries in Central and Latin America have put support schemes in place for PV electricity, and an increasing number of power plants are connected to the grid mainly in
Dominican Republic, Ecuador and El Salvador, closely followed by Uruguay and Panama which could indicate that the time has come for PV in the Americas. In countries with a high hydroelectricity contribution to the electricity mix, such as Venezuela, PV could become an alternative to the variable production due to changes in rain patterns.
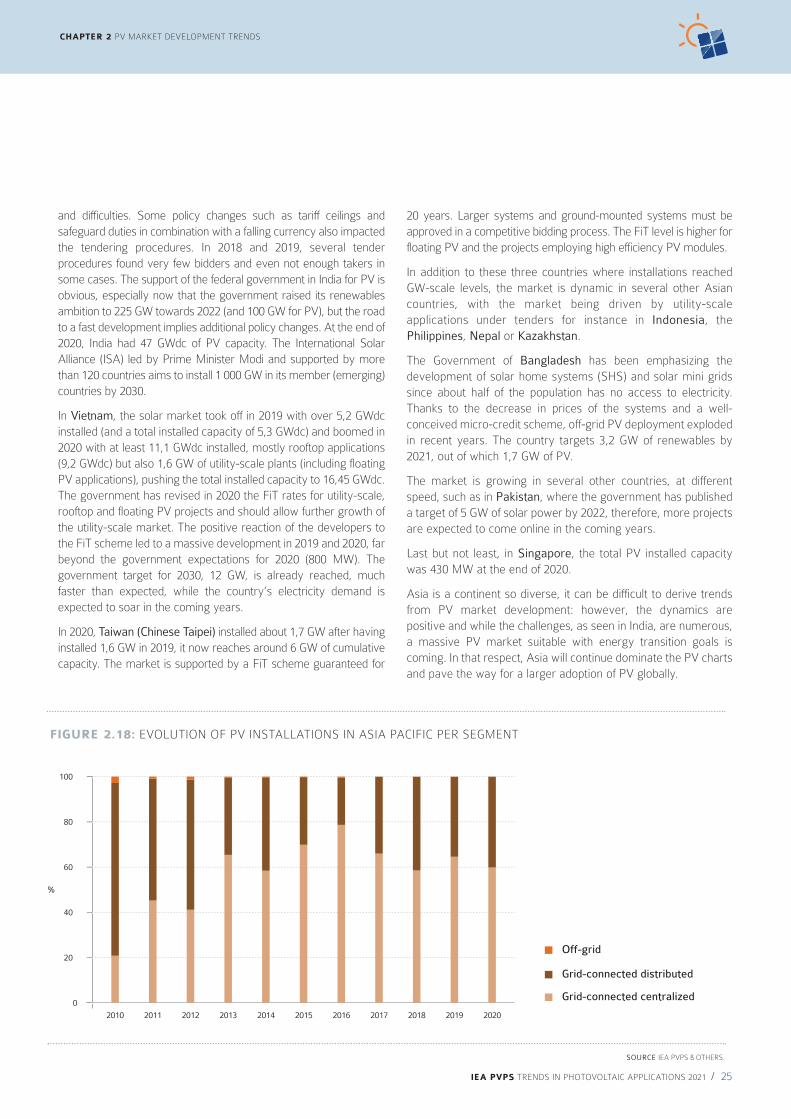
The Asia-Pacific region installed close to almost 88 GW in 2020 and the total installed capacity reached more around 450 GW. The market was dynamic in all parts of Asia, except in India, and significant growth was recorded. In 2020 the region represented 60% of the global PV installations.
As the most populated continent, Asia was poised to become the largest PV market globally and this happened relatively fast. Apart from the dynamism of China and Japan for several years now, Asia is home to several IEA-PVPS additional GW-scale markets: Australia, Korea, but also Thailand. The size of the Chinese PV market makes it a dominant player in the Asian and global PV markets, while all other markets are lagging.
Outside of the IEA-PVPS network, the largest market in terms of installations and potential is India. Given the population of the country, its potential would be at least at the level of China, or more, given the need for electrification. The Indian market developed in the last years but plateaued around the 10 GW mark on an annual basis, before going down to 4,4 GW in 2020 due to a series of administrative issues
CHAPTER 2 PV MARKET DEVELOPMENT TRENDS
IEA PVPS TRENDS IN PHOTOVOLTAIC APPLICATIONS 2021 / 24
ASIA-PACIFIC
THE AMERICAS
SOURCE IEA PVPS & OTHERS.
FIGURE 2.17: EVOLUTION OF PV INSTALLATIONS IN THE AMERICAS PER SEGMENT
0
%
2018 2019 20202010 2011 2012 2013 2014 2015 2016 2017
Grid-connected centralized
Grid-connected distributed
Off-grid20
40
60
80
100
IEA PVPS TRENDS IN PHOTOVOLTAIC APPLICATIONS 2021 / 25
CHAPTER 2 PV MARKET DEVELOPMENT TRENDS
20 years. Larger systems and ground-mounted systems must be approved in a competitive bidding process. The FiT level is higher for floating PV and the projects employing high efficiency PV modules.
In addition to these three countries where installations reached GW-scale levels, the market is dynamic in several other Asian countries, with the market being driven by utility-scale applications under tenders for instance in Indonesia, the Philippines, Nepal or Kazakhstan.
The Government of Bangladesh has been emphasizing the development of solar home systems (SHS) and solar mini grids since about half of the population has no access to electricity. Thanks to the decrease in prices of the systems and a well-conceived micro-credit scheme, off-grid PV deployment exploded in recent years. The country targets 3,2 GW of renewables by 2021, out of which 1,7 GW of PV.
The market is growing in several other countries, at different speed, such as in Pakistan, where the government has published a target of 5 GW of solar power by 2022, therefore, more projects are expected to come online in the coming years.
Last but not least, in Singapore, the total PV installed capacity was 430 MW at the end of 2020.
Asia is a continent so diverse, it can be difficult to derive trends from PV market development: however, the dynamics are positive and while the challenges, as seen in India, are numerous, a massive PV market suitable with energy transition goals is coming. In that respect, Asia will continue dominate the PV charts and pave the way for a larger adoption of PV globally.
and difficulties. Some policy changes such as tariff ceilings and safeguard duties in combination with a falling currency also impacted the tendering procedures. In 2018 and 2019, several tender procedures found very few bidders and even not enough takers in some cases. The support of the federal government in India for PV is obvious, especially now that the government raised its renewables ambition to 225 GW towards 2022 (and 100 GW for PV), but the road to a fast development implies additional policy changes. At the end of 2020, India had 47 GWdc of PV capacity. The International Solar Alliance (ISA) led by Prime Minister Modi and supported by more than 120 countries aims to install 1 000 GW in its member (emerging) countries by 2030.
In Vietnam, the solar market took off in 2019 with over 5,2 GWdc installed (and a total installed capacity of 5,3 GWdc) and boomed in 2020 with at least 11,1 GWdc installed, mostly rooftop applications (9,2 GWdc) but also 1,6 GW of utility-scale plants (including floating PV applications), pushing the total installed capacity to 16,45 GWdc. The government has revised in 2020 the FiT rates for utility-scale, rooftop and floating PV projects and should allow further growth of the utility-scale market. The positive reaction of the developers to the FiT scheme led to a massive development in 2019 and 2020, far beyond the government expectations for 2020 (800 MW). The government target for 2030, 12 GW, is already reached, much faster than expected, while the country’s electricity demand is expected to soar in the coming years.
In 2020, Taiwan (Chinese Taipei) installed about 1,7 GW after having installed 1,6 GW in 2019, it now reaches around 6 GW of cumulative capacity. The market is supported by a FiT scheme guaranteed for
SOURCE IEA PVPS & OTHERS.
FIGURE 2.18: EVOLUTION OF PV INSTALLATIONS IN ASIA PACIFIC PER SEGMENT
0
%
2018 2019 20202010 2011 2012 2013 2014 2015 2016 2017
Grid-connected centralized
Grid-connected distributed
Off-grid20
40
60
80
100

In the first years of this century, Europe led PV development for years and represented more than 70% of the global cumulative PV market until 2012. From 2013 to 2017, European PV installations decreased while there has been rapid growth in the rest of the world, mainly in Asia and the Americas. The fast development of PV led to a strong opposition from many stakeholders from the energy sector, and the market declined rapidly in several countries. In addition, several countries implemented measures aiming at decreasing the cost of PV installations for the community by retroactively changing the remuneration levels or by adding taxes. This phenomenon happened mostly in Europe, where the fast development of PV took place before other regions of the world: Spain, Italy, Czech Republic, Belgium, France and others took some measures with a consequent impact on the confidence of developers and prosumers.
But since then, the situation improved gradually in most countries and PV installations rose in Europe. This was the case again in 2020: With an improved competitiveness and new policies, Europe saw its PV market growing again in 2020, with 24 GW installed, which accounted for 16% of the global PV market. European countries had 167 GW of cumulative PV capacity by the end of 2020, the second largest capacity globally. It is important to distinguish the European Union and its countries, which benefit from a common regulatory framework for part of the energy market, and other European countries which have their own energy regulations and are not part of the European Union.
Most European countries used Feed-in Tariffs schemes to start developing PV and moved in the last years to self-consumption (or variants) for distributed PV while tenders became the standard for utility-scale PV. These trends are not typical to Europe, but self-consumption developed faster here than in other locations. Collective and delocalized self-consumption are developing in several countries. BIPV has been incentivized more than in any other location in the past but remains a niche market after several GW of installations. Simplified BIPV seems to develop well in some countries. Merchant utility-scale PV developed in Spain and Germany and could lead to a significant market share in a near future. Portugal saw competitive tenders below a reasonable price in 2020, sign of speculation on grid connections.
EUROPEAN UNION
Policy Framework
In December 2018, the revised European Renewable Energy Directive (RED II) set a 32% renewable energy target by 2030, up from 20% in 2020 [1]. In 2019 the European Green Deal was introduced, an action plan to boost the efficient use of resources by moving to a clean, circular economy and to restore biodiversity and reduce pollution. A pillar of the European Green Deal is a commitment to be climate neutral by 2050. In September 2020, the European Commission proposed raising the 2030 climate targets aiming at a 55% GHG reduction by 2030. The
CHAPTER 2 PV MARKET DEVELOPMENT TRENDS
IEA PVPS TRENDS IN PHOTOVOLTAIC APPLICATIONS 2021 / 26
EUROPE
SOURCE IEA PVPS & OTHERS.
FIGURE 2.19: EVOLUTION OF PV INSTALLATIONS IN EUROPE PER SEGMENT
0
%
2018 2019 20202010 2011 2012 2013 2014 2015 2016 2017
Grid-connected centralized
Grid-connected distributed
Off-grid20
40
60
80
100

IEA PVPS TRENDS IN PHOTOVOLTAIC APPLICATIONS 2021 / 27
CHAPTER 2 PV MARKET DEVELOPMENT TRENDS
PV capacity by 2030. To do so, a strong interconnection as well as the announced energy storage framework are crucial.
In March 2021, Hungary announced to close its last coal fired power plant 5 years earlier in 2025. This could lead to an increase of PV deployment, meaning that the 2030 target of 6,5 GW can be reached earlier. To what extend the 2040 target of 12 GW of PV systems will be brought forward is not yet clear.
The Polish recovery plan mentions rooftop PV but includes no concrete target. However, together with the Polish hydrogen strategy, which aims for 2 GW of electrolysers and the aim to replace coal heating system in residential buildings with heat pumps, will drive the demand for renewable electricity. The Polish Institute of Renewable Energy, responsible for tracking the capacity additions in the country, forecasts that the cumulative installed capacity will exceed the NECP target in 2022 and could reach 15 GW by 2025 and over 20 GW by 2030.
State of Play
At the end of 2020, the total installed PV power capacity in the European Union had surpassed 138 GW.
Almost 55% of this were residential and commercial rooftop installations. The PV market in the European Union was declining for six years before the trend reversed in 2018. This trend continued in 2020 when the European Union added about 19,8 GW of new PV power capacity. Spain (3,5 GW), Germany (4,9 GW) and the Netherlands (3 GW) were the leading three countries. Poland was again in the top five with a newly installed PV capacity of about 2,6 GW. Another five countries added more than 500 MW, namely Belgium, France, Italy, Hungary, and Sweden.
Over the last few years, the number of European Member States conducting auctions for solar energy has continuously increased and driven down prices to the current average level of EUR 35/MWh and EUR 70/MWh across the European Union. In 2020, the second Portuguese auction attracted the lowest bids. The winning projects offered electricity between EUR 11,2/MWh.
Other European Countries
Outside of the IEA-PVPS network, UK installed some hundreds of MW in 2020, far from the GW-scale market it used to be a few years ago. The country had more than 13 GW of PV at the end of the year 2020, with a market mostly focused on small-scale applications. PPA-driven utility-scale PV could develop in the coming years.
In the Russian Federation the “Energy Strategy of Russia for the Period Up to 2035” set a target share of renewable energy in total electricity production at 4.5% by 2024. Furthermore, the Russian government set a target of 25 GW for the installation of renewable electricity capacities towards 2030. In 2020 about 700 MW of new PV capacity was installed in Russia, increasing the total capacity to around 1,9 GW (including ca 400 MW in Crimea).
accompanying impact assessment [2] showed that such an increase in the climate ambition is realistic and economically feasible. The 55% GHG reduction target will require a share of renewable energy of approximately 38,5% according to the impact assessment.
On 31st May 2021, the European Council received the formal notification about the approval of the Recovery and Resilience Facility by all Member States. Together with the next long-term budget this represents EUR 2,02 trillion (USD 2,46 trillion) of spending between 2020 and 2027 [3] .
To be eligible for the Recovery and Resilience Facility, each EU Member State had to prepare a national recovery and resilience plan, which outlines their individual reform and investment agendas for the years 2021-2023. Each recovery and resilience plan has to include a minimum of 37% of expenditure earmarked for actions to combat climate change.
The recovery and resilience plans do not themselves set new targets for deployment of renewables at national level. Rather they describe a package of strategic projects, ranging from technological to socio-economic to administrative. Most national recovery and resilience plans include measures to support the installation of solar photovoltaic systems and several name targets for green hydrogen from renewable energy sources. In addition, the electrification of transport mentioned in various plans will require additional renewable electricity. Rooftop installations are mentioned by several countries, often in relation to building renovation. However, total numbers are often difficult to derive as PV and wind are often bundled.
Overall, the recovery funds will have a positive impact on the acceleration of PV deployment. This will be complemented with the ongoing revision of the renewable energy directive as part of the “Fit for 55” package of EU legislative measures to implement the new 55% GHG reduction target for 2030. Several countries have already indicated more ambitious timescales for the energy transition.
The Cypriot Recovery Plan includes investments into an “Euro Asia Interconnector” in the territory of Cyprus. The Euro Asia Interconnector is a cross border interconnector between Crete, Cypriot, and Israeli power grids. The realisation of this 1 208 km long interconnection would allow more PV electricity capacity without additional storage. In March 2021, Cyprus, Greece and Israel signed a memorandum of understanding for the interconnector with a power capacity between 1 000 to 2 000 MWac. It is expected that the connection will be completed by 2024, with operations starting in 2025.
The implications for new PV capacity in the three partnering countries are significant. Different to its partners Cyprus has not yet revealed the planned additional renewable electricity capacity. Israel announced that the interconnection would allow an additional installation of 12 to 15 GW PV capacity by 2030. Greece decided to phase out coal by 2028 and add an additional 5 GW of

For the past decade, many countries, especially in the Middle East have started to connect large-scale PV power plants and more are in the pipeline. Several countries are defining PV development plans and the prospects on the short to medium term are positive. The Middle East is amongst one of the most competitive places for PV installations, with PPAs granted through tendering processes among the lowest in the world. In 2020, around 6 GW have been installed in the region, representing 4% of the global market.
In MEA (Middle East and Africa) countries, the development of PV remains modest compared to the larger markets, especially in the African countries. However, almost all countries saw a small development of PV in the last years and some of them a significant increase. There is a clear trend in most countries to include PV in energy planning, to set national targets and to prepare the regulatory framework to accommodate PV.
Next to IEA-PVPS countries with a dynamic market such as Israel and more recently Morocco, the region’s PV development is extremely diverse. In the middle East, the market has been driven mostly for competitive tenders for years and distributed applications started to develop only recently (net metering policies have been implemented in Israel, Jordan, Saudi Arabia and Tunisia).
In Turkey, systems below 1 MW fall under the category of “non-licenced plants” which allowed the market to take off. At the end of 2020, the cumulative capacity had exceeded 9,5 GW, most of it in the category of “non-licenced” according to the Turkish transmission operator. In May 2019, the Turkish Energy Market Regulatory Authority (EPDK) published new rules for net metering of PV systems with a capacity between 3 and 10 kW. Also, in May 2019, the Turkish Government amended the rules for “non-licenced plants” increasing the project size up to 5 MW. However, only public installations used for agricultural irrigation, water treatment plants or waste treatment facilities are eligible as ground mounted projects.
In 2009, Ukraine introduced the “Green Tariff” policy, a feed-in tariff scheme for electricity generated from renewable energy sources. The scheme was modified a few times in the last years to adapt the remuneration levels. The latest change, in August 2020, introduced retroactive cuts for existing plants and compensations for curtailment. Around 1,5 GW of new PV power capacity was installed in 2020, thus increasing the total capacity to 6,5 GW (excluding the approx. 400 MW in Crimea).
CHAPTER 2 PV MARKET DEVELOPMENT TRENDS
IEA PVPS TRENDS IN PHOTOVOLTAIC APPLICATIONS 2021 / 28
MIDDLE EAST AND AFRICAEUROPE / CONTINUED
SOURCE IEA PVPS & OTHERS.
FIGURE 2.20: EVOLUTION OF PV INSTALLATIONS IN AFRICA AND THE MIDDLE EAST PER SEGMENT
0
%
2018 2019 20202010 2011 2012 2013 2014 2015 2016 2017
Grid-connected centralized
Grid-connected distributed
Off-grid20
40
60
80
100
IEA PVPS TRENDS IN PHOTOVOLTAIC APPLICATIONS 2021 / 29
CHAPTER 2 PV MARKET DEVELOPMENT TRENDS
leader with 1,5 GWac installed in one year. The policies engaged for several years now have started to produce positive effects and the market is poised to develop further.
South Africa was the first major African PV market, under several tenders that led to 4,2 GW cumulatively installed at the end of 2020. While a large part of the market was driven by tenders, the market should rebalance towards rooftop applications in the coming years under government support.
In Africa, besides the above-mentioned countries, Algeria has installed several hundreds of MW. Reunion Island, Senegal, Kenya, Mauritania, Namibia and Ghana have already installed some capacity. As the costs are decreasing, the interest in PV is growing in other African countries. However, the market has not really taken off despite the huge potential and the growing competitiveness of solar PV, especially in off-grid applications. The main barrier is the financial aspect as the higher upfront investment costs remains a barrier despite lower LCOE.
The most competitive segment for the development of solar in Africa, especially in remote areas, is PV plants to replace or complement existing diesel generators. Such kinds of hybrid plants have been developed in Democratic Republic of Congo, Rwanda, Ghana, Mali, Ivory Coast, Burkina Faso, Cameroon, Gambia, Mauritania, Benin, Sierra Leone, Lesotho and others.
Pay-as-you-go models are used to leverage financing difficulties for residential consumers, different pricing formats exist to foster access to clean and reliable electricity.
Several large-scale PV plants have been announced or are under construction in several countries in Africa: Burkina Faso (20 MW and 30 MW), Namibia (45 MW and 30 MW), Nigeria (100 MW), Cameroon (30 MW and 25 MW projects ongoing) and Kenya (several projects ranging from 30 MW to 80 MW) to name just a few. The question of African power markets is essential since many countries have a small, centralized power demand, sometimes below 500 MW. In this respect, the question is not only to connect PV to the grid but also to reinforce the electricity grid infrastructure and interconnection with neighbouring countries. However, concerning remote areas, micro-grids and off-grid PV applications, such as water pumping installations, are expected to play a growing role in bringing affordable power to the consumers, in a continent with 700 million people still lack a basic access to electricity.
Often, energy prices are supported by government spending, which limited for years the ability of PV to compete. This situation is changing slowly, with new distributed schemes being proposed such as in Dubai (UAE). Tenders are still competitive and Saudi Arabia became early 2021 the country with the most competitive tender: the lowest acceptable bid reached 10,4 USD per MWh, the lowest on record.
Another trend in the fast-developing region is the willingness for government to develop brand new cities or neighbourhoods, which aim at becoming showcases of renewable energies. This was the case for Masdar City (UAE) or Spark (Saudi Arabia).
The situation is similar in northern Africa, with tenders driving PV market development in Egypt (even of the development was slower than expected), Algeria, and Morocco. In several countries, the question of local manufacturing is essential even if not yet visible in current policies. The willingness to manufacture locally and develop a manufacturing industry is present and will influence PV deployment in the coming years.
In the Middle East, countries such as Saudi Arabia, Bahrain, Jordan, Oman and the United Arab Emirates have defined targets for renewable and solar energy for the coming years. Tenders are an integral part of the plans for PV development in the short or long term in the region, while several were organized again in 2019 and 2020 and more have been announced. Almost 3 GWdc have been installed in the UAE through several plants and more is expected to come.
Jordan is aiming for 1 GW of PV in 2030 and already launched several tenders and installed several hundreds of MW. Qatar published the results of its third tender for 800 MW in January 2020. Saudi Arabia launched a series of tenders in the past and has again in 2020, with an initial objective totalling 3,3 GW. Bahrain has announced the development of 225 MW; Oman has launched several tenders, each for at least 500 MW and plans to reach 4 GW of RES capacity by 2030, Tunisia launched a tender for 500 MW and for 70 MW, Libya 100 MW. Lebanon plans 180 MW towards 2020 and is investigating a plant of 500 MW as well.
In Sub-Saharan Africa, with the notable exception of South Africa, the market has been slower to develop. Development Aid is often a key tool for financing hybrid PV systems and electrify directly through new grid connection. Egypt is the new African market

CHAPTER 2 PV MARKET DEVELOPMENT TRENDS
IEA PVPS TRENDS IN PHOTOVOLTAIC APPLICATIONS 2021 / 30
MIDDLE EAST AND AFRICA / CONTINUED
TABLE 2.6: 2020 PV MARKET STATISTICS IN DETAIL
SOURCE IEA PVPS & OTHERS.
COUNTRY 2020 ANNUAL CAPACITY (MW) 2020 CUMULATIVE CAPACITY (MW)
DISTRIBUTED CENTRALIZED TOTAL DISTRIBUTED CENTRALIZED TOTAL
AUSTRALIA 3 081 1 422 4 503 13 618 7 205 20 823
AUSTRIA 336 4 341 2 020 23 2 043
BELGIUM 1 031 17 1 048 5 858 150 6 008
CANADA 79 121 200 1 462 2 063 3 525
CHILE 54 737 790 74 3 411 3 484
CHINA 15 500 32 700 48 200 79 300 174 340 253 640
DENMARK 36 228 264 1 242 383 1 624
FINLAND 98 0 98 313 0 313
FRANCE 513 460 973 6 339 4 581 10 920
GERMANY 3 685 1 200 4 885 44 806 9 095 53 901
ISRAEL 590 0 590 1 447 1 103 2 550
ITALY 615 170 785 12 819 8 831 21 650
JAPAN 3 819 4 857 8 676 44 739 27 129 71 868
KOREA 145 3 975 4 120 1 240 14 648 15 888
MALAYSIA 0 883 883 487 1 813 2 300
MEXICO 390 1 183 1 573 1 215 5 358 6 574
MOROCCO 0 0 0 0 0 206
NETHERLANDS 1 090 1 946 3 036 4 227 5 683 9 910
NORWAY 40 0 40 160 0 160
PORTUGAL 47 123 170 467 610 1 077
SOUTH AFRICA 500 800 1 300 1 000 3 172 4 172
SPAIN 715 2 813 3 528 1 877 11 726 13 603
SWEDEN 460 47 506 1 143 83 1 226
SWITZERLAND 475 0 475 2 973 0 2 973
THAILAND 0 49 49 650 2 928 3 578
TURKEY 0 958 958 10 9 494 9 504
UNITED STATES 5 268 14 457 19 725 35 731 59 764 954 95
IEA PVPS 38 556 69 150 107 716 265 216 353 593 619 016
NON-IEA PVPS 21 012 16 501 37 513 52 877 95 557 148 227
TOTAL 59 605 85 624 145 229 318 430 448 813 767 243

IEA PVPS TRENDS IN PHOTOVOLTAIC APPLICATIONS 2021 / 31
three POLICY FRAMEWORK
In addition to direct policies supporting PV development, other indirect policies have a tremendous effect on PV development, or on some technologies. Sustainable building requirements, for instance, will become increasingly essential to support a long-lasting PV market development.
Today, climate policies have an indirect effect but are shifting upwards the competitiveness of renewable energy sources. Some countries have indicated the willingness to significantly increase “carbon” taxes, propelling PV’s competitiveness and accelerating its development.
In some countries, sustainability policies are part of a push towards a cleaner industry and in particular some technologies. In addition to GHG emissions, they focus on hazardous materials, air or land pollution and more.
Grid codes and tariffs, even if not applicable to PV only, also frame the ecosystem in which PV develops and are adding or alleviating constraints for developers and prosumers.
This chapter focuses on existing policies and how they have contributed to develop PV. It pinpoints, as well, local improvements and examines how the PV market reacted to these changes.
Finally, cross-sectoral aspects of PV development will also imply that PV will be submitted to additional regulations and policies, especially in the building and transport sector, but also in agriculture, the urban environment, water areas (including the seas), industrial processes and more.
In the early development of PV, many markets have been powered by a broad spectrum of support policies, aiming at reducing the gap between PV’s cost of electricity and the price of conventional electricity sources. These support schemes took various forms depending on the local specificities and evolved to accommodate with market evolutions or policy changes.
In recent years, the increased competitiveness of PV has allowed a number of market segments to develop without any form of financial support. Since the question of the competitiveness of PV is less pressing, a large part of new policies also is focussed on developing distributed PV through self-consumption schemes. In parallel, the development of utility-scale PV is starting to see the development of private contracts known as Power Purchase Agreements (PPA). However, the competitiveness of PV is not yet guaranteed in all segments and locations. Furthermore, the increased penetration of PV electricity lowers the average electricity prices. Therefore, targeted financial incentives might still be needed for some years to overcome costs or investment barriers in many countries.
Policies supporting distributed PV and self-consumption policies might be considered as non-financial incentives since they set up the regulatory environment to allow consumers to become prosumers. However, these policies require fine tuning, especially on grid costs and taxes, which in some cases could be considered as indirect financial incentives. In general, self-consumption policies as explained in detail below simplify and adapt the regulatory framework to allow PV self-consumption to develop. Several countries continue to support financially self-consumption through various schemes like “net-metering” or “net-billing” or “feed-in-premiums”.
© Voltec Solar

The question of market drivers is a complex one since the market is always driven by a combination of several regulations and incentives. In these figures, the focus is put on the major driver for each macro-segment (distributed or centralized), while other drivers are playing a key role. This should be regarded as a general indication of the main PV drivers.
Figure 3.1a, 3.1b and 3.2 taken together shows that in 2020, around 5% of the volume of the market became independent of support schemes or adequate regulatory frameworks: this implies installations not financially supported and developed outside of tenders or similar schemes. This is a significant improvement compared to previous years. If small-scale, distributed installations based on self-consumption were the first segment to develop, non-subsidized is gaining momentum for utility-scale PV. The trend is clear, PV plants selling their production to corporate customers have started to emerge in Spain and Chile and were followed by project developers in the Australia, Germany, USA, Denmark and, more recently, Italy and Sweden. This number of countries is expected to grow fast, given the conditions for PV competitiveness.
Around 23% of utility-scale plants were developed through tenders: this is a significant increase which started a few years ago. In comparison, tenders contributed to 1% of the distributed market, even if this number is expected to increase as more tenders are launched for rooftop projects (amongst others in Bangladesh, Bahrain, India, France, Myanmar). It is highly debatable whether tenders are suitable for rooftop PV development, and even more for BIPV installations. France has tried such tenders but the result remains negligible in terms of
volume. The sign that competitive tenders have seen their share of the global market increasing to 14% (23% of centralized PV market) compared to 7% before 2017 is not a major concern yet for the industry. However, as most countries are transitioning to tenders to grant PPAs and the numbers are expected to further grow in the coming years, the shrinking profit margins, especially in super-competitive tenders, could become a threat for the long-term stability of some market actors, hence creating more market concentration. This is already visible in 2021 with the major increase of prices due to the impact of the pandemic, that results in huge difficulties for some developers to remain competitive on already granted tenders.
Globally, about 52% of the PV installations are receiving a predefined tariff for part or all of their production; respectively 55% and 50% for the distributed and the centralized segments. Even though the share of the market driven by FiT has not diminished significantly through the years, there is a global trend towards lower tariffs. This diminishing trend of the FiT is in line with the price decrease of the technology. The increase seen in 2021 and possibly temporary might put the brakes on market development unless tariffs are increased.
With around 15% global market share, 9% for the distributed segment and 18% of the centralized segment, direct subsidies are the third most represented form of support for PV, most of the time they cover only a part of the whole installation cost. They are a constraint to PV development, since they depend on public funding, which is, by nature, limited. However, they are easy to set up which explains their utilization.
CHAPTER 3 POLICY FRAMEWORK
IEA PVPS TRENDS IN PHOTOVOLTAIC APPLICATIONS 2021 / 32
PV MARKET DRIVERS
SOURCE IEA PVPS & OTHERS.
FIGURE 3.1A: MAIN DRIVERS OF THE DISTRIBUTED PV
MARKET IN 2020
59GW
TRADING OF GREEN CERTIFICATES OR
SIMILAR RPS-BASED SCHEMES, 0,3%
FEED-IN TARIFF THROUGH
TENDERS OR PPA, 1%
FEED-IN TARIFF 55%
NON-INCENTIVIZED
SELF-CONSUMPTION, 9%
DIRECT SUBSIDIES OR TAX BREAKS, 9%
INCENTIVIZED SELF-CONSUMPTION
OR NET-METERING, 26%
SOURCE IEA PVPS & OTHERS.
FIGURE 3.1B: MAIN DRIVERS OF THE CENTRALIZED PV
MARKET IN 2020
TRADING OF GREEN CERTIFICATES OR
SIMILAR RPS-BASED SCHEMES, 7%
NON INCENTIVIZED, 2%
FEED-IN TARIFF, 50%
DIRECT SUBSIDIES OR TAX BREAKS, 18%
FEED-IN TARIFF THROUGH
TENDERS OR PPA, 23%86GW

IEA PVPS TRENDS IN PHOTOVOLTAIC APPLICATIONS 2021 / 33
CHAPTER 3 POLICY FRAMEWORK
Self-consumption, supported by different mechanisms such as net-metering and net-billing, represented 26% of the distributed PV market, an important increase compared to historical installations. Various forms of support to self-consumption schemes exist, for example in Italy with the Scambio Sul Posto (a net-billing scheme), Israel, or Germany. Although net-metering is being abolished in historical markets, countries such as Thailand and Ecuador introduced net-metering for residential PV owners recently. Net-metering remains an easy way to activate the distributed PV market but requires shifting to self-consumption later.
Green certificates and similar schemes based on RPS represented around 4% of the market, a stable and low share which is explained by the greater complexity of this type of scheme. Green certificate trading still exists in countries such as Belgium, Norway, Romania and Sweden. Similar schemes based on RPS exist in Australia and Korea for instance.
Incentives can be granted by a wide variety of authorities or sometimes by utilities themselves. They can be unique or add up to each other. Their lifetime is generally quite short, with frequent policy changes, at least to adapt the financial parameters. Next to central governments, regional states or provinces can propose either the main incentive or some additional ones. Municipalities are more and more involved in renewable energy development and can offer additional advantages.
In some cases, utilities are proposing specific deployment schemes to their own customers, generally in the absence of national or local incentives, but sometimes to complement them.
FIGURE 3.2: EVOLUTION OF MARKET INCENTIVES AND ENABLERS: 2010, 2015, 2020
TRADING OF GREEN CERTIFICATES OR
SIMILAR RPS-BASED SCHEMES, 3%
FEED-IN TARIFF 85%
DIRECT SUBSIDIES OR TAX BREAKS, 11%
2010
TRADING OF GREEN CERTIFICATES OR
SIMILAR RPS-BASED SCHEMES, 2%
FEED-IN TARIFF THROUGH
TENDERS OR PPA, 7%
FEED-IN TARIFF 60%
NON-INCENTIVIZED SELF-CONSUMPTION, 0,2%
DIRECT SUBSIDIES OR TAX BREAKS, 16%
INCENTIVIZED SELF-CONSUMPTION
OR NET-METERING, 15%
2015
SOURCE IEA PVPS & OTHERS.
TRADING OF GREEN CERTIFICATES OR
SIMILAR RPS-BASED SCHEMES, 4%
FEED-IN TARIFF THROUGH
TENDERS OR PPA, 14%
NON INCENTIVIZED, 1%
FEED-IN TARIFF 52%
NON-INCENTIVIZED SELF-CONSUMPTION, 4%
DIRECT SUBSIDIES OR TAX BREAKS, 15%
INCENTIVIZED SELF-CONSUMPTION
OR NET-METERING, 11%
2020
development of the market. In France and Italy, the FiT decrease is dependent on both installation rates and on economic indicators. Other countries have opted for a market-based decrease strategy and adapt their FiT on a regular basis, such as Japan and, China for instance.
Tendering and Auctioning
Calls for tender are another way to grant FiT schemes with an indirect financial cap. This system has been adopted in many countries around the world, with the clear aim of increasing the competitiveness of PV electricity. Since bidders must compete with one another, they tend to reduce the bidding price at the minimum possible and shrink their margins. This process is currently showing how low the bids can go under the constraint of competitive tenders. However, many believe such low bids are possible with extremely low capital costs, low components costs and a reduced risk hedging. Therefore, it is conceivable that they do not represent the average PV price in all cases but are showcases for super-competitive developers.
The race to the bottom in international tenders is driving the solar power price down to the extent that project developers have started to bid at levels which speculate on further reductions in solar panel costs, and in interest rates. Certainly, tender competition has, in some countries, resulted in the emergence of dive bidding and what has been termed the “winner’s curse” whereby a successful bidder underbids in order to win the contract and then cannot deliver power at the agreed-upon price. Declining investment must also be considered in the context of interest rates, which determine the cost of capital used to finance solar projects, and which constitute a significant portion of total project costs.
Tenders have gained success in the entire world over the last years and Europe aligned with this trend while several countries adopted or reintroduced tenders. Several countries such as France, Germany, Greece, Poland, Portugal, Estonia and Spain introduced or reintroduced tenders for different market segments, with France using it for some market segments (above 100 kW in
FEED-IN TARIFFS INCLUDING PPA
The concept of FiT is quite simple. Electricity produced by the PV system and injected into the grid is paid at a predefined price and guaranteed during a fixed period. In theory, the price could be indexed on the inflation rate, but this is rarely the case. The FiT model generally assumes that a PV system produces electricity for injecting into the grid rather than for local consumption. However, a FiT can be used to incentivize self-consumption projects through a lower remuneration for the excess electricity injected into the grid.
Amongst the IEA PVPS members, 16 countries had a FiT scheme in 2020 (Australia, Austria, Canada, China, France, Germany, Israel, Italy, Japan, the Netherlands, Portugal, Sweden, Thailand, Switzerland, Turkey and the United States of America). The attractiveness of FiT has been slightly reduced compared to the early developments of PV but so far it still represents a major driver of PV installation, and some countries announced a phase-out, such as China for instance.
National or Local
Depending on the country specifics, FiT can be defined at the national level (China, Japan, Germany, etc.) and at the regional level (Australia, Canada, India, etc.) with some regions opting for it and others not, or with different characteristics. FiT can also be granted by utilities themselves (Austria, Sweden and Switzerland), outside of the policy framework to increase customers’ fidelity.
Automatic or Ad Hoc Adjustment
FiT remains a very simple instrument to develop PV, but it needs to be fine-tuned on a regular basis to ensure a stable market development. Indeed, the market can grow out of control if there is an imbalance between the level off the tariffs and effective cost of PV systems, especially when the budget available for the FiT payments is not limited. To be sure, most market booms in countries with unlimited FiT schemes were caused by the unpredictable steep price decrease of PV systems, while the level of the FiT was not adapted fast enough. This situation caused the market to grow out of control, mainly in early markets in European countries. The market booms occurred in countries such as Spain in 2008, Czech Republic in 2010, Italy in 2011, Belgium in 2012 and to a certain extent in China in 2015, 2016 and 2017, and to a lesser extend to other countries. Unfortunately, these booms have strained the budget and negatively affected the public perception of PV, most of these markets took years to recover and reexperience growth only recently.
Therefore, many countries adopted the principle of decreasing FiT levels over time or introduced limited budgets. In Germany, the level of the FiT can be adapted monthly to reduce the profitability of PV investments if the market is growing faster than the target decided by the government. Germany also planned a capacity ceiling which has been removed recently to allow further
IEA PVPS TRENDS IN PHOTOVOLTAIC APPLICATIONS 2021 / 34
CHAPTER 3 POLICY FRAMEWORK
Tenders
Tenders have not yet shown their full potential. For the time
being, they are mostly used to frame PV development and PV
costs. For regulators, this implies defining a maximum capacity
and proposing the cheapest suitable plants to develop. However,
it could be developed further and be part of a larger, long-term,
roadmap on power capacity development. By planning smartly,
together with transmission grid operators, tenders could allow to
develop specific capacities for defined technologies, optimize the
grid and plan smartly the energy transition. This principle could
also be applied to rooftop PV development.
THE SUPPORT SCHEMES

IEA PVPS TRENDS IN PHOTOVOLTAIC APPLICATIONS 2021 / 35
CHAPTER 3 POLICY FRAMEWORK
a simplified version and above 250 kW in all cases), while Germany is rather using it for utility-scale plants.
In the Middle East and North Africa, tenders were issued in Egypt, Israel, Jordan, Morocco, South Africa and the UAE. In the rest of the world, many others have joined the list of countries using calls for tenders to grant PPAs for PV plants. In Latin America, Argentina, Brazil, Chile, Mexico and Peru, just to mention the most visible, have implemented such tenders. In Asia, India, Nepal and Sri Lanka also started to launch tenders, while in Southern Africa, Nigeria, Senegal, Tunisia and Malawi can be cited amongst the newcomers.
Tenders are often technology specific, however, technology neutral tenders have been introduced in Denmark, Estonia, Italy, Lithuania, the Netherlands, Poland, UK and South Africa. In this case, PV is put in competition with other generation sources. Some countries such as France, Germany and Italy are experimenting with mixed auctions based on solar and wind in parallel with some technology specific tenders.
Spain innovated with a tender based not on the energy prices or capacities, but on the level of support required. In this auction process, bidders have to offer a discount on the standard value of the initial investment of a reference plant. The lowest bid winning the tender up to a predefined capacity level is required. This tender also has the particularity to be technology neutral but welcomes only PV and wind.
Competitive tenders can be used to promote specific technologies or impose additional constraints such as local manufacturing to boost the local industry. This type of requirement has enabled the development of local solar panel manufacturing in some African countries such as Algeria, Morocco and South Africa. The FiT payment can be adjusted to some parameters. Turkey, for instance, applies a premium for local content, on the top of the normal FiT. In several countries, a local content parameter has been discussed and acts as an additional primary or secondary key in the grant decision.
In summary, FiT remains the most popular support scheme for all sizes of grid-tied PV systems; from small household rooftops applications to large utility-scale PV systems. The ease of implementation continues to make it the most used regulatory framework for PV globally.
FEED-IN PREMIUM
In several countries, the FiT schemes are being replaced by feed-in premiums. The concept behind the premium is to be paid in addition to the wholesale electricity market price. Fixed and variable premiums can be considered. In Germany and the Netherlands, the remuneration of solar PV electricity is based on a variable Feed-in Premium (FiP) that is paid on top of the average electricity wholesale market price and Sweden is using a
fixed FiP for small decentralized systems. A so-called Contract for Difference scheme is a FiP that ensures a constant remuneration by covering the difference between the expected remuneration and the electricity market price.
CORPORATE POWER PURCHASE AGREEMENTS
While FiT are paid in general by official bodies or utilities, Power Purchase Agreements (PPAs) are becoming compulsory in some countries. In Chile, for instance, the PV plants built in the northern desert of Atacama had to find PPAs with local industries in order to be beneficial (even if the low prices are now pushing for PV electricity sold into the electricity market). Such plants can be considered as competitive, since they rely on PPAs with private companies rather than official FiT schemes.
Spain is probably leading the PPA market, if not worldwide, at least in Europe. Over the last years, more and more bilateral PPAs were signed between producers and consumers. The reduced LCOE allows new market segments development, more recently unsubsidized PPAs also started to appear in Denmark, Germany, Italy and Sweden.
The USA and Australia are also markets where PPAs are gaining market shares. In California, many PPAs, sometimes with record low prices, were approved over the last years. PPAs imply sourcing of solar electricity without necessarily being physically connected with the power plant, a solution favoured more and more by large companies willing to decrease their GHG emissions.
RENEWABLE PORTFOLIO STANDARDS AND GREEN CERTIFICATES
The regulatory approach commonly referred to as “Renewable Portfolio Standard” (RPS) aims at promoting the development of renewable energy sources by imposing a quota of RE sources. The authorities define a share of electricity to be produced by renewable sources that all utilities must adopt, either by producing themselves or by buying specific certificates on the market. When available, these certificates are sometimes called “green certificates” and allow renewable electricity producers to get a variable remuneration for their electricity, based on the market price of these certificates. This system exists under various forms. State incentives in the USA have been driven in large part by the passage of Renewable Portfolio Standards (RPS). An RPS, also called a renewable electricity standard (RES), requires electricity suppliers to purchase or generate a targeted amount of renewable energy by a certain date. In Belgium’s regions, Norway, Romania and Sweden, PV receives a specific number of these green certificates for each MWh produced. A multiplier can be used for PV, depending on the segment and size to differentiate the technology from other renewables. For example, different multipliers are applied to floating PV and PV with storage batteries in Korea. In Belgium, all three regions use the trading of green certificates for

CHAPTER 3 POLICY FRAMEWORK
IEA PVPS TRENDS IN PHOTOVOLTAIC APPLICATIONS 2021 / 36
THE SUPPORT SCHEMES / CONTINUED
In general, the conclusion of an agreement during the COP21 in Paris in 2015 has signalled the start of a potential new era for carbon free technologies and the need to accelerate the transition to a carbon-free electricity system. In this respect, some believe that PV would greatly benefit from a generalized carbon price, pushing CO2 emitting technologies out of the market.
SELF-CONSUMPTION AND NET-METERING
Given the rooftop potential, it seems logical that a part of the PV future will come from its deployment on buildings, to provide electricity locally. The declining cost of PV electricity puts it in direct competition with retail electricity provided by utilities through the grid and several countries have already adopted schemes allowing local consumption of electricity. These schemes are often referred to as self-consumption or net-metering schemes.
These schemes allow self-produced electricity to reduce the PV system owner’s electricity bill, on site or even between distant sites (Mexico, Brazil, France). Various schemes exist that allow compensating electricity consumption and the PV electricity production, some compensate real energy flows, while others are compensating financial flows. While details may vary, the bases are similar. The savings on the electricity bill can be decreased if grid taxes or levies are to be paid on the self-consumed electricity. Fixed or capacity-based grid tariffs can also have a detrimental effect on the revenues for the prosumers. These last years, countries such as Germany, Spain or Belgium introduced taxes on solar PV production for prosumers. These taxes were in most cases fought in court as they constitute a retroactive cut for existing installations and were finally delayed or recalled.
While the self-consumption and net-metering schemes are based on an energy compensation of electricity flows, other systems exist. Italy, through its Scambio Sul Posto (net-billing scheme), attributes different prices to consumed electricity and the electricity fed into the grid. In Israel, the net-billing system works on a similar basis. One must be careful when looking at self-consumption schemes since the same vocabulary can imply different regulations depending on the case. In Canada, the provinces of Manitoba and Saskatchewan have Net Billing systems whereas every other jurisdiction has some form of Net Metering in place. The best example is in the USA, with the wording “net-metering” being used for different self-consumption schemes in different states.
To better compare existing and future self-consumption schemes, the IEA PVPS published a comprehensive guide to analyse and compare self-consumption policies. This “Review of PV Self-Consumption Policies” proposes a methodology to understand, analyse and compare schemes that might be fundamentally diverse, sometimes under the same wording. It also proposes an analysis of the most important elements impacting the business models of all stakeholders, from grid operators to electric utilities.
commercial and industrial segments. Romania uses a quota system, too, which however experienced a drop in the value of the green certificates in 2014. The UK was still using a system called ROC (Renewable Obligation Certificates) for large-scale PV in 2015, but it was replaced in 2016. Remarkably, Sweden and Norway share a joint, cross-border, Green Electricity Certificate system.
DIRECT SUBSIDIES AND TAX CREDITS
PV is characterized by limited maintenance costs, no fuel costs but high upfront investment. This has led some countries to put policies in place that reduce the upfront investment to incentivize PV. Direct subsidies were implemented in countries such as Austria, Australia, Canada, Finland, Italy, Japan, Korea, Lithuania, Norway and Sweden just to mention a few. These subsidies are, by nature, part of the government expenditures and are limited by their capacity to free up enough money.
Tax credits have been used in a large variety of countries, ranging from Belgium, Canada, Japan, France and others. Italy uses a tax credit for small size plants. The debate was intense in the USA in 2015 whether extending the ITC (Investment Tax Credit) or to phase it out rapidly. Finally, the decision was taken to continue the current scheme at least until the end of the decade.
“CARBON” TAXES
Some attempts have been made to impose carbon taxes to support the development of renewables indirectly by putting a price on the external cost of CO2 emitting technologies. The most important regulation has been the Emission Trading System in Europe (ETS) which aims at putting a price on the ton of CO2. So far it has failed to really incentivize the development of PV or any other renewable source because of the low carbon price that came out of the system. A Market Stability Reserve (MSR) has been introduced to reduce the surplus of emission allowances in the carbon market and to improve the EU ETS's resilience to future shocks. The EU will further reinforce this mechanism: between 2019 and 2023, the number of allowances put in the reserve will double to 24% of the allowances in circulation and other measures could be introduced in the coming years.
Outside of Europe, Japan was amongst the first countries to adopt a carbon pricing in 2012. More recently, a national carbon-pricing plan took effect in 2018 in Canada. Although the carbon pricing framework is federal, each province and territory has implemented its own policy approach; these include both taxes and cap-and-trade mechanisms. China launched its own cap-and-trade carbon program in December 2017, the first phase of the market only covers power generation. A carbon tax also came into effect in South Africa in June 2019.
The share of global GHG emissions covered by carbon prices initiatives is now around 20%, with China and the EU as main contributors.
IEA PVPS TRENDS IN PHOTOVOLTAIC APPLICATIONS 2021 / 37
CHAPTER 3 POLICY FRAMEWORK
Excess PV Electricity Exported to the Grid
Traditional self-consumption systems assume that the electricity produced by a PV system should be consumed immediately or within a 10/15 minutes time frame to be compensated. The PV electricity not self-consumed is therefore injected into the grid.
Several ways to value this excess electricity exist today:
• The lowest remuneration is 0: excess PV injected on the grid electricity is not remunerated.
• Excess electricity gets the electricity market price, with or without a bonus.
• A FiT remunerates the excess electricity at a predefined price. Depending on the country, this tariff can be lower or higher than the retail price of electricity.
• Price of retail electricity (net-metering), sometimes with additional incentives or additional taxes.
A net-metering system allows such compensation to occur during a longer period, ranging from one month to several years, sometimes with the ability to transfer the surplus of consumption or production to the next month(s). In Belgium, the system exists for PV installations below 10 kW but will disappear in some regions in the coming years. In the USA, net-metering policies differ from state to state, consequently, the payoff time varies greatly. Several emerging PV countries have implemented net-metering schemes in recent years (Chile, Israel, Jordan, UAE (Dubai) and Tunisia).
PV Communities or Collective Self-Consumption
Collective self-consumption allows to share electricity between several users, in general behind the meter but also between distinct individual buildings. Self-consumption in collective buildings or sites allows one or more production units to feed their electricity to several consumers, using a predefined split key. The typical case concerns a multi-apartment building, with one single PV plant feeding several or all consumers in the building.
While self-consumption is allowed in most European countries, Europe has decided to go a step further with the comprehensive update of its energy policy - the Clean Energy for All Europeans package (“Clean Energy Package”). The European Union introduced new provisions on the energy market design and frameworks for new energy initiatives. Specifically, the actual recasts of the renewable energy directive (REDII) and the electricity market directive (EMDII) provide basic definitions and requirements for the activities of individual and collective self-consumption. Furthermore, the Clean Energy Package introduces energy communities into European legislation, which allow citizens to collectively organise their participation in the energy system. The European definitions provide guidelines for the implementation in the members states, however, the details concerning the perimeter and the limits to collective self-consumption, for instance, are being implemented at the national level.
Concerning collective consumption behind the meter, the most advanced legal frameworks have been implemented in France, the Netherlands and Italy The “Mieterstromgesetz” or Tenant Electricity Law in Germany enables building owners to produce and sell electricity to their tenants which makes the investment more attractive. The UK has also implemented a favourable framework for collective prosumers. Other countries such as Belgium, Croatia, and Portugal have introduced some definitions but are not yet fully implemented.
In the USA, community microgrids are emerging to reduce the cost of electricity consumption and provide local resilience through storage and backup power. In Australia, Community-owned Renewable Energy allows citizens to define and invest in renewable energy projects to transform their communities in some cases to zero-net emissions. In Korea, an energy self-sufficient community in Seoul city has allowed its members to reduce its energy costs through energy savings and PV installations.
Delocalized or “Virtual” Self-Consumption
While self-consumption could be understood as the compensation of production and consumption locally, decentralized (or “Virtual”) self-consumption expands to delocalized consumption and production and opens a wide range of possibilities involving ad hoc grid tariffs. In that respect, prosumers at district level would pay less grid costs than prosumers at regional or national level. Such policies are tested in some countries (Austria, the Netherlands, France, Lithuania, Mexico, Switzerland, etc.). Some utilities even launched pilot projects before the regulations were officially published (as in Austria or Switzerland). In this case, innovative products are already mixing with PV installations, PV investment and virtual storage. This evolution will be scrutinized in the coming years since it might open new market segments for solar PV.
Given the complex questions that such schemes create, especially with regard to the use of the grid, the legal aspects related to compensating electricity between several meters and the innovative aspect of the scheme, it is believed decentralized self-consumption can ease the integration of PV into the energy transformation, support the development of smarter buildings and accelerate the transition to electric vehicles.
The opportunities opened by such concepts are wide-ranging. For instance, this could allow charging an electric vehicle at the office with PV electricity produced at home or sharing the PV electricity in all public buildings in a small town between them depending on the consumption or installing a utility-scale plant in the field nearby a village to power it. Options are numerous and imply fair remuneration of the grid to be competitive for all. Using PV electricity in a decentralized location implies the use of the public grid, distribution or even transmission and would require putting a fair price on such use. With PV becoming competitive, such ideas emerge and could develop massively under the right regulations.
.
CHAPTER 3 POLICY FRAMEWORK
IEA PVPS TRENDS IN PHOTOVOLTAIC APPLICATIONS 2021 / 38
paid by all electricity consumers, with an exemption for large industrial consumers. Since 2014, prosumers with systems above 10 kW are required to pay 40% of this levy on the electricity consumption coming from PV. End users must pay the value added tax (19%) on this surcharge as well. The contribution of PV is considered as small compared to wind in the last year.
Italy has defined a financial cap for PV of 6,7 BEUR in terms of yearly payments that finances all tariffs of the previous FiT Law. All these costs are covered by a component of the electricity tariff. Japan uses a surcharge to promote renewable energy power generation for a household. High-volume electricity users such as manufacturers are entitled to reduce the surcharge. In Korea, the cost of PV incentives is mainly covered by the central and regional governments (taxpayers). Some costs are covered by the 21 RPS obligators indirectly affecting the electricity prices (Government controls the electricity price). Malaysia supports the tariffs by the Renewable Energy (RE) fund contributed by electricity consumers. Consumers with electricity consumption of more than 300 kWh per month are obliged to contribute additional charge of 1,6% of their electricity bill to the RE fund.
Spain uses a specific remuneration system for renewables through charges in the electricity tariff. Grant subsidies and other programs such as MOVES for alternative mobility are financed at least partially with funds from the European Regional Development Fund of the EU. Local tax exemptions are financed by the municipalities. In the USA, the ITC tax break is borne by the federal budget indirectly (since the budget is not used but it represents rather a decrease of the potential income from PV development costs). Besides federal benefits, solar project developers can rely on other state and local incentives, which come in many forms, including—but not limited to—up-front rebates, performance-based incentives, state tax credits, renewable energy certificate (REC) payments, property tax exemptions, and low-interest loans. Incentives at both the federal and state levels vary by sector and by size (utility scale or distributed).
Financial support schemes have not always succeeded in starting the deployment of PV in a country. Several examples of well-designed support systems have been proven unsuccessful because of inadequate and costly administrative barriers. Progress has been noted in most countries in the last years, with a streamlining of permit procedures, with various outcomes. The lead time could not only be an obstacle to fast PV development but also a risk of increased costs to compensate for legal and administrative costs.
The cost of these incentives can be supported through taxpayer’s money or, and this is the most common case, at least in Europe, through a specific levy on the electricity bill. In some countries, energy intensive industrials or large consumers are exempted from the levy for competitiveness reasons and to avoid carbon leakage.
In order to control the overall cost of the financial incentives, the budget available each year can be limited and, in that case, a first-come first-serve principle is applied. Most countries did not impose a yearly cap on FiT expenditures in the past, which led to fast market development in Japan, China, Germany, Italy, Spain and many others.
Some specific examples:
In Australia, Solar tenders come from a mix of state governments, local governments, electricity retailers, and the Australian Renewable Energy Agency (ARENA). Each has its own process with varying funding mechanisms, the most common being PPAs for energy generation or Renewable Energy Certificates or both. Belgium uses Green Certificates that have to be bought by utilities if they don’t produce the required quotas of renewable electricity, which make these costs transparent. However, when PV producers are not able to sell these certificates, they are bought by the Transmission System Operator who re-invoices these to customers through their electricity bill. In Canada, each province and territory in Canada has different policy mechanisms for supporting solar PV. There are currently several different federal, provincial and municipal grant programs providing rebates for the capital cost of behind-the-meter solar PV systems; these are funded through general revenue. China is in the middle of changing its schemes towards more competitive ones: The original benchmark price was changed to a guide price in 2019, which is the upper limit of competitive allocation projects. The subsidy level for self-consumption has dropped together with the subsidy level for household photovoltaics.
Denmark has financed PV systems by the so-called Public Service Obligation (PSO) administered by the state-owned TSO. The money involved was collected as a small levy on every kWh sold until 2016. After this, it was decided that in the future use the state budget to provide the financing of eventual RE support measures. In France, all remunerations (through Feed-in PPA, Additional remuneration -market premium-, bonuses, etc.) are paid to operators by a designated Co-contractor (EDF, other authorised organisations or, in certain areas, local public distribution grid managers). The Co-contractor is compensated for over-costs from a dedicated account in the national budget (Energy Transition). This account is financed by a tax on petrol and its derivatives when used as an energy source for transport or heating. Over-costs are calculated based on a typical production curve weighting of monthly average daytime spot prices on the national electricity market. Germany uses a so-called “EEG surcharge” that covers the cost of all renewable sources and is
SOFT COSTS
FINANCING OF SUPPORT SCHEMES

IEA PVPS TRENDS IN PHOTOVOLTAIC APPLICATIONS 2021 / 39
CHAPTER 3 POLICY FRAMEWORK
OWNERSHIP OF PV PLANTS
GRID INTEGRATION
Soft costs remain high in several countries, but prices have started to go down in some key markets, such as Japan or the USA. In these two markets for instance, system prices for residential systems continue to be significantly higher than prices in key European markets. While the reason could be that installers adapt to the existing incentives, it seems to be more a combination of various reasons explaining why final system prices are not converging faster in some key markets. Moreover, it seems that additional regulations in some countries tend to increase the soft costs compared to the best cases. This will have to be scrutinized in the coming years to avoid eating up the gains from components price decrease.
Until recently, a large part of the PV market was based on traditional business models based on the ownership of the PV plant. For rooftop applications, it was rather obvious that the PV system owner was the owner of the building. However, the high upfront capacity requirements are pushing different business models to develop, especially in the USA, and to a certain extent in some European countries. PV-as-a-service contributes significantly to the USA’s residential market for instance, with the idea that PV could be sold as a service contract, not implying the ownership or the financing of the installation. These business models could deeply transform the PV sector in the coming years, with their ability to include PV in long term contracts, reducing the uncertainty for the contractor. Such business models represent already more than 50% of the residential market in the USA, and some utilities in Germany, Austria, Sweden and Switzerland are starting to propose them, as we will see below. However, the US case is innovative by the existence of pure players proposing PV (such as SolarCity, Sunrun, etc.) as their main product. Since it solves many questions related to financing and operations, as well as reducing the uncertainty on the long term for the prosumer, it is possible that such services will further develop in the near future, along with the necessary developments which will push up distributed PV.
Similarly, the pay-as-you-go financial models have been very successful for the deployment of Solar Home Systems (SHS) and solar kits in African countries in the past years and are expected to further drive the development of PV in the residential and off-grid segments. Pay-as-you-go models are directly inspired from prepaid mobile payment schemes; the users pay a monthly fee or according to its needs and owns the solar kit when enough credits have been paid.
With the share of PV electricity growing in the electricity system of several countries, the question of integration to the electricity grid is becoming more acute. In some countries, temporary or permanent curtailment rules have been devised to avoid grid reinforcement or to avoid grid congestion in the meantime. In China, the adequacy of the grid remains one important question that pushed the government to favour the development of decentralized PV in the future over large utility-scale power plants.
It is interesting to note that many transmission system operators are increasing the penetration of PV in their scenarios and try to assess the impact of such developments. In 2019, RTE, France’s TSO has issued a clear assessment of the positive effect of massive PV development on generation adequacy during the morning peak while it concluded that the balancing costs for several dozen GW of PV in the French network would have negligible costs while high-voltage grid reinforcements costs would amount to significantly less than 1 EURcent per kWh in France. Such scenarios and calculations have been done by many TSOs and show how important PV development starts to become.
GRID CODES
By submitting PV applications to stricter grid codes and regulations, connecting PV systems to the grid becomes more complex and therefore more costly. The increased need to provide ancillary services to the grid, including frequency response for instance, and curtailment, changes the nature of the connection for the PV system and can increase prices or reduce revenues. This influences the competitiveness of PV solutions.
Grid codes have been reviewed in the European Union in an attempt to harmonise grid codes between member states and will lead to additional constraints for PV systems. In Australia, specific grid codes have been adapted for PV and more will come. In Mexico, specific grid requirements have in some cases been imposed to bidders in tendering processes. In any case, grid integration policies will become an important subject in the coming years, with the need to regulate PV installations in densely equipped areas.
GRID COSTS AND TAXES
Grid costs are another essential element, which deals with PV competitiveness, especially for distributed PV applications under self-consumption. Since the competitiveness of the solution depends on the ability to reduce the electricity bill of the consumer, the grid costs might affect the outcome tremendously. In particular, several countries discuss the shift of grid costs from an energy-based structure towards a capacity-based structure: this would affect significantly the profitability of distributed PV plants if all grid costs would have to be paid, even with large

IEA PVPS TRENDS IN PHOTOVOLTAIC APPLICATIONS 2021 / 40
CHAPTER 3 POLICY FRAMEWORK
In Korea, the NRE Mandatory Use for Public Buildings Programme imposes on new public institution buildings with floor areas exceeding 1 000 square meters to source more than 10% of their energy consumption from new and renewable sources. In Belgium, Flanders introduced a similar measure since 2014. The first results show that PV is chosen in more than 85% of the new buildings. In Denmark, the national building code has integrated PV to reduce the energy footprint. In all member states of the European Union, the new Energy Performance in Buildings Directive (EPBD) will impose to look for ways to decrease the local energy consumption in buildings, which could favour decentralized energy sources, among which PV appears to be the most developed one, from 2020 onwards.
Two concepts should be distinguished here:
• Near Zero Energy Buildings (reduced energy consumption but still a negative balance);
• Positive Energy Buildings (buildings producing more energy than what they consume).
These concepts will influence the use of PV systems on building in a progressive way now that competitiveness has improved in many countries.
BIPV support policies have been quite popular a few years ago, especially in Italy and France where they led to massive installations, with almost 5 GW of cumulative installations in these two countries. Since then, their level has been massively reduced and few countries now apply BIPV policies with dedicated incentives outside of China, Korea and Switzerland. Past policies supported the use of conventional PV modules for simplified BIPV installations, which led to abuses and more constraints in BIPV policies. Since then, the development of more constraining BAPV policies imposes, in some cases, higher constraints to BIPV development. An example is the limit at 100 kW for non-tendered applications in France which would impose de facto on BIPV to compete with BAPV and lead in all cases to the choice of BAPV for systems above 100 kW. Since BIPV targets building surfaces, limits are defined by the surface, rather than electricity consumption choices only. This will definitively limit BIPV development in such cases in the coming years. The lack of financial incentives reduces the attractiveness of BIPV which did not benefit as BAPV did of the tremendous price decrease linked to its massive development.
shares of the energy produced on site. The reason behind this originates from the loss of incomes of grid operators who see their revenues and therefore their capacity to invest and maintain the grid, being reduced significantly if prosumers or semi-independent energy communities would become the new normal.
The example of decentralized self-consumption indicates how important it will be for the grids to know their real costs and invoice prosumers with a fair tariff depending on the real use of the grids. The changing electricity landscape with the fast development of electric mobility in several countries, the development of distributed storage and the expected electrification of heating, would deserve a long-term analysis to find the right balance between the different incentives that grid tariffs ultimately provide.
The opposition from utilities and in some cases grid operators grew significantly against net-metering schemes. While some argue that the benefits of PV for the grid and the utilities cover the additional costs, others are pledging in the opposite direction. In Belgium, the attempt of adding a grid tax to maintain the level of financing of grid operators was stopped by the courts and then reintroduced. While these taxes were cancelled later, they reveal a concern from grid operators who see their income model diminishing. In Germany, the debate that started in 2013 about whether prosumers should pay an additional tax was finally concluded. The EEG surcharge is paid partially on self-consumed electricity. In Israel, the net-billing system is accompanied by grid-management fees to compensate the back-up costs and the balancing costs. In general, several regulators in Europe are expected to introduce capacity-based tariffs rather than energy-based tariffs for grid costs. This could change the landscape in which PV is playing for rooftop applications and delay its competitiveness in some countries.
The building sector has a major role to play in PV development and sustainable building regulations drive PV’s deployment in countries where the competitiveness of PV is close. These regulations include requirements for new building developments (residential and commercial) but also, in some cases, on properties for sale. PV may be included in a suite of options for reducing the energy footprint of the building or specifically mandated as an inclusion in the building development.
SUSTAINABLE BUILDING REQUIREMENTS & BIPV

IEA PVPS TRENDS IN PHOTOVOLTAIC APPLICATIONS 2021 / 41
CHAPTER 3 POLICY FRAMEWORK
China is a key global manufacturer of Li-Ion batteries, and its electric vehicles markets is the largest in the world.
France organized several solar tenders with storage between 2011 and 2017 in its islands: Corsica (15 MW), Reunion and Mayotte (17,5 MW), Guadeloupe, French Guiana and Martinique, Saint Barthelemy and Saint Martin (17,5 MW). In 2020, a tender has been launched to provide low carbon flexibility for the grid, around two-thirds of the selected projects are based on storage, the rest on load shifting.
Japan is as well trying to increase the numbers of projects to install storage batteries but with still limited subsidies. In the past years storage batteries for residential applications were part of a subsidy program to accelerate the development of net zero energy houses.
Since 2016, Korea’s government incentivizes energy storage systems (ESS) for peak-load reduction. Consumers can get maximum 50% savings in their electricity use under the current scheme. The government also provides a very attractive REC weighting factor for PV power with ESS system. It is a temporary subsidy, and it will be decreased in 2020.
Some consider that storage development for PV electricity will be massively realized through electric vehicles connected to the grid during a large part of the day and therefore, will be able to store and deliver energy to consumers at a larger scale than simple batteries. This vehicle-to-grid or V2G concepts are being explored and tested in several countries, with the Netherlands, Switzerland and Japan as front-runners.
In the current stage of development, electricity storage remains to be incentivized to develop. While some iconic actors are proposing trendy batteries, the real market remains more complex and largely uncompetitive without financial support.
Up to 2018, the market was still limited to some specific countries that have implemented specific incentives such as Australia and Germany. However, the cost of storage is pursuing its steep decline and storage is becoming more attractive in a growing number of markets. Amongst the countries that have issued laws to incentivize battery storage in PV systems to 2019, Austria and Italy have introduced a tax rebate (storage coupled with small PV plants) and some cantons in Switzerland have subsidy schemes. In region of Flanders, Belgium, a temporary rebate has been granted for the purchase of batteries.
In Germany, soft loans and capital grant covering up to 25% of the eligible solar PV panel were offered between 2016 and 2018 and the programme has been prolonged until 2020. In Sweden, the government has introduced a direct capital subsidy for energy storage owned by private households which led to a total battery capacity of 6 362 kWh installed in 2019. In the USA, several states, including California, provide rebates for qualifying distributed energy systems.
In 2017, the National Development and Reform Commission of China published the “Guidance opinion on promotion of energy storage technological and industrial development”. The document called for development of power storage to promote innovative renewable energy applications, support the grid, and allow the participation of power storage in the auxiliary service market.
ELECTRICITY STORAGE

THREE // CHAPTER 3 POLICY FRAMEWORK
IEA PVPS TRENDS IN PHOTOVOLTAIC APPLICATIONS 2021 / 42
projects. Needs for local manufacturing of PV were discussed to secure local value chains, reduce transportation cost, create jobs locally to support the economic recovery and enhance green manufacturing with lower carbon footprint.
This section reviews some trends in the value chain of crystalline silicon (c-Si) and thin-film PV technologies. While a PV system consists of various manufacturing processes and materials as shown in Figure 4.1, this section focuses on the key trends of polysilicon, ingot/wafer/cells and PV modules (c-Si and thin-film PV).
POLYSILICON PRODUCTION
Wafer-based c-Si technology remains dominant for producing PV cells. In that respect, this section focuses on the wafer-based production process. Although some IEA PVPS countries reported production of feedstock, ingots and wafers, the information from the National Survey Reports of these sections of the PV industry supply chain is uncomplete and, consequently, this section provides more background information on the upstream part of the PV value chain thanks to additional information.
The global polysilicon production (including semiconductor grade polysilicon) in 2020 was about 520 500 tonnes. Polysilicon used for solar cells increased from 469 000 tonnes in 2019 to approx. 486 000 tonnes in 2020 while 34 600 tonnes of polysilicon were used for the semiconductor industry. The production volume of polysilicon for solar cells accounted for about 93,4 % of total production of polysilicon in 2020.
This chapter provides a brief overview of the upstream part of the PV manufacturing industry. It is involved in the production of PV materials (feedstock, ingots, blocks/bricks and wafers), PV cells, PV modules and balance-of-system (BOS) components (inverters, mounting structures, charge regulators, storage batteries, appliances, etc.). The downstream part of the PV sector during 2020 and the first half of 2021, including project development as well as operation and maintenance (O&M) is also briefly presented. This chapter is intended to provide an overview of the PV industry: more detailed information on the PV industry of each IEA PVPS member country can be found in the relevant National Survey Reports.
As presented above in this report, as was the previous years, the production and the production capacity of polysilicon, ingots, wafers, PV cells and modules increased at a pace higher than the growth of the installed capacity while the global PV installed capacity in 2020 and further increase of the production capacity is expected in 2021. China remained the world’s largest producer and consumer of PV cells and modules: the Chinese PV market has significantly impacted the global PV supply and demand. The gap between the demand and the production capacity has contributed to further price reduction across the PV value chain from polysilicon to PV module until the end of 2020. However, in 2021, price increases of PV modules were reported due to accidents at polysilicon plants and shortage of materials, especially glass for PV modules. In the first part of 2021, due to the increase of demand for polysilicon by wafer manufacturers that enhanced their production capacity, a further increase of polysilicon prices was reported. Other factors such as the significant cost of transportation caused the visible module price hike. While global market growth is expected in the coming years, price increase of PV modules might lead to delays for utility-scale
four TRENDS IN THE PV INDUSTRY
THE UPSTREAM PV SECTOR
© Longi Solar
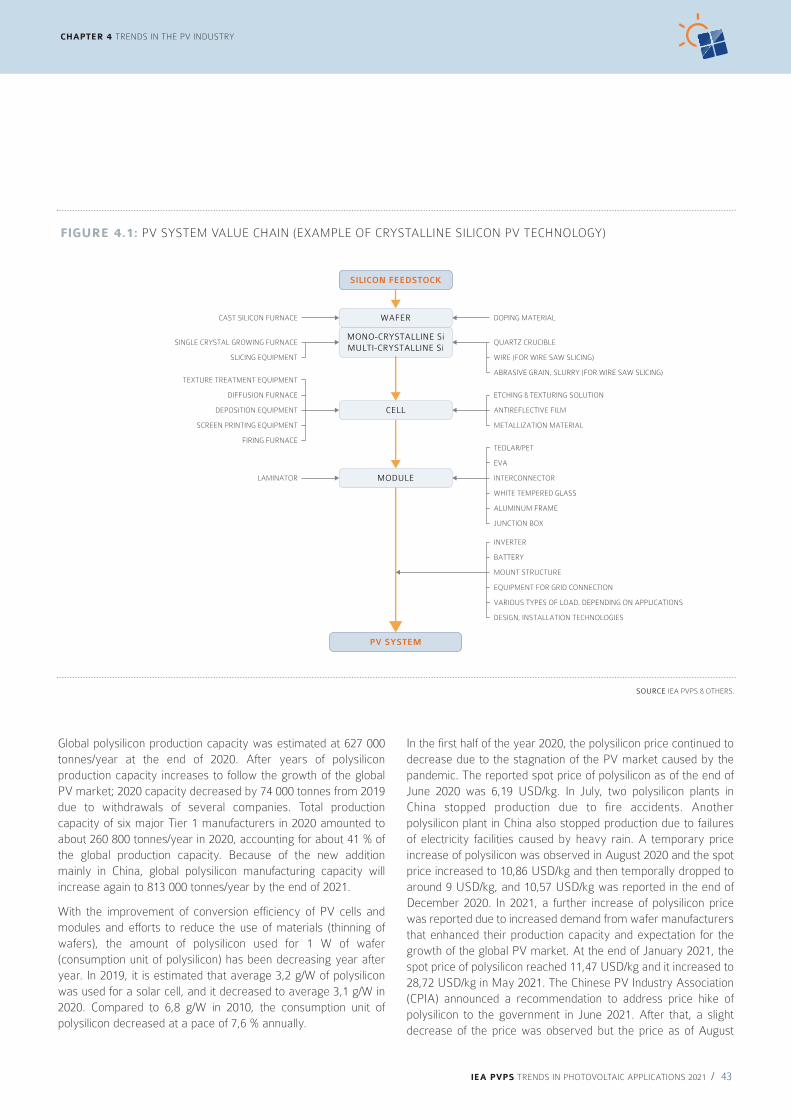
IEA PVPS TRENDS IN PHOTOVOLTAIC APPLICATIONS 2021 / 43
Global polysilicon production capacity was estimated at 627 000 tonnes/year at the end of 2020. After years of polysilicon production capacity increases to follow the growth of the global PV market; 2020 capacity decreased by 74 000 tonnes from 2019 due to withdrawals of several companies. Total production capacity of six major Tier 1 manufacturers in 2020 amounted to about 260 800 tonnes/year in 2020, accounting for about 41 % of the global production capacity. Because of the new addition mainly in China, global polysilicon manufacturing capacity will increase again to 813 000 tonnes/year by the end of 2021.
With the improvement of conversion efficiency of PV cells and modules and efforts to reduce the use of materials (thinning of wafers), the amount of polysilicon used for 1 W of wafer (consumption unit of polysilicon) has been decreasing year after year. In 2019, it is estimated that average 3,2 g/W of polysilicon was used for a solar cell, and it decreased to average 3,1 g/W in 2020. Compared to 6,8 g/W in 2010, the consumption unit of polysilicon decreased at a pace of 7,6 % annually.
In the first half of the year 2020, the polysilicon price continued to decrease due to the stagnation of the PV market caused by the pandemic. The reported spot price of polysilicon as of the end of June 2020 was 6,19 USD/kg. In July, two polysilicon plants in China stopped production due to fire accidents. Another polysilicon plant in China also stopped production due to failures of electricity facilities caused by heavy rain. A temporary price increase of polysilicon was observed in August 2020 and the spot price increased to 10,86 USD/kg and then temporally dropped to around 9 USD/kg, and 10,57 USD/kg was reported in the end of December 2020. In 2021, a further increase of polysilicon price was reported due to increased demand from wafer manufacturers that enhanced their production capacity and expectation for the growth of the global PV market. At the end of January 2021, the spot price of polysilicon reached 11,47 USD/kg and it increased to 28,72 USD/kg in May 2021. The Chinese PV Industry Association (CPIA) announced a recommendation to address price hike of polysilicon to the government in June 2021. After that, a slight decrease of the price was observed but the price as of August
CHAPTER 4 TRENDS IN THE PV INDUSTRY
SOURCE IEA PVPS & OTHERS.
FIGURE 4.1: PV SYSTEM VALUE CHAIN (EXAMPLE OF CRYSTALLINE SILICON PV TECHNOLOGY)
DOPING MATERIALCAST SILICON FURNACE
SINGLE CRYSTAL GROWING FURNACE
SLICING EQUIPMENT
TEXTURE TREATMENT EQUIPMENT
DIFFUSION FURNACE
DEPOSITION EQUIPMENT
SCREEN PRINTING EQUIPMENT
FIRING FURNACE
LAMINATOR
QUARTZ CRUCIBLE
WIRE (FOR WIRE SAW SLICING)
ABRASIVE GRAIN, SLURRY (FOR WIRE SAW SLICING)
ETCHING & TEXTURING SOLUTION
ANTIREFLECTIVE FILM
METALLIZATION MATERIAL
TEDLAR/PET
EVA
INTERCONNECTOR
WHITE TEMPERED GLASS
ALUMINUM FRAME
JUNCTION BOX
INVERTER
BATTERY
MOUNT STRUCTURE
EQUIPMENT FOR GRID CONNECTION
VARIOUS TYPES OF LOAD, DEPENDING ON APPLICATIONS
DESIGN, INSTALLATION TECHNOLOGIES
WAFER
SILICON FEEDSTOCK
PV SYSTEM
MONO-CRYSTALLINE Si
MULTI-CRYSTALLINE Si
CELL
MODULE
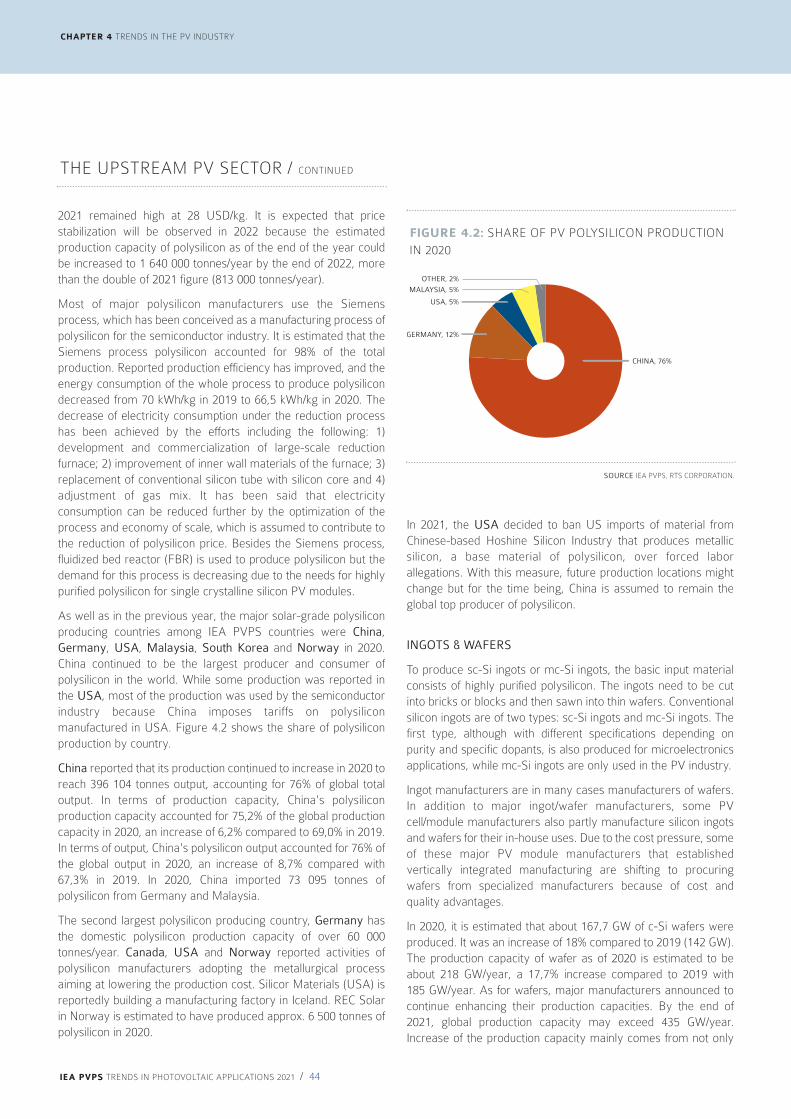
IEA PVPS TRENDS IN PHOTOVOLTAIC APPLICATIONS 2021 / 44
In 2021, the USA decided to ban US imports of material from Chinese-based Hoshine Silicon Industry that produces metallic silicon, a base material of polysilicon, over forced labor allegations. With this measure, future production locations might change but for the time being, China is assumed to remain the global top producer of polysilicon.
INGOTS & WAFERS
To produce sc-Si ingots or mc-Si ingots, the basic input material consists of highly purified polysilicon. The ingots need to be cut into bricks or blocks and then sawn into thin wafers. Conventional silicon ingots are of two types: sc-Si ingots and mc-Si ingots. The first type, although with different specifications depending on purity and specific dopants, is also produced for microelectronics applications, while mc-Si ingots are only used in the PV industry.
Ingot manufacturers are in many cases manufacturers of wafers. In addition to major ingot/wafer manufacturers, some PV cell/module manufacturers also partly manufacture silicon ingots and wafers for their in-house uses. Due to the cost pressure, some of these major PV module manufacturers that established vertically integrated manufacturing are shifting to procuring wafers from specialized manufacturers because of cost and quality advantages.
In 2020, it is estimated that about 167,7 GW of c-Si wafers were produced. It was an increase of 18% compared to 2019 (142 GW). The production capacity of wafer as of 2020 is estimated to be about 218 GW/year, a 17,7% increase compared to 2019 with 185 GW/year. As for wafers, major manufacturers announced to continue enhancing their production capacities. By the end of 2021, global production capacity may exceed 435 GW/year. Increase of the production capacity mainly comes from not only
2021 remained high at 28 USD/kg. It is expected that price stabilization will be observed in 2022 because the estimated production capacity of polysilicon as of the end of the year could be increased to 1 640 000 tonnes/year by the end of 2022, more than the double of 2021 figure (813 000 tonnes/year).
Most of major polysilicon manufacturers use the Siemens process, which has been conceived as a manufacturing process of polysilicon for the semiconductor industry. It is estimated that the Siemens process polysilicon accounted for 98% of the total production. Reported production efficiency has improved, and the energy consumption of the whole process to produce polysilicon decreased from 70 kWh/kg in 2019 to 66,5 kWh/kg in 2020. The decrease of electricity consumption under the reduction process has been achieved by the efforts including the following: 1) development and commercialization of large-scale reduction furnace; 2) improvement of inner wall materials of the furnace; 3) replacement of conventional silicon tube with silicon core and 4) adjustment of gas mix. It has been said that electricity consumption can be reduced further by the optimization of the process and economy of scale, which is assumed to contribute to the reduction of polysilicon price. Besides the Siemens process, fluidized bed reactor (FBR) is used to produce polysilicon but the demand for this process is decreasing due to the needs for highly purified polysilicon for single crystalline silicon PV modules.
As well as in the previous year, the major solar-grade polysilicon producing countries among IEA PVPS countries were China, Germany, USA, Malaysia, South Korea and Norway in 2020. China continued to be the largest producer and consumer of polysilicon in the world. While some production was reported in the USA, most of the production was used by the semiconductor industry because China imposes tariffs on polysilicon manufactured in USA. Figure 4.2 shows the share of polysilicon production by country.
China reported that its production continued to increase in 2020 to reach 396 104 tonnes output, accounting for 76% of global total output. In terms of production capacity, China's polysilicon production capacity accounted for 75,2% of the global production capacity in 2020, an increase of 6,2% compared to 69,0% in 2019. In terms of output, China's polysilicon output accounted for 76% of the global output in 2020, an increase of 8,7% compared with 67,3% in 2019. In 2020, China imported 73 095 tonnes of polysilicon from Germany and Malaysia.
The second largest polysilicon producing country, Germany has the domestic polysilicon production capacity of over 60 000 tonnes/year. Canada, USA and Norway reported activities of polysilicon manufacturers adopting the metallurgical process aiming at lowering the production cost. Silicor Materials (USA) is reportedly building a manufacturing factory in Iceland. REC Solar in Norway is estimated to have produced approx. 6 500 tonnes of polysilicon in 2020.
CHAPTER 4 TRENDS IN THE PV INDUSTRY
THE UPSTREAM PV SECTOR / CONTINUED
SOURCE IEA PVPS, RTS CORPORATION.
FIGURE 4.2: SHARE OF PV POLYSILICON PRODUCTION
IN 2020
CHINA, 76%
GERMANY, 12%
OTHER, 2%
USA, 5%
MALAYSIA, 5%
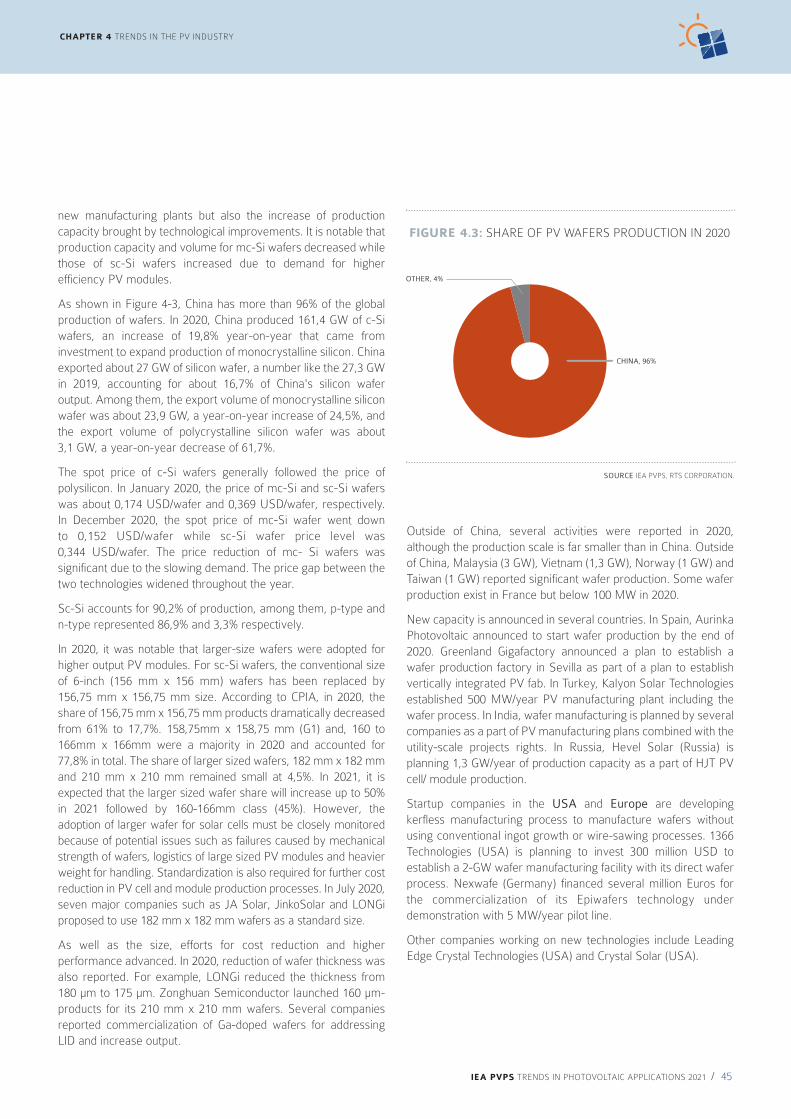
IEA PVPS TRENDS IN PHOTOVOLTAIC APPLICATIONS 2021 / 45
CHAPTER 4 TRENDS IN THE PV INDUSTRY
new manufacturing plants but also the increase of production capacity brought by technological improvements. It is notable that production capacity and volume for mc-Si wafers decreased while those of sc-Si wafers increased due to demand for higher efficiency PV modules.
As shown in Figure 4-3, China has more than 96% of the global production of wafers. In 2020, China produced 161,4 GW of c-Si wafers, an increase of 19,8% year-on-year that came from investment to expand production of monocrystalline silicon. China exported about 27 GW of silicon wafer, a number like the 27,3 GW in 2019, accounting for about 16,7% of China's silicon wafer output. Among them, the export volume of monocrystalline silicon wafer was about 23,9 GW, a year-on-year increase of 24,5%, and the export volume of polycrystalline silicon wafer was about 3,1 GW, a year-on-year decrease of 61,7%.
The spot price of c-Si wafers generally followed the price of polysilicon. In January 2020, the price of mc-Si and sc-Si wafers was about 0,174 USD/wafer and 0,369 USD/wafer, respectively. In December 2020, the spot price of mc-Si wafer went down to 0,152 USD/wafer while sc-Si wafer price level was 0,344 USD/wafer. The price reduction of mc- Si wafers was significant due to the slowing demand. The price gap between the two technologies widened throughout the year.
Sc-Si accounts for 90,2% of production, among them, p-type and n-type represented 86,9% and 3,3% respectively.
In 2020, it was notable that larger-size wafers were adopted for higher output PV modules. For sc-Si wafers, the conventional size of 6-inch (156 mm x 156 mm) wafers has been replaced by 156,75 mm x 156,75 mm size. According to CPIA, in 2020, the share of 156,75 mm x 156,75 mm products dramatically decreased from 61% to 17,7%. 158,75mm x 158,75 mm (G1) and, 160 to 166mm x 166mm were a majority in 2020 and accounted for 77,8% in total. The share of larger sized wafers, 182 mm x 182 mm and 210 mm x 210 mm remained small at 4,5%. In 2021, it is expected that the larger sized wafer share will increase up to 50% in 2021 followed by 160-166mm class (45%). However, the adoption of larger wafer for solar cells must be closely monitored because of potential issues such as failures caused by mechanical strength of wafers, logistics of large sized PV modules and heavier weight for handling. Standardization is also required for further cost reduction in PV cell and module production processes. In July 2020, seven major companies such as JA Solar, JinkoSolar and LONGi proposed to use 182 mm x 182 mm wafers as a standard size.
As well as the size, efforts for cost reduction and higher performance advanced. In 2020, reduction of wafer thickness was also reported. For example, LONGi reduced the thickness from 180 μm to 175 μm. Zonghuan Semiconductor launched 160 μm-products for its 210 mm x 210 mm wafers. Several companies reported commercialization of Ga-doped wafers for addressing LID and increase output.
Outside of China, several activities were reported in 2020, although the production scale is far smaller than in China. Outside of China, Malaysia (3 GW), Vietnam (1,3 GW), Norway (1 GW) and Taiwan (1 GW) reported significant wafer production. Some wafer production exist in France but below 100 MW in 2020.
New capacity is announced in several countries. In Spain, Aurinka Photovoltaic announced to start wafer production by the end of 2020. Greenland Gigafactory announced a plan to establish a wafer production factory in Sevilla as part of a plan to establish vertically integrated PV fab. In Turkey, Kalyon Solar Technologies established 500 MW/year PV manufacturing plant including the wafer process. In India, wafer manufacturing is planned by several companies as a part of PV manufacturing plans combined with the utility-scale projects rights. In Russia, Hevel Solar (Russia) is planning 1,3 GW/year of production capacity as a part of HJT PV cell/ module production.
Startup companies in the USA and Europe are developing kerfless manufacturing process to manufacture wafers without using conventional ingot growth or wire-sawing processes. 1366 Technologies (USA) is planning to invest 300 million USD to establish a 2-GW wafer manufacturing facility with its direct wafer process. Nexwafe (Germany) financed several million Euros for the commercialization of its Epiwafers technology under demonstration with 5 MW/year pilot line.
Other companies working on new technologies include Leading Edge Crystal Technologies (USA) and Crystal Solar (USA).
SOURCE IEA PVPS, RTS CORPORATION.
FIGURE 4.3: SHARE OF PV WAFERS PRODUCTION IN 2020
CHINA, 96%
OTHER, 4%

IEA PVPS TRENDS IN PHOTOVOLTAIC APPLICATIONS 2021 / 46
CHAPTER 4 TRENDS IN THE PV INDUSTRY
decreased to 15%. The share of higher efficiency technologies remained relatively small with TOPCon at 5%, IBC 2% and heterojunction (HJT) 2%. However, investment in those technologies has been active in 2020. More than 20 companies are planning to produce and commercialize HJT technologies. Announcement of new HJT capacity reach about 40 GW in total.
Major PV module manufacturers have continued investing to improve conversion efficiencies, through improvement of passivation process for PERC or PERT structures, adoption of four or more busbars, as well as adoption of multi-busbar wiring or wiring without busbars. Reduction of silver consumption for electrodes is also one of the challenges in the cell production sector.
Global PV module production (c-Si PV module and thin-film PV module) increased from 140 GW in 2019 to 178 GW in 2020. Global PV module production capacity increased from 220 GW/year in 2019 to 327 GW/year in 2020. As the investment for new capacity is progressing, the global nominal manufacturing capacity is expected to reach around 400 MW/year by the end of 2021 if announced plans would all be implemented.
As shown in Figure 4.5, China has remained to be the largest producer of PV modules in the world as well as in 2019. In 2020, the total production capacity of PV module was about 244 GW/year, and the production amount was 124,6 GW, a year-on-year growth of 61,4% and 26,4%. The value of PV module export amounted to approximately USD 16,99 billion in 2020, up 2,6% year-on-year, accounting for 86% of total PV product exports, up 2,6 percentage points year-on-year, while the export volume was approximately 78,8 GW, making a new record of module export, accounting for 63,2% of the total output.
SOLAR CELL AND MODULE PRODUCTION
Global solar cell (c-Si and thin-film solar cell) production in 2020 is estimated to be around 178 GW, a 20% increase from 2019 (144 GW). Global manufacturing capacity at the end of 2020 was around 257 GW/year and it is expected to reach 300 GW by the end of 2021.
As well as the previous year, China was the world’s largest producing country of solar cells. China produced around 135 GW of solar cells in 2020, a 22 % increase from the previous year (144 GW in 2019). China has been expanding its production capacity, and its solar cell production capacity was about 200 GW/year in the end of 2020.
As shown in Figure 4.4, China’s solar cell production volume accounts for 78% of the global total.
Countries other than China that reported production of solar cells are Malaysia (11,6 GW), Vietnam (9,4 GW), South Korea (6,3 GW), and Thailand (4,3 GW). Europe, USA, India and Japan also reported production. Thailand and Vietnam are not subject to the safeguard tariffs by the USA and the production and production capacities are increasing in these countries. As of 2020, Thailand and Vietnam had solar cell production capacity of 7 GW/year and over 11 GW/year, respectively. In the USA, solar cell production is mainly conducted by First Solar with CdTe thin-film PV technology. As for c-Si solar cells, demand for high efficiency solar cells has continued increasing.
The share of mc-Si solar cells decreased from about 54% in 2018 to 35% in 2019 and dropped to 14,5% in 2020. According to the IRTPV 2021 report, the share of PERC technologies in 2020 reached 76% and the conventional BSF technology share
THE UPSTREAM PV SECTOR / CONTINUED
SOURCE IEA PVPS, RTS CORPORATION.
FIGURE 4.4: SHARE OF PV CELLS PRODUCTION IN 2020
CHINA, 77,7%
MALAYSIA, 6,4%
VIETNAM, 5,4%
SOUTH KOREA, 3,5%
INDIA, 0,3%
EUROPE, 0,2%
SINGAPORE, 0,9%TAIWAN, 1,1%
USA,1,2%THAILAND, 2,5%
RoW, 0,7%
JAPAN, 0,3%
SOURCE IEA PVPS, RTS CORPORATION.
FIGURE 4.5: SHARE OF PV MODULES PRODUCTION IN 2020
CHINA, 69,8%
SOUTH KOREA, 5,2%
VIETNAM, 7,9%
MALAYSIA, 4,2%
USA, 3,2%
CANADA, 0,85%
JAPAN, 0,3%
TAIWAN, 1,2%THAILAND, 1,8%
EUROPE, 1,8%OTHER, 2,4%
SINGAPORE, 0,8%
INDIA, 0,5%
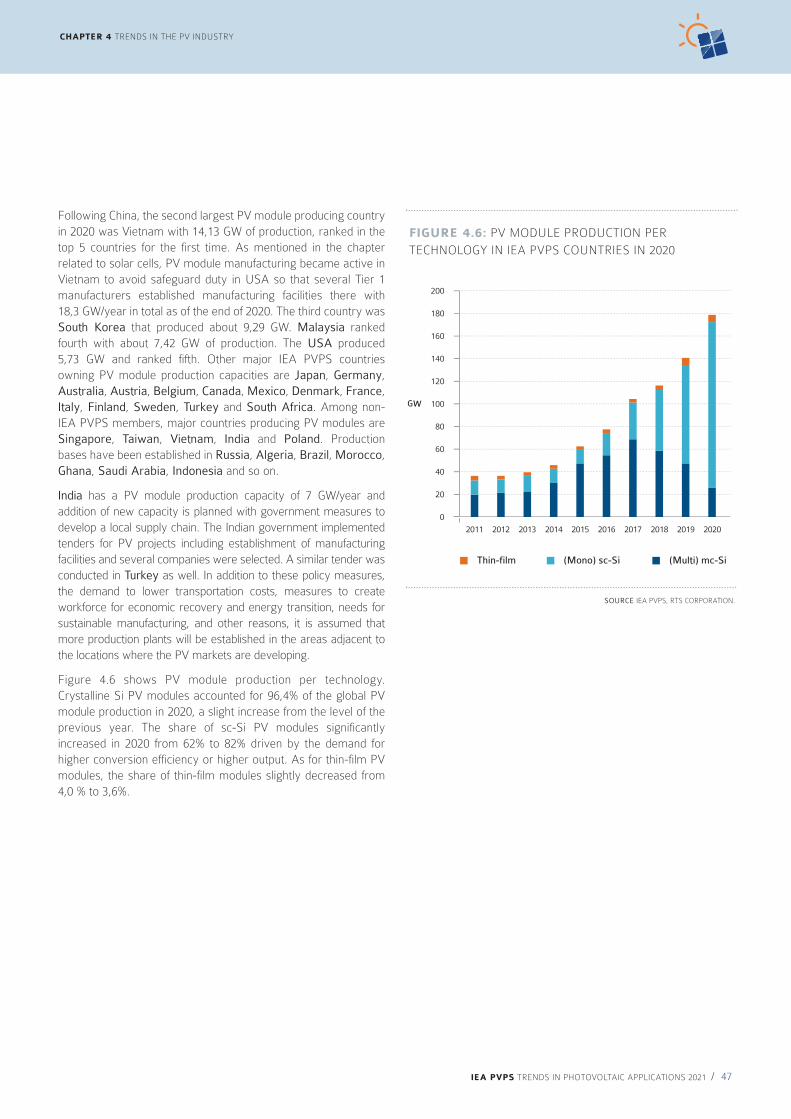
IEA PVPS TRENDS IN PHOTOVOLTAIC APPLICATIONS 2021 / 47
CHAPTER 4 TRENDS IN THE PV INDUSTRY
Following China, the second largest PV module producing country in 2020 was Vietnam with 14,13 GW of production, ranked in the top 5 countries for the first time. As mentioned in the chapter related to solar cells, PV module manufacturing became active in Vietnam to avoid safeguard duty in USA so that several Tier 1 manufacturers established manufacturing facilities there with 18,3 GW/year in total as of the end of 2020. The third country was South Korea that produced about 9,29 GW. Malaysia ranked fourth with about 7,42 GW of production. The USA produced 5,73 GW and ranked fifth. Other major IEA PVPS countries owning PV module production capacities are Japan, Germany, Australia, Austria, Belgium, Canada, Mexico, Denmark, France, Italy, Finland, Sweden, Turkey and South Africa. Among non-IEA PVPS members, major countries producing PV modules are Singapore, Taiwan, Vietnam, India and Poland. Production bases have been established in Russia, Algeria, Brazil, Morocco, Ghana, Saudi Arabia, Indonesia and so on.
India has a PV module production capacity of 7 GW/year and addition of new capacity is planned with government measures to develop a local supply chain. The Indian government implemented tenders for PV projects including establishment of manufacturing facilities and several companies were selected. A similar tender was conducted in Turkey as well. In addition to these policy measures, the demand to lower transportation costs, measures to create workforce for economic recovery and energy transition, needs for sustainable manufacturing, and other reasons, it is assumed that more production plants will be established in the areas adjacent to the locations where the PV markets are developing.
Figure 4.6 shows PV module production per technology. Crystalline Si PV modules accounted for 96,4% of the global PV module production in 2020, a slight increase from the level of the previous year. The share of sc-Si PV modules significantly increased in 2020 from 62% to 82% driven by the demand for higher conversion efficiency or higher output. As for thin-film PV modules, the share of thin-film modules slightly decreased from 4,0 % to 3,6%.
SOURCE IEA PVPS, RTS CORPORATION.
FIGURE 4.6: PV MODULE PRODUCTION PER
TECHNOLOGY IN IEA PVPS COUNTRIES IN 2020
0
20
40
60
80
100
120
140
160
180
200
GW
2011 2012 2013 2014 2015 2016 2017 2018 2019 2020
Thin-film (Mono) sc-Si (Multi) mc-Si

CHAPTER 4 TRENDS IN THE PV INDUSTRY
IEA PVPS TRENDS IN PHOTOVOLTAIC APPLICATIONS 2021 / 48
THE UPSTREAM PV SECTOR / CONTINUED
As for thin-film technologies, about 6,5 GW of thin-film PV modules were produced in 2020. Among them, 5,5 GW were CdTe PV modules produced by First Solar (USA). Other thin-film technologies produced in 2020 were CIGS with about 1 GW, half of the 2019 level. Thin-film PV modules were mainly produced in Malaysia, USA, Japan, Germany, and China. In many of the IEA PVPS member countries, R&D and commercialization efforts on CIGS thin-film PV modules focus on improvement of conversion efficiency and throughput as well as enlargement of module size.
In 2020, it is assumed that close to 1 GW of BIPV modules were produced. Among them, more than 700 MW of them are c-Si PV modules. The share of Thin-film PV modules in this segment is expected to grow for specific applications for curved surfaces, window or skylights with light transmitting function, or applications requiring light-weight modules.
In 2020, a price increase of PV modules was observed, and it continued in the first half of 2021. Average spot price of PV modules in the end of 2019 was 21,1 US cents/W and gradually decreased to 17,8 cents/W by the end of July 2020 because of a lower demand due to the COVID-19 pandemic, then it gradually increased from August affected by the outlook of temporary short supply of polysilicon caused by the accidents and the price increase of glass and other materials. At the end of 2020, the spot price of sc-Si PV module reached 19,2 US cents/W. In 2021, the price showed a further increase and went up to 23,4 US cents/W in the end of August. The shortage of the glass reported in the second half of 2020 has been eased with the Chinese government’s decision to allow new manufacturing capacity and glass manufacturers efforts to convert conventional factories to PV glass production. It is reported that PV glass capacity will increase by 48% if newly added capacity start operation by the
Table 4.1 shows the global top five manufacturers in terms of PV cell/module production and shipment volume. All of them are c-Si PV manufacturers. In the ranking of solar cell manufacturing, Tongwei Solar of China, who focuses on solar cell production, kept the first position with the production of 21,4 GW, a 60% increase from 2019. LONGi Green Energy Technology ranked first in PV module production with 26,6 GW production. JinkoSolar dropped to second position followed by Trina Solar. These major manufacturers plan to further increase their production capacity in 2021 onwards, so it is highly likely that a manufacturer with 30 GW/year level shipment will appear.
In the field of c-Si PV, reflecting the improvement of conversion efficiency of solar cells, output capacity of PV module is also increasing. Higher power for PV modules has been announced using high efficiency solar cells as well as half-cut, 1/3 cut or multi-cut solar cells. In 2020, it is reported that half-cut cell structure accounted for almost 80% of PV modules. Commercialization of PV modules with larger wafers has started as mentioned before. Other technologies such as shingled PV module technology (overlapping the edges of solar cells without ribbons) and seamless soldering technology are also adopted. With these technologies, output capacity of PV modules is increasing and > 500 W or > 600 W c-Si PV modules are commercialized and rapidly introduced in the market. It is also reported that bifacial PV modules using PERC or heterojunction solar cells on both sides of the module are on the rise to generate more power and lower LCOE seeking higher returns. Bifacial PV modules are expected to achieve the lowest LCOE with single axis trackers in utility-scale applications. They are used for agricultural PV and floating PV applications as well. It is expected that the share of bifacial PV modules might reach 50% by the end of 2023.
SOURCE RTS CORPORATION (WITH SOME ESTIMATES).NOTE: PRODUCTION VOLUMES ARE MANUFACTURERS’ OWN PRODUCTION, WHEREAS SHIPMENT VOLUMES INCLUDE COMMISSIONED PRODUCTION AND OEM PROCUREMENT.
TABLE 4.1: GLOBAL TOP FIVE MANUFACTURERS IN TERMS OF PV CELL/MODULE PRODUCTION AND SHIPMENT
VOLUME (2020)
RANK SOLAR CELL PRODUCTION (GW) PV MODULE PRODUCTION (GW) PV MODULE SHIPMENT (GW)
1 Tongwei Solar 21,4 LONGi Green Energy Technology 26,6 LONGi Green Energy Technology 24,5
2 LONGi Green Energy Technology 17,6 Jinko Solar 17,6 Jinko Solar 18,8
3 Shanghai Aiko Solar Energy JA 13,3 Trina Solar 16,4 Trina Solar 15,9
4 Solar Technology 11,3 JA Solar Technology 14 JA Solar Technology 15,9
5 Jinko Solar 10 Canadian Solar 11,4 Canadian Solar 11,3

IEA PVPS TRENDS IN PHOTOVOLTAIC APPLICATIONS 2021 / 49
CHAPTER 4 TRENDS IN THE PV INDUSTRY
first quarter in 2022. As was mentioned before, polysilicon price has been higher than the previous year and this affects the current high level of PV module price. In addition to material cost increase, soaring of transportation cost also affects the PV module price. While a stabilization of PV module price is expected with the increase of production capacity of polysilicon, it remains to be seen whether impacts of other factors such as transportation cost will be reduced or not.
Figure 4.7 shows the trends of global yearly PV installation, PV module production and production capacity. PV installed capacity in 2020 grew to 139 GW. It is estimated that PV module production volume and its manufacturing capacity as of the end of the year were 179 GW and 327 GW/year, respectively. The operation ratio of PV module production in 2020 was 55%. It should be noted that the production capacity figures include the capacities of aging facilities and idle facilities that are not competitive anymore: hence the real effective production capacity is assumed to be at the level of about 260 GW/year in 2020. By summing up announced new capacity of PV modules, the production capacity may reach more than 400 GW/year by the end of 2022.
Finally, high efficiency multi-junction PV cells/modules have been produced, mainly using III-V materials. They are mainly used for satellite or unmanned aerial vehicles and concentrating PV (CPV) systems. Installation of high efficiency multi-junction PV on vehicles has been studied under the stages of R&D and demonstration. Germany, USA, France, Japan, and Spain are active in this area. R&D for tandem solar cell using crystalline silicon and multi junction cell is also active in these countries. Hydrogen synthesis using high efficiency cells is also studied and demonstrated. Application of CPV for Agricultural PV is researched as well because of its spatial efficiency.
Following the rapid improvement of conversion efficiency in a short time, efforts on mass production of perovskite PV cells/modules were continuously reported in 2020. In China, Hangzhou Microquanta Semiconductor started construction of a perovskite PV factory aiming to produce 5 GW/year in 2021. GCL Optoelectronics (China) announced financing for a 100 MW/year production line in March 2021. In addition to these Chinese companies, Wonder Solar announced the plan to establish a 200 MW/year pilot line aiming at developing a 1 GW factory. Saule Technologies (Poland) completed a manufacturing facility for flexible perovskite solar cells in May 2021. Oxford PV completed a 100 MW/year production line for perovskite/ crystalline Si tandem PV in July 2021.
FIGURE 4.7: YEARLY PV INSTALLATION, PV PRODUCTION AND PRODUCTION CAPACITY 2010-2020
0
50
100
150
200
250
300
350
GW
2010 2011 2012 2013 2014 2015 2016 2017 2018 2019 2020
Total production capacityTotal productionPV installations
SOURCE IEA PVPS, RTS CORPORATION.

CHAPTER 4 TRENDS IN THE PV INDUSTRY
IEA PVPS TRENDS IN PHOTOVOLTAIC APPLICATIONS 2021 / 50
THE UPSTREAM PV SECTOR / CONTINUED
SOURCE IEA PVPS & RTS Corporation.NOTE: ALTHOUGH CHINA JOINED IEA PVPS IN 2010, DATA ON CHINA’S PRODUCTION VOLUME AND PRODUCTION CAPACITIES IN 2006 ONWARDS ARE INCLUDED IN THE STATISTICS.
TABLE 4.2: EVOLUTION OF ACTUAL MODULE PRODUCTION AND PRODUCTION CAPACITIES
ACTUAL PRODUCTION (MW) PRODUCTION CAPACITIES (MW)
YEAR IEA PVPS COUNTRIES
OTHER COUNTRIES
TOTAL IEA PVPS COUNTRIES
OTHER COUNTRIES
TOTALUTILIZATION
RATE
1993 52 52 80 80 65%
1994 0 0 0 0 0%
1995 56 56 100 100 56%
1996 0 0 0 0 0%
1997 100 100 200 200 50%
1998 126 126 250 250 50%
1999 169 169 350 350 48%
2000 238 238 400 400 60%
2001 319 319 525 525 61%
2002 482 482 750 750 64%
2003 667 667 950 950 70%
2004 1 160 1 160 1 600 1 600 73%
2005 1 532 1 532 2 500 2 500 61%
2006 2 068 2 068 2 900 2 900 71%
2007 3 778 200 3 978 7 200 500 7 700 52%
2008 6 600 450 7 050 11 700 1 000 12 700 56%
2009 10 511 750 11 261 18 300 2 000 20 300 55%
2010 19 700 1 700 21 400 31 500 3 300 34 800 61%
2011 34 000 2 600 36 600 48 000 4 000 52 000 70%
2012 33 787 2 700 36 487 53 000 5 000 58 000 63%
2013 37 399 2 470 39 869 55 394 5 100 60 494 66%
2014 43 799 2 166 45 965 61 993 5 266 67 259 68%
2015 58 304 4 360 62 664 87 574 6 100 93 674 67%
2016 73 864 4 196 78 060 97 960 6 900 104 860 74%
2017 97 942 7 200 105 142 144 643 10 250 154 893 68%
2018 106 270 9 703 115 973 165 939 17 905 183 844 63%
2019 123 124 17 173 140 297 190 657 28 530 219 187 64%
2020 156 430 23 044 179 474 289 581 37 095 326 676 55%

IEA PVPS TRENDS IN PHOTOVOLTAIC APPLICATIONS 2021 / 51
CHAPTER 4 TRENDS IN THE PV INDUSTRY
manufacturers entered the O&M business and the repowering business where aging PV power plants exist, mainly in Europe.
In addition to conventional inverters mentioned above, the market of module level power electronics (MLPE) is growing in specific markets. Microinverters and DC optimizers (working at module level) are highly adopted in the US residential market due to rapid shutdown requirement imposed by the National Electricity Code (NEC). MLPE can help achieving a higher output for PV systems which are affected by shading and a more efficient rapid shutdown can be realized in case of fire.
The production of specialized components such as tracking systems, PV connectors, DC switchgears and monitoring systems, represents an important business for many large-scale electric equipment manufacturers. With the increase of utility-scale PV power plants, the market for single-axis trackers has been growing. According to IHS Markit, the global single-axis tracker market increased shipment volume by 40% year on year to reach 45 GW in 2020. It is noted that some major tracker manufacturers successfully listed in the stock market in 2020 (Soltec in Spain and Array Technologies in USA). With the pressure to lower LCOE of utility scale projects, adoption of single axis trackers is becoming the standard in specific regions. In thr USA, 88% of the utility scale projects are already built using single axis trackers.
In the PV industry, an overview of the downstream sector can be described as in Figure 4-8 (example of utility-scale projects).
PV developers have been active in PV power plant developments in the countries where power purchase agreements (PPAs) are guaranteed under auctions, and where feed-in tariff (FIT) programs and other mechanisms are implemented. While developers sell PV power plants to Independent Power Producers (IPPs) or investors, some developers own PV power plants as their own assets.
Companies providing engineering, procurement and construction for PV systems (mainly utility-scale applications but larger commercial or industrial applications also fall into this category) are called EPCs. EPCs include pure-players companies and general construction companies offering services for installing PV systems. Integrated PV developers sometimes conduct EPC and operation and maintenance (O&M) services by themselves. Some companies develop PV power plants and own them, while others provide EPC and own PV power plants as well until they sell the PV power plants to IPPs. Generally, utility-scale projects are owned by IPPs (together with equity investors), who sell the power to utilities under long-term PPAs. Equity investors or other financial institutes also play an important role for the PV project development as equity or loan providers.
BALANCE OF SYSTEM COMPONENT MANUFACTURERS AND SUPPLIERS
Balance of system (BOS) component manufacturers and suppliers represent an important part of the PV value chain and BOS components are accounting for an increasing portion of the system cost as the PV module price is falling. Accordingly, the production of BOS products has become an important sector of the overall PV industry.
The inverter technology has become the focus since it is increasingly considered as the core of the PV system, supporting grid stability with new grid codes. Since these new grid codes require the active contribution of PV inverters to ensure grid management and grid protection, new inverters are now being developed with sophisticated control and interactive communications features. With these functions, the PV power plants can actively support the grid management, for instance, by providing reactive power and other ancillary services. In case of distributed PV systems, advanced inverters play a key role for storage batteries management, communication, monitoring, controlling home appliances, as well as charging EVs.
PV inverters are produced in many IEA PVPS member countries such as China, Japan, South Korea, Australia, USA, Canada, Germany, Spain, Austria, Switzerland, Denmark, Italy and Thailand. Originally, the supply chains of PV inverters were affected by national codes and regulations so that domestic or regional manufacturers tended to dominate domestic or regional PV markets. However, with the growth of the Chinese market, a dominance of Chinese products is visible in both utility scale market and distributed PV market and contributed to cost reduction. According to CPIA, the total production of inverters in China reached about 100 GW, a 36% increase from 2019 (73,5 GW), excluding OEM production for non-Chinese companies. China’s share in inverter production is estimated around 67% a 7% increase from 2019.
Inverters are mostly categorized in two types, string inverters for distributed application and centralized inverters for utility scale application. The typical products dedicated to the residential PV market have rated output powers ranging from 1 kW to 10 kW, for single phase (Europe) or split phase (USA and Japan) grid connection. 150 kW to 200 kW string inverters are also used for utility scale projects. String inverters accounts for about 64% of the total market. Centralized inverters are used for utility-scale applications and 3 to 4 MW centralized inverters are common, while 5 MW inverters are also available. Larger size inverters with higher DC voltage, up to 1 500 V, reduce BOS cost.
Some inverter manufacturers started using digital technology such as IoT and AI. Inverter manufacturers are providing smart monitoring and energy management solution combining storage batteries and EV charging. Application of AI and machine-learning for failure detection or optimization of electricity generation contributed to lowering the cost of O&M. In addition, inverter
THE DOWNSTREAM SECTOR
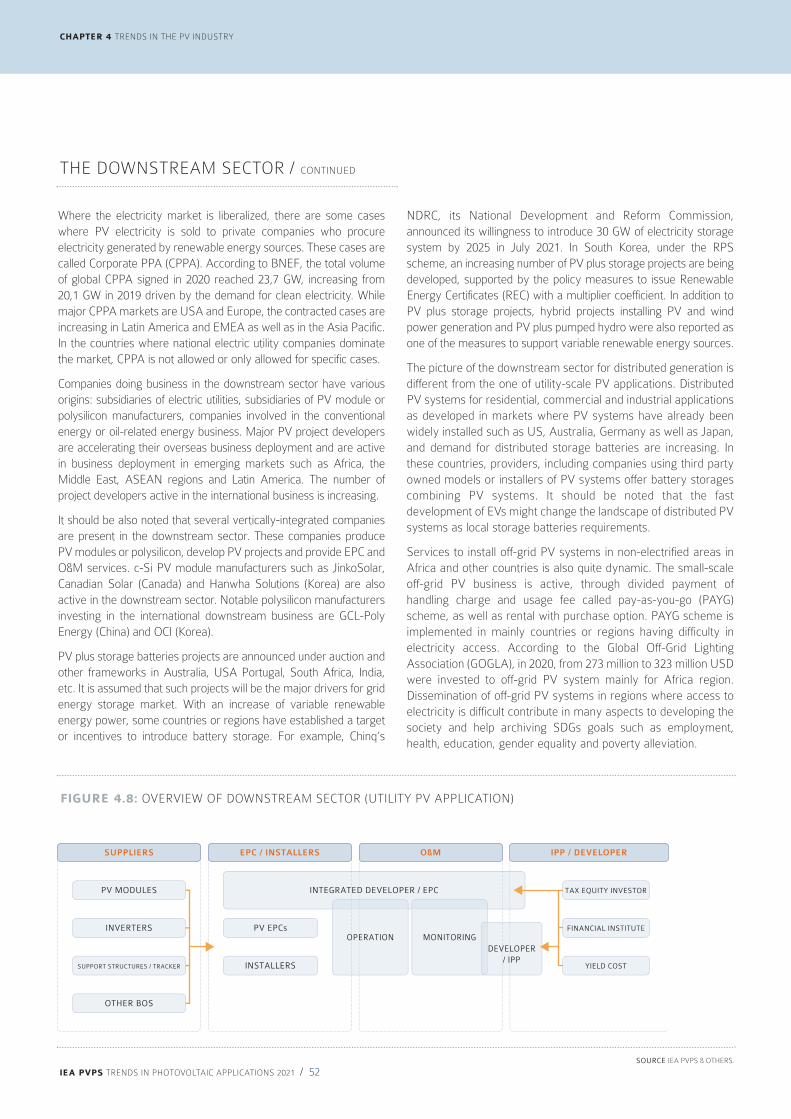
CHAPTER 4 TRENDS IN THE PV INDUSTRY
IEA PVPS TRENDS IN PHOTOVOLTAIC APPLICATIONS 2021 / 52
NDRC, its National Development and Reform Commission, announced its willingness to introduce 30 GW of electricity storage system by 2025 in July 2021. In South Korea, under the RPS scheme, an increasing number of PV plus storage projects are being developed, supported by the policy measures to issue Renewable Energy Certificates (REC) with a multiplier coefficient. In addition to PV plus storage projects, hybrid projects installing PV and wind power generation and PV plus pumped hydro were also reported as one of the measures to support variable renewable energy sources.
The picture of the downstream sector for distributed generation is different from the one of utility-scale PV applications. Distributed PV systems for residential, commercial and industrial applications as developed in markets where PV systems have already been widely installed such as US, Australia, Germany as well as Japan, and demand for distributed storage batteries are increasing. In these countries, providers, including companies using third party owned models or installers of PV systems offer battery storages combining PV systems. It should be noted that the fast development of EVs might change the landscape of distributed PV systems as local storage batteries requirements.
Services to install off-grid PV systems in non-electrified areas in Africa and other countries is also quite dynamic. The small-scale off-grid PV business is active, through divided payment of handling charge and usage fee called pay-as-you-go (PAYG) scheme, as well as rental with purchase option. PAYG scheme is implemented in mainly countries or regions having difficulty in electricity access. According to the Global Off-Grid Lighting Association (GOGLA), in 2020, from 273 million to 323 million USD were invested to off-grid PV system mainly for Africa region. Dissemination of off-grid PV systems in regions where access to electricity is difficult contribute in many aspects to developing the society and help archiving SDGs goals such as employment, health, education, gender equality and poverty alleviation.
Where the electricity market is liberalized, there are some cases where PV electricity is sold to private companies who procure electricity generated by renewable energy sources. These cases are called Corporate PPA (CPPA). According to BNEF, the total volume of global CPPA signed in 2020 reached 23,7 GW, increasing from 20,1 GW in 2019 driven by the demand for clean electricity. While major CPPA markets are USA and Europe, the contracted cases are increasing in Latin America and EMEA as well as in the Asia Pacific. In the countries where national electric utility companies dominate the market, CPPA is not allowed or only allowed for specific cases.
Companies doing business in the downstream sector have various origins: subsidiaries of electric utilities, subsidiaries of PV module or polysilicon manufacturers, companies involved in the conventional energy or oil-related energy business. Major PV project developers are accelerating their overseas business deployment and are active in business deployment in emerging markets such as Africa, the Middle East, ASEAN regions and Latin America. The number of project developers active in the international business is increasing.
It should be also noted that several vertically-integrated companies are present in the downstream sector. These companies produce PV modules or polysilicon, develop PV projects and provide EPC and O&M services. c-Si PV module manufacturers such as JinkoSolar, Canadian Solar (Canada) and Hanwha Solutions (Korea) are also active in the downstream sector. Notable polysilicon manufacturers investing in the international downstream business are GCL-Poly Energy (China) and OCI (Korea).
PV plus storage batteries projects are announced under auction and other frameworks in Australia, USA Portugal, South Africa, India, etc. It is assumed that such projects will be the major drivers for grid energy storage market. With an increase of variable renewable energy power, some countries or regions have established a target or incentives to introduce battery storage. For example, Chinq’s
THE DOWNSTREAM SECTOR / CONTINUED
SOURCE IEA PVPS & OTHERS.
FIGURE 4.8: OVERVIEW OF DOWNSTREAM SECTOR (UTILITY PV APPLICATION)
PV MODULES INTEGRATED DEVELOPER / EPC TAX EQUITY INVESTOR
SUPPLIERS EPC / INSTALLERS O&M IPP / DEVELOPER
OTHER BOS
INVERTERS PV EPCsOPERATION MONITORING
DEVELOPER
/ IPP
FINANCIAL INSTITUTE
SUPPORT STRUCTURES / TRACKER INSTALLERS YIELD COST
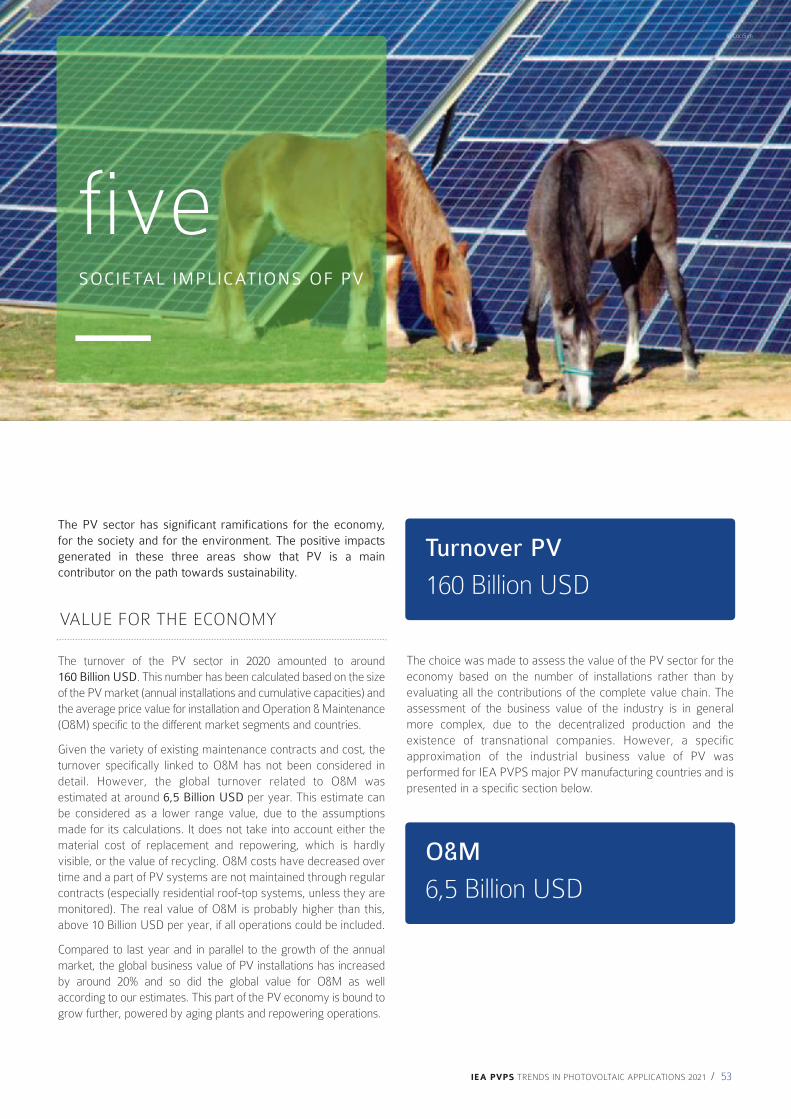
IEA PVPS TRENDS IN PHOTOVOLTAIC APPLICATIONS 2021 / 53
CHAPTER 4 TRENDS IN THE PV INDUSTRY
five SOCIETAL IMPLICATIONS OF PV
The choice was made to assess the value of the PV sector for the economy based on the number of installations rather than by evaluating all the contributions of the complete value chain. The assessment of the business value of the industry is in general more complex, due to the decentralized production and the existence of transnational companies. However, a specific approximation of the industrial business value of PV was performed for IEA PVPS major PV manufacturing countries and is presented in a specific section below.
The PV sector has significant ramifications for the economy, for the society and for the environment. The positive impacts generated in these three areas show that PV is a main contributor on the path towards sustainability.
The turnover of the PV sector in 2020 amounted to around 160 Billion USD. This number has been calculated based on the size of the PV market (annual installations and cumulative capacities) and the average price value for installation and Operation & Maintenance (O&M) specific to the different market segments and countries.
Given the variety of existing maintenance contracts and cost, the turnover specifically linked to O&M has not been considered in detail. However, the global turnover related to O&M was estimated at around 6,5 Billion USD per year. This estimate can be considered as a lower range value, due to the assumptions made for its calculations. It does not take into account either the material cost of replacement and repowering, which is hardly visible, or the value of recycling. O&M costs have decreased over time and a part of PV systems are not maintained through regular contracts (especially residential roof-top systems, unless they are monitored). The real value of O&M is probably higher than this, above 10 Billion USD per year, if all operations could be included.
Compared to last year and in parallel to the growth of the annual market, the global business value of PV installations has increased by around 20% and so did the global value for O&M as well according to our estimates. This part of the PV economy is bound to grow further, powered by aging plants and repowering operations.
VALUE FOR THE ECONOMY
Turnover PV
160 Billion USD
O&M
6,5 Billion USD
© LuciSun

IEA PVPS TRENDS IN PHOTOVOLTAIC APPLICATIONS 2021 / 54
CONTRIBUTION TO THE GDP
Figure 5.1 shows the estimated business value of the PV sector in IEA PVPS reporting countries as compared to their national GDPs. These values were determined based on the internal PV markets in each country, as described above, and hence they do not take imports or exports into account. Some countries benefited from exports that increased the business value they obtained through the internal PV market while huge imports in other countries had the opposite effect. However, as already mentioned, the market is integrated to the point that it would be extremely complex to assess the contribution from each part of the PV value chain.
As shown by Figure 5.1, the business value of PV compared to GDP represented less than 0,4% in all considered countries and more than 0,05% in most of them, a range very similar to last year.
On a general perspective, the numbers presented as a share of GDP show that the investment in the energy transition, even if these numbers would be multiplied by a factor of 10, would stay in a reasonable range and would not significantly change the availability of financial resources.
CHAPTER 5 SOCIETAL IMPLICATIONS OF PV
VALUE FOR THE ECONOMY / CONTINUED
TABLE 5.1: TOP 10 RANKING OF PV BUSINESS VALUES
SOURCE IEA PVPS & OTHERS.
RANK COUNTRY BILLION US$
1 CHINA 33
2 UNITED STATES 23
3 JAPAN 18
4 GERMANY 7
5 KOREA 5
6 AUSTRALIA 5
7 NETHERLANDS 3
8 SPAIN 2,9
9 MEXICO 1,6
10 FRANCE 1,4
FIGURE 5.1: BUSINESS VALUE OF THE PV MARKET IN 2020
0
0,05
0,10
0,15
0,20
0,25
0,30
0,35
0,40
Sha
re o
f G
DP
(%
)
Business value of PV installation Business value of PV Operations and Maintenance
JAPA
N
CHIN
A
PORTU
GAL
SWIT
ZERLAND
NETH
ERLANDS
BELGIU
M
FINLA
ND
DEN
MARK
AUSTR
ALI
A
AUSTR
IA
MEXIC
O
FRANCE
GERMANY
MALA
YSIA
KOREA
ITALY
USA
TURKEY
ISRA
EL
SWED
EN
CANADA
NORW
AY
THAIL
AND
CHIL
E
SPAIN
SOURCE IEA PVPS & OTHERS.

IEA PVPS TRENDS IN PHOTOVOLTAIC APPLICATIONS 2021 / 55
CHAPTER 5 SOCIETAL IMPLICATIONS OF PV
INDUSTRIAL VALUE OF PV
Even though assessing the detailed contributions of the different parts of the whole PV value chain is hardly possible in this report due to the level of integration of the market, an approximated evaluation of the industrial business value of PV has been performed and the results detailed for IEA PVPS major PV manufacturing countries.
The evaluation was made based on the production volumes and manufacturing shares of countries for polysilicon, wafers, cells and modules, including thin film technologies, as detailed in Chapter 4, as well as on an average estimated price for each of these four segments. The prices taken into account are based on average prices reported by member countries. We consider that equipment and materials are included in this computed value. BoS is not considered here.
The estimated global industrial value of PV established itself around 44 Billion USD in 2020. Figure 5.3A, 5.3B and 5.3C show for IEA PVPS major PV manufacturing countries the estimated contribution of each step of the value chain in the PV industrial value for each country in absolute and relative terms as well as the comparison of this value to their GDP.
SOURCE IEA PVPS & OTHERS.
FIGURE 5.2: CONTRIBUTION TO GLOBAL GDP OF PV BUSINESS VALUE AND ENERGY SECTOR INVESTMENTS
Energy investment*
PV business value
Power sector investment
*Investment in the power sector, fuel supply and end-use & efficiency
1,8%
0,19%
0,59%
FIGURE 5.3A: ABSOLUTE PV INDUSTRIAL BUSINESS
VALUE IN 2020
0
5
10
15
20
25
30
35
Indu
stri
al b
usin
ess
valu
e of
PV
(B
illio
n U
SD
)
PolySi
MALA
YSIAUSA
CHIN
A
EURO
PE
OTH
ER
JAPA
N
SOUTH
KOREA
Wafers Cells Modules
SOURCE IEA PVPS & OTHERS.
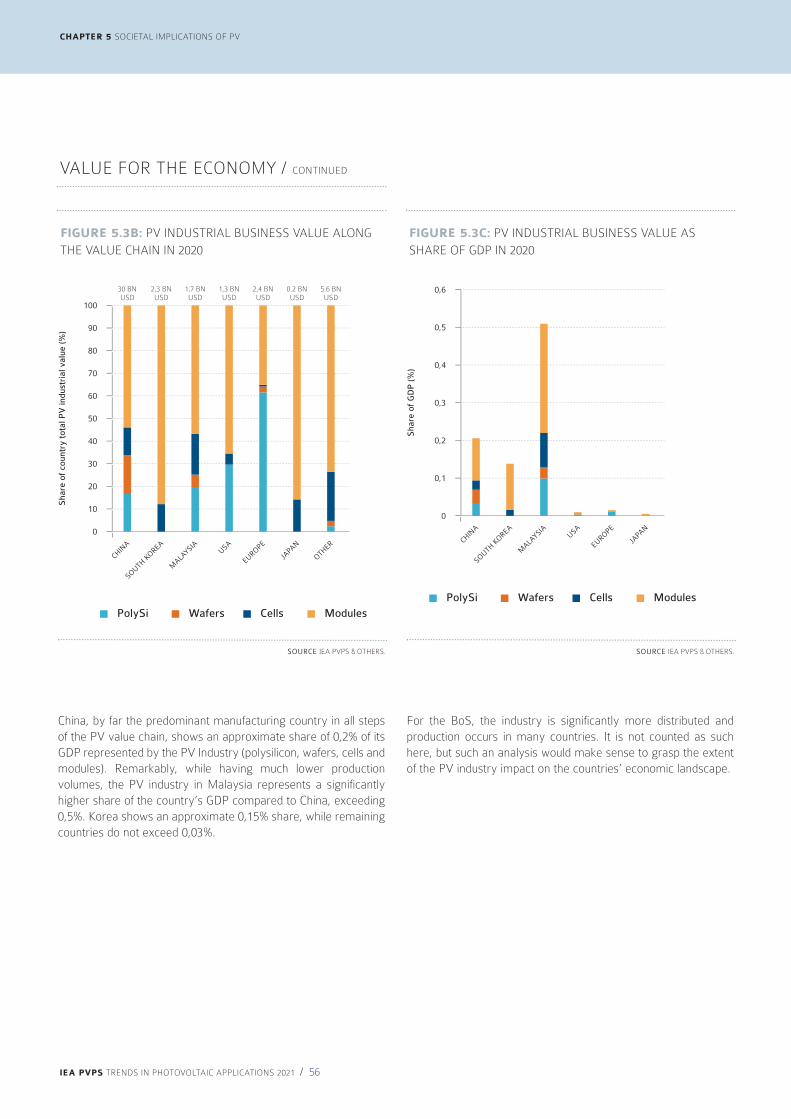
IEA PVPS TRENDS IN PHOTOVOLTAIC APPLICATIONS 2021 / 56
VALUE FOR THE ECONOMY / CONTINUED
CHAPTER 5 SOCIETAL IMPLICATIONS OF PV
For the BoS, the industry is significantly more distributed and production occurs in many countries. It is not counted as such here, but such an analysis would make sense to grasp the extent of the PV industry impact on the countries’ economic landscape.
China, by far the predominant manufacturing country in all steps of the PV value chain, shows an approximate share of 0,2% of its GDP represented by the PV Industry (polysilicon, wafers, cells and modules). Remarkably, while having much lower production volumes, the PV industry in Malaysia represents a significantly higher share of the country’s GDP compared to China, exceeding 0,5%. Korea shows an approximate 0,15% share, while remaining countries do not exceed 0,03%.
FIGURE 5.3B: PV INDUSTRIAL BUSINESS VALUE ALONG
THE VALUE CHAIN IN 2020
0
10
20
30
40
50
60
70
80
90
100
Sha
re o
f co
untr
y to
tal P
V in
dust
rial
val
ue (
%)
PolySi
MALA
YSIAUSA
CHIN
A
EURO
PE
OTH
ER
JAPA
N
SOUTH
KOREA
Wafers Cells Modules
30 BNUSD
2,3 BNUSD
1,7 BNUSD
1,3 BNUSD
2,4 BNUSD
0.2 BNUSD
5.6 BNUSD
SOURCE IEA PVPS & OTHERS.
FIGURE 5.3C: PV INDUSTRIAL BUSINESS VALUE AS
SHARE OF GDP IN 2020
0
0,1
0,2
0,3
0,4
0,5
0,6
Sha
re o
f G
DP
(%
)
PolySi
MALA
YSIAUSA
CHIN
A
EURO
PE
JAPA
N
SOUTH
KOREA
Wafers Cells Modules
SOURCE IEA PVPS & OTHERS.

IEA PVPS TRENDS IN PHOTOVOLTAIC APPLICATIONS 2021 / 57
CHAPTER 5 SOCIETAL IMPLICATIONS OF PV
As the leading producer of PV products and the world’s largest installation market, China is markedly leading PV employment with around 1,9 million jobs in 2020, which corresponds to a significantly higher job intensity than almost anywhere else. Lower by one order of magnitude, the European Union shows a total PV employment of about 185 000 FTE. The USA comes third in the ranking of IEA PVPS countries with about 150 000 jobs, followed by Japan that takes the fourth place with around 90 000 FTE. Generally, in good correlation with the market evolutions, PV employment expanded where the market developed: installation jobs are often temporary ones, depending on the market dynamics. In other words, 2,4 million people worked one way or another for the downstream part of the PV sector globally in 2020.
Employment dynamics in the PV sector are evolving in line with the changes in the PV markets and industry. PV labour place trends reflect the status of the PV industry landscape development and how the supply chain is becoming more globalised and geographically differentiated.
When specifically focusing on the development and installation activities, which are more labour intensive than manufacturing, it can be observed that the average FTE intensity per installed MW is around 15. However, these numbers vary considerably from one country to another and additionally from one market segment to another. Small scale PV generates more jobs than utility-scale
Figure 5.4 gives an overview of the total jobs in IEA PVPS countries and India. Reported numbers have been established based on the IEA PVPS National Survey Reports and additional sources such as the IRENA jobs database. It should be noted that these numbers are strongly dependent on the assumptions and field of activities considered in the upstream and downstream sectors and represent an estimate in the best case.
The methodology that was used started from the data provided by reporting countries on the upstream (industrial) and downstream (installation and O&M) job numbers, which were then extrapolated to other markets depending on their respective work market specifics. A distinction was therefore made between countries in developed economies having a costly, low intensity work market and the emerging economies with an affordable work force. Manufacturing numbers are based on industry reports and additional sources and split according to the same methodology. When numbers differed from official job numbers, official numbers were always considered. Installation numbers are always an approximation.
This report estimates that the PV sector employed up to 3,5 million people globally at the end of 2020. An estimated 1,1 million were employed in the upstream part, including materials and equipment, while 2,4 million were active in the downstream part, including O&M.
EMPLOYMENT IN PV
SOURCE IEA PVPS NSRS AND IRENA RESOURCE DATABASE.
FIGURE 5.4: GLOBAL EMPLOYMENT IN PV PER COUNTRY
0
0,5
0,4
0,3
0,2
0,1
2,0
Mill
ion
jobs
TURKEY
SWED
EN
MEXIC
O
THAIL
AND
ITALY
GERMANY
FINLA
ND
NORW
AY
JAPA
N
CHIL
E
BELGIU
M
AUSTR
ALI
AUSAEU
SPAIN
SWIT
ZERLAND
DEN
MARK
MORO
CCO
KOREA
FRANCE
AUSTR
IA
PORTU
GAL
NETH
ERLANDS
CHIN
A
CANADA
SOUTH
AFR
ICA
ISRA
EL
MALA
YSIA

eastern China by installing around 5 kW of PV per household. This leads to an additional annual income of over 3 000 CNY for these households through the selling of the generated PV electricity. In 2020, the established policy of 2018 was maintained.
In Malaysia, rural electrification is still a priority of the government, with a projected 100% electrification rate by 2025. Rural electrification is done together with utilities as a form of public-private partnership. In remote Sarawak, the Sarawak Alternative Rural Electrification Scheme (SARES) has electrified almost 5 000 households in 192 villages since its launch in 2016 and has received regional recognition in 2019. Solar PV and hybrid systems are often used in this scheme, as well as micro hydro-technologies.
In Korea, in Seoul, with the financial aid from Seoul Metropolitan government, a non-profit organization, Energy Peace Foundation, and Solar Terrace company installed 30 kW mini-PV systems for 100 energy-vulnerable households (300 W/household). This type of mini-PV installations is becoming popular in Korea to reduce the electricity bill burden during the summer.
In Italy, the Municipality of Porto Torres (Sardinia Region), with the collaboration of Gestore dei Servizi Energetici, introduced in 2017 the so called “reddito energetico” (energy income) project. The municipality allocated public resources to purchase PV systems, sold on loan to families in energy poverty conditions, to make them benefit from PV self-consumption and thus reduce their energy bills. The revenues of the net-billing (Scambio, Sul Posto, SSP) feed a public fund, in order to finance the maintenance of the plants or possibly the purchase of other plants for other families. After this project, some other municipalities and/or some Regions are planning and carrying out similar initiatives.
In Australia, a number of measures for solar for low-income households were announced by State Governments in 2020, going from interest free loans to rebates or even complete subsidies.
In general, the low cost of PV electricity could reach more households to alleviate poverty, both in developed and developing countries. It offers opportunities for social programs, and especially to fight energy poverty, which have not been widely used yet. While the reputation of PV, especially in the European countries that started to fund its development, is the one of a costly energy source, increasing electricity prices, the reality of PV in 2021 is that it represents a tremendous opportunity to reduce energy prices for the poorest citizens, as well as to reduce energy costs for social housing, public buildings, from schools to retirement homes, and increase the access to electricity for everyone.
PV in general. O&M generates many manual jobs while the entire PV value chain creates good quality jobs, from research centres to manufacturing. In summary, the upstream part generates around 5 FTE per MW produced while the downstream part generates around 15 FTE per MW installed.
With an estimated total of 3,5 million jobs in the solar PV sector worldwide in 2020, PV employs around one third of the total renewable energy workforce and remains number one in the employment ranking of the global renewable energy sector.
The emergence of PV as a mainstream technology wakes up the appetites for local manufacturing and job creation at all levels of the value chain. Looking at IEA PVPS member countries only, several countries have pushed through different schemes for local manufacturing in recent years, namely Canada, France, Morocco, Turkey and the USA. Other countries have succeeded in bringing many manufacturers to produce PV components in their country, such as Malaysia, which is the most successful example to date. Others, such as Chile and South Africa, are eyeing possibilities.
Besides its direct value in the economy and the jobs that it creates, both making contribution to the prosperity of the countries in which it is being installed and produced, PV entails additional positive implications on the social level if leveraged with appropriate policies. Several examples can be highlighted.
As shown through the off-grid PV market development in Africa and Asia (see Chapter 2), PV can be a competitive alternative to increase energy access in remote rural areas not connected to power grids. Improved energy access can benefit rural business performance, free up workers’ time, provide more studying hours for children, and create or enhance jobs as a result. Electrification is a key factor to reduce poverty and increase education, with a direct impact on women’s and children’s life standards in many regions in the world. In that respect, PV would deserve a significant attention for electrification.
In China, since the end of 2015, 100% electrification of the country has been reached. So, there are no government supported projects for off-grid rural electrification anymore since 2016. However, a massive program for poverty alleviation leaning on PV was launched. It aims to enhance the life standards of around 2 million households, especially in the most impoverished parts of
CHAPTER 5 SOCIETAL IMPLICATIONS OF PV
IEA PVPS TRENDS IN PHOTOVOLTAIC APPLICATIONS 2021 / 58
EMPLOYMENT IN PV / CONTINUED
PV FOR SOCIAL POLICIES
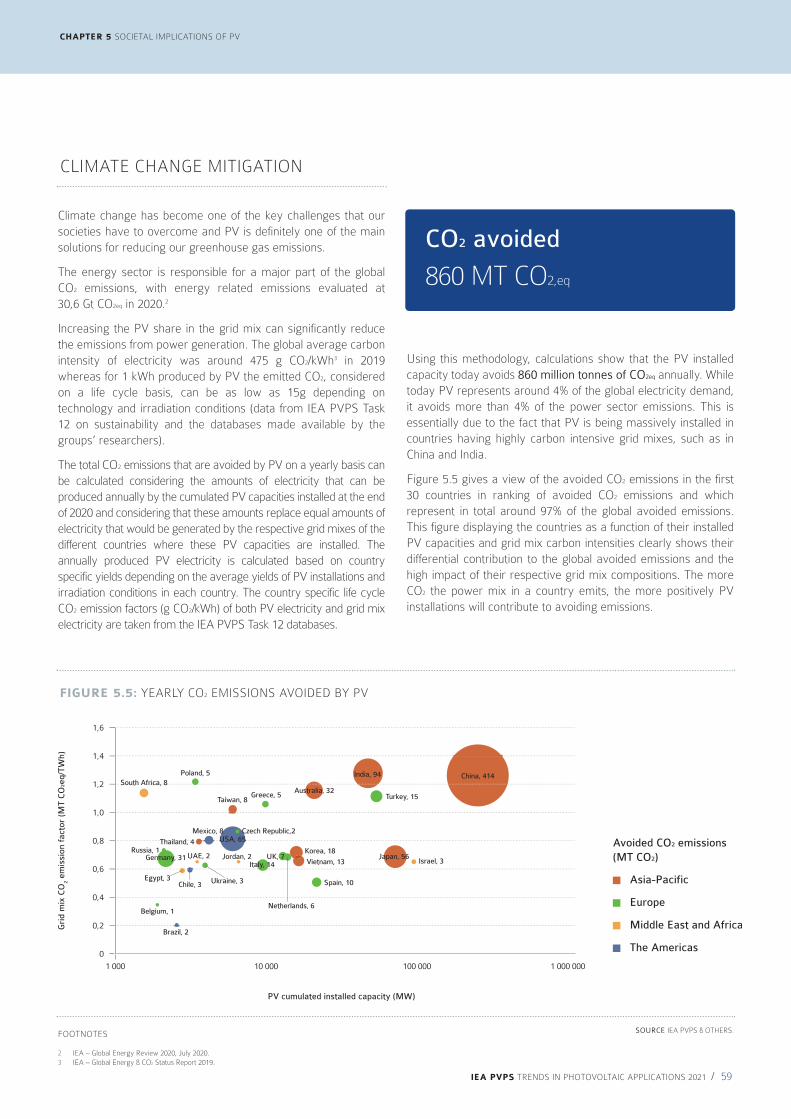
IEA PVPS TRENDS IN PHOTOVOLTAIC APPLICATIONS 2021 / 59
Using this methodology, calculations show that the PV installed capacity today avoids 860 million tonnes of CO2eq annually. While today PV represents around 4% of the global electricity demand, it avoids more than 4% of the power sector emissions. This is essentially due to the fact that PV is being massively installed in countries having highly carbon intensive grid mixes, such as in China and India.
Figure 5.5 gives a view of the avoided CO2 emissions in the first 30 countries in ranking of avoided CO2 emissions and which represent in total around 97% of the global avoided emissions. This figure displaying the countries as a function of their installed PV capacities and grid mix carbon intensities clearly shows their differential contribution to the global avoided emissions and the high impact of their respective grid mix compositions. The more CO2 the power mix in a country emits, the more positively PV installations will contribute to avoiding emissions.
Climate change has become one of the key challenges that our societies have to overcome and PV is definitely one of the main solutions for reducing our greenhouse gas emissions.
The energy sector is responsible for a major part of the global CO2 emissions, with energy related emissions evaluated at 30,6 Gt CO2eq in 2020.2
Increasing the PV share in the grid mix can significantly reduce the emissions from power generation. The global average carbon intensity of electricity was around 475 g CO2/kWh3 in 2019 whereas for 1 kWh produced by PV the emitted CO2, considered on a life cycle basis, can be as low as 15g depending on technology and irradiation conditions (data from IEA PVPS Task 12 on sustainability and the databases made available by the groups’ researchers).
The total CO2 emissions that are avoided by PV on a yearly basis can be calculated considering the amounts of electricity that can be produced annually by the cumulated PV capacities installed at the end of 2020 and considering that these amounts replace equal amounts of electricity that would be generated by the respective grid mixes of the different countries where these PV capacities are installed. The annually produced PV electricity is calculated based on country specific yields depending on the average yields of PV installations and irradiation conditions in each country. The country specific life cycle CO2 emission factors (g CO2/kWh) of both PV electricity and grid mix electricity are taken from the IEA PVPS Task 12 databases.
CLIMATE CHANGE MITIGATION
SOURCE IEA PVPS & OTHERS.
FIGURE 5.5: YEARLY CO2 EMISSIONS AVOIDED BY PV
0
Gri
d m
ix C
O2
emis
sion
fac
tor
(MT
CO
2eq/
TWh)
1 000 10 000 100 000 1 000 000
0,2
0,4
0,6
0,8
1,0
1,2
1,4
1,6
PV cumulated installed capacity (MW)
The Americas
Middle East and Africa
Europe
Asia-Pacific
Avoided CO2 emissions (MT CO2)
China, 414
Brazil, 2
Jordan, 2
Chile, 3
Czech Republic,2Mexico, 8
Netherlands, 6
Thailand, 4
Belgium, 1
Spain, 10
Russia, 1
Turkey, 15
Korea, 18UK, 7
Italy, 14
Poland, 5
Australia, 32
India, 94
Greece, 5Taiwan, 8
Germany, 31 Japan, 56
USA, 65
South Africa, 8
UAE, 2
Ukraine, 3
Vietnam, 13
Egypt, 3
Israel, 3
FOOTNOTES 2 IEA – Global Energy Review 2020, July 2020. 3 IEA – Global Energy & CO2 Status Report 2019.
CHAPTER 5 SOCIETAL IMPLICATIONS OF PV
CO2 avoided
860 MT CO2,eq

CHAPTER 5 SOCIETAL IMPLICATIONS OF PV
IEA PVPS TRENDS IN PHOTOVOLTAIC APPLICATIONS 2021 / 60
SOURCE IEA PVPS & OTHERS.
FIGURE 5.6: AVOIDED CO2 EMISSIONS AS PERCENTAGE OF ENERGY SECTOR TOTAL EMISSIONS
0
%
2
4
6
8
10
12
14
16
Energy sector emissions*
Emissions avoided by PV
VIETN
AM
AUSTR
ALI
A
JAPA
N
GERMANY
ITALY
INDIA
KOREA
CHIN
A
TURKEY
USA
*Energy related CO2 emissions from fuel combustion
30,6 GT CO2,eq
860 MT CO2,eq
CLIMATE CHANGE MITIGATION / CONTINUED

IEA PVPS TRENDS IN PHOTOVOLTAIC APPLICATIONS 2021 / 61
EXECUTIVE SUMMARY AND CONCLUSION
CHAPTER 5 SOCIETAL IMPLICATIONS OF PV
because the regulatory and financial structure is not tailored for so many coal units to become stranded assets. In addition, the choice of alternatives to coal is frequently not motivated by pure economics but is biased towards an electricity price and market design that favour gas-fuelled electricity. Since all sources of electricity have benefited at some point from such support, the question of the competitiveness of PV should be considered carefully. Hereunder, we will look at the key elements driving the competitiveness of PV solutions.
The very first period of PV market development can be considered starting from the first prototypes to small scale production leading to a total PV installed capacity of around 2 GW. During this first phase, prices reductions corresponding to a learning rate of 18% were achieved: this allowed the total PV installed capacity to continue growing further. At that point, prices stabilized until the total capacity reached around 10 GW: this period is known as the time of low availability of polysilicon that maintained prices at a high level. Then, a third period started which is still the case today, beginning with the mass production of PV, especially in China. During this period ranging from 10 GW to current levels, significant economies of scale led to an impressive 41% learning rate over the last decade.
Figure 6.2 illustrates the prices range for PV modules: it shows that prices globally stabilized in 2020.
The rapid price decline that PV experienced in the last years has already opened possibilities to develop PV systems in many locations with limited or no financial incentives. However, the road to full competitiveness of PV systems with conventional electricity sources depends on answering many questions and bringing innovative financial solutions, especially to emerging challenges.
This section aims at defining where PV stands regarding its own competitiveness, starting with a survey of module and system prices in several IEA PVPS reporting countries. Given the number of parameters involved in competitiveness simulations, this chapter will mostly highlight the comparative situation in key countries. Prices are often averaged and should always be looked at as segment related.
The question of competitiveness should always be contemplated in the context of a market environment created for conventional technologies and sometimes distorted by historical or existing incentives. The fast development of nuclear in some countries in the last 40 years is a perfect example of policy-driven investments, where governments imposed the way to go, rather than letting the market decide. The oil and gas markets are also perfect examples of policy-driven energies which are deemed too important not to be controlled. PV competitiveness should therefore be considered in this same respect, rather than the simple idea that it should be considered competitiveness without any regulatory or financial support. There are also further barriers, other than economic, for PV to become the obvious alternative to coal (rather than gas) for utilities. Currently, many already unprofitable coal power plants are still in operation
MODULE PRICES
six COMPETITIVENESS OF PV ELECTRICITY IN 2021
Autajon Arlon, Belgium. © Enerdeal
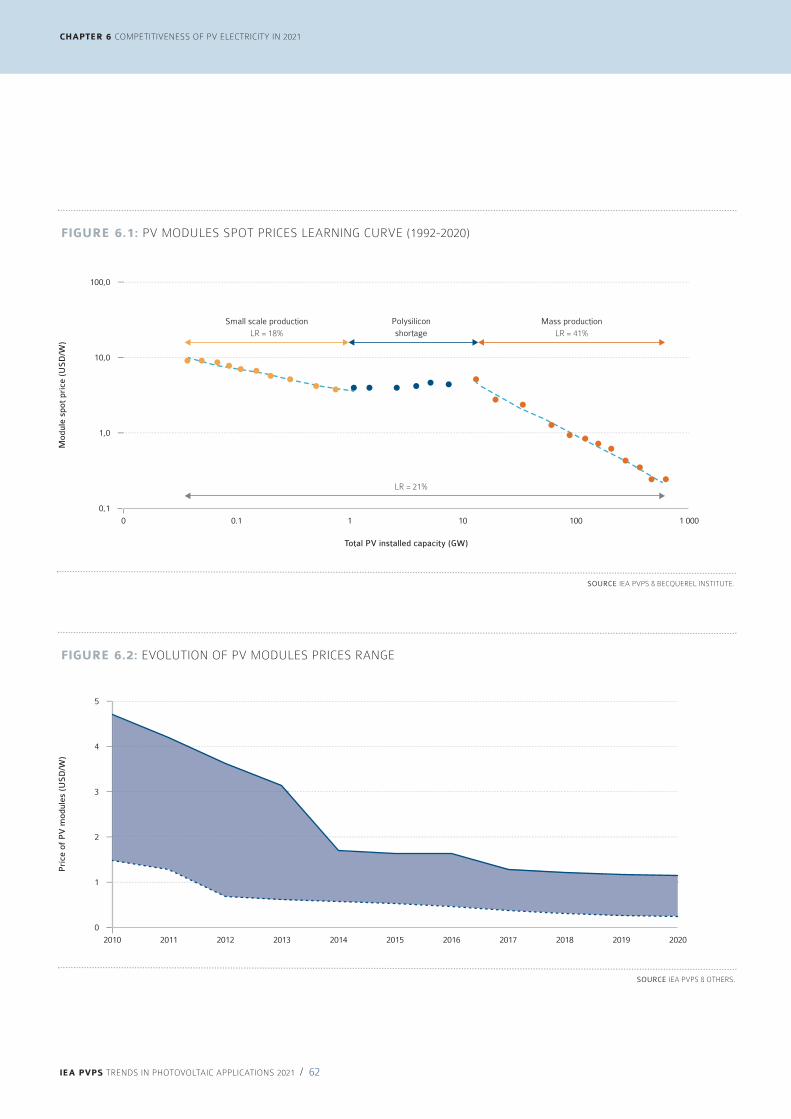
CHAPTER 6 COMPETITIVENESS OF PV ELECTRICITY IN 2021
IEA PVPS TRENDS IN PHOTOVOLTAIC APPLICATIONS 2021 / 62
SOURCE IEA PVPS & BECQUEREL INSTITUTE.
FIGURE 6.1: PV MODULES SPOT PRICES LEARNING CURVE (1992-2020)
0,1
100,0
Mod
ule
spot
pri
ce (
US
D/W
)
0 0.1 1 10 100 1 000
Small scale production
LR = 18%
Polysilicon
shortage
Mass production
LR = 41%
LR = 21%
1,0
10,0
Total PV installed capacity (GW)
SOURCE IEA PVPS & OTHERS.
FIGURE 6.2: EVOLUTION OF PV MODULES PRICES RANGE
0
1
2
3
4
5
Pri
ce o
f P
V m
odul
es (
US
D/W
)
2010 2015 2016 2017 2018 2019 20202011 2012 2013 2014

IEA PVPS TRENDS IN PHOTOVOLTAIC APPLICATIONS 2021 / 63
CHAPTER 6 COMPETITIVENESS OF PV ELECTRICITY IN 2021
Prices below 0,20 USD/W can hardly generate benefits and it is generally admitted that most companies are not selling a large part of their production at these low levels. It is also clear that such prices can be considered below the average production costs of many companies, even if production costs are declining as well. Looking in depth at the revenues of some manufacturers among the most competitive, it appears that average sales are above these low prices. It can also be assumed that such prices are obtained with new production lines which production costs are significantly lower than previously existing ones. It can also be assumed that the most competitive thin film technologies can outperform traditional crystalline silicon ones. The decrease in polysilicon and wafer costs also led to some PV modules’ price decreases without cost improvements at cells and modules levels.
Higher module prices are still observed depending on the market. For instance, the prices in Japan are consistently higher than in Germany and the United States, while average selling prices are in general still in the 0,3 USD/W range for most producers.
On average, the price of PV modules in 2020 (shown in Figure 6.3) accounted for approximately between 40% and 50% of the lowest achievable prices that have been reported for grid-connected systems. In 2020, the lowest price of modules in the reporting countries was slightly above 0,20 USD/W. It is assumed that such prices are valid for high volumes and late delivery (not for installations in 2020). However, module prices for utility-scale plants have been reported below the average values, down to around 0,20 USD/W at the end of 2020.
The Chinese decision in May 2018 led to a new imbalance between production and demand, with dozens of GW of new production capacities added in 2017 and 2018 in all segments of the value chain while the global PV market was stagnating. The price decrease that followed accelerated some project development and can be considered at least partially responsible for the market growth in 2020. In 2021, the pandemic started to impact the prices, with demand and supply being initially affected.
© Adobe Stock
FIGURE 6.3 INDICATIVE MODULE PRICES IN REPORTING COUNTRIES
0
0,10
0,20
0,30
0,40
0,50
0,60
0,70
0,80
US
D/W
Annual PV market 2020
50 GW
5 GW
0.5 GW
SOURCE IEA PVPS & OTHERS.

Reported prices for PV systems vary widely and depend on a variety of factors including system size, location, customer type, connection to an electricity grid, technical specifications and the extent to which end-user prices reflect the real costs of all the components. For more detailed information, the reader is directed to each country’s national survey report on the IEA PVPS website (www.iea-pvps.org).
Figure 6.4 shows the range of system prices in the global PV market in 2020. It shows that around 65% of the PV market consists in prices below 1 USD/W. Large distributed PV systems start around 0,75 USD/W while utility-scale PV saw prices as low as 0,55 USD/W. Floating PV and BIPV are given as indications given the low market development of these solutions. BIPV can be seen as a series of segments where the prices can significantly diverge. Off-grid applications suffer from a similar situation, with totally different cases illustrated in different prices. In general, the price range decreased from the previous year for all applications.
On average, system prices for the lowest priced off-grid applications are significantly higher than for the lowest priced grid-connected applications. This is mainly attributable to the relatively higher transport costs to access the sites. Indeed, large-scale off-grid systems are often installed in places far from the grid but also far from
major towns and highways. Higher prices asked for such installations also depend on higher costs for transport of components, technicians, without even mentioning the higher costs of maintenance. In 2020, the lowest system prices in the off-grid sector, irrespective of the type of application, typically ranged from about 2 USD/W to 6,5 USD/W but prices for some specific applications can be higher. The large range of reported prices in Figure 6.5 is a function of country and project specific factors. The highest prices haven’t been included in the figures given the very low level of installations: in general, off-grid prices have been averaged in the figures for readability reasons.
In 2020, an increased number of floating PV projects have been realized, in particular in Southeast Asia and in Europe. Nevertheless, floating PV would require some further developments to identify real-life prices.
Additional information about the systems and prices reported for most countries can be found in the various National Survey Reports; excluding VAT. More expensive grid-connected system prices are often associated with roof integrated slates, tiles, one-off building integrated designs or single projects: BIPV systems in general are considered more expensive when using dedicated components, even if prices are also showing some decline.
IEA PVPS TRENDS IN PHOTOVOLTAIC APPLICATIONS 2021 / 64
CHAPTER 6 COMPETITIVENESS OF PV ELECTRICITY IN 2021
SYSTEM PRICES
SOURCE IEA PVPS & BECQUEREL INSTITUTE.
FIGURE 6.4: 2020 PV MARKET COSTS RANGES
0
1
2
3
4
8
US
D/W
0
10 0
00
20 0
00
30 0
00
40 0
00
50 0
00
60 0
00
70 0
00
80 0
00
90 0
00
100 0
00
110 0
00
120 0
00
130 0
00
140 0
00
150 0
00
Installed capacity in MW
Off-Grid PV
Utility-scale PV Ground-mounted Floating PV
Distributed PV on Rooftops Distributed PV as Building Integrated

IEA PVPS TRENDS IN PHOTOVOLTAIC APPLICATIONS 2021 / 65
CHAPTER 6 COMPETITIVENESS OF PV ELECTRICITY IN 2021
SOURCE IEA PVPS & OTHERS.
FIGURE 6.5: EVOLUTION OF RESIDENTIAL AND GROUND MOUNTED SYSTEMS PRICE RANGE 2012 - 2020
0
1
2
3
4
5
Pri
ce o
f P
V s
yste
ms
(US
D/W
)
2012 2013 2018 2019 20202014 2015 2016 2017
High range residential systems High range ground mounted systems
Low range residential systems Low range ground mounted systems
Lowest price
in 2017 Lowest price
in 2018
Lowest price
in 2019Lowest price
in 2020
FIGURE 6.6 INDICATIVE INSTALLED SYSTEM PRICES IN SELECTED IEA PVPS REPORTING COUNTRIES IN 2020
0
1
2
3
4
5
6
7
8
US
D/W
Annual PV market 2020
50 GW
5 GW
0.5 GW
Off-grid Distributed-
Residential
Distributed-
Commercial
Distributed-
Industrial
Centralized
SOURCE IEA PVPS & OTHERS.

IEA PVPS TRENDS IN PHOTOVOLTAIC APPLICATIONS 2021 / 66
CHAPTER 6 COMPETITIVENESS OF PV ELECTRICITY IN 2021
SYSTEM PRICES / CONTINUED
The lowest achievable installed price of grid-connected systems in 2020 also varied between countries as shown in Figure 6.6. The average price of these systems is tied to the segment. Large grid-connected installations can have either lower system prices depending on the economies of scale achieved, or higher system prices where the nature of the building integration and installation, degree of innovation, learning costs in project management and the price of custom-made modules may be considered as quite significant factors. In summary, system prices continued to go down in 2020, through a decrease in module prices, balance of system, soft costs and margins. System prices significantly below 0,6 USD/W for large-scale PV systems are now common in very competitive tenders. The range of prices tends to converge, with the lowest prices decreasing at a reduced rate while the highest prices are reducing faster. Finally, the question of the lowest CAPEX is not always representative of the lowest LCOE: the case of utility-scale PV with trackers illustrates this, with additional CAPEX translating into a significantly higher LCOE. Bifacial costs are not visible in a system cost figure.
Residential PV systems price ranged from 0,8 USD/W to 2,9 USD/W in 2020 while utility-scale PV systems prices ranged from 0,6 USD/W to 1,8 USD/W in 2020 according to data collected.
In order to compete in the electricity sector, PV technologies need to provide electricity at a cost equal to or below the cost of other technologies. Obviously, power generation technologies are providing electricity at different costs, depending on their nature, the cost of fuel, the cost of maintenance and the number of operating hours during which they are delivering electricity.
The competitiveness of PV can be defined simply as the moment when, in a given situation, PV can produce electricity at a cheaper price than other sources of electricity that could have delivered electricity at the same time. Therefore, the competitiveness of a PV system is linked to the location, the technology, the cost of capital, and the cost of the PV system itself that highly depends on the nature of the installation and its size. However, it will also depend on the environment in which the system will operate. Off-grid applications in competition with diesel-based generation will not be competitive at the same moment as a large utility-scale PV installation competing with the wholesale prices on electricity markets. The competitiveness of PV is connected to the type of PV system and its environment.
GRID PARITY
Grid Parity (or Socket Parity) refers to the moment when PV can produce electricity (the Levelised Cost of Electricity or LCOE) at a price below the price of electricity consumed from the grid. While this is valid for pure players (the so-called “grid price” refers to the price of electricity on the market), this is based on two assumptions for prosumers (producers who are also consumers of electricity):
• That PV electricity can be consumed locally (either in real time or through some compensation scheme such as local or delocalized net metering);
• That all the components of the retail price of electricity can be compensated when it has been produced by PV and locally consumed.
However, it is assumed that the level of self-consumption that can be achieved with a system that provides up to the same amount of electricity as the local annual electricity consumption on a yearly basis, varies between less than 30% (residential applications) and 100% (for some industrial applications) depending on the country and the location.
Technical solutions will allow for increases in the self-consumption level (demand-side management including EV charging or direct use to heat water with heat pumps, local electricity storage, reduction of the PV system size, delocalized self-consumption, energy communities, etc.).
If only a part of the electricity produced can be self-consumed, then the remaining part must be injected into the grid and should generate revenues of the same order as any centralized production of electricity. Today this is often guaranteed for small size installations by the possibility of receiving a FiT (or similar) for the injected electricity. Nevertheless, if we consider how PV could become competitive, this will imply defining a way to price this electricity so that smaller producers will receive fair revenues.
The second assumption implies that the full retail price of electricity could be compensated. The price paid by electricity consumers is composed in general of four main components:
•The procurement price of electricity on electricity markets plus the margins of the reseller;
• Grid costs and fees, partially linked to the consumption, partially fixed; the key challenge is their future evolution;
• Taxes;
• Levies (used among other things to finance the incentives for some renewable sources, social programmes, solidarity between regions etc.);
If the electricity procurement price can be obviously compensated, the two other components require considering the system impact of such a measure; with tax loss on one side and the lack of financing of distribution and transmission grids on the other. While the debate
COST OF PV ELECTRICITY

IEA PVPS TRENDS IN PHOTOVOLTAIC APPLICATIONS 2021 / 67
CHAPTER 6 COMPETITIVENESS OF PV ELECTRICITY IN 2021
on taxes can be simple, since PV installations are generating taxes as well, the one on grid financing is more complex. Even if self-consumed electricity could be fully compensated, alternative ways to finance the grid should be considered given the loss of revenues for grid operators or a better understanding of PV positive impacts on the grid should be achieved.
Figure 6.7 shows how grid parity has already been reached in several countries and how declining electricity costs are paving the way for more countries becoming competitive for PV. The figure shows the range of retail prices in selected countries based on their average solar resource and the indicative PV electricity threshold for three different system prices (0,5, 1 and 2 USD/W, converted into LCOE). Green dots are cases where PV is competitive in most of the cases. Blue dots show where it really depends on the system prices and the retail prices of electricity. Orange dots are only competitive under very good conditions.
The specific case of BIPV consists, for new or renovated roofs, to assess the competitiveness for the BIPV solution minus the costs of the traditional roofing (or façade) elements. The rest of the assessment is similar to any building under self-consumption using a standard BAPV solution. Of course, if the BIPV solution has to be installed on a building outside of any planned works, this doesn’t apply. Metrics used for buildings can also be different, since the integration of PV components might be justified by non-
economic factors or the perspective of an added value. For such reasons, BIPV competitiveness is in general assessed against the traditional building costs.
COMPETITIVENESS OF PV ELECTRICITY WITH WHOLESALE ELECTRICITY PRICES
In countries with an electricity market, wholesale electricity prices when PV produces are one benchmark of PV competitiveness. These prices depend on the market organisation and the technology mix used to generate electricity. In order to be competitive with these prices, PV electricity has to be generated at the lowest possible price. This is already achieved with large utility-scale PV installations that allow reaching the lowest system prices today with low maintenance costs and a low cost of capital. Plants have been commissioned in 2019 and 2020 in Spain, Germany or Chile which rely only on remuneration from electricity markets. It is highly probable that energy-only markets will be completed by grid services and similar additional revenues. However, such plants are already viable and calculations show that most of western European countries for instance, from Portugal to Finland, would be suitable for such PV plants with already 2019 electricity prices. Such business models remain however riskier than conventional ones that guarantee prices paid to the producer over 15 years or more.
SOURCE IEA PVPS & OTHERS.*NOTE THE COUNTRY YIELD (SOLAR IRRADIANCE) HERE SHOWN MUST BE CONSIDERED AN AVERAGE.
KOREA
DENMARK
USA
0
50
100
150
200
250
300
350
400
Pri
ce o
f E
lect
rici
ty in
US
D/M
Wh
900800 1 000 1 100 1 200 1 300 1 400 1 500 1 600 1 700 1 800
LCOE at 2 USD/Wp LCOE at 1 USD/Wp LCOE at 0,5 USD/Wp
YIELD kWh/kW/year
CANADA
SWITZERLAND
TURKEY
JAPAN
GERMANY
BELGIUM
SWEDEN
ITALYAUSTRALIA
PORTUGAL
PORTUGAL
FRANCE
FINLAND
SPAIN
SPAIN
AUSTRIA
NORWAY
NETHERLANDS
MALAYSIA
CHINA
FIGURE 6.7: LCOE OF PV ELECTRICITY AS A FUNCTION OF SOLAR IRRADIANCE & RETAIL PRICES IN KEY MARKETS*

CHAPTER 6 COMPETITIVENESS OF PV ELECTRICITY IN 2021
IEA PVPS TRENDS IN PHOTOVOLTAIC APPLICATIONS 2021 / 68
COST OF PV ELECTRICITY / CONTINUED
The key risk associated with such business models lies in the evolution of wholesale market prices on the long term: it is known that PV reduces prices during the midday peak when penetration becomes significant. It has also been shown in recent years that such influence on prices still has a marginal impact on prices during the entire year. With high penetration and the shift to electricity of transport and heating, the influence of PV electricity on the market price is not yet precisely known and could represent (or not) an issue in the medium to long term: either prices during PV production will stay down and impair the ability to remunerate the investment or low prices will attract additional demand and will stabilise the market prices. At this point, both options remain possible without possibilities to identify which one will develop.
When a wholesale market doesn’t exist as such, (in China for instance), the comparison point is the production cost of electricity from coal-fired power plants.
FUEL-PARITY AND OFF-GRID SYSTEMS
Off-grid systems including hybrid PV/diesel can be considered competitive when PV can provide electricity at a cheaper cost than the conventional generator. For some off-grid applications, the cost of the battery bank and the charge controller should be considered in the upfront and maintenance costs while a hybrid system will consider the cost of fuel saved by the PV system.
The point at which PV competitiveness will be reached for these hybrid systems takes into account fuel savings due to the reduction of operating hours of the generator. Fuel-parity refers to the moment in time when the installation of a PV system can be financed with fuel savings only. It is assumed that PV has reached fuel-parity, based on fuel prices, in numerous Sunbelt countries.
Other off-grid systems are often not replacing existing generation sources but providing electricity in places with no network and no or little use of diesel generators. They represent a completely new way to provide electricity to hundreds of millions of people all over the world.
PRODUCING COMPETITIVE GREEN HYDROGEN WITH PV
The declining cost of PV electricity opens the door for other applications and especially the possible production of “green” hydrogen directly from PV (possibly in combination with wind). While the business model behind is being explored, in particular in Australia, Chile, China, France, Japan, Korea, Portugal and Spain, the cost of PV electricity should reach lower levels, while the cost of electrolysers should decrease as well to make green hydrogen competitive. This perspective is not so far away, and some start to envisage a possible competitiveness in the coming years for specific uses of hydrogen. While the competitiveness with “black” hydrogen seems still unreachable for the time being,
SOURCE IEA PVPS, BECQUEREL INSTITUTE.
0
20
40
60
80
100
120
US
D/M
Wh
Jan
2016
Apr
2016
Jul
2016
Oct
2016
Jan
2017
Apr
2017
Jul
2017
Oct
2017
Jan
2018
Apr
2018
Jul
2018
Oct
2018
Jan
2019
Apr
2019
Jul
2019
Oct
2019
Jan
2020
Apr
2020
Jul
2020
Oct
2020
Jan
2021
Apr
2021
Jul
2021
With Yield = 2 000 kWh/kWp With Yield = 1 000 kWh/kWp With Original Tenders
PERU
UAE
UAE INDIA
INDIA
JORDANTUNISIA
PORTUGALSPAIN
SAUDIA ARABIA
PORTUGAL
MEXICO
UAE
ALBANIA
FIGURE 6.8: NORMALIZED LCOE FOR SOLAR PV BASED ON RECENT PPA PRICES 2016 - Q2 2021

IEA PVPS TRENDS IN PHOTOVOLTAIC APPLICATIONS 2021 / 69
CHAPTER 6 COMPETITIVENESS OF PV ELECTRICITY IN 2021
other uses in transport, some industrial applications and possibly agriculture (through ammonia), might create a tremendous opportunity for PV to produce hydrogen without being connected to the grid. Such a development would increase possibly the PV market significantly outside of the constraints it experiences for the time being.
RECORD LOW TENDERS
With several countries having adopted tenders as a way to allocate PPAs to PV projects, the value of these PPAs achieved record low levels again in 2020 and in the first half of 2021. These levels are sufficiently low to be mentioned since they approach, or in many cases beat, the price of wholesale electricity in several countries. While these tenders do not represent the majority of PV projects, they have shown the ability of PV technology to provide extremely cheap electricity under the condition of a low system price. (below 0,6 USD/W) and a low cost of capital. The tenders in Portugal seem significant below the levels of costs that PV could reach for the time being and indicate the rise of new business models which can also comprise bets on future wholesale prices developments.
SOURCE IEA PVPS & OTHERS.EURO exchange rate adapted in september 2021. 1 EURO = 1.16 USD
TABLE 6.1: LOWEST WINNING BIDS IN PV TENDERS FOR UTILTY SCALE PV SYSTEM PER REGION
REGION COUNTRY/STATE USD/MWh YEAR
ASIA UZBEKISTAN 17,9 2021
AFRICA TUNISIA 24,4 2019
EUROPE PORTUGAL 13,2 2020
LATIN AMERICA BRAZIL 17,5 2019
MIDDLE EAST SAUDI ARABIA 10,4 2021
NORTH AMERICA MEXICO 20,6 2017
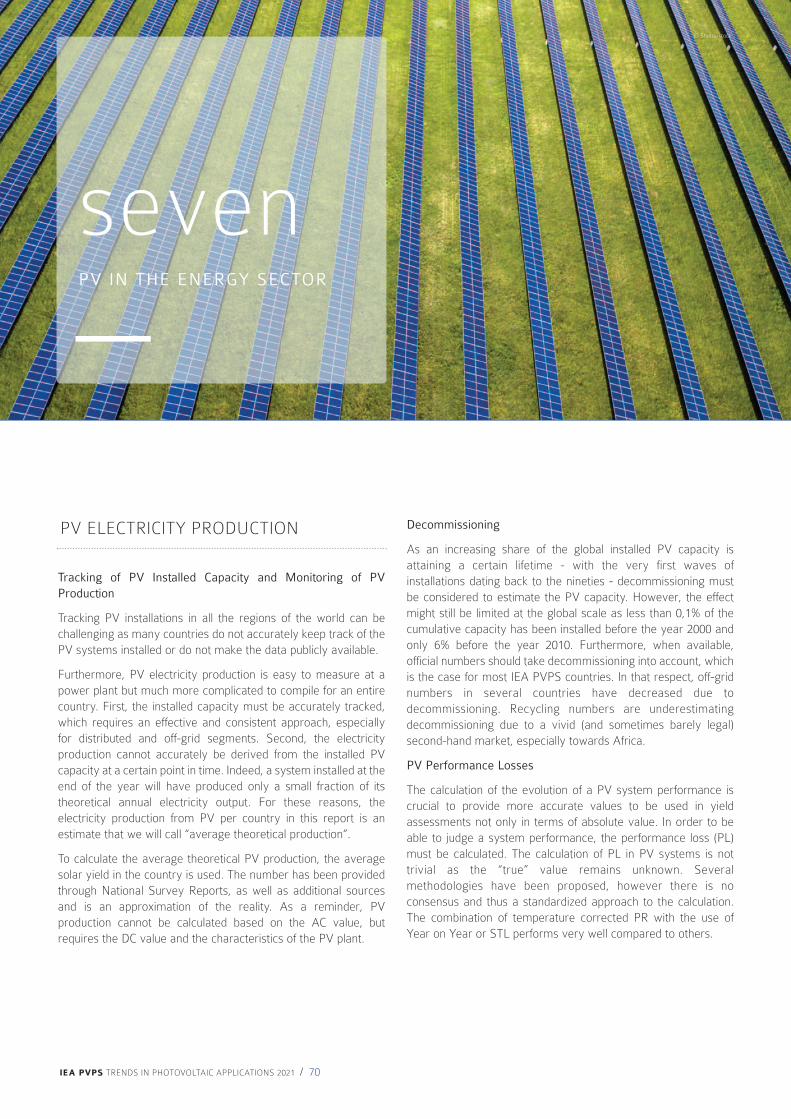
IEA PVPS TRENDS IN PHOTOVOLTAIC APPLICATIONS 2021 / 70
CHAPTER 6 COMPETITIVENESS OF PV ELECTRICITY IN 201870SIX // CHAPTER 6 COMPETITIVENESS OF PV ELECTRICITY IN 2016
IEA-PV
PS
seven PV IN THE ENERGY SECTOR
© Shutterstock
Decommissioning
As an increasing share of the global installed PV capacity is attaining a certain lifetime - with the very first waves of installations dating back to the nineties - decommissioning must be considered to estimate the PV capacity. However, the effect might still be limited at the global scale as less than 0,1% of the cumulative capacity has been installed before the year 2000 and only 6% before the year 2010. Furthermore, when available, official numbers should take decommissioning into account, which is the case for most IEA PVPS countries. In that respect, off-grid numbers in several countries have decreased due to decommissioning. Recycling numbers are underestimating decommissioning due to a vivid (and sometimes barely legal) second-hand market, especially towards Africa.
PV Performance Losses
The calculation of the evolution of a PV system performance is crucial to provide more accurate values to be used in yield assessments not only in terms of absolute value. In order to be able to judge a system performance, the performance loss (PL) must be calculated. The calculation of PL in PV systems is not trivial as the “true” value remains unknown. Several methodologies have been proposed, however there is no consensus and thus a standardized approach to the calculation. The combination of temperature corrected PR with the use of Year on Year or STL performs very well compared to others.
Tracking of PV Installed Capacity and Monitoring of PV Production
Tracking PV installations in all the regions of the world can be challenging as many countries do not accurately keep track of the PV systems installed or do not make the data publicly available.
Furthermore, PV electricity production is easy to measure at a power plant but much more complicated to compile for an entire country. First, the installed capacity must be accurately tracked, which requires an effective and consistent approach, especially for distributed and off-grid segments. Second, the electricity production cannot accurately be derived from the installed PV capacity at a certain point in time. Indeed, a system installed at the end of the year will have produced only a small fraction of its theoretical annual electricity output. For these reasons, the electricity production from PV per country in this report is an estimate that we will call “average theoretical production”.
To calculate the average theoretical PV production, the average solar yield in the country is used. The number has been provided through National Survey Reports, as well as additional sources and is an approximation of the reality. As a reminder, PV production cannot be calculated based on the AC value, but requires the DC value and the characteristics of the PV plant.
PV ELECTRICITY PRODUCTION

IEA PVPS TRENDS IN PHOTOVOLTAIC APPLICATIONS 2021 / 71
CHAPTER 7 PV IN THE ENERGY SECTOR
PV electricity penetration is the ratio between PV electricity production in a country and the electricity demand in that country and is expressed as a percentage. Electricity demand is obtained via publicly available databases and via the IEA PVPS experts.
Many other countries have lower production numbers, but in total 35 countries produced at least 1% of their electricity demand from PV in 2020.
Real figures might be lower since some installations didn’t produce electricity during the entire year, but also since some plants might have experienced production issues, due to technical problems or external constraints. The real PV production in a country is difficult to assess, especially when self-consumption and storage enter into consideration. IEA PVPS advocates for governments and energy stakeholders, including grid operators to create accurate databases and measure precisely PV production.
Concerning global PV penetration, with around 767 GW installed worldwide, PV could produce almost 1 000 TWh (see Table 7.1) of electricity on a yearly basis. This represents around 4% of the global electricity demand covered by PV as presented in figure 7.1. Performance losses due to aging of PV plants are not considered at this point.
Within the IEA PVPS Task 13, a group of experts representing several leading R&D centers, universities and industry companies, is developing a framework for the calculation of Performance Loss Rates (PLR) on a large number of commercial and research PV power plants and related weather data coming from various climatic zones. Various methodologies are applied for the calculation of PLR, which are benchmarked in terms of uncertainties and “true” values. The aim of the international collaboration is to show how to calculate the PLR on high quality data (high time resolution, reliable data, irradiance, yield, etc.) and on low quality data (low time resolution, only energy data available). Various algorithms and models, along with different time averaging and filtering criteria, can be applied for the PLR calculation, each of which can have an impact on the results. The approach considers three pathways to ensure broad collaboration and increase the statistical relevance of the study and the combination of metrics (PR or power based). Furthermore, methodologies are benchmarked in terms of deviation from the average value and in terms of standard deviation.
PV PENETRATION
SOURCE SOURCE IEA PVPS & OTHERS.
FIGURE 7.1: PV CONTRIBUTION TO ELECTRICITY DEMAND IN 2020
0
2
4
6
8
10
12
14
16
%
TURKEY
SWED
EN
MEXIC
O
HONDURA
S
VIETN
AM
ITALY
GERMANY
FINLA
ND
NORW
AY
GREECE
JAPA
N
CHIL
E
BELGIU
M
AUSTR
ALI
AUK
MALT
AUSA
BULG
ARIA
CZECH R
EPUBLI
C
SPAIN
SWIT
ZERLAND
ISRA
EL
DEN
MARK
SLOVEN
IA
SLOVA
KIA
KOREA
FRANCE
AUSTR
IA
THAIL
AND
PORTU
GAL
NETH
ERLANDS
ROM
ANIA
CHIN
A
CANADA
TAIW
AN
INDIA
SOUTH
AFR
ICA
BRAZIL
MALA
YSIA
PVPS countries Non-PVPS countries
WorldPVPS countries
Non-PVPS countries

IEA PVPS TRENDS IN PHOTOVOLTAIC APPLICATIONS 2021 / 72
CHAPTER 7 PV IN THE ENERGY SECTOR
In 2020, PV represented 53% of the world’s newly installed capacity of renewables, including hydropower. Wind power represented 36% with 93 GW installed.
Figure 7.3 shows the newly installed renewable capacity in 2020. Solar PV was the top source of new power generating capacity in 2020. This year gain, newly installed renewable power generation capacity outpaced net additions of fossil fuels and nuclear power combined4 and renewable energy accounted for around 29% of the global electricity mix.
4 Source: REN21Global Status Report.
PV PENETRATION / CONTINUED
TABLE 7.1: 2020 PV ELECTRICITY STATISTICS IN IEA PVPS COUNTRIES
COUNTRY FINAL ELECTRICITY
CONSUMPTION 2020
HABITANTS 2020
GDP 2020
SURFACE AVERAGE YIELD
PV ANNUAL INSTALLED CAPACITY
2020
PV CUMULATIVE
INSTALLED CAPACITY
2020
PV ELECTRICITY
PRODUCTION
ANNUAL CAPACITY
PER CAPITA
CUMULATIVE CAPACITY
PER CAPITA
CUMULATIVE CAPACITY PER km2
THEORETICAL PV
PENETRATION
TWh MILLION BUSD km2 kWh/kWp MW MW TWh W/cap W/cap kW/km2 %
AUSTRALIA 265 26 1 331 7 690 000 1 400 4 503 20 823 29 175 810 3 11,0%
AUSTRIA 64 9 429 84 000 1 050 341 2 043 2 38 230 24 3,4%
BELGIUM 83 11 515 33 688 925 1 048 6 008 6 91 523 178 6,7%
CANADA 540 38 1 643 9 985 000 1 150 200 3 525 4 5 93 0 0,8%
CHILE 73 19 253 756 096 1 699 790 3 484 6 42 184 5 8,1%
CHINA 7 620 1 400 14 723 9 634 000 1 300 48 200 253 640 330 34 181 26 4,3%
DENMARK 34 6 355 44 000 975 264 1 624 2 45 278 37 4,6%
FINLAND 81 6 271 390 908 875 98 313 0 18 56 1 0,3%
FRANCE 473 67 2 603 543 965 1 180 973 10 920 13 15 163 20 2,7%
GERMANY 531 83 3 806 357 170 978 4 885 53 901 53 59 649 151 9,9%
ISRAEL 68 9 402 20 770 1 750 590 2 550 4 63 274 123 6,6%
ITALY 320 59 1 886 301 336 1 176 785 21 650 25 13 365 72 8,0%
JAPAN 858 126 5 065 377 975 1 050 8 676 71 868 75 69 570 190 8,8%
KOREA 520 52 1 631 100 401 1 137 4 120 15 888 18 79 306 158 3,5%
MALAYSIA 149 33 337 330 621 1 314 883 2 300 3 27 70 7 2,0%
MEXICO 270 128 1 076 1 964 380 1 708 1 573 6 574 11 12 52 3 4,2%
NETHERLANDS 111 17 912 41 500 994 3 036 9 910 10 175 571 239 8,8%
NORWAY 135 5 362 385 178 882 40 160 0 7 30 0 0,1%
PORTUGAL 46 10 231 92 212 1 709 170 1 077 2 16 104 12 4,0%
SPAIN 250 47 1 281 505 990 1 646 3 528 13 603 22 75 291 27 9,0%
SWEDEN 132 10 538 407 284 900 506 1 226 1 49 119 3 0,8%
SWITZERLAND 56 9 748 41 285 985 475 2 973 3 55 343 72 5,3%
SOUTH AFRICA 193 59 351 1 219 090 1 733 1 300 4 172 7 22 71 3 3,7%
THAILAND 194 70 502 1 219 092 1 522 49 3 578 5 1 51 3 2,8%
TURKEY 303 83 720 783 560 1 500 958 9 504 14 11 114 12 4,7%
USA 3 852 329 20 937 9 147 281 1 416 19 725 95 495 135 60 290 10 3,5%
WORLD 24 700 7 673 84 705 134 325 435 1 300 145 229 767 243 997 19 100 6 4,0%

IEA PVPS TRENDS IN PHOTOVOLTAIC APPLICATIONS 2021 / 73
CHAPTER 7 PV IN THE ENERGY SECTOR
Globally, the largest part of batteries sold are used for transportation in EVs, stationary storage remains the exception and volumes remain small. However, the rapid development of electric mobility is driving battery prices down much faster than any could have expected in the stationary market alone. This could give a huge push to the development of storage as a tool to ease PV installations in some specific conditions. In addition, new requirements for grid integration in tenders tend to favour the use of stationary batteries in utility-scale plants to smooth the output of the plant, reduce curtailment or reduce the need for grid capacity reinforcement, however this trend would require some more years to be confirmed.
THE ELECTRIFICATION OF TRANSPORT
The role of PV as an enabler of that energy transition is more and more obvious and the idea of powering mobility with solar is becoming slowly a reality as an increasing number of commercial partnerships combine EV charging stations to solar systems for private and public use.
THE ENERGY STORAGE MARKET
In general, battery storage is seen by some as an opportunity to solve some grid integration issues linked to PV and to increase the self-consumption ratio of distributed PV plants. Despite their decreasing costs, such solutions are not yet economically viable in all countries and market segments. However, the adoption of batteries is on the rise both in the residential segments and in the commercial segments as more and more consumers are willing to maximise their self-consumption and to optimize their consumption profile.
More large-scale PV plants are being built in combination with batteries, which can be used to stabilize grid injection, reduce curtailment, and, in some cases, to provide ancillary services to the grid. The displacement of energy towards the evening peak allow benefiting from higher wholesale market prices and changes the injection pattern of PV. An increasing number of tenders are requiring PV to be installed with storage.
PV INTEGRATION AND SECTOR COUPLING
SOURCE REN21, IEA PVPS.
FIGURE 7.2: SHARE OF RENEWABLES IN GLOBAL
ELECTRICITY PRODUCTION IN 2020
FOSSIL & NUCLEAR, 71%
HYDRO POWER, 16%
OTHER RES, 3%
WIND, 6%
PV, 3,6%
SOURCE REN21, IEA PVPS.
FIGURE 7.3: NEW RENEWABLE INSTALLED CAPACITY
IN 2020
PV, 54%
OTHER RES (HYDRONOT INCLUDED), 3%
HYDROPOWER, 7%
WIND ONSHORE, 34%
WIND OFFSHORE, 2%

Another very promising segment in the use of solar PV electricity is the use for cooling. Beyond Europe, a lot of countries are very interested in the link between addressing the very rapidly increasing energy need for air conditioning due to the very attractive present and future cost of PV electricity.
China is at the forefront worldwide for the supply of PV air-conditioning solutions, mainly in the domestic household segment.
For larger coupling, no real commercial products are available. Nevertheless, more and more design of solar PV systems based on self-consumption are linked to some specific use of adapted water chillers including cold water storage.
This axis of innovation to convert green electricity in cooling and cold storage is therefore seen by the IEA PVPS Tasks as a very promising way to absorb the peak production of PV, especially in sunny emerging economies. Indeed, places where grid stress is very present in summertime, benefiting from solar cooling and cooling thermal storage based on local PV production can become a very powerful tool.
The use of solar energy, namely solar PV and solar thermal, for cooling is profiting from July 2020 a specific IEA SHC Task called Task 65 (https://task65.iea-shc.org/) which will focus worldwide on innovative ways to adapt and develop existing technologies (solar and heat pumps) for sunny and hot climates.
THE ELECTRIFICATION OF HEATING AND COOLING
The recent development of PV self-consumption especially in Europe has created new opportunities to use solar electricity for specific buildings appliances.
Among others, even if the solar production is not directly linked to consumption load in the case of space heating, it is becoming a real source of interest to use solar PV electricity to feed electric domestic hot water tanks for instance. Hot water tanks can also serve as storage and can be successfully combined with a heat pump.
Several European manufacturers of electric domestic hot water tanks are now offering specific electronic devices to directly link extra PV production to an electric boiler. Hot water tanks allow to increase the self-consumption and to store the PV production.
For instance, in France, some electric utilities are more and more interested in partially converting the nearly 15 TWh used yearly during night to heat domestic hot water into usable thermal energy storage for green electricity. The challenge is even more pressing in the short term for non-interconnected territories such as Corsica and overseas territories.
CHAPTER 7 PV IN THE ENERGY SECTOR
IEA PVPS TRENDS IN PHOTOVOLTAIC APPLICATIONS 2021 / 74
PV could make EVs greener faster
The shift from fossil fuels to electricity for individual
transportation and especially cars and light-duty vehicles is a
necessary step towards the decarbonization of the transport
sector. However, the real emissions of GHG for EVs depend on
the power mix used to charge cars. In countries with a power
mix heavily relying on fossil fuels, the emissions will remain
higher than in countries with a renewable or carbon-free mix.
In that respect, some initiatives popped up in the recent months
in Europe to connect the fast development of the EV market to
renewables and especially PV. The idea to propose to the
automotive industry to decarbonize completely electric vehicles
would imply to sell renewable energy contracts or, easier,
shares in PV plants, when an EV is brought to the market.
From PV to VIPV and VAPV
With its distributed nature, PV fits perfectly with EV charging
during the day when cars are stationed in the offices parking
or at home. Such slow charging is also highly compatible with
distribution grid constraints. Finally, the integration of PV in
the vehicles themselves, the so-called VIPV, also offers
opportunities to alleviate the burden on the grid, increase the
autonomy of EVs and connects the automotive and PV
sectors. 2018 and 2019 showed announcements from
several manufacturers, especially in Japan and Korea, but
also Germany and the Netherlands, for VIPV systems
integrated in EVs. The IEA PVPS Task 17 deals with this fast-
emerging subject.
PV INTEGRATION AND SECTOR COUPLING / CONTINUED
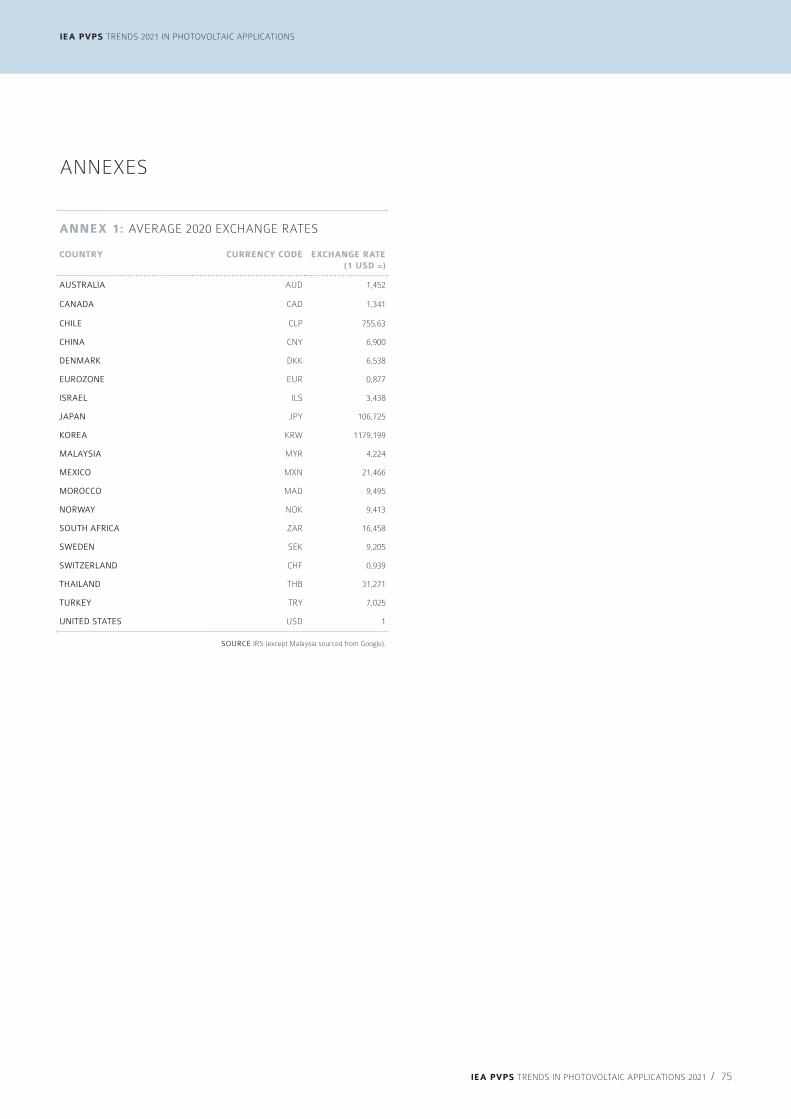
IEA PVPS TRENDS IN PHOTOVOLTAIC APPLICATIONS 2021 / 75
CHAPTER 1 PV TECHNOLOGY AND APPLICATIONSIEA PVPS TRENDS 2021 IN PHOTOVOLTAIC APPLICATIONS
ANNEXES
SOURCE IRS (except Malaysia sourced from Google).
ANNEX 1: AVERAGE 2020 EXCHANGE RATES
COUNTRY CURRENCY CODE EXCHANGE RATE (1 USD =)
AUSTRALIA AUD 1,452
CANADA CAD 1,341
CHILE CLP 755,63
CHINA CNY 6,900
DENMARK DKK 6,538
EUROZONE EUR 0,877
ISRAEL ILS 3,438
JAPAN JPY 106,725
KOREA KRW 1179,199
MALAYSIA MYR 4,224
MEXICO MXN 21,466
MOROCCO MAD 9,495
NORWAY NOK 9,413
SOUTH AFRICA ZAR 16,458
SWEDEN SEK 9,205
SWITZERLAND CHF 0,939
THAILAND THB 31,271
TURKEY TRY 7,025
UNITED STATES USD 1
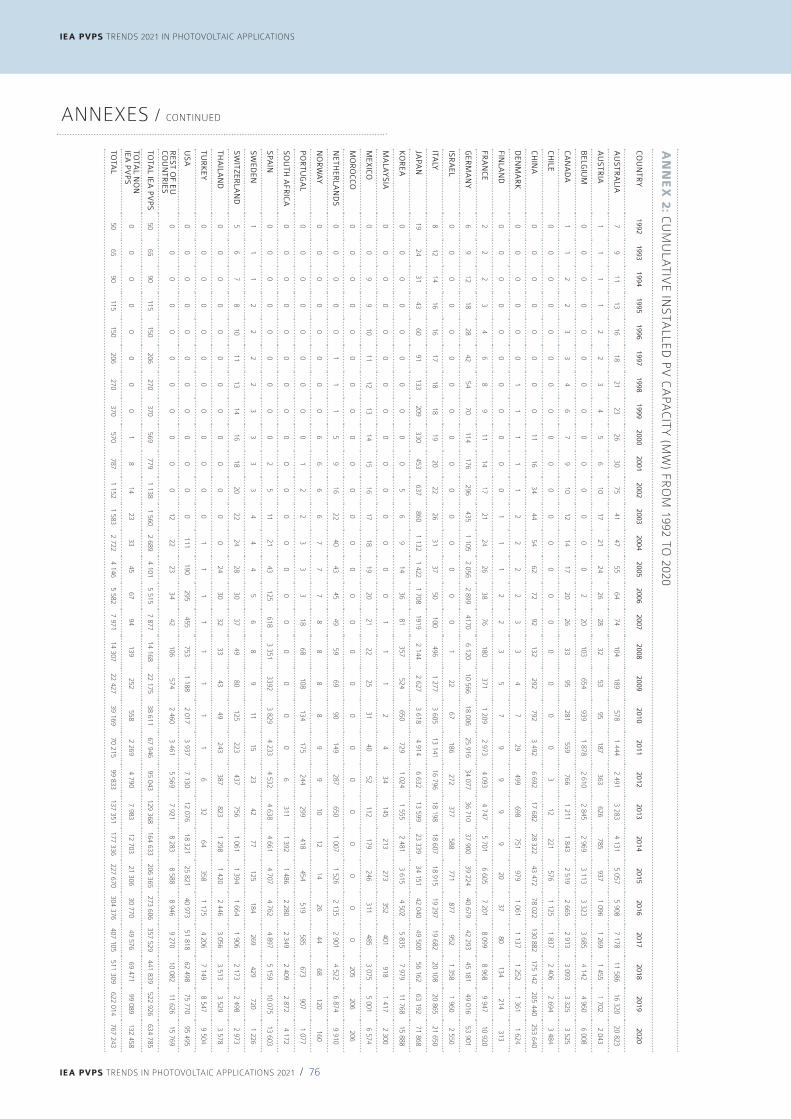
IEA PVPS TRENDS 2021 IN PHOTOVOLTAIC APPLICATIONS
IEA PVPS TRENDS IN PHOTOVOLTAIC APPLICATIONS 2021 / 76
ANNEXES / CONTINUEDA
NN
EX
2: C
UM
ULA
TIV
E IN
STA
LLED
PV
CA
PAC
ITY
(MW
) FR
OM
1992 TO 2020
CO
UN
TRY
19921993
19941995
19961997
19981999
20002001
20022003
20042005
20062007
20082009
20102011
20122013
20142015
20162017
20182019
2020
AU
STR
ALIA
7 9
11 13
16 18
21 23
26 30
75 41
47 55
64 74
104 189
578 1 444
2 491 3 283
4 131 5 057
5 908 7 178
11 586 16 320
20 823
AU
STR
IA1
1 1
1 2
2 3
4 5
6 10
17 21
24 26
28 32
53 95
187 363
626 785
937 1 096
1 269 1 455
1 702 2 043
BE
LGIU
M0
0 0
0 0
0 0
0 0
0 0
0 0
0 2
20 103
654 939
1 878 2 610
2 845 2 969
3 113 3 323
3 685 4 142
4 960 6 008
CA
NA
DA
1 1
2 2
3 3
4 6
7 9
10 12
14 17
20 26
33 95
281 559
766 1 211
1 843 2 519
2 665 2 913
3 093 3 325
3 525
CH
ILE0
0 0
0 0
0 0
0 0
0 0
0 0
0 0
0 0
0 0
0 3
12 221
576 1 125
1 837 2 406
2 694 3 484
CH
INA
0 0
0 0
0 0
0 0
11 16
34 44
54 62
72 92
132 292
792 3 492
6 692 17 682
28 322 43 472
78 022 130 882
175 142 205 440
253 640
DE
NM
AR
K0
0 0
0 0
0 1
1 1
1 1
2 2
2 2
3 3
4 7
29 499
698 751
979 1 061
1 137 1 252
1 361 1 624
FINLA
ND
0 0
0 0
0 0
0 0
0 0
0 1
1 1
2 2
3 5
7 9
9 9
9 20
37 80
134 214
313
FRA
NC
E2
2 2
3 4
6 8
9 11
14 17
21 24
26 38
76 180
371 1 209
2 973 4 093
4 747 5 701
6 605 7 201
8 099 8 968
9 947 10 920
GE
RM
AN
Y6
9 12
18 28
42 54
70 114
176 296
435 1 105
2 056 2 899
4170 6 120
10 566 18 006
25 916 34 077
36 710 37 900
39 224 40 679
42 293 45 181
49 016 53 901
ISR
AE
L0
0 0
0 0
0 0
0 0
0 0
0 0
0 0
0 1
22 67
186 272
377 588
771 877
952 1 358
1 960 2 550
ITALY
8 12
14 16
16 17
18 18
19 20
22 26
31 37
50 100
496 1 277
3 605 13 141
16 796 18 198
18 607 18 915
19 297 19 682
20 108 20 865
21 650
JAPA
N19
24 31
43 60
91 133
209 330
453 637
860 1 132
1 422 1 708
1919 2 144
2 627 3 618
4 914 6 632
13 599 23 339
34 151 42 040
49 500 56 162
63 192 71 868
KO
RE
A0
0 0
0 0
0 0
0 0
0 5
6 9
14 36
81 357
524 650
729 1 024
1 555 2 481
3 615 4 502
5 835 7 979
11 768 15 888
MA
LAY
SIA
0 0
0 0
0 0
0 0
0 0
0 0
0 0
0 1
1 1
2 4
34 145
213 273
352 401
918 1 417
2 300
ME
XIC
O0
0 9
9 10
11 12
13 14
15 16
17 18
19 20
21 22
25 31
40 52
112 179
246 311
485 3 075
5 001 6 574
MO
RO
CC
O0
0 0
0 0
0 0
0 0
0 0
0 0
0 0
0 0
0 0
0 0
0 0
0 0
0 205
206 206
NE
THE
RLA
ND
S0
0 0
0 0
1 1
1 5
9 16
22 40
43 45
49 59
69 90
149 287
650 1 007
1 526 2 135
2 901 4 522
6 874 9 910
NO
RW
AY
0 0
0 0
0 0
0 0
6 6
6 6
7 7
7 8
8 8
8 9
9 10
12 14
26 44
68 120
160
PO
RTU
GA
L0
0 0
0 0
0 0
0 0
1 2
2 3
3 3
18 68
108 134
175 244
299 418
454 519
585 673
907 1 077
SO
UTH
AFR
ICA
0 0
0 0
0 0
0 0
0 0
0 0
0 0
0 0
0 0
0 0
6 311
1 392 1 486
2 280 2 349
2 409 2 872
4 172
SPA
IN0
0 0
0 0
0 0
0 0
2 5
11 21
43 125
618 3 351
3392 3 829
4 233 4 532
4 638 4 661
4 707 4 762
4 897 5 159
10 075 13 603
SW
ED
EN
1 1
1 2
2 2
2 3
3 3
3 4
4 4
5 6
8 9
11 15
23 42
77 125
184 269
429 720
1 226
SW
ITZE
RLA
ND
5 6
7 8
10 11
13 14
16 18
20 22
24 28
30 37
49 80
125 223
437 756
1 061 1 394
1 664 1 906
2 173 2 498
2 973
THA
ILAN
D0
0 0
0 0
0 0
0 0
0 0
0 0
24 30
32 33
43 49
243 387
823 1 298
1 420 2 446
3 056 3 513
3 529 3 578
TUR
KE
Y0
0 0
0 0
0 0
0 0
0 0
0 1
1 1
1 1
1 1
1 6
32 64
358 1 175
4 206 7 149
8 547 9 504
US
A0
0 0
0 0
0 0
0 0
0 0
0 111
190 295
455 753
1 188 2 017
3 937 7 130
12 076 18 321
25 821 40 973
51 818 62 498
75 770 95 495
RE
ST O
F EU
C
OU
NTR
IES
0 0
0 0
0 0
0 0
0 0
0 12
22 23
34 42
106
574
2 460
3 461
5 569
7 921
8 283
8 588
8 946
9 270
10 082
11 626
15 769
TOTA
L IEA
PV
PS
50
65 90
115 150
206 270
370 569
779 1 138
1 560 2 689
4 101 5 515
7 877 14 168
22 175 38 611
67 946 95 043
129 368 164 633
206 365 273 606
357 529 441 839
522 926 634 785
TOTA
L NO
N
IEA
PV
PS
0 0
0 0
0 0
0 0
1 8
14 23
33 45
67 94
139 252
558 2 269
4 790 7 983
12 703 21 306
30 770 49 576
69 471 99 089
132 458
TOTA
L50
65 90
115 150
206 270
370 570
787 1 152
1 583 2 722
4 146 5 582
7 971 14 307
22 427 39 169
70 21599 833
137 351 177 336
227 670 304 376
407 105 511 309
622 014 767 243
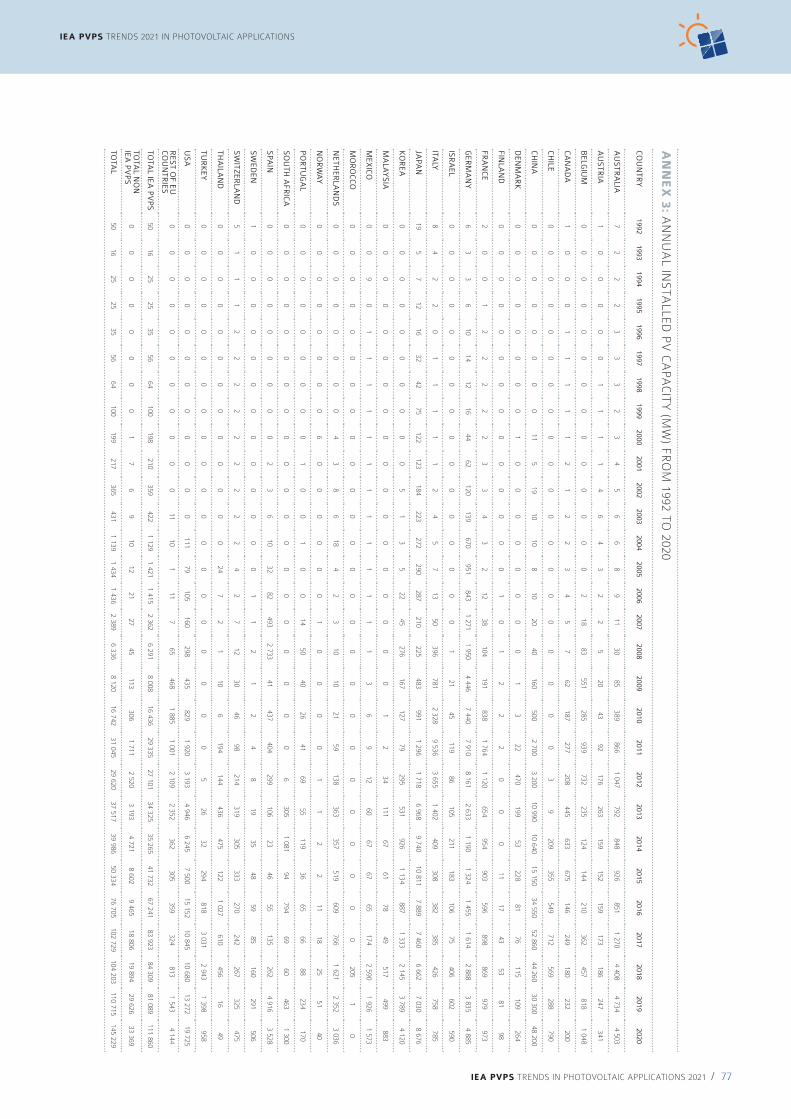
IEA PVPS TRENDS IN PHOTOVOLTAIC APPLICATIONS 2021 / 77
IEA PVPS TRENDS 2021 IN PHOTOVOLTAIC APPLICATIONS
AN
NE
X 3
: AN
NU
AL IN
STA
LLED
PV
CA
PAC
ITY
(MW
) FR
OM
1992 TO 2020
CO
UN
TRY
19921993
19941995
19961997
19981999
20002001
20022003
20042005
20062007
20082009
20102011
20122013
20142015
20162017
20182019
2020
AU
STR
ALIA
7 2
2 2
3 3
3 2
3 4
5 6
6 8
9 11
30 85
389 866
1 047 792
848 926
851 1 270
4 408 4 734
4 503
AU
STR
IA1
0 0
0 0
0 1
1 1
1 4
6 4
3 2
2 5
20 43
92 176
263 159
152 159
173 186
247 341
BE
LGIU
M0
0 0
0 0
0 0
0 0
0 0
0 0
0 2
18 83
551 285
939 732
235 124
144 210
362 457
818 1 048
CA
NA
DA
1 0
0 0
1 1
1 1
1 2
1 2
2 3
4 5
7 62
187 277
208 445
633 675
146 249
180 232
200
CH
ILE0
0 0
0 0
0 0
0 0
0 0
0 0
0 0
0 0
0 0
0 3
9 209
355 549
712 569
288 790
CH
INA
0 0
0 0
0 0
0 0
11 5
19 10
10 8
10 20
40 160
500 2 700
3 200 10 990
10 640 15 150
34 550 52 860
44 260 30 300
48 200
DE
NM
AR
K0
0 0
0 0
0 0
0 1
0 0
0 0
0 0
0 0
1 3
22 470
199 53
228 81
76 115
109 264
FINLA
ND
0 0
0 0
0 0
0 0
0 0
0 0
0 0
1 0
1 2
2 2
0 0
0 11
17 43
53 81
98
FRA
NC
E2
0 0
1 2
2 2
2 2
3 3
4 3
2 12
38 104
191 838
1 764 1 120
654 954
903 596
898 869
979 973
GE
RM
AN
Y6
3 3
6 10
14 12
16 44
62 120
139 670
951 843
1 271 1 950
4 446 7 440
7 910 8 161
2 633 1 190
1 324 1 455
1 614 2 888
3 835 4 885
ISR
AE
L0
0 0
0 0
0 0
0 0
0 0
0 0
0 0
0 1
21 45
119 86
105 211
183 106
75 406
602 590
ITALY
8 4
2 2
0 1
1 1
1 1
2 4
5 7
13 50
396 781
2 328 9 536
3 655 1 402
409 308
382 385
426 758
785
JAPA
N19
5 7
12 16
32 42
75 122
123 184
223 272
290 287
210 225
483 991
1 296 1 718
6 968 9 740
10 811 7 889
7 460 6 662
7 030 8 676
KO
RE
A0
0 0
0 0
0 0
0 0
0 5
1 3
5 22
45 276
167 127
79 295
531 926
1 134 887
1 333 2 145
3 789 4 120
MA
LAY
SIA
0 0
0 0
0 0
0 0
0 0
0 0
0 0
0 0
0 0
1 2
34 111
67 61
78 49
517 499
883
ME
XIC
O0
0 9
0 1
1 1
1 1
1 1
1 1
1 1
1 1
3 6
9 12
60 67
67 65
174 2 590
1 926 1 573
MO
RO
CC
O0
0 0
0 0
0 0
0 0
0 0
0 0
0 0
0 0
0 0
0 0
0 0
0 0
0 205
1 0
NE
THE
RLA
ND
S0
0 0
0 0
0 0
0 4
3 8
6 18
4 2
3 10
10 21
59 138
363 357
519 609
766 1 621
2 352 3 036
NO
RW
AY
0 0
0 0
0 0
0 0
6 0
0 0
0 0
0 1
0 0
0 0
1 1
2 2
11 18
25 51
40
PO
RTU
GA
L0
0 0
0 0
0 0
0 0
1 0
0 1
0 0
14 50
40 26
41 69
55 119
36 65
66 88
234 170
SO
UTH
AFR
ICA
0 0
0 0
0 0
0 0
0 0
0 0
0 0
0 0
0 0
0 0
6 305
1 081 94
794 69
60 463
1 300
SPA
IN0
0 0
0 0
0 0
0 0
2 3
6 10
32 82
493 2 733
41 437
404 299
106 23
46 55
135 262
4 916 3 528
SW
ED
EN
1 0
0 0
0 0
0 0
0 0
0 0
0 0
1 1
2 1
2 4
8 19
35 48
59 85
160 291
506
SW
ITZE
RLA
ND
5 1
1 1
2 2
2 2
2 2
2 2
2 4
2 7
12 30
46 98
214 319
305 333
270 242
267 325
475
THA
ILAN
D0
0 0
0 0
0 0
0 0
0 0
0 0
24 7
2 1
10 6
194 144
436 475
122 1 027
610 456
16 49
TUR
KE
Y0
0 0
0 0
0 0
0 0
0 0
0 0
0 0
0 0
0 0
0 5
26 32
294 818
3 031 2 943
1 398 958
US
A0
0 0
0 0
0 0
0 0
0 0
0 111
79 105
160 298
435 829
1 920 3 193
4 946 6 245
7 500 15 152
10 845 10 680
13 272 19 725
RE
ST O
F EU
C
OU
NTR
IES
0 0
0 0
0 0
0 0
0 0
0 11
10 1
11 7
65 468
1 885
1 001
2 109
2 352
362
305
359
324
813
1 543
4 144
TOTA
L IEA
PV
PS
50
16 25
25 35
56 64
100 198
210 359
422 1 129
1 421 1 415
2 362 6 291
8 008 16 436
29 335 27 101
34 325 35 265
41 732 67 241
83 923 84 309
81 089 111 860
TOTA
L NO
N
IEA
PV
PS
0 0
0 0
0 0
0 0
1 7
6 9
10 12
21 27
45 113
306 1 711
2 520 3 193
4 721 8 602
9 465 18 806
19 894 29 626
33 369
TOTA
L50
16 25
25 35
56 64
100 199
217 365
431 1 139
1 434 1 436
2 389 6 336
8 120 16 742
31 04529 620
37 517 39 986
50 334 76 705
102 729 104 203
110 715 145 229

IEA PVPS TRENDS 2021 IN PHOTOVOLTAIC APPLICATIONS
IEA PVPS TRENDS IN PHOTOVOLTAIC APPLICATIONS 2021 / 78
FIGURE 2.1: EVOLUTION OF CUMULATIVE PV INSTALLATIONS 11
FIGURE 2.2: EVOLUTION OF ANNUAL PV INSTALLATIONS 11
FIGURE 2.3: PV PENETRATION PER CAPITA 2020 12
FIGURE 2.4: EVOLUTION OF MARKET SHARE OF TOP COUNTRIES 13
FIGURE 2.5: GLOBAL PV MARKET IN 2020 15
FIGURE 2.6: CUMULATIVE PV CAPACITY END 2020 15
FIGURE 2.7: EVOLUTION OF REGIONAL PV INSTALLATIONS 16
FIGURE 2.8: 2017-2020 GROWTH PER REGION 16
FIGURE 2.9: CENTRALIZED PV INSTALLED CAPACITY PER REGION 2020 18
FIGURE 2.10: CENTRALIZED PV CUMULATIVE INSTALLED CAPACITY PER REGION 2020 18
FIGURE 2.11: DISTRIBUTED PV INSTALLED CAPACITY PER REGION 2020 19
FIGURE 2.12: DISTRIBUTED PV CUMULATIVE INSTALLED CAPACITY PER REGION 2020 19
FIGURE 2.13: ANNUAL SHARE OF CENTRALIZED AND DISTRIBUTED GRID-CONNECTED INSTALLATIONS 2010 - 2020 20
FIGURE 2.14: CUMULATIVE SHARE OF GRID CONNECTED PV INSTALLATIONS 2010 - 2020 20
FIGURE 2.15: EVOLUTION OF FLOATING PV INSTALLED CAPACITY FROM 2013 TO Q3 2021 21
FIGURE 2.16: ANNUAL GRID-CONNECTED CENTRALIZED AND DISTRIBUTED PV INSTALLATIONS BY REGION IN 2020 23
FIGURE 2.17: 2 EVOLUTION OF PV INSTALLATIONS IN THE AMERICAS PER SEGMENT 24
FIGURE 2.18: EVOLUTION OF PV INSTALLATIONS IN ASIA PACIFIC PER SEGMENT 25
FIGURE 2.19: EVOLUTION OF PV INSTALLATIONS IN EUROPE PER SEGMENT 26
FIGURE 2.20: EVOLUTION OF PV INSTALLATIONS IN AFRICA AND THE MIDDLE EAST PER SEGMENT 28
FIGURE 3.1A: MAIN DRIVERS OF THE DISTRIBUTED PV MARKET IN 2020 32
FIGURE 3.1B: MAIN DRIVERS OF THE CENTRALIZED PV MARKET IN 2020 32
FIGURE 3.2: EVOLUTION OF MARKET INCENTIVES AND ENABLERS: 2010, 2015, 2020 33
FIGURE 4.1: PV SYSTEM VALUE CHAIN (EXAMPLE OF CRYSTALLINE SILICON PV TECHNOLOGY) 43
FIGURE 4.2: SHARE OF PV POLYSILICON PRODUCTION IN 2020 44
FIGURE 4.3: SHARE OF PV WAFERS PRODUCTION IN 2020 45
FIGURE 4.4: SHARE OF PV CELLS PRODUCTION IN 2020 46
FIGURE 4.5: SHARE OF PV MODULES PRODUCTION IN 2020 46
FIGURE 4.6: PV MODULE PRODUCTION PER TECHNOLOGY IN IEA PVPS COUNTRIES IN 2020 47
FIGURE 4.7: YEARLY PV INSTALLATION, PV PRODUCTION AND PRODUCTION CAPACITY 2010 - 2020 49
FIGURE 4.8: OVERVIEW OF DOWNSTREAM SECTOR (UTILITY PV APPLICATION) 52
FIGURE 5.1: BUSINESS VALUE OF THE PV MARKET IN 2020 54
FIGURE 5.2: CONTRIBUTION TO GLOBAL GDP OF PV BUSINESS VALUE AND ENERGY SECTOR INVESTMENTS 55
FIGURE 5.3A: ABSOLUTE PV INDUSTRIAL BUSINESS VALUE IN 2020 55
FIGURE 5.3B: ABSOLUTE PV INDUSTRIAL BUSINESS VALUE IN 2020 56
FIGURE 5.3C: PV INDUSTRIAL BUSINESS VALUE AS SHARE OF GDP IN 2020 56
FIGURE 5.4: GLOBAL EMPLOYMENT IN PV PER COUNTRY 57
FIGURE 5.5: YEARLY CO2 EMISSIONS AVOIDED BY PV 59
FIGURE 5.6: AVOIDED CO2 EMISSIONS AS PERCENTAGE OF ENERGY SECTOR TOTAL EMISSIONS 60
FIGURE 6.1: PV MODULES SPOT PRICES LEARNING CURVE (1992-2020) 62
FIGURE 6.2: EVOLUTION OF PV MODULES PRICES RANGE 62
FIGURE 6.3: INDICATIVE MODULE PRICES IN REPORTING COUNTRIES 63
FIGURE 6.4: 2020 PV MARKET COSTS RANGES 64
FIGURE 6.5: EVOLUTION OF RESIDENTIAL AND GROUND MOUNTED SYSTEMS PRICE RANGE 2012 - 2020 65
FIGURE 6.6: INDICATIVE INSTALLED SYSTEM PRICES IN SELECTED IEA PVPS REPORTING COUNTRIES IN 2020 65
FIGURE 6.7: LCOE OF PV ELECTRICITY AS A FUNCTION OF SOLAR IRRADIANCE & RETAIL PRICES IN KEY MARKETS 67
FIGURE 6.8: NORMALIZED LCOE FOR SOLAR PV BASED ON RECENT PPA PRICES 2016 - Q2 2021 68
FIGURE 7.1: PV CONTRIBUTION TO THE ELECTRICITY DEMAND IN 2020 71
FIGURE 7.2: SHARE OF RENEWABLES IN GLOBAL ELECTRICITY PRODUCTION IN 2020 73
FIGURE 7.3: NEW RENEWABLE INSTALLED CAPACITY IN 2020 73
LIST OF FIGURES

IEA PVPS TRENDS 2021 IN PHOTOVOLTAIC APPLICATIONS
TABLE 2.1: EVOLUTION OF TOP 10 PV MARKETS 14
TABLE 2.2: TOP 10 COUNTRIES FOR CENTRALIZED PV INSTALLED IN 2020 17
TABLE 2.3: TOP 10 COUNTRIES FOR CENTRALIZED PV CUMULATIVE INSTALLED CAPACITY IN 2020 17
TABLE 2.4: TOP 10 COUNTRIES FOR DISTRIBUTED PV INSTALLED IN 2020 19
TABLE 2.5: TOP 10 COUNTRIES FOR DISTRIBUTED CUMULATIVE PV INSTALLED CAPACITY IN 2020 19
TABLE 2.6: 2020 PV MARKET STATISTICS IN DETAIL 30
TABLE 4.1: GLOBAL TOP FIVE MANUFACTURERS IN TERMS OF PV CELL/MODULE PRODUCTION AND SHIPMENT VOLUME (2020) 48
TABLE 4.2: EVOLUTION OF ACTUAL MODULE PRODUCTION AND PRODUCTION CAPACITIES 50
TABLE 5.1: TOP 10 RANKING OF PV BUSINESS VALUES 50
TABLE 6.1: LOWEST WINNING BIDS IN PV TENDERS FOR UTILTY SCALE PV SYSTEM PER REGION 69
TABLE 7.1: 2020 PV ELECTRICITY STATISTICS IN IEA PVPS COUNTRIES 72
ANNEX 1: AVERAGE 2020 EXCHANGE RATES 75
ANNEX 2: CUMULATIVE INSTALLED PV CAPACITY (MW) FROM 1992 TO 2020 76
ANNEX 3: ANNUAL INSTALLED PV CAPACITY (MW) FROM 1992 TO 2020 77
LIST OF TABLES