Embed Size (px)
Citation preview

TRANSMISSION CONNECTION PLANNING REPORT
Produced jointly by the Victorian Electricity Distribution Businesses
2021
West Melbourne Terminal Station Indoor 66 kV Gas Insulated Switchgear (Image credit: AusNet Services)

2021 Joint DB Transmission Connection Planning Report
Page 1
2021 TRANSMISSION CONNECTION PLANNING REPORT
TABLE OF CONTENTS
EXECUTIVE SUMMARY ....................................................................................................... 4
1 INTRODUCTION AND BACKGROUND .................................................................... 13
1.1 Purpose of this report ........................................................................................................ 13
1.2 Victorian joint planning arrangements for transmission connection assets ...................... 13
1.3 DBs’ obligations as transmission connection planners ..................................................... 15
1.3.1 Victorian regulatory instruments ........................................................................... 15
1.3.2 National Electricity Rules ...................................................................................... 17
1.3.3 Service Target Performance Incentive Scheme for the Distribution Businesses . 18
1.3.4 Role of transmission connection asset owners in delivering connection services 18
1.4 Matters to be addressed by proponents of non-network alternatives ............................... 19
1.5 Implementing Transmission Connection Projects ............................................................. 20
1.5.1 Land Acquisition ................................................................................................... 20
1.5.2 Connection Application to AEMO ......................................................................... 20
1.5.3 Connection Application to AusNet Transmission Group ...................................... 21
1.5.4 Town Planning Permit ........................................................................................... 21
1.5.5 Public Consultation Strategy ................................................................................ 22
1.5.6 Project Implementation ......................................................................................... 22
1.5.7 Project lead times ................................................................................................. 22
1.6 Overview of Transmission Connection Planning Process ................................................. 24
2 PLANNING STANDARDS ......................................................................................... 25
2.1 Planning standard applying to transmission connection assets ........................................ 25
2.2 Overall objective of transmission connection planning ..................................................... 26
2.3 Overall approach to transmission planning and investment evaluation ............................ 27
2.4 VCR: Valuing supply reliability from the customers’ perspective ..................................... 27
2.5 Application of the probabilistic approach to transmission connection planning ................ 29
3 RECENT MARKET DEVELOPMENTS AND INITIATIVES ........................................ 31
3.1 Energy Security Board’s Post-2025 Market Design Review ............................................. 31
3.2 DER access and pricing Rule change ............................................................................... 32
3.3 Initiatives announced in the 2020-21 Victorian state budget ............................................. 34
3.4 System strength and voltage management issues............................................................ 36
3.5 AEMO review of Under Frequency Load Shedding .......................................................... 37
3.6 Developments on the Victorian transmission network ...................................................... 38
4 HISTORIC AND FORECAST DEMAND ..................................................................... 41
4.1.1 Basis of forecasts ................................................................................................. 41
4.1.2 Impact of rooftop PV on estimates of energy at risk ............................................. 41

2021 Joint DB Transmission Connection Planning Report
Page 2
5 PLANNING APPROACH AND OPTION ANALYSIS ................................................. 43
5.1 Introduction ........................................................................................................................ 43
5.2 Quantifying “energy at risk” ............................................................................................... 44
5.3 Assessing the costs of transformer outages ..................................................................... 45
5.4 Base reliability statistics for transmission plant ................................................................. 46
5.5 Availability of spare transformers ...................................................................................... 47
5.6 Treatment of Load Transfer Capability .............................................................................. 48
5.7 Detailed risk assessments and options for alleviation of constraints, by terminal station . 49
5.8 Interpreting the dates shown in the risk assessments ...................................................... 50
5.9 Connection arrangements for embedded generators who are registered participants ..... 50
APPENDIX: ESTIMATION OF BASIC TRANSFORMER RELIABILITY DATA AND EXAMPLE OF EXPECTED TRANSFORMER UNAVAILABILITY CALCULATION ............ 51
RISK ASSESSMENTS FOR INDIVIDUAL TERMINAL STATIONS (IN ALPHABETICAL ORDER) .............................................................................................................................. 56
ALTONA/BROOKLYN TERMINAL STATION (ATS/BLTS) 66 kV ............................................... 57
ALTONA WEST TERMINAL STATION (ATS West) 66 kV ......................................................... 63
BALLARAT TERMINAL STATION (BATS) 66 kV ....................................................................... 69
BENDIGO TERMINAL STATION (BETS) 22 kV ......................................................................... 75
BENDIGO TERMINAL STATION (BETS) 66 kV ......................................................................... 77
BROOKLYN TERMINAL STATION (BLTS) 22 kV ...................................................................... 82
BRUNSWICK TERMINAL STATION 22 kV (BTS 22 kV) ............................................................ 84
BRUNSWICK TERMINAL STATION 66 kV (BTS 66 kV) ............................................................ 86
CRANBOURNE TERMINAL STATION (CBTS) .......................................................................... 88
DEER PARK TERMINAL STATION (DPTS) 66 kV ..................................................................... 95
EAST ROWVILLE TERMINAL STATION (ERTS) ..................................................................... 101
FISHERMAN’S BEND TERMINAL STATION 66 kV (FBTS 66 kV) .......................................... 106
FRANKSTON TERMINAL STATION (FTS) .............................................................................. 108
GEELONG TERMINAL STATION (GTS) 66 kV ........................................................................ 110
GLENROWAN TERMINAL STATION 66 kV (GNTS 66 kV) ..................................................... 117
HEATHERTON TERMINAL STATION (HTS) ........................................................................... 119
HEYWOOD TERMINAL STATION (HYTS) 22 kV ..................................................................... 121
HORSHAM TERMINAL STATION (HOTS) 66 kV ..................................................................... 122
KEILOR TERMINAL STATION 66 kV (KTS 66 kV) ................................................................... 124
KERANG TERMINAL STATION (KGTS) 66kV & 22kV............................................................. 129
MALVERN 22 kV TERMINAL STATION (MTS 22 kV) .............................................................. 131
MALVERN 66 kV TERMINAL STATION (MTS 66 kV) .............................................................. 132
MORWELL TERMINAL STATION 66 kV (MWTS 66 kV) .......................................................... 134
MT BEAUTY TERMINAL STATION 66 kV (MBTS 66 kV) ........................................................ 140

2021 Joint DB Transmission Connection Planning Report
Page 3
RED CLIFFS TERMINAL STATION (RCTS) 22 kV .................................................................. 142
RED CLIFFS TERMINAL STATION (RCTS) 66 kV .................................................................. 144
RICHMOND TERMINAL STATION 22 kV (RTS 22 kV) ............................................................ 149
RICHMOND TERMINAL STATION 66 kV (RTS 66 kV) ............................................................ 151
RINGWOOD TERMINAL STATION 22 kV (RWTS 22 kV) ........................................................ 156
RINGWOOD TERMINAL STATION 66 kV (RWTS 66 kV) ........................................................ 158
SHEPPARTON TERMINAL STATION (SHTS) 66 kV ............................................................... 162
SOUTH MORANG TERMINAL STATION (SMTS 66 kV) ......................................................... 164
SPRINGVALE TERMINAL STATION (SVTS) ........................................................................... 171
TEMPLESTOWE TERMINAL STATION (TSTS) ....................................................................... 175
TERANG TERMINAL STATION (TGTS) 66kV .......................................................................... 180
THOMASTOWN TERMINAL STATION 66 kV (TTS 66 kV) ...................................................... 186
TYABB TERMINAL STATION (TBTS)....................................................................................... 188
WEMEN TERMINAL STATION (WETS) ................................................................................... 190
WEST MELBOURNE TERMINAL STATION 22 kV (WMTS 22 kV) .......................................... 192
WEST MELBOURNE TERMINAL STATION 66 kV (WMTS 66 kV) .......................................... 194
WODONGA TERMINAL STATION (WOTS 66 kV and 22 kV) .................................................. 196

2021 Joint DB Transmission Connection Planning Report
Page 4
EXECUTIVE SUMMARY
This document is a joint report on transmission connection planning in Victoria, prepared by the five Victorian electricity Distribution Businesses (“the DBs”)1, in accordance with the transmission connection planning requirements of Clause 3.4 of the Victorian Electricity Distribution Code and clause 5.13.2 of the National Electricity Rules (the Rules).
Under their Electricity Distribution Licences, the DBs have responsibility for planning and directing the augmentation of the facilities that connect their distribution systems to the shared transmission network2. The assets connecting the DBs’ distribution networks to the shared transmission network are known as transmission connection assets. Those assets provide prescribed transmission services in accordance with Chapter 6A of the Rules.
Apart from the connection assets at Deer Park terminal station, which are owned, operated and maintained by TransGrid, the transmission assets that provide DB connection services are located within terminal stations which are owned, operated, and maintained by AusNet Transmission Group.
The DBs apply a probabilistic planning approach to transmission connection assets, which is consistent with the approach applied by the Australian Energy Market Operator (AEMO) in planning the Victorian shared transmission network.3 This approach involves estimating the probability of a transmission connection asset outage, and weighting the costs of such an occurrence by its probability.
This calculation enables the assessment of:
• the expected amount (and value) of energy that will not be supplied under a ‘do nothing’ scenario, and
• whether it is economic to take action to reduce or eliminate the expected supply interruptions.
An important point to note about the use of a probabilistic approach is that it involves customers accepting the risk that there may be circumstances when the available terminal station capacity will be insufficient to meet demand, and significant load shedding could be required.
This report examines whether there is an emerging limitation at each terminal station and, if so, provides a description of the preferred network solution. In presenting this information, the report seeks non-network alternatives and provides an indication of the maximum annual payment that may be available for non-network proponents.
1 The five DBs are: Jemena Electricity Networks (Vic) Ltd, CitiPower Pty, Powercor Australia Ltd, United
Energy Distribution Pty Ltd, and AusNet Electricity Services Pty Ltd. AusNet Electricity Services is owned by AusNet Services, a diversified energy infrastructure business that also owns the Victorian electricity transmission system. Throughout this document “AusNet Transmission Group” refers to the transmission business of AusNet Services and “AusNet Electricity Services” refers to the electricity distribution business of AusNet Services.
2 The shared transmission network is the main extra high voltage network that provides or potentially provides supply to more than a single point. This network includes all lines rated above 66 kV and main system tie transformers that operate at two or three voltage levels above 66 kV.
3 See: http://www.aemo.com.au/-/media/Files/Electricity/NEM/Planning_and_Forecasting/Victorian_Transmission/2016/Victorian-Electricity-Planning-Approach.pdf

2021 Joint DB Transmission Connection Planning Report
Page 5
It is emphasised that this report does not present the detailed investment decision analysis that is required under the RIT-T. Rather, the report presents a high-level indication of the expected balance between capacity and demand at each terminal station over the forecast period, and the likely investment requirements. Accordingly, the analysis in this report is presented at a high level, noting that the Regulatory Investment Test for transmission (RIT-T) will need to be undertaken prior to any investment proceeding.
The table below summarises the analysis for each terminal station. Following the summary table is a map showing the approximate locations of the existing transmission to distribution connection terminal stations. The following points should be noted in relation to the information presented in the summary table:
• For each terminal station, an indication of the potential exposure4 for customers under the ‘do nothing’ option is provided, in accordance with DBs’ obligations under clause 3.4 of the Victorian Electricity Distribution Code.
• The demand forecasts used in the preparation of this report are set out in the 2021 Terminal Station Demand Forecasts, which are prepared by the DBs and published alongside this report.
• Expected unserved energy estimates are provided for two forecasts of annual maximum demand: the first forecast has a 10% probability of being exceeded, while the second forecast has a 50% probability of being exceeded.
• For each terminal station, the table identifies alternatives to network augmentation that may alleviate constraints.
• The analysis presented in this report may be subject to change as new information, including demand forecasts and project costs, becomes available.
In August 2021 the Australian Energy Market Commission (AEMC) made a Rule change5 that will introduce new obligations on DBs to provide export services to customers. Accordingly, the DBs recognise that this report should also identify any plans or opportunities to augment transmission connection assets to provide export services or improved access for embedded generators. Where applicable, this additional information is included in the individual terminal station risk assessments presented in this report.
4 Throughout this report, the terms “energy at risk” and “expected unserved energy” are used to provide an
indication of the magnitude, and potential impact of loss of load for each terminal station. Unless stated otherwise, in this report:
“Energy at risk” is, for a given forecast of demand, the total energy that would not be supplied from a terminal station if a major outage of a transformer occurs at that station in a specified year (where a “major outage” is defined as one that has a mean duration of 2.65 months) and no other mitigation action is taken. This measure provides an indication of the magnitude of loss of energy that would arise in the unlikely event of a major outage of a transformer.
“Expected unserved energy” is the energy at risk weighted by the probability of a major outage of a transformer (again, where a “major outage” is defined as one that has a mean duration of 2.65 months). This measure provides an indication of the amount of energy, on average, that will not be supplied in a year, taking into account the very low probability that one transformer at the station will not be available because of a major outage.
5 AEMC, Rule Determination, National Electricity Amendment (Access, Pricing and Incentive Arrangements for Distributed Energy Resources) Rule 2021, 12 August 2021.

2021 Joint DB Transmission Connection Planning Report
Page 6
In accordance with their obligations under the Rules to undertake joint planning, the DBs provide AEMO with the transmission connection point data for sites with limitations as specified in section 4.1 of the Australian Energy Regulator’s (AER’s) Transmission Annual Planning Report (TAPR) Guideline.
Parties seeking further information about any matter contained in this report should contact any one of the following people:
• Aaron O’Brien, Network Optimisation Manager, CitiPower / Powercor, phone 9683 4938.
• Justin Harding, Manager – Distribution Network Strategy and Planning, AusNet Services, phone 9695 6000.
• Roshanth Sivanathan, Head of Network Planning, United Energy, phone 8846 9528.
• Andy Dickinson, Future Network and Planning Manager, Jemena, phone 9173 7383.
Any of these contact officers will either be able to answer your queries or will direct you to the organisation that is best placed to provide you with the information you are seeking.

2021 Joint DB Transmission Connection Planning Report
Page 7
Summary of risk assessment and options for alleviation of constraints
Terminal Station
Indicative timing for
completion of preferred
Expected unserved energy for the year shown in the column to the left (in MWh, and valued at 2021 VCR)
Preferred network solution Indicative annual cost of preferred network solution
Potentially feasible non-network solutions
network solution (using
2021 VCR)
10th percentile demand forecast
50th percentile demand forecast
Altona – Brooklyn (ATS/BLTS)
Not before 2031 11.8 MWh in 2031 ($0.52 million)
3.23 MWh in 2031 ($0.14 million)
Install additional transformation capacity and reconfigure 66 kV exits at ATS or BLTS
$1.26 million Demand reduction; Local generation.
Altona no 3 & 4 (ATS West) 66 kV
2026 59.3 MWh ($2.0 million)
41 MWh ($1.39 million)
Install additional transformation capacity and reconfigure 66 kV exits at ATS.
$1.26 million Demand reduction; Local generation.
Ballarat (BATS) Not before 2031 35.8 MWh in 2031 ($1.26 million)
21.7 MWh in 2031 ($0.76 million)
Install a third 150 MVA 220/66 kV transformer.
$1.26 million Demand reduction; Local generation
Bendigo 22 kV (BETS 22 kV)
No demand-driven augmentation of capacity is expected to be required within the ten year planning horizon.
Bendigo 66 kV (BETS 66 kV)
Not before 2031 5.7 MWh ($0.21 million)
3.4 MWh ($0.12 million)
Install an additional 150 MVA 220/66 kV transformer.
$1.26 million Demand reduction; Local generation
Brooklyn 22 kV (BLTS 22 kV)
No demand-driven augmentation of capacity is expected to be required within the ten year planning horizon.
Brunswick 22 kV (BTS 22 kV)
No demand-driven augmentation of capacity is expected to be required within the ten year planning horizon.
Brunswick 66 kV (BTS 66 kV)
No demand-driven augmentation of capacity is expected to be required within the ten year planning horizon.
Cranbourne 66 kV (CBTS 66 kV)
Subject to RIT-T which is currently
underway, but likely to be 2024/25
42.3 MWh ($1.44 million)
in 2021/22
7.9 MWh ($0.27 million)
in 2021/22
Install a fourth transformer. After load transfers and emergency ties are taken into account, the optimal economic timing of augmentation is estimated to be around 2024/25
$1.8 million Demand reduction; Local generation.
Deer Park (DPTS)
2027 21.4 MWh ($0.81 million)
10.3 MWh ($0.39 million)
Procure a dedicated spare transformer. A RIT-T will be commenced in 2025/26.
$0.3 million Demand reduction; Local generation.

2021 Joint DB Transmission Connection Planning Report
Page 8
Terminal Station
Indicative timing for
completion of preferred
Expected unserved energy for the year shown in the column to the left (in MWh, and valued at 2021 VCR)
Preferred network solution Indicative annual cost of preferred network solution
Potentially feasible non-network solutions
network solution (using
2021 VCR)
10th percentile demand forecast
50th percentile demand forecast
East Rowville (ERTS)
No demand-driven augmentation of capacity is expected to be required within the ten year planning horizon.
There is a small amount of energy at risk under 10% POE conditions over the forecast period. However AusNet Transmission Group plans to replace two aged and poor condition transformers at ERTS (transformers B1 and B4) by 2024. After this replacement project is completed, the station’s N-1 rating will be increased so that there would be no energy at risk over the forward planning period. In the period prior to the completion of the transformer replacement project, the load at risk will be managed using contingency load transfers.
Fishermans Bend (FBTS)
No demand-driven augmentation of capacity is expected to be required within the ten year planning horizon
Frankston (FTS) No demand-driven augmentation of capacity is expected to be required within the ten year planning horizon.
Geelong (GTS) Not before 2031 26.2 MWh ($0.96 million)
10.2 MWh ($375,000)
Install a fifth transformer and reconfigure 66 kV exits at GTS.
$1.26 million Demand reduction; Local generation
Glenrowan (GNTS)
No demand-driven augmentation of capacity is expected to be required within the ten year planning horizon.
Heatherton (HTS) No demand-driven augmentation of capacity is expected to be required within the ten year planning horizon.
Horsham (HOTS) No demand-driven augmentation of capacity is expected to be required within the ten year planning horizon.
Heywood (HYTS 22 kV)
A 22 kV point of supply was established in late 2009, by utilising the tertiary 22 kV on 2 of the existing 3 x 500/275/22 kV South Australian / Victorian interconnecting transformers. The station presently supplies a small number of customers in the local area. There is sufficient capacity at the station to supply all expected 22 kV load over the forecast period, even with one transformer out of service.
Keilor (KTS) Not before 2031 0.26 MWh ($9,300)
Nil No augmentation of capacity is expected to be required within the ten year planning horizon, however if recent large load connection enquiries result in committed new connections, there may be a need to augment the transformation capacity at KTS. Over the forecast period, the risk to supply reliability will be mitigated through contingency plans to transfer load quickly, where possible, to adjacent terminal stations.
N/A Demand reduction; Local generation
Kerang (KGTS) No demand-driven augmentation of capacity is expected to be required within the ten year planning horizon.

2021 Joint DB Transmission Connection Planning Report
Page 9
Terminal Station
Indicative timing for
completion of preferred
Expected unserved energy for the year shown in the column to the left (in MWh, and valued at 2021 VCR)
Preferred network solution Indicative annual cost of preferred network solution
Potentially feasible non-network solutions
network solution (using
2021 VCR)
10th percentile demand forecast
50th percentile demand forecast
Malvern 22 kV (MTS 22 kV)
No demand-driven augmentation of capacity is expected to be required within the ten year planning horizon.
Malvern 66 kV (MTS 66 kV)
No demand-driven augmentation of capacity is expected to be required within the ten year planning horizon.
Mount Beauty (MBTS)
At times of high demand and with low output from Clover Power Station a transformer outage at MBTS could result in the loss of some customer load for a period of no more than 4 hours, as the “hot spare” transformer at the station is brought into service. At a cost of approximately $2 million, it would not be economic to install full switching of the hot spare transformer at MBTS during the 10 year planning horizon to eliminate this risk.
Morwell (MWTS) Demand at MWTS is forecast to decline slightly over the ten year planning period. Bairnsdale Power Station’s contract to provide network support services to AusNet Services expires in March 2022, but may be extended beyond that date. A feasible option would be to recontract network support services from Bairnsdale or another network support service provider in the area. AusNet Services published Stage 1, the non-network options report, of a regulatory investment test for distribution (RIT-D) to address sub-transmission limitations in the East Gippsland area. Subsequently, AusNet decided not to proceed with the RIT-D project given the rapidly changing generation proposals in the region. AusNet will re-evaluate the network constraints, and publish another RIT-D in future. Continued availability of Bairnsdale or other embedded generation network support over the ten year planning horizon will obviate the need for network augmentation.
Red Cliffs 22 kV (RCTS 22 kV)
With one transformer out of service there is sufficient capacity at the station to supply all expected load at the 50th percentile forecast over the whole
forecast period. Under 10th percentile forecast conditions, there is a small amount of load at risk from 2030 onwards, which can be managed by utilising load transfers away to adjacent zone substations.
Red Cliffs 66 kV (RCTS 66 kV)
Not before 2031 8.1 MWh ($0.34 million)
4.9 MWh ($0.2 million)
Demand-driven augmentation is unlikely to be economic over the ten year planning horizon. A contingency plan to transfer approximately 25 MVA from RCTS 66 to WETS will be implemented in the event of the loss of one of the RCTS 220/66 kV transformers. Connection of additional embedded generation may require a new transformer to ensure generation at N-1 can occur.
N/A Demand reduction; Local generation
Richmond 22 kV (RTS 22 kV)
No demand-driven augmentation of capacity is expected to be required within the ten year planning horizon.
Richmond 66 kV (RTS 66 kV)
Not before 2031 6.1 MWh ($0.25 million)
0.65 MWh ($26,400)
Install a fourth transformer at RTS 66 kV. $1.26 million Demand reduction Embedded generation

2021 Joint DB Transmission Connection Planning Report
Page 10
Terminal Station
Indicative timing for
completion of preferred
Expected unserved energy for the year shown in the column to the left (in MWh, and valued at 2021 VCR)
Preferred network solution Indicative annual cost of preferred network solution
Potentially feasible non-network solutions
network solution (using
2021 VCR)
10th percentile demand forecast
50th percentile demand forecast
Ringwood 22 kV (RWTS 22 kV)
No demand-driven augmentation of capacity is expected to be required within the ten year planning horizon.
Ringwood 66 kV (RWTS 66 kV)
At the 10th percentile temperature, for an outage of one 220/66 kV transformer at RWTS, there will be a minor amount of load at risk in 2021/22, however this risk will reduce as forecast demand declines throughout the planning horizon.
Shepparton (SHTS)
No demand-driven augmentation of capacity is expected to be required within the ten year planning horizon. However, connection of additional generation may require augmentation of transformer capacity, as the installed capacity of existing and approved generation is fast approaching the station (N-1) nameplate rating of 300 MVA when three transformers operate in parallel. The cost of any augmentation would either be met by the connecting generator(s), or would be recovered from load customers where a RIT-T demonstrates that the augmentation delivers net market benefits.
South Morang (SMTS)
Not before 2031 20 MWh in 2030/31 assuming
no generation from Somerton PS
($0.69 million)
8 MWh in 2030/31 assuming no
generation from Somerton PS ($0.28 million)
Install a third 225 MVA 220/66 kV transformer at SMTS.
$1.5 million (including the cost
of fault limiting reactors)
Demand reduction Embedded generation
Springvale (SVTS)
No demand-driven augmentation of capacity is expected to be required within the ten year planning horizon.
Templestowe (TSTS)
Not before 2031 2.9 MWh ($90,000)
0.1 MWh ($2,200)
Install a fourth 150 MVA 220/66 kV transformer at TSTS.
$1.4 million Demand reduction; Local generation
Terang (TGTS) 2027 58 MWh ($1.9 million)
34 MWh ($1.1 million)
Install a third 220/66 kV transformer (150 MVA) at TGTS
$1.26 million Demand reduction; Local generation
Thomastown (TTS)
No demand-driven augmentation of capacity is expected to be required within the ten year planning horizon.
Tyabb (TBTS) No demand-driven augmentation of capacity is expected to be required within the ten year planning horizon.
Wemen (WETS) No demand-driven augmentation of capacity is expected to be required within the ten year planning horizon. Input of generation connected to the station results in reverse power flows that approach the station’s (N) rating. AEMO has a constraint equation managing the terminal station transformer reverse loading. The generators are sent dispatch signals to reduce generation if the constraint equation binds. In addition, Powercor has a transformer overload protection scheme installed as a backup to the AEMO constraint equation. Connection of additional generation may require augmentation of transformer capacity, the cost of which would either be met by the connecting generator(s), or would be recovered from load customers where a RIT-T demonstrates that the augmentation delivers net market benefits.

2021 Joint DB Transmission Connection Planning Report
Page 11
Terminal Station
Indicative timing for
completion of preferred
Expected unserved energy for the year shown in the column to the left (in MWh, and valued at 2021 VCR)
Preferred network solution Indicative annual cost of preferred network solution
Potentially feasible non-network solutions
network solution (using
2021 VCR)
10th percentile demand forecast
50th percentile demand forecast
West Melb 22 kV (WMTS 22 kV)
No augmentation of capacity is expected to be required within the ten year planning horizon. Under joint plans developed by CitiPower and AusNet Transmission Group, existing load supplied from WMTS 22 kV will be transferred to adjacent stations to enable the retirement of all of the existing WMTS 22 kV systems by the end of 2026.
West Melb 66 kV (WMTS 66 kV)
No demand-driven augmentation of capacity is expected to be required within the ten year planning horizon.
Wodonga (WOTS)
Not before 2031 2.5 MWh in 2031 ($0.11 million)
excluding generation from Hume PS or any
other source
0.02 MWh in 2031 ($8,600) excluding
generation from Hume PS or any
other source
In view of the forecast level of expected unserved energy, there are currently no plans to implement a network solution within the ten year planning horizon.
N/A Demand management; Local generation

2021 Joint DB Transmission Connection Planning Report
Page 12
DP
TS

2021 Joint DB Transmission Connection Planning Report
Page 13
1 INTRODUCTION AND BACKGROUND
1.1 Purpose of this report
This is a joint report on transmission connection asset planning in Victoria, prepared by the five Victorian electricity Distribution Businesses (the DBs)6, in accordance with the requirements of clause 3.4 of the Victorian Electricity Distribution Code7 and clause 5.13.2 of the National Electricity Rules (the Rules)8.
It is emphasised that this report does not present detailed investment decision analyses. Rather, the report presents a high-level indication of the expected balance between capacity and demand at each terminal station9 over the 10 year forecast period, and the intervention actions that may be required to address an emerging major constraint.
Accordingly, this report provides a means of identifying those terminal stations where further consultation and detailed analysis (in accordance with the RIT-T) is required. This report also provides preliminary information on potential opportunities to prospective proponents of alternatives to network augmentations at terminal stations where remedial action may be required. Providing this information to the market should facilitate the efficient development of network and non-network solutions to best meet the needs of load customers.
1.2 Victorian joint planning arrangements for transmission connection assets
In Victoria:
• as explained in further detail in section 1.3.1 below, the DBs have responsibility for planning and directing the augmentation of the facilities that connect their distribution systems to the Victorian shared transmission network;10 and
• the Australian Energy Market Operator (AEMO) is responsible for planning and directing the augmentation of the shared transmission network.
It is noted that pursuant to Chapter 6A of the Rules, transmission connection assets are used to provide prescribed transmission services.
Figure 1 below provides an example to illustrate the distinction between the shared transmission network and transmission connection assets in a notional network. The
6 The five DBs are: Jemena Electricity Networks (Vic) Ltd, CitiPower, Powercor Australia, United
Energy, and AusNet Electricity Services Pty Ltd. AusNet Electricity Services is owned by AusNet Services, a diversified energy infrastructure business that also owns the Victorian electricity transmission system. Throughout this document “AusNet Transmission Group” refers to the transmission business of AusNet Services and “AusNet Electricity Services” refers to the electricity distribution business of AusNet Services.
7 Version 13, effective from July 2021.
8 Version 171 of the Rules was in force at the time of preparing this report.
9 A terminal station is a facility that connects a distribution network to the shared transmission network.
10 The shared transmission network is the main extra high voltage network that provides or potentially provides supply to more than a single point. That network includes all lines rated above 66 kV and main system tie transformers that operate at two or three voltage levels above 66 kV.

2021 Joint DB Transmission Connection Planning Report
Page 14
delineation between shared network and connection assets depends on high voltage switching configurations and other factors that may vary from one transmission connection point to another. Nonetheless, Figure 1 provides a useful illustration of the distinction between shared network and connection assets.
Figure 1: Shared network and connection assets in a notional network
In regions other than Victoria, Rule 5.2A of the Rules sets out arrangements to promote contestability in the provision of certain transmission connection services. Clause 5.1.2(c) of the Rules states:
“Rule 5.2A sets out obligations and principles relevant to connection and access to transmission networks and designated network assets. This includes the classification of certain services relating to assets relevant to connection as prescribed transmission services, negotiated transmission services and non-regulated transmission services. Rule 5.2A does not apply to the declared transmission system of an adoptive jurisdiction.”11
In Victoria, the framework under which connections to the transmission network occur is fundamentally different to the processes and principles set out in Rule 5.2A. This is because, as explained below, section 50C of the National Electricity Law authorises AEMO to exercise declared shared network functions in Victoria.
The transmission planning responsibilities of AEMO are set out in section 50C(1) of the National Electricity (South Australia) (National Electricity Law—Australian Energy Market Operator) Amendment Act 2009. Under that act, AEMO’s functions include:
“to plan, authorise, contract for, and direct, augmentation of the declared shared network, where the declared shared network is defined as “the adoptive jurisdiction’s [in this case, Victoria’s] declared transmission system excluding any part of it that is a connection asset within the meaning of the Rules”.
In accordance with clause 5.14.1(a)(1) of the Rules, AEMO and the DBs undertake joint planning to ensure the efficient development of the shared transmission and distribution networks, and the transmission connection facilities. To formalise these arrangements, the parties have agreed a Memorandum of Understanding (MoU).
The MoU sets out a framework for cooperation and liaison between AEMO and the DBs regarding the joint planning of the shared transmission network and transmission connection assets in Victoria. In particular, the MoU sets out the approach to be applied by AEMO and the DBs in the assessment of options to address limitations in a distribution network where one of the options consists of investment in dual function assets or
11 Italicised terms are defined in the Rules.

2021 Joint DB Transmission Connection Planning Report
Page 15
transmission investment, including connection assets and the shared transmission network. Under the MoU, the DBs and AEMO have agreed that subject to the thresholds set out in the Rules, joint planning projects should be assessed by applying the RIT-T.
The DBs also liaise regularly with AusNet Transmission Group to coordinate their transmission connection augmentation plans with AusNet Transmission Group’s asset renewal and replacement plans12.
1.3 DBs’ obligations as transmission connection planners
1.3.1 Victorian regulatory instruments
Clause 14 of each DB’s Distribution Licence states:
“The Licensee is responsible for planning, and directing the augmentation of, transmission connection assets to assist it to fulfil its obligations [to offer connection services and supply to customers] under clause 6.”13
The licence defines “transmission connection assets” as:
“those parts of an electricity transmission network which are dedicated to the connection of customers at a single point, including transformers, associated switchgear and plant and equipment.”
In accordance with their obligations under clause 3.1(b) of the Victorian Electricity Distribution Code, the DBs plan and direct the augmentation of the transmission connection assets in a way which minimises costs to customers taking into account distribution losses and transmission losses.
Clause 3.4 of the Victorian Electricity Distribution Code states:
“3.4.1 Together with each other distributor, a distributor must submit to the Commission a joint annual report called the ‘Transmission Connection Planning Report’ detailing how together all distributors plan to meet predicted demand for electricity supplied into their distribution networks from transmission connections over the following ten calendar years.
3.4.2 The report must include the following information:
(a) the historical and forecast demand from, and capacity of, each transmission connection;
(b) an assessment of the magnitude, probability and impact of loss of load for each transmission connection;
12 Chapter 5 of AEMO’s 2021 Victorian Annual Planning Report provides information on AusNet
Transmission Group’s plans regarding asset retirement, replacement and deratings. The report is available from AEMO | Victorian Annual Planning Report.
AusNet Transmission Services’ asset renewal plan is available from Microsoft Word - AusNet Services Asset Renewal Plan 2021_Final_131021 (aemo.com.au).
13 Section 3.2 explains that the AEMC’s August 2021 “Access, pricing and incentive arrangements for distributed energy resources” Rule determination introduces changes that will result in the DBs also having an obligation to provide export services to customers.

2021 Joint DB Transmission Connection Planning Report
Page 16
(c) each distributor’s planning standards;
(d) a description of feasible options for meeting forecast demand at each transmission connection including opportunities for embedded generation and demand management and information on land acquisition where the possible options are constrained by land access or use issues;
(e) the availability of any contribution from each distributor including where feasible, an estimate of its size, which is available to embedded generators or customers to reduce forecast demand and defer or avoid augmentation of a transmission connection; and
(f) where a preferred option for meeting forecast demand has been identified, a description of that option, including its estimated cost, to a reasonable level of detail.
3.4.3 Each distributor must publish the Transmission Connection Planning Report on its website and, on request by a customer, provide the customer with a copy. The distributor may impose a charge (determined by reference to its Approved Statement of Charges) for providing a customer with a copy of the report.”
The Victorian Electricity Distribution Code was amended in March 2008 to include an additional provision (clause 3.1A) relating to the security of supply of the Melbourne CBD. This provision establishes a separate planning process that applies to the network supplying the Melbourne CBD only.
In accordance with this provision, CitiPower is implementing a CBD security of supply upgrade plan to ensure that the electricity network supplying the Melbourne CBD is 'N-1 Secure'. Under this standard, CitiPower must maintain supply after the loss of two 66 kV cable elements, with an allowance of 30 minutes switching time after the loss of the first element.
CitiPower has completed the 66 kV works required under the CBD security of supply upgrade plan. In accordance with the plan, a new Waratah Place zone substation was commissioned in June 2020 and new 66 kV cables have been constructed and reconfigured to provide the security needed to maintain supply from alternate supply points at West Melbourne Terminal Station and Brunswick Terminal Station for the loss of two 66kV sub-transmission cables. Details of the Waratah Place project are available from CitiPower’s website at the following web page:
https://www.powercor.com.au/media-and-resources/media-centre/media-release-historic-laneway-reopens-to-join-outdoor-dining-revolution-after-major-power-upgrade-works
Due to load growth in the southwest of Melbourne CBD, CitiPower is planning to rebuild the existing zone substation at Tavistock Place (TP). Elements of the new zone substation are required as part of the Melbourne CBD security program which seeks to increase resilience into the 66 kV sub-transmission network given the critical nature of reliable electricity supply to the area. The new TP zone substation with new distribution feeders will provide sufficient transfer capacity at 11 kV to meet the requirements of ‘N-1 Secure’.
Since the onset of the COVID pandemic, CitiPower has observed reductions in the peak demand on the Melbourne CBD network, due to the shutdown of retail businesses and restricted access to offices. Furthermore, the load uptake of the new commercial and residential developments in the CBD had slowed down during the lockdown. As a result, the load at risk under the ‘N-1 secure’ scenario is now lower than previously forecast. Currently, the TP rebuild project is being reviewed and the project’s timing is yet to be confirmed.

2021 Joint DB Transmission Connection Planning Report
Page 17
1.3.2 National Electricity Rules
Part D of Chapter 5 of the Rules14 sets out provisions governing the planning and development of networks. These provisions require, amongst other things, Transmission and Distribution Network Service Providers to:
• prepare and publish annual planning reports;
• consult with interested parties on the possible options, including but not limited to demand side options, generation options and market network service options to address any projected network limitations; and
• undertake analysis of proposed network investments using the Regulatory Investment Test for Distribution or the RIT-T, as appropriate.
As noted in section 1.2, the DBs and AEMO have agreed that joint planning projects involving transmission connection and distribution investment should be assessed by applying the RIT-T.
Clause 5.13.2 of the Rules requires Distribution Network Service Providers to publish a Distribution Annual Planning Report (DAPR). The DAPR must contain the information specified in schedule 5.8 of the Rules, unless that information is provided in accordance with jurisdictional electricity legislation15.
Pursuant to clause 5.13.2(d) of the Rules, this Transmission Connection Planning Report presents all of the information on transmission-distribution connection planning required under schedule 5.8. The table below lists the relevant clauses of schedule 5.8 and provides a cross reference to the section of this report where the required information is presented.
Table 1A: Schedule 5.8 requirements relating to transmission-distribution connection points addressed in this report
Schedule 5.8 clause
Matters addressed Where the information is presented in this report
S5.8(b)(1) A description of the forecasting methodology used.
Section 2.
S5.8(b)(2)(i), (iv), (v), (vi), (vii), (viii), and (ix)
Load forecasts and forecasts of capacity. Section 4, Section 5.6 and individual risk assessments for each terminal station.
S5.8(b)(3) Forecasts of future transmission-distribution connection points and any associated connection assets.
The Executive Summary and individual risk assessments for each terminal station.
14 Version 171 of the Rules was in force at the time of preparing this report.
15 Clause 5.13.2(d) of the Rules states: “a Distribution Network Service Provider is not required to include in its Distribution Annual Planning Report information required in relation to transmission-distribution connection points if it is required to do so under jurisdictional electricity legislation.”

2021 Joint DB Transmission Connection Planning Report
Page 18
Schedule 5.8 clause
Matters addressed Where the information is presented in this report
S5.8(h) The results of joint planning undertaken with Transmission Network Service Providers.
Section 1.2 describes the joint planning arrangements. The Executive Summary and individual risk assessments for each terminal station present the joint planning results.
S5.8(i)(1) The results of joint planning undertaken with other Distribution Network Service Providers.
As above
1.3.3 Service Target Performance Incentive Scheme for the Distribution Businesses
Version 2.0 of the Service Target Performance Incentive Scheme (STPIS)16 applies to the DBs. The STPIS provides a revenue bonus when service performance is better than target, and a penalty when service performance is worse than target.
The operation of the STPIS relates to the distribution network, and therefore is not directly relevant to the reliability of the transmission system. However, under clause 3.3(a)(6) of the STPIS, the DBs are exposed to financial penalties if load interruptions are caused by a failure of transmission connection assets, where the interruptions are due to inadequate planning of transmission connections and the distributor is responsible for transmission connection planning.
The financial incentives under these arrangements reinforce the DBs’ responsibilities with respect to transmission connection planning, which are set out in the Distribution Licences and the Victorian Electricity Distribution Code as explained in section 1.3.1 above.
1.3.4 Role of transmission connection asset owners in delivering connection services
With the exception of the connection assets at the Deer Park Terminal Station, the transmission assets that provide DB connection services are located within terminal stations which are owned, operated, and maintained by AusNet Transmission Group17. Connection services are provided by the owners of the transmission connection assets in accordance with their connection agreements with the relevant DBs. These agreements set out, amongst other things, the standard of connection services to be provided.
In addition, the revenue caps applying to AusNet Transmission Group and TransGrid also contain a Service Target Performance Incentive Scheme, which provides the transmission connection asset owners with a financial incentive to improve service performance.
16 AER, Electricity Distribution Network Service Providers - Service Target Performance Incentive
Scheme, Version 2.0, November 2018.
17 The connection assets at Deer Park Terminal Station were commissioned in September 2017, and are owned, operated and maintained by TransGrid.

2021 Joint DB Transmission Connection Planning Report
Page 19
1.4 Matters to be addressed by proponents of non-network alternatives
One purpose of this document is to provide information to proponents of non-network solutions (such as embedded generation, storage or demand-side management) regarding emerging network constraints. As noted in further detail in Chapter 2 below, the DBs aim to develop their networks and the associated transmission connection assets in a manner that minimises total costs (or maximises net economic benefit). To this end, proponents of non-network solutions to the emerging network constraints identified in this report are encouraged to lodge expressions of interest with the relevant DB(s).
Proponents of non-network proposals should make initial contact with the relevant DB as soon as possible, to ensure that sufficient time is available to the DB to fully assess feasible network and non-network potential solutions, having regard to the lead times associated with the evaluation, planning and implementation of various options. Indicative timeframes for the network solutions are provided in the table in the Executive Summary.
To assist in the assessment of non-network solutions, proponents are invited to make a detailed submission to the relevant DB. That submission should be informed by earlier discussions with the relevant DB, and should include all of the following details about the proposal, including:
(a) proponent name and contact details;
(b) a detailed description of the proposal;
(c) electrical layout schematics;
(d) a firm nominated site;
(e) capacity in MW and MVAr to be provided and number of units to be installed (if applicable);
(f) fault level contribution, load flows, and stability studies (if applicable);
(g) a commissioning date with contingency specified;
(h) availability and reliability performance benchmarks;
(i) network interface requirements (as agreed with the relevant DBs);
(j) the economic life of the proposal;
(k) banker / financier commitment;
(l) proposed operational and contractual arrangements that the proponent would be prepared to enter into with the relevant DBs;
(m) any special conditions to be included in a contract with the responsible DBs; and
(n) evidence of a planning application having been lodged, where appropriate.
All proposals must satisfy the requirements of any applicable Codes and Regulations.
In addition, as a general rule of thumb, any network reinforcement costs required to accommodate the non-network solution will typically be borne by the proponent(s) of the non-network project. Some non-network alternatives such as embedded generation may

2021 Joint DB Transmission Connection Planning Report
Page 20
raise issues relating to fault level control. In particular, connection of additional embedded generators will result in an increase in fault levels. Therefore, fault level mitigation measures may be required, in which case the proponents of embedded generation projects will bear the costs of fault level mitigation works.
1.5 Implementing Transmission Connection Projects
In the absence of any commitment by interested parties to offer non-network solutions such as embedded generation, storage or demand-side management, the process to implement the preferred network solution will commence. A brief description of the implementation process for network solutions and the issues involved is presented below.
1.5.1 Land Acquisition
Network solutions may require land acquisition. The process of land acquisition for new terminal stations may be complex especially in metropolitan areas. A detailed consideration of land acquisition issues and processes is beyond the scope of this report.
A limited number of vacant sites, currently owned by AusNet Transmission Group, have been reserved for possible future terminal station development in Victoria. DBs would need to seek AusNet Transmission Group’s consent to use any reserved land for transmission connection development.18
The granting of a town planning permit on lands reserved for future terminal station development is by no means certain. In some municipalities, town planning approval may also be required for network augmentation on existing developed sites.
1.5.2 Connection Application to AEMO
Where a network solution requires new connection points with the shared transmission network to be established, a connection agreement with AEMO is required in accordance with clause 5.3 (Establishing or Modifying Connection) of the National Electricity Rules. As noted in section 1.2, the assets that form part of the Victorian declared shared transmission network fall under the planning jurisdiction of AEMO.
Hence, issues associated with 220 kV switching arrangements and connection to the shared transmission network, including direct connection to a 66 kV terminal station bus, would be clarified with AEMO at the connection application stage.
It is also noted that AEMO’s requirements regarding new connections must be finalised through a joint planning process involving AEMO and the relevant DBs. These activities can increase the lead time for delivery of projects by some months.
For augmentations to existing connection points, a connection application to AEMO may be required so that the effect on the shared transmission network, if any, can be taken into consideration. In some cases, AEMO and the relevant DBs may undertake a public consultation process in relation to the proposed development, in addition to the
18 Electricity Industry Guideline No. 18 (Augmentation and Land Access Guidelines) issued by the ESC
on 1 April 2005 may govern access to such sites, in some circumstances. See: https://www.esc.vic.gov.au/electricity-and-gas/electricity-and-gas-codes-guidelines-policies-and-manuals

2021 Joint DB Transmission Connection Planning Report
Page 21
consultation processes that must be undertaken if the RIT-T applies. Similar to new connections, AEMO’s requirements regarding any augmentation of shared transmission network assets must be finalised through a joint planning process involving AEMO and the relevant DBs.
A more detailed overview of the Victorian transmission connections process is available from AEMO’s web page at: https://aemo.com.au/energy-systems/electricity/national-electricity-market-nem/participate-in-the-market/network-connections/victorian-transmission-connections.
1.5.3 Connection Application to AusNet Transmission Group
It is most likely that establishment of new transmission connections, or augmentation of existing transmission connections will require interface to transmission assets owned by AusNet Transmission Group. In such cases, an initial “Connection Inquiry” outlining the broad scope of service sought should be submitted to AusNet Transmission Group, followed by a “Connection Application” when the scope of the service has been accurately defined in consultation with AEMO and the relevant DB(s).
1.5.4 Town Planning Permit
For greenfield sites, DBs may need to engage the services of experienced town planning consultants, because very extensive planning requirements are usually laid down by local planning authorities. In most cases, the town planning permit application would need to be accompanied by extensive supporting documents such as:
• flora and fauna study;
• archaeological and cultural assessment;
• noise study;
• electromagnetic field (EMF) assessment;
• traffic analysis;
• layouts and elevation plans; and
• landscaping and fencing plans.
The choice of appropriate town planning consultants is very important, as they may need to provide expert witness statements to the Victorian Civil and Administrative Tribunal (VCAT) if objections to the transmission connection application are received. Due to the possibility of simultaneous shared network development by AEMO on the same site, it may become necessary to invite AEMO to participate in the town planning process at the same time so that both the council and the public are made aware of the entire proposed development on the site.
For augmentation to existing transmission connection assets, the requirement for a town planning permit varies from council to council, and depends on the extent of the proposed work. AusNet Transmission Group is likely to be the initiator of the planning permit application for augmentation work at an existing terminal station.

2021 Joint DB Transmission Connection Planning Report
Page 22
1.5.5 Public Consultation Strategy
A key aspect of the public consultation strategy is the positive engagement of various stakeholders in the project from the initial stages of the development. The strategy may include:
• distribution of leaflets that provide information on the proposal in clear, concise, non-technical language to every nearby resident;
• presentations to the councillors of the local municipality and the local members of parliament; and
• public consultation such as display stands in local shopping centres to highlight the need for the project and the resultant benefits to the community, and invitation of public comments on the proposal.
Feedback from stakeholders is then considered in the design of the transmission connection work to ensure the resultant project is acceptable to the local community.
1.5.6 Project Implementation
As noted in section 1.3.1, the DBs are required by the Victorian Electricity Distribution Code to augment the transmission connections in a way which minimises costs to customers. This can be achieved by a variety of means, including competitive tendering and cost benchmarking.
Transmission connection augmentation works will be arranged by the relevant DBs in accordance with the requirements of any applicable guidelines.
1.5.7 Project lead times
The lead-time required for the implementation of connection asset augmentation projects depends on the number of interdependent activities involved in the project, and varies from between 3 to 5 years.
The critical path activities in the delivery of such projects include the following:
• Finalisation of any requirements for shared network augmentation due to planned connection asset augmentation works. These requirements are assessed through the joint planning process, which involves AEMO, AusNet Transmission Group and the DBs in Victoria.
• Procurement of a planning permit in relation to the proposed works. In order to obtain planning consent for proposed works, the statutory planning requirements of the local council(s) must be met, and community expectations must be addressed. For connection asset augmentations involving either major augmentations on an established site or the development of new terminal station(s) on new site(s), a period of at least 24 to 36 months is required for land planning and associated community issues to be resolved. The timely completion of this task requires effective coordination and cooperation between AEMO, AusNet Transmission Group and the DBs through the joint planning process in Victoria.

2021 Joint DB Transmission Connection Planning Report
Page 23
• After completing the above two tasks successfully, the next important tasks are:
• finalisation of the scope of works;
• preparation of cost estimates (including invitation to tender if the project is contestable); and
• finalisation and execution of all contracts and agreements between distribution and transmission network service providers after obtaining all the necessary internal business approvals.
Once the project contracts are signed, the next important task is the delivery of the project itself, including installation and commissioning of the assets into service.
AusNet Transmission Group’s recent experience indicates that the lead-time required for the delivery of a connection asset augmentation involving power transformers is between 18 and 24 months. In some cases, issues identified during testing of completed units may further extend the overall process.
In view of this, for planning purposes it is assumed that approximately 24 months would be required to procure, install and commission power transformers from the time that a commercial contract is signed between the parties to complete the project works.

2021 Joint DB Transmission Connection Planning Report
Page 24
1.6 Overview of Transmission Connection Planning Process
The flow chart below provides a summary of the transmission connection planning and augmentation process under the regulatory framework which applies to the Victorian DBs.

2021 Joint DB Transmission Connection Planning Report
Page 25
2 PLANNING STANDARDS
2.1 Planning standard applying to transmission connection assets
Clause 3.4.2(c) of the Victorian Electricity Distribution Code requires this report to set out the planning standards applying to transmission connection assets.
The planning standard applied by the DBs is the RIT-T, the purpose of which is set out in clause 5.15A.1(c) of the Rules as follows:
“The purpose of the regulatory investment test for transmission […] is to identify the credible option that maximises the present value of net economic benefit to all those who produce, consume and transport electricity in the market (the preferred option). For the avoidance of doubt, a preferred option may, in the relevant circumstances, have a negative net economic benefit (that is, a net economic cost) to the extent the identified need is for reliability corrective action or the provision of inertia network services required under clause 5.20B.4 or the provision of system strength services required under clause 5.20C.3.”
Clause 5.10.2 of the Rules defines “reliability corrective action” as follows:
“Investment by a Transmission Network Service Provider or a Distribution Network Service Provider in respect of its transmission network or distribution network for the purpose of meeting the service standards linked to the technical requirements of schedule 5.1 or in applicable regulatory instruments and which may consist of network options or non-network options.”
The terms “applicable regulatory instruments” is defined in the Rules as follows:
“All laws, regulations, orders, licences, codes, determinations and other regulatory instruments (other than the Rules) which apply to Registered Participants from time to time, including those applicable in each participating jurisdiction as listed below, to the extent that they regulate or contain terms and conditions relating to access to a network, connection to a network, the provision of network services, network service price or augmentation of a network.”
Under the definition contained in the Rules, “applicable regulatory instruments” in Victoria include:
• the Electricity Industry Act 2000 (EI Act);
• all regulations made and licences (Licences) issued under the EI Act;
• the Essential Services Commission Act 2001 (ESCV Act);
• all regulations and determinations made under the ESCV Act;
• all regulatory instruments applicable under the Licences; and
• the Tariff Order made under section 158A(1) of the Electricity Industry Act 1993 and continued in effect by clause 6(1) of Schedule 4 to the Electricity Industry (Residual Provisions) Act 1993, as amended or varied in accordance with section 14 of the Electricity Industry Act.

2021 Joint DB Transmission Connection Planning Report
Page 26
Further background information on the planning standard applying to transmission connection assets, and the probabilistic planning approach applied by the DBs for the purpose of evaluating net economic benefits is set out in sections 2.2 to 2.5 below.
2.2 Overall objective of transmission connection planning
The planning standards and criteria applied in network development are a significant determinant of network-related costs. Costs associated with transmission connection facilities can be considered to be comprised of two parts:
• the direct cost of the service (as reflected in network charges and the costs of losses); and
• indirect costs borne by customers as a consequence of supply interruptions caused by network faults and / or insufficient network capacity.
The DBs aim to develop transmission connection facilities in an efficient manner that minimises the total (direct plus indirect) life-cycle cost of network services. This basic concept is illustrated in Figure 2 below.
Figure 2: Balancing the direct cost of service and the indirect cost of interruption
In accordance with the requirements of the RIT-T, the DBs’ transmission connection investment decisions aim to maximise the net present value to the market as a whole, having regard to the costs and benefits of non-network alternatives to augmentation. Such alternatives include, but are not necessarily limited to, demand-side management and embedded generation.
Supply reliability
Cost
Cost to customer of
supply interruptions
Cost of providing
reliability
Total cost
Optimum level of
supply reliability
Minimum
total cost

2021 Joint DB Transmission Connection Planning Report
Page 27
2.3 Overall approach to transmission planning and investment evaluation
In Victoria, pursuant to section 50F(2)(b) of the National Electricity Law, AEMO applies a probabilistic approach19 to planning the shared transmission network20.
Under the probabilistic approach, deterministic standards (such as N-1) are not applied. Instead, simulation studies are undertaken to assess the amount of energy that would not be supplied if an element of the network is out of service. The application of this approach can lead to the deferral of transmission capital works that might otherwise proceed if a deterministic standard were strictly applied. This is because:
• in a network planned using the probabilistic approach, there may be conditions under which some or all of the load cannot be supplied with a network element out of service (hence the N-1 standard is not met); however
• under these conditions, the value of the energy that is expected to be not supplied is not high enough to justify additional investment, taking into account the probability of a forced outage of a particular element of the transmission network.
However, implicit in the use of a probabilistic approach is acceptance of the risk that there may be circumstances (such as the loss of a transformer during a high demand period) when the available terminal station capacity will be insufficient to meet actual demand, and significant load shedding could be required.
In Victoria, the jurisdiction has not set deterministic standards applying to transmission connection assets. However, clause 5.2 of the Victorian Electricity Distribution Code sets out the following requirements relating to reliability of supply:
“A distributor must use best endeavours to meet targets required by the Price Determination and targets published under clause 5.1 and otherwise meet reasonable customer expectations of reliability of supply.”
In light of these considerations and the requirements of the RIT-T, the DBs apply probabilistic planning and economic investment decision analysis to transmission connection assets, subject to meeting the technical and other standards set out in the Rules and other applicable regulatory instruments including the Victorian Electricity Distribution Code.
2.4 VCR: Valuing supply reliability from the customers’ perspective
In order to determine the economically optimal level and configuration of connection capacity (and hence to deliver a level of supply reliability that will meet customers’
19 A copy of the Victorian transmission planning criteria can be obtained from AEMO’s web site at:
http://www.aemo.com.au/-/media/Files/Electricity/NEM/Planning_and_Forecasting/Victorian_Transmission/2016/Victorian-Electricity-Planning-Approach.pdf
20 As explained in section 1, the “shared transmission network” is the Victorian transmission system, excluding the transmission facilities that connect the distribution networks (and the generators) to the high voltage network. The distribution businesses are responsible for the planning and development of the transmission facilities that connect their distribution networks to the shared transmission network. These arrangements are set out in the distribution licences issued by the ESC.

2021 Joint DB Transmission Connection Planning Report
Page 28
reasonable expectations) it is necessary to place a value on supply reliability from the perspective of customers. This is referred to as the value of customer reliability (VCR).
Under clause 8.12 of the Rules, the AER is responsible for developing and publishing a VCR methodology and VCR estimates.
For the purpose of this 2021 Transmission Connection Planning Report, the DBs have applied the VCR sector estimates set out in Tables 1.1 to 1.5 of the AER’s December 2019 Final Report on VCR Values, escalated in accordance with Table A1.3 (Methodology for annual adjustment mechanism) of the Final Report.21
Table 1 below presents a summary of the sector VCR estimates that are used in this Transmission Connection Planning Report.
Table 1: VCR estimates by sector
Sector VCR for 2021 ($/kWh)
Source: AER’s Final Report on VCR values, December 2019
Residential (Victoria) 21.5822
Commercial (NEM) 44.83
Agricultural (NEM) 38.13
Industrial (NEM) 64.2323
It is noted that the AER’s estimates were determined prior to the COVID-19 pandemic, which may affect future VCR estimates. For example since December 2019, there has been a significant increase in the number of people working from home, so the AER’s current estimate of the residential VCR may be understated.24
The AER’s Final Report provides the following guidance on how the VCR should be applied25:
21 AER, Final Report on VCR values, December 2019, available at https://www.aer.gov.au/networks-
pipelines/guidelines-schemes-models-reviews/values-of-customer-reliability/final-decision
22 The Victorian residential VCR is estimated for four different climate zones, as shown in Table 1.1 of the AER’s Final Report. For simplicity, the value shown here is the composite Victorian residential VCR as per Table 1.2 of the AER’s Final Report.
23 For customers with a maximum demand below 10 MVA, as per Table 1.3 of the AER’s Final Report on VCR values, December 2019.
24 These considerations underscore the importance of sensitivity testing in investment decision analyses such as the RIT-T. It is noted that section 7.2 (page 84) of the AER’s Final Report suggests that sensitivity ranges of up to +/- 30 per cent of VCR estimates could be used.
25 AER, Final Report on VCR Values, December 2019, page 10.

2021 Joint DB Transmission Connection Planning Report
Page 29
“When applying the VCR, the value used should be reflective of the customer composition on the network. For example, network investment decisions should use a VCR reflective of the composition of customer types located on the feeder or substation, rather than the VCR for the region, to properly consider the competing tensions of reliability and affordability.”
In accordance with the AER’s guidance, this report applies VCR values for each terminal station that reflect the composition of station energy consumption by sector.
2.5 Application of the probabilistic approach to transmission connection planning
The probabilistic approach involves estimating the probability of a plant outage occurring, and weighting the costs of such an occurrence by its probability to assess:
• the expected cost that will be incurred if no action is taken to address an emerging constraint,26 and
• whether it is economic to augment terminal station capacity to reduce expected supply interruptions.
The quantity and value of energy at risk is a critical parameter in assessing a prospective network investment or other action in response to an emerging constraint.
Probabilistic network planning aims to ensure that an economic balance is struck between:
• the cost of providing additional network capacity to remove constraints; and
• the cost of having some exposure to loading levels beyond the network’s capability.
In particular, the probabilistic approach recognises that very high loading conditions may occur for only a few hours in each year, so it may be uneconomic to provide additional capacity to cover the possibility that a network plant outage could occur under conditions of very high loading.
The probabilistic approach therefore requires expenditure to be justified with reference to the expected benefits of lower volumes of unserved energy. This approach provides a reasonable estimate of the expected net present value to consumers of terminal station augmentation for planning purposes. However, as already noted, implicit in its use is acceptance of the risk that there may be circumstances (such as the loss of a transformer during a high demand period) when the available terminal station capacity will be insufficient to meet actual demand, and significant load shedding could be required.
The level of investment that should be committed to mitigate that risk is ultimately a matter of judgment, having regard to:
• the results of studies of possible outcomes, and the inherent uncertainty of those outcomes;
26 The energy that would not be supplied in the event of an interruption is valued in accordance with
the approach outlined in Section 2.4 above.

2021 Joint DB Transmission Connection Planning Report
Page 30
• the potential costs and other impacts that may be associated with very low probability events, such as single or coincident transformer outages at times of peak demand, and catastrophic plant failure leading to increased safety risk, increased risk of property damage, and/or extended periods of plant non-availability;
• the availability and technical feasibility of cost-effective contingency plans and other arrangements for management and mitigation of risk; and
• the Victorian DBs’ obligation (under clause 5.2 of the Victorian Electricity Distribution Code) to use best endeavours to meet, among other things, reasonable customer expectations of reliability of supply.

2021 Joint DB Transmission Connection Planning Report
Page 31
3 RECENT MARKET DEVELOPMENTS AND INITIATIVES
This chapter highlights recent developments in the electricity sector that may have a bearing on the DBs’ transmission connection planning activities. While such matters are considered routinely in preparing this report, the DBs recognise that stakeholders may value a short discussion of recent developments and how they relate to transmission connection planning.
3.1 Energy Security Board’s Post-2025 Market Design Review
In July 2021, the Energy Security Board (ESB) finalised its advice to Energy Ministers on its Post-2025 Market Design Review, following a request from the former Council of Australian Governments Energy Council. The context for the review is a recognition that the existing wholesale energy market may not be ‘fit for purpose’, given the rapid changes that are taking place across the electricity sector, as we move to a lower carbon economy.
The ESB highlights four key drivers of the current transition:27
• First, the dramatic and continuing increase in the supply of renewable energy driven by government policy and renewable energy targets. The government schemes incentivise the entry of both large-scale wind and solar generation and small-scale solar PV systems (by commercial investors and households).
• Second, much of the current thermal generation fleet is ageing and faces declining commercial viability. Variable renewable generation, with zero fuel costs, puts downward pressure on wholesale energy prices, reducing revenues for much of the existing thermal fleet. Together with the higher operating and maintenance costs of the ageing thermal fleet, there is significant pressure on this less economic generation to exit the market.
• Third, technology costs for renewable and storage resources, both large and small scale, are falling rapidly. These cost reductions, coupled with zero fuel costs and low operational costs, make this new technology highly competitive when compared with the costs of investing in more traditional forms of generation. Battery costs have fallen substantially and continue to drive consumer uptake of electric vehicles and home storage systems that complement small scale solar PV systems. Digitalisation drives technology advances that will radically change not only how energy is produced, but how it is used by consumers.
• Fourth, an increasing number of households and business customers have made investments in DER (such as solar panels, batteries, and smart appliances). With the new technology now available, customers can be rewarded for their export of electricity, their ability to manage their load across the day, and for their provision of services to the network. If managed well, integration of DER into the system will benefit the owners of the DER resources as well as the system as a whole.
The ESB has developed a series of reforms with the objective of promoting a secure, reliable, and efficient energy transition while maintaining affordability for customers. The ESB’s advice to Energy Ministers is organised across four reform pathways:
27 Energy Security Board, Post-2025 Market Design Final advice to Energy Ministers Part A, 27 July
2021 page 13.

2021 Joint DB Transmission Connection Planning Report
Page 32
• Resource adequacy mechanisms: to provide the right incentives to drive investment in an efficient mix of resources (that is variable renewables, storage, and flexible and firm generation) to minimise costs and maintain reliability;
• Essential system services and ahead scheduling: to ensure that the essential services required (frequency, control, operating reserves, inertia and system strength) are available to maintain system security;
• Integration of DER and flexible demand: to deliver benefits to customers through the integration of rooftop solar, battery storage, smart appliances, electric vehicles (EVs), and other distributed energy resources into the system in an efficient way; and
• Transmission and access: to ensure timely transmission investment, better use of capacity on the network to lower costs for consumers and reduce uncertainty for investors by making future patterns of congestion more predictable.
In the context of this Transmission Connection Planning Report, the ESB’s recommendations do not have any immediate impact on the DBs’ transmission connection planning. In the medium term, however, the impact of these reforms on the way that the transmission and distribution networks are used may affect future transmission connection requirements.
For example, potential enhancements in the integration of DER in the wholesale market, together with the projected increases in electric vehicles and domestic storage, may drive significant changes on the Victorian distribution networks, with consequential impacts on transmission connection assets.
In the shorter term, the DBs will continue to monitor the post-2025 market design reform program to ensure that these initiatives are fully understood and factored into our planning considerations.
3.2 DER access and pricing Rule change
On 12 August 2021, the AEMC made a final determination on its “Access, pricing and incentive arrangements for distributed energy resources” Rule change28. The revised rules aim to integrate DER (such as small-scale solar and batteries) more efficiently into the electricity grid.
The revised rules, which generally come into effect during 2021 and 2022, have the following key components:29
• Clear obligations on distribution businesses to support more DER connecting to the grid:
− Clarification that export services are part of the core services to be provided by distribution businesses;
28 AEMC, Rule Determination, National Electricity Amendment (Access, Pricing and Incentive
Arrangements for Distributed Energy Resources) Rule 2021, 12 August 2021.
29 Source: https://www.aemc.gov.au/rule-changes/access-pricing-and-incentive-arrangements-distributed-energy-resources

2021 Joint DB Transmission Connection Planning Report
Page 33
− Removing complete export bans: distributors will not be able to offer a static zero export limit to a small customer who is seeking to connect DER to the network, unless exemptions apply;
− Requiring distribution businesses to plan for the provision of export services and explicitly explain their approach to DER integration in their regulatory proposals; and
− Extending the existing planning and investment arrangements to exports, giving the AER the ability to review distribution businesses’ expenditure plans.
• Enabling distribution businesses to offer a range of options to encourage solar owners to limit solar waste, save money and benefit the grid:
− Removing the existing prohibition on distribution businesses from developing export pricing options, which can help get more out of the network infrastructure;
− Requiring all distribution businesses to offer a basic export level (which requires no or minimal augmentation) in all their tariffs without charge for 10 years; and
− Introducing new customer safeguards to help the transition to export pricing;
• Strengthening customer protections and regulatory oversight by the AER:
− Distribution businesses will be required to consult widely and test and trial the options they put forward using Export Tariff Guidelines to be developed by the AER; and
− The AER is required to consider a number of initiatives, including a review of the incentive arrangements for distribution businesses to deliver efficient levels of export service and performance.
The Rule determination also requires each distributor to report forecast embedded generation-related network limitations in their DAPR, to complement the existing reporting of load-related network limitations.
In relation to the transmission-distribution connection points30, each distributor must publish forecasts of use of distribution services by embedded generating units, including:
• total hosting capacity to accept supply from embedded generating units;
• firm delivery hosting capacity for each period during the year;
• peak power export into the distribution network from embedded generating units, and the hours per year that 95% of this peak is reached; and
• power factor at the time of peak export.
30 The same information must also be provided at the sub-transmission line, zone substation, and
primary distribution feeder levels of the network.

2021 Joint DB Transmission Connection Planning Report
Page 34
In addition, the details of each specific embedded generation-related network limitation needs to be reported. This includes reporting the extent of the limitation, the types of potential solutions to address the limitation, and the reduction in export needed to defer the forecast limitation by one year.
Under the Rule change, the AER is required to develop customer export curtailment values (“CECV”), which are an estimate of the cost to customers and the market of the curtailment of exports. CECVs are expected to play a similar role to the VCR under the current framework. That is, CECVs will help guide efficient levels of network expenditure for the provision of export services, and serve as an input into network planning, investment and incentive arrangements for export services.
As noted by the AEMC, the Rule change makes way for a future of solar, batteries and electric vehicles, bringing power networks into the 21st century. It recognises the significant uptake of solar PV and other DER by consumers and provides a long-term, sustainable plan to get more solar into the grid.
In relation to the DBs’ transmission connection planning responsibilities, in future we expect the Rule change to drive augmentation at some terminal stations in order to meet customers’ export needs. As such, future editions of this report will include any such augmentation plans.
3.3 Initiatives announced in the 2020-21 Victorian state budget
As explained in the 2020 edition of this report, the Victorian Government set aside significant funding in its 2020-21 budget for the establishment of clean energy initiatives and energy efficiency upgrades to homes, including $540 million to establish six Renewable Energy Zones (REZs).
In addition to funding REZ developments, the 2020-21 Victorian budget also provided:
• $335 million to replace old wood or gas fired heaters with energy-efficient heating and cooling for 250,000 low-income households;
• $191 million to expand the existing Solar Homes program, with an extra 42,000 solar panel rebates to be provided over the next two years; and
• $12.6 million to bring online more than 600 megawatts of new renewable capacity, through a renewable energy auction.
These initiatives are intended to assist Victoria in meeting its VRET targets31. In addition, these initiatives are likely to impact on the pattern of electricity supply and demand across Victoria, which will need to be considered in future demand forecasts and transmission connection planning assessments.
The recent rapid growth in renewable energy generation capacity continues to present challenges for Victoria’s transmission network. Thermal constraints are emerging in some parts of the network, limiting available capacity to host renewable generation. The stability of the system is also being challenged as more renewable energy projects are connecting. The Victorian Government has also highlighted that a lack of hosting
31 The Victorian Renewable Energy Target (VRET) is the Victorian government's legislated target for
renewable energy generation to be 25% of electricity generation by 2020, 40% by 2025 and 50% by 2030.

2021 Joint DB Transmission Connection Planning Report
Page 35
capacity on parts of the network is causing operational curtailment of some generators, while delaying or preventing the connection of new projects.
In order to address these challenges, the Victorian Government has decided to progress a series of network investment projects to address thermal constraints and strengthen the reliability of the system (‘REZ Stage One Projects’). Accordingly, AEMO has been requested to undertake:
• a two-stage competitive procurement process to strengthen the system to support up to 1500 MW of new generation across the Murray River, Western Victoria and South West REZs; and
• a request for proposal process with AusNet Transmission Group Pty Ltd, to procure up to three sets of minor network upgrades across the Murray River, South West and Central North REZs.32
Figure 3 below shows the existing spare hosting capacity in Victoria’s REZs, and the impact of the Stage One projects. It illustrates the benefits in three REZs of minor network upgrades to areas where there is less spare hosting capacity. System strength benefits are also outlined across the three REZs where these projects are being delivered.
Figure 3: Renewable Energy Zones – Victoria33
The Victorian Government continues to develop the framework for determining future transmission investment in REZs. VicGrid, a new body which has been established as a Division within the Department of Environment, Land, Water and Planning, will oversee investment decisions related to the $540 million REZ Fund. VicGrid will continue to evolve, following further stakeholder consultation, to coordinate the future development of Victoria’s REZs.
32 http://www.gazette.vic.gov.au/gazette/Gazettes2021/GG2021S417.pdf
33 Victorian State Government, Renewable Energy Zones Stage One Projects Fact Sheet

2021 Joint DB Transmission Connection Planning Report
Page 36
3.4 System strength and voltage management issues
The growth in renewable generation is continuing to raise system strength challenges, including how best to secure the provision of system strength services in a manner that delivers the lowest costs outcome for customers.
At a high level, system strength is a service that keeps the grid stable. Historically, it has been supplied by synchronous generators, such as coal, gas and hydro. However, as these generators leave the market or reduce their operations, the supply of system strength services has reduced. At the same time, the need for system strength services has increased as inverter based resources (IBR), such as wind, solar and batteries replace synchronous generation.
On 21 October the AEMC published its final determination on a Rule change proposal submitted by TransGrid, which identified a number of shortcomings with the existing framework for delivering system strength services. TransGrid’s concerns arose from the reactive nature of the then existing framework, which has not facilitated a coordinated approach to addressing the system strength challenges arising from new generation connections. As a result, customers are likely to be paying higher costs than necessary for a stable and secure transmission network.
In its final determination, the AEMC has adopted a more preferable Rule, which comprises three elements:
• Supply side: A new system strength standard for a subset of TNSPs, known as System Strength Service Providers. In Victoria, AEMO would be the nominated System Strength Service Provider, and will have responsibility for procuring system strength services to meet the required standard in Victoria.
• Demand side: Two new access standards for generators and one for market network service providers and certain loads that connect under Chapter 5 of the Rules.
• Efficient coordination of supply and demand side: A new charging arrangement so that a connecting party is able to either utilise a system strength service provided by the System Strength Service Provider, or to provide its own.
In its final determination, the AEMC noted that joint planning between System Strength Service Providers and distributors is critical when exploring and procuring potential system strength solutions that would be installed or operated in distribution networks. The AEMC explained that the existing joint planning arrangements under clause 5.14.1 of the Rules already provide distributors with opportunities for input and involvement in system strength planning.
In addition to the system strength issues, the DBs note that new connection asset transformers may require designs with wider tap ranges and/or more buck voltage capability to allow for the increased penetration of embedded generation driving lower minimum demand or reverse power flows through the transformers. In addition, existing transformers may require similarly wider operating ranges to ensure they can identify and operate for the wider fault level ranges being exhibited.
In relation to the DBs’ planning role for transmission assets that provide DB connection services (which is the subject of this report), no direct implications arise from the AEMC’s System Strength Rule change. However, the new framework reinforces the importance of considering emerging system strength issues across transmission and distribution

2021 Joint DB Transmission Connection Planning Report
Page 37
networks, including transmission connection assets. In this regard, the DBs will continue to work with AEMO to identify emerging system strength issues and take these into account in the DBs’ transmission connection planning.
In the risk assessments presented in this report, any known or emerging system strength issues have been highlighted.
3.5 AEMO review of Under Frequency Load Shedding
Continuing decreases in net minimum daytime demand, predominantly due to the ongoing uptake of distributed embedded generation, is reducing the net load available to the Under Frequency Load Shedding (UFLS) control scheme in Victoria.
UFLS arrangements are in place in Victoria to maintain power system security in the event of a large disturbance that causes an extreme frequency change such as loss of a large generation source. It is used as a last line of defence to manage multiple contingency events, by automatically disconnecting load to restore supply-demand balance and recover the system frequency after the event.
In Victoria, UFLS is enacted through local control systems installed at terminal stations (generally at the sub-transmission level), pre-set by AusNet Transmission Group in a coordinated manner with AEMO and the DBs, to prioritise and stage the tripping of load blocks nominated by the DBs.
UFLS schemes are designed on the assumption that they would shed blocks of net positive load. With the significant uptake of embedded generation (particularly solar PV), there is an increasing risk of some load blocks being net negative loads (i.e., net generation sources, with power flowing from distribution to transmission). The effect of shedding blocks of net generation would be to cause the supply-demand imbalance to worsen, causing system frequency to fall even further, rather than assisting to recover it. This could prevent the UFLS scheme from acting correctly to stop a system collapse.
AEMO has completed Phase 1 of its review of the Victorian UFLS scheme, in accordance with its responsibilities under the Rules (clauses 4.3.1, 4.3.2 and 5.20A.1)34 using 2018-2020 data. Clause S5.1.10.1 requires NSPs to ensure that sufficient load is under the control of the UFLS scheme to minimise the risk of frequency falling below the acceptable limits, in response to an unexpected loss of a generation source.
AEMO’s preliminary review found that the load available for the UFLS scheme to shed in 2020 is at times (particularly periods with high levels of embedded generation operating), below the minimum levels of 60% of load prescribed in clause 4.3.1(k). AEMO forecasts this situation will continue to deteriorate further as embedded generation growth continues.
AEMO’s review is still in its early stages. The DBs expect to be working closely with AEMO and AusNet Transmission Group to confirm the extent and timing of this emerging issue and ensure that effective arrangements continue to remain in place to maintain the integrity of the UFLS scheme.
It is anticipated further information will be provided in future TCPRs as AEMO’s review progresses into its later stages.
34 vic-ufls-data-report-public-aug-21.pdf (aemo.com.au)

2021 Joint DB Transmission Connection Planning Report
Page 38
3.6 Developments on the Victorian transmission network
As noted in section 1.2, AEMO is responsible for planning and directing augmentation on the Victorian electricity transmission Declared Shared Network (DSN). The Victorian Annual Planning Report (VAPR) reviews the performance of the DSN and assesses its adequacy to meet reliability and security needs over the next 10 years. While the VAPR does not directly affect the planning considerations in this TCPR, it provides useful context for the report.
In the 2021 VAPR35, AEMO highlighted the following developments:
• A record minimum demand occurring during the daytime of 2,529 MW occurred on 25 December 2020. This was 688 MW lower than the previous record, set in 2017-18. Low minimum demands continued to drive a need for operational interventions to manage high voltages on the network. However, transmission investments in reactive power plant are reducing the need for operational intervention.
• Network limitations in the west and north-west of Victoria continue to present challenges as large volumes of inverter-based renewable generation continue to connect. Generator restrictions have been needed to manage system security during high renewable generation periods, and outages have been accommodated to connect new projects. While minor augmentations on the transmission network and system strength services are reducing these constraints, further investment is required to unlock renewable generation in the western regions of the state.
• AEMO is progressing a suite of projects across the state through its Transmission Development Plan for Victoria, which is detailed in the 2021 VAPR. That plan is designed to deliver security, and reliability objectives in the context of Victorian Government policy and regulatory settings. The planned investments target key thermal, stability, voltage control, and system strength limitations across Victoria. They are intended to reduce overall costs to consumers by unlocking lower-cost generation supplies, enhancing competition, and improving the efficiency of resource sharing between neighbouring NEM regions.
The 2021 VAPR identifies the following projects, which are being progressed or investigated to deliver additional capacity across the state:
• Interconnection with NSW: AEMO and TransGrid are jointly progressing the VNI West RIT-T, to deliver additional transfer capacity between Victoria and New South Wales.
• Interconnection with Tasmania: TasNetworks has published a Project Assessment Conclusions Report to deliver Marinus Link, a new 1,500 MW high voltage direct current (HVDC) cable between Tasmania and Victoria, and associated works.
• Voltage control: High voltages in metropolitan Melbourne and South West Victoria caused by low and negative demand conditions are expected over the next decade. AEMO intends to begin a RIT-T in 2022, subject to the outcome of pre-feasibility assessments currently underway.
35 See AEMO | Victorian Annual Planning Report

2021 Joint DB Transmission Connection Planning Report
Page 39
• REZ expansion projects to address the following limitations:
o Overloading of the Ballarat – Berrybank – Terang – Moorabool 220 kV line for a trip of the Moorabool – Terang line, due to new connections.
o Overloading of the Bulgana – Horsham – Murra Warra 220 kV line for trip of the Bendigo – Kerang line, due to new connections between Horsham and Kerang.
o Overloading of the Red Cliffs – Wemen – Kerang – Bendigo 220 kV line for a trip of the Horsham – Murra Warra – Kiamal 220 kV line, due to new connections between Kiamal and Kerang.
o Voltage instability/collapse around Wemen Terminal Station for trip of the Horsham – Murra Warra – Kiamal 220 kV line, due to new connections between Kiamal and Wemen.
A summary of AEMO’s Transmission Development Plan for Victoria is shown in Figure 4 below.
Source: 2021 VAPR, page 8.
Figure 4: Transmission Development Plan for Victoria – future projects and priority limitations
In formulating augmentation plans at specific terminal stations, the DBs will liaise with AEMO to ensure that the DBs’ planning decisions are coordinated with, and take full account of AEMO’s Transmission Development Plan for Victoria.

2021 Joint DB Transmission Connection Planning Report
Page 40
In addition to working with AEMO, the DBs will also continue to liaise with AusNet Transmission Group in relation to its asset renewal program36.
The larger terminal station renewals require careful outage and construction sequencing to ensure security of supply to the distribution networks is not compromised. Security of supply risks can also be mitigated efficiently by planning some temporary or permanent reconfigurations of the distribution networks supplied from the terminal station.
36 A copy of the plan can be downloaded from AEMO’s website at: Microsoft Word - AusNet Services
Asset Renewal Plan 2021_Final_131021 (aemo.com.au)

2021 Joint DB Transmission Connection Planning Report
Page 41
4 HISTORIC AND FORECAST DEMAND
4.1.1 Basis of forecasts
In accordance with the requirements of clause 3.4.2 of the Victorian Electricity Distribution Code, data showing the historical and forecast demand from, and capacity of, each transmission connection are presented for each terminal station in the individual risk assessments that form part of this Transmission Connection Planning Report.
The demand forecasts used in the preparation of this report are referred to as the Victorian Terminal Station Demand Forecasts (TSDF). The TSDF report is prepared by the Victorian DBs, and is published alongside this Transmission Connection Planning Report.
As noted in last year’s Transmission Connection Planning Report, AEMO commenced publishing a separate connection point forecast report for Victoria in 2014. AEMO’s transmission connection point forecasts37 are provided on an Operational Demand basis, where Operational Demand in a region is:
“demand that is met by local scheduled generating units, semi-scheduled generating units, and non-scheduled intermittent generating units of aggregate capacity ≥ 30 MW, and by generation imports to the region. It excludes the demand met by non-scheduled non-intermittent generating units, non-scheduled intermittent generating units of aggregate capacity < 30 MW, exempt generation (e.g. rooftop solar, gas tri-generation, very small wind farms, etc), and demand of local scheduled loads. Please see Demand Terms in
EMMS Data Model for the list of exceptions that are included.”38
The Victorian DBs’ TSDF report provides forecasts on a total demand basis, effectively adding back demand met by non-scheduled non-intermittent generating units, non-scheduled intermittent generating units of aggregate capacity <30 MW, exempt generation (other than rooftop solar and behind the meter battery storage) and demand of local scheduled loads. Consequently, there are some differences between the demand forecasts in the DBs’ TSDF and AEMO’s Victorian connection point forecasts.
As in previous years, the DBs consider it appropriate to continue to adopt the TSDF forecasts for the purpose of preparing this Transmission Connection Planning Report. It is noted that the TSDF forecasts have been applied in all previous Transmission Connection Planning Reports.
4.1.2 Impact of rooftop PV on estimates of energy at risk
As already noted, there has been an increasing prominence of distributed generation at the consumer side of the supply chain, including rooftop solar PV generation and utility scale renewable generation. Embedded renewable generation has the effect of reducing
37 A copy of AEMO’s 2021 Victorian Connection Point Forecasting Report is available from its website
at: https://aemo.com.au/-/media/files/electricity/nem/planning_and_forecasting/vapr/2021/transmission-connection-point-data.xlsx?la=en
38 https://aemo.com.au/en/energy-systems/electricity/national-electricity-market-nem/data-nem/operational-demand-data

2021 Joint DB Transmission Connection Planning Report
Page 42
the energy consumption as seen by the grid, and to a lesser degree39, reducing the maximum demand at the transmission connection points.
In the event of a supply interruption, rooftop PV panels are tripped unless they have back-up battery systems configured and approved for island mode operation. Customers affected by such outages will experience a level of unserved energy equal to their total unserved consumption (that is, including the energy that would have been supplied by their PV panels and batteries). However, it is noted that most of the existing solar PV and battery installations are behind the meter. In other words, the electricity output is consumed by the customer without being measured by the customer’s meter. As a result, the DBs have limited ability to quantify the native energy consumption before the solar PV and battery contribution.
Under the current forecasting approach, estimates of energy at risk may not take the full effects of this into account. As a consequence, the amount of unserved energy due to a network outage may be underestimated, as the total unserved energy will include some energy served by embedded generation in addition to the unserved energy as a result of the constraint at the transmission connection point. The impact of this issue is discussed in the individual risk assessments where it is considered to be material.
39 This is due to the fact that the maximum demand typically occurs later in the afternoon or in the early
evening when the output of rooftop solar PV is well below its peak.

2021 Joint DB Transmission Connection Planning Report
Page 43
5 PLANNING APPROACH AND OPTION ANALYSIS
5.1 Introduction
This chapter presents an overview of the approach applied by the DBs to assess the magnitude, probability and impact of loss of load at each transmission connection, in accordance with the requirements of clause 3.4.2(b) of the Victorian Electricity Distribution Code.
The assessment presented is not a detailed planning analysis, but a high-level description of the expected balance between capacity and demand over the forecast period, and the likely investment requirements. Data presented in this high-level analysis may indicate an emerging major constraint. Therefore, this high-level assessment provides a means of identifying those terminal stations where further detailed analysis of risks and options for remedial action, in accordance with the RIT-T, is required.
It is emphasised that this high-level analysis focuses on risks to supply reliability that relate to the capacity and reliability of transformers only. Typically, there are risks to reliability associated with the performance and capacity of smaller plant items. However, these smaller items involve relatively low capital expenditure, the deferral of which is unlikely to entail a sufficiently high avoided cost to justify the employment of non-network alternatives.
In addition, capital expenditure is required from time to time to address fault level issues. This expenditure is driven chiefly by mandatory health and safety standards, and does not relate to terminal station capacity, per se. Fault level issues are therefore not within the scope of this report, however, the analysis of feasible and preferred options for increasing capacity will, where appropriate have due regard to issues relating to fault level control40.
The following key data are presented in this section for each Terminal Station, with the exception of Deer Park Terminal Station (DPTS)41:
• Energy at risk: For a given demand forecast, this is the amount of energy that would not be supplied from a terminal station if a major outage42 of a transformer occurs at that station in that particular year, the outage has a mean duration of 2.65 months (as discussed in section 5.4 below), and no other mitigation action is taken. This measure provides an indication of the magnitude of loss of load that would arise in the unlikely event of a major outage of a transformer.
• Expected unserved energy: For a given demand forecast, this is the energy at risk weighted by the probability of a major outage of a transformer. A load duration curve
40 Some non-network alternatives such as embedded generation may raise issues relating to fault level
control. A further discussion of this issue is set out in Section 1.4 of this report.
41 At present, a spare 225 MVA transformer suitable for installation at DPTS is not available. The DB responsible for planning DPTS (CitiPower-Powercor) has adopted the conservative assumption that a major transformer failure would not be repairable, and therefore a replacement transformer would need to be procured. The procurement of a replacement would take 12 months, so in the case of DPTS, a major outage of a transformer is assumed to have a duration of 12 months.
42 The term “major outage” refers to an outage that has a mean duration of 2.65 months, typically due to a significant failure within the transformer. The actual duration of an individual major outage may vary from under 1 month up to 12 months. Further details are provided in section 5.4.

2021 Joint DB Transmission Connection Planning Report
Page 44
is used to estimate the unserved energy in each hour of the year for a major transformer outage. The estimated unserved energy for each hour is then multiplied by the probability of the outage occurring in any hour of the year. The total expected unserved energy in a year is obtained by summing the probability-weighted estimates of unserved energy for each hour of the year. This measure provides an indication of the amount of energy, on average, that will not be supplied in a year, taking into account the very low probability that one transformer at the station will not be available for 2.65 months because of a major outage.
Risk assessments for each terminal station provide estimates of energy at risk and expected unserved energy based on the 50th percentile and 10th percentile demand forecasts set out in Section 4. Consideration of energy at risk and expected unserved energy at these two demand forecast levels provides:
• an indication of the sensitivity of these two parameters to temperature variation over the peak period; and
• an indication of the level of exposure to supply interruption costs under higher demand conditions (namely, 10th percentile levels).
As already noted, this information provides an aid to identifying the likely timing of economically justified augmentations or other actions. However, the precise timing of augmentation or non-network solutions aimed at alleviating emerging constraints will be a matter for more detailed analysis prepared in accordance with the RIT-T requirements.
In interpreting the information set out in this report, it is important to recognise that in the case of a summer peaking station, the 50th percentile demand forecast relates to a maximum average temperature that will be exceeded, on average, once every two years. By definition therefore, actual demand in any given year has a 50% probability of being higher than the 50th percentile demand forecast.43
5.2 Quantifying “energy at risk”
As noted above, “energy at risk” is an estimate of the amount of energy that would not be supplied if one transformer was out of service due to a major failure during the critical loading season(s), for a given demand forecast.
The capability of a terminal station with one transformer out of service is referred to as its “N minus 1” rating. The capability of the station with all transformers in service is referred to as its “N” rating. The relationship between the N and N-1 ratings of a station and the energy at risk is depicted in the diagram below.
43 Conversely, there is also a 50% chance that actual demand will be lower than the forecast in any
one year.

2021 Joint DB Transmission Connection Planning Report
Page 45
Figure 5: Relationship between N rating, N-1 rating and energy at risk
The owner of the connection assets (AusNet Transmission Services, with the exception of Deer Park Terminal Station which is owned by TransGrid) is responsible to determining the ratings of connection assets.
As a result of the increase in Distributed Energy Resources, several terminal stations now experience reverse power flows. Reverse power flows associated with substantial intermittent generation output may result in significantly increased variability of transformer loadings, increased transformer utilisation, and reduced time for transformers to cool down between periods of high loading in either direction. AusNet Transmission Services has advised that in these circumstances, the existing cyclic ratings may no longer be applicable to these transformers because they no longer exhibit a predictable cyclic loading pattern. Instead, it may be necessary to adopt the transformer’s name plate rating (rather than the higher cyclic rating) for planning and operational purposes.
AusNet Transmission Services reviews transformer load profiles on an ongoing basis and updates applicable ratings as required. The ratings of some stations with significantly changed load profiles, caused by either changing load patterns and/or significant generation connected, have recently been revised downwards. The relevant risk assessments presented in this report incorporate these changes.
5.3 Assessing the costs of transformer outages
As explained in Section 5.1 for a given demand forecast:
• “energy at risk” denotes the amount of energy that would not be supplied from a terminal station if a major outage of a single transformer occurs at that station in that particular year, and no other mitigation action is taken; and
• “expected unserved energy” is the energy at risk weighted by the probability of a major outage of a single transformer.
Time
Today In 10 years
N-1 rating
N rating
Demand forecast
Energy at risk is
represented by
the shaded area
Full “N” capacity expected to
be available, on average, for
99.7% of the time
Relationship between N rating, N-1 rating and energy at risk
Demand

2021 Joint DB Transmission Connection Planning Report
Page 46
In estimating the expected cost of connection plant outages, this report considers the first order contingency condition (“N minus 1”) only. It is recognised that in the case of terminal stations that consist of two transformers, there is a significant amount of energy at risk if both transformers are out of service at the same time, due to a major outage.
The DBs have carefully considered whether this report should be expanded to include consideration of the costs of major outages under N-2 (second order contingency) conditions, and concluded that it is not necessary to do so. The principal reason for this conclusion is that the value of expected unserved energy associated with second order contingencies would be unlikely to be sufficiently high to justify the advancement of any major augmentation, compared to the augmentation timing that is economically justified by an analysis that is limited to considering first order contingencies. Section 3 of the Appendix contains a detailed example which illustrates this point.
5.4 Base reliability statistics for transmission plant
Estimates of the expected unserved energy at each terminal station must be based on the expected reliability performance of the relevant transformers. With the exception of Deer Park Terminal Station (which is owned by TransGrid), the basic reliability data for terminal station transformers has been established and agreed with the asset owner, AusNet Transmission Group. The base data focuses on:
• the availability of the connection point main transformers; and
• the probability of a major problem forcing these plant items out of service for an average period of 2.65 months. This does not include minor faults that would result in a transformer being unavailable for a short period of time (ranging from a few hours up to no more than two days).
The basic reliability data adopted for the purpose of producing this report is summarised in the following table.
Table 2: Basic Reliability Data
Major plant item: Terminal station transformer Interpretation
Major outage rate for transformer
1.0% per annum A major outage is expected to occur once per 100 transformer-years. Therefore, in a population of 100 terminal station transformers, you would expect one major failure of any one transformer per year.
Weighted average of major outage duration
2.65 months On average, 2.65 months is required to return the transformer to service (if repair is possible) or to replace the transformer with a strategic spare transformer, during which time, the transformer is not available for service.
Expected transformer unavailability due to a major outage per transformer-year
0.01 x 2.65/12 = 0.221% approximately
On average, each transformer would be expected to be unavailable due to major outages for 0.221% of the time, or 19 hours in a year.
In September 2021, AusNet Transmission Group’s Principal Engineer, Strategic Network Planning confirmed that the transformer outage rate data and the estimated average time to restore a failed transformer to service (shown in the above table) are reasonable for

2021 Joint DB Transmission Connection Planning Report
Page 47
the purpose of preparing the transmission connection asset risk assessments, and it was noted that:44
• Recent changes in the Australian transformer industry have resulted in reduced capability to undertake repairs to transformers that are subject to a major failure, and therefore, supply is more likely to be restored by installing a strategic spare transformer than by undertaking major repairs of the transformer.
• Recent experience from major transformer failures has demonstrated that it is typically more economical to replace rather than repair a transformer following a major failure, particularly for transformers that have reached or are approaching the end of their expected service life.
• The estimated weighted average duration of a major outage is largely determined by the expected time that it takes to replace a failed transformer with a strategic spare (rather than the time taken to repair the transformer following a major transformer failure). Whilst it is expected to take around one month to replace a transformer with a strategic spare, it may take more than 12 months to procure a replacement transformer should no spare transformer be available at the time of the transformer failure. The 2.65 months that is being used for the TCPR risk assessments is a weighted average duration, which recognises the possibility that a strategic spare may not be available at the time of the major transformer failure.
Further details regarding the estimation of the weighted average duration of “major outages” are provided in the Appendix. The Appendix also sets out an example demonstrating the calculation of the “Expected Transformer Unavailability” for a terminal station with two transformers, using the basic reliability data contained in this section.
As explained in section 5.1, a spare 225 MVA transformer suitable for installation at DPTS is not available. The DB responsible for planning DPTS (CitiPower-Powercor) has adopted the conservative assumption that a major transformer failure would not be repairable, and therefore a replacement transformer would need to be procured. The procurement of a replacement would take 12 months, so in the case of DPTS, a major outage of a transformer is assumed to have a duration of 12 months.
5.5 Availability of spare transformers
In September 2021, AusNet Transmission Group’s Principal Engineer, Strategic Network Planning advised that:
• Both 220/66 kV metropolitan spare transformers are available to manage the risk of a metro transformer failure and they are located at Thomastown and Heatherton terminal stations.
• Both 220/66/22 kV country spare transformers are available to manage the risk of a country transformer failure and they are located at Keilor and South Morang terminal stations.
44 AusNet Transmission Group uses asset condition based failure risk information for asset
replacement decisions. Joint planning is undertaken with the DBs to coordinate connection asset terminal station augmentation works with AusNet Transmission Group’s replacement plans.

2021 Joint DB Transmission Connection Planning Report
Page 48
• A spare 66/22 kV transformer is located at Brooklyn Terminal Station. This transformer serves as a spare for 66/22 transformers including those at Malvern Terminal Station.
• Spare transformers held by AusNet Transmission Group may be used to support essential maintenance activities including refurbishment programs. Any transformer used in this way would no longer be available to replace a failed transformer.
• There is a small number of AusNet Transmission Group terminal stations for which a stock of spare transformers is not held. These terminal stations are the metropolitan 220/22 kV connection stations (being Ringwood, Brunswick, Richmond, West Melbourne and Brooklyn) and Wodonga 330/66/22 kV Terminal Station. For the metropolitan 220/22 kV stations, an in-service ‘hot’ spare is normally provided by one of the 220/22 kV transformers at Brunswick. The timeframes for deploying the ‘hot’ spare may exceed one calendar month. For the purposes of the risk assessments for these stations, 2.65 months is considered to be a reasonable estimate of the weighted average duration of a major outage. In the case of Wodonga 330/66/22 kV Terminal Station, AusNet Transmission Group is procuring a spare 330/66/22 kV transformer which should become available around 2023.
In the case of Deer Park Terminal Station (which is owned and operated by TransGrid), the total 10th percentile load at this two-transformer station is not expected to exceed the rating of a single transformer until 2023, at which time there is forecast to be 0.8 MWh of load at risk (at the 10th percentile temperature). Load will be transferred to other terminal stations in an event of a transformer failure at DPTS to avoid overloading the remaining transformer. It is therefore considered acceptable during the period prior to 2023 to operate the station without procuring further backup capacity. This approach is reviewed annually.
5.6 Treatment of Load Transfer Capability
Many terminal stations have some capability to transfer load from one station to adjacent ones using the distribution network. The amount of load that can be transferred varies from minimal amounts at most country terminal stations to significant amounts at some urban terminal stations. Some load transfers are able to be made at 66 kV and/or 22 kV and lower voltage levels.
In the event of a transformer failure at a terminal station, load could be transferred (where short-term transfer capability is available) to reduce unserved energy and the impact of an outage. The risk assessments presented in this planning report assume normal network operating conditions, and therefore they show estimates of load at risk and expected unserved energy before any potential short-term load transfers. The reasons for this approach are:
• There is no guarantee that capacity will be available at an adjacent terminal station to accept load transfers, due to uncertainty of the availability of transformation capacity at that station.
• The capability of the distribution network to effect load transfers is always changing. It will vary depending on network loading conditions and is usually at a minimum during peak demand times. The transfer capability can also be adversely affected by any abnormal configurations which may be implemented from time to time to manage power flows across the distribution network.

2021 Joint DB Transmission Connection Planning Report
Page 49
• Implementing short term transfers places the network in a suboptimal operating condition, thereby increasing operational risks. As already noted, the network planning studies presented in this report evaluate load at risk for a single contingency under otherwise normal network operating conditions. This approach accords with sound network planning practices.
Where short-term load transfer capability may be available, the relevant risk assessment identifies load transfer as an operational solution to mitigate the severity of a major outage.
5.7 Detailed risk assessments and options for alleviation of constraints, by terminal station
Set out on the following pages are the detailed risk assessments and a description of the options available for alleviation of constraints, for each individual terminal station. The assessments, by station, are set out in alphabetical order. For each station, the network augmentation requirements (if any) and the estimated annual costs of the augmentation works are identified.
We have adopted an annuity approach to estimating the annual costs, which means that the cost is constant in real terms throughout the estimated life of the asset, which is 45 years for the purpose of this report. The annualised cost calculation also assumes a real pre-tax discount rate of 5.5%45 and an annual operating cost that is 1% of the project’s capital costs. Using these inputs, for the purpose of this report the annualised cost is estimated to be 7% of the project’s capital cost.
This cost estimate also provides a broad indication of the maximum potential value available to proponents of non-network solutions in deferring or avoiding network augmentation. However, it should be noted that the value of a non-network solution depends on the extent to which it defers or avoids a network augmentation, and the expected timing of the network augmentation. For example, a non-network solution that defers a network augmentation from 2025 to 2028 is less valuable today than one which defers a similar network augmentation from, say, 2022 to 2025. These issues should be considered by proponents of non-network solutions in assessing the implications of this report.
In addition, any proponents of non-network solutions to emerging constraints should note that the lead time for completion of a major network augmentation (such as the development of a new station, or the installation of a new transformer) can easily be up to two to three years, taking into account the need to obtain local authority planning consent46. In view of this consideration, the individual risk assessment commentaries for each terminal station will:
• identify the estimated lead time for delivery of the preferred network solution; and/or
• identify the latest date by which the relevant DB(s) will generally require a firm commitment from proponents of non-network alternatives, in order to be confident that
45 In its 2021 Inputs, Assumptions and Scenarios Report, AEMO adopts a central discount rate of 5.5%
real pre-tax. Clause 18 of the RIT-T requires a RIT-T proponent to adopt the discount rate from the most recent Inputs, Assumptions and Scenarios Report. Accordingly, this Transmission Connection Planning Report applies a discount rate of 5.5% real pre-tax.
46 Section 1.5 provides a more detailed description of the processes and timeframes involved in implementing transmission connection projects.

2021 Joint DB Transmission Connection Planning Report
Page 50
the network augmentation can be displaced or deferred without compromising supply reliability in the future.
5.8 Interpreting the dates shown in the risk assessments
All charts and tables in the following risk assessments present data on a calendar year basis. However, the narrative within some of the risk assessments may refer to composite years; for instance “2022/23”, or “summer of 2022/23”.
References to composite years may be made in risk assessments relating to summer peaking stations. In these cases, the peak annual demand would typically be expected to occur around mid to late summer (that is, early in the calendar year, say, from late January to March).
Therefore, where a risk assessment refers to a peak demand occurring in a composite year (such as 2022/23, for instance), the peak would typically be expected to occur in the second year (in this example, 2023), and the relevant data for 2022/23 would be shown in the accompanying tables and charts as 2023.
5.9 Connection arrangements for embedded generators who are registered participants
An embedded generating unit connecting to a distribution network, where the Connection Applicant is a Registered Participant or a person intending to become a Registered Participant, is subject to the connection arrangements in Rules 5.3 and 5.3A. Under these arrangements the connecting party is required to pay the costs of providing the connection services which may, in principle, include augmentation of transmission connection assets.
At some terminal stations, power flows from new generation connections may lead to an increased risk of terminal station transformers overloading. In these circumstances, a connecting generator may determine that it is uneconomic for augmentation to be undertaken, in which case, the need for and suitability of a generation runback scheme would be investigated by the DB. These schemes are designed to reduce the amount of generation inflows, to ensure that distribution and transmission plant loadings are maintained within safe limits and the connection services provided to load customers are not adversely affected by the connection of additional embedded generation.

2021 Joint DB Transmission Connection Planning Report
Page 51
APPENDIX: ESTIMATION OF BASIC TRANSFORMER RELIABILITY DATA AND EXAMPLE OF EXPECTED TRANSFORMER UNAVAILABILITY CALCULATION
1. Estimation of basic transformer reliability data
The basic transformer reliability data adopted for the risk assessment is estimated as follows:
Based on historic data, a major outage is expected to occur once per 100 transformer-years (reflecting a 1% per annum failure rate). Therefore, in a population of 100 transformers, you would expect one major failure of any one transformer per year.
The mean duration of a major failure is derived from the following data.
Table 3: Transformer Failure Data
PROPORTION OF MAJOR FAILURES
MEAN OUTAGE DURATION
Restore supply with a strategic spare transformer
0.85 of failures 1 months
Restore supply with a new transformer or repaired transformer
0.15 of failures 12.0 month
Mean duration of a major failure = (0.85*1.0 month) + (0.15*12.0 months) = 2.65 months
2. Expected transformer unavailability calculation
The table below shows the calculation of the “Expected Transformer Unavailability” for a terminal station with two transformers, using the basic reliability data contained in Section 5.4.
Table 4: Expected Transformer Unavailability
Expected transformer unavailability due to major outage per transformer-year (Refer to Section 5.4 for the base reliability statistics)
A 0.221%
Number of transformers B 2
Expected unavailability of one transformer (probability of being in state N-1)
C=A*B 0.442%
Expected unavailability of both transformers (probability of being in state N-2)47
D=A*A 0.00049%
47 The coincident outages of two transformers are considered to be “independent events”. This means
that the failure of one transformer is assumed to not affect the availability of the other.

2021 Joint DB Transmission Connection Planning Report
Page 52
3. Example calculation of expected costs of first and second order contingencies
The following example is used to illustrate the methodology to calculate expected unserved energy for a 2-transformer terminal station, given the following data and the load duration curve shown below:
Data
• Maximum Demand = 80 MW
• (N-1) Rating = 70 MW
• (N-2) Rating = 0 MW
• Annual Maximum Demand Growth Rate = 3.0%
• Annual Energy Growth Rate = 1.5%
• VCR = $35,000 per MWh
Risk assessment results for first and second order contingencies (i.e. one and two transformers out of service, respectively) over 10 years are presented for this example. It is assumed that the shape of the load duration curve will not change over the forecast period. Detailed calculations are shown for the first year.
Figure 1: Annual Load Duration Curve
Risk Assessment Calculations for the first year
Energy at risk for an N-1 contingency is determined as the area below the load duration curve, but in excess of the N-1 rating, as shown above. For this example, this is given by:
Energy above N-1 Rating in year 1 = 132 MWh
Similarly, energy at risk for an N-2 contingency is determined as the area below the load duration curve, but in excess of the N-2 rating:

2021 Joint DB Transmission Connection Planning Report
Page 53
Energy above N-2 Rating in year 1 = 367,877 MWh
First Order Contingency (N-1)
Expected Unserved Energy = (Energy above N-1 Rating) * (N-1 Probability) = (132 MWh) * (0.442%) = 0.6 MWh Customer Value = (Expected Unserved Energy) * (VCR) = (0.6 MWh) * ($35,000 per MWh) = $20,420
Second Order Contingency (N-2)
Expected Unserved Energy = (Energy above N-2 Rating) * (N-2 Probability) = (367,877 MWh) * (0.00049%) = 1.8 MWh Customer Value = (Expected Unserved Energy) * (VCR) = (1.8 MWh) * ($35,000 per MWh) = $63,000
Based on the data set out above, the expected unserved energy and corresponding customer value can be calculated for each year over the next 10 years. The results of these calculations are summarised and presented in the table and chart below. The following conclusions can be drawn from the results:
• The value of expected unserved energy for a second order contingency is comparable to the value of expected unserved energy for a first order contingency in the earlier years (when the peak demand is roughly the same as the N-1 rating at the station). However, the combined total value of unserved energy for first and second order contingencies in those early years is highly unlikely to economically justify a large capital investment, such as the installation of a new transformer.
• Over the ten year planning horizon, the value of expected unserved energy for a first order contingency grows at a much faster rate than the value of expected unserved energy for a second order contingency.
• The value of expected unserved energy associated with second order contingencies only would be unlikely to be sufficiently high to economically justify any major augmentation. Hence, if a terminal station was expected to remain within its N-1 rating over the planning period, major augmentation (such as the installation of a third transformer) would not be economically justified.
• In undertaking a detailed economic evaluation of network investment, the quantity and value of energy at risk associated with higher order contingencies should be assessed. However, for the purpose of providing an indication of the likely timing of the need for new investment, it is sufficient to consider the expected unserved energy associated with first order contingencies only.

2021 Joint DB Transmission Connection Planning Report
Page 54
Figure 2: Value of expected unserved energy

2021 Joint DB Transmission Connection Planning Report
Page 55
Table 5: Summary of Risk Assessment Results for a 2-Transformer Terminal Station Example
Year 1 Year 2 Year 3 Year 4 Year 5 Year 6 Year 7 Year 8 Year 9 Year 10
Maximum Demand (MW) 80.0 82.4 84.9 87.4 90.0 92.7 95.5 98.4 101.3 104.4
N-1 Risk Assessment
Rating (MW) 70.0 70.0 70.0 70.0 70.0 70.0 70.0 70.0 70.0 70.0
Demand above Rating (MW) 10.0 12.4 14.9 17.4 20.0 22.7 25.5 28.4 31.3 34.4
Energy above Rating (MWh) 132 231 374 565 838 1,253 1,914 3,003 4,759 7,393
Probability 0.442% 0.442% 0.442% 0.442% 0.442% 0.442% 0.442% 0.442% 0.442% 0.442%
Expected Unserved Energy (MWh) 0.6 1.0 1.7 2.5 3.7 5.5 8.5 13.3 21.0 32.7
Customer Value ($) 20,420 35,736 57,858 87,406 129,639 193,839 296,096 464,564 736,217 1,143,697
N-2 Risk Assessment
Rating (MW) 0.0 0.0 0.0 0.0 0.0 0.0 0.0 0.0 0.0 0.0
Demand above Rating (MW) 80.0 82.4 84.9 87.4 90.0 92.7 95.5 98.4 101.3 104.4
Energy above Rating (MWh) 367,877 373,395 378,996 384,681 390,452 396,308 402,253 408,287 414,411 420,627
Probability 0.00049% 0.00049% 0.00049% 0.00049% 0.00049% 0.00049% 0.00049% 0.00049% 0.00049% 0.00049%
Expected Unserved Energy (MWh) 1.8 1.8 1.9 1.9 1.9 1.9 2.0 2.0 2.0 2.1
Customer Value ($) 63,091 64,037 64,998 65,973 66,963 67,967 68,986 70,021 71,071 72,138

2021 Joint DB Transmission Connection Planning Report
Page 56
RISK ASSESSMENTS FOR INDIVIDUAL TERMINAL STATIONS (IN ALPHABETICAL ORDER)

2021 Transmission Connection Planning Report Risk Assessment: ATS-BLTS
Page 57
ALTONA/BROOKLYN TERMINAL STATION (ATS/BLTS) 66 kV
Altona/Brooklyn Terminal Station (ATS/BLTS) 66 kV comprises two terminal stations in close proximity, connected by strong sub-transmission ties. The ATS/BLTS 66 kV supply area includes Altona, Bacchus Marsh, Brooklyn, Laverton North, Tottenham, Footscray and Yarraville. It is the main source of supply for 65,374 customers. The station is shared by Jemena Electricity Network (44%) and Powercor (56%).
Embedded generation
A total of 25.5 MW capacity of embedded generation (>1 MW) is connected to at ATS-BLTS which includes 22.5 MW in the Powercor distribution system and 3 MW in the Jemena distribution system.
In addition, about 36.7 MW of solar PV is installed on ATS-BLTS which includes 21.7 MW in the Powercor distribution system and 15 MW in the Jemena distribution system. This includes all the residential and small-commercial rooftop solar PV systems (<1 MW).
Magnitude, probability and impact of loss of load
The following observations and risk assessment are based on the net load observed at the terminal station connection points, i.e. customer load with the generation output netted off.
ATS consists of three 150 MVA 220/66 kV transformers with the 2-3 66 kV bus tie circuit breaker locked open to manage fault levels. Under these arrangements, only one ATS 150 MVA 220/66 kV transformer operates in parallel with the BLTS system. BLTS has two 150 MVA 220/66 kV transformers supplying the BLTS 66 kV bus.
The existing synchronous condenser connected to the BLTS 66 kV bus was decommissioned in 2017 as it is no longer required.
The load characteristic for ATS/BLTS substation is of a mixed nature, consisting of residential and industrial customers. The peak load demand on the entire ATS/BLTS 66 kV network reached 239 MW (240 MVA) in summer 2021. In 2017 the BATS-BLTS tie was closed and 12 MW of load was transferred to Ballarat Terminal Station (BATS). Further, the completion of Deer Park Terminal Station in 2017 has enabled transfers away from the ATS-BLTS Terminal Station. These load reductions are reflected in the ATS/BLTS load forecast graph below.
It is estimated that:
• For 6 hours per year, 95% of peak demand is expected to be reached under the 50th percentile demand forecast.
• The station load power factor at the time of peak demand is 0.99.
The graph below depicts the 10th and 50th percentile summer maximum demand forecast together
with the station’s operational “N” rating (all transformers in service) and the “N-1” rating at 35C ambient temperature.

2021 Transmission Connection Planning Report Risk Assessment: ATS-BLTS
Page 58
Due to new major load customers which are expected to have steady load uptake over the next ten-years, and residential developments in Bacchus Marsh and Laverton North, ATS-BLTS is forecasted to exhibit strong load growth.
The graph above shows that from 2027 there is insufficient capacity to supply the forecast demand at the 50th percentile temperature at ATS-BLTS if a forced outage of a transformer occurs.
Magnitude, probability and impact of loss of transformer (N-1 System Condition):
The bar chart below depicts the energy at risk with one transformer out of service for the 50th percentile demand forecast, and the hours per year that the 50th percentile demand forecast is expected to exceed the N-1 capability rating. The line graph shows the value to consumers of the expected unserved energy in each year, for the 50th percentile demand forecast.

2021 Transmission Connection Planning Report Risk Assessment: ATS-BLTS
Page 59
Comments on Energy at Risk
For an outage of one transformer at ATS-BLTS, there will be insufficient capacity at the station to supply all demand at the 50th percentile temperature for about 36.5 hours in 2031. The energy at risk at the 50th percentile temperature under N-1 conditions is estimated to be 497.7 MWh in 2031. The estimated value to consumers of the 497.7 MWh of energy at risk is approximately $21.9 million (based on a value of customer reliability of $43,928/MWh)48. In other words, at the 50th percentile demand level, and in the absence of any other operational response that might be taken to mitigate the impact of a forced outage, a major outage of one transformer at ATS-BLTS West in 2031 would be anticipated to lead to involuntary supply interruptions that would cost consumers $21.9 million.
It is emphasised however, that the probability of a major outage of one of the three 150 MVA transformers occurring over the year is very low at about 1.0% per transformer per annum, whilst the expected unavailability per transformer per annum is 0.217%. When the energy at risk (497.7 MWh for 2031) is weighted by this low unavailability, the expected unsupplied energy is estimated to be around 3.23 MWh. This expected unserved energy is estimated to have a value to consumers of $0.14 million (based on a value of customer reliability of $43,928/MWh).
It should also be noted that the above estimates of energy at risk and expected unserved energy are based on an assumption of average (50th percentile) summer temperatures occurring in each year. Under 10th percentile temperature conditions, the energy at risk in 2031 is estimated to be 1,812 MWh. The estimated value to consumers of this energy at risk in 2031 is approximately $79.6 million. The corresponding value of the expected unserved energy is $0.52 million.
48 The value of unserved energy is derived from the sector values given in Table 1 of Section 2.4, weighted in
accordance with the composition of the load at this terminal station.

2021 Transmission Connection Planning Report Risk Assessment: ATS-BLTS
Page 60
These key statistics for the year 2031 under N-1 outage conditions are summarised in the table below.
MWh Valued at consumer interruption cost
Energy at risk, at 50th percentile demand forecast under N-1 outage condition
497.7 $21.9 million
Expected unserved energy at 50th percentile demand under N-1 outage condition
3.23 $0.14 million
Energy at risk, at 10th percentile demand forecast under N-1 outage condition
1,812 $79.6 million
Expected unserved energy at 10th percentile demand under N-1 outage condition
11.78 $0.52 million
Possible Impact on Customers
System Normal Condition (Both transformers in service)
Applying the 50th percentile and 10th percentile demand forecasts, there is sufficient capacity at ATS-BLTS to meet all demand when both transformers are in service.
N-1 System Condition
If one of the 150 MVA 220/66 kV transformers at ATS-BLTS is taken offline during peak loading times and the N-1 station rating is exceeded, the OSSCA49 automatic load shedding scheme which is operated by AusNet Transmission Group’s TOC50 will act swiftly to reduce the loads in blocks to within safe loading limits. Any load reductions that are in excess of the minimum amount required to limit load to the rated capability of the station would be restored at zone substation feeder level in accordance with Powercor’s operational procedures after the operation of the OSSCA scheme.
Possible load transfers away to ATS West and DPTS terminal stations in the event of a transformer failure at ATS West total 24 MVA in summer 2022.
Feasible options for alleviation of constraints
The following options are technically feasible and potentially economic to mitigate the risk of supply interruption and/or to alleviate the emerging constraint:
1. Install additional transformation capacity and reconfigure 66 kV exits at ATS or BLTS, at an estimated indicative capital cost of $18 million (equating to a total annual cost of
49 Overload Shedding Scheme of Connection Asset.
50 Transmission Operation Centre

2021 Transmission Connection Planning Report Risk Assessment: ATS-BLTS
Page 61
approximately $1.26 million). This would result in the station being configured so that four transformers provide capacity to the ATS/BLTS system.
2. Demand reduction: There is an opportunity to develop innovative customer schemes to encourage voluntary demand reduction during times of network constraint. The amount of potential demand reduction depends on the customer uptake and would be taken into consideration when determining the optimum timing of any network capacity augmentation.
3. Embedded generation, connected to the ATS or BLTS 66kV bus, may substitute capacity augmentations.
Preferred network option(s) for alleviation of constraints
In the absence of commitment by interested parties to offer network support services by installing local generation or through demand side management initiatives that would reduce load at ATS-BLTS, it is proposed to install additional transformation capacity and to reconfigure 66 kV exits at ATS-BLTS system.
On the basis of the present demand forecasts and applying the 2021 VCR estimates, the installation of an additional transformer and the 66 kV exit reconfiguration works at ATS is not expected to be economically justified in the next ten-year period. As a temporary measure, the expected load at risk will be managed by load transfers to ATS West and DPTS.
Additional large load connections, however, may require augmentation of transformer capacity, as the existing load is expected to exceed the station (N-1) rating during the ten-year forecast period.
The tables on the following pages provide more detailed data on the station rating, demand forecasts, energy at risk and expected unserved energy.

2021 Transmission Connection Planning Report Risk Assessment: ATS/BLTS
Page 62
Notes: 1. “N-1” means cyclic station output capability rating with outage of one transformer. The rating is at an ambient temperature of 35 degrees Centigrade.
2. “N-1 energy at risk” is the amount of energy in a year during which specified demand forecast exceeds the N-1 capability rating.
3. “N-1 hours at risk” is the number of hours in a year during which the specified demand forecast exceeds the N-1 capability rating.
4. “Expected unserved energy” means “N-1 energy at risk” for the specified demand forecast multiplied by the probability of a major outage affecting one transformer. “Major outage” means an outage with a duration of 2.65 months. The outage probability is derived from the base reliability data given in Section 5.4.
5. The value of unserved energy is derived from the relevant climate zone and sector VCR values given in the AER VCR December 2019 final determination, weighted in accordance with the composition of the load at this terminal station.
6. The 0.7 and 0.3 weightings applied to the 50th and 10th percentile expected unserved energy estimates (respectively) are in accordance with the approach applied by AEMO, and described on page 12 of its publication titled Victorian Electricity Planning Approach, published in June 2016 (see http://www.aemo.com.au/-/media/Files/Electricity/NEM/Planning_and_Forecasting/Victorian_Transmission/2016/Victorian-Electricity-Planning-Approach.ashx).
2022 2023 2024 2025 2026 2027 2028 2029 2030 2031
267.2 280.1 292.1 313.1 324.0 338.9 365.0 371.6 378.0 384.5
249.3 263.9 277.1 299.7 311.8 328.3 357.3 365.0 372.4 379.8
289.9 303.2 314.9 335.9 348.1 362.4 389.3 396.2 402.2 408.3
260.8 275.5 288.7 311.4 323.8 340.7 370.2 378.3 386.3 394.4
0.0 0.0 0.0 0.0 0.0 0.0 74.3 171.4 311.6 497.7
0.0 0.0 0.0 0.0 0.0 0.0 9.8 19.3 26.5 36.5
0.0 0.0 0.0 0.0 3.7 49.8 675.3 1001.4 1356.5 1812.0
0.0 0.0 0.0 0.0 0.8 7.8 45.0 59.3 74.3 91.5
0.00 0.00 0.00 0.00 0.00 0.00 0.48 1.11 2.03 3.23
0.00 0.00 0.00 0.00 0.02 0.32 4.39 6.51 8.82 11.78
$0.00M $0.00M $0.00M $0.00M $0.00M $0.00M $0.02M $0.05M $0.09M $0.14M
$0.00M $0.00M $0.00M $0.00M $0.00M $0.01M $0.19M $0.29M $0.39M $0.52M
$0.00M $0.00M $0.00M $0.00M $0.00M $0.00M $0.07M $0.12M $0.18M $0.25MExpected Unserved Energy value using AEMO weighting of 0.7 X 50th
precentile value + 0.3 X 10th percentile value
Station: ATS-BLTS
Expected Unserved Energy value at 50th percentile demand
Expected Unserved Energy value at 10th percentile demand
N-1 energy at risk at 10% percentile demand (MWh)
50th percentile Summer Maximum Demand (MVA)
50th percentile Winter Maximum Demand (MVA)
Expected Unserved Energy at 50th percentile demand (MWh)
Expected Unserved Energy at 10th percentile demand (MWh)
10th percentile Summer Maximum Demand (MVA)
10th percentile Winter Maximum Demand (MVA)
N-1 energy at risk at 50% percentile demand (MWh)
N-1 hours at risk at 50th percentile demand (hours)
N-1 hours at risk at 10th percentile demand (hours)
Altona - Brooklyn Terminal Station Detailed data: Magnitude and probability of loss of load
Distribution Businesses supplied by this station: Powercor (56%) and Jemena (44%) MVA
Normal cyclic rating with all plant in service 514 via 3 transformers (Summer peaking)
Summer N-1 Station Rating: 339 [See Note 1 below for interpretation of N-1]
Winter N-1 Station Rating: 386

2021 Transmission Connection Planning Report Risk Assessment: ATS West
Page 63
ALTONA WEST TERMINAL STATION (ATS West) 66 kV
Altona Terminal Station 66 kV comprises three 150 MVA 220/66 kV transformers. For reliability and maintenance of existing supply requirements, the station is configured so that one transformer operates in parallel with the BLTS system, and is isolated from the other two transformers via a permanently open 2-3 bus tie CB at ATS. This electrically separates the two systems and effectively creates two separate terminal stations. These stations are referred to as ATS/BLTS and ATS West (ATS bus 3 & 4).
Embedded generation
A total of 14 MW capacity of embedded generation (>1 MW) is installed on the Powercor distribution system connected to at ATS West.
In addition, about 91.3 MW of solar PV is installed on the Powercor distribution system connected to ATS West. This includes all the residential and small-commercial rooftop solar PV systems (<1 MW).
Background
The ATS West 66 kV supply area includes Laverton, Laverton North, Altona Meadows, Werribee, Wyndham Vale, Mount Cottrell, Eynesbury, Tarneit, Hoppers Crossing and Point Cook. The station supplies 91,446 Powercor customers, as well as Air Liquide, a company supplied directly from the 66 kV bus at ATS. Air Liquide’s load has been included in the following load forecast and risk assessment.
ATS West is a summer peaking station and its peak load reached 182 MW (194 MVA) in 2020-21 summer. The reduction in the station maximum demand (MD) when compared to previous years was due to the mild weather and the planned load transfers from ATS West to DPTS that took place in 2020.
It is estimated that:
• For 10 hours per year, 95% of peak demand is expected to be reached under the 50th percentile demand forecast.
• The station load power factor at the time of peak demand is 0.94.
ATS West is summer peaking with high demand occurring over a five month period. The graph below depicts the 10th and 50th percentile summer maximum demand forecast together with
the stations operational “N” rating (all transformers in service) and the “N-1” rating at 35C ambient temperature. The chart shows a reduction in the 2021 actual MD due to planned transfers of approximately 30 MW from the heavily loaded LV and WBE zone substations (supplied by ATS West) to Deer Park Terminal Stations (DPTS).
In addition, as already noted, 2020-21 was a mild summer which contributed to reduced network MDs. According to AEMO, 2020-2021 was a record year:
• 2020 had the highest amount of distributed PV capacity installed, which broke 2019's record.
• Due to La Niña (mild summer) 2020 was one of the coolest years on record since 2000 and the coldest in the last 10 years.

2021 Transmission Connection Planning Report Risk Assessment: ATS West
Page 64
Load growth at ATS West is expected to remain strong due to high population growth and increasing commercial and industrial customer connections.
The “N” rating on the chart indicates the maximum load that can be supplied from ATS West with all transformers in service. The “N-1” rating on the chart is the load that can be supplied from ATS West with one 150 MVA transformer out of service.
The graph above shows that there is insufficient capacity to supply the forecast demand at 50th percentile temperature at ATS West if a forced outage of a transformer occurs.
Magnitude, probability and impact of loss of transformer (N-1 System Condition):
The bar chart below depicts the energy at risk with one transformer out of service for the 50th percentile demand forecast, and the hours per year that the 50th percentile demand forecast is expected to exceed the N-1 capability rating. The line graph shows the value to consumers of the expected unserved energy in each year, for the 50th percentile demand forecast.

2021 Transmission Connection Planning Report Risk Assessment: ATS West
Page 65
Comments on Energy at Risk
For an outage of one transformer at ATS West 66 kV, there will be insufficient capacity at the station to supply all demand at the 50th percentile temperature for about 388 hours in 2026. The energy at risk at the 50th percentile temperature under N-1 conditions is estimated to be 9,474 MWh in 2026. The estimated value to consumers of the 9,474 MWh of energy at risk is approximately $320 million (based on a value of customer reliability of $33,785/MWh)51. In other words, at the 50th percentile demand level, and in the absence of any other operational response that might be taken to mitigate the impact of a forced outage, a major outage of one transformer at ATS West in 2026 would be anticipated to lead to involuntary supply interruptions that would cost consumers $320 million.
It is emphasised however, that the probability of a major outage of one of the two 150 MVA transformers occurring over the year is very low at about 1.0% per transformer per annum, whilst the expected unavailability per transformer per annum is 0.221%. When the energy at risk (9,474 MWh for 2026) is weighted by this low unavailability, the expected unsupplied energy is estimated to be around 41 MWh. This expected unserved energy is estimated to have a value to consumers of $1.39 million (based on a value of customer reliability of $33,785/MWh).
It should also be noted that the above estimates of energy at risk and expected unserved energy are based on an assumption of average (50th percentile) summer temperatures occurring in each year. Under 10th percentile temperature conditions, the energy at risk in 2026 is estimated to be 13,687 MWh. The estimated value to consumers of this energy at risk is approximately $462 million. The corresponding value of the expected unserved energy (of 59.3 MWh) is $2.0 million.
51 The value of unserved energy is derived from the relevant climate zone and sector VCR values given in the
AER VCR December 2019 final determination, weighted in accordance with the composition of the load at this terminal station.

2021 Transmission Connection Planning Report Risk Assessment: ATS West
Page 66
These key statistics for the year 2026 under N-1 outage conditions are summarised in the table below.
MWh Valued at consumer interruption cost
Energy at risk, at 50th percentile demand forecast under N-1 outage condition
9,474 $320 million
Expected unserved energy at 50th percentile demand under N-1 outage condition
41 $1.39 million
Energy at risk, at 10th percentile demand forecast under N-1 outage condition
13,687 $462 million
Expected unserved energy at 10th percentile demand under N-1 outage condition
59.3 $2.0 million
Possible Impact on Customers
System Normal Condition (Both transformers in service)
Applying the 50th percentile and 10th percentile demand forecasts, there is sufficient capacity at Altona West Terminal Station to meet all demand when both transformers are in service.
N-1 System Condition
If one of the 150 MVA 220/66 kV transformers at ATS West is taken offline during peak loading times and the N-1 station rating is exceeded, the OSSCA52 automatic load shedding scheme which is operated by AusNet Transmission Group’s TOC53 will act swiftly to reduce the loads in blocks to within safe loading limits. Any load reductions that are in excess of the minimum amount required to limit load to the rated capability of the station would be restored at zone substation feeder level in accordance with Powercor’s operational procedures after the operation of the OSSCA scheme.
Possible load transfers away to ATS/BLTS and DPTS terminal stations in the event of a transformer failure at ATS West total 24 MVA in summer 2022.
Feasible options for alleviation of constraints
The following options are technically feasible and potentially economic to mitigate the risk of supply interruption and/or to alleviate the emerging constraint:
1. Install additional transformation capacity and reconfigure 66 kV exits at ATS, at an estimated indicative capital cost of $18 million (equating to a total annual cost of approximately $1.26 million). This would result in the station being configured so that three transformers are supplying the ATS West load, and one transformer will continue to provide capacity to the ATS/BLTS system.
52 Overload Shedding Scheme of Connection Asset.
53 Transmission Operation Centre

2021 Transmission Connection Planning Report Risk Assessment: ATS West
Page 67
2. A new Tarneit zone substation is planned for design in 2026 and construction in 2027; however it is not a committed project at this point in time. This zone substation would be supplied from DPTS and will offload Werribee and Laverton zones substations in the order of 40 MW. This will not eliminate the load at risk at ATS West, only reduce it.
3. Demand reduction: There is an opportunity to develop innovative customer schemes to encourage voluntary demand reduction during times of network constraint. The amount of potential demand reduction depends on the customer uptake and would be taken into consideration when determining the optimum timing of any network capacity augmentation.
4. Embedded generation, connected to the ATS 66 kV bus, may substitute capacity augmentations.
Preferred network option(s) for alleviation of constraints
In the absence of commitment by interested parties to offer network support services by installing local generation or through demand side management initiatives that would reduce load at ATS, it is proposed to install additional transformation capacity and to reconfigure 66 kV exits at ATS.
On the basis of the present demand forecasts and applying the 2021 VCR estimates, the installation of an additional transformer and the 66 kV exit reconfiguration works at ATS would be expected to be economically justified by around 2026. As a temporary measure, the expected load at risk will be managed by the load transfers to ATS-BLTS and DPTS.
The tables on the following pages provide more detailed data on the station rating, demand forecasts, energy at risk and expected unserved energy.

2021 Transmission Connection Planning Report Risk Assessment: ATS West
Page 68
Altona West Terminal Station Detailed data: Magnitude and probability of loss of load
Distribution Businesses supplied by this station: Powercor (100%) MW MVA
Normal cyclic rating with all plant in service 340 via 2 transformers (Summer peaking)
Summer N-1 Station Rating: 158 170 [See Note 1 below for interpretation of N-1]
Winter N-1 Station Rating: 176 187
Notes: 1. “N-1” means cyclic station output capability rating with outage of one transformer. The rating is at an ambient temperature of 35 degrees Centigrade.
2. “N-1 energy at risk” is the amount of energy in a year during which the specified demand forecast exceeds the N-1 capability rating.
Energy at risk at the specified demand forecast when all plant is in service (N) is shown separately.
3. “N-1 hours per year at risk” is the number of hours in a year during which the specified demand forecast exceeds the N-1 capability rating.
Hours at risk at the specified demand forecast when all plant is in service (N) are shown separately.
4. “Expected unserved energy” means “energy at risk” multiplied by the probability of a major outage affecting one transformer. “Major outage” means an outage with duration of
of 2.65 months. The outage probability is derived from the base reliability data given in Section 5.4.
5. The value of unserved energy is derived from the relevant climate zone and sector VCR values given in the AER VCR December 2019 final determination, weighted in accordance with the composition of the load at this terminal station.
6. The 0.7 and 0.3 weightings applied to the 50th and 10th percentile expected unserved energy estimates (respectively) is in accordance with the approach applied by AEMO,
and described on page 12 of its publication titled Victorian Electricity Planning Approach, published in June 2016
(see http://www.aemo.com.au/-/media/Files/Electricity/NEM/Planning_and_Forecasting/Victorian_Transmission/2016/Victorian-Electricity-Planning-Approach.ashx)
2022 2023 2024 2025 2026 2027 2028 2029 2030 2031
249.0 276.7 281.8 285.7 295.4 310.8 329.1 350.4 372.3 394.7
207.1 217.9 221.5 227.2 237.0 250.2 265.9 282.3 299.5 317.1
268.4 297.1 302.3 306.6 317.0 333.7 353.4 376.1 399.7 423.5
212.7 224.0 227.7 233.4 243.4 257.1 273.1 290.0 307.7 325.7
2086 4575 5375 6531 9474 15295 24624 38120 56337 79317
90.3 183.5 218.0 274.8 388.0 567.3 793.8 1097.3 1458.8 1844.3
3546 7119 8238 9825 13687 21064 32628 49250 71413 98969
140.3 264.0 306.3 369.8 498.0 690.5 961.3 1319.8 1732.8 2192.3
9.04 19.83 23.29 28.30 41.06 66.28 106.71 173.96 350.21 702.42
15.37 30.85 35.70 42.57 59.31 91.28 155.57 352.82 746.94 1355.31
$0.31M $0.67M $0.79M $0.96M $1.39M $2.24M $3.61M $5.88M $11.83M $23.73M
$0.52M $1.04M $1.21M $1.44M $2.00M $3.08M $5.26M $11.92M $25.24M $45.79M
$0.37M $0.78M $0.91M $1.10M $1.57M $2.49M $4.10M $7.69M $15.85M $30.35MExpected Unserved Energy value using AEMO weighting of 0.7 X 50th
precentile value + 0.3 X 10th percentile value
Station: ATS West
Expected Unserved Energy value at 50th percentile demand
Expected Unserved Energy value at 10th percentile demand
N-1 energy at risk at 10% percentile demand (MWh)
50th percentile Summer Maximum Demand (MVA)
50th percentile Winter Maximum Demand (MVA)
Expected Unserved Energy at 50th percentile demand (MWh)
Expected Unserved Energy at 10th percentile demand (MWh)
10th percentile Summer Maximum Demand (MVA)
10th percentile Winter Maximum Demand (MVA)
N-1 energy at risk at 50% percentile demand (MWh)
N-1 hours at risk at 50th percentile demand (hours)
N-1 hours at risk at 10th percentile demand (hours)

2021 Transmission Connection Planning Report Risk Assessment: BATS
Page 69
BALLARAT TERMINAL STATION (BATS) 66 kV
Ballarat Terminal Station (BATS) 66 kV consists of two 150 MVA 220/66 kV transformers and is the main source of supply for 73,094 customers in Ballarat and the surrounding area. The station supply area includes Ballarat CBD and Ararat via the interconnected 66 kV tie with Horsham Terminal Station (HOTS).
Embedded generation
A total of 250 MW capacity of large-scale embedded generation is installed on the Powercor sub-transmission and distribution systems connected to BATS.
The following table lists the registered embedded generators (>5 MW) that are installed on the Powercor network connected to BATS:
Site name Status Technology Type Nameplate capacity (MW)
Challicum Hills Existing Plant Wind Turbine 52.5
Chepstowe Wind Farm - VIC Existing Plant Wind Turbine 6.15
Yaloak South Wind Farm Existing Plant Wind Turbine 28.7
Maroona Wind Farm Existing Plant Wind Turbine 7.2
Yendon Wind Farm Existing Plant Wind Turbine 144.4
About 63 MW of rooftop solar PV is installed on the Powercor distribution system connected to BATS. This includes all the residential and small-commercial rooftop PV systems that are smaller than 1 MW.
Magnitude, probability and impact of loss of load
The following observations and risk assessment are based on actual readings of power flow at the Terminal Station Connection points. It therefore accounts for the existing load and generation combination.
The peak load on the station reached 149 MW (151 MVA) in summer 2021. It is noted that 2020-21 was a mild summer, and this contributed to reduced station maximum demands. The minimum demand at BATS reached -114.8 MW (-115.6 MVA) in December 2020.
It is estimated that:
• For 5 hours per year, 95% of peak demand is expected to be reached under the 50th percentile forecast.
• The station load power factor at the time of maximum demand is 0.98.
• The station load power factor at the time of peak minimum demand is 0.99.
The graph below depicts the 10th and 50th percentile maximum demand forecasts together with the station’s operational “N” rating (all transformers in service) and the “N-1” rating at
35C ambient temperature.

2021 Transmission Connection Planning Report Risk Assessment: BATS
Page 70
The N rating on the chart indicates the maximum load that can be supplied from BATS with all transformers in service. Exceeding this level will require load shedding or emergency load transfers to keep the terminal station operating within its limits.
The graph above shows that the historic peak demands had been at the ‘N-1” rating for the last three years and it is expected that the 2022 summer peak demand will exceed this rating, which means there will be insufficient capacity to supply the forecast demand at 50th percentile temperatures at BATS if a forced outage of a transformer occurs.
The bar chart below depicts the energy at risk with one transformer out of service for the 50th percentile demand forecast, and the hours per year that the 50th percentile demand forecast is expected to exceed the N-1 capability rating. The line graph shows the value to consumers of the expected unserved energy in each year, for the 50th percentile demand forecast.

2021 Transmission Connection Planning Report Risk Assessment: BATS
Page 71
Comments on Energy at Risk
For an outage of one transformer at BATS 66 kV, there will be insufficient capacity at the station to supply all demand at the 50th percentile temperature for about 272.3 hours in 2031. The energy at risk at the 50th percentile temperature under N-1 conditions is estimated to be 5004.3 MWh, which is valued at approximately $176 million (based on a value of customer reliability of $35,248/MWh). In other words, at the 50th percentile demand level, and in the absence of any other operational response that might be taken to mitigate the impact of a forced outage, a major outage of one transformer at BATS in 2031 would be anticipated to lead to involuntary supply interruptions that would cost consumers $176 million.
It is emphasised however, that the probability of a major outage of one of the two 150 MVA transformers occurring over the year is very low at about 1.0% per transformer per annum, whilst the expected unavailability per transformer per annum is 0.221%. When the energy at risk (5004.3 MWh for 2031) is weighted by this low unavailability, the expected unsupplied energy is estimated to be around 21.69 MWh. This expected unserved energy is estimated to have a value to consumers of $764,000 (based on a value of customer reliability of $35,248.35/MWh).
It should also be noted that the above estimates of energy at risk and expected unserved energy are based on an assumption of average (50th percentile) summer temperatures occurring in each year. Under 10th percentile temperature conditions, the energy at risk in 2031 is estimated to be 8270.4 MWh. The estimated value to consumers of this energy at risk in 2031 is approximately $292 million. The corresponding value of the expected unserved energy (of 35.84 MWh) is $1.26 million.
These key statistics for the year 2031 under N-1 outage conditions are summarised in the table below.

2021 Transmission Connection Planning Report Risk Assessment: BATS
Page 72
MWh Valued at consumer interruption cost
Energy at risk, at 50th percentile demand forecast 5,004 $176 million
Expected unserved energy at 50th percentile demand 21.7 $764,000
Energy at risk, at 10th percentile demand forecast 8,270 $292 million
Expected unserved energy at 10th percentile demand 35.8 $1.26 million
Feasible options for alleviation of constraints
The following options are technically feasible and potentially economic to mitigate the risk of supply interruption and/or to alleviate the emerging constraint:
1. Installation of a third 220/66 kV transformer (150 MVA) at BATS at an indicative capital cost of $18 million.
2. Demand reduction: There is an opportunity to develop a number of innovative customer schemes to encourage voluntary demand reduction during times of network constraint. The amount of demand reduction would depend on the customer uptake and would be taken into consideration when determining the optimum timing for any future capacity augmentation.
3. Embedded generation: The existing embedded generation that generates into the 66 kV infrastructure ex-BATS with a total capacity of 250 MW may help to supply the loads in the BATS supply area, and may defer the need for any capacity augmentation within the forecast period.
4. A new 30 MW 30 MWh battery storage system has been connected to one of the BATS 220/66/22 kV transformers. The battery storage will be able to help supply peak loads for short periods of time and may defer the need for any capacity augmentation within the forecast period.
5. The connection of additional large embedded generation to the BATS 66 kV infrastructure may lead to an increased risk of terminal station transformers overloading due to reverse power flows. In these circumstances, if it is uneconomic for augmentation to be undertaken, the need for and suitability of a generation runback scheme would be investigated by the DB.
Preferred option(s) for alleviation of constraints
In the absence of any commitment by interested parties to offer network support services by installing local generation or through demand side management initiatives that would reduce load at BATS, it is proposed to:
1. Install a third 220/66 kV transformer (150 MVA) at BATS at an indicative capital cost of $18 million. This equates to a total annual cost of approximately $1.26 million per annum. On the basis of the medium economic growth scenario and both 50th and 10th percentile weather probability, the transformer would not be expected to be economically justified in the forecast period.

2021 Transmission Connection Planning Report Risk Assessment: BATS
Page 73
2. As a temporary measure, maintain contingency plans to transfer load quickly to the Horsham Terminal Station (HOTS) and Brooklyn Terminal Station (BLTS 66) by the use of the 66 kV tie lines that run from BATS to HOTS and BATS to BLTS 66 in the event of an unplanned outage of one transformer at BATS under critical loading conditions. This load transfer is in the order of 18 MVA. Under these temporary measures, affected customers would be supplied from the 66 kV tie line infrastructure on a radial network, thereby reducing the level of supply reliability they receive.
3. Subject to availability, an AusNet Transmission Group spare 220/66 kV transformer for rural areas (refer Section 5.5) can be used to temporarily replace a failed transformer to minimise the transformer outage period. The table on the following page provides more detailed data on the station rating, demand forecasts, energy at risk and expected unserved energy.

2021 Transmission Connection Planning Report Risk Assessment: BATS
Page 74
Ballarat Terminal Station
Detailed data: Magnitude and probability of loss of load
Distribution Businesses supplied by this station: Powercor (100%)
MVA Normal cyclic rating with all plant in service 358 via 2 transformers (summer) Summer N-1 Station Rating: 183 [See Note 1 below for interpretation of N-1] Winter N-1 Station Rating: 206
Notes: 1. “N-1” means cyclic station output capability rating with outage of one transformer. The rating is at an ambient temperature of 35 degrees Centigrade.
2. “N-1 energy at risk” is the amount of energy in a year during which specified demand forecast exceeds the N-1 capability rating.
3. “N-1 hours at risk” is the number of hours in a year during which the specified demand forecast exceeds the N-1 capability rating.
4. “Expected unserved energy” means “N-1 energy at risk” for the specified demand forecast multiplied by the probability of a major outage affecting one transformer. “Major outage” means an outage with a duration of 2.65 months. The outage probability is derived from the base reliability data given in Section 5.4.
5. The value of unserved energy is derived from the relevant climate zone and sector VCR values given in the AER VCR December 2019 final determination, weighted in accordance with the composition of the load at this terminal station.
6. The 0.7 and 0.3 weightings applied to the 50th and 10th percentile expected unserved energy estimates (respectively) are in accordance with the approach applied by AEMO, and described on page 12 of its publication titled Victorian Electricity Planning Approach, published in June 2016 (see http://www.aemo.com.au/-/media/Files/Electricity/NEM/Planning_and_Forecasting/Victorian_Transmission/2016/Victorian-Electricity-Planning-Approach.ashx).
2022 2023 2024 2025 2026 2027 2028 2029 2030 2031
196.8 204.0 207.7 208.1 213.3 222.5 234.4 248.1 262.0 276.3
189.6 191.1 194.1 201.0 211.2 223.2 235.9 248.9 262.2 275.4
214.6 222.4 226.2 226.6 232.1 242.3 255.2 270.1 285.0 300.2
195.8 197.3 200.4 207.5 218.0 230.4 243.4 256.8 270.3 283.9
12.2 27.0 37.4 38.6 59.9 154.7 440.8 1166.4 2603.2 5004.3
1.8 3.0 3.5 3.5 6.3 15.3 40.8 90.5 169.3 272.3
62.0 103.1 128.8 132.0 199.6 435.9 1067.1 2406.5 4726.0 8270.4
5.0 7.8 9.8 10.5 16.8 37.5 84.0 154.8 259.8 393.0
0.05 0.12 0.16 0.17 0.26 0.67 1.91 5.05 11.28 21.69
0.27 0.45 0.56 0.57 0.87 1.89 4.62 10.43 20.48 35.84
$0.00M $0.00M $0.01M $0.01M $0.01M $0.02M $0.07M $0.18M $0.40M $0.76M
$0.01M $0.02M $0.02M $0.02M $0.03M $0.07M $0.16M $0.37M $0.72M $1.26M
$0.00M $0.01M $0.01M $0.01M $0.02M $0.04M $0.10M $0.23M $0.49M $0.91MExpected Unserved Energy value using AEMO weighting of 0.7 X 50th
precentile value + 0.3 X 10th percentile value
Station: BATS
Expected Unserved Energy value at 50th percentile demand
Expected Unserved Energy value at 10th percentile demand
N-1 energy at risk at 10% percentile demand (MWh)
Expected Unserved Energy at 10th percentile demand (MWh)
10th percentile Summer Maximum Demand (MVA)
10th percentile Winter Maximum Demand (MVA)
N-1 energy at risk at 50% percentile demand (MWh)
N-1 hours at risk at 50th percentile demand (hours)
N-1 hours at risk at 10th percentile demand (hours)
50th percentile Summer Maximum Demand (MVA)
50th percentile Winter Maximum Demand (MVA)
Expected Unserved Energy at 50th percentile demand (MWh)

2021 Transmission Connection Planning Report Risk Assessment: BETS 22 kV
Page 75
BENDIGO TERMINAL STATION (BETS) 22 kV
Bendigo Terminal Station (BETS) 22 kV consists of two 75 MVA 235/22.5 kV transformers supplying the 22 kV network ex-BETS. These two transformers have been in service since mid 2013 and they have enabled the separation of the 66 kV and 22 kV points of supply, and the transfer of load from the existing 230/66/22kV transformers. This configuration is the main source of supply for 27,845 customers in Bendigo and the surrounding area. The station supply area includes Marong, Newbridge and Lockwood.
Embedded generation
About 42 MW of rooftop solar PV is installed on the Powercor distribution system connected to BETS 22 kV. This includes all the residential and small-commercial rooftop PV systems that are smaller than 1 MW.
Magnitude, probability and impact of loss of load
BETS 22 kV demand is summer peaking. Growth in summer peak demand on the 22 kV network at BETS has averaged around -1.3 MVA (-1.1%) per annum over the last 5 years. The peak load for the 22 kV network now on the station reached 65.2 MVA in summer 2021. There were load transfers from Eaglehawk Zone Substation to BETS 22 which have contributed to the higher peak demand since 2016 compared to 2015. It is estimated that:
• For 15 hours per year, 95% of peak demand is expected to be reached under the 50th percentile demand forecast.
• The station load power factor at the time of peak demand is 0.99.
The graph below depicts the 10th and 50th percentile summer maximum demand forecast together with the station’s operational “N” rating (all transformers in service) and the “N-1”
rating at 35C ambient temperature.

2021 Transmission Connection Planning Report Risk Assessment: BETS 22 kV
Page 76
The above graph shows that there is sufficient capacity at the station to supply all expected demand at the 50th and 10th percentile temperatures until 2028, even with one transformer out of service. Under 10th percentile forecast conditions, there is a small amount of load at risk from 2028 onwards, while at the 50th percentile forecast, there is a small amount of load at risk from 2029 onwards. These risks can be managed by utilising load transfers away to adjacent zone substations. Therefore, the need for augmentation or other corrective action is not expected to arise over the next ten years.

2021 Transmission Connection Planning Report Risk Assessment: BETS 66 kV
Page 77
BENDIGO TERMINAL STATION (BETS) 66 kV
Background
Bendigo Terminal Station (BETS) 66 kV consists of one 150 MVA 220/66 kV transformers supplying the 66 kV buses in parallel with one existing 125/125/40 MVA 230/66/22 kV transformer. These transformers provide the main source of 66 kV supply for 58,367 customers in Bendigo and the surrounding area. The station supply area includes Bendigo CBD, Eaglehawk, Charlton, St. Arnaud, Maryborough and Castlemaine.
Embedded generation
A total of 29 MW capacity of large-scale embedded generation is installed on the Powercor sub-transmission and distribution systems connected to BETS 66kV.
The following table lists the registered embedded generators (>5MW) that are installed on the Powercor network connected to BETS:
Site name Status Technology Type Nameplate capacity (MW)
Coonooer Bridge Wind Farm Existing Plant Wind Turbine 19.8
Yawong Wind Farm Existing Plant Wind Turbine 7.2
About 66 MW of rooftop solar PV is installed on the Powercor distribution system connected to BETS 66 kV. This includes all the residential and small-commercial rooftop PV systems that are smaller than 1 MW.
Magnitude, probability and impact of loss of load
Growth in summer peak demand at BETS 66 kV has averaged around -4.37 MVA (-2.5%) per annum over the last 5 years. The peak load on the station reached 138.50 MW in summer of 2021. It is estimated that:
• For 14.5 hours per year, 95% of peak demand is expected to be reached under the 50th percentile demand forecast.
• The station load power factor at time of peak demand is 0.99.
BETS 66 kV demand is summer peaking. The graph below depicts the 10th and 50th percentile summer maximum demand forecast together with the station’s operational “N”
rating (all transformers in service) and the “N-1” rating at 35C ambient temperatures.

2021 Transmission Connection Planning Report Risk Assessment: BETS 66 kV
Page 78
The (N) rating on the chart indicates the maximum load that can be supplied from BETS 66 kV with all transformers in service. Exceeding this level will initiate automatic load shedding by AusNet Transmission Group’s automatic load shedding scheme.
The bar chart below depicts the energy at risk with one transformer out of service for the 50th percentile demand forecast, and the hours per year that the 50th percentile demand forecast is expected to exceed the N-1 capability rating. The line graph shows the value to consumers of the expected unserved energy in each year, for the 50th percentile demand forecast.

2021 Transmission Connection Planning Report Risk Assessment: BETS 66 kV
Page 79
Comments on Energy at Risk
For a major outage of one transformer at BETS 66 kV during the summer period, there will be insufficient capacity at the station to supply all demand at the 50th percentile temperature for about 78 hours in 2031. The energy at risk at the 50th percentile temperature under N-1 conditions is estimated to be 1,561 MWh in 2031. The estimated value to consumers of the 1,561 MWh of energy at risk is approximately $56.4 million (based on a value of customer reliability of $36,090/MWh).54 In other words, at the 50th percentile demand level, and in the absence of any other operational response that might be taken to mitigate the impact of a forced outage, a major outage of one transformer at BETS 66kV in 2031 would be anticipated to lead to involuntary supply interruptions that would cost consumers approximately $56.4 million.
It is emphasised however, that the probability of a major outage of one of the two transformers occurring over the year is very low at about 1.0% per transformer per annum, whilst the expected unavailability per transformer per annum is 0.221%. When the energy at risk (1,561 MWh for 2031) is weighted by this low unavailability, the expected unsupplied energy is estimated to be around 3.4 MWh. This expected unserved energy is estimated to have a value to consumers of around $0.12 million, (based on a value of customer reliability of $36,090/MWh).
It should also be noted that the above estimates of energy at risk and expected unserved energy are based on an assumption of average (50th percentile) summer temperatures occurring in each year. Under 10th percentile temperature conditions, the energy at risk in 2031 is estimated to be 2,649 MWh. The estimated value to consumers of this energy at risk in 2031 is approximately $95.6 million. The corresponding value of the expected unserved energy (of 5.7 MWh) is approximately $0.21 million.
These key statistics for the year 2031 under N-1 outage conditions are summarised in the table below.
MWh Valued at consumer interruption cost
Energy at risk, at 50th percentile demand forecast 1,561 $56.4 million
Expected unserved energy at 50th percentile demand 3.4 $0.12 million
Energy at risk, at 10th percentile demand forecast 2,649 $95.6million
Expected unserved energy at 10th percentile demand 5.7 $0.21 million
Possible impacts of a transformer outage on customers
If one of the 230/66/22 kV transformers at BETS 66 kV is taken off line during peak loading times and the N-1 station rating is exceeded, the OSSCA55 automatic load shedding scheme which is operated by AusNet Transmission Group’s TOC56 will act swiftly to reduce the loads
54 The value of unserved energy is derived from the relevant climate zone and sector VCR values given in
the AER VCR December 2019 final determination, weighted in accordance with the composition of the load at this terminal station.
55 Overload Shedding Scheme of Connection Asset.
56 Transmission Operation Centre.

2021 Transmission Connection Planning Report Risk Assessment: BETS 66 kV
Page 80
in blocks to within safe loading limits. Any load reductions that are in excess of the minimum amount required to limit load to the rated capability of the station would be restored at zone substation feeder level in accordance with Powercor’s operational procedures after the operation of the OSSCA scheme.
Feasible options for alleviation of constraints
The following options are technically feasible and potentially economic to mitigate the risk of supply interruption and/or alleviate the emerging constraint over the next ten year planning horizon:
1. Implement a contingency plan to transfer 10 MVA of load away to BETS 22 kV, WETS, KTS East and SHTS in the event of loss of a transformer at BETS 66 kV.
2. Install an additional 150 MVA 220/66 kV transformer at BETS 66 kV at an estimated indicative capital cost of approximately $18 million (equating to a total annual cost of approximately $1.26 million per annum). This would result in the station being configured so that three transformers are supplying the BETS 66 kV load.
3. Demand reduction: There is an opportunity for voluntary demand reduction to reduce peak demand during times of network constraint. The amount of demand reduction would be taken into consideration when determining the optimum timing for the capacity augmentation.
4. Embedded generation, connected to the BETS 66 kV bus, may defer the need for an additional 220/66 kV transformer at BETS 66 kV.
Preferred option(s) for alleviation of constraints
As already noted, a contingency plan to transfer 10 MVA of load to BETS 22 kV, WETS, KTS East and SHTS will be implemented in the event of the loss of one of the BETS 220/66 kV transformers.
Given the contingency plans in place to address the forecast load at risk, it is unlikely that additional capacity can be economically justified during the forecast period. Demand reduction to reduce the load below the N-1 rating would be the preferred option.
Subject to availability, an AusNet Transmission Group spare 220/66 kV transformer for rural areas (refer to Section 5.5) can be used to temporarily replace a failed transformer to minimise the transformer outage period.
The table on the following page provides more detailed data on the station rating, demand forecasts, energy at risk and expected unserved energy.
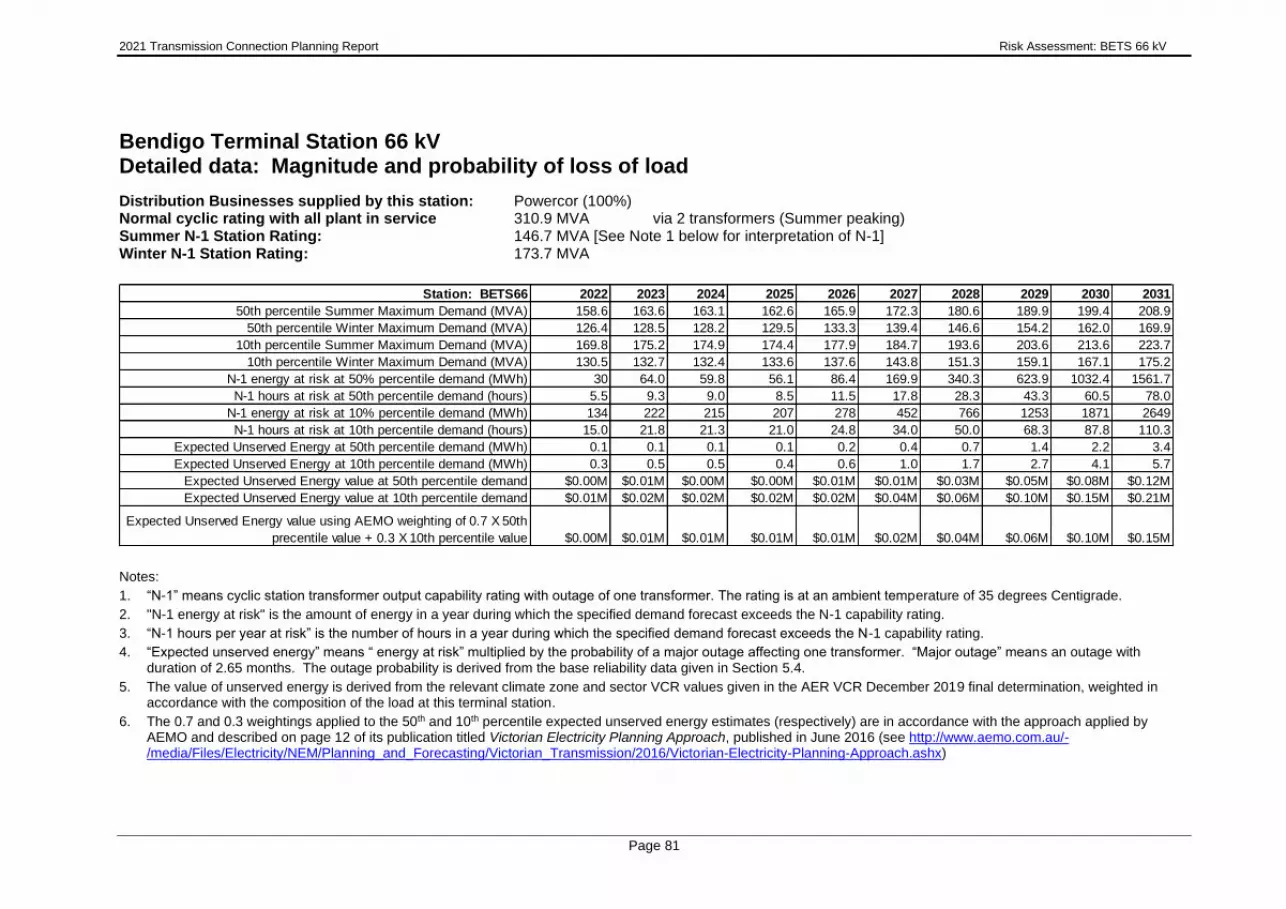
2021 Transmission Connection Planning Report Risk Assessment: BETS 66 kV
Page 81
Bendigo Terminal Station 66 kV
Detailed data: Magnitude and probability of loss of load
Distribution Businesses supplied by this station: Powercor (100%) Normal cyclic rating with all plant in service 310.9 MVA via 2 transformers (Summer peaking) Summer N-1 Station Rating: 146.7 MVA [See Note 1 below for interpretation of N-1] Winter N-1 Station Rating: 173.7 MVA
Notes:
1. “N-1” means cyclic station transformer output capability rating with outage of one transformer. The rating is at an ambient temperature of 35 degrees Centigrade.
2. "N-1 energy at risk" is the amount of energy in a year during which the specified demand forecast exceeds the N-1 capability rating.
3. “N-1 hours per year at risk” is the number of hours in a year during which the specified demand forecast exceeds the N-1 capability rating.
4. “Expected unserved energy” means “ energy at risk” multiplied by the probability of a major outage affecting one transformer. “Major outage” means an outage with duration of 2.65 months. The outage probability is derived from the base reliability data given in Section 5.4.
5. The value of unserved energy is derived from the relevant climate zone and sector VCR values given in the AER VCR December 2019 final determination, weighted in accordance with the composition of the load at this terminal station.
6. The 0.7 and 0.3 weightings applied to the 50th and 10th percentile expected unserved energy estimates (respectively) are in accordance with the approach applied by AEMO and described on page 12 of its publication titled Victorian Electricity Planning Approach, published in June 2016 (see http://www.aemo.com.au/-/media/Files/Electricity/NEM/Planning_and_Forecasting/Victorian_Transmission/2016/Victorian-Electricity-Planning-Approach.ashx)
2022 2023 2024 2025 2026 2027 2028 2029 2030 2031
158.6 163.6 163.1 162.6 165.9 172.3 180.6 189.9 199.4 208.9
126.4 128.5 128.2 129.5 133.3 139.4 146.6 154.2 162.0 169.9
169.8 175.2 174.9 174.4 177.9 184.7 193.6 203.6 213.6 223.7
130.5 132.7 132.4 133.6 137.6 143.8 151.3 159.1 167.1 175.2
30 64.0 59.8 56.1 86.4 169.9 340.3 623.9 1032.4 1561.7
5.5 9.3 9.0 8.5 11.5 17.8 28.3 43.3 60.5 78.0
134 222 215 207 278 452 766 1253 1871 2649
15.0 21.8 21.3 21.0 24.8 34.0 50.0 68.3 87.8 110.3
0.1 0.1 0.1 0.1 0.2 0.4 0.7 1.4 2.2 3.4
0.3 0.5 0.5 0.4 0.6 1.0 1.7 2.7 4.1 5.7
$0.00M $0.01M $0.00M $0.00M $0.01M $0.01M $0.03M $0.05M $0.08M $0.12M
$0.01M $0.02M $0.02M $0.02M $0.02M $0.04M $0.06M $0.10M $0.15M $0.21M
$0.00M $0.01M $0.01M $0.01M $0.01M $0.02M $0.04M $0.06M $0.10M $0.15M
Expected Unserved Energy at 10th percentile demand (MWh)
10th percentile Summer Maximum Demand (MVA)
10th percentile Winter Maximum Demand (MVA)
N-1 energy at risk at 50% percentile demand (MWh)
N-1 hours at risk at 50th percentile demand (hours)
N-1 hours at risk at 10th percentile demand (hours)
50th percentile Summer Maximum Demand (MVA)
50th percentile Winter Maximum Demand (MVA)
Expected Unserved Energy at 50th percentile demand (MWh)
Expected Unserved Energy value using AEMO weighting of 0.7 X 50th
precentile value + 0.3 X 10th percentile value
Station: BETS66
Expected Unserved Energy value at 50th percentile demand
Expected Unserved Energy value at 10th percentile demand
N-1 energy at risk at 10% percentile demand (MWh)

2021 Transmission Connection Planning Report Risk Assessment: BLTS
Page 82
BROOKLYN TERMINAL STATION (BLTS) 22 kV
The Brooklyn Terminal Station (BLTS) 22 kV supply area includes Altona, Brooklyn and Laverton North. The station supplies both Jemena Electricity Network (3%) and Powercor (97%) customers.
Embedded generation
About 5 MW of rooftop solar PV is installed on the Powercor distribution system connected to BLTS22. This includes all the residential and small-commercial rooftop PV systems that are smaller than 1 MW.
Magnitude, probability and impact of loss of load
Brooklyn Terminal Station (BLTS) 22 kV is the main source of supply for 7,835 customers in Brooklyn and the surrounding area. The load characteristic for BLTS 22 kV substation is of a mixed nature, consisting of residential and industrial customers. In recent years, the industrial load has declined in the area; however this has been offset by some growth from residential developments. The peak load demand on the entire BLTS 22 kV network reached 54.5 MW (60.6 MVA) in summer 2021. It is estimated that:
• For 15 hours per year, 95% of peak demand is expected to be reached under the 50th percentile demand forecast.
• The station transformer power factor at the time of peak demand is 0.90.
The graph below depicts the 10th and 50th percentile summer maximum demand forecast together with the station’s operational “N” rating (all transformers in service) and the “N-1”
rating at 35C ambient temperature.

2021 Transmission Connection Planning Report Risk Assessment: BLTS
Page 83
The “N” rating on the chart indicates the maximum load that can be supplied from BLTS 22 kV Terminal Station with all transformers in service. The “N-1” rating on the chart is the load that can be supplied with one 75 MVA transformer out of service.
The graph shows there is sufficient capacity at the station to supply all expected demand at the 10th and 50th percentile temperature, over the forecast period, with one transformer out of service. Therefore, the need for augmentation or other corrective action is not expected to arise over the next ten years.

2021 Transmission Connection Planning Report Risk Assessment: BTS 22 kV
Page 84
BRUNSWICK TERMINAL STATION 22 kV (BTS 22 kV)
BTS 22 kV is a terminal station located in an inner northern suburb of Melbourne and shared by Jemena Electricity Networks (41%) and CitiPower (59%). It operates at 220/22 kV and supplies a total of approximately 46,192 customers in the Brunswick, Fitzroy, Northcote, Fairfield, Essendon, Ascot Vale and Moonee Ponds areas.
Embedded Generation
About 14.1 MW of solar PV is installed on BTS 22 kV which includes 6.3 MW in the Powercor distribution system and 7.8 MW in the Jemena distribution system. This includes all the residential and small-commercial rooftop PV systems that are smaller than 1 MW.
There are no embedded generators greater than 1 MW connected to BTS 22 kV.
Magnitude, probability and impact of loss of load
BTS 22 kV is a summer critical station with three 75 MVA transformers operating in parallel.
The peak load on the station transformer reached 90.3 MW (or 93.3 MVA) on 25 January 2021.
It is estimated that:
• For 12 hours per year, 95% of peak demand is expected to be reached under the 50th percentile demand forecast.
• The station transformer load power factor at the time of peak demand is 0.97.
The graph below depicts the BTS 22 kV operational “N-1” rating (for an outage of one transformer) at ambient temperatures of 38°C and 43°C, and the 50th and 10th percentile summer maximum demand forecasts57.
57 Note that station transformer output capability rating and transformers’ loading is used.

2021 Transmission Connection Planning Report Risk Assessment: BTS 22 kV
Page 85
The graph shows there is sufficient station capacity to supply all anticipated loads and that no customers would be at risk if a forced transformer outage occurred at BTS 22 kV over the forecast period. Accordingly, no capacity augmentation or other corrective action is planned at BTS 22 kV over the next ten years.

2021 Transmission Connection Planning Report Risk Assessment: BTS 66 kV
Page 86
BRUNSWICK TERMINAL STATION 66 kV (BTS 66 kV)
Brunswick Terminal Station (BTS) 66 kV consists of 3 x 225 MVA 220/66 kV transformers. It reinforces the security of supply to the northern and inner suburbs and the Central Business District areas. It currently provides supply to approximately 37,453 customers.
Embedded generation
About 4.5 MW of solar PV is installed on the CitiPower distribution system connected to BTS66. This includes all the residential and small-commercial rooftop solar PV systems (<1 MW).
Magnitude, probability and impact of loss of load
The BTS demand is summer peaking. The graph below depicts the 10th and 50th percentile summer maximum demand forecast together with the station’s operational “N” rating (all transformers in service) and the “N-1” rating at 35 deg C ambient temperature.
The BTS load includes transfers from RTS 66 and WMTS 22 which occurred in September 2020. The station peak load reached 210.0 MW in summer 2020/21. However, it is noted that the 2020/21 summer peak demand of BTS 66 was lower than expected due to the mild weather over that period.
The 50th percentile peak load on with a station load power factor of 0.96.
The number of hours per year in which 95% of peak load is expected to be reached is estimated to be 4 hours.
BTS 66 is one of the terminal stations suppling the Melbourne CBD. In order to meet the code requirements of security of supply to the Melbourne CBD, CitiPower has been undertaking works to re-configure the CBD 66 kV network to provide the required security to maintain supply from alternate supply points. This means that for an ‘N-1’ event in other parts of the CBD network, additional load can be switched onto BTS 66. This

2021 Transmission Connection Planning Report Risk Assessment: BTS 66 kV
Page 87
required additional capacity must be reserved at the terminal station to ensure that CBD load can be supplied under any of the CBD Security contingency arrangements.
The graph above shows that there is expected to be sufficient capacity at the station to supply all expected load over the forecast period, even with one transformer out of service. Therefore, the need for augmentation or other corrective action at the station is not expected to arise over the current ten year planning horizon.

2021 Transmission Connection Planning Report Risk Assessment: CBTS
Page 88
CRANBOURNE TERMINAL STATION (CBTS)
Cranbourne Terminal Station (CBTS) was originally commissioned with two 150 MVA 220/66 kV transformers in 2005 to reinforce the security of supply for United Energy and AusNet Electricity Services customers and to off-load East Rowville Terminal Station (ERTS). In order to supply the growing electricity demand in the area, a third 150 MVA 220/66 kV transformer was commissioned in 2009.
In late-2020, AusNet Transmission Group reviewed and updated the cyclic ratings of the CBTS transformers. This review resulted in an increased “N” summer cyclic rating of 553 MVA, up from 538 MVA, and an increased “N-1” summer cyclic rating of 369 MVA, up from 356 MVA. This increased cyclic rating is a result of a changing transformer load profile driven by increased distributed energy resources (DER) reducing station loading during the day.
The geographic area supplied by CBTS spans from Narre Warren in the north to Clyde in the south, and from Pakenham in the east to Carrum and Frankston in the west. The electricity distribution networks for this area are the responsibility of both AusNet Electricity Services (61%) and United Energy (39%).
Embedded generation
About 173.3 MW of rooftop solar PV is installed on the AusNet distribution system and about 57.3 MW of rooftop solar PV is installed on the UE distribution system connected to CBTS. This includes all the residential and small commercial rooftop PV systems that are smaller than 1 MW.
Magnitude, probability and impact of loss of load
CBTS 66 kV is a summer peaking station. The summer peak demand at CBTS 66 kV has increased by 172 MVA between 2007/08 and 2019/20, which is equivalent to an average annual growth rate of 4.1%. In 2019/20 the summer peak demand on the station reached 470.6 MW (481.9 MVA), which is the highest annual peak demand recorded. The recorded peak demand in summer 2020/21 was 412.0 MW (422.8 MVA). The station load has a power factor of 0.98 at maximum demand. Demand at CBTS 66 kV is expected to exceed 95% of the 50th percentile peak demand for 2 hours per annum.
The graph below depicts the 10th and 50th percentile summer maximum demand forecast together with the station’s expected operational “N” rating (all transformers in service) and
the “N-1” rating at 35C as well as 40C ambient temperatures.

2021 Transmission Connection Planning Report Risk Assessment: CBTS
Page 89
The “N” rating on the chart indicates the maximum load that can be delivered from CBTS 66 kV with all transformers in service. Exceeding this level would require load shedding or emergency load transfers to keep the terminal station operating within its limits.
Load at CBTS 66 kV is forecast to be above the station’s “N” rating under 10th percentile summer maximum demand conditions from summer 2022/23 but remain within its 50th percentile “N” rating until summer 2029/2030.
The winter ratings of transformers are higher than the summer ratings due to lower ambient temperatures. The maximum demand at CBTS in winter is also much lower than in summer. Thus, energy at risk during the winter period is much lower than the summer period. The graph below demonstrates the 10th and the 50th percentile winter maximum demand forecast together with the station’s operational “N” rating and “N-1” rating for winter.

2021 Transmission Connection Planning Report Risk Assessment: CBTS
Page 90
The bar chart below depicts the energy at risk with one transformer out of service for the 50th percentile demand forecast, and the hours per year that the 50th percentile demand forecast is expected to exceed the “N-1” capability rating. The line graph shows the cost to consumers of the expected unserved energy in each year, for the 50th percentile demand forecast.
Comments on Energy at Risk
As already noted, CBTS 66 kV is a summer peaking station and most of the energy at risk occurs in the summer period because the rating of the transformers is lower at higher ambient temperatures in addition to higher summer demand. For simplicity therefore, the comments below focus on the energy at risk over the summer period.
For an outage of one 220/66 kV transformer at CBTS, there will be insufficient capacity at the station to supply all demand at the 50th percentile temperature for about 41 hours in 2021/22. The energy at risk under “N-1” conditions is estimated to be 1,219 MWh in 2021/22. The estimated value to consumers of the 1,219 MWh of energy at risk is approximately $41 million (based on a value of customer reliability of $33,953/MWh)58. In other words, at the 50th percentile demand level, and in the absence of any other operational response that might be taken to mitigate the impact of a forced outage, a major outage of one 220/66 kV transformer at CBTS for the entire duration of the 2021/22 summer would lead to involuntary supply interruptions that are valued by consumers at $41 million.
It is emphasised however, that the probability of a major transformer outage is very low, with a network average of 1.0% per transformer per annum applied for this TCPR assessment, contributing to an expected unavailability per transformer per annum of 0.221%. When the energy at risk (1,219 MWh) is weighted by this low unavailability, the expected unserved energy is estimated to be around 7.9 MWh. This expected unserved energy is estimated to
58 The value of unserved energy is derived from the sector values given in Table 1 in Section 2.4, weighted
in accordance with the composition of the load at this terminal station.

2021 Transmission Connection Planning Report Risk Assessment: CBTS
Page 91
have a value to consumers of around $0.27 million (based on a value of customer reliability of $33,953/MWh).
The above estimates of energy at risk and expected unserved energy are based on an assumption of moderate temperatures occurring in each year. Under higher temperature conditions (that is, at the 10th percentile level), there is a higher amount of energy at risk under. The energy at risk in summer 2021/22 is estimated to be 6,512 MWh. The total estimated value to consumers of this energy at risk in 2021/22 is approximately $221 million. The corresponding value of the expected unserved energy (of 42.3 MWh) is $1.44 million.
These key statistics for the year 2021/22 are summarised in the table below.
MWh Valued at consumer interruption cost
Energy at risk, at 50th percentile demand forecast 1,219 $41 million
Expected unserved energy at 50th percentile demand 7.9 $0.27 million
Energy at risk, at 10th percentile demand forecast 6,512 $221 million
Expected unserved energy at 10th percentile demand 42.3 $1.44 million
Possible impacts of a transformer outage on customers
If one of the 220/66 kV transformers at CBTS is taken out of service during peak loading times and the N-1 station rating is exceeded, the Overload Shedding Scheme for Connection Assets (OSSCA)59 which is operated by AusNet Transmission Group’s TOC60 will act swiftly to reduce the loads in blocks to within ratings of available plant. In the event of OSSCA operating, it would automatically shed up to 180 MVA of load, affecting up to 75,000 customers in 2021/22. Any load reductions that are in excess of the minimum amount required to limit load to the rated capability of the station would be restored at zone substation feeder level in accordance with United Energy’s and AusNet Electricity Services’ operational procedures after the operation of the OSSCA scheme.
Feasible options for alleviation of constraints
The following options are technically feasible actions to mitigate the risk of supply interruption and/or to alleviate the emerging constraint.
1. Implement contingency plans to transfer load to adjacent terminal stations: Both AusNet Electricity Services and United Energy have established and implemented the necessary plans that enable load transfers under contingency conditions via both 22 kV distribution and emergency 66 kV ties to the adjacent terminal stations at East Rowville (ERTS 66 kV), Tyabb (TBTS 66 kV) and Heatherton (HTS 66 kV). The 22 kV distribution network is capable of transferring approximately 70 MVA. Where required, such as if a 10th percentile temperature day was anticipated, the 22 kV load transfers would also be utilised to manage system normal loading to within the terminal station’s limits until
59 OSSCA is designed to protect connection transformers against transformer damage caused by
overloads. Damaged transformers can take months to repair or replace, which can result in prolonged, long term risks to the reliability of customer supply.
60 Transmission Operations Centre

2021 Transmission Connection Planning Report Risk Assessment: CBTS
Page 92
augmentation is economically justified and implemented. The emergency 66 kV ties can be in operation within 2 hours following a contingency event and have a combined capability to transfer up to 260 MVA of load.
2. Establish a new 220/66 kV terminal station: AusNet Electricity Services expects that a new terminal station in the Pakenham area (with a site yet to be acquired) will be required in around 10 to 20 years to service demand growth in the region. This development will help to off-load CBTS as well as address constraints on the existing 66 kV sub-transmission network from CBTS to the Pakenham area. AusNet Electricity Services will carry out planning studies to assess whether this option is economic, and if so, to determine the optimal timing of any investment. An alternative would be to develop a new terminal station on a reserved site in North Pearcedale. The North Pearcedale site, however, is not located within the growth area and is considered suboptimal at this time.
3. Install a 4th 220/66 kV transformer at Cranbourne Terminal Station: The site has provision for a 4th transformer and implementing this option is relatively straight forward, although it would require 66 kV lines to be re-arranged so that the station can operate with split 66 kV buses in order to maintain fault levels within equipment ratings.
4. Install two new 50 MVAR 66 kV capacitor banks: CBTS currently does not have 66 kV capacitor banks and the station operates with a power factor around 0.98 lagging in summer. Two 50 MVAR 66 kV capacitor banks will help to reduce the net MVA supplied by the transformers by approximately 11 MVA and could defer a network augmentation by approximately one year.
5. Demand Management: United Energy and AusNet Electricity Services have developed a number of innovative network tariffs that encourage voluntary demand reduction during times of network constraints. The amount of demand reduction depends on the tariff uptake and the subsequent change in the load pattern, and will be taken into consideration when determining the optimum timing for the capacity augmentation.
6. Embedded Generation: Embedded generation, with a capacity in the order of 15 to 20 MW, connected to the CBTS 66 kV bus, could defer the need for augmentation by approximately two years.
Preferred network option for alleviation of constraints
AusNet Electricity Services and United Energy have completed Stage 1, the project specification consultation report (PSCR), of the Regulatory Investment Test for Transmission (RIT-T) to address the supply risks at CBTS61. That report demonstrated that based on the 2019 maximum demand forecasts and the 2019 station ratings the optimal economic timing for installation of a fourth 220/66 kV transformer was by summer 2022/23. With the change in discount rate, demand forecasts and revision of the station cyclic ratings, the optimal timing is likely to be 2024/25 when available load transfers are considered.
Progression to Stage 2 of the RIT-T assessment, publication of the project assessment draft report (PADR), will take place by 25 June 2022. The PADR will assess the two submissions received to the PSCR to defer the installation of the fourth 220/66kV transformer.
Subject to availability, one of AusNet Transmission Group’s spare 220/66 kV transformers for the metropolitan area (refer Section 5.5) can be used to temporarily replace a failed transformer at CBTS.
61 Regulatory Investment Test (ausnetservices.com.au)

2021 Transmission Connection Planning Report Risk Assessment: CBTS
Page 93
Prior to implementing any augmentation option, the following temporary measures to cater for any “N” risk and an unplanned outage of one transformer at CBTS under critical loading conditions have been established:
• maintain emergency plans to transfer load to adjacent terminal stations via 22 kV feeders and 66 kV tie lines;
• fine-tune the OSSCA scheme settings to minimise the impact on customers of any automatic load shedding that may take place; and
• subject to the availability of a spare 220/66 kV transformer for metropolitan areas (refer Section 5.5), a spare transformer can be used to temporarily replace a failed transformer.
The capital cost of installing a fourth 150 MVA 220/66 kV transformer at CBTS is estimated to be $26 million. The cost of establishing, operating and maintaining a new transformer would be recovered from network users through network charges, over the life of the asset. The estimated total annual cost of this network augmentation is approximately $1.8 million. This cost provides a broad upper bound for the maximum annual network support payment which may be available to embedded generators or customers to reduce forecast demand, and to defer or avoid the transmission connection component of this augmentation.
The table on the following page provides more detailed data on the station rating, demand forecasts, energy at risk and expected unserved energy.

2021 Transmission Connection Planning Report Risk Assessment: CBTS
Page 94
Notes:
1. “N-1” means cyclic station output capability rating with outage of one transformer. The rating is at an summer ambient temperature of 35 degrees Centigrade.
2. “N-1 energy at risk” is the amount of energy in a year during which the specified demand forecast exceeds the N-1 capability rating. Energy at risk at the specified demand forecast when all plant is in service (N) is shown separately.
3. “N-1 hours per year at risk” is the number of hours in a year during which the specified demand forecast exceeds the N-1 capability rating. Hours at risk at the specified demand forecast when all plant is in service (N) are shown separately.
4. “Expected unserved energy” means “energy at risk” multiplied by the probability of a major outage affecting one transformer. “Major outage” means an outage with duration of 2.65 months. The outage probability is derived from the base reliability data given in Section 5.4.
5. The value of unserved energy is derived from the VCR relevant climate zone and sector values given in the AER VCR December 2019 final determination, weighted in accordance with the composition of the load at this terminal station.
6. The 0.7 and 0.3 weightings applied to the 50th and 10th percentile expected unserved energy estimates (respectively) are in accordance with the approach applied by AEMO, and described on page 12 of its publication titled Victorian Electricity Planning Approach, published in June 2016 (see http://www.aemo.com.au/-/media/Files/Electricity/NEM/Planning_and_Forecasting/Victorian_Transmission/2016/Victorian-Electricity-Planning-Approach.ashx)
CRANBOURNE TERMINAL STATION
Detailed data: Magnitude and probability of loss of load
Distribution Businesses supplied by this station: United Energy (39%) and AusNet Electricity Services (61%)
Normal cyclic rating with all plant in service 553 MVA via 3 transformers (Summer peaking)
Summer N-1 Station Rating 369 MVA [See Note 1 below for interpretation of N-1]
Winter N-1 Station Rating 413 MVA
Station: CBTS 66 kV 2022 2023 2024 2025 2026 2027 2028 2029 2030 2031
50th percentile Summer Maximum Demand (MVA) 463.0 475.9 487.2 495.9 506.9 518.2 529.0 540.6 551.3 562.6
50th percentile Winter Maximum Demand (MVA) 351.6 356.1 360.0 363.4 366.7 369.9 374.4 379.6 384.6 389.7
10th percentile Summer Maximum Demand (MVA) 532.6 546.2 559.0 569.9 583.8 597.7 610.5 624.1 637.1 650.9
10th percentile Winter Maximum Demand (MVA) 357.8 362.4 366.3 369.7 373.1 376.4 381.0 386.2 391.4 396.5
N - 1 energy at risk at 50th percentile demand (MWh) 1,219 1,727 2,257 2,724 3,396 4,183 5,025 6,033 7,052 8,223
N - 1 hours at risk at 50th percentile demand (hours) 41 52 61 69 81 93 104 117 129 141
N - 1 energy at risk at 10th percentile demand (MWh) 6,512 7,609 8,735 9,788 11,229 12,791 14,352 16,160 18,038 20,166
N - 1 hours at risk at 10th percentile demand (hours) 95 107 119 131 144 158 176 196 215 233
N energy at risk at 50th percentile demand (MWh) 0 0 0 0 0 0 0 0 0 5
N energy at risk at 10th percentile demand (MWh) 0 8 88 204 411 687 992 1,348 1,721 2,148
N and N-1 Expected Unserved Energy at 50th percentile demand (MWh) 8 11 15 18 23 28 33 40 47 59
N and N-1 Expected Unserved Energy at 10th percentile demand (MWh) 43 58 146 269 485 772 1,087 1,456 1,841 2,281
N and N-1 Expected Unserved Energy value at 50th percentile demand $0.27M $0.39M $0.51M $0.61M $0.76M $0.94M $1.13M $1.36M $1.59M $2.01M
N and N-1 Expected Unserved Energy value at 10th percentile demand $1.46M $1.98M $4.95M $9.12M $16.48M $26.21M $36.91M $49.42M $62.50M $77.46M
N and N-1 Expected Unserved Energy value using AEMO weighting of 0.7 X
50th percentile value + 0.3 X 10th percentile value$0.63M $0.87M $1.84M $3.17M $5.48M $8.52M $11.87M $15.78M $19.86M $24.65M

2021 Transmission Connection Planning Report Risk Assessment: DPTS
Page 95
DEER PARK TERMINAL STATION (DPTS) 66 kV
Deer Park Terminal Station (DPTS) 66 kV consists of two 225 MVA 220/66 kV transformers connected into one of three existing KTS-GTS 220 kV lines, and is located at the corner of Christies Road and Riding Boundary Road in Deer Park. The station supplies 87,505 Powercor customers in the areas of Sunshine, Truganina, Tarneit, Laverton North, Caroline Springs and Melton.
DPTS was commissioned for service in the fourth quarter of 2017. It has enabled the offloading of both transformer groups at KTS, thereby mitigating a significant emerging constraint at KTS from summer 2017/18 onwards. The initial transfer to the new DPTS of SU (Sunshine) zone substation from KTS (B1,2,5) transformer group has been completed and the transfer of MLN (Melton) zone substation from KTS (B3,4) group was completed during Autumn of 2018. DPTS also supplies a nearby new zone substation, Truganina (TNA), offloading nearby LV (Laverton), LVN (Laverton North), SU and WBE (Werribee) zone substations, and augments supply to the fast-growing western suburbs of Melbourne.
The transfer of load from LV, WBE and LVN zone substations which were supplied from ATS West and ATS/BLTS terminal stations respectively also defers augmentation at those terminal stations.
Embedded generation
About 88 MW of rooftop solar PV is installed on the Powercor distribution system connected to DPTS. This includes all the residential and small-commercial rooftop PV systems that are smaller than 1 MW.
A total of 8.8 MW capacity of large-scale embedded generation is installed on the Powercor sub-transmission and distribution systems connected to DPTS.
Magnitude, probability and impact of loss of load
The peak load on the station reached 214 MW in summer 2021. Peak demand at the 10th percentile temperature is forecast to increase to 432.2 MW by 2031, due to the high load growth in the western suburbs of Melbourne and additional transfers from LVN, LV and WBE zone substations.
It is estimated that:
• For 8 hours per year, 95% of peak demand is expected to be reached under the 50th percentile forecast.
• The station load power factor at time of peak demand is 0.98
The graph below depicts the 10th and 50th percentile maximum demand forecasts together with the stations estimated operational “N” rating (all transformers in service) and the “N-1” rating at
35C ambient temperature.

2021 Transmission Connection Planning Report Risk Assessment: DPTS
Page 96
The (N) rating on the chart indicates the maximum load that can be supplied from DPTS with all transformers in service. The “N-1” rating on the chart is the load that can be supplied from DPTS with one 225 MVA transformer out of service.
The graph shows there is insufficient capacity at the station to supply all expected demand at the 50th percentile temperature from 2024 and from 2023 at the 10th percentile temperature if a forced outage of a transformer occurs.
The bar chart below depicts the energy at risk with one transformer out of service for the 50th percentile demand forecast, and the hours per year that the 50th percentile demand forecast is expected to exceed the N-1 capability rating. The line graph shows the value to consumers of the expected unserved energy in each year, for the 50th percentile demand forecast.
At present, a spare 225 MVA transformer suitable for installation at DPTS is not available. CitiPower-Powercor have adopted the conservative assumption that a major transformer failure would be highly unlikely to be repairable, and therefore a replacement transformer would need to be procured. The procurement of a replacement would take 12 months, so in the case of DPTS, a major outage of a transformer is assumed to have a duration of 12 months.

2021 Transmission Connection Planning Report Risk Assessment: DPTS
Page 97
Comments on Energy at Risk
For a major (12 month) outage of one transformer at DPTS 66 kV, there will be insufficient capacity at the station to supply all demand at the 50th percentile temperature for about 15 hours in 2027. The energy at risk at the 50th percentile temperature under N-1 conditions is estimated to be 257.4 MWh in 2027. The estimated value to consumers of the 257.4 MWh of energy at risk is approximately $9.8 million (based on a value of customer reliability of $38,001/MWh)62. In other words, at the 50th percentile demand level, and in the absence of any other operational response that might be taken to mitigate the impact of a forced outage, a major outage of one transformer at DPTS in 2027 would be anticipated to lead to involuntary supply interruptions that would cost consumers $9.8 million.
It is emphasised however, that the probability of a major outage of one of the two 225 MVA transformers occurring over the year is very low at about 1.0% per transformer per annum, which, as already noted, in the case of DPTS equals the expected unavailability per transformer per annum due to TransGrid not holding a spare transformer. When the energy at risk (257.4 MWh for 2027) is weighted by this low unavailability, the expected unsupplied energy is estimated to be around 10.3 MWh. This expected unserved energy is estimated to have a value to consumers of $390,000 (based on a value of customer reliability of $38,001/MWh).
It should also be noted that the above estimates of energy at risk and expected unserved energy are based on an assumption of average (50th percentile) summer temperatures occurring in each year. Under 10th percentile temperature conditions, the energy at risk in 2027 is estimated to be 534 MWh. The estimated value to consumers of this energy at risk in 2027 is approximately $20.3 million. The corresponding value of the expected unserved energy (of 21.4 MWh) is $0.81 million.
62 The value of unserved energy is derived from the relevant climate zone and sector VCR values given in the
AER VCR December 2019 final determination, weighted in accordance with the composition of the load at this terminal station.

2021 Transmission Connection Planning Report Risk Assessment: DPTS
Page 98
These key statistics for the year 2027 under N-1 outage conditions are summarised in the table below.
MWh Valued at consumer interruption cost
Energy at risk, at 50th percentile demand forecast under N-1 outage condition
257.4 $9.8 million
Expected unserved energy at 50th percentile demand under N-1 outage condition
10.3 $0.39 million
Energy at risk, at 10th percentile demand forecast under N-1 outage condition
534 $20.3 million
Expected unserved energy at 10th percentile demand under N-1 outage condition
21.4 $0.81 million
Possible Impact on Customers
System Normal Condition (Both transformers in service)
Applying the 50th percentile and 10th percentile demand forecasts, there is sufficient capacity at Deer Park Terminal Station to meet all demand when both transformers are in service.
N-1 System Condition
If one of the 225 MVA 220/66 kV transformers at Deer Park is taken offline during peak loading times and the N-1 station rating is likely to be exceeded, transfers will be undertaken to KTS to avoid overloading the remaining transformer. Possible load transfers away to ATS/BLTS and ATS West terminal stations in the event of a transformer failure at DPTS total 15 MVA in summer 2022.
Preferred option(s) for alleviation of constraints
The following options are technically feasible and potentially economic to mitigate the risk of supply interruption and/or to alleviate the emerging constraint:
1. Install additional transformation capacity at DPTS, at an estimated indicative capital cost of approximately $18 million (equating to a total annual cost of approximately $1.26 million per annum). This would result in the station being configured so that three transformers are supplying the DPTS load.
2. Demand reduction: There is an opportunity to develop innovative customer schemes to encourage voluntary demand reduction during times of network constraint. The amount of potential demand reduction depends on the customer uptake and would be taken into consideration when determining the optimum timing of any network capacity augmentation.
3. Embedded generation, connected to the DPTS 66 kV bus, may possibly act as a substitute for capacity augmentations.

2021 Transmission Connection Planning Report Risk Assessment: DPTS
Page 99
4. Procurement of a dedicated spare transformer at an annual cost of approximately $300,000 to allow a fast replacement of a failed unit.
Preferred network option for alleviation of constraints
In the absence of a commitment by interested parties to offer network support services that would reduce the load at DPTS, the preferred network option to address emerging constraints at DPTS would be to procure a dedicated spare transformer. Given the present forecasts of expected unserved energy, the procurement of a spare transformer at DPTS is economically justified by 2027.

2021 Transmission Connection Planning Report Risk Assessment: DPTS
Page 100
Deer Park Terminal Station Detailed data: Magnitude and probability of loss of load
Distribution Businesses supplied by this station: Powercor (100%) MW MVA
Normal cyclic rating with all plant in service 560 via 2 transformers (Summer peaking)
Summer N-1 Station Rating: 269 280 [See Note 1 below for interpretation of N-1]
Winter N-1 Station Rating: 289 300
NOTES:
1. “N-1” means cyclic station output capability rating with outage of one transformer. The rating is at an ambient temperature of 35 degrees Centigrade.
2. “N-1 energy at risk” is the amount of energy in a year during which the specified demand forecast exceeds the N-1 capability rating.
Energy at risk at the specified demand forecast when all plant is in service (N) is shown separately.
3. “N-1 hours per year at risk” is the number of hours in a year during which the specified demand forecast exceeds the N-1 capability rating.
Hours at risk at the specified demand forecast when all plant is in service (N) are shown separately.
4. “Expected unserved energy” means “energy at risk” multiplied by the probability of a major outage affecting one transformer for one year.
5. The value of unserved energy is derived from the sector values given in Table 1 of Section 2.4, weighted in accordance with the composition of the load at this terminal station.
6. The 0.7 and 0.3 weightings applied to the 50th and 10th percentile expected unserved energy estimates (respectively) is in accordance with the approach applied by AEMO and described on page 12 of its publication titled Victorian Electricity Planning Approach, published in June 2016
(see http://www.aemo.com.au/-/media/Files/Electricity/NEM/Planning_and_Forecasting/Victorian_Transmission/2016/Victorian-Electricity-Planning-Approach.ashx)
2022 2023 2024 2025 2026 2027 2028 2029 2030 2031
233.0 269.4 297.6 302.9 314.1 330.9 351.3 374.1 397.8 421.7
204.4 240.6 249.6 256.3 267.5 282.6 300.1 318.6 337.8 357.3
246.3 283.4 311.6 317.1 329.0 346.7 368.3 392.4 417.4 442.5
211.2 247.7 256.7 263.7 275.4 290.9 309.1 328.2 348.1 368.3
0.0 0.0 14.0 27.0 81.9 257.4 636.4 1386.3 2992.6 6573.4
0.0 0.0 2.0 3.3 7.5 15.0 27.3 53.0 119.8 260.5
0.0 0.8 64.5 106.1 232.3 533.9 1126.7 2335.6 4994.3 10411.5
0.0 0.3 6.0 9.0 14.5 23.8 40.8 83.3 191.3 367.3
0.00 0.00 0.56 1.08 3.28 10.30 25.45 55.45 119.70 262.94
0.00 0.03 2.58 4.24 9.29 21.36 45.07 93.43 199.77 416.46
$0.00M $0.00M $0.02M $0.04M $0.12M $0.39M $0.97M $2.11M $4.55M $9.99M
$0.00M $0.00M $0.10M $0.16M $0.35M $0.81M $1.71M $3.55M $7.59M $15.83M
$0.00M $0.00M $0.04M $0.08M $0.19M $0.52M $1.19M $2.54M $5.46M $11.74M
50th percentile Summer Maximum Demand (MVA)
50th percentile Winter Maximum Demand (MVA)
Expected Unserved Energy at 50th percentile demand (MWh)
Expected Unserved Energy value using AEMO weighting of 0.7 X 50th
precentile value + 0.3 X 10th percentile value
Station: DPTS66
Expected Unserved Energy value at 50th percentile demand
Expected Unserved Energy value at 10th percentile demand
N-1 energy at risk at 10% percentile demand (MWh)
Expected Unserved Energy at 10th percentile demand (MWh)
10th percentile Summer Maximum Demand (MVA)
10th percentile Winter Maximum Demand (MVA)
N-1 energy at risk at 50% percentile demand (MWh)
N-1 hours at risk at 50th percentile demand (hours)
N-1 hours at risk at 10th percentile demand (hours)

2021 Transmission Connection Planning Report Risk Assessment: ERTS
Page 101
EAST ROWVILLE TERMINAL STATION (ERTS)
ERTS is the main source of supply for part of the outer south-eastern corridor of Melbourne. The geographic coverage of the area supplied by this station spans from Scoresby in the north to Lyndhurst in the south, and from Belgrave in the east to Mulgrave in the west. The electricity supply network for this large region is split between United Energy (UE) and AusNet Electricity Services.
Embedded generation
About 158 MW of rooftop solar PV is installed within the distribution system connected to ERTS. This includes all the residential and small-commercial rooftop PV systems that are smaller than 1 MW.
Five embedded generation units over 1 MW are connected at ERTS 66 kV.
Magnitude, probability and impact of loss of load
ERTS 66 kV is a summer critical station. The recorded peak demand in summer 2021 was 396.5 MW (404.1 MVA). This was 66.8 MW lower than the peak demand recorded in summer 2020.
The risk of supply interruption at ERTS 66 kV for a single contingency event was assessed as being unacceptable in 2007. As a result, a Regulatory Test was undertaken by both AusNet Electricity Services and United Energy which identified the installation of a fourth 150 MVA 220/66 kV transformer as the most economic network solution. A new fourth transformer was installed at ERTS and commissioned in January 2012. In 2019 the ERTS B3 transformer was replaced with a new higher impedance transformer. This resulted in a decline in the station ratings due to an increased load share on the older transformers.
When United Energy’s new Keysborough zone substation was commissioned in 2014-15, approximately 7 MW of demand was transferred away from ERTS to HTS. This load transfer is reflected in the graph below.
The graph below depicts the 10th and 50th percentile total summer maximum demand forecasts together with the station’s expected operational N rating (all transformers in
service) and the (N-1) rating at 35C as well as 40C ambient temperature.

2021 Transmission Connection Planning Report Risk Assessment: ERTS
Page 102
The N rating on the chart indicates the maximum load that can be supplied from ERTS with all transformers in service. Exceeding this level will require load shedding or emergency load transfers to keep the terminal station operating within its limits.
With the commissioning of the fourth transformer in 2012, the ERTS 66 kV bus was split into two bus groups (B12 and B34), each containing two transformers during normal operation, in order to reduce the 66 kV fault level. In the event of a transformer outage, the normally open 66 kV bus tie circuit breaker will automatically be closed to share the demand across the other three transformers.
The graph indicates that the overall demand at ERTS remains below its N rating within the 10 year planning period. However, with the reduction in ratings in 2019, the 10th percentile summer demand is expected to exceed the 35°C and 40°C N-1 rating of the station from summer 2022. The 50th percentile summer peak demand is not expected to exceed the station’s N-1 rating at 35°C in the forward planning period.
The station load is forecast to have a power factor of 0.982 at times of peak demand. The demand at ERTS is expected to exceed 95% of the peak demand for approximately 8 hours per annum. There is approximately 76 MVA of load transfer available at ERTS for summer 2022. This would reduce to 64 MVA if REFCLs are required to be in service.
As noted above, the 2019 reduction in rating results in a small amount of energy at risk under 10% POE conditions over the forecast period. However, AusNet Transmission Group plans to replace the remaining two aged and poor condition transformers at ERTS (transformers B1 and B4) by 2024. After this replacement project is completed, the load sharing of the transformers will become balanced, enabling the station N-1 rating to be increased so that there would be no energy at risk over the forward planning period. In the period prior to the completion of the transformer replacement project, the load at risk will be managed using contingency load transfers.
The following sections discuss the demand on the two bus groups under normal operating conditions.

2021 Transmission Connection Planning Report Risk Assessment: ERTS
Page 103
Transformer group ERTS (B12) Summer Peak Forecasts
This bus group supplies United Energy’s Mulgrave and Lyndale zone substations and AusNet Electricity Services’ Ferntree Gully, Rowville and Belgrave zone substations.
The graph below depicts the ERTS (B12) bus group rating with both transformers in service (“N” rating), the historical demand and the 10th and 50th percentile summer maximum demand forecasts.
The graph indicates that both the 10th and 50th percentile forecast maximum demands connected to the bus group ERTS (B12) are below its N rating for the entire planning period. Therefore, the maximum demand at ERTS (B12) bus group is not expected to exceed its total capacity under normal operation at any time over the 10 year planning period.
Transformer group ERTS (B34) Summer Peak Forecasts
This bus group supplies UE’s Dandenong South, Dandenong and Dandenong Valley zone substations and AusNet Electricity Services’ Hampton Park zone substation.
The graph below depicts the ERTS (B34) bus group rating with both transformers in service (“N” rating), the historical demand and the 10th and 50th percentile summer maximum demand forecasts.
As previously noted, the ERTS B3 transformer was replaced in 2019 resulting in an uneven load share and lower rating on this bus group. Also, approximately 7 MW of demand was transferred from ERTS to HTS after commissioning of the new Keysborough zone substation in 2014-15. This is reflected in the diagram below.
The graph indicates that the forecast demand connected to the bus group ERTS (B34) is below its N rating for the full planning period. Therefore, it is not expected that the connected demand will exceed the total capacity of the bus group under normal operation at any time over the 10 year planning period.

2021 Transmission Connection Planning Report Risk Assessment: ERTS
Page 104
Load at ERTS is marginally above the “N-1” rating under the 10th percentile maximum demand forecast up until the transformer replacement. The load remains below the “N-1” rating under both 10th percentile and 50th percentile maximum demand forecasts for the remainder of the planning period. Further, load at both bus groups remains below their respective N ratings within the ten-year planning period. Therefore, on the basis of the current forecasts, there is not expected to be any need for augmentation over the ten-year planning period.

2021 Transmission Connection Planning Report Risk Assessment: ERTS
Page 105
EAST ROWVILLE TERMINAL STATION 66 kV
Detailed data: Magnitude and probability of loss of load
Distribution Businesses supplied by this station: United Energy (73%) and AusNet Electricity Services (27%) Station operational rating (N elements in service): 680 MVA via 4 transformers (Summer peaking) Summer N-1 Station Rating: 500 MVA [See Note 1 below for interpretation of N-1] Winter N-1 Station Rating: 582 MVA
Station: ERTS 66kV 2022 2023 2024 2025 2026 2027 2028 2029 2030 2031
50th percentile Summer Maximum Demand (MVA) 449 456 456 452 452 455 456 458 464 468
50th percentile Winter Maximum Demand (MVA) 381 384 386 387 388 389 392 398 402 407
10th percentile Summer Maximum Demand (MVA) 498 503 504 500 501 506 507 510 516 521
10th percentile Winter Maximum Demand (MVA) 385 389 391 392 392 394 397 402 407 411
N-1 energy at risk at 50th percentile demand (MWh) 0 0 0 0 0 0 0 0 0 0
N-1 hours at risk at 50th percentile demand (hours) 0 0 0 0 0 0 0 0 0 0
N-1 energy at risk at 10th percentile demand (MWh) 4 41 44 31 34 54 59 76 109 142
N-1 hours at risk at 10th percentile demand (hours) 3 4 5 4 4 5 5 6 6 8
Expected Unserved Energy at 50th percentile demand (MWh) 0.0 0.0 0.0 0.0 0.0 0.0 0.0 0.0 0.0 0.0
Expected Unserved Energy at 10th percentile demand (MWh) 0.0 0.4 0.4 0.3 0.3 0.5 0.5 0.7 1.0 1.2
Expected Unserved Energy value at 50th percentile demand $0.0k $0.0k $0.0k $0.0k $0.0k $0.0k $0.0k $0.0k $0.0k $0.0k
Expected Unserved Energy value at 10th percentile demand $1.4k $14.9k $15.9k $11.0k $12.3k $19.6k $21.2k $27.5k $39.3k $51.2k
Expected Unserved Energy value using AEMO weighting of 0.7 x 50th percentile value + 0.3 x 10th percentile value
$0.4k $4.5k $4.8k $3.3k $3.7k $5.9k $6.4k $8.2k $11.8k $15.4k
Notes:
1. “N-1” means cyclic station output capability rating with outage of one transformer. The rating is at an ambient temperature of 35 degrees Centigrade.
2. “N-1 energy at risk” is the amount of energy in a year during which the specified demand forecast exceeds the N-1 capability rating. Energy at risk at the specified demand forecast when all plant is in service (N) is shown separately.
3. “N-1 hours per year at risk” is the number of hours in a year during which the specified demand forecast exceeds the N-1 capability rating. Hours at risk at the specified demand forecast when all plant is in service (N) are shown separately.
4. “Expected unserved energy” means “energy at risk” multiplied by the probability of a major outage affecting one transformer. “Major outage” means an outage with duration of 2.65 months. The outage probability is derived from the base reliability data given in Section 5.4.
5. The value of unserved energy is derived from the VCR relevant climate zone and sector values given in the AER VCR December 2019 final determination, weighted in accordance with the composition of the load at this terminal station.
6. The 0.7 and 0.3 weightings applied to the 50th and 10th percentile expected unserved energy estimates (respectively) are in accordance with the approach applied by AEMO, and described on page 12 of its publication titled Victorian Electricity Planning Approach, published in June 2016 (see http://www.aemo.com.au/-
/media/Files/Electricity/NEM/Planning_and_Forecasting/Victorian_Transmission/2016/Victorian-Electricity-Planning-Approach.ashx)

2021 Transmission Connection Planning Report Risk Assessment: FBTS
Page 106
FISHERMAN’S BEND TERMINAL STATION 66 kV (FBTS 66 kV)
FBTS 66 kV is a terminal station shared by both CitiPower (currently 98.4.%) and Powercor (currently 1.6%). It is a summer critical station consisting of three 150 MVA 220/66 kV transformers supplying the Docklands areas and an area south-west of the City of Melbourne bounded by the Yarra River in the north and west, St Kilda/Queen’s Roads in the east and Hobsons Bay in the south. FBTS 66 kV is the main source of supply for 40,748 customers in the areas of Docklands, Southbank, Port Melbourne, Fisherman’s Bend, Albert Park, Middle Park, St Kilda West and the south west corner of the CBD.
Embedded generation
About 5.8 MW of solar PV is installed on the CitiPower distribution system connected to FBTS. This includes all the residential and small-commercial rooftop solar PV systems (<1 MW).
Transformer replacement project
As part of its asset renewal program, AusNet Transmission Group replaced the B4 transformer with a new 150 MVA 220/66 kV transformer (B2) in March 2021.
Magnitude, probability and impact of loss of load
The peak load on the station reached 217.3 MW in summer 2021. It is estimated that:
• For 22 hours per year, 95% of peak demand is expected to be reached under the 50th percentile demand summer forecast.
• The station load power factor at the time of peak demand is 0.97.
2020-21 was a mild summer which contributed to reduced network MDs. According to AEMO, 2020-2021 was a record year in the sense that:
• 2020 had the highest amount of distributed PV capacity installed, which broke 2019's record.
• Due to La Niña (mild summer) 2020 was one of the coolest years on record since 2000 and the coldest in the last 10 years.
The graph below depicts the 10th and 50th percentile maximum demand forecasts during the summer periods over the next ten years, together with the station’s operational N and N-1 ratings.

2021 Transmission Connection Planning Report Risk Assessment: FBTS
Page 107
The graph shows that under the 10th and 50th percentile forecasts, there would be sufficient capacity at FBTS 66 kV to supply all expected load over the forecast period until 2030, even with one transformer out of service. There will be a small amount of load at risk under 10th percentile forecast conditions in 2031. CitiPower expects that such load at risk will be managed through load transfers or other cost-effective operational measures. The alternative would be to install a 4th transformer for which space exists, however due to the low expected unserved energy and the likely availability of cost effective alternatives, there are presently no plans to install a fourth transformer at that time. Therefore, the need for augmentation is not expected to arise over the next ten years.

2021 Transmission Connection Planning Report Risk Assessment: FTS
Page 108
FRANKSTON TERMINAL STATION (FTS)
FTS is a 66 kV switching station supplied via three 66 kV supply routes from CBTS.
Embedded generation
About 57.3 MW of rooftop solar PV is installed within the distribution system connected to FTS. This includes all the residential and small-commercial rooftop PV systems that are smaller than 1 MW.
There is one embedded generation unit over 1 MW connected at FTS 66 kV.
Magnitude, probability and impact of loss of load
In 2017 a project was completed to implement dynamic line ratings on the CBTS-FTS 66 kV double circuit tower lines using actual wind velocity, to increase the ratings of the two lines.
Arrangements relating to the ownership of assets supplying FTS, as well as the ratings of those assets are listed in the table below. For the purpose of this risk assessment, it is assumed that the CBTS-FTS lines are rated as per the higher of the two wind speed ratings shown.
66kV Supply Route to FTS
Thermal Rating
@ 35C
Dynamic Rating @ 35oC
Ownership
CBTS-FTS #1 825 Amp 825 Amp @ 1.2m/s
920 Amp @ 2.2m/s
Transmission connection asset owned by AusNet Transmission Group
CBTS-FTS #2 825 Amp 825 Amp @ 1.2m/s
920 Amp @ 2.2m/s
Transmission connection asset owned by AusNet Transmission Group
CBTS-CRM-(FTN/LWN)-FTS
1120 Amp N/A Distribution system assets owned by United Energy
The station load is forecast to have a power factor of 0.982 at times of peak demand. The demand at FTS is expected to exceed 95% peak demand for approximately 13 hours per annum. There is approximately 34 MVA of load transfer available for the loop for summer 2021/22.
The various 66 kV supply routes and ownership arrangements mean that the risk assessment for FTS is more complicated than for other terminal stations. Whilst there are more limiting constraints within the sub-transmission loop, as far as transmission connection assets are concerned, load flow studies indicate that the lowest (N-1) rating of FTS during summer corresponds to the outage of the CBTS-CRM 66 kV line which is limited by the thermal rating of the CBTS-FTS #2 66 kV line. The graph below depicts the 10th and 50th percentile summer maximum demand forecast together with the station’s
operational (N-1) rating at 35C as well as 40C ambient temperature.

2021 Transmission Connection Planning Report Risk Assessment: FTS
Page 109
It should be noted that if the CBTS-FTS 66 kV lines (owned and operated by AusNet Transmission Group) become overloaded, AusNet Transmission Group’s centralised System Overload Control Scheme (SOCS) would be initiated to trip both lines. This would result in loss of electricity supply to all customers connected at FTS until the lines are re-energised with sufficiently reduced demand level to avoid further overloading.
The (N-1) rating on the chart below indicates the maximum load that can be supplied from FTS with the CBTS-CRM 66 kV line out of service.
The graph indicates that overall summer maximum demand at FTS 66 kV is not expected to exceed the respective (N-1) ratings under both 10th POE and 50th percentile summer maximum demand over the next 10 years, except a marginal exceedance at the 10th POE for the 40 degrees Celsius rating. Therefore, no further works to address load at risk are expected to be required over the ten year planning horizon.

2021 Transmission Connection Planning Report Risk Assessment: GTS
Page 110
GEELONG TERMINAL STATION (GTS) 66 kV
Geelong Terminal Station (GTS) 66 kV consists of four 150 MVA 220/66 kV transformers. Due to the excessive fault levels associated with all four transformers operating in parallel, the station was rearranged with the 66 kV bus tie circuit breaker between 66 kV buses 2&3 normally open. Under system normal, 66 kV buses 1&2 are supplied via B1 and B2 transformers and 66 kV buses 3&4 are supplied via B3 and B4 transformers. For loss of a transformer, the normally open 66 kV bus tie circuit breaker between buses 2&3 is closed.
GTS is the main source of supply for over 159,211 customers in Geelong and the surrounding area. The station supply area includes Geelong, Corio, North Shore, Drysdale, Waurn Ponds and the Surf Coast.
Embedded generation
A total of 163 MW capacity of embedded generation (>1 MW) is installed on the Powercor distribution and sub-transmission system connected to GTS. This includes solar, wind natural gas and bio-mass types of generation.
The following table lists the large-scale embedded generator (>5 MW) that is installed on the Powercor network connected to GTS:
Site name Status Technology Type Nameplate capacity (MW)
Mt Gellibrand Wind Farm Existing Plant Wind turbine 138
In addition, about 146.5 MW of solar PV is installed on the Powercor distribution system connected to GTS. This includes all the residential and small-commercial rooftop solar PV systems (<1 MW).
Due to the operating arrangement at this station, load comparisons with the N rating are provided against the separate bus groups below, followed by comments on load comparisons against the N-1 rating shown in the overall station graph.
The following observations and risk assessment are based on actual readings of power flow at the Terminal Station Connection points. It therefore accounts for the existing load and generation combination.
GTS 1 & 2 66kV Bus Group Summer Peak Forecasts
This bus group supplies Powercor’s zone substations at Ford North Shore, Waurn Ponds, Colac and Winchelsea and 66kV customer substations Shell Refinery Corio and Blue Circle Cement
GTS 66 kV buses 1&2 demand is summer peaking. The peak load on the GTS 1 & 2 Bus group reached 162.2 MW (164.7 MVA) in summer 2021. The graph below depicts the 10th and 50th percentile summer maximum demand forecast together with the station’s operational “N” rating (all transformers in service).

2021 Transmission Connection Planning Report Risk Assessment: GTS
Page 111
The (N) rating on the chart indicates the maximum load that can be supplied from GTS bus 1&2 with two transformers in service. The graph shows there is sufficient capacity (N rating) at the station to supply all expected load over the forecast period.
GTS 3 & 4 66kV Bus Group Summer Peak Forecasts
This bus group supplies Powercor’s zone substations at Geelong East, Geelong City, Geelong B, Corio and 66kV customer substation Ford Norlane. The peak load on the GTS 3 & 4 Bus group reached 231.4 MW (244.0 MVA) in summer 2021.
GTS 66 kV buses 3&4 demand is summer peaking. The graph below depicts the 10th and 50th percentile summer maximum demand forecast together with the station’s operational “N” rating (all transformers in service).

2021 Transmission Connection Planning Report Risk Assessment: GTS
Page 112
The (N) rating on the chart indicates the maximum load that can be supplied from GTS bus 3&4 with two transformers in service. The graph shows there is sufficient capacity (N rating) at the station to supply all expected load over the forecast period.
GTS Total Load Summer Peak Forecasts
GTS is a summer peaking station and the peak total load reached 378.2 MW (390.5 MVA) in Summer 2021.
It is estimated that:
• For 9 hours per year, 95% of peak demand is expected to be reached under the 50th percentile forecast.
• The station load power factor at the time of peak demand is 0.97
It is noted that 2020-21 was a mild summer, and this contributed to reduced station maximum demands. According to AEMO, 2020-2021 was a record year:
• 2020 had the highest number of Distributed PV capacity installed, which broke 2019's record.
• Due to La Niña (mild summer) 2020 was one of the coolest years on record since 2000 and the coldest in the last 10 years.
Load growth at GTS is expected to remain strong due to high population growth and increasing commercial and industrial customer connections.
The graph below depicts the 10th and 50th percentile summer maximum demand forecast together with the station’s operational “N” rating (all transformers in service) and the “N-1”
rating at 35C ambient temperature.

2021 Transmission Connection Planning Report Risk Assessment: GTS
Page 113
The (N) rating on the chart indicates the maximum load that can be supplied from GTS with all transformers in service.
The bar chart below depicts the energy at risk with one transformer out of service for the 50th percentile demand forecast, and the hours per year that the 50th percentile demand forecast is expected to exceed the N-1 capability rating. The line graph shows the value to consumers of the expected unserved energy in each year, for the 50th percentile demand forecast.
Comments on Energy at Risk
For an outage of one transformer at GTS, there will be insufficient capacity at the station to supply all demand at the 50th percentile temperature for about 31.5 hours in 2031. The energy at risk at the 50th percentile temperature under N-1 conditions is estimated to be 1174 MWh in 2031. The estimated value to consumers of the 1171 MWh of energy at risk is approximately $43.2 million (based on a value of customer reliability of $36,916per MWh).63 In other words, at the 50th percentile demand level, and in the absence of any other operational response that might be taken to mitigate the impact of a forced outage, a major outage of one transformer at GTS in 2031 would be anticipated to lead to involuntary supply interruptions that would cost consumers $43.2 million.
It is emphasised however, that the probability of a major outage of one of the four transformers occurring over the year is very low at about 1.0% per transformer per annum, while the expected unavailability per transformer per annum is 0.221%. When the energy at risk (1171 MWh for 2031) is weighted by this low unavailability, the expected unsupplied energy is estimated to be 10.15 MWh. This expected unserved energy is estimated to have
63 The value of unserved energy is derived from the sector values given in Table 1 of Section 2.4,
weighted in accordance with the composition of the load at this terminal station.

2021 Transmission Connection Planning Report Risk Assessment: GTS
Page 114
a value to consumers of around $374,646 (based on a value of customer reliability of $36,916 per MWh).
It should also be noted that the above estimates of energy at risk and expected unserved energy are based on an assumption of average (50th percentile) summer temperatures occurring in each year. Under 10th percentile temperature conditions, the energy at risk in 2031 is estimated to be 3015 MWh. The estimated value to consumers of this energy at risk in 2031 is approximately $111.3 million. The corresponding value of the expected unserved energy (of 26.21 MWh) is $967,590.
Key statistics relating to energy at risk and expected unserved energy for the year 2031 under N-1 outage conditions are summarised in the table below.
MWh Valued at consumer interruption cost
Energy at risk, at 50th percentile demand forecast 1171 $43.23 million
Expected unserved energy at 50th percentile demand 10.15 $374,646
Energy at risk, at 10th percentile demand forecast 3015 $111.3 million
Expected unserved energy at 10th percentile demand 26.21 $967,590
Feasible options for alleviation of constraints
The following options are technically feasible and potentially economic to mitigate the risk of supply interruption and/or to alleviate the emerging constraint:
1. Installation of a fifth 220/66 kV transformer (150 MVA) at GTS at an indicative capital cost of $18 million, which equates to a total annual cost of $1.26 million.
2. Demand reduction: There is an opportunity to develop a number of innovative customer schemes to encourage voluntary demand reduction during times of network constraint. The amount of demand reduction would depend on the customer uptake and would be taken into consideration when determining the optimum timing for any future capacity augmentation.
3. Embedded generation: A new wind farm at Mt Gellibrand (132 MW) was commissioned in 2019 and some portion of this generation capacity will contribute into 66 kV infrastructure ex-GTS. This may defer the need for any capacity augmentation at GTS.
4. Possible uptake of battery storage in the future could provide some contribution to supporting the peak load.
Preferred option(s) for alleviation of constraints
In the absence of any commitment by interested parties to offer network support services by installing local generation or through demand side management initiatives that would reduce load at GTS, it is proposed to:

2021 Transmission Connection Planning Report Risk Assessment: GTS
Page 115
1. Install a fifth 220/66 kV transformer (150 MVA) at GTS at an indicative capital cost of $18 million. This equates to a total annual cost of approximately $1.26 million per annum. On the basis of the medium economic growth scenario and both 50th and 10th percentile weather probability, the transformer would not be expected to be required within the ten-year forecast period.
2. As a temporary measure, maintain contingency plans to transfer load quickly to TGTS by the use of the 66 kV tie lines between TGTS and GTS in the event of an unplanned outage of one transformer at GTS under critical loading conditions. This load transfer is in the order of 10 MVA. Under these temporary measures, affected customers would be supplied from the 66 kV tie line infrastructure on a radial network, thereby reducing their level of reliability.
3. Subject to availability, an AusNet Transmission Group spare 220/66 kV transformer for rural areas (refer Section 5.5) can be used to temporarily replace a failed transformer to minimise the transformer outage period.
The table on the following page provides more detailed data on the station rating, demand forecasts, energy at risk and expected unserved energy.

2021 Transmission Connection Planning Report Risk Assessment: GTS
Page 116
Geelong Terminal Station
Detailed data: Magnitude and probability of loss of load
Distribution Businesses supplied by this station: Powercor (100%) MVA Normal cyclic rating with all plant in service 704 via 4 transformers (summer) Summer N-1 Station Rating: 524 [See Note 1 below for interpretation of N-1] Winter N-1 Station Rating: 524
Notes:
1. “N-1” means cyclic station output capability rating with outage of one transformer. The winter rating is at an ambient temperature of 5 degrees Centigrade.
2. “N-1 energy at risk” is the amount of energy in a year during which specified demand forecast exceeds the N-1 capability rating.
3. “N-1 hours at risk” is the number of hours in a year during which the specified demand forecast exceeds the N-1 capability rating.
4. “Expected unserved energy” means “N-1 energy at risk” for the specified demand forecast multiplied by the probability of a major outage affecting one transformer. “Major outage” means an outage with a duration of 2.65 months. The outage probability is derived from the base reliability data given in Section 5.4.
5. The value of unserved energy is derived from the relevant climate zone and sector VCR values given in the AER VCR December 2019 final determination, weighted in accordance with the composition of the load at this terminal station.
6. The 0.7 and 0.3 weightings applied to the 50th and 10th percentile expected unserved energy estimates (respectively) are in accordance with the approach applied by AEMO, and described on page 12 of its publication titled Victorian Electricity Planning Approach, published in June 2016 (see http://www.aemo.com.au/-/media/Files/Electricity/NEM/Planning_and_Forecasting/Victorian_Transmission/2016/Victorian-Electricity-Planning-Approach.ashx)
2022 2023 2024 2025 2026 2027 2028 2029 2030 2031
466.4 492.5 507.1 507.3 516.7 535.3 559.8 588.4 617.4 646.7
401.6 419.8 429.3 433.5 446.7 465.5 488.2 512.1 536.6 562.2
510.8 537.2 551.1 551.3 562.1 582.7 609.9 641.1 672.5 704.3
420.1 438.3 447.9 452.3 466.1 485.8 509.6 534.6 560.2 586.9
0.0 0.0 0.0 0.0 0.0 13.0 87.1 267.7 582.1 1171.0
0.0 0.0 0.0 0.0 0.0 2.0 4.8 9.3 16.8 31.5
0.0 17.1 55.3 55.9 98.0 222.4 477.3 923.2 1647.0 3014.8
0.0 2.3 3.3 3.3 5.0 8.0 12.8 20.5 35.8 71.0
0.00 0.00 0.00 0.00 0.00 0.11 0.75 2.32 5.05 10.15
0.00 0.15 0.48 0.48 0.85 1.93 4.14 8.00 14.27 26.21
$0.00M $0.00M $0.00M $0.00M $0.00M $0.00M $0.03M $0.09M $0.19M $0.37M
$0.00M $0.01M $0.02M $0.02M $0.03M $0.07M $0.15M $0.30M $0.53M $0.97M
$0.00M $0.00M $0.01M $0.01M $0.01M $0.02M $0.07M $0.15M $0.29M $0.55MExpected Unserved Energy value using AEMO weighting of 0.7 X 50th
precentile value + 0.3 X 10th percentile value
Station: GTS 1-2 & 3-4
Expected Unserved Energy value at 50th percentile demand
Expected Unserved Energy value at 10th percentile demand
N-1 energy at risk at 10% percentile demand (MWh)
50th percentile Summer Maximum Demand (MVA)
50th percentile Winter Maximum Demand (MVA)
Expected Unserved Energy at 50th percentile demand (MWh)
Expected Unserved Energy at 10th percentile demand (MWh)
10th percentile Summer Maximum Demand (MVA)
10th percentile Winter Maximum Demand (MVA)
N-1 energy at risk at 50% percentile demand (MWh)
N-1 hours at risk at 50th percentile demand (hours)
N-1 hours at risk at 10th percentile demand (hours)

2021 Transmission Connection Planning Report Risk Assessment: GNTS
Page 117
GLENROWAN TERMINAL STATION 66 kV (GNTS 66 kV)
Glenrowan Terminal Station (GNTS) consists of one 125 MVA 220/66kV three phase transformer and one 150 MVA 220/66 kV three phase transformer.
The station is the main source of supply for a major part of north-eastern Victoria including Wangaratta in the north; to Euroa in the south; to Mansfield and Mt Buller in the east; and Benalla more centrally.
AusNet Electricity Services is responsible for planning the transmission connection and distribution networks for this region.
Embedded generation
About 60.7 MW of rooftop solar PV is installed on the AusNet distribution system connected to GNTS. This includes all the residential and small-commercial rooftop PV systems that are smaller than 1 MW.
A total of 196.8 MW capacity of large-scale embedded generation, predominately solar farms, is installed on the AusNet sub-transmission and distribution systems connected to GNTS.
The following table lists the registered embedded generators (>5 MW) that are installed on the AusNet network connected to GNTS:
Site name Status Technology Type Nameplate capacity (MW)
Winton Solar Farm Existing Plant Solar PV 85
Glenrowan West Solar Farm Existing Plant Solar PV 110
Magnitude, probability and impact of loss of load
GNTS has historically been a winter peaking station. However the summer peak demand has more recently been exceeding the winter peak demand. The rate of growth in summer and winter peak demand at GNTS 66 kV has been low in recent years, and winter demand is forecast to continue increasing slowly, averaging around 0.1% per annum for the 10 year planning horizon. Summer demand is forecast to continue decreasing at around 0.4% per annum for the 10 year planning horizon.
The peak load on the station reached 95.8 MW (99.7 MVA) in summer 2020/21 and 95.6 MW (98.4 MVA) in winter 2020. The demand at GNTS 66 kV is expected to exceed 95% of the 50th percentile peak demand for 5 hours per annum. The station load has a power factor of 0.96 at summer maximum demand.
The graph below depicts the 10th and 50th percentile summer maximum demand forecast, together with the station’s operational “N” rating (all transformers in service) and the “N-1”
rating at an ambient temperature of 35C.

2021 Transmission Connection Planning Report Risk Assessment: GNTS
Page 118
The graph shows that there is no energy at risk under 50th percentile or 10th percentile loading conditions for the summer period for the next ten years. There is therefore not expected to be any need for augmentation over the ten year planning period.

2021 Transmission Connection Planning Report Risk Assessment: HTS
Page 119
HEATHERTON TERMINAL STATION (HTS)
HTS is the main source of supply for a major part of the southern metropolitan area. The geographic coverage of the HTS supply area spans from Brighton in the north to Edithvale in the south.
Embedded generation
About 85.8 MW of rooftop solar PV is installed within the distribution system connected to HTS. This includes all the residential and small-commercial rooftop PV systems that are smaller than 1 MW. Other forms of generation smaller than 1 MW total approximately 0.9 MW at HTS.
There are no embedded generation units over 1 MW connected at HTS.
Magnitude, probability and impact of loss of load
HTS is a summer critical terminal station. The station reached a peak demand of 301.5 MW (308.7 MVA) in summer 2021 which was 62 MW lower than the previous record peak that was set the previous year in 2020. .. In 2017 AusNet Transmission Group replaced the existing HTS 220/66 kV transformers as part of their asset replacement programme. This resulted in an increase in the station ratings for summer 2018 as reflected in the graph below.
The graph below depicts the 10th and 50th percentile summer maximum demand forecast together with the station’s operational N rating (all transformers in service) and the (N-1)
rating at 35C as well as 40C ambient temperature.
The N rating on the graph indicates the maximum load that can be supplied from HTS with all transformers in service. Exceeding this level will require load shedding or emergency load transfers to keep the terminal station operating within its limits.
The graph above shows that with one transformer out of service, the demand at HTS will remain well within the (N-1) station rating over the next ten years.

2021 Transmission Connection Planning Report Risk Assessment: HTS
Page 120
The station load is forecast to have a power factor of 0.977 at times of peak demand. The demand at HTS is expected to exceed 95% of peak demand for approximately 6 hours. There is approximately 91 MVA of load transfer available at HTS for summer 2021/22. Government-led investment in infrastructure projects within supply area is expected to further increase demand at HTS. The impact of such projects is excluded from this year’s forecast until more details are confirmed. On the basis of the current forecasts, the need for augmentation of transmission connection assets at HTS is not expected to arise over the next decade.

2021 Transmission Connection Planning Report Risk Assessment: HYTS
Page 121
HEYWOOD TERMINAL STATION (HYTS) 22 kV
Heywood Terminal Station (HYTS) 22 kV consists of two 70 MVA 500/275/22 kV transformers and is the source of supply to an industrial customer in the local area and the only large customer supplied from this supply point. Another 105 small domestic and farming customers along the line route are also supplied from this supply point.
Embedded generation
About 100 kW of rooftop solar PV is installed on the Powercor distribution system connected to HYTS 22 kV. This includes all the residential and small-commercial rooftop PV systems that are smaller than 1 MW.
Magnitude, probability and impact of loss of load
The peak load on the station reached 1.42 MW (1.49 MVA) in 2021.
The 22 kV point of supply was established in late 2009, by utilising the tertiary 22 kV on 2 of the existing 3 x 500/275/22 kV South Australian / Victorian interconnecting transformers. The supply is arranged so that one transformer is on hot standby (on its tertiary 22 kV), due to excessive fault levels.
It is estimated that:
• For 12 hours per year, 95% of peak demand is expected to be reached under the 50th percentile forecast.
• The station load power factor at time of peak demand is 0.97.
The graph depicts the 10th and 50th percentile summer maximum demand forecast
together with the station’s operational “N-1” rating at 35C ambient temperature.
The graph shows that there is sufficient capacity at the station to supply all expected load over the forecast period, even with one transformer out of service. Therefore, the need for augmentation or other corrective action is not expected to arise over the next ten years.

2021 Transmission Connection Planning Report Risk Assessment: HOTS
Page 122
HORSHAM TERMINAL STATION (HOTS) 66 kV
Horsham Terminal Station (HOTS) 66 kV consists of two 100 MVA 235/67.5 kV transformers and is the main source of supply for some 32,121 customers in Horsham and the surrounding area. The station supply area includes Horsham, Edenhope, Warracknabeal and Nhill. The station also supplies Stawell via the inter-terminal 66 kV ties with Ballarat Terminal Station (BATS).
Embedded generation
A total of 38.45 MW capacity of large-scale embedded generation is installed on the Powercor sub-transmission and distribution systems connected to HOTS.
The following table lists the registered embedded generators (>5 MW) that are installed on the Powercor network connected to BATS:
Site name Status Technology Type Nameplate capacity (MW)
Kiata Wind Farm Existing Plant Wind Turbine 31.05
About 37 MW of rooftop solar PV is installed on the Powercor distribution system connected to HOTS. This includes all the residential and small-commercial rooftop PV systems that are smaller than 1 MW.
Magnitude, probability and impact of loss of load
HOTS 66 kV demand is summer peaking. Summer peak demand at HOTS has increased by an average of around 0.8 MVA (1.3%) per annum over the last 5 years. The peak load on the station reached 73.9 MVA in winter 2020.
It is estimated that:
• For 3 hours per year, 95% of peak demand is expected to be reached under the 50th percentile forecast.
• The station load power factor at the time of peak demand is 0.99.
The graph depicts the 10th and 50th percentile summer maximum demand forecast together with the station’s operational “N” rating (all transformers in service) and the “N-1”
rating at 35C ambient temperature.

2021 Transmission Connection Planning Report Risk Assessment: HOTS
Page 123
The graph shows there is sufficient capacity at the station to supply all expected load over the forecast period, even with one transformer out of service under 50th and 10th percentile forecast conditions. Therefore, the need for augmentation or other corrective action is not expected to arise over the next ten years.

2021 Transmission Connection Planning Report Risk Assessment: KTS
Page 124
KEILOR TERMINAL STATION 66 kV (KTS 66 kV)
Keilor Terminal Station is located in the north west of Greater Melbourne. It operates at 220/66 kV and currently supplies a total of approximately 193,000 customer in Jemena Electricity Networks and Powercor in the Airport West, St. Albans, Woodend, Pascoe Vale, Essendon and Braybrook areas.
Background
KTS has five 150 MVA transformers and is a summer critical station. Under system normal conditions, the No.1, No.2 & No.5 transformers are operated in parallel as one group (KTS (B1,2,5)) and supply the No.1, No.2 & No.5 66 kV buses. The No.3 & No.4 transformers are operated in parallel as a separate group (KTS (B3,4)) and supply the No.3 & No.4 66 kV buses. The 66 kV bus 3-5 and bus 1-4 tie circuit breakers are operated in the normally open position to limit the maximum prospective fault levels on the five 66 kV buses to within switchgear ratings.
For an unplanned transformer outage in the KTS (B3,4) group, the No.5 transformer will automatically change over to the KTS (B3,4) group. Therefore, an unplanned transformer outage of any one of the five transformers at KTS will result in both the KTS (B1,2,5) and KTS (B3,4) groups being comprised of two transformers each.
The following sections examine the two transformer groups separately.
Embedded Generation
About 131.7 MW of solar PV is installed on networks connected to KTS, which includes 67.5 MW in the Powercor distribution system and 64.2 MW in the Jemena distribution system. This includes all the residential and small-commercial rooftop PV systems that are smaller than 1 MW.
A total of 25.7 MW capacity of embedded generators greater than 1 MW is connected to KTS which includes 4.7 MW in the Powercor distribution system and 21 MW in the Jemena Distribution system.
Transformer group KTS (B1,2,5) Summer Peak Forecasts
The peak load on KTS (B1,2,5) reached 272.6 MW (or 284.4 MVA) on 25 January 2021.
The graph below depicts the KTS (B1,2,5) rating with all transformers (B1, B2 & B5) in service (“N” rating), and with one of the three transformers out of service (“N-1” rating), along with the 50th and 10th percentile summer maximum demand forecasts64.
64 Note that station transformer output capability rating and transformer loading are shown in the graph.

2021 Transmission Connection Planning Report Risk Assessment: KTS
Page 125
The above graph shows that with all transformers in service, there is adequate capacity to meet the anticipated maximum load demand for the entire forecast period. However, under N-1 condition during peak demand (at the 10th percentile temperature) the forecast load is greater than the N-1 rating of KTS (B1,2,5), which could affect some customers.
Transformer group KTS (B3,4) Summer Peak Forecasts
The peak load on KTS (B3,4) reached 182.4 MW (or 184.6MVA) on 24 January 2021.
The graph below depicts the summer maximum demand forecasts (for 50th and 10th percentile temperatures) for KTS (B3,4) and the corresponding rating with both transformers (B3 & B4) operating.
It shows that with all transformers in service, there will be sufficient capacity to meet the anticipated maximum load demand for the entire forecast period.
As explained above, if an unplanned transformer outage in the KTS (B3,4) group occurs, the No.5 transformer will automatically change over to the KTS (B3,4) group. In effect, the N-1 and N ratings of the KTS (B3,4) group are equivalent. Thus the load at risk level under a transformer outage condition is equivalent to the load at risk under system normal conditions.

2021 Transmission Connection Planning Report Risk Assessment: KTS
Page 126
The graph shows there is sufficient capacity at the station to supply all expected load at the 50th percentile temperature over the forecast period for both N and N-1 condition however there will be a small amount of load at risk at the 10th percentile temperature from 2030, which can be managed via load transfer to adjacent terminal station.
Comments on Energy at Risk at KTS
At the 10th percentile level, the demand forecast is expected to be below the N capability rating for the entire forecast period. There is no load at risk at under N-1 condition at both KTS (B1,2,5) and KTS (B3,4) at the 50th percentile demand forecast.
However, under 10th percentile summer temperature conditions there will be a small amount of energy at risk (2.5 MWh in 2022) at KTS (B1,2,5).
The energy at risk at KTS (B1,2,5) increases gradually over the ten year forecast period, to 23.5 MWh in 2031 at the 10th percentile demand forecast. Under these conditions, there would be insufficient capacity to meet demand for up to two hours in that year. The estimated value to customers of the 23.5 MWh of energy at risk in 2031 is approximately $0.84 million (based on a value of customer reliability of $35,693/MWh). In other words, at the 10th percentile demand level, and in the absence of any other operational response that might be taken to mitigate the impact of a forced outage, a major outage of one transformer at KTS (B1,2,5) over the summer of 2031 would be anticipated to lead to involuntary supply interruptions that would cost consumers $0.84 million.
Typically, the probability of a major outage of a terminal station transformer occurring over the year is very low at about 1.0% per transformer per annum, whilst the expected unavailability per transformer per annum is 0.221%. When the energy at risk (23.5 MWh in 2031) is weighted by this low unavailability, the expected unserved energy is estimated to be around 0.26 MWh. This expected unserved energy is estimated to have a value to consumers of around $9,272 (based on a value of customer reliability of $35,693/MWh).

2021 Transmission Connection Planning Report Risk Assessment: KTS
Page 127
These key statistics for 2031 under N-1 outage conditions are summarised in the table below.
MWh Valued at consumer interruption cost
Energy at risk, at 50th percentile demand forecast 0 $0
Expected unserved energy at 50th percentile demand 0 $0
Energy at risk, at 10th percentile demand forecast 23.5 $838,781
Expected unserved energy at 10th percentile demand 0.26 $9,272
Possible Impacts on Customers
System Normal Condition (All 5 transformers in service)
Applying the 10th percentile demand forecast, there will be sufficient capacity at the station to supply all customer demand for the entire forecast period under system normal condition.
N-1 System Condition
If one of the KTS 220/66 kV transformers is taken off line during peak loading times, causing the KTS (B1,2,5) rating to be exceeded, the OSSCA65 load shedding scheme which is operated by AusNet Transmission Group’s TOC66 will act swiftly to reduce the loads in blocks to within transformer capabilities. Any load reductions that are in excess of the minimum amount required to limit load to the rated capability of the station would be restored after the operation of the OSSCA scheme, at zone substation feeder level in accordance with Jemena Electricity Networks’ and Powercor’s operational procedures.
Feasible options and preferred network option(s) for alleviation of constraints
The amount of energy at risk over the 10 year forecast period is insufficient to economically justify capacity augmentation at the station. Over the forecast period, the risk to supply reliability will be mitigated through the following measures:
• Maintain contingency plans to transfer load quickly, where possible, to adjacent terminal stations. Jemena Electricity Networks has up to 35 MVA of load transfer capacity available and Powercor has up to 15 MVA of transfer capacity available
• Fine-tune the OSSCA scheme settings in conjunction with AusNet Transmission Group to minimise the impact on customers of any automatic load shedding that may take place; and
65 Overload Shedding Scheme of Connection Asset. 66 Transmission Operations Centre.

2021 Transmission Connection Planning Report Risk Assessment: KTS
Page 128
• Subject to the availability of an AusNet Transmission Group spare 220/66 kV transformer for urban areas (refer to section 5.5), a spare transformer could be installed at KTS and used to temporarily replace a failed transformer
In addition to the load forecast presented above some additional large load connection enquiries have been recently received in the KTS supply area. If these enquiries result in committed new connections, there may be a need to augment the transformation capacity at KTS.

2021 Transmission Connection Planning Report Risk Assessment: KGTS
Page 129
KERANG TERMINAL STATION (KGTS) 66kV & 22kV
Kerang Terminal Station (KGTS) 66 kV and 22 kV consists of three 35 MVA 235/66/22 kV transformers and is the main source of supply for over 15,997 customers in Kerang and the surrounding area. The station supply area includes Kerang, Swan Hill and Cohuna.
Embedded generation
About 25 MW of rooftop solar PV is installed on the Powercor distribution system connected to KGTS 66 & 22 kV. This includes all the residential and small-commercial rooftop PV systems that are smaller than 1 MW.
A total of 100.4MW capacity of large-scale embedded generation is installed on the Powercor distribution systems connected to KGTS 66 kV & 22 kV. Additionally, 30 MW of new solar generation has been approved and is expected to be commissioned in the next two years.
The following table lists the registered embedded generators (>5 MW) that are installed on the Powercor network connected to KGTS 66 kV & 22 kV:
Site name Status Technology Type
Nameplate capacity (MW)
Gannawarra Solar Farm Existing Plant Solar PV 55
Swan Hill Solar Farm Existing Plant Solar PV 14.4
Cohuna Solar Farm Existing Plant Solar PV 31
Confidential Approved project Solar PV 30
Magnitude, probability and impact of loss of load
The following observations and risk assessment are based on actual readings of power flow at the terminal station connection points. It therefore accounts for the current load and generation combination.
KGTS 22 & 66 kV peak load reached 47.8 MW (66 kV and 22 kV networks) in summer 2021. The peak demand was reduced compared to the previous summer due to the mild weather and the increasing solar PV uptake. Due to the input of generation connected to the station, reverse power flows occur during low load periods. The minimum demand at KGTS 66 kV & 22 kV reached -60.1 MW in November 2020.
As noted in section 5.2 of this report, the connection of significant embedded generation to networks supplied from some terminal stations is expected to lead to reverse power flows that may necessitate a reduction in the ratings of some stations. KGTS 66 kV & 22kV is being one such station and the station ratings will be reviewed by AusNet Transmission Services.
It is estimated that:

2021 Transmission Connection Planning Report Risk Assessment: KGTS
Page 130
• For 4 hours per year, 95% of peak demand is expected to be reached under the 50th percentile demand forecast.
• The station power factor at the time of maximum demand is 0.99.
• The station power factor at the time of minimum demand is -0.99.
KGTS 22 & 66 kV demand is summer peaking. The graph below depicts the 10th and 50th percentile summer maximum demand forecast together with the station’s operational “N”
rating (all transformers in service) and the “N-1” rating at 35C ambient temperature.
The above graph shows that there is sufficient capacity at the station to supply all expected demand at the 50th and 10th percentile temperatures over the forecast period, even with one transformer out of service. Therefore, the need for augmentation or other corrective action is not expected to arise over the next ten years.
The connection of additional embedded generation, however, may lead to an increased risk of terminal station transformers overloading due to reverse power flows. In these circumstances, if it is uneconomic for augmentation to be undertaken, the need for and suitability of a generation runback scheme would be investigated by the DB.

2021 Transmission Connection Planning Report Risk Assessment: MTS 22 kV
Page 131
MALVERN 22 kV TERMINAL STATION (MTS 22 kV)
MTS 22 kV is the source of supply for over 12,000 customers in Burwood, Ashwood, Glen Iris, Mount Waverley and Surrey Hills.
Embedded generation
About 9.4 MW of rooftop solar PV is installed within the distribution system connected to MTS 22 kV. This includes all the residential and small-commercial rooftop PV systems that are smaller than 1 MW. There are no embedded generation units over 1 MW connected at MTS 22 kV.
Magnitude, probability and impact of loss of load
MTS 22 kV is a summer critical terminal station. The recorded demand in summer 2021 was 33.9 MW (34.0 MVA), which was 3.3 MW lower than the summer 2020 peak.
In addition to historical summer maximum demands, the graph below depicts the 10th and 50th percentile summer maximum demand forecast together with the station’s operational
N rating (all transformers in service) and the (N-1) rating at 35C as well as 40C ambient temperature.
The N rating on the graph indicates the maximum load that can be supplied from MTS 22 kV with all transformers in service. Exceeding this level will require load shedding or emergency load transfers to keep the terminal station operating within its limits.
The graph above shows that with one transformer out of service, the demand at MTS 22 kV will remain well within the (N-1) station rating over the next ten years.
The station load is forecast to have a power factor of 0.996 at times of peak demand. The demand at MTS 22 kV is expected to exceed 95% of peak demand for approximately 5 hours per annum. There is approximately 4 MVA of load transfer available at MTS 22 kV for summer 2021/22.
On the basis of the current forecasts, the need for augmentation of transmission connection assets at MTS 22 kV is not expected to arise over the next decade.

2021 Transmission Connection Planning Report Risk Assessment: MTS 66 kV
Page 132
MALVERN 66 kV TERMINAL STATION (MTS 66 kV)
MTS 66 kV is the main source of supply for over 80,000 customers in Elsternwick, Caulfield, Carnegie, Malvern East, Ashburton, Chadstone, Oakleigh, Ormond, Murrumbeena, Hughesdale and Bentleigh East.
Embedded generation
About 31.9 MW of rooftop solar PV is installed within the distribution system connected to MTS 66 kV (excluding the solar PV connected at MTS 22 kV). This includes all the residential and small-commercial rooftop PV systems that are smaller than 1 MW.
There are no embedded generation units over 1 MW connected at MTS 66 kV.
Magnitude, probability and impact of loss of load
MTS 66 kV is a summer critical terminal station. The recorded demand in summer 2021 was 187.3 MW (189.0 MVA), which was 45.9 MW lower than the summer 2020 peak. Note that the transformers at MTS 66 kV support the demand of both 66 kV and 22 kV networks ex MTS (refer also to the Risk Assessment for MTS 22 kV).
The graph below depicts the 10th and 50th percentile summer maximum demand forecast together with the station’s operational N rating (all transformers in service) and the (N-1)
rating at 35C as well as 40C ambient temperature.
The N rating on the graph indicates the maximum load that can be supplied from MTS 66 kV with all transformers in service. Exceeding this level will require load shedding or emergency load transfers to keep the terminal station operating within its limits.
The graph above shows that with one transformer out of service, the demand at MTS 66 kV will remain well within the (N-1) station rating over the next ten years.

2021 Transmission Connection Planning Report Risk Assessment: MTS 66 kV
Page 133
The station load is forecast to have a power factor of 0.991 at times of peak demand. The demand at MTS 66 kV is expected to exceed 95% of the peak demand for approximately 4 hours per annum. There is approximately 16 MVA of load transfer available at MTS 66 kV for summer 2021/22.
Government-led investment in infrastructure projects within the MTS supply area is expected to increase demand at MTS. The impact of such projects is excluded from this year’s forecast until more details are confirmed. On the basis of the current forecasts, the need for augmentation of transmission connection assets at MTS 66 kV is not expected to arise over the next decade.

2021 Transmission Connection Planning Report Risk Assessment: MWTS
Page 134
MORWELL TERMINAL STATION 66 kV (MWTS 66 kV)
Morwell Terminal Station (MWTS) 66 kV is the main source of supply for a major part of south-eastern Victoria including Gippsland. It supplies Phillip Island, Wonthaggi and Leongatha in the west; Moe and Traralgon in the central area; to Omeo in the north; and to Bairnsdale and Mallacoota in the east.
AusNet Electricity Services is responsible for the transmission connection and distribution network planning for this region.
Embedded generation
About 195.5 MW of rooftop solar PV is installed on the AusNet distribution system connected to MWTS. This includes all the residential and small-commercial rooftop PV systems that are smaller than 1 MW.
A total of 277.4 MW capacity of large-scale embedded generation is installed on the AusNet sub-transmission and distribution systems connected to MWTS.
The following table lists the embedded generators (>5 MW) that are installed on the AusNet network connected to MWTS:
Site name Status Technology Type Nameplate capacity (MW)
Bald Hills Wind Farm Existing Plant Wind 106.6
Toora Wind Farm Existing Plant Wind 21
Wonthaggi Wind Farm Existing Plant Wind 12
Bairnsdale Power Station Existing Plant Gas 80
Traralgon Power Station Existing Plant Gas 10
Longford Existing Plant Gas 29.3
Thomson Dam Existing Plant Hydro 7.5
Magnitude, probability and impact of loss of load
MWTS 66 kV is supplied by two 150 MVA 220/66 kV transformers and one 165 MVA 220/66 kV transformer.
MWTS 66 kV is a summer peaking station and recorded a maximum demand of 452 MW (464 MVA) in early January 2013. The peak demand on the station reached 383.6 MW (384.7 MVA) in summer 2020/21. The peak demand period is usually quite short and coincides with a few weeks of peak tourism from Christmas to early January along the east coast of Victoria. The maximum demand recorded is very dependent on weather conditions during this short period. The load at MWTS 66 kV is forecast to slightly decline over the ten-year planning horizon. The station load has a power factor of 0.99 at maximum demand. MWTS 66 kV demand is expected to exceed 95% of the 50th percentile peak demand for 5 hours per annum.

2021 Transmission Connection Planning Report Risk Assessment: MWTS
Page 135
The assessment of the energy at risk at MWTS 66 kV needs to take into account the significant levels of embedded generation that is connected into the MWTS 66 kV network and directly offsets the loading on the 220/66 kV transformers at MWTS. The embedded generation includes the 80 MW Bairnsdale Power Station (BPS), the 10 MW Traralgon Power Station, the Wonthaggi and Toora Wind Farms, totalling 33 MW, and the 106 MW Bald Hills Wind Farm. While a precise assessment is difficult due to the intermittency of the generation in the 66 kV loop, to make a realistic assessment of the risk at MWTS the total output from these embedded generators is assumed to be 60 MVA.
The “N–1” and “N” ratings shown on the graph below include the transformer capacity as well as the assumed 60 MVA contribution from embedded generation. For example the 395 MVA “N–1” rating includes the 335 MVA capacity of two 220/66 kV transformers and 60 MVA from embedded generation. The graph also shows the 10th and 50th percentile summer maximum demand forecast together with the station’s operational “N” rating (all transformers in service plus 60 MVA from embedded generation) and the “N-1” rating at an
ambient temperature of 35C. The “N” rating on the chart indicates the maximum load that can be supplied from MWTS 66 kV with all transformers in service. Summer peak demand loading at MWTS is expected to exceed the station’s “N-1” rating for the entire 10-year planning period.
There is no energy at risk forecast under the 50th percentile demand forecast. The bar chart below depicts the energy at risk with one transformer out of service for the 10th percentile demand forecast, and the hours per year that the 10th percentile demand forecast is expected to exceed the “N-1” capability. The line graph shows the value to consumers of the expected unserved energy in each year, for the 10th percentile demand forecast.

2021 Transmission Connection Planning Report Risk Assessment: MWTS
Page 136
MWTS is not expected to be loaded above its “N-1” rating under 50th percentile or 10th percentile winter maximum demand forecasts during the 10 year planning horizon.
Comments on Energy at Risk
As noted above, embedded generation is assumed to be contributing 60 MVA during the peak demand period, which represents approximately 25 percent of the total installed capacity of the embedded generators in the MWTS 66 kV network.
There is no energy at risk forecast under the 50th percentile demand forecast. Under higher summer temperature conditions (that is at the 10th percentile level), the energy at risk in 2021/22 is estimated to be 117 MWh million. The estimated value to consumers of the energy at risk is $4.98 million (based on a value of customer reliability of $42,732/MWh)67. When this energy at risk is weighted by the transformer unavailability, the expected unserved energy is estimated to be 0.76 MWh, which has a value to consumers of around $0.032 million.
These key statistics for the year 2021/22 under “N-1” outage conditions are summarised in the table below.
67 The value of unserved energy is derived from the VCR relevant climate zone and sector values given in
the AER VCR December 2019 final determination, weighted in accordance with the composition of the load at this terminal station.

2021 Transmission Connection Planning Report Risk Assessment: MWTS
Page 137
MWh Valued at consumer interruption cost
Energy at risk, at 50th percentile demand forecast 0 0
Expected unserved energy at 50th percentile demand 0 0
Energy at risk, at 10th percentile demand forecast 117 $4.98 million
Expected unserved energy at 10th percentile demand 0.76 $0.032 million
If one of the 220/66 kV transformers at MWTS is taken off line during peak loading times and the “N-1” station rating is exceeded, then the Overload Shedding Scheme for Connection Assets (OSSCA) which is operated by AusNet Transmission Group’s TOC68 to protect the connection assets from overloading69, will act swiftly to reduce the load in blocks to within safe loading limits. Any load reductions that are in excess of the minimum amount required to limit load to the rated capability of the station would be restored at zone substation feeder level in accordance with AusNet Electricity Services’ operational procedures after the operation of the OSSCA scheme.
Feasible options for alleviation of constraints
The following options are technically feasible to mitigate the risk of supply interruption and/or to alleviate the emerging constraint:
1. Embedded generation: Bairnsdale Power Station is currently contracted to provide network support services to AusNet Services until March 2022, but may be extended beyond that date. A feasible option would be to recontract network support services from Bairnsdale or another network support service provider in the area. AusNet Services published Stage 1, the non-network options report, of a regulatory investment test for distribution (RIT-D) to address sub-transmission limitations in the East Gippsland area. Subsequently, AusNet decided not to proceed with the RIT-D project given the rapidly changing generation proposals in the region. AusNet will re-evaluate the network constraints, and publish another RIT-D in future. Continued availability of Bairnsdale or other embedded generation network support over the ten year planning horizon will lessen the need for network augmentation.
2. Subject to availability, an AusNet Transmission Services spare 220/66 kV transformer for rural areas (refer section 5.5) can be used to temporarily replace a failed transformer.
3. Install a fourth 220/66 kV transformer at MWTS: Installation of a 4th transformer at MWTS is a technically feasible option. However, fault level constraints would make such a solution costly to implement.
4. Installation of Power Factor Correction Capacitors: As the station is currently running with a power factor of around 0.99 at the summer peak, the use of additional capacitors
68 Transmission Operation Centre.
69 OSSCA is designed to protect connection transformers against transformer damage caused by overloads. Damaged transformers can take months to repair or replace, which can result in prolonged, long term risks to the reliability of customer supply.

2021 Transmission Connection Planning Report Risk Assessment: MWTS
Page 138
to further improve the power factor and to reduce the MVA loading on the transformers will provide only marginal benefits.
5. Load transfers: Only 5 MVA of load can be shifted away from MWTS using the existing 22 kV distribution network, so this option does not make a material contribution to managing the risk at MWTS.
Preferred network option for alleviation of constraints
In view of the current level of expected unserved energy and the slight decline in forecast demand at MWTS over the next 10 years, implementing a network solution is not considered to be economic over the ten-year planning horizon.
The table on the following page provides more detailed information on the station rating, demand forecasts, energy at risk and expected unserved energy assuming embedded generation is contributing 60 MVA.

2021 Transmission Connection Planning Report Risk Assessment: MWTS
Page 139
Notes:
1. “N-1” means cyclic station output capability rating with outage of one transformer. The summer rating is at an ambient temperature of 35 degrees Centigrade.
2. “N-1 energy at risk” is the amount of energy in a year during which the specified demand forecast exceeds the N-1 capability rating. Energy at risk at the specified demand forecast when all plant is in service (N) is shown separately.
3. “N-1 hours per year at risk” is the number of hours in a year during which the specified demand forecast exceeds the N-1 capability rating. Hours at risk at the specified demand forecast when all plant is in service (N) are shown separately.
4. “Expected unserved energy” means “energy at risk” multiplied by the probability of a major outage affecting one transformer. “Major outage” means an outage with duration of 2.65 months. The outage probability is derived from the base reliability data given in Section 5.4.
5. The value of unserved energy is derived from the VCR relevant climate zone and sector values given in the AER VCR December 2019 final determination, weighted in accordance with the composition of the load at this terminal station.
6. The 0.7 and 0.3 weightings applied to the 50th and 10th percentile expected unserved energy estimates (respectively) are in accordance with the approach applied by AEMO, and described on page 12 of its publication titled Victorian Electricity Planning Approach, published in June 2016 (see http://www.aemo.com.au/-/media/Files/Electricity/NEM/Planning_and_Forecasting/Victorian_Transmission/2016/Victorian-Electricity-Planning-Approach.ashx)
MORWELL TERMINAL STATION 66kV (MWTS 66)
Detailed data: Magnitude and probability of loss of load
Distribution Businesses supplied by this station: AusNet Electricity Services (100%)
Normal cyclic rating with all plant in service 544 MVA via 3 transformers and embedded generation
Summer N-1 Station Rating 395 MVA via 2 transformers and embedded generation
Winter N-1 Station Rating 474 MVA via 2 transformers and embedded generation
Station: MWTS 66kV 2022 2023 2024 2025 2026 2027 2028 2029 2030 2031
50th percentile Summer Maximum Demand (MVA) 367.8 364.2 360.4 357.5 354.5 351.4 348.9 348.0 349.0 346.8
50th percentile Winter Maximum Demand (MVA) 352.4 353.4 354.2 354.9 355.3 355.6 356.3 357.5 358.2 359.0
10th percentile Summer Maximum Demand (MVA) 427.6 424.2 420.7 418.0 415.2 412.5 410.2 409.5 410.8 408.8
10th percentile Winter Maximum Demand (MVA) 359.3 360.3 361.1 361.8 362.3 362.6 363.3 364.5 365.3 366.1
N - 1 energy at risk at 50th percentile demand (MWh) 0 0 0 0 0 0 0 0 0 0
N - 1 hours at risk at 50th percentile demand (hours) 0.0 0.0 0.0 0.0 0.0 0.0 0.0 0.0 0.0 0.0
N - 1 energy at risk at 10th percentile demand (MWh) 117 88 61 44 29 17 11 9 12 8
N - 1 hours at risk at 10th percentile demand (hours) 9.7 8.5 7.2 6.1 5.0 3.6 2.5 2.1 2.8 1.7
N and N-1 Expected Unserved Energy at 50th percentile demand (MWh) 0.0 0.0 0.0 0.0 0.0 0.0 0.0 0.0 0.0 0.0
N and N-1 Expected Unserved Energy at 10th percentile demand (MWh) 0.8 0.6 0.4 0.3 0.2 0.1 0.1 0.1 0.1 0.1
N and N-1 Expected Unserved Energy value at 50th percentile demand $0.00M $0.00M $0.00M $0.00M $0.00M $0.00M $0.00M $0.00M $0.00M $0.00M
N and N-1 Expected Unserved Energy value at 10th percentile demand $0.03M $0.02M $0.02M $0.01M $0.01M $0.00M $0.00M $0.00M $0.00M $0.00M
N and N-1 Expected Unserved Energy value using AEMO weighting of 0.7 X
50th percentile value + 0.3 X 10th percentile value$0.01M $0.01M $0.01M $0.00M $0.00M $0.00M $0.00M $0.00M $0.00M $0.00M

2021 Transmission Connection Planning Report Risk Assessment: MBTS
Page 140
MT BEAUTY TERMINAL STATION 66 kV (MBTS 66 kV)
Mt Beauty Terminal Station (MBTS) is the main point of connection into the 220 kV electricity grid for Victoria’s Kiewa hydro generation resources. The power stations include West Kiewa, McKay, Dartmouth, Clover and Eildon. MBTS is also the source of 66 kV supply for the alpine areas of Mt Hotham and Falls Creek along with the townships of Bright, Myrtleford and Mount Beauty.
The station has two 50 MVA 220/66 kV transformers with one transformer in service and the other available as a hot spare that can be brought into service in approximately 4 hours. With this transformer operating arrangement, the N rating will be equal to the “N-1” rating (i.e. equal to the capacity of one transformer). In addition, supply can also be taken from Clover Power Station and the 66 kV tie to Glenrowan Terminal Station via Myrtleford.
It is AusNet Electricity Services’ responsibility to plan the electricity supply network for this region.
Embedded generation
About 6.6 MW of rooftop solar PV is installed on the AusNet distribution system connected to MBTS. This includes all the residential and small-commercial rooftop PV systems that are smaller than 1 MW.
A total of 29 MW capacity of large-scale embedded generation, is installed on the AusNet sub-transmission and distribution systems connected to MBTS.
The following table lists the registered embedded generators (>5 MW) that are installed on the AusNet network connected to MBTS:
Site name Status Technology Type Nameplate capacity (MW)
Clover Power Station Existing Plant Hydro 29
Magnitude, probability and impact of loss of load
MBTS is a winter peaking station with the peak demand on the MBTS 66 kV bus forecast to remain flat for the next 10 years. Peak demand at the station reached 47.9 MVA in winter 2012. The recorded peak demand in winter 2020 was 38.7 MW (38.7 MVA), which remains lower than the 2012 peak demand. The station load has a power factor of 1.00 at maximum demand. The demand at MBTS 66 kV is expected to exceed 95% of the 50th percentile peak demand for approximately 4 hours per annum. The summer peak demand is around 30% lower than the winter peak demand.
The graph below depicts the 10th and 50th percentile winter maximum demand forecast together with the station’s operational “N-1” rating (equal to “N” rating) at an ambient
temperature of 5C. With demand forecast to remain flat, MBTS 66 kV is not expected to reach its “N-1” winter station rating during the 10 year planning horizon.

2021 Transmission Connection Planning Report Risk Assessment: MBTS
Page 141
The above analysis does not include the possibility of loss of load for the short period of about 4 hours that it takes to change over from the in-service transformer to the hot spare transformer. The 66 kV tie line to Glenrowan Terminal Station can support about 25 MW of MBTS load and this tie line is operated normally closed so if the load is below this limit there will not be any loss of customer load during a transformer outage. Clover Power Station can generate around 26 MW and so any generation would also minimise the likelihood of the loss of customer load during a transformer outage.
It is recognised that at times of high demand, and with low output from Clover Power Station, a transformer outage at MBTS could result in the loss of some customer load for a short period of no more than 4 hours.
The energy at risk for a major transformer outage70 in this situation (taking account of the limited 66 kV tie line capability) is significant at around 2,524 MWh in winter 2021. However, given that the hot spare transformer can be made available within 4 hours, the expected outage duration in the case of a major transformer failure at MBTS is 4 hours (rather than 2.65 months). Accordingly, the probability of the transformer being unavailable in this particular case is only 0.000457%. The expected unserved energy at MBTS is therefore approximately 0.012 MWh in 2021 and this is estimated to have a value to consumers of approximately $427 (based on a value of customer reliability of $37,006/MWh).
Full switching of the hot spare transformer with new 220 kV and 66 kV circuit breakers would eliminate this risk but this is estimated to cost around $2 million. The expected benefits of full switching of the hot spare transformer does not economically justify the cost of the project within the ten year planning horizon.
70 In this report, “major transformer outage” means an outage that has a mean duration of 2.65 months.

2021 Transmission Connection Planning Report Risk Assessment: RCTS 22 kV
Page 142
RED CLIFFS TERMINAL STATION (RCTS) 22 kV
Red Cliffs Terminal Station (RCTS) 22 kV consists of two 35 MVA 235/66/22 kV transformers supplying the 22 kV network ex-RCTS. An additional 140 MVA 235/66/22 kV transformer operates normally open on the 22 kV bus with an auto-close scheme to close this transformer onto the 22 kV bus in the event of a failure of either of the other two transformers. This configuration is the main source of supply for 4,648 customers in Red Cliffs and the surrounding area. The station supply area includes Red Cliffs, Colignan and Werrimull.
Embedded generation
About 13 MW of rooftop solar PV is installed on the Powercor distribution system connected to RCTS 22 kV. This includes all the residential and small-commercial rooftop PV systems that are smaller than 1 MW.
A total of 3.5 MW capacity of large-scale embedded generation is installed on the Powercor distribution systems connected to RCTS 22 kV. An additional 3 MW of new solar generation has been approved and is expected to be commissioned in the next two years.
Magnitude, probability and impact of loss of load
The peak load for the RCTS 22 kV network reached 35.2 MVA in summer 2021. The summer of 2020-21 was a mild summer which contributed to reduced network MDs.
It is estimated that:
• For 11 hours per year, 95% of peak demand is expected to be reached under the 50th percentile demand forecast.
• The station transformer power factor at the peak time demand is 0.93 with both capacitor banks in service.
In the event of a failure of either of the 35 MVA transformers, both 35 MVA transformers will be switched out and the 140 MVA 235/66/22 kV transformer (which operates normally open on the 22 kV bus) will be automatically closed onto the 22 kV bus. There will be a momentary supply interruption during this process. The 140 MVA 235/66/22 kV transformer can also be closed onto the 22 kV bus in the event that load exceeds 55 MVA (22 kV dropper rating), with the two 35 MVA transformers being switched out to maintain fault levels below the 13.1 kA limit. This arrangement results in the station’s “N-1” capacity being higher than the “N” capacity.
RCTS 22 kV demand is summer peaking. The graph below depicts the 10th and 50th percentile summer maximum demand forecast together with the station’s operational “N”
rating and the “N-1” rating at 35C ambient temperature.

2021 Transmission Connection Planning Report Risk Assessment: RCTS 22 kV
Page 143
The graph shows there is sufficient capacity at the station to supply all expected load at the 50th and 10th percentile temperatures until 2030, with one transformer out of service. Under 10th percentile forecast conditions, there is a small amount of load at risk from 2030 onwards, which can be managed by utilising load transfers away to adjacent zone substations. Therefore, the need for augmentation or other corrective action is not expected to arise over the next ten years.

2021 Transmission Connection Planning Report Risk Assessment: RCTS 66 kV
Page 144
RED CLIFFS TERMINAL STATION (RCTS) 66 kV
Red Cliffs Terminal Station (RCTS) 66 kV consists of two 70 MVA and one 140 MVA 235/66/22 kV transformers supplying the 66 kV network ex-RCTS. This configuration is the main source of supply for 21,965 customers in Red Cliffs and the surrounding area. The station supply area includes Merbein, Mildura and Robinvale.
Embedded generation
A total of 202 MW capacity of large-scale embedded generation is installed on the Powercor sub-transmission and distribution systems connected to RCTS 66.
The following table lists the registered embedded generators that are installed on the Powercor network connected to RCTS 66 kV:
Site name Status Technology Type Nameplate capacity (MW)
Karadoc Solar Farm Existing Plant Solar PV 103
Yatpool Solar Farm Existing Plant Solar PV 92
About 28 MW of rooftop solar PV is installed on the Powercor distribution system connected to RCTS 66 kV. This includes all the residential and small-commercial rooftop PV systems that are smaller than 1 MW.
Magnitude, probability and impact of loss of load
RCTS 66 kV demand is summer peaking. The maximum demand (load) for the 66 kV network now supplied from the station reached 121 MW in summer 2021. Due to the input of generation connected to the station, reverse power flows occur during low load periods. The minimum demand (export) at RCTS 66 reached -125 MW (-136 MVA) in February 2021.
As noted in section 5.2 of this report, the connection of significant embedded generation to networks supplied from some terminal stations is expected to lead to reverse power flows that may necessitate a reduction in the ratings of some stations. RCTS 66 kV is one such station. In 2019 the station rating of RCTS 66 kV was reduced from cyclic to nameplate. This reduction is shown in the graph below.
The following observations and risk assessment are based on actual readings of power flow at the Terminal Station Connection points. It therefore accounts for the current load and generation combination. It is estimated that:
• For 6 hours per year, 95% of peak demand is expected to be reached under the 50th percentile demand forecast.
• The station power factor at the time of maximum demand is 0.98.
• The station power factor at the time of minimum demand is -0.92.
The graph below depicts the 10th and 50th percentile summer maximum demand forecast together with the station’s operational “N” rating (all transformers in service) and the “N-1”
rating at 35C ambient temperature.

2021 Transmission Connection Planning Report Risk Assessment: RCTS 66 kV
Page 145
In the event of a transformer outage at RCTS 66 kV the generators may need to reduce generation to avoid overloading the remaining transformer. AEMO has a constraint equation managing the terminal station transformer reverse loading. The generators are sent dispatch signals to reduce generation if the constraint equation binds. Any generation reduction is implemented via AEMO’s dispatch process.
Currently there is no planned augmentation at RCTS 66 kV for generation connections. Additional generation, however, may require augmentation of transformer capacity, the cost of which would either be met by the connecting generator(s), or would be recovered from load customers where a RIT-T demonstrates that the augmentation delivers net market benefits.
The bar chart below depicts the energy at risk with one transformer out of service for the 50th percentile demand forecast, and the hours per year that the 50th percentile demand forecast is expected to exceed the N-1 capability rating. The line graph shows the value to consumers of the expected unserved energy in each year, for the 50th percentile demand forecast.

2021 Transmission Connection Planning Report Risk Assessment: RCTS 66 kV
Page 146
Comments on Energy at Risk
For a major outage of one transformer at RCTS 66 kV during the summer period, there will be insufficient capacity at the station to supply all demand at the 50th percentile temperature for about 53 hours in 2031. The energy at risk at the 50th percentile temperature under N-1 conditions is estimated to be 746 MWh in 2031. The estimated value to consumers of the 746 MWh of energy at risk is approximately $31 million (based on a value of customer reliability of $41,630 /MWh).71 In other words, at the 50th percentile demand level, and in the absence of any other operational response that might be taken to mitigate the impact of a forced outage, a major outage of one transformer at RCTS 66 kV in 2031 would be anticipated to lead to involuntary supply interruptions that would cost consumers approximately $31 million.
It is emphasised however, that the probability of a major outage of one of the two transformers occurring over the year is very low at about 1.0% per transformer per annum, whilst the expected unavailability per transformer per annum is 0.221%. When the energy at risk (746 MWh for 2031) is weighted by this low unavailability, the expected unsupplied energy is estimated to be around 4.9 MWh. This expected unserved energy is estimated to have a value to consumers of around $201,980 (based on a value of customer reliability of $41,630/MWh).
It should also be noted that the above estimates of energy at risk and expected unserved energy are based on an assumption of average (50th percentile) summer temperatures occurring in each year. Under 10th percentile temperature conditions, the energy at risk in 2031 is estimated to be 1,240 MWh. The estimated value to consumers of this energy at risk in 2031 is approximately $52 million. The corresponding value of the expected unserved energy (of 8.1 MWh) is approximately $335,600. Also these estimates do not attribute any value to the prospective loss of generation that may be constrained.
71 The value of unserved energy is derived from the relevant climate zone and sector VCR values given in
the AER VCR December 2020 final determination, weighted in accordance with the composition of the load at this terminal station.

2021 Transmission Connection Planning Report Risk Assessment: RCTS 66 kV
Page 147
These key statistics for the year 2031 under N-1 outage conditions are summarised in the table below.
MWh Valued at consumer interruption cost
Energy at risk, at 50th percentile demand forecast 746 $31 million
Expected unserved energy at 50th percentile demand 4.9 $201,980
Energy at risk, at 10th percentile demand forecast 1240 $52 million
Expected unserved energy at 10th percentile demand 8.1 $335,600
Feasible options for alleviation of constraints
The following options are technically feasible and potentially economic to mitigate the risk of supply interruption and/or alleviate the emerging constraint over the next ten year planning horizon:
1. Embedded generation: two large solar farms, Karadoc Solar Farm and Yatpool Solar Farm were commissioned in the last two years and are generating into the 66 kV infrastructure with a total capacity of nearly 200 MW. This will help to supply the loads in the RCTS supply area, and may defer the need for any capacity augmentation within the forecast period. Any new embedded generation may require a new transformer to ensure generation at N-1 can occur.
2. Possible uptake of battery storage in the future could provide some contribution to supporting the peak load.
3. A contingency plan to transfer RVL zone substation from RCTS to WETS (~25 MVA) will be implemented in the event of the loss of one of the RCTS 220/66 kV transformers.
4. Subject to availability, an AusNet Transmission Group spare 220/66 kV transformer for rural areas (refer to Section 5.5) can be used to temporarily replace a failed transformer to minimise the transformer outage period.
Preferred option(s) for alleviation of constraints
As already noted, a contingency plan to transfer RVL zone substation from RCTS to WETS (~25 MVA) will be implemented in the event of the loss of one of the RCTS 220/66 kV transformers. In addition, generation output from the solar farms may help supply the loads at RCTS if required.
The level of expected unserved energy over the forecast period suggests that installation of additional capacity at RCTS 66 kV is unlikely to be economically justified during the forecast period. The contingency plan described above will provide an effective means of mitigating load at risk over the ten year planning horizon.
The table on the following page provides more detailed data on the station rating, demand forecasts, energy at risk and expected unserved energy.

2021 Transmission Connection Planning Report Risk Assessment: RCTS 66 kV
Page 148
Red Cliffs Terminal Station 66 kV
Detailed data: Magnitude and probability of loss of load
Distribution Businesses supplied by this station: Powercor (100%) Nameplate rating with all plant in service 280 MVA via 2 transformers (Summer peaking) Summer N-1 Station Rating: 140 MVA [See Note 1 below for interpretation of N-1] Winter N-1 Station Rating: 140 MVA
Notes:
1. “N-1” means nameplate station transformer output capability rating with outage of one transformer. The rating is at an ambient temperature of 35 degrees Centigrade.
2. "N-1 energy at risk" is the amount of energy in a year during which the specified demand forecast exceeds the N-1 capability rating.
3. “N-1 hours per year at risk” is the number of hours in a year during which the specified demand forecast exceeds the N-1 capability rating.
4. “Expected unserved energy” means “ energy at risk” multiplied by the probability of a major outage affecting one transformer. “Major outage” means an outage with duration of 2.6 months. The outage probability is derived from the base reliability data given in Section 5.4.
5. The value of unserved energy is derived from the sector values given in Table 1 of Section 2.4, weighted in accordance with the composition of the load at this terminal station.
6. The 0.7 and 0.3 weightings applied to the 50th and 10th percentile expected unserved energy estimates (respectively) are in accordance with the approach applied by AEMO and described on page 12 of its publication titled Victorian Electricity Planning Approach, published in June 2016 (see http://www.aemo.com.au/-/media/Files/Electricity/NEM/Planning_and_Forecasting/Victorian_Transmission/2016/Victorian-Electricity-Planning-Approach.ashx)
2022 2023 2024 2025 2026 2027 2028 2029 2030 2031
140.9 146.0 148.6 148.0 149.8 154.3 160.4 167.2 174.0 180.6
94.5 98.7 99.3 99.7 101.7 105.2 109.6 114.2 119.0 123.9
147.8 152.9 155.3 154.7 156.6 161.3 167.7 174.9 182.0 188.9
106.5 110.6 111.9 112.0 113.7 117.4 122.2 127.3 132.2 137.3
0.3 6.6 14.5 12.3 20.1 50.2 122.6 255.0 462.2 746.4
0.3 1.8 3.5 3.0 4.5 8.0 15.0 25.3 38.0 53.0
11.6 38.5 59.4 53.5 73.4 137.1 267.5 497.5 817.1 1240.2
3.0 6.5 9.0 8.3 10.5 15.8 26.0 39.8 56.5 76.8
0.002 0.04 0.09 0.08 0.13 0.33 0.80 1.66 3.00 4.85
0.08 0.25 0.39 0.35 0.48 0.89 1.74 3.23 5.31 8.06
$0.00M $0.00M $0.00M $0.00M $0.01M $0.01M $0.03M $0.07M $0.13M $0.20M
$0.00M $0.01M $0.02M $0.01M $0.02M $0.04M $0.07M $0.13M $0.22M $0.34M
$0.00M $0.00M $0.01M $0.01M $0.01M $0.02M $0.04M $0.09M $0.15M $0.24MExpected Unserved Energy value using AEMO weighting of 0.7 X 50th
precentile value + 0.3 X 10th percentile value
Station: RCTS66
Expected Unserved Energy value at 50th percentile demand
Expected Unserved Energy value at 10th percentile demand
N-1 energy at risk at 10% percentile demand (MWh)
50th percentile Summer Maximum Demand (MVA)
50th percentile Winter Maximum Demand (MVA)
Expected Unserved Energy at 50th percentile demand (MWh)
Expected Unserved Energy at 10th percentile demand (MWh)
10th percentile Summer Maximum Demand (MVA)
10th percentile Winter Maximum Demand (MVA)
N-1 energy at risk at 50% percentile demand (MWh)
N-1 hours at risk at 50th percentile demand (hours)
N-1 hours at risk at 10th percentile demand (hours)

2021 Transmission Connection Planning Report Risk Assessment: RTS 22 kV
Page 149
RICHMOND TERMINAL STATION 22 kV (RTS 22 kV)
RTS 22 kV is a summer critical station equipped with two 75 MVA 220/22 kV transformers, providing supply to 6,282 customers in CitiPower’s distribution network. The terminal station’s supply area includes inner suburban areas in Richmond and surrounding areas. The station also provides supply to City Link and public transport railway substations east of the Central Business District.
Embedded generation
About 1 MW of solar PV is installed on the CitiPower distribution system connected to BTS66. This includes all the residential and small-commercial rooftop solar PV systems (<1 MW).
Magnitude, probability and impact of loss of load
As part of AusNet Transmission Group’s asset renewal program, the two existing 220/22 kV transformers were replaced by two new 75 MVA 220/22 kV transformers in 2018. The N and N-1 station rating have subsequently changed to approximately 190 MVA and 95 MVA respectively. This is reflected in the 39.1.0 MW in summer 2021. It is estimated that:
• For 9 hours per year, 95% of peak demand is expected to be reached under the 50th percentile summer forecast.
• The station load power factor at time of peak demand is 0.97.
The graph below depicts the latest 10% and 50% probability maximum demand forecasts for summer over the next 10 years, together with the operational N and N-1 ratings for RTS 22 kV. The demand forecasts include the effects of committed customer block loads and the planned offload of Russell Place zone substation.

2021 Transmission Connection Planning Report Risk Assessment: RTS 22 kV
Page 150
The graph shows there is sufficient station capacity to supply all anticipated load, and that no customers would be at risk if a forced transformer outage occurred at RTS 22 kV over the forecast period. Accordingly, no capacity augmentation is planned at RTS 22 kV over the next ten years.

2021 Transmission Connection Planning Report Risk Assessment: RTS 66 kV
Page 151
RICHMOND TERMINAL STATION 66 kV (RTS 66 kV)
RTS 66 kV is a summer critical station consisting of three 225 MVA 220/66 kV transformers. The terminal station is shared by CitiPower (86%) and United Energy (14%), providing supply to a total of 150,277 customers in the Eastern Central Business District and widespread inner suburban areas in the east and south-east of Melbourne.
Embedded generation
About 17.3 MW of solar PV is installed on the CitiPower distribution system and 5.6 MW on the United Energy distribution system that are connected to RTS 66. This includes all the residential and small-commercial rooftop solar PV systems (<1 MW).
Magnitude, probability and impact of loss of load
In 2018 AusNet Transmission Group completed an asset replacement project at RTS, which involved replacing the ageing five existing 150 MVA transformers with three 225 MVA transformers. The peak load on the station reached 393 MW in summer 2021. The reduced peak demand is due to load transfers from RTS 66 to BTS that took place in September 2020. Furthermore, summer 2021 was a mild summer which resulted in reduced peak demands across the network.
It is estimated that:
• For 28 hours per year, 95% of peak demand is expected to be reached in a 50th percentile summer.
• The station load power factor at time of peak demand is 0.96.
RTS 66 is one of the terminal stations supplying the Melbourne CBD. In order to meet the Code requirements of security of supply to the Melbourne CBD, CitiPower has been undertaking works to re-configure the CBD 66 kV network to provide the required security to maintain supply from alternate supply points. This means that for an ‘N-1’ event in other parts of the CBD network, additional load can be switched onto RTS 66. This required additional capacity must be reserved at the terminal station to ensure that CBD load can be supplied under any of the CBD Security contingency arrangements.
The following graph shows recent actual demand at the station, and the forecast demand from 2022 to 2031. The station’s (N) and (N-1) ratings at 35 degrees C are also shown.

2021 Transmission Connection Planning Report Risk Assessment: RTS 66 kV
Page 152
The graph shows that with one transformer out of service, there would be sufficient capacity at RTS 66 kV to supply all expected load over the forecast period until 2028 under 10th percentile demand and until 2030 under 50th percentile demand.
The bar chart below depicts the energy at risk with one transformer out of service for the 50th percentile demand forecast, and the hours per year that the 50th percentile demand forecast is expected to exceed the N-1 capability rating. The line graph shows the value to consumers of the expected unserved energy in each year, for the 50th percentile demand forecast.

2021 Transmission Connection Planning Report Risk Assessment: RTS 66 kV
Page 153
Comments on Energy at Risk
For an outage of one transformer at RTS 66, there will be insufficient capacity at the station to supply all demand at the 50th percentile temperature for about 4.3 hours in 2031. The energy at risk at the 50th percentile temperature under N-1 conditions is estimated to be 100 MWh in 2031. The estimated value to consumers of the 100 MWh of energy at risk is approximately $4 million (based on a value of customer reliability of $ $40,536/MWh)72. In other words, at the 50th percentile demand level, and in the absence of any other operational response that might be taken to mitigate the impact of a forced outage, a major outage of one transformer at RTS 66 in 2031 would be anticipated to lead to involuntary supply interruptions that would cost consumers $4 million.
It is emphasised however, that the probability of a major outage of one of the three 225 MVA transformers occurring over the year is very low at about 1.0% per transformer per annum, whilst the expected unavailability per transformer per annum is 0.217%. When the energy at risk (100 MWh for 2031) is weighted by this low unavailability, the expected unsupplied energy is estimated to be around 0.65 MWh. This expected unserved energy is estimated to have a value to consumers of $26,400 (based on a value of customer reliability of $40,536/MWh).
It should also be noted that the above estimates of energy at risk and expected unserved energy are based on an assumption of average (50th percentile) summer temperatures occurring in each year. Under 10th percentile temperature conditions, the energy at risk in 2031 is estimated to be 945 MWh. The estimated value to consumers of this energy at risk in 2031 is approximately $38 million. The corresponding value of the expected unserved energy is $248,890.
These key statistics for the year 2031 under N-1 outage conditions are summarised in the table below.
MWh Valued at consumer interruption cost
Energy at risk, at 50th percentile demand forecast under N-1 outage condition
100.3 $4 million
Expected unserved energy at 50th percentile demand under N-1 outage condition
0.65 $26,400
Energy at risk, at 10th percentile demand forecast under N-1 outage condition
944.6 $38 million
Expected unserved energy at 10th percentile demand under N-1 outage condition
6.14 $248,890
Possible Impact on Customers
System Normal Condition (Both transformers in service)
Applying the 50th percentile and 10th percentile demand forecasts, there is sufficient capacity at RTS66 to meet all demand when both transformers are in service.
72 The value of unserved energy is derived from the sector values given in Table 1 of Section 2.4, weighted in
accordance with the composition of the load at this terminal station.

2021 Transmission Connection Planning Report Risk Assessment: RTS 66 kV
Page 154
N-1 System Condition
If one of the 225 MVA transformers at RTS66 is taken offline during peak loading times and the N-1 station rating is exceeded, the OSSCA73 automatic load shedding scheme which is operated by AusNet Transmission Group’s TOC74 will act swiftly to reduce the loads in blocks to within safe loading limits. Any load reductions that are in excess of the minimum amount required to limit load to the rated capability of the station would be restored at zone substation feeder level in accordance with CitiPower’s operational procedures after the operation of the OSSCA scheme.
Feasible options for alleviation of constraints
The following options are technically feasible and potentially economic to mitigate the risk of supply interruption and/or to alleviate the emerging constraint:
1. Install a fourth transformer at RTS 66kV, at an estimated indicative capital cost of $18 million (equating to a total annual cost of approximately $1.26 million). This would result in the station being configured so that four transformers provide capacity to the RTS 66 kV system.
2. Demand reduction: There is an opportunity to develop innovative customer schemes to encourage voluntary demand reduction during times of network constraint. The amount of potential demand reduction depends on the customer uptake and would be taken into consideration when determining the optimum timing of any network capacity augmentation.
Preferred network option(s) for alleviation of constraints
In the absence of commitment by interested parties to offer network support services by installing local generation or through demand side management initiatives that would reduce load at RTS 66 kV, it is proposed to install additional transformation capacity at RTS 66kV.
On the basis of the present demand forecasts and applying the 2021 VCR estimates, the installation of an additional transformer and the 66 kV exit reconfiguration works at RTS 66kV is not expected to be economically justified in the next ten-year period. As a temporary measure, the expected load at risk will be managed by load transfers to BTS 66kV, WMTS 66kV and TSTS.
The tables on the following pages provide more detailed data on the station rating, demand forecasts, energy at risk and expected unserved energy.
73 Overload Shedding Scheme of Connection Asset.
74 Transmission Operation Centre

2021 Transmission Connection Planning Report Risk Assessment: RTS 66 kV
Page 155
Notes: 1. “N-1” means cyclic station output capability rating with outage of one transformer. The rating is at an ambient temperature of 35 degrees Centigrade.
2. “N-1 energy at risk” is the amount of energy in a year during which specified demand forecast exceeds the N-1 capability rating.
3. “N-1 hours at risk” is the number of hours in a year during which the specified demand forecast exceeds the N-1 capability rating.
4. “Expected unserved energy” means “N-1 energy at risk” for the specified demand forecast multiplied by the probability of a major outage affecting one transformer. “Major outage” means an outage with a duration of 2.65 months. The outage probability is derived from the base reliability data given in Section 5.4.
5. The value of unserved energy is derived from the relevant climate zone and sector VCR values given in the AER VCR December 2019 final determination, weighted in accordance with the composition of the load at this terminal station.
6. The 0.7 and 0.3 weightings applied to the 50th and 10th percentile expected unserved energy estimates (respectively) are in accordance with the approach applied by AEMO, and described on page 12 of its publication titled Victorian Electricity Planning Approach, published in June 2016 (see http://www.aemo.com.au/-/media/Files/Electricity/NEM/Planning_and_Forecasting/Victorian_Transmission/2016/Victorian-Electricity-Planning-Approach.ashx).
2022 2023 2024 2025 2026 2027 2028 2029 2030 2031
454 467 460 446 447 461 486 517 551 586
373 379 372 367 374 391 417 445 476 509
511 523 513 499 500 516 544 579 615 654
394 399 391 386 393 411 437 467 499 533
0.0 0.0 0.0 0.0 0.0 0.0 0.0 0.0 7.4 100.3
0.0 0.0 0.0 0.0 0.0 0.0 0.0 0.0 1.0 4.3
0.0 0.0 0.0 0.0 0.0 0.0 2.8 70.9 301.4 944.6
0.0 0.0 0.0 0.0 0.0 0.0 0.5 3.5 11.0 24.8
0.00 0.0 0.00 0.00 0.00 0.00 0.00 0.00 0.05 0.65
0.00 0.0 0.00 0.00 0.00 0.00 0.02 0.46 1.96 6.14
$0.00M $0.00M $0.00M $0.00M $0.00M $0.00M $0.00M $0.00M $0.00M $0.03M
$0.00M $0.00M $0.00M $0.00M $0.00M $0.00M $0.00M $0.02M $0.08M $0.25M
$0.00M $0.00M $0.00M $0.00M $0.00M $0.00M $0.00M $0.01M $0.03M $0.09M
Station: RTS 66 Total
Expected Unserved Energy at 10th percentile demand (MWh)
10th percentile Summer Maximum Demand (MVA)
10th percentile Winter Maximum Demand (MVA)
N-1 energy at risk at 50% percentile demand (MWh)
N-1 hours at risk at 50th percentile demand (hours)
Expected Unserved Energy value using AEMO weighting of 0.7 X 50th
precentile value + 0.3 X 10th percentile value
50th percentile Summer Maximum Demand (MVA)
50th percentile Winter Maximum Demand (MVA)
Expected Unserved Energy value at 50th percentile demand
Expected Unserved Energy value at 10th percentile demand
N-1 energy at risk at 10% percentile demand (MWh)
Expected Unserved Energy at 50th percentile demand (MWh)
N-1 hours at risk at 10th percentile demand (hours)
Richmond 66kV Terminal Station Detailed data: Magnitude and probability of loss of load
Distribution Businesses supplied by this station: CitiPower (86%) and United Energy (14%) MW MVA
Normal cyclic rating with all plant in service 805 via 3 transformers (Summer peaking)
Summer N-1 Station Rating: 536 [See Note 1 below for interpretation of N-1]
Winter N-1 Station Rating: 536

2021 Transmission Connection Planning Report Risk Assessment: RWTS 22 kV
Page 156
RINGWOOD TERMINAL STATION 22 kV (RWTS 22 kV)
Ringwood Terminal Station provides supply at two voltage levels - 66 kV and 22 kV. RWTS 22 kV is supplied by two 75 MVA 220/22 kV three-phase transformers. RWTS 22 kV is the main source of 22 kV supply for the local area and for the commuter railway network.
The geographic coverage of the station’s supply area includes Ringwood, Mitcham, Wantirna and Nunawading. The electricity distribution networks for this area are the responsibility of both AusNet Electricity Services (63%) and United Energy Distribution (37%).
Embedded generation
About 11.5 MW of rooftop solar PV is installed on the AusNet distribution system and about 10.8 MW of rooftop solar PV is installed on the UE distribution system connected to RWTS 22kV. This includes all the residential and small-commercial rooftop PV systems that are smaller than 1 MW.
There is no large-scale embedded generation installed on the AusNet and UE distribution systems connected to RWTS 22 kV.
Magnitude, probability and impact of loss of load
Peak demand at the station occurs in summer. Summer peak demand at RWTS 22 kV is forecast to reduce slightly over the ten year planning period. The 2020/21 summer peak demand reached 77.2 MW (77.7 MVA), whereas the highest recorded peak demand is 96.2 MVA, which occurred in summer 2008/09. Demand at RWTS 22 kV is expected to exceed 95% of the 50th percentile peak demand for 3 hours per annum. The station load has a power factor of 0.99 at maximum demand but load on the transformers has a power factor of 1.0 if all the 22 kV capacitors are switched in at the station.
The graph below depicts the 10th and 50th percentile summer maximum demand forecast together with the station’s expected operational “N” rating (all transformers in service) and
the “N-1” rating at an ambient temperature of 35C.
The graph indicates that the summer maximum demand at RWTS 22 kV remains below its “N” and “N-1” ratings within the 10 year planning period. Similarly, the winter demand at RWTS 22 kV is not expected to reach the station’s “N” or “N–1” winter rating during the ten year planning horizon.

2021 Transmission Connection Planning Report Risk Assessment: RWTS 22 kV
Page 157
With no forecast energy at risk over the planning horizon, there is no augmentation planned in the next ten years. Any risk will be managed through load transfers or other cost-effective operational action.

2021 Transmission Connection Planning Report Risk Assessment: RWTS 66 kV
Page 158
RINGWOOD TERMINAL STATION 66 kV (RWTS 66 kV)
Ringwood Terminal Station is the main source of supply for a major part of the outer eastern metropolitan area. The geographic coverage of the station’s supply area spans from Lilydale and Woori Yallock in the north east; to Croydon, Bayswater and Boronia in the east; and Box Hill, Nunawading and Ringwood to the west.
The electricity supply distribution networks for this region are the responsibility of both AusNet Electricity Services (75%) and United Energy (25%).
Embedded generation
About 120.5 MW of rooftop solar PV is installed on the AusNet distribution system and about 23.7 MW of rooftop solar PV is installed on the UE distribution system connected to RWTS 66 kV. This includes all the residential and small-commercial rooftop PV systems that are smaller than 1 MW.
A total of 6.2 MW capacity of large-scale embedded generation is installed on the AusNet and UE sub-transmission and distribution systems connected to RWTS 66 kV.
There are no embedded generators (>5 MW) that are installed on the AusNet or UE network connected to RWTS 66 kV.
Background
Ringwood Terminal Station provides supply at two voltage levels - 66 kV and 22 kV. RWTS 66 kV is supplied by four 150 MVA 220/66 kV transformers and peak demand occurs in summer.
In March 2016 the B2 transformer at RWTS failed. It was replaced in August 2016 by one of the metropolitan spare transformers. AusNet Transmission Group also replaced the No. 4 220/66 kV transformer with a new 150 MVA unit in July 2018.
The existing four transformers are operated in two separate bus groups to limit the maximum fault currents on the 66 kV buses to within their respective switchgear ratings. Under network normal configuration, the No. 1 and No. 2 transformers are operated in parallel as one group (RWTS bus group 1-3) and supply the No.1 and No. 3 66 kV buses respectively. The No. 3 and No. 4 transformers are operated in parallel as another group (RWTS bus group 2-4) and supply the No.2 and No. 4 66 kV buses respectively. To configure the station as two separate bus groups, the 66 kV bus 1-2 and bus 3-4 tie circuit breakers are operated normally open.
Given this configuration, load demand on the RWTS bus groups 1-3 and 2-4 must be kept within the capabilities of their respective two transformers at all times otherwise load shedding may occur. For an unplanned transformer outage in any of the two RWTS bus groups, an auto close scheme will operate resulting in parallel operation of the three remaining transformers.
Combined Summer Peak Demand forecasts for RWTS 66 kV - Total Station Demand
The peak demand on the station reached a record of 508 MW (516 MVA) in summer 2008/09 under extreme weather conditions. The recorded peak demand in summer 2020/21 was 393.5 MW (405.2 MVA), which was lower than the summer 2008/09 station

2021 Transmission Connection Planning Report Risk Assessment: RWTS 66 kV
Page 159
peak demand. The station load has a power factor of 0.97 at maximum demand but the load on the transformers has a power factor of 1 due to installed 66 kV capacitor banks. RWTS 66 kV demand is expected to exceed 95% of the 50th percentile peak demand for 7 hours per annum.
The graph below depicts the 10th and 50th percentile summer maximum demand forecast together with the station’s expected operational “N” rating (all transformers in service) and
the “N-1” rating at 35C as well as 40C ambient temperatures.
The graph indicates that the demand at RWTS 66 kV remains below its N rating throughout the 10-year planning period. Both 10th and 50th percentile summer peak demands are also not expected to exceed the station’s N-1 rating.
The combined winter demand at RWTS 66 kV is not expected to reach the station’s “N–1” winter rating during the ten year planning horizon.
RWTS Bus groups 1-3 and 2-4: Summer Peak Demand Forecasts
In addition to considering the station’s total summer demand under “N-1” conditions as shown above, it is essential to assess the risk of load shedding on the individual bus groups when both of their respective transformers are in service, i.e under “N” conditions.
RWTS Bus group 1-3: Peak demand at RWTS 66 kV bus group 1-3 occurs in summer. Based on the individual summer demand forecasts for this bus group, with both transformers in service, i.e. under “N” conditions, the demand on this bus group is forecast to remain within the 10th and 50th percentile demands. When required, such as if demand exceeds the 10th percentile level, 22 kV load transfers would be utilised to manage system normal loading to within the terminal station’s limits.
This bus group supplies United Energy’s zone substations Nunawading (NW) and Box Hill (BH), and AusNet Electricity Services’ zone substations Ringwood North (RWN), Lilydale (LDL), Chirnside Park (CPK) and Woori Yallock (WYK).

2021 Transmission Connection Planning Report Risk Assessment: RWTS 66 kV
Page 160
The graph below depicts the 10th and 50th percentile summer maximum demand forecasts
together with the bus group 1-3 “N” rating at an ambient temperature of 35C and 40C.
RWTS Bus group 2-4: Similar to bus group 1-3, the peak demand at RWTS 66 kV bus group 2-4 also occurs in summer. Based on the individual summer demand forecasts for this bus group, with both transformers in service, i.e. under “N” conditions, the demand on this bus group at the 50th or 10th percentile temperature is forecast to remain within its “N” rating throughout the ten year planning horizon. This means that there is no expectation of load shedding or load transfers being required to keep loading within plant ratings on this bus group under normal operating conditions during summer or winter.
This bus group supplies AusNet Electricity Services’ zone substations Boronia (BRA), Croydon (CYN) and Bayswater (BWR).
The graph below depicts the 10th and 50th percentile summer maximum demand forecasts
together with the bus group 2-4 rating at an ambient temperature of 35C and 40C.

2021 Transmission Connection Planning Report Risk Assessment: RWTS 66 kV
Page 161
Based on the latest demand forecast bus group No.1-3 has no pre-contingent energy at risk over the 10-year period.
For an outage of one 220/66 kV transformer at RWTS, the No. 1-3 and No. 2-4 bus groups will be tied and supplied by the three remaining in-service transformers. With a transformer out of service there will be sufficient capacity at the station to supply all demand at the 50th percentile temperature for the ten-year forecast period. At the 10th percentile temperature, for an outage of one 220/66 kV transformer at RWTS, there will be a minor amount of load at risk in 2021/22, however this risk will reduce as forecast demand declines throughout the planning horizon.

2021 Transmission Connection Planning Report Risk Assessment: SHTS
Page 162
SHEPPARTON TERMINAL STATION (SHTS) 66 kV
Shepparton Terminal Station (SHTS) 66 kV consists of three 150 MVA 220/66 kV transformers and is the main source of supply for over 66,007 customers in Shepparton and the Goulburn–Murray area. The station supply area includes the towns of Shepparton, Echuca, Mooroopna, Yarrawonga, Kyabram, Cobram, Numurkah, Tatura, Rochester, Nathalia, Tongala, and Rushworth.
Embedded generation
About 96.5 MW of rooftop solar PV is installed on the Powercor distribution system connected to SHTS. This includes all the residential and small-commercial rooftop PV systems that are smaller than 1 MW.
A total of 195 MW capacity of large-scale embedded generation, predominately solar farms, is installed on the Powercor sub-transmission and distribution systems connected to SHTS.
In addition, a total of 85 MW capacity of embedded generation has been approved and is expected to connect to the Powercor network in the next two years.
The following table lists the registered embedded generators (>5 MW) that are installed on the Powercor network connected to SHTS:
Site name Status Technology Type Nameplate capacity (MW)
Numurkah Solar Farm Existing Plant Solar PV 100
Confidential Approved project Solar PV 75
Transformer replacement works at SHTS
AusNet Services is planning to replace two transformers (B2 and B3) at SHTS. The replacement project will start in 2022 and be completed in 2026. During the replacement of a transformer the maximum reverse power flow for SHTS has to be limited to less than 225 MVA (pre-contingent) to avoid overloading the transformers should a transformer contingency occur during the planned transformer outage.
As noted in section 5.2 of this report, the connection of significant embedded generation to networks supplied from some terminal stations is expected to lead to reverse power flows that may necessitate a reduction in the ratings of some stations. SHTS is considered one such station and the ultimate station ratings will be reviewed upon completion of the transformer replacement works.
Magnitude, probability and impact of loss of load
The following observations and risk assessment are based on actual readings of power flow at the Terminal Station Connection points. It therefore accounts for the present load and generation combination.
Demand at SHTS is summer peaking. The maximum demand on the station reached 232.8 MW in summer 2021. Due to the input of generation connected to the station,

2021 Transmission Connection Planning Report Risk Assessment: SHTS
Page 163
reverse power flows occur during low load periods. The minimum demand at SHTS reached -123.3 MW in March 2021.
It is estimated that:
• For 14 hours per year, 95% of peak demand is expected to be reached under the 50th percentile forecast.
• The station load power factor at the time of maximum demand is 0.99.
• The station load power factor at the time of minimum demand is -0.93.
The chart below depicts the 10th and 50th percentile summer maximum demand forecast together with the station operational “N” rating (all transformers in service) and the “N−1” rating at 35°C ambient temperature.
The chart shows there is sufficient capacity at the station to supply all expected demand at the 50th and 10th percentile temperature, over the forecast period even with one transformer out of service. Therefore, the need for augmentation or other corrective action is not expected to arise over the next ten years.
Connection of additional generation, however, may require augmentation of transformer capacity, as the installed capacity of existing and approved embedded generation is fast approaching the station (N-1) nameplate rating of 300 MVA when three transformers operate in parallel. The cost of any such augmentation would either be met by the connecting generator(s), or would be recovered from load customers where a RIT-T demonstrates that the augmentation delivers net market benefits.

2021 Transmission Connection Planning Report Risk Assessment: SMTS 66 kV
Page 164
SOUTH MORANG TERMINAL STATION (SMTS 66 kV)
Background
A 220/66 kV connection station with two 220/66 kV 225 MVA transformers was established at the existing South Morang Terminal Station (SMTS) site in 2008. The re-arrangement of 66 kV loops with the establishment of SMTS resulted in the 160 MW Somerton Power Station being connected to the SMTS 66 kV bus.
The geographic coverage of the area supplied by the new connection assets at SMTS spans from Seymour, Kilmore, Kalkallo, Kinglake and Rubicon in the north to Mill Park in the south and from Doreen and Mernda in the east to Somerton and Craigieburn in the west. The electricity distribution networks for this area are the responsibility of both AusNet Electricity Services (72%) and Jemena Electricity Networks (28%).
SMTS 66 kV is a summer peaking station. In 2019/20 the summer peak demand on the station reached 372.3 MW (381.7 MVA), which is the historical maximum for the station. The recorded peak demand in summer 2020/21 was 292.7 MW (297.3 MVA). The station load has a power factor of 0.985 at maximum demand. Demand is expected to exceed 95% of the 50th percentile peak demand for 4 hours per annum.
Embedded generation
About 126.4 MW of rooftop solar PV is installed on the AusNet distribution system and about 27.9 MW of rooftop solar PV is installed on the Jemena distribution system connected to SMTS. This includes all the residential and small-commercial rooftop PV systems that are smaller than 1 MW.
A total of 247.2 MW capacity of large-scale embedded generation is installed on the AusNet and Jemena sub-transmission and distribution systems connected to SMTS.
The following table lists the embedded generators (>5 MW) that are installed on the AusNet and Jemena networks connected to SMTS:
Site name Status Technology Type Nameplate capacity (MW)
Somerton Power Station Existing Plant Gas 160
Cherry Tree Wind Farm Existing Plant Wind 57.5
Wollert Power Station Existing Plant Landfill Gas 7.7
Rubicon Power Station Existing Plant Hydro 14.6
Magnitude, probability and impact of loss of load
The graph below depicts the 10th and 50th percentile summer maximum demand forecast together with the station’s operational “N” rating (all transformers in service) and the “N-1”
rating at 35C as well as 40C ambient temperatures.

2021 Transmission Connection Planning Report Risk Assessment: SMTS 66 kV
Page 165
The “N” rating on the above chart indicates the maximum load that can be supplied from SMTS with both transformers in service.
With the projected growth in customer demand in the area, it is expected that SMTS will continue to exceed its “N-1” rating in summer at the 10th and 50th percentile summer demand forecasts, as shown in the graph above.
In the winter, the rating of the transformers is higher than the summer rating due to lower ambient temperatures. Thus, energy at risk during the winter period is generally lower than the summer period. The graph below demonstrates the 10th and the 50th percentile winter maximum demand forecast together with the station’s operational “N” rating and “N-1” rating. SMTS is expected to remain within its “N-1” rating under both 50th percentile and 10th percentile winter maximum demand forecasts for the 10-year planning horizon.

2021 Transmission Connection Planning Report Risk Assessment: SMTS 66 kV
Page 166
The bar chart below depicts the energy at risk over the winter and summer periods with one transformer out of service for the 10th percentile demand forecast, and the hours each year that the 10th percentile demand forecast is expected to exceed the “N-1” station capability. The line graph shows the value to consumers of the expected unserved energy in each year, for the 10th percentile demand forecast.
As already noted, SMTS 66 kV is a summer peaking station and the energy at risk occurs in the summer period because the rating of the transformers is lower at higher ambient temperatures in addition to higher summer demand. The comments below therefore focus on the energy at risk over the summer period.
Comments on Energy at Risk assuming Somerton Power Station is unavailable
Assuming that Somerton Power Station is unavailable, then for an outage of one transformer at SMTS over the entire summer period, there will be insufficient capacity at the station to supply all demand at the 50th percentile temperature for about 86 hours in summer 2030/31. The energy at risk at the 50th percentile temperature under “N-1” conditions is estimated to be 1,821 MWh in summer 2030/31. The estimated value to consumers of the 1,821 MWh of energy at risk is approximately $64 million (based on a value of customer reliability of $35,019/MWh)75. In other words, at the 50th percentile demand level, without any contribution from embedded generation and in the absence of any other operational response that might be taken to mitigate the impact of a forced outage, a major outage of one transformer at SMTS in summer 2030/31 would be anticipated to lead to involuntary supply interruptions that would cost consumers $64 million.
It is emphasised however, that the probability of a major outage of one of the two transformers occurring over the year is very low, at about 1.0% per transformer per annum, whilst the expected unavailability per transformer per annum is 0.221%. When the energy at risk (1,821 MWh) is weighted by this low transformer unavailability, the expected unserved
75 The value of unserved energy is derived from the sector values given in Table 1 in Section 2.4, weighted
in accordance with the composition of the load at this terminal station.

2021 Transmission Connection Planning Report Risk Assessment: SMTS 66 kV
Page 167
energy is estimated to be around 8 MWh. This expected unserved energy is estimated to have a value to consumers of around $0.28 million (based on a value of customer reliability of $35,019 /MWh).
It should also be noted that the above estimates of energy at risk and expected unserved energy are based on an assumption of average (50th percentile) temperatures occurring each year. Under higher temperature conditions (that is, at the 10th percentile level), the energy at risk in 2030/31 summer is estimated to be 4,480 MWh. The estimated value to consumers of the energy at risk in 2030/31 summer is approximately $157 million. The corresponding value of the expected unserved energy (of 20 MWh) is approximately $0.69 million.
These key statistics for the summer of 2030/31 under “N-1” outage conditions are summarised in the table below.
MWh Valued at consumer interruption cost
Energy at risk, at 50th percentile demand forecast 1,821 $64 million
Expected unserved energy at 50th percentile demand 8 $0.28 million
Energy at risk, at 10th percentile demand forecast 4,480 $157 million
Expected unserved energy at 10th percentile demand 20 $0.69 million
If one of the 220/66 kV transformers at SMTS is taken off line during peak loading times and the “N-1” station rating is exceeded, then the Overload Shedding Scheme for Connection Assets (OSSCA), which is operated by AusNet Transmission Group’s TOC76 to protect the connection assets from overloading77, will act swiftly to reduce the loads in blocks to within safe loading limits. In the event of OSSCA operating, it would automatically shed up to 130 MVA of load, affecting approximately 53,000 customers in 2021/22. Any load reductions that are in excess of the minimum amount required to limit load to the rated capability of the station would be restored at feeder level in accordance with AusNet Electricity Services and Jemena’s operational procedures after the operation of the OSSCA scheme.
Comments on Energy at Risk assuming Somerton Power Station is available
The previous comments on energy at risk are based on the assumption that there is no embedded generation available to offset the 220/66 kV transformer loading. The Somerton Power Station (SPS) is capable of generating up to 160 MW and this generation is connected to the SMTS 66 kV bus via the SMTS-ST-SSS-SMTS 66 kV loop. There is no firm commitment that generation will be available to offset transformer loading at SMTS; however it is most likely that the times of peak demand at SMTS will coincide with periods of high wholesale electricity prices, resulting in a high likelihood that SPS will be generating. If SPS is generating to its full capacity there would be no energy at risk at SMTS over the ten year planning horizon for 10th percentile summer maximum demand forecast.
76 Transmission Operation Centre.
77 OSSCA is designed to protect connection transformers against transformer damage caused by overloads. Damaged transformers can take months to repair or replace which can result in prolonged, long term risks to the reliability of customer supply.

2021 Transmission Connection Planning Report Risk Assessment: SMTS 66 kV
Page 168
Feasible options for alleviation of constraints
The following options are technically feasible and potentially economic to mitigate the risk of a supply interruption and/or to alleviate the emerging capacity constraints:
1. Implement contingency plans to transfer load to adjacent terminal stations. AusNet Electricity Services has established and implemented the necessary plans that enable up to 19 MVA of load transfers via existing 22 kV feeders to adjoining zone substations. Jemena has plans and the capability to transfer an additional 12.2 MVA. This option is able to partly reduce the interruption duration and load at risk resulting from a major transformer failure.
2. Install a third 225 MVA 220/66 kV transformer at South Morang Terminal Station (SMTS), which would also require the installation of fault limiting reactors.
3. Demand Management. AusNet Electricity Services is currently using an MVA tariff to encourage large customers to improve their power factor as well as a critical peak pricing tariff to encourage them to reduce load at peak demand times and thus reduce the station loading. Up to 50% of the maximum demand at SMTS 66 kV is expected to be summer residential load, consisting largely of air conditioning load. With the existing load mix it is likely that demand reduction initiatives can play a limited role in reducing the peak summer load at SMTS 66 kV.
4. Embedded Generation. As mentioned above, the Somerton power station is connected to SMTS. A network support agreement with SPS or other generators connected to the SMTS 66 kV bus will help to defer the need for network augmentation.
Preferred network option for alleviation of constraints
1. In the event that there are no firm commitments by interested parties to offer network support services by installing local generation or through demand side management initiatives that would reduce future load at SMTS 66 kV; it will be proposed to install a new third 220/66 kV transformer at SMTS 66 kV. The capital cost of this option is estimated at $22 million, which includes the cost of installing three fault limiting reactors. This equates to a total annual cost of approximately $1.5 million per annum. Under the latest demand forecast, the installation of the third transformer at SMTS would not be economically justified in the forecast period.
2. Implement the following temporary measures to cater for an unplanned outage of one transformer at SMTS under critical loading conditions until the new 220/66 kV transformer is commissioned:
• maintain contingency plans to transfer load quickly to adjacent terminal stations;
• rely on Somerton Power Station (SPS) generation to reduce loading at SMTS 66 kV, and investigate the option of formalising a network support agreement with SPS;
• fine-tune the OSSCA scheme settings in conjunction with TOC to minimise the impact on customers of any load shedding that may take place to protect the connection assets from overloading; and
• subject to availability, one of AusNet Transmission Group’s spare 220/66 kV transformers for the metropolitan area (refer Section 5.5) can be used to temporarily replace a failed transformer at SMTS. It is noted that AusNet Transmission Group currently has two 150 MVA spare transformers. Load sharing with a metro spare transformer will not be optimal, so the SMTS 66 kV capacity will be reduced under these emergency conditions.

2021 Transmission Connection Planning Report Risk Assessment: SMTS 66 kV
Page 169
The table on the following page provides more detailed data on the station rating, demand forecast, energy at risk and expected unserved energy assuming embedded generation is not available.

2021 Transmission Connection Planning Report Risk Assessment: SMTS 66 kV
Page 170
Notes:
1. “N-1” means cyclic station output capability rating with outage of one transformer. The summer rating is at an ambient temperature of 35 degrees Centigrade.
2. “N-1 energy at risk” is the amount of energy in a year during which the specified demand forecast exceeds the N-1 capability rating. Energy at risk at the specified demand forecast when all plant is in service (N) is shown separately.
3. “N-1 hours per year at risk” is the number of hours in a year during which the specified demand forecast exceeds the N-1 capability rating. Hours at risk at the specified demand forecast when all plant is in service (N) are shown separately.
4. “Expected unserved energy” means “energy at risk” multiplied by the probability of a major outage affecting one transformer. “Major outage” means an outage with duration of 2.65 months.
The outage probability is derived from the base reliability data given in Section 5.4.
5. The value of unserved energy is derived from the sector values given in Table 1 of Section 2.4, weighted in accordance with the composition of the load at this terminal station.
6. The 0.7 and 0.3 weightings applied to the 50th and 10th percentile expected unserved energy estimates (respectively) are in accordance with the approach applied by AEMO, and described on page 12 of its publication titled Victorian Electricity Planning Approach, published in June 2016 (see http://www.aemo.com.au/-/media/Files/Electricity/NEM/Planning_and_Forecasting/Victorian_Transmission/2016/Victorian-Electricity-Planning-Approach.ashx)
SOUTH MORANG TERMINAL STATION 66kV Loading (SMTS 66 kV)
Detailed data: Magnitude and probability of loss of load
Distribution Businesses supplied by this station: AusNet Electricity Services (72%) Jemina Electricity Networks (28%)
Normal cyclic rating with all plant in service 530 MVA via 2 transformers (Summer peaking)
Summer N-1 Station Rating 265 MVA [See Note 1 below for interpretation of N-1]
Winter N-1 Station Rating 294 MVA
Station: SMTS 66 kV 2022 2023 2024 2025 2026 2027 2028 2029 2030 2031
50th percentile Summer Maximum Demand (MVA) 328.1 329.6 330.5 331.0 330.7 332.3 334.1 336.6 340.3 341.9
50th percentile Winter Maximum Demand (MVA) 263.3 266.6 269.0 271.1 273.2 276.6 280.1 284.0 287.2 290.5
10th percentile Summer Maximum Demand (MVA) 356.7 358.7 359.6 360.3 361.0 362.3 364.7 367.7 371.2 372.7
10th percentile Winter Maximum Demand (MVA) 267.5 270.9 273.3 275.4 277.6 280.9 284.4 288.3 291.8 295.3
N - 1 energy at risk at 50th percentile demand (MWh) 1,009 1,079 1,124 1,148 1,135 1,219 1,314 1,466 1,704 1,821
N - 1 hours at risk at 50th percentile demand (hours) 55 57 59 59 59 63 67 73 82 86
N - 1 energy at risk at 10th percentile demand (MWh) 2,981 3,141 3,223 3,281 3,337 3,458 3,679 3,962 4,320 4,480
N - 1 hours at risk at 10th percentile demand (hours) 95 100 102 104 106 109 115 122 131 135
Expected Unserved Energy at 50th percentile demand (MWh) 4 5 5 5 5 5 6 6 8 8
Expected Unserved Energy at 10th percentile demand (MWh) 13 14 14 14 15 15 16 17 19 20
Expected Unserved Energy value at 50th percentile demand $0.16M $0.17M $0.17M $0.18M $0.18M $0.19M $0.20M $0.23M $0.26M $0.28M
Expected Unserved Energy value at 10th percentile demand $0.46M $0.49M $0.50M $0.51M $0.52M $0.53M $0.57M $0.61M $0.67M $0.69M
Expected Unserved Energy value using AEMO weighting of 0.7
X 50th percentile value + 0.3 X 10th percentile value$0.25M $0.26M $0.27M $0.28M $0.28M $0.29M $0.31M $0.34M $0.38M $0.41M

2021 Transmission Connection Planning Report Risk Assessment: SVTS
Page 171
SPRINGVALE TERMINAL STATION (SVTS)
Springvale Terminal Station (SVTS) is located in the south east of greater Melbourne. The geographic coverage of the station’s supply area spans from Blackburn in the north to Noble Park in the south and from Wantirna South in the east to Riversdale in the west. The electricity supply network for this large region is split between United Energy (UE) and CitiPower (CP).
Embedded generation
About 99.2 MW of rooftop solar PV is installed within the distribution system connected to SVTS. This includes all the residential and small-commercial rooftop PV systems that are smaller than 1 MW. Other forms of generation smaller than 1 MW total approximately 1.1 MW at SVTS.
Six embedded generation units (3 which operate only as a backup supply) over 1 MW are connected at SVTS 66 kV.
Magnitude, probability and impact of loss of load
SVTS has four 150 MVA 220/66 kV transformers and operates in a split bus arrangement. Under system normal conditions the No.1 & No.2 transformers (B1 & B2) are operated in parallel as one group (SVTS 1266) and supply the No.1 & No.2 buses. The No.3 & No.4 transformers (B3 & B4) are operated in parallel as a separate group (SVTS 3466) and supply the No.3 & No.4 buses. Connection between No.1 & No.4 buses is maintained via transfer buses No.5 & No.6. The 66 kV bus 2-3 and bus 4-5 tie circuit breakers are operated normally open to limit the fault levels on the 66 kV buses to within switchgear ratings. For an unplanned outage of any one of the four transformers, 66 kV bus 2-3 and bus 4-5 tie circuit breakers will close automatically and maintain the station in a 3-transformer closed loop arrangement. Given this configuration, the demand on the station will therefore need to be controlled as follows:
• Load demand on the SVTS 1266 group should be kept within the capabilities of the two transformers B1 & B2 at all times.
• Load demand on the SVTS 3466 group should be kept within the capabilities of the two transformers B3 & B4 at all times.
• Load demand on the total station should be kept within the capabilities of any three transformers when one transformer is out of service.
SVTS 66 kV is a summer critical terminal station. The peak demand in summer 2021 was 353.1 MW (356.5 MVA). This was 62.7MW lower than the peak demand recorded in summer 2020.
The magnitude, probability and load at risk for the two transformer groups are set out below.
SVTS 1266 (B12) Bus Group Summer Peak Forecasts
This bus group supplies Noble Park, Springvale South, Clarinda, Oakleigh East, Springvale and Springvale West zone substations owned by United Energy. Four generation units over 1 MW are connected at SVTS 1266 (B12) bus group.1

2021 Transmission Connection Planning Report Risk Assessment: SVTS
Page 172
The recorded peak demand in summer 2021 for the SVTS 1266 group was 187.6 MW (190.5 MVA). The load at SVTS 1266 (B12) is forecast to have a power factor of 0.985 at times of peak demand.
United Energy’s new Keysborough zone substation was commissioned in 2014. Approximately 15 MW of demand was transferred away from SVTS to HTS. This load transfer is reflected in the graph below.
The graph below depicts the 10th and 50th percentile summer maximum demand for SVTS 1266 and the corresponding rating with both transformers in service.
The graph above shows that with both transformers in service, there is adequate capacity to meet the anticipated maximum demand for the entire planning period.
SVTS 3466 (B34) Bus Group Summer Peak Forecasts
This bus group supplies East Burwood, Glen Waverley and Notting Hill zone substations owned by United Energy and Riversdale zone substation owned by CitiPower. Two generation units over 1 MW are connected at SVTS 3466 (B34) bus group.1
The recorded peak demand in summer 2021 for the SVTS 3466 group was 165.5 MW (166.2MVA). The load at SVTS 3466 (B34) is forecast to have a power factor of 0.998 at times of peak demand.
The graph below depicts the 10th and 50th percentile summer maximum demand for SVTS3466 and the corresponding rating with both transformers in service.

2021 Transmission Connection Planning Report Risk Assessment: SVTS
Page 173
The graph above shows that with both transformers in service, there is adequate capacity to meet the anticipated maximum demand for the entire planning period.
SVTS Total Summer Peak Forecasts
The graph below depicts the 10th and 50th percentile total summer maximum demand forecasts together with the station’s expected operational N rating (all transformers in
service) and the (N-1) rating at 35C as well as 40C ambient temperature.
If one of the 220/66 kV transformers at SVTS is taken off line during peak loading times and the (N-1) station rating is exceeded, the OSSCA78 load shedding scheme which is operated by AusNet Transmission Group’s NOC79 will act swiftly to reduce the loads in blocks to within safe loading limits. Any load reductions that are in excess of the minimum amount required to limit load to the rated capability of the station would be restored at zone substation feeder level in accordance with United Energy’s and CitiPower’s operational procedures after the operation of the OSSCA scheme.
78 Overload Shedding Scheme of Connection Asset.
79 Network Operations Centre.

2021 Transmission Connection Planning Report Risk Assessment: SVTS
Page 174
The N rating on the graph indicates the maximum load that can be supplied from SVTS with all transformers in service. Exceeding this level will require load shedding or emergency load transfers to keep the terminal station operating within its limits.
The graph also indicates that the demand at SVTS 66 kV remains below its N-1 rating within the ten year planning period. Subsequently no augmentation is planned at SVTS in the forward planning period.
The overall station load is forecast to have a power factor of 0.991 at times of peak demand. The demand at SVTS 66 kV is expected to exceed 95% of the peak demand for approximately 6 hours per annum. There is approximately 50 MVA of load transfer available at SVTS 66 kV for summer 2021/22.

2021 Transmission Connection Planning Report Risk Assessment: TSTS
Page 175
TEMPLESTOWE TERMINAL STATION (TSTS)
TSTS consists of three 150 MVA 220/66 kV transformers, and is the main source of supply for a major part of the north-eastern metropolitan area. The geographic coverage of the supply area spans from Eltham in the north to Canterbury in the south and from Donvale in the east to Kew in the west. The electricity supply network for this large region is split between United Energy, CitiPower, AusNet Electricity Services and Jemena Electricity Networks.
Embedded generation
About 72.1 MW of rooftop solar PV is installed within the distribution system connected to TSTS. This includes all the residential and small-commercial rooftop PV systems that are smaller than 1 MW. Other forms of generation smaller than 1 MW total approximately 0.2 MW at TSTS.
There is one embedded generation unit over 1 MW connected at TSTS. A second embedded generator site over 1 MW is scheduled to be connected to TSTS in mid-2022.
Magnitude, probability and impact of loss of load
TSTS 66 kV is a summer critical terminal station. The station reached a peak demand of 290.4 MW (298.9 MVA) in summer 2021. This is 82.5 MW lower than the peak demand recorded in summer 2020.
The graph below depicts the 10th and 50th percentile summer maximum demand forecast together
with the station’s operational N rating (all transformers in service) and the (N-1) rating at 35C as
well as 40C ambient temperature.
The N rating on the chart indicates the maximum load that can be supplied from TSTS with all transformers in service. Exceeding this level will require load shedding or emergency load transfers to keep the terminal station operating within its limits.

2021 Transmission Connection Planning Report Risk Assessment: TSTS
Page 176
The graph indicates that the overall demand at TSTS remains below its N rating within the 10 year planning period. The 10th and 50th percentile summer peak demand is forecast to exceed the station’s (N-1) rating at 35°C and 40°C from summer 2022 and summer 2030 respectively.
The demand at TSTS 66 kV is expected to exceed 95% of the peak demand for approximately 3 hours per annum. The station load has a power factor of 0.971 at times of peak demand.
Comments on Energy at Risk
For an outage of one transformer at TSTS, it is expected that there would be insufficient capacity at the station to supply demand at the 10th percentile temperature from summer 2022 onwards.
By the end of the ten-year planning period in 2031, the energy at risk under N-1 conditions is 437 MWh at the 10th percentile demand forecast. Under these conditions, there would be insufficient capacity to meet demand for 22 hours in that year. The estimated value to customers of the 437 MWh of energy at risk in 2031 is approximately $13.7 million (based on a value of customer reliability of $31,249/MWh)80. In other words, at the 10th percentile demand level, and in the absence of any other operational response that might be taken to mitigate the impact of a forced outage, a major outage of one transformer at TSTS over the summer of 2031 would be anticipated to lead to involuntary supply interruptions that would cost consumers $13.7 million.
It is emphasised however, that the probability of a major outage of one of the three transformers occurring over the year is very low at about 1.0% per transformer per annum, whilst the expected unavailability per transformer per annum is 0.221%. When the energy at risk (437 MWh in 2031) is weighted by this low unavailability, the expected unserved energy is estimated to be around 2.9 MWh. This expected unserved energy is estimated to have a value to consumers of around $89,900 (based on a value of customer reliability of $31,249/MWh).
AusNet Transmission Group indicated that two of the three transformers at TSTS have failure rates that are above average due to their condition. Therefore, the expected unserved energy calculated above may under-estimate the risk at this station. AusNet Transmission Group has evaluated the economic feasibility of replacing the B2 and B3 transformers at TSTS and concluded through a RIT-T that the preferred option is to replace the two transformers to address the asset failure risk with the earliest delivery timing in 2024/25. The transformers will be replaced with 150 MVA transformers with no expected change to the station ratings. Given that AusNet Transmission Group plans to replace these transformers as part of its asset replacement program, the elevated failure rates are unlikely to advance any augmentation works at this terminal station.81
These key statistics for the year 2031 under N-1 outage conditions are summarised in the table below.
80 The value of unserved energy is derived from the VCR relevant climate zone and sector values given in the
AER VCR December 2019 final determination, weighted in accordance with the composition of the load at this terminal station.
81 See link below for more details on Templestowe Terminal Station RIT-T:
https://www.ausnetservices.com/en/About/Projects-and-Innovation/Regulatory-Investment-Test

2021 Transmission Connection Planning Report Risk Assessment: TSTS
Page 177
MWh Valued at consumer interruption cost
Energy at risk, at 50th percentile demand forecast 11 $344,000
Expected unserved energy at 50th percentile demand 0.1 $2,200
Energy at risk, at 10th percentile demand forecast 437 $13.7 million
Expected unserved energy at 10th percentile demand 2.9 $89,900
If one of the 220/66 kV transformers at TSTS is taken off line during peak loading times and the (N-1) station rating is exceeded, the OSSCA82 load shedding scheme which is operated by AusNet Transmission Group’s TOC83 will act swiftly to reduce the loads in blocks to within safe loading limits. Any load reductions that are in excess of the minimum amount required to limit load to the rated capability of the station would be restored at zone substation feeder level in accordance with each distribution company’s operational procedures after the operation of the OSSCA scheme.
In the case of TSTS supply at maximum loading periods, the OSSCA scheme would shed about 85 MW of load, affecting approximately 28,000 customers in 2022.
Feasible options for alleviation of constraints
The following options are technically feasible and potentially economic to mitigate the risk of supply interruption and/or to alleviate the emerging constraint:
1. Implement a contingency plan to transfer load to adjacent terminal stations. United Energy, CitiPower, AusNet Electricity Services and Jemena Electricity Networks have established and implemented the necessary plans that enable load transfers under contingency conditions. These plans are reviewed annually prior to the summer season. The total transfer capability away from TSTS 66 kV onto adjacent terminal stations via the distribution network is assessed at 55 MVA for summer 2021-22.
2. Establish a new 220/66 kV terminal station. Two terminal station sites, one in Doncaster (DCTS) and another in Kew (KWTS), have been reserved for possible future electrical infrastructure development to meet customers’ needs in the area. With established 220 kV tower lines to both sites, development of either of these sites could be economic depending upon the geographical location of additional customer load.
3. Install a fourth 150 MVA 220/66 kV transformers at TSTS. There is provision in the yard for an additional transformer. The capital cost of installing a 220/66 kV transformer at TSTS 66 kV is estimated to be $20 million. The estimated total annual cost of this network augmentation is approximately $1.4 million.
On the present maximum demand forecasts, the fourth 220/66 kV transformer is not likely to be required within the ten-year planning horizon.
82 Overload Shedding Scheme of Connection Asset. 83 Transmission Operations Centre.

2021 Transmission Connection Planning Report Risk Assessment: TSTS
Page 178
Preferred network option(s) for alleviation of constraints
1. Implement the following temporary measures to cater for an unplanned outage of one transformer at TSTS under critical loading conditions:
• maintain contingency plans to transfer load quickly to adjacent terminal stations;
• periodically review the OSSCA scheme settings in conjunction with TOC to minimise the impact on customers of any load shedding that may take place; and
• subject to availability, an AusNet Transmission Group spare 220/66 kV transformer for metropolitan areas (refer to Section 5.5) can be used to temporarily replace the failed transformer.
2. Install a fourth 150 MVA 220/66 kV transformer at TSTS.
In the absence of any commitment by interested parties to offer network support services by installing local generation or through demand side management initiatives that would reduce load at TSTS, it is proposed to install a fourth 220/66 kV transformer at TSTS. On the present forecasts, an additional 220/66 kV transformer is unlikely to be economic within the ten year planning horizon.
The table on the following page provides more detailed data on the station rating, demand forecasts, energy at risk and expected unserved energy.

2021 Transmission Connection Planning Report Risk Assessment: TSTS
Page 179
TEMPLESTOWE TERMINAL STATION 66 kV
Detailed data: Magnitude and probability of loss of load
Distribution Businesses supplied by this station: United Energy (39%), CitiPower (28%), SPI Electricity (24%), Jemena (8%) Station operational rating (N elements in service): 532 MVA via 3 transformers (Summer peaking) Summer N-1 Station Rating: 354 MVA [See Note 1 below for interpretation of N-1] Winter N-1 Station Rating: 392 MVA
Station: TSTS 66kV 2022 2023 2024 2025 2026 2027 2028 2029 2030 2031
50th percentile Summer Maximum Demand (MVA) 324 329 328 326 326 332 337 345 354 363
50th percentile Winter Maximum Demand (MVA) 242 243 242 242 245 249 255 263 271 280
10th percentile Summer Maximum Demand (MVA) 366 371 370 368 369 376 382 390 400 410
10th percentile Winter Maximum Demand (MVA) 248 249 248 248 251 255 262 269 278 286
N-1 energy at risk at 50th percentile demand (MWh) 0 0 0 0 0 0 0 0 0 11
N-1 hours at risk at 50th percentile demand (hours) 0 0 0 0 0 0 0 0 1 2
N-1 energy at risk at 10th percentile demand (MWh) 33 52 46 40 45 73 109 170 272 437
N-1 hours at risk at 10th percentile demand (hours) 3 4 4 4 4 6 7 10 15 22
Expected Unserved Energy at 50th percentile demand (MWh) 0.0 0.0 0.0 0.0 0.0 0.0 0.0 0.0 0.0 0.1
Expected Unserved Energy at 10th percentile demand (MWh) 0.2 0.3 0.3 0.3 0.3 0.5 0.7 1.1 1.8 2.9
Expected Unserved Energy value at 50th percentile demand $0.0k $0.0k $0.0k $0.0k $0.0k $0.0k $0.0k $0.0k $0.0k $2.2k
Expected Unserved Energy value at 10th percentile demand $6.8k $10.6k $9.5k $8.2k $9.2k $15.1k $22.4k $34.9k $56.0k $89.9k
Expected Unserved Energy value using AEMO weighting of 0.7 x 50th percentile value + 0.3 x 10th percentile value
$2.1k $3.2k $2.8k $2.4k $2.8k $4.5k $6.7k $10.5k $16.8k $28.5k
Notes:
1. “N-1” means cyclic station output capability rating with outage of one transformer. For 50th percentile value, the rating is at an ambient temperature of 35 degrees Centigrade. For 10th percentile value, the rating is at an ambient temperature of 40 degrees Centigrade.
2. “N-1 energy at risk” is the amount of energy in a year during which the specified demand forecast exceeds the N-1 capability rating. Energy at risk at the specified demand forecast when all plant is in service (N) is shown separately.
3. “N-1 hours per year at risk” is the number of hours in a year during which the specified demand forecast exceeds the N-1 capability rating. Hours at risk at the specified demand forecast when all plant is in service (N) are shown separately.
4. “Expected unserved energy” means “energy at risk” multiplied by the probability of a major outage affecting one transformer. “Major outage” means an outage with duration of 2.65 months. The outage probability is derived from the base reliability data given in Section 5.4.
5. The value of unserved energy is derived from the VCR relevant climate zone and sector values given in the AER VCR December 2019 final determination, weighted in accordance with the composition of the load at this terminal station.
6. The 0.7 and 0.3 weightings applied to the 50th and 10th percentile expected unserved energy estimates (respectively) are in accordance with the approach applied by AEMO, and described on page 12 of its publication titled Victorian Electricity Planning Approach, published in June 2016 (see http://www.aemo.com.au/-/media/Files/Electricity/NEM/Planning_and_Forecasting/Victorian_Transmission/2016/Victorian-Electricity-Planning-Approach.ashx)

2021 Transmission Connection Planning Report Risk Assessment: TGTS
Page 180
TERANG TERMINAL STATION (TGTS) 66kV
Terang Terminal Station (TGTS) 66 kV consists of one 125 MVA transformer and one 150 MVA 220/66 kV transformer and is the main source of supply for over 69,154 customers in Terang and the surrounding area. The terminal station supply area includes Terang, Colac, Camperdown, Cobden, Warrnambool, Koroit, Portland and Hamilton.
Embedded generation
A total of 292 MW capacity of large-scale embedded generation is installed on the Powercor sub-transmission and distribution systems connected to TGTS.
The following table lists the registered embedded generators (>5 MW) that are installed on the Powercor network connected to TGTS:
Site name Status Technology Type Nameplate capacity (MW)
Codrington Wind Farm Existing Plant Wind turbine 18.2
Yambuk Existing Plant Wind turbine 30
Oaklands Hill Wind Farm Existing Plant Wind turbine 67.2
Mortons Lane Wind Farm Existing Plant Wind turbine 19.5
Timboon West Wind Farm Existing Plant Wind turbine 7.2
Ferguson Wind Farm Existing Plant Wind turbine 12
Mt Gellibrand Wind Farm84 Existing Plant Wind turbine 138
About 42 MW of rooftop solar PV is installed on the Powercor distribution system connected to TGTS. This includes all the residential and small-commercial rooftop PV systems that are smaller than 1 MW.
Magnitude, probability and impact of loss of load
There is now 292 MW of wind generation capacity connected to the Powercor network supplied from TGTS. As noted in section 5.2 of this report, the connection of significant embedded generation to networks supplied from some terminal stations is expected to lead to reverse power flows that may necessitate a reduction in the ratings of some stations. TGTS is one such station. In 2019 the station rating of TGTS was reduced from cyclic to nameplate. This reduction is shown in the graph below.
The following observations and risk assessment are based on actual readings of power flow at the Terminal Station Connection points. It therefore accounts for the current load and generation combination.
84 Mt Gellibrand Wind Farm is connected to a shared sub-transmission line between TGTS and GTS.

2021 Transmission Connection Planning Report Risk Assessment: TGTS
Page 181
TGTS demand for the past 5 years has been winter peaking but peaks can occur in summer or spring (depending upon the dairy industry load and the impact of wind farms connected to the 66 kV network). The metered station maximum demand (load) reached 157 MW (158 MVA) in 2020 winter. Due to the input from generation connected to the station, reverse power flows occur during low load periods. The recorded minimum demand (export) reached -75 MW (-120 MVA) in September 2020 as shown in the graph.
It is estimated that:
• For 8 hours per year, 95% of peak demand is expected to be reached under the 50th percentile forecast.
• The station load power factor at the time of peak demand is 0.99.
• The station load power factor at the time of minimum demand is -0.63.
The graph below depicts the 10th and 50th percentile summer maximum demand forecast together with the station’s operational “N” rating (all transformers in service) and the “N-1”
rating at 35C ambient temperature.
In the event of a transformer outage at TGTS the generators may need to reduce generation to avoid overloading the remaining transformer. AEMO has a constraint equation managing the terminal station transformer reverse loading. The generators are sent dispatch signals to reduce generation if the constraint equation binds. Any generation reduction is implemented via AEMO’s dispatch process.
Currently there is no planned augmentation at TGTS for generation connections. Additional generation, however, may require augmentation of transformer capacity, the cost of which would either be met by the connecting generator(s), or would be recovered from load customers where a RIT-T demonstrates that the augmentation delivers net market benefits.
The bar chart below depicts the energy at risk with one transformer out of service for the 50th percentile demand forecast, and the hours per year that the 50th percentile demand forecast is expected to exceed the N-1 capability rating. The line graph shows the value to consumers of the expected unserved energy in each year, for the 50th percentile demand forecast.

2021 Transmission Connection Planning Report Risk Assessment: TGTS
Page 182
Comments on Energy at Risk
For an outage of one transformer at TGTS, there will be insufficient capacity at the station to supply all demand at the 50th percentile temperature for about 563 hours in 2027. The energy at risk at the 50th percentile temperature under N-1 conditions is estimated to be 7,872 MWh in 2027. The estimated value to consumers of the 7,872 MWh of energy at risk is approximately $258 million (based on a value of customer reliability of $ $32,798 per MWh).85 In other words, at the 50th percentile demand level, and in the absence of any other operational response that might be taken to mitigate the impact of a forced outage, a major outage of one transformer at TGTS in 2027 would be anticipated to lead to involuntary supply interruptions that would cost consumers $258 million.
It is emphasised however, that the probability of a major outage of one of the two transformers occurring over the year is very low at about 1.0% per transformer per annum, while the expected unavailability per transformer per annum is 0.221%. When the energy at risk (7,872 MWh for 2027) is weighted by this low unavailability, the expected unsupplied energy is estimated to be 34 MWh. This expected unserved energy is estimated to have a value to consumers of around $1.1 million (based on a value of customer reliability of $32,798 MWh).
It should also be noted that the above estimates of energy at risk and expected unserved energy are based on an assumption of average (50th percentile) summer temperatures occurring in each year. Under 10th percentile temperature conditions, the energy at risk in 2027 is estimated to be 13,358 MWh. The estimated value to consumers of this energy at risk in 2027 is approximately $438 million. The corresponding value of the expected unserved energy (of 58 MWh) is $1.9 million. Also these estimates do not attribute any value to the prospective loss of generation that may be constrained.
85 The value of unserved energy is derived from the relevant climate zone and sector VCR values given in
the AER VCR December 2019 final determination, weighted in accordance with the composition of the load at this terminal station.

2021 Transmission Connection Planning Report Risk Assessment: TGTS
Page 183
Key statistics relating to energy at risk and expected unserved energy for the year 2027 under N-1 outage conditions are summarised in the table below.
MWh Valued at consumer interruption cost
Energy at risk, at 50th percentile demand forecast 7,872 $258 million
Expected unserved energy at 50th percentile demand 34 $1.1 million
Energy at risk, at 10th percentile demand forecast 13,358 $438 million
Expected unserved energy at 10th percentile demand 58 $1.9 million
Feasible options for alleviation of constraints
The following options are technically feasible and potentially economic to mitigate the risk of supply interruption and/or to alleviate the emerging constraint:
1. Replacing the #2 125 MVA 220/66 kV transformer at TGTS with a 150 MVA unit. For an indicative installation cost of $14 million this option will most likely prove to be uneconomic as it only provides a marginal increase in station capacity, hence necessitating additional capacity augmentation shortly afterwards.
2. Installation of a third 220/66 kV transformer (150 MVA) at TGTS at an indicative capital cost of $18 million (equating to a total annual cost of approximately $1.26 million).
3. Demand reduction: There is an opportunity to develop a number of innovative customer schemes to encourage voluntary demand reduction during times of network constraint. The amount of demand reduction would depend on the customer uptake and would be taken into consideration when determining the optimum timing for any future capacity augmentation.
4. Embedded generation: The existing embedded generators that generate into the 66 kV infrastructure ex-TGTS with a total capacity of 292 MW may help to supply the loads in the TGTS supply area, and may defer the need for any capacity augmentation within the forecast period.
5. There are presently several large embedded generation 66 kV wind farm proposals in the area which may drive the need for an additional 150 MVA 220/66 kV transformer at TGTS to accommodate the reverse power flow expected at TGTS.
6. Possible uptake of battery storage in the future could provide some contribution to supporting the peak load.
Preferred option(s) for alleviation of constraints
In the absence of any commitment by interested parties to offer network support services by installing local generation or through demand side management initiatives that would reduce load at TGTS, it is proposed to:
1. Install a third 220/66 kV transformer (150 MVA) at TGTS at an indicative capital cost of $18 million. This equates to a total annual cost of approximately $1.26 million per

2021 Transmission Connection Planning Report Risk Assessment: TGTS
Page 184
annum. On the basis of the present demand forecasts and applying the 2021 VCR estimates, the third transformer would be expected to be economically justified by around 2027. This date could be brought forward by considering the cost to customers of prospective generation constraints.
2. As a temporary measure, maintain contingency plans to transfer load quickly to the Geelong Terminal Station (GTS) by the use of the 66 kV tie lines between TGTS and GTS in the event of an unplanned outage of one transformer at TGTS under critical loading conditions. This load transfer is in the order of 15 MVA. Under these temporary measures, affected customers would be supplied from the 66 kV tie line infrastructure on a radial network, thereby reducing their level of reliability.
3. Subject to availability, an AusNet Transmission Group spare 220/66 kV transformer for rural areas (refer Section 5.5) can be used to temporarily replace a failed transformer to minimise the transformer outage period.
The table on the following page provides more detailed data on the station rating, demand forecasts, energy at risk and expected unserved energy.

2021 Transmission Connection Planning Report Risk Assessment: TGTS
Page 185
TGTS Terminal Station
Detailed data: Magnitude and probability of loss of load Distribution Businesses supplied by this station: Powercor (100%)
MVA Nameplate rating with all plant in service 275 via 2 transformers (summer) Summer N-1 Station Rating: 125 [See Note 1 below for interpretation of N-1] Winter N-1 Station Rating: 125
Notes: 1. “N-1” means nameplate station output capability rating with outage of one transformer. The winter rating is at an ambient temperature of 5 degrees Centigrade.
2. “N-1 energy at risk” is the amount of energy in a year during which specified demand forecast exceeds the N-1 capability rating.
3. “N-1 hours at risk” is the number of hours in a year during which the specified demand forecast exceeds the N-1 capability rating.
4. “Expected unserved energy” means “N-1 energy at risk” for the specified demand forecast multiplied by the probability of a major outage affecting one transformer. “Major outage” means an outage with a duration of 2.65 months. The outage probability is derived from the base reliability data given in Section 5.4.
5. The value of unserved energy is derived from the relevant climate zone and sector VCR values given in the AER VCR December 2019 final determination, weighted in accordance with the composition of the load at this terminal station.
6. The 0.7 and 0.3 weightings applied to the 50th and 10th percentile expected unserved energy estimates (respectively) are in accordance with the approach applied by AEMO, and described on page 12 of its publication titled Victorian Electricity Planning Approach, published in June 2016 (see http://www.aemo.com.au/-/media/Files/Electricity/NEM/Planning_and_Forecasting/Victorian_Transmission/2016/Victorian-Electricity-Planning-Approach.ashx
2022 2023 2024 2025 2026 2027 2028 2029 2030 2031
170.1 170.2 167.7 167.6 171.1 177.1 184.7 192.6 200.6 208.8
170.1 170.2 167.7 167.6 171.1 177.1 184.7 192.6 200.6 208.8
180.1 180.0 177.5 177.4 181.0 187.5 195.4 203.8 212.2 221.0
180.1 180.0 177.5 177.4 181.0 187.5 195.4 203.8 212.2 221.0
5073.3 5114.8 4305.1 4280.6 5436.5 7871.8 11688.9 16710.7 22886.4 30288.0
420.0 421.8 376.3 374.8 440.8 563.5 737.5 937.8 1158.3 1400.8
9298.7 9248.6 8024.6 8015.5 9746.2 13358.4 18741.0 25638.1 33786.5 43559.6
631.5 628.3 571.0 570.5 651.0 809.0 1009.8 1252.0 1508.3 1772.5
21.98 22.16 18.66 18.55 23.56 34.11 50.65 72.41 99.17 131.25
40.29 40.08 34.77 34.73 42.23 57.89 81.21 111.10 146.41 188.76
$0.72M $0.73M $0.61M $0.61M $0.77M $1.12M $1.66M $2.38M $3.25M $4.30M
$1.32M $1.31M $1.14M $1.14M $1.39M $1.90M $2.66M $3.64M $4.80M $6.19M
$0.90M $0.90M $0.77M $0.77M $0.96M $1.35M $1.96M $2.76M $3.72M $4.87M
Expected Unserved Energy at 10th percentile demand (MWh)
10th percentile Summer Maximum Demand (MVA)
10th percentile Winter Maximum Demand (MVA)
N-1 energy at risk at 50% percentile demand (MWh)
N-1 hours at risk at 50th percentile demand (hours)
N-1 hours at risk at 10th percentile demand (hours)
50th percentile Summer Maximum Demand (MVA)
50th percentile Winter Maximum Demand (MVA)
Expected Unserved Energy at 50th percentile demand (MWh)
Expected Unserved Energy value using AEMO weighting of 0.7 X 50th
precentile value + 0.3 X 10th percentile value
Station: TGTS
Expected Unserved Energy value at 50th percentile demand
Expected Unserved Energy value at 10th percentile demand
N-1 energy at risk at 10% percentile demand (MWh)

2021 Transmission Connection Planning Report Risk Assessment: TTS
Page 186
THOMASTOWN TERMINAL STATION 66 kV (TTS 66 kV)
Thomastown Terminal Station (TTS) is located in the north of greater Melbourne. It operates at 220/66 kV and supplies approximately 172,000 Jemena Electricity Networks and AusNet Electricity Services customers in the Thomastown, Coburg, Preston, Watsonia, North Heidelberg, Lalor, Coolaroo and Broadmeadows areas.
Background
TTS has five 150 MVA transformers and is a summer critical station. Under system normal conditions, the No.1 & No.2 transformers are operated in parallel as one group (TTS(B12)) and supply the No.1 & No.2 66 kV buses. The No.3, No.4 & No.5 transformers are operated in parallel as a separate group (TTS(B34)) and supply the No.3 & No.4 66 kV buses. The 66 kV bus 2-3 and bus 1-4 tie circuit breakers are operated open to limit the maximum prospective fault levels on the four 66 kV busses to within the switchgear ratings.
For an unplanned transformer outage in the TTS(B12) group, the No.5 transformer will automatically change over to the TTS(B12) group. Therefore, an unplanned transformer outage of any one of the five transformers at TTS will result in both the TTS(B12) & TTS(B34) groups being comprised of two transformers each. Given this configuration, load demand on the TTS(B12) group must be kept within the capabilities of the two transformers at all times or load shedding may occur.
Embedded Generation
About 97.4 MW of solar PV is installed on networks connected to TTS which includes 27.6 MW in the AusNet distribution system and 69.8 MW in the Jemena distribution system. This includes all the residential and small-commercial rooftop PV systems that are smaller than 1 MW.
A total of 14 MW capacity of embedded generation greater than 1 MW is connected to TTS in the Jemena Distribution system.
Transformer group TTS (B12) Summer Peak Forecasts
The peak load on TTS (B12) reached 203 MW (or 208.2 MVA) on 25 January 2021.
The graph below depicts the summer maximum demand forecasts (for 50th and 10th percentile temperatures) for TTS (B12) and the corresponding rating with both transformers (B1 & B2) operating. It is estimated that:
• For 7 hours per year, 95% of peak demand is expected to be reached under the 50th percentile demand forecast.
• The station load power factor at the time of peak demand is 0.98.
The graph shows that with all transformers in service, there is adequate capacity to meet the anticipated maximum load demand for the entire forecast period. As explained above, if an unplanned transformer outage in the TTS(B12) group occurs, the No.5 transformer will automatically change over to the TTS(B12) group. In effect then, the N-1 and N ratings of the TTS(B12) group are equivalent. Thus there is sufficient capacity provided by the TTS(B12) group to meet the anticipated maximum demand for the entire forecast period, even under a transformer outage condition.

2021 Transmission Connection Planning Report Risk Assessment: TTS
Page 187
Transformer group TTS (B34) Summer Peak Forecasts
The peak load on TTS (B34) reached 221.4 MW (229.1 MVA) on 25 January 2021.
The graph below depicts the TTS (B34) rating with all transformers (B3, B4 & B5) in service (“N” rating), and with one of the three transformers out of service (“N-1” rating), along with the 50th and 10th percentile summer maximum demand forecasts. It is estimated that:
• For 4 hours per year, 95% of peak demand is expected to be reached under the 50th percentile demand forecast.
• The station load power factor at the time of peak demand is 0.96.
The above graph shows that there is adequate capacity to meet the anticipated maximum load demand for the entire forecast period.
Hence, the need for augmentation of transmission connection assets at TTS 66 kV is not expected to arise over the next ten years.

2021 Transmission Connection Planning Report Risk Assessment: TBTS
Page 188
TYABB TERMINAL STATION (TBTS)
TBTS consists of three 150 MVA 220/66 kV transformers, and is the main source of supply for over 119,000 customers on the Mornington Peninsula. The geographic coverage of the area spans from Frankston South in the north to Portsea in the south.
Embedded generation
About 107.5 MW of rooftop solar PV is installed within the distribution system connected to TBTS. This includes all the residential and small-commercial rooftop PV systems that are smaller than 1 MW.
There are two embedded generation units over 1 MW connected at TBTS and 11 generation units providing 11 MW of network support for the lower Mornington Peninsula sub-transmission constraints only during the summer period.
Magnitude, probability and impact of loss of load
TBTS 66 kV is a summer critical station. Summer peak demand at TBTS generally occurs on days of high ambient temperature during the summer holiday period (from mid-December to the end of January). Given the peak demand at TBTS is directly related to air-conditioning use during the summer holiday period along the costal belt of the Mornington Peninsula, the peak is very sensitive to the maximum ambient temperature at this time. The station reached 260.1 MW (266.1 MVA) in summer 2020-21, which was 10.9 MW lower than the 2019-20 maximum demand.
Due to increasing risk at TBTS, a Regulatory Test was undertaken in 2011, which identified the installation of a third 150 MVA 220/66 kV transformer as the most economic network solution. A new third transformer was installed at TBTS and commissioned in November 2013 as shown in the graph below.
The graph below depicts the 10th and 50th percentile summer maximum demand forecast together with the station’s operational N rating (all transformers in service) and the N-1 rating at
35C as well as 40C ambient temperature.
The N rating on the chart below indicates the maximum load that can be supplied from TBTS with all transformers in service. Exceeding this level will initiate AusNet Transmission Group’s automatic load shedding scheme.

2021 Transmission Connection Planning Report Risk Assessment: TBTS
Page 189
The graph above shows that with one transformer out of service, the demand at TBTS will remain well within the (N-1) station rating over the next ten years.
The station load is forecast to have a power factor of 0.977 at times of peak demand. The demand at TBTS is expected to exceed 95% of peak demand for approximately 5 hours per annum. There is approximately 21 MVA of load transfer available at TBTS for summer 2021-22.
On the basis of the current forecasts, the need for augmentation of transmission connection assets at TBTS is not expected to arise over the next decade.

2021 Transmission Connection Planning Report Risk Assessment: WETS
Page 190
WEMEN TERMINAL STATION (WETS)
Wemen Terminal Station (WETS) is a new station which was commissioned in February 2012. WETS consisted of one 70 MVA 235/66 kV transformer supplying part of the 66 kV network previously supplied by RCTS. An additional 70 MVA transformer was installed in 2018 increasing the N rating to 140 MVA. This configuration is the main source of supply for approximately 5,204 customers in the Wemen, Boundary Bend and Ouyen areas.
Embedded generation
A total of 202 MW capacity of embedded generation is installed on the Powercor sub-transmission and distribution systems connected to WETS. As noted in section 5.2 of this report, the connection of significant embedded generation to networks supplied from some terminal stations is expected to lead to reverse power flows that may necessitate a reduction in the ratings of some stations. WETS 66 kV is one such station.
The following table lists the large-scale embedded generators (>5 MW) that are installed on the Powercor network connected to WETS:
Site name Status Technology Type Nameplate capacity (MW)
Bannerton Solar Park Existing Plant Solar PV 100
Wemen Solar Farm Existing Plant Solar PV 97.5
In addition, about 6.9 MW of solar PV is installed on the Powercor distribution system connected to WETS. This includes all the residential and small-commercial rooftop solar PV systems (<1 MW).
Magnitude, probability and impact of loss of load
The following observations and risk assessment are based on actual readings of power flow at the Terminal Station Connection points. It therefore accounts for the present load and generation combination.
WETS demand is summer peaking. The maximum demand on the station reached 57.9 MW in summer 2021. Due to the input of generation connected to the station, reverse power flows occur during low load periods. The minimum demand at WETS reached -142.5 MW (-143.6 MVA) in September 2020.
It is estimated that:
• For 4 hours per year, 95% of peak demand is expected to be reached under the 50th percentile demand forecast.
• The station load power factor at the time of maximum demand is 0.99.
• The station load power factor at the time of minimum demand is -0.99.
The graph below depicts the 10th and 50th percentile summer maximum demand forecast together with the station’s operational “N” rating (all transformers in service) and the “N-1” rating

2021 Transmission Connection Planning Report Risk Assessment: WETS
Page 191
at 35C ambient temperature. As WETS had only one transformer before the second transformer was installed in 2018, the “N-1” rating was zero until 2018/19.
In order to mitigate the risk of generation curtailment of new solar farms in the area an additional 70 MVA transformer was installed on the WETS 66 kV system in 2018. The transformer is running in parallel with the existing 70 MVA transformer. In advance of AusNet Transmission Services completing its review of ratings at WETS 66 kV this risk assessment adopts the conservative assumption that from 2019 the station rating of WETS 66 kV is reduced from cyclic to nameplate.
In the event of a transformer outage at WETS the generators will have to reduce generation to avoid overloading the remaining transformer. AEMO has a constraint equation managing the terminal station transformer reverse loading. The generators are sent dispatch signals to reduce generation if the constraint equation binds. Any generation reduction is implemented via AEMO’s dispatch process. In addition, Powercor has implemented transformer overload protection schemes at the large-scale generation sites as a backup to the AEMO constraint equation.
There is a small amount of load at risk under 10th percentile forecast conditions from 2029 onwards. This risk can be managed by utilising load transfers away to adjacent zone substations. Therefore, the need for load-driven augmentation is not expected to arise over the next ten years.
Connection of additional generation, however, may require augmentation of transformer capacity, the cost of which would either be met by the connecting generator(s), or would be recovered from load customers where a RIT-T demonstrates that the augmentation delivers net market benefits.

2021 Transmission Connection Planning Report Risk Assessment: WMTS 22 kV
Page 192
WEST MELBOURNE TERMINAL STATION 22 kV (WMTS 22 kV)
WMTS 22 kV is a summer critical station consisting of two 165 MVA 220/22 kV transformers, which supplies 9,955 customers in CitiPower’s distribution network. The terminal station provides major 22 kV supply to the West Melbourne area including Melbourne Docks, Docklands Areas, North Melbourne (including a railway substation), Parkville and Carlton.
As part of its asset renewal program, AusNet Transmission Group plans to retire all of the existing WMTS 22 kV systems. Load transfers have been planned from WMTS 22 to both BTS 66 and WMTS 66 over the next 6 years. These offloads are shown in the WMTS 22 load forecast below.
The peak load on the station reached 50.8 MW in summer 2021. It is estimated that:
• For 13 hours per year, 95% of peak demand is expected to be reached under the 50th percentile summer demand forecast.
• The station load power factor at the time of peak demand is 0.97.
Embedded generation
Currently there is 1.3 MW of rooftop PV and no large-scale embedded generation at WMTS 22. It is expected that those customers will be transferred to WMTS 66 by the middle of 2022.
Magnitude, probability and impact of loss of load
The graph below depicts the station’s operational N rating for all transformers in service and the N-1 rating (at 35 degrees ambient temperature), and the latest 10th and 50th percentile maximum demand forecasts for the next ten years. The N-1 ratings are restricted by over-voltage limits on transformer tapping.

2021 Transmission Connection Planning Report Risk Assessment: WMTS 22 kV
Page 193
The graph shows that there is sufficient capacity at the station to supply the forecast 50th and 10th percentile demands over the forecast period, even with one transformer out of service.
As noted above, it is planned that all WMTS 22 kV load will be offloaded to WMTS 66 kV and BTS 66kV before 2026. As part of its asset renewal program, AusNet Transmission Group had planned to retire all of the existing WMTS 22 kV systems by the end of 2021, but negotiations are currently underway to defer retirement to enable supply to be provided to a major customer until 2025.

2021 Transmission Connection Planning Report Risk Assessment: WMTS 66 kV
Page 194
WEST MELBOURNE TERMINAL STATION 66 kV (WMTS 66 kV)
WMTS 66 kV is a summer critical station consisting of three 225 MVA 220/66 kV transformers. The terminal station is shared by CitiPower (79%) and Jemena Electricity Networks (21%). The terminal station provides major supply for 67,583 customers in the western Central Business District, including Docklands areas, as well as the inner suburbs of Northcote and Brunswick West in the north, and Kensington, Flemington, Footscray and Yarraville in the west.
As part of its asset renewal program, AusNet Transmission Group replaced all four 150 MVA 220/66 kV transformer units (B1, B2, B3 and B4) with three 225 MVA transformer units. The project was completed in 2021. This enables all three transformers to operate in parallel which therefore increased the station ratings while maintaining the fault levels within the terminal station fault level rating.
Embedded generation
About 21 MW of solar PV is installed on WMTS 66 which includes 13 MW in the CitiPower distribution system and 8 MW in the Jemena distribution system. This total includes all the residential and small-commercial rooftop solar PV systems (<1 MW).
Magnitude, probability and impact of loss of load
2020-21 was a mild summer which contributed to reduced network MDs. The peak load on the station was 245.7 MW (253 MVA) in summer 2021.
It is estimated that:
• For 2 hours per year, 95% of peak demand is expected to be reached under the 50th percentile demand forecast.
• The station load power factor at time of peak demand is 0.97.
The graph below depicts:
• the station’s N and N-1 ratings at 35ºC prior to the transformer replacement works, during the replacement works, and the new N and N-1 ratings with three new 225 MVA transformers commissioned in 2021; and
• the latest 10th and 50th percentile maximum demand forecasts during the summer periods over the next ten years.
The forecast demand includes the load transfers from WMTS 22 to WMTS 66 prior to the planned decommissioning of the 22 kV supply from WMTS, and new 66 kV supplies for Melbourne Metro Tunnel which will connect in 2021 (8 MVA) and gradually increase to 53 MVA by 2040.
WMTS 66 is one of the terminal stations supplying the Melbourne CBD. In order to meet the code requirements of security of supply to the Melbourne CBD, CitiPower has been undertaking works to re-configure the CBD 66 kV network to provide the required security to maintain supply from alternate supply points. This means that for a ‘N-1’ event in other parts of the CBD network, additional load can be switched onto WMTS 66. This required additional capacity must be reserved at the terminal station to ensure that CBD load can be supplied under any of the CBD Security contingency arrangements.

2021 Transmission Connection Planning Report Risk Assessment: WMTS 66 kV
Page 195
The graph shows that currently there is sufficient capacity at WMTS 66 kV to supply the forecast 10th percentile and 50th percentile demand over the planning period, even with one transformer out of service. Therefore, the need for augmentation or other corrective action is not expected to arise over the next ten years.

2021 Transmission Connection Planning Report Risk Assessment: WOTS
Page 196
WODONGA TERMINAL STATION (WOTS 66 kV and 22 kV)
Wodonga Terminal Station is the main source of supply for a significant part of north-eastern Victoria. The supply is via two 330/66/22 kV three-winding transformers with a nominal rating of 75 MVA each.
This terminal station supplies Wodonga centrally as well as the area from Rutherglen in the west to Corryong in the east. The Hume Power Station (HPS) is connected to the WOTS 66 kV bus and can supply up to 58 MVA into the WOTS 66 kV bus, offsetting the load on the transformers.
AusNet Electricity Services is responsible for planning the transmission connection and distribution network for this region.
Embedded generation
About 42.8 MW of rooftop solar PV is installed on the AusNet distribution system connected to WOTS. This includes all the residential and small-commercial rooftop PV systems that are smaller than 1 MW.
A total of 52 MW capacity of large-scale embedded generation is installed on the AusNet sub-transmission and distribution systems connected to WOTS.
The following table lists the embedded generators (>5 MW) that are installed on the AusNet network connected to WOTS:
Site name Status Technology Type Nameplate capacity (MW)
Hume Power Station Existing Plant Hydro 50
Magnitude, probability and impact of loss of load
WOTS is a summer peaking station and the combined 66 kV and 22 kV summer peak demand is forecast to remain flat for the next ten years. To accurately assess the transformer loading, the 66 kV and 22 kV loads need to be considered together because of the physical arrangement of the transformer windings.
The peak load on the station reached 107.4 MVA in summer 2008/09 but had a period of decline before recently flattening. The recorded peak demand in summer 2020/21 was 79.0 MW (80.2 MVA), which is in-line with the flat forecast. The demand at WOTS 66 kV and 22 kV is expected to exceed 95% of the 50th percentile peak demand for 4 hours per annum. The station load has a power factor of 0.98 at maximum demand and load on the transformers is further supported by 22 kV capacitor banks installed at the station.
The graph below depicts the 10th and 50th percentile summer maximum demand forecast together with the station’s operational “N” rating (all transformers in service) and the “N-1”
rating at an ambient temperature of 35C.

2021 Transmission Connection Planning Report Risk Assessment: WOTS
Page 197
The combined 66 kV and 22 kV load at WOTS is not expected to reach the “N” summer station rating within the 10 year planning horizon, but it presently exceeds the “N-1” rating at the 50th and 10th percentile summer demand level, and is forecast to continue to do so. Demand on the individual 66 kV and 22 kV windings is well within the ratings of the individual windings.
The combined 66 kV and 22 kV winter maximum demand at WOTS is less than the summer maximum demand and the station winter rating is higher than the summer rating. Forecast 50th and 10th percentile winter demand at WOTS 66 kV and 22 kV is not expected to exceed the “N -1” winter station rating in the next ten years.
The bar chart below depicts the energy at risk with one transformer out of service for the 50th percentile summer demand forecast, and the hours each year that the 50th percentile summer demand forecast is expected to exceed the “N-1” capability. The line graph shows the value to consumers of the expected unserved energy in each year, for the 50th percentile demand forecast.

2021 Transmission Connection Planning Report Risk Assessment: WOTS
Page 198
Comments on Energy at Risk - Assuming HPS generation is not available
For a major outage of any one of the two 330/66/22 kV transformers at WOTS over the entire summer period, and assuming that Hume Power Station is unavailable, there will be insufficient capacity at the station to supply all demand at the 50th percentile temperature for about 17.8 hours in 2021/22, increasing slightly to 18.6 hours in summer 2030/31. The energy at risk under “N-1” conditions is forecast to increase from 42 MWh in 2021/22 to 46 MWh in summer 2030/31. The estimated value to consumers of the energy at risk in 2030/31 is approximately $1.98 million (based on a value of customer reliability of $43,052/MWh at WOTS)86.
However the probability of a major outage of one of the two transformers occurring over the year is very low, at about 1.0% per transformer per annum, whilst the expected unavailability per transformer per annum is 0.221%. When the energy at risk (46 MWh for summer 2030/31) is weighted by this low unavailability, the expected unsupplied energy is estimated to be around 0.20 MWh. The corresponding value of expected unserved energy is approximately $8,610.
It should also be noted that the above estimates of energy at risk and expected unserved energy are based on an assumption of average (50th percentile) summer temperatures occurring in each year. Under higher (10th percentile) summer temperature conditions, the energy at risk in 2030/31 is estimated to be 574 MWh. The estimated value to consumers of the energy at risk in 2030/31 is approximately $25 million. The corresponding expected unserved energy at the 10th percentile demand forecast is 2.5 MWh, which has an estimated value to consumers of approximately $0.11 million.
The key statistics for the year 2030/31 under “N-1” outage conditions are summarised in the table below.
86 The value of unserved energy is derived from the sector values given in Table 1 of Section 2.4,
weighted in accordance with the composition of the load at this terminal station.

2021 Transmission Connection Planning Report Risk Assessment: WOTS
Page 199
MWh Valued at consumer interruption cost
Energy at risk at 50th percentile demand forecast 46 $1.98 million
Expected unserved energy at 50th percentile demand 0.2 $8,610
Energy at risk at 10th percentile demand forecast 574 $25 million
Expected unserved energy at 10th percentile demand 2.5 $0.11 million
If one of the 330/66/22 kV transformers at WOTS is taken off line during peak loading times and the “N-1” station rating is exceeded, then the Overload Shedding Scheme for Connection Assets (OSSCA) which is enabled by AusNet Transmission Group’s TOC87 to protect the connection assets from overloading88, will act swiftly to reduce the loads in blocks to within safe loading limits. If OSSCA operation does occur, any load reductions that are in excess of the amount required to limit load to the rated capability of the station would be restored at zone substation feeder level in accordance with AusNet Electricity Services’ operational procedures after the operation of the OSSCA scheme.
Comments on Energy at Risk - Assuming HPS generation is available
The previous comments on energy at risk are based on the assumption that there is no embedded generation available to offset the 330/66/22 kV transformer loading.
However, the generation from Hume Power Station (HPS) can be fed into the WOTS 66 kV bus. The power station is capable of generating up to 58 MVA. This generation can also be connected to TransGrid’s 132 kV network in New South Wales. The generation from HPS is dependent on water releases from Hume Dam for irrigation and the water level in the dam can vary widely from year to year. There is presently no guarantee that generation from HPS will be available to offset transformer loading at WOTS. With HPS generating to its full capacity there would be no energy at risk at WOTS over the ten year planning horizon for the 50th or 10th percentile summer maximum demand forecasts.
Feasible options for alleviation of constraints
The demand at WOTS has remained relatively flat in recent years, a trend that is forecast to continue over the 10-year planning horizon. Actual demand at WOTS will continue to be monitored, and if demand increases above forecast, then action will be taken to manage the risk at the lowest cost to consumers.
The following are potentially feasible options for addressing constraints at this station.
1. Load transfers
Only 1 MVA of load can be shifted away from WOTS using the existing distribution network, so this option has limited ability to manage the risk at WOTS in the future.
87 Transmission Operation Centre.
88 OSSCA is designed to protect connection transformers against damage caused by overloads. Damaged transformers can take months to repair or replace which can result in prolonged, long term risks to the reliability of customer supply.

2021 Transmission Connection Planning Report Risk Assessment: WOTS
Page 200
2. Addition of Power Factor Correction Capacitors
The station is currently running with a power factor of around 0.98 at summer peak. At this power factor the use of additional capacitor banks to reduce the MVA loading would only provide marginal benefits.
3. Demand reduction
Over sixty percent of the peak demand is from Commercial and Industrial customers and AusNet Electricity Services may investigate demand management, through either special tariff incentives or a demand management aggregator, to assess these alternatives to network augmentation.
4. Embedded generation
As discussed above, subject to available water HPS can provide up to 58 MVA of network support to WOTS.
5. Fine tuning OSSCA
OSSCA scheme settings are reviewed annually to minimise the impact on customers of any load shedding that may take place to protect the connection assets from overloading.
It is noted that the two 330/66/22 kV transformers at WOTS are the only two of this voltage ratio in Victoria. AusNet Transmission Group does not have a spare transformer suitable for use at WOTS, so it is expected that it would take approximately 12 months to replace a failed transformer at WOTS.
Preferred network option for alleviation of constraints
In view of the current and forecast level of expected unserved energy at WOTS, implementation of a network solution is unlikely to be economic over the ten-year planning horizon.
The table on the following page provides more detailed data on the station rating, demand forecasts, energy at risk and expected unserved energy assuming embedded generation is not available.

2021 Transmission Connection Planning Report Risk Assessment: WOTS
Page 201
Notes:
1. “N-1” means cyclic station output capability rating with outage of one transformer. The summer rating is at an ambient temperature of 35 degrees Centigrade.
2. “N-1 energy at risk” is the amount of energy in a year during which the specified demand forecast exceeds the N-1 capability rating. Energy at risk at the specified demand forecast when all plant is in service (N) is shown separately.
3. “N-1 hours per year at risk” is the number of hours in a year during which the specified demand forecast exceeds the N-1 capability rating. Hours at risk at the specified demand forecast when all plant is in service (N) are shown separately.
4. “Expected unserved energy” means “energy at risk” multiplied by the probability of a major outage affecting one transformer. “Major outage” means an outage with duration of 2.65 months. The outage probability is derived from the base reliability data given in Section 5.4
5. The value of unserved energy is derived from the VCR relevant climate zone and sector values given in the AER VCR December 2019 final determination, weighted in accordance with the composition of the load at this terminal station.
6. The 0.7 and 0.3 weightings applied to the 50th and 10th percentile expected unserved energy estimates (respectively) are in accordance with the approach applied by AEMO, and described on page 12 of its publication titled Victorian Electricity Planning Approach, published in June 2016 (see http://www.aemo.com.au/-/media/Files/Electricity/NEM/Planning_and_Forecasting/Victorian_Transmission/2016/Victorian-Electricity-Planning-Approach.ashx
WODONGA TERMINAL STATION 66kV and 22kV Loading (WOTS)
Detailed data: Magnitude and probability of loss of load
Distribution Businesses supplied by this station: AusNet Electricity Services (100%)
Normal cyclic rating with all plant in service 162 MVA via 2 transformers (Summer peaking)
Summer N-1 Station Rating 81 MVA [See Note 1 below for interpretation of N-1]
Winter N-1 Station Rating 87 MVA
Station: WOTS 66kV & 22kV 2022 2023 2024 2025 2026 2027 2028 2029 2030 2031
50th percentile Summer Maximum Demand (MVA) 88.6 88.4 88.1 88.0 88.0 88.0 88.0 88.2 88.8 88.8
50th percentile Winter Maximum Demand (MVA) 68.2 68.4 68.8 69.1 69.4 69.7 70.0 70.5 70.7 71.0
10th percentile Summer Maximum Demand (MVA) 95.7 95.5 95.3 95.3 95.3 95.3 95.3 95.6 96.2 96.3
10th percentile Winter Maximum Demand (MVA) 70.1 70.2 70.2 70.3 70.6 70.9 71.3 71.7 71.9 72.2
N - 1 energy at risk at 50th percentile demand (MWh) 42 39 35 34 33 33 33 36 45 46
N - 1 hours at risk at 50th percentile demand (hours) 18 17 16 16 15 15 15 16 19 19
N - 1 energy at risk at 10th percentile demand (MWh) 518 502 483 481 481 480 485 510 568 574
N - 1 hours at risk at 10th percentile demand (hours) 105 103 101 100 100 100 101 104 110 111
Expected Unserved Energy at 50th percentile demand (MWh) 0.2 0.2 0.2 0.2 0.1 0.1 0.1 0.2 0.2 0.2
Expected Unserved Energy at 10th percentile demand (MWh) 2.3 2.2 2.1 2.1 2.1 2.1 2.1 2.3 2.5 2.5
Expected Unserved Energy value at 50th percentile demand $0.01M $0.01M $0.01M $0.01M $0.01M $0.01M $0.01M $0.01M $0.01M $0.01M
Expected Unserved Energy value at 10th percentile demand $0.10M $0.10M $0.09M $0.09M $0.09M $0.09M $0.09M $0.10M $0.11M $0.11M
Expected Unserved Energy value using AEMO weighting of 0.7 X 50th
percentile value + 0.3 X 10th percentile value$0.04M $0.03M $0.03M $0.03M $0.03M $0.03M $0.03M $0.03M $0.04M $0.04M