Embed Size (px)
Citation preview

Transitioning toAFFORDABLE AND CLEAN ENERGYEdwin C. Constable (Ed.)

Transitioning to Affordable and Clean Energy

Transitioning to Sustainability Series: Volume 7
Series Editor: Manfred Max Bergman
Volumes in the series:
Volume 1: Transitioning to No PovertyISBN 978-3-03897-860-2 (Hbk);ISBN 978-3-03897-861-9 (PDF)
Volume 2: Transitioning to Zero HungerISBN 978-3-03897-862-6 (Hbk);ISBN 978-3-03897-863-3 (PDF)
Volume 3: Transitioning to Good Healthand Well-BeingISBN 978-3-03897-864-0 (Hbk);ISBN 978-3-03897-865-7 (PDF)
Volume 4: Transitioning to QualityEducationISBN 978-3-03897-892-3 (Hbk);ISBN 978-3-03897-893-0 (PDF)
Volume 5: Transitioning to Gender EqualityISBN 978-3-03897-866-4 (Hbk);ISBN 978-3-03897-867-1 (PDF)
Volume 6: Transitioning to Clean Waterand SanitationISBN 978-3-03897-774-2 (Hbk);ISBN 978-3-03897-775-9 (PDF)
Volume 7: Transitioning to Affordable andClean EnergyISBN 978-3-03897-776-6 (Hbk);ISBN 978-3-03897-777-3 (PDF)
Volume 8: Transitioning to Decent Workand Economic GrowthISBN 978-3-03897-778-0 (Hbk);ISBN 978-3-03897-779-7 (PDF)
Volume 9: Transitioning to SustainableIndustry, Innovation and InfrastructureISBN 978-3-03897-868-8 (Hbk);ISBN 978-3-03897-869-5 (PDF)
Volume 10: Transitioning to ReducedInequalitiesISBN 978-3-03921-160-9 (Hbk);ISBN 978-3-03921-161-6 (PDF)
Volume 11: Transitioning to SustainableCities and CommunitiesISBN 978-3-03897-870-1 (Hbk);ISBN 978-3-03897-871-8 (PDF)
Volume 12: Transitioning to ResponsibleConsumption and ProductionISBN 978-3-03897-872-5 (Hbk);ISBN 978-3-03897-873-2 (PDF)
Volume 13: Transitioning to Climate ActionISBN 978-3-03897-874-9 (Hbk);ISBN 978-3-03897-875-6 (PDF)
Volume 14: Transitioning to SustainableLife below WaterISBN 978-3-03897-876-3 (Hbk);ISBN 978-3-03897-877-0 (PDF)
Volume 15: Transitioning to SustainableLife on LandISBN 978-3-03897-878-7 (Hbk);ISBN 978-3-03897-879-4 (PDF)
Volume 16: Transitioning to Peace, Justiceand Strong InstitutionsISBN 978-3-03897-880-0 (Hbk);ISBN 978-3-03897-881-7 (PDF)
Volume 17: Transitioning to StrongPartnerships for the SustainableDevelopment GoalsISBN 978-3-03897-882-4 (Hbk);ISBN 978-3-03897-883-1 (PDF)

Edwin C. Constable (Ed.)
MDPI • Basel • Beijing • Wuhan • Barcelona • Belgrade • Manchester • Tianjin • Tokyo • Cluj
Transitioning to Affordable and Clean EnergyTransitioning to Sustainability Series

EDITOREdwin C. ConstableUniversity of BaselSwitzerland
For citation purposes, cite each article independently as indicated below:
Author 1, and Author 2. 2022. Chapter Title. In Transitioning to Affordable and Clean Energy. Edited by Edwin C. Constable. Transitioning to Sustainability Series 7. Basel: MDPI, Page Range.
EDITORIAL OFFICEMDPISt. Alban-Anlage 664052 Basel, Switzerland
ISBN 978-3-03897-776-6 (Hbk)ISBN 978-3-03897-777-3 (PDF)
ISSN: 2624-9324 (Print)ISSN: 2624-9332 (Online)
doi.org/10.3390/books978-3-03897-777-3
© 2022 by the authors. Chapters in this volume are Open Access and distributed under the Creative Commons Attribution (CC BY 4.0) license, which allows users to download, copy and build upon published articles, as long as the author and publisher are properly credited, which ensures maximum dissemination and a wider impact of our publications.The book taken as a whole is © 2022 MDPI under the terms and conditions of the Creative Commons license CC BY-NC-ND.
Published with the generous support of the Swiss National Science Foundation.

Contents
About the Editors vii Contributors ix
Abstracts xi
1 Preface to Transitioning to Affordable and Clean Energy 1EDWIN C. CONSTABLE
Part 1: Methodology and Analysis
2 The Transition towards Affordable Electricity: Tools and Methods 7SEBASTIAN TROITZSCH, SARMAD HANIF, TOBIAS MASSIER, KAI ZHANG, BILAL A. BHATTI, ARIF AHMED AND MD JAN ALAM
3 Clean Energy Transition Challenge: The Contributions of Geology 47CRISTINA RODRIGUES, HENRIQUE PINHEIRO, MANUEL LEMOS DE SOUSA
4 Use of Storage and Renewable Electricity Generation to Reduce Domestic and 95 Transport Carbon Emissions—Whole Life Energy, Carbon and Cost Analysis of Single Dwelling Case Study (UK)VICKI STEVENSON
Part 2: Technology and Carbon Economy
5 Sustainable Energy Future with Materials for Solar Energy Collection, 133 Conversion, and Storage JUVET NCHE FRU, PANNAN I. KYESMEN AND MMANTSAE DIALE
6 Advanced Energy Management Systems and Demand-Side Measures for 173 Buildings towards the Decarbonisation of Our Society FABIANO PALLONETTO
Part 3: Regional Transition
7 Social Innovation for Energy Transition: Activation of Community 217 Entrepreneurship in Inner Areas of Southern ItalyMARIAROSARIA LOMBARDI, MAURIZIO PROSPERI AND GERARDO FASCIA
8 Finnish Forest Industry and Its Role in Mitigating Global 239 Environmental ChangesEKATERINA SERMYAGINA, SATU LIPIÄINEN AND KATJA KUPARINEN
9 Public Transit Challenges in Sparsely Populated Countries: Case Study of the 269 United StatesWARREN S. VAZ

10 A Systematic Analysis of Bioenergy Potentials for Fuels and Electricity 295 in Turkey: A Bottom-Up ModelingDANIAL ESMAEILI ALIABADI, DANIELA THRÄN, ALBERTO BEZAMA AND BIHTER AVŞAR

vii
About the Editor
Edwin C. Constable was born in Edinburgh but grew up in Hastings. He studied chemistry at Oxford, where he gained a B.A. and D.Phil. He moved to the University of Cambridge before being appointed to a University Lectureship and Fellowship of Robinson College in 1984. He remained at Cambridge until 1993 when he was appointed Professor of Inorganic Chemistry at the University of Basel. In 2000 he took up a position as Professor of Chemistry at the University of Birmingham (England) where he was appointed Head of School. He returned to the University of Basel as Professor of Chemistry in 2002. He publishes in all areas of chemistry with over 650 peer-reviewed publications and is highly cited (22,000 citations, h-index 74). His interests cover all aspects of chemistry, chemical history and the communication of science. He is Editor-in-Chief for a new open access journal Chemistry. He has held an ERC Advanced Grant and has been Research Dean and Vice-President of the University of Basel. He is currently Chairman of the Swiss Academies Expert Group on Research Integrity and President of Euresearch. When he is not being a chemist, he is to be found chasing insects and pursuing his love of photography.


ix
ALBERTO BEZAMA Prof., Department of Bioenergy, Helmholtz Centre for Environmental Research, UFZ, Leipzig, Germany
ARIF AHMED Dr., Energy and Power Systems Department, TUMCREATE, Singapore
BIHTER AVŞAR Dr., Faculty of Engineering and Natural Sciences, Sabanci University, Istanbul, Turkey
BILAL A. BHATTI Dr., Pacific Northwest National Laboratory, Richland, WA, USA
CRISTINA RODRIGUES Dr., UFP Energy, Environment and Health Research Unit (FP-ENAS), Fernando Pessoa University, Porto, Portugal
DANIAL ESMAEILI ALIABADI Dr., Department of Bioenergy, Helmholtz Centre for Environmental Research, UFZ, Leipzig, GermanyFaculty of Engineering and Natural Sciences, Sabanci University, Istanbul, Turkey
DANIELA THRÄN Prof., Department of Bioenergy, Helmholtz Centre for Environmental Research, UFZ, Leipzig, GermanyDepartment of Bioenergy Systems, German Biomass Research Center, DBFZ, Leipzig, Germany
EKATERINA SERMYAGINA Dr., LUT School of Energy Systems, Lappeenranta-Lahti University of Technology, Lappeenranta, Finland
FABIANO PALLONETTO Dr., School of Business, Maynooth University, Mariavilla, Maynooth, Co. Kildare, Ireland
GERARDO FASCIA M.Sc., Innovation Manager, Social Enterprise “Prometeus”, Lucera, Italy
HENRIQUE PINHEIRO Dr., UFP Energy, Environment and Health Research Unit (FP-ENAS), Fernando Pessoa University, Porto, Portugal
JUVET NCHE FRU Dr., Department of Physics, University of Pretoria, Pretoria, South Africa
KAI ZHANG Dr., Institute for High Performance Computing, A*STAR, Singapore
KATJA KUPARINEN Dr., LUT School of Energy Systems, Lappeenranta-Lahti University of Technology, Lappeenranta, Finland
MANUEL LEMOS DE SOUSADr., UFP Energy, Environment and Health Research Unit (FP-ENAS), Fernando Pessoa University, Porto, Portugal
MARIAROSARIA LOMBARDI Asst. Prof., Department of Economics, University of Foggia, Foggia, Italy
MAURIZIO PROSPERI Asst. Prof., Department of Agriculture, Food, Natural Resource and Engineering (DAFNE), University of Foggia, Foggia, Italy
MD JAN ALAM Dr., Pacific Northwest National Laboratory, Richland, WA, USA
Contributors

x
MMANTSAE DIALE Prof., Department of Physics, University of Pretoria, Pretoria, South Africa
PANNAN I. KYESMEN Dr., Department of Physics, University of Pretoria, Pretoria, South Africa
SARMAD HANIF Dr., Pacific Northwest National Laboratory, Richland, WA, USA
SATU LIPIÄINEN M.Sc., LUT School of Energy Systems, Lappeenranta-Lahti University of Technology, Lappeenranta, Finland
SEBASTIAN TROITZSCH M.Sc., Institute for High Performance Computing, A*STAR, Singapore
TOBIAS MASSIER Dr., Energy and Power Systems Department, TUMCREATE, Singapore
VICKI STEVENSON Dr., Architecture, Cardiff University, Cardiff, Wales, UK
WARREN S. VAZAsst. Prof., Department of Engineering and Engineering Technology, University of Wisconsin-Oshkosh, Fox Cities Campus, Menasha, WI, United States

xi
Abstracts
The Transition towards Affordable Electricity: Tools and Methodsby Sebastian Troitzsch, Sarmad Hanif, Tobias Massier, Kai Zhang, Bilal A. Bhatti, Arif Ahmed and Md Jan Alam
To decarbonize the electric energy sector, renewable energies are increasingly integrated into the generation mix. The main challenge, apart from the efficiency of renewable energy conversion, is maintaining the reliability of the electric grid, which is responsible for linking electric generators and consumers. To this end, the whole electric power system, covering generation, transmission, distribution, and consumption needs to be planned and operated in a cost-effective as well as reliable manner. The research in this domain has led to the development of tailor-made open-source software tools for electric grid modeling, simulation, and optimization. This chapter discusses the tools MATPOWER, GridLAB-D, MESMO, and URBS, which cater to the integration of renewable energies and other distributed energy resources (DERs) in the electric grid. The key features and applications for each tool are highlighted and compared, with a focus on district-scale electric grids, i.e., electric distribution systems. Furthermore, exemplary results are presented to emphasize suitable applications for each tool, based on a synthetic distribution system test case for Singapore.
Clean Energy Transition Challenge: The Contributions of Geologyby Cristina Rodrigues, Henrique Pinheiro and Manuel Lemos de Sousa
The transition from fossil fuel-dominant energy production to so-called carbon-neutral sources has been identified as an important new challenge seeking to address climate change. Climate change, specifically global warming, is presently considered as being intimately related to carbon dioxide (CO2) emissions, especially those of an anthropogenic origin. The issue of CO2 emissions of an anthropogenic origin from the combustion of fossil fuels remains rather controversial, due to the following main reasons: other greenhouse gases (GHGs) such as methane (CH4) produce a more negative environmental effect than CO2, and natural causes such as the sun and volcanic activities also play an important role. In addition, an important part of CO2 emissions is unrelated to energy production, but concerns other industries such as chemical and cement production. Furthermore, it should be stated that there still exists considerable disagreement in climate models and

xii
scenarios used by the UN Framework Convention on Climate Change (UNFCCC). A workable and viable strategy towards the production of clean energy must include the capture and storage of CO2 as one of the main targets in the energy and climate binomial strategy, despite facing criticism from some environmental organizations. The contribution of geology is not only related to the need of carbon capture and storage technologies, as already admitted in the Paris Agreement, but also to the exploitation of mineral raw materials essential to build renewable energy equipments, and, ultimately, to the underground energy storage associated to hydrogen energy production.
Use of Storage and Renewable Electricity Generation to Reduce Domestic and Transport Carbon Emissions—Whole Life Energy, Carbon and Cost Analysis of Single Dwelling Case Study (UK)by Vicki Stevenson
This case study is a detached dwelling situated in South Wales, UK. It had a3.6 kWp vertical photovoltaic (PV) system installed in 2014 and a 6.12 kWp roof-mounted PV system installed in 2020, along with a 13.5 kWh electricity storage device, closely followed by an electric vehicle and charger. The impact of these interventions on the reduction in domestic and transport carbon emissions is considered in relation to energy tariffs which encourage the user to shift consumption from high-carbon intensity generation times (generally matching peak consumption in the evening) to low-carbon intensity generation times (overnight). Based on the initial monitored data, the combination of renewable generation, energy storage and swapping to an electric vehicle is likely to avoid 1655.6 kg CO2 per year operational emissions based on the UK electricity grid carbon intensity in 2020.
Sustainable Energy Future with Materials for Solar Energy Collection, Conversion, and Storageby Juvet Nche Fru, Pannan I. Kyesmen and Mmantsae Diale
The transition to a sustainable energy future is dependent on a clean and efficient power supply. Solar power is the most attractive source of clean energy because of its abundance and numerous ways of harnessing it. Harvesting solar energy involves the use of a wide range of materials including metal oxides and halide perovskites (HaP) for conversion into hydrogen and electricity via photoelectrochemical (PEC) water splitting and photovoltaic technologies,

xiii
respectively. Hematite has emerged as one of the most suitable metal oxide photocatalysts for solar hydrogen production due to its small bandgap (~2.0 eV) and stability in solution. However, the major challenges limiting the use of hematite in PEC water splitting include its low conductivity, poor charge separation, and short charge carrier lifetime. Additionally, HaP solar cells are the fastest emerging photovoltaic technology in terms of power conversion efficiency. However, their instability and toxicity of lead and solvents are major bottlenecks blocking the commercialization of this technology. This chapter reviews the strategies that have been engaged towards overcoming the limitations of using hematite and HaP for direct conversion of solar energy into hydrogen fuels and electricity, respectively. The simultaneous engagement of strategies such as nanostructuring, doping, formation of heterostructures, use of co-catalysts, and plasmonic enhancement effects has shown great promise in improving the photocatalytic water splitting capabilities of hematite. Vapor methods for preparing HaP have the potential for improving their stability and eliminate the use of toxic solvents during fabrication. More research will be required for the eventual commercialization of solar hydrogen production and photovoltaic technologies using hematite and halide perovskites, respectively. Advanced Energy Management Systems and Demand-Side Measures for Buildings towards the Decarbonisation of Our Societyby Fabiano Pallonetto
Electricity supply/demand balancing measures have traditionally been achieved by controlling conventional generation in response to energy demand variations. However, increasing renewable generation can lead to more significant changes on the supply side, requiring a faster balancing response from grid operators. Standard generation units may not have sufficient ramping capabilities to counter high volatility in renewable energy generation. Modern forecasting techniques and advanced control systems can mitigate such challenges and flexible demand resources and demand-side management measures. Among demand-side management measures, demand response has been promoted as a critical mechanism to increase the percentage of renewable energies in the system. The widespread adoption of demand response programs leads to a paradigm shift in the way operators manage the grid. Such changes require a bi-directional communication link and advanced energy management systems that monitor building consumption and operations. Innovations such as building home automation, diffusion of intelligent appliances and energy management system integration are necessary

xiv
prerequisites to boost the power system’s efficiency while increasing the renewable penetration towards an affordable and clean energy supply. Combining these measures with energy management systems equipped with advanced artificial intelligence algorithms enables electricity end-users to modulate their electricity consumption by dynamically responding to fluctuations in the power generation caused by renewable. The increased capacity of the controllable load through these devices actively contributes to the higher penetration of renewable energy and the decarbonisation of our society.
Social Innovation for Energy Transition: Activation of Community Entrepreneurship in Inner Areas of Southern Italyby Mariarosaria Lombardi, Maurizio Prosperi and Gerardo Fascia
Sustainable Development Goal no. 7 of the UN 2030 Agenda refers to changing the route of energy production and consumption to contrast climate change. One way to reach this objective is to foster the development of the renewable energy sector by promoting community entrepreneurship in rural and remote areas endowed with relevant environmental resources and containing important cultural assets. The European Union (EU) legislative framework already formally acknowledges and defines specific types of community energy initiatives that can reinforce positive social norms and support the energy transition. However, there are some concerns regarding the economic feasibility and sustainability of these initiatives in difficult contexts, such as the case of inner areas of Southern Italy, which are affected by progressive abandonment and desertification, and where the recent widespread implementation of large-scale renewable energy plants has occurred without the engagement of the local community. This has led to limited social acceptance of new investment projects in renewable energy. In light of these premises, the aim of this chapter is to propose an operational approach for developing community entrepreneurship where the renewable energy sector will provide the financial flow needed to activate initiatives for the valorization of cultural assets, tourism initiatives and civic revitalization. In this way, the energy transition may represent a unique opportunity to spur economic growth in less developed regions across the EU, capable of exerting a multiplier effect on local development and the social revitalization of local communities.

xv
Finnish Forest Industry and Its Role in Mitigating Global Environmental Changesby Ekaterina Sermyagina, Satu Lipiäinen and Katja Kuparinen
The forest industry is an energy-intensive sector that emits approximately 2% of industrial fossil CO2 emissions worldwide. In Finland, the forest industry is a major contributor to wellbeing and has constantly worked on sustainability issues for several decades. The intensity of fossil fuel use has been continuously decreasing within the sector; however, there is still a lot of potential to contribute to the mitigation of environmental change. Considering the ambitious Finnish climate target to reach carbon-neutrality by 2035, the forest industry is aiming for net-zero emissions by switching fossil fuels to bio-based alternatives and reducing energy demand by improving energy efficiency. Modern pulp mills are expanding the traditional concept of pulp mills by introducing the effective combination of multifunctional biorefineries and energy plants. Sustainably sourced wood resources are used to produce not only pulp and paper products but also electricity and heat as well as different types of novel high-value products, such as biofuels, textile fibres, biocomposites, fertilizers, and various cellulose and lignin derivatives. Thus, the forest industry provides a platform to tackle global challenges and substitute greenhouse-gas-intensive materials and fossil fuels with renewable alternatives.
Public Transit Challenges in Sparsely Populated Countries: Case Study of the United Statesby Warren S. Vaz
Countries like Canada and the United States have a relatively low population density. Their population centers are located much further away, making nationwide public transit particularly challenging. As such, individuals travel predominantly via airplane and passenger cars. This results in an inefficient use of resources and pollution. These countries have some of the highest numbers of vehicles per person and per capita emissions in the world. Even public transit within cities is a challenge due to suburbs and urban sprawl. These countries have cities with relatively large areas and higher commute distances and times. These factors have historically been an impediment to widespread adoption of efficient public transit and clean transportation. Electric and hydrogen vehicles have yet to see significant market penetration in large part due to lagging infrastructure. These issues are explored in

xvi
greater detail, including some of their socioeconomic impacts. Potential solutions and recent developments are also presented.
A Systematic Analysis of Bioenergy Potentials for Fuels and Electricity in Turkey: A Bottom-Up Modelingby Danial Esmaeili Aliabadi, Daniela Thrän, Alberto Bezama and Bihter Avşar
Turkey is a member of the Organization for Economic Co-operation and Development (OECD) that enjoys suitable geography for renewable resources and, simultaneously, suffers from modest domestic fossil fuel reserves. The combination of mentioned factors supports devising new strategies through which renewable resources are not only being used in the power sector but also in industries and transportation. Unfortunately, bioenergy is underplayed in the past despite the country’s potential; nonetheless, this view is transforming rapidly. In this chapter, using a bottom-up optimization model, we analyze bioenergy sources in Turkey and offer a pathway in which renewable resources are utilized to lower future greenhouse gas emissions. Although Turkey is chosen as the case study, the outcomes and recommendations are generic; thus, they can be used by policymakers in other developing countries.


Preface to Transitioning to Affordable andClean Energy
Edwin C. Constable
In 2015, the United Nations Member States adopted ‘The 2030 Agenda forSustainable Development’, which provided a vision and a roadmap for a sustainablefuture, bringing peace and prosperity for people and our planet. This document isnot just a utopian vision of the future but has at its core 17 Sustainable DevelopmentGoals (SDGs), which were a call for all countries to act in a global partnership toend poverty, improve health and education, reduce inequality, encourage economicgrowth, tackle climate change, and preserve the forests and oceans.
This book is dedicated to SDG 7, which is tasked to ‘Ensure access to affordable,reliable, sustainable and modern energy for all’. The importance of the goal isemphasised by a few statistics identified by the United Nations. Over three-quartersof a billion people lack access to electricity, and one-third of the World’s populationrelies on dangerous and inefficient cooking systems. In particular, there is a needto improve the efficiency of energy generation and usage and to accelerate thedevelopment of modern renewable energy technologies and infrastructure. Of all ofthe SDGs, SDG 7 is the most likely to have an immediate impact on people’s dailylives, whether through changes in technology, transport systems, or energy tariffs.
For me, SDG 7 is also one of the most interesting goals, as it involves dialogueand interactions between scientists, technologists, the private sector, general society,as well as decision-, policy-, and lawmakers. I have had a long research involvementwith the development of new compounds and materials for use in photonicapplications, in particular, solar energy photoconversion using dye-sensitised solarcells, and efficient lighting devices incorporating ionic transition metal complexes inlight-emitting diodes and light-emitting electrochemical cells. A number of years ago,I realised that our search for proof-of-concept materials or improved efficiency wasresulting in the development of technologies that were themselves non-sustainableand were based upon rare and expensive resources such as the platinum group metals.This resulted in a change in emphasis within the research group to concentrate uponthe use of Earth-abundant elements with minimal ecological or biomedical impact.
This volume comprises nine chapters which emerge from many of the sectorsinvolved in the implementation of SDG 7. The first chapter begins in the science andtechnology area; in ‘Materials Development towards a Sustainable Energy Future’,
1

Diale, Fru, and Kyesmen survey the emerging materials which are attracting attentionin photovoltaic and related devices. In particular, they discuss the use of haematite,an Earth-abundant iron-based material which does not have optimal electronicproperties, and the halide perovskites, which exhibit excellent performance but arebased on the use of environmentally hazardous materials such as lead.
This is then followed by three chapters relating to the deployment of noveltechnologies and their societal impact. The first, by Aliabadi, Thrän, and Bezama, ‘ASystematic Analysis of Bioenergy Potentials for Fuels and Electricity in Turkey: ABottom-Up Modelling’ examines the under-exploitation of bioenergy in the mosaicmodels for energy production. This is followed by a study of the use of storageand renewable electricity generation for reducing domestic and transport carbonemissions by Stevenson. This real-world study is subtitled ‘Energy and Cost Analysisof Single Dwelling Case Study (UK)’. Rodrigues and Lemos de Sousa discuss thecontribution of geology for carbon capture and storage, as well as undergroundenergy storage, in their chapter entitled ‘Clean Energy Transition Challenge: TheContributions of Geology’.
One of the very important ways in which the broader society will be impactedby, or at least made aware of, the implementation of SDG 7 is in changes to transportsystems, and this is examined by Vaz in the chapter ‘Clean Transportation and PublicTransit Challenges in Sparsely Populated Countries’.
Sermyagina, Lipiäinen, and Kuparinen examine measures currently beingconsidered and evaluated by the wood-related industry in Finland, which isresponsible for 2% of industrial fossil CO2 emissions worldwide, in their contribution‘Finnish Forest Industry and Its Role in Mitigating Global Environmental Changes’.
The chapters in the last section of the book comprise the final group ofchapters, which are related to societal aspects of the energy turn. An operationalapproach for developing community entrepreneurship, driven by financial flowfrom the renewable energy sector, is examined by Lombardi, Prosperi, and Fascia,in their chapter ‘Social Innovation for Energy Transition: Activation of CommunityEntrepreneurship in Inner Areas of Southern Italy’. In particular, they analysecultural assets, tourism initiatives, and the potential for civic revitalization andconclude that the energy transition could represent an opportunity to spur economicgrowth with a multiplier effect on local communities. The final two chapters areconcerned with the systems requirements of the energy transition. Pallonettoidentifies the consequences of decarbonization strategies on the energy supplysystems as intelligent buildings become more common and recognises the needfor system-wide integration, in the chapter ‘Advanced Energy Management Systems
2

and Demand-Side Measures for the Full Decarbonisation of Our Society’. In theirchapter ‘Transition towards Affordable Electricity: Tools and Methods’, Hanif, Bhatti,Alam, Massier, Ramachandran, Ahmad, and Zhang analyse the tools available formodelling and evaluating district-scale electric grids and suitable applications forspecific tools are identified based upon a distribution system test case for Singapore.
Overall, this volume brings together many of the aspects with which societywill be confronted in the energy transition required by the implementation of SDG7. I hope that this heterogeneous collection will encourage the reader to delve intoareas outside her or his area of expertise.
Basel, November 2021
© 2022 by the authors. Licensee MDPI, Basel, Switzerland. This article is an openaccess article distributed under the terms and conditions of the Creative CommonsAttribution (CC BY) license (http://creativecommons.org/licenses/by/4.0/).
3


Part 1: Methodology and Analysis


The Transition towards AffordableElectricity: Tools and Methods
Sebastian Troitzsch, Sarmad Hanif, Tobias Massier, Kai Zhang,Bilal Ahmad Bhatti, Arif Ahmed, and Md Jan Alam
1. Introduction
In an effort to counteract climate change, the electric grid is subjectedto significant transformations, such as the integration of renewable generators,demand-side flexibility, and new electrified transportation. These changingparadigms highlight the importance of research into new methods and tools, whichcan equip the power system stakeholders to plan and operate the electric gridof the future. The electric grid has been divided into three major subsystems:(1) generation, (2) transmission, and (3) distribution. For the analysis of theelectric grid, modeling each subsystem in full detail may not be feasible in termsof complexity management and computational requirements. Instead, differentmodeling methodologies and software tools exist for the analysis of each subsystem.At the same time, the advancement of computational technology and the increasinginterdependency between different subsystems is pushing the boundaries of thesesoftware frameworks. For example, (1) demand response techniques can activatedemand-side control of the load to match generation, (2) battery charge/dischargecan mimic both load/generator, (3) microgrids can act as small independent gridoperators, and (4) renewable energies are considered as zero-variable-cost resources,which are highly variable and uncertain in nature.
To manage the diverse modeling requirements in this context, the researchcommunity is continuously developing open-source software tools for electric gridanalysis. The open-source aspect allows greater control for researchers to extendand customize modeling workflows to match the requirements of particular studies,which ensures a broad adoption of such tools alongside the more conventionalcommercial power system tools. An exemplary set of open-source tools for electricgrid analysis includes (1) OpenDSS and GridLAB-D for distribution grid analysis,(2) GRIDAPPS-D as a platform to standardize distribution grid interoperabilitywith respect to modeling and data exchange, (3) TESP as a co-simulation platformthat integrates multiple open-source tools, (4) MESMO for operational optimizationof DER dispatch in the distribution grid, (5) MATPOWER for large-scale system
7

integration studies, and (6) URBS for planning optimization of renewable energydeployment in the generation mix.
This chapter examines the landscape of open-source tools for electric gridanalysis to identify the suitability and applicability of various tools for specificproblem types in this domain. As a representative set of software frameworks, thefollowing tools are considered: (1) MATPOWER, (2) GridLAB-D, (3) MESMO, and (4)URBS. The first part of this chapter begins with an introduction to the requirementsof different problem types and a feature comparison of the software tools in order todifferentiate the purpose for each of the different tools. This is complemented witha brief introduction to each of the four frameworks. Furthermore, to characterizethe requirements for test case preparation, as well as for results post-processing,input/output specifications are compared for the four tools. In this context, the modelconversion and co-simulation platforms GridAPPS-D and TESP are introduced tohighlight possible workflows for test case preparation. In the second part of thechapter, the key capabilities of each tool are demonstrated for a district-scale test casebased in Singapore. The test case considers a synthetic electric grid model, thermalbuilding demand models, EV charging models, and photovoltaic (PV) generationpotentials. The key results are discussed to highlight the core analyses that thedifferent software tools can support. Eventually, the discussion section serves as aguideline for the choice of open-source tools for different electric grid modeling andanalysis tasks.
Existing reviews for open-source tools energy system modeling andoptimization, e.g., Després et al. (2015); Kriechbaum et al. (2018); Ringkjøb et al.(2018); van Beuzekom et al. (2015), focus on providing a classification of thetools by mathematical model types, as well as temporal, geographical, and sectorcoverage. Studies in Ringkjøb et al. (2018); van Beuzekom et al. (2015) provide adetailed comparison for a large number of tools across these dimensions. Anotherstudy (Després et al. 2015) compares a smaller number of tools in a similar fashion.Lastly, Kriechbaum et al. (2018) seeks to identify current challenges associated withthe available tools. In contrast to these methodical reviews, the core objective of thischapter is to differentiate key use cases for the presented software tools and to enablethe reader to pick the best tool for their problem. The chapter points out specificfeatures and application examples for each tool, such that choosing the right toolfor a specific study is made easy. Since the presented tools only represent a smallfraction of the available open-source frameworks, possible alternatives for each toolare indicated in Section 2.1.
8

2. Software Frameworks
2.1. Overview and Features
Software tools for distribution system analysis typically cater to specificproblem types and stakeholders of the electric grid. Therefore, the features ofthese software frameworks are driven by the requirements arising from differentproblem types. To begin with, the following problem types for energy system analysiscan be generalized based on Ringkjøb et al. (2018) (Section 2.2.1) and Klemm andVennemann (2021) (Section 3.1):
• Operational problems, which describe the analysis of the system at anoperational timescale with the purpose of providing operation decisionsupport. Examples for this category are unit commitment problems, optimalcontrol/model predictive control problems, and market-clearing problems.Operational problems can be cast into simulation problems and optimizationproblems depending on the application. For example, market-clearing problemswould be expressed as optimization problems, whereas simulation is moresuited for studying the nominal behavior of the distribution system with regardto a known set of control variables.
• Planning problems, which characterize design decisions for the energy system,i.e., at a planning timescale, with the goal of providing investment decisionsupport. These studies can be addressed in terms of simulation-based scenarioanalysis or optimal planning problems. The simulation-based approachcaptures a conventional method for district-scale energy system design, whereasoptimal planning seeks to determine optimal values for the design decisionvariables, e.g., component sizing and placement.
Essentially, problem type governs the temporal scale and resolution of themathematical model as well as the selection of decision variables. Independent ofthe problem type, the solution method can be categorized into (1) simulation and(2) optimization. Simulation or forecasting tools calculate the state variables of theenergy system based on fixed inputs for control and disturbance variables, whereasoptimization tools determine state and control variables that optimize some objectivesubject to operational constraints.
The different problem types rely on casting a mathematical model for theelectric grid into the particular solution logic. Mathematical models for the electricgrid are essentially obtained by aggregating the models of its subsystems, i.e.,generators, transmission systems, distribution systems, and DERs. To this end,
9

complexity management is an important aspect of electric grid modeling in managingmodel formulation effort, model parameter data requirements, and computationallimitations. In line with this, different software tools for electric analysis typicallyfocus on a limited subset of features. To compare the capabilities of the selectedsoftware tools, the following features are considered in Table 1:
• Power flow simulation describes the ability to solve the nonlinear steady-stateelectric power flow;
• Power flow optimization refers to the ability to solve an optimization problembased on the electric power flow;
• Balanced AC model highlights whether steady-state properties, i.e., voltage,branch flow, and losses, can be represented for single-phase electric grids;
• Multi-phase AC model highlights whether steady-state properties, i.e., voltage,branch flow, and losses, can be modeled for multi-phase unbalanced electricgrids;
• Transient dynamics model describes the ability to model transient properties ofthe electric grid, in addition to steady-state properties;
• Convex electric grid model denotes whether the electric grid model can beobtained in a convex form;
• DER simulation describes the ability to simulate the system dynamics andbehavior of DERs assuming fixed control inputs;
• DER optimization describes the ability to solve an optimization problemconsidering system dynamics and behavior of DERs;
• Convex DER model notes whether the DER model can be obtained in a convexform;
• Operational problems indicate the ability to express operational problems asoutlined above;
• Planning problems denote the capability to model planning problems asdescribed above;
• Simulation-based solution highlights whether the tool is suited forsimulation-based analysis, in which control or decision variables areprovided as an input;
• Optimization-based solution describes the inclusion of interfaces to numericaloptimization solvers, such that optimization problems can be modeled andsolved, where decision variables are obtained as outputs from the optimalsolution;
10
• Multi-period modeling refers to the ability to consider multiple time steps andcapture inter-temporal linkages during simulation/optimization.
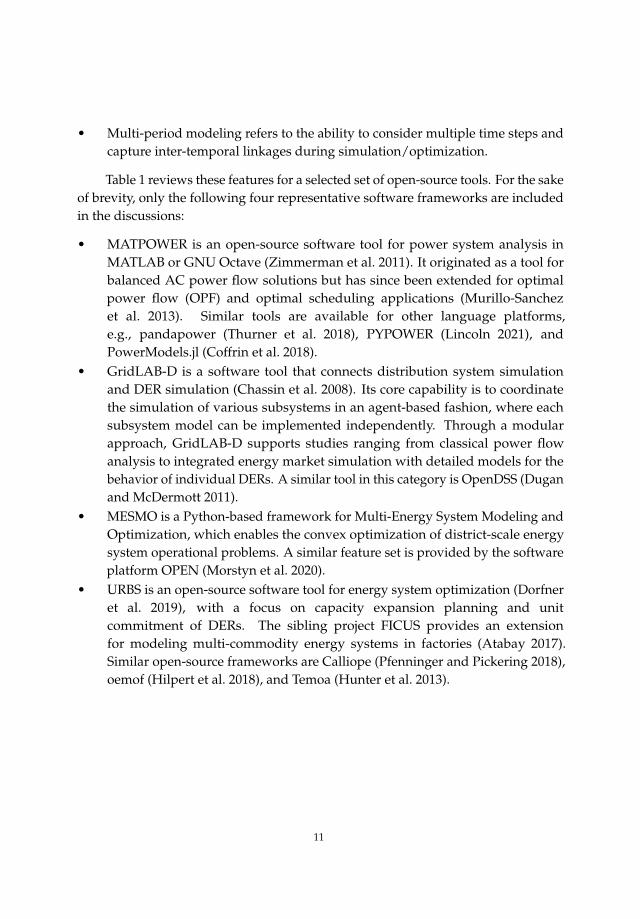
Table 1 reviews these features for a selected set of open-source tools. For the sakeof brevity, only the following four representative software frameworks are includedin the discussions:
• MATPOWER is an open-source software tool for power system analysis inMATLAB or GNU Octave (Zimmerman et al. 2011). It originated as a tool forbalanced AC power flow solutions but has since been extended for optimalpower flow (OPF) and optimal scheduling applications (Murillo-Sanchezet al. 2013). Similar tools are available for other language platforms,e.g., pandapower (Thurner et al. 2018), PYPOWER (Lincoln 2021), andPowerModels.jl (Coffrin et al. 2018).
• GridLAB-D is a software tool that connects distribution system simulationand DER simulation (Chassin et al. 2008). Its core capability is to coordinatethe simulation of various subsystems in an agent-based fashion, where eachsubsystem model can be implemented independently. Through a modularapproach, GridLAB-D supports studies ranging from classical power flowanalysis to integrated energy market simulation with detailed models for thebehavior of individual DERs. A similar tool in this category is OpenDSS (Duganand McDermott 2011).
• MESMO is a Python-based framework for Multi-Energy System Modeling andOptimization, which enables the convex optimization of district-scale energysystem operational problems. A similar feature set is provided by the softwareplatform OPEN (Morstyn et al. 2020).
• URBS is an open-source software tool for energy system optimization (Dorfneret al. 2019), with a focus on capacity expansion planning and unitcommitment of DERs. The sibling project FICUS provides an extensionfor modeling multi-commodity energy systems in factories (Atabay 2017).Similar open-source frameworks are Calliope (Pfenninger and Pickering 2018),oemof (Hilpert et al. 2018), and Temoa (Hunter et al. 2013).
11

Table 1. Differentiating components under each scenario.
Feature MATPOWER GridLAB-D MESMO URBS
Electric grid modeling
Power flow simulation X X X
Power flow optimization X X X a
Balanced AC model X X X
Multi-phase AC model X X
Transient dynamics model X
Convex electric grid model X X a
DER modeling
DER simulation X X
DER optimization X X
Convex DER model X X
Problem types and solution methods
Operational problems X X X X
Planning problems X
Simulation-based solution X X X
Optimization-based solution X X X
Multi-period modeling X b X X X
a URBS implements a simplified nodal flow balance model for the electric grid. b Requiresusing the MATPOWER Optimal Scheduling Tool (MOST) extension. Source: Table byauthors.
2.2. MATPOWER
MATPOWER (Zimmerman et al. 2011) is a MATLAB package that solves thenonlinear power flow, as well as OPF. Among other tools that are able to solvepower flow and OPF problems, MATPOWER stands out due to its computationalefficiency and extension capability, particularly in dealing with large-scale systemoperation and optimization problems. Researchers across the globe have relied onthe MATPOWER extension capability to solve a broad spectrum of power systemoperation and planning problems.
12

For OPF problems, MATPOWER implements multiple state-of-the-artmethods including the primal-dual interior-point method (Wang et al. 2007), thetrust-region-based augmented Lagrangian method and relaxation-based convexifiedOPF models. Furthermore, MATPOWER and its underlying modules are suitable forelectricity market applications. For example, MATPOWER Optimal SchedulingTool (MOST) (Murillo-Sanchez et al. 2013) is able to solve problems as simpleas a deterministic, single-period economic dispatch problem or as complex as astochastic, security-constrained, combined unit-commitment and multi-period OPFproblem with locational contingency and load-following reserve, e.g., in Cho et al.(2019); Murillo-Sanchez et al. (2013). Further studies have adopted MATPOWER indistribution network analysis and market applications (Hanif et al. 2019).
The basic features of MATPOWER are summarized in the following:
1. Modeling capabilities
• AC and DC single-phase electric grid models;• Nonlinear OPF models;• Relaxation-based convexified OPF models.
2. OPF problems types
• AC- and DC-OPFs;• Co-optimize energy and reserves;• Unit commitment problems;• Stochastic and contingency-constrained OPF problems;• Parallelizable OPF formulations.
2.3. GridLAB-D
As a mature open-source simulation tool, GridLAB-D (Chassin et al. 2008,2014) combines traditional power flow simulation capabilities with advanced DERmodeling and control. Its event-driven solution logic is able to simulate variousinteracting DERs of the electric grid, e.g., the room temperature evolution withinbuildings is simulated, along with the resulting load flow in the electric grid. Apartfrom its traditional simulation features, the recent new capabilities of GridLAB-Dcan be summarized as follows:
• End-use models, including thermostatically coupled and non-coupledappliances and equipment models (Pratt and Taylor 1994; Taylor et al. 2008);
• Event-driven agent-based simulation environment to allow for behavioraldecision modeling;
13

• Module to simulate market-based control, e.g., retail market modeling tools,including contract selection, business and operations simulation tools, modelsof SCADA controls, and metering technologies;
• Extension to high-level languages such as MATLAB and Python throughprogramming interfaces;
• Possibility to run parallel power flows for large-scale system simulation.
GridLAB-D’s thermal end-use models consist of commercial and residentialend uses, implemented using the equivalent thermal parameters model (Pratt andTaylor 1994). The innovation in these models is that they solve differential equationsof their end uses such that state changes can trigger an event for the power flow basesimulator to stop and sync with the end-use models. Currently, advanced modelssuch as heat pumps, resistance heating, electric hot water heaters, washer and dryers,cooking appliances (range and microwave), electronic plugs, and lights are capturedin the model.
2.4. Multi-Energy System Modeling and Optimization (MESMO)
The Multi-Energy System Modeling and Optimization (MESMO) is aPython-based software tool for optimal operation problems of electric and thermaldistribution grids along with distributed energy resources (DERs), such as flexiblebuilding loads, electric vehicle (EV) chargers, distributed generators (DGs), andenergy storage systems (ESS). It implements convex modeling techniques for electricgrids, thermal grids, and DERs, along with a set of optimization-focused utilities.Essentially, MESMO is a software framework for defining and solving numericaloptimization problems in the electric/thermal grid context, such as OPF, distributedmarket clearing with network constraints, strategic offering, or multi-energy systemdispatch problems. Additionally, the tool also includes classical steady-statenonlinear power flow models for electric and thermal grids.
The need for its development stems from the observation thatnumerical-optimization-based studies of district-level energy systems oftenrequire significant upfront implementation effort, due to domain-specific modelsbeing implemented in different software tools. Additionally, applications suchas distribution locational marginal pricing and distributed/decentralized marketclearing further require the underlying mathematical models to be implemented in aconvex manner, which often necessitates the implementation of custom mathematicalformulations. To improve this workflow, MESMO implements interoperationalconvex modeling techniques for electric grids, thermal grids, and DERs, along with aset of optimization-focused utilities.
14

MESMO is intended to complement the existing software in the domain ofdistrict-level energy system simulation and optimization. Therefore, it combines(1) convex multi-energy system modeling for (2) optimization-focused studies onthe operational timescale with a focus on (3) market-clearing and distributionlocational marginal price (DLMP) mechanisms. Essentially, MESMO is developedas a software framework for defining and solving numerical optimization problemsfor multi-energy system operation. It implements convex models for electric grids,thermal grids, and DERs, along with a set of optimization-focused utilities. To thisend, the feature set of MESMO can be summarized as follows:
1. Electric grid modeling
• Obtain nodal/branch admittance matrices and incidence matrices for theelectric grid;
• Obtain steady-state power flow solution for nodal voltage/branchflows/losses via fixed-point algorithm;
• Obtain sensitivity matrices of global/local linear approximate grid model;• All electric grid modeling is fully enabled for unbalanced/multi-phase
grid configuration.
2. Thermal grid modeling
• Obtain nodal/branch incidence matrices and friction factors;• Obtain thermal power flow solution for nodal head/branch
flows/pumping losses;• Obtain sensitivity matrices of global linear approximate grid model.
3. Distributed energy resource (DER) modeling
• Obtain time series models for fixed DERs;• Obtain state-space models for flexible DERs;• Enable detailed flexible building modeling with the Control-Oriented
Thermal Building Model (CoBMo) (Troitzsch and Hamacher 2020).
4. Multi-energy system operation
• Obtain and solve nominal operation problems, i.e., steady-statesimulations, of electric/thermal grids with DERs, i.e., multi-energysystems;
• Define and solve numerical optimization problems for combined optimaloperation for electric/thermal grids with DERs, i.e., multi-energy systems;
15

• Obtain DLMPs for the electric/thermal grids.
Figure 1 depicts a contextual view for the software architecture of MESMO, i.e.,a high-level overview of the most important components and the interaction betweenthe software system and its stakeholders, based on the C4 model (Brown 2015) forrepresenting software architecture.
Researcher[Person]
System planner [Person]
System operator[Person]
Decision maker[Person]
defines
Input files(*.csv)
[Data store]
Application programming Interface(api)
[Module]
models[Module]
dashboard[Module]
plots[Module]
problems[Module]
data_interface[Module]
reads
uses uses uses
uses
MESMO[Software system]
Low-level interfaces High-level interfaces
uses uses
uses
uses
Figure 1. Software architecture of MESMO depicted as a contextual view based onthe C4 model (Brown 2015). Source: Graphic by authors.
The user interfaces can be distinguished into high-level interfaces, i.e., theapi module and the dashboard module, as well as low-level interfaces, i.e., themodels modules. To this end, the api module and models modules describeprogramming interfaces, whereas the dashboard refers to a graphical user interface(GUI). Researchers primarily interface MESMO directly through the models modules,because they require highly granular access and modifiability of the modeled objectsfor custom workflows. System planners and system operators interface MESMOthrough the api module, which provides convenient access to the most commonworkflows, i.e., running of planning/operation problems and producing results plots.Decision makers interface MESMO through the GUI of the dashboard module. Notethat the dashboard module has not yet been implemented at the time of writing.
16

Scenario and model data definitions are enabled through a standardizedCSV-based input file format, which is referred to in Figure 1 as “Input files (*.csv)”.The input files are expected to be defined by researchers, system planners, and systemoperators, where decision makers would rely on these actors to define appropriatescenarios for their review.
Internally, the api module implements API functions that rely on the problemmodule and plots module. The dashboard module implements the GUI frameworkbut relies on the plots module to generate individual plots. The problems moduleimplements the main workflows for setup and solution of different problem types,for which it uses the mathematical models defined in the models modules. Theproblems module also implements a standardized results object across all problemtypes, which is used by the plots module. The models modules further rely on thedata_interface module to obtain the model data definitions from the input files.
MESMO has been utilized for a small number of studies focusing onmulti-energy systems modeling and operation in Kleinschmidt et al. (2021); Scheloet al. (2021) as well as the design of market mechanisms for distribution-level energysystems in Troitzsch et al. (2020, 2021). The initial software architecture iteration ofMESMO was developed as the Flexible Distribution Grid Demonstrator (FLEDGE)in Troitzsch et al. (2019).
2.5. URBS
URBS is an open-source linear energy system model (Dorfner et al. 2019). Itis time-step based, with the default time-step size being 1 h. URBS sets up anoptimization problem in which the objective is the minimization of costs or emissionsin scenarios specified by the user. It is implemented in Python using Pyomo for theformulation of the optimization problem. Various numerical optimization solvers canbe connected to URBS. The user can define various sites (e.g., countries or districts)and specify the following input data for each site:
• Sites (e.g., countries or districts);• Commodities (e.g., gas, coal, electricity) and their market prices;• Processes (i.e., power generators) and their characteristics such as installed
capacity, minimum load factor, efficiency, and costs;• Transmission and storage capacities, and costs;• Time series of demand and intermittent generation;• Demand-side management capacities.
17

Moreover, buying and selling prices for electricity and limits for costs andemissions can be specified, among others. Within the boundaries specified by theuser, URBS determines which generators to use and to what capacity in order tosatisfy the demand in each time step. URBS also decides whether to change theinstalled capacity of the given generators within the set boundaries. The user canalso specify which outputs to be generated in the form of spreadsheets and plots. Foreach scenario, the output of URBS comprises emissions; prices and costs; installed,added, and retired capacities; transmission and storage for each site.
URBS has mostly been used for studies on transmission networks, e.g.,in Europe (Schaber et al. 2012) or the Asia-Pacific region (Huber et al. 2015;Ramachandran et al. 2021; Stich et al. 2014; Stich and Massier 2015). However, it hasalso been used for smaller networks (Fleischhacker et al. 2019; Zwickl-Bernhard andAuer 2021) or specific applications such as managing the integration of intermittentsources of energy or electric vehicles (Massier et al. 2018), with some modifications.Due to its open-source availability, URBS can easily be modified and extended.Recently, uncertainty modeling has been integrated (Stüber and Odersky 2020), andfirst efforts to combine it with life cycle assessment have been made (Ramachandranet al. 2021).
3. Workflows for Test Case Preparation
3.1. Input/Output Specification
Inputs and outputs for different electric grid analysis software are typicallygoverned by the underlying mathematical model specifications that are implementedwithin each tool. Therefore, each tool usually defines custom input and outputformats in line with its internal data models. In this context, inputs refer to thetechnical system and problem parameters that define the test case, i.e., the subjectof the study. Outputs are the results that are obtained after a successful solution ofthe simulation or optimization within the software tool. Tables 2 and 3 outline thedifferent input and output data items for the presented software tools.
Input definitions can be provided either as (1) file-based input in text-basedand table-based format or (2) script-based input. The file-based input is often thedefault avenue, as it allows encoding the complete test case into a single datacontainer. At the same time, the script-based input allows for a more flexible wayof defining and modifying models during runtime. This is an important capabilityfor studies in which custom problem definitions or model coupling is desired. Forexample, MATPOWER can be utilized to iteratively obtain power flow (PF) solutionsthrough continuous modification of model parameters, thereby extending beyond
18

MATPOWER’s base functionality. In order to document their functionality, to allowfor benchmarking, and to serve as tutorials, most software tools provide a bundledset of input data definitions for selected test cases. For the presented tools, theavailable test cases are summarized in Table 4.
Table 2. Input specifications.
MATPOWER GridLAB-D MESMO URBS
Input MATLAB-based format Text-based format b CSV-based format a XLS-based format
Elec
tric
grid
para
met
ers
• Nodes: Nominalvoltage.
• Lines: Nodeconnections,resistance/reactance/capacitance, ratedcurrent limit.
• Transformers: Nodeconnections, phases,ratio, angles, ratedpower,resistance/reactanceparameters.
• Nodes: Nominalvoltage, phases.
• Lines: Nodeconnections, phases,resistance/ reactance/capacitance matrices,rated current limit.
• Transformers: Nodeconnections, phases,connection scheme(wye/delta), ratedpower, resistance/reactance parameters.
• Line and transformerparameters areencapsulated into linetype and transformertype definitions.
• Nodes: Nominalvoltage, phases.
• Lines: Nodeconnections, phases,resistance/reactance/capacitance matrices,rated current limit.
• Transformers: Nodeconnections, phases,connection scheme(wye/delta), ratedpower, resistance/reactance parameters.
• Line and transformerparameters areencapsulated into linetype and transformertype definitions.
• Lines: Nodeconnections, efficiency,reactance, voltageangle, base voltage,installed capacity, andminimum andmaximum permittedcapacity for expansionplanning.
DER
para
met
ers
• N.A.
• Connection: Node,phases, connectionscheme (wye/delta),nominal active/reactivepower.
• Fixed DERs: Dispatchtime series.
• Flexible DERs:Equivalent thermalparameters inputs suchas thermal resistanceand thermalcapacitance of thermalelectric loads; Batterymodel parameters suchas inverter ratings,operation strategy.
• Connection: Node,phases, connectionscheme (wye/delta),nominal active/reactivepower.
• Fixed DERs: Dispatchtime series.
• Flexible DERs: Detailedstate-space modelparameters, e.g.,thermal buildingparameters, batterymodel parameters, EVcharger efficiencies,generator modelparameters.
• Connection: DERs areaggregated in the sitesthey are located in.
• Time series: Fixed foreach site (demand andintermittent supply).
• Demand-sidemanagement: Can bespecified for eachcommodity.
Cos
tpa
ram
eter
s • Operation costs: Pricevalue.
• Customizable costfunctions.
• Tariff type based oncustomer class.
• Operation costs: Energyprice time series, pricesensitivity.
• Investment, fixed,variable, and fuel costsof processes, storage,transmission, weightedaverage cost of capital,depreciation periods,CO2 abatement costs.
a MESMO input data reference: https://purl.org/mesmo/docs/0.5.0/data_reference.html(accessed on 25 August 2021). b Base script format is .glm, whereas additional inputfiles could be .txt, .csv, etc. For an introduction to input/output of GridLAB-D referto: http://gridlab-d.shoutwiki.com/wiki/GridLAB-D_Wiki:GridLAB-D_Tutorial_Chapter_4_-_Data_Input_and_Output (accessed on 25 August 2021). c For more information on DER parametersrefer to: http://gridlab-d.shoutwiki.com/wiki/Residential_module_user%27s_guide (accessedon 25 August 2021). Source: Table by authors.
19

Table 3. Output specifications.
MATPOWER GridLAB-D MESMO URBS
Input CSV-based format XLS-based format
Elec
tric
grid
resu
lts
• State variables: Nodalvoltage magnitude,nodal voltage angles,branch power flow,total losses,single-branch losses.
• State variables:Per-phase voltagemagnitude, nodalvoltage angles, branchpower flow, total losses,single-branch losses, andreactive power flows.
• State variables timeseries: Per-phase nodalvoltage, branch powerflow, total losses.
• Capacities: Initial andnewly installed(processes, transmission,storage, etc.).
• Time series of importand export (i.e.,transmission betweensites) of electricity.
DER
resu
lts
• N.A.
• Temperature evolutionand dispatch time seriesof thermostaticallycontrolled loads andactive/reactive powerinjection by batteries.
• Fixed DERs: Dispatchtime series.
• Flexible DERs: Dispatchtime series, detailedstate/control variabletime series.
• Time series of electricitygeneration by processper time step, emissionsby generator per timestep, storage utilization,demand-sidemanagement, etc.)
Cos
tres
ults
• System-level costs.• DLMP values.
• Billing results ofcustomers with differentclasses, energy costs etc.
• System-level /DER-level operationcosts.
• DLMP time series,decomposed intocongestion, voltage, loss,and energy components.
• Costs: Total investment,fixed and variable costsof processes, storage,transmission, fuel costs.
• Emissions: Totalemissions (CO2 andothers if specified).
Source: Table by authors.
Table 4. Included test cases.
MATPOWER a GridLAB-D b MESMO URBS
Ava
ilabl
ete
stca
ses
• Small TransmissionSystem Test Cases
• Small DistributionSystem Test Cases
• Synthetic Grid TestCases
• European System TestCases
• French System TestCases
• Small-scaledistribution systemtest cases (e.g., IEEE4-Node and IEEE37-Node systems)
• A medium-scale testsystem withresidential models totest DER modelingcapabilities
• IEEE 8500-Node testsystem
• Small-scaledistribution test cases(e.g., IEEE 4-Node,Singapore 6-Node)
• Medium-scaledistribution test case(Singapore Geylang,see Section 4)
• Multi-energy systemtest case (SingaporeTanjong Pagar)
• Fictitious three-regionexample (Dorfner et al.2019)
• The 16 states ofGermany connected toa few other regions(Dorfner et al. 2019)
• HVDC connectionbetween Australia andSingapore (Siala 2021b)
• Mekong region (Siala2021a)
• Southeast Asia (Sialaet al. 2021)
a Refer to Zimmerman and Murillo-Sánchez (2019) for more information for individual testcases. b MESMO test cases are currently located in the data directory of the MESMO repositoryhttps://purl.org/mesmo/repository (accessed on 25 August 2021). Source: Table by authors.
Outputs can similarly be obtained either as (1) file-based format or (2) runtimeobjects. The former can include basic, text-based and table-based outputs, as wellas more sophisticated data visualization in image-based formats, e.g., through theintegrated plotting capabilities of MESMO and URBS. Runtime objects are data
20

containers that cater to custom post-processing workflows of the user and enablecoupling with other software tools. Such workflows for software coupling are furtherdiscussed in the context of TESP in Section 3.3.
Since each software typically defines custom data formats, the user eventuallyends up preparing dedicated pre-processing and post-processing workflows foreach tool. In order to reduce the upfront effort for test case input data preparation,conversion between common data formats may be possible through third-partytranslation tool chains, e.g., by means of GridAPPS-D, according to Section 3.2. Inthe long term, input/output data are foreseen to converge towards the CommonInterface Model (CIM), i.e., the standardized format for electric grid models accordingto IEC 61970/61968.
3.2. Model Conversion via GridAPPS-D
GridAPPS-D (Melton et al. 2017; Pacific Northwest National Laboratory 2021a)is a software tool that handles model input and output conversions, which enablesutilizing multiple models to build new application workflows; see Figure 2.
Application
Standars Based (CIM etc.) Data
Tools: Power flow,Optimization, etc.
I/O: Data modelsand
Data Interfaces
Developmentutilities
Districution Simulator (GridLAB-D, OpenDSS, etc.)
Commercialtools
Figure 2. Overview of the software architecture of GridAPPS-D. Source: Graphicby authors, information adapted from (Melton et al. 2019).
For the test case preparation of this chapter, we utilized the CommonInformation Model Hub (CIMHub) to demonstrate one of the key capabilities ofGridAPPS-D, i.e., the transformation of grid models across various data formats.CIMHub, as shown in Figure 3, is a module of GridAPPS-D that translates powerdistribution network models between different tools using the IEC 61970/61968Common Interface Model (CIM) as a hub. CIMHub can convert models from
21

commercial tools such as CYMDist to open-source research-grade tools such asOpenDSS and GridLAB-D. The supported inputs are CYMDist, CIM XML, OpenDSS,and Synergi Electric for distribution networks. The supported output formats areOpenDSS, GridLAB-D, and comma-separated value (CSV) for distribution systems.CIMHub can also be used to develop and propose extensions to the CIM standard.
CYMDISTSynergi
OpenDSS
Feeder Modelsfrom Utilities
CIMHub
Open sourceSimulators
GridLAB-DOpenDSS
Figure 3. Power distribution network model conversion workflow via CIMHub.Source: Graphic by authors.
One goal of the GridAPPS-D program is to encourage CIM adoption by manytool vendors, lowering the burden of model conversion and other costs of integration.Details describing the overall project and the CIM transformer model can be found inMelton et al. (2017), whereas CIM unbalanced line model and database are explainedin McDermott et al. (2018). CIMHub is open source under the Berkeley SoftwareDistribution (BSD) license.
3.3. Co-Simulation via TESP
With the utilities developed to bring models from CIM to common distributiongrid analysis software, a co-simulation platform can be utilized to run legacy softwarein an integrated fashion (Huang et al. 2018). An example of such a co-simulationplatform is given in Figure 4, called the Transactive Energy Simulation Platform(TESP). Summarizing the functionality of TESP briefly, various utilities are utilized totranslate the passive distribution grid into an active one by adding interactive DERs inthe GridLAB-D distribution grid model, e.g., using the feederGenerator.py (PacificNorthwest National Laboratory 2021b). The feederGenerator.py script providesa systematic way of changing the distribution grid passive loads to responsivebuildings, modeled using an equivalent thermal parameter approach from Tayloret al. (2008). This is important, as this makes the distribution grid load responsive
22
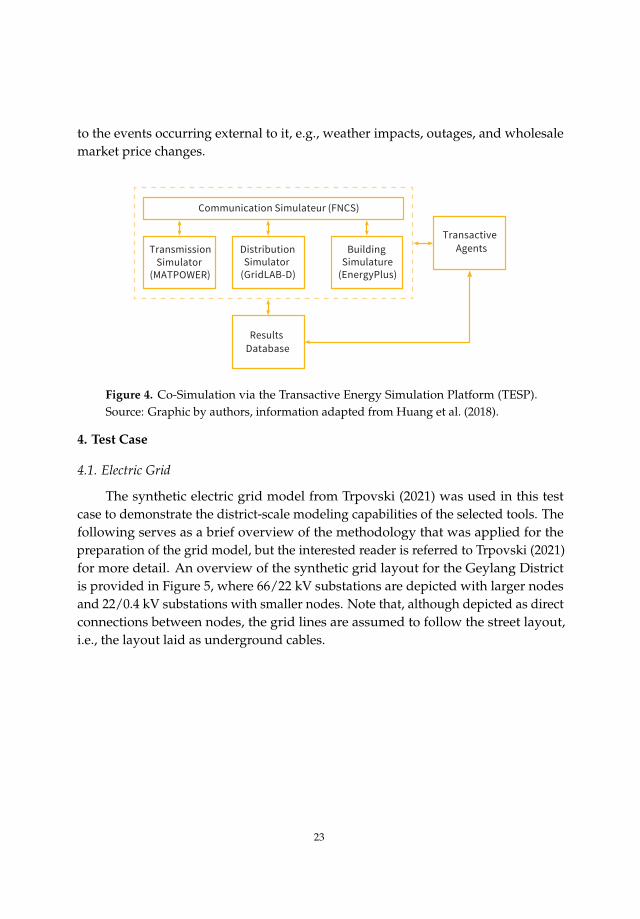
to the events occurring external to it, e.g., weather impacts, outages, and wholesalemarket price changes.
Communication Simulateur (FNCS)
TransmissionSimulator
(MATPOWER)
DistributionSimulator
(GridLAB-D)
ResultsDatabase
TransactiveAgentsBuilding
Simulature(EnergyPlus)
Figure 4. Co-Simulation via the Transactive Energy Simulation Platform (TESP).Source: Graphic by authors, information adapted from Huang et al. (2018).
4. Test Case
4.1. Electric Grid
The synthetic electric grid model from Trpovski (2021) was used in this testcase to demonstrate the district-scale modeling capabilities of the selected tools. Thefollowing serves as a brief overview of the methodology that was applied for thepreparation of the grid model, but the interested reader is referred to Trpovski (2021)for more detail. An overview of the synthetic grid layout for the Geylang Districtis provided in Figure 5, where 66/22 kV substations are depicted with larger nodesand 22/0.4 kV substations with smaller nodes. Note that, although depicted as directconnections between nodes, the grid lines are assumed to follow the street layout,i.e., the layout laid as underground cables.
23

Figure 5. Synthetic grid layout for the Geylang District in Singapore. Source:Graphic by authors.
The synthetic grid was derived based on information for (1)postal-code-clustered demand estimates and (2) 66/22 kV substation locations.Since every building block in Singapore is assigned an individual postal code,this served as a relatively detailed input for generating the 22 kV load clusters.A power system planning approach was devised to obtain the mapping and linelayout between 66/22 kV substations and 22/0.4 kV substations, i.e., transformers at22 kV load clusters. For the presented test case, the substation rating was assumedto be in 100 MVA units for 66/22 kV transformers and 1 MVA units for 22/0.4 kVtransformers. This means that the minimum transformer rating for 22/0.4 kV was
24

1 MVA, and an appropriate integer value of transformers was deployed dependingon the aggregate peak load at each 22/0.4 kV substation, where maximum utilizationof 0.9, i.e., a safety factor of 1.11, was assumed for the transformer rating. Thebaseload time series was homogeneously defined for all 22 kV load clusters based ona representative load shape from the aggregate demand data for Singapore, which ispublished, along with price data, by the EMC at Energy Market Company (2021).
The final test case for the Singapore Geylang District comprised 4 subnetworksof the 22 kV distribution grid, where each subnetwork was connected to exactlyone 66/22 kV substation. The total network consisted of 391 nodes and 387 lines.The lines of the synthetic grid were characterized by two line types, which definedelectric parameters and current-carrying capacity, as documented in Table 5. Bothline types represented underground cables, and their parameter values were basedon cable supplier information, as outlined in Trpovski (2021).
Table 5. Electric line types.
Line Type Max. Current Resistance Reactance
Type A 585 A 0.23 Ω km−1 0.325 Ω km−1
Type B 455 A 0.39 Ω km−1 0.325 Ω km−1
Source: Table by authors.
4.2. Building Models
The overview of the inputs, methods, and outputs for processing the feeder toattach flexible DERs to the passive loads is given in Figure 6. From the providedinputs, the stages to change the passive loads to an active one, i.e., loads that candynamically change response based on external (weather) and internal (temperature)variables are shown. The workflow is as follows:
1. First, back-bone feeders with information on substations, lines, and loads wereinputted in GLM format.
2. The module used the networkx Python package to perform graph-basedcapacity analysis and upgrades relevant protection equipment such as fuses,transformers, and lines to serve the expected load. For example, transformerscan be oversized with a margin of 20%, and the circuit breaker to the airconditioner can be rated 2 times the nominal electrical load.
3. Each load was then changed to contain ZIP load, plug loads schedules, andthermostatically controlled load, as intended with the percentage population.
25

For example, 40% thermostatically controlled load penetration would result inconvergence of only 40% load to thermodynamic models, and the rest wouldbe left as fixed loads with a time series, which could be modified to changetheir load shape.
4. For each thermostatically controlled load, the equivalent thermal propertiesparameter (Taylor et al. 2008) were randomized to represent a certain populationof devices.
• Back-bone feeder model (GLM file)• Feeder primary line-to-line vottages• Feeder primary line-to-neutral voltages
• Average residential building loads• Average commercial building loads
Taxanomy Feeder Process
• Replace load with building models and DERs
• Upgrade transformers and fuses as needed
Feeder model withdynamic building loads
Figure 6. Building model generation workflow with feederGenerator.py. Source:Graphic by authors, information adapted from Pacific Northwest NationalLaboratory (2021b).
4.3. EV Chargers
Figure 7 highlights the main steps for the derivation of the EV charger modelsfor private EV charging. First, historical car park availability data was used to deriverepresentative vehicle inflow and outflow time series for existing car parks in thestudy area through probabilistic modeling. Second, a car park charging simulationwas computed based on the representative vehicle inflow, outflow, EV penetration,and EV/charger parameters. This served to obtain the required input time series forthe definition of fixed EV chargers and flexible EV chargers in MESMO.
EV penetration,EV / chargerparameters
Carparkcharging
simulation
Representativeinflow / outflow
time series
Vehicle inflowmodelling
Historical carparkavailability
Fixed / flexiblecharger model
time series
Figure 7. Workflow for EV charger demand modeling. Source: Graphic by authors.
26

The main input data items for the synthetic EV charger demand modelingwere (1) the historical car park availability and (2) car park capacity. Both inputswere obtained from the LTA Datamall API (Land Transport Authority 2021b), whichcontains a selection of public residential, commercial, and mixed-use car parksin Singapore, particularly at public housing developments, government-operatedgeneral public car parks, and large-scale mixed-use developments, e.g., malls withattached office blocks. The input data was recorded at 10 min intervals betweenSeptember 2018 and March 2020. Additional technical model parameters for EVsand chargers are defined in Table 6. In this test case, four EV penetration scenarioswere considered: 0% (baseline scenario), 25%, 75%, and 100%.
Table 6. Electric line types.
Parameter Value Source
Private car population (Singapore) 520,000 (Land Transport Authority 2020a, 2020b)
Vehicle driving distance (Singapore), mean value 48 km d−1 (Land Transport Authority 2021a)
Vehicle driving distance (Singapore), standard deviation 16 km d−1 Assumed
EV energy consumption 170 W h km−1 (EV Database 2021)
Charger efficiency 95% Assumed
Charger power factor 0.95 Assumed
Slow charger active power 7.4 kW Assumed
Slow charger share 75% Assumed
Fast charger active power 50 kW Assumed
Fast charger share 25% Assumed
Source: Table by authors.
4.4. Photovoltaic Generators
Photovoltaic (PV) generation potentials were estimated for this test case todemonstrate the ability of URBS for determining the cost-optimal deploymentof renewable generators. To this end, PV generators were not directly modeled,but instead, the generation potential was estimated for each node of the electricgrid. Importantly, PV deployment was assumed only at building surfaces, as theconsidered test case was based in an urban environment. Therefore, in the firststep, the horizontal building surfaces were obtained from geographical informationsystem (GIS) data for the building polygons in the test case area. In the second step,the PV generation potential at individual buildings was estimated from the availablesurface area and historical solar irradiation data for Singapore. Third and last, the PVgeneration potential of each building was mapped to the corresponding node of the
27

synthetic electric grid. Input data items for this workflow were (1) the GIS data forbuilding polygons and (2) the historical solar irradiation time series for Singapore.The former was obtained from Open Street Map through the Overpass API, based onthe data in August 2021. The total installable PV capacity in the study area amountsto 2023 MW. Half-hourly time series of solar irradiance in Singapore were used.
Costs for rooftop PV system installations in Singapore were taken from SolarEnergy Research Institute of Singapore (SERIS) (2020). For a high-efficiency systemof more than 1 MWp, a cost of ca. SGD 0.92 per W (USD 0.68 per W) was reported for2021. For smaller systems (below 600 kWp), the reported cost was USD 0.74 per W,and for below 300 kWp, it was USD 0.95 per W.
4.5. Other Generators and Demand
Information on electricity generation capacity by generator type in Singaporewas taken from Energy Market Authority (2020a). The installed capacity of thedifferent generator types is listed in Table 7. These do not include the potential PVcapacity in Geylang. Cost efficiencies of power plants in Singapore were obtainedfrom Lacal Arantegui et al. (2014). They are given in Table 8.
The half-hourly electricity demand of Singapore was taken from Energy MarketAuthority (2020b), which is made available under the terms of the Singapore OpenData Licence version 1.01
Table 7. Installed capacity of existing generators in Singapore.
Generator Installed Capacity (GW) Efficiency (%)
Gas (CCGT) 10.50 59
Gas (OCGT) 0.18 40
Gas (steam turbine) 2.06 38
Oil 0.49 38
Waste-to-energy 0.26 28
PV 0.17 16
Source: Table by authors, values based on Energy Market Authority (2020a).
1 https://www.ema.gov.sg/Terms_of_use.aspx (accessed on 25 August 2021).
28

Table 8. Fuel prices.
Fuel Price (USD/MWh)
Gas 31
Oil 40
Waste 12
Biomass 6
Source: Table by authors, values based on Lacal Arantegui et al. (2014).
5. Results
5.1. MATPOWER
This part of the study utilizes the load flow analysis from MATPOWER to studythe impact on the electrical grid from different EV penetration levels. The result isshown in Figure 8, where the indicators are the branch losses and voltage profile at22 kV distribution lines in the Geylang test case. It is worth noting that the voltagedrop increases linearly to the additional peak demand from EV charging power,whereas losses increase exponentially to the additional EV charging demand.
1.02
1
0.98
0.96
0.94
0.92
0.90 50 100 150 200 250 300 350 400
volta
ge p
rofil
e (p
.u)
node index
nominal operation - voltage profile - 22 kV
25% EV penetration - voltage profile - 22 kV
100% EV penetration - voltage profile - 22 kV
Figure 8. Cont.
29

50
40
30
20
10
00 50
bran
ch lo
ss (M
Wh)
100 150 200 250 300 350 400
branch index
nominal operation - voltage profile - 22 kV
25% EV penetration - voltage profile - 22 kV
100% EV penetration - voltage profile - 22 kV
Figure 8. Voltage profile and branch losses for different scenarios fromMATPOWER. Source: Graphic by authors.
5.2. GridLAB-D
Figure 9 shows the feeder load profile of the grid, which has been shown tocontain thermostatically controlled loads. For the sake of simulation, we populated525 houses with an average 3 kW load. We can observe the capability of thedisaggregating contribution of thermostatically controlled load from the total load ofthe feeder.
Furthermore, one can select one of the thermostatically controlled loads from thepopulation and plot its internal variables, such as temperature evolution, setpoints,and load; see Figure 10. Note that in Figure 10, the cooling of two buildings is shownby plotting the aggregated temperature of the room. For both buildings, note thataggregated temperature decreases with an increase in consumption, showing thepowering of the air-conditioner and staying close to its set point.
30

2.00
1.75
1.50
1.25
1.00
0.75
0.50
0.25
32
30
28
26
24
22
08-10 00 08-10 12 08-11 00 08-11 12 08-12 00 08-12 12 08-13 00
Feeder Load
Days
MW
MW
Aggregated HVAC Load Aggregated Total Load
Figure 9. Feeder load profile—averaged over 5 min. Source: Graphic by authors.
Avg. HVAC LoadSet Pt.
08-10 00 08-10 12 08-11 00 08-11 12Days
Temperature
Building 1
Building 2
08-12 12 08-13 0008-12 00
72
72
71
Deg
FkW
Deg
FkW
71
70
70
69
69
68
68
0
0
1
2
3
4
5
1
2
3
4
Figure 10. Building temperature and consumption—averaged over 5 min. Source:Graphic by authors.
31

5.3. MESMO
For the uncontrolled charging scenario, Figure 11, in its lower portion, depictsthe cumulative distribution of substation transformer utilization in the test casearea. The upper portion of Figure 11 describes the distribution of the transformerutilization with a box plot. The utilization level is calculated as the ratio of peakloading to the rated loading of the transformers. Recall from Section 4.1 that 22/0.4 kVtransformers are assumed to occur in 1 MVA units. To this end, a large proportion,i.e., as much as 85% of transformers experience between 0.1 and 0.3 utilization in thebaseline scenario (0% EVs) because load clusters can be significantly smaller than1 MVA in the synthetic grid. In the baseline scenario, nearly 100% of substations areloaded below 0.9, where the median utilization occurs at approx. 0.11 and the meanutilization at approx. 0.21. With increasing EV penetration, the share of substationtransformers loaded below 0.9 falls to approx. 94% for 25% EVs and below 90% forboth 75% and 100% EVs. The median substation utilization increases to approx. 0.15and remains constant across the higher penetration levels, since the substations withallocated charging demand occur consistently above the median level. The meanutilization increases proportionally to the EV penetration level, i.e., up to approx. 0.5.Note that the plot is truncated at the utilization level 1.0 for consistency, althoughhigher-level EV penetration scenarios can cause significant overloading of selectedtransformers due to the highly localized nature of these loads.
0
0
10.90.80.70.60.50.40.30.20.1
0
0.1
Cum
ulat
ive
prop
ortio
n
Maximum transformer utilization (p.u.)
0.1
0.2
0.2
0.3
0.3
0.4
0.4
0.5
0.5
0.6
0.6
0.7
0.7
0.8
0.8
0.9
0.9
1
1
Baseline scenario
25% EVs (uncontrolled)
75% EVs (uncontrolled)
100% EVs (uncontrolled)
Figure 11. Substation transformer utilization for uncontrolled charging. Source:Graphic by authors.
32

Figure 12 depicts a comparison of the substation utilization for smart chargingand uncontrolled charging across the different EV penetration levels. For 25% EVs,the smart charging increases the share of transformers loaded below 0.9 from approx.94% to approx. 99%, and the mean utilization is decreased by approx. 0.08. Forhigher penetration levels, the benefit of smart charging reduces proportionally. At100% EVs, the share of transformers loaded below 0.9 only increases by approx. 1%,although mean utilization decreases by approx. 0.08, i.e., similar to 25% EVs and 75%EVs. This behavior is due to the very high peak load at local substations, i.e., even asignificant flattening of demand peaks still leads to highly overloaded substations inthe 100% EV penetration scenario.
0
0
10.90.80.70.60.50.40.30.20.1
0
0.1
0.1
0.2
0.2
0.3
0.3
0.4
0.4
0.5
0.5
0.6
0.6
0.7
0.7
0.8
0.8
0.9
0.9
1
1
Cum
ulat
ive
prop
ortio
n
Maximum transformer utilization (p.u.)
Baseline scenario
25% EVs (smart charging)
25% EVs (uncontrolled)
Figure 12. Cont.
33

0
0
10.90.80.70.60.50.40.30.20.1
0
0.1
0.1
0.2
0.2
0.3
0.3
0.4
0.4
0.5
0.5
0.6
0.6
0.7
0.7
0.8
0.8
0.9
0.9
1
1
Cum
ulat
ive
prop
ortio
n
Maximum transformer utilization (p.u.)
Baseline scenario
75% EVs (smart charging)
75% EVs (uncontrolled)
0
0
10.90.80.70.60.50.40.30.20.1
0
0.1
0.1
0.2
0.2
0.3
0.3
0.4
0.4
0.5
0.5
0.6
0.6
0.7
0.7
0.8
0.8
0.9
0.9
1
1
Cum
ulat
ive
prop
ortio
n
Maximum transformer utilization (p.u.)
Baseline scenario
100% EVs (smart charging)
100% EVs (uncontrolled)
Figure 12. Substation transformer utilization for smart charging. Source: Graphicby authors.
34

5.4. URBS
For URBS, we set up a model with the parameters defined in Sections 4.4 and 4.5.The model consisted of the grid defined in Section 4.1 plus one additional noderepresenting the “rest of Singapore”, with its demand and its fossil generators. Eachof the four 66/22-kV substations was connected to this additional node since the gridof the test case was divided into four isolated subgrids. Electricity can be transmittedboth ways between Geylang and the rest of Singapore. The transmission capacity ofthe lines between the four entry points to the Geylang grid and the rest of Singaporewas set sufficiently high to allow for unrestricted power exchange, which is realisticgiven the high robustness of Singapore’s grid.
In this case study, PV and electric vehicle chargers could be installed in Geylangonly. URBS could decide to increase the transmission capacity of the existing gridlines in the Geylang network if needed. We defined four scenarios with regard toPV and EV chargers to be deployed in Geylang, with Scenario 1 being the referencescenario. See Table 9.
Table 9. Scenarios in URBS. Scenario 1 is the reference scenario.
Scenario PV EV Chargers
1 no no
2 yes no
3 no yes
4 yes yes
Source: Table by authors.
The reference scenario was to test the feasibility of the model, i.e., whether thedemand could be satisfied in every time step and whether the existing distributioncapacity was sufficient. The costs and emissions of the system were determined aswell.
For scenarios 2 and 4, we analyzed how much PV power and additional linecapacity URBS decided to install for different costs of PV systems ranging fromUSD 0.70 per W to USD 0.85 per W. In these scenarios, all PV must be integrated.The results are displayed as subscenarios a, b, c, and d. A typical day regarding thesolar insolation profile in Singapore with an average irradiance of 363 W m−2 duringdaytime and a maximum irradiance of 815 W m−2 was chosen for the study. URBSdetermines the cost-optimal solution taking into account costs of fossil generation,
35

PV installations, and grid upgrades. The lower the price, the higher the installed PVand additional installed distribution capacity.
For scenarios 3 and 4, we chose the fixed EV charging case with and EVpenetration of 100%.
In the reference scenario, no additional transmission lines were built. Hence, thetest case is feasible. The amount of installed PV and additional transmission capacityfor all other scenarios, as well as resulting cost and emission reduction, comparedwith the reference scenario, are shown in Table 10. For the lowest PV price, the modelinstalls more than 1700 MW of the maximum possible amount of 2023 MW of PV. Thenew install grid capacity is up to almost 4200 MW for the highest value of installedPV capacity. This number does not depend significantly on the EV penetration of 0 or100% with fixed charging. Note that in scenario 3, without PV, an additional 150 MWof grid capacity is installed in order to supply the EV charging demand, while thedifference of installed grid capacity between cases 2 and 4 is lower than that, whichmeans that some of the PV power can be used directly to charge EVs.
Table 10. URBS scenarios showing installed PV capacity and additional gridcapacity for different prices of PV systems and EV penetration levels of 0 or 100%.
Scen. PV Inst. Cost EV Penetr. Inst. PV Cap. New Grid Cap. Cost. Red. Em. Red.
— (USD/W) (%) (MW) (MW) (%) (%)
1 — 0 0 0 0 0
2a 0.85 0 970 780 0.16 2.75
2b 0.80 0 1290 1820 0.30 3.62
2c 0.75 0 1580 2640 0.47 4.14
2d 0.70 0 1710 4170 0.67 4.77
3 — 100 0 150 −0.59 −0.59
4a 0.85 100 1020 870 −0.40 2.31
4b 0.80 100 1340 1900 −0.26 3.17
4c 0.75 100 1510 2690 −0.08 3.63
4d 0.70 100 1720 4060 0.12 4.22
Source: Table by authors.
Cost savings are marginal. When PV is installed, fuel costs decrease since lesspower from fossil fuels is required, but investment and fixed cost of PV and newgridlines are about as high as the savings. For scenarios 3, 4a, 4b, and 4c, a slightcost increase can be observed. Overall CO2 emission reduction in Singapore’s power
36

generation is up to almost 5%, depending on the amount of PV installed. Due to theadditional demand caused by EVs, the emission reduction is lower in scenario 4 andnegative in scenario 3, where installation of PV is not allowed.
Figure 13 shows the demand and PV generation in Geylang for one day withoutand with EV charging. The pattern under the blue demand curve depicts the demandcovered by fossil fuels. The white part is covered by PV. The pattern under the redPV curve depicts the amount of PV exported to the rest of Singapore. For both withand without EV charging, the curves appear similar. During the day, when power isgenerated by PV, the share of demand in Geylang covered by PV is 88% without EVcharging and 88% with EV charging. EV chargers are only connected at 43 nodes,while URBS decided to install PV at 302 nodes, such that PV supply and EV chargingdemand are not necessarily matched, and installing additional grid capacity is costly.
1750
1500
1250
1000
750
500
250
00 04
Pow
er (M
W)
Time of day (h)
Demand on PV generation without (left ) and with (right) EV charging
Time of day (h)48 812 1216 1620 2024 24
Demand PV generation
Figure 13. Demand (dark orange) and PV generation (light orange) in Geylangwithout (left) and with (right) EV charging. The dark orange area depicts the shareof the demand that has to be supplied from Singapore’s fossil fuel power plants,while the white area under the dark orange curve represents the amount suppliedby PV. The light orange pattern depicts the amount of solar PV that is exportedto the rest of Singapore where it replaces fossil generation. Source: Graphic byauthors.
6. Discussion
The presented results underline the key capabilities of each of the software tools.For district-scale electric grids, these capabilities can be summarized as follows:
37
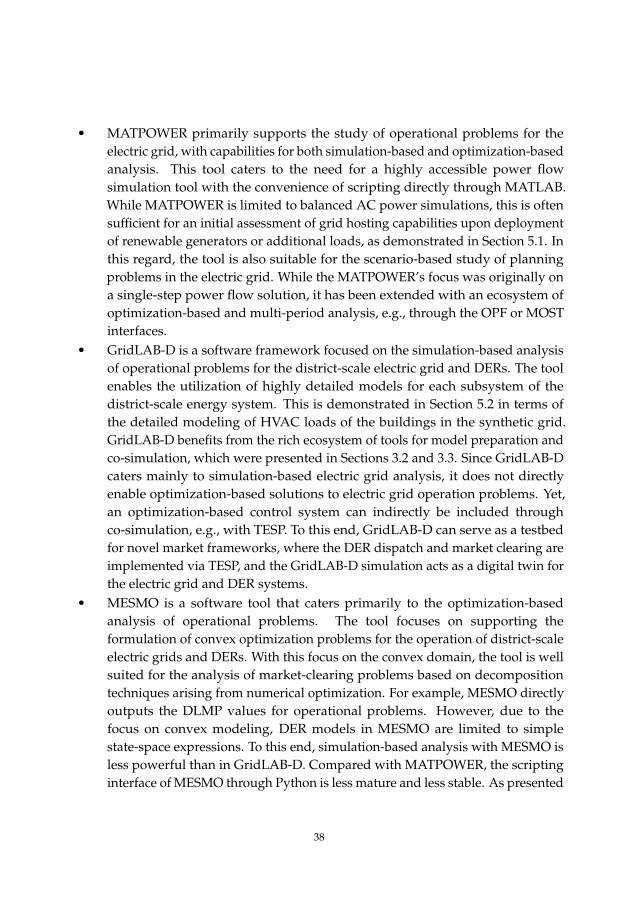
• MATPOWER primarily supports the study of operational problems for theelectric grid, with capabilities for both simulation-based and optimization-basedanalysis. This tool caters to the need for a highly accessible power flowsimulation tool with the convenience of scripting directly through MATLAB.While MATPOWER is limited to balanced AC power simulations, this is oftensufficient for an initial assessment of grid hosting capabilities upon deploymentof renewable generators or additional loads, as demonstrated in Section 5.1. Inthis regard, the tool is also suitable for the scenario-based study of planningproblems in the electric grid. While the MATPOWER’s focus was originally ona single-step power flow solution, it has been extended with an ecosystem ofoptimization-based and multi-period analysis, e.g., through the OPF or MOSTinterfaces.
• GridLAB-D is a software framework focused on the simulation-based analysisof operational problems for the district-scale electric grid and DERs. The toolenables the utilization of highly detailed models for each subsystem of thedistrict-scale energy system. This is demonstrated in Section 5.2 in terms ofthe detailed modeling of HVAC loads of the buildings in the synthetic grid.GridLAB-D benefits from the rich ecosystem of tools for model preparation andco-simulation, which were presented in Sections 3.2 and 3.3. Since GridLAB-Dcaters mainly to simulation-based electric grid analysis, it does not directlyenable optimization-based solutions to electric grid operation problems. Yet,an optimization-based control system can indirectly be included throughco-simulation, e.g., with TESP. To this end, GridLAB-D can serve as a testbedfor novel market frameworks, where the DER dispatch and market clearing areimplemented via TESP, and the GridLAB-D simulation acts as a digital twin forthe electric grid and DER systems.
• MESMO is a software tool that caters primarily to the optimization-basedanalysis of operational problems. The tool focuses on supporting theformulation of convex optimization problems for the operation of district-scaleelectric grids and DERs. With this focus on the convex domain, the tool is wellsuited for the analysis of market-clearing problems based on decompositiontechniques arising from numerical optimization. For example, MESMO directlyoutputs the DLMP values for operational problems. However, due to thefocus on convex modeling, DER models in MESMO are limited to simplestate-space expressions. To this end, simulation-based analysis with MESMO isless powerful than in GridLAB-D. Compared with MATPOWER, the scriptinginterface of MESMO through Python is less mature and less stable. As presented
38

in Section 5.3, MESMO is suitable for the analysis of flexibility potentials inDERs of the electric grid, which is enabled through the highly customizablerange of DER models without requiring external model coupling. Note thatMESMO also supports the analysis of multi-energy systems, e.g., in terms ofthermal grids.
• URBS is a toolbox that is heavily focused on the optimization-based analysis ofboth planning and operation problems. Hence, it is the only one of the presentedtools which directly addresses planning problems. Similar to MESMO, URBSfocuses on convex modeling of the electric grid and DERs, although the modelsare significantly more simplified with a focus on capturing capacity constraints.As presented in Section 5.4, URBS can be employed for determining the optimaldeployment of renewable generation, where emission reduction and otherobjectives can be considered in addition to conventional cost minimization.
Although there is an overlap in the capabilities of the presented tools, thereis currently no comprehensive solution that covers the complete feature set forelectric grid analysis. Particularly, there is a trade-off between optimization-basedtools, which are typically restricted in modeling detail, and simulation-based tools,which favor modeling detail over convex mathematical formulations. This highlightsthe importance of clarifying the focus of electric grid studies with stakeholdersin advance to identify a specific set of features expected for the chosen softwareplatform.
7. Conclusion
This chapter discussed the role of open-source software frameworks in thetransition towards affordable electricity. To this end, the chapter introduced thedifferent problem types and requirements for electric grid analysis in the context ofstudies for the integration of novel DERs, such as renewable generators, EV chargers,flexible loads, and energy storage systems. Along with this, a representative set ofopen-source tools and their feature sets were introduced and compared. This servedto identify and differentiate the key use cases for different software frameworks. Themain functionalities of each tool were demonstrated for a synthetic electric grid testcase based in Singapore. To conclude, this chapter, and Section 6 in particular, isintended as a guideline to open-source tools for various electric grid simulation andoptimization applications.
Author Contributions: Conceptualization, S.T., S.H.; software, S.T., S.H., K.Z., B.A.B.; formalanalysis, S.T., S.H., K.Z., T.M.; data curation, S.T., S.H., T.M., B.A.B.; writing–original draftpreparation, S.T., S.H.; writing–review and editing, S.T., T.M., K.Z., B.A.B., A.A., M.J.A.;
39

visualization, S.T., S.H., T.M.; All authors have read and agreed to the published version of themanuscript.
Funding: This work was financially supported by the Singapore National Research Foundationunder its Campus for Research Excellence and Technological Enterprise (CREATE) program.
Data Availability Statement: The test case definitions for GridLAB-D, MESMO and urbs(see Section 4) are available open-source, online at: https://github.com/mesmo-dev/testcase_transition_towards_affordable_electricity_2022 (accessed on 4 April 2022).
Acknowledgments: The authors would like to thank Andrej Trpovski, who developed thesynthetic distribution grid model for Singapore (Trpovski 2021) that forms the basis for thetest case presented in this work.
Conflicts of Interest: The authors declare no conflict of interest.
References
Atabay, Dennis. 2017. An open-source model for optimal design and operation of industrialenergy systems. Energy 121: 803–21. [CrossRef]
Brown, Simon. 2015. Software Architecture for Developers—Visualise, Document and Explore YourSoftware Architecture. Victoria: Leanpub, vol. 2.
Chassin, David P., Jason C. Fuller, and Ned Djilali. 2014. GridLAB-D: An agent-basedsimulation framework for smart grids. Journal of Applied Mathematics 2014: 1–12.[CrossRef]
Chassin, David P., Kevin Schneider, and Clint Gerkensmeyer. 2008. GridLAB-D: Anopen-source power systems modeling and simulation environment. Paper presented atthe 2008 IEEE/PES Transmission and Distribution Conference and Exposition, Chicago,IL, USA, 21–24 April 2008, pp. 1–5.
Cho, Youngchae, Takayuki Ishizaki, Nacim Ramdani, and Jun-ichi Imura. 2019. Box-basedtemporal decomposition of multi-period economic dispatch for two-stage robust unitcommitment. IEEE Transactions on Power Systems 34: 3109–18. [CrossRef]
Coffrin, Carleton, Russell Bent, Kaarthik Sundar, Yeesian Ng, and Miles Lubin. 2018.PowerModels.Jl: An open-source framework for exploring power flow formulations.Paper presented at the IEEE 2018 Power Systems Computation Conference (PSCC),Dublin, Ireland, 11–15 June 2018, pp. 1–8.
Després, Jacques, Nouredine Hadjsaid, Patrick Criqui, and Isabelle Noirot. 2015. Modelling theimpacts of variable renewable sources on the power sector: Reconsidering the typologyof energy modelling tools. Energy 80: 486–95.
Dorfner, Johannes, Konrad Schönleber, Magdalena Dorfner, sonercandas, froehlie, smuellr,dogauzrek, WYAUDI, Leonhard-B, lodersky, and et al. 2019. Urbs v1.0.1: A LinearOptimisation Model for Distributed Energy Systems. Munich: Zenodo. [CrossRef]
40

Dugan, Roger C., and Thomas E. McDermott. 2011. An open source platform for collaboratingon smart grid research. Paper presented at the 2011 IEEE Power and Energy SocietyGeneral Meeting, Detroit, MI, USA, 24–28 July 2011, pp. 1–7.
Energy Market Authority. 2020a. Electricity Generation Capacity by Generator (Sheet29RSU). Available online: https://www.ema.gov.sg/statistic.aspx?sta_sid=20141211PlH5tAbg9BY8 (accessed on 25 August 2021).
Energy Market Authority. 2020b. Half-Hourly System Demand Data. Available online:https://www.ema.gov.sg/statistic.aspx?sta_sid=20140826Y84sgBebjwKV (accessed on25 August 2021).
Energy Market Company. 2021. Price Information. Available online: https://www.emcsg.com/marketdata/priceinformation (accessed on 14 June 2021).
EV Database. 2021. Energy Consumption of Full Electric Vehicles. Available online:https://ev-database.org/cheatsheet/energy-consumption-electric-car (accessed on 16June 2021).
Fleischhacker, Andreas, Georg Lettner, Daniel Schwabeneder, and Hans Auer. 2019.Portfolio optimization of energy communities to meet reductions in costs and emissions.Energy 173: 1092–1105. [CrossRef]
Hanif, Sarmad, Kai Zhang, Christoph M. Hackl, Masoud Barati, Hoay Beng Gooi, and ThomasHamacher. 2019. Decomposition and equilibrium achieving distribution locationalmarginal prices using trust-region method. IEEE Transactions on Smart Grid 10: 3269–81.[CrossRef]
Hilpert, S., C. Kaldemeyer, U. Krien, S. Günther, C. Wingenbach, and G. Plessmann. 2018. TheOpen Energy Modelling Framework (oemof)—A new approach to facilitate open sciencein energy system modelling. Energy Strategy Reviews 22: 16–25. [CrossRef]
Huang, Qiuhua, Thomas E. McDermott, Yingying Tang, Atefe Makhmalbaf, Donald J.Hammerstrom, Andrew R. Fisher, Laurentiu Dan Marinovici, and Trevor Hardy. 2018.Simulation-based valuation of transactive energy systems. IEEE Transactions on PowerSystems 34: 4138–47. [CrossRef]
Huber, Matthias, Albert Roger, and Thomas Hamacher. 2015. Optimizing long-terminvestments for a sustainable development of the ASEAN power system. Energy 88:180–93. [CrossRef]
Hunter, Kevin, Sarat Sreepathi, and Joseph F. DeCarolis. 2013. Modeling for insight usingTools for Energy Model Optimization and Analysis (Temoa). Energy Economics 40:339–349. [CrossRef]
Kleinschmidt, Verena, Sebastian Troitzsch, Thomas Hamacher, and Vedran S. Peric. 2021.Flexibility in distribution systems—Modelling a thermal-electric multi-energy systemin MESMO. Paper presented at the IEEE PES Innovative Smart Grid TechnologiesConference Europe, Espoo, Finland, 18–21 October 2021.
41

Klemm, Christian, and Peter Vennemann. 2021. Modeling and optimization of multi-energysystems in mixed-use districts: A review of existing methods and approaches. Renewableand Sustainable Energy Reviews 135: 110206. [CrossRef]
Kriechbaum, Lukas, Gerhild Scheiber, and Thomas Kienberger. 2018. Grid-based multi-energysystems—Modelling, assessment, open source modelling frameworks and challenges.Energy, Sustainability and Society 8: 35. [CrossRef]
Lacal Arantegui, Roberto, Arnulf Jaeger-Waldau, Marika Vellei, Bergur Sigfusson, DavideMagagna, Mindaugas Jakubcionis, Maria del Mar Perez Fortes, Stavros Lazarou, JacopoGiuntoli, Eveline Weidner Ronnefeld, and et al. 2014. ETRI 2014—Energy technologyreference indicator projections for 2010–2050. EUR—Scientific and technical research reports.Luxembourg: Joint Research Center of the European Union.
Land Transport Authority. 2020a. Annual Mileage for Private Motor Vehicles. Available online:https://data.gov.sg/dataset/annual-mileage-for-private-motor-vehicles (accessed on16 June 2021).
Land Transport Authority. 2020b. Current Vehicle Growth Rate to Continue Until 31 January2022. Available online: https://www.lta.gov.sg/content/ltagov/en/newsroom/2020/8/news-releases/current-vehicle-growth-rate-to-continue-until-31-january-2022.html(accessed on 16 June 2021).
Land Transport Authority. 2021a. Annual Vehicle Statistics. Available online:https://www.lta.gov.sg/content/dam/ltagov/who_we_are/statistics_and_publications/statistics/pdf/MVP01-1_MVP_by_type.pdf (accessed on 16 June 2021).
Land Transport Authority. 2021b. DataMall. Available online: https://datamall.lta.gov.sg/(accessed on 16 June 2021).
Lincoln, Richard. 2021. PYPOWER. Github. Available online: https://github.com/rwl/PYPOWER (accessed on 16 July 2021).
Massier, Tobias, Dante Fernando Recalde Melo, Reinhard Sellmair, Marc Gallet, and ThomasHamacher. 2018. Electrification of road transport in Singapore and its integration intothe power system. Energy Technology 6: 21–32. [CrossRef]
McDermott, Thomas E., Eric G. Stephan, and Tara D. Gibson. 2018. Alternative databasedesigns for the distribution common information model. Paper presented at the 2018IEEE/PES Transmission and Distribution Conference and Exposition (T&D), Denver,CO, USA, 16–19 April 2018, pp. 1–9.
Melton, Ronald B., Kevin P. Schneider, Thomas E. McDermott, and Subramanian V. Vadari.2017. GridAPPS-D Conceptual Design v1.0. Technical report. Richland: Pacific NorthwestNational Laboratory (PNNL).
Melton, Ronald B., Kevin P. Schneider, and Subramanian Vadari. 2019. GridAPPS-D™ adistribution management platform to develop applications for rural electric utilities.Paper presented at the 2019 IEEE Rural Electric Power Conference (REPC), Bloomington,MN, USA, 28 April–1 May 2019, pp. 13–17.
42

Morstyn, Thomas, Katherine A. Collett, Avinash Vijay, Matthew Deakin, Scot Wheeler,Sivapriya M. Bhagavathy, Filiberto Fele, and Malcolm D. McCulloch. 2020. OPEN:An open-source platform for developing smart local energy system applications. AppliedEnergy 275: 115397. [CrossRef]
Murillo-Sanchez, Carlos E., Ray D. Zimmerman, C. Lindsay Anderson, and Robert J. Thomas.2013. Secure Planning and Operations of Systems With Stochastic Sources, EnergyStorage, and Active Demand. IEEE Transactions on Smart Grid 4: 2220–29. [CrossRef]
Pacific Northwest National Laboratory. 2021a. GridAPPS-D. Github. Richland, US-WA.Available online: https://github.com/GRIDAPPSD/ (accessed on 8 April 2022).
Pacific Northwest National Laboratory. 2021b. Transactive Energy Simulation Platform.Github. Richland, US-WA. Available online: https://github.com/pnnl/tesp/tree/master/src/tesp_support/tesp_support (accessed on 8 April 2022).
Pfenninger, Stefan, and Bryn Pickering. 2018. Calliope: A multi-scale energy systemsmodelling framework. Journal of Open Source Software 3: 825. [CrossRef]
Pratt, R. G., and Z. T. Taylor. 1994. Development and Testing of an Equivalent Thermal ParameterModel of Commercial Buildings from Time-Series End-Use Data. Technical report. Richland:Pacific Northwest Laboratory (PNNL).
Ramachandran, Srikkanth, Kais Siala, Cristina de la Rúa, Tobias Massier, Arif Ahmed, andThomas Hamacher. 2021. Carbon footprint of a cost-optimal HVDC connection to importsolar energy from Australia to Singapore. Energies 14: 7178. [CrossRef]
Ringkjøb, Hans-Kristian, Peter M. Haugan, and Ida Marie Solbrekke. 2018. A reviewof modelling tools for energy and electricity systems with large shares of variablerenewables. Renewable and Sustainable Energy Reviews 96: 440–59. [CrossRef]
Schaber, Katrin, Florian Steinke, and Thomas Hamacher. 2012. Transmission grid extensionsfor the integration of variable renewable energies in Europe: Who benefits where? EnergyPolicy 43: 123–35. [CrossRef]
Schelo, Tom, Antoine Bidel, and Thomas Hamacher. 2021. Biogas Plant Operation underDistribution Locational Marginal Prices. Paper presented at the 2021 IEEE MadridPowerTech, Madrid, Spain, 28 June–2 July 2021, pp. 1–6.
Siala, Kais. 2021a. Urbs Model for Mekong Project. Munich: Zenodo. [CrossRef]Siala, Kais. 2021b. Urbs Model for the SunCable Project. Munich: Zenodo. [CrossRef]Siala, Kais, A. F. M. Kamal Chowdhury, Thanh Duc Dang, and Stefano Galelli. 2021. Data
for Manuscript “Solar Energy and Regional Coordination as a Feasible Alternative to LargeHydropower in Southeast Asia”. Munich: Zenodo. [CrossRef]
Solar Energy Research Institute of Singapore (SERIS). 2020. Update of the Solar Photovoltaic(PV) Roadmap for Singapore. Technical report. Singapore: SERIS, National University ofSingapore.
43

Stich, Jürgen, Melanie Mannhart, Thomas Zipperle, Tobias Massier, Matthias Huber, andThomas Hamacher. 2014. Modelling a low-carbon power system for Indonesia, Malaysiaand Singapore. Paper presented at the 33rd International Energy Workshop, Beijing,China, 4–6 June 2014, pp. 1–11. ERI-NDRC.
Stich, Jürgen, and Tobias Massier. 2015. Enhancing the integration of renewables bytrans-border electricity trade in ASEAN. Paper presented at the 2015 IEEE PESAsia-Pacific Power and Energy Engineering Conference (APPEEC), Brisbane, QLD,Australia, 15–18 November 2015.
Stüber, Magdalena, and Leonhard Odersky. 2020. Uncertainty modeling with the open sourceframework urbs. Energy Strategy Reviews 29: 100486. [CrossRef]
Taylor, Zachary T., Krishnan Gowri, and Srinivas Katipamula. 2008. GridLAB-D TechnicalSupport Document: Residential End-Use Module Version 1.0. Technical report. Richland:Pacific Northwest National Lab (PNNL).
Thurner, Leon, Alexander Scheidler, Florian Schafer, Jan-Hendrik Menke, Julian Dollichon,Friederike Meier, Steffen Meinecke, and Martin Braun. 2018. Pandapower—AnOpen-Source Python Tool for Convenient Modeling, Analysis, and Optimization ofElectric Power Systems. IEEE Transactions on Power Systems 33: 6510–21. [CrossRef]
Troitzsch, Sebastian, Mischa Grussmann, Kai Zhang, and Thomas Hamacher. 2020.Distribution Locational Marginal Pricing for Combined Thermal and Electric GridOperation. Paper presented at the IEEE PES Innovative Smart Grid TechnologiesConference Europe, The Hague, Netherlands, 26–28 October 2020.
Troitzsch, Sebastian, and Thomas Hamacher. 2020. Control-oriented Thermal BuildingModelling. Paper presented at the IEEE PES General Meeting, Montreal, QC, Canada,2–6 August 2020.
Troitzsch, Sebastian, Sarmad Hanif, Kai Zhang, Andrej Trpovski, and Thomas Hamacher.2019. Flexible Distribution Grid Demonstrator (FLEDGE): Requirements and SoftwareArchitecture. Paper presented at the IEEE Power & Energy Society General Meeting(PESGM), Atlanta, GA, USA, 4–8 August 2019.
Troitzsch, Sebastian, Kai Zhang, Tobias Massier, and Thomas Hamacher. 2021. CoordinatedMarket Clearing for Combined Thermal and Electric Distribution Grid Operation. Paperpresented at the IEEE Power & Energy Society General Meeting (PESGM), Washington,DC, USA, 25–29 July 2021.
Trpovski, Andrej. 2021. Synthetic Grid Generation Using Power System Planning—CaseStudy of the Power System in Singapore. Ph.D. thesis, Technical University of Munich,Munich, Germany.
van Beuzekom, I., M. Gibescu, and J. G. Slootweg. 2015. A review of multi-energy systemplanning and optimization tools for sustainable urban development. Paper presented atthe 2015 IEEE Eindhoven PowerTech, Eindhoven, The Netherlands, 29 June–2 July 2015,pp. 1–7.
44

Wang, Hongye, Carlos E. Murillo-Sanchez, Ray D. Zimmerman, and Robert J. Thomas. 2007.On computational issues of market-based optimal power flow. IEEE Transactions onPower Systems 22: 1185–93. [CrossRef]
Zimmerman, Ray D., and Carlos E. Murillo-Sánchez. 2019. MATPOWER User’s Manual. NewYork: Zenodo. [CrossRef]
Zimmerman, Ray Daniel, Carlos Edmundo Murillo-Sánchez, and Robert John Thomas. 2011.MATPOWER: Steady-state operations, planning, and analysis tools for power systemsresearch and education. IEEE Transactions on Power Systems 26: 12–19. [CrossRef]
Zwickl-Bernhard, Sebastian, and Hans Auer. 2021. Open-source modeling of a low-carbonurban neighborhood with high shares of local renewable generation. Applied Energy 282:116166. [CrossRef]
© 2022 by the authors. Licensee MDPI, Basel, Switzerland. This article is an openaccess article distributed under the terms and conditions of the Creative CommonsAttribution (CC BY) license (http://creativecommons.org/licenses/by/4.0/).
45


Clean Energy Transition Challenge: TheContributions of Geology
Cristina Rodrigues, Henrique Pinheiro and Manuel Lemos de Sousa
1. Introduction
In order to discuss the global topic of the clean energy transition, it is essentialthat strategies by world decision makers are clearly understood. Internationalagencies and European Union (EU) institutions have developed and implementedsignificant programs, as described below. The first European strategy on climatewas developed in 1991 through the creation of the European Commission andClimate Program. Later on, in 1997, the Kyoto Protocol was designed, the maingoal being to stabilize atmospheric concentrations of GHGs at a level that wouldprevent dangerous interference with the climate system. Since then, several initiativeshave been promoted, such as the reports of the UNFCCC and the first (2000) andsecond (2005) European Climate Change Programmes, which included the needto identify the most environmentally and cost-effective policies and measures thatwould allow Europe to cut its GHGs, and to apply carbon capture and storage (CCS)technologies as part of the efforts. The agreements currently in force are as follows:
(i) In 2015, with the Paris Climate Agreement, a global political action plan wasdeveloped to put the world on track to avoid climate change, highly supportedby the idea of keeping the increase in the global average temperature to wellbelow 2 C (or ultimately 1.5 C) above pre-industrial levels. To reach this maingoal, it was established that renewable energies should embody a higher shareof the global energy matrix, as well as nuclear energy.
(ii) In 2019, the European Green Deal was established, with one of the main targetsfocusing on climate change, through actions to be developed by the EU. Theuse of “green hydrogen” and carbon neutrality are seen as priorities for a cleanand circular economy.
Given the above context, one should ask how best to respond to the mentionedpolitical agreements whilst taking into account the actual and forecast global andEuropean energy demand, notwithstanding the fact that the world energy supplyis, and will continue to be, highly dependent on fossil fuels, for both technologicaland economic reasons, at least in the short and medium terms. Accelerated, rapid
47
innovation and invention will certainly be the catalysts in developing non-fossil fuelalternatives to energy production, so long as they are sustainable and affordableand can reduce the time frame for achieving the goals of clean energy and almostneutral emissions.
Consequently, in the authors’ view, the need to implement the energy transitionstrategy, meaning to shift the global energy sector from fossil fuel based tozero-carbon energies by the second half of the 21st century, should be a main goal,allowing for growth in the global energy demand to continue whilst addressingclimate change concerns and targets. The energy transition has to be implementedin a conscious and coherent manner in order to achieve the clean and circulareconomy concepts. This means that strong efforts in technology and policy arerequired, capable of turning non-fossil fuel energy production into competitive andsustainable economically viable sources. Therefore, analysis of the cost of climatechange mitigation versus the cost of the energy transition is a must, given the costs ofrenewable energy solutions, and those of batteries and hydrogen energy (Nordhaus2018).
If one accepts the general framework described above, and in order toaccomplish the main goal of the Paris Climate Agreement, which is to reduce CO2
emissions in order to keep the global temperature rise well below 2 C (or even1.5 C), we insist that it is indispensable to use the contribution of geology in theapplication of carbon capture and storage, as well as in underground energy storagetechnologies, and to do so as soon as possible.
The main goal of this chapter is to discuss the energy and climate sectors, giventhe need to develop a workable international strategy for a clean energy transitionby considering the contribution of geology in the application of carbon capture andstorage, as well as in underground energy storage technologies, and to do so as soonas possible.
Energy transition is a well-known subject discussed at all climate and energymeetings. It is also one of the most controversial topics, and therefore an almostimpossible mission in seeking to establish successful and acceptable internationaleconomic, technical, political and social measures. To better address the energytransition thematic, it is pertinent to highlight and to clarify several related subjects,which are discussed in the present manuscript. This approach begins with a generaloverview of the international energy and climate strategies implemented in recentdecades, and the global and European decisions focusing on the politically bindingand non-binding measures established to meet the greenhouse gas (GHG) reductiontargets are also highlighted. In the second section, the topic of climate change
48

is presented, with emphasis on the need to contextualize climate change in thegeological evolution of planet Earth. The third topic addressed is the energytransition target in order to fulfill the current global energy demand. Finally, therole that geology can play, and will play, in the energy transition strategy is assessed,making it clear that this ambitious target will not be reached without a strongcontribution from geology.
2. Overview on International Energy and Climate Strategies
The energy transition was recently established as one of the key solutions toclimate change mitigation, which involves shifting from a system based on fossilfuels (oil, natural gas and coal) to one dominated by variable renewable energies.However, the starting point in discussing the energy transition topic goes back, atleast, to 1979 with the First World Climate Conference held at Geneva (Conference ofExperts on Climate and Mankind), where climate change was recognized as a seriousproblem. Rightly or wrongly, climate change is considered to be intimately relatedto the increase in GHGs, of which carbon dioxide (CO2) is a constituent, despite itsrelevance, for example, to agricultural production (Dayaratna et al. 2020). CO2 isacknowledged as playing an important role in the atmospheric temperature of theEarth, and therefore a CO2 increase can contribute to a gradual warming of the loweratmosphere, especially at high latitudes. It is assumed that anthropogenic activity,including the exploitation and burning of fossil fuels, deforestation and changes inland use, has a fundamental role in the amount of CO2 increase in the atmosphereand, consequently, in increasing GHG concentrations. The Declaration of the FirstWorld Climate Conference established a main goal “to foresee and prevent potentialman-made changes in climate that might be adverse to the well-being of humanity”(WMO (World Meteorological Organization) 1979, p. 3). Additionally, it was alsoadvised to implement efforts to reduce fossil fuels in the world energy matrix byincluding nuclear and renewable energies.
In the late 1980s and early 1990s, several intergovernmental conferences focusingon climate change occurred, in which both scientific and policy subjects werediscussed, and the ultimate conclusion reached was the need to establish a globalclimate action plan.
In 1990, although established in 1988, the Intergovernmental Panel onClimate Change (IPCC) released its First Assessment Report, which scientificallyconfirmed the climate change issue, allowing governments to adapt their policydecisions. The Second World Climate Conference, also held in 1990, establisheda framework treaty on climate change, the final declaration of which did not
49

specify any international targets for reducing CO2 emissions, but a number ofprinciples were defined that were included in the Climate Change Convention.The Intergovernmental Negotiating Committee for a Framework Convention onClimate Change (INC/FCCC) was approved later (December) in 1990.
Only in 1991 was the first European community strategy created on climatechange, establishing the need to limit CO2 emissions and to improve energy efficiencyas main objectives. The specific action plan was as follows:
(1) To create a directive to promote electricity from renewable energy;(2) To promote voluntary commitments by car markets to reduce CO2 emissions
by 25%;(3) To propose taxation of energy products.
The United Nations Framework Convention on Climate Change (UNFCCC)was signed at Rio de Janeiro in 1992, which was established as the main internationaltreaty on fighting climate change, in order to prevent dangerous human-madeinterference with the global climate system. A global agreement was requiredto implement UNFCCC strategies; therefore, in 1995, the first Conference of theParties (COP1) took place in Berlin, and finally in 1997, in Kyoto (Japan), theKyoto Protocol, an extension of the UNFCCC, was signed. Nevertheless, the KyotoProtocol was only implemented in Montreal (Canada) in 2005, with the main goal tostabilize atmospheric concentrations of GHGs at a level that will prevent dangerousanthropogenic interference with the climate system. This was to be achieved bycutting GHGs to 5% below 1990 levels, by the 2008–2012 period. The Kyoto Protocollegally binds industrialized countries and economies in transition and the EU toemission reduction targets. Targets for the first commitment period (2008–2012) ofthe Kyoto Protocol covered emissions of the six main GHGs, namely CO2, methane(CH4), nitrous oxide (N2O), hydrofluorocarbons (HFCs), perfluorocarbons (PFCs)and sulphur hexafluoride (SF6) (Wigley 1998). It was established that the Party’sassigned amount is the maximum amount of emissions, measured as equivalent inCO2, that a Party could emit during a commitment period.
The COP meetings continue to take place on a regular basis with the main goalto discuss, in detail, the rules for the implementation of the Kyoto Protocol by settingup new funding and planning instruments for adapting and establishing an outlinefor technology transfer.
As it is well known, the EU has long been committed to international effortsto reduce climate change and felt the responsibility to set an example through thecreation of strong policies in Europe. To ensure the development of a comprehensivepackage of the most environmentally effective policies and measures to reduce GHG
50

emissions, the EU established the European Climate Change Programme (ECCP).Two ECCP plans were developed in the period from 2000 to 2005. The first ECCP,established in 2000, was responsible for examining an extensive range of policysectors and instruments with potential for reducing GHG emissions, by creatingseveral working groups, namely, energy supply, energy demand, energy efficiency inend-use equipment and industrial processes, transport and research, among others,but the most important and innovative one was emissions trading. Each workinggroup had to identify different options for reducing GHG emissions based on costeffectiveness, seeking the promotion of energy security and air quality as a finaltarget. The second ECCP, launched in 2005, after four years of implementation ofthe first ECCP, aimed to further identify cost-effective options for reducing GHGemissions that would promote economic growth increase and job creation. Learningfrom the first period of the ECCP, when priorities allowed identifying five mainworking groups (energy supply, energy demand, transport, non-CO2 gases andagriculture), it was possible in the second ECCP period to add new working groups,namely, aviation, CO2 and cars, adaptation to the effects of climate change, reducinggreenhouse gas emissions from ships and carbon capture and storage. In this secondprogram, additional measures were taken, such as promoting the use of renewableenergies in heating applications.
As it has become clear, the 21st century has been marked by new energy andclimate challenges, in which the EU has played a leading role in identifying potentialefficient solutions, although mainly political ones. The European energy/climatestrategy has led to the development of several initiatives, namely, “Europe 2020”(EC (European Commission) 2007a), “European Strategic Energy Technology Plan(SET-Plan)” (EC (European Commission) 2007b), “Energy 2020: a strategy forcompetitive, sustainable and secure energy” (EC (European Commission) 2010),“The EU energy policy: engaging with partners beyond our borders” (EC (EuropeanCommission) 2011c), “Energy Roadmap 2050” (EC (European Commission) 2011b),“Directive on energy efficiency” (EC (European Commission) 2011a), “Guidelinesfor trans-European energy infrastructure” (EC (European Commission) 2011e) and“Smart grids: from innovation to deployment” (EC (European Commission) 2011d)(Rodrigues et al. 2015).
During this period, in order to ensure the security of supply and competitivenessand, at the same time, to promote decarbonization of the energy system, aimingat reducing GHG emissions, mainly CO2, the EU identified and recommendedsix European industrial initiatives for implementation: wind, solar, bioenergy,smart grids, nuclear fission and carbon capture and storage (CCS) (EC (European
51

Commission) 2007b). It was then clear that to meet the goals of the “LimitingGlobal Climate Change to 2 C: the way ahead for 2020 and beyond” (EC (EuropeanCommission) 2007a) report by reducing CO2 emissions will not be possible withoutgeological sequestration/storage (Rodrigues et al. 2015; D’Amore and Bezzo 2017).As a result, on 23 April 2009, the European Parliament and the European Councilunveiled Directive 2009/31/EC (Directive on Geological Storage of CO2) (EC(European Commission) 2009), in order to define a regulatory framework forgeological sequestration/storage of CO2 regarding the conditions to deliver “storagepermits” proposed by the Kyoto Protocol (2005) whilst promoting the vision of globalenvironmental integration. Nevertheless, it is pertinent to mention that over theyears, COP negotiations have been quite controversial. In fact, the COP15 meeting,in 2009 at Copenhagen, was recognized as disappointing for several reasons:
(1) It failed to set the basic targets for reducing global annual emissions of GHGsup to 2050;
(2) It did not secure commitments from countries to meet the emissionstargets collectively;
(3) The target agreement was not binding.
It is indisputable that the first period of the Kyoto Protocol (2008–2012) failed,due to deficiencies in the structure of the treaty, such as the time frame of theagreement and the choice to establish a five-year commitment period which wouldstart ten years after being signed, the exemption of developing countries fromreduction requirements and the lack of an effective progressive emissions tradingsystem (Rosen 2015). It is well known that the Kyoto Protocol was condemned fromthe beginning, given that it did not include the world’s largest and fastest growingeconomies, for example, China, which was excluded from binding targets, and thefact that the United States of America (USA) did not sign the agreement.
A second commitment period (2013–2020) to the Kyoto Protocol was agreedin 2012, in the so-called Doha Amendment (UN (United Nations) 2012). Thisamendment included new commitments for Annex I Parties to the Kyoto Protocol, arevised list of GHGs which included one more GHG (nitrogen trifluoride—NF3) andamendments to several articles of the Kyoto Protocol which needed to be updated.During the first period of the agreement, a 5% reduction in GHGs was established,but the second commitment period was really ambitious by establishing a reductionin GHG emissions by a least 8% below 1990 levels. Flexible market mechanismswere created in the second Kyoto Protocol period, which were based on a tradeof emissions permits, namely, international emissions trading, clean developmentmechanisms and joint implementation by the Parties. As a matter of fact, the
52

commitment period established by the second Kyoto Protocol agreement to meetthe GHG emission reduction target was rather ambitious and too short, and whenassociated with the energy demand increase, it led to a new GHG emissions strategy.In fact, the main goal became the removal of GHGs from the atmosphere, even if GHGemissions are not reduced. In this perspective, these new mechanisms motivatedGHG abatement techniques using the most cost-effective processes, such as CCStechnologies (UN (United Nations) 2012).
The Paris Agreement, adopted at the Paris Climate Conference (COP21) in 2015,is the first international legally binding global climate change agreement set out toavoid dangerous climate change. This agreement was recognized as a key pointbetween policies and climate carbon neutrality before the end of the 21st century,which implied reaching the following targets (UN (United Nations) 2015):
(1) To limit the increase in the global average temperature to well below 2.0 C, oreven 1.5 C, above pre-industrial levels;
(2) To reach the global emissions peak as soon as possible, which has already beenaccomplished in Europe and North America but will, most likely, take longerfor developing countries;
(3) To undertake a rapid reduction in emissions using the best available scienceknowledge to achieve an efficient balance between emissions and removals inthe second half of the 21st century;
(4) To strengthen the ability of countries to deal with the impacts of climate change,through appropriate financial programs and new technology frameworks.
In 2019, the European Green Deal (EGD) was proposed to transform the EUinto a modern, resource-efficient and competitive economy and therefore the world’sfirst carbon-neutral continent by 2050. The action plan established by the EGDaimed to increase the efficient use of all resources by moving to a clean and circulareconomy, to restore biodiversity and to cut pollution. In fact, the EGD is not a lawthat will put all countries on track to achieve climate change goals, but one of its maintargets is to propose a European Climate Law to transform this political commitmentinto a legal obligation through the revision of the EU Regulation (EU) 2018/1999(EC (European Commission) 2020b). The EGD has been seen as a powerful tool tocombine efforts to reduce GHG emissions and, at the same time, to prepare Europe’sindustry for a climate-neutral economy. In this perspective, hydrogen has beenconsidered as a key priority for addressing both the EGD and Europe’s clean energytransition (EC (European Commission) 2020a). The EU Hydrogen Strategy is seen asa prevailing strategy to increase electricity production from renewable energy, andsince hydrogen does not emit CO2, it can play an important role in decarbonizing the
53

industry. However, this energy scenario change will not be an easy task, given thathydrogen energy represents a small fraction of the world energy matrix, and it is stilllargely produced from fossil fuels, mainly from natural gas and coal. Consequently,the main goal of the hydrogen strategy is to decarbonize hydrogen production andexpand its use into sectors where it can replace fossil fuels. The EU proposed anadditional program, the Digital Transformation (EU (European Union) 2021), whichseems capable of accelerating the energy transition by making power-generatingassets more efficient, through grid modernization processes that make the systemmore secure and resilient, and that assist the industry in providing sustainable andaffordable power to final consumers.
Summarizing, the transition energy issue has been subjected to severalapproaches in recent decades, but it is an international consensus that countries arenot doing nearly enough to transition to non-fossil fuel energy sources. Undoubtedly,it is quite a hard task to accomplish a net zero-carbon economy by 2050, and tokeep the world temperature increase to 2 C, or even 1.5 C. However, it is pertinentto state that this 2 C target was a political decision, perceived by the public as arealistically achievable and acceptable goal, but it was never clearly advocated andrecommended as a safe level of warming through a scientific assessment (Knuttiet al. 2015). Additionally, transition energy has negative implications for cohesionand social inclusion of all countries, since several regions (Eastern and SoutheasternEuropean countries) will be obliged to make great investments, while other countries(Western Europe and North America) will be encouraged to reduce carbon-intensiveindustries which will imply infrastructure adaptations. In conclusion, to reachnet zero emissions by 2050, the EU needs to agree and ratify a consistent climatechange strategy, with strong and rapid investments, which must be accompaniedand supported by innovation in science and technology. In fact, several studies arein place that are focused on climate change mitigation, including understanding theinfluence (if any) of solar variability on surface air temperature (Soon et al. 2015).
3. Climate Change: Is It the Problem?
As previously mentioned, climate change was identified as a serious problemback in 1979, during the First World Climate Conference, which was globally acceptedas a result of the increase in GHG emissions. It was recognized that GHGs affectedthe energy balance of the global atmosphere, ultimately leading to an overall increasein the global average temperature.
First of all, it is pertinent to clearly understand the concept of climate changeused worldwide, and to accomplish that goal, the crucial role of two entities must
54
be highlighted, namely, the UNFCCC and the IPCC. However, both entities havedifferent approaches to the climate change definition, and, surely, this inconsistencyin the concept is one of the main reasons for the international standoff on a climatepolicy, leading to a lack of decision making regarding updating policies on climateand energy strategies. The UNFCCC established that “climate change is directlyor indirectly attributed to human activity that alters the composition of the globalatmosphere and which is in addition to natural climate variability observed overcomparable time periods” (UN (United Nations) 1992, p. 3). The IPCC definedclimate change as any change in climate over time, whether due to natural variabilityor induced by human activity (Rahman 2013).
The definition of climate change is a nontrivial and contentious exercise and,therefore, can be understood as the most complex and controversial question in theentire science of meteorology and climatology. In fact, several specialists (Allen 2003;Werndl 2016) argue that there are no strict criteria to justify the use of the expressionclimate change, and therefore its understanding remains unclear. As a result, theconcept of climate change is often roughly employed and, consequently, may lead toconsiderable confusion regarding the existence and extent of global warming.
Undeniably, climate change means, a priori, a change in the statisticaldistribution of weather patterns in the long term, which may take place overdecades (traditionally 30 years), but such changes and variations are typicallystudied over significantly longer periods of time, as shown through geologicalstudies covering millions of years. In fact, the Earth’s climate has changed inthe course of the geological evolution, even before human activity could haveplayed a role in its transformation. Thus, climate change consists of temporarychanges in climatic conditions (temperature, precipitation and wind, among others),which can encompass changes in both average conditions and changes in variability.Since planet Earth’s climate is naturally variable in the geological time scale, thelong-term characteristics—specifically average temperatures—are controlled by theEarth’s energy balance over time. In the last million years, the climate has naturallyshown fluctuations between warm periods and glacial ages, which are stronglycorrelated with the natural Milankovitch cycles, established between 1920 and 1942(Tarling 2010). According to Milankovitch, these oscillations are related to orbitalchanges, which, in turn, are controlled by three elements: eccentricity, obliquity andprecession. These elements also have different periodicities, which affect not only thegravitational field of the Earth’s surface but also the intensity and distribution of solarradiation that reaches the upper atmosphere. In this context, what is understoodtoday as climate change, meaning changes produced by anthropogenic activities,
55

is, from a geological time scale perspective, natural climate change (Figure 1). Infact, it appears that the role of human activity in the climate change increase can beaddressed as a time scale-dependent subject (Figure 1).
1364
1363
1362
1361
1360
1359
1358
13571974 1978 1982 1986 1990 1995
Years
(a)
Glob
al T
empe
ratu
re A
nom
alty
(°C)
Tota
l Sol
ar Ir
radi
ance
(W/m
2 )
W/m2 - Watt per square metre
1999 2003 2007 2011 2015
1.2
1.0
0.8
0.6
0.4
0.2
0.0
− 0.2
Total Solar Irradiance Global Temperature
450 400 350 300 250 200
Thousands of years before present
Glob
al T
empe
ratu
re A
nom
aly
(°C)
(b)
150 100 50 0
− 2
− 4
− 6
0
2
4
Warm V Warm IV Warm IIIWarm II
Present DayWarming
6
Figure 1. Cont.
56

600
1000
0
2000
3000
4000
5000
6000
7000
8000 − 4
− 3
− 2
− 1
0
1
2
3
Glacial Periods δ18O short-term average
δ18O long-term averageCO2
HOT
COLD
550 500 450 400 350 300 250
Millions of years before present
CO2
(ppm
)
Detr
ende
d ca
lcite
(par
ts p
er th
ousa
nd)
(c)
200 150 100 50 0
Precambrian Cambrian Ordovician Siluri. Devonian Carboniferous Permian Triassic Jurassic Cretaceous Paleogene Neog.
Figure 1. Historical temperature of planet Earth: (a) 44-year interval (adapted fromAugustin et al. 2004); (b) 450,000-year interval (adapted from Augustin et al. 2004);(c) 542,000-year interval. Source: Graphics by authors, adapted from Veizer et al.(2000), Berner and Kothavala (2001) and Moore (2019).
Herbert and Fischer (1986) and Park and Herbert (1987), by studyingpaleoclimatic periodicities in a geologic time series, stated “there is overwhelmingevidence for cyclicity at about 2 cycles/m, corresponding to Milankovitch oscillationswith periods near from 100 thousand of years” (Park and Herbert 1987, p. 14,037).This type of study will greatly improve our understanding of the role of orbitaloscillations in climate change, and, consequently, it could help in defining a timescale which will allow measuring the components and their variability over shortperiods (Schwarzacher 1993; Giraud et al. 1995; Crowley and Berner 2001; Stenniet al. 2010).
In the present work, the concept of climate change is not addressed with thecommonly fatalistic approach, where it is considered to be promoted by GHGemissions, these being responsible for an overall increase in the global averagetemperature; rather, GHG emissions are seen to correspond to local changessusceptible only to influencing the environment at the scale of humanity’s lifetime.
57

As it stands, one pertinent question arises: why is it that CO2 is taken asthe most dangerous GHG in the atmosphere? According to the EnvironmentalProtection Agency (EPA), and other international entities (IPCC and UNFCCC), themost dangerous GHGs are CO2, CH4, nitrous oxide (N2O) and fluorinated gases (e.g.,chlorofluorocarbons, hydrochlorofluorocarbons). It is assumed that an anthropogenicsource is responsible for almost all of the increase in GHGs in the atmosphere inrecent centuries, mainly attributing CO2 and CH4 emission increases to generalactivities in the fossil fuel sector, whereas those of nitrous oxide and fluorocarbonsto other human activities. Table 1 depicts some of the main characteristics of themajor GHGs, in which it is quite perceptible that CO2 is not the most dangerousGHG, since its lifetime can be a few days when it is quickly absorbed by the oceansurface, but some part will remain in the atmosphere for thousands of years; instead,CH4 and N2O have a more worrying lifetime average. Therefore, CH4 plays a morenegative role in the atmosphere than CO2.
Additionally, Figure 2 shows that CH4 concentrations (between ~300 and 800ppmv) in the atmosphere have always been higher than CO2 concentrations (between160 and 300 ppmv)—actually, more than double. Yet, again, how are these two GHGs’emissions closely related to anthropogenic activities? Several studies using datagoing back 800,000 years in time, extracted from ice cores located at Dome C inAntarctica (Jouzel et al. 2003; Jouzel et al. 2007; Pol et al. 2010; Kang and Larsson 2013;Persson 2019), have shown what had been proposed by Herbert and Fischer (1986),meaning that consistent fluctuations in CO2 and CH4 concentrations exist, and theserising and falling CO2 and CH4 concentrations coincide with the onset of ice ages(low CO2 and CH4) and interglacial (warm) periods (high CO2 and CH4). Indeed,these periodic fluctuations are promoted by changes in the Earth’s orbit around thesun, the so-called Milankovitch cycles (Figure 3).
A worrying scenario of an uncontrolled increase in CO2 emissions due toanthropogenic activities, mainly related to the burning of fossil fuels, has beenpresented by the IPCC (Intergovernmental Panel on Climate Change) (2013). Actually,Figure 4 displays a common projection of the atmospheric CO2 concentrationmeasured during the last 800,000 years until the present day, showing that the last fewyears are clearly marked by a strong increase in the CO2 concentration. Again, thisfatalistic approach is related to the time scale used, 800,000 years, which is negligiblefrom the geological scale point of view. Actually, taking into consideration Figure 1c,the time scale (800,000 years) used in Figure 4 could be understood as a “few minutes”from the geological scale perspective, and consequently, the approximately 4600
58
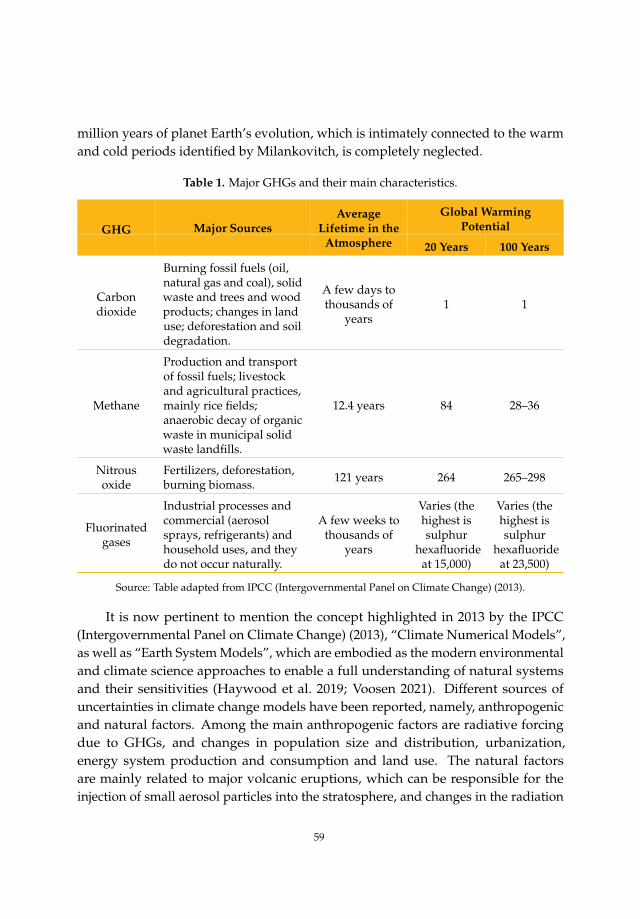
million years of planet Earth’s evolution, which is intimately connected to the warmand cold periods identified by Milankovitch, is completely neglected.
Table 1. Major GHGs and their main characteristics.
Global WarmingPotentialGHG Major Sources
AverageLifetime in the
Atmosphere 20 Years 100 Years
Carbondioxide
Burning fossil fuels (oil,natural gas and coal), solidwaste and trees and woodproducts; changes in landuse; deforestation and soildegradation.
A few days tothousands of
years1 1
Methane
Production and transportof fossil fuels; livestockand agricultural practices,mainly rice fields;anaerobic decay of organicwaste in municipal solidwaste landfills.
12.4 years 84 28–36
Nitrousoxide
Fertilizers, deforestation,burning biomass. 121 years 264 265–298
Fluorinatedgases
Industrial processes andcommercial (aerosolsprays, refrigerants) andhousehold uses, and theydo not occur naturally.
A few weeks tothousands of
years
Varies (thehighest issulphur
hexafluorideat 15,000)
Varies (thehighest issulphur
hexafluorideat 23,500)
Source: Table adapted from IPCC (Intergovernmental Panel on Climate Change) (2013).
It is now pertinent to mention the concept highlighted in 2013 by the IPCC(Intergovernmental Panel on Climate Change) (2013), “Climate Numerical Models”,as well as “Earth System Models”, which are embodied as the modern environmentaland climate science approaches to enable a full understanding of natural systemsand their sensitivities (Haywood et al. 2019; Voosen 2021). Different sources ofuncertainties in climate change models have been reported, namely, anthropogenicand natural factors. Among the main anthropogenic factors are radiative forcingdue to GHGs, and changes in population size and distribution, urbanization,energy system production and consumption and land use. The natural factorsare mainly related to major volcanic eruptions, which can be responsible for theinjection of small aerosol particles into the stratosphere, and changes in the radiation
59

emitted by the sun (Giorgi 2010; Mitchell et al. 2020; Pielke 2020; Shaviv 2008).The IPCC (Intergovernmental Panel on Climate Change) (2013) stated that theconcept of climate models is an attempt to assess the effects, risks and potentialimpacts associated with anthropogenic GHG emissions, which will allow scientificassessment of mitigation and societal adaptation strategies. Nevertheless, if theidyllic situation of immediately stopping CO2 emissions were a reality, most of thewarming and, consequently, its climate impacts would persist for many centuries.These irreversible changes are often misunderstood and are currently disregarded inmost climate models. The irreversibility on time scales is at least hundreds of years,meaning that planet Earth is a multiparameter system in a dynamic equilibrium,and implying that climate change resulting from past emissions, even in the absenceof future emissions, constitutes a global commitment for many future generations.Additionally, acknowledging that climate change will simply persist for centuries tomillennia due to the long lifetime of CO2 in the atmosphere is a key point in decisionmakers’ strategies (Knutti et al. 2015).
Another relevant subject, commonly discussed on climate change forums, isthe general rise in the sea level around the world (Figure 3). According to theIPCC (Intergovernmental Panel on Climate Change) (2013), the long-term effectsof the global average temperature increase are responsible for the general rise inthe sea level, resulting in the inundation of low-lying coastal areas and the possibledisappearance of some island states, and the melting of glaciers, sea ice and Arcticpermafrost. Actually, as already mentioned in this work, climate change correspondsto cyclic natural modifications, such as underwater volcanism, which significantlycontributes to the overall increase in temperature, mainly in the oceans. In thisregard, on the matter of underwater volcanism, it is worth emphasizing that arecent and remarkable scientific study, with the credibility of MIT (Huppert et al.2020), although already discussed by others (Johnson et al. 2018), has highlightedwhat geologists empirically already knew, but that is now supported by rigorousgeophysical observations and measurements. As is well known, volcanic islands donot last forever, and their longevity can differ significantly; for example, some islandssuch as the Canary Islands located in the Atlantic Ocean are more than 20 millionyears old, while the Galapagos Islands located in the Pacific Ocean have alreadydrowned. Recently, it has been demonstrated that the formation and longevity ofvolcanic islands are intimately related to the movement of tectonic plates and theirrelationship with mantle plumes (hotspots). Nevertheless, to determine the actualage of each island, including those that have drowned, the direction and speed atwhich tectonic plates are moving in relation to the swell uplift underneath need to be
60

measured, as does the length of each swell, which is formed when the mantle plumeraises the seafloor. The unavoidable drowning of all volcanic islands over time is anatural phenomenon, which depends on the tectonic plate’s speed and the size ofthe mantle plumes, and therefore it is not, in any way, related to an eventual rise inthe sea level.
800
260
CO2 (
ppm
v)
ppmv - part per million volume
Age (thousand of years before present)
ppbv - part per billion volume
(b)
CH4 (
ppbv
)
800
700
600
500
400
220
180
800 600 400600 400 200
Age (thousand of years before present)
(a)
2000 0
800
260
CO2 (
ppm
v)
Age (thousand of years before present)
ppmv - part per million volume
(a)
ppbv - part per billion volume
CH4 (
ppbv
)
800
700
600
500
400
220
180
800600 400 200 600 400 200
Age (thousand of years before present)
(b)
0 0
Figure 2. Atmosphere concentrations over the past 800,000 years before the present(1950): (a) CO2; (b) CH4. Source: Graphics by authors, adapted from Persson 2019.
61

0
900
700
500
1
3
524
23
22
× 10
−2
× 10−2
Ecce
ntri
city Precession
Obl
iqui
ty
260
220
180
0
− 40
− 80
− 120
− 4
0
4
CH4 (
ppb)
CO2 (ppm
)Sea level
(m relative to present)
ppb - part per billion
ppm - part per million
(d)
(c)
(b)
(a)
200 400
Age (thousand of years before present)600 800
Figure 3. Variability over 800,000 years before the present (1950) of: (a) orbitalparameters; (b) sea level; (c) CO2 concentration; (d) CH4 concentration. Source:Graphic by authors, adapted from Pol et al. (2010).
CO2
(ppm
)
− 803,719
ppm - part per million
50
0
100
150
200
250
300
350
400
− 600,000 − 400,000
Age
− 400,000 2018
Figure 4. Atmospheric CO2 concentration during the last 800,000 years. Source:Graphic by authors, adapted from Ritchie and Roser (2017).
62

One of the key mistakes made when dealing with climate change questions, andconsequently the cause of worldwide controversial opinions, is the considerationthat the climate change increase is due to anthropogenic sources, resulting from,above all, the use of fossil fuels (Giorgi 2010; Pielke 2020). Even if it is true thatfossil fuel activities play a relevant role in the increase in GHG emissions and requiremitigation, it is not true that they are the only cause, nor even the most dominant one.Be that as it may, in the second decade of the 21st century, questions related to climatechange gained a greater acceptance by private and/or public entities, specificallyas a result of the change in the definition or the perspective of the “climate change”concept. Actually, this change consists in a paradigm shift supported by the idea thatclimate change is no longer a cause of environmental degradation, but a requirementfor sustainable development.
The Paris Conference (COP21) represents the culmination of the convergenceof efforts of different players, with the main goal of reducing CO2 emissions, andtherefore limiting the global average temperature increase, which will allow meetingthe net zero GHG emissions target, in the second part of the 21st century.
4. Energy Transition and Energy Demand
In the Conference of the Parties meetings (COP22—Marrakech, COP23—Bonn,COP24—Katowice and COP25—Madrid) held after the Paris Conference (COP21,2015), it was emphasized that the future of climate change mitigation involves theprocesses of decarbonization and energy transition. The urgent need to align theuse of fossil fuels and climate goals was also recommended because a radical energytransition requiring a far more predominant use of renewable energies can never beachieved in the short and medium term. With the current state of knowledge, it isnot even possible to imagine, in a sustainable (economic and technical) way, a worldenergy supply exclusively from renewable sources.
The energy transition is not only related to the production of renewable energy,with the main goal to replace fossil fuels in the world energy supply, but it is also seen(IPCC (Intergovernmental Panel on Climate Change) 2013) as a long-term investmentopportunity that will transform the entire energy system over the next 30 years andbeyond. This means that significant investments across the entire value chain arerequired, namely, in clean energy generation, transmission and distribution networks,energy storage and electric transport infrastructure.
The EGD (EC (European Commission) 2019) is a set of policy initiatives whichcombines the twin effort of reducing GHG emissions and preparing Europe’s industryfor a climate-neutral economy, to be conducted through the implementation of
63

renewable energy sources. The EGD stands for a tech-driven energy revolution thatwill rapidly replace all hydrocarbons, and Kovac et al. (2021) went further by assuringthat such an energy transition process is already being implemented. This unrealistic“new energy economy” scenario is confident that the technologies of wind and solarpower and battery storage are undergoing innovative development in computingand communication technologies, to the extent that it will dramatically reduce costsand increase efficiency (Mills 2019). Given the intermittency of renewable energysources, highly dependent on weather conditions and the number of hours of daylight, energy storage has an essential role in the general energy transition framework.
In this context, the European Commission launched a new initiative entitled“A hydrogen strategy for a climate-neutral Europe” (EC (European Commission)2020a). Hydrogen energy is, today, seen as a key priority to achieve the EGDand, consequently, Europe’s clean energy transition. The relevant role of the newcarbon-neutral system scenario is, evidently, related to the fact that hydrogen energyproduction does not emit CO2, as it uses renewable energy sources, and that almostno air pollution is generated when it is used. Additionally, hydrogen energy canplay a crucial role in the renewable energy storage sector, and it can be used as afeedstock, as a fuel, as batteries and in many other industrial applications, such as inthe transport, power and building sectors.
However, how is hydrogen energy generated? Hydrogen energy is producedthrough a chemical process known as electrolysis, which uses an electrical current toseparate the hydrogen from the oxygen atoms in water. There are different processesto produce hydrogen energy which are associated with a wide range of emissions,depending on the technology and energy source used, namely: electricity-basedhydrogen (any type of electricity source); renewable hydrogen or clean hydrogen(renewable electricity source); fossil-based hydrogen (fossil fuel as an electricitysource); fossil-based hydrogen with carbon capture (fossil fuel as an electricitysource using carbon capture technologies); low-carbon hydrogen (any type ofelectricity source associated with fossil-based hydrogen with carbon capture); andhydrogen-derived synthetic fuels (gaseous and liquid fuels on the basis of hydrogenand carbon) (EC (European Commission) 2020a).
Presently, hydrogen represents a small fraction of the global and EU energymatrix, and according to IRENA (International Renewable Energy Agency) (2019),future projections on the breakdown of renewables used in the total final energyconsumption in 2050 indicate that hydrogen energy will continue to account for only3% (Figure 5).
64

Despite this reality check, for hydrogen energy to contribute to climate neutrality,it will need to achieve a far larger scale, and its production must be a fullydecarbonized process, meaning that hydrogen must be generated from renewablehydrogen (clean hydrogen or green hydrogen) using electricity generated fromrenewable sources. In such a process, hydrogen energy is produced without emittingCO2 into the atmosphere, with water vapor being the only emission. The renewablehydrogen process is quite complex, requiring the following requisites: (1) the waterused must contain salts and minerals to allow electrical conductivity, and (2) twoelectrodes must be immersed in the water and connected to an electrical powersource. Ultimately, the dissociation of hydrogen and oxygen atoms will occur whenthe electrodes attract ions with opposite charges.
Biomass buildings
Biomass industry
Renewable district heating
Geothermal heat
Wind
Solar photovoltaic
Solar thermal
Hydrogen 3%
10%
2%2%
2%
3% 3%
3%
7%
10%
Heat and other
direct uses29%
7%15%
Transport13%
Power58% 24%
8%Liquid biofuels/biogas
Others (including marine)
Concentrating Solar Power GeothermalBiomass power
Hydro power
Figure 5. Breakdown of renewables use in total final energy consumption in 2050.Source: Graphic by authors, adapted from Gielen et al. (2019).
However, there are unavoidable questions about the viability of clean hydrogenrelating its high production and storage costs (Figure 6), the difficulty of transportover long distances and the energy losses during conversion processes (Bosselet al. 2003), and, today, hydrogen energy is still largely produced from fossil fuels(Figure 7).
65

Hyd
roge
n pr
oduc
tion
cost
s (U
SD/k
g)8
7
6
5
4
3
2
1
0Natural gas Natural gas
with CCUSCoal Renewables
Figure 6. Hydrogen production costs by production source in 2018. Source: Graphicadapted from IEA (International Energy Agency) (2019).
Fossil based production
Coal Natural gas
Oil Renewables
Renewables
4%
18%
30%
48%
96%
Figure 7. Hydrogen production by major sources. Source: Graphic by authors,adapted from Molloy and Baronett (2019).
66

Of the four major sources used for commercial production of hydrogen, threerequire fossil fuels: (1) steam methane reformation (SMR), (2) oil oxidation and(3) coal gasification (Figure 7), and therefore emit CO2. These three processes arereferred to as gray hydrogen production. Nevertheless, if the production of hydrogenis accompanied by CO2 capture and storage, it is then referred to as blue hydrogen(EC (European Commission) 2020a). However, the effectiveness of CO2 capture(maximum 90%) needs to be taken into consideration.
The fourth source is renewable electrolysis, generating so-called green hydrogen,the only process that does not emit CO2 (Figure 8).
kgCO
2/kgH
2
20
15
10
5
Note: includes only CO2 emissions from combustion and chemical conversion.
Coalgasification
Steam methanereforming
Coal90%
capture
Gas90%
capture
Electrolysis renewable or
nuclear
Gas56%
capture
Figure 8. CO2 emissions by hydrogen production process in 2019. Note: Includesonly CO2 emissions from combustion and chemical conversion. Source: Graphic byauthors, adapted from Bartlett and Krupnick (2020).
In the extremely complex and high-cost scenario of the hydrogen sector,Germany aims for the European leadership in carbon capture and storage, andto produce hydrogen from natural gas, and has launched a new hydrogen strategywith a clear focus on green hydrogen production (BMWI 2020). To achieve carbonneutrality by 2050, Germany greatly relies on the energy transition strategy, keepingin mind that gaseous and liquid energy sources will continue to be an essential partof Germany’s energy supply, with the expectation that hydrogen energy will play akey role in enhancing and completing the energy transition.
67

There is no doubt that, today, green hydrogen (renewable hydrogen) is not costcompetitive against fossil-based hydrogen and, in particular, fossil-based hydrogenwith carbon capture and storage, which is highly dependent on natural gas prices.The EC (European Commission) (2020b) stated that costs for renewable hydrogen aredeclining quickly and will continue to get cheaper, with the cost of the electrolysisprocess having already reduced by 60% in the last ten years. Therefore, there is anexpectation that cost-competitive renewable hydrogen will eventually be achieved ifaccompanied by cost-competitive renewable energy.
In this optimistic scenario, where the generation of renewable energy willquickly become cheaper, the matter of intermittency comes to mind, as does theimperative need for cost-effective and reliable energy storage.
Schernikau and Smith (2021) highlighted the enormous difficulties and practicalissues related to one source of renewable energy—solar photovoltaic panels. Theyfocused on Germany as a case study and showed that supplying Germany’s electricitydemand entirely from solar photovoltaic panels (located in Spain, the optimal regionfor the production of solar energy due to the high direct normal solar irradiation),considering several adjustment factors (peak power, backup peak, transmission loss,winter capacity, etc.), would require a total area of approximately 35,000 km2 (7%of Spain´s surface area) covered with solar photovoltaic panels. Such a scenariowould equate to an installed capacity of 2000 GW, which is almost three times morethan the worldwide capacity installed in 2020 (715 GW). In addition, one cannotignore the fact that solar photovoltaic panels last, on average, 15 years and wouldrequire replacement every 15 years. Schernikau and Smith (2021) further estimatedthat the annual silicon and silver requirements for such a scenario would requireclose to 10% and 30% of the current global production capacity, respectively. Thisseems to be an unrealistic and unachievable scenario which will worsen once we addestimations of resource requirements for the production and installation of batterybackup systems. Advancing this scenario to cover about 40% (200,000 km2) of Spainwith solar photovoltaic panels in order to supply the entire European electricitydemand, as suggested by Schernikau and Smith (2021), how would all the energyproduced be stored?
In fact, the EC (European Commission) (2020b) stated that energy storage is thekey factor in promoting an increase in renewables into the global and EU energymatrix. Battery electricity storage has been established as a vital technology in theworld’ transition to a sustainable energy system, and its worldwide acceptance isalso connected to specific advantages, namely, its fast response capability, sustainedpower delivery and geographical independence (Yang et al. 2018). Despite the
68

major improvements in the battery sector, it seems that selecting the battery energystorage system sizing methodology, which is clearly dependent on the renewableenergy system used, is the biggest challenge of the entire process. Given thedifficulty for a single battery energy storage system to produce capable and reliablerenewable energy independent of electricity provided through main grids, unlessan oversized generator and storage capacities are utilized, new battery systems arebeing developed. Javed et al. (2020) proposed a hybrid pumped and battery storage(HPBS) system, in which “the battery is only used in order to meet very low energyshortfalls considering the net power deficiency and state of charge, while pumpedhydro storage works as the main storage for high energy demand” (Javed et al. 2020,p. 1).
On the subject of batteries, how many would be needed to store the worldrenewable energy demand? The study by Schernikau and Smith (2021) was a realisticanalysis of 14 days of energy storage backup for Germany during the winter period.For this period, Germany will require approximately 45 TWh of battery storage.However, producing the required storage capacity from batteries using currenttechnology would require the full production of 900 Tesla Gigafactories, such asthe Nevada Gigafactory (Mills 2019), working at full capacity for an entire year.Additionally, for the annual replacement of batteries, an extra output of 45 TeslaGigafactories, corresponding to a full production of 2.25 TWh, will be required.To gain a general idea of what these numbers actually mean, the global batteryproduction in 2020 was 0.5 TWh. Another key point on batteries is the futuredemand, and the rate of demand, for specific raw materials (such as lithium, copper,cobalt, nickel, graphite, rare earths, bauxite, iron and aluminum), leading to adramatic increase in production, which would significantly affect the global miningsector. The mining chain comprises several processes from prospecting to extraction,transportation and processing, requiring significant amounts of energy. Mills (2019)suggested that the energy equivalent of 100 barrels of oil is required to produce asingle battery that can store the equivalent of one barrel of oil. Additionally, today,natural gas accounts for more than 70% of the energy used to produce glass requiredto build solar photovoltaic planes, and if wind turbines are used to supply half theelectricity in the entire world, 2000 Mt of coal would be required to produce theconcrete and the steel needed to build the wind equipment (Mills 2020), knowing thatthe annual production of coal in 2019 was approximately 8000 Mt (IEA (InternationalEnergy Agency) 2020). Therefore, how will the clean energy system process work ifa dramatic increase in the production of raw materials is required to produce green
69

energy, which in themselves have negative environmental and health impacts, withhigh amounts of energy being required, which actually originates from fossil fuels?
Despite all the production issues related to battery systems, it is obvious thatthe raw materials required to produce battery storage systems will soon dominatethe global production of minerals. In fact, today’s production of lithium batteriesalready accounts for about 40% of all lithium and 25% of cobalt, meaning that,in the near future, global lithium mining would have to expand by at least 500%(Mills 2019). This analysis leads to another essential question—does planet Earthhave enough raw materials to fulfill the production of batteries that the market willdemand? The study by Schernikau and Smith (2021) clearly assists in answeringthis key point, by using the Germany case study. As mentioned, a 14-day batterystorage solution for Germany would imply 45 TWh of battery storage production,using Tesla’s newest technology, and consequently a 7000–13,000 Mt demand for rawmaterials. Battery replacement would require a capacity production of 2.25 TWh,implying a 400–700 Mt demand for raw materials. For example, 1,800,000 t of lithiumproduction would be needed, knowing that the 2020 global production was 230,000t, meaning feeding Germany’s battery storage systems would require a lithiumsupply which is 5.6 times greater than the current global production (Figure 9). Inthe case of cobalt, another essential mineral used in the production of batteries,225,000 t of cobalt production would be required, but the current global productionis about 120,000 t, meaning Germany’s battery storage production would demand1.9 times more than the 2020 global production (Figure 9). To conclude on this matter,considering the current global production of raw materials, the Germany case studyclearly demonstrates that the use of renewables, in the form of solar photovoltaicpanels and/or wind energy, is a rather unrealistic solution for Germany or for theworld—simply put, the rate of demand for raw materials, coupled with the energydemand that goes with their extraction and processing, current technology and theimmediate environmental impact typically associated with mining and processing,is totally impractical and unaffordable, especially given the time frame proposed byinternational organizations such as the EU and the IPCC (Table 2).
70

Table 2. Global reserves of most important raw materials by country.
ReservesCountry
Cobalt (kt) Lithium (kt) Nickel (kt) Graphite (kt)
Argentina 2000
Australia 1100 1500 19,000
Brazil 78 48 10,000 72,000
Canada 240 2900
Chile 7500
China 80 3200 3000 55,000
Colombia 1100
Cuba 500 5500
Democratic Republic ofthe Congo 3400
Guatemala 1800
India 8000
Indonesia 4500
Madagascar 130 1600 940
Mexico 3100
New Caledonia 200 8400
Philippines 250 3100
Russia 250 7900
South Africa 30 3700
Turkey 90,000
United States of America 23 38 160
Zambia 270
Zimbabwe 23
Other countries 610 6500 960
World total 7000 14,000 80,000 230,000
Source: Table adapted from EC (European Commission) (2018).
71

Lith
ium
(kt)
Coba
lt (k
t)
500
200
100350
50
40
450
150
80300
140
0
20
0
400
100
60250
120
2016 20162018 20182020 20202022 2022
Figure 9. Lithium and cobalt global production from 2016 until 2022. Source:Graphics by authors, adapted from Metso: Outotec (2021).
Ultimately, the world needs to sustain its energy supply and growth whilesignificantly reducing emissions, and the following question remains: how can thisbe achieved when world energy consumption continues to increase as a result ofpopulation increase, industrialization and improved quality of life?
A 30% increase in world energy consumption is expected between 2014 and2035, mainly related to the rapid growth of emerging economies, amongst whichChina and India account for half of this increase (Figure 10). Yet, an apparentmistake is consistently made, intentionally or not: that of discussing the globalenergy matrix based on the EU and/or the USA case studies, relegating the rest ofthe world, its populations and, above all, its energy needs and development rights toan obscure platform.
International policies, as well as the targets established in international treaties,namely, the Paris Agreement, play a very powerful role in the evolution of the worldenergy sector and may even cause real deviations in the evolution of the globalenergy matrix. In the current energy scenario (Figure 11), it is clear that fossil fuelswill continue to play an important role in the global energy matrix. GECF (GasExporting Countries Forum) (2017) still projects that approximately 75% of globalprimary energy consumption will be met by fossil fuels (oil, natural gas and coal) inthe year 2040, despite a decrease of 6% being projected between 2014 and 2040. Thereare expectations that a substantial increase in nuclear and renewable energies willoccur, corresponding to approximately 25% of the world energy matrix. Renewableenergies are the primary energy sources with the highest growth, from 13% in 1990to 18% in 2040. Despite this promising renewable energy scenario, direct use of fossil
72

fuels is, and is expected to remain, the dominant energy source in the modern world.Mills (2019) suggested that in order to completely replace fossil fuels over the next 20to 30 years, knowing that half a century was needed for global oil and gas productionto expand by 10-fold, global renewable energy production would have to increase byat least 90-fold, and this is an unrealistic proposition even when substantial financialefforts are involved. It is therefore quite obvious that the global energy demand willnot allow the Paris Agreement targets to be met, especially with the current energyand climate strategies, which lack binding agreements and carbon markets, as withthose proposed in the Kyoto Protocol.
OECD India Africa
China Other non-OECD Asia Other
OECD - Organisation for Economic Co-operation and Development
Billi
on o
f ton
oil
equi
vale
nt
19650
3
6
9
12
15
18
1975 1985 1995 2005 2015 2025 2035
Figure 10. World energy consumption by region. Source: Graphic by authors,adapted from BP (British Petroleum) (2017).
73

Nuclear Coal OilRenewables Gas
20401990
2014
28%
31%
37%
25%21%
19%
25%
13%
7%
5%
6%14%18%
29%
22%
Figure 11. Evolution of shares of global primary energy, between 1990 and 2040.Source: Graphic by authors, adapted from GECF (Gas Exporting Countries Forum)(2017).
Returning to the IEA’s assumed goal to achieve net zero CO2 emissions by 2050,we are of the view that, even with the enormous financial and technological effortsthat are continuously made, it is unlikely that total decarbonization of the energysector in the envisaged timespan will be achieved. In fact, full decarbonizationof the energy sector would imply an urgent and rapid deployment of availabletechnologies, but above all, worldwide use of technologies that are not on themarket yet. These new technologies are mainly related to battery storage systems,hydrogen electrolyzers and direct air capture and storage systems (IEA (InternationalEnergy Agency) 2021). As previously mentioned, there is still much to be conductedin the implementation process of new technologies, from the availability of rawmaterials to energy efficiency and cost competitiveness. For the implementation ofnew technologies, three main scenarios on global CO2 emissions have been proposedand projected, namely, business-as-usual, rapid transition and net zero (BP (BritishPetroleum) 2020). Additionally, BP (British Petroleum) (2020) and IEA (InternationalEnergy Agency) (2021) stated that the global CO2 emissions peak has already beenreached (Figure 12), mainly due to the impact of COVID-19, and they will not returnto their pre-pandemic levels. Nevertheless, it is important to keep in mind that the
74

previous projections are significantly different from these new proposals; actually,BP (British Petroleum) (2017) projected an increase in global CO2 emissions of 13%between 2014 and 2035 (Figure 13), which is far from the targets of achieving a 30%reduction by 2035, as proposed by the Paris Agreement.
Glob
al C
O2
emis
sion
s (Gt
)
40
35
30
25
20
15
10
5
01980 1990 2000 2010 2020 2030 2040 2050
Rapid Net zero Business-as-usual
Figure 12. Global CO2 emission scenarios. Source: Graphic by authors, adaptedfrom BP (British Petroleum) (2020).
Glob
al C
O2 e
mis
sion
s (Bt
)
40
30
20
10
01965 1975 1985 1995 2005 2015 2025 2035
Figure 13. Global CO2 emission projection. Source: Graphic by authors, adaptedfrom BP (British Petroleum) (2017).
75

The three CO2 emission scenarios presented by BP (British Petroleum) (2020) aresupported by differences in economies, energy policies and social preferences. Onemain subject that has been discussed since the Kyoto Protocol is the establishment ofcarbon prices and, consequently, the carbon market. The business-as-usual scenarioassumes carbon price increases of USD 65/t in developed countries and USD 35/t inemerging countries by 2050. Instead, both the rapid transition and net zero scenariosassume a substantial increase of USD 250/t in developed countries and USD 175/tin emerging economies by 2050.
The business-as-usual scenario corresponds to the global CO2 emissionprojection if government policies, technologies and social preferences continueworking in the usual way, as seen recently. In this scenario, projections address CO2
emissions above 30 Gt in 2050, showing a slight decline of 10% between 2020 and 2050,which is far from the carbon-neutral target established by the European Commission.
The rapid transition scenario is based on a series of policy measures, led by asignificant increase in carbon prices and supported by more targeted sector-specificmeasures, such as a significant shift away from traditional fossil fuels to non-fossilfuels, led by renewable energy, in order to achieve a more diversified global energymatrix (Figure 14). This rapid scenario projection suggests a 70% decline by 2050,which is consistent with the Paris Agreement targets of limiting the rise in the globalaverage temperature to well below 2 C above pre-industrial levels (Figure 12).
*Nuclear and hydroelectricity
Oil Coal Natural gas Other non-fossil fuels* Renewables
1900
100%
80%
60%
40%
20%
0%1915 1930 1945 1960 1975 1990 2005 2020 2035 2050
Figure 14. Shares of primary energy in the rapid transition scenario. Source:Graphic by authors, adapted from BP (British Petroleum) (2020).
76

The net zero scenario assumes that the policies in the rapid transition scenarioare reinforced by significant shifts in social behaviors and preferences. Nevertheless,this scenario believes that an accelerated energy transition cannot be achieved basedonly on government policies, and that binding strategies need to be established. Thenet zero scenario suggests a deep decline by over 95% in global CO2 emissions by2050, which will allow meeting the global average temperature rise of well below1.5 C above pre-industrial levels.
At this moment, it is quite obvious that achieving a carbon-neutral energysystem by 2050 will be a challenging task, requiring enormous efforts by allstakeholders, spanning social, economic, political and technological points of view.From the technological perspective, besides developments in new energy systems, itis undeniable that carbon capture and geological storage, so-called CCS technologiesand specifically carbon capture utilization and storage (CCUS) technologies, must beincluded, as suggested by the Paris Agreement, as one of the potential solutions tomeet the targets of carbon neutrality by 2050.
5. Geology Contribution to an Efficient Energy Transition
The contribution of geology on the path to achieving an efficient energytransition has different approaches. The first and inherent approach deals withthe important role that geology plays in understanding climate change in the generalcontext of planet Earth’s evolution, which will offer potential tools to calibrate ourfuture climate models. Three other major geological “contributors” are directly linkedto reducing GHG emissions in this overall energy transition framework, namely,(1) mineral raw materials to build renewable energy equipment, (2) undergroundgeological structures for hydrogen storage and (3) underground geological storagestructures for CO2 abatement.
The main target of the energy transition is to shift energy production from fossilfuels to non-fossil sources, meaning that the ultimate goal is to base the global energymatrix on CO2-free energy sources. These CO2-free energy sources and technologies,such as wind, solar, biomass or geothermal, require the exploration and exploitationof mineral raw materials for their deployment, with the obvious and often seriouslydetrimental consequences of the environmental impacts. Additionally, raw materialsare not only needed for the construction of renewable energy equipment, such assolar photovoltaic panels and aeolian turbines, but also for building battery energystorage systems, considering the variability and intermittency of renewable sources.
Another important contribution from geology is related to the need for energysavings and efficiency, commonly associated with hydrogen energy production,
77

which can be achieved by managing the heat and cold demand using undergroundstorage structures (Dalebrook et al. 2013). Hydrogen energy is consideredthe key priority of carbon-neutral energy systems, due to its regenerative andenvironmentally friendly features. Nevertheless, hydrogen energy has two majorinherent problems: its production and storage. Hydrogen energy production iscomplex, and it is not a cost-competitive energy, which must be produced fromwater or even hydrocarbons (Dalebrook et al. 2013). Hydrogen has a low criticaltemperature of −251.15 C, meaning that hydrogen is a gas at ambient temperatureand atmospheric pressure; therefore, its storage implies a reduction in an enormousvolume of hydrogen gas (Züttel 2003). Despite the significant issues in hydrogenproduction, hydrogen storage in large quantities is arguably the most challengingpart of the entire hydrogen energy chain. Hydrogen storage in itself is not the mainproblem, a subject already addressed by several authors in recent decades (Yartysand Lototsky 2004; Zhou 2005; Niaz et al. 2015), and six different methods havealready been sufficiently implemented, namely, (1) high-pressure gas cylinders (upto 800 bar), (2) liquid hydrogen in cryogenic tanks (at −252.15 C), (3) adsorbedhydrogen on materials with a large specific surface area (at −173.15 C), (4) absorbedhydrogen on interstitial sites in a host metal (at ambient pressure and temperature),(5) chemically bonded hydrogen in covalent and ionic compounds (at ambientpressure) or (6) oxidation of reactive metals (e.g., Li, Na, Mg, Al, Zn) with water,and hydrogen is already stored in underground salt cavities in the UK and theUSA. Nevertheless, the hydrogen storage issue can be avoided when hydrogenproduction is supported by fossil-based hydrogen processes, namely, blue and grayhydrogen processes, usually reflecting an efficient alignment between productionand consumption, where production occurs at the site of an industrial consumer, andusually where significant hydrogen storage is not required. The main issue is thelarge-scale storage of hydrogen commonly required for green hydrogen production,which is powered by intermittent renewable energies. For storing temporally largevolumes of renewable energy surplus, geological options probably have the lowestcost and represent the best solution (Schoenung 2011; Heilek et al. 2016; Tarkowski2017; Andersson and Grönkvist 2019; Karakilcik and Karakilcik 2020). Four specificgeological options have been evaluated: salt caverns, depleted oil fields, depletedgas fields and deep saline aquifers. In fact, these geological options are commonlyused in technological processes of CO2 abatement, which will be discussed later inthis section. Figure 15 shows a scheme for hydrogen production and storage whenusing 100% renewable energy sources.
78

Electrolyser hydrogen
Others hydrogenusing option
Gas combustion unit/Electricity
Renewableenergy sources
H2
inje
ctio
n H2 w
ithdrawal
Underground hydrogen storage
options
Salt caverns
Deep saline aquifers
Depleted oilfields
Depleted gasfields
Figure 15. Renewable energy system scheme with an underground geologicalhydrogen storage facility. Source: Graphic by authors, adapted from Tarkowski(2019).
Salt caverns, which are built in underground salt domes, are the most matureoption for geological storage facilities for hydrogen (Ozarslan 2012; Lemieux et al.2020; Liu et al. 2020). Several advantages are attributed to salt caverns, such as theirstorage efficiency given that only a small fraction of the hydrogen injected is unableto be extracted from the geological structure, their lack of contaminants and, lastly,one of the most crucial advantages, their high-pressure operating systems, enabling arapid discharge when hydrogen is needed (IEA (International Energy Agency) 2019).In this context, large-scale underground geological structures will play a crucial rolein the hydrogen energy economy as integrated power plants with grids that relymainly on renewable energy sources.
The last geological contribution, and perhaps the most controversial in recentyears to reduce GHG emissions, mainly CO2, is represented by CCS technologies(Figure 16). CCS technologies (Bui et al. 2018) were well studied at the beginningof the 21st century, resulting in several well-established geologic screening criteriafor “pure” sequestration/storage of CO2. As previously mentioned, a European
79

regulatory framework for geological sequestration/storage of CO2 (Directive2009/31/EC, Shogenova et al. 2014) was defined in 2009. Directive 2009/31/EC wasprepared for pure sequestration solutions in deep saline aquifers, and it was rapidlyunderstood that they could be one of the largest potential technical storage solutionsto reduce CO2 emissions (Celia et al. 2015; Khan et al. 2021), but economicallyunviable, mainly due to the lack of investor-motivating measures.
CO2 Abatement: State-of-the-art(Capture + Transport)
Geological storage/sequestration
Mineralcarbonation
Opensystems
OceanicCO2 lakes
DiversePorous
Lithologies
Shale gas(ESG)
Saltcavination
Deepsaline
aquifers
Depleted oiland gas
fields(EOR, EGR)
Coal seams(ECBM or Puresequestration)
Closedsystems
Figure 16. Geological storage solutions for CO2 abatement. Source: Graphic byauthors, adapted from Lemos de Sousa et al. (2008).
The subject became so important that the European Commission requestedthe European Academies Science Advisory Council (EASAC) to address the subjectof carbon capture and storage in Europe (EASAC (European Academies ScienceAdvisory Council) 2013). A similar important concern was developed by Chineseexperts (Jiang et al. 2020). It became clear that to address CCS technologies, the keypoint would be to transform these technologies into an effective economic approach(D’Amore and Bezzo 2017; Kapetaki and Scowcroft 2017; Shogenova et al. 2021).The term “CO2 utilization” was seen as the obvious solution, which allowed forthe definition of three main categories: CCUS—hydrocarbon resource recovery,CCUS—consumptive applications and CCU—reuse (non-consumptive) applications(CSLF (Carbon Sequestration Leadership Forum) 2012).
In CCUS—hydrocarbon resource recovery (EOR), CO2 is used to enhancehydrocarbon (oil and gas) production, which may partly compensate for the initial
80

cost of CCS and contribute to the implementation of long-term CO2 storage inother geological facilities, such as deep saline aquifers. The CCUS—consumptiveapplications involve the formation of minerals, also designated as mineralcarbonation, which results in CO2 storage by “locking up” the carbon componentin the structure of the new mineral formed. In CCU—reuse (non-consumptive)applications, the temporarily stored CO2 is also not directly consumed, and instead,the CO2 is reused or used only once while generating some additional benefit.
Additionally, in 2015, the Paris Conference (COP21) highlighted that CCS is oneof the key promising technologies that can effectively contribute to reducing CO2
emissions in the power generation sector, even if CO2 utilization options are used.Nonetheless, in this section, the main goal is to highlight the role of geological
sites in reducing CO2 emissions, and in such cases, those that allow for CO2
utilization. Therefore, considering the geological solutions for CO2 abatement thatare presented in Figure 16, four main groups can be identified, namely, (1) depletedoil fields (CO2 enhanced oil recovery—CO2-EOR), (2) CO2 enhanced gas recovery(CO2-EGR), (3) shale gas reservoirs (CO2 enhanced shale gas—CO2-ESG) and (4) coalseams (CO2 enhanced coalbed methane—CO2-ECBM). There are several key criteriafor CO2 storage projects that must be reached, which are different for each of thegeological solutions but supported by the same general assessment procedures,namely, risk assessment; monitoring, reporting and verification requirements;reservoir simulations; accounting for the amount of CO2 that can be stored;post-injection monitoring and site closure; economics evaluation; social contextanalysis; and legal and regulatory issues (Ajayi et al. 2019; MRI (Mitsubishi ResearchInstitute) 2020). Certainly, the amount of CO2 that can be stored in a geological site isone of the most important criteria in the whole key criteria list; thus, in this context,coal seams could play a major role in the CCUS technology framework.
Coal is a porous medium reservoir characterized by a unique organicmicrostructure, which allows for a CO2 storage volume that is much higher thanits pore volume capacity (Rodrigues and Sousa 2002), due to its adsorbed inherentfeatures. The dominant adsorption characteristics of coal mean that CO2 is mainlystored in the internal surface area of pores, in a condensed form, which is very closeto the liquid state. Therefore, reservoirs characterized by organic microporous mediasignify higher internal surface areas and, consequently, higher storage capacities(Rodrigues et al. 2015). The main attribute that justifies coal as the better storagesite option and, at the same time, the most permanent and secure solution for CO2
storage in the medium–long term is its high organic matter content (greater than 50%in weight) (ISO 11760 2005). Besides the CO2 storage capacity, the CO2 injectivity
81

rate is also a relevant criterium to select a geological site. The low CO2 injectivity ofa coal seam, due to its low permeability (usually lower than 5 millidarcy—mD), isundeniably an unfavorable key parameter suggesting not to use ECBM as the mosteconomically viable CCUS technology.
CO2-EOR projects have the largest potential of the various CO2 utilizationoptions, and they are the most used to date. In fact, they have been usedon a commercial scale since the 1970s, totalling more than 100 commercial andpilot/demonstration projects (Ajayi et al. 2019). Yet, due to amazing improvementsin the shale gas sector in recent years (Soeder and Borglum 2019), it is possibleto consider CO2-ECBM as an economically viable solution for CCUS technologies.These improvements are intimately related to horizontal drilling technologies, whichinvolve a special form of directional drilling, typically through a formation at awell inclination of 90 from the vertical, using air hammers with rotation, and withdirectional control by means of bent housing motors. The well is drilled verticallyuntil the reservoir’s calculated depth is reached, and then the well is drilled to turn atan angle that is steadily increased until the well becomes parallel with the reservoir(Jiang et al. 2017; Guo et al. 2018). The long laterals of horizontal wells increase thereservoir–well contact, allowing for significant improvement in the reservoir’s CO2
injectivity and therefore in hydrocarbon production, which avoids the commonlybut extremely expensive multi-well drilling approach used in the past.
Over the years, CCS technologies have been applied worldwide to both CO2
pure sequestration and to CO2 utilization. Nevertheless, due to the costs involvedin the entire process, the most implemented type has been the CCUS technologies.According to the Economic Forecasting and Policy Analysis (EPPA) model developedby the Massachusetts Institute of Technology, which takes into account severalpre-requisites to perform the assessment of storage capacity (MRI (MitsubishiResearch Institute) 2019), the word’s total accessible geological CO2 storage capacityis estimated to be between 8000 and 55,500 Gt, depending on the estimation scenario.The EPPA model includes the implementation of several CCS technologies, from CO2
pure sequestration to CO2 utilization projects. Considering the pre-requisites neededto address an efficient assessment of a site storage capacity, eighteen regions wereselected for the model (Table 3). This model presents two distinct approaches: (1) alower estimation, where a storage capacity factor of 0.037 Gt of CO2 stored per 1000km3 of the sedimentary basin is used, and (2) an upper estimation, where a storagecapacity factor of 0.26 Gt of CO2 per 1000 km3 of the sedimentary basin is used.Therefore, this EPPA model, taking into consideration the annual global CO2 emissionprojections proposed by BP (British Petroleum) (2020), which stated that the global
82

CO2 peak was reached in 2020, with annual total CO2 emissions of approximately35 Gt (Figure 12), implies that in the lower estimation scenario, the global storagecapacity will be able to store the emitted CO2 for approximately 228 years, and in theupper estimation scenario, CO2 abatement through CCS technologies would takeplace over approximately 1585 years.
CCS technologies seem to be a plausible option in the short and medium termto reduce CO2 emissions in the industrial sector. Actually, these technologies arecurrently known as the technological solution that will allow fighting for the globalclimate change targets, meaning to achieve carbon neutrality by 2050, despite severalchallenges related to costs, infrastructure and incentives that must be overcome.Significant progress has been made in recent decades; in fact, one of the first CCSprojects in the USA, initiated in 1972, remains operating, in which CO2 is capturedin a fertilizer facility (Enid Fertilizer) and utilized in an EOR project (CSLF (CarbonSequestration Leadership Forum) 2019). However, it has been during this last decadethat the implementation of CCS projects has increased worldwide. The facilityclassification system proposed by CSLF identified two major categories based ontheir annual CO2 capture capacity, namely, large-scale CCS facilities (capture capacityover 0.4 Mt/year), and pilot and demonstration CCS facilities (capture capacity lessthan 0.4 Mt/year) (CSLF (Carbon Sequestration Leadership Forum) 2019). Yet, anew CCS facility classification system was proposed by Global Status of GlobalCCS Institute (2020), which, besides the general pre-requisites list (CSLF (CarbonSequestration Leadership Forum) 2019), is mainly supported by the commercialreturn while operating parameter. Therefore, this new classification established thefollowing categories: (1) commercial CCS facilities, and (2) pilot and demonstrativeCCS facilities. Today, there are 65 commercial CCS facilities and 34 pilot anddemonstration CCS facilities around the world, but mainly located in North America,Europe and Asia. From the 65 commercial CCS facilities, 26 are operating, andthey can capture and permanently store around 40 Mt of CO2 per year. In thepresent scenario, it is only possible, when using CCS technologies, to provide a CO2
abatement of approximately 0.11% of the 35 Gt of current annual CO2 emissions inthe entire world.
At this stage, it is quite clear that significant improvements are requiredthroughout the entire energy chain in order to achieve carbon neutrality by 2050.
Gates (2021) was quite emphatic about the different approaches required formeeting reduction targets by 2030 and net zero targets by 2050. If the world is togo for the latter, he proposed both what can be done and what needs to be done.One thing is absolutely essential, and that is innovation at various levels, in order to
83

create and roll out breakthrough technologies that can assist in reaching the ultimategoal by 2050. It is hoped that CCS technologies will play an essential role throughthis challenge.
Table 3. EPPA global storage capacity by region.
Estimated Storage Capacity (Gt)
Region Lower Estimation(0.037 Gt/1000 km3)
Upper Estimation(0.26 Gt/1000 km3)
Africa 1563 10,986
Australia and New Zeland 595 4184
Dynamic Asia 119 834
Brazil 297 2087
Canada 318 2236
China 403 2830
Europe 302 2120
Indonesia 163 1144
India 99 697
Japan 8 59
Korea 3 24
Other Latin America 606 4257
Middle East 492 3454
Mexico 138 967
Other East Asia 272 1911
Other Eurasia 485 3410
Russia 1234 8673
United States of America 812 5708
Global 7910 55,581
Source: Table by authors, adapted from MRI (Mitsubishi Research Institute) (2019).
6. Conclusions
Whilst the world seeks to better understand climate science and significantlyimprove on climate models, predictions and interpretations of data relevant toso-called climate change, besides addressing the sustainability of resources, and the
84

reduction in emissions, in an effort to protect the environment, factors such as energyeconomics, security and cost of supply must be properly addressed at all times.
In an ever-changing world, highly dependent on hydrocarbon-based energysources, seeking to transition to new so-called cleaner sources, energy securityconcerns are heightened and the risks for disruption increase significantly. Such atransition needs to be as unincumbered as possible and should take into accountthe energy return on energy investment (EROEI) in order for sensible measuresand policies to be put in place and succeed in delivering the end result. Currentinvestments significantly favor renewables, but it seems as if work is being conductedat the expense of a major increase in additional natural resources and space, addingto even more environmental pressures. New renewable technologies will continueto raise the problem of waste disposal and recycling, adding further to the globalconcern of pollution and waste management, with a direct impact on nature, landand human and animal life. Under-investment in the old economy in favor of thenew economy will result in disruption to the energy supply chain, recently referred toas the “revenge of the old economy” (Gillespie 2021), with all the economic impactsand consequences that accompany it.
In conclusion, it is quite obvious that the energy transition system, mainlysupported by the idea of replacing fossil fuels, which are still responsible for about80% of global primary energy in 2021, by renewable sources, is an essential steprequired by the global energy sector, in order to try to meet the targets of carbonneutrality by 2050, which is considered to be a difficult, if not impossible, task toreach. This subject has been discussed since the 1970s and was strongly raised withthe implementation of the first Kyoto Protocol commitment, but the current globalclimate scenario is far from the main target, that is, net zero emissions.
The general analysis presented in this manuscript seeks to consider the differentaspects relating to climate and to global energy demands. The energy transition mustbe conducted in a gradually and consistent manner to avoid massive disruptions tothe energy and human development chains whilst seeking to ameliorate the impactsof climate change. Evidently, innovation and new developments need to come intoplay to accelerate the pace of change well beyond the impact seen from the currentsuit of alternative energy sources, namely, renewables. In this approach, fossil fuelswill most likely continue to share the global energy matrix, although they will startdecreasing, but most likely not in the medium term. To achieve carbon neutralityby 2050, a significant and intense multi-disciplinary effort in all sectors is required,with radical changes or improvements to cause a significant reduction in fossil fuelconsumption that can only result from processes that are not available as of yet. This
85

may include the likes of hydrogen, and perhaps an increased nuclear contributionto the energy matrix, but much work is required in a very short period of time (30years).
The contribution of geology to the energy transition phase, which forms partof the drive to achieve the target of zero carbon by 2050, is multi-faceted. Batteriesrequired to store energy produced from intermittent renewable sources requiremineral raw materials. Large-scale facilities required to store large volumes ofhydrogen can be provided by geological structures, such as salt caverns, depleted oiland gas fields and deep saline aquifers. Finally, given that a rapid energy transitionto a fossil fuel-free energy system is presently impossible, CO2 will continue to beemitted, and the most efficient solution to reduce CO2 emissions into the atmosphereis to apply CO2 abatement technologies, such as CCS technologies, by selecting thebest underground geological structures through a set of key criteria.
Author Contributions: Each author contributed with an equal amount of expertise anddiscussions in the development of the present investigation. All authors have read and agreedto the published version of the manuscript.
Funding: This research received no external funding.
Acknowledgments: The authors are indebted to Fundação Fernando Pessoa for supportingthis investigation in the scope of the research program of the FP-ENAS Research Unit. Thanks,are also due to Patrícia Moreira for her competent contributions to the literature research, andto the final organization of the reference list.
Conflicts of Interest: The authors declare no conflict of interest.
References
Ajayi, Temitope, Jorge Salgado Gomes, and Achinta Bera. 2019. A review of CO2 storagein geological formations emphasizing modeling, monitoring and capacity estimationapproaches. Petroleum Science 16: 1028–63. [CrossRef]
Allen, Myles. 2003. Liability for climate change. Nature 421: 891–92. [CrossRef] [PubMed]Andersson, Joakim, and Stefan Grönkvist. 2019. Large-scale storage of hydrogen. International
Journal of Hydrogen Energy 44: 11901–19. [CrossRef]Augustin, Laurent, Carlo Barbante, Piers R. F. Barnes, Jean Marc Barnola, Matthias Bigler,
Emiliano Castellano, Olivier Cattani, Jerome Chappellaz, Dorthe Dahl-Jensen,Barbara Delmonte, and et al. 2004. Eight glacial cycles from an Antarctic ice core.Nature 429: 623–28. [PubMed]
Bartlett, Jay, and Alan Krupnick. 2020. Decarbonized Hydrogen in the US Power and IndustrialSectors: Identifying and Incentivizing Opportunities to Lower Emissions. Report 20–25.Washington, DC: Resources for the Future.
86

Berner, Robert A., and Zavareth Kothavala. 2001. GEOCARB III: A revised model ofatmospheric CO2 over Phanerozoic time. American Journal of Science 301: 182–204.[CrossRef]
BMWI. 2020. The National Hydrogen Strategy. Berlin: Federal Ministry for Economic Affairsand Energy, pp. 1–32.
Bossel, Ulf, Baldur Eliasson, and Gordon Taylor. 2003. The Future of the Hydrogen Economy:Bright or Bleak? Cogeneration and Competitive Power Journal 18: 29–70. [CrossRef]
BP (British Petroleum). 2017. BP Energy Outlook: 2017 edition. London: British Petroleum,p. 103.
BP (British Petroleum). 2020. BP Energy Outlook: 2020 edition. London: British Petroleum,p. 157.
Bui, Mai, Claire S. Adjiman, André Bardow, Edward J. Anthony, Andy Boston, Solomon Brown,Paul S. Fennell, Sabine Fuss, Amparo Galindo, Leigh A. Hackett, and et al. 2018.Carbon capture and storage (CCS): The way forward. Energy & Environmental Science 11:1062–176.
Celia, Michael Anthony, Stefan Bachu, Jan Martin Nordbotten, and Karl W. Bandilla. 2015.Status of CO2 storage in deep saline aquifers with emphasis on modeling approachesand practical simulations. Water Resources Research 51: 6846–92. [CrossRef]
Crowley, Thomas J., and Robert A. Berner. 2001. Paleoclimate: Enhanced: CO2 and ClimateChange. Science 292: 870–72. [CrossRef]
CSLF (Carbon Sequestration Leadership Forum). 2012. CSLF Annual Meeting, 24–26 October2012, Perth, Australia. Bergen: Carbon Sequestration Leadership Forum.
CSLF (Carbon Sequestration Leadership Forum). 2019. Carbon Capture, Utilisation and Storage(CCUS) and Energy Intensive Industries (EIIs). Chatou: Carbon Sequestration LeadershipForum.
D’Amore, Federico, and Fabrizio Bezzo. 2017. Economic optimisation of European supplychains for CO2 capture, transport and sequestration. International Journal of GreenhouseGas Control 65: 99–116. [CrossRef]
Dalebrook, Andrew F., Weijia Gan, Martin Grasemann, Séverine Moret, and Gábor Laurenczy.2013. Hydrogen storage: Beyond conventional methods. Chemical Communications 49:8735–51. [CrossRef] [PubMed]
Dayaratna, Kevin D., Ross McKitrick, and Patrick J. Michaels. 2020. Climate sensitivity,agricultural productivity and the social cost of carbon in FUND. Environmental Economicsand Policy Studies 22: 433–48. [CrossRef]
EASAC (European Academies Science Advisory Council). 2013. Carbon capture and storage inEurope. (EASAC Policy Report 20). Halle (Saale): German National Academy of SciencesLeopoldina, p. 86.
EC (European Commission). 2007a. Limiting Global Climate Change to 2 C: The Way Ahead for2020 and Beyond. [COM (2007) 2 Final]. Brussels: European Commission, p. 13.
87

EC (European Commission). 2007b. Towards a European Strategic Energy Technology Plan. [COM(2006) 847 Final]. Brussels: European Commission, p. 12.
EC (European Commission). 2009. Directive 2009/31/EC of the European Parliament and of theCouncil of 23 April 2009 on the Geological Storage of Carbon Dioxide. Brussels: EuropeanCommission.
EC (European Commission). 2010. Energy 2020: A Strategy for Competitive, Sustainable andSecure Energy. [COM (2010) 639 Final]. Brussels: European Commission, p. 20.
EC (European Commission). 2011a. Energy Efficiency Plan 2011. [COM (2011) 109 Final].Brussels: European Commission, p. 16.
EC (European Commission). 2011b. Energy Roadmap 2050. [COM (2011) 885 Final]. Brussels:European Commission, p. 20.
EC (European Commission). 2011c. On Security of Energy Supply And internationalCooperation—“The EU Energy Policy: Engaging with Partners beyond Our Borders”. [COM(2011) 539 Final]. Brussels: European Commission, p. 19.
EC (European Commission). 2011d. Proposal for a Regulation of the European Parliament and ofThe Council on Guidelines for Trans-European Energy Infrastructure and Repealing Decision No1364/2006/EC. [COM (2011) 658 Final]. Brussels: European Commission, p. 48.
EC (European Commission). 2011e. Smart Grids: From Innovation to Deployment. [COM (2011)202 Final]. Brussels: European Commission, p. 12.
EC (European Commission). 2018. Report on Raw Materials for Battery Applications. [SWD (2018)245/2 Final]. Brussels: European Commission, p. 47.
EC (European Commission). 2019. The European Green Deal. [COM (2019) 640 Final]. Brussels:European Commission, p. 24.
EC (European Commission). 2020a. A Hydrogen Strategy for a Climate-Neutral Europe. [COM(2020) 301 Final]. Brussels: European Commission, p. 23.
EC (European Commission). 2020b. Proposal for a Regulation of the European Parliament and of TheCouncil Establishing the Framework for Achieving Climate Neutrality and Amending Regulation(EU) 2018/1999 (European Climate Law). [COM (2020) 80 Final-2020/0036 (COD)]. Brussels:European Commission, p. 25.
EU (European Union). 2021. Regulation (EU) 2021/694 of the European Parliament and ofthe Council of 29 April 2021: Establishing the Digital Europe Programme and repealingDecision (EU) 2015/2240. Official Journal of European Union 2021: L166/1–L166/34.
Gates, Bill. 2021. How to Avoid a Climate Disaster—The Solutions We Have and the BreakthroughsWe Need. New York: Penguin Random House, p. 257. ISBN 978-0-241-44830-4.
GECF (Gas Exporting Countries Forum). 2017. Global Gas Outlook 2017. Doha: Gas ExportingCountries Forum, p. 96.
Gielen, Dolf, Francisco Boshell, Deger Saygin, Morgan D. Bazilian, Nicholas Wagner, andRicardo Gorini. 2019. The role of renewable energy in the global energy transformation.Energy Strategy Reviews 24: 38–50. [CrossRef]
88

Gillespie, Todd. 2021. Energy Crisis Is Old Economy’s Revenge, Says Goldman’s Currie.Bloomberg News. Available online: https://www.bnnbloomberg.ca/energy-crisis-is-old-economy-s-revenge-says-goldman-s-currie-1.1658513 (accessed on 25 October 2021).
Giorgi, Filippo. 2010. Uncertainties in climate change projections, from the global to theregional scale. EPJ Web of Conferences 9: 115–29. [CrossRef]
Giraud, Fabienne, Luc Beaufort, and Pierre Cotillon. 1995. Periodicities of carbonate cycles inthe Valanginian of the Vocontian Trough: A strong obliquity control. Geological SocietySpecial Publications 85: 143–64. [CrossRef]
Global CCS Institute. 2020. The Global Status of CCS 2020 - CCS Vital to achieve Net-Zero.Melbourne: Global CCS Institute, p. 44.
Guo, Chaohua, Mingzhen Wei, and Hong Liu. 2018. Study of gas production from shalereservoirs with multi-stage hydraulic fracturing horizontal well considering multipletransport mechanisms. PLoS ONE 13: e0188480. [CrossRef]
Haywood, Alan M., Paul J. Valdes, Tracy Aze, Natasha Barlow, Ariane Burke, Aisling M. Dolan,Anna S. von der Heyd, Daniel J. Hill, Stewart S. R. Jamieson, Bette Lou Otto-Bliesner, andet al. 2019. What can Palaeoclimate Modelling do for you? Earth Systems and Environment3: 1–18. [CrossRef]
Heilek, Christian, Philipp Kuhn, and Maximilian Kühne. 2016. The Role of Large-ScaleHydrogen Storage in the Power System. In Hydrogen and Fuel Cell. Edited byJohannes Töpler and Jochen Lehmann. Berlin: Springer, pp. 21–37.
Herbert, Timothy D., and Alfred G. Fischer. 1986. Milankovitch climatic origin ofmid-Cretaceous black shale rhythms in central Italy. Nature 321: 739–43. [CrossRef]
Huppert, Kimberly L., J. Taylor Perron, and Leigh H. Royde. 2020. Hotspot swells and thelifespan of volcanic ocean islands. Science Advances 6: 1–8. [CrossRef]
IEA (International Energy Agency). 2019. The Future of Hydrogen Seizing Today’s Opportunities.Report Prepared by the IEA for the G20 Japan. Paris: International Energy Agency,p. 203.
IEA (International Energy Agency). 2020. Renewables 2020: Analysis and Forecast to 2025. Paris:International Energy Agency, p. 171.
IEA (International Energy Agency). 2021. Net Zero by 2050: A Roadmap for the Global EnergySector. Special Report. Paris: International Energy Agency, p. 223.
IPCC (Intergovernmental Panel on Climate Change). 2013. Climate Change 2013: The PhysicalScience Basis. Working Group I Contribution to the IPCC Fifth Assessment Report.Cambridge: Cambridge University Press, p. 203. Available online: www.ipcc.ch/report/ar5/wg1 (accessed on 28 June 2021).
IRENA (International Renewable Energy Agency). 2019. Global Energy Transformation: ARoadmap to 2050. Abu Dhabi: International Renewable Energy Agency, p. 52.
ISO 11760. 2005. Classification of Coals. Geneva: International Organization for Standardization,p. 9.
89

Javed, Muhammad Shahzad, Dan Zhong, Tao Ma, Aotian Song, and Salman Ahmed. 2020.Hybrid pumped hydro and battery storage for renewable energy based power supplysystem. Applied Energy 257: 114026. [CrossRef]
Jiang, Tingxue, Xiaobing Bian, Haitao Wang, Shuangming Li, Changgui Jia, Honglei Liu, andHaicheng Sun. 2017. Volume fracturing of deep shale gas horizontal wells. Natural GasIndustry B 4: 127–33. [CrossRef]
Jiang, Kai, Peta Ashworth, Shiyi Zhang, Xi Liang, Yan Sun, and Daniel Angus. 2020. China’scarbon capture, utilization and storage (CCUS) policy: A critical review. Renewable andSustainable Energy Reviews 119: 1–15. [CrossRef]
Johnson, Markes E., B. Gudveig Baarli, Mário Cachão, Eduardo Mayoral, Ricardo S. Ramalho,Ana Santos, and Carlos M. da Silva. 2018. On the rise and fall of oceanic islands: Towardsa global theory following the pioneering studies of Charles Darwin and James DwightDana. Earth-Science Reviews 180: 17–36. [CrossRef]
Jouzel, Jean, Françoise Vimeux, Nicolas Caillon, Gilles Delaygue, Georg Hoffmann,Valerie Masson-Delmotte, and Frederic Parrenin. 2003. Magnitude ofisotope/temperature scaling for interpretation of central Antarctic ice cores. Journal ofGeophysical Research 108: 4361. [CrossRef]
Jouzel, Jean, Valerie Masson-Delmotte, Olivier Cattani, Gabrielle Dreyfus, Sonia Falourd,Georg Hoffmann, Bénédicte Minster, Julius Nouet, Jean-Marc Barnola,Jérôme Chappellaz, and et al. 2007. Orbital and Millennial Antarctic ClimateVariability over the Past 800,000 Years. Science 317: 793–96. [CrossRef] [PubMed]
Kang, Jian, and Rolf Larsson. 2013. What is the link between temperature and carbon dioxidelevels? A Granger causality analysis based on ice core data. Theoretical and AppliedClimatology 116: 537–48. [CrossRef]
Kapetaki, Zoe, and John Scowcroft. 2017. Overview of Carbon and Storage (CCS)demonstration project business models: Risks and Enablers on the sides of the Atlantic.Energy Procedia 114: 6623–30. [CrossRef]
Karakilcik, Hatice, and Mehmet Karakilcik. 2020. Underground Large-Scale Hydrogen Storage.In Accelerating the Transition to a 100% Renewable Energy Era. Edited by Tanay Sidki Uyar.Istanbul: Springer, Volume 74, pp. 375–92.
Khan, Chawarwan, Julie K. Pearce, Suzanne D. Golding, Victor Rudolph, and JimR. Underschultz. 2021. Carbon Storage Potential of North American Oil & Gas ProducedWater Injection with Surface Dissolution. Geosciences 11: 123–32.
Knutti, Reto, Joeri Rogelj, Jan Sedlácek, and Erich M. Fischer. 2015. A scientific critique of thetwo-degree climate change target. Nature Geoscience 9: 13–18. [CrossRef]
Kovac, Ankica, Matej Paranos, and Doria Marcius. 2021. Hydrogen in energy transition: Areview. International Journal of Hydrogen Energy 46: 10016–35. [CrossRef]
90

Lemieux, Alexander, Alexi Shkarupin, and Karen Sharp. 2020. Geologic feasibility ofunderground hydrogen storage in Canada. International Journal of Hydrogen Energy45: 32243–59. [CrossRef]
Lemos de Sousa, Manuel, Cristina Fernanda Rodrigues, Maria Alzira Dinis, and GiselaMarta Oliveira. 2008. Overview on CO2 Geological Sequestration. Porto: UniversidadeFernando Pessoa.
Liu, Wei, Zhixin Zhang, Jie Chen, Deyi Jiang, Fei Wu, Jinyang Fan, and Yinping Li. 2020.Feasibility evaluation of large-scale underground hydrogen storage in bedded salt rocksof China: A case study in Jiangsu province. Energy 198: 117348. [CrossRef]
Metso: Outotec. 2021. Battery Metals. Available online: https://www.mogroup.com/commodities/battery-metals/ (accessed on 28 June 2021).
Mills, Marker P. 2019. The “New Energy Economy”: An Exercise in Magical Thinking. New York:Manhattan Institute, p. 23.
Mills, Marker P. 2020. Mines, Minerals, And “Green” Energy: A Reality Check. New York:Manhattan Institute, p. 19.
Mitchell, Dann M., Yuen Tung Eunice Lo, William J. M. Seviour, Leopold Haimberger, andLorenzo M. Polvani. 2020. The vertical profile of recent tropical temperature trends:Persistent model biases in the context of internal variability. Environmental ResearchLetters 15: 1–11. [CrossRef]
Molloy, Patrick, and LeeAnn Baronett. 2019. The Truth about Hydrogen, the Latest, TrendiestLow-Carbon Solution. Available online: https://www.greenbiz.com/article/truth-about-hydrogen-latest-trendiest-low-carbon-solution (accessed on 28 June 2021).
Moore, Patrick. 2019. The Positive Impact of Human CO2 Emissions on the Survival of Life on Earth.Winnipeg: Frontier Centre for Public Policy, p. 30.
MRI (Mitsubishi Research Institute). 2019. Think & Act. Corporate Communications Division.Tokyo: Mitsubishi Research Institute, Available online: https://www.mri.co.jp/en/about-us/info/group_report/index.html (accessed on 5 July 2021).
MRI (Mitsubishi Research Institute). 2020. FY2019 Study on the Infrastructure Development Projectfor Acquisition of JCM Credits (International Cooperation in CCUS) Report. Environment andEnergy Division. Tokyo: Mitsubishi Research Institute, p. 310.
Niaz, Saba, Taniya Manzoor, and Altaf Hussain Pandith. 2015. Hydrogen storage: Materials,methods and perspectives. Renewable and Sustainable Energy Reviews 50: 457–69.[CrossRef]
Nordhaus, William. 2018. Projections and Uncertainties about Climate Change in an Eraof Minimal Climate Policies. American Economic Journal: Economic Policy 10: 333–60.[CrossRef]
Ozarslan, Ahmet. 2012. Large-scale hydrogen energy storage in salt caverns. InternationalJournal of Hydrogen Energy 37: 14265–77. [CrossRef]
91

Park, Jeffrey, and Timothy D. Herbert. 1987. Hunting for Paleoclimatic Periodicities in aGeologic Time Series with an Uncertain Time Scale. Journal of Geophysical Research: SolidEarth 92: 14027–40. [CrossRef]
Persson, Erik K. 2019. What Is the Link Between Temperature, Carbon Dioxide and Methane?A Multivariate Granger Causality Analysis Based on Ice Core Data from Dome C inAntarctica. Master’s thesis, Uppsala University, Uppsala, Sweden.
Pielke, Roger. 2020. Understanding the Great Climate Science Scenario Debate. New York: Forbes,Available online: www.forbes.com/sites/rogerpielke/2020/02/03/understanding-the-great-climate-science-scenario-debate/?sh=5f3251bb26a7 (accessed on 11 October 2021).
Pol, Katy, Valérie Masson-Delmotte, Sigfús Johnsen, Matthias Bigler, Olivier Cattani,Gael Durand, Sonia Falourd, Jean Jouzel, Bénédicte Minster, Frédéric Parrenin, andet al. 2010. New MIS 19 EPICA Dome C high resolution deuterium data: Hints for aproblematic preservation of climate variability at sub-millennial scale in the “oldest ice. ”Earth and Planetary Science Letters 298: 95–103. [CrossRef]
Rahman, Muhammad Ishaq-ur. 2013. Climate Change: A Theoretical Review. InterdisciplinaryDescription of Complex Systems 11: 1–13. [CrossRef]
Ritchie, Hannah, and Max Roser. 2017. CO2 and Greenhouse Emissions. Our Worldin Data CO2 and Greenhouse Gas Emissions Database. Available online: https://ourworldindata.org/atmospheric-concentrations (accessed on 28 June 2021).
Rodrigues, Cristina F., and Manuel J. Lemos de Sousa. 2002. The measurement of coal porositywith different gases. International Journal of Coal Geology 48: 245–51. [CrossRef]
Rodrigues, Cristina F., Maria A. P. Dinis, and Manuel J. Lemos de Sousa. 2015. Review ofEuropean energy policies regarding the recent “carbon capture, utilization and storage”technologies scenario and the role of coal seams. Environmental Earth Sciences 74: 2553–61.[CrossRef]
Rosen, Amanda M. 2015. The Wrong Solution at the Right Time: The Failure of the KyotoProtocol on Climate Change. Politics & Policy 43: 30–58.
Schernikau, Lars, and William Hayden Smith. 2021. How Many km2 of Solar Panels in Spainand How Much Battery Backup Would It Take to Power Germany. Available online:https://ssrn.com/abstract=3730155 (accessed on 2 May 2021).
Schoenung, Susan M. 2011. Economic Analysis of Large-Scale Hydrogen Storage for RenewableUtility Applications. Alburquerque: Sandia National Laboratories, p. 41.
Schwarzacher, Walther. 1993. Milankovitch cycles in the pre-Pleistocene stratigraphic record:A review. Geological Society Special Publications 70: 187–94. [CrossRef]
Shaviv, Nir J. 2008. Using the oceans as a calorimeter to quantify the solar radiative forcing.Journal of Geophysical Research 113: 1–13. [CrossRef]
92

Shogenova, Alla, Kris Piessens, Sam Holloway, Michelle Bentham, Roberto Martínez, KristinM. Flornes, Niels E. Poulsen, Adam Wójcicki, Saulius Sliaupa, Ludovít Kucharic, andet al. 2014. Implementation of the EU CCS Directive in Europe: Results and developmentin 2013. Energy Procedia 63: 6662–70. [CrossRef]
Shogenova, Alla, Nicklas Nordback, Daniel Sopher, Kazbulat Shogenov, Auli Niemi,Christopher Juhlin, Saulius Sliaupa, Monika Ivandic, Adam Wojcicki, Jüri Ivask, andet al. 2021. Carbon Neutral Baltic Sea Region by 2050: Myth or Reality? Paper presentat the 15th Greenhouse Gas Control Technologies Conference, Abu Dhabi, United ArabEmirates, March 15–18; p. 12.
Soeder, Daniel J., and Scyller J. Borglum. 2019. The evolutionary U.S. shale plays. In The FossilFuel Revolution: Shale Gas and Tight Oil. Amsterdam: Elsevier, pp. 109–35.
Soon, Willie, Ronan Connolly, and Michael Connolly. 2015. Re-evaluating the role ofsolar variability on Northern Hemisphere temperature trends since the 19th century.Earth-Science Reviews 150: 409–52. [CrossRef]
Stenni, Barbara, Valérie Masson-Delmotte, Enricomaria Selmo, Hans Oerter, Hanno Meyer,Regine Röthlisberger, Jean Jouzel, Olivier Cattani, Sonia Falourd, Hubertus Fischer, andet al. 2010. The deuterium excess records of EPICA Dome C and Dronning Maud Landice cores (East Antarctica). Quaternary Science Reviews 29: 146–59. [CrossRef]
Tarkowski, Radoslaw. 2017. Perspectives of using the geological subsurface for hydrogenstorage in Poland. International Journal of Hydrogen Energy 42: 347–55. [CrossRef]
Tarkowski, Radoslaw. 2019. Underground hydrogen storage: Characteristics and prospects.Renewable and Sustainable Energy Reviews 105: 86–94. [CrossRef]
Tarling, Donald Harvey. 2010. Milankovitch Cycles in Climate Change, Geology andGeophysics. Paper present at the 6th International Symposium on Geophysics, November11–12, Tanta, Egypt, pp. 1–8.
UN (United Nations). 1992. United Nations Framework Convention on Climate Change. (DocumentFCCC/Informal/84: GE.5-62220 (E) 200705). New York: United Nations, p. 24.
UN (United Nations). 2012. Kyoto Protocol to the United Nations Framework Convention on ClimateChange, Kyoto, 11 December 1997. Doha Amendment to the Kyoto Protocol, Doha, 8 December2012. Adoption of Amendment to the Protocol. New York: United Nations, p. 41, [Reference:C.N.718.2012.TREATIES-XXVII.7.c (Depositary Notification)].
UN (United Nations). 2015. Paris Agreement. New York: United Nations, p. 25.Veizer, Ján, Yves Godderis, and Louis M. François. 2000. Evidence for decoupling of
atmospheric CO2 and global climate during the Phanerozoic eon. Nature 408: 698–701.[CrossRef] [PubMed]
Voosen, Paul. 2021. Climate panel confronts implausibly hot models. Science 373: 474–75.[CrossRef] [PubMed]
Werndl, Charlotte. 2016. On defining climate and climate change. The British Journal for thePhilosophy of Science 67: 337–64. [CrossRef]
93

Wigley, Tom M. L. 1998. The Kyoto Protocol: CO2, CH4 and climate implications. GeophysicalResearch Letters 25: 2285–88. [CrossRef]
WMO (World Meteorological Organization). 1979. World Climate Conference—A Conference ofExperts on Climate and Mankind. Geneva: Declaration and Supporting Documents, p. 50.
Yang, Yuqing, Setphen Bremner, Chris Menictas, and Merlinde Kay. 2018. Battery energystorage system size determination in renewable energy systems: A review. Renewable andSustainable Energy Reviews 91: 109–25. [CrossRef]
Yartys, Volodymyr A., and Mykhaylo V. Lototsky. 2004. An Overview of HydrogenStorage Methods. In Hydrogen Materials Science and Chemistry of Carbon Nanomaterials.NATO Science Series II: Mathematics, Physics and Chemistry. Edited by TurhanNejat Veziroglu, Svetlana Yu. Zaginaichenko, Dmitry V. Schur, Bogdan Baranowski,Anatoliy Petrovich Shpak and Skorokhod Valery Volodimirovich. Dordrecht: Springer,Volume 172, pp. 75–104.
Zhou, Li. 2005. Progress and problems in hydrogen storage methods. Renewable and SustainableEnergy Reviews 9: 395–408. [CrossRef]
Züttel, Andreas. 2003. Materials for hydrogen storage. Materials Today 6: 24–33. [CrossRef]
© 2022 by the author. Licensee MDPI, Basel, Switzerland. This article is an openaccess article distributed under the terms and conditions of the Creative CommonsAttribution (CC BY) license (http://creativecommons.org/licenses/by/4.0/).
94

Use of Storage and Renewable ElectricityGeneration to Reduce Domestic andTransport Carbon Emissions—Whole LifeEnergy, Carbon and Cost Analysis of SingleDwelling Case Study (UK)
Vicki Stevenson
1. Introduction
The IPCC investigated the relationship between likely atmospheric CO2 by theyear 2100 and the resulting climate change. The report found that the likelihood ofstaying below a 1.5 C temperature increase in the 21st century (relative to 1850–1900)was more unlikely than likely even if atmospheric CO2 did not exceed 450 ppm CO2
by 2100 (Intergovernmental Panel on Climate Change 2014). The case for reducingour atmospheric carbon emissions is clear.
Globally, transport and building energy use are both major causes ofCO2 emissions. Focusing on the UK, direct carbon emissions from homeswere 64 MT CO2 in 2017 (Climate Change Committee 2019a), while UK roadtransport emissions were 118 MT CO2, representing a 6% increase since 1990(Office for National Statistics 2019).
Net-zero energy buildings have been established as an aim globally, at theEuropean level and in the UK (World Green Building Council n.d.; EuropeanParliament 2010; Government Property Agency 2020). In the UK, battery storage(including electric vehicle charging) has potential to reduce the need to upgrade localelectricity grids and enable greater deployment of renewable electricity generation.
2. Literature Review
The UK (Climate Change Committee 2019b) has acknowledged that large-scaleonshore wind, offshore wind and solar PV are now the cheapest forms of electricitygeneration in the UK and expects their contribution to UK electricity to rise to 50–65%by 2030 and potentially even higher afterwards. This will be needed to reduce theUK grid electricity carbon intensity to 100 g CO2/kWh by 2030, then even furtherto 10 g CO2/kWh by 2050. However, this level of penetration requires additionalenergy storage infrastructure to (1) make best use of renewable generation, (2) ensure
95

that peak demand continues to be met and (3) bring electricity system costs down.Currently, the UK has the equivalent of 3 GW of pumped hydro storage, but only0.4 GW of battery devices.
In the UK, the important role of storage is presented in the recent Heat andBuildings Strategy (HM Government 2021). Previously, it was not specificallyconsidered, but there have been references to “enabling smart homes” andcommitments to introducing time of use tariffs and creating an opportunityfor domestic demand load shifting (HM Government 2017) which support theimplementation of domestic storage. Although battery storage is eligible for aninterest-free loan in Scotland (Home and Energy Scotland n.d.), there are currentlyno nationwide domestic energy storage incentives (Zakeri et al. 2021).
2.1. Benefits and Financial Viability of Domestic Energy Storage
Recent academic analysis of domestic energy storage has focused on its benefitsto the electricity grid and its financial viability. The benefits of domestic energystorage paired with on-site renewable energy generation include the following:
• Enables load management/load shifting (Sheha and Powell 2018);• Peak load management (Jankowiak et al. 2020; Koskela et al. 2019;
Gardiner et al. 2020);• Balancing grid frequency (Gardiner et al. 2020);• Reduced grid import/export (Zakeri et al. 2021; Jankowiak et al. 2020;
Dong et al. 2020);• Reduced consumption from the electricity grid (Jankowiak et al. 2020);• Improves electricity self-consumption and self-sufficiency (Jankowiak et al. 2020;
Koskela et al. 2019; Gardiner et al. 2020; Dong et al. 2020).
On a community scale, storage can improve the voltage quality of the localdistribution grid and is a cheaper alternative to distribution and transmission networkexpansion (Dong et al. 2020). However, domestic battery storage is commerciallyunviable—this has been tested across a wide range of markets (Zakeri et al. 2021;Sheha and Powell 2018; Gardiner et al. 2020; Dong et al. 2020). This explains whythe rate of storage with PV is still very low (Zakeri et al. 2021). Although there aremany benefits to increased domestic energy storage (Zakeri et al. 2021; Jankowiaket al. 2020; Koskela et al. 2019; Gardiner et al. 2020; Dong et al. 2020), there is a gap inthe linkages and markets which would enable the prosumer to gain financially fromproviding these benefits (Gardiner et al. 2020).
96

Fewer studies are available on the environmental impact of energy storagesystems. (Üçtug and Azapagic 2018) analysed a system in Turkey and found thatit generates 4.7–8 times more energy than it consumes while having a 1.6–82.6-foldlower impact than grid electricity. It has been found that community installationsrequire less battery capacity than individual installations (Dong et al. 2020; Mairet al. 2021); this shows that embodied carbon of battery storage could be reducedsignificantly if implemented on a larger scale than single dwellings.
2.2. Policy
California and Germany are making headway in encouraging domestic energystorage. California offers a USD 400/kWh subsidy and a 30% tax credit—despite this,adoption has been low until recently (Gardiner et al. 2020). Germany’s success isattributed to subsidies and low-cost loans (Gardiner et al. 2020; Uddin et al. 2017).Australia has little policy support, but increasing electricity prices are driving a surgein domestic battery storage (Gardiner et al. 2020).
A range of policy options have been analysed for the UK (Zakeri et al. 2021;Jankowiak et al. 2020; Gardiner et al. 2020). These include the following:
• Arbitrage (import electricity at a low price and export at a higher price)—Thisrelies on dynamic purchase and export tariffs. Although time of use tariffsexist for purchase, domestic export tariffs are fixed. Even though this improvesthe financial case for storage, it does not make it profitable unless a policyis implemented to widen the price gap of off-peak and peak hours (Zakeriet al. 2021). Although storage capacity needs to be retained for PV-generatedelectricity (reducing arbitrage availability), this does not have an operationalcost and thus is only a disadvantage if it displaces grid electricity at a negativepurchase price.
• Peak shaving tariff—Remuneration of GBP 0.24/kWh of peak shaved wouldimprove profitability of battery storage and incentivise prosumers to purchase alarger battery and operate it in a way that benefits the electricity grid (Jankowiaket al. 2020). Enabling monetisation of a peak shaving service is also supportedby (Gardiner et al. 2020).
• Capital subsidy—A 30% capital subsidy would make storage break evenassuming a time of use tariff is used; otherwise, a 50–60% subsidy wouldbe required (Zakeri et al. 2021). Another analysis of subsidy found that GBP2660 was required to support the purchase of a 4 kWh battery along with a4 kW PV system—this is significantly more than most international programmes(Gardiner et al. 2020).
97

• Storage tariff—This could be used to reward owners for electricity discharged atpeak times. The current electric vehicle subsidy could be repositioned to onlysupport vehicles with vehicle-to-grid capability (Zakeri et al. 2021).
• VAT reduction to 5% for retrofit installation only has a modest impact on theinvestment case (Gardiner et al. 2020).
There is a consensus that policies which monetise multiple services outperformsubsidies, and that battery owners need to be rewarded for the benefits they provideto the electricity grid (Gardiner et al. 2020).
2.3. Research Gap
There is a lack of information and supporting data which can be used to informprosumers on the energy and carbon payback of their potential investment in PVrenewable energy generation and energy storage. This study addresses this byanalysing the financial, energy and carbon payback based on a single dwellingcase study.
3. Methodology
The key components to the methodology are as follows:
• Description of the case study including capital cost (Section 3.1);• Calculation of embodied energy and carbon of the case study (Section 3.2);• Calculation of expected energy, carbon and financial payback of the case study
before installation (Section 3.3);• Process to analyse embodied energy, embodied carbon and financial payback
(Section 3.4).
3.1. Case Study Description
The dwelling is a split-level detached house in South Wales (UK) which wasbuilt in 2006. In November 2013, it received an EPC rating of C (78 points), with arecommendation that it could achieve an EPC rating of B (84 points) if 2.5 kWp of PVwas installed.
On 30 July 2014, a 3.6 kWp vertical, monocrystalline, 2-string PV array with anSMA 3600 TL single-phase inverter and a Sunny web unit was commissioned. Thesouth gable façade was chosen for PV installation as plans for an attic conversionwere being considered. As the PV system was at street level, it incorporated mattglass to reduce potential reflection nuisance to neighbours, and it was shaped tomaximise the space in the peak of the gable. These factors resulted in a higher cost
98

(GBP 10,610 including 5% VAT) than that of a roof-mounted system. The system hasa PV orientation within 5 of south, vertical inclination and a shading factor of 95%(due to potential shading from nearby trees in winter) and was based on the MCSirradiance dataset of 668 kWh/kWp.
In 2019, the decision was made to purchase an electric vehicle, and thus increasedrenewable generation was planned. As the vehicle was likely to be off site during theday, energy storage was also planned.
On 28 April 2020, a Tesla Powerwall 2 AC with Gateway 2 was installed in anattached garage. This provides 13.5 kWh of storage with a 10-year warranty for 80%of the capacity at a cost of GBP 8040.
On 16 May 2020, a 6.12 kWp monocrystalline PV array with a Solar Edge HD4 kW inverter and optimisers was commissioned. The west-facing roof was chosenfor PV installation as the east roof suffered from shading in the morning. Initially, a6.8 kWp system had been specified; however, Western Power set an export limit of5.18 kW (including the existing façade PV system) and reduced the roof PV array to6.12 kWp despite the inclusion of the Powerwall and optimisers which could be usedto control the export. The system cost GBP 7803 including 5% VAT and warranty forthe inverter. The system has a PV orientation within 5 of west, 35 inclination and ashading factor of 1 and was based on an irradiance dataset of 778 kWh/kWp.
The electric vehicle (EV) arrived on 11 September 2020 having been significantlydelayed by restrictions related to the COVID-19 pandemic. The vehicle cost GBP29,710 including 20% VAT and after deducting the GBP 2500 UK government plug-ingrant. In addition, a Zappi charger was purchased to enable home charging and makeuse of potential excess from the PV electricity generation. The Zappi charger cost GBP1219 including 20% VAT and after deducting the GBP 350 UK government ElectricVehicle Homecharge Scheme grant. The EV consumption is indicated as 270 Wh/mile(Electric Vehicle Database n.d.) which is equivalent to 167.8 Wh/km, 5.95 km/kWh or3.7 mile/kWh. Although the UK government considers electric vehicles as havingzero CO2 emissions for vehicle tax purposes, there will be CO2 emissions from theelectricity unless the car is entirely charged from renewable sources. Assuming the2018 annual average electricity carbon intensity of 260.25 g CO2/kWh (Electricity Infon.d.), this results in EV emissions of 43.9 g CO2/km. This is expected to decreaseas electricity carbon intensity reduces in line with future targets (Energy UK 2016).The electric vehicle replaced a diesel car with published emissions of 109 g CO2/km(Vehicle Certification Agency n.d.). However, the diesel car performance over a10-year period proved to be 125.8 g CO2/km based on actual fuel efficiency.
99

3.2. Embodied Energy and Carbon
Embodied energy and carbon data were sought for PV and storage and thenapplied to the case study.
3.2.1. Photovoltaics
There is a range of embodied energy and carbon data available for renewableenergy generation and storage technologies (Reddaway 2016; Circular Ecology n.d.;Finnegan et al. 2018; Ito et al. 2011; Kristjansdottir et al. 2016; Feng and van den Bergh2020; Wong et al. 2016; Kurland 2019; Hausfather 2019), but the data must be treatedwith care as they often relate to different materials, locations, assumed service life,balance of system, year of analysis, functional units, analysis approach and analysisboundaries.
Over the period 1998–2014, the embodied energy of monocrystalline (m-Si) PVmodules was found to range between 2397 and 11,673 MJ/m2, while polycrystalline(p-Si) PV modules ranged between 2699 and 5150 MJ/m2 (Ito et al. 2011; Wong et al.2016). The data are more stable over the period 2009–2014 and averaging these datareturns values of 3597 MJ/m2 for m-Si and 2848 MJ/m2 for p-Si. More recent datafor a fully installed PV system in Australia show values of 4185 kWh/kWp for m-Siand 3708 kWh/kWp for p-Si (Reddaway 2016). Although polycrystalline PV (as abyproduct) has a lower embodied energy than monocrystalline PV, it also has a lowerefficiency (13.9% vs. 14.3%) Ito et al. 2011, meaning monocrystalline PV is oftenchosen for dwellings (as in this case study) because it is more space efficient.
Over the period 2011 to 2016, embodied carbon of monocrystalline (m-Si) PV wasfound to range between 150 and 300 kg CO2/m2 (Finnegan et al. 2018; Ito et al. 2011;Kristjansdottir et al. 2016). Additional 2016 data show values of 2560 kg CO2/kWpfor m-Si (Circular Ecology n.d.). Feng analysed the CO2 emissions of a range of PVmodule types manufactured in China, the EU and the USA and found that the carbonintensity of the electricity in the country was the dominating factor, resulting in EUproduction having the lowest embodied carbon, followed by that of the USA andthen China (Feng and van den Bergh 2020).
Analysis of embodied energy of PV systems in Norway (Kristjansdottir et al.2016) and Australia (Reddaway 2016) indicated that panel manufacturing accountsfor over 80% of emissions, with the next highest impact being from the inverter.
3.2.2. Lithium Batteries
In the UK, 2020 saw 108,205 battery electric vehicles sold, representing a 180%rise on the previous year (Attwood 2021). This represents a significant increase in
100

lithium-ion battery production. Already 10% of Tesla’s batteries get reused, while60% get recycled (Forfar 2018), and stationary power storage applications are seen asa valuable use of second-life batteries (Engel et al. 2019). Stationary power storagerequires a lower current density than EVs, meaning it can use batteries with 80–85%of their original capacity (Pagliaro and Meneguzzo 2019). Nissan and Renault havepartnered with organisations to reuse battery packs (Engel et al. 2019), while Teslaalready has a stationary power storage product—the Powerwall.
Kurland’s analysis of energy use in lithium-ion battery production indicatedsignificant improvements from 2014 (163 kWh/kWhc) to 2019 (50–65 kWh/kWhc).Key factors include the following:
• Increased scale, although this did not seem to have an impact after increasingthe size of the facilities with an annual capacity above 2 GWh;
• All electricity production in comparison to utilising steam from fossil fuels;• For Tesla and Northvolt Ett, embodied carbon has reduced due to the use of
renewable electricity (Kurland 2019).
The importance of the grid carbon intensity was also reflected in Hausfather’sanalysis of lifecycle carbon emissions of EV batteries, which found that US- orEurope-sourced batteries had approximately 20% lower lifecycle emissions thanAsia-sourced batteries. This was attributed to the widespread use of coal for electricitygeneration in Asia (Hausfather 2019). Lifecycle carbon emissions of batteries analysedbetween 2017 and 2019 ranged between 61 and 106 kg CO2/kWh, with an average of100 kg CO2/kWh (Hausfather 2019).
3.2.3. Embodied Energy and Carbon Data Applied to Case Study
Due to embodied energy and carbon data from the literature being based ondifferent functional units, these are now considered in relation to the case studyelements to allow comparison. Embodied energy data are shown in Table 1, with thecalculated results for both PV systems and storage presented in kWh for comparison.Similarly, embodied carbon data are shown in Table 2, with the calculated resultspresented in kg CO2 for comparison.
101

Table 1. Embodied energy data calculated for façade PV system, roof PV systemand battery.
Element/Functional Unit
PVSystem—Australia
2016
PV Modules +Inverter—Japan
2011
PV ModulesAve
2009–2014
Tesla Battery(Large Scale
2019)
4185 kWh/kWp 3986 MJ/m2 3597 MJ/m2 57.5 kWh/kWc
Roof PV6.12 kWp 25,612 kWh 1 - - -
32.5 m2 - 36,664 kWh 32,514 kWh -
Roofinverter 4 kWp - - -
façade PV 3.6 kWp 15,066 kWh 1 - - -
TeslaPowerwall 13.5 kWh - - - 776 kWh
1 Data used in calculations. Source: Table by author, adapted from Reddaway (2016);Ito et al. (2011); Wong et al. (2016); Kurland (2019).
Table 2. Embodied carbon data calculated for façade PV system, roof PV systemand battery.
Element/Functional UnitUK Panels PV Modules Ave
2011–2016Battery—Large
Scale 2019
2560 kgCO2/kWp 225 kg CO2/m2 100 kg CO2/kWh
Roof PV6.12 kWp 15,667 kg CO2
1 - -
32.5 m2 - 7322 kg CO2 -
Roof inverter 4 kWp - - -
façade PV 3.6 kWp 9216 kg CO21 - -
Tesla Powerwall 13.5 kWh - - 1350 kg CO21
1 Data used in calculations. Source: Table by author, adapted from Circular Ecology (n.d.);Finnegan et al. (2018); Ito et al. (2011); Kristjansdottir et al. (2016); Hausfather (2019).
As an accurate area measurement is not available for the façade PV system, theonly embodied energy data which can be used for both case study PV arrays are fromthe Australian PV system. It is acknowledged that this is possibly an underestimateof the total embodied energy for the PV system.
The embodied carbon data, which are available for both PV arrays, are based onUK panels and are significantly higher than the alternative data. Given the potentialassumption differences between embodied energy and carbon data, this variance wasaccepted as inevitable, and the higher embodied carbon value was used for furthercalculations in this paper.
102

The embodied energy and carbon data for the Powerwall were considered to bethe most appropriate estimates from the data available and were used for furthercalculations in this paper.
3.3. Expected Energy, Carbon and Financial Payback before Installation
Data provided before installation were used to calculate a simplified energycarbon and financial payback.
3.3.1. Façade PV
Based on the installer information, the system was expected to produce 2295 kWhannually. To pay back the 15,066 kWh embodied energy (Table 1) would take6.56 years.
The carbon intensity of the UK grid electricity in 2013 (European EnvironmentAgency 2020) was 467 g CO2e/kWh. To pay back the 9216 kg CO2 embodied carbon(Table 2) based on the predicted energy generation would take 8.6 years.
The PV system was registered for the UK Government Feed in Tariff (FiT) scheme.This paid 14.9 p/kWh with an assumed 50% export qualifying for an additional5.5 p/kWh. Based on installer information, the PV system was anticipated to makean annual electricity cost saving of GBP 359.09, with an annual FiT contribution ofGBP 627.39 (total GBP 986 per year), leading to a payback of the GBP 10,610 cost over10.75 years.
3.3.2. Roof PV
The system was expected to produce 4761 kWh annually. To pay back the25,612kWh embodied energy (Table 1) would take 5.37 years.
The carbon intensity of the UK grid electricity in 2019 (European EnvironmentAgency 2020) was 228 g CO2e/kWh. To pay back the 15,667 kg CO2 embodied carbon(Table 2) based on the predicted energy generation would take 14.43 years.
The PV system was assumed to save GBP 675 in electricity costs with anadditional GBP 145 in export sales, leading to a financial payback time of 9.5 years.However, it was not cost effective to take an export tariff for the roof PV systeminstead of the FiT scheme for the façade PV system, meaning the financial paybacktime increased to 11.56 years.
103

3.3.3. Tesla Powerwall
It is more complex to calculate the energy, carbon and financial payback for theTesla Powerwall as more factors are involved.
The first factor in the financial payback for the Tesla Powerwall is the electricitytariff used. The tariffs considered were as follows:
• Bulb standard tariff (from Bulb energy statement of 30 June 2020)—14.35 p/kWh• Bulb EV tariff (Bulb n.d.):
# 00:00–07:59 9.03 p/kWh (off peak)# 08:00–16:59 and 20:00–23:50 13.53 p/kWh (standard)# 17:00–18:59 30.22 p/kWh (peak)
• Octopus Go (from Octopus energy statement of 6 July 2020):
# 00:30–04:29 5.00 p/kWh (off peak)# 04:30–00:29 14.02 p/kWh (standard)
• Octopus Agile (Energy-Stats n.d.):
# Tracking tariff which varies at half-hourly intervals depending on thepredicted combination of supply and demand, published at 17:00 the daybefore use;
# Initial analysis of diurnal electricity cost trends (Figure 1) indicated thatthe period 16:00–18:59 had a significantly higher tariff than the rest of theday, with a slightly cheaper period of 01:00–04:49. Averaging costs forthese periods over the year resulted in a mean Agile tariff of:
16:00–18:59 23.00 p/kWh (peak) 19:00–15:59 7.00 p/kWh (standard)
104

40
30
20
10
00:00 2:00 4:00 6:00 8:00 10:00 12:00 14:00 16:00 18:00 20:00 22:00
p/kW
h
Jan
Jul
Feb
Aug
Mar
Sep
Apr
Oct
May
Nov
Jun
Dec
Figure 1. Half-hourly costs for Octopus Agile tariff 2019. Source: Graphic by author.
It was assumed that no grid electricity would be required in the period 16:00–18:59to avoid the most expensive periods, but that the Powerwall could charge at anyother time of day. Electricity consumption was based on actual consumption datafrom 1 January to 31 December 2019. Energy consumption for the planned EV wasassumed to be 42.6 kWh per week for 48 weeks (allowing 4 weeks in the year withoutsignificant commuting). It was assumed that the EV would charge during the off-peakperiod. These assumptions resulted in an assumed consumption for 2019 of:
• Peak electricity 1834.53 kWh• Standard electricity 10,225.76 kWh• Off-peak electricity 4708.76 kWh (2044.8 kWh for EV)
Table 3 indicates the 2019 electricity cost for the following:
• Each tariff;• The potential saving over the Bulb standard tariff;• The cost saving of using a Powerwall via load shifting from grid (and financial
payback in years).
105

Table 3. Electricity tariff options and financial benefit for load shifting.
Tariff OctopusGo
OctopusAgile Bulb EV Bulb Standard
2019 electricity cost (GBP) 2017.54 1544.01 2437.75 2477.42
Saving vs. Bulb standard(GBP) 459.88 933.42 39.68 -
Powerwall load shiftingsaving (GBP) 165.47 293.52 388.74 -
Powerwall load shiftingpayback (y) 48.6 27.4 20.7 -
Source: Table from author, adapted from Bulb energy statement of 30 June 2020; Bulb (n.d.);Octopus energy statement of 6th July 2020; Energy-Stats (n.d.).
On its own, load shifting to avoid peak costs does not justify the financial costof a Powerwall. However, in 2019, 172.571 kWh of PV energy was exported to thegrid from the gable PV system, and with the planned installation of an additional PVsystem, the likely export of PV (or throttling of generation) could be mitigated byusing the Powerwall.
The embodied energy of the Tesla Powerwall is 776 kWh (Table 1), while theembodied carbon is 1350 kg CO2 (Table 2). Insufficient data were available to enablecalculation of energy and carbon payback at this stage.
3.4. Process to Analyse Embodied Energy, Embodied Carbon and Financial Payback of theCase Study
Payback is calculated for each of the elements in relation to energy, carbon andcapital cost:
Energy payback (years) = Embodied Energy/Annual Energy Generation1
Carbon payback (years) = Embodied Carbon/Annual CO2 savings
Financial payback (years) = Capital Cost/Annual financial benefit
The embodied energy, embodied carbon and capital cost have already beenpresented in Sections 3.1 and 3.2.
Annual energy generation was obtained through monitoring (Section 3.4.1)up until December 2020. Beyond this, the performance was based on the periodJuly–December 2020 (justified in Section 4.1.2).
106

Annual CO2 savings were derived from monitored energy generation andanalysis of existing UK electricity grid carbon intensity data (Section 3.4.2) andpredicted grid carbon intensity (Section 4.2.2). This includes the capability of thePowerwall to store off-peak low-carbon electricity to use at higher carbon periods. Forthe EV, the CO2 savings are based on the reduction in carbon emissions in comparisonto the diesel car it replaced (Section 4.4).
Annual financial benefit was derived from monitored energy generation andelectricity tariff, FiT and export payments (Section 4.3.1).
3.4.1. Monitoring
The monitoring options for each element of the renewable generation andstorage system are discussed in the following paragraphs, summarised in Table 4and illustrated in Figure 2.
HWM Solarlogger
HWM Eleclogger
GardenLoads
HWM Solar2logger
Solar Edge Inverter
Sunny Inverter
ConsumerUnit
HWM Shed logger
Backup Generator
Transfer Switch
Export MeterRoof PV
Gable PV FiT Meter
House meter
Powerwall 2
Tesla Gateway 2
Zappi
Hub
NET
NET
NET
NET
EV Loads
House Loads
Renewable generation Storage HWM loggers Loads Pre-existing
Figure 2. Schematic of equipment for monitoring renewable generation and storage.Source: Graphic by author.
107

Table 4. Summary of monitoring equipment.
Monitor Data SourceStart
Date/TimeZone
Interval Accuracy
Cardashboard
EV efficiencyand distancetravelled 2
EV11 September
2020n/a
Manual -
Export meter Roof PVgeneration
Wiredbetween
inverter andincoming grid
16 May 2020n/a Manual
Schedule 7:Electricity Act
1989
FiT meter Façade PVgeneration
Wiredbetween
inverter andincoming grid
30 July 2014n/a Manual
Schedule 7:Electricity Act
1989
HWM SarnSolar 1
Façade PVgeneration
Pulse counteron FiT meter
19 December2014
BST/GMT15 min 1 pulse/Wh
HWM SarnSolar 2 1
Roof PVgeneration
Pulse counteron export
meter
17 May 2020BST/GMT 15 min 1 pulse/Wh
Solaredge.comRoof PV
generation 2Solar Edge
inverter 16 May 2020BST/GMT 15 min
1% var vs.Utility bill
Grid importGrid export
Currentclamp belowGateway 2
Sunnyportal.com Façade PVgeneration 2
Sunnyinverter
30 July 2014BST/GMT 60 min -
Tesla app
Total PVgenerationPowerwall
import 2
Powerwallexport 2
Grid importGrid export
TeslaGateway 2and currentclamp belowGateway 2
29 April 2020BST/GMT 5 min 1% var vs.
Utility bill
Utility billingdata Grid import 2
Houseelectricity
meter
24 May–19October 2020 30 min
Schedule 7:Electricity Act
1989
1 Equipment loaned by HWM-Water Ltd., Wales, UK; 2 Data used for monitoring. Source:Table by author.
108

Façade PV—Energy Generation
The Feed in Tariff export meter meets the requirements of Schedule 7 of theElectricity Act 1989; however, only manual readings can be taken from it. The Sunnyweb unit transmits data directly from the inverter to Sunnyportal.com, which arerecorded at hourly intervals. Unfortunately, a data service change resulted in lost datain 2018. The HWM “Sarn Solar” logger was installed in December 2014 and recordsdata at 15 min intervals. Unfortunately, this suffered some data loss in 2016 and2017. In years with no apparent data loss, the HWM “Sarn Solar” logged electricitygeneration figures 95.3–97.7% of those logged by Sunnyportal.com. Sunnyportal.comwas used as the primary source of data for the façade PV system. HWM “Sarn Solar”was used for the periods of data loss by Sunnyportal.com.
Roof PV—Energy Generation
The export meter meets the requirements of Schedule 7 of the Electricity Act 1989;however, only manual readings can be taken from it. Data are transmitted directlyfrom the inverter to monitoring.solaredge.com and recorded at 15 min intervals. TheHWM Sarn Solar 2 logger is battery operated and suffered from some data loss inSeptember 2020. Prior to this (17 May–31 August 2020), the HWM Sarn Solar 2 andsolaredge data were within 1% of each other. As electricity generation reduced inOctober–December 2020, the discrepancy increased to 2–3%. Solaredge was used asthe primary source of data for the roof PV system.
Total PV—Energy Generation
A current clamp on cables between the utility meter and Gateway 2 transmitsdata to the Tesla app, which are recorded at 5 min intervals.
Electricity Import to Site for Electricity Stored by Powerwall and EV
The utility meter meets the requirements of Schedule 7 of the Electricity Act 1989,with half-hourly data available from 24 May 2020 until 19 October 2020. However,no data after that date have been published.
Data from a current clamp on cables between the utility meter and Gateway 2are available at 15 min intervals via monitoring.solaredge.com. Over the period 24May to 19 October, solaredge and the average daily utility data were within 1% ofeach other.
Data from a separate current clamp on cables between the utility meter andGateway 2 are available at 5 min intervals via the Tesla app. Over the period 24
109

May–19 October, the Tesla app and the average daily utility data were within 1% ofeach other.
Utility billing data were used as the primary source of data for electricity importto the site. When utility billing data were not available, the Tesla data were averagedto half-hourly intervals and used.
To Powerwall/From Powerwall—Electricity Stored by Powerwall
The electricity directed to and from the Powerwall is available at 5 min intervalsvia the Tesla app.
EV Efficiency and Distance Travelled
Electric vehicle efficiency and distance travelled data were read manually fromthe car dashboard at monthly intervals.
The monitoring options are summarised in Table 4, and their relationship to thecase study is illustrated in Figure 2.
Figure 2 illustrates the relationship of the monitoring equipment to the house,renewable generation and storage infrastructure.
3.4.2. UK Electricity Grid Carbon Intensity Data
The UK electricity grid carbon intensity was required to calculate the carbonpayback. High-resolution (half-hourly) data were required for the Powerwall analysis.There are different sources of UK grid carbon intensity data depending on the timeperiod and resolution required. These are explained below and presented in Tables 5and 6 and Figure 3.
Average annual data for 1990–2019 are available from the (European EnvironmentAgency 2020). Data for 2014–2019 are presented in Table 5. The progress indecarbonising the UK grid electricity is clear from these data.
110

340
255
170
85
00:00 2:00 4:00 6:00 8:00 10:00 12:00 14:00 16:00 18:00 20:00 22:00
gCO
2/kW
Jan
Jul
Feb
Aug
Mar
Sep
Apr
Oct
May
Nov
Jun
Dec
Figure 3. Monthly averaged UK grid electricity carbon intensity 2020 (half-hourlydata). Source: Graphic by author.
Table 5. Average annual carbon intensity data for UK grid: 2014–2018.
Year UK Electricity Generation g CO2e/kWh
2013 467
2014 425
2015 380
2016 294
2017 264
2018 250
2019 228
Source: Table by author, adapted from European Environment Agency (2020).
Daily carbon intensity data from 12 September 2017 (Electricity Info n.d.) can beused to produce monthly average figures. Average monthly data since January 2018are shown in Table 6. The average annual data for 2018 and 2019 are observed toapproximate to the annual data in Table 5. The year 2020 saw a significant drop in theindustrial and service sectors’ electricity consumption compared to previous years.This reduced the requirement for carbon-intensive electricity generation (Departmentfor Business, Energy & Industrial Strategy 2021).
111

Table 6. Average monthly carbon intensity data for UK grid: January 2018–March2021.
Carbon Intensity of UK Electricity Supply g CO2/kWhPeriod
2018 2019 2020 2021
January 254 281 209 191
February 293 217 176 179
March 319 197 189 185
April 228 213 168 -
May 216 210 142 -
June 238 215 172 -
July 248 223 185 -
August 219 188 204 -
September 223 178 194 -
Octorber 234 202 162 -
November 261 240 177 -
December 390 202 185 -
Annual Average 260 214 180 -
Source: Table by author, adapted from Electricity Info (n.d.).
Half-hourly UK electric grid carbon intensity was calculated. Half-hourly powerdata detailing the various sources feeding the electricity grid (BMRS n.d.a.) weremultiplied by the carbon intensity for each fuel type to calculate the half-hourlycarbon emissions for the UK grid electricity. The mean carbon intensity for eachfuel type (World Nuclear Association n.d.) is illustrated in Table 7 (Gridwatchn.d.). Finally, the half-hourly carbon emissions for the UK grid electricity weredivided by the UK energy demand (BMRS n.d.b.) to obtain the carbon intensity perMW electricity.
112

Table 7. Mean carbon intensity of fuels used in UK electricity production.
Source Tonnes CO2e/GWh
Combined cycle gas turbine 499
Nuclear 29
Biomass 45
Coal 888
Wind 26
Solar 85
Oil 733
Open cycle gas turbine 499
Hydroelectric 26
Pumped hydro 415
Interconnector (import) 273
Other 273
Source: Table by author, adapted from World Nuclear Association (n.d.).
Half-hourly data averaged for each month of 2020 are shown in Figure 3. Thesedata confirm that electricity consumed between approximately 00:30 and 06:00 has alower carbon intensity than that consumed in the rest of the day.
4. Results
The energy, carbon and financial paybacks of the façade PV system, roofPV system, Tesla Powerwall and EV battery are considered in relation to actualperformance since purchase.
4.1. Energy Payback
4.1.1. Façade PV
Up to 31 March 2021, the façade PV system generated 12,209.1 kWh. The averageannual generation from 2015 to 2020 was 1881.9 kWh, approximately 18% lower thanpredicted. The monthly yield is illustrated in Figure 4.
113

2014 2015 2016 2017 2018 2019 2020 2021
Jan Feb Mar Apr May Jun Jul Aug Sep Oct Nov Dec0
75
150
225
300
kWh
Figure 4. Monthly renewable energy generation of the façade PV system sinceinstallation in 2014. Source: Graphic by author.
Based on past energy generation trends, the façade PV system will achieve energypayback between August 2022 and March 2023 depending on weather conditions—atleast 8 years to achieve energy payback. Even though this is slower than anticipatedbased on installer data, it is well within the expected service life of the PV system.
4.1.2. Roof PV
As of 31 March 2021, the roof PV system generated 4156.6 kWh of renewableelectricity (illustrated in Figure 5). As the roof PV system was installed in May 2020,there was not a full year of renewable generation data to analyse. Instead, the period22 June–21 December 2020, which represents a half year between the highest sunavailability in summer to the lowest sun availability in winter, was analysed.
Referring to the renewable energy generation of the façade PV system for theperiod July–December (illustrated in Figure 4), the ranking (best to worst) was2016, 2015, 2019, 2017, 2020 and then 2018. Table 8 presents the façade PV system’srenewable energy generation annually and for the period July–December. For thefull year, 2020 ranked third; therefore, the poor performance between July andDecember can be attributed to weather conditions rather than purely to the expectedperformance degradation of the façade PV system. As the July–December 2020 period
114

ranks fifth since 2015, the data can be used to predict payback, without being undulyoptimistic.
2020 2021
Jan0
100
200
300
400
kWh
500
600
700
800
Feb Mar Apr May Jun Jul Aug Sep Oct Nov Dec
Figure 5. Monthly renewable energy generation of the roof PV system sinceinstallation in May 2020. NB: The star highlights that May 2020 data only represents15 days. Source: Graphic by author.
Table 8. Renewable energy generation of façade PV system (annual and 12 year
from July to December).
Year kWh/year%
Normalisedto 2015
Ranking kWh (1/2year)
%Normalised
to 2015Ranking
2015 2021.57 100.0 1 883.58 100.0 2
2016 1945.47 96.2 2 904.05 102.3 1
2017 1751.35 86.6 6 845.44 95.7 4
2018 1752.78 86.7 5 739.57 83.7 6
2019 1893.87 93.7 4 864.57 97.8 3
2020 1926.39 95.3 3 803.49 90.9 5
Source: Table by author.
The roof PV system’s generation from 22 June to 21 December 2020 was2231.2 kWh. To pay back the 25,612 kWh embodied energy of the roof PV systemwould take 5.6 years. This is close to the expected figure of 5.37 years and well withinits service life.
115
4.1.3. Tesla Powerwall
The energy payback of the Tesla Powerwall is dependent on its ability tocapture renewable energy generated by the façade and roof PV systems which wouldotherwise have been exported or throttled.
There was not a full year of operational data to analyse, and thus the samehalf-year period as for the roof PV system was analysed. During this period,21.44 kWh of renewable energy was captured which would otherwise have beenexported/throttled (23.26 kWh for the full installation period until 31 March 2021).Based on this, we can assume 42.88 kWh would be captured over a year, resultingin an energy payback in 18.1 years. Although this is beyond the warranty period,the system may still be operating for that period of time. Energy attributed to thePowerwall was not attributed to the roof PV system in order to avoid double counting.
4.2. Carbon Payback
4.2.1. Façade PV
The annual UK electricity grid carbon intensity was taken from Table 5 (EuropeanEnvironment Agency 2020) for 2014–2017, as more detailed data could not be foundfor this period. For 2018–2021, the monthly data shown in Table 6 (Electricity Infon.d.) were used.
A total of 3.24 tonnes of CO2 emissions has been avoided by the façade PVsystem since installation in 2014. The annual CO2 saving has varied from 768.2 kgCO2e in 2015 (which combined the highest UK electricity grid carbon intensity withthe highest electricity generation) down to 342.2 kg CO2e in 2020, which had thesecond highest electricity generation since installation but the lowest electricity gridcarbon intensity (as illustrated in Figure 6).
A projection of the future carbon payback based on average energy generationthus far, in combination with an assumed linear progression of the UK grid electricityto 100 g CO2/kWh by 2030, and then to 10 g CO2/kWh by 2050, is illustrated inFigure 7. Following this trend, it will take until 2126 to reach a carbon payback of9216 kg CO2. This significantly exceeds the expected service life.
116

kgCO
2e
0
20
40
60
80
100
120
2014 2015 2016 2017 2018 2019 2020 2021
Jan Feb Mar Apr May Jun Jul Aug Sep Oct Nov Dec
Figure 6. Monthly CO2 emissions avoided (kg CO2e) by the façade PV system sinceinstallation in 2014. Source: Graphic by author.
180 400
135 300
90 200
45 100
0 02020 205020472044204120382035203220292026
carb
on in
tens
ity (g
CO2e
/kW
h)
CO2 s
avin
gs k
gCO
2
2023
Carbon intensity CO2 savings
Figure 7. Projected UK electricity grid carbon intensity and annual façade PVsystem carbon savings until 2050. Source: Graphic by author.
117

4.2.2. Roof PV
The monthly UK electricity grid carbon intensity was taken from Table 6(Electricity Info n.d.). The CO2 emissions avoided by the roof PV system sinceinstallation equal 0.71 tonnes CO2e.
Using the projection of the UK grid carbon intensity illustrated in Figure 7, andassuming annual renewable energy generation by the roof PV system of 4562.4 kWh,it will take until 2036 to reach a carbon payback of 9216 kg CO2. The carbon paybackperiod has been extended significantly due to sharing the CO2 saving with the TeslaPowerwall in the first few years when the electricity carbon intensity is higher. Despitethis, the roof PV system achieves carbon payback in its expected service lifetime.
4.2.3. Tesla Powerwall
The carbon payback of the Tesla Powerwall is dependent on two elements:
1. Its ability to capture renewable energy which exceeds the current demand ofthe site for use at another time;
2. Its ability to capture grid electricity with a low carbon intensity for use whengrid electricity has a higher carbon intensity (load shifting).
By the end of March 2021, 332.5 kg of CO2 emissions had been avoided bycapturing renewable energy for use at another time. However, half of this is attributedto the roof PV system until the Powerwall’s payback is achieved (to avoid doublecounting); thus, based on the half-year data, 211.85 kg of CO2 emissions will beavoided annually. This indicates that a significant proportion of the renewable energygenerated by the roof PV system is not used immediately. After the Powerwall’spayback is achieved, the full CO2 saving is applied to the roof PV system.
On days when significant renewable generation is expected from the façadeand roof PV systems, storage of excess renewable energy should take priority overload shifting. However, from November to February, there is a significant drop inexcess renewable energy generation, and load shifting can be utilised instead. ThePowerwall has settings which allow it to selectively charge at off-peak times and usethe stored energy to minimise grid import at peak times. Although these settings arebased around electricity costs, the Octopus tariff’s off-peak cost period (00:30–04:30)fits within the lower-carbon intensity period illustrated in Figure 3, while the peakperiod (16:00–19:00) is associated with a higher carbon intensity (Figure 3).
The carbon saving from load shifting is based on the difference between theaverage carbon intensity between 16:00 and 19:00 and the carbon intensity of thestored energy while allowing for energy loss between storage and return (referred to
118

as round-trip energy efficiency). Table 9 indicates the monthly energy storage in thePowerwall, the resulting round-trip efficiency and the electricity source. Using thehalf-year data, the average round-trip efficiency was 90.2%. The round-trip efficiencywould be lower for a Powerwall located in a colder place (e.g., outdoors).
Table 9. Energy stored in the Powerwall, round-trip efficiency and electricity source.
Date From Powerwall(kWh)
Round-Trip EnergyEfficiency (%) Electricity Source
29 April–15 May 2020 11.6 30.1 Façade PV
16–25 May 2020 122.7 86.2 Façade PV + Roof PV
26 May–30 June 2020 492.6 91.1
Façade PV + Roof PV+ Off-peak grid
July 2020 422.4 90.0
August 2020 405.5 88.4
September 2020 520.7 91.7
October 2020 497.1 90.3
November 2020 389.7 89.3
December 2020 418.1 89.3Façade PV + Roof PV
+ Off-peak grid(minimising peak rate
import)January 2021 415.9 89.112 year (22 June–21December 2020) 2567 1 90.2 -
1 Data used for calculation. Source: Table by author.
By the end of March 2021, 157.2 kg of CO2 emissions had been avoided by loadshifting off-peak energy for use at another time. Based on the half-year data, 166.4 kgof CO2 emissions will be avoided annually. However, care should be taken to avoidusing load shifting at periods when there is less than a 10% difference in the carbonintensity of off-peak and peak electricity, as the carbon reduction benefit will beoutweighed by the energy loss during storage and release.
Combining both elements of carbon saving from the Powerwall results in378.3 kg CO2e savings per year. Even allowing for the decreasing carbon intensity ofgrid electricity in the future, the carbon payback of the Powerwall will be achievedby 2025.
119

4.3. Financial Payback
4.3.1. Façade PV
There are three elements contributing to the financial payback of the façadePV system:
1. The FiT was 14.9 p/kWh at installation. Retained FiT statements show that therate was 15.78 p/kWh in 2018, 16.2 p/kWh in 2019 and 16.56 p/kWh in 2020. TheUK Retail Prices Index (RPI) (Office for National Statistics n.d.) was used todetermine the approximate tariff for 2015–2017.
2. The export payment—5.5 p/kWh for an assumed 50% export.3. Saving on electricity payments. Retained electricity bills show that the rate
(excluding service charge) was as follows:
a. September 2017–April 2018 12.45 p/kWh + 5% VATb. May–June 2018 12.48 p/kWh + 5% VATc. July–October 2018 13.62 p/kWh + 5% VATd. October 2018–April 2020 13.63 p/kWh + 5% VATe. May–October 2020 13.35 p/kWh + 5% VAT
Prior to 2017, electricity rates were derived based on the Consumer Price Indexfor electricity (Statista n.d.) relative to the 2017 tariff. At the time of calculation, noevidence could be found of an anticipated increase in electricity costs, meaning theaverage of 2015–2020 was used for future years.
Financial savings since installation total GBP 3719.38 (approximately GBP598/year), and this equates to a payback period of 18 years. The expected paybackwas affected by the lower than expected energy generation. The proportionalcontributions are as follows: FiT 49.5%, export 8.7% and electricity cost savings 41.8%.
4.3.2. Roof PV
The only contribution to the financial payback of the roof PV system is the savingon electricity payments. Retained electricity bills show that the rate (excluding servicecharge) was 13.35 p/kWh + 5% VAT. Financial savings since installation total GBP557.73. Based on the half-year data, the assumed annual renewable energy generationwill be 4476 kWh. Relating this to the current electricity tariff, annual savings will beGBP 639.53; however, GBP 105.86 annually is attributed to the Powerwall, resultingin a financial payback of GBP 7803 within 15.4 years.
120

4.3.3. Tesla Powerwall
As with the carbon payback, the financial payback of the Tesla Powerwall isdependent on two elements:
1. Its ability to capture renewable energy which exceeds the current demand ofthe site for use at another time;
2. Its ability to capture grid electricity with a low cost (and carbon intensity) foruse when grid electricity has a higher cost (and carbon intensity) known as“load shifting”.
The renewable energy element of the cost saving is shared equally between thePowerwall and the roof PV system until the roof PV system’s payback is achieved,whereon the full cost saving applies to the Powerwall. By the end of March 2021, aGBP 174.00 saving had been made based on storing the roof PV system’s generationfor later use. Based on the half-year period, the annual cost saving will be GBP 211.71,which will be equally shared between the Powerwall and the roof PV system.
The cost saving from load shifting is based on the Octopus Go tariff which hasan off-peak period (00:30–04:30). Accounting for the average 9.8% energy loss duringstorage and return, the cost saving up to 31 March 2021 was GBP 192.27. Based onthe half-year period, the annual cost saving will be GBP 296.29.
Combining both elements of the cost saving from the Powerwall results in GBP402.15 savings per year, achieving a financial payback of GBP 8040 by 2039.
4.4. Electric Vehicle
The electric vehicle has a 35.5 kWh battery which has an embodied carbon valueof 3550 kg CO2 assuming 100 kg CO2/kWh (Hausfather 2019).
The monthly distance travelled by the EV, along with average energy efficiency,electricity consumption and carbon emissions, for the period is presented in Table 10,along with a comparison of the carbon emissions which would have resulted fromthe replaced diesel vehicle (Figure 8).
121

Table 10. Electric vehicle monthly distance travelled, energy efficiency, electricityconsumption and carbon emissions.
Month Distance(km)
EnergyEfficiency(km/kWh)
ElectricityConsumption
(kWh)
EV CarbonEmissions(kg CO2) 1
Diesel CarbonEmissions for
Same Distance(kg CO2)
October 2020 850 4.82 176.2 28.5 92.6
November 2020 1379 4.67 295.5 52.3 150.3
December 2020 1447 4.50 321.2 59.4 157.7
January 2021 780 4.34 179.4 34.3 85.0
February 2021 943 4.50 209.4 37.5 102.8
March 2021 1337 4.83 276.9 51.2 145.7
1 Carbon emissions are based on the monthly average for the UK electricity grid. Source:Table by author, adapted from Electricity Info (n.d.).
Jan0 2.6
40 2.7
80 2.8
120 2.9
160 3
Apr JulFeb May Aug
EV e iciency (miles/kW
h)kg
CO2
Mar Jun Sept Oct Nov Dec
e iciency (miles/kWh) 2020 e iciency (miles/kWh) 2021
EV kgCO2 emissions 2020 EV kgCO2 emissions 2021
Diesel kgCO2 emissions 2020 Diesel kgCO2 emissions 2021
Figure 8. Carbon emission comparison between electric vehicle and diesel vehicle,plus electric vehicle efficiency. Source: Graphic by author.
Based on monthly UK electricity carbon emissions (Table 6), the EV saved 471 kgof CO2 in six months of operation in comparison to the diesel car it replaced. On thisbasis, the electric vehicle batteries will achieve carbon payback within 7.5 years.
Cost payback has not been considered as it is difficult to assess how much moreexpensive the EV is than a comparable diesel car, although it is acknowledged that
122

electric variants are generally more expensive than their diesel equivalents. Energypayback is not considered as the car consumes energy.
5. Discussion
The calculated energy, carbon and financial paybacks of each part of therenewable generation and storage system are summarized in Table 11.
Table 11. Calculated energy, carbon and financial paybacks of façade PV system,roof PV system, Tesla Powerwall and EV battery.
Element Energy Payback (y) Carbon Payback (y) Financial Payback(y)
Façade PV 8.0 132.0 18.0
Roof PV 5.6 16.0 15.4
Tesla Powerwall 18.1 5.0 19.0
EV Battery N/A 7.5 N/A
Source: Table by author.
5.1. Energy Payback
The energy payback of both PV systems is well within the expected servicelifetime. The energy payback of the Tesla Powerwall is more complex as its ability tofacilitate energy payback relies on the specification of the renewable generation it ispartnered with. In this case, the energy payback is 18.1 years, which is significantlybeyond the warranty period, but there is potential for the system to still be operatingin that time period. It should be considered that the captured energy would havebeen higher (and energy payback shorter) if the full 6.8 kWp roof PV system hadbeen permitted.
5.2. Carbon Payback
The carbon payback is less certain than the energy payback because thecalculations vary depending on the future potential decarbonisation of the UKelectricity grid. The decarbonisation of the grid in recent years has had a noticeableimpact on the carbon payback of the façade PV system, which was initially expectedto achieve carbon payback within 8.6 years.
Assuming that targets to reach 100 g CO2/kWh by 2030 and then 10 g CO2/kWhby 2050 are achieved, the roof PV system will achieve carbon payback within itsservice life. However, the carbon payback of the façade PV system is much longer.
123

Some people may argue that the reduced carbon intensity of the electricity gridnegates the requirement for renewable energy installation. For this reason, it needsto be acknowledged that the decarbonisation of the electricity grid is only possible ifrenewable energy generation is increased. Approximately 162 TWh of low-carbongeneration is required to meet the 100 g CO2/kWh target by 2030 while coveringthe planned retiral of nuclear plants and increased electrification of transport andheating (Evans 2020). It should also be considered that the electricity decarbonisationcontributes to reduce embodied carbon of new renewable energy generation systems.This trend is already being observed in the decreasing embodied carbon data forbatteries (Hausfather 2019).
The carbon payback of the Tesla Powerwall benefitted from its year-roundcapability to save carbon. In sunny weather, the maximum carbon saving comesfrom “saving” solar energy for a higher-carbon intensity period. However, even inlow-sun conditions during the winter, it is able to powershift lower-carbon intensityelectricity generated overnight to a higher-carbon intensity period. This enables acarbon payback of 5 years which is well within its service life.
Under the 2020 electricity grid carbon intensity, the electric vehicle battery islikely to reach carbon payback in less than 8 years (which is the warranty period forthe EV battery). There is potential for this to be even earlier as the data analysed donot consider the following factors:
• EV grid charging was scheduled from 00:30 to 04:30. Analysis of 2020 data (asillustrated in Figure 3) has shown that the carbon intensity during this period isnearly 20% lower than that during the rest of the day (202.239 g CO2 comparedto 249.975 g CO2).
• Not all of the electricity came from the electricity grid. Periods of solar PVgeneration being stored directly in the car were observed in October 2020, andFebruary, March and April 2021. Unfortunately, the amount could not be loggedwith the current equipment.
• The period analysed was during cold months which are known to adverselyaffect vehicle energy efficiency.
• As decarbonisation of the electricity grid improves, the carbon emissions of theelectric vehicle will reduce further.
5.3. Financial Payback
The financial payback of the façade PV system will be reached within its servicelife due to the FiT contribution. The roof PV system was a simpler installation andwill reach financial payback within its service life without any subsidy. However, the
124

roof PV system can only reach financial payback in tandem with the Tesla Powerwall;otherwise, much of the energy generated would be exported to the grid with nobenefit to the owner. This is why its financial benefit has been shared with theTesla Powerwall. Even with the payback contribution from the PV system, the TeslaPowerwall will not achieve financial payback within its expected service life. Thisagrees with the findings in the literature (Zakeri et al. 2021; Sheha and Powell 2018;Gardiner et al. 2020; Dong et al. 2020).
There is an element of uncertainty in the financial paybackcalculations—particularly over an extended period. There is potential forfluctuation in electricity prices which could significantly extend or reduce thepayback period.
5.4. Behaviour
Visual displays were used to ensure that the status of solar generation and thebattery can be considered when scheduling use of appliances such as the washingmachine in order to minimise grid electricity imports.
6. Conclusions
Although the façade PV system’s financial payback was only made viable by theFiT contribution, this subsidy had wider benefits as it transformed the UK marketand established PV as a viable renewable energy generation technology in the UK.
The energy, carbon and financial payback for simple roof-installed PV generationcovering the base load is clear.
The installation of PV generation beyond the base load can be justified as long assuitable storage capability is also installed to reduce stress on the grid and maximisebenefit to the owner. However, this can impact on financial payback, as previouslyindicated in the literature (Zakeri et al. 2021; Sheha and Powell 2018; Gardineret al. 2020; Dong et al. 2020). It should be noted that the main benefits of storageinstalled with PV are to the electricity grid (Zakeri et al. 2021; Sheha and Powell2018; Jankowiak et al. 2020; Koskela et al. 2019; Gardiner et al. 2020; Dong et al.2020); however, owners of the storage are not currently rewarded for providingthese benefits. In fact, the payback of this system has been adversely affected bythe reduction in the intended PV installation from 6.8 to 6.12 kWp (as required byWestern Power). The literature has indicated that policy changes which monetise thebenefits offered by energy storage to the grid will outperform subsidies (Gardineret al. 2020).
125

The ability of a PV system to achieve carbon payback through its own generationwill vary depending on the solar efficiency of its installation and future electricitygrid decarbonisation. As renewable generation is contributing to decarbonisation ofthe electricity grid—which, in turn, reduces the embodied carbon of the equipmentproduced in future—it is important that solar-efficient installations continue.
The carbon payback of the electric vehicle battery is clear and will benefit fromfuture electric grid decarbonisation.
The combination of renewable generation, energy storage and swapping to anelectric vehicle is likely to avoid 1655.6 kg CO2 per year operational emissions atthe 2020 UK electric grid carbon intensity. Obviously, this is a small decrease on thenational scale, but there is potential to replicate this approach in other buildings.
This study has been limited by a relatively short monitoring period. Futurework to review the data after an extended period would be beneficial.
Funding: This research received no external funding.
Acknowledgments: I would like to express my eternal gratitude to my husband, AndrewEarp, for co-funding the PV systems, the Tesla Powerwall and the electric vehicle, as well asfor managing the monitoring equipment and prototyping the visual displays. I would like toacknowledge the loan of sensors by HWM.
Conflicts of Interest: The author declares no conflict of interest.
References
Attwood, James. 2021. Analysis: 2020 UK Car Sales Hit 28-Year Low, EV Market Grows Rapidly.Available online: https://www.autocar.co.uk/car-news/industry-news/analysis-2020-uk-car-sales-hit-28-year-low-ev-market-grows-rapidly (accessed on 3 February 2021).
BMRS. n.d.a. Generation by Fuel Type. Available online: https://www.bmreports.com/bmrs/?q=generation/fueltype/current (accessed on 1 February 2021).
BMRS. n.d.b. Rolling System Demand. Available online: https://www.bmreports.com/bmrs/?q=demand/rollingsystemdemand/historic (accessed on 1 February 2021).
Bulb. n.d. About Bulb’s Smart Tariff. Available online: https://help.bulb.co.uk/hc/en-us/articles/360017795731-About-Bulb-s-smart-tariff (accessed on 7 April 2021).
Circular Ecology. n.d. Embodied Carbon of Solar PV: Here’s Why It Must Be Includedin Net Zero Carbon Buildings. Available online: https://circularecology.com/solar-pv-embodied-carbon.html (accessed on 3 February 2021).
Climate Change Committee. 2019a. UK Housing: Fit for the Future? Available online:https://www.theccc.org.uk/publication/uk-housing-fit-for-the-future/ (accessed on 29April 2021).
126

Climate Change Committee. 2019b. Net Zero—Technical Annex: IntegratingVariable Renewables into the UK Electricity System. Available online:https://www.theccc.org.uk/wp-content/uploads/2019/05/Net-Zero-Technical-Annex-Integrating-variable-renewables.pdf (accessed on 29 April 2021).
Department for Business, Energy & Industrial Strategy. 2021. Energy Trends UK, Octoberto December 2020 and 2020. Available online: https://assets.publishing.service.gov.uk/
government/uploads/system/uploads/attachment_data/file/972790/Energy_Trends_March_2021.pdf (accessed on 1 February 2021).
Dong, Siyuan, Enrique Kremers, Maria Brucoli, Rachael Rothman, and Solomon Brown. 2020.Techno-enviro-economic assessment of household and community energy storage in theUK. Energy Conversion and Management 205: 112330. [CrossRef]
Electric Vehicle Database. n.d. Honda-E: Battery Electric Vehicle. Availableonline: https://ev-database.uk/car/1171/Honda-e#:~:text=is%2090%20mph.-,Battery%20and%20Charging,on%20a%20fully%20charged%20battery (accessed on 3 February 2021).
Electricity Info. n.d. National Grid Carbon Intensity Archive. Available online: https://electricityinfo.org/carbon-intensity-archive/#data (accessed on 1 February 2021).
Energy-Stats. n.d. Download Historical Pricing Data. Available online: https://www.energy-stats.uk/download-historical-pricing-data/ (accessed on 4 February 2021).
Energy UK. 2016. Pathways for the GB Electricity Sector to 2030. Available online: https://www.energy-uk.org.uk/publication.html?task=file.download&id=5722 (accessed on 8April 2021).
Engel, Hauke, Patrick Hertzke, and Giulia Siccardo. 2019. Second-LifeEV Batteries: The Newest Value Pool in Energy Storage. Availableonline: https://www.mckinsey.com/industries/automotive-and-assembly/our-insights/second-life-ev-batteries-the-newest-value-pool-in-energy-storage (accessed on 3February 2021).
European Environment Agency. 2020. Greenhouse Gas Emission Intensity of ElectricityGeneration. Available online: https://www.eea.europa.eu/data-and-maps/daviz/
co2-emission-intensity-6#tab-googlechartid_googlechartid_chart_111_filters=%7B%22rowFilters%22%3A%7B%7D%3B%22columnFilters%22%3A%7B%22pre_config_date%22%3A%5B2018%5D%7D%3B%22sortFilter%22%3A%5B%22ugeo%22%5D%7D(accessed on 7 April 2021).
European Parliament. 2010. Directive 2010/31/EU of the European Parliament andof the Council of 19 May 2010 on the Energy Performance of Buildings (Recast).Available online: https://eur-lex.europa.eu/LexUriServ/LexUriServ.do?uri=OJ:L:2010:153:0013:0035:EN:PDF (accessed on 29 April 2021).
Evans, Simon. 2020. Analysis: UK Low-Carbon Electricity Generation Stalls in2019. Available online: https://www.carbonbrief.org/analysis-uk-low-carbon-electricity-generation-stalls-in-2019 (accessed on 12 April 2021).
127

Feng, Liu, and Jeroen C. J. M. van den Bergh. 2020. Differences in CO2 emissions of solar PVproduction among technologies and regions: Application to China, EU and USA. EnergyPolicy 138: 111234. [CrossRef]
Finnegan, Stephen, Craig Jones, and Steve Sharples. 2018. The embodied CO2e of sustainableenergy technologies used in buildings: A review article. Energy and Buildings 181: 50–61.[CrossRef]
Forfar, John. 2018. Tesla’s Approach to Recycling Is the Way of the Future for Sustainable Production.Available online: https://medium.com/tradr/teslas-approach-to-recycling-is-the-way-of-the-future-for-sustainable-production-5af99b62aa0e (accessed on 3 February 2021).
Gardiner, Dan, Oliver Schmidt, Phil Heptonstall, Rob Gross, and Iain Staffell. 2020. Quantifyingthe impact of policy on the investment case for residential electricity storage in the UK.Journal of Energy Storage 27: 101140. [CrossRef]
Government Property Agency. 2020. Net Zero and Sustainability Design Guide—Net ZeroAnnex. Available online: https://assets.publishing.service.gov.uk/government/uploads/system/uploads/attachment_data/file/925231/Net_Zero_and_Sustainability_Annex__August_2020_pdf (accessed on 29 April 2021).
Gridwatch. n.d. GB Electricity National Grid CO2e Output per Production Type. Availableonline: https://gridwatch.co.uk/co2-emissions?src=lk01 (accessed on 1 February 2021).
Hausfather, Zeke. 2019. How Electric Vehicles Help to Tackle Climate Change. Available online:https://www.carbonbrief.org/factcheck-how-electric-vehicles-help-to-tackle-climate-change#:~:text=The%20IVL%20researchers%20now%20estimate,upper%20bound%20of%20146%20kg.&text=Literature%20review%20of%20lifecycle%20greenhouse,per%20kWh%20of%20battery%20capacity (accessed on 3 February 2021).
HM Government. 2017. Upgrading Our Energy System: Smart Systems and Flexibility Plan.Available online: https://assets.publishing.service.gov.uk/government/uploads/system/
uploads/attachment_data/file/633442/upgrading-our-energy-system-july-2017.pdf(accessed on 20 November 2021).
HM Government. 2021. Heat and Buildings Strategy. Available online: https://assets.publishing.service.gov.uk/government/uploads/system/uploads/attachment_data/file/1032119/heat-buildings-strategy.pdf (accessed on 19 November 2021).
Home and Energy Scotland. n.d. Home and Energy Scotland Loan Overview. Availableonline: https://www.homeenergyscotland.org/find-funding-grants-and-loans/interest-free-loans/overview/ (accessed on 19 November 2021).
Intergovernmental Panel on Climate Change. 2014. Climate Change 2014 Synthesis ReportSummary for Policymakers. Paris: IPCC.
Ito, Masakazu, Mitsuru Kudo, Masashi Nagura, and Kosuke Kurokawa. 2011. A comparativestudy on life cycle analysis of 20 different PV modules installed at the Hokuto mega-solarplant. Progress in Photovoltaics 19: 878–86. [CrossRef]
128
Jankowiak, Corentin, Aggelos Zacharopoulos, Caterina Brandoni, Patrick Keatley, PaulMacArtain, and Neil Hewitt. 2020. Assessing the benefits of decentralised residentialbatteries for load peak shaving. Journal of Energy Storage 32: 101779. [CrossRef]
Koskela, Juha, Antti Rautiainen, and Pertti Järventausta. 2019. Using electrical energy storagein residential buildings—Sizing of battery and photovoltaic panels based on electricitycost optimization. Applied Energy 239: 1175–89. [CrossRef]
Kristjansdottir, Torhildur F., Clara S. Good, Marianne R. Inman, Reidun D. Schlanbusch,and Inger Andresen. 2016. Embodied greenhouse gas emissions from PV systemsin Norwegian residential Zero Emission Pilot Buildings. Solar Energy 133: 155–71.[CrossRef]
Kurland, Simon D. 2019. Energy use for GWh-scale lithium-ion battery production.Environmental Research Communications 2: 012001. [CrossRef]
Mair, Jason, Kiti Suomalaienen, David M. Eyers, and Michael W. Jack. 2021. Sizing domesticbatteries for load smoothing and peak shaving based on real-world demand data. Energyand Buildings 247: 111109. [CrossRef]
Office for National Statistics. 2019. Road Transport and Air Emissions.Available online: https://www.ons.gov.uk/economy/environmentalaccounts/articles/roadtransportandairemissions/2019-09-16 (accessed on 29 April 2021).
Office for National Statistics. n.d. Retail Prices Index: Long Run Series: 1947–2019.Available online: https://www.ons.gov.uk/economy/inflationandpriceindices/timeseries/cdko/mm23 (accessed on 5 February 2021).
Pagliaro, Mario, and Francesco Meneguzzo. 2019. Lithium battery reusing and recycling: Acircular economy insight. Heliyon 5: E01866. [CrossRef] [PubMed]
Reddaway, Andrew. 2016. Energy Flows: How Green Is My Solar? Available online: https://renew.org.au/renew-magazine/solar-batteries/energy-flows-how-green-is-my-solar/#:~:text=Embodied%20energy,-Manufacturing%20a%20solar&text=Estimating%20the%20energy%20use%20is,including%20an%20allowance%20for%20transport(accessed on 29 April 2021).
Sheha, Moataz N., and Kody M. Powell. 2018. An economic and policy case for proactive homeenergy management systems with photovoltaics and batteries. The Electricity Journal 32:6–12. [CrossRef]
Statista. n.d. Consumer Price Index (CPI) of Electricity Annually in the United Kingdom(UK) from 2008 to 2020. Available online: https://www.statista.com/statistics/286548/
electricity-consumer-price-index-cpi-annual-average-uk/#:~:text=This%20statistic%20shows%20the%20Consumer,electricity%20was%20measured%20at%20124.3 (accessedon 7 April 2021).
Üçtug, Fehmi G., and Adisa Azapagic. 2018. Environmental impacts of small-scale hybridenergy systems: Coupling solar photovoltaics and lithium-ion batteries. Science of TheTotal Environment 643: 1579–89. [CrossRef] [PubMed]
129

Uddin, Kotub, Rebecca Gough, Jonathan Radcliffe, James Marco, and Paul Jennings. 2017.Techno-economic analysis of the viability of residential photovoltaic systems usinglithium-ion batteries for energy storage in the United Kingdom. Applied Energy 206:12–21. [CrossRef]
Vehicle Certification Agency. n.d. Car Fuel Data, CO2 and Vehicle Tax Tools. Available online:https://carfueldata.vehicle-certification-agency.gov.uk/ (accessed on 31 January 2021).
Wong, J. H., M. Royapoor, and C. W. Chan. 2016. Review of life cycle analyses and embodiedenergy requirements of single-crystalline and multi-crystalline silicon photovoltaicssystems. Renewable and Sustainable Energy Reviews 58: 608–18. [CrossRef]
World Green Building Council. n.d. The Net Zero Carbon Buildings Commitment. Availableonline: https://www.worldgbc.org/thecommitment#:~:text=The%20Net%20Zero%20Carbon%20Buildings%20Commitment%20(the%20Commitment)%20challenges%20business,carbon%20in%20operation%20by%202050 (accessed on 29 April 2021).
World Nuclear Association. n.d. Comparison of Lifecycle Greenhouse GasEmissions of Various Electricity Generation Sources. Available online:http://www.world-nuclear.org/uploadedFiles/org/WNA/Publications/Working_Group_Reports/comparison_of_lifecycle.pdf (accessed on 1 February 2021).
Zakeri, Behnam, Samuel Cross, Paul E. Dodds, and Giorgio C. Gissey. 2021. Policy options forenhancing economic profitability of residential solar photovoltaic with battery energystorage. Applied Energy 290: 116697. [CrossRef]
© 2022 by the authors. Licensee MDPI, Basel, Switzerland. This article is an openaccess article distributed under the terms and conditions of the Creative CommonsAttribution (CC BY) license (http://creativecommons.org/licenses/by/4.0/).
130

Technology and Carbon Economy


Sustainable Energy Future with Materialsfor Solar Energy Collection, Conversion,and Storage
Juvet Nche Fru, Pannan I. Kyesmen and Mmantsae Diale
1. Introduction
During the last 12 years, halide perovskites (HaP) have emerged as thefastest-emerging third-generation solar cell material, competing well with siliconand other thin-film technologies. The power conversion efficiency (PCE) of theseeasy-to-process and low-cost solar cells has risen from 3.58% to 25.6% from2009 to 2021 (Zheng and Pullerits 2019; Jeong et al. 2021), already exceedingthat of commercially available thin-film photovoltaics (PV) and rivaling that ofthe best single-junction silicon solar cells. Moreover, HaP have a wide rangeof applications including solar cells, water splitting and carbon dioxide (CO2)reduction, light-emitting diodes, photodiodes in photodetectors, gas sensing, lasersand solar batteries. However, instability, toxicity of lead and solvents, poorlaboratory-to-laboratory reproducibility, and scalability remain bottlenecks blockingthe commercialization of this technology. Among all these difficulties, instability andshort lifespan are the major impediments to the commercialization of HaP solar cells.It is crucial to understand the causes of instabilities and develop strategies that willstabilize this low-cost technology and facilitate its transfer to the market.
The production of solar hydrogen by water splitting through the PEC processwas initially demonstrated by Fujishima and Honda in 1972 (Fujishima and Honda1972). Fujishima and Honda used titanium dioxide (TiO2) as a semiconductorphotoanode and achieved a low quantum efficiency of 0.1%. A contributing factorto the low quantum efficiency was the inability of TiO2 to absorb photons in thevisible spectrum due to its large bandgap of 3.0 eV. The use of nitrides, chalcogenides,metal sulfides, and metal oxides as photoelectrodes for PEC water splitting has beenexplored for decades (Wang et al. 2017; Tee et al. 2017). Despite several decades spentin search of suitable materials, no single semiconducting material has been found tofulfill all the required performance benchmarks for efficiency, durability, and cost(Shen et al. 2014). Metal oxides are among the most promising candidates for useas photoanodes in PEC devices for hydrogen production. Their low cost, ease of
133

preparation, lattice manipulation flexibility, and stability in the PEC environmentmake them attractive (Eftekhari et al. 2017).
Popular metal oxide photoelectrodes for water splitting are TiO2 (Eidsvåg et al.2021), α-Fe2O3 (Kyesmen et al. 2021), bismuth vanadate (BiVO4), and tungstentrioxide (WO3) (Kafizas et al. 2017). Among these, α-Fe2O3 is a promising materialfor use as a photoelectrode in PEC water splitting due to its low bandgap, availability,low cost, non-toxicity, and stability in aqueous environments. It can absorb light inthe visible region due to its bandgap of ~2.0 eV and promises a maximum theoreticalphotocurrent and solar-to-hydrogen (STH) efficiency of ~14 mA/cm2 and ~17%,respectively (Dias et al. 2014; Murphy et al. 2006). In addition, α-Fe2O3 is the mostcommon crystal structure of the oxides of iron, and it is easy to process (Yilmazand Unal 2016). However, the efficiency of α-Fe2O3 is yet to attain the theoreticallypredicted value due to its poor conductivity, high electron–hole recombination,inefficient charge separation (Lee et al. 2014; Xi and Lange 2018), high overpotential,and low absorption coefficient, requiring films with a thickness of over 400 nm forsufficient photon utilization (Sivula et al. 2011). Numerous approaches have beenemployed in dealing with the challenges associated with the use of α-Fe2O3 for PECwater splitting. These strategies include nanostructuring (Ito et al. 2017), doping(Feng et al. 2020), formation of heterostructures (Natarajan et al. 2017), the use ofco-catalysts (Eftekhari et al. 2017), plasmonic enhancement effects (Archana et al.2015), and the use of light-harvesting bio-molecules (Ihssen et al. 2014).
In this chapter, we present the challenges of using HaP and α-Fe2O3 for thedirect conversion of solar energy into electricity and hydrogen fuels, respectively,with a special focus on the up-to-date strategies that have been engaged towardsovercoming them. The instability of perovskite solar cells is influenced by theGoldschmidt tolerance, chemical composition, and defects in halide perovskites.The use of additives to achieve large grain sizes with few grain boundaries andto passivate the surface and boundaries of HaP is effective in improving thestability of HaP solar cells. In addition, protecting back-metal contacts fromreacting with the halide perovskites, passivation of 2D perovskites to form 2D/3Dmixed-dimensional perovskites, encapsulation of the devices/modules, and useof MA-free perovskites as strategies for the long-term stability and lifetime ofperovskite solar cells are presented. For α-Fe2O3 films, the simultaneous engagementof strategies such as nanostructuring, doping, formation of heterostructures, useof co-catalysts, and plasmonic enhancement effects has shown great promise inenhancing their photocatalytic hydrogen production. The concurrent use of multiplestrategies for the enhancement of the solar-to-hydrogen conversion (STH) efficiency
134

of α-Fe2O3-based photoanodes is mostly implemented through the systematic useof interface engineering. More research is still needed to realize the anticipatedcommercialization of solar hydrogen production and photovoltaic technologies usingα-Fe2O3 and halide perovskites, respectively.
2. Developments Towards Sustainability of Perovskite Solar Cells
2.1. Stability of Perovskite Solar Cells
Perovskite solar cells/panels in operation must withstand eternal environmentalconditions including heat, moisture, oxygen, hail and external stresses such asheat/cold cycles, light/dark cycles. Stability can be regarded as the ability tomaintain constant performance while operating under these conditions.
2.1.1. Goldschmidt’s Tolerance Factor and Intrinsic Structural Stability of 3D HaP
Three-dimensional (3D) HaP solar cells are highly efficient but very unstable.In the AMX3 form for 3D halide perovskites, A stands for a monovalent cationsuch as cesium (Cs+), methylammonium (CH3NH3
+, MA), and formamidinium(H2NCHNH2
+, FA), M represents a divalent cation such as lead (Pb2+) and tin (Sn2+),and X is a halide anion such as bromide (Br¯), iodide (I¯), and chloride (Cl¯). Some3D HaP have mixtures of the different A-cations, M-cations, and/or X-anions. Thecubic perovskite crystal structure has an M-cation in the 6-fold coordination position,enclosed by a corner-linked octahedron of X-anions, called the MX6 octahedralframework, and A-cations in the 12-fold coordination positions, as shown in Figure 1a.The size of the A-cation is larger than that of the M-cation, large enough to fit into the12-fold coordinated voids of the MX6 octahedral inorganic framework, to maintainthe cubic symmetry, as shown in Figure 1b. HaP can reversibly transition betweencubic, tetragonal, and orthorhombic crystal structures at different temperatures(Thomson 2018).
The ideal cubic symmetry of the 3D HaP structure is normally distorted inpractice. Possible distortions include M-cation displacement from its central positionand tilting of the MX6 octahedron, depending on the sizes of the A-cation andM-cation. The degree of distortion is determined by Goldschmidt’s tolerance factor(t), given by Equation (1),
t =√
2 (RA + RX)
2 (RM + RX)(1)
where RA is the ionic radius of the A-cation, RM is the ionic radius of the M-cation,and RX is the ionic radius of the X-anion. It can also predict whether a combination of
135

anions and cations will form a stable HaP structure. For the ideal cubic symmetry, theionic size requirement for stability is quite stringent, and the A-cation and M-cationadjust their equilibrium bond distances to the X-anions, without distortion of theunit cell, such that t = 1. The tolerance factor ranges from 0.8 to 1.0 for practicalHaP because the cubic symmetry is distorted slightly to accommodate a wide rangeof cations and anions. For instance, the MX6 octahedron may distort by tilting toreduce the coordination number from 12, so that a smaller sized A-cation can beaccommodated, thereby decreasing t.
A M X
(a) (b)
Figure 1. Cubic crystal structure (a) and A-Cation in 12-fold coordinated voids ofthe MX6 octahedral inorganic framework (b) of HaP with general formula AMX3.Source: Liu et al. (2015b).
2.1.2. Environmental/External Factors Responsible for the Degradation of HaPSolar Cells
Heat, light, moisture, oxygen and electrical bias, are among the environmentalfactors responsible for degradation of HaP. The action of light and heat onmethylammonium lead tri-iodide may cause the evaporation of volatile componentssuch as ammonia (NH3) and iodine gas (I2) (Juarez-Perez et al. 2018). As a result, thehalide perovskite is irreversibly degraded/decomposed. Light soaking of HaP cancause negative effects such as ion migration (Zhao et al. 2017), halide segregation(Hoke et al. 2015), and photodecomposition (Kim et al. 2018).
136

2.1.3. Impact of Defects on the Stability of Perovskite Materials
The presence of defects in HaP reduces the charge carrier lifetime and impactsstability. Defects can be located at the interface between the active layers or in the bulkof the halide perovskites. These defects can be point (zero dimensional), line (onedimensional), surface (two dimensional), and volume (three dimensional) defects.Point defects in the widely studied MAPbI3 include native defects such as positiveiodine vacancies (IV
+), negative iodine vacancies (IV−), neutral iodine vacancies (IV),
negative lead vacancies (PbV−2), positive lead interstitials (Pbi
2+), iodide interstitials(Ii), positive methylammonium interstitials (MAi
+), negative methylammoniumvacancy (MAV
−), and impurities such as Au interstitials (Yang et al. 2016; Sherkaret al. 2017; Motti et al. 2019). Yang and co-workers (Yang et al. 2016) showed thatthe bulk IV
+ have low formation energies, low diffusion barriers, and fast hoppingrates, making them primarily responsible for ionic conductivity in MAPbI3. Theyalso showed that the diffusion barrier and formation energy of gold (Au) interstitialimpurities in MAPbI3 are low, leading to possible diffusion of Au into MAPbI3
devices with biased Au/MAPbI3 interfaces. Meanwhile, defects such as PbV−2,
Pbi2+, and MAV
+ have very high activation energies, implying that their formationmay require very high temperatures or strong irradiation conditions to form, thusnot likely participating in the defects (Motti et al. 2019). Cation substitutions suchas MAPb and PbMA and substitution anti-sites including MAI, PbI, IMA, and IPb arealso present in MAPbI3 (Jin et al. 2020; Yang et al. 2017b). The nature of Schottkydefects and Frenkel-type defects has also been studied in HaPs. Dewinggih andco-workers (Dewinggih et al. 2017) showed that iodine vacancy/interstitial (IV
+/IV−)
Frenkel pair trapping centers are abundant in MAPbI3 and are annihilated underillumination conditions which increases photoluminescence quantum efficiency. Kimand co-workers (Kim et al. 2014) showed that the formation energies of Schottkydefects (neutral vacancy pairs) such as PbI2 and MAI in MAPbI3 are relatively low.Fortunately, these defects are not trap states that can reduce the carrier lifetime. ASchottky couple in HaP has very low formation energies and originates from halidevacancy coupling with the metal vacancies (Motti et al. 2019).
Planar defects include grain boundaries (GBs), surfaces or perovskite/transportlayer interfaces, stacking faults, and twin boundaries. GBs are interfaces betweentwo grains in polycrystalline materials, as shown in Figure 2a. It has been shownthat degradation in HaP starts at the surface and grain boundaries (Shao et al.2016). This is because GBs are sources of high defect densities, trap accumulationsites, infiltration sites for water vapor, and fast pathways for ion migration dueto reduced steric hindrance (Shao et al. 2016). Grain boundaries absorb moisture
137

and oxygen from the environment and cause HaP degradation (Wu et al. 2021).The transformation of the perovskite phase to a non-perovskite phase is initiatedat boundaries which are active sites accumulating chemical species (Yun et al.2018). GBs serve as trapping centers for charge carriers, leading to non-radiativerecombination that reduces the carrier lifetime, and also causing hysteresis inthe current–voltage characteristic (Uratani and Yamashita 2017). DeQuilettes andco-workers (DeQuilettes et al. 2015) measured the photoluminescence intensitiesand carrier lifetimes from different grains and grain boundaries of the same MAPbI3
thin film. They concluded that grain boundaries are dimmers and show thefastest non-radiative recombination. The surfaces of HaP are also defective, asshown in Figure 2b. They contain a large number of charged defects (Zhang et al.2019b) including iodine vacancies (Wu et al. 2020), X-terminating surfaces withnonstoichiometric compositions (Qiu et al. 2020), and improper bonding: (110)-X2
halide surfaces with a large number of broken bonds (Jain et al. 2019; Kong et al. 2016),and Pb dangling bonds (Kong et al. 2016). SRH recombination at interfaces with thetransport layers is the dominant loss mechanism in perovskite solar cells (Sherkaret al. 2017). With regard to stacking faults, they occur in crystals characterized bya periodic sequence of atomic planes due to an interruption in the typical regulararrangement. Song and co-workers (Song et al. 2015) showed that MAPbI3 phaseswith I/Pb ratios ranging from 3.2 to 3.5 form stacked perovskite sheets with a largeamount of stacking faults, whereas thin films with I/Pb ratios ranging from 2.9to 3.1 form the conventional 3D perovskite with few stacking faults (alpha phase).First principle studies of the electronic properties of 111 twin boundaries in mixedHaP containing FA, Cs, Br, and I revealed that twin boundaries in these perovskitesare nucleation sites for I-rich and Cs-rich formation, which are hole traps and cancause electron–hole recombination, leading to a loss in Voc (Mckenna 2018). Directimaging using TEM has revealed twin boundaries in a MAPbI3 thin film rangefrom 100 to 300 nm wide with twin boundaries parallel to 112t (Rothmann et al.2017). By varying the anti-solvent during deposition, Tan and co-workers (Tanet al. 2020) were able to change the defect density of the (111) twin boundary forCs0.05FA0.81MA0.14PbI2.55Br0.45 mixed perovskite to establish the relationship withPCE. It has been shown that recombination centers limiting charge carrier lifetimesin HaP are preferentially located close to the surface rather than in the bulk of thecrystal (Stewart et al. 2016).
138

Surface with danglingbonds
Grain boundary
Dangling bond
(a) (b)
Figure 2. Schematic diagram showing grain boundaries (a) and surface defects(dangling bonds) (b) in HaP. Source: Graphic by authors.
2.1.4. The Reaction of HaP with Metal Back-Electrodes
Another primary source of instability is caused by the reaction of HaP withwidely used metal electrodes when in direct or indirect contact. Gold (Au), silver(Ag), and copper (Cu) are widely preferred as back-electrodes in perovskite solarcells due to their high conductivity. Indirect contact occurs when the metal diffusesthrough the hole and electron transport layers into the active layer of the device andreacts with the perovskite to form insulating metal halide species or defect statesin the bulk or at the surface (Domanski et al. 2016), reducing the thermal stabilityof the device (Boyd et al. 2018; Domanski et al. 2016). Halide can also diffuse outof the active layer and make contact with the electrodes. For instance, corrosionof a silver (Ag) electrode due to the reaction with diffused hydrogen iodide (HI),produced during the decomposition of a MAPbI3 absorber of an encapsulated solarcell, has been shown to speed up the degradation of MAPbI3 (Han et al. 2015). Wangand co-workers (Wang et al. 2018) showed that MAPbI3 reacted rapidly with Agelectrodes, and the reaction was driven by diffused iodide (I−) ions which causedcorrosion of the electrode. Gold electrodes corrode rapidly due to the aggressivechemical interaction between gold and highly reactive iodine-containing by-productsformed in the course of perovskite decomposition under illumination with intense
139

UV radiation (Shlenskaya et al. 2018). In addition, metal electrodes can diffuse intothe HaP active layer through the hole transport layer or electron transport layer,leading to degradation of the perovskite (Ming et al. 2018; Zhao et al. 2016b). InCH3NH3PbI3 devices with Al electrodes and the presence of moisture, Al rapidlyreduces Pb2+ to Pb0 and converts CH3NH3PbI3 to (CH3NH3)4PbI6·2H2O and thento CH3NH3I (Zhao et al. 2016b).
Electrodes are deposited directly on perovskite in hole conduction layer-freesolar cells (Asad et al. 2019). The perovskites are deposited directly on metalelectrodes in cells without charge transport layers (Lin et al. 2017). Metal electrodesalso make direct contact with HaP in Schottky diodes, resistive switching devices,and photodetectors. The electrodes of Schottky diodes, resistive switching devices,and photodetectors also directly contact HaP (Li et al. 2019; Kang et al. 2019). Halideperovskite becomes unstable when in direct contact with metal electrodes. Wehave shown that methylammonium lead tri-bromide (MAPbBr3) perovskite grainsdelaminate rapidly on Al-coated substrates as opposed to Au, Ag, Au-Zn, and Snsubstrates (Fru et al. 2021). The direct contact of Ag with perovskites also speedsup their degradation, leading to a loss in organic cations (Svanström et al. 2020).These results are important in the selection of electrodes for stable charge transportlayer-free solar cells.
2.2. HaP Panel/Module Lifetime
A sustainable transfer of the perovskite solar cell technology from the laboratoryto market requires the module/panel lifetime to be greater than 20 years. A widelyused definition of module lifetime, known as the T80 lifetime, is the time taken forits efficiency to decrease by 20% of the initial value (He et al. 2020). The failure ofa module in photovoltaic technology is determined using the T80 lifetime. The T80
lifetime is calculated using Equation (2),
T80 =20%
Degradrate(2)
The median degradation rate (Degradrate) of commercially available solarmodules ranges from 0.36%/year for monocrystalline silicon to 0.96%/year forcopper indium gallium selenide (CIGS), providing T80 lifetimes of over 55.6 and 20.8years, respectively. These degradation rates were determined from a field test withsolar modules operating under normal working conditions. However, the averagedegradation rate of perovskite solar modules is 66%/year, corresponding to anaverage lifetime of 0.30 years (3.6 months). These results indicate that perovskite solar
140

modules are very unstable under real operating conditions, and intensive researchis needed to commercialize the technology. The lifetime of a solar panel/module ishighly correlated with the stability of the constituent solar cells.
2.3. Improving the Stability of Perovskite Solar Cells/Panels
Various strategies have been employed to improve the stability of perovskitesolar cells. These techniques can be grouped into stable materials synthesis, additivesand passivation, alternative robust functional layers, encapsulation, and engineeringof 2D and 2D/3D mixed-dimensional perovskites.
2.3.1. Towards Compositional Stability 3D Halide Perovskite Materials
Degradation due to light and heat is mitigated by improvement in the HaPmaterial and interfaces of the solar cell. Careful selection of the organic cation in HaPis necessary to prevent irreversible degradation (decomposition) under the actionof heat and light (Juarez-Perez et al. 2018). This decomposition is mainly due tothe release of volatile components in MA-containing perovskites. Thus, it has beenshown that going MA free will produce inherently stable perovskites (Turren-Cruzet al. 2018). An alternative organic cation for 3D HaP is formamidinum (FA). Thehigh enthalpy and activation energy needed for its decomposition make FA moreresistant to thermal decomposition and produce more thermally stable perovskitesthan MA (Juarez-Perez et al. 2019). However, FA-based perovskites lack phasestability under humidity and thermal stress (Chen et al. 2021). Much effort is beingdirected towards the stabilization of the black phase of FA-based perovskites throughadditives, doping, alloying, interfacial engineering, etc. (Chen et al. 2021). The useof a low-vapor pressure inorganic cation such as cesium (Cs) as a substitute forhigh-vapor pressure MA leads to a more stable completely inorganic HaP. By mixingthe A-site cations, composition stability can also be achieved.
2.3.2. Additives and Passivation
Figure 3a,b show the schematic diagrams of defective and passivated surfaces.Most attempts to mitigate these surface defects involve using different additivesthat will either improve the film morphology by increasing the grain size toreduce the number of grain boundaries or cause surface passivation (Zhang et al.2016a). Passivation can be conducted by using various additives including smallmolecules (Xu et al. 2016), polymers (Dunn et al. 2017), ligands (Zhang et al. 2019a),perovskite quantum dots (Zheng et al. 2019), and 2D perovskites (Rahmany andEtgar 2021). The effect of grain boundaries on the lifetime of charge carriers has
141

been reduced by passivation of the perovskite surface with Lewis acid additivessuch as 1,2-ethanedithiol (Stewart et al. 2016) and Lewis base additives (Noel et al.2014). These studies suggested that the Lewis bases donate electrons to surfacetraps, thus preventing them from capturing charge carriers, while the Lewis acidsdonate protons, as shown in Figure 3b. Surface treatment by post-depositionof a variety of Lewis bases (electron-donating molecules) and surface ligandspassivates surface defects, thereby reducing non-radiative recombination. Thepresence of excess PbI2 between grain boundaries also has a passivation effect(Chen et al. 2014). The addition of an optimum amount of potassium iodide (KI)in triple-cation (Cs0.06FA0.79MA0.15)Pb(I0.85Br0.15)3 perovskite reduces non-radiativelosses and photoinduced halide ion migration by passivation of the perovskitefilm and interfaces (Abdi-jalebi et al. 2018). This is achieved by the excess iodidefrom KI compensating for any halide vacancies (trap states). At the same time,potassium ion selectively depletes bromide from the crystal, thereby reducingtrap states that result from bromide-rich perovskites. The formation of benign(potassium-rich, halide-sequestering species) from excess halides at the grainboundaries and interfaces immobilizes halide ion migration. The addition of a strongelectron acceptor of 2,3,5,6-tetrafluoro7,7,8,8-tetracyanoquinodimethane (F4TCNQ)into the perovskite functional layer fills grain boundaries, thus reducing metallic leaddefects and iodide vacancies significantly (Liu et al. 2018). Excess MAI intrinsicallypassivates the surface of MAPbI3 films, leading to a reduced surface recombinationvelocity and an improved total carrier lifetime (Yang et al. 2017a). Additives suchas sulfonated carbon nanotubes (Zhang et al. 2016a), Lewis bases such as urea andthurea (Hsieh et al. 2018), and Lewis acid−base adducts (for example, the PbI2
adduct with the O-donor DMSO is excellent for improving grain size in MAPbI3
and PbI2 adducts, while the S-donor thiourea is excellent for FAPbI3) (Lee et al.2015) mitigate defects by producing larger grains with fewer grain boundaries. Theaddition of sulfonated carbon nanotubes also passivates perovskite by filling grainboundaries (Zhang et al. 2016a). Other Lewis bases such as thiophene and pyridinepassivate the perovskite surface by donating an electron to under-coordinated Pbatoms present in the crystal (Noel et al. 2014). Fullerenes (PCBM) deposited onthe top of the perovskite have a passivation effect which reduces photocurrenthysteresis and the trap density (Shao et al. 2014). Fang and co-workers (Fang et al.2020) showed that the 4-fluorophenylmethylammonium-trifluoroacetate additivepassivates both uncoordinated lead and halide ions in the mixed-cation mixed HaPFA0.33Cs0.67Pb(I0.7Br0.3)3. This is possible because the trifluoroacetate anion bindswith the lead cation, and the 4-fluorophenylmethylammonium cations bind with the
142

halide ion. This dual passivation suppressed hysteresis, halide segregation, and ionmigration, leading to an improvement in the operational lifetime of light-emittingdiodes from 1.0 to 14.0 h. Qiao and co-workers (Qiao et al. 2019) showed that alkalimetals mitigate Ii defects in two ways: by increasing their formation energy, thusreducing their concentration, and binding strongly to them, thereby eliminatingmid-gap states that act as traps for electrons and holes, thus increasing the carrierdensity and extending the carrier lifetimes significantly.
− −+ +− −− −+ − + +
Passivated surface
Passivation(lewis acid)
Passivation(lewis base)
Dangling bond
Detective Surface with dangling bonds
(a) (b)
Figure 3. The schematic diagrams of defective (a) and passivated (b) surfaces.Source: Graphic by authors.
2.3.3. Encapsulation
Encapsulation is an important method to solve instability problems, preventthe leakage of toxic and water-soluble lead compounds to the environment, andhelp the perovskite solar module to pass the hail impact test (He et al. 2020).In addition, it prevents contact with ambient air, prevents leakage of volatilecomponents, and reduces moisture and heat degradation. Table 1 describes varioustechniques and materials for encapsulating HaP solar cells. High-performanceencapsulation materials should be easy to process and chemically inert and have
143

a low oxygen transmission rate, low water vapor transmission rate, high dielectricconstant, resistance to UV and thermal oxidation, high adhesion to perovskitesolar modules, similar coefficients of thermal expansion to perovskite solar cellmaterials, and high mechanical impact strength (Griffini and Turri 2016; Arandaet al. 2021). The techniques used for perovskite solar cells include rigid glass–glassencapsulation, ultra-thin flexible glass sheet encapsulation, polymeric laminates,thin-film barrier-coated webs, and thin-film encapsulation (TFE).
Table 1. Summary of encapsulation methods and materials.
Encapsulation Method Description Materials
Glass–glass encapsulation(rigid, widely used,
straightforward, veryeffective, very affordable,
incompatible withflexible devices)
The device is sandwichedbetween two rigid glass sheets
using thermo-curable adhesivesor UV-curable sealants. Edges
are sealed with sealants toprevent ingress of oxygen
and moisture.
Examples of thermo-curableadhesives include ethylene-vinylacetate (EVA) (Bush et al. 2017),surlyn ionomer (Cheacharoen
et al. 2018), and polyisobutylene(PIB) (Shi et al. 2017). UV-curable
adhesives include epoxy resin(Mansour Rezaei Fumani et al.2020; Ierides et al. 2021). Edge
sealants include butyl rubber andPIB (Vidal et al. 2021).
Ultra-thin flexible glasssheet encapsulation (mostrecent, flexible, high cost,
effects on performance andlong-term stability,
needs investigation)
Flexible device sandwichedbetween ultra-thin flexible
glass sheets.
Hermetic glass frit (Fantanas et al.2018; Emami et al. 2020).
Polymeric laminates andthin-film barrier-coated
webs (used for both flexibleand rigid solar cells)
Can be used as substrates inflexible solar cells and as an
encapsulating agent on varioustypes of substrates.
Poly(methylmethacrylate)(PMMA), polyethylene
terephthalate (PET),polydimethylsiloxane (PDMS),
polyethylenenaphthalate (PEN).
Thin-film encapsulation(TFE) (emerging andpromising, expensive,
challenging)
Direct deposition of a singleultra thin-film flexible protective
layer on the device usingvacuum deposition methods
including physical vapordeposition, chemical vapor
deposition, plasma-enhancedchemical vapor deposition, and
atomic layer deposition.
Metal oxides including Al2O3,SiOx, TiO2, and Zn2SnO4
(Aranda et al. 2021). Multilayerstacked organic/organic layers
called dyads (Lee et al. 2018) andultra-thin plasma polymeric films
(Idígoras et al. 2018).
Source: Table by authors.
144

2.3.4. 2D and 2D/3D Mixed-Dimensional Perovskites
Two-dimensional HaP have layered structures that are similar to theRuddlesden–Popper (RP) phases (Ruddlesden and Popper 1958), consisting of ananoplatelet (nanosheet) perovskite that is separated by large spacer cations. TheRP phase has the general formula An-1L2MnX3n+1. In this form, A is a small-sizemonovalent cation (Cs+, MA+), L corresponds to a large-size aromatic or aliphaticalkylammonium spacer cation including phenyl-ethyl ammonium (PEA+) andbutylammonium (BA+), M is a transition metal cation (such as Pb2+ and Sn2+),X stands for a halide anion (such as I¯, Br¯, and Cl¯), and the integer n representsthe number of metal halide octahedral [MX6]4− layers between the two L-cations,determined by careful control of the stoichiometry (Shi et al. 2018). Two-dimensionalperovskites have strong quantum confinement effects and large bandgaps (Zhanget al. 2020). In solar cells, 2D perovskites have been applied as primary lightharvesters (Cao et al. 2015), capping layers (Chen et al. 2018), passivation layers(Jiang et al. 2019), and 2D/3D interfacial layers (Niu et al. 2019). Two-dimensionalHaP solar cells are more stable than their 3D counterparts but less efficient. Moreover,their hydrophobicity and moisture resistance improve device stability under highhumidity (Zheng et al. 2018).
Two-dimensional/three-dimensional mixed-dimensional perovskite solar cellscombine the stability of 2D perovskites with the excellent light-harvesting propertiesof 3D perovskites to produce stable and efficient devices. When grown on 3Dperovskites to form a 2D/3D mixed-dimensional perovskite, grain boundaries andsurface charged defects are passivated to enhance stability (Wu et al. 2021). In2017, Grancini et al. (2017) obtained a stable 10 cm × 10 cm perovskite solar cellthat maintained its 11.6% PCE for more than 10,000 h under controlled standardconditions using a fully printable industrial process. Remarkable stability wasachieved through 2D/3D interface engineering in which the 2D layer preventedmoisture ingress.
2.3.5. Use of Stable Metal Electrodes and Very Thin Interlayers
As explained above, diffusion of the widely used Au, Al, Ag, and Cu electrodesinto the HaP active layer is one of the leading causes of instability. Very thin barrierlayers including chromium (Domanski et al. 2016), chromium oxide-chromium(Cr2O3/Cr) (Kaltenbrunner et al. 2015), MoOx (Sanehira et al. 2016), bismuth (Bi) (Wuet al. 2019), and amine-mediated titanium suboxide (AM-TiOx) (Back et al. 2016) havebeen employed between the perovskite and hole transport layers to protect metal topcontacts from reaction with the halide perovskites. Domanski et al. (2016) showed
145

that, at 70 C, gold (Au) diffused through the HTL into the HaP layer. However,the diffusion was prevented by depositing a layer of chromium (Cr) between theHTL and the Au electrode. The Cr layer alleviated the severe degradation of thedevice performance at elevated temperatures. In comparison to Au and Ag, Cuelectrodes do not diffuse into the perovskite active layer and produce more stableperovskite solar cells (Zhao et al. 2016a). Zhao et al. demonstrated that high-PCECu electrode-based solar cells with efficiency above 20% retain 98% of the initialPCE after 816 h of storage in an ambient environment without encapsulation (Zhaoet al. 2016a). Cu and Ag do not form deep-level trap states in MAPbI3-based solarcells (Ming et al. 2018). Additionally, the conventional noble metal electrodes arenot sustainable because of the cost, scarcity, and complexity of metal ore extraction.To overcome these problems, carbon electrodes are gaining increased attention dueto their low cost, excellent stability, and compatibility with up-scaling techniques.However, ultra-thin buffer layers of materials such as Cr are required between theelectrode and the charge transport layers to ensure good electrical contact (Babu et al.2020).
3. Solar Hydrogen Production
PEC water splitting, a technology for solar hydrogen production, is an attractiveapproach for numerous reasons. First, photocatalytic hydrogen production offers anattractive route for solar energy storage. This is because hydrogen energy storagehas been considered as the most suitable means for storing excess off-peak powerwhere long-term storage is a priority (Benato and Stoppato 2018). In addition,hydrogen can be easily transported via land, air, or sea, making it possible to transportsolar energy (converted to hydrogen) from one geographical location to another.Additionally, hydrogen fuel already has a vast and established economy withnumerous applications in homes and industries. Hydrogen can be converted directlyinto electricity for domestic consumption, use for the powering of automobiles, andas fuel in the aviation industry (Glanz 2010). The numerous applications of hydrogenmake its production from solar energy more attractive considering the global needfor clean energy production for a sustainable future.
The device used for harvesting solar energy for photocatalytic hydrogenproduction is often known as a PEC cell (Figure 4). The basic operation of a PECdevice has been reported by many authors (Glanz 2010; Ihssen et al. 2014). Here,a summary of the operation of a PEC cell is explained using a device consisting ofa photoanode and a metallic counter electrode immersed in an acidic electrolyte.Equation (3) presents an illustration of the basic operation of a PEC device for water
146

splitting. First, the photoanode will absorb photons when irradiated with incidentphoton energy hν and become ionized, resulting in the generation of electron–holepairs. If recombination does not occur, the hole (h+) becomes separated from theelectron (e−), moves to the surface of the photoanode, and oxidizes water to produceoxygen gas and H+ ions, as shown in Equation (1). The H+ ions produced at thesurface of the photoanode are transported to the cathode. Simultaneously, theelectrons produced in the photoanode are driven to the cathode through the externalcircuit where they interact with the H+ ions to produce H2 gas, as shown in Equation(4). The chemical reaction for the decomposition of water into O2 and H2 via PECwater splitting is summarized in Equation (5). Examples of materials that couldbe used as a photoanode in PEC devices include n-type semiconductors such TiO2,BiVO4, and α-Fe2O3.
e−
e−e−
e− Back contact
hv
H2
H2O
O2
Photoanode Pt counter electrode
H+
H+
e−
h+
Electrolyte
Bias
2hv + H2O O2 + H212
Figure 4. Schematic illustration of the basic operation of a PEC device. Source:Graphic by authors.
At the photoanode : 2h+ + H2O → 12
O2 + 2H+ (3)
At the counter electrode: 2H+ + 2e− → H2 (4)
147

Summary : hν + H2O → 12
O2 + H2 (5)
3.1. Hematite as Photocatalyst
Hardee and Bard were the first to use a hematite photoelectrode for waterphotolysis in 1976 (Cattarin and Decker 2009). The stability of hematite in an aqueousenvironment and its ability to absorb photons in the visible region are the majorproperties that have continued to attract increased research into its application in PECwater splitting. An increasing amount of research is still being channeled towardsovercoming the major challenges inhibiting the use of hematite as a photoanode insolar hydrogen production. The main challenges are outlined in Section 1, whichinclude its poor conductivity, high electron–hole recombination, and inefficientcharge separation, among others. The strategies which have been developed overthe years towards overcoming the problems that have been limiting the applicationof hematite-based photoanodes in solar hydrogen production are discussed in thefollowing section.
3.2. Strategies for Enhancing the PEC Properties of α-Fe2O3 Films
3.2.1. Nanostructuring
Nanostructuring is the fabrication of materials consisting of structural featuresin the nanometer scale (Singh and Terasaki 2008). Nanostructured materials provideflexible space for ease of fabrication, enhanced mechanical stability, confinementeffects, and a large surface area, making them suitable for photocatalytic applications(Rani et al. 2018). The nanostructuring approach has long been employed in thefabrication of α-Fe2O3 thin films to mitigate their poor charge transport propertywithout compromising their photon absorption for PEC applications. α-Fe2O3 has alow absorption coefficient and, as a result, requires films of 400–500 nm thicknessfor complete light absorption. Because of the short hole diffusion length of 2–4 nm(Ahn et al. 2014), photogenerated charge carriers in bulk α-Fe2O3 films will likelyrecombine before reaching the surface of the films to perform water oxidation, whichwill result in a low photocurrent in the PEC device. Since thinner α-Fe2O3 filmsare not able to absorb sufficient photons for a significant photocatalytic activity,nanostructuring has been employed to help solve this paradox. Nanostructuredα-Fe2O3 films that can absorb sufficient photons can also offer a large interfacialarea for interaction with the electrolyte, making them suitable for promoting chargecarrier transport during photocatalytic reactions (Tamirat et al. 2016; Annamalai et al.2016).
148

The nanostructuring approach has been widely utilized in preparing α-Fe2O3
films of different morphologies and has been shown to help promote chargeseparation on the film’s surfaces where water oxidation/reduction reactions occurduring photocatalysis (Annamalai et al. 2016). Nanostructured α-Fe2O3 filmswith morphologies such as nanoparticles (Souza et al. 2009), nanorods (Ito et al.2017), nanoflowers (Tsege et al. 2016), nanocones (Li et al. 2014), nanosheets(Peerakiatkhajohn et al. 2016), nanotubes (Kim et al. 2016a), and nanowires (Xieet al. 2018; Grigorescu et al. 2012) have been prepared for PEC water splitting,yielding an improved photocurrent density compared to the bulk films (Chouet al. 2013). Figure 5 presents a schematic illustration for some of the differentmorphologies of hematite films for PEC water splitting. One of the major limitationsof nanostructuring is its inability to influence the intrinsic properties of hematitesuch as its low electrical conductivity of 10−14 Ω−1 cm−1 (Tamirat et al. 2016) andcharge carrier lifetime of 3–10 ps (Grave et al. 2018).
Conducting substrate Conducting substrate
Conducting substrate
Conducting substrate Conducting substrate
Conducting substrate
Conducting substrate
α-Fe
2O3
α-Fe
2O3
α-Fe
2O3
α-Fe
2O3
α-Fe
2O3
α-Fe
2O3
α-Fe
2O3
Nanorods Nanoparticles
Nanocones
Nanotubes Nanowires
Nanosheets
Nanoflowers
Figure 5. Schematic illustration of different morphologies of hematite films for PECwater splitting. Source: Graphic by authors.
149

3.2.2. Doping
The introduction of impurities into a semiconductor, termed doping(Grundmann 2010), can positively alter its intrinsic properties for PEC applications.Doping of semiconductor materials can help to narrow their optical bandgapand influence electrical properties, such as an increase in the charge carrier’sconcentration and mobility, thereby improving PEC performance (Yang et al. 2019).For α-Fe2O3, elemental doping involves replacing the lattice iron with foreign atoms,in order to influence its intrinsic properties for improved photocatalytic capability.The intrinsic properties of α-Fe2O3 which negatively affects its efficacy in PEC devicessuch as its low electrical conductivity of 10−14 Ω−1 cm−1, charge carrier concentrationon the order of 1018 cm3, electron mobility of 10−2 cm2 V−1 s−1, hole mobility of0.0001 cm2 V−1 s−1, and charge carrier lifetime of 3–10 ps have been improvedthrough doping (Tamirat et al. 2016; Grave et al. 2018). Doping can significantlycause an increase in the charge carrier concentration in hematite films which directlyimproves their conductivity. Both experimental evidence (Gurudayal et al. 2014;Mao et al. 2011) and theoretical calculations (Zhang et al. 2016b) have confirmedthe enhancement of the charge carrier concentration through doping. In addition,enhancement of the photocatalytic capabilities of hematite through doping has alsobeen associated with the passivation of surface states and grain boundaries, shiftingof band edge positions, and the distortion of its crystal structure which facilitatescharge carrier hopping and transport (Grave et al. 2018).
The PEC performance of α-Fe2O3 films has been improved through doping withn-type dopants such as Ti (Feng et al. 2020; Peng et al. 2021), Pt (Mao et al. 2011),and Sn (Li et al. 2017), p-type dopants such as Mn2+ (Gurudayal et al. 2014), Cu2+
(Tsege et al. 2016), and Ag+ (Shen et al. 2014) [4], and non-metals such as Si (Dias et al.2014), S (Bemana and Rashid-Nadimi 2017), and P (Zhang et al. 2015). Feng et al.(2020) achieved an over 2-fold increment in the photocurrent density at 1.23 V vs.RHE and a negative onset potential shift of over 200 mV for α-Fe2O3 photoanodesthrough Ti doping. They attributed the improved PEC water splitting to an increasein the charge carrier density and enhanced charge separation. Elsewhere, a 3-foldincrease in the photocurrent density was achieved for α-Fe2O3 nanorods throughp-type doping with Mn, and the onset potential shifted by 30 mV to a more negativevalue. The boost in PEC water splitting was also associated with the increased chargecarrier density as well as the reduced electron–hole recombination rate in Mn-dopedα-Fe2O3 photoanodes (Gurudayal et al. 2014). In another study, a photocurrentdensity of 1.42 mA/cm2 at 1.23 V vs. RHE was achieved for S-doped α-Fe2O3
nanorods, representing a 4-fold increase compared to the undoped films. The authors
150

attributed the superior PEC activity to the improved charge carrier mobility of theS-doped α-Fe2O3 films (Zhang et al. 2017).
3.2.3. Heterojunction Formation
The heterojunction architecture involves the coupling of two semiconductingmaterials to improve PEC water splitting efficiency. Depending on the semiconductormaterials used to form the heterostructure (n-type or p-type), n–n, p–p, or p–njunction structures could be formed. Heterojunction formation confers three majorcontributions: enhanced visible light absorption, improved charge separation, andincreased lifetime of charge carriers (Tamirat et al. 2016). Heterojunction structuresallow for the incorporation of materials of different bandgaps, broadening the photonabsorption spectrum of the heterostructure for better photocatalysis (Mayer et al.2012; Sharma et al. 2015; Kyesmen et al. 2021). Additionally, the formation of aheterojunction results in the development of an internal electric field at the spacecharge region between the heterostructures which helps in facilitating charge carriertransport. This will culminate in improving charge separation and increasing thecarrier lifetime, leading to reduced electron–hole recombination and enhanced PECefficiency during water splitting (Bai et al. 2018; Selim et al. 2019).
The charge transport mechanism and energy band diagram of hematite-basedphotoanodes during PEC water splitting can be explained using the p–nheterojunction structure presented in Figure 6. When a heterojunction is formedbetween two semiconductors, a space charge layer is created at the interface betweenthem. For a p–n heterojunction with a hematite-based photoanode, the valence band(VB) and conduction band (CB) edges of the p-type semiconductor material bothneed to be more negative than those of α-Fe2O3 (Afroz et al. 2018). Additionally,the electrons from the CB of the p-type semiconductor are transferred to theCB of α-Fe2O3 and then to the fluorine-doped tin oxide (FTO) substrate, wherethey move onto the counter electrode through the back-contact to reduce H+ toH2. The movement of photogenerated charge carriers across the heterojunctionis facilitated by the electric field formed at the interface between the compositematerials, enhancing the effective charge separation and reducing the recombinationrate of electron–hole pairs (Liu et al. 2015a). For an n–n heterojunction-structuredhematite-based photoanode, a similar operation mechanism and energy bandbending to those of the p–n junction apply. However, the semiconductor materialis required to have more negative CB and VB band positions relative to thoseof hematite.
151

4
3
Pote
ntia
l vs.
NH
E (e
V)
+ -
+ -
+ -
+ -
+ -
+ -
+ -
+ -
+ -
+ +
2
1
CB
CB
VB
H2O
H2 / H2O
O2 / H2O
Ef
O2
0
−1
−2
+ + +
+
++
-
VB
2.0 eV
FTO α-Fe2o3 (n-type)
p-type material
- -
-- - -
Figure 6. The charge transport mechanism and energy band diagram of thehematite-based p–n heterojunction structure during PEC water splitting. Source:Graphic by authors.
Furthermore, different composite materials have been employed in improvingthe PEC water splitting of α-Fe2O3. The formation of the α-Fe2O3/NiOheterojunction structure has been reported to improve the photocurrent densityof α-Fe2O3 from 0.042 to 0.156 mA/cm2 at 0.4 V vs. AgCl. The improvement wasattributed to the enhanced charge transfer kinetics resulting from the formation ofthe α-Fe2O3/NiO heterostructure (Bemana and Rashid-Nadimi 2019). Natarajanet al. (2017) fabricated α-Fe2O3/CdS heterostructures and achieved a photocurrentdensity of 0.6 mA/cm2 at 0.92 V vs. RHE and a 0.4 V negative shift in theonset potential compared to the value recorded for pristine α-Fe2O3 films. Theyattributed the enhancement in PEC water splitting to the improved photon absorptionand facilitated charge transfer kinetics also resulting from the formation of theheterojunction structure (ibid. 2017). While different materials have been used toform the heterojunction structure with α-Fe2O3 for PEC applications, the choiceof the composite material is important for achieving a notable improvement inwater splitting efficiency. Materials that can enhance light absorption and promote
152

charge transport can play a significant role in boosting the photocurrent density ofα-Fe2O3-based heterojunction photocatalysts.
3.2.4. The Use of Co-Catalysts
One of the biggest challenges of PEC water splitting using α-Fe2O3 is theoverpotential required to drive the water oxidation reaction due to its high activationenergy barrier. The presence of a co-catalyst on photoanodes can improve PEC watersplitting by facilitating water oxidation reactions and decreasing the overpotentialand activation energy, thus shifting the onset potential to a more negative value(Tamirat et al. 2016).
Noble metal oxides (Badia-Bou et al. 2013), amorphous phosphates (Eftekhariniaet al. 2017; Kwon et al. 2021), borates (Dang et al. 2017), and oxyhydroxides (Kimet al. 2016b) have been used as co-catalysts on α-Fe2O3 photoanodes. α-Fe2O3 hasbeen modified with the iridium oxide (IrO2) co-catalyst and used as a photoanodein PEC water splitting, yielding a photocurrent density of 200 µA/cm2 at 1.29 Vvs. RHE, while the pristine films required a positive shift of 300 mV to achievethe same photoresponse. The IrO2 co-catalyst promoted charge separation andacted as a storage site for photogenerated holes, leading to an improvement inPEC water splitting achieved for modified α-Fe2O3 films (Badia-Bou et al. 2013).Additionally, the cobalt-phosphate (Co-Pi) co-catalyst has been used to modifyα-Fe2O3 photoanodes and recorded a photocurrent density of 1.5 mA/cm2 at 1.5V vs. RHE, plus a negative shift of 185 mV in the onset potential. The improvedperformance was also attributed to the catalytic property of Co-Pi which can capturephotogenerated holes, leading to suppressed charge recombination and facilitatingwater oxidation (Eftekharinia et al. 2017). Elsewhere, Kim et al. (2016b) usedultra-thin amorphous FeOOH as a co-catalyst on an α-Fe2O3 photoanode, recordinga 2-fold increase in the photocurrent density, with an onset potential drop of about120 mV, when applied towards PEC water splitting. The improved PEC behavior wasattributed to the enhanced water oxidation kinetics and passivation of the surfacestates of the α-Fe2O3 photoanode due to the modification with the FeOOH co-catalyst(ibid. 2016b).
3.2.5. Plasmonic Enhancement Effects
Plasmonic metal nanostructures offer a promising route for improving thesolar energy conversion efficiency of semiconductors (Li et al. 2013). Plasmonicmetals can improve the performance of photoelectrodes in PEC water splittingvia three major mechanisms. First, light scattering through localized surface
153

plasmonic resonance (LSPR) absorption and re-emission can prolong the meanphoton path in metal/semiconductor composites, resulting in an increased capturerate of incident photons. Second, hot electrons in the metal nanostructure generatedthrough the decay of optically excited plasmons are transferred across the Schottkybarrier to the nearby semiconductor, culminating in extra photoactivity. Finally,when metal/semiconductor composite nanostructures have overlapping LSPRsand energy band gaps, a large electric field enhancement occurs near the metalnanostructure’s surface, leading to increased generation of electron–hole pairs in thenearby semiconductor, a concept known as the plasmonic near-field effect (Fan et al.2016; Augustynski et al. 2016).
In efforts to improve the photocurrent density of α-Fe2O3 photoanodes duringPEC water splitting, plasmonic metals such as Au (Archana et al. 2015; Shindeet al. 2017) and Ag (Liu et al. 2015a; Kwon et al. 2016) have been widely employed,showing great promise. Archana et al. (2015) deposited Au nanoparticles on α-Fe2O3
films and achieved a photocurrent enhancement that was three times higher thanthat of the pristine films at 0.6 V vs. Ag/AgCl. The photocurrent enhancement wasattributed to a higher generation of charge carriers due to the plasmonic effects ofAu nanoparticles on the α-Fe2O3 films (ibid. 2015). Additionally, Ag nanoparticlesdeposited on hydrothermally grown α-Fe2O3 nanowires produced a photocurrentdensity of about 0.18 mA/cm2 at 1.23 vs. RHE when utilized as photoanodes in aPEC cell, representing a 10-fold enhancement relative to the value obtained for thepristine α-Fe2O3. The improvement was also associated with the surface plasmoniceffects of Ag nanoparticles on the α-Fe2O3 nanowires (Kwon et al. 2016).
3.2.6. The Use of Multiple Approaches
The simultaneous use of multiple approaches to produce a single photoelectrodeis a concept which harnesses the benefits of the different approaches to enhancingthe PEC performance of hematite to produce a synergetic effect. The concurrentuse of different approaches to produce a more efficient photocatalyst has beenexploited by researchers with some significant successes recorded. Table 2 showsa list of hematite-based photoanodes in which multiple approaches to enhancingPEC performance were implemented, yielding a synergetic effect and an enhancedphotocatalytic response.
154

Table 2. Hematite-based photoanodes in which multiple approaches to enhancingPEC performance were implemented.
Hematite-BasedPhotoelectrode
StrategiesEngaged
PhotocurrentDensity
Achieved Under1 Sun
PhotocurrentDensity Increase
Relative to That ofPristine α-Fe2O3
Reference
Ti-dopedα-Fe2O3
Nanostructuring,doping
2.1 mA/cm2 at0.67 V vs.
Ag/AgCl in 1 MNaOH electrolyte
2.8 times (Lee et al. 2014)
α-Fe2O3/Co-PiNanostructuring,
co-catalystloading
1.5 mA/cm2 at1.5 V vs. RHE 1
M NaOHelectrolyte
1.39 times (Eftekharinia et al.2017)
α-Fe2O3/Au Nanostrucring,plasmonic effects
1.0 mA/cm2 at1.23 VRHE in 1 MKOH electrolyte
2.86 times (Wang et al. 2015)
α-Fe2O3/NiO Nanostructing,heterojunction
1.55 mA/cm2 at1 V vs. RHE in
1M KOHelectrolyte
19.37 times (Rajendran et al.2015)
α-Fe2O3/BiVO4/
NiFe-LDH
Nanostructuring,heterojunction,
co-catalyst
1.7 mA/cm2 at1.8 V vs. RHE in
1 M NaOHelectrolyte
4.25 times (Bai et al. 2018)
Pt-dopedα-Fe2O3/Co-Pi
Nanostructuring,doping,
co-catalyst
4.32 mA/cm2 at1.23 V vs. RHE in
1 M NaOHelectrolyte
3.43 times (Kim et al. 2013)
Ti-dopedα-Fe2O3/Cu2O
Nanostructuring,doping,
heterojunction
2.60 mA/cm2 at0.95 V vs. SCE in
1 M NaOHelectrolyte
16.25 times (Sharma et al. 2015)
α-Fe2O3/Au/Co-Pi
Nanostructuring,plasmonic effects,
co-catalyst
4.68 mA/cm2 at1.23 V vs. RHE in
1 M NaOHelectrolyte
3 times (Peerakiatkhajohnet al. 2016)
α-Fe2O3/Nb-doped
SnO2/Co-Pi
Nanostructuring,heterojunction,
doping,co-catalyst
3.16 mA/cm2 at1.23 V vs. RHE in
. . . electrolyteunder 1 sun
not given (Yan et al. 2017)
Bai et al. (2018) in their work improved the performance of an α-Fe2O3
photoanode by combining the concepts of nanostructuring, heterojunction formation,and the use of co-catalysts. In their work, an α-Fe2O3/BiVO4/NiFe-LDH photoanodewas fabricated and applied towards PEC water splitting. A maximum photocurrent
155

density of 1.7 mA/cm2 was attained by the photoanode at 1.8 V vs. RHE, representing1.3 and 4.25 times increases compared to the values obtained for α-Fe2O3/BiVO4
and α-Fe2O3 films at the same potential, respectively (ibid. 2018). Elsewhere, Kimet al. (2013) prepared doped nanostructured α-Fe2O3 with the Pt dopant followedby surface modification with a Co-Pi co-catalyst-based photoanode when appliedtowards PEC water splitting. The doping of the pristine α-Fe2O3 photoanode withPt increased its photocurrent density by 74% to 2.19 mA/cm2 at 1.23 V vs. RHE,which was further enhanced to 4.32 mA/cm2 at the same potential after loadingwith the Co-Pi co-catalyst (ibid. 2013). In a similar approach, Peerakiatkhajohn et al.(2016) demonstrated the synergetic effect of coating hematite nanosheets with Aunanoparticles for a plasmonic effect, followed by loading the surface with the Co-Pico-catalyst, and achieved a photocurrent of 4.68 mA/cm (at 1.23 V vs. RHE), whichis one of the highest performances reported in the literature for a modified hematitephotoanode (ibid. 2016). The improved performances obtained for hematite-basedphotoanodes through the use of multiple approaches were achieved by harnessingthe benefits of the different methods of boosting PEC performance via the systematicapplication of interface engineering.
4. Conclusion
In this chapter, promising materials for solar energy harnessing have beendiscussed with a special focus on HaP and α-Fe2O3 for direct conversion intoelectricity and hydrogen fuels, respectively. Long-term stability is an importantrequirement for the sustainable transfer of HaP solar cells from the laboratory tothe market. The instability of perovskite solar cells depends on the Goldschmidttolerance, chemical composition, and defects in halide perovskites. Othercomponents of the solar cell architecture including the back-metal contact andthe charge transport layers greatly contribute to the instability of the device. Allthese issues are responsible for the extremely low T80 (less than 2 years) forperovskite solar cells as opposed to the commercially available solar cells withT80 lifetimes exceeding 20 years. Protecting metal top contacts from reacting withhalide perovskites, passivation of 2D perovskites to form 2D/3D mixed-dimensionalperovskites, encapsulation of the devices and modules, and focusing on MA-freeperovskites are credible strategies that, if well developed, will enhance the long-termstability and lifetime of perovskite solar cells. The intrinsic properties of α-Fe2O3
films such as their poor conductivity and short carrier lifetime have continued to limittheir application for solar hydrogen production. Various strategies for improvingthe durability of HaP solar cells and the efficiency of α-Fe2O3 films in photocatalytic
156

hydrogen production were discussed. The use of additives to achieve large grainsizes with few grain boundaries and to passivate the surface and boundaries of HaPis effective in improving the stability of HaP solar cells. Meanwhile, the concurrentuse of multiple approaches such as nanostructuring, doping, the formation ofheterostructures, the use of co-catalysts, and plasmonic enhancement effects hasshown great promise in improving the photocatalytic efficiency of α-Fe2O3-basedfilms for solar hydrogen production. Further research is still required for the eventualcommercialization of solar hydrogen production and photovoltaic technologies usingα-Fe2O3 and HaP, respectively.
Author Contributions: Conceptualization, J.N.F., and P.I.K.; methodology, J.N.F., and P.I.K.;software, J.N.F., and P.I.K.; validation, J.N.F., P.I.K., and M.D.; formal analysis, J.N.F., andP.I.K.; investigation, J.N.F., and P.I.K.; resources, J.N.F., P.I.K., and M.D.; data curation, J.N.F.,and P.I.K.; writing—original draft preparation, J.N.F., and P.I.K.; writing—review and editing,J.N.F., and P.I.K.; visualization, J.N.F., and P.I.K.; supervision, M.D.; project administration,J.N.F., and P.I.K.; funding acquisition, M.D. substantially to the work reported.
Funding: This project was funded by the National Research Foundation, South Africa (grantnumber: N0115/115463) and the University of Pretoria (grant number: A0X816). APC fundingis being sought externally.
Acknowledgments: The authors wish to thank the University of Pretoria, the NationalResearch Foundation, UP postdoctoral fellowship program: grant DRI-cost center: A0X816,and the Externally Funded UP Post-Doctoral Fellowship Program: Grant Cost CentreN0115/115463, for the SARChI financial support.
Conflicts of Interest: The authors declare no conflict of interest.
References
Abdi-jalebi, Mojtaba, Zahra Andaji-garmaroudi, Stefania Cacovich, Camille Stavrakas,Bertrand Philippe, Eline M. Hutter, Andrew J. Pearson, Samuele Lilliu, Tom J. Savenije,Håkan Rensmo, and et al. 2018. Halide Perovskites with Potassium Passivation. NaturePublishing Group 555: 497–501. [CrossRef]
Afroz, Khurshida, Md Moniruddin, Nurlan Bakranov, Sarkyt Kudaibergenov, andNurxat Nuraje. 2018. A Heterojunction Strategy to Improve the Visible Light SensitiveWater Splitting Performance of Photocatalytic Materials. Journal of Materials Chemistry A6: 21696–718. [CrossRef]
Ahn, Hyo Jin, Myung Jun Kwak, Jung Soo Lee, Ki Yong Yoon, and Ji Hyun Jang. 2014.Nanoporous Hematite Structures to Overcome Short Diffusion Lengths in Water Splitting.Journal of Materials Chemistry A 2: 19999–20003. [CrossRef]
157

Annamalai, Alagappan, Pravin S. Shinde, Tae Hwa Jeon, Hyun Hwi Lee, Hyun Gyu Kim,Wonyong Choi, and Jum Suk Jang. 2016. Fabrication of Superior α-Fe2O3 NanorodPhotoanodes through Ex-Situ Sn-Doping for Solar Water Splitting. Solar Energy Materialsand Solar Cells 144: 247–55. [CrossRef]
Aranda, Clara A., Laura Caliò, and Manuel Salado. 2021. Toward Commercialization of StableDevices: An Overview on Encapsulation of Hybrid Organic-Inorganic Perovskite SolarCells. Crystals 11: 1–16. [CrossRef]
Archana, Panikar Sathyaseelan, Neha Pachauri, Zhichao Shan, Shanlin Pan, andArunava Gupta. 2015. Plasmonic Enhancement of Photoactivity by Gold NanoparticlesEmbedded in Hematite Films. Journal of Physical Chemistry C 119: 15506–16. [CrossRef]
Augustynski, Jan, Krzysztof Bienkowski, and Renata Solarska. 2016. PlasmonResonance-Enhanced Photoelectrodes and Photocatalysts. Coordination Chemistry Reviews325: 116–24. [CrossRef]
Babu, Vivek, Rosinda Fuentes Pineda, Taimoor Ahmad, Agustin O. Alvarez,Luigi Angelo Castriotta, Aldo Di Carlo, Francisco Fabregat-Santiago, andKonrad Wojciechowski. 2020. Improved Stability of Inverted and Flexible PerovskiteSolar Cells with Carbon Electrode. ACS Applied Energy Materials 3: 5126–34. [CrossRef]
Back, Hyungcheol, Geunjin Kim, Junghwan Kim, Jaemin Kong, Tae Kyun Kim, Hongkyu Kang,Heejoo Kim, Jinho Lee, Seongyu Lee, and Kwanghee Lee. 2016. Achieving Long-TermStable Perovskite Solar Cells: Via Ion Neutralization. Energy and Environmental Science 9:1258–63. [CrossRef]
Badia-Bou, Laura, Elena Mas-Marza, Pau Rodenas, Eva M. Barea, Francisco Fabregat-Santiago,Sixto Gimenez, Eduardo Peris, and Juan Bisquert. 2013. Water Oxidation at HematitePhotoelectrodes with an Iridium-Based Catalyst. Journal of Physical Chemistry C 117:3826–33. [CrossRef]
Bai, Shouli, Haomiao Chu, Xu Xiang, Ruixian Luo, Jing He, and Aifan Chen. 2018.Fabricating of Fe2O3/BiVO4 Heterojunction Based Photoanode Modified with NiFe-LDHNanosheets for Efficient Solar Water Splitting. Chemical Engineering Journal 350: 148–56.[CrossRef]
Bemana, Hossein, and Sahar Rashid-Nadimi. 2017. Effect of Sulfur Doping onPhotoelectrochemical Performance of Hematite. Electrochimica Acta 229: 396–403.[CrossRef]
Bemana, Hossein, and Sahar Rashid-Nadimi. 2019. Incorporation of NiO Electrocatalyst withα-Fe2O3 Photocatalyst for Enhanced and Stable Photoelectrochemical Water Splitting.Surfaces and Interfaces 14: 184–91. [CrossRef]
Benato, Alberto, and Anna Stoppato. 2018. Pumped Thermal Electricity Storage: A TechnologyOverview. Thermal Science and Engineering Progress 6: 301–15. [CrossRef]
158

Boyd, Caleb C., Rongrong Cheacharoen, Kevin A. Bush, Rohit Prasanna, Tomas Leijtens,and Michael D. McGehee. 2018. Barrier Design to Prevent Metal-Induced Degradationand Improve Thermal Stability in Perovskite Solar Cells. ACS Energy Letters 3: 1772–78.[CrossRef]
Bush, Kevin A., Axel F. Palmstrom, Zhengshan J. Yu, Mathieu Boccard, Rongrong Cheacharoen,Jonathan P. Mailoa, David P. McMeekin, Robert L. Z. Hoye, Colin D. Bailie,Tomas Leijtens, and et al. 2017. 23.6%-Efficient Monolithic Perovskite/Silicon TandemSolar Cells With Improved Stability. Nature Energy 2: 1–7. [CrossRef]
Cao, Duyen H., Constantinos C. Stoumpos, Omar K. Farha, Joseph T. Hupp, and KanatzidisG. Mercouri. 2015. 2D Homologous Perovskites as Light-Absorbing Materials for SolarCell Applications. Journal of the American Chemical Society 137: 7843–50. [CrossRef]
Cattarin, Sandro, and Franco Decker. 2009. Electrodes|Semiconductor Electrodes. Encyclopediaof Electrochemical Power Sources 9: 121–33. [CrossRef]
Cheacharoen, Rongrong, Nicholas Rolston, Duncan Harwood, Kevin A. Bush, ReinholdH. Dauskardt, and Michael D. McGehee. 2018. Design and Understanding ofEncapsulated Perovskite Solar Cells to Withstand Temperature Cycling. Energy andEnvironmental Science 11: 144–50. [CrossRef]
Chen, Haoran, Yuetian Chen, Taiyang Zhang, Xiaomin Liu, Xingtao Wang, and Yixin Zhao.2021. Advances to High-Performance Black-Phase FAPbI3 Perovskite for Efficient andStable Photovoltaics. Small Structures 2: 2000130. [CrossRef]
Chen, Peng, Yang Bai, Songcan Wang, Miaoqiang Lyu, Jung-ho Yun, and Lianzhou Wang. 2018.In Situ Growth of 2D Perovskite Capping Layer for Stable and Efficient Perovskite SolarCells. Advanced Functional Materials 28: 1706923. [CrossRef]
Chen, Qi, Huanping Zhou, Tze-bin Song, Song Luo, Ziruo Hong, Hsin-sheng Duan, Letian Dou,Yongsheng Liu, and Yang Yang. 2014. Controllable Self-Induced Passivation of HybridLead Iodide Perovskites toward High-Performance Solar Cells. Nano Letters 14: 4158–63.[CrossRef] [PubMed]
Chou, Jen Chun, Szu An Lin, Chi Young Lee, and Jon Yiew Gan. 2013. Effect of Bulk Dopingand Surface-Trapped States on Water Splitting with Hematite Photoanodes. Journal ofMaterials Chemistry A 1: 5908–14. [CrossRef]
Dang, Ke, Tuo Wang, Chengcheng Li, Jijie Zhang, Shanshan Liu, and Jinlong Gong. 2017.Improved Oxygen Evolution Kinetics and Surface States Passivation of Ni-Bi Co-Catalystfor a Hematite Photoanode. Engineering 3: 285–89. [CrossRef]
DeQuilettes, Dane W., Sarah M. Vorpahl, Samuel D. Stranks, Hirokazu Nagaoka, GilesE. Eperon, Mark E. Ziffer, Henry J. Snaith, and David S. Ginger. 2015. Impact ofMicrostructure on Local Carrier Lifetime in Perovskite Solar Cells. Science 348: 683–86.[CrossRef]
159

Dewinggih, Tanti, Shobih, Lia Muliani, Herman, and Rahmat Hidayat. 2017. The TemperatureEffect on the Working Characteristics of Solar Cells Based on Organometal HalidePerovskite Crystals The Temperature Effect on the Working Characteristics of SolarCells Based on Organometal Halide Perovskite Crystals. Journal of Physics: ConferenceSeries 877: 012043. [CrossRef]
Dias, Paula, Tânia Lopes, Luísa Andrade, and Adélio Mendes. 2014. Temperature Effect onWater Splitting Using a Si-Doped Hematite Photoanode. Journal of Power Sources 272:567–80. [CrossRef]
Domanski, Konrad, Juan Pablo Correa-Baena, Nicolas Mine, Mohammad Khaja Nazeeruddin,Antonio Abate, Michael Saliba, Wolfgang Tress, Anders Hagfeldt, and Michael Grätzel.2016. Not All That Glitters Is Gold: Metal-Migration-Induced Degradation in PerovskiteSolar Cells. ACS Nano 10: 6306–14. [CrossRef]
Dunn, Bruce, Yang Yang, Mingkui Wang, Lijian Zuo, Hexia Guo, Nicholas De Marco, DavidS. Ginger, Bruce Dunn, Mingkui Wang, and Yang Yang. 2017. Polymer-Modified HalidePerovskite Films for Efficient and Stable Planar Heterojunction Solar Cells. ScienceAdvances 3: e1700106. [CrossRef]
Eftekhari, Ali, Veluru Jagadeesh Babu, and Seeram Ramakrishna. 2017. PhotoelectrodeNanomaterials for Photoelectrochemical Water Splitting. International Journal of HydrogenEnergy 42: 11078–109. [CrossRef]
Eftekharinia, Behrooz, Ahmad Moshaii, Ali Dabirian, and Nader Sobhkhiz Vayghan. 2017.Optimization of Charge Transport in a Co-Pi Modified Hematite Thin Film Produced byScalable Electron Beam Evaporation for Photoelectrochemical Water Oxidation. Journalof Materials Chemistry A 5: 3412–24. [CrossRef]
Eidsvåg, Håkon, Said Bentouba, Ponniah Vajeeston, Shivatharsiny Yohi, andDhayalan Velauthapillai. 2021. TiO2 as a Photocatalyst for Water Splitting—AnExperimental and Theoretical Review. Molecules 26: 1–30. [CrossRef] [PubMed]
Emami, Seyedali, Jorge Martins, Dzmitry Ivanou, and Adélio Mendes. 2020. AdvancedHermetic Encapsulation of Perovskite Solar Cells: The Route to Commercialization.Journal of Materials Chemistry A 8: 2654–62. [CrossRef]
Fan, Wenguang, Michael K. H. Leung, Jimmy C. Yu, and Wing Kei Ho. 2016. RecentDevelopment of Plasmonic Resonance-Based Photocatalysis and Photovoltaics for SolarUtilization. Molecules 21: 180. [CrossRef]
Fang, Zhibin, Wenjing Chen, Yongliang Shi, Jin Zhao, Shenglong Chu, and Ji Zhang. 2020.Dual Passivation of Perovskite Defects for Light-Emitting Diodes with External QuantumEfficiency Exceeding 20%. Advanced Functional Materials 30: 1909754. [CrossRef]
Fantanas, Dimitrios, Adam Brunton, Simon J. Henley, and Robert A. Dorey. 2018. Investigationof the mechanism for current induced network failure for spray deposited silvernanowires. Nanotechnology 29: 465705. [CrossRef]
160
Feng, Fan, Can Li, Jie Jian, Fan Li, Youxun Xu, Hongqiang Wang, and Lichao Jia. 2020. GradientTi-Doping in Hematite Photoanodes for Enhanced Photoelectrochemical Performance.Journal of Power Sources 449: 227473. [CrossRef]
Fru, Juvet N., Nolwazi Nombona, and Mmantsae Diale. 2021. Growth and Degradationof Methylammonium Lead Tri-Bromide Perovskite Thin Film at Metal/PerovskiteInterfaces. Thin Solid Films 722: 138568. [CrossRef]
Glanz, Karen. 2010. Using Behavioral Theories to Guide Decisions of What to Measure, andWhy. International Journal of Hydrogen Energy 27: 991–1022.
Grancini, Giulia, Cristina Roldán-Carmona, Ivan Zimmermann, Edoardo Mosconi, Xuhui Lee,Daniel Martineau, Stéphanie Narbey, F. Oswald, F. De Angelis, M. Graetzel, and et al.2017. One-Year Stable Perovskite Solar Cells by 2D/3D Interface Engineering. NatureCommunications 8: 1–8. [CrossRef]
Grave, Daniel A., Natav Yatom, David S. Ellis, Maytal Caspary Toroker, and Avner Rothschild.2018. The ‘Rust’ Challenge: On the Correlations between Electronic Structure, ExcitedState Dynamics, and Photoelectrochemical Performance of Hematite Photoanodes forSolar Water Splitting. Advanced Materials 30: 1–10. [CrossRef] [PubMed]
Griffini, Gianmarco, and Stefano Turri. 2016. Polymeric Materials for Long-Term Durability ofPhotovoltaic Systems. Journal of Applied Polymer Science 133: 1–16. [CrossRef]
Grigorescu, Sabina, Chong-yong Lee, Kiyoung Lee, Sergiu Albu, Indhumati Paramasivam,Ioana Demetrescu, and Patrik Schmuki. 2012. Electrochemistry CommunicationsThermal Air Oxidation of Fe: Rapid Hematite Nanowire Growth andPhotoelectrochemical Water Splitting Performance. Electrochemistry Communications 23:59–62. [CrossRef]
Gurudayal, Sing Yang Chiam, Mulmudi Hemant Kumar, Prince Saurabh Bassi, HweeLeng Seng, James Barber, and Lydia Helena Wong. 2014. Improving the Efficiency ofHematite Nanorods for Photoelectrochemical Water Splitting by Doping with Manganese.ACS Applied Materials and Interfaces 6: 5852–59. [CrossRef] [PubMed]
Han, Yu, Steffen Meyer, Yasmina Dkhissi, Karl Weber, Jennifer M. Pringle, Udo Bach,Leone Spiccia, and Yi-Bing Cheng. 2015. Degradation Observations of EncapsulatedPlanar CH3NH3PbI3 Perovskite Solar Cells at High Temperatures and Humidity. Journalof Materials Chemistry A 3: 8139–47. [CrossRef]
He, Sisi, Longbin Qiu, Luis K. Ono, and Yabing Qi. 2020. How Far Are We from Attaining10-Year Lifetime for Metal Halide Perovskite Solar Cells? Materials Science and EngineeringR: Reports 140: 100545. [CrossRef]
Hoke, Eric T., Daniel J. Slotcavage, Emma R. Dohner, Andrea R. Bowring, HemamalaI. Karunadasa, and Michael D. McGehee. 2015. Reversible Photo-Induced Trap Formationin Mixed-Halide Hybrid Perovskites for Photovoltaics. Chemical Science 6: 613–17.[CrossRef]
161

Fujishima, Akira, and Kenichi Honda. 1972. Electrochemical Photolysis of Water at aSemiconductor Electrode. Nature 238: 737–40. [CrossRef]
Hsieh, Cheng-ming, Yung-sheng Liao, Yan-ru Lin, Chih-ping Chen, Cheng-min Tsai, EricWei-guang Diau, and Shih-ching Chuang. 2018. Of Perovskite Solar Cells Using LewisBases Urea and Thiourea as Additives: Stimulating Large Grain. RSC Advances 8:19610–15. [CrossRef]
Idígoras, Jesús, Francisco J. Aparicio, Lidia Contreras-Bernal, Susana Ramos-Terrón,María Alcaire, Juan Ramón Sánchez-Valencia, Ana Borras, Ángel Barranco, and JuanA. Anta. 2018. Enhancing Moisture and Water Resistance in Perovskite Solar Cells byEncapsulation with Ultrathin Plasma Polymers. ACS Applied Materials and Interfaces 10:11587–94. [CrossRef]
Ierides, Ioannis, Isaac Squires, Giulia Lucarelli, Thomas M. Brown, and Franco Cacialli. 2021.Inverted Organic Photovoltaics with a Solution-Processed ZnO/MgO Electron TransportBilayer. Journal of Materials Chemistry C 9: 3901–10. [CrossRef]
Ihssen, Julian, Artur Braun, Greta Faccio, Krisztina Gajda-Schrantz, and Linda Thöny-Meyer.2014. Light Harvesting Proteins for Solar Fuel Generation in BioengineeredPhotoelectrochemical Cells. Current Protein & Peptide Science 15: 374–84. [CrossRef]
Ito, Nathalie Minko, Waldemir Moura Carvalho, Dereck Nills Ferreira Muche, Ricardo HauchRibeiro Castro, Gustavo Martini Dalpian, and Flavio Leandro Souza. 2017. HighTemperature Activation of Hematite Nanorods for Sunlight Driven Water OxidationReaction. Physical Chemistry Chemical Physics 19: 25025–32. [CrossRef] [PubMed]
Jain, Deepak, Suryanaman Chaube, Prerna Khullar, Sriram Goverapet Srinivasan, andBeena Rai. 2019. Bulk and Surface DFT Investigations of Inorganic Halide PerovskitesScreened Using Machine Learning and Materials Property Databases. Physical ChemistryChemical Physics 21: 19423–36. [CrossRef] [PubMed]
Jeong, Jaeki, Minjin Kim, Jongdeuk Seo, Haizhou Lu, Paramvir Ahlawat, Aditya Mishra,Yingguo Yang, Michael A. Hope, Felix T. Eickemeyer, Maengsuk Kim, and et al. 2021.Pseudo-Halide Anion Engineering for α-FAPbI3 Perovskite Solar Cells. Nature 592:381–85. [CrossRef]
Jiang, Qi, Yang Zhao, Xingwang Zhang, Xiaolei Yang, Yong Chen, Zema Chu, Qiufeng Ye,Xingxing Li, Zhigang Yin, and Jingbi You. 2019. Surface Passivation of Perovskite Filmfor Efficient Solar Cells. Nature Photonics 13: 460–66. [CrossRef]
Jin, Handong, Elke Debroye, Masoumeh Keshavarz, Ivan G. Scheblykin, Maarten B.J. Roeffaers, and Julian A. Steele. 2020. It’s a Trap ! On the Nature of Localised States andCharge Trapping in Lead Halide Perovskites. Materials Horizons 7: 397–410. [CrossRef]
Juarez-Perez, Emilio J., Luis K. Ono, Maki Maeda, Yan Jiang, Zafer Hawash, and Yabing Qi.2018. Photodecomposition and Thermal Decomposition in Methylammonium HalideLead Perovskites and Inferred Design Principles to Increase Photovoltaic Device Stability.Journal of Materials Chemistry A 6: 9604–12. [CrossRef]
162

Juarez-Perez, Emilio J., Luis K. Ono, and Yabing Qi. 2019. Thermal Degradation ofFormamidinium Based Lead Halide Perovskites into Sym-Triazine and HydrogenCyanide Observed by Coupled Thermogravimetry-Mass Spectrometry Analysis. Journalof Materials Chemistry A 7: 16912–19. [CrossRef]
Kafizas, Andreas, Robert Godin, and James R. Durrant. 2017. Charge Carrier Dynamics inMetal Oxide Photoelectrodes for Water Oxidation. Semiconductors and Semimetals 97: 3–46.[CrossRef]
Kaltenbrunner, Martin, Getachew Adam, Eric Daniel Głowacki, Michael Drack,Reinhard Schwödiauer, Lucia Leonat, Dogukan Hazar Apaydin, Heiko Groiss, MarkusClark Scharber, Matthew Schuette White, and et al. 2015. Flexible High Power-per-WeightPerovskite Solar Cells with Chromium Oxide-Metal Contacts for Improved Stability inAir. Nature Materials 14: 1032–39. [CrossRef] [PubMed]
Kang, Keehoon, Heebeom Ahn, Younggul Song, Woocheol Lee, Junwoo Kim, Youngrok Kim,Daekyoung Yoo, and Takhee Lee. 2019. High-Performance Solution-ProcessedOrgano-Metal Halide Perovskite Unipolar Resistive Memory Devices in a Cross-BarArray Structure. Advanced Materials 31: 1804841. [CrossRef] [PubMed]
Kim, Do Hong, Dinsefa M. Andoshe, Young Seok Shim, Cheon Woo Moon, Woonbae Sohn,Seokhoon Choi, Taemin Ludvic Kim, Migyoung Lee, Hoonkee Park, Kootak Hong,and et al. 2016a. Toward High-Performance Hematite Nanotube Photoanodes:Charge-Transfer Engineering at Heterointerfaces. ACS Applied Materials and Interfaces 8:23793–800. [CrossRef] [PubMed]
Kim, Jae Young, Duck Hyun Youn, Kyoungwoong Kang, and Jae Sung Lee. 2016b. HighlyConformal Deposition of an Ultrathin FeOOH Layer on a Hematite Nanostructure forEfficient Solar Water Splitting. Angewandte Chemie - International Edition 55: 10854–58.[CrossRef] [PubMed]
Kim, Gee Yeong, Alessandro Senocrate, Tae Youl Yang, Giuliano Gregori, Michael Grätzel, andJoachim Maier. 2018. Large Tunable Photoeffect on Ion Conduction in Halide Perovskitesand Implications for Photodecomposition. Nature Materials 17: 445–49. [CrossRef]
Kim, Jae Young, Ganesan Magesh, Duck Hyun Youn, Ji Wook Jang, Jun Kubota,Kazunari Domen, and Jae Sung Lee. 2013. Single-Crystalline, Wormlike HematitePhotoanodes for Efficient Solar Water Splitting. Scientific Reports 3: 1–8. [CrossRef]
Kim, Jongseob, Sung-hoon Lee, Jung Hoon Lee, and Ki-ha Hong. 2014. The Role of IntrinsicDefects in Methylammonium Lead Iodide. The journal of physical chemistry letters 5:1312–17. [CrossRef]
Kong, Weiguang, Tao Ding, Gang Bi, and Huizhen Wu. 2016. Optical Characterizations of theSurface States in Hybrid Lead–Halide Perovskites. Physical Chemistry Chemical Physics 18:12626–32. [CrossRef]
163

Kwon, In, Mahadeo A. Mahadik, Jun Beom, Weon-sik Chae, Sun Hee, and Jum Suk. 2021.Lowering the Onset Potential of Zr-Doped Hematite Nanocoral Photoanodes by AlCo-Doping and Surface Modification with Electrodeposited Co–Pi. Journal of Colloid AndInterface Science 581: 751–63. [CrossRef]
Kwon, Jinhyeong, Junyeob Yeo, Sukjoon Hong, Young D. Suh, Habeom Lee, Jun Ho Choi,Seung S. Lee, and Seung Hwan Ko. 2016. Photoreduction Synthesis of HierarchicalHematite/Silver Nanostructures for Photoelectrochemical Water Splitting. EnergyTechnology 4: 271–77. [CrossRef]
Kyesmen, Pannan I., Nolwazi Nombona, and Mmantsae Diale. 2021. Heterojunction ofNanostructured α-Fe2O3/CuO for Enhancement of Photoelectrochemical Water Splitting.Journal of Alloys and Compounds 863: 158724. [CrossRef]
Lee, Jin-wook, Hui-seon Kim, and Nam-gyu Park. 2015. Lewis Acid − Base Adduct Approachfor High Efficiency Perovskite Solar Cells. Accounts of chemical research 49: 311–19.[CrossRef] [PubMed]
Lee, Myeong Hwan, Jong Hoon Park, Hyun Soo Han, Hee Jo Song, In Sun Cho, Jun Hong Noh,and Kug Sun Hong. 2014. Nanostructured Ti-Doped Hematite (α-Fe2O3) Photoanodesfor Efficient Photoelectrochemical Water Oxidation. International Journal of HydrogenEnergy 39: 17501–7. [CrossRef]
Lee, Young Il, Nam Joong Jeon, Bong Jun Kim, Hyunjeong Shim, Tae Youl Yang, Sang Il Seok,Jangwon Seo, and Sung Gap Im. 2018. A Low-Temperature Thin-Film Encapsulation forEnhanced Stability of a Highly Efficient Perovskite Solar Cell. Advanced Energy Materials8: 1–8. [CrossRef]
Li, Jiangtian, Scott K. Cushing, Peng Zheng, Fanke Meng, Deryn Chu, and Nianqiang Wu. 2013.Plasmon-Induced Photonic and Energy-Transfer Enhancement of Solar Water Splittingby a Hematite Nanorod Array. Nature Communications 4: 1–8. [CrossRef]
Li, Jinkai, Yongcai Qiu, Zhanhua Wei, Qingfeng Lin, Qianpeng Zhang, Keyou Yan,Haining Chen, Shuang Xiao, Zhiyong Fan, and Shihe Yang. 2014. A Three-DimensionalHexagonal Fluorine-Doped Tin Oxide Nanocone Array: A Superior Light HarvestingElectrode for High Performance Photoelectrochemical Water Splitting. Energy andEnvironmental Science 7: 3651–58. [CrossRef]
Li, Mingyang, Yi Yang, Yichuan Ling, Weitao Qiu, Fuxin Wang, Tianyu Liu, Yu Song,Xiaoxia Liu, Pingping Fang, Yexiang Tong, and et al. 2017. Morphology and DopingEngineering of Sn-Doped Hematite Nanowire Photoanodes. Nano Letters 17: 2490–95.[CrossRef]
Li, Bixin, Wei Hui, Xueqin Ran, Yingdong Xia, Fei Xia, Lingfeng Chao, Yonghua Chen, andWei Huang. 2019. Memory Devices and Artificial Synapses. Journal of Materials ChemistryC 7: 7476–93. [CrossRef]
164

Lin, Xiongfeng, Askhat N. Jumabekov, Niraj N. Lal, Alexander R. Pascoe, Daniel E. Gómez,Noel W. Duffy, Anthony S.R. Chesman, Kallista Sears, Maxime Fournier, Yupeng Zhang,and et al. 2017. Dipole-Field-Assisted Charge Extraction in Metal-Perovskite-MetalBack-Contact Solar Cells. Nature Communications 8: 1–8. [CrossRef]
Liu, Cong, Zengqi Huang, Xiaotian Hu, Xiangchuan Meng, Liqiang Huang, and Jian Xiong.2018. Grain Boundary Modi Fi Cation via F4TCNQ To Reduce Defects of Perovskite SolarCells with Excellent Device Performance. ACS Applied Materials & Interfaces 10: 1909–16.[CrossRef]
Liu, Dong, David M. Bierman, Andrej Lenert, Hai-Tong Yu, Zhen Yang, Evelyn N. Wang, andYuan-Yuan Duan. 2015a. Ultrathin Planar Hematite Film for Solar PhotoelectrochemicalWater Splitting. Optics Express 23: A1491. [CrossRef] [PubMed]
Liu, Xiangye, Wei Zhao, Houlei Cui, Yi Xie, Yaoming Wang, Tao Xu, and Fuqiang Huang.2015b. Organic–Inorganic Halide Perovskite Based Solar Cells–Revolutionary Progressin Photovoltaics. Inorganic Chemistry Frontiers 2: 584–84. [CrossRef]
Grundmann, Marius. 2010. Physics of Semiconductors. Berlin: Springer, vol. 11, pp. 401–72.[CrossRef]
Mansour Rezaei Fumani, Nasibeh, Farzaneh Arabpour Roghabadi, Maryam Alidaei, SeyedMojtaba Sadrameli, Vahid Ahmadi, and Farhood Najafi. 2020. Prolonged Lifetimeof Perovskite Solar Cells Using a Moisture-Blocked and Temperature-ControlledEncapsulation System Comprising a Phase Change Material as a Cooling Agent. ACSOmega 5: 7106–14. [CrossRef] [PubMed]
Mao, Aiming, Nam Gyu Park, Gui Young Han, and Jong Hyeok Park. 2011. ControlledGrowth of Vertically Oriented Hematite/Pt Composite Nanorod Arrays: Use forPhotoelectrochemical Water Splitting. Nanotechnology 22: 175703. [CrossRef]
Mayer, Matthew T., Chun Du, and Dunwei Wang. 2012. Hematite/Si Nanowire Dual-AbsorberSystem for Photoelectrochemical Water Splitting at Low Applied Potentials. Journal of theAmerican Chemical Society 134: 12406–9. [CrossRef]
Mckenna, Keith P. 2018. Electronic Properties of 111 Twin Boundaries in a Mixed-Ion LeadHalide Perovskite Solar Absorber. ACS Energy Letters 3: 2663–68. [CrossRef]
Ming, Wenmei, Dongwen Yang, Tianshu Li, Lijun Zhang, and Mao Hua Du. 2018. Formationand Diffusion of Metal Impurities in Perovskite Solar Cell Material CH3NH3PbI3:Implications on Solar Cell Degradation and Choice of Electrode. Advanced Science 5:1700662. [CrossRef]
Motti, Silvia G., Daniele Meggiolaro, Samuele Martani, Roberto Sorrentino, Alex J. Barker,Filippo De Angelis, and Annamaria Petrozza. 2019. Defect Activity in Lead HalidePerovskites. Advanced Materials 31: 1901183. [CrossRef]
165

Murphy, Anthony B., Piers R. F. Barnes, Lakshman K. Randeniya, Ian C. Plumb, Ian E. Grey,Mike D. Horne, and Julie A. Glasscock. 2006. Efficiency of Solar Water SplittingUsing Semiconductor Electrodes. International Journal of Hydrogen Energy 31: 1999–2017.[CrossRef]
Natarajan, Kaushik, Mohit Saraf, and Shaikh M. Mobin. 2017. Visible-Light-Induced WaterSplitting Based on a Novel α-Fe2O3/CdS Heterostructure. ACS Omega 2: 3447–56.[CrossRef]
Niu, Tianqi, Jing Lu, Xuguang Jia, Zhuo Xu, Ming-chun Tang, Dounya Barrit, Ningyi Yuan,Jianning Ding, Xu Zhang, Yuanyuan Fan, and et al. 2019. Interfacial Engineering at the2D/3D Heterojunction for High-Performance Perovskite Solar Cells. Nano Letters 19:7181–90. [CrossRef] [PubMed]
Noel, Nakita Kimberly, Antonio Abate, Samuel David Stranks, Elizabeth Parrott,Victor Burlakov, Alain Goriely, and Henry J. Snaith. 2014. Enhanced Photoluminescenceand Solar Cell Performance via Lewis Base Passivation of Organic-Inorganic Lead HalidePerovskites. ACS nano 8: 9815–21. [CrossRef] [PubMed]
Rothmann, Mathias Uller, Wei Li, Ye Zhu, Udo Bach, Leone Spiccia, Joanne Etheridge,and Yi-Bing Cheng. 2017. Direct observation of intrinsic twin domains in tetragonalCH3NH3PbI3. Nature Communications 8: 6–13. [CrossRef] [PubMed]
Peerakiatkhajohn, Piangjai, Jung Ho Yun, Hongjun Chen, Miaoqiang Lyu, Teera Butburee,and Lianzhou Wang. 2016. Stable Hematite Nanosheet Photoanodes for EnhancedPhotoelectrochemical Water Splitting. Advanced Materials 28: 6405–10. [CrossRef][PubMed]
Peng, Yong, Qingdong Ruan, Chun Ho Lam, Fanxu Meng, Chung-yu Guan,Shella Permatasari Santoso, Xingli Zou, Edward T. Yu, Paul K. Chu, andHsien-yi Hsu. 2021. Plasma-Implanted Ti-Doped Hematite Photoanodes with EnhancedPhotoelectrochemical Water Oxidation Performance. Journal of Alloys and Compounds 870:159376. [CrossRef]
Qiao, Lu, Wei-hai Fang, and Run Long. 2019. Forschungsartikel Extending Carrier Lifetimesin Lead Halide Perovskites with Alkali Metals by Passivating and Eliminating HalideInterstitial Defects Forschungsartikel. Angewandte Chemie 132: 4714–20. [CrossRef]
Qiu, Longbin, Sisi He, Luis K. Ono, and Yabing Qi. 2020. Progress of Surface Science Studies onABX3-Based Metal Halide Perovskite Solar Cells. Advanced Energy Materials 10: 1902726.[CrossRef]
Rahmany, Stav, and Lioz Etgar. 2021. Two-Dimensional or Passivation Treatment: The Effectof Hexylammonium Post Deposition Treatment on 3D Halide Perovskite-Based SolarCells. Materials Advances 2: 2617–25. [CrossRef]
Rajendran, Kumar, Vithiya Karunagaran, Biswanath Mahanty, and Shampa Sen. 2015.Biosynthesis of Hematite Nanoparticles and Its Cytotoxic Effect on HepG2 Cancer Cells.International Journal of Biological Macromolecules 74: 376–81. [CrossRef]
166

Rani, Ankita, Rajesh Reddy, Uttkarshni Sharma, Priya Mukherjee, Priyanka Mishra,Aneek Kuila, Lan Ching Sim, and Pichiah Saravanan. 2018. A Review on the Progress ofNanostructure Materials for Energy Harnessing and Environmental Remediation. Journalof Nanostructure in Chemistry 8: 255–91. [CrossRef]
Ruddlesden, S. N., and Paul Popper. 1958. The Compound Sr3Ti2O7 and Its Structure. ActaCrystallographica 11: 54–55. [CrossRef]
Sanehira, Erin M., Bertrand J. Tremolet De Villers, Philip Schulz, Matthew O. Reese,Suzanne Ferrere, Kai Zhu, Lih Y. Lin, Joseph J. Berry, and Joseph M. Luther. 2016.Influence of Electrode Interfaces on the Stability of Perovskite Solar Cells: ReducedDegradation Using MoOx/Al for Hole Collection. ACS Energy Letters 1: 38–45. [CrossRef]
Selim, Shababa, Laia Francàs, Miguel García-Tecedor, Sacha Corby, Chris Blackman,Sixto Gimenez, James R. Durrant, and Andreas Kafizas. 2019. WO3/BiVO4: Impact ofCharge Separation at the Timescale of Water Oxidation. Chemical Science 10: 2643–52.[CrossRef]
Asad, Jihad, Samy K. K. Shaat, Hussam Musleh, Nabil Shurrab, Ahmed Issa, Abelilah Lahmar,Amal Al-Kahlout, and Naji Al Dahoudi. 2019. Perovskite Solar Cells Free of HoleTransport Layer. Journal of Sol-Gel Science and Technology, 443–49. [CrossRef]
Shao, Yuchuan, Yanjun Fang, Tao Li, Qi Wang, Qingfeng Dong, Yehao Deng, Yongbo Yuan,Haotong Wei, Meiyu Wang, Alexei Gruverman, and et al. 2016. Environmental ScienceGrain Boundary Dominated Ion Migration in Polycrystalline Organic – Inorganic HalidePerovskite Films. Energy & Environmental Science 9: 1752–59. [CrossRef]
Shao, Yuchuan, Zhengguo Xiao, Cheng Bi, Yongbo Yuan, and Jinsong Huang. 2014. Originand Elimination of Photocurrent Hysteresis by Fullerene Passivation in CH3NH3PbI3
Planar Heterojunction Solar Cells. Nature Communications 5: 1–7. [CrossRef] [PubMed]Sharma, Dipika, Sumant Upadhyay, Anuradha Verma, Vibha R. Satsangi, Rohit Shrivastav,
and Sahab Dass. 2015. Nanostructured Ti-Fe2O3/Cu2O Heterojunction Photoelectrodefor Efficient Hydrogen Production. Thin Solid Films 574: 125–31. [CrossRef]
Shen, Shaohua, Jigang Zhou, Chung Li Dong, Yongfeng Hu, Eric Nestor Tseng, Penghui Guo,Liejin Guo, and Samuel S. Mao. 2014. Surface Engineered Doping of Hematite NanorodArrays for Improved Photoelectrochemical Water Splitting. Scientific Reports 4: 1–9.[CrossRef]
Sherkar, Tejas S., Cristina Momblona, A. Jorge, Michele Sessolo, Henk J. Bolink, and L. JanAnton Koster. 2017. Recombination in Perovskite Solar Cells: Significance of GrainBoundaries, Interface Traps, and Defect Ions. ACS Energy Letters 2: 1214–22. [CrossRef]
Shi, Enzheng, Gao Yao, Blake P. Finkenauer, Akriti, Aidan H. Coffey, and Letian Dou. 2018.Two-Dimensional Halide Perovskite Nanomaterials and Heterostructures. ChemicalSociety Reviews 47: 6001–446. [CrossRef]
167

Shi, Lei, Trevor L. Young, Jincheol Kim, Yun Sheng, Lei Wang, Yifeng Chen, Zhiqiang Feng,Mark J. Keevers, Xiaojing Hao, Pierre J. Verlinden, and et al. 2017. Accelerated LifetimeTesting of Organic-Inorganic Perovskite Solar Cells Encapsulated by Polyisobutylene.ACS Applied Materials and Interfaces 9: 25073–81. [CrossRef] [PubMed]
Shinde, Pravin S., Su Yong Lee, Jungho Ryu, Sun Hee Choi, and Jum Suk Jang. 2017.Enhanced Photoelectrochemical Performance of Internally Porous Au-Embeddedα-Fe2O3 Photoanodes for Water Oxidation. Chemical Communications 53: 4278–81.[CrossRef] [PubMed]
Shlenskaya, Natalia N., Nikolai A. Belich, Michael Grätzel, Eugene A. Goodilin, and AlexeyB. Tarasov. 2018. Light-Induced Reactivity of Gold and Hybrid Perovskite as a NewPossible Degradation Mechanism in Perovskite Solar Cells. Journal of Materials ChemistryA 6: 1780–86. [CrossRef]
Singh, David J., and Ichiro Terasaki. 2008. Thermoelectrics: Nanostructuring and More. NatureMaterials 7: 616–17. [CrossRef]
Sivula, Kevin, Florian Le Formal, and Michael Grätzel. 2011. Solar Water Splitting: ProgressUsing Hematite (α-Fe2O3) Photoelectrodes. ChemSusChem 4: 432–49. [CrossRef]
Song, Zhaoning, Suneth C. Watthage, Adam B. Phillips, Brandon L. Tompkins, RandyJ. Ellingson, and Michael J. Heben. 2015. Impact of Processing Temperature andComposition on the Formation of Methylammonium Lead Iodide Perovskites. Chemistryof Materials 27: 4612–19. [CrossRef]
Souza, Flavio L., Kirian P. Lopes, Pedro A. P. Nascente, and Edson R. Leite. 2009.Nanostructured Hematite Thin Films Produced by Spin-Coating Deposition Solution:Application in Water Splitting. Solar Energy Materials and Solar Cells 93: 362–68. [CrossRef]
Stewart, Robert J., Christopher Grieco, Alec V. Larsen, Joshua J. Maier, and John B. Asbury. 2016.Approaching Bulk Carrier Dynamics in Organo-Halide Perovskite Nanocrystalline Filmsby Surface Passivation. The Journal of Physical Chemistry Letters 7: 1148–53. [CrossRef]
Svanström, Sebastian, T. Jesper Jacobsson, Gerrit Boschloo, Erik M. J. Johansson,Håkan Rensmo, and Ute B. Cappel. 2020. Degradation Mechanism of Silver MetalDeposited on Lead Halide Perovskites. ACS Applied Materials and Interfaces 12: 7212–21.[CrossRef]
Tamirat, Andebet Gedamu, John Rick, Amare Aregahegn Dubale, Wei Nien Su, and BingJoe Hwang. 2016. Using Hematite for Photoelectrochemical Water Splitting: A Review ofCurrent Progress and Challenges. Nanoscale Horizons 1: 243–67. [CrossRef]
Tan, Chih Shan, Yi Hou, Makhsud I. Saidaminov, Andrew Proppe, Yu Sheng Huang,Yicheng Zhao, Mingyang Wei, Grant Walters, Ziyun Wang, Yongbiao Zhao, and et al.2020. Heterogeneous Supersaturation in Mixed Perovskites. Advanced Science 7: 1903166.[CrossRef] [PubMed]
168

Tee, Si Yin, Khin Yin Win, Wee Siang Teo, Leng Duei Koh, Shuhua Liu, Choon Peng Teng,and Ming Yong Han. 2017. Recent Progress in Energy-Driven Water Splitting. AdvancedScience 4: 1600337. [CrossRef] [PubMed]
Thomson, Stuart. 2018. Observing Phase Transitions in a Halide Perovskite Using TemperatureDependent Photoluminescence Spectroscopy. Livingston: Edinburgh Instruments, AN_P45.
Tsege, Ermias Libnedengel, Timur Sh Atabaev, Md Ashraf Hossain, Dongyun Lee, HyungKook Kim, and Yoon Hwae Hwang. 2016. Cu-Doped Flower-like HematiteNanostructures for Efficient Water Splitting Applications. Journal of Physics and Chemistryof Solids 98: 283–89. [CrossRef]
Turren-Cruz, Silver Hamill, Anders Hagfeldt, and Michael Saliba. 2018.Methylammonium-Free, High-Performance, and Stable Perovskite Solar Cellson a Planar Architecture. Science 362: 449–53. [CrossRef] [PubMed]
Uratani, Hiroki, and Koichi Yamashita. 2017. Charge Carrier Trapping at Surface Defects ofPerovskite Solar Cell Absorbers: A First-Principles Study. The Journal of Physical ChemistryLetters 8: 742–46. [CrossRef]
Vidal, Rosario, Jaume-Adrià Alberola-Borràs, Núria Sánchez-Pantoja, and Iván Mora-Seró.2021. Comparison of Perovskite Solar Cells with Other Photovoltaics Technologies fromthe Point of View of Life Cycle Assessment. Advanced Energy and Sustainability Research 2:2000088. [CrossRef]
Wang, Jie, Xiaolian Chen, Fangyuan Jiang, Qun Luo, Lianping Zhang, Mingxi Tan, Menglan Xie,Yan-Qing Li, Yinhua Zhou, Wenming Su, and et al. 2018. Electrochemical Corrosion ofAg Electrode in the Silver Grid Electrode-Based Flexible Perovskite Solar Cells and theSuppression Method. Solar RRL 2: 1800118. [CrossRef]
Wang, Lei, Xuemei Zhou, Nhat Truong Nguyen, and Patrik Schmuki. 2015. Plasmon-EnhancedPhotoelectrochemical Water Splitting Using Au Nanoparticles Decorated on HematiteNanoflake Arrays. ChemSusChem 8: 618–22. [CrossRef]
Wang, Songcan, Jung Ho Yun, and Lianzhou Wang. 2017. Nanostructured Semiconductors forBifunctional Photocatalytic and Photoelectrochemical Energy Conversion. Semiconductorsand Semimetals 97: 315–47. [CrossRef]
Wu, Shaohang, Rui Chen, Shasha Zhang, B. Hari Babu, Youfeng Yue, Hongmei Zhu,Zhichun Yang, Chuanliang Chen, Weitao Chen, Yuqian Huang, and et al. 2019. AChemically Inert Bismuth Interlayer Enhances Long-Term Stability of Inverted PerovskiteSolar Cells. Nature Communications 10: 1–11. [CrossRef]
Wu, Wu-qiang, Peter N. Rudd, Zhenyi Ni, Charles Henry Van Brackle, Haotong Wei, Qi Wang,Benjamin R. Ecker, Yongli Gao, and Jinsong Huang. 2020. Reducing Surface HalideDeficiency for Efficient and Stable Iodide- Based Perovskite Solar Cells. Journal of theAmerican Chemical Society 142: 3989–96. [CrossRef] [PubMed]
Wu, Yinghui, Dong Wang, Jinyuan Liu, and Houzhi Cai. 2021. Review of Interface Passivationof Perovskite Layer. Nanomaterials 11: 1–19. [CrossRef] [PubMed]
169

Xi, Lifei, and Kathrin M. Lange. 2018. Surface Modification of Hematite Photoanodes forImprovement of Photoelectrochemical Performance. Catalysts 8: 497. [CrossRef]
Xie, Yiyuan, Yang Ju, Yuhki Toku, and Yasuyuki Morita. 2018. Synthesis of a Single-CrystalFe2O3 Nanowire Array Based on Stress-Induced Atomic Diffusion Used for Solar WaterSplitting. Royal Society Open Science 5: 172126. [CrossRef]
Xu, Ming, Jing Feng, Xia Li Ou, Zhen Yu Zhang, Yi Fan Zhang, Hai Yu Wang, and HongBo Sun. 2016. Surface Passivation of Perovskite Film by Small Molecule Infiltration forImproved Efficiency of Perovskite Solar Cells. IEEE Photonics Journal 8: 1–7. [CrossRef]
Yan, Keyou, Yongcai Qiu, Shuang Xiao, Junbo Gong, Shenghe Zhao, Jiantie Xu,Xiangyue Meng, Shihe Yang, and Jianbin Xu. 2017. Self-Driven Hematite-BasedPhotoelectrochemical Water Splitting Cells with Three-Dimensional NanobowlHeterojunction and High-Photovoltage Perovskite Solar Cells. Materials Today Energy 6:128–35. [CrossRef]
Yang, Dongwen, Wenmei Ming, Hongliang Shi, Lijun Zhang, and Mao-Hua Du. 2016. FastDiffusion of Native Defects and Impurities in Perovskite Solar Cell Material CH3NH3PbI3.Chemistry of Materials 28: 4349–57. [CrossRef]
Yang, Woon Seok, Byung-Wook Park, Eui Hyuk Jung, and Nam Joong Jeon. 2017a. IodideManagement in Formamidinium-Lead-Halide–Based Perovskite Layers for EfficientSolar Cells. Science 356: 1376–791. [CrossRef]
Yang, Wooseok, Rajiv Ramanujam Prabhakar, Jeiwan Tan, S. David Tilley, and Jooho Moon.2019. Strategies for Enhancing the Photocurrent, Photovoltage, and Stability ofPhotoelectrodes for Photoelectrochemical Water Splitting. Chemical Society Reviews 48:4979–5015. [CrossRef]
Yang, Ye, Mengjin Yang, David T. Moore, Yong Yan, Elisa M. Miller, Kai Zhu, and MatthewC. Beard. 2017b. Top and bottom surfaces limit carrier lifetime in lead iodide perovskitefilms. Nature Energy 2: 1–7. [CrossRef]
Yilmaz, Ceren, and Ugur Unal. 2016. Morphology and Crystal Structure Control of α-Fe2O3
Films by Hydrothermal-Electrochemical Deposition in the Presence of Ce3+ and/orAcetate, F− Ions. RSC Advances 6: 8517–27. [CrossRef]
Yun, Jae Sung, Jincheol Kim, Trevor Young, Robert J. Patterson, Dohyung Kim,Jan Seidel, Sean Lim, Martin A. Green, Shujuan Huang, and Anita Ho-Baillie.2018. Humidity-Induced Degradation via Grain Boundaries of HC(NH2)2PbI3 PlanarPerovskite Solar Cells. Advanced Functional Materials 28: 1705363. [CrossRef]
Zhang, Chengxi, Dai-bin Kuang, and Wu-Qiang Wu. 2020. A Review of Diverse HalidePerovskite Morphologies for Efficient Optoelectronic Applications. Small Methods 4:1900662. [CrossRef]
Zhang, Hong, Mohammad Khaja Nazeeruddin, and Wallace C. H. Choy. 2019a. PerovskitePhotovoltaics: The Significant Role of Ligands in Film Formation, Passivation, andStability. Advanced Materials 31: 1–29. [CrossRef] [PubMed]
170

Zhang, Moyao, Qi Chen, Rongming Xue, Yu Zhan, Cheng Wang, Junqi Lai, Jin Yang,Hongzhen Lin, Jianlin Yao, Yaowen Li, and et al. 2019b. Reconfiguration of InterfacialEnergy Band Structure for High-Performance Inverted Structure Perovskite Solar Cells.Nature Communications 10: 1–9. [CrossRef] [PubMed]
Zhang, Rong, Yiyu Fang, Tao Chen, Fengli Qu, Zhiang Liu, Gu Du, Abdullah M. Asiri, Tao Gao,and Xuping Sun. 2017. Enhanced Photoelectrochemical Water Oxidation Performance ofFe2O3 Nanorods Array by S Doping. ACS Sustainable Chemistry and Engineering 5: 7502–6.[CrossRef]
Zhang, Yong, Licheng Tan, Qingxia Fu, Lie Chen, Ting Ji, and Yiwang Chen. 2016a. Enhancingthe grain size of organic halide perovskites by sulfonate-carbon nanotube incorporationin high performance perovskite solar cells. Chemical Communications 52: 5674–77.[CrossRef]
Zhang, Yuchao, Hongwei Ji, Wanhong Ma, Chuncheng Chen, Wenjing Song, and Jincai Zhao.2016b. Doping-Promoted Solar Water Oxidation on Hematite Photoanodes. Molecules 21:868. [CrossRef]
Zhang, Yuchao, Shiqi Jiang, Wenjing Song, Peng Zhou, Hongwei Ji, Wanhong Ma,Weichang Hao, Chuncheng Chen, and Jincai Zhao. 2015. Nonmetal P-Doped HematitePhotoanode with Enhanced Electron Mobility and High Water Oxidation Activity. Energyand Environmental Science 8: 1231–36. [CrossRef]
Zhao, Jingjing, Xiaopeng Zheng, Yehao Deng, Tao Li, Yuchuan Shao, Alexei Gruverman,Jeffrey Shield, and Jinsong Huang. 2016a. Is Cu a Stable Electrode Material in HybridPerovskite Solar Cells for a 30-Year Lifetime? Energy and Environmental Science 9: 3650–56.[CrossRef]
Zhao, Lianfeng, Ross A. Kerner, Zhengguo Xiao, Yunhui Lisa, Kyung Min Lee, Jeffrey Schwartz,Barry P. Rand, and Barry P. Rand. 2016b. Redox Chemistry Dominates theDegradation and Decomposition of Metal Halide Perovskite Optoelectronic DevicesRedox Chemistry Dominates the Degradation and Decomposition of Metal HalidePerovskite Optoelectronic Devices. ACS Energy Letters 1: 595–602. [CrossRef]
Zhao, Yi Cheng, Wen Ke Zhou, Xu Zhou, Kai Hui Liu, Da Peng Yu, and Qing Zhao. 2017.Quantification of Light-Enhanced Ionic Transport in Lead Iodide Perovskite Thin Filmsand Its Solar Cell Applications. Light: Science and Applications 6: e16243. [CrossRef][PubMed]
Zheng, Haiying, Guozhen Liu, Liangzheng Zhu, Jiajiu Ye, Xuhui Zhang, Ahmed Alsaedi,Tasawar Hayat, Xu Pan, and Songyuan Dai. 2018. The Effect of Hydrophobicity ofAmmonium Salts on Stability of Quasi-2D Perovskite Materials in Moist Condition.Advanced Energy Materials 8: 1–8. [CrossRef]
Zheng, Kaibo, and Tönu Pullerits. 2019. Two Dimensions Are Better for Perovskites. Journal ofPhysical Chemistry Letters 10: 5881–85. [CrossRef]
171

Zheng, Xiaopeng, Joel Troughton, Nicola Gasparini, Yuanbao Lin, Mingyang Wei, Yi Hou,Jiakai Liu, Kepeng Song, Zhaolai Chen, Chen Yang, and et al. 2019. Quantum DotsSupply Bulk- and Surface-Passivation Agents for Efficient and Stable Perovskite SolarCells. Joule 3: 1963–76. [CrossRef]
© 2022 by the authors. Licensee MDPI, Basel, Switzerland. This article is an openaccess article distributed under the terms and conditions of the Creative CommonsAttribution (CC BY) license (http://creativecommons.org/licenses/by/4.0/).
172

Advanced Energy Management Systems andDemand-Side Measures for Buildingstowards the Decarbonisation of Our Society
Fabiano Pallonetto
1. Introduction
The synchronised power system is one of the top human engineeringachievements of the twentieth century (Almassalkhi and Hiskens 2015). Throughoutthe early part of the twentieth century, the number of electrified cities increased,leading to a connected system identified as the synchronised power grid(Hughes 1993). Since then, the power system has evolved, presenting new hurdlesfor system operators, both at transmission (TSO) and distribution (DNO) level.Environmental impact, increased penetration of renewable energies, the continuedgrowth in demand, and the uncertainty of fuel reserves are just a tiny part of aset of new challenges that the power systems research community is addressing(Nolan and O’Malley 2015). Grid reinforcement can be part of the solution tothese challenges; however, it is costly and does not always improve the system’srobustness. Recent blackouts in Germany, Texas and Italy caused by a dominoeffect of small evaluation mistakes are the empirical evidence of a more significantresearch problem (Boemer et al. 2011; Gimon and Fellow 2021). Assessing theseissues requires complex modelling and extensive computational capabilities and canlead to counterintuitive results.
In 2012, researchers at the Max Planck Institute for Dynamics and SelfOrganisation in Göttingen, discovered that the power grid is affected by Braess’paradox. This phenomenon was discovered by the German mathematicianDietrich Braess in 1968 while undertaking studies on road network models(Pas and Principio 1997). The definition of the paradox as stated in Braess (1968,p. 1) is as follows:
“For each point of a road network, let there be given the number of carsstarting from it and the destination of the cars. Under these conditions,one wishes to estimate the distribution of traffic flow. Whether one streetis preferable to another depends not only on the quality of the road butalso on the density of the flow. If every driver takes the path that looks
173

most favourable to him, the resultant running times need not be minimal.Furthermore, it is indicated by an example that an extension of the roadnetwork may cause a redistribution of the traffic that results in longerindividual running times.”
The same principle applies to the power grid, where adding one or morelinks to the power grid could degrade the overall efficiency of the system(Witthaut and Timme 2012). The increasing energy demand, environmental concernsand the installation of interconnected Renewable Energy Systems (RES) addto the underlying complexity of the problem. RESs are associated with lowcarbon emissions; however, for the general public, the threats caused by theirintermittent nature are underrated and not well understood (Vargas et al. 2015).Despite these technical challenges, post-Kyoto regulations endorsed by theEuropean Union have established the target of full decarbonisation by 2050(International Energy Agency 2016).
Historically, system operators owned most of the system, and they plannedthe generation mix a day-ahead while tuning the daily electricity productionto compensate for unplanned generator outages or unexpected load oscillations.High penetration of renewable energy increases the complexity of this process toan unexplored level (Bozalakov et al. 2014). Furthermore, the increasing electricityconsumption caused by a larger adoption of low-carbon technologies in end-usesectors represents another influencing factor on the demand side of the network. Theincreasing percentage of electric vehicles and heat pumps can strain the networkcapacity and ultimately lead to blackouts (Veldman et al. 2011).
Extending the control to the demand-side of the system can become part of thesolution (Cecati et al. 2011; Fuller et al. 2011; McKenna and Keane 2016; Nolan andO’Malley 2015; Torriti et al. 2010). The adaptability of demand is not new to thedynamics of the power grid infrastructure. These measures have been promoted invarious countries across the world to clip winter or summer peaks and defer gridreinforcement (Paterakis et al. 2017).
Following these measures, power grids have gradually adapted to the increaseddemand and are adopting a higher percentage of new renewable energy generatorssuch as photovoltaics and wind turbines. System operators did not embrace thepenetration of RES until it started to affect the supply/demand balance of the wholesystem, altering the system frequency beyond safety thresholds (Ulbig et al. 2014). Atthat point, system operators had to take into account not only the unscheduledload demand but also the variability of power generation caused by weatherconditions (Bozalakov et al. 2014). These open challenges cannot be addressed
174

within the boundaries of the existing power system (Farhangi 2010). The integrationof information technology, communications, and circuit infrastructure could lead todisruptive technological innovations for the integration of higher penetration of RES,increasing assets efficiency and reducing overall carbon emissions (Yan et al. 2013).
In this chapter, relevant research on the topic of the built environment, DemandResponse (DR) and optimisation algorithms for DR are critically reviewed, and thekey results and advancements in the area are contextualised. Section 2 assesses theimpact of buildings on the energy system while Section 3 introduces the concept ofdemand-side management and DR, assessing the advantages and disadvantagesof automatic versus manual DR. Section 4 assesses how an energy managementsystems (EMS) can be used to implement demand response strategies. Section 4.1examines the idea of home area network (HAN) or local area network (LAN)and how technological innovation. is changing the interaction between users andbuildings. This part discusses the effect of technological advancements in developinginterconnected appliances and communication protocols. It also focuses on thedefinition and characterisation of EMS in a smart-grid scenario. This section disclosesseveral research gaps on the communication infrastructure between buildings andthe power grid. In this part, an extensive analysis of optimisation algorithmsfor DR is presented. Section 5 analyses how advanced controllers can foster thetransition to a lower-carbon economy, reducing the energy costs and facilitatingthe integration of renewable in the system. In Section 6, an overall contribution ofbuildings towards the full decarbonisation is analysed. The chapter concludes withSection 7 by identifying a path towards the decarbonisation of our society throughadvanced energy management systems.
2. Buildings as a Fundamental Asset for the Decarbonisation
Generally, the building stock can be divided into residential and commercialbuildings. Census data or building surveys can be used to collect relevant informationto characterise the building stock at the country level (Mata et al. 2014). In recentyears, building energy certificates and other geographical information systems haveenriched existing databases and increased data accuracy (Võsa et al. 2021). Moreover,some European and national projects have compiled available information for acountry or group of countries or new methodologies to certify energy rating forbuildings such as Active Building Research Programme (2013); ePANACEA (2020);Episcope EU (2013); U-CERT (2019).
The built environment accounts at least for 40% of the total electricityconsumption (Pérez-Lombard et al. 2008). Seasonal peaks are caused by increased
175

lighting, cooling or heating demands, and such profiles are also peakingwholesale electricity prices and reduced reliability due to tight generation reservemargins. Higher penetration of electric vehicles and heat pumps have causedan increased demand which is being modulated by RES and the smart grid rollout(Arteconi et al. 2013; Smith 2010). In these transitional circumstances, where theglobal target of 2050 is looming closer, the motivations of massively employingdemand response programs using buildings have never been so compelling.
As illustrated in Figure 1, the European Union has a large and old buildingstock that requires retrofitting and upgrading. Despite a significant variation inthe EU members’ built environment, full decarbonisation would not be possiblewithout a massive retrofitting plan across the EU. Furthermore, within the EU, thereis a large variance in the energy consumption required to heat or cool the buildings.Figure 2 illustrates how more than half of the European countries have an averageconsumption per square meter above the average and far from NZEB or passivebuilding standards.
Belgium
0
50M
100M
150M
Mill
ions
of b
uild
ings 200M
250M
5.3
Bulgaria3.9
Czechia4
Denm
ark2.9
Germ
any40.6
Estonia0.6
Ireland1.6
Greece
6.4
Spain24.5
France33.5
Croatia2
Italy31.1
Cyprus0.4
Latvia1
Lithuania1.3
Hungary
4.4
Malta
0.2
Netherlands
7.2
Austria4.4
Poland12.5
Portugal5.9
Romania
8.5
Slovenia0.8
Sweden
4.3
Iceland0.1
Liechtenstein0
Norw
ay2.3
Switzerland
4.1
United Kingdom
27.5
Figure 1. Building older than 15 years old of retrofit potential for Europe. Source:Graphic by author, adapted from Pallonetto et al. (2022).
176

Latvia
Estonia
Belgium
Croatia
Finland
Poland
Czech Republic
Slovenia
Sweden
Luxembourg
Lithuania
Germ
any
France
EU United Kingdom
Italy
Slovakia
Denm
ark
Ireland
Netherlands
Hungary
Bulgaria
Greece
Spain
Average 187.4 kWh/m2
Portugal
Cyprus
Malta
Romania
350
300
Annu
al C
onsu
mpt
ion
in k
Wh/
m2
250
200
150
100
50
0
Figure 2. Average building consumption for square meter across Europe. Source:Graphic by author, data from Eurostat (2020).
Among low carbon technologies worth mentioning for the built environment,there is the heat pump. Heat pumps can reduce the energy consumption of thebuilding and can be installed and used in tandem with renewable energy sourcessuch as photovoltaic systems. Heat pumps deployment can also support the evolutionof the power system and contribute to the high penetration of renewable sourcesthrough end-users participation in demand-response markets. Such a combinationmakes heat pumps more attractive. Such an advanced technology can meet theheat demand of the building while reducing carbon emissions by a factor of three(Boemer et al. 2011; Eriksen et al. 2005; Paterakis et al. 2017). From the power systemperspective, innovations such as building home automation, smart grid rollout, diffusionof intelligent appliances and EMS integration are necessary prerequisites to boostthe efficiency of the power system while increasing the RES penetration to meet theemissions target (European Commission 2010). These features will enable electricityend-users to modulate their electricity consumption by dynamically responding tofluctuations in the power generation caused by RES (Mohsenian-Rad et al. 2010b;Pedersen et al. 2017). End-users can manually or automatically alter their consumptionpatterns via home automation or EMS controllers in a smart built environment. Gridreliability and evolution in the regulations to enable DR in the electricity market are
177

the primary reasons for the intense interest to develop intelligent EMS that can reduceenergy costs and dynamically adapt to grid constraints (Conka et al. 2014; Pereira andda Silva 2017).
3. Demand-Side Measures towards the Full Decarbonisation of Our Society
DR is one of the Demand Side Measures (DSM) measures promoted asa mechanism to increase the percentage of renewable energies in the system (Albadiand El-Saadany 2008). It is defined as “changes in electricity use by demand-sideresources from their normal consumption patterns in response to changes in theprice of electricity or to incentive payments designed to induce lower electricity useat times of high wholesale market prices or when system reliability is jeopardised”(Gils 2014, p. 1).
This measure is being implemented worldwide by various TSOs throughthe remuneration of DR aggregators in the electricity market. In some cases, theaggregators were the TSOs or a related entity. Aggregators can control the energydemand of residential and commercial buildings, representing 40% of the totalprimary energy consumption.
The widespread adoption of DR programs leads to a paradigm shift in how TSOsmanage the grid. Such changes require a bi-directional communication link betweenbuildings and operators occurring with the smart grid rollout (Silva et al. 2012).
3.1. DR Objective and Programs
A DR signal by an aggregator or TSO, triggers the intentional reshape ofthe electricity demand profile. The variation can be measured as the level ofinstantaneous demand or total electricity consumption deferred. DR assets candynamically change the electricity demand curve, providing peak shaving, frequencycontrol, load shifting and forcing measures (Nolan and O’Malley 2015).
DR programs can be classified by financial schemes. DR aggregators canremunerate DR events to end-users with Incentive Based Programs (IBP) or PriceBased Programs (PBP) (Aghamohamadi et al. 2018; Albadi and El-Saadany 2008).The difference between PBP and IBP is that in the latter one, end users get a financialbenefit or a price reduction due to their affiliation to the scheme.
Among IBP programs, there are market-centred schemes. Market-centred DRis for medium size users or demand response aggregators. The schemer requiresmarket access and equipment to connect to the TSOs communication infrastructure.In these cases, the financial benefit for the user is correlated with the flexibility
178

provided. As described in Qdr (2006), the Market-centred DR programs include thefollowing categories:
1. Emergency DR. These incentives are proportional to load reduction duringemergency reserve shortfalls events. When utilised, a demand reduction signalis sent to all large users enrolled.
2. Capacity Market Program. This program is for users who can precisely estimatea determined load reduction when system contingencies happen. The usersinvolved have a day-ahead notice, and if they do not answer, they are penalised.The payment is based on the declared peak load reduction achievable bythe asset.
3. Ancillary Service Program. Operating reserve is bid in terms of curtailmentcapacity. If the bid is accepted after the measure is implemented, customers arepaid the spot market price.
4. Demand Bidding (also called Buyback). In this program, consumers bid theload reduction in the wholesale market, where a bid is accepted if it is less thanthe market price.
In the PBP, the electricity price is directly correlated with the market price(Albadi and El-Saadany 2008). The objective of these schemes is to flatten theelectricity profile to lower peak demand. Typical PBPs may encompass some orall of the following features:
1. Time of Use Tariffs (TOU) tariffs where there are two or more time blocks suchas night, peak and off-peak electricity prices.
2. Critical Peak Price (CPP) is often utilised during high contingencies or higherelectricity usage for a few days or hours or months.
3. Extreme Day Price (EDP) is a specific subset of the CPP program. In this case,the electricity tariff increases during a specific time of the day. During therest of the day, a flat tariff is used. In this case, the DR event is set for one ormore days.
4. Real Time Price (RTP), where the electricity tariff is synchronised to the markettime resolution, which typically changes every hour.
3.1.1. Lessons Learnt from DR Pilot Programs
The development and testing of demand response programs have shownbenefits and challenges yet to be addressed. China started piloting DR programsin 1990, but energy shortages during 2003–2008 reinforced the implementation ofDR pilot projects. Since then, the established DR programs were based on TOU
179

rates, Curtailable/Interruptible loads, the use of off-peak storage devices such asheat storage boilers and ice-storage air conditioners. These programs highlightedchallenges related to human behaviour, absence of competitive electricity markets,customers unawareness of prices and absence of recovery mechanism for usersand utility investments (Tahir et al. 2020). It should be noted that shifting frommanual load-shifting in response to network stress at predictable times of day todynamic programs price- or quantity-based requires additional Information andCommunication Technology (ICT) support. The uncertainties associated with humanbehaviour are the main challenges in the implementation of these programs. TheRealValue project included a test bed of more than 800 households across threedifferent EU nations (Darby et al. 2018). Customers who were used to paying fora service from the power system became prosumers through distributed generation,storage and demand response. As a consequence, the connections across theresources dynamically managed by users and the established actors such as utilitiesrequired innovative ideas and additional user and ICT support to provide a fractionof potential theoretical flexibility estimated (Darby 2020).
Table 1 summarises and compares the experience of different demand responsetrials deployed worldwide and highlights different types of barriers, benefits andtechnology enablers (Lu et al. 2020). The table shows how critical is the useand identification of shiftable/curtailable loads coupled with storage to enablethe deployment of DR programs. Switching to automated direct load control iscomplex and requires a reliable and trustworthy IT infrastructure and data exchangemechanisms. Additional, similar works highlight the importance of user acceptanceand how occupants behaviour is the primary barrier to the success of these programs(Anaya and Pollitt 2021).
180

Table 1. Demand response measures and limitations Legend: X Support it,(X) Partially supported.
Type
ofM
easu
re
Dis
trib
uted
Gen
erat
ion
Shif
tabl
e/C
urta
ilabl
eLo
ad
Stor
age
Com
plex
ity
Sign
alTy
pe
Sign
alVo
lati
lity
Priv
acy
Ris
k
Pric
eR
isk
Hum
anBe
havi
our
Unc
erta
inty
Ris
k
Not
es
TOU pricing (X) X X Low Price Static Low Low High
Distributedgeneration cansupport it if iscontrollable or
synchronise withhigh prices periods
Dynamic pricing (X) X X High Price Dynamic Medium High HighIt requires a complex
IT infrastructure,high risk
Fixed load capping X X X Low Volume Static Low None LowIf hardware
controlled is simpleto deploy
Dynamic load capping X X X High Volume Dynamic Low None HighCan be complex and
the signal can behacked
Direct load control (X) X X High Control Predefined High None Low
Complex and highprivacy risk, high
potential, it requiresdetailed data
Critical Peak Price (X) X X Low Price Static Low None LowSimple but limited
benefits, depends onoccupant behaviour
Extreme Day Price (X) X X Low Price Static Low None LowSimple but limited
benefits, depends onoccupant behaviour
Source: Table by author, data from Lu et al. (2020).
3.1.2. Summary of DR Benefits
Figure 3 shows the correlation between stakeholders and DR schemes. Thebenefit for end-users is typically a reduction in the electricity bill or financialremuneration. On the other side, operators such as TSOs can increase the efficiencyof the market, reducing the volatility and the use of peak generators (Albadi andEl-Saadany 2008). Moreover, from a broad market perspective, DR programs canreduce the electricity price increasing the capacity of the system (Aghamohamadiet al. 2018; Braithwait and Eakin 2002). Such benefits also defer grid reinforcement,reducing the running costs and improving the market efficiency (Paterakis et al. 2017;
181

Qdr 2006). The overall reliability of the grid increases thanks to the use of DR schemesbecause the dynamic demand curtailment reduces the outage and transmission strainsrisks. Furthermore, reducing the contribution of peak generators and reducing thecurtailment operation caused by a surplus of RES generation (EDP Consortium 2016;Hamidi et al. 2009) reduces the carbon emission of the system.
Benefits of Demand Response Programs
Reliability
Redu
ced
Out
rage
s
Cust
omer
Pa
rtic
ipat
ions
Div
ersi
ficat
ion
of re
ssou
rces
Ince
ntiv
ePa
ymen
ts
Bill
savi
ngs
Pric
ere
duct
ion
Capa
city
incr
ease
Redu
ced
Out
rage
s
Redu
ced
Out
rage
s
Redu
ced
Out
rage
s
Redu
ced
Out
rage
s
Participant Market Wide MarketPerformance
Figure 3. Overview of demand response schemes for different stakeholders andfrom the market perspective. Source: Graphic by author, data from Qdr (2006).
3.1.3. DR Operational Challenges
DR programs can also be classified by the level of automation. Manual DRmeasures rely on human actions to reduce or increase loads or alter the demandprofile. For semi-automated DR measures, the user controls a digital system to triggera demand response action. When using automated DR strategies, an external signaloperates a programmed method and consequently does no human intervention isrequired. However, in this case, users must always be able to override the system(Piette et al. 2006; Rothleder and Loutan 2017).
Within the many challenges to DR schemes, a key factor is the availability ofreliable resources. In some cases the system cannot respond to the DR signal; thereforecapturing the available flexibility and capacity of the resources using flexibility metricsand metering equipment is a fundamental requirement to implement such programs.Additionally, the stochastic consumer behaviour could reduce the benefit of DRschemes if not considered. The high variability of the DR resources could be smoothedby aggregation. In fact, in Nolan and O’Malley (2015), when stochastic behaviour is
182

accounted for, the aggregation of few thousand households represents a stable DRasset. Hence, the domestic sector electricity demand has the potential to provideservices such as spinning reserves, frequency controls and Short Term OperatingReserve (STOR). In the building sector, STOR can be exploited using automation orincreasing the energy awareness of the occupants.
4. The Role of Advanced Energy Management Systems
The smart grid is the next generation of the power system that enables atwo-way communication channel from the end-user to the TSO, with the objectiveof monitoring and controlling end-user electricity demand in a power system withhigh RES penetration (Farhangi 2010).
The employment of smart grid technologies will support European countriesto reach their CO2 emissions reduction target and renewable generation increase(European Union 2017). In particular, the EU climate-neutral goal by 2050 isambitious; increase penetration of RES to meet annual maximum generation. Toreach the target, RES generators with their variable and uncertain electricity supplyhave been connected to the grid, thus increasing the operational challenges for systemoperators. The increasing wind and solar penetration impose significant technicaldifficulties such as large frequency variations, which require strict voltage control.These requirements have led to the utilisation of the smart grid for automatic DRprojects in commercial, industrial and residential buildings (O’Sullivan et al. 2014).
Automatic DR control of heating, cooling and light systems requires the presenceof one or more interconnected sensors and one or more corresponding controllerdevices. The sensors are usually connected to the cloud with a HAN or LAN. ADR controller device, called EMS, can read the sensor data and reshape the energydemand of the building according to a price or an interrupt signal from a TSO. Someof the systems are defined as intelligent. In this context, an intelligent appliance,algorithm or control indicates a system that uses various artificial intelligencecomputing approaches like neural networks, Bayesian network or optimisationtechniques (Antsaklis and Passino 1993).
4.1. HAN/LAN, Definition and Developments
A HAN is a dedicated data network infrastructure within buildings built fordata transfer and device communication. In the late 1990s, HANs became the emerginggateway to connect devices to the Internet. The availability of Internet access in buildingshas boosted the diffusion of HAN systems since the early 2000s (Clements et al. 2011).
183

The de facto standard for the first period of HAN development was the Ethernet and802.11 Wi-Fi standard (Huq and Islam 2010).
In the coming decades, the rate of diffusion of HANs across buildings is set toincrease exponentially. In fact, the total number of connected devices is expected toreach 50 billion by 2030 (Ahmed et al. 2016). A good percentage of such devices willexchange sensor data in real-time and require low bandwidth, meaning that thereis less stress on the overall network infrastructure. The phenomenon of connectingany device to the Internet is covered by the all-encompassing phrase the IoT (Ahmedet al. 2016; Atzori et al. 2010).
The use IoT devices connected to the HAN to perform actions that couldreduce carbon emissions or peak power consumption has different requirementsthan the standard use of HAN (Darby 2006). In fact, only a small percentage of HANconnected devices can be classified as smart-grid enabled.
A smart-grid enabled device provides a two-way communication system to utilitycompanies and could be remotely controlled to increase the overall efficiency of thepower grid (Balakrishnan 2012; Bazydło and Werminski 2018). It is necessary withthese devices to have a stable link and low bandwidth allocation (Gungor et al. 2011).The devices affected by these changes include thermostats, HVAC systems, majorappliances, home automation systems, EMS, lighting, gas meters, water meters, andelectricity meters.
In recent years, the increased installation of local renewable energy systemssuch as PV and solar panels has raised additional challenges for the HAN researchcommunity (Liserre et al. 2010). Controlling in real time a RES at the building levelwith smart-grid enabled devices increases the complexity of the problem.
Additionally, inhibitors to the adoption of HAN as part of the smart-gridinfrastructure are categorised in Eustis et al. (2007):
• Energy pricing that provides financial benefits to control energy use moreefficiently and enable consumers to reduce their costs.
• Open, flexible, secure and efficient communication protocol established andaccessible.
• Compliance of the services with consumer choice and privacy; wherein theconsumer, ultimately, is the decision-maker.
Despite a general awareness that an interconnected system can enable utilitiesto more effectively balance energy demands and integrate with renewable energiessystems, the above challenges raise additional questions about the architecture ofHAN, different communication protocols (Huq and Islam 2010) and the strategy andalgorithms that can be implemented by an EMS connected to HANs.
184

4.2. The Architecture of HAN in a Smart Grid Scenario
As previously noted, there is a trade-off between keeping the HAN architecturesimple and efficient versus safeguarding the privacy and security of the users. Ina smart grid scenario, it is essential to guarantee the safety of the network againstcyberattacks that could compromise the entire power grid.
The interconnection between the various devices and the HAN should considerthe bandwidth allocation and the potential vulnerabilities that each device couldexpose. As illustrated in Figure 4, installing a Home Energy Gateway or EMS thatcan separate the smart-grid-enabled devices from other devices could increase thesecurity of the system. This architecture design utilises a connected gateway as ademilitarised zone, enhancing the security of the data transfer and controls. Thepresence of an EMS or smart gateway is also mentioned in Clements et al. (2011),where they draw a clear distinction between the two different layouts.
Energy ManagementSystem
HAN/LAN
Power Line Energy Consumption/Production
Pulse SigbalTCP/IP datagramsMOD BusZigBee
Allocate energy to appliances/HCAV systemsSwitch On/Off Increase Temp of Hot WaterThermal mass exploitation
API Interface
Weather forecast
Elec
tric
ity
Pric
e/Si
gnal
Cloud
DataRepository
BUS
Figure 4. Overview of connected devices and local renewable energies systems to aHAN infrastructure via a home energy gateway devices. Source: Adapted fromPallonetto et al. (2021).
185

The layout in Figure 5 assumes the presence of a dedicated network with theTSO connected to the appliances. In this example, the home gateway is a proprietarystand-alone device. This layout keeps the data transmission physically separatedthrough a virtual private network. The main advantage of this configuration isthe increased data security and reliability. The dedicated network can also providea minimum band allocation to ensure a sufficient data throughput. The maindisadvantage of this layout is the high infrastructural cost. Hybrid designs requireless network infrastructure because the appliances are connected to the utility using ashared network such as the Internet. In this scenario, the band allocation may representa challenge, and several security risks have been identified (Huq and Islam 2010).
UtilityNetworkInternet
Utility or DR aggregatpr
Internetgateway
Utilitygateway
Control System
Water heater Appliances HCAV EV
Settings customer’s preferences
Third party Consumer Utility
Figure 5. Overview of HAN infrastructure on a dedicated network. Source: Graphicby author, data from Pedreiras et al. (2002).
In contrast, in rural areas which lack sufficient network infrastructure, thelayout in Figure 6 represents the only viable solution for data exchange between theHAN and TSO. Different communication protocols can also affect the layout of theinterconnection between appliances and EMS or between the EMS and TSO. Thefollowing section examines the required band allocation, common communicationprotocols and their characteristics.
186

UtilityNetworkInternet
Utility or DR aggregatpr
LAN / HAN Gateway
Premises edge
Internetgateway
Utilitygateway
Control SystemWater heater Appliances HCAV EV
Settings customer’s preferences
Third party Consumer Utility
Figure 6. Overview of HAN infrastructure on a shared network. Source: Graphicby author, data from Pedreiras et al. (2002).
4.3. Communication Protocols for HAN
Communication protocols are used for data transmission between sensors andthe HAN. During the last decade, various attempts at protocol standardisation havebeen made, each with limited success (Eustis et al. 2007). Different protocols can becategorised into three broad categories: new wires, no new wires and wireless, asillustrated in Table 2.
187
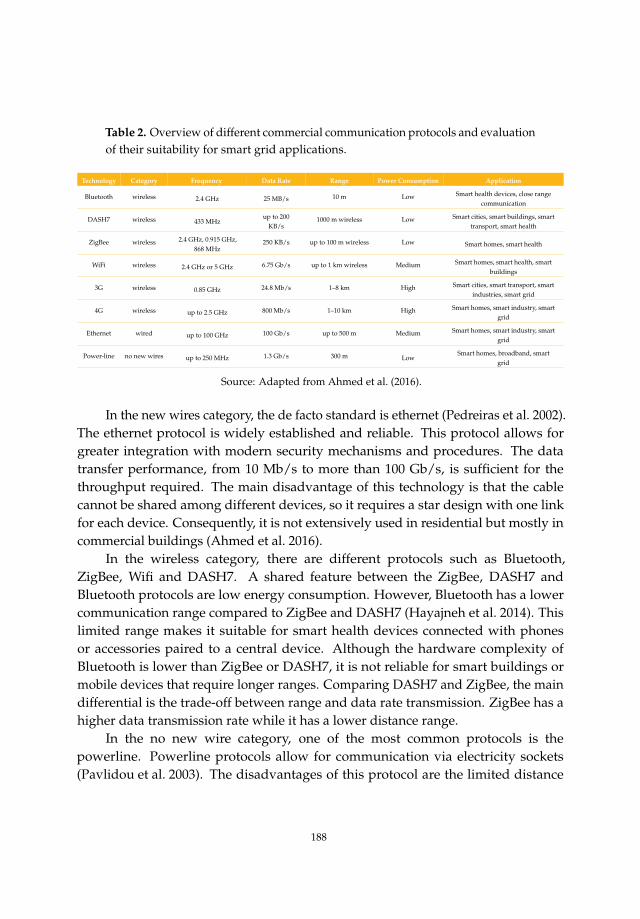
Table 2. Overview of different commercial communication protocols and evaluationof their suitability for smart grid applications.
Technology Category Frequency Data Rate Range Power Consumption Application
Bluetooth wireless 2.4 GHz 25 MB/s 10 m Low Smart health devices, close rangecommunication
DASH7 wireless 433 MHzup to 200
KB/s1000 m wireless Low Smart cities, smart buildings, smart
transport, smart health
ZigBee wireless 2.4 GHz, 0.915 GHz,868 MHz
250 KB/s up to 100 m wireless Low Smart homes, smart health
WiFi wireless 2.4 GHz or 5 GHz 6.75 Gb/s up to 1 km wireless Medium Smart homes, smart health, smartbuildings
3G wireless 0.85 GHz 24.8 Mb/s 1–8 km High Smart cities, smart transport, smartindustries, smart grid
4G wireless up to 2.5 GHz 800 Mb/s 1–10 km High Smart homes, smart industry, smartgrid
Ethernet wired up to 100 GHz 100 Gb/s up to 500 m Medium Smart homes, smart industry, smartgrid
Power-line no new wires up to 250 MHz 1.3 Gb/s 300 m LowSmart homes, broadband, smart
grid
Source: Adapted from Ahmed et al. (2016).
In the new wires category, the de facto standard is ethernet (Pedreiras et al. 2002).The ethernet protocol is widely established and reliable. This protocol allows forgreater integration with modern security mechanisms and procedures. The datatransfer performance, from 10 Mb/s to more than 100 Gb/s, is sufficient for thethroughput required. The main disadvantage of this technology is that the cablecannot be shared among different devices, so it requires a star design with one linkfor each device. Consequently, it is not extensively used in residential but mostly incommercial buildings (Ahmed et al. 2016).
In the wireless category, there are different protocols such as Bluetooth,ZigBee, Wifi and DASH7. A shared feature between the ZigBee, DASH7 andBluetooth protocols are low energy consumption. However, Bluetooth has a lowercommunication range compared to ZigBee and DASH7 (Hayajneh et al. 2014). Thislimited range makes it suitable for smart health devices connected with phonesor accessories paired to a central device. Although the hardware complexity ofBluetooth is lower than ZigBee or DASH7, it is not reliable for smart buildings ormobile devices that require longer ranges. Comparing DASH7 and ZigBee, the maindifferential is the trade-off between range and data rate transmission. ZigBee has ahigher data transmission rate while it has a lower distance range.
In the no new wire category, one of the most common protocols is thepowerline. Powerline protocols allow for communication via electricity sockets(Pavlidou et al. 2003). The disadvantages of this protocol are the limited distance
188

range and the interference in the power supply, which can lead to fluctuations in thequality of the communication.
4.4. Overview of EMS Features and Objectives
During the last few years, the research and development on EMS haveincreased (Beaudin and Zareipour 2015). An EMS can be defined as a group oftechnologies used to manage the energy profile of a building, reducing the overallenergy expenditure. Among these technologies, it is possible to include sensors,smart thermostats, electronic displays and smartphone apps that increase energyconsumption awareness and offer remote or automatic control.
As suggested by Aman et al. (2013), an EMS should exhibit the followingcharacteristics:
1. Monitor the energy consumption. The system provides energy consumptioninformation at various time resolutions.
2. Disaggregation of the energy consumption. End-users can benefit frominformation about the real-time impact of appliances over a period of time.
3. Data availability and accessibility. The system makes the information availableto the end-user via an interface. The interface is deployed as a physical deviceor through a web or mobile portal.
4. Appliances control. The EMS should provide programmable, remote andautomatic control of devices
5. Data Integration. Integration of different types of information such as indoortemperature, humidity, acoustics, and light; and consumer historical data.
6. Ensuring cyber-security and data privacy. The system must restrictunauthorised access to third parties.
7. Intelligent controls and insights of data analytics. A requirement is totrigger smart actions that optimise energy consumption, maintainingconsumer comfort.
As Paradiso et al. (2011) highlighted, EMS should perform intelligent actionsthat balance energy consumption and comfort. Specific algorithm techniques such asmachine learning, data analysis or predictive control can be used. From the powersystem perspective, an EMS must be used more extensively for DR or to draw upa house profile o target energy improvement measures.
In Table 3, several studies have been examined based on some of featuressuggested by Aman et al. (2013) and Paradiso et al. (2011). All the EMSs have energymonitoring capabilities, and five have data disaggregation capabilities. The featureabsent in the studies was the possibility to control load using intelligent algorithms.
189

In general, consumers are not aware of how an electrical system inside the buildingworks, and, due to a low electricity price, they are not motivated to use their time tomake energy-related decisions (Bartram et al. 2010). Therefore, to reach the objectiveof the EMS, the algorithm must perform intelligent actions to balance consumercomfort and energy consumption. Moreover, in a DR scenario, a smart EMS canadjust the power consumption to reduce the cost by exploiting the price signals, suchas RTP, CPP or TOU. The action reduces the responsibility of the consumer to controland manipulate all their appliances all the time, while also providing flexibility tothe power system for the integration of RES. The load controllability and the use ofintelligent algorithms represent a research gap in the current literature that shouldbe addressed.
Table 3. Features and characteristics of EMS technologies.
EvaluationCriteria
Metering andAnalytics
Dis-Aggregation Availability Interoperability Scalability Actuators Cybersecurity Smart Controlsand Intelligence
Totu (Totu et al.2013)
Yes No Not discussedYes for large scale
infrastructuresYes Yes No Yes advanced
algorithms
PERSON (Yangand Li 2010)
Yes (API) Yes
Decentralised atuser premise; noweb or mobile
interface
Not discussed
High scalabilityLow cost and low
powerconsumption
Manual remotecontrol of theswitches and
dimmers in thehome.
NoContext-aware
intelligentalgorithm
Bess(Mahfuz-Ur-Rahman
et al. 2021)
Yes No Not available Yes Not available Yes No Yes, smart AIcontrol
WattDepot(Brewer and
Johnson 2010)
Yes No Web basedinterface
NoOpen source;
freely availablenot scalable as it is
No Limited No
Viridiskope (Kimet al. 2009)
Yes (discontinued) Yes Not discussed No API present
Requires indirectsensors; no inline
installationrequires
No No No
Mobile feedback(Weiss et al. 2009)
Yes YesInteractive; readilyavailable feedback
on smartphoneNot discussed
Low scalabilitybecause of the
mobile app
No No No
DEHEMS (Liuet al. 2013)
Yes YesWeb based UI,
real-time displayunit
No API butpossibility to haveintegrated sensors,electric supply, gas
supply line
Medium, itrequires thirdparty sensors
No No No
EnergyWiz(Petkov and Foth
2011)
Yes No Mobile phone app
Integratedhistorical usage
and user info frompeers
Requires mobileapp installation
No No No
Nobel(Karnouskos 2011)
Yes Yes Mobile phone app No
Low, requiresmobile app
installation andsensor integration
not present
No No
Yes, smartalgorithm but
requires humaninteraction
Simapi (Pallonettoet al. 2021)
Yes No Web and mobileapp
APIYes, highscalability
Yes No Yes
Alis (Rodgers andBartram 2010)
Yes No Web, smart phoneapp, touch panel
Integrated API,based on
community usage
No, requiresextensive
installation; lessaffordable
Yes (limited) No No
Source: Adapted from Aman et al. (2013).
190

4.5. EMS in Smart and Active Buildings
As illustrated in Figure 7, one of the key features of the smart grid is to enhancethe communication capabilities between building systems and the power grid. Suchcommunication includes a network infrastructure inside buildings that could monitorand control the electric systems connected to the HAN.
Home Area Network
Energy Gateway
Utilities
Distributed Energy Resources
Metering
Aggregators
Generation
Renewables and Storage
Power Generation, Transmission, Monitoringand Control
System control for monitoring and control
Monitoring and control systems• MPC8XXX• QorlQ
Aggregator or Data Concentrator
Sends collected data (or commands) between the utility and the NAN or HAN
Data concentrator• MPC8308• l.MX28• P102x
Neighbour Area Network
Wired/wireless connection from meter to utility either directly or via data aggregator
NAN :• G3 OFDM PLC on metering comms• MC12311• Metering Comms SoC
Metrology
Hardware that measure and controls flow of energy to/from building
Low end meter :• 8-bit MCU• 9S08LL/LH/AC
• Smart Single- and Three- phase Meters 32-bit MCU• MK30• MCF51EM256
Home area network
Wireless/wired for load control and dynamic response by utilities Load control : meter communicate with appliances water heater, pool pumps, electric hybrids vehicles
Demand Response : send price/volume signals to users for load shifting and smart consumptionEnergy Gateway/Manager : inteface with smart objects in home to monito control energy
Grid Power ProtectionRelay/Switch Control and Monitoring
Grid power supervision, control and network protection system solutions, protection system solutions, protective relays and controls switches for the power grid
Power protection• MSC9130Relay/Switch control• 8-bit MCU• 32-bit Coldfire• 32-bit Kinetis
Distribution
Solar Panels Wind Batteries
Co-generatorThermal storage
EV chargers Generators
Fuel cellsHydro electric
Figure 7. Example of a HAN/LAN and EMS communication in a smart grid context.Source: Adapted from Balakrishnan (2012).
Alam et al. (2012) define a smart dwelling as the end node of the smart grid thatprovides services in ambient intelligence, remote home control or home automation.Furthermore, each dwelling or node of the smart grid has the possibility to broadcastinformation about its electricity consumption profile and status. In a smart house,the EMS adapts the house energy consumption to the overall grid requirementswithout affecting the comfort of the occupants. However, to provide flexibility tothe grid and reduce carbon emissions, buildings require communication capabilities(smart buildings) and advanced energy features. Therefore, in the last few years,researchers have pushed for a standardisation effort to formally define and categorisebuildings with the capability of being integrated into the power system as active
191

buildings. An active building is a building that can generate, store and modulateenergy to adapt to their own demand or to the needs of the local grid (Fosas et al.2021). The massive deployment of EMS in active and smart buildings could boostthe decarbonisation both at the end-user and system level.
5. Control Algorithms for Implementing Demand Response in EMS
An EMS is defined as a system that can access information on energyconsumption and generation at the building level and can implement DR measuresto control heating and cooling systems, appliances or other devices connectedto optimise the power usage and respond to grid signals. As illustrated inPallonetto et al. (2020), the EMS in a DR scheme aims to different objectives:
• Reducing the overall energy consumption by increasing awareness providingdata analytics and decomposition of energy use. Additionally, the EMS cancontrol systems and appliances i.e., operating an HP at maximum COP, oroptimising the inverter efficiency in a PV system with an MPPT algorithm.
• Shifting energy demand. Reducing peak consumption by exploiting TES orelectric storage is a common DR measure. A signal can also trigger the measureand so that the control can shift the load to off-peak hours.
• Forcing loads. Forcing the use of high-load systems can be facilitated by storageand can be triggered by a DR signal during high penetration of RES in thesystem or locally generated electricity/energy.
The consumption reduction method is implementable in many different ways,whereas, the implementations for shifting and forcing is challenging. The main issueis the lack of standard flexibility metrics and the slow adoption of domotics systems.Additionally, time-dependent electricity tariffs provided by utilities or the marketare not necessarily aligned to end-user demand profiles, hence storage is required toimplement DR measures (Gottwalt et al. 2017).
Encoding a smart algorithm in the EMS can potentially minimise the overallenergy consumption and cost while ensuring the expected service level andthermal comfort.
Optimisation Problems and Solution Methods
The use of control algorithms for building management systems is a recurrenttheme in the literature. (Gatsis and Giannakis 2011b; Mariano-Hernández et al. 2021;McKenna and Keane 2016; Yoon et al. 2014). The control algorithms are characterisedby a specific objective function and a set of constraints. In a DR program, the objective
192

function aims to cost or energy minimisation or welfare maximisation. Welfare is definedas the utility profit minus the generation cost and system losses (Dong et al. 2012).
As described in Pallonetto et al. (2020), Table 4 summarised an extensiveliterature on DR optimisation algorithms. Optimisation methods are reported onthe columns while rows indicate the objective functions. The control algorithmsassessed in this table have been tested to enable buildings to participate in DRprograms. Nevertheless, other perspectives for intelligent EMS can include themarket, the distribution grid and the buildings. Thus, 4 of the 38 papers assessed (3L,7U, 20W, 36B) embed multiple optimisation strategies, such as mixed linear integer,continuous integer and quadratic programming, to reduce power flow overloadscaused by variable renewable energy generation or load variations. In 7U and 36B,the EMS use electric storage to provide flexibility to the power system. The paper20W illustrates a distributed algorithm with a minimal communication overhead.The system force loading in proportion to high uncertainty loads or generationsuch as renewable. The paper 3L include specialised constraints for balancing thedistribution network. These two papers, despite the different approaches, top-downand bottom-up, respectively, aim to maximise the welfare in a smart grid system.One of the limitations of the control systems analysed is that none of these papersprovides a comparable optimal solution.
Table 4. Optimisation problems and solution methods in for DR in the literature(see Table 5 for legend).
ObjectiveFunction
OptimisationMethod
LinearInteger
Programm
ing
Mixed
IntegerProgram
ming
Mixed
IntegerLinear
Programm
ing
Mixed
IntegerN
on-LinearProgram
ming
Mixed
Discrete/C
ontinuousProgram
ming
Convex
Optim
isationProblem
Non
Convex
Optim
isationProblem
Non
LinearProgram
ming
Heuristics
ParticleSw
armO
ptimisation
BinaryParticalSw
armO
ptimisation
StochasticO
ptimisation
Markov
Decision
Problem
RobustO
ptimisation
Other
Methods
Gam
eTheory
Min. Cost23U38U
1U 22B 24B 36U 13Y21D28E35U
14U13B
14U 15F31T32T33T
28A
Min. Consumption 29Q 7U 22T9B
8B 19U23U
26U 16B 11U 26U 34T 23U
Max. Welfare 25B 3L 2U18U
10M 8E8O
24O6U
Min. Cost andMin. Consumption
30T 27B 39U 4U17B
5U
Max. WelfareMin. Consumption
20W12A37U
Source: Reused from Pallonetto et al. (2020).
193

Table 5. Legend for Table 4.
Position Reference Reference Algorithm
1 Behrangrad et al. (2010) A Interior point method
2 Cao et al. (2012) B Commercial software
3 Cecati et al. (2011) C Multiple-looping algorithm
4 Chang et al. (2012) D Evolutionary algorithm
5 Chen et al. (2011) E Greedy search algorithm
6 Chen et al. (2012) F Lyapunov optimisation technique
7 Choi et al. (2011) G Relaxed convex programming
8 Cui et al. (2012) H Simulated annealing
9 Zhang et al. (2011) I Lagrange–Newton method
10 Doostizadeh and Ghasemi (2012) L Sequential Quadratic Programming
11 Ferreira et al. (2012) M Benders decomposition
12 Gatsis and Giannakis (2011a) N Q-Learning algorithm
13 Gatsis and Giannakis (2011b) O Filling method
14 Gudi et al. (2012) P Co-Evolutionary PSO algorithm
15 Guo et al. (2012) Q Branch and bound method
16 Jiang and Fei (2011) R Parallel distribution computation
17 Hedegaard et al. (2017) S Signaled particle swarm optimisation
18 Alibabaei et al. (2016) T MPC (Model Predictive Control)
19 Joe-Wong et al. (2012) U Author’s software
20 Kallitsis et al. (2012) V Distributed subgradient algorithm
21 Logenthiran et al. (2012) W Iterative decentralised algorithm
22 Mohsenian-Rad et al. (2010a) Y Lagrangian dual algorithm
23 Molderink et al. (2009)
24 Soares et al. (2011)
25 Sortomme and El-Sharkawi (2012)
26 Totu et al. (2013)
27 Wang et al. (2012)
28 Xiao et al. (2010)
194

Table 5. Cont.
Position Reference Reference Algorithm
29 Zhu et al. (2012)
30 Yoon et al. (2014)
31 Ma et al. (2011)
32 Cole et al. (2014)
33 Bianchini et al. (2016)
34 Kircher and Zhang (2015)
35 Schibuola et al. (2015)
36 Knudsen and Petersen (2016)
37 Park et al. (2017)
38 Alimohammadisagvand et al. (2016)
39 Pallonetto et al. (2019)
Furthermore, the analysis elicits a trade-off between optimisation at a singlebuilding and power grid level. It is a requirement for a smart grid DR algorithmto ensure the optimisation of the resources at an isolated building level whilecontributing to the power grid stability and reduction of the environmental impactvia two-way communication to aggregators or TSOs.
This double aim can be reached if the optimisation algorithm objective functionminimises both cost and consumption. As also demonstrated (Cole et al. 2014;Hedegaard et al. 2017) (32T, 17T), in the case of merely cost minimisation, the energyconsumption and associated emissions can increase.
As illustrated in Figure 9, the majority of the optimisation algorithms whichwere analysed have a single objective function that minimises costs. Nevertheless,various studies used a double objective function (4U, 5U, 27B, 30T). In this category,different techniques were utilised such as heuristics, analytical solutions and gametheory. Only the heuristic controller (30T) was able to reduce the consumption by
195

9.2% and the costs by 14.4%, using a threshold limit to operate the controllable loadsunder RTP prices.
0
Min Cost
Number of research papers
Min. Cost and Emissions
Min. Cost and Consumption
Min. Cost
Min. Consumption
Max. Welfare and Min. Consumption
Max. Welfare
5 10 15 20
Figure 8. Classification of the most common algorithm objective functions in theliterature. Source: Graphic by author, data from Pallonetto et al. (2020).
Two works (4U, 5U) used a cluster of residential buildings (10 and 60,respectively) to assess the results of the algorithm. When tested on the test loadprofiles, 5U showed a demand reduction of 13.5% and cost savings of 3.6%, while4U used a randomly generated problem, and the approach cannot be compared withequivalent works. The remaining two works (27B, 30T) utilised a model of a singlebuilding to assess the benefits of the double objective function algorithm. Wang et al.(2012) (27B) reached an overall cost savings of 9% and a load reduction of 6%.
Although these results were significant, the MPC approach outperformedthe others. Among the literature examined which aimed to minimise the cost ofthe energy expenditure, the MPC systems (17T, 18T, 31T, 32T, 33T, 38U) reachedsavings up to 28%. Above all, the papers analysed used a white box model such asEnergyPlus. The literature includes both residential (17T, 18T, 31T, 32T, 38U) andcommercial buildings (33T). The predictive models used for the forecast were linearmodels (38U), autoregressive statistical models (31T, 33T), reduced-order model (32T)or grey-box model (17T) while other used machine learning algorithms (39U). Itshould be also noted that none of the MPC systems used a white box as a predictivemodel but as a testbed.
196

In Knudsen and Petersen (2016) (38U), the authors developed an MPC withtwo objective functions (emissions and electricity price). The MPC was a state-spacemodel which is similar to a reduced-order model (Dehkordi and Candanedo 2016).Such an EMS reduced the carbon footprint by 5 to 10 per cent.
Moreover, as illustrated in Figure 10, of all the works analysed, the majorityof them was tested on a single residential building. However, none of the papersmentioned any calibration of the building model despite, as illustrated in Figure 8,the majority of the works used a BES model for testing.
0
Aggregated
Distribution level
Single residential
Market level
Single commercial
Number of papers5 10 15
Figure 9. Classification of testing methodology in the literature. Source: Graphicby author, data from Pallonetto et al. (2020).
0
Matlab or similar
IDA ICE
EnergyPlus + BCVTB + Matlab
EnergyPlus
TRSNSYS + Matlab
Number of papers5 10 15 20
Figure 10. Software platform utilised for control algorithm. Source: Graphic byauthor, data from Pallonetto et al. (2020).
197

Figure 11 shows that the RTP price was used in the majority of the assessments.The RTP price is proportional to the market price but requires a fully automated EMSand could incur in low acceptance among end-users. Moreover, using RTP price, theassessment of control algorithms is more complex from considering the electricityprofile perspective.
0
Others
RTP
Day-ahead
TOU
Number of research papers
5 10 15 20
Figure 11. Most common electricity price schemes for algorithm testing. Source:Graphic by author, data from Pallonetto et al. (2020).
6. A Path towards the Full Decarbonisation
In the past decade, the distinction between energy efficiency measures andDR has become less stratified (Goldman et al. 2010). High penetration of variableRES generation and storage has widened the use of DR beyond peak hours to beapplicable throughout the day (Calvillo et al. 2017; Jiang and Low 2011). From anend-user perspective, energy efficiency measures have been enhanced by controllingtechnologies in buildings (EDP Consortium 2016) that allow the exploitation ofthermal storage and local renewable energy system as dynamic controllable load.
The effectiveness of full decarbonisation of our building stock using advancedenergy management systems is dependable on energy efficiency regulations andpolicies that generally target the national building stock from an isolated (or single)building point of view. The building retrofit measures are designed to reduce energyconsumption by deploying energy-efficient and low-carbon building technologies asillustrated by the IEA (2013) roadmap towards 2050. These methodologies do not takeinto account that the building, as a responsive leaf element of a smart grid system,could dynamically provide flexibility, both at distribution and transmission level,exploiting thermal and electric storage as well as deferrable loads within end-userthermal comfort constraints. Therefore, there is a need to deploy a more holistic
198

approach to designing energy efficiency regulations that recognise the building asa dynamic energy asset. The implications of evaluating deferrable loads, storageand end-user comfort and constraints, can provide a comprehensive assessment ofthe impact of these new technologies and the influence of human behaviour on theenergy profiles of residential buildings.
Additionally, the assessment of a DR resource must be calculated based onthe quantity of energy that could be altered compared to a baseline use. Theidentification of a baseline and the quantification of the flexibility as a deviation froma baseline consumption are still open challenges in the research community (Jazaeriet al. 2016; Mathieu et al. 2011; Wijaya et al. 2014). The temporal quantificationof available DR resources is a critical research need to enable DR at a householdlevel (Gils 2014; Herter et al. 2007; Hurtado et al. 2017; McKenna and Keane2016). The use of high-resolution simulation models defined as digital twins forcommercial and residential buildings, embedding occupancy, consumer behaviourprofiles and comfort constraints, is a new research frontier that could lead to a betterunderstanding of the benefit of DR measures and the impact of large scale trials onthe power system.
From an integration perspective, the implementation process of controlalgorithms that ensure occupant thermal comfort while increasing the energyflexibility of the system by providing DR capabilities is a critical research needfor the smart grid rollout (CER 2011; Farhangi 2010; Gottwalt et al. 2017; Nolan andO’Malley 2015). Although in the research community, the design of new algorithmsfor DR optimisation is a subject undergoing intense study, new machine learningtechniques and technology advancements need to be assessed as suitable for thedevelopment of intelligent residential controllers.
The contribution of the built environment is paramount for the fulldecarbonisation of our society. Five different perspectives have been the narrativethreads of this chapter:
• Energy perspective: the implications of evaluating retrofit measures,load shifting, storage and end-user comfort and constraints provided acomprehensive assessment of the impact of new technologies as well as theinfluence of human behaviour on the energy profiles for buildings. Themethodology for an energy perspective assessment was further applied tothe evaluation of control algorithms for estimating the impact of EMS and RESat a building level upon the energy consumption and profiles.
• End-user perspective: evaluating the research findings for the benefit ofend-users in terms of reduction of energy expenditure, adherence to thermal
199

comfort constraints and accessibility to energy data is an essential instrumentfor new technology adoption. The end-user perspective also concerns thetransferability of the technology benefit across all the building categories.
• Utility perspective: where the evaluation of the results of the research benefitsthe utility in terms of reducing the system contingencies caused by thepenetration of RES via demand-side measures and improving the predictabilityof building electricity demand is a fundamental criterion for the deploymentof these new technologies. The utility perspective concerns the reliability,resilience and stability of the power grid with the objective of improving theoverall efficiency hence leading to a generation cost reduction.
• Integration perspective: where the interaction between buildings, electromobilityand their control system, the end-user, utilities and a bi-directional communicationinfrastructure defined within the smart grid needs to be evaluated from the pointof view of the accessibility, interoperability, availability and controllability ofthe assets. The integration side of the research also allows the convergence ofobjectives for both the utility and the end-user.
• Environmental perspective: through an online data-driven assessment of thecarbon emissions associated with the electricity consumption of the buildingat system and building level can increase awareness and drive the change.The implications of the retrofit measures and the use of control algorithms onthe carbon footprint of the building are of interest to policy-makers and localgovernment authorities.
7. Conclusions
Besides demand-side management and the installation of advanced energymanagement systems, several future lines of intervention are critical towards thefull decarbonisation of the built environment: monitoring equipment, IoT datacollection infrastructures, user engagement, distributed energy generation, storageand energy efficiency management measures. Data gathering and sensors installationcan provide useful insights into the occupancy profile patterns of the building. Theycould also help to locate areas where the temperature constraints need to be preciselydefined because of ongoing activities at low metabolic rates or areas where thesetpoints can be dynamic. Sensor installations and data collection can also supporta more accurate calibration of digital twins and therefore provide insight even onfine-tuned energy efficiency measures such as detailed multi-zone air ventilationrate and thermostatic set points. Occupants and buildings users are at the core ofthe transition to a low carbon economy. They can be empowered as smart energyusers of the building. A smart energy user should not only consume energy but also
200

be a conscious actor in energy savings, building energy policy and even in futureenergy measures either as an individual or as part of an energy community. Smartenergy users are well aware of the consequences of their choices and way of lifefor energy consumption and the environment. Smart energy users are also actorsin climate policy not only with their individual and collective decisions but alsoby creating awareness among fellow users and organising community events andmovements to accelerate the transition to a post-carbon world. To facilitate userempowerment, the energy manager could support the engagement with screens anddynamic visualisation of the building energy consumption. Interactive screens withcarbon emissions, zone energy performances, temperature and weather indicatorscan also facilitate gamification among users and promote a virtuous cycle whereindividuals gain awareness and lead energy efficiency measures. Another line ofaction is the installation of renewable energy generators and storage. Differenttechnologies such as photovoltaic, solar thermal systems, heat pumps or biomasscogenerator (CHP) can represent viable solutions for further reducing the emissionsof buildings. A biomass cogenerator can provide both electricity and thermal energy,making buildings a central element of a green circular ecosystem. Additionally, aCHP can contribute to heating and cooling loads through a trigeneration system.Other options to consider are power purchase agreements with wind and solar farmsor heat recovery systems from nearby processing plants. Electric and thermal storageare the main enabler of all these technologies and can support the mass deployment ofadvanced DR programs. It should also be noted that the electrification of the mobilitysector will allow a capillary diffusion of EVs. The latest charging technologiesfor EV batteries support a bidirectional electricity transfer with the grid (V2G).Therefore, EVs batteries can also provide distributed electricity storage to furthersupport the increased penetration of renewable energies in the power system if theflexibility of these devices can be dynamically controlled and dispatched. Energyefficiency and management are at the heart of the decarbonisation process. Thecurrent work has highlighted several measures for reducing the energy consumptionof the building and the provision of energy system services. However, the suggestedline of actions can be further developed to depict a comprehensive roadmap for thefull decarbonisation of the built environment. For instance, multi-zone thermostaticset points or zone air ventilation controllers can contribute to adapting the energydemand to the current occupancy profile of the building. Areas of the building thatare not used or with a reduced occupancy profile can have a dynamic schedule.Additionally, a digital twin can be used to further design an innovative insulationlayer with advanced materials such as phase change materials and similar. These
201

lines of intervention coupled with advanced energy management systems anddemand-side measures will allow reaching the ambitious emission target for 2050and beyond reducing the overall impact of climate changes.
Funding: SFI Grant Number for NexSys is 21/SPP/3756.
Data Availability Statement: The data that support the findings of this study are availablefrom the corresponding author, F.P., upon reasonable request.
Acknowledgments: This work was conducted in the Innovation Value Institute Institutewithin the Sustainability Cluster and the School of Business in the National University ofIreland, Maynooth (NUIM) in collaboration with the Energy Institute at the University CollegeDublin, Ireland. This publication has emanated from research conducted with the financialsupport of Science Foundation Ireland under Grant Number 21/SPP/3756.
Conflicts of Interest: The author declare no conflict of interest.
References
Active Building Research Programme. 2013. The Active Building Centre Research Programme.Available online: https://abc-rp.com/ (accessed on 25 October 2021).
Aghamohamadi, Mehrdad, Mohammad Ebrahim Hajiabadi, and Mahdi Samadi. 2018.A novel approach to multi energy system operation in response to dr programs;an application to incentive-based and time-based schemes. Energy 156: 534–47.doi:10.1016/j.energy.2018.05.034.
Ahmed, Ejaz, Ibrar Yaqoob, Abdullah Gani, Muhammad Imran, and Mohsen Guizani. 2016.Internet-of-things-based smart environments: State of the art, taxonomy, and open researchchallenges. IEEE Wireless Communications 23: 10–16. doi:10.1109/MWC.2016.7721736.
Alam, Muhammad Raisul, Mamun Bin Ibne Reaz, and Mohd Alauddin Mohd Ali. 2012. A reviewof smart homes—Past, present, and future. IEEE Transactions on Systems, Man, and Cybernetics,Part C (Applications and Reviews) 42: 1190–203. doi:10.1109/TSMCC.2012.2189204.
Albadi, Mohamed H., and Ehab. F. El-Saadany. 2008. A summary of demand response in electricitymarkets. Electric Power Systems Research 78: 1989–996. doi:10.1016/j.epsr.2008.04.002.
Alibabaei, Nima, Alan S. Fung, and Kaamran Raahemifar. 2016. Development of Matlab-TRNSYSco-simulator for applying predictive strategy planning models on residential house HVACsystem. Energy and Buildings 128: 81–98. doi:10.1016/j.enbuild.2016.05.084.
Alimohammadisagvand, Behrang, Juha Jokisalo, Simo Kilpeläinen, Mubbashir Ali, and KaiSirén. 2016. Cost-optimal thermal energy storage system for a residential buildingwith heat pump heating and demand response control. Applied Energy 174: 275–87.doi:10.1016/j.apenergy.2016.04.013.
Almassalkhi, Mads R., and Ian A. Hiskens. 2015. Model-Predictive Cascade Mitigation in ElectricPower Systems With Storage and Renewables—Part I: Theory and Implementation. IEEETransactions on Power Systems 30: 67–77. doi:10.1109/TPWRS.2014.2320982.
202

Aman, Saima, Yogesh Simmhan, and Viktor K. Prasanna. 2013. Energy managementsystems: State of the art and emerging trends. IEEE Communications Magazine 51: 114–19.doi:10.1109/MCOM.2013.6400447.
Anaya, Karim L., and Michael G. Pollitt. 2021. How to Procure Flexibility Services within theElectricity Distribution System: Lessons from an International Review of Innovation Projects.Energies 14: 4475. doi:10.3390/en14154475.
Antsaklis, Panos J., and Kevin M. Passino. 1993. An Introduction to Intelligent and AutonomousControl. Dordrecht: Kluwer Academic Publishers.
Arteconi, Alessia, Neil J. Hewitt, and Fabio Polonara. 2013. Domestic demand-side management(DSM): Role of heat pumps and thermal energy storage (TES) systems. Applied ThermalEngineering 51: 155–65. doi:10.1016/j.applthermaleng.2012.09.023.
Atzori, Luigi, Antonio Iera, and Giacomo Morabito. 2010. The Internet of Things: A survey.Computer Networks 54: 2787–805. doi:10.1016/j.comnet.2010.05.010.
Balakrishnan, Meera. 2012. Smart Energy Solutions for Home Area Networks andGrid-End Applications. Available online: https://www.nxp.com/docs/en/brochure/PWRARBYNDBITSSES.pdf (accessed on 6 April 2022).
Bartram, Lyn, Johnny Rodgers, and Kevin Muise. 2010. Chasing the Negawatt:Visualization for Sustainable Living. IEEE Computer Graphics and Applications 30: 8–14.doi:10.1109/MCG.2010.50.
Bazydło, Grzegorz, and Szymon Werminski. 2018. Demand side management through homearea network systems. International Journal of Electrical Power & Energy Systems 97: 174–85.doi:10.1016/j.ijepes.2017.10.026.
Beaudin, Marc, and Hamidreza Zareipour. 2015. Home energy management systems: Areview of modelling and complexity. Renewable and Sustainable Energy Reviews 45: 318–35.doi:10.1016/j.rser.2015.01.046.
Behrangrad, Mahdi, Hideharu Sugihara, and Tsuyoshi Funaki. 2010. Analyzing the systemeffects of optimal demand response utilization for reserve procurement and peak clipping.Paper presented at Power and Energy Society General Meeting, Minneapolis, MN, USA,25–29 July 2010. doi:10.1109/PES.2010.5589597.
Bianchini, Gianni, Marco Casini, Antonio Vicino, and Donato Zarrilli. 2016. Demand-responsein building heating systems: A Model Predictive Control approach. Applied Energy 168:159–70. doi:10.1016/j.apenergy.2016.01.088.
Boemer, Jens C., Karsten Burges, Pavel Zolotarev, Joachim Lehner, Patrick Wajant, Markus Fürst,Rainer Brohm, and Thomas Kumm. 2011. Overview of German grid issues and retrofit ofphotovoltaic power plants in Germany for the prevention of frequency stability problems inabnormal system conditions of the ENTSO-E region Continental Europe. Paper presentedat 1st International Workshop on Integration of Solar Power into Power Systems, Aarhus,Denmark, 24 October 2011.
203

Bozalakov, Dimitar, Tine Vandoorn, Bart Meersman, and Lieven Vandevelde. 2014. Overviewof increasing the penetration of renewable energy sources in the distribution grid bydeveloping control strategies and using ancillary services. Paper presented at IEEE YoungResearchers Symposium, Ghent, Belgium, 24–25 April 2014.
Braess, Dietrich. 1968. Über ein paradoxon aus der verkehrsplanung. Unternehmensforschung 12:258–68.
Braithwait, Steven D., and Kelly Eakin. 2002. The Role of Demand Response in Electric Power MarketDesign. Madison: Edison Electric Institute, pp. 1–57.
Brewer, Robert S., and Philip M. Johnson. 2010. WattDepot: An Open Source Software Ecosystemfor Enterprise-Scale Energy Data Collection, Storage, Analysis, and Visualization. Paperpresented at 2010 First IEEE International Conference on Smart Grid Communications,Gaithersburg, MD, USA, 4–6 October 2010. doi:10.1109/SMARTGRID.2010.5622023.
Calvillo, Christian F., Karen Turner, Keith Bell, and Peter McGregor. 2017. Impacts of residentialenergy efficiency and electrification of heating on energy market prices. Paper presented at15th IAEE European Conference 2017, Vienna, Austria, 3–6 September 2017.
Cao, Jun, Bo Yang, Cailian Chen, and Xinping Guan. 2012. Optimal demand response usingmechanism design in the smart grid. Paper presented at Chinese Control Conference (CCC),Hefei, China, 25–27 July 2012.
Cecati, Carlo, Costantino Citro, and Pierluigi Siano. 2011. Combined operations of renewableenergy systems and responsive demand in a smart grid. IEEE Transactions on SustainableEnergy 2: 468–76. doi:10.1109/TSTE.2011.2161624.
CER. 2011. Demand Side Vision for 2020. Available online: https://www.semcommittee.com/sites/semcommittee.com/files/media-files/SEM-11-022%20Demand%20Side%20Vision%20for%202020.pdf (accessed on 6 April 2022).
Chang, Tsung-Hui, Mahnoosh Alizadeh, and Anna Scaglione. 2012. Coordinated home energymanagement for real-time power balancing. Paper presented at IEEE General Meeting Power& Energy Society, San Diego, CA, USA, 22–26 July 2012. doi:10.1109/PESGM.2012.6345639.
Chen, Chen, Shalinee Kishore, and Lawrence V. Snyder. 2011. An innovative RTP-basedresidential power scheduling scheme for smart grids. Paper presented at InternationalConference on Acoustics, Speech, and Signal Processing (ICASSP), Prague, Czech Republic,22–27 May 2011. doi:10.1109/ICASSP.2011.5947718.
Chen, Yan, W. Sabrina Lin, Feng Han, Yu-Han Yang, Zoltan Safar, and K. J. Ray Liu. 2012. Acheat-proof game theoretic demand response scheme for smart grids. Paper presented atIEEE International Conference on Communications (ICC), Ottawa, ON, Canada, 10–15 June2012. doi:10.1109/ICC.2012.6364397.
Choi, Soojeong, Sunju Park, Dong-Joo Kang, Seung-jae Han, and Hak-Man Kim. 2011. A microgridenergy management system for inducing optimal demand response. Paper presented atIEEE International Conference on Smart Grid Communications (SmartGridComm), Brussels,Belgium, 17–20 October 2011. doi:10.1109/SmartGridComm.2011.6102317.
204

Clements, Samuel L., Thomas E. Carroll, and Mark D. Hadley. 2011. Home Area Networks andthe Smart Grid. Technical report No. PNNL-20374; Richland: Pacific Northwest NationalLaboratory.
Cole, Wesley J., Kody M. Powell, Elaine T. Hale, and Thomas F. Edgar. 2014. Reduced-orderresidential home modeling for model predictive control. Energy and Buildings 74: 6–7.doi:10.1016/j.enbuild.2014.01.033.
Conka, Zsolt, Pavol Hocko, Matuš Novák, Michal Kolcun, and Morva György. 2014. Impactof renewable energy sources on stability of EWIS transmision system. Paper presentedat International Conference on Environment and Electrical Engineering (EEEIC), Krakow,Poland, 10–12 May 2014. doi:10.1109/EEEIC.2014.6835840.
Cui, Tiansong, Hadi Goudarzi, Safar Hatami, Shahin Nazarian, and Massoud Pedram.2012. Concurrent optimization of consumer’s electrical energy bill and producer’spower generation cost under a dynamic pricing model. Paper presented atInnovative Smart Grid Technologies (ISGT), Washington, DC, USA, 16–20 January 2012.doi:10.1109/ISGT.2012.6175810.
Darby, Sarah. 2006. The Effectiveness of Feedback on Energy Consumption. A Review forDEFRA of the Literature on Metering, Billing and Direct Displays. Available online: https://copperalliance.starringjane.com/uploads/2018/04/smart-metering-report.pdf (accessedon 6 April 2022).
Darby, Sarah J. 2020. Demand response and smart technology in theory and practice: Customerexperiences and system actors. Energy Policy 143: 111573. doi:10.1016/j.enpol.2020.111573.
Darby, Sarah, Sarah Higginson, Marina Topouzi, Julie Goodhew, and Stefanie Reiss. 2018.Getting the Balance Right: Can Smart Thermal Storage Work for Both Customers and Grids?Available online: https://ec.europa.eu/research/participants/documents/downloadPublic?documentIds=080166e5bb1417aa&appId=PPGMS (accessed on 6 April 2022).
Dehkordi, Vahid Raissi, and José Agustín Candanedo. 2016. State-Space Modeling of ThermalSpaces in a Multi-Zone Building. Paper presented at 4th International High PerformanceBuildings Conference, West Lafayette, IN, USA, 1–14 July 2016.
Dong, Qifen, Li Yu, Wen-Zhan Song, Lang Tong, and Shaojie Tang. 2012. Distributed Demandand Response Algorithm for Optimizing Social-Welfare in Smart Grid. Paper presented atInternational Symposium on Parallel and Distributed Processing (IPDPS), Shanghai, China,21–25 May 2012. doi:10.1109/IPDPS.2012.112.
Doostizadeh, Meysam, and Hassan Ghasemi. 2012. A day-ahead electricity pricingmodel based on smart metering and demand-side management. Energy 46: 221–30.doi:10.1016/j.energy.2012.08.029.
EDP Consortium. 2016. Demand Response. The Road Ahead. Availableonline: http://www.wedgemere.com/wp-content/uploads/2013/03/Evolution-of-DR-Dialogue-Project-Report.pdf (accessed on 6 April 2022).
205

ePANACEA. 2020. ePANACEA Horizon 2020 Project. Available online: https://epanacea.eu/(accessed on 25 October 2021).
Episcope EU. 2013. Project Episcope. Available online: https://episcope.eu/ (accessed on 25October 2021).
Eriksen, Peter Borre, Thomas Ackermann, Hans Abildgaard, Paul Smith, Wilhelm Winter, andJuanMa Rodríguez García. 2005. System operation with high wind penetration. IEEE Powerand Energy Magazine 3: 65–74. doi:10.1109/MPAE.2005.1524622.
European Commission. 2010. Energy Roadmap 2050. Available online: https://www.roadmap2050.eu/attachments/files/Volume1_fullreport_PressPack.pdf (accessed on 21March 2022).
European Union. 2017. 2050 Climate and Energy Package. Available online: https://ec.europa.eu/clima/policies/strategies/2050_en (accessed on 25 October 2021).
Eurostat. 2020. Final Energy Consumption in Households. Available online: https://ec.europa.eu/eurostat/web/products-datasets/-/t2020_rk200 (accessed on 21 March 2022).
Eustis, Conrad, Gale Horst, and Donald J. Hammerstrom. 2007. Appliance Interface for GridResponses. Paper presented at Grid-Interop 2007 Forum, Albuquerque, NM, USA, 7–9November 2007.
Farhangi, Hassan. 2010. The path of the smart grid. IEEE Power and Energy Magazine 8: 18–28.doi:10.1109/MPE.2009.934876.
Ferreira, Rafael de Sa, Luiz Augusto N. Barroso, and Martha Martins Carvalho. 2012. Demandresponse models with correlated price data: A robust optimization approach. AppliedEnergy 96: 133–49. doi:10.1016/j.apenergy.2012.01.016.
Fosas, Daniel, Elli Nikolaidou, Matthew Roberts, Stephen Allen, Ian Walker, and David Coley.2021. Towards active buildings: Rating grid-servicing buildings. Building ServicesEngineering Research and Technology 42: 129–155. doi:10.1177/0143624420974647.
Fuller, Jason C., Kevin P. Schneider, and David Chassin. 2011. Analysis of Residential DemandResponse and double-auction markets. Paper presented at IEEE General Meeting Power &Energy Society, Detroit, MI, USA, 24–28 July 2011. doi:10.1109/PES.2011.6039827.
Gatsis, Nikolaos, and Georgios B. Giannakis. 2011a. Cooperative multi-residence demandresponse scheduling. Paper presented at Annual Conference on Information Sciences andSystems (CISS), Baltimore, MD, USA, 23–25 March 2011. doi:10.1109/CISS.2011.5766245.
Gatsis, Nikolaos, and Georgios B. Giannakis. 2011b. Residential demand response withinterruptible tasks: Duality and algorithms. Paper presented at IEEE Conference on Decisionand Control, Orlando, FL, USA, 12–15 December 2011. doi:10.1109/CDC.2011.6161103.
Gils, Hans Christian. 2014. Assessment of the theoretical demand response potential in Europe.Energy 67: 1–18. doi:10.1016/j.energy.2014.02.019.
Gimon, Eric, and Senior Fellow. 2021. Lessons from the Texas Big Freeze. Availableonline: https://energyinnovation.org/wp-content/uploads/2021/05/Lessons-from-the-Texas-Big-Freeze.pdf (accessed on 21 March 2022).
206

Goldman, Charles, Michael Reid, Roger Levy, and Alison Silverstein. 2010. Coordination of EnergyEfficiency and Demand Response. Technical report No. LBNL-3044E. Berkeley: LawrenceBerkeley National Lab (LBNL). doi:10.2172/981732.
Gottwalt, Sebastian, Johannes Gärttner, Hartmut Schmeck, and Christof Weinhardt. 2017.Modeling and Valuation of Residential Demand Flexibility for Renewable EnergyIntegration. IEEE Transactions on Smart Grid 8: 2565–74. doi:10.1109/TSG.2016.2529424.
Gudi, Nikhil, Lingfeng Wang, and Vijay Devabhaktuni. 2012. A demand side managementbased simulation platform incorporating heuristic optimization for management ofhousehold appliances. International Journal of Electrical Power & Energy Systems 4: 185–93.doi:10.1016/j.ijepes.2012.05.023.
Gungor, Vehbi C., Dilan Sahin, Taskin Kocak, Salih Ergut, Concettina Buccella, Carlo Cecati,and Gerhard P. Hancke. 2011. Smart Grid Technologies: CommunicationTechnologies and Standards. IEEE Transactions on Industrial Informatics 7: 529–39.doi:10.1109/TII.2011.2166794.
Guo, Yuanxiong, Miao Pan, and Yuguang Fang. 2012. Optimal Power Management of ResidentialCustomers in the Smart Grid. IEEE Transactions on Parallel and Distributed Systems 23:1593–606. doi:10.1109/TPDS.2012.25.
Hamidi, Vandad, Furong Li, and Francis Robinson. 2009. Demand response in the UK’s domesticsector. Electric Power Systems Research 79: 1722–26. doi:10.1016/j.epsr.2009.07.013.
Hayajneh, Thaier, Ghada Almashaqbeh, Sana Ullah, and Athanasios V. Vasilakos. 2014. A surveyof wireless technologies coexistence in WBAN: Analysis and open research issues. WirelessNetworks 20: 2165–99. doi:10.1007/s11276-014-0736-8.
Hedegaard, Rasmus Elbæk, Theis Heidmann Pedersen, and Steffen Petersen. 2017. Multi-marketdemand response using economic model predictive control of space heating in residentialbuildings. Energy and Buildings 150: 25–61. doi:10.1016/j.enbuild.2017.05.059.
Herter, Karen, Patrick McAuliffe, and Arthur Rosenfeld. 2007. An exploratory analysis ofCalifornia residential customer response to critical peak pricing of electricity. Energy 32:25–34. doi:10.1016/j.energy.2006.01.014.
Hughes, Thomas Parke. 1993. Networks of Power: Electrification in Western Society, 1880–1930.Baltimore: JHU Press.
Huq, Md. Zahurul, and Syed Islam. 2010. Home Area Network technology assessment fordemand response in smart grid environment. Paper presented at Australasian UniversitiesPower Engineering Conference, AUPEC, Christchurch, New Zealand, 5–8 December 2010.
Hurtado, L. A., J. D. Rhodes, P. H. Nguyen, I. G. Kamphuis, and M. E. Webber. 2017. Quantifyingdemand flexibility based on structural thermal storage and comfort management ofnon-residential buildings: A comparison between hot and cold climate zones. AppliedEnergy 195: 1047–54. doi:10.1016/j.apenergy.2017.03.004.
IEA. 2013. Transition to Sustainable Buildings: Strategies and Opportunities to 2050. Technical report.Paris: Internationl Energy Agency.
207

International Energy Agency. 2016. Renewables and Energy Market Report Information 2016.Paris: IEA Publications. Available online: https://www.iea.org/reports/medium-term-renewable-energy-market-report-2016 (accessed on 6 April 2022).
Jazaeri, Javad, Tansu Alpcan, Robert Gordon, Miguel Brandao, Tim Hoban, and Chris Seeling.2016. Baseline methodologies for small scale residential demand response. Paper presentedat IEEE Innovative Smart Grid Technologies-Asia (ISGT Asia), Melbourne, Australia, 28November–1 December 2016. doi:10.1109/ISGT-Asia.2016.7796478.
Jiang, Bingnan, and Yunsi Fei. 2011. Dynamic Residential Demand Response and DistributedGeneration Management in Smart Microgrid with Hierarchical Agents. Energy Procedia 12:76–90. doi:10.1016/j.egypro.2011.10.012.
Jiang, Libin, and Steven Low. 2011. Multi-period optimal energy procurement anddemand response in smart grid with uncertain supply. Paper presented at IEEEConference on Decision and Control, Orlando, FL, USA, 12–15 December 2011.doi:10.1109/CDC.2011.6161320.
Joe-Wong, Carlee, Soumya Sen, Sangtae Ha, and Mung Chiang. 2012. Optimized Day-AheadPricing for Smart Grids with Device-Specific Scheduling Flexibility. IEEE Journal on SelectedAreas in Communications 30: 1075–85. doi:10.1109/JSAC.2012.120706.
Kallitsis, Michael G., George Michailidis, and Michael Devetsikiotis. 2012. Optimal PowerAllocation Under Communication Network Externalities. IEEE Transactions on Smart Grid 3:162–73. doi:10.1109/TSG.2011.2169995.
Karnouskos, Stamatis. 2011. Demand Side Management via prosumer interactions in asmart city energy marketplace. Paper presented at IEEE PES Innovative Smart GridTechnologies Conference Europe (ISGT Europe), Manchester, UK, 5–7 December 2011.doi:10.1109/ISGTEurope.2011.6162818.
Kim, Younghun, Thomas Schmid, Zainul M. Charbiwala, and Mani B. Srivastava. 2009.ViridiScope: Design and implementation of a fine grained power monitoring system forhomes. Paper presented at Ubicomp ’09: The 11th International Conference on UbiquitousComputing, Orlando, FL, USA, 30 September–3 October 2009.
Kircher, Kevin J., and K. Max Zhang. 2015. Model predictive control of thermal storage fordemand response. Paper presented at American Control Conference (ACC), Chicago, IL,USA, 1–3 July 2015. doi:10.1109/ACC.2015.7170857.
Knudsen, Michael Dahl, and Steffen Petersen. 2016. Demand response potential of modelpredictive control of space heating based on price and carbon dioxide intensity signals.Energy and Buildings 125: 196–204. doi:10.1016/j.enbuild.2016.04.053.
Liserre, Marco, Thilo Sauter, and John Y. Hung. 2010. Future Energy Systems: IntegratingRenewable Energy Sources into the Smart Power Grid Through Industrial Electronics. IEEEIndustrial Electronics Magazine 4: 18–37. doi:10.1109/MIE.2010.935861.
208

Liu, Qi, Grahame Cooper, Nigel Linge, Haifa Takruri, and Richard Sowden. 2013. DEHEMS:Creating a digital environment for large-scale energy management at homes. IEEETransactions on Consumer Electronics 59: 62–69. doi:10.1109/TCE.2013.6490242.
Logenthiran, Thillainathan, Dipti Srinivasan, and Tan Zong Shun. 2012. Demand SideManagement in Smart Grid Using Heuristic Optimization. IEEE Transactions on SmartGrid 3: 1244–52. doi:10.1109/TSG.2012.2195686.
Lu, Xiaoxing, Kangping Li, Hanchen Xu, Fei Wang, Zhenyu Zhou, and Yagang Zhang. 2020.Fundamentals and business model for resource aggregator of demand response in electricitymarkets. Energy 204: 117885. doi:10.1016/j.energy.2020.117885.
Ma, Jingran, S. Joe Qin, Bo Li, and Tim Salsbury. 2011. Economic model predictive control forbuilding energy systems. Paper presented at Innovative Smart Grid Technologies (ISGT),Anaheim, CA, USA, 17–19 January 2011. doi:10.1109/ISGT.2011.5759140.
Mahfuz-Ur-Rahman, A. M., Md. Rabiul Islam, Kashem M. Muttaqi, and Danny Sutanto. 2021.An Effective Energy Management With Advanced Converter and Control for a PV-BatteryStorage Based Microgrid to Improve Energy Resiliency. IEEE Transactions on IndustryApplications 57: 6659–68. doi:10.1109/TIA.2021.3115085.
Mariano-Hernández, D., L. Hernández-Callejo, A. Zorita-Lamadrid, O. Duque-Pérez, andF. Santos García. 2021. A review of strategies for building energy management system:Model predictive control, demand side management, optimization, and fault detect &diagnosis. Journal of Building Engineering 33: 101692. doi:10.1016/j.jobe.2020.101692.
Mata, Érika, A. Sasic Kalagasidis, and Filip Johnsson. 2014. Building-stock aggregation througharchetype buildings: France, Germany, Spain and the UK. Building and Environment 81:270–82. doi:10.1016/j.buildenv.2014.06.013.
Mathieu, Johanna L., Duncan S. Callaway, and Sila Kiliccote. 2011. Examining uncertaintyin demand response baseline models and variability in automated responses to dynamicpricing. Paper presented at IEEE Conference on Decision and Control, Orlando, FL, USA,12–15 December 2011. doi:10.1109/CDC.2011.6160628.
McKenna, Killian, and Andrew Keane. 2016. Residential Load Modeling of Price-BasedDemand Response for Network Impact Studies. IEEE Transactions on Smart Grid 7: 2285–94.doi:10.1109/TSG.2015.2437451.
Mohsenian-Rad, Amir-Hamed, and Alberto Leon-Garcia. 2010a. Optimal Residential LoadControl With Price Prediction in Real-Time Electricity Pricing Environments. IEEETransactions on Smart Grid 1: 120–33. doi:10.1109/TSG.2010.2055903.
Mohsenian-Rad, Amir-Hamed, Vincent W. S. Wong, Juri Jatskevich, and Robert Schober. 2010b.Optimal and autonomous incentive-based energy consumption scheduling algorithm forsmart grid. Paper presented at Innovative Smart Grid Technologies (ISGT), Gaithersburg,MD, USA, 19–21 January 2010. doi:10.1109/ISGT.2010.5434752.
209

Molderink, Albert, Vincent Bakker, Maurice G.C. Bosman, Johann L. Hurink, and Gerard J.M.Smit. 2009. Domestic energy management methodology for optimizing efficiency in SmartGrids. Paper presented at Power Tech Conference, Bucharest, Romania, 28 June–2 July 2009.doi:10.1109/PTC.2009.5281849.
Nolan, Sheila, and Mark O’Malley. 2015. Challenges and barriers to demand response deploymentand evaluation. Applied Energy 152: 1–10. doi:10.1016/j.apenergy.2015.04.083.
O’Sullivan, Jon, Alan Rogers, Damian Flynn, Paul Smith, Alan Mullane, and Mark O’Malley.2014. Studying the Maximum Instantaneous Non-Synchronous Generation in an IslandSystem—Frequency Stability Challenges in Ireland. IEEE Transactions on Power Systems 29:2943–51. doi:10.1109/TPWRS.2014.2316974.
Pallonetto, Fabiano, Mattia De Rosa, Federico Milano, and Donal P. Finn. 2019. Demandresponse algorithms for smart-grid ready residential buildings using machine learningmodels. Applied Energy 239: 1265–82. doi:10.1016/j.apenergy.2019.02.020.
Pallonetto, Fabiano, Mattia De Rosa, Francesco D’Ettorre, and Donal P. Finn. 2020. On theassessment and control optimisation of demand response programs in residential buildings.Renewable and Sustainable Energy Reviews 127: 109861. doi:10.1016/j.rser.2020.109861.
Pallonetto, Fabiano, Mattia De Rosa, and Donal P. Finn. 2021. Impact of intelligent controlalgorithms on demand response flexibility and thermal comfort in a smart grid readyresidential building. Smart Energy 2: 100017. doi:10.1016/j.segy.2021.100017.
Pallonetto, Fabiano, Mattia De Rosa, and Donal P. Finn. 2022. Environmental and economicbenefits of building retrofit measures for the residential sector by utilizing sensor dataand advanced calibrated models. Advances in Building Energy Research 16: 89–117.doi:10.1080/17512549.2020.1801504.
Paradiso, Joseph, Prabal Dutta, Hans Gellersen, and Eve Schooler. 2011. GuestEditors’ Introduction: Smart Energy Eystems. IEEE Pervasive Computing 10: 11–12.doi:10.1109/MPRV.2011.4.
Park, Laihyuk, Yongwoon Jang, Sungrae Cho, and Joongheon Kim. 2017. Residential DemandResponse for Renewable Energy Resources in Smart Grid Systems. IEEE Transactions onIndustrial Informatics 13: 3165–73 doi:10.1109/TII.2017.2704282.
Pas, Eric I., and Shari L. Principio. 1997. Braess’ paradox: Some new insights. TransportationResearch Part B: Methodological 31: 265–76. doi:10.1016/S0191-2615(96)00024-0.
Paterakis, Nikolaos G., Ozan Erdinc, and JoalP.S. Catalao. 2017. An overview of DemandResponse: Key-elements and international experience. Renewable and Sustainable EnergyReviews 69: 871–91. doi:10.1016/j.rser.2016.11.167.
Pavlidou, Niovi, A.J. Han Vinck, Javad Yazdani, and Bahram Honary. 2003. Power linecommunications: State of the art and future trends. IEEE Communications magazine 41:34–40. doi:10.1109/MCOM.2003.1193972.
210

Pedersen, Theis Heidmann, Rasmus Elbæk Hedegaard, and Steffen Petersen. 2017. Spaceheating demand response potential of retrofitted residential apartment blocks. Energy andBuildings 141: 158–66. doi:10.1016/j.enbuild.2017.02.035.
Pedreiras, Paulo, Luis Almeida, and Paolo Gai. 2002. The FTT-Ethernet Protocol: MergingFlexibility, Timeliness and Efficiency. Paper presented at Euromicro RTS 2002, Vienna,Austria, 19–21 June 2002 doi:10.1109/EMRTS.2002.1019195.
Pereira, Guillermo Ivan, and Patrícia Pereira da Silva. 2017. Energy efficiency governance inthe EU-28: Analysis of institutional, human, financial, and political dimensions. EnergyEfficiency 10: 1279–97. doi:10.1007/s12053-017-9520-9.
Pérez-Lombard, Luis, José Ortiz, and Christine Pout. 2008. A review onbuildings energy consumption information. Energy and Buildings 40: 394–98.doi:10.1016/j.enbuild.2007.03.007.
Petkov, Petromil, and Marcus Foth. 2011. EnergyWiz. Available online: https://eprints.qut.edu.au/80773/ (accessed on 6 April 2022).
Piette, Mary Ann, David Watson, Naoya Motegi, Sila Kiliccote, and Eric Linkugel. 2006.Automated Demand Response Strategies and Commissioning Commercial BuildingControls. Paper presented at National Conference on Building Commissioning, SanFrancisco, CA, USA, 19–21 April 2006.
Qdr, Q. 2006. Benefits of Demand Response in Electricity Markets and Recommendations for AchievingThem. Technical Report. Washington, DC: U.S. Department of Energy.
Rodgers, Johnny, and Lyn Bartram. 2010. ALIS: An interactive ecosystem for sustainable living.Paper presented at Ubicomp ’10: The 2010 ACM Conference on Ubiquitous Computing,Copenhagen, Denmark, 26–29 September 2010. doi:10.1145/1864431.1864467.
Rothleder, Mark, and Clyde Loutan. 2017. Case Study–Renewable Integration: FlexibilityRequirement, Potential Overgeneration, and Frequency Response Challenges. In RenewableEnergy Integration (Second Edition). Edited by Lawrence E. Jones. Amsterdam: Elsevier B.V.,pp. 69–81.
Schibuola, Luigi, Massimiliano Scarpa, and Chiara Tambani. 2015. Demand responsemanagement by means of heat pumps controlled via real time pricing. Energy andBuildings 90: 15–28 doi:10.1016/j.enbuild.2014.12.047.
Silva, Marisa, Hugo Morais, and Zita Vale. 2012. An integrated approach for distributed energyresource short-term scheduling in smart grids considering realistic power system simulation.Energy Conversion and Management 64: 273–88. doi:10.1016/j.enconman.2012.04.021.
Smith, William J. 2010. Can EV (electric vehicles) address Ireland’s CO2 emissions from transport?Energy 35: 4514–21. doi:10.1016/j.energy.2010.07.029.
Soares, João, Tiago Sousa, Hugo Morais, Zita Vale, and Pedro Faria. 2011. An optimal schedulingproblem in distribution networks considering V2G. Paper presented at IEEE Symposiumon Computational Intelligence Applications in Smart Grid (CIASG), Paris, France, 11–15April 2011. doi:10.1109/CIASG.2011.5953342.
211

Sortomme, Eric, and Mohamed A. El-Sharkawi. 2012. Optimal Scheduling of Vehicle-to-GridEnergy and Ancillary Services. IEEE Transactions on Smart Grid 3: 351–59.doi:10.1109/TSG.2011.2164099.
Tahir, Muhammad Faizan, Haoyong Chen, Asad Khan, Muhammad Sufyan Javed,Khalid Mehmood Cheema, and Noman Ali Laraik. 2020. Significance of demand responsein light of current pilot projects in China and devising a problem solution for futureadvancements. Technology in Society 63: 101374. doi:10.1016/j.techsoc.2020.101374.
Torriti, Jacopo, Mohamed G. Hassan, and Matthew Leach. 2010. Demand responseexperience in Europe: Policies, programmes and implementation. Energy 35: 1575–83.doi:10.1016/j.energy.2009.05.021.
Totu, Luminita C., John Leth, and Rafael Wisniewski. 2013. Control for large scale demandresponse of thermostatic loads. Paper presented at American Control Conference (ACC),Washington, DC, USA, 17–19 June 2013. doi:10.1109/ACC.2013.6580618.
U-CERT. 2019. ePANACEA Horizon 2020 Project. Available online: https://u-certproject.eu(accessed on 25 October 2021).
Ulbig, Andreas, Theodor S. Borsche, and Göran Andersson. 2014. Impact of Low RotationalInertia on Power System Stability and Operation. IFAC Proceedings Volumes 47: 7290–97.doi:10.3182/20140824-6-ZA-1003.02615.
Vargas, Luis S., Gonzalo Bustos-Turu, and Felipe Larrain. 2015. Wind Power Curtailment andEnergy Storage in Transmission Congestion Management Considering Power Plants RampRates. IEEE Transactions on Power Systems 30: 2498–506. doi:10.1109/TPWRS.2014.2362922.
Veldman, Else, Madeleine Gibescu, Han Slootweg, and Wil L. Kling. 2011. Impact of electrificationof residential heating on loading of distribution networks. Paper presented at Power TechConference, Trondheim, Norway, 19–23 June 2011. doi:10.1109/PTC.2011.6019179.
Võsa, Karl-Villem, Andrea Ferrantelli, Dragomir Tzanev, Kamen Simeonov, Pablo Carnero,Carlos Espigares, Miriam Navarro Escudero, Pedro Vicente Quiles, Thibault Andrieu,Florian Battezzati, and et al. 2021. Building performance indicators and IEQ assessmentprocedure for the next generation of EPC-s. E3S Web of Conferences 246: 13003.doi:10.1051/e3sconf/202124613003.
Wang, Jidong, Zhiqing Sun, Yue Zhou, and Jiaqiang Dai. 2012. Optimal dispatchingmodel of Smart Home Energy Management System. Paper presented at IEEEInnovative Smart Grid Technologies-Asia (ISGT Asia), Tianjin, China, 21–24 May 2012.doi:10.1109/ISGT-Asia.2012.6303266.
Weiss, Markus, Friedemann Mattern, Tobias Graml, Thorsten Staake, and Elgar Fleisch. 2009.Handy feedback: Connecting smart meters with mobile phones. Paper presented at MUM’09: 8th International Conference on Mobile and Ubiquitous Multimedia, Cambridge, UK,22–25 November 2009. doi:10.1145/1658550.1658565.
212

Wijaya, Tri Kurniawan, Matteo Vasirani, and Karl Aberer. 2014. When Bias Matters: An EconomicAssessment of Demand Response Baselines for Residential Customers. IEEE Transactions onSmart Grid 5: 1755–63. doi:10.1109/TSG.2014.2309053.
Witthaut, Dirk, and Marc Timme. 2012. Braess’s paradox in oscillator networks,desynchronization and power outage. New Journal of Physics 14: 083036.
Xiao, Jin, Jae Yoon Chung, Jian Li, Raouf Boutaba, and James Won-Ki Hong. 2010. Nearoptimal demand-side energy management under real-time demand-response pricing. Paperpresented at International Conference on Network and Service Management, Niagara Falls,ON, Canada, 25–29 October 2010. doi:10.1109/CNSM.2010.5691349.
Yan, Ye, Yi Qian, Hamid Sharif, and David Tipper. 2013. A Survey on Smart Grid CommunicationInfrastructures: Motivations, Requirements and Challenges. IEEE Communications Surveys& Tutorials 15: 5–20. doi:10.1109/SURV.2012.021312.00034.
Yang, Guang-Hua, and Victor O.K. Li. 2010. Energy Management System and PervasiveService-Oriented Networks. Paper presented at IEEE International Conference on SmartGrid Communications (SmartGridComm), Gaithersburg, MD, USA, 4–6 October 2010.doi:10.1109/SMARTGRID.2010.5622001.
Yoon, Ji Hoon, Ross Baldick, and Atila Novoselac. 2014. Dynamic Demand Response ControllerBased on Real-Time Retail Price for Residential Buildings. IEEE Transactions on Smart Grid 5:121–129. doi:10.1109/TSG.2013.2264970.
Zhang, Di, Lazaros G. Papageorgioua, Nouri J. Samsatlib, and Nilay Shahb. 2011. OptimalScheduling of Smart Homes Energy Consumption with Microgrid. Energy 1: 70–75.
Zhu, Ziming, Jie Tang, Sangarapillai Lambotharan, Woon Hau Chin, and Zhong Fan. 2012. Aninteger linear programming based optimization for home demand-side management insmart grid. Paper presented at Innovative Smart Grid Technologies (ISGT), Washington,DC, USA, 16–20 January 2012. doi:10.1109/ISGT.2012.6175785.
© 2022 by the authors. Licensee MDPI, Basel, Switzerland. This article is an openaccess article distributed under the terms and conditions of the Creative CommonsAttribution (CC BY) license (http://creativecommons.org/licenses/by/4.0/).
213


Regional Transition


Social Innovation for Energy Transition:Activation of Community Entrepreneurshipin Inner Areas of Southern Italy
Mariarosaria Lombardi, Maurizio Prosperi and Gerardo Fascia
1. Introduction
The current reliance on fossil fuels is unsustainable and harmful to the planet,being the main cause of climate change. It is well known that the use of renewableenergy sources is one of the actions to pursue the energy transition towardszero-carbon fuels, capable of reducing the emission of greenhouse gases (GHGs),which are listed amongst the main causes of climate change.
In this context, inner areas, characterized by constant demographic decline andpopulation aging, could play an important role in adopting measures of mitigationof and adaptation to climate change. Meanwhile, they could also benefit fromthis opportunity, through which they could valorize important and unique culturalassets and relevant environmental resources. The idea is to foster new forms ofcommunity entrepreneurship, based on collective renewable energy actions involvingcitizens in the energy system, as “renewable energy communities” or “citizen energycommunities” (EU 2018). This basically means adopting a social innovation approach,capable of promoting a democracy process for ensuring environmental and economicbenefits to the whole community.
This is particularly true for inner areas of Southern Italy, which have experiencedwidespread implementation of large-scale renewable energy plants without theengagement of the local community in the planning processes. This has led to limitedacceptance of new investment projects in renewable energy by the citizens.
In light of these premises, the aim of this chapter is to propose an operationalapproach for developing community entrepreneurship in inner areas, where thefinancial resources obtained from the production, distribution and consumption ofgreen energy are locally reinvested to valorize the cultural and natural resources,activating a comprehensive process of social and economic revitalization.
217

2. Political Pathway for Energy Transition at International, European and ItalianLevels
Nowadays, access to energy represents one of the most central challenges andopportunities the world has to tackle for ensuring employment, mitigation of climatechange and food production.
Thus, by the second half of this century, it is necessary to move towards a moreaffordable and clean global energy system (i.e., from fossil-based to zero-carbonsystems) (SDG Tracker 2021). This implies the start of the energy transition process,which requires public support through adequate policy frameworks and financialinstruments.
Hennicke et al. (2019) claimed that “the energy transition resembles aninter-generational contract in which the current generation pre-finances a gradualreplacement of the entire fossil and nuclear energy system in the 21st centurywith energy efficiency, energy saving and renewable energies, and organizesthe implementation processes in order to protect children, grandchildren, futuregenerations and developing countries and its people from the risks of a non-renewableenergy system” (ibid., p. 4). It is an enormous challenge, which requires the activeinvolvement and commitment of various levels of governance, from the supranationalones (i.e., UN, EU) to the lower levels (i.e., national, regional and local), which haveto include all individuals and the territorial communities. Some important politicalinitiatives have been launched in this direction. Figure 1 shows the overall frameworklinking the global, European and Italian levels.
The 2030 Agenda, developed by the United Nations (UN) in 2015, representsa universal action plan. It defines 17 Sustainable Development Goals (SDGs) and169 targets as strategies “to achieve a better and more sustainable future for all”(UN—United Nations 2021).
Among them, SDG 7, Affordable and Clean Energy, emphasizes the importanceof changing the route of energy production and consumption for contrasting climatechange. Specifically, this implies the following: achievement of universal access tomodern energy; increase in the global percentage of renewable energy; doubling theimprovement in energy efficiency; promotion of access, technology and investmentsin clean energy; and expanding and upgrading energy services for developingcountries. These are the five targets defined by the UN taking into account that 13%of the global population does not have access to modern electricity, that 3 billionpeople depend on wood, coal, charcoal or animal waste for cooking and heating andthat energy is the main factor responsible for climate change, accounting for around60% of total GHG emissions (IEA et al. 2019).
218

Figure 1. Main political initiatives for energy transition. Source: Graphic by authors,2021.
In order to implement the UN 2030 Agenda, in 2019, the European Commission(EC) issued a plan called the Green Deal, a new growth strategy with the overarchingaim of making Europe climate-neutral by 2050, through the deep decarbonization ofall sectors of the economy (EC 2019). The approach consists of nine core policies thatwill bring tangible progress in the areas of the SDGs. Among them, “clean energy”specifically aims at decarbonizing the EU’s energy system. Indeed, over 75% of theEU’s GHG emissions come from the production and use of energy in the variouseconomic sectors.
To reach this goal, some priorities have been identified, such as the increasein energy efficiency and use of renewable sources (RES). Regarding the latter, thestrategy stresses the necessity of the transition from today’s energy system to anintegrated one largely based on RES. As specified in the impact assessment for theClimate Target Plan for a 55% GHG reduction, the 2030 share of renewables mustreach 38–40% (EC 2020), compared with the 1990 levels. The first strategy aims atdeveloping an integrated energy system based on multiple energy carriers, such aselectricity, heat, cold, gas, solid and liquid fuels, infrastructure and end use sectors,
219

such as buildings, transport or industry (EC 2020). The second strategy aims at atechnology shift towards hydrogen, which refers to the production of hydrogen fromRES and a subsequent deployment at a large scale through large-scale plants, aboveall large wind and solar plants (EC 2020).
Regarding the energy efficiency priority, particular attention is paid to buildings,taking into account that about 75% of the building stock is not energy-efficient, yetalmost 85–95% of today’s buildings will still be in use in 2050. Additionally, buildingsare responsible for about 40% of the EU’s total energy consumption, and for 36% ofits GHG emissions from energy. Therefore, the renovation wave strategy has beenlaunched for doubling the annual energy renovation rates in the next ten years bothfor public and private buildings (EC 2020).
Certainly, the implementation of the New Green Deal will be an importantincentive to revitalize the European economy that has ended up in a deep recessionfollowing the pandemic crisis of COVID-19. This is why there is a profound linkbetween the Next Generation EU-NGEU (known as the European Recovery Planadopted in February 2021 following COVID-19) and the New Green Deal. Infact, it represents a temporary financial mechanism, for the period 2021–2026, tosupport reforms and investments promoted by member states, aimed at makingEuropean countries more sustainable, resilient and prepared for the challenges andopportunities of the ecological and digital transition (EU 2021). Indeed, among thesix main pillars of the NGEU, one is dedicated to the green transition. In this regard,the president of the EC clarified that 37% of these funds will be allocated to greenpolicies (i.e., expenditure related to climate change) in compliance with the systemicapproach of the SDGs.
Specifically, the European Commission approved the Italian plan in June 2021(Camera dei Deputati 2021). It identified six missions, among which the second oneis related to the Green Revolution and Ecological Transition, aimed at improving thesustainability and resilience of the economic system, as well as ensuring a fair andinclusive environmental transition. It represents 31% of the total budget of the plan.This mission is structured in four components, in line with the European Green Deal,where two out of four are dedicated to the energy transition: (i) energy transitionand sustainable mobility; and (ii) energy efficiency and building renovation.
Specifically, the first one is the component with the highest budget, equalto EUR 23.7 billion (40% of the total), and covers five lines of action: increasein the RES share in the system (biomethane, agrophotovoltaic, RES for energycommunities, innovative RES plants, etc.); strengthening and digitalization of networkinfrastructure; promotion of the production, distribution and end uses of hydrogen;
220

developing more sustainable local transport; and developing international leadershipat the industrial and research levels, as well as in the main transition supply chains.
Regarding the second component, with a budget of EUR 15.36 billion (29% of thetotal), there are three lines of action: energy efficiency of public buildings (schools);energy efficiency and seismicity of public and private residential constructions; anddistrict heating systems (Governo Italiano 2021).
This new framework may represent a unique opportunity for the inner areas,as it may promote investments which are compatible with the potentials of ruralregions and that local communities may activate. For instance, the renovation ofpublic buildings or the realization of small-size energy systems may be the typesof initiatives which can be easily carried out by the local community, by using theterritorial resources and know-how and generating positive spillovers on the wholeeconomic system.
3. Characteristics and Strategies of Inner Areas
The rapid economic growth from an economy based on agriculture towardsthe industrial sector, which occurred after World War II, has paved the way for aprogressive migration of people from rural to urban areas. This rapid transformationhas occurred due to better job opportunities, but also due to better opportunities toimprove the quality of life, which could be captured by young and (relatively) mosteducated people.
This process occurred at different speeds across the EU territory and is stillongoing in rural areas, especially in those regions which are more isolated fromurban areas and industrial settlements. In particular, local communities located ininner and mountainous areas are still dramatically shrinking, and there seems tobe a lack of an effective strategy to contrast this phenomenon of depopulation anddesertification with specific intervention policies. These areas are characterized byrelevant distances from the main service centers (education, health and mobility).Specifically, in Southern Italy, they cover about 70% of the territory, underlining theimportance to plan efficient policies and strategies.
The most important drivers of depopulation of rural areas have been widelyinvestigated in the past (Zelinsky 1971). Among them, it is worth mentioning thetransition from agricultural jobs (available in rural areas) to more appealing jobs ofsecondary and tertiary sectors (available in urban areas), which are socially moreattractive, are well remunerated and offer some opportunities for career advancement.In addition, another important issue is related to the higher attractiveness of urban
221

areas, due to a higher availability of public goods and services (i.e., education,transportation, access to information).
Despite the fact that the declining importance of rural areas with respect tourban areas is a typical phenomenon commonly occurring in all countries, it is worthnoting that the complete abandonment of rural areas is not desirable, as it may causeseveral problems for the whole society.
The recognition of several functions of rural areas dates back to the 1990s,with the Buckwell report (Buckwell 1997), arguing the importance of a substantialCommon Agricultural Policy (CAP) reform aimed at rural development incentivesand environmental and cultural landscape payments. The basic principle wasthat, beside agricultural goods, rural areas would also produce stable semi-naturaleco-system services, which are greatly valued by the public. This was the basic ideaof the European Model of Agriculture (Swinbank 1999).
After two decades of policy interventions, addressed at supporting ruraldevelopment with agricultural policies (i.e., CAP) and regional policies, there stillremains a gap between rural and urban areas, probably due to the failure of theclassic top-down approach, where developing projects do not require the activeinvolvement of local communities. The problem arises when exogenous models (e.g.,the establishment of an industrial settlement) are introduced in a socio- economiccontext which is not suitable for enhancing its correct and sustainable functioningand, furthermore, for generating positive externalities and spillovers, with positiverebound effects on the whole territorial system. The lack of active participationof local communities has caused high costs for the whole society. In fact, theterritory will mainly provide the basic resources for the industrial operations (e.g.,natural resources, labor), while the value added will be mainly transferred elsewhere(Hubbard and Gorton 2011). The impact on the livelihood of the local economy willbe negligible, and there will be only limited chances for the emancipation of the ruralcommunities.
On the contrary, the novel approach adopted since the 1990s by the EU, bymeans of the bottom-up approach, with the LEADER programs, has introducedthe concept that local communities are key players in maintaining a full connectionbetween needs, resources and economic and social activities and represent the “socialfabric” paving the way for long-term sustainable development (Shucksmith 2000).
In fact, the local community detains the property rights of local resources andembeds tacit knowledge, that is, information, skills and abilities which are needed tovalorize low-value and highly heterogeneous local resources (e.g., different types
222

of biomass), according to development projects, which will preserve the territorialintegrity.
Regarding the energy transition from fossil-based to zero-carbon systems, such ashydropower, wind power, solar radiation, geothermal and biomass, the involvementand active participation of the local community are crucial for several reasons.First, local resources are available at a low cost (e.g., labor, land). Second, therevenues generated with the new activities may activate the creation of new businessopportunities and generate a multiplier effect and the revitalization of the localeconomy. Third, the extended redistributive effect of the project will facilitate thesocial acceptance of innovative initiatives, especially in the case of renewable energy,as rural communities do not urgently need the creation of additional sources ofenergy, while fearing the possible negative impacts on the environment and publichealth (Prosperi et al. 2019).
The well-known theoretical approach of total economic value is useful to graspthe relevance of the active involvement of the local community in the energy transitionprocess, as it provides the basic understanding of different values which can beattributed to an economic good. This approach, widely used for the identificationof different values of resources, goods and services (Adamowicz 1995; Perman et al.2003), will help us to understand that the involvement of the local community mayextend the value of renewable energy from the direct use value (i.e., revenue collectedfrom the sale of energy) to many other categories of values. In short, the transitiontowards renewable energy systems, occurring with the engagement of the localcommunity, will generate a multidimensional combination of impacts (Figure 2).
Direct UseValue
Indirect UseValue
ExistenceValue
OptionValue
BequestValue
Non-use ValueUse Value
TOTAL ECONOMIC VALUE
Figure 2. Conceptualization of total economic value. Source: Graphic by authors,2021.
223

The total economic value of renewable energy can be conceived as the result oftwo categories of values: the use value, which is directly related to the generation ofrenewable energy, and the non-use value, which is more related to the wellbeing oflocal citizens.
The direct use value is quite self-evident, as it refers to the value of sales for theenergy produced, to different types of consumers (i.e., households, public structures,industrial plants, commercial resellers).
The indirect use value may refer to the “greening effect” consequent to thereduction in carbon emissions and the impact that it may have on the reputation ofthe local community. Despite the fact that the local community may have a weakperception regarding to this type of value, it may be highly appreciated especially bythe urban society, which is more sensitive towards global environmental problems.
The option value may refer to the strengthening of social ties and relationships(i.e., social capital), which provides the pre-condition for the development of furtherinitiatives. Regarding the second group of values, they arise from the shared socialdimensions (i.e., ethical and moral values) within the local community. The existencevalue refers to the higher level of wellbeing, which may be reached by a communitywhen it proves it can undertake a global societal challenge (i.e., a rural community isable to achieve targets of renewable energy production and GHG reduction). Thebequest value refers to the social preference towards innovative goods and services,which will (possibly) be beneficial to the future generations.
4. Community Entrepreneurship: The Italian Experience between Expectationsand Disillusionment
The experience of community enterprise in Italy dates back to the 1960s, whenits development spontaneously started from some bottom-up movements. A relevantexample of an attempt to reinforce the local identity hindered by the massivedepopulation of rural areas is the case of the small hamlet of Monticchiello (provinceof Siena, in Tuscany), where since 1967, theatrical performances have been heldduring the summer time to represent the changes affecting the local community overtime (Andrews and Rosa 2005). The continuous confrontation among the communitymembers paved the way to cooperative actions for facing common problems andnew challenges.
Community enterprises have been developed in marginalized communities,characterized by large distances from lively urban settlements and profitable markets,and deprived of public services and infrastructure. The typical trends affecting thesecommunities are aging, depopulation, economic stagnation, job insecurity, low income
224

levels, incapacity to valorize available resources, deterioration of infrastructure andecosystems and degradation and loss of natural resources caused by abandonment(e.g., farmland, forests, water streams and reservoirs). In addition, the investmentof big energy companies has worsened the situation by causing serious impacts onthe landscape and loss of farmland due to the installation of large-scale wind andphotovoltaic plants.
Commonly, these problems are typical of inner rural and mountainous areas,but they also occur in some urban areas and suburbs in less developed regions, suchas the case of Southern Italy (Confcooperative—Confederazione Cooperative Italiane2018a).
In these situations, the key driver triggering the emergence of a communityinitiative is represented by the marginality and the vulnerability of the territory.Another relevant driver is represented by the existence of a system of mutualrelationships among individuals, organizations, the environment and cultural tieswithin the same territory. Consequently, the so-called “virtual communities” are nottaken into account, as they refer to occasional and weak relationships establishedwithin the context of the global community, as in the case of experiences referringto a shared and collaborative economy (MISE e Invitalia—Ministero dello SviluppoEconomico e Invitalia 2016). According to Mori (2015), the link with a specific territoryis the basic requirement characterizing community initiatives.
Another requisite of community enterprise generation relies on the unmet needs,difficulties or problems faced by the local community, which may arise from thechanges occurring over time. For instance, in recent decades, in order to pursue theenhancement of the efficiency of national public expenditure, several public serviceshave been deactivated in rural areas and relocated in urban areas. Similarly, thedepopulation of rural areas caused the closure of small and traditional firms andshops, with unavoidable consequences on the availability of job opportunities forlocal people, or, in some cases, the loss of symbolic social aggregation places(e.g., the closure of the last bakery shop or the largest manufacturing plant)(Confcooperative—Confederazione Cooperative Italiane 2018). Certainly, alongwith the closure of economic activities, the disappearance of other social institutions(e.g., civic association, political groups, sport clubs, parish) which play an importantrole for the aggregation of individuals and families may also occur.
The reaction against these difficulties requires the identification of strategiesbased on the valorization of idle local resources (material and immaterial commongoods), that is, resources that are not used for any purpose, or resources that areinefficiently and unprofitably used. Furthermore, a system of strategic partnerships
225

and social networks within the local community, and also with external agents,is the basic premise to activate an innovation process. A spontaneous process ofrevitalization of the local community cannot be expected, but, on the contrary, apromoting group of actors (i.e., a clique) may actively and deliberately pursue atransformation path, leading to the engagement of the community members in thedefinition of the vision and the mission of the community enterprise. The role oflocal public institutions is highly relevant, as they may endorse the initiative and theymay also provide some asset to favor the establishment of the enterprise. In addition,local institutions may activate some public tendering regarding the provision ofessential services, which will contribute to the business consolidation of the enterprise(Confcooperative—Confederazione Cooperative Italiane 2018).
The most relevant type of community enterprise diffused in Italy is the“cooperative of the community”, whose diffusion has been moderately increasedsince the beginning of the 2000s. In fact, several Italian regional governments haveenacted some specific regulations in order to promote its diffusion and strengthening.For instance, the Apulia region was among the first Italian regions enacting aspecific regulation in this matter in (Bollettino Ufficiale della Regione Puglia n. 66del 26/05/2014). However, at present, a national legislation is still missing, and,consequently, it is difficult to adequately monitor the diffusion process.
The cooperative of community seems a promising approach to address thedevelopment of marginal areas (Mastronardi et al. 2020). In fact, it can be conceivedas a bottom-up initiative through which it is possible to boost social innovation, withthe main purpose of satisfying local unmet needs, and to overcome the limitationof public interventions. In fact, the current public policy seems to be ineffective inaddressing the problems of less favored areas. Similarly, it cannot be expected thatthe private sector, while pursuing market competitiveness and the maximization ofprofits, may always perform better than the public sector.
It appears that the expectations towards the cooperative of community areexcessively optimistic. At present, there are still too limited successful casesconfirming the adequacy of the model to face the development problems of regionslagging behind. Furthermore, there is still a literature gap regarding the lessons tobe learned, in terms of possible solutions applied in different contexts (Bodini et al.2016). In this regard, the adoption of evaluation tools would be desirable in orderto perform economic assessment and social accountability of different initiatives,similar to what is occurring in the non-profit sector (i.e., the third sector) (Ministerodel Lavoro e delle Politiche Sociali 2019). The evaluation exercises would be usefulto verify the effects of the cooperation in the local context in which they operate.
226

The main features of the cooperative of community, which are included in thecurrent legislation, are the following:
• It is an enterprise able to use idle and common resources, and to offer a steadyand continuous provision of goods and services mainly to the local community;
• The membership is open, according to inclusive and democratic criteria;• The cooperative is well rooted in the community, as its objective is the
amelioration of the quality of life of the local community, conceived as thesocial group of the residents of a certain territory and people sharing values,culture and identity enshrined within a place, monuments, interests, resourcesand projects;
• The cooperative must guarantee that the provision of goods and services isaccessible by the whole community (Bodini et al. 2016).
Despite the great expectations for the cooperative of the community, the Italianexperience has not always been positive. The most frequent causes of failure arerelated to the incapacity of the management group in identifying an adequate businessmodel through which to pursue the financial sustainability of the company, in orderto guarantee the provision of goods and services to the local community. In fact,in several cases, the revenue of the cooperative mostly relies on public subsidiesand contracts for public procurements, which are uncertain and discontinuous,as they derive from the political process. In addition, when the cooperative is tooconcentrated on public support, it lacks the capacity to adapt to the market conditions,and the emergence of economic inefficiencies. In other words, the cooperative, insteadof acting as a firm, will gradually become similar to a public institution. Therefore,successful cases demonstrate that cooperatives have pursued financial sustainabilitythrough business diversification, including the market opportunities existing outsidethe local community (i.e., provision of goods and services to customers not belongingto the community) (MISE e Invitalia—Ministero dello Sviluppo Economico e Invitalia2016).
Another strategy relies on the consolidation of a core business capable ofensuring a constant revenue stream through which to finance the general economicactivity of the cooperative and provide either the ability to establish some investments(i.e., training of personnel, elaboration of new projects) or offset the temporal lagexisting between the cost anticipation and the collection of payments (i.e., cash flowstabilization). For instance, almost all Italian cooperatives of community are involvedin rural tourism activities, which are highly seasonal, or the organization of culturalactivities and services, which are precarious and unprofitable but are still highlybeneficial for the local community, in order to reinforce the cohesion among the
227

population, and to create the conditions for the economic development of the territory.This is the reason why Italian cooperative communities rarely report successfulstories. However, there are some instances of successful stories such as the case ofthe cooperative of Melpignano (in the Apulia region), which has been considered abest practice. In fact, it has been focused on the core business of energy productionfrom renewable sources and represents an exemplary case for sustainability andprofitability.
In this context, the energy transition towards renewable energy represents a veryimportant opportunity which could be captured by rural communities, as they maybe able to use local resources (e.g., agricultural and forest biomass, solar energy) withrelatively small investments, but facing a constant and reliable demand, capable ofgenerating a considerable amount of revenue flow. In this way, the energy transitionwill boost community entrepreneurship, will generate a positive impact on the localeconomy and will (indirectly) support the social wellbeing of the community.
A Cooperative of Community for Energy Transition: Bovino Municipality Case Study
The orientation of global policy makers to favor and support, through specificstrategies, the energy transition towards more sustainable and accessible productionsystems may represent an important development opportunity for the communitiesof the inner areas of Southern Italy. Very soon, they will have to choose eitherto be protagonists of these changes, exploiting the opportunities offered by thisparadigm shift in the energy sector, or to continue in passively suffering the effects.In the past, the populations of these territories have, indeed, been subjected to theconsequences of energy policies at the national level without being able to participatein the decision-making processes which have defined and implemented these policies.Consequently, the realization of renewable energy plants (both photovoltaic andwind) by large industrial companies, as well as modifying the landscape aspect andcompromising the naturalistic profile of these territories, was experienced by localpopulations as an exploitation of resources. Actually, the resulting benefits belongedto few people, and there was not an adequate refreshment system for mitigating thesuffering. Thus, there was a rising natural distrust of local communities towardsany attempt to address the energy issue, also in terms of local development. This isreminiscent of the importance of the local communities’ social acceptance. This is arelevant determinant of the development of renewable energy systems because itsabsence can cause delays or even the abandonment of innovative projects. In otherwords, community engagement and the democracy of the energy policy processes at
228
the local level have to be favored above all in this transition phase, learning by pastmistakes (Prosperi et al. 2019).
In this section, the authors describe the experience of the GenerativeCommunities project, funded by the local government of the Apulia region, inSouthern Italy, under the public call Cooperative of Community 2018. This call aimedat supporting the establishment of new community-type entrepreneurial realities. Theinitiative, promoted by the CRESCO training department of Confcooperative Foggia1,in partnership with the municipality of Bovino and two local non-profit organizations,concerned the creation of a participatory path in favor of the population of a smallinner area community (Bovino) to achieve the basic requirements needed for theestablishment of a local “cooperative of community” that would be, at the same time,an energy community for self-production and local distribution of renewable energy(see the EU Directive 2018/2001).
Bovino is a mountain municipality in the province of Foggia (Apulia region) witha population of 3256 inhabitants, included in the inner areas of the “Monti Dauni”.Indeed, it is located 37 km northwest of the provincial capital Foggia (Figure 3).
Similar to most municipalities located in mountainous areas, Bovino has showna constant decline in the number of residents in the last twenty years, overall equaling20% (Istat 2020). Its main economic sectors are agriculture and services (commercialactivities and professional firms) (IPRES 2016). All these factors denote the existenceof territorial problems related to the marginalization of the area from the main linesof development with consequent phenomena of de-anthropization, economic declineand strong social hardship, as reported in Figure 4.
In this context, the model proposed by the authors, as reported in theGenerative Communities project, aims at contributing to the improvement in the localsocio-economic situation by reactivating the “local” economy, essentially leveraginglatent territorial capital and the offer of some services to the resident population. Themain development assets are based on the energy sector and cultural heritage.
The value proposition is to transform the endurance of the local community,meant as a passive adaptation to conditioning coming from outside the referencecommunity context (selective market outcomes, consequences of administrativereorganization, etc.), into resilience, that is, a proactive attitude of catchingopportunities, essentially by leveraging the territorial capital. The main impact,
1 Representative body of cooperatives in the province of Foggia.
229

expected at the local level, is mainly concerned with the empowerment and capacitybuilding of the local community and the organizations involved.
The participatory approach consisted of the following steps:
a. Public forum, open to the whole community, to favor the engagement ofcitizens;
b. Focus groups with representatives of different stakeholders, to focus on themain strategic orientation of the cooperative of community;
c. Expert committee, in order to analyze and perform a screening of proposalsemerging from the focus groups, by considering the capacity and the resourceendowment (project tailoring).
Province of Foggia
Municipality of BovinoApulia region
Figure 3. Location of the municipality of Bovino. Source: Graphic by authors, 2021.
230

CONTINOUS REDUCTION OF RESIDENTS’ WELL-
BEING
Distance from service centres
Dissolution of proximity economy
Scarse use of social capital
Costant depopulationDecrease in job and
entrepreneurial opportunities
Low attractivenessof territory
WORSENING OF THE LOCAL SOCIO-ECONOMIC
SITUATION
Figure 4. Typical issues of a rural marginalized area such as Bovino. Source:Graphic by authors, 2021.
The technical committee examined and selected the proposals coming from theparticipatory process for formulating some valid operational areas, which, coherentlywith the identified strategies, were suitable for the local context. This last phaserepresents the novelty of this process.
The project, which started in September 2019, has been structured in six phases,as reported in Table 1.
It is worth noting that the feasibility study, based on the energy balance, isa very important document for the whole sustainability of the cooperative. Thedrafting of the feasibility plan, relating to the investment in the energy sector, hasbeen completed thanks to the information provided by the energy balance of themunicipality and the suggestions derived from the thematic round tables.
From the experience acquired from this case study, it is possible to underlinehow this specific participatory approach has changed the general attitude of thecommunity.
During the focus groups, some interesting results emerged from the participants’dialogues (30 informed individuals). In general, they expressed a strong distrusttowards renewable energy plants managed by multinational companies. Themain reason for this mistrust and opposition is due to the imbalance between
231

the exploitation of local resources (mainly the landscape and farmland) and theeconomic compensation granted to the communities.
Table 1. Synthesis of the activities undertaken during the project.
Phase Technique People Involved
Participatory designForum, focus groups,
technical committee (7experts)
50 people attending theforum; 30 people
participating in focusgroups
Identification of apromoting group
Self-selection spontaneouslyoccurred during the public
events15 people
Balance of competences ofthe cooperative founders
Evaluation of competences,skills and experiences,operated by the expertcommittee (2 members)
15 people
Training course Lectures and study trip toother rural areas (100 hours) 13 people
Feasibility study based onthe energy balance
Study performed by theexpert committee (4 experts) -
Dissemination of results Open conference 50 people
Source: Table by authors, 2021.
On the contrary, at the end of the Generative Communities project, there wasa radical change in attitude. In fact, during the final conference (through the opendebate with 50 participants), it emerged that the acceptability of the renewable energyplants would significantly increase if there were more economic benefits for thecommunity or if they are involved in the plants’ management.
This change may be explained as follows: the ways in which citizens areeffectively involved in the planning process; transparency and circulation ofinformation; the development of the empowerment of organizations and individuals.In fact, with reference to the last aspect, the initiative has contributed to increasingthe ability to influence and activate change through a process of participation,empowerment and awareness. Furthermore, it has facilitated a process of capacitybuilding, that is, the construction of individual and collective skills, as well asthe strengthening of the social cohesion of the community, which is also anintergenerational key.
232

Consequently, the proposed and implemented methodology can representa useful tool to facilitate the energy transition in inner areas in terms of localdevelopment, overcoming the distrust of local communities, which, in this context,can assume the role of the driver of innovation and change.
5. Concluding Remarks
The energy transition is a technological change based on the shift from fossil torenewable sources, which may represent a unique opportunity for the developmentof marginalized rural areas and may generate multiple benefits for local communities.In fact, rural areas are endowed with abundant idle resources that are suitable forgenerating renewable energy, such as residual biomass from agriculture, agro-industryand forestry, and locations for the siting of geothermal, wind and solar energy plants.The operations needed for energy conversion may revitalize the local economy, bycreating new job opportunities and by generating new sources of income.
The energy transition may be pursued according to two different approaches,that is, the typical top-down approach, where the investments are exogenous and thelocal community is marginally involved in the decision making, and the bottom-upapproach, where the local community is engaged during all stages of the projectdevelopment.
In this chapter, several arguments supporting the advantages arising frompursuing the bottom-up approach and, in particular, the formation of communityenterprises were presented. First, the engagement of the local community may easethe social acceptance of new investments, leading to a reduction in transaction costsarising from opportunistic behavior, asymmetric information and idiosyncrasy. Infact, the local community, having a better understanding and knowledge of the localresources and having skills, know-how and capabilities to use them in more efficientand effective ways, may find low-cost and sustainable solutions. Second, the membersof the local community may become, through community entrepreneurship, activeactors of the energy generation, distribution and consumption processes, enablingthem to revitalize their local economy and be able to consolidate a core businesscapable of ensuring a constant revenue stream, through which they can finance someprecarious and seasonal activities and services which, though financially unprofitable,may be highly beneficial for the local community, in order to reinforce the cohesionamong the population, and to create the conditions for the economic development ofthe territory.
The lesson learned from the study case of the municipality of Bovino is thatthe engagement of the local community in the energy transition process is not
233

spontaneous, and that many efforts are needed in order to activate the public debateand to let citizens find their own solutions. Unfortunately, in the context of escalatingsocial, environmental and economic challenges, business as usual, based on thetop-down approach, and the introduction of exogenous industrial and businessmodels are not suitable for pursuing a viable long-term development strategy. Inaddition, after several programming cycles occurred in the past, there is a risk ofdisillusionment and “community burn-out”, leading to a diffused and generalizedsocial opposition towards new development projects, which are worsening thealready poor conditions of inner areas.
Author Contributions: Conceptualization, writing—original draft preparation,writing—review and editing, M.L., M.P. and G.F.; project administration, M.L. andG.F. All authors have read and agreed to the published version of the manuscript.
Funding: This research received no external funding.
Conflicts of Interest: The authors declare no conflict of interest.
References
Adamowicz, Vic. 1995. Alternative Valuation Techniques: A Comparison and Movementto a Synthesis. In Environmental Valuation: New Persectives. Edited by K. Willis and J.Corkindale. Oxford: CAB International.
Andrews, Richard, and Alberto Asor Rosa. 2005. Teatro Povero di Monticchiello 1967–2004. AttoI. Edited by R. M. Trentadue and U. Bindi. Montevarchi: Aska Editions, pp. 1–96.
Bodini, Riccardo, Carlo Borzaga, Pierangelo Mori, Gianluca Salvatori, Jacopo Sforzi, andFlaviano Zandonai. 2016. Libro bianco—La Cooperazione di Comunità, Azioni e Politiche perConsolidare le Pratiche e Sbloccare il Potenziale di Imprenditoria Comunitaria. Trento: EuricsePublisher, pp. 1–84.
Buckwell, Allan. 1997. Towards a Common Agricultural and Rural policy for Europe. Reports andStudies, No 5. Brussels: European Commission Directorate General for Economic andFinancial Affairs DGII.
Camera dei Deputati. 2021. Il Piano Nazionale di Ripresa e Resilienza (PNRR). Availableonline: https://temi.camera.it/leg18/temi/piano-nazionale-di-ripresa-e-resilienza.html(accessed on 10 September 2021).
Confcooperative—Confederazione Cooperative Italiane. 2018a. La Cooperativa diComunità: Un Circolo Virtuoso, Collana “Strumenti” n. 5. pp. 1–43. Availableonline: http://www.fontecchio.gov.it/wp-content/uploads/2018/02/N.5-La-cooperativa-di-comunita.pdf (accessed on 10 April 2021).
234

Confcooperative—Confederazione Cooperative Italiane. 2018. Processi Generativi di SviluppoTerritoriale: La Dimensione Comunitaria, Collana “Strumenti” n. 8. pp. 1–39.Available online: https://lavoro.chiesacattolica.it/wp-content/uploads/sites/27/2019/07/09/
TENEGGI-Processi-di-sviluppo-territoriale.pdf (accessed on 10 April 2021).Ministero del Lavoro e delle Politiche Sociali. 2019. Decreto del Ministero del Lavoro
e delle Politiche Sociali del 23 Luglio, 2019. Linee Guida per la Realizzazione diSistemi di Valutazione Dell’impatto Sociale delle Attività Svolte Dagli enti del TerzoSettore, Gazzetta Ufficiale Serie Generale n. 214 del 12/09/2019. Available online:https://www.gazzettaufficiale.it/eli/id/2019/09/12/19A05601/sg (accessed on 10 April 2021).
EC. 2019. Communication from the Commission to the European Parliament, the European Council, theCouncil, the European Economic and Social Committee and the Committee of the Regions—TheEuropean Green Deal, Brussels, 11.12.2019 COM (2019) 640 Final. Brussels: EC.
EC. 2020. Report from the Commission to the European Parliament, the Council, the EuropeanEconomic and Social Committee and the Committee of the Regions Renewable Energy ProgressReport, Brussels, 14.10.2020 COM (2020) 952 Final. Brussels: EC.
EC. 2020. Communication from the Commission to the European Parliament, the Council, the EuropeanEconomic and Social Committee and the Committee of the Regions Powering a Climate—NeutralEconomy: An EU Strategy for Energy System Integration COM/2020/299 Final. Brussels: EC.
EC. 2020. Communication from the Commission to the European Parliament, the Council, the EuropeanEconomic and Social Committee and the Committee of the Regions a Hydrogen Strategy for aClimate—Neutral Europe COM/2020/301 Final. Brussels: EC.
EC. 2020. Communication from the Commission to the European Parliament, the Council, theEuropean Economic and Social Committee and the Committee of the Regions a Renovation Wavefor Europe—Greening our Buildings, Creating Jobs, Improving Lives COM/2020/662 Final.Brussels: EC.
EU. 2018. Directive 2018/2001 of the European Parliament and of the Council of 11December 2018 on the Promotion of the Use of Energy from Renewable Sources.Available online: https://eur--lex.europa.eu/legal--content/EN/TXT/PDF/?uri=CELEX:32018L2001&from=fr (accessed on 5 May 2021).
EU. 2021. Regulation (EU) 2021/241 of the European Parliament and of the Council of 12February 2021 Establishing the Recovery and Resilience Facility. Official Journal of theEuropean Union L 57: 17–75.
Governo Italiano. 2021. Piano Nazionale di Ripresa eResilienza—#NEXTGENERATIONITALIA. Available online: https://www.governo.it/sites/governo.it/files/PNRR_0.pdf (accessed on 19 May 2021).
Hennicke, Peter, Jana Rasch, Judith Schröder, and Daniel Lorberg. 2019. The Energy Transitionin Europe: A Vision of Progress, Wuppertal Spezial, No. 54, Wuppertal Institut für Klima,Umwelt, Energie, Wuppertal. Available online: http://nbn-resolving.de/urn:nbn:de:bsz:wup4-opus-73368 (accessed on 4 May 2021).
235

Hubbard, Carmen, and Matthew Gorton. 2011. Placing agriculture within rural development:Evidence from EU case studies, Environ. Plann. C: Gov. Policy 29: 80–95.
IEA, IRENA, UNSD, WB, and WHO. 2019. Tracking SDG 7: The Energy Progress Report 2019.Washington DC. Available online: https://trackingsdg7.esmap.org/data/files/download-documents/2019-Tracking%20SDG7-Full%20Report.pdf (accessed on 5 May 2021).
IPRES. 2016. Imprese Attive e Localizzazioni D’impresa. Available online: https://www.ipres.it/it/news/item/49-imprese-e-addetti-in-puglia-2016 (accessed on 17 April 2021).
Istat. 2020. Popolazione Residente al 1 Gennaio: Puglia. Available online: http://dati.istat.it/Index.aspx?QueryId=18550 (accessed on 17 April 2021).
Bollettino Ufficiale della Regione Puglia n. 66 del 26/05/2014. Available online:http://burp.regione.puglia.it/documents/10192/4806320/LEGGE+REGIONALE+
20+maggio+2014%2C%20n.+23+%28id+4806333%29/4ae8b341-640f-4e7b-be57-f48c694d87ff;jsessionid=C4D05BB4DF54C823E19A4943604050A1 (accessed on 15 April2021).
Mastronardi, Luigi, Maria Giagnacovo, and Luca Romagnoli. 2020. Bridging regional gaps:Community-based cooperatives as a tool for Italian inner areas resilience. Land Use Policy99: 104979. [CrossRef]
MISE e Invitalia—Ministero dello Sviluppo Economico e Invitalia. 2016. La Cooperazionedi Comunità per uno Sviluppo Locale Sostenibile. Studio di Fattibilità su “Lo Sviluppodelle Cooperative di Comunità”—Report Finale. Roma: MISE e Invitalia, pp. 1–280.Available online: https://www.cooperativedicomunita.confcooperative.it/Portals/0/News/INVITALIA-LA%20COOPERAZIONE%20DI%20COMUNITA-Report%20finale.pdf(accessed on 20 May 2021).
Mori, Pier Angelo. 2015. Community and Cooperation: The Evolution of Cooperatives towards NewModels of Citizens’ Democratic Participation in Public Services Provision. Trento: Euricse, pp.1–25.
Perman, Roger, Yue Ma, James McGilvray, and Michael Common. 2003. Natural Resource andEnvironmental Economics, 3rd ed. Boston: Pearson Addison Wesley, pp. 1–699.
Prosperi, Maurizio, Mariarosaria Lombardi, and Alessia Spada. 2019. Ex ante assessmentof social acceptance of small-scale agro-energy system: A case study in southern Italy.Energy Policy 124: 346–54. [CrossRef]
SDG Tracker. 2021. Ensure Access to Affordable, Reliable, Sustainable and Modern Energy forAll. Available online: https://sdg--tracker.org/energy (accessed on 10 May 2021).
Shucksmith, Mark. 2000. Endogenous development, social capital and social inclusion:Perspectives from LEADER in the UK. Sociologia Ruralis 40: 208–18. [CrossRef]
Swinbank, Allan. 1999. CAP reform and the WTO: Compatibility and developments. EuropeanReview of Agricultural Economics 26: 389–407. [CrossRef]
236

UN—United Nations. 2021. The Sustainable Development Agenda. Available online:https://www.un.org/sustainabledevelopment/development--agenda/ (accessed on 5 April2021).
Zelinsky, Wilbur. 1971. The hypothesis of the mobility transition. Geographical Review 61:219–49. [CrossRef]
© 2022 by the authors. Licensee MDPI, Basel, Switzerland. This article is an openaccess article distributed under the terms and conditions of the Creative CommonsAttribution (CC BY) license (http://creativecommons.org/licenses/by/4.0/).
237


Finnish Forest Industry and Its Role inMitigating Global Environmental Changes
Ekaterina Sermyagina, Satu Lipiäinen and Katja Kuparinen
1. Introduction
Climate change is currently one of the greatest global threats. Mitigating globalwarming requires a significant reduction in greenhouse gas (GHG) emissions eitherby reducing emission sources or enhancing the sinks to remove these gases fromthe atmosphere. To succeed, long-term structural changes are needed for differentsectors, thus creating more balanced and sustainable patterns of energy supply anddemand. The forest industry is an energy-intensive sector that emits approximately2% of industrial fossil carbon dioxide emissions worldwide. Considering the highshare of biofuels already used within this sector, the forest industry may shortlybecome a significant user of bio-based carbon capture technologies. The possibilityto implement these technologies can transform pulp and paper mills into negativeCO2 emitters. Moreover, the forest industry can also contribute to GHG emissionmitigation outside the mill gates by producing biomass-derived heat, electricity andliquid biofuels, and by providing wood-based products, such as packaging materials,textiles and chemicals, which will substitute the fossil-based alternatives.
The global forest industry has managed to decrease its dependence on fossilfuels as a result of energy efficiency improvement, fuel switching and structuralchanges, and thus its fossil CO2 emissions have decreased substantially in the 21stcentury (International Energy Agency 2020). However, the paper demand is expectedto increase from the current 400 Mt/a to 750–900 Mt/a by 2050, and thus there isa huge need to develop towards more sustainable operation in order to avoid anincrease in CO2 emissions. Therefore, more understanding of the possibilities of theforest sector is essentially required. In Europe, the forest sector has ambitious targetsto contribute to the mitigation of GHG emissions (CEPI 2011). The sector aims toemission reduction from the 1990 level of 60 MtCO2/a to 12 MtCO2/a in 2050 withan increasingly significant role of generated wood-based materials in substitutionof fossil materials in different applications. This book chapter considers the forestindustry’s possibilities to contribute to the mitigation of environmental change usingFinland as a target country. The Finnish Forest Industries have recently presenteda roadmap towards low-carbon operation (Finnish Forest Industries 2020a). The
239

roadmap takes into account CO2 reduction from increased annual forest growth,increased production of bio-based materials and reduction in fossil fuel use inindustrial processes, transportation and off-site production of energy. However, thereis a lack of academic studies that discuss extensively the CO2 mitigation possibilitiesof the forest sector.
Finland is an important producer of pulp, paper, and sawn wood. Besides thesetraditional goods, Finnish mills are generating a range of innovative wood-basedproducts that will be discussed in this study. Even though the Finnish forest industryis an important energy producer on a national level, it has currently only 13% of fossilfuels in its fuel mix, and therefore fossil CO2 emissions are already relatively low.The previous reports, however, claim that the Finnish forest industry can becomefossil-free by 2035. Finland’s government confirmed the National Energy and ClimateStrategy for 2030, which should help to achieve a long-term goal of a carbon-freesociety and keep the stable course for reach 80−95% reduction in GHG emissionsfrom the level of 1990 by 2050 (Ministry of Employment and the Economy 2014).Finland is among the world leaders in the utilization of renewable energy sources,especially bioenergy. The substantial forest resources, developed forest industryand the well-established forest infrastructure mean that wood-based bioenergy hasa significant place within the renewable energy sector in Finland. According toStatistics Finland (2020a), the total consumption of energy in Finland amounted to1362 petajoules (PJ) in 2019 with 38% covered by renewables. Figure 1 provides ahistorical trend on the total energy consumption from 1970 to 2019 (ibid.). The shiftfrom fossil fuels towards renewable alternatives continues in different spheres, witha significantly increasing increased share of the latter ones in total consumption fromthe 2010s.
The energy-transition tendencies and general development in the Finnish pulpand paper sector have been analysed in a few recent papers. The efficiency of theFinnish pulp and paper industry has been evaluated and compared to the EU averagelevel (Koreneff et al. 2019). The results of this study showed that while the productionefficiency is on a high level, the dominancy of kraft pulp production leads to thenotably higher energy intensity of the production process. Lipiäinen et al. (2022)have evaluated the main steps towards decarbonization in Finnish and Swedishpulp and paper industries, highlighting the essential steps performed there to reducefossil CO2 emissions and at the same time maintain competitiveness on a high level.While previous works limited their scope to the pulp and paper sector, the currentstudy aims to help in better understanding of the general picture and provides themost updated knowledge on the situation with forest industry in Finland: structure,
240

characteristics, fuel consumption and GHG emissions. In addition, we identifyimportant research directions to facilitate the transition towards a sustainable future.
1970
0
200
400
600
800
1000
Ener
gy c
onsu
mpt
ion
(PJ)
1200
1400
1600
1972
1974
1976
1978
1980
1982
1984
1986
1988
1990
1992
1994
1996
1998
2000
2002
2004
2006
2008
2010
2012
2014
2016
2018
Oil
Wood fuels
Coal
Hydro power
Peat
Others
Natural gas
Net imports of electricity
Nuclear energy
Figure 1. Total energy consumption in 1970–2019 in Finland. Source: Graphic byauthors based on data from Statistics Finland (2020a).
2. Methods
2.1. Data Gathering
Data were gathered from several sources to evaluate both the current stateand the development of the Finnish forest sector. The main sources for energyconsumption, production and emissions were Finnish Forest Industries and StatisticsFinland databases (Finnish Forest Industries 2020b; Statistics Finland 2020c). Duringthe study, a large number of previous studies were reviewed and the Finnish forestsector’s possibilities to participate in mitigation of climate change were evaluated.
241

Moreover, the emerging forest industry projects, such as the production of newbioproducts in Finland, have been identified and introduced.
2.2. Energy Efficiency Index Method
Energy efficiency development in the Finnish forest industry was studied usingthe energy efficiency index method. The method was applied in the previousstudy for assessing energy efficiency development in the pulp and paper industry(Lipiäinen et al. 2022). The present work follows the same method and uses the samereference-specific energy consumption values.
3. Finnish Forest Industry
The forest industry is a globally important industrial sector. Several wood-basedproducts, such as paper, paperboard and sawn wood participate in people’s everydaylife. The forest industry can be divided into the chemical forest industry that producesmainly pulp and paper, and the mechanical one that focuses on producing sawnwood and wood-based panels. The global forest industry produced 188 Mt of woodpulp, 409 Mt of paper, 493 Mm3 of sawn wood and 408 Mm3 of wood-based panelsin 2018 (Food and Agriculture Organization of the United Nations 2019).
In 2019, Finland produced 30%, 11% and 7% of European pulp, paper and board,and sawn wood, respectively (CEPI 2019; Food and Agriculture Organization of theUnited Nations 2019). 73% of produced pulp was kraft (sulphate) pulp. The restconsists of mechanical, chemi-mechanical, and semi-chemical pulp. Within paperproduction, the major shares had printing and writing papers (47%), and packagingmaterials (45%). A minor amount of newsprint and hygiene papers were produced.The Finnish forest industry has been recently going through a structural change(Kähkönen et al. 2019). The development of information technology has led to adecrease in the consumption of printing and writing papers (Johnston 2016), whereasthe demand for packaging materials has increased globally (Hetemäki et al. 2013).The changes in the production volumes between 1990 and 2019 are presented inTable 1. Production of newsprint, printing and writing papers has declined andseveral mills have been closed, while substantial growth in volumes of chemicalpulp, packaging materials and sawn wood has taken place. The role of new products,such as chemicals, biofuels, and energy, is increasing, and forest industry companiesare looking for new product opportunities, which will be discussed later.
242

Table 1. Production volumes in the Finnish forest industry.
Grade 1990 2019 Change
Domestic wood usage [Mm3] 44 61 +38%
Imported wood usage [Mm3] 6 10 +66%
Chemical pulp [Mt] 5.16 8.72 +69%
Mechanical pulp [Mt] 3.73 3.28 −12%
Newsprint [Mt] 1.43 0.27 −81%
Printing and writing paper [Mt] 4.68 4.60 −2%
Packaging materials [Mt] 2.32 4.44 +91%
Household and sanitary papers [Mt] 0.16 0.20 +22%
Other paper and paperboard [Mt] 0.37 0.20 −46%
Sawn wood [Mm3] 7.50 11.39 +52%
Wood-based panels [Mm3] 1.34 1.29 −4%
Source: Data from Food and Agriculture Organization of the United Nations (2020) andNature Resource Institute (LUKE) (2020).
The forest industry, especially the pulp and paper industry (PPI), is anenergy-intensive sector. The PPI is the fourth largest industrial energy user andglobally it consumed 7 EJ of energy in 2018 (International Energy Agency 2018). Theshare of biofuels was 48%, which is 18% higher than at the beginning of the 2000s.Energy demand per ton of produced paper has decreased substantially, and fuelswitching together with increased efficiency has led to lower fossil CO2 intensity. InFinland, the manufacturing of forest industry products is by far the largest industrialenergy consumer, which accounts for more than half of total industrial energy use:316.8 PJ in 2019 (Statistics Finland 2020b). The forest industry is also a significantenergy producer: it can cover a major share of its heat demand and about half ofits electricity demand. This highlights the importance of efficiency improvementand cost-efficient reduction in GHG emissions along with the promotion of cleanand sustainable technologies for this energy-intensive sector. The characteristics ofenergy use and emissions in the Finnish forest industry are presented in Table 2.
243

Table 2. Energy and emissions in the Finnish forest industry in 2019.
Energy and Emissions Finnish Forest Industry Share in Total DomesticValues
Electricity consumption 19.3 TWh/a 22.4%
Electricity production 10.1 TWh/a 1 15.3%
Energy consumption 316.8 PJ/a 23.3%
Dominant energy sources Biomass 87%, NG 5% 2 -
Fossil CO2 emissions 2.7 Mt/a 2 5.1%
NOx 17.5 kt/a 10.9%
S 1.7 kt/a 10.9%
1 2016 electricity production used due to lack of data. 2 Include only on-site fuel use. NG =natural gas. Source: Data from Finnish Forest Industries (2020b) and Statistics Finland (2020c).
4. Climate Change Mitigation Opportunities in the Forest Industry
Climate change mitigation requires both reducing GHG emissions andenhancing carbon sinks. There is no single solution to solve the problem of climatechange, but a wide range of solutions is needed, some of which are more maturethan others. The forest industry has a significant role in promoting these in Finland.Sustainable forest management enables not only the efficient utilization of forestresources but also their increase thus enhancing the role of forests as carbon sinks.Many changes and challenges have already transformed the forest industry inFinland in recent years and there should be more developments to come to adaptto the rapidly changing global situation. Modern pulp mills are expanding thetraditional concept of pulp mills by introducing the combination of multifunctionalbiorefineries and energy plants that utilize wood resources to produce not only pulpbut also energy as well as new high-value products from side-streams and residues.
Previous studies have estimated the contribution of the forest sector tomitigation of climate change by direct or indirect CO2 emission reduction (e.g.,Finnish and Swedish roadmaps). Based on the results from the previous studies, themain possibilities for the forest industry are addressed in the present work:
• Direct CO2 emissions reduction;• Green energy production• Bio-based materials.
The present study does not consider forest management but assumes that woodused by the forest industry is sustainably harvested.
244

4.1. CO2 Emissions and the Reduction Possibilities
The Finnish forest industry emitted 2.7 Mt of fossil and about 22 Mt of biogenicCO2 in 2019 (Finnish Forest Industries 2020b). The mechanical forest industry is aminor energy user and CO2 emitter in comparison to the chemical forest industry. Alarge part of CO2 produced in a pulp and paper mill comes from biomass combustionand can be considered carbon-neutral when the wood is from a sustainable origin.The fossil CO2 emissions from the PPI are energy-related, which makes theirreduction easier compared with for example the cement industry, since it does notrequire direct process modifications. The lime kilns also produce process-related CO2
emissions, but they are largely biogenic. The fossil CO2 emissions have decreasedby 44% over the last 20 years (1999–2019) (Figure 2). Emissions per ton of productdecreased by 37% from 194 to 122 kgCO2/ton. The industrial strike in 2005 andthe economic crisis around 2009 decreased absolute emissions strongly due to asignificant drop in production volume. During those crises, emissions per ton ofproduct did not change significantly. The reforms in energy taxation around 2003 and2011 have most probably contributed to the drops in emissions. The European Union(EU) introduced Emission Trading System (ETS) in 2005. It may have affected thefossil CO2 emissions, but it has been argued that ETS has had only a limited effect onthe PPI due to excess emission allowances (Gulbrandsen and Stenqvist 2013). After aperiod of steady emission levels between 2012 and 2016, the emissions have beendeclining again. The emissions are expected to continue to decline in the future as theFinnish forest industry is aiming towards net-zero emissions. A recently publishedreport argues that nearly zero emissions can be achieved in 2035 (Pöyry 2020).
The primary means to reduce CO2 emissions of the PPI are switching tolow-carbon fuels, electrification, and energy efficiency improvement. Carbon captureand storage (CCS) technologies that initially had been aimed mainly at the powersector, have significant potential in the PPI. In Finland, the role of the forest industryin mitigating environmental change and meeting the national carbon neutrality targetby 2035 is not limited to emissions reduction in the mills (Lipiäinen and Vakkilainen2021). The PPI supplies green electricity to the grid and produces other renewableenergy carriers. Moreover, it has been evaluated that products of the Finnish forestindustry can annually mitigate 16.6 Mt of CO2 emissions (Finnish Forest Industries2020b). However, forests are a significant carbon sink, and therefore they must bemanaged sustainably to achieve emission reductions.
245

1999
0
1000
2000
3000
4000
5000
CO2 e
mis
sion
s (10
00 t)
CO2 e
mis
sion
s per
ton
of p
rodu
ct (k
g/to
n)
300
250
200
150
100
50
0
6000
2000
2001
2002
2003
2004
2005
2006
2007
2008
2009
2010
2011
2012
2013
2014
2015
2016
2017
2018
2019
CO2 CO2 per ton of product
Figure 2. Trends in fossil CO2 emissions in the Finnish pulp and paper industry.Source: Graphic by authors based on data from Finnish Forest Industries (2020b).
4.1.1. Fuel Switching
The largest part of fossil-based CO2 emission savings is expected to comefrom replacing the current use of fossil fuels with renewables (Moya and Pavel2018; Metsäteollisuus ry 2020). The forest industry typically meets a large shareof its energy demand by its own production. A modern stand-alone pulp mill caneven surpass its heat and electricity demand by combusting wood residues (IRENAet al. 2018). Black liquor, a side-stream from kraft pulping, is the most importantbiofuel in the PPI. Mills combust it in the recovery boilers, and many mills have anadditional power boiler for combusting wood residues. The boilers supply steamfor the processes and for turbines to generate electricity. In the modern stand-alonepulp mills, fossil fuel consumption can be limited to start-ups, shutdowns, and otherexceptional situations, but many mills still combust fossil fuels in the lime kilns,mainly natural gas or oil (Kuparinen et al. 2019). Stand-alone paper mills and someintegrated pulp and paper mills cannot meet their energy demand by combustingtheir own residues. These mills either combust fossil fuels or purchase energy. Manykraft pulp mills produce an excess of electricity that is typically sold but can be
246

also used for hydrogen or e-fuels generation. However, the role of electrification isestimated to be minor in the emission reduction within the Finnish forest industry,mainly it is expected to substitute for natural gas use.
Biomass has been an important fuel in the Finnish forest industry for a longtime, but the fuel mix includes also natural gas, oil, coal, and peat (Figure 3). In1990, the share of biofuels was 64%, natural gas covered 15%, and oil, coal, and peatstand for approximately 7% each. In 2019, the share of biofuels had increased to87%, and the shares of natural gas, peat, oil, and coal were decreased to 6%, 3%,2% and 1%, respectively. Peat is a specific fuel in Finland that is typically co-firedwith biomass in power boilers. The recent political decisions in Finland promotethe replacement of coal and peat by biomass. Increased volumes of chemical pulphave increased the use of biofuels, but many mills have also actively looked forsolutions to decrease the use of fossil fuels. Currently, biomass has been seen as themost potential alternative for fossil fuels in the Finnish forest industry, and otherrenewables have not played a large role. The possibility to use wind power forcovering paper mills’ energy demand has been recently realized with a long-termWind Power Purchase agreement of Finnish company UPM with German wind parkdevelopment company (wpd) (UPM Communication Papers 2020). This agreementwill enable the decrease in CO2 emissions by 200,000 tonnes annually starting from2022 and help to achieve the company’s ambitious 65% CO2 emission reductiontarget by 2030. In addition, UPM is utilizing hydropower sources and upgrading theperformance of the existing hydropower plants (UPM Energy 2021).
The lime kilns are the primary fossil fuel users in chemical pulp production.CO2 is produced from both the combustion and the actual lime regeneration reactionduring the calcining process. The CO2 from the reaction originates mainly from woodand is thus biogenic. The lime kiln process requires stable combustion conditionsand easily controllable hot-end temperature. Consequently, fuel characteristics andquality should be consistent (Isaksson 2007). In addition to fossil fuels, alternativefuels such as methanol, tall oil, strong odorous gases, tall oil pitch, hydrogen, andturpentine are often co-fired in the lime kilns. Technically, it is also possible to utilizeexisting side-streams to substitute for fossil fuels there (Kuparinen and Vakkilainen2017). However, biomass fuels typically have lower adiabatic flame temperature andlower energy content than fossil oil or natural gas. Therefore, higher firing rates arerequired to maintain the kiln capacity in the case of biomass supply. Another problemis that the impurities that originated from the solid biomass tend to accumulate insuch a closed cycle process. These non-process elements can cause, e.g., corrosion and
247

ring formation in the kiln and decrease the lime quality. The use of alternative fuelscan thus lead to increased use of make-up lime and should be evaluated thoughtfully.
19900
50
100
150
200
250
Fuel
con
sum
ptio
n (P
J)
Shar
e of
bio
fuel
s
300
100%
90%
80%
70%
60%
50%
40%
30%
20%
10%
0%1995 2000 2005 2010 2015 2019
Liquid biofuels Heavy fuel oil
Solid biofuels Coal
Natural gas Other
Peat Share of biofuels
Figure 3. Development of fuels use in the Finnish forest industry. Source: Graphicby authors based on data from Finnish Forest Industries (2020b).
4.1.2. Energy Efficiency Improvement
Improvement of energy efficiency has played a notable role in the reductionin CO2 emissions so far (European Commission 2018). Efficient reduction in heatlosses, recovery of process heat and process optimization offer further possibilities foremissions reduction but require other concurrent actions to achieve the climate goals.The Best Available Technologies (BAT) reference document (European Commission2015) presents state-of-the-art technologies. Energy efficiency is however not astraightforward concept. It is often measured by specific energy consumption (SEC),i.e., the energy consumed for the production of a unit of product. However, achange in SEC may result for example from increased utilization rate instead ofimprovements in energy efficiency. The forest industry is a heterogeneous sectorwith a diverse product portfolio and highly energy intensive production processes.
248

No uniform practice on collecting process information exists. The collection ofreliable process information is necessary for efficiency improvement. While ingeneral, the increased energy efficiency leads to a decrease in CO2 emissions, anenergy-efficient mill is not necessarily CO2 efficient due to different products, processalternatives, and mill configurations. Stenqvist and Åhman (2016) noticed that thebenchmark-based emission allowance allocation of the EU ETS does not result inthe best performance in a heterogeneous sector like the PPI due to, e.g., lack ofbenchmark curves and biased reference values.
Energy efficiency within the forest industry can be improved by newtechnologies but also new modes of operation. Energy audits, motivated andcompetent employees, and process monitoring and control advance energy efficiency(Vakkilainen and Kivistö 2014). Finland has a long history of energy auditing, andboth mandatory and voluntary energy auditing schemes are carried out to measureenergy consumption and identify energy-saving opportunities (Ministry of EconomicAffairs and Employment of Finland 2021). The Finnish know-how on energy auditshas also been relied upon in other countries building their own audit schemes (MotivaLtd. 2019). Enhanced process integration typically improves energy efficiency. Thepulp and paper production processes result in secondary heat streams, whose furtherutilization would improve the total efficiency. The ongoing transformation fromtraditional pulp and paper mills to modern multi-product biorefineries offers apossibility to utilize these in the production of advanced bioproducts. Another viableoption is improved drying techniques that help to reduce emissions from one of themost energy-intensive process stages.
The Finnish forest industry has been historically an energy-efficient operator(Fracaro et al. 2012). Finnish pulp and paper production is already rather efficient,despite the need for heating due to the cold climate. Compared to the EU average,the Finnish mills are large, efficient, and modern (Koreneff et al. 2019). Nevertheless,it is still possible to increase efficiency. The development of the forest industry’sefficiency is presented in Figure 4. Between 2002 and 2019, primary energy efficiencyand electricity efficiency improved 1.4% and 1.2% per year, respectively. The strikein 2005 and the economic crisis around 2009 decreased the efficiency because severalmills were operating only part of their capacity. Several factors, such as closures ofold mills, start-ups of new mills, technology development and increase in energyprices, have contributed to the efficiency improvement (Kähkönen et al. 2019).
249

2002
50%
Ener
gy e
ffici
ency
55%
60%
65%
70%
75%
80%
85%
90%
95%
100%
2003
2004
2005
2006
2007
2008
2009
2010
2011
2012
2013
2014
2015
2016
2017
Primary energy Electricity
Figure 4. Trends in energy efficiency in the Finnish forest industry. Source: Graphicby authors based on data from Statistics Finland (2020c), Food and AgricultureOrganization of the United Nations (2019) and Finnish Forest Industries (2020b).
4.1.3. Carbon Capture Technologies
When the target is net-zero or even negative emissions, carbon capture,utilization, and storage (CCUS) technologies have to be included in the palette. CCUShas a remarkable role in many decarbonizing scenarios, especially in the ones thatinclude fossil fuels in the energy mix also in the future (European Commission 2018).Bioenergy with carbon capture and storage or utilization (BECCS/U) is one of thekey negative emission technologies. The pulp and paper industry, being a significantbioenergy producer, has a unique possibility for the implementation of BECCS/U.The global technical capture potential from kraft pulp mills has been estimated atapproximately 137 MtCO2/a (Kuparinen et al. 2019). One of the primary concernsregarding large-scale utilization of BECCS/U is increased land use since BECCS/Uis often seen as promoting additional use of biomass for energy. Large existingpulp and paper units however offer the possibility to implement BECCS/U without
250

additional biomass harvesting. The main weaknesses of BECCS/U currently are thelack of experience and political support. Public acceptance and uncertainties on thelong-term behaviour of the stored carbon have also hindered their implementationin the EU (European Commission 2018). Besides, carbon capture processes requireheat and electricity. Therefore, their integration into a mill affects the mill’s energybalance and total CO2 emissions.
The primary CO2 sources in the PPI are the combustion processes, namely therecovery boilers, the power boilers, and the lime kilns. The minor CO2 sourcesinclude, e.g., non-condensable gas destruction and biosludge treatment to producebiogas in some mills. The magnitude of the recovery process is often not fullyappreciated. In 2016, the global sulphate pulp production was 137 Mt (FAO 2017).Consequently, more than 1300 Mt of weak black liquor was processed in recoveryboilers globally and 206 Mt of black liquor dry solids were combusted to produceabout 1.8 EJ of energy (Tran and Vakkilainen 2008). According to (InternationalEnergy Agency 2018), it makes black liquor the fifth most important fuel in theworld after coal, oil, natural gas, and gasoline, and the most used biofuel globally.Therefore, the recovery boilers alone offer a notable possibility for BECCS/U.
The capture of biogenic CO2 from the pulp and paper mill processes is alittle-studied subject so far (Leeson et al. 2017). Recent publications (IEAGHG2016; Kuparinen et al. 2019) have however indicated the technical feasibility ofBECCS/U within the pulp mills. Several technologies including pre-combustion,post-combustion and oxy-combustion methods can be applied to pulp and papermills. Many of these are in the development stage. The most studied capture methodis the monoethanolamine (MEA) process (Onarheim et al. 2017; Leeson et al. 2017).The commercial MEA process is a post-combustion method and thus can be easilyapplied to existing mills. Based on earlier estimates, the cost of CO2 avoided in pulpmills ranges between 20 and 92 EUR/tCO2 depending on the chosen processes andmill characteristics (Fuss et al. 2018; IEAGHG 2016).
CO2 is typically seen as emission or waste; its value as a raw material forcarbon-based products has not been recognized until recently. CO2 conversiontechnologies include biotechnical and chemical or catalytic processes, a few of whichhave been commercialized so far (Lehtonen et al. 2019). The value of captured CO2
as a raw material can be a push for cost-effective carbon capture. It has a widerange of potential utilization routes in industrial and chemical applications, where itcurrently comes mostly from fossil sources. CCU processes enable CO2 recycling andtherefore reduction in the CO2 in the atmosphere. Net negative CO2 emissions canbe reached only if at least part of the captured CO2 is stored or utilized in a process
251

that permanently removes it from the atmosphere. Using it for fuel production, forinstance, delays the release and enables the indirect reduction in the atmosphere, ifthe fuel is used to substitute for traditional fossil fuels.
The possibilities to utilize CO2 in the PPI depend on mill-specific details.Currently, the chemical forest industry utilizes CO2, e.g., for pH control and in brownstock washing. Instead of purchase, it can be captured from the mills (Ruostemaa2018). Carbon capture from lime kiln flue gases and subsequent use as calciumcarbonate paper filler (precipitated calcium carbonate, PCC) is a well-known andwidely applied technology (Hirsch et al. 2013). In 2005, Teir et al. (2005) estimated thatthe potential to eliminate CO2 emissions considering only the PCC used in the PPI inFinland would be 200 kt/a. Apart from this, softwood pulp mill typically producestall oil as a by-product. Raw soap is separated from black liquor and converted tocrude tall oil by acidulation, typically using sulfuric acid. Part of the acid, up to 50%,can be replaced by CO2. Tall oil can be further converted to renewable fuels and usedto substitute for fossil alternatives. Another relevant alternative is lignin separationfrom black liquor using sulfuric acid, which can be also replaced by CO2: 150–250kgCO2/tlignin.
The reduction in direct CO2 emissions by fuel switching and energy efficiencyimprovement can avoid up to 2.5 MtCO2 of emissions, which correspond to 5%of the Finnish total fossil CO2 emissions. Moreover, capturing biogenic CO2 has asignificant potential to provide extended climate benefits.
4.2. Green Energy
Wood-derived energy made up 74% of total renewable energy in Finland in2019 with the largest share covered by black liquor combustion (47.2 TWh) (NaturalResources Institute 2019). According to the Natural Resources Institute (2019), solidwood fuels used at power and heating plants accounted for 39.5 TWh, the small-scalecombustion of wood comprised 16.8 TWh and other wood fuels covered 2.1 TWhin 2019. Wood energy resources for energy generation are typically used in highlyefficient district heating (DH) systems and combined heat and power (CHP) plants(Alakangas et al. 2018). Several examples of biomass-fired CHP plants in Finland aregiven in Table 3. All presented plants rely mainly on woody biomass with a minorshare of energy peat in consumption.
252

Table 3. Biomass-fired CHP plants in Finland.
PowerStation Location Electricity Heat Fuel Reference
AlholmensKraft power
plantJakobstad 265 MW
60 MW DH100 MW
process heat
forest residuespeat
AlholmensKraft (2020)
Vaasa powerplant Vaasa 230 MW 175 MW DH wood and peat
coalVaskiluodonVoima (2017)
Keljonlahtipower plant Jyväskylä 130 MW 260 MW DH wood
peat Alva (2020)
KaukaanVoima power
plantLappeenranta 125 MW
110 MW DH152 MW
process heat
forest residuesenergy wood
peat
Kaukaan VoimaOy (2019)
Seinäjokipower plant Seinäjoki 120 MW 100 MW DH
forest chipswood residuesrecycled wood
peat
VaskiluodonVoima (2017)
Most of the bioenergy in Finland is produced in pulp and paper mills. Themodern pulp and paper mills and sawmills operate with an integrated approachby using the residuals and by-products producing heat and power, biofuels andbiomaterials (Kuparinen et al. 2019). Figure 5 presents some alternative technologiesto produce biofuels or bioenergy by conversion of kraft pulp mill side streams.Many of these technologies are already used in Finnish mills and some, such as theproduction of synthetic hydrocarbons, are new possibilities.
Pulp and paper mills generate large amounts of sludges during wastewatertreatment, which can be converted to renewable energy streams. Due to their highwater content and poor dewaterability, pulp and paper mill sludges are extremelyproblematic streams, which are generally incinerated with low efficiency (Hagelqvist2013). Anaerobic digestion is a noteworthy alternative to convert sludge into valuablecommodities, i.e., biogas (mainly methane) and digestate (Bakraoui et al. 2019a,2019b). Numerous studies have shown that most pulp and paper mill effluentscan be to some extent anaerobically treated (Meyer and Edwards 2014; Bayr 2014).Hydrothermal carbonization (HTC) is another promising path to treat sludge, whichhas been actively studied at a laboratory scale (Saha et al. 2019; Areeprasert et al.2015; Mäkelä et al. 2016). HTC converts sludge into hydrochar with upgradedproperties that can be then combusted more effectively. World’s first OxyPowerHTC biofuel plant for sludge recycling is recently built by C-Green Technology inHeinola, Finland (C-Green Technology AB 2019). The facility will recycle 16,000
253

tons of biosludge annually at Stora Enso’s fluting paper mill to reduce annual CO2
emissions by 2500 tons.
ElectricityFlue gasBlack liquorSludge
HTC CO2 capture
SynthesisGasificationTorrefactionPulverizing
Pelletizing
Solid fuel
Heat Electricity Biofuels
UpgradingCombustion
Pretreatment processes - Screening, drying, chipping
Liquid fuel Gaseous fuel
Drying
Woodhandlingresidue : Bark, fines
Anaerobicdigestion
Ligninextraction
Tail oilrecovery
Fastpyrolysis
Water electrolysis
Figure 5. Alternative technologies for bioenergy and biofuel production by theusage of kraft pulp mill side streams. Source: Graphic by authors.
The most widely proposed utilization for captured CO2 is the production ofsynthetic hydrocarbons from H2 and CO2 (Lehtonen et al. 2019). These hydrocarbonsrepresent possible substitutes for fossil fuels in energy generation. Currently, H2
is mostly produced from fossil fuels, usually, natural gas, using a steam reformingprocess, but renewable H2 can be produced via electrolysis. Synthetic hydrocarbonsproduced from H2 and CO2 can be considered carbon neutral if H2 is produced usingrenewable electricity and CO2 originates from biomass or direct air capture. E-fuelsand advanced biofuels have the significant benefit of being suitable for conventional
254

engines and the traditional distribution infrastructure. Pulp mills offer an attractiveoption for integration of these processes due to their own production of renewableelectricity, availability of biogenic CO2, and abundant secondary heat streams.
Some examples of emerging technologies that may change the PPI in the future:
• Black liquor gasification is a promising technology to increase self-generationcapabilities in the PPI. The process aims to replace the recovery boiler andproduce energy, chemicals and fuels (Naqvi et al. 2010; Consonni et al. 2009).Despite of some technical difficulties, this technology can possibly providesignificant investment returns along with energy and environmental benefits(Consonni et al. 2009; Bajpai 2016).
• Hydrogen production. The conversion of mill’s streams to hydrogen-rich gasesis actively studied recently. Supercritical water gasification (SWG) of black liquoris an innovative method to produce H2-rich gases (Cao et al. 2020; Casademontet al. 2020; Özdenkçi et al. 2019, 2020). SWG is a potentially cost-effective wayto improve pulp mill profitability (Özdenkçi et al. 2019). The applicability ofSWG towards sludges was also intensively studied. This is a promising way toproduce high-quality fuels like methane, H2 and heavy oils (Zhang et al. 2010;Rönnlund et al. 2011).
Increased production of green electricity can contribute to grid decarbonization,and thus reduce CO2 emissions from electricity generation. The new biofuelsgenerated by the forest industry can play an important role in the decarbonization ofother sectors. Some sectors are considered challenging or even impossible to electrify,and consequently, renewable fuels present a viable solution for their emissionreduction. Decreasing the fossil fuel dependency in the heavy road, marine andair transport, for instance, most probably requires large amounts of bio-based andsynthetic fuels.
4.3. Bio-Based Materials
Wood-derived materials are actively used in various applications, such asthe production of paper, packaging, cosmetics, construction materials, compositeand textile products. New innovative products are being constantly developedalongside the traditional ones in response to global challenges. Using woodto substitute intensive materials and fossil fuels can provide significant climatebenefits (Leskinen et al. 2018). In addition, bio-based materials have a major rolein climate change mitigation through temporary carbon storage (Jørgensen et al.2015). Nowadays, besides the range of the standard products, such as pulp, tall oil,
255

bark, turpentine, electricity and process steam, the forest industry mills can offeradditional bioproducts such as textile fibres, biocomposites, fertilizers, biofuels andvarious cellulose- and lignin-derivatives. Finnish companies are actively expandingtheir product portfolio to new value chains thus allowing the Finnish forest industryto be successfully transformed into a bioproduct industry (Ministry of EconomicAffairs and Employment 2017). One good example is Metsä Fibre bioproduct millin Äänekoski, Finland (Metsä Group 2018). This unique mill is based on traditionalkraft pulping technology and produces typical pulp mill products as well as a rangeof other commodities, such as product gas from bark gasification, sulphuric acidfrom odorous gases, biogas, biopellets from sludge digestion and biocomposites.The mill is highly self-sufficient in terms of electricity, producing 2.4 times moreelectricity than needed for mill operation.
The development of novel biomaterials from wood and produced with a reducedcarbon footprint contributes significantly to the sustainable approach and bringshigher flexibility to the forest industry. The most promising wood-based productsfor emerging markets are discussed in the following:
• Biochemicals and biofuels: Wood-based chemicals are considered as one ofthe main possibilities to compensate for the decline in revenues of PPI fromreduced demand for graphic papers (Ignatius 2019). The main route is producingacids and alcohols by fermenting monomeric sugars from sawdust and chips(Hurmekoski et al. 2018). Biochemicals can be used for biofuels production, theneed of which is expected to increase towards 2030 (Hurmekoski et al. 2018).The Finnish Parliament has approved a law that sets a gradually increasing30% biofuels target for 2030. The tall oil-based technology route to generaterenewable diesel seems effective and economically competitive (Heuser et al.2013; UPM 2021b). The world’s first UPM biorefinery in Lappeenranta, Finlanduses the hy)drotreatment technology to produce UPM BioVerno diesel andnaphtha from crude tall oil. The BioVerno diesel shows superior fuel propertiesin comparison with regular diesel and first-generation ester-type diesel fuel(Heuser et al. 2013).
• Biocomposites: A combination of biomass-derived fibres (mostly based onnatural cellulosic fibers) with either virgin or recycled polymers offers a valuablealternative to oil-based plastics. Lignin-reinforced bioplastics have recentlygained attention worldwide (Yang et al. 2019; Thakur et al. 2014). Finnishcompany Woodio has recently developed the world’s first 100% waterproofwood composite of wood chips and resin-based adhesives that has a wide rangeof possible applications (Woodio 2021).
256

• Bio-based textiles: Dissolving wood pulp is a sustainable replacement forcotton and synthetic fibres in the textile and clothing industries, and its globalproduction is increasing steadily (Kallio 2021). New textile wood-based fibreproduction technologies to manufacturing such materials as viscose and lyocellare actively investigated and applied. Innovation company Metsä Spring islaunching a demo phase project in Äänekoski, Finland to produce the textilefibre Kuura®, which is produced by a novel direct-dissolution method (MetsäGroup 2021). The carbamate, BioCelSol and Ioncell-F are sustainable and safecellulose dissolution technologies recently developed in Finland (VTT 2017).
• Lignin-based materials: The majority of lignin is consumed as a fuel on-site, andonly about 5% of lignin is currently utilized for the production of value-addedproducts (Dessbesell et al. 2017). At the same time, lignin has potential fornumerous applications: as a precursor for carbon fibers (Souto et al. 2018;Mainka et al. 2015), resins and adhesives (Cheng et al. 2011) and within differentother applications (Kienberger 2019). Stora Enso’s Sunila pulp mill, Finland isthe largest integrated kraft lignin extraction plant in the world (50,000 tonnes ofextracted lignin annually) (Stora Enso 2020). The new pilot plant to use ligninfor manufacturing a graphite replacement for energy storage applications iscurrently under construction there.
• Nanocellulose: Cellulose nanomaterials possess a range of promising propertiesthat enable their utilization in diverse applications, including packaging,filtering, biomedical applications, energy and electronics, construction andso forth (Lin and Dufresne 2014; Dhali et al. 2021). Stora Enso runs theworld’s largest micro-fibrillated cellulose (MFC) production facility at Imatra,Finland (Stora Enso 2019). MFC is used to produce an MFC-enhanced liquidpackaging board New Natura™, which has extra strength and low weight.Another Finnish company, UPM, is implementing a novel method to producewood-based cellulose nanofibril hydrogel GrowDex® for 3D cell culturingand other biomedical applications (UPM 2016). UPM is also producinga nanocellulose-based wound dressing FibDex® that provides an optimalenvironment for wound healing (UPM 2021a).
• Hemicellulose products: Hemicelluloses are generally burned along with ligninin the kraft pulp mills; however, the cost-effective extraction method wouldenable their more efficient utilization. Water solubility, biodegradability andamorphous structure make hemicellulose a promising precursor for high-valueapplications. It can be used as an environmentally friendly and inexpensiveemulsifier to stabilize food, cosmetic and pharmaceutical products (Carvalheiroet al. 2008). Also, it can be hydrolyzed to produce biofuels and chemicals
257

(Hurmekoski et al. 2018). CH-Bioforce, a Finnish start-up company, hasdeveloped a method of biomass fractionation, which can be used to extracteffectively biomass components (Bioforce 2020).
In addition to the aforementioned products, other concepts are being activelydeveloped, such as advanced materials (porous cellulosic materials, coatings, films,foams), fertilizers and earthwork materials (Fabbri et al. 2018). Novel products bringadditional flexibility to the mills, however, the production of new commodities maybe significantly constrained by the availability of by-product flows within the mills(Hurmekoski et al. 2018).
The forest industry has significant potential to participate in the substitution offossil-based materials in various sectors, and thus it plays a major role in creatingand developing bioeconomy. The products of the Finnish forest industry alreadyprovide substantial climate benefits, but it is expected that the benefits will expandeven more in the future (Finnish Forest Industries 2020a).
5. Conclusions
Climate change increases the significance of forest energy. The circular economygoals outlined globally, and within the EU, include improvements in material andenergy efficiency, a realization of industrial symbiosis potential and a significantincrease in the use of residues and wastes as valuable raw materials. Combiningdifferent technologies and using the potential of wood resources to the highest extentcan boost energy and economic efficiency by providing fuel flexibility along with awide range of products generated with a reduced carbon footprint.
Sustainability and life cycle thinking play a major role in the developmentof a circular economy in the forest sector in Finland. Finnish forest industrycompanies are constantly improving their energy efficiency and decreasing theirdependency on fossil sources. The structural changes affecting the forest industrysector bring simultaneously new opportunities through novel outputs. The use ofthe best available techniques, tighter emissions regulations and emission-relatedcosts are enabling a more effective transition of the forest industry towardseffective biorefineries. Modern Finnish pulp and paper mills and sawmills operatewith an integrated approach by utilizing the process residuals for producingrenewable heat, power, and bioproducts. Among the most promising wood-derivedproducts are biofuels, textile fibres, biocomposites, fertilizers, various cellulose- andlignin-derivatives. Carbon capture technologies have a remarkable potential withinthe PPI. While producing a significant amount of bioenergy, pulp and paper millsintegrated with CO2 capture technologies can become major sources of negative
258

CO2 emissions. At the same time, as long as the political environment for bioenergycarbon capture is uncertain, the future potential is extremely challenging to evaluate.
The climate benefit from forest industry products in Finland has been estimatedto be currently 16.6 MtCO2, and it is expected to increase in the future. Many of thenew bioproducts are in an early stage of development and thus further studies areneeded to bring them to the markets. Replacement of fossil fuels used and efficiencyimprovement in the Finnish pulp and paper mills can lead to roughly 2.5 MtCO2
emission reduction, which corresponds to approximately 5% of the domestic CO2
emissions. An increase in demand for biomass sources might be the major challengein the replacement of fossil fuels. While the role of forests as a carbon sink was out ofthe scope of this study, it is worth noting that the improved forest management cansubstantially enhance carbon removal from the atmosphere. As the aforementionedexamples show, the possibilities of the forest industry to contribute to the mitigationof environmental changes evaluated on the Finnish example are certainly impressive.However, further studies are needed to enhance understanding of climate benefitsof different solutions and to release the potential of the forest sector by overcomingtechnical, economic and political barriers.
Author Contributions: Conceptualization, S.L.; Validation, K.K., S.L. and E.S.; Investigation,K.K., S.L. and E.S.; Writing—Original Draft Preparation, K.K., S.L. and E.S.; Writing —Reviewand Editing, K.K., S.L. and E.S.; Visualization, K.K. and S.L.; Supervision and ProjectAdministration, E.S. All authors have read and agreed to the published version of themanuscript
Funding: This research was funded by the Academy of Finland project “Role of ForestIndustry Transformation in Energy Efficiency Improvement and Reducing CO2 Emissions”,grant number 315019.
Conflicts of Interest: The authors declare no conflict of interest.
References
Alakangas, Eija, Tomi J. Lindroos, Tiina Koljonen, and Jeffrey Skeer. 2018. Bioenergy fromFinnish Forests: Sustainable, Efficient and Modern Use of Wood. Abu Dhabi: InternationalRenewable Energy Agency. Available online: www.irena.org (accessed on 12 April 2021).
Alholmens Kraft. 2020. Alholmens Kraft Is the Largest Bio-Fuelled Power Plant in the World.Available online: https://www.alholmenskraft.com/en/company/bio-fuelled_power_plan (accessed on 10 March 2021).
Alva. 2020. Energiantuotanto. Available online: https://www.alva.fi/alva/yhtio/energiantuotanto/ (accessed on 27 March 2021).
259

Areeprasert, Chinnathan, Antonio Coppola, Massimo Urciuolo, Riccardo Chirone, KunioYoshikawa, and Fabrizio Scala. 2015. The Effect of Hydrothermal Treatment on Attritionduring the Fluidized Bed Combustion of Paper Sludge. Fuel Processing Technology 140:57–66. [CrossRef]
Bajpai, Pratima. 2016. Emerging Technologies. In Pulp and Paper Industry. Edited by PratimaBajpai. Amsterdam: Elsevier, pp. 189–251. [CrossRef]
Bakraoui, Mohammed, Fadoua Karouach, Badr Ouhammou, Mohammed Aggour, AzzouzEssamri, and Hassan El Bari. 2019a. Kinetics Study of the Methane Production fromExperimental Recycled Pulp and Paper Sludge by CSTR Technology. Journal of MaterialCycles and Waste Management 21: 1426–36. [CrossRef]
Bakraoui, Mohammed, Mohammed Hazzi, Fadoua Karouach, Badr Ouhammou, and HassanEl Bari. 2019b. Experimental Biogas Production from Recycled Pulp and PaperWastewater by Biofilm Technology. Biotechnology Letters 41: 1299–307. [CrossRef][PubMed]
Bayr, Suvi. 2014. Biogas Production from Meat and Pulp and Paper IndustryBy-Products. Ph.D. thesis, University of Jyväskylä, Jyväskylä. Availableonline: https://jyx.jyu.fi/dspace/bitstream/handle/123456789/43316/978-951-39-5680-6_vaitos23052014.pdf?sequence=1 (accessed on 15 February 2021).
Bioforce. 2020. Biomass Consists of Cellulose, Hemicellulose and Lignin. Available online:https://www.ch-bioforce.com/ (accessed on 15 February 2021).
Cao, Changqing, Yupeng Xie, Liuhao Mao, Wenwen Wei, Jinwen Shi, and Hui Jin. 2020.Hydrogen Production from Supercritical Water Gasification of Soda Black Liquor withVarious Metal Oxides. Renewable Energy 157: 24–32. [CrossRef]
Carvalheiro, Florbela, Luís C. Duarte, and Francisco M. Gírio. 2008. HemicelluloseBiorefineries: A Review on Biomass Pretreatments. Journal of Scientific and IndustrialResearch 67: 849–64.
Casademont, Pau, Jezabel Sánchez-Oneto, Ana Paula Jambers Scandelai, Lúcio Cardozo-Filho,and Juan Ramón Portela. 2020. Hydrogen Production by Supercritical Water Gasificationof Black Liquor: Use of High Temperatures and Short Residence Times in a ContinuousReactor. Journal of Supercritical Fluids 159: 104772. [CrossRef]
CEPI. 2011. The Forest Fibre Industry. Available online: https://www.cepi.org/the-forest-fibre-industry-2050-roadmap-to-a-low-carbon-bio-economy/ (accessed on 2 February2022).
CEPI. 2019. European Pulp & Paper Industry. Available online: http://www.cepi.org/topics/statistics (accessed on 29 April 2021).
C-Green Technology AB. 2019. C-Green Builds World’s First OxyPower HTC Biofuel Plant forSludge Recycling in Finland. Available online: https://static1.squarespace.com/static/5df0c803d3862346753f82d3/t/5e2895ff443f762e37439b76/1579718144028/20190927_C-Green_Heinola1_EN.pdf (accessed on 13 April 2021).
260

Cheng, Shuna, Ian D’Cruz, Zhongshun Yuan, Mingcun Wang, Mark Anderson, Mathew Leitch,and Chunbao Charles Xu. 2011. Use of Biocrude Derived from Woody Biomass toSubstitute Phenol at a High-Substitution Level for the Production of Biobased PhenolicResol Resins. Journal of Applied Polymer Science 121: 2743–51. [CrossRef]
Consonni, Stefano, Ryan E. Katofsky, and Eric D. Larson. 2009. A Gasification-BasedBiorefinery for the Pulp and Paper Industry. Chemical Engineering Research and Design 87:1293–317. [CrossRef]
Dessbesell, Luana, Chunbao Xu, Reino Pulkki, Mathew Leitch, and Nubla Mahmood.2017. Forest Biomass Supply Chain Optimization for a Biorefinery Aiming to ProduceHigh-Value Bio-Based Materials and Chemicals from Lignin and Forestry Residues: AReview of Literature. Canadian Journal of Forest Research 47: 277–88. [CrossRef]
Dhali, Kingshuk, Mehran Ghasemlou, Fugen Daver, Peter Cass, and Benu Adhikari. 2021.A Review of Nanocellulose as a New Material towards Environmental Sustainability.Science of the Total Environment 775: 145871. [CrossRef]
European Commission. 2015. Integrated Pollution Prevention and Control, Best AvailableTechniques (BAT) Reference Document for the Production of Pulp, Paper and Board.Luxembourg: Publications Office of the European Union, vol. EUR 27235. [CrossRef]
European Commission. 2018. A Clean Planet for All—A European Long-Term StrategicVision for a Prosperous, Modern, Competitive and Climate Neutral Economy. COM(2018) 773: 114. Available online: https://ec.europa.eu/clima/sites/clima/files/docs/pages/com_2018_733_en.pdf%0Ahttps://ec.europa.eu/clima/sites/clima/files/docs/pages/com_2018_733_en.pdf?utm_campaign=AktuellHållbarhet-Direkten_181129_Username&utm_medium=email&utm_source=Eloqua&elqTrackId (accessed on 1February 2021).
Fabbri, Paola, Davide Viaggi, Fabrizio Cavani, Lorenzo Bertin, Melania Michetti, ErikaCarnevale, Juliana Velasquez Ochoa, Gonzalo Martinez, Micaela Esposti, and PiretFischer. 2018. Top Emerging Bio-Based Products, Their Properties and Industrial Applications.Berlin: Ecologic Institut. Available online: www.ecologic.eu (accessed on 22 March 2021).
FAO. 2017. FAOSTAT—Forestry Production and Trade. Roma: FAO.Finnish Forest Industries. 2020a. A Green and Vibrant Economy: Finnish Forest Industry Climate
Roadmap. Helsinki: Finnish Forest Industries. (In Finnish)Finnish Forest Industries. 2020b. Statistics. Available online: https://tem.fi/documents/
1410877/2132212/IRENA_FinnishForest.pdf/8159091a-8fad-49b4-bfae-2266d2c32b84/IRENA_FinnishForest.pdf?t=1521204974000 (accessed on 15 February 2021).
Food and Agriculture Organization of the United Nations. 2019. Forestry Production and Trade.Roma: FAO.
Fracaro, Guilherme, Esa Vakkilainen, Marcelo Hamaguchi, and Samuel Nelson Melegari deSouza. 2012. Energy Efficiency in the Brazilian Pulp and Paper Industry. Energies 5: 3550.[CrossRef]
261

Fuss, Sabine, William F. Lamb, Max W. Callaghan, Jérôme Hilaire, Felix Creutzig, ThorbenAmann, Tim Beringer, Wagner de Oliveira Garcia, Jens Hartmann, Tarun Khanna, andet al. 2018. Negative Emissions—Part 2: Costs, Potentials and Side Effects. EnvironmentalResearch Letters 13: 63002. [CrossRef]
Gulbrandsen, Lars H., and Christian Stenqvist. 2013. The Limited Effect of EU EmissionsTrading on Corporate Climate Strategies: Comparison of a Swedish and a NorwegianPulp and Paper Company. Energy Policy 56: 516–25. [CrossRef]
Hagelqvist, Alina. 2013. Sludge from Pulp and Paper Mills for Biogas Production Treatment andSludge Management. Karlstad: Karlstad University.
Hetemäki, Lauri, Riikka Hänninen, and Alexander Moiseyev. 2013. Markets and MarketForces for Pulp and Paper Products. In The Global Forest Sector: Changes, Practices, andProspects. Edited by Eric Hansen, Rajat Panwar and Richard Vlosky. Boca Raton: CRCPress, Taylor and Francis Group, pp. 57–92. [CrossRef]
Heuser, Benedikt, Ville Vauhkonen, Sari Mannonen, Hans Rohs, and Andreas Kolbeck. 2013.Crude Tall Oil-Based Renewable Diesel as a Blending Component in Passenger CarDiesel Engines. SAE International Journal of Fuels and Lubricants 6: 817–25. [CrossRef]
Hirsch, Georg, Antje Kersten, Hans-Joachim Putz, Brigitte Bobek, Udo Hamm, and SamuelSchabel. 2013. CaCO3 in the Paper Industry—Blessing or Curse? Paper presented atTappi PEERS Conference 2013, Green Bay, WI, USA, 15–18 September 2013; p. 44.
Hurmekoski, Elias, Ragnar Jonsson, Jaana Korhonen, Janne Jänis, Marko Mäkinen, PekkaLeskinen, and Lauri Hetemäki. 2018. Diversification of the Forest Industries: Role ofNew Wood-Based Products. Canadian Journal of Forest Research 48: 1417–32. [CrossRef]
IEAGHG. 2016. Techno-Economic Evaluation of Retrofitting CCS in a Market Pulp Mill and anIntegrated Pulp and Board Mill. Cheltenham: IEA Greenhouse Gas R&D Programme, vol.2016/10.
Ignatius, Heikki. 2019. Wood-Based Biochemical Innovation Systems: Challenges and Opportunities.Helsinki: University of Helsinki.
International Energy Agency. 2018. Statistics. Paris: International Energy Agency.International Energy Agency. 2020. Pulp and Paper. Paris: International Energy Agency.IRENA, VTT, and MEAE. 2018. Bioenergy from Finnish Forests. Abu Dhabi: International
Renewable Energy Agency.Isaksson, Juhani. 2007. Meesauunikaasutin (Lime Kiln Gasifier). Recovery Boiler Seminar 18
October 2007. Helsinki: Finnish Recovery Boiler Committee.Johnston, Craig M.T. 2016. Global Paper Market Forecasts to 2030 under Future Internet
Demand Scenarios. Journal of Forest Economics 25: 14–28. [CrossRef]Jørgensen, Susanne V., Michael Z. Hauschild, and Per H. Nielsen. 2015. The Potential
Contribution to Climate Change Mitigation from Temporary Carbon Storage inBiomaterials. International Journal of Life Cycle Assessment 20: 451–62. [CrossRef]
262

Kallio, Maarit. 2021. Wood-Based Textile Fibre Market as Part of the Global Forest-BasedBioeconomy. Forest Policy and Economics 123: 102364. [CrossRef]
Kaukaan Voima Oy. 2019. Kaukaan Voima, Lappeenranta—Pohjolan Voima. Availableonline: https://www.pohjolanvoima.fi/voimalaitokset/kaukaan-voima-lappeenranta/(accessed on 12 April 2021).
Kienberger, Marlene. 2019. Potential Applications of Lignin. In Economics of Bioresources. NewYork: Springer International Publishing, pp. 183–93. [CrossRef]
Koreneff, Göran, Jarno Suojanen, and Pirita Huotari. 2019. Energy Efficiency of Finnish Pulp andPaper Sector—Indicators and Estimates. Espoo: VTT.
Kuparinen, Katja, and Esa Vakkilainen. 2017. Green Pulp Mill: Renewable Alternatives toFossil Fuels in Lime Kiln Operations. BioResources 12: 4031–48. [CrossRef]
Kuparinen, Katja, Esa Vakkilainen, and Tero Tynjälä. 2019. Biomass-Based Carbon Captureand Utilization in Kraft Pulp Mills. Mitigation and Adaptation Strategies for Global Change24: 1213–30. [CrossRef]
Kähkönen, Satu, Esa Vakkilainen, and Timo Laukkanen. 2019. Impact of Structural Changeson Energy Efficiency of Finnish Pulp and Paper Industry. Energies 12: 3689. [CrossRef]
Leeson, Duncan, Niall Mac Dowell, Nilay Shah, Camille Petit, and Paul S. Fennell. 2017. ATechno-Economic Analysis and Systematic Review of Carbon Capture and Storage (CCS)Applied to the Iron and Steel, Cement, Oil Refining and Pulp and Paper Industries, asWell as Other High Purity Sources. International Journal of Greenhouse Gas Control 61:71–84. [CrossRef]
Lehtonen, Juha, Sami Alakurtti, Antti Arasto, Ilkka Hannula, Ali Harlin, Tiina Koljonen, RaijaLantto, Michael Lienemann, Kristin Onarheim, Juha-Pekka Pitkänen, and et al. 2019. TheCarbon Reuse Economy—Transforming CO2 from a Pollutant into a Resource. Espoo: VTTTechnical Research Centre of Finland Ltd. [CrossRef]
Leskinen, Pekka, Giuseppe Cardellini, Sara González-García, Elias Hurmekoski, Roger Sathre,Jyri Seppälä, Carolyn Smyth, Tobias Stern, and Pieter Johannes Verkerk. 2018. SubstitutionEffects of Wood-Based Products in Climate Change Mitigation. From Science to Policy 7.Joensuu: European Forest Institute.
Lin, Ning, and Alain Dufresne. 2014. Nanocellulose in Biomedicine: Current Status and FutureProspect. European Polymer Journal 59: 302–25. [CrossRef]
Lipiäinen, Satu, and Esa Vakkilainen. 2021. Role of the Finnish Forest Industry in MitigatingGlobal Change: Energy Use and Greenhouse Gas Emissions towards 2035. Mitigationand Adaptation Strategies for Global Change 26: 1–19. [CrossRef]
Lipiäinen, Satu, Katja Kuparinen, Ekaterina Sermyagina, and Esa Vakkilainen. 2022. Pulpand Paper Industry in Energy Transition: Towards Energy-Efficient and Low CarbonOperation in Finland and Sweden. Sustainable Production and Consumption 29: 421–31.[CrossRef]
263
Mainka, Hendrik, Olaf Täger, Enrico Körner, Liane Hilfert, Sabine Busse, Frank T. Edelmann,and Axel S. Herrmann. 2015. Lignin—An Alternative Precursor for Sustainable andCost-Effective Automotive Carbon Fiber. Journal of Materials Research and Technology 4:283–96. [CrossRef]
Metsä Group. 2018. Next-Generation Bioproduct Mill in Äänekoski. Available online: www.metsagroup.com (accessed on 12 February 2021).
Metsä Group. 2021. Metsä Group’s New Textile Fibre Is Kuura. European Commision.Available online: https://www.metsagroup.com (accessed on 12 February 2021).
Metsäteollisuus ry. 2020. Vihreä Ja Vireä Talous: Metsäteollisuuden Ilmastotiekartta 2035 (Green andDynamic Economy: The Climate Road Map of Forest Industry 2035). Helsinki: Metsäteollisuusry. (In Finnish)
Meyer, Torsten, and Elizabeth A. Edwards. 2014. Anaerobic Digestion of Pulp and Paper MillWastewater and Sludge. Water Research 65: 321–49. [CrossRef]
Ministry of Economic Affairs and Employment of Finland. 2021. Energy Efficiency Agreements2017–2025. Helsinki: Ministry of Economic Affairs and Employment.
Ministry of Economic Affairs and Employment. 2017. Wood-Based Bioeconomy Solving GlobalChallenges. Helsinki: Ministry of Economic Affairs and Employment.
Ministry of Employment and the Economy. 2014. Energy and Climate Roadmap 2050. Report of theParliamentary Committee on Energy and Climate Issues. Helsinki: Ministry of Employmentand the Economy.
Motiva Ltd. 2019. Energy Audits. Available online: https://www.motiva.fi/en/solutions/policy_instruments/energy_audits (accessed on 2 February 2022).
Moya, Jose A., and Claudiu C. Pavel. 2018. Energy Efficiency and GHG Emissions: ProspectiveScenarios for the Pulp and Paper Industry. Luxembourg: Publications Office of the EuropeanUnion, vol. EUR 29280. [CrossRef]
Mäkelä, Mikko, Verónica Benavente, and Andrés Fullana. 2016. Hydrothermal Carbonizationof Industrial Mixed Sludge from a Pulp and Paper Mill. Bioresource Technology 200: 444–50.[CrossRef]
Naqvi, Muhammad, Jinyue Yan, and Erik Dahlquist. 2010. Black Liquor GasificationIntegrated in Pulp and Paper Mills: A Critical Review. Bioresource Technology 101: 8001–15.[CrossRef]
Natural Resources Institute. 2019. Total Energy Consumption by Energy Source by Unit.Available online: http://statdb.luke.fi/PXWeb/pxweb/en/LUKE/LUKE__04Metsa__08Muut__Energia/09.01_Energian_kokonaiskulutus.px/?rxid=dc711a9e-de6d-454b-82c2-74ff79a3a5e0 (accessed on 22 April 2021).
Nature Resource Institute (LUKE). 2020. Metsäteollisuuden Puunkäyttö Väheni 2019 (Wood UsageDecreased in Forest Industry in 2019). Helsinki: Nature Resource Institute (LUKE). (InFinnish)
264
Onarheim, Kristin, Stanley Santos, Petteri Kangas, and Ville Hankalin. 2017. Performance andCost of CCS in the Pulp and Paper Industry Part 2: Economic Feasibility of Amine-BasedPost-Combustion CO2 Capture. International Journal of Greenhouse Gas Control 66: 60–75.[CrossRef]
Özdenkçi, Karhan, Cataldo De Blasio, Golam Sarwar, Kristian Melin, Jukka Koskinen, andVille Alopaeus. 2019. Techno-Economic Feasibility of Supercritical Water Gasification ofBlack Liquor. Energy 189: 116284. [CrossRef]
Özdenkçi, Karhan, Mauro Prestipino, Margareta Björklund-Sänkiaho, Antonio Galvagno, andCataldo De Blasio. 2020. Alternative Energy Valorization Routes of Black Liquor byStepwise Supercritical Water Gasification: Effect of Process Parameters on HydrogenYield and Energy Efficiency. Renewable and Sustainable Energy Reviews 134: 110146.[CrossRef]
Pöyry. 2020. Tiekartta Metsäteollisuudelle Vähähiilistyvässä Yhteiskunnassa—Osa: Päästöt.(Road Map for the Forest Industry in a Low-Carbon Society—Part: Emissions). Availableonline: https://www.metsateollisuus.fi/uutishuone/ilmastoteot-metsateollisuuden-keskiossa (accessed on 2 June 2021). (In Finnish).
Ruostemaa, Seppo. 2018. Talteenotetun Hiilidioksidin Käyttö Kemiallisen MetsäteollisuudenTuotantolaitoksessa (Utilization of Locally Captured Carbon Dioxide in a ChemicalForest Biorefinery). Master’s Thesis, Aalto University, Espoo. (In Finnish).
Rönnlund, Ida, Lillemor Myréen, Kurt Lundqvist, Jarl Ahlbeck, and Tapio Westerlund. 2011.Waste to Energy by Industrially Integrated Supercritical Water Gasification and Effectsof Alkali Salts in Residual By-Products from the Pulp and Paper Industry. Energy 36:2151–63. [CrossRef]
Saha, Nepu, Akbar Saba, Pretom Saha, Kyle McGaughy, Diana Franqui-Villanueva, WilliamOrts, William Hart-Cooper, and M. Reza. 2019. Hydrothermal Carbonization of VariousPaper Mill Sludges: An Observation of Solid Fuel Properties. Energies 12: 858. [CrossRef]
Souto, Felipe, Veronica Calado, and Nei Pereira. 2018. Lignin-Based Carbon Fiber: A CurrentOverview. Materials Research Express. Bristol: Institute of Physics Publishing. [CrossRef]
Statistics Finland. 2020a. Statistics Finland—Energy Supply and Consumption.Available online: http://www.stat.fi/til/ehk/2019/ehk_2019_2020-12-21_tie_001_en.html (accessed on 14 March 2021).
Statistics Finland. 2020b. Statistics Finland—Energy Use in Manufacturing. Available online:http://www.stat.fi/til/tene/2019/tene_2019_2020-11-12_tie_001_en.html (accessed on14 March 2021).
Statistics Finland. 2020c. Statistis Finland’s PxWeb Databases. Helsinki: Statistics Finland.Stenqvist, Christian, and Max Åhman. 2016. Free Allocation in the 3rd EU ETS Period:
Assessing Two Manufacturing Sectors. Climate Policy 16: 125–44. [CrossRef]
265

Stora Enso. 2019. New Natura Enhanced with MFC. Available online: https://www.storaenso.com/en/newsroom/news/2019/6/new-natura-enhanced-with-mfc (accessed on 22April 2021).
Stora Enso. 2020. Trees Can Become Batteries for Electric Cars—A Unique PilotPlant Is under Construction at Our Sunila Mill in Finland. Available online:https://www.storaenso.com/en/newsroom/news/2020/6/trees-can-become-batteries-for-electric-cars----unique-pilot-plant-in-sunila-mill (accessed on 22April 2021).
Teir, Sebastian, Sanni Eloneva, and Ron Zevenhoven. 2005. Production of PrecipitatedCalcium Carbonate from Calcium Silicates and Carbon Dioxide. Energy Conversionand Management 46: 2954–79. [CrossRef]
Thakur, Vijay Kumar, Manju Kumari Thakur, Prasanth Raghavan, and Michael R. Kessler. 2014.Progress in Green Polymer Composites from Lignin for Multifunctional Applications: AReview. ACS Sustainable Chemistry and Engineering 2: 1072–92. [CrossRef]
Tran, Honghi, and Esa Vakkilainen. 2008. The Kraft Chemical Recovery Process. In Tappi KraftPulping Short Course. Available online: https://www.tappi.org/content/events/08kros/manuscripts/1-1.pdf (accessed on 2 February 2022).
UPM Communication Papers. 2020. UPM Takes next Step towards 65% CO2Emission Reduction Goal by 2030. Press Release. February 12. Availableonline: https://www.upmpaper.com/knowledge-inspiration/news/2020/02/upm-takes-next-step-towards-65-co2-emission-reduction-goal-by-2030/ (accessed on 23April 2021).
UPM Energy. 2021. Renewable Hydropower Generates Flexible Power. Press Release. May 6.Available online: https://www.upm.com/articles/energy/21/renewable-hydropower-generates-flexible-power/ (accessed on 23 April 2021).
UPM. 2016. Growing Cells in Nanocellulose. Available online: https://www.upm.com/news-and-stories/articles/2016/08/growing-cells-in-nanocellulose/ (accessed on 22 April2021).
UPM. 2021a. Advanced Nanocellulose Dressing for Natural Wound Healing. Accessed April12. Available online: https://www.upm.com/about-us/this-is-biofore/bioforecase/fibdex-nanocellulose-dressing-for-wound-healing/ (accessed on 24 April 2021).
UPM. 2021b. UPM BioVerno-Diesel. Available online: https://www.upmbiofuels.com/fi/liikennepolttoaineet/upm-bioverno-diesel-polttoaine/ (accessed on 23 April 2021).
Vakkilainen, Esa, and Aija Kivistö. 2014. Forest Industry Energy Consumption—Trends and Effectsof Modern Mills. Report. Lappeenranta: LUT University.
Vaskiluodon Voima. 2017. Vaskiluodon Voima. Available online: https://www.vv.fi/wp-content/uploads/sites/8/2017/03/Vaskiluodon_Voima_ENG_FINAL-1.pdf (accessedon 2 February 2022).
266

Woodio. 2021. Shop Woodio—A Sustainable Choice—Woodio. Available online: https://woodio.fi/ (accessed on 12 April 2021).
VTT. 2017. Environmentally Friendly Textile Fibres. Available online: https://www.chemistryviews.org/details/news/10513472/Environmentally_Friendly_Textile_Fibres.html (accessed on 16 March 2021).
Yang, Jianlei, Yern Chee Ching, and Cheng Hock Chuah. 2019. Applications of LignocellulosicFibers and Lignin in Bioplastics: A Review. Polymers 11: 751. [CrossRef]
Zhang, Linghong, Chunbao Xu, and Pascale Champagne. 2010. Energy Recovery fromSecondary Pulp/Paper-Mill Sludge and Sewage Sludge with Supercritical WaterTreatment. Bioresource Technology 101: 2713–21. [CrossRef]
© 2022 by the authors. Licensee MDPI, Basel, Switzerland. This article is an openaccess article distributed under the terms and conditions of the Creative CommonsAttribution (CC BY) license (http://creativecommons.org/licenses/by/4.0/).
267


Public Transit Challenges in SparselyPopulated Countries: Case Study of theUnited States
Warren S. Vaz
1. Introduction
Transportation has long been recognized both as a critical pillar of developedsocieties and a major contributor to pollution. Transportation is critical for access tofood and other resources, employment, communication, and, thus, providing accessto transportation is key to eliminating discrimination and socioeconomic barriersthat limit several marginalized populations (Dostál and Adamec 2011). According toa 2020 report by the U.S. Environmental Protection Agency, transportation globallyaccounts for about 28% of CO2 emissions (US EPA 2020). Thus, transportation todayprovides salient benefits to society, but also exacts a cost in terms of health and impacton the environment. With the global population continuing to grow and severallarge countries like Brazil, China, India, Indonesia, and most of Africa continuing todevelop, the demand for transportation is only projected to increase.
To meet this growth in the most sustainable way possible, the answer must beclean transportation. The poster child is the electric vehicle (EV) powered by cleanenergy (e.g., solar, wind). An alternative is the hydrogen fuel cell vehicle powered bygreen hydrogen, which is hydrogen generated by electrolysis using clean electricity.These technologies also tend to be more efficient, from an energy standpoint, thanconventional vehicles. For example, consider the 2020 versions of the Tesla Model3 and the Toyota Camry, two passenger sedans of comparable size (~1550 kg). Thefuel efficiency of the electric Tesla is about 5.7 km/kWh. For the Toyota, it is about1.3 km/kWh, when the energy content of gasoline is factored in. Another way toconsider efficiency is considering the efficiency of moving cargo or people. Forexample, the same Toyota can transport at most five passengers, but typically closerto 1–2. Thus, its efficiency would be about 0.4–0.8 kWh/km/passenger. For atypical mass transit bus that can transport 40 passengers, this efficiency is about0.13 kWh/km/passenger, assuming the bus is full. Thus, the conclusion here is thatmass transit is a critical piece in the transition towards a clean and sustainable future.Ideally, this mass transit would be fueled by clean energy sources, but even usingconventional sources would result in a reduction in emissions (Yuan et al. 2019).
269

The focus in this chapter is on passengers, but a similar argument can be positedfor goods or cargo. This chapter focuses on public transit challenges in sparselypopulated countries. The case study of the United States is used to demonstrate howand why the historical factors that shape a country’s policies are critical to planningany future improvements. Accordingly, some suggestions for the future of publictransit policy are presented, together with a selection of recent projects and upcomingprojects taking shape.
2. Sparsely Populated Countries
While mass transit may be an effective way to handle the increasing needfor transportation in the most efficient manner, this would require a significantinvestment in infrastructure. Individual vehicles only require a road network. Transitbuses also require bus stops, depots, drivers, transit schedules, coordinators, etc., notto mention the huge initial cost of the actual buses. Rail is more efficient, but evenmore capital intensive. Governments or private industry are willing to invest in theseprojects if there is an economic case. Additionally, this typically is a function of thepopulation: the larger the target market, the larger the expected revenue. However, ifthe population density is too low, then there are additional challenges. Short, efficienttrips become impossible and an expansive infrastructure leads to a prohibitiveupfront investment. Compounding these factors are areas that house historicallypoor populations. While these populations have the greatest dependency on cheaptransportation and would benefit the most, such areas are the least likely to seesignificant public investment as they are typically underrepresented in governmentand policymaking. On the other end of the spectrum are affluent areas. There is astrong correlation between vehicle ownership and per capita gross domestic product(GDP) (IRF 2013). Similarly, one would expect a strong correlation between per capitaemissions and per capita GDP. However, other factors might be worth considering.
Figure 1 shows five indicators for 28 countries, which account for abouttwo-thirds of the total global population as well as about two-thirds of the totalglobal GDP (PPP or purchasing power parity). For each of these, the per capitaemissions are plotted in relation to the population, population density (per squarekilometer), GDP (PPP), GDP per capita, and percentage of urbanization. A trendlinefor the plot is also shown. Indeed, it can be concluded, based on the R2-valuesobtained, that the GDP per capita has the strongest correlation to emissions. Thenext most important factor is urbanization, or the fraction of the population thatlives in cities compared to rural areas. Another interesting trend is in the populationdensity plot. It can be observed that countries with very low population densities
270

tend to produce far more emissions than those with high population densities. Takentogether, the data point to the conclusion that the biggest polluters are countrieswith a high per capita GDP and urbanization, but low population density. Suchcountries also have high levels of vehicle ownership. All these factors contributeto high emissions per capita. In addition, it is argued here that such countries facesignificant challenges to adopting or expanding mass transit. To demonstrate this,the case of North America is examined, particularly focusing on the United States.The countries are highly developed and very rich in natural resources. They havea lot in common, including being sparsely populated and relatively isolated, bothinternally and externally.
50 50
5050
50
40 40
4040
40
30 30
3030
30
20 20
2020
20
Emis
sion
s (to
ns p
er c
apit
a)
Emis
sion
s (to
ns p
er c
apit
a)Em
issi
ons (
tons
per
cap
ita)
Emis
sion
s (to
ns p
er c
apit
a)Em
issi
ons (
tons
per
cap
ita)
10 10
1010
10
0 0
00
0
0 0
00
0 20 40 60Urbanization (%)
GDP (million $) GDP per capita ($)
80 100 120
10,000,000 20,000
500500,000,000 1,000,000,000Population
Emissions vs. Population R2 = 0.0339
Figure 1. Influence of population, population density, GDP (PPP), GDP per capita, and urbanization on per capita emissions (WDI 2021, Ritchie 2019, IMF 2020, UN 2019)
Emissions vs. GDP R2 = 0.0026
Emissions vs. Urbanization R2 = 0.4924
Emissions vs. GDP per capita R2 = 0.6153
Populartion density (people per sq. km)
Emissions vs. Population density
1,500,000,000 1000 1500
40,000 60,000 80,000 100,00020,000,000 30,0000,000
Figure 1. Influence of population, population density, GDP (PPP), GDP per capita,and urbanization on per capita emissions. Source: Graphic by author, data from(WDI 2021; Ritchie 2019; IMF 2020; UN 2019).
271

North America has three countries: Canada, Mexico, and the United States.These countries have a similar history and share many common characteristics. Allthree are relatively young, ranging from 1776 (United States) to 1867 (Canada). Thesecountries were inhabited by various Native American civilizations, then settled byEuropeans, who also brought several enslaved peoples to the continent. By themiddle of the 19th century, slavery had been abolished in all three countries and eachone experienced waves of immigration from various parts of the globe continuing tothis day. This has only added to, and in many ways catalyzed, the natural populationand industrial growth that is virtually unprecedented in history.
Table 1 shows statistics for various economic and transportation categoriesfor Canada, the United States, and Mexico. There are some commonalities, likethe degree of urbanization. However, Canada and the United States have more incommon with each other than Mexico. Canada and the United States are considerablywealthier than Mexico. Part of the reason is because both countries are huge: secondand fourth, by area. The United States is also third in the world by population, but itspopulation density is still about half that of Mexico. Even if only the contiguous 48states are considered, the population density only changes from 33.6 to 40 per sq. km.With wealth comes a higher standard of living and energy consumption, resultingin greater emissions. The United States and Canada emit about four times morethan Mexico. The per capita vehicle ownership is similar. Even though the degree ofurbanization is about the same, a closer look at the distribution is instructive. Thetop 100 combined statistical areas (CSA) account for 81% and 66% for Canada andthe United States, respectively, compared to just 45% for Mexico. Summing the totalfor all cities above 100,000 residents, they account for 74% and 85%, respectively,compared to just 48% for Mexico. This leads to the conclusion that populations inCanada and the United States are much more concentrated than in Mexico. Part ofthis can be due to the presence of huge suburbs around a major city.
While Canada and the United States have a lot in common, this chapter willfocus on the United States for several reasons. The United States has almost ninetimes the population, over 12 times the GDP, and is seen as a global leader andinfluencer in the world and has been that way since World War II. Furthermore, theUnited States has a history of invention and innovation in several critical sectors,including transportation: railways, automobiles, including mass production, roadinfrastructure, traffic laws, etc., aircraft, rockets, and more. Countries have looked toit for benchmarks and manufacturing standards and lessons learned and technologiesdiscovered have often translated to international markets. Thus, if the United Stateswere to, for example, stop manufacturing internal combustion vehicles and fully
272

switch to electric vehicles, that would put significant pressure on other countries tofollow suit considering how huge a market space is controlled by the United States.Finally, the United States is also one of the largest consumer markets in the world inseveral sectors such as automobiles, electricity, petroleum, etc. Changes here wouldhave a much greater impact than virtually any other country.
Table 1. Various economic and transportation statistics for NorthAmerican countries.
Country Canada United States Mexico
Area (million sq. km) 9.984 9.833 1.973
Population (millions) 38.01 328.24 126.01
Population density (per sq. km) 3.92 33.6 61.0
Population of top 100 CSAs(fraction of total) 0.81 0.66 0.45
Population of >100K cities(fraction of total) 0.74 0.85 0.48
GDP (nominal, trillion USdollars) 1.6 20.807 1.322
GDP (per capita, US dollars) 42,080 63,051 10,405
Emissions (per capita, metrictons of CO2) 16.3 16.1 3.8
Urbanization (%) 81.6 82.7 80.7
Vehicle ownership (per 1000people) 685 838 297
Source: Table by author, data from (IMF 2020; UN 2019; Statistics Canada 2016;US Census Bureau 2019; INEGI 2010; IOMVM 2013).
3. History of the United States: An Overview
The United States declared its independence from colonial rule in 1776. Inits early years, it was not universally recognized as a nation for several years.Several established nations still viewed it as a potential colonial acquisition. Mostimportantly, the entire territory of the first 13 colonies was east of the AppalachianMountains, north of Florida—about 11% of its extent today. Gradually, severalterritories were acquired, organized, and formalized as states. This includedterritories east of the Mississippi, then the entire Mississippi River basic (LouisianaPurchase), the Oregon Territory, Florida and the Republic of Texas, and Spanish
273

Territories all the way to the Pacific Ocean. Much later came the additions of Alaskaand Hawaii. There were numerous smaller changes to the territory of the UnitedStates, but these were predominately outside the contiguous or lower 48 states—inthe Caribbean and Pacific.
From the earliest colonial days, settlers engaged in importing slaves from Africa.From the 17th century up to the American Civil War that ended in 1865, millions ofslaves worked predominantly in the Southern states on large cash crop plantations(cotton, tobacco, sugar, etc.). By contrast, the economy of the Northern states waspredominantly predicated on agriculture and industry. Innovations in manufacturingand transportation technology—such as the steam engine—propelled the rise offactories and factory workers with several Northern states abolishing slavery in theirterritories. Southern fears over the abolishment of slavery in the Union led to theCivil War, which culminated in the permanent abolishment of slavery in the UnitedStates in 1863 and the defeat of the Confederacy of Southern States in 1865.
After the war, the conditions in the South degenerated for virtually the entirepopulation. Black Americans were now free and full citizens of the Union. However,their White counterparts, some of whom were their former slaveowners, rejectedall attempts of the federal government to integrate free slaves into society, evenrequiring military invention in certain cases. Simultaneously, unable to profit fromfree slave labor, several White landowners, including women, had to work the landthemselves—a hardship not previously endured. Those in power engaged in varioustactics to restrict the rights of Blacks, keep a stranglehold on political power, restricttheir access to education, land ownership, etc. They set up various mechanisms thatensured a system very similar to the slave-owner system before the war, known assharecropping. The Jim Crow Era in the South ensured segregation on the basisof race.
Meanwhile, the new territories in the West continued to grow and develop at theexpense of the native population, who were continually pushed further west. Initially,the Indian Territory was west of the 13 colonies, then moved to the Missouri Territory,and finally reduced to the area of the modern State of Oklahoma. On the back of therailroad and steam locomotive, American industry grew prodigiously. Total tracklength progressed from about 60,000 miles (96,000 km) to about 160,000 miles (100,000km) in the 1890s with the completion of the Transcontinental Railroad. This figurepeaked during World War 1 (254,000 miles) and is about 140,000 miles today (Stover1999). Some of the most iconic and enduring American companies were foundedduring the latter half of the 19th century and the early 20th century: Standard Oil(later Marathon, ExxonMobil, BP, and Chevron), General Electric, AT&T, Emerson
274

Electric, Carnegie Steel (later U.S. Steel), Ford, General Motors, etc. The vast majorityof these were headquartered and had most of their operations in Northern States.
After World War I, there was a period of booming economic growth in thecountry. The transportation section grew with major innovations in aviation,automobile technology, rail (e.g., diesel locomotive), and shipping. Then, camethe Great Depression followed by the New Deal, a series of major economic andinfrastructure reforms aimed to lift the country out of the Depression. WorldWar II continued to drive the growth of the massive American industrial complexaccompanied by a surge in population, the “baby boom”. The Interstate System thatwas signed into law during the war made road travel easier than ever. Simultaneously,little progress towards equity was happening in the American South. Multipleincidents of racial violence, voter suppression, the rise of the Ku Klux Klan, lynching,segregation, etc. made it virtually impossible for Blacks to gain political poweror good jobs or education or even improve their lives in any tangible way. Thisprompted a mass exodus of millions of Black families from the South to the Northand West. Coupled with continued immigration, several cities like Philadelphia,Detroit, Chicago, Cleveland, Baltimore, and New York City saw a huge increasein their population and a change in their demographics. This lasted roughly from1916 to 1970. On the other hand, after World War II, thousands of veterans left thecold harsh winters of the North and migrated to the Sun Belt states. Cities like LosAngeles, San Diego, Las Vegas, Dallas, Houston, and Phoenix grew significantly.
3.1. Urban Sprawl
During this period of urbanization, a pattern began to emerge: the gradual moveof large populations from city centers to small satellite towns and communities withinclose proximity, commonly called the suburban development or suburbs. Spurred bylegislation like the Federal Home Loan Bank Act of 1932 and the National HousingAct of 1934 along with contributions from the Veterans Administration, families wereable to buy homes in newly developed areas outside cities. No longer did they needto live in cramped, densely packed apartments in crowded, polluted, and noisy citycenters. The United States transitioned from a primary economy (natural resources)to a secondary one (manufacturing). To travel to these well-paying jobs in the cities,workers bought increasingly affordable cars, one of the most important products ofthis new economy. The total number of miles of paved road continued to increase,especially between cities.
Thus, what happed was that the traditional city centers absorbed the majority ofthe Black and immigrant population, while most of the middle-class White residents
275

flocked to the suburbs. Under the National Housing Act, the Federal HousingAuthority (FHA) created several guidelines and minimum standards for new housingdevelopments. Unfortunately, it also strongly promoted racial segregation in itsguidelines. The design of suburbs focused on car-friendly, wide streets and left outpedestrians. Instead of grid plans, curved and dead-end or cul-de-sac designs wereadopted. These were designed to slow cars down, limit traffic through streets, butalso ensure that cars were necessary to get around. The FHA rated any designssubmitted within these guidelines as “good plans” and the rest as “bad plans”,making it riskier for developers to pursue. Suburbs grew, their design made walkingand public transit inefficient, and existing public transit systems in the city centersfell out of favor and became neglected. Their use was associated with being of thepoor class. The people who depended on these systems the most had little power toinfluence their improvement.
Even if Black families wanted to move out of the city centers, ‘redlining’ madeit impossible for them to secure affordable housing. This was the practice bygovernment agencies of systematically denying goods or services to particular groupsby a number of tactics ranging from selectively raising interest rates or prices toplacing strict criteria on specific goods and services. The Fair Housing Act of 1968 puta gradual end to this practice, but the intervening decades had done their damage.Whole generations of minority populations, such as Blacks, were unable to affordhomes or had to buy homes in less desirable or segregated neighborhoods. Formost middle- and low-income families, home ownership is the surest way to buildwealth. For those unable to do so, renting is the only option and does not result inany increase in equity. Similarly, minorities were also denied access to education andpolitical power with suppression of voting. It was only after the Civil Rights Actsof the 1960s that some of these practices slowly began to decrease. Still, the countryis recovering from these effects to this day. Some studies show that segregation insome cases, such as the workplace, is worsening (Hall et al. 2019).
Figure 2 shows the urban sprawl for two major cities: Dallas, Texas located in thesouthern United States and Detroit, Michigan located in the northern United States.The figures show not only growth of population within the city center itself (DallasCounty for Dallas and Wayne County for Detroit), but the surrounding counties aswell. Some of these experienced triple-digit growth rates. The average home in theUnited States grew in size from 1500 sq. ft. in the 1970s to over 2,000 sq. ft. nowadays(Friedman and Krawitz 2001). Interestingly, the average lot size has continued todecrease as pressure for suburban housing continues to increase.
276

1940
Kaufman
Johnson
Tarrant Dallas
Ellis
CollinDenton14.78
Population (ln)
12.50
8.86
Kaufman
Johnson
Tarrant Dallas
Ellis
CollinDenton
1970
14.78
Population (ln)
12.50
8.86
Figure 2. Cont.
277

Kaufman
Johnson
Tarrant Dallas
Ellis
CollinDenton
2000
14.78
Population (ln)
12.50
8.86
Kaufman
Johnson
Tarrant Dallas
Ellis
CollinDenton
2019
14.78
Population (ln)
12.50
8.86
Figure 2. Cont.
278

(a)
GeneseeLapeer
St Clair
Oakland
Washtenaw Wayne
Monroe
Macomb
14.80
12.60
10.39
1910
Population (ln)
Figure 2. Cont.
279

14.80
12.60
10.39
1970
Population (ln)
GeneseeLapeer
St Clair
Oakland
Washtenaw Wayne
Monroe
Macomb
14.80
12.60
10.39
2000
Population (ln)
GeneseeLapeer
St Clair
Oakland
Washtenaw Wayne
Monroe
Macomb
Figure 2. Cont.
280

14.80
12.60
10.39
2019
Population (ln)
GeneseeLapeer
St Clair
Oakland
Washtenaw Wayne
Monroe
Macomb
(b)
Figure 2. Growth of suburbs in the 20th century in (a) Dallas, Texas and (b) Detroit,Michigan. Source: Graphic by author, data from (US Census Bureau 2020).
281

3.2. Public Transit Challenges
Therefore, the United States arrived at the situation in which it is today:declining urban centers surrounded by sprawling suburban development. Thecoronavirus pandemic of 2020 has only continued to accelerate a general moveout of major cities as companies allow employees to work from home. This hasshaped transportation policy and consumer trends. According to the Bureau ofTransportation Statistics, 76% of employees who commute to work do so in apassenger vehicle alone, whereas only 5% use public transit (US DOT 2020). Similarly,total public transit ridership has continued to trend down in recent years, reachinga peak in 2014. Part of this has been attributed to the rise in ride-hailing andvehicle-sharing apps. Average commute time has gone from under 22 minutesin 1980 to a peak of 27 minutes in 2018. Passenger vehicles continue to become biggerand more expensive. For example, the number of midsize sedans sold in 2020 wasabout 50% of what it was in 2012. Sport utility vehicles (SUV) made up 47.4% of allsales in 2019 and that is expected to rise to 78%. Expectedly, the average transactionprice of a new vehicle continues to trend upwards, reaching about USD 39 thousandin 2020, up from USD 35.5 thousand in 2016. In 1960, about 80% of households hadone car or less. In 2019, it was only about 40%. As for local travel, defined as trips of50 miles or less, there were 3140 average person-trips per household in 2017. Of those,329 were walking, 2592 were by passenger vehicle, and only 80 by public transit.As for the totality of domestic travel, between 2010 and 2018, air travel, passengervehicle travel, and public transit increased—though the increase in public transit wasonly about 2%. Inter-city rail saw a slight decrease. When looking at passenger-milestraveled in 2018, inter-city rail and public transit combined were 62 times lower thanpassenger vehicles.
The above statistics provide sufficient evidence on the preference of personalpassenger vehicles over more efficient public transport. Personal vehicles are lessenvironmentally friendly and more expensive than using public transit. However,they offer more convenience and flexibility. Given the lack of demand, there is avery weak economic incentive to improve existing public transit infrastructure. Thepeople who rely on it the most typically have the least political power or financialcapital to do so. This leads to a vicious cycle of further neglect and depredation.Transportation has been identified as one of the critical factors in helping peopleto escape poverty (Department for Transport 1997). The transformative InterstateSystem was a huge boom to the country’s economy. However, in several cases, poorcommunities were displaced and bypassed by the new highways. Transportationis also the second biggest expense for the average family. Thus, minorities and
282

immigrants continue to have reduced access to transportation options. This onlyworsens the inequity within society.
The United States has led the world in innovation in several keytransportation-related technologies. However, implementation of the next generationof clean mass transit projects is severely lacking. There are plenty of demonstrationsand projects to prove the efficacy of technologies that are viewed skeptically by thepublic in this country (Bamwesigye and Hlavackova 2019; Behrendt 2019; Fialováet al. 2021; Freudendal-Pedersen et al. 2019; Łukaszkiewicz et al. 2021). Of course,with transportation, proper land use is another critical issue in United States. Thereare several recent studies and analyses on smart and sustainable land use (Al-Thaniet al. 2018; Hammad et al. 2019; Tobey et al. 2019) that can inspire policymakers inthe United States as well.
Another important thing to keep in mind is that, like Canada and Mexico, theUnited States has a federal government with strong state governments. Criticalsectors like education and transportation are funded and regulated by all levels ofgovernment. Most importantly, there is no federal transit authority that operates onebus or rail network for the entire country. This includes Amtrak, which providesinter-city rail service in the United States. It receives funding through a combinationof state and federal subsidies, but is a for-profit organization. This makes it verydifficult to improve existing transit services or invest in the development of newprojects, whether by government or private industry. Approvals, cooperation, andshared resources need to come from multiple agencies and governing bodies, and thisoften becomes the prohibiting factor. For example, any bus service across multiplestates would have to abide by emissions regulations, safety regulations, disabilityservices, etc. in each state. Further, minimum pay, employee benefits, levels offunding from each state authority involved, etc. would all serve to complicatethe project.
Arguably the biggest challenge to implementing widescale public transit in theUnited States is geography or population distribution across its geography, which canbe understood with Figure 3. It shows the locations of all the CSAs with a populationgreater than 200,000 in both Canada and the United States. The marker size is scaled,the smallest being about 200,000 and the largest being about 8.4 million. Almostthe entire population of Canada lives within 100 miles of the Canada–United Statesborder. For this reason, a lot of companies and services operate across the border.Examples are sports leagues, companies, particularly in the Seattle–Vancouver,Detroit–Windsor, and Toronto–Buffalo areas, and service by Amtrak railway. TheQuebec City–Windsor corridor, which includes Ottawa, Montreal, and Toronto, has a
283

population of about 18 million, nearly half of Canada. The Great Lakes region hasabout 55.5 million people and the Northeast corridor (Boston to Richmond, Virginia)has about 52 million people. Other notable megalopolises include the California(north and south) region (38 million) and the Texas Triangle–Gulf Coast region (33million). All these regions are clearly visible in Figure 3. Given this distribution andconsidering that these megalopolises are hundreds and thousands of miles apart, itis not easy to create a nationwide public transit system like the Eurozone. Americansprefer the flexibility of air travel and road trips to travel between major cities andeverywhere in between. Unfortunately, both these forms are the worst emitters ofgreenhouse gases.
United States Canada
Figure 3. CSAs with population over 200,000 in Canada and the UnitedStates—marker size scaled from 200,000 to 8,400,000. Source: Graphic by author,data from (Statistics Canada 2016; US Census Bureau 2019).
284

4. Potential Solutions
4.1. Sustainable Transportation: A Multiobjective Approach
Despite the challenges described, climate change appears to be the extremecoercion driving promising new projects. This section briefly introduces amulti-objective approach to selecting sustainable transportation options. The idealpublic transit system would satisfy multiple objectives:
- Accommodate multiple passengers;- Efficient, use the least amount of fuel to cover the most distance;- Safe;- Affordable;- Level of service;- Low maintenance and operating costs;- Low initial capital requirement;- Technologically feasible;- Sustainable, environmentally friendly.
Of course, there are other considerations; these are just examples. Note thatsome of these are ‘cooperating’, meaning improving one also improves another.Using a more efficient powertrain contributes to being sustainable. Other objectivesare ‘conflicting’, meaning improving one worsens another. Having a high levelof service typically means a more expensive system due to having a larger fleetor perhaps longer travel times due to frequent stops. In classical multi-objectiveoptimization, it is desirable to optimize conflicting objectives to produce a series ofoptimal solutions. This technique can be extended to the choice of public transit typein order to demonstrate how such a technique might be adopted in such cases.
Table 2 shows some key transit metrics for the most common types: busesand trains. Electric buses are also shown along with conventional diesel buses. Asfor trains, the two most widely used categories are shown: rapid transit rail andcommuter or inter-city rail. The operating cost refers to how expensive it is to operatethe vehicle. The capital refers to the upfront cost to purchase one additional vehiclefor an existing transit system. Speed and trip time are average or typical values. Theefficiency is the amount of energy consumed per passenger-mile. The cost refers tothe price the customer pays per passenger-mile. Note that, given the complexity indetermining the values in Table 1, a lot of assumptions are made by the reportingagency. Ranges are provided wherever appropriate. Thus, these should be taken asrepresentative values only for comparison. However, by comparing the numbersdirectly, an informed decision can be made.
285

Table 2. Various economic and transportation statistics for NorthAmerican countries.
Mode
ObjectiveBus Electric Bus Rapid Transit
RailCommuter/
Inter-City Rail
Operating cost(USD/vehiclerevenue hour)
166.51 41 312.09 562.96
Capital (millionUSD) 1.1 1.7 30.4 30.4
Speed (mph) 9 9 16 40
Trip time (min) 22–45 22–45 47 47–120
Efficiency(kWh/passenger-mile) 3319 1107 3228 1688
Cost (USD/unlinkedpassenger-mile) 1.31 1.31 0.92 0.51
Source: Table by author, data from (US DOT 2010, 2018, 2020).
When multiple conflicting objectives are in play, improving one often worsensanother. Thus, it may be difficult for a customer or a transit authority to choose onemode over another. A graphical representation of the decision-making criteria isshown in Figure 4. Only three modes of transportation are shown. More can beadded as needed. Only two objectives are plotted: average trip cost to the passengerand the average emissions per passenger-mile. It is desirable to minimize both theseobjectives, so values of zero and zero would be ideal. However, this is not practical.However, whichever mode can approach this point would be the closest to ideal.Accordingly, it is clear that trains are the best mode, having the lowest cost andemissions. Personal passenger cars are the worst. Note that electric buses couldprove to be the best if powered by clean, renewable energy. For Figure 4, it wasassumed that the electricity was the average grid mix for the United States. Even so,the choice between electric buses and conventional buses is clear: the former havelower emissions and lower average trip costs. This methodology can be extended toan arbitrary number of objectives and “solutions” (modes of transportation).
286

0
150
200
0
50
100
1
Cost per trip ($)
Emis
sion
s (g/
pass
enge
r-km
)
2 3
Figure 4. Emissions versus trip costs for common modes of transportation.
Figure 4. Emissions versus trip costs for common modes of transportation. Source:Graphic by author, data from Table 2.
4.2. Transportation Policy
In the United States, only about 17% of the total cost of public transit projects(capital only) are funded by the Federal government (Mallett 2021). The rest comesfrom state and local governments and, in some cases, private investors. The FederalPublic Transportation Program has gradually increased its funding from 2011 ($10billion) to 2018 ($13 billion). For 2020 and 2021, the COVID-19 relief packageprovided an additional $39 billion in total. As climate change and its effects, bothimmediate and long term, come into sharper focus, federal and state governmentsare increasing funds allocated to public transit projects. These are geared to reducecarbon emissions. They also increase access to transportation across the differentsegments of population, increasing equity. This, too, has moved into the spotlightduring the social unrest in the United States during the COVID-19 pandemic.
The next section presents some of the largest upcoming public projects inthe United States. However, none of these are interstate projects and there arefew inter-city projects in the works. Consider that, between 2010 and 2019, theUnited States added 1203 miles (1936 km) of transit compared to 21,950 miles (35,318km) of new highway and arterial roadway (US DOT 2019). This is emblematic oftransportation trends in the United States. Given the trends in oil prices, consumervehicle purchases, and the complicated nature of funding and politics in the country,
287

passenger vehicles and planes will continue to dominate long-distance and evenlocal travel.
For cross-country or even interstate transit, the country’s geography andpopulation distribution will continue to pose a significant challenge. This is alsotrue for Canada. In the short term, the best bet would be for the United States toimprove domestic transit infrastructure and electrify its fleet. The reason China hasabout 99% of the world’s electric buses and over 500,000 charging stations is becauseelectric vehicles are part of the transportation policy at a national level. The UnitedStates has not prioritized electrification in the same way. The current administrationhas emphasized electrification of the federal fleet, a good way to lead by example.This means conversion or replacement of some 645,000 vehicles, comparable to theannual emissions of countries like Haiti or DR Congo. Once the federal governmenttakes the lead, state and local governments would follow. Consumers are alreadyadopting electric vehicles, with several automakers planning for all-electric fleets asearly as 2035.
However, this is only one piece of the puzzle. The other piece is public transit.Cities and suburbs in the United States are not pedestrian-friendly. Transit mapsare oriented to facilitate travel from the suburbs to the city centers. There is littleinterconnectedness between suburbs and neighborhoods. This makes it very difficultfor people to use the transit system outside of work or trips to the city. This meansthat owning at least one personal vehicle is virtually a requirement for living in andaround major cities. In rural communities, the vast majority of the land area of theUnited States, personal vehicles are the only way to travel. Future transit projectsneed to address this disparity or shortcoming to reduce the dependence on personalvehicles. This is reflected in places like New York City. In the borough of Manhattan,22% of households have at least one vehicle compared to the nationwide rate of 838per 1000 residents.
The final facet of sustainable transportation for sparse countries is land use. Infilldevelopment is the rededication of vacant parcels or plots of land within large urbanspaces. City planners need to focus on transit-oriented development. City blocksand spaces need to be designed around the concept of the “15-minute-city”. This isthe idea where the majority of daily needs are located within a 15-minute walk. Thisincludes mass transit. Rather than removing housing from work, new developmentsshould integrate housing with businesses and office spaces. Furthermore, developersneed to ensure that new development has sufficient variety to serve the needs ofyoung, single professionals, small families, and also the retired community.
288

4.3. Current and Future Projects
The following are some of the largest public transit projects that are beingundertaken or are soon to be undertaken.
1. Heavy rail and subway—this project was completed in the San Francisco Bayarea in 2020, the largest public infrastructure project undertaken in Santa ClaraCounty. Its project cost was USD 2.4 billion and added 10 miles to the existingcoverage. It is set to link San Jose and Santa Clara, two neighboring cities. Thisproject required the cooperation of multiple transit authorities, such as theBay Area Rapid Transit and the Santa Clara Valley Transit Authority. Issuespertaining to platform configuration and additional training for operators usingramped tunnels had to be overcome during the project.
2. Light rail—the cities of Boston, Los Angeles, San Diego, and Seattle have lightrail projects totaling USD 8.5 billion opening in 2021. These projects accountfor over 28 miles of light rail. COVID has impacted all these projects, as can beexpected. Even outside the pandemic, some of these projects faced technicalchallenges, cost overruns, issues with contractors and unions, etc. All of thesehave been delayed in coming online. This is the nature of such mass transitmulti-billion-dollar projects.
3. Electric bus—Indianapolis’ Bus Rapid Transit system has a planned extension,the Purple Line, under construction and slated to open in 2022 or 2023. Thiswould double the existing capacity of the Red Line. The 15-mile extensionis expected to cost USD 155 million. The entire transit system is electric,specifically using the BYD K11 electric bus. The fate of the project is abit uncertain—including future extensions. This is because of legislationintroduced that challenges the financial obligations of the county and theoperator, IndyGo (Indianapolis Public Transportation Corporation).
4. Hyperloop—this refers to the proposed mode of passenger transportationwhere a high-speed train travels in a sealed tube at vacuum or very lowpressure. This low air resistance allows the train to travel at very high speedsvery efficiently, making it competitive with air travel over distances under 1,500km in terms of travel time. White papers have proposed a project along the LosAngeles–San Francisco corridor with an estimated cost of USD 6 billion. VirginHyperloop conducted its first human passenger trial at a speed of 172 km/h atits test site in Las Vegas. SpaceX built a one-km track in Hawthorne, California.This technology has the potential to be a true interstate transit system. Variouscountries are also investigating this new transportation technology. In theUnited States, significant political and economic challenges would need to be
289

overcome to make this idea a reality. In California, for instance, the CaliforniaHigh-Speed Rail Authority is already working on its first project, slated toopen in 2029, costing upwards of USD 64 billion for Phase I. It would be verydifficult to justify a second similar project. It must be noted that in the UnitedStates, while there is technically high-speed rail, only about 34 miles of trackactually allow trains to reach up to 150 mph (241 km/h) for only 34 mi (55 km)of the 457 mi (735 km) track.
5. Closing Remarks
The future of clean transportation and public transit in the United States is farfrom decided. While the United States has been a leader and innovator in severalareas, it severely lags in this one. It need not be stated that this is because of its uniquehistory and particular circumstances. This chapter examines the complex history andmultitude of factors quite briefly and with a focus on trying to understand the stateof affairs from an engineering and technological standpoint. Public transit and urbansprawl are far from the only public interest items shaped by the country’s history.Additionally, it would be overly simplistic to assert that what was presented hereinwere the only factors. Indeed, the influence of geopolitics, the progress of technology,political and economic cycles, public opinion, etc. all have left their mark on theUnited States.
Thus, it is not prudent to generalize the lessons learned here to other regionswith similar characteristics. It is not sufficient to just consider the statistics, but alsothe history and societal factors. Consider neighboring Canada: despite the vastsimilarities, it has a considerably different climate. Its history was also shapeddifferently, having been largely influenced by its relationship with the UnitedKingdom. Recent developments, such as the effect of heat waves and wildfiresand the discovery of thousands of Indigenous children buried in unmarked graves,will, no doubt, have an effect going forward. Perhaps this is the key takeaway fromthe foregoing chapter: when applying policy to populations, one must do so inconsultation with the population while being respectful of their history and culture.
Funding: This work received no external funding.
Acknowledgments: The author is grateful to the University of Wisconsin-Oshkosh forproviding resources to support this work.
Conflicts of Interest: The author declares no conflict of interest.
290

References
Al-Thani, Soud K., Cynthia P. Skelhorn, Alexandre Amato, Muammer Koc, and SamiG. Al-Ghamdi. 2018. Smart Technology Impact on Neighborhood Form for a SustainableDoha. Sustainability 10: 4764. [CrossRef]
Bamwesigye, Dastan, and Petra Hlavackova. 2019. Analysis of Sustainable Transport for SmartCities. Sustainability 11: 2140. [CrossRef]
Behrendt, Frauke. 2019. Cycling the Smart and Sustainable City: Analyzing EC PolicyDocuments on Internet of Things, Mobility and Transport, and Smart Cities. Sustainability11: 763. [CrossRef]
Department for Transport. 1997. A New Deal for Transport: Better for Everyone. Availableonline: https://www.gov.uk/government/organisations/department-for-transport(accessed on 11 March 2021).
Dostál, Ivo, and Vladimir Adamec. 2011. Transport and its Role in the Society. Transactions onTransport Science 4: 43–56. [CrossRef]
Fialová, Jitka, Dastan Bamwesigye, Jan Łukaszkiewicz, and Beata Fortuna-Antoszkiewicz.2021. Smart Cities Landscape and Urban Planning for Sustainability in Brno City. Land10: 870. [CrossRef]
Freudendal-Pedersen, Malene, Sven Kesselring, and Eriketti Servou. 2019. What is Smart forthe Future City? Mobilities and Automation. Sustainability 11: 221. [CrossRef]
Friedman, Avi, and David Krawitz. 2001. Peeking Through the Keyhole: The Evolution of NorthAmerican Homes. Montreal: McGill-Queen’s University Press.
Hall, Matthew, John Iceland, and Youngmin Yi. 2019. Racial Separation at Home and Work:Segregation in Residential and Workplace Settings. Population Research and Policy Review38: 694. [CrossRef]
Hammad, Ahmed W., Ali Akbarnezhad, Assed Haddad, and Elaine Garrido Vazquez. 2019.Sustainable Zoning, Land-Use Allocation and Facility Location Optimisation in SmartCities. Energies 12: 1318. [CrossRef]
International Monetary Fund (IMF). 2020. World Economic Outlook Database; Report forSelected Countries and Subjects: October 2020. Washington, DC: World Economicand Financial Surveys. Available online: https://www.imf.org/en/Publications/WEO/weo-database/2020/October/ (accessed on 22 January 2021).
INEGI. 2010. Censo de Población y Vivienda 2010—Consulta. Available online: https://www.inegi.org.mx/sistemas/scitel/Default?ev=5 (accessed on 14 February 2021). (In Spanish)
International Organization of Motor Vehicle Manufacturers (IOMVM). 2013. World Vehicles inUse All Vehicles (PDF). Available online: https://www.oica.net/wp-content/uploads/total-inuse-2013.pdf (accessed on 14 February 2021).
International Road Federation (IRF). 2013. IRF World Road Statistics. Geneva: InternationalRoad Federation Press.
291

Łukaszkiewicz, Jan, Beata Fortuna-Antoszkiewicz, Łukasz Oleszczuk, and Jitka Fialová. 2021.The Potential of Tram Networks in the Revitalization of the Warsaw Landscape. Land 10:375. [CrossRef]
Mallett, William J. 2021. Federal Public Transportation Program: In Brief ; Report R42706;Washington, DC: Congressional Research Service.
Ritchie, Hannah. 2019. Where in the World Do People Emit the Most CO2? Our World in Data.Available online: https://ourworldindata.org/per-capita-co2 (accessed on 22 January2021).
Statistics Canada. 2016. Population Estimates, July 1, by Census Metropolitan Area andCensus Agglomeration, 2016 Boundaries. Available online: https://www150.statcan.gc.ca/t1/tbl1/en/tv.action?pid=1710013501 (accessed on 30 January 2021).
Stover, John F. 1999. The Routledge Historical Atlas of The American Railroads. New York:Routledge.
Tobey, Michael B., Robert B. Binder, Soowon Chang, Takahiro Yoshida, Yoshiki Yamagata, andPerry P. J. Yang. 2019. Urban Systems Design: A Conceptual Framework for PlanningSmart Communities. Smart Cities 2: 522–37. [CrossRef]
United Nations (UN). 2019. 2019 Revision of World Population Prospects. Department ofEconomic and Social Affairs Population Dynamics. Available online: https://population.un.org/wpp/ (accessed on 22 January 2021).
United States (US) Census Bureau. 2019. Metropolitan and Micropolitan Statistical AreasPopulation Totals and Components of Change: 2010–2019. Population Division. Availableonline: https://www.census.gov/data/tables/time-series/demo/popest/2010s-total-metro-and-micro-statistical-areas.html (accessed on 14 February 2021).
United States (US) Census Bureau. 2020. Population and Housing Unit Estimates Tables; ArchivedData; Sutland: United States (US) Census Bureau.
United States Department of Transportation (Hodges, Tina) (US DOT). 2010. PublicTransportation’s Role in Responding to Climate Change; Washington, DC: Federal TransitAdministration.
United States Department of Transportation (US DOT). 2018. 2018 National Transit Summariesand Trends; Washington, DC: Federal Transit Administration, Office of Budget and Policy.
United States Department of Transportation (US DOT). 2019. Highway Statistics 2019;Washington, DC: Federal Highway Administration, Office of Highway Policy andInformation.
United States Department of Transportation (US DOT). 2020. Transportation Statistics AnnualReport 2020; Washington, DC: Bureau of Transportation Statistics. [CrossRef]
United States Environmental Protection Agency (US EPA). 2020. Inventory of U.S. GreenhouseGas Emissions and Sinks 1990–2018; Environmental Protection Agency 430-R-20-002.Washington, DC: US EPA.
292

World Development Indicators (WDI). 2021. CO2 Emissions (Metric Tons per Capita).Washington, DC: Data Bank: The World Bank Group, Available online: https://databank.worldbank.org/reports.aspx?source=2&series=EN.ATM.CO2E.PC&country=# (accessedon 22 January 2021).
Yuan, Rui-Qiang, Xin Tao, and Xiang-Long Yang. 2019. CO2 emission of urban passengertransportation in China from 2000 to 2014. Advances in Climate Change Research 10: 59–67.[CrossRef]
© 2022 by the author. Licensee MDPI, Basel, Switzerland. This article is an openaccess article distributed under the terms and conditions of the Creative CommonsAttribution (CC BY) license (http://creativecommons.org/licenses/by/4.0/).
293


A Systematic Analysis of BioenergyPotentials for Fuels and Electricity in Turkey:A Bottom-Up Modeling
Danial Esmaeili Aliabadi, Daniela Thrän, Alberto Bezama and Bihter Avsar
1. Introduction
1.1. Global Warming: A Thread Ahead
For decades, scientists have been warning about the negative consequencesof climate change on society. In late 2015, as the public demand from authoritiesgrew, a considerable majority of countries decided to boost their actions to restricta global-mean temperature rise to 1.5 C above pre-industrial levels. This ambitioustarget in the Paris Agreement was designed to be achieved through countries’contributions (i.e., nationally determined contributions). Unlike the Kyoto Protocol,which expired in 2012, the Paris Agreement differentiates countries’ responsibilitiesby distinguishing “developed” countries from “developing” countries. Althoughthis approach enables developing countries to improve their future contributions,relying on self-imposed contributions may result in countries declining to makeambitious targets (Pauw et al. 2019). That is why some countries have requestedto be recognized as a member of non-Annex I countries (UNFCCC 2018), whileothers find targets not bold enough. For instance, the European Union (EU) hasfurther propelled the actions of members in the “Green Deal” by committing to slashemissions by half from 1990 levels, by 2030 (European Commission 2019). The UnitedStates also rejoined the Paris climate agreement after leaving it for a short interval inthe previous administration (Pedaliu 2020).
Many solutions have been proposed to slow down, and eventually stop, globalwarming, among which are decarbonizing societies using renewable resources anddemand response management. Moving toward a bio-based economy is one of theproposed solutions that promise a cleaner production of energy for various sectorssuch as industries and transportation. This is particularly important since mostefforts in the past were solely focused on the power sector. As stated by experts andpolicymakers around the world, the underlined targets in the Paris Agreement aredifficult to reach if we rely on renewable electricity alone (FSR 2019). This stemsfrom the fact that emissions from energy-intensive industries (such as iron and
295

steel, and cement), as well as the transport sector, comprise a considerable share ofthe total greenhouse gas (GHG) emissions every year. These hard-to-abate sectorsrequire storable energy sources with high energy density (Friedmann et al. 2019). Forovercoming this challenge, currently, there are several technological concepts underdevelopment (e.g., all-electric commercial jets).
1.2. Gas-Power Network
According to the World Energy Outlook, which is published by the InternationalEnergy Agency (IEA), natural gas is expected to play a significant role in the globalenergy landscape in the future by replacing coal (IEA 2020b). Using gas-fired peakerpower plants, natural gas can also hedge against the intermittency of renewablesources such as solar and wind (United Nations 2020). In fact, the EU believes that anycost-optimal solutions to achieve a near-zero carbon energy system by the mid-centuryshould consider a “dual” gas-power network (Bowden 2019). Yet, combusting fossilnatural gas is destructive for the environment, even though it pollutes less than coaland crude oil; therefore, in long-term solutions, natural gas should be replaced withother renewable alternatives.
Methane (CH4) production from biological origins (bio-CH4) and (green)hydrogen (H2) can be suitable substitutes for natural gas. Due to their similarcompositions, bio-CH4 is easier to implement than H2, since it does not require hugeinvestments in infrastructures. Indeed, existing natural gas facilities for storageand transportation can also be used for bio-CH4 (Matschoss et al. 2020). Thus,through investment grants and tax incentives, many countries invest heavily inthe decarbonization of the gas sector using bio-CH4 (Brémond et al. 2020). Whilebio-CH4 can partially fulfill the energy demand, we should also prevent fugitive CH4
emissions in various sectors, as the detrimental impact of CH4 on the climate is muchhigher than carbon dioxide (CO2). As a matter of fact, the sixth assessment report ofthe Intergovernmental Panel on Climate Change (IPCC) emphasizes that methaneemissions are responsible for 0.5 C of warming to date (IPCC 2021, Figure SPM.2).
1.3. Turkey’s Current Status
Turkey is a developing country and a member of the Organization for EconomicCo-operation and Development (OECD), which is growing to be an influential playerin West Asia and southeastern Europe. Current Turkey’s energy consumption percapita falls short when compared with other OECD peer countries, although this isexpected to change (Difiglio et al. 2020). Turkey is investing heavily in the energysector to support its rapidly growing economy. Unfortunately, Turkey’s domestic
296

reserves are not adequate to fulfill its demands; thus, the nation has to rely on oil andnatural gas imports from neighboring countries such as Russia, Iraq, Azerbaijan, andIran (Esmaeili Aliabadi 2020). Owing to imported fossil fuels, Turkey’s energy tradedeficit is soaring to a massive amount, with natural gas being the second importantcause after crude oil and petroleum products (Erkoyun et al. 2020).
In order to ameliorate the trade deficit and achieve supply security, Turkey isdiversifying its energy generation portfolio by investing in domestic renewableresources under law No. 6094, including bioenergy. The Turkish governmentintroduced technology-specific feed-in tariffs (FITs), the so-called renewable energyresources support mechanism (YEKDEM, by its Turkish acronym). According toYEKDEM, the government is obligated to purchase the generated power for a decadewith fixed prices from the renewable facilities that are commissioned prior to July2021 (EMRA 2005; IEA 2021). As appeared in Table 1, this support mechanism alsoprovides incentives to local energy technologies.
Table 1. Technology-specific feed-in tariffs according to the renewable energyresources support mechanism (YEKDEM).
Technology Base Incentive (US ¢/kWh) Local Equipment (US ¢/kWh) Total (US ¢/kWh)
Concentrated solar power 13.3 9.2 22.5
Solar photovoltaics 13.3 6.7 20
Biomass and waste 13.3 5.6 18.9
Geothermal 10.5 2.7 13.2
Wind 7.3 3.7 11
Hydro 7.3 2.3 9.6
Source: Table by authors, data from EMRA Law No. 5346 (EMRA 2005).
The YEKDEM scheme caused a boom in the deployment of clean energytechnologies such as wind and solar; however, as depicted in Figure 1, bioenergy didnot receive the same attention (Esmaeili Aliabadi 2019). As of January 2021, the totalinstalled capacities of solar power plants are more than six times of biogas, biomass,and waste heat power plants combined.
Despite the low utilization of biogas as a fuel source for electric power production,which is not on par with other renewable resources, Turkey’s biogas productionpotential is estimated to be over 221 PJ per year in 2016 (Daniel-Gromke et al. 2016).The biogas production efficiency is a function of both biological matter properties (e.g.,lignocellulose content) and the production parameters (e.g., technology). In Turkey,firewood, as the classic biomass fuel, attracts more attention for energy production, as
297

it is convenient to process and have a high production rate; however, other biomasssources such as agricultural residues including hazelnut shell, tea waste, and wheatstraw have been utilized to meet the energy demand. Maltsoglou et al. (2016) provideregional assessments for the availability and potential of agricultural residues for heatand power production in Turkey. Preparing an up-to-date regional plan for bioenergyis vital since there is no silver bullet that can solve the energy issue in every province.
2014
50
0
10
20
30
40
Inst
alle
d Ca
paci
ty (G
We)
2015 2016 2017 2018 2019 2020
Biomass and Waste Geothermal Hydro Solar Wind
Figure 1. Breakdown of installed capacity by renewable technologies from 2014 to2020. Source: Graphic by authors.
In the transport sector, biodiesel and bioethanol production is again supportedby law. From 2018, Turkey’s energy market regulatory authority made it compulsoryto blend a minimum of 0.5% biodiesel in diesel oil (Tiryakioglu 2017). In 2014, Turkeyincreased the percentage of bioethanol blended with gasoline to 3% from the initialvalue of 2% in 2013. Thus far, bioethanol is produced in Turkey almost entirely fromsugar beet, corn, and barley (AGWeek 2011; Ozdingis and Kocar 2018). Producingbioethanol fuel from limited energy crops can be disrupted frequently in the long
298

term, as it competes with the food and medical supply chains. For example, due tothe high demand for disinfectants amid the pandemic, bioethanol production forgasoline was suspended in 2020 (Erkul 2020).
Supporting biofuels is not limited to Turkey. In Germany, similar policies are inplace since 2015 through a GHG-based quota, which requests fuel suppliers to mixbiofuels with conventional fuels such that the resulting mixture achieves a specific(i.e., 6% in 2020) GHG mitigation (Meisel et al. 2020).
While Turkey is facing unique challenges, it shares a common ground with otherdeveloping countries; hence, successful practices can be adopted by the rest of theworld. To this end, we calculated Turkey’s sectoral GHG emissions until 2040, usinga bottom-up technology-oriented energy model. Analyzing the collected information,we propose strategies to curtail GHG emissions by promoting bioenergy productionand consumption.
2. Materials and Methods
2.1. Energy Systems Modeling
In order to model intertwined energy systems, there are two fundamentalmodeling perspectives: the top-down macroeconomic approach and the bottom-upengineering approach. Both of these approaches have their own advantages anddisadvantages: for instance, top-down models assume an unalterable world, whereasbottom-up models account for technological breakthroughs over time. Bottom-upmodels serve as the practical method to estimate energy trends in mid- and longterm (Esmaeili Aliabadi et al. 2021).
In order to evaluate the total GHG emissions at the country level, the wholeenergy system should be considered, with all components and their interactions.To this end, a bottom-up technology-rich optimization model based on TIMES1
(Loulou et al. 2005) has been developed, in which parallel technologies compete tosatisfy end-use demand with minimum costs and within the frame of financial,environmental, and technological constraints. As illustrated in Figure 2, thedeveloped model creates a complex network of processes, in which commodities arebeing acquired (imported or extracted), transformed (through conversion processes),
1 TIMES is the acronym for The Integrated MARKAL-EFOM (MARKet ALlocation-Energy FlowOptimization Model) System. The TIMES source code can be acquired from https://github.com/etsap-TIMES/TIMES_model (accessed on 21 September 2021).
299

and transferred to be used by others. The results determine the optimal technologymix for each demand service until 2040, using 1200 processes, 181 commodities, andover 50 thousand data values.
In the proposed model, years are divided into eight time slices distinguishingday and night in each season. Hourly available datasets, such as electricity demand,wind speed, precipitation, and solar irradiation in each region, are transformed to bein accordance with the specified setting.
While the developed model consists of a single region (i.e., Turkey), it respectsthe regional characteristics of its elements. For instance, the availability factor ofwind farms considers the local wind speed and employed technologies.
Considering the technical properties, we assigned emission factors (EFs) toprocesses for various gases (CO2, CH4, and N2O). To assess the potency of GHGs intrapping heat, experts employ a relative measure called global warming potential,by which the greenhouse effects of GHGs are compared with those of CO2 as thereference gas. We used coefficients mentioned in Gillenwater et al. (2002, Table 2) tocalculate the total annual CO2-equivalent emissions.
300

AYAGNELCCOL
PAMUKOR_CELIKLE_4_GPPELC
TUZLA_ENDA_34_GPPELC
KIZILDE_ZORLU_3_GPPELC
KIZILDE_ZORLU_23_GPPELC
KIZILDE_ZORLU_2_GPPELC
GUMUSKO_BM_27_GPPELC
ELCGEO
AMSNELCCOL
ANANELCCOL
ATLELCCOL
Figure 2. Magnifying a section of the reference energy system. In the magnifiedsection of the network, one can see the exploitable geothermal energy is redirectedto individual geothermal power plants, which illustrates the level of details inprocesses. Interested readers are invited to zoom into the digital version of thisfigure for the details. Source: Graphic by authors.
301

2.2. Scenarios
For this study, we devised two scenarios: (1) the current policy (CP) scenario, inwhich established regulations and available technologies were taken into account,and (2) the pro-bioenergy (Pro-Bio) scenario, in which bioenergy was used intenselyfor producing liquid fuels and electricity.
In the pro-bioenergy scenario, we assumed that YEKDEM (or the replacingmechanism) continues supporting bioenergy (IEA 2021) and that an aggressiveapproach is adopted to produce biofuels in the transport sector. We adoptedtechnology descriptions of the BioENergy OPTimization (BENOPT) model (Millinger2020; Millinger et al. 2021) for technologies that convert crops and biomass residues toliquid biofuels, heat, and electricity. Specifically speaking, under the Pro-Bio scenario,methane emissions from dairy and non-dairy cattle and fugitive emissions fromnatural gas reserves were redirected to power and heat sectors. Furthermore, wastecooking oil was purchased and transformed into biodiesel using two technologies:
• Hydro treating vegetable or waste cooking oil;• Producing fatty-acid methyl ester via transesterification of cooking oil.
Due to an active tourist sector in Turkey, centralized management of waste oil ispossible to a great extent via unions2. Turkey’s government can further support thispolicy using tax incentives. Nonetheless, producing biodiesel from waste cookingoil is limited to consumption in the country. To relax this constraint, oil (i.e., lipid)production from microalgae is assumed to become economically viable in the future.
To achieve commercial-scale production of algae-based biodiesel, scientists andengineers should overcome many techno-economic challenges such as enhancinglipid production and designing an efficient dewatering method. In order to enhancelipid production, biologists are genetically engineering microalgal strains usingstate-of-the-art technologies such as CRISPR-cas9, which can decrease the costof biodiesel downstream (Lü et al. 2011; Ng et al. 2017; Radakovits et al. 2010).Furthermore, open pond systems for microalgae cultivation are prone to parasitesand invasive species; therefore, scientists need to investigate gene editing strategies toincrease microalgae strain’s tolerance against a/biotic stressors. The current problemwith oil production from microalgae is dewatering, which is energy intensive.
2 In Turkey, the alternative energy and biodiesel manufacturers union (ALBIYOBIR by its Turkishacronym) is a major association that collects waste cooking oil for biodiesel production.
302

Researchers are investigating energy efficient dewatering methods that can becombined with the lipid extraction step (Ghasemi Naghdi et al. 2016).
By enhancing the technology and increasing yield, we can make microalgaean attractive alternative to produce oil on a commercial scale. Under the Pro-Bioscenario, we assumed a higher cost for producing energy from microalgae thanwaste cooking oil that drops rapidly over time due to the learning effect. All in all,we introduced five new technologies that produce heat and electricity from biogas,biomethane, and vegetable oil. Furthermore, we added four new technologies toproduce bioethanol and biodiesel from lignocellulose, sugar beet, microalgae, andwaste cooking oil.
Finally, no upper bound was set for the GHG emissions under the Pro-Bio andCP scenarios. Table 2 summarizes the differences between the two scenarios.
Table 2. Differentiating components under each scenario.
Component Type Current Policy Scenario Pro-Bio Scenario
Fugitive gases Technology Release into atmosphere Utilized for heat production
Technologies Technology Available technologies Adopted from BENOPT
YEKDEM Policy Ends at 2021 Continues until 2040
Blending bioethanolwith gasoline
Policy increasing the blending ratioto about 8% by 2040
increasing the blending ratio toabout 20% by 2040
Blending biodieselwith diesel
Policy increasing the blending ratioto 0.7% by 2040
increasing the blending ratio to20% by 2040
Source: Table by authors.
It is noteworthy to mention that the results of the presented model in thismanuscript should not be compared with Difiglio et al. (2020), as the presentedmodel was modified thoroughly to include only publicly available informationand datasets.
3. Results
3.1. Current Policy Scenario
The total GHG emissions (CO2-equivalent) from each sector under the CPscenario are illustrated in Figure 3a. Due to the massive deployment of solarphotovoltaics and wind turbines, the GHG emission intensity of the power sectoris expected to decrease from ∼490 g CO2-eq./kWh, in 2020, to 252 g CO2-eq./kWh,
303

in 2040. This declining trend results in dropping GHG emissions from the electricpower sector despite higher electricity demand.
As one can see from Figure 3b, the total GHG emissions of Turkey (includingnon-energy sectors such as agriculture and chemical industries) are steadily rising.The color bars in Figure 3b are adopted from the Climate Action Tracker website3.The colors represent different ranges in the selected years. The emission abatementstrategies within these ranges are likely to cause global warming mentioned in twoends of that particular color if all countries follow similar approaches.
Mt C
O2-
eq.
(a) (b)
2014
2016
2018
2020
2022
2024
2032
2026
2034
2028
2036
2030
2038
2040
900
800
700
600
500
400
300
200
100
0
900
800
700
600
500
400
300
200
100
02000 2010
<<1.5 °C
1.5 °C
2 °C
3 °C
4 °C
2020 2030 2040
Transportation Mining Historical
CPResidential Industries
Refineries Commercial and Public Sector
Other activities Electricity and Heat Generation
Figure 3. (a) Sectoral GHG emissions (expressed in Mt CO2-eq.) from 2014 until2040; (b) comparing the total GHG emissions with the Paris climate agreement. Thesolid line shows the historical emissions, and the dashed line displays the projectedemissions. Source: Graphic by authors.
According to our calculations, the existing GHG abatement strategies in Turkeyare highly insufficient. Although the current trend is above an acceptable level, itis below Turkey’s intended nationally determined contribution, which was 929 MtCO2-eq. in 2030 (Republic of Turkey 2015).
3 Please see https://climateactiontracker.org/countries/turkey/ (accessed on 20 September 2021).
304

Further investigation in Figure 4a shows that methane, which can be used asa fuel source, comprises a considerable amount of emissions. By exploiting emittedCH4, we can prevent polluting the atmosphere with a gas multiple times strongerthan CO2 in trapping heat, and simultaneously, combust less of imported (andrelatively expensive) natural gas. Among various CH4 emission sources in Figure 4b,the agriculture and mining sectors contribute between 69% and 91% of the total CH4
emissions from 2014 to 2040. It is estimated that Turkey holds 679 billion cubic metersof shale gas reserves in the Thrace region and southeastern Anatolia4. Extractingthese resources as planned, with similar EFs as the current technology, can emita considerable amount of CH4 into the atmosphere. Among other sources of bio-CH4
emissions in the agriculture sector, dairy and non-dairy cattle can be counted asbig-ticket items.
2014
100
0
200
300
400
500
600
700
800
Mt C
O2-
eq.
Mt C
H4
8
6
4
2
0
2016
2018
2020
2022
2024
2026
2028
2030
2032
2034
2036
2038
2040 2015 2020 2025 2030 2035 2040
CH4Agriculture OthersCO2Commertial Refineries
N2O
Industries Residential
Others
Power Sector Transportation
Mining Wastes
(a) (b)
Figure 4. (a) Total GHG emissions by type (expressed in Mt CO2-eq.) from 2014until 2040; (b) methane emissions from various sectors. Source: Graphic by authors.
4 Please see https://politicstoday.org/what-is-turkeys-shale-gas-potential/ (accessed on 20 September2021).
305

In the transportation sector, vehicle ownership growth leads to higher fuelconsumption. Subsequently, there are intentions to increase the blending ratio ofbioethanol and biodiesel. Increasing the blending ratio of bioethanol to about 8%and biodiesel to 0.7% by 2040 can double these biofuels consumptions (15.7 PJ)5. Toincrease the blending ratios, while not competing with food crops, it is required toadopt better production technologies such as second-generation bioethanol.
In rural areas, biomass is still being exploited for residential space heating, waterheating, and cooking. However, we expect biomass consumption to decline, drivenby electrification and gasification in the residential sector.
3.2. Pro-Bio Scenario
According to our calculations in Figure 5a, the total GHG emissions of Turkeycan reach 570 Mt in 2040. Under the Pro-Bio scenario, Turkey can produceapproximately 250 PJ biodiesel and bioethanol per annum by 2040, using wastecooking oil, microalgae, lignocellulosic biomass, and food crops (see Figure 5c).
In the power sector, the installed capacity of biomass-based power plants canraise to 11 GW by 2040, of which combined heat and power using waste cookingoil would play a significant role (see Figure 5b). Subsequently, the GHG emissionintensity in the power sector would drop to 226 g CO2-eq./kWh in 2040.
Finally, as illustrated in Figure 5d, the biomass consumption in the buildingsector in 2040 is negligible (∼48 PJ), which paves the way for better managementof forests. As reported by the IEA (2020a) and Schimschar et al. (2016), biomassconsumption share in buildings for space heating is decreasing, owing to betterstandards, and electrification and gasification of the residential sector, especially inrural areas.
5 Producing biodiesel over 0.7% ratio is difficult to achieve when waste cooking oil is solely considered.
306

(a) (b)
(d)(c)
0
100
250
200
150
100
50
0
200
300
400
500
600
700
800
900
2000
<<1.5°C
1.5 °C
2 °C
3 °C
4 °C
2020 2040
<<1.5°C
Historical CP Pro-Bio
Mt C
O2e
q
Inst
alle
d Ca
paci
ty (G
W)
CP Pro-Bio
12
10
8
6
4
2
0
2020
2022
2024
2026
2028
2030
2032
2034
2036
2038
2040
Biodiesel Bioethanol
6.9
2019 2030 2040
8.1 11.2
61.0
15.7
249.9
CP CP CP
Pro-
Bio
Pro-
Bio
Pro-
Bio
Cons
umed
Ene
rgy
(PJ)
Waste vegetable oil(produced andimported): 123
Micro-algae: 500
Dairy cattle manure: 31
Non-dairy cattle manure: 31
Suger beet: 10Solid biomass(produced andimported): 109
MunicipalityIndustrialwastes: 442
Biogas: 504
Cooking (rural areas): 1Transportation Gasoline: 142
Electricity: 270
Residential water heating (rural areas): 3Residential space heating (rural areas): 45
Combined heat andpower: 767
Transportation Diesel: 1187
Fatty acids: 623
Heat: 54
Lignocellulose: 56BeetEtOH: 6 Ethanol: 29
Biomass power plant: 5
Biogasoline: 28
Gasoline: 114
FAME: 360
Diesel: 966
Biodiesel: 221
4 °C
Figure 5. (a) The total GHG emissions under the CP and Pro-Bio scenarios; (b) thetotal installed capacity of power plants based on biogas, biomethane, biomass, andwaste oil; (c) bioethanol and biodiesel consumption in the transportation sector;(d) the energy flow from biomass, wastes, and biofuels (PJ) in Turkey’s energysystem under the Pro-Bio scenario in 2040. Source: Graphic by authors.
4. Discussion
In this chapter, we assessed the effect of introducing biogas and biofuels moreactively in Turkey’s energy system till 2040. In the CP scenario, the contributionof biofuels to the transport sector is 275.4 PJ from 2014 till 2040, which displacesabout 7.3 Mt of diesel and gasoline and avoids emitting 20.64 Mt CO2-eq. into theatmosphere. However, by assuming higher biofuel blending ratios in the Pro-Bioscenario, an extra 153 Mt CO2-eq. GHG emissions can be avoided within the same
307

time frame. This is equivalent to not purchasing 57 Mt of petroleum products, which,by itself, can improve Turkey’s trade deficit.
To provide the additional biofuels, a wider range of technical options should beconsidered. For this reason, preparing a strategic plan to develop bioenergy in eachregion respecting their ecological characteristics (ecotype) is crucial. In short-termsolutions, agricultural residues produced on a provincial scale can play a significantrole, as they entail fairly low costs and great accessibility. For instance, Turkey isone of the major hazelnut producers, and hazelnut is the most important tree nutcrop for the country’s economy; hence, the Turkish hazelnut cultivar’s genome hasrecently been sequenced to unravel the critical properties for crop improvement(Avsar and Esmaeili Aliabadi 2017; Lucas et al. 2021). Most hazelnut productionin Turkey occurs in Ordu, Samsun, and Giresun near the Black Sea Coast. Thecentralized production of hazelnut in these neighboring provinces provides a uniqueopportunity to exploit hazelnut wastes and shells as the main agricultural wastesfor biogas production (Senol 2019). Simultaneously, endemic terrestrial plants, suchas Origanum Sp. Tekin-2017 (Cilgin 2020), should be evaluated to analyze theirapplications in biodiesel production.
Utilizing aquatic plant-like organisms, such as microalgae, can also be seenas a viable alternative to produce oil for biodiesel production. According to ourcalculations, the total surface area of all reservoirs behind hydroelectric power plantsis above 4451 km2. When the lakes are included, the total surface area of thesewaterbodies surpasses 8000 km2. This potential can be utilized to cultivate microalgaefor fuel production. Assuming a 45 tFM yield per hectare and year, Turkey canproduce over 83.53 PJ of energy by exploiting 50% of this potential. Hence, achieving500 PJ in 2040, which is required by the Pro-Bio scenario, might be infeasible withoutconsidering coastlines (e.g., the Black Sea and the Mediterranean Sea). To this end,investing in offshore technologies similar to the Offshore Membrane Enclosures forGrowing Algae (OMEGA) project (Colen 2014; Wiley 2013) seems inevitable, whichrequires solving many techno-economic challenges to tap into this potential.
As the market diffusion of intermittent renewable resources (e.g., solar andwind) increases, and coal-burning power plants become less attractive for investors,independent system operators will have to be prepared to cope with the powerbalancing issue in real time. Flexible biogas-burning power plants can be viewedas a green alternative to gas-fired peaker plants to produce power on demand.Managing biogas optimally can complement the advantages of other renewableresources (Dotzauer et al. 2019; Lauer and Thrän 2018). Considering the technology
308

mix, the produced power in the Pro-Bio scenario from biogas and vegetable cookingoil can prevent emitting 241.53 Mt CO2-eq. until 2040.
5. Conclusions
In this chapter, a TIMES-based model was employed to compare the impact ofhigher bioenergy consumption in Turkey on greenhouse gas emissions via contrastingscenarios: the current policy and pro-bioenergy. According to the results, Turkeyneeds to invest in novel technologies to resolve the competition between biofuelsand other critical supply chains (e.g., for food and medical applications), as thecurrently used waste cooking oil and sugar beet are hardly enough to supportnotable consumption levels. Furthermore, flexible biogas-based power plants shouldbe supported using FITs as a green alternative to gas-fired peaker plants to hedgeagainst volatilities caused by intermittent renewable sources. By so doing, powersystems will be enabled to invest more in harnessing energy from solar and wind.
Author Contributions: Conceptualization, D.E.A., D.T. and A.B.; methodology and modeling,D.E.A.; visualization, D.E.A. and B.A.; formal analysis, D.E.A. and D.T.; investigation, D.E.A.,D.T. and B.A.; data curation, D.E.A. and D.T.; writing–original draft preparation, D.E.A., D.T.and B.A.; writing–reviewing and editing, D.E.A. and A.B. All authors have read and agreed tothe published version of the manuscript.
Funding: This research received no specific grant from any funding agency.
Acknowledgments: The authors would like to thank Sabanci University and Carmine Difigliofor their support.
Conflicts of Interest: The authors declare no conflict of interest.
Abbreviations
The following abbreviations are used in this manuscript:
ALBIYOBIR The alternative energy and biodiesel manufacturers union
BENOPT BioENergy OPTimization model
CAS9 CRISPR-Associated Protein 9
CRISPER Clustered Regularly Interspaced Short Palindromic Repeats
CP Current Policy scenario
EF Emission Factor
EFOM The Energy Flow Optimization Model
EU The European Union
FIT Feed-in tariff
309

GHG Greenhouse gas
IEA International Energy Agency
IPCC Intergovernmental Panel on Climate Change
km Kilometer
kWh Kilowatt hour
MARKAL Market allocation
Mt Million tonne
OECD Organization for Economic Co-operation and Development
OMEGA Offshore membrane enclosures for growing algae
PJ Petajoule
Pro-Bio Pro-Bioenergy scenario
tFM Tonne of Fresh Matter
TIMES The Integrated MARKAL-EFOM System
US The United States of America
References
AGWeek. 2011. Sugarbeets in Turkey. Available online: https://agweek.com/sugarbeet/sugarbeets-in-turkey (accessed on 1 November 2021).
Avsar, Bihter, and Danial Esmaeili Aliabadi. 2017. Identification of microRNA elements fromgenomic data of european hazelnut (Corylus avellana L.) and its close relatives. PlantOmics 10: 190–96. [CrossRef]
Bowden, Jeremy. 2019. EU Sees Dual Gas-Power Energy System as Best Bet to ReachZero Carbon by 2050. Available online: https://informaconnect.com/eu-sees-dual-gas-power-energy-system-as-best-bet-to-reach-zero-carbon-by-2050 (accessed on 20September 2021).
Brémond, Ulysse, Aude Bertrandias, Jean-Philippe Steyer, Nicolas Bernet, and Hélène Carrere.2020. A vision of European biogas sector development towards 2030: Trends andchallenges. Journal of Cleaner Production 287: 125065. [CrossRef]
Cilgin, Erdal. 2020. Investigation of biodiesel potential of new hybrid of Origanum Sp.Tekin-2017, native to Turkey. Fuel 277: 118180. [CrossRef]
Colen, Jerry. 2014. OMEGA Project (2009–2012). Available online: https://nasa.gov/centers/ames/research/OMEGA (accessed on 21 September 2021).
310

Daniel-Gromke, Jaqueline, Funda Cansu Ertem, Ronny Kittler, Fatih Gökgöz, Peter Neubauer,and Walter Stinner. 2016. Analyses of regional biogas potentials in Turkey. Paperpresented at Eurasia 2016 Waste Management Symposium, Istanbul, Turkey, 2–4 May2016.
Difiglio, Carmine, Bora Sekip Güray, Ersin Merdan, and Danial Esmaeili Aliabadi. 2020.Turkey Energy Outlook 2020. Istanbul: Sabancı University Istanbul International Centerfor Energy and Climate.
Dotzauer, Martin, Diana Pfeiffer, Markus Lauer, Marcel Pohl, Eric Mauky, Katharina Bär,Matthias Sonnleitner, Wilfried Zörner, Jessica Hudde, Björn Schwarz, and et al. 2019.How to measure flexibility–Performance indicators for demand driven power generationfrom biogas plants. Renewable Energy 134: 135–46. [CrossRef]
EMRA. 2005. Law on the Use of Renewable Energy Sources for Electric Energy GenerationNo. 5346. Available online: https://www.mevzuat.gov.tr/MevzuatMetin/1.5.5346.pdf(accessed on 13 October 2021).
Erkoyun, Ezgi, Daren Butler, and Jonathan Spicer. 2020. Turkey Trade Deficit Soars asLira Drop Sets Off Gold Rush. Available online: https://www.reuters.com/article/turkey-economy-trade-int/turkey-trade-deficit-soars-as-lira-drop-sets-off-gold-rush-idUSKBN25T1CM (accessed on 21 September 2021).
Erkul, Nuran. 2020. Turkey Halts Ethanol-Mixed Fuel for More Disinfectants. Availableonline: https://www.aa.com.tr/en/energy/refining-petro-chemistry/turkey-halts-ethanol-mixed-fuel-for-more-disinfectants/28639 (accessed on 21 September 2021).
Esmaeili Aliabadi, Danial. 2019. IICEC-Sabanci University TIMES Energy Model: Overview.Istanbul: Sabancı University Istanbul International Center For Energy and Climate(IICEC), p. 90. [CrossRef]
Esmaeili Aliabadi, Esmaeili. 2020. Decarbonizing existing coal-fired power stationsconsidering endogenous technology learning: A Turkish case study. Journal of CleanerProduction 261: 121100. [CrossRef]
Esmaeili Aliabadi, Danial, Emre Çelebi, Murat Elhüseyni, and Güvenç Sahin. 2021. Modeling,simulation, and decision support. In Local Electricity Markets. Edited by Tiago Pinto, ZitaVale and Steve Widergren. Amsterdam: Elsevier, pp. 177–97. [CrossRef]
European Commission. 2019. The European Green Deal. Communication form the Commission tothe European Parliament, the European Council, the Council, the European Economic and SocialCommittee and the Committee of the Regions. Available online: https://eur-lex.europa.eu/legal-content/EN/TXT/?uri=COM (accessed on 21 September 2021).
311

Friedmann, Julio, Zhiyuan Fan, and Ke Tang. 2019. Low-Carbon HeatSolutions for Heavy Industry: Sources, Options, and Costs Today. NewYork: Columbia University Center on Global Energy Policy. Availableonline: https://www.energypolicy.columbia.edu/research/report/low-carbon-heat-solutions-heavy-industry-sources-options-and-costs-today (accessed on 21 September2021).
FSR. 2019. Exclusive Interview with Borchardt (EC)! from Madrid Forum to the GasPackage. Available online: https://fsr.eui.eu/exclusive-interview-with-borchardt-ec-from-madrid-forum-to-the-gas-package (accessed on 20 September 2021).
Ghasemi Naghdi, Forough, Lina M. González González, William Chan, and Peer M. Schenk.2016. Progress on lipid extraction from wet algal biomass for biodiesel production.Microbial biotechnology 9: 718–26. [CrossRef]
Gillenwater, Michael, Marian Martin Van Pelt, and Katrin Peterson. 2002. Greenhouse Gasesand Global Warming Potential Values. Washington: Office of Atmospheric Programs ofUnited States Environmental Protection Agency.
IEA. 2020a. Energy Efficiency Indicators: Highlights. Available online: https://iea.org/reports/energy-efficiency-indicators (accessed on 21 September 2021).
IEA. 2020b. World Energy Outlook 2020. Available online: https://www.oecd-ilibrary.org/energy/world-energy-outlook-2020_557a761b-en (accessed on 21 September 2021).
IEA. 2021. Turkey 2021: Energy Policy Review. Available online: https://www.oecd-ilibrary.org/energy/turkey-2021-energy-policy-review_0633467f-en (accessed on 21 September2021).
IPCC. 2021. Climate Change 2021: The Physical Science Basis. Contribution of WorkingGroup I to the Sixth Assessment Report of the Intergovernmental Panel on ClimateChange. Available online: https://www.ipcc.ch/report/ar6/wg1/downloads/report/IPCC_AR6_WGI_Full_Report.pdf (accessed on 21 September 2021).
Lauer, Markus, and Daniela Thrän. 2018. Flexible biogas in future energy systems–sleepingbeauty for a cheaper power generation. Energies 11: 761. [CrossRef]
Loulou, Richard, Uwe Remne, Amit Kanudia, Antti Lehtila, and Gary Goldstein. 2005.Documentation for the TIMES Model—Part I: Energy Technology Systems Analysis Programme.Paris: International Energy Agency.
Lü, Jing, Con Sheahan, and Pengcheng Fu. 2011. Metabolic engineering of algae for fourthgeneration biofuels production. Energy & Environmental Science 4: 2451–66. [CrossRef]
Lucas, Stuart J., Kadriye Kahraman, Bihter Avsar, Richard J. A. Buggs, and Ipek Bilge. 2021.A chromosome-scale genome assembly of European hazel (Corylus avellana L.) revealstargets for crop improvement. The Plant Journal 105: 1413–30. [CrossRef] [PubMed]
Maltsoglou, Irini, Luis Rincon, Ana Kojakovic, Evren Deniz Yaylaci, Manas Puri, and OlivierDubios. 2016. BEFS Assessment for Turkey: Sustainable Bioenergy Options from Crop andLivestock Residues. Rome: Food and Agriculture Organization of the United Nations.
312

Matschoss, Patrick, Michael Steubing, Joachim Pertagnol, Yue Zheng, Bernhard Wern, MartinDotzauer, and Daniela Thrän. 2020. A consolidated potential analysis of bio-methaneand e-methane using two different methods for a medium-term renewable gas supply inGermany. Energy, Sustainability and Society 10: 1–17. [CrossRef]
Meisel, Kathleen, Markus Millinger, Karin Naumann, Franziska Müller-Langer, Stefan Majer,and Daniela Thrän. 2020. Future renewable fuel mixes in transport in Germany underRED II and climate protection targets. Energies 13: 1712. [CrossRef]
Millinger, Markus. 2020. BioENergy OPTimisation model–BENOPT. Available online: https://www.ufz.de/export/data/2/245341_Supplementary.pdf (accessed on 21 September2021).
Millinger, Markus, Philip Tafarte, Matthias Jordan, Alena Hahn, Kathleen Meisel, and DanielaThrän. 2021. Electrofuels from excess renewable electricity at high variable renewableshares: cost, greenhouse gas abatement, carbon use and competition. Sustainable Energy& Fuels 5: 828–43. [CrossRef]
Ng, I-Son, Shih-I Tan, Pei-Hsun Kao, Yu-Kaung Chang, and Jo-Shu Chang. 2017. Recentdevelopments on genetic engineering of microalgae for biofuels and bio-based chemicals.Biotechnology Journal 2: 1600644. [CrossRef] [PubMed]
Ozdingis, Asiye Gul Bayrakci and Gunnur Kocar. 2018. Current and future aspects ofbioethanol production and utilization in Turkey. Renewable and Sustainable EnergyReviews 81: 2196–203. [CrossRef]
Pauw, Pieter, Kennedy Mbeva, and Harro van Asselt. 2019. Subtle differentiation of countries’responsibilities under the paris agreement. Palgrave Communications 5: 1–7. [CrossRef]
Pedaliu, Effie G.H. 2020. The Biden Era: What Can Europe Expect from America’sNew President? Available online: https://blogs.lse.ac.uk/europpblog/2020/11/09/the-biden-era-what-can-europe-expect-from-americas-new-president/ (accessed on 21September 2021).
Radakovits, Randor, Robert E. Jinkerson, Al Darzins, and Matthew C. Posewitz. 2010. Geneticengineering of algae for enhanced biofuel production. Eukaryotic Cell 9: 486–501.[CrossRef] [PubMed]
Republic of Turkey. 2015. Republic of Turkey Intended Nationally DeterminedContribution. Available online: https://www4.unfccc.int/sites/submissions/INDC/PublishedDocuments/Turkey/1/The_INDC_of_TURKEY_v.15.19.30.pdf (accessed on20 September 2021).
Schimschar, Sven, Thomas Boermans, David Kretschmer, Markus Offermann, and Ashok John.2016. U-Value Maps Turkey: Applying the Comparative Methodology Framework forCost-Optimality in the Context of the EPBD. Number BUIDE15722. Ecofys. Availableonline: https://izoder.org.tr/dosyalar/haberler/Turkiye-U-degerleri-haritasi-raporu-2016-Ingilizce.pdf (accessed on 21 September 2021).
313

Senol, Halil. 2019. Biogas potential of hazelnut shells and hazelnut wastes in Giresun city.Biotechnology Reports 24: e00361. [CrossRef]
Tiryakioglu, Muhsin Baris. 2017. Turkey’s EMRA Ups Max-Limit of Gas Distribution Regions.Available online: https://www.aa.com.tr/en/energy/regulation/turkeys-emra-ups-max-limit-of-gas-distribution-regions/1870 (accessed on 21 September 2021).
UNFCCC. 2018. Proposal from Turkey to Amend the List of Parties Included in Annex I to theConvention. Available online: https://unfccc.int/sites/default/files/resource/inf2.pdf(accessed on 21 September 2021).
United Nations. 2020. How Natural Gas Can Support the Uptake of Renewable Energy.Available online: https://www.un-ilibrary.org/content/books/9789210046589 (accessedon 21 September 2021).
Wiley, Patrick Edward. 2013. Microalgae Cultivation Using Offshore Membrane Enclosuresfor Growing Algae (OMEGA). Ph.D. thesis, University of California, Merced, CA, USA.
© 2022 by the authors. Licensee MDPI, Basel, Switzerland. This article is an openaccess article distributed under the terms and conditions of the Creative CommonsAttribution (CC BY) license (http://creativecommons.org/licenses/by/4.0/).
314

MDPISt. Alban-Anlage 66
4052 BaselSwitzerland
Tel. +41 61 683 77 34Fax +41 61 302 89 18
www.mdpi.com
MDPI Books Editorial OfficeE-mail: [email protected]/books


ISBN 978-3-03897-777-3
MDPI St. Alban-Anlage 66 4052 Basel Switzerland
Tel: +41 61 683 77 34
www.mdpi.com


