Embed Size (px)
Citation preview
Transforming XML trees for efficientclassification and clustering
Laurent Candillier1,2, Isabelle Tellier1, Fabien Torre1
1 GRAppA - Charles de Gaulle University - Lille 3http://[email protected]
2 Pertinence - 32 rue des Jeuneurs -75002 Parishttp://www.pertinence.com
Abstract. Most of the existing methods we know to tackle datasetsof XML documents directly work on the trees representing these XMLdocuments. We investigate in this paper the use of a different kind ofrepresentation for the manipulation of XML documents.Our idea is to transform the trees into sets of attribute-values, so as to beable to apply various existing methods of classification and clustering onsuch data, and benefit from their strengths. We apply this strategy bothfor the classification task and for the clustering task using the structuraldescription of XML documents alone.For instance, we show that the use of boosted C5 [1] leads to very goodresults in the classification task of XML documents transformed in thisway. The use of SSC [2] in the clustering task benefits from its ability toprovide as output an interpretable representation of the clusters found.Finally, we also propose an adaptation of SSC for the classification ofXML documents, so that the produced classifier is understandable.
1 Introduction
Most of the existing methods we know to tackle datasets of XML documentsdirectly work on the trees representing these XML documents. Some methodsare based on the use of metric distances to compare the trees: the edit distance,minimum number of mutations required to change a tree into another one [3,4],or the number of paths they share [5–7]. Other methods aim at discoveringfrequent subtrees in the data [8, 9].
We investigate in this paper the use of a different kind of representation forthe manipulation of XML documents. We propose to transform the trees into setsof attribute-values. In [10], the authors used such an idea to take into account thestructure when classifying XML documents. But the representation they chosefor the trees was a simple bag-of-tags. We propose to use richer features: theset of parent-child relations, the set of “next-sibling” relations, the set of pathsstarting from the root and the arity of the nodes.
The use of such representations allows us to apply various existing methodsfor classifying or clustering sets of XML documents. And we can thus benefit fromthe strengths of these methods. In particular, our experiments exhibit very good

results when applying boosted C5 [1] on sets of XML documents transformed inthis way. The use of SSC [2] for clustering tasks on such transformed datasetsalso benefits from its ability to provide as output an interpretable representationof the clusters found. Moreover, we also propose in this paper an adaptation ofSSC for the classification of XML documents, so that the produced classifier isunderstandable.
The remainder of the paper is organized as follows: in section 2, we presentour proposed methodology to transform a tree into a set of attribute-values,and how such new dataset can be used for classification tasks; in section 3, wedescribe the adaptation of the SSC algorithm for XML datasets; the resultsof our experiments, conducted on the datasets provided by the XML miningchallenge at INEX [11] on the structure only tasks, are then reported in section 4;finally, section 5 concludes the paper and suggests topics for future research.
2 Tree transformation
There are many possible ways to transform a tree into a set of attribute-values.The first basic possibility is to transform the tree into the set of labels present atits nodes. An XML document would thus be transformed into a simple bag-of-
tags. If the different sets of documents to be identified use different sets of tags,this representation would be sufficient to distinguish them. However, by doingthat, we do not take into account the structure of the XML trees. To go further,we propose to construct the following attributes from a set of available trees:
– the set of parent-child relations (whose domain is the set of pairs of tagslabelling the nodes);
– the set of next-sibling relations (whose domain is the set of pairs of tagslabelling the nodes);
– the set of distinct paths (including sub-paths), starting from the root (whosedomain is the set of finite sequences of tags labelling the nodes).
So, we create as many new attributes as distinct features are encounteredin the training set. For each of them, their value for a given document is thenumber of their occurences in this document. Finally, we also define as manynew attributes as there are absolute distinct node positions represented in thetrees. The identifier of such a node position can be coded, for example, by asequence of integers: the root is coded 0, its first child is coded 0.0, its secondchild 0.1, etc. For every identifier of a node position, the value of the attribute fora document is the arity of the node, that is the number of its child nodes in thedocument (whose domain is an integer). So the new introduced attributes all taketheir value into the set of natural numbers. As an intuition, such representationshould allow to distinguish, for example:
– two sets of documents that use different tags, or in which the number ofsome given tags are different;
– one set of documents in which a given relation (parent-child or next-sibling)between some given tags is allowed, from another set that does not allowsuch a relation;
– or a set of documents in which the number of children of a given node positionis different from the one in another set of documents.
Such representation could lead to a high number of generated attributes.So the algorithms used to tackle such new datasets should be able to handlemany attributes, and to perform feature selection during their learning process.In a classification task, C5 [1] is for example well suited. In a clustering task, asubspace clustering algorithm, that is a clustering algorithm able to characterizeevery distinct cluster on a limited number of dimensions (eventually distinct foreach cluster) could be useful. We describe such a method in the next section.
3 Algorithm SSC
SSC [2] is a subspace clustering algorithm based on the use of a probabilisticmodel under the assumption that the clusters follow independent distributionson each dimension. It uses the well-known EM algorithm [12]. SSC has beenshown to be effective, and it is able to provide as output an interpretable rep-resentation of the clusters found, as a set of rules, and a way to visualize themeffectively. Moreover, a new step of hard feature selection has been added to keeponly the best attributes for each cluster, and thus be less sensitive to irrelevantdimensions, and faster.
In the next subsections, we first formalize the different steps of the method.We then present an adaptation for facing datasets of XML documents, and an-other adaptation for supervised classification. One of the interests of this methodis that it provides an output which can be represented by a hierarchy of tests.
3.1 Formalization of the method
Let us first introduce some notations. We denote by N the number of data points−→Xi of the input dataset D, and by M the number of dimensions on which theyare defined. We only present here the case where the dimensions are numerical,but the adaptation for datasets containing also categorical dimensions can befound in [2].
The basis of our model is the classical mixture of probability distributionsθ = (θ1, ..., θK) where each θk is the vector of parameters associated with the kth
cluster to be found, denoted by Ck (we set to K the total number of clusters). Inour model, we suppose that the data follow gaussian distributions. So the modelhas the following parameters θk for each cluster Ck : πk denotes its weight, µkd
its mean and σkd its standard deviation on dimension d. We then use the EM
algorithm [12] to find the model parameters that best fit the data.The E-step consists in computing the membership probability of each data
point−→Xi to each cluster Ck with parameters θk. In our case, dimensions are
supposed to be independent. So the membership probability of a data point toa cluster is the product of membership probabilities on each dimension:
P (−→Xi|θk) =
M∏
d=1
1√2πσkd
e− 1
2
(
Xid−µkdσkd
)
2
P (−→Xi|θ) =
∑Kk=1 πk × P (
−→Xi|θk) and P (θk|−→Xi) = πk×P (
−→Xi|θk)
P (−→Xi|θ)
Then the M-step consists in updating the model parameters according to thenew class probabilities as follows:
πk =1
N
∑
i
P (θk|−→Xi)
µkd =
∑
iXid×P (θk|
−→Xi)
∑
iP (θk|
−→Xi)
and σkd =
√∑
iP (θk|
−→Xi)×(Xid−µkd)2
∑
iP (θk|
−→Xi)
These two steps iterate until a stopping criterion is reached. Usually, it stopswhen the log-likelihood of the model to the data, LL(θ|D) =
∑
i log P (−→Xi|θ),
increases less than a small positive constant δ from one iteration to another.But in order to cope with the problem of slow convergence with the classicalEM algorithm, it has been shown in [2] that adding the following k-means like
stopping criterion is effective: stop whenever the membership of each data pointto their most probable cluster does not change from one iteration to another. Todo this, we introduce a new view on each cluster Ck, corresponding to the set ofdata points belonging to it:
Sk = {−→Xi|ArgmaxKj=1P (
−→Xi|θj) = k}
The set of all Sk thus define a partition on the dataset.And finally, to cope with the problem of sensitivity to the choice of the initial
solution, we run the algorithm many times with random initial solutions and keepthe model that optimizes the log-likelihood of the model to the data LL(θ|D).
Moreover, a new step of hard feature selection has been added to keep onlythe best attributes for each cluster. This is done by using a user parameter,denoted by nb ds, that specifies how many attributes to keep for each cluster.Thus, for each cluster, the attributes of highest weights are kept, and the othersare ignored. These weights Wkd are computed as the ratio between local andglobal standard deviations:
Wkd = 1 − σ2kd
σ2d
, with σ2d =
1
N
∑
i
(Xid − µkd)2
To make the results as comprehensible as possible, we now introduce a thirdview on each cluster, corresponding to its description as a rule defined with asfew dimensions as possible.
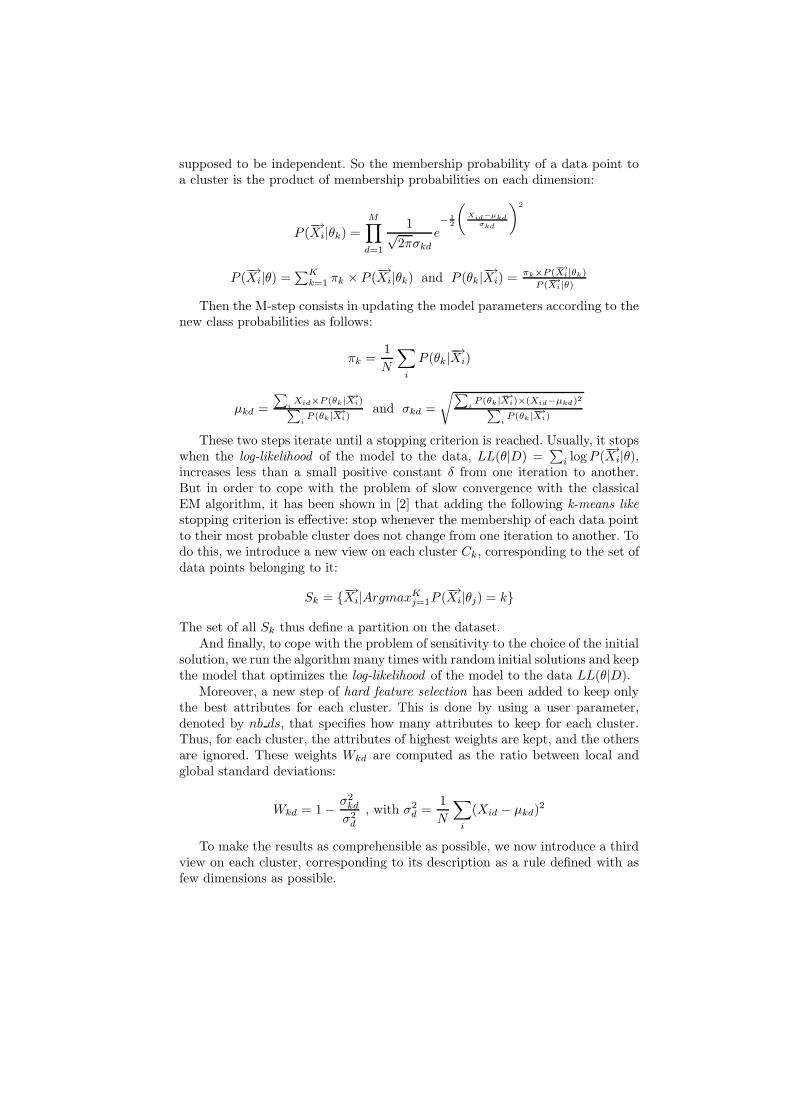
Although we have already selected a subset of dimensions relevant for eachcluster, it is still possible to prune some and simplify the clusters representationwhile keeping the same partition of the data. See figure 1 as an example. Inthis case, the cluster on the right is dense on both dimensions X and Y . So itstrue description subspace is X × Y . However, we do not need to consider Y todistinguish it from the other clusters: defining it by high values on X is sufficient.The same reasoning holds for the cluster on the top and the dimension Y .
X
Y
� � � � �� �� �
��
��
� ��
�
��
� ��� � � �� �
��
��
�� �� �
�
�
�
�
�
�
��
�
�
�
�
�
��� �
�
� �
����
��
�
�
�
���
��
���
�
� �
�� ��
�
� � ��� �
��
�
��
�
�
� ���
Fig. 1. Example of minimal description.
To do this dimension pruning, we first create the rule Rk associated with thecurrent cluster Ck. We now only consider the set of dimensions considered asrelevant according to the previous selection, and associate with the rule Rk thesmallest interval containing all the coordinates of the data points belonging toSk. We then compute the support of the rule (the set of data points comprisedin the rule). This step is necessary since it is possible that some data pointsbelong to the rule but not to the cluster. And then, for all relevant dimensions d
presented in ascending order of their weights Wkd, we delete the dimension fromthe rule if the deletion does not modify its support.
3.2 Adaptation for clustering XML documents
For ease of interpretation, and to speed up the algorithm for clustering XMLdocuments based on their structure, we propose to adapt SSC so that the datasetis recursively cut into two parts according to a given set of attributes associatedwith the trees. The output of our clustering method is then a hierarchy in whicheach node represents a test on various attributes.
Before giving more details on our procedure, let us introduce some notations.A denotes the set of possible attributes associated with the XML documents. Aspresented in the previous section, A can be partitioned into groups of attributesof increasing complexity:
– we call A1 the set of tags,– A2 is the set of parent-child relations,– A3 is the set of next-sibling relations,– A4 is the set of node positions,– and A5 is the set of paths starting from the root.

A is thus composed of SA = 5 classes of attributes. Finally, we denote byCut(Ck, Ai) the partitionning into two parts of the dataset that is made of thedocuments included in the cluster Ck, and transformed with the given set ofattributes Ai.
The main steps of our new clustering method are presented by algorithm 1.It consists in choosing at each step the cut of highest interest, among all thepossible cuts of the current clusters Ck for k ∈ [1..K] on the possible sets ofattributes Ai ∈ A, until the desired number of clusters is reached. The interest ofpartitionning the elements of the cluster Ck with the attributes of Ai is computedas the ratio between the log-likelihood of a partition with two clusters and the log-
likelihood of a partition with only one cluster, weighted by the number of datapoints in Ck, to prefer the divisions of clusters containing many data points.The output of the procedure is a hierarchy in which each node corresponds to amembership test to a rule, created as presented in the previous subsection, anddefined with as few attributes as possible.
Algorithm 1 SSC for XML
Input: the dataset D of XML documents and the desired number of clusters nb clus
- set K, the current number of clusters of the partition, to 1- initialize the unique cluster C1 with all the documents of the dataset D
- create a new empty hierarchy H
while K 6= nb clus do
for all k ∈ [1..K] do
for all i ∈ [1..SA] do
- compute the interest of Cut(Ck, Ai)end for
end for
- select and perform the cut of highest interest- compute the associated rule and add it to the hierarchy H
end while
Output: the hierarchy H, with nb clus − 1 tests
3.3 Adaptation for understandable classification
In order to benefit from the ability of the previously presented method to provideunderstandable results, we now propose to adapt it for supervised classification.The new method has two main steps: a first step that is clustering like but usesthe classes, and a second step that is completely guided by the classes.
The first step is described by algorithm 2 and consists in a clustering phasethat allows to mix various classes in one cluster but does not allow a class to besplitted into different clusters. At this step, we prefer that a cutting rule is definedon the tags attributes better than on any other set of attributes, because theyare simpler attributes. In the same way, we prefer to use attributes representingrelations between tags (parent-child or next-sibling) than paths information. So
more generally, we prefer using Ai than Aj if i < j. That’s why we perform a cuteach time it is possible, rather than comparing the interest on various possiblecuts, as is done for clustering. The same reasoning will also holds in the nextstep.
Algorithm 2 Step 1
Input: the dataset D of XML documents- initialize the unique cluster C1 with all the documents of the dataset D
- create a new empty hierarchy H
- set CUT = 1while CUT = 1 do
- set CUT = 0for all k ∈ [1..K] do
- set CUTk = 0 and i = 1while CUTk = 0 and i <= SA do
if in Cut(Ck, Ai), no class is splitted into different parts then
- perform the partitionning- compute the associated rules and update the hierarchy- set CUTk = 1 and CUT = 1
else
- i = i + 1end if
end while
end for
end while
Output: the hierarchy H, and the current partition
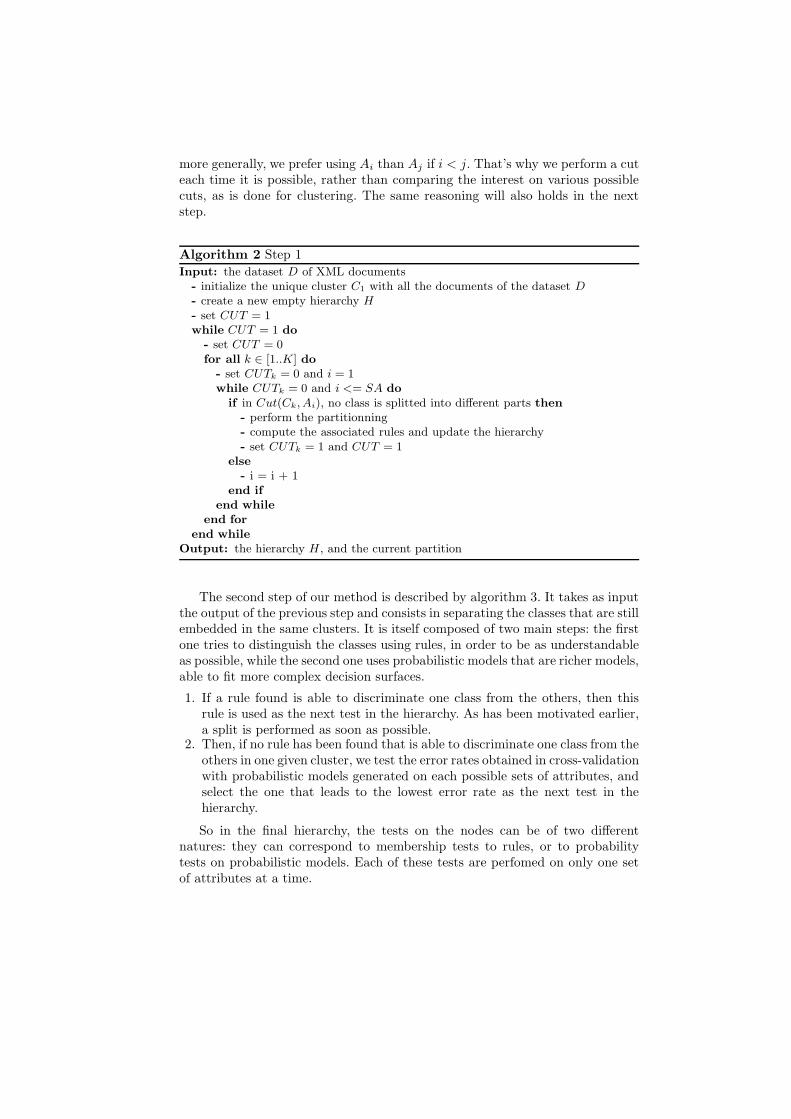
The second step of our method is described by algorithm 3. It takes as inputthe output of the previous step and consists in separating the classes that are stillembedded in the same clusters. It is itself composed of two main steps: the firstone tries to distinguish the classes using rules, in order to be as understandableas possible, while the second one uses probabilistic models that are richer models,able to fit more complex decision surfaces.
1. If a rule found is able to discriminate one class from the others, then thisrule is used as the next test in the hierarchy. As has been motivated earlier,a split is performed as soon as possible.
2. Then, if no rule has been found that is able to discriminate one class from theothers in one given cluster, we test the error rates obtained in cross-validationwith probabilistic models generated on each possible sets of attributes, andselect the one that leads to the lowest error rate as the next test in thehierarchy.
So in the final hierarchy, the tests on the nodes can be of two differentnatures: they can correspond to membership tests to rules, or to probabilitytests on probabilistic models. Each of these tests are perfomed on only one setof attributes at a time.
Algorithm 3 Step 2
Input: the hierarchy H and the partition from the first stepfor all k ∈ [1..K] do
while Ck contains different classes do
for all i ∈ [1..SA] do
for all class ∈ Ck do
if a rule is able to distinguish the class from the others then
- perform the partitionning and update the hierarchyend if
end for
end for
if no split has been done then
for all i ∈ [1..SA] do
- compute the classification error rate in cross-validation of the probabilisticmodel generated on the attributes Ai
end for
- choose the model that leads to the lowest error rate and update the hierarchyend if
end while
end for
Output: the hierarchy H
4 Experiments
Our experiments were conducted on the datasets provided by the XML min-ing challenge at INEX on the structure only tasks. The classification methodpresented in section 2 was applied on all datasets: inex-s, m-db-s-0, m-db-s-1, m-
db-s-2 and m-db-s-3. The results are presented in the first subsection. The othertwo methods presented in section 3 were only applied on the m-db-s-0 dataset,due to the lack of time. Their results are presented in the second subsection.
4.1 Boosted C5 on the transformed datasets
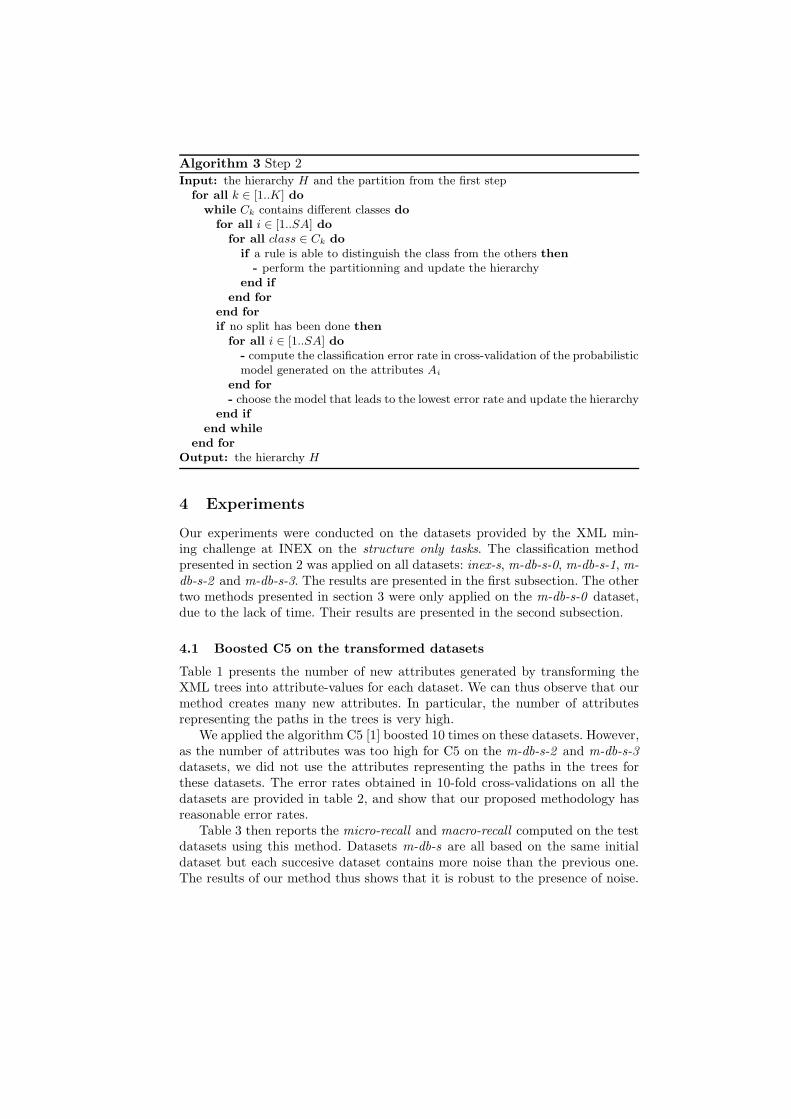
Table 1 presents the number of new attributes generated by transforming theXML trees into attribute-values for each dataset. We can thus observe that ourmethod creates many new attributes. In particular, the number of attributesrepresenting the paths in the trees is very high.
We applied the algorithm C5 [1] boosted 10 times on these datasets. However,as the number of attributes was too high for C5 on the m-db-s-2 and m-db-s-3
datasets, we did not use the attributes representing the paths in the trees forthese datasets. The error rates obtained in 10-fold cross-validations on all thedatasets are provided in table 2, and show that our proposed methodology hasreasonable error rates.
Table 3 then reports the micro-recall and macro-recall computed on the testdatasets using this method. Datasets m-db-s are all based on the same initialdataset but each succesive dataset contains more noise than the previous one.The results of our method thus shows that it is robust to the presence of noise.
number number of number of number of numberdataset of parent-child next-sibling node of total
tags relations relations positions paths
inex-s 150 1038 827 2475 3674 8164
m-db-s-0 197 2172 419 6575 320 9683
m-db-s-1 197 6477 5617 9159 16772 38222
m-db-s-2 196 8953 7455 9183 25628 51415
m-db-s-3 199 10639 9557 8537 37576 66508
Table 1. Number of attributes generated for each dataset.
dataset error rate
inex-s 0.011
m-db-s-0 0.026
m-db-s-1 0.038
m-db-s-2 0.062
m-db-s-3 0.062
Table 2. Error rates of boosted C5 on the datasets transformed into attribute-values.
dataset micro-recall macro-recall
inex-s 0.941 0.958
m-db-s-0 0.968 0.960
m-db-s-1 0.966 0.956
m-db-s-2 0.942 0.932
m-db-s-3 0.947 0.935
Table 3. Micro-recall and macro-recall of boosted C5 on the test datasets transformedinto attribute-values.
4.2 Adaptations of SSC
For reasons of time, the algorithms adapted from SSC were only experimented onthe m-db-s-0 dataset. The parameter nb ds defined in section 3, and representingthe number of most relevant dimensions to be selected for each cluster, was setto 10.
Our clustering method managed to identify correctly the classes number 1 to5. It mixed classes number 7 and 9 together, and the remaining classes were alsomixed together. This clustering thus leads to a micro purity of 0.78, a macro
purity of 0.75, a micro entropy of 0.18, a macro entropy of 0.21, and a mutual
information of 1.87 on test data.The hierarchy formed is presented by figure 2. R4, R10, R6, and R7 are
conjunctions of 10 tests:
– R4 is defined on the attributes representing the next-sibling relations,– R10 concerns the number of children according to the node positions,– R6 is defined on the attributes representing the tags,– and R7 concerns the number of children according to the node positions.
Finally, R11 tests whether the number of paths (BE-AL-AT) is lower or equalto 1, and if there is no path (BE-AL-AT-AR).
The adaptation of our method for supervised learning leads to very interest-ing results. The hierarchy obtained is presented by figure 3. We can thus observethat the given hierarchy is very understandable.
– S2, S3, S4 and S5 represent the probabilities on models based on next-siblingrelations, respectively concerning classes 2, 3, 4 and 5.
– P6 and P11 represent the probabilities on models based on the paths of thetrees, concerning classes 6 and 11.
– And Nb(0.0.0) indicates the number of children of the first grand-child ofthe root.
Thus, for example, the membership to class 1 only depends on the presenceof the tag named movie. And in the same way, the membership to class 8 onlydepends on the absence of the tags movie, CL, BJ, AJ, and the presence of theparent-child relation between tags AT and AQ. The error rate of this tree on thetrain dataset is 0.03. It misclassified very few documents, except those of classes6 and 11 that were mixed.
The results of this method on test data were also very reasonable, leading toa micro-recall of 0.906 and a micro-recall of 0.924.
5 Conclusion
We have shown in this paper that transforming XML document trees into sets ofattribute-values can lead to very promising results, provided that these attributesare considered as sets of increasing complexity. This representation allows us to

Tag(title) = 0 & Tag(BD) ≤ 2
Parent(AW − BC) = 1
R4
4 5
Tag(BQ) = 1
Next − sibling(CU − CV ) = 1
3 2
R10
R6
6 R11
11 8
10
Tag(title) = 1
1 R7
7 9
Fig. 2. Tree obtained when clustering dataset m-db-s-0.

Tag(movie) = 1
1 Tag(CL) = 1
S2 > S3
2 3
Tag(BG) = 1
S4 > S5
4 5
Tag(AJ) = 1
Tag(BA) = 0
7 9
Parent(AT − AQ) = 0
8 Nb(0.0.0) = 0
10 P6 > P11
6 11
Fig. 3. Tree obtained for classifying dataset m-db-s-0.
benefit from the strengths of existing methods. We have also presented a neworiginal method able to provide an interpretable classifier as an output.
We conjecture it is now possible to go further in the way we transform thetrees. For instance, it is possible to consider as new attributes some forks of thetrees, of some given height and width, or to identify in which part of the treesthe tags or relations between tags are present. But, as has been shown in theexperiments part of the paper, we already constructed a lot of new attributeswith our method. And by using such attributes, we already obtain very goodresults.
To take into account such possible differences between trees, a special careshould now be taken to find a compromise between the number of new createdattributes and the information they carry. This point should be studied in furtherresearchs.
References
1. Quinlan, R.: Data mining tools see5 and c5.0 (2004)2. Candillier, L., Tellier, I., Torre, F., Bousquet, O.: SSC : Statistical Subspace Clus-
tering. In Perner, P., Imiya, A., eds.: 4th International Conference on MachineLearning and Data Mining in Pattern Recognition (MLDM’2005). Volume LNAI3587 of LNCS., Leipzig, Germany, Springer Verlag (2005) 100–109
3. Nierman, A., Jagadish, H.V.: Evaluating structural similarity in XML documents.In: 5th International Workshop on the Web and Databases (WebDB 2002), Madi-son, Wisconsin, USA (2002)
4. Dalamagas, T., Cheng, T., Winkel, K.J., Sellis, T.: Clustering XML documentsby structure. In: 3rd Hellenic Conference on Artificial Intelligence, Samos, Greece(May 2004)
5. Flesca, S., Manco, G., Masciari, E., Pontieri, L., Pugliese, A.: Detecting structuralsimilarities between XML documents. In: 5th International Workshop on The Weband Databases (WebDB’02), Madison, Wisconsin (2002)
6. Lian, W., Cheung, D.W., Mamoulis, N., Yiu, S.M.: An efficient and scalable algo-rithm for clustering XML documents by structure. IEEE transactions on Knowl-edge and Data Engineering 16 (January 2004) 82–96
7. Costa, G., Manco, G., Ortale, R., Tagarelli, A.: A tree-based approach to cluster-ing XML documents by structure. Technical report, Institute of Italian NationalResearch Council, Rende, Italy (April 2004)
8. Termier, A., Rousset, M.C., Sebag, M.: Treefinder: a first step towards xml datamining. In: IEEE International Conference on Data Mining (ICDM02). (2002)450–457
9. Zaki, M.J., Aggarwal, C.C.: Xrules: An effective structural classifier for xml data.In: SIGKDD 03, Washington, DC (2003)
10. Doucet, A., Ahonen-Myka, H.: Naıve clustering of a large XML document collec-tion. In: 1st Annual Workshop of the Initiative for the Evaluation of XML retrieval(INEX’02), Schloss Dagstuhl, Germany (2002)
11. Denoyer, L., Gallinari, P., Vercoustre, A.M.: XML Mining Challenge at INEX2005. Technical report, University of Paris VI, INRIA (2006)
12. Ye, L., Spetsakis, M.: Clustering on unobserved data using mixture of gaussians.Technical report, York University, Toronto, Canada (Oct. 2003)
![Modélisation multidimensionnelle de documents XML centrés-données | [Multidimensional modeling XML data documents]](https://img.dokumen.tips/doc/110x75/635634e686104ea1570c13f0/modelisation-multidimensionnelle-de-documents-xml-centres-donnees-multidimensional.jpg)


