Embed Size (px)
Citation preview
Pergamon
World Development, Vol. 24, No. 1, pp. 1 Y-170, 1996 Copyright 0 1995 Elsevier Science Ltd
Printed in Great Britain. All rights reserved 0305-750X/96 $15 .OO + 0.00
0305-750X(95)001204
Trade Interdependence and Direct Foreign Investment
Between ASEAN and China
ZHAOYONG ZHANG and OW CHIN HOCK* National University of Singapore
Summary. - The objective of this paper is to examine the connection between international trade and foreign direct investment (FDI), by comparing some salient features of the Association of Southeast Asian Nations (ASEAN) FDI flows into China with those of ID1 flows from the United States and other developed countries. This analysis should be especially instructive in light of the recent macroeconomic model of PDI pioneered by Kojima on the relationship between a country’s comparative advantage and its outward direct investment. We postulate that the changing patterns of the ASEAN countries’ compar- ative advantage and other macro-level factors play an important role in motivating fiis to venture in China. Similarity of trade structure and lack of complementarity of the Chinese and ASEAN economies limit the absorptive capacity of each other’s products, which further challenges the entrepreneurs of the ASEAN countries to a high commitment of direct investment into China.
1. INTRODUCTION
China’s trade relations with the countries of the Association of Southeast Asian Nations (ASEAN) have been longstanding, though large-scale trade occurred only around the turn of this century, espe- cially after the establishment of the People’s Republic of China. The development of the ASEAN-China bilateral trade relation has been characterized by its “dynamic” nature, manifested in the (dis)similarities of the these countries’ economic structures and trade patterns.
China and ASEAN are arguably the most dynamic economies in the world today. This can be seen not only from their rapid economic growth, but also from the changes in national comparative advantage and industrial restructuring. During 1965-80, GDP growth in China was only about 6.4% annually, which is below the ASEAN average of 7.7% in this period (World Bank, 1987). During 198&91, however, China’s growth, accelerated sharply to 9.4%. This rate nearly doubles the ASEAN average and exceeds the growth rate of every ASEAN member country (World Bank, 1993). China’s openness to the outside world and rapid economic expansion provide the world, especially ASEAN countries, with certain opportuni- ties for expanded trade and greater outlets for their direct investment. This apparently meets the objec- tives of the ASEAN countries aiming to diversify the highly concentrated market structure of their foreign trade.
During the 1970s and 1980s some ASEAN coun- tries experienced changes in the commodity composi- tion of their foreign trade, reflecting changes in their comparative advantage. Singapore has successfully changed its export structure by greatly reducing the export share of traditional labor-intensive products while increasing the share of more sophisticated prod- ucts such as electrical machinery and equipment. Similar changes can also be observed in Malaysia, Thailand and the Philippines. Although the export share of the manufactured goods in China’s export structures increased in the 198Os, it hardly changed China’s basic trade pattern since about 80% of those manufactured goods are still resource-based manumc- tures. In line with the changes in national comparative advantage, large overseas direct investments have been committed between China and ASEAN. Among the sourcing countries, Singapore is the fourth largest investor in China, surpassed only by Hong Kong, Japan and the United States. The other ASEAN coun- tries played a relatively minor role in contributing to the total foreign direct investment (FIX) in China. The
*An earlier version of this paper was presented at the Sixth ACAES 1994 Conference (Boston, USA). We are indebted to the participants for useful comments. We are especially grateful to Eric Nordmoe, Gavin Peebles, and the anony- mous referees for their valuable comments and suggestions. We are of course solely responsible for any errors or omis- sions. Final revision accepted: July 7, 1995.
155
156 WORLD DEVELOPMENT
sectoral distribution of ASEAN FDI has shown that then turn to in section 4 an analysis of the develop- the service sector, light industry, and other labor- ment of ASEAN direct investments in China: their intensive manufactures are the major fields attracting characteristics, motivations and linkage with the the bulk of their investments. This pattern of FDI is ASEAN-China trade pattern. The final section con- closely associated with the trade structures and the tains some concluding remarks and implications for changes of national comparative advantage of China the future development of ASEAN-China economic and the ASEAN countries. interdependence.
The purpose of this paper is therefore to assess the overall interdependence of foreign trade and FDI between China and ASEAN during the 1970s and 198Os, to study the trade pattern resulting from indus- trial development in these economies, and to examine the connection between international trade and for- eign direct investment. This analysis should be espe- cially instructive in light of the recent macroeconomic model of FDI pioneered by Kojima (1973, 1978) on the relationship between a country’s comparative advantage and its outward direct investment. We pos- tulate that the changing patterns of the ASEAN coun- tries’ comparative advantage and other macro-level factors play an important role in motivating firms to venture in China. Although the role of fiscal incen- tives in attracting FDI is arguable,’ the favorable gov- ernment policies of these ASEAN countries in reduc- ing the risk of the firms venturing abroad may have helped this process. The similarity of trade structure and lack of complementarity of the Chinese and ASEAN economies limit the absorptive capacity of each other’s products, which further challenges the entrepreneurs of the ASEAN countries to a high com- mitment of direct investment into China.
2. TRADE INTERDEPENDENCE BETWEEN CHINA AND ASEAN
The structure of the paper is as follows. Section 2 studies the trade pattern and the economic interdepen- dence between China and the ASEAN countries, to compare the dynamic features of ASEAN-China trade. In section 3 the structures of the ASEANXhina trade are examined by classifying the commodities into five groups according to their factor-intensive uses, and by assessing the measures of their revealed comparative advantage over the last two decades. We
The economies of ASEAN and China differ signif- icantly in at least the following three aspects: eco- nomic size, the economic system, and the economic development strategy. All three factors have func- tioned both as a “pushing” force to stimulating the development of bilateral trade relations between ASEAN and China, and also as a “resisting” force to limiting the trade expansion. First, comparing the eco- nomic size, it is self-evident that China is a giant economy in terms of land size, population and GDP (Table 1). According to World Bank (1993), China has a land size of 9.6 million sq km, with a population of over one billion and GDP of US$370 billion in 1991. A recent International Monetary Fund (IMF) report further proved that China’s GNP should be four times bigger than the published figure if a new approach is used to measure it.2 If so, China should be the third largest economy in the world after the United States and Japan. In contrast, the ASEAN countries are small- and medium-sized in economic terms with the exception of Indonesia. The combined land sizes, populations and GDP of the six ASEAN economies only accounted for about one-third, a little over one- quarter and four-fifths of China’s, respectively. This difference makes the Chinese market especially attractive to the ASEAN countries.
Second, the Chinese economy is still organized through a socialist system even though efforts have
Table 1. Indicators of ASEAh’and China economies, 1991
Country Area
(looosql@
Population 1991 (million)
GDP 1991 (US$ B)
GDP growth Trade/GDP 1970-80 1980-90 ratio (%)
ASEAN
Brunei Indonesia Malaysia Philippines Singapore Thailand
China
6 0.3* 4.7 n.a.t n.a. n.a. 1,905 181.3 116.5 7.2 5.6 47.1
330 18.2 47.0 7.9 5.7 147.8 300 62.9 44.9 6.0 1.1 46.5
1 2.8 40.0 8.3 6.6 312.1 514 57.2 93.3 7.1 7.9 70.5
9,561 lJ49.5 369.7 5.2 9.4 37.0
Sources: World Bank (1993). and Asia Yearbook (1993). *Figure is for 1992. tn.a. = not available
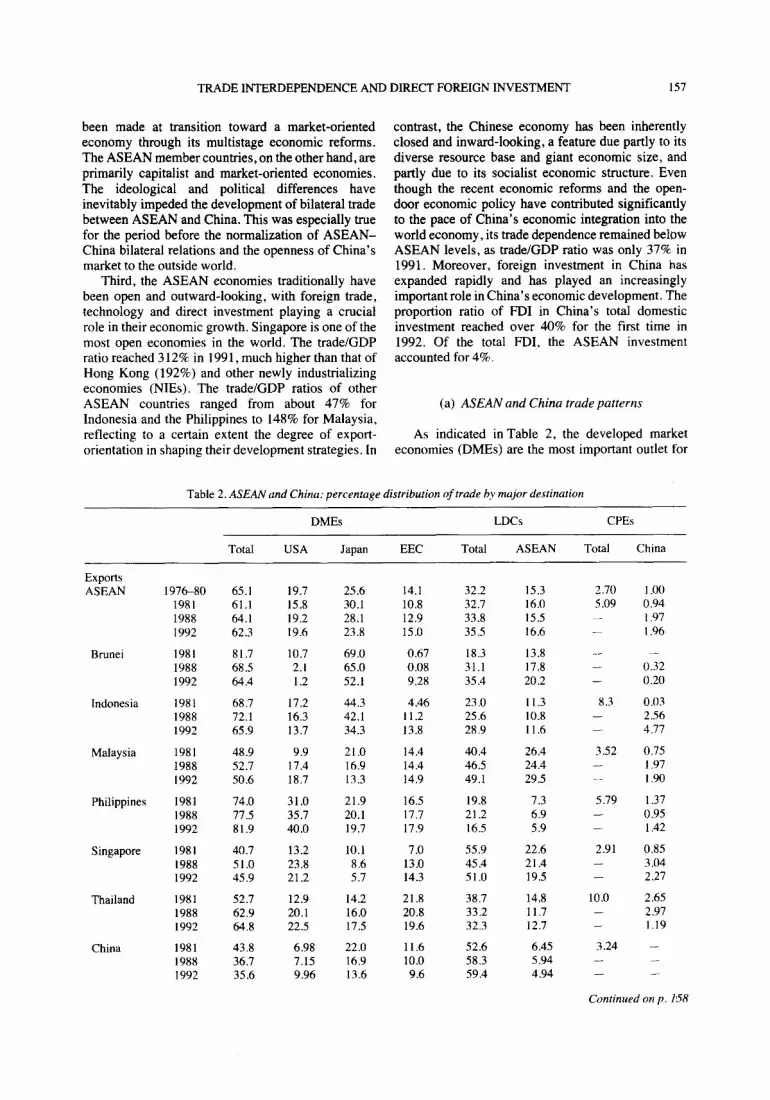
been made at transition toward a market-oriented economy through its multistage economic reforms. The ASEAN member countries, on the other hand, are primarily capitalist and market-oriented economies. The ideological and political differences have inevitably impeded the development of bilateral trade between ASEAN and China. This was especially true for the period before the normalization of ASEAN- China bilateral relations and the openness of China’s market to the outside world.
Third, the ASEAN economies traditionally have been open and outward-looking, with foreign trade, technology and direct investment playing a crucial role in their economic growth. Singapore is one of the most open economies in the world. The trade/GDP ratio reached 3 12% in 199 1, much higher than that of Hong Kong (192%) and other newly industrializing economies (NIEs). The trade/GDP ratios of other ASEAN countries ranged from about 47% for Indonesia and the Philippines to 148% for Malaysia, reflecting to a certain extent the degree of export- orientation in shaping their development strategies. In
contrast, the Chinese economy has been inherently closed and inward-looking, a feature due partly to its diverse resource base and giant economic size, and partly due to its socialist economic structure. Even though the recent economic reforms and the open- door economic policy have contributed significanrly to the pace of China’s economic integration into the world economy, its trade dependence remained below ASEAN levels, as trade/GDP ratio was only 37% in 1991. Moreover, foreign investment in China has expanded rapidly and has played an increasingly important role in China’s economic development. The proportion ratio of FDI in China’s total domestic investment reached over 40% for the first time in 1992. Of the total PDI, the ASEAN investment accounted for 4%.
(a) ASEAN and China trade patterns
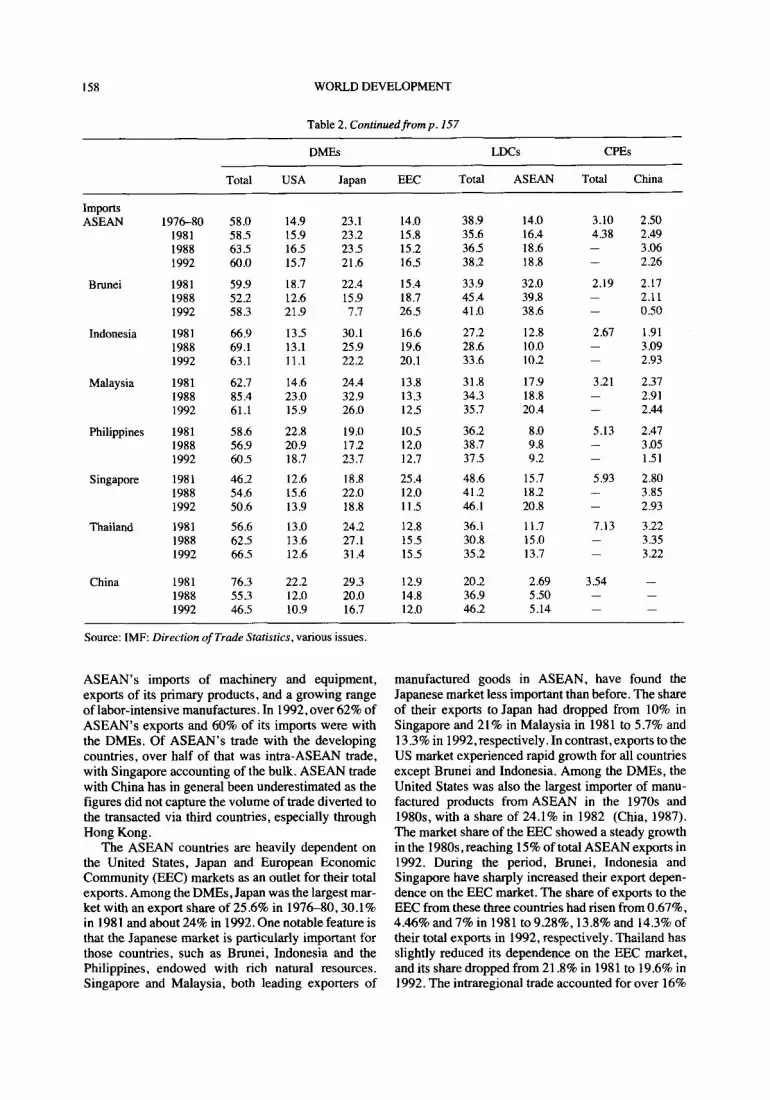
As indicated in Table 2, the developed market economies (DMEs) are the most important outlet for
TRADE INTERDEPENDENCE AND DIRECT FOREIGN INVESTMENT 157
Table 2. ASEAN and China: percentuge distribution of trade by major destination
DMEs LDCs CPEs
Total USA Japan EEC Total ASEAN Total China
Exports ASEAN
Brunei
Indonesia
Malaysia
Philippines
Singapore
Thailand
China
1976-80 65.1 19.7 25.6 14.1 32.2 15.3 1981 61.1 15.8 30.1 10.8 32.7 16.0 1988 64.1 19.2 28.1 12.9 33.8 15.5 1992 62.3 19.6 23.8 15.0 35.5 16.6
1981 81.7 10.7 69.0 0.67 18.3 13.8 1988 68.5 2.1 65 .O 0.08 31.1 17.8 1992 64.4 1.2 52.1 9.28 35.4 20.2
1981 68.7 17.2 44.3 4.46 23 .O 11.3 1988 72.1 16.3 42.1 11.2 25.6 10.8 1992 65.9 13.7 34.3 13.8 28.9 11.6
1981 48.9 9.9 21.0 14.4 40.4 26.4 1988 52.7 17.4 16.9 14.4 46.5 24.4 1992 50.6 18.7 13.3 14.9 49.1 29.5
1981 74.0 31.0 21.9 16.5 19.8 7.3 1988 77.5 35.7 20.1 17.7 21.2 6.9 1992 81.9 40.0 19.7 17.9 16.5 5.9
1981 40.7 13.2 10.1 7.0 55.9 22.6 1988 5 1 .o 23.8 8.6 13.0 45.4 21.4 1992 45.9 21.2 5.7 14.3 51.0 19.5
1981 52.7 12.9 14.2 21.8 38.7 14.8 1988 62.9 20.1 16.0 20.8 33.2 11.7 1992 64.8 22.5 17.5 19.6 32.3 12.7
1981 43.8 6.98 22.0 11.6 52.6 6.45 1988 36.7 7.15 16.9 10.0 58.3 5.94 1992 35.6 9.96 13.6 9.6 59.4 4.94
2.70 s .09 _
- - -
8.3 - -
3.52 - -
5.79 -
2.91 - -
10.0 - -
3.24 - -
1 .oo 0.94 I .97 1.96
-
0.32 0.20
0.03 2.56 4.77
0.75 1.97 I .90
1.37 0.95 1.42
0.85 3.04 2.27
2.65 2.97 1.19
- _ -
Continued on p. 158
158 WORLD DEVELOPMENT
Table 2. Continuedfromp. 157
DMES LDCs CPEs
Total USA Japan EEC Total ASEAN Total China
Imports ASEAN
Brunei
Indonesia
Malaysia
Philippines
Singapore
Thailand
China
1976-80 58.0 14.9 23.1 1981 58.5 15.9 23.2 1988 63.5 16.5 23.5 1992 60.0 15.7 21.6
1981 59.9 18.7 22.4 1988 52.2 12.6 15.9 1992 58.3 21.9 7.7
1981 66.9 13.5 30.1 1988 69.1 13.1 25.9 1992 63.1 11.1 22.2
1981 62.1 14.6 24.4 1988 85.4 23.0 32.9 1992 61.1 15.9 26.0
1981 58.6 22.8 19.0 1988 56.9 20.9 17.2 1992 60.5 18.7 23 .I
1981 46.2 12.6 18.8 1988 54.6 15.6 22.0 1992 50.6 13.9 18.8
1981 56.6 13.0 24.2 1988 62.5 13.6 27.1 1992 66.5 12.6 31.4
1981 76.3 22.2 29.3 1988 55.3 12.0 20.0 1992 46.5 10.9 16.7
14.0 38.9 15.8 35.6 15.2 36.5 16.5 38.2
15.4 33.9 18.7 45.4 26.5 41.0
16.6 27.2 19.6 28.6 20.1 33.6
13.8 31.8 13.3 34.3 12.5 35.7
10.5 36.2 12.0 38.7 12.7 37.5
25.4 48.6 12.0 41.2 11.5 46.1
12.8 36.1 15.5 30.8 15.5 35.2
12.9 20.2 14.8 36.9 12.0 46.2
14.0 16.4 18.6 18.8
32.0 39.8 38.6
12.8 10.0 10.2
17.9 18.8 20.4
8.0 9.8 9.2
15.7 18.2 20.8
11.7 15.0 13.7
2.69 5.50 5.14
3.10 4.38 - -
2.19
2.67
3.21
-
5.13 -
5.93 - -
7.13 -
3.54
2.50 2.49 3.06 2.26
2.17 2.11 0.50
1.91 3.09 2.93
2.37 2.91 2.44
2.47 3.05 1.5 1
2.80 3.85 2.93
3.22 3.35 3.22
Source: IMF: Direction ofTrade Statistics, various issues.
ASEAN’s imports of machinery and equipment, exports of its primary products, and a growing range of labor-intensive manufactures. In 1992, over 62% of ASEAN’s exports and 60% of its imports were with the DMEs. Of ASEAN’s trade with the developing countries, over half of that was intra-ASEAN trade, with Singapore accounting of the bulk. ASEAN trade with China has in general been underestimated as the figures did not capture the volume of trade diverted to the transacted via third countries, especially through Hong Kong.
The ASEAN countries are heavily dependent on the United States, Japan and European Economic Community (EEC) markets as an outlet for their total exports. Among the DMEs, Japan was the largest mar- ket with an export share of 25.6% in 197680,30.1% in 198 1 and about 24% in 1992. One notable feature is that the Japanese market is particularly important for those countries, such as Brunei, Indonesia and the Philippines, endowed with rich natural resources. Singapore and Malaysia, both leading exporters of
manufactured goods in ASEAN, have found the Japanese market less important than before. The share of their exports to Japan had dropped from 10% in Singapore and 21% in Malaysia in 1981 to 5.7% and 13.3% in 1992,respectively. In contrast,exports to the US market experienced rapid growth for all countries except Brunei and Indonesia. Among the DMEs, the United States was also the largest importer of manu- factured products from ASEAN in the 1970s and 198Os, with a share of 24.1% in 1982 (Chia, 1987). The market share of the EEC showed a steady growth in the 1980s) reaching 1.5 % of total ASEAN exports in 1992. During the period, Brunei, Indonesia and Singapore have sharply increased their export depen- dence on the EEC market. The share of exports to the EEC from these three countries had risen from 0.67%, 4.46% and 7% in 1981 to 9.28%, 13.8% and 14.3% of their total exports in 1992, respectively. Thailand has slightly reduced its dependence on the EEC market, and its share dropped from 21.8% in 1981 to 19.6% in 1992. The intraregional trade accounted for over 16%
TRADE INTERDEPENDENCE AND DIRECT FOREIGN INVESTMENT 159
of all ASEAN exports. Malaysia had the largest export share with ASEAN, and the Philippines economy had the least, ranging from 7.3% in 1981 to 5.9% in 1992. The market share of ASEAN exports to the centrally planned economies (CPEs) and China remained the smallest though it showed an increasing trend.
The import pattern of the ASEAN countries matched their export pattern, with the heaviest depen- dence on the DMEs, less on the less-developed coun- tries (LDCs), and the least on the CPEs. Among the DMEs, Japan was the largest import supplier, accounting for about 23% of all ASEAN imports, followed by the United States and the EEC each with a similar share of around 16%. Intra-ASEAN trade accounted for about 50% of ASEAN’s total imports from the LDCs. Brunei depends most heavily on the ASEAN market for its imports, ranging from 32% of its total imports in 1981 to 38.6% in 1992.The Philippines recorded the least, only taking 9.2% of its imports from the ASEAN market in 1992. The CPEs and China were still not the significant source of sup- ply to ASEAN though there is a trend of improvement over time.
Such a highly concentrated market structure of for- eign trade has made the ASEAN economies most vul- nerable to their trade partners’ economic perfor- mance. The slowdown of world trade and decline in external demand as well as the 1980-82 recession in the industrialized countries finally brought the first post-independence recession to the Singapore econ- omy in 1985-86, which also shocked other ASEAN countries. The real GDP growth for the Singapore economy collapsed dramatically from 8.3% in 1984 to -1.6% in 1985, for Malaysia falling from 7.8% in 1984 to -1% in 1985, for Indonesia from 4.5% to 1.6%. from 6% to 4.1% for Thailand, and from -5.5% to -4% for the Philippines. Moreover, the United States graduated the Singapore economy from its Generalized System of Preferences (GSP), together with three other Asian NIEs, in 1989, which made Singapore suffer a loss of trade benefits from US GSP ranging from 2.5% to 8.4% of total US GSP duty-free imports from Singapore.’ The greatest concern for the Singapore economy now is the graduation from the next two largest GSP export markets - the EEC and Japan. The sluggish economic growth of the DMEs, keen competition in the DME market and the threat of increasing protectionism and GSP graduation forced the ASEAN economies to diversify and redirect their concentrated market structure of foreign trade.
As seen in Table 2, China has a market structure of foreign trade similar to that of ASEAN though China’s trade dependence on the DMEs is much less than that of ASEAN. Among the DMEs, the Japanese market was China’s largest outlet of exports and sup- ply of imports though with a declining trend. In 198 1, 22% of China’s exports and 29.3% of China’s imports were conducted with Japan. These shares were
reduced to 13.6% and 16.7% in 1992, respectively. The decline of China’s trade dependence has gener- ally been complemented by a rapid growth of Japanese direct investment in China during the period. The US market has become increasingly important for China’s exports, with the US share of exports rising steadily from 7% in 1981 to about 10% in 1992. The EEC remained an important market for both China’s exports and imports.
The strong similarity in market structure of foreign trade has raised serious concerns in ASEAN over the potential competition with China in both local and third-country markets. As China drives toward eco- nomic modernization, its trade expansion will in the short run, intensify competition with, or even produce some displacement effects on, the ASEAN economies’ exports in the DME market. This will be true for labor-intensive manufactured exports as those products accounted for a large percentage in both China’s and ASEAN’s total exports (except Singapore). Another striking feature of China’s trade pattern is its growing trade dependence on the LDCs. In 1992, about 60% of its total export and 46% of its imports were conducted with the LDCs. This could offer rising opportunities to the ASEAN countries and expand the ASEAN-China bilateral trade.
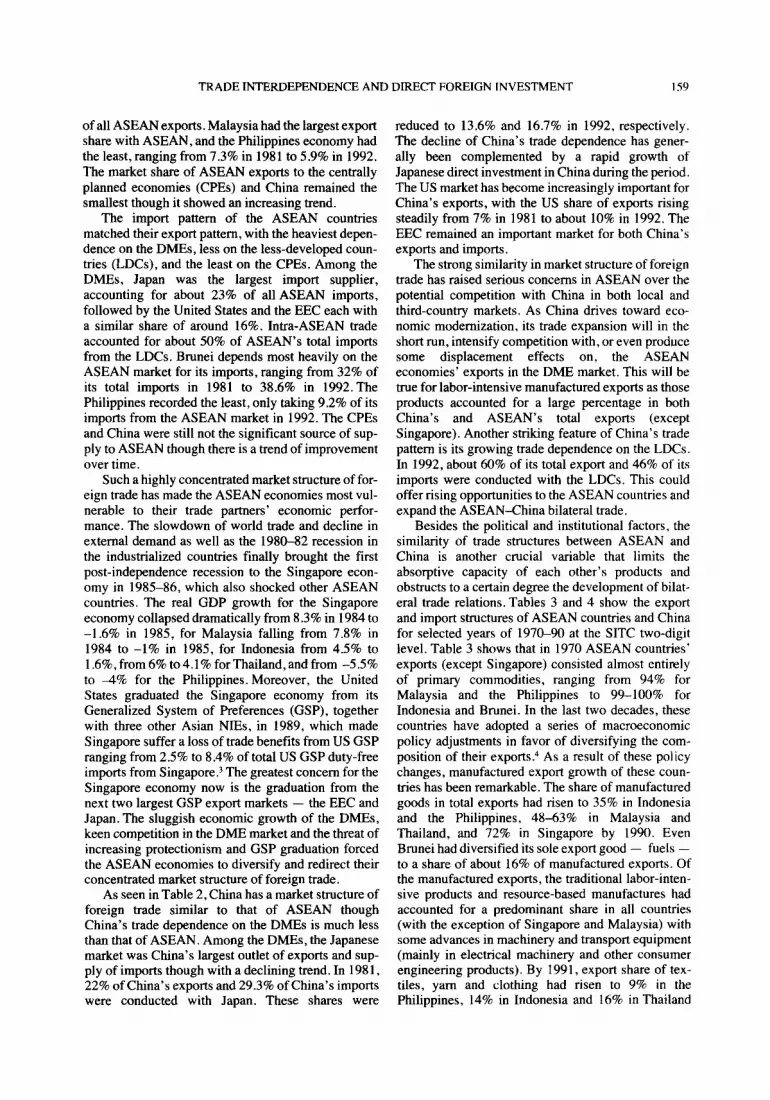
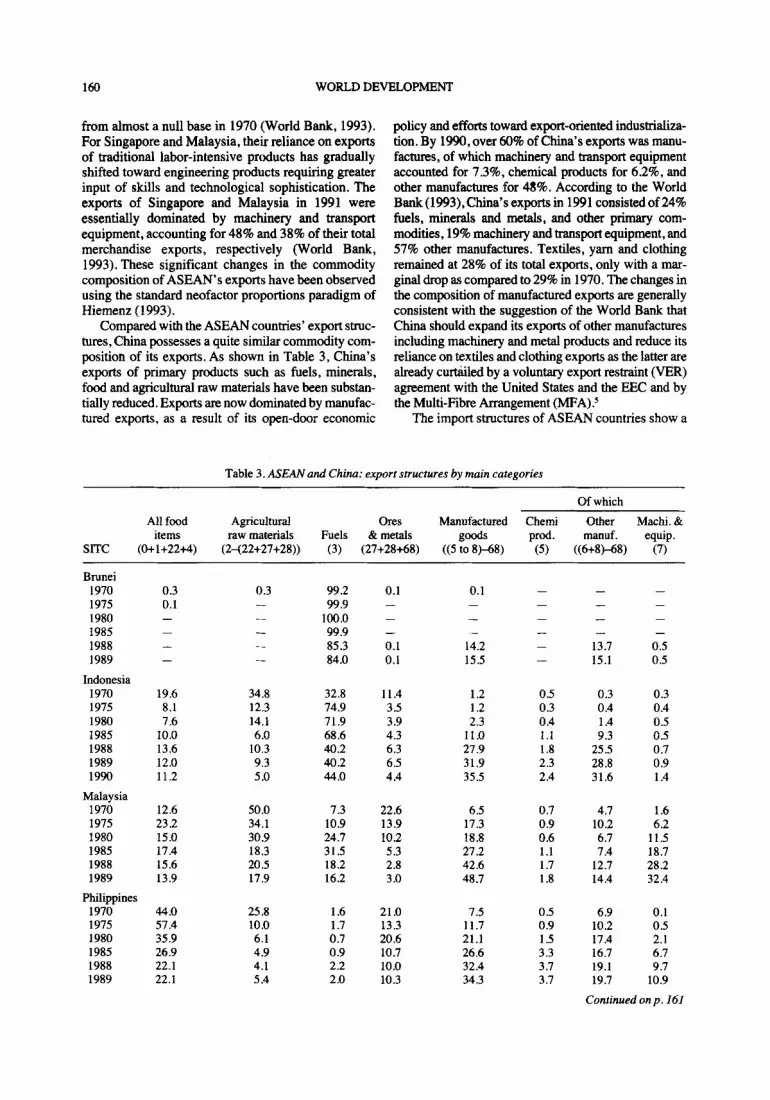
Besides the political and institutional factors, the similarity of trade structures between ASEAN and China is another crucial variable that limits the absorptive capacity of each other’s products and obstructs to a certain degree the development of bilat- eral trade relations. Tables 3 and 4 show the export and import structures of ASEAN countries and China for selected years of 1970-90 at the SITC two-digit level. Table 3 shows that in 1970 ASEAN countries’ exports (except Singapore) consisted almost entirely of primary commodities, ranging from 94% for Malaysia and the Philippines to 99-100% for Indonesia and Brunei. In the last two decades, these countries have adopted a series of macroeconomic policy adjustments in favor of diversifying the com- position of their exports.“ As a result of these policy changes, manufactured export growth of these coun- tries has been remarkable. The share of manufactured goods in total exports had risen to 35% in Indonesia and the Philippines, 48-63% in Malaysia and Thailand, and 72% in Singapore by 1990. Even Brunei had diversified its sole export good - fuels - to a share of about 16% of manufactured exports. Of the manufactured exports, the traditional labor-inten- sive products and resource-based manufactures had accounted for a predominant share in all countries (with the exception of Singapore and Malaysia) with some advances in machinery and transport equipment (mainly in electrical machinery and other consumer engineering products). By 1991, export share of tex- tiles, yarn and clothing had risen to 9% in the Philippines, 14% in Indonesia and 16% in Thailand
160 WORLD DEVELOPMENT
from almost a null base in 1970 (World Bank, 1993). For Singapore and Malaysia, their reliance on exports of traditional labor-intensive products has gradually shifted toward engineering products requiring greater input of skills and technological sophistication. The exports of Singapore and Malaysia in 1991 were essentially dominated by machinery and transport equipment, accounting for 48% and 38% of their total merchandise exports, respectively (World Bank, 1993). These significant changes in the commodity composition of ASEAN’s exports have been observed using the standard neofactor proportions paradigm of Hiemenz (1993).
Compared with the ASEAN countries’ export struc- tures, China possesses a quite similar commodity com- position of its exports. As shown in Table 3, China’s exports of primary products such as fuels, minerals, food and agricultural raw materials have been substan- tially reduced. Exports are now dominated by manufac- tured exports, as a result of its open-door economic
policy and efforts toward export-oriented industrializa- tion. By 1990, over 60% of China’s exports was manu- factures, of which machinery and transport equipment accounted for 7.3%, chemical products for 6.2%, and other manufactures for 48%. According to the World Bank(1993),China’sexportsin 1991 consistedof24% fuels, minerals and metals, and other primary com- modities, 19% machinery and transport equipment, and 57% other manufactures. Textiles, yarn and clothing remained at 28% of its total exports, only with a mar- ginal drop as compared to 29% in 1970. The changes in the composition of manufactured exports are generally consistent with the suggestion of the World Bank that China should expand its exports of other manufactures including machinery and metal products and reduce its reliance on textiles and clothing exports as the latter are already curtailed by a voluntary export testraint (VER) agreement with the United States and the EEC and by the Multi-Fibre Arrangement (MFA)?
The import structures of ASEAN countries show a
Table 3. ASEWand China: export structures by main categories
Of which
SITC
All food Agricultural ores Manufactured Chemi Other Machi. & items raw materials Fuels & metals goods prod. manuf. equip.
(0+1+22+4) (2-(22+27+28)) (3) (27+28+68) ((5 to 8)-68) (5) #+8t68) (7)
Brunei 1970 1975 1980 1985 1988 1989
1970 19.6 34.8 32.8 1975 8.1 12.3 74.9 1980 7.6 14.1 71.9 1985 10.0 6.0 68.6 1988 13.6 10.3 40.2 1989 12.0 9.3 40.2 1990 11.2 5.0 44.0
Malaysia 1970 1975 1980 1985 1988 1989
12.6 50.0 7.3 22.6 6.5 0.7 4.7 1.6 23.2 34.1 10.9 13.9 17.3 0.9 10.2 6.2 15.0 30.9 24.7 10.2 18.8 0.6 6.7 11.5 17.4 18.3 31.5 5.3 27.2 1.1 7.4 18.7 15.6 20.5 18.2 2.8 42.6 1.7 12.7 28.2 13.9 17.9 16.2 3.0 48.7 1.8 14.4 32.4
Philippines 1970 1975 1980 1985 1988 1989
44.0 25.8 1.6 21.0 7.5 0.5 6.9 0.1 57.4 10.0 1.7 13.3 11.7 0.9 10.2 0.5 35.9 6.1 0.7 20.6 21.1 1.5 17.4 2.1 26.9 4.9 0.9 10.7 26.6 3.3 16.7 6.7 22.1 4.1 2.2 10.0 32.4 3.7 19.1 9.7 22.1 5.4 2.0 10.3 34.3 3.7 19.7 10.9
0.3 - - -
99.2 99.9
100.0 99.9 85.3 84.0
0.1 0.1 -
- -
0.1 14.2 0.1 15.5
11.4 1.2 3.5 1.2 3.9 2.3 4.3 11.0 6.3 27.9 6.5 31.9 4.4 35.5
- - -
- -
-
- 13.7 15.1
- 0.5 0.5
0.5 0.3 0.3 0.3 0.4 0.4 0.4 1.4 0.5 1.1 9.3 0.5 1.8 25.5 0.7 2.3 28.8 0.9 2.4 31.6 1.4
Continued on p. 161
TRADE INTERDEPENDENCE AND DIRECT FOREIGN INVESTMENT 161
Table 3. Continuedfrom p. 160
Of which
SITC
All food Agricultural Ores Manufactured Chemi Other Machi. & items raw materials Fuels & metals goods prod. manuf equip.
(0+1+22+4) (2-(22+27+28)) (3) (27+28+68) ((5 to 8)-68) (5) ((6+8t68) (7)
Singapore 1970 1975 1980 1985 1988 1989 1990
Thailand 1970 1975 1980 1985 1988 1989 1990
China 1975 1980 1985 1987 1989 1990
16.4 28.3 23.2 1.6 27.5 2.7 13.9 11.0 9.5 12.5 33.6 1 .o 41.5 3.7 15.1 22.7 8.1 10.3 28.9 2.4 43.1 3.4 12.9 26.8 8.1 4.4 27.1 2.1 51.0 5.4 12.6 33.0 6.1 4.5 12.8 2.7 69.7 6.6 15.2 48.0 5.8 3.7 15.1 2.5 71.7 3.9 17.6 47 2 5.2 2.6 17.9 1.6 71.7 6.6 17.6 47 5
52.3 24.7 0.3 14.6 4.7 0.2 4.4 0.1 62.7 12.3 0.6 7.4 14.7 0.6 12.6 1 .B 47.0 11.2 0.1 13.6 25.2 0.7 18.6 5.9 46.2 9.2 1.3 4.4 38.1 1.3 28.0 8.8 34.7 8.0 0.8 1.8 54.1 1.6 37.1 15.4 33.2 7.3 0.8 1.7 56.3 1.7 37.5 17.1 28.8 5.1 0.8 1 .o 63.1 1.9 41.4 19.8
32.8 7.9 12.5 3.8 41.8 4.6 35.7 1.5 25.1 7.3 16.3 3.4 47.5 6.0 38.7 2.9 16.7 6.2 25.9 3.0 35.9 5.0 28.1 2.8 14.5 5.7 11.5 3.3 46.2 5.7 36.1 4.41 13.7 5.0 8.2 2.6 53.9 6.2 40.4 7.3 12.7 3.5 8.3 2.1 61.6 6.2 48 .O 7.3
Source: UNCTAD: Handbook of International Trade and Development Statistics, various issues.
Table 4. ASEANand Chino: import structures by main categories
Of which
SlTC
All food Agricultural Ores Manufactured Chemi Other Machi. & items raw materials Fuels & metals goods prod. manuf. equiP.
(0+1+22+4) (2-(22+27+28)) (3) (27+28+68) ((5 to 8t68) (5) ((6+8)-68) (7)
Brunei 1970 1975 1980 1983 1984 1985
Indonesia 1971 1975 1980 1985 1988 1989 1990
17.2 0.3 2.2 3.4 74.9 5.0 33.3 36.6 13.9 0.2 1.5 1.3 82.5 8.1 44.4 30.0 15.2 0.2 1.9 1.7 78.8 8.2 30.2 40.3 17.0 0.3 1.4 2.1 75.6 7.6 29.7 38.2 21.5 0.2 1.6 1.3 71.6 7.8 28.6 35.2 20.6 0.2 1.8 1.7 72.8 7.2 3 1.6 34.1
9.4 1.7 2.6 2.0 84.1 12.5 31.9 39.7 12.5 2.8 5.4 1.9 77.3 16.9 23.2 37.2 12.7 3.5 16.2 2.4 64.9 11.6 19.8 33.5 6.9 4.1 12.5 3.9 72.1 17.8 19.0 35.3 7.7 5.4 7.2 3.9 75.2 19.7 16.8 38.7 7.6 5.4 7.7 4.4 74.5 18.9 17.9 37.7 5.1 4.7 8.9 4.3 76.9 16.1 18.2 42.5
Continued on p. 162
162 WORLD DEVELOPMENT
Table 4. Continuedfrom p. 161
Of which
SITC
All food Agricultural Ores Manufactured Chemi Other Machi. & items raw materials Fuels & metals goods prod. manuf. equip.
(0+1+22+4) (2-(22+27+28)) (3) (27+28+68) ((5 to 8-8) (5) ((6+8)-68) (7)
Malaysia 1970 1975 1980 1985 1986 1988
Philippines 1970 1975 1980 1985 1986 1988
Singapore 1970 1975 1980 1985 1988 1989 1990
Thailand 1970 1975 1980 1985 1988 1989 1990
China 1984 1985 1987 1988 1989 1990
21.5 18.2 11.9 11.8 12.2 10.8
11.2 5.0 12.0 3.4 68.0 11.5 21.1 35.4 10.5 3.1 21.2 2.0 57.7 11.7 14.1 31.8 7.8 2.1 28.4 3.0 47.5 9.8 13.9 23.8
10.7 2.2 27.7 1.6 37.1 11.9 11.1 14.2 10.3 3.0 17.0 2.8 44.1 14.5 14.0 15.7 10.5 3.0 13.2 3.5 48.8 13.0 15.9 19.9
16.4 10.3 13.5 1.6 56.1 5.2 28.1 22.8 10.8 5.6 24.6 1.3 56.4 5.8 24.4 26.2 8.5 5.1 28.7 1.7 54.1 5.6 19.2 29.4 9.6 2.7 29.5 1.3 55.4 5.1 19.1 31.3 7.4 2.9 14.1 3.1 11.3 6.6 22.5 42.3 6.8 2.2 13.9 2.5 73.3 7.5 23.8 42.0 6.1 1 .I 15.9 2.1 13.2 7.6 23.3 42.4
5.4 3.4 8.7 3.7 74.7 12.9 26.2 35.6 4.3 4.0 21.6 3.9 64.1 13.4 15.9 34.8 5.2 3.5 30.4 3.7 50.8 11.4 14.6 24.8 5.2 4.3 22.7 3.7 60.1 13.6 18.4 28.1 5.8 4.4 7.7 5.0 73.1 12.6 21.4 39.0 5.5 4.9 9.1 4.3 72.0 11.5 23.8 36.7 5.0 4.7 9.3 3.6 75.0 10.4 24.1 40.5
9.0 7.7 0.5 5.5 69.2 15.3 26.8 27.1 4.4 6.2 0.4 22.0 61.3 10.4 11.9 39.0 7.3 6.5 1.2 2.9 81.6 11.8 30.3 39.4 7.8 8.6 1.4 2.5 19.2 16.7 25.7 36.7 9.1 7.2 2.8 3.1 77.4 13.1 26.5 37.8 8.7 6.1 2.4 2.6 79.8 12.9 25.9 40.9
2.1 2.1 1.9 1.3 1.5 1.7
12.1 5.8 56.9 7.3 21.2 21.9 12.0 5.2 61.7 8.3 20.7 32.7 15.2 4.0 66.6 8.9 18.8 38.8 12.1 2.9 71.6 9.0 18.8 43.8 8.3 2.9 74.8 10.1 19.3 45.4 5.4 4.1 17.7 11.2 21.2 45.3
Source: UNCTAD: Handbook of International Trade and Development Statistics, various issues.
cyclical trend of growing importance of fuels and met- als as well as manufactured products, and a declining share of food and agricultural raw materials. In 1990, of the manufactured imports, machinery and transport equipment were the predominant categories, account- ing for 20% in the Philippines, 34% in Brunei, and over 40% for the rest, followed by other manufactures and chemical products. China has an import pattern quite similar to that of ASEAN. The import share of manufactures grew rapidly while the importance of food and agricultural raw materials has been main-
tained at around 15%. Only about 5% of mineral fuels and metals have been imported, reflecting its resource-rich nature. Of the manufactured imports, machinery and transport equipment expanded sharply to 40.9% in 1990 from a level of 27% in 1984. This can be attributed to China’s industrialization strategy and the rapid growth of FDI activities in China.
To compare China and ASEAN’s overall trade structures, one notable feature is the high similarities of import and export structures and the lack of com- plementarity in absorbing each other’s products. This

TRADE INTERDEPENDENCE AND DIRECT FOREIGN INVESTMENT 163
feature helps explain the small scale of bilateral trade between China and ASEAN.
(b) Trade interdependence between ASEtW and
China
Although ASEAN-China trade does not account for a significant portion of each other’s total trade, the growth of bilateral trade is very impressive. In 1970 ASEAN’s total two-way trade with China was only US$O.18 billion. It rose rapidly to US$2.38 billion in 198 1, an increase of over 1 Zfold, and further jumped to US$9.54 billion in 1992, triple the value of 1981. During this period, ASEAN countries’ exports to China grew from US$45 million in 1970 to US$539 million in 1981 and further to US$4.04 billion in 1992, while imports from China grew from US$131 million to US$1.841 billion and US$5.48 billion, respectively. The balance of trade has remained in China’s favor. The relative trade interdependence between ASEAN and China is illustrated in Table 5.
As indicated in Table 5, China is much more important as a source of supply for imports of the ASEAN countries rather than as an outlet for ASEAN’s exports. One may note that in 1981 ASEAN as a whole shipped only 0.74% of its total exports to China, which is much smaller than the share (2.58%) it purchased from the Chinese market in the
same year. ASEAN’s dependence on the Chinese market as the source of supply reached a peak (5.15%) in 1985, then declined over time but remaining at 2.71% in 1992. In contrast to this trend, sales to China peaked at 2.52% of ASEAN’s total exports in 1488 and recovered to 2.39% in 1992. Such slow growth and small scale of trade interdependence between ASEAN and China have to be attributed to the simi- larities of trade structures, not only to the institutional factors. Moreover, the 1985 economic recession led by Singapore has undoubtedly caused changes in ASEAN’s comparative advantage in trade, resulting in a modest market penetration of the Chinese market.
Among the ASEAN member countries, Singapore depends most heavily on the Chinese market mainly for its imports of foodstuffs, crude oil and resource- based manufactures, ranging from 2.8% of its total imports in 198 1, to 8.6% in 1985, and then gradually falling to 2.93% in 1992. The Chinese market also attracted 3% in 1988 and 2.49% of Singapore’s total exports in 1992, accounting for 2.13% and 1.53% of the Chinese total imports respectively. In value terms, Singapore’s imports from China grew from US$I ,25 billion in 1988 to US$2.03 billion in 1992, while exports to China grew from US$O.42 billion to US$l.24 billion. This made Singapore China’s sixth largest trade partner in 1988 and seventh in 1992.6 It is noted that Singapore is also China’s largest trade part- ner among the ASEAN countries due largely to its
Table 5. Chinese trade interdependence with ASEANcountries (in percentage)
Exports to China as % of total Exports to China as % of the exporting Chinese imports country’s total exports
198 1 1985 1988 1990 1991 1992 1981 19x5 1988 1990 1991 1992
ASEAN 2.11 2.19 4.79 4.85 5.14 4.94 0.74 1.30 2.52 1.83 1.93 2.39
Brunei 0.01 0.01 0.004 0.006 - - 0.27 0.16 0.09 0.22 Indonesia 0.04 0.20 0.89 1.51 2.20 1.93 0.04 0.45 2.88 3.13 4.82 4.59 Malaysia 0.45 0.39 0.15 1.58 1.26 1.03 0.75 1.06 1.97 2.86 2.34 2.04 Philippines 0.40 0.18 0.12 0.16 0.205 0.19 1.37 1.63 0.94 1.04 1.48 1 .bl Singapore 0.92 0.78 2.13 1.59 1.67 1.53 0.85 1.46 3.00 1.61 1.80 2.49 Thailand 0.96 0.64 0.86 0.70 0.66 0.53 2.66 3.x1 2.98 1.61 1.46 I.31
Imports from China as % of total Imports from China as % of the exporting Chinese exports country’s total imports
1981 1985 1988 1990 1991 1992 1981 1985 1988 1990 1991 1992
ASEAN 8.55 12.05 7.46 7.42 7.46 6.37 2.58 5.15 3.42 2.89 2.85 2.71
Brunei 0.06 0.04 0.01 0.01 0.02 0.01 2.19 1.98 0.27 0.53 0.66 0.50 Indonesia 1.18 0.91 0.92 1.05 1.16 0.61 1.95 2.43 3.31 2.97 3.23 1.88 Malaysia 1.21 0.94 1.02 0.90 1.12 1.14 2.38 2.04 2.92 1.92 2.18 2 .Q3 Philippines 0.97 1.07 0.56 0.29 0.34 0.29 2.48 5.36 3.07 I .A0 1.88 1.51 Singapore 3.58 8.27 3.54 3.37 3.10 2.63 2.80 8.60 3.84 3.44 3.36 2.93 Thailand 1.49 0.82 1.43 1.78 1.60 1.44 3.19 2.42 3.35 3.31 3.03 3.00
Sources: UN, Foreign Trade Statistics of Asia and the Pacific; IMF, Direction of Trade Statistics; and Almanac of Chinia’s Foreign Economic Relations and Trade.
164 WORLD DEVELOPMENT
emrep& role, followed by Thailand, Indonesia, Malaysia, the Philippines and Brunei. It is interesting to note that the Chinese market has become increas- ingly important for resource-rich Indonesia as an out- let for its exports. The share grew rapidly from 0.04% in 1981 to 4.59% of its total exports in 1992.This could be attributed to its strong comparative advan- tage in the resource-intensive industry relative to China, as shown in the next section.
As mentioned earlier, Chinese trade dependence on the ASEAN countries is relatively greater than the latter’s dependence on China, especially in the pri- mary commodities and resource-based manufactures categories. The share of ASEAN’s imports from China accounted for 8.55% of total Chinese exports in 1981, further increasing to 12.05% in 1985, and then falling continuously to 6.37% in 1992. Singapore, Thailand and Malaysia remained the most important markets for China’s exports in 1981-92, which accounted for about 3% of each country’s total imports during the period. China’s exports of crude oil and petroleum products to ASEAN, for example, were mainly directed to Singapore, accounting for 40% of Singapore’s imports from China in 1990 and 1.4% of Singapore’s total import market. It seems that China has been losing its market shares in Brunei, Indonesia and the Philippines; China’s share in the total imports of these countries has declined over time. Once again, the small share and wide fluctuations of bilateral trade interdependence over time can be attributed to the low complementarity of the commodity mixes of ASEAN’s and China’s imports and exports. This con- clusion is lent further support by the analysis of changes in comparative advantage in the following section.
3. CHANGES IN COMPARATIVE ADVANTAGE
The theory of comparative costs as a means of explaining the location of production has been well developed. This includes the extensions of the classi- cal Heckscher-Ohlin model to separate out human capital from physical capital (Kenen, 1965; Keesing, 1966; Balassa, 1965), and further disaggregation of capital to separate out technology (Branson and Junz, 197 1; Vernon, 1966), as well as to incorporate natural resources as a factor of production (Jones, 1971; Krueger, 1977). Krause (1982) further disaggregates the factors of production into natural resources, labor, technology and human capital to analyze the exports of the United States to ASEAN. This approach is adopted and further extended by separating out agri- cultural from mineral resources in Tyers and Phillips (1984). The analysis in this section follows that of Tyers and Phillips (1984), in which commodities at the three-digit level of the SITC have been divided into five groups according to their intensities in the
five factors, i.e. agricultural resources, mineral resources, labor, technology and human capital. This classification permits a more accurate investigation of the structure of ASEAN and Chinese exports (as both are primarily natural resource-based) and the possible trends in economic interdependence. Although all products embody multiple factors in the production processes, each can be classified according to its dom- inant factor that is used most intensively and/or that which determines the location of production. We adopt the “revealed” comparative advantage index introduced by Balassa (1965) as a measure of export specialization and changes in production and trade structure..
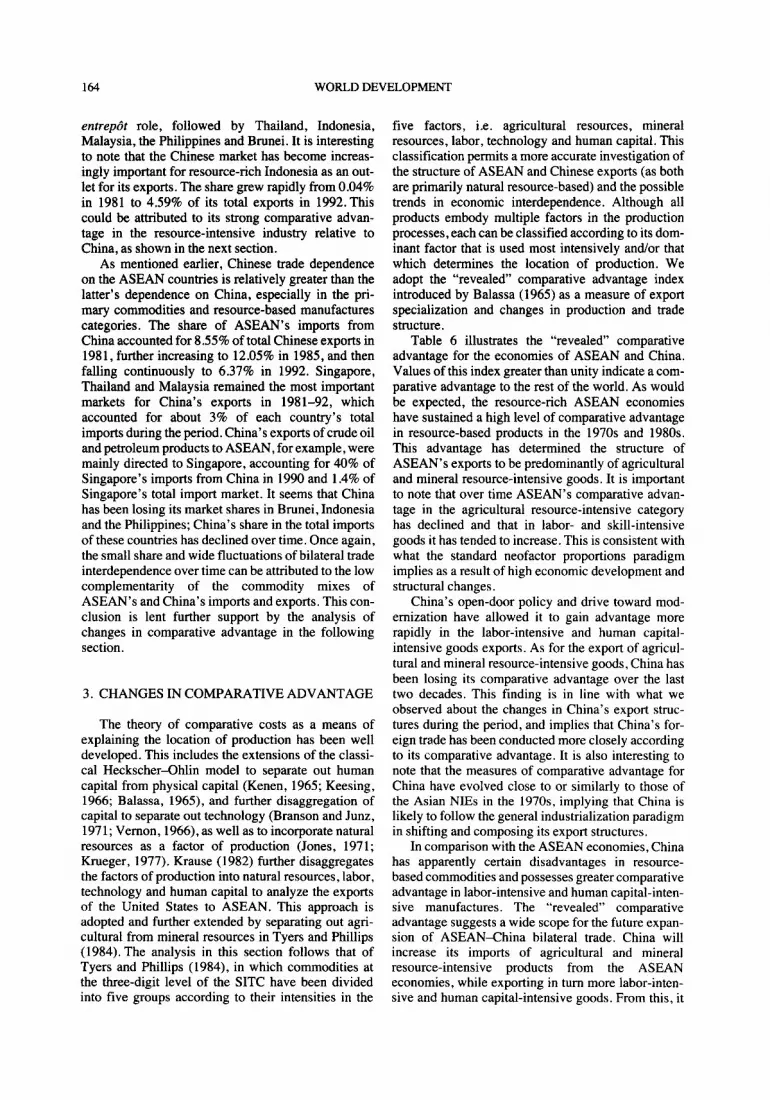
Table 6 illustrates the “revealed’ comparative advantage for the economies of ASEAN and China. Values of this index greater than unity indicate a com- parative advantage to the rest of the world. As would be expected, the resource-rich ASEAN economies have sustained a high level of comparative advantage in resource-based products in the 1970s and 1980s. This advantage has determined the structure of ASEAN’s exports to be predominantly of agricultural and mineral resource-intensive goods. It is important to note that over time ASEAN’s comparative advan- tage in the agricultural resource-intensive category has declined and that in labor- and skill-intensive goods it has tended to increase. This is consistent with what the standard neofactor proportions paradigm implies as a result of high economic development and structural changes.
China’s open-door policy and drive toward mod- ernization have allowed it to gain advantage more rapidly in the labor-intensive and human capital- intensive goods exports. As for the export of agricul- tural and mineral resource-intensive goods, China has been losing its comparative advantage over the last two decades. This finding is in line with what we observed about the changes in China’s export struc- tures during the period, and implies that China’s for- eign trade has been conducted more closely according to its comparative advantage. It is also interesting to note that the measures of comparative advantage for China have evolved close to or similarly to those of the Asian NIEs in the 1970s. implying that China is likely to follow the general industrialization paradigm in shifting and composing its export structures.
In comparison with the ASEAN economies, China has apparently certain disadvantages in resource- based commodities and possesses greater comparative advantage in labor-intensive and human capital-inten- sive manufactures. The “revealed’ comparative advantage suggests a wide scope for the future expan- sion of ASEANChina bilateral trade. China will increase its imports of agricultural and mineral resource-intensive products from the ASEAN economies, while exporting in turn more labor-inten- sive and human capital-intensive goods. From this, it
TRADE INTERDEPENDENCE AND DIRECT FOREIGN INVESTMENT 165
Table 6. ASEANand China: indices of revealed comparative advantage, 1970-90
Agricultural Mineral Unskilled Human Technology-intensive resource-intensive resource-intensive labor-intensive capital-intensive goods
ASEAN 1970 1980 1990
Brunei 1980 1986
Indonesia 1980 1990
Malaysia 1980 1990
Philippines 1980 1988
Singapore 1980 1990
Thailand 1980 1990
China 1970 1980 1990
2.78 1.50 0.25 0.14 0.13 2.09 1.47 0.60 0.27 0.43 1.55 1.62 2.04 0.93 0.37
3.48 0.002 na. 0.09 6.79 na. n.a. n.a.
1.62 2.68 0.09 2.17 3.38 1.40
n.a. 0.05
3.60 1.23 0.63 0.15 0.11 2.09 1.41 0.93 1.23 0.32
3.40 0.78 1.46 0.11 0.45 2.19 0.88 1.28 0.10 0.24
1.46 1.10 0.96 1.12 0.72 0.62 1.38 0.80 1.53 0.75
4.41 0.58 1.29 0.24 0.52 2.20 0.28 7.23 0.22 n.a.
2.34 0.3 1 2.45 0.33 0.27 1.67 0.90 3.23 0.37 0.34 1.25 0.84 4.59 1.33 0.42
Sources: Findlay, Phillips and Tyers (1985); UN, International Trade Sratistics Yearbook, with authors’ compilation
should not be surprising to observe a dynamic eco- nomic relationship between ASEAN and China, inter- acting both competitively and complementarily. Intense competition is to be expected in the manufac- tured goods category, particularly in unskilled labor- intensive goods and increasingly in human capital- intensive goods, both in ASEAN and the rest of the world markets. On the other hand, direct investment will be increasingly important in the development of ASEAN-China economic interdependence.
Thailand has developed a significant comparative advantage in labor-intensive goods exports over the last decade, while experiencing declining advantage in agricultural and mineral resource-intensive sectors. This is predicted by the theory, considering that Thailand sustained the highest economic growth (GDP grew at 7.9% in 1980-91) among ASEAN, shifted to export-oriented industrialization policy and absorbed a large amount of foreign investment. What remains unclear is its complete extinction of the “revealed” comparative advantage in technology-intensive goods.
The “revealed” comparative advantage indices show a similarity between China and Thailand, both gaining advantage rapidly in labor-intensive manufactures and losing advantage in resource-intensive exports. By keeping this point in mind, it should be not surprising that trade interdependence between China and Thailand decreased in the 1980s (Table 5), and only a small share of trade has been conducted with each other. It would be unrealistic to expect a sudden tremendous expansion of bilateral trade in the near future. The changes of comparative advantage will, however, induce or stimulate more direct investment commitment in each other’s territory.
The Singapore economy has completely graduated to become a newly industrialized country. It possesses apparently a strong comparative advantage in mineral resource-intensive and human capital-intensive goods, with the latter increasing throughout the decade. Singapore has been developing its compara- tive advantage in the technology-intensive goods category. It is apparent that China and Singapore are at
166 WORLD DEVELOPMENT
different stages of industrial development and have different production structures. Trade conducted between the two countries is more complementary in nature. This explains to a large extent the rapid growth and the great share of bilateral trade between the two economies besides Singapore’s entrepbt trade. In the short and medium run, the present Sino-Singapore trade pattern will persist, as Singapore has a high demand for China’s resource-based and unskilled labor-intensive exports for which Singapore has no comparative advantage due to its land scarcity and resource poverty. China has, in turn, a demand for the high value-added and capital- and technology-inten- sive goods and services that Singapore can supply with comparative advantage. The economic interde- pendence between the two countries will be strength- ened further following the Singapore Government’s recent promotion of going regional and global, thus facilitating outward investment.
In comparison with China’s measures of the revealed comparative advantage, Brunei, Indonesia and Malaysia have all sustained a very strong comparative advantage in the mineral resource-intensive exports in the 198Os, while Indonesia, Malaysia and the Philippines have maintained their advantage in agricul- tural resource-based products. China’s comparative advantage lies clearly in labor-intensive and human capital-intensive manufactures. Although the tradi- tional trade patterns between China and these countries are very narrowly concentrated on a few primary prod- ucts, such as industrial raw materials and agricultural produce, the revealed comparative advantage suggests a wider scope for complementarity. It is also clear from Table 6 that competition between China and these ASEAN countries is most intense in the manufactured goods category, particularly in the labor- or skill-inten- sive goods, both directly in these countries’ markets and indirectly in a third-country market.
Thus, changes over the last decade in comparative advantage for ASEAN and China indicate that com- modity mix complementarity exists in certain goods categories and between individual countries. The evi- dence suggests an economic basis for future expan- sion of bilateral trade. As both ASEAN and China have been rapidly developing their comparative advantage in the labor-intensive manufactures, severe competition would be expected, both directly and indirectly, in the ASEAN market and the rest of the world market, reflecting the “dynamic” nature of their trade relationship. To cope with the severe competi- tive threat, the ASEAN countries started to shift, at least partially, certain labor-intensive manufactures to China and heavily promote outward investments in those fields where they do not retain comparative advantage relative to China. This trend has become more obvious since the middle of 1980s when China has significantly improved its infrastuctural facilities and the investment climate.
4. ASEAN’S DIRECT INVESTMENT IN CHINA
Since the inauguration of its open-door policy in 1979, China has actively promoted the inflow of for- eign investments to accelerate the pace of economic development. By the end of 1991 total FDI commit- ment in China reached US$52 billion, increasing at an average annual rate of 30%. In 1992 alone, over US$58 billion foreign capital was invested, recording an increase of 385% over the previous year. The bulk came from other Asian countries, notably Hong Kong and Japan, which accounted for about 68% and 13% of the total FDI in 1979-92, respectively. The United States ranked next to Japan with a similar share in the total, followed by Singapore and Germany. The Republic of Korea and Taiwan have become increas- ingly important sourcing countries since the late 198Os.7 The rest of the world played a relatively minor role in contributing to the total flows into China. Due to China’s more flexible policy in choosing invest- ment sectors, foreign investment has been committed in various economic sectors, ranging from high tech- nology-oriented industries to natural resource explo- ration and extraction, as well as in hotels, consumer goods, construction, and other service-oriented opera- tions. Besides its preferential fiscal incentives, China’s attraction for foreign investors lies in its vast domestic market, an abundant and cheap labor force, and its rapid economic growth.
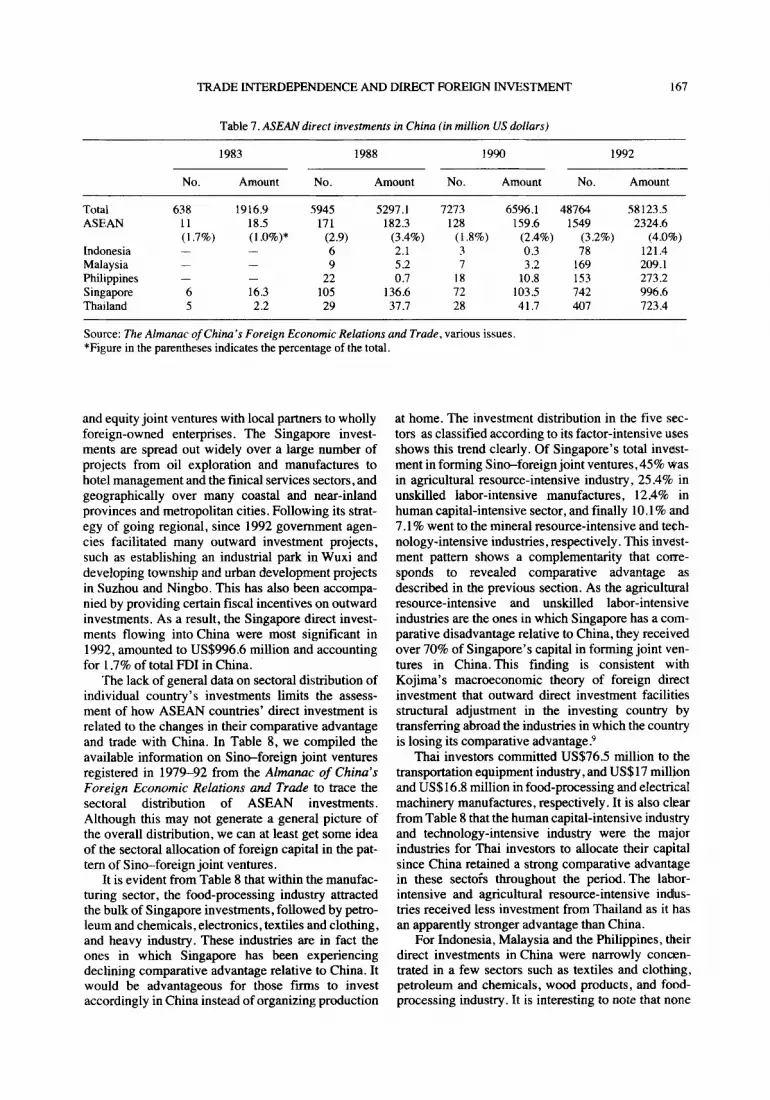
The development of ASEAN’s direct investment in China during 1979-92 generally corresponded to the growth of trade interdependence. Table 7, shows that ASEAN outward investments flowing into China grew quickly and amounted from US$l8.5 million in 1983 to US$2324.6 million in 1992, accounting for 0.97% and 4% of China’s total FDI inflows, respectively. It is important to note that the average size of ASEAN investment projects greatly exceeds the average size of FDI activities in China during the whole period with the exception of the early 1980s. FDI projects of the longest duration are also from ASEAN. Most strikingly, the growth and share of ASEAN direct investment in the late 1980s and early 1990s seem to be inversely associated with its growth and share of exports to China. The declin- ing trend of ASEAN’s export share in its total exports has been matched by a rapid increase in committing direct investment in China. Considering that ASEAN possesses a quite similar trade struc- ture to that of China, one may find that it is to ASEAN’s advantage to shift the corresponding pro- duction to China in order to maintain or enlarge its market share and complement its comparative advantage.
Of the ASEAN countries,8 Singapore is the largest investor in China, followed by Thailand, the Philippines, Malaysia and Indonesia. Each had a different investment pattern, ranging from contractual
TRADE INTERDEPENDENCE AND DIRECT FOREIGN INVESTMENT 167
Table 7. ASEAN direct investments in China (in million US dollars)
1983 1988 1990 1992
No. Amount No. Amount No. Amount No. Amount
Total ASEAN
Indonesia Malaysia Philippines Singapore Thailand
638 1916.9 5945 5297.1 7273 6596.1 48764 11 18.5 171 182.3 128 159.6 1549 (1.7%) (l.o%)* (2.9) (3.4%) (1.8%) (2.4%) (3.2%) _ - 6 2.1 3 0.3 78
- 9 5.2 7 3.2 169 22 0.7 18 10.8 153
6 16.3 105 136.6 72 103.5 742 5 2.2 29 37.7 28 41.7 407
Source: The Almanac of China’s Foreign Economic Relations and Trade, various issues. *Figure in the parentheses indicates the percentage of the total.
58123.5 2324.6
(4.0%) 121.4 209.1 273.2 996.6 723.4
and equity joint ventures with local partners to wholly foreign-owned enterprises. The Singapore invest- ments are spread out widely over a large number of projects from oil exploration and manufactures to hotel management and the finical services sectors, and geographically over many coastal and near-inland provinces and metropolitan cities. Following its strat- egy of going regional, since 1992 government agen- cies facilitated many outward investment projects, such as establishing an industrial park in Wuxi and developing township and urban development projects in Suzhou and Ningbo. This has also been accompa- nied by providing certain fiscal incentives on outward investments. As a result, the Singapore direct invest- ments flowing into China were most significant in 1992, amounted to US$996.6 million and accounting for 1.7% of total FDI in China.
The lack of general data on sectoral distribution of individual country’s investments limits the assess- ment of how ASEAN countries’ direct investment is related to the changes in their comparative advantage and trade with China. In Table 8, we compiled the available information on Sino-foreign joint ventures registered in 1979-92 from the Almanac of China’s Foreign Economic Relations and Trade to trace the sectoral distribution of ASEAN investments. Although this may not generate a general picture of the overall distribution, we can at least get some idea of the sectoral allocation of foreign capital in the pat- tern of Sino-foreign joint ventures.
It is evident from Table 8 that within the manufac- turing sector, the food-processing industry attracted the bulk of Singapore investments, followed by petro- leum and chemicals, electronics, textiles and clothing, and heavy industry. These industries are in fact the ones in which Singapore has been experiencing declining comparative advantage relative to China. It would be advantageous for those fiis to invest accordingly in China instead of organizing production
at home. The investment distribution in the five sec- tors as classified according to its factor-intensive uses shows this trend clearly. Of Singapore’s total invest- ment in forming Sino-foreign joint ventures, 45% was in agricultural resource-intensive industry, 25.4% in unskilled labor-intensive manufactures, 12.4% in human capital-intensive sector, and finally 10.1% and 7.1% went to the mineral resource-intensive and tech- nology-intensive industries, respectively. This invest- ment pattern shows a complementarity that come- spends to revealed comparative advantage as described in the previous section. As the agricultural resource-intensive and unskilled labor-intensive industries are the ones in which Singapore has a com- parative disadvantage relative to China, they received over 70% of Singapore’s capital in forming joint ven- tures in China. This finding is consistent with Kojima’s macroeconomic theory of foreign direct investment that outward direct investment facilities structural adjustment in the investing country by transferring abroad the industries in which the country is losing its comparative advantage.9
Thai investors committed US$76.5 million to the transportation equipment industry, and US$l7 million and US$16.8 million in food-processing and electrical machinery manufactures, respectively. It is also clear from Table 8 that the human capital-intensive industry and technology-intensive industry were the major industries for Thai investors to allocate their capital since China retained a strong comparative advantage in these sectois throughout the period. The labor- intensive and agricultural resource-intensive indus- tries received less investment from Thailand as it has an apparently stronger advantage than China.
For Indonesia, Malaysia and the Philippines, their direct investments in China were narrowly concen- trated in a few sectors such as textiles and clothing, petroleum and chemicals, wood products, and food- processing industry. It is interesting to note that none
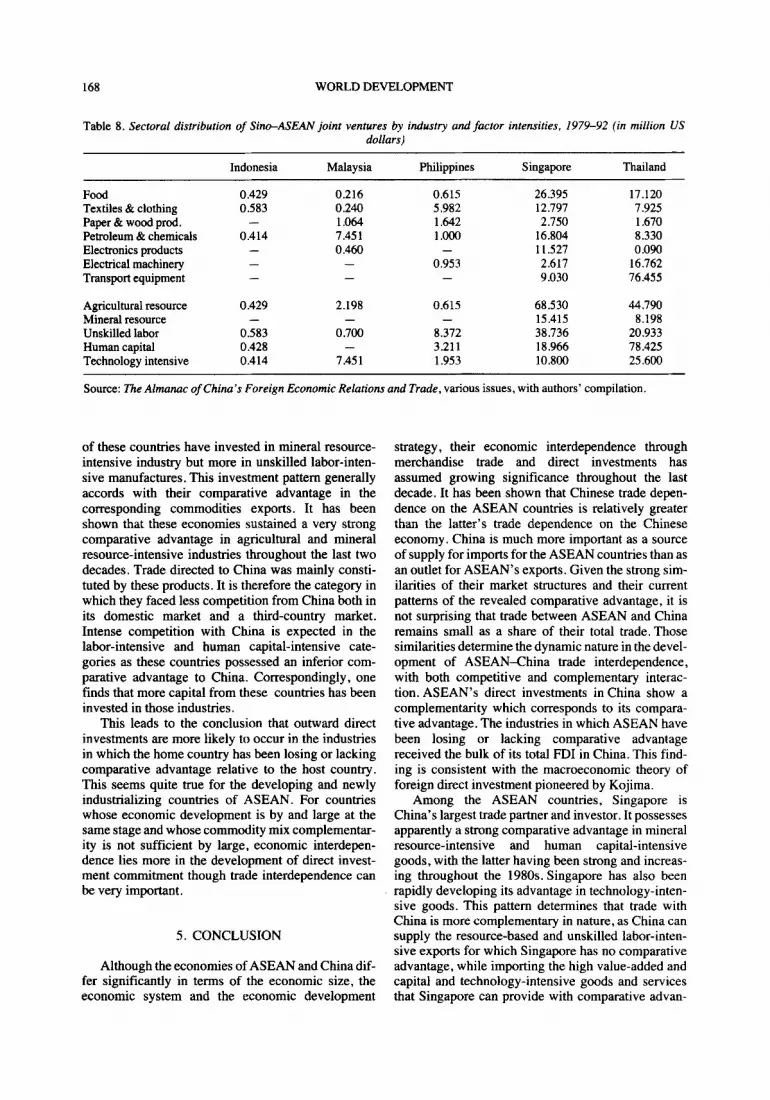
168 WORLD DEVELOPMENT
Table 8. Sectoral distribution of Sin+ASEAN joint ventures by industry and factor intensities, 1979-92 (in million US dollars)
Indonesia Malaysia Philippines Singapore Thailand
Food Textiles &clothing Paper & wood prod. Petroleum & chemicals Electronics products Electrical machinery Transport equipment
Agricultural resource Mineral resource Unskilled labor Human capital Technology intensive
0.429 0.216 0.583 0.240
- 1.064 0.414 1.451
- 0.460 - -
0.429 2.198 - -
0.583 0.700 0.428 -
0.414 7.451
0.615 26.395 17.120 5.982 12.797 7.925 1.642 2.750 1.670 1.000 16.804 8.330
- 11.527 0.090 0.953 2.617 16.762
- 9.030 76.455
0.615 -
8.372 3.211 1.953
68.530 15.415 38.736 18.966 10.800
44.790 8.198
20.933 78.425 25.600
Source: The Almanac of China’s Foreign Economic Relations and Trade, various issues, with authors’ compilation.
of these countries have invested in mineral resource- intensive industry but more in unskilled labor-inten- sive manufactures. This investment pattern generally accords with their comparative advantage in the corresponding commodities exports. It has been shown that these economies sustained a very strong comparative advantage in agricultural and mineral resource-intensive industries throughout the last two decades. Trade directed to China was mainly consti- tuted by these products. It is therefore the category in which they faced less competition from China both in its domestic market and a third-country market. Intense competition with China is expected in the labor-intensive and human capital-intensive cate- gories as these countries possessed an inferior com- parative advantage to China. Correspondingly, one finds that more capital from these countries has been invested in those industries.
This leads to the conclusion that outward direct investments are more likely to occur in the industries in which the home country has been losing or lacking comparative advantage relative to the host country. This seems quite true for the developing and newly industrializing countries of ASEAN. For countries whose economic development is by and large at the same stage and whose commodity mix complementar- ity is not sufficient by large, economic interdepen- dence lies more in the development of direct invest- ment commitment though trade interdependence can be very important.
5. CONCLUSION
Although the economies of ASEAN and China dif- fer significantly in terms of the economic size, the economic system and the economic development
strategy, their economic interdependence through merchandise trade and direct investments has assumed growing significance throughout the last decade. It has been shown that Chinese trade depen- dence on the ASEAN countries is relatively greater than the latter’s trade dependence on the Chinese economy. China is much more important as a source of supply for imports for the ASEAN countries than as an outlet for ASEAN’s exports. Given the strong sim- ilarities of their market structures and their current patterns of the revealed comparative advantage, it is not surprising that trade between ASEAN and China remains small as a share of their total trade. Those similarities determine the dynamic nature in the devel- opment of ASEAN-China trade interdependence, with both competitive and complementary interac- tion.ASEAN’s direct investments inChina show a complementarity which corresponds to its compara- tive advantage. The industries in which ASEAN have been losing or lacking comparative advantage received the bulk of its total FDI in China. This find- ing is consistent with the macroeconomic theory of foreign direct investment pioneered by Kojima.
Among the ASEAN countries, Singapore is China’s largest trade partner and investor. It possesses apparently a strong comparative advantage in mineral resource-intensive and human capital-intensive goods, with the latter having been strong and increas- ing throughout the 1980s. Singapore has also been rapidly developing its advantage in technology-inten- sive goods. This pattern determines that trade with China is more complementary in nature, as China can supply the resource-based and unskilled labor-inten- sive exports for which Singapore has no comparative advantage, while importing the high value-added and capital and technology-intensive goods and services that Singapore can provide with comparative advan-
TRADE INTERDEPENDENCE AND DIRECT FOREIGN INVESTMENT 169
tage. To complement its comparative advantage, Singapore direct investment in China has been com- mitted primarily in agricultural resource-intensive and labor-intensive manufactures in which it has no com- parative advantage relative to China. The economic interdependence between China and Singapore is expected to increase given the high commodities mix complementarity between the two countries, appreci- ation of the Singapore dollar, and the promotion of regional trade and investment by the Singapore gov- ernment as a part of its long-term strategy.
In comparison with the rest of ASEAN, China has a quite similar trade structure; importing technology, machinery and equipment from the developed market economies, and exporting in return resource-based goods and labor-intensive products. The limited com- plementarity between China and these ASEAN coun- tries exists in the primary goods trade. It has been shown that China possesses a comparative disadvan- tage in agricultural resource-intensive goods relative to Indonesia, Malaysia, the Philippines and Thailand, and in mineral resource-intensive goods relative to Brunei, Indonesia and Malaysia. Trade in those sec- tors can be expected to expand between China and these countries. China has an increasing demand for industrial raw material and agricultural produce because of its industrialization drive. The competition is expected to be more intense between them in the labor-intensive manufactured goods category with the
movement of the comparative advantage of these ASEAN countries toward labor-intensive manufac- tures *
The outward investments from these ASEAN countries show that the human capital-intensive and technology-intensive industries were the major indvs- tries for Thai investors to allocate their capital in China. The unskilled labor-intensive manufactures were much more attractive to the investors from Indonesia, Malaysia and the Philippines, as these were the sectors that China possessed a strong comparative advantage. This investment pattern is predicted by the theory.
The long-run economic interdependence between ASEAN and China will be further strengthened kl- lowing the implementation of their industrialization programs and the rapid integration of the Chinese economy into the world economy. Although the rapid expansion of the Chinese economy may generate cer- tain negative spillover effects on the ASEAN economies in the short run, the potential economic benefits for ASEAN from an economically resurgent China far outweigh the costs. Most prominently. China’s openness to the outside world and rapid eco- nomic expansion will offer rising opportunities to the ASEAN countries for expanded trade and a greater outlet for their direct investment, and contribute to ASEAN’s efforts at diversifying the highly concen- trated market structures of its foreign trade.
NOTES
1. Some studies show that fiscal incentives do not play an important role in attracting foreign direct investment. See, e,g.,ShahandToye(l978).
2. The International Monetary Fund (IMF) measure was based on the purchase power parity method rather than the conventional market rate approach, see IMF (1993).
3. See Ow (1990), and Ow and Ow (1991). In 1987, Singapore’s GSP exports to the United States was US$2.07 billion, out of which US$1.30 billion entered the US market GSP duty-free. Of the US$16.3 billion worth of GSP duty- free imports, 8% was from Singapore.
4. In the last two decades, the ASEAN countries (with the exception of Brunei) have all abandoned import substitution and adopted export-oriented industialization to varying degrees, with Singapore pursuing it most vigorously and Indonesia the least. A series of macroeconomic policy reforms has since been adopted, which included tariff reforms, exchange rate adjustments, liberalization of foreign direct investment, establishment of export-processing zones and various other incentives. By and large, the ASEAN economies have achieved considerable success and eco- nomic benefits from these policy adjustments, manifested in
their rapid growth of manufacturing production and exports, their growing market share of the world trade in mam- factures, and their significant changes in the product compo- sition of exports, as well as in the contribution to economic growth and employment. The growing range and increasing technological sophistication of their manufactured exports made these ASEAN countries less vulnerable to price and demand fluctuations for individual products in the world market. See,e.g.,Chia (1987),andHiemenz (1983).
5. See Chia (1987) and World Bank (1985).
6. Prior to 1991, the Chinese trade statistics did not include Taiwan and the Republic of Korea. In 1991, Taiwan’s exports to China were US$3.64 billion, and rose rapidly to US$.5.87 billion in 1992, while imports from China were much smaller, only USXl.59 billion in 1988 and US$O.69 billion in 1992, respectively. For the Republic of Korea, imports from and exp&ts to China were USi2.18 bil- lion and US$l.O7 billion in 1991. and grew to US$2.4 billion and US$2.62 billion in 1992, respectively.
7. There were no statistical data available for FDI flows from the Republic of Korea and Taiwan into China until 1991. According to the Almanac of China’s Fore&z

170 WORLD DEVELOPMENT
Economic Relarions and Trade, in 1991-92, Taiwan’s direct 8. Brunei did not commit any FDI in China until 1992 investment in China increased significantly, with over US$I when one project worth US$O.56 million was established. billion having been committed each year. The Republic of Korea committed US$I 19 million of foreign capital in China 9. See Kojima (1973,1978), Kojima and Ozawa (1984), in 1992. andLee(1990).
REFERENCES
Asia Yearbook (Hong Kong, 1993). of Southeast Asian Nations - Meeting the Japanese Balassa, B., “Trade liberalization and revealed comparative Challenge (Washington, DC: The Brookings Institution,
advantage,” The Manchester School of Economics and 1982). SociaZSmdies,Vol.33,No.2(1965),pp.99-123. Krueger, A. O., “Growth, distortions and patterns of trade
Branson, W. H. and H. Junz, “Trends in US comparative among many countries,” Princeton Studies in advantage,” Brookings Papers on Economic kctivity, Vol. 2 (1971). pp. 285-346.
Chia, S. Y., “ASEAN-China trade in manufactured goods,” in S. Y. Chia and B. F. Cheng (Ms.), ASEAN-China Economic Relations (Singapore: ISEAS, 1987).
Dunning, J. H., Inrernarional Production and the Mulrinarional Enterprise (London: Allen and Unwin, 1981).
Findlay, C., P. Phillips and R. Tyers, “China’s merchandise trade: composition and export growth in the 1980s.” ASEAN-Australia Economic Papers, No., 19 (Kuala Lumpur and Canberra: ASEAN-Australia Joint Research Project, 1985).
Gmbaugh, S. G., “Determinants of direct investment,” The Review of Economics and Statisrics, Vol. 69, No. 1 (1987),pp. 149-152.
Hiemenz, U., “Export growth in developing Asian countries: past trends and policy issues,” - W&vir&zaftliches Archiv,Vol. 119.No.4(1983).uo.686-707.
International Monetary Fund, Dirk’,hon of Trade Stadsrics (Washington, DC: International Monetary Fund, various issues).
International Monetary Fund, World Economic Ourlook 1993 (Washington, DC: International Monetary Fund, 1993).
Jones, R. W., “A three-factor model in theory, trade and his- tory,” in J. Bhagwati, R. W. Jones, R. A. Mundell and J. Vanek (as.), Trade, Balance of Payments and Growth (Amsterdam: North Holland, 1971).
Keesing, D. B., “Labour skills and comparative advantage,” American Economic Review, Vol. 56, No. 2 (1966). pp. 249-258.
Kenen, P., “Nature, capital and trade,” Journal of Political Economy,Vol.73,No.5(1965),pp.437460.
Kojima, K., Direct Foreign Investmenr: A Japanese Model of Multinarional Business Operations (New York: Praeger Publishers, 1978).
Kojima, K., “A macroeconomic approach to foreign direct investment,” Hitotsubashi Journal of Economics, Vol. 14,No. 1 (1973),pp. 1-21.
Kojima, K. and T. Ozawa, “Micro- and macro-economic models of direct foreign investment: toward a synthesis,” Hitorsubashi Journal of Economics, Vol. 25, No. 1 (1984),pp. l-20.
Kause, L. B., U.S. Economic Policy Toward the Association
Inrerktional hinance, No. 40 (Princeton, NJ: Princeton University, 1977).
Lee, C. H., “Direct foreign investment, structural adjustment, and international division of labor: A dynamic macro- economic theory of direct foreign investment,” Hirorsubashi Journal of Economics, Vol. 31, No. 2 (1990). pp. 61-72.
Lipsey, R. E. and M. Y. Weiss, “Foreign production and exports of individual firms,” The Review of Economics and Sratistics, Vol. 66, No. 2 (1984), pp. 304308.
Lipsey, R. E. and M. Y. Weiss, “Foreign production and exports in manufacturing industries,” The Review of EconomicsandSra&ics,Vol.63,No.4(1981),pp.488- 494.
Ow, C. H., “Development strategies, economic perfor- mances and relations with the United States: Singapore’s experience,” Journal of Asian Economies, Vol. 1, No. 1 (199O),pp.61-85.
Ow,C.H.andC.H.Ow,“GraduatingfromtbeUSGSP: The Case of Singapore,” Journal ofAsian Economies, Vol. 2, No. 2 (1991),pp. 285-299.
Shah, S. M. S. and J. F. J. Toye, “Fiscal incentives for some firms in some developing countries: Survey and cri- tique,” m J. F. J. Toye (Ed.), Taxation and Economic Development (Cambridge: University of Cambridge, 1978).
The Almanac of China’s Foreign Economic Relations and Trade (Beijing, China), various issues.
Tyers, R. and P. Phillips, “Australia, ASEAN and Pacific Basin merchandise trade: Factor composition and pcrfor- mance in the 1970s.” ASEAl-Australia Economic Papers No. 13 (Kuala Lumpur and Canberra: ASEAN- Australia Joint Research Project, 1984).
United Nations, Inrernational Tade Sratistics Yearbook (New York: United Nations, various issues).
United Nations, Foreign Trade Srarisrics of Asia and the Pacific (New York: United Nations, various issues).
UNCTAD, Handbook of lnternarional Trade and Developmenr Sratistics (New York: UNCTAD, various issues).
Vernon, R., “International investment and international trade in the product cycle,” The Quaterly Journal of Economics, Vol. 80,No. 2 (1966),pp. 190-207.
World Bank, World Developmenr Report (New York: Oxford University Press, various years).


