Embed Size (px)
Citation preview
Tracing Groundwater Flow Systems with Hydrogeochemistryin Contrasting Geological Environments
J. Joel Carrillo-Rivera & Irén Varsányi &Lajos Ó. Kovács & Antonio Cardona
Received: 4 August 2006 /Accepted: 30 March 2007 / Published online: 15 May 2007# Springer Science + Business Media B.V. 2007
Abstract The importance of the chemical composi-tion in evaluating groundwater flow is discussed. Twodifferent geological environments, a felsic volcanicregion around San Luis Potosí (SLPB), Mexico, and asedimentary basin, part of the Pannonian Basin (PB),in Hungary, were chosen to explore the effect of local,intermediate and regional groundwater flows on thechemical evolution of water in different geologicalcircumstances. In the study areas contrasting stableisotopes and groundwater temperature values, as well asthe chemical composition of groundwater were conve-nient tools to propose groundwater flow direction and tostudy contamination processes in the different ground-
water flow systems. Results indicate that regardless ofthe geological framework variability of the chemicalcomposition of the shallow (<100 m) groundwater issignificant; at depth the chemical content of ground-water becomes homogeneous, and the concentrationsare smaller than at shallow depths. The Cl– and NO–
3
concentrations indicate mainly up- and downwardvertical flow directions suggesting local flow systemsin the shallow layers. The linear regression betweenCl– and Na+ suggests that evaporation processes arethe main control of the Cl– concentration. Deviationsfrom the regression line suggest processes such aspollution at shallow depths in both study areas.Based on the distribution of Ca+2, Mg+2 and Na+, alateral flow can be traced. The large dimensions of thegeological units involved with the regional flow systemsimplies a long groundwater flow path, also these flowsremain isolated from anthropogenic contamination, thengroundwater has not been altered by human influence,although in the SLPB a communication between thelocal and intermediate flows has been found. Rechargeareas of the local and intermediate flow systems aremore vulnerable to contamination processes than thedischarge areas, where the expected low dissolvedoxygen content of ascending water could play a control.Differences in the lithology between the PB (sedimen-tary basin) and the SLPB (felsic volcanic basin) explainthe contrasting saturation indices calculated for chalce-dony and calcite and the lack of the expected deve-lopment of HCO–
3, SO–24 Cl– facies and contrasting
aerobic/oxidizing conditions.
Water Air Soil Pollut (2007) 184:77–103DOI 10.1007/s11270-007-9400-6
J. J. Carrillo-RiveraInstituto de Geografía, UNAM, CU,Coyoacán, DF 04510, Mexicoe-mail: [email protected]
I. VarsányiDepartment of Mineralogy, Geochemistry and Petrology,University of Szeged,6701 Szeged, P.O.Box 651, Hungarye-mail: [email protected]
L. Ó. KovácsHungarian Geological Survey,1440 Budapest, P.O.Box 17, Hungarye-mail: [email protected]
A. Cardona (*)Ciencias de La Tierra, Facultad de Ingeniería, UASLP,Av. Manuel Nava No. 8, Zona Universitaria,San Luis Potosí, S.L.P. 78290, Mexicoe-mail: [email protected]
Keywords Pollution . Groundwater flow systems .
Hydrogeochemistry . Hungary .Mexico
1 Introduction
Chemical composition of groundwater is controlledby various factors, like evaporation, dissolution-precipitation, weathering of silicates, oxidation-reduction,sorption and exchange reactions, transformation oforganic matter, and mixing processes. In differentgeological environments the relative importance ofthese factors varies according to flow scale dimensionsand geological setting. Geochemistry of groundwater isoften used to investigate its origin, the time and locationof infiltration, and as well as the water flow direction(Kharaka and Carothers 1986; Lambert 1991; Chaudhuriet al. 1992; Varsányi et al. 1999; Carrillo-Rivera et al.2002). To determine the impact of the hydrogeologicalenvironment on the groundwater chemistry, two well-documented study areas with different geology werechosen. One study area is volcanic in nature, the SanLuis Potosí Basin (SLPB), Mexico, while the other is asedimentary environment in the central part of thePannonian Basin (PB), Hungary.
The issue of chemical evolution along the flowpath as proposed by Tóth (2000) was considered incomparative terms regarding flows of different hier-archy with contrasting chemical and temperaturecharacteristics. In agreement with Tóth (1995, 2000)the definition of a flow system path may be reachedthrough the assistance from the vertical distribution ofthe hydraulic potential. A vertical flow net wouldprovide with an adequate assistance to define eachflow system path as long as an adequate density ofinformation allows such analysis. However, for somefield conditions specially in developing countries asin the studied areas, such information is lacking,therefore an adequate possibility for their agreeabledefinition leans on the physical and chemical charac-teristics of groundwater, that are to provide with amore exact flow system definition than an incompletevertical potentiometric evaluation. Flow system anal-ysis may not be reached only by the evaluation ofchemical characteristics or a potentiometric flow netanalysis, but in the real world it requires a compar-ative analysis of contrasts in soil characteristics,vegetation cover, geomorphological setting, all withinthe prevailing geological framework and basement
rock location. In addition, they are not defined byabsolute values, a hierarchy analysis is required.Local systems are characterized by cold water withpH below 7, high DO and Eh content, low salinity,low minor and trace elements content. In contrast, aregional system involves warmer water with pHabove 7, low or nil DO and negative Eh values,higher salinity, higher minor and trace elementscontent than the local flow system. In the supportingreference bibliography, all of such characteristics wereused to separate the flow systems and to understandtheir behaviour and controls within the correspondinghydrogeological setting.
The expected steady state groundwater flowconditions in the SLPB as those described by Tóth(1995, 2000) permitted the identification of threegroundwater flow systems according to their differenthierarchy and contrasting nature: local, intermediateand regional, this separation was achieved withgroundwater temperature measured at wellhead aswell as reported Li+, F− and Na+. The contents ofgroundwater samples were separated into three groupswhose concentrations are directly related with residencetime. The Caþ2 � Cl� � HCO�
3 type water circulatingat shallow depths represents the local flows, averagevalues indicate that groundwater has low temper-ature (21.0°C) and moderate Li+ (0.0014 mmol/l),F− (0.0211 mmol/l) and Na+ (2.1750 mmol/l)content, sewage effluents contaminate the local flowsystem, so NO�
3 and Cl− were used as additionalsupport in the definition of the interference of localflows. The Caþ2 � HCO�
3 type water is associated tothe intermediate flows, it has moderate temperature(between 23 and 27°C) and low Li+ (0.0014 mmol/l),F− (0.0158 mmol/l) and Na+ (0.5176 mmol/l)concentration, the main chemical processes re-sponsible of its composition are dissolution ofcarbonate, ion exchange, and incongruent dissolutionof sanidine, Ca-montmorillonite, Na-montmorilloniteand illite (Cardona and Carrillo-Rivera 2006). Regionalflow is represented by Naþ � HCO�
3 , it has hightemperature (36.6°C) and high Li+ (0.0274 mmol/l),F− (0.1684 mmol/l) and Na+ (2.4359 mmol/l) content,groundwater chemistry is controlled by devitrificationof the abundant glassy matrix in the volcanic rocks andrepresents water travelling from and beyond the surfacebasin boundary (Carrillo-Rivera et al. 1996, 2002).Available samples suggested the presence of twogroups that were considered as end-members (those
78 Water Air Soil Pollut (2007) 184:77–103
of the intermediate and regional flows), another grouprepresenting mixed water was not included, becausethis paper only presents data from boreholes and(shallow) dug-wells tapping an individual flow systemat a time.
In the sediments of the PB two main groundwaterflow systems have been described: an intermediate flow(Caþ2 � HCO�
3 and Naþ � HCO�3 types), and a
regional flow (Naþ � HCO�3 type) (Erdélyi 1979;
Varsányi and Kovács 2001). The main chemicalprocesses controlling the groundwater chemistry aredissolution of calcite and dolomite, ion exchange,transformation of organic matter and feldspar weather-ing (Varsányi and Kovács 1997). A satisfactorydescription of the local flow systems is still lackingin the available literature.
There appears to be specific chemical controls inthe groundwater of the studied areas that could berelated to the flow path length and the geologicalcharacteristics; consequently the aim of this paper is tocompare processes determining the chemical compo-sition of groundwater in different flow systems incontrasting geological conditions, and to identify therelationship between the distribution of mineralogyand the groundwater flow, using information from tworegions where the groundwater flow regime haspreviously been established. The purpose of themanuscript is to show that in cases where (for eco-nomical conditions in countries under development)there is a lack of detailed direct evidence such as thevertical distribution of hydraulic heads (or differentialwater sampling) in geological formations with con-trasting hydraulic conductivity, the chemistry ofgroundwater from pumping wells interpreted withinthe prevailing hydrogeological framework, may ade-quately identify the presence of different flow systems.
2 Geological and Hydrogeological Setting
2.1 San Luis Potosi Basin
The main geological features of the area are similar tothose of a number of similar surface basins in theSierra Madre Occidental and Central Alluvial Basinsof Mexico, which are characterised by massiveTertiary lava flows (Back et al. 1988), features thatare found in other regions of north-western Mexicoand south-western USA. Distensive structures that
affected the massive Tertiary lava flows produced lowtopographic features that contain valleys filled upwith debris from the surrounding highlands as well asfrom other volcanic processes. This graben structureresulting of tensional tectonic forces implies that thereare no tectonic compression effects, which from thegroundwater flow system analysis suggest the lack ofa compression driven flow. The PSLB area is locatedon a border of these volcanic aquifer units that havean extensive surface area of 400×1,500 km and ajointly thickness of 2–3 km. Locally, an averagethickness of about 1,700 m of Tertiary fractured lavaflow, tuff and ignimbrite (Sierra San Miguelito) coversan inferred hydrogeological basement represented byCretaceous limestone and calcareous mudstone, and aTertiary quartz-monzonite intrusive body in the east-ern part of the basin (Sierra San Pedro). Volcanicrocks have an abundant glassy matrix of about 80% involume. Geochemical analyses of local lava flowsreported they are K and F-rich (F≈2,651 ppm) withsmall topaz crystals partially filling fractures andcavities in the rock (Cardona 2007).
A number of boreholes were used to determine thesubsurface geologic structure and to provide data forthe groundwater chemistry interpretation (Fig. 1a). Aclastic sequence of gravel, sand, silt and clay derivedfrom the surrounding Tertiary volcanic rocks wasdeposited on the volcanic units as basin-fill (Fig. 1b).Calcareous material resulting from erosion of Creta-ceous rocks, located in Sierra San Pedro, is expectedto be a source of clastic deposit in the basin fill. Thesesediments are inter-bedded with pyroclastic material;together referred to as Tertiary Granular Undifferen-tiated (TGU). Borehole logging and lithology samplesindicate the presence of a 50 to 150 m thick bed offine-grained and compact sand layer (locally referredto as “clay layer”) fully enclosed in the TGU. Thislayer is found under most of the plane of the SLPBexcept at the TGU’s margin and has an extent ofabout 300 km2. X-ray diffractometry of this compact-sand shows about 90% by volume of quartz andsanidine, as well as a small fraction of carbonates andclay (halloysite, illite and montmorillonite).
Carrillo-Rivera (1992) and Carrillo-Rivera et al.(1996) defined the hydrogeological features of theSLPB and surrounding area. The potentiometrichorizontal data for the SLPB may be represented bytwo cones of depression; one located in the city areaand another to the south-east of the former, with
Water Air Soil Pollut (2007) 184:77–103 79
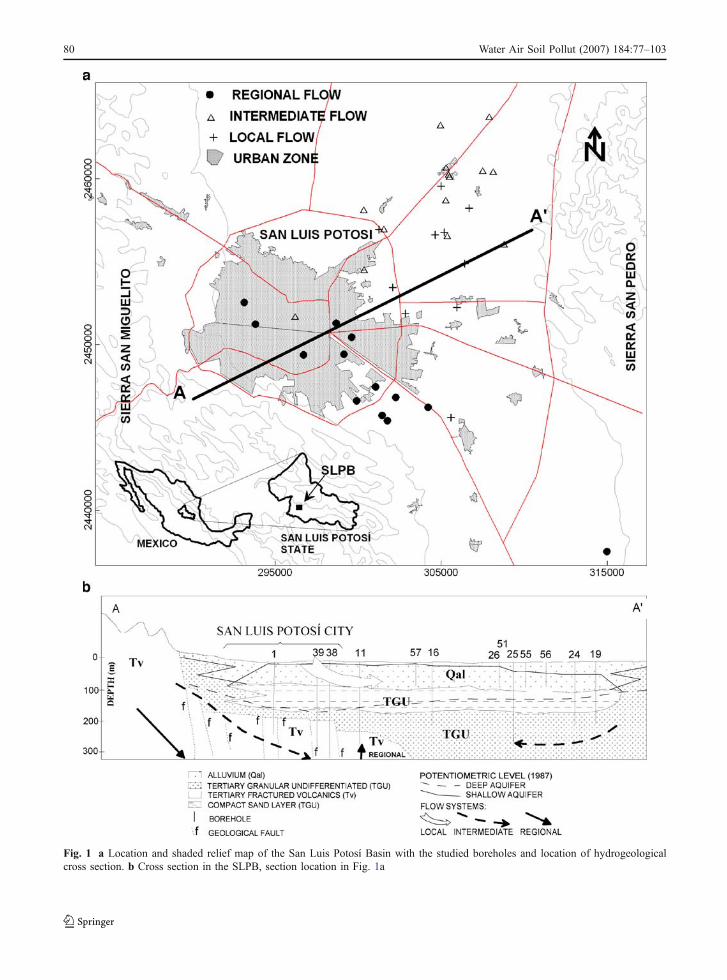
Fig. 1 a Location and shaded relief map of the San Luis Potosí Basin with the studied boreholes and location of hydrogeologicalcross section. b Cross section in the SLPB, section location in Fig. 1a
80 Water Air Soil Pollut (2007) 184:77–103
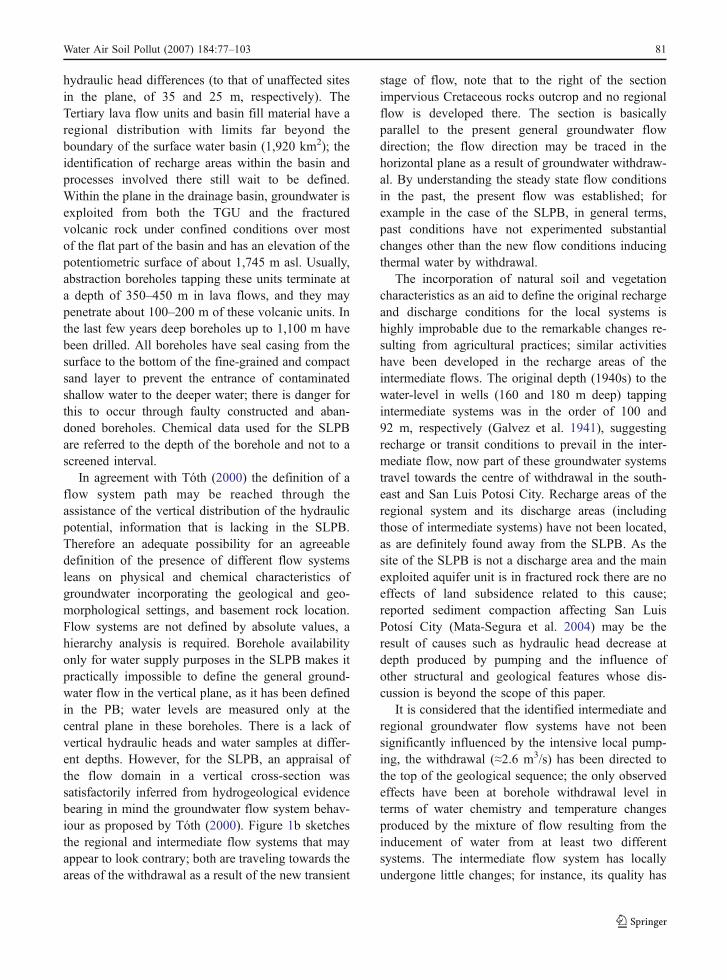
hydraulic head differences (to that of unaffected sitesin the plane, of 35 and 25 m, respectively). TheTertiary lava flow units and basin fill material have aregional distribution with limits far beyond theboundary of the surface water basin (1,920 km2); theidentification of recharge areas within the basin andprocesses involved there still wait to be defined.Within the plane in the drainage basin, groundwater isexploited from both the TGU and the fracturedvolcanic rock under confined conditions over mostof the flat part of the basin and has an elevation of thepotentiometric surface of about 1,745 m asl. Usually,abstraction boreholes tapping these units terminate ata depth of 350–450 m in lava flows, and they maypenetrate about 100–200 m of these volcanic units. Inthe last few years deep boreholes up to 1,100 m havebeen drilled. All boreholes have seal casing from thesurface to the bottom of the fine-grained and compactsand layer to prevent the entrance of contaminatedshallow water to the deeper water; there is danger forthis to occur through faulty constructed and aban-doned boreholes. Chemical data used for the SLPBare referred to the depth of the borehole and not to ascreened interval.
In agreement with Tóth (2000) the definition of aflow system path may be reached through theassistance of the vertical distribution of the hydraulicpotential, information that is lacking in the SLPB.Therefore an adequate possibility for an agreeabledefinition of the presence of different flow systemsleans on physical and chemical characteristics ofgroundwater incorporating the geological and geo-morphological settings, and basement rock location.Flow systems are not defined by absolute values, ahierarchy analysis is required. Borehole availabilityonly for water supply purposes in the SLPB makes itpractically impossible to define the general ground-water flow in the vertical plane, as it has been definedin the PB; water levels are measured only at thecentral plane in these boreholes. There is a lack ofvertical hydraulic heads and water samples at differ-ent depths. However, for the SLPB, an appraisal ofthe flow domain in a vertical cross-section wassatisfactorily inferred from hydrogeological evidencebearing in mind the groundwater flow system behav-iour as proposed by Tóth (2000). Figure 1b sketchesthe regional and intermediate flow systems that mayappear to look contrary; both are traveling towards theareas of the withdrawal as a result of the new transient
stage of flow, note that to the right of the sectionimpervious Cretaceous rocks outcrop and no regionalflow is developed there. The section is basicallyparallel to the present general groundwater flowdirection; the flow direction may be traced in thehorizontal plane as a result of groundwater withdraw-al. By understanding the steady state flow conditionsin the past, the present flow was established; forexample in the case of the SLPB, in general terms,past conditions have not experimented substantialchanges other than the new flow conditions inducingthermal water by withdrawal.
The incorporation of natural soil and vegetationcharacteristics as an aid to define the original rechargeand discharge conditions for the local systems ishighly improbable due to the remarkable changes re-sulting from agricultural practices; similar activitieshave been developed in the recharge areas of theintermediate flows. The original depth (1940s) to thewater-level in wells (160 and 180 m deep) tappingintermediate systems was in the order of 100 and92 m, respectively (Galvez et al. 1941), suggestingrecharge or transit conditions to prevail in the inter-mediate flow, now part of these groundwater systemstravel towards the centre of withdrawal in the south-east and San Luis Potosi City. Recharge areas of theregional system and its discharge areas (includingthose of intermediate systems) have not been located,as are definitely found away from the SLPB. As thesite of the SLPB is not a discharge area and the mainexploited aquifer unit is in fractured rock there are noeffects of land subsidence related to this cause;reported sediment compaction affecting San LuisPotosí City (Mata-Segura et al. 2004) may be theresult of causes such as hydraulic head decrease atdepth produced by pumping and the influence ofother structural and geological features whose dis-cussion is beyond the scope of this paper.
It is considered that the identified intermediate andregional groundwater flow systems have not beensignificantly influenced by the intensive local pump-ing, the withdrawal (≈2.6 m3/s) has been directed tothe top of the geological sequence; the only observedeffects have been at borehole withdrawal level interms of water chemistry and temperature changesproduced by the mixture of flow resulting from theinducement of water from at least two differentsystems. The intermediate flow system has locallyundergone little changes; for instance, its quality has
Water Air Soil Pollut (2007) 184:77–103 81
locally been protected from above contaminants by afine-grained and compact sand layer. An up-coning ofwater of regional flow (≈70% of the total withdrawal)through fractures has permitted to reach an under-standing of transient flow resulting from withdrawalthrough the explanation of steady state conditions.The low hydraulic conductivity (10−9 m/s) fine-grained and compact sand layer separates the localflow from the intermediate and regional flows asdefined by evidence of studied shallow dug-wells anddeep boreholes and their chemical response as relativeto the position of the layer. Any downward flow thatmay occur through this layer is expected to have anegligible roll in observed chemistry due to itsprevailing quartz and sanidine mineralogy.
Main local flow systems show a shallow water-table elevation of 1,800 m asl, they travel troughalluvium fill below the plane and the result of thepresence of the fine-grained and compact sand layerthat produces an unconfined perched aquifer. They arerecharged by local rainfall and untreated sewagederived from agricultural return flow. Other localsystems present in the highlands, their discharge isrepresented by local seasonal springs. Availableinformation indicates that local flow systems naturallydeveloped at the plane of the surface-closed basin,their recharge and discharge areas are bounded withinthe plane. These systems were initially tapped byshallow dug-wells and were the San Luis Potosi Citymain water supply up to about 100 years ago. Time atwhich surface water was captured by the San José andlater by El Peaje dams (0.2 m3/s) constructed withinthe basin to provide for the required resource to thecity located at the plane; the lack of a sewage systemand under prevailing morphology, gathered sewageused for agricultural practices in low topographic areasproduced contamination of the local flow systems.This water quality may be now used as tracer to detectits presence in extracted water from other systems.
2.2 Pannonian Basin
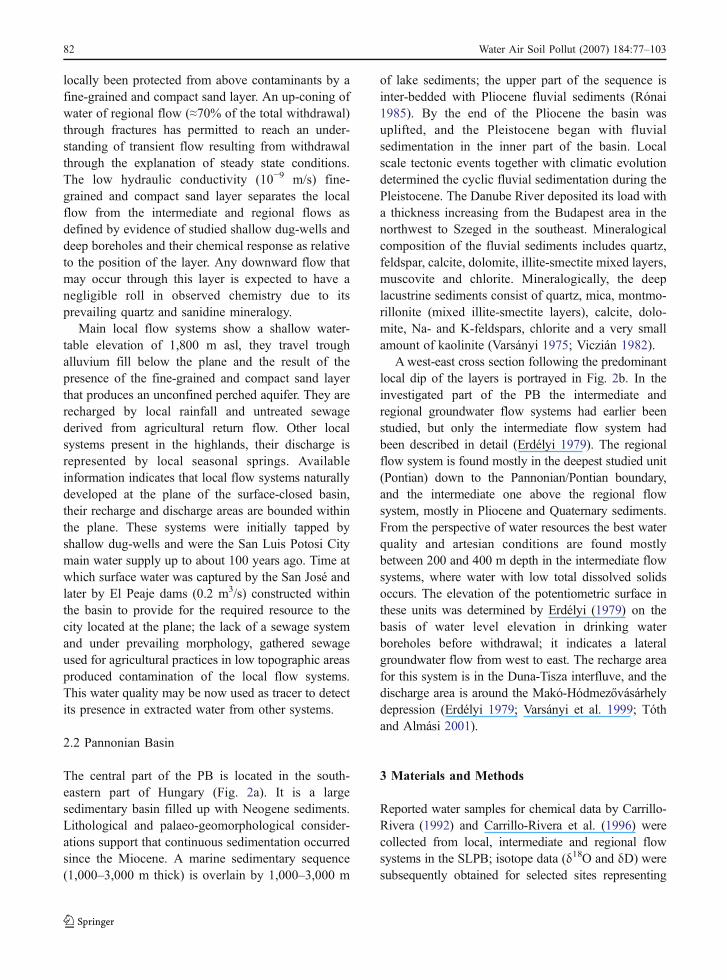
The central part of the PB is located in the south-eastern part of Hungary (Fig. 2a). It is a largesedimentary basin filled up with Neogene sediments.Lithological and palaeo-geomorphological consider-ations support that continuous sedimentation occurredsince the Miocene. A marine sedimentary sequence(1,000–3,000 m thick) is overlain by 1,000–3,000 m
of lake sediments; the upper part of the sequence isinter-bedded with Pliocene fluvial sediments (Rónai1985). By the end of the Pliocene the basin wasuplifted, and the Pleistocene began with fluvialsedimentation in the inner part of the basin. Localscale tectonic events together with climatic evolutiondetermined the cyclic fluvial sedimentation during thePleistocene. The Danube River deposited its load witha thickness increasing from the Budapest area in thenorthwest to Szeged in the southeast. Mineralogicalcomposition of the fluvial sediments includes quartz,feldspar, calcite, dolomite, illite-smectite mixed layers,muscovite and chlorite. Mineralogically, the deeplacustrine sediments consist of quartz, mica, montmo-rillonite (mixed illite-smectite layers), calcite, dolo-mite, Na- and K-feldspars, chlorite and a very smallamount of kaolinite (Varsányi 1975; Viczián 1982).
A west-east cross section following the predominantlocal dip of the layers is portrayed in Fig. 2b. In theinvestigated part of the PB the intermediate andregional groundwater flow systems had earlier beenstudied, but only the intermediate flow system hadbeen described in detail (Erdélyi 1979). The regionalflow system is found mostly in the deepest studied unit(Pontian) down to the Pannonian/Pontian boundary,and the intermediate one above the regional flowsystem, mostly in Pliocene and Quaternary sediments.From the perspective of water resources the best waterquality and artesian conditions are found mostlybetween 200 and 400 m depth in the intermediate flowsystems, where water with low total dissolved solidsoccurs. The elevation of the potentiometric surface inthese units was determined by Erdélyi (1979) on thebasis of water level elevation in drinking waterboreholes before withdrawal; it indicates a lateralgroundwater flow from west to east. The recharge areafor this system is in the Duna-Tisza interfluve, and thedischarge area is around the Makó-Hódmezővásárhelydepression (Erdélyi 1979; Varsányi et al. 1999; Tóthand Almási 2001).
3 Materials and Methods
Reported water samples for chemical data by Carrillo-Rivera (1992) and Carrillo-Rivera et al. (1996) werecollected from local, intermediate and regional flowsystems in the SLPB; isotope data (δ18O and δD) weresubsequently obtained for selected sites representing
82 Water Air Soil Pollut (2007) 184:77–103
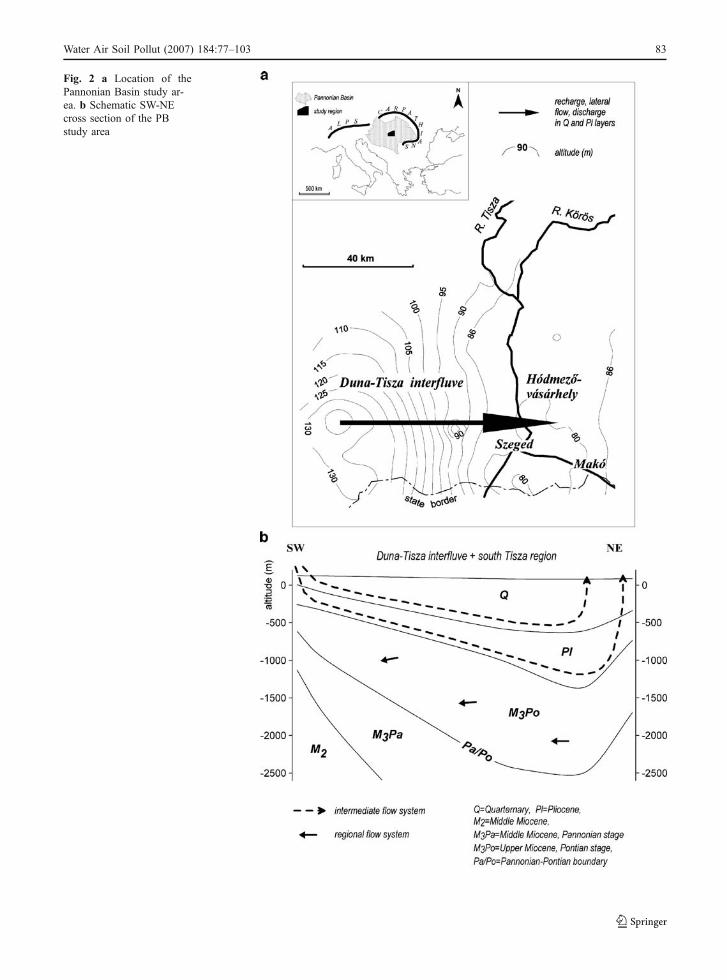
Fig. 2 a Location of thePannonian Basin study ar-ea. b Schematic SW-NEcross section of the PBstudy area
Water Air Soil Pollut (2007) 184:77–103 83
the flow systems. Water samples were collected indouble acid washed, low-density polyethylene bot-tles; temperature, pH, Eh and electrical conductivitywere measured at site with portable equipment.Stable isotope analyses were carried out by massspectrometry at G.G. Hatch Isotope Laboratories,University of Ottawa, using the Gasbench +DeltaPlus XP isotope ratio mass spectrometer;results are reported relative to SMOW. Analyticalprecision is ±0.15‰ and ± 2.0‰ for δ18O and δD,respectively.
Varsányi and Kovács (1997) identified samplesfrom an intermediate flow system including shallowwater in the recharge and discharge areas in the PB.The sampling procedure, sample preservation andmethods of analyses are described by Carrillo-Riveraet al. (1996) and Varsányi and Kovács (1997), and thechemical and isotopic data are given in Tables 1, 2and 3 for the SLPB and the PB, respectively.
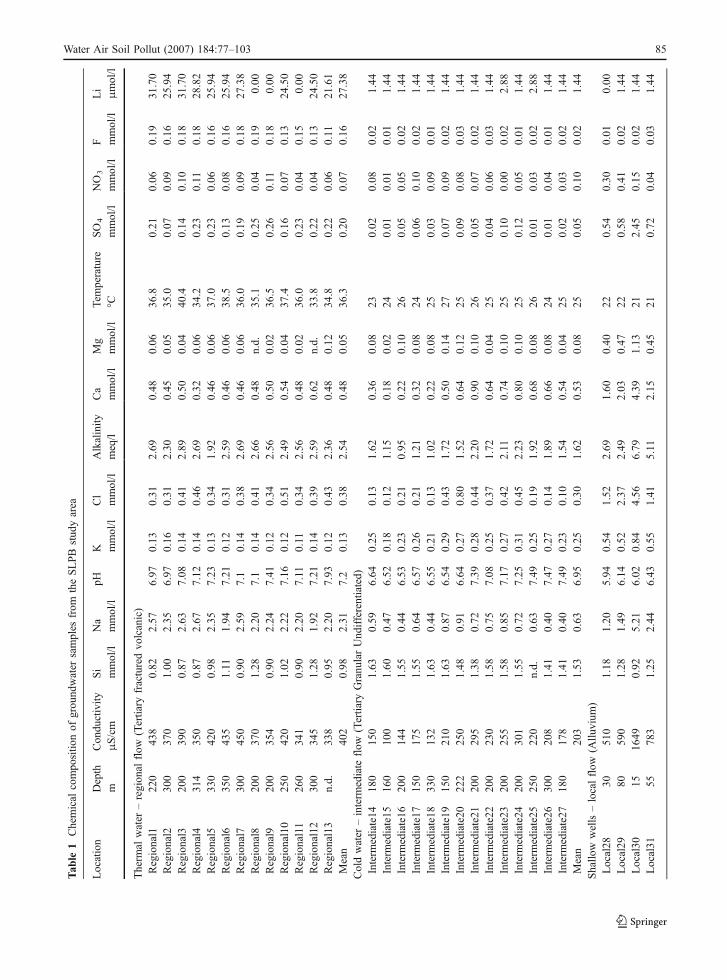
4 Results
In SLPB, Mexico, 27 groundwater samples werecollected and analysed from regional and intermediateflow systems from the Tertiary fractured volcanic (Tv)and TGU, respectively, (see Figs. 1a and b). Anotherset of 10 samples from a shallow aquifer unit inalluvium represents local flows. Samples taken forisotope analyses included 26 from the local, 9 from theintermediate and 12 from the regional flow systems.
The intermediate and regional flows were identifiedfrom water extracted by deep boreholes with a depththat varies between 150 and 350 m (Tables 1 and 2),while the temperature at wellhead is between 23.3 and40.4°C; these flows are represented by two maintypes of water: Caþ2 � HCO�
3 type and Naþ �HCO�
3 type, respectively. The mean temperature ofthe Caþ2 � HCO�
3 type water is 25.8°C with a max-imum of 29.3°C, for the Naþ � HCO�
3 type water themean temperature is 35.4°Cwith a maximum of 40.4°C.The depth of boreholes of the shallow water varies from10 to 36 m; mean temperature of this water is 21.2°C.Further support of potentiometric difference betweenlocal and intermediate-regional flows is presented inCarrillo-Rivera et al. (1996, 2002), distinction that isdue to the presence of the fine-grained and compactsand layer. There is lack of data to attempt any verticalhydraulic potential separation between intermediate
and regional flows, their differentiation was definedthrough physical and chemical means (Tóth 2000) asavailable sampling sites are water supply boreholes.The lack of radioisotope data as a sound tool forestablishing relative water age was compensated bythe use of Li+ as a proxy to support system hierarchywith residence time (Edmunds et al. 1986; Carrillo-Rivera et al. 1996).
Tables 1 and 2, show that the electrical conductivityranges from 96 to 426 μS/cm, and from 223 to 389 μS/cm in the intermediate and regional flows, respectively.Mean concentrations of the relevant species in theintermediate flow system are as follows: Na+=0.977 mmol/l, Ca2+=0.611 mmol/l, K+=0.31 mmol/l,Mg2+=0.083 mmol/l, Li+=3.44 μmol/l, alkalinity=1.92 meq/l, Cl−=0.47 mmol/l, SO4
2−=0.181 mmol/l,NO3
−=0.033 mmol/l, F−=0.028 mmol/l, and H4SiO4=1.487 mmol/l. In the regional flow, mean concentra-tions of the cations are: Na+=2.155 mmol/l, Ca2+=0.464 mmol/l, K+=0.126 mmol/l, Mg2+=0.014 mmol/l,and Li+=20.71 μmol/l, while those of the anions are:Cl−=0.485 mmol/l, SO2�
4 ¼ 0:30mmol=l, NO�3 ¼
0:027mmol=l, and F−=0.131 mmol/l. The averageconcentration of H4SiO4 is 1.058 mmol/l, and thealkalinity is 2.346 meq/l. In the local flow system(Fig. 1b) the average value of electrical conductivity andconcentration of most cations and anions are higher thanin the waters from the intermediate and regional systems;however the F− and Li+ concentrations are lower. Theaverage values of the cations are: Na+=5.113 mmol/l,Ca2+=1.178 mmol/l, K+=1.178 mmol/l, Mg2+=0.461 mmol/l, and Li+=1.355 μmol/l, and those of theanions: alkalinity=5.838meq/l, Cl−=3.386 mmol/l,SO2�
4 ¼ 2:692mmol=l, NO�3 ¼ 1:55mmol=l, and F−=
0.048 mmol/l. The mean values for H4SiO4 and electricconductivity are 1.267 mmol/l and 1,364 μS/cm,respectively.
The chemical contrasting characteristics of theflow systems in the SLPB is poorly reflected on theirisotopic composition; mean values of δD are basical-ly similar (−73.4‰ ±2), the only significant differ-ence is found in regard of δ18O between the regionalwith −9.65‰ (and the shallow, −9.42‰) as comparedto the intermediate system that has −10.37‰.
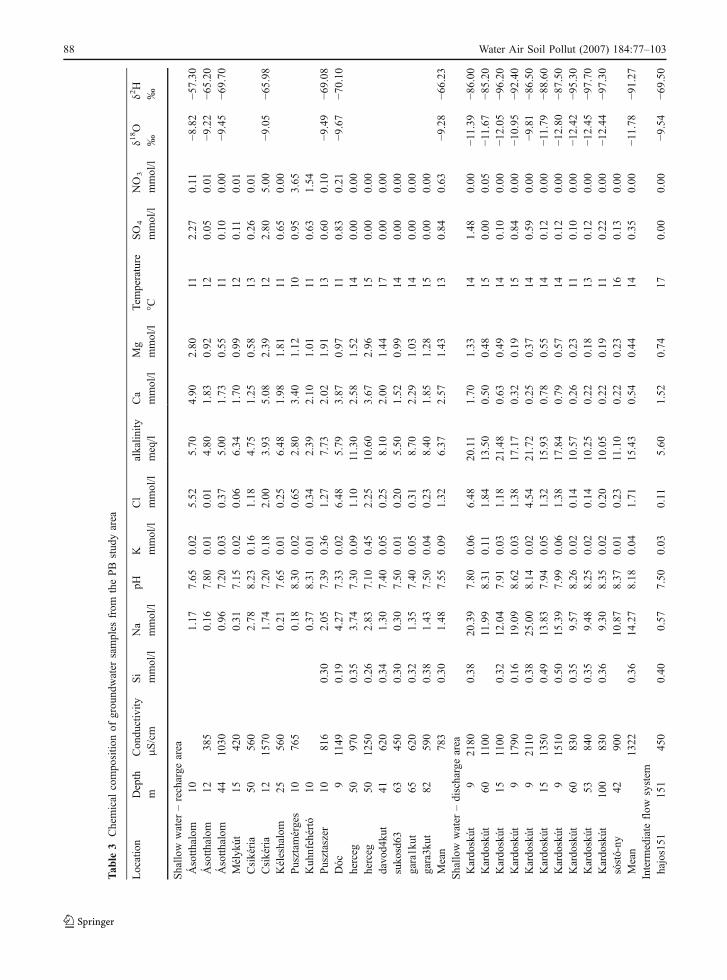
In regard of the PB, Hungary, Table 3 shows 44samples that have been collected along the flow pathof the intermediate flow system (Fig. 2b). The depthof the samples is from 9 to 741 m; the wellheadtemperatures are between 10 and 36°C. The shallow
84 Water Air Soil Pollut (2007) 184:77–103
Tab
le1
Chemical
compo
sitio
nof
grou
ndwater
samples
from
theSLPBstud
yarea
Location
Depth
Con
ductivity
Si
Na
pHK
Cl
Alkalinity
Ca
Mg
Tem
perature
SO
4NO
3F
Li
mμS/cm
mmol/l
mmol/l
mmol/l
mmol/l
meq/l
mmol/l
mmol/l
°Cmmol/l
mmol/l
mmol/l
μmol/l
Therm
alwater
–region
alflow
(Tertiary
fracturedvo
lcanic)
Regional1
220
438
0.82
2.57
6.97
0.13
0.31
2.69
0.48
0.06
36.8
0.21
0.06
0.19
31.70
Regional2
300
370
1.00
2.35
6.97
0.16
0.31
2.30
0.45
0.05
35.0
0.07
0.09
0.16
25.94
Regional3
200
390
0.87
2.63
7.08
0.14
0.41
2.89
0.50
0.04
40.4
0.14
0.10
0.18
31.70
Regional4
314
350
0.87
2.67
7.12
0.14
0.46
2.69
0.32
0.06
34.2
0.23
0.11
0.18
28.82
Regional5
330
420
0.98
2.35
7.23
0.13
0.34
1.92
0.46
0.06
37.0
0.23
0.06
0.16
25.94
Regional6
350
435
1.11
1.94
7.21
0.12
0.31
2.59
0.46
0.06
38.5
0.13
0.08
0.16
25.94
Regional7
300
450
0.90
2.59
7.1
0.14
0.38
2.69
0.46
0.06
36.0
0.19
0.09
0.18
27.38
Regional8
200
370
1.28
2.20
7.1
0.14
0.41
2.66
0.48
n.d.
35.1
0.25
0.04
0.19
0.00
Regional9
200
354
0.90
2.24
7.41
0.12
0.34
2.56
0.50
0.02
36.5
0.26
0.11
0.18
0.00
Regional10
250
420
1.02
2.22
7.16
0.12
0.51
2.49
0.54
0.04
37.4
0.16
0.07
0.13
24.50
Regional11
260
341
0.90
2.20
7.11
0.11
0.34
2.56
0.48
0.02
36.0
0.23
0.04
0.15
0.00
Regional12
300
345
1.28
1.92
7.21
0.14
0.39
2.59
0.62
n.d.
33.8
0.22
0.04
0.13
24.50
Regional13
n.d.
338
0.95
2.20
7.93
0.12
0.43
2.36
0.48
0.12
34.8
0.22
0.06
0.11
21.61
Mean
402
0.98
2.31
7.2
0.13
0.38
2.54
0.48
0.05
36.3
0.20
0.07
0.16
27.38
Coldwater
–interm
ediate
flow
(Tertiary
Granu
larUnd
ifferentiated)
Interm
ediate14
180
150
1.63
0.59
6.64
0.25
0.13
1.62
0.36
0.08
230.02
0.08
0.02
1.44
Interm
ediate15
160
100
1.60
0.47
6.52
0.18
0.12
1.15
0.18
0.02
240.01
0.01
0.01
1.44
Interm
ediate16
200
144
1.55
0.44
6.53
0.23
0.21
0.95
0.22
0.10
260.05
0.05
0.02
1.44
Interm
ediate17
150
175
1.55
0.64
6.57
0.26
0.21
1.21
0.32
0.08
240.06
0.10
0.02
1.44
Interm
ediate18
330
132
1.63
0.44
6.55
0.21
0.13
1.02
0.22
0.08
250.03
0.09
0.01
1.44
Interm
ediate19
150
210
1.63
0.87
6.54
0.29
0.43
1.72
0.50
0.14
270.07
0.09
0.02
1.44
Interm
ediate20
222
250
1.48
0.91
6.64
0.27
0.80
1.52
0.64
0.12
250.09
0.08
0.03
1.44
Interm
ediate21
200
295
1.38
0.72
7.39
0.28
0.44
2.20
0.90
0.10
260.05
0.07
0.02
1.44
Interm
ediate22
200
230
1.58
0.75
7.08
0.25
0.37
1.72
0.64
0.04
250.04
0.06
0.03
1.44
Interm
ediate23
200
255
1.58
0.85
7.17
0.27
0.42
2.11
0.74
0.10
250.10
0.00
0.02
2.88
Interm
ediate24
200
301
1.55
0.72
7.25
0.31
0.45
2.23
0.80
0.10
250.12
0.05
0.01
1.44
Interm
ediate25
250
220
n.d.
0.63
7.49
0.25
0.19
1.92
0.68
0.08
260.01
0.03
0.02
2.88
Interm
ediate26
300
208
1.41
0.40
7.47
0.27
0.14
1.89
0.66
0.08
240.01
0.04
0.01
1.44
Interm
ediate27
180
178
1.41
0.40
7.49
0.23
0.10
1.54
0.54
0.04
250.02
0.03
0.02
1.44
Mean
203
1.53
0.63
6.95
0.25
0.30
1.62
0.53
0.08
250.05
0.10
0.02
1.44
Shallo
wwells–localflow
(Allu
vium
)Local28
3051
01.18
1.20
5.94
0.54
1.52
2.69
1.60
0.40
220.54
0.30
0.01
0.00
Local29
8059
01.28
1.49
6.14
0.52
2.37
2.49
2.03
0.47
220.58
0.41
0.02
1.44
Local30
1516
490.92
5.21
6.02
0.84
4.56
6.79
4.39
1.13
212.45
0.15
0.02
1.44
Local31
5578
31.25
2.44
6.43
0.55
1.41
5.11
2.15
0.45
210.72
0.04
0.03
1.44
Water Air Soil Pollut (2007) 184:77–103 85
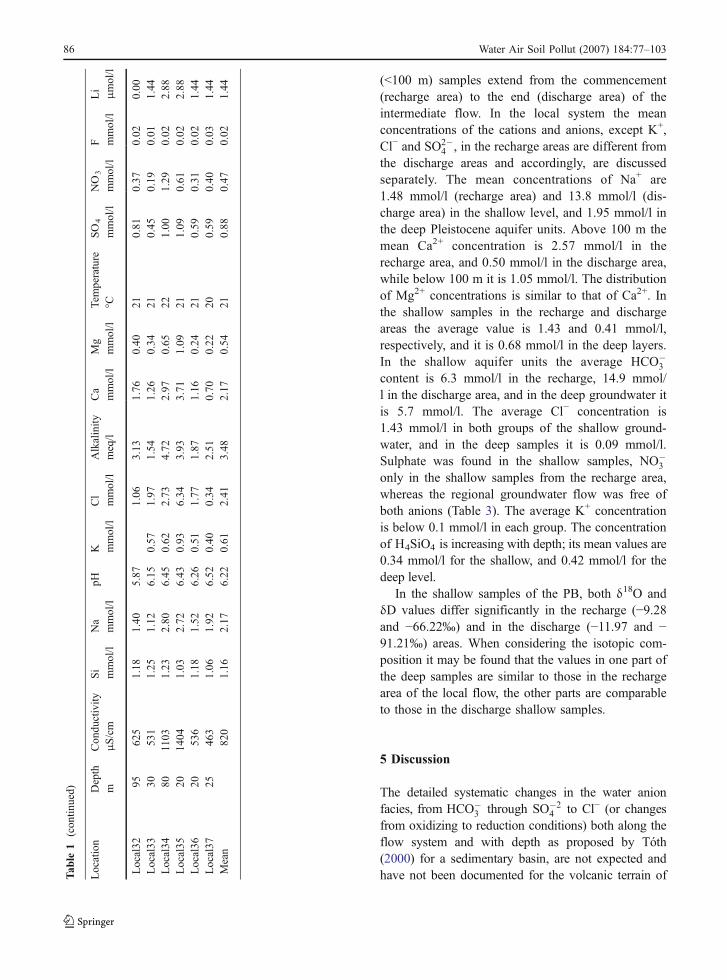
(<100 m) samples extend from the commencement(recharge area) to the end (discharge area) of theintermediate flow. In the local system the meanconcentrations of the cations and anions, except K+,Cl− and SO2�
4 , in the recharge areas are different fromthe discharge areas and accordingly, are discussedseparately. The mean concentrations of Na+ are1.48 mmol/l (recharge area) and 13.8 mmol/l (dis-charge area) in the shallow level, and 1.95 mmol/l inthe deep Pleistocene aquifer units. Above 100 m themean Ca2+ concentration is 2.57 mmol/l in therecharge area, and 0.50 mmol/l in the discharge area,while below 100 m it is 1.05 mmol/l. The distributionof Mg2+ concentrations is similar to that of Ca2+. Inthe shallow samples in the recharge and dischargeareas the average value is 1.43 and 0.41 mmol/l,respectively, and it is 0.68 mmol/l in the deep layers.In the shallow aquifer units the average HCO�
3
content is 6.3 mmol/l in the recharge, 14.9 mmol/l in the discharge area, and in the deep groundwater itis 5.7 mmol/l. The average Cl− concentration is1.43 mmol/l in both groups of the shallow ground-water, and in the deep samples it is 0.09 mmol/l.Sulphate was found in the shallow samples, NO�
3
only in the shallow samples from the recharge area,whereas the regional groundwater flow was free ofboth anions (Table 3). The average K+ concentrationis below 0.1 mmol/l in each group. The concentrationof H4SiO4 is increasing with depth; its mean values are0.34 mmol/l for the shallow, and 0.42 mmol/l for thedeep level.
In the shallow samples of the PB, both δ18O andδD values differ significantly in the recharge (−9.28and −66.22‰) and in the discharge (−11.97 and −91.21‰) areas. When considering the isotopic com-position it may be found that the values in one part ofthe deep samples are similar to those in the rechargearea of the local flow, the other parts are comparableto those in the discharge shallow samples.
5 Discussion
The detailed systematic changes in the water anionfacies, from HCO�
3 through SO�24 to Cl− (or changes
from oxidizing to reduction conditions) both along theflow system and with depth as proposed by Tóth(2000) for a sedimentary basin, are not expected andhave not been documented for the volcanic terrain ofT
able
1(con
tinued)
Location
Depth
Con
ductivity
Si
Na
pHK
Cl
Alkalinity
Ca
Mg
Tem
perature
SO
4NO
3F
Li
mμS/cm
mmol/l
mmol/l
mmol/l
mmol/l
meq/l
mmol/l
mmol/l
°Cmmol/l
mmol/l
mmol/l
μmol/l
Local32
9562
51.18
1.40
5.87
1.06
3.13
1.76
0.40
210.81
0.37
0.02
0.00
Local33
3053
11.25
1.12
6.15
0.57
1.97
1.54
1.26
0.34
210.45
0.19
0.01
1.44
Local34
801103
1.23
2.80
6.45
0.62
2.73
4.72
2.97
0.65
221.00
1.29
0.02
2.88
Local35
2014
041.03
2.72
6.43
0.93
6.34
3.93
3.71
1.09
211.09
0.61
0.02
2.88
Local36
2053
61.18
1.52
6.26
0.51
1.77
1.87
1.16
0.24
210.59
0.31
0.02
1.44
Local37
2546
31.06
1.92
6.52
0.40
0.34
2.51
0.70
0.22
200.59
0.40
0.03
1.44
Mean
820
1.16
2.17
6.22
0.61
2.41
3.48
2.17
0.54
210.88
0.47
0.02
1.44
86 Water Air Soil Pollut (2007) 184:77–103

Table 2 Isotopic (δ18O and δD) information of groundwater samples from the SLPB study area
Location Temperature °C δ18O ‰ δ2H ‰
Thermal water – regional flow (Tertiary fractured volcanic)Regional38 35.6 −9.91 −69.40Regional39 35.5 −9.81 −74.53Regional40 33.7 −10.46 −76.10Regional41 30.2 −10.15 −72.03Regional42 32.1 −10.09 −73.91Regional43 32.0 −9.94 −70.46Regional44 34.1 −9.82 −70.51Regional45 35.1 −9.78 −69.05Regional46 33.5 −9.65 −69.90Regional47 34.7 −9.19 −66.11Regional48 34.9 −9.25 −66.65Regional49 32.6 −8.38 −62.68Cold water – intermediate flow (Tertiary Granular Undifferentiated)Intermediate50 24.1 −10.98 −79.40Intermediate51 25.2 −11.49 −81.13Intermediate52 26.5 −11.27 −82.68Intermediate53 29.3 −10.80 −80.61Intermediate54 26.5 −9.32 −66.60Intermediate55 26.5 −11.34 −84.67Intermediate56 28.0 −9.47 −70.13Intermediate57 28.8 −9.51 −74.72Intermediate58 28.0 −9.18 −71.47Shallow wells – local flow (Alluvium)Local59 20.9 −11.58 −86.18Local60 20.6 −9.60 −75.23Local61 20.6 −8.53 −64.80Local62 19.2 −6.28 −49.56Local63 23.4 −9.96 −76.65Local64 20.0 −9.68 −78.13Local65 21.3 −8.42 −67.54Local66 22.0 −5.42 −56.12Local67 20.9 −9.08 −79.12Local68 20.6 −9.91 −75.88Local69 22.8 −11.86 −67.57Local70 23.3 −4.72 −77.49Local71 22.2 −9.99 −83.84Local72 21.6 −10.40 −81.80Local73 22.0 −10.31 −81.32Local74 19.4 −10.26 −81.67Local75 20.7 −9.92 −79.64Local76 20.7 −9.45 −76.71Local77 20.8 −9.69 −68.83Local78 21.7 −9.57 −70.08Local79 22.6 −9.63 −68.95Local80 20.7 −10.44 −82.13Local81 23.0 −9.99 −73.88Local82 20.2 −8.77 −70.48Local83 20.8 −11.51 −83.87Local84 20.1 −9.85 −68.83
Water Air Soil Pollut (2007) 184:77–103 87
Tab
le3
Chemical
compo
sitio
nof
grou
ndwater
samples
from
thePB
stud
yarea
Location
Depth
Con
ductivity
Si
Na
pHK
Cl
alkalin
ityCa
Mg
Tem
perature
SO
4NO
3δ1
8O
δ2H
mμS/cm
mmol/l
mmol/l
mmol/l
mmol/l
meq/l
mmol/l
mmol/l
°Cmmol/l
mmol/l
‰‰
Shallo
wwater
–recharge
area
Ásotth
alom
101.17
7.65
0.02
5.52
5.70
4.90
2.80
112.27
0.11
−8.82
−57.30
Ásotth
alom
1238
50.16
7.80
0.01
0.01
4.80
1.83
0.92
120.05
0.01
−9.22
−65.20
Ásotth
alom
4410
300.96
7.20
0.03
0.37
5.00
1.73
0.55
110.10
0.00
−9.45
−69.70
Mélyk
út15
420
0.31
7.15
0.02
0.06
6.34
1.70
0.99
120.11
0.01
Csikéria
5056
02.78
8.23
0.16
1.18
4.75
1.25
0.58
130.26
0.01
Csikéria
1215
701.74
7.20
0.18
2.00
3.93
5.08
2.39
122.80
5.00
−9.05
−65.98
Kéleshalom
2556
00.21
7.65
0.01
0.25
6.48
1.98
1.81
110.65
0.00
Pusztam
érges
1076
50.18
8.30
0.02
0.65
2.80
3.40
1.12
100.95
3.65
Kuh
nfehértó
100.37
8.31
0.01
0.34
2.39
2.10
1.01
110.63
1.54
Pusztaszer
1081
60.30
2.05
7.39
0.36
1.27
7.73
2.02
1.91
130.60
0.10
−9.49
−69.08
Dóc
91149
0.19
4.27
7.33
0.02
6.48
5.79
3.87
0.97
110.83
0.21
−9.67
−70.10
herceg
5097
00.35
3.74
7.30
0.09
1.10
11.30
2.58
1.52
140.00
0.00
herceg
5012
500.26
2.83
7.10
0.45
2.25
10.60
3.67
2.96
150.00
0.00
davo
d4ku
t41
620
0.34
1.30
7.40
0.05
0.25
8.10
2.00
1.44
170.00
0.00
suko
sd63
6345
00.30
0.30
7.50
0.01
0.20
5.50
1.52
0.99
140.00
0.00
gara1k
ut65
620
0.32
1.35
7.40
0.05
0.31
8.70
2.29
1.03
140.00
0.00
gara3k
ut82
590
0.38
1.43
7.50
0.04
0.23
8.40
1.85
1.28
150.00
0.00
Mean
783
0.30
1.48
7.55
0.09
1.32
6.37
2.57
1.43
130.84
0.63
−9.28
−66.23
Shallo
wwater
–dischargearea
Kardo
skút
921
800.38
20.39
7.80
0.06
6.48
20.11
1.70
1.33
141.48
0.00
−11.39
−86.00
Kardo
skút
601100
11.99
8.31
0.11
1.84
13.50
0.50
0.48
150.00
0.05
−11.67
−85.20
Kardo
skút
151100
0.32
12.04
7.91
0.03
1.18
21.48
0.63
0.49
140.10
0.00
−12.05
−96.20
Kardo
skút
917
900.16
19.09
8.62
0.03
1.38
17.17
0.32
0.19
150.84
0.00
−10.95
−92.40
Kardo
skút
92110
0.38
25.00
8.14
0.02
4.54
21.72
0.25
0.37
140.59
0.00
−9.81
−86.50
Kardo
skút
1513
500.49
13.83
7.94
0.05
1.32
15.93
0.78
0.55
140.12
0.00
−11.79
−88.60
Kardo
skút
915
100.50
15.39
7.99
0.06
1.38
17.84
0.79
0.57
140.12
0.00
−12.80
−87.50
Kardo
skút
6083
00.35
9.57
8.26
0.02
0.14
10.57
0.26
0.23
110.10
0.00
−12.42
−95.30
Kardo
skút
5384
00.35
9.48
8.25
0.02
0.14
10.25
0.22
0.18
130.12
0.00
−12.45
−97.70
Kardo
skút
100
830
0.36
9.30
8.35
0.02
0.20
10.05
0.22
0.19
110.22
0.00
−12.44
−97.30
sóstó-ny
4290
010
.87
8.37
0.01
0.23
11.10
0.22
0.23
160.13
0.00
Mean
1322
0.36
14.27
8.18
0.04
1.71
15.43
0.54
0.44
140.35
0.00
−11.78
−91.27
Interm
ediate
flow
system
hajos151
151
450
0.40
0.57
7.50
0.03
0.11
5.60
1.52
0.74
170.00
0.00
−9.54
−69.50
88 Water Air Soil Pollut (2007) 184:77–103
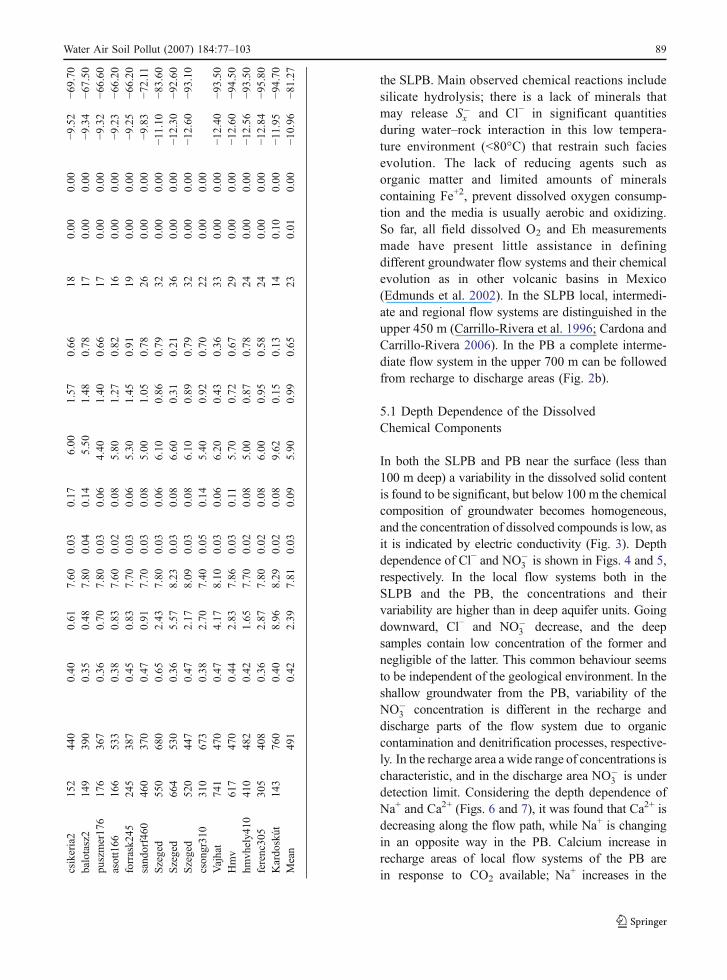
the SLPB. Main observed chemical reactions includesilicate hydrolysis; there is a lack of minerals thatmay release S�x and Cl− in significant quantitiesduring water–rock interaction in this low tempera-ture environment (<80°C) that restrain such faciesevolution. The lack of reducing agents such asorganic matter and limited amounts of mineralscontaining Fe+2, prevent dissolved oxygen consump-tion and the media is usually aerobic and oxidizing.So far, all field dissolved O2 and Eh measurementsmade have present little assistance in definingdifferent groundwater flow systems and their chemicalevolution as in other volcanic basins in Mexico(Edmunds et al. 2002). In the SLPB local, intermedi-ate and regional flow systems are distinguished in theupper 450 m (Carrillo-Rivera et al. 1996; Cardona andCarrillo-Rivera 2006). In the PB a complete interme-diate flow system in the upper 700 m can be followedfrom recharge to discharge areas (Fig. 2b).
5.1 Depth Dependence of the DissolvedChemical Components
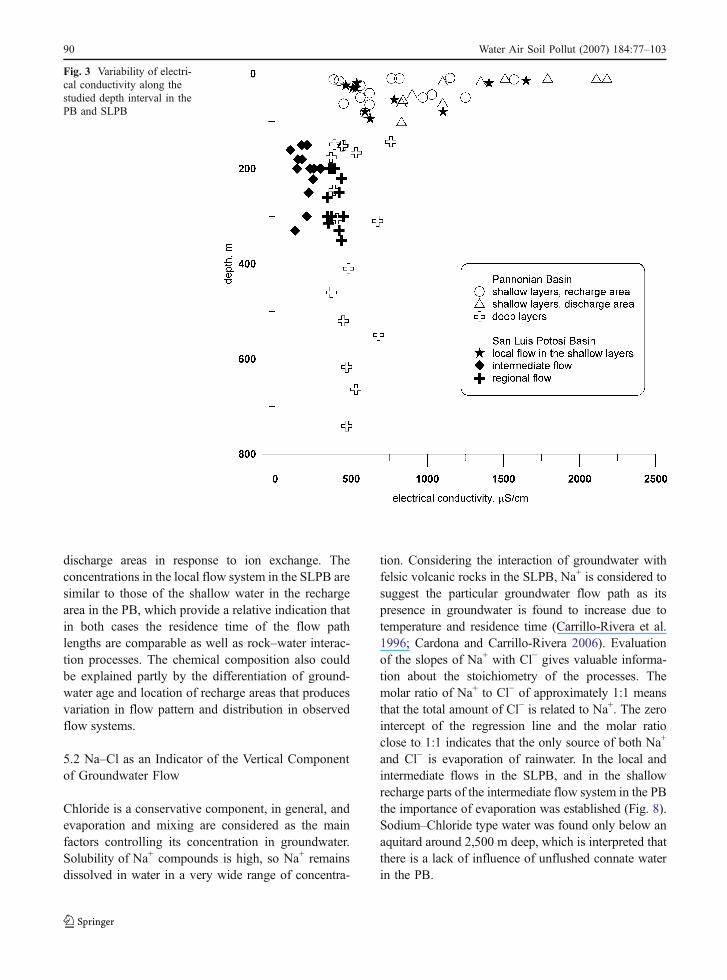
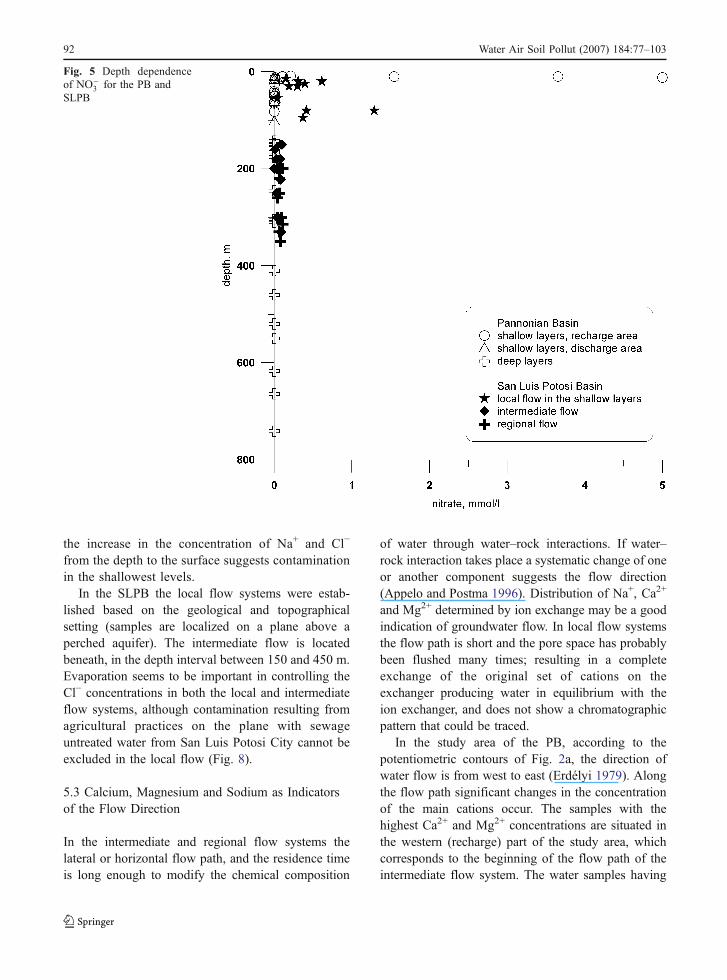
In both the SLPB and PB near the surface (less than100 m deep) a variability in the dissolved solid contentis found to be significant, but below 100 m the chemicalcomposition of groundwater becomes homogeneous,and the concentration of dissolved compounds is low, asit is indicated by electric conductivity (Fig. 3). Depthdependence of Cl− and NO�
3 is shown in Figs. 4 and 5,respectively. In the local flow systems both in theSLPB and the PB, the concentrations and theirvariability are higher than in deep aquifer units. Goingdownward, Cl− and NO�
3 decrease, and the deepsamples contain low concentration of the former andnegligible of the latter. This common behaviour seemsto be independent of the geological environment. In theshallow groundwater from the PB, variability of theNO�
3 concentration is different in the recharge anddischarge parts of the flow system due to organiccontamination and denitrification processes, respective-ly. In the recharge area a wide range of concentrations ischaracteristic, and in the discharge area NO�
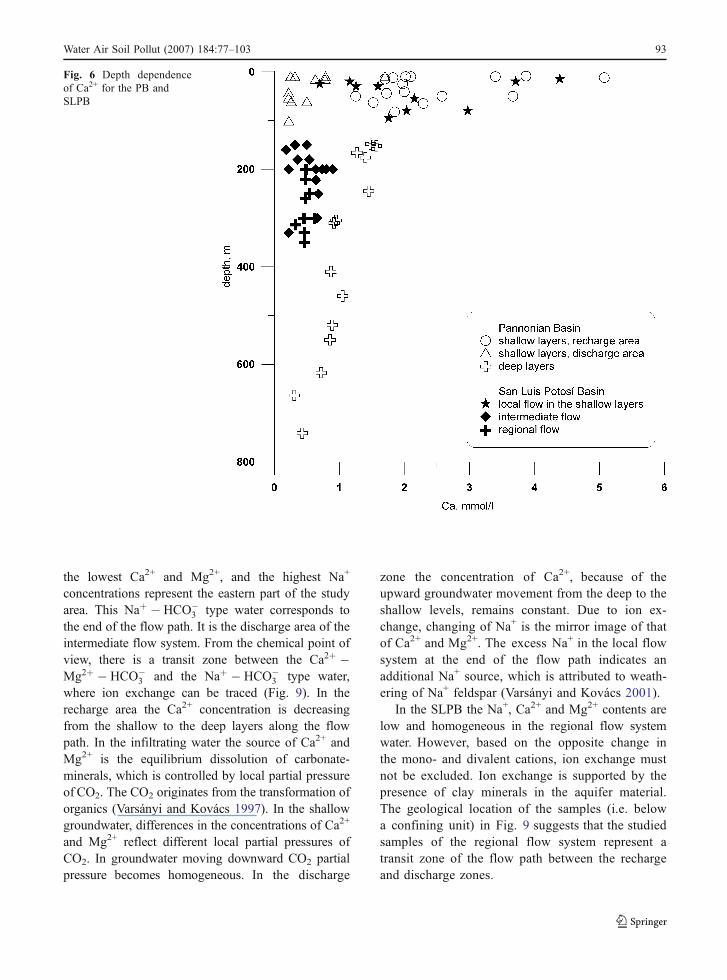
3 is underdetection limit. Considering the depth dependence ofNa+ and Ca2+ (Figs. 6 and 7), it was found that Ca2+ isdecreasing along the flow path, while Na+ is changingin an opposite way in the PB. Calcium increase inrecharge areas of local flow systems of the PB arein response to CO2 available; Na+ increases in thecs
ikeria2
152
440
0.40
0.61
7.60
0.03
0.17
6.00
1.57
0.66
180.00
0.00
−9.52
−69.70
balotasz2
149
390
0.35
0.48
7.80
0.04
0.14
5.50
1.48
0.78
170.00
0.00
−9.34
−67.50
puszmer17
617
636
70.36
0.70
7.80
0.03
0.06
4.40
1.40
0.66
170.00
0.00
−9.32
−66.60
asott166
166
533
0.38
0.83
7.60
0.02
0.08
5.80
1.27
0.82
160.00
0.00
−9.23
−66.20
forrask2
4524
538
70.45
0.83
7.70
0.03
0.06
5.30
1.45
0.91
190.00
0.00
−9.25
−66.20
sand
orf460
460
370
0.47
0.91
7.70
0.03
0.08
5.00
1.05
0.78
260.00
0.00
−9.83
−72.11
Szeged
550
680
0.65
2.43
7.80
0.03
0.06
6.10
0.86
0.79
320.00
0.00
−11.10
−83.60
Szeged
664
530
0.36
5.57
8.23
0.03
0.08
6.60
0.31
0.21
360.00
0.00
−12.30
−92.60
Szeged
520
447
0.47
2.17
8.09
0.03
0.08
6.10
0.89
0.79
320.00
0.00
−12.60
−93.10
cson
gr31
031
067
30.38
2.70
7.40
0.05
0.14
5.40
0.92
0.70
220.00
0.00
Vajhat
741
470
0.47
4.17
8.10
0.03
0.06
6.20
0.43
0.36
330.00
0.00
−12.40
−93.50
Hmv
617
470
0.44
2.83
7.86
0.03
0.11
5.70
0.72
0.67
290.00
0.00
−12.60
−94.50
hmvh
ely4
1041
048
20.42
1.65
7.70
0.02
0.08
5.00
0.87
0.78
240.00
0.00
−12.56
−93.50
ferenc30
530
540
80.36
2.87
7.80
0.02
0.08
6.00
0.95
0.58
240.00
0.00
−12.84
−95.80
Kardo
skút
143
760
0.40
8.96
8.29
0.02
0.08
9.62
0.15
0.13
140.10
0.00
−11.95
−94.70
Mean
491
0.42
2.39
7.81
0.03
0.09
5.90
0.99
0.65
230.01
0.00
−10.96
−81.27
Water Air Soil Pollut (2007) 184:77–103 89
discharge areas in response to ion exchange. Theconcentrations in the local flow system in the SLPB aresimilar to those of the shallow water in the rechargearea in the PB, which provide a relative indication thatin both cases the residence time of the flow pathlengths are comparable as well as rock–water interac-tion processes. The chemical composition also couldbe explained partly by the differentiation of ground-water age and location of recharge areas that producesvariation in flow pattern and distribution in observedflow systems.
5.2 Na–Cl as an Indicator of the Vertical Componentof Groundwater Flow
Chloride is a conservative component, in general, andevaporation and mixing are considered as the mainfactors controlling its concentration in groundwater.Solubility of Na+ compounds is high, so Na+ remainsdissolved in water in a very wide range of concentra-
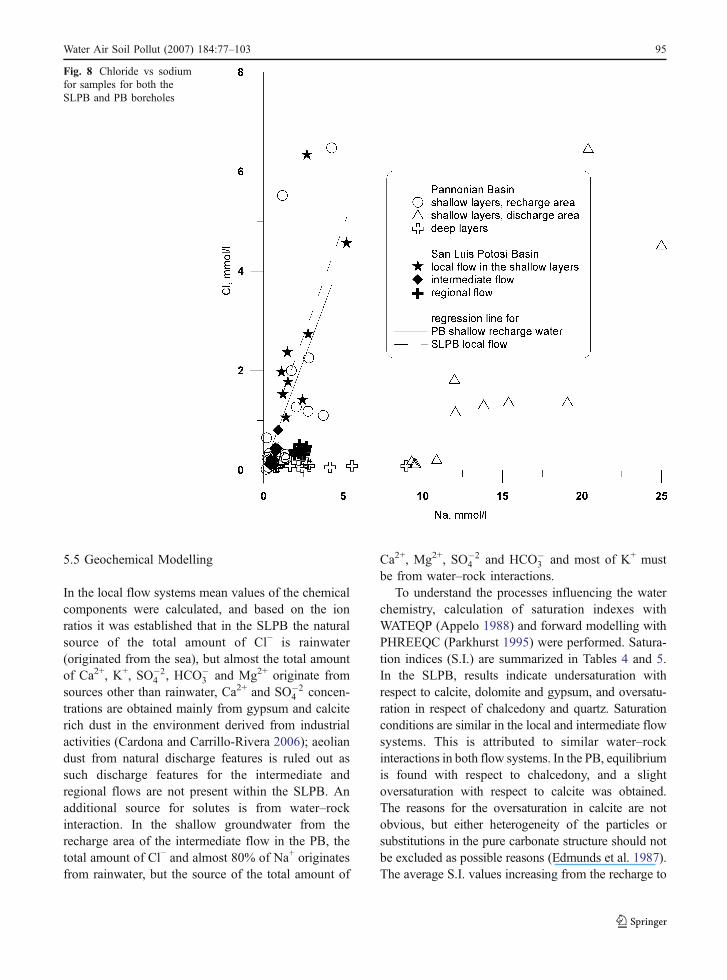
tion. Considering the interaction of groundwater withfelsic volcanic rocks in the SLPB, Na+ is considered tosuggest the particular groundwater flow path as itspresence in groundwater is found to increase due totemperature and residence time (Carrillo-Rivera et al.1996; Cardona and Carrillo-Rivera 2006). Evaluationof the slopes of Na+ with Cl− gives valuable informa-tion about the stoichiometry of the processes. Themolar ratio of Na+ to Cl− of approximately 1:1 meansthat the total amount of Cl− is related to Na+. The zerointercept of the regression line and the molar ratioclose to 1:1 indicates that the only source of both Na+
and Cl− is evaporation of rainwater. In the local andintermediate flows in the SLPB, and in the shallowrecharge parts of the intermediate flow system in the PBthe importance of evaporation was established (Fig. 8).Sodium–Chloride type water was found only below anaquitard around 2,500 m deep, which is interpreted thatthere is a lack of influence of unflushed connate waterin the PB.
Fig. 3 Variability of electri-cal conductivity along thestudied depth interval in thePB and SLPB
90 Water Air Soil Pollut (2007) 184:77–103
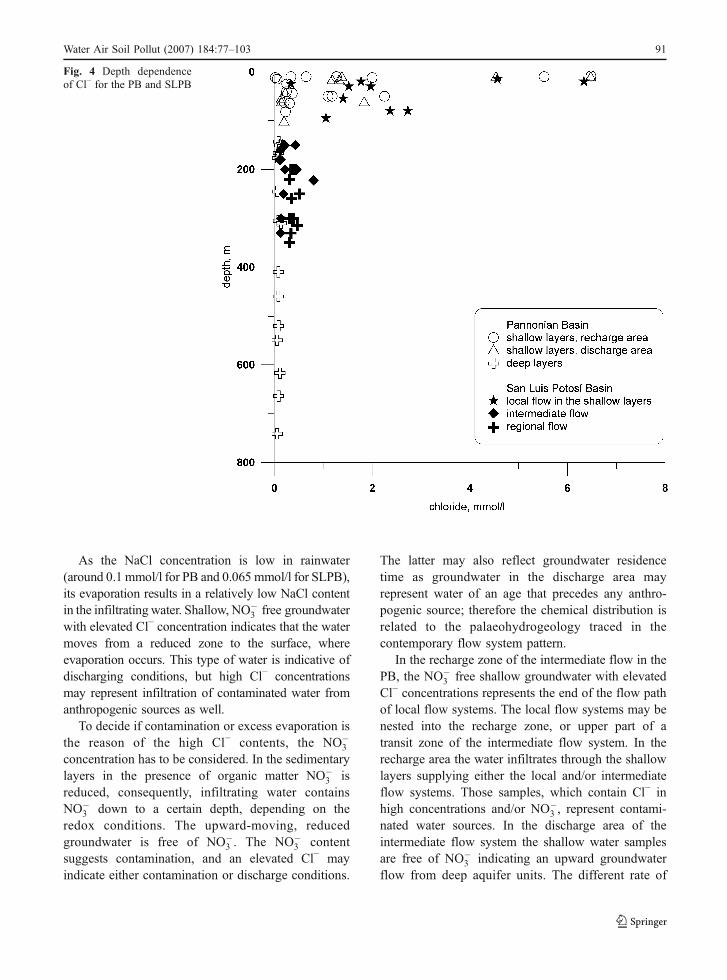
As the NaCl concentration is low in rainwater(around 0.1 mmol/l for PB and 0.065 mmol/l for SLPB),its evaporation results in a relatively low NaCl contentin the infiltrating water. Shallow, NO�
3 free groundwaterwith elevated Cl− concentration indicates that the watermoves from a reduced zone to the surface, whereevaporation occurs. This type of water is indicative ofdischarging conditions, but high Cl− concentrationsmay represent infiltration of contaminated water fromanthropogenic sources as well.
To decide if contamination or excess evaporation isthe reason of the high Cl− contents, the NO�
3
concentration has to be considered. In the sedimentarylayers in the presence of organic matter NO�
3 isreduced, consequently, infiltrating water containsNO�
3 down to a certain depth, depending on theredox conditions. The upward-moving, reducedgroundwater is free of NO�
3 . The NO�3 content
suggests contamination, and an elevated Cl− mayindicate either contamination or discharge conditions.
The latter may also reflect groundwater residencetime as groundwater in the discharge area mayrepresent water of an age that precedes any anthro-pogenic source; therefore the chemical distribution isrelated to the palaeohydrogeology traced in thecontemporary flow system pattern.
In the recharge zone of the intermediate flow in thePB, the NO�
3 free shallow groundwater with elevatedCl− concentrations represents the end of the flow pathof local flow systems. The local flow systems may benested into the recharge zone, or upper part of atransit zone of the intermediate flow system. In therecharge area the water infiltrates through the shallowlayers supplying either the local and/or intermediateflow systems. Those samples, which contain Cl− inhigh concentrations and/or NO�
3 , represent contami-nated water sources. In the discharge area of theintermediate flow system the shallow water samplesare free of NO�
3 indicating an upward groundwaterflow from deep aquifer units. The different rate of
Fig. 4 Depth dependenceof Cl− for the PB and SLPB
Water Air Soil Pollut (2007) 184:77–103 91
the increase in the concentration of Na+ and Cl−
from the depth to the surface suggests contaminationin the shallowest levels.
In the SLPB the local flow systems were estab-lished based on the geological and topographicalsetting (samples are localized on a plane above aperched aquifer). The intermediate flow is locatedbeneath, in the depth interval between 150 and 450 m.Evaporation seems to be important in controlling theCl− concentrations in both the local and intermediateflow systems, although contamination resulting fromagricultural practices on the plane with sewageuntreated water from San Luis Potosi City cannot beexcluded in the local flow (Fig. 8).
5.3 Calcium, Magnesium and Sodium as Indicatorsof the Flow Direction
In the intermediate and regional flow systems thelateral or horizontal flow path, and the residence timeis long enough to modify the chemical composition
of water through water–rock interactions. If water–rock interaction takes place a systematic change of oneor another component suggests the flow direction(Appelo and Postma 1996). Distribution of Na+, Ca2+
and Mg2+ determined by ion exchange may be a goodindication of groundwater flow. In local flow systemsthe flow path is short and the pore space has probablybeen flushed many times; resulting in a completeexchange of the original set of cations on theexchanger producing water in equilibrium with theion exchanger, and does not show a chromatographicpattern that could be traced.
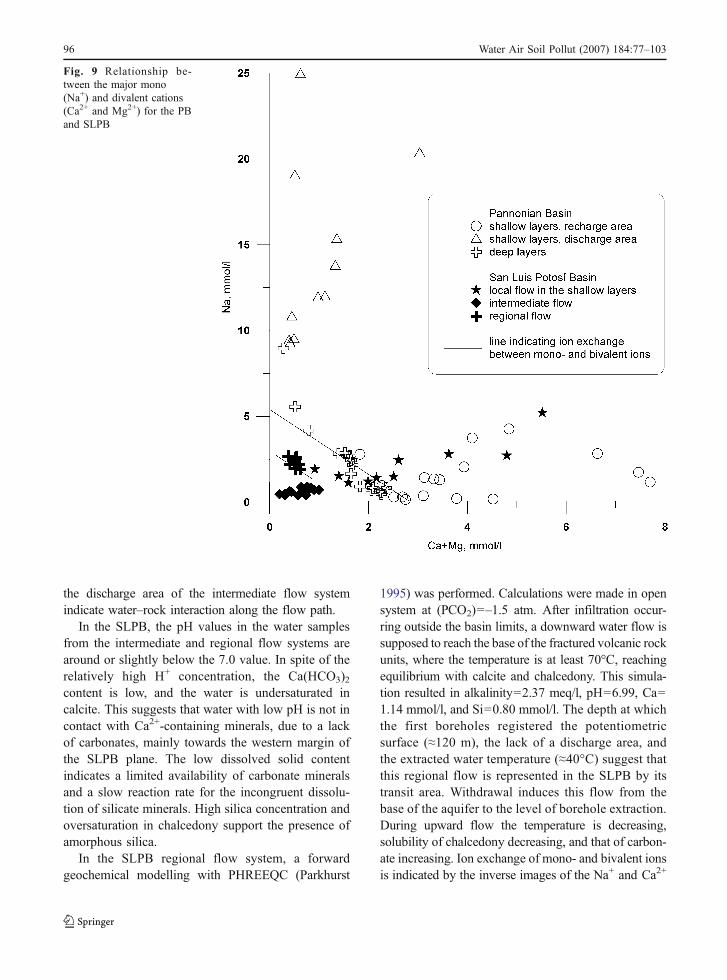
In the study area of the PB, according to thepotentiometric contours of Fig. 2a, the direction ofwater flow is from west to east (Erdélyi 1979). Alongthe flow path significant changes in the concentrationof the main cations occur. The samples with thehighest Ca2+ and Mg2+ concentrations are situated inthe western (recharge) part of the study area, whichcorresponds to the beginning of the flow path of theintermediate flow system. The water samples having
Fig. 5 Depth dependenceof NO�
3 for the PB andSLPB
92 Water Air Soil Pollut (2007) 184:77–103
the lowest Ca2+ and Mg2+, and the highest Na+
concentrations represent the eastern part of the studyarea. This Naþ � HCO�
3 type water corresponds tothe end of the flow path. It is the discharge area of theintermediate flow system. From the chemical point ofview, there is a transit zone between the Ca2þ �Mg2þ � HCO�
3 and the Naþ � HCO�3 type water,
where ion exchange can be traced (Fig. 9). In therecharge area the Ca2+ concentration is decreasingfrom the shallow to the deep layers along the flowpath. In the infiltrating water the source of Ca2+ andMg2+ is the equilibrium dissolution of carbonate-minerals, which is controlled by local partial pressureof CO2. The CO2 originates from the transformation oforganics (Varsányi and Kovács 1997). In the shallowgroundwater, differences in the concentrations of Ca2+
and Mg2+ reflect different local partial pressures ofCO2. In groundwater moving downward CO2 partialpressure becomes homogeneous. In the discharge
zone the concentration of Ca2+, because of theupward groundwater movement from the deep to theshallow levels, remains constant. Due to ion ex-change, changing of Na+ is the mirror image of thatof Ca2+ and Mg2+. The excess Na+ in the local flowsystem at the end of the flow path indicates anadditional Na+ source, which is attributed to weath-ering of Na+ feldspar (Varsányi and Kovács 2001).
In the SLPB the Na+, Ca2+ and Mg2+ contents arelow and homogeneous in the regional flow systemwater. However, based on the opposite change inthe mono- and divalent cations, ion exchange mustnot be excluded. Ion exchange is supported by thepresence of clay minerals in the aquifer material.The geological location of the samples (i.e. belowa confining unit) in Fig. 9 suggests that the studiedsamples of the regional flow system represent atransit zone of the flow path between the rechargeand discharge zones.
Fig. 6 Depth dependenceof Ca2+ for the PB andSLPB
Water Air Soil Pollut (2007) 184:77–103 93
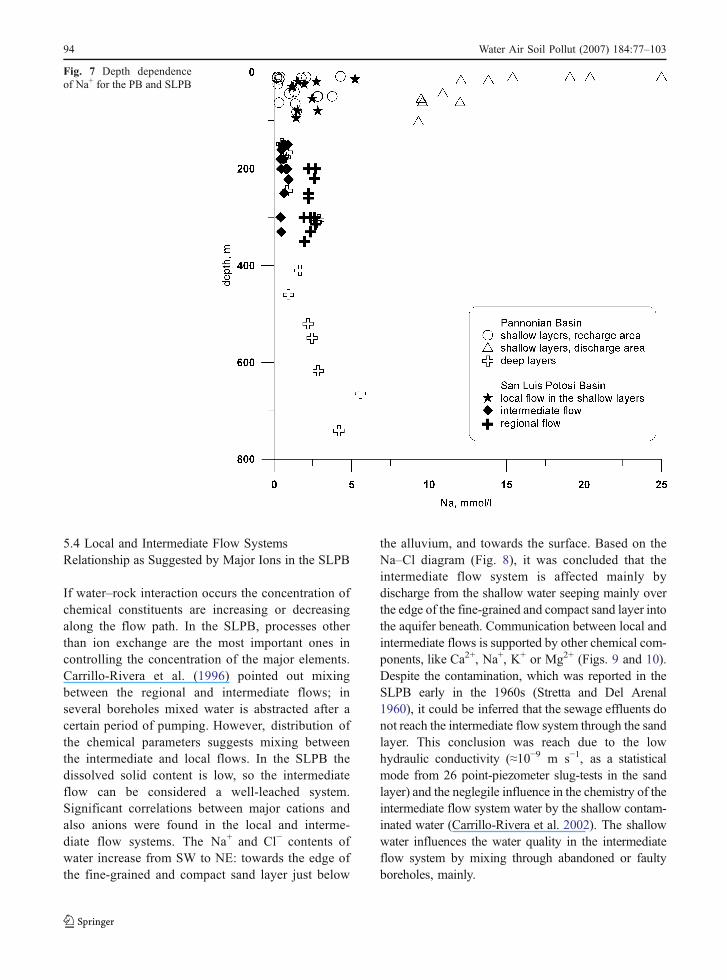
5.4 Local and Intermediate Flow SystemsRelationship as Suggested by Major Ions in the SLPB
If water–rock interaction occurs the concentration ofchemical constituents are increasing or decreasingalong the flow path. In the SLPB, processes otherthan ion exchange are the most important ones incontrolling the concentration of the major elements.Carrillo-Rivera et al. (1996) pointed out mixingbetween the regional and intermediate flows; inseveral boreholes mixed water is abstracted after acertain period of pumping. However, distribution ofthe chemical parameters suggests mixing betweenthe intermediate and local flows. In the SLPB thedissolved solid content is low, so the intermediateflow can be considered a well-leached system.Significant correlations between major cations andalso anions were found in the local and interme-diate flow systems. The Na+ and Cl− contents ofwater increase from SW to NE: towards the edge ofthe fine-grained and compact sand layer just below
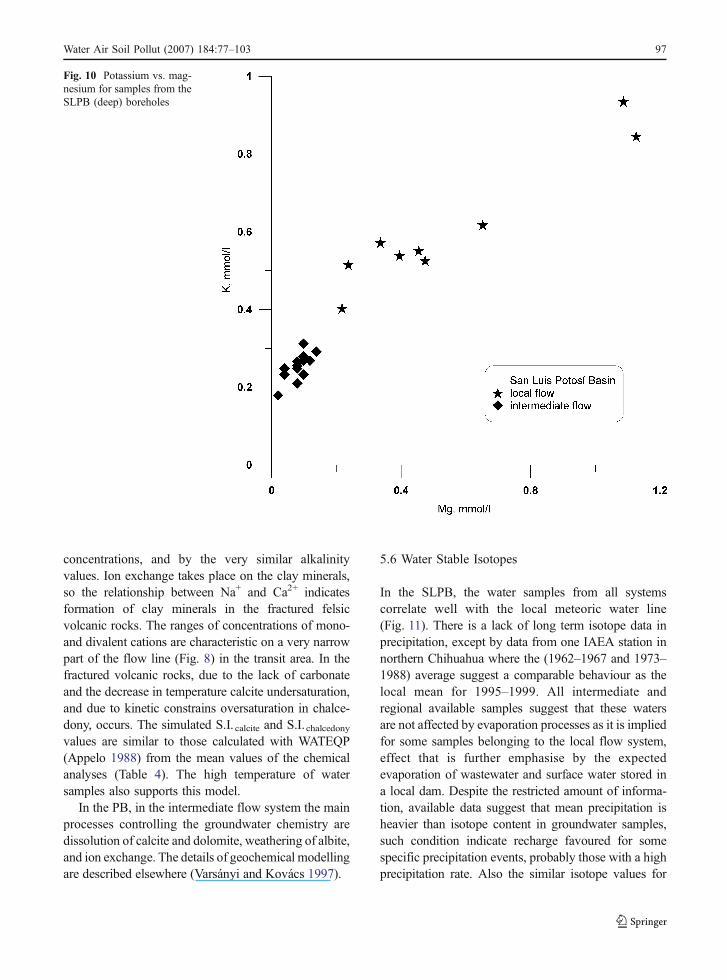
the alluvium, and towards the surface. Based on theNa–Cl diagram (Fig. 8), it was concluded that theintermediate flow system is affected mainly bydischarge from the shallow water seeping mainly overthe edge of the fine-grained and compact sand layer intothe aquifer beneath. Communication between local andintermediate flows is supported by other chemical com-ponents, like Ca2+, Na+, K+ or Mg2+ (Figs. 9 and 10).Despite the contamination, which was reported in theSLPB early in the 1960s (Stretta and Del Arenal1960), it could be inferred that the sewage effluents donot reach the intermediate flow system through the sandlayer. This conclusion was reach due to the lowhydraulic conductivity (≈10−9 m s−1, as a statisticalmode from 26 point-piezometer slug-tests in the sandlayer) and the neglegile influence in the chemistry of theintermediate flow system water by the shallow contam-inated water (Carrillo-Rivera et al. 2002). The shallowwater influences the water quality in the intermediateflow system by mixing through abandoned or faultyboreholes, mainly.
Fig. 7 Depth dependenceof Na+ for the PB and SLPB
94 Water Air Soil Pollut (2007) 184:77–103
5.5 Geochemical Modelling
In the local flow systems mean values of the chemicalcomponents were calculated, and based on the ionratios it was established that in the SLPB the naturalsource of the total amount of Cl− is rainwater(originated from the sea), but almost the total amountof Ca2+, K+, SO�2
4 , HCO�3 and Mg2+ originate from
sources other than rainwater, Ca2+ and SO�24 concen-
trations are obtained mainly from gypsum and calciterich dust in the environment derived from industrialactivities (Cardona and Carrillo-Rivera 2006); aeoliandust from natural discharge features is ruled out assuch discharge features for the intermediate andregional flows are not present within the SLPB. Anadditional source for solutes is from water–rockinteraction. In the shallow groundwater from therecharge area of the intermediate flow in the PB, thetotal amount of Cl− and almost 80% of Na+ originatesfrom rainwater, but the source of the total amount of
Ca2+, Mg2+, SO�24 and HCO�
3 and most of K+ mustbe from water–rock interactions.
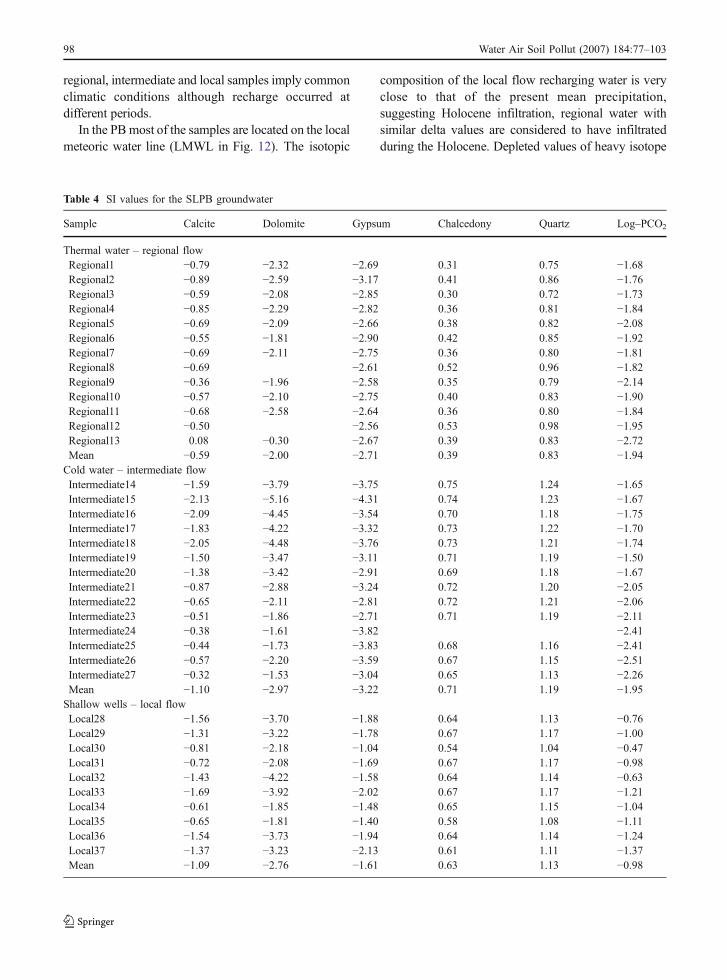
To understand the processes influencing the waterchemistry, calculation of saturation indexes withWATEQP (Appelo 1988) and forward modelling withPHREEQC (Parkhurst 1995) were performed. Satura-tion indices (S.I.) are summarized in Tables 4 and 5.In the SLPB, results indicate undersaturation withrespect to calcite, dolomite and gypsum, and oversatu-ration in respect of chalcedony and quartz. Saturationconditions are similar in the local and intermediate flowsystems. This is attributed to similar water–rockinteractions in both flow systems. In the PB, equilibriumis found with respect to chalcedony, and a slightoversaturation with respect to calcite was obtained.The reasons for the oversaturation in calcite are notobvious, but either heterogeneity of the particles orsubstitutions in the pure carbonate structure should notbe excluded as possible reasons (Edmunds et al. 1987).The average S.I. values increasing from the recharge to
Fig. 8 Chloride vs sodiumfor samples for both theSLPB and PB boreholes
Water Air Soil Pollut (2007) 184:77–103 95
the discharge area of the intermediate flow systemindicate water–rock interaction along the flow path.
In the SLPB, the pH values in the water samplesfrom the intermediate and regional flow systems arearound or slightly below the 7.0 value. In spite of therelatively high H+ concentration, the Ca(HCO3)2content is low, and the water is undersaturated incalcite. This suggests that water with low pH is not incontact with Ca2+-containing minerals, due to a lackof carbonates, mainly towards the western margin ofthe SLPB plane. The low dissolved solid contentindicates a limited availability of carbonate mineralsand a slow reaction rate for the incongruent dissolu-tion of silicate minerals. High silica concentration andoversaturation in chalcedony support the presence ofamorphous silica.
In the SLPB regional flow system, a forwardgeochemical modelling with PHREEQC (Parkhurst
1995) was performed. Calculations were made in opensystem at (PCO2)=–1.5 atm. After infiltration occur-ring outside the basin limits, a downward water flow issupposed to reach the base of the fractured volcanic rockunits, where the temperature is at least 70°C, reachingequilibrium with calcite and chalcedony. This simula-tion resulted in alkalinity=2.37 meq/l, pH=6.99, Ca=1.14 mmol/l, and Si=0.80 mmol/l. The depth at whichthe first boreholes registered the potentiometricsurface (≈120 m), the lack of a discharge area, andthe extracted water temperature (≈40°C) suggest thatthis regional flow is represented in the SLPB by itstransit area. Withdrawal induces this flow from thebase of the aquifer to the level of borehole extraction.During upward flow the temperature is decreasing,solubility of chalcedony decreasing, and that of carbon-ate increasing. Ion exchange of mono- and bivalent ionsis indicated by the inverse images of the Na+ and Ca2+
Fig. 9 Relationship be-tween the major mono(Na+) and divalent cations(Ca2+ and Mg2+) for the PBand SLPB
96 Water Air Soil Pollut (2007) 184:77–103
concentrations, and by the very similar alkalinityvalues. Ion exchange takes place on the clay minerals,so the relationship between Na+ and Ca2+ indicatesformation of clay minerals in the fractured felsicvolcanic rocks. The ranges of concentrations of mono-and divalent cations are characteristic on a very narrowpart of the flow line (Fig. 8) in the transit area. In thefractured volcanic rocks, due to the lack of carbonateand the decrease in temperature calcite undersaturation,and due to kinetic constrains oversaturation in chalce-dony, occurs. The simulated S.I. calcite and S.I.chalcedonyvalues are similar to those calculated with WATEQP(Appelo 1988) from the mean values of the chemicalanalyses (Table 4). The high temperature of watersamples also supports this model.
In the PB, in the intermediate flow system the mainprocesses controlling the groundwater chemistry aredissolution of calcite and dolomite, weathering of albite,and ion exchange. The details of geochemical modellingare described elsewhere (Varsányi and Kovács 1997).
5.6 Water Stable Isotopes
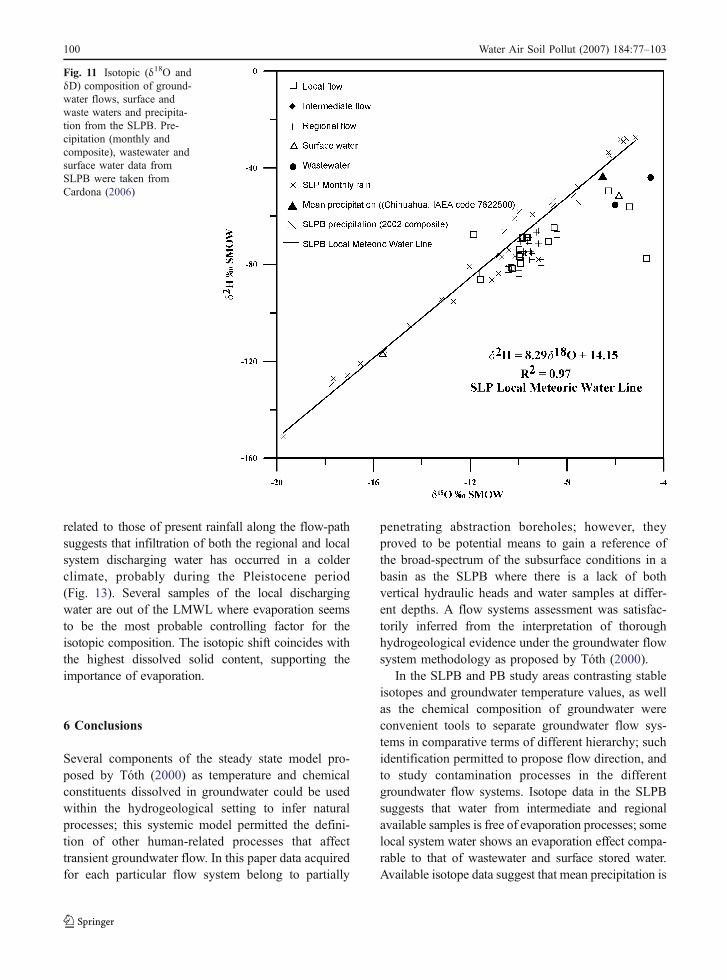
In the SLPB, the water samples from all systemscorrelate well with the local meteoric water line(Fig. 11). There is a lack of long term isotope data inprecipitation, except by data from one IAEA station innorthern Chihuahua where the (1962–1967 and 1973–1988) average suggest a comparable behaviour as thelocal mean for 1995–1999. All intermediate andregional available samples suggest that these watersare not affected by evaporation processes as it is impliedfor some samples belonging to the local flow system,effect that is further emphasise by the expectedevaporation of wastewater and surface water stored ina local dam. Despite the restricted amount of informa-tion, available data suggest that mean precipitation isheavier than isotope content in groundwater samples,such condition indicate recharge favoured for somespecific precipitation events, probably those with a highprecipitation rate. Also the similar isotope values for
Fig. 10 Potassium vs. mag-nesium for samples from theSLPB (deep) boreholes
Water Air Soil Pollut (2007) 184:77–103 97
regional, intermediate and local samples imply commonclimatic conditions although recharge occurred atdifferent periods.
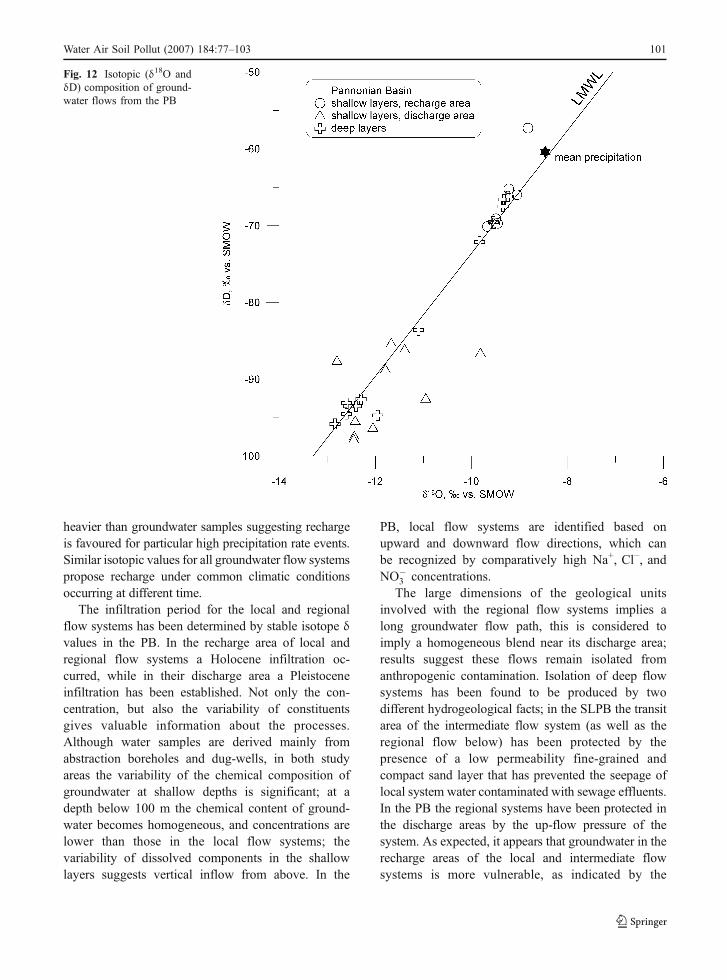
In the PBmost of the samples are located on the localmeteoric water line (LMWL in Fig. 12). The isotopic
composition of the local flow recharging water is veryclose to that of the present mean precipitation,suggesting Holocene infiltration, regional water withsimilar delta values are considered to have infiltratedduring the Holocene. Depleted values of heavy isotope
Table 4 SI values for the SLPB groundwater
Sample Calcite Dolomite Gypsum Chalcedony Quartz Log–PCO2
Thermal water – regional flowRegional1 −0.79 −2.32 −2.69 0.31 0.75 −1.68Regional2 −0.89 −2.59 −3.17 0.41 0.86 −1.76Regional3 −0.59 −2.08 −2.85 0.30 0.72 −1.73Regional4 −0.85 −2.29 −2.82 0.36 0.81 −1.84Regional5 −0.69 −2.09 −2.66 0.38 0.82 −2.08Regional6 −0.55 −1.81 −2.90 0.42 0.85 −1.92Regional7 −0.69 −2.11 −2.75 0.36 0.80 −1.81Regional8 −0.69 −2.61 0.52 0.96 −1.82Regional9 −0.36 −1.96 −2.58 0.35 0.79 −2.14Regional10 −0.57 −2.10 −2.75 0.40 0.83 −1.90Regional11 −0.68 −2.58 −2.64 0.36 0.80 −1.84Regional12 −0.50 −2.56 0.53 0.98 −1.95Regional13 0.08 −0.30 −2.67 0.39 0.83 −2.72Mean −0.59 −2.00 −2.71 0.39 0.83 −1.94Cold water – intermediate flowIntermediate14 −1.59 −3.79 −3.75 0.75 1.24 −1.65Intermediate15 −2.13 −5.16 −4.31 0.74 1.23 −1.67Intermediate16 −2.09 −4.45 −3.54 0.70 1.18 −1.75Intermediate17 −1.83 −4.22 −3.32 0.73 1.22 −1.70Intermediate18 −2.05 −4.48 −3.76 0.73 1.21 −1.74Intermediate19 −1.50 −3.47 −3.11 0.71 1.19 −1.50Intermediate20 −1.38 −3.42 −2.91 0.69 1.18 −1.67Intermediate21 −0.87 −2.88 −3.24 0.72 1.20 −2.05Intermediate22 −0.65 −2.11 −2.81 0.72 1.21 −2.06Intermediate23 −0.51 −1.86 −2.71 0.71 1.19 −2.11Intermediate24 −0.38 −1.61 −3.82 −2.41Intermediate25 −0.44 −1.73 −3.83 0.68 1.16 −2.41Intermediate26 −0.57 −2.20 −3.59 0.67 1.15 −2.51Intermediate27 −0.32 −1.53 −3.04 0.65 1.13 −2.26Mean −1.10 −2.97 −3.22 0.71 1.19 −1.95Shallow wells – local flowLocal28 −1.56 −3.70 −1.88 0.64 1.13 −0.76Local29 −1.31 −3.22 −1.78 0.67 1.17 −1.00Local30 −0.81 −2.18 −1.04 0.54 1.04 −0.47Local31 −0.72 −2.08 −1.69 0.67 1.17 −0.98Local32 −1.43 −4.22 −1.58 0.64 1.14 −0.63Local33 −1.69 −3.92 −2.02 0.67 1.17 −1.21Local34 −0.61 −1.85 −1.48 0.65 1.15 −1.04Local35 −0.65 −1.81 −1.40 0.58 1.08 −1.11Local36 −1.54 −3.73 −1.94 0.64 1.14 −1.24Local37 −1.37 −3.23 −2.13 0.61 1.11 −1.37Mean −1.09 −2.76 −1.61 0.63 1.13 −0.98
98 Water Air Soil Pollut (2007) 184:77–103
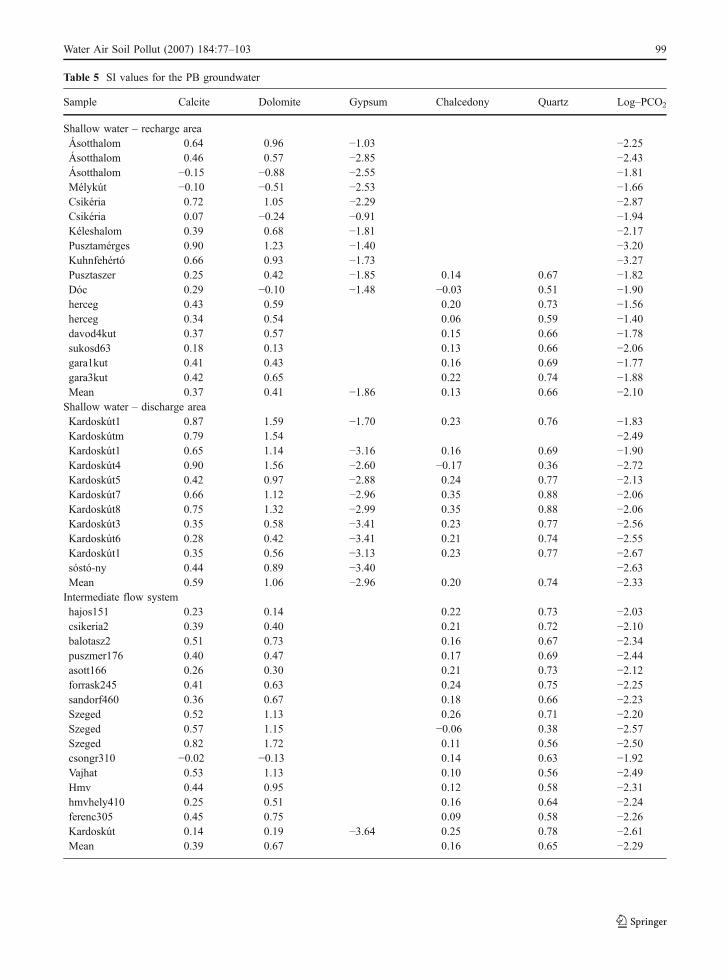
Table 5 SI values for the PB groundwater
Sample Calcite Dolomite Gypsum Chalcedony Quartz Log–PCO2
Shallow water – recharge areaÁsotthalom 0.64 0.96 −1.03 −2.25Ásotthalom 0.46 0.57 −2.85 −2.43Ásotthalom −0.15 −0.88 −2.55 −1.81Mélykút −0.10 −0.51 −2.53 −1.66Csikéria 0.72 1.05 −2.29 −2.87Csikéria 0.07 −0.24 −0.91 −1.94Kéleshalom 0.39 0.68 −1.81 −2.17Pusztamérges 0.90 1.23 −1.40 −3.20Kuhnfehértó 0.66 0.93 −1.73 −3.27Pusztaszer 0.25 0.42 −1.85 0.14 0.67 −1.82Dóc 0.29 −0.10 −1.48 −0.03 0.51 −1.90herceg 0.43 0.59 0.20 0.73 −1.56herceg 0.34 0.54 0.06 0.59 −1.40davod4kut 0.37 0.57 0.15 0.66 −1.78sukosd63 0.18 0.13 0.13 0.66 −2.06gara1kut 0.41 0.43 0.16 0.69 −1.77gara3kut 0.42 0.65 0.22 0.74 −1.88Mean 0.37 0.41 −1.86 0.13 0.66 −2.10Shallow water – discharge areaKardoskút1 0.87 1.59 −1.70 0.23 0.76 −1.83Kardoskútm 0.79 1.54 −2.49Kardoskút1 0.65 1.14 −3.16 0.16 0.69 −1.90Kardoskút4 0.90 1.56 −2.60 −0.17 0.36 −2.72Kardoskút5 0.42 0.97 −2.88 0.24 0.77 −2.13Kardoskút7 0.66 1.12 −2.96 0.35 0.88 −2.06Kardoskút8 0.75 1.32 −2.99 0.35 0.88 −2.06Kardoskút3 0.35 0.58 −3.41 0.23 0.77 −2.56Kardoskút6 0.28 0.42 −3.41 0.21 0.74 −2.55Kardoskút1 0.35 0.56 −3.13 0.23 0.77 −2.67sóstó-ny 0.44 0.89 −3.40 −2.63Mean 0.59 1.06 −2.96 0.20 0.74 −2.33Intermediate flow systemhajos151 0.23 0.14 0.22 0.73 −2.03csikeria2 0.39 0.40 0.21 0.72 −2.10balotasz2 0.51 0.73 0.16 0.67 −2.34puszmer176 0.40 0.47 0.17 0.69 −2.44asott166 0.26 0.30 0.21 0.73 −2.12forrask245 0.41 0.63 0.24 0.75 −2.25sandorf460 0.36 0.67 0.18 0.66 −2.23Szeged 0.52 1.13 0.26 0.71 −2.20Szeged 0.57 1.15 −0.06 0.38 −2.57Szeged 0.82 1.72 0.11 0.56 −2.50csongr310 −0.02 −0.13 0.14 0.63 −1.92Vajhat 0.53 1.13 0.10 0.56 −2.49Hmv 0.44 0.95 0.12 0.58 −2.31hmvhely410 0.25 0.51 0.16 0.64 −2.24ferenc305 0.45 0.75 0.09 0.58 −2.26Kardoskút 0.14 0.19 −3.64 0.25 0.78 −2.61Mean 0.39 0.67 0.16 0.65 −2.29
Water Air Soil Pollut (2007) 184:77–103 99
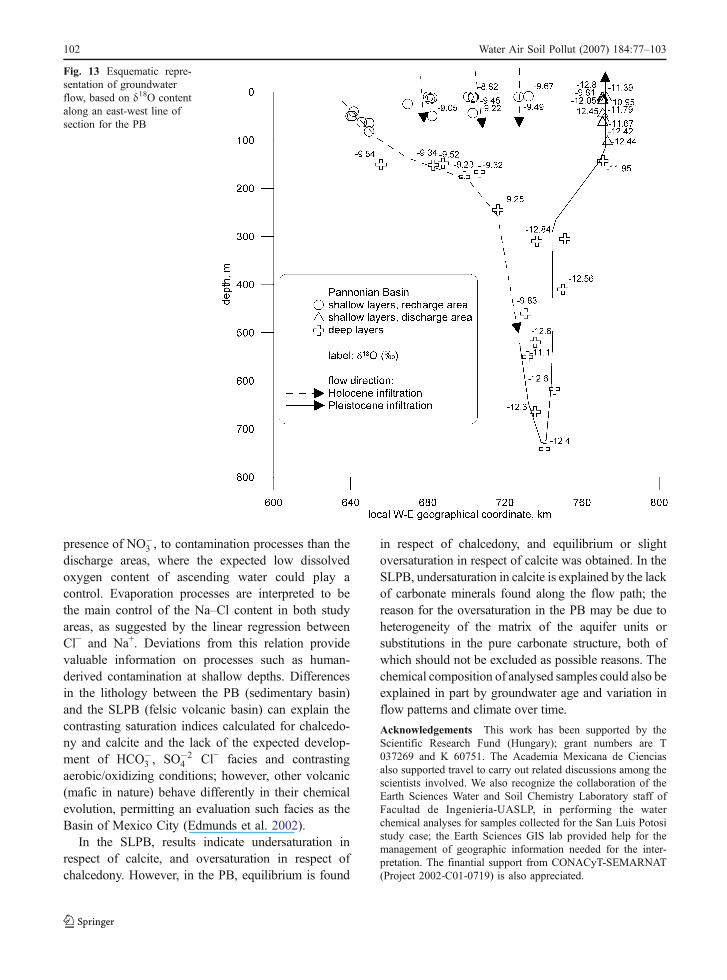
related to those of present rainfall along the flow-pathsuggests that infiltration of both the regional and localsystem discharging water has occurred in a colderclimate, probably during the Pleistocene period(Fig. 13). Several samples of the local dischargingwater are out of the LMWL where evaporation seemsto be the most probable controlling factor for theisotopic composition. The isotopic shift coincides withthe highest dissolved solid content, supporting theimportance of evaporation.
6 Conclusions
Several components of the steady state model pro-posed by Tóth (2000) as temperature and chemicalconstituents dissolved in groundwater could be usedwithin the hydrogeological setting to infer naturalprocesses; this systemic model permitted the defini-tion of other human-related processes that affecttransient groundwater flow. In this paper data acquiredfor each particular flow system belong to partially
penetrating abstraction boreholes; however, theyproved to be potential means to gain a reference ofthe broad-spectrum of the subsurface conditions in abasin as the SLPB where there is a lack of bothvertical hydraulic heads and water samples at differ-ent depths. A flow systems assessment was satisfac-torily inferred from the interpretation of thoroughhydrogeological evidence under the groundwater flowsystem methodology as proposed by Tóth (2000).
In the SLPB and PB study areas contrasting stableisotopes and groundwater temperature values, as wellas the chemical composition of groundwater wereconvenient tools to separate groundwater flow sys-tems in comparative terms of different hierarchy; suchidentification permitted to propose flow direction, andto study contamination processes in the differentgroundwater flow systems. Isotope data in the SLPBsuggests that water from intermediate and regionalavailable samples is free of evaporation processes; somelocal system water shows an evaporation effect compa-rable to that of wastewater and surface stored water.Available isotope data suggest that mean precipitation is
Fig. 11 Isotopic (δ18O andδD) composition of ground-water flows, surface andwaste waters and precipita-tion from the SLPB. Pre-cipitation (monthly andcomposite), wastewater andsurface water data fromSLPB were taken fromCardona (2006)
100 Water Air Soil Pollut (2007) 184:77–103
heavier than groundwater samples suggesting rechargeis favoured for particular high precipitation rate events.Similar isotopic values for all groundwater flow systemspropose recharge under common climatic conditionsoccurring at different time.
The infiltration period for the local and regionalflow systems has been determined by stable isotope δvalues in the PB. In the recharge area of local andregional flow systems a Holocene infiltration oc-curred, while in their discharge area a Pleistoceneinfiltration has been established. Not only the con-centration, but also the variability of constituentsgives valuable information about the processes.Although water samples are derived mainly fromabstraction boreholes and dug-wells, in both studyareas the variability of the chemical composition ofgroundwater at shallow depths is significant; at adepth below 100 m the chemical content of ground-water becomes homogeneous, and concentrations arelower than those in the local flow systems; thevariability of dissolved components in the shallowlayers suggests vertical inflow from above. In the
PB, local flow systems are identified based onupward and downward flow directions, which canbe recognized by comparatively high Na+, Cl−, andNO�
3 concentrations.The large dimensions of the geological units
involved with the regional flow systems implies along groundwater flow path, this is considered toimply a homogeneous blend near its discharge area;results suggest these flows remain isolated fromanthropogenic contamination. Isolation of deep flowsystems has been found to be produced by twodifferent hydrogeological facts; in the SLPB the transitarea of the intermediate flow system (as well as theregional flow below) has been protected by thepresence of a low permeability fine-grained andcompact sand layer that has prevented the seepage oflocal system water contaminated with sewage effluents.In the PB the regional systems have been protected inthe discharge areas by the up-flow pressure of thesystem. As expected, it appears that groundwater in therecharge areas of the local and intermediate flowsystems is more vulnerable, as indicated by the
Fig. 12 Isotopic (δ18O andδD) composition of ground-water flows from the PB
Water Air Soil Pollut (2007) 184:77–103 101
presence of NO�3 , to contamination processes than the
discharge areas, where the expected low dissolvedoxygen content of ascending water could play acontrol. Evaporation processes are interpreted to bethe main control of the Na–Cl content in both studyareas, as suggested by the linear regression betweenCl− and Na+. Deviations from this relation providevaluable information on processes such as human-derived contamination at shallow depths. Differencesin the lithology between the PB (sedimentary basin)and the SLPB (felsic volcanic basin) can explain thecontrasting saturation indices calculated for chalcedo-ny and calcite and the lack of the expected develop-ment of HCO�
3 , SO�24 Cl− facies and contrasting
aerobic/oxidizing conditions; however, other volcanic(mafic in nature) behave differently in their chemicalevolution, permitting an evaluation such facies as theBasin of Mexico City (Edmunds et al. 2002).
In the SLPB, results indicate undersaturation inrespect of calcite, and oversaturation in respect ofchalcedony. However, in the PB, equilibrium is found
in respect of chalcedony, and equilibrium or slightoversaturation in respect of calcite was obtained. In theSLPB, undersaturation in calcite is explained by the lackof carbonate minerals found along the flow path; thereason for the oversaturation in the PB may be due toheterogeneity of the matrix of the aquifer units orsubstitutions in the pure carbonate structure, both ofwhich should not be excluded as possible reasons. Thechemical composition of analysed samples could also beexplained in part by groundwater age and variation inflow patterns and climate over time.
Acknowledgements This work has been supported by theScientific Research Fund (Hungary); grant numbers are T037269 and K 60751. The Academia Mexicana de Cienciasalso supported travel to carry out related discussions among thescientists involved. We also recognize the collaboration of theEarth Sciences Water and Soil Chemistry Laboratory staff ofFacultad de Ingeniería-UASLP, in performing the waterchemical analyses for samples collected for the San Luis Potosistudy case; the Earth Sciences GIS lab provided help for themanagement of geographic information needed for the inter-pretation. The finantial support from CONACyT-SEMARNAT(Project 2002-C01-0719) is also appreciated.
Fig. 13 Esquematic repre-sentation of groundwaterflow, based on δ18O contentalong an east-west line ofsection for the PB
102 Water Air Soil Pollut (2007) 184:77–103
References
Appelo, C. A. J. (1988). WATEQP – A computer program forequilibrium calculations of water analyses. Amsterdam:Vrije Universiteit.
Appelo, C. A. J., & Postma D. (1996). Geochemistry,groundwater and pollution. Rotterdam: Balkema.
Back, W., Rosenshein, J. S., & Seaber, P. R. (Eds.) (1988).Hydrogeology: The geology of North America. Boulder,CO: Geological Society of America, 2, 524.
Cardona, A. (2006). Identificación y cuantificación de larecarga natural, urbana y por actividades agrícolas en lascuencas de San Luis Potosí-Villa de Reyes. ProjectSEMARNAT-2002-C01-0719.
Cardona, A. (2007). Hidrogeoquímica de sistemas de flujoregional intermedio y local, resultado del marco geológicoen la Mesa Central: Reacciones, procesos y contaminación.PhD Thesis, Universidad Nacional Autónoma de México.
Cardona, A., & Carrillo-Rivera, J. J. (2006). Hidrogeoquímicade sistemas de flujo intermedio que circulan por sedimen-tos continentales derivados de rocas riolíticas. IngenieríaHidráulica en Mexico, XXI(3), 69–86.
Carrillo-Rivera, J. J. (1992). The hydrogeology of the San LuisPotosí area, Mexico. PhD Thesis, University of London.
Carrillo-Rivera, J. J., Cardona, B. A., & Edmunds, W. M.(2002). Use of abstraction regime and knowledge ofhydrogeological conditions to control high-fluoride con-centration in abstracted groundwater: San Luis Potosíbasin, Mexico. Journal of Hydrology, 261, 24–47.
Carrillo-Rivera, J. J., Cardona, B. A., & Moss, D. (1996).Importance of the vertical component of groundwaterflow: A hydrogeochemical approach in the valley of SanLuis Potosí, Mexico. Journal of Hydrology, 185, 23–44.
Chaudhuri, S., Furlan, S., & Clauer, N. (1992). The signature ofwater–rock interactions in formation waters of sedimenta-ry basins: Some new evidence. Paper presented at the 7thInternational Symposium on Water–Rock Interaction, ParkCity, Utah, USA.
Edmunds, W. M., Carrillo-Rivera, J. J., & Cardona, A. (2002).Geochemical evolution of groundwater beneath MexicoCity. Journal of Hydrology, 258, 1–24.
Edmunds, W. M., Cook, J. M., Darling, W. G., Kinniburgh, D. G.,Miles, D. L., Bath, A. H., et al. (1987). Baseline geochemicalconditions in the Chalk aquifer, Berkshire, U.K.: A basis forgroundwater quality management. Applied Geochemistry, 2,251–274.
Edmunds, W. M., Cook, J. M., & Miles, D. L. (1986). Lithiummobility and cycling in dilute continental waters. Paperpresented at the 5th International Symposium on Water–Rock Interaction.
Erdélyi, M. (1979). Hydrodynamics of the Hungarian basin.Proceedings No. 18. of Vituki, Budapest.
Galvez, V., Hernández, A., & Blásquez L. (1941). Estudioshidrogeológicos practicados en el estado de San LuisPotosí. Instituto Panamericano de Geografía e Historia,Publicación 56, (Mexico, D. F.).
Kharaka, Y. K., & Carothers, W. W. (1986). Oxygen andhydrogen isotope geochemistry of deep basin brines. In P.Fritz & J. C. Fontes (Eds.), Handbook of environmentalgeochemistry, vol. 2. The Terrestrial Environment, B,(pp. 305–361) Amsterdam: Elsevier.
Lambert, S. J. (1991). Fossil meteoric groundwaters in theDelaware Basin of southeastern New Mexico. In H. P.Taylor, J. R. Jr. O’Neil, & I. R. Kaplan (Eds.), Stable isotopegeochemistry: A tribute to Samuel Epstein (pp. 135–156).The Geochemical Society Special Publication no. 3.
Mata-Segura, J. L., López-Doncel, R., Rodríguez-Ríos, R.,Arzate-Flores, J. A., & Pacheco-Martínez, J. (2004).Problemática de las fallas geológicas en la zona urbana yconurbana de San Luis Potosí-Soledad de GracianoSánchez, IV Reunión Nacional de Ciencias de la Tierra,Juriquilla, Querétaro.
Parkhurst, D. L. (1995). User's guide to PHREEQC – A com-puter program for speciation, reaction-path, advective-transport, and inverse geochemical calculations. U.S.Geological Survey Water Resources Investigations Report95–4227.
Rónai, A. (1985). The quaternary of the great Hungarian plain.Geologica Hungarica Series Geologica, 21, 446.
Stretta, E. J. P., & Del Arenal, R. (1960). Estudio para elabastecimiento de agua potable para la ciudad de SanLuis Potosí. Applied Sciences Institute, UNESCO andInstituto de Geofísica, UNAM, Internal Report
Tóth, J. (1995). Hydraulic continuity in large sedimentarybasins. Hydrogeology Journal, 3, 4–16.
Tóth, J. (2000). Las aguas subterráneas como agente geológico:Causas, procesos y manifestaciones. Boletín Geológico yMinero, 111(4), 9–26.
Tóth, J., & Almási, I. (2001). Interpretation of observed fluidpotential patterns in a deep sedimentary basin undertectonic compression: Hungarian Great Plain, PannonianBasin. Geofluids, 1, 11–36.
Varsányi, I. (1975). Clay minerals of the Southern GreatHungarian Plain. Acta Mineralogica Petrografica Szeged,XXII/1, 51–60.
Varsányi, I., & Kovács, O. L. (1997). Chemical evolution ofgroundwater in the River Danube deposits in the southernpart of the Pannonian Basin (Hungary). Applied Geo-chemistry, 12, 625–637.
Varsányi, I., & Kovács, O. L. (2001). The source of sodiumin groundwater, Pannonian Basin, Hungary. Paperpresented at the 10th International Symposium onWater–Rock Interaction, Villasimius, Italy. Rotterdam:Balkema.
Varsányi, I., Matray, J. M., & Kovács, O. L. (1999). Hydro-geochemistry in two adjacent areas in the Pannonian Basin(Southeast-Hungary). Chemical Geology, 156, 25–39.
Viczián, I. (1982). An expanding mixed-layer clay mineral inUpper Pannonian to Pleistocene fine-grained clastic rocksof the borehole Pusztaottlaka I/P (SE Hungary). A MagyarÁllami Földtani Intézet Évi Jelentése az 1980. évről,Műszaki Könyvkiadó, 449–457.
Water Air Soil Pollut (2007) 184:77–103 103


