Embed Size (px)
Citation preview
TOWARDS OVERCOMING THE DEFICIENCIES OF RECENTLY EVOLVED
BIODEGRADATIVE ENZYMES
by
NANCY ESTELA HERNÁNDEZ
A dissertation submitted to the
School of Graduate Studies
Rutgers, The State University of New Jersey
In partial fulfillment of the requirements
For the degree of
Doctor of Philosophy
Graduate Programs in Chemistry and Chemical Biology and Quantitative Biomedicine
Written under the direction of
Dr. Sagar D. Khare
And approved by
__________________________________
__________________________________
__________________________________
__________________________________
New Brunswick, New Jersey
January, 2019
ii
ABSTRACT OF THE DISSERTATION
Towards overcoming the deficiencies of recently evolved biodegradative enzymes
By Nancy Estela Hernández
Dissertation Director:
Professor Sagar D. Khare
This thesis describes a computational protein engineering approach, which utilizes
protein assemblies and enzyme engineering, for the biodegradation of an endocrine
disruptor and common pollutant, atrazine, and describes all the experimental approaches
that were used to further characterize the designed enzymes. A computational
generalizable approach for designing fusion proteins that can self-assembly into fractal-
like morphologies on the 10 nm – 10 µM length scale was developed. This approach will
allow for any set of oligomeric proteins (with cyclic, dihedral, and other symmetries) to
form multivalent connections along with designed flexible loops enabling the control of
size of a fractal shaped assembly. Our current approach utilizes the SH2 binding domain-
pY peptide to allow for a stimulus control of assembly formation through the post-
translational modification of phosphorylation. This same generalizable approach can be
applied to other metabolic pathways with other domain-peptide recognition proteins with
various different responsiveness to other chemicals or physical stimuli. The phase to
phase transition that the assembly produces under self-assembly has the potential to
provide various applications, such as creating protein-based nanobiomaterials or creating

iii
nanocages (in our case protein fractals) to sequester antibodies and easily precipitate out
the antibody as needed.
In addition to engineering a stimulus responsive protein fractal assembly, the bottle neck
enzyme in the biodegradation of atrazine, atzC, was computationally engineered to
improve the catalytic efficiency of other known pollutants, N-t-butylammelide and
ammelide. This general approach for computationally designing the active site of an
enzyme by probing with energetically acceptable substitutions in the various shells of the
protein (first and second shell), not including the active site, but instead focusing on
mutations nearby the active site resulted in successfully designing variants of atzC with a
broadened s-triazine substrate spectrum. To summarize, this dissertation presents a novel
and innovative approach for engineering fractal self-assembly of enzymes and explores
the design approach for engineering an enzyme with limited abilities for novel substrates.
iv
ACKNOWLEDGEMENTS
I would like to thank my advisor, Dr. Sagar D. Khare for his guidance, suggestions,
constant mentorship, and for being a role model that has encouraged me to become a
successful scientist. I would like to thank my committee members, Dr. Helen Berman,
Dr. Andrew Nieuwkoop, and Dr. Vikas Nanda for encouragement, advice, suggestions,
and scientific discussions over the years. In addition, I acknowledge the support received
from the NSF Graduate Research Fellowship (DGE-1433187).
I would like to thank our collaborators Dr. Lawrence P. Wackett and Tony Dodge for all
their helpful advice on the s-triazine biodegradation pathway and for happily providing
many useful plasmids and substrates that aided my research experience. I would like to
thank Ileana Marrero-Berríos, Dr. Viacheslav Manichev, Matthew Putnins, Dr. Muyuan
Chen, Melissa Banal, Dr. Torgny Gustaffson, Dr. Leonard Feldman, Dr. John D.
Chodera, Dr. Sang-Hyuk Lee, and Dr. Wei Dai, for all their experimental assistance
during my research.
I would like to thank all the undergraduate students that have worked with me over the
years: Denzel Zhu, Maria Shea, Marium Khalid, Natali Abreu, Barry Li, Jason Li,
Alejandro Herrera, Chris Herrera, Sophia Tan, Akshada Chordiya, Illesha Patel, Milton
Liu, Alisa Permaul, Olivia G. Dineen, and Grant L. Bilker. I specially thank Denzel Zhu,
Maria Shea, Marium Khalid, and Natali Abreu, all exceptional undergraduate researchers
that made my Ph.D. research a lot more fun and have made me extremely proud to have
mentored them.

v
I specially thank Dr. Brahm J. Yachnin, who has dealt with all my experimental questions
and has answered them every time with extreme patience. I thank William Hansen for
being the best dry lab mentor, collaborator, and always providing contagious optimism on
our designed enzymes. I would like to thank my friend, previous housemate, and labmate,
Kristin Blacklock, for all her support throughout the years and for always inviting me to
travel the world with her, in addition to all the fun activities. I would like to thank past
and current Khare Lab members for being awesome friends Dr. Manasi Pethe, Dr. Lu
Yang, Dr. Aliza Rubenstein, Elliott Dolan, Dmitri Zorine, and Dr. Srinivas Annavarappu.
I would like to thank my friend Debbie Cifuentes-Ramírez, a Grinnellian friend and posse
mate, for her constant support throughout my Ph.D., and for always making sure I attend
a music festival a year and meet my favorite artists. I thank my previous Grinnell College
Professors Dr. Heriberto Hernández-Soto and Dr. Leslie Gregg-Jolly for their
professional advice and encouragement to pursue a Ph.D. while at Grinnell.
I specially thank my friends Dr. Nick Lease (and Snoopy), Shayla Fray, Dr. Patrick
Nosker, Marissa Ringgold, Ryan Woltz, Kyle Nosker, and Yoliem Miranda-Alarcón (and
Olympia), for all their support and for making living in New Jersey so much fun. In
addition, I specially thank my second grade teacher Ms. Jane Hingert and Mr. Mark
Eiduson, for very early on as a child always supporting me, encouraging me, guiding me,
and motivating me to pursue an education.
I would like to thank my brothers Mario Cartagena and Daniel Cartagena for forcing me
as a little kid to always do my homework, rewarding me with video games afterwards,
and being the best older brothers. I thank my sister Estrella Ramírez, my brother-in-law
Nilson Ramírez, my niece Andrea Ramírez, my sister-in-law Celeste Cartagena, my

vi
sister-in-law Diana Cartagena, my godparents Francisco and Sandra Osorio, and my
godsisters Victoria and Sophia Osorio, for all their support. I would like to specially
thank Dr. Paula Holcomb and Claudia Holcomb, for accepting me into their family and
supporting me during my graduate career. I thank my boyfriend David Holcomb, for
always being there for me during the bad and the good days, for always having dinner
ready when I get home from lab, helping me with my coding, playing video games with
me, and waking up early every day to make me breakfast. Lastly, I cannot thank enough,
my parents Jose Saul Hernández and Estela Francisca Guandique for their bravery to seek
out a better life for themselves and their kids, even if that entailed migrating to a new
country where they didn’t even speak the language, and doing the dirty work of cleaning
houses and carpets for over 35 years.
Parts of the thesis have been previously published as follows:
Chapter 2 of the thesis has been published as a preprint at:
Stimulus-responsive self-assembly of enzymatic fractal structures by computational
design
Nancy Hernandez, William Hansen, Denzel Zhu, Maria Shea, Marium Khalid,
Viacheslav Manichev, Matthew Putnis, Muyuan Chen, Anthony Dodge, Lu Yang,
Melissa Banal, Torgny Gustaffson, Leonard Feldman, Sang-Hyuk Lee, Lawrence
Wackett, Wei Dai, Sagar Khare
bioRxiv 274183; doi: https://doi.org/10.1101/274183

vii
DEDICATION
To my parents,
José Saul Hernández and Francisca Estela Guandique
Who are my biggest inspirations --They have faced so many harsh obstacles in their lives
just to ensure I received an education. I dedicate my Ph.D. to them for all the love and
support.
To David Holcomb,
For always supporting me and being there with me during my all-nighters in lab. (in
addition to all the great tasting food).
viii
Table of Contents
ABSTRACT OF THE DISSERTATION ........................................................................... ii
ACKNOWLEDGEMENTS ............................................................................................... iv
Table of Contents ............................................................................................................. viii
List of Tables .................................................................................................................... xii
List of Schemes ................................................................................................................ xiii
List of Illustrations ........................................................................................................... xiv
1. Introduction ............................................................................................................... 1
1.1 Atrazine, a herbicide, is a pollutant and endocrine disruptor ............................... 3
1.2 Atrazine poses serious health risks to humans ..................................................... 4
1.3 Terbuthylazine and Melamine contamination ...................................................... 5
1.4 Atrazine Metabolic Pathway ................................................................................ 7
1.5 How does nature organize enzymes for metabolic pathway enhancements?....... 8
1.6 Self-similar patterns (fractals) are frequently observed in Nature and have the
potential to improve various important applications ..................................................... 10
1.8 Comparison of ordered structures to fractals ..................................................... 13
1.9 Design approach for stimulus responsive self-assembly of enzymatic fractals
utilizing the “superbinder” Src homology 2 (SH2) domain .......................................... 14
1.10 Design a series of stable, efficient catalysts for cyanuric acid biodegradation .. 15
1.11 Thesis Summary ................................................................................................. 16
1.12 References .......................................................................................................... 18
2. Stimulus-responsive Self-Assembly of Enzymatic Fractals by Computational
Design ............................................................................................................................... 33
2.1. Abstract .................................................................................................................. 33
2.2. Introduction ............................................................................................................ 34
2.3 Experimental Results ............................................................................................... 40
2.3.1. Protein Expression, Phosphorylation, ELISA assays, binding and assembly
formation ....................................................................................................................... 40
2.3.2. Assembly formation was characterized: using Src kinase and phosphatase
(YopH) under Dynamic Light Scattering, under ATP dependence, inhibitor
concentration, and under different stoichiometric conditions ....................................... 49
ix
2.3.3. Assembly structures were investigated with optical and fluorescence microscopy,
helium ion microscopy, atomic force microscopy, transmission electron microscopy,
and cryo-electron tomography....................................................................................... 59
2.3.4. Computational annotations of the density clusters from ET-derived images was
compared to Rosetta models and analyzed ................................................................... 67
2.3.5. Fractal and globular assemblies were further characterized for molecular capture
capabilities. .................................................................................................................... 72
2.3.6. Fractal assemblies were further characterized through cyanuric acid activity
assays and compared to extended linker (globular and random) assemblies. ............... 76
2.4. Conclusion .............................................................................................................. 83
2.5. Main References ..................................................................................................... 84
2.6. Materials and Methods ........................................................................................... 87
2.6.1. Computational Design ......................................................................................... 87
2.6.1.1 Preparation of a two-component scaffold library .............................................. 87
2.6.1.2 RosettaMatch: simultaneous fusion domain and peptide pair stitching ............ 88
2.6.1.4 Stochastic fractal assembly simulation summary .............................................. 89
2.6.2. Experimental Characterization ............................................................................ 95
2.6.2.1 Creation of the designed AtzA, AtzB, and AtzC fusion constructs .................. 95
2.6.2.2 AtzA and AtzC expression and purification ..................................................... 96
2.6.2.3 AtzB expression and purification ...................................................................... 97
2.6.2.4 Src human kinase, super binder SH2 domain, SH2-DhaA expression and
purification .................................................................................................................... 97
2.6.2.5 YopH phosphatase construct, expression, and purification .............................. 98
2.6.2.6 Biuret hydrolase and cyanuric acid hydrolase expression and purification ...... 98
2.6.2.7 Enzyme-linked immunosorbent assay (ELISA) ................................................ 98
2.6.2.8 Bio-layer interferometry (BLI) .......................................................................... 99
2.6.2.9 Phosphorylation, assembly formation, and disassembly ................................... 99
2.6.2.10 Dynamic light scattering (DLS) .................................................................... 100
2.6.2.12 DLS Titration Experiment ............................................................................. 101
2.6.3. Microscopy Experiments ................................................................................... 102
2.6.3.1 Transmission electron microscope (TEM) ...................................................... 102
2.6.3.2 Atomic force microscopy (AFM) .................................................................... 102
2.6.3.3 Helium ion microscopy (HIM) ........................................................................ 103
x
2.6.3.4 High-resolution fluorescence microscopy ....................................................... 103
2.6.3.5 Cryo-EM Tomographic tilt series acquisition and reconstruction .................. 103
2.6.3.7 Confocal microscopy fluorescent images of fractal and globular assembly with
GFP-SH2 and Goat anti-mouse IgG (H+L) Cross-Adsorbed Secondary Antibody,
Alexa Fluor 568 ........................................................................................................... 105
2.6.4. Enzymatic Assays ............................................................................................. 105
2.6.4.1 Enzymatic activity was measured using the Berthelot assay .......................... 105
2.6.4.4 Construction and assay of Basotect® polymer foam with trapped assemblies
and free enzymes ......................................................................................................... 107
2.6.4.5 Gfp-Sh2 incorporation fluorescent assays ....................................................... 108
2.6.4.6 Dhaa-Sh2 incorporation assays ....................................................................... 108
2.6.4.7 Goat anti-mouse IgG (H+L) Cross-Adsorbed Secondary Antibody, Alexa Fluor
568 incorporation assays ............................................................................................. 108
2.7. Discussion ............................................................................................................ 109
2.7.1 Fractal design parameters and model selection .................................................. 109
2.7.2 Fractal dimension from image analysis .............................................................. 110
2.7.3 Comparison of control (GS-rich-linker containing) and designed assembly
topologies .................................................................................................................... 113
2.7.4 Evaluating the effects of AtzB-SH2 on overall fractal structure and topology.. 114
2.8. Methods and Discussion References .................................................................... 116
3. Substrate specificity trade-offs upon active site-distal mutations in a recently-
evolved biodegradation pathway enzyme ................................................................... 131
3.1 Abstract ................................................................................................................. 131
3.2 Introduction ........................................................................................................... 131
3.3 Materials and Methods .......................................................................................... 136
3.3.1. Generation of the starting models ..................................................................... 136
3.3.2. In silico saturation mutagenesis ........................................................................ 138
3.3.3. Subcloning AtzC into pET29b+ ........................................................................ 138
3.3.4. AtzC Expression and Purification ..................................................................... 141
3.3.5. End Point Activity Assay .................................................................................. 142
3.3.6. Michaelis-Menten Assay ................................................................................... 142
3.3.7. Full pathway Berthelot assay with atrazine and terbuthylazine ........................ 143
3.3.6. Supplementary Computational Methods ........................................................... 144
xi
3.4 Results ................................................................................................................... 149
3.4 In silico saturation mutagenesis yields 28 single substitutions for specificity
modulation ................................................................................................................... 149
3.4.1. Specificity zone point mutations showed favorable butylammelide hydrolysis 152
3.4.2. Combinatorial Kinetic Analysis ........................................................................ 153
3.4.2. Computational models of the combinatorial mutants demonstrate changes in the
binding cavity .............................................................................................................. 155
3.4 Discussion ............................................................................................................. 162
3.5 References ............................................................................................................. 164
4. Investigating the potential of metalloenzymes from the amidohydrolase super
family of enzymes to catalyze cyanuric acid hydrolysis ............................................ 166
4.1. Abstract ................................................................................................................ 166
4.2. Introduction .......................................................................................................... 166
4.2. Computational Approach and Results .................................................................. 168
4.2.1. Dinuclear Metalloenzyme Calculations ............................................................ 172
4.2.2. Dinuclear Metalloenzyme Calculations ............................................................ 187
4.3. Discussion ............................................................................................................ 194
4.4. Materials and Methods ......................................................................................... 195
4.4.1. Computational Details ....................................................................................... 195
4.4.2. Active Site Models ............................................................................................ 196
4.5. Experimental Methods and Results ...................................................................... 197
4.5.1. Protein Expression ............................................................................................. 197
4.5.2. Experimental Discussion ................................................................................... 198
4.6. References ............................................................................................................ 199
xii
List of Tables
Table 2.1. Curve fitting data for Figure 2.15………………………………………56
Table 2.2. Comparison of the different AtzA and AtzC ratio components with their
fractal dimensions (Df) and λ……………………………………………………….78
Table 3.1. All the primers used for amplification of the AtzC gene and site-directed
mutagenesis, ordered from Integrated DNA Technologies……………………….139
Table 3.2. The first four columns show the relative expression level and activity
towards isopropylammelide (I), butylammelide (B), and ammelide (A)………....151
Table 3.3. AtzC WT and all mutant kinetic parameters for isopropylammelide (I),
butylammelide (B), and ammelide (A)…………………………………………….155
Table 4.1. Important distances labeled b1-b7 [Å] for the various atoms that play roles
in the reaction pathway…………………………………………………………….183
Table 4.2. Important distances labeled b1-b6 [Å] for the various atoms that play roles
in the cyanuric acid reaction pathway for CDA…………………………………..193
Table 4.3. Protein concentrations are shown for the 12 designed proteins……...198
xiii
List of Schemes
Scheme 3.1. Atrazine degradation pathway that has evolved in Pseudomonas sp.
AtzC is the third enzyme in the pathway and converts N-isopropylammelide to the
relatively benign compound cyanuric acid………………………………………..134
Scheme 4.1. Comparison of DHO and CDA………………………………………168
Scheme 4.2. Suggested cyanuric acid hydrolysis reaction mechanism based on the
energy barrier calculations…………………………………………………………177
Scheme 4.3. Suggested cyanuric acid hydrolysis reaction mechanism based on the
energy barrier calculations for both the K and Q side chain placement
variants………………………………………………………………………………186
Scheme 4.4. Suggested cyanuric acid hydrolysis reaction mechanism based on the
energy barrier calculations for CDA………………………………………………194
xiv
List of Illustrations
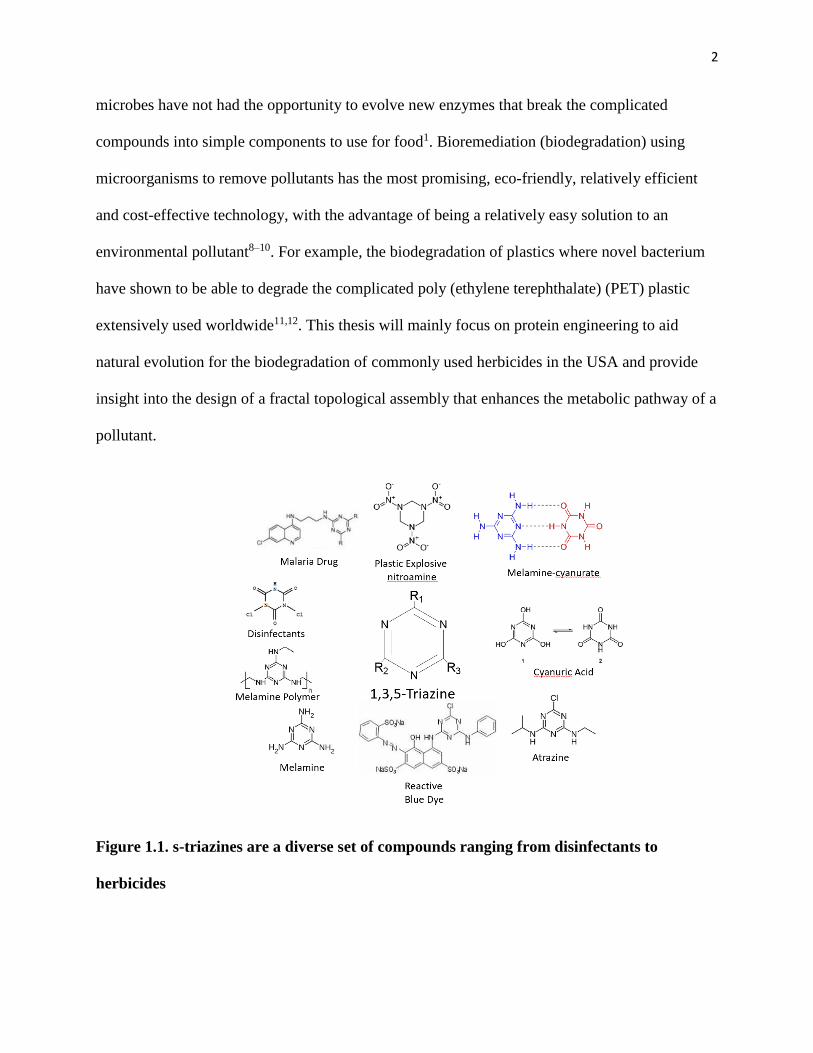
Figure 1.1. s-triazines are a diverse set of compounds ranging from disinfectants to
herbicides ........................................................................................................................... 2
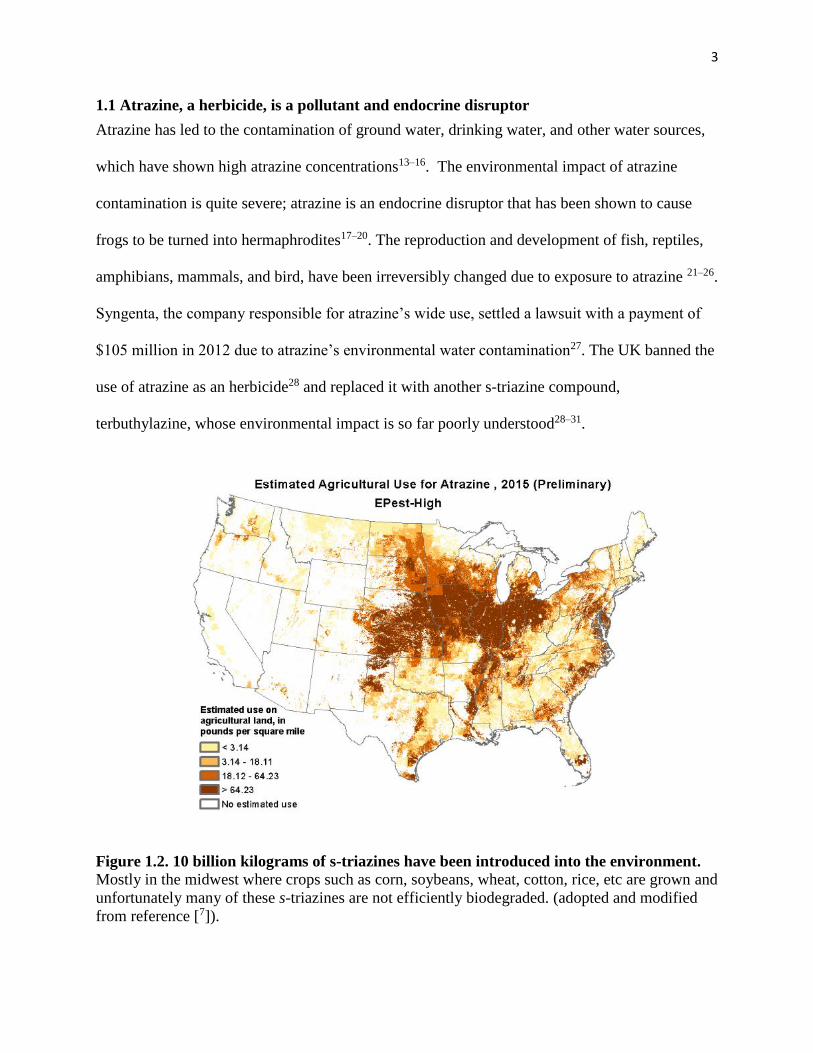
Figure 1.2. 10 billion kilograms of s-triazines have been introduced into the
environment. ...................................................................................................................... 3
Figure 1.3. Atrazine degradation in Pseudomonas sp. ADP. ........................................ 8
Figure 1.4. Nature uses triggerable supramolecular colocalization of enzymes
(metabolons) to enhance the metabolic pathway of enzymes........................................ 9
Figure 1.5. Examples of natural and synthetic fractals. .............................................. 12
Figure. 1.6. Representation of an ordered 2-dimensional plane and 3-dimensional
lattice is compare to a fractal. ........................................................................................ 14
Figure 1.7. Design approach for constructing stimulus responsive self-assembly
using the SH2 binding domain. ...................................................................................... 15
Figure 1.8. Cyanuric acid hydrolase (CAH) crystal structure from Azorhizobium
caulinodans ORS 571 ...................................................................................................... 16
Figure. 2.1. Multi-scale Computational Design Approach for fractal assembly design
with pY-AtzA and AtzC-SH2 ......................................................................................... 38
Figure. 2.2. Computational parameter sweep .............................................................. 39
Figure. 2.3. Representative simulated fractal images .................................................. 40
Figure. 2.4. Phosphorylation of SH2 peptide AtzA fusion (pY-AtzA) by Src kinase 41
Figure. 2.5. Experimental selection process for pY-AtzA and AtzC-SH2 ................. 42
Figure. 2.6. Experimental selection of AtzA, AtzC subunits for characterization.... 43
Figure. 2.7. Biolayer interferometry (BLI) binding profiles of AtzC wildtype SH2
fusion (AtzC-wtSH2) and AtzC superbinder SH2 fusion (AtzC-SH2) to
phosphorylated SH2 binding peptide AtzA fusion (pY-AtzA) ................................... 44
Figure 2.8. Assembly Formation, Dissolution and Inhibition in vitro ....................... 45
Figure. 2.9.A. Sequence alignment of AtzC-SH2 designs AtzCM0-AtzCM1. ........... 46
Figure. 2.9.B. Sequence alignment of AtzC-SH2 designs AtzCM0-AtzCM1 (con’t) 47
xv
Figure. 2.10. Sequence alignment of pY-AtzA designs ................................................ 48
Figure. 2.11. Visible turbidity is seen with assembly formation ................................. 50
Figure. 2.12. Inhibition of assembly at 0.66 µM AtzC-SH2, 1 µM pY-AtzA, 0-6 µM
SH2-DhaA ........................................................................................................................ 51
Figure. 2.13. Inhibition of assembly at 2 µM AtzC-SH2, 3 µM pY-AtzA with 0-15
µM inhibitor .................................................................................................................... 52
Figure. 2.14. Inhibition of assembly at 2 µM AtzC-SH2, 3 µM pY-AtzA with 0-15
µM inhibitor (con’t) ........................................................................................................ 53
Figure. 2.15. Rate of assembly formation is dependent on ATP concentration ........ 55
Figure. 2.16. Bright-field view of the assembly growing after the addition of Src
kinase ................................................................................................................................ 57
Figure. 2.17. Average size of particle formed by pY-AtzA and wild type AtzC-SH258
Figure. 2.18. Average size of particle formed by pY-AtzA and super-binder AtzC-
SH2 ................................................................................................................................... 59
Figure 2.19. Assembly formation and characterization with Helium Ion Microscopy
(HIM), Atomic Force Microscopy (AFM), and Transmission Electron Microscopy
(TEM), all reveal fractal-like topologies on a surface ................................................. 61
Figure. 2.20. Helium Ion Microscopy (HIM) depict fractal-like assembly with
increasing AtzA concentrations ..................................................................................... 62
Figure. 2.21. Atomic Force Microscopy (AFM) images show fractal-like structures,
fern-like, and petal-like structures, similar to Helium Ion Microscopy (HIM) ........ 63
Figure 2.22. Helium Ion Microscopy (HIM) buffer and non-phosphorylated controls
preclude salt precipitation .............................................................................................. 64
Figure. 2.23. Helium Ion Microscopy comparison of fractal assembly and globular
assembly ........................................................................................................................... 65
Figure. 2.25. Comparison of the fractal assembly CryoEM tomograms and the
extended linker globular assemblies.............................................................................. 67
Figure. 2.27. Length distribution of short chains that are not included in the large
assembly ........................................................................................................................... 70
xvi
Figure 2.28. Analysis of the fractal assembly CryoEM tomograms and the extended
linker globular assemblies .............................................................................................. 71
Figure. 2.29. Isosurface views of the assembly tomograms, from large to small ...... 72
Figure 2.30. Fractal assemblies captured greater amounts of cargo, as evidenced by
fluorescence (GFP), enzymatic activity (DhaA) measurements, and molecular cargo
release (YopH) ................................................................................................................. 74
Figure. 2.31. Fluorescence microscopy and bright-field images of the 4-component
assembly (AtzAM1, AtzCM1, ProteinA-SH2, and antibody, along with extended
linker versions of AtzA and AtzC) confirm incorporation of IgG-Antibody-Alexa
Fluor 568 into assemblies ............................................................................................... 75
Figure. 2.32. Helium Ion Microscopy (HIM) images depict fractal-like assembly
with 3 µM AtzAM1, 1 µMAtzBSH2, 1 µM AtzCM1 final protein concentrations ... 77
Figure. 2.33. Helium Ion Microscopy (HIM) images depict fractal-like assembly
with 3 µM AtzAM1, 1 µMAtzBSH2, 2 µM AtzCM1 final concentrations ................ 77
Figure. 2.34. DLS and SDS PAGE confirm AtzBSH2 incorporation into the 3-
component assembly ....................................................................................................... 79
Figure. 2.35. Fluorescence microscopy and bright-field images of the 3-component
assembly confirm incorporation of AtzBSH2 into assembly while bright-field images
confirm the fractal-like nature of the 2-component assembly .................................... 80
Figure 2.36. AtzBSH2 incorporation to construct a three-enzyme assembly. ........... 81
Figure. 2.37. Phase contrast micrographs of the Basotect® polymer foam with and
without assemblies. ......................................................................................................... 82
Figure. 2.38. The fractal-like assemblies (Reg-Assembly) and the extended linker
globular assemblies (ExtLinker-Assembly) enzymatic conversion of atrazine to
cyanuric acid demonstrates no enzymatic benefit of a globular assembly. ............... 83
Figure 3.1. Superimposed crystal structures of the AtzC monomer Open and Closed
conformations. ............................................................................................................... 135
Figure 3.2. QM optimized MC of the AtzC (2QT3) active site bound to ammelide 137
Figure 3.3. QM optimized Ammelide MC. ................................................................. 137
Figure 3.4. The variants with the highest N-t-butylammelide activity are shown in
comparison to wild type activity .................................................................................. 152
xvii
Figure 3.5. All the point mutants that expressed had an end-point assay performed
with the three substrates, N-isopropylammelide (cyan), N-t-butylammelide (salmon),
and ammelide (grey) ..................................................................................................... 153
Figure 3.6. The relative kcat/KM value for wild type AtzC, S280T, and the
combinatorial mutants is shown for isopropylammelide (blue), butylammelide
(orange), and ammelide (grey). .................................................................................... 154
Figure 3.7. Expanding and Shrinking Cavity is shown with mutations. ................. 157
Figure 3.8. Normalized kcat/KM demonstrate three-way trade-offs between the
substitutions. .................................................................................................................. 158
Figure 3.9. Rosetta energy scores utilizing constraints or no constraints for the
binding, specificity, and cavity zones for both the Closed and Open AtzC
combinatorial models docked with N-Isopropylammelide are shown in histograms.
......................................................................................................................................... 159
Figure 3.10. Rosetta energy scores utilizing constraints or no constraints for the
binding, specificity, and cavity zones for both the Closed and Open AtzC
combinatorial models docked with N-t-Butylammelide are shown in histograms. 160
Figure 3.11. Rosetta energy scores utilizing constraints or no constraints for the
binding, specificity, and cavity zones for both the Closed and Open AtzC
combinatorial models docked with Ammelide are shown in histograms. ............... 161
Figure 3.12. Full pathway berthelot assay with terbuthylazine and atrazine
degradation. AtzA wild-type, AtzB wild-type, and AtzC wt (and combinational
mutants) were incubated with 400 µM of substrate and allowed to react for 1.5
hours and the amount of cyanuric acid was measured. ............................................ 162
Figure 4.1. General approach for identifying latent promiscuous activities in the
amidohydrolase superfamily of enzymes (DHO and CDA). ..................................... 169
Figure 4.2. DHO crystal structure ............................................................................... 171
Figure 4.3. Optimized Michaelis complex of the DHO active-site model bound to
cyanuric acid (CA). Atoms marked with asterisks were fixed at their x-ray structure
positions. Distances are given in Å. ............................................................................. 173
Figure 4.4. Optimized geometries for the intermediates, transition states, and
product state along the reaction mechanism of cyanuric acid hydrolysis ............... 175
Figure 4.5. Optimized Michaelis complex of the DHO active-site model bound to
cyanuric acid (CA) with the Glutamine variant ......................................................... 178
xviii
Figure 4.6. Optimized geometries for the intermediates, transition states, and
product state along the reaction mechanism of cyanuric acid hydrolysis with the
glutamine mutation ....................................................................................................... 179
Figure 4.7. Optimized Michaelis complex of the DHO active-site model bound to
cyanuric acid (CA) with the lysine variant ................................................................. 180
Figure 4.8. Optimized geometries for the intermediates, transition states, and
product state along the reaction mechanism of cyanuric acid hydrolysis with the
lysine placement ............................................................................................................ 181
Figure 4.9. Rate determining transition states. .......................................................... 182
Figure 4.10. Calculated potential-energy curve for cyanuric acid hydrolysis by DHO
......................................................................................................................................... 182
Figure 4.11. Calculated potential-energy curve for cyanuric acid hydrolysis by DHO
with the glutamine/lysine sidechain placements along with the native residue
(Arg20), all low level. .................................................................................................... 184
Figure 4.12. Calculated potential-energy curve for cyanuric acid hydrolysis by CDA,
low level. ......................................................................................................................... 185
Figure 4.13. Optimized Michaelis complex of the CDA active-site model bound to
cyanuric acid (CA). ....................................................................................................... 188
Figure 4.15. Calculated potential-energy curve for the hydrolysis of cyanuric acid
with CDA; cluster + CPCM (ɛ=4). .............................................................................. 192
1
1. Introduction
Humans in the last 150 years have introduced tens of thousands of non-natural anthropogenic
compounds into the environment in a relatively short span1. Anthropogenic chemicals are widely
used in agriculture, industry, medicine, and military operations. Examples include pesticides
such as phencyclidine (PCP)2, dichlorodiphenyltrichloroethane (DDT)3,4, and explosives such as
TriNitroToluene (TNT)5. In the year 2012, the Environment America Research & Policy Center
reported that industrial facilities released 1.4 million pounds of chemicals linked to cancer into
688 local watersheds (examples include such as the Great Lakes, San Francisco Bay, Colorado
River, and Chesapeake Bay), including compounds such as arsenic, benzene, and chromium. Of
which more than 460,000 pounds of chemicals linked to developmental disorders were released
into local watersheds6. An example of these anthropogenic compounds are known as the s-
triazines, which are a diverse set of compounds ranging from disinfectants (sodium
dichloroisocyanurate dehydrate), explosives (nitroamine), melamine polymers, reactive dyes,
various pharmaceuticals, and herbicides (Figure 1.1). The department of the Interior reported that
in 2015, 10 billion kilograms of s-triazines were introduced into the environment and a lot of
these compounds are not efficiently biodegraded (Figure 1.2)7. Examples of known s-triazine
compounds that are not efficiently degraded are Atrazine and Terbuthylazine (widely used in
Europe).
The problem with introducing various different anthropogenic compounds into the environment,
is not only the pollution and the health effects they have, but these are new compounds that
2
microbes have not had the opportunity to evolve new enzymes that break the complicated
compounds into simple components to use for food1. Bioremediation (biodegradation) using
microorganisms to remove pollutants has the most promising, eco-friendly, relatively efficient
and cost-effective technology, with the advantage of being a relatively easy solution to an
environmental pollutant8–10. For example, the biodegradation of plastics where novel bacterium
have shown to be able to degrade the complicated poly (ethylene terephthalate) (PET) plastic
extensively used worldwide11,12. This thesis will mainly focus on protein engineering to aid
natural evolution for the biodegradation of commonly used herbicides in the USA and provide
insight into the design of a fractal topological assembly that enhances the metabolic pathway of a
pollutant.
Figure 1.1. s-triazines are a diverse set of compounds ranging from disinfectants to
herbicides
3
1.1 Atrazine, a herbicide, is a pollutant and endocrine disruptor
Atrazine has led to the contamination of ground water, drinking water, and other water sources,
which have shown high atrazine concentrations13–16. The environmental impact of atrazine
contamination is quite severe; atrazine is an endocrine disruptor that has been shown to cause
frogs to be turned into hermaphrodites17–20. The reproduction and development of fish, reptiles,
amphibians, mammals, and bird, have been irreversibly changed due to exposure to atrazine 21–26.
Syngenta, the company responsible for atrazine’s wide use, settled a lawsuit with a payment of
$105 million in 2012 due to atrazine’s environmental water contamination27. The UK banned the
use of atrazine as an herbicide28 and replaced it with another s-triazine compound,
terbuthylazine, whose environmental impact is so far poorly understood28–31.
Figure 1.2. 10 billion kilograms of s-triazines have been introduced into the environment. Mostly in the midwest where crops such as corn, soybeans, wheat, cotton, rice, etc are grown and
unfortunately many of these s-triazines are not efficiently biodegraded. (adopted and modified
from reference [7]).
4
1.2 Atrazine poses serious health risks to humans
Various studies throughout the years have shown that atrazine has an effect on frogs, rats, etc.
But more importantly recent studies have shown that atrazine has very serious health effects in
humans, especially those that spray the herbicide onto the crops. For example, atrazine levels in
the urine of men has been tested and shown to have a significant correlation between infertility
(low sperm count) and to the amount of atrazine in urine32. Atrazine found in the urine of men,
field workers in California, and the applicators have a significant amount of atrazine in their
urine (2400 pbb of atrazine in their urine) 33. In addition, women that are field workers and who
also apply atrazine to the crops have a higher chance of obtaining breast cancer34.
Atrazine increases aromatase (enzyme that converts Testosterone to Estrogen) which has been
associated with the mechanism of cancer35. More atrazine leads to more estrogen and more
estrogen leads to mammary tumors and prostate cancer36–39. It has been shown that there is a 4
fold increase of prostate cancer in men working in factories packaging atrazine (community that
is 80% African American) and an increase in breast cancer40–46. Recent studies have also shown
that atrazine causes prostate and mammary cancer, immune failure, and neural damage47–53.
There is also a correlation of birth defects vs atrazine (1996-2002)54, indicating that if women are
pregnant during peak atrazine contamination, then they are more likely to have babies with birth
defects such as gastroschisis, choanal atresia, genital malformations (hypospadias), and
cryptorchidism55–57. Overall, concern over atrazine contamination and its potential effects on
human health are warranted.

5
1.3 Terbuthylazine and Melamine contamination
Related compounds, Terbuthylazine, is being widely used in the EU with new studies indicating
that terbuthylazine is more dangerous to life compared to atrazine because its solubility in water
is higher than atrazine’s and it binds tighter to soil matter which allows it to stay as an
environmental contaminate for a long time. In addition, the metabolite desethylterbuthylazine
(DET) has higher water solubility as well58. Terbuthylazine’s cytotoxicity was also evaluated and
shown to cause high levels of DNA damage in liver and kidney cells59. With terbuthylazine
polluting the environment, especially contaminated soils and aquatic life, there is a need of
providing a biodegradation solution. The use of bacteria such as Escherichia coli has been
explored as a remediation strategy to remove organic and inorganic forms of mercury, by
harboring a subset of genes (merRTPAB) encoding for proteins capable cleaving C-Hg bonds,
transportation of mercury into the cell, and reduction of ionic mercury toxicity. Then taking the
e.coli containg merRTPAB and encapsulating the cells in silica beads allowing for the
construction of a biological-based filtration system where mercury can be removed efficiently60.
Interestingly enough, the same approach has been explored for terbuthylazine. Researchers in
Portugal have been able to use a Arthrobacter aurescens strain TC1 developed by the Wackett
group at the University of Minnesota 60,61 that can biodegrade terbuthylazine in high quantities in
soil. The bacteria strain can also degrade atrazine (and other chloro-s-triazine herbicides) to use
as a nitrogen and/or carbon source. The strain has been engineered to express three enzymes:
TrzN (dechlorination step), AtzB and AtzC that hydrolyze and remove the N-alkylamine R
groups to produce the benign compound cyanuric acid61,62. Cyanuric acid and relevant hydroxy-
s-triazines have been shown to pose lower risks to soil and aquatic organisms making the use of
6
bioremediation with this bacteria strain a potential solution. In addition, the encapsulation
material (silica beads) have been developed with the potential of being used with the
Arthrobacter aurescens strain TC1 that allows contaminated atrazine water into the beads, where
the bacteria can perform the chemistry of breaking down atrazine, and not allowing the bacteria
to escape into the treated/de-contaminated water60.
Another compound of interest is melamine. Melamine is a metabolite of cyromazine (a pesticide)
and mainly forms the dangerous melamine cyanurate (with cyanuric acid) that has been shown to
cause kidney failure and has been found to contaminate human and pet food63–68. An incident of
this occurred in China where 290,000 people were poisoned by infant milk powder tainted with
melamine causing infants to develop kidney stones which cause renal failure and death, if left
untreated69. Biodegradation of melamine has been explored by finding microbacterium strains
capable of degrading melamine, such as the species of MEL1 strain70 and the novel bacterium
Nocardioides sp. Strain ATD671. The pathway of melamine metabolism is similar to atrazine
except the first step in the reaction is performed by TriA/TrzA enzymes, with two intermediates
ammeline and ammelide, with AtzC/TrzC removing the last R-group to form cyanuric acid72,73.
This thesis will focus on the protein engineering approach of these s-triazines: atrazine,
terbuthylazine, and ammelide (melamine intermediate and bottleneck reaction), with the goal of
applying the designed enzymes and fractal assemblies for bioremediation.
7
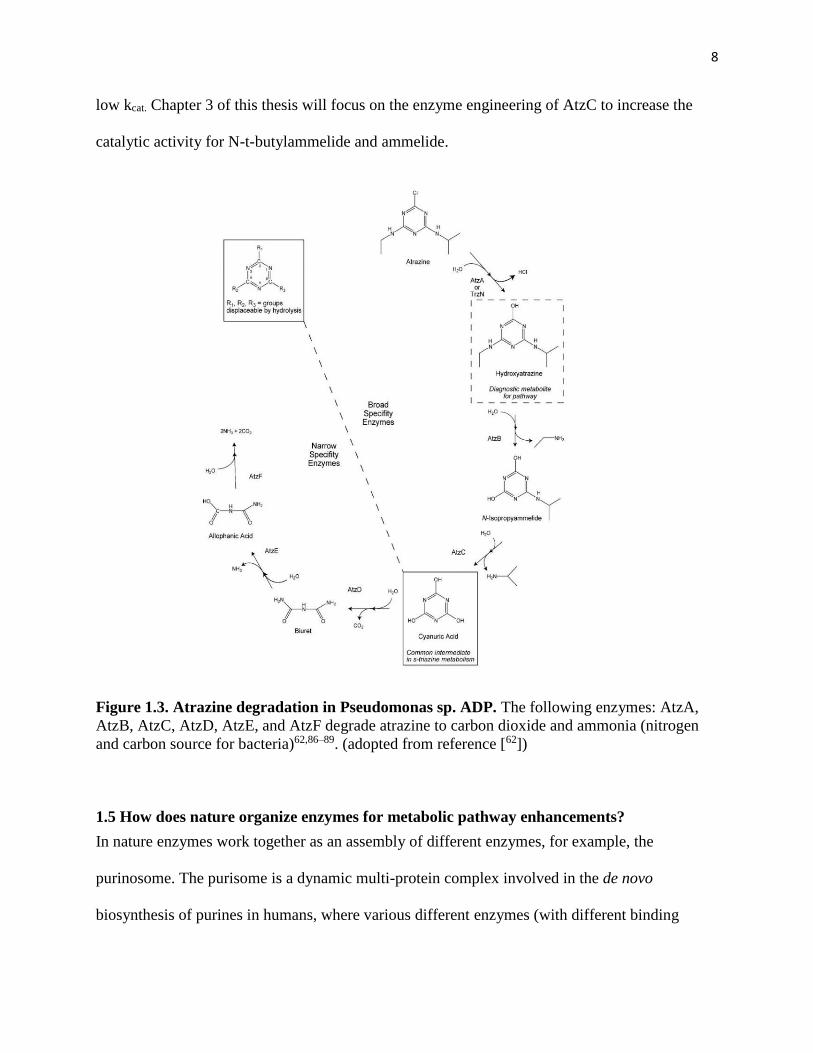
1.4 Atrazine Metabolic Pathway
Atrazine’s presence in the environment has resulted in Pseudomonas sp. strain ADP to evolve
enzymes that degrade it into simpler nitrogen and carbon compounds, which can be used as a
nitrogen and carbon source74–76. The early enzymes in this biodegradation pathway sequentially
remove the various R groups from the cyanuric acid ring (AtzA, AtzB, AtzC), while the later
enzymes further break down the cyanuric acid ring into smaller components (AtzD, AtzE,
AtzF)62,77 (Figure 1.3). The atrazine biodegradation pathway starts with the hydrolysis of the
chlorine group on atrazine by chlorohydrolase AtzA78 (or TrzN) to produce hydroxyatrazine
(HA). N-ethylaminohydrolase (AtzB) then catalyzes the hydrolytic conversion of
hydroxyatrazine to N-isopropylammelide79,80. Isopropylaminohydrolase (AtzC) catalysis the
hydrolysis of N-isopropylammelide to cyanuric acid81,82. AtzC is the bottleneck enzyme in the
degradation of terbuthylazine, as the first two substituents can be removed efficiently by AtzA
and AtzB, but AtzC is unable to efficiently remove the last bulky R group83,84 to form the
environmentally safe cyanuric acid. AtzC is also the bottleneck enzyme in the degradation of
ammelide, intermediate in the melamine biodegradation pathway.
AtzC catalyzes the most important step in the biodegradation of atrazine: the hydrolysis of the
aminoalkyl group to yield cyanuric acid85. While AtzC shows high activity towards N-
isopropylammelide, other substrates, such as N-t-butylammelide and ammelide, are much poorer
substrates for AtzC, preventing the effective environmental degradation of other s-triazines by
AtzC82. AtzC kinetic parameters for several substrates was previously tested with indicating that
N-t-butylammelide binds tightly to AtzC (KM ~ 299 µM) but has a catalytic efficiency issue with
a low kcat while ammelide has a high Km indicating substrate barely binds (KM ~1320 µM) and a
8
low kcat. Chapter 3 of this thesis will focus on the enzyme engineering of AtzC to increase the
catalytic activity for N-t-butylammelide and ammelide.
Figure 1.3. Atrazine degradation in Pseudomonas sp. ADP. The following enzymes: AtzA,
AtzB, AtzC, AtzD, AtzE, and AtzF degrade atrazine to carbon dioxide and ammonia (nitrogen
and carbon source for bacteria)62,86–89. (adopted from reference [62])
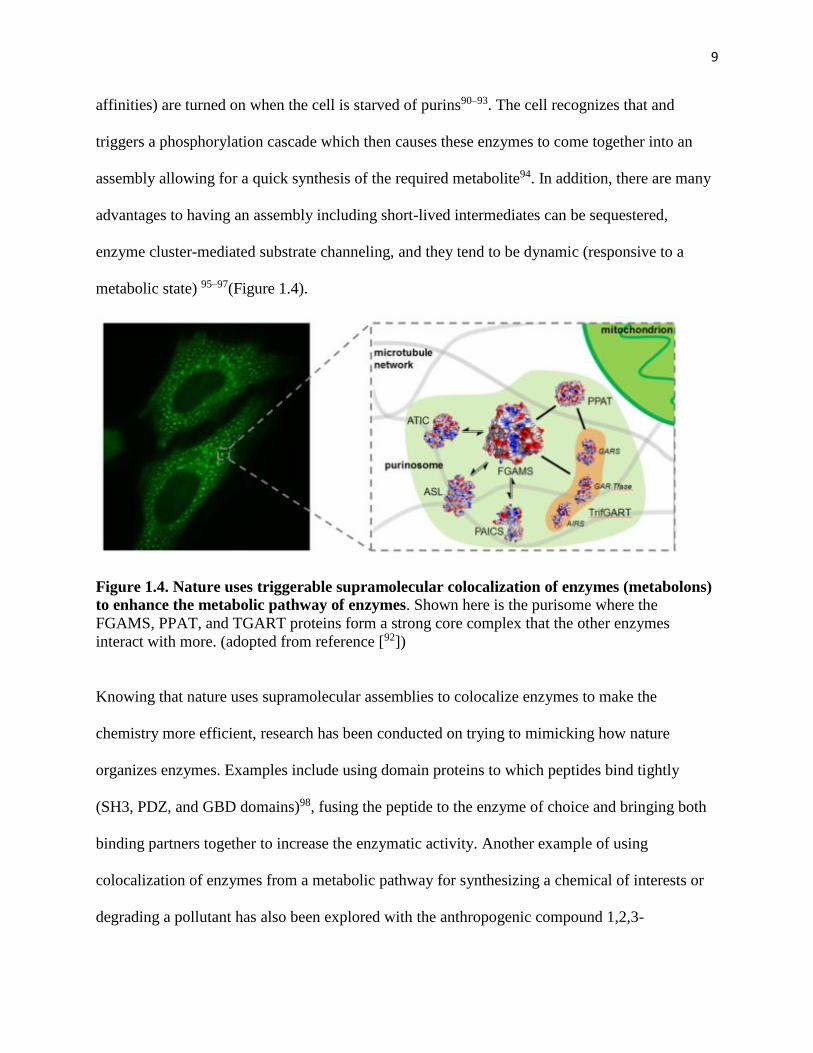
1.5 How does nature organize enzymes for metabolic pathway enhancements?
In nature enzymes work together as an assembly of different enzymes, for example, the
purinosome. The purisome is a dynamic multi-protein complex involved in the de novo
biosynthesis of purines in humans, where various different enzymes (with different binding
9
affinities) are turned on when the cell is starved of purins90–93. The cell recognizes that and
triggers a phosphorylation cascade which then causes these enzymes to come together into an
assembly allowing for a quick synthesis of the required metabolite94. In addition, there are many
advantages to having an assembly including short-lived intermediates can be sequestered,
enzyme cluster-mediated substrate channeling, and they tend to be dynamic (responsive to a
metabolic state) 95–97(Figure 1.4).
Figure 1.4. Nature uses triggerable supramolecular colocalization of enzymes (metabolons)
to enhance the metabolic pathway of enzymes. Shown here is the purisome where the
FGAMS, PPAT, and TGART proteins form a strong core complex that the other enzymes
interact with more. (adopted from reference [92])
Knowing that nature uses supramolecular assemblies to colocalize enzymes to make the
chemistry more efficient, research has been conducted on trying to mimicking how nature
organizes enzymes. Examples include using domain proteins to which peptides bind tightly
(SH3, PDZ, and GBD domains)98, fusing the peptide to the enzyme of choice and bringing both
binding partners together to increase the enzymatic activity. Another example of using
colocalization of enzymes from a metabolic pathway for synthesizing a chemical of interests or
degrading a pollutant has also been explored with the anthropogenic compound 1,2,3-
10
trichloropropane (TCP). The chemical glutaraldehyde was used to cross-link the enzymes in the
TCP biodegradation pathway99 while recently (in the Khare Lab) phosphorylation and UV light
was used to make a multi-enzyme assembly for TCP biodegradation100. In chapter 1, a similar
stimulus-responsive multi-enzyme assembly strategy for the biodegradation of atrazine will be
described.
1.6 Self-similar patterns (fractals) are frequently observed in Nature and have the potential
to improve various important applications
Enzymes can be organized into a multi-enzyme assemblies as previously described but what
types of topologies do they exemplify? There have been various examples of protein assemblies
being constructed in very controlled and defined shapes inspired by nature such as icosahedrons,
layers, cages, lattices, and polyhedrals101–108. All designed in a two or three dimensional ordered
patterns. But fractional-dimensional (fractal) geometries have not been utilized to construct
multi-enzyme assemblies. Fractals are a property of shapes that are invariant or nearly invariant
to scale magnification or contraction across many length scales, which means it is a common
feature of many natural objects109.
Nature utilizes fractals to maximize surface area:volume ratios, examples include our lungs. Our
lungs have a volume of six liters and the surface area that is available for the exchange of gases
is 100 m2 which is the size of a tennis court. One key advantage of fractals is the feature to being
self-similar, as in looking the same on multiple scales or scale free. These kinds of fractal
topologies can be built by iterative branching, so for example, you can start with a “Y” shape and
then you can branch the shape to continue to branch further (Figure 1.5. A). Fractal forms have
been shown to be everywhere in nature including geology such as rivers, mountain ranges,
11
coastlines, snowflakes, and in physiology, with capillary, nasal, and neural networks, where high
surface area:volume ratios are needed for highly efficient exchange110. It has also been shown
that using fractal-like nanomaterials provide high physical connectivity (high surface
area:volume ratio) within pattern objects by exploiting the recurrence of patterns at increasingly
small scales and are desirable in various technological and electronic applications such as radio
antennae to storm barriers111. In addition, highly branched patterns (fractals) have been shown to
be efficient nucleic acid biosensors112, while organic-inorganic nanoflowers with high surface
are:volume ratios have exhibited enhancement of enzymatic activity and stability 113. Fractals are
used in nature extensively because it guarantees efficiency, which has led to researchers creating
fractal nanostructures with the potential for ultrasensitive detection of disease-relevant
biomarkers such as microRNA, cancer antigens, and breast cancer cells114.
On account of these advantageous fractal properties, there has been considerable interest in the
controlled fabrication of nanoscale fractal-like materials for wide-ranging applications in next-
generation electronic circuits (fractal electronics), solar energy capture, ultrasensitive biosensing,
filtration, and catalysis, among others115–119, of which are generally constructed in a top-down
patterning of surfaces120. Fractals have been constructed with small molecule building blocks
(inorganic metal-ligand complexes), synthetic dendritic polymers, and the semimetallic
compound antimony displays the ability to from fractals on surfaces (Figure 1.5. B). However,
fractal topologies have not been designed with biomacromolecules121,122. Fractal-like topology
intermediates have been found in the natural occurring protein such as biosilica and silk (Figure
1.5.C, D), and peptide assemblies, but they have not been constructed with biomacromolecules in
a reversible non-covalent interaction123–125.
12
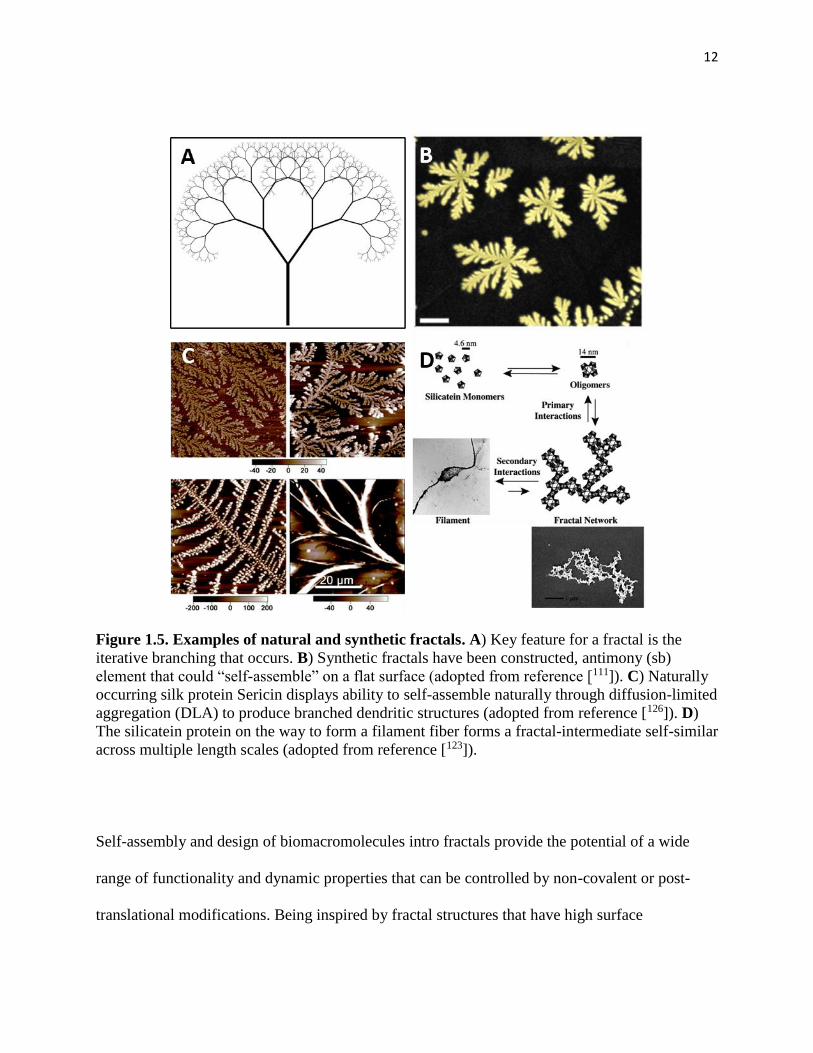
Figure 1.5. Examples of natural and synthetic fractals. A) Key feature for a fractal is the
iterative branching that occurs. B) Synthetic fractals have been constructed, antimony (sb)
element that could “self-assemble” on a flat surface (adopted from reference [111]). C) Naturally
occurring silk protein Sericin displays ability to self-assemble naturally through diffusion-limited
aggregation (DLA) to produce branched dendritic structures (adopted from reference [126]). D)
The silicatein protein on the way to form a filament fiber forms a fractal-intermediate self-similar
across multiple length scales (adopted from reference [123]).
Self-assembly and design of biomacromolecules intro fractals provide the potential of a wide
range of functionality and dynamic properties that can be controlled by non-covalent or post-
translational modifications. Being inspired by fractal structures that have high surface

13
area:volume ratios and the potential of self-assembly of engineering proteins, we describe in
chapter 2 of this thesis the computational design approach on creating fractal enzymatic
assemblies containing high surface area to volume ratios with the goal of biodegrading the
pollutant atrazine.
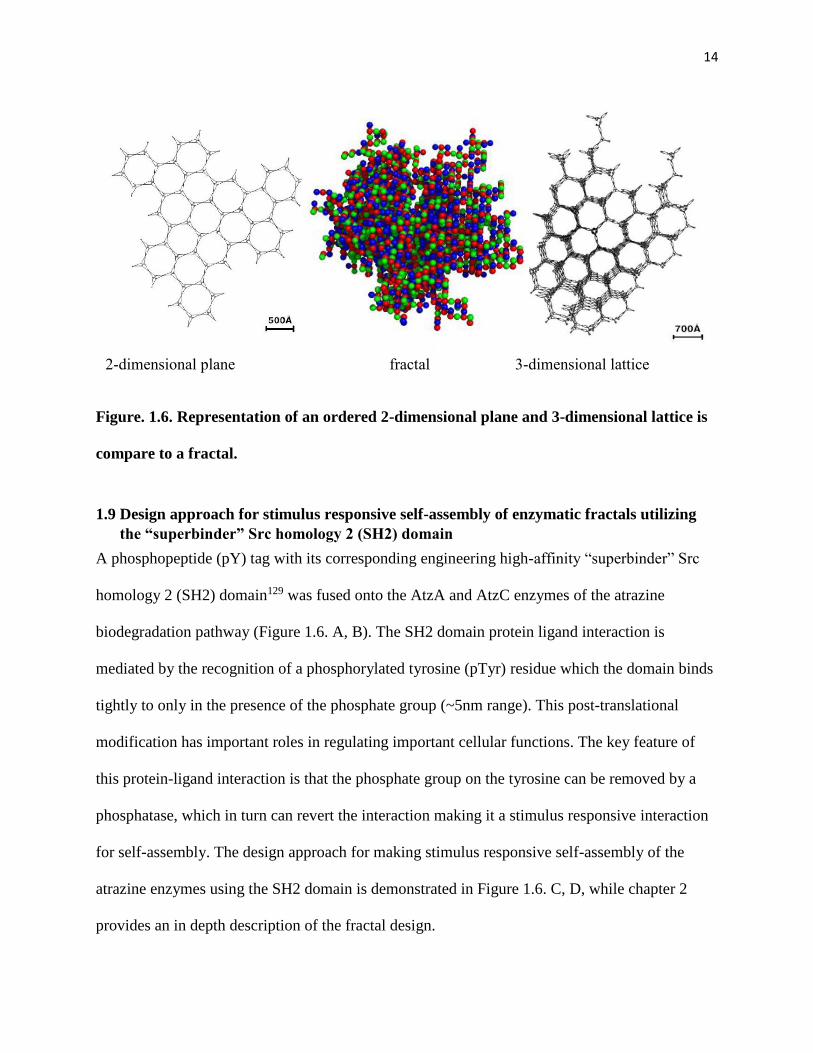
1.8 Comparison of ordered structures to fractals
Initially, the goal of Chapter 2 in this thesis sought out to design planes and lattices with
enzymes. Utilizing Rosetta design, we aimed to control the angles necessary to form planes and
lattices. Our initial designs were an attempt to control the atomic-level angles to get the perfect
regularly ordered 2D protein planes or 3D protein lattices. But through our further
characterization of the assemblies being formed, we noticed that the proteins were not forming
ordered structures and instead were forming fractal-like structures. It seems in order to form a
lattice – it is required to design the right orientation and rigidity of inter-protein
components127,128. For example, to design a crystal lattice, the protein components need to have
very low flexibility, but if the protein components are too flexible, then a protein agglomerate
will form. Dimensionally is controlled by attachment flexibility, angle, and relative orientation of
the protein components, as seen in Figure.1.6. A fractal is more flexible and allows for various
different angles to be sampled. Even though, we were unsuccessful at designing an ordered
structure, chapter 2 reports the first time that protein fractals made from enzymes have been
designed.
14
Figure. 1.6. Representation of an ordered 2-dimensional plane and 3-dimensional lattice is
compare to a fractal.
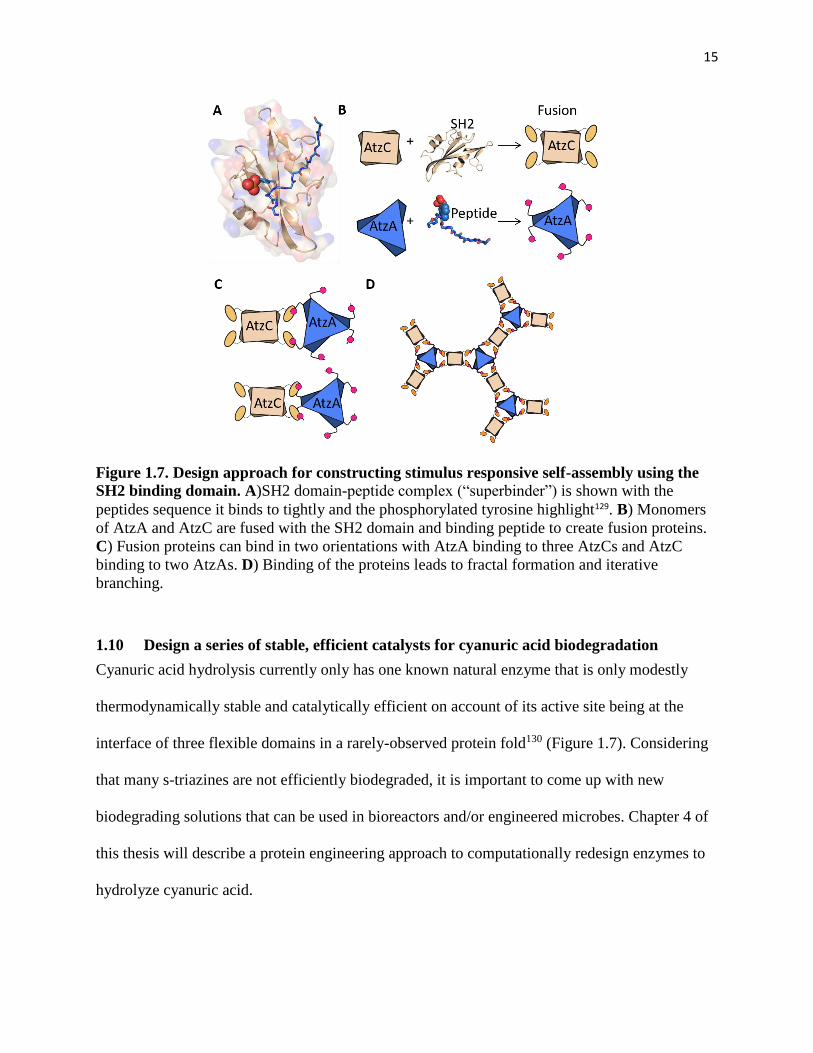
1.9 Design approach for stimulus responsive self-assembly of enzymatic fractals utilizing
the “superbinder” Src homology 2 (SH2) domain
A phosphopeptide (pY) tag with its corresponding engineering high-affinity “superbinder” Src
homology 2 (SH2) domain129 was fused onto the AtzA and AtzC enzymes of the atrazine
biodegradation pathway (Figure 1.6. A, B). The SH2 domain protein ligand interaction is
mediated by the recognition of a phosphorylated tyrosine (pTyr) residue which the domain binds
tightly to only in the presence of the phosphate group (~5nm range). This post-translational
modification has important roles in regulating important cellular functions. The key feature of
this protein-ligand interaction is that the phosphate group on the tyrosine can be removed by a
phosphatase, which in turn can revert the interaction making it a stimulus responsive interaction
for self-assembly. The design approach for making stimulus responsive self-assembly of the
atrazine enzymes using the SH2 domain is demonstrated in Figure 1.6. C, D, while chapter 2
provides an in depth description of the fractal design.
2-dimensional plane fractal 3-dimensional lattice
15
Figure 1.7. Design approach for constructing stimulus responsive self-assembly using the
SH2 binding domain. A)SH2 domain-peptide complex (“superbinder”) is shown with the
peptides sequence it binds to tightly and the phosphorylated tyrosine highlight129. B) Monomers
of AtzA and AtzC are fused with the SH2 domain and binding peptide to create fusion proteins.
C) Fusion proteins can bind in two orientations with AtzA binding to three AtzCs and AtzC
binding to two AtzAs. D) Binding of the proteins leads to fractal formation and iterative
branching.
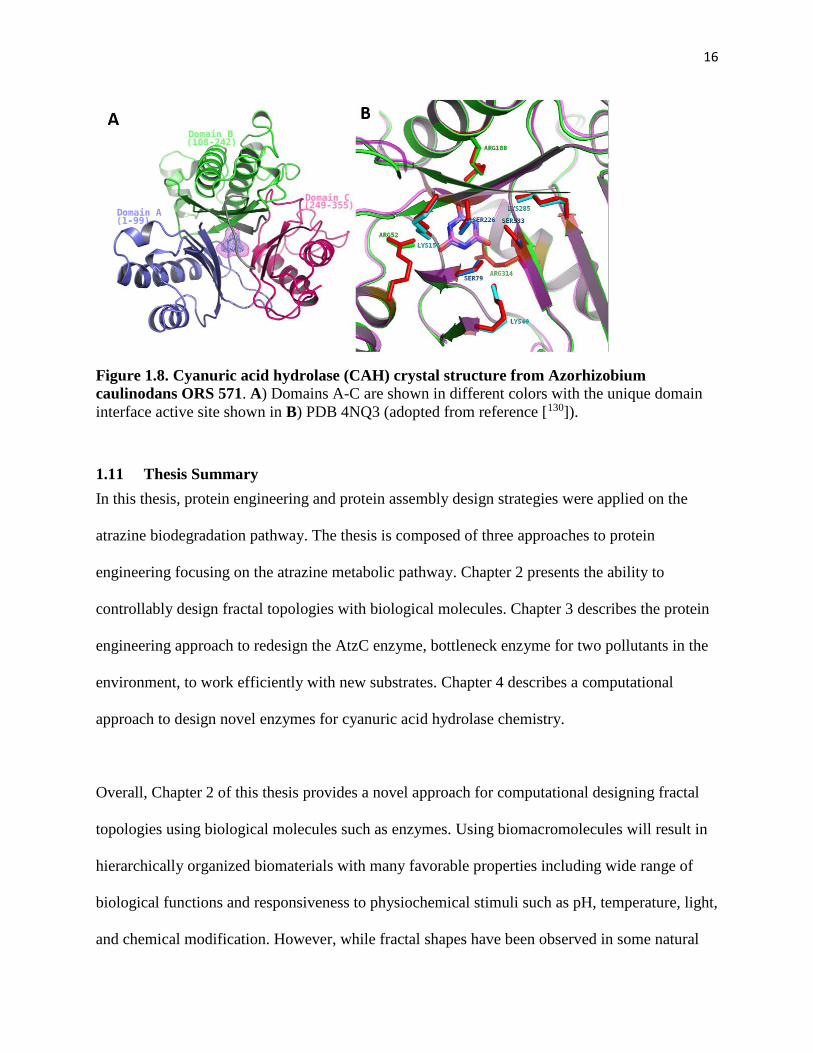
1.10 Design a series of stable, efficient catalysts for cyanuric acid biodegradation
Cyanuric acid hydrolysis currently only has one known natural enzyme that is only modestly
thermodynamically stable and catalytically efficient on account of its active site being at the
interface of three flexible domains in a rarely-observed protein fold130 (Figure 1.7). Considering
that many s-triazines are not efficiently biodegraded, it is important to come up with new
biodegrading solutions that can be used in bioreactors and/or engineered microbes. Chapter 4 of
this thesis will describe a protein engineering approach to computationally redesign enzymes to
hydrolyze cyanuric acid.
16
Figure 1.8. Cyanuric acid hydrolase (CAH) crystal structure from Azorhizobium
caulinodans ORS 571. A) Domains A-C are shown in different colors with the unique domain
interface active site shown in B) PDB 4NQ3 (adopted from reference [130]).
1.11 Thesis Summary
In this thesis, protein engineering and protein assembly design strategies were applied on the
atrazine biodegradation pathway. The thesis is composed of three approaches to protein
engineering focusing on the atrazine metabolic pathway. Chapter 2 presents the ability to
controllably design fractal topologies with biological molecules. Chapter 3 describes the protein
engineering approach to redesign the AtzC enzyme, bottleneck enzyme for two pollutants in the
environment, to work efficiently with new substrates. Chapter 4 describes a computational
approach to design novel enzymes for cyanuric acid hydrolase chemistry.
Overall, Chapter 2 of this thesis provides a novel approach for computational designing fractal
topologies using biological molecules such as enzymes. Using biomacromolecules will result in
hierarchically organized biomaterials with many favorable properties including wide range of
biological functions and responsiveness to physiochemical stimuli such as pH, temperature, light,
and chemical modification. However, while fractal shapes have been observed in some natural
17
protein assemblies it is not clear (1) what the design rules for protein-based fractal topologies
are, and (2) how to control the fractal properties of protein assemblies on a nm – µm length
scale, which is crucially relevant for the characterization of such materials and for the myriad
applications in biotechnology.
Recent years have seen a great deal of development in the design of integer-dimensional (two,
three dimensional) protein assemblies such as layers, polyhedra and lattices, but hyperbranched
arboreal fractal assemblies have not yet been reported. My dissertation focuses on developing
and demonstrating a bottom-up, multi-scale (from atomic resolution to micrometer scale) design
approach for the production of hierarchically-organized, supramolecular fractal structures with
proteins. These first-in-class molecular assemblies were constructed with enzymes of the
pollutant atrazine degradation pathway and are controllable (reversibly) by phosphorylation (de-
phosphorylation), providing also the first example of a phosphorylation controlled de novo
designed protein assembly. We performed structural characterization of assemblies using several
different microscopy techniques at various resolutions – light, fluorescence, helium ion, atomic
force, transmission electron microscopy and cryo-electron tomography – to thoroughly
characterize and uncover the rules for controlling fractal topologies over three decades of length
scale. Using these techniques and protein engineering/modeling, we could correlate how changes
made at the individual molecular level at the angstrom scale, for example, a few amino acid
substitutions in a protein, could lead to changes in the emergent properties of the fractal
assemblies at the micrometer scale. Control over assembly topology, formation dynamics, and
functional enhancements due to dynamic multicomponent assemblies constructed with three
atrazine degradation pathway enzymes (AtzA, AtzB, and AtzC) were also demonstrated. The
18
observed functional enhancements have set the stage for our ongoing efforts aimed at fabrication
of catalytic bioremediation sponges for atrazine-contaminated water treatment using our
designed fractal assemblies. Furthermore, our design method is general and should enable the
construction of a variety of responsive protein-based nanobiomaterials, which take simultaneous
advantage of the properties of organized fractal shapes and the functional versatility,
biocompatibility, and controllability of proteins.
1.12 References
1. Copley, S. D. Evolution of efficient pathways for degradation of anthropogenic chemicals.
Nature Chemical Biology (2009). doi:10.1038/nchembio.197
2. Khan, M. Z. & Law, F. C. P. Adverse effects of pesticides and related chemicals on
enzyme and hormone systems of fish, amphibians and reptiles: a review. Proc. Pakistan
Acad. Sci. (2005).
3. Eskenazi, B. et al. The pine river statement: Human health consequences of DDT use.
Environmental Health Perspectives (2009). doi:10.1289/ehp.11748
4. Kabasenche, W. P. & Skinner, M. K. DDT, epigenetic harm, and transgenerational
environmental justice. Environmental Health: A Global Access Science Source (2014).
doi:10.1186/1476-069X-13-62
5. Islam, M. N., Shin, M. S., Jo, Y. T. & Park, J. H. TNT and RDX degradation and
extraction from contaminated soil using subcritical water. Chemosphere (2015).
doi:10.1016/j.chemosphere.2014.09.101
6. Inglis, J., Dutzik, T. & Rumpler, J. Wasting Our Waterways. 71 (2014).
7. Survey, U. S. D. of I. S. G. Estimated Annual Agricultural Pesticide Use for Atrazine,
2015. Available at:
https://water.usgs.gov/nawqa/pnsp/usage/maps/show_map.php?year=2015&map=ATRAZ
INE&hilo=L&disp=Atrazine.
8. Megharaj, M., Ramakrishnan, B., Venkateswarlu, K., Sethunathan, N. & Naidu, R.
Bioremediation approaches for organic pollutants: A critical perspective. Environment
International (2011). doi:10.1016/j.envint.2011.06.003
9. Azubuike, C. C., Chikere, C. B. & Okpokwasili, G. C. Bioremediation techniques–
classification based on site of application: principles, advantages, limitations and
19
prospects. World Journal of Microbiology and Biotechnology (2016).
doi:10.1007/s11274-016-2137-x
10. Bansal, O. P. Fate of pesticides in the environment. Journal of the Indian Chemical
Society (2011). doi:10.1002/elsc.200520098
11. Yang, Y., Yang, J. & Jiang, L. Comment on "a bacterium that degrades and assimilates
poly(ethylene terephthalate) ". Science (2016). doi:10.1126/science.aaf8305
12. Austin, H. P. et al. Characterization and engineering of a plastic-degrading aromatic
polyesterase. Proc. Natl. Acad. Sci. (2018). doi:10.1073/pnas.1718804115
13. Benotti, M. J. et al. Pharmaceuticals and endocrine disrupting compounds in U.S. drinking
water. Environ. Sci. Technol. (2009). doi:10.1021/es801845a
14. United States Environmental Protection Agency (US EPA). Ground Water
Contamination. Getting Up to Speed (2008).
15. Graymore, M., Stagnitti, F. & Allinson, G. Impacts of atrazine in aquatic ecosystems.
Environ. Int. (2001). doi:10.1016/S0160-4120(01)00031-9
16. Satapanajaru, T., Anurakpongsatorn, P., Pengthamkeerati, P. & Boparai, H. Remediation
of atrazine-contaminated soil and water by nano zerovalent iron. Water. Air. Soil Pollut.
(2008). doi:10.1007/s11270-008-9661-8
17. Hayes, T. et al. Atrazine-induced hermaphroditism at 0.1 ppb in American leopard frogs
(Rana pipiens): Laboratory and field evidence. Environ. Health Perspect. 111, 568–575
(2003).
18. Hayes, T. B. et al. Hermaphroditic, demasculinized frogs after exposure to the herbicide
atrazine at low ecologically relevant doses. Proc. Natl. Acad. Sci. U. S. A. 99, 5476–80
(2002).
19. Hayes, T. B. et al. Atrazine induces complete feminization and chemical castration in
male African clawed frogs (Xenopus laevis). Proc. Natl. Acad. Sci. 107, 4612–4617
(2010).
20. Solomon, K. R. et al. Effects of atrazine on fish, amphibians, and aquatic reptiles: A
critical review. Critical Reviews in Toxicology (2008). doi:10.1080/10408440802116496
21. Spanò, L. et al. Effects of atrazine on sex steroid dynamics, plasma vitellogenin
concentration and gonad development in adult goldfish (Carassius auratus). Aquat.
Toxicol. (2004). doi:10.1016/j.aquatox.2003.10.009
22. Beldomenico, P. M. et al. In ovum exposure to pesticides increases the egg weight loss
and decreases hatchlings weight of Caiman latirostris (Crocodylia: Alligatoridae).
20
Ecotoxicol. Environ. Saf. (2007). doi:10.1016/j.ecoenv.2006.12.018
23. Rey, F. et al. Prenatal exposure to pesticides disrupts testicular histoarchitecture and alters
testosterone levels in male Caiman latirostris. Gen. Comp. Endocrinol. (2009).
doi:10.1016/j.ygcen.2009.03.032
24. Victor-Costa, A. B., Bandeira, S. M. C., Oliveira, A. G., Mahecha, G. A. B. & Oliveira, C.
A. Changes in testicular morphology and steroidogenesis in adult rats exposed to Atrazine.
Reprod. Toxicol. (2010). doi:10.1016/j.reprotox.2009.12.006
25. Hussain, R. et al. Cellular and biochemical effects induced by atrazine on blood of male
Japanese quail (Coturnix japonica). Pestic. Biochem. Physiol. (2012).
doi:10.1016/j.pestbp.2012.03.001
26. Hayes, T. B. et al. Demasculinization and feminization of male gonads by atrazine:
Consistent effects across vertebrate classes. Journal of Steroid Biochemistry and
Molecular Biology (2011). doi:10.1016/j.jsbmb.2011.03.015
27. Hakim, D. N. Y. T. A Pesticide Banned, or Not, Underscores Trans-Atlantic Trade
Sensitivities. The New York Times (2015). Available at:
https://www.nytimes.com/2015/02/24/business/international/a-pesticide-banned-or-not-
underscores-trans-atlantic-trade-sensitivities.html.
28. Sass, J. B. & Colangelo, A. European Union bans atrazine, while the United States
negotiates continued use. Int. J. Occup. Environ. Health 12, 260–267 (2006).
29. Wang, H., Lin, K., Hou, Z., Richardson, B. & Gan, J. Sorption of the herbicide
terbuthylazine in two New Zealand forest soils amended with biosolids and biochars. J.
Soils Sediments (2010). doi:10.1007/s11368-009-0111-z
30. Stara, A., Zuskova, E., Kouba, A. & Velisek, J. Effects of terbuthylazine-desethyl, a
terbuthylazine degradation product, on red swamp crayfish (Procambarus clarkii). Sci.
Total Environ. (2016). doi:10.1016/j.scitotenv.2016.05.113
31. Bottoni, P., Grenni, P., Lucentini, L. & Caracciolo, A. B. Terbuthylazine and other
triazines in Italian water resources. Microchem. J. (2013).
doi:10.1016/j.microc.2012.06.011
32. Swan, S. H. et al. Semen quality relation to biomarkers of pesticide exposure. Environ.
Health Perspect. (2003). doi:10.1289/ehp.6417
33. Lucas, A. D. et al. Determination of Atrazine Metabolites in Human Urine: Development
of a Biomarker of Exposure. Chem. Res. Toxicol. (1993). doi:10.1021/tx00031a017
34. Mills, P. K. & Yang, R. Regression Analysis of Pesticide Use and Breast Cancer
Incidence in California Latinas. J. Environ. Health (2006).
21
35. Fan, W. Q. et al. Atrazine-induced aromatase expression is SF-1 dependent: Implications
for endocrine disruption in wildlife and reproductive cancers in humans. Environ. Health
Perspect. (2007). doi:10.1289/ehp.9758
36. Gunier, R. B., Harnly, M. E., Reynolds, P., Hertz, A. & Von Behren, J. Agricultural
pesticide use of California: Pesticide prioritization, use densities, and population
distributions for a childhood cancer study. Environ. Health Perspect. (2001).
doi:10.1289/ehp.011091071
37. Sanderson, J. T., Letcher, R. J., Heneweer, M., Giesy, J. P. & Van Den Berg, M. Effects
of chloro-s-triazine herbicides and metabolites on aromatase activity in various human cell
lines and on vitellogenin production in male carp hepatocytes. Environ. Health Perspect.
(2001). doi:10.1289/ehp.011091027
38. Sanderson, J. T. 2-Chloro-s-Triazine Herbicides Induce Aromatase (CYP19) Activity in
H295R Human Adrenocortical Carcinoma Cells: A Novel Mechanism for Estrogenicity?
Toxicol. Sci. (2000). doi:10.1093/toxsci/54.1.121
39. MacLennan, P. A. et al. Cancer incidence among triazine herbicide manufacturing
workers. J. Occup. Environ. Med. (2002). doi:10.1097/00043764-200211000-00011
40. Kettles, M. A., Browning, S. R., Prince, T. S. & Horstman, S. W. Triazine herbicide
exposure and breast cancer incidence: An ecologic study of Kentucky counties. Environ.
Health Perspect. (1997). doi:10.1289/ehp.971051222
41. Engel, L. S. et al. Pesticide use and breast cancer risk among farmers’ wives in the
agricultural health study. Am. J. Epidemiol. (2005). doi:10.1093/aje/kwi022
42. Reynolds, P. et al. Residential proximity to agricultural pesticide use and incidence of
breast cancer in the California Teachers Study cohort. Environ. Res. (2004).
doi:10.1016/j.envres.2004.03.001
43. Hopenhayn-Rich, C., Stump, M. L. & Browning, S. R. Regional assessment of atrazine
exposure and incidence of breast and ovarian cancers in Kentucky. Arch. Environ.
Contam. Toxicol. (2002). doi:10.1007/s002440010300
44. Muir, K. et al. Breast cancer incidence and its possible spatial association with pesticide
application in two counties of England. Public Health (2004).
doi:10.1016/j.puhe.2003.12.019
45. Reynolds, P. et al. Residential proximity to agricultural pesticide use and incidence of
breast cancer in California, 1988-1997. Environmental Health Perspectives (2005).
doi:10.1289/ehp.7765
46. Wetzel, L. T. et al. Chronic effects of atrazine on estrus and mammary tumor formation in
female sprague-dawley and fischer 344 rats. J. Toxicol. Environ. Health (1994).
22
doi:10.1080/15287399409531913
47. Rooney, A. A., Matulka, R. A. & Luebke, R. W. Developmental atrazine exposure
suppresses immune function in male, but not female Sprague-Dawley rats. Toxicol. Sci.
(2003). doi:10.1093/toxsci/kfg250
48. Imaida, K. & Shirai, T. [Endocrine disrupting chemicals and carcinogenesis--breast, testis
and prostate cancer]. Nihon Rinsho. (2000).
49. Hu, K. et al. Atrazine promotes RM1 prostate cancer cell proliferation by activating
STAT3 signaling. Int. J. Oncol. (2016). doi:10.3892/ijo.2016.3433
50. Inoue-Choi, M. et al. Atrazine in public water supplies and risk of ovarian cancer among
postmenopausal women in the Iowa Women’s Health Study. Occup. Environ. Med.
(2016). doi:10.1136/oemed-2016-103575
51. Rastegar-Moghaddam, S. H., Mohammadipour, A., Hosseini, M., Bargi, R. &
Ebrahimzadeh-Bideskan, A. Maternal exposure to atrazine induces the hippocampal cell
apoptosis in mice offspring and impairs their learning and spatial memory. Toxin Reviews
(2018). doi:10.1080/15569543.2018.1466804
52. Song, X. Y., Li, J. N., Wu, Y. P., Zhang, B. & Li, B. X. Atrazine causes autophagy- and
apoptosis-related neurodegenerative effects in dopaminergic neurons in the rat
nigrostriatal dopaminergic system. Int. J. Mol. Sci. (2015). doi:10.3390/ijms160613490
53. Zhang, B., Ma, K. & Li, B. Inflammatory reaction regulated by microglia plays a role in
atrazine-induced dopaminergic neuron degeneration in the substantia nigra. J. Toxicol. Sci.
(2015). doi:10.2131/jts.40.437
54. Winchester, P. D., Huskins, J. & Ying, J. Agrichemicals in surface water and birth defects
in the United States. Acta Paediatr. Int. J. Paediatr. (2009). doi:10.1111/j.1651-
2227.2008.01207.x
55. Waller, S. A., Paul, K., Peterson, S. E. & Hitti, J. E. Agricultural-related chemical
exposures, season of conception, and risk of gastroschisis in Washington state. Obstetrical
and Gynecological Survey (2010). doi:10.1097/OGX.0b013e3181e5f139
56. Agopian, A. J., Cai, Y., Langlois, P. H., Canfield, M. A. & Lupo, P. J. Maternal
residential atrazine exposure and risk for choanal atresia and stenosis in offspring. J.
Pediatr. (2013). doi:10.1016/j.jpeds.2012.08.012
57. Agopian, A. J., Lupo, P. J., Canfield, M. A. & Langlois, P. H. Case-Control Study of
Maternal Residential Atrazine Exposure and Male Genital Malformations. Am. J. Med.
Genet. Part A (2013). doi:10.1002/ajmg.a.35815
58. Tasca, A. L., Puccini, M. & Fletcher, A. Terbuthylazine and desethylterbuthylazine:
23
Recent occurrence, mobility and removal techniques. Chemosphere (2018).
doi:10.1016/j.chemosphere.2018.03.091
59. Želježić, D. et al. Effects of the chloro-s-triazine herbicide terbuthylazine on DNA
integrity in human and mouse cells. Environ. Sci. Pollut. Res. (2018). doi:10.1007/s11356-
018-2046-7
60. Kane, A. L. et al. Toward bioremediation of methylmercury using silica encapsulated
Escherichia coli harboring the mer operon. PLoS One (2016).
doi:10.1371/journal.pone.0147036
61. Strong, L. C., Rosendahl, C., Johnson, G., Sadowsky, M. J. & Wackett, L. P. Arthrobacter
aurescens TC1 metabolizes diverse s-triazine ring compounds. Appl. Environ. Microbiol.
(2002). doi:10.1128/AEM.68.12.5973-5980.2002
62. Shapir, N. et al. Evolution of catabolic pathways: Genomic insights into microbial s-
triazine metabolism. Journal of Bacteriology (2007). doi:10.1128/JB.01257-06
63. Tyan, Y. C., Yang, M. H., Jong, S. Bin, Wang, C. K. & Shiea, J. Melamine contamination.
Analytical and Bioanalytical Chemistry (2009). doi:10.1007/s00216-009-3009-0
64. Gossner, C. M. E. et al. The melamine incident: Implications for international food and
feed safety. Environmental Health Perspectives (2009). doi:10.1289/ehp.0900949
65. Lin, M. et al. Detection of melamine in gluten, chicken feed, and processed foods using
surface enhanced Raman spectroscopy and HPLC. J. Food Sci. (2008).
doi:10.1111/j.1750-3841.2008.00901.x
66. Hau, A. K., Kwan, T. H. & Li, P. K. Melamine toxicity and the kidney. J. Am. Soc.
Nephrol. 20, 245–250 (2009).
67. Pei, X. et al. The China melamine milk scandal and its implications for food safety
regulation. Food Policy (2011). doi:10.1016/j.foodpol.2011.03.008
68. Bischoff, K. & Rumbeiha, W. K. Pet Food Recalls and Pet Food Contaminants in Small
Animals. Veterinary Clinics of North America - Small Animal Practice (2012).
doi:10.1016/j.cvsm.2011.12.007
69. Xiu, C. & Klein, K. K. Melamine in milk products in China: Examining the factors that
led to deliberate use of the contaminant. Food Policy 35, 463–470 (2010).
70. Shiomi, N. Biodegradation of Melamine and Cyanuric Acid by a Newly-Isolated
Microbacterium Strain. Adv. Microbiol. 02, 303–309 (2012).
71. Takagi, K., Fujii, K., Yamazaki, K. I., Harada, N. & Iwasaki, A. Biodegradation of
melamine and its hydroxy derivatives by a bacterial consortium containing a novel
24
Nocardioides species. Appl. Microbiol. Biotechnol. (2012). doi:10.1007/s00253-011-3673-
9
72. Seffernick, J. L., Dodge, A. G., Sadowsky, M. J., Bumpus, J. A. & Wackett, L. P.
Bacterial ammeline metabolism via guanine deaminase. J. Bacteriol. (2010).
doi:10.1128/JB.01243-09
73. Shelton, D. R., Karns, J. S., Mccarty, G. W. & Durham, D. R. Metabolism of melamine by
Klebsiella terragena. Appl. Environ. Microbiol. (1997).
74. De Souza, M. L., Wackett, L. P., Boundy-Mills, K. L., Mandelbaum, R. T. & Sadowsky,
M. J. Cloning, characterization, and expression of a gene region from Pseudomonas sp.
strain ADP involved in the dechlorination of atrazine. Appl. Environ. Microbiol. 61,
3373–3378 (1995).
75. Souza, M. L. De, Sadowsky, M. J. & Wackett, L. P. Atrazine chlorohydrolase from
Pseudomonas sp . strain ADP : gene sequence , enzyme purification , and protein
characterization . Atrazine Chlorohydrolase from Pseudomonas sp . Strain ADP : Gene
Sequence , Enzyme Purification , and Protein Characterization. J. Bacteriol. 178, 4894–
4900 (1996).
76. De Souza, M. L. et al. Erratum: Molecular basis of a bacterial consortium: Interspecies
catabolism of atrazine (Applied and Environmental (1998) 64:1 (178-184)). Applied and
Environmental Microbiology (2000). doi:10.1128/AEM.66.3.1252-1252.2000
77. Solomon, R. D. J., Kumar, A. & Satheeja Santhi, V. Atrazine biodegradation efficiency,
metabolite detection, and trzD gene expression by enrichment bacterial cultures from
agricultural soil. J. Zhejiang Univ. Sci. B (2013). doi:10.1631/jzus.B1300001
78. Peat, T. S. et al. The structure of the hexameric atrazine chlorohydrolase AtzA research
papers. 710–720 (2015). doi:10.1107/S1399004715000619
79. Boundy-mills, K. L., Souza, M. L. D. E. & Mandelbaum, R. T. The atzB gene of
Pseudomonas sp . strain ADP encodes the second enzyme of a novel atrazine degradation
pathway . The atzB Gene of Pseudomonas sp . Strain ADP Encodes the Second Enzyme
of a Novel Atrazine Degradation Pathway †. 63, 916–923 (1997).
80. Seffernick, J. L. et al. Hydroxyatrazine N-ethylaminohydrolase (AtzB): An
amidohydrolase superfamily enzyme catalyzing deamination and dechlorination. J.
Bacteriol. 189, 6989–6997 (2007).
81. Sadowsky, M. J., Tong, Z., De Souza, M. & Wackett, L. P. AtzC is a new member of the
amidohydrolase protein superfamily and is homologous to other atrazine-metabolizing
enzymes. J. Bacteriol. 180, 152–158 (1998).
82. Shapir, N., Osborne, J. P., Johnson, G., Sadowsky, M. J. & Wackett, L. P. Purification,
25
substrate range, and metal center of AtzC: The N-isopropylammelide aminohydrolase
involved in bacterial atrazine metabolism. J. Bacteriol. 184, 5376–5384 (2002).
83. Jurina, T. et al. Catabolism of terbuthylazine by mixed bacterial culture originating from
s-triazine-contaminated soil. Appl. Microbiol. Biotechnol. 98, 7223–7232 (2014).
84. Udikoviç-Koliç, N., Scott, C. & Martin-Laurent, F. Evolution of atrazine-degrading
capabilities in the environment. Applied Microbiology and Biotechnology (2012).
doi:10.1007/s00253-012-4495-0
85. Balotra, S. et al. X-Ray Structure and Mutagenesis Studies of the N-Isopropylammelide
Isopropylaminohydrolase, AtzC. PLoS One 10, e0137700 (2015).
86. Chelinho, S. et al. Cleanup of atrazine-contaminated soils: Ecotoxicological study on the
efficacy of a bioremediation tool with Pseudomonas sp. ADP. J. Soils Sediments (2010).
doi:10.1007/s11368-009-0145-2
87. Chelinho, S. et al. Semifield testing of a bioremediation tool for atrazine-contaminated
soils: Evaluating the efficacy on soil and aquatic compartments. Environ. Toxicol. Chem.
(2012). doi:10.1002/etc.1840
88. Wackett, L., Sadowsky, M., Martinez, B. & Shapir, N. Biodegradation of atrazine and
related s-triazine compounds: From enzymes to field studies. Applied Microbiology and
Biotechnology 58, 39–45 (2002).
89. Johannesen, H. & Aamand, J. Mineralization of aged atrazine, terbuthylazine, 2,4-D, and
mecoprop in soil and aquifer sediment. Environ. Toxicol. Chem. (2003).
doi:10.1897/1551-5028(2003)022<0722:MOAATD>2.0.CO;2
90. Narayanaswamy, R. et al. Widespread reorganization of metabolic enzymes into
reversible assemblies upon nutrient starvation. Proc. Natl. Acad. Sci. (2009).
doi:10.1073/pnas.0812771106
91. Kurganov, B. I. The role of multienzyme complexes in integration of cellular metabolism.
J. Theor. Biol. (1986). doi:10.1016/S0022-5193(86)80194-1
92. Zhao, H., French, J. B., Fang, Y. & Benkovic, S. J. The purinosome, a multi-protein
complex involved in the de novo biosynthesis of purines in humans. Chem. Commun.
(2013). doi:10.1039/c3cc41437j
93. An, S., Kumar, R., Sheets, E. D. & Benkovic, S. J. Reversible compartmentalization of de
novo purine biosynthetic complexes in living cells. Science 320, 103–106 (2008).
94. Pedley, A. M. & Benkovic, S. J. A New View into the Regulation of Purine Metabolism:
The Purinosome. Trends in Biochemical Sciences (2017). doi:10.1016/j.tibs.2016.09.009
26
95. Castellana, M. et al. Enzyme clustering accelerates processing of intermediates through
metabolic channeling. Nat. Biotechnol. (2014). doi:10.1038/nbt.3018
96. Küchler, A., Yoshimoto, M., Luginbühl, S., Mavelli, F. & Walde, P. Enzymatic reactions
in confined environments. Nat. Nanotechnol. (2016). doi:10.1038/nnano.2016.54
97. Bulutoglu, B., Garcia, K. E., Wu, F., Minteer, S. D. & Banta, S. Direct Evidence for
Metabolon Formation and Substrate Channeling in Recombinant TCA Cycle Enzymes.
ACS Chem. Biol. (2016). doi:10.1021/acschembio.6b00523
98. Dueber, J. E. et al. Synthetic protein scaffolds provide modular control over metabolic
flux. Nat. Biotechnol. 27, 753–759 (2009).
99. Dvorak, P., Bidmanova, S., Damborsky, J. & Prokop, Z. Immobilized synthetic pathway
for biodegradation of toxic recalcitrant pollutant 1,2,3-trichloropropane. Environ. Sci.
Technol. (2014). doi:10.1021/es500396r
100. Yang, L. et al. Computation-Guided Design of a Stimulus-Responsive Multienzyme
Supramolecular Assembly. ChemBioChem 18, 2000–2006 (2017).
101. Hsia, Y. et al. Design of a hyperstable 60-subunit protein icosahedron. Nature 535, 136–
139 (2016).
102. Bale, J. B. et al. Accurate design of megadalton-scale two-component icosahedral protein
complexes. Science (80-. ). (2016). doi:10.1126/science.aaf8818
103. King, N. P. et al. Computational design of self-assembling protein nanomaterials with
atomic level accuracy. Science (80-. ). 336, 1171–1174 (2012).
104. Votteler, J. et al. Designed proteins induce the formation of nanocage-containing
extracellular vesicles. Nature (2016). doi:10.1038/nature20607
105. Suzuki, Y. et al. Self-assembly of coherently dynamic, auxetic, two-dimensional protein
crystals. Nature 533, 369–373 (2016).
106. Sinclair, J. C., Davies, K. M., Vénien-Bryan, C. & Noble, M. E. M. Generation of protein
lattices by fusing proteins with matching rotational symmetry. Nat. Nanotechnol. 6, 558–
562 (2011).
107. Padilla, J. E., Colovos, C. & Yeates, T. O. Nanohedra: Using symmetry to design self
assembling protein cages, layers, crystals, and filaments. Proc. Natl. Acad. Sci. 98, 2217–
2221 (2001).
108. Zhang, J., Zheng, F. & Grigoryan, G. Design and designability of protein-based
assemblies. Current Opinion in Structural Biology 27, 79–86 (2014).
27
109. Mandelbrot, B. Fractals - a geometry of nature. New Sci. (1990). doi:citeulike-article-
id:580392
110. Havlin, S. et al. Fractals in biology and medicine. Chaos, Solitons and Fractals (1995).
doi:10.1016/0960-0779(95)80025-C
111. Fairbanks, M. S., McCarthy, D. N., Scott, S. A., Brown, S. A. & Taylor, R. P. Fractal
electronic devices: Simulation and implementation. Nanotechnology 22, (2011).
112. Soleymani, L., Fang, Z., Sargent, E. H. & Kelley, S. O. Programming the detection limits
of biosensors through controlled nanostructuring. Nat. Nanotechnol. 4, 844–848 (2009).
113. Ge, J., Lei, J. & Zare, R. N. Protein-inorganic hybrid nanoflowers. Nat. Nanotechnol. 7,
428–432 (2012).
114. Zhang, P. & Wang, S. Designing fractal nanostructured biointerfaces for biomedical
applications. ChemPhysChem 15, 1550–1561 (2014).
115. Lim, B. et al. Pd-Pt bimetallic nanodendrites with high activity for oxygen reduction.
Science (80-. ). 324, 1302–1305 (2009).
116. Thekkekara, L. V. & Gu, M. Bioinspired fractal electrodes for solar energy storages. Sci.
Rep. (2017). doi:10.1038/srep45585
117. Chamousis, R. L. et al. Effect of fractal silver electrodes on charge collection and light
distribution in semiconducting organic polymer films. J. Mater. Chem. A (2014).
doi:10.1039/c4ta03204g
118. Watterson, W. J., Montgomery, R. D. & Taylor, R. P. Fractal Electrodes as a Generic
Interface for Stimulating Neurons. Sci. Rep. (2017). doi:10.1038/s41598-017-06762-3
119. Yang, C. et al. Fractal dendrite-based electrically conductive composites for laser-scribed
flexible circuits. Nat. Commun. (2015). doi:10.1038/ncomms9150
120. Cerofolini, G. F., Narducci, D., Amato, P. & Romano, E. Fractal nanotechnology.
Nanoscale Res. Lett. 3, 381–385 (2008).
121. Shang, J. et al. Assembling molecular Sierpiński triangle fractals. Nat. Chem. 7, 389–393
(2015).
122. Shin, S. et al. Polymer Self-Assembly into Unique Fractal Nanostructures in Solution by a
One-Shot Synthetic Procedure. J. Am. Chem. Soc. 140, 475–482 (2018).
123. Murr, M. M. & Morse, D. E. Fractal intermediates in the self-assembly of silicatein
filaments. Proc. Natl. Acad. Sci. 102, 11657–11662 (2005).
28
124. Khire, T. S., Kundu, J., Kundu, S. C. & Yadavalli, V. K. The fractal self-assembly of the
silk protein sericin. Soft Matter 6, 2066 (2010).
125. Lomander, A., Hwang, W. & Zhang, S. Hierarchical self-assembly of a coiled-coil peptide
into fractal structure. Nano Lett. 5, 1255–1260 (2005).
126. Kurland, N. E., Kundu, J., Pal, S., Kundu, S. C. & Yadavalli, V. K. Self-assembly
mechanisms of silk protein nanostructures on two-dimensional surfaces. Soft Matter
(2012). doi:10.1039/c2sm25313e
127. Yeates, T. O. Geometric Principles for Designing Highly Symmetric Self-Assembling
Protein Nanomaterials. Annu. Rev. Biophys. (2017). doi:10.1146/annurev-biophys-
070816-033928
128. Lai, Y. T., King, N. P. & Yeates, T. O. Principles for designing ordered protein
assemblies. Trends in Cell Biology 22, 653–661 (2012).
129. Kaneko, T. et al. Superbinder SH2 domains act as antagonists of cell signaling. Sci.
Signal. 5, (2012).
130. Cho, S. et al. Cyanuric Acid Hydrolase from Azorhizobium caulinodans ORS 571: Crystal
Structure and Insights into a New Class of Ser-Lys Dyad Proteins. PLoS One 9, e99349
(2014).
131. Mandelbrot, B. The fractal geometry of nature. 406 (1983). doi:10.1002/esp.3290080415
132. Losa, G.A., Merlini, D., Nonnenmacher, T.F., Weibel, E. . Mathematics and biosciences
in interaction. in Fractals in biology and medicine. Volume IV. vii, 314 (Birkhäuser,
Basel, 2005).
133. Newkome, G. R. et al. Nanoassembly of a fractal polymer: A molecular ‘Sierpinski
hexagonal gasket’. Science (80-. ). 312, 1782–1785 (2006).
134. Newkome, G. R. & Moorefield, C. N. From 1 → 3 dendritic designs to fractal
supramacromolecular constructs: understanding the pathway to the Sierpiński gasket.
Chem. Soc. Rev. 44, 3954–3967 (2015).
135. Astier, Y., Bayley, H. & Howorka, S. Protein components for nanodevices. Current
Opinion in Chemical Biology 9, 576–584 (2005).
136. Shen, W., Lammertink, R. G. H., Sakata, J. K., Kornfield, J. A. & Tirrell, D. A. Assembly
of an artificial protein hydrogel through leucine zipper aggregation and bisulfide bond
formation. Macromolecules 38, 3909–3916 (2005).
137. McManus, J. J., Charbonneau, P., Zaccarelli, E. & Asherie, N. The physics of protein self-
assembly. Curr. Opin. Colloid Interface Sci. 22, 73–79 (2016).
29
138. Brodin, J. D. et al. Metal-directed, chemically tunable assembly of one-, two- and three-
dimensional crystalline protein arrays. Nat. Chem. 4, 375–382 (2012).
139. Ringler, P. & Schulz, G. E. Self-assembly of proteins into designed networks. Science
(80-. ). 302, 106–109 (2003).
140. Lindenmayer, A. Mathematical models for cellular interactions in development II. Simple
and branching filaments with two-sided inputs. J. Theor. Biol. 18, 300–315 (1968).
141. Kaneko, T. et al. Superbinder SH2 Domains Act as Antagonists of Cell Signaling. Sci.
Signal. 5, ra68-ra68 (2012).
142. Richter, F., Leaver-Fay, A., Khare, S. D., Bjelic, S. & Baker, D. De novo enzyme design
using Rosetta3. PLoS One 6, (2011).
143. Van Anders, G., Ahmed, N. K., Smith, R., Engel, M. & Glotzer, S. C. Entropically patchy
particles: Engineering valence through shape entropy. ACS Nano 8, 931–940 (2014).
144. Zhang, Z. & Glotzer, S. C. Self-assembly of patchy particles. Nano Lett. 4, 1407–1413
(2004).
145. Nicolas-Carlock, J. R., Carrillo-Estrada, J. L. & Dossetti, V. Fractality a la carte: A
general particle aggregation model. Sci. Rep. 6, (2016).
146. Dantas, G., Kuhlman, B., Callender, D., Wong, M. & Baker, D. A large scale test of
computational protein design: Folding and stability of nine completely redesigned
globular proteins. J. Mol. Biol. 332, 449–460 (2003).
147. Tinberg, C. E. et al. Computational design of ligand-binding proteins with high affinity
and selectivity. Nature 501, 212–6 (2013).
148. Meiler, J. & Baker, D. ROSETTALIGAND: Protein-small molecule docking with full
side-chain flexibility. Proteins Struct. Funct. Genet. 65, 538–548 (2006).
149. Tyka, M. D. et al. Alternate states of proteins revealed by detailed energy landscape
mapping. J. Mol. Biol. 405, 607–618 (2011).
150. Zanghellini, A. et al. New algorithms and an in silico benchmark for computational
enzyme design. Protein Sci. 15, 2785–2794 (2006).
151. Berman, H. M. et al. The protein data bank. Nucleic Acids Res. 28, 235–242 (2000).
152. Mandell, D. J. & Kortemme, T. Backbone flexibility in computational protein design.
Current Opinion in Biotechnology 20, 420–428 (2009).
153. Fleishman, S. J. et al. Rosettascripts: A scripting language interface to the Rosetta
30
Macromolecular modeling suite. PLoS One 6, (2011).
154. Mandelbaum, R. T., Allan, D. l. & Wackett, L. P. Isolation and Characterization of a
Pseudomonas sp . That Mineralizes the s -Triazine Herbicide Atrazine. Appl. Environ.
Microbiol. 61, 1451–1457 (1995).
155. Seffernick, J. L., Johnson, G., Sadowsky, M. J. & Wackett, L. P. Substrate specificity of
atrazine chlorohydrolase and atrazine-catabolizing bacteria. Appl. Environ. Microbiol. 66,
4247–4252 (2000).
156. Gibson, D. G. et al. Enzymatic assembly of DNA molecules up to several hundred
kilobases. Nat. Methods 6, 343–5 (2009).
157. Shapir, N. et al. TrzN from Arthrobacter aurescens TC1 is a zinc amidohydrolase. J.
Bacteriol. 188, 5859–5864 (2006).
158. Parton, D. L. et al. An open library of human kinase domain constructs for automated
bacterial expression. bioRxiv (2016).
159. Cameron, S. M., Durchschein, K., Richman, J. E., Sadowsky, M. J. & Wackett, L. P. New
family of biuret hydrolases involved in s -triazine ring metabolism. ACS Catal. 1, 1075–
1082 (2011).
160. Li, Q., Seffernick, J. L., Sadowsky, M. J. & Wackett, L. P. Thermostable cyanuric acid
hydrolase from Moorella thermoacetica ATCC 39073. Appl. Environ. Microbiol. 75,
6986–6991 (2009).
161. Nečas, D. & Klapetek, P. Gwyddion: an open-source software for SPM data analysis.
Open Phys. 10, 181–188 (2012).
162. Kremer, J. R., Mastronarde, D. N. & McIntosh, J. R. Computer visualization of three-
dimensional image data using IMOD. J. Struct. Biol. 116, 71–6 (1996).
163. Pettersen, E. F. et al. UCSF Chimera - A visualization system for exploratory research and
analysis. J. Comput. Chem. 25, 1605–1612 (2004).
164. Mutlu, B. R., Yeom, S., Wackett, L. P. & Aksan, A. Modelling and optimization of a
bioremediation system utilizing silica gel encapsulated whole-cell biocatalyst. Chem. Eng.
J. 259, 574–580 (2015).
165. Sontz, P. A., Bailey, J. B., Ahn, S. & Tezcan, F. A. A Metal Organic Framework with
Spherical Protein Nodes: Rational Chemical Design of 3D Protein Crystals. J. Am. Chem.
Soc. 137, 11598–11601 (2015).
166. Hausdorff, F. Dimension und äußeres Maß. Math. Ann. 79, 157–179 (1919).
31
167. Meakin, P. Formation of fractal clusters and networks by irreversible diffusion-limited
aggregation. Phys. Rev. Lett. 51, 1119–1122 (1983).
168. Meakin, P. Diffusion-controlled cluster formation in 2-6 dimensional space. Phys. Rev. A
27, 1495–1507 (1983).
169. Kirkby, M. J. The fractal geometry of nature. Benoit B. Mandelbrot. W. H. Freeman and
co., San Francisco, 1982. No. of pages: 460. Price: £22.75 (hardback). Earth Surf.
Process. Landforms 8, 406–406 (1983).
170. Smith, T. G., Lange, G. D. & Marks, W. B. Fractal methods and results in cellular
morphology - Dimensions, lacunarity and multifractals. Journal of Neuroscience Methods
69, 123–136 (1996).
171. Sass, J. B. & Colangelo, A. European Union bans atrazine, while the United States
negotiates continued use. Int. J. Occup. Environ. Health 12, 260–267 (2006).
172. Fuhrmann, A., Gans, O., Weiss, S., Haberhauer, G. & Gerzabek, M. H. Determination of
bentazone, chloridazon and terbuthylazine and some of their metabolites in complex
environmental matrices by liquid chromatography-electrospray ionization-tandem mass
spectrometry using a modified QuEChERS method: An optimization and vali. Water. Air.
Soil Pollut. 225, (2014).
173. Kolić, N. U. et al. Combined metabolic activity within an atrazine-mineralizing
community enriched from agrochemical factory soil. Int. Biodeterior. Biodegrad. 60, 299–
307 (2007).
174. Frisch, M. J. et al. Gaussian 09, Revision D.01. Gaussian Inc. Wallingford CT (2009).
doi:10.1159/000348293
175. Lee, C., Yang, W. & Parr, R. G. Development of the Colle-Salvetti correlation-energy
formula into a functional of the electron density. Phys. Rev. B 37, 785–789 (1988).
176. Hay, P. J. & Wadt, W. R. Ab initio effective core potentials for molecular calculations.
Potentials for the transition metal atoms Sc to Hg. J. Chem. Phys. 82, 270 (1985).
177. Kunkel, T. a. Rapid and efficient site-specific mutagenesis without phenotypic selection.
Proc. Natl. Acad. Sci. U. S. A. 82, 488–492 (1985).
178. Kuhlman, B. & Baker, D. Native protein sequences are close to optimal for their
structures. Proc. Natl. Acad. Sci. 97, 10383–10388 (2000).
179. Copley, S. D. Evolution of Efficient Pathways for Degradation of Anthropogenic
Chemicals. Dev. Biol. 5, 559–566 (2010).
180. Shapir, N., Osborne, J. P., Johnson, G., Sadowsky, M. J. & Wackett, L. P. Purification,
32
substrate range, and metal center of AtzC: The N-isopropylammelide aminohydrolase
involved in bacterial atrazine metabolism. J. Bacteriol. 184, 5376–5384 (2002).
181. Thoden, J. B., Phillips, G. N., Neal, T. M., Raushel, F. M. & Holden, H. M. Molecular
structure of dihydroorotase: a paradigm for catalysis through the use of a binuclear metal
center. Biochemistry 40, 6989–6997 (2001).
182. Hall, R. S. et al. Three-dimensional structure and catalytic mechanism of cytosine
deaminase. Biochemistry 50, 5077–5085 (2011).
183. Liao, R. Z., Yu, J. G., Raushel, F. M. & Himo, F. Theoretical investigation of the reaction
mechanism of the dinuclear zinc enzyme dihydroorotase. Chem. - A Eur. J. 14, 4287–4292
(2008).
184. Copley, S. D. Evolution of efficient pathways for degradation of anthropogenic chemicals.
Nat. Chem. Biol. 5, 559–566 (2009).
185. Gaussian 09, Revision D.01, M. J. Frisch, G. W. Trucks, H. B. Schlegel, G. E. Scuseria,
M. A. Robb, J. R. Cheeseman, G. Scalmani, V. Barone, B. Mennucci, G. A. Petersson, H.
Nakatsuji, M. Caricato, X. Li, H. P. Hratchian, A. F. Izmaylov, J. Bloino, G. Zhe, 2009.
No Title.
186. Barone, V. & Cossi, M. Quantum calculation of molecular energies and energy gradients
in solution by a conductor solvent model. J. Phys. Chem. A 5639, 1995–2001 (1998).
33
2. Stimulus-responsive Self-Assembly of Enzymatic Fractals by Computational Design
2.1. Abstract
Fractal topologies, which are statistically self-similar over multiple length scales, are pervasive
in nature. The recurrence of patterns at increasing length scales in fractal-shaped branched
objects, e.g., trees, lungs, and sponges, results in high effective surface areas, and provides key
functional advantages, e.g., for molecular trapping and exchange. Mimicking these topologies in
designed protein-based assemblies will provide access to novel classes of functional biomaterials
for wide ranging applications. Here we describe a modular, multi-scale computational design
method for the reversible self-assembly of proteins into tunable supramolecular fractal-like
topologies in response to phosphorylation. Computationally-guided atomic-resolution modeling
of fusions of symmetric, oligomeric proteins with Src homology 2 (SH2) binding domain and its
phosphorylatable ligand peptide was used to design iterative branching leading to assembly
formation by two enzymes of the atrazine degradation pathway. Structural characterization using
various microscopy techniques and Cryo-electron tomography revealed a variety of dendritic,
hyperbranched, and sponge-like topologies which are self-similar over three decades (~10nm-
10m) of length scale, in agreement with models from multi-scale computational simulations.
Control over assembly topology and formation dynamics is demonstrated. Owing to their
sponge-like structure on the nanoscale, fractal assemblies are capable of efficient and
phosphorylation-dependent reversible macromolecular capture. The described design method
should enable the construction of a variety of novel, spatiotemporally responsive biomaterials
featuring fractal topologies.
34
2.2. Introduction
Fractional-dimensional (fractal) geometry – a property of shapes that are invariant or nearly
invariant to scale magnification or contraction across many length scales – is a common feature
of many natural objects131. Fractal forms are ubiquitous in geology, e.g., in the architecture of
mountain ranges, coastlines, snowflakes, and in physiology, e.g., neuronal and capillary
networks, and nasal membranes, where highly efficient molecular exchange occurs due to a
fractal-induced high surface area:volume ratio132. Fabrication of fractal-like nanomaterials
affords high physical connectivity within patterned objects111, ultrasensitive detection of target
binding moieties by patterned nanosensors112, and rapid exchange and dispersal of energy and
matter113. An intimate link between structural fractal properties of designed, nanotextured
materials and functional advantages (e.g., detection sensitivity) has been demonstrated112, and
synthetic fractal materials are finding applications in sensing, molecular electronics, high-
performance filtration, sunlight collection, surface charge storage, and catalysis, among myriad
other uses114,115. Many fractal fabrication efforts have relied on top-down patterning of
surfaces120. The bottom-up design of supramolecular fractal topologies – both deterministic (e.g.,
Sierpinski’s triangles)121,133 and stochastic fractals (e.g., arborols)122,134– has been performed
with small molecule building blocks such as inorganic metal-ligand complexes or synthetic
dendritic polymers utilizing co-ordinate or covalent bonds, respectively. However, fractal
topologies have not been designed with biomacromolecules, which possess a wide range of
functionality, biocompatibility, and whose properties are dynamically controllable by reversible
non-covalent forces135. While fractal-like topologies have been detected as intermediates in the
formation of natural protein-based biomaterials such as biosilica and silk123,124, and observed in
peptide assemblies125,136, their tunable construction by utilizing reversible non-covalent
35
interactions between protein building blocks under mild conditions remains a fundamental
design challenge.
Self-assembly of engineered proteins137 provides a general framework for the controllable and
bottom-up fabrication of novel biomaterials with chosen supramolecular topologies but these
approaches have, thus far, been applied to the design of integer (two or three)-dimensional
ordered patterns such as layers, lattices, and polyhedra101,103,105–108. While external triggers such
as metal ions and redox conditions have been used to trigger synthetic protein and peptide
assemblies125,136,138,139, phosphorylation – a common biological stimulus used for dynamic
control over protein function – has yet to be utilized for controlling protein assembly formation.
Among stochastic fractals, an arboreal (tree-like) shape is an elementary topology that can be
generated using stochastic branching algorithms, e.g., L-systems140, in which the probability of
branching, length and number of branches, and branching angle ranges at each iteration
determine the emergent topology (Fig. 2.1.A). To implement a general approach for tunably
building arboreal fractal morphologies using triggerable self-assembly of protein building
blocks, we envisioned the need for three design elements: (a) multiply branching components,
(b) a modular system for connecting these components reversibly in response to a chosen
chemical trigger, and (c) limited conformational flexibility at protein-protein connection points,
such that stochastic but directional propagation of multiple branching geometries leads to
emergent fractal-like supramolecular topologies. We chose (a) the oligomeric enzymes AtzA
(hexameric) and AtzC (tetrameric) of the atrazine biodegradation pathway88 featuring dihedral
(D3 and D2, respectively) symmetry (Fig. 2.1.B), (b) a phosphopeptide (pY) tag with its
36
corresponding engineered high-affinity “superbinder” Src homology 2 (SH2) domain100,141, and
(c) short designed linker segments as these design elements, respectively (Fig. 2.1.B,C,D). The
sequences and conformational landscapes of the designed protein components were obtained
using a procedure implemented in the Rosetta macromolecular modeling program aimed at
making a maximum of three divalent connections between AtzA and AtzC mediated by SH2
domain-phosphopeptide binding: first, one of the C2 axes of the crystallographic structures of the
two components were aligned. (Fig. 2.1.B). Two alignments (Fig. 2.1.E,F), obtained by rotating
AtzA (hexamer) by 180o about its C3 axis, were considered, and the remaining two symmetry-
compatible degrees of freedom for placement – the inter-component center-of-mass distance d
and rotation angle about the aligned axis of symmetry – were varied (Fig. 2.1.B,E,F). The
resulting placements were evaluated using RosettaMatch142 for geometrically feasible fusion to
the SH2 domain and phosphopeptide with the C-terminal AtzC and N-terminal of AtzA,
respectively. Loop closure and optimization of the new intra- and inter-component interfaces
generated by fusion and placement, respectively, were performed using Rosetta Kinematic Loop
Closure and RosettaDesign. Five AtzA-AtzC design pairs were chosen for experimental
characterization based on calculated interface energies in the designed conformation, number of
residue insertions in connecting loops (zero), total number of substitutions (<5), and visual
examination of design models.
To evaluate the energetically favorable emergent structures upon assembly formation dictated by
designed inter-component interactions, the conformational landscape over all (d,) pairs (Fig.
2.1.E,F) was constructed using Rosetta SymmetricFastRelax simulations for a designed
hexamer-tetramer complex, and the calculated energies (Figs. 2.1.E,F, Fig.2.2) were Boltzmann-
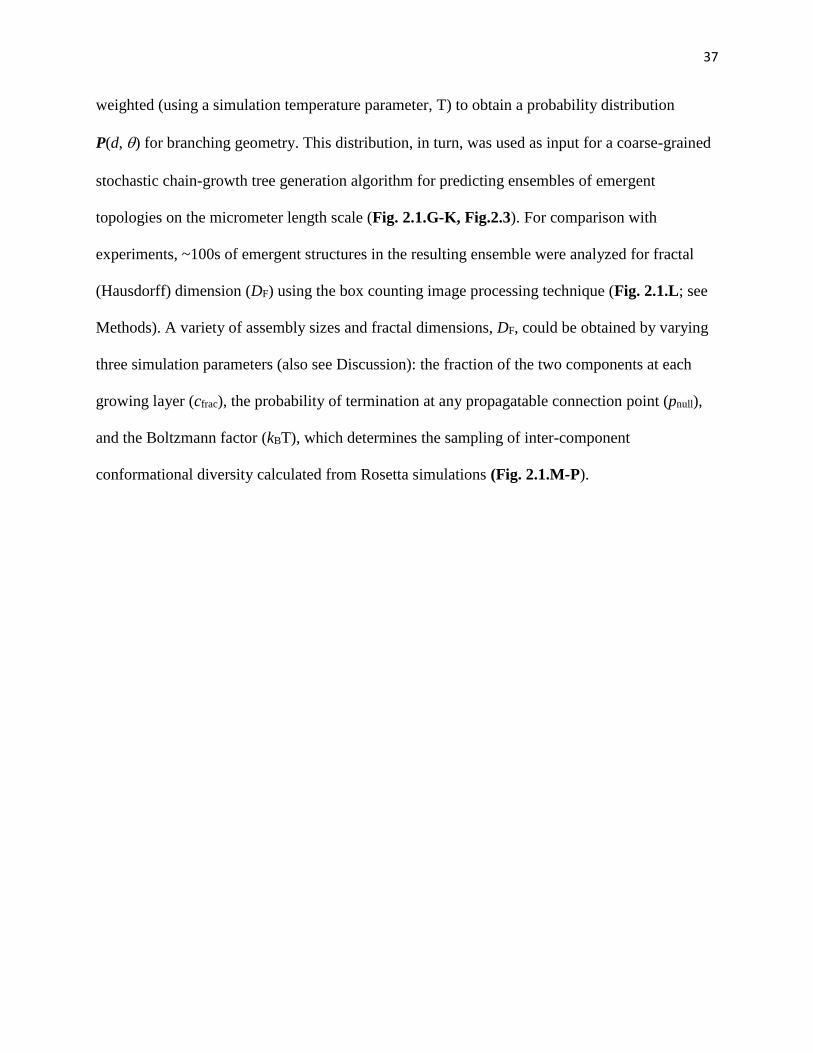
37
weighted (using a simulation temperature parameter, T) to obtain a probability distribution
P(d,) for branching geometry. This distribution, in turn, was used as input for a coarse-grained
stochastic chain-growth tree generation algorithm for predicting ensembles of emergent
topologies on the micrometer length scale (Fig. 2.1.G-K, Fig.2.3). For comparison with
experiments, ~100s of emergent structures in the resulting ensemble were analyzed for fractal
(Hausdorff) dimension (DF) using the box counting image processing technique (Fig. 2.1.L; see
Methods). A variety of assembly sizes and fractal dimensions, DF, could be obtained by varying
three simulation parameters (also see Discussion): the fraction of the two components at each
growing layer (cfrac), the probability of termination at any propagatable connection point (pnull),
and the Boltzmann factor (kBT), which determines the sampling of inter-component
conformational diversity calculated from Rosetta simulations (Fig. 2.1.M-P).
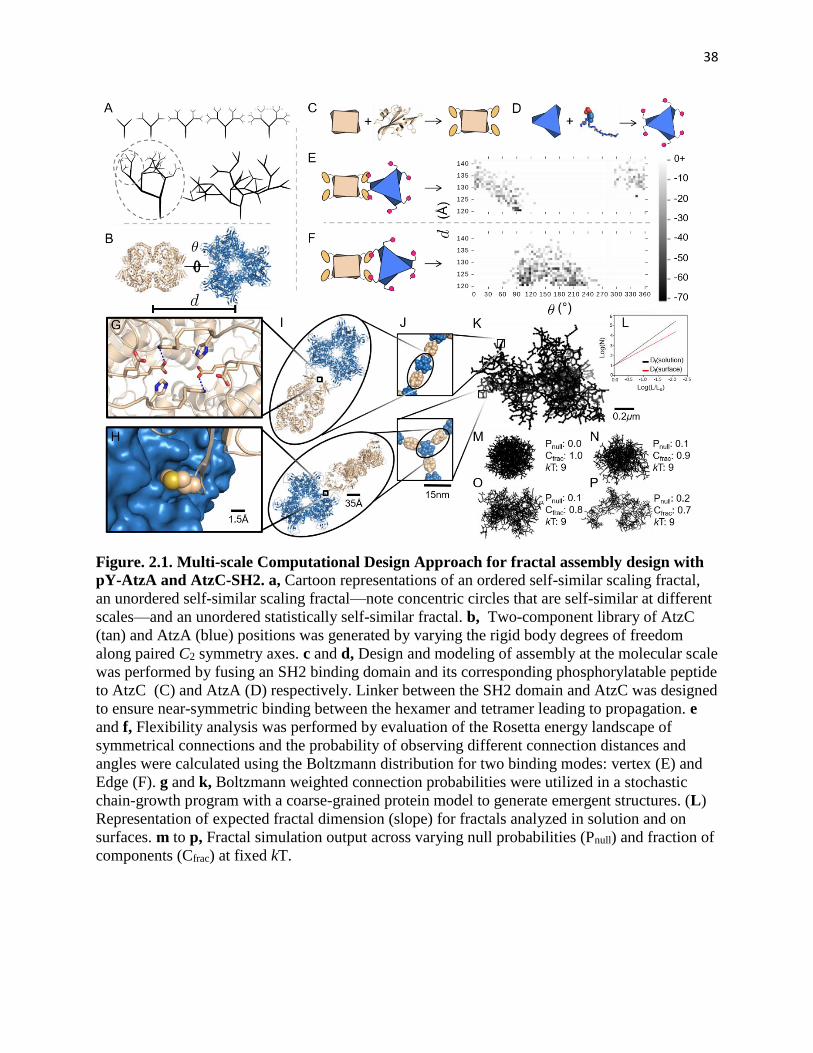
38
Figure. 2.1. Multi-scale Computational Design Approach for fractal assembly design with
pY-AtzA and AtzC-SH2. a, Cartoon representations of an ordered self-similar scaling fractal,
an unordered self-similar scaling fractal—note concentric circles that are self-similar at different
scales—and an unordered statistically self-similar fractal. b, Two-component library of AtzC
(tan) and AtzA (blue) positions was generated by varying the rigid body degrees of freedom
along paired C2 symmetry axes. c and d, Design and modeling of assembly at the molecular scale
was performed by fusing an SH2 binding domain and its corresponding phosphorylatable peptide
to AtzC (C) and AtzA (D) respectively. Linker between the SH2 domain and AtzC was designed
to ensure near-symmetric binding between the hexamer and tetramer leading to propagation. e
and f, Flexibility analysis was performed by evaluation of the Rosetta energy landscape of
symmetrical connections and the probability of observing different connection distances and
angles were calculated using the Boltzmann distribution for two binding modes: vertex (E) and
Edge (F). g and k, Boltzmann weighted connection probabilities were utilized in a stochastic
chain-growth program with a coarse-grained protein model to generate emergent structures. (L)
Representation of expected fractal dimension (slope) for fractals analyzed in solution and on
surfaces. m to p, Fractal simulation output across varying null probabilities (Pnull) and fraction of
components (Cfrac) at fixed kT.
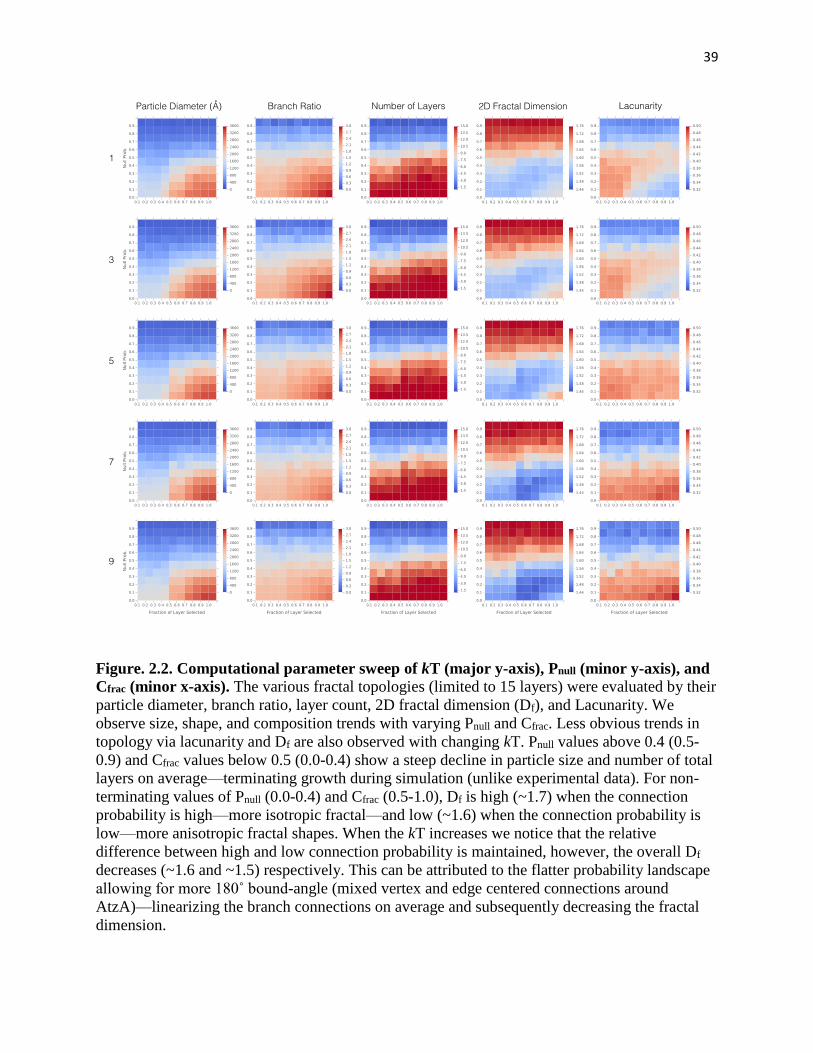
39
Figure. 2.2. Computational parameter sweep of kT (major y-axis), Pnull (minor y-axis), and
Cfrac (minor x-axis). The various fractal topologies (limited to 15 layers) were evaluated by their
particle diameter, branch ratio, layer count, 2D fractal dimension (Df), and Lacunarity. We
observe size, shape, and composition trends with varying Pnull and Cfrac. Less obvious trends in
topology via lacunarity and Df are also observed with changing kT. Pnull values above 0.4 (0.5-
0.9) and Cfrac values below 0.5 (0.0-0.4) show a steep decline in particle size and number of total
layers on average—terminating growth during simulation (unlike experimental data). For non-
terminating values of Pnull (0.0-0.4) and Cfrac (0.5-1.0), Df is high (~1.7) when the connection
probability is high—more isotropic fractal—and low (~1.6) when the connection probability is
low—more anisotropic fractal shapes. When the kT increases we notice that the relative
difference between high and low connection probability is maintained, however, the overall Df
decreases (~1.6 and ~1.5) respectively. This can be attributed to the flatter probability landscape
allowing for more 180˚ bound-angle (mixed vertex and edge centered connections around
AtzA)—linearizing the branch connections on average and subsequently decreasing the fractal
dimension.
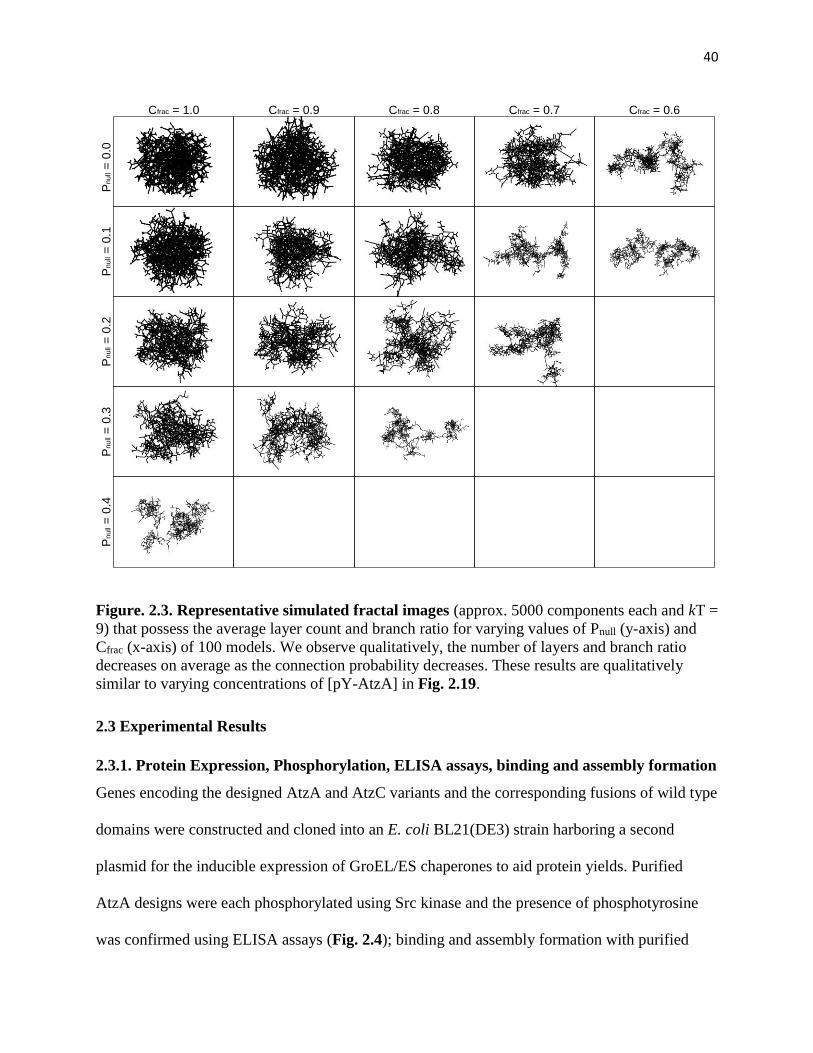
40
Figure. 2.3. Representative simulated fractal images (approx. 5000 components each and kT =
9) that possess the average layer count and branch ratio for varying values of Pnull (y-axis) and
Cfrac (x-axis) of 100 models. We observe qualitatively, the number of layers and branch ratio
decreases on average as the connection probability decreases. These results are qualitatively
similar to varying concentrations of [pY-AtzA] in Fig. 2.19.
2.3 Experimental Results
2.3.1. Protein Expression, Phosphorylation, ELISA assays, binding and assembly formation
Genes encoding the designed AtzA and AtzC variants and the corresponding fusions of wild type
domains were constructed and cloned into an E. coli BL21(DE3) strain harboring a second
plasmid for the inducible expression of GroEL/ES chaperones to aid protein yields. Purified
AtzA designs were each phosphorylated using Src kinase and the presence of phosphotyrosine
was confirmed using ELISA assays (Fig. 2.4); binding and assembly formation with purified
Cfrac = 1.0 Cfrac = 0.9 Cfrac = 0.8 Cfrac = 0.7 Cfrac = 0.6P
null =
0.4
Pn
ull =
0.3
Pn
ull =
0.2
Pn
ull =
0.1
Pnu
ll =
0.0
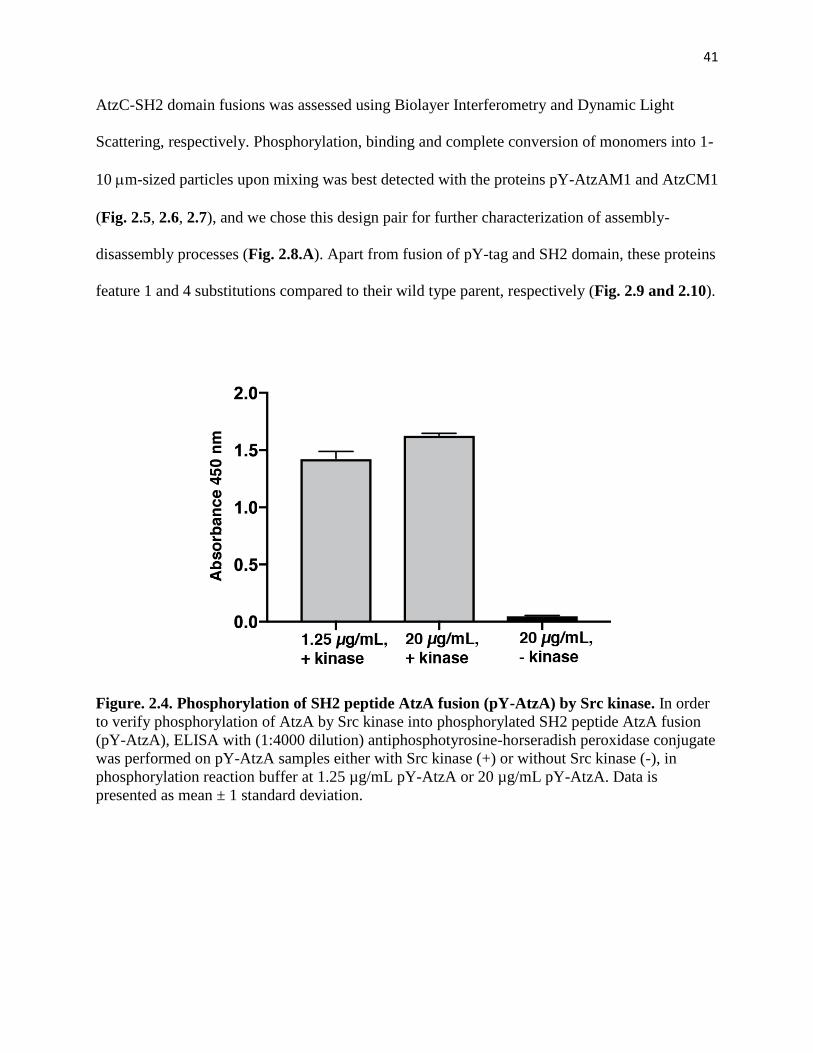
41
AtzC-SH2 domain fusions was assessed using Biolayer Interferometry and Dynamic Light
Scattering, respectively. Phosphorylation, binding and complete conversion of monomers into 1-
10 m-sized particles upon mixing was best detected with the proteins pY-AtzAM1 and AtzCM1
(Fig. 2.5, 2.6, 2.7), and we chose this design pair for further characterization of assembly-
disassembly processes (Fig. 2.8.A). Apart from fusion of pY-tag and SH2 domain, these proteins
feature 1 and 4 substitutions compared to their wild type parent, respectively (Fig. 2.9 and 2.10).
Figure. 2.4. Phosphorylation of SH2 peptide AtzA fusion (pY-AtzA) by Src kinase. In order
to verify phosphorylation of AtzA by Src kinase into phosphorylated SH2 peptide AtzA fusion
(pY-AtzA), ELISA with (1:4000 dilution) antiphosphotyrosine-horseradish peroxidase conjugate
was performed on pY-AtzA samples either with Src kinase (+) or without Src kinase (-), in
phosphorylation reaction buffer at 1.25 µg/mL pY-AtzA or 20 µg/mL pY-AtzA. Data is
presented as mean ± 1 standard deviation.
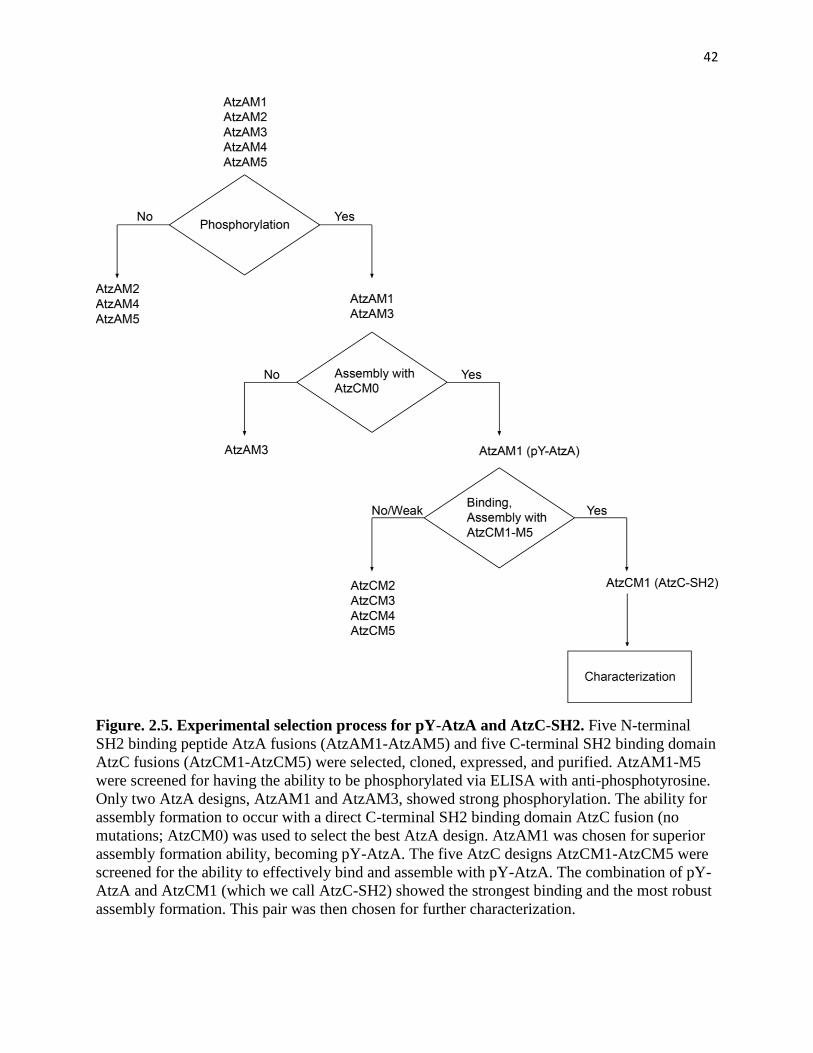
42
Figure. 2.5. Experimental selection process for pY-AtzA and AtzC-SH2. Five N-terminal
SH2 binding peptide AtzA fusions (AtzAM1-AtzAM5) and five C-terminal SH2 binding domain
AtzC fusions (AtzCM1-AtzCM5) were selected, cloned, expressed, and purified. AtzAM1-M5
were screened for having the ability to be phosphorylated via ELISA with anti-phosphotyrosine.
Only two AtzA designs, AtzAM1 and AtzAM3, showed strong phosphorylation. The ability for
assembly formation to occur with a direct C-terminal SH2 binding domain AtzC fusion (no
mutations; AtzCM0) was used to select the best AtzA design. AtzAM1 was chosen for superior
assembly formation ability, becoming pY-AtzA. The five AtzC designs AtzCM1-AtzCM5 were
screened for the ability to effectively bind and assemble with pY-AtzA. The combination of pY-
AtzA and AtzCM1 (which we call AtzC-SH2) showed the strongest binding and the most robust
assembly formation. This pair was then chosen for further characterization.
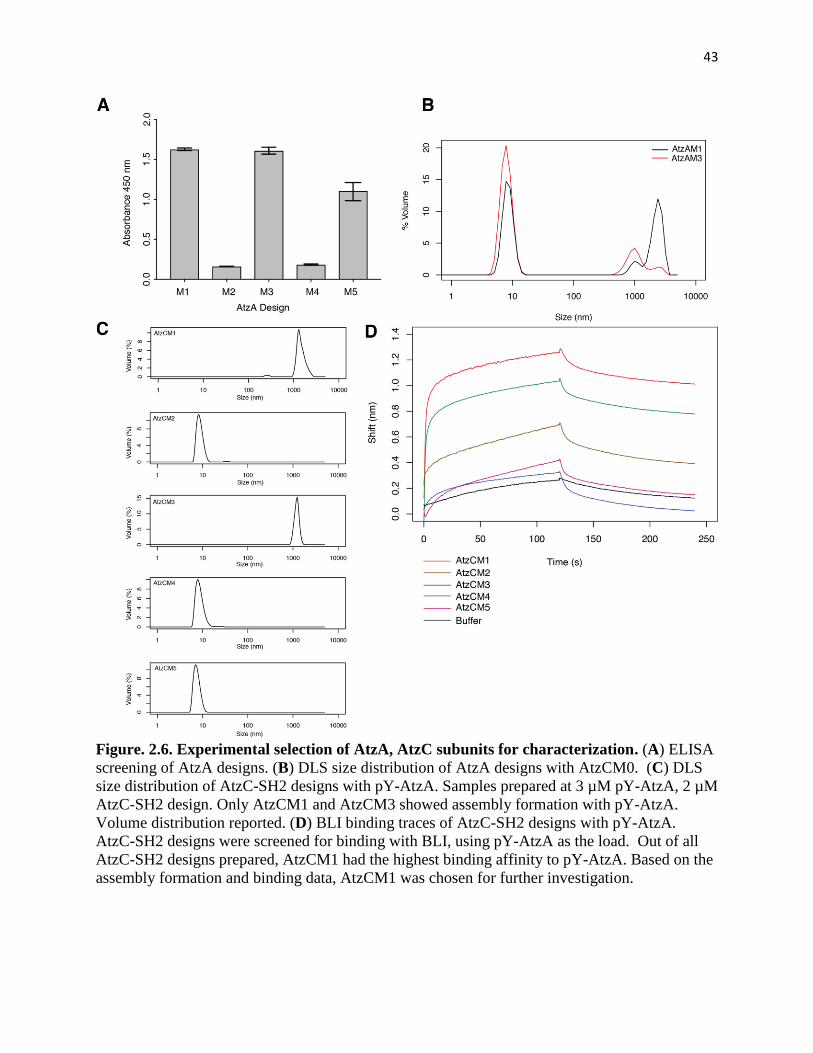
43
Figure. 2.6. Experimental selection of AtzA, AtzC subunits for characterization. (A) ELISA
screening of AtzA designs. (B) DLS size distribution of AtzA designs with AtzCM0. (C) DLS
size distribution of AtzC-SH2 designs with pY-AtzA. Samples prepared at 3 µM pY-AtzA, 2 µM
AtzC-SH2 design. Only AtzCM1 and AtzCM3 showed assembly formation with pY-AtzA.
Volume distribution reported. (D) BLI binding traces of AtzC-SH2 designs with pY-AtzA.
AtzC-SH2 designs were screened for binding with BLI, using pY-AtzA as the load. Out of all
AtzC-SH2 designs prepared, AtzCM1 had the highest binding affinity to pY-AtzA. Based on the
assembly formation and binding data, AtzCM1 was chosen for further investigation.
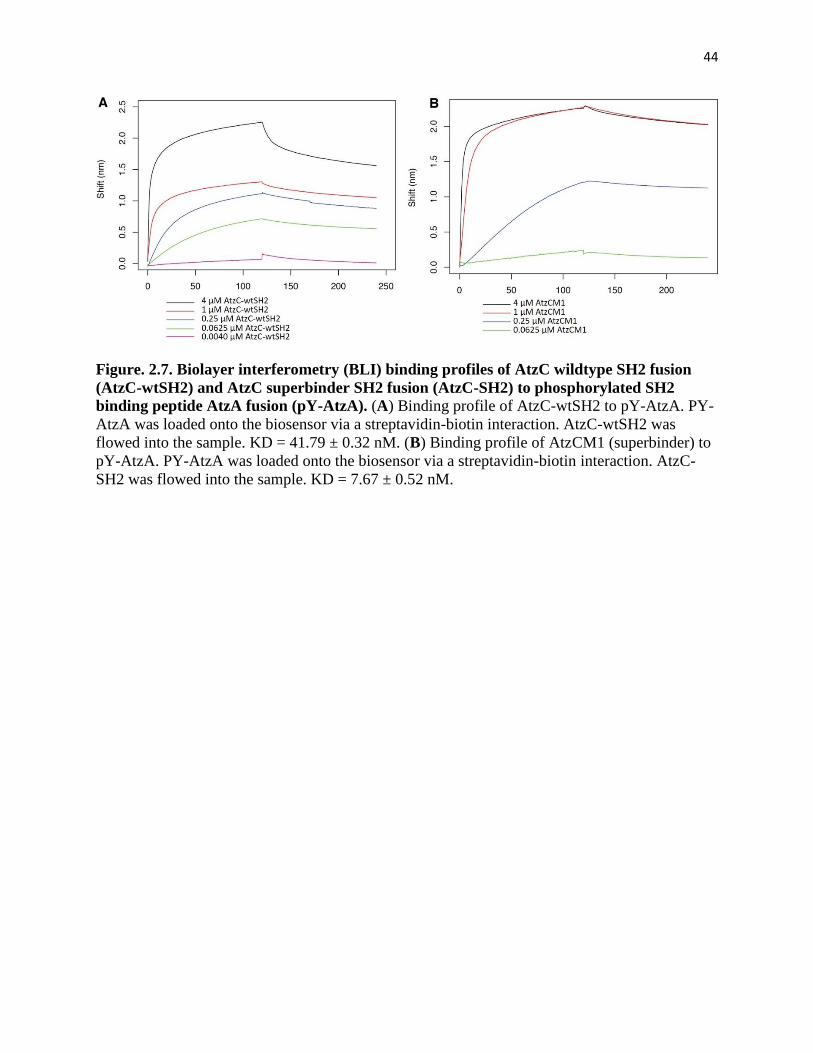
44
Figure. 2.7. Biolayer interferometry (BLI) binding profiles of AtzC wildtype SH2 fusion
(AtzC-wtSH2) and AtzC superbinder SH2 fusion (AtzC-SH2) to phosphorylated SH2
binding peptide AtzA fusion (pY-AtzA). (A) Binding profile of AtzC-wtSH2 to pY-AtzA. PY-
AtzA was loaded onto the biosensor via a streptavidin-biotin interaction. AtzC-wtSH2 was
flowed into the sample. KD = 41.79 ± 0.32 nM. (B) Binding profile of AtzCM1 (superbinder) to
pY-AtzA. PY-AtzA was loaded onto the biosensor via a streptavidin-biotin interaction. AtzC-
SH2 was flowed into the sample. KD = 7.67 ± 0.52 nM.
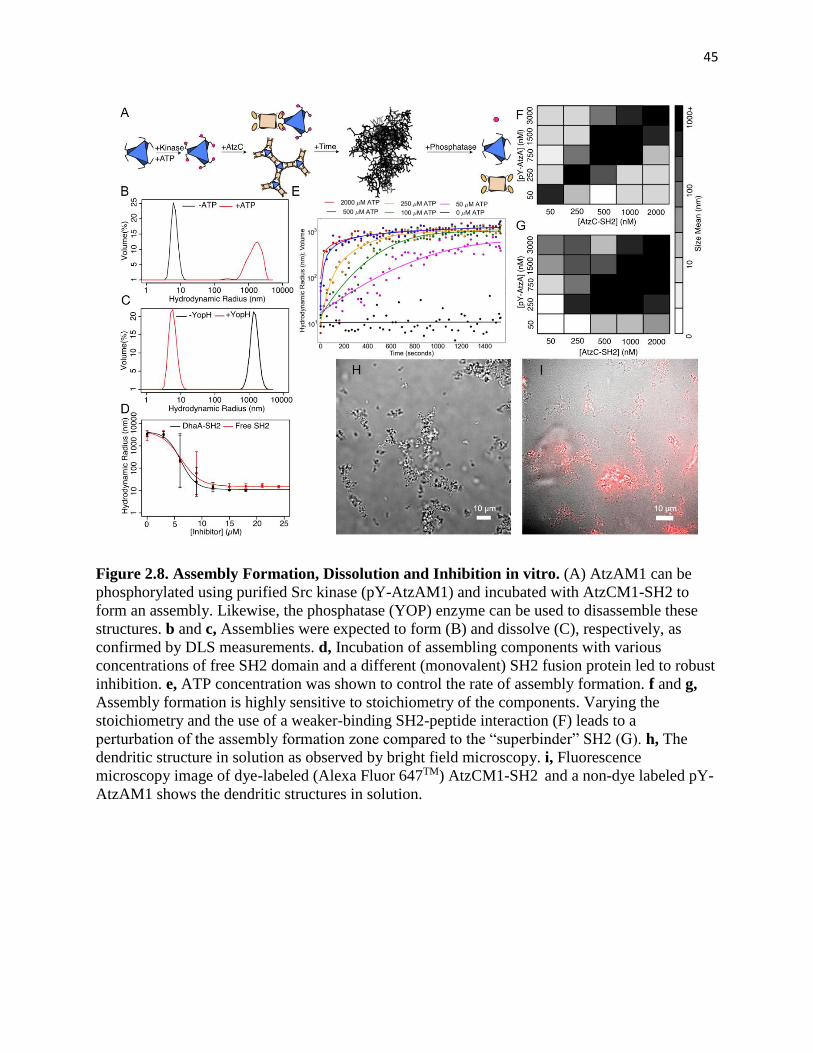
45
Figure 2.8. Assembly Formation, Dissolution and Inhibition in vitro. (A) AtzAM1 can be
phosphorylated using purified Src kinase (pY-AtzAM1) and incubated with AtzCM1-SH2 to
form an assembly. Likewise, the phosphatase (YOP) enzyme can be used to disassemble these
structures. b and c, Assemblies were expected to form (B) and dissolve (C), respectively, as
confirmed by DLS measurements. d, Incubation of assembling components with various
concentrations of free SH2 domain and a different (monovalent) SH2 fusion protein led to robust
inhibition. e, ATP concentration was shown to control the rate of assembly formation. f and g,
Assembly formation is highly sensitive to stoichiometry of the components. Varying the
stoichiometry and the use of a weaker-binding SH2-peptide interaction (F) leads to a
perturbation of the assembly formation zone compared to the “superbinder” SH2 (G). h, The
dendritic structure in solution as observed by bright field microscopy. i, Fluorescence
microscopy image of dye-labeled (Alexa Fluor 647TM) AtzCM1-SH2 and a non-dye labeled pY-
AtzAM1 shows the dendritic structures in solution.
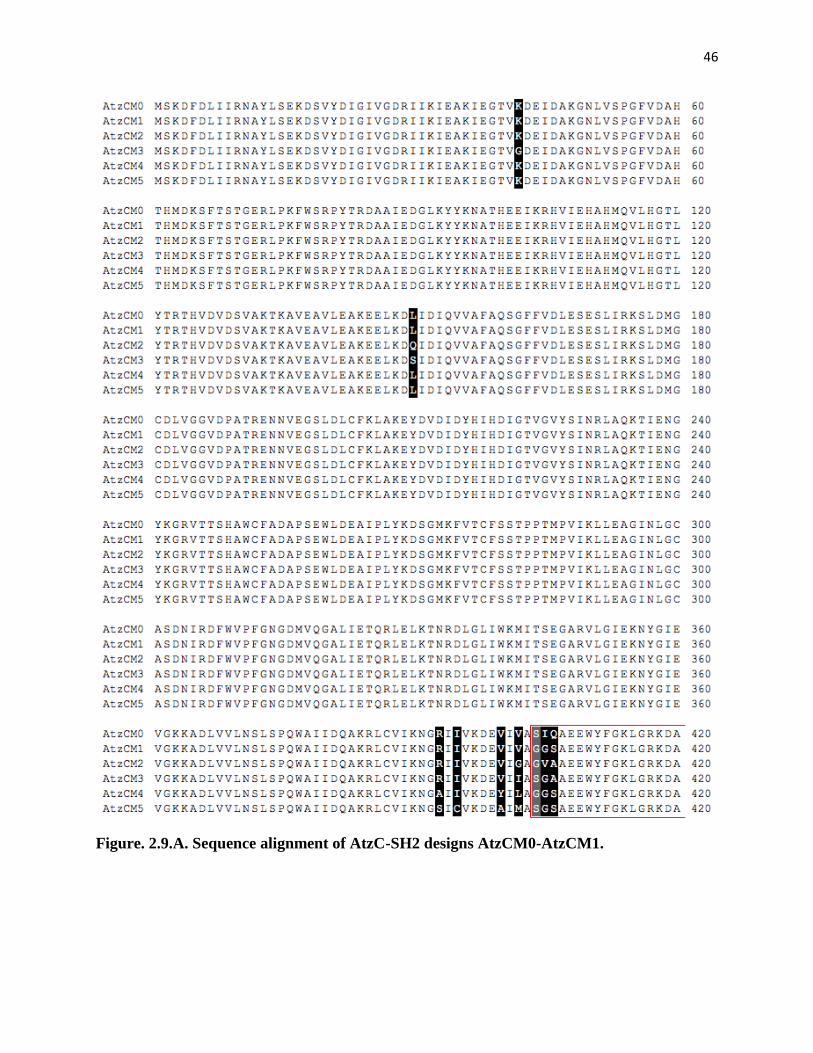
46
Figure. 2.9.A. Sequence alignment of AtzC-SH2 designs AtzCM0-AtzCM1.
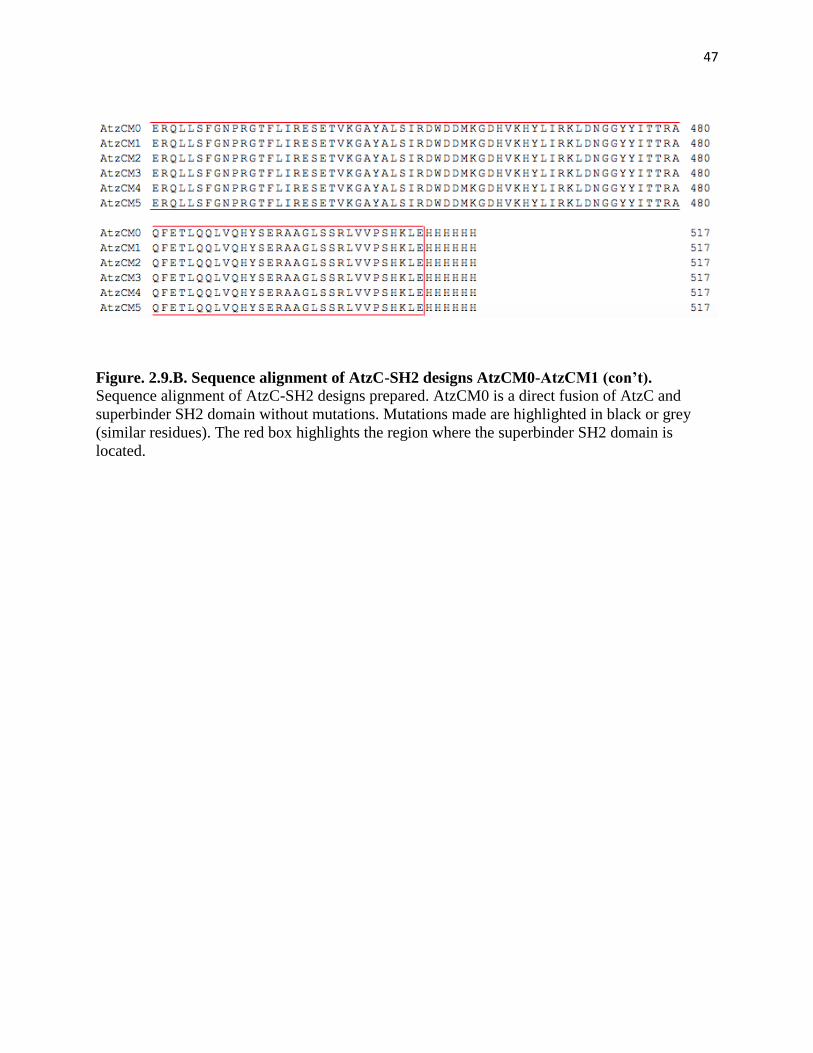
47
Figure. 2.9.B. Sequence alignment of AtzC-SH2 designs AtzCM0-AtzCM1 (con’t).
Sequence alignment of AtzC-SH2 designs prepared. AtzCM0 is a direct fusion of AtzC and
superbinder SH2 domain without mutations. Mutations made are highlighted in black or grey
(similar residues). The red box highlights the region where the superbinder SH2 domain is
located.
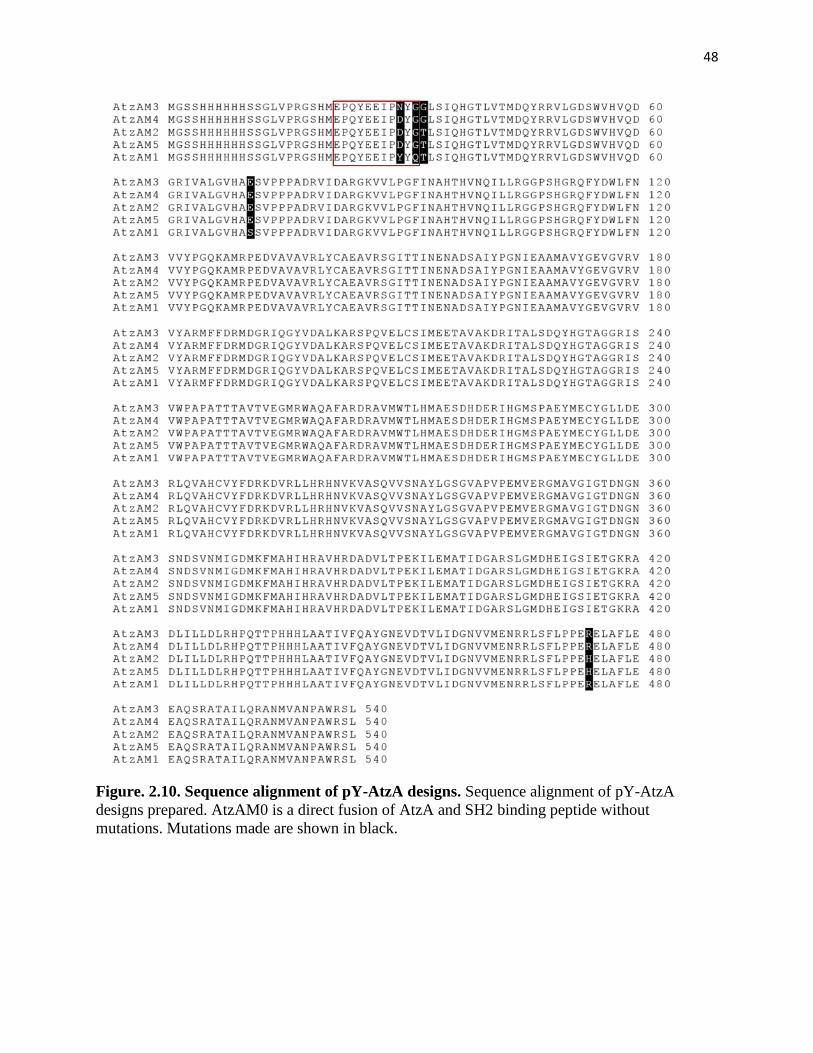
48
Figure. 2.10. Sequence alignment of pY-AtzA designs. Sequence alignment of pY-AtzA
designs prepared. AtzAM0 is a direct fusion of AtzA and SH2 binding peptide without
mutations. Mutations made are shown in black.
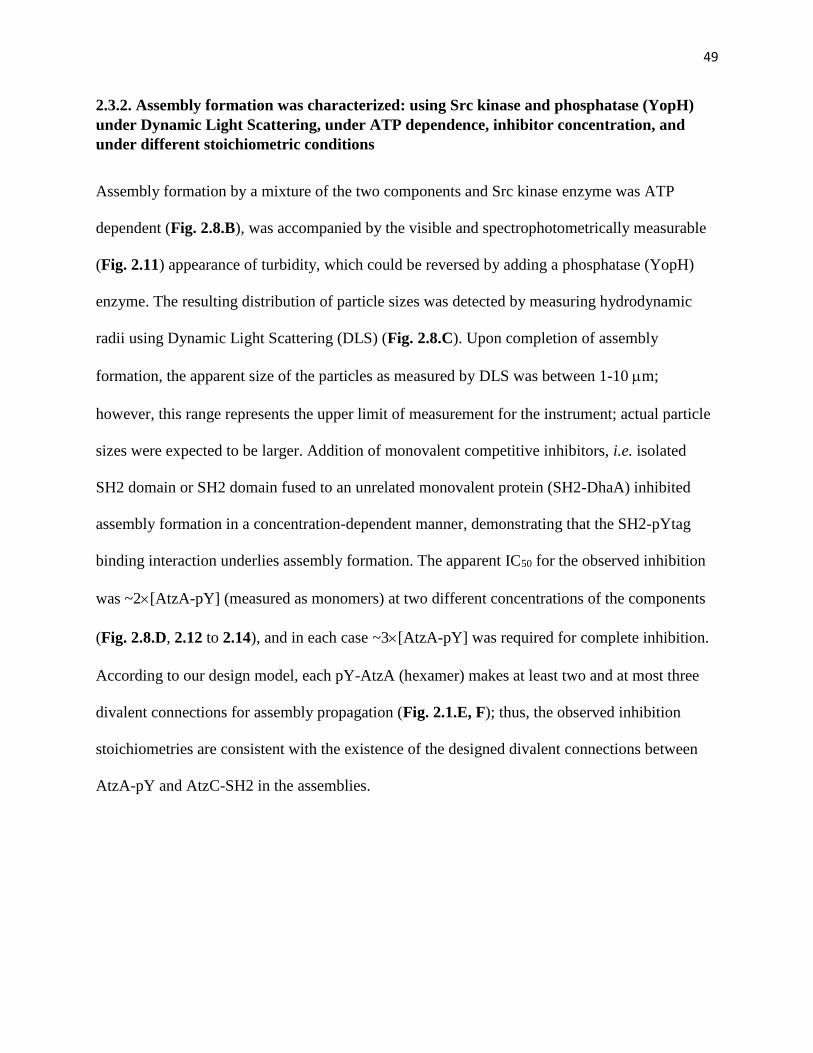
49
2.3.2. Assembly formation was characterized: using Src kinase and phosphatase (YopH)
under Dynamic Light Scattering, under ATP dependence, inhibitor concentration, and
under different stoichiometric conditions
Assembly formation by a mixture of the two components and Src kinase enzyme was ATP
dependent (Fig. 2.8.B), was accompanied by the visible and spectrophotometrically measurable
(Fig. 2.11) appearance of turbidity, which could be reversed by adding a phosphatase (YopH)
enzyme. The resulting distribution of particle sizes was detected by measuring hydrodynamic
radii using Dynamic Light Scattering (DLS) (Fig. 2.8.C). Upon completion of assembly
formation, the apparent size of the particles as measured by DLS was between 1-10 m;
however, this range represents the upper limit of measurement for the instrument; actual particle
sizes were expected to be larger. Addition of monovalent competitive inhibitors, i.e. isolated
SH2 domain or SH2 domain fused to an unrelated monovalent protein (SH2-DhaA) inhibited
assembly formation in a concentration-dependent manner, demonstrating that the SH2-pYtag
binding interaction underlies assembly formation. The apparent IC50 for the observed inhibition
was ~2[AtzA-pY] (measured as monomers) at two different concentrations of the components
(Fig. 2.8.D, 2.12 to 2.14), and in each case ~3[AtzA-pY] was required for complete inhibition.
According to our design model, each pY-AtzA (hexamer) makes at least two and at most three
divalent connections for assembly propagation (Fig. 2.1.E, F); thus, the observed inhibition
stoichiometries are consistent with the existence of the designed divalent connections between
AtzA-pY and AtzC-SH2 in the assemblies.
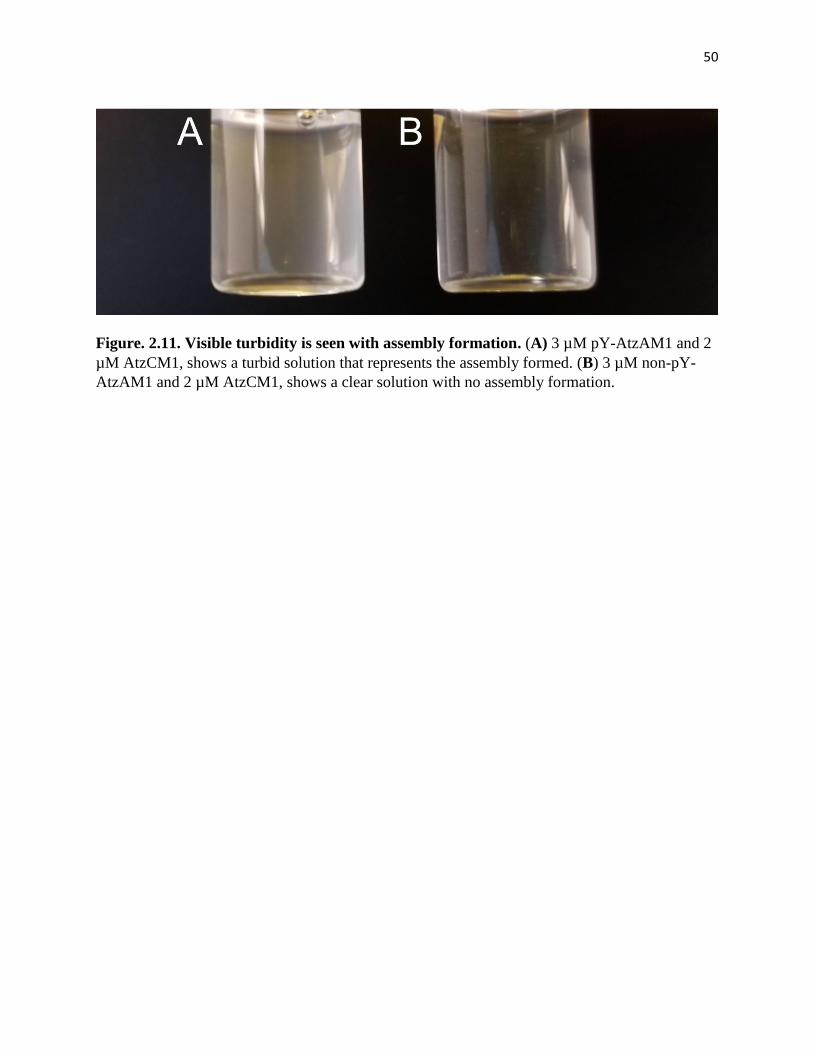
50
Figure. 2.11. Visible turbidity is seen with assembly formation. (A) 3 µM pY-AtzAM1 and 2
µM AtzCM1, shows a turbid solution that represents the assembly formed. (B) 3 µM non-pY-
AtzAM1 and 2 µM AtzCM1, shows a clear solution with no assembly formation.
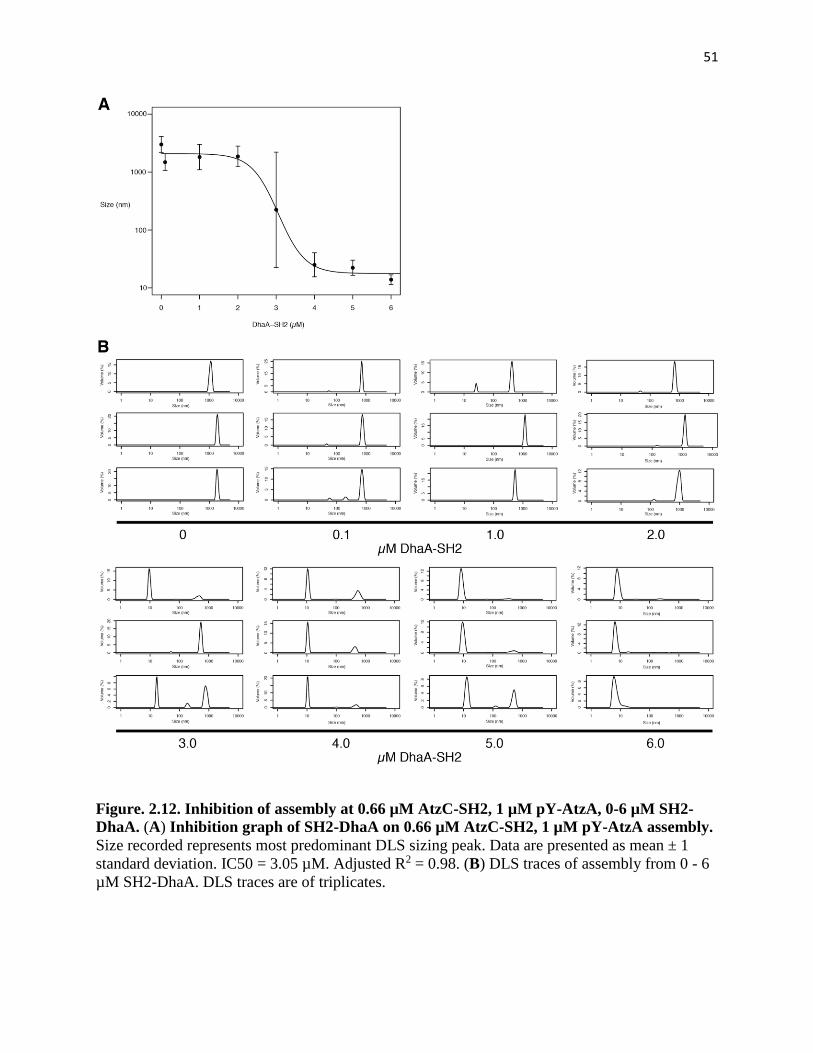
51
Figure. 2.12. Inhibition of assembly at 0.66 µM AtzC-SH2, 1 µM pY-AtzA, 0-6 µM SH2-
DhaA. (A) Inhibition graph of SH2-DhaA on 0.66 µM AtzC-SH2, 1 µM pY-AtzA assembly.
Size recorded represents most predominant DLS sizing peak. Data are presented as mean ± 1
standard deviation. IC50 = 3.05 µM. Adjusted R2 = 0.98. (B) DLS traces of assembly from 0 - 6
µM SH2-DhaA. DLS traces are of triplicates.
52
Figure. 2.13. Inhibition of assembly at 2 µM AtzC-SH2, 3 µM pY-AtzA with 0-15 µM
inhibitor.
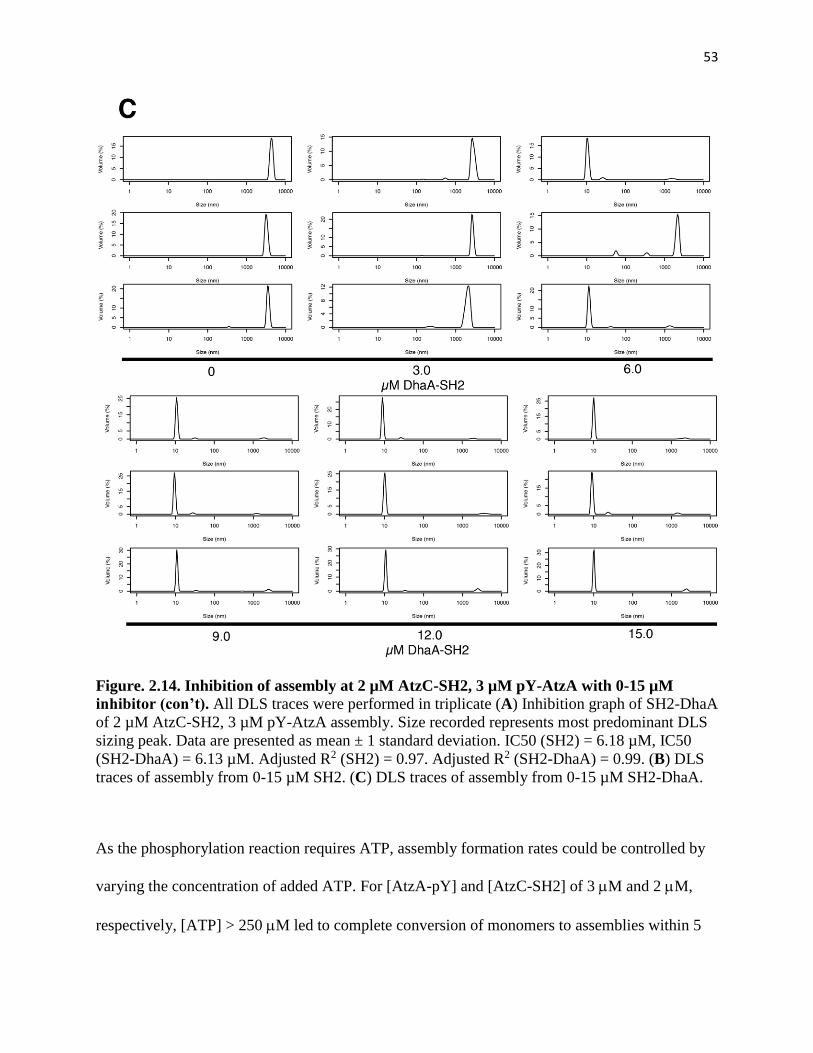
53
Figure. 2.14. Inhibition of assembly at 2 µM AtzC-SH2, 3 µM pY-AtzA with 0-15 µM
inhibitor (con’t). All DLS traces were performed in triplicate (A) Inhibition graph of SH2-DhaA
of 2 µM AtzC-SH2, 3 µM pY-AtzA assembly. Size recorded represents most predominant DLS
sizing peak. Data are presented as mean ± 1 standard deviation. IC50 (SH2) = 6.18 µM, IC50
(SH2-DhaA) = 6.13 µM. Adjusted R2 (SH2) = 0.97. Adjusted R2 (SH2-DhaA) = 0.99. (B) DLS
traces of assembly from 0-15 µM SH2. (C) DLS traces of assembly from 0-15 µM SH2-DhaA.
As the phosphorylation reaction requires ATP, assembly formation rates could be controlled by
varying the concentration of added ATP. For [AtzA-pY] and [AtzC-SH2] of 3 M and 2 M,
respectively, [ATP] > 250 M led to complete conversion of monomers to assemblies within 5
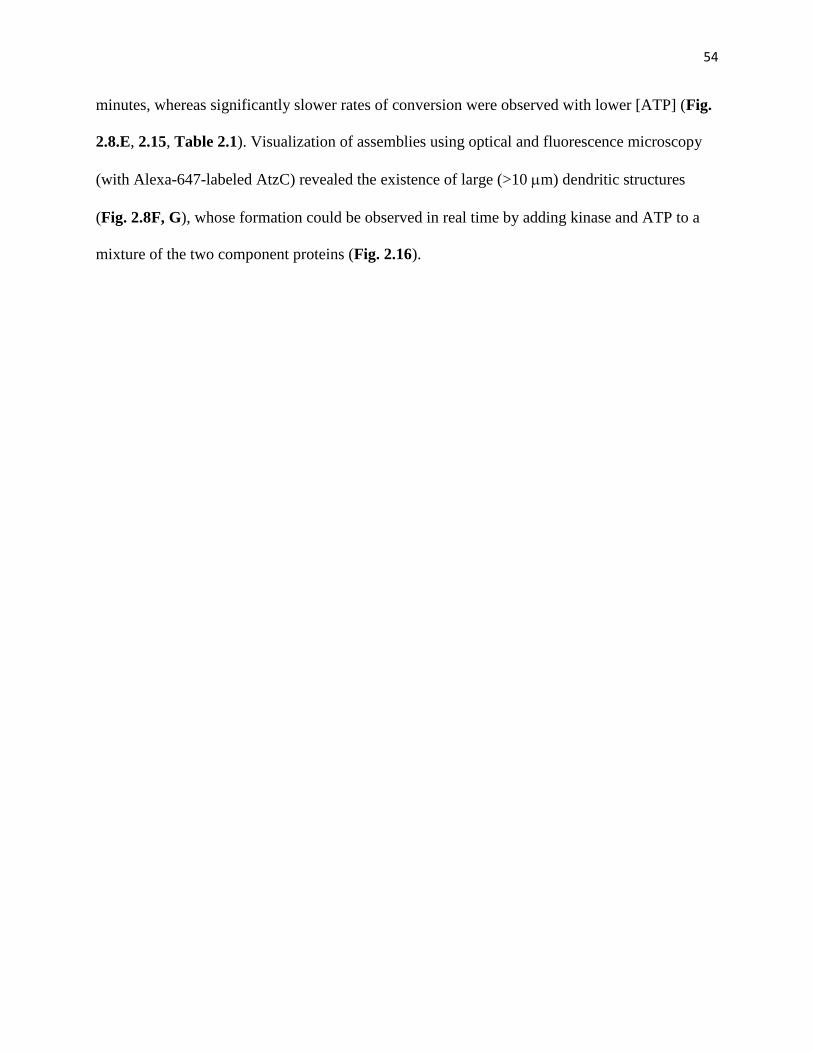
54
minutes, whereas significantly slower rates of conversion were observed with lower [ATP] (Fig.
2.8.E, 2.15, Table 2.1). Visualization of assemblies using optical and fluorescence microscopy
(with Alexa-647-labeled AtzC) revealed the existence of large (>10 m) dendritic structures
(Fig. 2.8F, G), whose formation could be observed in real time by adding kinase and ATP to a
mixture of the two component proteins (Fig. 2.16).
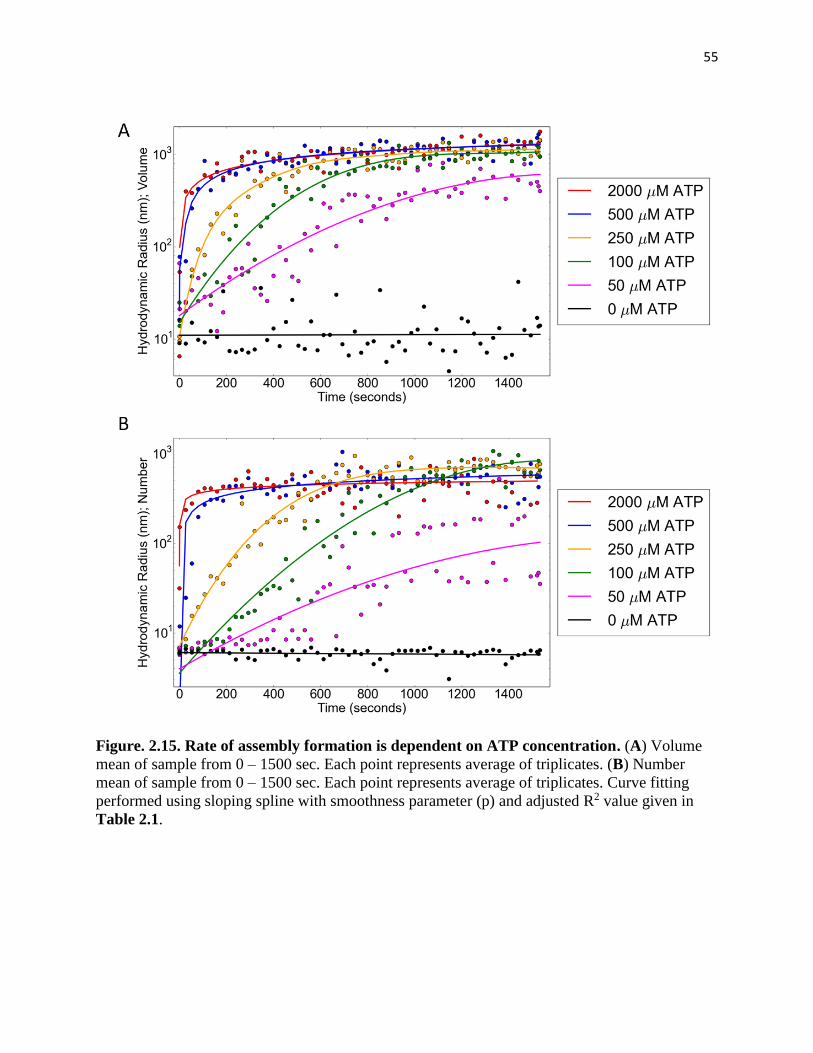
55
Figure. 2.15. Rate of assembly formation is dependent on ATP concentration. (A) Volume
mean of sample from 0 – 1500 sec. Each point represents average of triplicates. (B) Number
mean of sample from 0 – 1500 sec. Each point represents average of triplicates. Curve fitting
performed using sloping spline with smoothness parameter (p) and adjusted R2 value given in
Table 2.1.
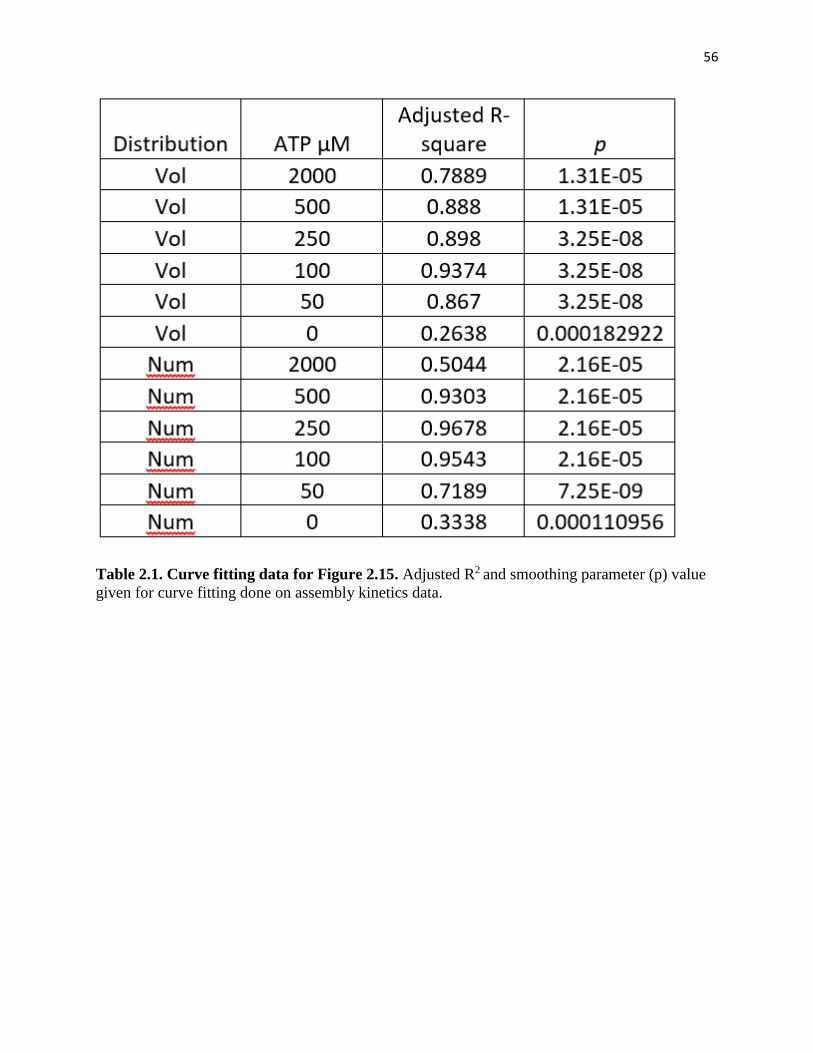
56
Table 2.1. Curve fitting data for Figure 2.15. Adjusted R2 and smoothing parameter (p) value
given for curve fitting done on assembly kinetics data.
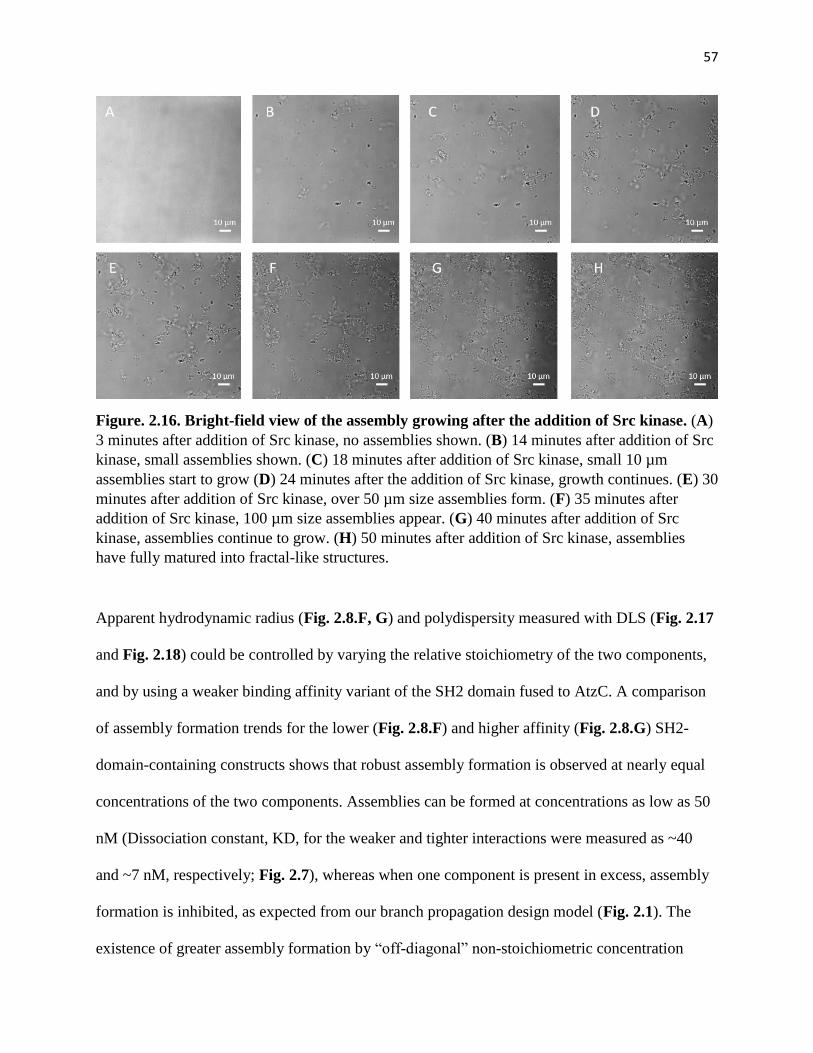
57
Figure. 2.16. Bright-field view of the assembly growing after the addition of Src kinase. (A)
3 minutes after addition of Src kinase, no assemblies shown. (B) 14 minutes after addition of Src
kinase, small assemblies shown. (C) 18 minutes after addition of Src kinase, small 10 µm
assemblies start to grow (D) 24 minutes after the addition of Src kinase, growth continues. (E) 30
minutes after addition of Src kinase, over 50 µm size assemblies form. (F) 35 minutes after
addition of Src kinase, 100 µm size assemblies appear. (G) 40 minutes after addition of Src
kinase, assemblies continue to grow. (H) 50 minutes after addition of Src kinase, assemblies
have fully matured into fractal-like structures.
Apparent hydrodynamic radius (Fig. 2.8.F, G) and polydispersity measured with DLS (Fig. 2.17
and Fig. 2.18) could be controlled by varying the relative stoichiometry of the two components,
and by using a weaker binding affinity variant of the SH2 domain fused to AtzC. A comparison
of assembly formation trends for the lower (Fig. 2.8.F) and higher affinity (Fig. 2.8.G) SH2-
domain-containing constructs shows that robust assembly formation is observed at nearly equal
concentrations of the two components. Assemblies can be formed at concentrations as low as 50
nM (Dissociation constant, KD, for the weaker and tighter interactions were measured as ~40
and ~7 nM, respectively; Fig. 2.7), whereas when one component is present in excess, assembly
formation is inhibited, as expected from our branch propagation design model (Fig. 2.1). The
existence of greater assembly formation by “off-diagonal” non-stoichiometric concentration
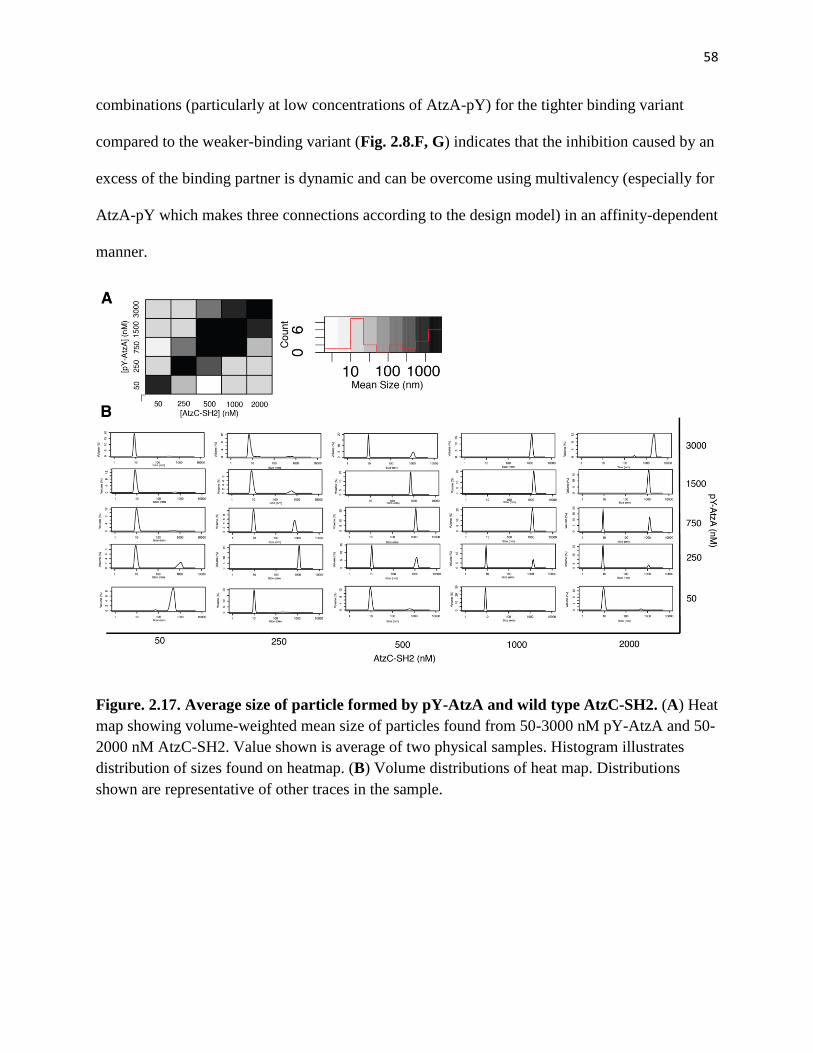
58
combinations (particularly at low concentrations of AtzA-pY) for the tighter binding variant
compared to the weaker-binding variant (Fig. 2.8.F, G) indicates that the inhibition caused by an
excess of the binding partner is dynamic and can be overcome using multivalency (especially for
AtzA-pY which makes three connections according to the design model) in an affinity-dependent
manner.
Figure. 2.17. Average size of particle formed by pY-AtzA and wild type AtzC-SH2. (A) Heat
map showing volume-weighted mean size of particles found from 50-3000 nM pY-AtzA and 50-
2000 nM AtzC-SH2. Value shown is average of two physical samples. Histogram illustrates
distribution of sizes found on heatmap. (B) Volume distributions of heat map. Distributions
shown are representative of other traces in the sample.
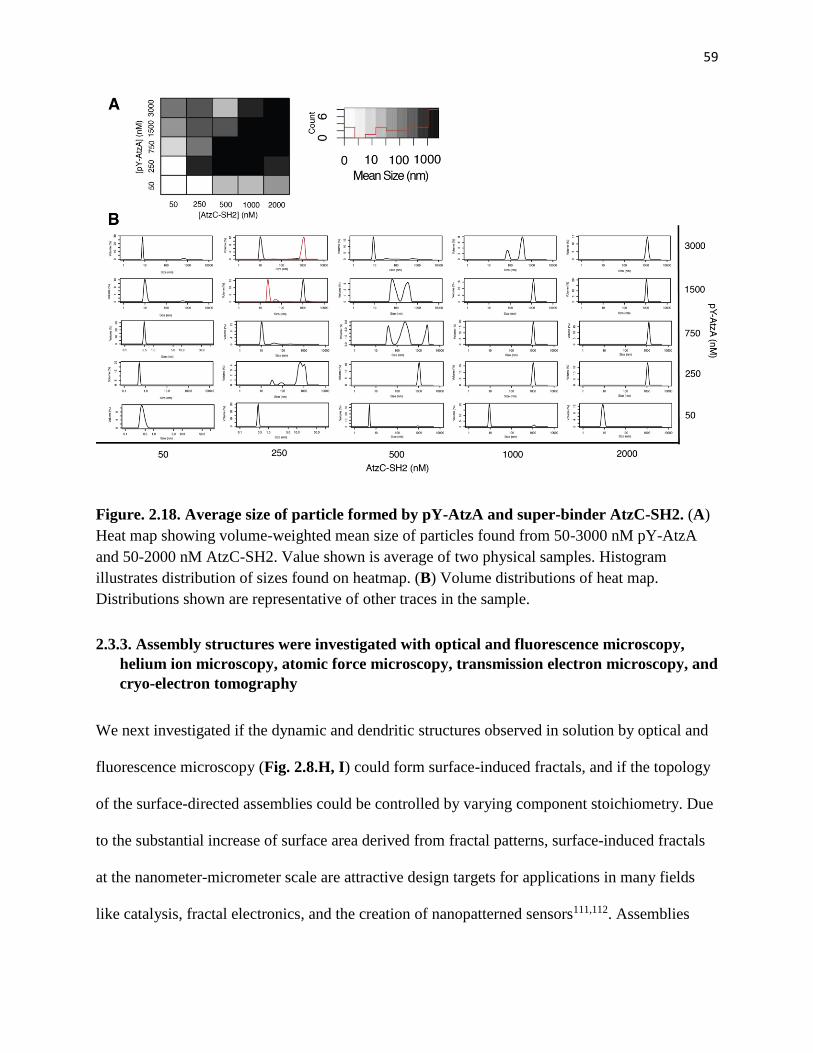
59
Figure. 2.18. Average size of particle formed by pY-AtzA and super-binder AtzC-SH2. (A)
Heat map showing volume-weighted mean size of particles found from 50-3000 nM pY-AtzA
and 50-2000 nM AtzC-SH2. Value shown is average of two physical samples. Histogram
illustrates distribution of sizes found on heatmap. (B) Volume distributions of heat map.
Distributions shown are representative of other traces in the sample.
2.3.3. Assembly structures were investigated with optical and fluorescence microscopy,
helium ion microscopy, atomic force microscopy, transmission electron microscopy, and
cryo-electron tomography
We next investigated if the dynamic and dendritic structures observed in solution by optical and
fluorescence microscopy (Fig. 2.8.H, I) could form surface-induced fractals, and if the topology
of the surface-directed assemblies could be controlled by varying component stoichiometry. Due
to the substantial increase of surface area derived from fractal patterns, surface-induced fractals
at the nanometer-micrometer scale are attractive design targets for applications in many fields
like catalysis, fractal electronics, and the creation of nanopatterned sensors111,112. Assemblies
60
with a chosen stoichiometry of components were generated in buffer, dropped on the surface of a
silicon (or mica) chip, and the solvent was evaporated at room temperature (298 K) under a dry
air atmosphere. Visualization of these coated surfaces using Helium Ion and Atomic Force
microscopy reveals striking, intricately textured patterns that coat up to 100 m2 areas (Fig.
2.19.A-E). Various morphologies on the micron scale including rod-like, tree-like, fern-like, and
petal-like were observed (Fig. 2.19.A-E); image analysis revealed fractal dimensions between
1.4-1.5 (Fig. 2.19.A, B) to the more Diffusion Limited Aggregation (DLA)-like 1.78
(Figs.2.19.C, D, Fig. 2.20, and Fig. 2.21). Assembly sizes and fractal dimensions could be tuned
by varying the stoichiometry of components (Fig. 2.19.F), although some heterogeneity in
morphologies was present in each sample. At 1:1 stoichiometry of the two components, DLA-
like topologies with ~10 m size were observed, whereas more dendritic assemblies were
observed when unequal stoichiometry samples were used (Fig. 2.19.F). Similarly, smaller
assembly sizes resulted when the concentration of one component became limiting.
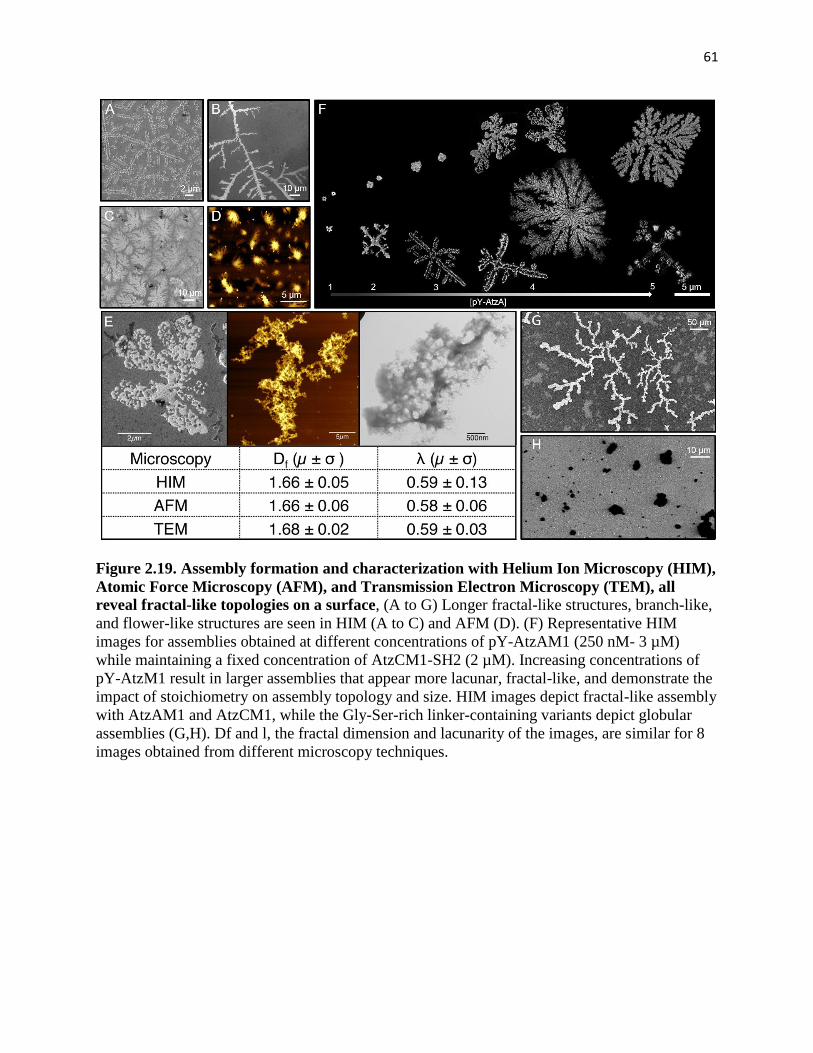
61
Figure 2.19. Assembly formation and characterization with Helium Ion Microscopy (HIM),
Atomic Force Microscopy (AFM), and Transmission Electron Microscopy (TEM), all
reveal fractal-like topologies on a surface, (A to G) Longer fractal-like structures, branch-like,
and flower-like structures are seen in HIM (A to C) and AFM (D). (F) Representative HIM
images for assemblies obtained at different concentrations of pY-AtzAM1 (250 nM- 3 µM)
while maintaining a fixed concentration of AtzCM1-SH2 (2 µM). Increasing concentrations of
pY-AtzM1 result in larger assemblies that appear more lacunar, fractal-like, and demonstrate the
impact of stoichiometry on assembly topology and size. HIM images depict fractal-like assembly
with AtzAM1 and AtzCM1, while the Gly-Ser-rich linker-containing variants depict globular
assemblies (G,H). Df and l, the fractal dimension and lacunarity of the images, are similar for 8
images obtained from different microscopy techniques.
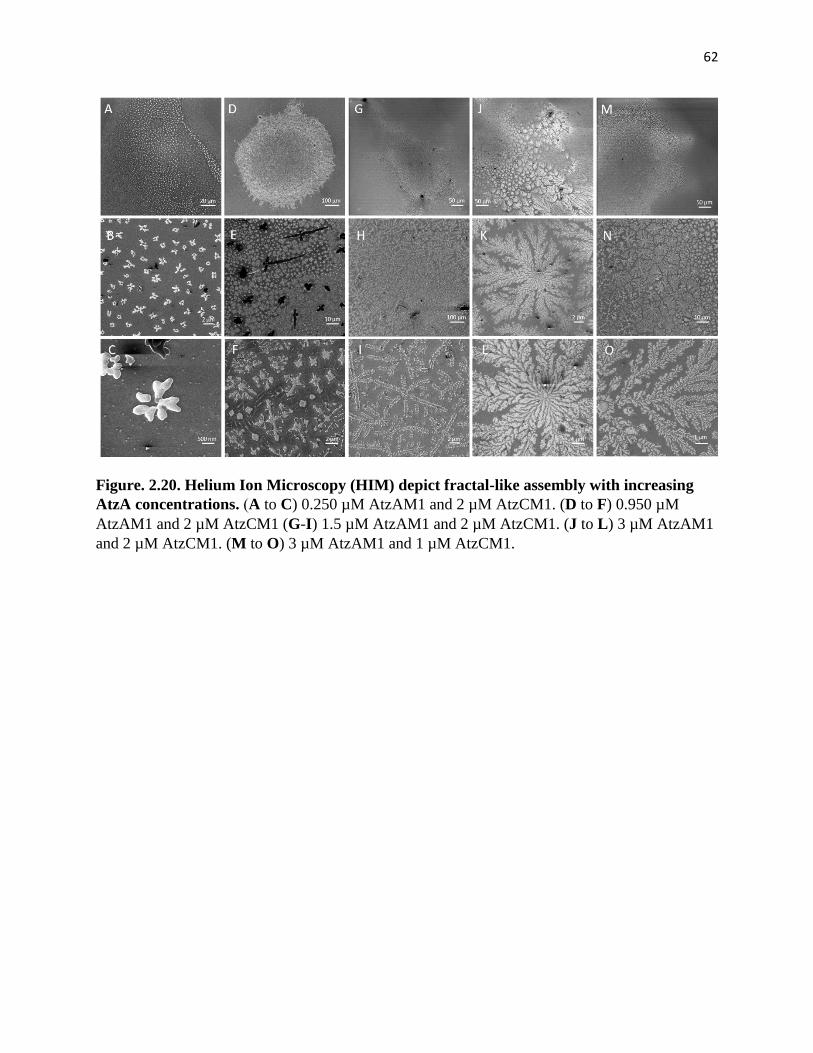
62
Figure. 2.20. Helium Ion Microscopy (HIM) depict fractal-like assembly with increasing
AtzA concentrations. (A to C) 0.250 µM AtzAM1 and 2 µM AtzCM1. (D to F) 0.950 µM
AtzAM1 and 2 µM AtzCM1 (G-I) 1.5 µM AtzAM1 and 2 µM AtzCM1. (J to L) 3 µM AtzAM1
and 2 µM AtzCM1. (M to O) 3 µM AtzAM1 and 1 µM AtzCM1.
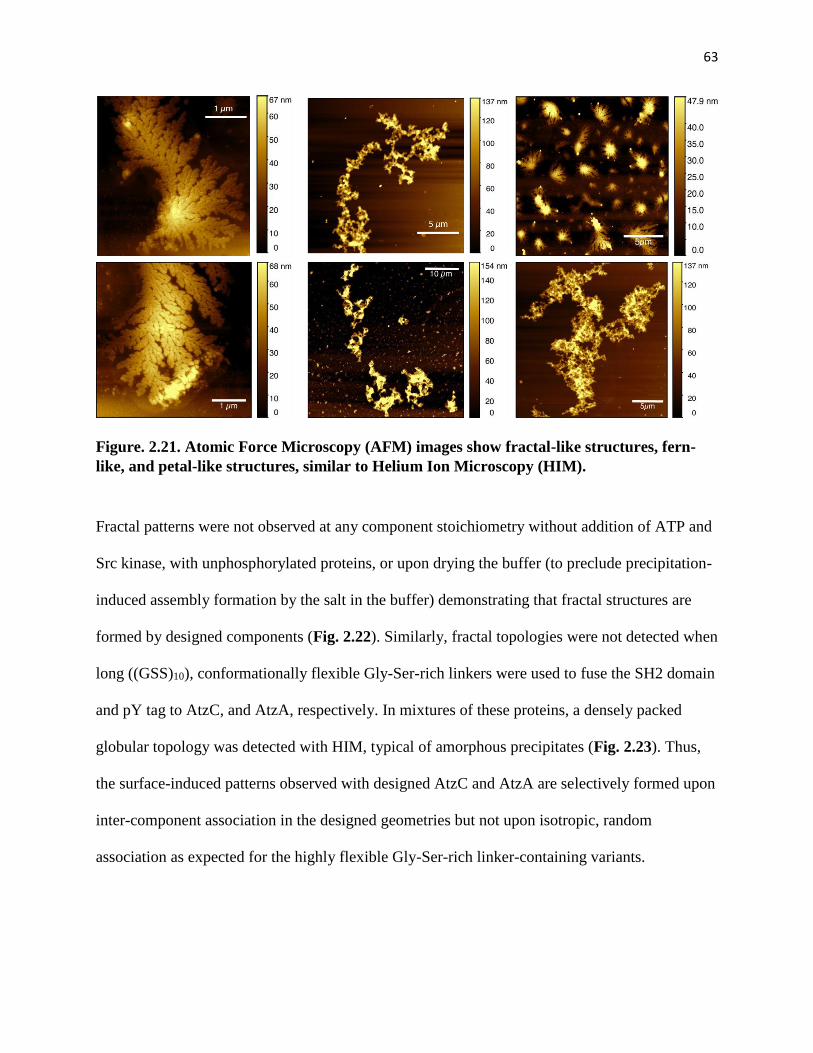
63
Figure. 2.21. Atomic Force Microscopy (AFM) images show fractal-like structures, fern-
like, and petal-like structures, similar to Helium Ion Microscopy (HIM).
Fractal patterns were not observed at any component stoichiometry without addition of ATP and
Src kinase, with unphosphorylated proteins, or upon drying the buffer (to preclude precipitation-
induced assembly formation by the salt in the buffer) demonstrating that fractal structures are
formed by designed components (Fig. 2.22). Similarly, fractal topologies were not detected when
long ((GSS)10), conformationally flexible Gly-Ser-rich linkers were used to fuse the SH2 domain
and pY tag to AtzC, and AtzA, respectively. In mixtures of these proteins, a densely packed
globular topology was detected with HIM, typical of amorphous precipitates (Fig. 2.23). Thus,
the surface-induced patterns observed with designed AtzC and AtzA are selectively formed upon
inter-component association in the designed geometries but not upon isotropic, random
association as expected for the highly flexible Gly-Ser-rich linker-containing variants.
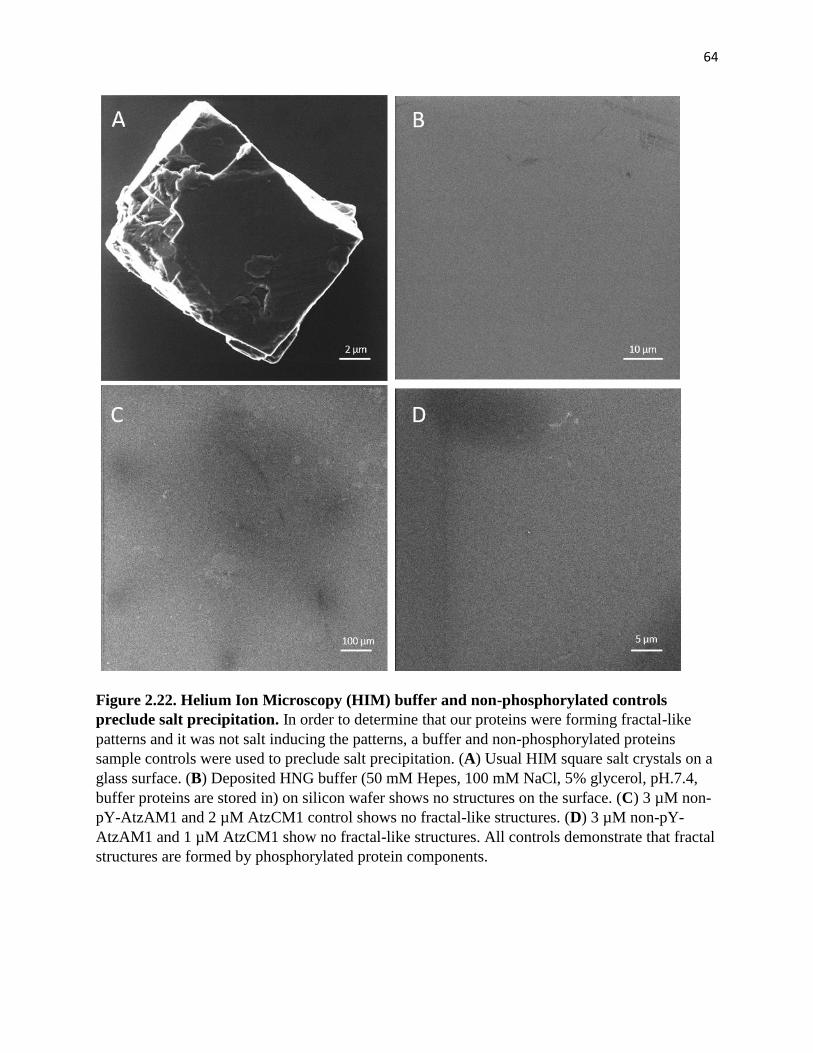
64
Figure 2.22. Helium Ion Microscopy (HIM) buffer and non-phosphorylated controls
preclude salt precipitation. In order to determine that our proteins were forming fractal-like
patterns and it was not salt inducing the patterns, a buffer and non-phosphorylated proteins
sample controls were used to preclude salt precipitation. (A) Usual HIM square salt crystals on a
glass surface. (B) Deposited HNG buffer (50 mM Hepes, 100 mM NaCl, 5% glycerol, pH.7.4,
buffer proteins are stored in) on silicon wafer shows no structures on the surface. (C) 3 µM non-
pY-AtzAM1 and 2 µM AtzCM1 control shows no fractal-like structures. (D) 3 µM non-pY-
AtzAM1 and 1 µM AtzCM1 show no fractal-like structures. All controls demonstrate that fractal
structures are formed by phosphorylated protein components.
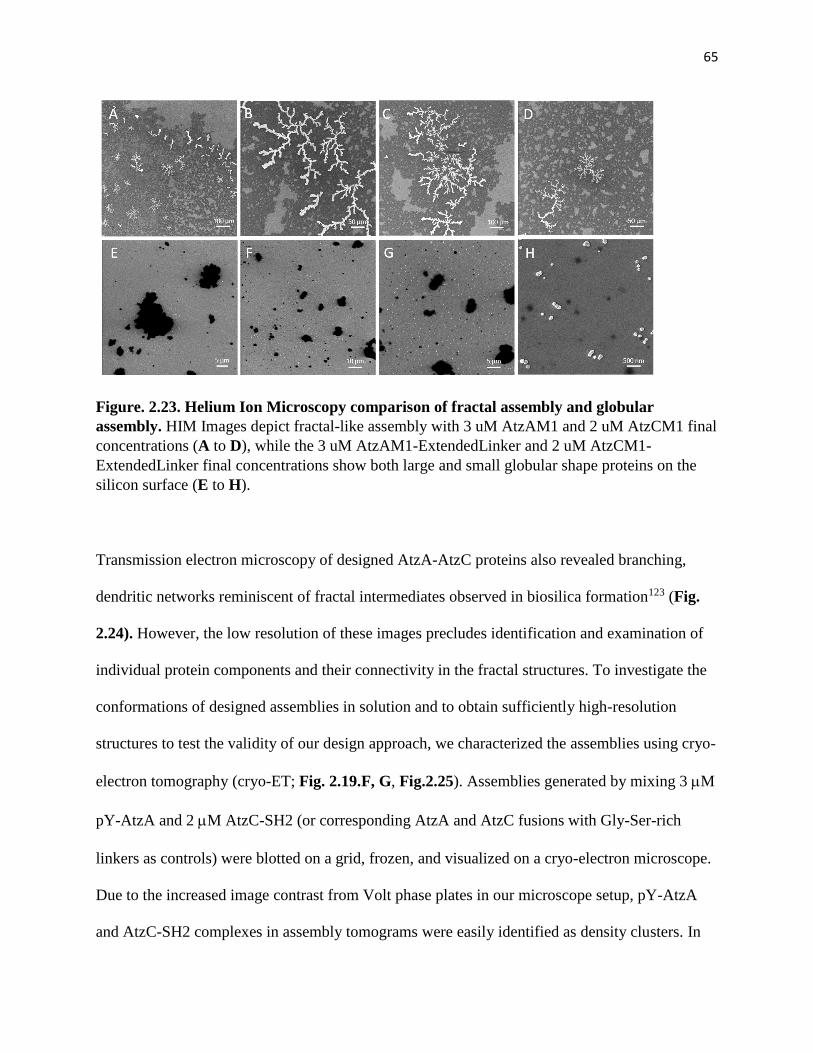
65
Figure. 2.23. Helium Ion Microscopy comparison of fractal assembly and globular
assembly. HIM Images depict fractal-like assembly with 3 uM AtzAM1 and 2 uM AtzCM1 final
concentrations (A to D), while the 3 uM AtzAM1-ExtendedLinker and 2 uM AtzCM1-
ExtendedLinker final concentrations show both large and small globular shape proteins on the
silicon surface (E to H).
Transmission electron microscopy of designed AtzA-AtzC proteins also revealed branching,
dendritic networks reminiscent of fractal intermediates observed in biosilica formation123 (Fig.
2.24). However, the low resolution of these images precludes identification and examination of
individual protein components and their connectivity in the fractal structures. To investigate the
conformations of designed assemblies in solution and to obtain sufficiently high-resolution
structures to test the validity of our design approach, we characterized the assemblies using cryo-
electron tomography (cryo-ET; Fig. 2.19.F, G, Fig.2.25). Assemblies generated by mixing 3 M
pY-AtzA and 2 M AtzC-SH2 (or corresponding AtzA and AtzC fusions with Gly-Ser-rich
linkers as controls) were blotted on a grid, frozen, and visualized on a cryo-electron microscope.
Due to the increased image contrast from Volt phase plates in our microscope setup, pY-AtzA
and AtzC-SH2 complexes in assembly tomograms were easily identified as density clusters. In
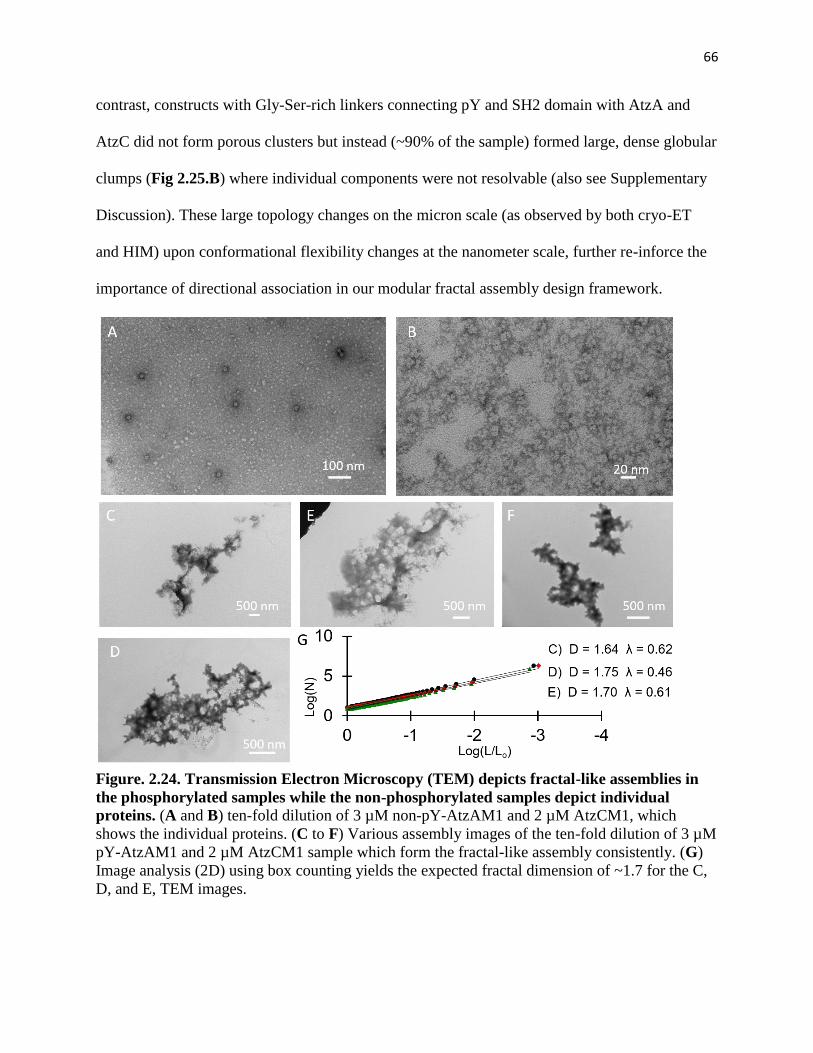
66
contrast, constructs with Gly-Ser-rich linkers connecting pY and SH2 domain with AtzA and
AtzC did not form porous clusters but instead (~90% of the sample) formed large, dense globular
clumps (Fig 2.25.B) where individual components were not resolvable (also see Supplementary
Discussion). These large topology changes on the micron scale (as observed by both cryo-ET
and HIM) upon conformational flexibility changes at the nanometer scale, further re-inforce the
importance of directional association in our modular fractal assembly design framework.
Figure. 2.24. Transmission Electron Microscopy (TEM) depicts fractal-like assemblies in
the phosphorylated samples while the non-phosphorylated samples depict individual
proteins. (A and B) ten-fold dilution of 3 µM non-pY-AtzAM1 and 2 µM AtzCM1, which
shows the individual proteins. (C to F) Various assembly images of the ten-fold dilution of 3 µM
pY-AtzAM1 and 2 µM AtzCM1 sample which form the fractal-like assembly consistently. (G)
Image analysis (2D) using box counting yields the expected fractal dimension of ~1.7 for the C,
D, and E, TEM images.
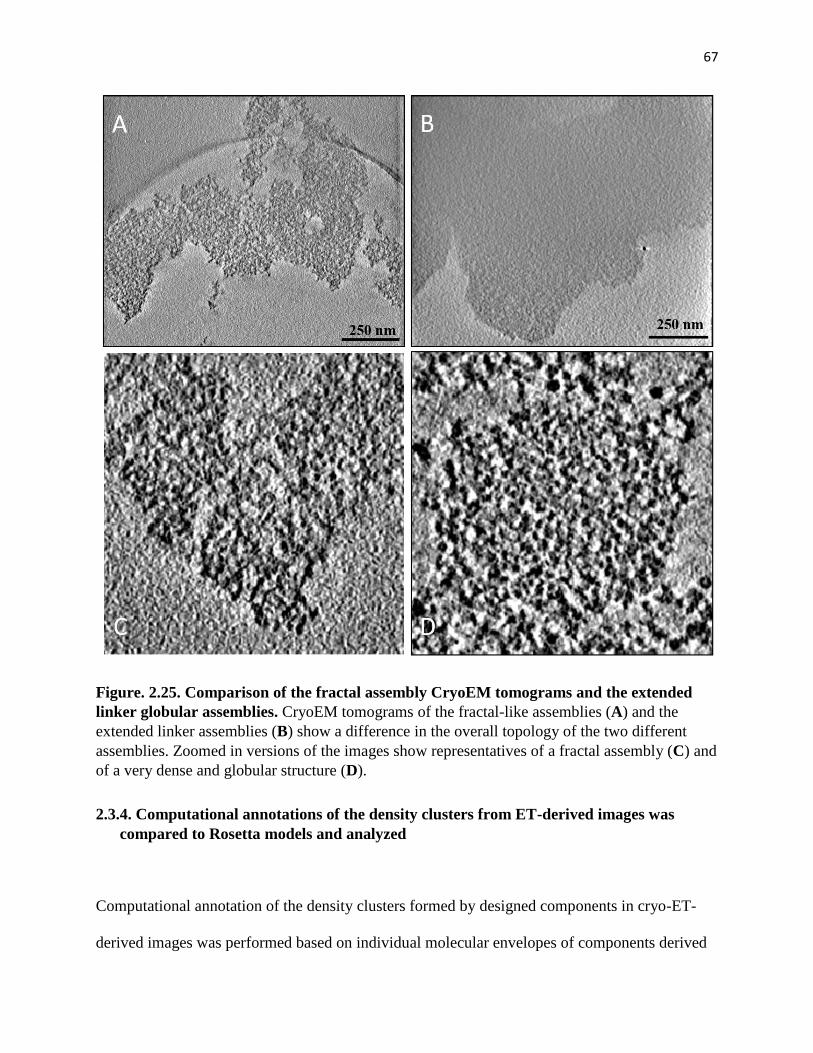
67
Figure. 2.25. Comparison of the fractal assembly CryoEM tomograms and the extended
linker globular assemblies. CryoEM tomograms of the fractal-like assemblies (A) and the
extended linker assemblies (B) show a difference in the overall topology of the two different
assemblies. Zoomed in versions of the images show representatives of a fractal assembly (C) and
of a very dense and globular structure (D).
2.3.4. Computational annotations of the density clusters from ET-derived images was
compared to Rosetta models and analyzed
Computational annotation of the density clusters formed by designed components in cryo-ET-
derived images was performed based on individual molecular envelopes of components derived
68
from Rosetta models of pY-AtzA and AtzC-SH2, respectively, to identify inter-component
connections along assembly branches (Fig. 2.26.A). The topology of the largest, nearly fully
interconnected assembly based on electron density (Fig. 2.26.B), consisting of approximately
6000 individual protein components, was further analyzed, and compared with an ensemble of
simulated structures with approximately the same number of components. We compared the
observed distributions of nearest-neighbor counts for AtzA-pY (Fig. 2.26.C, Fig 2.27, Fig 2.28),
relative numbers of component types incorporated (Fig. 2.26.D) and the observed fractal
dimension (Fig. 2.26.E) of the assemblies with ensembles of structures generated using
computational modeling (Fig. 2.26.F) and found good agreement between the data and our
simulations performed at specific parameter values (Fig. 2.3). The observed nearest neighbor
distribution for the AtzA-pY component shows that a large majority of these proteins are
connected to 1, 2, or 3 neighboring AtzC-SH2, in agreement with the divalent connections
envisioned in the design model and implemented in the simulated assemblies (Fig. 2.1).
Additionally, a small but significant number of AtzA-pY proteins have 4 AtzC neighbors in both
the computational ensemble and the cryo-ET images, which indicates physically unconnected
components being proximal to each other in space due to the packing in the assembly (Fig.
2.26.C). We found that the fractal dimensions from the cryo-ET images and simulations (2.1)
show good agreement (Fig. 2.26. E, F). The expected fractal dimension for a DLA-like cluster,
which results from isotropic interactions, is 2.3 and the observed decreased fractal dimension
(2.1) indicates the non-isotropic nature143–145 and/or lack of diffusion-limited association of the
underlying protein-protein interactions. Particle counting (and volume estimation) in a convex
hull enclosing the largest assembly component yields an approximate local concentration of the
proteins as ~600-700 M, a ~125-fold increase compared to their bulk concentration (3 M
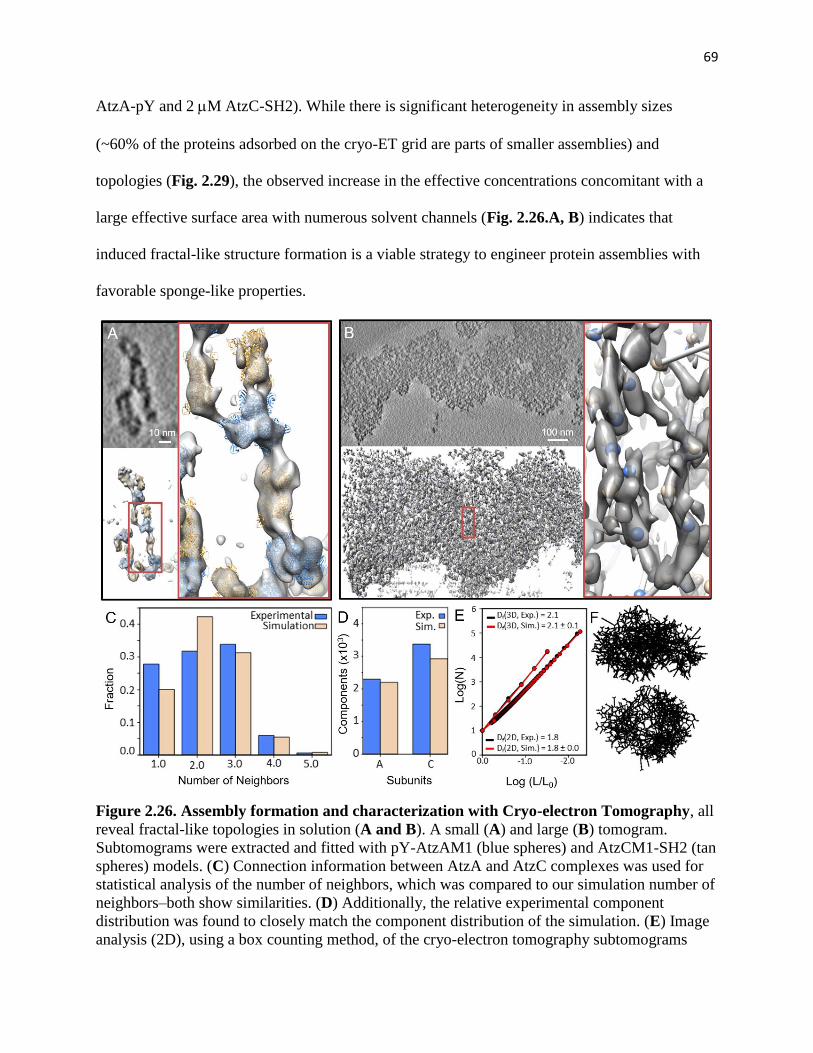
69
AtzA-pY and 2 M AtzC-SH2). While there is significant heterogeneity in assembly sizes
(~60% of the proteins adsorbed on the cryo-ET grid are parts of smaller assemblies) and
topologies (Fig. 2.29), the observed increase in the effective concentrations concomitant with a
large effective surface area with numerous solvent channels (Fig. 2.26.A, B) indicates that
induced fractal-like structure formation is a viable strategy to engineer protein assemblies with
favorable sponge-like properties.
Figure 2.26. Assembly formation and characterization with Cryo-electron Tomography, all
reveal fractal-like topologies in solution (A and B). A small (A) and large (B) tomogram.
Subtomograms were extracted and fitted with pY-AtzAM1 (blue spheres) and AtzCM1-SH2 (tan
spheres) models. (C) Connection information between AtzA and AtzC complexes was used for
statistical analysis of the number of neighbors, which was compared to our simulation number of
neighbors–both show similarities. (D) Additionally, the relative experimental component
distribution was found to closely match the component distribution of the simulation. (E) Image
analysis (2D), using a box counting method, of the cryo-electron tomography subtomograms
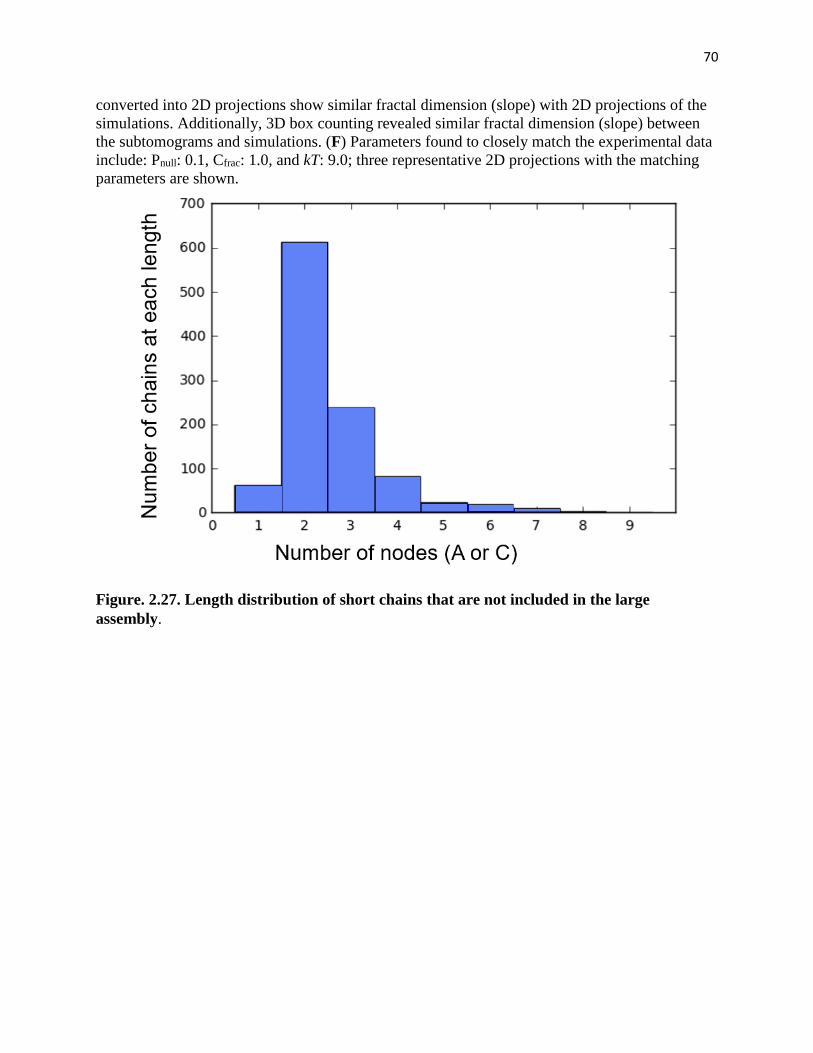
70
converted into 2D projections show similar fractal dimension (slope) with 2D projections of the
simulations. Additionally, 3D box counting revealed similar fractal dimension (slope) between
the subtomograms and simulations. (F) Parameters found to closely match the experimental data
include: Pnull: 0.1, Cfrac: 1.0, and kT: 9.0; three representative 2D projections with the matching
parameters are shown.
Figure. 2.27. Length distribution of short chains that are not included in the large
assembly.
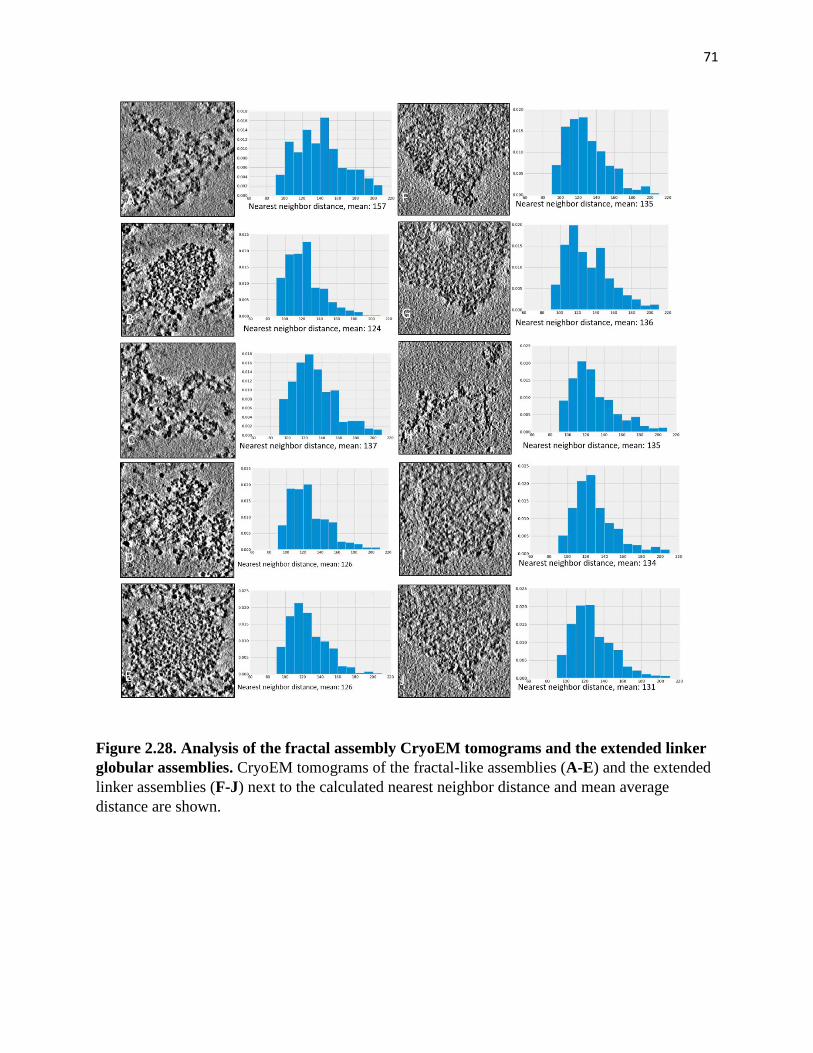
71
Figure 2.28. Analysis of the fractal assembly CryoEM tomograms and the extended linker
globular assemblies. CryoEM tomograms of the fractal-like assemblies (A-E) and the extended
linker assemblies (F-J) next to the calculated nearest neighbor distance and mean average
distance are shown.
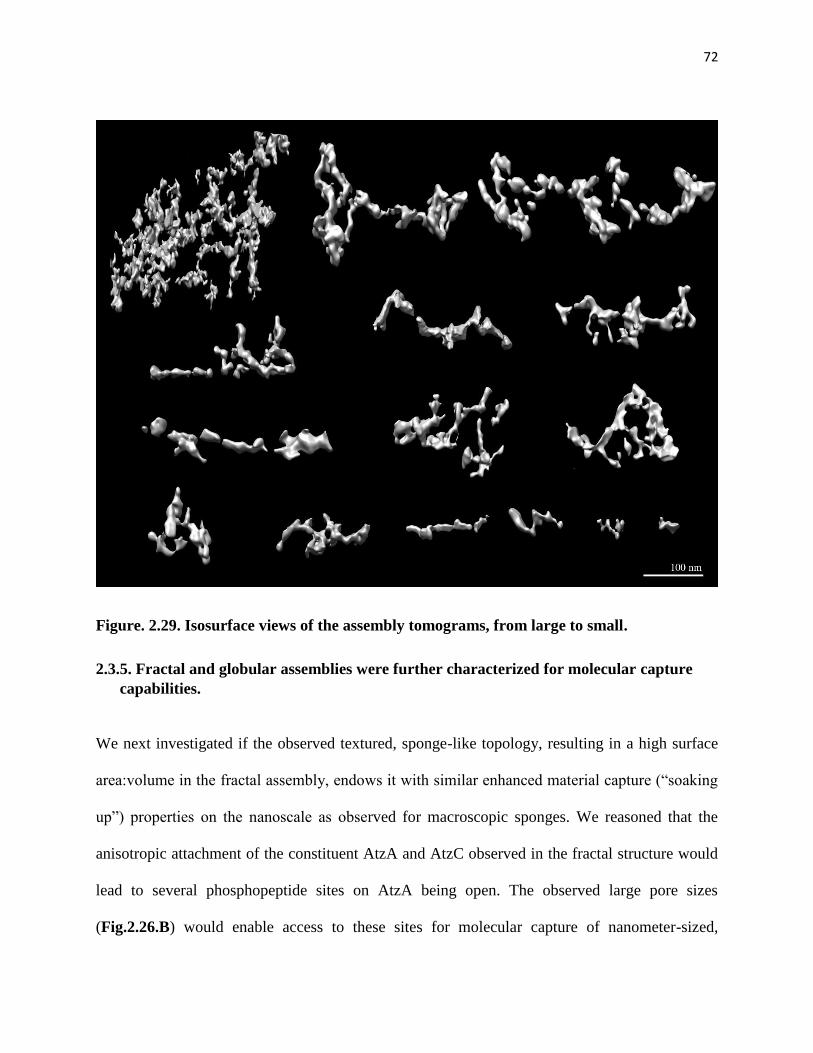
72
Figure. 2.29. Isosurface views of the assembly tomograms, from large to small.
2.3.5. Fractal and globular assemblies were further characterized for molecular capture
capabilities.
We next investigated if the observed textured, sponge-like topology, resulting in a high surface
area:volume in the fractal assembly, endows it with similar enhanced material capture (“soaking
up”) properties on the nanoscale as observed for macroscopic sponges. We reasoned that the
anisotropic attachment of the constituent AtzA and AtzC observed in the fractal structure would
lead to several phosphopeptide sites on AtzA being open. The observed large pore sizes
(Fig.2.26.B) would enable access to these sites for molecular capture of nanometer-sized,
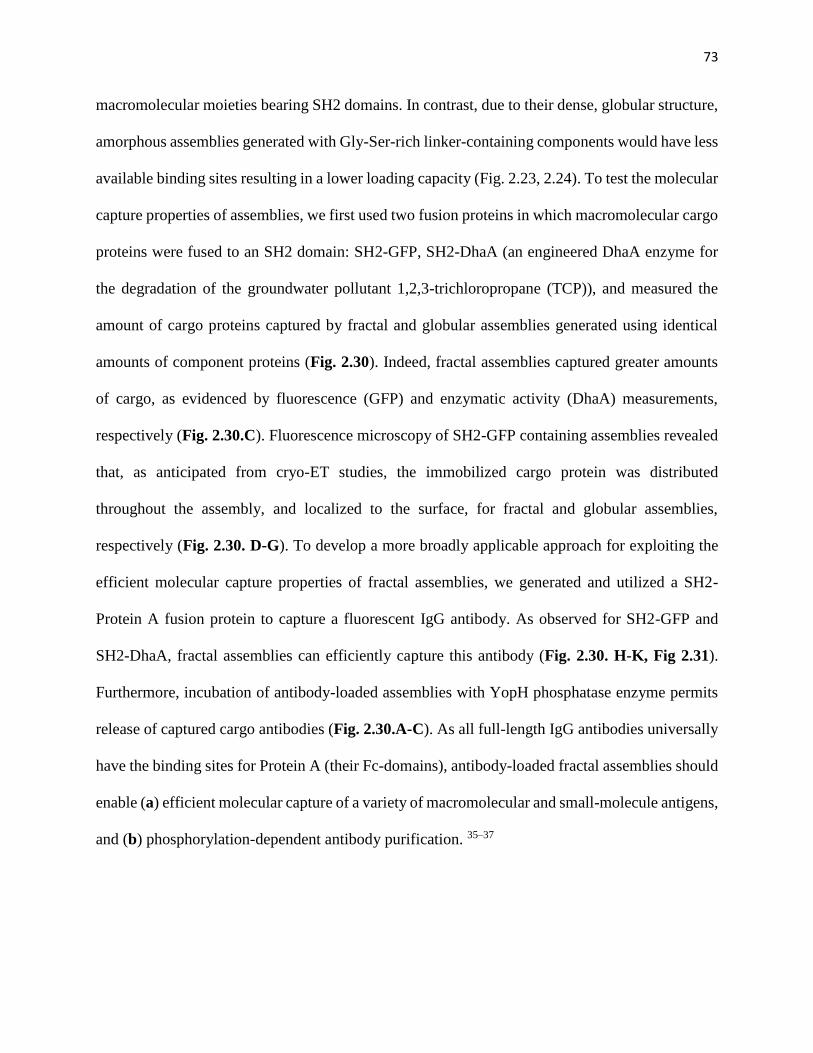
73
macromolecular moieties bearing SH2 domains. In contrast, due to their dense, globular structure,
amorphous assemblies generated with Gly-Ser-rich linker-containing components would have less
available binding sites resulting in a lower loading capacity (Fig. 2.23, 2.24). To test the molecular
capture properties of assemblies, we first used two fusion proteins in which macromolecular cargo
proteins were fused to an SH2 domain: SH2-GFP, SH2-DhaA (an engineered DhaA enzyme for
the degradation of the groundwater pollutant 1,2,3-trichloropropane (TCP)), and measured the
amount of cargo proteins captured by fractal and globular assemblies generated using identical
amounts of component proteins (Fig. 2.30). Indeed, fractal assemblies captured greater amounts
of cargo, as evidenced by fluorescence (GFP) and enzymatic activity (DhaA) measurements,
respectively (Fig. 2.30.C). Fluorescence microscopy of SH2-GFP containing assemblies revealed
that, as anticipated from cryo-ET studies, the immobilized cargo protein was distributed
throughout the assembly, and localized to the surface, for fractal and globular assemblies,
respectively (Fig. 2.30. D-G). To develop a more broadly applicable approach for exploiting the
efficient molecular capture properties of fractal assemblies, we generated and utilized a SH2-
Protein A fusion protein to capture a fluorescent IgG antibody. As observed for SH2-GFP and
SH2-DhaA, fractal assemblies can efficiently capture this antibody (Fig. 2.30. H-K, Fig 2.31).
Furthermore, incubation of antibody-loaded assemblies with YopH phosphatase enzyme permits
release of captured cargo antibodies (Fig. 2.30.A-C). As all full-length IgG antibodies universally
have the binding sites for Protein A (their Fc-domains), antibody-loaded fractal assemblies should
enable (a) efficient molecular capture of a variety of macromolecular and small-molecule antigens,
and (b) phosphorylation-dependent antibody purification. 35–37
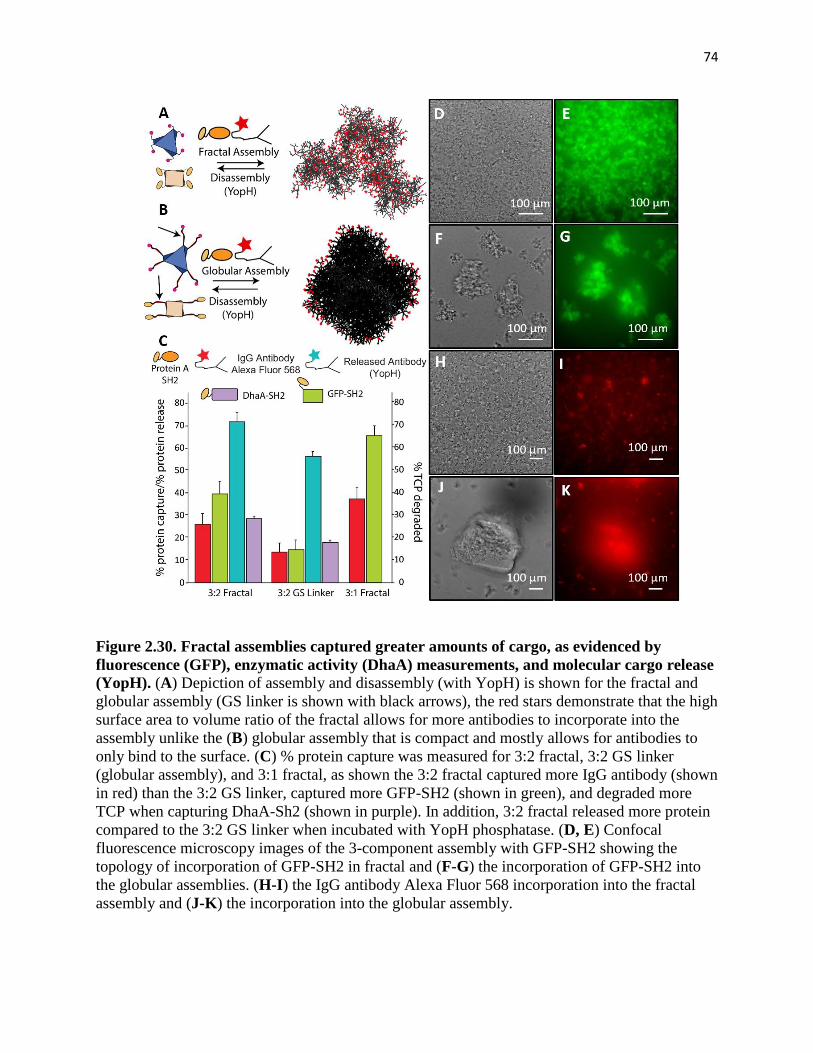
74
Figure 2.30. Fractal assemblies captured greater amounts of cargo, as evidenced by
fluorescence (GFP), enzymatic activity (DhaA) measurements, and molecular cargo release
(YopH). (A) Depiction of assembly and disassembly (with YopH) is shown for the fractal and
globular assembly (GS linker is shown with black arrows), the red stars demonstrate that the high
surface area to volume ratio of the fractal allows for more antibodies to incorporate into the
assembly unlike the (B) globular assembly that is compact and mostly allows for antibodies to
only bind to the surface. (C) % protein capture was measured for 3:2 fractal, 3:2 GS linker
(globular assembly), and 3:1 fractal, as shown the 3:2 fractal captured more IgG antibody (shown
in red) than the 3:2 GS linker, captured more GFP-SH2 (shown in green), and degraded more
TCP when capturing DhaA-Sh2 (shown in purple). In addition, 3:2 fractal released more protein
compared to the 3:2 GS linker when incubated with YopH phosphatase. (D, E) Confocal
fluorescence microscopy images of the 3-component assembly with GFP-SH2 showing the
topology of incorporation of GFP-SH2 in fractal and (F-G) the incorporation of GFP-SH2 into
the globular assemblies. (H-I) the IgG antibody Alexa Fluor 568 incorporation into the fractal
assembly and (J-K) the incorporation into the globular assembly.
75
Figure. 2.31. Fluorescence microscopy and bright-field images of the 4-component
assembly (AtzAM1, AtzCM1, ProteinA-SH2, and antibody, along with extended linker
versions of AtzA and AtzC) confirm incorporation of IgG-Antibody-Alexa Fluor 568 into
assemblies. (A) Fractal assembly in DIC and (B) fluorescent image of fractal indicating
incorporation of antibody into assembly. (C) Globular assembly in DIC and (D) fluorescent
images of globular assembly indicating incorporation of antibody into assembly. The depiction
of a fractal and globular topology is easily distinguishable in these images.
76
2.3.6. Fractal assemblies were further characterized through cyanuric acid activity assays
and compared to extended linker (globular and random) assemblies.
In our design framework, fractal loading capacity is a determined by the number and accessibility
of open phosphopeptide binding sites in the assembly, which are expected to be greater at smaller
fractal dimensions and higher lacunarity. Thus, assemblies formed by 3 (AtzA-pY):1 (SH2-AtzC)
are expected to have a greater loading capacity compared to those formed by 3 (AtzA-pY):2 (SH2-
AtzC) (Fig. 2.30.C, Fig.2.32, Fig.2.33, Table 2.2). Indeed, as anticipated, more antibody was
captured and released by the former compared to the latter (Fig. 2.30.C), demonstrating that
customized optimization of molecular capture-and-release of specific nanoscale objects should be
possible by varying component stoichiometry to obtain desired the fractal properties on the nano-
micrometer scales. Finally, we asked if the observed functional advantages of fractal topology over
a globular one would extend to the capture and transport of small molecules within the assembly
by measuring the efficacy of atrazine degradation. We incorporated as cargo AtzB – the third
pathway enzyme, apart from AtzA and AtzC, required to convert atrazine to the relatively benign
metabolite cyanuric acid (Fig.2.34-2.37). While both the fractal and globular assemblies appear to
be more robustly active under harsh reactions compared to unassembled enzymes, both globular
and fractal assemblies are equally active (Fig. 2.38). The significantly small size of atrazine (Rg <
1nm) and other metabolic pathway intermediates likely allows them to diffuse as efficiently in
either assembly. Thus, for objects with size length scales (~10-100X) smaller than the size of the
component proteins, differences in assembly topology no longer have functional effects. Future
studies of molecular fractal design would benefit from focusing on length scales greater than the
size of assembly components, where functional advantages of the high surface:volume are
significant.
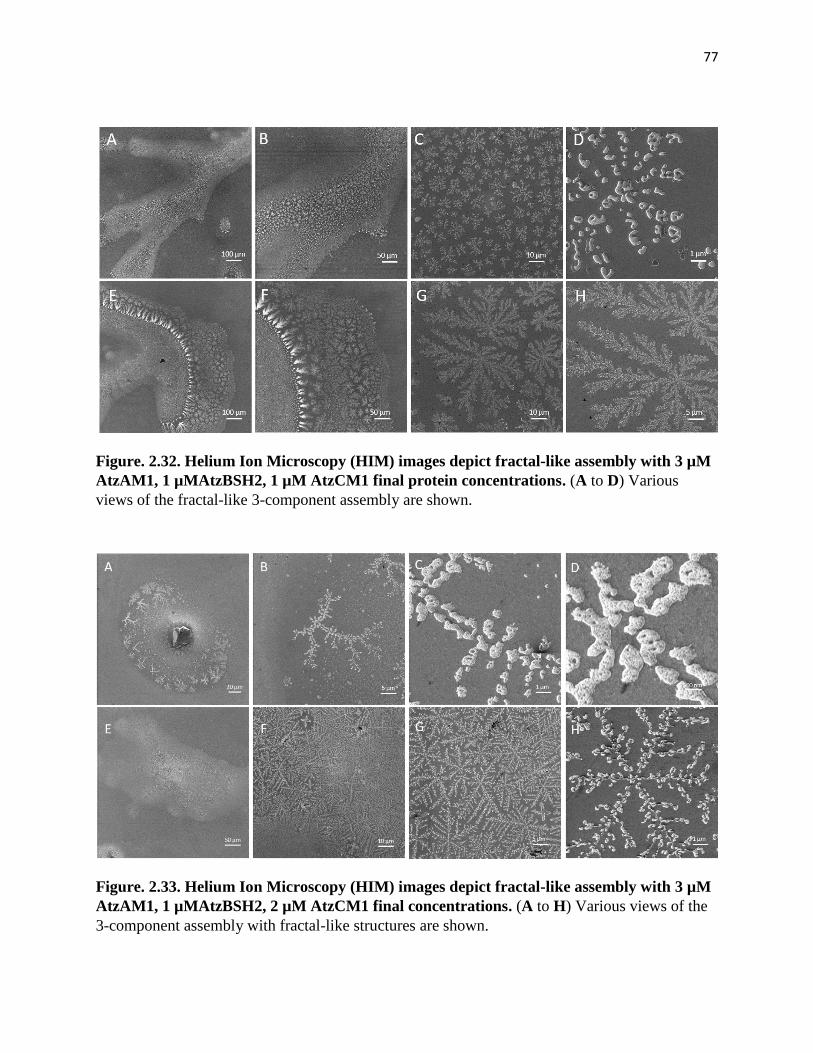
77
Figure. 2.32. Helium Ion Microscopy (HIM) images depict fractal-like assembly with 3 µM
AtzAM1, 1 µMAtzBSH2, 1 µM AtzCM1 final protein concentrations. (A to D) Various
views of the fractal-like 3-component assembly are shown.
Figure. 2.33. Helium Ion Microscopy (HIM) images depict fractal-like assembly with 3 µM
AtzAM1, 1 µMAtzBSH2, 2 µM AtzCM1 final concentrations. (A to H) Various views of the
3-component assembly with fractal-like structures are shown.
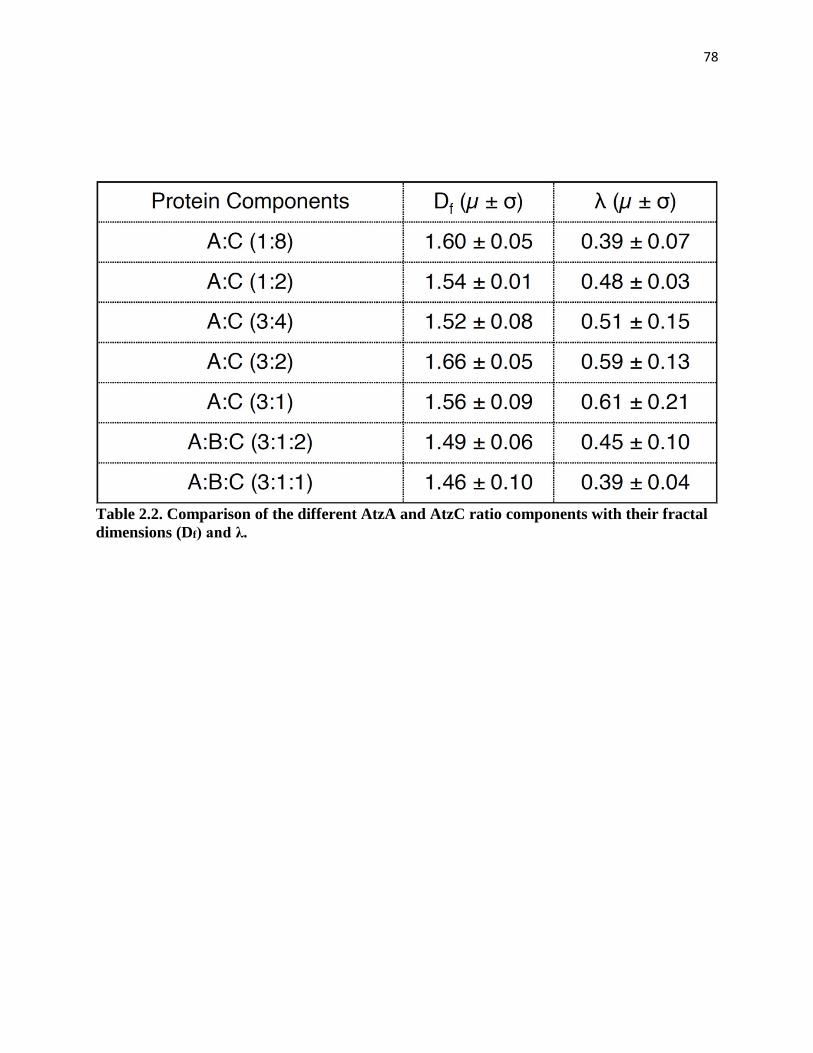
78
Table 2.2. Comparison of the different AtzA and AtzC ratio components with their fractal
dimensions (Df) and λ.
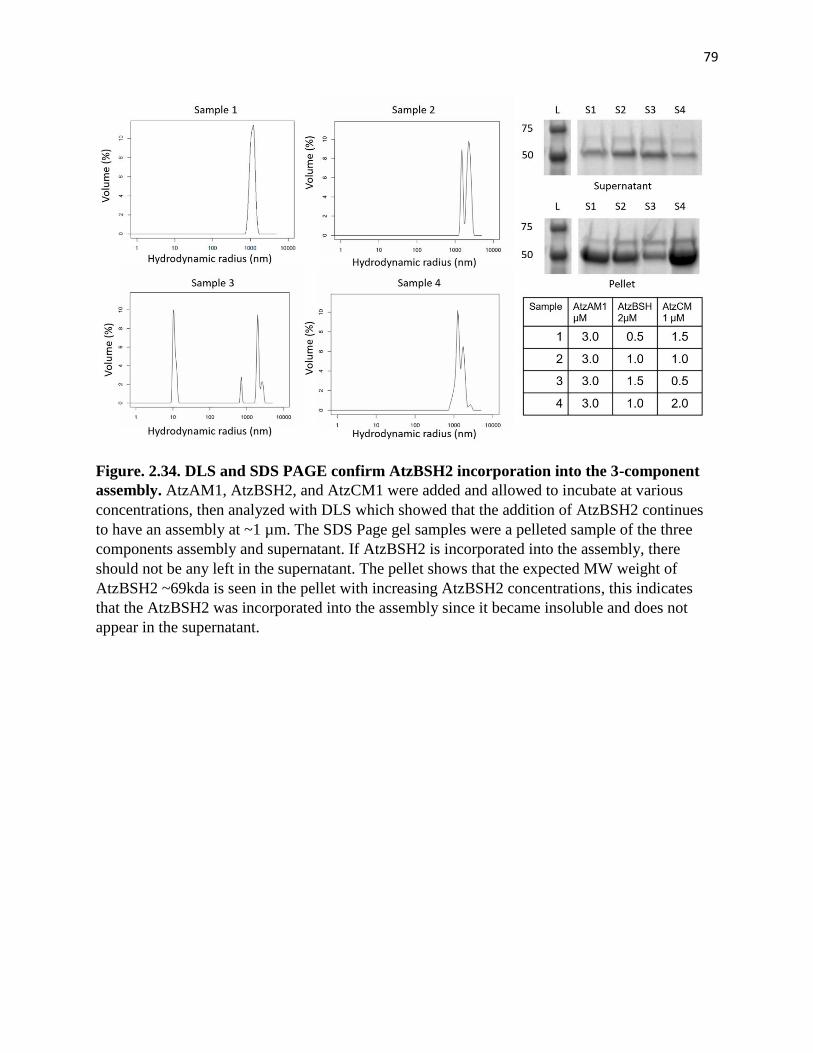
79
Figure. 2.34. DLS and SDS PAGE confirm AtzBSH2 incorporation into the 3-component
assembly. AtzAM1, AtzBSH2, and AtzCM1 were added and allowed to incubate at various
concentrations, then analyzed with DLS which showed that the addition of AtzBSH2 continues
to have an assembly at ~1 µm. The SDS Page gel samples were a pelleted sample of the three
components assembly and supernatant. If AtzBSH2 is incorporated into the assembly, there
should not be any left in the supernatant. The pellet shows that the expected MW weight of
AtzBSH2 ~69kda is seen in the pellet with increasing AtzBSH2 concentrations, this indicates
that the AtzBSH2 was incorporated into the assembly since it became insoluble and does not
appear in the supernatant.
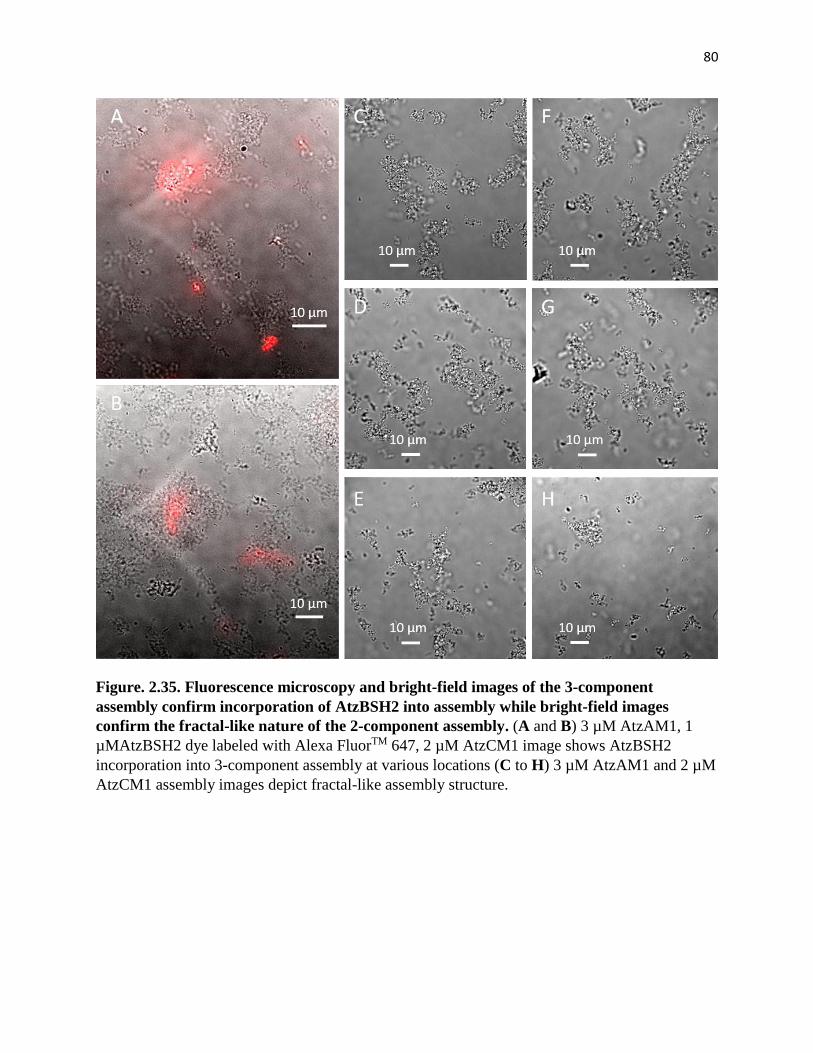
80
Figure. 2.35. Fluorescence microscopy and bright-field images of the 3-component
assembly confirm incorporation of AtzBSH2 into assembly while bright-field images
confirm the fractal-like nature of the 2-component assembly. (A and B) 3 µM AtzAM1, 1
µMAtzBSH2 dye labeled with Alexa FluorTM 647, 2 µM AtzCM1 image shows AtzBSH2
incorporation into 3-component assembly at various locations (C to H) 3 µM AtzAM1 and 2 µM
AtzCM1 assembly images depict fractal-like assembly structure.
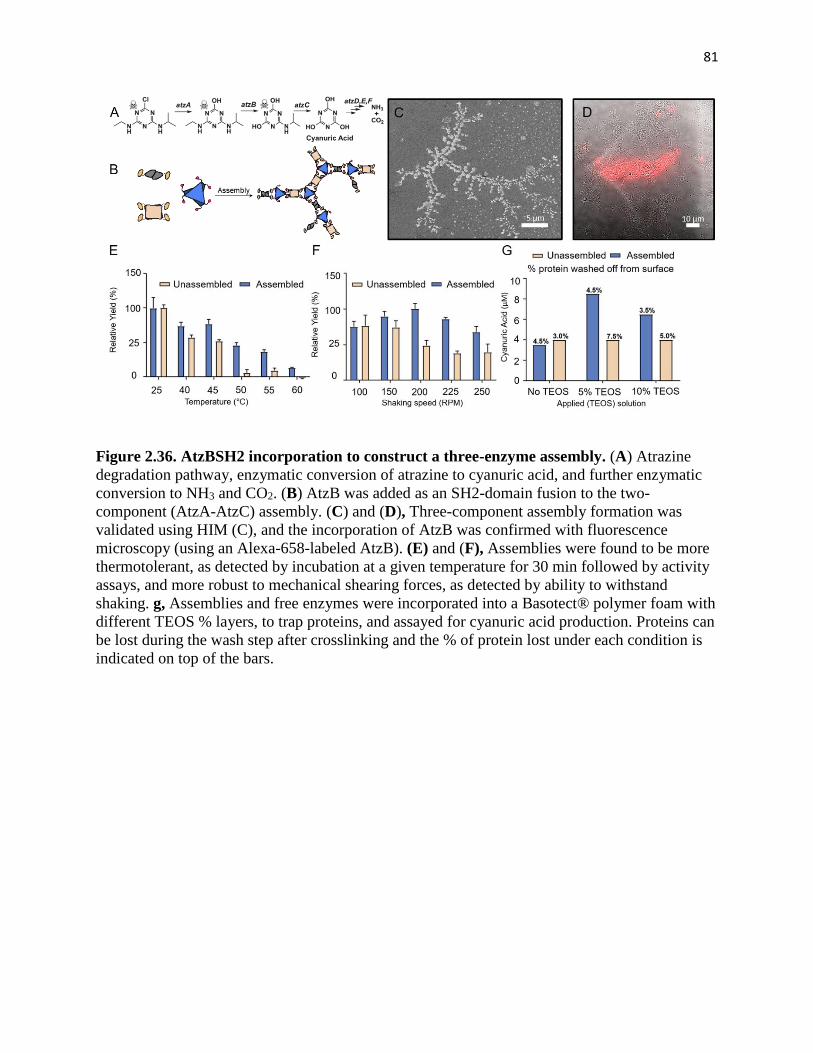
81
Figure 2.36. AtzBSH2 incorporation to construct a three-enzyme assembly. (A) Atrazine
degradation pathway, enzymatic conversion of atrazine to cyanuric acid, and further enzymatic
conversion to NH3 and CO2. (B) AtzB was added as an SH2-domain fusion to the two-
component (AtzA-AtzC) assembly. (C) and (D), Three-component assembly formation was
validated using HIM (C), and the incorporation of AtzB was confirmed with fluorescence
microscopy (using an Alexa-658-labeled AtzB). (E) and (F), Assemblies were found to be more
thermotolerant, as detected by incubation at a given temperature for 30 min followed by activity
assays, and more robust to mechanical shearing forces, as detected by ability to withstand
shaking. g, Assemblies and free enzymes were incorporated into a Basotect® polymer foam with
different TEOS % layers, to trap proteins, and assayed for cyanuric acid production. Proteins can
be lost during the wash step after crosslinking and the % of protein lost under each condition is
indicated on top of the bars.
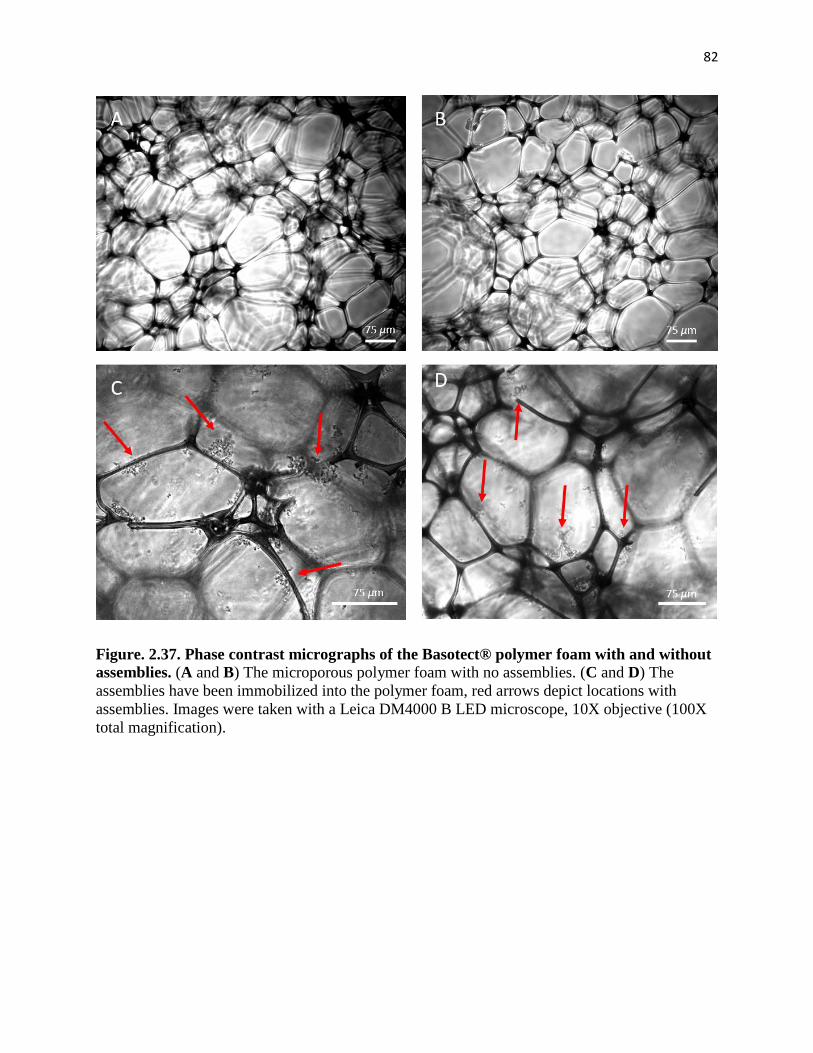
82
Figure. 2.37. Phase contrast micrographs of the Basotect® polymer foam with and without
assemblies. (A and B) The microporous polymer foam with no assemblies. (C and D) The
assemblies have been immobilized into the polymer foam, red arrows depict locations with
assemblies. Images were taken with a Leica DM4000 B LED microscope, 10X objective (100X
total magnification).
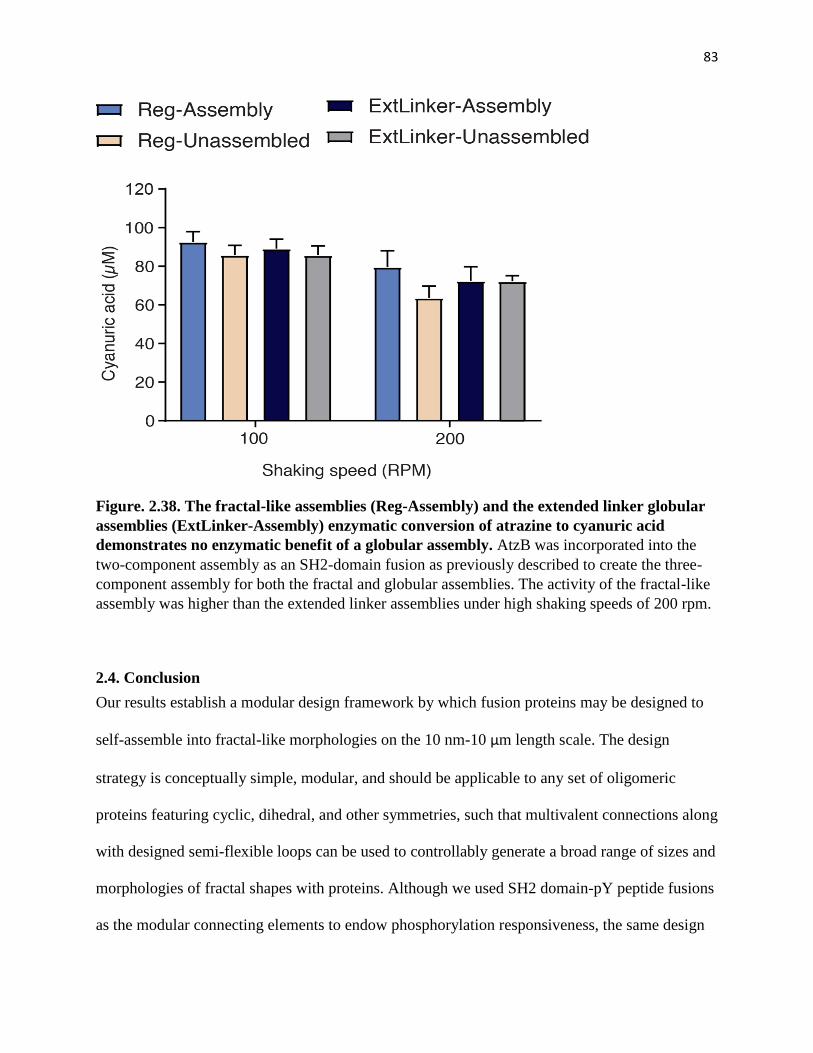
83
Figure. 2.38. The fractal-like assemblies (Reg-Assembly) and the extended linker globular
assemblies (ExtLinker-Assembly) enzymatic conversion of atrazine to cyanuric acid
demonstrates no enzymatic benefit of a globular assembly. AtzB was incorporated into the
two-component assembly as an SH2-domain fusion as previously described to create the three-
component assembly for both the fractal and globular assemblies. The activity of the fractal-like
assembly was higher than the extended linker assemblies under high shaking speeds of 200 rpm.
2.4. Conclusion
Our results establish a modular design framework by which fusion proteins may be designed to
self-assemble into fractal-like morphologies on the 10 nm-10 µm length scale. The design
strategy is conceptually simple, modular, and should be applicable to any set of oligomeric
proteins featuring cyclic, dihedral, and other symmetries, such that multivalent connections along
with designed semi-flexible loops can be used to controllably generate a broad range of sizes and
morphologies of fractal shapes with proteins. Although we used SH2 domain-pY peptide fusions
as the modular connecting elements to endow phosphorylation responsiveness, the same design
84
strategy should be applicable for the incorporation of other peptide recognition domains,
responsive to other chemical or physical stimuli. The combination of multivalency and chain
flexibility is a key determinant of other recently discovered phases formed by proteins, including
droplets formed by liquid-liquid phase separation38. Our results show that this rich phase
behavior of proteins also includes fractal-like morphologies that form colloidal particles with
constituent microscopic molecular networks which may be visualized at high resolution using
cryo-ET. Given the wide-ranging applications of fractal-like nanomaterials for molecular
capture, further development in the design of protein-based fractals described here is expected to
enable the production of novel classes of bionanomaterials and devices.
2.5. Main References
1. Mandelbrot, B. The fractal geometry of nature. 406 (1983). doi:10.1002/esp.3290080415
2. Losa, G.A., Merlini, D., Nonnenmacher, T.F., Weibel, E. . in Fractals in biology and
medicine. Volume IV. vii, 314 (Birkhäuser, Basel, 2005).
3. Fairbanks, M. S., McCarthy, D. N., Scott, S. A., Brown, S. A. & Taylor, R. P. Fractal
electronic devices: Simulation and implementation. Nanotechnology 22, (2011).
4. Soleymani, L., Fang, Z., Sargent, E. H. & Kelley, S. O. Programming the detection limits
of biosensors through controlled nanostructuring. Nat. Nanotechnol. 4, 844–848 (2009).
5. Ge, J., Lei, J. & Zare, R. N. Protein-inorganic hybrid nanoflowers. Nat. Nanotechnol. 7,
428–432 (2012).
6. Zhang, P. & Wang, S. Designing fractal nanostructured biointerfaces for biomedical
applications. ChemPhysChem 15, 1550–1561 (2014).
7. Lim, B. et al. Pd-Pt bimetallic nanodendrites with high activity for oxygen reduction.
Science (80-. ). 324, 1302–1305 (2009).
8. Cerofolini, G. F., Narducci, D., Amato, P. & Romano, E. Fractal nanotechnology.
Nanoscale Res. Lett. 3, 381–385 (2008).
85
9. Newkome, G. R. et al. Nanoassembly of a fractal polymer: A molecular ‘Sierpinski
hexagonal gasket’. Science (80-. ). 312, 1782–1785 (2006).
10. Shang, J. et al. Assembling molecular Sierpiński triangle fractals. Nat. Chem. 7, 389–393
(2015).
11. Newkome, G. R. & Moorefield, C. N. From 1 → 3 dendritic designs to fractal
supramacromolecular constructs: understanding the pathway to the Sierpiński gasket.
Chem. Soc. Rev. 44, 3954–3967 (2015).
12. Shin, S. et al. Polymer Self-Assembly into Unique Fractal Nanostructures in Solution by a
One-Shot Synthetic Procedure. J. Am. Chem. Soc. 140, 475–482 (2018).
13. Astier, Y., Bayley, H. & Howorka, S. Protein components for nanodevices. Current
Opinion in Chemical Biology 9, 576–584 (2005).
14. Murr, M. M. & Morse, D. E. Fractal intermediates in the self-assembly of silicatein
filaments. Proc. Natl. Acad. Sci. 102, 11657–11662 (2005).
15. Khire, T. S., Kundu, J., Kundu, S. C. & Yadavalli, V. K. The fractal self-assembly of the
silk protein sericin. Soft Matter 6, 2066 (2010).
16. Lomander, A., Hwang, W. & Zhang, S. Hierarchical self-assembly of a coiled-coil peptide
into fractal structure. Nano Lett. 5, 1255–1260 (2005).
17. Shen, W., Lammertink, R. G. H., Sakata, J. K., Kornfield, J. A. & Tirrell, D. A. Assembly
of an artificial protein hydrogel through leucine zipper aggregation and bisulfide bond
formation. Macromolecules 38, 3909–3916 (2005).
18. McManus, J. J., Charbonneau, P., Zaccarelli, E. & Asherie, N. The physics of protein self-
assembly. Curr. Opin. Colloid Interface Sci. 22, 73–79 (2016).
19. King, N. P. et al. Computational design of self-assembling protein nanomaterials with
atomic level accuracy. Science (80-. ). 336, 1171–1174 (2012).
20. Hsia, Y. et al. Design of a hyperstable 60-subunit protein icosahedron. Nature 535, 136–
139 (2016).
21. Suzuki, Y. et al. Self-assembly of coherently dynamic, auxetic, two-dimensional protein
crystals. Nature 533, 369–373 (2016).
22. Sinclair, J. C., Davies, K. M., Vénien-Bryan, C. & Noble, M. E. M. Generation of protein
lattices by fusing proteins with matching rotational symmetry. Nat. Nanotechnol. 6, 558–
562 (2011).
23. Padilla, J. E., Colovos, C. & Yeates, T. O. Nanohedra: Using symmetry to design self
86
assembling protein cages, layers, crystals, and filaments. Proc. Natl. Acad. Sci. 98, 2217–
2221 (2001).
24. Zhang, J., Zheng, F. & Grigoryan, G. Design and designability of protein-based
assemblies. Current Opinion in Structural Biology 27, 79–86 (2014).
25. Brodin, J. D. et al. Metal-directed, chemically tunable assembly of one-, two- and three-
dimensional crystalline protein arrays. Nat. Chem. 4, 375–382 (2012).
26. Ringler, P. & Schulz, G. E. Self-assembly of proteins into designed networks. Science (80-
. ). 302, 106–109 (2003).
27. Lindenmayer, A. Mathematical models for cellular interactions in development II. Simple
and branching filaments with two-sided inputs. J. Theor. Biol. 18, 300–315 (1968).
28. Wackett, L., Sadowsky, M., Martinez, B. & Shapir, N. Biodegradation of atrazine and
related s-triazine compounds: From enzymes to field studies. Applied Microbiology and
Biotechnology 58, 39–45 (2002).
29. Kaneko, T. et al. Superbinder SH2 Domains Act as Antagonists of Cell Signaling. Sci.
Signal. 5, ra68-ra68 (2012).
30. Yang, L. et al. Computation-Guided Design of a Stimulus-Responsive Multienzyme
Supramolecular Assembly. ChemBioChem 18, 2000–2006 (2017).
31. Richter, F., Leaver-Fay, A., Khare, S. D., Bjelic, S. & Baker, D. De novo enzyme design
using Rosetta3. PLoS One 6, (2011).
32. Van Anders, G., Ahmed, N. K., Smith, R., Engel, M. & Glotzer, S. C. Entropically patchy
particles: Engineering valence through shape entropy. ACS Nano 8, 931–940 (2014).
33. Zhang, Z. & Glotzer, S. C. Self-assembly of patchy particles. Nano Lett. 4, 1407–1413
(2004).
34. Nicolas-Carlock, J. R., Carrillo-Estrada, J. L. & Dossetti, V. Fractality a la carte: A
general particle aggregation model. Sci. Rep. 6, (2016).
35. Swartz, A. R. & Chen, W. SpyTag/Spycatcher functionalization of E2 nanocages with
stimuli-responsive Z-ELP affinity domains for tunable monoclonal antibody binding and
precipitation properties. Bioconjug. Chem. 29, acs.bioconjchem.8b00458 (2018).
36. Bilgiçer, B. et al. A non-chromatographic method for the purification of a bivalently
active monoclonal IgG antibody from biological fluids. J. Am. Chem. Soc. (2009).
doi:10.1021/ja9023836
37. Handlogten, M. W., Stefanick, J. F., Deak, P. E. & Bilgicer, B. Affinity-based
87
precipitation via a bivalent peptidic hapten for the purification of monoclonal antibodies.
Analyst (2014). doi:10.1039/c4an00780h
38. Brangwynne, C. P., Tompa, P. & Pappu, R. V. Polymer physics of intracellular phase
transitions. Nat. Phys. 11, 899–904 (2015).
2.6. Materials and Methods
2.6.1. Computational Design
2.6.1.1 Preparation of a two-component scaffold library - Crystal structure files for AtzA
(PDB:4V1X) and AtzC (PDB:2QT3) were subject to several preparatory scripts to clean,
symmetrize, and process the files for Rosetta Design146–148. The processed crystal structure files
were then subject to a Rosetta Fast Relax149 protocol to obtain starting structures of sufficiently
low Rosetta Energy to serve as starting structures and ideal wild-type models. We created a two-
component (AtzA:monomer and AtzC:monomer) scaffold library where the rigid-body position
of AtzC:tetramer altered with respect to AtzA:hexamer along aligned C2 symmetry axes via
rotation and translation. To prepare the scaffold library we first aligned the proteins along paired
C2 symmetry axes (A+B chains for both AtzA and AtzC). We then translated AtzC along the
aligned C2 symmetry axis until the backbone atoms of each structure were at least 3Å apart to
find the minimum starting distance (125Å). From the minimum starting distance we translated
AtzC(monomer) in intervals of 1Å to a maximum distance of 145Å. To complete the two
component scaffold library, for each translated AtzC(monomer) position we rotated the
AtzC(monomer) about the C2 symmetry axis by 360˚ in intervals of 5˚ for a total of 1440 library
members.
88
2.6.1.2 RosettaMatch: simultaneous fusion domain and peptide pair stitching – After visual
inspection of the two-component scaffold library, we noted the accessibility of the AtzA N-
terminus and the AtzC C-terminus along the C2 symmetry axis (chains A+B). Therefore, we
decided to fuse the N-terminus of an fyn-SH2 super-binder (PDB:1A0T) to the C-terminus of
AtzC and the C-terminus of the fyn-SH2 peptide binding partner to the N-terminus of AtzA. To
achieve the simultaneous fusion, we converted the SH2-peptide crystal structure into an all-Cα
‘ligand’ file and used RosettaMatch150 with geometric constraints to sample all sterically feasible
rigid body placements of the SH2-peptide between each AtzA-AtzC pair in the two-component
scaffold library. The geometric constraints used to coordinate the SH2 domain for simultaneous
fusion were derived from a non-redundant protein library generated by the RCSB-PDB151. From
N to C terminus, regardless of secondary structure we collected distances and angles between
backbone atoms (Cα, nitrogen, and carboxyl carbon) up to and including 7 residues downstream
(sequence-space) of each residue along the primary structure. The averages and standard
deviations of these distributions were used to place matching constrains between residues of the
AtzA-AtzC termini and the all-Cα SH2-peptide ligand. The full-atom SH2-peptide crystal
structure was re-threaded back onto each of the matched SH2-peptide ligands creating 7,005
models with paired termini in proximally close and geometrically favorable positions. Rosetta
GeneralizedKIC (kinematic loop closure)152 was used to covalently link the paired termini and
generate 3 potential linker-models for each matched SH2-peptide model, creating a library of
21,015 fused and bound AtzA-AtzC pairs.
2.6.1.3 Rosetta Design: interface design – A Rosetta FastRelax protocol was used to design the
89
novel interfaces between the closely placed protein models generated in the previous steps. For
each round of the FastRelax protocol we allowed all residues to sample every rotameric degree
of freedom. In addition to rotameric sampling, novel interface residues with a maximum Cα-Cα
distance of 6Å as well as linker residues were allowed to change residue identity before energy
minimization. All backbone atoms with the exception of the linker residues were constrained
with atom-coordinate constraints to favor the SH2-peptide placements determined in the
RosettaMatch step. A final visual inspection was made to confirm the validity of each mutation
made during this protocol. Mutations alleviating steric clashes were widely accepted; spurious
mutations with little benefit were reverted to native residue identities before a subsequent round
of repack and energy minimization153. Designs were filtered by favorable ∆∆G residue energy
and smallest number of mutations.
2.6.1.4 Stochastic fractal assembly simulation summary – In order to better predict the
supramolecular structure and topology we created a stochastic fractal assembly simulation that
utilizes Boltzmann weighted probability distributions for an ensemble of predicted low-energy
binding modes along the C2-symmetry axes of the AtzA-AtzC pairs. The algorithm operates by
starting with one oligomer (AtzA for this study) and attaches each complementary oligomer in
layers. The Boltzmann probability distribution was used to decide how the oligomers in each
layer were placed. A few key assumptions were made during the simulations that were based on
chemical intuition. We assumed: 1) The symmetric divalent connection along a C2-symmetry
axis (two chains of pY-AtzA bound two chains of AtzC-SH2) would be energetically more likely
than the monovalent connection formed between just one chain from each oligomer—reducing
the probability of monovalent connection to an insignificant value. 2) Flexibility in the linker
90
region would only lead to variations along the C2-symmetry axis via the translation and rotation
parameters used to create the two-component library—maintaining the inherent symmetry found
in either oligomer. 3) Symmetry could but is not required to extend to 3 or 4 component
substructures. Mixed vertex-centered and edge-centered species could occur around a single
AtzA. This would lead to a substructure where two AtzC oligomers have a 180° bound-angle
about AtzA, different from the more symmetric 120° bound-angles. 4) Changes in size and
topology would arise from concentration changes of the enzyme and would need to be
represented in the algorithm. 5) During fractal growth it is possible (and likely) that oligomers in
one layer could come within 125Å (minimum connected distance) of other oligomers within
another layer even if they are not directly connected. The details of this algorithm are described
below.
2.6.1.5 Coarse-graining AtzA-C oligomers for stochastic fractal growth simulations – We
predicted that fractal growth could continue indefinitely in all directions. To reduce the
computational load and file size of particle models exceeding 100s or even 1000s of oligomers,
we thought to coarse-grain our symmetric oligomers by reducing each chain to just 10
representative points in space (60 and 40 for whole hexamer and tetramer respectively). To
coarse-grain we used a K-means-style clustering algorithm to place the 10 points at locations
with the highest concentration of Cα atoms in each monomer (chain A). We then calculated and
applied the symmetric transform to the 10 representative points to obtain a coarse-grained
representation of each oligomer (hexamer and tetramer). When each point is converted into a
sphere with a 12Å radius, the coarse-grained model shows agreement with the overall shape and
size of the full-atom model.
91
2.6.1.6 Stochastic fractal assembly simulation – After experimental analysis revealed the best
pY-AtzA and AtzC-SH2 variants we repeated the above Rosetta FastRelax protocol on all
21,015 fused AtzA-AtzC pairs while forcing the sequence identity of the best pY-AtzA and
AtzC-SH2 pair. We generated an energy profile (Figure 1E-F) for conformations whose
evaluated energy scored better than the wild-type components (504 models). Each conformation
was represented by three parameters, translation (d), rotation (θ), and axis-binding preference
(vertex or edge centered). The conformations were assigned Boltzmann weighted probabilities
which were used to randomly propagate the coarse grained A-C components during simulation.
We varied the kT term to obtain a total of 5 different Boltzmann weighted probability
distributions (kT = 1, 3, 5, 7, and 9). Propagation was achieved by alternating layers of AtzA and
AtzC components starting from an initial seed component (pY-AtzA in this study) which would
continue until either placement of new components was determined either impossible or
improbable or an external criterion was met (number of layers, size of particle, etc.). The
propagation algorithm can be broken into 10 steps at any given layer:
1) Randomly choose the number of components in the previous layer (or the seed component)
based on a variable fraction with which new complementary oligomers would be placed.
2) Randomly select individuals from the chosen pool (1) to place new components.
3) Based on a random generated number from 0.0-1.0, select a matching d-θ-axis conformation
via the probability of the conformation.
92
4) Randomly select available C2-symmetry axes of the individual selected in (2) compatible with
the conformation chosen in (3).
5) Choose whether or not to keep the selected C2-symmetry axis (4) based on a variable null
probability.
6a) If (5) passes the null, apply the rigid body transformation (d and θ) to the new member of the
current layer.
6b) If (5) fails the null, mark the C2-symmetry axis (4) of the individual selected in (2) as
unviable and continue.
7) Repeat 3-6b until all C2-symmetry axes of individual (2) are exhausted.
8) Perform a coarse grid-based clash check to ensure new layer members are sterically feasible.
9) Repeat 2-8 until all of the individuals chosen in (1) are exhausted.
10) Move to the next layer.
2.6.1.7 Temperature, fraction, and null parameter sweep – Varying the fraction (1) and null
(5-6b) parameters gave rise to changes in topology and structure. We created 100 fractal models
93
for each combination of fraction (range: 0.1-1.0, interval: 0.1) and null (range: 0.0-0.9, interval:
0.1) using the 5 different Boltzmann weighted probability distributions (with varying
temperature)—creating 50,000 total fractal assemblies. An external criterion (15 layer limit) was
set during the simulation stage to reduce the computational load of the simulation program as
well as on the downstream data processing software. We analyzed each particle's individual size,
number of layers, AtzA branch ratio (number of AtzC units bound to a unit of AtzA), lacunarity,
and dimensionality (Df) from a 2D image. For every combination of temperature, fraction, and
null we averaged the data across the 100 fractal assemblies. The results can be found in Figure
S1 and S2.
2.6.1.8 Preparing fractal models for image analysis – Each fractal assembly was passed
through a deterministic PyMOL script that would color the assembly black, convert the
background white, show as spheres of scale 12Å, orient the image such that the longest
diameters are in the X-Y plane, remove the glossy lighting and shine from the sphere models,
and finally ray-trace render the image.
2.6.1.9 Preparing helium ion microscopy (HIM) images for image analysis – HIM images
were loaded into ImageJ9. The initial image contrast was enhanced with 5-20% saturated pixels
setting; this can be achieved with Process -> Enhance Contrast. We then create a new blank
(black) image with the same pixel dimensions as the HIM image. Gaussian noise is added to the
blank image with a standard deviation 5-10 (Process -> Noise -> Add Specified Noise).
Background noise is subtracted from the HIM image using the noisy blank image (Process ->
Image Calculator -> set Image1 to HIM image and image2 to noisy blank -> set operation to
94
subtract). Finally, we create a binary image from the processed HIM image with subtracted
background. The resulting image contains white protein islands on a black background.
Individual fractal islands are then copy/pasted into a new blank (black) image using the polygon
selection tool and are ready for fractal analysis.
2.6.1.10 Determining fractal lacunarity and 2-D fractal dimension with ImageJ - The
FracLac package10 designed for ImageJ was used to determine both the 2D lacunarity and fractal
dimension (Df). With FracLac mode on, outside of the standard parameters, we checked the
'alternate random generator' box and allowed the minimum pixel size to be 1, and the color code
was turned off. We then ran in batch-mode to process all of the fractal images. ImageJ outputs
four files: summary, box count per grid, scan types, and batch data. Lacunarity and dimension
were taken from the summary file for the parameter sweep while the 2D log vs log plot values
were taken from the box counting grid file (ε and F ).
2.6.1.11 Computational comparison of simulation and tomography fractals from Cryo-EM
– Fitting of the experimentally computed protein density (Cryo-EM tomography) resulted in
Cartesian coordinates representing the center of mass of the oligomeric components. To compare
the experimental results to simulation we ran the simulation until at least a total of 5000
components were present in the model and calculated the geometric centers for all oligomeric
components in the coarse-grained assembly to create new center-of-mass models. Using the
experimentally derived Cartesian coordinates and the center-of-mass models we performed a
computational analysis (see Cryo-EM fitting and statistical analysis below) to evaluate the fractal
size, nearest component neighbor distances, and relative AtzA-AtzC ratio (Fig. 3H,I). We
95
analyzed the 3D fractal dimension (Fig. 3J) with a 3D box counting program that counts the
number of geometric centers within a scaling (doubling) box size. The 2D fractal dimension (Fig.
3J) was calculated in the same way as previously mentioned. We found highest agreement of
simulations with kT = 9, Pnull = 0.1, and Cfrac = 1.0. An array of fractal images that represent the
average fractal for each value of Pnull and Cfrac at kT = 9 can be found in Figure S2.
2.6.2. Experimental Characterization
2.6.2.1 Creation of the designed AtzA, AtzB, and AtzC fusion constructs – The DNA
sequence of the full-length atzA was amplified from the pMD4::atzA; atzB amplified from
pAAJLS3::atzB; and atzC was amplified from pKK223-3::atzC.80,82,154,155 The Src kinase
activator phosphopeptide sequence, EPQYEEIPIYL, was created by ordering two
complementary primers that formed a linear fragment encoding the peptide sequence, used with
the amplified atzA gene and inserted into the linearized pET15b+ vector through Gibson
Assembly.156 The Fyn SH2 superbinder gene was ordered as a gBlock fragment141,156 and
inserted into pET29b+ (linearized with NdeI and XhoI) using Gibson Assembly.The Fyn SH2
amplified gene was designed to be placed on the C-terminal side of the pET15b+::atzB and
pET29b+::atzC with a flexible GSS linker between the proteins. The Fyn SH2 superbinder
amplified gene SH2 and the atzC amplified gene were both inserted into the pET29b+ linear
vector using Gibson Assembly. The atzBSH2 fusion gene was ordered as a Gibson fragment156
and inserted into the pET15b+ linear vector using Gibson Assembly. Point mutations were
introduced using the QuickChange Site-Directed Directed Mutagenesis Kit (Agilent
Technologies) to create the final designs for AtzA and AtzC models. DNA sequencing was used
96
to confirm proper insertion and mutations (Genscript).
2.6.2.2 AtzA and AtzC expression and purification – The pET15b+::atzApep and
pET29b+::atzCSH2 plasmids were co-transformed into Escherichia coli BL21 (DE3) with pAG
plasmid containing genes for the chaperone proteins, groEL and groES 157.For expression of the
AtzA models a 10 mL LB culture with 30 µg/mL of chloramphenicol and 100 µg/mL of
ampicillin was inoculated with a single colony and incubated overnight at 37°C and 250 rpm.
For the expression of the AtzC models a 10 mL LB culture with 30 µg/mL of chloramphenicol
and 50 µg/mL of kanamycin was inoculated. After growing overnight, the 10 mL cultures of the
AtzA and AtzC models were used to inoculate 500 mL of LB media, which was grown at 37°C
to an OD600 of 0.5-0.6, at which point the expression of chaperones was induced with the
addition of 1% (wt/vol) L-arabinose and grown for an additional 1-2 hours at 16°C . Expression
of the AtzA and AtzC models was then induced with 0.1mM IPTG (isopropyl-β-D-thiogalacto-
pyranoside) and grown overnight at 16°C. All subsequent steps were performed at 4°C. Cells
were centrifuged at 6,000 x g for 30 min. Cell pellets were re-suspended in 30 mL of 25 mM
HEPES, 200 mM NaCl, 5% glycerol, 40 mM imidazole, pH 7.5, and lysed by sonication. Cell
extracts were obtained by centrifugation at 50,000 x g for 30 min at 4°C. Protein purification was
performed using 5 mL Ni-NTA agarose resin (Qiagen) equilibrated with 10 mL of 25 mM
HEPES, 200 mM NaCl, 5% glycerol, 40 mM imidazole, pH 7.5. The lysate was applied to the
resin, the resin was washed with 45 mL of the same buffer, and the protein eluted with 20 mL of
25 mM HEPES, 200 mM NaCl, 5% glycerol, 400 mM imidazole, pH 7.5,. The purified protein
was buffer exchanged (PD10-desalting column, GE Healthcare #17085101) into 50 mM HEPES,
100 mM NaCl, 5% glycerol, pH 7.4 (HNG). AtzA was expressed in high yields and precipitated
97
if the buffer was not exchanged quickly. Proteins were frozen using liquid nitrogen and stored at
-80°C. All proteins precipitated if dialyzed in HNG for 2 hours.
2.6.2.3 AtzB expression and purification – The pET15b+::atzBSH2 plasmid was transformed
into E.coli BL21 (DE3) cells. For expression of AtzB, a 10 mL LB culture with 100 µg/mL of
ampicillin was inoculated overnight at 37°C and 250 rpm. The 10 mL overnight culture was used
to inoculate 500 mL of LB media which was grown to an OD600 of 0.5-0.7 and induced with 1
mM IPTG and grown overnight at 16°C. The same purification protocol for the AtzA and AtzC
models was used for AtzB. AtzBSH2 did not express if grown with zinc sulfate, as had been
done customarily in previous literature.80
2.6.2.4 Src human kinase, super binder SH2 domain, SH2-DhaA expression and
purification – The expression plasmid for Src human kinase158 (gift from John Chodera,
Nicholas Levinson, and Markus Seeliger. Addgene plasmid # 79700 was co-transformed with the
expression plasmid for Yersinia YopH protein tyrosine phosphatase (PTPase)158 (gift from John
Chodera, Nicholas Levinson, and Markus Seeliger, Addgene plasmid # 79749) into E. coli
Rosetta2 (DE3) (Novagen). For Src kinase expression a 10 mL LB culture with 50 µg/mL
spectinomycin and 100 µg/mL of ampicillin was inoculated with a single colony and incubated
overnight at 37°C, 250 rpm. The overnight culture was used to inoculate 500 mL of LB media
which was grown to an OD600 of 0.5-0.7 and induced with 1mM IPTG and grown overnight at
18°C. The super binder SH2 domain and SH2-DhaA were transformed into E. coli BL21 (DE3)
and expressed in the same way as the Src kinase above. Purification for the Src kinase was
performed similarly and with the same buffers as AtzAM1, AtzBSH2, and AtzCM1. While, the
98
super binder SH2 domain and SH2-DhaA were purified with the same purification protocol but
with the following buffers: a wash buffer containing 137 mM NaCl, 2.7 mM KCl, 10 mM
Na2HPO4, 2 mM KH2PO4, pH 7.4, 20 mM imidazole and an elution buffer containing 137 mM
NaCl, 2.7 mM KCl, 10 mM Na2HPO4, 2 mM KH2PO4, pH 7.4, 200 mM imidazole. All proteins
were buffer exchanged into HNG, frozen in liquid nitrogen and stored at -80°C.
2.6.2.5 YopH phosphatase construct, expression, and purification – The linear catalytic
domain YopH gene (residues 164-468) was amplified from pET13S-A::YopH158 and inserted with
Gibson Assembly into a linearized pET15b+ vector. A 10 mL LB culture with 100 µg/mL of
ampicillin was inoculated with a single colony and incubated overnight at 37°C. The expression
and purification protocol is the same as the protocol used for the Src kinase.
2.6.2.6 Biuret hydrolase and cyanuric acid hydrolase expression and purification – Biuret
hydrolase (BH)159 expression strain (E. coli DH5α) and the Moorella Cyanuric acid hydrolase
(CAH)160 strain (E.coli BL21 (DE3)) were provided by Dr. Larry Wackett. A 10 mL culture with
50 µg/mL of kanamycin was inoculated for both BH and CAH and incubated at 37°C until OD600
of 0.5-0.7 and induced with 1 mM IPTG for 4 hours at 37°C, 250 rpm. The expression and
purification protocol is the same as the protocol used for the Src kinase.
2.6.2.7 Enzyme-linked immunosorbent assay (ELISA) – Phosphorylated AtzAM1 (pY-
AtzAM1) was loaded onto clear flat-bottom immuno 96-well plates (Thermo Scientific item #
442404) at 20μg/mL and 1.25μg/mL in 50μL 1X PBS (Gibco pH 7.4, #10010023) overnight at
4◦C. Plates were rinsed twice in 200μL 1X TBS (Biorad #1706435). 1% BSA in TBS 0.05%
99
Tween 20 was used to block wells at 200μL block solution for 1.5hr at 25°C under gentle
agitation. Anti-phosphotyrosine 4G10 Platinum HRP conjugate (EMD #16-316) was diluted
1:5000 in 1% BSA TBS 0.05% Tween 20 and loaded onto the well at 25°C for 1.5hr under
gentle agitation. Excess anti-phosphotyrosine was washed off with 200μL of TBS 0.05% Tween
20 in triplicate. To detect bound antibody, 100μL of TMB substrate reagent (Biolegend
#421101) was added to each well and incubated for 5 minutes at 25°C. 100μL of TMB stop
solution (Biolegend #423001) was added to the wells. Absorbance was read at 450nm using the
Tecan Infinite M200 Pro plate reader.
2.6.2.8 Bio-layer interferometry (BLI) – AtzAM1 was phosphorylated using the conditions
described below. pY-AtzAM1 was then biotinylated at 10mM Sulfo-NHS-Biotin (APExBIO) for
30min at 25°C. Excess biotin was buffer exchanged with a PD-10 desalting column (GE
Healthcare) equilibrated with HNG. Biotinylated pY-AtzAM1 was loaded onto streptavidin (SA)
coated biosensors (ForteBio) and used for BLI. AtzCM1 was flowed in from 4nM to 4μM. BLI
experiments were performed using the BLItz System (ForteBio).
2.6.2.9 Phosphorylation, assembly formation, and disassembly – The phosphorylation
protocol was based upon Src kinase activity assay by Sigma (Catalog # S1076). In a final
reaction volume of 150μL, 3μM AtzAM1 was mixed into 1X Kinase Activity Buffer (4mM
MgCl2, 2.5mM MnCl2, 0.25mM DTT, 5mM MOPS, 2.5mM glycerol-2-phosphate, 1mM EGTA,
400nM EDTA, pH 7.6), 2.5 mM MnCl2,HNG, 2 mM ATP, 800ng Src kinase, and incubated for
7 – 16 hr at 25°C for phosphorylation to occur. After phosphorylating, AtzCM1 was added to a
final 2μM concentration. Assembly was allowed to form at 2hr 25°C. Disassembly was
100
performed by adding 4.8μg of YopH phosphatase into the 150μL reaction mixture after assembly
formation occurred. Size measurements using DLS were performed to determine assembly
formation/disassembly.
2.6.2.10 Dynamic light scattering (DLS) – 50 μL of an assembly sample was used for size
determination using a Malvern Zetasizer and a quartz cuvette (ZEN2112, Malvern). Ten spectra
measures were recorded for eleven replicates at 25 °C. The standard operating procedure
accounted for 5% glycerol in solution.
2.6.2.11 DLS Inhibition Experiment - 6 µM pY-AtzAM1 was phosphorylated (1X KAB, 2 mM
ATP, 1 mM DTT, HNG, 1 µg Src kinase) in a reaction volume of 75 µL. Incubation time was
overnight at 25°C. SH2 or SH2-DhaA was added to each sample at 0 µM, 3 µM, 6 µM, 9 µM, 12
µM, 15 µM, 18 µM final concentration and allowed to “block” binding sites on the pY-AtzAM1
for 1 hr at 25°C. AtzCM1 was added to each sample at 2 µM final concentration. Therefore, the
final concentrations of all components was 3 µM pyAtzA, 1 µM AtzCM1, 0 µM - 18 µM SH2 or
SH2-DhaA. The sample was incubated for 2 hr at 25°C. DLS was performed to analyze
assembly sizes. DLS was performed at 25°C, 50 µL/sample volume, in a low-volume quartz
sizing cuvette (Malvern; ZEN2112) using a Zetasizer Nano ZS (Malvern). Measurements were
performed in triplicates while each sample was read and averaged 15 times. This protocol was
repeated at a final concentration of 1 µM pyAtzA, 0.66 µM AtzCM1, 0 µM -6 µM SH2-DhaA.
Curve fitting was performed in MATLAB (R2016b; Mathworks) using the general model:
101
where A, B, k, x0 are constants. Adjusted R2 was used to determine model validity. Inhibition
concentration 50 (IC50) was determined based upon concentration of inhibitor that resulted in
assembly size of 100nm measured.
2.6.2.12 DLS Titration Experiment – 6 µM, 3 µM, 1.5 µM, 0.5 µM, 0.1 µM pyAtzA was
phosphorylated (as described previously) with an incubation time of overnight at 25°C. Either
AtzCM1 wildtype (WT) or AtzCM1 superbinder (SB) was added to each sample at 2 µM, 1 µM,
0.5 µM, 0.25 µM, 0.50 µM final concentration. The sample was allowed to incubate for 2 hr at
25°C. Therefore, the final concentrations of all components was from 3 µM – 0.05 µM pyAtzA,
2 µM – 0.05 µM AtzCM1-WT or AtzCM1-SB. DLS was performed at 25°C, 50 µL/sample
volume, in a low-volume quartz sizing cuvette (Malvern; ZEN2112) using a Zetasizer Nano ZS
(Malvern). Measurements were performed in duplicate with each sample read and averaged 15
times.
2.6.2.13 DLS Kinetics (varying ATP) Experiment – An assembly mixture of 3 µM non-
pyAtzA and 2 µM AtzCM1 was prepared (as described previously) and syringe-filtered at 0.22
µm. To each 50 µL reaction volume, 1.2 µg of src kinase was added. Size was monitored
continuously for 30 min at 25°C in a low-volume quartz sizing cuvette (Malvern; ZEN2112)
using a Zetasizer Nano ZS (Malvern) at 50 µL/sample. Measurements were performed in
triplicates. Each sample was read and averaged five times over the course of 25 seconds for a
single time point. Curve fitting was performed in MATLAB (R2016b; Mathworks) using sloping
spline function, with varying smoothing parameters. Adjusted R2 was used to determine model
validity.
102
2.6.3. Microscopy Experiments
2.6.3.1 Transmission electron microscope (TEM) – Assembly (3 µM pY-AtzAM1 and 2 µM
AtzCM1) and non-assembly (3 µM non-pyAtzA and 2µM AtzCM1) samples were mixed, and
diluted ten-fold in deionized water. The diluted samples were applied to the carbon-coated
FCF400-Cu grids (Electron Microscopy Sciences, Hatfield, PA) which were glow-discharged for
two hours under UV light to render the grids hydrophilic and adsorptive. A drop of sample
(~5uL) was added on a piece of wax film and the grid was placed onto the sample droplet for
absorption for two minutes. Excess sample solution was removed with a filter paper. A drop
(~5uL) of 1% uranyl acetate was dropped on the wax paper and the grid was placed onto the
staining solution droplet for two minutes to stain. Excess staining solution was removed by
blotting with a filter paper, the grids were allowed to air dry for two minutes. Images were
collected on JEOL 1200EX electron microscope with AMT-XR41 digital camera.
2.6.3.2 Atomic force microscopy (AFM) – The assemblies were directly visualized by non-
contact mode atomic force microscopy (AFM) Parks Systems. Samples were prepared by
depositing 20 µls of sample on silicon wafer and incubated for 5 minutes. After incubation, the
silicon was washed with deionized water to remove salt and air dried overnight at 25°C.
Assemblies were visualized by anAFM (Parks System). The AFM was used in non-contact mode
(330 kHz resonant frequency and 42 N/m spring constant, PPP-NCHR Park Systems, #610-
1051). Images were taken with 2048x2048 pixels with scan rates of 2 µm/s to 30 µm/s. The
AFM images analysis was performed using Gwyddion software161.
103
2.6.3.3 Helium ion microscopy (HIM) – The AFM sample preparation on a silicon wafer was
used for HIM. Imaging was done on the Carl Zeiss Orion Plus Helium Ion Microscope (Carl
Zeiss Microscopy, Peabody, MA) operating at 30 KeV acceleration voltage with a beam currents
of about 1 pA. Most samples did not exhibit significant charging therefore electron flood gun
was not used for charge neutralization. The vacuum reading in the analysis chamber during
imaging was 2x10⁻⁷ torr.
2.6.3.4 High-resolution fluorescence microscopy – For the growth video, 20 µL of 3 µM
AtzAM1 and 2 µM AtzCM1 sample (with all the required buffers as described previously) was
deposited on a glass cover and 0.2 µm of Src kinase was added to the sample to allow for
assembly formation to occur. The sample was monitored for an hour. For the 3-component
assembly image (3 µM pY-AtzAM1, 1 µM AtzBSH2, 2 µM AtzCM1) the AtzBSH2 protein was
dye labeled with the Alexa FluorTM 647 NHS Ester (Succinimidyl Ester, ThermoFisher Scientific
#A2006) and buffer exchanged into HNG with a PD10-desalting column. Fluorescent images
along with bright-field images were collected. Images were captured using a Nikon Ti-E inverted
microscope. A Coherent Genesis laser at 567 and Coherent Obis Laser at 647 were used for
fluorescent imaging, using 1mW power.
2.6.3.5 Cryo-EM Tomographic tilt series acquisition and reconstruction – For cryo-electron
tomography, an AtzAM1 and AtzCM1 assembly sample was mixed with 10 nm gold fiducial
markers to facilitate alignment in data processing. An aliquot of 3.5ml sample was applied to
2.0/1.0mm Quantifoil holey grids (Quantifoil, Germany) and plunge frozen using a Leica EM GP
plunger (Leica). Tomographic tilt series acquisition was performed on a Talos Arctica
104
microscope (Thermal Fisher) operated at an acceleration voltage of 200kV. This microscope was
equipped with a field-emission gun, Volta phase plates, Gatan postcolumn energy filter and a K2
summit direct electron detector. Tilt series were collected at 39,000x microscope magnification
with -0.5 µm defocus using FEI Tomography software. The sampling of the data was calibrated
to be 3.49 Å/pixel. Typically, a tilt series ranged from -60° to 60° at 3° step increment. The
accumulated dose for each tilt series was 60 electrons/Å2. Tilt series were aligned based on
fiducial gold markers using the IMOD package162. 3D tomograms were obtained by weighted
backprojection of aligned tilt series. Visualization and annotation of the 3D volumes were done
in Chimera163.
2.6.3.6 Cryo-EM AtzAM1 and AtzCM1 model fitting and statistical analysis – AtzAM1 and
AtzCM1 complex subtomograms were extracted from 3D tomograms and bandpass filtered to
reduce high frequency noises and low frequency gradient from ice thickness variation. Centers of
AtzAM1 and AtzCM1 densities were identified as peaks within solid voxel clusters that were
approximately sizes of an AtzAM1 hexamer, or an AtzCM1 tetramer. Potential free AtzAM1 or
AtzCM1 complexes that were too close to a neighboring voxel peak (<120A) were removed.
Assignment of AtzAM1 or AtzCM1 to an identified voxel cluster was done by applying the
condition that AtzAM1 and AtzCM1 alternate in a chain. Densities that had three or more linkers
to neighbors were assigned to be AtzAM1. Linear, unbranched assemblies were assigned by first
determining identity of one end based on cross-correlation scores between the end peak densities
and AtzAM1 or AtzCM1 models computed from their PDB structures. Assignment conflicts
were resolved by pruning along the branches in the order of intensity values. The above protocol
was first applied to a small assembly, and optimized and validated by human visual inspection
105
before it was used on larger assemblies. Coordinates and connection information of each
AtzAM1 or AtzCM1 complex in an assembly were extracted and used for statistical analysis and
for comparison to simulation data. The volume of the assembly is defined by the volume of the
convex hull that encloses all determined AtzAM1 or AtzCM1 molecule.
2.6.3.7 Confocal microscopy fluorescent images of fractal and globular assembly with GFP-
SH2 and Goat anti-mouse IgG (H+L) Cross-Adsorbed Secondary Antibody, Alexa Fluor
568 - Fluorescently tagged samples were placed in chamber slides and allowed to air dry
overnight. Fluorescent images were acquired using a spinning disc confocal microscope
(Olympus DSU-IX81) fitted with 482nm and 543nm excitation filters and emission filters of
536nm and 593nm, respectively. Z-sections of approximately 200µM were taken at 1µm
intervals using an oil immersion objective (Olympus UPlanFL N 40X/1.3 Oil) and 300ms as
exposure time. Image processing was performed with SlideBook 5.0 (3i, Intelligent Imaging
Innovations).
2.6.4. Enzymatic Assays
2.6.4.1 Enzymatic activity was measured using the Berthelot assay – Assembled enzyme
samples (1.5 µM AtzAM1, 0.5 µM AtzBSH2, and 1 µM AtzCM1) were made by incubating the
enzymes in 1X kinase activity buffer (with no DTT), 2.5 mM MnCl2, HNG, 0.2 µM Src kinase,
and 2 mM ATP in a total volume of 500 µl at 25°C for four hours. The unassembled enzyme
samples were prepared using the same conditions, except no ATP was added to the sample. DLS
was performed to verify assembly formation. 10 µL of 20 mM Atrazine dissolved in methanol
was added to each 500 µL sample, for a final concentration of 400 µM atrazine, and another
106
sample with the same conditions had no substrate added in order to establish a baseline
measurement. Each condition was done in triplicate. After the addition of substrate, the samples
are shaken at 100 RPM for 1.5 hr at 25°C. 140 µL of each sample is transferred to PCR tubes,
then boiled at 99°C for 1.5 minutes, and then cooled at 4°C. The 140 µl were transferred to 1.5
mL microcentrifuge tubes and spun down at 20,000 rcf for 20 minutes to remove precipitated
protein. 80 µl of the supernatant was used for the following steps. 1µg per 20 µL of sample of
CAH and 1µg per 20 µL of sample of BH was added to each sample. The samples were
incubated at 25°C for 2 hours to allow for the complete conversion of the cyanuric acid to
ammonia by CAH and BH. The Berthelot assay was performed in triplicate on the resulting
samples to determine the production of ammonia. For every mole of cyanuric acid produced, one
mole of ammonia was assumed to have been produced. 20 µL of each sample was added to a
96-well plate (Greiner half area clear #675101). 60 µL of solution A (0.05 g/L sodium
nitroprusside and 10g/L phenol) was added and mixed into every sample. Then 80 µL of solution
B (5 g/L NaOH and 8.4 mL/L bleach) was added and mixed into every sample. The samples
were incubated for 30 minutes at 25°C for a blue color to develop. The absorbance at 630 nm
was read using Tecan Infinite M200 Pro plate reader. The extinction coefficient was determined
using standards of cyanuric acid at known concentrations in the enzyme activity buffer that had
been reacted with the BH and CAH for 2 hours.
2.6.4.2 Temperature stress activity assays – Assembled and unassembled enzyme samples
were made as described above and incubated at 25°C for 4 hours to allow full assembly
formation. The assemblies were then incubated at the following temperatures: 25°C, 40°C, 45°C,
50°C, 55°C, and 60°C for fifteen minutes, and cooled back to 25°C before the addition of 400
µM atrazine. After atrazine was added, the enzyme activity assay was performed as described
107
above.
2.6.4.3 Shaking stress activity assay – Assembled and unassembled enzyme samples were
made as described above and incubated at 25°C 4 hours. Both samples were shaken at 50, 100,
150, 200, 225, and 250 RPM 25°C for 1 hour before any addition of atrazine. 400 µM atrazine
was added to the samples and shaking continued at their respective shaking speeds for 1.5 hour.
The rest of the activity assay protocol was conducted the same as described above.
2.6.4.4 Construction and assay of Basotect® polymer foam with trapped assemblies and
free enzymes – Hydrolyzed TEOS was prepared by combining 7 ml TEOS (Aldrich #131903), 3
ml water, and 0.04 ml 0.1N hydrochloric acid and stirring the solution for 2 h at room
temperature164. Basotect® polymer foam (Procter and Gamble UPC# 0 37000 43515 0) was cut
into 2.0 x 2.0 x 0.3 cm squares with a razor and 0.250 ml of assemblies or free enzyme solution
was spotted onto each 2 x 2 cm face of the foam squares. Aliquots (1.0 or 0.5 ml) of hydrolyzed
TEOS were diluted with HNG buffer to a final volume of 10 ml (10% or 5% TEOS). A single
application of 5% or 10% hydrolyzed TEOS solutions was done with a small paint brush
(Richeson 95822). The TEOS was allowed to set for 2 h, and then liquid was squeezed out of
each foam square and total protein concentration in the liquid was measured with the Bradford
assay (BioRad #500-0006). To assay activity in the embedded foam, 1 ml of 150 μM atrazine in
1X phosphate buffered saline (pH 7.4) was soaked into the foam squares and incubated for 1.5
hour at 25°C. Liquid was squeezed out after incubation and boiled as above to inactivate eluted
enzymes. Cyanuric acid produced during the incubation was assayed as described except that the
Berthelot reactions were conducted in 10 x 4 x 45 mm cuvettes (Sarstedt #67-742) and read
using a Beckman DU 640 spectrophotometer.
108
2.6.4.5 Gfp-Sh2 incorporation fluorescent assays– AtzAM1 and AtzCM1 (AtzA10X and
AtzC10X) assemblies were formed in a reaction volume of 3 mL, 15 μM AtzAM1 and 10 μM
AtzCM1 into 1X Kinase Activity Buffer, 2.5 mM MnCl2, HNG, 2 mM ATP, 0.2 μM Src Kinase,
and allowed to form for 10 minutes before the addition of 1.8 μM Gfp-Sh2 protein, and
incubated for 4 hr at 25°C for phosphorylation to occur. Samples were spun down for 2 minutes
(500 x g) and supernatant measured in a black half-area microplate (excitation 395 nm, emission
509 nm) with a gain of 140 on a Tecan Infinite M200 Pro plate reader.
2.6.4.6 Dhaa-Sh2 incorporation assays – AtzAM1 and AtzCM1 (along with AtzA/AtzC
extended linker versions for globular assemblies) assemblies were formed in a reaction volume
of 3 mL, 15 μM AtzAM1 and 10 μM AtzCM1 into 1X Kinase Activity Buffer, 2.5 mM MnCl2,
HNG, 2 mM ATP, 0.2 μM Src Kinase, and allowed to form for 10 minutes before the addition of
1.8 μM of Dhaa-Sh2, and incubated for 4 hr at 25°C. Assemblies were spun down and pellet
resuspended with 10 mM TCP and incubated for 1 and 16 hr. Assemblies were spun down again
and supernatant was measured at A560 nm.
2.6.4.7 Goat anti-mouse IgG (H+L) Cross-Adsorbed Secondary Antibody, Alexa Fluor 568
incorporation assays - AtzAM1 and AtzCM1 (along with AtzA/AtzC extended linker versions
for globular assemblies) assemblies were formed in a reaction volume of 1.8 mL, 12 μM
AtzAM1 and 8 μM AtzCM1 into 1X Kinase Activity Buffer, 2.5 mM MnCl2, HNG, 2 mM ATP,
0.2 μM Src Kinase, and allowed to form for 10 minutes before the addition of 8 μM of ProteinA-
Sh2, and incubated for 4 hr at 25°C. Assemblies were spun down 20,000 x g for 20 min in order
109
to measure fluorescence in supernatant. For disassembly assays with YopH, assembly pellets
were spun down 20,000 x g for 20 min, supernatant removed, pellets washed with HNG buffer,
and spun down again to remove wash, and resuspended in HNG containing YopH. Assemblies
were left shaking at 100 RPM for 12 and 24 hrs at 25°C. Assemblies were spun down again and
supernatant measured for released antibody.
2.7. Discussion
2.7.1 Fractal design parameters and model selection
It has been demonstrated128 that atomic-level control is necessary to achieve in computational
design periodic, regularly ordered 2D protein lattices165 or closed form 3D icosahedra101. In
contrast, where 2D lattices and 3D closed form assemblies require exacting orientation and
rigidity of inter-protein components, fractal assemblies require a degree of flexibility at the
interface of protein components. However, the amount of flexibility needs to be tuned: too little
and crystal lattices will form, too much and protein agglomerates will result.
To obtain a fractal assembly with protein components, we believe that three factors contribute:
valency, affinity, and flexibility.
Valency, the measure of possible favorable connections between protein components, contributes
to the amount of branching as well as the orientation of the inter-protein components. With
homomeric D2 and D3 protein components, we anticipated the D3 (atzA) to make up to 6
connections to the D2 (atzC) which is capable of 4 connections. If the affinity of the inter-protein
connection is sufficiently strong, and the length of the bridging interactions is kept short we
could observe an avidity effect between components—where two bridges (divalent connection)
110
are formed between two components. (Fig 2.1) The formation of divalent bridging connections,
localized to C2 sub-symmetries of D-symmetric proteins, can greatly reduce the flexibility
between connected protein components. In this way, avidity and symmetry together can be
utilized to constrain the orientation and rigidity of the inter-component connections.
To promote the greatest chance of avidity, we chose strong (nM affinity) peptide-binding motifs
which could be fused to the D-symmetric protein building blocks. During design, to ensure that
any divalent connections made between components were restricted to connections along the C2
sub-symmetry axes, we imposed design constraints on the fusion linker lengths—maintaining
that no additional residues would be added beyond the residues found in the crystallographic
structure files creating a direct fusion (0-residue linker). RosettaMatch was used to find rigid-
body locations of the motif-peptide pair such that the 0-residue linker design constraint could be
met for an ensemble of inter-protein arrangements along paired C2 sub-symmetric axes (for
method details see section 2.6.1 Computational Design). We performed novel interface design
(described in section 2.6.1 Computational Design) and selected 5 models with the fewest clash-
alleviating mutations and favorable ∆∆G measured in Rosetta energy units.
2.7.2 Fractal dimension from image analysis
The fractal (Hausdorff-Besicovitch) dimension166, a concept introduced in 1918 to measure the
dimensions and local size of a shape, has been used to characterize simulated fractal
patterns167,168 as well as peptide-based fractals obtained on a surface and imaged with AFM125.
The Hausdorff-Besicovitch dimension equation, defined by the divider formula
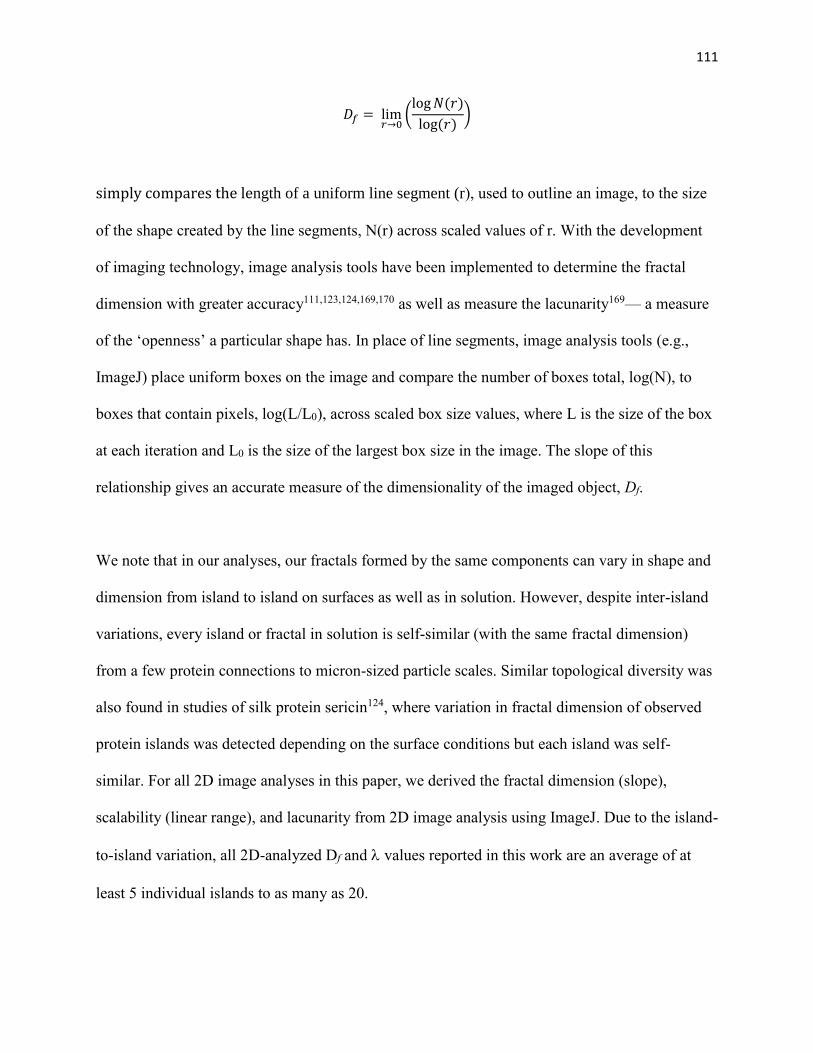
111
𝐷𝑓 = lim𝑟→0
(log 𝑁(𝑟)
log(𝑟))
simply compares the length of a uniform line segment (r), used to outline an image, to the size
of the shape created by the line segments, N(r) across scaled values of r. With the development
of imaging technology, image analysis tools have been implemented to determine the fractal
dimension with greater accuracy111,123,124,169,170 as well as measure the lacunarity169— a measure
of the ‘openness’ a particular shape has. In place of line segments, image analysis tools (e.g.,
ImageJ) place uniform boxes on the image and compare the number of boxes total, log(N), to
boxes that contain pixels, log(L/L0), across scaled box size values, where L is the size of the box
at each iteration and L0 is the size of the largest box size in the image. The slope of this
relationship gives an accurate measure of the dimensionality of the imaged object, Df.
We note that in our analyses, our fractals formed by the same components can vary in shape and
dimension from island to island on surfaces as well as in solution. However, despite inter-island
variations, every island or fractal in solution is self-similar (with the same fractal dimension)
from a few protein connections to micron-sized particle scales. Similar topological diversity was
also found in studies of silk protein sericin124, where variation in fractal dimension of observed
protein islands was detected depending on the surface conditions but each island was self-
similar. For all 2D image analyses in this paper, we derived the fractal dimension (slope),
scalability (linear range), and lacunarity from 2D image analysis using ImageJ. Due to the island-
to-island variation, all 2D-analyzed Df and values reported in this work are an average of at
least 5 individual islands to as many as 20.
112
We observed differences in size and topological features when varying the concentration ratio of
the fractal formed from AtzAM1-AtzCM1 (Fig. 2.19). Computational fractal analysis was used
to determine how the change in component ratio would impact both Df and (Table 2.2). We
found that increasing the concentration of AtzAM1 (A) with respect to AtzCM1 (C), the Df
would decrease (more linear structural properties) and would increase (more open or branch
structural properties). This observation holds until the ratio of A:C reaches 3:2, at which point
the Df greatly increases—but drops once again with increasing concentrations of A (3:1). Upon
addition of 1 unit AtzB-SH2 to the 3A:2C ratio (added before phosphorylation) we find that the
observed fractals show a marked decrease in both Df and compared to the 3A:2C fractals.
When the concentration of A is increased in the three-component assembly we once again see a
decrease in Df; however, we also see a decrease in . The observed Df and in the three-
component assembly resemble the Df and values in the two-component fractals with low
concentrations of A relative to C. These findings, combined with the dye-labeled AtzB-SH2 data
(Fig.2.35 and Fig. 2.36.D), suggest that AtzB-SH2 is competing for locations to bind the SH2-
peptide fused to AtzAM1 and is further changing the structural features of the fractal.
Helium ion microscopy (HIM) is a new technique seldom used to image proteins; to our
knowledge this paper is the first to use HIM to image purely protein samples. In order to validate
the surface fractals observed under HIM (Fig.2.19, Fig.2.20, Fig.2.23, Fig.2.32, and Fig.2.33),
we obtained images of fractals with the component ratio observed to have the highest average Df
(3A:2C) with other well-known imaging techniques (AFM and TEM). When comparing HIM,
AFM (Fig. 2.21), and TEM (Fig. 2.24) imaged fractals, we found close agreement across the
three imaging techniques in both Df and lacunarity (Fig 2.19.E).
113
When comparing the Cryo-ET data to the computational simulation results, projections were
made to be analyzed with the same 2D image analysis. Additionally, 3D-fractal dimension
analysis was performed with an in-house 3D box-counting algorithm that works in the same way
that 2D image analysis does except the two-dimensional boxes are replaced with three-
dimensional cubes (voxels) during the scaling analysis. As described in section
2.2.Introduction, close agreement was observed between the computationally simulated fractal
models (Fig. 2.2 and Fig.2.3) and the Cryo-ET assigned density (Fig.2.26).
2.7.3 Comparison of control (GS-rich-linker containing) and designed assembly topologies
Although we could differentiate the density of the fractal assemblies at all scales from µm to nm
scale (Fig. S2.25), the globular (GS-rich-linker containing) assemblies varied too greatly in
structure topology across samples to analyze—the majority of these images were dominated by
dark shadowy particles too dense to obtain meaningful assignments of density to individual
protein components (Fig. S2.25.B). However, a few images (<10%) from the GS-linker rich set
had small resolvable nm-scale regions where density could be interpreted and assigned to
individual protein components (Fig. S2.25.D). For these images, we compared the average
monomer-monomer distance across 5 control (GS-rich) and 5 fractal-shaped assemblies
(Fig.2.28) on the nm-scale. In the fractal-shaped assemblies the inter-monomer distance is tightly
clustered (134 ± 2 Å) among images of large (>25 nm size) assemblies (~40% of the set),
suggesting uniformity of inter-component connections in agreement with the design conception.
In contrast, in the resolvable parts of the control assembly tomograms (<10% of the entire
imaged sample), we see three different types of structures: dispersed assembly (inter-monomer
distance ~157Å), fractal-similar assemblies (~134Å), and densely packed globular ball-like
114
structures (~125 Å). The robust catalytic activity of the control assembly (Fig. 2.38)
demonstrates that the observed topologies in the control tomograms are not the result of protein
unfolding but are in fact, mediated by the engineered SH2 domain-pY peptide interactions.
2.7.4 Evaluating the effects of AtzB-SH2 on overall fractal structure and topology
Unfortunately, the structure of AtzB—let along AtzB-SH2—is unknown. It is unclear exactly
how AtzB-SH2 is binding to AtzAM1 in the three component assembly. If protein fractals are
indeed reliant on valency, affinity, and flexibility we can be certain that AtzB-SH2 does not
change affinity—as the fused binding domain is the same as AtzCM1. If we examine valency,
AtzB-SH2 is a C2-symmetric protein and can either increase flexibility of the system, if it lacks
avidity (monovalent connection), or—if it forms a divalent connection due to avidity—decrease
the available binding locations for AtzCM1. It is also possible that both cases are true as well.
We observe a decrease in Df and when 1 unit of AtzB-SH2 is introduced to the 3A:2C two-
component fractal assembly—comparable to (1A:2C); this supports that AtzB-SH2 is making a
divalent connection and artificially lowering the concentration of AtzAM1 with respect to
AtzCM1. However, as we increase the concentration of AtzAM1 in the three-component
assembly, Df decreases as expected but also decreases—a change not observed under any
increasing concentrations of AtzAM1 in the two-component assembly. This result suggests
monovalent connections are also possible and are increasing the flexibility of the system. We
hypothesized that AtzCM1 can bind to AtzAM1 at either an edge C2 or face C2 sub-symmetry
axis (section 2.2.Introduction, Fig. 2.1). If two AtzCM1 bind one AtzAM1, each binding
AtzAM1 at an edge and a face, they would create a C-A-C structure where the three-component
angle about AtzAM1 is 180—leaving two free SH2-peptides free on either side of AtzAM1.
115
Simulation results (Fig. 2.2 and Fig. 2.3), where the possibility of a linear C-A-C connection is
encoded in the algorithm showed close agreement to fractal structures observed with Cryo-ET
(Fig. 2.26). With two free SH2-peptides, it is more sterically feasible for a C2 AtzB-SH2 to bind
over a D2 AtzCM1 (roughly twice as large). AtzB-SH2 making a monovalent connection to 180
C-A-C structures could lead to the observed changes in with increasing concentrations of
AtzAM1.
Interestingly, the samples imaged with dyed AtzB-SH2 show non-uniform clustering of AtzB-
SH2 to sub-sections of the imaged fractals (Fig. 2.29.D and Fig. 2.35). If AtzB-SH2 is
competing equally with AtzCM1 (i.e. same affinity and avidity effects), then we would expect a
uniform distribution of AtzB-SH2. Therefore, clustering of AtzB-SH2 to the fractals supports
binding with monovalent connections to repeated stretches of C-A-C. From our computational
analyses, we observed that repeated stretches of the C-A-C structure in the two-component
assembly resulted to elongated fractals (Fig. 2.2 and Fig. 2.3)—in direct contrast to observed
localization of dye-labeled AtzB-SH2 at the most densely clustered regions of the sample
(section 2.2.Introduction, Fig. 2.29.D, and Fig. 2.35). However, if the C2 symmetric AtzB-SH2
is making a monovalent connection to a C-A-C structure it can in theory make a bridging
connection to another C-A-C structure—increasing the local density. Another possibility is that
the dye reduces the affinity of AtzB-SH2 with respect to AtzCM1; even a small decrease in
affinity could lessen the impact of avidity. Additionally, incomplete labeling can also be a factor
leading to sparsely labeled three-component samples. In our dye-labeled AtzCM1 two-
component sample (section 2.2.Introduction, Fig. 2.8.I), we see a more uniform distribution of
red-dye-labeled fractal but, parts of the fractal are not labeled—only the most densely clustered
116
regions are labeled. One thing is certain, AtzB-SH2 is indeed incorporated into the fractal
scaffold and the fractal dimension of the scaffold is uniform across multiple length scales (nm-
µm) just like the two-component assembly. Teasing out exactly how AtzB-SH2 impacts overall
fractal growth and topology are ongoing efforts in our lab.
2.8. Methods and Discussion References
1. Copley, S. D. Evolution of efficient pathways for degradation of anthropogenic chemicals.
Nature Chemical Biology (2009). doi:10.1038/nchembio.197
2. Khan, M. Z. & Law, F. C. P. Adverse effects of pesticides and related chemicals on
enzyme and hormone systems of fish, amphibians and reptiles: a review. Proc. Pakistan
Acad. Sci. (2005).
3. Eskenazi, B. et al. The pine river statement: Human health consequences of DDT use.
Environmental Health Perspectives (2009). doi:10.1289/ehp.11748
4. Kabasenche, W. P. & Skinner, M. K. DDT, epigenetic harm, and transgenerational
environmental justice. Environmental Health: A Global Access Science Source (2014).
doi:10.1186/1476-069X-13-62
5. Islam, M. N., Shin, M. S., Jo, Y. T. & Park, J. H. TNT and RDX degradation and
extraction from contaminated soil using subcritical water. Chemosphere (2015).
doi:10.1016/j.chemosphere.2014.09.101
6. Inglis, J., Dutzik, T. & Rumpler, J. Wasting Our Waterways. 71 (2014).
7. Survey, U. S. D. of I. S. G. Estimated Annual Agricultural Pesticide Use for Atrazine,
2015. Available at:
https://water.usgs.gov/nawqa/pnsp/usage/maps/show_map.php?year=2015&map=ATRAZ
INE&hilo=L&disp=Atrazine.
8. Megharaj, M., Ramakrishnan, B., Venkateswarlu, K., Sethunathan, N. & Naidu, R.
Bioremediation approaches for organic pollutants: A critical perspective. Environment
International (2011). doi:10.1016/j.envint.2011.06.003
9. Azubuike, C. C., Chikere, C. B. & Okpokwasili, G. C. Bioremediation techniques–
classification based on site of application: principles, advantages, limitations and
prospects. World Journal of Microbiology and Biotechnology (2016).
doi:10.1007/s11274-016-2137-x
10. Bansal, O. P. Fate of pesticides in the environment. Journal of the Indian Chemical
117
Society (2011). doi:10.1002/elsc.200520098
11. Yang, Y., Yang, J. & Jiang, L. Comment on "a bacterium that degrades and assimilates
poly(ethylene terephthalate) ". Science (2016). doi:10.1126/science.aaf8305
12. Austin, H. P. et al. Characterization and engineering of a plastic-degrading aromatic
polyesterase. Proc. Natl. Acad. Sci. (2018). doi:10.1073/pnas.1718804115
13. Benotti, M. J. et al. Pharmaceuticals and endocrine disrupting compounds in U.S. drinking
water. Environ. Sci. Technol. (2009). doi:10.1021/es801845a
14. United States Environmental Protection Agency (US EPA). Ground Water
Contamination. Getting Up to Speed (2008).
15. Graymore, M., Stagnitti, F. & Allinson, G. Impacts of atrazine in aquatic ecosystems.
Environ. Int. (2001). doi:10.1016/S0160-4120(01)00031-9
16. Satapanajaru, T., Anurakpongsatorn, P., Pengthamkeerati, P. & Boparai, H. Remediation
of atrazine-contaminated soil and water by nano zerovalent iron. Water. Air. Soil Pollut.
(2008). doi:10.1007/s11270-008-9661-8
17. Hayes, T. et al. Atrazine-induced hermaphroditism at 0.1 ppb in American leopard frogs
(Rana pipiens): Laboratory and field evidence. Environ. Health Perspect. 111, 568–575
(2003).
18. Hayes, T. B. et al. Hermaphroditic, demasculinized frogs after exposure to the herbicide
atrazine at low ecologically relevant doses. Proc. Natl. Acad. Sci. U. S. A. 99, 5476–80
(2002).
19. Hayes, T. B. et al. Atrazine induces complete feminization and chemical castration in
male African clawed frogs (Xenopus laevis). Proc. Natl. Acad. Sci. 107, 4612–4617
(2010).
20. Solomon, K. R. et al. Effects of atrazine on fish, amphibians, and aquatic reptiles: A
critical review. Critical Reviews in Toxicology (2008). doi:10.1080/10408440802116496
21. Spanò, L. et al. Effects of atrazine on sex steroid dynamics, plasma vitellogenin
concentration and gonad development in adult goldfish (Carassius auratus). Aquat.
Toxicol. (2004). doi:10.1016/j.aquatox.2003.10.009
22. Beldomenico, P. M. et al. In ovum exposure to pesticides increases the egg weight loss
and decreases hatchlings weight of Caiman latirostris (Crocodylia: Alligatoridae).
Ecotoxicol. Environ. Saf. (2007). doi:10.1016/j.ecoenv.2006.12.018
23. Rey, F. et al. Prenatal exposure to pesticides disrupts testicular histoarchitecture and alters
testosterone levels in male Caiman latirostris. Gen. Comp. Endocrinol. (2009).
118
doi:10.1016/j.ygcen.2009.03.032
24. Victor-Costa, A. B., Bandeira, S. M. C., Oliveira, A. G., Mahecha, G. A. B. & Oliveira, C.
A. Changes in testicular morphology and steroidogenesis in adult rats exposed to Atrazine.
Reprod. Toxicol. (2010). doi:10.1016/j.reprotox.2009.12.006
25. Hussain, R. et al. Cellular and biochemical effects induced by atrazine on blood of male
Japanese quail (Coturnix japonica). Pestic. Biochem. Physiol. (2012).
doi:10.1016/j.pestbp.2012.03.001
26. Hayes, T. B. et al. Demasculinization and feminization of male gonads by atrazine:
Consistent effects across vertebrate classes. Journal of Steroid Biochemistry and
Molecular Biology (2011). doi:10.1016/j.jsbmb.2011.03.015
27. Hakim, D. N. Y. T. A Pesticide Banned, or Not, Underscores Trans-Atlantic Trade
Sensitivities. The New York Times (2015). Available at:
https://www.nytimes.com/2015/02/24/business/international/a-pesticide-banned-or-not-
underscores-trans-atlantic-trade-sensitivities.html.
28. Sass, J. B. & Colangelo, A. European Union bans atrazine, while the United States
negotiates continued use. Int. J. Occup. Environ. Health 12, 260–267 (2006).
29. Wang, H., Lin, K., Hou, Z., Richardson, B. & Gan, J. Sorption of the herbicide
terbuthylazine in two New Zealand forest soils amended with biosolids and biochars. J.
Soils Sediments (2010). doi:10.1007/s11368-009-0111-z
30. Stara, A., Zuskova, E., Kouba, A. & Velisek, J. Effects of terbuthylazine-desethyl, a
terbuthylazine degradation product, on red swamp crayfish (Procambarus clarkii). Sci.
Total Environ. (2016). doi:10.1016/j.scitotenv.2016.05.113
31. Bottoni, P., Grenni, P., Lucentini, L. & Caracciolo, A. B. Terbuthylazine and other
triazines in Italian water resources. Microchem. J. (2013).
doi:10.1016/j.microc.2012.06.011
32. Swan, S. H. et al. Semen quality relation to biomarkers of pesticide exposure. Environ.
Health Perspect. (2003). doi:10.1289/ehp.6417
33. Lucas, A. D. et al. Determination of Atrazine Metabolites in Human Urine: Development
of a Biomarker of Exposure. Chem. Res. Toxicol. (1993). doi:10.1021/tx00031a017
34. Mills, P. K. & Yang, R. Regression Analysis of Pesticide Use and Breast Cancer
Incidence in California Latinas. J. Environ. Health (2006).
35. Fan, W. Q. et al. Atrazine-induced aromatase expression is SF-1 dependent: Implications
for endocrine disruption in wildlife and reproductive cancers in humans. Environ. Health
Perspect. (2007). doi:10.1289/ehp.9758
119
36. Gunier, R. B., Harnly, M. E., Reynolds, P., Hertz, A. & Von Behren, J. Agricultural
pesticide use of California: Pesticide prioritization, use densities, and population
distributions for a childhood cancer study. Environ. Health Perspect. (2001).
doi:10.1289/ehp.011091071
37. Sanderson, J. T., Letcher, R. J., Heneweer, M., Giesy, J. P. & Van Den Berg, M. Effects
of chloro-s-triazine herbicides and metabolites on aromatase activity in various human cell
lines and on vitellogenin production in male carp hepatocytes. Environ. Health Perspect.
(2001). doi:10.1289/ehp.011091027
38. Sanderson, J. T. 2-Chloro-s-Triazine Herbicides Induce Aromatase (CYP19) Activity in
H295R Human Adrenocortical Carcinoma Cells: A Novel Mechanism for Estrogenicity?
Toxicol. Sci. (2000). doi:10.1093/toxsci/54.1.121
39. MacLennan, P. A. et al. Cancer incidence among triazine herbicide manufacturing
workers. J. Occup. Environ. Med. (2002). doi:10.1097/00043764-200211000-00011
40. Kettles, M. A., Browning, S. R., Prince, T. S. & Horstman, S. W. Triazine herbicide
exposure and breast cancer incidence: An ecologic study of Kentucky counties. Environ.
Health Perspect. (1997). doi:10.1289/ehp.971051222
41. Engel, L. S. et al. Pesticide use and breast cancer risk among farmers’ wives in the
agricultural health study. Am. J. Epidemiol. (2005). doi:10.1093/aje/kwi022
42. Reynolds, P. et al. Residential proximity to agricultural pesticide use and incidence of
breast cancer in the California Teachers Study cohort. Environ. Res. (2004).
doi:10.1016/j.envres.2004.03.001
43. Hopenhayn-Rich, C., Stump, M. L. & Browning, S. R. Regional assessment of atrazine
exposure and incidence of breast and ovarian cancers in Kentucky. Arch. Environ.
Contam. Toxicol. (2002). doi:10.1007/s002440010300
44. Muir, K. et al. Breast cancer incidence and its possible spatial association with pesticide
application in two counties of England. Public Health (2004).
doi:10.1016/j.puhe.2003.12.019
45. Reynolds, P. et al. Residential proximity to agricultural pesticide use and incidence of
breast cancer in California, 1988-1997. Environmental Health Perspectives (2005).
doi:10.1289/ehp.7765
46. Wetzel, L. T. et al. Chronic effects of atrazine on estrus and mammary tumor formation in
female sprague-dawley and fischer 344 rats. J. Toxicol. Environ. Health (1994).
doi:10.1080/15287399409531913
47. Rooney, A. A., Matulka, R. A. & Luebke, R. W. Developmental atrazine exposure
suppresses immune function in male, but not female Sprague-Dawley rats. Toxicol. Sci.
120
(2003). doi:10.1093/toxsci/kfg250
48. Imaida, K. & Shirai, T. [Endocrine disrupting chemicals and carcinogenesis--breast, testis
and prostate cancer]. Nihon Rinsho. (2000).
49. Hu, K. et al. Atrazine promotes RM1 prostate cancer cell proliferation by activating
STAT3 signaling. Int. J. Oncol. (2016). doi:10.3892/ijo.2016.3433
50. Inoue-Choi, M. et al. Atrazine in public water supplies and risk of ovarian cancer among
postmenopausal women in the Iowa Women’s Health Study. Occup. Environ. Med.
(2016). doi:10.1136/oemed-2016-103575
51. Rastegar-Moghaddam, S. H., Mohammadipour, A., Hosseini, M., Bargi, R. &
Ebrahimzadeh-Bideskan, A. Maternal exposure to atrazine induces the hippocampal cell
apoptosis in mice offspring and impairs their learning and spatial memory. Toxin Reviews
(2018). doi:10.1080/15569543.2018.1466804
52. Song, X. Y., Li, J. N., Wu, Y. P., Zhang, B. & Li, B. X. Atrazine causes autophagy- and
apoptosis-related neurodegenerative effects in dopaminergic neurons in the rat
nigrostriatal dopaminergic system. Int. J. Mol. Sci. (2015). doi:10.3390/ijms160613490
53. Zhang, B., Ma, K. & Li, B. Inflammatory reaction regulated by microglia plays a role in
atrazine-induced dopaminergic neuron degeneration in the substantia nigra. J. Toxicol. Sci.
(2015). doi:10.2131/jts.40.437
54. Winchester, P. D., Huskins, J. & Ying, J. Agrichemicals in surface water and birth defects
in the United States. Acta Paediatr. Int. J. Paediatr. (2009). doi:10.1111/j.1651-
2227.2008.01207.x
55. Waller, S. A., Paul, K., Peterson, S. E. & Hitti, J. E. Agricultural-related chemical
exposures, season of conception, and risk of gastroschisis in Washington state. Obstetrical
and Gynecological Survey (2010). doi:10.1097/OGX.0b013e3181e5f139
56. Agopian, A. J., Cai, Y., Langlois, P. H., Canfield, M. A. & Lupo, P. J. Maternal
residential atrazine exposure and risk for choanal atresia and stenosis in offspring. J.
Pediatr. (2013). doi:10.1016/j.jpeds.2012.08.012
57. Agopian, A. J., Lupo, P. J., Canfield, M. A. & Langlois, P. H. Case-Control Study of
Maternal Residential Atrazine Exposure and Male Genital Malformations. Am. J. Med.
Genet. Part A (2013). doi:10.1002/ajmg.a.35815
58. Tasca, A. L., Puccini, M. & Fletcher, A. Terbuthylazine and desethylterbuthylazine:
Recent occurrence, mobility and removal techniques. Chemosphere (2018).
doi:10.1016/j.chemosphere.2018.03.091
59. Želježić, D. et al. Effects of the chloro-s-triazine herbicide terbuthylazine on DNA
121
integrity in human and mouse cells. Environ. Sci. Pollut. Res. (2018). doi:10.1007/s11356-
018-2046-7
60. Kane, A. L. et al. Toward bioremediation of methylmercury using silica encapsulated
Escherichia coli harboring the mer operon. PLoS One (2016).
doi:10.1371/journal.pone.0147036
61. Strong, L. C., Rosendahl, C., Johnson, G., Sadowsky, M. J. & Wackett, L. P. Arthrobacter
aurescens TC1 metabolizes diverse s-triazine ring compounds. Appl. Environ. Microbiol.
(2002). doi:10.1128/AEM.68.12.5973-5980.2002
62. Shapir, N. et al. Evolution of catabolic pathways: Genomic insights into microbial s-
triazine metabolism. Journal of Bacteriology (2007). doi:10.1128/JB.01257-06
63. Tyan, Y. C., Yang, M. H., Jong, S. Bin, Wang, C. K. & Shiea, J. Melamine contamination.
Analytical and Bioanalytical Chemistry (2009). doi:10.1007/s00216-009-3009-0
64. Gossner, C. M. E. et al. The melamine incident: Implications for international food and
feed safety. Environmental Health Perspectives (2009). doi:10.1289/ehp.0900949
65. Lin, M. et al. Detection of melamine in gluten, chicken feed, and processed foods using
surface enhanced Raman spectroscopy and HPLC. J. Food Sci. (2008).
doi:10.1111/j.1750-3841.2008.00901.x
66. Hau, A. K., Kwan, T. H. & Li, P. K. Melamine toxicity and the kidney. J. Am. Soc.
Nephrol. 20, 245–250 (2009).
67. Pei, X. et al. The China melamine milk scandal and its implications for food safety
regulation. Food Policy (2011). doi:10.1016/j.foodpol.2011.03.008
68. Bischoff, K. & Rumbeiha, W. K. Pet Food Recalls and Pet Food Contaminants in Small
Animals. Veterinary Clinics of North America - Small Animal Practice (2012).
doi:10.1016/j.cvsm.2011.12.007
69. Xiu, C. & Klein, K. K. Melamine in milk products in China: Examining the factors that
led to deliberate use of the contaminant. Food Policy 35, 463–470 (2010).
70. Shiomi, N. Biodegradation of Melamine and Cyanuric Acid by a Newly-Isolated
Microbacterium Strain. Adv. Microbiol. 02, 303–309 (2012).
71. Takagi, K., Fujii, K., Yamazaki, K. I., Harada, N. & Iwasaki, A. Biodegradation of
melamine and its hydroxy derivatives by a bacterial consortium containing a novel
Nocardioides species. Appl. Microbiol. Biotechnol. (2012). doi:10.1007/s00253-011-3673-
9
72. Seffernick, J. L., Dodge, A. G., Sadowsky, M. J., Bumpus, J. A. & Wackett, L. P.
122
Bacterial ammeline metabolism via guanine deaminase. J. Bacteriol. (2010).
doi:10.1128/JB.01243-09
73. Shelton, D. R., Karns, J. S., Mccarty, G. W. & Durham, D. R. Metabolism of melamine by
Klebsiella terragena. Appl. Environ. Microbiol. (1997).
74. De Souza, M. L., Wackett, L. P., Boundy-Mills, K. L., Mandelbaum, R. T. & Sadowsky,
M. J. Cloning, characterization, and expression of a gene region from Pseudomonas sp.
strain ADP involved in the dechlorination of atrazine. Appl. Environ. Microbiol. 61,
3373–3378 (1995).
75. Souza, M. L. De, Sadowsky, M. J. & Wackett, L. P. Atrazine chlorohydrolase from
Pseudomonas sp . strain ADP : gene sequence , enzyme purification , and protein
characterization . Atrazine Chlorohydrolase from Pseudomonas sp . Strain ADP : Gene
Sequence , Enzyme Purification , and Protein Characterization. J. Bacteriol. 178, 4894–
4900 (1996).
76. De Souza, M. L. et al. Erratum: Molecular basis of a bacterial consortium: Interspecies
catabolism of atrazine (Applied and Environmental (1998) 64:1 (178-184)). Applied and
Environmental Microbiology (2000). doi:10.1128/AEM.66.3.1252-1252.2000
77. Solomon, R. D. J., Kumar, A. & Satheeja Santhi, V. Atrazine biodegradation efficiency,
metabolite detection, and trzD gene expression by enrichment bacterial cultures from
agricultural soil. J. Zhejiang Univ. Sci. B (2013). doi:10.1631/jzus.B1300001
78. Peat, T. S. et al. The structure of the hexameric atrazine chlorohydrolase AtzA research
papers. 710–720 (2015). doi:10.1107/S1399004715000619
79. Boundy-mills, K. L., Souza, M. L. D. E. & Mandelbaum, R. T. The atzB gene of
Pseudomonas sp . strain ADP encodes the second enzyme of a novel atrazine degradation
pathway . The atzB Gene of Pseudomonas sp . Strain ADP Encodes the Second Enzyme
of a Novel Atrazine Degradation Pathway †. 63, 916–923 (1997).
80. Seffernick, J. L. et al. Hydroxyatrazine N-ethylaminohydrolase (AtzB): An
amidohydrolase superfamily enzyme catalyzing deamination and dechlorination. J.
Bacteriol. 189, 6989–6997 (2007).
81. Sadowsky, M. J., Tong, Z., De Souza, M. & Wackett, L. P. AtzC is a new member of the
amidohydrolase protein superfamily and is homologous to other atrazine-metabolizing
enzymes. J. Bacteriol. 180, 152–158 (1998).
82. Shapir, N., Osborne, J. P., Johnson, G., Sadowsky, M. J. & Wackett, L. P. Purification,
substrate range, and metal center of AtzC: The N-isopropylammelide aminohydrolase
involved in bacterial atrazine metabolism. J. Bacteriol. 184, 5376–5384 (2002).
83. Jurina, T. et al. Catabolism of terbuthylazine by mixed bacterial culture originating from
123
s-triazine-contaminated soil. Appl. Microbiol. Biotechnol. 98, 7223–7232 (2014).
84. Udikoviç-Koliç, N., Scott, C. & Martin-Laurent, F. Evolution of atrazine-degrading
capabilities in the environment. Applied Microbiology and Biotechnology (2012).
doi:10.1007/s00253-012-4495-0
85. Balotra, S. et al. X-Ray Structure and Mutagenesis Studies of the N-Isopropylammelide
Isopropylaminohydrolase, AtzC. PLoS One 10, e0137700 (2015).
86. Chelinho, S. et al. Cleanup of atrazine-contaminated soils: Ecotoxicological study on the
efficacy of a bioremediation tool with Pseudomonas sp. ADP. J. Soils Sediments (2010).
doi:10.1007/s11368-009-0145-2
87. Chelinho, S. et al. Semifield testing of a bioremediation tool for atrazine-contaminated
soils: Evaluating the efficacy on soil and aquatic compartments. Environ. Toxicol. Chem.
(2012). doi:10.1002/etc.1840
88. Wackett, L., Sadowsky, M., Martinez, B. & Shapir, N. Biodegradation of atrazine and
related s-triazine compounds: From enzymes to field studies. Applied Microbiology and
Biotechnology 58, 39–45 (2002).
89. Johannesen, H. & Aamand, J. Mineralization of aged atrazine, terbuthylazine, 2,4-D, and
mecoprop in soil and aquifer sediment. Environ. Toxicol. Chem. (2003).
doi:10.1897/1551-5028(2003)022<0722:MOAATD>2.0.CO;2
90. Narayanaswamy, R. et al. Widespread reorganization of metabolic enzymes into
reversible assemblies upon nutrient starvation. Proc. Natl. Acad. Sci. (2009).
doi:10.1073/pnas.0812771106
91. Kurganov, B. I. The role of multienzyme complexes in integration of cellular metabolism.
J. Theor. Biol. (1986). doi:10.1016/S0022-5193(86)80194-1
92. Zhao, H., French, J. B., Fang, Y. & Benkovic, S. J. The purinosome, a multi-protein
complex involved in the de novo biosynthesis of purines in humans. Chem. Commun.
(2013). doi:10.1039/c3cc41437j
93. An, S., Kumar, R., Sheets, E. D. & Benkovic, S. J. Reversible compartmentalization of de
novo purine biosynthetic complexes in living cells. Science 320, 103–106 (2008).
94. Pedley, A. M. & Benkovic, S. J. A New View into the Regulation of Purine Metabolism:
The Purinosome. Trends in Biochemical Sciences (2017). doi:10.1016/j.tibs.2016.09.009
95. Castellana, M. et al. Enzyme clustering accelerates processing of intermediates through
metabolic channeling. Nat. Biotechnol. (2014). doi:10.1038/nbt.3018
96. Küchler, A., Yoshimoto, M., Luginbühl, S., Mavelli, F. & Walde, P. Enzymatic reactions
124
in confined environments. Nat. Nanotechnol. (2016). doi:10.1038/nnano.2016.54
97. Bulutoglu, B., Garcia, K. E., Wu, F., Minteer, S. D. & Banta, S. Direct Evidence for
Metabolon Formation and Substrate Channeling in Recombinant TCA Cycle Enzymes.
ACS Chem. Biol. (2016). doi:10.1021/acschembio.6b00523
98. Dueber, J. E. et al. Synthetic protein scaffolds provide modular control over metabolic
flux. Nat. Biotechnol. 27, 753–759 (2009).
99. Dvorak, P., Bidmanova, S., Damborsky, J. & Prokop, Z. Immobilized synthetic pathway
for biodegradation of toxic recalcitrant pollutant 1,2,3-trichloropropane. Environ. Sci.
Technol. (2014). doi:10.1021/es500396r
100. Yang, L. et al. Computation-Guided Design of a Stimulus-Responsive Multienzyme
Supramolecular Assembly. ChemBioChem 18, 2000–2006 (2017).
101. Hsia, Y. et al. Design of a hyperstable 60-subunit protein icosahedron. Nature 535, 136–
139 (2016).
102. Bale, J. B. et al. Accurate design of megadalton-scale two-component icosahedral protein
complexes. Science (80-. ). (2016). doi:10.1126/science.aaf8818
103. King, N. P. et al. Computational design of self-assembling protein nanomaterials with
atomic level accuracy. Science (80-. ). 336, 1171–1174 (2012).
104. Votteler, J. et al. Designed proteins induce the formation of nanocage-containing
extracellular vesicles. Nature (2016). doi:10.1038/nature20607
105. Suzuki, Y. et al. Self-assembly of coherently dynamic, auxetic, two-dimensional protein
crystals. Nature 533, 369–373 (2016).
106. Sinclair, J. C., Davies, K. M., Vénien-Bryan, C. & Noble, M. E. M. Generation of protein
lattices by fusing proteins with matching rotational symmetry. Nat. Nanotechnol. 6, 558–
562 (2011).
107. Padilla, J. E., Colovos, C. & Yeates, T. O. Nanohedra: Using symmetry to design self
assembling protein cages, layers, crystals, and filaments. Proc. Natl. Acad. Sci. 98, 2217–
2221 (2001).
108. Zhang, J., Zheng, F. & Grigoryan, G. Design and designability of protein-based
assemblies. Current Opinion in Structural Biology 27, 79–86 (2014).
109. Mandelbrot, B. Fractals - a geometry of nature. New Sci. (1990). doi:citeulike-article-
id:580392
110. Havlin, S. et al. Fractals in biology and medicine. Chaos, Solitons and Fractals (1995).
125
doi:10.1016/0960-0779(95)80025-C
111. Fairbanks, M. S., McCarthy, D. N., Scott, S. A., Brown, S. A. & Taylor, R. P. Fractal
electronic devices: Simulation and implementation. Nanotechnology 22, (2011).
112. Soleymani, L., Fang, Z., Sargent, E. H. & Kelley, S. O. Programming the detection limits
of biosensors through controlled nanostructuring. Nat. Nanotechnol. 4, 844–848 (2009).
113. Ge, J., Lei, J. & Zare, R. N. Protein-inorganic hybrid nanoflowers. Nat. Nanotechnol. 7,
428–432 (2012).
114. Zhang, P. & Wang, S. Designing fractal nanostructured biointerfaces for biomedical
applications. ChemPhysChem 15, 1550–1561 (2014).
115. Lim, B. et al. Pd-Pt bimetallic nanodendrites with high activity for oxygen reduction.
Science (80-. ). 324, 1302–1305 (2009).
116. Thekkekara, L. V. & Gu, M. Bioinspired fractal electrodes for solar energy storages. Sci.
Rep. (2017). doi:10.1038/srep45585
117. Chamousis, R. L. et al. Effect of fractal silver electrodes on charge collection and light
distribution in semiconducting organic polymer films. J. Mater. Chem. A (2014).
doi:10.1039/c4ta03204g
118. Watterson, W. J., Montgomery, R. D. & Taylor, R. P. Fractal Electrodes as a Generic
Interface for Stimulating Neurons. Sci. Rep. (2017). doi:10.1038/s41598-017-06762-3
119. Yang, C. et al. Fractal dendrite-based electrically conductive composites for laser-scribed
flexible circuits. Nat. Commun. (2015). doi:10.1038/ncomms9150
120. Cerofolini, G. F., Narducci, D., Amato, P. & Romano, E. Fractal nanotechnology.
Nanoscale Res. Lett. 3, 381–385 (2008).
121. Shang, J. et al. Assembling molecular Sierpiński triangle fractals. Nat. Chem. 7, 389–393
(2015).
122. Shin, S. et al. Polymer Self-Assembly into Unique Fractal Nanostructures in Solution by a
One-Shot Synthetic Procedure. J. Am. Chem. Soc. 140, 475–482 (2018).
123. Murr, M. M. & Morse, D. E. Fractal intermediates in the self-assembly of silicatein
filaments. Proc. Natl. Acad. Sci. 102, 11657–11662 (2005).
124. Khire, T. S., Kundu, J., Kundu, S. C. & Yadavalli, V. K. The fractal self-assembly of the
silk protein sericin. Soft Matter 6, 2066 (2010).
125. Lomander, A., Hwang, W. & Zhang, S. Hierarchical self-assembly of a coiled-coil peptide
126
into fractal structure. Nano Lett. 5, 1255–1260 (2005).
126. Kurland, N. E., Kundu, J., Pal, S., Kundu, S. C. & Yadavalli, V. K. Self-assembly
mechanisms of silk protein nanostructures on two-dimensional surfaces. Soft Matter
(2012). doi:10.1039/c2sm25313e
127. Yeates, T. O. Geometric Principles for Designing Highly Symmetric Self-Assembling
Protein Nanomaterials. Annu. Rev. Biophys. (2017). doi:10.1146/annurev-biophys-
070816-033928
128. Lai, Y. T., King, N. P. & Yeates, T. O. Principles for designing ordered protein
assemblies. Trends in Cell Biology 22, 653–661 (2012).
129. Kaneko, T. et al. Superbinder SH2 domains act as antagonists of cell signaling. Sci.
Signal. 5, (2012).
130. Cho, S. et al. Cyanuric Acid Hydrolase from Azorhizobium caulinodans ORS 571: Crystal
Structure and Insights into a New Class of Ser-Lys Dyad Proteins. PLoS One 9, e99349
(2014).
131. Mandelbrot, B. The fractal geometry of nature. 406 (1983). doi:10.1002/esp.3290080415
132. Losa, G.A., Merlini, D., Nonnenmacher, T.F., Weibel, E. . Mathematics and biosciences
in interaction. in Fractals in biology and medicine. Volume IV. vii, 314 (Birkhäuser,
Basel, 2005).
133. Newkome, G. R. et al. Nanoassembly of a fractal polymer: A molecular ‘Sierpinski
hexagonal gasket’. Science (80-. ). 312, 1782–1785 (2006).
134. Newkome, G. R. & Moorefield, C. N. From 1 → 3 dendritic designs to fractal
supramacromolecular constructs: understanding the pathway to the Sierpiński gasket.
Chem. Soc. Rev. 44, 3954–3967 (2015).
135. Astier, Y., Bayley, H. & Howorka, S. Protein components for nanodevices. Current
Opinion in Chemical Biology 9, 576–584 (2005).
136. Shen, W., Lammertink, R. G. H., Sakata, J. K., Kornfield, J. A. & Tirrell, D. A. Assembly
of an artificial protein hydrogel through leucine zipper aggregation and bisulfide bond
formation. Macromolecules 38, 3909–3916 (2005).
137. McManus, J. J., Charbonneau, P., Zaccarelli, E. & Asherie, N. The physics of protein self-
assembly. Curr. Opin. Colloid Interface Sci. 22, 73–79 (2016).
138. Brodin, J. D. et al. Metal-directed, chemically tunable assembly of one-, two- and three-
dimensional crystalline protein arrays. Nat. Chem. 4, 375–382 (2012).
127
139. Ringler, P. & Schulz, G. E. Self-assembly of proteins into designed networks. Science
(80-. ). 302, 106–109 (2003).
140. Lindenmayer, A. Mathematical models for cellular interactions in development II. Simple
and branching filaments with two-sided inputs. J. Theor. Biol. 18, 300–315 (1968).
141. Kaneko, T. et al. Superbinder SH2 Domains Act as Antagonists of Cell Signaling. Sci.
Signal. 5, ra68-ra68 (2012).
142. Richter, F., Leaver-Fay, A., Khare, S. D., Bjelic, S. & Baker, D. De novo enzyme design
using Rosetta3. PLoS One 6, (2011).
143. Van Anders, G., Ahmed, N. K., Smith, R., Engel, M. & Glotzer, S. C. Entropically patchy
particles: Engineering valence through shape entropy. ACS Nano 8, 931–940 (2014).
144. Zhang, Z. & Glotzer, S. C. Self-assembly of patchy particles. Nano Lett. 4, 1407–1413
(2004).
145. Nicolas-Carlock, J. R., Carrillo-Estrada, J. L. & Dossetti, V. Fractality a la carte: A
general particle aggregation model. Sci. Rep. 6, (2016).
146. Dantas, G., Kuhlman, B., Callender, D., Wong, M. & Baker, D. A large scale test of
computational protein design: Folding and stability of nine completely redesigned
globular proteins. J. Mol. Biol. 332, 449–460 (2003).
147. Tinberg, C. E. et al. Computational design of ligand-binding proteins with high affinity
and selectivity. Nature 501, 212–6 (2013).
148. Meiler, J. & Baker, D. ROSETTALIGAND: Protein-small molecule docking with full
side-chain flexibility. Proteins Struct. Funct. Genet. 65, 538–548 (2006).
149. Tyka, M. D. et al. Alternate states of proteins revealed by detailed energy landscape
mapping. J. Mol. Biol. 405, 607–618 (2011).
150. Zanghellini, A. et al. New algorithms and an in silico benchmark for computational
enzyme design. Protein Sci. 15, 2785–2794 (2006).
151. Berman, H. M. et al. The protein data bank. Nucleic Acids Res. 28, 235–242 (2000).
152. Mandell, D. J. & Kortemme, T. Backbone flexibility in computational protein design.
Current Opinion in Biotechnology 20, 420–428 (2009).
153. Fleishman, S. J. et al. Rosettascripts: A scripting language interface to the Rosetta
Macromolecular modeling suite. PLoS One 6, (2011).
154. Mandelbaum, R. T., Allan, D. l. & Wackett, L. P. Isolation and Characterization of a
128
Pseudomonas sp . That Mineralizes the s -Triazine Herbicide Atrazine. Appl. Environ.
Microbiol. 61, 1451–1457 (1995).
155. Seffernick, J. L., Johnson, G., Sadowsky, M. J. & Wackett, L. P. Substrate specificity of
atrazine chlorohydrolase and atrazine-catabolizing bacteria. Appl. Environ. Microbiol. 66,
4247–4252 (2000).
156. Gibson, D. G. et al. Enzymatic assembly of DNA molecules up to several hundred
kilobases. Nat. Methods 6, 343–5 (2009).
157. Shapir, N. et al. TrzN from Arthrobacter aurescens TC1 is a zinc amidohydrolase. J.
Bacteriol. 188, 5859–5864 (2006).
158. Parton, D. L. et al. An open library of human kinase domain constructs for automated
bacterial expression. bioRxiv (2016).
159. Cameron, S. M., Durchschein, K., Richman, J. E., Sadowsky, M. J. & Wackett, L. P. New
family of biuret hydrolases involved in s -triazine ring metabolism. ACS Catal. 1, 1075–
1082 (2011).
160. Li, Q., Seffernick, J. L., Sadowsky, M. J. & Wackett, L. P. Thermostable cyanuric acid
hydrolase from Moorella thermoacetica ATCC 39073. Appl. Environ. Microbiol. 75,
6986–6991 (2009).
161. Nečas, D. & Klapetek, P. Gwyddion: an open-source software for SPM data analysis.
Open Phys. 10, 181–188 (2012).
162. Kremer, J. R., Mastronarde, D. N. & McIntosh, J. R. Computer visualization of three-
dimensional image data using IMOD. J. Struct. Biol. 116, 71–6 (1996).
163. Pettersen, E. F. et al. UCSF Chimera - A visualization system for exploratory research and
analysis. J. Comput. Chem. 25, 1605–1612 (2004).
164. Mutlu, B. R., Yeom, S., Wackett, L. P. & Aksan, A. Modelling and optimization of a
bioremediation system utilizing silica gel encapsulated whole-cell biocatalyst. Chem. Eng.
J. 259, 574–580 (2015).
165. Sontz, P. A., Bailey, J. B., Ahn, S. & Tezcan, F. A. A Metal Organic Framework with
Spherical Protein Nodes: Rational Chemical Design of 3D Protein Crystals. J. Am. Chem.
Soc. 137, 11598–11601 (2015).
166. Hausdorff, F. Dimension und äußeres Maß. Math. Ann. 79, 157–179 (1919).
167. Meakin, P. Formation of fractal clusters and networks by irreversible diffusion-limited
aggregation. Phys. Rev. Lett. 51, 1119–1122 (1983).
129
168. Meakin, P. Diffusion-controlled cluster formation in 2-6 dimensional space. Phys. Rev. A
27, 1495–1507 (1983).
169. Kirkby, M. J. The fractal geometry of nature. Benoit B. Mandelbrot. W. H. Freeman and
co., San Francisco, 1982. No. of pages: 460. Price: £22.75 (hardback). Earth Surf.
Process. Landforms 8, 406–406 (1983).
170. Smith, T. G., Lange, G. D. & Marks, W. B. Fractal methods and results in cellular
morphology - Dimensions, lacunarity and multifractals. Journal of Neuroscience Methods
69, 123–136 (1996).
171. Sass, J. B. & Colangelo, A. European Union bans atrazine, while the United States
negotiates continued use. Int. J. Occup. Environ. Health 12, 260–267 (2006).
172. Fuhrmann, A., Gans, O., Weiss, S., Haberhauer, G. & Gerzabek, M. H. Determination of
bentazone, chloridazon and terbuthylazine and some of their metabolites in complex
environmental matrices by liquid chromatography-electrospray ionization-tandem mass
spectrometry using a modified QuEChERS method: An optimization and vali. Water. Air.
Soil Pollut. 225, (2014).
173. Kolić, N. U. et al. Combined metabolic activity within an atrazine-mineralizing
community enriched from agrochemical factory soil. Int. Biodeterior. Biodegrad. 60, 299–
307 (2007).
174. Frisch, M. J. et al. Gaussian 09, Revision D.01. Gaussian Inc. Wallingford CT (2009).
doi:10.1159/000348293
175. Lee, C., Yang, W. & Parr, R. G. Development of the Colle-Salvetti correlation-energy
formula into a functional of the electron density. Phys. Rev. B 37, 785–789 (1988).
176. Hay, P. J. & Wadt, W. R. Ab initio effective core potentials for molecular calculations.
Potentials for the transition metal atoms Sc to Hg. J. Chem. Phys. 82, 270 (1985).
177. Kunkel, T. a. Rapid and efficient site-specific mutagenesis without phenotypic selection.
Proc. Natl. Acad. Sci. U. S. A. 82, 488–492 (1985).
178. Kuhlman, B. & Baker, D. Native protein sequences are close to optimal for their
structures. Proc. Natl. Acad. Sci. 97, 10383–10388 (2000).
179. Copley, S. D. Evolution of Efficient Pathways for Degradation of Anthropogenic
Chemicals. Dev. Biol. 5, 559–566 (2010).
180. Shapir, N., Osborne, J. P., Johnson, G., Sadowsky, M. J. & Wackett, L. P. Purification,
substrate range, and metal center of AtzC: The N-isopropylammelide aminohydrolase
involved in bacterial atrazine metabolism. J. Bacteriol. 184, 5376–5384 (2002).
130
181. Thoden, J. B., Phillips, G. N., Neal, T. M., Raushel, F. M. & Holden, H. M. Molecular
structure of dihydroorotase: a paradigm for catalysis through the use of a binuclear metal
center. Biochemistry 40, 6989–6997 (2001).
182. Hall, R. S. et al. Three-dimensional structure and catalytic mechanism of cytosine
deaminase. Biochemistry 50, 5077–5085 (2011).
183. Liao, R. Z., Yu, J. G., Raushel, F. M. & Himo, F. Theoretical investigation of the reaction
mechanism of the dinuclear zinc enzyme dihydroorotase. Chem. - A Eur. J. 14, 4287–4292
(2008).
184. Copley, S. D. Evolution of efficient pathways for degradation of anthropogenic chemicals.
Nat. Chem. Biol. 5, 559–566 (2009).
185. Gaussian 09, Revision D.01, M. J. Frisch, G. W. Trucks, H. B. Schlegel, G. E. Scuseria,
M. A. Robb, J. R. Cheeseman, G. Scalmani, V. Barone, B. Mennucci, G. A. Petersson, H.
Nakatsuji, M. Caricato, X. Li, H. P. Hratchian, A. F. Izmaylov, J. Bloino, G. Zhe, 2009.
No Title.
186. Barone, V. & Cossi, M. Quantum calculation of molecular energies and energy gradients
in solution by a conductor solvent model. J. Phys. Chem. A 5639, 1995–2001 (1998).
131
3. Substrate specificity trade-offs upon active site-distal mutations in a recently-evolved
biodegradation pathway enzyme
3.1 Abstract
Recently-evolved or designed enzymatic pathways often involve suboptimal enzymes with narrow
substrate specificities. The enzyme AtzC, an isopropylamidohydrolase, catalyzes the third step in
the biodegradation of the herbicide and endocrine disruptor atrazine, but is inefficient in
hydrolyzing related substrates t-butylammelide (bulkier) and ammelide (smaller), intermediates
produced in the biodegradation of terbuthylazine (atrazine substitute in EU) and melamine,
respectively. To address this inefficiency, we developed a mechanism-based computationally-
guided screening approach for enzyme specificity modulation using the Rosetta modeling
program. Based on in silico modeling of ~800 variants in the context of two enzyme conformations
(with open and closed active site lid, respectively), we identified and screened ~30 variants in
vitro, and obtained AtzC mutants with enhanced selectivity for both the bulkier and the smaller
substrate, respectively, by combining beneficial single mutations. Modeling indicates that
specificity switching is based on subtle structural changes in the second shell of residues
surrounding the active site. Combinatorial mutagenesis and activity measurements show that the
mutational landscape of substrate specificity involves extensive trade-offs. Our approach provides
a blueprint for combining computational design and experimental screening for rapid and efficient
specificity optimization in biocatalysis, and highlights the trade-offs associated with specificity
modulation.
3.2 Introduction
The ability to identify adaptive mutations in the large background of deleterious and neutral
mutations is key for our understanding of enzyme evolution and for our ability to engineer
132
enzymes. An often-encountered problem in enzyme evolution and engineering is alteration of
substrate specificity. Atrazine (2-chloro-4-ethylamino-6-isopropylamino-s-triazine) is an
herbicide that is widely used in the United States, and whose undesirable contamination of water
sources can potentially be prevented by the use of atrazine-degrading enzymes that have recently
(in the last 70 years) evolved in soil bacteria 154 . Related compounds, such as the atrazine
substitute in EU, terbuthylazine, are being widely used but their environmental fate is less well
understood, and their degradation by the naturally evolved atrazine degradation pathway is
inefficient 171,172. Of the six atrazine-degradation pathway enzymes, AtzC is the likely bottleneck
enzyme in the degradation of compounds like terbuthylazine and melamine (Scheme 3.1), as two
substituents on the triazine ring from these compounds can be removed efficiently by the first two
enzymes of the pathway, AtzA and AtzB, but AtzC (Fig. 3.1.A, B) is unable to efficiently remove
the final alkyl group 83,173 (Fig3.1.C) to form the relatively environmentally benign cyanuric acid.
AtzC has been extensively structurally characterized. There are 5 reported crystals structures that
show a major difference in the position of the N-terminal helix (mobile helix, Fig. 3.1.A). We refer
to these as the Open (PDB ID 2QT3) and Closed (PDB ID 4CQB) conformations82,85. AtzC is a
tetramer with a catalytically important Zn2+ in each of its four active sites 78. The kinetics of the
reaction catalyzed by AtzC with various s-triazine substrates has been previously reported82 and
the exploration of the substrate-binding pocket using mutagenesis has allowed the identification
of catalytically important active site residues 78.
133
As a first step towards a designed biodegradation pathway that can degrade atrazine congeners
with broad specificity and high efficiency, we set out to rationally modify the substrate specificity
of the bottleneck enzyme, AtzC. We utilized a mechanism-based computational screening
approach for enzyme specificity modulation using the Rosetta modeling program. Based on in
silico modeling of ~800 variants in the context of two enzyme conformations, we identified and
experimentally screened ~30 variants in vitro, and obtained AtzC mutants with enhanced
selectivity for both the bulkier and the smaller substrate, respectively, by combining beneficial
single mutations. Modeling indicates that specificity switching is based on subtle structural
changes in the second shell of residues surrounding the active site, and the mutational landscape
of substrate specificity involves extensive epistasis and specificity trade-offs. Our approach
provides a blueprint for combining computational design and experimental screening for rapid and
efficient specificity optimization in biocatalysis, and highlights the trade-offs associated with
specificity modulation.
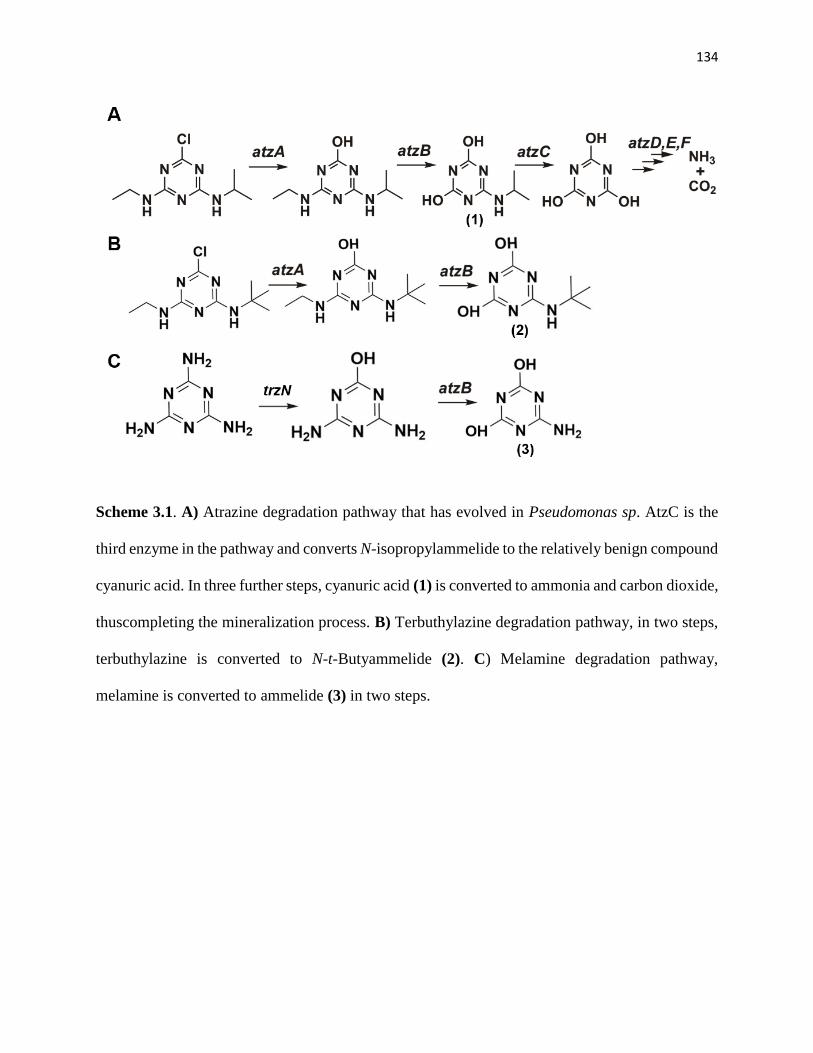
134
Scheme 3.1. A) Atrazine degradation pathway that has evolved in Pseudomonas sp. AtzC is the
third enzyme in the pathway and converts N-isopropylammelide to the relatively benign compound
cyanuric acid. In three further steps, cyanuric acid (1) is converted to ammonia and carbon dioxide,
thuscompleting the mineralization process. B) Terbuthylazine degradation pathway, in two steps,
terbuthylazine is converted to N-t-Butyammelide (2). C) Melamine degradation pathway,
melamine is converted to ammelide (3) in two steps.
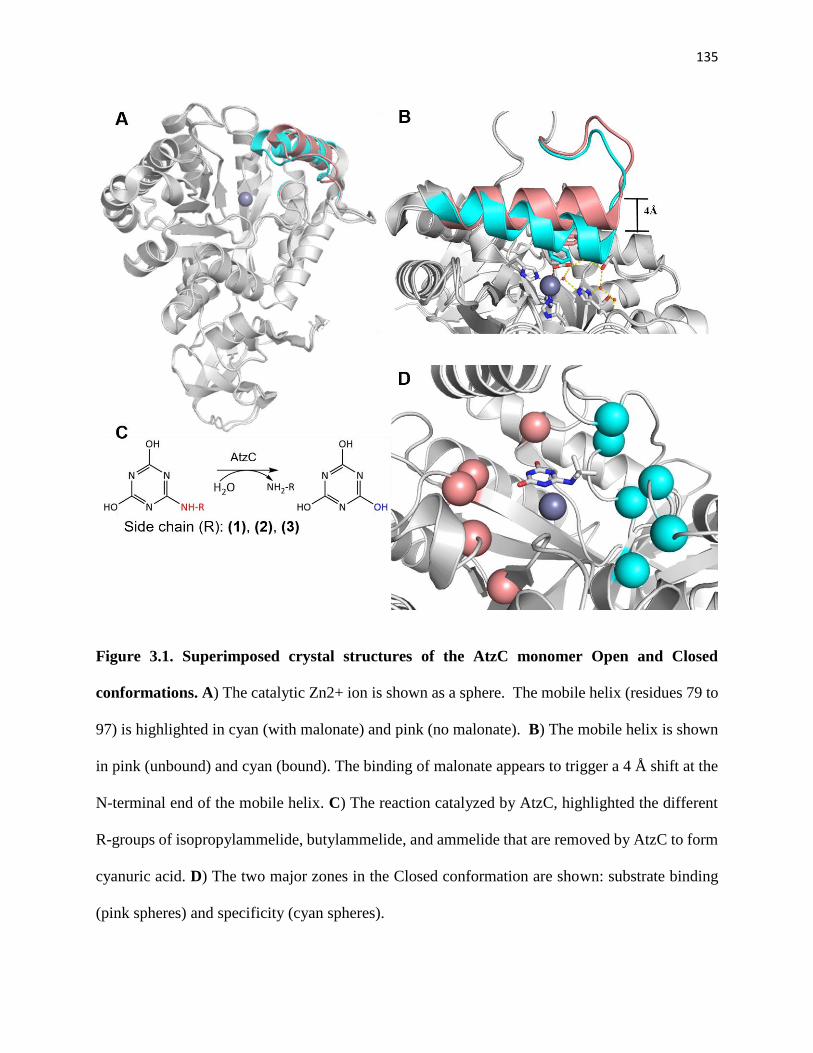
135
Figure 3.1. Superimposed crystal structures of the AtzC monomer Open and Closed
conformations. A) The catalytic Zn2+ ion is shown as a sphere. The mobile helix (residues 79 to
97) is highlighted in cyan (with malonate) and pink (no malonate). B) The mobile helix is shown
in pink (unbound) and cyan (bound). The binding of malonate appears to trigger a 4 Å shift at the
N-terminal end of the mobile helix. C) The reaction catalyzed by AtzC, highlighted the different
R-groups of isopropylammelide, butylammelide, and ammelide that are removed by AtzC to form
cyanuric acid. D) The two major zones in the Closed conformation are shown: substrate binding
(pink spheres) and specificity (cyan spheres).
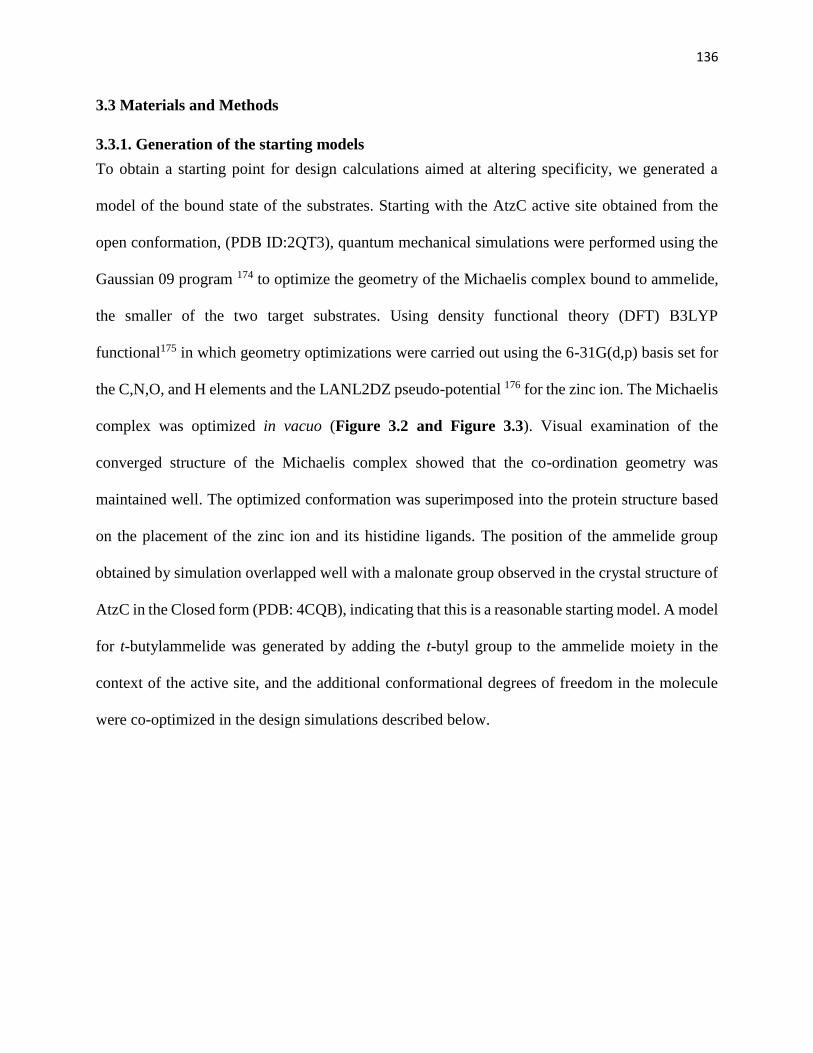
136
3.3 Materials and Methods
3.3.1. Generation of the starting models
To obtain a starting point for design calculations aimed at altering specificity, we generated a
model of the bound state of the substrates. Starting with the AtzC active site obtained from the
open conformation, (PDB ID:2QT3), quantum mechanical simulations were performed using the
Gaussian 09 program 174 to optimize the geometry of the Michaelis complex bound to ammelide,
the smaller of the two target substrates. Using density functional theory (DFT) B3LYP
functional175 in which geometry optimizations were carried out using the 6-31G(d,p) basis set for
the C,N,O, and H elements and the LANL2DZ pseudo-potential 176 for the zinc ion. The Michaelis
complex was optimized in vacuo (Figure 3.2 and Figure 3.3). Visual examination of the
converged structure of the Michaelis complex showed that the co-ordination geometry was
maintained well. The optimized conformation was superimposed into the protein structure based
on the placement of the zinc ion and its histidine ligands. The position of the ammelide group
obtained by simulation overlapped well with a malonate group observed in the crystal structure of
AtzC in the Closed form (PDB: 4CQB), indicating that this is a reasonable starting model. A model
for t-butylammelide was generated by adding the t-butyl group to the ammelide moiety in the
context of the active site, and the additional conformational degrees of freedom in the molecule
were co-optimized in the design simulations described below.
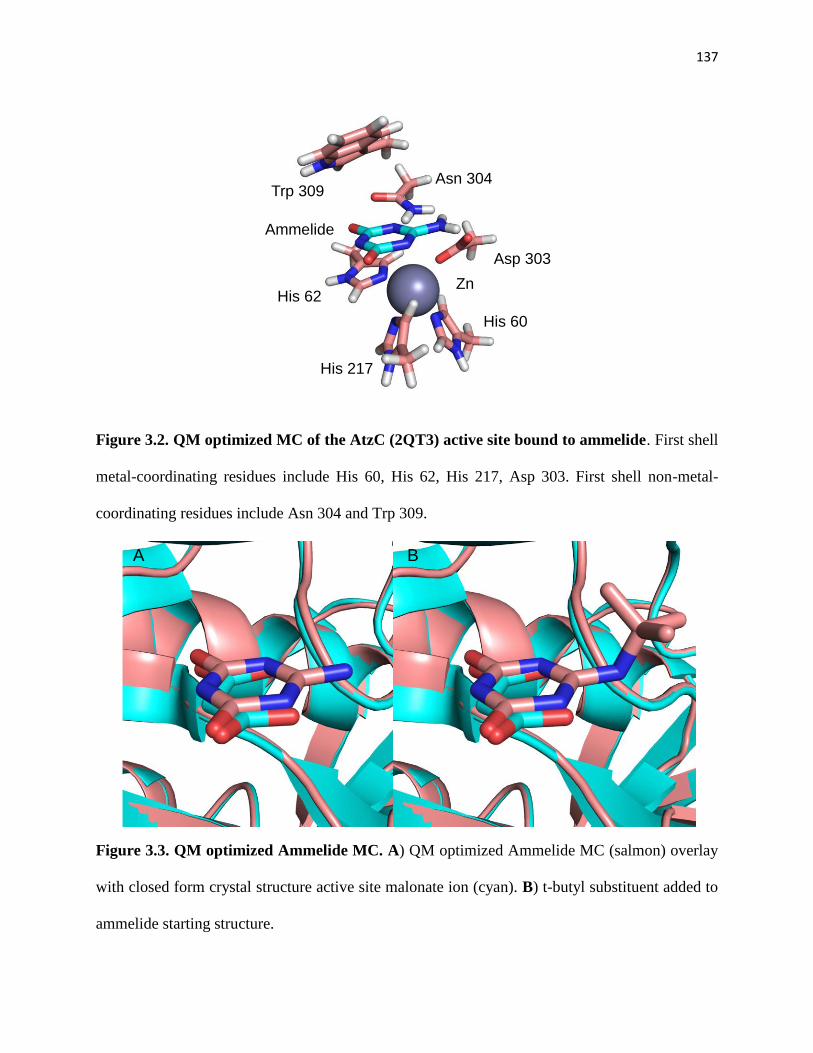
137
Figure 3.2. QM optimized MC of the AtzC (2QT3) active site bound to ammelide. First shell
metal-coordinating residues include His 60, His 62, His 217, Asp 303. First shell non-metal-
coordinating residues include Asn 304 and Trp 309.
Figure 3.3. QM optimized Ammelide MC. A) QM optimized Ammelide MC (salmon) overlay
with closed form crystal structure active site malonate ion (cyan). B) t-butyl substituent added to
ammelide starting structure.
Trp 309 Asn 304
His 62
His 217
His 60
Asp 303
Ammelide
Zn
A B
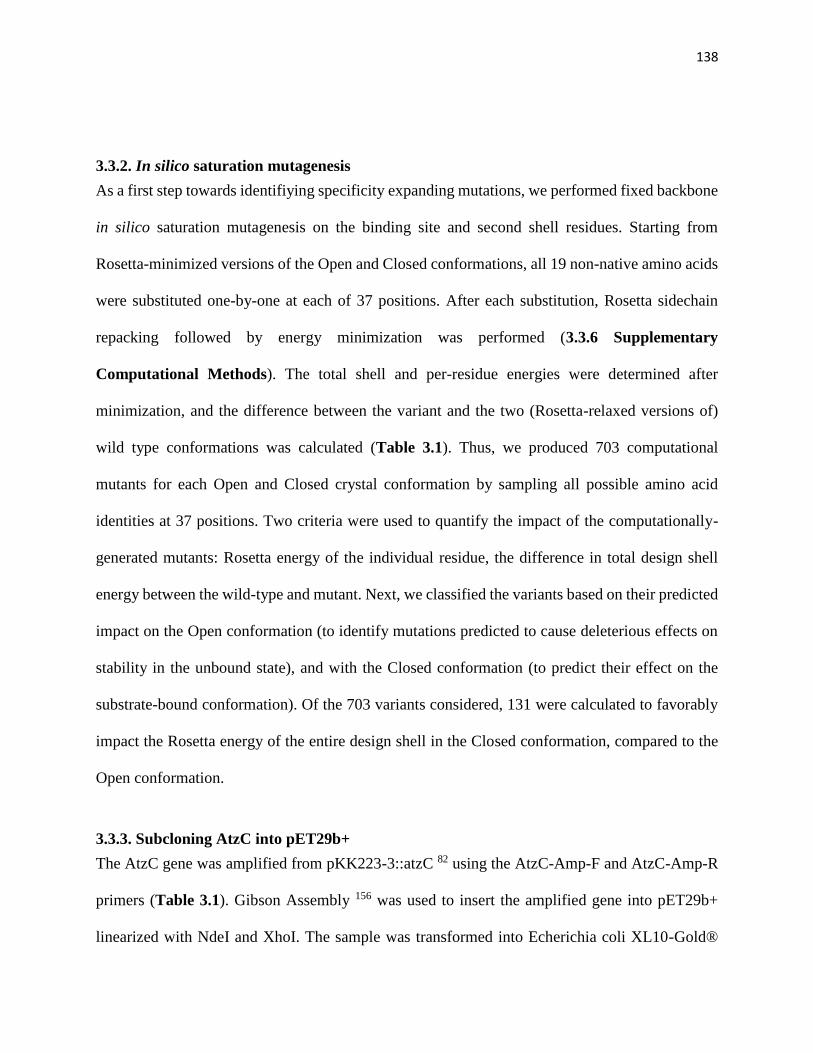
138
3.3.2. In silico saturation mutagenesis
As a first step towards identifiying specificity expanding mutations, we performed fixed backbone
in silico saturation mutagenesis on the binding site and second shell residues. Starting from
Rosetta-minimized versions of the Open and Closed conformations, all 19 non-native amino acids
were substituted one-by-one at each of 37 positions. After each substitution, Rosetta sidechain
repacking followed by energy minimization was performed (3.3.6 Supplementary
Computational Methods). The total shell and per-residue energies were determined after
minimization, and the difference between the variant and the two (Rosetta-relaxed versions of)
wild type conformations was calculated (Table 3.1). Thus, we produced 703 computational
mutants for each Open and Closed crystal conformation by sampling all possible amino acid
identities at 37 positions. Two criteria were used to quantify the impact of the computationally-
generated mutants: Rosetta energy of the individual residue, the difference in total design shell
energy between the wild-type and mutant. Next, we classified the variants based on their predicted
impact on the Open conformation (to identify mutations predicted to cause deleterious effects on
stability in the unbound state), and with the Closed conformation (to predict their effect on the
substrate-bound conformation). Of the 703 variants considered, 131 were calculated to favorably
impact the Rosetta energy of the entire design shell in the Closed conformation, compared to the
Open conformation.
3.3.3. Subcloning AtzC into pET29b+
The AtzC gene was amplified from pKK223-3::atzC 82 using the AtzC-Amp-F and AtzC-Amp-R
primers (Table 3.1). Gibson Assembly 156 was used to insert the amplified gene into pET29b+
linearized with NdeI and XhoI. The sample was transformed into Echerichia coli XL10-Gold®
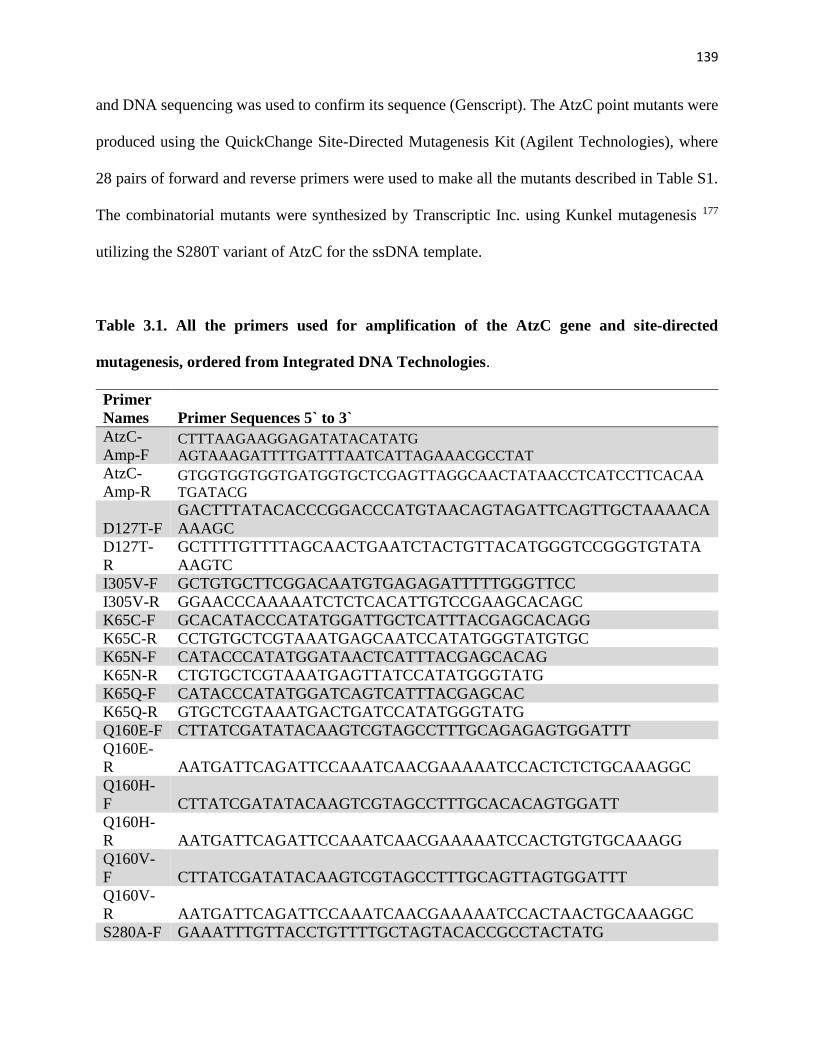
139
and DNA sequencing was used to confirm its sequence (Genscript). The AtzC point mutants were
produced using the QuickChange Site-Directed Mutagenesis Kit (Agilent Technologies), where
28 pairs of forward and reverse primers were used to make all the mutants described in Table S1.
The combinatorial mutants were synthesized by Transcriptic Inc. using Kunkel mutagenesis 177
utilizing the S280T variant of AtzC for the ssDNA template.
Table 3.1. All the primers used for amplification of the AtzC gene and site-directed
mutagenesis, ordered from Integrated DNA Technologies.
Primer
Names Primer Sequences 5` to 3`
AtzC-
Amp-F CTTTAAGAAGGAGATATACATATG
AGTAAAGATTTTGATTTAATCATTAGAAACGCCTAT
AtzC-
Amp-R GTGGTGGTGGTGATGGTGCTCGAGTTAGGCAACTATAACCTCATCCTTCACAA
TGATACG
D127T-F
GACTTTATACACCCGGACCCATGTAACAGTAGATTCAGTTGCTAAAACA
AAAGC
D127T-
R
GCTTTTGTTTTAGCAACTGAATCTACTGTTACATGGGTCCGGGTGTATA
AAGTC
I305V-F GCTGTGCTTCGGACAATGTGAGAGATTTTTGGGTTCC
I305V-R GGAACCCAAAAATCTCTCACATTGTCCGAAGCACAGC
K65C-F GCACATACCCATATGGATTGCTCATTTACGAGCACAGG
K65C-R CCTGTGCTCGTAAATGAGCAATCCATATGGGTATGTGC
K65N-F CATACCCATATGGATAACTCATTTACGAGCACAG
K65N-R CTGTGCTCGTAAATGAGTTATCCATATGGGTATG
K65Q-F CATACCCATATGGATCAGTCATTTACGAGCAC
K65Q-R GTGCTCGTAAATGACTGATCCATATGGGTATG
Q160E-F CTTATCGATATACAAGTCGTAGCCTTTGCAGAGAGTGGATTT
Q160E-
R AATGATTCAGATTCCAAATCAACGAAAAATCCACTCTCTGCAAAGGC
Q160H-
F CTTATCGATATACAAGTCGTAGCCTTTGCACACAGTGGATT
Q160H-
R AATGATTCAGATTCCAAATCAACGAAAAATCCACTGTGTGCAAAGG
Q160V-
F CTTATCGATATACAAGTCGTAGCCTTTGCAGTTAGTGGATTT
Q160V-
R AATGATTCAGATTCCAAATCAACGAAAAATCCACTAACTGCAAAGGC
S280A-F GAAATTTGTTACCTGTTTTGCTAGTACACCGCCTACTATG
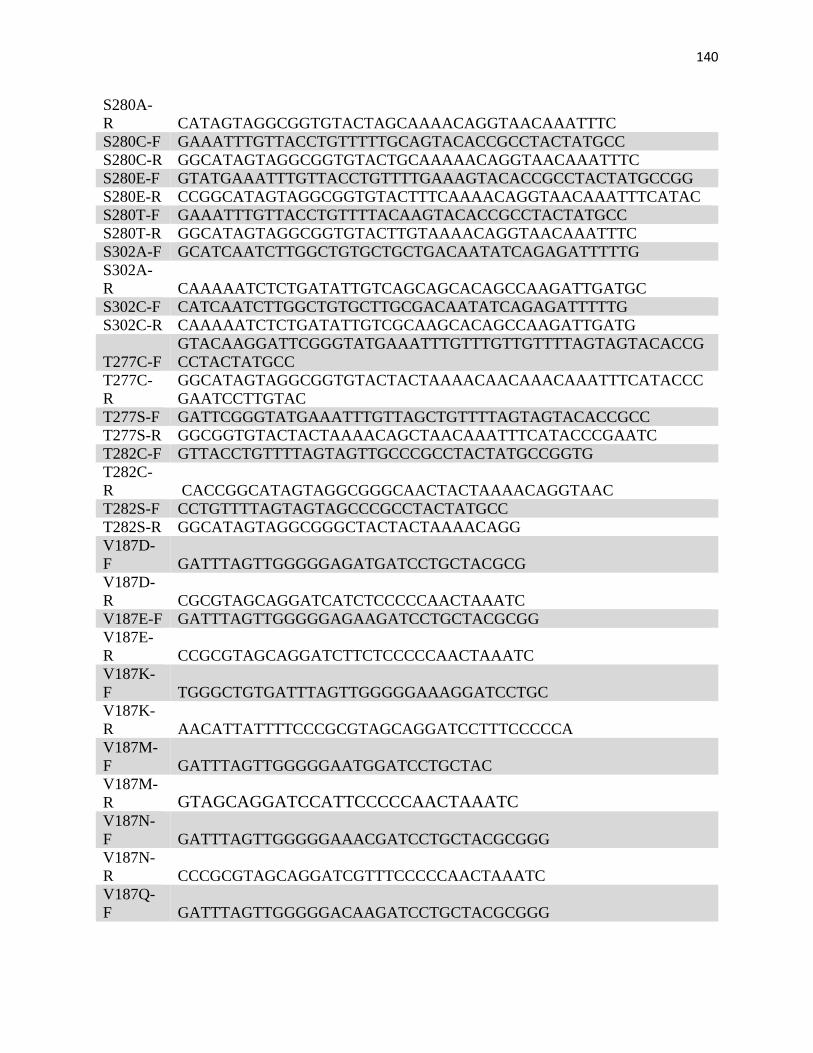
140
S280A-
R CATAGTAGGCGGTGTACTAGCAAAACAGGTAACAAATTTC
S280C-F GAAATTTGTTACCTGTTTTTGCAGTACACCGCCTACTATGCC
S280C-R GGCATAGTAGGCGGTGTACTGCAAAAACAGGTAACAAATTTC
S280E-F GTATGAAATTTGTTACCTGTTTTGAAAGTACACCGCCTACTATGCCGG
S280E-R CCGGCATAGTAGGCGGTGTACTTTCAAAACAGGTAACAAATTTCATAC
S280T-F GAAATTTGTTACCTGTTTTACAAGTACACCGCCTACTATGCC
S280T-R GGCATAGTAGGCGGTGTACTTGTAAAACAGGTAACAAATTTC
S302A-F GCATCAATCTTGGCTGTGCTGCTGACAATATCAGAGATTTTTG
S302A-
R CAAAAATCTCTGATATTGTCAGCAGCACAGCCAAGATTGATGC
S302C-F CATCAATCTTGGCTGTGCTTGCGACAATATCAGAGATTTTTG
S302C-R CAAAAATCTCTGATATTGTCGCAAGCACAGCCAAGATTGATG
T277C-F
GTACAAGGATTCGGGTATGAAATTTGTTTGTTGTTTTAGTAGTACACCG
CCTACTATGCC
T277C-
R
GGCATAGTAGGCGGTGTACTACTAAAACAACAAACAAATTTCATACCC
GAATCCTTGTAC
T277S-F GATTCGGGTATGAAATTTGTTAGCTGTTTTAGTAGTACACCGCC
T277S-R GGCGGTGTACTACTAAAACAGCTAACAAATTTCATACCCGAATC
T282C-F GTTACCTGTTTTAGTAGTTGCCCGCCTACTATGCCGGTG
T282C-
R CACCGGCATAGTAGGCGGGCAACTACTAAAACAGGTAAC
T282S-F CCTGTTTTAGTAGTAGCCCGCCTACTATGCC
T282S-R GGCATAGTAGGCGGGCTACTACTAAAACAGG
V187D-
F GATTTAGTTGGGGGAGATGATCCTGCTACGCG
V187D-
R CGCGTAGCAGGATCATCTCCCCCAACTAAATC
V187E-F GATTTAGTTGGGGGAGAAGATCCTGCTACGCGG
V187E-
R CCGCGTAGCAGGATCTTCTCCCCCAACTAAATC
V187K-
F TGGGCTGTGATTTAGTTGGGGGAAAGGATCCTGC
V187K-
R AACATTATTTTCCCGCGTAGCAGGATCCTTTCCCCCA
V187M-
F GATTTAGTTGGGGGAATGGATCCTGCTAC
V187M-
R GTAGCAGGATCCATTCCCCCAACTAAATC V187N-
F GATTTAGTTGGGGGAAACGATCCTGCTACGCGGG
V187N-
R CCCGCGTAGCAGGATCGTTTCCCCCAACTAAATC
V187Q-
F GATTTAGTTGGGGGACAAGATCCTGCTACGCGGG
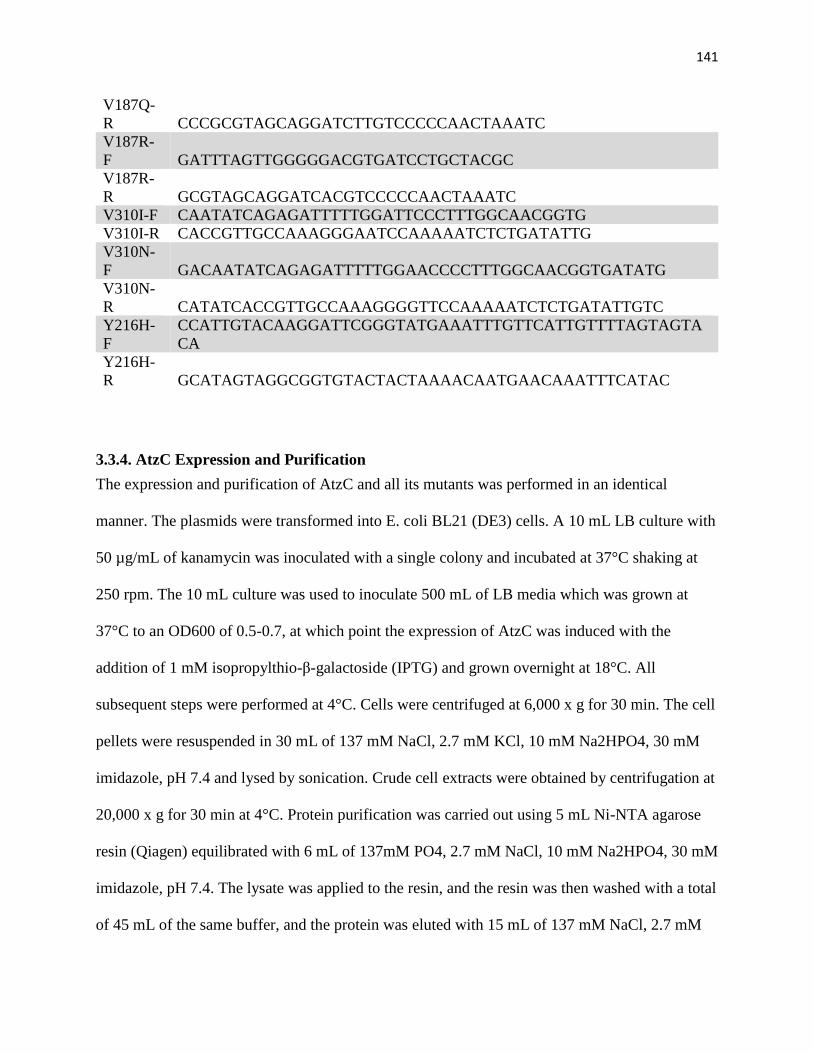
141
V187Q-
R CCCGCGTAGCAGGATCTTGTCCCCCAACTAAATC
V187R-
F GATTTAGTTGGGGGACGTGATCCTGCTACGC
V187R-
R GCGTAGCAGGATCACGTCCCCCAACTAAATC
V310I-F CAATATCAGAGATTTTTGGATTCCCTTTGGCAACGGTG
V310I-R CACCGTTGCCAAAGGGAATCCAAAAATCTCTGATATTG
V310N-
F GACAATATCAGAGATTTTTGGAACCCCTTTGGCAACGGTGATATG
V310N-
R CATATCACCGTTGCCAAAGGGGTTCCAAAAATCTCTGATATTGTC
Y216H-
F
CCATTGTACAAGGATTCGGGTATGAAATTTGTTCATTGTTTTAGTAGTA
CA
Y216H-
R GCATAGTAGGCGGTGTACTACTAAAACAATGAACAAATTTCATAC
3.3.4. AtzC Expression and Purification
The expression and purification of AtzC and all its mutants was performed in an identical
manner. The plasmids were transformed into E. coli BL21 (DE3) cells. A 10 mL LB culture with
50 µg/mL of kanamycin was inoculated with a single colony and incubated at 37°C shaking at
250 rpm. The 10 mL culture was used to inoculate 500 mL of LB media which was grown at
37°C to an OD600 of 0.5-0.7, at which point the expression of AtzC was induced with the
addition of 1 mM isopropylthio-β-galactoside (IPTG) and grown overnight at 18°C. All
subsequent steps were performed at 4°C. Cells were centrifuged at 6,000 x g for 30 min. The cell
pellets were resuspended in 30 mL of 137 mM NaCl, 2.7 mM KCl, 10 mM Na2HPO4, 30 mM
imidazole, pH 7.4 and lysed by sonication. Crude cell extracts were obtained by centrifugation at
20,000 x g for 30 min at 4°C. Protein purification was carried out using 5 mL Ni-NTA agarose
resin (Qiagen) equilibrated with 6 mL of 137mM PO4, 2.7 mM NaCl, 10 mM Na2HPO4, 30 mM
imidazole, pH 7.4. The lysate was applied to the resin, and the resin was then washed with a total
of 45 mL of the same buffer, and the protein was eluted with 15 mL of 137 mM NaCl, 2.7 mM
142
KCl, 10 mM Na2HPO4, 300 mM imidazole, pH 7.4. The purified protein was dialyzed against
137mM NaCl, 2.7 mM KCl, 10mM Na2HPO4, 2mM KH2PO4, pH 7.4. Protein purity was
assessed using sodium dodecyl sulfate-polyacrylamide gel electrophoresis (SDS-PAGE). The
concentration of AtzC was measured using its OD280 nm with a DeNovix DS-11+
spectrophotometer using the 51, 255 extinction coefficient.
3.3.5. End Point Activity Assay
The activity of wild type AtzC and its mutants was measured using isopropylammelide,
butylammelide, and ammelide as substrates. All experiments were performed in triplicate.
Isopropylammelide was dissolved in distilled water, while butylammelide and ammelide were
dissolved in 1M NaOH. All substrates were then diluted in the reaction buffer 25 mM HEPES
buffer, pH 7.6. Substrate concentrations were determined using previously determined extinction
coefficients in the reaction buffer 82: isopropylammelide ɛ240 = 1.7 ×
10−3 μM−1 cm−1; butylammelide ɛ243 = 1.7 × 10⁻³ μM−1 cm−1; ammelide, ɛ240 = 1.1 ×
10−3 μM−1 cm−1. Cyanuric acid, the product for all three substrates, does not absorb at 240 nm
or 243 nm. Purified protein was preincubated in 25 mM HEPES, 100 µM ZnSO4, pH 7.6, for 30
min before starting any reaction. The end point assays for the wild type AtzC and 27 single point
mutants was conducted with 1500 µM of isopropylammelide, butylammelide, and ammelide,
with enzyme concentrations of 0.3 µM for a total of 12 hours. The beginning reading and ending
reading were used to determine the overall difference in absorbance per mutant.
3.3.6. Michaelis-Menten Assay
The enzymes and substrates were prepared as described for the endpoint assay. The kinetic
reaction was started by adding 10 µL of enzyme to 90 µL of reaction buffer 25 mM HEPES pH
143
7.6, containing varying amounts of substrate, such that the final enzyme concentration was 0.08
µM and 0.5 µM for isopropylammelide and butylammelide reactions, respectively. Ammelide
reactions were started by adding 5 µL of enzyme to 45 µL of reaction buffer (25 mM HEPES pH
7.6) containing varying amounts of substrate, such that the final enzyme concentration was 0.5
µM. The absorbance at 240 nm (for isopropylammelide and ammelide) and 243 nm
(butylammelide) was measured continuously in the SpectraMax M3 for one hour at 23°C in a
Greiner Bio-One UV Star µClear 96 half area well microplate. The substrate concentration
ranges that were used were 10 µM – 550 µM for isopropylammelide, 1 µM – 300 µM for
butylammelide, and 25 µM – 300 µM for ammelide. Controls without enzyme, substrate alone,
and buffer alone were conducted. Initial rates were determined using linear regression and
kinetic parameters of AtzC were calculated using the Michaelis-Menten equation in SigmaPlot
13.0.
3.3.7. Full pathway Berthelot assay with atrazine and terbuthylazine
Samples were incubated (1.5 µM AtzA wild-type, 0.5 µM AtzB wild-type, and 1 µM AtzC wild-
type (or combinatorial mutants)) with 100 µM final concentration ZnSO4 for 30 minutes at 25°C
and then dialyzed (2 hours) to remove excess ZnSO4 into 50 mM Hepes, 150 mM NaCl, and 5%
glycerol. Protein mixtures were incubated with final concentration of 400 µM atrazine (or
terbuthylazine) in a 500 µl total volume and another sample with the same conditions had no
substrate added in order to establish a baseline measurement. Each condition was done in
triplicate. After the addition of substrate, the samples are shaken at 100 RPM for 1.5 hr at 25°C.
Samples were then boiled at 99°C for 5 minutes, then cooled at 4°C, and spun down at 20,000 rcf
for 20 minutes to remove precipitated protein. 80 µl of the supernatant was used for the
following steps. 1µg per 20 µL of sample of CAH and 1µg per 20 µL of sample of BH was
144
added to each sample. The samples were incubated at 25°C for 2 hours to allow for the complete
conversion of the cyanuric acid to ammonia by CAH and BH. The Berthelot assay was
performed in triplicate on the resulting samples to determine the production of ammonia. For
every mole of cyanuric acid produced, one mole of ammonia was assumed to have been
produced. 20 µL of each sample was added to a 96-well plate (Greiner half area clear #675101).
60 µL of solution A (0.05 g/L sodium nitroprusside and 10g/L phenol) was added and mixed into
every sample. Then 80 µL of solution B (5 g/L NaOH and 8.4 mL/L bleach) was added and
mixed into every sample. The samples were incubated for 30 minutes at 25°C for a blue color to
develop. The absorbance at 630 nm was read using Tecan Infinite M200 Pro plate reader. The
extinction coefficient was determined using standards of cyanuric acid at known concentrations
in the enzyme activity buffer that had been reacted with the BH and CAH for 2 hours.
3.3.6. Supplementary Computational Methods
In silico saturation mutagenesis
We performed a fixed backbone, single site saturation mutagenesis simulation to identify
energetically favorable mutations of the Open and Closed active sites. Residues that we
identified as being necessary for Zn2+ ion chelation (H62, H217, H60, and D303), substrate
binding (W309, N304, H219), or nucleophile activation (H249), were selected as the active site
unchangeable core. Residues within 12 Å of the geometric center of the unchangeable core were
selected as potential 1st and 2nd shell mutation site locations. Using the Rosetta design178, we
sampled all 20 canonical amino acids at each residue position within the shell, excluding the
unchangeable core residues. The computational mutagenesis involves the following three steps.
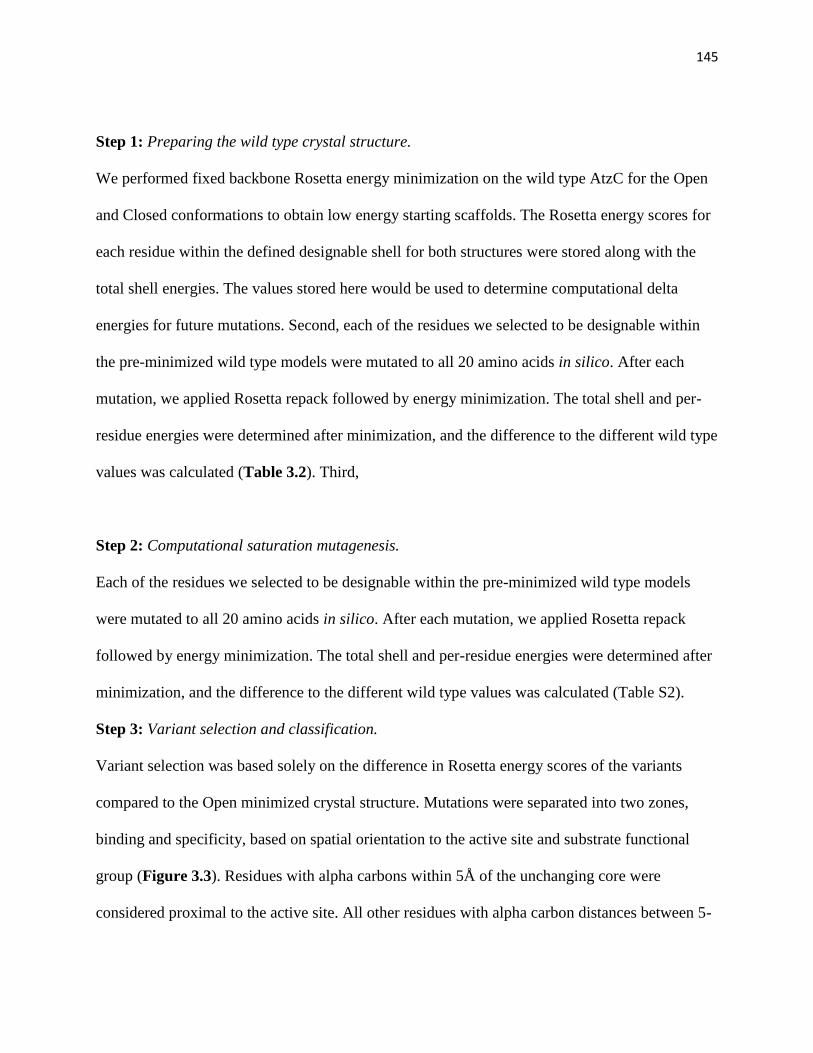
145
Step 1: Preparing the wild type crystal structure.
We performed fixed backbone Rosetta energy minimization on the wild type AtzC for the Open
and Closed conformations to obtain low energy starting scaffolds. The Rosetta energy scores for
each residue within the defined designable shell for both structures were stored along with the
total shell energies. The values stored here would be used to determine computational delta
energies for future mutations. Second, each of the residues we selected to be designable within
the pre-minimized wild type models were mutated to all 20 amino acids in silico. After each
mutation, we applied Rosetta repack followed by energy minimization. The total shell and per-
residue energies were determined after minimization, and the difference to the different wild type
values was calculated (Table 3.2). Third,
Step 2: Computational saturation mutagenesis.
Each of the residues we selected to be designable within the pre-minimized wild type models
were mutated to all 20 amino acids in silico. After each mutation, we applied Rosetta repack
followed by energy minimization. The total shell and per-residue energies were determined after
minimization, and the difference to the different wild type values was calculated (Table S2).
Step 3: Variant selection and classification.
Variant selection was based solely on the difference in Rosetta energy scores of the variants
compared to the Open minimized crystal structure. Mutations were separated into two zones,
binding and specificity, based on spatial orientation to the active site and substrate functional
group (Figure 3.3). Residues with alpha carbons within 5Å of the unchanging core were
considered proximal to the active site. All other residues with alpha carbon distances between 5-
146
12Å distances were considered distal to the active site. We selected 15 proximal mutations from
each zone that impacted the shape of the active site, 13 of which featured favorable shell energy
in the binding zone. Four favorable low energy proximal mutations within the specificity zone
were selected. Additionally, due to spatial proximity to the cleavable R group we selected 2
unfavorable mutations at position 310 in the specificity zone. We selected 10 mutations
classified as distal to the active site. Distal mutations were generally restricted to subtle steric
size changes, such as the addition or subtraction of a methyl group (Ile → Val) or element
replacement (Glu → Gln and Ser → Cys). We classified the selected mutations based on steric
size, distance from the active site, and change in net charge. All selected mutations, energies, and
classifications can be found in Table 3.2.
We produced 703 computational mutants for each Open and Closed crystal conformation by
sampling all possible amino acid identities at 37 positions. Three criterion were used to select
computational mutants for further experimental studies: Rosetta residue energy, the difference in
total design shell energy between the wild-type and mutant, and available space for substrate
binding. Initially, we performed the mutagenesis screening with the Open conformation only to
identify mutations predicted to cause deleterious effects on stability, then we further evaluated
the mutations in order to predict their effect on the catalytic efficiency with the Closed
conformation. Of those 703 mutants, 131 were calculated to favorably impact the Rosetta energy
of the entire design shell, compared to the Open conformation. Inspection of the beneficial
mutants allowed us to identify two major zones, specificity and binding. From the binding zone,
residue V187 featured 7 mutants with favorable shell energy, all of which added steric bulk to
the pocket. Residues 65 and 160 featured 5 mutants that removed steric bulk and 1 mutant that
added steric bulk, all with favorable shell energy. The specificity zone contained zero proximal
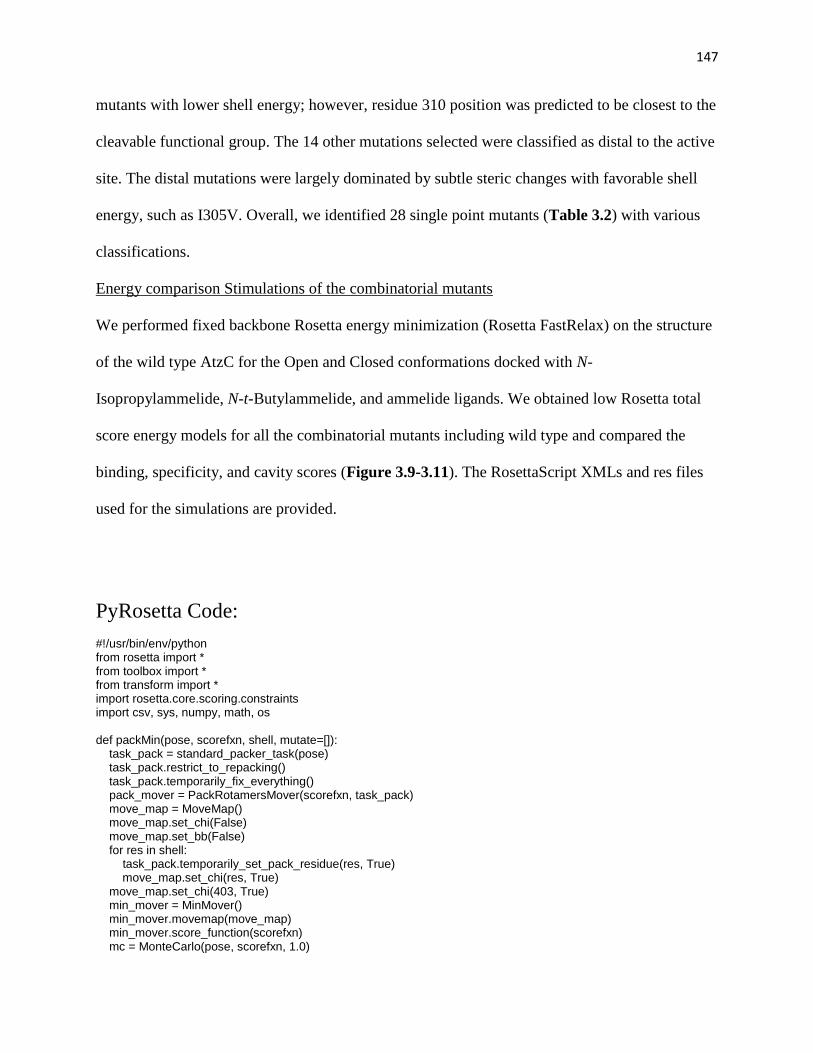
147
mutants with lower shell energy; however, residue 310 position was predicted to be closest to the
cleavable functional group. The 14 other mutations selected were classified as distal to the active
site. The distal mutations were largely dominated by subtle steric changes with favorable shell
energy, such as I305V. Overall, we identified 28 single point mutants (Table 3.2) with various
classifications.
Energy comparison Stimulations of the combinatorial mutants
We performed fixed backbone Rosetta energy minimization (Rosetta FastRelax) on the structure
of the wild type AtzC for the Open and Closed conformations docked with N-
Isopropylammelide, N-t-Butylammelide, and ammelide ligands. We obtained low Rosetta total
score energy models for all the combinatorial mutants including wild type and compared the
binding, specificity, and cavity scores (Figure 3.9-3.11). The RosettaScript XMLs and res files
used for the simulations are provided.
PyRosetta Code: #!/usr/bin/env/python from rosetta import * from toolbox import * from transform import * import rosetta.core.scoring.constraints import csv, sys, numpy, math, os def packMin(pose, scorefxn, shell, mutate=[]): task_pack = standard_packer_task(pose) task_pack.restrict_to_repacking() task_pack.temporarily_fix_everything() pack_mover = PackRotamersMover(scorefxn, task_pack) move_map = MoveMap() move_map.set_chi(False) move_map.set_bb(False) for res in shell: task_pack.temporarily_set_pack_residue(res, True) move_map.set_chi(res, True) move_map.set_chi(403, True) min_mover = MinMover() min_mover.movemap(move_map) min_mover.score_function(scorefxn) mc = MonteCarlo(pose, scorefxn, 1.0)
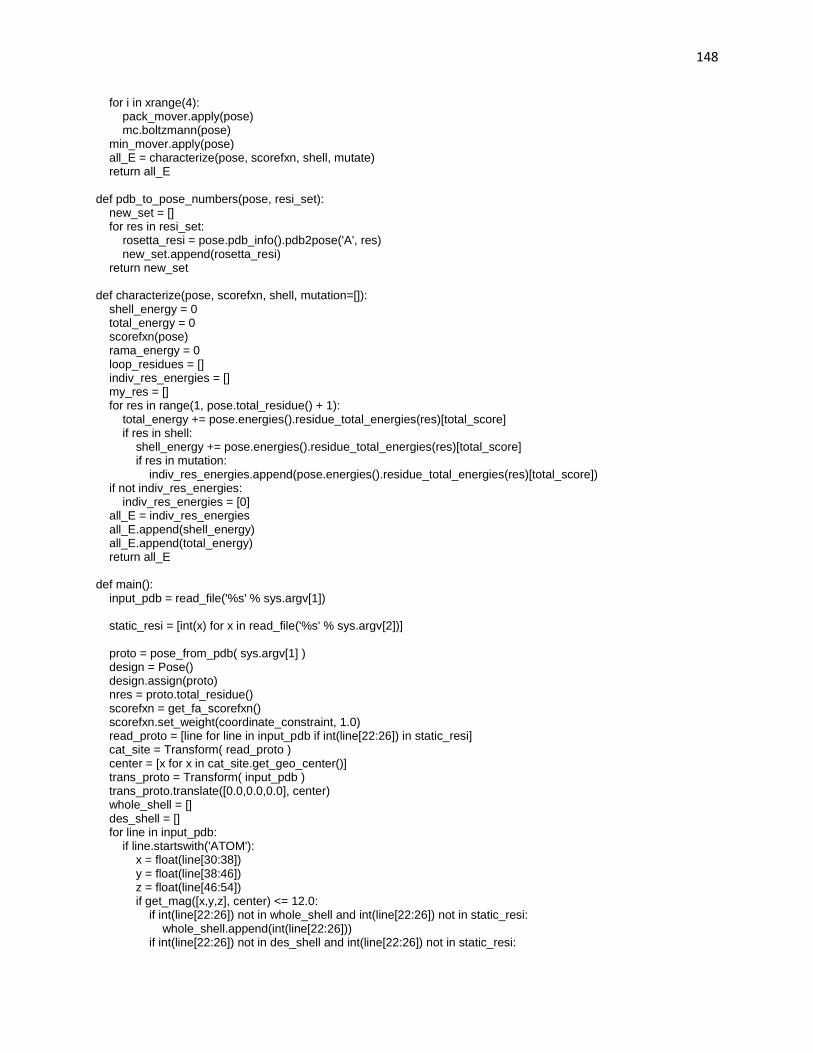
148
for i in xrange(4): pack_mover.apply(pose) mc.boltzmann(pose) min_mover.apply(pose) all_E = characterize(pose, scorefxn, shell, mutate) return all_E def pdb_to_pose_numbers(pose, resi_set): new_set = [] for res in resi_set: rosetta_resi = pose.pdb_info().pdb2pose('A', res) new_set.append(rosetta_resi) return new_set def characterize(pose, scorefxn, shell, mutation=[]): shell_energy = 0 total_energy = 0 scorefxn(pose) rama_energy = 0 loop_residues = [] indiv_res_energies = [] my_res = [] for res in range(1, pose.total_residue() + 1): total_energy += pose.energies().residue_total_energies(res)[total_score] if res in shell: shell_energy += pose.energies().residue_total_energies(res)[total_score] if res in mutation: indiv_res_energies.append(pose.energies().residue_total_energies(res)[total_score]) if not indiv_res_energies: indiv_res_energies = [0] all_E = indiv_res_energies all_E.append(shell_energy) all_E.append(total_energy) return all_E def main(): input_pdb = read_file('%s' % sys.argv[1]) static_resi = [int(x) for x in read_file('%s' % sys.argv[2])] proto = pose_from_pdb( sys.argv[1] ) design = Pose() design.assign(proto) nres = proto.total_residue() scorefxn = get_fa_scorefxn() scorefxn.set_weight(coordinate_constraint, 1.0) read_proto = [line for line in input_pdb if int(line[22:26]) in static_resi] cat_site = Transform( read_proto ) center = [x for x in cat_site.get_geo_center()] trans_proto = Transform( input_pdb ) trans_proto.translate([0.0,0.0,0.0], center) whole_shell = [] des_shell = [] for line in input_pdb: if line.startswith('ATOM'): x = float(line[30:38]) y = float(line[38:46]) z = float(line[46:54]) if get_mag([x,y,z], center) <= 12.0: if int(line[22:26]) not in whole_shell and int(line[22:26]) not in static_resi: whole_shell.append(int(line[22:26])) if int(line[22:26]) not in des_shell and int(line[22:26]) not in static_resi:
149
if line[13:15] == 'CA': des_shell.append(int(line[22:26])) wholeP_shell = pdb_to_pose_numbers(proto, whole_shell) desP_shell = pdb_to_pose_numbers(proto, des_shell) proto_to_score = Pose() proto_to_score.assign(proto) proto_scores = packMin(proto_to_score, scorefxn, wholeP_shell) test = Pose() test.assign(proto) canonicals = ['A','R','N','D','C','Q','E','G','H','I','L','K','M','F','P','S','T','W','Y','V'] out_lines = [['Mutation', 'E-res', 'del-E-shell', 'del-E-whole']] for ind, res in enumerate(desP_shell): for restype in canonicals: test = mutate_residue(test, res, restype) test_scores = packMin(test, scorefxn, wholeP_shell, [res]) print "\n\n\nResidue %s was changed to %s and the score is: %s\n\n\n" % (res, restype, test_scores[1]) mute = '%s%s' % (des_shell[ind], restype) out_lines.append([ mute, test_scores[0], \ test_scores[1] - proto_scores[1], \ test_scores[2] - proto_scores[2] ]) if test_scores[0] < 10.0: test.dump_pdb('./AtzC_holo_%s.pdb' % mute) test.assign(proto) with open('AtzC_output.csv', 'w') as csvfile: writer = csv.writer(csvfile) for line in out_lines: writer.writerow( line ) if __name__ == "__main__": rosetta.init( extra_options='-ignore_zero_occupancy -extra_res_fa "LG.params"') main()
3.4 Results
3.4 In silico saturation mutagenesis yields 28 single substitutions for specificity modulation
Inspection of the predicted stabilizing mutants allowed us to identify two major zones, specificity
and binding (Figure 3.1.D). From the binding zone, residue V187 featured 7 substitutions with
favorable shell energy, all of which added steric bulk to the pocket. Residues 65 and 160 featured
5 substitutions that removed steric bulk and 1 substitution that added steric bulk, all with a
favorable design-shell energy. The specificity zone contained zero proximal mutants with lower
150
design-shell energy; however, residue 310 position was predicted to be closest to the leaving t-
butyl group. The 14 other mutations selected were classified as distal to the active site. The distal
mutations were largely dominated by subtle steric changes with favorable shell energy, such as
I305V. Overall, we identified 28 single point mutants (Table 3.2) and classified them based on
their predicted effect on the shape of the binding cavity, as well as stability.
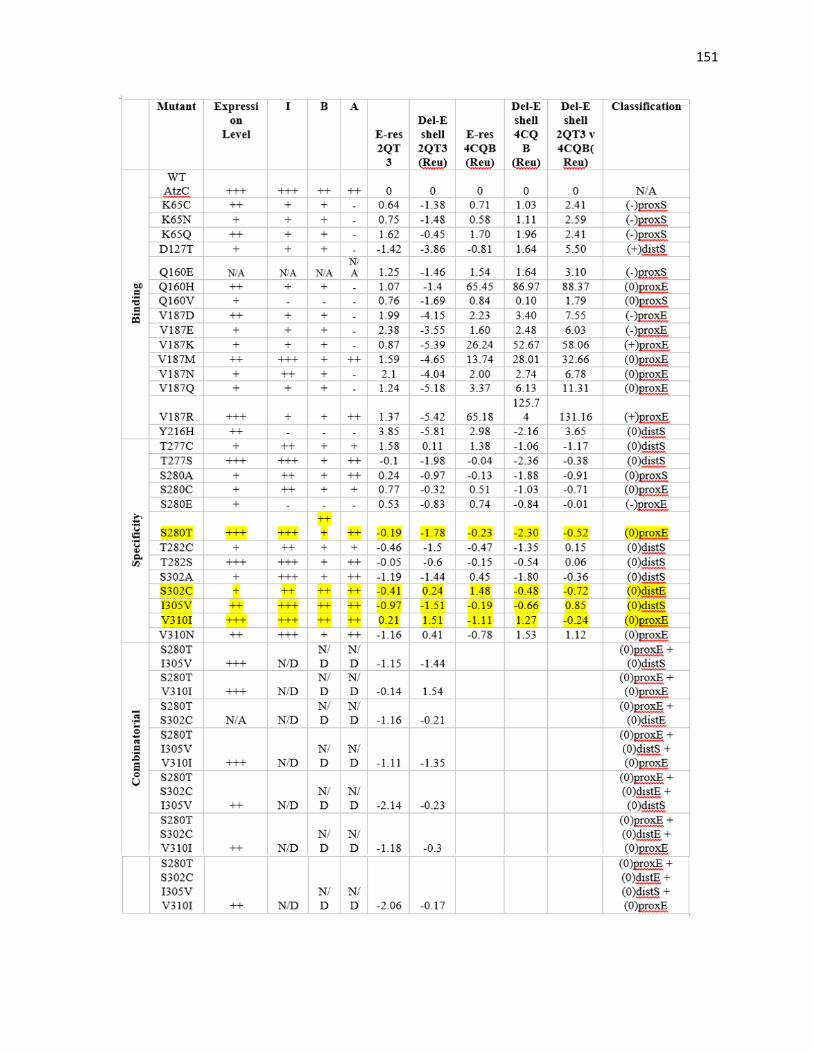
151
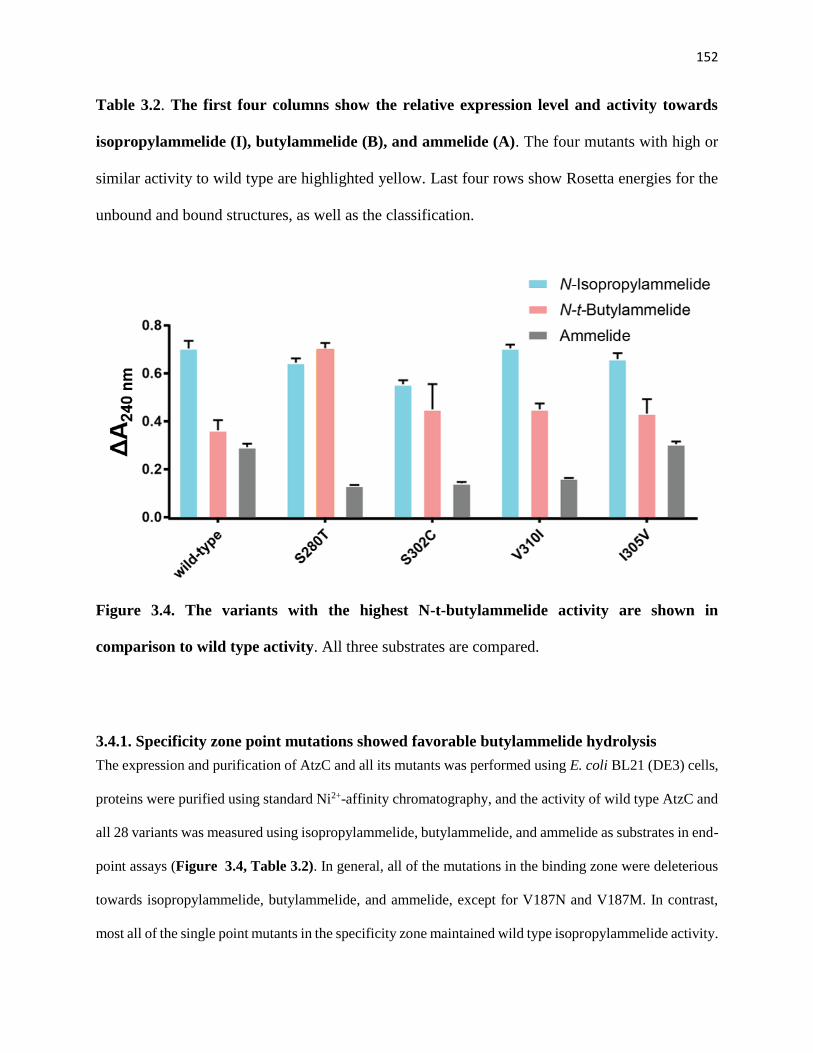
152
Table 3.2. The first four columns show the relative expression level and activity towards
isopropylammelide (I), butylammelide (B), and ammelide (A). The four mutants with high or
similar activity to wild type are highlighted yellow. Last four rows show Rosetta energies for the
unbound and bound structures, as well as the classification.
Figure 3.4. The variants with the highest N-t-butylammelide activity are shown in
comparison to wild type activity. All three substrates are compared.
3.4.1. Specificity zone point mutations showed favorable butylammelide hydrolysis
The expression and purification of AtzC and all its mutants was performed using E. coli BL21 (DE3) cells,
proteins were purified using standard Ni2+-affinity chromatography, and the activity of wild type AtzC and
all 28 variants was measured using isopropylammelide, butylammelide, and ammelide as substrates in end-
point assays (Figure 3.4, Table 3.2). In general, all of the mutations in the binding zone were deleterious
towards isopropylammelide, butylammelide, and ammelide, except for V187N and V187M. In contrast,
most all of the single point mutants in the specificity zone maintained wild type isopropylammelide activity.
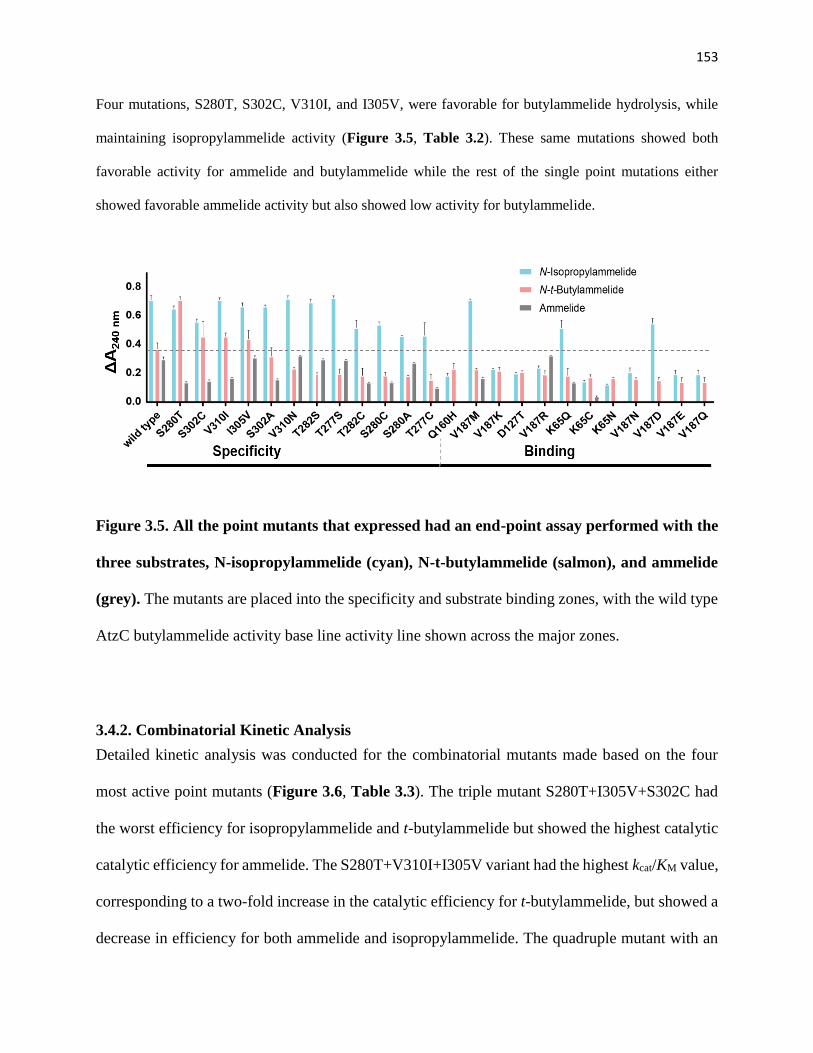
153
Four mutations, S280T, S302C, V310I, and I305V, were favorable for butylammelide hydrolysis, while
maintaining isopropylammelide activity (Figure 3.5, Table 3.2). These same mutations showed both
favorable activity for ammelide and butylammelide while the rest of the single point mutations either
showed favorable ammelide activity but also showed low activity for butylammelide.
Figure 3.5. All the point mutants that expressed had an end-point assay performed with the
three substrates, N-isopropylammelide (cyan), N-t-butylammelide (salmon), and ammelide
(grey). The mutants are placed into the specificity and substrate binding zones, with the wild type
AtzC butylammelide activity base line activity line shown across the major zones.
3.4.2. Combinatorial Kinetic Analysis
Detailed kinetic analysis was conducted for the combinatorial mutants made based on the four
most active point mutants (Figure 3.6, Table 3.3). The triple mutant S280T+I305V+S302C had
the worst efficiency for isopropylammelide and t-butylammelide but showed the highest catalytic
catalytic efficiency for ammelide. The S280T+V310I+I305V variant had the highest kcat/KM value,
corresponding to a two-fold increase in the catalytic efficiency for t-butylammelide, but showed a
decrease in efficiency for both ammelide and isopropylammelide. The quadruple mutant with an
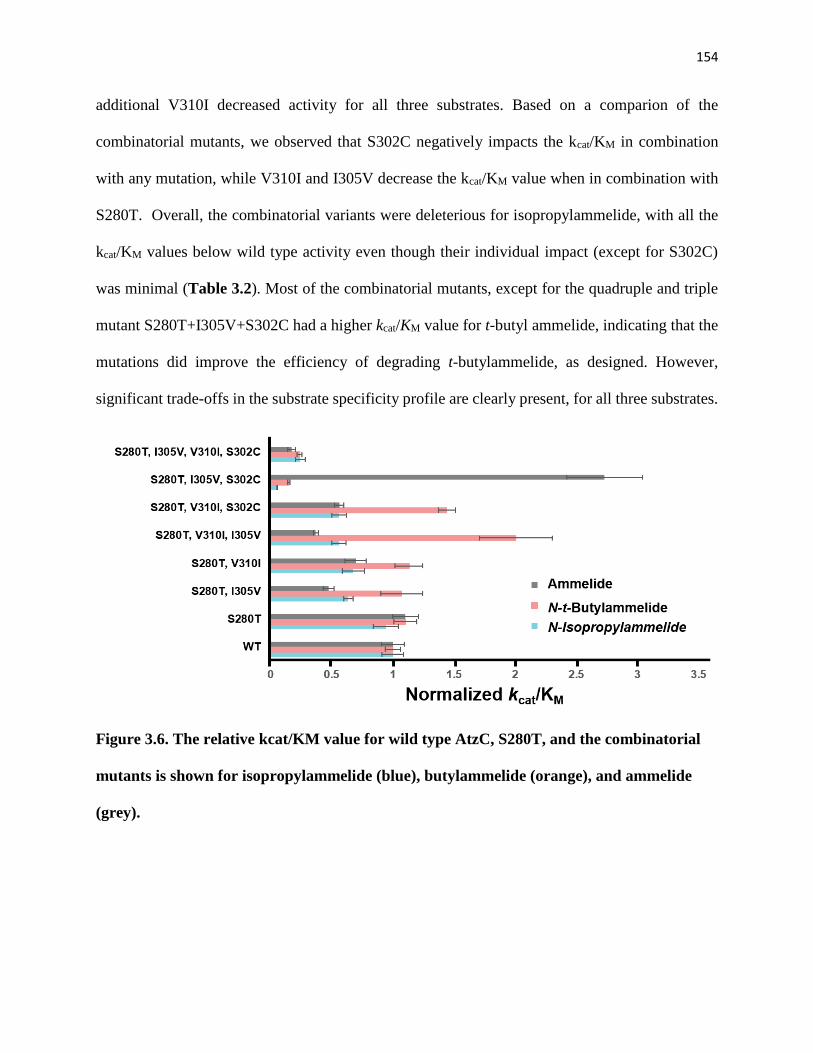
154
additional V310I decreased activity for all three substrates. Based on a comparion of the
combinatorial mutants, we observed that S302C negatively impacts the kcat/KM in combination
with any mutation, while V310I and I305V decrease the kcat/KM value when in combination with
S280T. Overall, the combinatorial variants were deleterious for isopropylammelide, with all the
kcat/KM values below wild type activity even though their individual impact (except for S302C)
was minimal (Table 3.2). Most of the combinatorial mutants, except for the quadruple and triple
mutant S280T+I305V+S302C had a higher kcat/KM value for t-butyl ammelide, indicating that the
mutations did improve the efficiency of degrading t-butylammelide, as designed. However,
significant trade-offs in the substrate specificity profile are clearly present, for all three substrates.
Figure 3.6. The relative kcat/KM value for wild type AtzC, S280T, and the combinatorial
mutants is shown for isopropylammelide (blue), butylammelide (orange), and ammelide
(grey).
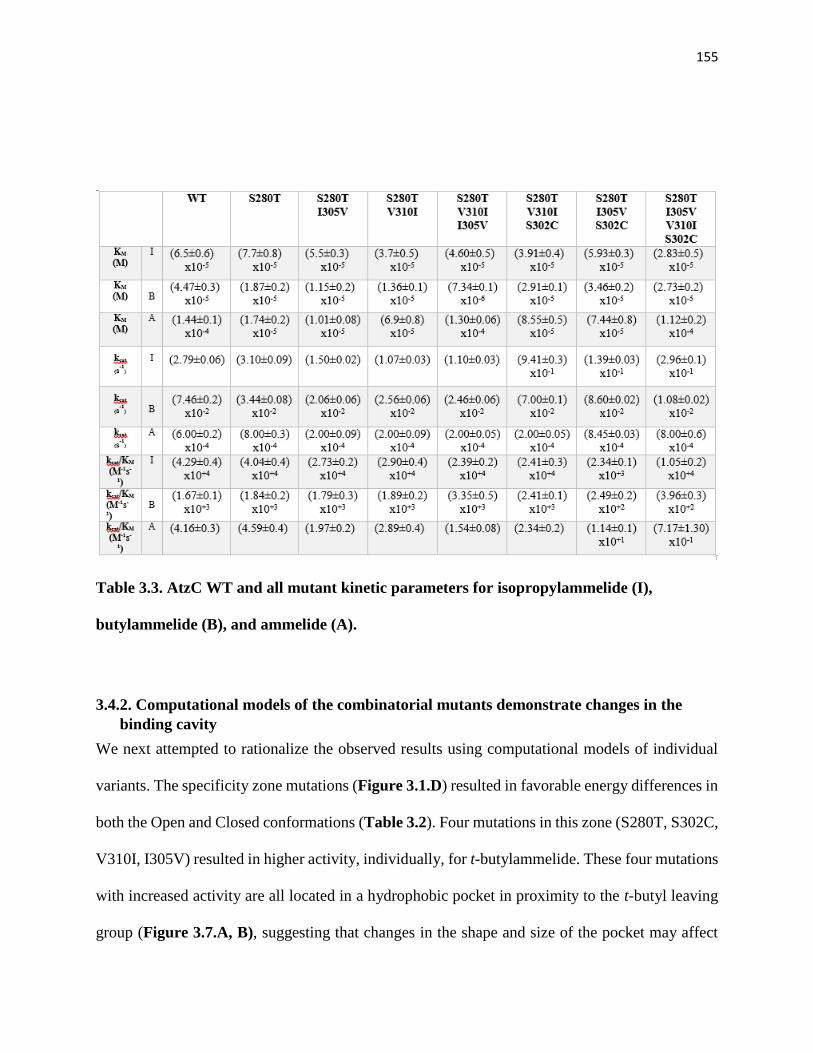
155
Table 3.3. AtzC WT and all mutant kinetic parameters for isopropylammelide (I),
butylammelide (B), and ammelide (A).
3.4.2. Computational models of the combinatorial mutants demonstrate changes in the
binding cavity
We next attempted to rationalize the observed results using computational models of individual
variants. The specificity zone mutations (Figure 3.1.D) resulted in favorable energy differences in
both the Open and Closed conformations (Table 3.2). Four mutations in this zone (S280T, S302C,
V310I, I305V) resulted in higher activity, individually, for t-butylammelide. These four mutations
with increased activity are all located in a hydrophobic pocket in proximity to the t-butyl leaving
group (Figure 3.7.A, B), suggesting that changes in the shape and size of the pocket may affect
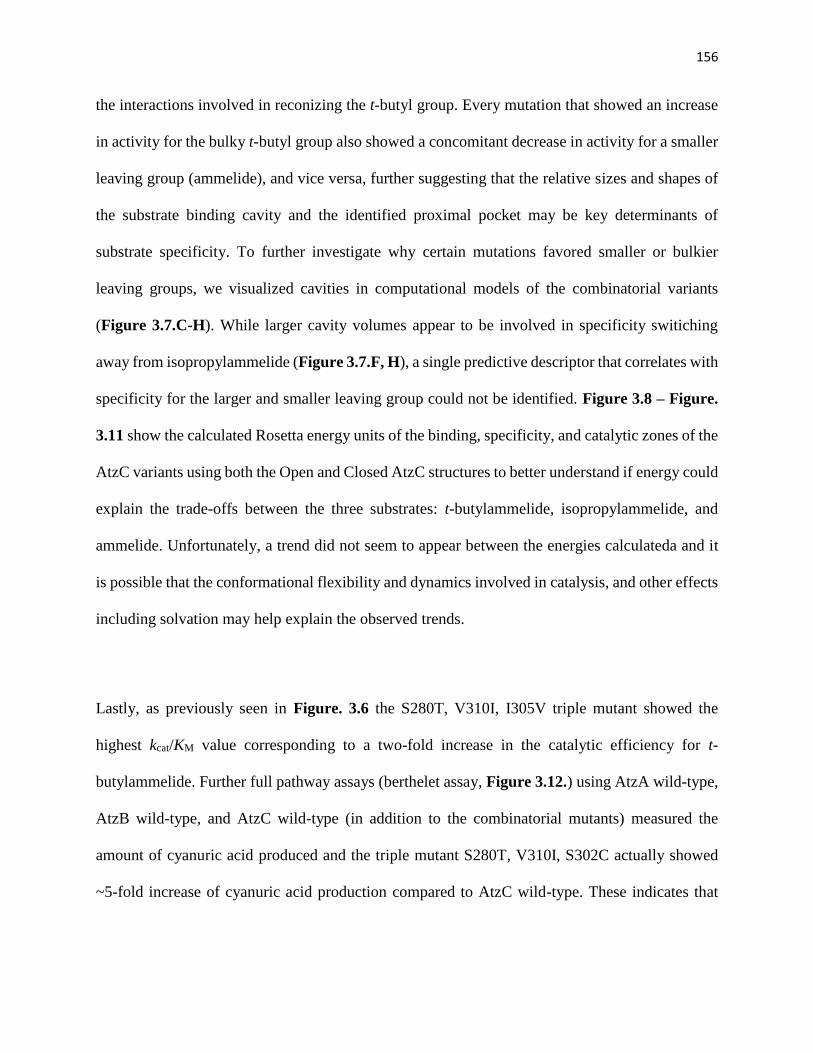
156
the interactions involved in reconizing the t-butyl group. Every mutation that showed an increase
in activity for the bulky t-butyl group also showed a concomitant decrease in activity for a smaller
leaving group (ammelide), and vice versa, further suggesting that the relative sizes and shapes of
the substrate binding cavity and the identified proximal pocket may be key determinants of
substrate specificity. To further investigate why certain mutations favored smaller or bulkier
leaving groups, we visualized cavities in computational models of the combinatorial variants
(Figure 3.7.C-H). While larger cavity volumes appear to be involved in specificity switiching
away from isopropylammelide (Figure 3.7.F, H), a single predictive descriptor that correlates with
specificity for the larger and smaller leaving group could not be identified. Figure 3.8 – Figure.
3.11 show the calculated Rosetta energy units of the binding, specificity, and catalytic zones of the
AtzC variants using both the Open and Closed AtzC structures to better understand if energy could
explain the trade-offs between the three substrates: t-butylammelide, isopropylammelide, and
ammelide. Unfortunately, a trend did not seem to appear between the energies calculateda and it
is possible that the conformational flexibility and dynamics involved in catalysis, and other effects
including solvation may help explain the observed trends.
Lastly, as previously seen in Figure. 3.6 the S280T, V310I, I305V triple mutant showed the
highest kcat/KM value corresponding to a two-fold increase in the catalytic efficiency for t-
butylammelide. Further full pathway assays (berthelet assay, Figure 3.12.) using AtzA wild-type,
AtzB wild-type, and AtzC wild-type (in addition to the combinatorial mutants) measured the
amount of cyanuric acid produced and the triple mutant S280T, V310I, S302C actually showed
~5-fold increase of cyanuric acid production compared to AtzC wild-type. These indicates that
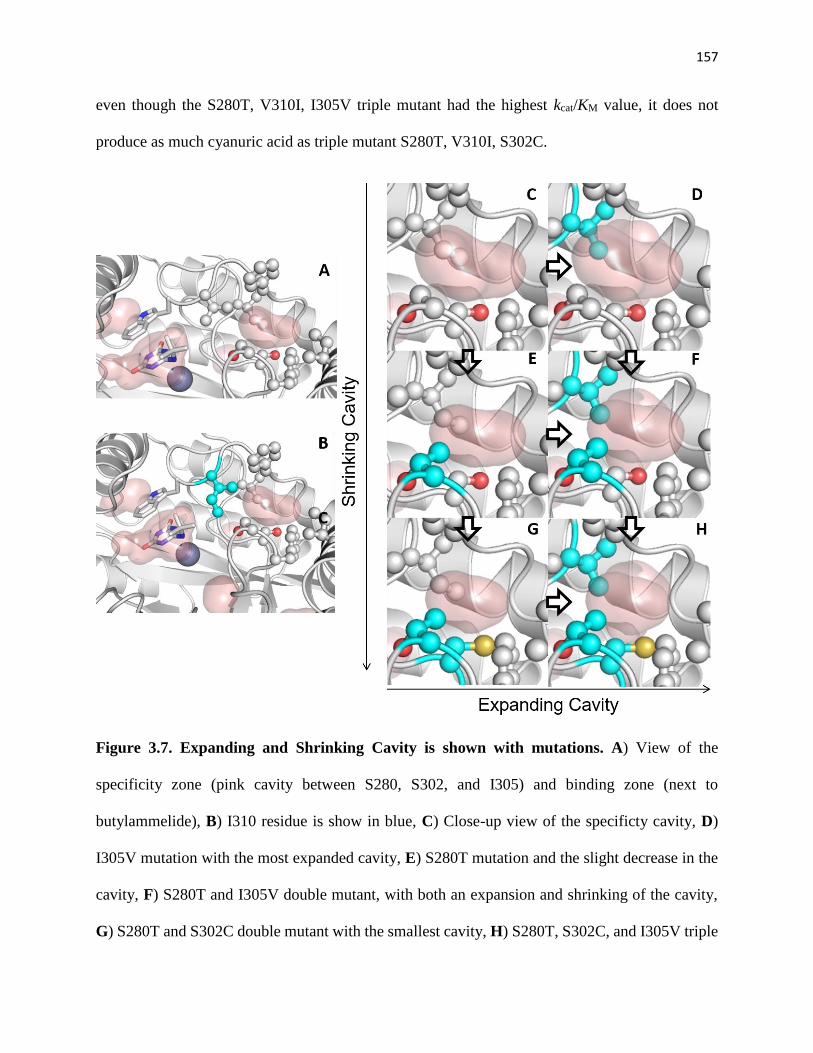
157
even though the S280T, V310I, I305V triple mutant had the highest kcat/KM value, it does not
produce as much cyanuric acid as triple mutant S280T, V310I, S302C.
Figure 3.7. Expanding and Shrinking Cavity is shown with mutations. A) View of the
specificity zone (pink cavity between S280, S302, and I305) and binding zone (next to
butylammelide), B) I310 residue is show in blue, C) Close-up view of the specificty cavity, D)
I305V mutation with the most expanded cavity, E) S280T mutation and the slight decrease in the
cavity, F) S280T and I305V double mutant, with both an expansion and shrinking of the cavity,
G) S280T and S302C double mutant with the smallest cavity, H) S280T, S302C, and I305V triple
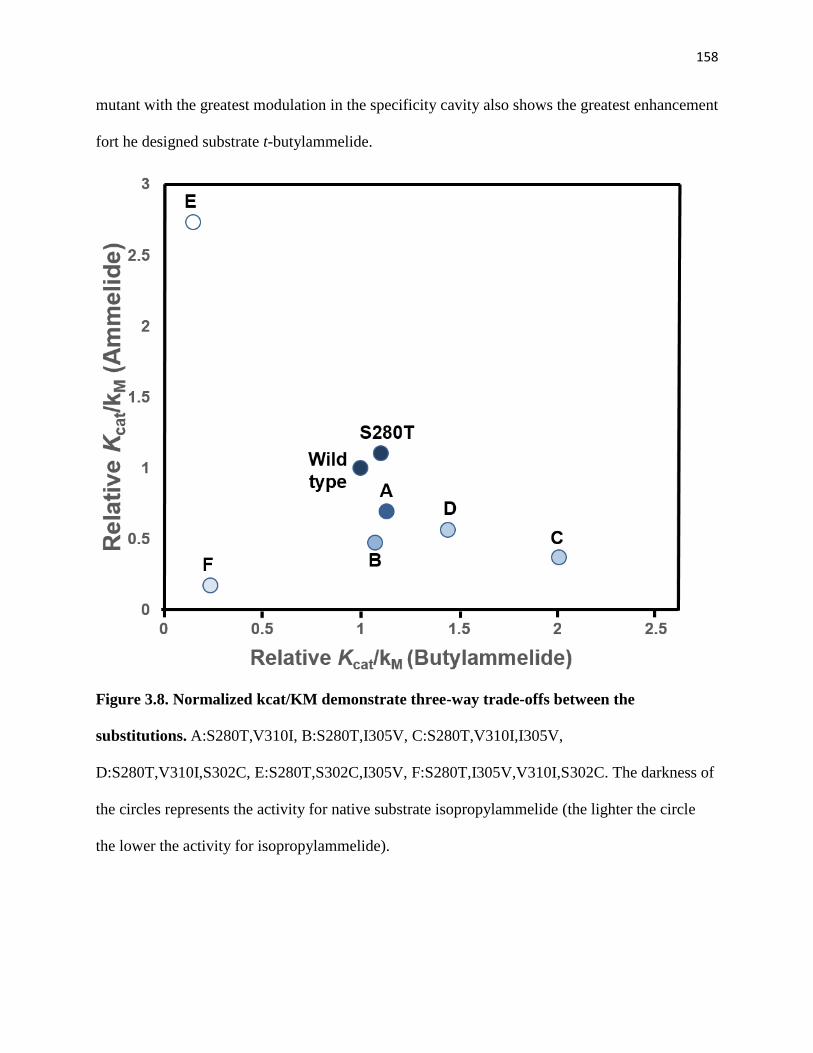
158
mutant with the greatest modulation in the specificity cavity also shows the greatest enhancement
fort he designed substrate t-butylammelide.
Figure 3.8. Normalized kcat/KM demonstrate three-way trade-offs between the
substitutions. A:S280T,V310I, B:S280T,I305V, C:S280T,V310I,I305V,
D:S280T,V310I,S302C, E:S280T,S302C,I305V, F:S280T,I305V,V310I,S302C. The darkness of
the circles represents the activity for native substrate isopropylammelide (the lighter the circle
the lower the activity for isopropylammelide).
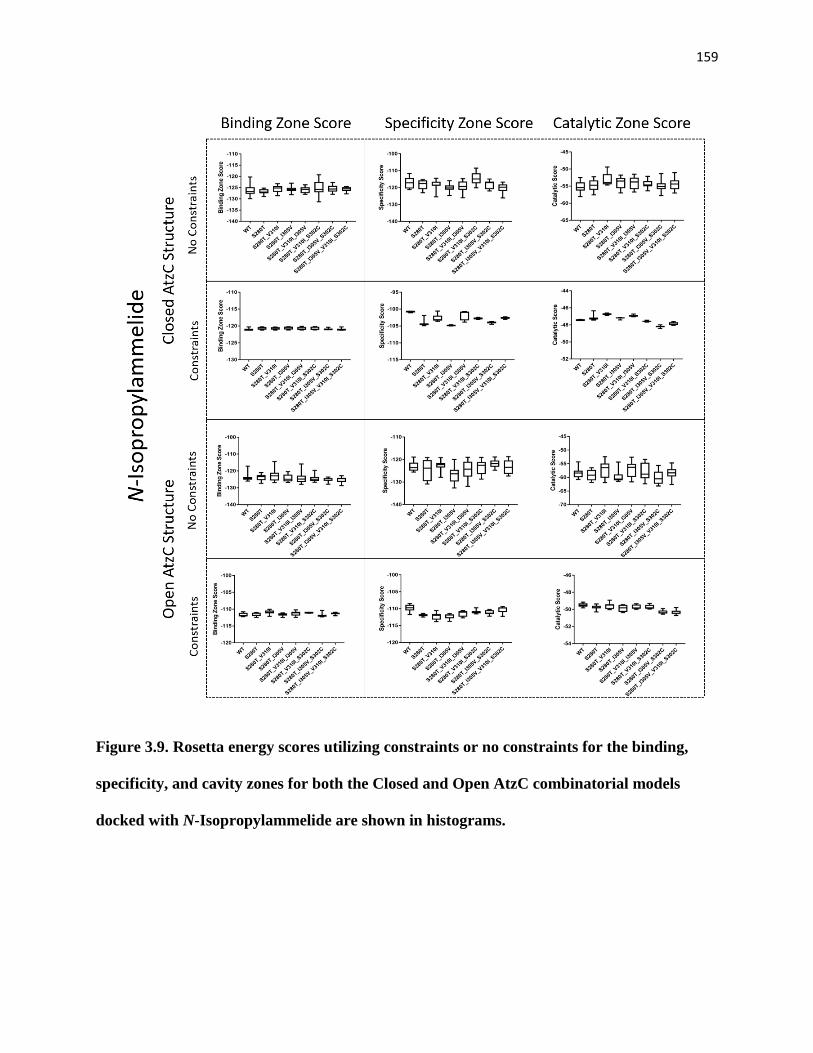
159
Figure 3.9. Rosetta energy scores utilizing constraints or no constraints for the binding,
specificity, and cavity zones for both the Closed and Open AtzC combinatorial models
docked with N-Isopropylammelide are shown in histograms.
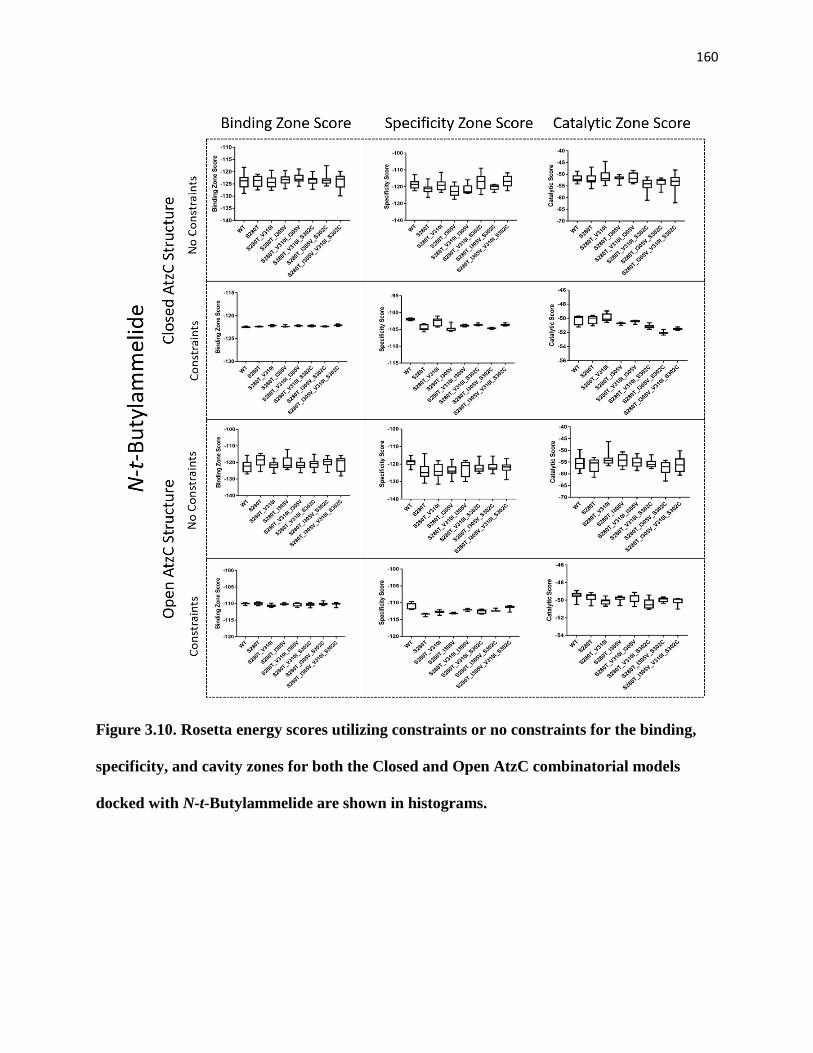
160
Figure 3.10. Rosetta energy scores utilizing constraints or no constraints for the binding,
specificity, and cavity zones for both the Closed and Open AtzC combinatorial models
docked with N-t-Butylammelide are shown in histograms.
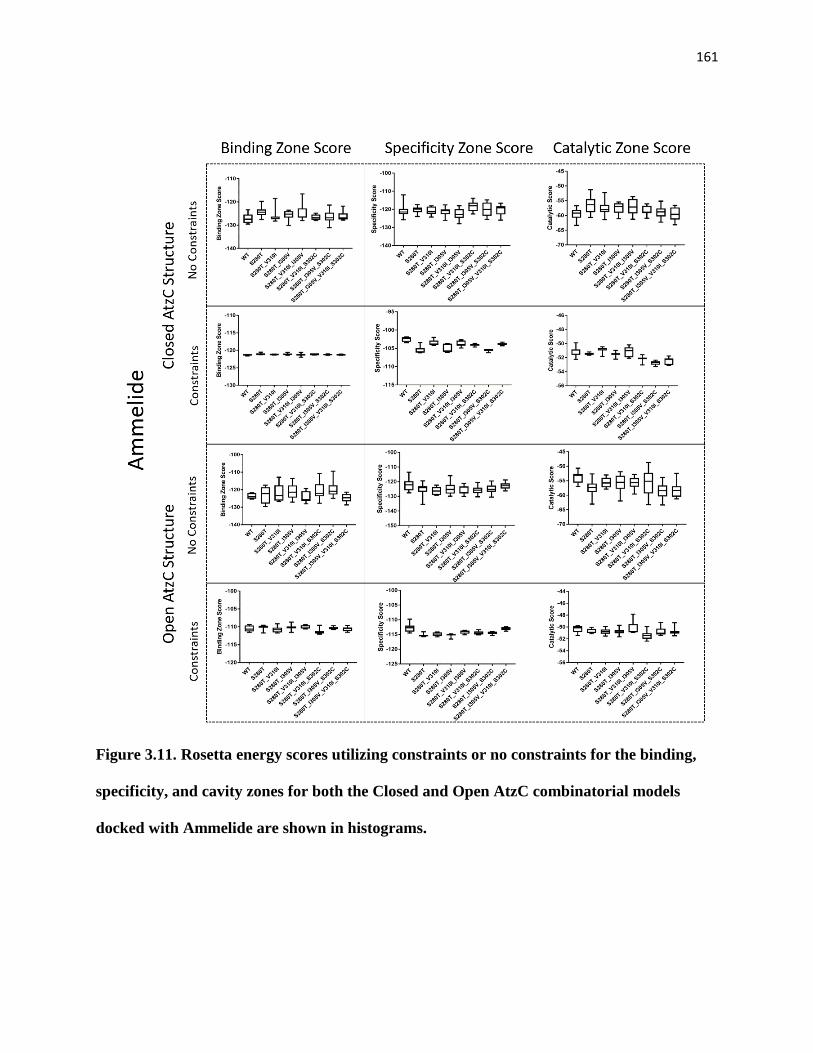
161
Figure 3.11. Rosetta energy scores utilizing constraints or no constraints for the binding,
specificity, and cavity zones for both the Closed and Open AtzC combinatorial models
docked with Ammelide are shown in histograms.
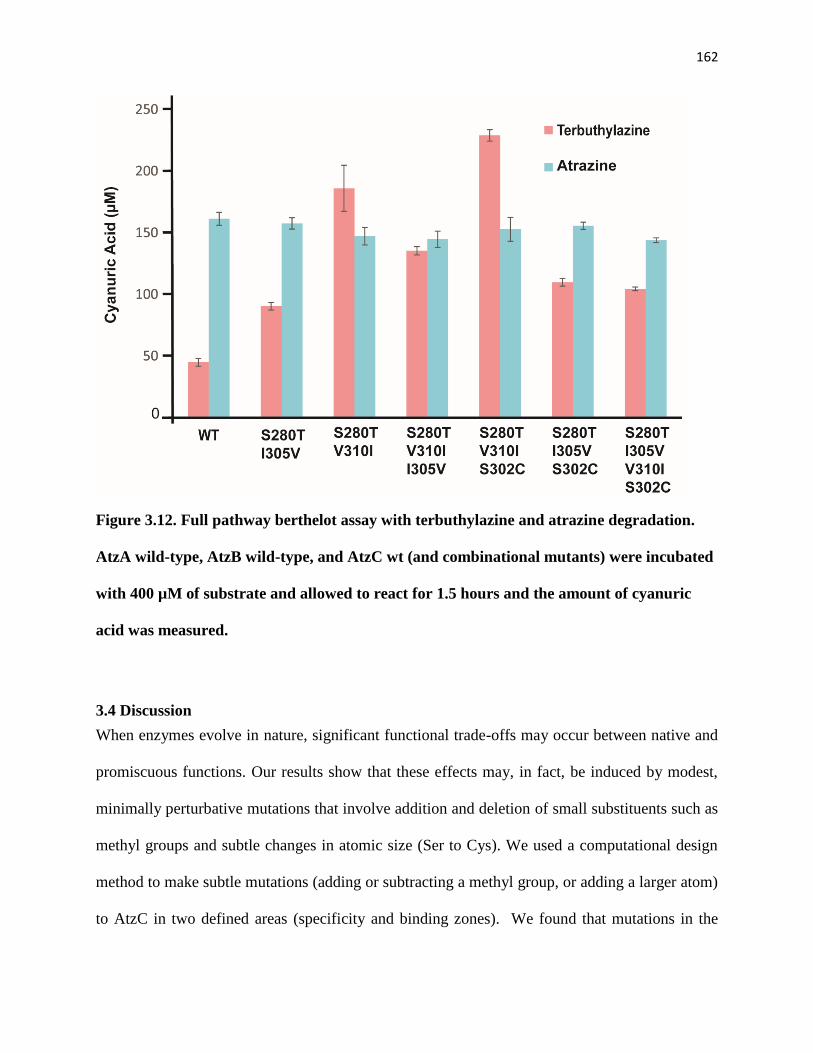
162
Figure 3.12. Full pathway berthelot assay with terbuthylazine and atrazine degradation.
AtzA wild-type, AtzB wild-type, and AtzC wt (and combinational mutants) were incubated
with 400 µM of substrate and allowed to react for 1.5 hours and the amount of cyanuric
acid was measured.
3.4 Discussion
When enzymes evolve in nature, significant functional trade-offs may occur between native and
promiscuous functions. Our results show that these effects may, in fact, be induced by modest,
minimally perturbative mutations that involve addition and deletion of small substituents such as
methyl groups and subtle changes in atomic size (Ser to Cys). We used a computational design
method to make subtle mutations (adding or subtracting a methyl group, or adding a larger atom)
to AtzC in two defined areas (specificity and binding zones). We found that mutations in the
163
specificity zone generally resulted in variants that had increased catalytic efficiency for two
substrates, butylammelide (bulkier R group) and ammelide (smaller R group), while only
moderately impacting the catalytic efficiency for the natural substrate, isopropylammelide. As
such, we have been able to design variants of AtzC with a broadened s-triazine substrate spectrum.
In summary, five different combinatorial variants showed higher kcat/KM values for t-
butylammelide compared to wild type AtzC, with the S280T, V310I, I305V mutant showing a 2-
fold increase in activity and a 4-fold increase in cyanuric acid production. While triple mutant
S280T, V310I, S302C showed a 5-fold increase in cyanuric acid production. Similarly, the S280T,
I305V, and S302C variant demonstrates a 3-fold increase in activity for ammelide compared to
the wild type. Thus, with small changes involving shuffling of methyl groups and atomic size (Cys,
Ser), we were successful in designing AtzC variants with greater specificity for t-butlammelide
and ammelide. The presented approach of probing with energetically acceptable substitutions in
the first and second shell region, which do not all make direct contacts with the substrate, allows
uncovering these specificity trade-offs (Figure 3.8). The use of the two protein states, Open and
Closed, in the modeling was crucial for the identification of successful mutants, and dramatic
trade-offs between substrates were obtained with seemingly minor changes in second shell
residues. Some of these effects could be explained by the packing interactions around key active
site elements, and further evaluation of enzymatic structure and dynamics may be necessary for a
fuller understanding of the molecular basis of specificity expansion and trade-offs.
164
3.5 References
1. Mandelbaum, R. T., Allan, D. l. & Wackett, L. P. Isolation and Characterization of a
Pseudomonas sp . That Mineralizes the s -Triazine Herbicide Atrazine. Appl. Environ.
Microbiol. 61, 1451–1457 (1995).
2. Sass, J. B. & Colangelo, A. European Union bans atrazine, while the United States
negotiates continued use. Int. J. Occup. Environ. Health 12, 260–267 (2006).
3. Fuhrmann, A., Gans, O., Weiss, S., Haberhauer, G. & Gerzabek, M. H. Determination of
bentazone, chloridazon and terbuthylazine and some of their metabolites in complex
environmental matrices by liquid chromatography-electrospray ionization-tandem mass
spectrometry using a modified QuEChERS method: An optimization and vali. Water. Air.
Soil Pollut. 225, (2014).
4. Jurina, T. et al. Catabolism of terbuthylazine by mixed bacterial culture originating from
s-triazine-contaminated soil. Appl. Microbiol. Biotechnol. 98, 7223–7232 (2014).
5. Kolić, N. U. et al. Combined metabolic activity within an atrazine-mineralizing
community enriched from agrochemical factory soil. Int. Biodeterior. Biodegrad. 60, 299–
307 (2007).
6. Shapir, N., Osborne, J. P., Johnson, G., Sadowsky, M. J. & Wackett, L. P. Purification,
substrate range, and metal center of AtzC: The N-isopropylammelide aminohydrolase
involved in bacterial atrazine metabolism. J. Bacteriol. 184, 5376–5384 (2002).
7. Balotra, S. et al. X-Ray Structure and Mutagenesis Studies of the N-Isopropylammelide
Isopropylaminohydrolase, AtzC. PLoS One 10, e0137700 (2015).
8. Peat, T. S. et al. The structure of the hexameric atrazine chlorohydrolase AtzA research
papers. 710–720 (2015). doi:10.1107/S1399004715000619
9. Frisch, M. J. et al. Gaussian 09, Revision D.01. Gaussian Inc. Wallingford CT (2009).
doi:10.1159/000348293
10. Lee, C., Yang, W. & Parr, R. G. Development of the Colle-Salvetti correlation-energy
formula into a functional of the electron density. Phys. Rev. B 37, 785–789 (1988).
11. Hay, P. J. & Wadt, W. R. Ab initio effective core potentials for molecular calculations.
Potentials for the transition metal atoms Sc to Hg. J. Chem. Phys. 82, 270 (1985).
12. Gibson, D. G. et al. Enzymatic assembly of DNA molecules up to several hundred
kilobases. Nat. Methods 6, 343–5 (2009).

165
13. Kunkel, T. a. Rapid and efficient site-specific mutagenesis without phenotypic selection.
Proc. Natl. Acad. Sci. U. S. A. 82, 488–492 (1985).
14. Kuhlman, B. & Baker, D. Native protein sequences are close to optimal for their
structures. Proc. Natl. Acad. Sci. 97, 10383–10388 (2000).
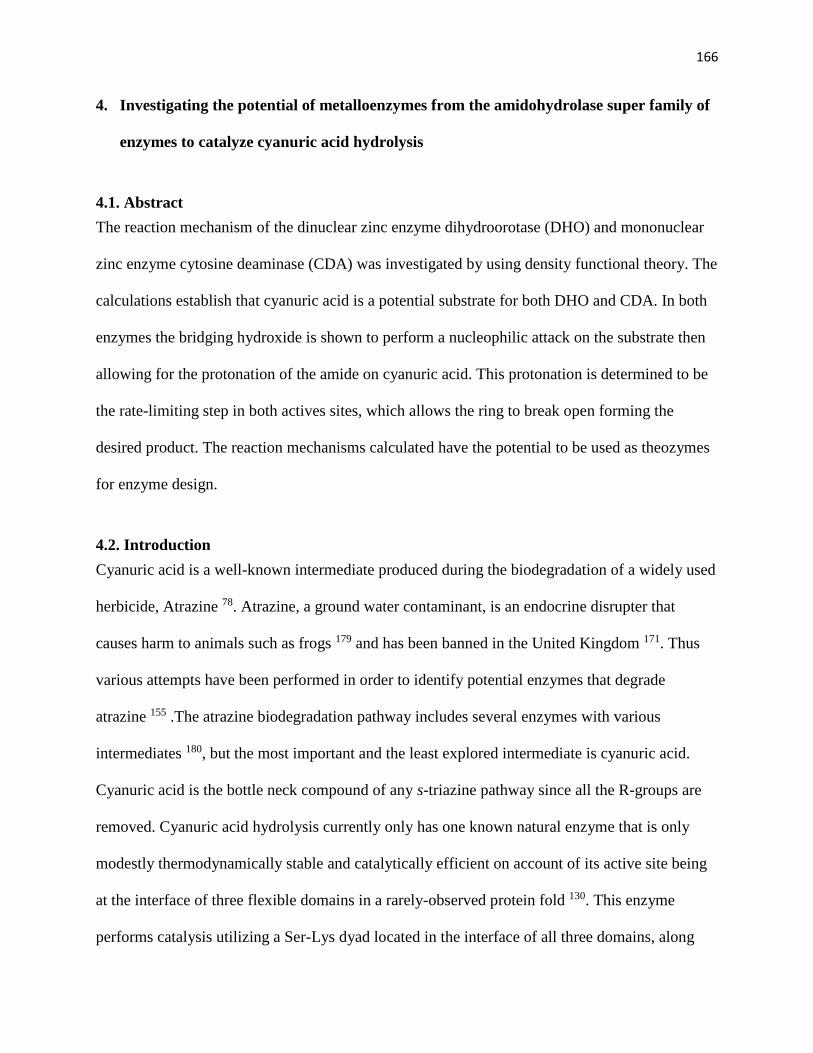
166
4. Investigating the potential of metalloenzymes from the amidohydrolase super family of
enzymes to catalyze cyanuric acid hydrolysis
4.1. Abstract
The reaction mechanism of the dinuclear zinc enzyme dihydroorotase (DHO) and mononuclear
zinc enzyme cytosine deaminase (CDA) was investigated by using density functional theory. The
calculations establish that cyanuric acid is a potential substrate for both DHO and CDA. In both
enzymes the bridging hydroxide is shown to perform a nucleophilic attack on the substrate then
allowing for the protonation of the amide on cyanuric acid. This protonation is determined to be
the rate-limiting step in both actives sites, which allows the ring to break open forming the
desired product. The reaction mechanisms calculated have the potential to be used as theozymes
for enzyme design.
4.2. Introduction
Cyanuric acid is a well-known intermediate produced during the biodegradation of a widely used
herbicide, Atrazine 78. Atrazine, a ground water contaminant, is an endocrine disrupter that
causes harm to animals such as frogs 179 and has been banned in the United Kingdom 171. Thus
various attempts have been performed in order to identify potential enzymes that degrade
atrazine 155 .The atrazine biodegradation pathway includes several enzymes with various
intermediates 180, but the most important and the least explored intermediate is cyanuric acid.
Cyanuric acid is the bottle neck compound of any s-triazine pathway since all the R-groups are
removed. Cyanuric acid hydrolysis currently only has one known natural enzyme that is only
modestly thermodynamically stable and catalytically efficient on account of its active site being
at the interface of three flexible domains in a rarely-observed protein fold 130. This enzyme
performs catalysis utilizing a Ser-Lys dyad located in the interface of all three domains, along
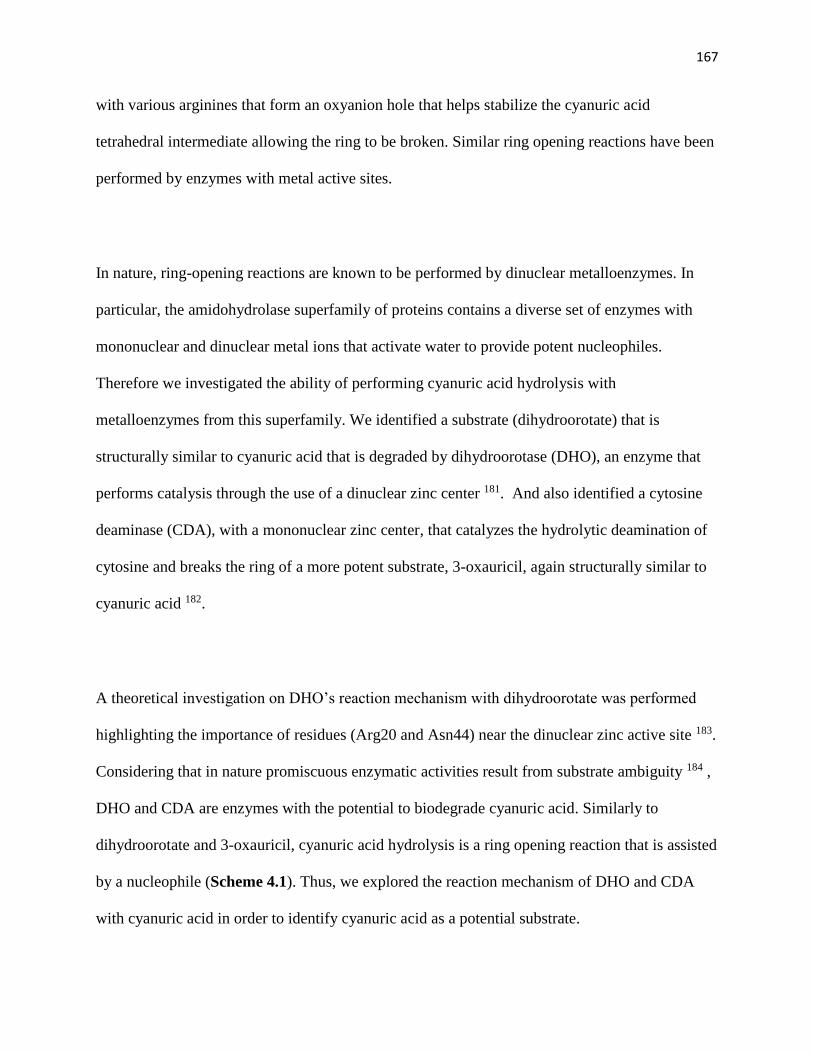
167
with various arginines that form an oxyanion hole that helps stabilize the cyanuric acid
tetrahedral intermediate allowing the ring to be broken. Similar ring opening reactions have been
performed by enzymes with metal active sites.
In nature, ring-opening reactions are known to be performed by dinuclear metalloenzymes. In
particular, the amidohydrolase superfamily of proteins contains a diverse set of enzymes with
mononuclear and dinuclear metal ions that activate water to provide potent nucleophiles.
Therefore we investigated the ability of performing cyanuric acid hydrolysis with
metalloenzymes from this superfamily. We identified a substrate (dihydroorotate) that is
structurally similar to cyanuric acid that is degraded by dihydroorotase (DHO), an enzyme that
performs catalysis through the use of a dinuclear zinc center 181. And also identified a cytosine
deaminase (CDA), with a mononuclear zinc center, that catalyzes the hydrolytic deamination of
cytosine and breaks the ring of a more potent substrate, 3-oxauricil, again structurally similar to
cyanuric acid 182.
A theoretical investigation on DHO’s reaction mechanism with dihydroorotate was performed
highlighting the importance of residues (Arg20 and Asn44) near the dinuclear zinc active site 183.
Considering that in nature promiscuous enzymatic activities result from substrate ambiguity 184 ,
DHO and CDA are enzymes with the potential to biodegrade cyanuric acid. Similarly to
dihydroorotate and 3-oxauricil, cyanuric acid hydrolysis is a ring opening reaction that is assisted
by a nucleophile (Scheme 4.1). Thus, we explored the reaction mechanism of DHO and CDA
with cyanuric acid in order to identify cyanuric acid as a potential substrate.
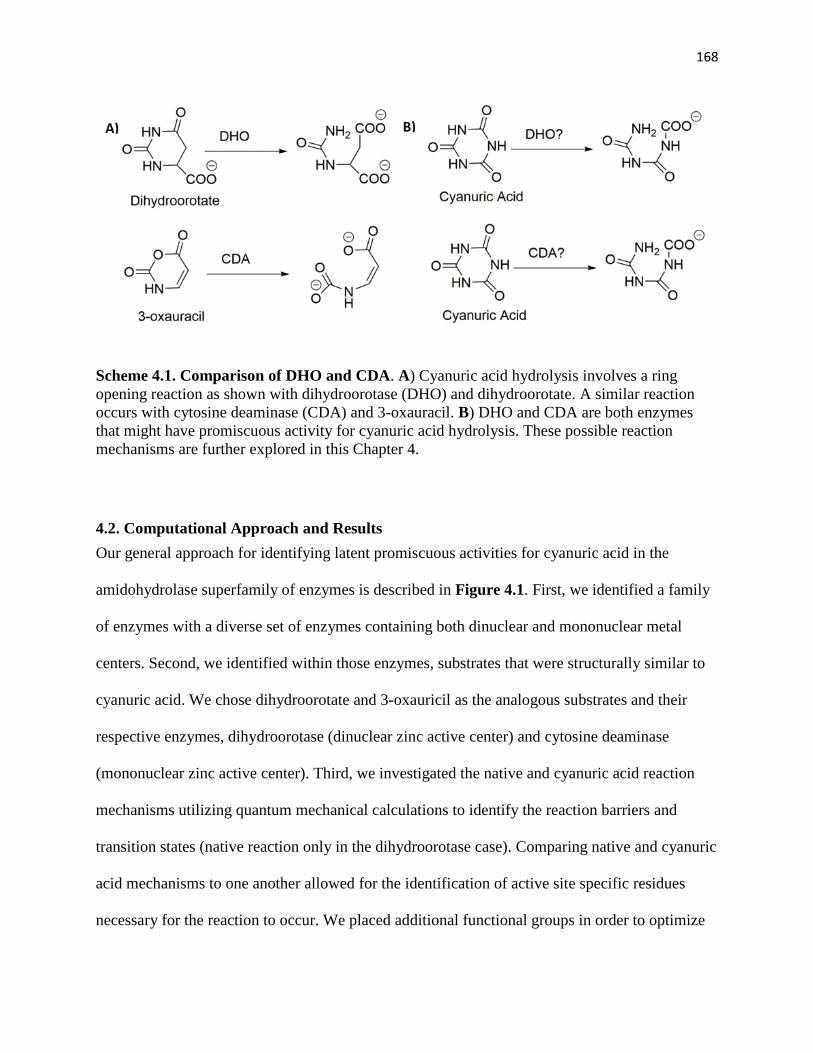
168
Scheme 4.1. Comparison of DHO and CDA. A) Cyanuric acid hydrolysis involves a ring
opening reaction as shown with dihydroorotase (DHO) and dihydroorotate. A similar reaction
occurs with cytosine deaminase (CDA) and 3-oxauracil. B) DHO and CDA are both enzymes
that might have promiscuous activity for cyanuric acid hydrolysis. These possible reaction
mechanisms are further explored in this Chapter 4.
4.2. Computational Approach and Results
Our general approach for identifying latent promiscuous activities for cyanuric acid in the
amidohydrolase superfamily of enzymes is described in Figure 4.1. First, we identified a family
of enzymes with a diverse set of enzymes containing both dinuclear and mononuclear metal
centers. Second, we identified within those enzymes, substrates that were structurally similar to
cyanuric acid. We chose dihydroorotate and 3-oxauricil as the analogous substrates and their
respective enzymes, dihydroorotase (dinuclear zinc active center) and cytosine deaminase
(mononuclear zinc active center). Third, we investigated the native and cyanuric acid reaction
mechanisms utilizing quantum mechanical calculations to identify the reaction barriers and
transition states (native reaction only in the dihydroorotase case). Comparing native and cyanuric
acid mechanisms to one another allowed for the identification of active site specific residues
necessary for the reaction to occur. We placed additional functional groups in order to optimize
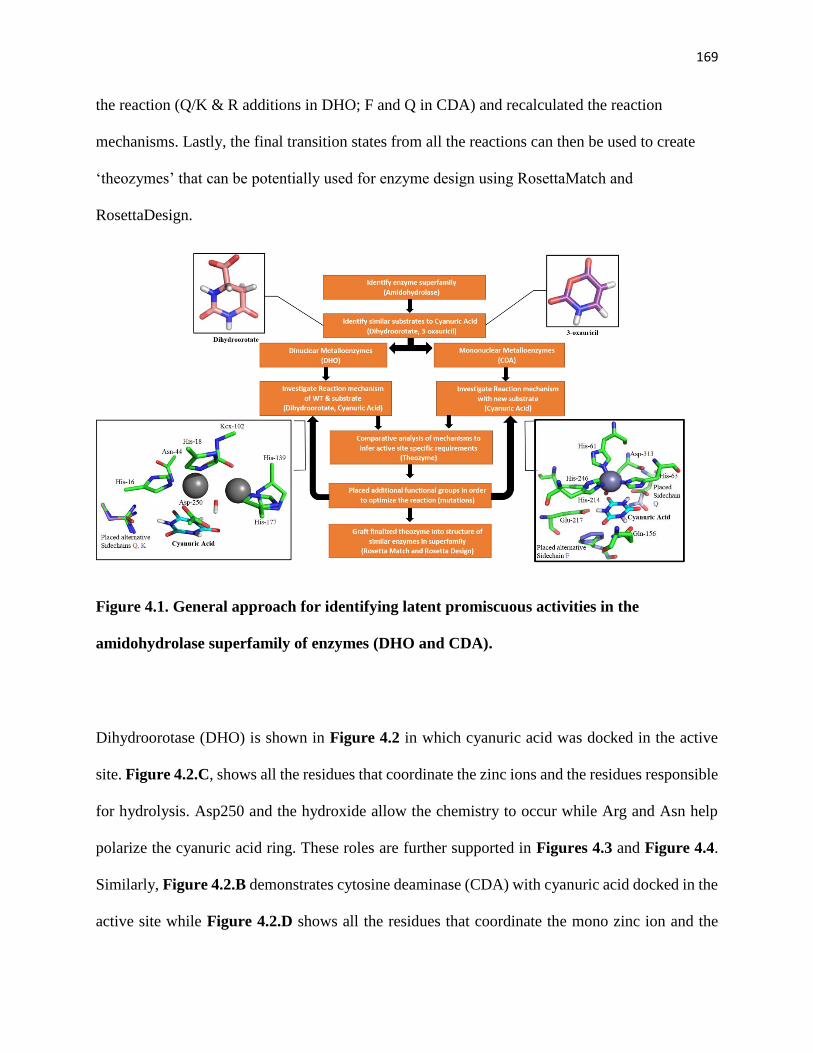
169
the reaction (Q/K & R additions in DHO; F and Q in CDA) and recalculated the reaction
mechanisms. Lastly, the final transition states from all the reactions can then be used to create
‘theozymes’ that can be potentially used for enzyme design using RosettaMatch and
RosettaDesign.
Figure 4.1. General approach for identifying latent promiscuous activities in the
amidohydrolase superfamily of enzymes (DHO and CDA).
Dihydroorotase (DHO) is shown in Figure 4.2 in which cyanuric acid was docked in the active
site. Figure 4.2.C, shows all the residues that coordinate the zinc ions and the residues responsible
for hydrolysis. Asp250 and the hydroxide allow the chemistry to occur while Arg and Asn help
polarize the cyanuric acid ring. These roles are further supported in Figures 4.3 and Figure 4.4.
Similarly, Figure 4.2.B demonstrates cytosine deaminase (CDA) with cyanuric acid docked in the
active site while Figure 4.2.D shows all the residues that coordinate the mono zinc ion and the

170
residues responsible for the reaction Glu217, His246, Gln156, and the hydroxide. The full reaction
mechanism is shown in Figure 4.13.
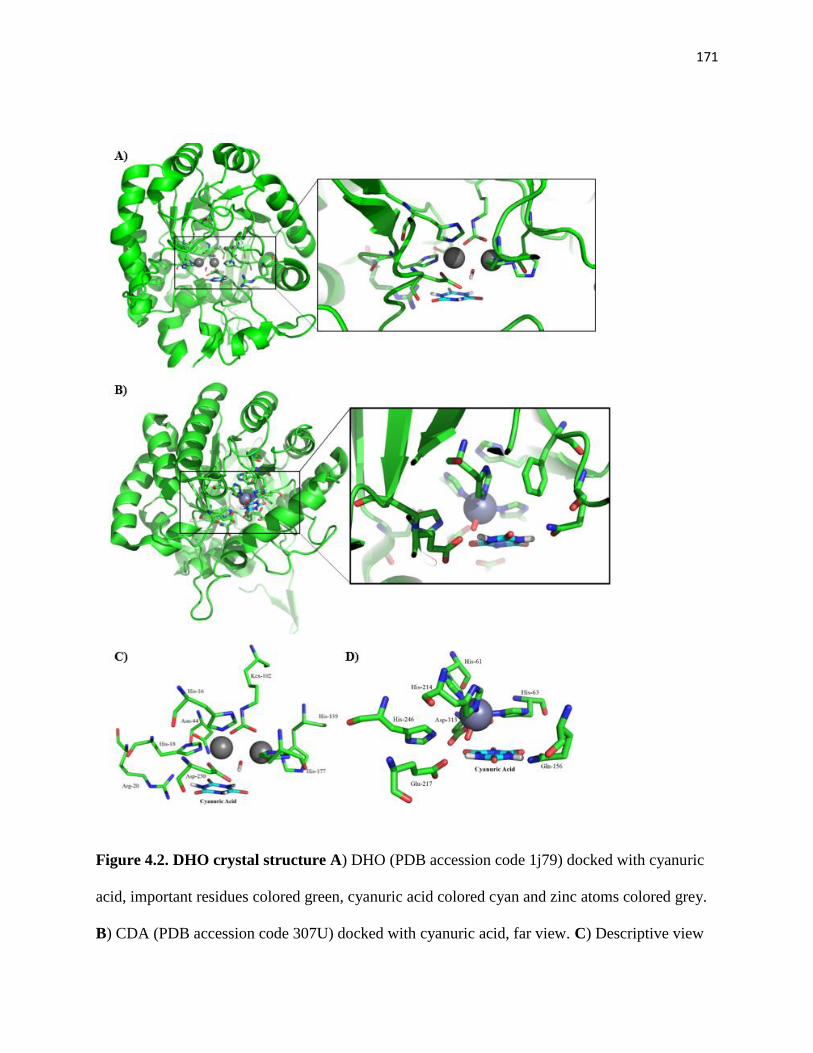
171
Figure 4.2. DHO crystal structure A) DHO (PDB accession code 1j79) docked with cyanuric
acid, important residues colored green, cyanuric acid colored cyan and zinc atoms colored grey.
B) CDA (PDB accession code 307U) docked with cyanuric acid, far view. C) Descriptive view
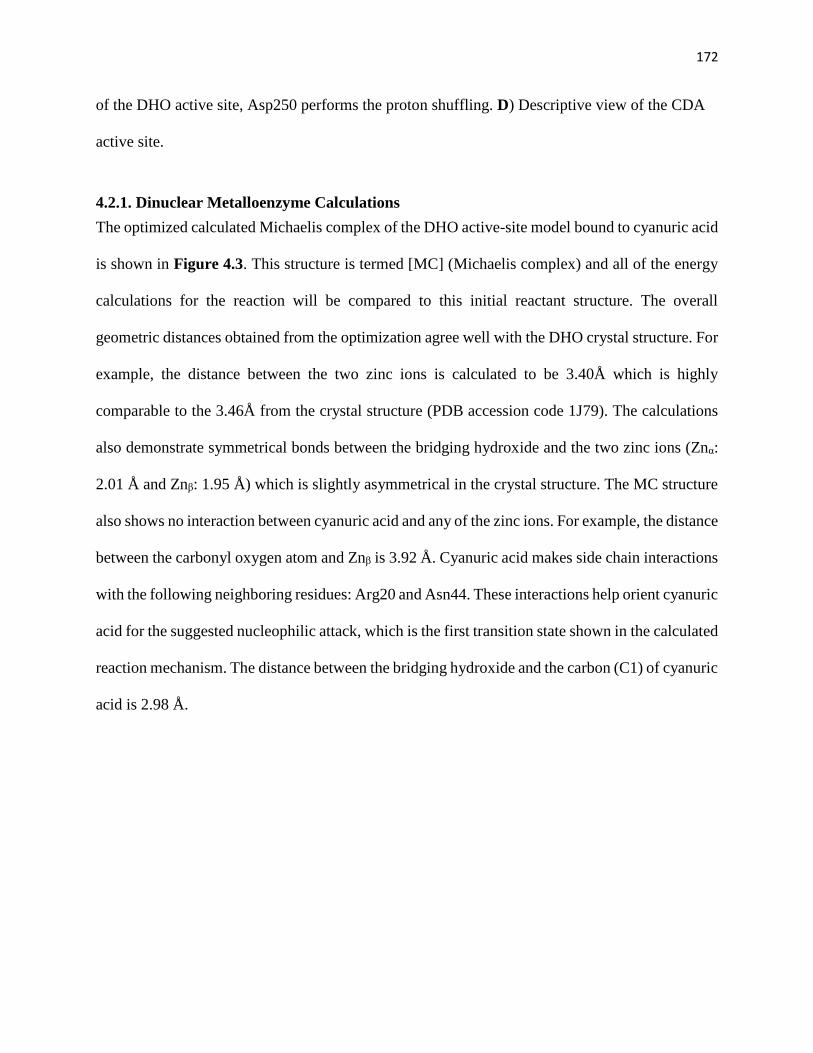
172
of the DHO active site, Asp250 performs the proton shuffling. D) Descriptive view of the CDA
active site.
4.2.1. Dinuclear Metalloenzyme Calculations
The optimized calculated Michaelis complex of the DHO active-site model bound to cyanuric acid
is shown in Figure 4.3. This structure is termed [MC] (Michaelis complex) and all of the energy
calculations for the reaction will be compared to this initial reactant structure. The overall
geometric distances obtained from the optimization agree well with the DHO crystal structure. For
example, the distance between the two zinc ions is calculated to be 3.40Å which is highly
comparable to the 3.46Å from the crystal structure (PDB accession code 1J79). The calculations
also demonstrate symmetrical bonds between the bridging hydroxide and the two zinc ions (Znα:
2.01 Å and Znβ: 1.95 Å) which is slightly asymmetrical in the crystal structure. The MC structure
also shows no interaction between cyanuric acid and any of the zinc ions. For example, the distance
between the carbonyl oxygen atom and Znβ is 3.92 Å. Cyanuric acid makes side chain interactions
with the following neighboring residues: Arg20 and Asn44. These interactions help orient cyanuric
acid for the suggested nucleophilic attack, which is the first transition state shown in the calculated
reaction mechanism. The distance between the bridging hydroxide and the carbon (C1) of cyanuric
acid is 2.98 Å.
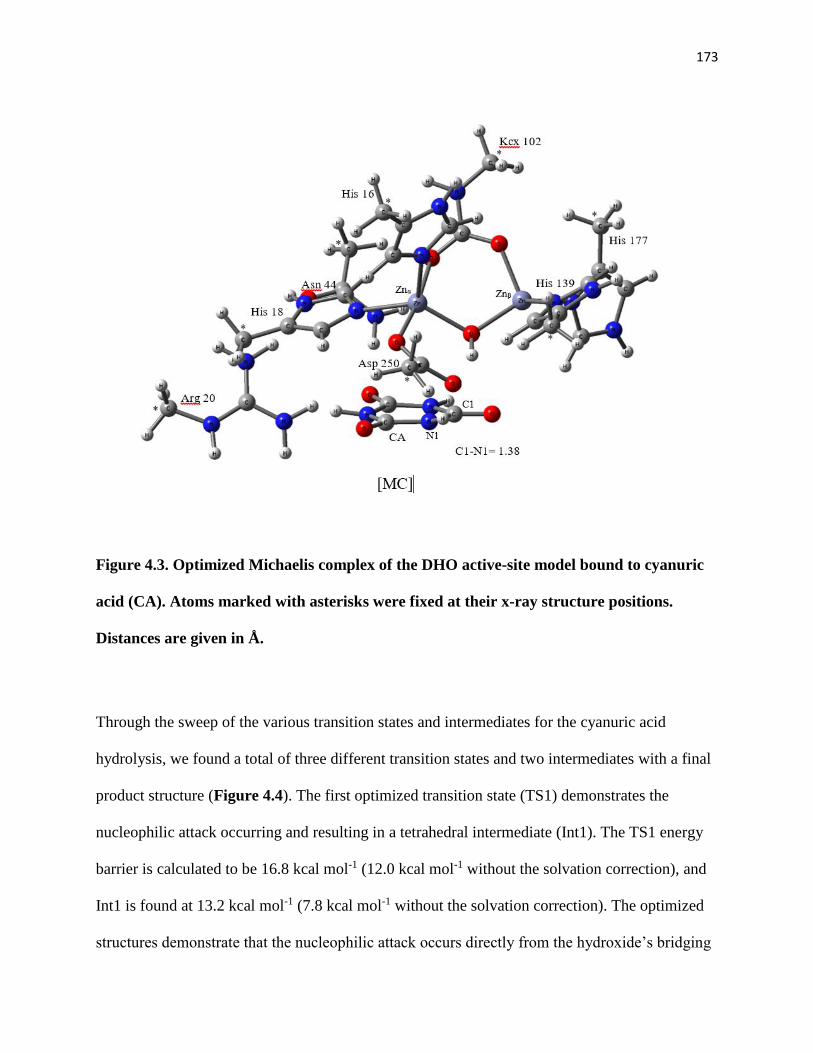
173
Figure 4.3. Optimized Michaelis complex of the DHO active-site model bound to cyanuric
acid (CA). Atoms marked with asterisks were fixed at their x-ray structure positions.
Distances are given in Å.
Through the sweep of the various transition states and intermediates for the cyanuric acid
hydrolysis, we found a total of three different transition states and two intermediates with a final
product structure (Figure 4.4). The first optimized transition state (TS1) demonstrates the
nucleophilic attack occurring and resulting in a tetrahedral intermediate (Int1). The TS1 energy
barrier is calculated to be 16.8 kcal mol-1 (12.0 kcal mol-1 without the solvation correction), and
Int1 is found at 13.2 kcal mol-1 (7.8 kcal mol-1 without the solvation correction). The optimized
structures demonstrate that the nucleophilic attack occurs directly from the hydroxide’s bridging
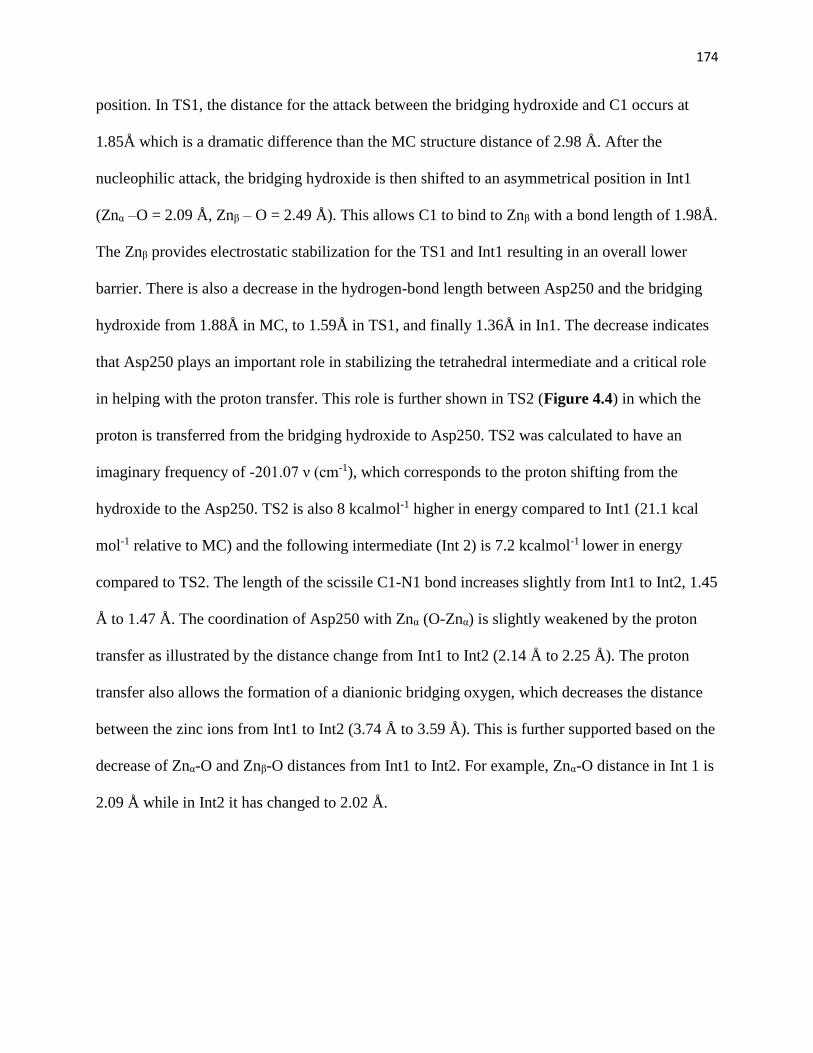
174
position. In TS1, the distance for the attack between the bridging hydroxide and C1 occurs at
1.85Å which is a dramatic difference than the MC structure distance of 2.98 Å. After the
nucleophilic attack, the bridging hydroxide is then shifted to an asymmetrical position in Int1
(Znα –O = 2.09 Å, Znβ – O = 2.49 Å). This allows C1 to bind to Znβ with a bond length of 1.98Å.
The Znβ provides electrostatic stabilization for the TS1 and Int1 resulting in an overall lower
barrier. There is also a decrease in the hydrogen-bond length between Asp250 and the bridging
hydroxide from 1.88Å in MC, to 1.59Å in TS1, and finally 1.36Å in In1. The decrease indicates
that Asp250 plays an important role in stabilizing the tetrahedral intermediate and a critical role
in helping with the proton transfer. This role is further shown in TS2 (Figure 4.4) in which the
proton is transferred from the bridging hydroxide to Asp250. TS2 was calculated to have an
imaginary frequency of -201.07 ν (cm-1), which corresponds to the proton shifting from the
hydroxide to the Asp250. TS2 is also 8 kcalmol-1 higher in energy compared to Int1 (21.1 kcal
mol-1 relative to MC) and the following intermediate (Int 2) is 7.2 kcalmol-1 lower in energy
compared to TS2. The length of the scissile C1-N1 bond increases slightly from Int1 to Int2, 1.45
Å to 1.47 Å. The coordination of Asp250 with Znα (O-Znα) is slightly weakened by the proton
transfer as illustrated by the distance change from Int1 to Int2 (2.14 Å to 2.25 Å). The proton
transfer also allows the formation of a dianionic bridging oxygen, which decreases the distance
between the zinc ions from Int1 to Int2 (3.74 Å to 3.59 Å). This is further supported based on the
decrease of Znα-O and Znβ-O distances from Int1 to Int2. For example, Znα-O distance in Int 1 is
2.09 Å while in Int2 it has changed to 2.02 Å.
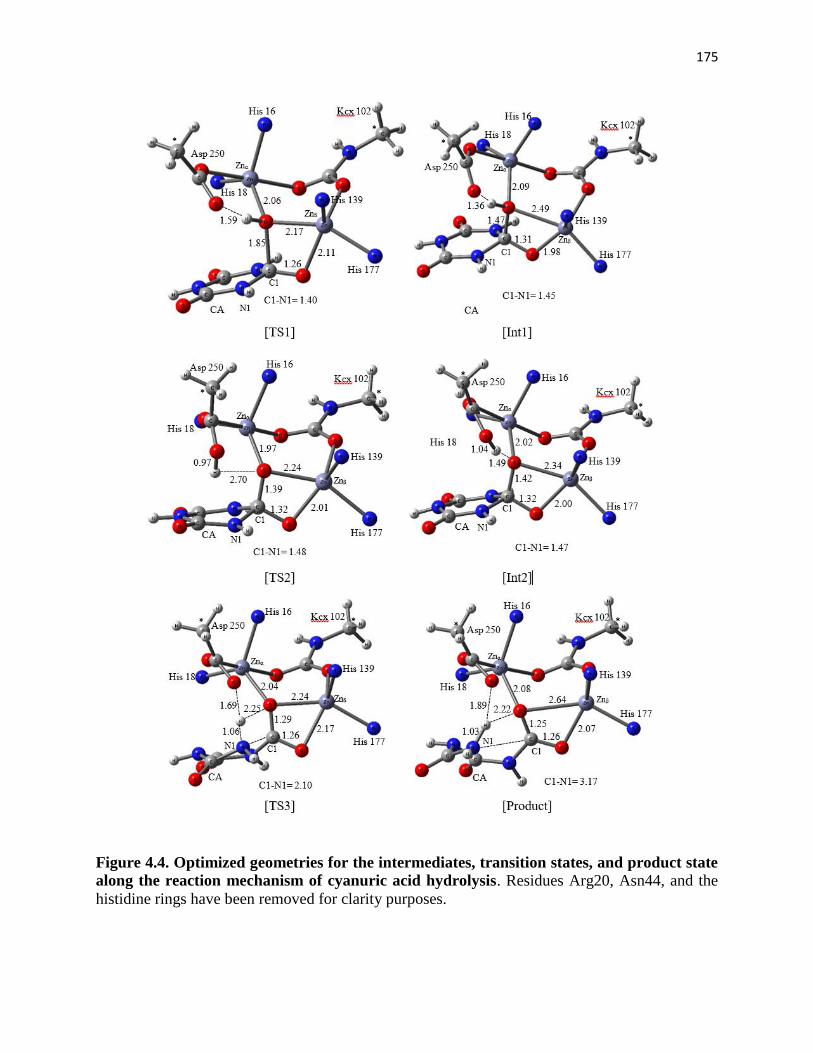
175
Figure 4.4. Optimized geometries for the intermediates, transition states, and product state
along the reaction mechanism of cyanuric acid hydrolysis. Residues Arg20, Asn44, and the
histidine rings have been removed for clarity purposes.
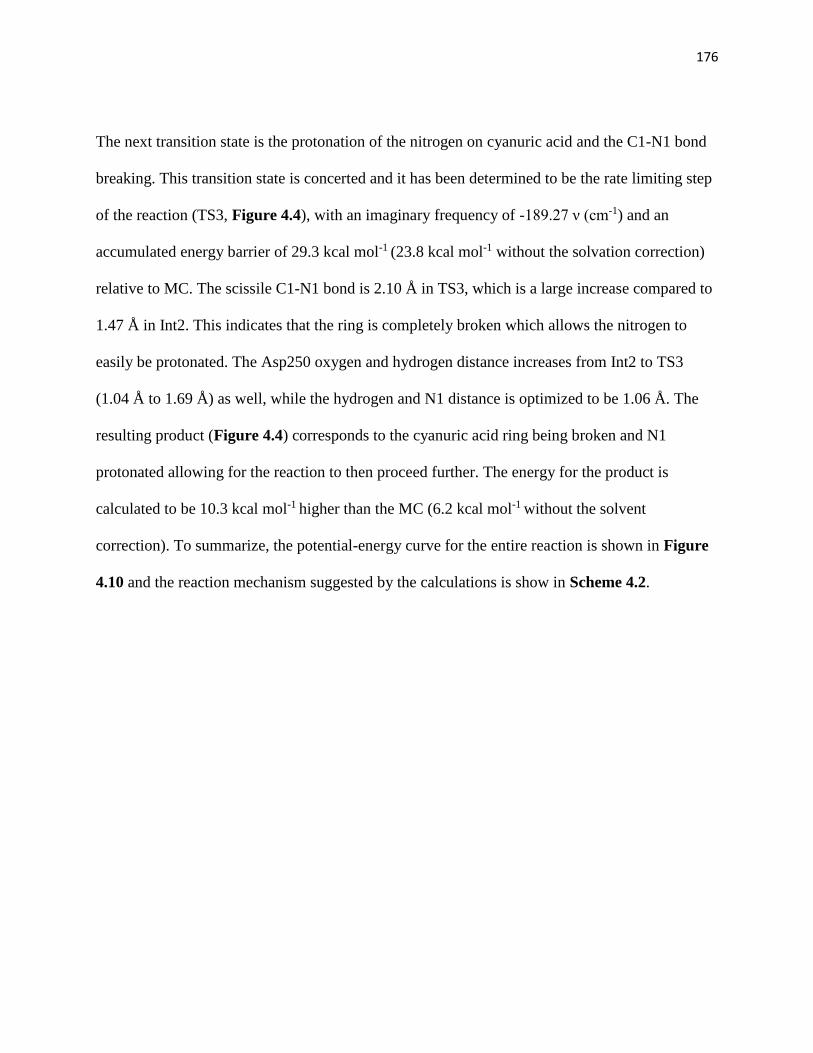
176
The next transition state is the protonation of the nitrogen on cyanuric acid and the C1-N1 bond
breaking. This transition state is concerted and it has been determined to be the rate limiting step
of the reaction (TS3, Figure 4.4), with an imaginary frequency of -189.27 ν (cm-1) and an
accumulated energy barrier of 29.3 kcal mol-1 (23.8 kcal mol-1 without the solvation correction)
relative to MC. The scissile C1-N1 bond is 2.10 Å in TS3, which is a large increase compared to
1.47 Å in Int2. This indicates that the ring is completely broken which allows the nitrogen to
easily be protonated. The Asp250 oxygen and hydrogen distance increases from Int2 to TS3
(1.04 Å to 1.69 Å) as well, while the hydrogen and N1 distance is optimized to be 1.06 Å. The
resulting product (Figure 4.4) corresponds to the cyanuric acid ring being broken and N1
protonated allowing for the reaction to then proceed further. The energy for the product is
calculated to be 10.3 kcal mol-1 higher than the MC (6.2 kcal mol-1 without the solvent
correction). To summarize, the potential-energy curve for the entire reaction is shown in Figure
4.10 and the reaction mechanism suggested by the calculations is show in Scheme 4.2.
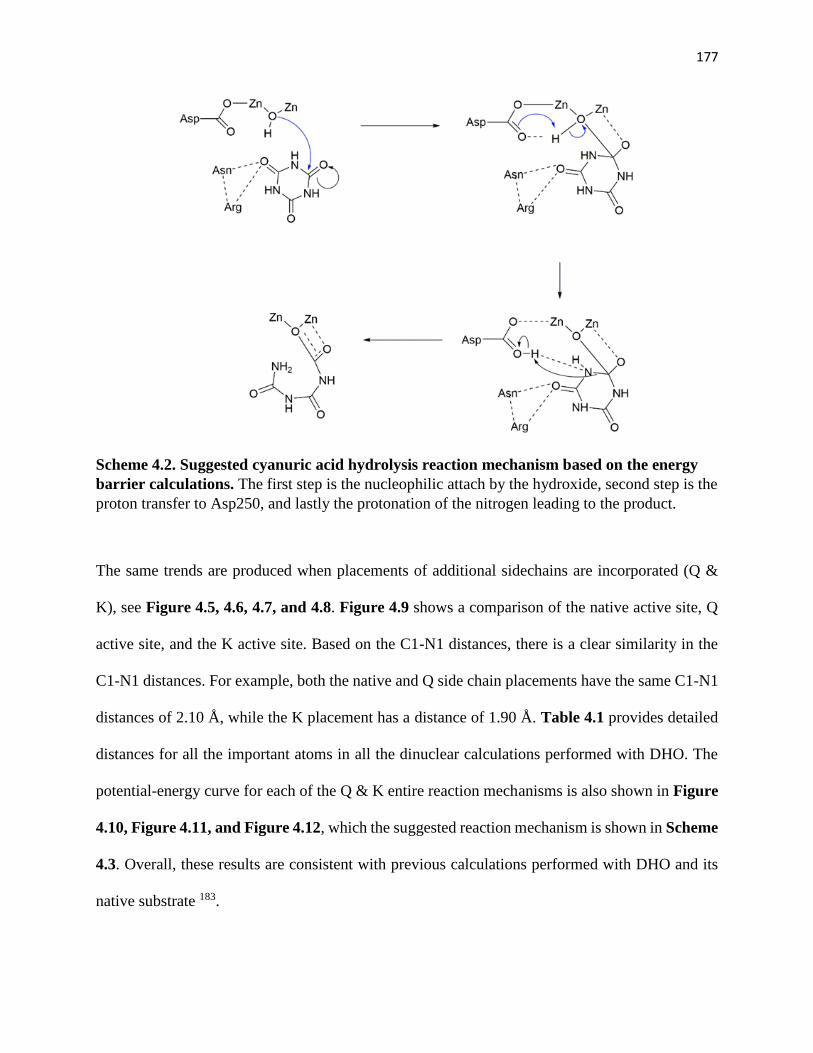
177
Scheme 4.2. Suggested cyanuric acid hydrolysis reaction mechanism based on the energy
barrier calculations. The first step is the nucleophilic attach by the hydroxide, second step is the
proton transfer to Asp250, and lastly the protonation of the nitrogen leading to the product.
The same trends are produced when placements of additional sidechains are incorporated (Q &
K), see Figure 4.5, 4.6, 4.7, and 4.8. Figure 4.9 shows a comparison of the native active site, Q
active site, and the K active site. Based on the C1-N1 distances, there is a clear similarity in the
C1-N1 distances. For example, both the native and Q side chain placements have the same C1-N1
distances of 2.10 Å, while the K placement has a distance of 1.90 Å. Table 4.1 provides detailed
distances for all the important atoms in all the dinuclear calculations performed with DHO. The
potential-energy curve for each of the Q & K entire reaction mechanisms is also shown in Figure
4.10, Figure 4.11, and Figure 4.12, which the suggested reaction mechanism is shown in Scheme
4.3. Overall, these results are consistent with previous calculations performed with DHO and its
native substrate 183.
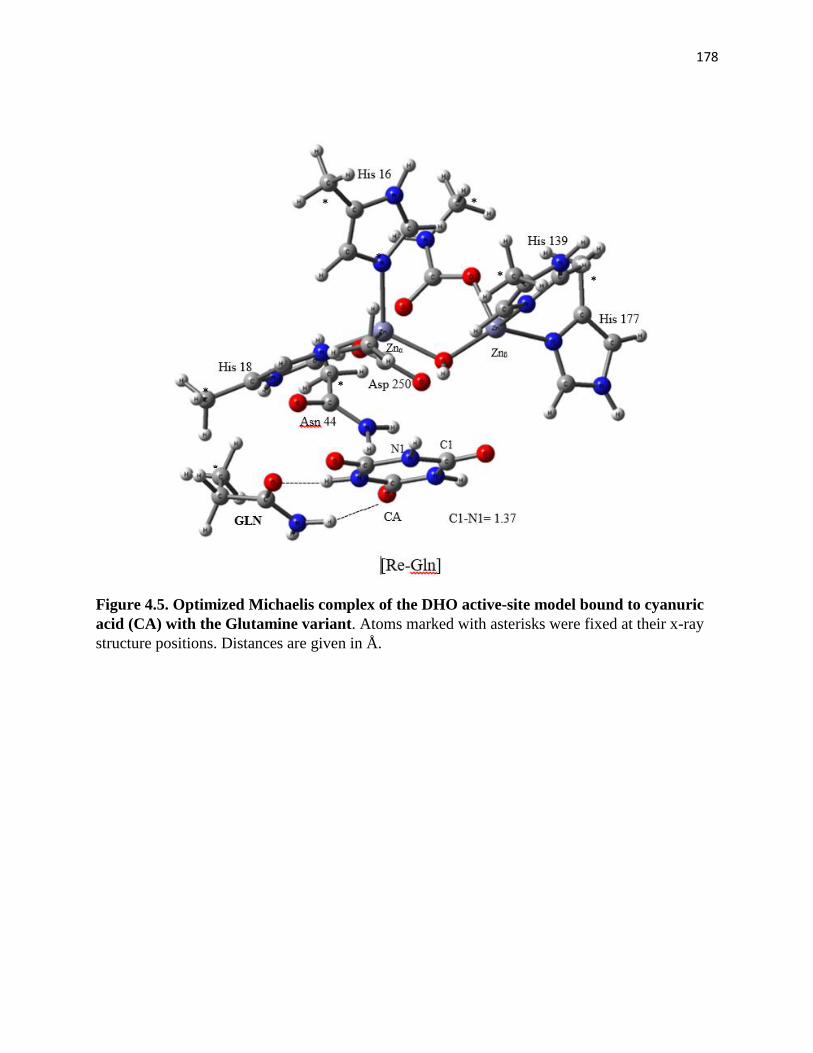
178
Figure 4.5. Optimized Michaelis complex of the DHO active-site model bound to cyanuric
acid (CA) with the Glutamine variant. Atoms marked with asterisks were fixed at their x-ray
structure positions. Distances are given in Å.
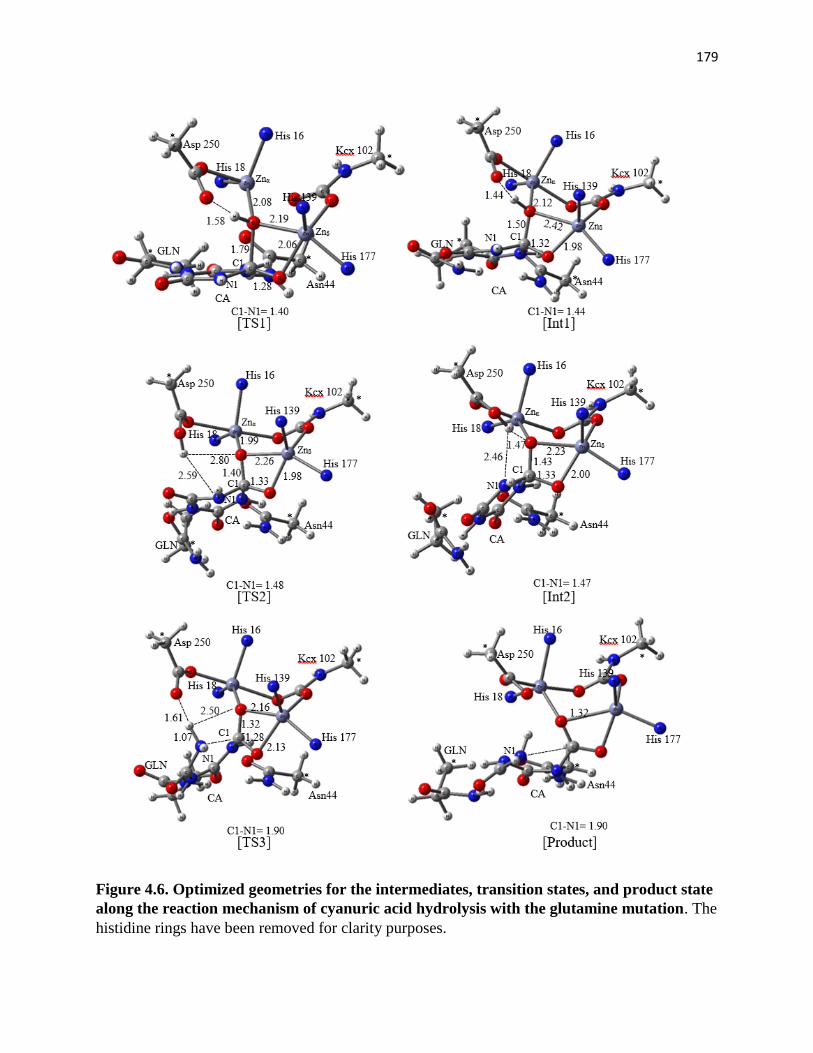
179
Figure 4.6. Optimized geometries for the intermediates, transition states, and product state
along the reaction mechanism of cyanuric acid hydrolysis with the glutamine mutation. The
histidine rings have been removed for clarity purposes.
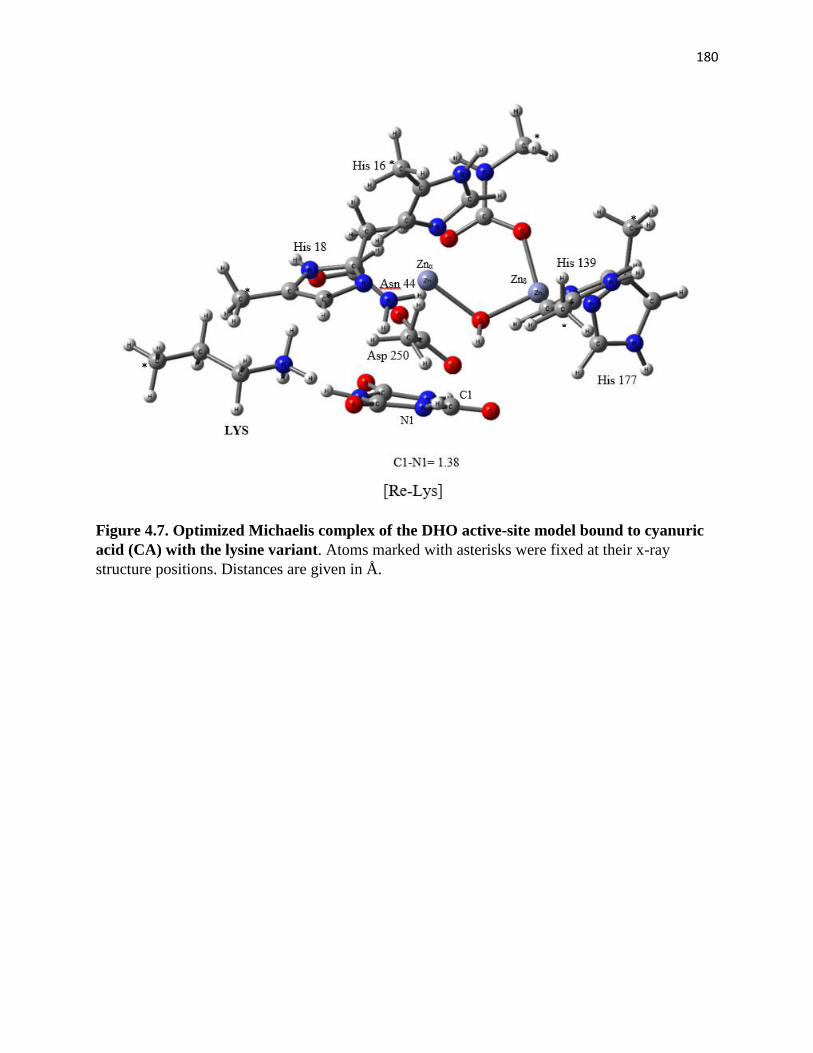
180
Figure 4.7. Optimized Michaelis complex of the DHO active-site model bound to cyanuric
acid (CA) with the lysine variant. Atoms marked with asterisks were fixed at their x-ray
structure positions. Distances are given in Å.
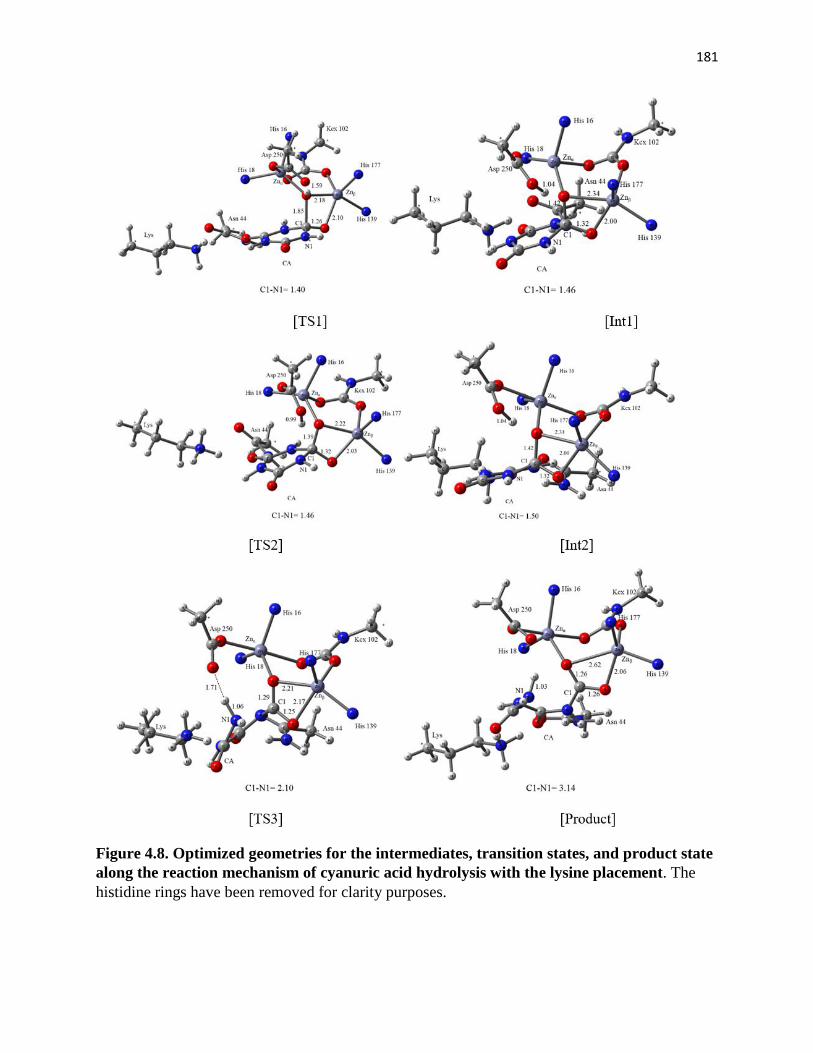
181
Figure 4.8. Optimized geometries for the intermediates, transition states, and product state
along the reaction mechanism of cyanuric acid hydrolysis with the lysine placement. The
histidine rings have been removed for clarity purposes.
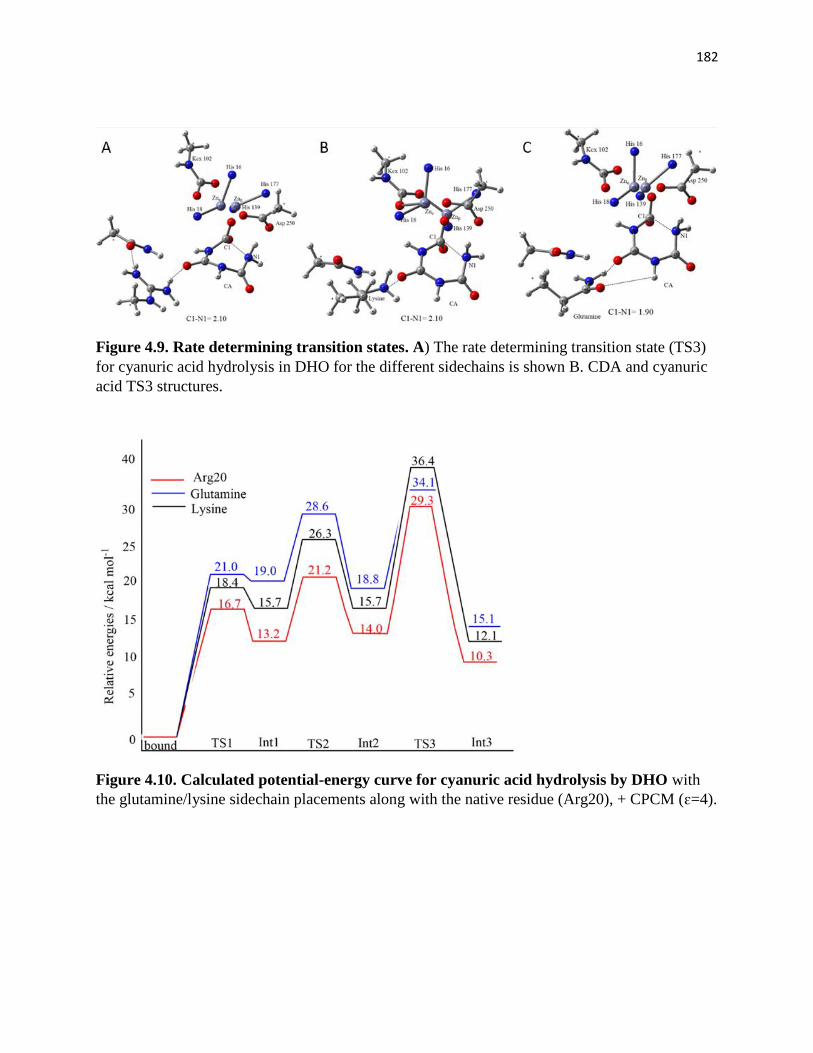
182
Figure 4.9. Rate determining transition states. A) The rate determining transition state (TS3)
for cyanuric acid hydrolysis in DHO for the different sidechains is shown B. CDA and cyanuric
acid TS3 structures.
Figure 4.10. Calculated potential-energy curve for cyanuric acid hydrolysis by DHO with
the glutamine/lysine sidechain placements along with the native residue (Arg20), + CPCM (ɛ=4).
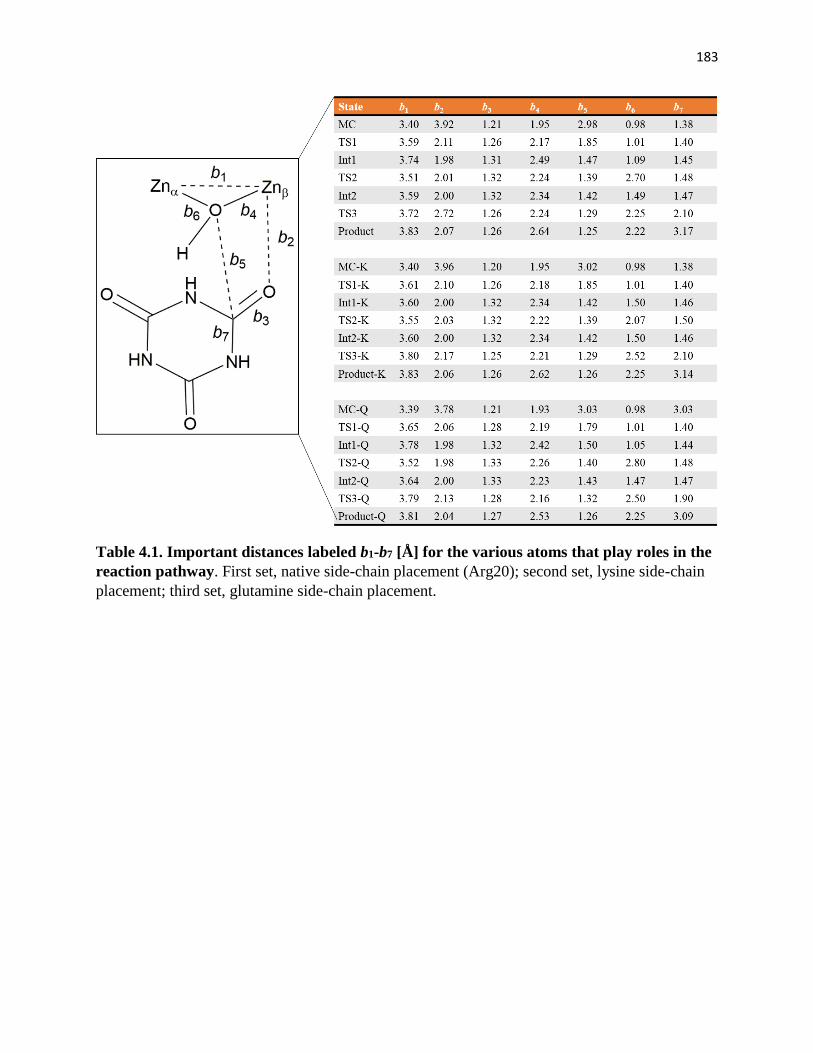
183
Table 4.1. Important distances labeled b1-b7 [Å] for the various atoms that play roles in the
reaction pathway. First set, native side-chain placement (Arg20); second set, lysine side-chain
placement; third set, glutamine side-chain placement.
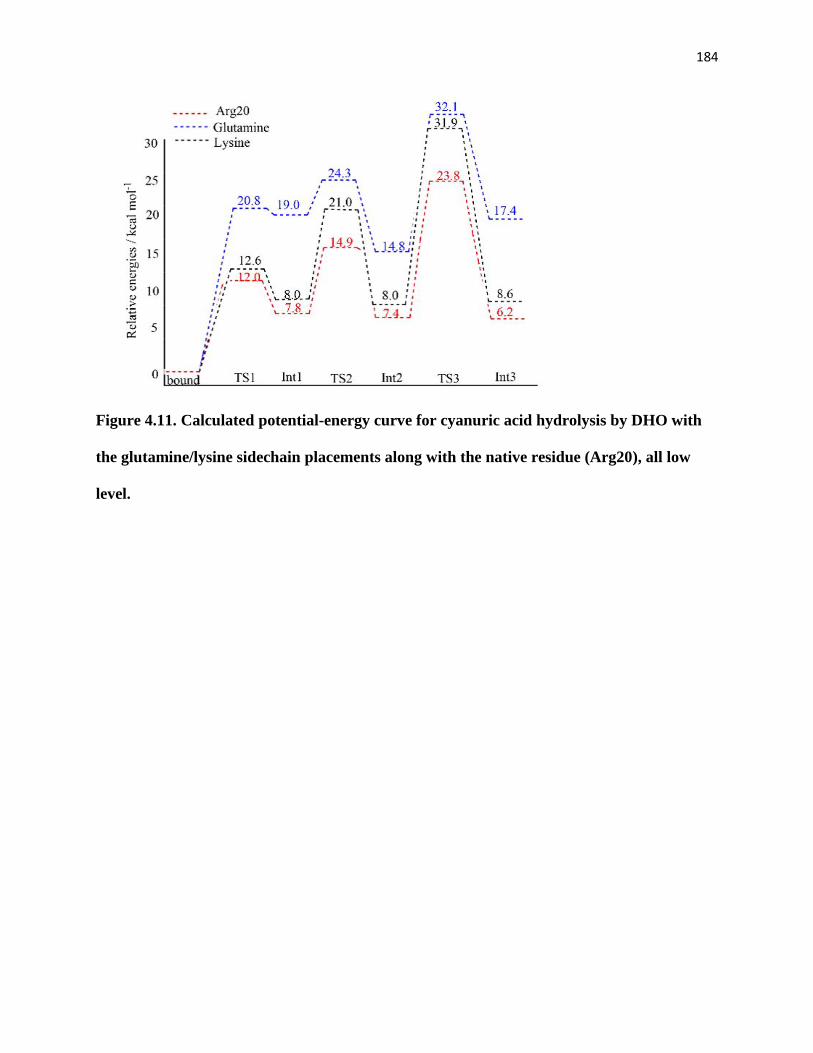
184
Figure 4.11. Calculated potential-energy curve for cyanuric acid hydrolysis by DHO with
the glutamine/lysine sidechain placements along with the native residue (Arg20), all low
level.
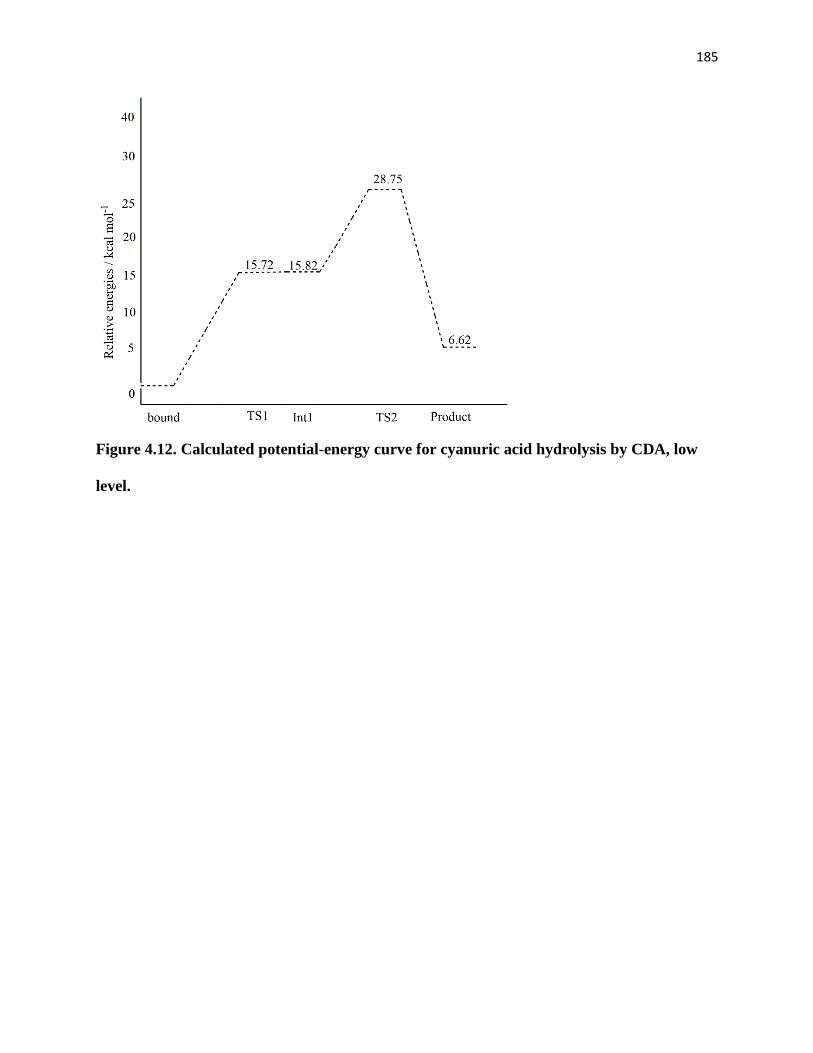
185
Figure 4.12. Calculated potential-energy curve for cyanuric acid hydrolysis by CDA, low
level.
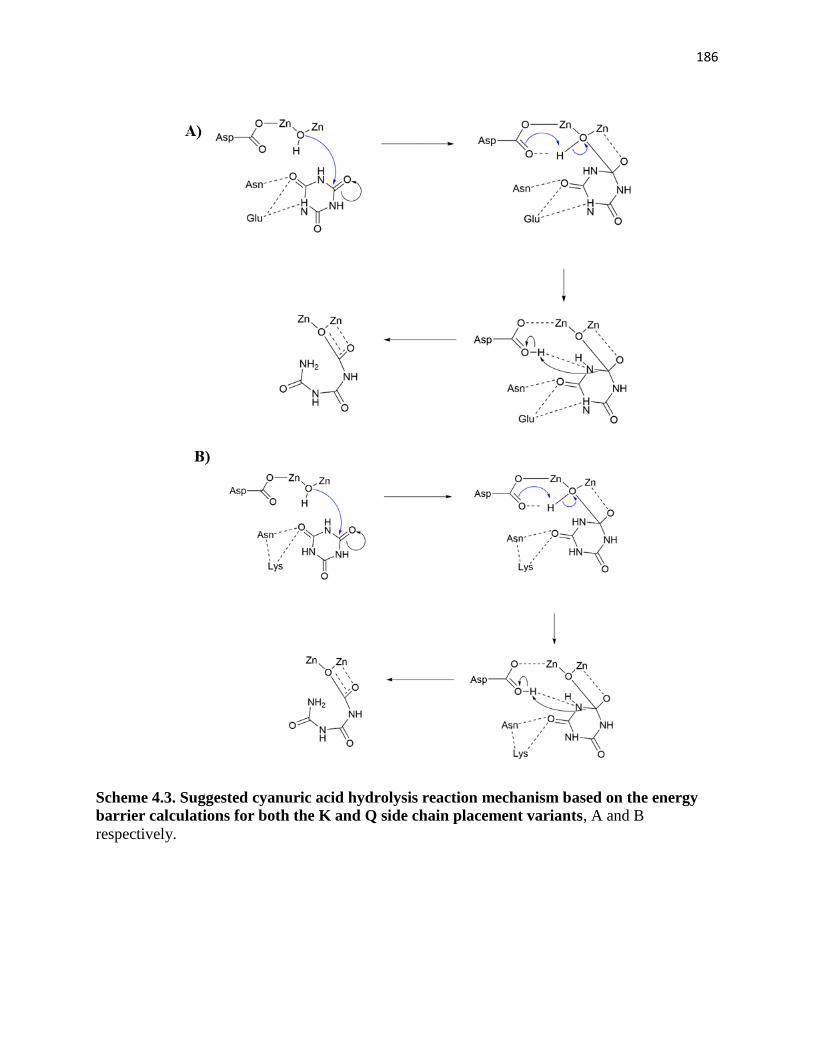
186
Scheme 4.3. Suggested cyanuric acid hydrolysis reaction mechanism based on the energy
barrier calculations for both the K and Q side chain placement variants, A and B
respectively.
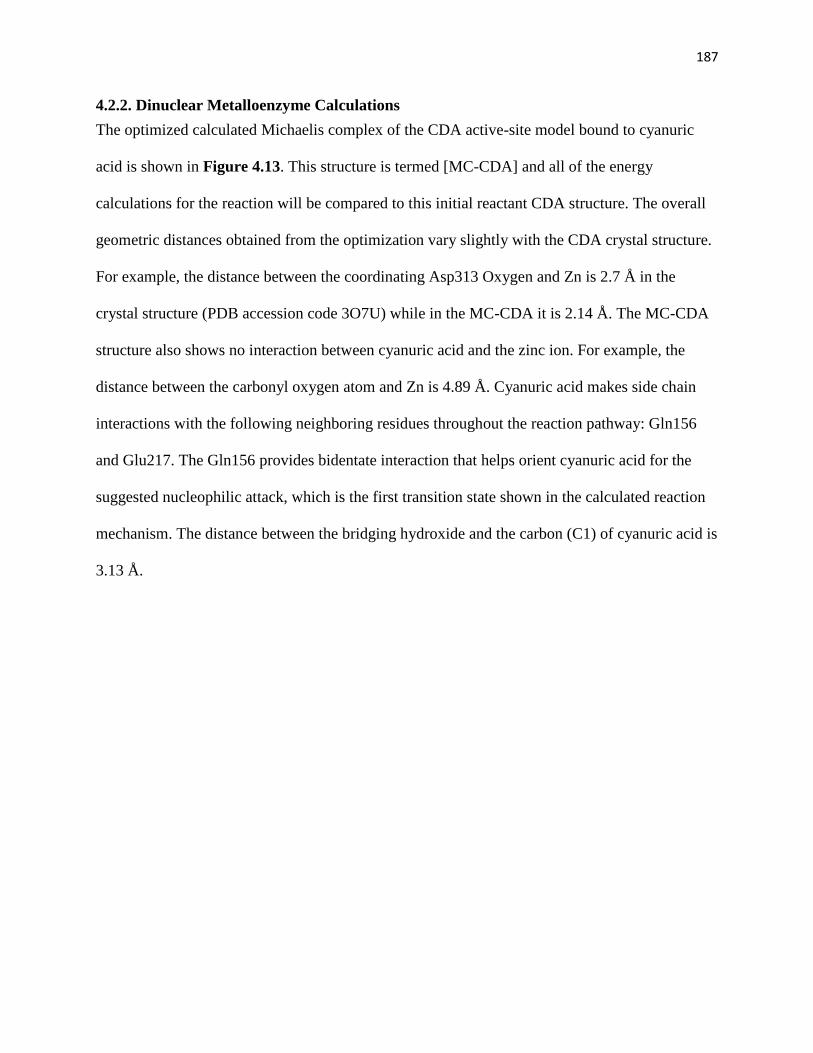
187
4.2.2. Dinuclear Metalloenzyme Calculations
The optimized calculated Michaelis complex of the CDA active-site model bound to cyanuric
acid is shown in Figure 4.13. This structure is termed [MC-CDA] and all of the energy
calculations for the reaction will be compared to this initial reactant CDA structure. The overall
geometric distances obtained from the optimization vary slightly with the CDA crystal structure.
For example, the distance between the coordinating Asp313 Oxygen and Zn is 2.7 Å in the
crystal structure (PDB accession code 3O7U) while in the MC-CDA it is 2.14 Å. The MC-CDA
structure also shows no interaction between cyanuric acid and the zinc ion. For example, the
distance between the carbonyl oxygen atom and Zn is 4.89 Å. Cyanuric acid makes side chain
interactions with the following neighboring residues throughout the reaction pathway: Gln156
and Glu217. The Gln156 provides bidentate interaction that helps orient cyanuric acid for the
suggested nucleophilic attack, which is the first transition state shown in the calculated reaction
mechanism. The distance between the bridging hydroxide and the carbon (C1) of cyanuric acid is
3.13 Å.
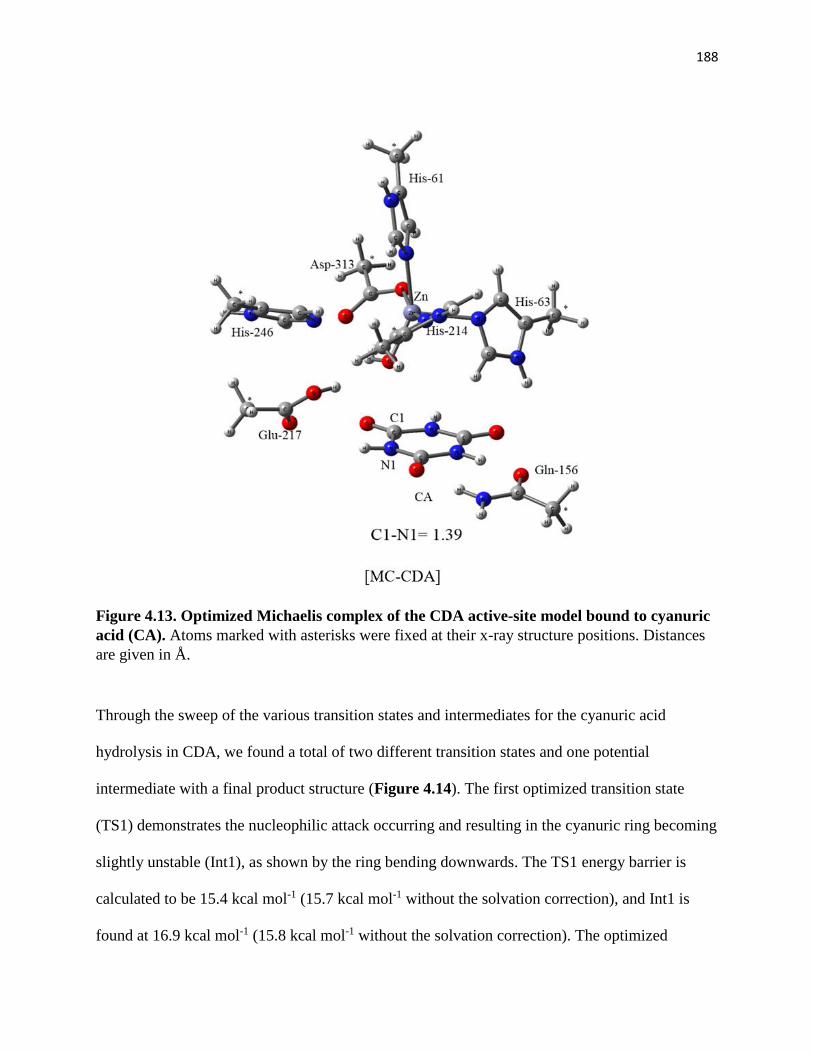
188
Figure 4.13. Optimized Michaelis complex of the CDA active-site model bound to cyanuric
acid (CA). Atoms marked with asterisks were fixed at their x-ray structure positions. Distances
are given in Å.
Through the sweep of the various transition states and intermediates for the cyanuric acid
hydrolysis in CDA, we found a total of two different transition states and one potential
intermediate with a final product structure (Figure 4.14). The first optimized transition state
(TS1) demonstrates the nucleophilic attack occurring and resulting in the cyanuric ring becoming
slightly unstable (Int1), as shown by the ring bending downwards. The TS1 energy barrier is
calculated to be 15.4 kcal mol-1 (15.7 kcal mol-1 without the solvation correction), and Int1 is
found at 16.9 kcal mol-1 (15.8 kcal mol-1 without the solvation correction). The optimized
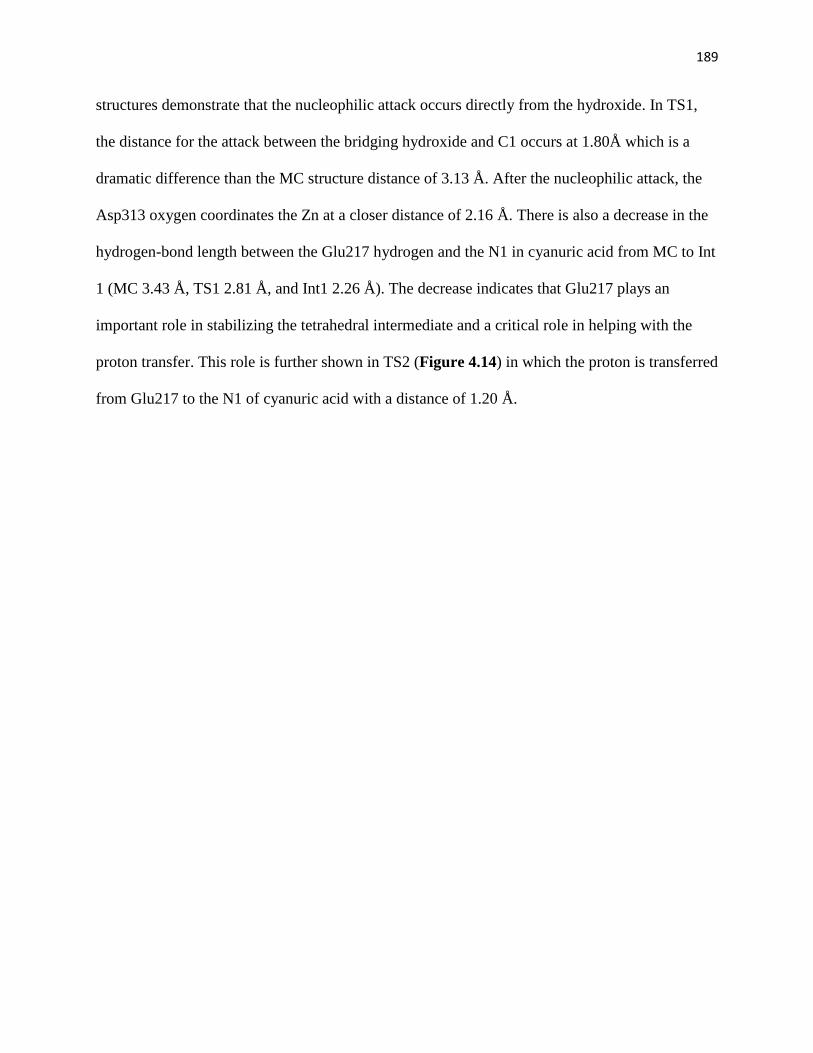
189
structures demonstrate that the nucleophilic attack occurs directly from the hydroxide. In TS1,
the distance for the attack between the bridging hydroxide and C1 occurs at 1.80Å which is a
dramatic difference than the MC structure distance of 3.13 Å. After the nucleophilic attack, the
Asp313 oxygen coordinates the Zn at a closer distance of 2.16 Å. There is also a decrease in the
hydrogen-bond length between the Glu217 hydrogen and the N1 in cyanuric acid from MC to Int
1 (MC 3.43 Å, TS1 2.81 Å, and Int1 2.26 Å). The decrease indicates that Glu217 plays an
important role in stabilizing the tetrahedral intermediate and a critical role in helping with the
proton transfer. This role is further shown in TS2 (Figure 4.14) in which the proton is transferred
from Glu217 to the N1 of cyanuric acid with a distance of 1.20 Å.
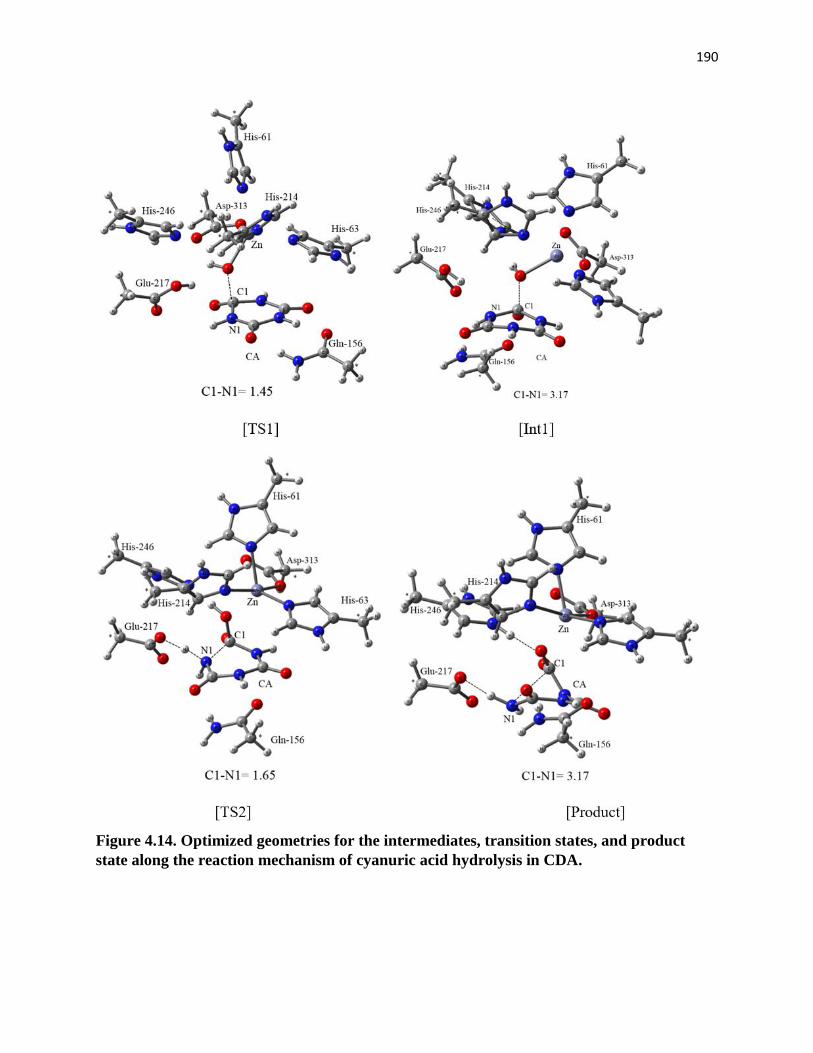
190
Figure 4.14. Optimized geometries for the intermediates, transition states, and product
state along the reaction mechanism of cyanuric acid hydrolysis in CDA.
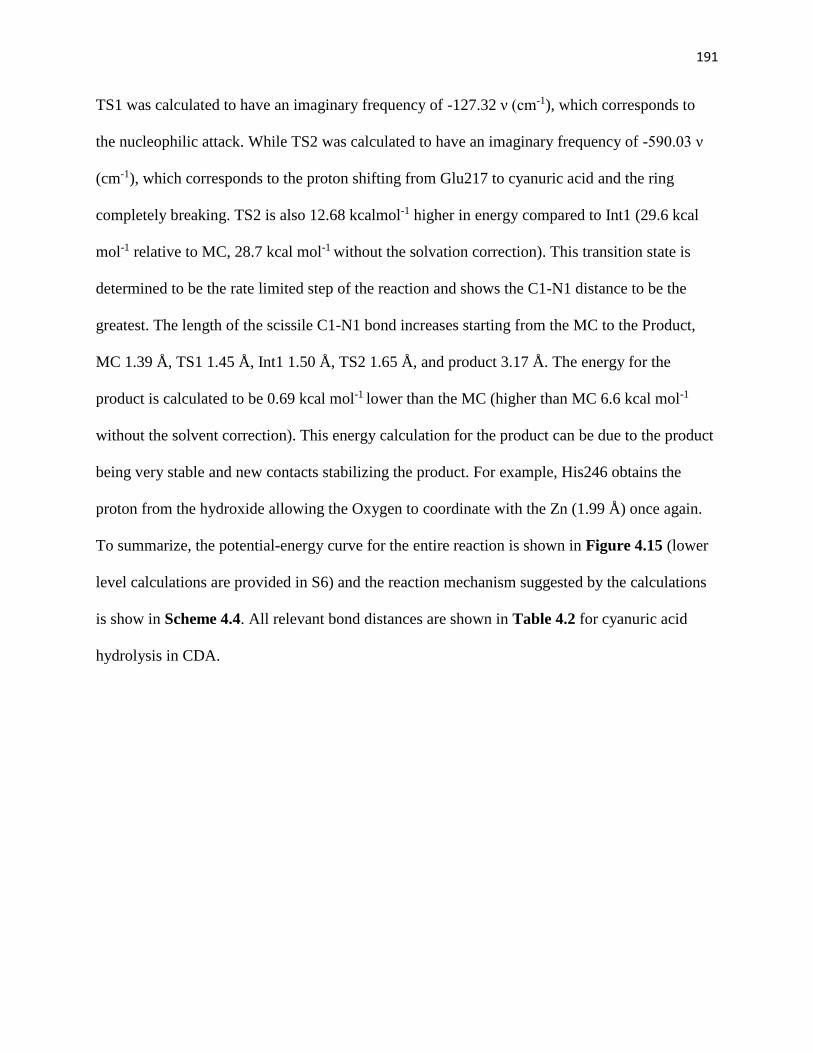
191
TS1 was calculated to have an imaginary frequency of -127.32 ν (cm-1), which corresponds to
the nucleophilic attack. While TS2 was calculated to have an imaginary frequency of -590.03 ν
(cm-1), which corresponds to the proton shifting from Glu217 to cyanuric acid and the ring
completely breaking. TS2 is also 12.68 kcalmol-1 higher in energy compared to Int1 (29.6 kcal
mol-1 relative to MC, 28.7 kcal mol-1 without the solvation correction). This transition state is
determined to be the rate limited step of the reaction and shows the C1-N1 distance to be the
greatest. The length of the scissile C1-N1 bond increases starting from the MC to the Product,
MC 1.39 Å, TS1 1.45 Å, Int1 1.50 Å, TS2 1.65 Å, and product 3.17 Å. The energy for the
product is calculated to be 0.69 kcal mol-1 lower than the MC (higher than MC 6.6 kcal mol-1
without the solvent correction). This energy calculation for the product can be due to the product
being very stable and new contacts stabilizing the product. For example, His246 obtains the
proton from the hydroxide allowing the Oxygen to coordinate with the Zn (1.99 Å) once again.
To summarize, the potential-energy curve for the entire reaction is shown in Figure 4.15 (lower
level calculations are provided in S6) and the reaction mechanism suggested by the calculations
is show in Scheme 4.4. All relevant bond distances are shown in Table 4.2 for cyanuric acid
hydrolysis in CDA.
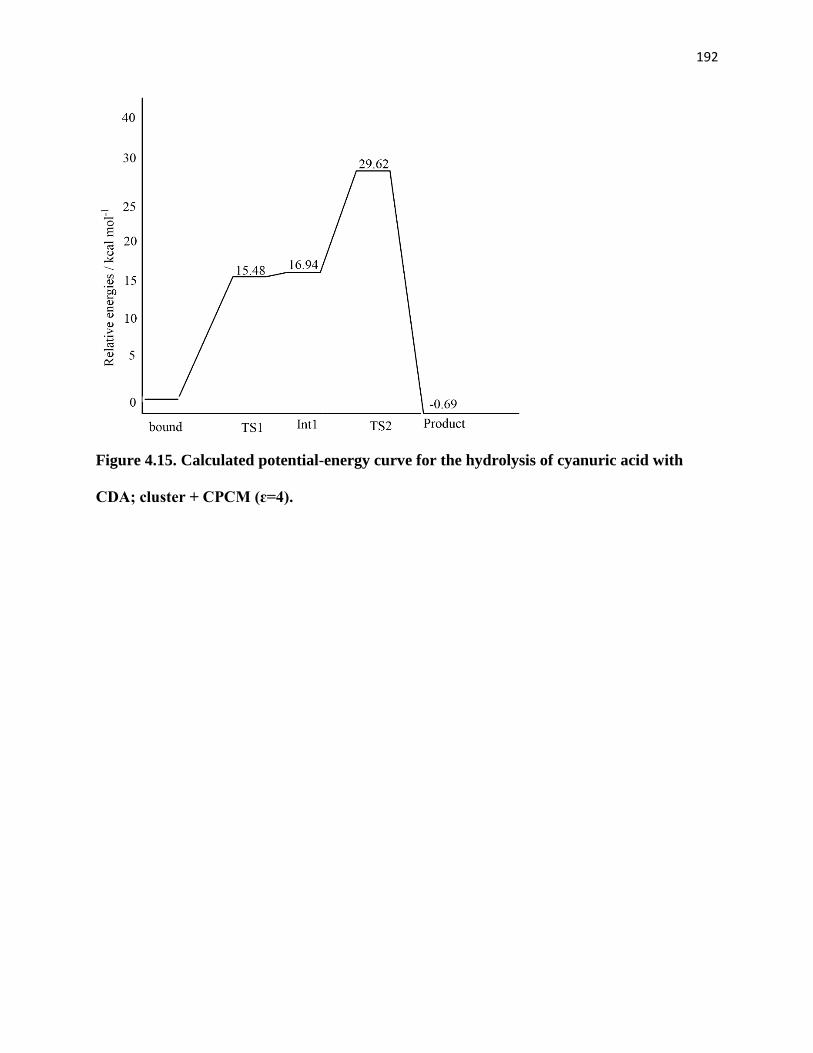
192
Figure 4.15. Calculated potential-energy curve for the hydrolysis of cyanuric acid with
CDA; cluster + CPCM (ɛ=4).
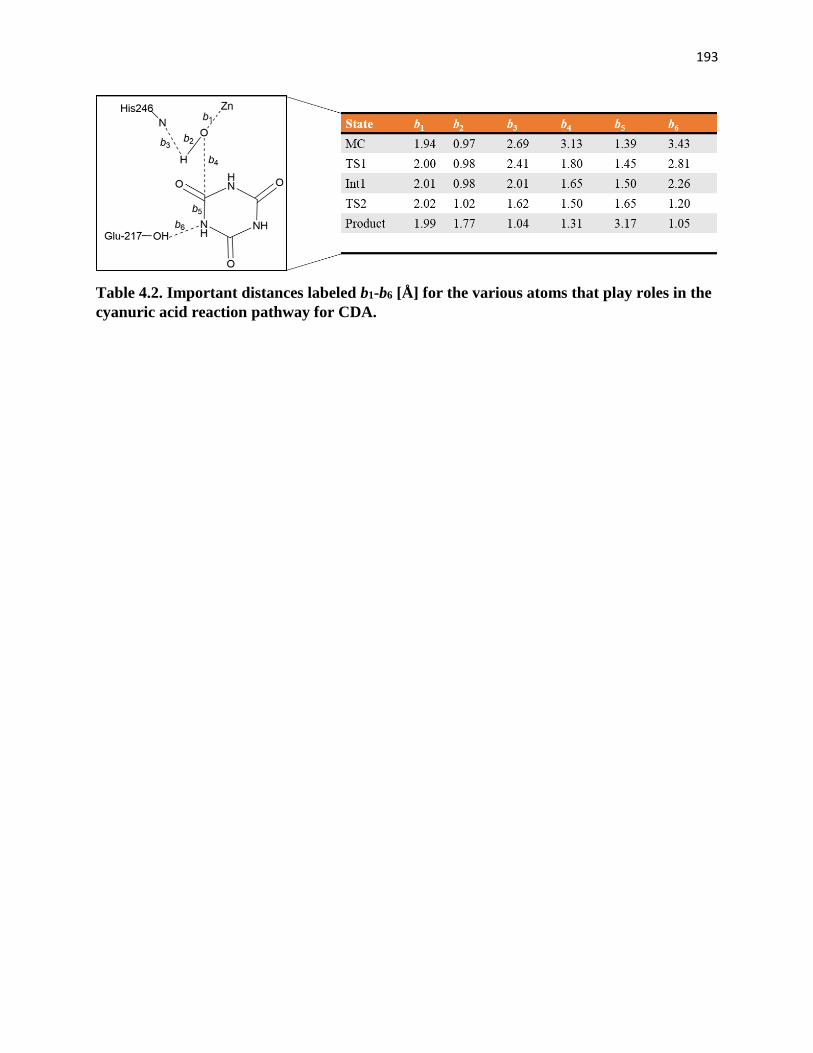
193
Table 4.2. Important distances labeled b1-b6 [Å] for the various atoms that play roles in the
cyanuric acid reaction pathway for CDA.
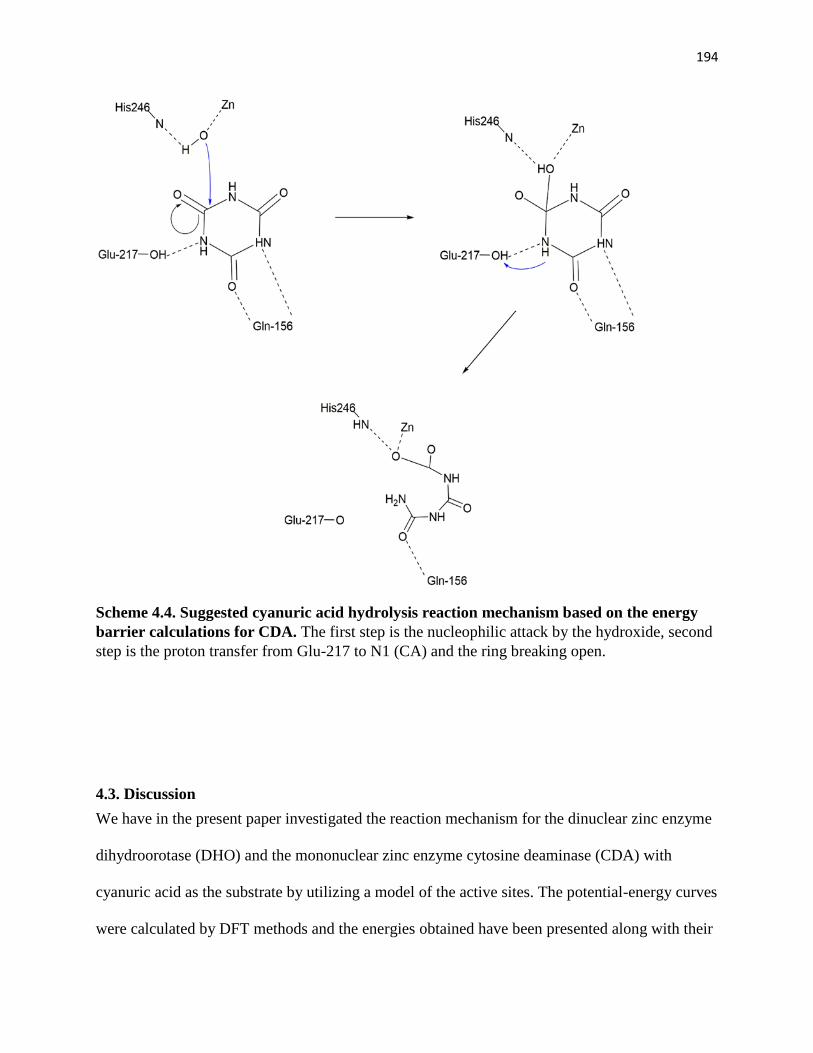
194
Scheme 4.4. Suggested cyanuric acid hydrolysis reaction mechanism based on the energy
barrier calculations for CDA. The first step is the nucleophilic attack by the hydroxide, second
step is the proton transfer from Glu-217 to N1 (CA) and the ring breaking open.
4.3. Discussion
We have in the present paper investigated the reaction mechanism for the dinuclear zinc enzyme
dihydroorotase (DHO) and the mononuclear zinc enzyme cytosine deaminase (CDA) with
cyanuric acid as the substrate by utilizing a model of the active sites. The potential-energy curves
were calculated by DFT methods and the energies obtained have been presented along with their
195
corresponding structures (Figure 4.4, 4.10, 4.14, 4.13). The important optimized geometric
parameters and distances are summarized in Table 4.1 and Table 4.2. Based on the calculations
for DHO and CDA, the following conclusions can be drawn about the reaction mechanisms.
First, cyanuric acid binds the actives sites mainly through hydrogen-bonding interactions with
neighboring residues: Arg20 and Asn 44 in DHO, Gln156 in CDA. Cyanuric acid does not
coordinate any of the Zn ions prior to any nucleophilic attack.
Second, the bridging hydroxide performs the nucleophilic attack in both DHO and CDA. In
DHO, Znβ helps catalyze the reaction by stabilizing the resulting states therefore helping lower
the barrier for nucleophilic attack. In CDA, Gln156 helps stabilize the ring through bidentate
interactions. Third, the rate-limiting step, in both active sites (TS3 in DHO, TS2 in CDA), is the
protonation of the amide nitrogen atom (in cyanuric acid) either through Asp250 or Glu217,
which then allows the C1-N1 bond to cleave causing the ring to break open.
Lastly, the reaction mechanism and structures found will be used to create ‘theozymes’ that can
be potentially used for enzyme design using RosettaMatch and RosettaDesign. This opens up the
possibility of identifying enzymes that will be useful for the biodegradation of cyanuric acid, the
bottleneck of the reaction for any s-triazine, many of which are harmful to the environment.
4.4. Materials and Methods
4.4.1. Computational Details
Starting from the disambiguated active site obtained from a crystal structure of DHO (PDB code:
1j79) and utilizing the Gaussian 09 program185 , quantum mechanical (QM) simulations of
196
cyanuric acid hydrolysis were performed. Transition and intermediate states were modeled and
analyzed using Density Functional Theory (DFT) B3LYP functional175 in which geometry
optimizations were carried out with the 6-31G(d,p) basis set for the C,N,O, and H elements and
the LANL2DZ pseudo-potential176 for the zinc ions. Based on the geometries, more accurate
energies were obtained through single-point calculations on the optimized structures using the 6-
311++G(2d,2p) basis set for the C,N,O, and H elements. All of the calculated geometries were
optimized in vacuo.
The energetics of the protein environment were also considered through calculations that
considered solvation effects. The same theory level as the single-point optimizations was used on
the optimized structures using the conductor like polarizable continuum model (CPCM)
method186 . The standard protein surrounding dielectric constant (ɛ = 4) was used with the CPCM
method. Frequency calculations were performed for all the optimizations in order to obtain zero-
point energies (ZPE) and to confirm stationary points throughout the reaction. The outermost
carbons for various residues were kept fixed to their X-ray crystal structure positions resulting in
a few imaginary frequencies (~ -20 ν cm -1). These imaginary frequencies do not contribute to the
ZPE.
4.4.2. Active Site Models
The model of DHO and CDA active sites were constructed based on the crystal structures of the
enzymes (PDB 1J79 and PDB 3O7U respectively). The DHO model consisted of two zinc ions
coordinated by His16, His18, His139, His177, Asp250, and a bridging carboxylated Lys102 and
hydroxide (-OH). Important neighboring residues included Arg20 and Asn44 which are involved
in substrate orientation and binding. The CDA model consisted of one zinc ion coordinated by
197
His63, His61, His214, Asp313, and hydroxide (-OH). Important neighboring residues include
His246, Glu217, and Gln156 all of which interact either with the hydroxide or substrate. For both
models, the amino acids were truncated so that the important side chain interactions were kept in
the model and the last truncated atom was supplemented with hydrogens (Scheme 4.2).
Hydrogen atoms were then manually added to the rest of the atoms. To keep the optimized
structures as close to their crystal structures, the truncated atoms were fixed to their
corresponding positions (see Scheme 4.2* marked atoms). The DHO cyanuric acid model
consisted of 102 atoms with a charge of +2, while the CDA cyanuric acid model consisted of 87
atoms.
4.5. Experimental Methods and Results
4.5.1. Protein Expression
A total of 12 genes, representing the designed enzymes, were ordered from Integrated DNA
Technologies. The 12 genes were successfully sub-cloned into a pet29B+ vector utilizing the
Gibson Assembly® Protocol (E5510) and transformed into DH5α competent cells. Colonies that
grew on KAN plates were grown overnight, plasmid extracted, and sent for sequencing in order
to verify the gene was correctly inserted. Once sequenced verified, the plasmids were
transformed into E.coli (BL21 DE3) cells for expression. A single colony was picked and grown
overnight in 50 mL of LB (50 μl 50mg/ml KAN) at 37°C. The 50 mL culture was inoculated into
0.5L of ZY Auto Induction media containing 35 mL of Automix (1M MgSO4, 100X Metals
Mix, 20X NPS, 50X 5052, and KAN) and grown at 37°C for 3 hours (or until O.D reached .5).
The temperature was dropped to 18°C and left to continue to grow overnight. Cells were
collected by spinning at 4000 rpm (4°C) for 20 minutes in which the pellet was re-suspended in
35 mL of wash buffer (1X PBS, pH 7.4, 20 mM Imidazole pH 7.4). PMSF, Lysozyme and
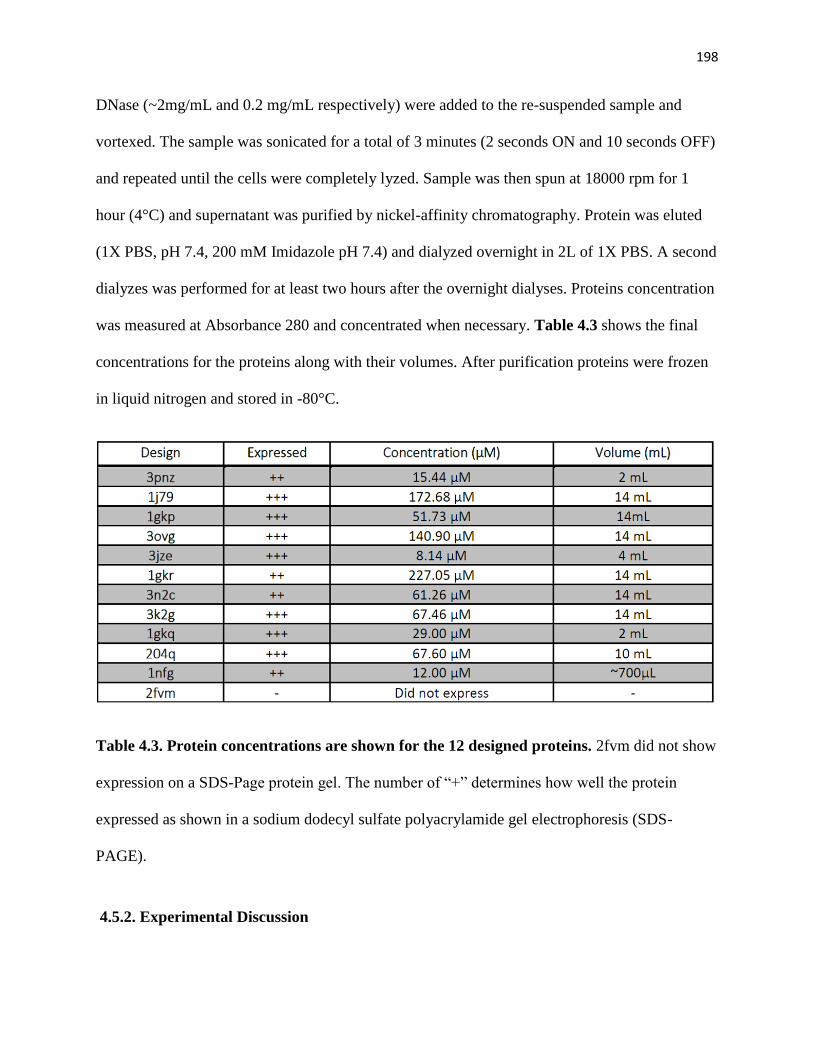
198
DNase (~2mg/mL and 0.2 mg/mL respectively) were added to the re-suspended sample and
vortexed. The sample was sonicated for a total of 3 minutes (2 seconds ON and 10 seconds OFF)
and repeated until the cells were completely lyzed. Sample was then spun at 18000 rpm for 1
hour (4°C) and supernatant was purified by nickel-affinity chromatography. Protein was eluted
(1X PBS, pH 7.4, 200 mM Imidazole pH 7.4) and dialyzed overnight in 2L of 1X PBS. A second
dialyzes was performed for at least two hours after the overnight dialyses. Proteins concentration
was measured at Absorbance 280 and concentrated when necessary. Table 4.3 shows the final
concentrations for the proteins along with their volumes. After purification proteins were frozen
in liquid nitrogen and stored in -80°C.
Table 4.3. Protein concentrations are shown for the 12 designed proteins. 2fvm did not show
expression on a SDS-Page protein gel. The number of “+” determines how well the protein
expressed as shown in a sodium dodecyl sulfate polyacrylamide gel electrophoresis (SDS-
PAGE).
4.5.2. Experimental Discussion
199
Our goal was to design a series of stable, efficient catalysts for cyanuric acid biodegradation and
test through experimental assays and selection. Quantum Mechanical (QM) simulations of
cyanuric acid hydrolysis suggested whether the dinuclear zinc machinery in dihydroorotase
(DHO) has the potential to catalyze cyanuric acid. With the potential energy curves calculated
alongside the complete reaction mechanism for cyanuric acid hydrolysis, they provided insight
into key transition states (TS) for the reaction. These transition states were used as a theozyme in
the design process using RosettaMatch and RosettaDesign. The top designs were ordered and
characterized for activity. The designed enzymes were shipped to the University of Minnesota
where our collaborator, Dr. Lawrence Wackett and Tony Dodge, performed a cyanuric acid
assay in order to check for activity. Unfortunately, none of the designed enzymes showed any
activity for cyanuric acid.
4.6. References
1. Copley, S. D. Evolution of efficient pathways for degradation of anthropogenic chemicals.
Nature Chemical Biology (2009). doi:10.1038/nchembio.197
2. Khan, M. Z. & Law, F. C. P. Adverse effects of pesticides and related chemicals on
enzyme and hormone systems of fish, amphibians and reptiles: a review. Proc. Pakistan
Acad. Sci. (2005).
3. Eskenazi, B. et al. The pine river statement: Human health consequences of DDT use.
Environmental Health Perspectives (2009). doi:10.1289/ehp.11748
4. Kabasenche, W. P. & Skinner, M. K. DDT, epigenetic harm, and transgenerational
environmental justice. Environmental Health: A Global Access Science Source (2014).
doi:10.1186/1476-069X-13-62
5. Islam, M. N., Shin, M. S., Jo, Y. T. & Park, J. H. TNT and RDX degradation and
extraction from contaminated soil using subcritical water. Chemosphere (2015).
doi:10.1016/j.chemosphere.2014.09.101
6. Inglis, J., Dutzik, T. & Rumpler, J. Wasting Our Waterways. 71 (2014).
200
7. Survey, U. S. D. of I. S. G. Estimated Annual Agricultural Pesticide Use for Atrazine,
2015. Available at:
https://water.usgs.gov/nawqa/pnsp/usage/maps/show_map.php?year=2015&map=ATRAZ
INE&hilo=L&disp=Atrazine.
8. Megharaj, M., Ramakrishnan, B., Venkateswarlu, K., Sethunathan, N. & Naidu, R.
Bioremediation approaches for organic pollutants: A critical perspective. Environment
International (2011). doi:10.1016/j.envint.2011.06.003
9. Azubuike, C. C., Chikere, C. B. & Okpokwasili, G. C. Bioremediation techniques–
classification based on site of application: principles, advantages, limitations and
prospects. World Journal of Microbiology and Biotechnology (2016).
doi:10.1007/s11274-016-2137-x
10. Bansal, O. P. Fate of pesticides in the environment. Journal of the Indian Chemical
Society (2011). doi:10.1002/elsc.200520098
11. Yang, Y., Yang, J. & Jiang, L. Comment on "a bacterium that degrades and assimilates
poly(ethylene terephthalate) ". Science (2016). doi:10.1126/science.aaf8305
12. Austin, H. P. et al. Characterization and engineering of a plastic-degrading aromatic
polyesterase. Proc. Natl. Acad. Sci. (2018). doi:10.1073/pnas.1718804115
13. Benotti, M. J. et al. Pharmaceuticals and endocrine disrupting compounds in U.S. drinking
water. Environ. Sci. Technol. (2009). doi:10.1021/es801845a
14. United States Environmental Protection Agency (US EPA). Ground Water
Contamination. Getting Up to Speed (2008).
15. Graymore, M., Stagnitti, F. & Allinson, G. Impacts of atrazine in aquatic ecosystems.
Environ. Int. (2001). doi:10.1016/S0160-4120(01)00031-9
16. Satapanajaru, T., Anurakpongsatorn, P., Pengthamkeerati, P. & Boparai, H. Remediation
of atrazine-contaminated soil and water by nano zerovalent iron. Water. Air. Soil Pollut.
(2008). doi:10.1007/s11270-008-9661-8
17. Hayes, T. et al. Atrazine-induced hermaphroditism at 0.1 ppb in American leopard frogs
(Rana pipiens): Laboratory and field evidence. Environ. Health Perspect. 111, 568–575
(2003).
18. Hayes, T. B. et al. Hermaphroditic, demasculinized frogs after exposure to the herbicide
atrazine at low ecologically relevant doses. Proc. Natl. Acad. Sci. U. S. A. 99, 5476–80
(2002).
19. Hayes, T. B. et al. Atrazine induces complete feminization and chemical castration in
male African clawed frogs (Xenopus laevis). Proc. Natl. Acad. Sci. 107, 4612–4617
201
(2010).
20. Solomon, K. R. et al. Effects of atrazine on fish, amphibians, and aquatic reptiles: A
critical review. Critical Reviews in Toxicology (2008). doi:10.1080/10408440802116496
21. Spanò, L. et al. Effects of atrazine on sex steroid dynamics, plasma vitellogenin
concentration and gonad development in adult goldfish (Carassius auratus). Aquat.
Toxicol. (2004). doi:10.1016/j.aquatox.2003.10.009
22. Beldomenico, P. M. et al. In ovum exposure to pesticides increases the egg weight loss
and decreases hatchlings weight of Caiman latirostris (Crocodylia: Alligatoridae).
Ecotoxicol. Environ. Saf. (2007). doi:10.1016/j.ecoenv.2006.12.018
23. Rey, F. et al. Prenatal exposure to pesticides disrupts testicular histoarchitecture and alters
testosterone levels in male Caiman latirostris. Gen. Comp. Endocrinol. (2009).
doi:10.1016/j.ygcen.2009.03.032
24. Victor-Costa, A. B., Bandeira, S. M. C., Oliveira, A. G., Mahecha, G. A. B. & Oliveira, C.
A. Changes in testicular morphology and steroidogenesis in adult rats exposed to Atrazine.
Reprod. Toxicol. (2010). doi:10.1016/j.reprotox.2009.12.006
25. Hussain, R. et al. Cellular and biochemical effects induced by atrazine on blood of male
Japanese quail (Coturnix japonica). Pestic. Biochem. Physiol. (2012).
doi:10.1016/j.pestbp.2012.03.001
26. Hayes, T. B. et al. Demasculinization and feminization of male gonads by atrazine:
Consistent effects across vertebrate classes. Journal of Steroid Biochemistry and
Molecular Biology (2011). doi:10.1016/j.jsbmb.2011.03.015
27. Hakim, D. N. Y. T. A Pesticide Banned, or Not, Underscores Trans-Atlantic Trade
Sensitivities. The New York Times (2015). Available at:
https://www.nytimes.com/2015/02/24/business/international/a-pesticide-banned-or-not-
underscores-trans-atlantic-trade-sensitivities.html.
28. Sass, J. B. & Colangelo, A. European Union bans atrazine, while the United States
negotiates continued use. Int. J. Occup. Environ. Health 12, 260–267 (2006).
29. Wang, H., Lin, K., Hou, Z., Richardson, B. & Gan, J. Sorption of the herbicide
terbuthylazine in two New Zealand forest soils amended with biosolids and biochars. J.
Soils Sediments (2010). doi:10.1007/s11368-009-0111-z
30. Stara, A., Zuskova, E., Kouba, A. & Velisek, J. Effects of terbuthylazine-desethyl, a
terbuthylazine degradation product, on red swamp crayfish (Procambarus clarkii). Sci.
Total Environ. (2016). doi:10.1016/j.scitotenv.2016.05.113
31. Bottoni, P., Grenni, P., Lucentini, L. & Caracciolo, A. B. Terbuthylazine and other
202
triazines in Italian water resources. Microchem. J. (2013).
doi:10.1016/j.microc.2012.06.011
32. Swan, S. H. et al. Semen quality relation to biomarkers of pesticide exposure. Environ.
Health Perspect. (2003). doi:10.1289/ehp.6417
33. Lucas, A. D. et al. Determination of Atrazine Metabolites in Human Urine: Development
of a Biomarker of Exposure. Chem. Res. Toxicol. (1993). doi:10.1021/tx00031a017
34. Mills, P. K. & Yang, R. Regression Analysis of Pesticide Use and Breast Cancer
Incidence in California Latinas. J. Environ. Health (2006).
35. Fan, W. Q. et al. Atrazine-induced aromatase expression is SF-1 dependent: Implications
for endocrine disruption in wildlife and reproductive cancers in humans. Environ. Health
Perspect. (2007). doi:10.1289/ehp.9758
36. Gunier, R. B., Harnly, M. E., Reynolds, P., Hertz, A. & Von Behren, J. Agricultural
pesticide use of California: Pesticide prioritization, use densities, and population
distributions for a childhood cancer study. Environ. Health Perspect. (2001).
doi:10.1289/ehp.011091071
37. Sanderson, J. T., Letcher, R. J., Heneweer, M., Giesy, J. P. & Van Den Berg, M. Effects
of chloro-s-triazine herbicides and metabolites on aromatase activity in various human cell
lines and on vitellogenin production in male carp hepatocytes. Environ. Health Perspect.
(2001). doi:10.1289/ehp.011091027
38. Sanderson, J. T. 2-Chloro-s-Triazine Herbicides Induce Aromatase (CYP19) Activity in
H295R Human Adrenocortical Carcinoma Cells: A Novel Mechanism for Estrogenicity?
Toxicol. Sci. (2000). doi:10.1093/toxsci/54.1.121
39. MacLennan, P. A. et al. Cancer incidence among triazine herbicide manufacturing
workers. J. Occup. Environ. Med. (2002). doi:10.1097/00043764-200211000-00011
40. Kettles, M. A., Browning, S. R., Prince, T. S. & Horstman, S. W. Triazine herbicide
exposure and breast cancer incidence: An ecologic study of Kentucky counties. Environ.
Health Perspect. (1997). doi:10.1289/ehp.971051222
41. Engel, L. S. et al. Pesticide use and breast cancer risk among farmers’ wives in the
agricultural health study. Am. J. Epidemiol. (2005). doi:10.1093/aje/kwi022
42. Reynolds, P. et al. Residential proximity to agricultural pesticide use and incidence of
breast cancer in the California Teachers Study cohort. Environ. Res. (2004).
doi:10.1016/j.envres.2004.03.001
43. Hopenhayn-Rich, C., Stump, M. L. & Browning, S. R. Regional assessment of atrazine
exposure and incidence of breast and ovarian cancers in Kentucky. Arch. Environ.
203
Contam. Toxicol. (2002). doi:10.1007/s002440010300
44. Muir, K. et al. Breast cancer incidence and its possible spatial association with pesticide
application in two counties of England. Public Health (2004).
doi:10.1016/j.puhe.2003.12.019
45. Reynolds, P. et al. Residential proximity to agricultural pesticide use and incidence of
breast cancer in California, 1988-1997. Environmental Health Perspectives (2005).
doi:10.1289/ehp.7765
46. Wetzel, L. T. et al. Chronic effects of atrazine on estrus and mammary tumor formation in
female sprague-dawley and fischer 344 rats. J. Toxicol. Environ. Health (1994).
doi:10.1080/15287399409531913
47. Rooney, A. A., Matulka, R. A. & Luebke, R. W. Developmental atrazine exposure
suppresses immune function in male, but not female Sprague-Dawley rats. Toxicol. Sci.
(2003). doi:10.1093/toxsci/kfg250
48. Imaida, K. & Shirai, T. [Endocrine disrupting chemicals and carcinogenesis--breast, testis
and prostate cancer]. Nihon Rinsho. (2000).
49. Hu, K. et al. Atrazine promotes RM1 prostate cancer cell proliferation by activating
STAT3 signaling. Int. J. Oncol. (2016). doi:10.3892/ijo.2016.3433
50. Inoue-Choi, M. et al. Atrazine in public water supplies and risk of ovarian cancer among
postmenopausal women in the Iowa Women’s Health Study. Occup. Environ. Med.
(2016). doi:10.1136/oemed-2016-103575
51. Rastegar-Moghaddam, S. H., Mohammadipour, A., Hosseini, M., Bargi, R. &
Ebrahimzadeh-Bideskan, A. Maternal exposure to atrazine induces the hippocampal cell
apoptosis in mice offspring and impairs their learning and spatial memory. Toxin Reviews
(2018). doi:10.1080/15569543.2018.1466804
52. Song, X. Y., Li, J. N., Wu, Y. P., Zhang, B. & Li, B. X. Atrazine causes autophagy- and
apoptosis-related neurodegenerative effects in dopaminergic neurons in the rat
nigrostriatal dopaminergic system. Int. J. Mol. Sci. (2015). doi:10.3390/ijms160613490
53. Zhang, B., Ma, K. & Li, B. Inflammatory reaction regulated by microglia plays a role in
atrazine-induced dopaminergic neuron degeneration in the substantia nigra. J. Toxicol. Sci.
(2015). doi:10.2131/jts.40.437
54. Winchester, P. D., Huskins, J. & Ying, J. Agrichemicals in surface water and birth defects
in the United States. Acta Paediatr. Int. J. Paediatr. (2009). doi:10.1111/j.1651-
2227.2008.01207.x
55. Waller, S. A., Paul, K., Peterson, S. E. & Hitti, J. E. Agricultural-related chemical
204
exposures, season of conception, and risk of gastroschisis in Washington state. Obstetrical
and Gynecological Survey (2010). doi:10.1097/OGX.0b013e3181e5f139
56. Agopian, A. J., Cai, Y., Langlois, P. H., Canfield, M. A. & Lupo, P. J. Maternal
residential atrazine exposure and risk for choanal atresia and stenosis in offspring. J.
Pediatr. (2013). doi:10.1016/j.jpeds.2012.08.012
57. Agopian, A. J., Lupo, P. J., Canfield, M. A. & Langlois, P. H. Case-Control Study of
Maternal Residential Atrazine Exposure and Male Genital Malformations. Am. J. Med.
Genet. Part A (2013). doi:10.1002/ajmg.a.35815
58. Tasca, A. L., Puccini, M. & Fletcher, A. Terbuthylazine and desethylterbuthylazine:
Recent occurrence, mobility and removal techniques. Chemosphere (2018).
doi:10.1016/j.chemosphere.2018.03.091
59. Želježić, D. et al. Effects of the chloro-s-triazine herbicide terbuthylazine on DNA
integrity in human and mouse cells. Environ. Sci. Pollut. Res. (2018). doi:10.1007/s11356-
018-2046-7
60. Kane, A. L. et al. Toward bioremediation of methylmercury using silica encapsulated
Escherichia coli harboring the mer operon. PLoS One (2016).
doi:10.1371/journal.pone.0147036
61. Strong, L. C., Rosendahl, C., Johnson, G., Sadowsky, M. J. & Wackett, L. P. Arthrobacter
aurescens TC1 metabolizes diverse s-triazine ring compounds. Appl. Environ. Microbiol.
(2002). doi:10.1128/AEM.68.12.5973-5980.2002
62. Shapir, N. et al. Evolution of catabolic pathways: Genomic insights into microbial s-
triazine metabolism. Journal of Bacteriology (2007). doi:10.1128/JB.01257-06
63. Tyan, Y. C., Yang, M. H., Jong, S. Bin, Wang, C. K. & Shiea, J. Melamine contamination.
Analytical and Bioanalytical Chemistry (2009). doi:10.1007/s00216-009-3009-0
64. Gossner, C. M. E. et al. The melamine incident: Implications for international food and
feed safety. Environmental Health Perspectives (2009). doi:10.1289/ehp.0900949
65. Lin, M. et al. Detection of melamine in gluten, chicken feed, and processed foods using
surface enhanced Raman spectroscopy and HPLC. J. Food Sci. (2008).
doi:10.1111/j.1750-3841.2008.00901.x
66. Hau, A. K., Kwan, T. H. & Li, P. K. Melamine toxicity and the kidney. J. Am. Soc.
Nephrol. 20, 245–250 (2009).
67. Pei, X. et al. The China melamine milk scandal and its implications for food safety
regulation. Food Policy (2011). doi:10.1016/j.foodpol.2011.03.008
205
68. Bischoff, K. & Rumbeiha, W. K. Pet Food Recalls and Pet Food Contaminants in Small
Animals. Veterinary Clinics of North America - Small Animal Practice (2012).
doi:10.1016/j.cvsm.2011.12.007
69. Xiu, C. & Klein, K. K. Melamine in milk products in China: Examining the factors that
led to deliberate use of the contaminant. Food Policy 35, 463–470 (2010).
70. Shiomi, N. Biodegradation of Melamine and Cyanuric Acid by a Newly-Isolated
Microbacterium Strain. Adv. Microbiol. 02, 303–309 (2012).
71. Takagi, K., Fujii, K., Yamazaki, K. I., Harada, N. & Iwasaki, A. Biodegradation of
melamine and its hydroxy derivatives by a bacterial consortium containing a novel
Nocardioides species. Appl. Microbiol. Biotechnol. (2012). doi:10.1007/s00253-011-3673-
9
72. Seffernick, J. L., Dodge, A. G., Sadowsky, M. J., Bumpus, J. A. & Wackett, L. P.
Bacterial ammeline metabolism via guanine deaminase. J. Bacteriol. (2010).
doi:10.1128/JB.01243-09
73. Shelton, D. R., Karns, J. S., Mccarty, G. W. & Durham, D. R. Metabolism of melamine by
Klebsiella terragena. Appl. Environ. Microbiol. (1997).
74. De Souza, M. L., Wackett, L. P., Boundy-Mills, K. L., Mandelbaum, R. T. & Sadowsky,
M. J. Cloning, characterization, and expression of a gene region from Pseudomonas sp.
strain ADP involved in the dechlorination of atrazine. Appl. Environ. Microbiol. 61,
3373–3378 (1995).
75. Souza, M. L. De, Sadowsky, M. J. & Wackett, L. P. Atrazine chlorohydrolase from
Pseudomonas sp . strain ADP : gene sequence , enzyme purification , and protein
characterization . Atrazine Chlorohydrolase from Pseudomonas sp . Strain ADP : Gene
Sequence , Enzyme Purification , and Protein Characterization. J. Bacteriol. 178, 4894–
4900 (1996).
76. De Souza, M. L. et al. Erratum: Molecular basis of a bacterial consortium: Interspecies
catabolism of atrazine (Applied and Environmental (1998) 64:1 (178-184)). Applied and
Environmental Microbiology (2000). doi:10.1128/AEM.66.3.1252-1252.2000
77. Solomon, R. D. J., Kumar, A. & Satheeja Santhi, V. Atrazine biodegradation efficiency,
metabolite detection, and trzD gene expression by enrichment bacterial cultures from
agricultural soil. J. Zhejiang Univ. Sci. B (2013). doi:10.1631/jzus.B1300001
78. Peat, T. S. et al. The structure of the hexameric atrazine chlorohydrolase AtzA research
papers. 710–720 (2015). doi:10.1107/S1399004715000619
79. Boundy-mills, K. L., Souza, M. L. D. E. & Mandelbaum, R. T. The atzB gene of
Pseudomonas sp . strain ADP encodes the second enzyme of a novel atrazine degradation
206
pathway . The atzB Gene of Pseudomonas sp . Strain ADP Encodes the Second Enzyme
of a Novel Atrazine Degradation Pathway †. 63, 916–923 (1997).
80. Seffernick, J. L. et al. Hydroxyatrazine N-ethylaminohydrolase (AtzB): An
amidohydrolase superfamily enzyme catalyzing deamination and dechlorination. J.
Bacteriol. 189, 6989–6997 (2007).
81. Sadowsky, M. J., Tong, Z., De Souza, M. & Wackett, L. P. AtzC is a new member of the
amidohydrolase protein superfamily and is homologous to other atrazine-metabolizing
enzymes. J. Bacteriol. 180, 152–158 (1998).
82. Shapir, N., Osborne, J. P., Johnson, G., Sadowsky, M. J. & Wackett, L. P. Purification,
substrate range, and metal center of AtzC: The N-isopropylammelide aminohydrolase
involved in bacterial atrazine metabolism. J. Bacteriol. 184, 5376–5384 (2002).
83. Jurina, T. et al. Catabolism of terbuthylazine by mixed bacterial culture originating from
s-triazine-contaminated soil. Appl. Microbiol. Biotechnol. 98, 7223–7232 (2014).
84. Udikoviç-Koliç, N., Scott, C. & Martin-Laurent, F. Evolution of atrazine-degrading
capabilities in the environment. Applied Microbiology and Biotechnology (2012).
doi:10.1007/s00253-012-4495-0
85. Balotra, S. et al. X-Ray Structure and Mutagenesis Studies of the N-Isopropylammelide
Isopropylaminohydrolase, AtzC. PLoS One 10, e0137700 (2015).
86. Chelinho, S. et al. Cleanup of atrazine-contaminated soils: Ecotoxicological study on the
efficacy of a bioremediation tool with Pseudomonas sp. ADP. J. Soils Sediments (2010).
doi:10.1007/s11368-009-0145-2
87. Chelinho, S. et al. Semifield testing of a bioremediation tool for atrazine-contaminated
soils: Evaluating the efficacy on soil and aquatic compartments. Environ. Toxicol. Chem.
(2012). doi:10.1002/etc.1840
88. Wackett, L., Sadowsky, M., Martinez, B. & Shapir, N. Biodegradation of atrazine and
related s-triazine compounds: From enzymes to field studies. Applied Microbiology and
Biotechnology 58, 39–45 (2002).
89. Johannesen, H. & Aamand, J. Mineralization of aged atrazine, terbuthylazine, 2,4-D, and
mecoprop in soil and aquifer sediment. Environ. Toxicol. Chem. (2003).
doi:10.1897/1551-5028(2003)022<0722:MOAATD>2.0.CO;2
90. Narayanaswamy, R. et al. Widespread reorganization of metabolic enzymes into
reversible assemblies upon nutrient starvation. Proc. Natl. Acad. Sci. (2009).
doi:10.1073/pnas.0812771106
91. Kurganov, B. I. The role of multienzyme complexes in integration of cellular metabolism.
207
J. Theor. Biol. (1986). doi:10.1016/S0022-5193(86)80194-1
92. Zhao, H., French, J. B., Fang, Y. & Benkovic, S. J. The purinosome, a multi-protein
complex involved in the de novo biosynthesis of purines in humans. Chem. Commun.
(2013). doi:10.1039/c3cc41437j
93. An, S., Kumar, R., Sheets, E. D. & Benkovic, S. J. Reversible compartmentalization of de
novo purine biosynthetic complexes in living cells. Science 320, 103–106 (2008).
94. Pedley, A. M. & Benkovic, S. J. A New View into the Regulation of Purine Metabolism:
The Purinosome. Trends in Biochemical Sciences (2017). doi:10.1016/j.tibs.2016.09.009
95. Castellana, M. et al. Enzyme clustering accelerates processing of intermediates through
metabolic channeling. Nat. Biotechnol. (2014). doi:10.1038/nbt.3018
96. Küchler, A., Yoshimoto, M., Luginbühl, S., Mavelli, F. & Walde, P. Enzymatic reactions
in confined environments. Nat. Nanotechnol. (2016). doi:10.1038/nnano.2016.54
97. Bulutoglu, B., Garcia, K. E., Wu, F., Minteer, S. D. & Banta, S. Direct Evidence for
Metabolon Formation and Substrate Channeling in Recombinant TCA Cycle Enzymes.
ACS Chem. Biol. (2016). doi:10.1021/acschembio.6b00523
98. Dueber, J. E. et al. Synthetic protein scaffolds provide modular control over metabolic
flux. Nat. Biotechnol. 27, 753–759 (2009).
99. Dvorak, P., Bidmanova, S., Damborsky, J. & Prokop, Z. Immobilized synthetic pathway
for biodegradation of toxic recalcitrant pollutant 1,2,3-trichloropropane. Environ. Sci.
Technol. (2014). doi:10.1021/es500396r
100. Yang, L. et al. Computation-Guided Design of a Stimulus-Responsive Multienzyme
Supramolecular Assembly. ChemBioChem 18, 2000–2006 (2017).
101. Hsia, Y. et al. Design of a hyperstable 60-subunit protein icosahedron. Nature 535, 136–
139 (2016).
102. Bale, J. B. et al. Accurate design of megadalton-scale two-component icosahedral protein
complexes. Science (80-. ). (2016). doi:10.1126/science.aaf8818
103. King, N. P. et al. Computational design of self-assembling protein nanomaterials with
atomic level accuracy. Science (80-. ). 336, 1171–1174 (2012).
104. Votteler, J. et al. Designed proteins induce the formation of nanocage-containing
extracellular vesicles. Nature (2016). doi:10.1038/nature20607
105. Suzuki, Y. et al. Self-assembly of coherently dynamic, auxetic, two-dimensional protein
crystals. Nature 533, 369–373 (2016).
208
106. Sinclair, J. C., Davies, K. M., Vénien-Bryan, C. & Noble, M. E. M. Generation of protein
lattices by fusing proteins with matching rotational symmetry. Nat. Nanotechnol. 6, 558–
562 (2011).
107. Padilla, J. E., Colovos, C. & Yeates, T. O. Nanohedra: Using symmetry to design self
assembling protein cages, layers, crystals, and filaments. Proc. Natl. Acad. Sci. 98, 2217–
2221 (2001).
108. Zhang, J., Zheng, F. & Grigoryan, G. Design and designability of protein-based
assemblies. Current Opinion in Structural Biology 27, 79–86 (2014).
109. Mandelbrot, B. Fractals - a geometry of nature. New Sci. (1990). doi:citeulike-article-
id:580392
110. Havlin, S. et al. Fractals in biology and medicine. Chaos, Solitons and Fractals (1995).
doi:10.1016/0960-0779(95)80025-C
111. Fairbanks, M. S., McCarthy, D. N., Scott, S. A., Brown, S. A. & Taylor, R. P. Fractal
electronic devices: Simulation and implementation. Nanotechnology 22, (2011).
112. Soleymani, L., Fang, Z., Sargent, E. H. & Kelley, S. O. Programming the detection limits
of biosensors through controlled nanostructuring. Nat. Nanotechnol. 4, 844–848 (2009).
113. Ge, J., Lei, J. & Zare, R. N. Protein-inorganic hybrid nanoflowers. Nat. Nanotechnol. 7,
428–432 (2012).
114. Zhang, P. & Wang, S. Designing fractal nanostructured biointerfaces for biomedical
applications. ChemPhysChem 15, 1550–1561 (2014).
115. Lim, B. et al. Pd-Pt bimetallic nanodendrites with high activity for oxygen reduction.
Science (80-. ). 324, 1302–1305 (2009).
116. Thekkekara, L. V. & Gu, M. Bioinspired fractal electrodes for solar energy storages. Sci.
Rep. (2017). doi:10.1038/srep45585
117. Chamousis, R. L. et al. Effect of fractal silver electrodes on charge collection and light
distribution in semiconducting organic polymer films. J. Mater. Chem. A (2014).
doi:10.1039/c4ta03204g
118. Watterson, W. J., Montgomery, R. D. & Taylor, R. P. Fractal Electrodes as a Generic
Interface for Stimulating Neurons. Sci. Rep. (2017). doi:10.1038/s41598-017-06762-3
119. Yang, C. et al. Fractal dendrite-based electrically conductive composites for laser-scribed
flexible circuits. Nat. Commun. (2015). doi:10.1038/ncomms9150
120. Cerofolini, G. F., Narducci, D., Amato, P. & Romano, E. Fractal nanotechnology.
209
Nanoscale Res. Lett. 3, 381–385 (2008).
121. Shang, J. et al. Assembling molecular Sierpiński triangle fractals. Nat. Chem. 7, 389–393
(2015).
122. Shin, S. et al. Polymer Self-Assembly into Unique Fractal Nanostructures in Solution by a
One-Shot Synthetic Procedure. J. Am. Chem. Soc. 140, 475–482 (2018).
123. Murr, M. M. & Morse, D. E. Fractal intermediates in the self-assembly of silicatein
filaments. Proc. Natl. Acad. Sci. 102, 11657–11662 (2005).
124. Khire, T. S., Kundu, J., Kundu, S. C. & Yadavalli, V. K. The fractal self-assembly of the
silk protein sericin. Soft Matter 6, 2066 (2010).
125. Lomander, A., Hwang, W. & Zhang, S. Hierarchical self-assembly of a coiled-coil peptide
into fractal structure. Nano Lett. 5, 1255–1260 (2005).
126. Kurland, N. E., Kundu, J., Pal, S., Kundu, S. C. & Yadavalli, V. K. Self-assembly
mechanisms of silk protein nanostructures on two-dimensional surfaces. Soft Matter
(2012). doi:10.1039/c2sm25313e
127. Yeates, T. O. Geometric Principles for Designing Highly Symmetric Self-Assembling
Protein Nanomaterials. Annu. Rev. Biophys. (2017). doi:10.1146/annurev-biophys-
070816-033928
128. Lai, Y. T., King, N. P. & Yeates, T. O. Principles for designing ordered protein
assemblies. Trends in Cell Biology 22, 653–661 (2012).
129. Kaneko, T. et al. Superbinder SH2 domains act as antagonists of cell signaling. Sci.
Signal. 5, (2012).
130. Cho, S. et al. Cyanuric Acid Hydrolase from Azorhizobium caulinodans ORS 571: Crystal
Structure and Insights into a New Class of Ser-Lys Dyad Proteins. PLoS One 9, e99349
(2014).
131. Mandelbrot, B. The fractal geometry of nature. 406 (1983). doi:10.1002/esp.3290080415
132. Losa, G.A., Merlini, D., Nonnenmacher, T.F., Weibel, E. . Mathematics and biosciences
in interaction. in Fractals in biology and medicine. Volume IV. vii, 314 (Birkhäuser,
Basel, 2005).
133. Newkome, G. R. et al. Nanoassembly of a fractal polymer: A molecular ‘Sierpinski
hexagonal gasket’. Science (80-. ). 312, 1782–1785 (2006).
134. Newkome, G. R. & Moorefield, C. N. From 1 → 3 dendritic designs to fractal
supramacromolecular constructs: understanding the pathway to the Sierpiński gasket.
210
Chem. Soc. Rev. 44, 3954–3967 (2015).
135. Astier, Y., Bayley, H. & Howorka, S. Protein components for nanodevices. Current
Opinion in Chemical Biology 9, 576–584 (2005).
136. Shen, W., Lammertink, R. G. H., Sakata, J. K., Kornfield, J. A. & Tirrell, D. A. Assembly
of an artificial protein hydrogel through leucine zipper aggregation and bisulfide bond
formation. Macromolecules 38, 3909–3916 (2005).
137. McManus, J. J., Charbonneau, P., Zaccarelli, E. & Asherie, N. The physics of protein self-
assembly. Curr. Opin. Colloid Interface Sci. 22, 73–79 (2016).
138. Brodin, J. D. et al. Metal-directed, chemically tunable assembly of one-, two- and three-
dimensional crystalline protein arrays. Nat. Chem. 4, 375–382 (2012).
139. Ringler, P. & Schulz, G. E. Self-assembly of proteins into designed networks. Science
(80-. ). 302, 106–109 (2003).
140. Lindenmayer, A. Mathematical models for cellular interactions in development II. Simple
and branching filaments with two-sided inputs. J. Theor. Biol. 18, 300–315 (1968).
141. Kaneko, T. et al. Superbinder SH2 Domains Act as Antagonists of Cell Signaling. Sci.
Signal. 5, ra68-ra68 (2012).
142. Richter, F., Leaver-Fay, A., Khare, S. D., Bjelic, S. & Baker, D. De novo enzyme design
using Rosetta3. PLoS One 6, (2011).
143. Van Anders, G., Ahmed, N. K., Smith, R., Engel, M. & Glotzer, S. C. Entropically patchy
particles: Engineering valence through shape entropy. ACS Nano 8, 931–940 (2014).
144. Zhang, Z. & Glotzer, S. C. Self-assembly of patchy particles. Nano Lett. 4, 1407–1413
(2004).
145. Nicolas-Carlock, J. R., Carrillo-Estrada, J. L. & Dossetti, V. Fractality a la carte: A
general particle aggregation model. Sci. Rep. 6, (2016).
146. Dantas, G., Kuhlman, B., Callender, D., Wong, M. & Baker, D. A large scale test of
computational protein design: Folding and stability of nine completely redesigned
globular proteins. J. Mol. Biol. 332, 449–460 (2003).
147. Tinberg, C. E. et al. Computational design of ligand-binding proteins with high affinity
and selectivity. Nature 501, 212–6 (2013).
148. Meiler, J. & Baker, D. ROSETTALIGAND: Protein-small molecule docking with full
side-chain flexibility. Proteins Struct. Funct. Genet. 65, 538–548 (2006).
211
149. Tyka, M. D. et al. Alternate states of proteins revealed by detailed energy landscape
mapping. J. Mol. Biol. 405, 607–618 (2011).
150. Zanghellini, A. et al. New algorithms and an in silico benchmark for computational
enzyme design. Protein Sci. 15, 2785–2794 (2006).
151. Berman, H. M. et al. The protein data bank. Nucleic Acids Res. 28, 235–242 (2000).
152. Mandell, D. J. & Kortemme, T. Backbone flexibility in computational protein design.
Current Opinion in Biotechnology 20, 420–428 (2009).
153. Fleishman, S. J. et al. Rosettascripts: A scripting language interface to the Rosetta
Macromolecular modeling suite. PLoS One 6, (2011).
154. Mandelbaum, R. T., Allan, D. l. & Wackett, L. P. Isolation and Characterization of a
Pseudomonas sp . That Mineralizes the s -Triazine Herbicide Atrazine. Appl. Environ.
Microbiol. 61, 1451–1457 (1995).
155. Seffernick, J. L., Johnson, G., Sadowsky, M. J. & Wackett, L. P. Substrate specificity of
atrazine chlorohydrolase and atrazine-catabolizing bacteria. Appl. Environ. Microbiol. 66,
4247–4252 (2000).
156. Gibson, D. G. et al. Enzymatic assembly of DNA molecules up to several hundred
kilobases. Nat. Methods 6, 343–5 (2009).
157. Shapir, N. et al. TrzN from Arthrobacter aurescens TC1 is a zinc amidohydrolase. J.
Bacteriol. 188, 5859–5864 (2006).
158. Parton, D. L. et al. An open library of human kinase domain constructs for automated
bacterial expression. bioRxiv (2016).
159. Cameron, S. M., Durchschein, K., Richman, J. E., Sadowsky, M. J. & Wackett, L. P. New
family of biuret hydrolases involved in s -triazine ring metabolism. ACS Catal. 1, 1075–
1082 (2011).
160. Li, Q., Seffernick, J. L., Sadowsky, M. J. & Wackett, L. P. Thermostable cyanuric acid
hydrolase from Moorella thermoacetica ATCC 39073. Appl. Environ. Microbiol. 75,
6986–6991 (2009).
161. Nečas, D. & Klapetek, P. Gwyddion: an open-source software for SPM data analysis.
Open Phys. 10, 181–188 (2012).
162. Kremer, J. R., Mastronarde, D. N. & McIntosh, J. R. Computer visualization of three-
dimensional image data using IMOD. J. Struct. Biol. 116, 71–6 (1996).
163. Pettersen, E. F. et al. UCSF Chimera - A visualization system for exploratory research and
212
analysis. J. Comput. Chem. 25, 1605–1612 (2004).
164. Mutlu, B. R., Yeom, S., Wackett, L. P. & Aksan, A. Modelling and optimization of a
bioremediation system utilizing silica gel encapsulated whole-cell biocatalyst. Chem. Eng.
J. 259, 574–580 (2015).
165. Sontz, P. A., Bailey, J. B., Ahn, S. & Tezcan, F. A. A Metal Organic Framework with
Spherical Protein Nodes: Rational Chemical Design of 3D Protein Crystals. J. Am. Chem.
Soc. 137, 11598–11601 (2015).
166. Hausdorff, F. Dimension und äußeres Maß. Math. Ann. 79, 157–179 (1919).
167. Meakin, P. Formation of fractal clusters and networks by irreversible diffusion-limited
aggregation. Phys. Rev. Lett. 51, 1119–1122 (1983).
168. Meakin, P. Diffusion-controlled cluster formation in 2-6 dimensional space. Phys. Rev. A
27, 1495–1507 (1983).
169. Kirkby, M. J. The fractal geometry of nature. Benoit B. Mandelbrot. W. H. Freeman and
co., San Francisco, 1982. No. of pages: 460. Price: £22.75 (hardback). Earth Surf.
Process. Landforms 8, 406–406 (1983).
170. Smith, T. G., Lange, G. D. & Marks, W. B. Fractal methods and results in cellular
morphology - Dimensions, lacunarity and multifractals. Journal of Neuroscience Methods
69, 123–136 (1996).
171. Sass, J. B. & Colangelo, A. European Union bans atrazine, while the United States
negotiates continued use. Int. J. Occup. Environ. Health 12, 260–267 (2006).
172. Fuhrmann, A., Gans, O., Weiss, S., Haberhauer, G. & Gerzabek, M. H. Determination of
bentazone, chloridazon and terbuthylazine and some of their metabolites in complex
environmental matrices by liquid chromatography-electrospray ionization-tandem mass
spectrometry using a modified QuEChERS method: An optimization and vali. Water. Air.
Soil Pollut. 225, (2014).
173. Kolić, N. U. et al. Combined metabolic activity within an atrazine-mineralizing
community enriched from agrochemical factory soil. Int. Biodeterior. Biodegrad. 60, 299–
307 (2007).
174. Frisch, M. J. et al. Gaussian 09, Revision D.01. Gaussian Inc. Wallingford CT (2009).
doi:10.1159/000348293
175. Lee, C., Yang, W. & Parr, R. G. Development of the Colle-Salvetti correlation-energy
formula into a functional of the electron density. Phys. Rev. B 37, 785–789 (1988).
176. Hay, P. J. & Wadt, W. R. Ab initio effective core potentials for molecular calculations.
213
Potentials for the transition metal atoms Sc to Hg. J. Chem. Phys. 82, 270 (1985).
177. Kunkel, T. a. Rapid and efficient site-specific mutagenesis without phenotypic selection.
Proc. Natl. Acad. Sci. U. S. A. 82, 488–492 (1985).
178. Kuhlman, B. & Baker, D. Native protein sequences are close to optimal for their
structures. Proc. Natl. Acad. Sci. 97, 10383–10388 (2000).
179. Copley, S. D. Evolution of Efficient Pathways for Degradation of Anthropogenic
Chemicals. Dev. Biol. 5, 559–566 (2010).
180. Shapir, N., Osborne, J. P., Johnson, G., Sadowsky, M. J. & Wackett, L. P. Purification,
substrate range, and metal center of AtzC: The N-isopropylammelide aminohydrolase
involved in bacterial atrazine metabolism. J. Bacteriol. 184, 5376–5384 (2002).
181. Thoden, J. B., Phillips, G. N., Neal, T. M., Raushel, F. M. & Holden, H. M. Molecular
structure of dihydroorotase: a paradigm for catalysis through the use of a binuclear metal
center. Biochemistry 40, 6989–6997 (2001).
182. Hall, R. S. et al. Three-dimensional structure and catalytic mechanism of cytosine
deaminase. Biochemistry 50, 5077–5085 (2011).
183. Liao, R. Z., Yu, J. G., Raushel, F. M. & Himo, F. Theoretical investigation of the reaction
mechanism of the dinuclear zinc enzyme dihydroorotase. Chem. - A Eur. J. 14, 4287–4292
(2008).
184. Copley, S. D. Evolution of efficient pathways for degradation of anthropogenic chemicals.
Nat. Chem. Biol. 5, 559–566 (2009).
185. Gaussian 09, Revision D.01, M. J. Frisch, G. W. Trucks, H. B. Schlegel, G. E. Scuseria,
M. A. Robb, J. R. Cheeseman, G. Scalmani, V. Barone, B. Mennucci, G. A. Petersson, H.
Nakatsuji, M. Caricato, X. Li, H. P. Hratchian, A. F. Izmaylov, J. Bloino, G. Zhe, 2009.
No Title.
186. Barone, V. & Cossi, M. Quantum calculation of molecular energies and energy gradients
in solution by a conductor solvent model. J. Phys. Chem. A 5639, 1995–2001 (1998).


