Embed Size (px)
Citation preview
Towards indicators for a post‐2015 education framework Post-2015 Education Indicators Technical Advisory Group of the EFA Steering Committee
November 2014, version 2
Published in 2014 by:
UNESCO Institute for Statistics P.O. Box 6128, Succursale Centre-Ville Montreal, Quebec H3C 3J7 Canada
Tel: +1-514-343-6880 Email: [email protected] http://www.uis.unesco.org
©UNESCO-UIS 2014
Ref: UIS/2014/ED/TD/11/REV
This publication is available in Open Access under the Attribution-ShareAlike 3.0 IGO (CC-BY-SA 3.0 IGO) license (http://creativecommons.org/licenses/by-sa/3.0/igo/). By using the content of this publication, the users accept to be bound by the terms of use of the UNESCO Open Access Repository (http://www.unesco.org/open-access/terms-use-ccbysa-en).
The designations employed and the presentation of material throughout this publication do not imply the expression of any opinion whatsoever on the part of UNESCO concerning the legal status of any country, territory, city or area or of its authorities or concerning the delimitation of its frontiers or boundaries.
- iii -
Acronyms and abbreviations CFS Child-friendly schools DAC Development Assistance Committee (OECD) DHS Demographic Health Surveys ECD Early childhood development ECDI Early Childhood Development Index EFA SC Education for All Steering Committee EGRA/EGMA Early Grade Reading Assessment/Early Grade Math Assessment EMIS Education management information system GCE/ESD Global citizenship education/education for sustainable development GSHS Global School-based Health Surveys HBSC Health Behaviour in School-aged Children Study (WHO) ICCS International Civic and Citizenship Education Study (IEA) ICILS International Computer and Information Literacy Study ICT information and communication technology IEA International Association for the Evaluation of Educational Achievement INES Indicators of National Education Systems (OECD) LAMP Literacy Assessment and Monitoring Programme LDC Least-developed country LLECE Laboratorio Latinoamericano de Evaluación de la Calidad de la Educación (Latin
American Laboratory for the Assessment of the Quality of Education MDG Millennium Development Goal MICS Multiple Indicator Cluster Survey NEET Not in education, employment or training OOS Out of school OWG Open Working Group PASEC Programme d'Analyses des Systèmes Éducatifs (Programme of Analysis of
Education Systems) PIAAC Programme for the International Assessment of Adult Competencies (OECD) PIRLS Progress in International Reading Literacy Study PISA Programme for International Student Assessment PTR Pupil-teacher ratio SABER-ECD Systems Approach for Better Education Results – Early Childhood Development
(World Bank) SACMEQ Southern and Eastern Africa Consortium for Monitoring Educational Quality SDSN Sustainable Development Solutions Network SERCE Second Regional Comparative and Explanatory Study (UNESCO) SIDS Small Island Developing States STEP Skills Toward Employment and Productivity (World Bank) TALIS Teaching and Learning International Survey TIMSS Trends in International Mathematics and Science Study TVET Technical and vocational education U5MR Under five mortality rate U5SR Under five stunting rate
- iv -
Guidance note for the public consultation About this report: This report puts forward a set of global education indicators related to:
the seven post-2015 education targets proposed by the Education for All (EFA) Steering Committee in its Joint Proposal and endorsed with some variations in the Muscat Agreement in May 2014; and
the ten education targets proposed by the Open Working Group (OWG) of the United Nations General Assembly in its document published in July 2014.
About the public consultation: This new document is the subject of a public consultation running from 17 November 2014 to 30 January 2015. Please use the comment form and submit your feedback by email to [email protected]. In view of the expected number of comments, we may not be able to respond to individual comments received. Please focus your comments on the proposed indicators and not the goals and targets which have already been the subject of extensive consultations by different partners. At the end of the public consultation period, the responses (sent via the feedback forms) will be made publicly available on the website of the UNESCO Institute for Statistics, unless the submitting organization or individual requests the contrary. We will also publish a brief synthesis of the comments received. The Technical Advisory Group reserves the right not to post comments that are inappropriate for posting. We also encourage readers to discuss the report on Twitter, referencing #Education2015, although this communication is not a substitute for sending comments by email.
- 5 -
Towards indicators for the post-2015 education framework Post-2015 Education Indicators Technical Advisory Group of the EFA Steering Committee November 2014
The Technical Advisory Group (TAG) for post-2015 education indicators was established to provide technical guidance to the Education for All Steering Committee (EFA SC). It is composed of experts from the EFA Global Monitoring Report, OECD, UNESCO Institute for Statistics, UNESCO, UNICEF and World Bank. Its role is to provide feedback on the proposed post-2015 targets, to develop recommendations for indicators and to set out a measurement agenda that meets the demands of the new education and development frameworks.
1. Introduction
This report puts forward a set of global education indicators related to:
the seven post-2015 education targets proposed by the Education for All (EFA) Steering Committee in its Joint Proposal1 and endorsed with some variations in the Muscat Agreement2 in May 2014 and
the ten education targets proposed by the Open Working Group (OWG) of the United Nations General Assembly in its document published in July 2014.3
The two sets of targets overlap to a considerable degree. The note will inform discussions at a series of regional EFA meetings that are scheduled for late 2014 and early 2015 which will review the proposed education goals and targets in advance of the global EFA meeting in the Republic of Korea in May 2015. The new post-2015 Global Education Agenda will be adopted at the May meeting. The TAG is now soliciting input on this latest version of its note on indicators with the aim of updating the paper during the first quarter of 2015 and will continue revising it in response to comments until May 2015. This note also recognises two processes at the heart of the development of a monitoring framework for the overall post-2015 global development agenda, They have both proposed indicators: the Sustainable Development Solutions Network (SDSN), launched by the UN Secretary-General in August 2012;4 and the Friends of the Chair Group on Broader Measures of Progress of the United Nation’s Statistical Commission.5 The TAG adopts some of these proposals but wishes to contribute its own sector-specific knowledge to the debate, as well as covering concepts within the targets that go beyond the scope of the other two processes. There is an important caveat. The role of national monitoring in global tracking is not covered in this paper, which is focused on global monitoring only. The recommendations here can be considered to be a global framework that countries can use as the starting point for developing national monitoring systems, which can be expanded and supplemented with national or regional data and which may be more accurate and useful than what is available at the global level. Nonetheless, the indicator framework presented here is important for the consistent and reliable tracking of progress towards global goals.
1 http://unesdoc.unesco.org/images/0022/002276/227658E.pdf 2 http://unesdoc.unesco.org/images/0022/002281/228122E.pdf 3 http://sustainabledevelopment.un.org/content/documents/1579SDGs%20Proposal.pdf 4 http://unsdsn.org/wp-content/uploads/2014/07/140724-Indicator-working-draft1.pdf 5 http://unstats.un.org/unsd/broaderprogress/work.html
- 6 -
Setting measurable, actionable targets is an important element of building the post-2015 global education agenda. Targets that are easily understood, clearly defined, and that can be tracked with existing indicators over time help to promote change at the national and global levels. In addition, targets can inspire action in new areas for which there are currently no indicators. This document: 1) sets out key issues for consideration in relation to the overall monitoring approach; 2) discusses the proposed education targets and highlights the aspects that can and should be measured; and 3) identifies the relevant data currently available at the global level as well as the key measurement challenges that must be addressed to measure the full intent of the proposed post-2015 education agenda. 2. Technically robust and globally comparable indicators
The indicators needed to globally track the targets should ideally meet a range of standards that ensure technical strength, feasibility, frequency of reporting, cross-national comparability and availability of data over time. For simplicity we focus on two criteria, notably:
Alignment: The construct to be measured must be valid and reliable across all countries, such that the indicator used for this purpose has the same meaning and significance in all settings, ideally measured by a similar question or item. The more specific and concrete the indicator, the more likely this will be the case. For example, it is relatively straightforward to track enrolment rates globally, but many indicators related to education outcomes, such as skills for work, might vary based on the country, cultural context or other factors. Measuring constructs that vary across settings pose challenges for global tracking, as the most effective measures may not be the same in all places. For complex constructs, it may be possible to measure some elements globally, while others may be best measured at the national or regional level, with freedom to adapt constructs to local contexts.
Global comparability: The data must be collected frequently and in all or nearly all countries, representing the entire population. Global tracking is most effective when the data are collected on a regular basis (though not necessarily annually) and all or nearly all countries routinely collect the data in a manner that ensures representation across the population, including, for example, children and youth who are out of school. Infrequent or low coverage of data constrains the ability to track changes over time. It must be feasible and cost-effective to collect data over time. For example, to produce indicators on the quality of early childhood programmes, it is possible to collect some basic underlying data but accurate measurement requires observations by trained staff. So it may be more feasible for countries to invest in this type of observation as part of an on-going monitoring and evaluation system, rather than including quality observations as part of a system of global tracking.
While emphasis is often placed on data required for global monitoring, national and regional tracking are essential and play an important role in determining the extent to which a construct can be practically measured in a consistent way across countries. Regular and reliable national measurement of learning outcomes, equity, and other constructs of interest will play a critical role in monitoring progress towards the proposed education goals. There are several reasons why national data are important. First, more frequent and locally-relevant data can be collected through national systems; and second, in addition to providing the primary source of information for countries to track progress towards goals, national and regional tracking serve as the basis for global tracking over time. Finally, for some constructs, the standards required for global tracking may not be met or feasible across all areas of the proposed targets, but may be more feasibly tracked at the national level.
- 7 -
3. Key issues and challenges As part of the post-2015 global education agenda, the international community will need to address many existing measurement challenges. For example, while considerable progress has been made in extending the coverage of input indicators, such as pupil-teacher ratios, and output indicators, such as completion rates, there are still gaps. However, the post-2015 agenda also presents new issues in the areas of learning outcomes and equity that require careful attention and considerable investment. These two new issues are discussed below. Learning outcomes The first five of the seven targets proposed by the EFA SC and five of those proposed by the OWG focus on learning outcomes of individual children, young people and adults. This is a shift from previous global education targets, such as those in the Millennium Development Goals (MDGs), which narrowly focused on ensuring access, participation and completion in formal education systems. The proposed post-2015 education targets highlight that enrolment and participation (e.g. in early childhood development programmes, formal and non-formal schooling or adult education opportunities) are the means to attaining results and learning outcomes at every stage (e.g. school preparedness for young children; academic competencies for children in primary and secondary education; functional literacy and numeracy skills and skills for work, global citizenship and sustainable development for youth and adults). The emphasis on the measurement of learning outcomes at all levels of education will require global agreement on certain existing indicators and, in several cases, the development of new indicators. There are three immediate challenges:
First, there needs to be agreement on key concepts. To achieve global comparability of learning outcomes, a clearly-articulated and shared understanding of desirable results for children, young people and adults is required, as well as agreement on whether such learning results vary based on context:
o What does it mean for a young child to be ready for school?
o What is a minimum learning standard that should be achieved by the end of primary and during and at the end of secondary education?
o What level of literacy and numeracy is required to fully participate in society?
o What knowledge and skills are required for accessing decent work?
o What knowledge, skills, values and attitudes characterise global citizens?
Second, once a concept is clarified and agreed, measurement tools must be aligned, developed and approved by consensus. Various outcome measures are at different stages of development.
o Some are close to global comparability: all that is needed is a mapping of how concepts are already measured and how they could be made more consistent (e.g. in the case of reading and mathematics outcomes in primary and lower secondary education).
o Others are very far from global comparability: for example, it is not clear what skills for work or global citizenship (other than basic cognitive skills of literacy and numeracy) are equally relevant for people around the world. Some measurement tools will therefore need to be developed and validated.
- 8 -
Third, there is the need for global consensus concerning the underlying components of a universal monitoring framework and mechanisms that facilitate regular reporting on the targets and indicators. In some cases, the most efficient path would be the development of fit-for-purpose tools, such as flexible modules that can be used in different ways. For example:
o Instead of a resource-intensive national literacy survey, it may be better to agree on “lighter” tools to help establish minimum levels of competencies that can be used in national surveys.
o Alternatively, the international community could support expansion of existing surveys that are critical for global monitoring but currently only cover a minority of countries.
o An important challenge is that outcome measures are needed for all children, young people and adults – and not just those in educational institutions. This will require household surveys or other means of collecting data from individuals who are not in school.
Overall, it is possible to measure outputs and some outcomes for all the proposed targets at the national level. However, further development work is needed to establish the foundations and baselines required for monitoring at regional and global levels. At present, there is little information on some important learning outcomes in non-cognitive skills and other areas extending beyond reading and mathematics skills. Further effort is needed to refine definitions, develop tools and improve coverage for these outcomes. Equity Both the EFA SC and the OWG proposals call for an explicit focus on equity in the post-2015 global education agenda.6 In response, monitoring indicators should aim to capture how trends may differ between population groups defined by group and individual characteristics, such as gender, wealth, location, ethnicity, language, or disability (and combinations of these characteristics). The focus on equity raises the following issues:
Global monitoring of inequalities has so far mainly captured differences by gender. This reflects the focus on gender inequalities in the MDGs, which was also enabled by the availability of data for most countries (enrolment and literacy rate indicators based on administrative data and censuses are disaggregated by sex).
Some of these sources allow other dimensions to be taken into account. However, looking systematically at other potential dimensions of disadvantage requires disaggregated data on individuals, which can be administrative but is often more feasible in developing countries through household or school-level surveys. The UIS, through its Data Centre and MDG reporting, the World Bank through its EdStats Education Equality Query and the EFA Global Monitoring Report through its World Inequality Database in Education, have used these surveys to highlight inequalities between groups defined in terms of wealth, location, and ethnicity or language.
6 The OWG proposal declares that the agenda aims “to strive for a world that is just, equitable and inclusive”.
It includes two overall goals on reducing income inequality and achieving gender equality, while all goals except those related to the environment include references to equal, equitable or universal access to services.
- 9 -
The parameters of interest for measuring equity are generally country and context specific (e.g. comparing education attainment between linguistic groups or between different provinces). But some individual characteristics can be compared, when defined in the same way, across countries. Global monitoring of equity could potentially focus on disaggregation of indicators by sex, urban/rural location, and a measure which captures socioeconomic status.
Summary indicators, such as a relative indicator (parity, i.e. the ratio of an indicator’s value between two groups) or an absolute indicator (range, i.e. the gap in the indicator’s value between two groups) could provide a starting point for tracking changes over time, although this is not currently possible for many of the specific groups noted in the targets, as discussed in Section 5.4. Annex A shows how the proposed indicators could be potentially disaggregated by selected individual and household characteristics. In principle, it is possible to introduce a distributional dimension for targets, especially those related to learning outcomes, and proposed indicators provided that a number of serious measurement challenges are addressed. 4. Next steps
A broader roadmap or strategy is needed to establish an agenda to work with national partners to raise demand for data use, improve data systems, strengthen technical expertise and invest in the longer-term methodological development required to implement national and cross-national standards and best practices. This will require a multi-stakeholder effort to help align and guide the activities and ambitions of a wide range of global, regional and national actors, as in the case of similar initiatives to support economic or health data. Coordinated, aligned efforts to improve data currently do not exist for the education sector in the same way as for other sectors. Learning outcomes As noted above, work is needed to further define many of the proposed outcome measures. The most immediate steps include the following:
Coordination and syntheses of new indicator development, especially those that are relevant for children, youth or adults at a particular age. Certain outcomes related to global citizenship education, for example, could be potentially explored in assessments that capture literacy and acquisition of basic academic skills among youth.
Using existing measures and items to create a common metric of reading and numeracy as a first fit-for-purpose mapping of learning outcomes that spans all education levels, to allow for global comparisons within the context of national systems. Work is underway by the UIS, the Australian Council for Education Research and other partners to create a common scale of learning outcomes in the domains of literacy and numeracy that would place items from a range of surveys within a single scale, which is a first step towards facilitating comparisons between countries. Ideally, this would lead to a global set of items that could be integrated into national assessments to facilitate more robust measurement. Such a metric would probably be less workable for other areas of learning, such as social-emotional development, which may depend more on context. However, the many commonalities in the pathways to competencies in reading and numeracy create a real opportunity for generating global comparisons using existing data.
- 10 -
Although attention is often placed on global surveys, investment in national large-scale assessment systems and regional surveys can also help to build the necessary capacity for reliable tracking of learning outcomes by providing the basis for the development of comparable items to track at the regional and global levels.
Equity Once the concepts have been defined and agreed upon and the tools to globally monitor education outputs and outcomes have been developed, the main challenges for the international community in ensuring that equity is captured are the following:
Ensuring accurate data collection on equity also means strengthening the coverage of existing administrative and household-based data collection, identifying ways to locate hard-to-reach populations and capturing information on access, participation and equivalent learning in non-formal settings is essential to providing a full picture of the situation.
Countries should have surveys that capture the relevant education inputs, outputs and outcomes on a regular basis and make the datasets publicly accessible. While some indicators can be captured by existing international surveys, national surveys will also be needed to ensure sufficient levels of coverage. For that reason, a stocktaking exercise would help to assess whether national surveys ask the relevant questions in comparable ways. Further methodological consensus would be required on defining socioeconomic status and other aspects of disadvantage for the purposes of globally-comparable measurement. Standards will need to be set as to how surveys can be used for global monitoring purposes.
Consensus will be needed on how indicators will be estimated and reported and on how international statistical bodies and national statistical agencies can work together to create the mechanisms needed to ensure the use of common methodologies and definitions and the coordination of analysis and reporting.
There is currently little information on other important individual characteristics of interest, notably persons with disabilities, migrants/refugees, linguistic minorities, etc. Further effort is needed to refine definitions, develop tools and improve coverage.
5. Review of the proposed targets In this section all the education targets proposed by either the EFA SC or the OWG are reviewed. The targets are organized by theme with proposals from both sources grouped together. For each concept to be measured within each target, a set of indicators is proposed, their degree of alignment to the concept is assessed and their current availability or potential for global comparability reported. In addition, each indicator has been colour coded as follows in terms of its feasibility. As discussed in the introduction, this paper also incorporates many of the education indicators for monitoring sustainable development that have been proposed by two other organizations: the Sustainable Development Solutions Network7 and the Friends of the Chair Group on Broader Measures of Progress of the United Nation’s Statistical Commission8 where they meet the criteria described above. The full list of indicators proposed by these organizations is presented in Annex B.
7 http://unsdsn.org/wp-content/uploads/2014/07/140724-Indicator-working-draft1.pdf 8 http://unstats.un.org/unsd/broaderprogress/work.html
- 11 -
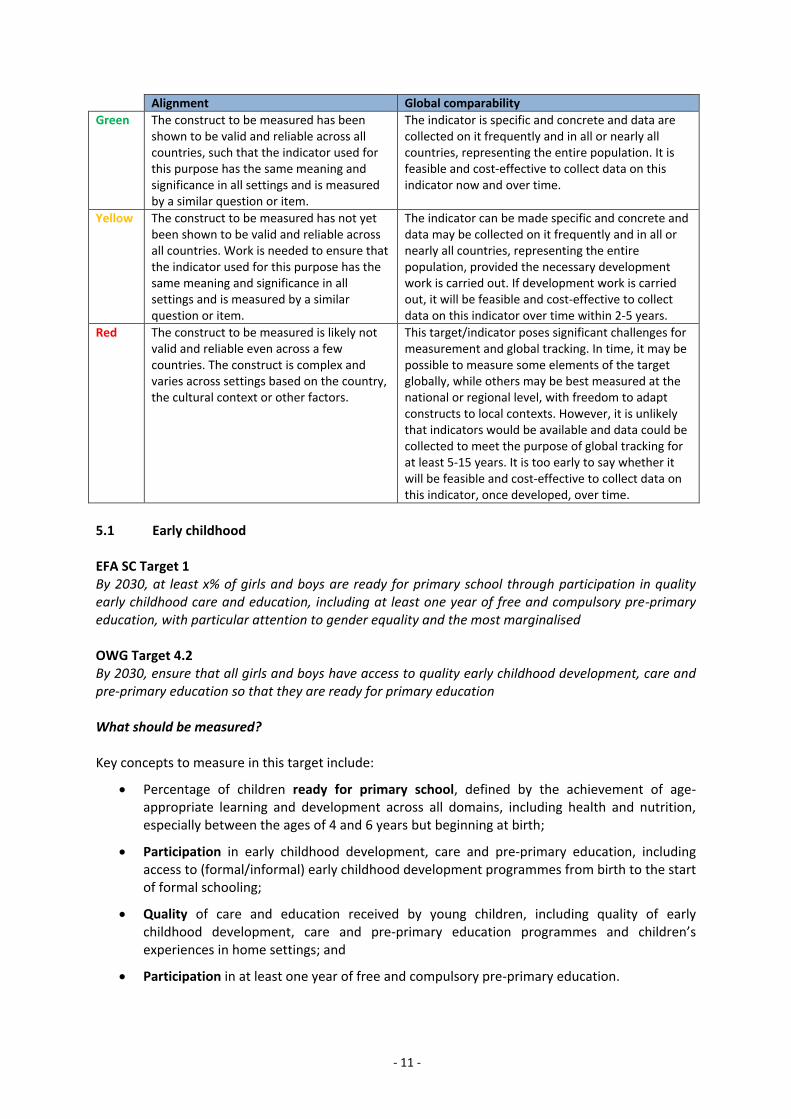
Alignment Global comparability
Green The construct to be measured has been shown to be valid and reliable across all countries, such that the indicator used for this purpose has the same meaning and significance in all settings and is measured by a similar question or item.
The indicator is specific and concrete and data are collected on it frequently and in all or nearly all countries, representing the entire population. It is feasible and cost-effective to collect data on this indicator now and over time.
Yellow The construct to be measured has not yet been shown to be valid and reliable across all countries. Work is needed to ensure that the indicator used for this purpose has the same meaning and significance in all settings and is measured by a similar question or item.
The indicator can be made specific and concrete and data may be collected on it frequently and in all or nearly all countries, representing the entire population, provided the necessary development work is carried out. If development work is carried out, it will be feasible and cost-effective to collect data on this indicator over time within 2-5 years.
Red The construct to be measured is likely not valid and reliable even across a few countries. The construct is complex and varies across settings based on the country, the cultural context or other factors.
This target/indicator poses significant challenges for measurement and global tracking. In time, it may be possible to measure some elements of the target globally, while others may be best measured at the national or regional level, with freedom to adapt constructs to local contexts. However, it is unlikely that indicators would be available and data could be collected to meet the purpose of global tracking for at least 5-15 years. It is too early to say whether it will be feasible and cost-effective to collect data on this indicator, once developed, over time.
5.1 Early childhood EFA SC Target 1 By 2030, at least x% of girls and boys are ready for primary school through participation in quality early childhood care and education, including at least one year of free and compulsory pre-primary education, with particular attention to gender equality and the most marginalised OWG Target 4.2 By 2030, ensure that all girls and boys have access to quality early childhood development, care and pre-primary education so that they are ready for primary education What should be measured? Key concepts to measure in this target include:
Percentage of children ready for primary school, defined by the achievement of age-appropriate learning and development across all domains, including health and nutrition, especially between the ages of 4 and 6 years but beginning at birth;
Participation in early childhood development, care and pre-primary education, including access to (formal/informal) early childhood development programmes from birth to the start of formal schooling;
Quality of care and education received by young children, including quality of early childhood development, care and pre-primary education programmes and children’s experiences in home settings; and
Participation in at least one year of free and compulsory pre-primary education.
- 12 -
There is general consensus that early childhood development should be measured across health, nutrition, education and social protection and reflect children’s development across both cognitive and non-cognitive domains, as both contribute to children’s long-term well-being and school success. What is available now? There are indicators available now to track inputs, outputs and outcomes related to these targets, but the data are limited in scope and do not comprehensively align with the intent of either target. Available outcome indicators include reliable and widely-reported indicators of children’s health (under-five mortality rates) and nutrition (under-five stunting), both of which are critical for children’s school success. There is also some information available on children’s development and learning before primary school, including a recent effort by UNICEF to collect data for an Early Childhood Development Index, including information on children’s learning and development at ages 3 and 4 years. Such data were collected in about 60 countries to date. There are a number of technically-sound national and regional measures of school readiness. Consistent information on access to early childhood development, care and pre-primary education is available for a limited range of settings, with the most reliable information available on access to formal pre-primary settings. Administrative data on enrolment in formal pre-primary settings are available for about 165 countries. More comprehensive but less precise data on participation in a range of different types of early childhood development and care for 3- and 4-year-olds are estimated through household Multiple Indicator Cluster Surveys (MICS). What are the main measurement challenges? More consistent information on learning outcomes and participation in early childhood development, care and pre-primary education for children from birth to the start of formal schooling is needed.
While important, formal pre-primary settings are just one form of provision; community-based preschools, home-visiting programmes, and parenting support have all been shown to be effective routes for improving children’s learning and development, and therefore, access to a range of early childhood development, care and pre-primary education programmes should be included in tracking these targets. Children’s experiences in home settings, which plays a critical role in preparing them for school, is also important to measure, especially if the final target refers to child development and care, as well as education.
While some access information exists, no data are presently available on the intensity of participation in such programmes, which makes it difficult to know whether children have had enough exposure to lead to positive effects on learning and development.
Information on quality in early childhood development, care and pre-primary education is largely not available, with the exception of child-teacher ratios, which are collected in early childhood education programmes through administrative data but are not a consistent marker of quality in all countries. The quality of children’s home environments is collected through the MICS survey.
The presence of early childhood development, care and pre-primary education in legal frameworks of education is readily available for most countries, although it should be noted that the presence of a legal right to education provision does not guarantee its implementation.
- 13 -
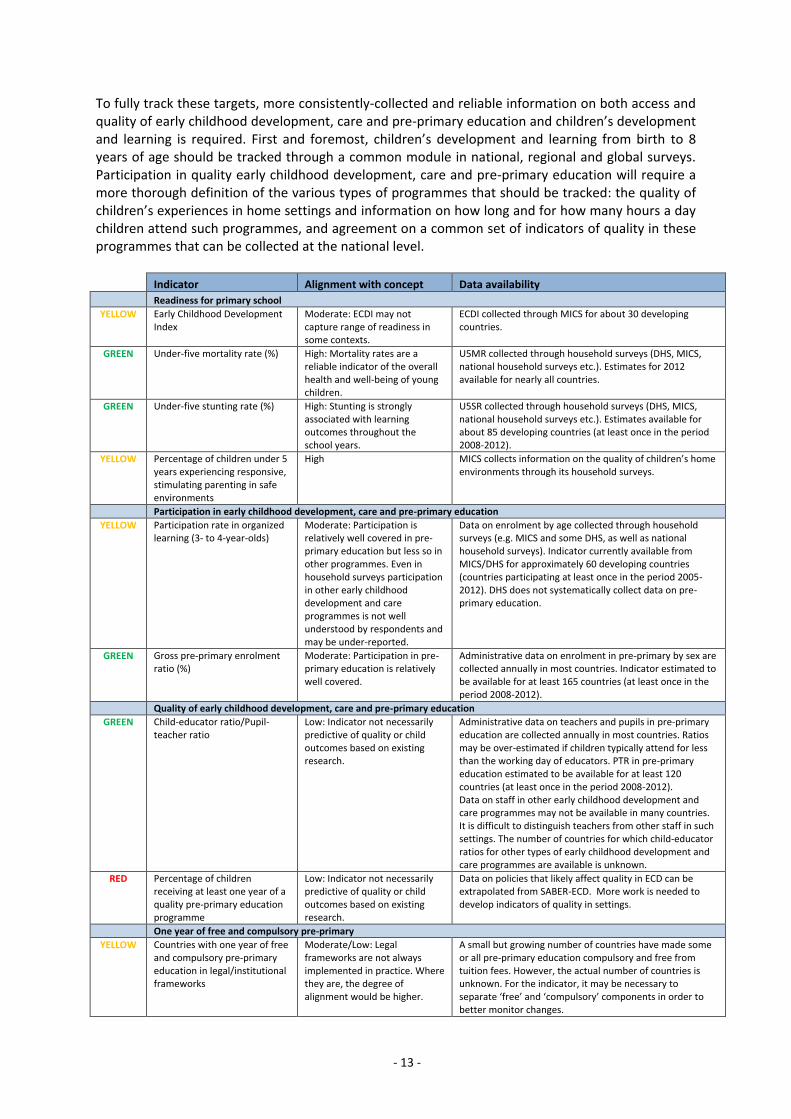
To fully track these targets, more consistently-collected and reliable information on both access and quality of early childhood development, care and pre-primary education and children’s development and learning is required. First and foremost, children’s development and learning from birth to 8 years of age should be tracked through a common module in national, regional and global surveys. Participation in quality early childhood development, care and pre-primary education will require a more thorough definition of the various types of programmes that should be tracked: the quality of children’s experiences in home settings and information on how long and for how many hours a day children attend such programmes, and agreement on a common set of indicators of quality in these programmes that can be collected at the national level. Indicator Alignment with concept Data availability
Readiness for primary school YELLOW Early Childhood Development
Index Moderate: ECDI may not capture range of readiness in some contexts.
ECDI collected through MICS for about 30 developing countries.
GREEN
Under-five mortality rate (%) High: Mortality rates are a reliable indicator of the overall health and well-being of young children.
U5MR collected through household surveys (DHS, MICS, national household surveys etc.). Estimates for 2012 available for nearly all countries.
GREEN
Under-five stunting rate (%) High: Stunting is strongly associated with learning outcomes throughout the school years.
U5SR collected through household surveys (DHS, MICS, national household surveys etc.). Estimates available for about 85 developing countries (at least once in the period 2008-2012).
YELLOW Percentage of children under 5 years experiencing responsive, stimulating parenting in safe environments
High MICS collects information on the quality of children’s home environments through its household surveys.
Participation in early childhood development, care and pre-primary education
YELLOW Participation rate in organized learning (3- to 4-year-olds)
Moderate: Participation is relatively well covered in pre-primary education but less so in other programmes. Even in household surveys participation in other early childhood development and care programmes is not well understood by respondents and may be under-reported.
Data on enrolment by age collected through household surveys (e.g. MICS and some DHS, as well as national household surveys). Indicator currently available from MICS/DHS for approximately 60 developing countries (countries participating at least once in the period 2005-2012). DHS does not systematically collect data on pre-primary education.
GREEN
Gross pre-primary enrolment ratio (%)
Moderate: Participation in pre-primary education is relatively well covered.
Administrative data on enrolment in pre-primary by sex are collected annually in most countries. Indicator estimated to be available for at least 165 countries (at least once in the period 2008-2012).
Quality of early childhood development, care and pre-primary education
GREEN Child-educator ratio/Pupil-teacher ratio
Low: Indicator not necessarily predictive of quality or child outcomes based on existing research.
Administrative data on teachers and pupils in pre-primary education are collected annually in most countries. Ratios may be over-estimated if children typically attend for less than the working day of educators. PTR in pre-primary education estimated to be available for at least 120 countries (at least once in the period 2008-2012). Data on staff in other early childhood development and care programmes may not be available in many countries. It is difficult to distinguish teachers from other staff in such settings. The number of countries for which child-educator ratios for other types of early childhood development and care programmes are available is unknown.
RED
Percentage of children receiving at least one year of a quality pre-primary education programme
Low: Indicator not necessarily predictive of quality or child outcomes based on existing research.
Data on policies that likely affect quality in ECD can be extrapolated from SABER-ECD. More work is needed to develop indicators of quality in settings.
One year of free and compulsory pre-primary
YELLOW Countries with one year of free and compulsory pre-primary education in legal/institutional frameworks
Moderate/Low: Legal frameworks are not always implemented in practice. Where they are, the degree of alignment would be higher.
A small but growing number of countries have made some or all pre-primary education compulsory and free from tuition fees. However, the actual number of countries is unknown. For the indicator, it may be necessary to separate ‘free’ and ‘compulsory’ components in order to better monitor changes.
- 14 -
5.2 Primary and secondary education EFA SC Target 2 By 2030, all girls and boys complete free and compulsory quality basic education of at least nine years and achieve relevant learning outcomes, with particular attention to gender equality and the most marginalised
OWG Target 4.1 By 2030, ensure that all girls and boys complete free, equitable and quality primary and secondary education leading to relevant and effective learning outcomes What should be measured? The key concepts covered by this target are:
Achievement of relevant and effective learning outcomes for primary, lower and upper secondary education;
Access to and participation in primary, lower and upper secondary education;
Completion of primary, lower and upper secondary education of at least nine years’ duration;
Quality of primary and secondary education; and
Guarantee of free and compulsory education of at least nine years’ duration. What is available now? In the last 20 years, considerable efforts have been made to develop and expand assessments of student learning, and many countries are now measuring aspects of the achievement of relevant learning outcomes by girls and boys, including those in marginalised groups, from primary and lower secondary education. In particular, some countries are directly assessing reading and mathematics at the end of Grade 2, although most are doing so at the end of primary education through national systems and regional surveys, such as PIRLS,9 LLECE,10 PASEC11 and SACMEQ.12 These two domains of learning, as well as science, are also being assessed at the end of lower secondary education through national systems and international surveys, such as TIMSS13 and PISA.14 TIMSS also assesses students at the end of upper secondary education (in Grade 12). Countries are generally already well-placed to measure the access, participation and, at least according to national definitions, completion concepts of these targets. Such indicators are often seen as indirect measures of learning outcomes but are easier and cheaper to measure both nationally and internationally and are therefore more widely and frequently available in countries.
9 Progress in International Reading Literacy Study. 10 Laboratorio Latinoamericano de Evaluación de la Calidad de la Educación (Latin American Laboratory for
the Assessment of the Quality of Education). 11 Programme d’Analyses des Systèmes Éducatifs (Programme of Analysis of Education Systems). 12 The Southern and Eastern Africa Consortium for Monitoring Educational Quality. 13 Trends in International Mathematics and Science Study. 14 Programme for International Student Assessment.
- 15 -
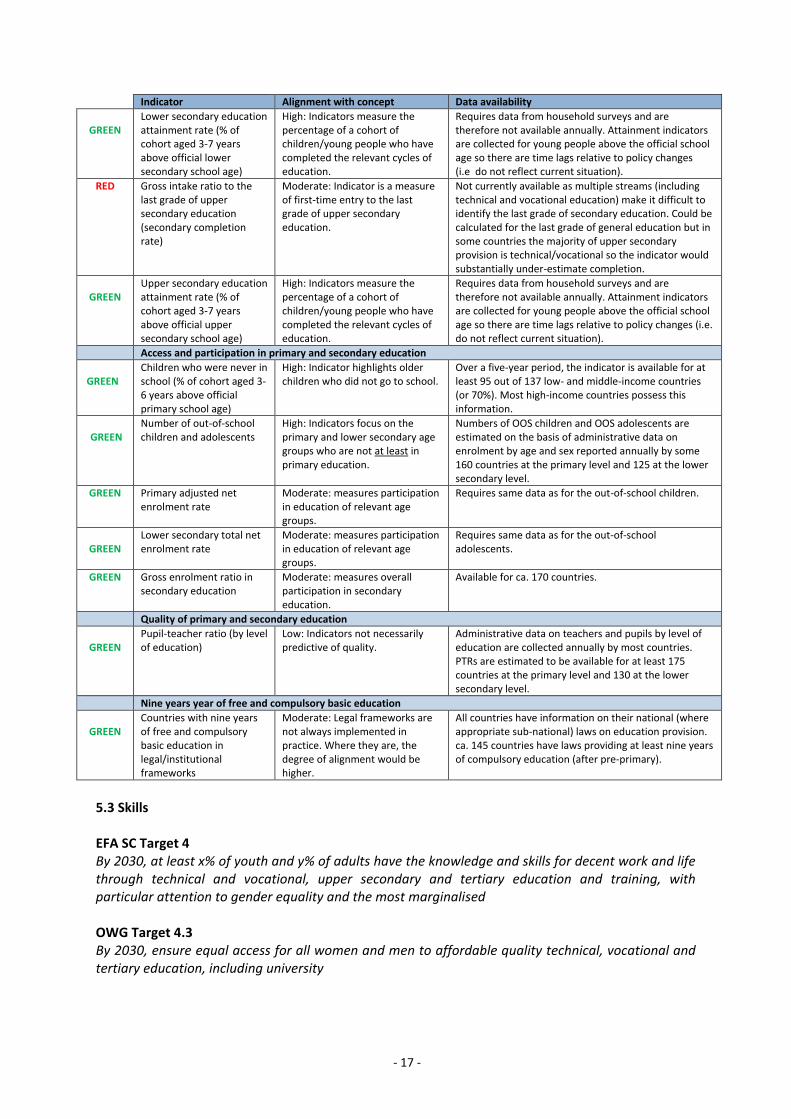
Most countries already collect sufficient administrative data on an annual basis (via school censuses and similar surveys) to measure access to and participation in the relevant levels of education for both girls and boys. Such indicators – gross and net intake and enrolment rates – also require up-to-date estimates of the population of the relevant age groups for the given level of education or age of entry, data which are also available annually for many countries with the exception of small states or those in situations of crisis. In addition to disaggregation by sex, administrative sources often allow for data by regions or districts within countries, provided the relevant population estimates are available at the sub-national level. Many countries also conduct periodic household surveys – at least once every three to five years – from which access and participation rates can be measured directly both by sex and, usually, by region within countries. Sample sizes or sampling methods/structures may not always be sufficient to allow for disaggregation to smaller population groups or lower administrative levels (e.g. districts, municipalities) within countries. Where countries are able to measure access to and participation in education, it allows a focus on those who are excluded from education or are at risk of being excluded. This is particularly important from a policy point of view as the magnitude of exclusion and the reasons for lack of access or participation will determine the most appropriate policies to reverse the situation. It is also increasingly important to focus on those who are excluded the closer a country comes to attaining a given target, in order to reach children often facing the greatest disadvantage. Administrative data and surveys can usually provide estimates of completion rates of relevant cycles of education (e.g. primary, lower secondary, upper secondary) in a given country based on similar breakdowns for access and participation indicators. The measurement of completion rates for given grades or ages is often more complex. It is also important to consider the quality and duration of the education provided. Nearly all countries in the world have laws specifying a certain number of years of education (measured in terms of the ages of pupils or the grades or years of education, or both) as “compulsory” for children and young people. In more than two-thirds of countries, compulsory education lasts at least nine years (after pre-primary). Countries at all stages of development are introducing or extending the duration of compulsory education. At the same time, countries are increasingly ensuring that compulsory education is free from tuition fees, at least in public schools, although globally the number of countries that provide both free and compulsory education is not yet fully known. Nevertheless, all countries are theoretically able to report on their national – and where appropriate sub-national – laws regarding access to education and on the actions being taken to ensure that these laws are implemented in practice. What are the main measurement challenges? While access and participation are relatively easy concepts to measure in cross-nationally comparable ways, the measurement of completion can be problematic as it is much more dependent on the actual curricula taught in schools and, often, on the processes for transferring between levels of education which can vary greatly across countries. Therefore, cross-nationally comparable indicators of completion are usually based on proxy measures (e.g. first-time participation in a given grade or year of education or educational attainment rates of children and young people in a given age range) than direct measures of successful completion.
- 16 -
While quality of education is a more difficult concept to measure, indicators such as student-teacher ratios, teacher qualifications, and access to learning materials can provide a perspective on the extent to which students are experiencing the necessary inputs for learning. While some have proposed that quality is synonymous with outcomes – meaning that the quality of education can be inferred based on the extent to which learning outcomes are achieved – equating quality with learning can provide misleading views on classroom environments and also provides little information on which elements of the education system are amenable to policy changes to improve learning. Instead of relying solely on learning outcomes as a judge of quality, groups of indicators with relevance at the national, regional or global level may be useful in providing an indication of quality. For example, resources – in particular teaching resources devoted to education or measures of pupils’ progression through the education system – have been used as proxy measures of quality. Most countries annually collect the necessary administrative data on teacher and pupil numbers from schools to calculate pupil-teacher ratios or average class sizes. An important next step is to analyse these indicators in relation to classroom observations and student learning and to begin clarifying which indicators of quality are most valuable to track over time. As noted above, for reading and mathematics at primary and secondary education levels, a considerable amount of effort has already been invested in defining the key constructs and creating assessments. Yet despite the notable progress in recent years, a major limitation is the absence of global scales or learning metrics that describe the learning trajectories of all students in reading and mathematics, including those at the lower end of the achievement distribution. This gap can be filled in the case of the learning domains of reading, mathematics and, to a lesser extent, science. To achieve a set of global scales in these domains, considerable technical work will be required to draft learning metrics on the basis of existing national, regional and international assessment programmes at primary and secondary education levels. The next steps entail calibrating these metrics through an empirical equating exercise and then aligning national assessment activities with the metrics to facilitate reporting against the internationally-accepted common learning metrics. This work is technically feasible for primary and lower secondary education in the learning domains of reading and mathematics and, additionally, at the lower secondary level only for science, and can be completed within the time available before the UN General Assembly in September 2015. The TAG recommends that this work is completed as it is vital for ensuring the availability of indicators for measuring at least a minimum core of learning outcomes from 2015.
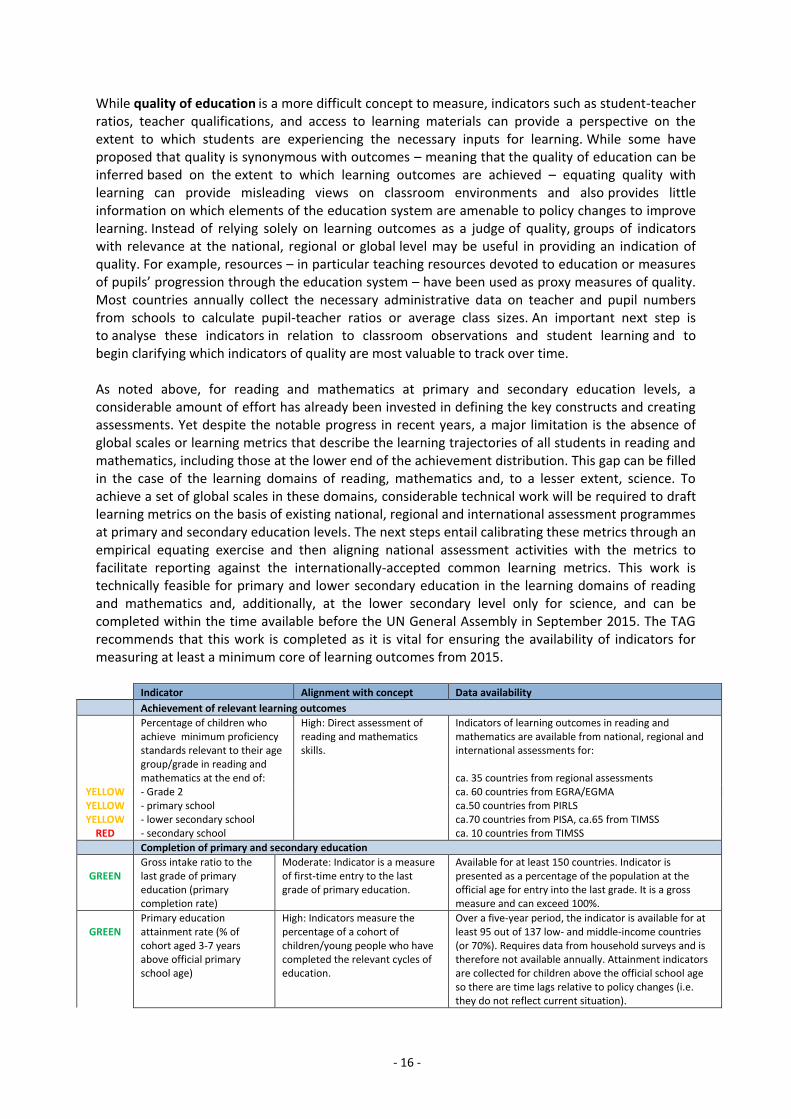
Indicator Alignment with concept Data availability
Achievement of relevant learning outcomes
Percentage of children who achieve minimum proficiency standards relevant to their age group/grade in reading and mathematics at the end of:
High: Direct assessment of reading and mathematics skills.
Indicators of learning outcomes in reading and mathematics are available from national, regional and international assessments for: ca. 35 countries from regional assessments
YELLOW - Grade 2 ca. 60 countries from EGRA/EGMA YELLOW - primary school ca.50 countries from PIRLS YELLOW - lower secondary school ca.70 countries from PISA, ca.65 from TIMSS
RED - secondary school ca. 10 countries from TIMSS
Completion of primary and secondary education
GREEN
Gross intake ratio to the last grade of primary education (primary completion rate)
Moderate: Indicator is a measure of first-time entry to the last grade of primary education.
Available for at least 150 countries. Indicator is presented as a percentage of the population at the official age for entry into the last grade. It is a gross measure and can exceed 100%.
GREEN
Primary education attainment rate (% of cohort aged 3-7 years above official primary school age)
High: Indicators measure the percentage of a cohort of children/young people who have completed the relevant cycles of education.
Over a five-year period, the indicator is available for at least 95 out of 137 low- and middle-income countries (or 70%). Requires data from household surveys and is therefore not available annually. Attainment indicators are collected for children above the official school age so there are time lags relative to policy changes (i.e. they do not reflect current situation).
- 17 -
Indicator Alignment with concept Data availability
GREEN
Lower secondary education attainment rate (% of cohort aged 3-7 years above official lower secondary school age)
High: Indicators measure the percentage of a cohort of children/young people who have completed the relevant cycles of education.
Requires data from household surveys and are therefore not available annually. Attainment indicators are collected for young people above the official school age so there are time lags relative to policy changes (i.e do not reflect current situation).
RED Gross intake ratio to the last grade of upper secondary education (secondary completion rate)
Moderate: Indicator is a measure of first-time entry to the last grade of upper secondary education.
Not currently available as multiple streams (including technical and vocational education) make it difficult to identify the last grade of secondary education. Could be calculated for the last grade of general education but in some countries the majority of upper secondary provision is technical/vocational so the indicator would substantially under-estimate completion.
GREEN
Upper secondary education attainment rate (% of cohort aged 3-7 years above official upper secondary school age)
High: Indicators measure the percentage of a cohort of children/young people who have completed the relevant cycles of education.
Requires data from household surveys and are therefore not available annually. Attainment indicators are collected for young people above the official school age so there are time lags relative to policy changes (i.e. do not reflect current situation).
Access and participation in primary and secondary education
GREEN
Children who were never in school (% of cohort aged 3-6 years above official primary school age)
High: Indicator highlights older children who did not go to school.
Over a five-year period, the indicator is available for at least 95 out of 137 low- and middle-income countries (or 70%). Most high-income countries possess this information.
GREEN
Number of out-of-school children and adolescents
High: Indicators focus on the primary and lower secondary age groups who are not at least in primary education.
Numbers of OOS children and OOS adolescents are estimated on the basis of administrative data on enrolment by age and sex reported annually by some 160 countries at the primary level and 125 at the lower secondary level.
GREEN
Primary adjusted net enrolment rate
Moderate: measures participation in education of relevant age groups.
Requires same data as for the out-of-school children.
GREEN
Lower secondary total net enrolment rate
Moderate: measures participation in education of relevant age groups.
Requires same data as for the out-of-school adolescents.
GREEN Gross enrolment ratio in secondary education
Moderate: measures overall participation in secondary education.
Available for ca. 170 countries.
Quality of primary and secondary education
GREEN
Pupil-teacher ratio (by level of education)
Low: Indicators not necessarily predictive of quality.
Administrative data on teachers and pupils by level of education are collected annually by most countries. PTRs are estimated to be available for at least 175 countries at the primary level and 130 at the lower secondary level.
Nine years year of free and compulsory basic education
GREEN
Countries with nine years of free and compulsory basic education in legal/institutional frameworks
Moderate: Legal frameworks are not always implemented in practice. Where they are, the degree of alignment would be higher.
All countries have information on their national (where appropriate sub-national) laws on education provision. ca. 145 countries have laws providing at least nine years of compulsory education (after pre-primary).
5.3 Skills EFA SC Target 4 By 2030, at least x% of youth and y% of adults have the knowledge and skills for decent work and life through technical and vocational, upper secondary and tertiary education and training, with particular attention to gender equality and the most marginalised OWG Target 4.3 By 2030, ensure equal access for all women and men to affordable quality technical, vocational and tertiary education, including university
- 18 -
OWG Target 4.4 By 2030, increase by x% the number of youth and adults who have relevant skills, including technical and vocational skills, for employment, decent jobs and entrepreneurship What should be measured? Key concepts to measure in this target include:
Knowledge and skills for employment, decent work and life, and entrepreneurship;
Participation in technical and vocational, upper secondary and tertiary education and training;
Affordable technical, vocational and tertiary education; and
Quality technical, vocational and tertiary education. What is available now? It is relatively straightforward to measure participation in upper secondary and tertiary education, including technical and vocational education (TVET), at least at the upper secondary level. Most countries collect administrative data annually on participation in different types of programmes which can be used to calculate relevant enrolment ratios. What are the main measurement challenges? The first two main concepts in the target pose distinct challenges for indicator development. First, the outcome-oriented concept of “knowledge and skills for employment, decent work and life, and entrepreneurship” is new to the education agenda, which was previously focused on “access to skills programmes”. However, there is as yet no clear measure of knowledge and skills that can be applied across countries:
Most attempts at cross-country comparable measures of skills have focused on literacy (and to a lesser extent numeracy) as a cognitive skill. However, literacy and numeracy skills, which also have a non-cognitive aspect, are covered under EFA SC Target 3/OWG Target 4.6.
Therefore, the challenge is to develop skill concept(s) that are comparable and universally-relevant, whether for farmers in rural areas of low-income countries or office workers in urban areas of high-income countries.
Surveys such as the OECD Programme for the International Assessment of Adult Competencies (PIAAC) or the World Bank framework Skills Toward Employment and Productivity (STEP) have mainly focused on demand for skills rather than whether different workers possess particular skills.
Two indicators are proposed below. Neither is fully aligned with the concept and they partly depend on skills related to information technology. Nevertheless, these indicators offer an avenue to explore especially in light of the increasing importance of these skills in the labour markets of countries at all income levels. Second, the output-oriented concept of participation in “technical and vocational, upper secondary and tertiary education and training” is also new in the sense that there was previously no explicit focus on these levels. More work is needed on three proposed indicators:
- 19 -
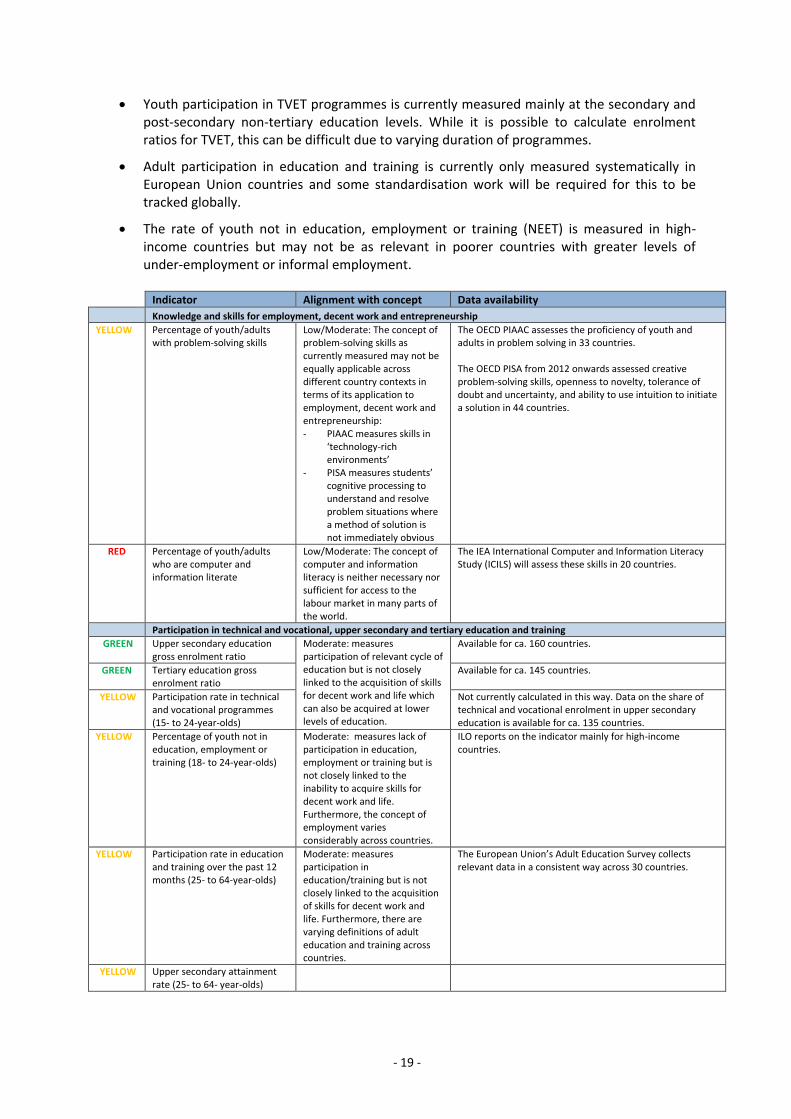
Youth participation in TVET programmes is currently measured mainly at the secondary and post-secondary non-tertiary education levels. While it is possible to calculate enrolment ratios for TVET, this can be difficult due to varying duration of programmes.
Adult participation in education and training is currently only measured systematically in European Union countries and some standardisation work will be required for this to be tracked globally.
The rate of youth not in education, employment or training (NEET) is measured in high-income countries but may not be as relevant in poorer countries with greater levels of under-employment or informal employment.
Indicator Alignment with concept Data availability
Knowledge and skills for employment, decent work and entrepreneurship YELLOW Percentage of youth/adults
with problem-solving skills Low/Moderate: The concept of problem-solving skills as currently measured may not be equally applicable across different country contexts in terms of its application to employment, decent work and entrepreneurship: - PIAAC measures skills in
‘technology-rich environments’
- PISA measures students’ cognitive processing to understand and resolve problem situations where a method of solution is not immediately obvious
The OECD PIAAC assesses the proficiency of youth and adults in problem solving in 33 countries. The OECD PISA from 2012 onwards assessed creative problem-solving skills, openness to novelty, tolerance of doubt and uncertainty, and ability to use intuition to initiate a solution in 44 countries.
RED
Percentage of youth/adults who are computer and information literate
Low/Moderate: The concept of computer and information literacy is neither necessary nor sufficient for access to the labour market in many parts of the world.
The IEA International Computer and Information Literacy Study (ICILS) will assess these skills in 20 countries.
Participation in technical and vocational, upper secondary and tertiary education and training
GREEN
Upper secondary education gross enrolment ratio
Moderate: measures participation of relevant cycle of education but is not closely linked to the acquisition of skills for decent work and life which can also be acquired at lower levels of education.
Available for ca. 160 countries.
GREEN
Tertiary education gross enrolment ratio
Available for ca. 145 countries.
YELLOW Participation rate in technical and vocational programmes (15- to 24-year-olds)
Not currently calculated in this way. Data on the share of technical and vocational enrolment in upper secondary education is available for ca. 135 countries.
YELLOW
Percentage of youth not in education, employment or training (18- to 24-year-olds)
Moderate: measures lack of participation in education, employment or training but is not closely linked to the inability to acquire skills for decent work and life. Furthermore, the concept of employment varies considerably across countries.
ILO reports on the indicator mainly for high-income countries.
YELLOW Participation rate in education and training over the past 12 months (25- to 64-year-olds)
Moderate: measures participation in education/training but is not closely linked to the acquisition of skills for decent work and life. Furthermore, there are varying definitions of adult education and training across countries.
The European Union’s Adult Education Survey collects relevant data in a consistent way across 30 countries.
YELLOW Upper secondary attainment rate (25- to 64- year-olds)
- 20 -
5.4 Equity
EFA SC targets
(1, 2, 4) …, with particular attention to gender equality and the most marginalised
(3) …, with particular attention to girls and women and the most marginalised
OWG Target 4.5
By 2030, eliminate gender disparities in education and ensure equal access to all levels of education and vocational training for the vulnerable, including persons with disabilities, indigenous peoples and children in vulnerable situations
What should be measured?
Key concepts to measure in this target include:
disparities in education provision at all levels;
disparities in access to education at all levels; and
disparities in education outcomes such as the acquisition of skills and knowledge.
In addition to these three concepts, a key issue is the subject or characteristic by which equity is to be assessed. Some characteristics are explicitly defined in the targets (i.e. gender, ethnicity and disability) while others require more precise definitions (i.e. marginalisation and vulnerability). For example, marginalisation can be defined in terms of some of the characteristics mentioned above, such as ethnicity, or by other characteristics not mentioned above, such as income or location.
Note that comparing education outcomes across countries by particular individual characteristics could allow for global comparisons in some cases (e.g. gender) but not in others (e.g. ethnicity). For example, belonging to an ethnic minority might be associated with a disadvantage in some countries but with an advantage in other countries. While comparing minority and majority ethnic groups is meaningful in the context of a particular country, grouping together all minority groups and all majority groups in order to perform a global comparison has no such meaning.
What is available now?
Gender parity in education has been extensively monitored in recent years. Gender parity indices have been used extensively to assess differences in access to education or literacy skills between males and females. By contrast, there is no commonly agreed global definition for location (i.e. comparing the value of indicators in urban and rural areas) or wealth (i.e. comparing the value of indicators for the poorest and the richest quintile in the population). It is possible to use available data from household surveys employing either an absolute measure (e.g. the difference in enrolment rates between urban areas and rural areas) or a relative measure (e.g. the ratio of rural to urban enrolment rates).
Indicators proposed in this document, regardless of their source allow some disaggregation by sex, location and wealth.
- 21 -
What measurement challenges exist?
As mentioned in Section 4, there are four different challenges to the measurement of equity:
Need for conceptual clarity.
Need to ask key questions according to clear and consistent standards and definitions, which implies considerable methodological work in developing standards for surveys. This applies to both:
o education inputs/outputs/outcomes: for example, surveys in different countries may not be asking questions related to the level of education attended in consistent ways; and
o individual characteristics: for example, the definition of urban location (or socioeconomic status) differs across surveys of different countries.
The systematic use of the results of household surveys to inform and guide education policies is not common in many countries. This raises the issue of how the demand and use of such information could be promoted in order to ensure more sustainable monitoring systems.
There is little information on other individual characteristics for which education experience could be compared at a global level. Two examples:
o Persons with disabilities are difficult to capture in surveys for various reasons ranging from costs (i.e. assessing disability may require special processes and medically-trained survey enumerators) to complications of definition and concept (e.g. whether physical/mental impairment or functioning approach). The UN Statistical Commission’s Washington Group on Disability has developed and tested a short set of six questions that can be used on censuses and surveys for identifying people with disabilities in coming years. However, the challenge remains to get these questions adopted across surveys and countries, while it is also accepted that these questions may still represent a starting point in the assessment of disability in children and require further work; and
o Nomadic populations constitute a potentially vulnerable group in many countries. However, they are routinely not captured in surveys either because they do not live in census enumeration areas or because it is expensive to reach them.
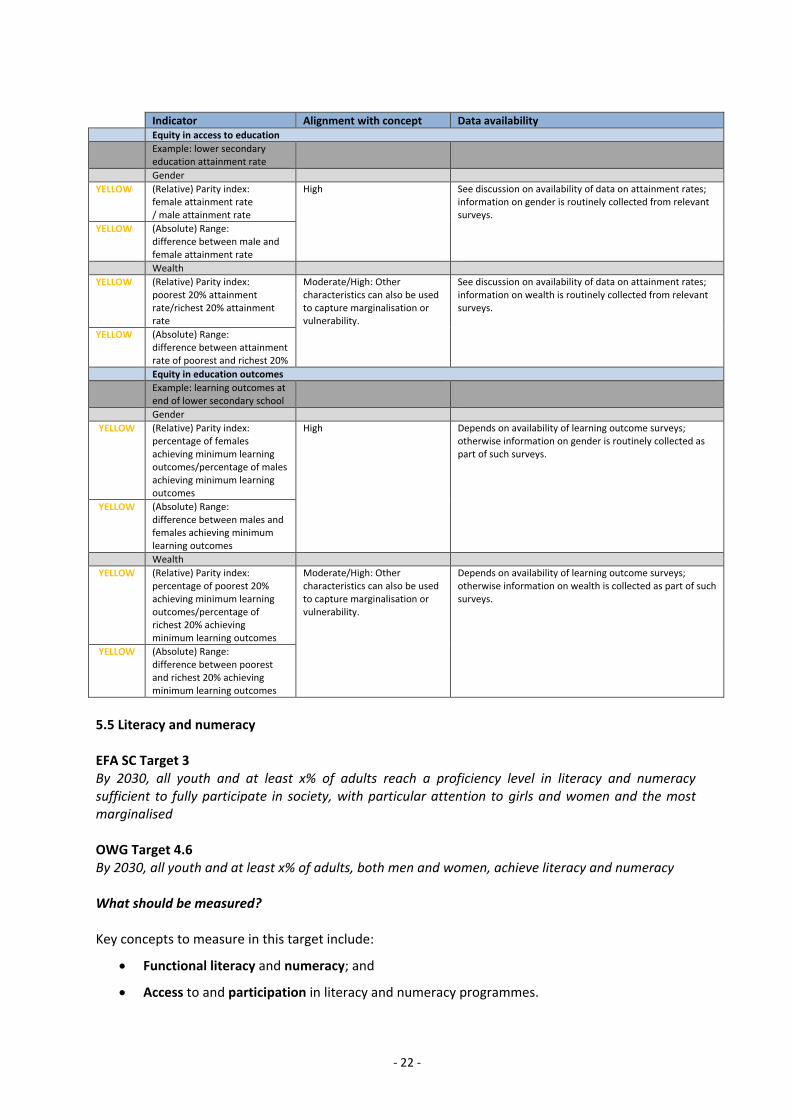
Unlike in the discussion of other targets, the table below does not represent a systematic listing of indicators. Rather it presents two examples of indicators from other targets to demonstrate the variety of ways in which equity in education can be measured i) by different individual characteristics and ii) by different measures of inequality (e.g. ratios or ranges).
- 22 -
Indicator Alignment with concept Data availability Equity in access to education
Example: lower secondary education attainment rate
Gender
YELLOW (Relative) Parity index: female attainment rate / male attainment rate
High See discussion on availability of data on attainment rates; information on gender is routinely collected from relevant surveys.
YELLOW (Absolute) Range: difference between male and female attainment rate
Wealth
YELLOW (Relative) Parity index: poorest 20% attainment rate/richest 20% attainment rate
Moderate/High: Other characteristics can also be used to capture marginalisation or vulnerability.
See discussion on availability of data on attainment rates; information on wealth is routinely collected from relevant surveys.
YELLOW (Absolute) Range: difference between attainment rate of poorest and richest 20%
Equity in education outcomes
Example: learning outcomes at end of lower secondary school
Gender
YELLOW (Relative) Parity index: percentage of females achieving minimum learning outcomes/percentage of males achieving minimum learning outcomes
High Depends on availability of learning outcome surveys; otherwise information on gender is routinely collected as part of such surveys.
YELLOW (Absolute) Range: difference between males and females achieving minimum learning outcomes
Wealth
YELLOW (Relative) Parity index: percentage of poorest 20% achieving minimum learning outcomes/percentage of richest 20% achieving minimum learning outcomes
Moderate/High: Other characteristics can also be used to capture marginalisation or vulnerability.
Depends on availability of learning outcome surveys; otherwise information on wealth is collected as part of such surveys.
YELLOW (Absolute) Range: difference between poorest and richest 20% achieving minimum learning outcomes
5.5 Literacy and numeracy EFA SC Target 3 By 2030, all youth and at least x% of adults reach a proficiency level in literacy and numeracy sufficient to fully participate in society, with particular attention to girls and women and the most marginalised OWG Target 4.6 By 2030, all youth and at least x% of adults, both men and women, achieve literacy and numeracy What should be measured? Key concepts to measure in this target include:
Functional literacy and numeracy; and
Access to and participation in literacy and numeracy programmes.
- 23 -
What is available now? The shift in the definition of literacy from the ability to “read and write, with understanding, a short simple statement about everyday life” to functional literacy has implications for measurement. Functional literacy is the ability to “engage in all those activities in which literacy is required for effective function of an individual, group or community”. It implies a higher skill level than that required to read or write a simple statement. Youth and adult literacy rates, derived from data collected in reference to the previous concept of basic literacy, are available for about 155 countries and territories for the most recent census cycle (2005-2014). Some of these literacy rates are projections based on data collected in previous years. Yet to measure progress towards these targets, the youth and adult literacy rates based on previous definitions are limited in their ability to capture actual skills and may overestimate the true percentage of the youth or adult population who can read. In recent years there have been attempts to assess literacy (and to a lesser extent numeracy) directly. For example, simple reading tests in Demographic and Health Surveys (DHS) and Multiple Indicator Cluster Surveys (MICS) demonstrate that the percentage of persons who claim to be able to read and write is usually higher than the percentage of persons who can read a simple sentence such as, “the child is reading a book”. Moreover, even directly assessed measures give higher estimates of literacy compared with those that try to assess whether individuals are able to read with comprehension. What are the main measurement challenges? The outcome-oriented concept of a “proficiency level in literacy and numeracy sufficient to fully participate in society” is new and poses distinct challenges for indicator development. In the past, the focus was on basic literacy only, which in most cases was self-reported and not directly assessed. Numeracy was not covered. The new target shifts attention to functional literacy and numeracy – seen as a continuum of skills – and acknowledges that the ability to read or count is not a sufficient skill level to prevent exclusion. The direct measurement of literacy and numeracy skills, which have been collected in some household surveys, is not enough to assess whether adults have achieved sufficient proficiency in these areas to participate fully in society. And, because the ability to “read and write, with understanding, a short simple statement about everyday life” is very different from “proficiency in literacy and numeracy sufficient to fully participate in society,” there is no straightforward relationship between these two concepts. It is therefore not possible to use the existing data on basic literacy rates to estimate functional literacy or numeracy rates. Data collection for functional literacy and numeracy requires thorough assessments of skills and is consequently more challenging and expensive. For this reason, there is relatively little data available on tested literacy or numeracy skills. The Programme for the International Assessment of Adult Competencies (PIAAC) by the OECD collects data on functional literacy and numeracy that could be used to measure progress towards this target, but this survey has been carried out in 33 countries. Similar data could also, in principle, be collected through the Literacy Assessment and Monitoring Programme (LAMP), but this survey has been conducted in few countries. Both surveys can be used to assess gender equity in literacy and numeracy skills. However, because they are sample surveys, their ability to provide representative data for small sub-groups of the population is limited. Thorough assessments of functional literacy or numeracy cannot be added to
- 24 -
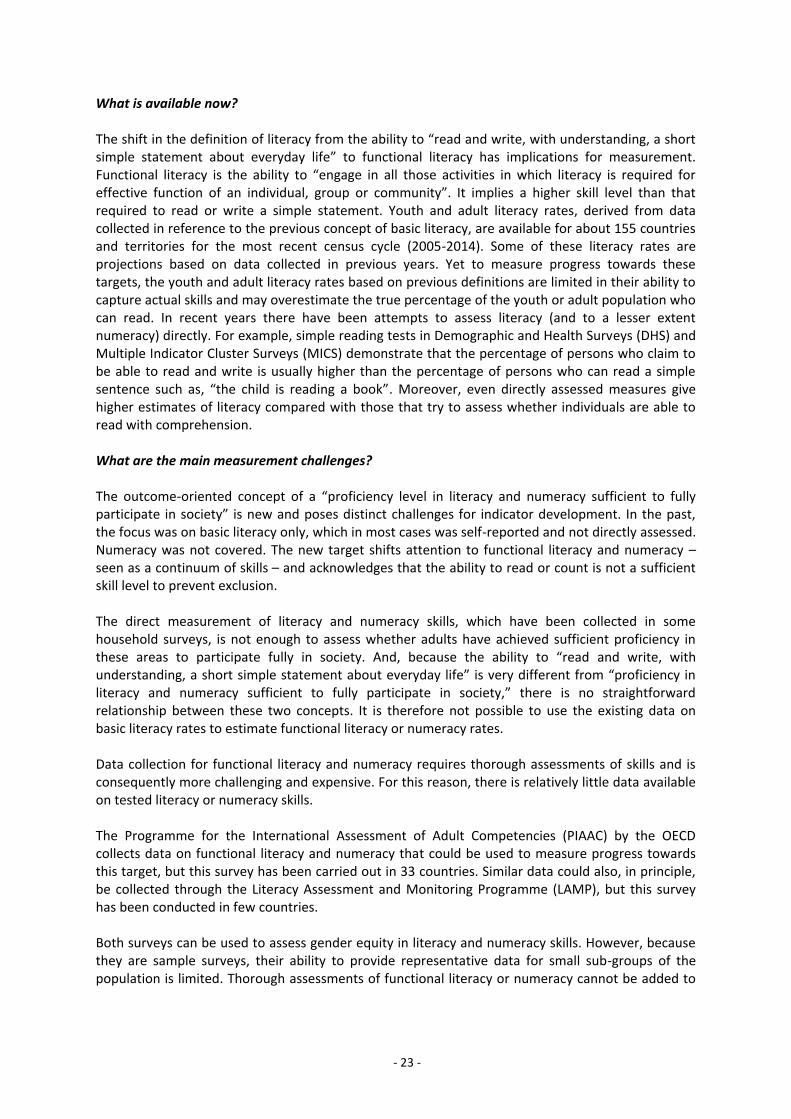
the questionnaires used in population censuses (which would provide data on small sub-groups of the population) because of the added complexity of data collection. It should also be noted that these types of assessment surveys are very expensive and impractical to run on a frequent basis in most countries. However, both LAMP and PIAAC surveys have modules that assess low-level literacy skills as filters: these might be used as a basis for developing a less expensive module that could be implemented in other surveys. For example, the World Bank Skills Toward Employment and Productivity (STEP) survey employed a subset of questions from PIAAC and could be used as a basis for such an approach. The output-oriented concept of participation in literacy and numeracy programmes is also new in the sense that this information has not been previously collected on a systematic basis. This will require administrative systems to report on second chance and adult education programmes. Alternatively, more use could be made of household surveys. To monitor this target, the question should focus on a specific and recent time period. Indicator Alignment with concept Data availability Proficiency in literacy/numeracy to fully participate in society
YELLOW Percentage of youth and adults proficient in literacy skills
High The OECD PIAAC assesses the proficiency of youth and adults in literacy and numeracy in 33 mostly high-income countries. The World Bank STEP has collected similar information in (urban areas of) 13 low- and middle-income countries.
YELLOW Percentage of youth and adults proficient in numeracy skills
High The OECD PIAAC assesses the proficiency of youth and adults in literacy and numeracy in 33 mostly high-income countries. The World Bank STEP has collected similar information in (urban areas of) 13 low- and middle-income countries.
GREEN
Youth/adult literacy rate Low: The indicator does not measure skills in terms of proficiency or ability to participate fully in society.
A simple measure of literacy, i.e. the ability to read and write a simple sentence, usually self-reported, is collected regularly (but not annually) by about 155 countries in household surveys and censuses and reported to the UIS. Few developed countries collect similar information.
Participation in literacy/numeracy programmes
YELLOW Participation rate in literacy programmes over the past 12 months (as % of illiterate 25- to 64-year-olds)
High Not currently available at the international level. Administrative data on participants in literacy and numeracy programmes are not collected regularly at the international level. Demographic and Health Surveys include a question on participation in adult literacy programmes.
5.6 Global citizenship and sustainability EFA SC Target 5 By 2030, all learners acquire knowledge, skills, values and attitudes to establish sustainable and peaceful societies, including through global citizenship education and education for sustainable development OWG Target 4.7 By 2030, ensure all learners acquire knowledge and skills needed to promote sustainable development, including among others through education for sustainable development and sustainable lifestyles, human rights, gender equality, promotion of a culture of peace and non-violence, global citizenship, and appreciation of cultural diversity and of culture’s contribution to sustainable development
- 25 -
What should be measured? Key concepts to measure in this target include:
Knowledge, skills, values and attitudes required to establish sustainable and peaceful societies;
Participation in global citizenship education, education for sustainable development and sustainable lifestyles.
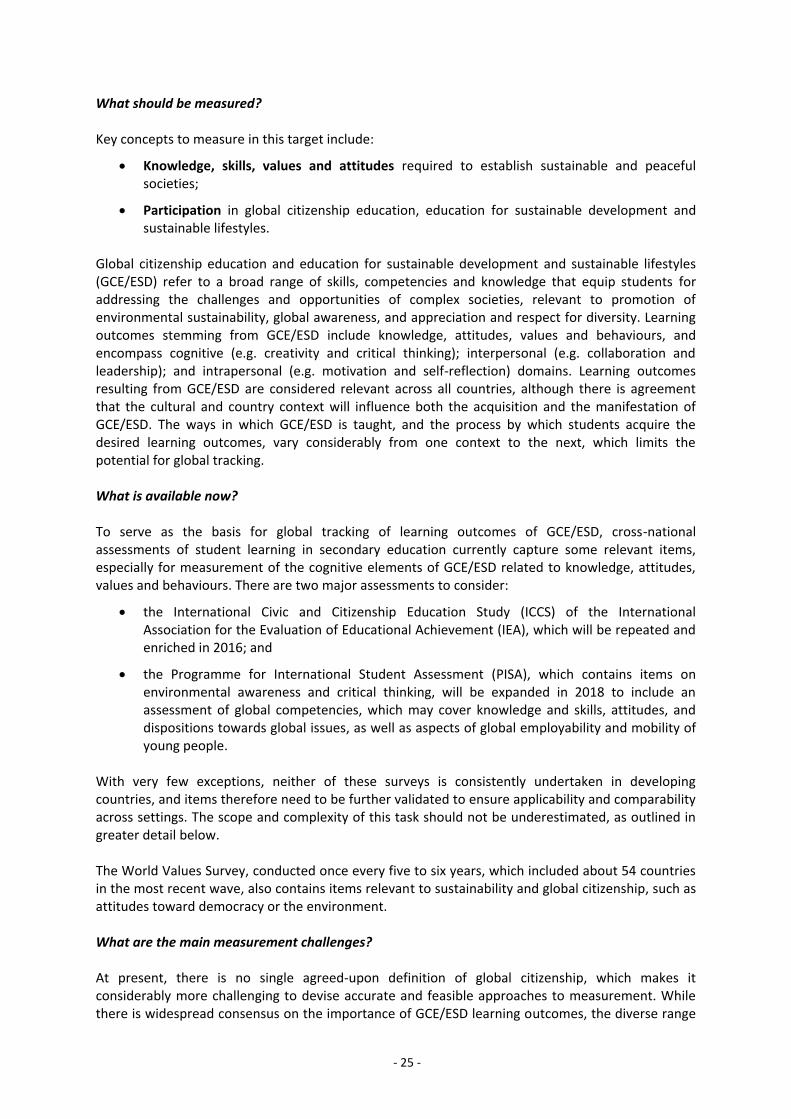
Global citizenship education and education for sustainable development and sustainable lifestyles (GCE/ESD) refer to a broad range of skills, competencies and knowledge that equip students for addressing the challenges and opportunities of complex societies, relevant to promotion of environmental sustainability, global awareness, and appreciation and respect for diversity. Learning outcomes stemming from GCE/ESD include knowledge, attitudes, values and behaviours, and encompass cognitive (e.g. creativity and critical thinking); interpersonal (e.g. collaboration and leadership); and intrapersonal (e.g. motivation and self-reflection) domains. Learning outcomes resulting from GCE/ESD are considered relevant across all countries, although there is agreement that the cultural and country context will influence both the acquisition and the manifestation of GCE/ESD. The ways in which GCE/ESD is taught, and the process by which students acquire the desired learning outcomes, vary considerably from one context to the next, which limits the potential for global tracking. What is available now? To serve as the basis for global tracking of learning outcomes of GCE/ESD, cross-national assessments of student learning in secondary education currently capture some relevant items, especially for measurement of the cognitive elements of GCE/ESD related to knowledge, attitudes, values and behaviours. There are two major assessments to consider:
the International Civic and Citizenship Education Study (ICCS) of the International Association for the Evaluation of Educational Achievement (IEA), which will be repeated and enriched in 2016; and
the Programme for International Student Assessment (PISA), which contains items on environmental awareness and critical thinking, will be expanded in 2018 to include an assessment of global competencies, which may cover knowledge and skills, attitudes, and dispositions towards global issues, as well as aspects of global employability and mobility of young people.
With very few exceptions, neither of these surveys is consistently undertaken in developing countries, and items therefore need to be further validated to ensure applicability and comparability across settings. The scope and complexity of this task should not be underestimated, as outlined in greater detail below. The World Values Survey, conducted once every five to six years, which included about 54 countries in the most recent wave, also contains items relevant to sustainability and global citizenship, such as attitudes toward democracy or the environment. What are the main measurement challenges? At present, there is no single agreed-upon definition of global citizenship, which makes it considerably more challenging to devise accurate and feasible approaches to measurement. While there is widespread consensus on the importance of GCE/ESD learning outcomes, the diverse range
- 26 -
of skills and competencies, and the complexity of measurement, present challenges for tracking global progress. As well, GCE/ESD should begin at the start of school and extend through the education cycle, which will require selecting one or two age points at which it should be measured. At present, there is no survey or set of items that aligns well with the concept of GCE/ESD; instead, more comprehensive tracking may require several different types of items from more than one survey. Because global tracking requires use of the same measures or items, there is a tension between the uniformity necessary for global tracking and the sensitivity to context. Yet despite these challenges, there is both an empirical basis for measurement and a constituency committed to moving the measurement agenda forward. Beyond the cognitive elements of GCE/ESD, intrapersonal and interpersonal knowledge, attitudes, values and behaviours are not as frequently measured on a global or regional basis, but several research studies have proposed and tested measures of creativity, collaboration and empathy. These studies can be mined to develop a proposed set of items or a module that could then be included in global, regional or national surveys. Solutions could include the designation of a small set of items for global tracking (perhaps those specifically focused on cognitive knowledge, attitudes or values), whereas some of the other elements, especially interpersonal and intrapersonal, may be more suitable for national or regional tracking to allow more flexibility and sensitivity to context. The IEA survey, for example, has both a global component and regional modules, to better capture the contextual dimensions relevant to GCE/ESD. It also may be possible to design and collect indicators of GCE/ESD inputs and outputs, including the presence of curricula and teacher training for GCE/ESD, and students’ participation in GCE/ESD throughout the school years, which could provide information on progress towards implementation of GCE/ESD and the likelihood that desired student outcomes will be achieved. However, the difficulties of comparing curricular content across countries should be carefully considered. Indicator Alignment with concept Data availability Knowledge and skills for sustainable peaceful societies
YELLOW Percentage of 15-year-old students showing proficiency in knowledge of global issues including knowledge of environmental science and geoscience
Moderate: Knowledge is seen as important component but does not cover the full concept of GCE/ESD
PISA 2006, administered in 57 countries, estimated an “environmental science performance index.” ICCS 2009, which included 38 countries, contains workable items for larger-scale tracking that will require validation in developing world settings. ICCS 2016 will provide globally-comparable data on civic knowledge and engagement, and students’ roles in peaceful functioning of schools.
Values and attitudes for sustainable peaceful societies
RED Percentage of 13-year-old students endorsing values and attitudes promoting equality, trust and participation in governance
Moderate: Covers important values and attitudes but is not comprehensive
ICCS 2009; see notes above.
YELLOW Percentage of adults who respond positively to the statement: “Protecting the environment should be given priority even if it causes slower economic growth and some loss of jobs”
Moderate: Covers important values and attitudes but is not comprehensive.
World Values Survey 2012, which has included over 100 countries in various survey waves, contains items on values and attitudes on environmental protection, views on citizenship, freedom of information, and global awareness. These items will also require further validation and testing for youth and in developing world settings.
Global citizenship education (GCE)
YELLOW Percentage of 13-year-old students participating in citizenship education
Moderate: Participation in citizenship education is only one component of GCE/ESD
ICCS 2009; see notes above. The inclusion of classroom characteristics relevant to GCE/ESD (i.e. openness of classroom dialogue) can also be considered. PISA 2018 will incorporate an assessment of global competence, which may cover knowledge and skills, attitudes, and dispositions towards global issues as well as aspects of global employability and mobility of young people
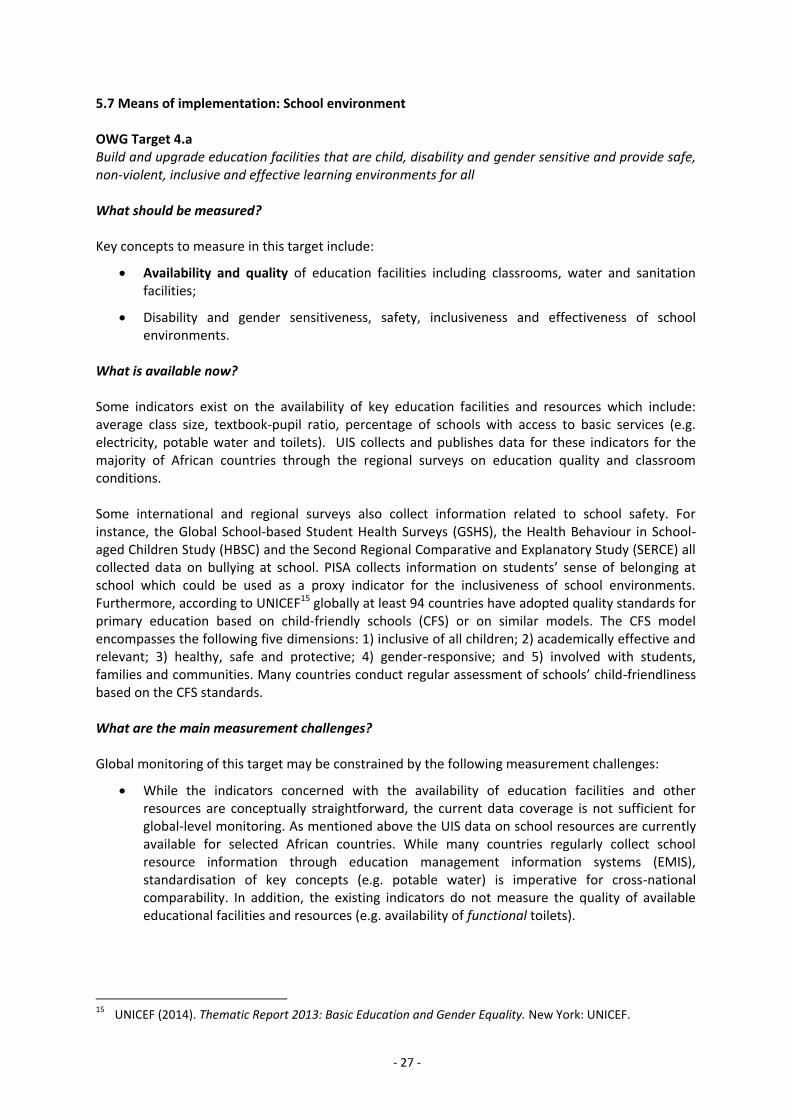
- 27 -
5.7 Means of implementation: School environment OWG Target 4.a Build and upgrade education facilities that are child, disability and gender sensitive and provide safe, non-violent, inclusive and effective learning environments for all What should be measured? Key concepts to measure in this target include:
Availability and quality of education facilities including classrooms, water and sanitation facilities;
Disability and gender sensitiveness, safety, inclusiveness and effectiveness of school environments.
What is available now? Some indicators exist on the availability of key education facilities and resources which include: average class size, textbook-pupil ratio, percentage of schools with access to basic services (e.g. electricity, potable water and toilets). UIS collects and publishes data for these indicators for the majority of African countries through the regional surveys on education quality and classroom conditions. Some international and regional surveys also collect information related to school safety. For instance, the Global School-based Student Health Surveys (GSHS), the Health Behaviour in School-aged Children Study (HBSC) and the Second Regional Comparative and Explanatory Study (SERCE) all collected data on bullying at school. PISA collects information on students’ sense of belonging at school which could be used as a proxy indicator for the inclusiveness of school environments. Furthermore, according to UNICEF15 globally at least 94 countries have adopted quality standards for primary education based on child-friendly schools (CFS) or on similar models. The CFS model encompasses the following five dimensions: 1) inclusive of all children; 2) academically effective and relevant; 3) healthy, safe and protective; 4) gender-responsive; and 5) involved with students, families and communities. Many countries conduct regular assessment of schools’ child-friendliness based on the CFS standards. What are the main measurement challenges? Global monitoring of this target may be constrained by the following measurement challenges:
While the indicators concerned with the availability of education facilities and other resources are conceptually straightforward, the current data coverage is not sufficient for global-level monitoring. As mentioned above the UIS data on school resources are currently available for selected African countries. While many countries regularly collect school resource information through education management information systems (EMIS), standardisation of key concepts (e.g. potable water) is imperative for cross-national comparability. In addition, the existing indicators do not measure the quality of available educational facilities and resources (e.g. availability of functional toilets).
15 UNICEF (2014). Thematic Report 2013: Basic Education and Gender Equality. New York: UNICEF.
- 28 -
A greater challenge is posed for the measurability and comparability of such concepts as inclusiveness, gender sensitivity, safety and academic effectiveness. While the CFS model provides a broader common framework, what each dimension of CFS entails and encompasses might vary greatly from country to country or even from school to school. It may be more suitable for such complex constructs to be measured and monitored at the national level, allowing flexible adaptation to local needs and contexts.
Indicator Alignment with concept Data availability Availability of education facilities and resources
YELLOW Average size of single grade classes in primary schools
Low/Moderate: The indicator not necessarily predictive of the overall quality of school environments.
Available for 26 African countries in UIS database.
YELLOW Access to basic services (electricity, potable water and toilets)
Moderate: Indicators measure the availability of facilities and services essential for healthy and effective learning environments.
Available for 41 African countries in UIS database.
Disability and gender sensitiveness, safety, inclusiveness and effectiveness of school environments
YELLOW Percentage of students with a sense of belonging and inclusion at school
Low/Moderate: Indicators address important aspects of school inclusiveness but not comprehensive.
Available for: 65 countries from PISA 2012. 72 countries from GSHS between 2003 and 2012. 43 countries in Europe and North America from HBSC in 2009/2010.
YELLOW Percentage of students experiencing of bullying
Low/Moderate: Indicators address important aspects of school inclusiveness and safety but not comprehensive.
Available for: 72 countries from GSHS between 2003 and 2012. 43 countries in Europe and North America from HBSC in 2009/2010. Available for 16 countries in Latin America and the Caribbean that participated in SERCE in 2006/2007.
RED Percentage of schools that meet child-friendly school standards: 1) inclusive of all children; 2) academically effective and relevant; 3) healthy, safe and protective; 4) gender-responsive; and 5) involved with students, families and communities
High: While the indicators cover all the key aspects of the target, what each dimension entails and encompasses may greatly vary from country to country and thus not be suitable for cross-country comparison.
No cross-nationally comparable data are available although at least 94 countries have adopted quality standards for primary education based on child-friendly schools (CFS) or on similar models.
5.8 Means of implementation: Scholarships OWG Target 4.b By 2020, expand by x% globally the number of scholarships for developing countries in particular Least Developed Countries (LDCs), Small Island Developing States (SIDS) and African countries to enrol in higher education, including vocational training, information and communication technology (ICT), technical, engineering and scientific programmes in developed countries and other developing countries What should be measured? Key concepts to measure in this target include:
number of scholarships from donor countries for students from developing countries to study in higher education in the donor countries or third countries.
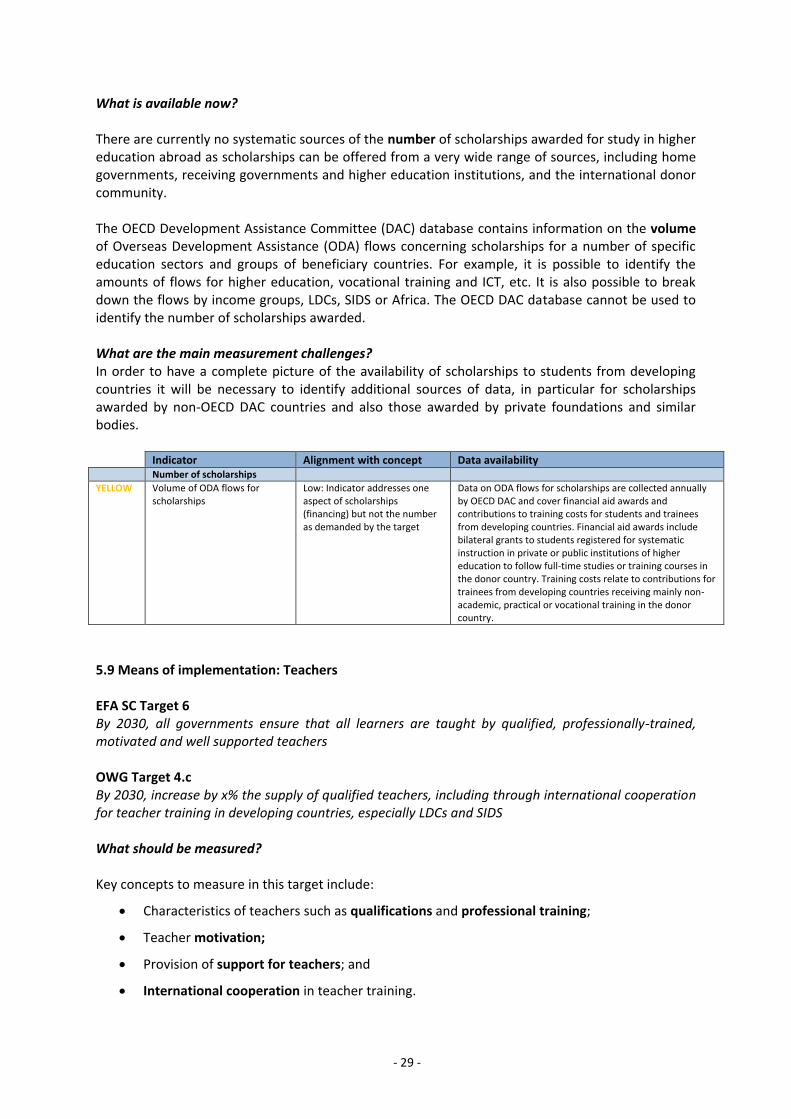
- 29 -
What is available now? There are currently no systematic sources of the number of scholarships awarded for study in higher education abroad as scholarships can be offered from a very wide range of sources, including home governments, receiving governments and higher education institutions, and the international donor community. The OECD Development Assistance Committee (DAC) database contains information on the volume of Overseas Development Assistance (ODA) flows concerning scholarships for a number of specific education sectors and groups of beneficiary countries. For example, it is possible to identify the amounts of flows for higher education, vocational training and ICT, etc. It is also possible to break down the flows by income groups, LDCs, SIDS or Africa. The OECD DAC database cannot be used to identify the number of scholarships awarded. What are the main measurement challenges? In order to have a complete picture of the availability of scholarships to students from developing countries it will be necessary to identify additional sources of data, in particular for scholarships awarded by non-OECD DAC countries and also those awarded by private foundations and similar bodies. Indicator Alignment with concept Data availability Number of scholarships
YELLOW Volume of ODA flows for scholarships
Low: Indicator addresses one aspect of scholarships (financing) but not the number as demanded by the target
Data on ODA flows for scholarships are collected annually by OECD DAC and cover financial aid awards and contributions to training costs for students and trainees from developing countries. Financial aid awards include bilateral grants to students registered for systematic instruction in private or public institutions of higher education to follow full-time studies or training courses in the donor country. Training costs relate to contributions for trainees from developing countries receiving mainly non-academic, practical or vocational training in the donor country.
5.9 Means of implementation: Teachers EFA SC Target 6 By 2030, all governments ensure that all learners are taught by qualified, professionally-trained, motivated and well supported teachers OWG Target 4.c By 2030, increase by x% the supply of qualified teachers, including through international cooperation for teacher training in developing countries, especially LDCs and SIDS What should be measured? Key concepts to measure in this target include:
Characteristics of teachers such as qualifications and professional training;
Teacher motivation;
Provision of support for teachers; and
International cooperation in teacher training.
- 30 -
The core assumption underlying this target is that supported, qualified, motivated and professionally-trained teachers will deliver higher-quality instruction. It is important to note that the key concepts underlying this target are assumed to contribute to the quality of instruction within the classroom. The investigation of which factors are most strongly associated with quality instruction is beyond the scope of this target but should be noted as an area in need of further investigation. What is available now? Most countries collect data annually on teachers’ working modality (part-time/full-time) and sex by education level. From an international monitoring perspective, the available teacher-related indicators are not extensive but do cover some form of teacher qualifications and training. However, these are typically reported by national teaching standards (e.g. higher education qualification) which can vary markedly from country to country. Thus, observed performance on this target can be “improved” by lowering standards or “worsened” by setting a higher standard (although the latter will eventually have a positive effect on the knowledge and skills of the teaching force), neither of which would meaningfully indicate shifts in the quality of instruction received by students. More detailed indicators related to teaching work conditions – which could perhaps provide some basis for indicators of teacher motivation and support for teachers – have been developed in the Indicators of National Education Systems (INES) programme for OECD countries and have been applied by the UIS in about 15 additional middle-income countries. Cross-national surveys of student achievement (such as PIRLS, TIMSS, PISA, SACMEQ, PASEC and LLECE) provide additional information on teachers, reported by teachers themselves as well as head teachers and students on different aspects of teaching, including teacher knowledge. The UIS, with the OECD and partner countries, has fielded a school-based survey in 11 middle-income countries which provides lessons to take forward this kind of approach. Partly based on this experience, the OECD Teaching and Learning International Survey (TALIS) also incorporates teacher perspectives in 33 developed countries. TALIS is an international survey of teachers and teaching based on questionnaire responses by individual teachers and their school principals. The 2013 TALIS survey covered 107,000 lower secondary school teachers in 34 countries and provides policy information regarding the conditions of teaching and learning environments. What are the main measurement challenges? The use of data on statutory salaries and working time collected by the UIS, the OECD and Eurostat, and tools such as the World Bank’s System Approach for Better Education Results (SABER) diagnostic, represent a helpful step towards better understanding the design of policies related to teachers, teaching and education quality. However, there are still measurement issues to address. For example, statutory salary scales do not fully reflect the benefits that accrue to teachers, as in some countries non-salary benefits can account for up to 60% of income. It is very difficult to quantify and therefore compare these benefits across countries or over time. Most importantly, this information does not capture their implementation. Nonetheless, labour force surveys could be explored as a source of information to assess the income of teachers relative to other professionals. The emphasis on teachers as instrumental to education quality and positive education progress has been widely recognised, however, there are still significant gaps in information which will require new indicator frameworks:
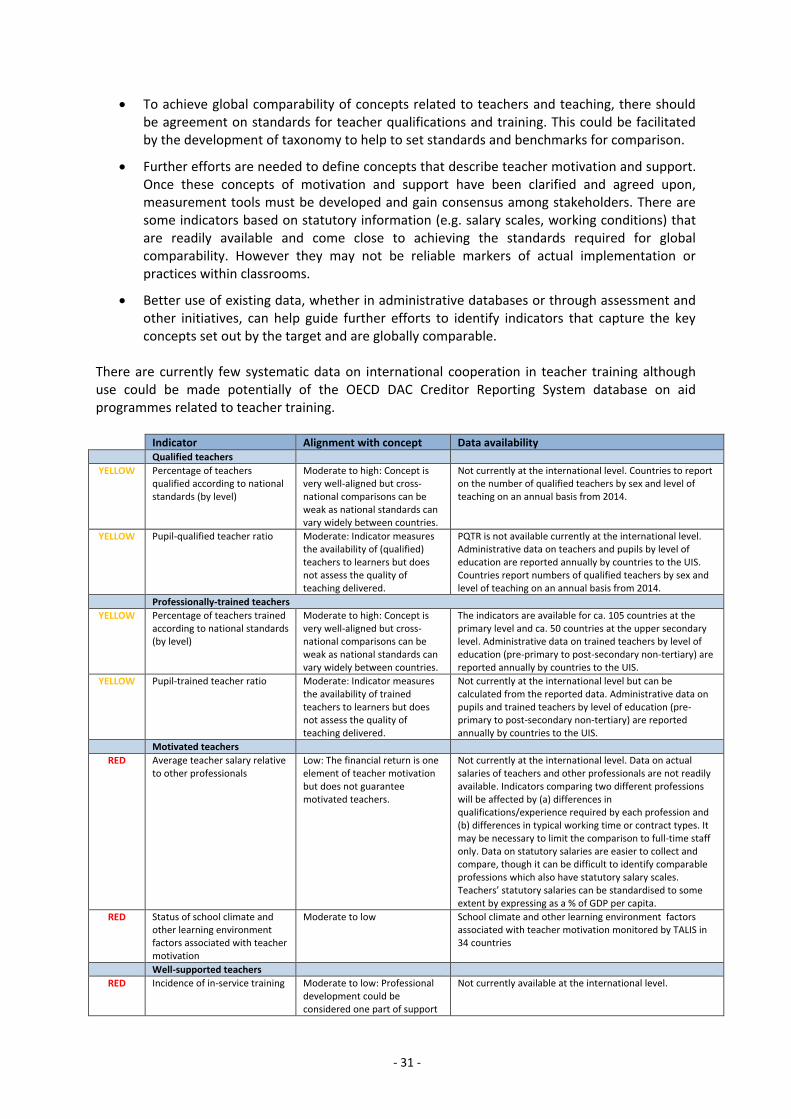
- 31 -
To achieve global comparability of concepts related to teachers and teaching, there should be agreement on standards for teacher qualifications and training. This could be facilitated by the development of taxonomy to help to set standards and benchmarks for comparison.
Further efforts are needed to define concepts that describe teacher motivation and support. Once these concepts of motivation and support have been clarified and agreed upon, measurement tools must be developed and gain consensus among stakeholders. There are some indicators based on statutory information (e.g. salary scales, working conditions) that are readily available and come close to achieving the standards required for global comparability. However they may not be reliable markers of actual implementation or practices within classrooms.
Better use of existing data, whether in administrative databases or through assessment and other initiatives, can help guide further efforts to identify indicators that capture the key concepts set out by the target and are globally comparable.
There are currently few systematic data on international cooperation in teacher training although use could be made potentially of the OECD DAC Creditor Reporting System database on aid programmes related to teacher training. Indicator Alignment with concept Data availability Qualified teachers
YELLOW
Percentage of teachers qualified according to national standards (by level)
Moderate to high: Concept is very well-aligned but cross-national comparisons can be weak as national standards can vary widely between countries.
Not currently at the international level. Countries to report on the number of qualified teachers by sex and level of teaching on an annual basis from 2014.
YELLOW
Pupil-qualified teacher ratio Moderate: Indicator measures the availability of (qualified) teachers to learners but does not assess the quality of teaching delivered.
PQTR is not available currently at the international level. Administrative data on teachers and pupils by level of education are reported annually by countries to the UIS. Countries report numbers of qualified teachers by sex and level of teaching on an annual basis from 2014.
Professionally-trained teachers
YELLOW
Percentage of teachers trained according to national standards (by level)
Moderate to high: Concept is very well-aligned but cross-national comparisons can be weak as national standards can vary widely between countries.
The indicators are available for ca. 105 countries at the primary level and ca. 50 countries at the upper secondary level. Administrative data on trained teachers by level of education (pre-primary to post-secondary non-tertiary) are reported annually by countries to the UIS.
YELLOW
Pupil-trained teacher ratio Moderate: Indicator measures the availability of trained teachers to learners but does not assess the quality of teaching delivered.
Not currently at the international level but can be calculated from the reported data. Administrative data on pupils and trained teachers by level of education (pre-primary to post-secondary non-tertiary) are reported annually by countries to the UIS.
Motivated teachers
RED
Average teacher salary relative to other professionals
Low: The financial return is one element of teacher motivation but does not guarantee motivated teachers.
Not currently at the international level. Data on actual salaries of teachers and other professionals are not readily available. Indicators comparing two different professions will be affected by (a) differences in qualifications/experience required by each profession and (b) differences in typical working time or contract types. It may be necessary to limit the comparison to full-time staff only. Data on statutory salaries are easier to collect and compare, though it can be difficult to identify comparable professions which also have statutory salary scales. Teachers’ statutory salaries can be standardised to some extent by expressing as a % of GDP per capita.
RED
Status of school climate and other learning environment factors associated with teacher motivation
Moderate to low School climate and other learning environment factors associated with teacher motivation monitored by TALIS in 34 countries
Well-supported teachers
RED
Incidence of in-service training Moderate to low: Professional development could be considered one part of support
Not currently available at the international level.
- 32 -
5.10 Finance EFA SC Target 7 By 2030, all countries allocate at least 4%-6% of their gross domestic product (GDP) or at least 15%-20% of their public expenditure to education, prioritising groups most in need; and strengthen financial cooperation for education, prioritising countries most in need.
No equivalent OWG target What should be measured? Key concepts to measure in this target include:
Public education expenditure;
Aid to education;
Countries most in need; and
Groups most in need. What is available now? This target refers to concepts that are well established: public financial data are available through the UIS database, and the EFA Global Monitoring Report has been reporting on aid to education based on the OECD DAC database. What are the main measurement challenges? However, the target also includes an explicit reference to equity, which presents new challenges:
In the case of public education expenditure, “groups most in need” should be prioritised. There is currently no systematic approach to monitor how public education resources are shared across population groups. One approach would be to identify the share of public education expenditure that accrues to the poorest (and richest) quintiles through benefit incidence analyses. The advantage of the approach is that it is standardised and comparable. The disadvantage is that the share of resources accruing to poor households will be mainly driven by characteristics of the education system (e.g. percentage of rich children attending private schools, percentage of poor children attending secondary and tertiary education) and will not capture explicit government efforts to target poor children. However, the information requirements for the latter are very high.
In the case of expenditure on aid to education, “countries most in need” must be prioritised. A definition based on either the country’s income level and/or the country’s percentage of out-of-school children (or not learning the basics) would be needed to use as a basis for monitoring the share of aid that is received specifically by that group of countries.
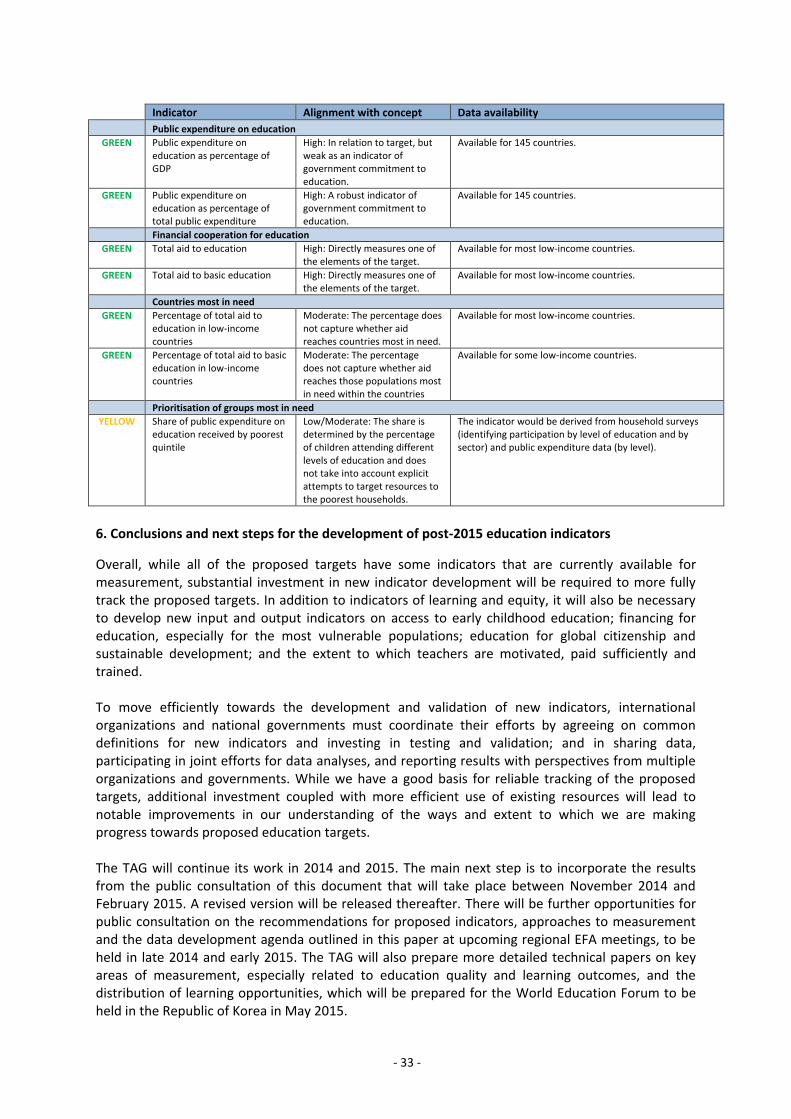
- 33 -
Indicator Alignment with concept Data availability
Public expenditure on education GREEN
Public expenditure on education as percentage of GDP
High: In relation to target, but weak as an indicator of government commitment to education.
Available for 145 countries.
GREEN
Public expenditure on education as percentage of total public expenditure
High: A robust indicator of government commitment to education.
Available for 145 countries.
Financial cooperation for education
GREEN
Total aid to education High: Directly measures one of the elements of the target.
Available for most low-income countries.
GREEN
Total aid to basic education High: Directly measures one of the elements of the target.
Available for most low-income countries.
Countries most in need
GREEN
Percentage of total aid to education in low-income countries
Moderate: The percentage does not capture whether aid reaches countries most in need.
Available for most low-income countries.
GREEN
Percentage of total aid to basic education in low-income countries
Moderate: The percentage does not capture whether aid reaches those populations most in need within the countries
Available for some low-income countries.
Prioritisation of groups most in need
YELLOW Share of public expenditure on education received by poorest quintile
Low/Moderate: The share is determined by the percentage of children attending different levels of education and does not take into account explicit attempts to target resources to the poorest households.
The indicator would be derived from household surveys (identifying participation by level of education and by sector) and public expenditure data (by level).
6. Conclusions and next steps for the development of post-2015 education indicators
Overall, while all of the proposed targets have some indicators that are currently available for measurement, substantial investment in new indicator development will be required to more fully track the proposed targets. In addition to indicators of learning and equity, it will also be necessary to develop new input and output indicators on access to early childhood education; financing for education, especially for the most vulnerable populations; education for global citizenship and sustainable development; and the extent to which teachers are motivated, paid sufficiently and trained. To move efficiently towards the development and validation of new indicators, international organizations and national governments must coordinate their efforts by agreeing on common definitions for new indicators and investing in testing and validation; and in sharing data, participating in joint efforts for data analyses, and reporting results with perspectives from multiple organizations and governments. While we have a good basis for reliable tracking of the proposed targets, additional investment coupled with more efficient use of existing resources will lead to notable improvements in our understanding of the ways and extent to which we are making progress towards proposed education targets. The TAG will continue its work in 2014 and 2015. The main next step is to incorporate the results from the public consultation of this document that will take place between November 2014 and February 2015. A revised version will be released thereafter. There will be further opportunities for public consultation on the recommendations for proposed indicators, approaches to measurement and the data development agenda outlined in this paper at upcoming regional EFA meetings, to be held in late 2014 and early 2015. The TAG will also prepare more detailed technical papers on key areas of measurement, especially related to education quality and learning outcomes, and the distribution of learning opportunities, which will be prepared for the World Education Forum to be held in the Republic of Korea in May 2015.
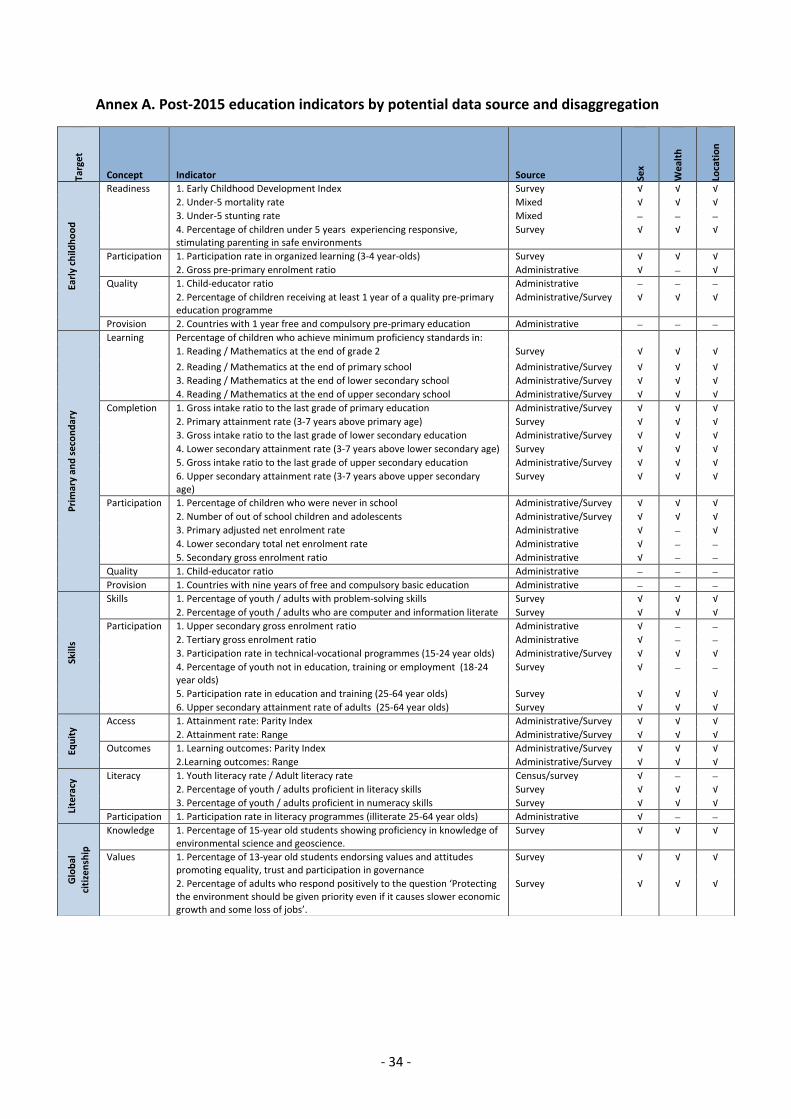
- 34 -
Annex A. Post-2015 education indicators by potential data source and disaggregation
Targ
et
Concept Indicator Source Sex
We
alth
Loca
tio
n
Earl
y ch
ildh
oo
d
Readiness 1. Early Childhood Development Index Survey √ √ √
2. Under-5 mortality rate Mixed √ √ √
3. Under-5 stunting rate Mixed 4. Percentage of children under 5 years experiencing responsive,
stimulating parenting in safe environments Survey √ √ √
Participation 1. Participation rate in organized learning (3-4 year-olds) Survey √ √ √
2. Gross pre-primary enrolment ratio Administrative √ √
Quality 1. Child-educator ratio Administrative 2. Percentage of children receiving at least 1 year of a quality pre-primary
education programme Administrative/Survey √ √ √
Provision 2. Countries with 1 year free and compulsory pre-primary education Administrative
Pri
mar
y an
d s
eco
nd
ary
Learning Percentage of children who achieve minimum proficiency standards in:
1. Reading / Mathematics at the end of grade 2 Survey √ √ √
2. Reading / Mathematics at the end of primary school Administrative/Survey √ √ √
3. Reading / Mathematics at the end of lower secondary school Administrative/Survey √ √ √
4. Reading / Mathematics at the end of upper secondary school Administrative/Survey √ √ √
Completion 1. Gross intake ratio to the last grade of primary education Administrative/Survey √ √ √
2. Primary attainment rate (3-7 years above primary age) Survey √ √ √
3. Gross intake ratio to the last grade of lower secondary education Administrative/Survey √ √ √
4. Lower secondary attainment rate (3-7 years above lower secondary age) Survey √ √ √
5. Gross intake ratio to the last grade of upper secondary education Administrative/Survey √ √ √
6. Upper secondary attainment rate (3-7 years above upper secondary age)
Survey √ √ √
Participation 1. Percentage of children who were never in school Administrative/Survey √ √ √
2. Number of out of school children and adolescents Administrative/Survey √ √ √
3. Primary adjusted net enrolment rate Administrative √ √
4. Lower secondary total net enrolment rate Administrative √ 5. Secondary gross enrolment ratio Administrative √ Quality 1. Child-educator ratio Administrative Provision 1. Countries with nine years of free and compulsory basic education Administrative
Skill
s
Skills 1. Percentage of youth / adults with problem-solving skills Survey √ √ √
2. Percentage of youth / adults who are computer and information literate Survey √ √ √
Participation 1. Upper secondary gross enrolment ratio Administrative √ 2. Tertiary gross enrolment ratio Administrative √ 3. Participation rate in technical-vocational programmes (15-24 year olds) Administrative/Survey √ √ √
4. Percentage of youth not in education, training or employment (18-24 year olds)
Survey √
5. Participation rate in education and training (25-64 year olds) Survey √ √ √
6. Upper secondary attainment rate of adults (25-64 year olds) Survey √ √ √
Equ
ity
Access 1. Attainment rate: Parity Index Administrative/Survey √ √ √
2. Attainment rate: Range Administrative/Survey √ √ √
Outcomes 1. Learning outcomes: Parity Index Administrative/Survey √ √ √
2.Learning outcomes: Range Administrative/Survey √ √ √
Lite
racy
Literacy 1. Youth literacy rate / Adult literacy rate Census/survey √ 2. Percentage of youth / adults proficient in literacy skills Survey √ √ √
3. Percentage of youth / adults proficient in numeracy skills Survey √ √ √
Participation 1. Participation rate in literacy programmes (illiterate 25-64 year olds) Administrative √
Glo
bal
ci
tize
nsh
ip
Knowledge 1. Percentage of 15-year old students showing proficiency in knowledge of environmental science and geoscience.
Survey √ √ √
Values 1. Percentage of 13-year old students endorsing values and attitudes promoting equality, trust and participation in governance
Survey √ √ √
2. Percentage of adults who respond positively to the question ‘Protecting the environment should be given priority even if it causes slower economic growth and some loss of jobs’.
Survey √ √ √
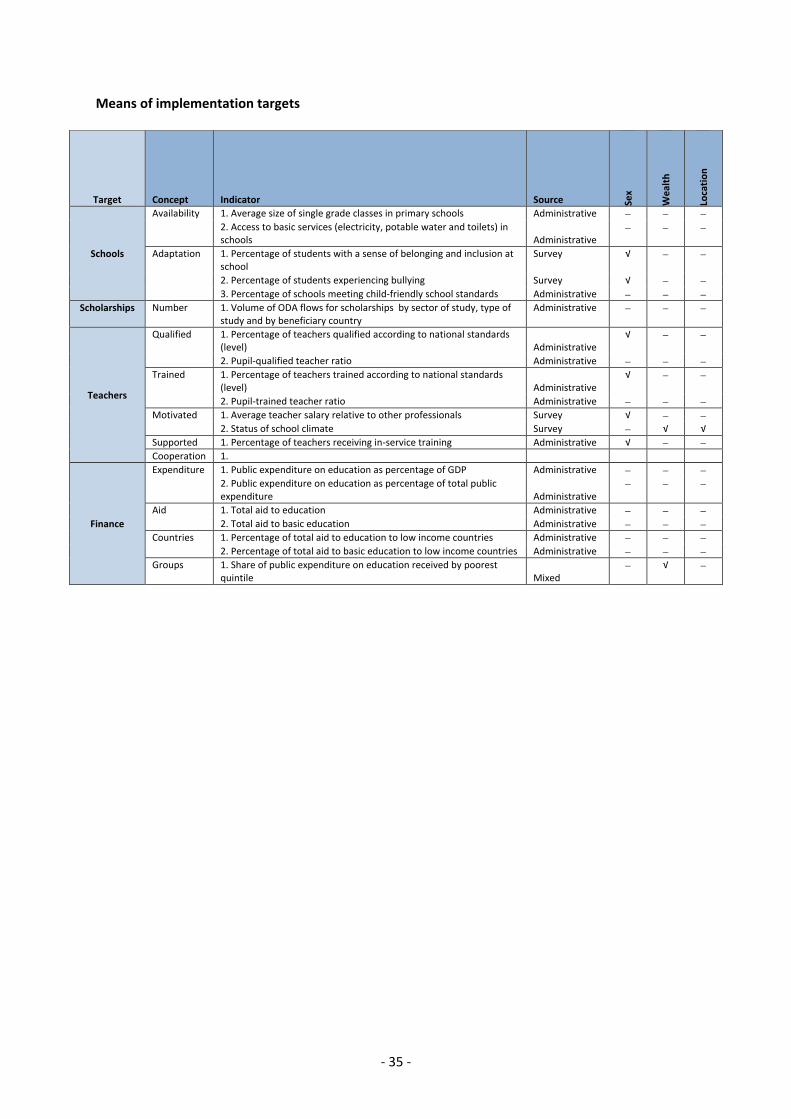
- 35 -
Means of implementation targets
Target Concept Indicator Source Sex
We
alth
Loca
tio
n
Schools
Availability 1. Average size of single grade classes in primary schools Administrative 2. Access to basic services (electricity, potable water and toilets) in
schools Administrative
Adaptation 1. Percentage of students with a sense of belonging and inclusion at school
Survey √
2. Percentage of students experiencing bullying Survey √ 3. Percentage of schools meeting child-friendly school standards Administrative
Scholarships Number 1. Volume of ODA flows for scholarships by sector of study, type of study and by beneficiary country
Administrative
Teachers
Qualified 1. Percentage of teachers qualified according to national standards (level) Administrative
√
2. Pupil-qualified teacher ratio Administrative Trained 1. Percentage of teachers trained according to national standards
(level) Administrative √
2. Pupil-trained teacher ratio Administrative Motivated 1. Average teacher salary relative to other professionals Survey √
2. Status of school climate Survey √ √
Supported 1. Percentage of teachers receiving in-service training Administrative √ Cooperation 1.
Finance
Expenditure 1. Public expenditure on education as percentage of GDP Administrative 2. Public expenditure on education as percentage of total public expenditure Administrative
Aid 1. Total aid to education Administrative 2. Total aid to basic education Administrative
Countries 1. Percentage of total aid to education to low income countries Administrative 2. Percentage of total aid to basic education to low income countries Administrative
Groups 1. Share of public expenditure on education received by poorest quintile Mixed
√
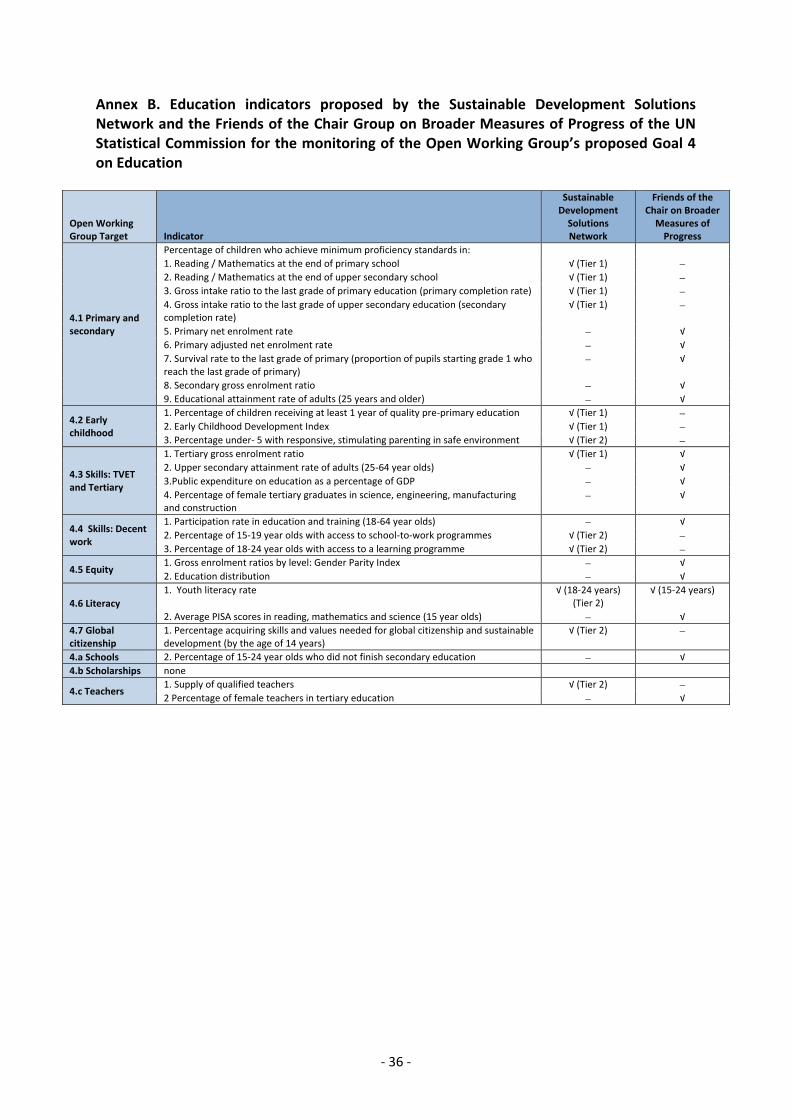
- 36 -
Annex B. Education indicators proposed by the Sustainable Development Solutions Network and the Friends of the Chair Group on Broader Measures of Progress of the UN Statistical Commission for the monitoring of the Open Working Group’s proposed Goal 4 on Education
Open Working Group Target Indicator
Sustainable Development
Solutions Network
Friends of the Chair on Broader
Measures of Progress
4.1 Primary and secondary
Percentage of children who achieve minimum proficiency standards in:
1. Reading / Mathematics at the end of primary school √ (Tier 1) 2. Reading / Mathematics at the end of upper secondary school √ (Tier 1) 3. Gross intake ratio to the last grade of primary education (primary completion rate) √ (Tier 1) 4. Gross intake ratio to the last grade of upper secondary education (secondary completion rate)
√ (Tier 1)
5. Primary net enrolment rate √
6. Primary adjusted net enrolment rate √
7. Survival rate to the last grade of primary (proportion of pupils starting grade 1 who reach the last grade of primary)
√
8. Secondary gross enrolment ratio √
9. Educational attainment rate of adults (25 years and older) √
4.2 Early childhood
1. Percentage of children receiving at least 1 year of quality pre-primary education √ (Tier 1) 2. Early Childhood Development Index √ (Tier 1) 3. Percentage under- 5 with responsive, stimulating parenting in safe environment √ (Tier 2)
4.3 Skills: TVET and Tertiary
1. Tertiary gross enrolment ratio √ (Tier 1) √
2. Upper secondary attainment rate of adults (25-64 year olds) √
3.Public expenditure on education as a percentage of GDP √
4. Percentage of female tertiary graduates in science, engineering, manufacturing and construction
√
4.4 Skills: Decent work
1. Participation rate in education and training (18-64 year olds) √
2. Percentage of 15-19 year olds with access to school-to-work programmes √ (Tier 2) 3. Percentage of 18-24 year olds with access to a learning programme √ (Tier 2)
4.5 Equity 1. Gross enrolment ratios by level: Gender Parity Index √
2. Education distribution √
4.6 Literacy
1. Youth literacy rate √ (18-24 years) (Tier 2)
√ (15-24 years)
2. Average PISA scores in reading, mathematics and science (15 year olds) √
4.7 Global citizenship
1. Percentage acquiring skills and values needed for global citizenship and sustainable development (by the age of 14 years)
√ (Tier 2)
4.a Schools 2. Percentage of 15-24 year olds who did not finish secondary education √
4.b Scholarships none
4.c Teachers 1. Supply of qualified teachers √ (Tier 2) 2 Percentage of female teachers in tertiary education √


