Embed Size (px)
Citation preview

1
2
3
45
6
8
910111213
141516171819
2 0
35
36
37
38
39
40
41
42
43
44
45
46
47
48
Information Sciences xxx (2010) xxx–xxx
INS 8555 No. of Pages 21, Model 3G
26 January 2010ARTICLE IN PRESS
Contents lists available at ScienceDirect
Information Sciences
journal homepage: www.elsevier .com/locate / ins
OFA non-linear index to evaluate a journal’s scientific impact
Sozon Papavlasopoulos a, Marios Poulos a, Nikolaos Korfiatis b,*, George Bokos a
a Information Technology Laboratory, Dept. of Archives and Library Sciences, Ionian University, Ioannou Theotoki 9, GR-49100, Corfu, Greeceb Department of Economics, University of Copenhagen, Øster Farimagsgade 5, Copenhagen, Denmark
a r t i c l e i n f o a b s t r a c t
2122232425262728293031
Article history:Received 4 December 2008Received in revised form 29 November 2009Accepted 14 January 2010Available online xxxx
Keywords:BibliometricsSemantic classificationElman neural networkImpact factor
UN
3233
0020-0255/$ - see front matter � 2010 Elsevier Incdoi:10.1016/j.ins.2010.01.018
* Corresponding author.E-mail addresses: [email protected] (S. Papavlasopo
Bokos).1 With Elsevier’s SCOPUS and other products such
have advanced the evaluation of publications to an iCenter (SLAC).
Please cite this article in press as: S. Papavlasodoi:10.1016/j.ins.2010.01.018
ED
PR
O
The purpose of this study is to define a bibliometric indicator of the scientific impact of ajournal, which combines objectivity with the ability to bridge many different bibliometricfactors and in particular the side factors presented along with celebrated ISI impact factor.The particular goal is to determine a standard threshold value in which an independentself-organizing system will decide the correlation between this value and the impact factorof a journal. We name this factor ‘‘Cited Distance Factor (CDF)” and it is extracted via awell-fitted, recurrent Elman neural network. For a case study of this implementation weused a dataset of all journals of cell biology, ranking them according to the impact factorfrom the Web of Science Database and then comparing the rank according to the cited dis-tance. For clarity reasons we also compare the cited distance factor with already knownmeasures and especially with the recently introduced eigenfactor of the institute of scien-tific information (ISI).
� 2010 Elsevier Inc. All rights reserved.
T 34CO
RR
EC1. Introduction
1.1. Background and motivation
Ever since the initial celebrated work by Garfield [13], Garfield and Merton [14], Pinski and Narin [33] on the evaluation ofa scientific impact of a scientific journal, a great body of research has emerged on the application of information processingmethods for evaluating scientific publication venues, extending it also to the evaluation of an individuals’ research output[20].
Nonetheless, the issue concerning the evaluation of a journals’ scientific impact still remains the essential priority of thescientometrics field [4,37,22] due to the fact that is often used as a yardstick to provide an indication for the allocation ofscientific budgets, the direction and future of research, as well as organizational decisions such as the employment of theresearchers, the effectiveness of the research policy pursued and the subscription policy of academic libraries. The journalcitation reports (JCR) provided by the Institute for Scientific Information (ISI), instituted by the work of Garfield [12] are oftenthe main source for these indicators to academic and research evaluation committees. Undoubtedly, in current academicpractice, JCR is one of the most used sources for facilitating a researcher’s access to high-quality, latter-day research.1
. All rights reserved.
ulos), [email protected] (M. Poulos), [email protected] (N. Korfiatis), [email protected] (G.
as NCBI Pubmed to receive also significant attention from researchers. Several disciplines such as Physicsndividual level such as for example the SPIRES research database hosted at Stanford Linear Accelerator
poulos et al., A non-linear index to evaluate a journal’s scientific impact, Inform. Sci. (2010),

49
50
51
52
53
54
55
56
57
58
59
60
61
62
63
64
65
66
67
68
69
70
71
72
73
74
75
76
77
78
79
80
81
82
83
84
85
86
87
88
89
90
91
92
93
94
95
96
97
98
99
100
101
2 S. Papavlasopoulos et al. / Information Sciences xxx (2010) xxx–xxx
INS 8555 No. of Pages 21, Model 3G
26 January 2010ARTICLE IN PRESS
Apart from the impact factor, ISI provides a set of journal performance indicators supplied along with the impact factor ofthe journal. These performance indicators are categorized as follows: (a) Impact Factor (IF), a measure of the frequency withwhich the average article in a journal has been cited in a given period of time which is referred to, in a two year time spanafter publication in other words this cites in year x to items published in: x � 1 and x � 2; (b) Immediacy index (I.I) whichconcerns the average number of times an article is cited in the year it is published; (c) Cited half-life (Cd. H-L), the number ofyears, going back from the current year, that account for half the total citations received by the cited journal in the currentyear; (d) Citing half-life (Cg. H-L), the number of years from the current year that account for 50% of the cited references fromarticles published by a journal in the current year.2
DPR
OO
F
1.2. Problems with the impact factor
While undoubtedly the impact factor is accepted as a key indicator for scientific quality there are criticism as to its misusesince it cannot be directly related to an individuals’ research output and thus is not always a reliable instrument for mea-suring the quality of publication venues [38]. Also several attempts made by different authors to count the number of cita-tions, no matter how prestigious the citing journal is [18], or to introduce more sophisticated journal citation measures andthe reasons why many indicators aiming at a correction of methodological limitations of the Impact Factor have also made apoint to that direction. In particular the shortcomings of the slow citation window and subject biases [16] cannot be tackledby the overall assessment of the impact factor and any attempt to evaluate a journal should take into account these factorsand that is in fact an intuition in this study. It is broadly argued that its use for purposes for which it was not intended, causeseven greater unfairness [1,21]. Related research also suggests that research evaluation should also be adjusted to account forvariables such as domain specialty, citation density, and half-life [42,27]. Furthermore, apart from being non-representative,the journal impact factor is encumbered with several shortcomings of a technical and more fundamental nature such as theintention to cite [28].
To this end, the focus of this study is to provide an index that results as a combination of the different performance indi-cators that cover a publication period and citation window. These indicators are designed to measure ageing characteristicsof subject fields and journal literature, or to help to distinguish between slow and fast reception of scientific information[16]. Therefore the problem which originates from the separation slow and fast reception sciences journal, leads to calculateunequal values for Impact Factor in different scientific areas while they have the same impact in their category. We summa-rize the aim and scopes of this study in the section that follows.
EUN
CO
RR
EC
T1.3. Aim and scopes of this study
The major goal of this study, is to provide empirical evidence to support that journal performance indicators, and in par-ticular the indexes provided by Journal Citation Report (JCR): Impact Factor (IF), Immediacy Index (I.I), Cited half-life (Cd-h.l)and Citing half-life (Cg-h.l), play an important role in differentiating the original ranking by the IF when taking also thesefactors into consideration. To achieve this objective we create an ideal factor namely the Cited Distance factor, which mea-sures the difference between a predetermined value and a representative value for each journal. Thus, the smallest the afore-mentioned distance is, the higher the ranking of the journal will be. The determination of these values is given in Sections 2.2and 2.3.
All the journal performance indicators mentioned above have a common property: they evaluate the citations in a differ-ent statistical way. The next issue that we address in this study is to identify the statistical procedure that could solve theproblem of the combination of these indicators in a single non-linear index for measuring and evaluating publication venues.
We chose to address this issue with a well-defined neural network (NN) in order to provide an appropriate weight in theprocess of learning for input vectors. This can be judged by the fact that each indicator refers to a different characteristic ofthe performance of the journal (e.g. citation window) and a simple linear combination of the above cannot provide an accu-rate picture. Some similar attempts such as the Eigenfactor move to that direction as well [2]. Furthermore the recent intro-duction by ISI of the Eigenfactor as a measure for evaluating the scientific impact for a journal, justifies the need for a moresophisticated way of combining the different journal performance indicators into a more accurate and holistic measure. Theintuition of the Eigenfactor can to some extend be considered similar with other celebrated measures that rely on the cal-culation of eigenvalues [3] such as for example the celebrated page rank algorithm (where the page rank values are com-puted from the stationary vector rather than the eigenvector) and to that extend we also examine the relation of theproposed CD factor with other measures and in particular with the Eigenfactor and journal adapted h-index,
The problems which are handled with these vectors are the variability which they present periodically for which theydepend in turn on the differentiation of the aforementioned indicators. Furthermore, this NN could be trained to recognizeand produce both spatial and temporal patterns which solve the problem of the factors variability using a threshold value inorder to support rule-based decision process. Thus, the proposed cited distance factor,which is extracted via a neural net-work processing, returns a number which may be considered as an ideal combination of the JCR side factors. In this way, we
2 http://www.isi.org/ (Accessed 6th June 2009).
Please cite this article in press as: S. Papavlasopoulos et al., A non-linear index to evaluate a journal’s scientific impact, Inform. Sci. (2010),doi:10.1016/j.ins.2010.01.018

102
103
104
105
106
107
108
109
110
111
112
113
114
115
116
117
118
119
120
121
122
123
124
125
126
127
128
129
130
131
132
133
134
135
136
137
138
139
140
141
142
143
144145
147147
148
149
150
151
152
153
154
155
S. Papavlasopoulos et al. / Information Sciences xxx (2010) xxx–xxx 3
INS 8555 No. of Pages 21, Model 3G
26 January 2010ARTICLE IN PRESS
RO
OF
proposed an alternative measure to solve the problem of the separation of the slow and fast reception of journals as well asthe fair separation of high, medium and low class.
The intuition to select the recurrent Elman Neural network over other similar neural network models such as the stan-dard back-propagation (BP), or the self-organizing map (SOM) was based on the nature of the research inquiry tackled in thispaper which entails the combination of several side indexes into one index. Furthermore a similar paper by [26] on the com-parison of NN architectures (multilayer perceptron (MLP) trained with the back-propagation and Resilient Back-propagation(RPROP)), showed that the best prediction accuracy was obtained with the extended Elman neural network. Also, one of theoriginal issues with SOM is that it is not appropriate for clustering but mostly as a way of obtaining a mapping of a complex,multidimensional space onto a simpler two-dimensional space, as represented by the network [24].
The broad goal of the suggested index is that it should cover universality and objectivity. Furthermore in the process ofdeveloping the learning procedure of the evaluated neural network model, we created weighted values for every four coef-ficients, which with the use of a training function we unify them in one index that we call a. This index a represents a bib-liometric indicator which includes the features of the aforementioned partially uncorrelated journal performance indicators.Thus, this value a is compared with a predetermined bound value hh that defines the neural network. The hh value is one ofthe four (4) thresholds, namely (1.5,0.5,�0.5,�1.5) which create an activation function which determines the discriminationbetween a number of classes of the input vectors. In this way the proposed cited distancevalue is calculated from the differ-ence between the specific indicator and the value 1.5 (see Eq. (6)). These classes represent the probabilistic categories ofjournals. The selection of the suitable number of categories used in this study is three (3) which was extracted using thek-means clustering and t-test methods. More details are given in Sections 3.2 and 3.3.
To this end this paper is structured as follows. Section 2 presents the methodology and the configuration of the ElmanNeural Network used for the calculation of the citing distance. We believe that this method includes an unbiased and fairevaluation of the scientific impact of a journal as compared with the IF The pre-processing of the data to be analyzed is pre-sented in the experimental part in Sections 3.1 and 3.2 respectively. We provide the experimental procedure and results aswell as an evaluation of their validity in Section 4. We conclude this study in Section 5 with remarks for future research.
POR
REC
TED
2. Method and constructs
As aforementioned, the objective of this study can be abstracted to the problem of classification among three probabilisticcategories of journals. Each category creates an upper and lower bound in which we have classified the IF for each journal.
These categories are determined from three evaluated decisions: maximum (max), medium (med) and minimum (min)groups of IF’s. Taking this problem into account, we selected the artificial Elman neural network as the most efficient net-work in order to classify the proposed categories. While the Elman setting is essentially a variation of the general class ofneural networks called multilayer perceptron [5] the selection of this setting was done because of the ability of the particularnetwork topology to store information for future updated factors. Due to this fact this neural network setting is able to learntemporal as well as spatial patterns. The Elman network can be trained to respond, and to generate, both kinds of patterns[32]. Thus, this classification model adapts successfully to the training procedure of the proposed categories because thesecategories present the temporal and spatial characteristics of the network’s units. These characteristics are the source of theunpredictable rhythm for those cited journals that are published continually. Furthermore, this neural network has the abil-ity to produce a well-determined statistical indicator, which would be considered as the ideal global indicator [6].
2.1. Architecture of the Elman neural network
The Elman network is a two-layer network with feedback in the first layer. This recurrent connection allows the Elmannetwork to both detect and generate time-varying patterns [29]. In particular, the Elman network consists of two layers: ahidden (recurrent) layer and an output layer. The hidden layer, which is the recurrent layer is composed of neurons with ahyperbolic tangent activation function (tansig) as described in the original implementation [9] and is governed by the fol-lowing equation:
Pleasedoi:10
CtansigðXÞ ¼ 1� e�2x
1þ e�2x: ð1Þ
UNThe output layer is characterized by a linear activation function [7]. In our case this is responded by the three different types
of input vectors.
2.2. Summing and activation functions
A modified Elman, with non-linear neurons in the hidden layer and linear neurons in the remaining layers, is employed,and the hyperbolic tangent function (see Eq. (1)) has been adopted as the activation function of the non-linear neurons. Inthis case, the significant issue to address is the discrimination thresholds between the input classes of vectors [11] where thethreshold is an adaptive value obtained as a function of the maximum of the difference between the log-likelihood of themaximum category and the log-likelihood of the medium and minimum categories, respectively [36,46]. Furthermore, it
cite this article in press as: S. Papavlasopoulos et al., A non-linear index to evaluate a journal’s scientific impact, Inform. Sci. (2010),.1016/j.ins.2010.01.018

156
157
158
159
160
161
162163
165165
166
167
168
169
170
171
172
173
175175
176
177
178
179
181181
182
183
184
186186
187
189189
190
191
192
193
194
195
196
197198
200200
201
202
203
204
205
206
207
208
209
210
211
4 S. Papavlasopoulos et al. / Information Sciences xxx (2010) xxx–xxx
INS 8555 No. of Pages 21, Model 3G
26 January 2010ARTICLE IN PRESS
is known from a biological context that a neuron becomes activated when it detects electrical signals from the neurons towhich it is connected [30]. If these signals are sufficient, the neuron will send electrical signals to the neurons connected to it.An activation function is similar – the artificial neuron will output a value based on inputs received. It is almost always thecase that a neuron will output a value between [0,1] or [�1,1]. This normalization of data occurs by using the summed in-puts as a parameter to a normalization function which represents the activation function [40]. In the Elman network, theactivation function is accomplished by the network training procedure, which receives xj input training vectors, and the fol-lowing polynomial y term in sigma–pi units is extracted:
Pleasedoi:10
y ¼ fXðwijxjÞ
� �; ð2Þ
OF
where:
j = represents the number of training vectors in the input; andi = the number of training epochs.
The network described here uses back-propagation as the learning algorithm. This algorithm permits us to modify theweights in the network in response to the errors produced for the training data. In the most general terms, the algorithmcan be understood as a way to accomplish credit/blame assignment. More specifically, the algorithm involves the followingweight adjustment equation [10,41]:
Owij ¼ ndiaj:
PRThis equation defines the weight change between any two units, i and j, as the product of three terms. The first term, n, is a
scaling constant and is referred to as the learning rate. It is typically a small value, so learning occurs in small increments.The last term, aj, is the activation of the sender and implements the credit/blame aspect of the algorithm [10,44]. The middleterm, di, is calculated as follows:
dl ¼ f 0ðnetÞ;
Dwhere the error (in the case of an output unit) simply represents the discrepancy between the target output of the unit andthe actual output, while f0(net) represents the derivative of the receiver unit’s activation function, given its current net input.Eq. (2) is transformed by the following equation:
Ey ¼ f ðg � hhÞ; TwhereCg ¼YN
i¼1;j¼1
xwij
i ;
RR
EN is the number of experimental training epochs; f(x) is the activation function, which normally takes the form of a sigmoidalor threshold function; g is the total input stimulus; and hh is the threshold.
In this section we argue that the coordinated trajectory dynamics clearly represent a solution that can process the max-imum, medium and minimum performance cases. The argument is based on the dynamic properties of the linearised sys-tems derived in the analysis (see Section 2.1). Our construction is an application of the counting solutions of analogcomputation theory, except that our system can produce output predictions that are linearly separable [36]. The Elman net-work is set to respond within the following thresholds, which are determined by the following piecewise-linear function[36]:
O
f ðxÞ ¼þ1! if ; þ1:5 < x 6 þ0:50! if ; þ0:5 < x 6 �0:5�1! if ; �0:5 < x 6 �1:5
8><>:
9>=>;: ð4Þ
UN
C
In our case, function f(1) corresponds to the maximum (citations) case with a low threshold value of 0.5; function f(2) cor-responds to the medium (citations) case with a low threshold value of 1.5; and function f(2) corresponds to the minimum(citations) case with a low threshold value of 2.5. The minimum threshold of 0.5 is considered to be the value of an idealarticle, which is compared to an extracted value denoting an article’s impact factor. This configuration is established by de-fault in the activation learning procedure, where a neuron that is activated by a class of input vectors, u1 (maximum case),returns threshold values between 0.5 and 1.5 (see Figs. 2 and 3). The same is true for u2 and u3. So the purpose of a specificminimum threshold is to compare each extracted value of the unknown vector being tested using the Matlab purellin [8]function with a value of 0.5.
Thus, the inputs to the network are coded in binary using 1, 2 or 3 values (see Eq. (4)). Each input is weighted with itsappropriate weight, Wji, and the sum of the weighted inputs and the bias form the input to the transfer function. The outputsof the transfer function are then fed into the hidden layer as inputs. The output prediction value is derived using the same
cite this article in press as: S. Papavlasopoulos et al., A non-linear index to evaluate a journal’s scientific impact, Inform. Sci. (2010),.1016/j.ins.2010.01.018

212
213
215215
216
217
218
219
220
221
222
223
224
226226
227
228230230
231
232
233
234
235
236
237
238
239
240
241
242
243
244
245
246
247
248
249
250
251
252
253
254
256256
257
258
259
260
S. Papavlasopoulos et al. / Information Sciences xxx (2010) xxx–xxx 5
INS 8555 No. of Pages 21, Model 3G
26 January 2010ARTICLE IN PRESS
procedure from the hidden layer to the output layer. The log-sigmoid transfer function used and the relationship betweeninputs and outputs is as follows [8]:
Pleasedoi:10
f ðxÞ ¼ 11þ e�x
:
In the training procedure, the extracted weights (W1 and W2) create the rule by organising the normalized input vectors inrelation to the thresholds. In this way, the constructed Elman neural network creates a global ‘cited’ coefficient. Theextracted distance values depend exclusively upon a well-fitted neural network. This adaptation depends upon the correctranking of the trained vectors in the established categories, a suitable setting for the trained vector values for each category,and finally, the selected number of neurons.
F2.3. Extraction of the cited distance
In the network testing procedure, each candidate testing vector x is related to the extracted weights of the training pro-cedure via Eq. (3), and this relation is depicted by the following equation:
Oa ¼ � ln jðf ðxÞ � 1:5Þjx
: ð5Þ
OFinally, the cited distance is calculated by the following equation:dist ¼ ja� hhj; ð6Þ
PR
where, in our case hh ¼ �1:5Having described the methodology and the constructs for the development of the proposed indicator we proceed to the
evaluation and the experimental part of this study.
REC
TED3. Experimental part
3.1. Dataset description
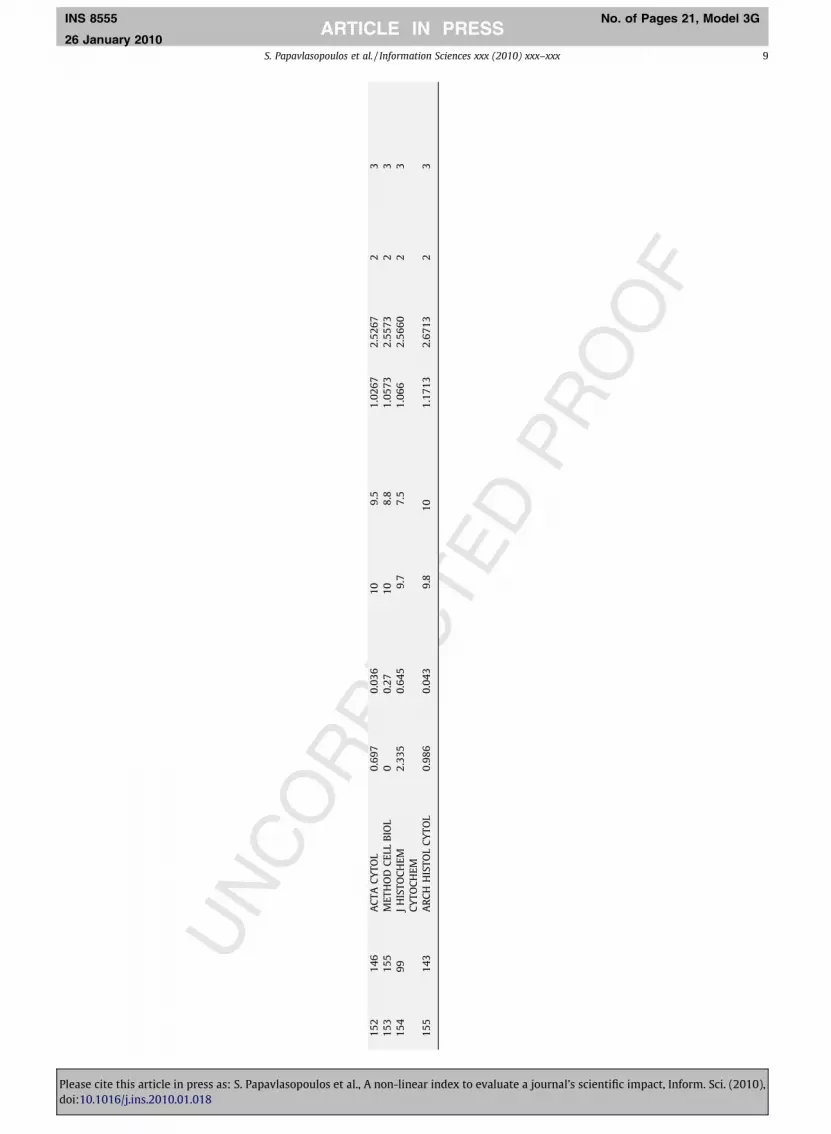
In our study we conducted a search of the Web of Science database in the 2007 (citations in 2007 to articles published in2006 and 2005) for the subject category of Cell Biology and ranked the journals by the corresponding IF (see Table 1).
It must be noted that the citations amounts are refereed indirectly via IF which is calculated as Cites to recent items/Num-ber of recent items. In our case, the constructed NN used only the IF values and in this case we used indirectly and the cita-tions amount.
Table 1 presents the complete ranking of the selected journals (with their acronyms corresponding to the abbreviatedtitles in the JCR database). The last two columns (value a and cited distance) have been completed following the procedurein Section 2.3. As a sampling scientific field the area of cell biology was selected because is a highly dynamic research field,where published reports rapidly become obsolete, a large proportion of citations are captured by the short-term index usedto calculate journal impact factors, as previously discussed; but fields with a more durable literature, such as mathematics,have a smaller fraction of short-term citations and hence lower journal impact factors [27,38].
NC
OR3.2. Unsupervised data clustering using K-means
One particular issue with the dataset is to define the number of categories to which we will classify the journals accordingto their impact factor. In order to come with a safe result we used the celebrated K-means clustering algorithm to examinewhether two or three groups is the optimal clustering approach for the dataset presented in Table 1. The procedure follows atrivial way to classify a given data set through a certain number of clusters (assume k clusters) fixed a priori. The main idea isto define k centroids, one for each cluster. These centroids should be placed in a cunning way because of different locationcauses different result and a loop evaluates this case recurrently . In our case we submitted the IF data set (of Table 1) intok = 2 or 3 clusters using the following objective function.
UJ ¼Xk
j¼1
Xn
i¼1
xðjÞi � cj
��� ���:
The results of the clustering for the cases k = 2 and 3 are given in Table 1. This is generated from a k-mean processing of 176vectors with size 4 from IF, I.I, Cd-h.l and Cg-h.l indexes and the result for the k = 2 and k = 3 are present in Fig. 1.Having obtained the classification of the ranked list of the journals in k = 2 and k = 3 we proceed with a statistical eval-uation of the classification results in order to assert that the neural network input vectors are accurate.
cite this article in press as: S. Papavlasopoulos et al., A non-linear index to evaluate a journal’s scientific impact, Inform. Sci. (2010),.1016/j.ins.2010.01.018

UNCORRECTEDPROOF
Table 1The alteration in the journals ranking according to the cited distance index.
Rank CD Rank IF Abbreviated journal title Impact factor Immediacy index Cited half-life Citing half-time Value a Cited distance Clustering k = 2 Clustering k = 3
1 1 NAT REV MOL CELL BIO 31.921 6.205 4 4.1 �0.9845 0.5155 1 12 3 NAT MED 26.382 6.342 5.7 4.5 �0.9771 0.5229 1 13 4 ANNU REV CELL DEV BI 23.545 1.32 6.7 5.4 �0.9718 0.5282 1 14 2 CELL 29.887 6.402 8.7 4.5 �0.9716 0.5284 1 15 6 CELL METAB 17.148 2.772 2.1 4.8 �0.9673 0.5327 1 16 5 NAT CELL BIOL 17.623 4.347 4.9 4.7 �0.9596 0.5404 1 17 9 CURR OPIN CELL BIOL 13.444 1.667 5.7 3 �0.9345 0.5655 1 18 8 TRENDS CELL BIOL 13.527 2.403 4.9 3.8 �0.9339 0.5661 1 19 7 GENE DEV 14.795 2.389 6.9 4.8 �0.9256 0.5744 1 110 10 MOL CELL 13.156 3.01 4.6 4.9 �0.9215 0.5785 1 111 11 DEV CELL 12.436 3.037 3.7 5.1 �0.9125 0.5875 1 112 12 CYTOKINE GROWTH F R 11.816 0.784 4.4 6.2 �0.8941 0.6059 1 113 15 CURR OPIN STRUC BIOL 10.15 0.802 5.5 2.9 �0.8701 0.6299 1 114 14 CURR OPIN GENET DEV 10.15 1.436 5.3 3.1 �0.8658 0.6342 2 315 13 NAT STRUCT MOL BIOL 11.085 3.025 5.8 4.8 �0.8596 0.6404 2 316 16 PLANT CELL 9.653 1.579 5.8 5.5 �0.8035 0.6965 1 117 19 CELL DEATH DIFFER 8.254 2.075 4 5.5 �0.7412 0.7588 1 118 20 STEM CELLS 7.531 1.331 2.8 5.1 �0.7088 0.7912 1 119 21 EMBO REP 7.45 1.53 3.9 4.4 �0.7085 0.7915 1 120 17 J CELL BIOL 9.598 1.854 8.8 5.5 �0.7077 0.7923 1 221 22 TRENDS MOL MED 7.244 1.984 3.7 3.7 �0.7057 0.7943 2 322 18 EMBO J 8.662 2.086 8 5.7 �0.6553 0.8447 1 223 24 TRAFFIC 6.533 0.98 3.7 5.9 �0.5909 0.9091 1 224 25 SEMIN CELL DEV BIOL 6.482 0.761 3.9 5.7 �0.5909 0.9091 1 225 29 AGEING RES REV 6.365 0.5 3.6 6 �0.5766 0.9234 1 226 23 FASEB J 6.791 1.361 6 6.1 �0.5474 0.9526 2 327 26 ONCOGENE 6.44 1.444 5.3 5.6 �0.5412 0.9588 2 328 28 J CELL SCI 6.383 0.964 5.6 5.8 �0.5287 0.9713 1 229 31 AGING CELL 5.854 1.37 3.1 5.8 �0.5114 0.9886 1 230 30 MOL BIOL CELL 6.028 1.16 5 6.2 �0.4834 1.0166 1 231 27 MOL CELL BIOL 6.42 1.307 6.9 5.9 �0.4621 1.0379 1 232 37 AUTOPHAGY 4.657 1.322 1.7 3.9 �0.4346 1.0654 1 233 33 CELL MICROBIOL 5.293 1.368 3 6 �0.4251 1.0749 1 234 35 CELL MOL LIFE SCI 5.239 0.597 4.4 5.8 �0.409 1.0910 1 235 34 J MOL CELL CARDIOL 5.246 1.109 6.5 5.8 �0.2999 1.2001 1 236 40 TISSUE ENG 4.409 0.4 3.6 5.7 �0.2948 1.2052 1 237 47 CELL RES 4.217 1.024 2.7 5.2 �0.2869 1.2131 1 238 43 MOL CANCER RES 4.317 0.459 3.4 5.6 �0.2853 1.2147 1 239 48 CELL ONCOL 4.17 0.361 2.4 5.5 �0.2825 1.2175 1 240 36 STRUCTURE 5.231 1.036 6.4 6.4 �0.282 1.2180 1 241 41 BBA-MOL CELL RES 4.374 0.692 4 6.2 �0.2476 1.2524 1 242 45 PIGM CELL RES 4.288 0.469 4.8 5.6 �0.2333 1.2667 1 243 42 CELL CALCIUM 4.338 0.874 4.8 6.7 �0.1812 1.3188 1 244 49 CELL SIGNAL 4.147 0.942 4 6.5 �0.1806 1.3194 1 245 44 MECH AGEING DEV 4.308 0.868 6 5.5 �0.1652 1.3348 1 246 53 CELL TRANSPLANT 3.871 0.675 4.5 5.4 �0.1616 1.3384 2 347 38 AM J RESP CELL MOL 4.608 1.095 6.5 6.2 �0.1561 1.3439 1 248 64 CYTOTHERAPY 3.553 0.308 3.2 5.3 �0.1561 1.3439 2 349 51 INT J BIOCHEM CELL B 4.009 0.991 4.5 6.1 �0.1474 1.3526 1 250 68 CELL CYCLE 3.314 0.673 2.5 4.9 �0.1368 1.3632 1 2
6S.Papavlasopoulos
etal./Inform
ationSciences
xxx(2010)
xxx–xxx
INS
8555
No
.o
fP
ag
es
21,
Mo
del
3G
26
Jan
uary
2010
AR
TIC
LE
INP
RE
SS
Pleasecite
thisarticle
inpress
as:S.Papavlasop
ouloset
al.,Anon-linear
indexto
evaluatea
journal’sscientifi
cim
pact,Inform.Sci.(2010),
doi:10.1016/j.ins.2010.01.018

UNCORRECTEDPROOF
51 32 INT REV CYTOL 5.506 0.6 9.1 7.3 �0.1200 1.3800 1 252 54 MOL MEMBR BIOL 3.87 0.312 4.7 6.6 �0.1085 1.3915 1 253 50 J LEUKOCYTE BIOL 4.128 0.994 5.6 6.3 �0.1073 1.3927 2 354 138 IEE P SYST BIOL 1.157 0 1.9 0 �0.1009 1.3991 1 255 66 PHYSIOL GENOMICS 3.493 0.705 3.7 5.6 �0.0999 1.4001 1 256 63 CELL PHYSIOL BIOCHEM 3.557 0.352 3.9 6.5 �0.0737 1.4263 1 257 56 BIOL CELL 3.752 0.525 4.8 6.7 �0.0643 1.4357 1 258 46 AM J PHYSIOL-CELL PH 4.23 0.901 6.3 7.1 �0.0532 1.4468 1 259 75 BMC CELL BIOL 3.092 0.19 3.1 5.9 �0.0287 1.4713 1 260 57 GROWTH FACTORS 3.742 0 5.9 6.7 �0.0241 1.4759 1 261 79 CYTOM PART A 2.978 0.624 2.8 5.9 0.0015 1.5015 1 262 67 J CELL BIOCHEM 3.381 0.597 4.9 6.5 0.022 1.5220 1 263 72 MITOCHONDRION 3.209 0.397 3.3 7.3 0.0284 1.5284 1 264 61 PLANT CELL PHYSIOL 3.654 0.663 6.1 6.6 0.0344 1.5344 1 265 76 APOPTOSIS 3.043 0.592 3.7 6.3 0.0385 1.5385 1 266 131 CELL COMMUN ADHES 1.447 0.053 4.6 6.2 0.0484 1.5484 1 267 65 BBA-MOL CELL BIOL L 3.539 0.813 5.4 7.1 0.0509 1.5509 1 268 69 GENES CELLS 3.299 0.569 5.4 6.2 0.0534 1.5534 1 269 73 CELL PROLIFERAT 3.12 0.394 4.7 6.3 0.0575 1.5575 1 270 62 J CELL PHYSIOL 3.643 0.94 6.6 6.4 0.0748 1.5748 1 271 60 J STRUCT BIOL 3.677 1.047 6.4 7 0.0878 1.5878 1 272 59 MATRIX BIOL 3.687 0.714 6.6 7.1 0.0881 1.5881 2 373 77 IMMUNOL CELL BIOL 3.033 0.72 5.5 5.6 0.1006 1.6006 1 274 78 FRONT BIOSCI 2.989 0.828 4 7 0.1112 1.6112 1 275 71 EUR J CELL BIOL 3.224 0.29 8.7 6.7 0.1272 1.6272 1 276 58 EXP CELL RES 3.695 0.681 7.8 6.3 0.1362 1.6362 1 277 85 IUBMB LIFE 2.857 0.256 4.8 6.6 0.14 1.6400 1 278 55 HISTOPATHOLOGY 3.791 0.6 7.6 7.4 0.1467 1.6467 1 279 97 CYTOGENET GENOME
RES2.402 0.222 3.1 6.5 0.1763 1.6763 1 2
80 39 PROG HISTOCHEM CYTO 4.571 0.2 10 8.3 0.1860 1.6860 2 381 100 NEUROSIGNALS 2.308 0 3.9 6.1 0.2024 1.7024 2 382 81 ANAL QUANT CYTOL 2.94 0.163 5.8 7.4 0.2146 1.7146 1 283 84 HISTOCHEM CELL BIOL 2.893 1.25 5 7.4 0.2291 1.7291 1 284 86 CELL STRESS CHAPERON 2.853 0.275 5.6 7.5 0.2361 1.7361 1 285 70 FEBS LETT 3.263 0.458 8.3 6 0.2566 1.7566 1 286 129 STEM CELL REV 1.493 0.034 2.2 4.8 0.2582 1.7582 1 287 83 DIFFERENTIATION 2.899 0.419 6.8 6.6 0.262 1.7620 1 288 80 MOL CELL ENDOCRINOL 2.971 0.682 6.3 7.4 0.2642 1.7642 1 289 82 NITRIC OXIDE-BIOL CH 2.9 0.547 5.2 8.6 0.2719 1.7719 2 390 96 BIOCHEM CELL BIOL 2.419 0.105 6.2 6.4 0.3216 1.8216 1 391 109 CELL BIOCHEM BIOPHYS 1.953 0.169 4.2 6.2 0.3257 1.8257 1 392 74 BIOSCIENCE REP 3.115 0.2 7.8 7.8 0.3311 1.8311 1 393 98 MOL CELL PROBE 2.364 0.525 5.9 6.4 0.3373 1.8373 1 394 95 WOUND REPAIR REGEN 2.445 0.281 5.1 7.9 0.3403 1.8403 1 395 110 J NEUROCYTOL 1.935 0 10 0 0.347 1.8470 1 396 88 J BIOENERG BIOMEMBR 2.634 0.238 7.5 6.3 0.3568 1.8568 1 397 87 J INTERF CYTOK RES 2.667 0.264 6.4 8.1 0.3689 1.8689 1 398 111 MOL CELLS 1.916 0.119 4.2 6.8 0.3703 1.8703 1 399 101 TISSUE ANTIGENS 2.245 0.643 6.7 5.9 0.4001 1.9001 1 3100 94 CELL MOL NEUROBIOL 2.483 0.25 5.7 8.8 0.4132 1.9132 1 3101 119 CELLS TISSUES ORGANS 1.776 0.218 4.7 6.5 0.4214 1.9214 1 3
(continued on next page)
S.Papavlasopouloset
al./Information
Sciencesxxx
(2010)xxx–
xxx7
INS
8555
No
.o
fP
ag
es
21,
Mo
del
3G
26
Jan
uary
2010
AR
TIC
LE
INP
RE
SS
Pleasecite
thisarticle
inpress
as:S.Papavlasop
ouloset
al.,Anon-linear
indexto
evaluatea
journal’sscientifi
cim
pact,Inform.Sci.(2010),
doi:10.1016/j.ins.2010.01.018

UNCORRECTEDPROOF
Table 1 (continued)
Rank CD Rank IF Abbreviated journal title Impact factor Immediacy index Cited half-life Citing half-time Value a Cited distance Clustering k = 2 Clustering k = 3
102 112 PLATELETS 1.915 0.548 4.4 7.2 0.4226 1.9226 1 3103 102 CYTOKINE 2.169 0.046 6.4 6.9 0.4275 1.9275 1 3104 117 J RECEPT SIG TRANSD 1.815 0.208 4.7 6.9 0.4341 1.9341 1 3105 121 ENDOTHELIUM-J
ENDOTH1.74 0.195 4.2 7.1 0.4414 1.9414 1 3
106 106 HISTOL HISTOPATHOL 2.007 0.397 5.3 7.4 0.4471 1.9471 2 3107 107 PROSTAG LEUKOTR ESS 2 0 5.8 7.2 0.4509 1.9509 1 3108 104 DEV GENES EVOL 2.068 0.595 5.5 7.4 0.452 1.9520 1 3109 116 GROWTH HORM IGF RES 1.831 0.281 4 8.1 0.4547 1.9547 1 3110 105 EUR CYTOKINE NETW 2.064 0.222 7.1 6.3 0.469 1.9690 1 3111 103 MOL MED 2.078 0.29 7.5 6 0.4772 1.9772 1 3112 92 MOL REPROD DEV 2.538 0.67 7.4 8.1 0.488 1.9880 1 3113 115 DNA CELL BIOL 1.861 0.359 7.8 5.1 0.4919 1.9919 1 3114 108 PROSTAG OTH LIPID M 1.968 0.577 5.5 8.1 0.519 2.0190 1 3115 124 CELL MOL BIOL LETT 1.676 0.22 4.1 8.4 0.5223 2.0223 2 3116 155 CELL STEM CELL 0 2.587 0.5 4.1 0.5342 2.0342 2 3117 91 CELL MOTIL CYTOSKEL 2.542 0.27 8.9 7.7 0.5376 2.0376 2 3118 140 J MOL HISTOL 1.13 0.27 3.2 7 0.5562 2.0562 2 3119 89 CELL TISSUE RES 2.613 0.405 9.2 8.1 0.5686 2.0686 2 3120 154 IET SYST BIOL 0 0.286 5.3 0.586 2.0860 2 3121 114 CELL STRUCT FUNCT 1.882 0.75 6.8 7.7 0.6031 2.1031 2 3122 93 J MEMBRANE BIOL 2.527 0.135 9.8 7.6 0.6092 2.1092 2 3123 125 CELL BIOCHEM FUNCT 1.561 0.311 4.4 8.9 0.6123 2.1123 2 3124 127 PATHOBIOLOGY 1.547 0.143 7.4 6.2 0.6161 2.1161 2 3125 123 MOL CELL BIOCHEM 1.707 0.381 6.4 8 0.6237 2.1237 2 3126 128 INFLAMM RES 1.504 0.278 6.4 7.2 0.6319 2.1319 2 3127 126 CELL BIOL INT 1.547 0.221 6 7.9 0.6378 2.1378 2 3128 113 DEV GROWTH DIFFER 1.908 0.544 7.8 7.9 0.6407 2.1407 2 3129 90 ADV ANAT EMBRYOL CEL 2.6 0.077 10 9 0.6642 2.1642 2 3130 137 MEDIAT INFLAMM 1.162 0.078 5.1 7.4 0.6651 2.1651 2 3131 120 CELL BIOL TOXICOL 1.758 0.439 7.2 8.5 0.6668 2.1668 2 3132 134 EUR J HISTOCHEM 1.261 0.167 5.3 8.4 0.6934 2.1934 2 3133 118 CELL IMMUNOL 1.808 0.25 9.8 6.4 0.7118 2.2118 2 3134 136 CYTOPATHOLOGY 1.222 0.302 6.1 8.1 0.7266 2.2266 2 3135 145 FOLIA HISTOCHEM CYTO 0.886 0.091 5.5 7.4 0.7485 2.2485 2 3136 153 BRAIN CELL BIOL 0.214 0 7.6 0.7513 2.2513 2 3137 132 ZYGOTE 1.443 0.132 6.7 9.3 0.7659 2.2659 2 3138 122 J MUSCLE RES CELL M 1.731 0.12 8.2 10 0.767 2.2670 2 3139 139 CELL MOL BIOL 1.154 0.118 7.3 9 0.7787 2.2787 2 3140 130 PROTOPLASMA 1.493 0.258 10 8.4 0.8111 2.3111 2 3141 149 IN VITRO CELL DEV-PL 0.548 0 6.1 8.5 0.8659 2.3659 2 3142 144 ACTA HISTOCHEM 0.938 0.167 6.7 10 0.884 2.3840 2 3143 133 BIOTECH HISTOCHEM 1.286 0.074 9.3 10 0.9455 2.4455 2 3144 141 CONNECT TISSUE RES 1.085 0.098 10 8.3 0.9496 2.4496 2 3145 135 TISSUE CELL 1.237 0.073 10 10 0.9525 2.4525 2 3146 148 CYTOTECHNOLOGY 0.589 0.04 9.2 7.3 0.9551 2.4551 2 3147 147 IN VITRO CELL DEV-AN 0.66 0.041 8.5 8.5 0.983 2.4830 2 3148 142 INFLAMMATION 1 0.379 10 8.9 0.9881 2.4881 2 3149 152 BIOL MEMBRANY 0.266 0.04 6.4 8.2 1.0014 2.5014 2 3150 150 ACTA HISTOCHEM CYTOC 0.456 0.053 8.4 8.1 1.009 2.5090 2 3151 151 BIOCELL 0.333 0 5.2 10 1.0158 2.5158 2 3
8S.Papavlasopoulos
etal./Inform
ationSciences
xxx(2010)
xxx–xxx
INS
8555
No
.o
fP
ag
es
21,
Mo
del
3G
26
Jan
uary
2010
AR
TIC
LE
INP
RE
SS
Pleasecite
thisarticle
inpress
as:S.Papavlasop
ouloset
al.,Anon-linear
indexto
evaluatea
journal’sscientifi
cim
pact,Inform.Sci.(2010),
doi:10.1016/j.ins.2010.01.018
UN
CO
RR
EC
TED
PR
OO
F
152
146
AC
TAC
YTO
L0.
697
0.03
610
9.5
1.02
672.
5267
23
153
155
MET
HO
DC
ELL
BIO
L0
0.27
108.
81.
0573
2.55
732
315
499
JH
ISTO
CH
EMC
YTO
CH
EM2.
335
0.64
59.
77.
51.
066
2.56
602
3
155
143
AR
CH
HIS
TOL
CY
TOL
0.98
60.
043
9.8
101.
1713
2.67
132
3
S. Papavlasopoulos et al. / Information Sciences xxx (2010) xxx–xxx 9
INS 8555 No. of Pages 21, Model 3G
26 January 2010ARTICLE IN PRESS
Please cite this article in press as: S. Papavlasopoulos et al., A non-linear index to evaluate a journal’s scientific impact, Inform. Sci. (2010),doi:10.1016/j.ins.2010.01.018

OF
261
262
263
264
265
266
267
268
269
270
271
272
273
274
275
276
277
278
279
280
282282
0 0.5 1 1.5 2 2.5 3 3.5x 10⁴
0
1000
2000
3000
4000
5000
6000
7000
0 0.5 1 1.5 2 2.5 3 3.5x 10⁴
0
1000
2000
3000
4000
5000
6000
7000
Fig. 1. K-mean clustering procedure, the colours blue and red represent the clusters k = 2 case while the colours blue, red and green represent the clustersk = 2 case. (For interpretation of the references to colour in this figure legend, the reader is referred to the web version of this article.)
10 S. Papavlasopoulos et al. / Information Sciences xxx (2010) xxx–xxx
INS 8555 No. of Pages 21, Model 3G
26 January 2010ARTICLE IN PRESS
EC
TED
PR
O
3.3. Validation of homogeneity and hypothesis testing
In order to evaluate the optimal value for k we used a t-test evaluation between the two cases (k = 2 and k = 3). For thisreason, we use first the t-test technique procedure among the three groups as can be seen in Table 5, where it is obvious(columns with gray background) that the first, second and third category have got strong differentiation, r value is less than0.80 (see Eq. (9)). Therefore we confirm that indeed the journals from 1 to 11, 64 to 76 and 143 to 155 belong to first, secondand third category respectively and this is the optimal value for the K.
According to Section 2, we created input vectors of size 1 � 4, that represent the values of the four examined factors. Pre-paring to setting data values of the three categories (max med, min) of input vectors, we tested in t-statistic differentiationcontrol, having in mind the learning procedure of the neural network. For this reason we checked the fundamental data valuethat differentiates one category from another, using Tests of (least-squares) Correlation Coefficients.
In particular, for this implementation, we created a number of Ci vectors (1 � 4) for each time. In particular, we createdfour (4) categories of vectors which were generated as follows:
1. Ci vectors (1 � 4) sizes’ with IF between, 12.436 6 IF 6 31.921 (see Table 2) with i = 1, . . . ,k, where k = 11.2. Ci vectors (1 � 4) sizes’ with IF between, 3.092 6 IF 6 3.557 (see Table 3) with i = 1, . . . ,k, where k = 10.3. Ci vectors (1 � 4) sizes’ with IF between, 0 6 IF 6 0.986 (see Table 4) with i = 1, . . . ,k, where k = 10.4. Ci vectors (1 � 4) sizes’ selected of difference categories (see Table 5) i = 1, . . . ,k, where k = 9.
After that, we implemented the cross-correlation procedure by correlating each time a vector Cx of each category with theother vector Cy of the same category. This correlation is repeated until all the combinations will be executed see Tables 2–5.
The cross-correlation coefficients for each time were extracted by the following equation:
Table 2The t-te
Rank
123456891011
Pleasedoi:10
RR
r ¼Pk
i¼1ðbCxi � bCxiÞðbCyi � bCyiÞffiffiffiffiffiffiffiffiffiffiffiffiffiffiffiffiffiffiffiffiffiffiffiffiffiffiffiffiffiffiffiffiffiffiffiffiffiPki¼1ðbCxi � bCxiÞ2
q Pki¼1ðbCyi � bCyiÞ
2
UN
CO
st control for journals with IF between, 12.436 6 IF 6 31.921.
IF Impact factor Immediacy index Cited half-life Citing half-time r
31.921 6.205 4.0 4.1 1.029.887 6.402 8.7 4.5 0.9926.382 6.342 5.7 4.5 1.023.545 1.320 6.7 5.4 0.9517.623 4.347 4.9 4.7 0.9917.148 2.772 2.1 4.8 0.9813.527 2.403 4.9 3.8 0.9613.444 1.667 5.7 3.0 0.9313.156 3.010 4.6 4.9 0.9712.436 3.037 3.7 5.1 0.97
cite this article in press as: S. Papavlasopoulos et al., A non-linear index to evaluate a journal’s scientific impact, Inform. Sci. (2010),.1016/j.ins.2010.01.018

REC
TED
PR
OO
F283
284
285286
288288
289
290
291
293293
294
295
296
Table 3The t-test control for journals with IF between, 3.092 6 IF 6 3.557 Table 3.
Rank IF Impact factor Immediacy index Cited half-life Citing half-time r
64 3.557 0.352 3.9 6.5 1.0065 3.553 0.308 3.2 5.3 0.9466 3.539 0.813 5.4 7.1 0.9967 3.493 0.705 3.7 5.6 0.9568 3.381 0.597 4.9 6.5 0.9969 3.314 0.673 2.5 4.9 0.9172 3.224 0.29 8.7 6.7 0.9673 3.209 0.397 3.3 7.3 0.9575 3.115 0.2 7.8 7.8 0.9976 3.092 0.19 3.1 5.9 0.97
Table 4The t-test control for journals with IF, between 0 6 IF 6 0.986.
Rank IF Impact factor Immediacy index Cited half-life Citing half-time r
143 0.986 0.043 9.8 10.0 0.99144 0.938 0.167 6.7 10.0 0.92145 0.886 0.091 5.5 7.4 0.95146 0.697 0.036 10.0 9.5 1.00147 0.66 0.041 8.5 8.5 0.99148 0.589 0.04 9.2 7.3 0.99149 0.548 0.0 6.1 8.5 0.94150 0.456 0.053 8.4 8.1 1.00152 0.266 0.04 6.4 8.2 0.96155 0.0 0.27 10.0 8.8 1.00
Table 5The cross-correlation procedure among the three groups (K-means classification results in brackets where the first bracket corresponds in k = 2 cluster and thesecond in k = 3 cluster).
Rank IF 1 2 3 64 66 68 150 152 156
1 1.00[1]/[1] 0.99 [1]/[1] 1.00 [1]/[1] 0.07 [1]/[3] 0.24 [1]/ [2] 0.20 [1]/[2] 0.61 [1]/[3] 0.61 [1]/[3] 0.39 [1]/[3]2 0.99 [1]/[1] 1.00 [1]/[1] 0.99 [1]/[1] 0.10 [1]/[3] 0.01 [1]/ [2] 0.10 [1]/[2] 0.54 [1]/[3] 0.56 [1]/[3] 0.57 [1]/[3]3 1.00 [1]/[1] 0.99 [1]/[1] 1.00 [1]/[1] 0.10 [1]/[3] 0.03 [1]/ [2] 0.10 [1]/[2] 0.57 [1]/[3] 0.60 [1]/[3] 0.42 [1]/[3]64 0.08 [2]/[1] 0.09 [2]/[1]] 0.08 [2]/[1] 1.00 [2]/[3] 0.99 [2]/[2] 0.99 [2]/[2] 0.66 [2]/[3] 0.72 [2]/[3] 0.59 [2]/[3]66 0.03 [1]/[1] 0.01 [1]/[1] 0.03 [1]/[1] 0.99 [1]/[3] 1.00 [1]/[2] 0.97 [1]/[2] 0.74 [1]/[3] 0.80 [1]/[3] 0.68 [1]/[3]68 0.12 [1]/[1] 0.10 [1]/[1] 0.10 [1]/[1] 0.99 [1]/[3] 0.97 [1]/[2] 1.00 [1]/[2] 0.57 [1]/[3] 0.66 [1]/[3] 0.49 [1]/[3]150 0.61 [2]/[1] 0.53 [2]/[1] 0.60 [2]/[1] 0.65 [2]/[3] 0.74 [2]/[2] 0.57 [2]/[2] 1.00 [2]/[3] 0.98 [2]/[3] 1.00 [2]/[3]152 0.61 [2]/[1] 0.56 [2]/[1] 0.60 [2]/[1] 0.72 [2]/[3] 0.80 [2]/[2] 0.66 [2]/[2] 0.98 [2]/[3] 1.00 [2]/[3] 0.96 [2]/[3]155 0.65 [2]/[1] 0.57 [2]/[1] 0.63 [2]/[1] 0.60 [2]/[3] 0.68 [2]/[2] 0.50 [2]/[2] 1.00 [2]/[3] 0.96 [2]/[3] 1.00 [2]/[3]
S. Papavlasopoulos et al. / Information Sciences xxx (2010) xxx–xxx 11
INS 8555 No. of Pages 21, Model 3G
26 January 2010ARTICLE IN PRESS
RIn our case, we needed to test whether r was significant. In such tests, r is the sample-derived estimate of q. Then we con-sidered that the null hypothesis is: H0 : q0 ¼ 0. Therefore, the sampling distribution of rfor a population that has zero cor-relation ðq ¼ 0Þ has a mean value ofl ¼ 0 and, hence, a t-statistic can be calculated as:
Pleasedoi:10
COr ¼
ffiffiffiffiffiffiffiffiffiffiffiffiffiffiffiffiffið1� r2Þ
k� 2
r; ð7Þ
t ¼ r � lr¼ rffiffiffiffiffiffiffiffiffiffi
ð1�r2Þk�2
q ¼ rffiffiffiffiffiffiffiffiffiffiffiffik� 2pffiffiffiffiffiffiffiffiffiffiffiffiffi1� r2p :
NThe next step was to determine the appropriate value of the r coefficient in order to characterize it as a significant linearrelationship between the correlated sets in our experiment. Thus, having k ¼ 4, and the degree of freedom v ¼ k� 2 ¼ 2,we chose a ¼ 0:1 and thus found critical ta=2 ¼ 1:89. Then the significant value of r was calculated as follows:
Uta=2 ¼rffiffiffiffiffiffiffiffiffiffiffiffik� 2pffiffiffiffiffiffiffiffiffiffiffiffiffi1� r2p ) 1:892 ¼ 2r2
1� r2 ) r ¼ �0:80: ð7Þ
In our case, r may be characterized as significant when the null hypothesis is rejected ð1 6 jrj 6 0:80Þ. The procedure ofchoosing the sets was done by adhering to the following procedure: We chose, after many experimental tests, each categoryvector that satisfied the null hypothesis ð1 6 jrj 6 0:80Þ because if there are three groups to compare (1–3) then we would
cite this article in press as: S. Papavlasopoulos et al., A non-linear index to evaluate a journal’s scientific impact, Inform. Sci. (2010),.1016/j.ins.2010.01.018

ED
PR
OO
F297
298
299
300
301
302
303
304
305
306
307
308
309
310
311
312
313
314
315
316
317
318
319
Fig. 2. TheQ1 training procedure, which is divided into the following steps: (a) the input vectors P, (b) the vector C of classes (�1,0,1), and (c) the functionsinitelm and the trainelm which implement the training procedure.
12 S. Papavlasopoulos et al. / Information Sciences xxx (2010) xxx–xxx
INS 8555 No. of Pages 21, Model 3G
26 January 2010ARTICLE IN PRESS
CT
need three separate t-tests (comparing 1 with 2, 1 with 3, and 2 with 3). As an initial grouping we took the IF ranking andconstructed three input categories These input categories show up in Tables 2–4.
The above followed an extra control to check if the vectors of the three categories (Tables 2–4) differentiated among them(see Table 5).
ERR3.4. Experimental Elman neural network setting
Having prepared the dataset and the classification of the items in three groups we proceed with the evaluation of the El-man Neural Network. This part is divided into two sub-stages: (a) the appropriate pre-processing of the vectors which trainthe Elman network, and (b) the experimental setting. We describe these two stages below.
UN
CO3.4.1. Training preprocess
We train vectors with various features by minimizing an appropriate error function defined with respect to an Elman neu-ral network using the holdout method [35].
The holdout method is the simplest kind of cross validation. The dataset is separated into two sets, called the training setand the testing set. The function approximation fits a function using only the training set. Then it is asked to predict the out-put values for the data in the testing set (it has never seen these values before). The errors it makes are accumulated, as be-fore, to give the mean absolute test set error, which is used to evaluate the model. The advantage of this method is that it isusually preferable to the residual method and takes no longer to compute [25].
According to this method we used three classes of 10 vectors each (first for the maximum, second for the medium andthird for the minimum values of IF):
In the first class we put the journals that have a high IF in a way that is explained in Section 3.2 (see Table 2). In the secondclass, we put the journals with a medium IF, which were extracted from the same t-test control (see Table 3). Finally, in thethird class, we put the journals with a minimum IF, also extracted from the same t-test control (see Table 4). For the imple-mentation of the training procedure we used first the Elman network training procedure included in Matlab (initelm), in or-der to normalize the input vectors (u,k_,m) and to extract the weights and bias coefficients of input vectors; thereafter, we
Please cite this article in press as: S. Papavlasopoulos et al., A non-linear index to evaluate a journal’s scientific impact, Inform. Sci. (2010),doi:10.1016/j.ins.2010.01.018
320
321
322
323
324
325
326
327
328
329
330
331
332
333
334
335
336
337
338
339
340
341
342
343
344
345
346
347
348
349
350
351
S. Papavlasopoulos et al. / Information Sciences xxx (2010) xxx–xxx 13
INS 8555 No. of Pages 21, Model 3G
26 January 2010ARTICLE IN PRESS
CTED
PR
OO
F
trained these coefficients with the trainelm function. Partial view of the code implementation of the self-developed system isprovided in Fig. 2.
3.4.2. Experimental settingHaving provided the configuration of the Elman network and the input data, we proceed to the experiment setting. In this
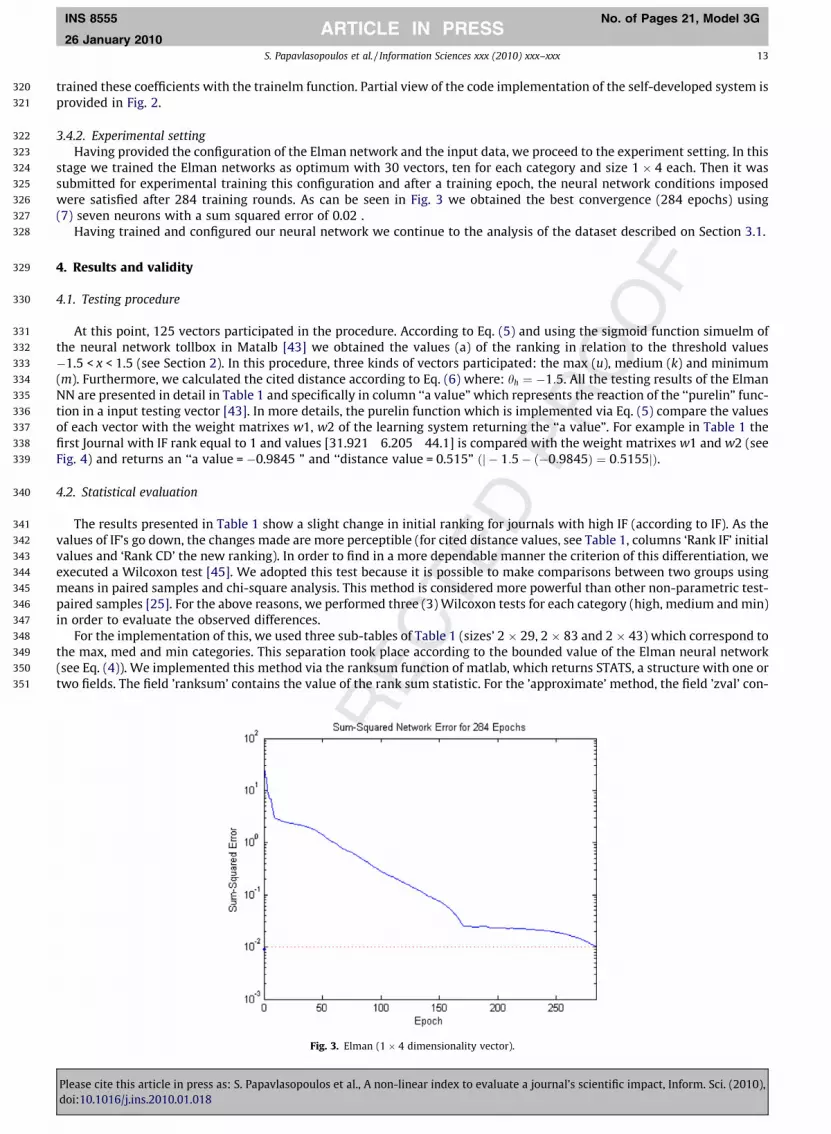
stage we trained the Elman networks as optimum with 30 vectors, ten for each category and size 1 � 4 each. Then it wassubmitted for experimental training this configuration and after a training epoch, the neural network conditions imposedwere satisfied after 284 training rounds. As can be seen in Fig. 3 we obtained the best convergence (284 epochs) using(7) seven neurons with a sum squared error of 0.02 .
Having trained and configured our neural network we continue to the analysis of the dataset described on Section 3.1.
4. Results and validity
4.1. Testing procedure
At this point, 125 vectors participated in the procedure. According to Eq. (5) and using the sigmoid function simuelm ofthe neural network tollbox in Matalb [43] we obtained the values (a) of the ranking in relation to the threshold values�1.5 < x < 1.5 (see Section 2). In this procedure, three kinds of vectors participated: the max (u), medium (k) and minimum(m). Furthermore, we calculated the cited distance according to Eq. (6) where: hh ¼ �1:5. All the testing results of the ElmanNN are presented in detail in Table 1 and specifically in column ‘‘a value” which represents the reaction of the ‘‘purelin” func-tion in a input testing vector [43]. In more details, the purelin function which is implemented via Eq. (5) compare the valuesof each vector with the weight matrixes w1, w2 of the learning system returning the ‘‘a value”. For example in Table 1 thefirst Journal with IF rank equal to 1 and values [31.921 6.205 44.1] is compared with the weight matrixes w1 and w2 (seeFig. 4) and returns an ‘‘a value = �0.9845 ” and ‘‘distance value = 0.515” ðj � 1:5� ð�0:9845Þ ¼ 0:5155jÞ.
4.2. Statistical evaluation
The results presented in Table 1 show a slight change in initial ranking for journals with high IF (according to IF). As thevalues of IF’s go down, the changes made are more perceptible (for cited distance values, see Table 1, columns ‘Rank IF’ initialvalues and ‘Rank CD’ the new ranking). In order to find in a more dependable manner the criterion of this differentiation, weexecuted a Wilcoxon test [45]. We adopted this test because it is possible to make comparisons between two groups usingmeans in paired samples and chi-square analysis. This method is considered more powerful than other non-parametric test-paired samples [25]. For the above reasons, we performed three (3) Wilcoxon tests for each category (high, medium and min)in order to evaluate the observed differences.
For the implementation of this, we used three sub-tables of Table 1 (sizes’ 2 � 29, 2 � 83 and 2 � 43) which correspond tothe max, med and min categories. This separation took place according to the bounded value of the Elman neural network(see Eq. (4)). We implemented this method via the ranksum function of matlab, which returns STATS, a structure with one ortwo fields. The field ’ranksum’ contains the value of the rank sum statistic. For the ’approximate’ method, the field ’zval’ con-
UN
CO
RR
E
Fig. 3. Elman (1 � 4 dimensionality vector).
Please cite this article in press as: S. Papavlasopoulos et al., A non-linear index to evaluate a journal’s scientific impact, Inform. Sci. (2010),doi:10.1016/j.ins.2010.01.018

ED
PR
OO
F352
353
354
355
356
357
359359
360361
363363
364
365
366
367
368
369
370
371
372
373
374
Fig. 4. The calculation weight matrixes w1, w2 using the function initelm implemented via Eq. (1).
14 S. Papavlasopoulos et al. / Information Sciences xxx (2010) xxx–xxx
INS 8555 No. of Pages 21, Model 3G
26 January 2010ARTICLE IN PRESS
CTtains the value of the normal (Z) statistic. In our case, the null hypothesis is based on the hypothesis test, performed at the
0.05 significance level, in H. H == 0 indicates that the null hypothesis (‘‘medians are equal”) cannot be rejected at the 5% le-vel. H == 1 indicates that the null hypothesis can be rejected at the 5% level. Thus, as data of the first sub-table of max cat-egory we used the first 29 values of the columns Rank IF (first population) and Rank CD (second population) respectively (seeTable 6). In the same way, we used the data from the second category (2 � 83) and the third category (2 � 43). Then, for dataconsisting of a large number of pairs (n) the random variable T is distributed approximated normally with a mean of:
Pleasedoi:10
E
lT ¼nðnþ 1Þ
4: ð8Þ
RAnd a standard error ofORrT ¼
ffiffiffiffiffiffiffiffiffiffiffiffiffiffiffiffiffiffiffiffiffiffiffiffiffiffiffiffiffiffiffiffiffiffiffiffinðnþ 1Þð2nþ 1Þ
24
r; ð9Þ
Thus;wecancalculate Z ¼ jT � lT jrT
: ð10Þ
UN
CWe have considered as the null Hypothesis that the categories of the population of IF and CD results are not differentiatedsignificantly for a two-tailed test, and that Z is compared to the critical value, Zað2Þ which for a ¼ 0:05. This control is alsorealised in the three categories (max, med, min) using the same hull hypothesis, that is to say:
H0 ¼ 0 if �1:96 < Z < 1:96 accept, or reject when the H0 if Z < �1:96 or Z > 1:96.Taking into account that all cases (29,83,43) belong to the above case; we calculated the probability in which the null
hypothesis is satisfied by the criterion (see Eq. (10)). The results of these Wilcoxon tests are presented in Table 6.
4.3. Benchmarking comparison of the CD index with the impact factor, H-index and Eigenfactor
Taking so far into account that the proposed CD index takes into account journal performance indicators on a similar wayas the IF, we performed a comparison between the CD factor and other ranking indexes. In this way we were particularlyinterested to compare the CD factor with other journal ranking indexes and in particular as aforementioned in the introduc-tion, the journal adapted H-Index (obtained from [19]) and the recently introduced ISI Eigenfactor.
cite this article in press as: S. Papavlasopoulos et al., A non-linear index to evaluate a journal’s scientific impact, Inform. Sci. (2010),.1016/j.ins.2010.01.018

RR
EC
TED
PR
OO
F
375
376
377
378
379
380
382382
383
384
385
386
Table 6Wilcoxon test for the max, med and min categories.
Category Populations Ranking values Statistic indexes
Max Rank IF 1 3 4 2 6 5 9 8 7 Probability: 0.9752 ranksum: 853 Z: �0.0311 �1.96 < �0.0 311 < 1.96 H0 ¼ 0 accepted10 11 12 15 14 13 1619 20 21 17 22 18 2425 29 23 26 28 31
Rank CD 1 2 3 4 5 6 7 8 910 11 12 13 14 15 1617 18 19 20 21 22 2324 25 26 27 28 29
Med Rank IF 30 27 37 33 35 34 40 Probability: 0.5974 ranksum: 6.7665e+003 Z: �0.5281 �1.96 < �0.5281 < 1.96 H0 ¼ 0accepted47 43 48 36 41 45 42
49 44 53 38 64 51 6832 54 50 138 66 63 5646 75 57 79 67 72 6176 131 65 69 73 62 6059 77 78 71 58 85 5597 39 100 81 84 86 70129 83 80 82 96 109 7498 95 110 88 87 111 10194 119 112 102 117 121106 107 104 116 105 103
Rank CD 30 31 32 33 34 35 3637 38 39 40 41 42 4344 45 46 47 48 49 5051 52 53 54 55 56 5758 59 60 61 62 63 6465 66 67 68 69 70 7172 73 74 75 76 77 7879 80 81 82 83 84 8586 87 88 89 90 91 9293 94 95 96 97 98 99100 101 102 103 104 105106 107 108 109 110 111
Min Rank IF 92 115 108 124 155 91 Probability 0.7297 ranksum: 1911 Z: 0.3455 �1.96 < 0.3455 < 1.96 H0 ¼ 0 accepted140 89 154 114 93 125127 123 128 126 113 90137 120 134 118 136 145153 132 122 139 130 149144 133 141 135 148 147142 152 150 151 146 15699 143
Rank CD 112 113 114 115 116 117118 119 120 121 122 123124 125 126 127 128 129130 131 132 133 134 135136 137 138 139 140 141142 143 144 145 146 147148 149 150 151 152 153154 155
S. Papavlasopoulos et al. / Information Sciences xxx (2010) xxx–xxx 15
INS 8555 No. of Pages 21, Model 3G
26 January 2010ARTICLE IN PRESS
COThe objective of this step was to evaluate the degree of possible (strong or weak) correlation between those indexes. For
this purpose, we used the Spearman correlation coefficient because of its robustness and based on the assumption that theseindexes have non-normal distributions and thus a non-parametric measure was needed [19]. In our case, we used 155 valuesof each of the correlated indexes The data for the calculation of Eigenfactor and the H-index was collected from the ISI Webof Science and Elsevier Scopus3 database for the period 2005–2007. Applying this method we considered that for large valuen = 155 we used for probability a ¼ 0:05 critical value z = 1.96 [47] and the significant value r is calculated by the formula
3 http
Pleasedoi:10
N
r ¼ �zffiffiffiffiffiffiffiffiffiffiffiffin� 1p� �
¼ �1:96ffiffiffiffiffiffiffiffiffiffiffiffiffiffiffiffiffiffi155� 1p� �
¼ 0:1579 ½47�:
UIn the case the absolute value of the test statistic r exceeds the positive critical value, then we reject the null hypothesis thatH0 : Po ¼ 0, thus conclude that the parts are correlated.To this end, using this critical value we extracted all the combination pairs of the spearman correlation coefficient. In totalsix pairs were measured and the results are listed as follows (significance level in parenthesis).
://www.info.scopus.com/.
cite this article in press as: S. Papavlasopoulos et al., A non-linear index to evaluate a journal’s scientific impact, Inform. Sci. (2010),.1016/j.ins.2010.01.018
387
388
389
390
391
392
393
394
395
396
397
398
399
400
401
402
403
404
405
406
407
408
409
410
411
412
413
414
415
416
417
418
419
420
421
422
423
16 S. Papavlasopoulos et al. / Information Sciences xxx (2010) xxx–xxx
INS 8555 No. of Pages 21, Model 3G
26 January 2010ARTICLE IN PRESS
OO
F
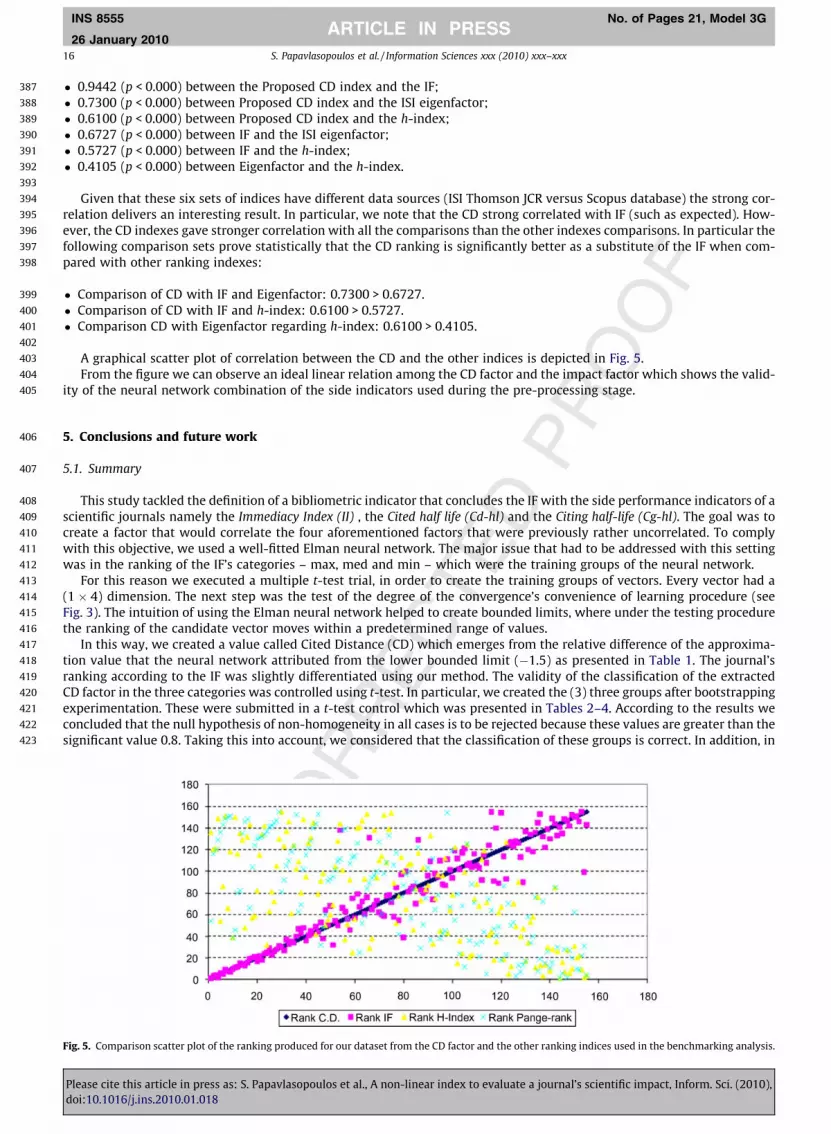
� 0.9442 (p < 0.000) between the Proposed CD index and the IF;� 0.7300 (p < 0.000) between Proposed CD index and the ISI eigenfactor;� 0.6100 (p < 0.000) between Proposed CD index and the h-index;� 0.6727 (p < 0.000) between IF and the ISI eigenfactor;� 0.5727 (p < 0.000) between IF and the h-index;� 0.4105 (p < 0.000) between Eigenfactor and the h-index.
Given that these six sets of indices have different data sources (ISI Thomson JCR versus Scopus database) the strong cor-relation delivers an interesting result. In particular, we note that the CD strong correlated with IF (such as expected). How-ever, the CD indexes gave stronger correlation with all the comparisons than the other indexes comparisons. In particular thefollowing comparison sets prove statistically that the CD ranking is significantly better as a substitute of the IF when com-pared with other ranking indexes:
� Comparison of CD with IF and Eigenfactor: 0.7300 > 0.6727.� Comparison of CD with IF and h-index: 0.6100 > 0.5727.� Comparison CD with Eigenfactor regarding h-index: 0.6100 > 0.4105.
A graphical scatter plot of correlation between the CD and the other indices is depicted in Fig. 5.From the figure we can observe an ideal linear relation among the CD factor and the impact factor which shows the valid-
ity of the neural network combination of the side indicators used during the pre-processing stage.
REC
TED
PR5. Conclusions and future work
5.1. Summary
This study tackled the definition of a bibliometric indicator that concludes the IF with the side performance indicators of ascientific journals namely the Immediacy Index (II) , the Cited half life (Cd-hl) and the Citing half-life (Cg-hl). The goal was tocreate a factor that would correlate the four aforementioned factors that were previously rather uncorrelated. To complywith this objective, we used a well-fitted Elman neural network. The major issue that had to be addressed with this settingwas in the ranking of the IF’s categories – max, med and min – which were the training groups of the neural network.
For this reason we executed a multiple t-test trial, in order to create the training groups of vectors. Every vector had a(1 � 4) dimension. The next step was the test of the degree of the convergence’s convenience of learning procedure (seeFig. 3). The intuition of using the Elman neural network helped to create bounded limits, where under the testing procedurethe ranking of the candidate vector moves within a predetermined range of values.
In this way, we created a value called Cited Distance (CD) which emerges from the relative difference of the approxima-tion value that the neural network attributed from the lower bounded limit (�1.5) as presented in Table 1. The journal’sranking according to the IF was slightly differentiated using our method. The validity of the classification of the extractedCD factor in the three categories was controlled using t-test. In particular, we created the (3) three groups after bootstrappingexperimentation. These were submitted in a t-test control which was presented in Tables 2–4. According to the results weconcluded that the null hypothesis of non-homogeneity in all cases is to be rejected because these values are greater than thesignificant value 0.8. Taking this into account, we considered that the classification of these groups is correct. In addition, in
UN
CO
R
Fig. 5. Comparison scatter plot of the ranking produced for our dataset from the CD factor and the other ranking indices used in the benchmarking analysis.
Please cite this article in press as: S. Papavlasopoulos et al., A non-linear index to evaluate a journal’s scientific impact, Inform. Sci. (2010),doi:10.1016/j.ins.2010.01.018

UN
CO
RR
EC
TED
PR
OO
F
Table 7The ranking correlation between 155 journals selected via ISI biological recourse.
Rank CD Rank IF Rank H index Rank eigenfactor CD Impact factor H index Eigenfactor Abbr. journal title
1 1 136 54 0.5155 31.921 157 .178 NAT REV MOL CELL BIO2 3 120 116 0.5229 26.382 287 .235 NAT MED3 4 121 120 0.5282 23.545 116 .052 ANNU REV CELL DEV BI4 2 149 129 0.5284 29.887 408 .670 CELL5 6 54 136 0.5327 17.148 82 .032 CELL METAB6 5 86 143 0.5404 17.623 173 .187 NAT CELL BIOL7 9 151 149 0.5655 13.444 168 .057 CURR OPIN CELL BIOL8 8 66 150 0.5661 13.527 133 .070 TRENDS CELL BIOL9 7 118 151 0.5744 14.795 253 .316 GENE DEV10 10 39 39 0.5785 13.156 192 .309 MOL CELL11 11 150 46 0.5875 12.436 106 .146 DEV CELL12 12 116 80 0.6059 11.816 82 .023 CYTOKINE GROWTH F R13 15 135 82 0.6299 10.15 112 .056 CURR OPIN STRUC BIOL14 14 129 135 0.6342 10.15 116 .057 CURR OPIN GENET DEV15 13 48 146 0.6404 11.085 60 .122 NAT STRUCT MOL BIOL16 16 132 148 0.6965 9.653 160 .146 PLANT CELL17 19 143 66 0.7588 8.254 93 .057 CELL DEATH DIFFER18 20 57 104 0.7912 7.531 76 .037 STEM CELLS19 21 59 124 0.7915 7.45 79 .071 EMBO REP20 17 82 130 0.7923 9.598 214 .272 J CELL BIOL21 22 115 131 0.7943 7.244 64 .029 TRENDS MOL MED22 18 134 132 0.8447 8.662 247 .342 EMBO J23 24 142 134 0.9091 6.533 64 .039 TRAFFIC24 25 32 137 0.9091 6.482 61 .022 SEMIN CELL DEV BIOL25 29 63 141 0.9234 6.365 34 .007 AGEING RES REV26 23 81 142 0.9526 6.791 150 .130 FASEB J27 26 72 145 0.9588 6.44 172 .269 ONCOGENE28 28 105 147 0.9713 6.383 137 .193 J CELL SCI29 31 130 155 0.9886 5.854 36 .012 AGING CELL30 30 155 81 10.166 6.028 125 .177 MOL BIOL CELL31 27 123 92 10.379 6.42 206 .369 MOL CELL BIOL32 37 137 105 10.654 4.657 21 .005 AUTOPHAGY33 33 146 110 10.749 5.293 52 .028 CELL MICROBIOL34 35 61 118 10.910 5.239 94 .060 CELL MOL LIFE SCI35 34 124 123 12.001 5.246 77 .031 J MOL CELL CARDIOL36 40 102 152 12.052 4.409 60 .026 TISSUE ENG37 47 109 63 12.131 4.217 33 .013 CELL RES38 43 80 69 12.147 4.317 36 .017 MOL CANCER RES39 48 148 102 12.175 4.17 13 .001 CELL ONCOL40 36 95 115 12.180 5.231 90 .060 STRUCTURE41 41 126 121 12.524 4.374 70 .035 BBA-MOL CELL RES42 45 131 128 12.667 4.288 30 .010 PIGM CELL RES43 42 145 140 13.188 4.338 58 .018 CELL CALCIUM44 49 42 144 13.194 4.147 74 .031 CELL SIGNAL45 44 79 153 13.348 4.308 53 .018 MECH AGEING DEV46 53 91 32 13.384 3.871 46 .001 CELL TRANSPLANT47 38 98 48 13.439 4.608 91 .034 AM J RESP CELL MOL48 64 50 60 13.439 3.553 18 .005 CYTOTHERAPY49 51 55 91 13.526 4.009 88 .035 INT J BIOCHEM CELL B50 68 60 93 13.632 3.314 31 .045 CELL CYCLE51 32 69 95 13.800 5.506 33 .012 INT REV CYTOL52 54 104 101 13.915 3.87 42 .007 MOL MEMBR BIOL53 50 128 109 13.927 4.128 95 .050 J LEUKOCYTE BIOL54 138 144 111 13.991 1.157 9 .000 IEE P SYST BIOL55 66 101 138 14.001 3.493 31 .021 PHYSIOL GENOMICS56 63 37 139 14.263 3.557 34 .006 CELL PHYSIOL BIOCHEM57 56 51 56 14.357 3.752 19 .011 BIOL CELL58 46 92 107 14.468 4.23 95 .057 AM J PHYSIOL-CELL PH59 75 25 113 14.713 3.092 19 .007 BMC CELL BIOL60 57 56 114 14.759 3.742 31 .005 GROWTH FACTORS61 79 140 126 15.015 2.978 26 .008 CYTOM PART A62 67 141 25 15.220 3.381 77 .272 J CELL BIOCHEM63 72 147 52 15.284 3.209 21 .004 MITOCHONDRION64 61 93 59 15.344 3.654 58 .033 PLANT CELL PHYSIOL65 76 153 84 15.385 3.043 45 .015 APOPTOSIS66 131 29 89 15.484 1.447 12 .002 CELL COMMUN ADHES
(continued on next page)
S. Papavlasopoulos et al. / Information Sciences xxx (2010) xxx–xxx 17
INS 8555 No. of Pages 21, Model 3G
26 January 2010ARTICLE IN PRESS
Please cite this article in press as: S. Papavlasopoulos et al., A non-linear index to evaluate a journal’s scientific impact, Inform. Sci. (2010),doi:10.1016/j.ins.2010.01.018

UN
CO
RR
EC
TED
PR
OO
F
Table 7 (continued)
Rank CD Rank IF Rank H index Rank eigenfactor CD Impact factor H index Eigenfactor Abbr. journal title
67 65 38 94 15.509 3.539 77 .020 BBA-MOL CELL BIOL L68 69 138 96 15.534 3.299 67 .022 GENES CELLS69 73 94 100 15.575 3.12 31 .004 CELL PROLIFERAT70 62 110 127 15.748 3.643 87 .041 J CELL PHYSIOL71 60 114 61 15.878 3.677 69 .027 J STRUCT BIOL72 59 152 98 15.881 3.687 24 .10 MATRIX BIOL73 77 108 108 16.006 3.033 48 .009 IMMUNOL CELL BIOL74 78 139 133 16.112 2.989 65 .032 FRONT BIOSCI75 71 154 73 16.272 3.224 52 .012 EUR J CELL BIOL76 58 89 106 16.362 3.695 107 .065 EXP CELL RES77 85 52 117 16.400 2.857 42 .010 IUBMB LIFE78 55 77 42 16.467 3.791 58 .015 HISTOPATHOLOGY79 97 113 77 16.763 2.402 30 .021 CYTOGENET GENOME RES80 39 100 87 16.860 4.571 28 .001 PROG HISTOCHEM CYTO81 100 65 97 17.024 2.308 21 .003 NEUROSIGNALS82 81 106 99 17.146 2.94 20 .001 ANAL QUANT CYTOL83 84 107 57 17.291 2.893 49 .011 HISTOCHEM CELL BIOL84 86 46 83 17.361 2.853 46 .007 CELL STRESS CHAPERON85 70 84 90 17.566 3.263 145 .171 FEBS LETT86 129 117 122 17.582 1.493 11 .037 STEM CELL REV87 83 73 29 17.620 2.899 49 .010 DIFFERENTIATION88 80 103 51 17.642 2.971 66 .026 MOL CELL ENDOCRINOL89 82 83 75 17.719 2.9 41 .007 NITRIC OXIDE-BIOL CH90 96 87 103 18.216 2.419 88 .011 BIOCHEM CELL BIOL91 109 133 37 18.257 1.953 30 .005 CELL BIOCHEM BIOPHYS92 74 33 112 18.311 3.115 33 .003 BIOSCIENCE REP93 98 75 65 18.373 2.364 35 .005 MOL CELL PROBE94 95 97 78 18.403 2.445 37 .007 WOUND REPAIR REGEN95 110 45 38 18.470 1.935 29 .005 J NEUROCYTOL96 88 96 43 18.568 2.634 54 .007 J BIOENERG BIOMEMBR97 87 112 45 18.689 2.667 52 .010 J INTERF CYTOK RES98 111 43 154 18.703 1.916 30 .008 MOL CELLS99 101 64 67 19.001 2.245 61 .010 TISSUE ANTIGENS100 94 78 119 19.132 2.483 44 .007 CELL MOL NEUROBIOL101 119 122 55 19.214 1.776 32 .005 CELLS TISSUES ORGANS102 112 15 79 19.226 1.915 27 .004 PLATELETS103 102 36 24 19.275 2.169 48 .012 CYTOKINE104 117 24 68 19.341 1.815 31 .002 J RECEPT SIG TRANSD105 121 99 12 19.414 1.74 24 .003 ENDOTHELIUM-J ENDOTH106 106 125 125 19.471 2.007 45 .009 HISTOL HISTOPATHOL107 107 21 36 19.509 2 45 .006 PROSTAG LEUKOTR ESS108 104 23 88 19.520 2.068 40 .008 DEV GENES EVOL109 116 74 71 19.547 1.831 27 .005 GROWTH HORM IGF RES110 105 88 33 19.690 2.064 37 .003 EUR CYTOKINE NETW111 103 68 21 19.772 2.078 67 .005 MOL MED112 92 111 35 19.880 2.538 57 .014 MOL REPROD DEV113 115 119 44 19.919 1.861 43 .006 DNA CELL BIOL114 108 71 5 20.190 1.968 38 .006 PROSTAG OTH LIPID M115 124 41 74 20.223 1.676 20 .004 CELL MOL BIOL LETT116 155 44 64 20.342 0 15 .000 CELL STEM CELL117 91 18 47 20.376 2.542 47 .009 CELL MOTIL CYTOSKEL118 140 35 41 20.562 1.13 12 .003 J MOL HISTOL119 89 62 49 20.686 2.613 67 .020 CELL TISSUE RES120 154 67 18 20.860 0 4 .000 IET SYST BIOL121 114 19 86 21.031 1.882 4 .004 CELL STRUCT FUNCT122 93 127 23 21.092 2.527 58 .011 J MEMBRANE BIOL123 125 5 70 21.123 1.561 25 .003 CELL BIOCHEM FUNCT124 127 12 50 21.161 1.547 26 .002 PATHOBIOLOGY125 123 70 53 21.237 1.707 61 .023 MOL CELL BIOCHEM126 128 49 3 21.319 1.504 29 .006 INFLAMM RES127 126 90 13 21.378 1.547 80 .007 CELL BIOL INT128 113 40 7 21.407 1.908 31 .004 DEV GROWTH DIFFER129 90 47 14 21.642 2.6 17 .000 ADV ANAT EMBRYOL CEL130 137 17 17 21.651 1.162 24 .002 MEDIAT INFLAMM131 120 34 58 21.668 1.758 29 .002 CELL BIOL TOXICOL132 134 53 34 21.934 1.261 18 .002 EUR J HISTOCHEM133 118 58 40 22.118 1.808 49 .008 CELL IMMUNOL134 136 11 76 22.266 1.222 20 .002 CYTOPATHOLOGY135 145 76 8 22.485 0.886 16 .001 FOLIA HISTOCHEM CYTO136 153 13 19 22.513 0.214 3 .000 BRAIN CELL BIOL
18 S. Papavlasopoulos et al. / Information Sciences xxx (2010) xxx–xxx
INS 8555 No. of Pages 21, Model 3G
26 January 2010ARTICLE IN PRESS
Please cite this article in press as: S. Papavlasopoulos et al., A non-linear index to evaluate a journal’s scientific impact, Inform. Sci. (2010),doi:10.1016/j.ins.2010.01.018

OO
F
424
425
426
427
428
429
430
431
432
433
434
435
436
437 Q2
438
Table 7 (continued)
Rank CD Rank IF Rank H index Rank eigenfactor CD Impact factor H index Eigenfactor Abbr. journal title
137 132 3 72 22.659 1.443 25 .002 ZYGOTE138 122 14 15 22.670 1.731 36 .005 J MUSCLE RES CELL M139 139 30 26 22.787 1.154 40 .005 CELL MOL BIOL140 130 8 11 23.111 1.493 34 .004 PROTOPLASMA141 149 28 16 23.659 0.548 34 .002 IN VITRO CELL DEV-PL142 144 85 85 23.840 0.938 20 .002 ACTA HISTOCHEM143 133 26 30 24.455 1.286 18 .000 BIOTECH HISTOCHEM144 141 1 1 24.496 1.085 31 .004 CONNECT TISSUE RES145 135 16 6 24.525 1.237 29 .002 TISSUE CELL146 148 7 28 24.551 0.589 25 .001 CYTOTECHNOLOGY147 147 27 2 24.830 0.66 34 .002 IN VITRO CELL DEV-AN148 142 6 27 24.881 1 28 .001 INFLAMMATION149 152 10 20 25.014 0.266 5 .000 BIOL MEMBRANY150 150 31 62 25.090 0.456 13 .000 ACTA HISTOCHEM CYTOC151 151 20 10 25.158 0.333 11 .000 BIOCELL152 146 22 9 25.267 0.697 38 .003 ACTA CYTOL153 155 9 22 25.573 0 35 .004 METHOD CELL BIOL154 99 2 31 25.660 2.335 40 .018 J HISTOCHEM CYTOCHEM155 143 4 4 26.713 0.986 24 .002 ARCH HISTOL CYTOL
S. Papavlasopoulos et al. / Information Sciences xxx (2010) xxx–xxx 19
INS 8555 No. of Pages 21, Model 3G
26 January 2010ARTICLE IN PRESS
CTED
PRan extra Cross-correlation control among different vectors, which have been chosen randomly (see Table 5), an extra corrob-
oration of the Tables 2–4, for example, the vector 2 versus 68 has been observed, which gave a significant value, namelyr = 0.10, showing the non-homogeneity relationship, while the vector 1 versus 2 yielded another significant value, namelyr = 0.99, showing the homogeneity relationship.
The differentiation test was performed using the non- parametric Wilcoxon method (see Table 6). and showed that theranking according to the IF did not change dramatically using the CD According to Table 6 a bigger differentiation was no-ticed in category (P > 0.5974), whereas the differentiation was lower in the max (P > 0.9752) and intercalary in the min(P > 0.7297).The probability value was explicated as the satisfaction’s coefficient of the null hypothesis with (P = 1) in thecase where the two groups were identical.
The qualitative analysis of the results showed that all the vectors took part in the configuration (and they should) of theranking. In Table 8, which is a part of Table 1, we can see that the differentiation occurred from cited half-life, citing half-timeand immediacy index. As cited half-life, citing half-time and immediacy index are closer to zero, the order of the initial rank-ing increases (see Tables 7–9). The benchmarking analysis presented in Section 4.3 also concludes the merit of the CD factoras a complementary index for the evaluation of a scientific venue, in that case a scientific journal (see Table 10).
To this end the contributions of this study can be summarized in the three following points:
UN
CO
RR
E
Table 8Changes in order in terms of cited half-life.
Rank CD Rank IF Abbreviated journal title Impact factor Immediacy index Cited half-life Citing half-time
2 3 NAT MED 26.382 6.342 5.7 4.54 2 CELL 29.887 6.402 8.7 4.5
Table 9Changes in order in terms of citing half-time.
Rank CD Rank IF Abbreviated journal title Impact factor Immediacy index Cited half-life Citing half-time
144 141 CONNECT TISSUE RES 1.085 0.098 10 8.3145 135 TISSUE CELL 1.237 0.073 10 10
Table 10Changes in order in terms of immediacy index.
Rank CD Rank IF Abbreviated journal title Impact factor Immediacy index Cited half-life Citing half-time
23 24 TRAFFIC 6.533 0.98 3.7 5.925 29 AGEING RES REV 6.365 0.5 3.6 6
Please cite this article in press as: S. Papavlasopoulos et al., A non-linear index to evaluate a journal’s scientific impact, Inform. Sci. (2010),doi:10.1016/j.ins.2010.01.018

439
440
441
442
443
444
445
446
447
448
449
450
451
452
453
454
455
456
457458459460461462463464465466467468469470471472473474475476477478479480481482483484485486487488489490491492493494495496497498499500501502503504505506507
20 S. Papavlasopoulos et al. / Information Sciences xxx (2010) xxx–xxx
INS 8555 No. of Pages 21, Model 3G
26 January 2010ARTICLE IN PRESS
UN
CO
RR
EC
TED
PR
OO
F
1. We introduced a new standard measure (threshold �1.5) for the evaluation of each journal, which has taken us towardsthe direction of using indirect comparison for the journals.
2. We created a global factor called CD which includes the four (4) most significant factors, which, according to evaluatedresults, is considered to be sounder than those of IF.
3. We introduced three new homogeneous categories (max, med, min) for evaluation the journals. Their statistical evalua-tion showed that these may be validly used for the characterization of each journal.
5.2. Future work
The approach presented in this study could be extended to other topics such as the incorporation of social indexes to theevaluation of the scientific impact of the individuals by combining a set of different bibliometric indicators that measure theindividual research output across different scientific domains [17]. A future study could be for example to modify the inputvector of the neural network by adding the ‘‘Price index” in order to investigate the problem of the distinction between hardand soft science where the citation rates are significantly different [34]. Also an interesting direction could be to extend tothe direction of web information retrieval, where we could evaluate the correlation of a URL with others of the same the-matic subject [15,23,39]. Furthermore, a future extension of this study will be to add more ranking indexes to one in orderto make the provided index a bridging coefficient with other significant factors such as social connectedness factors (e.g. inthe context of co-authorship networks), which would give it an even more accurate scientific impact indication [31].
References
[1] D. Adam, The counting house, Nature 415 (6873) (2002) 726.[2] B.M. Althouse, J.D. West, C.T. Bergstrom, T. Bergstrom, Differences in impact factor across fields and over time, Journal of the American Society for
Information Science and Technology 60 (1) (2009) 27–34.[3] C.T. Bergstrom, J.D. West, Assessing citations with the Eigenfactor™ Metrics, Neurology 71 (2008) 1850–1851.[4] J. Bollen, M.A. Rodriquez, H. Van De Sompel, Journal status, Scientometrics 69 (3) (2006) 669–687.[5] H. Bourlard, Y. Kamp, Auto-association by multilayer perceptrons and singular value decomposition, Biological Cybernetics 59 (4) (1988) 291–294.[6] T.J. Cholewo, J.M. Zurada, Sequential network construction for time series prediction, International Conference on Neural Networks, 1997.[7] F. Codeca, F. Casella, Neural network library in modelica, Proceedings of the 5th International Modelica Conference, 2006.[8] H. Demuth, M. Beale, Neural Network Toolbox User’s Guide, The MathWorks Inc., 1998.[9] J.L. Elman, Learning and development in neural networks: the importance of starting small, Cognition 48 (1) (1993) 71–99.
[10] J.L. Elman, Learning and development in neural networks: the importance of starting small, Cognition 48 (1) (1993) 71–99.[11] A.P. Engelbrecht, I. Cloete, Selective learning using sensitivity analysis, in: The 1998 IEEE International Joint Conference onNeural Networks
Proceedings, IEEE World Congress on Computational Intelligence, 1998.[12] E. Garfield, Citation analysis as a tool in journal evaluation journals can be ranked by frequency and impact of citations for science policy studies,
Science 178 (4060) (1972) 471–479.[13] E. Garfield, The history and meaning of the journal impact factor, Journal of the American Medical Association 295 (2006) 90–93.[14] E. Garfield, R.K. Merton, Citation Indexing. Its Theory and Application in Science, Technology, and Humanities, Wiley, New York, 1979.[15] N. Giannadakis, A. Rowe, M. Ghanem, Y. Guo, InfoGrid: Providing information integration for knowledge discovery, Information Sciences 155 (3–4)
(2003) 199–226.[16] W. Glänzel, H.F. Moed, Journal impact measures in bibliometric research, Scientometrics 53 (2) (2002) 171–193.[17] G.M. Guo, A computer-aided bibliometric system to generate core article ranked lists in interdisciplinary subjects, Information Sciences 177 (17)
(2007) 3539–3556.[18] F. Habibzadeh, M. Yadollahie, Journal weighted impact factor: a proposal, Journal of Informetrics 2 (2) (2008) 164–172.[19] A.W. Harzing, R. van der Wal, A Google Scholar h-index for journals: an alternative metric to measure journal impact in economics and business,
Journal of the American Society for Information Science and Technology 60 (2009) 1.[20] J.E. Hirsch, An index to quantify an individual’s scientific research output, Proceedings of the National Academy of Sciences 102 (46) (2005) 16569–
16572.[21] G. Holden, G. Rosenberg, K. Barker, P. Onghena, An assessment of the predictive validity of impact factor scores: implications for academic employment
decisions in social work, Research on Social Work Practice 16 (6) (2006) 613.[22] W.W. Hood, C.S. Wilson, Informetric studies using databases: opportunities and challenges, Scientometrics 58 (3) (2003) 587–608.[23] P. Ingwersen, The calculation of web impact factors, Journal of Documentation 54 (2) (1998) 236–243.[24] T. Kohonen, P. Somervuo, Self-organizing maps of symbol strings, Neurocomputing 21 (1–3) (1998) 19–30.[25] R.J.A. Little, D.B. Rubin, Statistical Analysis with Missing Data, Wiley, New York, 2003.[26] H. Lounis, M. Boukadoum, V. Siveton, Assessing hydro power system relevant variables: a comparison between a neural network and different machine
learning approaches, Proceedings of the International Conference on Neuro-Fuzzy Technology (2002) 45–51.[27] J. Marton, Obsolescence or immediacy? evidence supporting Price’s hypothesis, Scientometrics 7 (3) (1985) 145–153.[28] H.F. Moed, T.N. Van Leeuwen, Improving the accuracy of Institute for Scientific Information’s journal impact factors, Journal of the American Society for
Information Science 46 (6) (1995) 461–467.[29] S. Nolfi, D. Parisi, J.L. Elman, Learning and evolution in neural networks, Adaptive Behavior 3 (1) (1994) 5–28.[30] R.C. O’Reilly, Y. Munakata, Computational Explorations in Cognitive Neuroscience: Understanding the Mind by Simulating the Brain, MIT Press, 2000.[31] E. Otte, R. Rousseau, Social network analysis: a powerful strategy, also for the information sciences, Journal of Information Science 28 (6) (2002) 441–
452.[32] D.T. Pham, X. Liu, Training of Elman networks and dynamic system modeling, International Journal of Systems Science 27 (2) (1996) 221–226.[33] G. Pinski, F. Narin, Citation influence for journal aggregates of scientific publications: theory, with application to the literature of physics, Information
Processing and Management 12 (1976) 297.[34] D.D.S. Price, Little Science, Big Science. . .and Beyond, Columbia University Press, 1986.[35] B.D. Ripley, Pattern Recognition and Neural Networks, Cambridge University Press, 1996.[36] P. Rodriguez, J. Wiles, J.L. Elman, A recurrent neural network that learns to count, Connection Science 11 (1) (1999) 5–40.[37] R. Rousseau, Median and percentile impact factors: a set of new indicators, Scientometrics 63 (3) (2005) 431–441.[38] P.O. Seglen, Why the impact factor of journals should not be used for evaluating research, British Medical Journal 314 (1997).[39] A. Selamat, S. Omatu, Web page feature selection and classification using neural networks, Information Sciences 158 (2004) 69–88.
Please cite this article in press as: S. Papavlasopoulos et al., A non-linear index to evaluate a journal’s scientific impact, Inform. Sci. (2010),doi:10.1016/j.ins.2010.01.018

508509510511512513514515516517518519
520
S. Papavlasopoulos et al. / Information Sciences xxx (2010) xxx–xxx 21
INS 8555 No. of Pages 21, Model 3G
26 January 2010ARTICLE IN PRESS
[40] D.F. Specht, Probabilistic neural networks, Neural Networks 3 (1) (1990) 109–118.[41] J.C. Valle-Lisboa, F. Reali, H. Anastası́a, E. Mizraji, Elman topology with sigma–pi units: an application to the modeling of verbal hallucinations in
schizophrenia, Neural Networks 18 (7) (2005) 863–877.[42] A.F.J. Van Raan, Scaling rules in the science system: influence of field-specific citation characteristics on the impact of research groups, Journal of the
American Society for Information Science and Technology 59 (4) (2008) 565–576.[43] W.J. Vankan, W.F. Lammen, J. Kos, R. Maas, Complementary approximate modeling in Matlab and Modelica, in: Proceedings of the EuroSim 2004
Conference, 2004.[44] J.H. Wang, Y.W. Yu, J.H. Tsai, On the internal representations of product units, Neural Processing Letters 12 (3) (2000) 247–254.[45] F. Wilcoxon, Individual comparisons by ranking methods, Biometrics Bulletin (1945) 80–83.[46] F. Wong, K.H. Park, Z. Bien, A skin color model parameter prediction by using Elman network, in: Proceedings of the 6th Symposium on Advanced
Intelligent Systems (ISIS 2005), Korean Institute of Intelligent Systems, 2005, pp. 704–706.[47] J.H. Zar, Biostatistical Analysis, Prentice-Hall, Inc., Upper Saddle River, NJ, USA, 2007.
UN
CO
RR
EC
TED
PR
OO
F
Please cite this article in press as: S. Papavlasopoulos et al., A non-linear index to evaluate a journal’s scientific impact, Inform. Sci. (2010),doi:10.1016/j.ins.2010.01.018


