Embed Size (px)
Citation preview
Towards an Evaluation Framework for ProcessMining Algorithms
A. Rozinat, A.K. Alves de Medeiros, C.W. Gunther, A.J.M.M. Weijters, andW.M.P. van der Aalst
Eindhoven University of TechnologyP.O. Box 513, NL-5600 MB, Eindhoven, The Netherlands
{a.rozinat,a.k.medeiros,c.w.gunther,a.j.m.m.weijters,w.m.p.v.d.aalst}@tue.nl
Abstract. Although there has been a lot of progress in developing pro-cess mining algorithms in recent years, no e!ort has been put in devel-oping a common means of assessing the quality of the models discoveredby these algorithms. In this paper, we outline elements of an evaluationframework that is intended to enable (a) process mining researchers tocompare the performance of their algorithms, and (b) end users to evalu-ate the validity of their process mining results. Furthermore, we describetwo possible approaches to evaluate a discovered model (i) using existingcomparison metrics that have been developed by the process mining re-search community, and (ii) based on the so-called k-fold-cross validationknown from the machine learning community. To illustrate the applica-tion of these two approaches, we compared a set of models discovered bydi!erent algorithms based on a simple example log.
1 Introduction
Process mining has proven to be a valuable approach that provides new andobjective insights into the way business processes are actually conducted withinorganizations. Taking a set of real executions (the so-called “event log”) as thestarting point, these techniques attempt to extract non-trivial and useful processinformation from various perspectives, such as control flow, data flow, organi-zational structures, and performance characteristics. A common mining XML(MXML) log format was defined in [5] to enable researchers and practitionersto share their logs in a standardized way. However, while process mining hasreached a certain level of maturity and has been used in a variety of real-lifecase studies (see [3, 25] for two examples), a common framework to evaluateprocess mining results is still lacking. We believe that there is the need for aconcrete framework that enables (a) process mining researchers to compare theperformance of their algorithms, and (b) end users to evaluate the validity oftheir process mining results. This paper is a first step into this direction.
The driving element in the process mining domain is some operational pro-cess, for example a business process such as an insurance claim handling proce-dure in an insurance company, or the booking process of a travel agency. Nowa-days, many business processes are supported by information systems that help

coordinating the steps that need to be performed in the course of the process.Workflow systems, for example, assign work items to employees according totheir roles and the status of the process. Typically, these systems record eventsrelated to the activities that are performed, e.g., in audit trails or transactionlogs [5].1 These event logs form the input for process mining algorithms.
In this paper we focus on providing a means of comparison for algorithmsthat discover the control-flow perspective of a process (which we simply refer to asprocess discovery algorithms from now on). In particular, we focus on validationtechniques for these process discovery algorithms. We argue that this evaluationcan take place in di!erent dimensions, and we describe two di!erent validationapproaches: one based on existing validation metrics, and another based on theso-called k-fold cross validation technique known from the machine learning do-main. To directly support the evaluation and comparison of di!erent miningresults (both for researchers and end users), we have implemented an extensibleControl Flow Benchmark plug-in in the context of the ProM framework2.
The remainder of this paper is organized as follows. Section 2 motivates theneed for an evaluation framework. Then, Section 3 outlines first steps towardssuch a common framework. Subsequently, two di!erent evaluation approachesare described and illustrated based on the running example in Section 4 and inSection 5. Finally, Section 6 presents the Control Flow Benchmark plug-in inProM, and the paper concludes. Related work is reviewed throughout the paperand, therefore, not provided in a separate section.
2 Process Discovery: Which Model is the “Best”?
The goal of a process discovery algorithm is to construct a process model whichreflects the behavior that has been observed in the event log. Di!erent processmodeling languages3 can be used to capture the causal relationships of the steps,or activities, in the process. The idea of applying process mining in the contextof workflow management was first introduced in [8]. Over the last decade manyprocess mining approaches have been proposed [10, 18]. For more information onprocess mining we refer to a special issue of Computers in Industry on processmining [6] and a survey paper [5]. While all these approaches aim at the discoveryof a “good” process model, often targeting particular challenges (e.g., the miningof loops, or duplicate tasks), they have their limitations and many di!erent eventlogs and quality measurements are used. Hence, no standard measure is available.1 It is important to note that information systems that do not enforce users to follow
a particular process often still provide detailed event logs, e.g., hospital informationsystems, ERP systems etc.
2 ProM o!ers a wide range of tools related to process mining and process analysis.Both documentation and software (including the source code) can be downloadedfrom http://www.processmining.org.
3 In the remainder of this paper we will use Petri nets, motivated by their formalsemantics. Note that in our tool ProM there exist translations from process modelinglanguages such as EPC, YAWL, and BPEL to Petri nets and vice-versa.
2

I
HC
BA
G
F
E
D
H
A
B
D
DE
IC
GH F
AB D
EI
C GH
F
(b) Heuristic Miner
(d) Duplicates Genetic Miner
(f) Petrify Miner
AB D E
IC G H F
AB D
EI
C G H
F
AB
D EIC
GH
F
(a) Alpha Miner
(c) Alpha++ Miner
(e) Genetic Miner
Fig. 1. Process models that were discovered by di!erent process discovery algorithmsbased on the same log
To illustrate the dilemma, we consider a simple example log, which onlycontains the following five di!erent traces: ABDEI, ACDGHFI, ACGDHFI,ACHDFI, and ACDHFI. We applied six di!erent process mining algorithmsthat are available in ProM and obtained six di!erent process models (for ev-ery plug-in, we used the default settings in ProM 4.1). Figure 1 depicts themining results for the Alpha miner [7], the Heuristic miner [27], the Alpha++miner [29], the Duplicates Genetic miner and the Genetics miner [12], andthe Petrify miner [4]. The models seem similar, but are all di!erent4. Are theyequivalent? If not, which one is the “best”?
These questions are interesting both for researchers and end users: (a) Re-searchers typically attempt to let their process discovery algorithms constructprocess models that completely and precisely reflect the observed behavior in astructurally suitable way. It would be useful to have common data sets contain-ing logs with di!erent characteristics, which can be used within the scientificcommunity to systematically compare the performance of various algorithms indi!erent, controlled environments. (b) Users of process discovery techniques, onthe other hand, need to know how well the discovered model describes reality,how many cases are actually covered by the generated process description etc.For example, if in an organization process mining is to be used as a knowledgediscovery tool in the context of a Business Process Intelligence (BPI) frame-work, it must be possible to estimate the “accuracy” of a discovered model, i.e.,the “confidence” with which it reflects the underlying process. Furthermore, endusers need to be able to compare the results obtained from di!erent processdiscovery algorithms.
4 Note that throughout this paper the invisible (i.e., unlabeled) tasks need to beinterpreted using the so-called “lazy semantics”, i.e., they are only fired if theyenable a succeeding, visible task [12].
3

3 Towards a Common Evaluation Framework
In an experimental setting, we usually know the original model that was usedto generate an event log. For example, the log in Figure 2(a) was created fromthe simulation of the process model depicted in Figure 2(b). Knowing this, onecould leverage process equivalence notions to evaluate the discovered model withrespect to the original model [1]. But in many practical situations no originalmodel is available. However, if we assume that the behavior observed in thelog is what really happened (and somehow representative for the operationalprocess at hand), it is possible to compare the discovered model to the event logthat was used as input for the discovery algorithm. This essentially results in aconformance analysis problem [24, 11]. In either case quality criteria need to bedetermined.
In the remainder of this section, we first consider a number of evaluationdimensions (Section 3.1). Afterwards, we outline ingredients of a possible evalu-ation framework (Section 3.2).
3.1 Evaluation Dimensions
Figure 2 depicts an event log (a) and four di!erent process models (b-e). WhileFigure 2(b) depicts a “good” model for the event log in Figure 2(a), the remainingthree models show undesirable, extreme models that might also be returned bya process mining algorithm. They illustrate that the evaluation of an event logand a process model can take place in di!erent, orthogonal dimensions.
Fig. 2. The evaluation of a process model can take place in di!erent dimensions
4
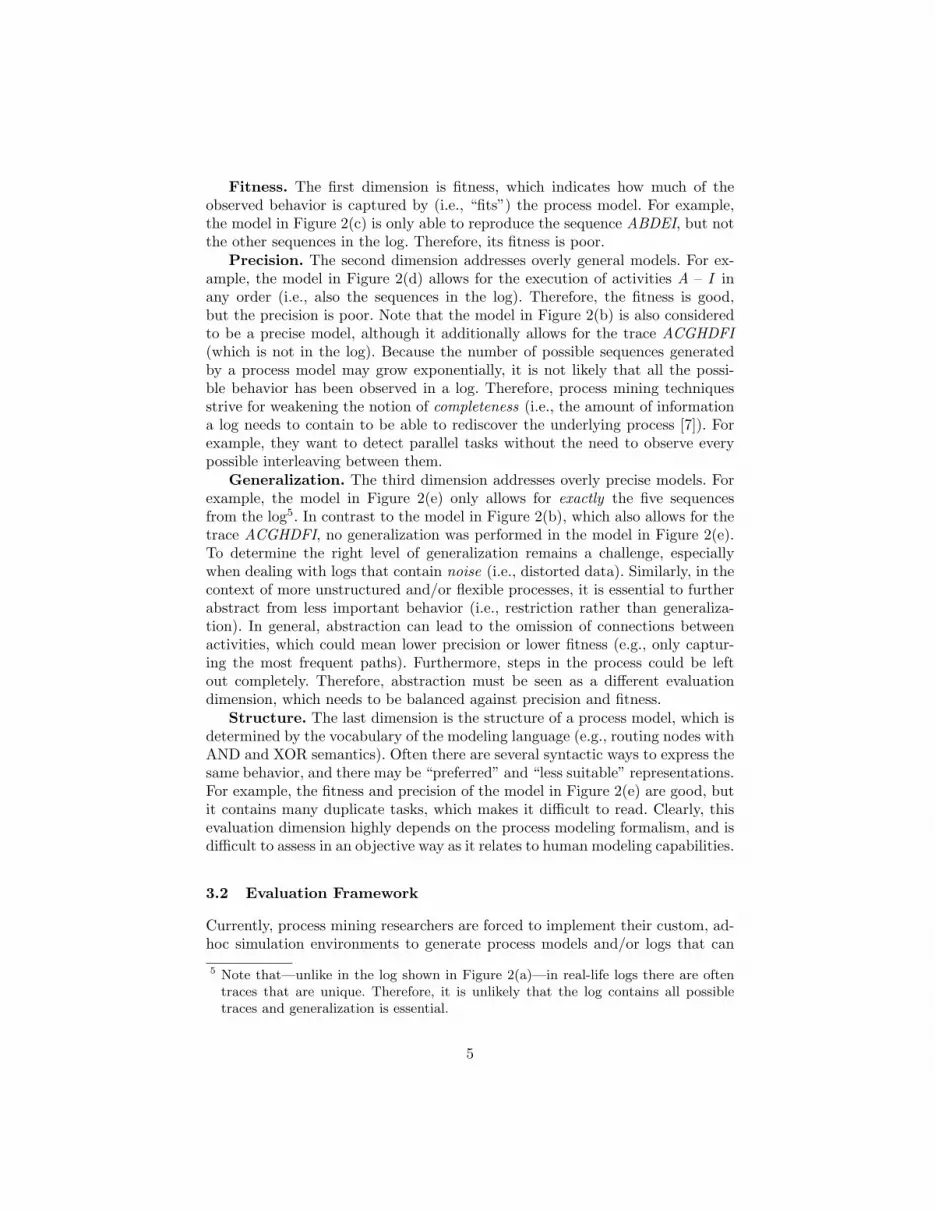
Fitness. The first dimension is fitness, which indicates how much of theobserved behavior is captured by (i.e., “fits”) the process model. For example,the model in Figure 2(c) is only able to reproduce the sequence ABDEI, but notthe other sequences in the log. Therefore, its fitness is poor.
Precision. The second dimension addresses overly general models. For ex-ample, the model in Figure 2(d) allows for the execution of activities A – I inany order (i.e., also the sequences in the log). Therefore, the fitness is good,but the precision is poor. Note that the model in Figure 2(b) is also consideredto be a precise model, although it additionally allows for the trace ACGHDFI(which is not in the log). Because the number of possible sequences generatedby a process model may grow exponentially, it is not likely that all the possi-ble behavior has been observed in a log. Therefore, process mining techniquesstrive for weakening the notion of completeness (i.e., the amount of informationa log needs to contain to be able to rediscover the underlying process [7]). Forexample, they want to detect parallel tasks without the need to observe everypossible interleaving between them.
Generalization. The third dimension addresses overly precise models. Forexample, the model in Figure 2(e) only allows for exactly the five sequencesfrom the log5. In contrast to the model in Figure 2(b), which also allows for thetrace ACGHDFI, no generalization was performed in the model in Figure 2(e).To determine the right level of generalization remains a challenge, especiallywhen dealing with logs that contain noise (i.e., distorted data). Similarly, in thecontext of more unstructured and/or flexible processes, it is essential to furtherabstract from less important behavior (i.e., restriction rather than generaliza-tion). In general, abstraction can lead to the omission of connections betweenactivities, which could mean lower precision or lower fitness (e.g., only captur-ing the most frequent paths). Furthermore, steps in the process could be leftout completely. Therefore, abstraction must be seen as a di!erent evaluationdimension, which needs to be balanced against precision and fitness.
Structure. The last dimension is the structure of a process model, which isdetermined by the vocabulary of the modeling language (e.g., routing nodes withAND and XOR semantics). Often there are several syntactic ways to express thesame behavior, and there may be “preferred” and “less suitable” representations.For example, the fitness and precision of the model in Figure 2(e) are good, butit contains many duplicate tasks, which makes it di"cult to read. Clearly, thisevaluation dimension highly depends on the process modeling formalism, and isdi"cult to assess in an objective way as it relates to human modeling capabilities.
3.2 Evaluation Framework
Currently, process mining researchers are forced to implement their custom, ad-hoc simulation environments to generate process models and/or logs that can
5 Note that—unlike in the log shown in Figure 2(a)—in real-life logs there are oftentraces that are unique. Therefore, it is unlikely that the log contains all possibletraces and generalization is essential.
5
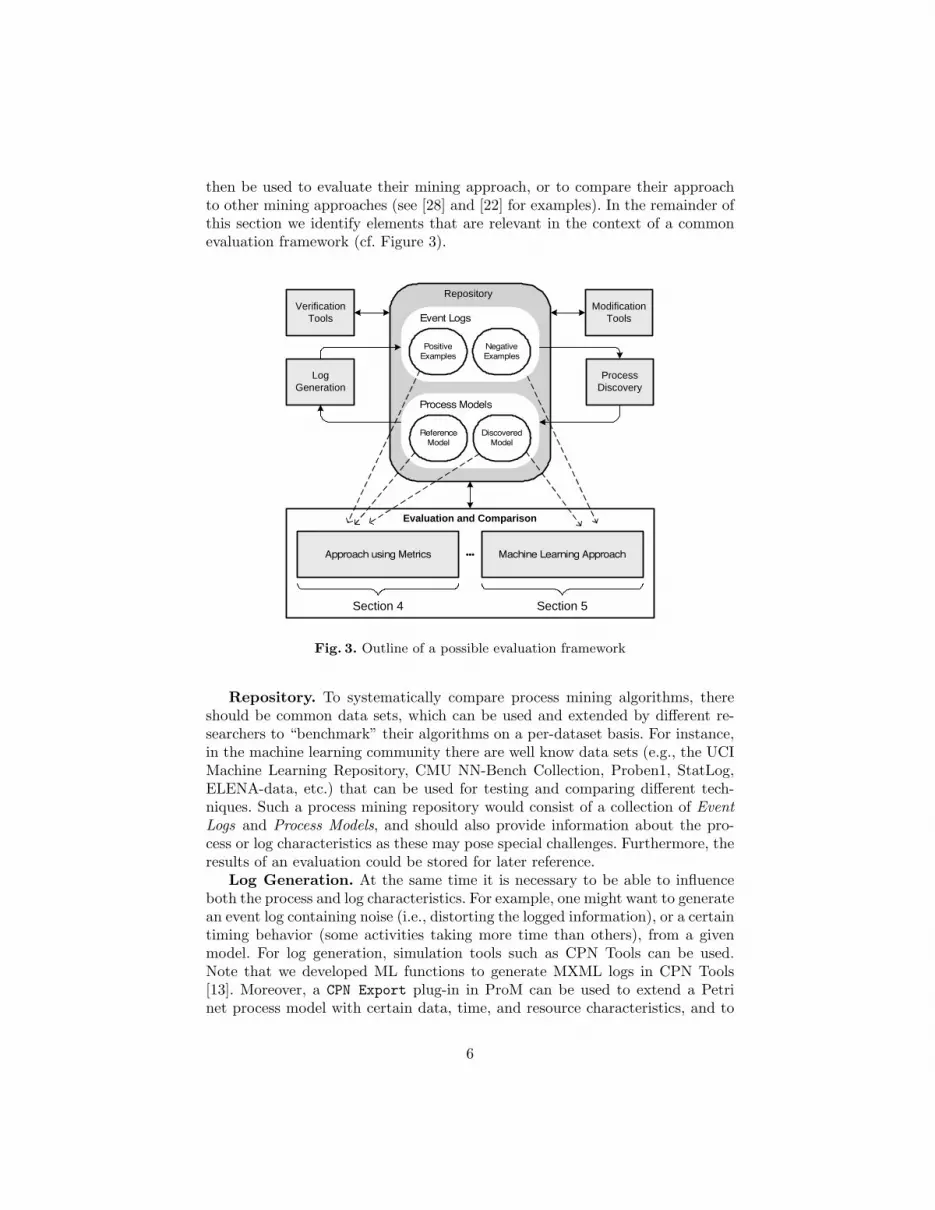
then be used to evaluate their mining approach, or to compare their approachto other mining approaches (see [28] and [22] for examples). In the remainder ofthis section we identify elements that are relevant in the context of a commonevaluation framework (cf. Figure 3).
Repository
Process Models
Event Logs
NegativeExamples
DiscoveredModel
PositiveExamples
Reference Model
Modification Tools
Process Discovery
Log Generation
Verification Tools
Evaluation and Comparison
Approach using Metrics Machine Learning Approach
Section 4 Section 5
Fig. 3. Outline of a possible evaluation framework
Repository. To systematically compare process mining algorithms, thereshould be common data sets, which can be used and extended by di!erent re-searchers to “benchmark” their algorithms on a per-dataset basis. For instance,in the machine learning community there are well know data sets (e.g., the UCIMachine Learning Repository, CMU NN-Bench Collection, Proben1, StatLog,ELENA-data, etc.) that can be used for testing and comparing di!erent tech-niques. Such a process mining repository would consist of a collection of EventLogs and Process Models, and should also provide information about the pro-cess or log characteristics as these may pose special challenges. Furthermore, theresults of an evaluation could be stored for later reference.
Log Generation. At the same time it is necessary to be able to influenceboth the process and log characteristics. For example, one might want to generatean event log containing noise (i.e., distorting the logged information), or a certaintiming behavior (some activities taking more time than others), from a givenmodel. For log generation, simulation tools such as CPN Tools can be used.Note that we developed ML functions to generate MXML logs in CPN Tools[13]. Moreover, a CPN Export plug-in in ProM can be used to extend a Petrinet process model with certain data, time, and resource characteristics, and to
6
automatically generate a Colored Petri net including the monitors necessary togenerate logs during simulation in CPN Tools [26]. Another example for loggeneration is the generation of “forbidden” scenarios (i.e., negative examples) asa complement to the actual execution log (i.e., positive examples).
Modification and Verification Tools. Furthermore, it is necessary to ver-ify certain properties with respect to event logs or process models. For example,assumptions such as the absence of duplicate tasks in the model must be checkedto ensure the validity of a certain evaluation metric (see also Section 4), or thecompleteness of the log needs to be ensured before starting the process discov-ery algorithm. Finally, the modification of event logs or process models might benecessary to, e.g., generate “noisy” logs (to test the performance of the processmining algorithm on distorted data), add artificial start and end activities (tofulfill certain pre-conditions), or the log needs to be split up into training andtest set (see also Section 5).
Evaluation and Comparison. Clearly, there may be many di!erent ap-proaches for evaluation and comparison of the discovered process models. This isindicated by the lower half of Figure 3 and the remainder of this paper will focuson this aspect. As a first step, we looked at existing work both in the process min-ing and data mining domain, and describe two di!erent evaluation approaches.In the first approach (Section 4), the quality of the discovered model is directlyevaluated using existing validation metrics. Some of these metrics make use ofa reference model (i.e., the model that was used to generate the event log). Thesecond approach (Section 5) is based on evaluation techniques known from themachine learning domain, where a part of the input data is held back for eval-uation purposes. Furthermore, it uses negative examples to punish over-generalmodels.
4 Approach using Metrics
Process mining literature describes several measures to assess the quality ofa model. In the desire to discover a “good” model for the behavior observedin the execution log, shared notions of, e.g., fitness, precision and structurehave been developed. Naturally, these quality measures can be used to evaluateand compare discovered process models. They are typically applied in a specificmining context, i.e., assumptions are made with respect to the correspondingmining algorithm. However, these assumptions do not need to be relevant for theapplicability of the defined validation metrics, and, therefore, it is interesting toinvestigate to which extent these metrics can be used in a more general evaluationsetting.
In the remainder of this section, we first review existing metrics that havebeen used by di!erent authors to validate the quality of their (mined) models(Section 4.1). Here the dimensions defined in Section 3.1 are used to structurethe review. Then, we calculate some of these metrics for the process modelsshown in Figure 1 (Section 4.2).
7

4.1 Review of Existing Metrics
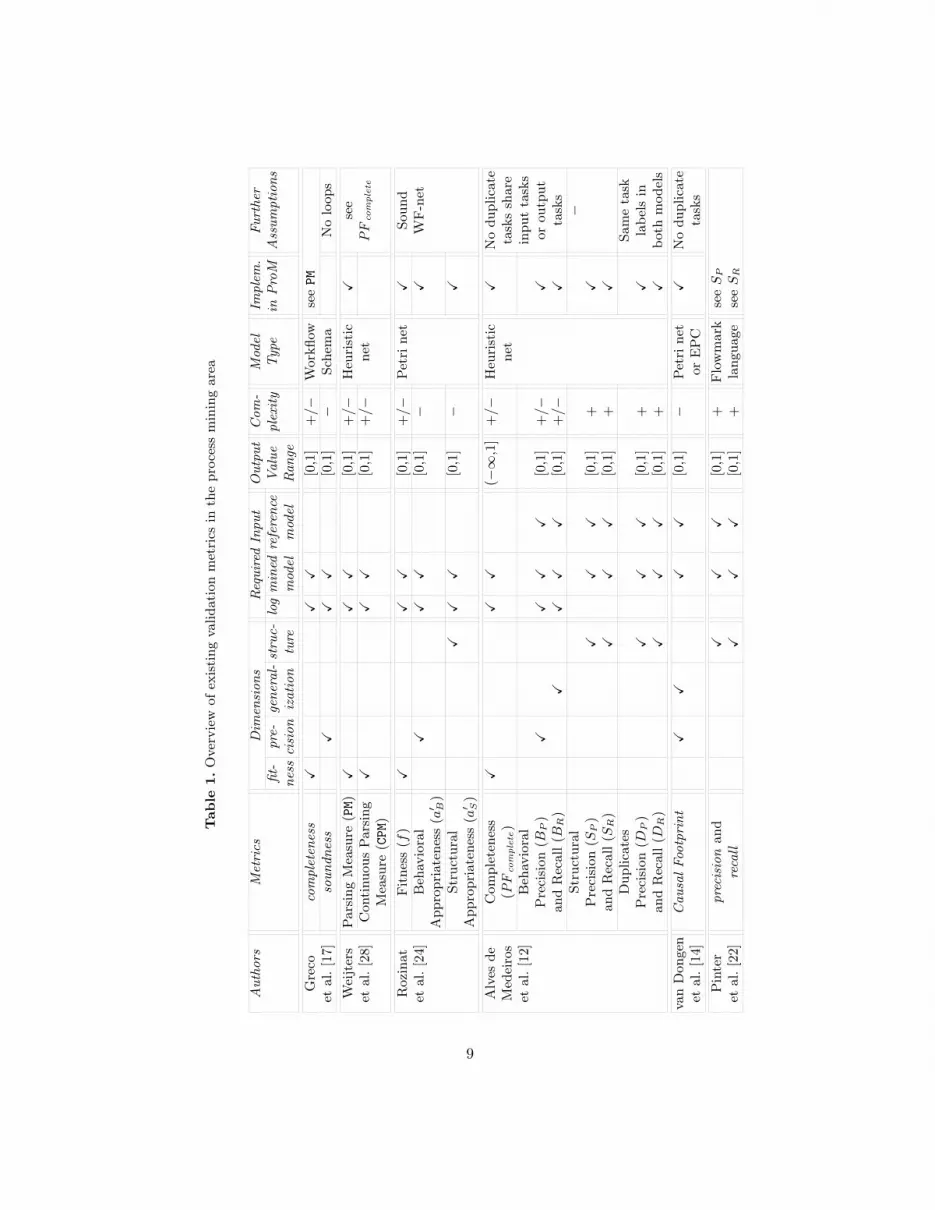
To provide an overview about the reviewed validation metrics in the processmining area, Table 1 summarizes the following aspects:
– Which of the dimensions, i.e., fitness, precision, generalization, and structure(cf. Section 3.1), are addressed by this metric?
– Which input is required to calculate the metric (reference log and/or refer-ence model)?
– What is the output value range?– What is the computational complexity? Here, we give a rough indication
based on whether the state space of the model needs to be explored (!),some form of log replay is performed (+/!), or purely structural aspects ofthe model need to be considered (+).
– For which process model type is the metric defined?– Is it already implemented in the ProM framework?– Which further assumptions need to hold to calculate the metric, or to obtain
a valid result?
In the following, we briefly review the metrics listed in Table 1 (for furtherdetails the interested reader is kindly referred to the cited papers).
Metrics to quantify fitness. Fitness refers to how much behavior in a logis correctly captured (or can be reproduced) by a model. From literature, weidentified five metrics that relate to the fitness dimension: Completeness (bothcompleteness [17] and PF complete [12]), Fitness (f) [24], Parsing Measure (PM)and Continuous Parsing Measure (CPM) [28]. All these metrics are based onreplaying logs in process models and they mainly di!er in what they consider tobe the “unit of behavior”.
– For the metrics completeness and PM, the trace is the unit of behavior. Bothmetrics quantify which percentage of the traces in a log can also be generatedby a model. For the remaining three metrics (CPM, f , and PF complete), bothtraces and tasks are units of behavior. The metric CPM gives equal importanceto the total number of correctly replayed traces and the total number ofcorrectly replayed tasks.
– The metric f is more fine-grained than the metric CPM because it also con-siders which problems (missing and remaining tokens) happened during thelog replay. This way, it equally punishes problems of events that cannot bereplayed as the corresponding activity is “not activated”, and the problemof activities that “remain activated” in an improper way.
– The metric PF complete is very similar to the metric f , but it also takes intoaccount trace frequencies when weighing the problems during the log replay.Consequently, problems in low-frequent traces become less important thanproblems in traces that are very frequent in the log.
8
Table
1.O
verv
iew
ofex
isting
validat
ion
met
rics
inth
epro
cess
min
ing
area
Auth
ors
Met
rics
Dim
ensi
ons
Req
uired
Inpu
tO
utp
ut
Com
-M
odel
Impl
em.
Furt
her
fit-
pre-
gener
al-
stru
c-lo
gm
ined
refe
rence
Val
ue
plex
ity
Typ
ein
Pro
MA
ssum
ptio
ns
nes
sci
sion
izat
ion
ture
mod
elm
odel
Ran
ge
Gre
coco
mpl
eten
ess
!!
![0
,1]
+/!
Wor
kflow
seePM
etal
.[1
7]so
undn
ess
!!
![0
,1]
!Sch
ema
No
loop
s
Wei
jter
sPar
sing
Mea
sure
(PM)
!!
![0
,1]
+/!
Heu
rist
ic!
see
etal
.[2
8]C
ontinuou
sPar
sing
!!
![0
,1]
+/!
net
PF
com
ple
te
Mea
sure
(CPM)
Roz
inat
Fitnes
s(f
)!
!!
[0,1
]+
/!Pet
rinet
!Sou
nd
etal
.[2
4]B
ehav
iora
l!
!!
[0,1
]!
!W
F-n
etA
ppro
pri
aten
ess
(a! B
)Str
uct
ura
l!
!!
[0,1
]!
!A
ppro
pri
aten
ess
(a! S)
Alv
esde
Com
ple
tenes
s!
!!
(!"
,1]
+/!
Heu
rist
ic!
No
duplica
teM
edei
ros
(PF
com
plete
)net
task
ssh
are
etal
.[1
2]B
ehav
iora
lin
put
task
sP
reci
sion
(BP)
!!
!!
[0,1
]+
/!!
orou
tput
and
Rec
all(B
R)
!!
!!
[0,1
]+
/!!
task
sStr
uct
ura
l!
Pre
cisi
on(S
P)
!!
![0
,1]
+!
and
Rec
all(S
R)
!!
![0
,1]
+!
Duplica
tes
Sam
eta
skP
reci
sion
(DP)
!!
![0
,1]
+!
label
sin
and
Rec
all(D
R)
!!
![0
,1]
+!
bot
hm
odel
s
van
Don
gen
Cau
salFoo
tpri
nt
!!
!!
[0,1
]!
Pet
rinet
!N
oduplica
teet
al.[1
4]or
EP
Cta
sks
Pin
ter
prec
isio
nan
d!
!!
[0,1
]+
Flo
wm
ark
see
SP
etal
.[2
2]re
call
!!
![0
,1]
+la
ngu
age
see
SR
9

Metrics to quantify precision and generalization. Precision and gener-alization refer to how much more behavior is captured in the model than wasobserved in the log. The following metrics focus only on the precision dimension:soundness [17], (advanced) Behavioral Appropriateness (a!
B) [24], and Behav-ioral Precision (BP ) [12]. The Behavioral Recall (BR) [12] metric focuses onlyon the generalization dimension, and the Causal Footprint [14] addresses bothprecision and generalization (basically evaluating the equivalence of a minedmodel with respect to the reference model).
– The metric soundness calculates the percentage of traces that can be gen-erated by a model and are in a log. The problem with this metric is thatit only makes sense when the log contains all possible traces. As mentionedearlier, this might be unrealistic when the target model has many tasks inparallel and is impossible when the target model has loop constructs.
– The a!B metric derives “sometimes” follows and precedes relations (reflecting
alternative or parallel behavior) for tasks in a log and for tasks in a model,and compares these relations. The less relations derived from the modelcan also be derived from the log, the less precise is the model. While theserelations can be derived from the log in a linear way, deriving them from themodel requires an exploration of the state space of the model.
– The behavioral precision (BP ) and recall (BR) quantify the precision andgeneralization of the mined model with respect to the input log and thereference model that was used to generate this log. The metrics BP and BR
measure the intersection between the set of enabled tasks that the mined andreference models have at every moment of the log replay. This intersectionis further weighed by the frequency of traces in the log. BP measures howmuch extra behavior the mined model allows for with respect to a givenreference model and log. BR quantifies the opposite. These metrics have theadvantage that they capture the moment of choice in the models and thedi!erences of behavior in low and high frequent traces.
– The metric Causal Footprint measures behavioral similarity based on twomodels’ structures. It works by (i) mapping these models to their causal clo-sure graphs, (ii) transforming these graphs to vectors in a multidimensionalspace, and (iii) measuring the cosine distance between these two vectors.
Metrics to quantify structure. The structure of a model consists of (i) itstasks, (ii) the connections (or dependencies) between these tasks, and (iii) thesemantics of the split/join points. The existing metrics for structural comparisontypically focus on one or more of these constituent elements, but not all of them.
– The metric Structural Appropriateness (a!S) [24] measures if a model is less
compact (in terms of the number of tasks) than necessary. It punishes modelswith extra alternative duplicate tasks and redundant invisible tasks indepen-dently of the model behavior (so it can also be used to compare models withdi!erent behaviors).
10

– The metrics precision and recall [22] (like the respective metrics StructuralPrecision (SP ) and Structural Recall (SR) [12]) quantify how many connec-tions the mined model and the reference models have in common. When themined model has connections that do not appear in the reference model,precision will have a value lower than 1. When the reference model has con-nections that do not appear in the mined model, recall will have a valuesmaller than 1.
– The metrics Duplicates Precision (DP ) and Duplicates Recall (DR) [12] aresimilar to the metrics precision and recall [22]. The only di!erence is thatthey check how many duplicate tasks the mined and reference models have incommon with respect to each other, under the assumption that the numberof task labels is the same for the discovered model and the reference model(which is the case in a typical mining setting).
4.2 Example Comparison using Metrics
We compare the discovered models depicted in Figure 1 using some of the val-idation metrics discussed in above. For those metrics that need a reference logand/or reference model, we use the log in Figure 2(a) and the model in Fig-ure 2(b), respectively. The results of the comparison can be computed with theControl Flow Benchmark plug-in in ProM (cf. Section 6), and are given in Ta-ble 2.
Table 2. Overview of the presented fitness, precision and generalization, and structuremetric values for the process models in Figure 1(a)–(f). If the assumptions of the metricare not fulfilled, and therefore no valid result can be obtained, “n.a.” (not applicable)is given rather than the calculated value
Alpha Alpha++ Genetic Dupl. GA Heuristic Petrify
PM 0.965 0.965 1.0 1.0 1.0 1.0f 0.995 0.995 1.0 1.0 1.0 1.0
PF complete 0.993 0.993 1.0 1.0 1.0 1.0a!B 0.646 1.0 1.0 1.0 0.664 1.0BP 0.964 0.993 1.0 1.0 0.972 1.0BR 0.983 0.983 1.0 1.0 1.0 0.997
Causal Footprint 0.975 0.986 1.0 n.a. 0.988 n.a.a!S 1.0 1.0 1.0 0.818 1.0 0.727SP 1.0 1.0 1.0 1.0 1.0 0.854SR 0.938 1.0 1.0 0.938 0.938 1.0DP 1.0 1.0 1.0 0.9 1.0 0.9DR 1.0 1.0 1.0 1.0 1.0 1.0
It is clear that the values of the di!erent metrics are not directly comparableto each other as they measure di!erent aspects of quality, and at a di!erent levelof granularity; they are even defined for di!erent modeling formalisms. Never-theless, they can highlight potential problems and provide an overall indication
11

of quality. It remains a continuous challenge to define good validation metricsthat can be used to evaluate desired aspects of process models in an e"cient,stable and analyzable way.
From the results in Table 2 we can see that: (i) All discovered models exceptthe models returned by the Alpha and Alpha++ miner fit the log (cf. metrics PM,f , and PFcomplete). The algorithms Alpha and Alpha++ have problems to re-turn fitting models because they cannot correctly discover the skipping of tasks.Note that task “G” can be skipped in the model in Figure 2(b); (ii) Amongthe fitting models, the Genetic, Duplicates GA and Petrify miner returned alsoprecise models (cf. metrics BP and a!
B). Note that there is a long-term depen-dency between task “B” and “E”; (iii) The Petrify miner returned an overlyprecise model, which does not allow for the trace ACGHDFI (cf. metric BR);(iv) The structure of the models returned by the Duplicates GA and Petrifyminer contains unnecessary duplicate and invisible tasks (cf. metrics DP , DR,and a!
S).This demonstrates that the discussed metrics are able to successfully capture
real deficiencies of the discovered models. According to the results in Table 2,all the discovered models in Figure 1 are relatively good models, among whichthe model discovered by the Genetic miner (cf. Figure 1(e)) seems to be the bestsolution for the example log in Figure 2(a).
5 Machine Learning Approach
From a theoretical point of view, process discovery is related to some workdiscussed in the Machine Learning (ML) domain. In [9, 15, 16, 23] the limits ofinductive inference are explored. For example, in [16] it is shown that the com-putational problem of finding a minimum finite-state acceptor compatible withgiven data is NP-hard. Several of the more generic concepts discussed in thesepapers could be translated to the domain of process mining. It is possible tointerpret the process discovery problem as an inductive inference problem spec-ified in terms of rules, a hypothesis space, examples, and criteria for successfulinference. However, despite the many relations with the work described in [9,15, 16, 23] there are also many di!erences, e.g., we are mining at the net levelrather than sequential or lower level representations (e.g., Markov chains, finitestate machines, or regular expressions), and therefore process mining needs todeal with various forms of concurrency.
Furthermore, there is a long tradition of theoretical work dealing with theproblem of inferring grammars out of examples: given a number of sentences(traces) out of a language, find the simplest model that can generate these sen-tences. There is a strong analogy with the process-mining problem: given a num-ber of process traces, can we find the simplest process model that can generatethese traces. A good overview of prominent computational approaches for learn-ing di!erent classes of formal languages is given in [21] and a special issue ofthe machine learning journal about this subject [19]. Many issues important inthe language-learning domain are also relevant for process mining (i.e. learning
12
from only positive examples, how to deal with noise, measuring the quality ofa model, etc.). However, as indicated before, an important di!erence betweenthe grammar inference domain and the process-mining domain is the problemof concurrency in the traces: concurrency seems not relevant in the grammarinference domain.
Given the similarities between the problems addressed in the process miningand the ML domain, it appears to be beneficial to consider existing validationmechanisms used in the ML community and test their applicability in the processmining area. In the remainder of this section, we investigate how the well-knownk-fold cv setup can be used for the evaluation of process discovery algorithms(Section 5.1), and apply the approach to the discovery algorithms used in Fig-ure 1 (Section 5.2).
5.1 K-fold CV Setup for Process Mining
Within the ML community, there is a relatively simple experimental frameworkcalled k-fold cross validation [20]. Based on the observation that estimating theperformance of the learned model on the learning material leads to overly opti-mistic results, a strict separation between training data and test (or validation)data is advocated. The following steps can be distinguished: The available datais divided into k subsets numbered 1 to k. The ML-algorithm is trained k times.In training i (1 " i " k), subset i is used as test material, the rest of the mate-rial, i.e., {1, ..., i!1, i+1, ..., k}, is used as learning material. The performance ofthe ML-algorithm on the current data set (or the performance of the definitivelearned model) is estimated by the average (or otherwise combined) error overthe k test sets. The framework can also be used for parameter optimization,and for comparing the performance of di!erent learning algorithms (using thepaired T-test to calculate a confidence interval).
We want to investigate whether this validation framework is useful for theevaluation of process discovery algorithms. One can think of the concept tobe learned as the process behavior, which should be captured by the discoveredprocess model (the knowledge description). The starting point in a typical k-fold-cv experiment is a data set with positive and negative examples. However, duringprocess discovery an event log only contains positive examples; negative examplesare only available if the underlying model is known (impossible process behavior).To apply the k-fold cross validation framework in our process discovery setting,we have to answer the following questions: (i) How to deal with the lack ofnegative examples?, (ii) How to partition the data in training and test material(so that both parts contain representative behavior)?, and (iii) How to calculatethe error for each test run i? Di!erent options are possible and need to beinvestigated in more detail; in this paper only two illustrative combinations arechosen.
(i) Negative examples. We want to generate negative examples, for whichwe use the following simple solution: Starting with an event log called EventLoganother event log (EventLogRandom) is generated by building m random traces
13
of length n (where m is the number of traces in EventLog and n is the num-ber of di!erent activities in event log EventLog). In the presence of a referencemodel, one could also use more sophisticated approaches that generate nega-tive examples that better reflect really “forbidden” behavior. Note that withoutan explicit reference model, the log EventLogRandom may accidentally containpositive examples.
(ii) Partitioning the data. To partition the 1459 positive examples (cf.total number of instances) of the event log in Figure 2(a) into training and testdata, we take two di!erent approaches. First, we use k = 10 (a commonly usedvalue for k), and randomly partition the log in 10 pieces of equal size. In this10-fold cv experiment, we then use 9 of the 10 partitions as training data andthe remaining part as test data. However, because we only have 5 di!erent tracesin this simple example log, each of the 10 partitions contains these 5 traces (indi!erent frequencies), and, therefore, the test set does not contain really “new”data. Here, the running example seems too simple6. Therefore, we also choseanother partitioning strategy, where k is the number of di!erent traces in thelog (i.e., here k = 5) and each partition contains those instances that exhibitthe same sequence of activities. In this 5-fold cv experiment, 4 out of these 5partitions were then used as training data, and the remaining part as test data.A problem here is, however, that—because the example the log only contains theminimal number of traces needed to rediscover the model—important behavioris missing in the training data.
(iii) Calculating the error. For each test run i, we first discover a processmodel based on the training data. Then, we calculate the error pos based onthe positive examples of the test set (should be parsed by the model), andthe error neg based on the negative examples (should not be parsed by themodel). The idea is that—while the model should account for enough fitnessand generalization to parse the positive examples from the test set—negativeexamples should not be accepted frequently as otherwise the precision is low.To calculate the errors pos and neg, we used the fitness metric f (cf. Section4; other fitness metrics could be chosen). For each test run i, the overall erroris then (pos + (1 ! neg))/2, where pos and neg are fractions of positive andnegative examples that “fit”. The average error of all the k test runs is takenas the result of the k-fold cv experiment. For example, for the Heuristic minerthe overall error for each of the 10 test runs evaluates to (1.0 + (1.0-0.389))/2= 0.805.
5.2 Example Comparison using the ML Approach
This section compares the discovered models depicted in Figure 1 using the setupdescribed in Section 5.1. As explained earlier, the performance of the definite
6 As indicated in Section 3.1, real-life logs often contain traces that are unique. Typ-ically, traces are hardly reproduced in the log and logs are far from complete (i.e.,only contain a fraction of the possible behavior). Therefore, the test set will containalso unseen (i.e., “new”) traces in more realistic scenarios.
14
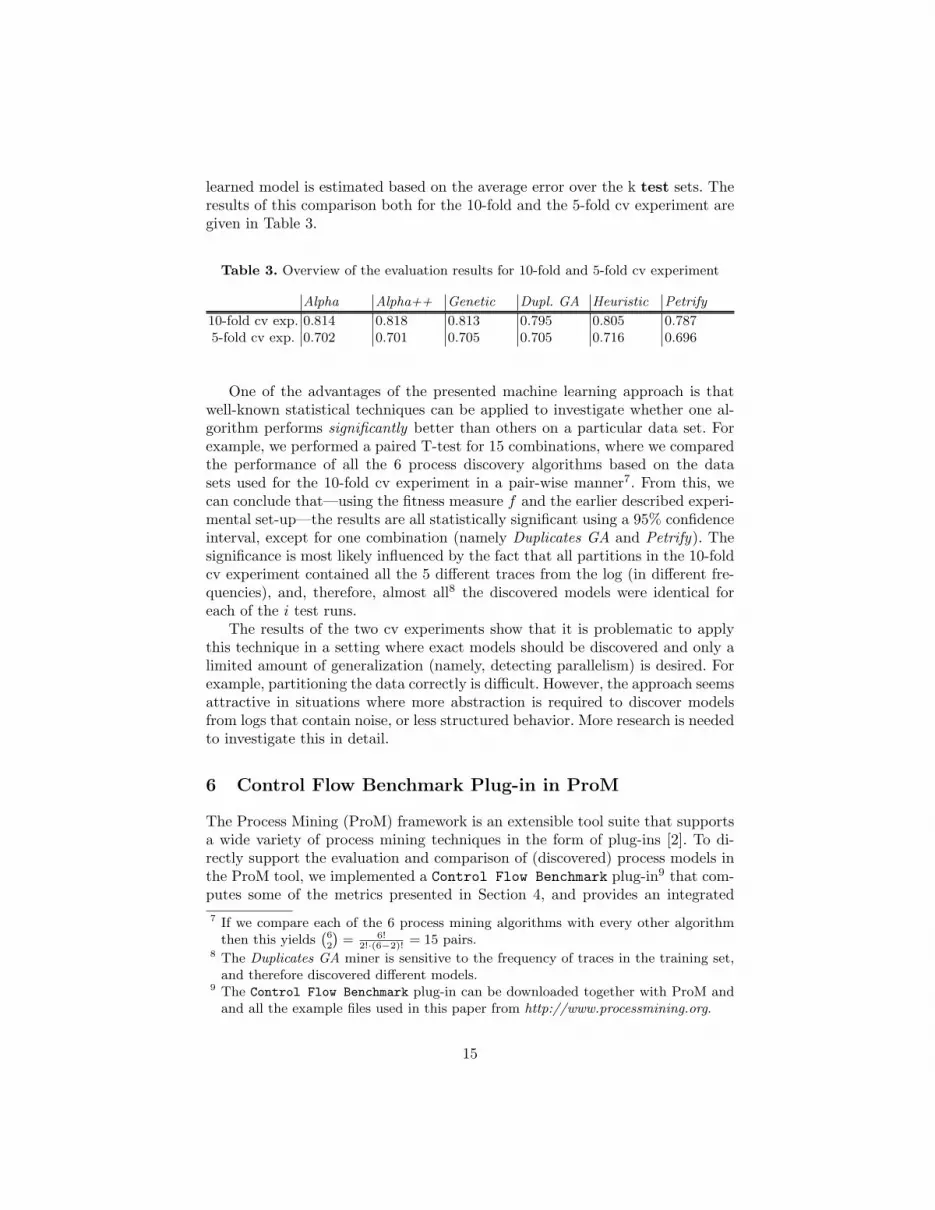
learned model is estimated based on the average error over the k test sets. Theresults of this comparison both for the 10-fold and the 5-fold cv experiment aregiven in Table 3.
Table 3. Overview of the evaluation results for 10-fold and 5-fold cv experiment
Alpha Alpha++ Genetic Dupl. GA Heuristic Petrify
10-fold cv exp. 0.814 0.818 0.813 0.795 0.805 0.7875-fold cv exp. 0.702 0.701 0.705 0.705 0.716 0.696
One of the advantages of the presented machine learning approach is thatwell-known statistical techniques can be applied to investigate whether one al-gorithm performs significantly better than others on a particular data set. Forexample, we performed a paired T-test for 15 combinations, where we comparedthe performance of all the 6 process discovery algorithms based on the datasets used for the 10-fold cv experiment in a pair-wise manner7. From this, wecan conclude that—using the fitness measure f and the earlier described experi-mental set-up—the results are all statistically significant using a 95% confidenceinterval, except for one combination (namely Duplicates GA and Petrify). Thesignificance is most likely influenced by the fact that all partitions in the 10-foldcv experiment contained all the 5 di!erent traces from the log (in di!erent fre-quencies), and, therefore, almost all8 the discovered models were identical foreach of the i test runs.
The results of the two cv experiments show that it is problematic to applythis technique in a setting where exact models should be discovered and only alimited amount of generalization (namely, detecting parallelism) is desired. Forexample, partitioning the data correctly is di"cult. However, the approach seemsattractive in situations where more abstraction is required to discover modelsfrom logs that contain noise, or less structured behavior. More research is neededto investigate this in detail.
6 Control Flow Benchmark Plug-in in ProM
The Process Mining (ProM) framework is an extensible tool suite that supportsa wide variety of process mining techniques in the form of plug-ins [2]. To di-rectly support the evaluation and comparison of (discovered) process models inthe ProM tool, we implemented a Control Flow Benchmark plug-in9 that com-putes some of the metrics presented in Section 4, and provides an integrated7 If we compare each of the 6 process mining algorithms with every other algorithm
then this yields`62
´= 6!
2!·(6"2)! = 15 pairs.8 The Duplicates GA miner is sensitive to the frequency of traces in the training set,
and therefore discovered di!erent models.9 The Control Flow Benchmark plug-in can be downloaded together with ProM and
and all the example files used in this paper from http://www.processmining.org.
15
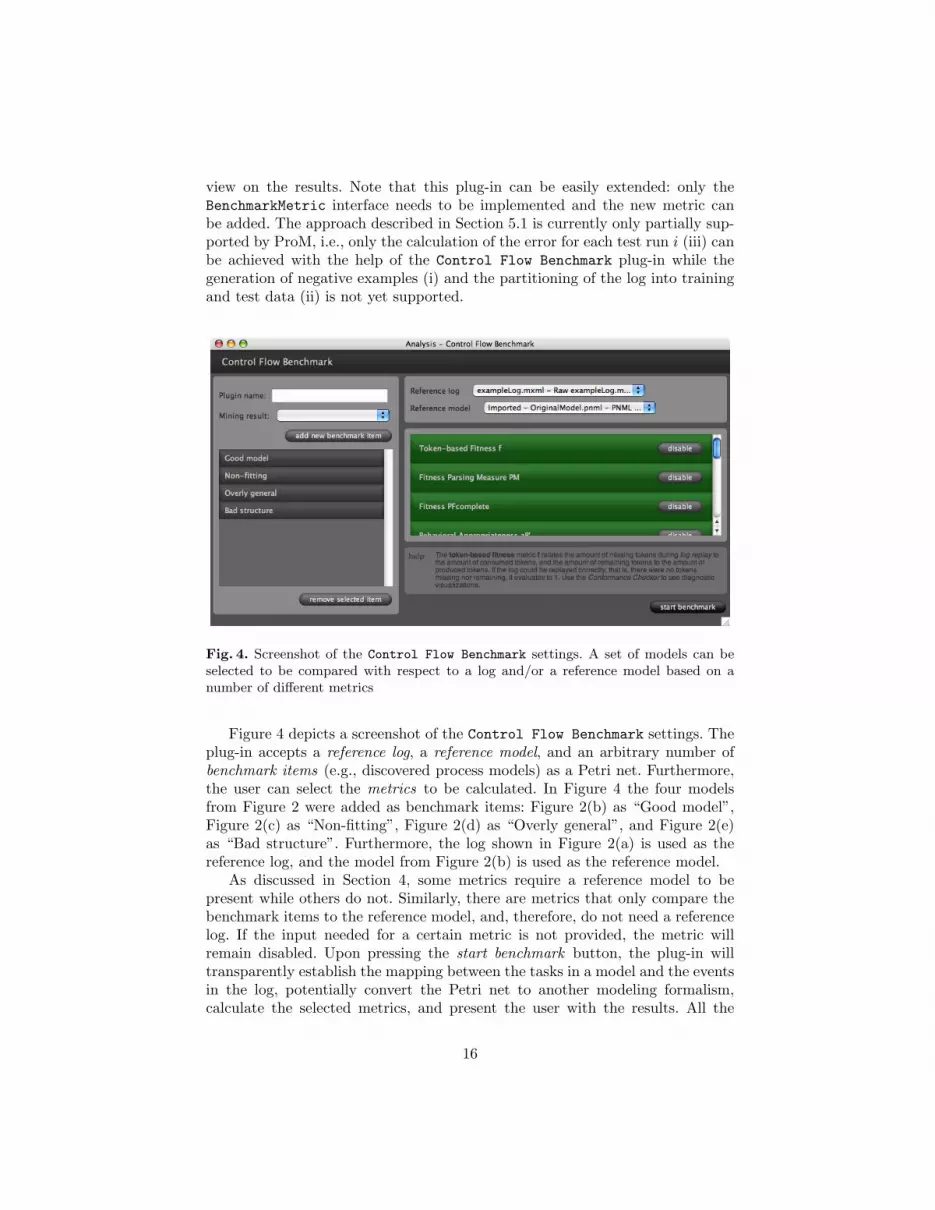
view on the results. Note that this plug-in can be easily extended: only theBenchmarkMetric interface needs to be implemented and the new metric canbe added. The approach described in Section 5.1 is currently only partially sup-ported by ProM, i.e., only the calculation of the error for each test run i (iii) canbe achieved with the help of the Control Flow Benchmark plug-in while thegeneration of negative examples (i) and the partitioning of the log into trainingand test data (ii) is not yet supported.
Fig. 4. Screenshot of the Control Flow Benchmark settings. A set of models can beselected to be compared with respect to a log and/or a reference model based on anumber of di!erent metrics
Figure 4 depicts a screenshot of the Control Flow Benchmark settings. Theplug-in accepts a reference log, a reference model, and an arbitrary number ofbenchmark items (e.g., discovered process models) as a Petri net. Furthermore,the user can select the metrics to be calculated. In Figure 4 the four modelsfrom Figure 2 were added as benchmark items: Figure 2(b) as “Good model”,Figure 2(c) as “Non-fitting”, Figure 2(d) as “Overly general”, and Figure 2(e)as “Bad structure”. Furthermore, the log shown in Figure 2(a) is used as thereference log, and the model from Figure 2(b) is used as the reference model.
As discussed in Section 4, some metrics require a reference model to bepresent while others do not. Similarly, there are metrics that only compare thebenchmark items to the reference model, and, therefore, do not need a referencelog. If the input needed for a certain metric is not provided, the metric willremain disabled. Upon pressing the start benchmark button, the plug-in willtransparently establish the mapping between the tasks in a model and the eventsin the log, potentially convert the Petri net to another modeling formalism,calculate the selected metrics, and present the user with the results. All the
16

benchmark metrics return values between 0 (interpreted as the “worst” value)and 1 (interpreted as the “best” value). Furthermore, each metric is expected tocheck its assumptions and to indicate the result being “invalid” if pre-conditionsare not met.
Fig. 5. Screenshot of the Bar Profile view in the Control Flow Benchmark plug-in inProM. The visualization of the metric values provides an overview, and makes it easyto spot problems
The first result view is the Bar Profile view (see screenshot in Figure 5).It visualizes the calculated values along a so-called bar profile in a fixed order.Green and wide segments resemble “good” values while red and narrow segmentsresemble “problematic” values according to the corresponding metric. Invalidvalues are left out (i.e., the bar profile will have a gap at this place). This view isintended to provide a graphical overview that makes it easy to spot problematicareas, which can be subsequently inspected in further detail.
For the extreme models from Figure 2 we can clearly see some di!erences.The “Good model” shows a consistently green and wide profile, while the “Non-fitting” model has a reduced fitness (although the three fitness values PM, f , andPFcomplete are still relatively high because the most frequent trace is correctlycaptured) and less behavior and less connections than the reference model (cf.Causal Footprint and Structural Recall SR). The “Overly general” model ex-hibits extra behavior (cf. Behavioral Appropriateness a!
B , Behavioral Recall BR,and Causal Footprint) and has more connections than the reference model (cf.Structural Precision SP ). Finally, the model with the “Bad structure” showsa reduced Structural Appropriateness a!
S as it has many unnecessary duplicatetasks. Similarly, the Duplicates Precision DP is low.
17

Fig. 6. Screenshot of the Table view in the Control Flow Benchmark plug-in in ProM.The concrete metric values can be inspected in detail and exported to a CSV file
The view can be changed to Table view (see screenshot in Figure 6) forinspecting the detailed results. The exact values are shown for each benchmarkitem, or “invalid” is given if it could not be computed for a certain case (forexample, the Causal Footprint metric cannot deal with the duplicate tasks in themodel with the “Bad Structure”). Finally, the results can be exported as CommaSeparated Values (CSV) and analyzed/visualized using di!erent analysis tools.
7 Conclusion
Adequate validation techniques in the process mining domain are needed to eval-uate and compare discovered process models both in research and practice. Wehave outlined an evaluation framework and introduced evaluation dimensionsfor discovered process models. Furthermore, we described two evaluation strate-gies, and presented a Control Flow Benchmark plug-in in the ProM framework,which can be used to evaluate models with these two approaches.
The metrics discussed in the context of the first approach can be directlyapplied to evaluate the quality of a process model. Nevertheless, many obsta-cles such as bridging the gap between di!erent modeling languages, defininggood validation criteria and good metrics that capture them remain. The sec-ond approach seems especially promising in less structured environments wheremore abstraction is required, and should be subject to further research. Finally,completely new evaluation approaches might help to move towards a commonvalidation methodology for process mining techniques. Moreover, a comprehen-sive set of benchmark examples (ideally containing both artificial and real-lifedata) is needed.
18

Acknowledgements
This research is supported by Technology Foundation STW, EIT, SUPER, NWO,and the IOP program of the Dutch Ministry of Economic A!airs. The authorswould also like to thank all ProM developers for their on-going work on processmining techniques.
References
1. W.M.P. van der Aalst, A.K. Alves de Medeiros, and A.J.M.M. Weijters. ProcessEquivalence: Comparing Two Process Models Based on Observed Behavior. InS. Dustdar, J.L. Fiadeiro, and A. Sheth, editors, BPM 2006, volume 4102 of LectureNotes in Computer Science, pages 129–144. Springer-Verlag, Berlin, 2006.
2. W.M.P. van der Aalst, B.F. van Dongen, C.W. Gunther, R.S. Mans, A.K. Alvesde Medeiros, A. Rozinat, V. Rubin, M. Song, H.M.W. Verbeek, and A.J.M.M.Weijters. ProM 4.0: Comprehensive Support for Real Process Analysis. In J. Kleijnand A. Yakovlev, editors, Application and Theory of Petri Nets and Other Models ofConcurrency (ICATPN 2007), volume 4546 of Lecture Notes in Computer Science,pages 484–494. Springer-Verlag, Berlin, 2007.
3. W.M.P. van der Aalst, H.A. Reijers, A.J.M.M. Weijters, B.F. van Dongen, A.K.Alves de Medeiros, M. Song, and H.M.W. Verbeek. Business Process Mining: AnIndustrial Application. Information Systems, 32(5):713–732, 2007.
4. W.M.P. van der Aalst, V. Rubin, B.F. van Dongen, E. Kindler, and C.W. Gunther.Process Mining: A Two-Step Approach using Transition Systems and Regions.BPM Center Report BPM-06-30, BPMcenter.org, 2006.
5. W.M.P. van der Aalst, B.F. van Dongen, J. Herbst, L. Maruster, G. Schimm, andA.J.M.M. Weijters. Workflow Mining: A Survey of Issues and Approaches. Dataand Knowledge Engineering, 47(2):237–267, 2003.
6. W.M.P. van der Aalst and A.J.M.M. Weijters, editors. Process Mining, SpecialIssue of Computers in Industry, Volume 53, Number 3. Elsevier Science Publishers,Amsterdam, 2004.
7. W.M.P. van der Aalst, A.J.M.M. Weijters, and L. Maruster. Workflow Mining:Discovering Process Models from Event Logs. IEEE Transactions on Knowledgeand Data Engineering, 16(9):1128–1142, 2004.
8. R. Agrawal, D. Gunopulos, and F. Leymann. Mining Process Models from Work-flow Logs. In Sixth International Conference on Extending Database Technology,pages 469–483, 1998.
9. D. Angluin and C.H. Smith. Inductive Inference: Theory and Methods. ComputingSurveys, 15(3):237–269, 1983.
10. J.E. Cook and A.L. Wolf. Discovering Models of Software Processes from Event-Based Data. ACM Transactions on Software Engineering and Methodology,7(3):215–249, 1998.
11. J.E. Cook and A.L. Wolf. Software Process Validation: Quantitatively Measuringthe Correspondence of a Process to a Model. ACM Transactions on SoftwareEngineering and Methodology, 8(2):147–176, 1999.
12. A.K. Alves de Medeiros. Genetic Process Mining. PhD thesis, Eindhoven Univer-sity of Technology, Eindhoven, 2006.
19
13. A.K. Alves de Medeiros and C.W. Guenther. Process Mining: Using CPN Toolsto Create Test Logs for Mining Algorithms. In K. Jensen, editor, Proceedings ofthe Sixth Workshop and Tutorial on Practical Use of Coloured Petri Nets and theCPN Tools, pages 177–190, 2005.
14. B.F. van Dongen, J. Mendling, and W.M.P. van der Aalst. Structural Patterns forSoundness of Business Process Models. In EDOC ’06: Proceedings of the 10th IEEEInternational Enterprise Distributed Object Computing Conference (EDOC’06),pages 116–128, Washington, DC, USA, 2006. IEEE Computer Society.
15. E.M. Gold. Language Identfication in the Limit. Information and Control,10(5):447–474, 1967.
16. E.M. Gold. Complexity of Automaton Identification from Given Data. Informationand Control, 37(3):302–320, 1978.
17. G. Greco, A. Guzzo, L. Pontieri, and D. Sacca. Discovering expressive processmodels by clustering log traces. IEEE Transactions on Knowledge and Data En-gineering, 18(8):1010–1027, 2006.
18. J. Herbst. A Machine Learning Approach to Workflow Management. In Proceedings11th European Conference on Machine Learning, volume 1810 of Lecture Notes inComputer Science, pages 183–194. Springer-Verlag, Berlin, 2000.
19. P. Langley, editor. Grammar Induction, Special issue of Machine Learning, Volume2, Number 1. Kluwer Academic Publishers, Boston/Dordrecht, 1987.
20. T.M. Mitchell. Machine Learning. McGraw-Hill, New York, 1997.21. R. Parekh and V. Honavar. Automata Induction, Grammar Inference, and Lan-
guage Acquisition. In Dale, Moisl, and Somers, editors, Handbook of Natural Lan-guage Processing. New York: Marcel Dekker, 2000.
22. S.S. Pinter and M. Golani. Discovering Workflow Models from Activities Lifespans.Computers in Industry, 53(3):283–296, 2004.
23. L. Pitt. Inductive Inference, DFAs, and Computational Complexity. In K.P. Jan-tke, editor, Proceedings of International Workshop on Analogical and InductiveInference (AII), volume 397 of Lecture Notes in Computer Science, pages 18–44.Springer-Verlag, Berlin, 1889.
24. A. Rozinat and W.M.P. van der Aalst. Conformance Checking of Processes Basedon Monitoring Real Behavior. Accepted for publication in Information Systems:DOI 10.1016/j.is.2007.07.001.
25. A. Rozinat, I.S.M. de Jong, C.W. Gunther, and W.M.P. van der Aalst. ProcessMining of Test Processes: A Case Study. BETA Working Paper Series, WP 220,Eindhoven University of Technology, Eindhoven, 2007.
26. A. Rozinat, R.S. Mans, and W.M.P. van der Aalst. Mining CPN Models: Discover-ing Process Models With Data from Event Logs. In K. Jensen, editor, Proceedingsof the Seventh Workshop on the Practical Use of Coloured Petri Nets and CPNTools, pages 57–76. University of Aarhus, Denmark, 2006.
27. A.J.M.M. Weijters and W.M.P. van der Aalst. Rediscovering Workflow Modelsfrom Event-Based Data using Little Thumb. Integrated Computer-Aided Engi-neering, 10(2):151–162, 2003.
28. A.J.M.M. Weijters, W.M.P. van der Aalst, and A.K. Alves de Medeiros. ProcessMining with HeuristicsMiner Algorithm. BETA Working Paper Series, WP 166,Eindhoven University of Technology, Eindhoven, 2006.
29. L. Wen, J. Wang, and J.G. Sun. Detecting Implicit Dependencies Between Tasksfrom Event Logs. In Asia-Pacific Web Conference on Frontiers of WWW Researchand Development (APWeb 2006), Lecture Notes in Computer Science, pages 591–603. Springer, 2006.
20


