Embed Size (px)
Citation preview
2020-21 | AnnuAl RepoRt
Towards a Sustainable & Thriving Future in a Changing World
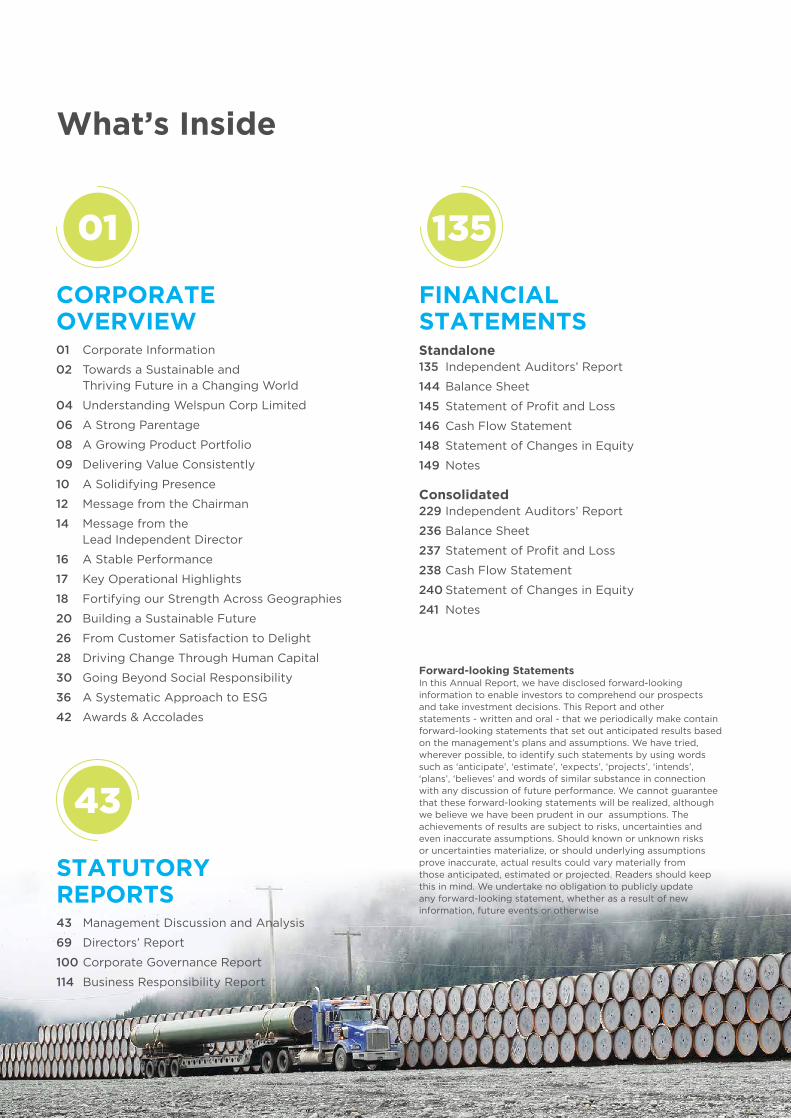
Forward-looking StatementsIn this Annual Report, we have disclosed forward-looking information to enable investors to comprehend our prospects and take investment decisions. This Report and other statements - written and oral - that we periodically make contain forward-looking statements that set out anticipated results based on the management’s plans and assumptions. We have tried, wherever possible, to identify such statements by using words such as ‘anticipate’, ‘estimate’, ‘expects’, ‘projects’, ‘intends’, ‘plans’, ‘believes’ and words of similar substance in connection with any discussion of future performance. We cannot guarantee that these forward-looking statements will be realized, although we believe we have been prudent in our assumptions. The achievements of results are subject to risks, uncertainties and even inaccurate assumptions. Should known or unknown risks or uncertainties materialize, or should underlying assumptions prove inaccurate, actual results could vary materially from those anticipated, estimated or projected. Readers should keep this in mind. We undertake no obligation to publicly update any forward-looking statement, whether as a result of new information, future events or otherwise
Corporate overvieW01 Corporate Information
02 Towards a Sustainable and Thriving Future in a Changing World
04 Understanding Welspun Corp Limited
06 A Strong Parentage
08 A Growing Product Portfolio
09 Delivering Value Consistently
10 A Solidifying Presence
12 Message from the Chairman
14 Message from the Lead Independent Director
16 A Stable Performance
17 Key Operational Highlights
18 Fortifying our Strength Across Geographies
20 Building a Sustainable Future
26 From Customer Satisfaction to Delight
28 Driving Change Through Human Capital
30 Going Beyond Social Responsibility
36 A Systematic Approach to ESG
42 Awards & Accolades
What’s inside
01
FinanCiaL StateMentSStandalone135 Independent Auditors’ Report
144 Balance Sheet
145 StatementofProfitandLoss
146 Cash Flow Statement
148 Statement of Changes in Equity
149 Notes
Consolidated229 Independent Auditors’ Report
236 Balance Sheet
237StatementofProfitandLoss
238 Cash Flow Statement
240 Statement of Changes in Equity
241 Notes
135
Statutory reportS43 Management Discussion and Analysis
69 Directors’ Report
100 Corporate Governance Report
114 Business Responsibility Report
43
Corporate Information
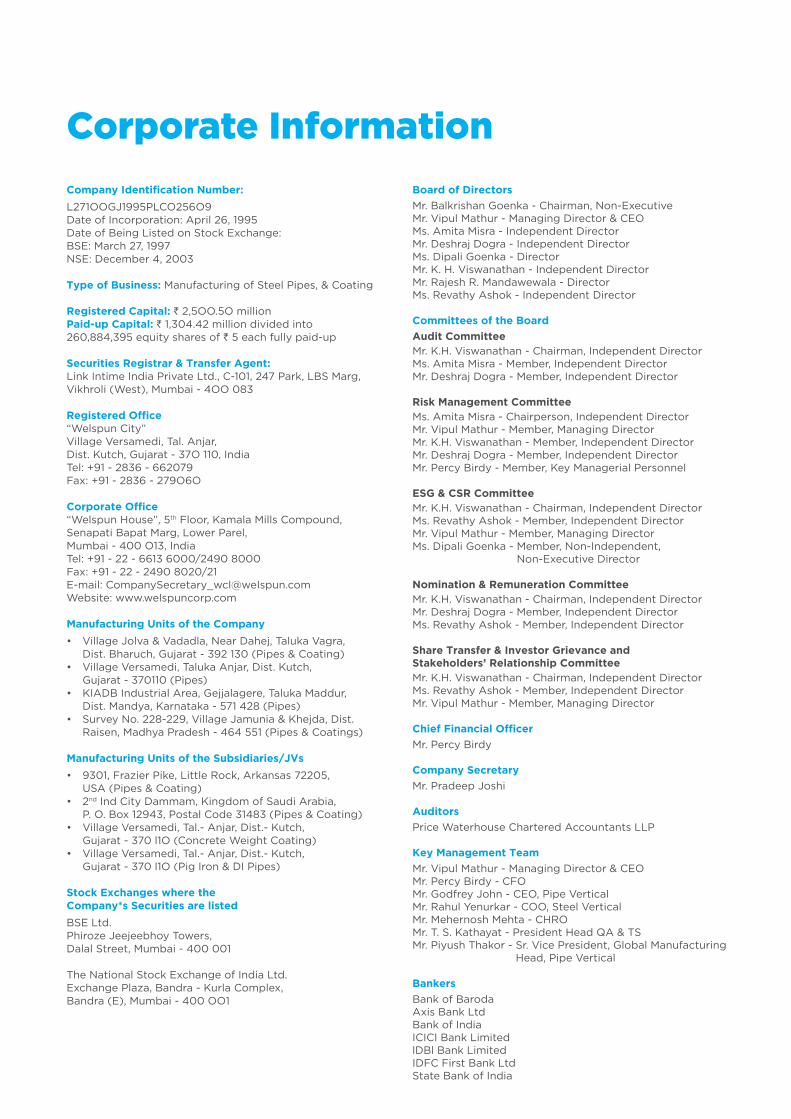
Company Identification Number:
L271OOGJ1995PLCO256O9Date of Incorporation: April 26, 1995 Date of Being Listed on Stock Exchange: BSE: March 27, 1997NSE: December 4, 2003
Type of Business: Manufacturing of Steel Pipes, & Coating
Registered Capital: ` 2,5OO.5O millionPaid-up Capital: ` 1,304.42 million divided into 260,884,395 equity shares of ` 5 each fully paid-up
Securities Registrar & Transfer Agent:Link Intime India Private Ltd., C-101, 247 Park, LBS Marg,Vikhroli (West), Mumbai - 4OO 083
Registered Office“Welspun City”Village Versamedi, Tal. Anjar,Dist. Kutch, Gujarat - 37O 110, IndiaTel: +91 - 2836 - 662079Fax: +91 - 2836 - 279O6O
Corporate Office “Welspun House”, 5th Floor, Kamala Mills Compound,Senapati Bapat Marg, Lower Parel,Mumbai - 400 O13, IndiaTel: +91 - 22 - 6613 6000/2490 8000Fax: +91 - 22 - 2490 8020/21E-mail: [email protected] Website: www.welspuncorp.com
Manufacturing units of the Company
• VillageJolva&Vadadla,NearDahej,TalukaVagra, Dist. Bharuch, Gujarat - 392 130 (Pipes & Coating)
• VillageVersamedi,TalukaAnjar,Dist.Kutch, Gujarat - 370110 (Pipes)
• KIADBIndustrialArea,Gejjalagere,TalukaMaddur, Dist. Mandya, Karnataka - 571 428 (Pipes)
• SurveyNo.228-229,VillageJamunia&Khejda,Dist.Raisen, Madhya Pradesh - 464 551 (Pipes & Coatings)
Manufacturing units of the Subsidiaries/Jvs
• 9301,FrazierPike,LittleRock,Arkansas72205, USA (Pipes & Coating)
• 2nd Ind City Dammam, Kingdom of Saudi Arabia, P. O. Box 12943, Postal Code 31483 (Pipes & Coating)
• VillageVersamedi,Tal.-Anjar,Dist.-Kutch, Gujarat - 370 l1O (Concrete Weight Coating)
• VillageVersamedi,Tal.-Anjar,Dist.-Kutch, Gujarat - 370 l1O (Pig Iron & DI Pipes)
Stock exchanges where the Company*s Securities are listed
BSE Ltd.Phiroze Jeejeebhoy Towers, Dalal Street, Mumbai - 400 001
The National Stock Exchange of India Ltd.Exchange Plaza, Bandra - Kurla Complex,Bandra (E), Mumbai - 400 OO1
Board of Directors
Mr. Balkrishan Goenka - Chairman, Non-ExecutiveMr. Vipul Mathur - Managing Director & CEO Ms. Amita Misra - Independent DirectorMr. Deshraj Dogra - Independent DirectorMs. Dipali Goenka - Director Mr. K. H. Viswanathan - Independent Director Mr. Rajesh R. Mandawewala - DirectorMs. Revathy Ashok - Independent Director
Committees of the Board
audit Committee Mr. K.H. Viswanathan - Chairman, Independent DirectorMs. Amita Misra - Member, Independent DirectorMr. Deshraj Dogra - Member, Independent Director
risk Management Committee Ms. Amita Misra - Chairperson, Independent DirectorMr. Vipul Mathur - Member, Managing Director Mr. K.H. Viswanathan - Member, Independent DirectorMr. Deshraj Dogra - Member, Independent DirectorMr. Percy Birdy - Member, Key Managerial Personnel
eSG & CSr Committee Mr. K.H. Viswanathan - Chairman, Independent DirectorMs. Revathy Ashok - Member, Independent DirectorMr. Vipul Mathur - Member, Managing Director Ms. Dipali Goenka - Member, Non-Independent,
Non-Executive Director
nomination & remuneration Committee Mr. K.H. Viswanathan - Chairman, Independent DirectorMr. Deshraj Dogra - Member, Independent DirectorMs. Revathy Ashok - Member, Independent Director
Share transfer & investor Grievance and Stakeholders’ relationship CommitteeMr. K.H. Viswanathan - Chairman, Independent DirectorMs. Revathy Ashok - Member, Independent DirectorMr. Vipul Mathur - Member, Managing Director
Chief Financial Officer
Mr. Percy Birdy
Company Secretary
Mr. Pradeep Joshi
auditors
Price Waterhouse Chartered Accountants LLP
Key Management team
Mr. Vipul Mathur - Managing Director & CEOMr. Percy Birdy - CFOMr. Godfrey John - CEO, Pipe VerticalMr. Rahul Yenurkar - COO, Steel VerticalMr. Mehernosh Mehta - CHROMr. T. S. Kathayat - President Head QA & TSMr. Piyush Thakor - Sr. Vice President, Global Manufacturing
Head, Pipe Vertical
Bankers
Bank of Baroda Axis Bank Ltd Bank of IndiaICICI Bank LimitedlDBl Bank LimitedIDFC First Bank Ltd State Bank of India
Annual Report 2020-21 3Annual Report 2020-212
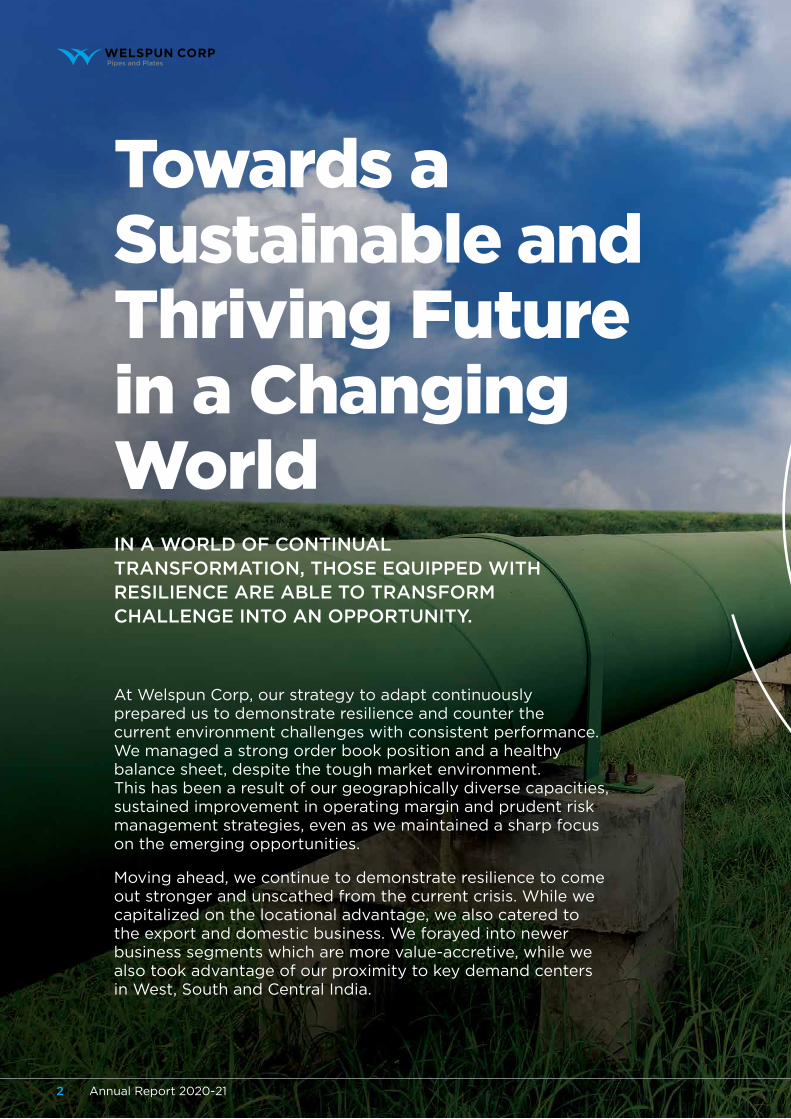
Towards a Sustainable and Thriving Futurein a ChangingWorldIn a world of contInual transformatIon, those equIpped wIth resIlIence are able to transform challenge Into an opportunIty.
At Welspun Corp, our strategy to adapt continuously prepared us to demonstrate resilience and counter the current environment challenges with consistent performance. We managed a strong order book position and a healthy balance sheet, despite the tough market environment. This has been a result of our geographically diverse capacities, sustained improvement in operating margin and prudent risk management strategies, even as we maintained a sharp focus on the emerging opportunities.
Moving ahead, we continue to demonstrate resilience to come out stronger and unscathed from the current crisis. While we capitalized on the locational advantage, we also catered to the export and domestic business. We forayed into newer business segments which are more value-accretive, while we also took advantage of our proximity to key demand centers in West, South and Central India.
Annual Report 2020-212
Corporate Overview Statutory Reports Financial Statements
Annual Report 2020-21 3Annual Report 2020-212
leadIng wIth InnovatIon, we contInue to buIld a strong organIzatIon, progressIng as we address the needs of the present – towards a sustaInable and a thrIvIng future.
We built new capacities and further strengthened the organization with a strong focus to embrace automation and digitalization and are leveraging our deep domain knowledge and understanding of global business opportunities. We continue to fortify our portfolio to serve the ever-evolving needs of our customers and further expanding our ambit. We are focusing on improvingourinternalefficienciesandproductivitytopositionourselves for a sustainable future.
corporate overview Statutory Reports Financial Statements
Annual Report 2020-21 3
Annual Report 2020-21 5Annual Report 2020-214
Understanding Welspun Corp Limited
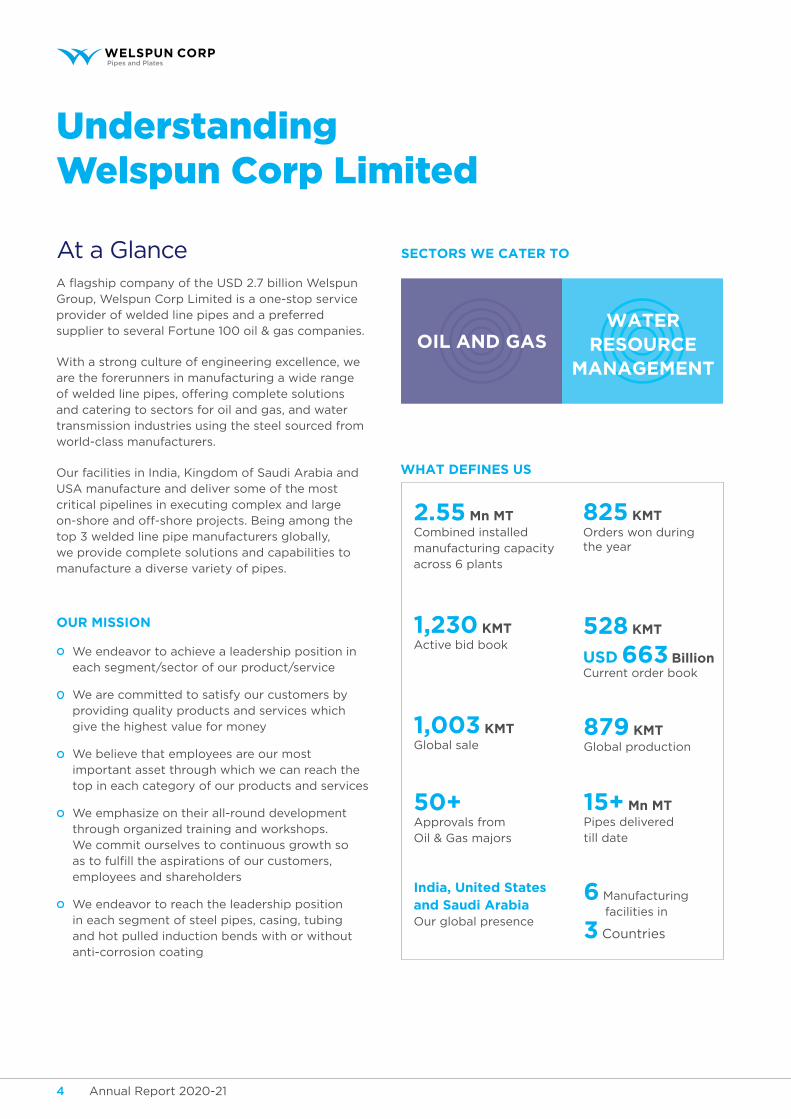
At a GlanceAflagshipcompanyoftheUSD2.7billionWelspunGroup, Welspun Corp Limited is a one-stop service provider of welded line pipes and a preferred supplier to several Fortune 100 oil & gas companies.
With a strong culture of engineering excellence, we are the forerunners in manufacturing a wide range of welded line pipes, offering complete solutions and catering to sectors for oil and gas, and water transmission industries using the steel sourced from world-class manufacturers.
Our facilities in India, Kingdom of Saudi Arabia and USA manufacture and deliver some of the most critical pipelines in executing complex and large on-shore and off-shore projects. Being among the top 3 welded line pipe manufacturers globally, we provide complete solutions and capabilities to manufacture a diverse variety of pipes.
We endeavor to achieve a leadership position in each segment/sector of our product/service
We are committed to satisfy our customers by providing quality products and services which give the highest value for money
We believe that employees are our most important asset through which we can reach the top in each category of our products and services
We emphasize on their all-round development through organized training and workshops. We commit ourselves to continuous growth so astofulfilltheaspirationsofourcustomers,employees and shareholders
We endeavor to reach the leadership position in each segment of steel pipes, casing, tubing and hot pulled induction bends with or without anti-corrosion coating
our MiSSion
SeCtorS We Cater to
What DeFineS uS
Water reSourCe
ManaGeMent
879 KMtGlobal production
1,003 KMtGlobal sale
15+ Mn MtPipes delivered till date
50+Approvals from Oil & Gas majors
825 KMt Orders won during the year
2.55 Mn MtCombined installed manufacturing capacity across 6 plants
1,230 KMtActive bid book
528 KMt
uSD 663 BillionCurrent order book
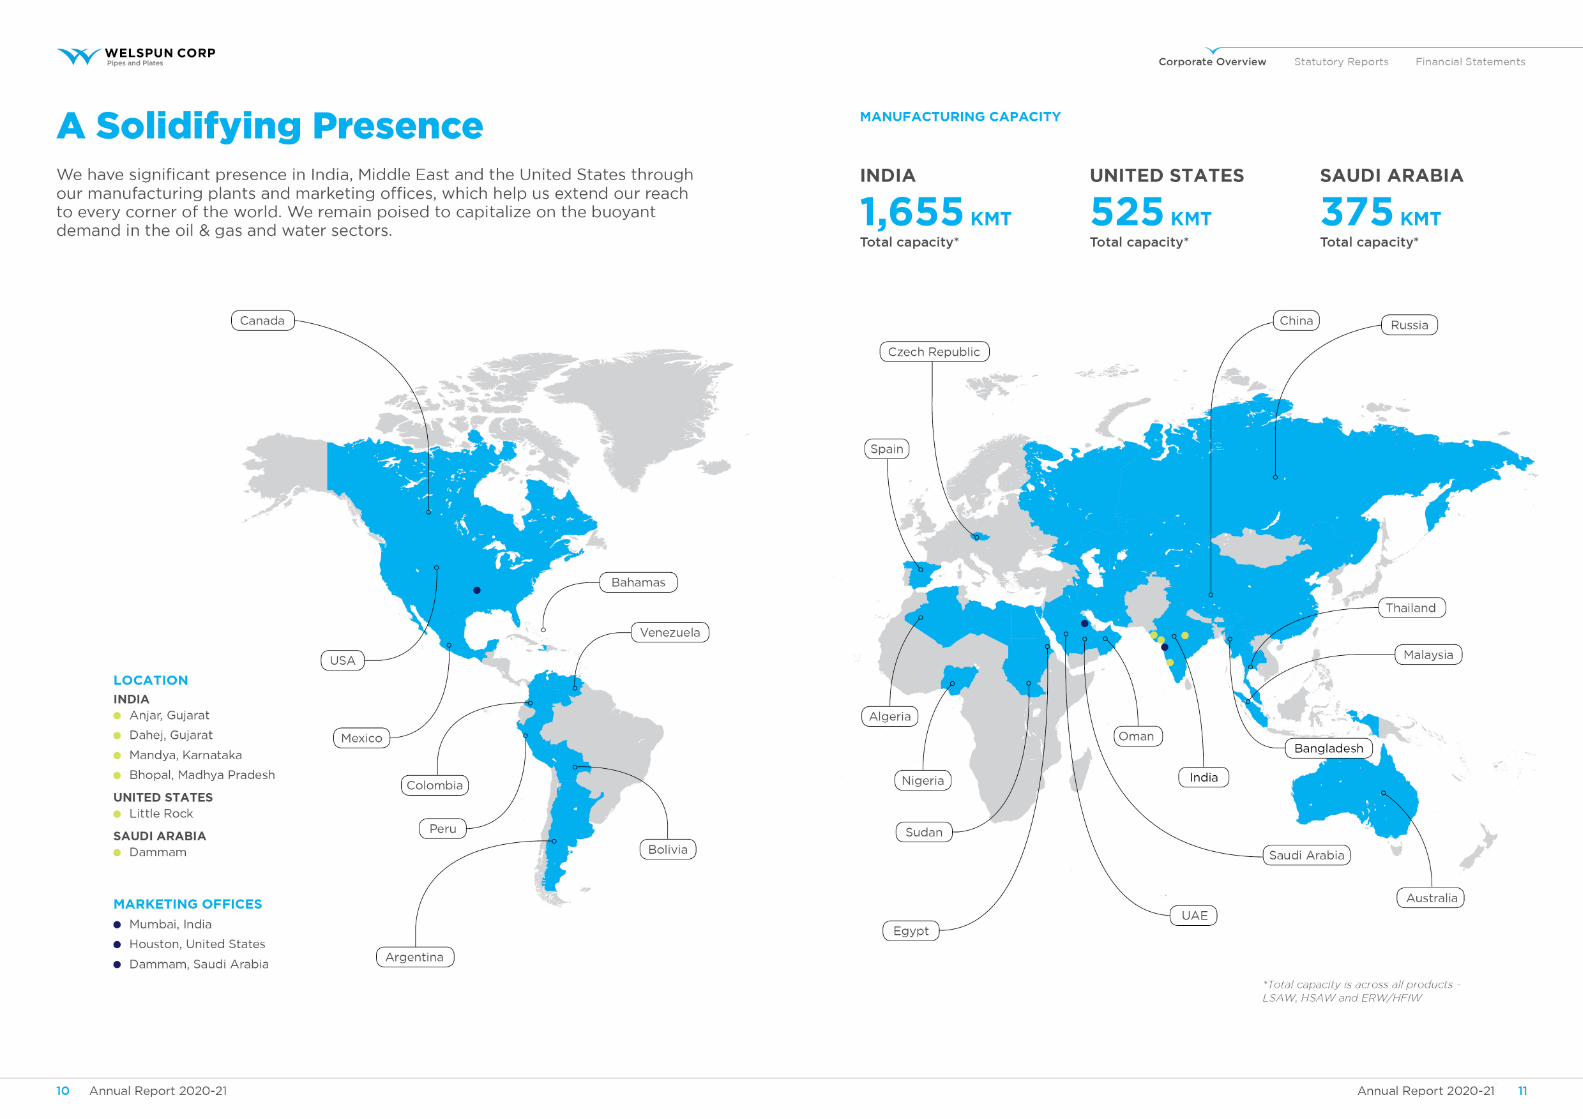
india, united States and Saudi arabiaOur global presence
6 Manufacturing facilities in
3 Countries
oiL anD GaS
Corporate Overview Statutory Reports Financial Statements
Annual Report 2020-21 5Annual Report 2020-214
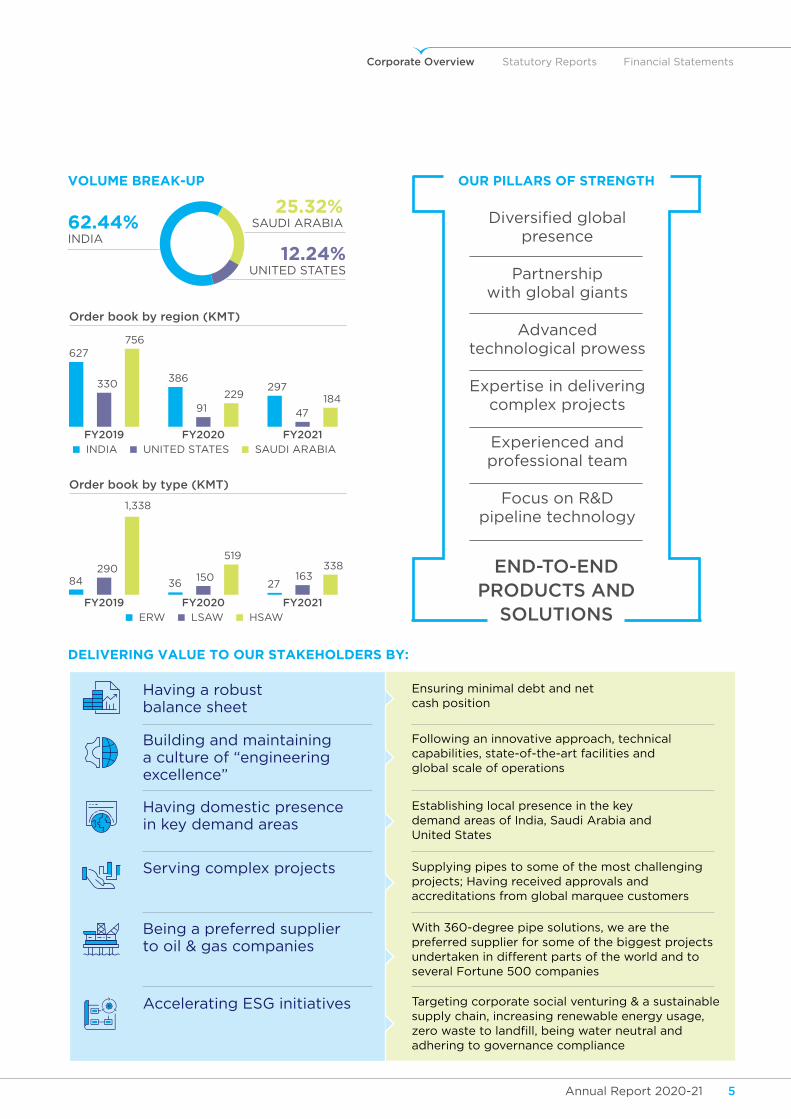
voLuMe BreaK-up
DelIveRINg vAlue TO OuR STAkehOlDeRS By:
our piLLarS oF StrenGth
Diversifiedglobal presence
Partnership with global giants
Advanced technological prowess
Expertise in delivering complex projects
Experienced and professional team
Focus on R&D pipeline technology
end-to-end products and
solutIons
order book by region (Kmt)
627
386297330
91 47
756
229 184
INDIA UNITED STATES SAUDI ARABIA
fy2019 fy2020 fy2021
order book by type (Kmt)
84 36 27
290150 163
1,338
519338
ERW LSAW HSAW
fy2019 fy2020 fy2021
12.24%UNITED STATES
62.44%INDIA
25.32%SAUDI ARABIA
Having a robust balance sheet
Ensuring minimal debt and net cash position
Building and maintaining a culture of “engineering excellence”
Following an innovative approach, technical capabilities, state-of-the-art facilities and global scale of operations
Having domestic presence in key demand areas
Establishing local presence in the key demand areas of India, Saudi Arabia and United States
Being a preferred supplier to oil & gas companies
With 360-degree pipe solutions, we are the preferred supplier for some of the biggest projects undertaken in different parts of the world and to several Fortune 500 companies
Serving complex projects Supplying pipes to some of the most challenging projects; Having received approvals and accreditations from global marquee customers
Targeting corporate social venturing & a sustainable supply chain, increasing renewable energy usage, zero waste to landfill, being water neutral and adhering to governance compliance
Accelerating ESG initiatives
Annual Report 2020-21 7Annual Report 2020-216
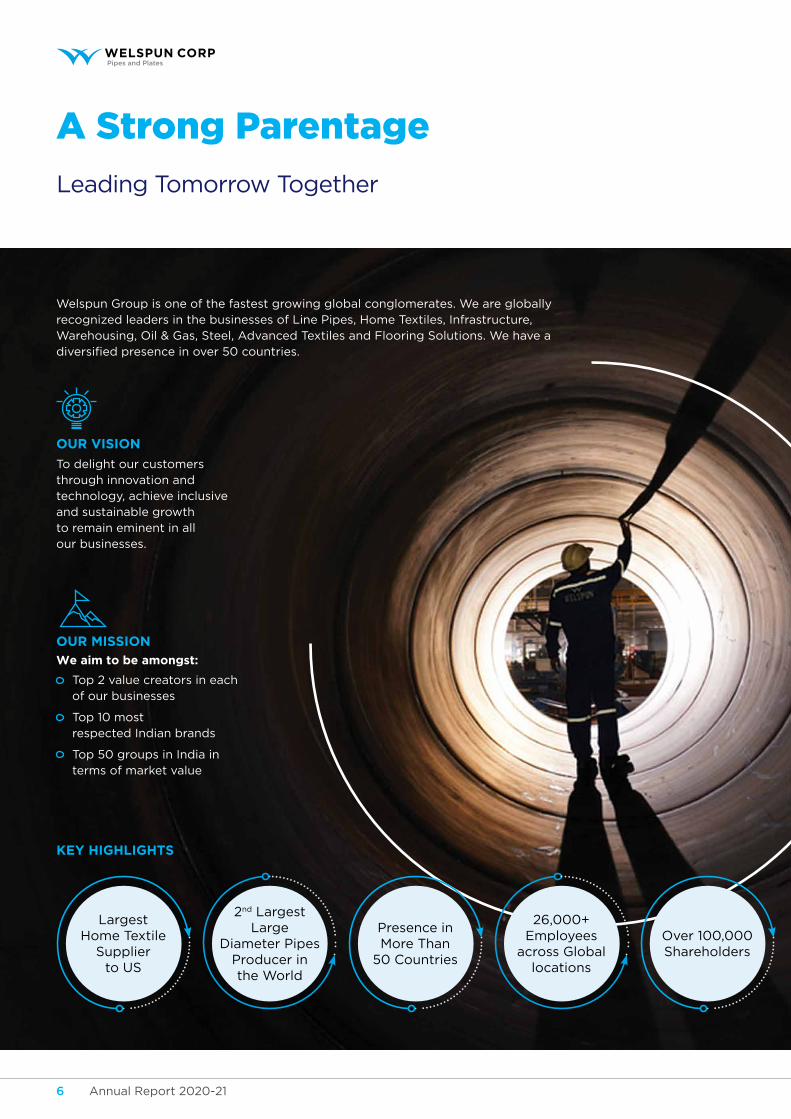
A Strong Parentage
Leading Tomorrow Together
Welspun Group is one of the fastest growing global conglomerates. We are globally recognized leaders in the businesses of Line Pipes, Home Textiles, Infrastructure, Warehousing, Oil & Gas, Steel, Advanced Textiles and Flooring Solutions. We have a diversifiedpresenceinover50countries.
our viSion
To delight our customers through innovation and technology, achieve inclusive and sustainable growth to remain eminent in all our businesses.
Key hiGhLiGhtS
our MiSSion
We aim to be amongst:
Top 2 value creators in each of our businesses
Top 10 most respected Indian brands
Top 50 groups in India in terms of market value
Largest Home Textile
Supplier to US
2nd Largest Large
Diameter Pipes Producer in the World
Presence in More Than
50 Countries
26,000+ Employees
across Global locations
Over 100,000 Shareholders
Corporate Overview Statutory Reports Financial Statements
Annual Report 2020-21 7Annual Report 2020-216
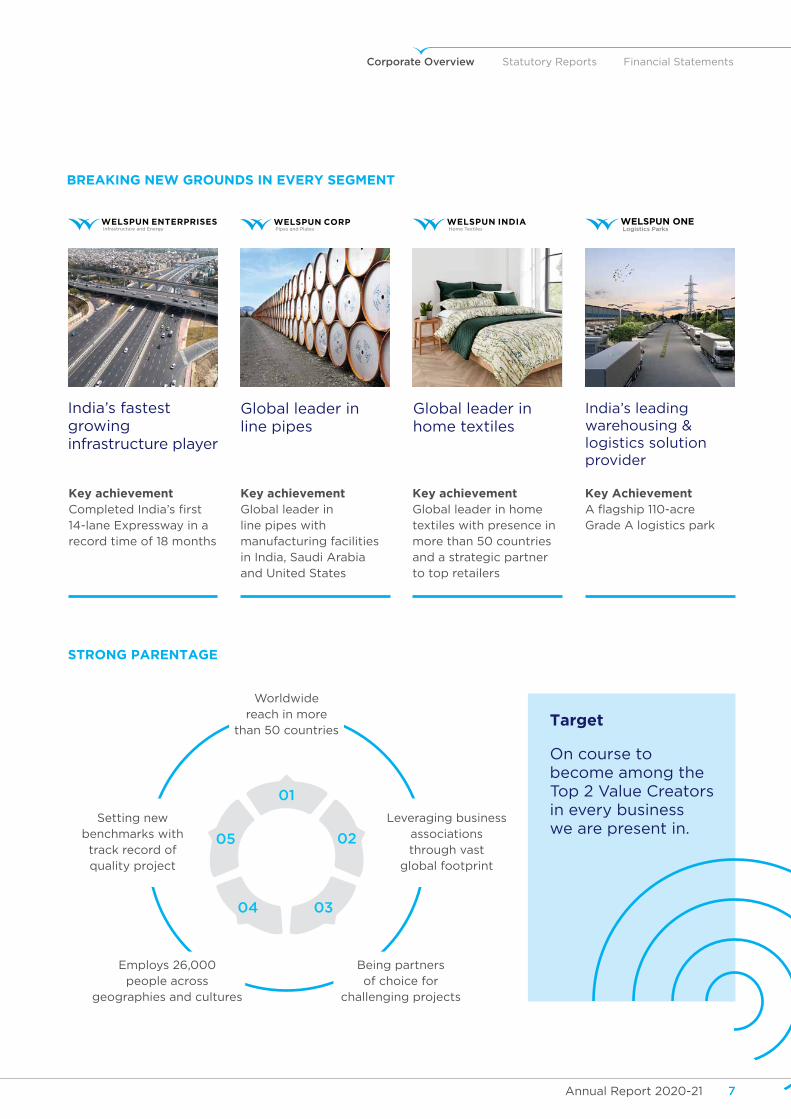
BreaKinG neW GrounDS in every SeGMent
India’s fastest growing infrastructure player
Global leader in line pipes
Global leader in home textiles
India’s leading warehousing & logistics solution provider
Key achievementCompletedIndia’sfirst 14-lane Expressway in a record time of 18 months
Key achievement Global leader in line pipes with manufacturing facilities in India, Saudi Arabia and United States
Key achievement Global leader in home textiles with presence in more than 50 countries and a strategic partner to top retailers
Key achievementAflagship110-acre Grade A logistics park
target
On course to become among the Top 2 Value Creators in every business we are present in.
Worldwide reach in more
than 50 countries
Setting new benchmarks with track record of quality project
Leveraging business associations through vast
global footprint
Employs 26,000 people across
geographies and cultures
Being partners of choice for
challenging projects
StronG parentaGe
01
0205
0304
Annual Report 2020-21 9Annual Report 2020-218
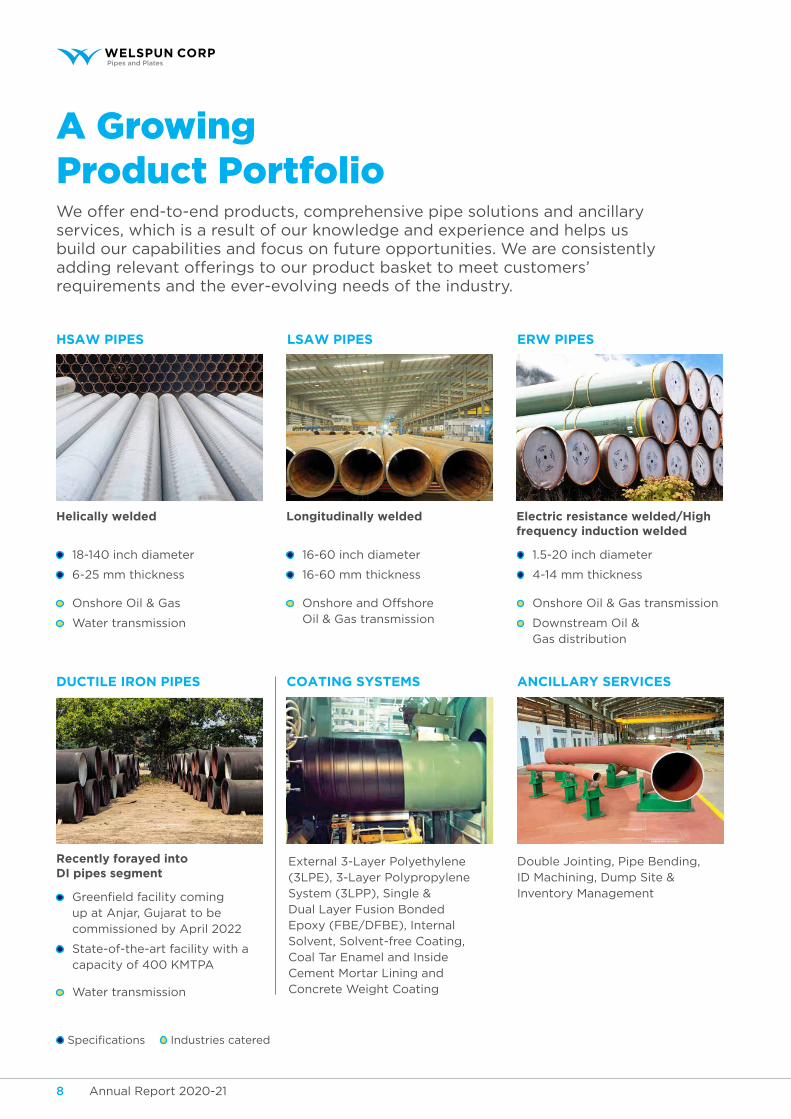
A Growing Product PortfolioWe offer end-to-end products, comprehensive pipe solutions and ancillary services, which is a result of our knowledge and experience and helps us build our capabilities and focus on future opportunities. We are consistently adding relevant offerings to our product basket to meet customers’ requirements and the ever-evolving needs of the industry.
LSaW pipeS
Longitudinally welded
16-60 inch diameter
16-60 mm thickness
Onshore and Offshore Oil & Gas transmission
hSaW pipeS
helically welded
18-140 inch diameter
6-25 mm thickness
Onshore Oil & Gas
Water transmission
erW pipeS
electric resistance welded/high frequency induction welded
1.5-20 inch diameter
4-14 mm thickness
Onshore Oil & Gas transmission
Downstream Oil & Gas distribution
Specifications Industries catered
DuCtiLe iron pipeS
recently forayed into Di pipes segment
Greenfieldfacilitycoming up at Anjar, Gujarat to be commissioned by April 2022
State-of-the-art facility with a capacity of 400 KMTPA
Water transmission
CoatinG SySteMS anCiLLary ServiCeS
External 3-Layer Polyethylene (3LPE), 3-Layer Polypropylene System (3LPP), Single & Dual Layer Fusion Bonded Epoxy (FBE/DFBE), Internal Solvent, Solvent-free Coating, Coal Tar Enamel and Inside Cement Mortar Lining and Concrete Weight Coating
Double Jointing, Pipe Bending, ID Machining, Dump Site & Inventory Management
Corporate Overview Statutory Reports Financial Statements
Annual Report 2020-21 9Annual Report 2020-218
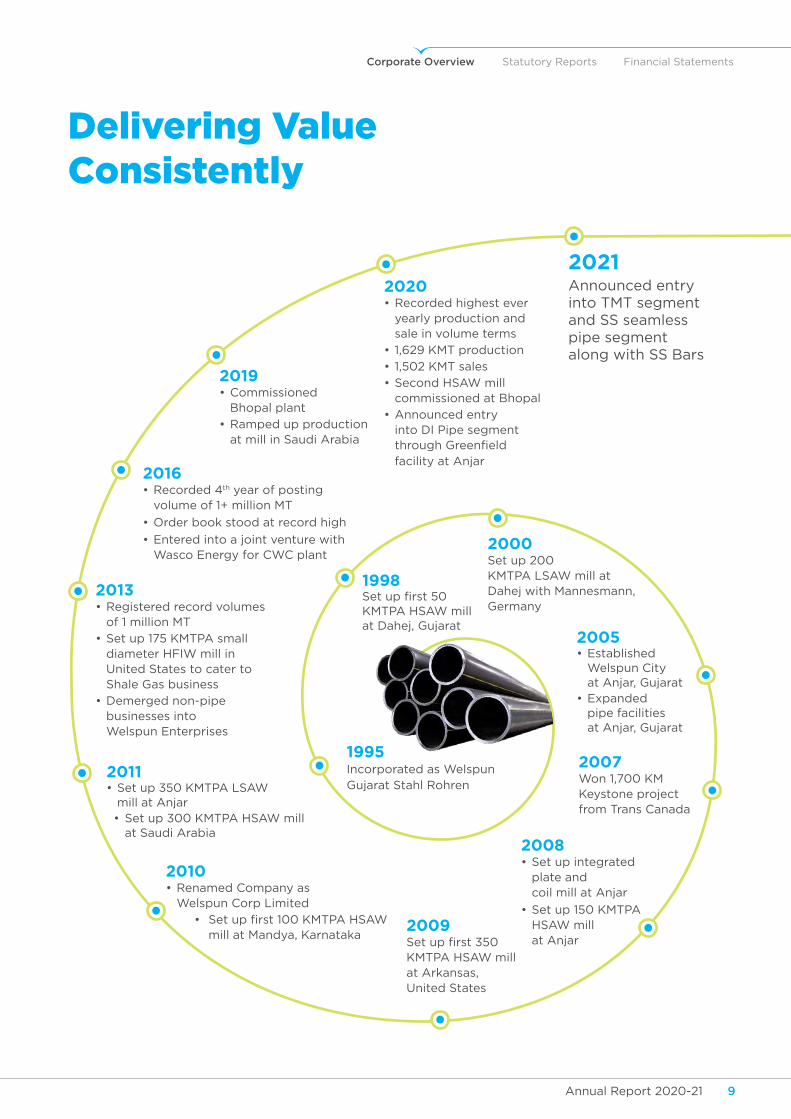
Delivering Value Consistently
2021Announced entry into TMT segment and SS seamless pipe segment along with SS Bars
2020• Recordedhighestever
yearly production and sale in volume terms
• 1,629KMTproduction
• 1,502KMTsales
• SecondHSAWmillcommissioned at Bhopal
• Announcedentryinto DI Pipe segment throughGreenfieldfacility at Anjar
2019• Commissioned
Bhopal plant
• Rampedupproduction at mill in Saudi Arabia
2016• Recorded4th year of posting
volume of 1+ million MT
•Orderbookstoodatrecordhigh
• EnteredintoajointventurewithWasco Energy for CWC plant
2013• Registeredrecordvolumes
of 1 million MT
• Setup175KMTPAsmalldiameter HFIW mill in United States to cater to Shale Gas business
• Demergednon-pipebusinesses into Welspun Enterprises
2011• Setup350KMTPALSAW
mill at Anjar• Setup300KMTPAHSAWmill
at Saudi Arabia
2010• RenamedCompanyas
Welspun Corp Limited
• Setupfirst100KMTPAHSAWmill at Mandya, Karnataka
2008• Setupintegrated
plate and coil mill at Anjar
• Setup150KMTPA HSAW mill at Anjar
2009Setupfirst350KMTPA HSAW mill at Arkansas, United States
2007Won 1,700 KM Keystone project from Trans Canada
2000Set up 200 KMTPA LSAW mill at Dahej with Mannesmann, Germany
1998Setupfirst50KMTPA HSAW mill at Dahej, Gujarat
1995Incorporated as WelspunGujarat Stahl Rohren
2005• Established
Welspun City at Anjar, Gujarat
• Expandedpipe facilities at Anjar, Gujarat
Annual Report 2020-21 13Annual Report 2020-2112
Messagefrom the Chairman
Dear Shareholders,I am writing to you at a time when the world, as we know it, has been changing. In the beginning of thefinancialyear,reducedeconomicactivityandlockdowns had an impact on the demand and supply in the energy markets. This was followed by a strong recovery with improvement in business conditions, strengthening demand and overall better market conditions. The pace of business activity resumption again took a knock due to the second wave of COVID-19 seen across the world at different points of time. However, stimulus programs and the vaccination drives across countries is enabling a recovery. India should also witness a recovery as increasing number of people get inoculated with the vaccine.
At Welspun Corp, we demonstrated resilience and rose to the challenges. We moved swiftly to respond to the situation and took several steps to secure the interests of all our stakeholders. Despite the prevailing uncertainty, we had a strong order book movement and resilient performance. We assessed our inherent strengths, targeted opportunities for change,identifiedsmarterstrategiesandbuiltstrongpartnerships. We are continually converting our challenges into opportunities through our robust balance sheet, superior governance framework and maximum asset utilization, and in the process, capturing a high share of the overall opportunities.
Having built our business on sound fundamentals, it gives us enough room to tackle the unprecedented situation.Ourstrongfinancialpositionandexecution capability has enabled us, to explore and fund new business opportunities like ductile iron pipestobringgrowthandconsistencyinfinancialearnings. We continue to strengthen our business through automation, digitization and developing talent.Weareconfidentofbeingabletopursueour focus on the long term, while we address the near-term challenges.
CoviD-19 anD our reSponSe
We have adopted several measures across our organization to ensure that our commitment to our stakeholders is not compromised. A robust IT infrastructure has been put in place for remote working to ensure business functions seamlessly from any location. A Special task force team has been
formed across locations to support affected employees
and their family members. The highest standards of
hygiene and safety are being practiced by our staff
across all our locations. Additional measures have been
taken to ensure the well-being and create awareness
amongst our employees through Employee Connect
Drives. Various activities like Meditation with Family,
Wellness tips, COVID Myth Busters by eminent Doctors,
Counselors, Yoga practitioners, Nutritionists have
been organized. We have extended advance leaves
for COVID-affected employees who can avail them for
their hospitalization or home quarantine period.
Employees have also been given advances to meet
financialurgencies.ApartfromtheGroupTerm
Life Insurance plan, a formal policy has also been
announced to support employees who have lost their
lives during pandemic. This includes 50% monthly
salary for 2 years as living allowance, medical insurance
for family (Spouse and 2 children) of ` 5 Lakhs for
10 years, Education fees for 2 children till graduation
(Scholarship scheme). Additionally, we will consider
the spouse or children for suitable job roles based on
Company’spolicyasperrequisitequalificationandskill.
Whileanykindoffinancialsupportcannotcompensate
for the magnitude of the loss of life, we will always
remainwiththefamiliesduringthesedifficulttimes.
Corporate Overview Statutory Reports Financial Statements
Annual Report 2020-21 13Annual Report 2020-2112
FinanCiaL perForManCe
Duringtheyear,ourfinancialperformanceacrossthe three geographies were satisfactory despite the challenging environment. Total income from operations stood at ` 64,397 million, consolidated EBITDA was ` 10,099 million and PAT after Minorities, Associates & JVs (Continuing Operations) was ` 6,299 million. We ended the year with a net cash position of ` 6,204 million.
Oursolidfinancialpositionhasbeensupportedbya healthy product mix and the cost optimization measures taken by the management. Several order wins in the domestic and overseas markets helped in reasonable capacity utilization and give clear businesscontinuity.Operationalexcellence,financialdiscipline and a sharp focus on new opportunities resulted in a steady order book position and a healthy balance sheet. Our current order book stands at 528 KMT valued at ` 48 billion, while our active bid book is at 1,230 KMT.
BuSineSS upDateS
We spent the year strengthening our competitive advantages. Our Bhopal project, which was under construction, was duly completed. The state-of-the-art facility is spread across 150 acres in the Raisen district. This project will cater to the growing demand for Oil & Gas and Water infrastructure in Central and Eastern India. Moreover, attractive industry prospects and synergies with our existing business has given us the confidencetoforayintotheductileironpipesegmentbysettingupaGreenfieldfacilityatAnjar.Theplantisexpected to be commissioned by April 2022.
The Board has approved the listing of Saudi joint venture company, Welspun Middle East Pipes, at the local stock exchange. This involves divesting a total 30% stake along with our JV partners. Currently, we hold 50.01% stake in the JV through our overseas subsidiary. The additional cash from the stake sale will furtherstrengthenourfinancialposition.
I am also pleased to share that we consummated the Plate & Coil Mill Division (PCMD) Divestment during the year. PCMD was transferred to JSW Steel Limited as on 31st March 2021 for the purchase consideration of `848.5crore.Thishasfurtherfortifiedourstrongnet cash position.
The Company has accelerated its ESG journey. We have begun by setting a clear ambition with
bold targets. We are aiming for increasing use of
renewableenergy,zerowastetolandfillandbeing
water neutral. There are also targets for corporate
social venturing and a sustainable supply chain.
WehaveidentifiedESGasastrategicpriorityandare
undertaking several management interventions with
sustainability at its core.
outLooK
Therolloutofvaccinesandfiscalstimulusprograms
will result in an improved scenario for Oil and Gas
demand globally. In India, there is a big thrust on
natural gas as part of the Government’s plan of
raising its share in the country’s energy basket. In the
domestic water segment, irrigation projects will drive
demand, though we expect a delay in pickup as states
continue to battle with COVID-19.
As far as export market is concerned, we have been
receiving several enquiries for upcoming projects
across the world. We are also optimistic of the
prospects in Saudi Arabia at the current level of
oil prices. In the US, there is caution after major
pipeline projects have been stalled by environmental
opposition. While we make the most of a challenging
present, we are ready for a focused and progressive
journey ahead. Overall growth prospects in India
and Saudi Arabia are attractive, while the US market
is also expected to recover in the medium term.
We remain perfectly poised for a thriving future
setting new benchmarks of excellence.
vote oF thanKS
In closing, I would like to take this opportunity
to thank our talented team of employees, whose
unwavering resolve and commitment has enabled
us to conquer many a challenge and achieve
new benchmarks.
Let me also take this opportunity to thank our
Board of Directors and all Stakeholders for the
encouragement and unstinted support and to drive
the Company to greater heights.
Wish you all good health.
Best regards,
Balkrishan GoenkaChairman

Annual Report 2020-21 15Annual Report 2020-2114
Message from the Lead Independent Director
dear shareholders,
As your Lead Independent Director, I take this opportunity to share insights into the functioning of the Board & its Committees and the key board priorities during the year.
The last year has been a challenging year due to the pandemic and has necessitated the need for increased Board oversight. Your Board met 11 times during the year (up from 5 times last year).
Key BoarD prioritieS DurinG the year
Strategic guidance and support to the management to navigate through the uncertain times
Oversight on risk management and strengthening resilience
Ensuring safety of our people (Safety First)
Sustainability and long-term value creation
Accelerating digitization and analytics initiatives
Specificmajorbusinessandorganizational initiatives, capital allocation priorities andbusinessdiversification opportunities
Corporate Overview Statutory Reports Financial Statements
Annual Report 2020-21 15Annual Report 2020-2114
Corporate GovernanCe
Your Board is committed to maintain the highest standards of corporate governance, transparency and fairness in dealing with all stakeholders. The Board continues to take various initiatives from time to time to sustain and further advance the governance practices. During the year, your Company’s Board re-assessed the corporate governance structures and practices. Based on the deliberations at the Board andabenchmarkingexercisebyaleadingbusinessconsultingfirm,keyenhancementsundertakenduringthe year are as follows:
Strengthening governance structure
Designating a Lead Independent Director
Fully Independent Audit Committee & Nomination & Remuneration Committee (100% Independent Directors)
Reconstituting Board Committees for balancing of skills, diversity, experience and tenure to provide effective oversight
Board Succession Planning & Diversity framework
Review and revision of Ethics Framework to incorporate leading practices (whistle blower policy & mechanism, anti-bribery and anti-corruption, fraud prevention)
Review and revision of related party transaction policy to further enhance it in line with the evolving leading practices. Further, a holistic pricing framework has been formalized to serve as a guideline for all related party transactions
Board effectiveness
Dedicated meeting on strategy
Formalizing Board Charter & Committee Charters
Refreshing key policies
unlocking eSG’s strategic value
making esg a strategic priority
ESG Committee established at the Board level
Developing ESG Committee Charter
ESG Materiality and Maturity assessment
ESG strategy, goals and roadmap
ESG Rating preparedness
Benchmarking ESG Governance indicators
Linkage of ESG Goals with Executive remuneration
Formalizing ESG Organization structure, roles & responsibilities
Key initiatives planned
ESG Governance – Operationalizing ESG into the overall governance structure
Carbon neutrality initiatives
Sustainable supply chain
ESG Data Governance
ESG Rating submission
Whistle blower platform to facilitate anonymous reporting
As a Lead Independent Director of your Company, I want to emphasize about the Board’s collective commitment towards highest standards of governance, transparency and fairness in dealing with all stakeholders.
Should you have any suggestions, please share your views during the upcoming Annual General Meeting or write to the Company Secretary. We value your feedback.
Thank you for your continued faith in the Board of your Company. We would continue to work to represent the interest of all stakeholders.
Sincerely,
K.h. viswanathanLead Independent Director
Annual Report 2020-21 17Annual Report 2020-2116
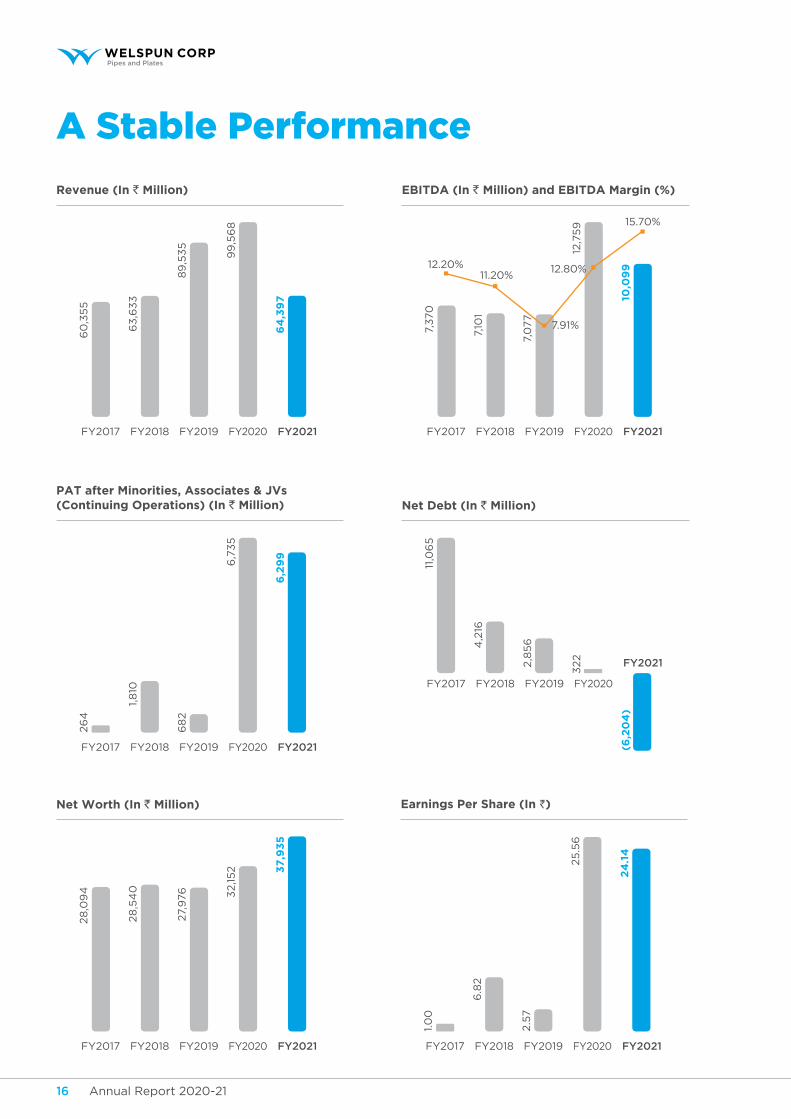
A Stable Performance
net Worth (in ` Million)
FY2017 FY2018 FY2019 FY2020 fy2021
28
,09
4
28
,54
0
27,
976 32,15
2 37
,93
5
earnings per Share (in `)
FY2017 FY2018 FY2019 FY2020 fy2021
1.0
0
6.8
2
2.5
7
25
.56
24
.14
pat after Minorities, associates & Jvs (Continuing operations) (in ` Million)
FY2017 FY2018 FY2019 FY2020 fy2021
26
4
1,8
10
68
2
6,7
35
6,2
99
net Debt (in ` Million)
FY2017 FY2018 FY2019 FY2020
11,0
65
4,2
16
2,8
56
322
(6,2
04
)
fy2021
revenue (in ` Million)
FY2017 FY2018 FY2019 FY2020 fy2021
60
,35
5
63
,63
3
89
,53
5
99
,56
8
64
,39
7
eBitDa (in ` Million) and eBitDa Margin (%)
FY2017 FY2018 FY2019 FY2020 fy20217,
370
12.20%11.20%
12.80%
15.70%
7,10
1
7,0
77
12,7
59
10,0
99
7.91%
Corporate Overview Statutory Reports Financial Statements
Annual Report 2020-21 17Annual Report 2020-2116
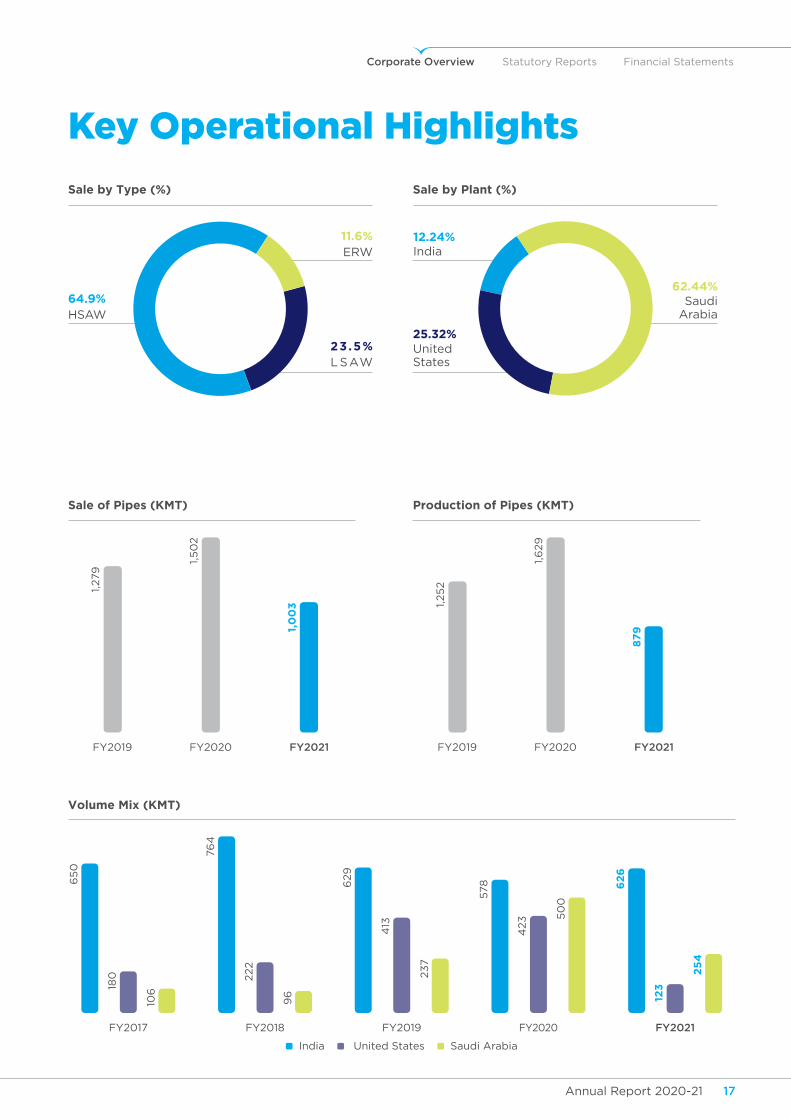
Key Operational Highlights
Sale by type (%)
64.9%HSAW
11.6%ERW
23.5%L SAW
Sale by plant (%)
12.24% India
62.44% Saudi
Arabia
25.32% United States
Sale of pipes (KMt)
FY2019 FY2020 fy2021
1,279
1,5
02
1,0
03
production of pipes (KMt)
FY2019 FY2020 fy2021
1,25
2
1,6
29
87
9
volume Mix (KMt)
FY2017 FY2018 FY2019 FY2020 fy2021
India United States Saudi Arabia
65
0
76
4
629
578 62
6
180 222
413
423
123
106
96
237
50
0
25
4

Annual Report 2020-21 19Annual Report 2020-2118
Fortifying our Strength Across Geographies
At Welspun Corp, we exhibited consistent resilience in all the three geographies where we have a presence. Our key performance indicators of sales volume, realization per metric ton and EBITDApermetrictonreflectsouroperationalexcellenceandefficiency.
We have grown from strength to strength by leveraging the changing market dynamics and increasing opportunities, which have translated into year-on-year growth. On account of energy prices, expansion of national grid in India and increased water projects planned in India and Saudi Arabia, we assume excellent order visibility during the next few years. While we continue to keep a watch on the emerging opportunities, we are formulating strategies to face the market challenges.
Corporate Overview Statutory Reports Financial Statements
Annual Report 2020-21 19Annual Report 2020-2118
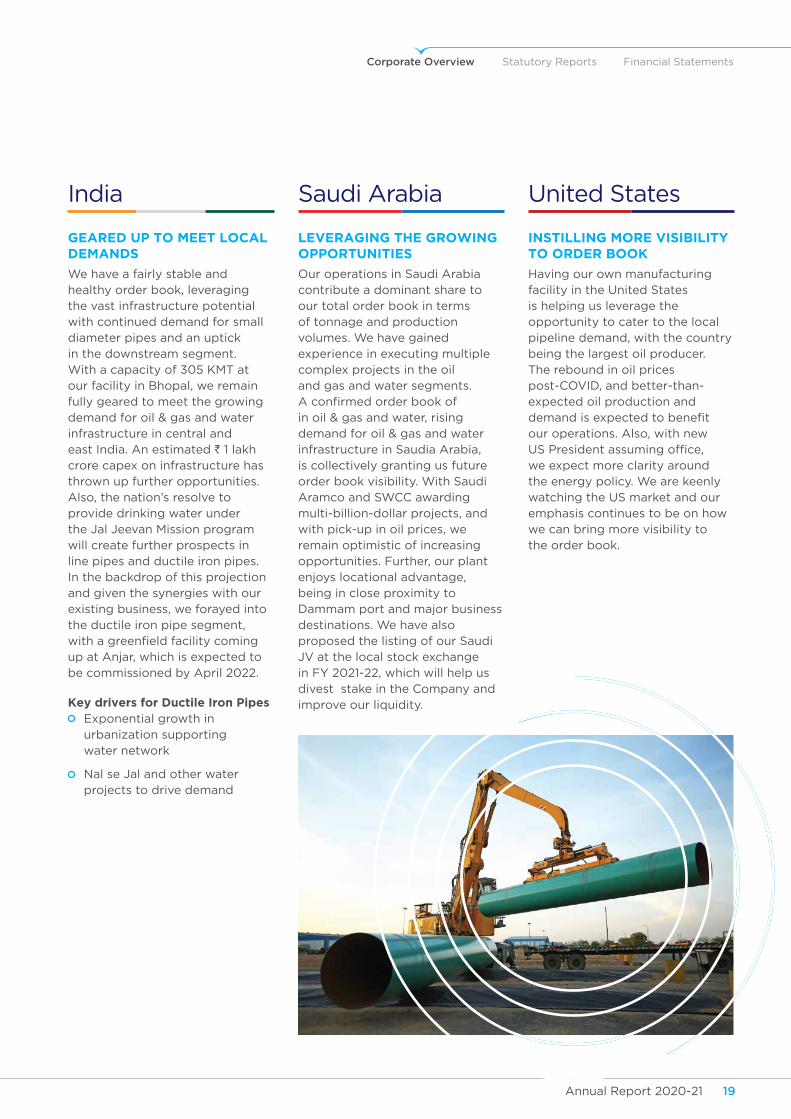
India
GeareD up to Meet LoCaL DeManDS
We have a fairly stable and healthy order book, leveraging the vast infrastructure potential with continued demand for small diameter pipes and an uptick in the downstream segment. With a capacity of 305 KMT at our facility in Bhopal, we remain fully geared to meet the growing demand for oil & gas and water infrastructure in central and east India. An estimated ` 1 lakh crore capex on infrastructure has thrown up further opportunities. Also, the nation’s resolve to provide drinking water under the Jal Jeevan Mission program will create further prospects in line pipes and ductile iron pipes. In the backdrop of this projection and given the synergies with our existing business, we forayed into the ductile iron pipe segment, withagreenfieldfacilitycomingup at Anjar, which is expected to be commissioned by April 2022.
Key drivers for Ductile iron pipes Exponential growth in
urbanization supporting water network
Nal se Jal and other water projects to drive demand
United States
inStiLLinG More viSiBiLity to orDer BooK
Having our own manufacturing facility in the United States is helping us leverage the opportunity to cater to the local pipeline demand, with the country being the largest oil producer. The rebound in oil prices post-COVID, and better-than-expected oil production and demandisexpectedtobenefitour operations. Also, with new USPresidentassumingoffice,we expect more clarity around the energy policy. We are keenly watching the US market and our emphasis continues to be on how we can bring more visibility to the order book.
Saudi Arabia
LeveraGinG the GroWinG opportunitieS
Our operations in Saudi Arabia contribute a dominant share to our total order book in terms of tonnage and production volumes. We have gained experience in executing multiple complex projects in the oil and gas and water segments. Aconfirmedorderbookofin oil & gas and water, rising demand for oil & gas and water infrastructure in Saudia Arabia, is collectively granting us future order book visibility. With Saudi Aramco and SWCC awarding multi-billion-dollar projects, and with pick-up in oil prices, we remain optimistic of increasing opportunities. Further, our plant enjoys locational advantage, being in close proximity to Dammam port and major business destinations. We have also proposed the listing of our Saudi JV at the local stock exchange in FY 2021-22, which will help us divest stake in the Company and improve our liquidity.
Annual Report 2020-21 21Annual Report 2020-2120
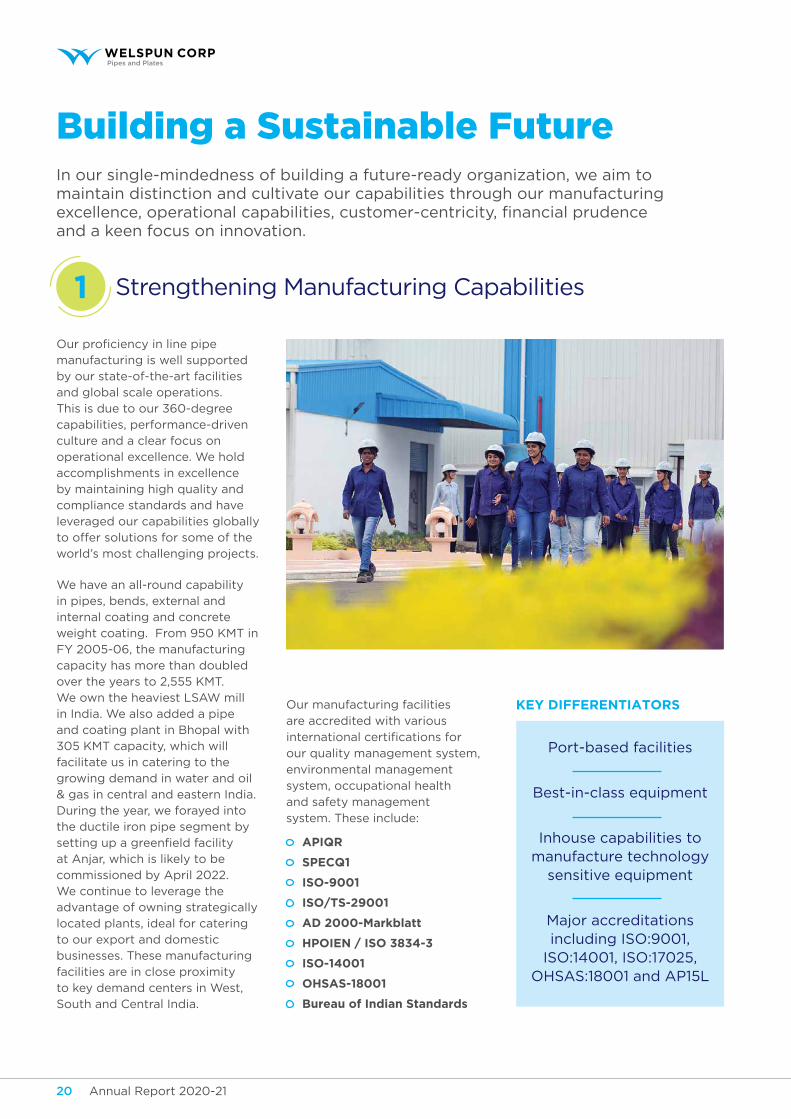
Building a Sustainable FutureIn our single-mindedness of building a future-ready organization, we aim to maintain distinction and cultivate our capabilities through our manufacturing excellence,operationalcapabilities,customer-centricity,financialprudenceand a keen focus on innovation.
Ourproficiencyinlinepipe
manufacturing is well supported
by our state-of-the-art facilities
and global scale operations.
This is due to our 360-degree
capabilities, performance-driven
culture and a clear focus on
operational excellence. We hold
accomplishments in excellence
by maintaining high quality and
compliance standards and have
leveraged our capabilities globally
to offer solutions for some of the
world’s most challenging projects.
We have an all-round capability
in pipes, bends, external and
internal coating and concrete
weight coating. From 950 KMT in
FY 2005-06, the manufacturing
capacity has more than doubled
over the years to 2,555 KMT.
We own the heaviest LSAW mill
in India. We also added a pipe
and coating plant in Bhopal with
305 KMT capacity, which will
facilitate us in catering to the
growing demand in water and oil
& gas in central and eastern India.
During the year, we forayed into
the ductile iron pipe segment by
settingupagreenfieldfacility
at Anjar, which is likely to be
commissioned by April 2022.
We continue to leverage the
advantage of owning strategically
located plants, ideal for catering
to our export and domestic
businesses. These manufacturing
facilities are in close proximity
to key demand centers in West,
South and Central India.
Our manufacturing facilities
are accredited with various
internationalcertificationsfor
our quality management system,
environmental management
system, occupational health
and safety management
system. These include:
apiQr
SpeCQ1
iSo-9001
iSo/tS-29001
aD 2000-Markblatt
hpoien / iSo 3834-3
iSo-14001
ohSaS-18001
Bureau of indian Standards
Key DiFFerentiatorS
Port-based facilities
Best-in-class equipment
Inhouse capabilities to manufacture technology
sensitive equipment
Major accreditations including ISO:9001,
ISO:14001, ISO:17025, OHSAS:18001 and AP15L
Strengthening Manufacturing Capabilities1
Corporate Overview Statutory Reports Financial Statements
Annual Report 2020-21 21Annual Report 2020-2120
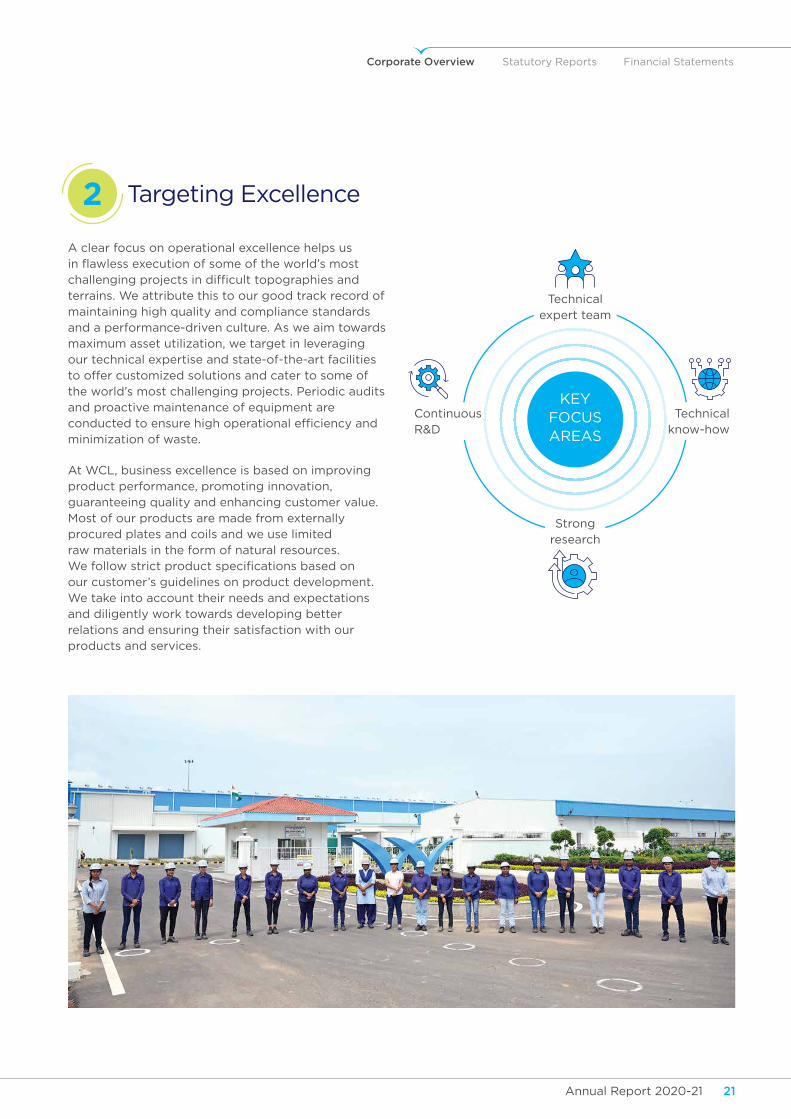
Targeting Excellence 2
A clear focus on operational excellence helps us inflawlessexecutionofsomeoftheworld’smostchallengingprojectsindifficulttopographiesandterrains. We attribute this to our good track record of maintaining high quality and compliance standards and a performance-driven culture. As we aim towards maximum asset utilization, we target in leveraging our technical expertise and state-of-the-art facilities to offer customized solutions and cater to some of the world’s most challenging projects. Periodic audits and proactive maintenance of equipment are conductedtoensurehighoperationalefficiencyandminimization of waste.
At WCL, business excellence is based on improving product performance, promoting innovation, guaranteeing quality and enhancing customer value. Most of our products are made from externally procured plates and coils and we use limited raw materials in the form of natural resources. Wefollowstrictproductspecificationsbasedonour customer’s guidelines on product development. We take into account their needs and expectations and diligently work towards developing better relations and ensuring their satisfaction with our products and services.
KEY FOCUS AREAS
Technical expert team
Strong research
Continuous R&D
Technical know-how
Annual Report 2020-21 23Annual Report 2020-2122
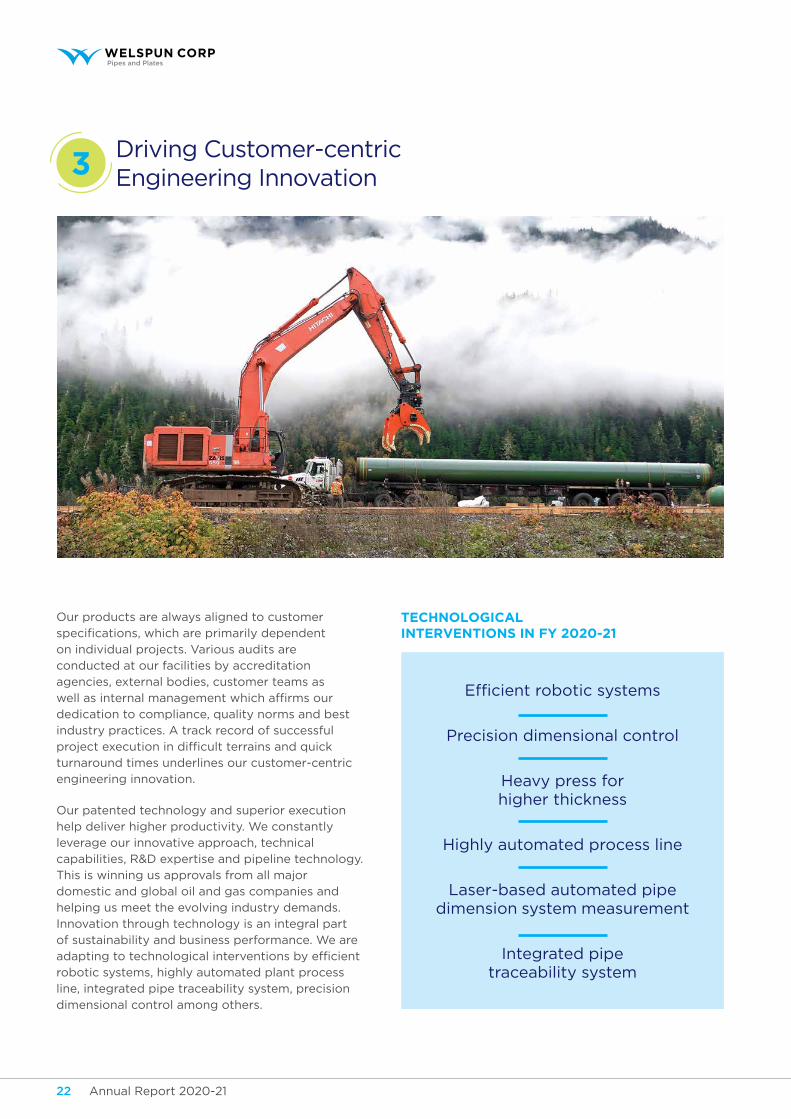
Driving Customer-centric Engineering Innovation3
Our products are always aligned to customer
specifications,whichareprimarilydependent
on individual projects. Various audits are
conducted at our facilities by accreditation
agencies, external bodies, customer teams as
wellasinternalmanagementwhichaffirmsour
dedication to compliance, quality norms and best
industry practices. A track record of successful
projectexecutionindifficultterrainsandquick
turnaround times underlines our customer-centric
engineering innovation.
Our patented technology and superior execution
help deliver higher productivity. We constantly
leverage our innovative approach, technical
capabilities, R&D expertise and pipeline technology.
This is winning us approvals from all major
domestic and global oil and gas companies and
helping us meet the evolving industry demands.
Innovation through technology is an integral part
of sustainability and business performance. We are
adaptingtotechnologicalinterventionsbyefficient
robotic systems, highly automated plant process
line, integrated pipe traceability system, precision
dimensional control among others.
teChnoLoGiCaL interventionS in Fy 2020-21
Efficientroboticsystems
Precision dimensional control
Heavy press for higher thickness
Highly automated process line
Laser-based automated pipe dimension system measurement
Integrated pipe traceability system
Corporate Overview Statutory Reports Financial Statements
Annual Report 2020-21 23Annual Report 2020-2122
ExecutingEfficientFinancial Engineering4
We have followed the approachoffinancialprudence.We strengthened our balance sheet by paring our debt and improving return on capital employed. From a net debt company, we have become a net cash company, with a net cash position of ` 620 crore, as we reduced our gross debt to the tune of ` 500 crore and substantially reduced the net financecost.Thesestrategiesaredrivingustowardsprofitablegrowth and enabling us to deliver superior return on equity. ThereaffirmingofCRISIL’srating on our bank facilities anddebtprogramsreflectsourstrengthenedriskprofile,backedby improvement in capacity utilization in India, US and Saudi Arabia and leading to strong revenue growth and better operationalprofitability.
Key DiFFerentiatorS
Optimizing our capex and working capital
Efficient utilization of cash
Mobilizing funds for future growth
-0.16Xnet debt/equity
-0.61Xnet debt/eBitDa
Annual Report 2020-21 25Annual Report 2020-2124
Technology Absorption and Research & Development5
innovation
Development of Automatic Enquiry Management System
Development of Automated Vendor Audit System
Development of Laboratory sample traceability system at LSAW
Development of facility to coat FBE/DFBE/2LPE/2LPP on hot induction bends
Development of Automatic Pipe Dimensions Measurement system
Installation of weld bead height measurement system at OD welding station for better control on bead height
Development of new stripping station to replace conventional LPG system for pipe stripping
Development of laser compatible software for FUT seam tracking at Spiral-2 using LSAW plant Laser i-control unit
teChnoLoGy upGraDation (pLan For Fy 2021-22)
Development of face sealing arrangement at Spiral-2 hydro-static tester (API) to eliminate untested pipe ends
Installation of new weld ultrasonic testing machine at ERW 16” with conventional and tandem UT techniques
Development of crystal probes for ROTO UT to detect 1.6 mm TDH
Development of automatic UT machine to test pipes ends including body and weld with conventional technique
ModificationofSpiralFUTmachineelectronicswithTCG facility and Phased Array compliance
Development of Utility digital dashboard for online monitoring of Air, CO
2, LPG, Water consumptions
reSearCh & DeveLopMent
Conductedasuccessfulpre-qualificationof heavy wall thick LSAW (JCOE Process) pipes by using TMCP plates for extreme sour service application for offshore pipe lines as per customer requirements jointly with steel suppliers
Development of API 5L X60M PSL2 LSAW pipes with enhanced weld and HAZ CVN shear area for oil pipe line
Development of domestic steel mills for the supply of API 5L X65M PSL2 hot rolled coils for oil & gas pipe lines
Development of international steel mills for the supply of API 5L X65MS PSL2 hot rolled plates for oil & gas pipe lines
QualificationofheavywallAPI5LX65MPSL2hot induction bends for oil pipe lines using TMCP plates to replace Q&T bends
CompliancetoDNVGL-ST-F101specificationfordeep offshore low D/t ratio API 5L X65MO PSL2 LSAW pipes for oil & gas pipe lines
Development of offshore low D/t ratio LSAW API 5L X60MO PSL2 pipes for oil pipe lines
Qualificationofautomaticpipedimensionmeasurement system for critical oil and gas pipe lines
Developed various coating material suppliers after successful trials like; Food Grade Liquid Epoxy from Asian Paints, HDPE Material from KPIC & Hyundai, High Temperature FBE powder from Jotun & 3M India
Corporate Overview Statutory Reports Financial Statements
Annual Report 2020-21 25Annual Report 2020-2124
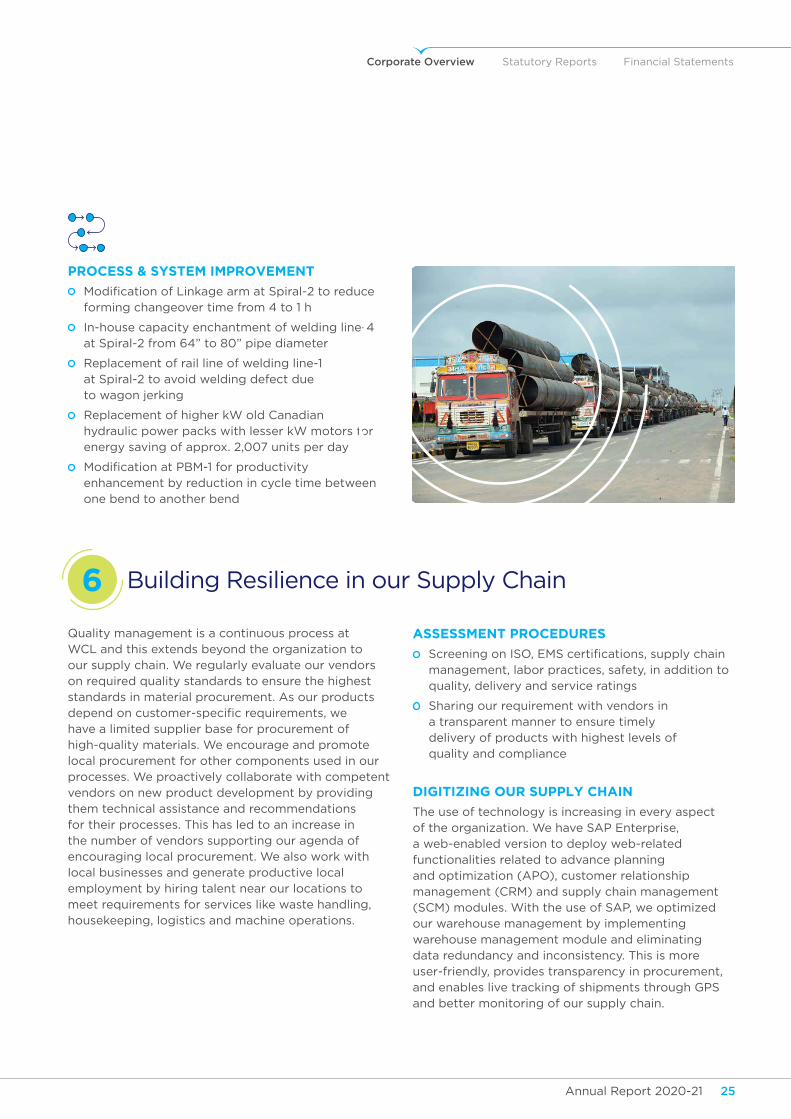
Building Resilience in our Supply Chain6
proCeSS & SySteM iMproveMent
ModificationofLinkagearmatSpiral-2toreduceforming changeover time from 4 to 1 h
In-house capacity enchantment of welding line-4 at Spiral-2 from 64” to 80” pipe diameter
Replacement of rail line of welding line-1 at Spiral-2 to avoid welding defect due to wagon jerking
Replacement of higher kW old Canadian hydraulic power packs with lesser kW motors for energy saving of approx. 2,007 units per day
ModificationatPBM-1forproductivityenhancement by reduction in cycle time between one bend to another bend
Quality management is a continuous process at WCL and this extends beyond the organization to our supply chain. We regularly evaluate our vendors on required quality standards to ensure the highest standards in material procurement. As our products dependoncustomer-specificrequirements,wehave a limited supplier base for procurement of high-quality materials. We encourage and promote local procurement for other components used in our processes. We proactively collaborate with competent vendors on new product development by providing them technical assistance and recommendations for their processes. This has led to an increase in the number of vendors supporting our agenda of encouraging local procurement. We also work with local businesses and generate productive local employment by hiring talent near our locations to meet requirements for services like waste handling, housekeeping, logistics and machine operations.
aSSeSSMent proCeDureS
ScreeningonISO,EMScertifications,supplychainmanagement, labor practices, safety, in addition to quality, delivery and service ratings
Sharing our requirement with vendors in a transparent manner to ensure timely delivery of products with highest levels of quality and compliance
DiGitiZinG our SuppLy Chain
The use of technology is increasing in every aspect of the organization. We have SAP Enterprise, a web-enabled version to deploy web-related functionalities related to advance planning and optimization (APO), customer relationship management (CRM) and supply chain management (SCM) modules. With the use of SAP, we optimized our warehouse management by implementing warehouse management module and eliminating data redundancy and inconsistency. This is more user-friendly, provides transparency in procurement, and enables live tracking of shipments through GPS and better monitoring of our supply chain.
Annual Report 2020-21 27Annual Report 2020-2126
From Customer Satisfaction to DelightWeunderstandthereisafinelinebetweensatisfactionanddelight.Wehavebuilt a consolidated base of loyal customers, and connect with them in a manner that best suits them. While enhancing our global focus, we consolidate our inherent strengths, while demonstrating continuity in quality assurance.
We maintain strong and healthy relationships with our customers and also with international and domestic steel suppliers. We are a preferred supplier to most Fortune 100 Oil & Gas companies and serve our customers’ needs through innovative and customized solutions. We are also leveraging our tech advancement and digital platforms to serve our customers. We have won accreditations and approvals from domestic and global marquee customers across Oil & Gas, Transportation and others.
our teCh-LeD initiativeS
Using automated solutions
Reducing operational expenditure
Enhancing speed across processes, increasingefficiency
CuStoMer aCCreDitationS
oil & Gas transportation others
Corporate Overview Statutory Reports Financial Statements
Annual Report 2020-21 27Annual Report 2020-2126
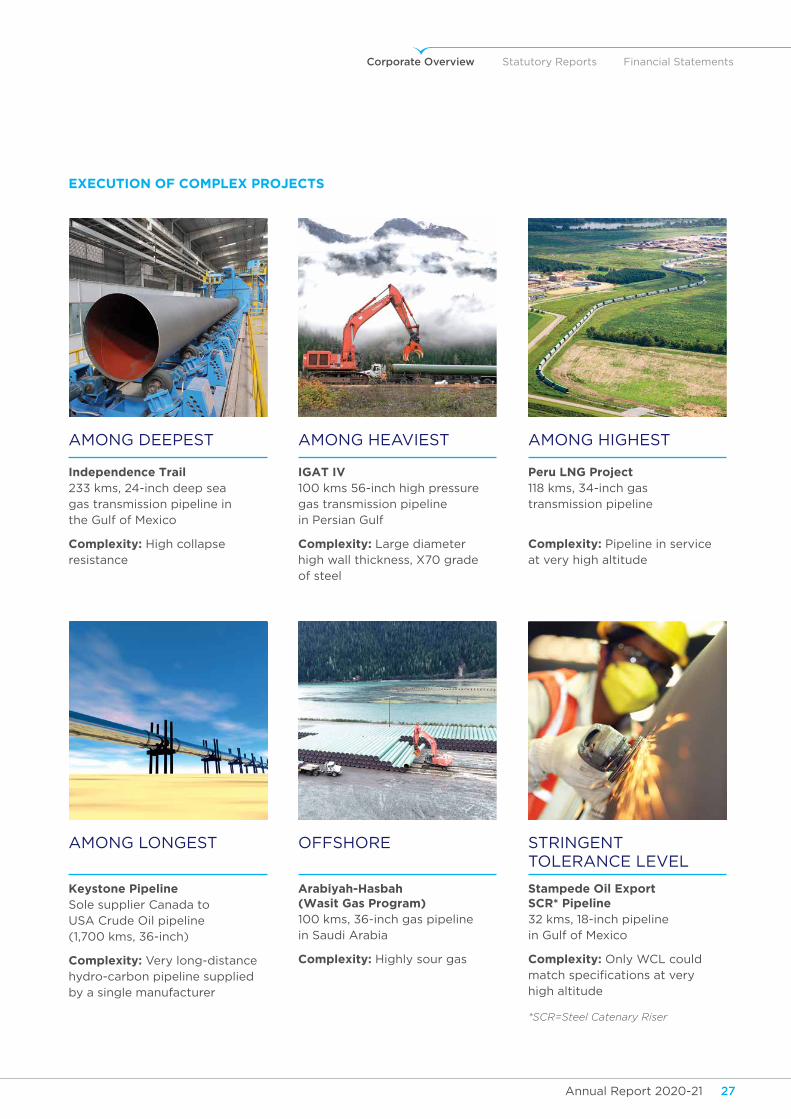
eXeCution oF CoMpLeX proJeCtS
AMONG DEEPEST
AMONG LONGEST
AMONG HEAVIEST
OFFSHORE
AMONG HIGHEST
STRINGENT TOLERANCE LEVEL
independence trail233 kms, 24-inch deep sea gas transmission pipeline in the Gulf of Mexico
Complexity: High collapse resistance
Keystone pipelineSole supplier Canada to USA Crude Oil pipeline (1,700 kms, 36-inch)
Complexity: Very long-distance hydro-carbon pipeline supplied by a single manufacturer
iGat iv100 kms 56-inch high pressure gas transmission pipeline in Persian Gulf
Complexity: Large diameter high wall thickness, X70 grade of steel
arabiyah-hasbah (Wasit Gas program)100 kms, 36-inch gas pipeline in Saudi Arabia
Complexity: Highly sour gas
peru LnG project118 kms, 34-inch gas transmission pipeline
Complexity: Pipeline in service at very high altitude
Stampede oil export SCr* pipeline32 kms, 18-inch pipeline in Gulf of Mexico
Complexity: Only WCL could matchspecificationsatveryhigh altitude
*SCR=Steel Catenary Riser
Annual Report 2020-21 29Annual Report 2020-2128
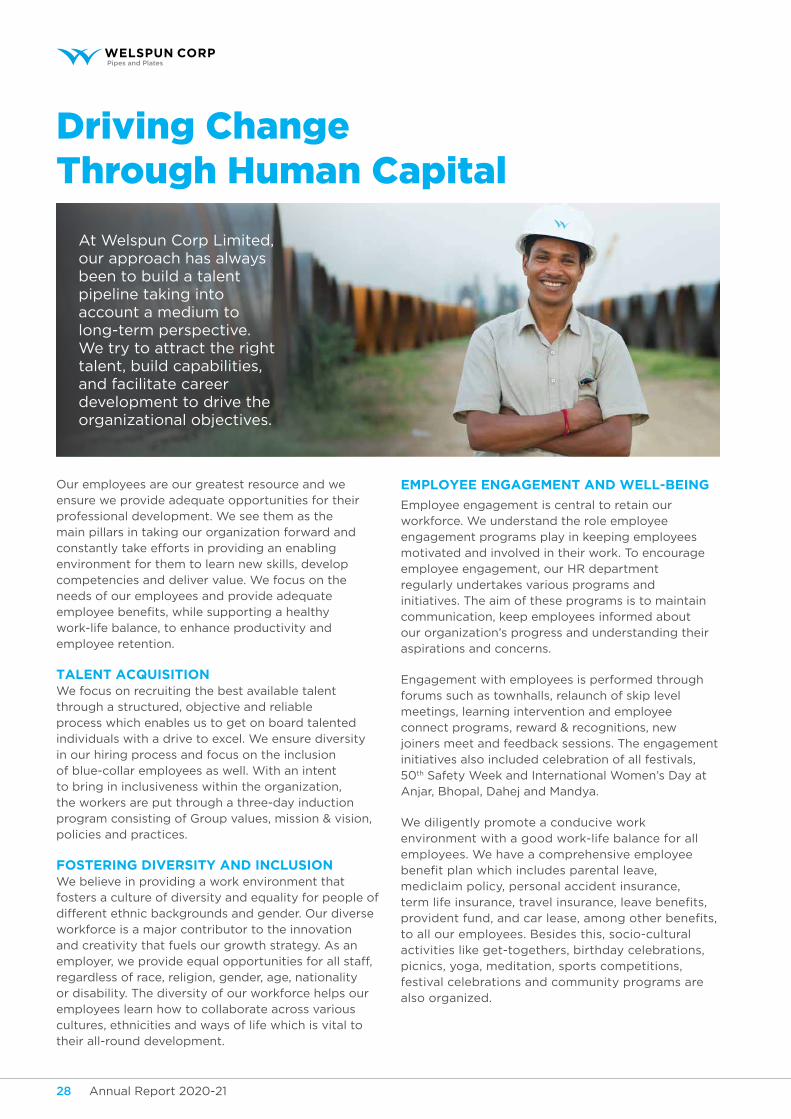
Driving Change Through Human Capital
Our employees are our greatest resource and we ensure we provide adequate opportunities for their professional development. We see them as the main pillars in taking our organization forward and constantly take efforts in providing an enabling environment for them to learn new skills, develop competencies and deliver value. We focus on the needs of our employees and provide adequate employeebenefits,whilesupportingahealthywork-life balance, to enhance productivity and employee retention.
taLent aCQuiSition We focus on recruiting the best available talent through a structured, objective and reliable process which enables us to get on board talented individuals with a drive to excel. We ensure diversity in our hiring process and focus on the inclusion of blue-collar employees as well. With an intent to bring in inclusiveness within the organization, the workers are put through a three-day induction program consisting of Group values, mission & vision, policies and practices.
FoSterinG DiverSity anD inCLuSionWe believe in providing a work environment that fosters a culture of diversity and equality for people of different ethnic backgrounds and gender. Our diverse workforce is a major contributor to the innovation and creativity that fuels our growth strategy. As an employer, we provide equal opportunities for all staff, regardless of race, religion, gender, age, nationality or disability. The diversity of our workforce helps our employees learn how to collaborate across various cultures, ethnicities and ways of life which is vital to their all-round development.
eMpLoyee enGaGeMent anD WeLL-BeinG
Employee engagement is central to retain our workforce. We understand the role employee engagement programs play in keeping employees motivated and involved in their work. To encourage employee engagement, our HR department regularly undertakes various programs and initiatives. The aim of these programs is to maintain communication, keep employees informed about our organization’s progress and understanding their aspirations and concerns.
Engagement with employees is performed through forums such as townhalls, relaunch of skip level meetings, learning intervention and employee connect programs, reward & recognitions, new joiners meet and feedback sessions. The engagement initiatives also included celebration of all festivals, 50th Safety Week and International Women’s Day at Anjar, Bhopal, Dahej and Mandya.
We diligently promote a conducive work environment with a good work-life balance for all employees. We have a comprehensive employee benefitplanwhichincludesparentalleave,mediclaim policy, personal accident insurance, termlifeinsurance,travelinsurance,leavebenefits,providentfund,andcarlease,amongotherbenefits,to all our employees. Besides this, socio-cultural activities like get-togethers, birthday celebrations, picnics, yoga, meditation, sports competitions, festival celebrations and community programs are also organized.
At Welspun Corp Limited, our approach has always been to build a talent pipeline taking into account a medium to long-term perspective. We try to attract the right talent, build capabilities, and facilitate career development to drive the organizational objectives.
Corporate Overview Statutory Reports Financial Statements
Annual Report 2020-21 29Annual Report 2020-2128
StiMuLatinG a LearninG environMent
WCL has an extensive approach towards learning and development that aims to develop new competencies and enhancing existing skills. We encourage innovative ideation at the workplace and ensure that our learning programs and initiatives are aligned with the development needs of our people and our business goals. Our training approach is holistically designed to enhance skills covering a wide range of subject matter, with modules on people management, emotional intelligence, and customer relationship management, professional and personal excellence. The HR team focuses on enhancing competencies, developing leadership potential and leveraging technology for advanced learning. With the backdrop of the pandemic, this year a lot of focus with regards to training and awareness was given on health as well as preventing the spread of COVID-19.
Welspun Digital instituteThefirstbatchofWelspunDigitalInstitute(WDI)completed training sessions and as per adopted Shark Tank Model presented their projects to the management. Our journey of WDI continued with second batch which started training programs in January 2021. Participants were trained on Automation & Digitization, Emerging Technologies Trends and Landscape, Solution of Lifecycle Management, Digital Transformation, Machine Learning & AI, Customer Experience Management and Data Analytics.
reimagine youReimagineYouprogramisdesignedforidentifiedsenior leaders. The module comprises of:
leading self: Self-management, Emotional Intelligence
leading others: Effective Delegation, Leadership
leading: Change Management, Finance for Non-Finance
WCL Learning ChampionshipWCL Learning Championship was launched in January 2021, with employees being motivated and encouraged to participate with self-registrations for the Group L&D programs. There was virtual felicitation of Learning Championship Winners in the presence of senior management.
proviDinG a SaFe anD heaLthy environMent
Ensuring a healthy and safe work environment is never compromised at WCL. We strive to maintain the highest safety standards to reduce incidents from occurring. The safety culture is driven by the top management and executed at every level through the EHS Management System. Specificresponsibilitieshavebeendefinedforeachlevel and have been implemented by various types of management programs and by conducting regular audits. WCL is accredited with OHSAS 18001 that enables risk assessment of all activities for achieving organizational HSE goals.
Our Safety Committees at the facilities ensure adherence to Occupational Health, Safety and Environment (OHSE) policy, compliance with regulations and provide safety trainings to our employees and contract staff. Additionally, they access near-miss and other incidents at sites to identify the gaps in preventive risk mitigation, improving processes and procedures. Feedback from employees is regularly obtained on various health and safety considerations. In each level of the committee, there is participation from non-managerial workers.
96% employees received skill upgradation training
18,654 hours for Permanent employees
7,241 hours of training imparted specifically on safety
training hours taken up
1,028 hours for Women employees
70.5 hours for Employees with disabilities
106 hours for Contractual employees
Annual Report 2020-21 31Annual Report 2020-2130
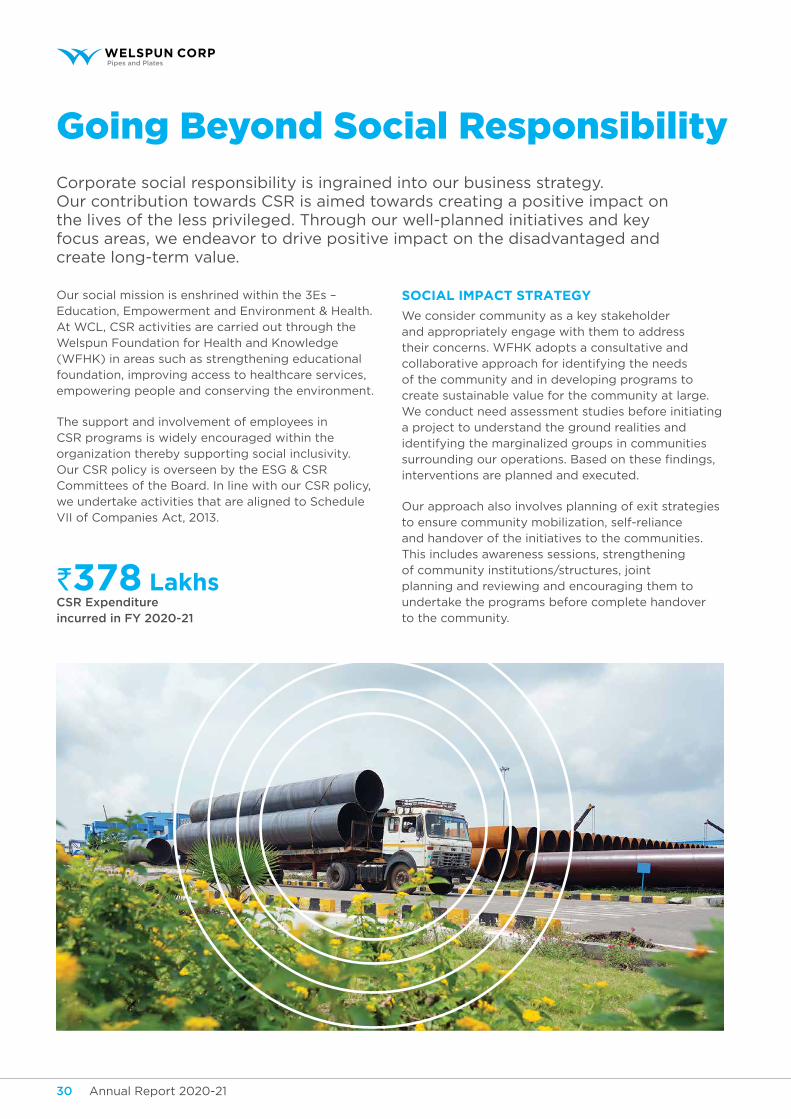
Going Beyond Social ResponsibilityCorporate social responsibility is ingrained into our business strategy. Our contribution towards CSR is aimed towards creating a positive impact on the lives of the less privileged. Through our well-planned initiatives and key focus areas, we endeavor to drive positive impact on the disadvantaged and create long-term value.
Our social mission is enshrined within the 3Es – Education, Empowerment and Environment & Health. At WCL, CSR activities are carried out through the Welspun Foundation for Health and Knowledge (WFHK) in areas such as strengthening educational foundation, improving access to healthcare services, empowering people and conserving the environment.
The support and involvement of employees in CSR programs is widely encouraged within the organization thereby supporting social inclusivity. Our CSR policy is overseen by the ESG & CSR Committees of the Board. In line with our CSR policy, we undertake activities that are aligned to Schedule VII of Companies Act, 2013.
SoCiaL iMpaCt StrateGy
We consider community as a key stakeholder and appropriately engage with them to address their concerns. WFHK adopts a consultative and collaborative approach for identifying the needs of the community and in developing programs to create sustainable value for the community at large. We conduct need assessment studies before initiating a project to understand the ground realities and identifying the marginalized groups in communities surroundingouroperations.Basedonthesefindings,interventions are planned and executed.
Our approach also involves planning of exit strategies to ensure community mobilization, self-reliance and handover of the initiatives to the communities. This includes awareness sessions, strengthening of community institutions/structures, joint planning and reviewing and encouraging them to undertake the programs before complete handover to the community.
`378 Lakhs csr expenditure incurred in fy 2020-21
Corporate Overview Statutory Reports Financial Statements
Annual Report 2020-21 31Annual Report 2020-2130
Focus Areas and Interventions
eDuCation
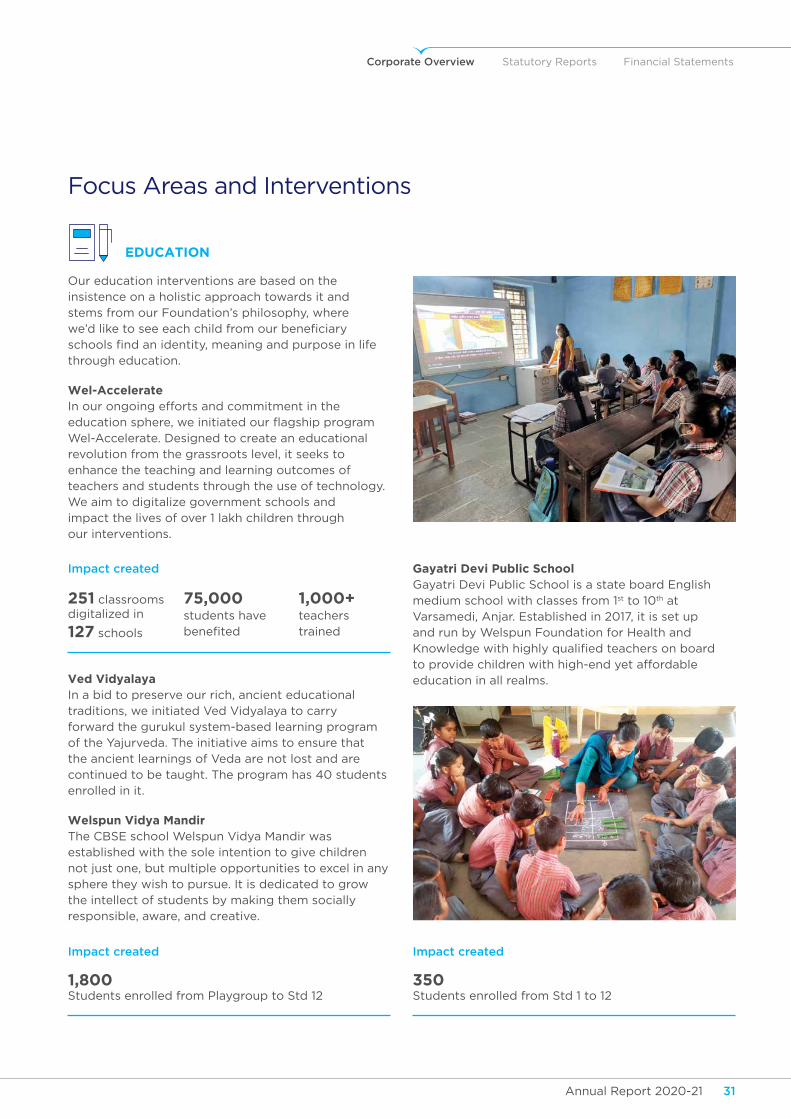
Our education interventions are based on the insistence on a holistic approach towards it and stems from our Foundation’s philosophy, where we’dliketoseeeachchildfromourbeneficiaryschoolsfindanidentity,meaningandpurposeinlifethrough education.
Wel-accelerateIn our ongoing efforts and commitment in the educationsphere,weinitiatedourflagshipprogramWel-Accelerate. Designed to create an educational revolution from the grassroots level, it seeks to enhance the teaching and learning outcomes of teachers and students through the use of technology. We aim to digitalize government schools and impact the lives of over 1 lakh children through our interventions.
Impact created
251 classrooms digitalized in
127 schools
75,000 students have benefited
1,000+ teachers trained
Impact created
1,800 Students enrolled from Playgroup to Std 12
Impact created
350 Students enrolled from Std 1 to 12
ved vidyalayaIn a bid to preserve our rich, ancient educational traditions, we initiated Ved Vidyalaya to carry forward the gurukul system-based learning program of the Yajurveda. The initiative aims to ensure that the ancient learnings of Veda are not lost and are continued to be taught. The program has 40 students enrolled in it.
Welspun vidya MandirThe CBSE school Welspun Vidya Mandir was established with the sole intention to give children not just one, but multiple opportunities to excel in any sphere they wish to pursue. It is dedicated to grow the intellect of students by making them socially responsible, aware, and creative.
Gayatri Devi public SchoolGayatri Devi Public School is a state board English medium school with classes from 1st to 10th at Varsamedi, Anjar. Established in 2017, it is set up and run by Welspun Foundation for Health and Knowledgewithhighlyqualifiedteachersonboardto provide children with high-end yet affordable education in all realms.
Annual Report 2020-21 33Annual Report 2020-2132
Model villagesOur modern vision for villages in India is one where there are sustainable rural communities that can generate and maintain the resources necessary to improve their level of well-being and happiness, without depleting economic, social and environmental values. Our ‘Model Village Program’ seeks to provide communities with employment, while creating ancillary livelihood opportunities that leverage technology and green growth opportunities.
Women empowermentAt Welspun, our empowerment endeavors have been focused on enabling women to create alternative livelihoods and improve their earning capacities. By encouraging economic independence amongst women, we not only inch closer towards gender equality, but also advance their social status and increase civic participation, making for a more well-rounded society.
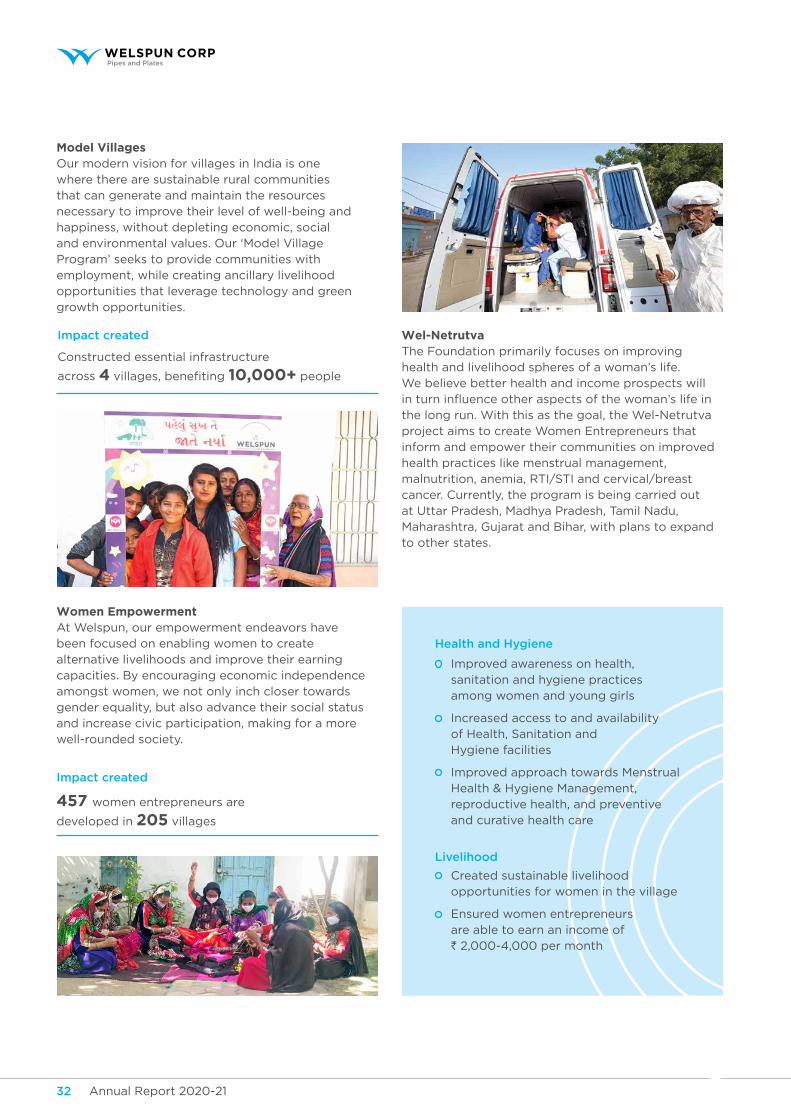
Wel-netrutva The Foundation primarily focuses on improving health and livelihood spheres of a woman’s life. We believe better health and income prospects will inturninfluenceotheraspectsofthewoman’slifeinthe long run. With this as the goal, the Wel-Netrutva project aims to create Women Entrepreneurs that inform and empower their communities on improved health practices like menstrual management, malnutrition, anemia, RTI/STI and cervical/breast cancer. Currently, the program is being carried out at Uttar Pradesh, Madhya Pradesh, Tamil Nadu, Maharashtra, Gujarat and Bihar, with plans to expand to other states.
Impact created
Impact created
Constructed essential infrastructure
across 4villages,benefiting10,000+ people
457 women entrepreneurs are
developed in 205 villages
health and hygiene
Improved awareness on health, sanitation and hygiene practices among women and young girls
Increased access to and availability of Health, Sanitation and Hygiene facilities
Improved approach towards Menstrual Health & Hygiene Management, reproductive health, and preventive and curative health care
livelihood
Created sustainable livelihood opportunities for women in the village
Ensured women entrepreneurs are able to earn an income of ` 2,000-4,000 per month
Corporate Overview Statutory Reports Financial Statements
Annual Report 2020-21 33Annual Report 2020-2132
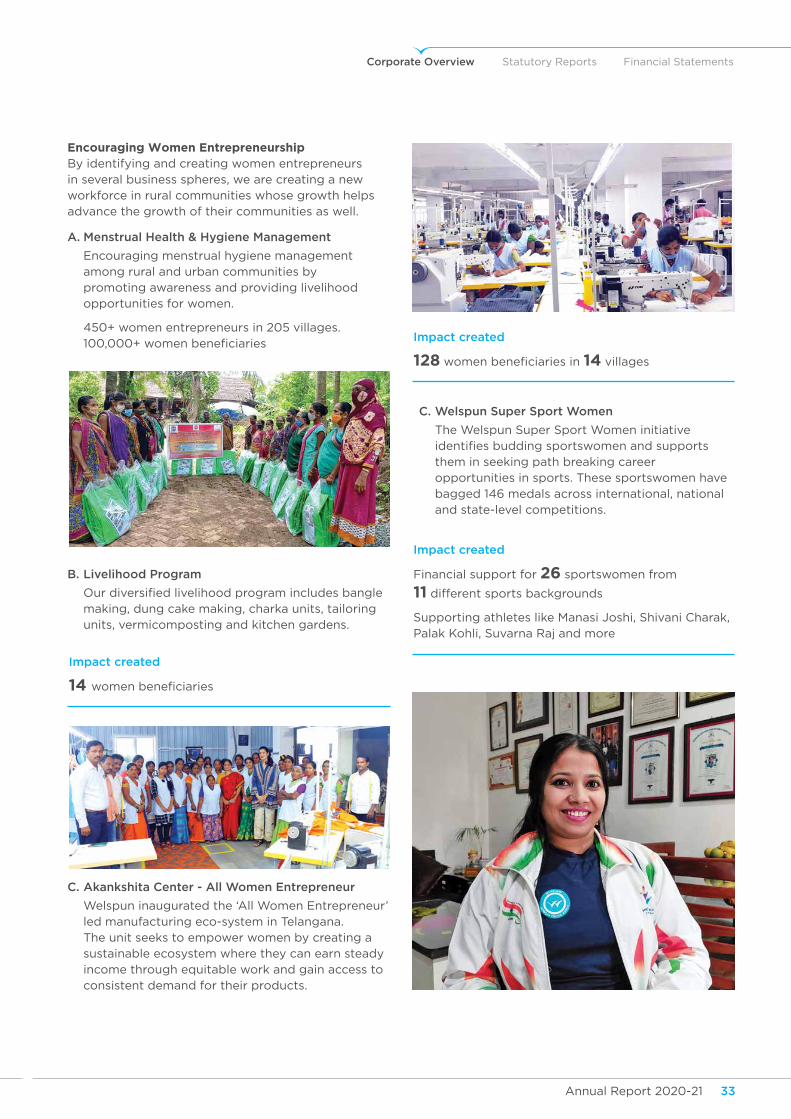
encouraging Women entrepreneurshipBy identifying and creating women entrepreneurs in several business spheres, we are creating a new workforce in rural communities whose growth helps advance the growth of their communities as well.
Impact created
Financial support for 26 sportswomen from
11 different sports backgrounds
Supporting athletes like Manasi Joshi, Shivani Charak, Palak Kohli, Suvarna Raj and more
Impact created
14 womenbeneficiaries
Impact created
128womenbeneficiariesin14 villages
a. menstrual health & hygiene management
Encouraging menstrual hygiene management among rural and urban communities by promoting awareness and providing livelihood opportunities for women.
450+ women entrepreneurs in 205 villages. 100,000+womenbeneficiaries
c. akankshita center - all women entrepreneur
Welspun inaugurated the ‘All Women Entrepreneur’ led manufacturing eco-system in Telangana. The unit seeks to empower women by creating a sustainable ecosystem where they can earn steady income through equitable work and gain access to consistent demand for their products.
c. welspun super sport women
The Welspun Super Sport Women initiative identifiesbuddingsportswomenandsupportsthem in seeking path breaking career opportunities in sports. These sportswomen have bagged 146 medals across international, national and state-level competitions.
b. livelihood program
Ourdiversifiedlivelihoodprogramincludesbanglemaking, dung cake making, charka units, tailoring units, vermicomposting and kitchen gardens.
Annual Report 2020-21 35Annual Report 2020-2134
heaLthCare
environMent
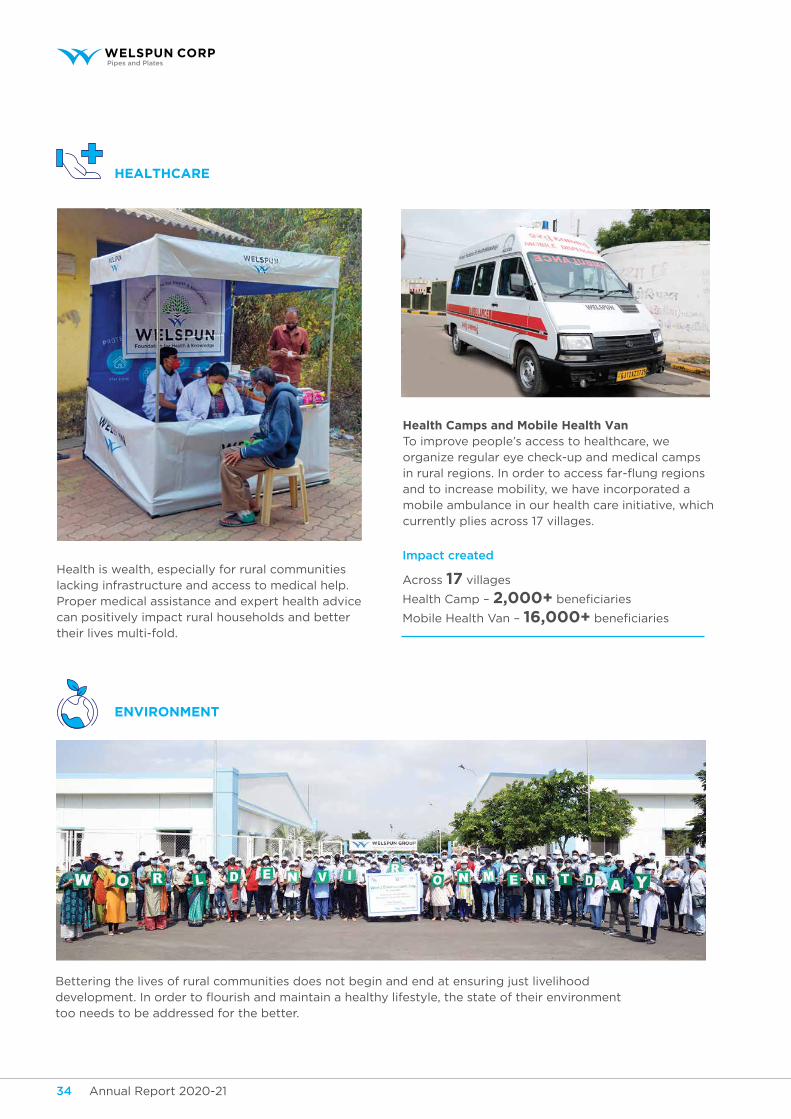
Health is wealth, especially for rural communities lacking infrastructure and access to medical help. Proper medical assistance and expert health advice can positively impact rural households and better their lives multi-fold.
health Camps and Mobile health vanTo improve people’s access to healthcare, we organize regular eye check-up and medical camps inruralregions.Inordertoaccessfar-flungregionsand to increase mobility, we have incorporated a mobile ambulance in our health care initiative, which currently plies across 17 villages.
Impact created
Across 17 villages
Health Camp – 2,000+beneficiaries Mobile Health Van – 16,000+beneficiaries
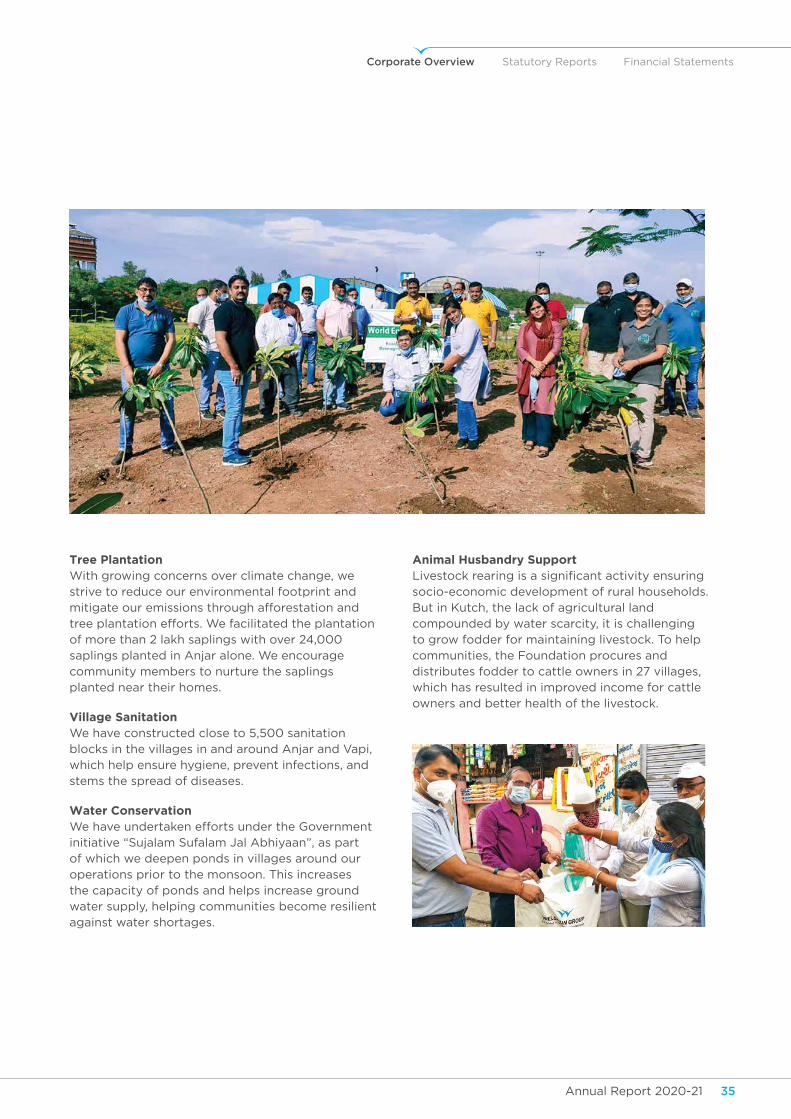
Bettering the lives of rural communities does not begin and end at ensuring just livelihood development.Inordertoflourishandmaintainahealthylifestyle,thestateoftheirenvironmenttoo needs to be addressed for the better.
Corporate Overview Statutory Reports Financial Statements
Annual Report 2020-21 35Annual Report 2020-2134
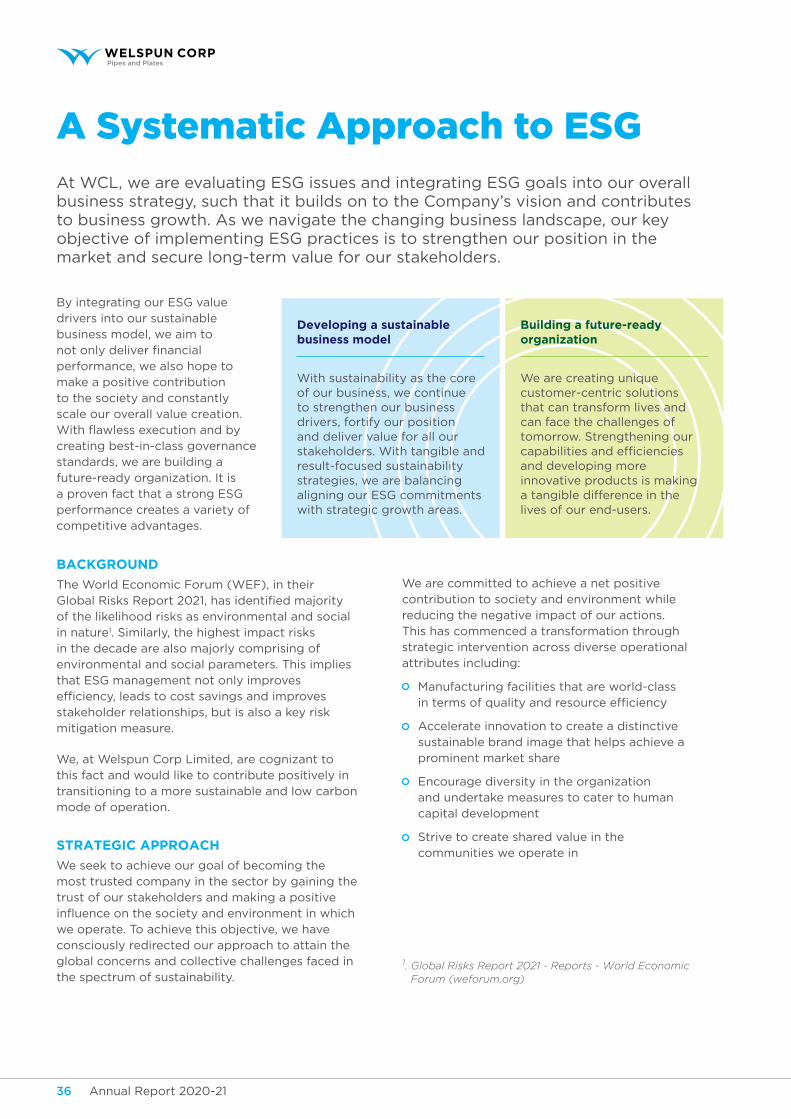
tree plantationWith growing concerns over climate change, we strive to reduce our environmental footprint and mitigate our emissions through afforestation and tree plantation efforts. We facilitated the plantation of more than 2 lakh saplings with over 24,000 saplings planted in Anjar alone. We encourage community members to nurture the saplings planted near their homes.
village SanitationWe have constructed close to 5,500 sanitation blocks in the villages in and around Anjar and Vapi, which help ensure hygiene, prevent infections, and stems the spread of diseases.
Water ConservationWe have undertaken efforts under the Government initiative “Sujalam Sufalam Jal Abhiyaan”, as part of which we deepen ponds in villages around our operations prior to the monsoon. This increases the capacity of ponds and helps increase ground water supply, helping communities become resilient against water shortages.
animal husbandry SupportLivestockrearingisasignificantactivityensuringsocio-economic development of rural households. But in Kutch, the lack of agricultural land compounded by water scarcity, it is challenging to grow fodder for maintaining livestock. To help communities, the Foundation procures and distributes fodder to cattle owners in 27 villages, which has resulted in improved income for cattle owners and better health of the livestock.
Annual Report 2020-21 37Annual Report 2020-2136
A Systematic Approach to ESGAt WCL, we are evaluating ESG issues and integrating ESG goals into our overall business strategy, such that it builds on to the Company’s vision and contributes to business growth. As we navigate the changing business landscape, our key objective of implementing ESG practices is to strengthen our position in the market and secure long-term value for our stakeholders.
By integrating our ESG value drivers into our sustainable business model, we aim to notonlydeliverfinancialperformance, we also hope to make a positive contribution to the society and constantly scale our overall value creation. Withflawlessexecutionandbycreating best-in-class governance standards, we are building a future-ready organization. It is a proven fact that a strong ESG performance creates a variety of competitive advantages.
BaCKGrounD
The World Economic Forum (WEF), in their GlobalRisksReport2021,hasidentifiedmajorityof the likelihood risks as environmental and social in nature1. Similarly, the highest impact risks in the decade are also majorly comprising of environmental and social parameters. This implies that ESG management not only improves efficiency,leadstocostsavingsandimprovesstakeholder relationships, but is also a key risk mitigation measure.
We, at Welspun Corp Limited, are cognizant to this fact and would like to contribute positively in transitioning to a more sustainable and low carbon mode of operation.
StrateGiC approaCh
We seek to achieve our goal of becoming the most trusted company in the sector by gaining the trust of our stakeholders and making a positive influenceonthesocietyandenvironmentinwhichwe operate. To achieve this objective, we have consciously redirected our approach to attain the global concerns and collective challenges faced in the spectrum of sustainability.
1. Global Risks Report 2021 - Reports - World Economic Forum (weforum.org)
With sustainability as the core of our business, we continue to strengthen our business drivers, fortify our position and deliver value for all our stakeholders. With tangible and result-focused sustainability strategies, we are balancing aligning our ESG commitments with strategic growth areas.
We are creating unique customer-centric solutions that can transform lives and can face the challenges of tomorrow. Strengthening our capabilitiesandefficienciesand developing more innovative products is making a tangible difference in the lives of our end-users.
Developing a sustainable business model
Building a future-ready organization
We are committed to achieve a net positive contribution to society and environment while reducing the negative impact of our actions. This has commenced a transformation through strategic intervention across diverse operational attributes including:
Manufacturing facilities that are world-class intermsofqualityandresourceefficiency
Accelerate innovation to create a distinctive sustainable brand image that helps achieve a prominent market share
Encourage diversity in the organization and undertake measures to cater to human capital development
Strive to create shared value in the communities we operate in
Corporate Overview Statutory Reports Financial Statements
Annual Report 2020-21 37Annual Report 2020-2136
SuStainaBiLity GoaLS
The reporting year FY 2020-21 was a crucial year as it helped us set the baseline of our Sustainability Goals and KPIs extending across multiple aspects of Environment and Social. We have targets on energy, carbon, water, waste, safety, community development initiatives and public disclosures inalignmentwiththeidentifiedcriticalmaterialissues. To achieve these goals, we intend to prioritize our inhouse operations along with incorporating upstream and downstream suppliers into our strategy as a synergy to create a wave of transition across the value chain. The purpose is to integrate our value chain with our approach towards product-centric sustainability to achieve holistic sustainable development.
We, at Welspun Corp Limited, are cognizant to this fact and would like to contribute positively in transitioning to a more sustainable and low carbon mode of operation.
WCL reinforces the core values of Customer Centricity, Collaboration, Technology and Inclusive Growth in its sustainability initiatives to optimize Welspun’s group philosophy and corporate values. Sustainability is not a new concept at Welspun and we have implemented environmental and social initiatives over the years. However, we realize the need to articulate our ESG approach and ethos, imbibing them into business operations and accordingly communicating the same with our stakeholders.
To put this into action, we structured our approach to ESG implementation with commitments, goals and targets across environmental and social parameters; including energy, water, waste, safety, employee welfare, diversity, CSR and Governance. We believe that to arrive at these targets and commitments, it was critical for us to diagnose our current stance on ESG and where we desire to be, in the years to come. The journey from ‘current state’ to ‘desired state’ required identifying key focus areas, align to national and global guidelines and framework, arrive at the baseline and design a governance framework for managing ESG implementation.
Aspartofthefocusareaidentification,westreamlined our approach to identify 20 ESG material issues across core values of Welspun which are critical forourbusinessoperations.Theseidentifiedissues& focus areas were prioritized through consultation, sectoral research & national and global ESG standards and guidelines.
We have undertaken initiatives to record and monitor the KPIs of sustainability in alignment with these metrices. A maturity assessment was conducted to evaluate the current ESG practices of WCL and identify the gaps in the internal systems and processes. The assessment followed a comparative analysis with respect to global ESG metrics and industry best practices. All these efforts resulted in formulation of an action plan to integrate E&S factors across risk management, strategic decision-making and communication.
WCL believes in a robust governance mechanism for the companies’ persistent performance. Hence, we haveredefinedthegovernanceofEnvironment&Social (E&S) aspects across organizational levels which ensured delegation of accountability and led to an effective monitoring of action and associated outcomes. Incorporating a review mechanism of E&S KPIs at the board level acted as a control measure that will showcase transparent outcomes against targets and enable effective decision-making.
All these efforts led to creation of an overarching roadmap of WCL to safeguarding desires of stakeholders, strengthening access resources and ultimately promote economic prosperity. This roadmap will guide action, implementation and take us closer to meeting our commitments on carbon, water, waste, supply chain and CSR.
Annual Report 2020-21 39Annual Report 2020-2138
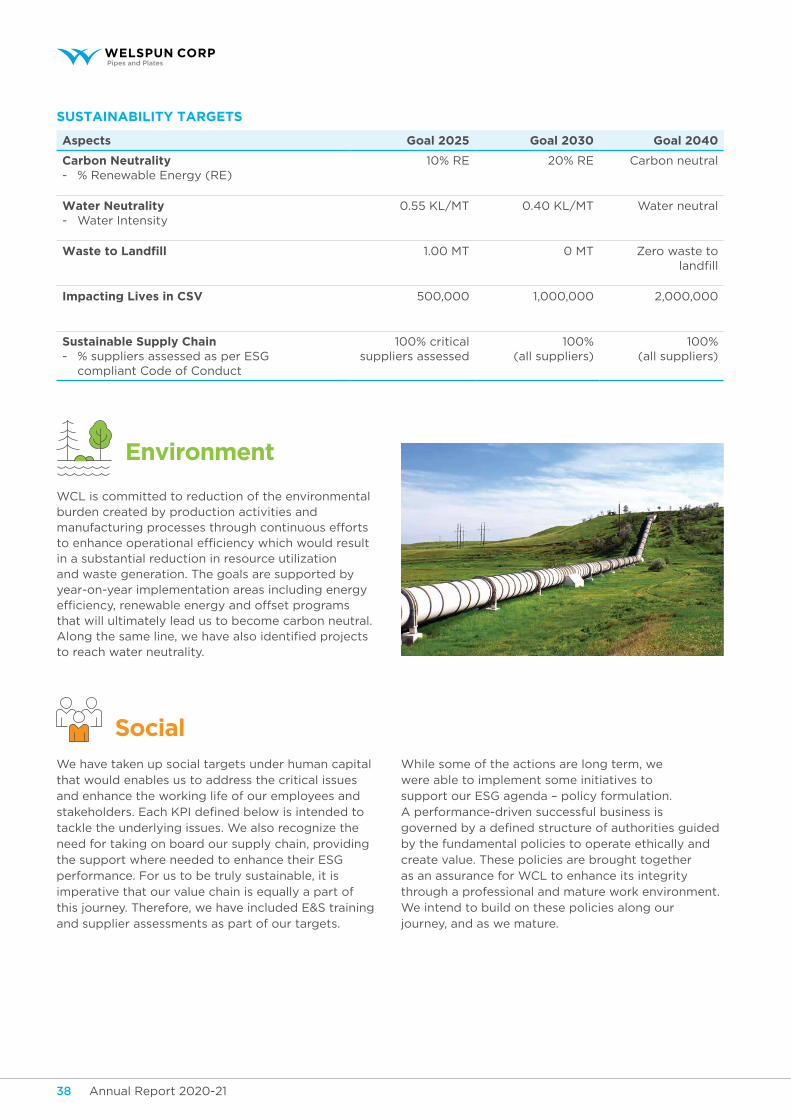
SuStainaBiLity tarGetS
aspects Goal 2025 Goal 2030 Goal 2040
Carbon neutrality - % Renewable Energy (RE)
10% RE 20% RE Carbon neutral
Water neutrality- Water Intensity
0.55 KL/MT 0.40 KL/MT Water neutral
Waste to landfill 1.00 MT 0 MT Zero waste to landfill
impacting Lives in CSv 500,000 1,000,000 2,000,000
Sustainable Supply Chain- % suppliers assessed as per ESG
compliant Code of Conduct
100% critical suppliers assessed
100% (all suppliers)
100% (all suppliers)
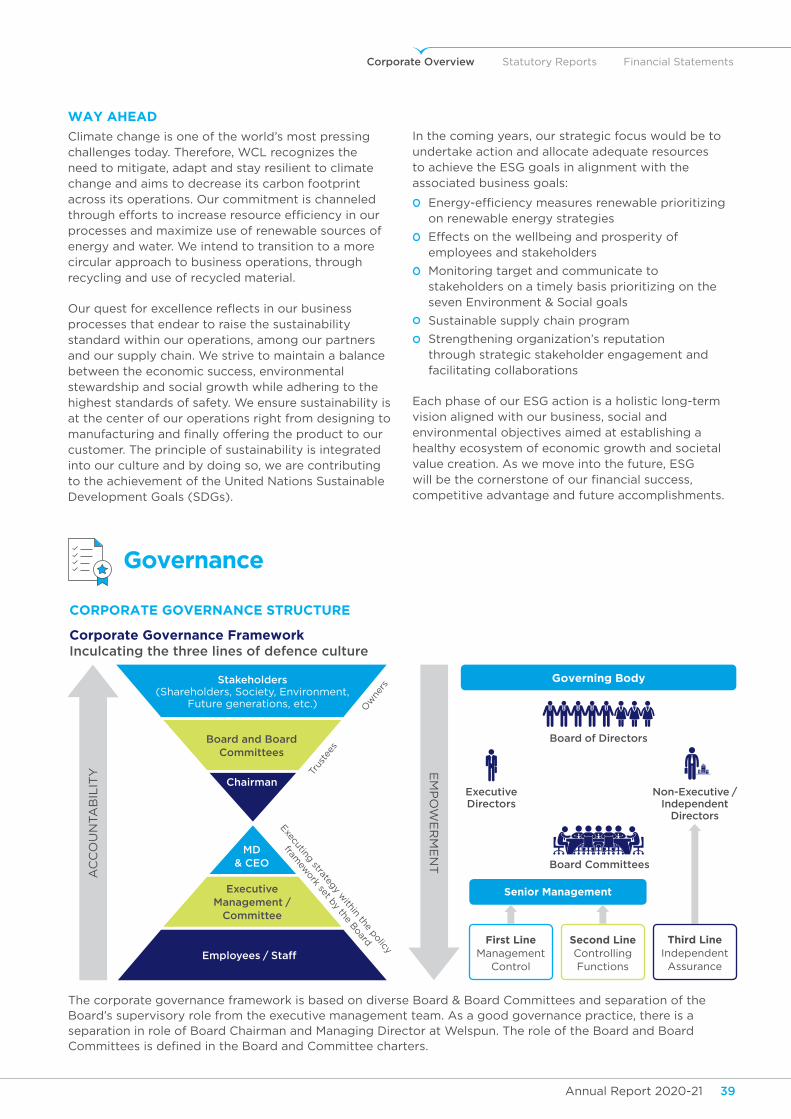
WCL is committed to reduction of the environmental burden created by production activities and manufacturing processes through continuous efforts toenhanceoperationalefficiencywhichwouldresultin a substantial reduction in resource utilization and waste generation. The goals are supported by year-on-year implementation areas including energy efficiency,renewableenergyandoffsetprogramsthat will ultimately lead us to become carbon neutral. Alongthesameline,wehavealsoidentifiedprojectsto reach water neutrality.
environment
We have taken up social targets under human capital that would enables us to address the critical issues and enhance the working life of our employees and stakeholders.EachKPIdefinedbelowisintendedtotackle the underlying issues. We also recognize the need for taking on board our supply chain, providing the support where needed to enhance their ESG performance. For us to be truly sustainable, it is imperative that our value chain is equally a part of this journey. Therefore, we have included E&S training and supplier assessments as part of our targets.
While some of the actions are long term, we were able to implement some initiatives to support our ESG agenda – policy formulation. A performance-driven successful business is governedbyadefinedstructureofauthoritiesguidedby the fundamental policies to operate ethically and create value. These policies are brought together as an assurance for WCL to enhance its integrity through a professional and mature work environment. We intend to build on these policies along our journey, and as we mature.
Social
Corporate Overview Statutory Reports Financial Statements
Annual Report 2020-21 39Annual Report 2020-2138
Governance
Corporate GovernanCe StruCture
Corporate Governance Framework Inculcating the three lines of defence culture
Trus
tees
O
wne
rs
Executing strategy within the policy
framew
ork set by the Board
board of directors
board committees
executive directors
non-executive / Independent
directors
AC
CO
UN
TA
BIL
ITY E
MP
OW
ER
ME
NT
stakeholders(Shareholders, Society, Environment,
Future generations, etc.)
board and board committees
chairman
executive management /
committee
employees / staff
md & ceo
Senior Management
Governing Body
The corporate governance framework is based on diverse Board & Board Committees and separation of the Board’s supervisory role from the executive management team. As a good governance practice, there is a separation in role of Board Chairman and Managing Director at Welspun. The role of the Board and Board CommitteesisdefinedintheBoardandCommitteecharters.
third LineIndependent Assurance
Second LineControlling Functions
First LineManagement
Control
Way aheaD
Climate change is one of the world’s most pressing challenges today. Therefore, WCL recognizes the need to mitigate, adapt and stay resilient to climate change and aims to decrease its carbon footprint across its operations. Our commitment is channeled througheffortstoincreaseresourceefficiencyinourprocesses and maximize use of renewable sources of energy and water. We intend to transition to a more circular approach to business operations, through recycling and use of recycled material.
Ourquestforexcellencereflectsinourbusinessprocesses that endear to raise the sustainability standard within our operations, among our partners and our supply chain. We strive to maintain a balance between the economic success, environmental stewardship and social growth while adhering to the highest standards of safety. We ensure sustainability is at the center of our operations right from designing to manufacturingandfinallyofferingtheproducttoourcustomer. The principle of sustainability is integrated into our culture and by doing so, we are contributing to the achievement of the United Nations Sustainable Development Goals (SDGs).
In the coming years, our strategic focus would be to undertake action and allocate adequate resources to achieve the ESG goals in alignment with the associated business goals:
Energy-efficiencymeasuresrenewableprioritizingon renewable energy strategies
Effects on the wellbeing and prosperity of employees and stakeholders
Monitoring target and communicate to stakeholders on a timely basis prioritizing on the seven Environment & Social goals
Sustainable supply chain program
Strengthening organization’s reputation through strategic stakeholder engagement and facilitating collaborations
Each phase of our ESG action is a holistic long-term vision aligned with our business, social and environmental objectives aimed at establishing a healthy ecosystem of economic growth and societal value creation. As we move into the future, ESG willbethecornerstoneofourfinancialsuccess,competitive advantage and future accomplishments.
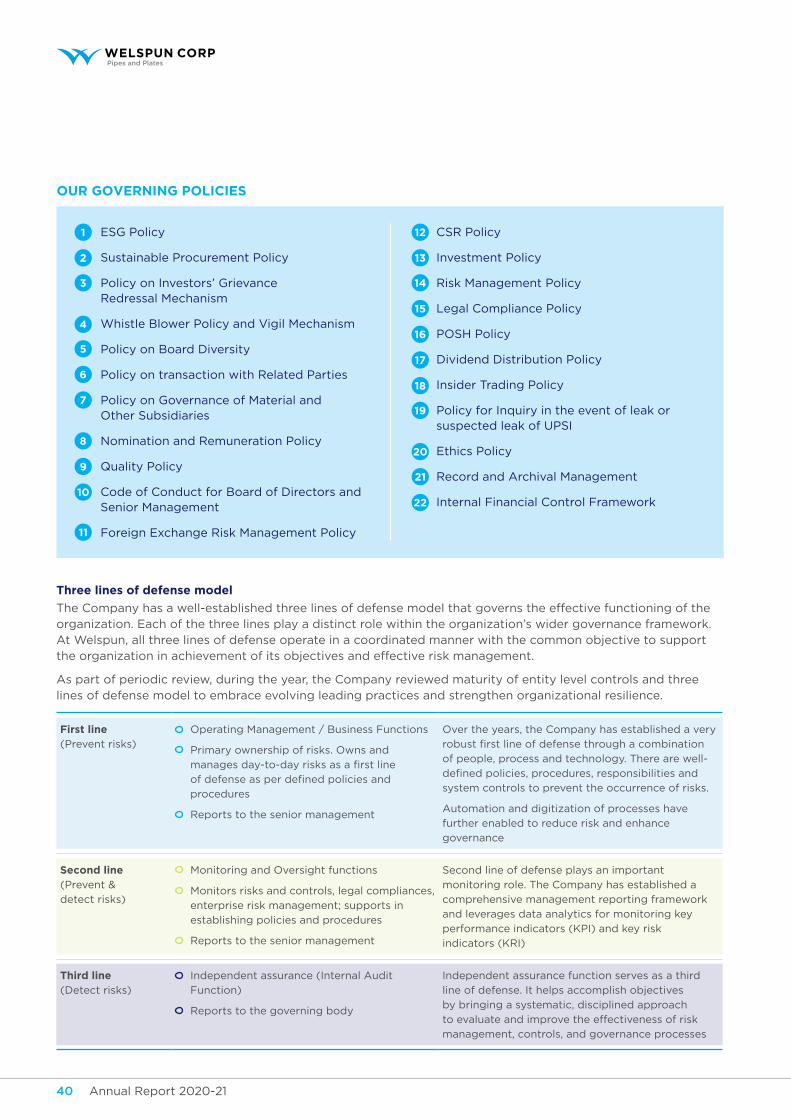
Annual Report 2020-21 41Annual Report 2020-2140
three lines of defense model
The Company has a well-established three lines of defense model that governs the effective functioning of the organization. Each of the three lines play a distinct role within the organization’s wider governance framework. At Welspun, all three lines of defense operate in a coordinated manner with the common objective to support the organization in achievement of its objectives and effective risk management.
As part of periodic review, during the year, the Company reviewed maturity of entity level controls and three lines of defense model to embrace evolving leading practices and strengthen organizational resilience.
First line(Prevent risks)
Operating Management / Business Functions
Primary ownership of risks. Owns and
managesday-to-dayrisksasafirstline
ofdefenseasperdefinedpoliciesand
procedures
Reports to the senior management
Over the years, the Company has established a very
robustfirstlineofdefensethroughacombination
of people, process and technology. There are well-
definedpolicies,procedures,responsibilitiesand
system controls to prevent the occurrence of risks.
Automation and digitization of processes have
further enabled to reduce risk and enhance
governance
Second line(Prevent &
detect risks)
Monitoring and Oversight functions
Monitors risks and controls, legal compliances,
enterprise risk management; supports in
establishing policies and procedures
Reports to the senior management
Second line of defense plays an important
monitoring role. The Company has established a
comprehensive management reporting framework
and leverages data analytics for monitoring key
performance indicators (KPI) and key risk
indicators (KRI)
third line(Detect risks)
Independent assurance (Internal Audit
Function)
Reports to the governing body
Independent assurance function serves as a third
line of defense. It helps accomplish objectives
by bringing a systematic, disciplined approach
to evaluate and improve the effectiveness of risk
management, controls, and governance processes
our GoverninG poLiCieS
ESG Policy
Sustainable Procurement Policy
Policy on Investors’ Grievance Redressal Mechanism
Whistle Blower Policy and Vigil Mechanism
Policy on Board Diversity
Policy on transaction with Related Parties
Policy on Governance of Material and Other Subsidiaries
Nomination and Remuneration Policy
Quality Policy
Code of Conduct for Board of Directors and Senior Management
Foreign Exchange Risk Management Policy
1
2
3
4
5
6
7
8
9
10
11
12
13
14
15
16
17
18
19
20
21
22
CSR Policy
Investment Policy
Risk Management Policy
Legal Compliance Policy
POSH Policy
Dividend Distribution Policy
Insider Trading Policy
Policy for Inquiry in the event of leak or suspected leak of UPSI
Ethics Policy
Record and Archival Management
Internal Financial Control Framework
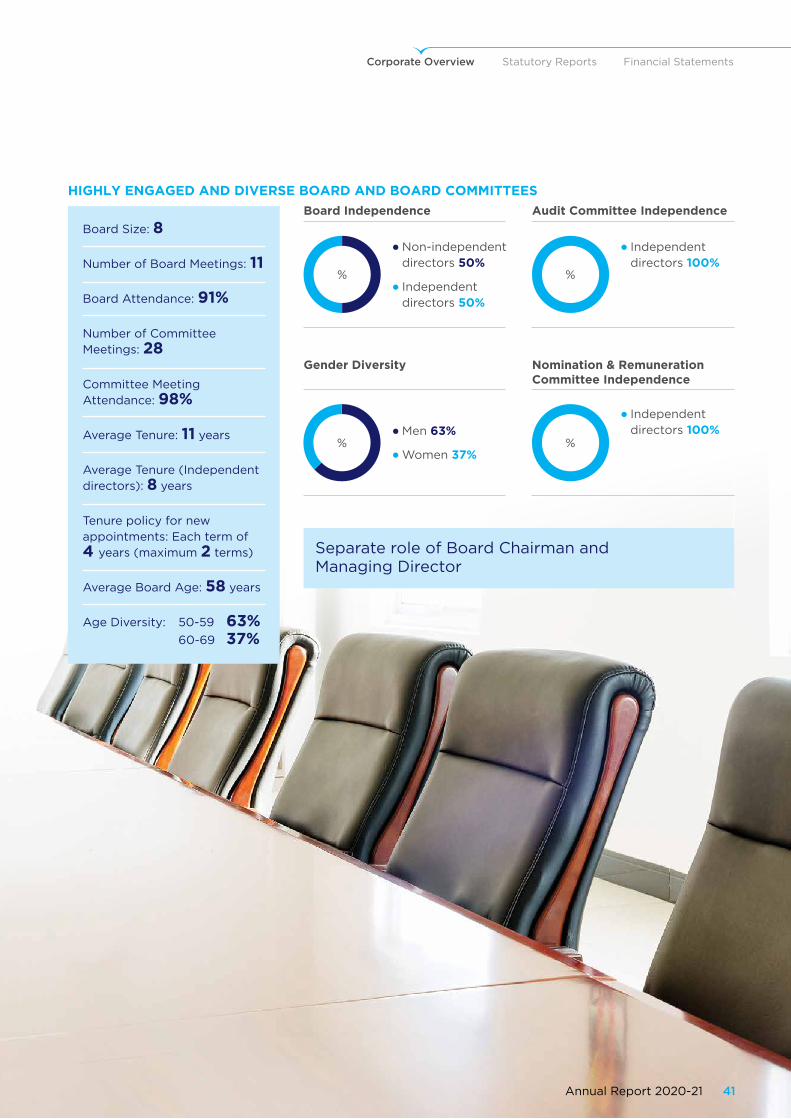
Corporate Overview Statutory Reports Financial Statements
Annual Report 2020-21 41Annual Report 2020-2140
hiGhLy enGaGeD anD DiverSe BoarD anD BoarD CoMMitteeS
Annual Report 2020-21 41
Board Size: 8
Number of Board Meetings: 11
Board Attendance: 91%
Number of Committee Meetings: 28
Committee Meeting Attendance: 98%
Average Tenure: 11 years
Average Tenure (Independent directors): 8 years
Tenure policy for new appointments: Each term of 4 years (maximum 2 terms)
Average Board Age: 58 years
Age Diversity: 50-59 63% 60-69 37%
Gender Diversity
Men 63%
Women 37%%
nomination & remuneration Committee independence
Independent directors 100%
%
Board independence
Non-independent directors 50%
Independent directors 50%
%
audit Committee independence
Independent directors 100%
%
Separate role of Board Chairman and Managing Director

Annual Report 2020-21 pbAnnual Report 2020-2142
Awards & Accolades
plant at anjar received gold award in the
7th exceed environment award 2020 under environment
preservation category at the 7th exceed environment award
2020 in manufacturing sector at the national level
plant at anjar received golden peacock
occupational health & safety award
for the year 2020
gold award in engineering sector for achievement in
sustainability by golden bird - foundation of accelerated mass empowerment (fame)
India – anjar factory
gold award under apeX India green leaf award 2019
– anjar factory
dahej pipes received best on-time performance award
from bpcl for ennore project for executing 24” lsaw pipes
fire safety champion for achievement in safety
management system by greentech foundation
– anjar factory
Annual Report 2020-2142
Corporate Overview Statutory Reports Financial Statements
Annual Report 2020-21 43Annual Report 2020-21PB
Management Discussion and Analysis
MANAGEMENT DISCUSSION AND ANALYSIS:
The Management Discussion and Analysis (MD&A) should be read in conjunction with the Audited Consolidated Financial Statements of Welspun Corp Limited (”Welspun” or “WCL” or the “Company”), and the notes thereto for the year ended 31st March 2021. This MD&A covers Welspun’s financial position and operations for FY 2020-21. Legal tender is stated in Indian Rupees unless indicated otherwise. The numbers used in the analysis are on a consolidated basis, the corresponding number for the previous year have been regrouped and reclassified wherever necessary.
FY 2020-21 was a year of unprecedented challenges. The responsibility towards our customers, employees and all other stakeholders was of paramount importance. We were successful in securing health and safety across our operations and ensuring clear communication in a volatile environment. During the year, we took several measures to not only weather the storm but to also strengthen our organization. This has enabled us to explore several new opportunities and to enter the Ductile Iron Pipes business which will increase and bring predictability to our profits. We have also built a strong ESG foundation that will make us more attractive to all our stakeholders while helping to mitigate long-term risks. Overall, the strong performance has once again demonstrated our resilience and we remain optimistic in a challenging environment.
Vipul MathurMD & CEO
FORWARD-LOOKING STATEMENT
This analysis contains forward-looking statements, which may be identified by their use of words like ‘plans’, ‘expects’, ‘will’, ‘anticipates’, ‘believes’, ‘intends’, ‘projects’, ‘estimates’ or other words of similar meaning. All statements that address expectations or projections about the future, including but not limited to statements about the Company’s strategy for growth, product development, market position, expenditures, and financial results, are forward-looking statements. Forward-looking statements are based on certain assumptions and expectations of future events. The Company assumes no responsibility to publicly amend, modify or revise any forward-looking statements, on the basis of any subsequent developments, information or events.
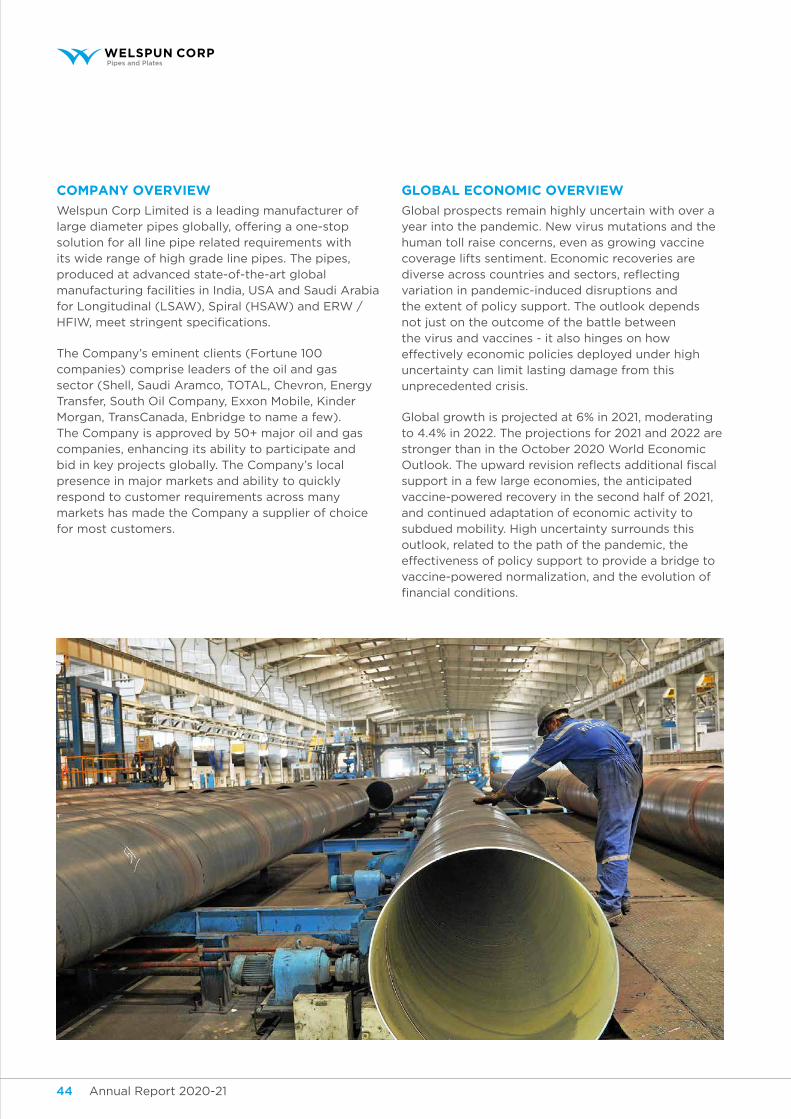
Annual Report 2020-21 45Annual Report 2020-2144
COMPANY OVERVIEW
Welspun Corp Limited is a leading manufacturer of large diameter pipes globally, offering a one-stop solution for all line pipe related requirements with its wide range of high grade line pipes. The pipes, produced at advanced state-of-the-art global manufacturing facilities in India, USA and Saudi Arabia for Longitudinal (LSAW), Spiral (HSAW) and ERW / HFIW, meet stringent specifications.
The Company’s eminent clients (Fortune 100 companies) comprise leaders of the oil and gas sector (Shell, Saudi Aramco, TOTAL, Chevron, Energy Transfer, South Oil Company, Exxon Mobile, Kinder Morgan, TransCanada, Enbridge to name a few). The Company is approved by 50+ major oil and gas companies, enhancing its ability to participate and bid in key projects globally. The Company’s local presence in major markets and ability to quickly respond to customer requirements across many markets has made the Company a supplier of choice for most customers.
GLOBAL ECONOMIC OVERVIEW
Global prospects remain highly uncertain with over a year into the pandemic. New virus mutations and the human toll raise concerns, even as growing vaccine coverage lifts sentiment. Economic recoveries are diverse across countries and sectors, reflecting variation in pandemic-induced disruptions and the extent of policy support. The outlook depends not just on the outcome of the battle between the virus and vaccines - it also hinges on how effectively economic policies deployed under high uncertainty can limit lasting damage from this unprecedented crisis.
Global growth is projected at 6% in 2021, moderating to 4.4% in 2022. The projections for 2021 and 2022 are stronger than in the October 2020 World Economic Outlook. The upward revision reflects additional fiscal support in a few large economies, the anticipated vaccine-powered recovery in the second half of 2021, and continued adaptation of economic activity to subdued mobility. High uncertainty surrounds this outlook, related to the path of the pandemic, the effectiveness of policy support to provide a bridge to vaccine-powered normalization, and the evolution of financial conditions.
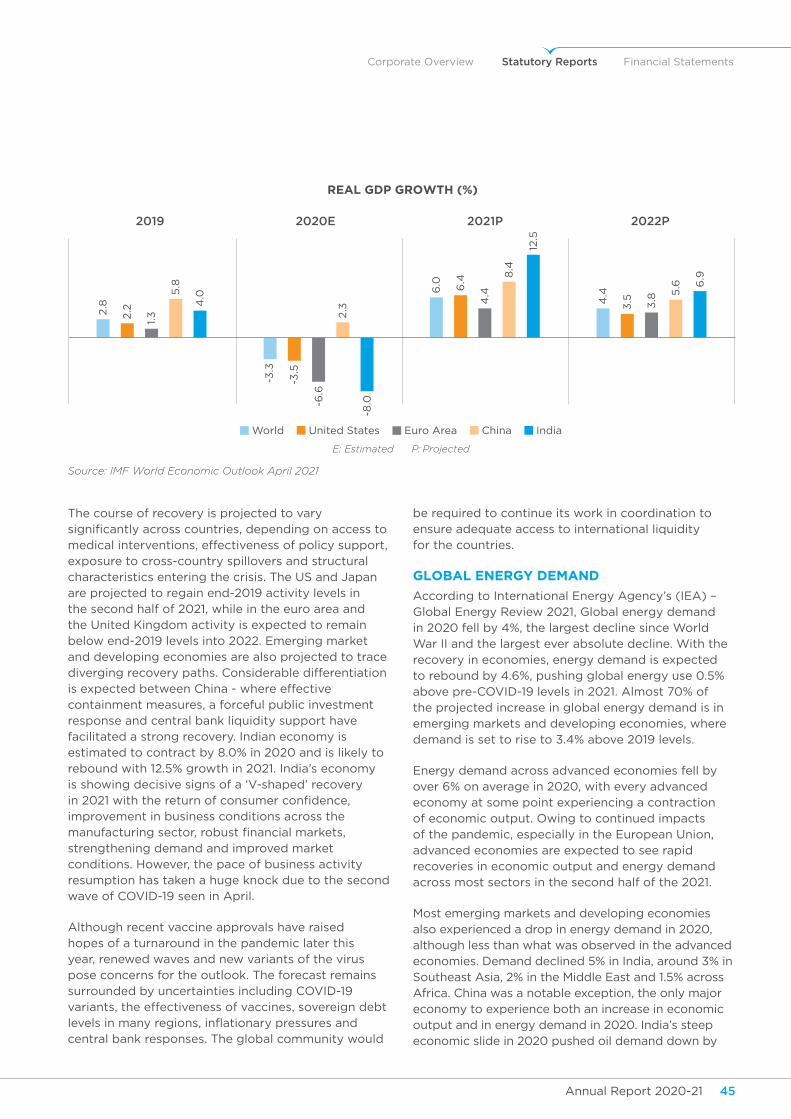
Corporate Overview Statutory Reports Financial Statements
Annual Report 2020-21 45Annual Report 2020-2144
The course of recovery is projected to vary significantly across countries, depending on access to medical interventions, effectiveness of policy support, exposure to cross-country spillovers and structural characteristics entering the crisis. The US and Japan are projected to regain end-2019 activity levels in the second half of 2021, while in the euro area and the United Kingdom activity is expected to remain below end-2019 levels into 2022. Emerging market and developing economies are also projected to trace diverging recovery paths. Considerable differentiation is expected between China - where effective containment measures, a forceful public investment response and central bank liquidity support have facilitated a strong recovery. Indian economy is estimated to contract by 8.0% in 2020 and is likely to rebound with 12.5% growth in 2021. India’s economy is showing decisive signs of a ‘V-shaped’ recovery in 2021 with the return of consumer confidence, improvement in business conditions across the manufacturing sector, robust financial markets, strengthening demand and improved market conditions. However, the pace of business activity resumption has taken a huge knock due to the second wave of COVID-19 seen in April.
Although recent vaccine approvals have raised hopes of a turnaround in the pandemic later this year, renewed waves and new variants of the virus pose concerns for the outlook. The forecast remains surrounded by uncertainties including COVID-19 variants, the effectiveness of vaccines, sovereign debt levels in many regions, inflationary pressures and central bank responses. The global community would
be required to continue its work in coordination to ensure adequate access to international liquidity for the countries.
GLOBAL ENERGY DEMAND
According to International Energy Agency’s (IEA) – Global Energy Review 2021, Global energy demand in 2020 fell by 4%, the largest decline since World War II and the largest ever absolute decline. With the recovery in economies, energy demand is expected to rebound by 4.6%, pushing global energy use 0.5% above pre-COVID-19 levels in 2021. Almost 70% of the projected increase in global energy demand is in emerging markets and developing economies, where demand is set to rise to 3.4% above 2019 levels.
Energy demand across advanced economies fell by over 6% on average in 2020, with every advanced economy at some point experiencing a contraction of economic output. Owing to continued impacts of the pandemic, especially in the European Union, advanced economies are expected to see rapid recoveries in economic output and energy demand across most sectors in the second half of the 2021.
Most emerging markets and developing economies also experienced a drop in energy demand in 2020, although less than what was observed in the advanced economies. Demand declined 5% in India, around 3% in Southeast Asia, 2% in the Middle East and 1.5% across Africa. China was a notable exception, the only major economy to experience both an increase in economic output and in energy demand in 2020. India’s steep economic slide in 2020 pushed oil demand down by
Source: IMF World Economic Outlook April 2021
World United States Euro Area China India
REAL GDP GROWTH (%)
2019 2020E 2021P 2022P
2.8
6.0
4.4
-3.3
2.2
6.4
3.5
-3.5
1.3
4.4
3.8
-6.6
5.8
8.4
5.6 6
.9
2.34
.0
12.5
-8.0
E: Estimated P: Projected
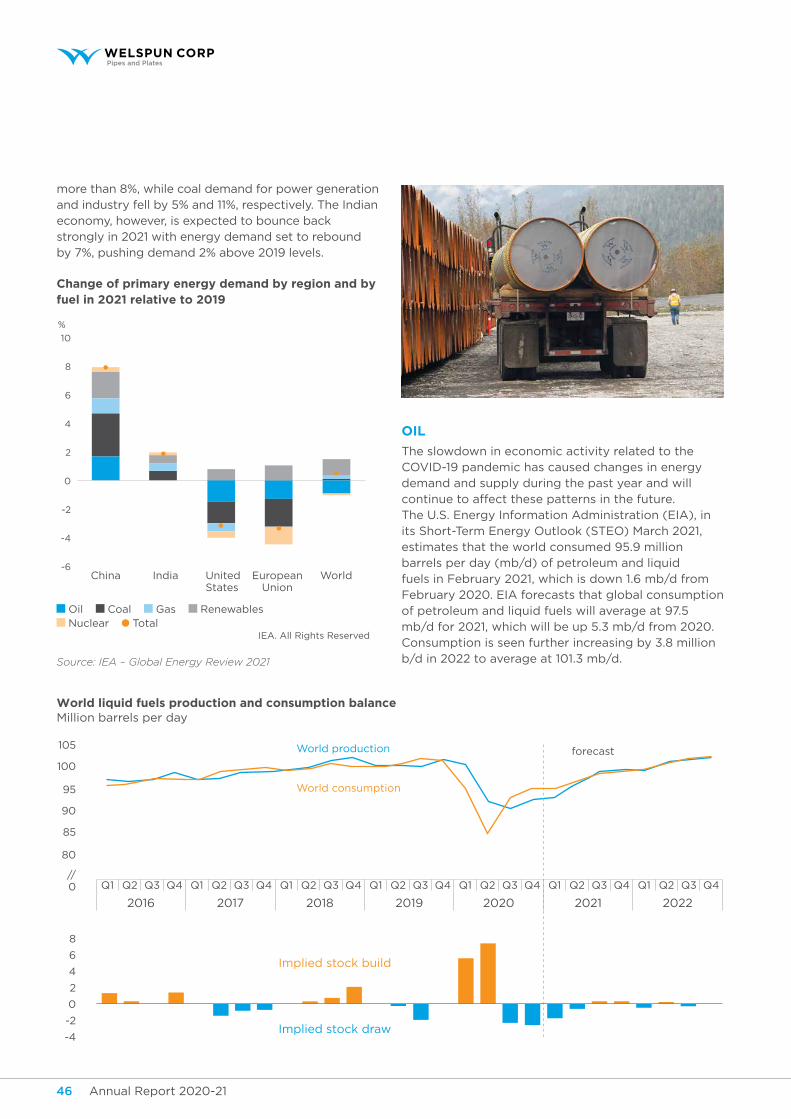
Annual Report 2020-21 47Annual Report 2020-2146
more than 8%, while coal demand for power generation and industry fell by 5% and 11%, respectively. The Indian economy, however, is expected to bounce back strongly in 2021 with energy demand set to rebound by 7%, pushing demand 2% above 2019 levels.
Change of primary energy demand by region and by fuel in 2021 relative to 2019
Source: IEA – Global Energy Review 2021
OIL
The slowdown in economic activity related to the COVID-19 pandemic has caused changes in energy demand and supply during the past year and will continue to affect these patterns in the future. The U.S. Energy Information Administration (EIA), in its Short-Term Energy Outlook (STEO) March 2021, estimates that the world consumed 95.9 million barrels per day (mb/d) of petroleum and liquid fuels in February 2021, which is down 1.6 mb/d from February 2020. EIA forecasts that global consumption of petroleum and liquid fuels will average at 97.5 mb/d for 2021, which will be up 5.3 mb/d from 2020. Consumption is seen further increasing by 3.8 million b/d in 2022 to average at 101.3 mb/d.
Oil Coal Gas Renewables Nuclear Total
IEA. All Rights Reserved
10
8
6
4
2
0
-2
-4
-6WorldUnited
StatesEuropean
UnionIndiaChina
%
Implied stock build
Implied stock draw
Q1 Q2 Q3 Q4 Q1 Q2 Q3 Q4 Q1 Q2 Q3 Q4 Q1 Q2 Q3 Q4 Q1 Q2 Q3 Q4 Q1 Q2 Q3 Q4 Q1 Q2 Q3 Q4
2016 2017 2018 2019 2020 2021 2022
105
100
95
90
85
80
//0
8
6
4
2
0
-2
-4
World liquid fuels production and consumption balanceMillion barrels per day
World production
World consumption
forecast
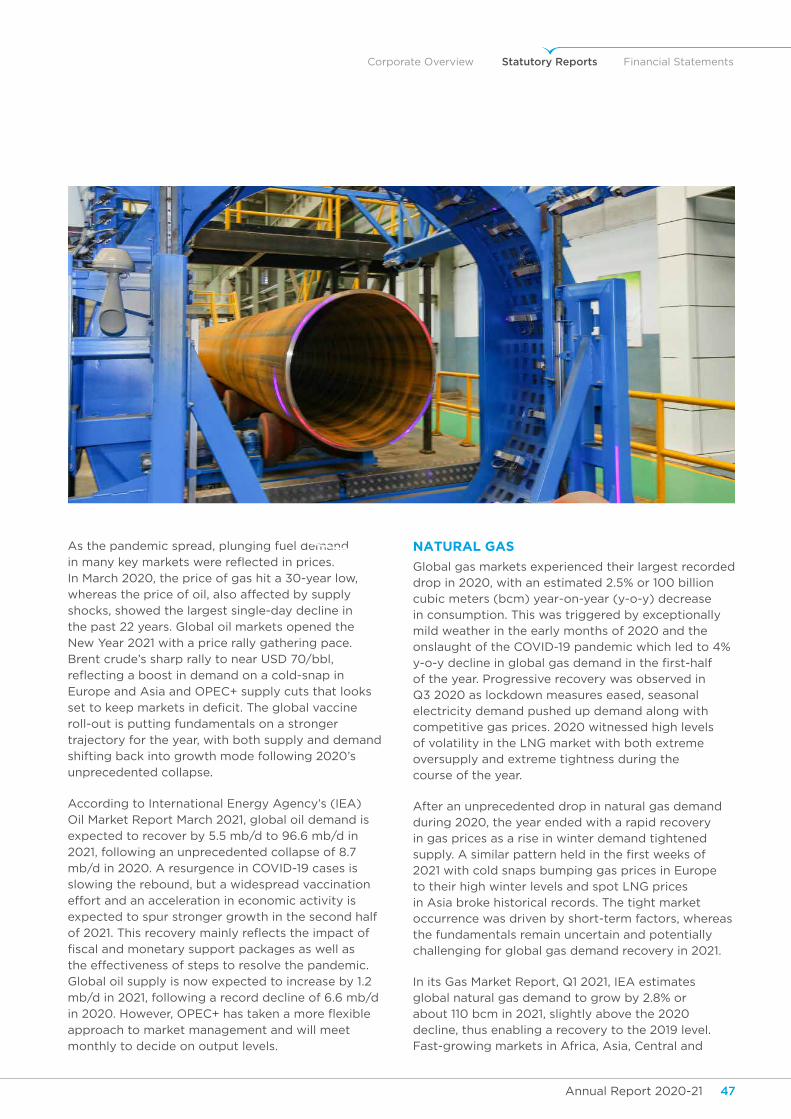
Corporate Overview Statutory Reports Financial Statements
Annual Report 2020-21 47Annual Report 2020-2146
As the pandemic spread, plunging fuel demand
in many key markets were reflected in prices.
In March 2020, the price of gas hit a 30-year low,
whereas the price of oil, also affected by supply
shocks, showed the largest single-day decline in
the past 22 years. Global oil markets opened the
New Year 2021 with a price rally gathering pace.
Brent crude’s sharp rally to near USD 70/bbl,
reflecting a boost in demand on a cold-snap in
Europe and Asia and OPEC+ supply cuts that looks
set to keep markets in deficit. The global vaccine
roll-out is putting fundamentals on a stronger
trajectory for the year, with both supply and demand
shifting back into growth mode following 2020’s
unprecedented collapse.
According to International Energy Agency’s (IEA)
Oil Market Report March 2021, global oil demand is
expected to recover by 5.5 mb/d to 96.6 mb/d in
2021, following an unprecedented collapse of 8.7
mb/d in 2020. A resurgence in COVID-19 cases is
slowing the rebound, but a widespread vaccination
effort and an acceleration in economic activity is
expected to spur stronger growth in the second half
of 2021. This recovery mainly reflects the impact of
fiscal and monetary support packages as well as
the effectiveness of steps to resolve the pandemic.
Global oil supply is now expected to increase by 1.2
mb/d in 2021, following a record decline of 6.6 mb/d
in 2020. However, OPEC+ has taken a more flexible
approach to market management and will meet
monthly to decide on output levels.
NATURAL GAS
Global gas markets experienced their largest recorded drop in 2020, with an estimated 2.5% or 100 billion cubic meters (bcm) year-on-year (y-o-y) decrease in consumption. This was triggered by exceptionally mild weather in the early months of 2020 and the onslaught of the COVID-19 pandemic which led to 4% y-o-y decline in global gas demand in the first-half of the year. Progressive recovery was observed in Q3 2020 as lockdown measures eased, seasonal electricity demand pushed up demand along with competitive gas prices. 2020 witnessed high levels of volatility in the LNG market with both extreme oversupply and extreme tightness during the course of the year.
After an unprecedented drop in natural gas demand during 2020, the year ended with a rapid recovery in gas prices as a rise in winter demand tightened supply. A similar pattern held in the first weeks of 2021 with cold snaps bumping gas prices in Europe to their high winter levels and spot LNG prices in Asia broke historical records. The tight market occurrence was driven by short-term factors, whereas the fundamentals remain uncertain and potentially challenging for global gas demand recovery in 2021.
In its Gas Market Report, Q1 2021, IEA estimates global natural gas demand to grow by 2.8% or about 110 bcm in 2021, slightly above the 2020 decline, thus enabling a recovery to the 2019 level. Fast-growing markets in Africa, Asia, Central and
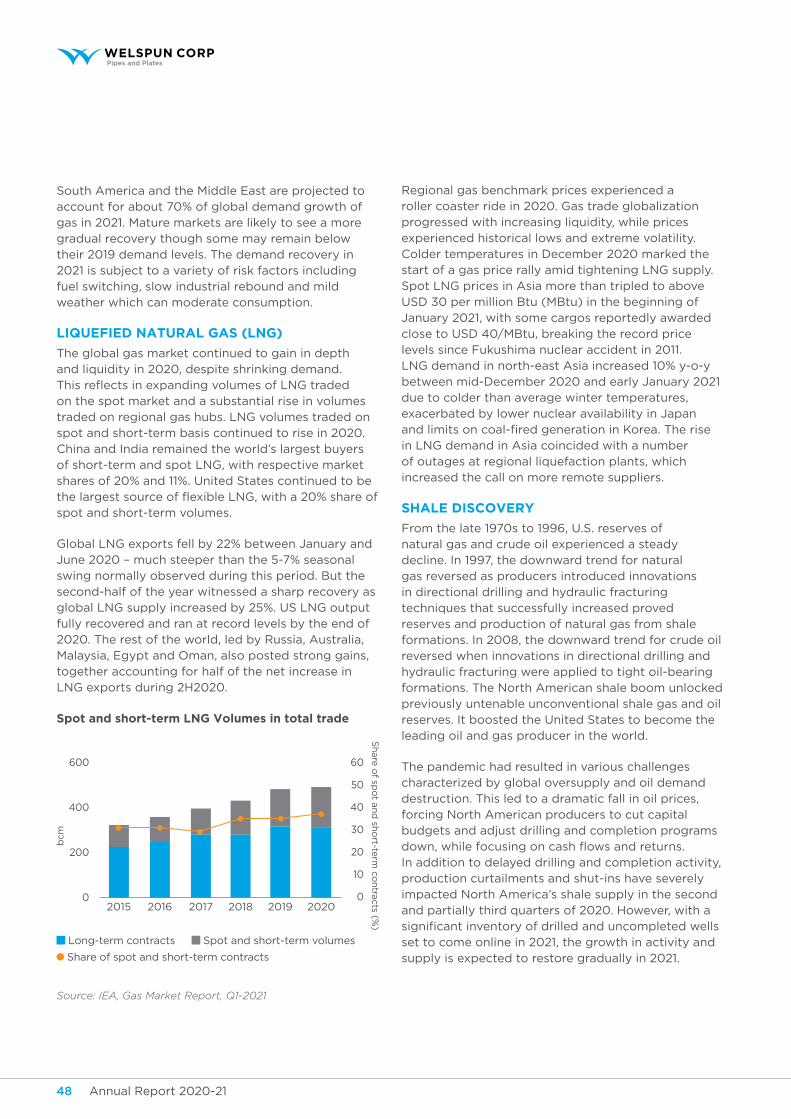
Annual Report 2020-21 49Annual Report 2020-2148
South America and the Middle East are projected to account for about 70% of global demand growth of gas in 2021. Mature markets are likely to see a more gradual recovery though some may remain below their 2019 demand levels. The demand recovery in 2021 is subject to a variety of risk factors including fuel switching, slow industrial rebound and mild weather which can moderate consumption.
LIQUEFIED NATURAL GAS (LNG)
The global gas market continued to gain in depth and liquidity in 2020, despite shrinking demand. This reflects in expanding volumes of LNG traded on the spot market and a substantial rise in volumes traded on regional gas hubs. LNG volumes traded on spot and short-term basis continued to rise in 2020. China and India remained the world’s largest buyers of short-term and spot LNG, with respective market shares of 20% and 11%. United States continued to be the largest source of flexible LNG, with a 20% share of spot and short-term volumes.
Global LNG exports fell by 22% between January and June 2020 – much steeper than the 5-7% seasonal swing normally observed during this period. But the second-half of the year witnessed a sharp recovery as global LNG supply increased by 25%. US LNG output fully recovered and ran at record levels by the end of 2020. The rest of the world, led by Russia, Australia, Malaysia, Egypt and Oman, also posted strong gains, together accounting for half of the net increase in LNG exports during 2H2020.
Spot and short-term LNG Volumes in total trade
Source: IEA, Gas Market Report, Q1-2021
Regional gas benchmark prices experienced a roller coaster ride in 2020. Gas trade globalization progressed with increasing liquidity, while prices experienced historical lows and extreme volatility. Colder temperatures in December 2020 marked the start of a gas price rally amid tightening LNG supply. Spot LNG prices in Asia more than tripled to above USD 30 per million Btu (MBtu) in the beginning of January 2021, with some cargos reportedly awarded close to USD 40/MBtu, breaking the record price levels since Fukushima nuclear accident in 2011. LNG demand in north-east Asia increased 10% y-o-y between mid-December 2020 and early January 2021 due to colder than average winter temperatures, exacerbated by lower nuclear availability in Japan and limits on coal-fired generation in Korea. The rise in LNG demand in Asia coincided with a number of outages at regional liquefaction plants, which increased the call on more remote suppliers.
SHALE DISCOVERY
From the late 1970s to 1996, U.S. reserves of natural gas and crude oil experienced a steady decline. In 1997, the downward trend for natural gas reversed as producers introduced innovations in directional drilling and hydraulic fracturing techniques that successfully increased proved reserves and production of natural gas from shale formations. In 2008, the downward trend for crude oil reversed when innovations in directional drilling and hydraulic fracturing were applied to tight oil-bearing formations. The North American shale boom unlocked previously untenable unconventional shale gas and oil reserves. It boosted the United States to become the leading oil and gas producer in the world.
The pandemic had resulted in various challenges characterized by global oversupply and oil demand destruction. This led to a dramatic fall in oil prices, forcing North American producers to cut capital budgets and adjust drilling and completion programs down, while focusing on cash flows and returns. In addition to delayed drilling and completion activity, production curtailments and shut-ins have severely impacted North America’s shale supply in the second and partially third quarters of 2020. However, with a significant inventory of drilled and uncompleted wells set to come online in 2021, the growth in activity and supply is expected to restore gradually in 2021.
Long-term contracts Spot and short-term volumes
Share of spot and short-term contracts
Sh
are
of sp
ot a
nd
sho
rt-term
con
tracts (%
)
bcm
2015 2016 2017 2018
600
400
200
02019 2020
60
50
40
30
20
10
0
Corporate Overview Statutory Reports Financial Statements
Annual Report 2020-21 49Annual Report 2020-2148
OIL AND GAS IN INDIA
India is the world’s third-largest energy consuming country, and its economic growth is closely related to energy demand. Energy use in India has doubled since 2000, with 80% of the demand still being met by coal, oil and solid biomass. India is the 3rd largest importer of crude and has limited crude oil reserves in the country. Changes in crude oil prices and global demand-supply directly affects the Indian economy. Fields operated by National Oil Companies (NOCs) have contributed around 76% of the total domestic crude oil production, whilst private companies have undertaken the remaining 24% production during FY 2020-21.
Crude oil
Domestic crude oil production fell by 5.3% during FY 2020-21 to 30.5 million metric tons (MMT), compared with 5.8% de-growth achieved during FY 2019-20. Onshore fields constituted around 49.5% of the total
crude oil production and the remaining 50.5% has been produced by offshore fields. Continuous decline in domestic production is mainly attributed to the aging of existing fields and muted response from the industry to take up new projects, mainly due to lack of adequate incentives. Technical mishaps due to COVID-19 implications, reservoir issues and shut-in of wells and delays in field development activities have led to fall in production in FY 2020-21.
India imported 198 MMT of crude oil during FY 2020-21, compared with the 227 MMT in FY 2019-20, a fall of 12.7% due to fall in demand of petro-products. Crude oil was imported mainly from Iraq, Saudi Arabia, Kuwait and UAE. Region-wise, imports from Middle East contributed 61.4%, Africa 14.1%, North America 12.3%, South America 5.7%, Eurasia 3.9%, Europe 0.3% and Australia 0.1%. With the roll-out of vaccine and subsequent inoculation drives undertaken by the Government, the need for fuel is expected to rise, thereby leading to an increase in crude oil demand.
Domestic Production, Consumption and Imports of Crude Oil (Unit: MMT)
Change (y-o-y)FY19 FY20 FY21 FY20 FY21
Production 34.2 32.2 30.5 -5.8% -5.3%Imports 226.5 227.0 198.1 0.2% -12.7%Consumption / Crude Processed 257.2 254.4 221.8 -1.1% -12.8%
Source: PPAC - Snapshot of India’s Oil & Gas data - April 2021
Natural gas
Natural gas is primarily sourced from KG-D6, Mumbai Offshore, Cambay Basin, Ravva Offshore, KG Basin, Cauvery Basin and through imports of LNG. Domestic natural gas production declined sharply by 8.2% during FY 2020-21, compared with 5.6% decrease registered during FY 2019-20. Fall in production is mainly due to restricted gas offtake by consumers due to the ongoing COVID-19 situation. NOCs have contributed around 85% of the total domestic output, whereas Production Sharing Contract (PSC) fields contributed the remaining around 15%.
Consumption of natural gas fell by 5.5% on a y-o-y basis during FY 2020-21. Fertilizer and power sectors are the largest consumers of natural gas consuming ~51% of total gas available in India. City Gas Distribution
(CGD) consumed ~16% of total gas, followed by refining with 14% and other industries at 18%.
Cumulative imports of natural gas in the form of LNG declined 3.0% during FY 2020-21 to 32,861 million metric standard cubic meters (mmscm). India imported LNG from Qatar, Nigeria, UAE and Nigeria during the year. Having declined 36% MoM to 61 million standard cubic meters per day (mmscmd) in April 2020, low prices and recovery in industrial activity drove up LNG consumption in India by ~69% to 103 mmscmd in October 2020. A rise in LNG prices curtailed monthly LNG consumption between Oct 2020–Jan 2021 by ~12% to 91 mmscmd (+3% YoY). With LNG prices projected to head down over the next few quarters, LNG consumption is expected to rise again in FY 2021-22.
Domestic Production, Consumption and Imports of Natural Gas (Unit: MMSCM)
Change (y-o-y)FY19 FY20 FY21 (P) FY20 FY21
Production 32,058 30,257 27,785 -5.6% -8.2%Imports 28,740 33,887 32,861 17.9% -3.0%Consumption 60,798 64,144 60,646 5.5% -5.5%
Source: PPAC - Snapshot of India’s Oil & Gas data - April 2021 P: Projected
Annual Report 2020-21 51Annual Report 2020-2150
Infrastructure
As of 1st May 2021, India had 10,419 kms of crude pipeline, with a capacity of 147.9 million metric tons per annum (mmtpa). In terms of length, Indian Oil Corporation Limited (IOCL) accounts for 50.8% or 5,301 kms of India’s crude pipeline network.
Major crude oil pipeline network as on 1st May 2021
ONGC OIL Cairn HMEL IOCL BPCL Total
Length (KM) 1,283 1,193 688 1,107 5,301 937 10,419
Capacity (MMTPA) 60.6 9 10.7 11.3 48.6 7.8 147.9
Source: PPAC - Snapshot of India’s Oil & Gas data - April 2021
Gas pipeline grid determines the structure of the gas market and its development. Therefore, an interconnected National Gas Grid has been envisaged to ensure adequate availability and equitable distribution of natural gas in all parts of the country. At present, there are Natural Gas pipelines of about 17,016 km operational in the country. In order to make natural gas available across India, additional pipelines are under construction to complete the National Gas Grid. This will ensure easy availability of natural gas across all regions and potentially help in achieving uniform economic and social progress. In November 2020, oil regulator Petroleum and Natural Gas Regulatory Board (PNGRB) simplified the country’s gas pipeline tariff structure to make fuel more affordable for distant users and attract investment for building gas infrastructure.
As of December 2020, the total authorized length of natural gas pipelines is 32,559 km, of which 15,543 km is under construction. Union Budget FY 2020-21 and FY 2021-22 contained announcements to increase the use of natural gas including: (i) expansion of national gas grid to 27,000 km (Budget FY 2020-21), (ii) addition of 100 districts to the city gas distribution network, and (iii) setting up an independent gas transport system operator to facilitate booking of common carrier capacity in natural gas pipelines.
Major natural gas pipeline network (Km) as on 31st December 2020
GAIL GSPL PIL IOCL AGCL RGPL GGL DFPCL ONGC GIGL GITL Others Total
Operational
Length 8,241 2,265 1,460 132 105 312 73 42 24 - - - 12,654
Capacity 171.6 43 85 20 2.4 3.5 5.1 0.7 6 - - - 337.3
Partially Commissioned#
Length 3,643 - - 23 - - - - - 442 364 - 4,472
Total Operating
Length 11,884 2,265 1,460 155 105 312 73 42 24 442 364 - 17,216
Under Construction
Length 6,242 - - 1,398 - - - - - 2,335 1,678 3,780 15,433
Capacity 23.2 - - - 157.7 -
Overall Total
Length 18,126 2,265 1,460 1,553 105 312 73 42 24 2,777 2,042 3,780 32,559
Source: PPAC - Snapshot of India’s Oil & Gas data - April 2021
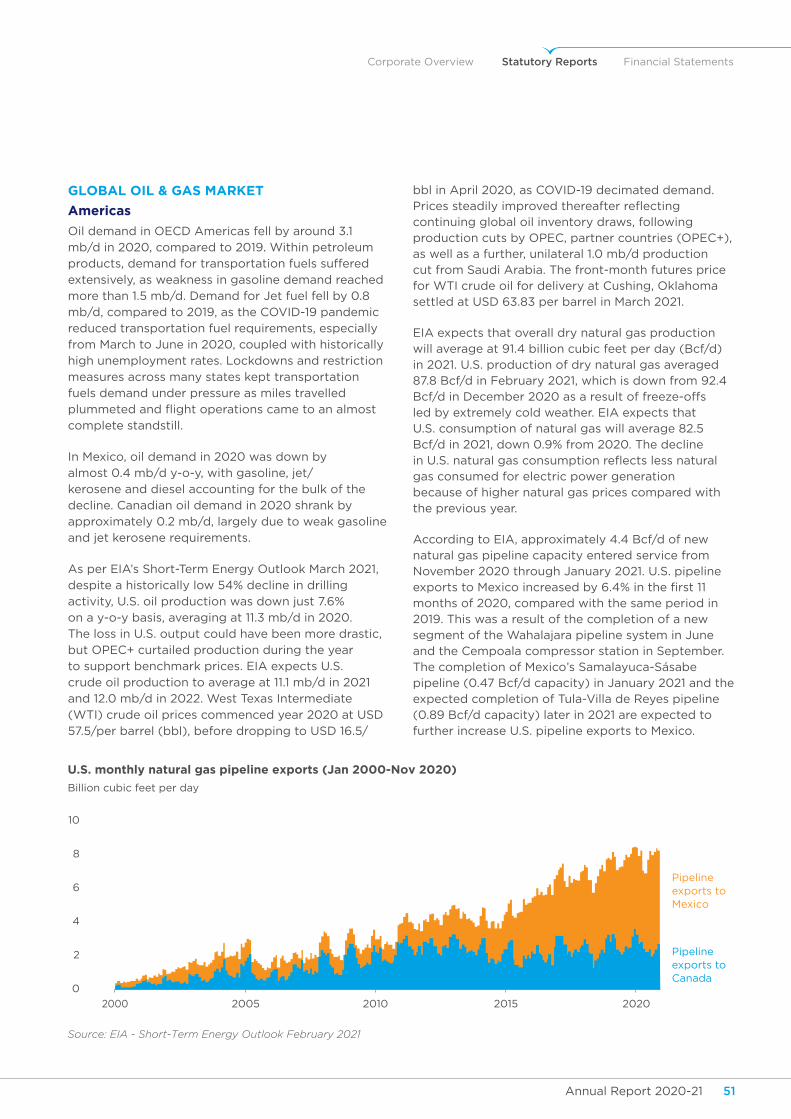
Corporate Overview Statutory Reports Financial Statements
Annual Report 2020-21 51Annual Report 2020-2150
GLOBAL OIL & GAS MARKET
Americas
Oil demand in OECD Americas fell by around 3.1
mb/d in 2020, compared to 2019. Within petroleum
products, demand for transportation fuels suffered
extensively, as weakness in gasoline demand reached
more than 1.5 mb/d. Demand for Jet fuel fell by 0.8
mb/d, compared to 2019, as the COVID-19 pandemic
reduced transportation fuel requirements, especially
from March to June in 2020, coupled with historically
high unemployment rates. Lockdowns and restriction
measures across many states kept transportation
fuels demand under pressure as miles travelled
plummeted and flight operations came to an almost
complete standstill.
In Mexico, oil demand in 2020 was down by
almost 0.4 mb/d y-o-y, with gasoline, jet/
kerosene and diesel accounting for the bulk of the
decline. Canadian oil demand in 2020 shrank by
approximately 0.2 mb/d, largely due to weak gasoline
and jet kerosene requirements.
As per EIA’s Short-Term Energy Outlook March 2021,
despite a historically low 54% decline in drilling
activity, U.S. oil production was down just 7.6%
on a y-o-y basis, averaging at 11.3 mb/d in 2020.
The loss in U.S. output could have been more drastic,
but OPEC+ curtailed production during the year
to support benchmark prices. EIA expects U.S.
crude oil production to average at 11.1 mb/d in 2021
and 12.0 mb/d in 2022. West Texas Intermediate
(WTI) crude oil prices commenced year 2020 at USD
57.5/per barrel (bbl), before dropping to USD 16.5/
bbl in April 2020, as COVID-19 decimated demand. Prices steadily improved thereafter reflecting continuing global oil inventory draws, following production cuts by OPEC, partner countries (OPEC+), as well as a further, unilateral 1.0 mb/d production cut from Saudi Arabia. The front-month futures price for WTI crude oil for delivery at Cushing, Oklahoma settled at USD 63.83 per barrel in March 2021.
EIA expects that overall dry natural gas production will average at 91.4 billion cubic feet per day (Bcf/d) in 2021. U.S. production of dry natural gas averaged 87.8 Bcf/d in February 2021, which is down from 92.4 Bcf/d in December 2020 as a result of freeze-offs led by extremely cold weather. EIA expects that U.S. consumption of natural gas will average 82.5 Bcf/d in 2021, down 0.9% from 2020. The decline in U.S. natural gas consumption reflects less natural gas consumed for electric power generation because of higher natural gas prices compared with the previous year.
According to EIA, approximately 4.4 Bcf/d of new natural gas pipeline capacity entered service from November 2020 through January 2021. U.S. pipeline exports to Mexico increased by 6.4% in the first 11 months of 2020, compared with the same period in 2019. This was a result of the completion of a new segment of the Wahalajara pipeline system in June and the Cempoala compressor station in September. The completion of Mexico’s Samalayuca-Sásabe pipeline (0.47 Bcf/d capacity) in January 2021 and the expected completion of Tula-Villa de Reyes pipeline (0.89 Bcf/d capacity) later in 2021 are expected to further increase U.S. pipeline exports to Mexico.
Source: EIA - Short-Term Energy Outlook February 2021
Pipeline exports to Mexico
Pipeline exports to Canada
U.S. monthly natural gas pipeline exports (Jan 2000-Nov 2020)
Billion cubic feet per day
10
8
6
4
2
0
2000 2005 2010 2015 2020
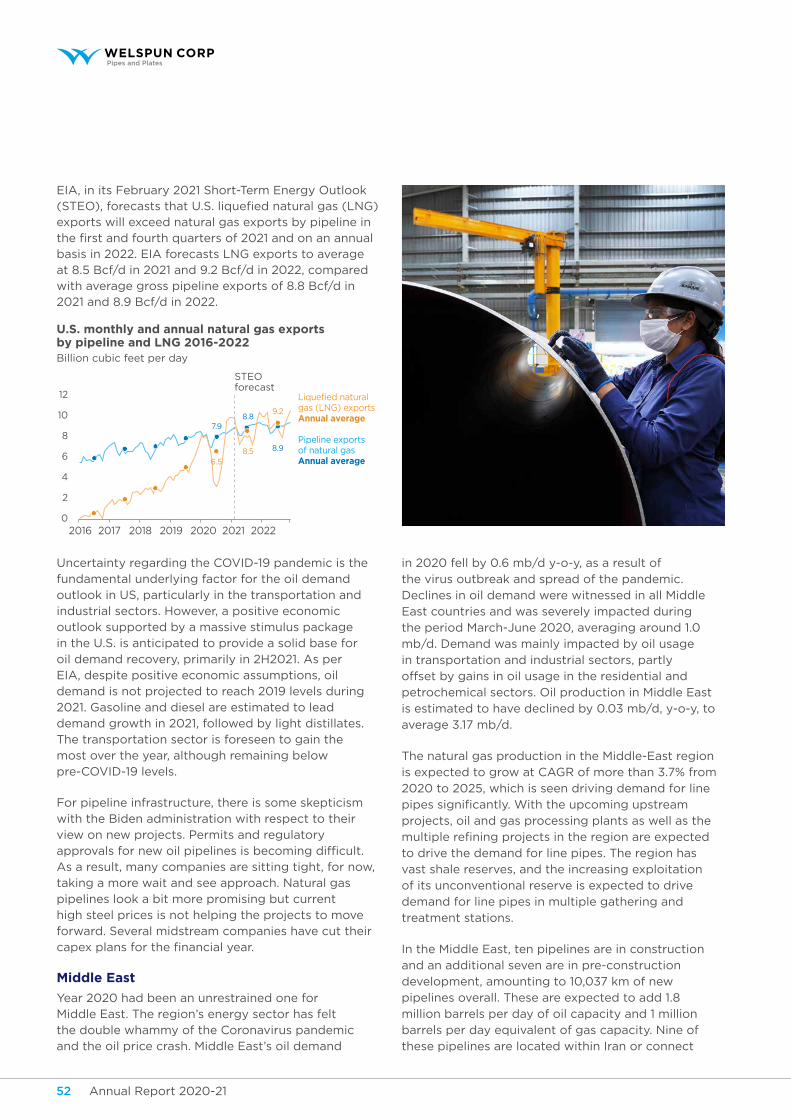
Annual Report 2020-21 53Annual Report 2020-2152
Uncertainty regarding the COVID-19 pandemic is the fundamental underlying factor for the oil demand outlook in US, particularly in the transportation and industrial sectors. However, a positive economic outlook supported by a massive stimulus package in the U.S. is anticipated to provide a solid base for oil demand recovery, primarily in 2H2021. As per EIA, despite positive economic assumptions, oil demand is not projected to reach 2019 levels during 2021. Gasoline and diesel are estimated to lead demand growth in 2021, followed by light distillates. The transportation sector is foreseen to gain the most over the year, although remaining below pre-COVID-19 levels.
For pipeline infrastructure, there is some skepticism with the Biden administration with respect to their view on new projects. Permits and regulatory approvals for new oil pipelines is becoming difficult. As a result, many companies are sitting tight, for now, taking a more wait and see approach. Natural gas pipelines look a bit more promising but current high steel prices is not helping the projects to move forward. Several midstream companies have cut their capex plans for the financial year.
Middle East
Year 2020 had been an unrestrained one for Middle East. The region’s energy sector has felt the double whammy of the Coronavirus pandemic and the oil price crash. Middle East’s oil demand
in 2020 fell by 0.6 mb/d y-o-y, as a result of
the virus outbreak and spread of the pandemic.
Declines in oil demand were witnessed in all Middle
East countries and was severely impacted during
the period March-June 2020, averaging around 1.0
mb/d. Demand was mainly impacted by oil usage
in transportation and industrial sectors, partly
offset by gains in oil usage in the residential and
petrochemical sectors. Oil production in Middle East
is estimated to have declined by 0.03 mb/d, y-o-y, to
average 3.17 mb/d.
The natural gas production in the Middle-East region
is expected to grow at CAGR of more than 3.7% from
2020 to 2025, which is seen driving demand for line
pipes significantly. With the upcoming upstream
projects, oil and gas processing plants as well as the
multiple refining projects in the region are expected
to drive the demand for line pipes. The region has
vast shale reserves, and the increasing exploitation
of its unconventional reserve is expected to drive
demand for line pipes in multiple gathering and
treatment stations.
In the Middle East, ten pipelines are in construction
and an additional seven are in pre-construction
development, amounting to 10,037 km of new
pipelines overall. These are expected to add 1.8
million barrels per day of oil capacity and 1 million
barrels per day equivalent of gas capacity. Nine of
these pipelines are located within Iran or connect
Liquefied natural gas (LNG) exportsAnnual average
Pipeline exports of natural gas Annual average
U.S. monthly and annual natural gas exportsby pipeline and LNG 2016-2022 Billion cubic feet per day
2016
12
10
8
6
4
2
02017 2018
7.9
2019 2020 2021 2022
STEO forecast
6.58.5 8.9
9.28.8
EIA, in its February 2021 Short-Term Energy Outlook (STEO), forecasts that U.S. liquefied natural gas (LNG) exports will exceed natural gas exports by pipeline in the first and fourth quarters of 2021 and on an annual basis in 2022. EIA forecasts LNG exports to average at 8.5 Bcf/d in 2021 and 9.2 Bcf/d in 2022, compared with average gross pipeline exports of 8.8 Bcf/d in 2021 and 8.9 Bcf/d in 2022.
Corporate Overview Statutory Reports Financial Statements
Annual Report 2020-21 53Annual Report 2020-2152
Iran to its neighboring countries. Among the most
significant projects under development are the
IGAT 9 gas pipeline, connecting Azerbaijan to the
Persian Gulf and the Iran-Pakistan gas pipeline, also
known as the Peace Pipeline. Construction of IGAT
9 gas pipeline has been completed and operations
are expected to begin in 2022. The Pakistan
portion of the Iran-Pakistan gas pipeline has been
completed, while the Iran portion has been delayed
by U.S. economic sanctions. In Oman, three major
pipelines are in construction: Oman Main Line–Ras
Markaz oil pipeline, Fahud-Sohard gas pipeline, and
Fahud-Sohard NGL pipeline.
Saudi Aramco plans to produce 0.65 bcm of
natural gas per day by 2028. It is expected to
target unconventional gas reserves in North Arabia,
the South Ghawar, and the Jafurah Basin, East of
Ghawar. Saudi Aramco and Saudi Basic Industries
Corp (SABIC) are planning to set up a joint oil-to-
chemicals project to produce chemicals and base oils
directly from 20 million tons per annum of crude oil.
It is expected that the facility will be completed by
2028 and is likely to witness significant application
of line pipes. With upgradation and expansion
projects in refineries like SASREF, Petro Rabigh, and
Jubail and launching of Jizan refinery, deployment
of line pipes in Saudi Arabia is expected to increase
considerably. Saudi Aramco has also issued tenders
for development work at the offshore Zuluf oilfield as
well as work on the expansion of two other offshore
oilfields, Marjan and Berri.
Source: Report on Middle-East Oil and Gas Line
Pipe Market - Growth, Trends, COVID-19 Impact and
forecasts (2021 - 2026), Pipeline Bubble 2021 Report
by Global Energy Monitor
Africa Region
Africa contributes approximately 20% of global
oil discoveries between 2011 and 2014, along with
nearly 50% of global gas discoveries between 2011
and 2018. The East African states of Kenya, Tanzania,
Mozambique and Uganda now make up one of the
world’s top hydrocarbon hotspots. Most notable
western and Chinese oil and gas majors are lining up
to produce and transport the region’s reserves for
ultimate shipping to international markets across the
Indian Ocean. One important pipeline development
is the Uganda-Tanzania crude oil pipeline. It is a
proposed USD 3.5 billion, 1,444-km pipeline which will
have the capacity to transport 216,000 barrels of oil
a day from Uganda’s Albertine Graben oilfields to the
Tanzanian port of Tanga for shipment to international
markets. After several years of protracted negotiations, the agreement was executed on the pipeline’s construction in September 2020.
Source: Pipeline Bubble 2021 Report by Global Energy Monitor, S&P Global
Australia
Australia is the world’s largest exporter of liquefied natural gas and has an extensive pipeline network all over the country. Its gas pipeline capacity dominates the landscape relative to the oil pipelines. The National COVID-19 Commission (NCC) recommended that the Australian government should dramatically increase spending for new pipelines, gas hubs, and other gas infrastructure, as a part of a “gas-fired recovery” promised by Prime Minister Scott Morrison. Among the projects targeted for government support is the proposed Queensland Hunter gas pipeline, which will cost an estimated AUD 1.2 billion and run from the Wallumbilla gas hub in Queensland to Newcastle, South Wales.
According to S&P Global Ratings, Australia had around 44 LNG projects worth around AUD 130 billion-AUD 152 billion in pipeline. The largest of these mega projects is Woodside Energy’s Browse to North West Shelf gas/LNG project, and others include Woodside’s ‘Scarborough to Pluto’ project on the west coast and Arrow Energy’s Surat gas project on the east coast.
In March 2021 Australian oil and gas company Santos announced a final investment decision (FID) to proceed with the USD 3.6 billion gas and condensate project, located offshore the Northern Territory, Australia. The Barossa development will comprise a BW Offshore supplied FPSO, subsea production wells, supporting subsea infrastructure and a gas export pipeline tied into the existing Bayu-Undan to Darwin LNG pipeline. First gas production is targeted for the first half of 2025.
A significant increase in the production of gas is expected to be the most prominent driver for investment in the gas pipeline and storage infrastructure in the near future. 2021 is shaping up to be the most important year in Australian upstream investment in over a decade with Barossa being the single largest upstream project to be sanctioned since 2012. Woodside is also targeting Pluto T2 and Scarborough FID in H2, and Chevron is aiming to sanction additional subsea spend at Gorgon LNG. Investment in the sector and increase in production of oil and gas is likely to contribute to the rise in the growth of the pipelines infrastructure.
Source: Pipeline Bubble 2021 Report by Global Energy Monitor
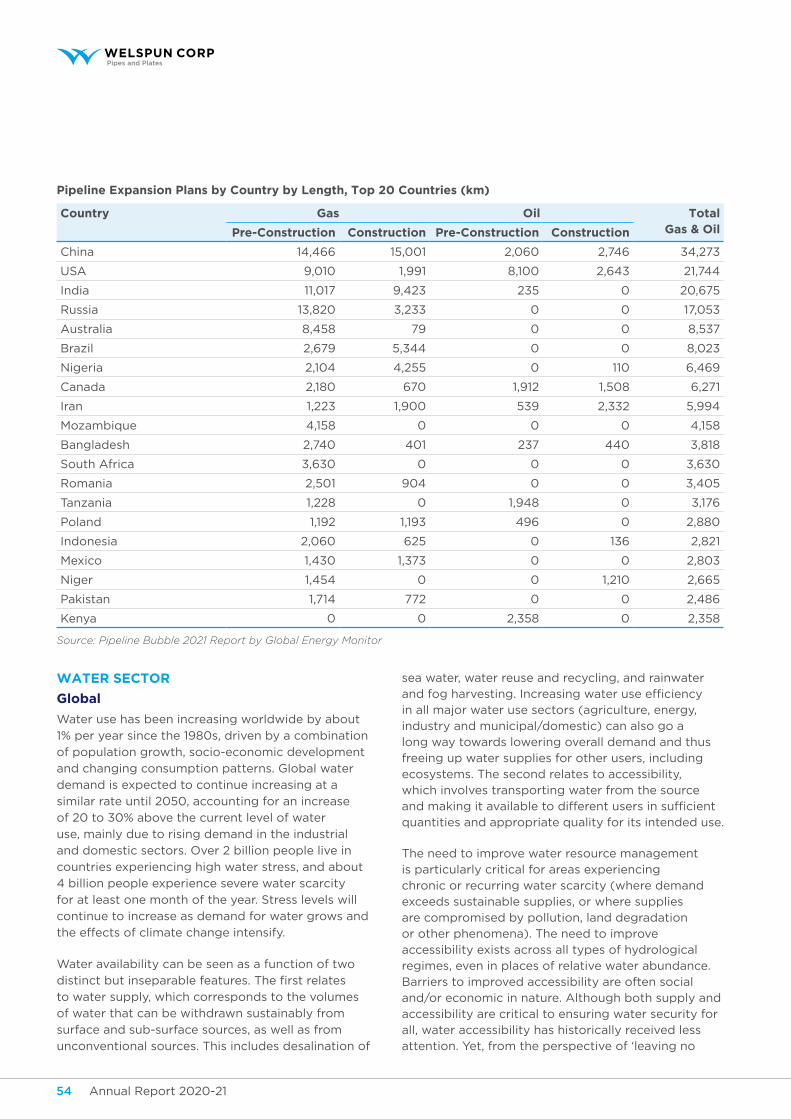
Annual Report 2020-21 55Annual Report 2020-2154
Pipeline Expansion Plans by Country by Length, Top 20 Countries (km)
Country Gas Oil Total Gas & OilPre-Construction Construction Pre-Construction Construction
China 14,466 15,001 2,060 2,746 34,273
USA 9,010 1,991 8,100 2,643 21,744
India 11,017 9,423 235 0 20,675
Russia 13,820 3,233 0 0 17,053
Australia 8,458 79 0 0 8,537
Brazil 2,679 5,344 0 0 8,023
Nigeria 2,104 4,255 0 110 6,469
Canada 2,180 670 1,912 1,508 6,271
Iran 1,223 1,900 539 2,332 5,994
Mozambique 4,158 0 0 0 4,158
Bangladesh 2,740 401 237 440 3,818
South Africa 3,630 0 0 0 3,630
Romania 2,501 904 0 0 3,405
Tanzania 1,228 0 1,948 0 3,176
Poland 1,192 1,193 496 0 2,880
Indonesia 2,060 625 0 136 2,821
Mexico 1,430 1,373 0 0 2,803
Niger 1,454 0 0 1,210 2,665
Pakistan 1,714 772 0 0 2,486
Kenya 0 0 2,358 0 2,358
Source: Pipeline Bubble 2021 Report by Global Energy Monitor
WATER SECTOR
Global
Water use has been increasing worldwide by about
1% per year since the 1980s, driven by a combination
of population growth, socio-economic development
and changing consumption patterns. Global water
demand is expected to continue increasing at a
similar rate until 2050, accounting for an increase
of 20 to 30% above the current level of water
use, mainly due to rising demand in the industrial
and domestic sectors. Over 2 billion people live in
countries experiencing high water stress, and about
4 billion people experience severe water scarcity
for at least one month of the year. Stress levels will
continue to increase as demand for water grows and
the effects of climate change intensify.
Water availability can be seen as a function of two
distinct but inseparable features. The first relates
to water supply, which corresponds to the volumes
of water that can be withdrawn sustainably from
surface and sub-surface sources, as well as from
unconventional sources. This includes desalination of
sea water, water reuse and recycling, and rainwater and fog harvesting. Increasing water use efficiency in all major water use sectors (agriculture, energy, industry and municipal/domestic) can also go a long way towards lowering overall demand and thus freeing up water supplies for other users, including ecosystems. The second relates to accessibility, which involves transporting water from the source and making it available to different users in sufficient quantities and appropriate quality for its intended use.
The need to improve water resource management is particularly critical for areas experiencing chronic or recurring water scarcity (where demand exceeds sustainable supplies, or where supplies are compromised by pollution, land degradation or other phenomena). The need to improve accessibility exists across all types of hydrological regimes, even in places of relative water abundance. Barriers to improved accessibility are often social and/or economic in nature. Although both supply and accessibility are critical to ensuring water security for all, water accessibility has historically received less attention. Yet, from the perspective of ‘leaving no
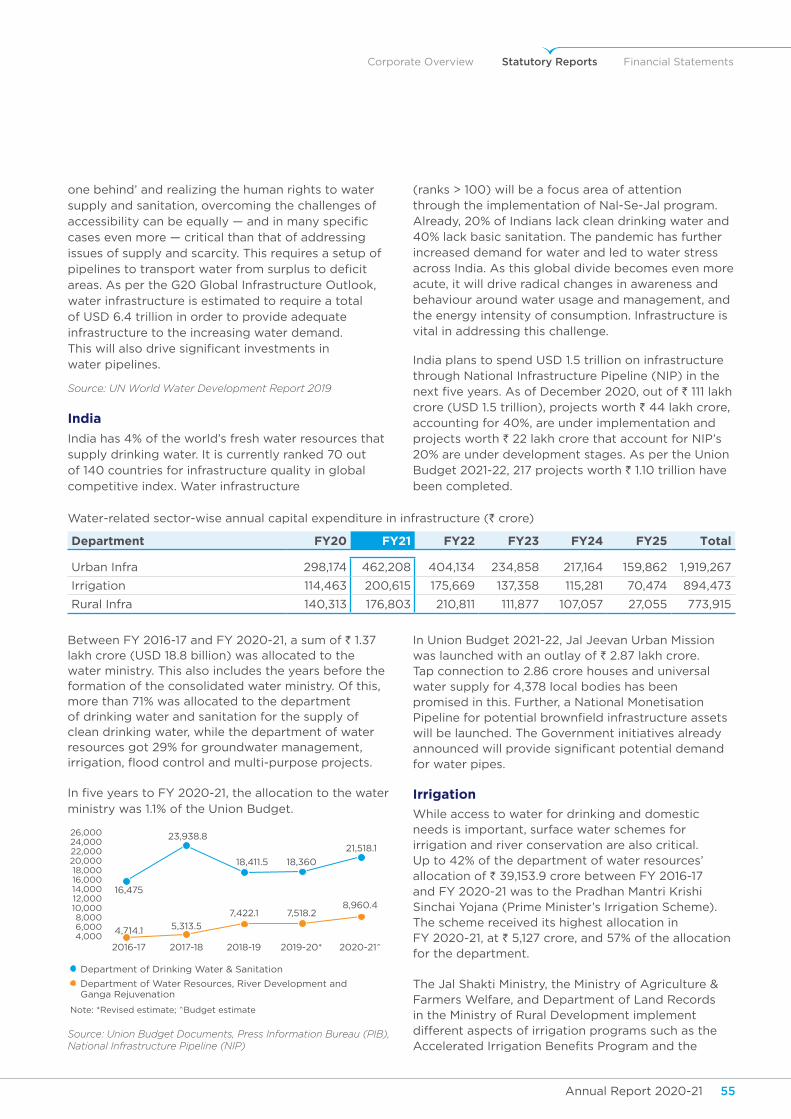
Corporate Overview Statutory Reports Financial Statements
Annual Report 2020-21 55Annual Report 2020-2154
one behind’ and realizing the human rights to water supply and sanitation, overcoming the challenges of accessibility can be equally — and in many specific cases even more — critical than that of addressing issues of supply and scarcity. This requires a setup of pipelines to transport water from surplus to deficit areas. As per the G20 Global Infrastructure Outlook, water infrastructure is estimated to require a total of USD 6.4 trillion in order to provide adequate infrastructure to the increasing water demand. This will also drive significant investments in water pipelines.
Source: UN World Water Development Report 2019
India
India has 4% of the world’s fresh water resources that supply drinking water. It is currently ranked 70 out of 140 countries for infrastructure quality in global competitive index. Water infrastructure
(ranks > 100) will be a focus area of attention through the implementation of Nal-Se-Jal program. Already, 20% of Indians lack clean drinking water and 40% lack basic sanitation. The pandemic has further increased demand for water and led to water stress across India. As this global divide becomes even more acute, it will drive radical changes in awareness and behaviour around water usage and management, and the energy intensity of consumption. Infrastructure is vital in addressing this challenge.
India plans to spend USD 1.5 trillion on infrastructure through National Infrastructure Pipeline (NIP) in the next five years. As of December 2020, out of ` 111 lakh crore (USD 1.5 trillion), projects worth ` 44 lakh crore, accounting for 40%, are under implementation and projects worth ` 22 lakh crore that account for NIP’s 20% are under development stages. As per the Union Budget 2021-22, 217 projects worth ` 1.10 trillion have been completed.
Water-related sector-wise annual capital expenditure in infrastructure (` crore)
Department FY20 FY21 FY22 FY23 FY24 FY25 Total
Urban Infra 298,174 462,208 404,134 234,858 217,164 159,862 1,919,267
Irrigation 114,463 200,615 175,669 137,358 115,281 70,474 894,473
Rural Infra 140,313 176,803 210,811 111,877 107,057 27,055 773,915
Between FY 2016-17 and FY 2020-21, a sum of ` 1.37 lakh crore (USD 18.8 billion) was allocated to the water ministry. This also includes the years before the formation of the consolidated water ministry. Of this, more than 71% was allocated to the department of drinking water and sanitation for the supply of clean drinking water, while the department of water resources got 29% for groundwater management, irrigation, flood control and multi-purpose projects.
In five years to FY 2020-21, the allocation to the water ministry was 1.1% of the Union Budget.
Source: Union Budget Documents, Press Information Bureau (PIB), National Infrastructure Pipeline (NIP)
In Union Budget 2021-22, Jal Jeevan Urban Mission was launched with an outlay of ` 2.87 lakh crore. Tap connection to 2.86 crore houses and universal water supply for 4,378 local bodies has been promised in this. Further, a National Monetisation Pipeline for potential brownfield infrastructure assets will be launched. The Government initiatives already announced will provide significant potential demand for water pipes.
Irrigation
While access to water for drinking and domestic needs is important, surface water schemes for irrigation and river conservation are also critical. Up to 42% of the department of water resources’ allocation of ` 39,153.9 crore between FY 2016-17 and FY 2020-21 was to the Pradhan Mantri Krishi Sinchai Yojana (Prime Minister’s Irrigation Scheme). The scheme received its highest allocation in FY 2020-21, at ` 5,127 crore, and 57% of the allocation for the department.
The Jal Shakti Ministry, the Ministry of Agriculture & Farmers Welfare, and Department of Land Records in the Ministry of Rural Development implement different aspects of irrigation programs such as the Accelerated Irrigation Benefits Program and the
Department of Drinking Water & Sanitation
Department of Water Resources, River Development and Ganga Rejuvenation
26,00024,00022,00020,00018,00016,00014,00012,00010,0008,0006,0004,000
2016-17
4,714.1
16,475
23,938.8
18,411.5 18,360
21,518.1
5,313.5
7,422.1 7,518.28,960.4
2017-18 2018-19 2019-20* 2020-21^
Note: *Revised estimate; ^Budget estimate
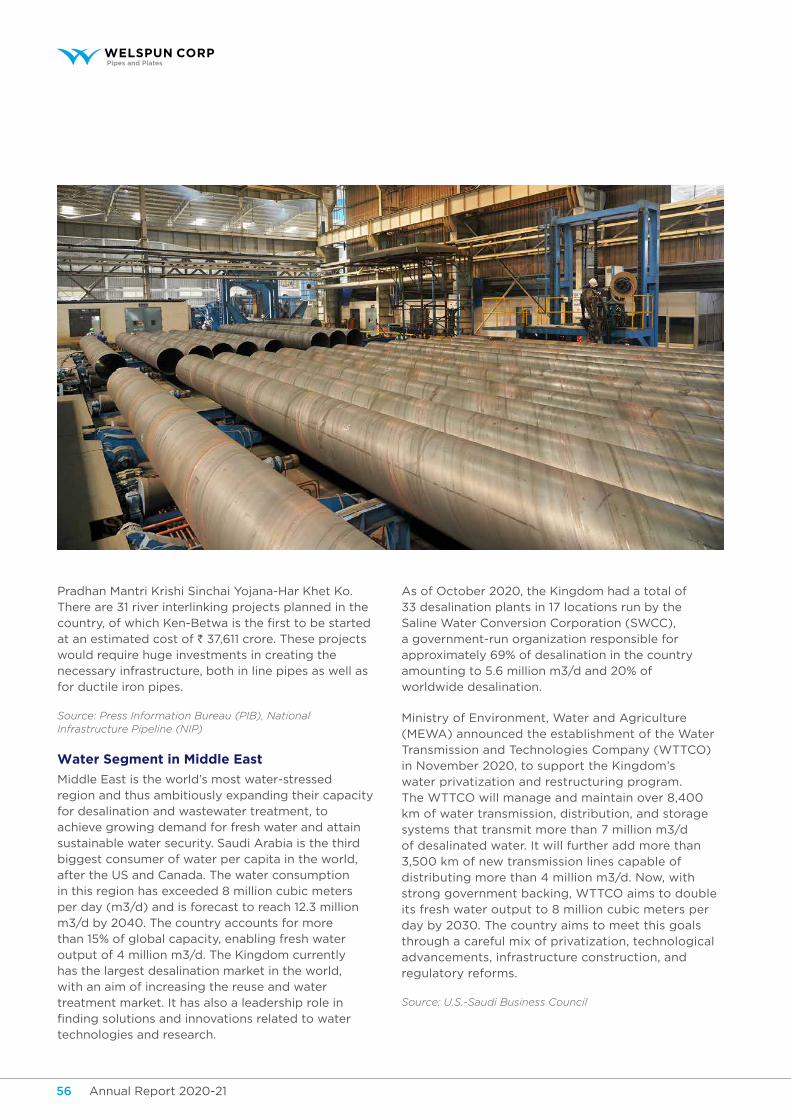
Annual Report 2020-21 57Annual Report 2020-2156
Pradhan Mantri Krishi Sinchai Yojana-Har Khet Ko. There are 31 river interlinking projects planned in the country, of which Ken-Betwa is the first to be started at an estimated cost of ` 37,611 crore. These projects would require huge investments in creating the necessary infrastructure, both in line pipes as well as for ductile iron pipes.
Source: Press Information Bureau (PIB), National Infrastructure Pipeline (NIP)
Water Segment in Middle East
Middle East is the world’s most water-stressed region and thus ambitiously expanding their capacity for desalination and wastewater treatment, to achieve growing demand for fresh water and attain sustainable water security. Saudi Arabia is the third biggest consumer of water per capita in the world, after the US and Canada. The water consumption in this region has exceeded 8 million cubic meters per day (m3/d) and is forecast to reach 12.3 million m3/d by 2040. The country accounts for more than 15% of global capacity, enabling fresh water output of 4 million m3/d. The Kingdom currently has the largest desalination market in the world, with an aim of increasing the reuse and water treatment market. It has also a leadership role in finding solutions and innovations related to water technologies and research.
As of October 2020, the Kingdom had a total of 33 desalination plants in 17 locations run by the Saline Water Conversion Corporation (SWCC), a government-run organization responsible for approximately 69% of desalination in the country amounting to 5.6 million m3/d and 20% of worldwide desalination.
Ministry of Environment, Water and Agriculture (MEWA) announced the establishment of the Water Transmission and Technologies Company (WTTCO) in November 2020, to support the Kingdom’s water privatization and restructuring program. The WTTCO will manage and maintain over 8,400 km of water transmission, distribution, and storage systems that transmit more than 7 million m3/d of desalinated water. It will further add more than 3,500 km of new transmission lines capable of distributing more than 4 million m3/d. Now, with strong government backing, WTTCO aims to double its fresh water output to 8 million cubic meters per day by 2030. The country aims to meet this goals through a careful mix of privatization, technological advancements, infrastructure construction, and regulatory reforms.
Source: U.S.-Saudi Business Council
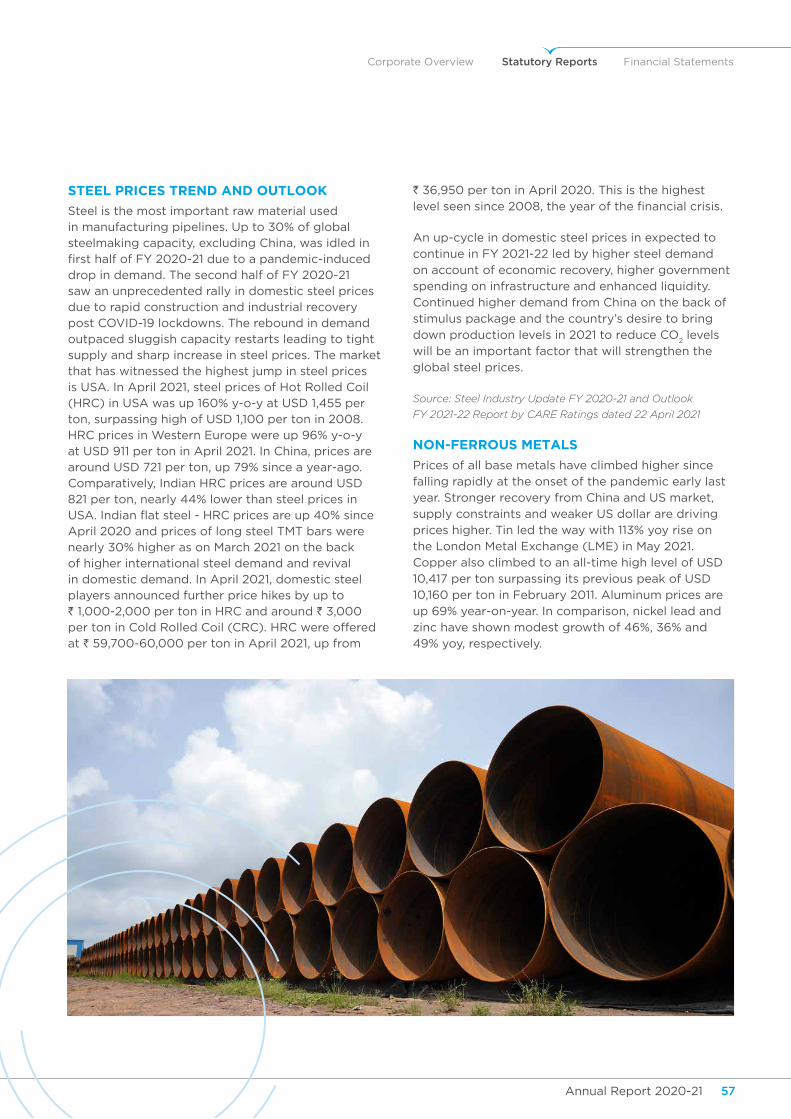
Corporate Overview Statutory Reports Financial Statements
Annual Report 2020-21 57Annual Report 2020-2156
STEEL PRICES TREND AND OUTLOOK
Steel is the most important raw material used in manufacturing pipelines. Up to 30% of global steelmaking capacity, excluding China, was idled in first half of FY 2020-21 due to a pandemic-induced drop in demand. The second half of FY 2020-21 saw an unprecedented rally in domestic steel prices due to rapid construction and industrial recovery post COVID-19 lockdowns. The rebound in demand outpaced sluggish capacity restarts leading to tight supply and sharp increase in steel prices. The market that has witnessed the highest jump in steel prices is USA. In April 2021, steel prices of Hot Rolled Coil (HRC) in USA was up 160% y-o-y at USD 1,455 per ton, surpassing high of USD 1,100 per ton in 2008. HRC prices in Western Europe were up 96% y-o-y at USD 911 per ton in April 2021. In China, prices are around USD 721 per ton, up 79% since a year-ago. Comparatively, Indian HRC prices are around USD 821 per ton, nearly 44% lower than steel prices in USA. Indian flat steel - HRC prices are up 40% since April 2020 and prices of long steel TMT bars were nearly 30% higher as on March 2021 on the back of higher international steel demand and revival in domestic demand. In April 2021, domestic steel players announced further price hikes by up to ` 1,000-2,000 per ton in HRC and around ` 3,000 per ton in Cold Rolled Coil (CRC). HRC were offered at ` 59,700-60,000 per ton in April 2021, up from
` 36,950 per ton in April 2020. This is the highest
level seen since 2008, the year of the financial crisis.
An up-cycle in domestic steel prices in expected to
continue in FY 2021-22 led by higher steel demand
on account of economic recovery, higher government
spending on infrastructure and enhanced liquidity.
Continued higher demand from China on the back of
stimulus package and the country’s desire to bring
down production levels in 2021 to reduce CO2 levels
will be an important factor that will strengthen the
global steel prices.
Source: Steel Industry Update FY 2020-21 and Outlook
FY 2021-22 Report by CARE Ratings dated 22 April 2021
NON-FERROUS METALS
Prices of all base metals have climbed higher since
falling rapidly at the onset of the pandemic early last
year. Stronger recovery from China and US market,
supply constraints and weaker US dollar are driving
prices higher. Tin led the way with 113% yoy rise on
the London Metal Exchange (LME) in May 2021.
Copper also climbed to an all-time high level of USD
10,417 per ton surpassing its previous peak of USD
10,160 per ton in February 2011. Aluminum prices are
up 69% year-on-year. In comparison, nickel lead and
zinc have shown modest growth of 46%, 36% and
49% yoy, respectively.
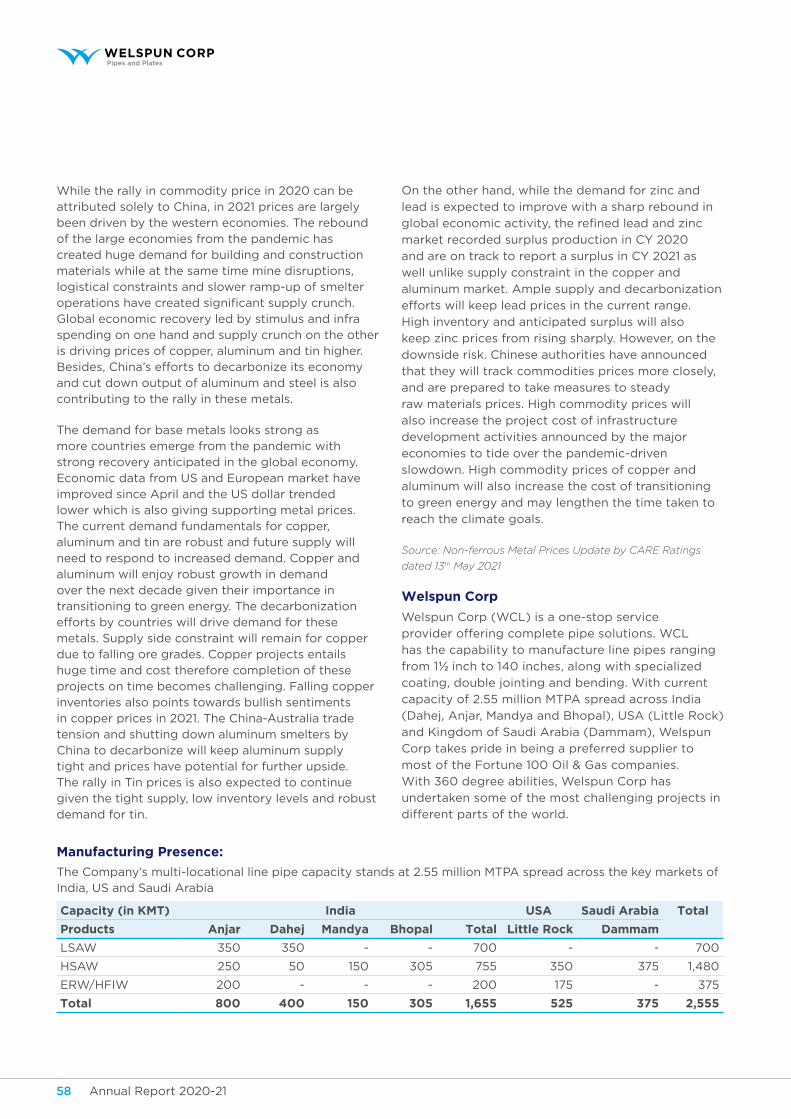
Annual Report 2020-21 59Annual Report 2020-2158
While the rally in commodity price in 2020 can be attributed solely to China, in 2021 prices are largely been driven by the western economies. The rebound of the large economies from the pandemic has created huge demand for building and construction materials while at the same time mine disruptions, logistical constraints and slower ramp-up of smelter operations have created significant supply crunch. Global economic recovery led by stimulus and infra spending on one hand and supply crunch on the other is driving prices of copper, aluminum and tin higher. Besides, China’s efforts to decarbonize its economy and cut down output of aluminum and steel is also contributing to the rally in these metals.
The demand for base metals looks strong as more countries emerge from the pandemic with strong recovery anticipated in the global economy. Economic data from US and European market have improved since April and the US dollar trended lower which is also giving supporting metal prices. The current demand fundamentals for copper, aluminum and tin are robust and future supply will need to respond to increased demand. Copper and aluminum will enjoy robust growth in demand over the next decade given their importance in transitioning to green energy. The decarbonization efforts by countries will drive demand for these metals. Supply side constraint will remain for copper due to falling ore grades. Copper projects entails huge time and cost therefore completion of these projects on time becomes challenging. Falling copper inventories also points towards bullish sentiments in copper prices in 2021. The China-Australia trade tension and shutting down aluminum smelters by China to decarbonize will keep aluminum supply tight and prices have potential for further upside. The rally in Tin prices is also expected to continue given the tight supply, low inventory levels and robust demand for tin.
On the other hand, while the demand for zinc and
lead is expected to improve with a sharp rebound in
global economic activity, the refined lead and zinc
market recorded surplus production in CY 2020
and are on track to report a surplus in CY 2021 as
well unlike supply constraint in the copper and
aluminum market. Ample supply and decarbonization
efforts will keep lead prices in the current range.
High inventory and anticipated surplus will also
keep zinc prices from rising sharply. However, on the
downside risk. Chinese authorities have announced
that they will track commodities prices more closely,
and are prepared to take measures to steady
raw materials prices. High commodity prices will
also increase the project cost of infrastructure
development activities announced by the major
economies to tide over the pandemic-driven
slowdown. High commodity prices of copper and
aluminum will also increase the cost of transitioning
to green energy and may lengthen the time taken to
reach the climate goals.
Source: Non-ferrous Metal Prices Update by CARE Ratings
dated 13th May 2021
Welspun Corp
Welspun Corp (WCL) is a one-stop service
provider offering complete pipe solutions. WCL
has the capability to manufacture line pipes ranging
from 1½ inch to 140 inches, along with specialized
coating, double jointing and bending. With current
capacity of 2.55 million MTPA spread across India
(Dahej, Anjar, Mandya and Bhopal), USA (Little Rock)
and Kingdom of Saudi Arabia (Dammam), Welspun
Corp takes pride in being a preferred supplier to
most of the Fortune 100 Oil & Gas companies.
With 360 degree abilities, Welspun Corp has
undertaken some of the most challenging projects in
different parts of the world.
Manufacturing Presence:
The Company’s multi-locational line pipe capacity stands at 2.55 million MTPA spread across the key markets of India, US and Saudi Arabia
Capacity (in KMT) India USA Saudi Arabia Total
Products Anjar Dahej Mandya Bhopal Total Little Rock Dammam
LSAW 350 350 - - 700 - - 700
HSAW 250 50 150 305 755 350 375 1,480
ERW/HFIW 200 - - - 200 175 - 375
Total 800 400 150 305 1,655 525 375 2,555
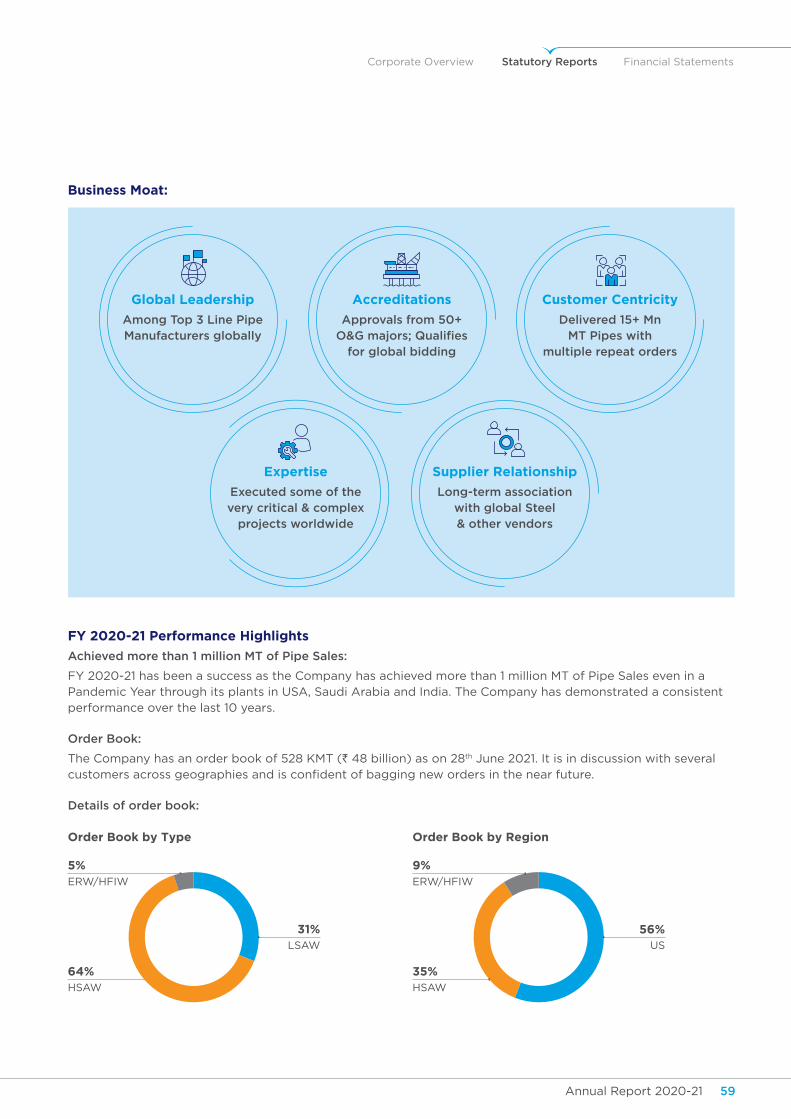
Corporate Overview Statutory Reports Financial Statements
Annual Report 2020-21 59Annual Report 2020-2158
FY 2020-21 Performance Highlights
Achieved more than 1 million MT of Pipe Sales:
FY 2020-21 has been a success as the Company has achieved more than 1 million MT of Pipe Sales even in a Pandemic Year through its plants in USA, Saudi Arabia and India. The Company has demonstrated a consistent performance over the last 10 years.
Order Book:
The Company has an order book of 528 KMT (` 48 billion) as on 28th June 2021. It is in discussion with several customers across geographies and is confident of bagging new orders in the near future.
Details of order book:
Order Book by Type
31%
5%
64%
LSAW
ERW/HFIW
HSAW
Order Book by Region
56%
9%
35%
US
ERW/HFIW
HSAW
Business Moat:
Global Leadership
Among Top 3 Line Pipe Manufacturers globally
Customer Centricity
Delivered 15+ Mn MT Pipes with
multiple repeat orders
Supplier Relationship
Long-term association with global Steel & other vendors
Expertise
Executed some of the very critical & complex
projects worldwide
Accreditations
Approvals from 50+ O&G majors; Qualifies
for global bidding
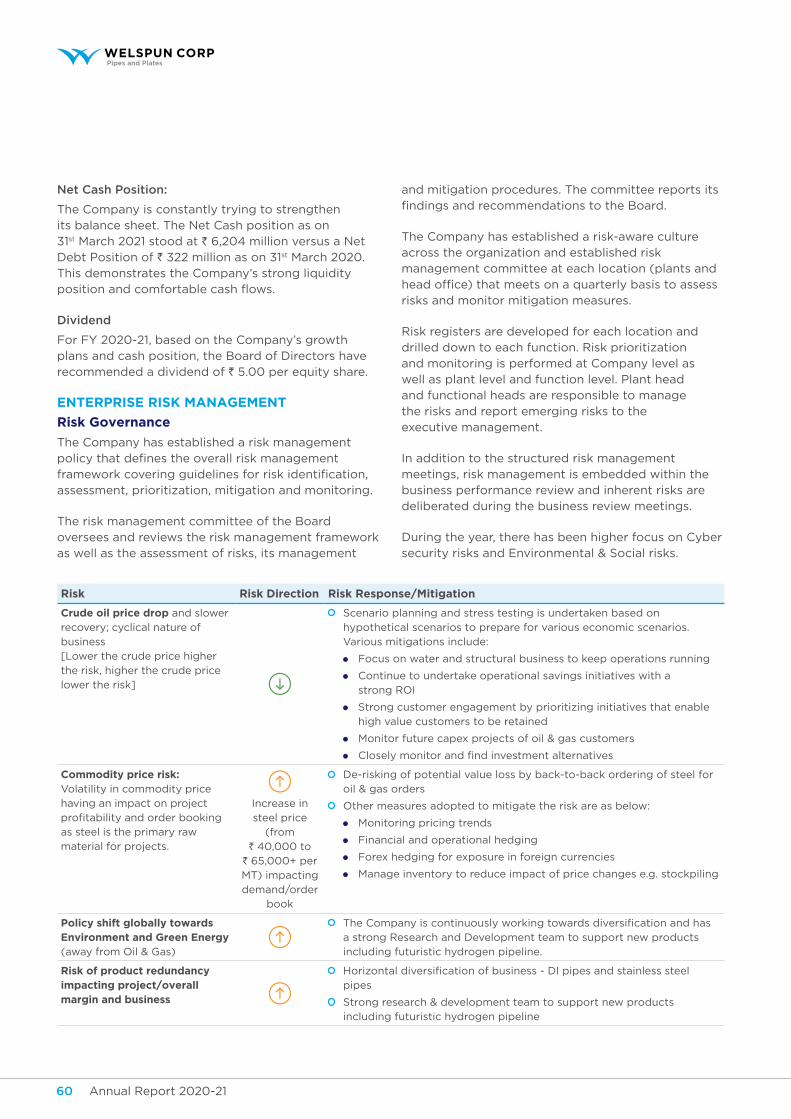
Annual Report 2020-21 61Annual Report 2020-2160
Net Cash Position:
The Company is constantly trying to strengthen its balance sheet. The Net Cash position as on 31st March 2021 stood at ` 6,204 million versus a Net Debt Position of ` 322 million as on 31st March 2020. This demonstrates the Company’s strong liquidity position and comfortable cash flows.
Dividend
For FY 2020-21, based on the Company’s growth plans and cash position, the Board of Directors have recommended a dividend of ` 5.00 per equity share.
ENTERPRISE RISK MANAGEMENT
Risk Governance
The Company has established a risk management policy that defines the overall risk management framework covering guidelines for risk identification, assessment, prioritization, mitigation and monitoring.
The risk management committee of the Board oversees and reviews the risk management framework as well as the assessment of risks, its management
and mitigation procedures. The committee reports its findings and recommendations to the Board.
The Company has established a risk-aware culture across the organization and established risk management committee at each location (plants and head office) that meets on a quarterly basis to assess risks and monitor mitigation measures.
Risk registers are developed for each location and drilled down to each function. Risk prioritization and monitoring is performed at Company level as well as plant level and function level. Plant head and functional heads are responsible to manage the risks and report emerging risks to the executive management.
In addition to the structured risk management meetings, risk management is embedded within the business performance review and inherent risks are deliberated during the business review meetings.
During the year, there has been higher focus on Cyber security risks and Environmental & Social risks.
Risk Risk Direction Risk Response/Mitigation
Crude oil price drop and slower
recovery; cyclical nature of
business
[Lower the crude price higher
the risk, higher the crude price
lower the risk]
Scenario planning and stress testing is undertaken based on
hypothetical scenarios to prepare for various economic scenarios.
Various mitigations include:
Focus on water and structural business to keep operations running
Continue to undertake operational savings initiatives with a
strong ROI
Strong customer engagement by prioritizing initiatives that enable
high value customers to be retained
Monitor future capex projects of oil & gas customers
Closely monitor and find investment alternatives
Commodity price risk:Volatility in commodity price
having an impact on project
profitability and order booking
as steel is the primary raw
material for projects.
Increase in
steel price
(from
` 40,000 to
` 65,000+ per
MT) impacting
demand/order
book
De-risking of potential value loss by back-to-back ordering of steel for
oil & gas orders
Other measures adopted to mitigate the risk are as below:
Monitoring pricing trends
Financial and operational hedging
Forex hedging for exposure in foreign currencies
Manage inventory to reduce impact of price changes e.g. stockpiling
Policy shift globally towards Environment and Green Energy
(away from Oil & Gas)
The Company is continuously working towards diversification and has
a strong Research and Development team to support new products
including futuristic hydrogen pipeline.
Risk of product redundancy impacting project/overall margin and business
Horizontal diversification of business - DI pipes and stainless steel
pipes
Strong research & development team to support new products
including futuristic hydrogen pipeline
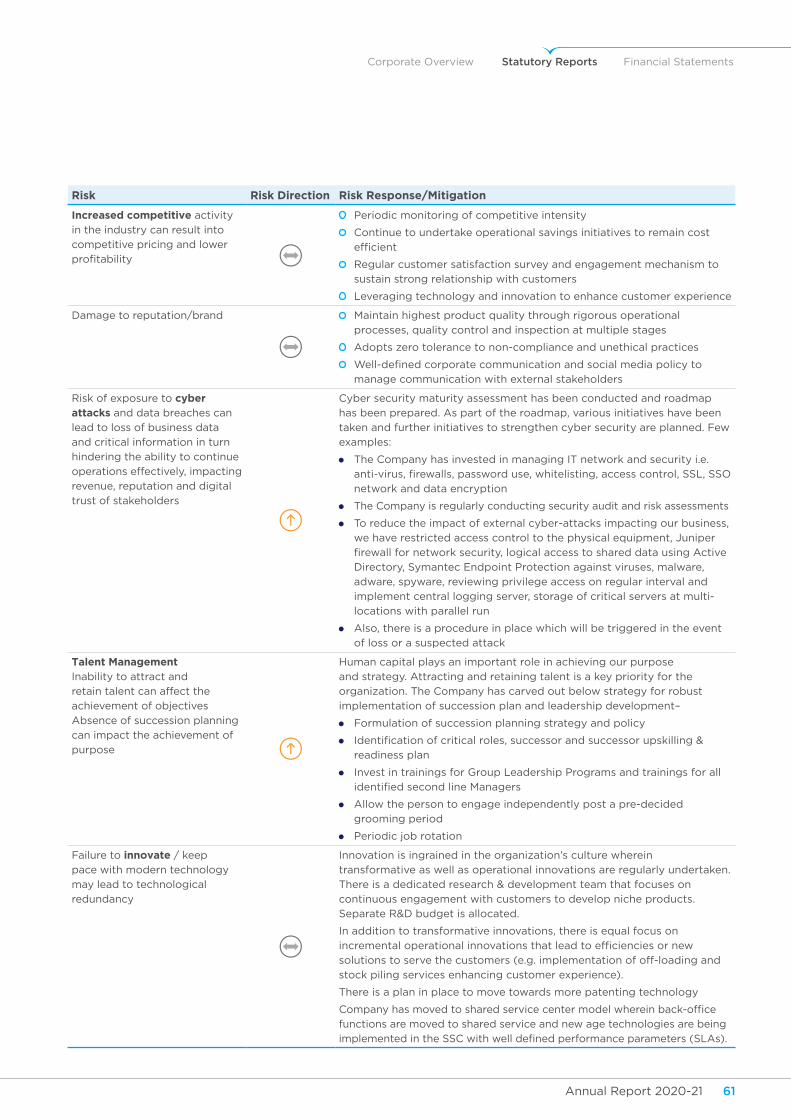
Corporate Overview Statutory Reports Financial Statements
Annual Report 2020-21 61Annual Report 2020-2160
Risk Risk Direction Risk Response/Mitigation
Increased competitive activity
in the industry can result into
competitive pricing and lower
profitability
Periodic monitoring of competitive intensity
Continue to undertake operational savings initiatives to remain cost
efficient
Regular customer satisfaction survey and engagement mechanism to
sustain strong relationship with customers
Leveraging technology and innovation to enhance customer experience
Damage to reputation/brand Maintain highest product quality through rigorous operational
processes, quality control and inspection at multiple stages
Adopts zero tolerance to non-compliance and unethical practices
Well-defined corporate communication and social media policy to
manage communication with external stakeholders
Risk of exposure to cyber attacks and data breaches can
lead to loss of business data
and critical information in turn
hindering the ability to continue
operations effectively, impacting
revenue, reputation and digital
trust of stakeholders
Cyber security maturity assessment has been conducted and roadmap
has been prepared. As part of the roadmap, various initiatives have been
taken and further initiatives to strengthen cyber security are planned. Few
examples:
The Company has invested in managing IT network and security i.e.
anti-virus, firewalls, password use, whitelisting, access control, SSL, SSO
network and data encryption
The Company is regularly conducting security audit and risk assessments
To reduce the impact of external cyber-attacks impacting our business,
we have restricted access control to the physical equipment, Juniper
firewall for network security, logical access to shared data using Active
Directory, Symantec Endpoint Protection against viruses, malware,
adware, spyware, reviewing privilege access on regular interval and
implement central logging server, storage of critical servers at multi-
locations with parallel run
Also, there is a procedure in place which will be triggered in the event
of loss or a suspected attack
Talent ManagementInability to attract and
retain talent can affect the
achievement of objectives
Absence of succession planning
can impact the achievement of
purpose
Human capital plays an important role in achieving our purpose
and strategy. Attracting and retaining talent is a key priority for the
organization. The Company has carved out below strategy for robust
implementation of succession plan and leadership development–
Formulation of succession planning strategy and policy
Identification of critical roles, successor and successor upskilling &
readiness plan
Invest in trainings for Group Leadership Programs and trainings for all
identified second line Managers
Allow the person to engage independently post a pre-decided
grooming period
Periodic job rotation
Failure to innovate / keep
pace with modern technology
may lead to technological
redundancy
Innovation is ingrained in the organization’s culture wherein
transformative as well as operational innovations are regularly undertaken.
There is a dedicated research & development team that focuses on
continuous engagement with customers to develop niche products.
Separate R&D budget is allocated.
In addition to transformative innovations, there is equal focus on
incremental operational innovations that lead to efficiencies or new
solutions to serve the customers (e.g. implementation of off-loading and
stock piling services enhancing customer experience).
There is a plan in place to move towards more patenting technology
Company has moved to shared service center model wherein back-office
functions are moved to shared service and new age technologies are being
implemented in the SSC with well defined performance parameters (SLAs).
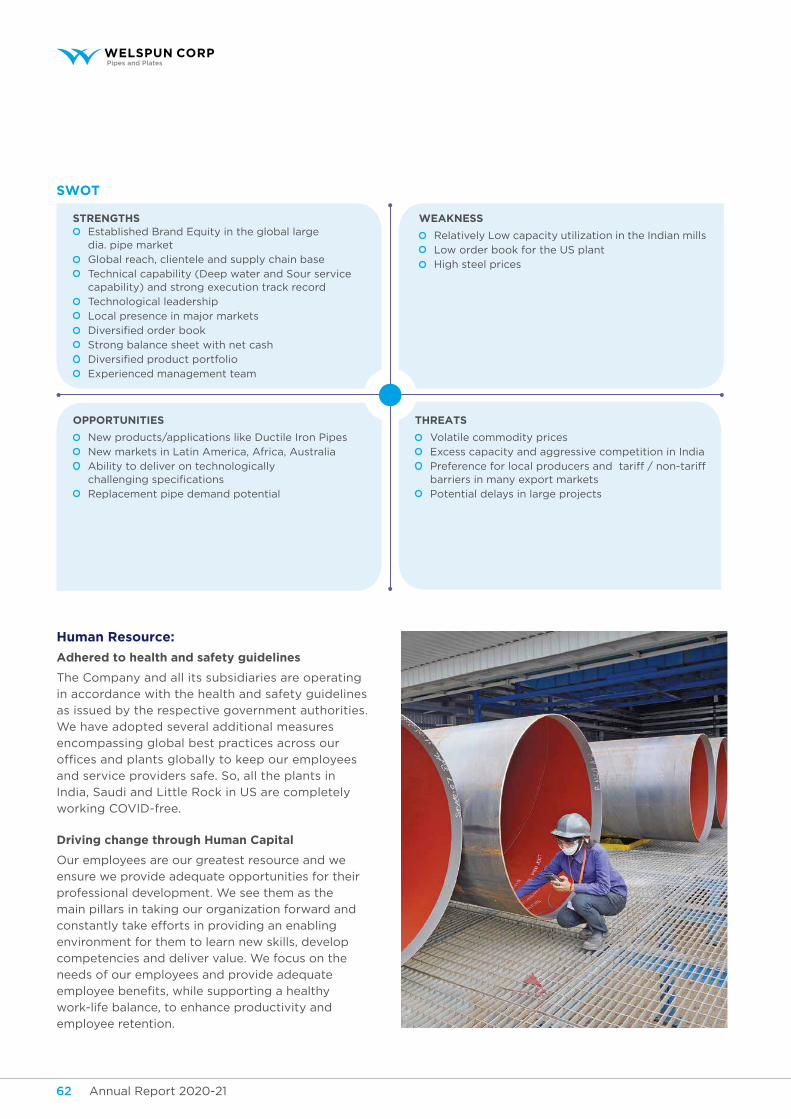
Annual Report 2020-21 63Annual Report 2020-2162
STRENGTHS Established Brand Equity in the global large
dia. pipe market
Global reach, clientele and supply chain base
Technical capability (Deep water and Sour service capability) and strong execution track record
Technological leadership
Local presence in major markets
Diversified order book
Strong balance sheet with net cash
Diversified product portfolio
Experienced management team
WEAKNESS
Relatively Low capacity utilization in the Indian mills
Low order book for the US plant
High steel prices
OPPORTUNITIES
New products/applications like Ductile Iron Pipes
New markets in Latin America, Africa, Australia
Ability to deliver on technologically challenging specifications
Replacement pipe demand potential
THREATS
Volatile commodity prices
Excess capacity and aggressive competition in India
Preference for local producers and tariff / non-tariff barriers in many export markets
Potential delays in large projects
SWOT
Human Resource:
Adhered to health and safety guidelines
The Company and all its subsidiaries are operating
in accordance with the health and safety guidelines
as issued by the respective government authorities.
We have adopted several additional measures
encompassing global best practices across our
offices and plants globally to keep our employees
and service providers safe. So, all the plants in
India, Saudi and Little Rock in US are completely
working COVID-free.
Driving change through Human Capital
Our employees are our greatest resource and we
ensure we provide adequate opportunities for their
professional development. We see them as the
main pillars in taking our organization forward and
constantly take efforts in providing an enabling
environment for them to learn new skills, develop
competencies and deliver value. We focus on the
needs of our employees and provide adequate
employee benefits, while supporting a healthy
work-life balance, to enhance productivity and
employee retention.
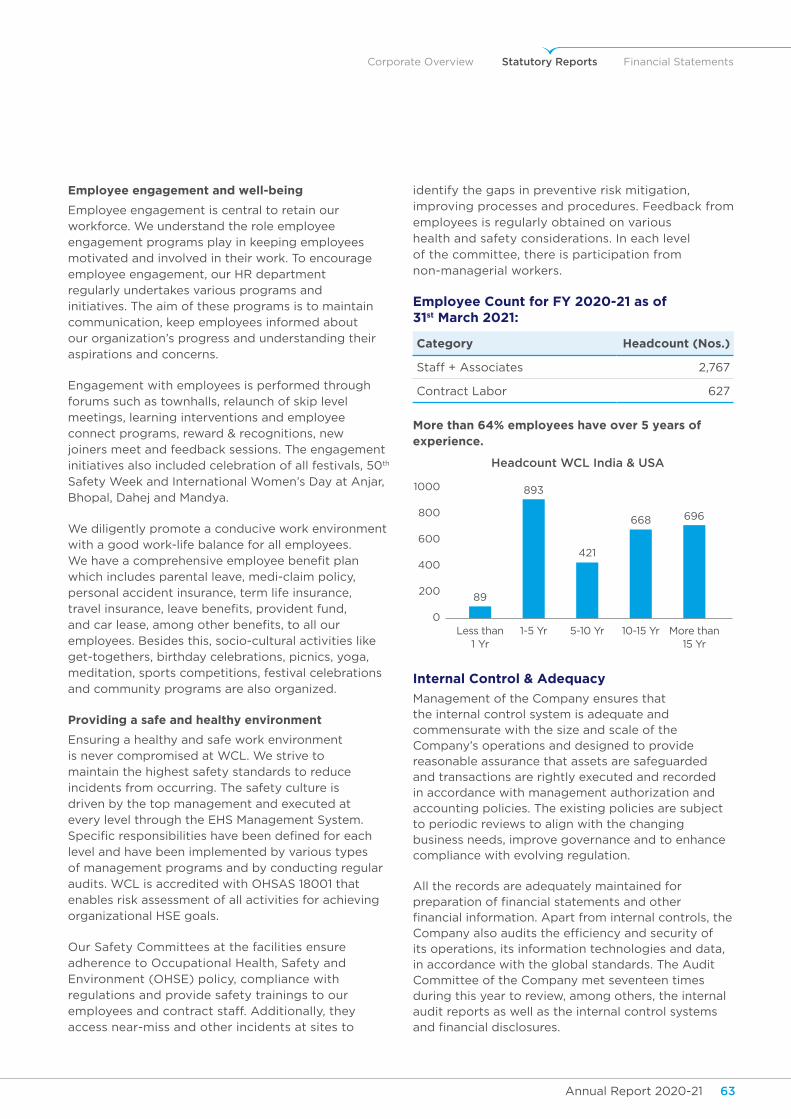
Corporate Overview Statutory Reports Financial Statements
Annual Report 2020-21 63Annual Report 2020-2162
Employee engagement and well-being
Employee engagement is central to retain our workforce. We understand the role employee engagement programs play in keeping employees motivated and involved in their work. To encourage employee engagement, our HR department regularly undertakes various programs and initiatives. The aim of these programs is to maintain communication, keep employees informed about our organization’s progress and understanding their aspirations and concerns.
Engagement with employees is performed through forums such as townhalls, relaunch of skip level meetings, learning interventions and employee connect programs, reward & recognitions, new joiners meet and feedback sessions. The engagement initiatives also included celebration of all festivals, 50th Safety Week and International Women’s Day at Anjar, Bhopal, Dahej and Mandya.
We diligently promote a conducive work environment with a good work-life balance for all employees. We have a comprehensive employee benefit plan which includes parental leave, medi-claim policy, personal accident insurance, term life insurance, travel insurance, leave benefits, provident fund, and car lease, among other benefits, to all our employees. Besides this, socio-cultural activities like get-togethers, birthday celebrations, picnics, yoga, meditation, sports competitions, festival celebrations and community programs are also organized.
Providing a safe and healthy environment
Ensuring a healthy and safe work environment is never compromised at WCL. We strive to maintain the highest safety standards to reduce incidents from occurring. The safety culture is driven by the top management and executed at every level through the EHS Management System. Specific responsibilities have been defined for each level and have been implemented by various types of management programs and by conducting regular audits. WCL is accredited with OHSAS 18001 that enables risk assessment of all activities for achieving organizational HSE goals.
Our Safety Committees at the facilities ensure adherence to Occupational Health, Safety and Environment (OHSE) policy, compliance with regulations and provide safety trainings to our employees and contract staff. Additionally, they access near-miss and other incidents at sites to
identify the gaps in preventive risk mitigation, improving processes and procedures. Feedback from employees is regularly obtained on various health and safety considerations. In each level of the committee, there is participation from non-managerial workers.
Employee Count for FY 2020-21 as of 31st March 2021:
Category Headcount (Nos.)
Staff + Associates 2,767
Contract Labor 627
More than 64% employees have over 5 years of experience.
Internal Control & Adequacy
Management of the Company ensures that the internal control system is adequate and commensurate with the size and scale of the Company’s operations and designed to provide reasonable assurance that assets are safeguarded and transactions are rightly executed and recorded in accordance with management authorization and accounting policies. The existing policies are subject to periodic reviews to align with the changing business needs, improve governance and to enhance compliance with evolving regulation.
All the records are adequately maintained for preparation of financial statements and other financial information. Apart from internal controls, the Company also audits the efficiency and security of its operations, its information technologies and data, in accordance with the global standards. The Audit Committee of the Company met seventeen times during this year to review, among others, the internal audit reports as well as the internal control systems and financial disclosures.
Headcount WCL India & USA
Less than 1 Yr
10-15 Yr
1000
800
600
400
200
0
89
893
421
668 696
More than 15 Yr
1-5 Yr 5-10 Yr
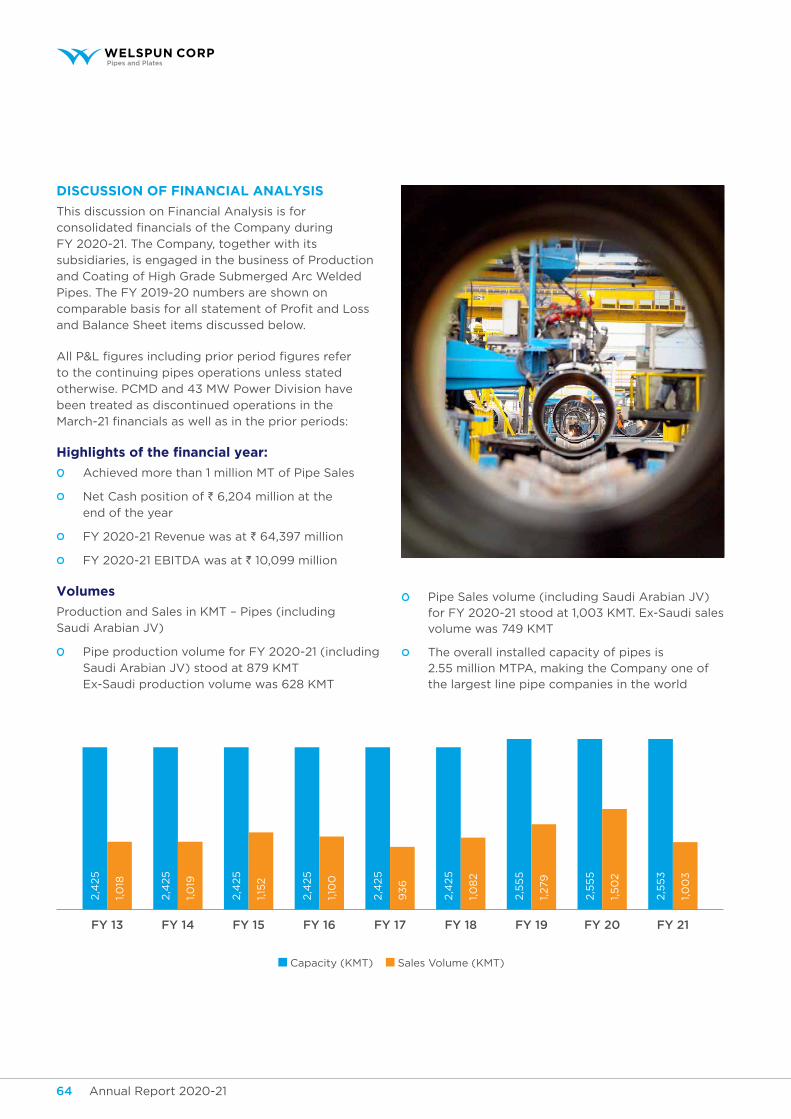
Annual Report 2020-21 65Annual Report 2020-2164
DISCUSSION OF FINANCIAL ANALYSIS
This discussion on Financial Analysis is for
consolidated financials of the Company during
FY 2020-21. The Company, together with its
subsidiaries, is engaged in the business of Production
and Coating of High Grade Submerged Arc Welded
Pipes. The FY 2019-20 numbers are shown on
comparable basis for all statement of Profit and Loss
and Balance Sheet items discussed below.
All P&L figures including prior period figures refer
to the continuing pipes operations unless stated
otherwise. PCMD and 43 MW Power Division have
been treated as discontinued operations in the
March-21 financials as well as in the prior periods:
Highlights of the financial year:
Achieved more than 1 million MT of Pipe Sales
Net Cash position of ` 6,204 million at the
end of the year
FY 2020-21 Revenue was at ` 64,397 million
FY 2020-21 EBITDA was at ` 10,099 million
Volumes
Production and Sales in KMT – Pipes (including
Saudi Arabian JV)
Pipe production volume for FY 2020-21 (including
Saudi Arabian JV) stood at 879 KMT
Ex-Saudi production volume was 628 KMT
Pipe Sales volume (including Saudi Arabian JV) for FY 2020-21 stood at 1,003 KMT. Ex-Saudi sales volume was 749 KMT
The overall installed capacity of pipes is 2.55 million MTPA, making the Company one of the largest line pipe companies in the world
FY 13 FY 14 FY 15 FY 16 FY 17 FY 18 FY 19 FY 20 FY 21
2,4
25
1,0
18
2,4
25
1,0
19
2,4
25
1,15
2
2,4
25
1,10
0
2,4
25
93
6
2,4
25
1,0
82
2,5
55
1,279
2,5
55
1,5
02
2,5
53
1,0
03
Capacity (KMT) Sales Volume (KMT)
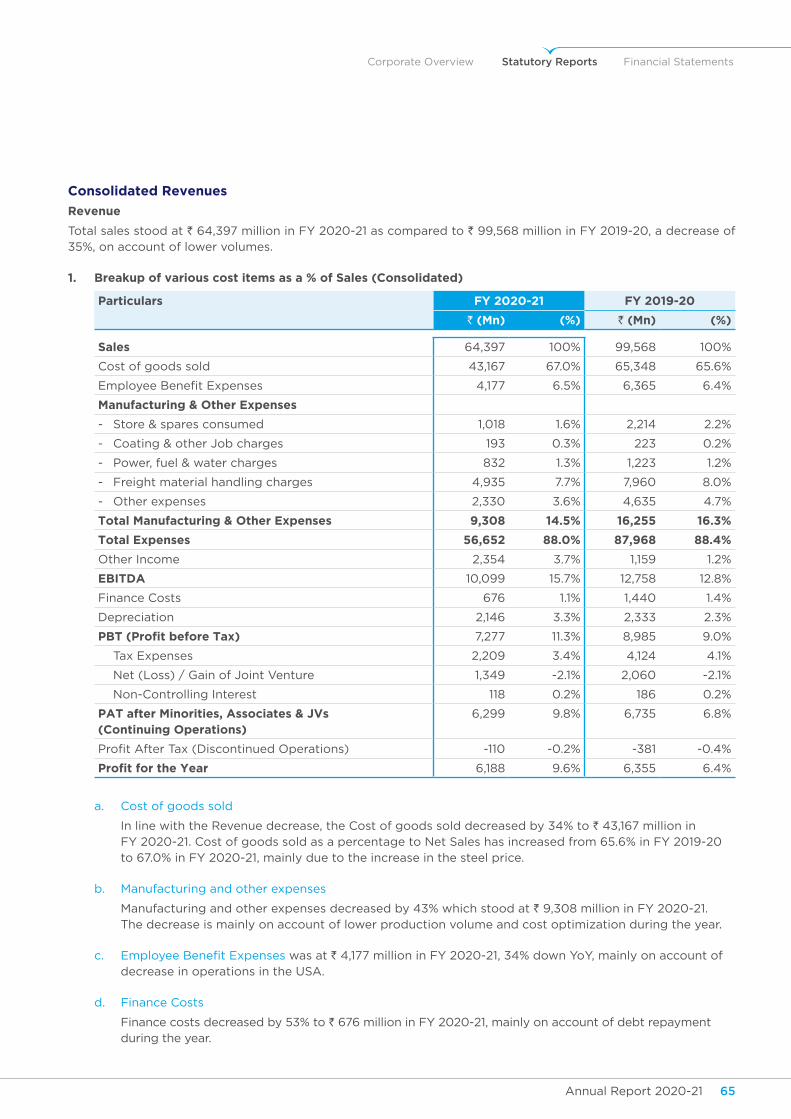
Corporate Overview Statutory Reports Financial Statements
Annual Report 2020-21 65Annual Report 2020-2164
Consolidated Revenues
Revenue
Total sales stood at ` 64,397 million in FY 2020-21 as compared to ` 99,568 million in FY 2019-20, a decrease of 35%, on account of lower volumes.
1. Breakup of various cost items as a % of Sales (Consolidated)
Particulars FY 2020-21 FY 2019-20
` (Mn) (%) ` (Mn) (%)
Sales 64,397 100% 99,568 100%
Cost of goods sold 43,167 67.0% 65,348 65.6%
Employee Benefit Expenses 4,177 6.5% 6,365 6.4%
Manufacturing & Other Expenses
- Store & spares consumed 1,018 1.6% 2,214 2.2%
- Coating & other Job charges 193 0.3% 223 0.2%
- Power, fuel & water charges 832 1.3% 1,223 1.2%
- Freight material handling charges 4,935 7.7% 7,960 8.0%
- Other expenses 2,330 3.6% 4,635 4.7%
Total Manufacturing & Other Expenses 9,308 14.5% 16,255 16.3%
Total Expenses 56,652 88.0% 87,968 88.4%
Other Income 2,354 3.7% 1,159 1.2%
EBITDA 10,099 15.7% 12,758 12.8%
Finance Costs 676 1.1% 1,440 1.4%
Depreciation 2,146 3.3% 2,333 2.3%
PBT (Profit before Tax) 7,277 11.3% 8,985 9.0%
Tax Expenses 2,209 3.4% 4,124 4.1%
Net (Loss) / Gain of Joint Venture 1,349 -2.1% 2,060 -2.1%
Non-Controlling Interest 118 0.2% 186 0.2%
PAT after Minorities, Associates & JVs (Continuing Operations)
6,299 9.8% 6,735 6.8%
Profit After Tax (Discontinued Operations) -110 -0.2% -381 -0.4%
Profit for the Year 6,188 9.6% 6,355 6.4%
a. Cost of goods sold
In line with the Revenue decrease, the Cost of goods sold decreased by 34% to ` 43,167 million in FY 2020-21. Cost of goods sold as a percentage to Net Sales has increased from 65.6% in FY 2019-20 to 67.0% in FY 2020-21, mainly due to the increase in the steel price.
b. Manufacturing and other expenses
Manufacturing and other expenses decreased by 43% which stood at ` 9,308 million in FY 2020-21. The decrease is mainly on account of lower production volume and cost optimization during the year.
c. Employee Benefit Expenses was at ` 4,177 million in FY 2020-21, 34% down YoY, mainly on account of decrease in operations in the USA.
d. Finance Costs
Finance costs decreased by 53% to ` 676 million in FY 2020-21, mainly on account of debt repayment during the year.
Annual Report 2020-21 67Annual Report 2020-2166
e. Depreciation/Amortization charge
Depreciation/amortization decreased by 8% to ` 2,146 million in FY 2020-21.
f. EBITDA
EBITDA for FY 2020-21 is ` 10,099 million, as compared to ` 12,758 million for FY 2019-20. EBITDA margin increased to 15.7% in FY 2020-21 from 12.8% in FY 2019-20.
g. Net Profit
PAT after Minorities, Associates & JVs (Incl. Discontinued Operations) was ` 6,188 million in FY 2020-21 as compared to ` 6,355 million in FY 2019-20 down by 3%. The impact of lower sales volumes has been offset by an increase in Net profit margin to 9.6% in FY 2020-21 vs. 6.4% in FY 2019-20.
2. Balance Sheet (Consolidated)
(` Mn)
Particulars As atMarch 31, 2021
As atMarch 31, 2020
Net Worth 37,928 32,152
Short-Term Loans 1,233 2,693
Long-Term Loans 6,478 7,260
Gross Debt 7,710 9,953
Cash & Cash Equivalents 13,914 9,631
Net Debt / (Cash) -6,204 322
Net Fixed Assets (incl. CWIP) 16,833 16,199
Net Current Assets 21,326 11,954
Net Assets Held for Sale 0 8,293
Total Assets 65,246 79,432
3. Networth:
Networth at the end of FY 2020-21 was at ` 37,928 million vs. ` 32,152 million at the end of FY 2019-20.
The details of Net Worth are as under:
a. Share Capital
The number of shares as at 31st March 2021 is 260,884,395 (face value of ` 5 each). There is no change versus 31st March 2020.
b. Reserves and Surplus
Reserves and Surplus increased by ` 6,083 million to ` 35,193 million as at 31st March 2021 vs ` 29,110 million as at 31st March 2020. The increase is on account of higher retained earnings.
4. Loan Funds:
The Gross Debt at the end of FY 2020-21 stands at ` 7,710 million. The components included in Gross Debt are long-term borrowings of
` 6,193 million, current portion of long-term
borrowings of ` 285 million, and short-term
borrowings of ` 1,233 million at the
end of FY 2020-21.
Major movements during the year are:
i. The overall long-term borrowings and
current portion of long-term debt has gone
down by ` 782 million, primarily due to
re-payment of loans.
ii. The short-term borrowings have decreased
by ` 1,460 million mainly due to decrease in
commercial paper.
Cash & Bank Balances and liquid/current
investments at FY 2020-21-end stood at
` 13,914 million.
Net debt decreased by ` 6,526 million and the
Net cash position stands at ` 6,204 million as of
31st March 2021 after accounting for cash & bank
balances and liquid investments.
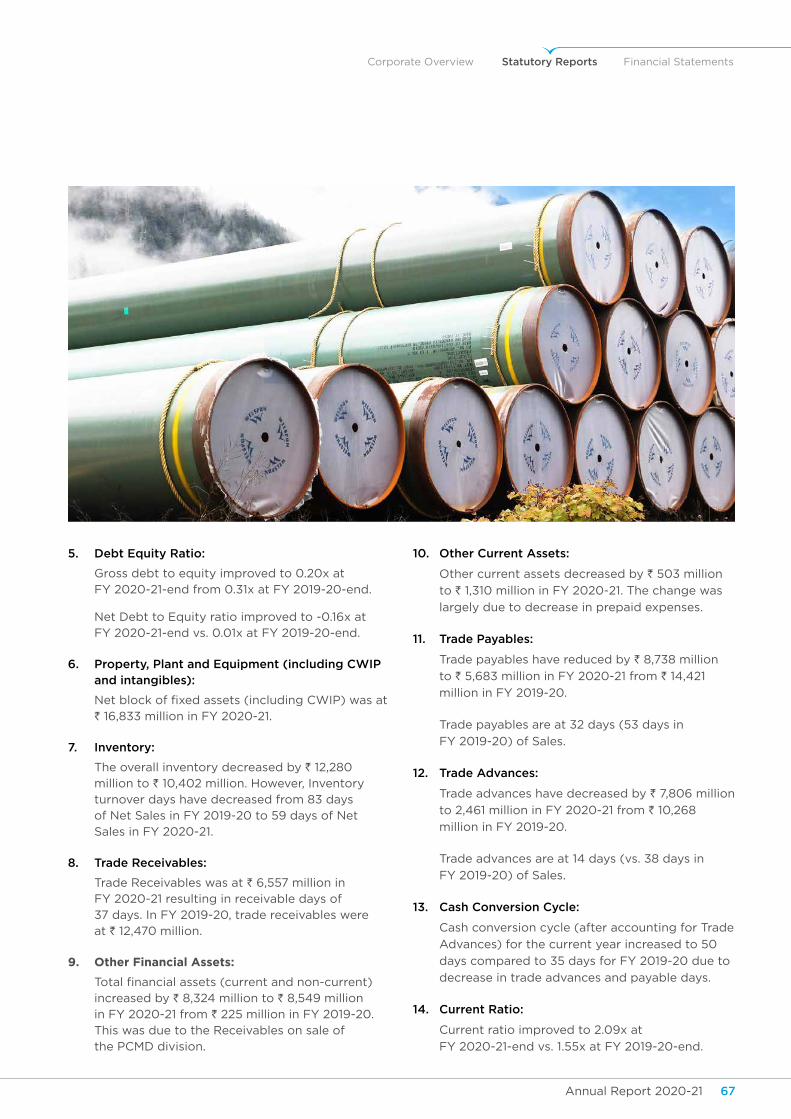
Corporate Overview Statutory Reports Financial Statements
Annual Report 2020-21 67Annual Report 2020-2166
5. Debt Equity Ratio:
Gross debt to equity improved to 0.20x at
FY 2020-21-end from 0.31x at FY 2019-20-end.
Net Debt to Equity ratio improved to -0.16x at
FY 2020-21-end vs. 0.01x at FY 2019-20-end.
6. Property, Plant and Equipment (including CWIP and intangibles):
Net block of fixed assets (including CWIP) was at ` 16,833 million in FY 2020-21.
7. Inventory:
The overall inventory decreased by ` 12,280
million to ` 10,402 million. However, Inventory turnover days have decreased from 83 days of Net Sales in FY 2019-20 to 59 days of Net
Sales in FY 2020-21.
8. Trade Receivables:
Trade Receivables was at ` 6,557 million in FY 2020-21 resulting in receivable days of 37 days. In FY 2019-20, trade receivables were at ` 12,470 million.
9. Other Financial Assets:
Total financial assets (current and non-current) increased by ` 8,324 million to ` 8,549 million
in FY 2020-21 from ` 225 million in FY 2019-20. This was due to the Receivables on sale of
the PCMD division.
10. Other Current Assets:
Other current assets decreased by ` 503 million
to ` 1,310 million in FY 2020-21. The change was
largely due to decrease in prepaid expenses.
11. Trade Payables:
Trade payables have reduced by ` 8,738 million
to ` 5,683 million in FY 2020-21 from ` 14,421
million in FY 2019-20.
Trade payables are at 32 days (53 days in
FY 2019-20) of Sales.
12. Trade Advances:
Trade advances have decreased by ` 7,806 million
to 2,461 million in FY 2020-21 from ` 10,268
million in FY 2019-20.
Trade advances are at 14 days (vs. 38 days in
FY 2019-20) of Sales.
13. Cash Conversion Cycle:
Cash conversion cycle (after accounting for Trade
Advances) for the current year increased to 50
days compared to 35 days for FY 2019-20 due to
decrease in trade advances and payable days.
14. Current Ratio:
Current ratio improved to 2.09x at
FY 2020-21-end vs. 1.55x at FY 2019-20-end.
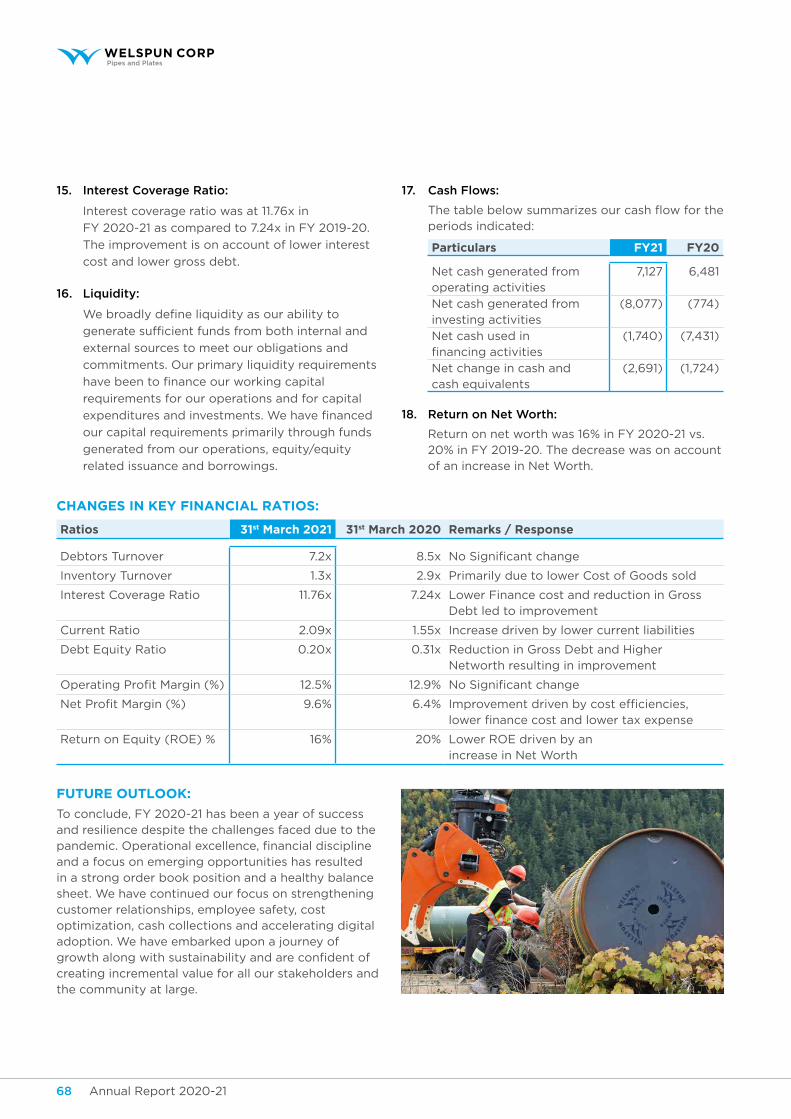
Annual Report 2020-21 PBAnnual Report 2020-2168
15. Interest Coverage Ratio:
Interest coverage ratio was at 11.76x in
FY 2020-21 as compared to 7.24x in FY 2019-20.
The improvement is on account of lower interest
cost and lower gross debt.
16. Liquidity:
We broadly define liquidity as our ability to
generate sufficient funds from both internal and
external sources to meet our obligations and
commitments. Our primary liquidity requirements
have been to finance our working capital
requirements for our operations and for capital
expenditures and investments. We have financed
our capital requirements primarily through funds
generated from our operations, equity/equity
related issuance and borrowings.
17. Cash Flows:
The table below summarizes our cash flow for the periods indicated:
Particulars FY21 FY20
Net cash generated from operating activities
7,127 6,481
Net cash generated from investing activities
(8,077) (774)
Net cash used in financing activities
(1,740) (7,431)
Net change in cash and cash equivalents
(2,691) (1,724)
18. Return on Net Worth:
Return on net worth was 16% in FY 2020-21 vs. 20% in FY 2019-20. The decrease was on account of an increase in Net Worth.
CHANGES IN KEY FINANCIAL RATIOS:
Ratios 31st March 2021 31st March 2020 Remarks / Response
Debtors Turnover 7.2x 8.5x No Significant change
Inventory Turnover 1.3x 2.9x Primarily due to lower Cost of Goods sold
Interest Coverage Ratio 11.76x 7.24x Lower Finance cost and reduction in Gross Debt led to improvement
Current Ratio 2.09x 1.55x Increase driven by lower current liabilities
Debt Equity Ratio 0.20x 0.31x Reduction in Gross Debt and Higher Networth resulting in improvement
Operating Profit Margin (%) 12.5% 12.9% No Significant change
Net Profit Margin (%) 9.6% 6.4% Improvement driven by cost efficiencies, lower finance cost and lower tax expense
Return on Equity (ROE) % 16% 20% Lower ROE driven by an increase in Net Worth
FUTURE OUTLOOK:
To conclude, FY 2020-21 has been a year of success and resilience despite the challenges faced due to the pandemic. Operational excellence, financial discipline and a focus on emerging opportunities has resulted in a strong order book position and a healthy balance sheet. We have continued our focus on strengthening customer relationships, employee safety, cost optimization, cash collections and accelerating digital adoption. We have embarked upon a journey of growth along with sustainability and are confident of creating incremental value for all our stakeholders and the community at large.
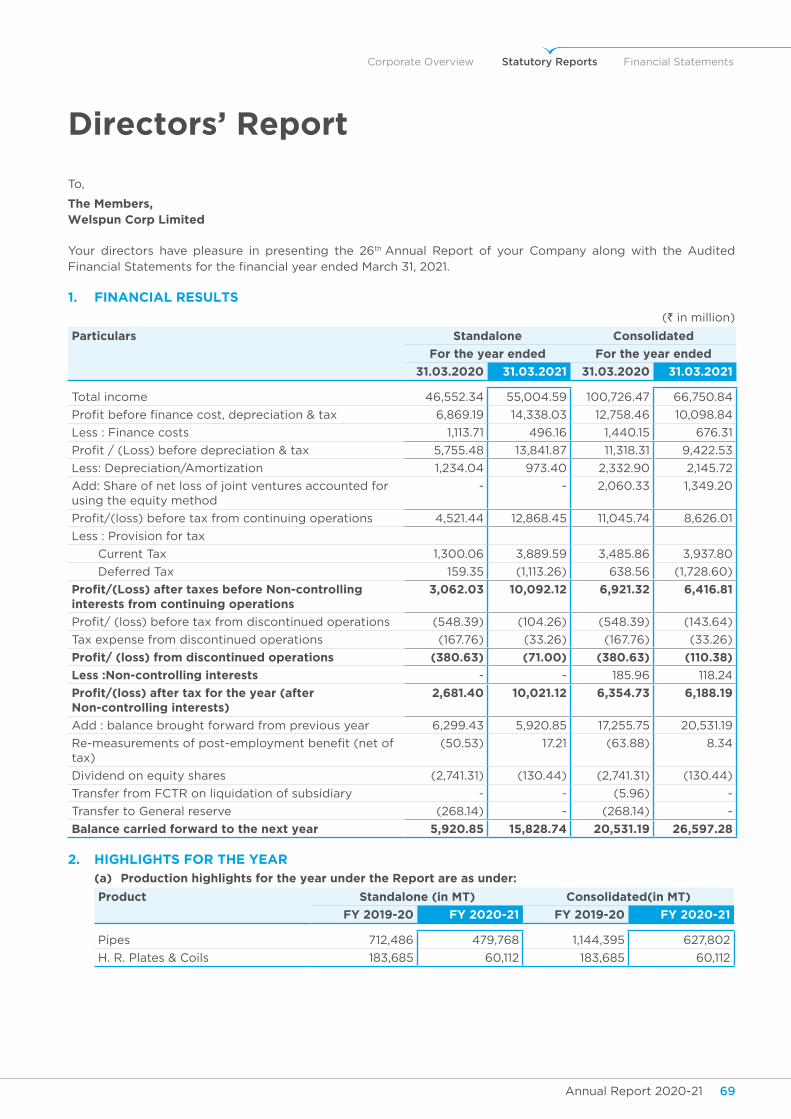
Annual Report 2020-21 69Annual Report 2020-21PB
Corporate Overview Statutory Reports Financial Statements
Directors’ Report
To,
The Members,Welspun Corp Limited
Your directors have pleasure in presenting the 26th Annual Report of your Company along with the Audited Financial Statements for the financial year ended March 31, 2021.
1. FinanCiaL ResuLTs
(` in million)
Particulars standalone Consolidated
For the year ended For the year ended
31.03.2020 31.03.2021 31.03.2020 31.03.2021
Total income 46,552.34 55,004.59 100,726.47 66,750.84
Profit before finance cost, depreciation & tax 6,869.19 14,338.03 12,758.46 10,098.84
Less : Finance costs 1,113.71 496.16 1,440.15 676.31
Profit / (Loss) before depreciation & tax 5,755.48 13,841.87 11,318.31 9,422.53
Less: Depreciation/Amortization 1,234.04 973.40 2,332.90 2,145.72
Add: Share of net loss of joint ventures accounted for using the equity method
- - 2,060.33 1,349.20
Profit/(loss) before tax from continuing operations 4,521.44 12,868.45 11,045.74 8,626.01
Less : Provision for tax
Current Tax 1,300.06 3,889.59 3,485.86 3,937.80
Deferred Tax 159.35 (1,113.26) 638.56 (1,728.60)
Profit/(Loss) after taxes before Non-controlling interests from continuing operations
3,062.03 10,092.12 6,921.32 6,416.81
Profit/ (loss) before tax from discontinued operations (548.39) (104.26) (548.39) (143.64)
Tax expense from discontinued operations (167.76) (33.26) (167.76) (33.26)
Profit/ (loss) from discontinued operations (380.63) (71.00) (380.63) (110.38)
Less :Non-controlling interests - - 185.96 118.24
Profit/(loss) after tax for the year (after Non-controlling interests)
2,681.40 10,021.12 6,354.73 6,188.19
Add : balance brought forward from previous year 6,299.43 5,920.85 17,255.75 20,531.19
Re-measurements of post-employment benefit (net of tax)
(50.53) 17.21 (63.88) 8.34
Dividend on equity shares (2,741.31) (130.44) (2,741.31) (130.44)
Transfer from FCTR on liquidation of subsidiary - - (5.96) -
Transfer to General reserve (268.14) - (268.14) -
Balance carried forward to the next year 5,920.85 15,828.74 20,531.19 26,597.28
2. HigHLigHTs FoR THe yeaR
(a) Production highlights for the year under the Report are as under:
Product Standalone (in MT) Consolidated(in MT)
FY 2019-20 FY 2020-21 FY 2019-20 FY 2020-21
Pipes 712,486 479,768 1,144,395 627,802
H. R. Plates & Coils 183,685 60,112 183,685 60,112
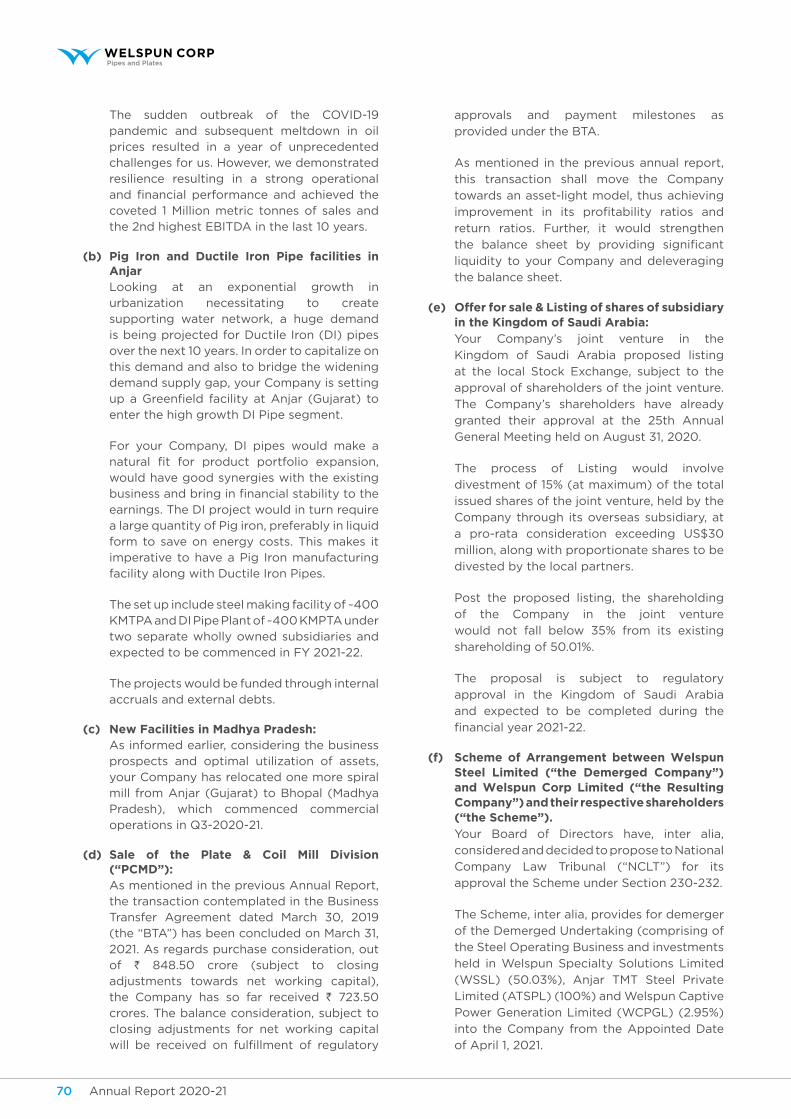
Annual Report 2020-21 71Annual Report 2020-2170
The sudden outbreak of the COVID-19 pandemic and subsequent meltdown in oil prices resulted in a year of unprecedented challenges for us. However, we demonstrated resilience resulting in a strong operational and financial performance and achieved the coveted 1 Million metric tonnes of sales and the 2nd highest EBITDA in the last 10 years.
(b) Pig Iron and Ductile Iron Pipe facilities in anjar
Looking at an exponential growth in urbanization necessitating to create supporting water network, a huge demand is being projected for Ductile Iron (DI) pipes over the next 10 years. In order to capitalize on this demand and also to bridge the widening demand supply gap, your Company is setting up a Greenfield facility at Anjar (Gujarat) to enter the high growth DI Pipe segment.
For your Company, DI pipes would make a natural fit for product portfolio expansion, would have good synergies with the existing business and bring in financial stability to the earnings. The DI project would in turn require a large quantity of Pig iron, preferably in liquid form to save on energy costs. This makes it imperative to have a Pig Iron manufacturing facility along with Ductile Iron Pipes.
The set up include steel making facility of ~400 KMTPA and DI Pipe Plant of ~400 KMPTA under two separate wholly owned subsidiaries and expected to be commenced in FY 2021-22.
The projects would be funded through internal accruals and external debts.
(c) New Facilities in Madhya Pradesh: As informed earlier, considering the business
prospects and optimal utilization of assets, your Company has relocated one more spiral mill from Anjar (Gujarat) to Bhopal (Madhya Pradesh), which commenced commercial operations in Q3-2020-21.
(d) Sale of the Plate & Coil Mill Division (“PCMD”):
As mentioned in the previous Annual Report, the transaction contemplated in the Business Transfer Agreement dated March 30, 2019 (the “BTA”) has been concluded on March 31, 2021. As regards purchase consideration, out of ` 848.50 crore (subject to closing adjustments towards net working capital), the Company has so far received ` 723.50 crores. The balance consideration, subject to closing adjustments for net working capital will be received on fulfillment of regulatory
approvals and payment milestones as
provided under the BTA.
As mentioned in the previous annual report,
this transaction shall move the Company
towards an asset-light model, thus achieving
improvement in its profitability ratios and
return ratios. Further, it would strengthen
the balance sheet by providing significant
liquidity to your Company and deleveraging
the balance sheet.
(e) Offer for sale & Listing of shares of subsidiary in the Kingdom of Saudi Arabia:
Your Company’s joint venture in the
Kingdom of Saudi Arabia proposed listing
at the local Stock Exchange, subject to the
approval of shareholders of the joint venture.
The Company’s shareholders have already
granted their approval at the 25th Annual
General Meeting held on August 31, 2020.
The process of Listing would involve
divestment of 15% (at maximum) of the total
issued shares of the joint venture, held by the
Company through its overseas subsidiary, at
a pro-rata consideration exceeding US$30
million, along with proportionate shares to be
divested by the local partners.
Post the proposed listing, the shareholding
of the Company in the joint venture
would not fall below 35% from its existing
shareholding of 50.01%.
The proposal is subject to regulatory
approval in the Kingdom of Saudi Arabia
and expected to be completed during the
financial year 2021-22.
(f) Scheme of Arrangement between Welspun Steel Limited (“the Demerged Company”) and Welspun Corp Limited (“the Resulting Company”) and their respective shareholders (“the Scheme”).
Your Board of Directors have, inter alia,
considered and decided to propose to National
Company Law Tribunal (“NCLT”) for its
approval the Scheme under Section 230-232.
The Scheme, inter alia, provides for demerger
of the Demerged Undertaking (comprising of
the Steel Operating Business and investments
held in Welspun Specialty Solutions Limited
(WSSL) (50.03%), Anjar TMT Steel Private
Limited (ATSPL) (100%) and Welspun Captive
Power Generation Limited (WCPGL) (2.95%)
into the Company from the Appointed Date
of April 1, 2021.
Annual Report 2020-21 71Annual Report 2020-2170
Corporate Overview Statutory Reports Financial Statements
The business of the Demerged Undertaking
will supplement the business of the Resulting
Company and the consolidation of the
Demerged Undertaking with the business
of the Resulting Company is expected to
provide, inter-alia, the following benefits:
a. The consolidation will result in earning
predictability, stronger revenue and
improved competitiveness, with
diversification in product portfolio
thereby reducing business risks for mutual
benefit of the shareholders. This will
result in strong presence across market
segments, provide access to new markets
and product offerings. Further, the
operations of the Demerged Undertaking
could have access to the Resulting
Company’s marketing capabilities.
b. Greater economies of scale and will
provide a larger and stronger base for
potential future growth;
c. Consolidation and simplification of the
group structure;
d. reduction in overheads, administrative,
managerial and other expenditure;
e. operational rationalization and increase
in operating efficiency; and
f. Synergistic benefits, expansion and
acquisition opportunities.
The Scheme does not provide for any cash
consideration. The consideration shall
be paid as under:
81 (Eighty-one) 6% Cumulative Redeemable
Preference Shares (“CRPS”) of the Resulting
Company of ` 10 (Rupees Ten only) each fully
paid up, which will be redeemable subject
to the terms specified in Annexure to the
Scheme, shall be issued and allotted for every
100 (Hundred) equity share of the Demerged
Company of the face value of ` 10/- (Rupees
Ten only) each fully paid
The above ratio would translate in issue
of CRPS of ` 362.73 crores, at face value,
redeemable at the option of the holder, upon
the expiry of 18 months from the date of issue.
3. ReSeRveS, DIvIDeND & DIvIDeND POLICY.
The Board is pleased to recommend a dividend
@ 100% for the year ended March 31, 2021 i.e. ` 5
per equity share of ` 5/- each fully paid-up out
of the net profits for the year. In respect of the
dividend declared for the previous financial years,
` 6.41 million remained unclaimed as on March 31,
2021. During the year under Report, the Company
has transferred dividend of ` 416,092 remaining
unclaimed for the financial year 2012-13 to the
Investor Education and Protection Fund. Detail of
unclaimed dividend is available on the website of
the Company at “www.welspuncorp.com”.
The Company has appointed Mr. Pradeep Joshi,
Company Secretary as the Nodal Officer for the
purpose of co-ordination with Investor Education
and Protection Fund Authority. Details of the
Nodal Officer are available on the website of the
Company at www.welspuncorp.com.
The Board does not propose to transfer any
amount to General Reserves.
In terms of the Regulation 43A of the SEBI
(Listing Obligations and Disclosure Requirements)
Regulations, 2015, the Board of Directors
approved and adopted Dividend Distribution
Policy of the Company setting out the parameters
and circumstances that will be taken into account
by the Board in determining the distribution of
dividend to the shareholders and/ or retaining
the profits earned by the Company. The Policy is
annexed to this Report as Annexure – 1 and is also
available on your Company’s website at “http://
www.welspuncorp.com” under the tab “Who We
Are --> Polices, Disclosures, Notices.”
4. inTeRnaL ConTRoLs
Your Company has adequate internal control
system, which is commensurate with the size, scale
and complexity of its operations. Your Company
has a process in place to continuously monitor
existing controls and identify gaps and implement
new and / or improved controls wherever the
effect of such gaps would have a material impact
on your Company’s operation. The controls were
tested during the year under Report and no
reportable material weaknesses either in their
design or operations were observed. In other
observations, appropriate corrective actions were
taken as advised by the Audit Committee.
5. SuBSIDIARY/JOINT veNTuReS/assoCiaTe CoMPanies anD THeiR PeRFoRManCe
A report on the performance and financial position
of each of the subsidiaries and joint venture
companies included in the consolidated financial
statement is presented in Form AOC-1 annexed to
this Report as Annexure - 2.
Annual Report 2020-21 73Annual Report 2020-2172
Financial statements of the subsidiaries and joint venture are hosted on the website of the Company at “http://www.welspuncorp.com” under the tab “Investor Relations --> Subsidiary Accounts”.
6. DePosiTs
The Company has not accepted any deposit within the meaning of the Chapter V to the Companies Act, 2013. Further, no amount on account of principal or interest on deposit was outstanding as at the end of the year under report.
7. DeTAILS OF uTILIzATION OF FuNDS RaiseD THRougH PReFeRenTiaL aLLoTMenT oR quaLiFieD insTiTuTions PLaCeMenT as sPeCiFieD unDeR ReguLATION 32 (7A)
During the year under Report, the Company raised ` 400 crores by issuing secured, rated, listed, taxable, redeemable, non-convertible debentures on private placement basis for the purpose of long term working capital requirements and towards General Corporate Purposes. The funds have been used for the purpose for which the same were raised.
8. auDiToRs
i) Statutory Auditors: Your Company’s Auditors M/s. Price
Waterhouse Chartered Accountants LLP, who have given their consent and confirmation of qualification for re-appointment as the Statutory Auditors have been re-appointed for second term ending on the conclusion of the 29th Annual General Meeting at a remuneration of ` 13.35 million p.a. plus travelling and out-of-pocket expenses.
Total fees for all services paid by the Company and its subsidiaries, on a consolidated basis, to the statutory auditor and all entities in the network firm/network entity of which the statutory auditor is a part during the financial year under Report is `23.80 million.
ii) Cost Auditors: M/s. Kiran J. Mehta & Co, Cost Accountants
(Firm Registration No. 000025), are proposed to be appointed as the Cost Auditors under Section 148 of the Companies Act, 2013 for the Financial Year 2021-22. The members are requested to approve their remuneration by passing an ordinary resolution pursuant to Rule 14 of the Companies (Audit and Auditors) Rules, 2015.
iii) Secretarial Auditors: The Board of Directors have re-appointed
M/s. Mihen Halani & Associates, Practicing Company Secretary, as the Secretarial Auditor of your Company for the Financial Year 2021-22.
9. auDiToR’s RePoRT
(a) Statutory Auditor’s Report: The Auditor’s observations read with Notes to
Accounts are self-explanatory and therefore do not call for any comment.
No frauds or instances of mismanagement were reported by the Statutory Auditor under Section 143(12) of the Companies Act, 2013.
(b) Cost Audit Report : As required under the Companies (Accounts)
Rules, 2014, the cost accounting records, as specified by the Central Government under Section 148(1) of the Companies Act, 2013, were made and maintained by the Company.
The Company had appointed M/s. Kiran J. Mehta & Co., Cost Accountants as the Cost Auditors of the Company for auditing cost accounting records for the financial year 2020-21. The Cost Audit Report for the year 2019-20 was e-filed on August 6, 2020. The Cost Audit for the financial year 2020-21 is in progress and the report will be e-filed to the Ministry of Corporate Affairs, Government of India, in due course.
(c) Secretarial Audit Report : Secretarial Audit Report given by
M/s. Mihen Halani & Associates, Company Secretaries is annexed with the Report as Annexure 3. The Report, read with the annexure thereto, is self-explanatory and therefore, do not call for any further comments.
10. ShARe CAPITAL & LISTINg
A) The Company does not have any equity shares with differential rights and hence disclosures as per Rule 4(4) of the Companies (Share Capital and Debentures) Rules, 2014 are not required. Further, the Company has not issued any sweat equity and hence no disclosure is required under Rule 8 (13) of Companies (Share Capital and Debentures) Rules, 2014.
The Company granted stock options during the financial year 2018-2019. Disclosure as required under Regulation 14 of
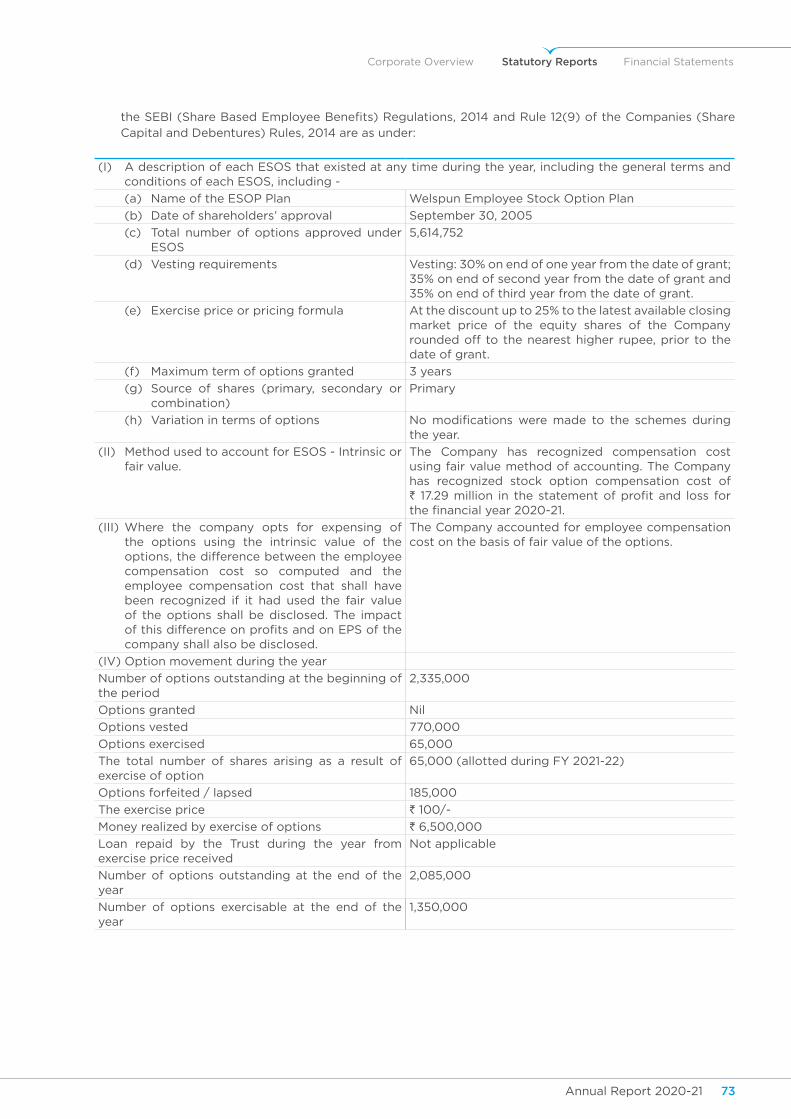
Annual Report 2020-21 73Annual Report 2020-2172
Corporate Overview Statutory Reports Financial Statements
the SEBI (Share Based Employee Benefits) Regulations, 2014 and Rule 12(9) of the Companies (Share Capital and Debentures) Rules, 2014 are as under:
(I) A description of each ESOS that existed at any time during the year, including the general terms and conditions of each ESOS, including -
(a) Name of the ESOP Plan Welspun Employee Stock Option Plan
(b) Date of shareholders’ approval September 30, 2005
(c) Total number of options approved under ESOS
5,614,752
(d) Vesting requirements Vesting: 30% on end of one year from the date of grant; 35% on end of second year from the date of grant and 35% on end of third year from the date of grant.
(e) Exercise price or pricing formula At the discount up to 25% to the latest available closing market price of the equity shares of the Company rounded off to the nearest higher rupee, prior to the date of grant.
(f) Maximum term of options granted 3 years
(g) Source of shares (primary, secondary or combination)
Primary
(h) Variation in terms of options No modifications were made to the schemes during the year.
(II) Method used to account for ESOS - Intrinsic or fair value.
The Company has recognized compensation cost using fair value method of accounting. The Company has recognized stock option compensation cost of ` 17.29 million in the statement of profit and loss for the financial year 2020-21.
(III) Where the company opts for expensing of the options using the intrinsic value of the options, the difference between the employee compensation cost so computed and the employee compensation cost that shall have been recognized if it had used the fair value of the options shall be disclosed. The impact of this difference on profits and on EPS of the company shall also be disclosed.
The Company accounted for employee compensation cost on the basis of fair value of the options.
(IV) Option movement during the year
Number of options outstanding at the beginning of the period
2,335,000
Options granted Nil
Options vested 770,000
Options exercised 65,000
The total number of shares arising as a result of exercise of option
65,000 (allotted during FY 2021-22)
Options forfeited / lapsed 185,000
The exercise price ` 100/-
Money realized by exercise of options ` 6,500,000
Loan repaid by the Trust during the year from exercise price received
Not applicable
Number of options outstanding at the end of the year
2,085,000
Number of options exercisable at the end of the year
1,350,000
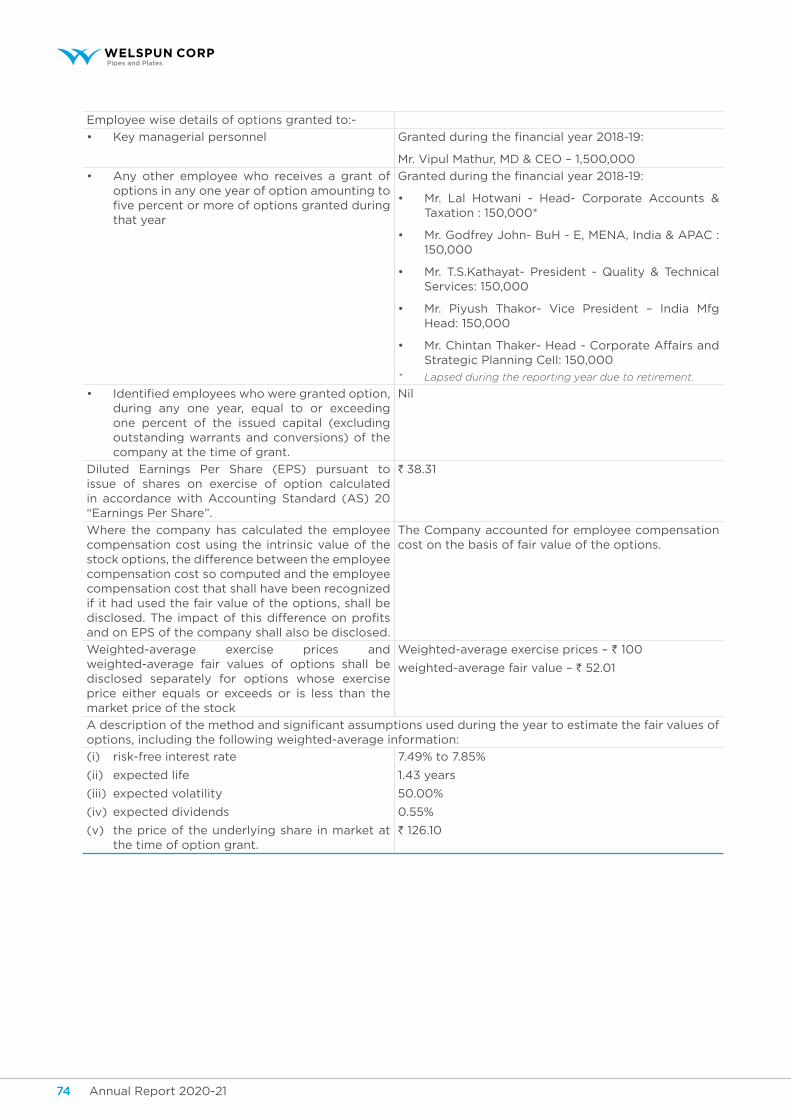
Annual Report 2020-21 75Annual Report 2020-2174
Employee wise details of options granted to:-
• Key managerial personnel Granted during the financial year 2018-19:
Mr. Vipul Mathur, MD & CEO – 1,500,000
• Any other employee who receives a grant of options in any one year of option amounting to five percent or more of options granted during that year
Granted during the financial year 2018-19:
• Mr. Lal Hotwani - Head- Corporate Accounts & Taxation : 150,000*
• Mr. Godfrey John- BuH - E, MENA, India & APAC : 150,000
• Mr. T.S.Kathayat- President - Quality & Technical Services: 150,000
• Mr. Piyush Thakor- Vice President – India Mfg Head: 150,000
• Mr. Chintan Thaker- Head - Corporate Affairs and Strategic Planning Cell: 150,000
* Lapsed during the reporting year due to retirement.
• Identified employees who were granted option, during any one year, equal to or exceeding one percent of the issued capital (excluding outstanding warrants and conversions) of the company at the time of grant.
Nil
Diluted Earnings Per Share (EPS) pursuant to issue of shares on exercise of option calculated in accordance with Accounting Standard (AS) 20 “Earnings Per Share”.
` 38.31
Where the company has calculated the employee compensation cost using the intrinsic value of the stock options, the difference between the employee compensation cost so computed and the employee compensation cost that shall have been recognized if it had used the fair value of the options, shall be disclosed. The impact of this difference on profits and on EPS of the company shall also be disclosed.
The Company accounted for employee compensation cost on the basis of fair value of the options.
Weighted-average exercise prices and weighted-average fair values of options shall be disclosed separately for options whose exercise price either equals or exceeds or is less than the market price of the stock
Weighted-average exercise prices – ` 100
weighted-average fair value – ` 52.01
A description of the method and significant assumptions used during the year to estimate the fair values of options, including the following weighted-average information:
(i) risk-free interest rate
(ii) expected life
(iii) expected volatility
(iv) expected dividends
(v) the price of the underlying share in market at the time of option grant.
7.49% to 7.85%
1.43 years
50.00%
0.55%
` 126.10
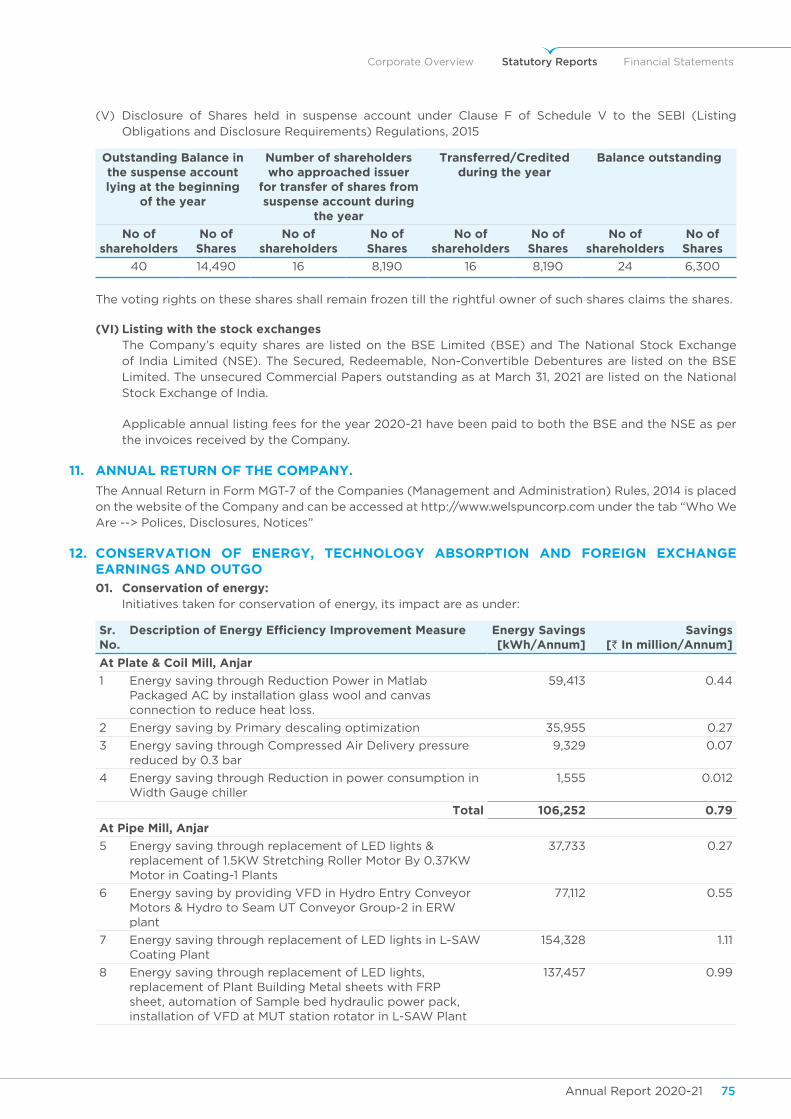
Annual Report 2020-21 75Annual Report 2020-2174
Corporate Overview Statutory Reports Financial Statements
(V) Disclosure of Shares held in suspense account under Clause F of Schedule V to the SEBI (Listing Obligations and Disclosure Requirements) Regulations, 2015
Outstanding Balance in the suspense account lying at the beginning
of the year
Number of shareholders who approached issuer
for transfer of shares from suspense account during
the year
Transferred/Credited during the year
Balance outstanding
No of shareholders
No of shares
No of shareholders
No of shares
No of shareholders
No of shares
No of shareholders
No of shares
40 14,490 16 8,190 16 8,190 24 6,300
The voting rights on these shares shall remain frozen till the rightful owner of such shares claims the shares.
(vI) Listing with the stock exchanges The Company’s equity shares are listed on the BSE Limited (BSE) and The National Stock Exchange
of India Limited (NSE). The Secured, Redeemable, Non-Convertible Debentures are listed on the BSE Limited. The unsecured Commercial Papers outstanding as at March 31, 2021 are listed on the National Stock Exchange of India.
Applicable annual listing fees for the year 2020-21 have been paid to both the BSE and the NSE as per the invoices received by the Company.
11. annuaL ReTuRn oF THe CoMPany.
The Annual Return in Form MGT-7 of the Companies (Management and Administration) Rules, 2014 is placed on the website of the Company and can be accessed at http://www.welspuncorp.com under the tab “Who We Are --> Polices, Disclosures, Notices”
12. ConseRvaTion oF eneRgy, TeCHnoLogy absoRPTion anD FoReign exCHange eaRnings anD ouTgo
01. Conservation of energy: Initiatives taken for conservation of energy, its impact are as under:
sr. no.
Description of energy efficiency Improvement Measure energy Savings [kWh/Annum]
Savings [` In million/Annum]
At Plate & Coil Mill, Anjar
1 Energy saving through Reduction Power in Matlab Packaged AC by installation glass wool and canvas connection to reduce heat loss.
59,413 0.44
2 Energy saving by Primary descaling optimization 35,955 0.27
3 Energy saving through Compressed Air Delivery pressure reduced by 0.3 bar
9,329 0.07
4 Energy saving through Reduction in power consumption in Width Gauge chiller
1,555 0.012
Total 106,252 0.79
at Pipe Mill, anjar
5 Energy saving through replacement of LED lights & replacement of 1.5KW Stretching Roller Motor By 0.37KW Motor in Coating-1 Plants
37,733 0.27
6 Energy saving by providing VFD in Hydro Entry Conveyor Motors & Hydro to Seam UT Conveyor Group-2 in ERW plant
77,112 0.55
7 Energy saving through replacement of LED lights in L-SAW Coating Plant
154,328 1.11
8 Energy saving through replacement of LED lights, replacement of Plant Building Metal sheets with FRP sheet, automation of Sample bed hydraulic power pack, installation of VFD at MUT station rotator in L-SAW Plant
137,457 0.99
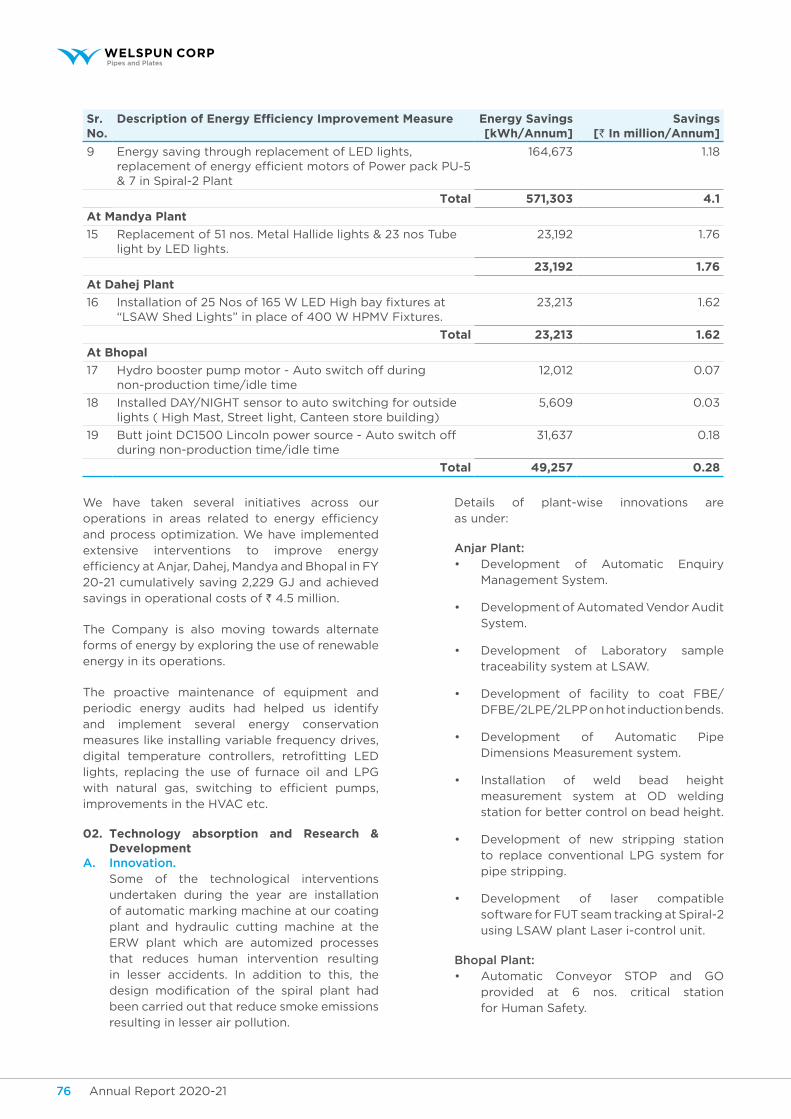
Annual Report 2020-21 77Annual Report 2020-2176
sr. no.
Description of energy efficiency Improvement Measure energy Savings [kWh/Annum]
Savings [` In million/Annum]
9 Energy saving through replacement of LED lights, replacement of energy efficient motors of Power pack PU-5 & 7 in Spiral-2 Plant
164,673 1.18
Total 571,303 4.1
at Mandya Plant
15 Replacement of 51 nos. Metal Hallide lights & 23 nos Tube light by LED lights.
23,192 1.76
23,192 1.76
at Dahej Plant
16 Installation of 25 Nos of 165 W LED High bay fixtures at “LSAW Shed Lights” in place of 400 W HPMV Fixtures.
23,213 1.62
Total 23,213 1.62
at bhopal
17 Hydro booster pump motor - Auto switch off during non-production time/idle time
12,012 0.07
18 Installed DAY/NIGHT sensor to auto switching for outside lights ( High Mast, Street light, Canteen store building)
5,609 0.03
19 Butt joint DC1500 Lincoln power source - Auto switch off during non-production time/idle time
31,637 0.18
Total 49,257 0.28
We have taken several initiatives across our operations in areas related to energy efficiency and process optimization. We have implemented extensive interventions to improve energy efficiency at Anjar, Dahej, Mandya and Bhopal in FY 20-21 cumulatively saving 2,229 GJ and achieved savings in operational costs of ` 4.5 million.
The Company is also moving towards alternate forms of energy by exploring the use of renewable energy in its operations.
The proactive maintenance of equipment and periodic energy audits had helped us identify and implement several energy conservation measures like installing variable frequency drives, digital temperature controllers, retrofitting LED lights, replacing the use of furnace oil and LPG with natural gas, switching to efficient pumps, improvements in the HVAC etc.
02. Technology absorption and Research & Development
A. Innovation. Some of the technological interventions
undertaken during the year are installation of automatic marking machine at our coating plant and hydraulic cutting machine at the ERW plant which are automized processes that reduces human intervention resulting in lesser accidents. In addition to this, the design modification of the spiral plant had been carried out that reduce smoke emissions resulting in lesser air pollution.
Details of plant-wise innovations are as under:
Anjar Plant: • Development of Automatic Enquiry
Management System.
• Development of Automated Vendor Audit System.
• Development of Laboratory sample traceability system at LSAW.
• Development of facility to coat FBE/DFBE/2LPE/2LPP on hot induction bends.
• Development of Automatic Pipe Dimensions Measurement system.
• Installation of weld bead height measurement system at OD welding station for better control on bead height.
• Development of new stripping station to replace conventional LPG system for pipe stripping.
• Development of laser compatible software for FUT seam tracking at Spiral-2 using LSAW plant Laser i-control unit.
Bhopal Plant: • Automatic Conveyor STOP and GO
provided at 6 nos. critical station for Human Safety.
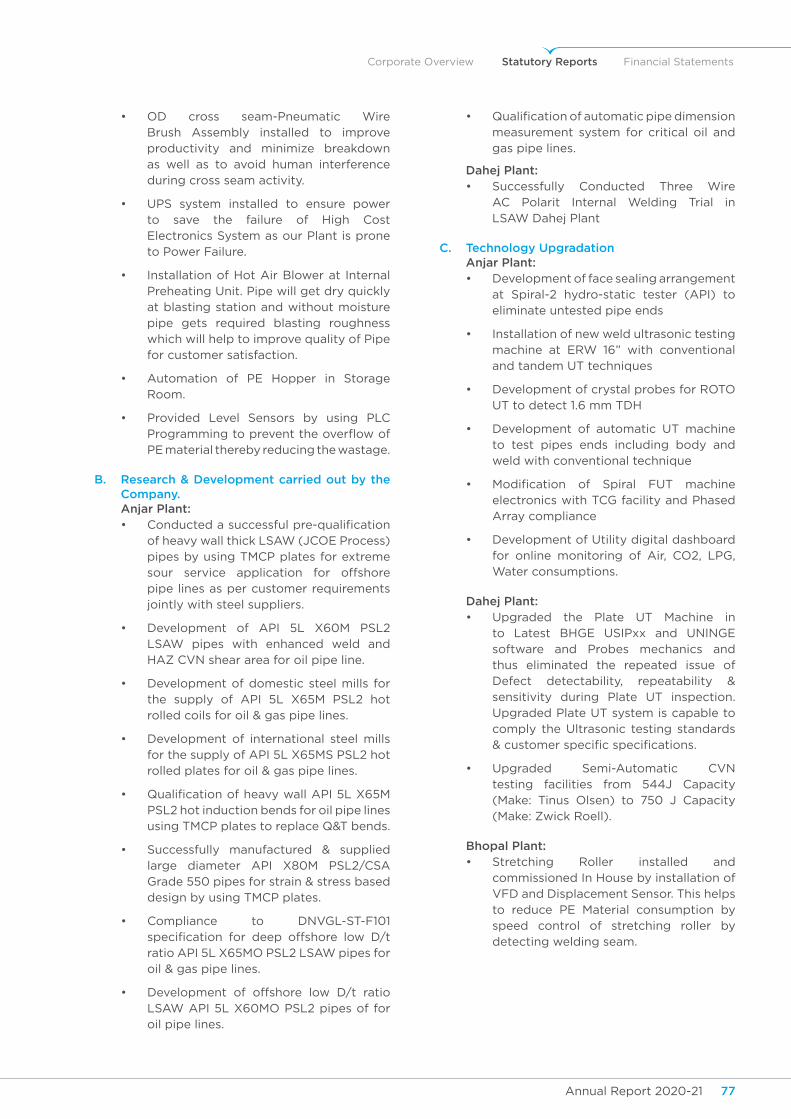
Annual Report 2020-21 77Annual Report 2020-2176
Corporate Overview Statutory Reports Financial Statements
• OD cross seam-Pneumatic Wire Brush Assembly installed to improve productivity and minimize breakdown as well as to avoid human interference during cross seam activity.
• UPS system installed to ensure power to save the failure of High Cost Electronics System as our Plant is prone to Power Failure.
• Installation of Hot Air Blower at Internal Preheating Unit. Pipe will get dry quickly at blasting station and without moisture pipe gets required blasting roughness which will help to improve quality of Pipe for customer satisfaction.
• Automation of PE Hopper in Storage Room.
• Provided Level Sensors by using PLC Programming to prevent the overflow of PE material thereby reducing the wastage.
B. Research & Development carried out by the Company.
Anjar Plant: • Conducted a successful pre-qualification
of heavy wall thick LSAW (JCOE Process) pipes by using TMCP plates for extreme sour service application for offshore pipe lines as per customer requirements jointly with steel suppliers.
• Development of API 5L X60M PSL2 LSAW pipes with enhanced weld and HAZ CVN shear area for oil pipe line.
• Development of domestic steel mills for the supply of API 5L X65M PSL2 hot rolled coils for oil & gas pipe lines.
• Development of international steel mills for the supply of API 5L X65MS PSL2 hot rolled plates for oil & gas pipe lines.
• Qualification of heavy wall API 5L X65M PSL2 hot induction bends for oil pipe lines using TMCP plates to replace Q&T bends.
• Successfully manufactured & supplied large diameter API X80M PSL2/CSA Grade 550 pipes for strain & stress based design by using TMCP plates.
• Compliance to DNVGL-ST-F101 specification for deep offshore low D/t ratio API 5L X65MO PSL2 LSAW pipes for oil & gas pipe lines.
• Development of offshore low D/t ratio LSAW API 5L X60MO PSL2 pipes of for oil pipe lines.
• Qualification of automatic pipe dimension measurement system for critical oil and gas pipe lines.
Dahej Plant: • Successfully Conducted Three Wire
AC Polarit Internal Welding Trial in LSAW Dahej Plant
C. Technology Upgradation Anjar Plant:
• Development of face sealing arrangement at Spiral-2 hydro-static tester (API) to eliminate untested pipe ends
• Installation of new weld ultrasonic testing machine at ERW 16” with conventional and tandem UT techniques
• Development of crystal probes for ROTO UT to detect 1.6 mm TDH
• Development of automatic UT machine to test pipes ends including body and weld with conventional technique
• Modification of Spiral FUT machine electronics with TCG facility and Phased Array compliance
• Development of Utility digital dashboard for online monitoring of Air, CO2, LPG, Water consumptions.
Dahej Plant: • Upgraded the Plate UT Machine in
to Latest BHGE USIPxx and UNINGE software and Probes mechanics and thus eliminated the repeated issue of Defect detectability, repeatability & sensitivity during Plate UT inspection. Upgraded Plate UT system is capable to comply the Ultrasonic testing standards & customer specific specifications.
• Upgraded Semi-Automatic CVN testing facilities from 544J Capacity (Make: Tinus Olsen) to 750 J Capacity (Make: Zwick Roell).
Bhopal Plant: • Stretching Roller installed and
commissioned In House by installation of VFD and Displacement Sensor. This helps to reduce PE Material consumption by speed control of stretching roller by detecting welding seam.
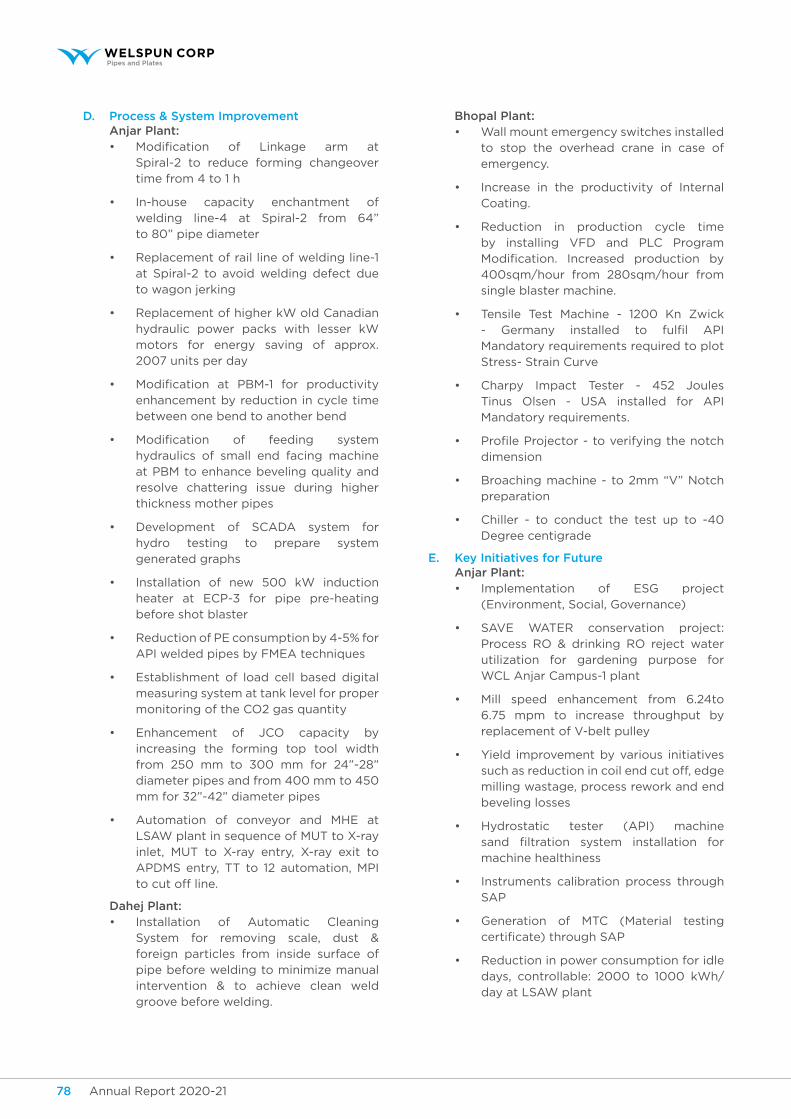
Annual Report 2020-21 79Annual Report 2020-2178
D. Process & System Improvement Anjar Plant:
• Modification of Linkage arm at Spiral-2 to reduce forming changeover time from 4 to 1 h
• In-house capacity enchantment of welding line-4 at Spiral-2 from 64” to 80” pipe diameter
• Replacement of rail line of welding line-1 at Spiral-2 to avoid welding defect due to wagon jerking
• Replacement of higher kW old Canadian hydraulic power packs with lesser kW motors for energy saving of approx. 2007 units per day
• Modification at PBM-1 for productivity enhancement by reduction in cycle time between one bend to another bend
• Modification of feeding system hydraulics of small end facing machine at PBM to enhance beveling quality and resolve chattering issue during higher thickness mother pipes
• Development of SCADA system for hydro testing to prepare system generated graphs
• Installation of new 500 kW induction heater at ECP-3 for pipe pre-heating before shot blaster
• Reduction of PE consumption by 4-5% for API welded pipes by FMEA techniques
• Establishment of load cell based digital measuring system at tank level for proper monitoring of the CO2 gas quantity
• Enhancement of JCO capacity by increasing the forming top tool width from 250 mm to 300 mm for 24”-28” diameter pipes and from 400 mm to 450 mm for 32”-42” diameter pipes
• Automation of conveyor and MHE at LSAW plant in sequence of MUT to X-ray inlet, MUT to X-ray entry, X-ray exit to APDMS entry, TT to 12 automation, MPI to cut off line.
Dahej Plant: • Installation of Automatic Cleaning
System for removing scale, dust & foreign particles from inside surface of pipe before welding to minimize manual intervention & to achieve clean weld groove before welding.
Bhopal Plant: • Wall mount emergency switches installed
to stop the overhead crane in case of emergency.
• Increase in the productivity of Internal Coating.
• Reduction in production cycle time by installing VFD and PLC Program Modification. Increased production by 400sqm/hour from 280sqm/hour from single blaster machine.
• Tensile Test Machine - 1200 Kn Zwick - Germany installed to fulfil API Mandatory requirements required to plot Stress- Strain Curve
• Charpy Impact Tester - 452 Joules Tinus Olsen - USA installed for API Mandatory requirements.
• Profile Projector - to verifying the notch dimension
• Broaching machine - to 2mm “V” Notch preparation
• Chiller - to conduct the test up to -40 Degree centigrade
E. Key Initiatives for Future Anjar Plant:
• Implementation of ESG project (Environment, Social, Governance)
• SAVE WATER conservation project: Process RO & drinking RO reject water utilization for gardening purpose for WCL Anjar Campus-1 plant
• Mill speed enhancement from 6.24to 6.75 mpm to increase throughput by replacement of V-belt pulley
• Yield improvement by various initiatives such as reduction in coil end cut off, edge milling wastage, process rework and end beveling losses
• Hydrostatic tester (API) machine sand filtration system installation for machine healthiness
• Instruments calibration process through SAP
• Generation of MTC (Material testing certificate) through SAP
• Reduction in power consumption for idle days, controllable: 2000 to 1000 kWh/day at LSAW plant
Annual Report 2020-21 79Annual Report 2020-2178
Corporate Overview Statutory Reports Financial Statements
• Utilization of robot compressor for idle day
• Load optimization of pumps of plant utility
• Replacement of transparent sheet for reduce power consumption of shade lighting
• Solar powered AC for epoxy godown having 365 days operation - detailing under progress
• Position sensor based momentary stoppages - restart of motors basis the pipe travel and operations (approx. 50 kWh reduction - detailing under progress)
• Trial on addition of polymer processing additives in HDPE extrusion for reduction of power and increasing output
• Installation of solar panels for admin, street lights, cabin ACs and other area at WCL Anjar
• Common air network grid establishment for cost optimization
• Plan to set up Cut-To-Line (CTL) line
• Development of spray marking system for existing PUT machine at LSAW Anjar
• ERW 16” plant Procurement of HF Welder and Second Finishing Line.
Dahej Plant: • Modification in Continuous Tack Welding
Machine for Auto Offset Control to minimize manual intervention & Weld Seam Defects.
• Develop business opportunities through the Product Innovation and Process Optimization (ICME Approach) through Artificial Intelligence – WDI Initiative.
• Development of Customer Inquiry to Execution software (CIES) through Artificial Intelligence – WDI Initiative.
Bhopal Plant: • Modification in Hydrotester, End Facer
and Final Section to run the plant for 6 Meter pipe production.
• Modification in the plant for enhancing it to run the Higher Thickness, Higher Diameter Pipe(132” x 25 mm)
Mandya Plant: • Implementation of Quick change over
project at Spiral Mill – Average change over time reduced from 8.6 hours to 5.9
hours and added capacity of 4157 MT by saving 12 days from FY 2020-21.
expenditure on R&D
(a) Capital : Nil
(b) Recurring : ` 24.99 million
(c) Total : ` 24.99 million
(d) Total R&D expenditure as a percentage of revenue from operations : 0.06%
Total Foreign exchange:
Used - ` 11,359.70 million,
Earned- ` 25,197.78 million.
13. CoRPoRaTe soCiaL ResPonsibiLiTy (CSR)
Disclosures as required under Rule 9 of the Companies (Corporate Social Responsibility Policy) Rules, 2014 are annexed to this Report as Annexure 4.
14. DiReCToRs anD Key ManageRiaL PeRsonneL
A) Changes in Directors and Key Managerial Personnel
Since the last report, following changes took place in the Board of Directors and Key Managerial Personnel:-
• Mr. Rajkumar Jain ceased to be a director due to resignation with effect from October 31, 2020
• Ms. Dipali Goenka has been appointed as an additional director with effect from October 29, 2020.
• Nomination and Remuneration Committee recommended re-appointment of Mr. Desh Raj Dogra, an independent director of the Company, for a second term of appointment, whose tenure is expiring on February 9, 2022.
In accordance with the provisions of the Companies Act, 2013 and the Articles of Association of the Company, Mr. Rajesh Mandawewala is retiring by rotation at the forthcoming Annual General Meeting and being eligible, he has been recommended for re-appointment by the Board.
Details about the directors being (re)-appointed are given in the Notice of the forthcoming Annual General Meeting which is being sent to the members along with the Annual Report.
Annual Report 2020-21 81Annual Report 2020-2180
B) Independent Directors The independent directors have individually
declared to the Board that they meet the criteria of independence as provided under Section 149(6) of the Companies Act, 2013 at the beginning of the year and there is no change in the circumstances as on the date of this Report which may affect their status as an independent director.
Your Board confirms that in their opinion the independent directors fulfill the conditions of the independence as prescribed under the SEBI (LODR), 2015 and they are independent of the management. Further, in the opinion of the Board the independent directors appointed during the year under Report or continuing on the Board, possess requisite expertise, experience and integrity. All the independent directors on the Board of the Company are registered with the Indian Institute of Corporate Affairs, Manesar, Gurgaon as notified by the Central Government under Section 150(1) of the Companies Act, 2013 and shall undergo online proficiency self-assessment test, as may be applicable, within the time prescribed by the IICA.
C) Formal Annual evaluation Background:
The performance evaluation of the Board, its committees and individual directors was conducted by the entire Board (excluding the Director being evaluated) on the basis of a structured questionnaire which was prepared after taking into consideration inputs received from the Directors covering
various aspects of the Board’s functioning viz. adequacy of the composition of the Board and its Committees, time spent by each of the directors; accomplishment of specific responsibilities and expertise; conflict of interest; integrity of the Director; active participation and contribution during discussions and governance.
Mode of evaluation: Assessment is conducted through a structured
questionnaire. Each question contains a scale of 0 to 3. The Company has developed an in-house digital platform to facilitate confidential responses to a structured questionnaire. All the directors participated in the evaluation process.
For the financial year 2020-21 the annual performance evaluation was carried out by the Independent Directors, Nomination and Remuneration Committee and the Board, which included evaluation of the Board, Independent Directors, Non-independent Directors, Executive Directors, Chairman, Committees of the Board, Quantity, Quality and Timeliness of Information to the Board.
Results: The evaluation results were discussed
at the meeting of Board of Directors, Nomination & Remuneration Committee and the Independent Directors meeting. The Directors were satisfied with the overall corporate governance standards, Board performance and effectiveness. The results are summarised below:
Key parameters Number of evaluation
parameters
score %
Board of Directors
• Board structure and composition
• Board meeting practices (agenda, frequency, duration)
• Functions of the Board (Strategic direction etc.)
• Quantity, quality & timeliness of information
• Board culture and effectiveness
• Functioning of Board Committees
• Director induction and development programs
20 91%
Board Committees
• Composition, roles & responsibilities and effectiveness of the committee
• Meeting structure and information flow
• Contributions to Board decisions
7-10 88-94%
Independent directors
• Independence from company (no conflict of interest)
• Independent views and judgement
• Objective contribution to the Board deliberations
8 86-96%
Annual Report 2020-21 81Annual Report 2020-2180
Corporate Overview Statutory Reports Financial Statements
Key parameters Number of evaluation
parameters
score %
Chairperson • Promote effective decision-making
• Encourage high quality of constructive debate
• Open-minded and listening to the members
• Effectively dealing with dissent and work constructively towards consensus
• Shareholders’ interest supreme while taking decisions.
6 95%
Executive Directors
• Relevant industry experience
• Performance vis-à-vis business plan
• Capabilities to deal with challenging situations
• Established leadership position
• Development of expertise and general competence of people under him
9 96%
Non- executive non- independent director
• Contribution to the Board discussions with his/her expertise and experience
• Depth of understanding about the business model and the industry
8 89-95%
Board of Directors
Parameters with high performance scores:
• In-depth understanding of Board about key performance drivers, risks and opportunities
• Board culture - Collectively and constructively work as a team
• Board effectiveness in establishing a corporate environment that promotes accountability, high ethical standards, compliance with laws and a corporate culture and value
• Oversight on quality of financial reporting process & internal financial controls
• Monitoring of actions taken on key decisions
Key suggestions / focus areas:
• Induction & Continuous training for Independent Directors (Action plan: comprehensive induction toolkit shall be developed for new directors and periodic re-assessment of training needs)
• Strive to balance time spent between strategic matters and day-to-day responsibilities (Action Plan : Agenda-wise time allocation implemented to strive balance)
• Re-assess Board size, composition and diversity with the future requirements (Action plan: Develop long term Board succession plan considering tenure and diversity)
• Re-balance the level of information and insights in the presentations submitted to the Board (Action Plan: Key highlights to be provided well in advance)
board Committees
Parameters with high performance scores:
• Size, composition and diversity of each committee
• Strong oversight on financial reporting process, internal financial controls, compliance with related party transactions regulations and reporting to Board on key control gaps
• Performance monitoring of subsidiaries
• Effective process of selection of new directors and well-defined board evaluation framework
• Transparent & effective monitoring mechanism for CSR projects undertaken by the company and amount of expenditure incurred
• Adequacy of information and effective monitoring of security transfer system
Key focus areas for next year:
• Review and revision of whistle blower mechanism to adopt leading practices [Action plan: Benchmarking of whistle blower mechanism has been completed and the revised policy under review]
• Review the process for appointment and remuneration of KMP and SMP [Action plan: Strengthen process for appointment of, and compensation to, KMP & SMP]
Annual Report 2020-21 83Annual Report 2020-2182
Key actions taken as a result of previous year’s evaluation:
• Fixing and sharing with the Board and Committee members, the calendar of meetings for the Company as well as subsidiaries for the entire year at the beginning of the year.
• Separate and dedicated meetings for discussing the strategic matters.
• Based on the suggestion by the directors, duration of the meeting increased.
D) Committees of the Board of Directors Information on the Audit Committee, the
Nomination and Remuneration Committee, the Stakeholders’ Relationship, Share Transfer and Investor Grievance Committee, the Risk Management Committee and the ESG & CSR Committee (erstwhile Corporate Social Responsibility Committee) and meetings of those committees held during the year under Report is given in the “Corporate Governance Report” annexed to the Annual Report as Annexure 5.
15. PaRTiCuLaRs oF ouTsTanDing Loans, guaRanTees anD invesTMenTs unDeR seCTion 186 aRe as unDeR:
(` in million)
Name of the entity / beneficiary
Investment Corporate guarantee
Loans
Welspun Pipes Inc. 0.44 7,311.00 -
Welspun Tradings Limited
50.22 - -
Welspun Captive Power Generation Limited*
694.48 - -
Welspun Mauritius Holdings Limited*
298.46 - -
Welspun Wasco Coatings Private Limited(provision made)
254.65 86.70 247.01
Bonds* 9,850.86East Pipes Integrated Company for Industry (formerly known as Welspun Middle East Pipes Company LLC)
- 18,782.67 -
Welspun Metallics Limited
1,601.94 3,240.00 -
Welspun DI Pipes Limited
245.68 3,240.00 60.00
Welassure Services Limited
1.16 - -
Welspun Global Services Limited
0.02 - -
* Investment carried at fair value through profit and loss.
The corporate guarantees were given to secure credit facilities availed by the subsidiaries / joint ventures of your Company, to guarantee export obligations of the subsidiaries / joint ventures to the custom authorities and to guarantee performance of the subsidiaries of the Company.
16. PaRTiCuLaRs oF ConTRaCTs oR aRRangeMenTs WiTH ReLaTeD PaRTies
All related party transactions that were entered into during the year under Report were on an arm’s length basis and were in the ordinary course of business. There were no materially significant related party transactions undertaken by the Company with Promoters, Directors, Key Managerial Personnel or other designated persons which might have a potential conflict with the interest of the Company at large.
The Company’s policy on Related Party Transactions as approved by the Board is uploaded on the Company’s website “http://www.welspuncorp.com” under the tab “Who We Are --> Polices, Disclosures, Notices”.
Save and except as disclosed in the financial statements, none of the Directors or Key Managerial Personnel had any pecuniary relationships or transactions vis-à-vis the Company.
Accordingly, the disclosure of related party transactions as required under Section 134(3)(h) of the Act in Form AOC-2 is not applicable to the Company for financial year 2020-21 and hence does not form part of this report. Details of related party transactions entered into by the Company, in terms of Ind AS-24 have been disclosed in the Note No. 42 of the standalone financial statements.
17. MANAgeRIAL ReMuNeRATION
a. Details of the ratio of the remuneration of each director to the median employee’s remuneration and other details as required pursuant to Rule 5(1) of the Companies (Appointment and Remuneration of Managerial Personnel) Rules, 2014.
Non-executive, independent directors are paid sitting fees at a fixed rate per meeting of the Board or the Committee attended by them and as such the same cannot compared with the remuneration to the employees.
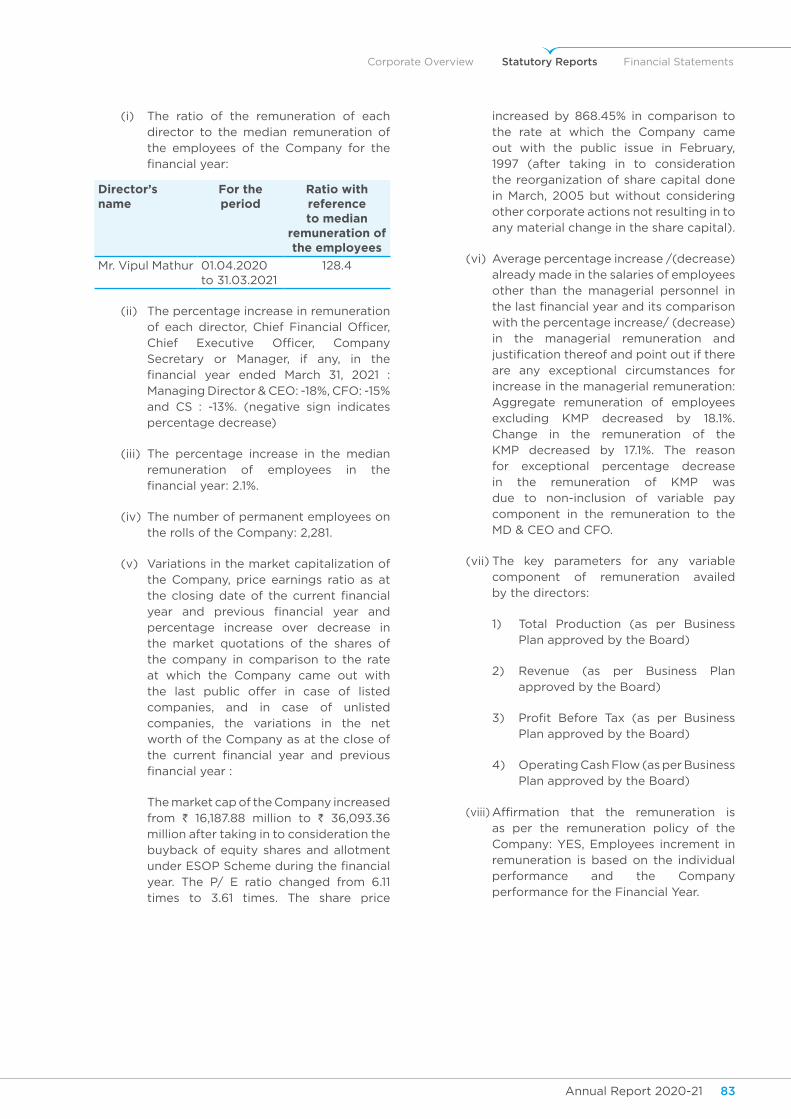
Annual Report 2020-21 83Annual Report 2020-2182
Corporate Overview Statutory Reports Financial Statements
(i) The ratio of the remuneration of each director to the median remuneration of the employees of the Company for the financial year:
Director’s name
For the period
Ratio with reference to median
remuneration of the employees
Mr. Vipul Mathur 01.04.2020 to 31.03.2021
128.4
(ii) The percentage increase in remuneration of each director, Chief Financial Officer, Chief Executive Officer, Company Secretary or Manager, if any, in the financial year ended March 31, 2021 : Managing Director & CEO: -18%, CFO: -15% and CS : -13%. (negative sign indicates percentage decrease)
(iii) The percentage increase in the median remuneration of employees in the financial year: 2.1%.
(iv) The number of permanent employees on the rolls of the Company: 2,281.
(v) Variations in the market capitalization of the Company, price earnings ratio as at the closing date of the current financial year and previous financial year and percentage increase over decrease in the market quotations of the shares of the company in comparison to the rate at which the Company came out with the last public offer in case of listed companies, and in case of unlisted companies, the variations in the net worth of the Company as at the close of the current financial year and previous financial year :
The market cap of the Company increased from ` 16,187.88 million to ` 36,093.36 million after taking in to consideration the buyback of equity shares and allotment under ESOP Scheme during the financial year. The P/ E ratio changed from 6.11 times to 3.61 times. The share price
increased by 868.45% in comparison to the rate at which the Company came out with the public issue in February, 1997 (after taking in to consideration the reorganization of share capital done in March, 2005 but without considering other corporate actions not resulting in to any material change in the share capital).
(vi) Average percentage increase /(decrease) already made in the salaries of employees other than the managerial personnel in the last financial year and its comparison with the percentage increase/ (decrease) in the managerial remuneration and justification thereof and point out if there are any exceptional circumstances for increase in the managerial remuneration: Aggregate remuneration of employees excluding KMP decreased by 18.1%. Change in the remuneration of the KMP decreased by 17.1%. The reason for exceptional percentage decrease in the remuneration of KMP was due to non-inclusion of variable pay component in the remuneration to the MD & CEO and CFO.
(vii) The key parameters for any variable component of remuneration availed by the directors:
1) Total Production (as per Business Plan approved by the Board)
2) Revenue (as per Business Plan approved by the Board)
3) Profit Before Tax (as per Business Plan approved by the Board)
4) Operating Cash Flow (as per Business Plan approved by the Board)
(viii) Affirmation that the remuneration is as per the remuneration policy of the Company: YES, Employees increment in remuneration is based on the individual performance and the Company performance for the Financial Year.
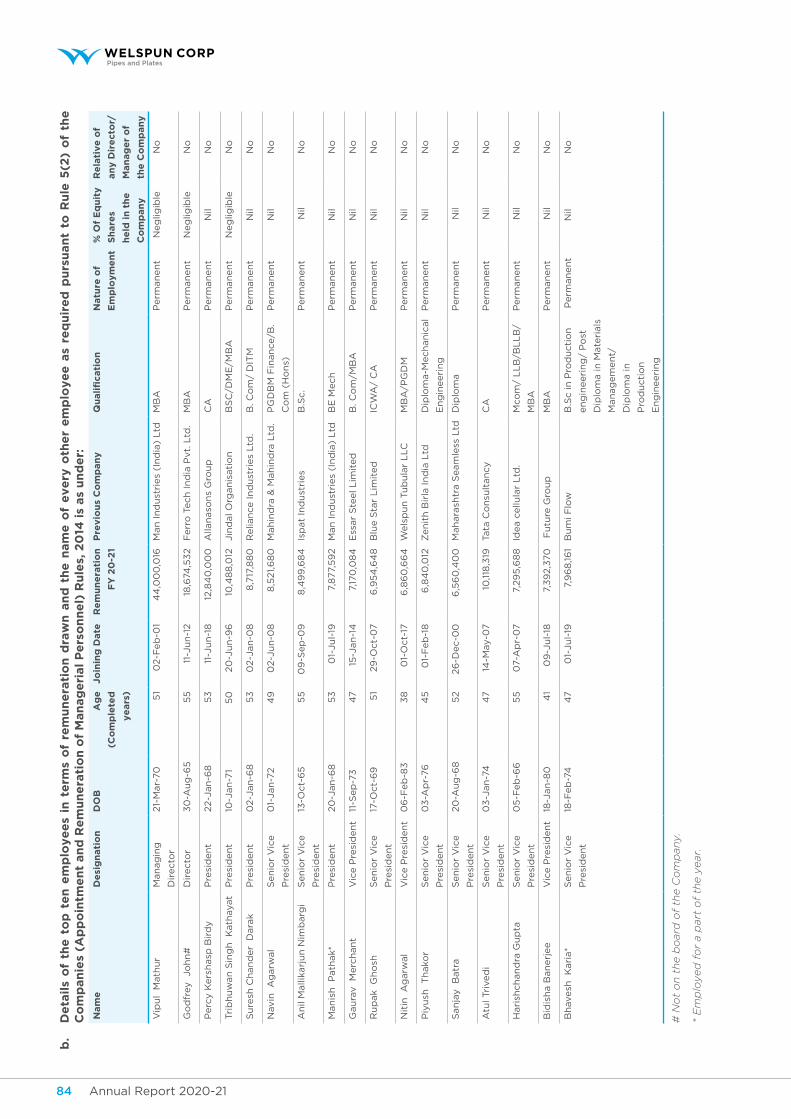
Annual Report 2020-21 85Annual Report 2020-2184
b.
De
tail
s o
f th
e t
op
te
n e
mp
loye
es
in t
erm
s o
f re
mu
ne
rati
on
dra
wn
an
d t
he
nam
e o
f e
ve
ry o
the
r e
mp
loy
ee
as
req
uir
ed
pu
rsu
an
t to
Ru
le 5
(2)
of
the
C
om
pan
ies
(Ap
po
intm
en
t an
d R
em
un
era
tio
n o
f M
an
ag
eri
al
Pe
rso
nn
el)
Ru
les,
20
14 i
s as
un
de
r:
nam
eD
esi
gn
ati
on
Do
bA
ge
(Co
mp
lete
d
ye
ars
)
Jo
inin
g D
ate
Re
mu
ne
rati
on
FY
20
-21
Pre
vio
us
Co
mp
an
yQ
uali
ficati
on
Natu
re o
f
em
plo
ym
en
t
% O
f e
qu
ity
sh
are
s
he
ld i
n t
he
Co
mp
an
y
Re
lati
ve
of
an
y D
ire
cto
r/
Man
ag
er
of
the
Co
mp
an
y
Vip
ul M
ath
ur
Man
ag
ing
Dir
ecto
r
21-
Mar-
70
51
02-F
eb
-01
44
,00
0,0
16M
an
In
du
stri
es
(In
dia
) Ltd
MB
AP
erm
an
en
tN
eg
ligib
le
No
Go
dfr
ey Jo
hn
#D
irecto
r3
0-A
ug
-65
55
11-J
un
-12
18,6
74,5
32
Ferr
o T
ech
In
dia
Pvt.
Ltd
.M
BA
Perm
an
en
tN
eg
ligib
le
No
Perc
y K
ers
hasp
Bir
dy
Pre
sid
en
t22-J
an
-68
53
11-J
un
-18
12,8
40
,00
0A
llan
aso
ns
Gro
up
CA
Perm
an
en
tN
ilN
o
Tri
bh
uw
an
Sin
gh
K
ath
ayat
Pre
sid
en
t10
-Jan
-71
50
20
-Ju
n-9
610
,48
8,0
12Jin
dal O
rgan
isati
on
BS
C/D
ME
/MB
AP
erm
an
en
tN
eg
ligib
le
No
Su
resh
Ch
an
der
Dara
kP
resi
den
t0
2-J
an
-68
53
02-J
an
-08
8,7
17,8
80
Relia
nce In
du
stri
es
Ltd
.B
. C
om
/ D
ITM
Perm
an
en
tN
ilN
o
Navin
A
garw
al
Sen
ior
Vic
e
Pre
sid
en
t
01-
Jan
-72
49
02-J
un
-08
8,5
21,
68
0M
ah
ind
ra &
Mah
ind
ra L
td.
PG
DB
M F
inan
ce/B
.
Co
m (
Ho
ns)
Perm
an
en
tN
ilN
o
An
il M
alli
karj
un
Nim
barg
iS
en
ior
Vic
e
Pre
sid
en
t
13-O
ct-
65
55
09
-Sep
-09
8,4
99
,68
4Is
pat
Ind
ust
ries
B.S
c.
Perm
an
en
t N
ilN
o
Man
ish
P
ath
ak*
Pre
sid
en
t20
-Jan
-68
53
01-
Ju
l-19
7,8
77,
59
2M
an
In
du
stri
es
(In
dia
) Ltd
BE
Mech
Perm
an
en
tN
il N
o
Gau
rav M
erc
han
tV
ice P
resi
den
t11
-Sep
-73
47
15-J
an
-14
7,17
0,0
84
Ess
ar
Ste
el L
imit
ed
B. C
om
/MB
AP
erm
an
en
tN
ilN
o
Ru
pak G
ho
shS
en
ior
Vic
e
Pre
sid
en
t
17-O
ct-
69
51
29
-Oct-
07
6,9
54
,64
8B
lue S
tar
Lim
ited
ICW
A/
CA
Perm
an
en
tN
ilN
o
Nit
in A
garw
al
Vic
e P
resi
den
t0
6-F
eb
-83
38
01-
Oct-
176
,86
0,6
64
Wels
pu
n T
ub
ula
r L
LC
MB
A/P
GD
MP
erm
an
en
tN
ilN
o
Piy
ush
T
hako
rS
en
ior
Vic
e
Pre
sid
en
t
03
-Ap
r-76
45
01-
Feb
-18
6,8
40
,012
Zen
ith
Bir
la In
dia
Ltd
Dip
lom
a-M
ech
an
ical
En
gin
eeri
ng
Perm
an
en
tN
ilN
o
San
jay B
atr
aS
en
ior
Vic
e
Pre
sid
en
t
20
-Au
g-6
85
226
-Dec-0
06
,56
0,4
00
Mah
ara
shtr
a S
eam
less
Ltd
Dip
lom
aP
erm
an
en
t N
ilN
o
Atu
l Tri
ved
iS
en
ior
Vic
e
Pre
sid
en
t
03
-Jan
-74
47
14-M
ay-0
710
,118
,319
Tata
Co
nsu
ltan
cy
CA
Perm
an
en
t N
ilN
o
Hari
shch
an
dra
Gu
pta
Sen
ior
Vic
e
Pre
sid
en
t
05
-Feb
-66
55
07-A
pr-
07
7,2
95
,68
8Id
ea c
ellu
lar
Ltd
.M
co
m/
LL
B/B
LL
B/
MB
A
Perm
an
en
t N
ilN
o
Bid
ish
a B
an
erj
ee
Vic
e P
resi
den
t18
-Jan
-80
41
09
-Ju
l-18
7,3
92,3
70
Fu
ture
Gro
up
MB
AP
erm
an
en
t N
ilN
o
Bh
avesh
K
ari
a*
Sen
ior
Vic
e
Pre
sid
en
t
18-F
eb
-74
47
01-
Ju
l-19
7,9
68
,16
1B
um
i F
low
B.S
c in
Pro
du
cti
on
en
gin
eeri
ng
/ P
ost
Dip
lom
a in
Mate
rials
Man
ag
em
en
t/
Dip
lom
a in
Pro
du
cti
on
En
gin
eeri
ng
Perm
an
en
tN
ilN
o
#
No
t o
n t
he b
oard
of
the C
om
pan
y.
*
Em
plo
yed
fo
r a p
art
of
the y
ear.
Annual Report 2020-21 85Annual Report 2020-2184
Corporate Overview Statutory Reports Financial Statements
c. Managing Director of the Company was not in receipt of any commission from the Company and at the same time, remuneration or commission from the Company’s Subsidiary Company.
d. Particulars of remuneration to the executive directors including the details of remuneration paid/payable to the executive directors for the financial year 2020-21 are as under:
Name of the Director
Salary & Allowance
Perquisites Commission Service Contract/
Tenure
Performance linked
incentives
notice Period
Severance Fees
Stock option
Pension
1 Mr. Vipul Mathur ` 55 million^ Nil Nil 5 years Nil 1 month Nil Refer note
below
Nil
^ In addition to salary & allowance, entitled for other benefits as per the Company’s policy.
Note: 1,500,000 Employee Stock Options granted during FY 2018-19 at an exercise price of ` 100 per option and can be exercised as per the vesting schedule given under the Welspun Employee Stock Option Plan which is 30%, 35% and 35% each year, from the end of 1st year from the grant date.
Mr. Balkrishan Goenka, Non-Executive Chairman was paid Commission of ` 5.292 crores i.e. @1% of the Net Profits in terms of the approval granted by the members of the Company at the 25th Annual General Meeting held on August 31, 2020.
No remuneration or perquisite was paid to, and no service contract was entered into with, or stock options granted to any non-executive director, but the sitting fees were paid / payable to the following directors for attending meetings of Board / Committees of the Board and General Meetings. Only Letter of Appointment were issued to the independent directors.
Name of the Director (`) Name of the Director (`)
1 Ms. Amita Misra 1,258,000 4 Mrs. Revathy Ashok 1,160,000
2 Mr. Desh Raj Dogra 1,918,000 5 Mr. Rajkumar Jain 1,499,600
3 Mr. K. H. Viswanathan 1,988,200
The above mentioned sitting fee paid / payable to the non-executive directors was within the limits prescribed under the Companies Act, 2013 for payment of sitting fees. Hence prior approval of the members as stipulated under Regulation 17(6) of the SEBI (Listing Obligations and Disclosure Requirements) Regulations, 2015 was not required.
18. sHaReHoLDing oF THe DiReCToRs oF THe CoMPany as on MaRCH 31, 2021
For detail of shareholding of the directors, refer to the “Corporate Governance Report” annexed to this Report.
Except as mentioned in the “Corporate Governance Report”, none of the other directors hold any shares or convertible securities in the Company.
19. CoRPoRaTe goveRnanCe CeRTiFiCaTe
The Compliance certificate obtained from M/s. Mihen Halani & Associates, Practicing Company Secretary regarding compliance of conditions of corporate governance as stipulated under Chapter IV read with relevant Schedule to the SEBI (Listing Obligations and Disclosure Requirements) Regulations, 2015 is annexed with this Report.
20. RisK ManageMenT PoLiCy
With its fast and continuous expansion in different areas of businesses across the globe, the Company is exposed to plethora of risks which
may adversely impact growth and profitability. The Company recognizes that risk management is of concern to all levels of the businesses and requires a structured risk management policy and process involving all personnel. With this objective, the Company had formulated structured Risk Management Policy thereby to effectively address those risks such as, strategic, business, regulatory and operational risks, including cyber security & data Privacy risks. The Policy envisages identification of risks by each business segment and location, together with the impact that these may have on the business objectives. It also provides a mechanism for categorization of risks into Low, Medium and High according to the severity of risks. The risks identified are reviewed by a committee of the Managing Director & CEO of the Company and the relevant senior executives and the appropriate actions for mitigation of risks are advised; the risk profile is updated on the basis of change in the business environment. The Risk Management Committee, periodically reviews the risk management process, risks and mitigation plans and provide appropriate advise in the improvement areas, if any, identified during the review.
Annual Report 2020-21 87Annual Report 2020-2186
For the key business risks identified by the Company, please refer to the Management Discussion and Analysis annexed to this Report.
21. FAMILIARIzATION PROgRAM FOR inDePenDenT DiReCToRs
The details of familiarization program (for independent directors) are disclosed on the Company’s website and a web link thereto is “http://www.welspuncorp.com” under the tab “Who We Are --> Polices, Disclosures, Notices”. 40 hours spent by the independent directors cumulatively in several familiarization program during the reporting year. During the year, the Company also conducted a separate session on ESG familiarization for directors as part of the committee meetings.
22. CoDe oF ConDuCT
The Company has a Code of Conduct for the Board members and Senior Management Personnel. A copy of the Code has been put for information of all the members of the Board and management personnel on the Company’s website “http://www.welspuncorp.com” under the tab “Who We Are --> Polices, Disclosures, Notices”.
All the members of the Board and the Senior Management Personnel have affirmed compliance with the same.
A declaration signed by the Managing Director & CEO of the Company is given below:
I hereby confirm that the Company has obtained from all the members of the Board and the Senior Management Personnel, affirmation that they have complied with the Code of Conduct for the financial year 2020-21.
Sd/-vipul Mathur
Managing Director& CEODIN: 07990476
23. MisCeLLaneous DisCLosuRes
During the year under Report, there was no change in the general nature of business of your Company.
Except as mentioned in this Report, no material change or commitment has occurred which would have affected the financial position of your Company between the end of the financial year of your Company to which the financial statements relate and the date of the Report.
No significant and material order was passed by the regulators or courts or tribunals which would have impacted the going concern status and your Company’s operations in future.
Your Company has not made any provision of money for the purchase of, or subscription for, shares in your Company, to be held by or for the benefit of the employees of your Company and hence the disclosure as required under Rule 16(4) of the Companies (Share Capital and Debentures) Rules, 2014 is not required.
The Board of Directors affirms that the Directors have devised proper systems to ensure compliance with the provisions of all applicable Secretarial Standards issued by the Institute of Companies Secretaries of India and that such systems are adequate and operating effectively. The Company has complied with the applicable Secretarial Standards.
The company has complied with provisions relating to the constitution of Internal Complaints Committee under the Sexual Harassment of Women at Workplace (Prevention, Prohibition and Redressal) Act, 2013. The ICC comprises of internal as well external members.
Disclosure of number of complaints filed, disposed of and pending in relation to the Sexual Harassment of Women at Workplace (Prevention, Prohibition and Redressal) Act, 2013 as on the end of the financial year under Report are as under:
• number of complaints filed during the financial year Nil
• number of complaints disposed of during the financial year : N/A
• number of complaints pending as on end of the financial year Nil
24. DiReCToRs’ ResPonsibiLiTy sTaTeMenT
Pursuant to Section 134(3)(c) & 134(5) of the Companies Act, 2013, your directors hereby confirm that:
a. in the preparation of the annual accounts, the applicable accounting standards had been followed along with proper explanation relating to material departures;
b. the directors had selected such accounting policies and applied them consistently and made judgments and estimates that are
Annual Report 2020-21 87Annual Report 2020-2186
Corporate Overview Statutory Reports Financial Statements
reasonable and prudent so as to give a true and fair view of the state of affairs of the Company at the end of the financial year and of the profit and loss of the Company for that period;
c. the directors had taken proper and sufficient care for the maintenance of adequate accounting records in accordance with the provisions of the Companies Act, 2013 for safeguarding the assets of the Company and for preventing and detecting fraud and other irregularities;
d. the directors had prepared the annual accounts on a going concern basis;
e. being a listed company, the directors had laid down internal financial controls to be followed by the Company and that such internal financial controls are adequate and were operating effectively; and
f. the directors had devised proper systems to ensure compliance with the provisions of all applicable laws and that such systems were adequate and operating effectively.
aCKnoWLeDgeMenTs
Your directors would like to thank all stakeholder, customers, bankers, employees, government authorities, contractors, suppliers, joint venture partners and associates of your Company for the support received from them during the year.
For and on behalf of the Board of Directors
Balkrishan goenka vipul MathurChairman Managing Director & CEODIN: 00270175 DIN : 07990476
Date: June 28, 2021Place: Mumbai
Annual Report 2020-21 89Annual Report 2020-2188
1. ReguLaToRy FRaMeWoRK
The Securities Exchange Board of India (“SEBI”) on July 8, 2016 inserted Regulation 43A in SEBI (Listing Obligations and Disclosure Requirements) Regulations, 2015, which requires top five hundred listed companies (based on market capitalization of every financial year) to formulate a Dividend Distribution Policy.
Welspun Corp Limited (“Company”) being one of the top five hundred listed companies as per the market capitalization as on the last day of the immediately preceding financial year, frames this policy to comply with the requirements of the SEBI (Listing Obligations and Disclosure Requirements) Regulations, 2015.
2. OBJeCTIve & PhILOSOPhY
The objective of this Policy is to provide predictability of dividend to the investors and at the same time to enable them to plan for utilization of their income and to ensure the right balance between the quantum of dividend paid and amount of profits retained in the business for various purposes. Through this Policy, the Company would endeavor to maintain a consistent approach to dividend pay-out plans, subject to the applicable laws and conditions.
The philosophy of the Company is to maximize the shareholders’ wealth in the Company through various means. The focus will continue to be on sustainable returns, through an appropriate capital strategy for both medium term and longer term value creation. Accordingly, the Board would continue to adopt a progressive and dynamic dividend policy, ensuring the immediate as well as long term needs of the business.
Welspun Corp Limited’s Dividend Distribution PolicyannexuRe 1
3. DIvIDeND DeCLARATION - CiRCuMsTanCes anD FinanCiaL PaRaMeTeRs.
The Board will consider present situation of the Company, internal and external factors influencing performance of the Company, its strategy and business plan for the future. After considering such factors, the Board will endeavor to achieve distributing upto 25% of Profit After Tax for a financial year, on standalone basis, with equity shareholders (including by way of dividend and Dividend Distribution Tax thereon).
The shareholders may expect dividend in following circumstances:
a. The Board will assess the Company’s financial requirement, including present and future organic and inorganic growth opportunities and other relevant factors.
b. In the circumstances where no material event has occurred affecting the long term business stability of the Company.
c. No event has happened which may have long term material effect on the business of the Company.
In such circumstances, dividend may be recommended or declared at the discretion of the Board.
Any deviation from the Policy may be disclosed in the Directors’ Report to the Shareholders.
In the event of inadequacy or absence of profits in any year, the Company may declare dividend out of free reserves subject to the fulfillment of the conditions prescribed under applicable laws and in compliance with the terms of sanction from the Banks / Financial Institutions.
4. FaCToRs FoR DeTeRMining DiviDenD
In determining the Company’s dividend payout, the Board of Directors would consider a variety of factors, including:
a. internal Factors B. external Factors
i) Stability / trends of earnings
ii) Liquidity of funds
iii) Need for additional capital
iv) Acquisitions and/or any other potential strategic action
v) Expansion of business
vi) Past dividend trends
vii) Dividend type and time of its payment
i) Prevailing legal requirements, tax rules, Government policies, Statutory conditions or restrictions as may be provided under applicable laws
ii) State of the industry or economy of the country
iii) Capital market scenario
iv) Financial covenants stipulated by the lenders
v) Covenants in agreement with shareholding group(s)
Annual Report 2020-21 89Annual Report 2020-2188
Corporate Overview Statutory Reports Financial Statements
5. PaRaMeTeRs WiTH RegaRDs To vaRious CLasses oF sHaRes
The Company shall first declare dividend on outstanding preference shares, if any, at the rate of dividend fixed at the time of issue of preference shares and thereafter, the dividend would be declared on equity shares.
6. uTILIzATION OF ReTAINeD eARNINgS
The earnings retained by the Company after distribution of dividend to the members may be used, inter alia, to:-
a. Maintain existing operations;
b. Acquisitions, expansion or diversification;
c. Funding organic and inorganic growth;
d. Short-term investment in risk-free instruments with moderate returns;
e. Repayment of borrowings;
f. Meet contingent and other liabilities;
g. Issue of Bonus Shares;
h. Buyback of securities;
i. Investment in Subsidiaries;
j. Research and Development;
k. Innovation;
l. Acquisition of Intellectual Property Rights;
m. Any other purpose as the Board may deem appropriate in the best interest of the Company.
7. AMeNDMeNTS / MODIFICATIONS
1. This Policy would be subject to revision/amendment in accordance with the guidelines
as may be issued by Ministry of Corporate Affairs, Securities Exchange Board of India or such other regulatory authority as may be authorized, from time to time, on the subject matter.
2. The Company reserves its right to alter, modify, add, delete or amend any of the provisions of this Policy.
3. In case of any amendment(s), clarification(s), circular(s) etc. issued by the relevant authorities, not being consistent with the provisions laid down under this Policy, then such amendment(s), clarification(s), circular(s) etc. shall prevail upon the provisions hereunder and this Policy shall stand amended accordingly from the effective date as laid down under such amendment(s), clarification(s), circular(s) etc.
4. Any difficulty or ambiguity in this Policy will be resolved by the Board of Directors in line with the broad intent of this Policy. The Board may also establish further rules and procedures, from time to time, to give effect to the intent of this Policy and further the objective of good corporate governance.
5. When the Company proposes to declare dividend on the basis of parameters other than what is mentioned in the Policy or proposes to change its dividend distribution policy, the same along with the rationale shall be disclosed.
Approved & adopted by the Board of Directors at its meeting held on May 8, 2017.
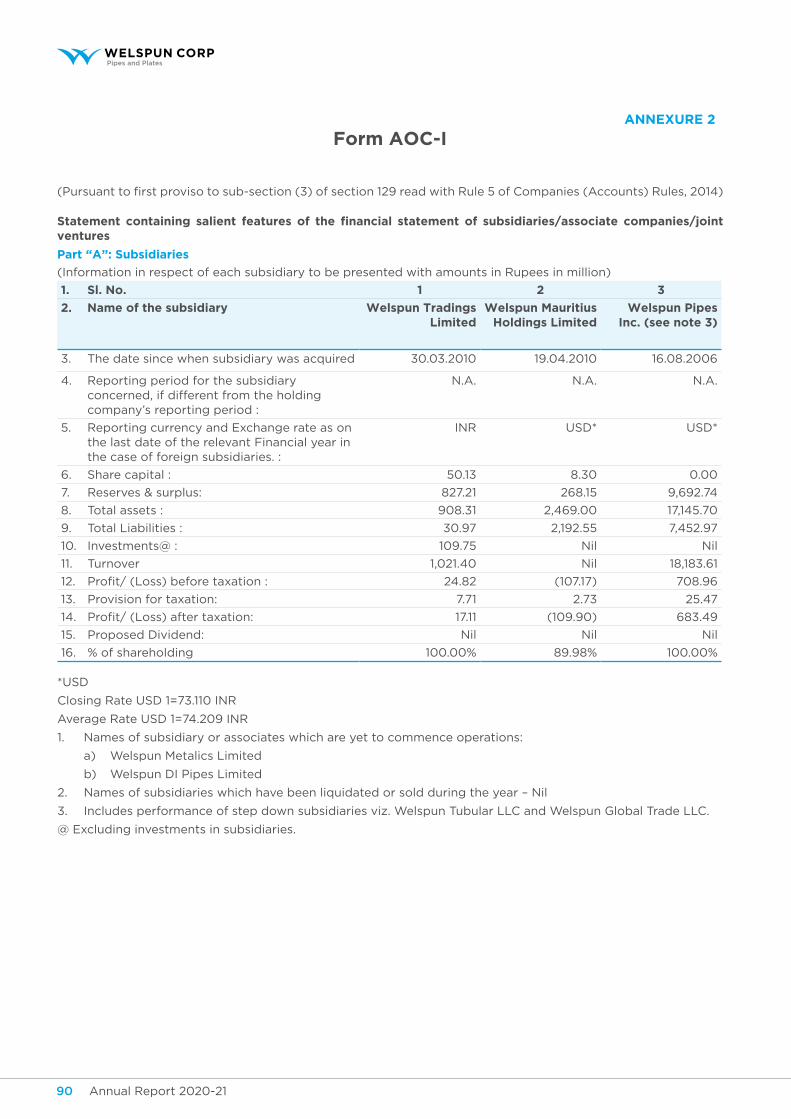
Annual Report 2020-21 91Annual Report 2020-2190
annexuRe 2
(Pursuant to first proviso to sub-section (3) of section 129 read with Rule 5 of Companies (Accounts) Rules, 2014)
Statement containing salient features of the financial statement of subsidiaries/associate companies/joint ventures
Part “A”: Subsidiaries
(Information in respect of each subsidiary to be presented with amounts in Rupees in million)
1. sl. no. 1 2 3
2. Name of the subsidiary Welspun Tradings Limited
Welspun Mauritius holdings Limited
Welspun Pipes Inc. (see note 3)
3. The date since when subsidiary was acquired 30.03.2010 19.04.2010 16.08.2006
4. Reporting period for the subsidiary concerned, if different from the holding company’s reporting period :
N.A. N.A. N.A.
5. Reporting currency and Exchange rate as on the last date of the relevant Financial year in the case of foreign subsidiaries. :
INR USD* USD*
6. Share capital : 50.13 8.30 0.00
7. Reserves & surplus: 827.21 268.15 9,692.74
8. Total assets : 908.31 2,469.00 17,145.70
9. Total Liabilities : 30.97 2,192.55 7,452.97
10. Investments@ : 109.75 Nil Nil
11. Turnover 1,021.40 Nil 18,183.61
12. Profit/ (Loss) before taxation : 24.82 (107.17) 708.96
13. Provision for taxation: 7.71 2.73 25.47
14. Profit/ (Loss) after taxation: 17.11 (109.90) 683.49
15. Proposed Dividend: Nil Nil Nil
16. % of shareholding 100.00% 89.98% 100.00%
*USD
Closing Rate USD 1=73.110 INR
Average Rate USD 1=74.209 INR
1. Names of subsidiary or associates which are yet to commence operations:
a) Welspun Metalics Limited
b) Welspun DI Pipes Limited
2. Names of subsidiaries which have been liquidated or sold during the year – Nil
3. Includes performance of step down subsidiaries viz. Welspun Tubular LLC and Welspun Global Trade LLC.
@ Excluding investments in subsidiaries.
Form AOC-I
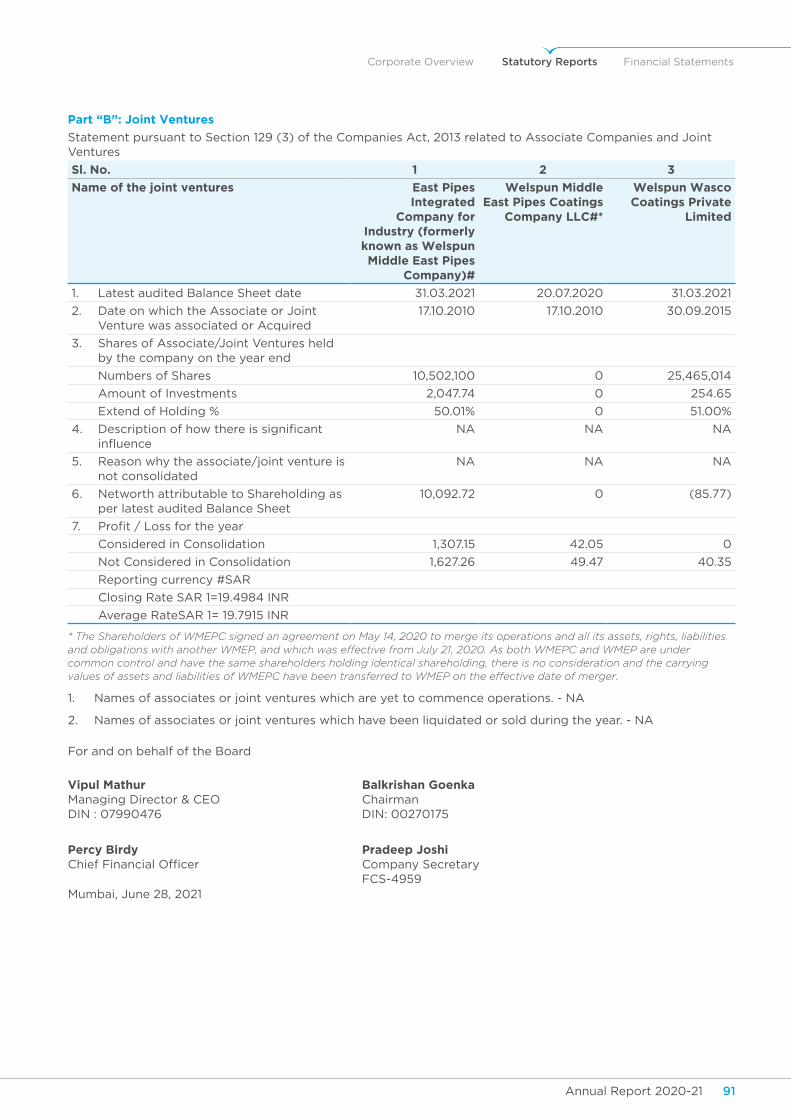
Annual Report 2020-21 91Annual Report 2020-2190
Corporate Overview Statutory Reports Financial Statements
Part “B”: Joint ventures
Statement pursuant to Section 129 (3) of the Companies Act, 2013 related to Associate Companies and Joint Ventures
sl. no. 1 2 3
Name of the joint ventures east Pipes Integrated
Company for Industry (formerly known as Welspun Middle east Pipes
Company)#
Welspun Middle east Pipes Coatings
Company LLC#*
Welspun Wasco Coatings Private
Limited
1. Latest audited Balance Sheet date 31.03.2021 20.07.2020 31.03.2021
2. Date on which the Associate or Joint Venture was associated or Acquired
17.10.2010 17.10.2010 30.09.2015
3. Shares of Associate/Joint Ventures held by the company on the year end
Numbers of Shares 10,502,100 0 25,465,014
Amount of Investments 2,047.74 0 254.65
Extend of Holding % 50.01% 0 51.00%
4. Description of how there is significant influence
NA NA NA
5. Reason why the associate/joint venture is not consolidated
NA NA NA
6. Networth attributable to Shareholding as per latest audited Balance Sheet
10,092.72 0 (85.77)
7. Profit / Loss for the year
Considered in Consolidation 1,307.15 42.05 0
Not Considered in Consolidation 1,627.26 49.47 40.35
Reporting currency #SAR
Closing Rate SAR 1=19.4984 INR
Average RateSAR 1= 19.7915 INR
* The Shareholders of WMEPC signed an agreement on May 14, 2020 to merge its operations and all its assets, rights, liabilities and obligations with another WMEP, and which was effective from July 21, 2020. As both WMEPC and WMEP are under common control and have the same shareholders holding identical shareholding, there is no consideration and the carrying values of assets and liabilities of WMEPC have been transferred to WMEP on the effective date of merger.
1. Names of associates or joint ventures which are yet to commence operations. - NA
2. Names of associates or joint ventures which have been liquidated or sold during the year. - NA
For and on behalf of the Board
vipul Mathur Managing Director & CEODIN : 07990476
Balkrishan goenkaChairmanDIN: 00270175
Percy birdyChief Financial Officer
Pradeep Joshi Company SecretaryFCS-4959
Mumbai, June 28, 2021
Annual Report 2020-21 93Annual Report 2020-2192
FORM MR-3seCReTaRiaL auDiT RePoRT
for the Financial Year ended March 31, 2021
[Pursuant to section 204(1) of the Companies Act, 2013 and rule No.9 of the Companies (Appointment and Remuneration of Managerial Personnel) Rules, 2014]
annexuRe 3
To,
The Members,
WeLsPun CoRP LiMiTeD
CIN: L27100gJ1995PLC025609
We have conducted the secretarial audit of the compliance of applicable statutory provisions and the adherence to good corporate practices by WELSPUN CORP LIMITED (“the Company”). Secretarial Audit was conducted in a manner that provided us a reasonable basis for evaluating the corporate conducts/statutory compliances and expressing our opinion thereon.
Based on our verification of the Company’s books, papers, minute books, forms and returns filed and other records maintained by the Company and also the information provided by the Company, its officers, agents and authorized representatives during the conduct of secretarial audit, we hereby report that in our opinion, the Company has, during the audit period covering the financial year ended on March 31, 2021 complied with the statutory provisions listed hereunder and also that the Company has proper Board processes and compliance-mechanism in place to the extent, in the manner and subject to the reporting made hereinafter:
We have examined the books, papers, minute books, forms and returns filed and other records maintained by the Company for the financial year ended on March 31, 2021 according to the provisions of:
i. The Companies Act, 2013 (“the Act”) and the rules made thereunder;
ii. The Securities Contracts (Regulation) Act, 1956 (“SCRA”) and the Rules made there under;
iii. The Depositories Act, 2018 and the Regulations and Bye-laws framed thereunder;
iv. Foreign Exchange Management Act, 1999 and the rules and regulations made thereunder to the extent of Foreign Direct Investment, Overseas Direct Investment and External Commercial Borrowings;
v. The following Regulations and Guidelines prescribed under the Securities and Exchange Board of India Act, 1992 (“SEBI Act”);
a) The Securities and Exchange Board of India (Substantial Acquisition of Shares and Takeovers) Regulations, 2011;
b) The Securities and Exchange Board of India (Listing Obligations and Disclosure Requirements) Regulations, 2015;
c) The Securities and Exchange Board of India (Prohibition of Insider Trading) Regulations, 2015;
d) The Securities and Exchange Board of India (Issue of Capital and Disclosure Requirements) Regulations, 2018 - Not Applicable during the period under review;
e) The Securities And Exchange Board Of India (Share Based Employee Benefits) Regulations, 2014;
f) The Securities and Exchange Board of India (Issue and Listing of Debt Securities) Regulations, 2008;
g) The Securities and Exchange Board of India (Registrars to an Issue and Share Transfer Agents) Regulations, 1993 regarding the Companies Act and dealing with client;
h) The Securities and Exchange Board of India (Delisting of Equity Shares) Regulations, 2009 - Not Applicable during the period under review, and
i) The Securities and Exchange Board of India (Buyback of Securities) Regulations, 2018 - Not Applicable during the period under review.
vi. We have relied on the representations made by the Company and its officers for systems and mechanism formed by the Company for
Mihen halani & associatesPracticing Company Secretaries
A-501/L, Jaswanti Allied Business Centre, Next to Hotel Khwaishh Presidency,Kachpada, Ramchandra Lane Extn. Road, Malad (West), Mumbai – 400 064
Tel.: 022 – 6236 0279 E-mail: [email protected]
Annual Report 2020-21 93Annual Report 2020-2192
Corporate Overview Statutory Reports Financial Statements
compliances under other various applicable Acts, Laws, Rules and Regulations to the Company.
We have also examined compliance with the applicable clauses of following:
(i) the Secretarial Standards issued by The Institute of Company Secretaries of India (“ICSI”);
(ii) The Listing Agreement / SEBI (Listing Obligations and Disclosure Requirements) Regulations, 2015 entered into by the Company with Stock Exchanges.
To the best of our knowledge and belief, during the period under review, the Company has generally complied with the provisions of the Act, Rules, Regulations, Guidelines, Standards, etc. mentioned above.
We further report that:
a) During the year under review, the Board of Directors of the Company was duly constituted with proper balance of Executive Directors, Non-Executive Directors and Independent Directors.
The committee of the Board is duly constituted. The changes in the composition of the Board of Directors that took place during the period under review were carried out in compliance with the provisions of the Act.
b) Adequate notice is given to all directors to schedule the Board Meetings and Committee Meetings, agenda and notes on agenda were sent at least seven days in advance or with due consents for shorter notice from the directors and adequate system exists for seeking and obtaining further information and clarifications on the agenda items before the meeting and for meaningful participation at the meeting.
c) Majority decision is carried through while the dissenting members’ views are captured and recorded as part of the minutes, wherever applicable.
We further report that there are adequate systems and processes in the Company commensurate with the size and operations of the Company to monitor and ensure compliance with applicable laws, rules, regulations and guidelines.
We further report that during the audit period, the following event/action has taken place
having a major bearing on the Company’s affairs in pursuance of the above referred laws, rules, regulations, guidelines, standards, etc. referred to above;
• The Company has acquired stake upto 19% equity share capital in Welassure Private Limited (“Welassure”) at the total consideration not exceeding ` 2 million;
• The Company has made investment of 19% equity share capital in Welspun Global Services Limited;
• The Company has declared and paid final dividend @ 10% (i.e. ` 0.5 per share) on Equity Shares for the F.Y. ended March 31, 2020;
• The Company has approved payment of remuneration by way of commission @ 1% of the net profits of the Company to Mr. Balkrishan Goenka, Non-Executive Chairman of the Company by Special resolution;
• The Company has approved borrowing by offer of issue of securities including but not limited to secured / unsecured, redeemable, Non-Convertible Debentures and/ or Commercial Papers upto ` 500 crore on Private Placement basis by Special resolution;
• The Company has approved listing & offer for sale of partial investment in Welspun Middle East Pipes LLC, a step-down subsidiary and joint venture in the Kingdom of Saudi Arabia;
• The Company has altered the Main Object Clause of Memorandum of Association;
We further report that during the audit period, the Company has co-operated with us and have produced before us all the required forms information, clarifications, returns and other documents as required for the purpose of our audit.
For MIheN hALANI & ASSOCIATeS
Practicing Company Secretaries
Mihen Halani(Proprietor)CP No: 12015FCS No: 9926UDIN: F009926C000342995
Date: June 28, 2021Place: Mumbai
Note: This report is to be read with our letter of even date which is annexed as “Annexure A” herewith and forms as integral part of this report.
Annual Report 2020-21 95Annual Report 2020-2194
To,
The Members,
WeLsPun CoRP LiMiTeD
CIN: L27100gJ1995PLC025609
Our report of even date is to be read along with this letter.
1. Maintenance of Secretarial record is the responsibility of the management of the Company. Our responsibility is to express an opinion on these secretarial records based on our audit.
2. We have followed the audit practices and process as were appropriate to obtain reasonable assurance about the correctness of the contents of the Secretarial records. The verification was done on test basis to ensure that correct facts are reflected in Secretarial records. We believe that the process and practices, we followed provide a reasonable basis for our opinion.
3. We have not verified the correctness and appropriateness of financial records and Books of Accounts of the Company.
4. Wherever required, we have obtained the Management representation about the
annexuRe a
Compliance of laws, rules and regulations and happening of events etc.
5. The Compliance of the provisions of Corporate and other applicable laws, rules, regulations, standards is the responsibility of the management. Our examination was limited to the verification of procedure on test basis.
6. The Secretarial Audit Report is neither an assurance as to the future viability of the Company nor of the efficacy or effectiveness with which the management has conducted the affairs of the Company.
For MIheN hALANI & ASSOCIATeS
Practicing Company Secretaries
Mihen Halani(Proprietor)CP No: 12015FCS No: 9926UDIN: F009926C000342995
Date: June 28, 2021Place: Mumbai
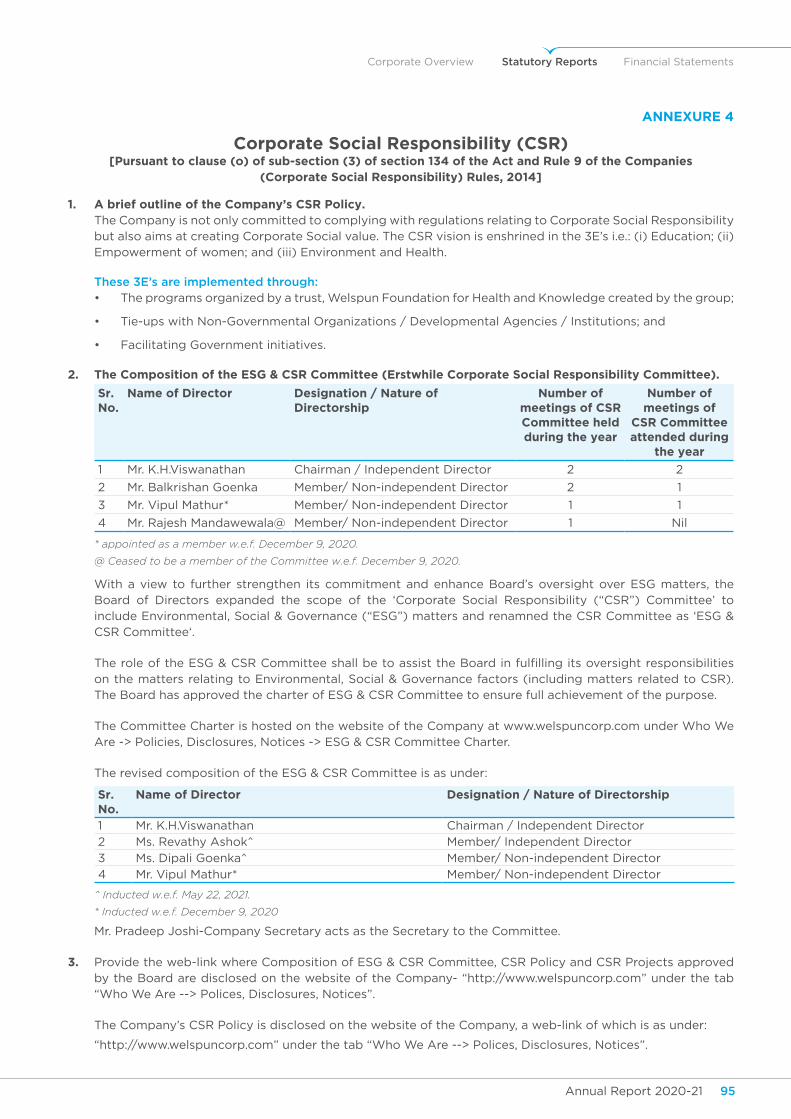
Annual Report 2020-21 95Annual Report 2020-2194
Corporate Overview Statutory Reports Financial Statements
Corporate Social Responsibility (CSR)[Pursuant to clause (o) of sub-section (3) of section 134 of the Act and Rule 9 of the Companies
(Corporate Social Responsibility) Rules, 2014]
annexuRe 4
1. A brief outline of the Company’s CSR Policy. The Company is not only committed to complying with regulations relating to Corporate Social Responsibility
but also aims at creating Corporate Social value. The CSR vision is enshrined in the 3E’s i.e.: (i) Education; (ii) Empowerment of women; and (iii) Environment and Health.
These 3E’s are implemented through:• The programs organized by a trust, Welspun Foundation for Health and Knowledge created by the group;
• Tie-ups with Non-Governmental Organizations / Developmental Agencies / Institutions; and
• Facilitating Government initiatives.
2. The Composition of the eSg & CSR Committee (erstwhile Corporate Social Responsibility Committee).
sr. no.
Name of Director Designation / Nature of Directorship
Number of meetings of CSR Committee held during the year
Number of meetings of
CsR Committee attended during
the year
1 Mr. K.H.Viswanathan Chairman / Independent Director 2 2
2 Mr. Balkrishan Goenka Member/ Non-independent Director 2 1
3 Mr. Vipul Mathur* Member/ Non-independent Director 1 1
4 Mr. Rajesh Mandawewala@ Member/ Non-independent Director 1 Nil
* appointed as a member w.e.f. December 9, 2020.
@ Ceased to be a member of the Committee w.e.f. December 9, 2020.
With a view to further strengthen its commitment and enhance Board’s oversight over ESG matters, the Board of Directors expanded the scope of the ‘Corporate Social Responsibility (“CSR”) Committee’ to include Environmental, Social & Governance (“ESG”) matters and renamned the CSR Committee as ‘ESG & CSR Committee‘.
The role of the ESG & CSR Committee shall be to assist the Board in fulfilling its oversight responsibilities on the matters relating to Environmental, Social & Governance factors (including matters related to CSR). The Board has approved the charter of ESG & CSR Committee to ensure full achievement of the purpose.
The Committee Charter is hosted on the website of the Company at www.welspuncorp.com under Who We Are -> Policies, Disclosures, Notices -> ESG & CSR Committee Charter.
The revised composition of the ESG & CSR Committee is as under:
sr. no.
Name of Director Designation / Nature of Directorship
1 Mr. K.H.Viswanathan Chairman / Independent Director
2 Ms. Revathy Ashok^ Member/ Independent Director
3 Ms. Dipali Goenka^ Member/ Non-independent Director
4 Mr. Vipul Mathur* Member/ Non-independent Director
^ Inducted w.e.f. May 22, 2021.
* Inducted w.e.f. December 9, 2020
Mr. Pradeep Joshi-Company Secretary acts as the Secretary to the Committee.
3. Provide the web-link where Composition of ESG & CSR Committee, CSR Policy and CSR Projects approved by the Board are disclosed on the website of the Company- “http://www.welspuncorp.com” under the tab “Who We Are --> Polices, Disclosures, Notices”.
The Company’s CSR Policy is disclosed on the website of the Company, a web-link of which is as under:
“http://www.welspuncorp.com” under the tab “Who We Are --> Polices, Disclosures, Notices”.

Annual Report 2020-21 97Annual Report 2020-2196
4. Provide the details of Impact assessment of CSR projects carried out in pursuance of sub-rule (3) of rule 8 of the Companies (Corporate Social Responsibility Policy) Rules, 2014, if applicable (attach the report) – Not applicable.
5. Details of the amount available for set-off in pursuance of sub-rule (3) of rule 7 of the Companies (Corporate Social Responsibility Policy) Rules, 2014 and amount required to be set-off for the financial year, if any.
sr. no.
Financial year Amount available for set-off from preceding financial year (in `)
Amount required to be set-off for the financial year, if any (in `)
1 Not applicable
Total
6. Average net profit / (loss) of the Company as per Section 135(5): ` 1,888.35 million.
7. (a) Two per cent of average net profit of the Company as per Section 135(5): ` 37.77 million.
(b) Surplus arising out of the CSR Projects or programs or activities of the previous financial years - Nil
(c) Amount required to be set-off for the financial year, if any – N/A.
(d) Total CSR Obligation for the financial year (7a+7b-7c) = ` 37.77 million.
8. (a) CSR amount spent or unspent for the financial year:
Amount unspent (In `)
Total amount Spent for the Financial year (in `)
Total Amount transferred to unspent CsR account as per
Section 135(6)
Amount transferred to any fund specified under Schedule vII as per second proviso to Section
135(5)
amount Date of Transfer Name of the Fund
amount Date of Transfer
37.77 million Nil N/A N/A Nil N/A
(b) Detail of CSR amount spent against Ongoing Projects for the financial year:
1 2 3 4 5 6 7 8 9 10 11
sr. no.
Name of the Project
Item from the list of
activities in schedule vii
of the Act
Local area (Yes/No)
Location of the Project
Project Duration
amount allocated
for the Project
(In ` lakh)
amount spent in the
current financial year (in ` Lakh)
amount transferred to unspent
CsR account for the
Project as per section
135(6)
Mode of implementation
- Direct
Mode of implementation- through implementing
agency
state District (years) (in `) (Yes/No) name CsR Registration
number
1 Smart class Project, Advance Learning, Para Teacher, Siksha Saathi & Other education related projects
Promoting Education
Yes Gujarat Bharuch 6 525 46.77 Nil No Welspun Foundation
for Health &
Knowledge
CSR00001502
2 Relief / Support / Financial Aid for flood, Covid etc
Covid Support Yes Gujarat Kutch 5 475 101.32
3 Providing Mobile Health Van and other Health awareness program
Promoting Healthcare
Yes Gujarat Kutch 10 200 26.55
4 Horticulture Development & Plantation of Trees
Promoting Environment
Yes Gujarat Kutch 5 175 33.4
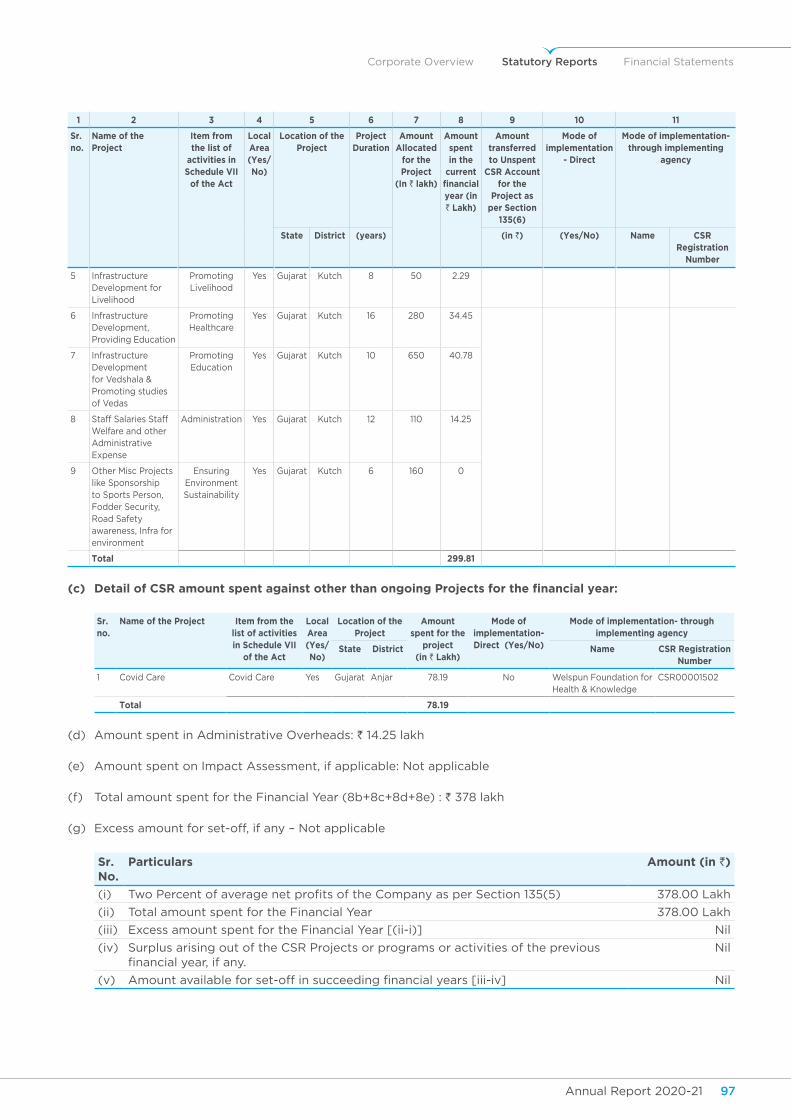
Annual Report 2020-21 97Annual Report 2020-2196
Corporate Overview Statutory Reports Financial Statements
1 2 3 4 5 6 7 8 9 10 11
sr. no.
Name of the Project
Item from the list of
activities in schedule vii
of the Act
Local area (Yes/No)
Location of the Project
Project Duration
amount allocated
for the Project
(In ` lakh)
amount spent in the
current financial year (in ` Lakh)
amount transferred to unspent
CsR account for the
Project as per section
135(6)
Mode of implementation
- Direct
Mode of implementation- through implementing
agency
state District (years) (in `) (Yes/No) name CsR Registration
number
5 Infrastructure Development for Livelihood
Promoting Livelihood
Yes Gujarat Kutch 8 50 2.29
6 Infrastructure Development, Providing Education
Promoting Healthcare
Yes Gujarat Kutch 16 280 34.45
7 Infrastructure Development for Vedshala & Promoting studies of Vedas
Promoting Education
Yes Gujarat Kutch 10 650 40.78
8 Staff Salaries Staff Welfare and other Administrative Expense
Administration Yes Gujarat Kutch 12 110 14.25
9 Other Misc Projects like Sponsorship to Sports Person, Fodder Security, Road Safety awareness, Infra for environment
Ensuring Environment Sustainability
Yes Gujarat Kutch 6 160 0
Total 299.81
(c) Detail of CSR amount spent against other than ongoing Projects for the financial year:
sr. no.
Name of the Project Item from the list of activities in schedule vii
of the Act
Local area (Yes/No)
Location of the Project
amount spent for the
project (in ` Lakh)
Mode of implementation- Direct (Yes/No)
Mode of implementation- through implementing agency
state District name CSR Registration number
1 Covid Care Covid Care Yes Gujarat Anjar 78.19 No Welspun Foundation for Health & Knowledge
CSR00001502
Total 78.19
(d) Amount spent in Administrative Overheads: ` 14.25 lakh
(e) Amount spent on Impact Assessment, if applicable: Not applicable
(f) Total amount spent for the Financial Year (8b+8c+8d+8e) : ` 378 lakh
(g) Excess amount for set-off, if any – Not applicable
sr. no.
Particulars Amount (in `)
(i) Two Percent of average net profits of the Company as per Section 135(5) 378.00 Lakh
(ii) Total amount spent for the Financial Year 378.00 Lakh
(iii) Excess amount spent for the Financial Year [(ii-i)] Nil
(iv) Surplus arising out of the CSR Projects or programs or activities of the previous financial year, if any.
Nil
(v) Amount available for set-off in succeeding financial years [iii-iv] Nil
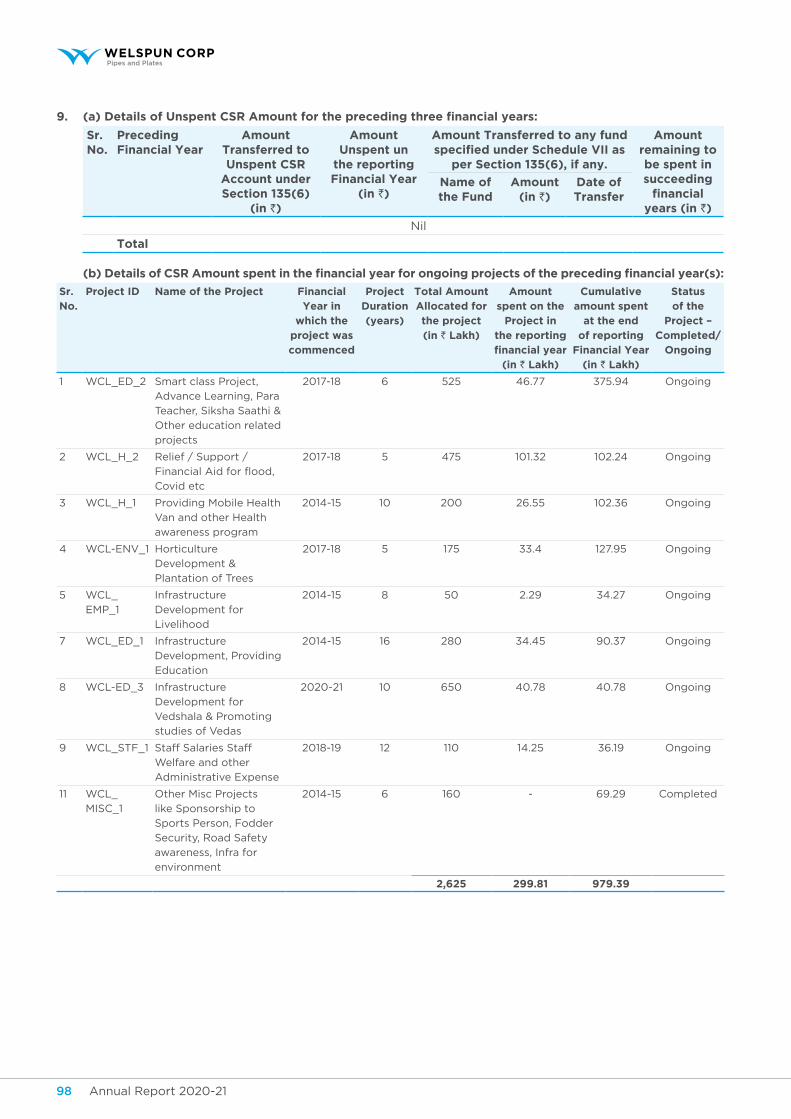
Annual Report 2020-21 99Annual Report 2020-2198
9. (a) Details of unspent CSR Amount for the preceding three financial years:
sr. no.
Preceding Financial year
amount Transferred to unspent CsR
account under Section 135(6)
(in `)
amount unspent un
the reporting Financial year
(in `)
Amount Transferred to any fund specified under Schedule vII as
per Section 135(6), if any.
amount remaining to be spent in succeeding
financial years (in `)
Name of the Fund
amount (in `)
Date of Transfer
Nil
Total
(b) Details of CSR Amount spent in the financial year for ongoing projects of the preceding financial year(s):
sr. no.
Project iD Name of the Project Financial year in
which the project was commenced
Project Duration (years)
Total amount Allocated for the project (in ` Lakh)
amount spent on the
Project in the reporting financial year
(in ` Lakh)
Cumulative amount spent
at the end of reporting
Financial year (in ` Lakh)
status of the
Project – Completed/
Ongoing
1 WCL_ED_2 Smart class Project,
Advance Learning, Para
Teacher, Siksha Saathi &
Other education related
projects
2017-18 6 525 46.77 375.94 Ongoing
2 WCL_H_2 Relief / Support /
Financial Aid for flood,
Covid etc
2017-18 5 475 101.32 102.24 Ongoing
3 WCL_H_1 Providing Mobile Health
Van and other Health
awareness program
2014-15 10 200 26.55 102.36 Ongoing
4 WCL-ENV_1 Horticulture
Development &
Plantation of Trees
2017-18 5 175 33.4 127.95 Ongoing
5 WCL_
EMP_1
Infrastructure
Development for
Livelihood
2014-15 8 50 2.29 34.27 Ongoing
7 WCL_ED_1 Infrastructure
Development, Providing
Education
2014-15 16 280 34.45 90.37 Ongoing
8 WCL-ED_3 Infrastructure
Development for
Vedshala & Promoting
studies of Vedas
2020-21 10 650 40.78 40.78 Ongoing
9 WCL_STF_1 Staff Salaries Staff
Welfare and other
Administrative Expense
2018-19 12 110 14.25 36.19 Ongoing
11 WCL_
MISC_1
Other Misc Projects
like Sponsorship to
Sports Person, Fodder
Security, Road Safety
awareness, Infra for
environment
2014-15 6 160 - 69.29 Completed
2,625 299.81 979.39
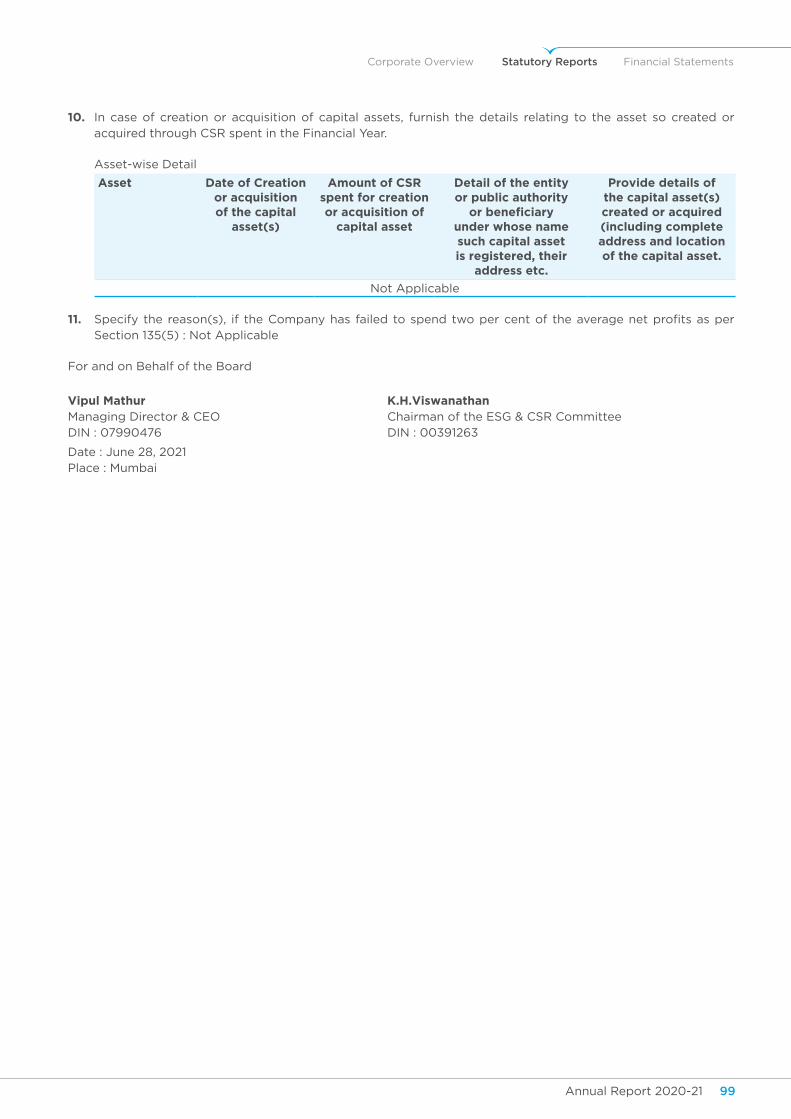
Annual Report 2020-21 99Annual Report 2020-2198
Corporate Overview Statutory Reports Financial Statements
10. In case of creation or acquisition of capital assets, furnish the details relating to the asset so created or acquired through CSR spent in the Financial Year.
Asset-wise Detail
asset Date of Creation or acquisition of the capital
asset(s)
Amount of CSR spent for creation or acquisition of
capital asset
Detail of the entity or public authority
or beneficiary under whose name such capital asset is registered, their
address etc.
Provide details of the capital asset(s) created or acquired (including complete address and location of the capital asset.
Not Applicable
11. Specify the reason(s), if the Company has failed to spend two per cent of the average net profits as per Section 135(5) : Not Applicable
For and on Behalf of the Board
vipul MathurManaging Director & CEODIN : 07990476
K.h.viswanathanChairman of the ESG & CSR CommitteeDIN : 00391263
Date : June 28, 2021Place : Mumbai
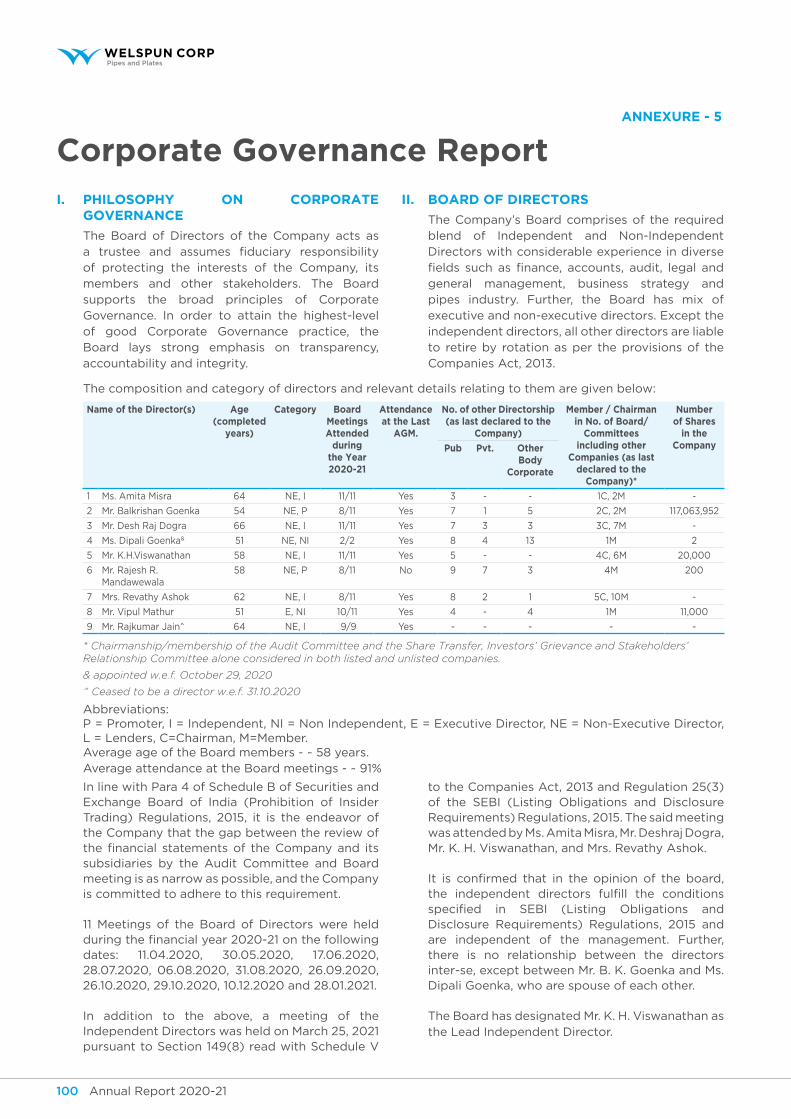
Annual Report 2020-21 101Annual Report 2020-21100
i. PHiLosoPHy on CoRPoRaTe goveRnanCe
The Board of Directors of the Company acts as a trustee and assumes fiduciary responsibility of protecting the interests of the Company, its members and other stakeholders. The Board supports the broad principles of Corporate Governance. In order to attain the highest-level of good Corporate Governance practice, the Board lays strong emphasis on transparency, accountability and integrity.
Corporate governance ReportANNexuRe - 5
ii. boaRD oF DiReCToRs
The Company’s Board comprises of the required blend of Independent and Non-Independent Directors with considerable experience in diverse fields such as finance, accounts, audit, legal and general management, business strategy and pipes industry. Further, the Board has mix of executive and non-executive directors. Except the independent directors, all other directors are liable to retire by rotation as per the provisions of the Companies Act, 2013.
The composition and category of directors and relevant details relating to them are given below:
Name of the Director(s) Age (completed
years)
Category board Meetings attended
during the year 2020-21
attendance at the Last
agM.
No. of other Directorship (as last declared to the
Company)
Member / Chairman in No. of Board/
Committees including other
Companies (as last declared to the
Company)*
number of Shares
in the CompanyPub Pvt. other
body Corporate
1 Ms. Amita Misra 64 NE, I 11/11 Yes 3 - - 1C, 2M -
2 Mr. Balkrishan Goenka 54 NE, P 8/11 Yes 7 1 5 2C, 2M 117,063,952
3 Mr. Desh Raj Dogra 66 NE, I 11/11 Yes 7 3 3 3C, 7M -
4 Ms. Dipali Goenka& 51 NE, NI 2/2 Yes 8 4 13 1M 2
5 Mr. K.H.Viswanathan 58 NE, I 11/11 Yes 5 - - 4C, 6M 20,000
6 Mr. Rajesh R. Mandawewala
58 NE, P 8/11 No 9 7 3 4M 200
7 Mrs. Revathy Ashok 62 NE, I 8/11 Yes 8 2 1 5C, 10M -
8 Mr. Vipul Mathur 51 E, NI 10/11 Yes 4 - 4 1M 11,000
9 Mr. Rajkumar Jain^ 64 NE, I 9/9 Yes - - - - -
* Chairmanship/membership of the Audit Committee and the Share Transfer, Investors’ Grievance and Stakeholders’ Relationship Committee alone considered in both listed and unlisted companies.
& appointed w.e.f. October 29, 2020
^ Ceased to be a director w.e.f. 31.10.2020
Abbreviations: P = Promoter, I = Independent, NI = Non Independent, E = Executive Director, NE = Non-Executive Director,
L = Lenders, C=Chairman, M=Member. Average age of the Board members - ~ 58 years. Average attendance at the Board meetings - ~ 91%
In line with Para 4 of Schedule B of Securities and Exchange Board of India (Prohibition of Insider Trading) Regulations, 2015, it is the endeavor of the Company that the gap between the review of the financial statements of the Company and its subsidiaries by the Audit Committee and Board meeting is as narrow as possible, and the Company is committed to adhere to this requirement.
11 Meetings of the Board of Directors were held during the financial year 2020-21 on the following dates: 11.04.2020, 30.05.2020, 17.06.2020, 28.07.2020, 06.08.2020, 31.08.2020, 26.09.2020, 26.10.2020, 29.10.2020, 10.12.2020 and 28.01.2021.
In addition to the above, a meeting of the Independent Directors was held on March 25, 2021 pursuant to Section 149(8) read with Schedule V
to the Companies Act, 2013 and Regulation 25(3) of the SEBI (Listing Obligations and Disclosure Requirements) Regulations, 2015. The said meeting was attended by Ms. Amita Misra, Mr. Deshraj Dogra, Mr. K. H. Viswanathan, and Mrs. Revathy Ashok.
It is confirmed that in the opinion of the board, the independent directors fulfill the conditions specified in SEBI (Listing Obligations and Disclosure Requirements) Regulations, 2015 and are independent of the management. Further, there is no relationship between the directors inter-se, except between Mr. B. K. Goenka and Ms. Dipali Goenka, who are spouse of each other.
The Board has designated Mr. K. H. Viswanathan as the Lead Independent Director.
Annual Report 2020-21 101Annual Report 2020-21100
Corporate Overview Statutory Reports Financial Statements
The names of the listed entities where the person is a director and the category of directorship and matrix of the skills/expertise/competence identified by the board of directors as required in the context of its business(es) and sector(s) for it to function effectively and those actually available with the board and directors who have such skills / expertise / competence. Details of current members of the Board is given below:
Name of the Director(s)
Skills/expertise/competence Names of the listed entities where the person is a director
Category of Directorship
Detailed reasons for the resignation of an independent director
who resigns before the expiry of his tenure (as
applicable)
1 Ms. Amita Misra Finance, Oversight, Procurement, Governance, Technical Cooperation, Framing Policy, Advocacy, Resource Mobilization
Dalmia Bharat Sugar Industries Limited
Independent N.A.
2 Mr. Balkrishan Goenka Leading figure in textile and steel industry, Strategy & Business Management
Welspun India Limited, Welspun Enterprises Limited
Welspun Specialty Solutions Limited (formerly known as RMG Alloy Steel Limited)
Non- Independent
N.A.
3 Mr. Desh Raj Dogra Financial sector in the areas of banking and credit rating
S.Chand and Company Limited,
Sintex Plastics Technology Ltd.
IFB Industries Ltd
AXISCADES Technologies Limited
Capri Global Capital Ltd.
Independent N.A.
4 Ms. Dipali Goenka General Management and Strategy, Brand Building, Global Business, Finance & Accounts, Diversity, ESG/ Sustainability
Welspun India Limited Non- Independent
N.A.
5 Mr. K. H. Viswanathan Corporate Tax and Legal, Transaction advisory and structuring, Internal, Management and Due-diligence audits, formulation of business strategy, mergers and acquisitions etc.
AYM Syntex Limited Independent N.A.
6 Mr. Rajesh R. Mandawewala
Textile & Steel Industry, Research & product development, strategy and business management.
Welspun India Limited, AYM Syntex Limited Welspun Enterprises Limited
Non- Independent
N.A.
7 Mrs. Revathy Ashok Women Economic Empowerment, Mentoring Start-ups, Governance, Capital Raising, Business Development, Finance, Commercial and other strategic general management
ADC India Communications Ltd. Quess Corp Limited, Astrazeneca Pharma India Limited
Independent N.A.
8 Mr. Vipul Mathur Rich experience in heavy electrical equipment, manufacturing of pipes, Oil & gas etc. Management, Marketing, Operations and manufacturing efficiencies, excellent managerial skills, leadership quality, strategy & business management.
None Non- Independent
N.A.
9 Mr. Rajkumar Jain Accounts, finance & Taxation - Independent Due to other commitments requiring his substantial time, Mr. Rajkumar Jain, an independent director aged 64 years has tendered his resignation as a member of the Board of Directors of the Company with effect from October 31, 2020.
Annual Report 2020-21 103Annual Report 2020-21102
Skills & expertise required by the Company are mainly knowledge of steel industry, oil & gas market, strategy & business management, finance and accounts & auditing, legal & compliance.
The directors who ceased to be a member of the Board have confirmed that that there were no other material reasons other than those provided in the resignation letter submitted to the Company.
Detailed Charter of the Board is available at the web-link: “http://www.welspuncorp.com” under the tab “Who We Are --> Polices, Disclosures, Notices”.
iii. auDiT CoMMiTTee
The Committee comprises of 3 non-executive directors having accounting and finance back-ground. All the members and the Chairman are independent director. The composition of the Committee and attendance of the members is given hereunder:
Name of the Member Member/ Chairman
Number of Meetings attended
Mr. K. H. Viswanathan Chairman 17/17
Ms. Amita Misra* Member 4/4
Mr. Deshraj Dogra Member 17/17
Mr. Rajkumar Jain@ Member 13/13
* appointed as a member we.f. December 9, 2020.
@ Ceased to be a member w.e.f. October 31, 2020
The Company Secretary of the Company, Mr. Pradeep Joshi acts as the Secretary of the Committee. The Chief Financial Officer is invited for all the meetings of the Audit Committee. Whenever required, the Managing Director and CEO is also invited for the Committee meetings for seeking his views on certain strategic items.
17 Meetings of the Audit Committee were held during the financial year 2020-21 on following dates: 29.04.2020, 30.05.2020, 12.06.2020, 17.06.2020, 25.07.2020, 27.07.2020, 28.07.2020, 31.08.2020, 26.09.2020, 08.10.2020, 13.10.2020, 27.10.2020, 29.10.2020, 10.12.2020, 06.01.2021, 27.01.2021 and 28.01.2021. In addition, the Audit Committee had a meeting with the credit rating agency during the financial year 2020-21.
The statutory auditors and internal auditors have periodic and exclusive meetings with the Audit Committee.
Terms of Reference: The terms of reference stipulated by the Board of Directors to the Audit Committee are as contained under Regulation 18 read with Part C of Schedule II of the SEBI (Listing Obligations and Disclosure
Requirements) Regulations, 2015, Section 177 of the Companies Act, 2013 and the SEBI (Prohibition of Insider Trading) Regulations, 2015 as amended from time to time. Detailed Charter of the Committee is available at the web-link : “http://www.welspuncorp.com” under the tab “Who We Are --> Polices, Disclosures, Notices”.
None of recommendations made by the Audit Committee were rejected by the Board.
iv. DeTaiLs oF esTabLisHMenT oF vigiL MeCHanisM FoR DiReCToRs anD eMPLoyees.
The Company has a Whistle Blower Policy and Vigil Mechanism for its Employees, Employees of other agencies deployed for the Company’s activities, contractors, vendors, suppliers or agencies (or any of their employees) providing any material or service to the Company; customers, bankers of the Company; and any other person having an association with the Company and no personnel had been denied access to the Audit Committee Chairman. The Policy provide adequate safeguard against victimization. The Chairman of the Audit Committee can be approached at [email protected]. Web-link where details of whistle blower mechanism are available at “http://www.welspuncorp.com” under the tab “Who We Are --> Polices, Disclosures, Notices”.
v. noMinaTion anD ReMuneRaTion CoMMiTTee.
The Committee comprises of 3 non-executive directors. All the member and the Chairman are independent. The composition of the Committee and attendance of the members is given hereunder:
Name of the Member Member/ Chairman
Number of Meetings attended
Mr. K.H.Viswanathan Chairman^ 3/3
Mr. Deshraj Dogra Member 3/3
Ms. Revathy Ashok* Member 1/1
Mr. Rajkumar Jain@ Chairman 2/2
@ ceased to be a member w.e.f. October 31, 2020
* appointed as a member w.e.f. December 9, 2020
^ appointed as the Chairman w.e.f. December 9, 2020
The Company Secretary of the Company, Mr. Pradeep Joshi acts as the Secretary of the Committee.
During the year under review, 3 meetings of the Committee were held on 12.06.2020, 27.10.2020 and 27.01.2021.
Terms of reference: To recommend appointment of, and remuneration to, Managerial Personnel and
Annual Report 2020-21 103Annual Report 2020-21102
Corporate Overview Statutory Reports Financial Statements
review thereof from time to time. Detailed Charter of the Committee is available at the web-link : “http://www.welspuncorp.com” under the tab “Who We Are --> Polices, Disclosures, Notices”.
None of recommendations made by the Nomination and Remuneration Committee were rejected by the Board.
The Company has in place a policy for remuneration of Directors, Key Managerial Personnel and Senior Management Personnel as well as a well-defined criteria for the selection of candidates for appointment to the said positions which has been approved by the Board. The Policy broadly lays down the guiding principles, philosophy and the basis for payment of remuneration to the executive and non-executive Directors (by way of sitting fees and commission), Key Managerial Personnel and Senior Management Personnel.
The salient features of the Nomination and Remuneration Policy (the “Policy”) are as under:
Appointment of Directors: The Committee identifies the person who qualifies
to become directors and who may be appointed in senior management in accordance with the criteria as mentioned in the policy.
Remuneration of Directors, Key Managerial Personnel, senior management personnel:• The Committee shall consider top industry
indicators, requirements of role, qualification and experience of candidate, expected contribution of executive to the profitability challenges specific to the Company and such other matters as the Committee may deem fit.
• The Non-Executive directors shall not be eligible for any remuneration / commission, unless specifically approved by the Board of Directors on recommendation of the Nomination and Remuneration Committee and by the shareholders.
• The Non- Executive Directors including independent directors may receive remuneration by way of fees for attending meetings of Board or Committee thereof.
Besides, the Committee shall take into consideration performance of the concerned executive as well as the Company, to the growth of business, profitability, company potentiality and critical role played / initiatives taken while considering pay hike / increment to the concerned executives.
The Policy is available on your Company’s website at: “http://www.welspuncorp.com” under the tab “Who We Are --> Polices, Disclosures, Notices”.
vi. sHaRe TRansFeR, invesToRs’ gRievanCe anD sTaKeHoLDeRs’ ReLaTionsHiP CoMMiTTee.
The Share Transfer, Investors’ Grievance and Stakeholders’ Relationship Committee is in accordance with the Section 178 of the Companies Act, 2013 and the Regulation 20 of the SEBI (Listing Obligations and Disclosure Requirements) Regulations, 2015 to look into, among others, the transfer of securities and redress investors’ complaints and to review the functioning of the investors grievance redressal system.
The Policy on Investors’ Grievance Redressal Mechanism is available on your Company’s website at: “http://www.welspuncorp.com” under the tab “Who We Are --> Polices, Disclosures, Notices” and the responses to the Frequently Asked Questions by the shareholders are available on the website under the tab “Investor Relations --> FAQs”
The composition of the Committee and attendance of the members is given hereunder:
Name of the Member Member/ Chairman
Number of Meetings attended
M. K.H.Viswanathan- Independent Director
Chairman 4/4
Mr. B.K.Goenka- Non-Independent Director^
Member 4/4
Ms. Revathy Ashok- Independent Director *
Member 1/1
Mr. Vipul Mathur – Managing Director & CEO*
Member 1/1
Mr. Rajesh Mandawewala- Non Independent Director @
Member 3/3
* appointed as a member w.e.f. December 9, 2020.
@ ceased to be a member w.e.f. December 9, 2020
^ ceased to be a member w.e.f. June 28, 2021.
Compliance Officer: Mr. Pradeep Joshi – Company Secretary.
During the year under review, 4 meetings of the Committee were held on 17.06.2020, 28.07.2020, 29.10.2020 and 28.01.2021.
Number of security holder’s complaints / requests received during the year
During the financial year under review, one complaint of a shareholder was forwarded by the Ministry of Corporate Affairs which was responded to the satisfaction of the Ministry of Corporate Affairs. One complaint received in the last few working days of the financial year was pending resolution, which has subsequently been resolved within prescribed time.
Annual Report 2020-21 105Annual Report 2020-21104
All the requests received from the investors during the year under Report, were resolved within the stipulated time to the satisfaction of the investors/shareholders and no complaints / request were pending for more than 15 days as on March 31, 2021. All the shares/debentures received for transfer/transmission were transferred / transmitted and no transfer was pending as at March 31, 2021.
vii. RisK ManageMenT CoMMiTTee
The Company has constituted a Risk Management Committee in compliance with the SEBI (Listing Obligations and Disclosure Requirements) Regulations, 2015 on February 2, 2019. The composition of the Committee and attendance of the members is given hereunder:
Name of the Member Member/ Chairman
Number of Meetings attended
Mr. Vipul Mathur - Managing Director & CEO^
Member 2/2
Ms. Amita Misra- Independent Director*$
Chairperson Nil/Nil
Mr. Deshraj Dogra- Independent Director
Member 2/2
Mr. K. H. Viswanathan-Independent Director
Member 2/2
Mr. Percy Birdy- Chief Financial Officer
Member 2/2
Mr. Rajkumar Jain- Independent Director@
Member 2/2
* appointed as a member w.e.f. December 9, 2020.
stepped down from the position of the Chairman w.e.f. June 28, 2021
$ appointed as the Chairperson w.e.f. June 28, 2021
@ ceased to be a member of the Committee w.e.f. October 31, 2020
The Company Secretary of the Company, Mr. Pradeep Joshi acts as the Secretary of the Committee.
The objectives and scope of the Committee broadly comprise of monitoring and reviewing risk management plan including cyber security.
During the year under review, 2 meetings of the Committee were held on 24.04.2020, and 08.10.2020.
The Company has a Risk Management Framework to identify, monitor, mitigate and minimize risks.
viii. CoRPoRaTe soCiaL ResPonsibiLiTy CoMMiTTee
The Company’s philosophy has always been to practice ethical business and be socially
responsible. There is a strong commitment to a wider all-round social progress, as well as to a sustainable development that balances the needs of the present with those of the future. The key philosophy of all CSR initiatives of the Company is enshrined in the three E’s which have become guiding principles of the CSR initiatives – Education, Empowerment (of Women) and Environment & Health.
The web-link to our CSR Policy and the initiatives undertaken by your Company during FY 2020-21 in CSR have been detailed in this Report. Disclosures as required under Rule 9 of the Companies (Corporate Social Responsibility) Rules, 2014 are given in Annexure – 4 to this Report.
The composition of the Committee and attendance of the members is given in the Annexure-4 to this report.
During the year under review, 2 meetings of the Committee were held on 18.07.2020, and 12.03.2021.
ix. DeTaiLs oF esTabLisHMenT oF CoDe oF ConDuCT FoR ReguLaTing, MoniToRing anD RePoRTing oF TRaDing by insiDeRs.
The Company has a Code of Conduct for Regulating, Monitoring and Reporting of Trading by Insiders (“PIT Policy”) for connected persons, designated persons and the insiders as defined under the SEBI (Prohibition of Insider Trading) Regulations, 2015 (“PIT Regulations”). The Policy provide adequate safeguard against victimization. The Audit Committee reviews the Institutional Mechanism for prevention of insider trading.
Periodic training sessions are organized for creating awareness amongst the insiders about the PIT Policy and PIT Regulations.
Web-link where details of the PIT Policy are available “http://www.welspuncorp.com” under the tab “Who We Are --> Polices, Disclosures, Notices -->Code of Conduct for Regulating, Monitoring and Reporting of Trading by Insiders.”
x. geneRaL boDy MeeTings
The details of Annual General Meetings held and the special resolutions passed in the last three years are given hereunder:
1) At the 23rd Annual General Meeting held on Tuesday, August 14, 2018 at 2:30 pm at Registered Office of the Company at Welspun City, Village Versamedi, Taluka Anjar, Dist. Kutch, Gujarat – 370110, following special resolutions were passed:
Annual Report 2020-21 105Annual Report 2020-21104
Corporate Overview Statutory Reports Financial Statements
• For appointment of Mr. Vipul Mathur (holding DIN 07990476) as the Managing Director & Chief Executive Officer of the Company for a period of 5 years and fixing his remuneration for a period of three years commencing from December 1, 2017.
• For appointment of Mr. S.Krishnan (holding DIN 06829167) as the Executive Director & Chief Executive Officer (PCMD) of the Company for a period of 5 years and fixing his remuneration for a period of three years commencing from December 1, 2017.
• To borrow from time to time, by way of issue of securities including but not limited to secured/unsecured redeemable Non-convertible Debentures (NCDs) to be issued on Private Placement basis, in domestic and/or international market, in one or more series/tranches aggregating upto an amount not exceeding ` 700 crores during the period of 1 (one) year from the date of the Annual General Meeting.
2) National Company Law Tribunal Convened Meeting held on March 7, 2019 and the Resolution(s) passed therein
As per the directions of Ahmedabad Bench of National Company Law Tribunal (”NCLT“), by its Order dated January 18, 2019, your Company convened a Meeting of the Equity Shareholders of the Company on March 7, 2019, to consider and approve, if thought fit, with or without modification(s), the arrangement proposed and embodied in the Scheme of Arrangement between the Company and Welspun Pipes Limited and their respective Shareholders and Creditors.
3) In addition to the above, at the Extra Ordinary General Meeting held on Tuesday, March 19, 2019 at 12:00 noon at Registered Office of the Company at Welspun City, Village Versamedi, Taluka Anjar, Dist. Kutch, Gujarat – 370110, following special resolutions were passed:
• To revise remuneration to the Managing Director & CEO from ` 450 lakh to ` 500 lakh and grant of 1,500,000 Employee Stock Options at an Exercise Price of ` 100 per Stock Option.
• Reclassification of Intech Metals SA as “Public” Shareholder under Regulation 31A of the SEBI (LODR), 2015.
• Re-appointment of Mr. Rajkumar Jain as an independent director.
• Re-appointment of Mr. K.H.Viswanathan as an independent director.
• Re-appointment of Ms. Revathy Ashok as an independent director.
4) At the 24th Annual General Meeting held on Monday, August 12, 2019 at 11:30 am at Registered Office of the Company at Welspun City, Village Versamedi, Taluka Anjar, Dist. Kutch, Gujarat – 370110, following special resolutions were passed:
• For appointment of Mr. Dhruv Kaji as an independent director.
• To borrow from time to time, by way of issue of securities including but not limited to secured/unsecured redeemable Non-convertible Debentures (NCDs) to be issued on Private Placement basis, in domestic and/or international market, in one or more series/tranches aggregating upto an amount not exceeding ` 500 crores during the period of 1 (one) year from the date of the Annual General Meeting.
• For payment of commission @1% of Net Profits of the Company as computed under Section 198 of the Companies Act, 2013 for the financial year 2019-20 to Mr. Balkrishan Goenka, Non-Executive Chairman.
During the year 2019-20, following resolutions were passed through postal ballot:
• Postal Ballot Notice dated May 15, 2019 : Special Resolution for buyback of its fully paid up equity shares of the face value of `5/- (Rupees Five Only) each at a price to be finalized by the Buyback Committee subject to a maximum price of ` 140/- per Equity Share payable in cash for a maximum aggregate amount up to ` 3,900 Million (i.e. up to 27,857,142 equity shares), representing 24.76% and 14.60% of aggregate paid-up equity share capital and free reserves (including securities premium account), as per the audited accounts of the Company on standalone and consolidated basis respectively, as on March 31, 2019, being within the 25% limit of the aggregate paid-up equity share capital and free reserves (including securities premium account) as per the provisions of the Act,
Annual Report 2020-21 107Annual Report 2020-21106
out of the free reserves and/or surplus and / or the securities premium account of the Company or such other source as may be permitted by the Buyback Regulations or the Act, from the Members of the Company, as on record date to be determined by the Board.
Mr. Mihen Halani, Proprietor of M/s. Mihen Halani & Associates, Company Secretaries, having Membership No. 32176 and CP No.12015, was appointed as the Scrutinizer for conducting process of the Postal Ballot and voting by electronic means in a fair and transparent manner and the Company has engaged the services of National Securities Depository Limited (NSDL) as the agency for providing e-voting facility.
Procedure adopted for Postal Ballot: The Notice of Postal Ballot dated May 15,
2019, containing the Resolution, Explanatory Statement, Postal Ballot Form along with the details of Login ID and password were e-mailed on May 22, 2019 to those Members whose emails were registered with the Depository Participants/Registrar & Transfer Agents and were sent to the rest of the Members by Courier/Registered Post/speed post along with a self-addressed postage and pre-paid Business Reply Envelope dispatch of which was completed on May 22, 2019.
The advertisement was published in the Newspapers viz. Financial Express (English), Kutch Mitra (Gujarati) and Kutch Uday (Gujarati) on May 23, 2019
The voting period commenced @09.00 a.m. on Friday, May 24, 2019 and ended @05.00 p.m. on Saturday, June 22, 2019.
Details of Voting of the above Resolution are as under:
sr. no.
Particulars number of votes
% of total votes
Result
1 Votes in favor of the Resolution
59,516,334 99.99 Passed with the requisite majority
2 Votes against the Resolution
4,414 0.01
• Postal Ballot Notice dated February 3, 2020 : i. Special Resolution for appointment of
Ms. Amita Misra as an independent director.
ii. Special Resolution for revision in the remuneration of Mr. Vipul Mathur, Managing Director & CEO with effect from July 1, 2019.
iii. Special Resolution for alteration of Articles of Association by deleting entire Article 241 and Schedule 1 to the Articles of Association and their references, wherever appearing, in the Articles of Association.
iv. Ordinary Resolution for Reclassification of Intech Metals SA as “Public” Shareholder under Regulation 31A of the SEBI (LODR), 2015
v. Special Resolution for sale of Plate and Coil Mill Division of the Company on a slump sale basis.
Mr. Mihen Halani, Proprietor of M/s. Mihen Halani & Associates, Company Secretaries, having Membership No. 32176 and CP No.12015, was appointed as the Scrutinizer for conducting process of the Postal Ballot and voting by electronic means in a fair and transparent manner and the Company has engaged the services of National Securities Depository Limited (NSDL) as the agency for providing e-voting facility.
Procedure adopted for Postal Ballot: The Notice of Postal Ballot dated February 3,
2020, containing the Resolution, Explanatory Statement, Postal Ballot Form along with the details of Login ID and password were e-mailed on February 14, 2020 to those Members whose emails were registered with the Depository Participants/Registrar & Transfer Agents and were sent to the rest of the Members by Courier/Registered Post/speed post along with a self-addressed postage and pre-paid Business Reply Envelope dispatch of which was completed on February 15, 2020.
The advertisement was published in the Newspapers viz. Financial Express (English), Kutch Mitra (Gujarati) and Kutch Uday (Gujarati) on February 17, 2020
The voting period commenced @09.00 a.m. on Monday, February 17, 2020 and ended @05.00 p.m. on Wednesday, March 18, 2020.
The Scrutinizer submitted his combined report on March 19, 2020.
Annual Report 2020-21 107Annual Report 2020-21106
Corporate Overview Statutory Reports Financial Statements
Details of Voting of the above Resolution are as under:
Resolutions as given in Postal Ballot Notice dated February 03, 2020
Particulars of votes Cast Result
Number of votes
% of votes
Resolution No. 1 as a Special Resolution Votes cast in favor 162,080,064 99.93
Approved by requisite
majority
Votes cast against 108,451 0.67
Resolution No. 2 as a Special Resolution Votes cast in favor 145,265,202 89.61
Votes cast against 16,849,717 10.39
Resolution No. 3 as an Special Resolution Votes cast in favor 162,184,708 100.00
Votes cast against 3,924 0.00
Resolution No.4 as an Ordinary Resolution Votes cast in favor 162,186,629 100.00
Votes cast against 2,010 0.00
Resolution No.5 as an Special Resolution Votes cast in favor 153,077,248 100.00
Votes cast against 1,870 0.00
5) At the 25th Annual General Meeting held on Monday, August 31, 2020 at 11:00 am via Other Audio-Visual Means, following special resolutions were passed:
• To borrow from time to time, by way of issue of securities including but not limited to secured/unsecured redeemable Non-convertible Debentures (NCDs) and/or Commercial Papers (CPs) to be issued on Private Placement basis, in domestic and/or international market, in one or more series/tranches aggregating upto an amount not exceeding ` 500 crores during the period of 1 (one) year from the date of the Annual General Meeting.
• For payment of commission @1% of Net Profits of the Company as computed under Section 198 of the Companies Act, 2013 for the financial year 2020-21 to Mr. Balkrishan Goenka, Non-Executive Chairman.
• For listing of its joint venture Company viz. Welspun Middle East Pipes LLC (“WMEPL”) at the local Stock Exchange through divestment of 15% (at maximum) of the total issued shares of WMEPL held by the Company through its overseas subsidiary, at a pro-rata consideration exceeding US$30 million, along with proportionate shares to be divested by the local partners.
6) In addition to the above, at the Extra Ordinary General Meeting held on Monday, September 28, 2020 at 12:00 noon via Other Audio-Visual Means, following special resolutions were passed:
• For amendment to the Objects Clause, and for commencement of all or any of
the business proposed in the amended Objects Clause of the Memorandum of Association of the Company.
• To borrow from time to time, by way of issue of securities including but not limited to secured/unsecured redeemable Non-convertible Debentures (NCDs) to be issued on Private Placement basis, in domestic and/or international market, in one or more series/tranches aggregating upto an amount not exceeding ` 500 crores during the period of 1 (one) year from the date of the resolution.
xi. DisCLosuRe
a. Related Party Transactions.
For materially significant related party transactions, refer Note No. 42 of Notes to Accounts annexed to the Financial Statement and Annexure 5 to the Directors’ Report.
The Company’s policy on dealing with Related Party Transactions as required under Regulation 23 of the SEBI (Listing Obligations and Disclosure Requirements) Regulations, 2015 is disclosed on the Company’s website and a web link thereto is “http://www.welspuncorp.com” under the tab “Who We Are --> Polices, Disclosures, Notices”.
b. Disclosure Pursuant to Regulation 34(3) of the SeBI (LODR), 2015.
For disclosures pursuant to Regulation 34(3), refer Note No. 55 of Notes to the Accounts annexed to the Financial Statement.
c. Non-Compliance
There were no non-compliances by the Company and hence no penalties and strictures were imposed on the Company by the Stock Exchanges or SEBI or any statutory
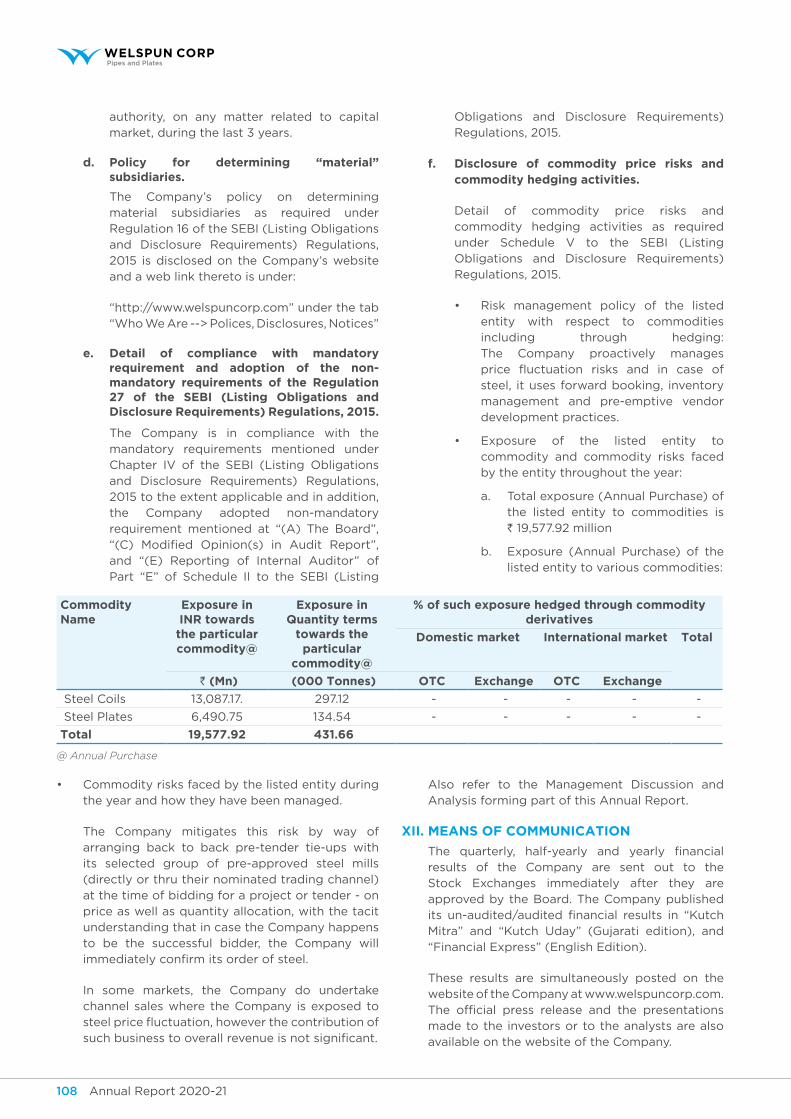
Annual Report 2020-21 109Annual Report 2020-21108
authority, on any matter related to capital market, during the last 3 years.
d. Policy for determining “material” subsidiaries.
The Company’s policy on determining material subsidiaries as required under Regulation 16 of the SEBI (Listing Obligations and Disclosure Requirements) Regulations, 2015 is disclosed on the Company’s website and a web link thereto is under:
“http://www.welspuncorp.com” under the tab “Who We Are --> Polices, Disclosures, Notices”
e. Detail of compliance with mandatory requirement and adoption of the non-mandatory requirements of the Regulation 27 of the SeBI (Listing Obligations and Disclosure Requirements) Regulations, 2015.
The Company is in compliance with the mandatory requirements mentioned under Chapter IV of the SEBI (Listing Obligations and Disclosure Requirements) Regulations, 2015 to the extent applicable and in addition, the Company adopted non-mandatory requirement mentioned at “(A) The Board”, “(C) Modified Opinion(s) in Audit Report”, and “(E) Reporting of Internal Auditor” of Part “E” of Schedule II to the SEBI (Listing
Obligations and Disclosure Requirements) Regulations, 2015.
f. Disclosure of commodity price risks and commodity hedging activities.
Detail of commodity price risks and commodity hedging activities as required under Schedule V to the SEBI (Listing Obligations and Disclosure Requirements) Regulations, 2015.
• Risk management policy of the listed entity with respect to commodities including through hedging: The Company proactively manages price fluctuation risks and in case of steel, it uses forward booking, inventory management and pre-emptive vendor development practices.
• Exposure of the listed entity to commodity and commodity risks faced by the entity throughout the year:
a. Total exposure (Annual Purchase) of the listed entity to commodities is ` 19,577.92 million
b. Exposure (Annual Purchase) of the listed entity to various commodities:
Commodity name
exposure in INR towards the particular commodity@
exposure in quantity terms
towards the particular
commodity@
% of such exposure hedged through commodity derivatives
Domestic market International market Total
` (Mn) (000 Tonnes) oTC exchange oTC exchange
Steel Coils 13,087.17. 297.12 - - - - -
Steel Plates 6,490.75 134.54 - - - - -
Total 19,577.92 431.66
@ Annual Purchase
• Commodity risks faced by the listed entity during the year and how they have been managed.
The Company mitigates this risk by way of arranging back to back pre-tender tie-ups with its selected group of pre-approved steel mills (directly or thru their nominated trading channel) at the time of bidding for a project or tender - on price as well as quantity allocation, with the tacit understanding that in case the Company happens to be the successful bidder, the Company will immediately confirm its order of steel.
In some markets, the Company do undertake channel sales where the Company is exposed to steel price fluctuation, however the contribution of such business to overall revenue is not significant.
Also refer to the Management Discussion and Analysis forming part of this Annual Report.
xii. Means oF CoMMuniCaTion
The quarterly, half-yearly and yearly financial results of the Company are sent out to the Stock Exchanges immediately after they are approved by the Board. The Company published its un-audited/audited financial results in “Kutch Mitra” and “Kutch Uday” (Gujarati edition), and “Financial Express” (English Edition).
These results are simultaneously posted on the website of the Company at www.welspuncorp.com. The official press release and the presentations made to the investors or to the analysts are also available on the website of the Company.
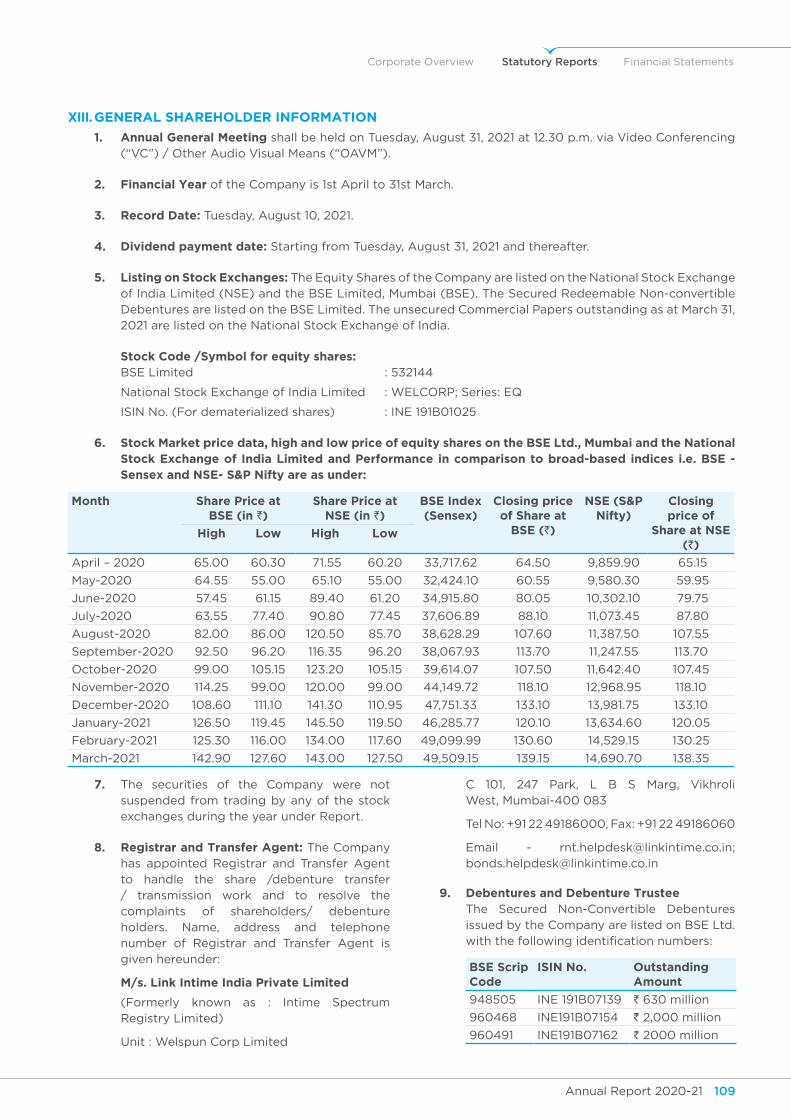
Annual Report 2020-21 109Annual Report 2020-21108
Corporate Overview Statutory Reports Financial Statements
xiii. geneRaL sHaReHoLDeR inFoRMaTion
1. Annual general Meeting shall be held on Tuesday, August 31, 2021 at 12.30 p.m. via Video Conferencing (“VC”) / Other Audio Visual Means (“OAVM”).
2. Financial year of the Company is 1st April to 31st March.
3. Record Date: Tuesday, August 10, 2021.
4. Dividend payment date: Starting from Tuesday, August 31, 2021 and thereafter.
5. Listing on Stock exchanges: The Equity Shares of the Company are listed on the National Stock Exchange of India Limited (NSE) and the BSE Limited, Mumbai (BSE). The Secured Redeemable Non-convertible Debentures are listed on the BSE Limited. The unsecured Commercial Papers outstanding as at March 31, 2021 are listed on the National Stock Exchange of India.
Stock Code /Symbol for equity shares: BSE Limited : 532144
National Stock Exchange of India Limited : WELCORP; Series: EQ
ISIN No. (For dematerialized shares) : INE 191B01025
6. Stock Market price data, high and low price of equity shares on the BSe Ltd., Mumbai and the National Stock exchange of India Limited and Performance in comparison to broad-based indices i.e. BSe - Sensex and NSe- S&P Nifty are as under:
Month share Price at BSe (in `)
share Price at NSe (in `)
BSe Index (Sensex)
Closing price of Share at
BSe (`)
NSe (S&P Nifty)
Closing price of
share at nse (`)
high Low high Low
April – 2020 65.00 60.30 71.55 60.20 33,717.62 64.50 9,859.90 65.15
May-2020 64.55 55.00 65.10 55.00 32,424.10 60.55 9,580.30 59.95
June-2020 57.45 61.15 89.40 61.20 34,915.80 80.05 10,302.10 79.75
July-2020 63.55 77.40 90.80 77.45 37,606.89 88.10 11,073.45 87.80
August-2020 82.00 86.00 120.50 85.70 38,628.29 107.60 11,387.50 107.55
September-2020 92.50 96.20 116.35 96.20 38,067.93 113.70 11,247.55 113.70
October-2020 99.00 105.15 123.20 105.15 39,614.07 107.50 11,642.40 107.45
November-2020 114.25 99.00 120.00 99.00 44,149.72 118.10 12,968.95 118.10
December-2020 108.60 111.10 141.30 110.95 47,751.33 133.10 13,981.75 133.10
January-2021 126.50 119.45 145.50 119.50 46,285.77 120.10 13,634.60 120.05
February-2021 125.30 116.00 134.00 117.60 49,099.99 130.60 14,529.15 130.25
March-2021 142.90 127.60 143.00 127.50 49,509.15 139.15 14,690.70 138.35
7. The securities of the Company were not suspended from trading by any of the stock exchanges during the year under Report.
8. Registrar and Transfer Agent: The Company has appointed Registrar and Transfer Agent to handle the share /debenture transfer / transmission work and to resolve the complaints of shareholders/ debenture holders. Name, address and telephone number of Registrar and Transfer Agent is given hereunder:
M/s. Link Intime India Private Limited
(Formerly known as : Intime Spectrum Registry Limited)
Unit : Welspun Corp Limited
C 101, 247 Park, L B S Marg, Vikhroli West, Mumbai-400 083
Tel No: +91 22 49186000, Fax: +91 22 49186060
Email - [email protected]; [email protected]
9. Debentures and Debenture Trustee The Secured Non-Convertible Debentures
issued by the Company are listed on BSE Ltd. with the following identification numbers:
bse scrip Code
isin no. Outstanding amount
948505 INE 191B07139 ` 630 million
960468 INE191B07154 ` 2,000 million
960491 INE191B07162 ` 2000 million
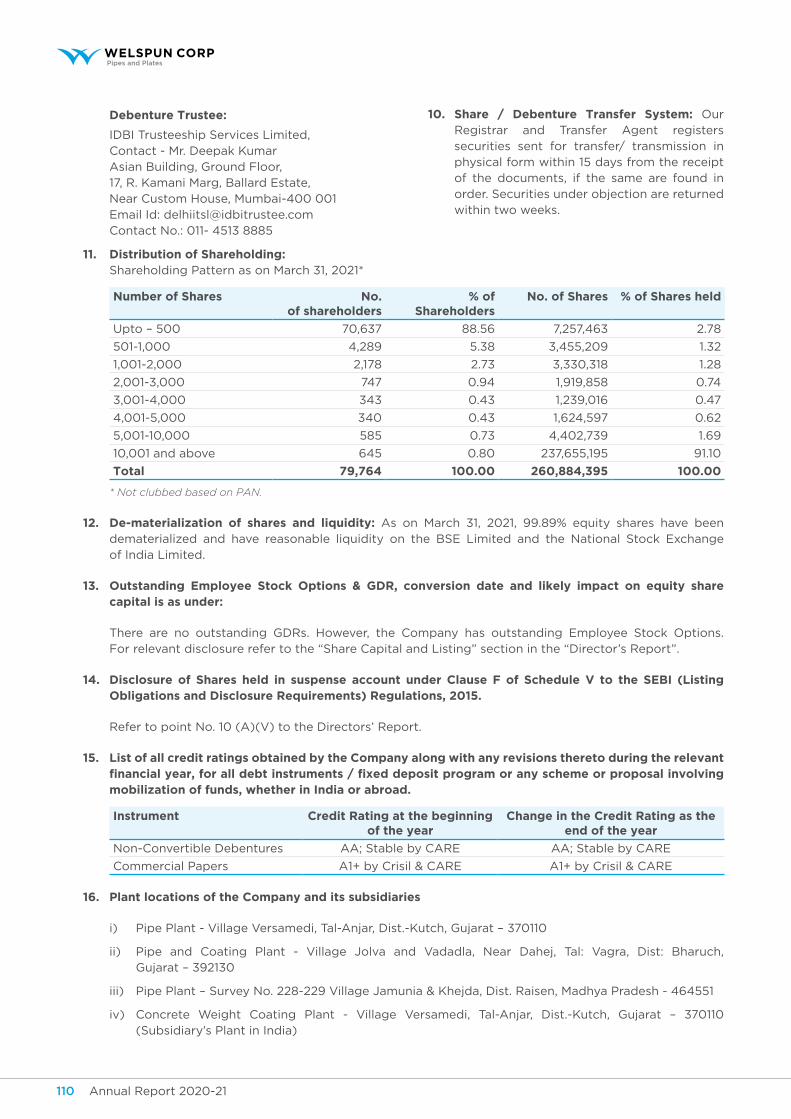
Annual Report 2020-21 111Annual Report 2020-21110
Debenture Trustee:
IDBI Trusteeship Services Limited, Contact - Mr. Deepak Kumar Asian Building, Ground Floor, 17, R. Kamani Marg, Ballard Estate, Near Custom House, Mumbai-400 001 Email Id: [email protected] Contact No.: 011- 4513 8885
10. Share / Debenture Transfer System: Our Registrar and Transfer Agent registers securities sent for transfer/ transmission in physical form within 15 days from the receipt of the documents, if the same are found in order. Securities under objection are returned within two weeks.
11. Distribution of Shareholding: Shareholding Pattern as on March 31, 2021*
Number of Shares no. of shareholders
% of shareholders
No. of Shares % of Shares held
Upto – 500 70,637 88.56 7,257,463 2.78
501-1,000 4,289 5.38 3,455,209 1.32
1,001-2,000 2,178 2.73 3,330,318 1.28
2,001-3,000 747 0.94 1,919,858 0.74
3,001-4,000 343 0.43 1,239,016 0.47
4,001-5,000 340 0.43 1,624,597 0.62
5,001-10,000 585 0.73 4,402,739 1.69
10,001 and above 645 0.80 237,655,195 91.10
Total 79,764 100.00 260,884,395 100.00
* Not clubbed based on PAN.
12. De-materialization of shares and liquidity: As on March 31, 2021, 99.89% equity shares have been dematerialized and have reasonable liquidity on the BSE Limited and the National Stock Exchange of India Limited.
13. Outstanding employee Stock Options & gDR, conversion date and likely impact on equity share capital is as under:
There are no outstanding GDRs. However, the Company has outstanding Employee Stock Options. For relevant disclosure refer to the “Share Capital and Listing” section in the “Director’s Report”.
14. Disclosure of Shares held in suspense account under Clause F of Schedule v to the SeBI (Listing Obligations and Disclosure Requirements) Regulations, 2015.
Refer to point No. 10 (A)(V) to the Directors’ Report.
15. List of all credit ratings obtained by the Company along with any revisions thereto during the relevant financial year, for all debt instruments / fixed deposit program or any scheme or proposal involving mobilization of funds, whether in India or abroad.
instrument Credit Rating at the beginning of the year
Change in the Credit Rating as the end of the year
Non-Convertible Debentures AA; Stable by CARE AA; Stable by CARE
Commercial Papers A1+ by Crisil & CARE A1+ by Crisil & CARE
16. Plant locations of the Company and its subsidiaries
i) Pipe Plant - Village Versamedi, Tal-Anjar, Dist.-Kutch, Gujarat – 370110
ii) Pipe and Coating Plant - Village Jolva and Vadadla, Near Dahej, Tal: Vagra, Dist: Bharuch, Gujarat – 392130
iii) Pipe Plant – Survey No. 228-229 Village Jamunia & Khejda, Dist. Raisen, Madhya Pradesh - 464551
iv) Concrete Weight Coating Plant - Village Versamedi, Tal-Anjar, Dist.-Kutch, Gujarat – 370110 (Subsidiary’s Plant in India)
Annual Report 2020-21 111Annual Report 2020-21110
Corporate Overview Statutory Reports Financial Statements
v) Pipe Plant - KIADB Industrial Area, Gejjalagere, Taluka-Maddur, Dist.- Mandya, Karnataka -571428
vi) Pipe Coating, Double Jointing Plant - 9301 Frazier Pike, Little Rock, Arkansas 72205 (Subsidiary’s plant in the US)
vii) Pipe and Coating Plant - Industrial City-2, Dammam-31483, Kingdom of Saudi Arabia (Subsidiary’s plant in the KSA).
viii) Pig Iron project under implementation phase – Village Versamedi, Tal-Anjar, Dist.-Kutch, Gujarat – 370110 (Subsidiary’s Plant in India)
ix) DI Pipe project under implementation phase - Village Versamedi, Tal-Anjar, Dist.-Kutch, Gujarat – 370110 (Subsidiary’s Plant in India)
17. Address for correspondence The Company Secretary, Compliance Officer and Nodal Officer Welspun Corp Limited
5th Floor, Welspun House, Kamala Mills Compound,
Senapati Bapat Marg, Lower Parel (W), Mumbai - 400 013.
Tel: +91-22-66136000; +91-22-24908000, Fax: +91-22-24908020 /21
e-mail: [email protected]
Annual Report 2020-21 113Annual Report 2020-21112
CeRTiFiCaTe oF PRaCTiCing CoMPany seCReTaRy on CoRPoRaTe goveRnanCe RePoRT
To,
The Members,
WELSPUN CORP LIMITED
CIN: L27100GJ1995PLC025609
We have examined the compliance of conditions of Corporate Governance by WELSPUN CORP LIMITED (“the Company”), for the year ended on March 31, 2021, as stipulated in Clause E of Schedule V of the SEBI (Listing Obligations and Disclosure Requirements) Regulations, 2015.
The compliance of conditions of Corporate Governance is the responsibility of the management. Our examination was limited to procedure and implementation thereof, adopted by the Company for ensuring the compliance of the conditions of the Corporate Governance. It is neither an audit nor an expression of opinion on the financial statements of the Company.
We have conducted our examination on the basis of the relevant records and documents maintained by the Company and furnished to us for the examination, and the information and explanations given to us by the Company. Accordingly, in our opinion and to the best of our information and the explanations as given to us, we certify that the Company has complied with the conditions of Corporate Governance as stipulated in the above mentioned Regulations, as applicable.
We state that in respect of investor’s grievance received during the year ended March 31 2021, the Registrar and Transfer Agent of the Company have certified that as at March 31, 2021, there were no investors’ grievances remaining unattended / pending to the satisfaction of the investor except one complaint that have received during the last few days of the March 2021 and the same satisfactorily resolved in April 2021.
We further state that such compliance is neither an assurance as to the future viability of the Company nor the efficiency or effectiveness with which the management has conducted the affairs of the Company.
For MIheN hALANI & ASSOCIATeSPracticing Company Secretaries
Mihen Halani(Proprietor)CP No: 12015FCS No: 9926UDIN: F009926C000342973
Date: May 20, 2021Place: Mumbai
Mihen halani & associatesPracticing Company Secretaries
A-501/L, Jaswanti Allied Business Centre, Next to Hotel Khwaishh Presidency,Kachpada, Ramchandra Lane Extn. Road, Malad (West), Mumbai – 400 064
Tel.: 022 – 6236 0279 E-mail: [email protected]
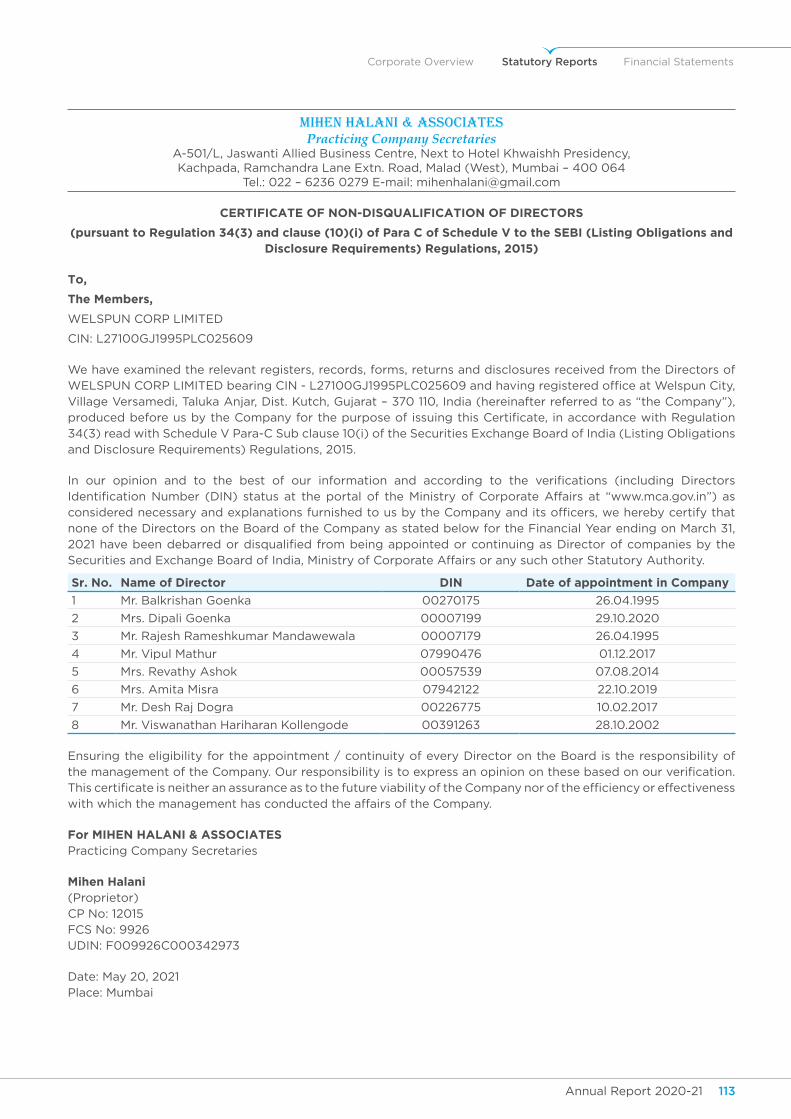
Annual Report 2020-21 113Annual Report 2020-21112
Corporate Overview Statutory Reports Financial Statements
CeRTIFICATe OF NON-DISQuALIFICATION OF DIReCTORS
(pursuant to Regulation 34(3) and clause (10)(i) of Para C of Schedule v to the SeBI (Listing Obligations and Disclosure Requirements) Regulations, 2015)
To,
The Members,
WELSPUN CORP LIMITED
CIN: L27100GJ1995PLC025609
We have examined the relevant registers, records, forms, returns and disclosures received from the Directors of WELSPUN CORP LIMITED bearing CIN - L27100GJ1995PLC025609 and having registered office at Welspun City, Village Versamedi, Taluka Anjar, Dist. Kutch, Gujarat – 370 110, India (hereinafter referred to as “the Company”), produced before us by the Company for the purpose of issuing this Certificate, in accordance with Regulation 34(3) read with Schedule V Para-C Sub clause 10(i) of the Securities Exchange Board of India (Listing Obligations and Disclosure Requirements) Regulations, 2015.
In our opinion and to the best of our information and according to the verifications (including Directors Identification Number (DIN) status at the portal of the Ministry of Corporate Affairs at “www.mca.gov.in”) as considered necessary and explanations furnished to us by the Company and its officers, we hereby certify that none of the Directors on the Board of the Company as stated below for the Financial Year ending on March 31, 2021 have been debarred or disqualified from being appointed or continuing as Director of companies by the Securities and Exchange Board of India, Ministry of Corporate Affairs or any such other Statutory Authority.
sr. no. Name of Director Din Date of appointment in Company
1 Mr. Balkrishan Goenka 00270175 26.04.1995
2 Mrs. Dipali Goenka 00007199 29.10.2020
3 Mr. Rajesh Rameshkumar Mandawewala 00007179 26.04.1995
4 Mr. Vipul Mathur 07990476 01.12.2017
5 Mrs. Revathy Ashok 00057539 07.08.2014
6 Mrs. Amita Misra 07942122 22.10.2019
7 Mr. Desh Raj Dogra 00226775 10.02.2017
8 Mr. Viswanathan Hariharan Kollengode 00391263 28.10.2002
Ensuring the eligibility for the appointment / continuity of every Director on the Board is the responsibility of the management of the Company. Our responsibility is to express an opinion on these based on our verification. This certificate is neither an assurance as to the future viability of the Company nor of the efficiency or effectiveness with which the management has conducted the affairs of the Company.
For MIheN hALANI & ASSOCIATeSPracticing Company Secretaries
Mihen Halani(Proprietor)CP No: 12015FCS No: 9926UDIN: F009926C000342973
Date: May 20, 2021Place: Mumbai
Mihen halani & associatesPracticing Company Secretaries
A-501/L, Jaswanti Allied Business Centre, Next to Hotel Khwaishh Presidency,Kachpada, Ramchandra Lane Extn. Road, Malad (West), Mumbai – 400 064
Tel.: 022 – 6236 0279 E-mail: [email protected]
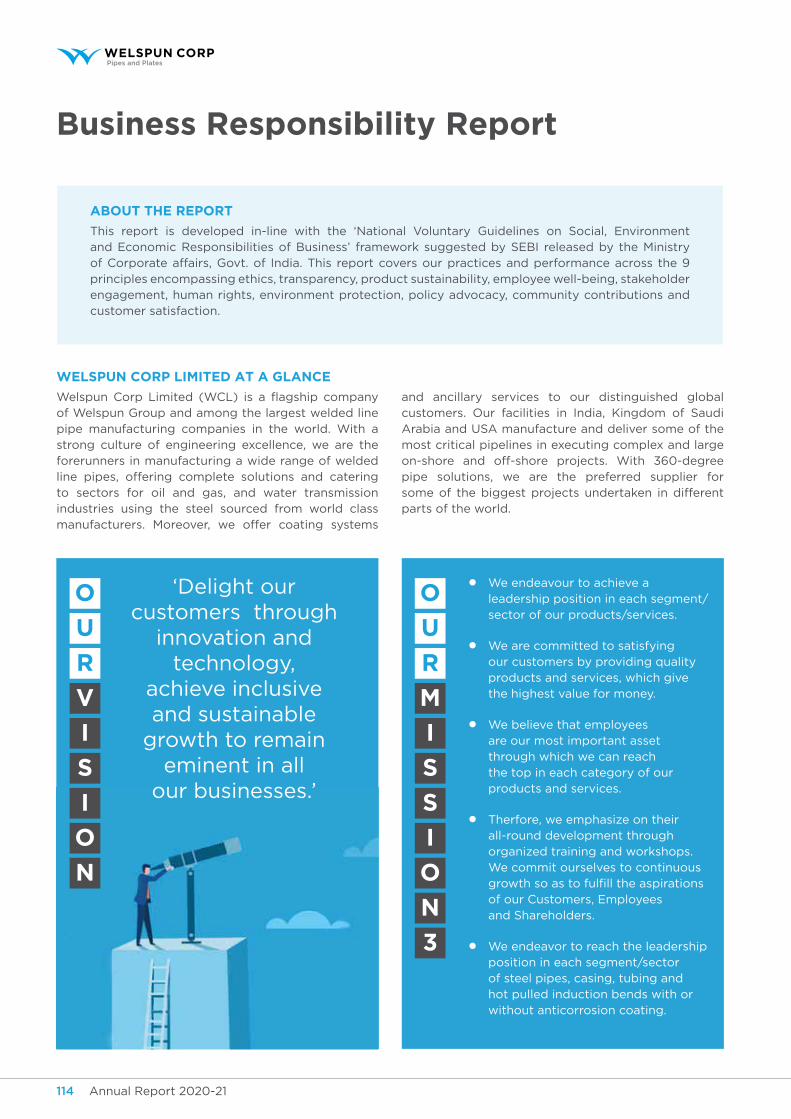
Annual Report 2020-21 115Annual Report 2020-21114
Welspun Corp limited at a glanCe
Welspun Corp Limited (WCL) is a flagship company of Welspun Group and among the largest welded line pipe manufacturing companies in the world. With a strong culture of engineering excellence, we are the forerunners in manufacturing a wide range of welded line pipes, offering complete solutions and catering to sectors for oil and gas, and water transmission industries using the steel sourced from world class manufacturers. Moreover, we offer coating systems
Business responsibility report
aBout the report
This report is developed in-line with the ‘National Voluntary Guidelines on Social, Environment and Economic Responsibilities of Business’ framework suggested by SEBI released by the Ministry of Corporate affairs, Govt. of India. This report covers our practices and performance across the 9 principles encompassing ethics, transparency, product sustainability, employee well-being, stakeholder engagement, human rights, environment protection, policy advocacy, community contributions and customer satisfaction.
and ancillary services to our distinguished global customers. Our facilities in India, Kingdom of Saudi Arabia and USA manufacture and deliver some of the most critical pipelines in executing complex and large on-shore and off-shore projects. With 360-degree pipe solutions, we are the preferred supplier for some of the biggest projects undertaken in different parts of the world.
We endeavour to achieve a leadership position in each segment/sector of our products/services.
We are committed to satisfying our customers by providing quality products and services, which give the highest value for money.
We believe that employees are our most important asset through which we can reach the top in each category of our products and services.
Therfore, we emphasize on their all-round development through organized training and workshops. We commit ourselves to continuous growth so as to fulfill the aspirations of our Customers, Employees and Shareholders.
We endeavor to reach the leadership position in each segment/sector of steel pipes, casing, tubing and hot pulled induction bends with or without anticorrosion coating.
‘Delight our customers through
innovation and technology,
achieve inclusive and sustainable
growth to remain eminent in all
our businesses.’
o
u
r
V
i
s
i
o
n
o
u
r
m
i
s
s
i
o
n
3
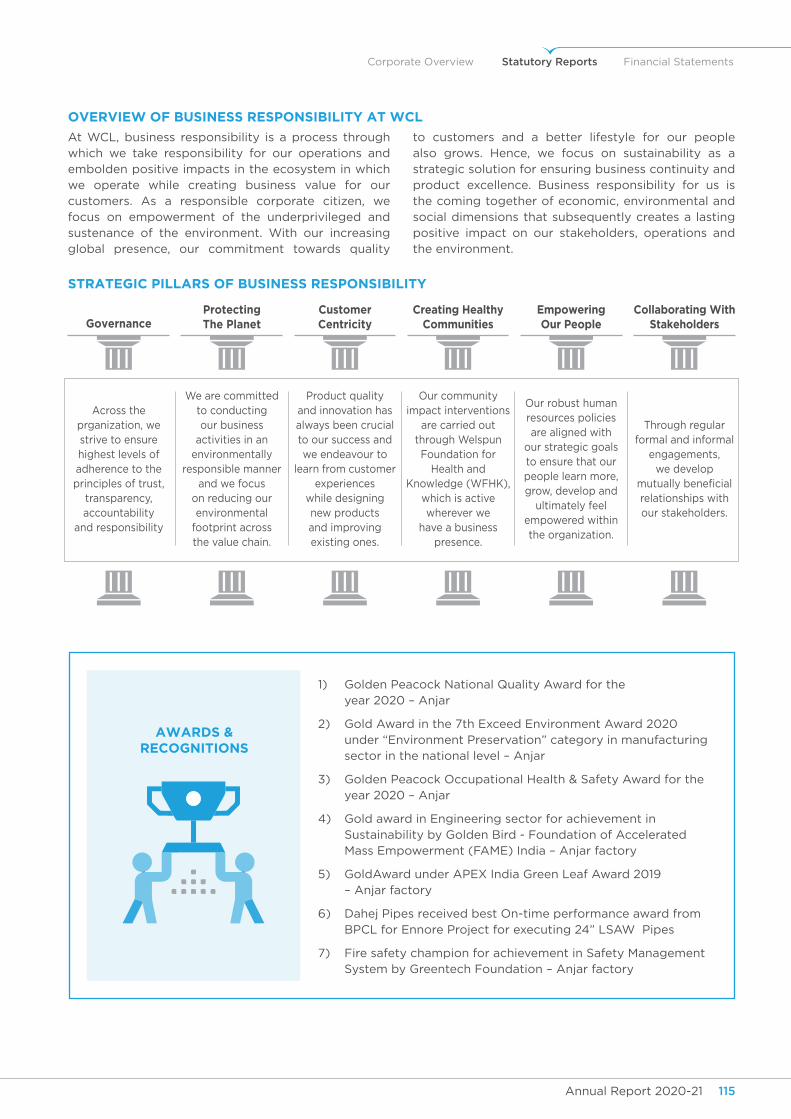
Annual Report 2020-21 115Annual Report 2020-21114
Corporate Overview Statutory Reports Financial Statements
oVerVieW of Business responsiBility at WCl
At WCL, business responsibility is a process through which we take responsibility for our operations and embolden positive impacts in the ecosystem in which we operate while creating business value for our customers. As a responsible corporate citizen, we focus on empowerment of the underprivileged and sustenance of the environment. With our increasing global presence, our commitment towards quality
to customers and a better lifestyle for our people also grows. Hence, we focus on sustainability as a strategic solution for ensuring business continuity and product excellence. Business responsibility for us is the coming together of economic, environmental and social dimensions that subsequently creates a lasting positive impact on our stakeholders, operations and the environment.
strategiC pillars of Business responsiBility
Across the prganization, we strive to ensure highest levels of adherence to the principles of trust,
transparency, accountability
and responsibility
We are committed to conducting our business
activities in an environmentally
responsible manner and we focus
on reducing our environmental
footprint across the value chain.
Product quality and innovation has always been crucial to our success and we endeavour to
learn from customer experiences
while designing new products and improving existing ones.
Our community impact interventions
are carried out through Welspun Foundation for
Health and Knowledge (WFHK),
which is active wherever we
have a business presence.
Our robust human resources policies are aligned with
our strategic goals to ensure that our people learn more, grow, develop and
ultimately feel empowered within the organization.
Through regular formal and informal
engagements, we develop
mutually beneficial relationships with our stakeholders.
governanceprotecting the planet
Customer Centricity
Creating healthyCommunities
Collaborating Withstakeholders
empowering our people
1) Golden Peacock National Quality Award for the year 2020 – Anjar
2) Gold Award in the 7th Exceed Environment Award 2020 under “Environment Preservation” category in manufacturing sector in the national level – Anjar
3) Golden Peacock Occupational Health & Safety Award for the year 2020 – Anjar
4) Gold award in Engineering sector for achievement in Sustainability by Golden Bird - Foundation of Accelerated Mass Empowerment (FAME) India – Anjar factory
5) GoldAward under APEX India Green Leaf Award 2019 – Anjar factory
6) Dahej Pipes received best On-time performance award from BPCL for Ennore Project for executing 24” LSAW Pipes
7) Fire safety champion for achievement in Safety Management System by Greentech Foundation – Anjar factory
aWards & reCognitions
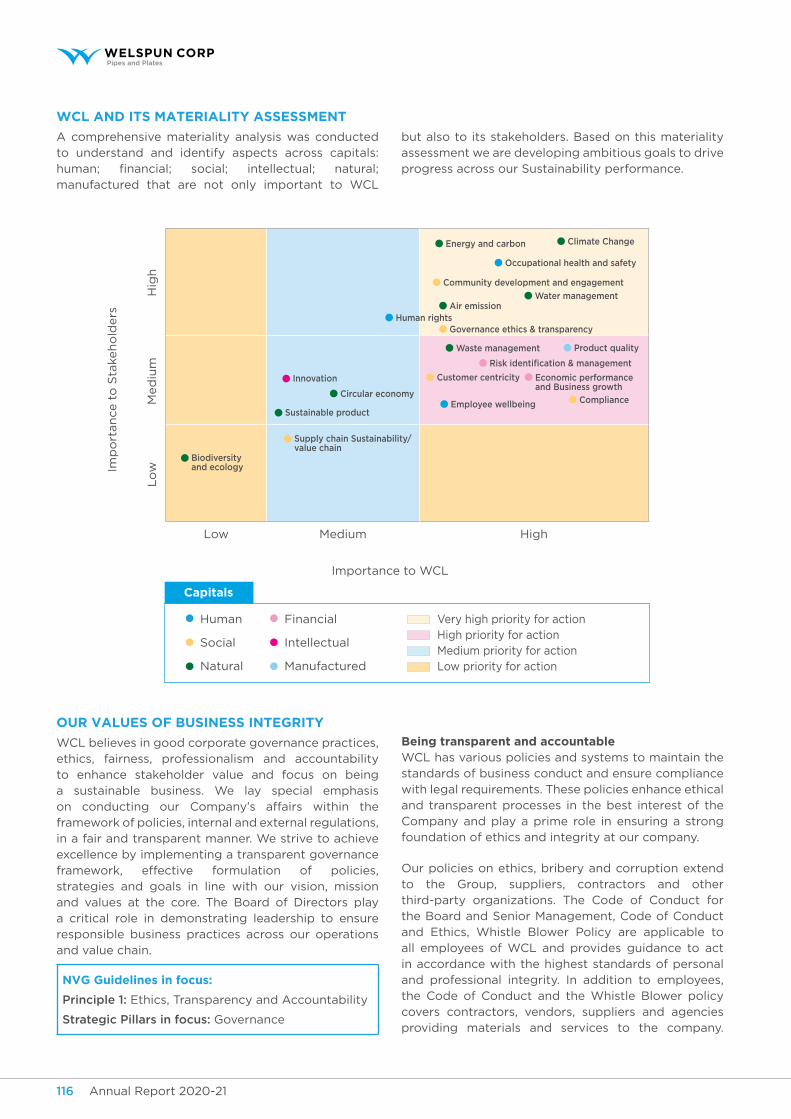
Annual Report 2020-21 117Annual Report 2020-21116
Hig
hM
ed
ium
Lo
w
Low Medium High
WCl and its materiality assessment
A comprehensive materiality analysis was conducted to understand and identify aspects across capitals: human; financial; social; intellectual; natural; manufactured that are not only important to WCL
but also to its stakeholders. Based on this materiality assessment we are developing ambitious goals to drive progress across our Sustainability performance.
our Values of Business integrity
WCL believes in good corporate governance practices, ethics, fairness, professionalism and accountability to enhance stakeholder value and focus on being a sustainable business. We lay special emphasis on conducting our Company’s affairs within the framework of policies, internal and external regulations, in a fair and transparent manner. We strive to achieve excellence by implementing a transparent governance framework, effective formulation of policies, strategies and goals in line with our vision, mission and values at the core. The Board of Directors play a critical role in demonstrating leadership to ensure responsible business practices across our operations and value chain.
nVg guidelines in focus:
Principle 1: Ethics, Transparency and Accountability
Strategic Pillars in focus: Governance
Being transparent and accountableWCL has various policies and systems to maintain the standards of business conduct and ensure compliance with legal requirements. These policies enhance ethical and transparent processes in the best interest of the Company and play a prime role in ensuring a strong foundation of ethics and integrity at our company.
Our policies on ethics, bribery and corruption extend to the Group, suppliers, contractors and other third-party organizations. The Code of Conduct for the Board and Senior Management, Code of Conduct and Ethics, Whistle Blower Policy are applicable to all employees of WCL and provides guidance to act in accordance with the highest standards of personal and professional integrity. In addition to employees, the Code of Conduct and the Whistle Blower policy covers contractors, vendors, suppliers and agencies providing materials and services to the company.
Energy and carbon Climate Change
Water managementAir emission
Waste management
Customer centricity
Employee wellbeing
Economic performance and Business growth
Compliance
Product quality
Human rights
Innovation
Circular economy
Sustainable product
Biodiversity and ecology
Supply chain Sustainability/ value chain
Governance ethics & transparency
Risk identification & management
Occupational health and safety
Community development and engagement
Imp
ort
an
ce t
o S
takeh
old
ers
Importance to WCL
Human
Social
Natural
Financial
Intellectual
Manufactured
Very high priority for actionHigh priority for actionMedium priority for actionLow priority for action
Capitals
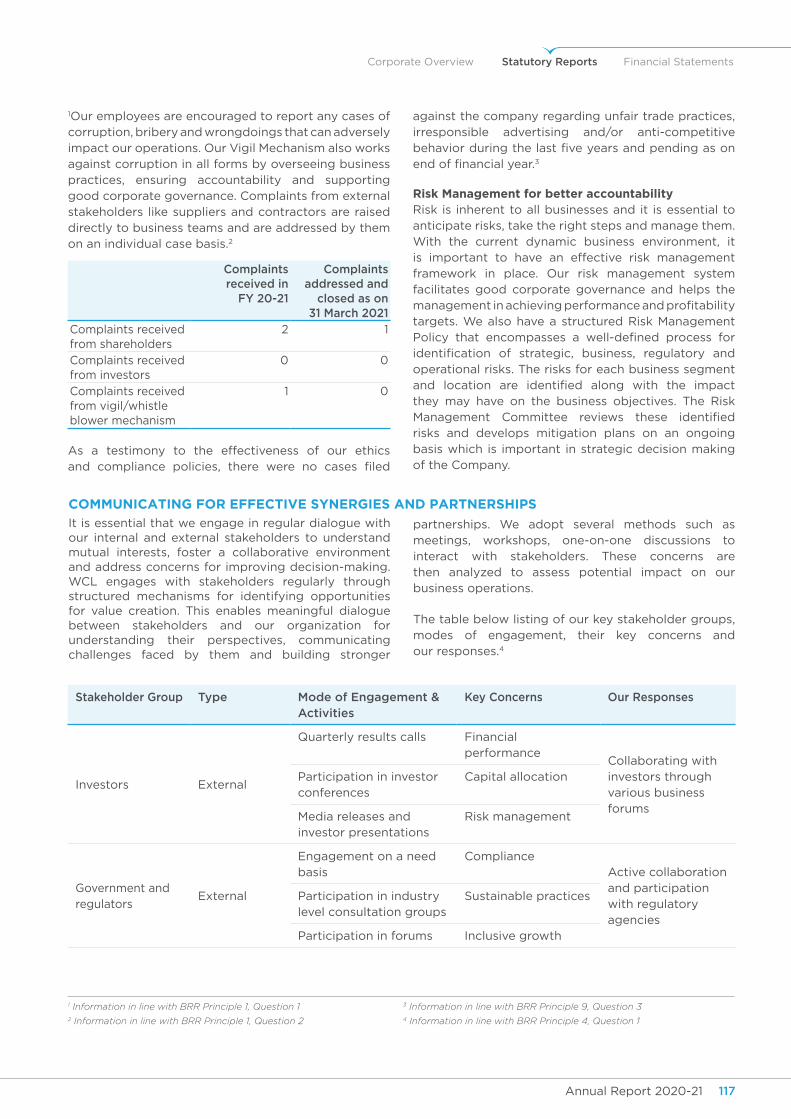
Annual Report 2020-21 117Annual Report 2020-21116
Corporate Overview Statutory Reports Financial Statements
1Our employees are encouraged to report any cases of corruption, bribery and wrongdoings that can adversely impact our operations. Our Vigil Mechanism also works against corruption in all forms by overseeing business practices, ensuring accountability and supporting good corporate governance. Complaints from external stakeholders like suppliers and contractors are raised directly to business teams and are addressed by them on an individual case basis.2
Complaints received in
FY 20-21
Complaints addressed and
closed as on 31 March 2021
Complaints received from shareholders
2 1
Complaints received from investors
0 0
Complaints received from vigil/whistle blower mechanism
1 0
As a testimony to the effectiveness of our ethics and compliance policies, there were no cases filed
against the company regarding unfair trade practices, irresponsible advertising and/or anti-competitive behavior during the last five years and pending as on end of financial year.3
risk management for better accountabilityRisk is inherent to all businesses and it is essential to anticipate risks, take the right steps and manage them. With the current dynamic business environment, it is important to have an effective risk management framework in place. Our risk management system facilitates good corporate governance and helps the management in achieving performance and profitability targets. We also have a structured Risk Management Policy that encompasses a well-defined process for identification of strategic, business, regulatory and operational risks. The risks for each business segment and location are identified along with the impact they may have on the business objectives. The Risk Management Committee reviews these identified risks and develops mitigation plans on an ongoing basis which is important in strategic decision making of the Company.
CommuniCating for effeCtiVe synergies and partnerships
It is essential that we engage in regular dialogue with our internal and external stakeholders to understand mutual interests, foster a collaborative environment and address concerns for improving decision-making. WCL engages with stakeholders regularly through structured mechanisms for identifying opportunities for value creation. This enables meaningful dialogue between stakeholders and our organization for understanding their perspectives, communicating challenges faced by them and building stronger
partnerships. We adopt several methods such as meetings, workshops, one-on-one discussions to interact with stakeholders. These concerns are then analyzed to assess potential impact on our business operations.
The table below listing of our key stakeholder groups, modes of engagement, their key concerns and our responses.4
Stakeholder Group Type Mode of Engagement & Activities
Key Concerns Our Responses
Investors External
Quarterly results calls Financial performance
Collaborating with investors through various business forums
Participation in investor conferences
Capital allocation
Media releases and investor presentations
Risk management
Government and regulators
External
Engagement on a need basis
ComplianceActive collaboration and participation with regulatory agencies
Participation in industry level consultation groups
Sustainable practices
Participation in forums Inclusive growth
1 Information in line with BRR Principle 1, Question 1 3 Information in line with BRR Principle 9, Question 32 Information in line with BRR Principle 1, Question 2 4 Information in line with BRR Principle 4, Question 1
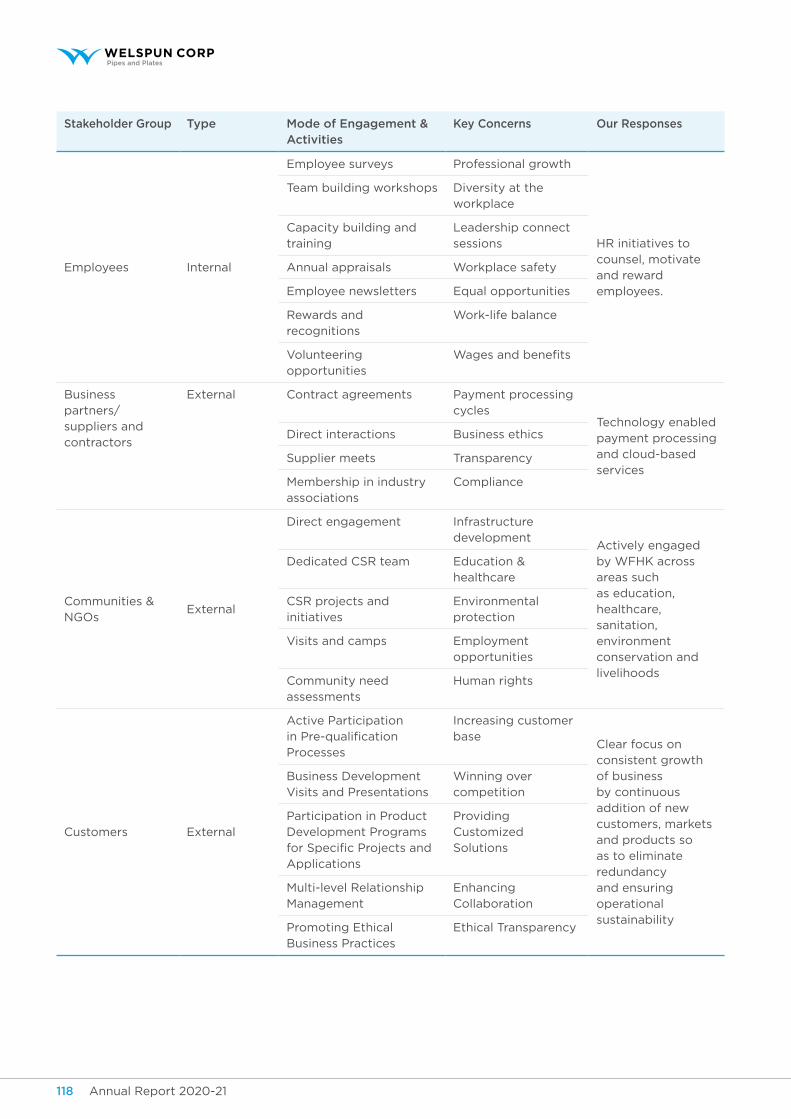
Annual Report 2020-21 119Annual Report 2020-21118
Stakeholder Group Type Mode of Engagement & Activities
Key Concerns Our Responses
Employees Internal
Employee surveys Professional growth
HR initiatives to counsel, motivate and reward employees.
Team building workshops Diversity at the workplace
Capacity building and training
Leadership connect sessions
Annual appraisals Workplace safety
Employee newsletters Equal opportunities
Rewards and recognitions
Work-life balance
Volunteering opportunities
Wages and benefits
Business partners/suppliers and contractors
External Contract agreements Payment processing cycles
Technology enabled payment processing and cloud-based services
Direct interactions Business ethics
Supplier meets Transparency
Membership in industry associations
Compliance
Communities & NGOs
External
Direct engagement Infrastructure development
Actively engaged by WFHK across areas such as education, healthcare, sanitation, environment conservation and livelihoods
Dedicated CSR team Education & healthcare
CSR projects and initiatives
Environmental protection
Visits and camps Employment opportunities
Community need assessments
Human rights
Customers External
Active Participation in Pre-qualification Processes
Increasing customer base
Clear focus on consistent growth of business by continuous addition of new customers, markets and products so as to eliminate redundancy and ensuring operational sustainability
Business Development Visits and Presentations
Winning over competition
Participation in Product Development Programs for Specific Projects and Applications
Providing Customized Solutions
Multi-level Relationship Management
Enhancing Collaboration
Promoting Ethical Business Practices
Ethical Transparency
Annual Report 2020-21 119Annual Report 2020-21118
Corporate Overview Statutory Reports Financial Statements
and ensuring their satisfaction with our products and services. WCL believes that there are multiple strategic advantages that can be achieved by exploring opportunities to improve operational efficiency through several measures. Periodic audits and proactive maintenance of equipment are conducted to ensure high operational efficiency and minimization of waste8
nVg guidelines in focus:
Principle 2: Products Life Cycle Sustainability
Principle 9: Customer Value
Strategic Pillars in focus: Protecting the Planet,Customer Centricity, Collaborating with Stakeholders
striding towards excellence Our proficiency in line pipe manufacturing is well supported by our state-of-the-art facilities and global scale operations. This is due to our 360-degrees capabilities, performance-driven culture and a clear focus on operational excellence. We hold accomplishments in excellence by maintaining high quality and compliance standards and have leveraged our capabilities globally to offer solutions for some of the world’s most challenging projects. Our pledge towards continuous improvement and engineering excellence drives us to work toward exceeding minimum standards. It ensures consistency, increases productivity, reduces costs and enhances efficiency. WCL’s manufacturing facilities are accredited with various international certifications for our quality management system, environmental management system, occupational health and safety management system including APIQR, SPECQ1, ISO-9001, ISO/TS- 29001, AD 2000-Markblatt, HPOIEN/ISO 3834-3, ISO-14001, OHSAS-18001 and Bureau of Indian Standards.
Quality – a key differentiatorThe quality of our products is one of the key pivots around which our brand value and trust with key stakeholders has been built. We aim to maintain a leadership position by embedding the highest standards of quality in each of our pipe segments in line with the requirements of national and international standards. Research and development interventions at WCL is focused on identifying opportunities to embed quality into the design of our processes and products. We have been dedicated to quality management and control to understand and satisfy the needs and expectations of our customers. This reputation of a quality focused enterprise has been central in us emerging as a trusted brand in the industry. Our approach to quality covers all aspects of our operations from procurement to final product delivery. The Quality Management System continually incorporates technology in manufacturing, inspection and testing aligned to our organization’s quality-oriented culture.
responsiBle poliCy adVoCaCy
As WCL caters to the sectors like oil & gas and water resource management with a global footprint and supply chain, we believe in driving change and taking efforts towards effective policy development that fosters industrial growth. WCL participates in policy advocacy process in a responsible and ethical manner which is economically, environmentally and socially sustainable for our company and our stakeholders. We do not lobby for any specific issue and all such engagements are done in line with our code of conduct.5
nVg guidelines in focus:
Principle 7: Policy Advocacy
Strategic Pillars in focus: GovernanceCollaborating with Stakeholders
We are a part of several associations that enable value addition to the pipe industry6:
Bombay Chamber of Commerce and Industry (BCCI)
The Associated Chambers of Commerce and Industry (ASSOCHAM)
Indian Merchants Chamber (IMC)
Indian Pipe Manufacturers Association (IPMA)
Federation of Kutch Industries Associations, (FOKIA)
International Tube Association, India Chapter (ITA)
Pipeline Research Council International (PRCI)
National Association of Corrosion Engineers (NACE)
American Society of Mechanical Engineers (ASME)
Engineering Export Promotion Council (EEPC)
Federation of Indian Exporters Organization (FIEO)
Interstate Natural Gas Association of America (INGAA)
Southern Gas Association (SGA)
North American Steel Pipe Distributors (NASPD)
Pipeliners Association of Houston
San Antonio Pipeliners Association (SAPA)
American Line Pipe Association (ALPA)
US-India Business Council (USIBC)
redefining innoVation toWards Catalyzing groWth
WCL is committed towards continuous improvement and growth. Our business excellence is based on improving product performance, promoting innovation, guaranteeing quality and enhancing customer value. Most of our products are made from externally procured plates and coils and we use limited raw materials in the form of natural resources. We follow strict product specifications based on our customer’s guidelines on product development. 7We take into account their needs and expectations and diligently work towards developing better relations
5 Information in line with BRR Principle 7, Question 26 Information in line with BRR Principle 7, Question 1
7 Information in line with BRR Principle 2, Question 18 Information in line with BRR Principle 2, Question 1
Annual Report 2020-21 121Annual Report 2020-21120
Customer centric approachAt WCL, we believe that customer satisfaction, loyalty and trust is a driving force for customer value creation. Our products are always aligned to customer specifications, which are primarily dependent on individual projects. Various audits are conducted at our facilities by accreditation agencies, external bodies, customer teams as well as internal management which affirms our dedication to compliance, quality norms and best industry practices
We measure customer satisfaction through internal and external mechanisms. External mechanisms involve surveys by third party organizations covering wide range of customers from Oil & Gas, EPC to traders. Internal systems include feedback surveys and satisfaction scoring post completion of delivery of services. An analysis of the internal and external satisfaction scores is carried out to obtain an overall customer satisfaction index (CSI) that can be measured against our marketing objectives. We strive to maintain a high CSI and incorporate feedback received through these processes. Our Standard Operating Procedures (SOPs) are also reviewed to ensure alignment to customer requirements.9
We have a robust mechanism of recording every complain through a dedicated customer complaints management . The nature of complain, physical verification and investigation of the recorded complaints is carried out to analyze the causes and corrective & preventive actions are taken which is then incorporated in the SOPs. There were 4 complaints received from customers out of which 3 stand closed as on end of FY 2020-21. We are in the process of resolving the pending complaint and significant progress has already been made for its successful closure.10
We ensure complete transparency with our customers. Though our industry is not governed by any regulations with respect to product labelling, we ensure customer awareness on product details. Technical information such as specification, usage, quality and commercial information such as location of manufacture, schedule, warranty, among others are shared with the customers.11
unlocking opportunities through innovation and technologyInnovation through technology is an integral part of sustainability and business performance for WCL. We are adapting to technological interventions by efficient robotic systems, highly automated plant process line integrated pipe traceability system, precision dimensional control among others. Some of
the technological interventions undertaken during the
year are installation of automatic marking machine
at our coating plant and hydraulic cutting machine
at the ERW plant which are automized processes
that reduces human intervention resulting in lesser
accidents. In addition to this, the design modification
of the spiral plant has been carried out that reduces
smoke emissions resulting in lesser air pollution.
Building resilience in the supply chainFor WCL, quality management is a continuous process
and extends beyond the organization to our supply
chain. We regularly evaluate our vendors on required
quality standards to ensure the highest standards in
material procurement. The assessment procedures
include screening on ISO, EMS certifications, supply
chain management, labour practices, safety, in addition
to quality, delivery and service ratings. We also share
our requirements with our vendors in a transparent
manner to ensure timely delivery of products with the
highest levels of quality and compliance.12
As our products depend on customer specific
requirements, we have a limited supplier base for
procurement of high-quality materials. Steel forms
a major part of our procurement which is sourced
from trusted vendors to deliver best products.
WCL encourages and promotes local procurement for
other components used in our processes. We proactively
collaborate with competent vendors on new product
development by providing them technical assistance
and recommendations for their processes. This has led
to an increase in the number of our vendors supporting
our agenda of encouraging local procurement. We also
work with local businesses and generate productive
local employment by hiring talent near our locations
to meet requirements for services like waste handling,
housekeeping, logistics and machine operations.13
Digitizing our supply chain
The use of technology is increasing in every aspect
of our organization. We have SAP Enterprise, a web
enabled version to deploy web-related functionalities
related to advance planning and optimization (APO),
customer relationship management (CRM) and supply
chain management (SCM) modules. With the use of
SAP, we have optimized our warehouse management
by implementing warehouse management module
and eliminating data redundancy & inconsistency.
This is more user friendly, provides transparency
in procurement, enables live tracking of shipments
through GPS and better monitoring of our supply chain.14
9 Information in line with BRR Principle 9, Question 410 Information in line with BRR Principle 9, Question 111 Information in line with BRR Principle 9, Question 2
12 Information in line with BRR Principle 2, Question 313 Information in line with BRR Principle 2, Question 414 Information in line with BRR Principle 2, Question 3
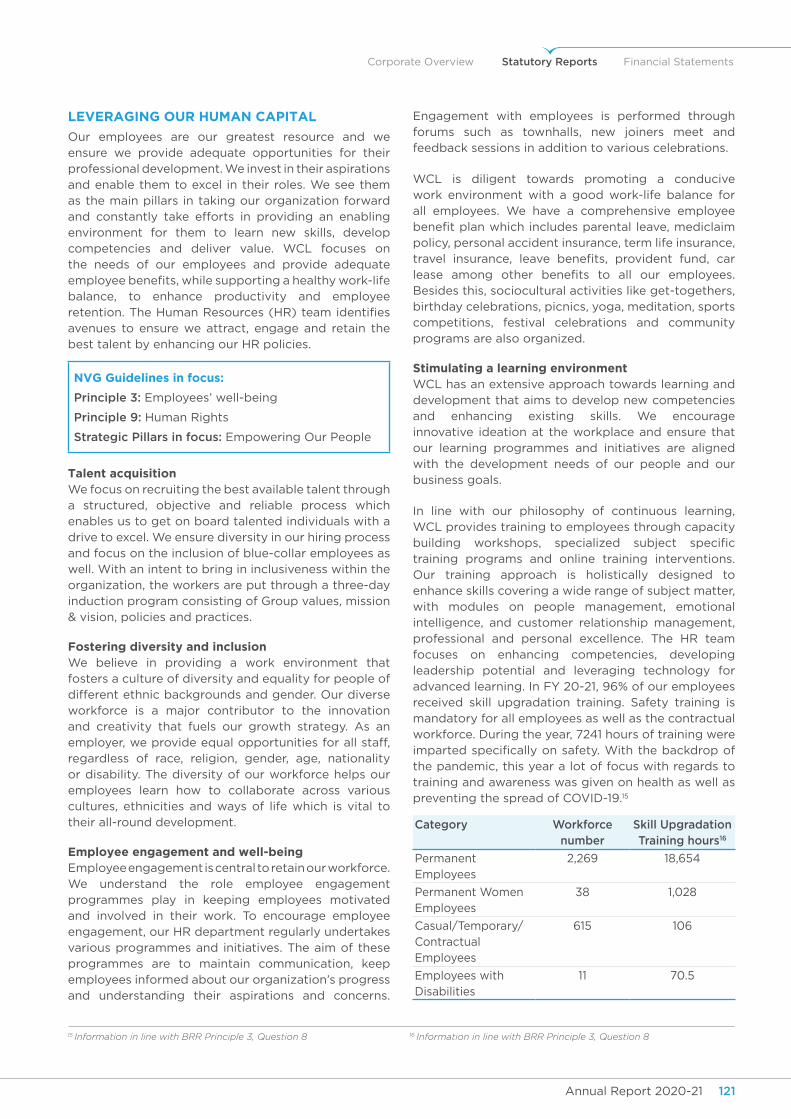
Annual Report 2020-21 121Annual Report 2020-21120
Corporate Overview Statutory Reports Financial Statements
leVeraging our human Capital
Our employees are our greatest resource and we ensure we provide adequate opportunities for their professional development. We invest in their aspirations and enable them to excel in their roles. We see them as the main pillars in taking our organization forward and constantly take efforts in providing an enabling environment for them to learn new skills, develop competencies and deliver value. WCL focuses on the needs of our employees and provide adequate employee benefits, while supporting a healthy work-life balance, to enhance productivity and employee retention. The Human Resources (HR) team identifies avenues to ensure we attract, engage and retain the best talent by enhancing our HR policies.
nVg guidelines in focus:
Principle 3: Employees’ well-being
Principle 9: Human Rights
Strategic Pillars in focus: Empowering Our People
talent acquisition We focus on recruiting the best available talent through a structured, objective and reliable process which enables us to get on board talented individuals with a drive to excel. We ensure diversity in our hiring process and focus on the inclusion of blue-collar employees as well. With an intent to bring in inclusiveness within the organization, the workers are put through a three-day induction program consisting of Group values, mission & vision, policies and practices.
fostering diversity and inclusionWe believe in providing a work environment that fosters a culture of diversity and equality for people of different ethnic backgrounds and gender. Our diverse workforce is a major contributor to the innovation and creativity that fuels our growth strategy. As an employer, we provide equal opportunities for all staff, regardless of race, religion, gender, age, nationality or disability. The diversity of our workforce helps our employees learn how to collaborate across various cultures, ethnicities and ways of life which is vital to their all-round development.
employee engagement and well-beingEmployee engagement is central to retain our workforce. We understand the role employee engagement programmes play in keeping employees motivated and involved in their work. To encourage employee engagement, our HR department regularly undertakes various programmes and initiatives. The aim of these programmes are to maintain communication, keep employees informed about our organization’s progress and understanding their aspirations and concerns.
Engagement with employees is performed through forums such as townhalls, new joiners meet and feedback sessions in addition to various celebrations.
WCL is diligent towards promoting a conducive work environment with a good work-life balance for all employees. We have a comprehensive employee benefit plan which includes parental leave, mediclaim policy, personal accident insurance, term life insurance, travel insurance, leave benefits, provident fund, car lease among other benefits to all our employees. Besides this, sociocultural activities like get-togethers, birthday celebrations, picnics, yoga, meditation, sports competitions, festival celebrations and community programs are also organized.
stimulating a learning environmentWCL has an extensive approach towards learning and development that aims to develop new competencies and enhancing existing skills. We encourage innovative ideation at the workplace and ensure that our learning programmes and initiatives are aligned with the development needs of our people and our business goals.
In line with our philosophy of continuous learning, WCL provides training to employees through capacity building workshops, specialized subject specific training programs and online training interventions. Our training approach is holistically designed to enhance skills covering a wide range of subject matter, with modules on people management, emotional intelligence, and customer relationship management, professional and personal excellence. The HR team focuses on enhancing competencies, developing leadership potential and leveraging technology for advanced learning. In FY 20-21, 96% of our employees received skill upgradation training. Safety training is mandatory for all employees as well as the contractual workforce. During the year, 7241 hours of training were imparted specifically on safety. With the backdrop of the pandemic, this year a lot of focus with regards to training and awareness was given on health as well as preventing the spread of COVID-19.15
Category Workforce number
Skill Upgradation Training hours16
Permanent Employees
2,269 18,654
Permanent Women Employees
38 1,028
Casual/Temporary/Contractual Employees
615 106
Employees with Disabilities
11 70.5
15 Information in line with BRR Principle 3, Question 8 16 Information in line with BRR Principle 3, Question 8
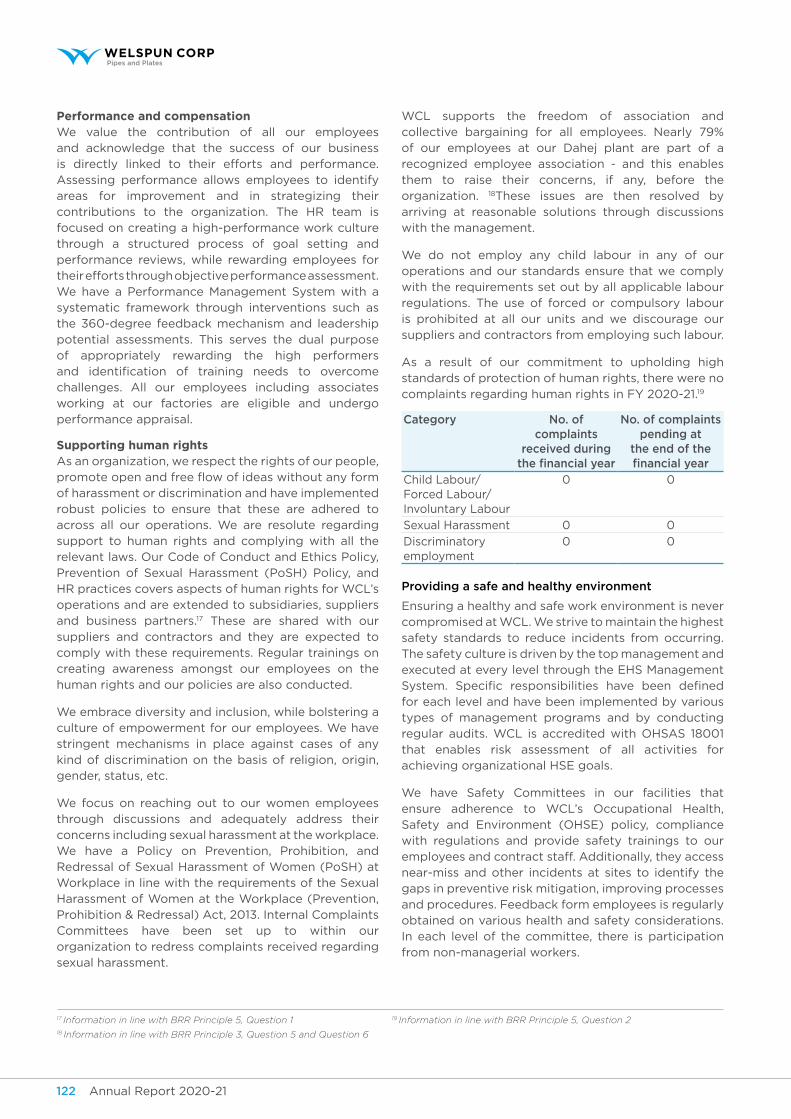
Annual Report 2020-21 123Annual Report 2020-21122
performance and compensationWe value the contribution of all our employees and acknowledge that the success of our business is directly linked to their efforts and performance. Assessing performance allows employees to identify areas for improvement and in strategizing their contributions to the organization. The HR team is focused on creating a high-performance work culture through a structured process of goal setting and performance reviews, while rewarding employees for their efforts through objective performance assessment. We have a Performance Management System with a systematic framework through interventions such as the 360-degree feedback mechanism and leadership potential assessments. This serves the dual purpose of appropriately rewarding the high performers and identification of training needs to overcome challenges. All our employees including associates working at our factories are eligible and undergo performance appraisal.
supporting human rightsAs an organization, we respect the rights of our people, promote open and free flow of ideas without any form of harassment or discrimination and have implemented robust policies to ensure that these are adhered to across all our operations. We are resolute regarding support to human rights and complying with all the relevant laws. Our Code of Conduct and Ethics Policy, Prevention of Sexual Harassment (PoSH) Policy, and HR practices covers aspects of human rights for WCL’s operations and are extended to subsidiaries, suppliers and business partners.17 These are shared with our suppliers and contractors and they are expected to comply with these requirements. Regular trainings on creating awareness amongst our employees on the human rights and our policies are also conducted.
We embrace diversity and inclusion, while bolstering a culture of empowerment for our employees. We have stringent mechanisms in place against cases of any kind of discrimination on the basis of religion, origin, gender, status, etc.
We focus on reaching out to our women employees through discussions and adequately address their concerns including sexual harassment at the workplace. We have a Policy on Prevention, Prohibition, and Redressal of Sexual Harassment of Women (PoSH) at Workplace in line with the requirements of the Sexual Harassment of Women at the Workplace (Prevention, Prohibition & Redressal) Act, 2013. Internal Complaints Committees have been set up to within our organization to redress complaints received regarding sexual harassment.
WCL supports the freedom of association and collective bargaining for all employees. Nearly 79% of our employees at our Dahej plant are part of a recognized employee association - and this enables them to raise their concerns, if any, before the organization. 18These issues are then resolved by arriving at reasonable solutions through discussions with the management.
We do not employ any child labour in any of our operations and our standards ensure that we comply with the requirements set out by all applicable labour regulations. The use of forced or compulsory labour is prohibited at all our units and we discourage our suppliers and contractors from employing such labour.
As a result of our commitment to upholding high standards of protection of human rights, there were no complaints regarding human rights in FY 2020-21.19
Category No. of complaints
received during the financial year
No. of complaints pending at
the end of the financial year
Child Labour/Forced Labour/ Involuntary Labour
0 0
Sexual Harassment 0 0
Discriminatory employment
0 0
Providing a safe and healthy environment
Ensuring a healthy and safe work environment is never compromised at WCL. We strive to maintain the highest safety standards to reduce incidents from occurring. The safety culture is driven by the top management and executed at every level through the EHS Management System. Specific responsibilities have been defined for each level and have been implemented by various types of management programs and by conducting regular audits. WCL is accredited with OHSAS 18001 that enables risk assessment of all activities for achieving organizational HSE goals.
We have Safety Committees in our facilities that ensure adherence to WCL’s Occupational Health, Safety and Environment (OHSE) policy, compliance with regulations and provide safety trainings to our employees and contract staff. Additionally, they access near-miss and other incidents at sites to identify the gaps in preventive risk mitigation, improving processes and procedures. Feedback form employees is regularly obtained on various health and safety considerations. In each level of the committee, there is participation from non-managerial workers.
17 Information in line with BRR Principle 5, Question 1 19 Information in line with BRR Principle 5, Question 218 Information in line with BRR Principle 3, Question 5 and Question 6
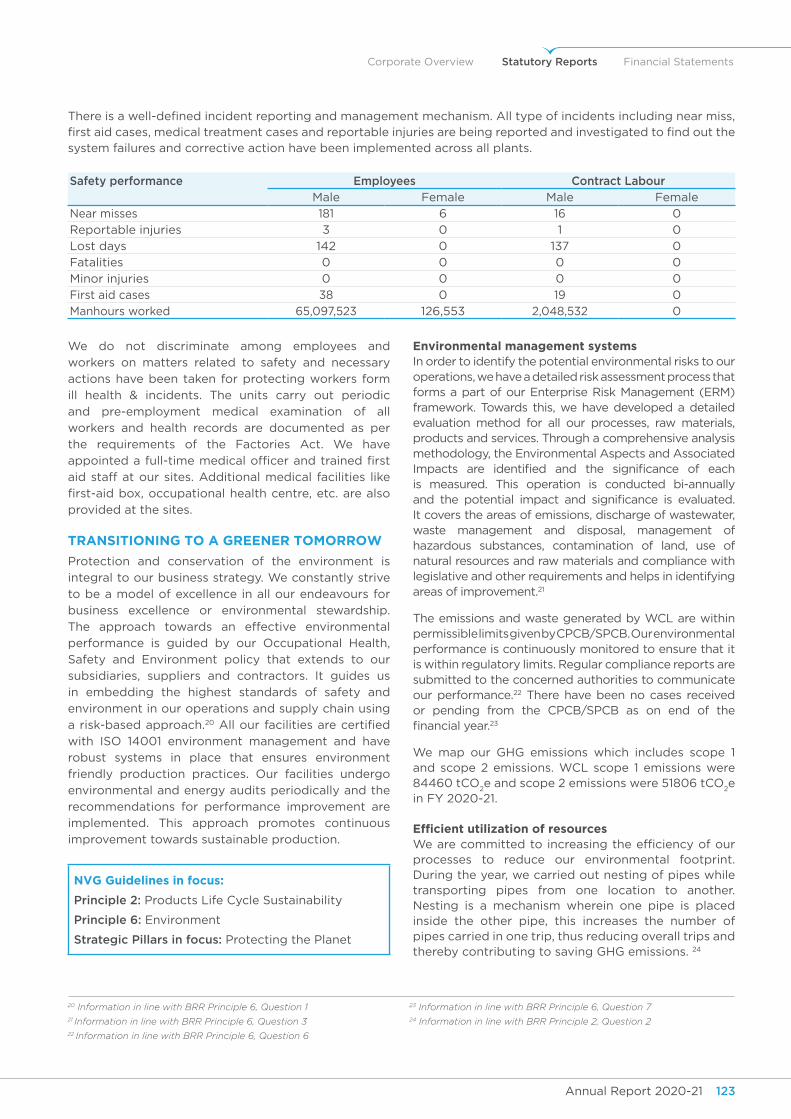
Annual Report 2020-21 123Annual Report 2020-21122
Corporate Overview Statutory Reports Financial Statements
There is a well-defined incident reporting and management mechanism. All type of incidents including near miss, first aid cases, medical treatment cases and reportable injuries are being reported and investigated to find out the system failures and corrective action have been implemented across all plants.
Safety performance Employees Contract LabourMale Female Male Female
Near misses 181 6 16 0
Reportable injuries 3 0 1 0
Lost days 142 0 137 0
Fatalities 0 0 0 0
Minor injuries 0 0 0 0
First aid cases 38 0 19 0
Manhours worked 65,097,523 126,553 2,048,532 0
We do not discriminate among employees and
workers on matters related to safety and necessary
actions have been taken for protecting workers form
ill health & incidents. The units carry out periodic
and pre-employment medical examination of all
workers and health records are documented as per
the requirements of the Factories Act. We have
appointed a full-time medical officer and trained first
aid staff at our sites. Additional medical facilities like
first-aid box, occupational health centre, etc. are also
provided at the sites.
transitioning to a greener tomorroW
Protection and conservation of the environment is
integral to our business strategy. We constantly strive
to be a model of excellence in all our endeavours for
business excellence or environmental stewardship.
The approach towards an effective environmental
performance is guided by our Occupational Health,
Safety and Environment policy that extends to our
subsidiaries, suppliers and contractors. It guides us
in embedding the highest standards of safety and
environment in our operations and supply chain using
a risk-based approach.20 All our facilities are certified
with ISO 14001 environment management and have
robust systems in place that ensures environment
friendly production practices. Our facilities undergo
environmental and energy audits periodically and the
recommendations for performance improvement are
implemented. This approach promotes continuous
improvement towards sustainable production.
nVg guidelines in focus:
Principle 2: Products Life Cycle Sustainability
Principle 6: Environment
Strategic Pillars in focus: Protecting the Planet
environmental management systemsIn order to identify the potential environmental risks to our operations, we have a detailed risk assessment process that forms a part of our Enterprise Risk Management (ERM) framework. Towards this, we have developed a detailed evaluation method for all our processes, raw materials, products and services. Through a comprehensive analysis methodology, the Environmental Aspects and Associated Impacts are identified and the significance of each is measured. This operation is conducted bi-annually and the potential impact and significance is evaluated. It covers the areas of emissions, discharge of wastewater, waste management and disposal, management of hazardous substances, contamination of land, use of natural resources and raw materials and compliance with legislative and other requirements and helps in identifying areas of improvement.21
The emissions and waste generated by WCL are within permissible limits given by CPCB/SPCB. Our environmental performance is continuously monitored to ensure that it is within regulatory limits. Regular compliance reports are submitted to the concerned authorities to communicate our performance.22 There have been no cases received or pending from the CPCB/SPCB as on end of the financial year.23
We map our GHG emissions which includes scope 1 and scope 2 emissions. WCL scope 1 emissions were 84460 tCO
2e and scope 2 emissions were 51806 tCO
2e
in FY 2020-21.
Efficient utilization of resourcesWe are committed to increasing the efficiency of our processes to reduce our environmental footprint. During the year, we carried out nesting of pipes while transporting pipes from one location to another. Nesting is a mechanism wherein one pipe is placed inside the other pipe, this increases the number of pipes carried in one trip, thus reducing overall trips and thereby contributing to saving GHG emissions. 24
20 Information in line with BRR Principle 6, Question 121 Information in line with BRR Principle 6, Question 322 Information in line with BRR Principle 6, Question 6
23 Information in line with BRR Principle 6, Question 7 24 Information in line with BRR Principle 2, Question 2
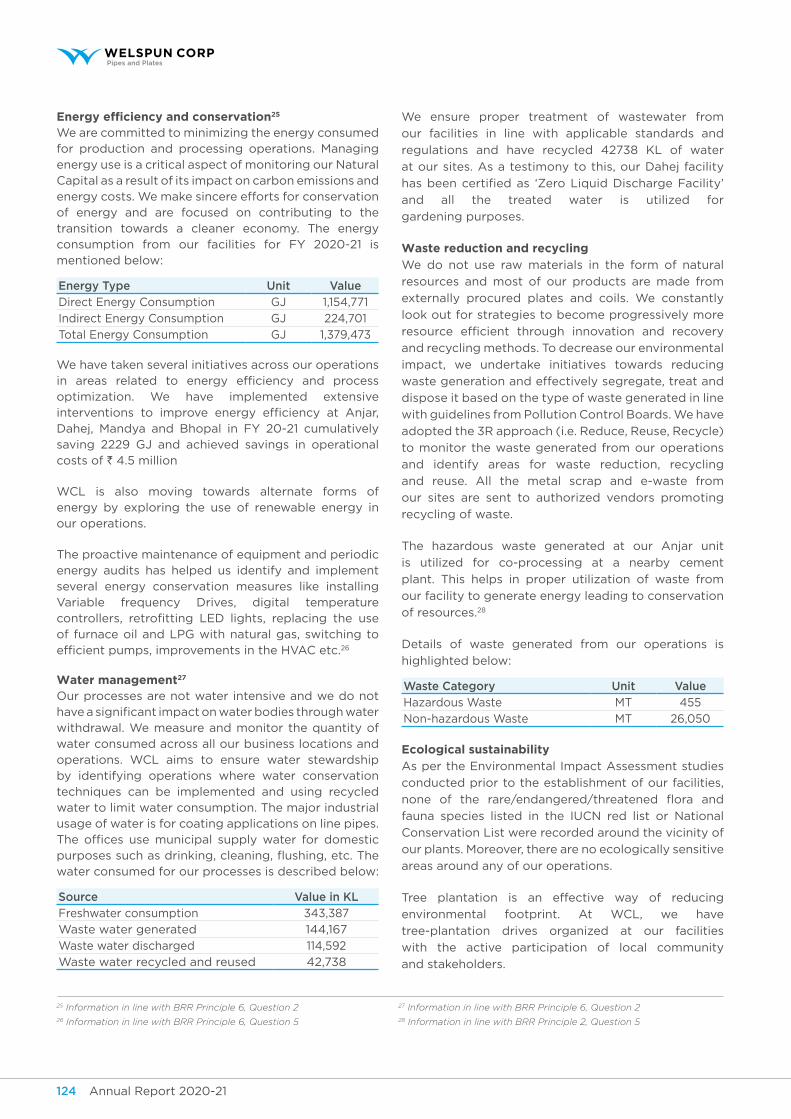
Annual Report 2020-21 125Annual Report 2020-21124
Energy efficiency and conservation25
We are committed to minimizing the energy consumed for production and processing operations. Managing energy use is a critical aspect of monitoring our Natural Capital as a result of its impact on carbon emissions and energy costs. We make sincere efforts for conservation of energy and are focused on contributing to the transition towards a cleaner economy. The energy consumption from our facilities for FY 2020-21 is mentioned below:
Energy Type Unit ValueDirect Energy Consumption GJ 1,154,771
Indirect Energy Consumption GJ 224,701
Total Energy Consumption GJ 1,379,473
We have taken several initiatives across our operations in areas related to energy efficiency and process optimization. We have implemented extensive interventions to improve energy efficiency at Anjar, Dahej, Mandya and Bhopal in FY 20-21 cumulatively saving 2229 GJ and achieved savings in operational costs of ` 4.5 million
WCL is also moving towards alternate forms of energy by exploring the use of renewable energy in our operations.
The proactive maintenance of equipment and periodic energy audits has helped us identify and implement several energy conservation measures like installing Variable frequency Drives, digital temperature controllers, retrofitting LED lights, replacing the use of furnace oil and LPG with natural gas, switching to efficient pumps, improvements in the HVAC etc.26
Water management27
Our processes are not water intensive and we do not have a significant impact on water bodies through water withdrawal. We measure and monitor the quantity of water consumed across all our business locations and operations. WCL aims to ensure water stewardship by identifying operations where water conservation techniques can be implemented and using recycled water to limit water consumption. The major industrial usage of water is for coating applications on line pipes. The offices use municipal supply water for domestic purposes such as drinking, cleaning, flushing, etc. The water consumed for our processes is described below:
Source Value in KLFreshwater consumption 343,387
Waste water generated 144,167
Waste water discharged 114,592
Waste water recycled and reused 42,738
We ensure proper treatment of wastewater from
our facilities in line with applicable standards and
regulations and have recycled 42738 KL of water
at our sites. As a testimony to this, our Dahej facility
has been certified as ‘Zero Liquid Discharge Facility’
and all the treated water is utilized for
gardening purposes.
Waste reduction and recycling
We do not use raw materials in the form of natural
resources and most of our products are made from
externally procured plates and coils. We constantly
look out for strategies to become progressively more
resource efficient through innovation and recovery
and recycling methods. To decrease our environmental
impact, we undertake initiatives towards reducing
waste generation and effectively segregate, treat and
dispose it based on the type of waste generated in line
with guidelines from Pollution Control Boards. We have
adopted the 3R approach (i.e. Reduce, Reuse, Recycle)
to monitor the waste generated from our operations
and identify areas for waste reduction, recycling
and reuse. All the metal scrap and e-waste from
our sites are sent to authorized vendors promoting
recycling of waste.
The hazardous waste generated at our Anjar unit
is utilized for co-processing at a nearby cement
plant. This helps in proper utilization of waste from
our facility to generate energy leading to conservation
of resources.28
Details of waste generated from our operations is
highlighted below:
Waste Category Unit ValueHazardous Waste MT 455
Non-hazardous Waste MT 26,050
ecological sustainability
As per the Environmental Impact Assessment studies
conducted prior to the establishment of our facilities,
none of the rare/endangered/threatened flora and
fauna species listed in the IUCN red list or National
Conservation List were recorded around the vicinity of
our plants. Moreover, there are no ecologically sensitive
areas around any of our operations.
Tree plantation is an effective way of reducing
environmental footprint. At WCL, we have
tree-plantation drives organized at our facilities
with the active participation of local community
and stakeholders.
25 Information in line with BRR Principle 6, Question 226 Information in line with BRR Principle 6, Question 5
27 Information in line with BRR Principle 6, Question 228 Information in line with BRR Principle 2, Question 5
Annual Report 2020-21 125Annual Report 2020-21124
Corporate Overview Statutory Reports Financial Statements
serVing the Communities – Creating shared Value
WCL is committed to building a sustainable and progressive community. Corporate social responsibility is ingrained into our business strategy and various initiatives have been undertaken to address the developmental needs of the communities. Our social mission is enshrined within the 3Es i.e. Education, Empowerment and Environment & Health. WCL’s contributions are crucial for creating a positive impact on the lives of those who are marginalized and less privileged. Through well-planned initiatives we endeavour to drive positive impact on the disadvantaged populace. Over the years we have built mutual trust and a strong relationship with the communities around our operations areas. Our community development initiatives are focused on creating long term economic and social benefits for them.
At WCL, CSR activities are carried out through the Welspun Foundation for Health and Knowledge (WFHK), in areas such as strengthening educational foundation, improving access to healthcare services, empowering people and conserving the environment. The support of and involvement of employees in our CSR programs is widely encouraged within the organization thereby supporting social inclusivity.29
We have a corporate social responsibility (CSR) policy which is overseen by the ESG & CSR Committee of the Board. In line with our CSR policy, we undertake activities that are aligned to schedule VII of Companies Act, 2013.
nVg guidelines in focus:
Principle 4: Stakeholder Engagement
Principle 8: Inclusive Growth
Strategic Pillars in focus: Creating Healthy Communities, Collaborating with Stakeholders
Csr expenditure for the year fy 2020-21 was ` 378 lakh30
social impact strategyWe consider community as a key stakeholder and appropriately engage with them to address their concerns. WFHK adopts a consultative and collaborative approach for identifying the needs of the community and in developing programs to create sustainable value for the community at large. These engagements are important in developing meaningful partnerships and addressing developmental challenges.
We conduct need assessment studies before initiating a project to understand the ground realities and
identifying the marginalized groups in communities surrounding our operations. Based on these findings, the interventions are planned and executed. By interacting with influential members of the community, our CSR team understands their vulnerabilities.31
We have initiatives to ensure that the programs are adopted and accepted by the communities. WCL also includes the planning of exit strategies to ensure community mobilization, self-reliance and handover of the initiatives to the communities. This includes awareness sessions, strengthening of community institutions/structures, joint planning and reviewing and encouraging them to undertake the programs before complete handover to the community.32
monitoring Csr projectsAt WCL we have a Board level ESG & CSR Committee that ensures the implementation of the CSR policy and determine the contribution to initiatives. The ESG & CSR Committee conducts half-yearly review meetings to access the impact of the initiatives against quantified targets set for projects and wherever necessary, midcourse corrections are carried out.
focus areas and interventions33
Promoting Education34
Our Education interventions are based on the insistence on a holistic approach towards it and stems from our Foundation’s philosophy, where we’d like to see each child from our beneficiary schools find an identity, meaning and purpose in life through education.
Wel-AccelerateIn our ongoing efforts and commitment in the education sphere, we initiated our flagship program Wel-Accelerate. Designed to create an educational revolution from the grassroots level, it seeks to enhance the teaching and learning outcomes of teachers and students through the use of technology. We aim to digitalize government schools and impact the lives of over 1 lakh children through our interventions.
impact:
251 classrooms digitalized in 127 schools | 75,000 students have benefitted | 1,000+ teachers trained.
Ved VidyalayaIn a bid to preserve our rich, ancient educational traditions, we initiated Ved Vidyalaya to carry forward the gurukul system-based learning program of the Yajurveda. The initiative aims to ensure that the ancient learnings of Veda are not lost and are continued to be taught. The program has 40 students enrolled in it.
29 Information in line with BRR Principle 8, Question 230 Information in line with BRR Principle 8, Question 431 Information in line with BRR Principle 4, Question 2
32 Information in line with BRR Principle 8, Question 533 Information in line with BRR Principle 4, Question 3 and BRR
Principle 8, Question 134 Information in line with BRR Principle 8, Question 3
Annual Report 2020-21 127Annual Report 2020-21126
Welspun Vidya MandirThe Welspun Vidhya Mandir CBSE School was established with the sole intention to give children, not just one, but multiple opportunities, to excel in any sphere they wish to pursue. It is dedicated to growing the intellect of students by making them socially responsible, aware, and creative.
Reach: 1800 students. Playgroup to Std. 12.
Gayatri Devi Public SchoolThe Gayatri Devi Public School is a state board English medium school, with classes from 1st to 10th, in Varsamedi, Anjar set up and run by the Welspun Foundation for Health and Knowledge. It was established in 2017, with highly qualified teachers on board, to provide kids from that area with high-end yet very affordable education in all realms.
Reach: 350 students. Std. 1 to Std. 10.
Model Villages35
Our modern vision for villages in India is one where they are sustainable rural communities that can generate and maintain the resources necessary to improve their level of wellbeing and happiness, without depleting economic, social and environmental values. Our ‘Model Village Program’ seeks to provide communities with employment, while creating ancillary livelihood opportunities that leverage technology and green growth opportunities.
impact:
Constructed essential infrastructure across 4 villages, benefitting 10,000+ people.
Women Empowerment36
• 457 women entrepreneurs are developed in 205 villages
At Welspun, our empowerment endeavors have been focused on enabling women to create alternative livelihoods and improve their earning capacities. By encouraging economic independence amongst women, we not only inch closer towards gender equality, but also advance their social status and increase civic participation, making for a more well-rounded society.
Wel-Netrutva While ‘empowerment’ comprises several aspects, our Foundation focuses primarily on improving the health and livelihood spheres of a woman’s life. We believe better health and income prospects will in turn influence other aspects of the woman’s life in the long run. With this as the goal, the Wel-Netrutva project
aims to create Women Entrepreneurs that inform and empower their communities on improved health practices like menstrual management, malnutrition, anemia, RTI/STI and cervical/breast cancer.
Currently the program is being carried out in the states of Uttar Pradesh, Madhya Pradesh, Tamil Nadu, Maharashtra, Gujarat and Bihar, with plans to expand to other states.
Health & Hygiene LivelihoodImproved awareness on health, sanitation and hygiene practices among women and young girls
Create sustainable livelihood opportunities for women in the village
Increased access to and availability of Health, Sanitation and Hygiene facilities
Ensure women entrepreneurs are able to earn an income of ` 2,000-4,000 per month
Improved approach towards Menstrual Health & Hygiene Management, reproductive health, and preventive and curative health care
Encouraging Women EntrepreneurshipBy identifying and creating women entrepreneurs in several business spheres, we are creating a new workforce in rural communities whose growth helps advance the growth of their communities as well.
Menstrual Health & Hygiene Management
Livelihood Program
Akankshita Center - All Women Entrepreneur
Encouraging menstrual hygiene management among rural and urban communities by promoting awareness and providing livelihood opportunities for women.
Our diversified livelihood program includes bangle making, dung cake making, charka units, tailoring units, vermi-composting and kitchen gardens.
Welspun inaugurated the ‘All Women Entrepreneur’ led manufacturing eco-system in Telangana.
The unit seeks to empower women by creating a sustainable ecosystem where they can earn steady incomes through equitable work and gain access to consistent demand for their products.
450+ women entrepreneurs in 205 villages. 1,00,000+ women beneficiaries.
14 Women 128 women beneficiaries in 14 villages
35 Information in line with BRR Principle 8, Question 3 36 Information in line with BRR Principle 8, Question 3
Annual Report 2020-21 127Annual Report 2020-21126
Corporate Overview Statutory Reports Financial Statements
Welspun Super Sport Women
In a country as large and diverse as ours, there exists
vast potential to churn out some of the best athletes
in the world. But most often, talents from lesser-known
towns and from underserved communities are
overlooked because they don’t have the means to get
trained professionally.
Our Welspun Super Sport Women initiative identifies
budding sportswomen across the country and supports
them in seeking path breaking career opportunities in
sports. These sportswomen have made not just us, but
the whole nation proud by bagging 146 medals across
International, National and State Level competitions.
impact:
financial support for 26 sportswomen from 11 different sports backgrounds
Supporting athletes like Manasi Joshi, Shivani Charak,
Palak Kohli, Suvarna Raj and more.
HEALTHCARE
Health is wealth is not just an idiom but a reality, especially
for rural communities that lack the infrastructure and
access to medical help. Proper medical assistance
and expert health advice can positively impact rural
households and better their lives multi-fold.
Health Camps and Mobile Health Van
To improve people’s access to healthcare, we organize
regular eye check-up and medical camps in rural
regions. In order to access far flung regions and to
increase mobility, we have incorporated a mobile
ambulance in our health care initiative, which currently
plies across 17 villages.
Impact: Health Camp – 2000+ beneficiaries | Mobile
Health Van – 16,000+ beneficiaries across 17 villages
ENVIRONMENT
Bettering the lives of rural communities does not
begin and end at ensuring just livelihood development.
In order to flourish and maintain a healthy lifestyle, the
state of their environment too needs to be addressed
for the better.
Tree Plantation
With growing concerns over climate change, at
Welspun, we strive to reduce our environmental
footprint and mitigate our emissions through
afforestation and tree plantation efforts. We have
facilitated the plantation of more than 2 lakh saplings
with over 24,000 saplings planted in Anjar alone.
We encourage community members to nurture the
saplings planted near their homes.
Village Sanitation
We have constructed close to 5,500 sanitation blocks
in the villages in and around Anjar and Vapi. These helps
ensure hygiene, prevent infections, and stems the
spread of diseases.
Water Conservation
We have undertaken efforts under the government
initiative “Sujalam Sufalam Jal Abhiyaan”, under which
we deepen ponds in the villages around our operations
before the monsoon. This increases the capacity of the
ponds and helps increase ground water supply, helping
communities be resilient against water shortages.
Animal Husbandry Support
Livestock rearing is a significant activity ensuring
socio-economic development of rural households.
But in Kutch, the lack of agricultural land compounded
by water scarcity, it is challenging to grow fodder
for maintaining livestock. To help the communities
in this regard, the Welspun Foundation procures and
distributes fodder to cattle owners in 27 villages.
The program has resulted in improved income for the
cattle owners and better health of the livestock.
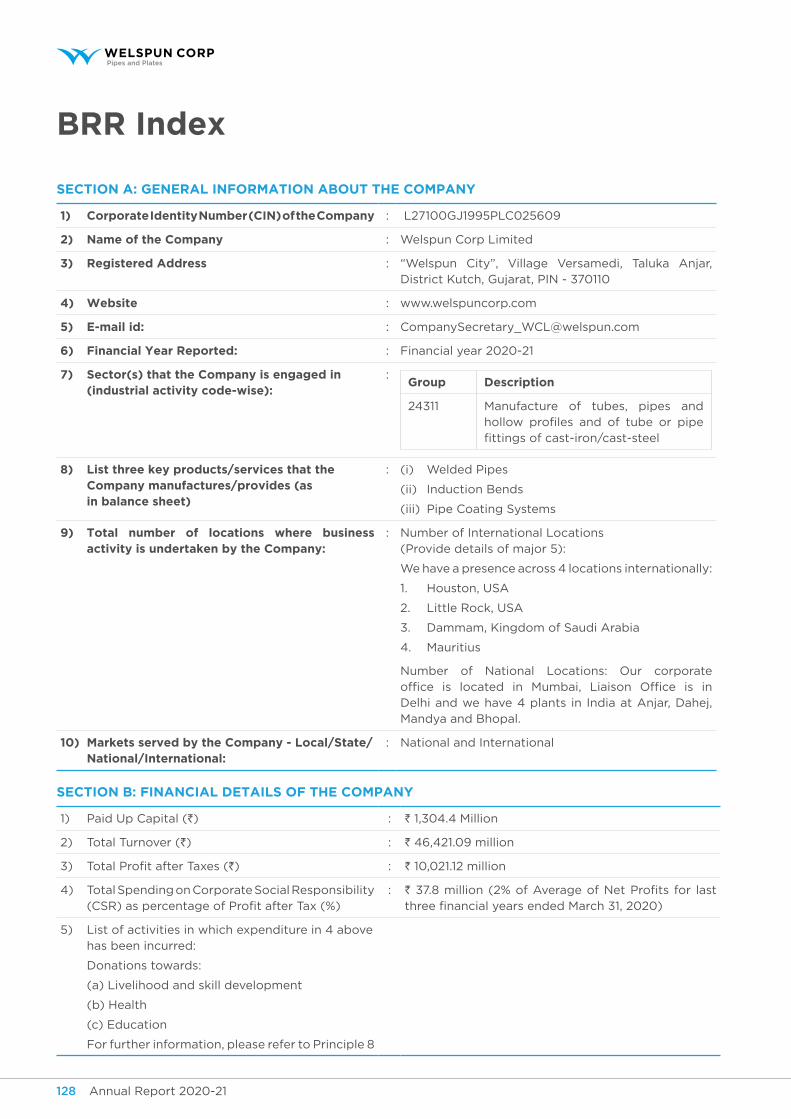
Annual Report 2020-21 129Annual Report 2020-21128
seCtion a: general information aBout the Company
1) Corporate identity number (Cin) of the Company : L27100GJ1995PLC025609
2) name of the Company : Welspun Corp Limited
3) registered address : “Welspun City”, Village Versamedi, Taluka Anjar, District Kutch, Gujarat, PIN - 370110
4) Website : www.welspuncorp.com
5) e-mail id: : [email protected]
6) financial year reported: : Financial year 2020-21
7) sector(s) that the Company is engaged in (industrial activity code-wise):
:group description
24311 Manufacture of tubes, pipes and hollow profiles and of tube or pipe fittings of cast-iron/cast-steel
8) list three key products/services that the Company manufactures/provides (as in balance sheet)
: (i) Welded Pipes
(ii) Induction Bends
(iii) Pipe Coating Systems
9) total number of locations where business activity is undertaken by the Company:
: Number of International Locations (Provide details of major 5):
We have a presence across 4 locations internationally:
1. Houston, USA
2. Little Rock, USA
3. Dammam, Kingdom of Saudi Arabia
4. Mauritius
Number of National Locations: Our corporate office is located in Mumbai, Liaison Office is in Delhi and we have 4 plants in India at Anjar, Dahej, Mandya and Bhopal.
10) markets served by the Company - local/state/national/international:
: National and International
seCtion B: finanCial details of the Company
1) Paid Up Capital (`) : ` 1,304.4 Million
2) Total Turnover (`) : ` 46,421.09 million
3) Total Profit after Taxes (`) : ` 10,021.12 million
4) Total Spending on Corporate Social Responsibility (CSR) as percentage of Profit after Tax (%)
: ` 37.8 million (2% of Average of Net Profits for last three financial years ended March 31, 2020)
5) List of activities in which expenditure in 4 above has been incurred:
Donations towards:
(a) Livelihood and skill development
(b) Health
(c) Education
For further information, please refer to Principle 8
Brr index
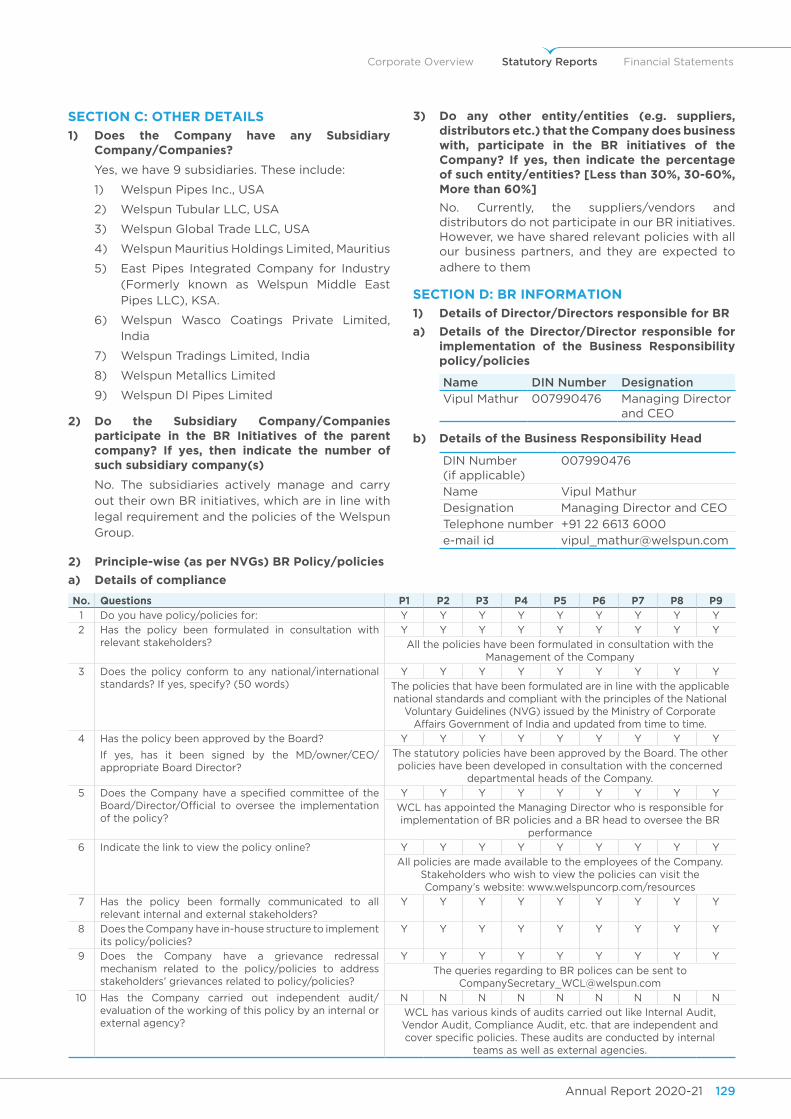
Annual Report 2020-21 129Annual Report 2020-21128
Corporate Overview Statutory Reports Financial Statements
seCtion C: other details
1) does the Company have any subsidiary Company/Companies?
Yes, we have 9 subsidiaries. These include:
1) Welspun Pipes Inc., USA
2) Welspun Tubular LLC, USA
3) Welspun Global Trade LLC, USA
4) Welspun Mauritius Holdings Limited, Mauritius
5) East Pipes Integrated Company for Industry (Formerly known as Welspun Middle East Pipes LLC), KSA.
6) Welspun Wasco Coatings Private Limited, India
7) Welspun Tradings Limited, India
8) Welspun Metallics Limited
9) Welspun DI Pipes Limited
2) do the subsidiary Company/Companies participate in the Br initiatives of the parent company? If yes, then indicate the number of such subsidiary company(s)
No. The subsidiaries actively manage and carry out their own BR initiatives, which are in line with legal requirement and the policies of the Welspun Group.
3) Do any other entity/entities (e.g. suppliers, distributors etc.) that the Company does business with, participate in the BR initiatives of the Company? If yes, then indicate the percentage of such entity/entities? [Less than 30%, 30-60%, more than 60%]
No. Currently, the suppliers/vendors and distributors do not participate in our BR initiatives. However, we have shared relevant policies with all our business partners, and they are expected to adhere to them
seCtion d: Br information
1) details of director/directors responsible for Br
a) details of the director/director responsible for implementation of the Business responsibility policy/policies
Name DIN Number DesignationVipul Mathur 007990476 Managing Director
and CEO
b) details of the Business responsibility head
DIN Number (if applicable)
007990476
Name Vipul Mathur
Designation Managing Director and CEO
Telephone number +91 22 6613 6000
e-mail id [email protected]
2) principle-wise (as per nVgs) Br policy/policies
a) details of compliance
No. Questions p1 p2 p3 p4 p5 p6 p7 p8 p91 Do you have policy/policies for: Y Y Y Y Y Y Y Y Y
2 Has the policy been formulated in consultation with relevant stakeholders?
Y Y Y Y Y Y Y Y Y
All the policies have been formulated in consultation with the Management of the Company
3 Does the policy conform to any national/international standards? If yes, specify? (50 words)
Y Y Y Y Y Y Y Y Y
The policies that have been formulated are in line with the applicable national standards and compliant with the principles of the National
Voluntary Guidelines (NVG) issued by the Ministry of Corporate Affairs Government of India and updated from time to time.
4 Has the policy been approved by the Board?
If yes, has it been signed by the MD/owner/CEO/appropriate Board Director?
Y Y Y Y Y Y Y Y Y
The statutory policies have been approved by the Board. The other policies have been developed in consultation with the concerned
departmental heads of the Company.
5 Does the Company have a specified committee of the Board/Director/Official to oversee the implementation of the policy?
Y Y Y Y Y Y Y Y Y
WCL has appointed the Managing Director who is responsible for implementation of BR policies and a BR head to oversee the BR
performance
6 Indicate the link to view the policy online? Y Y Y Y Y Y Y Y Y
All policies are made available to the employees of the Company. Stakeholders who wish to view the policies can visit the Company’s website: www.welspuncorp.com/resources
7 Has the policy been formally communicated to all relevant internal and external stakeholders?
Y Y Y Y Y Y Y Y Y
8 Does the Company have in-house structure to implement its policy/policies?
Y Y Y Y Y Y Y Y Y
9 Does the Company have a grievance redressal mechanism related to the policy/policies to address stakeholders’ grievances related to policy/policies?
Y Y Y Y Y Y Y Y Y
The queries regarding to BR polices can be sent to [email protected]
10 Has the Company carried out independent audit/evaluation of the working of this policy by an internal or external agency?
N N N N N N N N N
WCL has various kinds of audits carried out like Internal Audit, Vendor Audit, Compliance Audit, etc. that are independent and cover specific policies. These audits are conducted by internal
teams as well as external agencies.
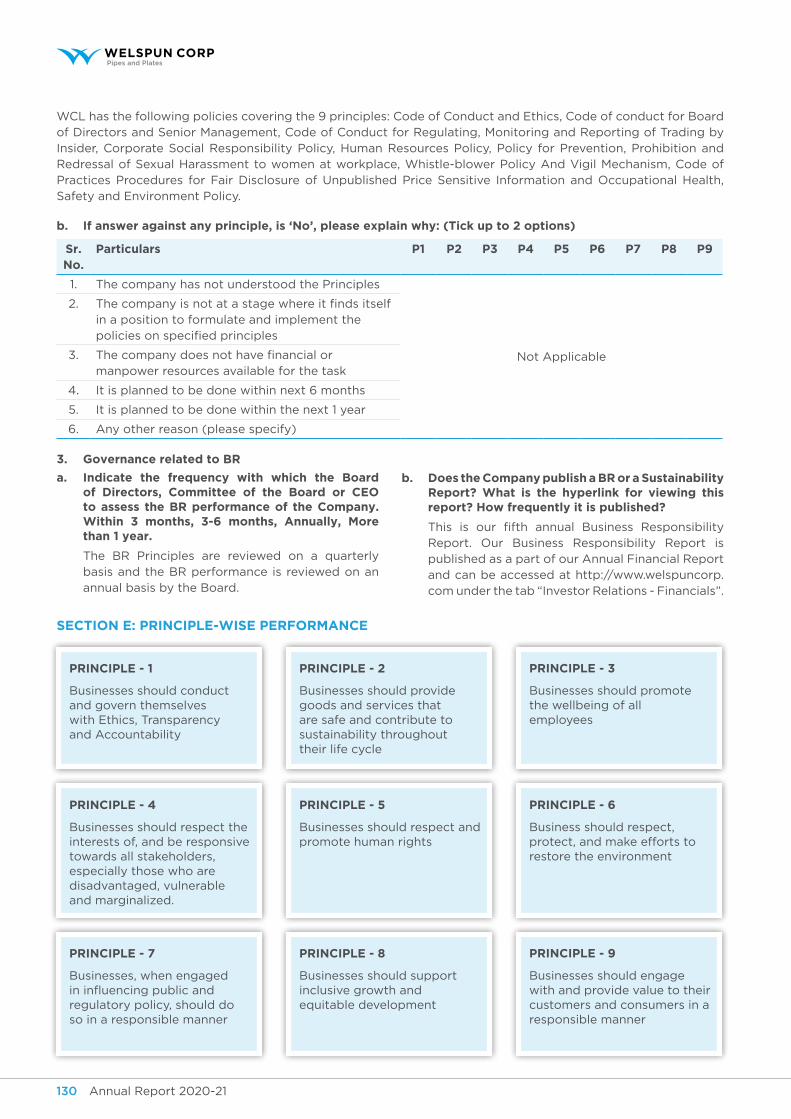
Annual Report 2020-21 131Annual Report 2020-21130
WCL has the following policies covering the 9 principles: Code of Conduct and Ethics, Code of conduct for Board of Directors and Senior Management, Code of Conduct for Regulating, Monitoring and Reporting of Trading by Insider, Corporate Social Responsibility Policy, Human Resources Policy, Policy for Prevention, Prohibition and Redressal of Sexual Harassment to women at workplace, Whistle-blower Policy And Vigil Mechanism, Code of Practices Procedures for Fair Disclosure of Unpublished Price Sensitive Information and Occupational Health, Safety and Environment Policy.
b. If answer against any principle, is ‘No’, please explain why: (Tick up to 2 options)
Sr. No.
particulars p1 p2 p3 p4 p5 p6 p7 p8 p9
1. The company has not understood the Principles
Not Applicable
2. The company is not at a stage where it finds itself in a position to formulate and implement the policies on specified principles
3. The company does not have financial or manpower resources available for the task
4. It is planned to be done within next 6 months
5. It is planned to be done within the next 1 year
6. Any other reason (please specify)
3. Governance related to BR
a. Indicate the frequency with which the Board of Directors, Committee of the Board or CEO to assess the BR performance of the Company. Within 3 months, 3-6 months, Annually, More than 1 year.
The BR Principles are reviewed on a quarterly basis and the BR performance is reviewed on an annual basis by the Board.
b. Does the Company publish a BR or a Sustainability report? What is the hyperlink for viewing this report? how frequently it is published?
This is our fifth annual Business Responsibility Report. Our Business Responsibility Report is published as a part of our Annual Financial Report and can be accessed at http://www.welspuncorp.com under the tab “Investor Relations - Financials”.
seCtion e: prinCiple-Wise performanCe
prinCiple - 1
Businesses should conduct and govern themselves with Ethics, Transparency and Accountability
prinCiple - 4
Businesses should respect the interests of, and be responsive towards all stakeholders, especially those who are disadvantaged, vulnerable and marginalized.
prinCiple - 7
Businesses, when engaged in influencing public and regulatory policy, should do so in a responsible manner
prinCiple - 2
Businesses should provide goods and services that are safe and contribute to sustainability throughout their life cycle
prinCiple - 5
Businesses should respect and promote human rights
prinCiple - 8
Businesses should support inclusive growth and equitable development
prinCiple - 3
Businesses should promote the wellbeing of all employees
prinCiple - 6
Business should respect, protect, and make efforts to restore the environment
prinCiple - 9
Businesses should engage with and provide value to their customers and consumers in a responsible manner
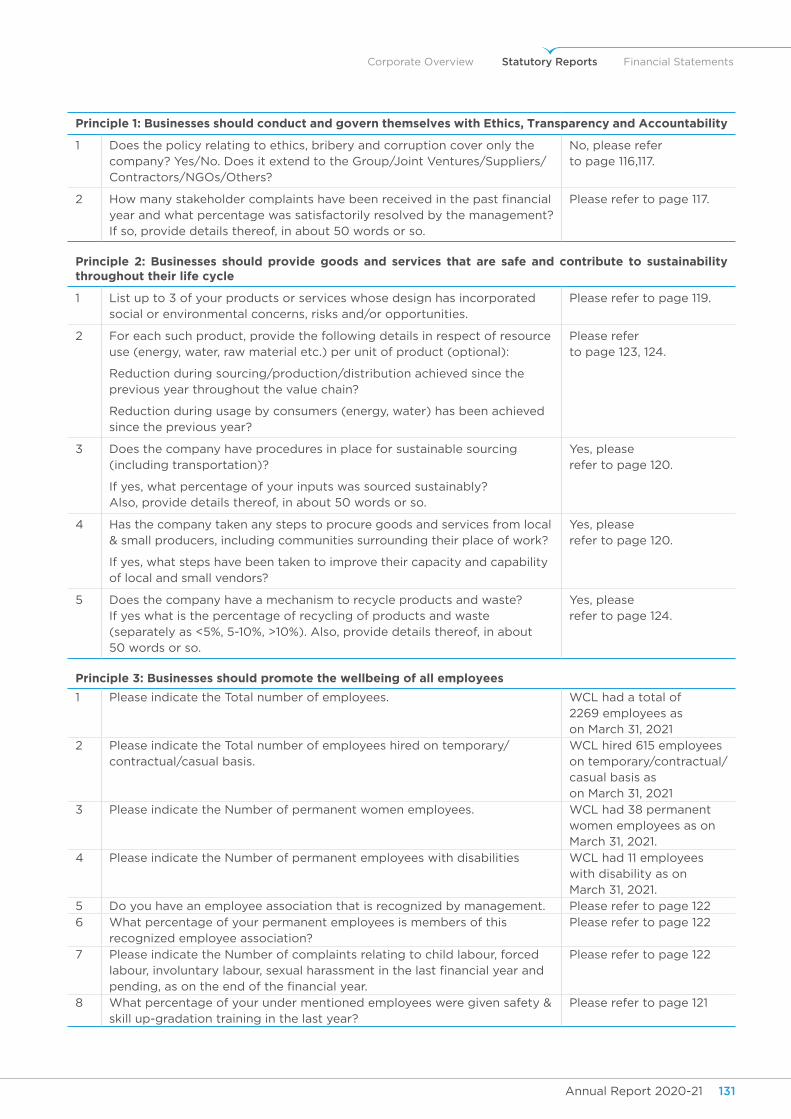
Annual Report 2020-21 131Annual Report 2020-21130
Corporate Overview Statutory Reports Financial Statements
Principle 1: Businesses should conduct and govern themselves with Ethics, Transparency and Accountability
1 Does the policy relating to ethics, bribery and corruption cover only the company? Yes/No. Does it extend to the Group/Joint Ventures/Suppliers/Contractors/NGOs/Others?
No, please refer to page 116,117.
2 How many stakeholder complaints have been received in the past financial year and what percentage was satisfactorily resolved by the management? If so, provide details thereof, in about 50 words or so.
Please refer to page 117.
principle 2: Businesses should provide goods and services that are safe and contribute to sustainability throughout their life cycle
1 List up to 3 of your products or services whose design has incorporated social or environmental concerns, risks and/or opportunities.
Please refer to page 119.
2 For each such product, provide the following details in respect of resource use (energy, water, raw material etc.) per unit of product (optional):
Reduction during sourcing/production/distribution achieved since the previous year throughout the value chain?
Reduction during usage by consumers (energy, water) has been achieved since the previous year?
Please refer to page 123, 124.
3 Does the company have procedures in place for sustainable sourcing (including transportation)?
If yes, what percentage of your inputs was sourced sustainably? Also, provide details thereof, in about 50 words or so.
Yes, please refer to page 120.
4 Has the company taken any steps to procure goods and services from local & small producers, including communities surrounding their place of work?
If yes, what steps have been taken to improve their capacity and capability of local and small vendors?
Yes, please refer to page 120.
5 Does the company have a mechanism to recycle products and waste? If yes what is the percentage of recycling of products and waste (separately as <5%, 5-10%, >10%). Also, provide details thereof, in about 50 words or so.
Yes, please refer to page 124.
principle 3: Businesses should promote the wellbeing of all employees
1 Please indicate the Total number of employees. WCL had a total of 2269 employees as on March 31, 2021
2 Please indicate the Total number of employees hired on temporary/contractual/casual basis.
WCL hired 615 employees on temporary/contractual/casual basis as on March 31, 2021
3 Please indicate the Number of permanent women employees. WCL had 38 permanent women employees as on March 31, 2021.
4 Please indicate the Number of permanent employees with disabilities WCL had 11 employees with disability as on March 31, 2021.
5 Do you have an employee association that is recognized by management. Please refer to page 122
6 What percentage of your permanent employees is members of this recognized employee association?
Please refer to page 122
7 Please indicate the Number of complaints relating to child labour, forced labour, involuntary labour, sexual harassment in the last financial year and pending, as on the end of the financial year.
Please refer to page 122
8 What percentage of your under mentioned employees were given safety & skill up-gradation training in the last year?
Please refer to page 121
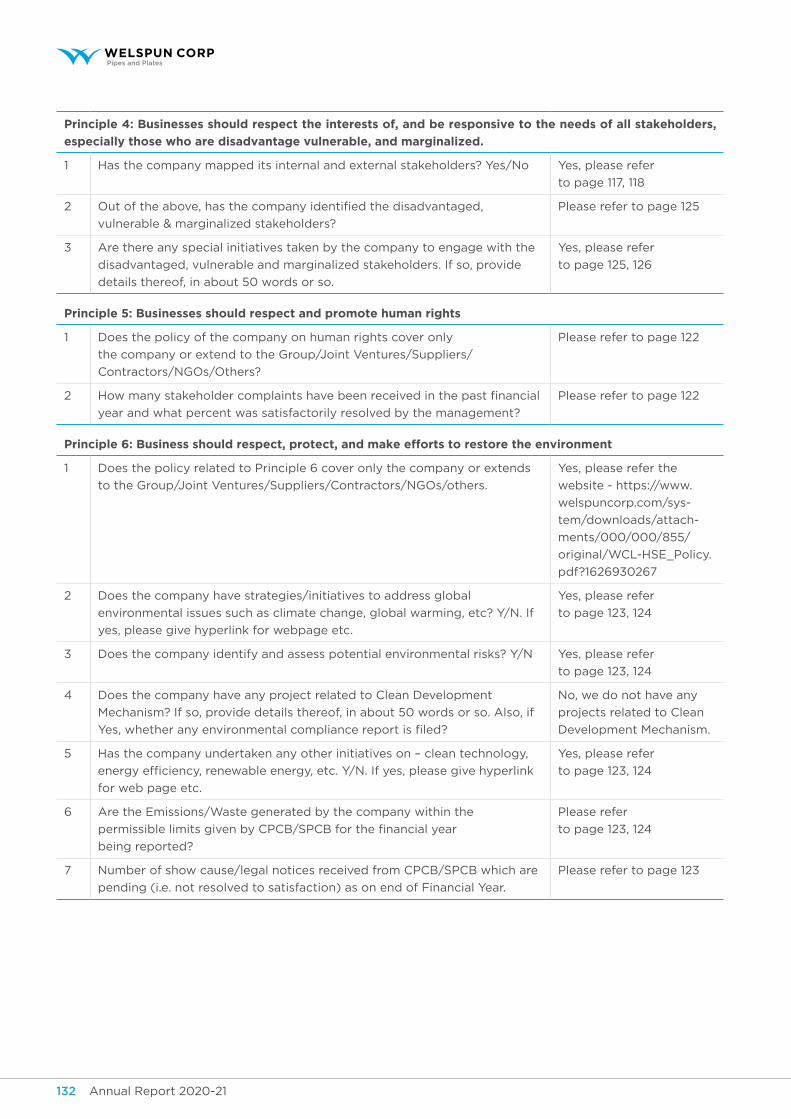
Annual Report 2020-21 133Annual Report 2020-21132
Principle 4: Businesses should respect the interests of, and be responsive to the needs of all stakeholders,
especially those who are disadvantage vulnerable, and marginalized.
1 Has the company mapped its internal and external stakeholders? Yes/No Yes, please refer
to page 117, 118
2 Out of the above, has the company identified the disadvantaged,
vulnerable & marginalized stakeholders?
Please refer to page 125
3 Are there any special initiatives taken by the company to engage with the
disadvantaged, vulnerable and marginalized stakeholders. If so, provide
details thereof, in about 50 words or so.
Yes, please refer
to page 125, 126
principle 5: Businesses should respect and promote human rights
1 Does the policy of the company on human rights cover only
the company or extend to the Group/Joint Ventures/Suppliers/
Contractors/NGOs/Others?
Please refer to page 122
2 How many stakeholder complaints have been received in the past financial
year and what percent was satisfactorily resolved by the management?
Please refer to page 122
Principle 6: Business should respect, protect, and make efforts to restore the environment
1 Does the policy related to Principle 6 cover only the company or extends
to the Group/Joint Ventures/Suppliers/Contractors/NGOs/others.
Yes, please refer the
website - https://www.
welspuncorp.com/sys-
tem/downloads/attach-
ments/000/000/855/
original/WCL-HSE_Policy.
pdf?1626930267
2 Does the company have strategies/initiatives to address global
environmental issues such as climate change, global warming, etc? Y/N. If
yes, please give hyperlink for webpage etc.
Yes, please refer
to page 123, 124
3 Does the company identify and assess potential environmental risks? Y/N Yes, please refer
to page 123, 124
4 Does the company have any project related to Clean Development
Mechanism? If so, provide details thereof, in about 50 words or so. Also, if
Yes, whether any environmental compliance report is filed?
No, we do not have any
projects related to Clean
Development Mechanism.
5 Has the company undertaken any other initiatives on – clean technology,
energy efficiency, renewable energy, etc. Y/N. If yes, please give hyperlink
for web page etc.
Yes, please refer
to page 123, 124
6 Are the Emissions/Waste generated by the company within the
permissible limits given by CPCB/SPCB for the financial year
being reported?
Please refer
to page 123, 124
7 Number of show cause/legal notices received from CPCB/SPCB which are
pending (i.e. not resolved to satisfaction) as on end of Financial Year.
Please refer to page 123
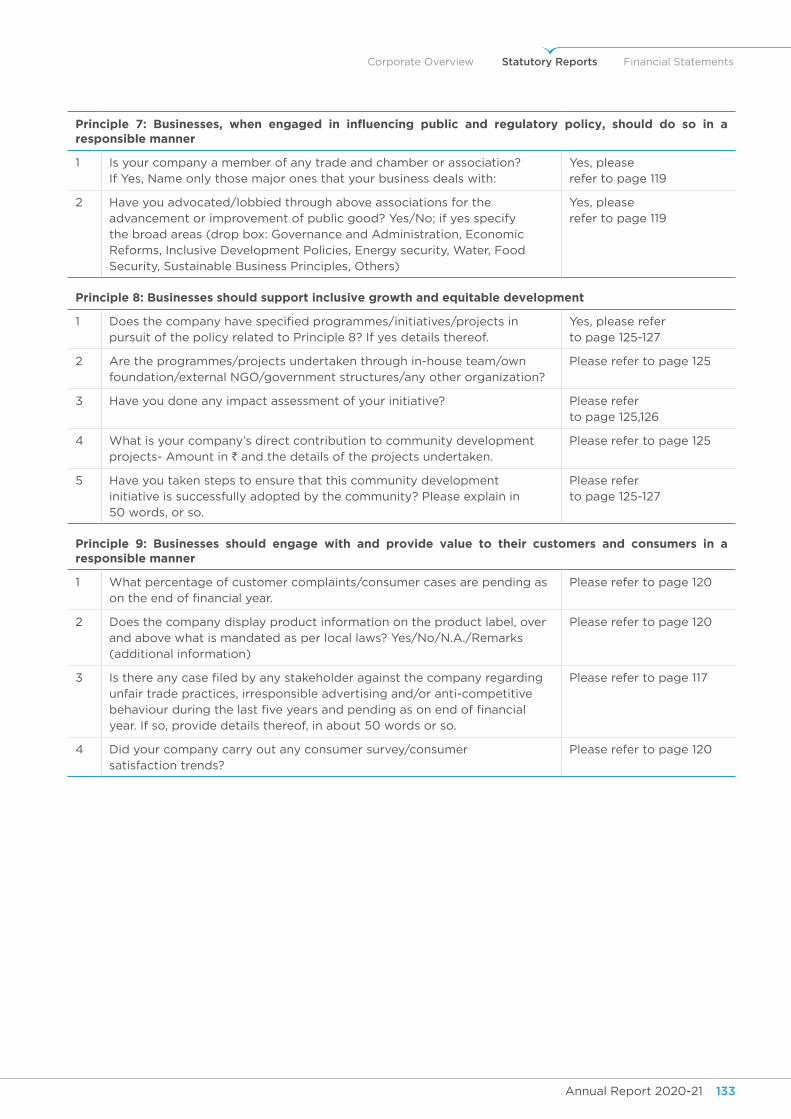
Annual Report 2020-21 133Annual Report 2020-21132
Corporate Overview Statutory Reports Financial Statements
Principle 7: Businesses, when engaged in influencing public and regulatory policy, should do so in a responsible manner
1 Is your company a member of any trade and chamber or association? If Yes, Name only those major ones that your business deals with:
Yes, please refer to page 119
2 Have you advocated/lobbied through above associations for the advancement or improvement of public good? Yes/No; if yes specify the broad areas (drop box: Governance and Administration, Economic Reforms, Inclusive Development Policies, Energy security, Water, Food Security, Sustainable Business Principles, Others)
Yes, please refer to page 119
principle 8: Businesses should support inclusive growth and equitable development
1 Does the company have specified programmes/initiatives/projects in pursuit of the policy related to Principle 8? If yes details thereof.
Yes, please refer to page 125-127
2 Are the programmes/projects undertaken through in-house team/own foundation/external NGO/government structures/any other organization?
Please refer to page 125
3 Have you done any impact assessment of your initiative? Please refer to page 125,126
4 What is your company’s direct contribution to community development projects- Amount in ` and the details of the projects undertaken.
Please refer to page 125
5 Have you taken steps to ensure that this community development initiative is successfully adopted by the community? Please explain in 50 words, or so.
Please refer to page 125-127
principle 9: Businesses should engage with and provide value to their customers and consumers in a responsible manner
1 What percentage of customer complaints/consumer cases are pending as on the end of financial year.
Please refer to page 120
2 Does the company display product information on the product label, over and above what is mandated as per local laws? Yes/No/N.A./Remarks (additional information)
Please refer to page 120
3 Is there any case filed by any stakeholder against the company regarding unfair trade practices, irresponsible advertising and/or anti-competitive behaviour during the last five years and pending as on end of financial year. If so, provide details thereof, in about 50 words or so.
Please refer to page 117
4 Did your company carry out any consumer survey/consumer satisfaction trends?
Please refer to page 120
Financial Statements
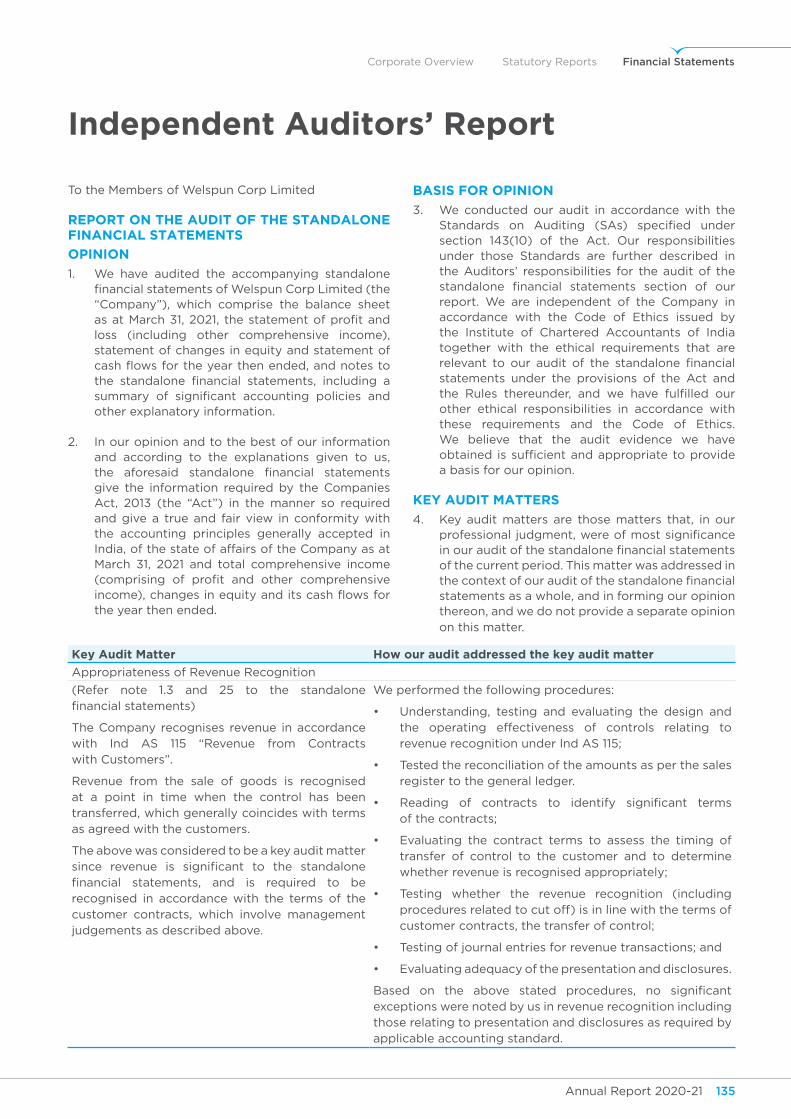
Annual Report 2020-21 135Annual Report 2020-21PB
Corporate Overview Statutory Reports Financial Statements
Independent Auditors’ Report
To the Members of Welspun Corp Limited
RepoRt on the AudIt of the stAndAlone fInAncIAl stAtements
opInIon
1. We have audited the accompanying standalone financial statements of Welspun Corp Limited (the “Company”), which comprise the balance sheet as at March 31, 2021, the statement of profit and loss (including other comprehensive income), statement of changes in equity and statement of cash flows for the year then ended, and notes to the standalone financial statements, including a summary of significant accounting policies and other explanatory information.
2. In our opinion and to the best of our information and according to the explanations given to us, the aforesaid standalone financial statements give the information required by the Companies Act, 2013 (the “Act”) in the manner so required and give a true and fair view in conformity with the accounting principles generally accepted in India, of the state of affairs of the Company as at March 31, 2021 and total comprehensive income (comprising of profit and other comprehensive income), changes in equity and its cash flows for the year then ended.
BAsIs foR opInIon
3. We conducted our audit in accordance with the Standards on Auditing (SAs) specified under section 143(10) of the Act. Our responsibilities under those Standards are further described in the Auditors’ responsibilities for the audit of the standalone financial statements section of our report. We are independent of the Company in accordance with the Code of Ethics issued by the Institute of Chartered Accountants of India together with the ethical requirements that are relevant to our audit of the standalone financial statements under the provisions of the Act and the Rules thereunder, and we have fulfilled our other ethical responsibilities in accordance with these requirements and the Code of Ethics. We believe that the audit evidence we have obtained is sufficient and appropriate to provide a basis for our opinion.
Key AudIt mAtteRs
4. Key audit matters are those matters that, in our professional judgment, were of most significance in our audit of the standalone financial statements of the current period. This matter was addressed in the context of our audit of the standalone financial statements as a whole, and in forming our opinion thereon, and we do not provide a separate opinion on this matter.
Key Audit matter how our audit addressed the key audit matter
Appropriateness of Revenue Recognition
(Refer note 1.3 and 25 to the standalone financial statements)
The Company recognises revenue in accordance with Ind AS 115 “Revenue from Contracts with Customers”.
Revenue from the sale of goods is recognised at a point in time when the control has been transferred, which generally coincides with terms as agreed with the customers.
The above was considered to be a key audit matter since revenue is significant to the standalone financial statements, and is required to be recognised in accordance with the terms of the customer contracts, which involve management judgements as described above.
We performed the following procedures:
• Understanding, testing and evaluating the design and the operating effectiveness of controls relating to revenue recognition under Ind AS 115;
• Tested the reconciliation of the amounts as per the sales register to the general ledger.
• Reading of contracts to identify significant terms of the contracts;
• Evaluating the contract terms to assess the timing of transfer of control to the customer and to determine whether revenue is recognised appropriately;
• Testing whether the revenue recognition (including procedures related to cut off) is in line with the terms of customer contracts, the transfer of control;
• Testing of journal entries for revenue transactions; and
• Evaluating adequacy of the presentation and disclosures.
Based on the above stated procedures, no significant exceptions were noted by us in revenue recognition including those relating to presentation and disclosures as required by applicable accounting standard.
Annual Report 2020-21 137Annual Report 2020-21136
otheR InfoRmAtIon
5. The Company’s Board of Directors is responsible for the other information. The other information comprises the information included in Management Discussion and Analysis, Directors’ Report, Corporate Governance Report and Business Responsibility Report and Other Information in Annual Report including Annexure thereto, but does not include the standalone financial statements and our auditors’ report thereon.
Our opinion on the standalone financial statements does not cover the other information and we do not express any form of assurance conclusion thereon.
In connection with our audit of the standalone financial statements, our responsibility is to read the other information and, in doing so, consider whether the other information is materially inconsistent with the standalone financial statements or our knowledge obtained in the audit or otherwise appears to be materially misstated. If, based on the work we have performed, we conclude that there is a material misstatement of this other information, we are required to report that fact.
We have nothing to report in this regard.
ResponsIBIlItIes of mAnAgement And those chARged wIth goveRnAnce foR the stAndAlone fInAncIAl stAtements
6. The Company’s Board of Directors is responsible for the matters stated in section 134(5) of the Act with respect to the preparation of these standalone financial statements that give a true and fair view of the financial position, financial performance, changes in equity and cash flows of the Company in accordance with the accounting principles generally accepted in India, including the Accounting Standards specified under section 133 of the Act. This responsibility also includes maintenance of adequate accounting records in accordance with the provisions of the Act for safeguarding of the assets of the Company and for preventing and detecting frauds and other irregularities; selection and application of appropriate accounting policies; making judgments and estimates that are reasonable and prudent; and design, implementation and maintenance of adequate internal financial controls, that were operating effectively for ensuring the accuracy and completeness of the accounting records, relevant to the preparation and presentation of the standalone financial statements that give a true and fair view and are free from material misstatement, whether due to fraud or error.
7. In preparing the standalone financial statements, management is responsible for assessing the Company’s ability to continue as a going concern, disclosing, as applicable, matters related to going concern and using the going concern basis of accounting unless management either intends to liquidate the Company or to cease operations, or has no realistic alternative but to do so. Those Board of Directors are also responsible for overseeing the Company’s financial reporting process.
AudItoRs’ ResponsIBIlItIes foR the AudIt of the stAndAlone fInAncIAl stAtements
8. Our objectives are to obtain reasonable assurance about whether the standalone financial statements as a whole are free from material misstatement, whether due to fraud or error, and to issue an auditors’ report that includes our opinion. Reasonable assurance is a high level of assurance, but is not a guarantee that an audit conducted in accordance with SAs will always detect a material misstatement when it exists. Misstatements can arise from fraud or error and are considered material if, individually or in the aggregate, they could reasonably be expected to influence the economic decisions of users taken on the basis of these standalone financial statements.
9. As part of an audit in accordance with SAs, we exercise professional judgment and maintain professional scepticism throughout the audit. We also:
• Identify and assess the risks of material misstatement of the standalone financial statements, whether due to fraud or error, design and perform audit procedures responsive to those risks, and obtain audit evidence that is sufficient and appropriate to provide a basis for our opinion. The risk of not detecting a material misstatement resulting from fraud is higher than for one resulting from error, as fraud may involve collusion, forgery, intentional omissions, misrepresentations, or the override of internal control.
• Obtain an understanding of internal control relevant to the audit in order to design audit procedures that are appropriate in the circumstances. Under Section 143(3)(i) of the Act, we are also responsible for expressing our opinion on whether the company has adequate internal financial controls with reference to financial statements in place and the operating effectiveness of such controls.
Annual Report 2020-21 137Annual Report 2020-21136
Corporate Overview Statutory Reports Financial Statements
• Evaluate the appropriateness of accounting policies used and the reasonableness of accounting estimates and related disclosures made by management.
• Conclude on the appropriateness of management’s use of the going concern basis of accounting and, based on the audit evidence obtained, whether a material uncertainty exists related to events or conditions that may cast significant doubt on the Company’s ability to continue as a going concern. If we conclude that a material uncertainty exists, we are required to draw attention in our auditors’ report to the related disclosures in the standalone financial statements or, if such disclosures are inadequate, to modify our opinion. Our conclusions are based on the audit evidence obtained up to the date of our auditors’ report. However, future events or conditions may cause the Company to cease to continue as a going concern.
• Evaluate the overall presentation, structure and content of the standalone financial statements, including the disclosures, and whether the standalone financial statements represent the underlying transactions and events in a manner that achieves fair presentation.
10. We communicate with those charged with governance regarding, among other matters, the planned scope and timing of the audit and significant audit findings, including any significant deficiencies in internal control that we identify during our audit.
11. We also provide those charged with governance with a statement that we have complied with relevant ethical requirements regarding independence, and to communicate with them all relationships and other matters that may reasonably be thought to bear on our independence, and where applicable, related safeguards.
12. From the matters communicated with those charged with governance, we determine those matters that were of most significance in the audit of the standalone financial statements of the current period and are therefore the key audit matters. We describe these matters in our auditors’ report unless law or regulation precludes public disclosure about the matter or when, in extremely rare circumstances, we determine that a matter should not be communicated in our report because the adverse consequences of doing so
would reasonably be expected to outweigh the public interest benefits of such communication.
RepoRt on otheR legAl And RegulAtoRy RequIRements
13. As required by the Companies (Auditor’s Report) Order, 2016 (the “Order”), issued by the Central Government of India in terms of sub-section (11) of section 143 of the Act, we give in the Annexure B, a statement on the matters specified in paragraphs 3 and 4 of the Order, to the extent applicable.
14. As required by Section 143(3) of the Act, we report that:
(a) We have sought and obtained all the information and explanations which to the best of our knowledge and belief were necessary for the purposes of our audit.
(b) In our opinion, proper books of account as required by law have been kept by the Company so far as it appears from our examination of those books.
(c) The Balance Sheet, the Statement of Profit and Loss (including other comprehensive income), the Statement of Changes in Equity and Statement of Cash Flows dealt with by this Report are in agreement with the books of account.
(d) In our opinion, the aforesaid standalone financial statements comply with the Accounting Standards specified under Section 133 of the Act.
(e) On the basis of the written representations received from the directors subsequent to March 31, 2021 taken on record by the Board of Directors, none of the directors is disqualified as on March 31, 2021 from being appointed as a director in terms of Section 164 (2) of the Act.
(f) With respect to the adequacy of the internal financial controls with reference to financial statements of the Company and the operating effectiveness of such controls, refer to our separate Report in “Annexure A”.
(g) With respect to the other matters to be included in the Auditors’ report in accordance with Rule 11 of the Companies (Audit and Auditors) Rules, 2014, in our opinion and to the best of our information and according to the explanations given to us:
Annual Report 2020-21 139Annual Report 2020-21138
i. The Company has disclosed the impact of pending litigations on its financial position in its standalone financial statements – Refer Note 45 to the standalone financial statements.
ii. The Company has long-term contracts at March 31, 2021 for which there were no material foreseeable losses. The Company did not have any long-term derivative contracts as at March 31, 2021.
iii. There has been no delay in transferring amounts, required to be transferred, to the Investor Education and Protection Fund by the Company.
iv. The reporting on disclosures relating to Specified Bank Notes is not applicable to the Company for the year ended March 31, 2021.
15. The Company has provided for managerial remuneration in accordance with the requisite approvals mandated by the provisions of Section 197 read with Schedule V to the Act.
for price waterhouse chartered Accountants llpFirm Registration Number: 012754N/N500016
Place: PuneDate: June 28, 2021
neeraj sharmaPartner
Membership No. 108391UDIN: 21108391AAAAEF3124
Annual Report 2020-21 139Annual Report 2020-21138
Corporate Overview Statutory Reports Financial Statements
Annexure A to Independent Auditors’ ReportReferred to in paragraph 14(f) of the Independent auditors’ report of even date to the members of welspun Corp Limited on the standalone financial statements for the year ended March 31, 2021
RepoRt on the InteRnAl fInAncIAl contRols wIth RefeRence to fInAncIAl stAtements undeR clAuse (i) of suB-seCtion 3 of seCtion 143 of the ACt
1. We have audited the internal financial controls with reference to financial statements of Welspun Corp Limited (the “Company”) as of March 31, 2021 in conjunction with our audit of the standalone financial statements of the Company for the year ended on that date.
mAnAgement’s ResponsIBIlIty foR InteRnAl fInAncIAl contRols
2. The Company’s management is responsible for establishing and maintaining internal financial controls based on the internal control over financial reporting criteria established by the Company considering the essential components of internal control stated in the Guidance Note on Audit of Internal Financial Controls Over Financial Reporting issued by the Institute of Chartered Accountants of India (ICAI). These responsibilities include the design, implementation and maintenance of adequate internal financial controls that were operating effectively for ensuring the orderly and efficient conduct of its business, including adherence to company’s policies, the safeguarding of its assets, the prevention and detection of frauds and errors, the accuracy and completeness of the accounting records, and the timely preparation of reliable financial information, as required under the Act.
AudItoRs’ ResponsIBIlIty
3. Our responsibility is to express an opinion on the Company’s internal financial controls with reference to financial statements based on our audit. We conducted our audit in accordance with the Guidance Note on Audit of Internal Financial Controls Over Financial Reporting (the “Guidance Note”) and the Standards on Auditing deemed to be prescribed under section 143(10) of the Act to the extent applicable to an audit of internal financial controls, both applicable to an audit of internal financial controls and both issued by the ICAI. Those Standards and the Guidance Note require that we comply with ethical requirements and plan and perform the audit to obtain reasonable assurance about whether adequate internal financial controls with reference to financial statements was established and maintained and if such controls operated effectively in all material respects.
4. Our audit involves performing procedures to obtain audit evidence about the adequacy of the internal financial controls system with reference to financial statements and their operating effectiveness. Our audit of internal financial controls with reference to financial statements included obtaining an understanding of internal financial controls with reference to financial statements, assessing the risk that a material weakness exists, and testing and evaluating the design and operating effectiveness of internal control based on the assessed risk. The procedures selected depend on the auditors’ judgement, including the assessment of the risks of material misstatement of the standalone financial statements, whether due to fraud or error.
5. We believe that the audit evidence we have obtained is sufficient and appropriate to provide a basis for our audit opinion on the Company’s internal financial controls system with reference to financial statements.
meAnIng of InteRnAl fInAncIAl contRols wIth RefeRence to fInAncIAl stAtements
6. A company’s internal financial controls with reference to financial statements is a process designed to provide reasonable assurance regarding the reliability of financial reporting and the preparation of standalone financial statements for external purposes in accordance with generally accepted accounting principles. A company’s internal financial controls with reference to financial statements includes those policies and procedures that (1) pertain to the maintenance of records that, in reasonable detail, accurately and fairly reflect the transactions and dispositions of the assets of the company; (2) provide reasonable assurance that transactions are recorded as necessary to permit preparation of standalone financial statements in accordance with generally accepted accounting principles, and that receipts and expenditures of the company are being made only in accordance with authorisations of management and directors of the company; and (3) provide reasonable assurance regarding prevention or timely detection of unauthorised acquisition, use, or disposition of the company’s assets that could have a material effect on the standalone financial statements.
Annual Report 2020-21 141Annual Report 2020-21140
InheRent lImItAtIons of InteRnAl fInAncIAl contRols wIth RefeRence to fInAncIAl stAtements
7. Because of the inherent limitations of internal financial controls with reference to financial statements, including the possibility of collusion or improper management override of controls, material misstatements due to error or fraud may occur and not be detected. Also, projections of any evaluation of the internal financial controls with reference to financial statements to future periods are subject to the risk that the internal financial control controls with reference to financial statements may become inadequate because of changes in conditions, or that the degree of compliance with the policies or procedures may deteriorate.
opInIon
8. In our opinion, the Company has, in all material respects, an adequate internal financial controls
system with reference to financial statements and such internal financial controls with reference to financial statements were operating effectively as at March 31, 2021, based on the internal control over financial reporting criteria established by the Company considering the essential components of internal control stated in the Guidance Note on Audit of Internal Financial Controls Over Financial Reporting issued by the Institute of Chartered Accountants of India.
for price waterhouse chartered Accountants llpFirm Registration Number: 012754N/N500016
Place: PuneDate: June 28, 2021
neeraj sharmaPartner
Membership No. 108391UDIN: 21108391AAAAEF3124
Annexure A to Independent Auditors’ ReportReferred to in paragraph 14(f) of the Independent auditors’ report of even date to the members of welspun Corp Limited on the standalone financial statements for the year ended March 31, 2021
Annual Report 2020-21 141Annual Report 2020-21140
Corporate Overview Statutory Reports Financial Statements
Annexure B to Independent Auditors’ ReportReferred to in paragraph 13 of the independent auditors’ report of even date to the members of Welspun Corp Limited on the standalone financial statements as of and for the year ended March 31, 2021
i. (a) The Company is maintaining proper records showing full particulars, including quantitative details and situation, of property, plant and equipment.
(b) The property, plant and equipment are physically verified by the Management according to a phased programme designed to cover all the items over a period of 3 years which, in our opinion, is reasonable having regard to the size of the Company and the nature of its assets. Pursuant to the programme, a portion of the property, plant and equipment has been physically verified by the Management during the year and no material discrepancies have been noticed on such verification.
(c) The title deeds of immovable properties, as disclosed in Note 3(a) on property, plant and equipment, Note 3(b) on Right-of-use assets and Note 4 on investment property, to the standalone financial statements, are held in the name of the Company.
ii. The physical verification of inventory excluding stocks with third parties and goods in transit have been conducted at reasonable intervals by the Management during the year. In respect of inventory lying with third parties, these have substantially been confirmed by them. The discrepancies noticed on physical verification of inventory as compared to book records were not material.
iii. The Company has not granted any loans, secured or unsecured, to companies, firms, Limited Liability Partnerships or other parties covered in the register maintained under Section 189 of the Act. Therefore, the provisions of Clause 3(iii), (iii)(a), (iii)(b) and (iii)(c) of the said Order are not applicable to the Company.
iv. In our opinion, and according to the information and explanations given to us, the Company has complied with the provisions of Section 185 and 186 of the Companies Act, 2013 in respect of the loans and investments made, and guarantees and security provided by it.
v. The Company has not accepted any deposits from the public within the meaning of Sections 73, 74, 75 and 76 of the Act and the Rules framed there under to the extent notified.
vi. Pursuant to the rules made by the Central Government of India, the Company is required to maintain cost records as specified under Section 148(1) of the Act in respect of its products. We have broadly reviewed the same, and are of the opinion that, prima facie, the prescribed accounts and records have been made and maintained. We have not, however, made a detailed examination of the records with a view to determine whether they are accurate or complete.
vii. (a) According to the information and explanations given to us and the records of the Company examined by us, in our opinion, the Company is regular in depositing the undisputed statutory dues, including provident fund, employees’ state insurance, income tax, duty of customs, cess, goods and service tax and other material statutory dues, as applicable, with the appropriate authorities. Further, for the period April 01, 2020 to May 31, 2020, the company has paid goods and service tax and filed Form GSTR 3B after the due date but within the timelines allowed by Central Board of Indirect Taxes and Customs under the Notification No. 31/2020 and Notification No. 36/2020 both dated April 03, 2020, on fulfilment of conditions specified therein. Also refer note 38 to the standalone financial statements regarding management’s assessment on certain matters relating to the provident fund.
(b) According to the information and explanations given to us and the records of the Company examined by us, there are no dues of goods and service tax which have not been deposited on account of any dispute. The particulars of dues of duty of excise, central sales tax, sales tax, value added tax, service tax, duty of customs and income tax as at March 31, 2021 which have not been deposited on account of a dispute, are as follows
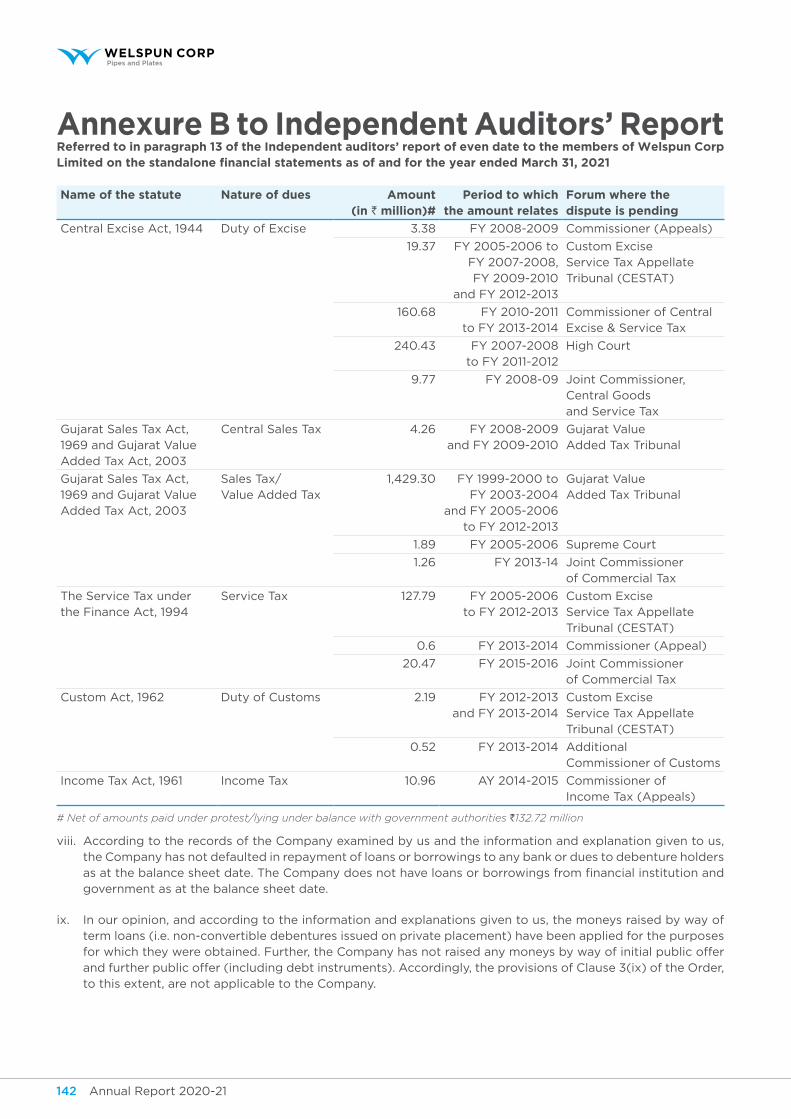
Annual Report 2020-21 143Annual Report 2020-21142
name of the statute nature of dues Amount (in ` million)#
period to which the amount relates
forum where the dispute is pending
Central Excise Act, 1944 Duty of Excise 3.38 FY 2008-2009 Commissioner (Appeals)
19.37 FY 2005-2006 to FY 2007-2008, FY 2009-2010
and FY 2012-2013
Custom Excise Service Tax Appellate Tribunal (CESTAT)
160.68 FY 2010-2011 to FY 2013-2014
Commissioner of Central Excise & Service Tax
240.43 FY 2007-2008 to FY 2011-2012
High Court
9.77 FY 2008-09 Joint Commissioner, Central Goods and Service Tax
Gujarat Sales Tax Act, 1969 and Gujarat Value Added Tax Act, 2003
Central Sales Tax 4.26 FY 2008-2009 and FY 2009-2010
Gujarat Value Added Tax Tribunal
Gujarat Sales Tax Act, 1969 and Gujarat Value Added Tax Act, 2003
Sales Tax/ Value Added Tax
1,429.30 FY 1999-2000 to FY 2003-2004
and FY 2005-2006 to FY 2012-2013
Gujarat Value Added Tax Tribunal
1.89 FY 2005-2006 Supreme Court
1.26 FY 2013-14 Joint Commissioner of Commercial Tax
The Service Tax under the Finance Act, 1994
Service Tax 127.79 FY 2005-2006 to FY 2012-2013
Custom Excise Service Tax Appellate Tribunal (CESTAT)
0.6 FY 2013-2014 Commissioner (Appeal)
20.47 FY 2015-2016 Joint Commissioner of Commercial Tax
Custom Act, 1962 Duty of Customs 2.19 FY 2012-2013 and FY 2013-2014
Custom Excise Service Tax Appellate Tribunal (CESTAT)
0.52 FY 2013-2014 Additional Commissioner of Customs
Income Tax Act, 1961 Income Tax 10.96 AY 2014-2015 Commissioner of Income Tax (Appeals)
# Net of amounts paid under protest/lying under balance with government authorities `132.72 million
viii. According to the records of the Company examined by us and the information and explanation given to us, the Company has not defaulted in repayment of loans or borrowings to any bank or dues to debenture holders as at the balance sheet date. The Company does not have loans or borrowings from financial institution and government as at the balance sheet date.
ix. In our opinion, and according to the information and explanations given to us, the moneys raised by way of term loans (i.e. non-convertible debentures issued on private placement) have been applied for the purposes for which they were obtained. Further, the Company has not raised any moneys by way of initial public offer and further public offer (including debt instruments). Accordingly, the provisions of Clause 3(ix) of the Order, to this extent, are not applicable to the Company.
Annexure B to Independent Auditors’ ReportReferred to in paragraph 13 of the independent auditors’ report of even date to the members of Welspun Corp Limited on the standalone financial statements as of and for the year ended March 31, 2021
Annual Report 2020-21 143Annual Report 2020-21142
Corporate Overview Statutory Reports Financial Statements
x. During the course of our examination of the books and records of the Company, carried out in accordance with the generally accepted auditing practices in India, and according to the information and explanations given to us, we have neither come across any instance of material fraud by the Company or on the Company by its officers or employees, noticed or reported during the year, nor have we been informed of any such case by the Management.
xi. The Company has provided for managerial remuneration in accordance with the requisite approvals mandated by the provisions of Section 197 read with Schedule V to the Act. Also refer paragraph 15 of our main audit report.
xii. As the Company is not a Nidhi Company and the Nidhi Rules, 2014 are not applicable to it, the provisions of Clause 3(xii) of the Order are not applicable to the Company.
xiii. The Company has entered into transactions with related parties in compliance with the provisions of Sections 177 and 188 of the Act. The details of such related party transactions have been disclosed in the standalone financial statements as required under Indian Accounting Standard (Ind AS) 24, Related Party Disclosures specified under Section 133 of the Act
Annexure B to Independent Auditors’ ReportReferred to in paragraph 13 of the independent auditors’ report of even date to the members of Welspun Corp Limited on the standalone financial statements as of and for the year ended March 31, 2021
xiv. The Company has not made any preferential allotment or private placement of shares or fully or partly convertible debentures during the year under review. Accordingly, the provisions of Clause 3(xiv) of the Order are not applicable to the Company.
xv. The Company has not entered into any non-cash transactions with its directors or persons connected with them within the meaning of Section 92 of the Act. Accordingly, the provisions of Clause 3(xv) of the Order are not applicable to the Company.
xvi. The Company is not required to be registered under Section 45-IA of the Reserve Bank of India Act, 1934. Accordingly, the provisions of Clause 3(xvi) of the Order are not applicable to the Company.
for price waterhouse chartered Accountants llpFirm Registration Number: 012754N/N500016
Place: PuneDate: June 28, 2021
neeraj sharmaPartner
Membership No. 108391UDIN: 21108391AAAAEF3124
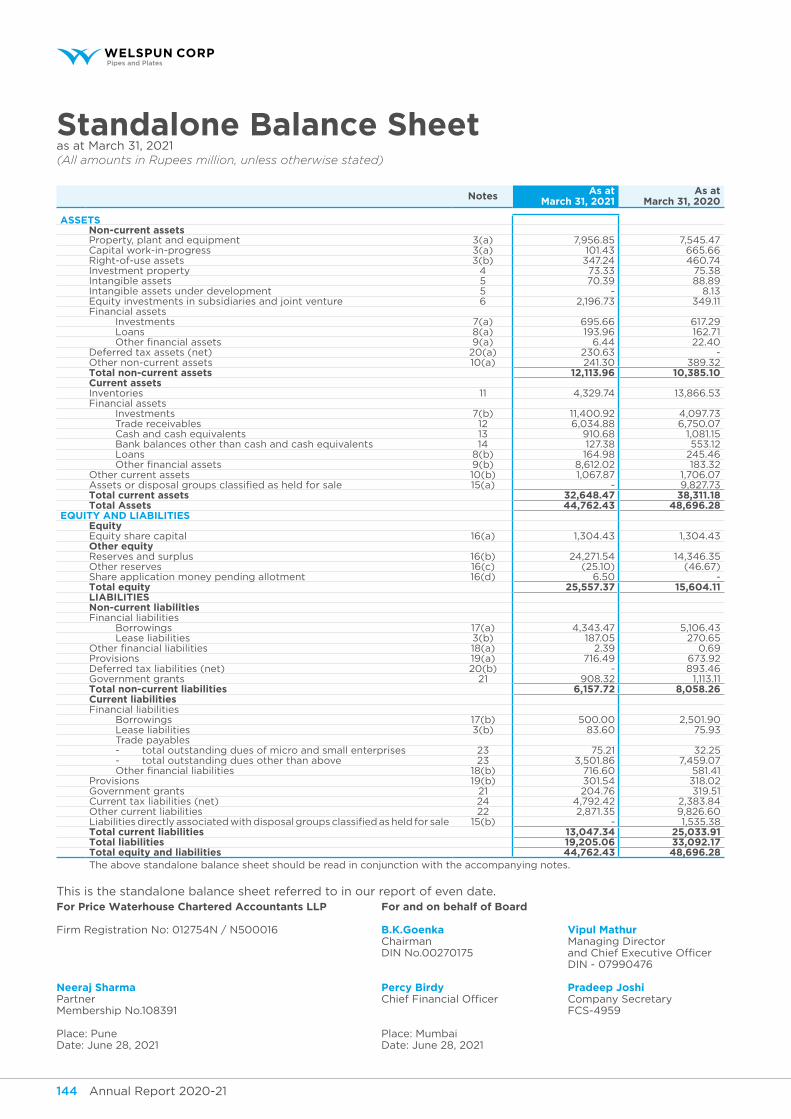
Annual Report 2020-21 145Annual Report 2020-21144
This is the standalone balance sheet referred to in our report of even date.for price waterhouse chartered Accountants llp for and on behalf of Board
Firm Registration No: 012754N / N500016 B.K.goenka vipul mathurChairman Managing DirectorDIN No.00270175 and Chief Executive Officer
DIN - 07990476
neeraj sharma percy Birdy pradeep JoshiPartner Chief Financial Officer Company SecretaryMembership No.108391 FCS-4959
Place: Pune Place: MumbaiDate: June 28, 2021 Date: June 28, 2021
standalone Balance sheetas at March 31, 2021(All amounts in Rupees million, unless otherwise stated)
notes As atMarch 31, 2021
As atMarch 31, 2020
Assetsnon-current assetsProperty, plant and equipment 3(a) 7,956.85 7,545.47 Capital work-in-progress 3(a) 101.43 665.66 Right-of-use assets 3(b) 347.24 460.74 Investment property 4 73.33 75.38 Intangible assets 5 70.39 88.89 Intangible assets under development 5 - 8.13 Equity investments in subsidiaries and joint venture 6 2,196.73 349.11 Financial assets Investments 7(a) 695.66 617.29 Loans 8(a) 193.96 162.71 Other financial assets 9(a) 6.44 22.40 Deferred tax assets (net) 20(a) 230.63 - Other non-current assets 10(a) 241.30 389.32 total non-current assets 12,113.96 10,385.10 current assetsInventories 11 4,329.74 13,866.53 Financial assets Investments 7(b) 11,400.92 4,097.73 Trade receivables 12 6,034.88 6,750.07 Cash and cash equivalents 13 910.68 1,081.15 Bank balances other than cash and cash equivalents 14 127.38 553.12 Loans 8(b) 164.98 245.46 Other financial assets 9(b) 8,612.02 183.32 Other current assets 10(b) 1,067.87 1,706.07 Assets or disposal groups classified as held for sale 15(a) - 9,827.73 total current assets 32,648.47 38,311.18 total Assets 44,762.43 48,696.28
equIty And lIABIlItIesequityEquity share capital 16(a) 1,304.43 1,304.43 other equityReserves and surplus 16(b) 24,271.54 14,346.35 Other reserves 16(c) (25.10) (46.67)Share application money pending allotment 16(d) 6.50 - total equity 25,557.37 15,604.11 lIABIlItIesnon-current liabilitiesFinancial liabilities Borrowings 17(a) 4,343.47 5,106.43 Lease liabilities 3(b) 187.05 270.65 Other financial liabilities 18(a) 2.39 0.69 Provisions 19(a) 716.49 673.92 Deferred tax liabilities (net) 20(b) - 893.46 Government grants 21 908.32 1,113.11 total non-current liabilities 6,157.72 8,058.26 current liabilitiesFinancial liabilities Borrowings 17(b) 500.00 2,501.90 Lease liabilities 3(b) 83.60 75.93 Trade payables - total outstanding dues of micro and small enterprises 23 75.21 32.25 - total outstanding dues other than above 23 3,501.86 7,459.07 Other financial liabilities 18(b) 716.60 581.41 Provisions 19(b) 301.54 318.02 Government grants 21 204.76 319.51 Current tax liabilities (net) 24 4,792.42 2,383.84 Other current liabilities 22 2,871.35 9,826.60 Liabilities directly associated with disposal groups classified as held for sale 15(b) - 1,535.38 total current liabilities 13,047.34 25,033.91 total liabilities 19,205.06 33,092.17 total equity and liabilities 44,762.43 48,696.28 The above standalone balance sheet should be read in conjunction with the accompanying notes.
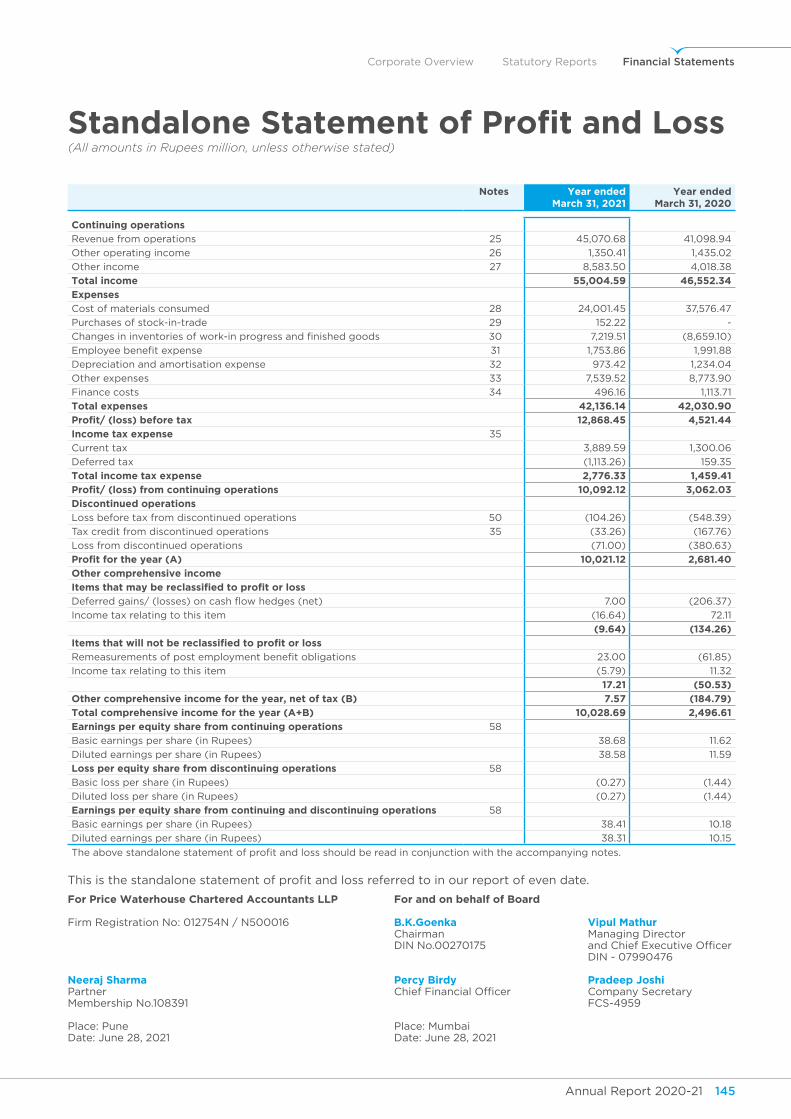
Annual Report 2020-21 145Annual Report 2020-21144
Corporate Overview Statutory Reports Financial Statements
standalone statement of Profit and Loss(All amounts in Rupees million, unless otherwise stated)
notes year ended March 31, 2021
year ended March 31, 2020
continuing operations
Revenue from operations 25 45,070.68 41,098.94
Other operating income 26 1,350.41 1,435.02
Other income 27 8,583.50 4,018.38
total income 55,004.59 46,552.34
expenses
Cost of materials consumed 28 24,001.45 37,576.47
Purchases of stock-in-trade 29 152.22 -
Changes in inventories of work-in progress and finished goods 30 7,219.51 (8,659.10)
Employee benefit expense 31 1,753.86 1,991.88
Depreciation and amortisation expense 32 973.42 1,234.04
Other expenses 33 7,539.52 8,773.90
Finance costs 34 496.16 1,113.71
total expenses 42,136.14 42,030.90
Profit/ (loss) before tax 12,868.45 4,521.44
Income tax expense 35
Current tax 3,889.59 1,300.06
Deferred tax (1,113.26) 159.35
total income tax expense 2,776.33 1,459.41
Profit/ (loss) from continuing operations 10,092.12 3,062.03
discontinued operations
Loss before tax from discontinued operations 50 (104.26) (548.39)
Tax credit from discontinued operations 35 (33.26) (167.76)
Loss from discontinued operations (71.00) (380.63)
Profit for the year (A) 10,021.12 2,681.40
other comprehensive income
items that may be reclassified to profit or loss
Deferred gains/ (losses) on cash flow hedges (net) 7.00 (206.37)
Income tax relating to this item (16.64) 72.11
(9.64) (134.26)
items that will not be reclassified to profit or loss
Remeasurements of post employment benefit obligations 23.00 (61.85)
Income tax relating to this item (5.79) 11.32
17.21 (50.53)
other comprehensive income for the year, net of tax (B) 7.57 (184.79)
total comprehensive income for the year (A+B) 10,028.69 2,496.61
earnings per equity share from continuing operations 58
Basic earnings per share (in Rupees) 38.68 11.62
Diluted earnings per share (in Rupees) 38.58 11.59
loss per equity share from discontinuing operations 58
Basic loss per share (in Rupees) (0.27) (1.44)
Diluted loss per share (in Rupees) (0.27) (1.44)
earnings per equity share from continuing and discontinuing operations 58
Basic earnings per share (in Rupees) 38.41 10.18
Diluted earnings per share (in Rupees) 38.31 10.15
The above standalone statement of profit and loss should be read in conjunction with the accompanying notes.
This is the standalone statement of profit and loss referred to in our report of even date.
for price waterhouse chartered Accountants llp for and on behalf of Board
Firm Registration No: 012754N / N500016 B.K.goenka vipul mathurChairman Managing DirectorDIN No.00270175 and Chief Executive Officer
DIN - 07990476
neeraj sharma percy Birdy pradeep JoshiPartner Chief Financial Officer Company SecretaryMembership No.108391 FCS-4959
Place: Pune Place: MumbaiDate: June 28, 2021 Date: June 28, 2021
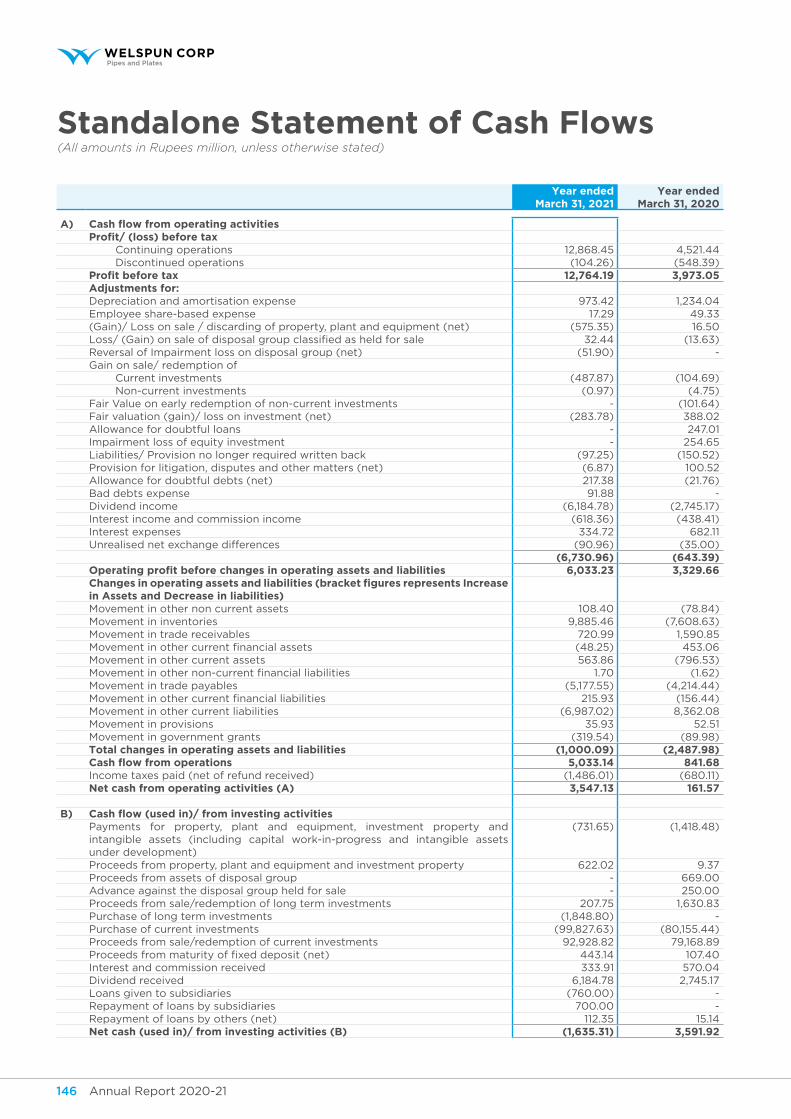
Annual Report 2020-21 147Annual Report 2020-21146
year ended March 31, 2021
year ended March 31, 2020
A) Cash flow from operating activitiesProfit/ (loss) before tax Continuing operations 12,868.45 4,521.44 Discontinued operations (104.26) (548.39)Profit before tax 12,764.19 3,973.05 Adjustments for:Depreciation and amortisation expense 973.42 1,234.04 Employee share-based expense 17.29 49.33 (Gain)/ Loss on sale / discarding of property, plant and equipment (net) (575.35) 16.50 Loss/ (Gain) on sale of disposal group classified as held for sale 32.44 (13.63)Reversal of Impairment loss on disposal group (net) (51.90) - Gain on sale/ redemption of Current investments (487.87) (104.69) Non-current investments (0.97) (4.75)Fair Value on early redemption of non-current investments - (101.64)Fair valuation (gain)/ loss on investment (net) (283.78) 388.02 Allowance for doubtful loans - 247.01 Impairment loss of equity investment - 254.65 Liabilities/ Provision no longer required written back (97.25) (150.52)Provision for litigation, disputes and other matters (net) (6.87) 100.52 Allowance for doubtful debts (net) 217.38 (21.76)Bad debts expense 91.88 - Dividend income (6,184.78) (2,745.17)Interest income and commission income (618.36) (438.41)Interest expenses 334.72 682.11 Unrealised net exchange differences (90.96) (35.00)
(6,730.96) (643.39)operating profit before changes in operating assets and liabilities 6,033.23 3,329.66 Changes in operating assets and liabilities (bracket figures represents increase in Assets and decrease in liabilities)Movement in other non current assets 108.40 (78.84)Movement in inventories 9,885.46 (7,608.63)Movement in trade receivables 720.99 1,590.85 Movement in other current financial assets (48.25) 453.06 Movement in other current assets 563.86 (796.53)Movement in other non-current financial liabilities 1.70 (1.62)Movement in trade payables (5,177.55) (4,214.44)Movement in other current financial liabilities 215.93 (156.44)Movement in other current liabilities (6,987.02) 8,362.08 Movement in provisions 35.93 52.51 Movement in government grants (319.54) (89.98)total changes in operating assets and liabilities (1,000.09) (2,487.98)Cash flow from operations 5,033.14 841.68 Income taxes paid (net of refund received) (1,486.01) (680.11)net cash from operating activities (A) 3,547.13 161.57
B) Cash flow (used in)/ from investing activitiesPayments for property, plant and equipment, investment property and intangible assets (including capital work-in-progress and intangible assets under development)
(731.65) (1,418.48)
Proceeds from property, plant and equipment and investment property 622.02 9.37 Proceeds from assets of disposal group - 669.00 Advance against the disposal group held for sale - 250.00 Proceeds from sale/redemption of long term investments 207.75 1,630.83 Purchase of long term investments (1,848.80) - Purchase of current investments (99,827.63) (80,155.44)Proceeds from sale/redemption of current investments 92,928.82 79,168.89 Proceeds from maturity of fixed deposit (net) 443.14 107.40 Interest and commission received 333.91 570.04 Dividend received 6,184.78 2,745.17 Loans given to subsidiaries (760.00) - Repayment of loans by subsidiaries 700.00 - Repayment of loans by others (net) 112.35 15.14 net cash (used in)/ from investing activities (B) (1,635.31) 3,591.92
standalone statement of cash flows(All amounts in Rupees million, unless otherwise stated)
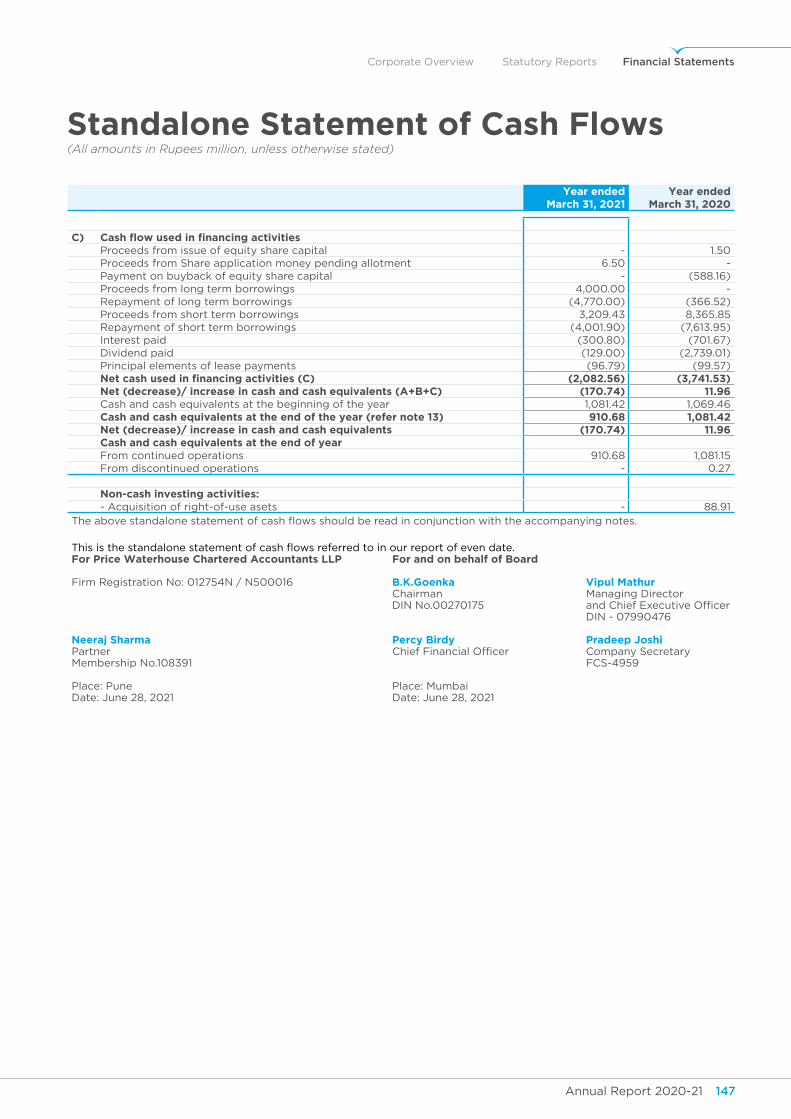
Annual Report 2020-21 147Annual Report 2020-21146
Corporate Overview Statutory Reports Financial Statements
year ended March 31, 2021
year ended March 31, 2020
c) Cash flow used in financing activitiesProceeds from issue of equity share capital - 1.50 Proceeds from Share application money pending allotment 6.50 - Payment on buyback of equity share capital - (588.16)Proceeds from long term borrowings 4,000.00 - Repayment of long term borrowings (4,770.00) (366.52)Proceeds from short term borrowings 3,209.43 8,365.85 Repayment of short term borrowings (4,001.90) (7,613.95)Interest paid (300.80) (701.67)Dividend paid (129.00) (2,739.01)Principal elements of lease payments (96.79) (99.57)net cash used in financing activities (C) (2,082.56) (3,741.53)net (decrease)/ increase in cash and cash equivalents (A+B+C) (170.74) 11.96 Cash and cash equivalents at the beginning of the year 1,081.42 1,069.46 Cash and cash equivalents at the end of the year (refer note 13) 910.68 1,081.42 net (decrease)/ increase in cash and cash equivalents (170.74) 11.96 cash and cash equivalents at the end of yearFrom continued operations 910.68 1,081.15 From discontinued operations - 0.27
non-cash investing activities:- Acquisition of right-of-use asets - 88.91
The above standalone statement of cash flows should be read in conjunction with the accompanying notes.
This is the standalone statement of cash flows referred to in our report of even date.for price waterhouse chartered Accountants llp for and on behalf of Board
Firm Registration No: 012754N / N500016 B.K.goenka vipul mathurChairman Managing DirectorDIN No.00270175 and Chief Executive Officer
DIN - 07990476
neeraj sharma percy Birdy pradeep JoshiPartner Chief Financial Officer Company SecretaryMembership No.108391 FCS-4959
Place: Pune Place: MumbaiDate: June 28, 2021 Date: June 28, 2021
standalone statement of cash flows(All amounts in Rupees million, unless otherwise stated)
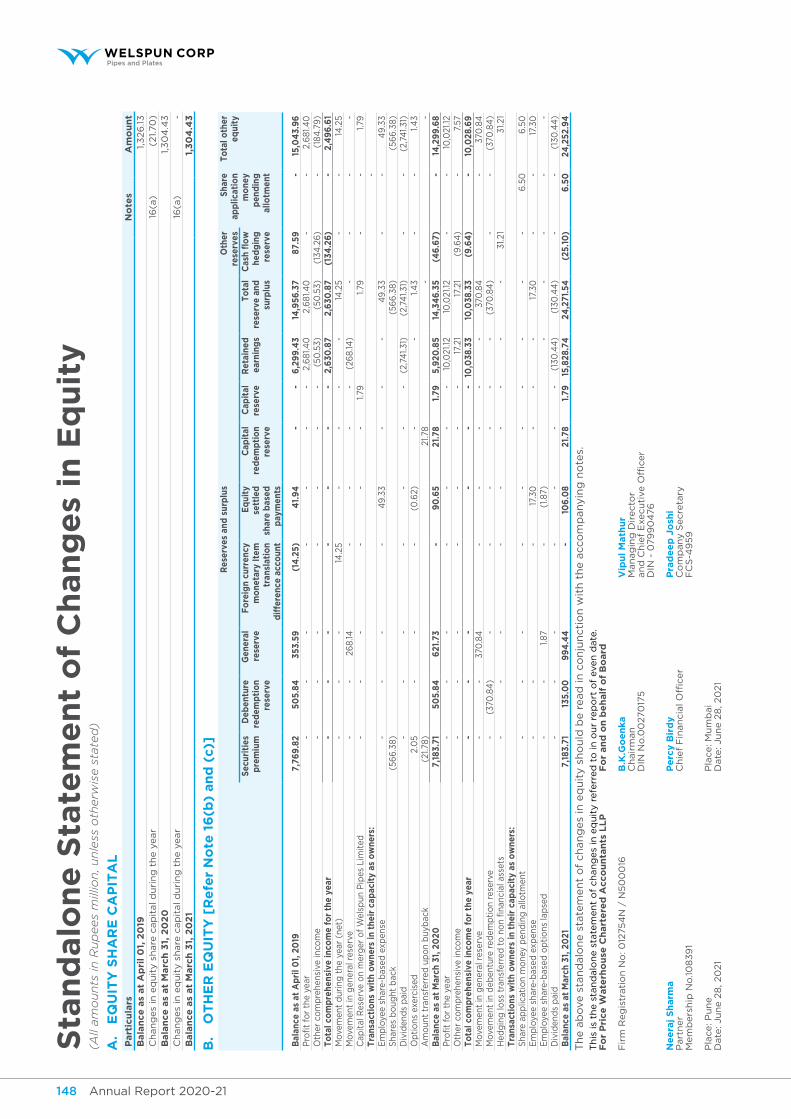
Annual Report 2020-21 149Annual Report 2020-21148 Annual Report 2020-21 149Annual Report 2020-21148
sta
nd
alo
ne
sta
tem
en
t o
f c
han
ge
s in
eq
uit
y(A
ll am
ou
nts
in
Ru
pees
mill
ion
, un
less
oth
erw
ise s
tate
d)
A.
eq
uIt
y s
hA
Re
cA
pIt
Al
part
icu
lars
no
tes
Am
ou
nt
Bala
nce
as
at
Ap
ril
01,
20
19 1
,326
.13
C
han
ges
in e
qu
ity s
hare
cap
ital d
uri
ng
th
e y
ear
16(a
) (
21.70
)B
ala
nce
as
at
Marc
h 3
1, 2
02
0 1
,30
4.4
3
Ch
an
ges
in e
qu
ity s
hare
cap
ital d
uri
ng
th
e y
ear
16(a
) -
B
ala
nce
as
at
Marc
h 3
1, 2
02
1 1
,30
4.4
3
B.
ot
he
R e
qu
Ity
[R
efe
r n
ote
16
(b)
an
d (
c)]
Res
erve
s an
d s
urp
lus
oth
er
rese
rves
sha
re
app
licat
ion
mo
ney
pen
din
g
allo
tmen
t
to
tal o
ther
eq
uity
s
ecur
itie
s p
rem
ium
deb
entu
re
red
emp
tio
n re
serv
e
gen
eral
re
serv
ef
ore
ign
curr
ency
m
one
tary
Ite
m
tran
slat
ion
dif
fere
nce
acco
unt
eq
uity
se
ttle
d
shar
e b
ased
p
aym
ents
cap
ital
re
dem
pti
on
rese
rve
cap
ital
re
serv
eR
etai
ned
ea
rnin
gs
to
tal
rese
rve
and
su
rplu
s
Cas
h fl
ow
he
dg
ing
re
serv
e
Bal
ance
as
at A
pri
l 01,
20
19 7
,76
9.8
2 5
05.
84
353
.59
(
14.2
5) 4
1.9
4
-
-
6,2
99
.43
14,9
56.3
7 8
7.59
-
1
5,0
43.
96
P
rofi
t fo
r th
e ye
ar -
-
-
-
-
-
-
2
,68
1.40
2
,68
1.40
-
-
2
,68
1.40
O
ther
co
mp
rehe
nsiv
e in
com
e -
-
-
-
-
-
-
(
50.5
3) (
50.5
3) (
134
.26
) -
(
184
.79
)t
ota
l co
mp
rehe
nsiv
e in
com
e fo
r th
e ye
ar -
-
-
-
-
-
-
2
,630
.87
2,6
30.8
7 (
134
.26
) -
2
,49
6.6
1 M
ovem
ent
dur
ing
the
yea
r (n
et)
-
-
-
14
.25
-
-
-
-
14
.25
-
-
14
.25
Mov
emen
t in
gen
eral
res
erve
-
-
26
8.14
-
-
-
-
(
268
.14)
-
-
-
-
Cap
ital
Res
erve
on
mer
ger
of
Wel
spun
Pip
es L
imit
ed
-
-
-
-
-
-
1.7
9
1.7
9
-
-
1.7
9
tra
nsac
tio
ns w
ith
ow
ners
in t
heir
cap
acit
y as
ow
ners
: -
E
mp
loye
e sh
are-
bas
ed e
xpen
se -
-
-
-
4
9.3
3 -
-
-
4
9.3
3 -
-
4
9.3
3 S
hare
s b
oug
ht b
ack
(56
6.3
8)
(56
6.3
8)
(56
6.3
8)
Div
iden
ds
pai
d
-
-
-
-
-
-
-
(2,
741.3
1) (
2,74
1.31)
-
-
(2,
741.3
1)O
pti
ons
exe
rcis
ed 2
.05
-
-
-
(0
.62)
-
-
1.4
3 -
-
1
.43
Am
oun
t tr
ansf
erre
d u
po
n b
uyb
ack
(21
.78
) 2
1.78
-
-
B
alan
ce a
s at
Mar
ch 3
1, 2
020
7,1
83.7
1 5
05.
84
621
.73
-
90
.65
21.
78
1.7
9
5,9
20.8
5 14
,34
6.3
5 (
46
.67)
-
14
,29
9.6
8 P
rofi
t fo
r th
e ye
ar -
-
-
-
-
-
-
1
0,0
21.12
1
0,0
21.12
-
-
1
0,0
21.12
O
ther
co
mp
rehe
nsiv
e in
com
e -
-
-
-
-
-
-
1
7.21
1
7.21
(
9.6
4)
-
7.5
7 t
ota
l co
mp
rehe
nsiv
e in
com
e fo
r th
e ye
ar -
-
-
-
-
-
10
,038
.33
10
,038
.33
(9
.64
) -
1
0,0
28.6
9
Mov
emen
t in
gen
eral
res
erve
-
-
370
.84
-
-
-
-
-
3
70.8
4
-
370
.84
M
ovem
ent
in d
eben
ture
red
emp
tio
n re
serv
e -
(
370
.84
) -
-
-
-
-
-
(
370
.84
) -
-
(
370
.84
)H
edg
ing
loss
tra
nsfe
rred
to
no
n fi
nanc
ial a
sset
s -
-
-
-
-
-
-
-
-
3
1.21
31.2
1 t
rans
acti
ons
wit
h o
wne
rs in
the
ir c
apac
ity
as o
wne
rs:
Sha
re a
pp
licat
ion
mo
ney
pen
din
g a
llotm
ent
-
-
-
-
-
-
-
-
-
-
6.5
0
6.5
0
Em
plo
yee
shar
e-b
ased
exp
ense
-
-
-
17.
30
-
-
-
17.
30
-
-
17.
30
Em
plo
yee
shar
e-b
ased
op
tio
ns la
pse
d -
-
1
.87
-
(1.8
7) -
-
-
-
-
D
ivid
end
s p
aid
-
-
-
-
-
-
-
(13
0.4
4)
(13
0.4
4)
-
-
(13
0.4
4)
Bal
ance
as
at M
arch
31,
20
21 7
,183
.71
135
.00
9
94
.44
-
1
06
.08
21.
78
1.7
9
15,8
28.7
4
24,2
71.5
4
(25
.10
) 6
.50
2
4,2
52.9
4
Th
e a
bo
ve s
tan
dalo
ne s
tate
men
t o
f ch
an
ges
in e
qu
ity s
ho
uld
be r
ead
in
co
nju
ncti
on
wit
h t
he a
cco
mp
an
yin
g n
ote
s.T
his
is
the s
tan
dalo
ne s
tate
men
t o
f ch
an
ges
in e
qu
ity r
efe
rred
to
in
ou
r re
po
rt o
f even
date
.f
or
pri
ce
wate
rho
use
ch
art
ere
d A
cco
un
tan
ts l
lp
fo
r an
d o
n b
eh
alf
of
Bo
ard
Fir
m R
eg
istr
ati
on
No
: 0
1275
4N
/ N
50
00
16B
.K.g
oe
nka
vip
ul
math
ur
Ch
air
man
M
an
ag
ing
Dir
ecto
rD
IN N
o.0
0270
175
an
d C
hie
f E
xecu
tive O
fficer
DIN
- 0
79
90
476
ne
era
j s
harm
ap
erc
y B
ird
y
pra
de
ep
Jo
shi
Part
ner
Ch
ief
Fin
an
cia
l O
fficer
Co
mp
an
y S
ecre
tary
Mem
bers
hip
No
.10
83
91
FC
S-4
95
9
Pla
ce: P
un
eP
lace: M
um
bai
Date
: Ju
ne 2
8, 20
21
Date
: Ju
ne 2
8, 20
21
Annual Report 2020-21 149Annual Report 2020-21148
Corporate Overview Statutory Reports Financial Statements
Notesannexed to and forming part of the standalone balance sheet as at March 31, 2021 andthe standalone statement of profit and loss for the year ended March 31, 2021(All amounts in Rupees million, unless otherwise stated)
Annual Report 2020-21 149Annual Report 2020-21148
geneRAl InfoRmAtIon
Welspun Corp Limited (hereinafter referred to as “WCL” or “the Company”) is engaged in the business of Production and Coating of High Grade Submerged Arc Welded Pipes, Hot Rolled Steel Plates and Coils.
The Company is a public limited company which is listed on the Bombay Stock Exchange (BSE) and the National Stock Exchange (NSE) and is incorporated and domiciled in India. The address of its registered office is “Welspun City”, Village Versamedi, Tal. Anjar, Dist Kutch, Gujarat - 370110, India.
These standalone financial statements were approved for issue by the Board of Directors on June 28, 2021.
note 1: sIgnIfIcAnt AccountIng polIcIes
This note provides a list of the significant accounting policies adopted in the preparation of these standalone financial statements. These policies have been consistently applied to all the years presented, unless otherwise stated.
1.1 BAsIs of pRepARAtIon of stAndAlone fInAncIAl stAtements
a) compliance with Ind As The standalone financial statements comply
in all material aspects with Indian Accounting Standards (Ind AS) notified under Section 133 of the Companies Act, 2013 (the Act) [Companies (Indian Accounting Standards) Rules, 2015 as amended] and other relevant provisions of the Act.
b) historical cost convention The standalone financial statements have been
prepared on an accrual and going concern basis. The standalone
Financial statements have been prepared on a historical cost basis, except for the following items:
Items Measurement basis
Certain financial assets and liabilities (including derivatives instruments)
Fair value
Assets or disposal groups held for sale
Fair value less cost to sell
Share based payments Fair value
Net defined benefit (asset)/ liability
Fair value of plan assets less present value of defined benefit obligations
c) Current and non-current classification All assets and liabilities have been classified as
current or non-current as per the Company’s normal operating cycle (i.e 12 months) and other criteria set out in Schedule III (Division II) to the Act.
d) Recent Accounting pronouncements i) new and amended standards adopted by
the company The Company has applied the following
amendments to Ind AS for the first time for their annual reporting period commencing 1 April 2020:
• Definition of Material – amendments to Ind AS 1 and Ind AS 8
Amendments are made to Ind AS 1- Presentation of Financial Statements and Ind AS 8 - Accounting Policies, Changes in Accounting Estimates and Errors, which use a consistent definition of materiality, clarify when information is material and incorporate some of the guidance in Ind AS 1 about immaterial information.
In particular, the amendments clarify:
– that the reference to obscuring information addresses situations in which the effect is similar to omitting or misstating that information, and that an entity assesses materiality in the context of the financial statements as a whole, and
– the meaning of ‘primary users of general purpose financial statements’ to whom those financial statements are directed, by defining them as ‘existing and potential investors, lenders and other creditors’ that must rely on general purpose financial statements for much of the financial information they need.
• Definition of a Business – amendments to Ind AS 103
The amended definition of a business requires an acquisition to include an input and a substantive process that together significantly contribute to the ability to create outputs. The definition of the term ‘outputs’ is amended to focus on goods and services provided
Annual Report 2020-21 151Annual Report 2020-21150
Notesannexed to and forming part of the standalone balance sheet as at March 31, 2021 andthe standalone statement of profit and loss for the year ended March 31, 2021(All amounts in Rupees million, unless otherwise stated)
to customers, generating investment income and other income, and it excludes returns in the form of lower costs and other economic benefits.
• COVID-19 related concessions – amendments to Ind AS 116
Amendments to Ind AS 116 Leases, provides a practical expedient to apply rent concessions occurring as a direct consequence of the COVID-19 pandemic. Lessee that makes this election shall account for any change in lease payments resulting from the rent concession the same way it would account for the change applying this Standard if the change were not a lease modification.
• Interest Rate Benchmark Reform – amendments to Ind AS 109 and Ind AS 107
The amendments made to Ind AS 109 Financial Instruments, and Ind AS 107 Financial Instruments: Disclosures provide certain reliefs in relation to interest rate benchmark reform. The reliefs relate to hedge accounting and have the effect that the reforms should not generally cause hedge accounting to terminate. However, any hedge ineffectiveness should continue to be recorded in the income statement.
The amendments listed above did not have any material impact on Company’s financial statements.
ii) Amended applicable from next financial year
On March 24, 2021, the Ministry of Corporate Affairs (“MCA”) through a notification, amended Schedule III of the Companies Act, 2013. The amendments revise Division I, II and III of Schedule III and are applicable from April 1, 2021. Key amendments relating to Division II which relate to companies whose financial statements are required to comply with Companies (Indian Accounting Standards) Rules 2015 are:
Balance sheet: • Lease liabilities should be separately
disclosed under the head ‘financial liabilities’, duly distinguished as current or non-current.
• Certain additional disclosures in the statement of changes in equity such as changes in equity share capital due to prior period errors and restated balances at the beginning of the current reporting period.
• Specified format for disclosure of shareholding of promoters.
• Specified format for ageing schedule of trade receivables, trade payables, capital work-in-progress and intangible asset under development.
• If a company has not used funds for the specific purpose for which it was borrowed from banks and financial institutions, then disclosure of details of where it has been used.
• Specific disclosure under ‘additional regulatory requirement’ such as compliance with approved schemes of arrangements, compliance with number of layers of companies, title deeds of immovable property not held in name of company, loans and advances to promoters, directors, key managerial personnel (KMP) and related parties, details of benami property held, certain specified ratios etc.
statement of profit and loss: • Additional disclosures relating to
Corporate Social Responsibility (CSR), undisclosed income and crypto or virtual currency specified under the head ‘additional information’ in the notes forming part of the standalone financial statements.
The amendments are extensive and the Company will evaluate the same to give effect to them as required by law.
1.2 foReign CuRRenCy tRAnsLAtion
a) functional and presentation currency Items included in the standalone financial
statements of the Company are measured using the currency of the primary economic environment in which the Company operates (‘the functional currency’). The standalone financial statements are presented in Indian rupee (INR), which is Company’s functional and presentation currency.
Annual Report 2020-21 151Annual Report 2020-21150
Corporate Overview Statutory Reports Financial Statements
Notesannexed to and forming part of the standalone balance sheet as at March 31, 2021 andthe standalone statement of profit and loss for the year ended March 31, 2021(All amounts in Rupees million, unless otherwise stated)
b) transactions and balances Foreign currency transactions are translated into
the functional currency using the exchange rates at the dates of the transactions. Foreign exchange gains and losses resulting from the settlement of such transactions and from the translation of monetary assets and liabilities denominated in foreign currencies at year end exchange rates are generally recognised in profit or loss.
Foreign exchange differences regarded as an adjustment to borrowing costs are presented in the statement of profit and loss, within finance costs. All other foreign exchange gains and losses are presented in the statement of profit and loss on a net basis within other expenses or other income, as applicable.
Non-monetary items that are measured in terms of historical cost in a foreign currency are translated using the exchange rates at the date of initial transaction.
Non-monetary items that are measured at fair value in a foreign currency are translated using the exchange rates at the date when the fair value was determined. Translation differences on assets and liabilities carried at fair value are reported as part of the fair value gain or loss.
The Company has elected to apply the exemption from the transition date i.e. April 01, 2015 in respect of accounting policy followed for long term foreign currency monetary items. Accordingly, long term foreign currency monetary items in the standalone financial statement have been accounted in accordance with adopted under previous GAAP as given below:
• Foreign exchange differences on account of depreciable assets are adjusted in the cost of depreciable assets and depreciated over the balance life of the assets.
• In other cases, foreign exchange differences are accumulated in “Foreign Currency Monetary Item Translation Difference Account” and amortised over the balance period of such long term assets / liabilities.
1.3 Revenue ReCognition
a) sale of goods The Company derives revenue principally
from sale of pipes.
The Company recognises revenue when it satisfies a performance obligation in accordance with the provisions of contract with the customer. This is achieved when control of the product has been transferred to the customer, which is generally determined when title, ownership, risk of obsolescence and loss pass to the customer and the Company has the present right to payment, all of which occurs at a point in time upon shipment or delivery of the product. The Company considers freight activities as costs to fulfil the promise to transfer the related products and the customer payments for freight costs are recorded as a component of revenue.
A receivable is recognised when the goods are delivered as this is the point in time that the consideration is unconditional because only the passage of time is required before the payment is due.
In certain customer contracts, freight services are treated as a distinct separate performance obligation and the Company recognises revenue for such services when the performance obligation is completed.
The Company considers the terms of the contract in determining the transaction price. The transaction price is based upon the amount the Company expects to be entitled to in exchange for transferring of promised goods and services to the customer after deducting incentive programs, included but not limited to discounts, volume rebates, etc.
Revenue is recognized at a determined transaction price when identified performance obligations are satisfied. The bill and hold contracts are entered at the request of the customer. Revenue from bill and hold contracts is recognised at the agreed transaction price (determined price) .The price for bill and hold contracts is determined at the time of entering into the transaction and the performance obligation is satisfied when goods have been appropriated towards the sale transaction (the control of asset is transferred to the customer).
Revenue excludes any taxes and duties collected on behalf of the government.
b) sale of services The Company provides freight services to its
customers. Revenue from providing freight
Annual Report 2020-21 153Annual Report 2020-21152
Notesannexed to and forming part of the standalone balance sheet as at March 31, 2021 andthe standalone statement of profit and loss for the year ended March 31, 2021(All amounts in Rupees million, unless otherwise stated)
services is recognised in the accounting period in which the services are rendered. The related freight costs incurred are included in freight expenses when the Company is acting as principal in the freight arrangement.
Freight services may be considered a separate performance obligation if control of the goods transfers to the customer before goods reach to the agreed place of shipment, but the entity has promised to ship the goods (or arrange for the goods to be shipped). In contrast, if control of a good does not transfer to the customer before goods reach to the agreed place of shipment, freight service is not a promised service to the customer. This is because freight service is a fulfillment activity as the costs are incurred as part of transferring the goods to the customer.
1.4 contRAct Assets And contRAct lIABIlItIes
When the Company performs a service or transfers a good in advance of receiving consideration, it recognises a contract asset or receivable.
A contract asset is a Company’s right to consideration in exchange for goods or services that the Company has transferred to a customer. If the Company transfers control of goods or services to a customer before the customer pays consideration, the Company records a contract asset when the nature of the Company’s right to consideration for its performance is other than passage of time. A contract asset will be classified as a receivable when the Company’s right to consideration is unconditional (that is, when payment is due only on the passage of time).The Company shall assess a contract asset for impairment in accordance with Ind AS 109. Impairment of a contract asset is measured, presented and disclosed on similar basis as other financial asset in nature of trade receivable within the scope of Ind AS 109. The Company discloses contract assets under “Other Assets”.
The Company recognises a contract liability if the customer’s payment of consideration precedes the Company’s performance. A contract liability is recognised if the Company receives consideration (or if it has the unconditional right to receive consideration) in advance of performance. The Company discloses contract liabilities under “Other Liabilities”.
1.5 segMent RePoRting
The board of directors of the Company assess the financial performance and position of the Company, and makes strategic decisions. The chief operating decision makers are board of directors of the Company. Operating segments are reported in a manner consistent with the internal reporting provided to the chief operating decision maker.
1.6 goveRnMent gRAnts
Grants from the government are recognised at their fair value where there is a reasonable assurance that the grant will be received, and the Company will comply with all attached conditions.
Export incentives and subsidies are recognized when there is reasonable assurance that the Company will comply with the conditions and the incentive will be received.
Grants related to assets are government grants whose primary condition is that an entity qualifying for them should purchase, construct or otherwise acquire long-term assets. Grants related to income are government grants other than those related to assets.
Government grants relating to income are deferred and recognised in the profit or loss over the period necessary to match them with the costs that they are intended to compensate and presented either under “other operating income” or are deducted in reporting the related expense.
Government grants relating to the purchase of property, plant and equipment are included in liabilities as “Government grants” and are credited to profit or loss on a straight-line basis over the expected lives of the related assets and presented within “Other operating income”. In case of disposal of such property, plant and equipment, related Government Grants included in the liabilities are written back and charged to the statement of profit and loss.
1.7 inCoMe tAx, defeRRed tAx And dividend distRiBution tAx
The Income tax expense or credit for the year is the tax payable on the current year’s taxable income based on the applicable income tax rate adjusted by changes in deferred tax assets and liabilities attributable to temporary differences and to unused tax losses.
Annual Report 2020-21 153Annual Report 2020-21152
Corporate Overview Statutory Reports Financial Statements
Notesannexed to and forming part of the standalone balance sheet as at March 31, 2021 andthe standalone statement of profit and loss for the year ended March 31, 2021(All amounts in Rupees million, unless otherwise stated)
Current and deferred tax is recognised in the profit and loss except to the extent it relates to items recognised directly in equity or other comprehensive income, in which case it is recognised in equity or other comprehensive income respectively.
a) current income tax Current tax charge is based on taxable
profit for the year. The tax rates and tax laws used to compute the amount are those that are enacted or substantively enacted, at the reporting date where the Company operates and generates taxable income. Management periodically evaluates positions taken in tax returns with respect to situations in which applicable tax regulation is subject to interpretation. It establishes provisions where appropriate on the basis of amounts expected to be paid to the tax authorities.
Current tax assets and tax liabilities are offset when there is a legally enforceable right to set off current tax assets against current tax liabilities and Company intends either to settle on a net basis, or to realise the asset and settle the liability simultaneously.
b) deferred tax Deferred tax is provided in full using the liability
method, on temporary differences arising between the tax bases of assets and liabilities and their carrying amounts in the standalone financial statements. However, deferred tax liabilities are not recognized if they arise from the initial recognition of goodwill.
Deferred tax is determined using tax rates that have been enacted or substantially enacted by the end of the reporting period and are expected to apply when the related deferred tax assets is realized or deferred tax liability is settled.
Deferred tax are recognised for all deductible temporary difference and unused tax losses only if it is probable that future taxable amounts will be available to utilise those temporary differences and losses.
Deferred income tax is not accounted for if it arises from initial recognition of an asset or liability in a transaction other than a business combination that at the time of the
transaction affects neither accounting profit nor taxable profit (tax loss).
The carrying amount of deferred tax assets is reviewed at each reporting date and adjusted to reflect changes in probability that sufficient taxable profits will be available to allow all or part of the asset to be recovered.
Deferred income tax assets and liabilities are off-set against each other and the resultant net amount is presented in the Balance Sheet, if and only when, (a) the Company has a legally enforceable right to set-off the current income tax assets and liabilities, and (b) the deferred income tax assets and liabilities relate to income tax levied by the same taxation authority.
Current and deferred tax is recognised in profit or loss, except to the extent that it relates to items recognised in other comprehensive income or directly in equity. In this case, the tax is also recognised in other comprehensive income or directly in equity, respectively
c) dividend distribution tax Dividend distribution tax paid on the
dividends is recognised consistently with the presentation of the transaction that creates the income tax consequence. Dividend distribution tax is charged to statement of profit and loss if the dividend itself is charged to statement of profit and loss. If the dividend is recognised in equity, the presentation of dividend distribution tax is recognised in equity.
1.8 LeAses
a) As a lessee The Company leases various leasehold lands,
buildings, vehicles, and office and other equipments. Rental contracts are typically made for fixed periods of one to ninety-nine years but may have extension options as described in note 3(b). Lease terms are negotiated on an individual basis and contain a wide range of different terms and conditions. The lease agreements do not impose any covenants, but leased assets may not be used as security for borrowing purposes.
Based on the notification released by MCA, Ind AS 116 has been made applicable w.e.f April 01, 2019. From April 01, 2019, leases are recognized
Annual Report 2020-21 155Annual Report 2020-21154
Notesannexed to and forming part of the standalone balance sheet as at March 31, 2021 andthe standalone statement of profit and loss for the year ended March 31, 2021(All amounts in Rupees million, unless otherwise stated)
as a right-of-use assets and a corresponding lease liability at the date at which the leased assets is available for the use by the Company.
Assets and liabilities arising from a lease are initially measured on a present value basis. Lease liabilities include the net present value of the following lease payments, as applicable:
• fixed payments (including in-substance fixed payments), less any lease incentives receivable
• variable lease payment that are based on an index or a rate, initially measured using the index or rate as at the commencement date
• amounts expected to be payable by the Company under residual value guarantees
• the exercise price of a purchase option if the lessee is reasonably certain to exercise that option, and
• payments of penalties for terminating the lease, if the lease term reflects the lessee exercising that option.
Lease payment to be made under reasonably certain extension options are also included in the measurement of the liability. The lease payments are discounted using the interest rate implicit in the lease. If that rate cannot be readily determined, the lessee’s incremental borrowing rate is used, being the rate that the lessee would have to pay to borrow the funds necessary to obtain an asset of similar value to the right-of-use asset in a similar economic environment with similar terms, security and conditions.
Lease payments are allocated between principal and finance cost. The finance cost is charged to profit or loss over the lease period so as to produce a constant periodic rate of interest on the remaining balance of the liability for each period.
Right-of-use assets are measured at cost comprising the following, wherever applicable:
• the amount of the initial measurement of lease liability
• any lease payments made at or before the commencement date less any lease incentives received
• any initial direct costs, and
• restoration costs.
Right-of-use assets are generally depreciated over the shorter of the asset’s useful life and the lease term (including extension considering reasonable certainty), on a straight-line basis. If the Company is reasonably certain to exercise a purchase option, the right-of-use asset is depreciated over the underlying asset’s useful life.
Payments associated with short-term leases of equipment and all leases of low-value assets are recognised on a straight-line basis as an expense in profit or loss. Short-term leases are leases with a lease term of 12 months or less. Low-value assets and short term lease assets comprises of dumpsite land, laptops and other office equipements.
b) As a lessor Lease income from operating leases where the
Company is a lessor is recognised in income on a straight-line basis over the lease term. Initial direct cost incurred in obtaining an operating lease are added to the carrying amount of the underlying asset and recognised as expense over the lease term on the same basis as lease income. The respective leased assets are included in the balance sheet based on their nature. The Company did not need to make any adjustments to the accounting for assets held as lessor as a result of adopting the new leasing standard.
1.9 PRoPeRty, PLAnt And equiPMent
Freehold land is carried at historical cost. All other items of property, plant and equipment are stated at historical cost less depreciation. Historical cost includes expenditure that is directly attributable to the acquisition of the items.
Subsequent costs are included in the asset’s carrying amount or recognised as a separate asset, as appropriate, only when it is probable that future economic benefits associated with the item will flow to the company and the cost of the item can be measured reliably. The carrying amount of any component accounted for as a separate asset is derecognised when replaced. All other repairs and maintenance are charged to profit or loss during the reporting period in which they are incurred.
Cost of Capital Work in Progress (‘CWIP’) comprises amount paid towards acquisition of
Annual Report 2020-21 155Annual Report 2020-21154
Corporate Overview Statutory Reports Financial Statements
Notesannexed to and forming part of the standalone balance sheet as at March 31, 2021 andthe standalone statement of profit and loss for the year ended March 31, 2021(All amounts in Rupees million, unless otherwise stated)
property, plant and equipment outstanding as of each balance sheet date and construction expenditures, other expenditures necessary for the purpose of preparing the CWIP for it intended use and borrowing cost incurred before the qualifying asset is ready for intended use. CWIP is not depreciated until such time as the relevant asset is completed and ready for its intended use.
depreciation methods, estimated useful lives and residual value
Freehold land is not depreciated.Leasehold improvements and Lease hold land are amortised over the shorter of estimated useful life or the related lease term. Depreciation is calculated using the straight-line method to allocate their cost, net of their residual values, over their estimated useful lives as follows:
Assets estimated useful lives (in years)
Buildings
Building 30
Residential and other buildings
60
Road, fencing, etc.
Ranging between 3 to 15 years
office and other equipments
Office equipment
Ranging between 3 to 10 years
Computer 3 years except Networking equipment’s which are depreciated over useful life of 5 years
Vehicles 8
Furniture and fixtures
10
These estimated useful lives are in accordance with those prescribed under Schedule II to the Companies Act, 2013 except in respect of plant and machinery wherein the estimated useful lives are different than those under Schedule II to the Companies Act, 2013 based on a technical evaluation done by the Management.
Plant and machinery is depreciated on straight line method over the useful life ranging between 2 years to 40 years in order to reflect the actual usage of the assets. The estimated useful lives of plant and machinery has been determined based on internal technical advice which considers the nature of the asset, the usage of the asset, expected
physical wear and tear, the operating conditions of the asset, anticipated technological changes, etc.
The residual values are not more than 5% of the original cost of the asset.
An asset’s carrying amount is written down immediately to its recoverable amount if the asset’s carrying amount is greater than its estimated recoverable amount.
Estimated useful lives, residual values and depreciation methods are reviewed annually, taking into account commercial and technological obsolescence as well as normal wear and tear and adjusted prospectively, if appropriate.
Gains and losses on disposals are determined by comparing proceeds with carrying amount. These are included in profit or loss within other expenses or other income or other expenses, as applicable.
1.10 investMent PRoPeRties
Property that is held for long-term rental yields or for capital appreciation or both, and that is not occupied by the Company, is classified as Investment property. Investment property is measured initially at its cost, including related transaction costs and where applicable borrowing costs. Subsequent expenditure is capitalised to the asset’s carrying amount only when it is probable that future economic benefits associated with the expenditure will flow to the Company and the cost of the item can be measured reliably. All other repairs and maintenance costs are expensed when incurred. When part of an investment property is replaced, the carrying amount of the replaced part is derecognised.
Investment properties (except freehold land) are depreciated using the straight-line method over their estimated useful lives over a period of thirty years. These estimated useful lives are in accordance with those prescribed under Schedule II to the Companies Act, 2013.
1.11 IntAngIBle Assets
Intangible assets with finite useful lives acquired by the Company are measured at cost less accumulated amortization and accumulated impairment losses. Amortization is charged on a straight-line basis over the estimated useful lives. The estimated useful life and amortization
Annual Report 2020-21 157Annual Report 2020-21156
Notesannexed to and forming part of the standalone balance sheet as at March 31, 2021 andthe standalone statement of profit and loss for the year ended March 31, 2021(All amounts in Rupees million, unless otherwise stated)
method are reviewed at the end of each annual reporting period, with the effect of any changes in the estimate being accounted for on a prospective basis.
Amortisation methods and periods Intangible assets comprise of computer software
which is amortised on a straight-line basis over its expected useful life over a period of five years which is based on a technical evaluation done by the Management.
1.12 non-CuRRent Assets (oR disPosAL gRoups) held foR sAle And dIscontInued opeRAtIons
Non-current assets (or disposal groups) are classified as held for sale if their carrying amount will be recovered principally through a sale transaction rather than through continuing use and a sale is considered highly probable. They are measured at the lower of their carrying amount and fair value less costs to sell, except for assets such as deferred tax assets, assets arising from employee benefits, financial assets, which are specifically exempt from this requirement.
An impairment loss is recognised for any initial or subsequent write-down of the asset (or disposal groups) to fair value less costs to sell. A gain is recognised for any subsequent increases in fair value less costs to sell of an asset (or disposal groups), but not in excess of any cumulative impairment loss previously recognised. A gain or loss not previously recognised by the date of the sale of the non-current asset (or disposal groups) is recognised at the date of de-recognition.
Non-current assets (including those that are part of disposal groups) are not depreciated or amortised while they are classified as held for sale. Interest and other expenses attributable to liabilities of disposal groups classified as held for sale continue to be recognized.
Non-current assets classified as held for sale and the assets of disposal groups classified as held for sale are presented separately from the other assets in the balance sheet under the head “Assets or disposal groups classified as held for sale”. The liabilities of disposal groups classified as held for sale are presented separately from other liabilities in the balance sheet under the head “Liabilities directly associated with disposal groups classified as held for sale”.
A discontinued operation is a component of the entity that has been disposed of or is classified as held for sale and that represents a separate major line of business or geographical area of operations, is part of a single co-ordinated plan to dispose of such a line of business or are of operations, or is a subsidiary acquired exclusively with a view to resale. The results of discontinued operations are presented separately in the statement of profit and loss.
1.13 iMPAiRMent of Assets
Intangible assets that have an indefinite useful life are not subject to amortization and are tested annually for impairment or more frequently if events or changes in circumstances indicate that they might be impaired. Other assets are tested for impairment whenever events or changes in circumstances indicate that the carrying amount may not be recoverable. An impairment loss is recognised for the amount by which the asset’s carrying amount exceeds its recoverable amount. The recoverable amount is the higher of an asset’s fair value less costs of disposal and value in use. For the purposes of assessing impairment, assets are grouped at the lowest levels for which there are separately identifiable cash inflows which are largely independent of the cash inflows from other assets or groups of assets (cash-generating units). Non-financial assets that suffered impairment are reviewed for possible reversal of the impairment at the end of each reporting period.
1.14 InventoRIes
Raw materials, stores and spares, work in progress, traded goods and finished goods
Raw materials, stores, work in progress, traded and finished goods are stated at the lower of cost and net realisable value. Cost of raw materials and traded goods comprises cost of purchases on moving weighted average basis. Cost of work-in progress and finished goods comprises direct materials, direct labour and an appropriate proportion of variable and fixed overhead expenditure, the latter being allocated on the basis of normal operating capacity. Cost of inventories also includes all other costs incurred in bringing the inventories to their present location and condition. Costs are assigned to individual items of inventory on moving weighted average basis. Costs of purchased inventory are determined after deducting rebates and discounts. Net realisable value is the estimated selling price in the ordinary
Annual Report 2020-21 157Annual Report 2020-21156
Corporate Overview Statutory Reports Financial Statements
Notesannexed to and forming part of the standalone balance sheet as at March 31, 2021 andthe standalone statement of profit and loss for the year ended March 31, 2021(All amounts in Rupees million, unless otherwise stated)
course of business less the estimated costs of completion and the estimated costs necessary to make the sale.
1.15 investMent in suBsidiARies, joint ventuRes And AssocIAte
The investments in subsidiaries, joint ventures and associate are carried in the standalone financial statements at historical cost except when the investment, or a portion thereof, is classified as held for sale, in which case it is accounted for as Non-current assets held for sale and discontinued operations.
When the Company is committed to a sale plan involving disposal of an investment, or a portion of an investment, in any subsidiary or joint venture, the investment or the portion of the investment that will be disposed of is classified as held for sale when the criteria described above are met. Any retained portion of an investment in a subsidiary or a joint venture that has not been classified as held for sale continues to be accounted for at historical cost.
Company considers issuance of non-market rate redeemable preference shares by subsidiary as compound instrument comprising a loan with market terms and a capital injection and hence treat the difference between the cash paid and fair value on initial recognition as an addition to the investment in the subsidiary and presented separately as ‘Investment in equity component of preference shares’ under ‘Equity investments in subsidiaries and joint ventures’. Equity Component is not subsequent remeasured.
1.16 finAnCiAL instRuMents
A financial instrument is any contract that gives rise to a financial asset of one entity and a financial liability or equity instrument of another entity.
a) financial assets
(i) Classification The Company classifies its financial assets in
the following measurement categories:
• those to be measured subsequently at fair value (either through other comprehensive income, or through profit or loss); and
• those measured at amortised cost.
The classification depends on the entity’s business model for managing the financial assets and the contractual terms of the cash flows.
For assets measured at fair value, gains and losses will either be recorded in profit or loss or other comprehensive income. For investments in debt instruments, this will depend on the business model in which the investment is held.
For investments in equity instruments, this will depend on whether the Company has made an irrevocable election at the time of initial recognition to account for the equity investment at fair value through other comprehensive income.
The Company reclassifies debt investments when and only when its business model for managing those assets changes.
(II) measurement At initial recognition, the Company measures
a financial asset at its fair value plus, in the case of a financial asset not at fair value through profit or loss, transaction costs that are directly attributable to the acquisition of the financial asset. After initial recognition, financial assets not measured at fair value through profit & Loss are measured using effective interest method. The effective interest rate is the rate that exactly discounts estimated future cash flow through the expected life of the financial asset, or, where appropriate, a shorter period, to the net carrying amount on initial recognition. Transaction costs of financial assets carried at fair value through profit or loss are expensed in profit or loss.
(i) debt instruments Subsequent measurement of debt
instruments depends on the Company’s business model for managing the asset and the cash flow characteristics of the asset. There are three measurement categories into which the Company classifies its debt instruments:
• Amortised cost: Assets that are held for collection of contractual cash flows where those cash flows represent solely payments of
Annual Report 2020-21 159Annual Report 2020-21158
Notesannexed to and forming part of the standalone balance sheet as at March 31, 2021 andthe standalone statement of profit and loss for the year ended March 31, 2021(All amounts in Rupees million, unless otherwise stated)
principal and interest are measured at amortised cost. A gain or loss on a debt investment that is subsequently measured at amortised cost and is not part of a hedging relationship is recognised in profit or loss when the asset is derecognised or impaired. Interest income from these financial assets is included in other income using the effective interest rate method.
• Fair value through other comprehensive income (FVOCI): Assets that are held for collection of contractual cash flows and for selling the financial assets, where the assets’ cash flows represent solely payments of principal and interest, are measured at fair value through other comprehensive income (FVOCI). Movements in the carrying amount are taken through OCI, except for the recognition of impairment gains or losses, interest income and foreign exchange gains and losses which are recognised in profit and loss. When the financial asset is derecognised, the cumulative gain or loss previously recognised in OCI is reclassified from equity to profit or loss and recognised in other income or other expenses (as applicable). Interest income from these financial assets is included in other income using the effective interest rate method.
• Fair value through profit or loss (FVTPL): Assets that do not meet the criteria for amortised cost or FVOCI are measured at fair value through profit or loss. A gain or loss on a debt investment that is subsequently measured at fair value through profit or loss and is not part of a hedging relationship is recognised in profit or loss and presented net in the statement of profit and loss within other income or other expenses (as applicable) in the period in which it arises. Interest income from these financial assets is included in other income or other expenses, as applicable.
(ii) equity instruments The Company subsequently measures
all equity investments at fair value. Where the Company’s management has elected to present fair value gains and losses on equity investments in other comprehensive income and there is no subsequent reclassification of fair value gains and losses to profit or loss. Dividends from such investments and gain/loss on restatement of equity shares held in foreign currency are recognised in profit or loss as other income when the Company’s right to receive payments is established.
Changes in the fair value of financial assets at fair value through profit or loss are recognised in other income or other expenses, as applicable in the statement of profit and loss. Impairment losses (and reversal of impairment losses) on equity investments measured at FVOCI are not reported separately from other changes in fair value.
(iii) impairment of financial assets The Company assesses on a forward looking
basis the expected credit losses associated with its assets carried at amortised cost and FVOCI debt instruments. The impairment methodology applied depends on whether there has been a significant increase in credit risk.
For trade receivables and contract assets, the Company applies the simplified approach permitted by Ind AS 109 Financial Instruments, which requires expected lifetime losses to be recognised from initial recognition of the receivables.
(iv) derecognition of financial assets A financial asset is derecognised only when
• The Company has transferred the rights to receive cash flows from the financial asset or
• Retains the contractual rights to receive the cash flows of the financial asset, but assumes a contractual obligation to pay the cash flows to one or more recipients.
Annual Report 2020-21 159Annual Report 2020-21158
Corporate Overview Statutory Reports Financial Statements
Notesannexed to and forming part of the standalone balance sheet as at March 31, 2021 andthe standalone statement of profit and loss for the year ended March 31, 2021(All amounts in Rupees million, unless otherwise stated)
Where the entity has transferred an asset, the Company evaluates whether it has transferred substantially all risks and rewards of ownership of the financial asset. In such cases, the financial asset is derecognised. Where the entity has not transferred substantially all risks and rewards of ownership of the financial asset, the financial asset is not derecognised.
Where the entity has neither transferred a financial asset nor retains substantially all risks and rewards of ownership of the financial asset, the financial asset is derecognised if the Company has not retained control of the financial asset. Where the Company retains control of the financial asset, the asset is continued to be recognised to the extent of continuing involvement in the financial asset.
(v) Income recognition
(i) Interest income Interest income from a financial assets is
recognized when it is probable that the economic benefits will flow to the Company and the amount of income can be measured reliably. Interest income is accrued on time basis by reference to principal outstanding and the effective interest rate applicable which is the rate that exactly discounts estimated future cash receipts through the expected life of the financial asset to the gross carrying amount of a financial asset. When calculating the effective interest rate, the Company estimates the expected cash flows by considering all the contractual terms of the financial instrument (for example, prepayment, extension, call and similar options) but does not consider the expected credit losses.
Interest on income tax and indirect tax are recognised in the year in which it is received.
(ii) dividend income Dividend income are recognised in profit or
loss only when the right to receive payment is established, it is probable that the economic benefits associated with the dividend will flow to the Company and the amount of the dividend can be measured reliably.
(iii) export Benefits In case of sale made by the Company as
Support Manufacturer, export benefits arising from Duty Entitlement Pass Book (DEPB), Duty
Drawback scheme and Merchandise Export Incentive Scheme (MEIS) are recognised on export of such goods in accordance with the agreed terms and conditions with customers. In case of direct exports made by the Company, export benefits arising from DEPB, Duty Drawback scheme and Merchandise Export Incentive Scheme are recognised on shipment of direct exports.
(vI) cash and cash equivalents Cash and cash equivalents comprise cash at
bank and in hand, short-term deposits with an original maturity of three months or less and short term highly liquid investments that are readily convertible to known amounts of cash and which are subject to an insignificant risk of changes in value.
For the purposes of the statement of cash flow, cash and cash equivalents is as defined above, net of outstanding bank overdrafts. In the balance sheet, bank overdrafts are shown within borrowings in current liabilities.
(vII)trade receivable Trade Receivables are amounts due from
customers for goods sold or services performed in the ordinary course of business. Trade receivables are recognised initially at the amount of consideration that is unconditional unless they contain significant financing components, when they are recognised at fair value. The Company holds the trade receivables with the objective to collect the contractual cash flows and therefore measures them subsequently at amortised cost less loss allowance.
b) financial liabilities
(I) measurement Financial liabilities are initially recognised
at fair value, reduced by transaction costs (in case of financial liability not at fair value through profit or loss), that are directly attributable to the issue of financial liability. After initial recognition, financial liabilities are measured at amortised cost using effective interest method. The effective interest rate is the rate that exactly discounts estimated future cash outflow (including all fees paid, transaction cost, and other premiums or discounts) through the expected life of the financial liability, or, where appropriate, a
Annual Report 2020-21 161Annual Report 2020-21160
Notesannexed to and forming part of the standalone balance sheet as at March 31, 2021 andthe standalone statement of profit and loss for the year ended March 31, 2021(All amounts in Rupees million, unless otherwise stated)
shorter period, to the net carrying amount on initial recognition. At the time of initial recognition, there is no financial liability irrevocably designated as measured at fair value through profit or loss.
(II) derecognition A financial liability is derecognised when the
obligation under the liability is discharged or cancelled or expires. When an existing financial liability is replaced by another from the same lender on substantially different terms, or the terms of an existing liability are substantially modified, such an exchange or modification is treated as the de-recognition of the original liability and the recognition of a new liability. The difference in the respective carrying amounts is recognised in the statement of profit or loss.
(III) Borrowings Borrowings are initially recognised at fair
value, net of transaction costs incurred. Borrowings are subsequently measured at amortised cost. Any difference between the proceeds (net of transaction costs) and the redemption amount is recognised in profit or loss over the period of the borrowings using the effective interest method.
Fees paid on the establishment of loan facilities are recognised as transaction costs of the loan to the extent that it is probable that some or all of the facility will be drawn down. In this case, the fee is deferred until the draw down occurs. To the extent there is no evidence that it is probable that some or all of the facility will be drawn down, the fee is capitalised as a prepayment for liquidity services and amortised over the period of the facility to which it relates.
Borrowings are removed from the balance sheet when the obligation specified in the contract is discharged, cancelled or expired. The difference between the carrying amount of a financial liability that has been extinguished or transferred to another party and the consideration paid, including any non-cash assets transferred or liabilities assumed, is recognised in profit and loss as other income or other expenses, as applicable.
Where the terms of a financial liability are renegotiated and the entity issues equity instruments to a creditor to extinguish all or
part of the liability (debt for equity swap), a gain or loss is recognised in profit or loss, which is measured as the difference between the carrying amount of the financial liability and the fair value of the equity instruments issued.
Borrowings are classified as current liabilities unless the Company has an unconditional right to defer settlement of the liability for at least 12 months after the reporting period. Where there is a breach of a material provision of a long-term loan arrangement on or before the end of the reporting period with the effect that the liability becomes payable on demand on the reporting date, the entity does not classify the liability as current, if the lender agreed, after the reporting period and before the approval of the standalone financial statements for issue, not to demand payment as a consequence of the breach.
(Iv) trade and other payables These amounts represent liabilities for goods
and services provided to the Company prior to the end of financial year which are unpaid. Trade and other payables are presented as current liabilities unless payment is not due within 12 months after the reporting period. Trade and other payables are recognised, initially at fair value, and subsequently measured at amortised cost using effective interest rate method.
Trade payables includes acceptances arrangements where operational suppliers of goods are paid by banks while Company continues to recognise the liability till settlement with the banks.
c) financial guarantee contracts Financial guarantee contracts are recognized
as a financial liability at the time the guarantee is issued. The liability is initially measured at fair value and subsequently at the higher of the amount determined in accordance with Ind AS 37 and amount initially recognized less cumulative amortization, where appropriate. The fair value of guarantee is determined as at the present value of difference in net cash flows between the contractual payments under the debt instrument and the payment that would be required without the guarantee, or the estimated amount that would be payable to a third party for assuming the obligation. Where guarantee in relation to loan or other payables of group companies
Annual Report 2020-21 161Annual Report 2020-21160
Corporate Overview Statutory Reports Financial Statements
Notesannexed to and forming part of the standalone balance sheet as at March 31, 2021 andthe standalone statement of profit and loss for the year ended March 31, 2021(All amounts in Rupees million, unless otherwise stated)
are provided for no consideration, the fair values are accounted for as contributions and recognized as part of the cost of investment.
d) derivatives and hedging activities In order to hedge its exposure to foreign
exchange and interest rate, the Company enters into forward and interest rate swap contracts and other derivative financial instruments. The Company does not hold derivative financial instruments for speculative purposes.
Derivatives are initially recognised at fair value on the date a derivative contract is entered into and are subsequently marked to market to their fair value at the end of each reporting period.
The accounting for subsequent changes in fair value depends on whether the derivative is designated as a hedging instrument, and if so, the nature of the item being hedged and the type of hedge relationship designated.
The Company designates their derivatives as hedges of foreign exchange risk associated with the cash flows of highly probable forecast transactions and variable interest rate risk associated with borrowings (cash flow hedges).
The Company documents at the inception of the hedging transaction the economic relationship between hedging instruments and hedged items including whether the hedging instrument is expected to offset changes in cash flows of hedged items. The Company documents its risk management objective and strategy for undertaking various hedge transactions at the inception of each hedge relationship.
The full fair value of a hedging derivative is classified as a non-current asset or liability when the remaining maturity of the hedged item is more than 12 months; it is classified as a current asset or liability when the remaining maturity of the hedged item is less than 12 months.
(i) Cash flow hedges that qualify for hedge accounting
The effective portion of changes in the fair value of derivatives that are designated and qualify as cash flow hedges is recognised in the other comprehensive income in cash flow
hedging reserve within equity, limited to the cumulative change in fair value of the hedged item on a present value basis from the inception of the hedge. The gain or loss relating to the ineffective portion is recognised immediately in profit or loss, within other income or other expenses (as applicable).
When forward contracts are used to hedge forecast transactions, the Company generally designates the full change in fair value of the forward contract (including forward points) as the hedging instrument. In such cases, the gains and losses relating to the effective portion of the change in fair value of the entire forward contract are recognised in the cash flow hedging reserve within equity.
Amounts accumulated in equity are reclassified to profit or loss in the periods when the hedged item affects profit or loss.
Where the hedged item subsequently results in the recognition of a non-financial asset (such as inventory), both the deferred hedging gains and losses and the deferred time value of the deferred forward contracts, if any are included within the initial cost of the asset.
When a hedging instrument expires, or is sold or terminated, or when a hedge no longer meets the criteria for hedge accounting, any cumulative deferred gain or loss in equity at that time remains in equity until the forecast transaction occurs. When the forecast transaction is no longer expected to occur, the cumulative gain or loss that was reported in equity is immediately reclassified to profit or loss within other income or other expense (as applicable). If the hedge ratio for risk management purposes is no longer optimal but the risk management objective remains unchanged and the hedge continues to qualify for hedge accounting, the hedge relationship will be rebalanced by adjusting either the volume of the hedging instrument or the volume of the hedged item so that the hedge ratio aligns with the ratio used for risk management purposes. Any hedge ineffectiveness is calculated and accounted for in statement of profit or loss at the time of the hedge relationship rebalancing.
(II) derivatives that are not designated as hedges
The Company enters into derivative contracts to hedge risks which are not designated as
Annual Report 2020-21 163Annual Report 2020-21162
Notesannexed to and forming part of the standalone balance sheet as at March 31, 2021 andthe standalone statement of profit and loss for the year ended March 31, 2021(All amounts in Rupees million, unless otherwise stated)
hedges. Such contracts are accounted for at fair value through profit or loss and are included in other income or other expenses (as applicable).
e) embedded derivatives Derivatives embedded in a host contract that
is an asset within the scope of Ind AS 109 are not separated. Financial assets with embedded derivatives are considered in their entirety when determining whether their cash flows are solely payment of principal and interest.
f) embedded foreign currency derivatives Embedded foreign currency derivatives are
not separated from the host contract if they are closely related. Such embedded derivatives are closely related to the host contract, if the host contract is not leveraged, does not contain any option feature and requires payments in one of the following currencies:
• the functional currency of any substantial party to that contract,
• the currency in which the price of the related good or service that is acquired or delivered is routinely denominated in commercial transactions around the world, and
• the currency that is commonly used in contracts to purchase or sell non-financial items in the economic environment in which the transaction takes place (i.e. relatively liquid and stable currency).
Foreign currency embedded derivatives which do not meet the above criteria are separated and the derivative is accounted for at fair value through profit and loss. The Company currently does not have any such derivatives which are not closely related.
g) offsetting financial instruments Financial assets and liabilities are offset and
the net amount is reported in the balance sheet where there is a legally enforceable right to offset the recognised amounts and there is an intention to settle on a net basis or realise the asset and settle the liability simultaneously. The legally enforceable right must not be contingent on future events and must be enforceable in the normal course of business and in the event of default, insolvency or bankruptcy of the Company or the counterparty.
1.17 BoRRoWing Costs
General and specific borrowing costs that are directly attributable to the acquisition, construction or production of a qualifying asset are capitalised during the period of time that is required to complete and prepare the asset for its intended use or sale. Qualifying assets are assets that necessarily take a substantial period of time to get ready for their intended use or sale. Investment income earned on the temporary investment of specific borrowings pending their expenditure on qualifying assets is deducted from the borrowing costs eligible for capitalisation. Other borrowing costs are expensed in the period in which they are incurred.
1.18 eMPLoyee Benefits
a) short-term obligations Liabilities for wages and salaries, including
non-monetary benefits that are expected to be settled wholly within 12 months after the end of the period in which the employees render the related service are recognised in respect of employees’ services up to the end of the reporting period and are measured at the amounts expected to be paid when the liabilities are settled. The liabilities are presented as current employee benefit obligations in the balance sheet.
b) other long-term employee benefit obligations The liabilities for earned leave are not expected
to be settled wholly within 12 months after the end of the period in which the employees render the related service. They are therefore measured as the present value of expected future payments to be made in respect of services provided by employees up to the end of the reporting period using the projected unit credit method. The benefits are discounted using the market yields at the end of the reporting period that have terms approximating to the terms of the related obligation. Remeasurements as a result of experience adjustments and changes in actuarial assumptions are recognised in profit or loss.
The obligations are presented as current liabilities in the balance sheet if the entity does not have an unconditional right to defer settlement for at least twelve months after the reporting period, regardless of when the actual settlement is expected to occur.
c) post-employment obligations The Company operates the following
post-employment schemes:
• defined benefit plans such as gratuity; and
Annual Report 2020-21 163Annual Report 2020-21162
Corporate Overview Statutory Reports Financial Statements
Notesannexed to and forming part of the standalone balance sheet as at March 31, 2021 andthe standalone statement of profit and loss for the year ended March 31, 2021(All amounts in Rupees million, unless otherwise stated)
• defined contribution plans such as provident fund and superannuation fund.
(i) defined Benefit Plans
(i) gratuity obligations The liability or asset recognised in the
balance sheet in respect of defined benefit gratuity plans is the present value of the defined benefit obligation at the end of the reporting period less the fair value of plan assets. The defined benefit obligation is calculated annually by actuaries using the projected unit credit method.
The present value of the defined benefit obligation denominated in INR is determined by discounting the estimated future cash outflows by reference to market yields at the end of the reporting period on government bonds that have terms approximating to the terms of the related obligation.
The net interest cost is calculated by applying the discount rate to the net balance of the defined benefit obligation and the fair value of plan assets. This cost is included in employee benefit expense in the statement of profit and loss.
Remeasurement gains and losses arising from experience adjustments and changes in actuarial assumptions are recognised in the period in which they occur, directly in other comprehensive income. They are included in retained earnings in the statement of changes in equity and in the balance sheet. Remeasurements are not reclassified to profit and loss in the subsequent periods.
Changes in the present value of the defined benefit obligation resulting from plan amendments or curtailments are recognised immediately in profit or loss as past service cost.
(ii) defined contribution plans (i) Provident fund, employee state
Insurance corporation (esIc) and pension fund
The Contribution towards provident fund, ESIC and pension fund for certain employees is made to the regulatory
authorities where the Company has no further obligations. Such benefits are classified as Defined Contribution Schemes as the Company does not carry any further obligations apart from the contributions made on a monthly basis.
(ii) superannuation fund Contribution towards superannuation
fund for certain employees is made to SBI Life Insurance Company where the Company has no further obligations. Such benefits are classified as Defined Contribution Schemes as the Company does not carry any further obligations, apart from contribution made on monthly basis.
d) Bonus plan The Company recognises a liability and an
expense for bonus. The Company recognises a provision where contractually obliged or where there is a past practice that has created a constructive obligation.
e) equity-settled share-based payments (esop) Equity-settled share-based payments to
employees are measured at the fair value of the options at the grant date.
The fair value of option at the grant date is expensed over the vesting period with a corresponding increase in equity as “Equity settled share based payments”. In case of forfeiture of unvested option, portion of amount already expensed is reversed. In a situation where the vested option forfeited or expires unexercised, the related balance standing to the credit of the “Equity settled share based payments” are transferred to the “Retained Earnings”.
When the options are exercised, the Company issues new equity shares of the Company of ` 5 each fully paid-up. The proceeds received and the related balance standing to credit of the Equity settled share based payments, are credited to share capital (nominal value) and Securities Premium.
1.19 PRovisions, Contingent LiABiLities And contIngent Assets
a) provisions Provisions for legal claims are recognised when
the Company has a present legal or constructive obligation as a result of past events, it is probable that an outflow of resources will be required
Annual Report 2020-21 165Annual Report 2020-21164
Notesannexed to and forming part of the standalone balance sheet as at March 31, 2021 andthe standalone statement of profit and loss for the year ended March 31, 2021(All amounts in Rupees million, unless otherwise stated)
to settle the obligation and the amount can be reliably estimated. Provisions are not recognised for future operating losses.
Where there are a number of similar obligations, the likelihood that an outflow will be required in settlement is determined by considering the class of obligations as a whole. A provision is recognised even if the likelihood of an outflow with respect to any one item included in the same class of obligations may be small. Provisions are measured at the present value of management’s best estimate of the expenditure required to settle the present obligation at the end of the reporting period. The discount rate used to determine the present value is a pre-tax rate that reflects current market assessments of the time value of money and the risks specific to the liability. The increase in the provision due to the passage of time is recognised as interest expense.
The measurement of provision for restructuring includes only direct expenditures arising from the restructuring, which are both necessarily entailed by the restructuring and not associated with the ongoing activities of the Company.
b) contingent liabilities Contingent liabilities are disclosed when there
is a possible obligation arising from past events the existence of which will be confirmed only by the occurrence or non-occurrence of one or more uncertain future events not wholly within the control of the company or a present obligation that arises from past events where it is either not probable that an outflow of resources will be required to settle or a reliable estimate of the amount cannot be made.
c) contingent Assets Contingent Assets are disclosed, where an inflow
of economic benefits is probable.
1.20 contRIButed equIty
Equity shares are classified as equity. Incremental costs directly attributable to the issue of new shares or options are shown in equity as a deduction, net of tax, from the proceeds.
1.21 dividends
Provision is made for the amount of any dividend declared, being appropriately authorised and no longer at the discretion of the entity, on or before the end of the reporting period but not distributed at the end of the reporting period.
1.22 eARnings PeR shARe
a) Basic earnings per share Basic earnings per share is calculated by dividing:
• the profit attributable to owners of the Company; and
• by the weighted average number of equity shares outstanding during the financial year, adjusted for bonus elements in equity shares issued during the year and excluding treasury shares.
b) diluted earnings per share Diluted earnings per share adjust the figures used
in the determination of basic earnings per share to take into account:
• the after income tax effect of interest and other financing costs associated with dilutive potential equity shares; and
• the weighted average number of additional equity shares that would have been outstanding assuming the conversion of all dilutive potential equity shares.
1.23 Rounding of AMounts
All amounts disclosed in the standalone financial statements and notes have been rounded off to the nearest Rupees millions (upto two decimals), unless otherwise stated as per the requirement of Schedule III (Division II).
1.24 ReCent ACCounting PRonounCeMents
There are no other new updates or standards issued through the date of issuance of these financial statements that have not yet been adopted by the group.
note 2: CRitiCAL estiMAtes And judgMents
The preparation of standalone financial statements requires the use of accounting estimates which, by definition, will seldom equal the actual results. Management also needs to exercise judgment in applying the Company’s accounting policies. This note provides an overview of the areas that involved a higher degree of judgment or complexity, and of items which are more likely to be materially adjusted due to estimates and assumptions turning out to be different than those originally assessed. Detailed information about each of these estimates and judgments is included in relevant notes together with information about the basis of calculation for each affected line item in the standalone financial statements.
Annual Report 2020-21 165Annual Report 2020-21164
Corporate Overview Statutory Reports Financial Statements
Notesannexed to and forming part of the standalone balance sheet as at March 31, 2021 andthe standalone statement of profit and loss for the year ended March 31, 2021(All amounts in Rupees million, unless otherwise stated)
critical estimates and judgmentsi) estimation of provisions and contingent
liabilities The Company exercises judgment in measuring
and recognising provisions and the exposures to contingent liabilities which is related to pending litigation or other outstanding claims. Judgement is necessary in assessing the likelihood that a pending claim will succeed, or a liability will arise, and to quantify the possible range of the financial settlement. Because of the inherent uncertainty in this evaluation process, actual liability may be different from the originally estimated as provision (Refer note 37 and 45).
ii) estimation of useful life of Property, Plant and equipment
Property, Plant and Equipment represent a significant proportion of the asset base of the Company. The charge in respect of periodic depreciation is derived after determining an estimate of an asset’s expected useful life and the expected residual value at the end of its life. The useful lives and residual values of Company’s assets are determined by management at the time the asset is acquired and reviewed periodically, including at each financial year end. The lives are based on historical experience with similar assets as well as anticipation of future events, which may impact their life, such as changes in technology (Refer note 1.9).
iii) estimation of provision for Inventory The Company writes down inventories to
net realisable value based on an estimate of the realisability of inventories. Write downs on inventories are recorded where events or changes in circumstances indicate that the balances may not realised. The identification of write-downs requires the use of estimates of net selling prices of the down-graded inventories. Where the expectation is different from the original estimate, such difference will impact the carrying value of inventories and write-downs of inventories in the periods in which such estimate has been changed.
Write-downs of inventories to net realisable value amounted to `40.64 (March 31, 2020: ` 234.79). These were recognised as an expense during the year and included in ‘cost of material consumed’ and ‘changes in the inventories of work-in-progress and finished goods’ in statement of Profit and Loss.
iv) estimation of defined Benefit obligation The present value of the defined benefit
obligations depends on a number of factors that are determined on an actuarial basis using a number of assumptions. The assumptions used in determining the net cost (income) for post employments plans include the discount rate. Any changes in these assumptions will impact the carrying amount of such obligations.
The Company determines the appropriate discount rate at the end of each year. This is the interest rate that should be used to determine the present value of estimated future cash outflows expected to be required to settle the defined benefit obligations. In determining the appropriate discount rate, the Company considers the interest rates of government bonds of maturity approximating the terms of the related plan liability (Refer note 36).
v) estimated fair value of financial Instruments The fair value of financial instruments that are not
traded in an active market is determined using valuation techniques. The Management uses its judgment to select a variety of methods and make assumptions that are mainly based on market conditions existing at the end of each reporting period (Refer note 40).
vi) Impairment of carrying value of investments and recoverability of loans and other receivables in Investee companies.
Determining whether the impairment of carrying value of investments in a subsidiary, recoverability of other receivables from joint ventures of a subsidiary, and impairment of carrying value of investments in and recoverability of loans to a joint venture are impaired requires an estimate of the value in use of investments, other receivables and loans (collectively the entities described above are referred as Investee Companies).
In considering the value in use, the board of directors of respective Investee Companies have anticipated the future sales prices, capacity utilisation of plants, operating margins, other expenses, availability of raw materials, discount rates, terminal growth rate, payment of taxes, working capital norms, inflation rate, growth rate of economy and other factors of the underlying businesses / operations of the Investee Companies. Any subsequent changes to the cash flows due to changes in the above mentioned factors could impact the carrying value of investments and recoverability of loans and other receivables in Investee Companies. (Refer note 7 and 52).
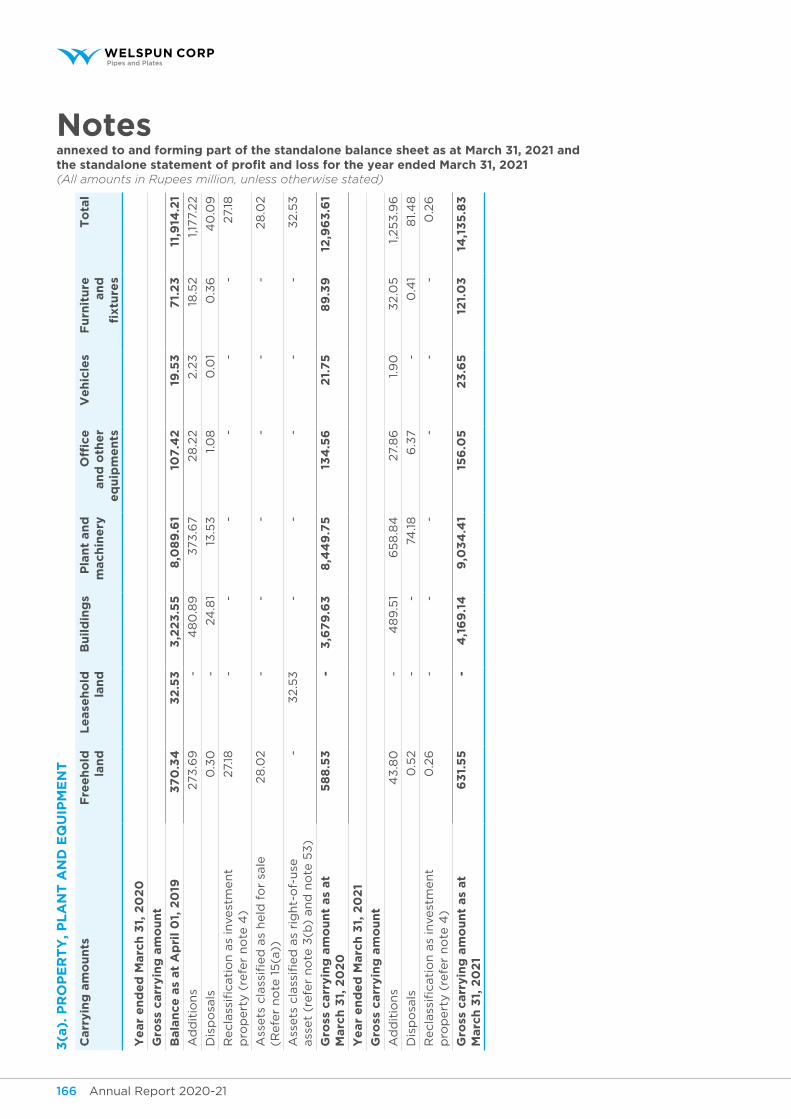
Annual Report 2020-21 167Annual Report 2020-21166
Notesannexed to and forming part of the standalone balance sheet as at March 31, 2021 andthe standalone statement of profit and loss for the year ended March 31, 2021(All amounts in Rupees million, unless otherwise stated)
3(a
). P
Ro
Pe
Rt
y, P
LA
nt
An
d e
qu
iPM
en
t
carr
yin
g a
mo
un
tsf
ree
ho
ld
lan
d
le
ase
ho
ld
lan
d
Bu
ild
ing
sp
lan
t an
d
mach
ine
ryo
ffice
an
d o
the
r e
qu
ipm
en
ts
ve
hic
les
fu
rnit
ure
an
d
fixtu
res
to
tal
ye
ar
en
de
d M
arc
h 3
1, 2
02
0
gro
ss c
arr
yin
g a
mo
un
t
Bala
nce
as
at
Ap
ril
01,
20
19 3
70
.34
3
2.5
3
3,2
23
.55
8
,08
9.6
1 1
07
.42
1
9.5
3
71.
23
1
1,9
14.2
1
Ad
dit
ion
s 2
73
.69
-
4
80
.89
3
73
.67
28
.22
2.2
3
18
.52
1,177.
22
Dis
po
sals
0.3
0
-
24
.81
13
.53
1
.08
0
.01
0.3
6
40
.09
Recla
ssifi
cati
on
as
invest
men
t p
rop
ert
y (
refe
r n
ote
4)
27.
18
-
-
-
-
-
-
27.
18
Ass
ets
cla
ssifi
ed
as
held
fo
r sa
le
(Refe
r n
ote
15
(a))
28
.02
-
-
-
-
-
-
28
.02
Ass
ets
cla
ssifi
ed
as
rig
ht-
of-
use
ass
et
(refe
r n
ote
3(b
) an
d n
ote
53
) -
3
2.5
3
-
-
-
-
-
32.5
3
gro
ss c
arr
yin
g a
mo
un
t as
at
Marc
h 3
1, 2
02
0 5
88
.53
-
3
,67
9.6
3
8,4
49
.75
1
34
.56
2
1.7
5
89
.39
1
2,9
63
.61
ye
ar
en
de
d M
arc
h 3
1, 2
02
1
gro
ss c
arr
yin
g a
mo
un
t
Ad
dit
ion
s 4
3.8
0
-
48
9.5
1 6
58
.84
2
7.8
6
1.9
0
32.0
5
1,2
53
.96
Dis
po
sals
0.5
2
-
-
74
.18
6
.37
-
0.4
1 8
1.4
8
Recla
ssifi
cati
on
as
invest
men
t p
rop
ert
y (
refe
r n
ote
4)
0.2
6
-
-
-
-
-
-
0.2
6
gro
ss c
arr
yin
g a
mo
un
t as
at
Marc
h 3
1, 2
02
1 6
31.
55
-
4
,16
9.1
4
9,0
34
.41
15
6.0
5
23
.65
1
21.
03
1
4,1
35
.83
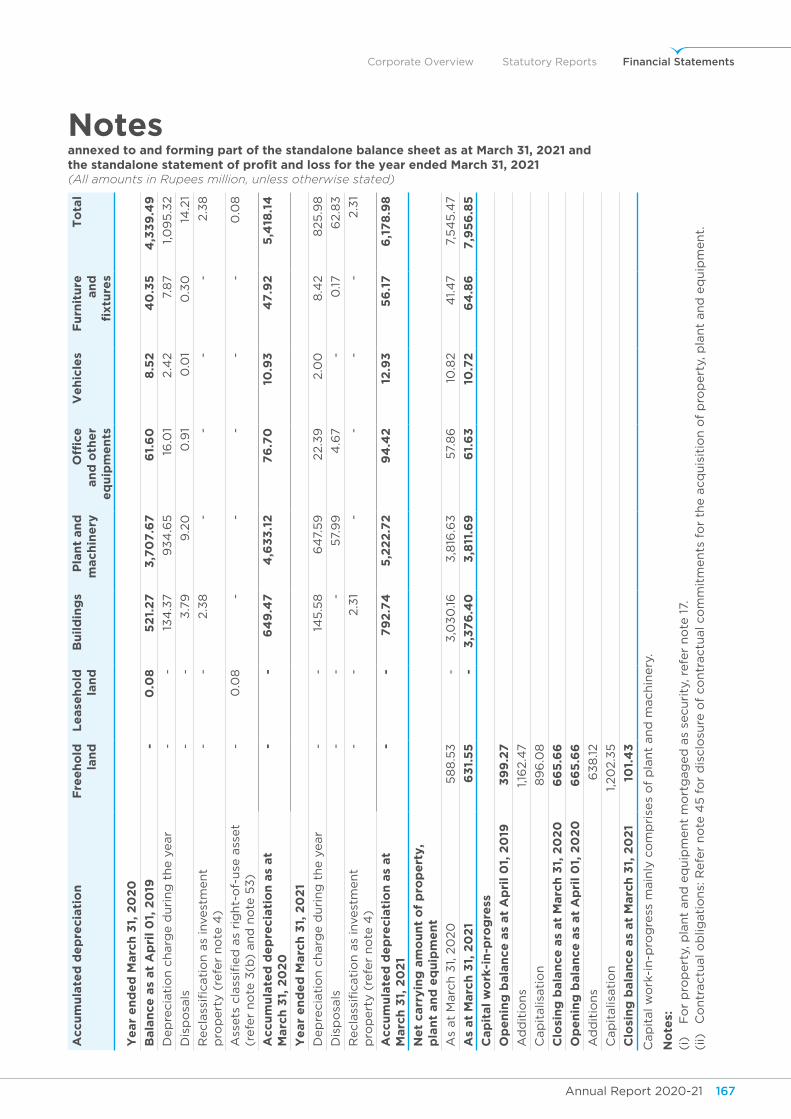
Annual Report 2020-21 167Annual Report 2020-21166
Corporate Overview Statutory Reports Financial Statements
Notesannexed to and forming part of the standalone balance sheet as at March 31, 2021 andthe standalone statement of profit and loss for the year ended March 31, 2021(All amounts in Rupees million, unless otherwise stated)
Accu
mu
late
d d
ep
recia
tio
nf
ree
ho
ld
lan
d
le
ase
ho
ld
lan
d
Bu
ild
ing
sp
lan
t an
d
mach
ine
ryo
ffice
an
d o
the
r e
qu
ipm
en
ts
ve
hic
les
fu
rnit
ure
an
d
fixtu
res
to
tal
ye
ar
en
de
d M
arc
h 3
1, 2
02
0
Bala
nce
as
at
Ap
ril
01,
20
19 -
0
.08
5
21.
27
3
,70
7.6
7
61.
60
8
.52
4
0.3
5
4,3
39
.49
Dep
recia
tio
n c
harg
e d
uri
ng
th
e y
ear
-
-
13
4.3
7
93
4.6
5
16
.01
2.4
2
7.8
7
1,0
95
.32
Dis
po
sals
-
-
3.7
9
9.2
0
0.9
1 0
.01
0.3
0
14
.21
Recla
ssifi
cati
on
as
invest
men
t p
rop
ert
y (
refe
r n
ote
4)
-
-
2.3
8
-
-
-
-
2.3
8
Ass
ets
cla
ssifi
ed
as
rig
ht-
of-
use
ass
et
(refe
r n
ote
3(b
) an
d n
ote
53
) -
0
.08
-
-
-
-
-
0
.08
Accu
mu
late
d d
ep
recia
tio
n a
s at
Marc
h 3
1, 2
02
0 -
-
6
49
.47
4
,63
3.1
2
76
.70
1
0.9
3
47
.92
5
,418
.14
ye
ar
en
de
d M
arc
h 3
1, 2
02
1
Dep
recia
tio
n c
harg
e d
uri
ng
th
e y
ear
-
-
14
5.5
8
64
7.5
9
22.3
9
2.0
0
8.4
2
825
.98
Dis
po
sals
-
-
-
57.
99
4
.67
-
0.17
62.8
3
Recla
ssifi
cati
on
as
invest
men
t p
rop
ert
y (
refe
r n
ote
4)
-
-
2.3
1 -
-
-
-
2
.31
Accu
mu
late
d d
ep
recia
tio
n a
s at
Marc
h 3
1, 2
02
1 -
-
7
92
.74
5
,22
2.7
2
94
.42
1
2.9
3
56
.17
6
,17
8.9
8
ne
t carr
yin
g a
mo
un
t o
f p
rop
ert
y,
pla
nt
an
d e
qu
ipm
en
t
As
at
Marc
h 3
1, 2
020
58
8.5
3
-
3,0
30
.16
3
,816
.63
5
7.8
6
10
.82
41.
47
7,5
45
.47
As
at
Marc
h 3
1, 2
02
1 6
31.
55
-
3
,37
6.4
0
3,8
11.6
9
61.
63
1
0.7
2
64
.86
7
,95
6.8
5
cap
ital
wo
rk-i
n-p
rog
ress
op
en
ing
bala
nce
as
at
Ap
ril
01,
20
19 3
99
.27
Ad
dit
ion
s 1
,16
2.4
7
Cap
italis
ati
on
89
6.0
8
Clo
sin
g b
ala
nce
as
at
Marc
h 3
1, 2
02
0 6
65
.66
op
en
ing
bala
nce
as
at
Ap
ril
01,
20
20
66
5.6
6
Ad
dit
ion
s 6
38
.12
Cap
italis
ati
on
1,2
02.3
5
Clo
sin
g b
ala
nce
as
at
Marc
h 3
1, 2
02
1 1
01.
43
Cap
ital w
ork
-in
-pro
gre
ss m
ain
ly c
om
pri
ses
of
pla
nt
an
d m
ach
inery
.
no
tes:
(i)
F
or
pro
pert
y, p
lan
t an
d e
qu
ipm
en
t m
ort
gag
ed
as
secu
rity
, re
fer
no
te 1
7.(i
i)
Co
ntr
actu
al o
blig
ati
on
s: R
efe
r n
ote
45
fo
r d
isclo
sure
of
co
ntr
actu
al co
mm
itm
en
ts f
or
the a
cq
uis
itio
n o
f p
rop
ert
y, p
lan
t an
d e
qu
ipm
en
t.
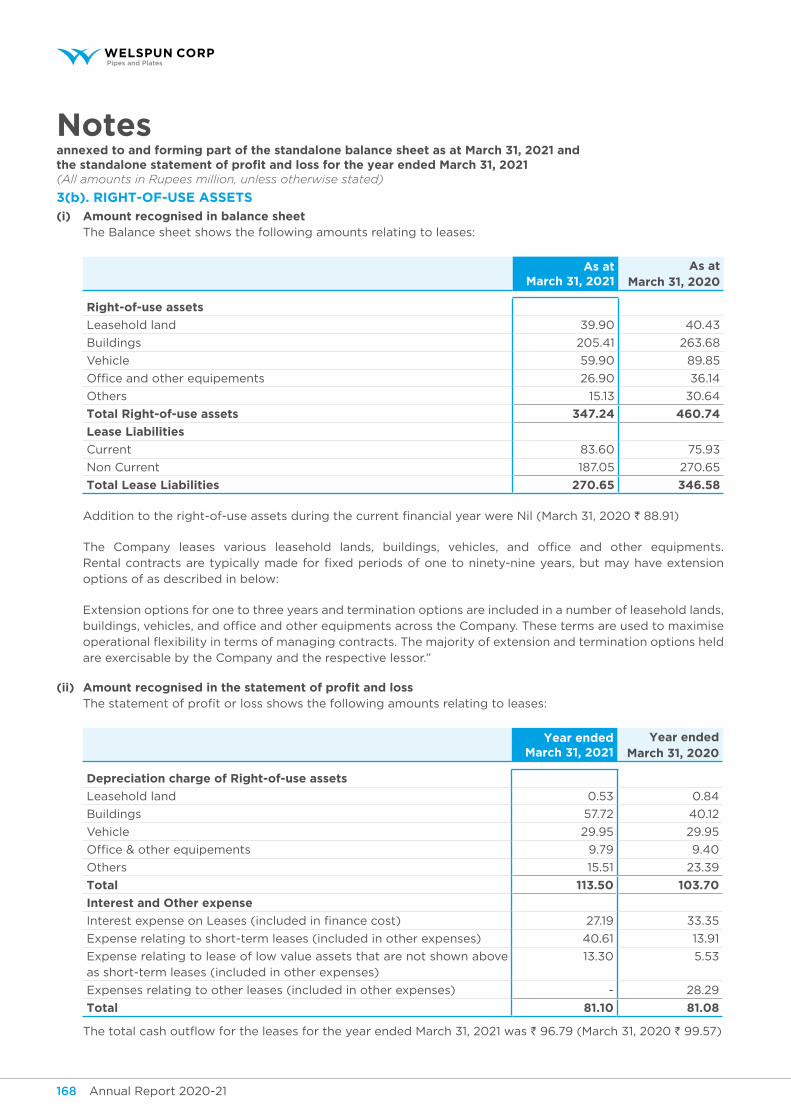
Annual Report 2020-21 169Annual Report 2020-21168
Notesannexed to and forming part of the standalone balance sheet as at March 31, 2021 andthe standalone statement of profit and loss for the year ended March 31, 2021(All amounts in Rupees million, unless otherwise stated)
3(b). RIght-of-use Assets
(i) Amount recognised in balance sheet The Balance sheet shows the following amounts relating to leases:
As at March 31, 2021
As at March 31, 2020
Right-of-use assets
Leasehold land 39.90 40.43
Buildings 205.41 263.68
Vehicle 59.90 89.85
Office and other equipements 26.90 36.14
Others 15.13 30.64
total Right-of-use assets 347.24 460.74
lease liabilities
Current 83.60 75.93
Non Current 187.05 270.65
total lease liabilities 270.65 346.58
Addition to the right-of-use assets during the current financial year were Nil (March 31, 2020 ` 88.91)
The Company leases various leasehold lands, buildings, vehicles, and office and other equipments. Rental contracts are typically made for fixed periods of one to ninety-nine years, but may have extension options of as described in below:
Extension options for one to three years and termination options are included in a number of leasehold lands, buildings, vehicles, and office and other equipments across the Company. These terms are used to maximise operational flexibility in terms of managing contracts. The majority of extension and termination options held are exercisable by the Company and the respective lessor.”
(ii) Amount recognised in the statement of profit and loss The statement of profit or loss shows the following amounts relating to leases:
year ended March 31, 2021
year ended March 31, 2020
depreciation charge of Right-of-use assets
Leasehold land 0.53 0.84
Buildings 57.72 40.12
Vehicle 29.95 29.95
Office & other equipements 9.79 9.40
Others 15.51 23.39
total 113.50 103.70
Interest and other expense
Interest expense on Leases (included in finance cost) 27.19 33.35
Expense relating to short-term leases (included in other expenses) 40.61 13.91
Expense relating to lease of low value assets that are not shown above as short-term leases (included in other expenses)
13.30 5.53
Expenses relating to other leases (included in other expenses) - 28.29
total 81.10 81.08
The total cash outflow for the leases for the year ended March 31, 2021 was ` 96.79 (March 31, 2020 ` 99.57)
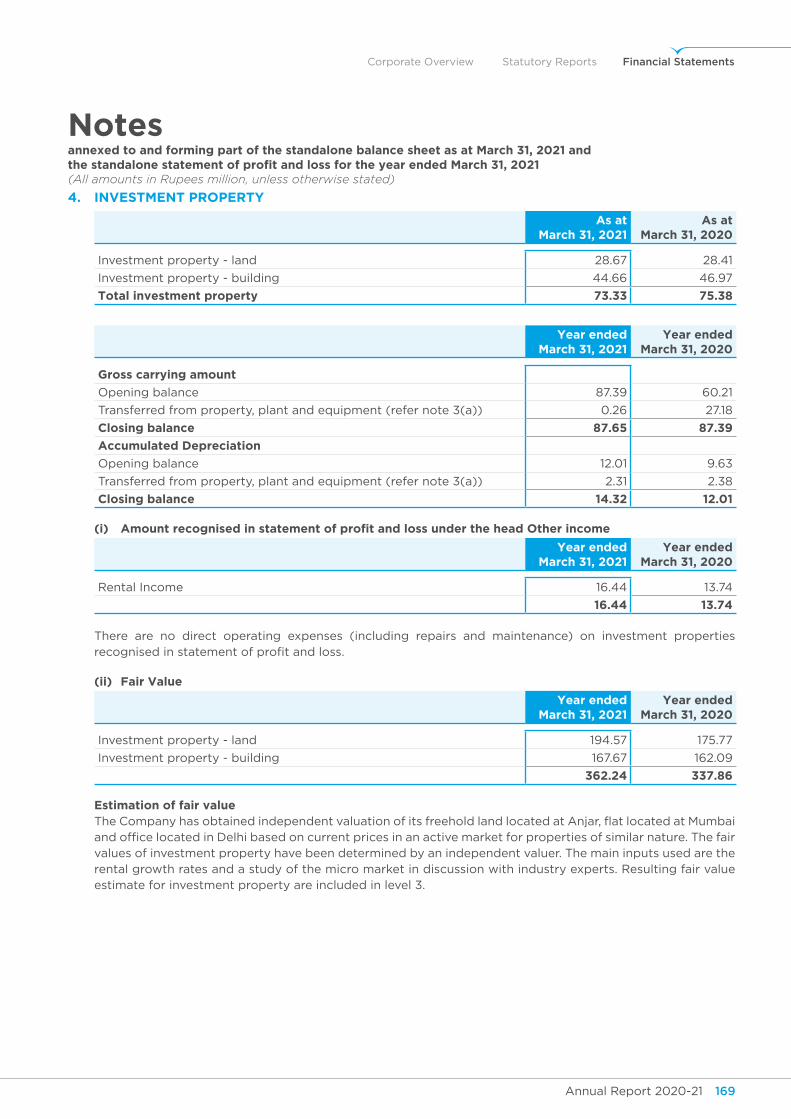
Annual Report 2020-21 169Annual Report 2020-21168
Corporate Overview Statutory Reports Financial Statements
Notesannexed to and forming part of the standalone balance sheet as at March 31, 2021 andthe standalone statement of profit and loss for the year ended March 31, 2021(All amounts in Rupees million, unless otherwise stated)
4. Investment pRopeRty
As at March 31, 2021
As at March 31, 2020
Investment property - land 28.67 28.41
Investment property - building 44.66 46.97
total investment property 73.33 75.38
year ended March 31, 2021
year ended March 31, 2020
gross carrying amount
Opening balance 87.39 60.21
Transferred from property, plant and equipment (refer note 3(a)) 0.26 27.18
closing balance 87.65 87.39
Accumulated depreciation
Opening balance 12.01 9.63
Transferred from property, plant and equipment (refer note 3(a)) 2.31 2.38
closing balance 14.32 12.01
(i) Amount recognised in statement of profit and loss under the head other income
year ended March 31, 2021
year ended March 31, 2020
Rental Income 16.44 13.74
16.44 13.74
There are no direct operating expenses (including repairs and maintenance) on investment properties recognised in statement of profit and loss.
(ii) fair value
year ended March 31, 2021
year ended March 31, 2020
Investment property - land 194.57 175.77
Investment property - building 167.67 162.09
362.24 337.86
estimation of fair value The Company has obtained independent valuation of its freehold land located at Anjar, flat located at Mumbai
and office located in Delhi based on current prices in an active market for properties of similar nature. The fair values of investment property have been determined by an independent valuer. The main inputs used are the rental growth rates and a study of the micro market in discussion with industry experts. Resulting fair value estimate for investment property are included in level 3.
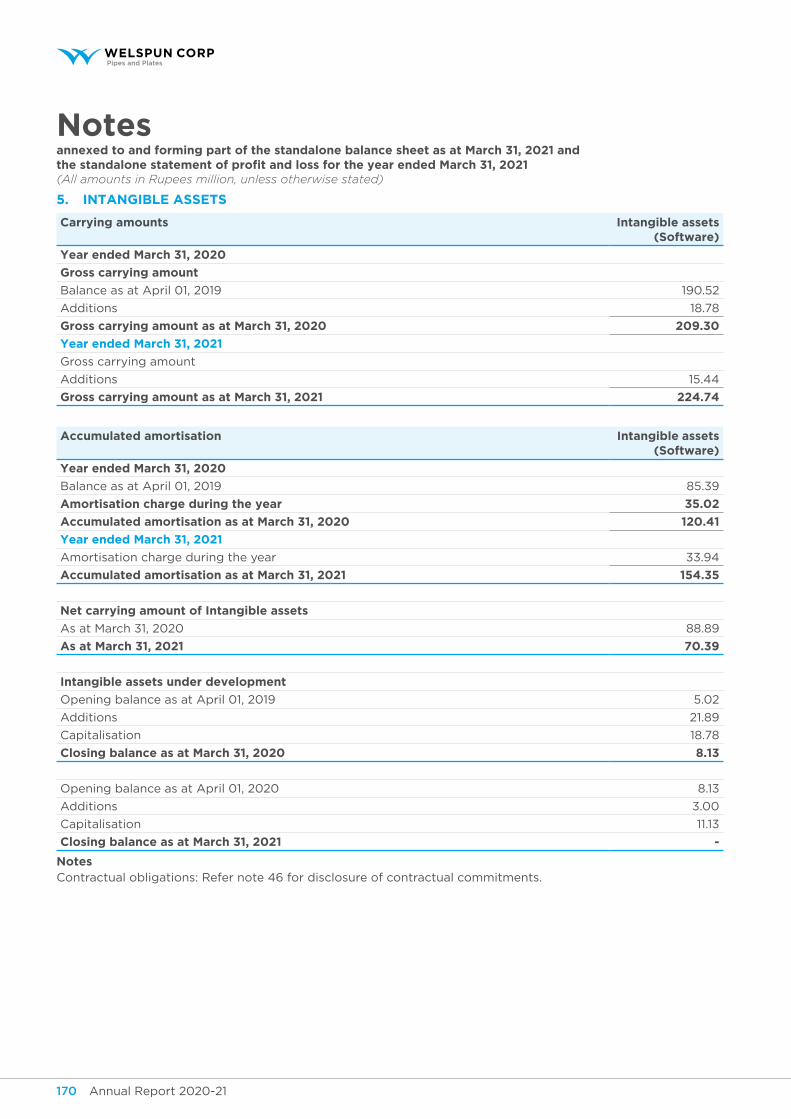
Annual Report 2020-21 171Annual Report 2020-21170
Notesannexed to and forming part of the standalone balance sheet as at March 31, 2021 andthe standalone statement of profit and loss for the year ended March 31, 2021(All amounts in Rupees million, unless otherwise stated)
5. intAngiBLe Assets
carrying amounts Intangible assets (software)
year ended March 31, 2020
gross carrying amount
Balance as at April 01, 2019 190.52
Additions 18.78
gross carrying amount as at March 31, 2020 209.30
year ended March 31, 2021
Gross carrying amount
Additions 15.44
gross carrying amount as at March 31, 2021 224.74
Accumulated amortisation Intangible assets (software)
year ended March 31, 2020
Balance as at April 01, 2019 85.39
Amortisation charge during the year 35.02
Accumulated amortisation as at March 31, 2020 120.41
year ended March 31, 2021
Amortisation charge during the year 33.94
Accumulated amortisation as at March 31, 2021 154.35
net carrying amount of Intangible assets
As at March 31, 2020 88.89
As at March 31, 2021 70.39
Intangible assets under development
Opening balance as at April 01, 2019 5.02
Additions 21.89
Capitalisation 18.78
Closing balance as at March 31, 2020 8.13
Opening balance as at April 01, 2020 8.13
Additions 3.00
Capitalisation 11.13
Closing balance as at March 31, 2021 -
notesContractual obligations: Refer note 46 for disclosure of contractual commitments.
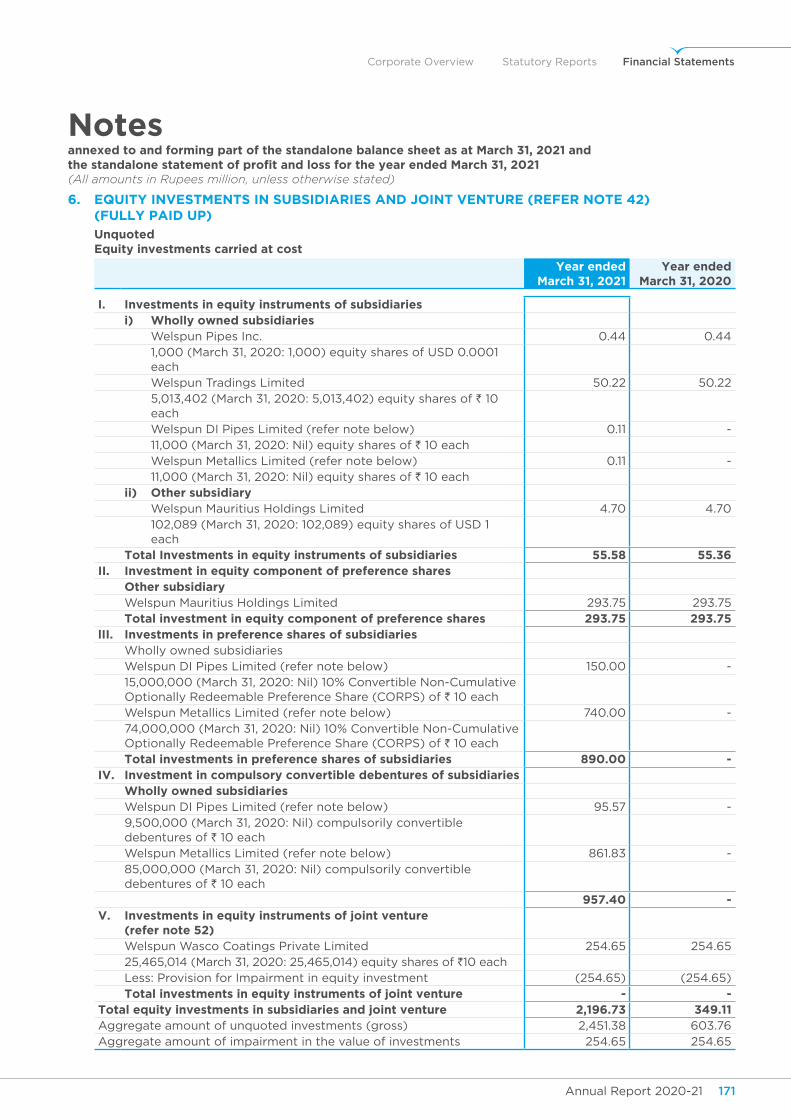
Annual Report 2020-21 171Annual Report 2020-21170
Corporate Overview Statutory Reports Financial Statements
Notesannexed to and forming part of the standalone balance sheet as at March 31, 2021 andthe standalone statement of profit and loss for the year ended March 31, 2021(All amounts in Rupees million, unless otherwise stated)
6. equity investMents in suBsidiARies And joint ventuRe (RefeR note 42) (fully pAId up)
unquoted equity investments carried at cost
year ended March 31, 2021
year ended March 31, 2020
I. Investments in equity instruments of subsidiariesi) wholly owned subsidiaries Welspun Pipes Inc. 0.44 0.44 1,000 (March 31, 2020: 1,000) equity shares of USD 0.0001
each Welspun Tradings Limited 50.22 50.22 5,013,402 (March 31, 2020: 5,013,402) equity shares of ` 10
each Welspun DI Pipes Limited (refer note below) 0.11 - 11,000 (March 31, 2020: Nil) equity shares of ` 10 each Welspun Metallics Limited (refer note below) 0.11 - 11,000 (March 31, 2020: Nil) equity shares of ` 10 eachii) other subsidiary Welspun Mauritius Holdings Limited 4.70 4.70 102,089 (March 31, 2020: 102,089) equity shares of USD 1
eachtotal Investments in equity instruments of subsidiaries 55.58 55.36
II. Investment in equity component of preference sharesother subsidiaryWelspun Mauritius Holdings Limited 293.75 293.75 total investment in equity component of preference shares 293.75 293.75
lII. Investments in preference shares of subsidiariesWholly owned subsidiariesWelspun DI Pipes Limited (refer note below) 150.00 - 15,000,000 (March 31, 2020: Nil) 10% Convertible Non-Cumulative Optionally Redeemable Preference Share (CORPS) of ` 10 eachWelspun Metallics Limited (refer note below) 740.00 - 74,000,000 (March 31, 2020: Nil) 10% Convertible Non-Cumulative Optionally Redeemable Preference Share (CORPS) of ` 10 eachtotal investments in preference shares of subsidiaries 890.00 -
Iv. Investment in compulsory convertible debentures of subsidiarieswholly owned subsidiariesWelspun DI Pipes Limited (refer note below) 95.57 - 9,500,000 (March 31, 2020: Nil) compulsorily convertible debentures of ` 10 eachWelspun Metallics Limited (refer note below) 861.83 - 85,000,000 (March 31, 2020: Nil) compulsorily convertible debentures of ` 10 each
957.40 - v. Investments in equity instruments of joint venture
(refer note 52)Welspun Wasco Coatings Private Limited 254.65 254.65 25,465,014 (March 31, 2020: 25,465,014) equity shares of `10 each Less: Provision for Impairment in equity investment (254.65) (254.65)total investments in equity instruments of joint venture - -
total equity investments in subsidiaries and joint venture 2,196.73 349.11 Aggregate amount of unquoted investments (gross) 2,451.38 603.76 Aggregate amount of impairment in the value of investments 254.65 254.65
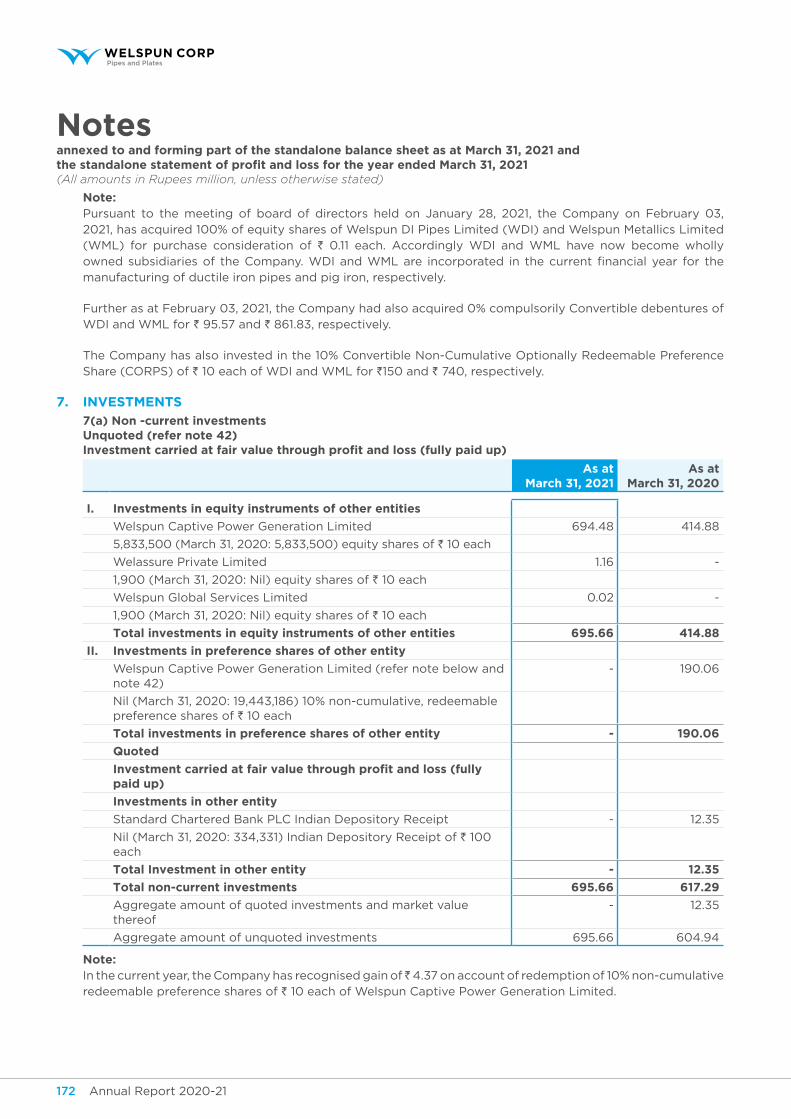
Annual Report 2020-21 173Annual Report 2020-21172
Notesannexed to and forming part of the standalone balance sheet as at March 31, 2021 andthe standalone statement of profit and loss for the year ended March 31, 2021(All amounts in Rupees million, unless otherwise stated)
note: Pursuant to the meeting of board of directors held on January 28, 2021, the Company on February 03,
2021, has acquired 100% of equity shares of Welspun DI Pipes Limited (WDI) and Welspun Metallics Limited (WML) for purchase consideration of ` 0.11 each. Accordingly WDI and WML have now become wholly owned subsidiaries of the Company. WDI and WML are incorporated in the current financial year for the manufacturing of ductile iron pipes and pig iron, respectively.
Further as at February 03, 2021, the Company had also acquired 0% compulsorily Convertible debentures of WDI and WML for ` 95.57 and ` 861.83, respectively.
The Company has also invested in the 10% Convertible Non-Cumulative Optionally Redeemable Preference Share (CORPS) of ` 10 each of WDI and WML for `150 and ` 740, respectively.
7. investMents
7(a) non -current investments unquoted (refer note 42) investment carried at fair value through profit and loss (fully paid up)
As at March 31, 2021
As at March 31, 2020
I. Investments in equity instruments of other entities
Welspun Captive Power Generation Limited 694.48 414.88
5,833,500 (March 31, 2020: 5,833,500) equity shares of ` 10 each
Welassure Private Limited 1.16 -
1,900 (March 31, 2020: Nil) equity shares of ` 10 each
Welspun Global Services Limited 0.02 -
1,900 (March 31, 2020: Nil) equity shares of ` 10 each
total investments in equity instruments of other entities 695.66 414.88
II. Investments in preference shares of other entity
Welspun Captive Power Generation Limited (refer note below and note 42)
- 190.06
Nil (March 31, 2020: 19,443,186) 10% non-cumulative, redeemable preference shares of ` 10 each
total investments in preference shares of other entity - 190.06
quoted
investment carried at fair value through profit and loss (fully paid up)
Investments in other entity
Standard Chartered Bank PLC Indian Depository Receipt - 12.35
Nil (March 31, 2020: 334,331) Indian Depository Receipt of ` 100 each
total Investment in other entity - 12.35
total non-current investments 695.66 617.29
Aggregate amount of quoted investments and market value thereof
- 12.35
Aggregate amount of unquoted investments 695.66 604.94
note: In the current year, the Company has recognised gain of 4.37 on account of redemption of 10% non-cumulative
redeemable preference shares of ` 10 each of Welspun Captive Power Generation Limited.
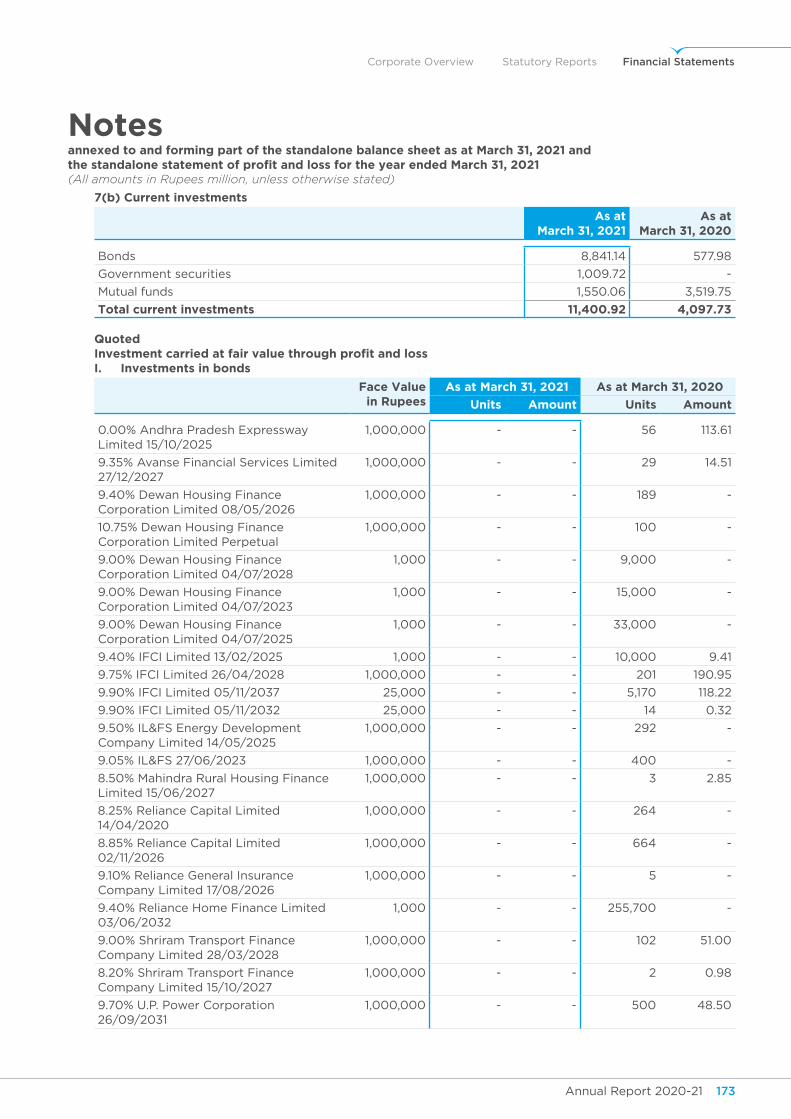
Annual Report 2020-21 173Annual Report 2020-21172
Corporate Overview Statutory Reports Financial Statements
Notesannexed to and forming part of the standalone balance sheet as at March 31, 2021 andthe standalone statement of profit and loss for the year ended March 31, 2021(All amounts in Rupees million, unless otherwise stated)
7(b) Current investments
As at March 31, 2021
As at March 31, 2020
Bonds 8,841.14 577.98
Government securities 1,009.72 -
Mutual funds 1,550.06 3,519.75
total current investments 11,400.92 4,097.73
quoted investment carried at fair value through profit and loss I. Investments in bonds
face value in Rupees
As at March 31, 2021 As at March 31, 2020
units Amount units Amount
0.00% Andhra Pradesh Expressway Limited 15/10/2025
1,000,000 - - 56 113.61
9.35% Avanse Financial Services Limited 27/12/2027
1,000,000 - - 29 14.51
9.40% Dewan Housing Finance Corporation Limited 08/05/2026
1,000,000 - - 189 -
10.75% Dewan Housing Finance Corporation Limited Perpetual
1,000,000 - - 100 -
9.00% Dewan Housing Finance Corporation Limited 04/07/2028
1,000 - - 9,000 -
9.00% Dewan Housing Finance Corporation Limited 04/07/2023
1,000 - - 15,000 -
9.00% Dewan Housing Finance Corporation Limited 04/07/2025
1,000 - - 33,000 -
9.40% IFCI Limited 13/02/2025 1,000 - - 10,000 9.41
9.75% IFCI Limited 26/04/2028 1,000,000 - - 201 190.95
9.90% IFCI Limited 05/11/2037 25,000 - - 5,170 118.22
9.90% IFCI Limited 05/11/2032 25,000 - - 14 0.32
9.50% IL&FS Energy Development Company Limited 14/05/2025
1,000,000 - - 292 -
9.05% IL&FS 27/06/2023 1,000,000 - - 400 -
8.50% Mahindra Rural Housing Finance Limited 15/06/2027
1,000,000 - - 3 2.85
8.25% Reliance Capital Limited 14/04/2020
1,000,000 - - 264 -
8.85% Reliance Capital Limited 02/11/2026
1,000,000 - - 664 -
9.10% Reliance General Insurance Company Limited 17/08/2026
1,000,000 - - 5 -
9.40% Reliance Home Finance Limited 03/06/2032
1,000 - - 255,700 -
9.00% Shriram Transport Finance Company Limited 28/03/2028
1,000,000 - - 102 51.00
8.20% Shriram Transport Finance Company Limited 15/10/2027
1,000,000 - - 2 0.98
9.70% U.P. Power Corporation 26/09/2031
1,000,000 - - 500 48.50
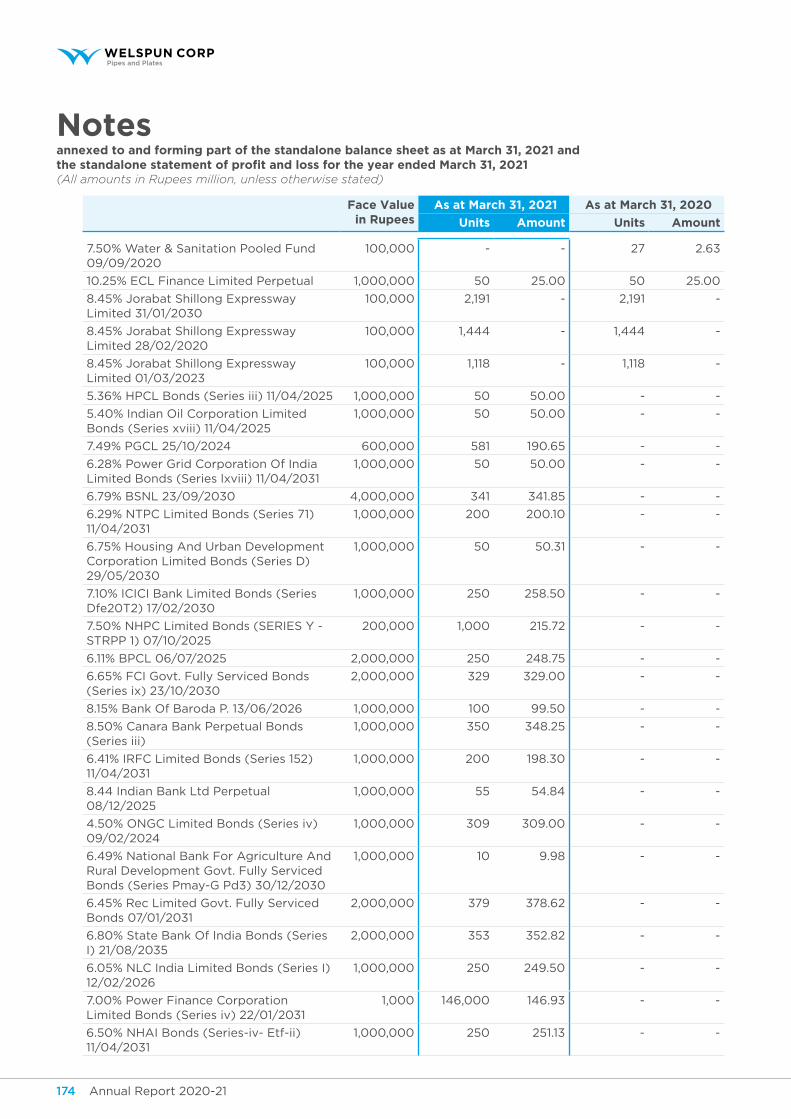
Annual Report 2020-21 175Annual Report 2020-21174
Notesannexed to and forming part of the standalone balance sheet as at March 31, 2021 andthe standalone statement of profit and loss for the year ended March 31, 2021(All amounts in Rupees million, unless otherwise stated)
face value in Rupees
As at March 31, 2021 As at March 31, 2020
units Amount units Amount
7.50% Water & Sanitation Pooled Fund 09/09/2020
100,000 - - 27 2.63
10.25% ECL Finance Limited Perpetual 1,000,000 50 25.00 50 25.00
8.45% Jorabat Shillong Expressway Limited 31/01/2030
100,000 2,191 - 2,191 -
8.45% Jorabat Shillong Expressway Limited 28/02/2020
100,000 1,444 - 1,444 -
8.45% Jorabat Shillong Expressway Limited 01/03/2023
100,000 1,118 - 1,118 -
5.36% HPCL Bonds (Series iii) 11/04/2025 1,000,000 50 50.00 - -
5.40% Indian Oil Corporation Limited Bonds (Series xviii) 11/04/2025
1,000,000 50 50.00 - -
7.49% PGCL 25/10/2024 600,000 581 190.65 - -
6.28% Power Grid Corporation Of India Limited Bonds (Series lxviii) 11/04/2031
1,000,000 50 50.00 - -
6.79% BSNL 23/09/2030 4,000,000 341 341.85 - -
6.29% NTPC Limited Bonds (Series 71) 11/04/2031
1,000,000 200 200.10 - -
6.75% Housing And Urban Development Corporation Limited Bonds (Series D) 29/05/2030
1,000,000 50 50.31 - -
7.10% ICICI Bank Limited Bonds (Series Dfe20T2) 17/02/2030
1,000,000 250 258.50 - -
7.50% NHPC Limited Bonds (SERIES Y - STRPP 1) 07/10/2025
200,000 1,000 215.72 - -
6.11% BPCL 06/07/2025 2,000,000 250 248.75 - -
6.65% FCI Govt. Fully Serviced Bonds (Series ix) 23/10/2030
2,000,000 329 329.00 - -
8.15% Bank Of Baroda P. 13/06/2026 1,000,000 100 99.50 - -
8.50% Canara Bank Perpetual Bonds (Series iii)
1,000,000 350 348.25 - -
6.41% IRFC Limited Bonds (Series 152) 11/04/2031
1,000,000 200 198.30 - -
8.44 Indian Bank Ltd Perpetual 08/12/2025
1,000,000 55 54.84 - -
4.50% ONGC Limited Bonds (Series iv) 09/02/2024
1,000,000 309 309.00 - -
6.49% National Bank For Agriculture And Rural Development Govt. Fully Serviced Bonds (Series Pmay-G Pd3) 30/12/2030
1,000,000 10 9.98 - -
6.45% Rec Limited Govt. Fully Serviced Bonds 07/01/2031
2,000,000 379 378.62 - -
6.80% State Bank Of India Bonds (Series I) 21/08/2035
2,000,000 353 352.82 - -
6.05% NLC India Limited Bonds (Series I) 12/02/2026
1,000,000 250 249.50 - -
7.00% Power Finance Corporation Limited Bonds (Series iv) 22/01/2031
1,000 146,000 146.93 - -
6.50% NHAI Bonds (Series-iv- Etf-ii) 11/04/2031
1,000,000 250 251.13 - -
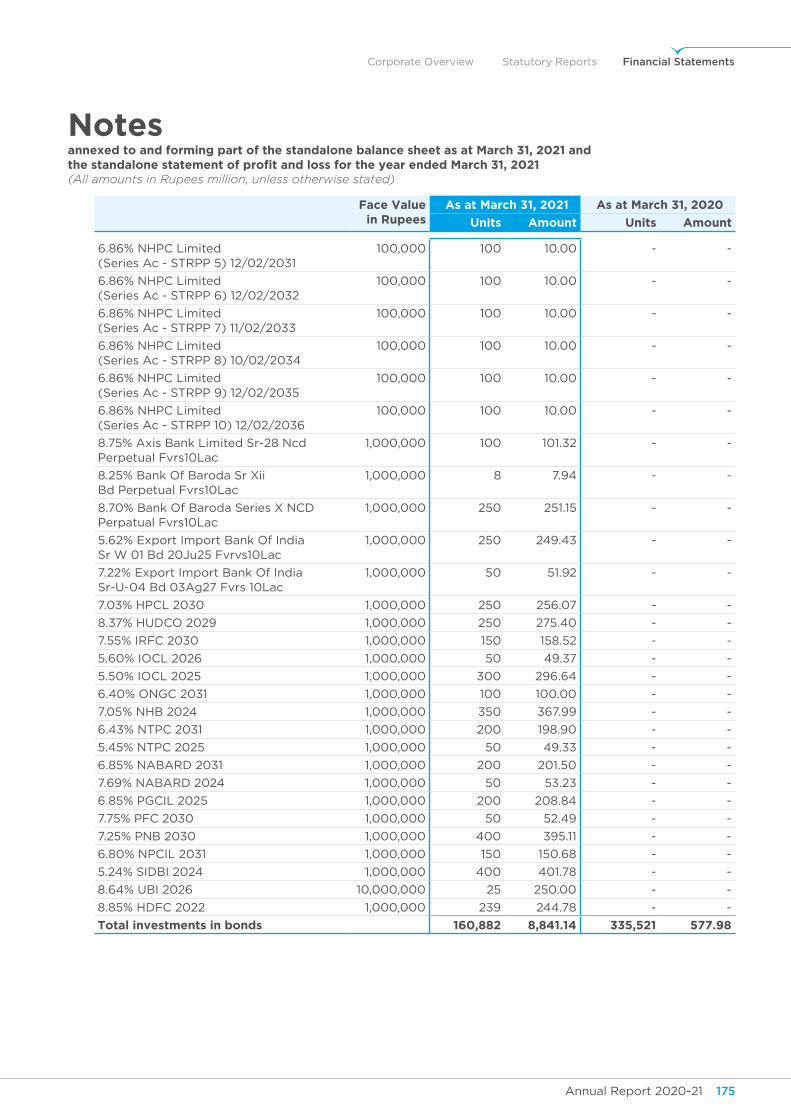
Annual Report 2020-21 175Annual Report 2020-21174
Corporate Overview Statutory Reports Financial Statements
Notesannexed to and forming part of the standalone balance sheet as at March 31, 2021 andthe standalone statement of profit and loss for the year ended March 31, 2021(All amounts in Rupees million, unless otherwise stated)
face value in Rupees
As at March 31, 2021 As at March 31, 2020
units Amount units Amount
6.86% NHPC Limited (Series Ac - STRPP 5) 12/02/2031
100,000 100 10.00 - -
6.86% NHPC Limited (Series Ac - STRPP 6) 12/02/2032
100,000 100 10.00 - -
6.86% NHPC Limited (Series Ac - STRPP 7) 11/02/2033
100,000 100 10.00 - -
6.86% NHPC Limited (Series Ac - STRPP 8) 10/02/2034
100,000 100 10.00 - -
6.86% NHPC Limited (Series Ac - STRPP 9) 12/02/2035
100,000 100 10.00 - -
6.86% NHPC Limited (Series Ac - STRPP 10) 12/02/2036
100,000 100 10.00 - -
8.75% Axis Bank Limited Sr-28 Ncd Perpetual Fvrs10Lac
1,000,000 100 101.32 - -
8.25% Bank Of Baroda Sr Xii Bd Perpetual Fvrs10Lac
1,000,000 8 7.94 - -
8.70% Bank Of Baroda Series X NCD Perpatual Fvrs10Lac
1,000,000 250 251.15 - -
5.62% Export Import Bank Of India Sr W 01 Bd 20Ju25 Fvrvs10Lac
1,000,000 250 249.43 - -
7.22% Export Import Bank Of India Sr-U-04 Bd 03Ag27 Fvrs 10Lac
1,000,000 50 51.92 - -
7.03% HPCL 2030 1,000,000 250 256.07 - -
8.37% HUDCO 2029 1,000,000 250 275.40 - -
7.55% IRFC 2030 1,000,000 150 158.52 - -
5.60% IOCL 2026 1,000,000 50 49.37 - -
5.50% IOCL 2025 1,000,000 300 296.64 - -
6.40% ONGC 2031 1,000,000 100 100.00 - -
7.05% NHB 2024 1,000,000 350 367.99 - -
6.43% NTPC 2031 1,000,000 200 198.90 - -
5.45% NTPC 2025 1,000,000 50 49.33 - -
6.85% NABARD 2031 1,000,000 200 201.50 - -
7.69% NABARD 2024 1,000,000 50 53.23 - -
6.85% PGCIL 2025 1,000,000 200 208.84 - -
7.75% PFC 2030 1,000,000 50 52.49 - -
7.25% PNB 2030 1,000,000 400 395.11 - -
6.80% NPCIL 2031 1,000,000 150 150.68 - -
5.24% SIDBI 2024 1,000,000 400 401.78 - -
8.64% UBI 2026 10,000,000 25 250.00 - -
8.85% HDFC 2022 1,000,000 239 244.78 - -
total investments in bonds 160,882 8,841.14 335,521 577.98
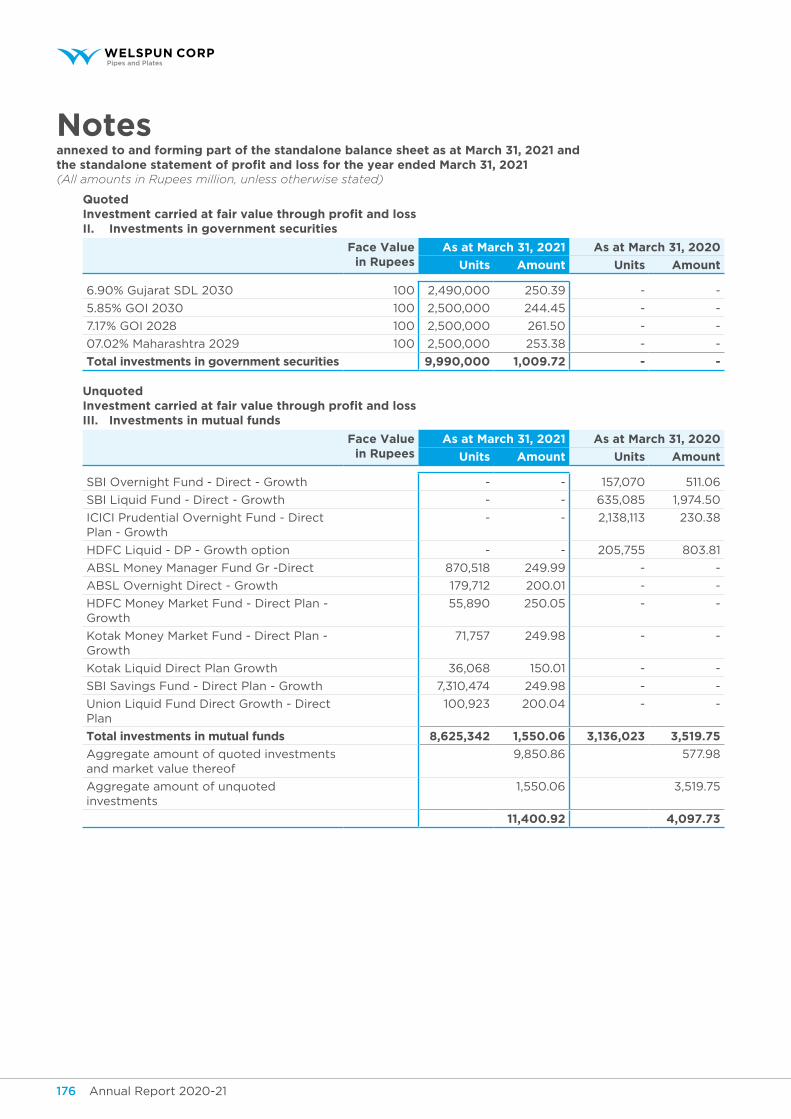
Annual Report 2020-21 177Annual Report 2020-21176
Notesannexed to and forming part of the standalone balance sheet as at March 31, 2021 andthe standalone statement of profit and loss for the year ended March 31, 2021(All amounts in Rupees million, unless otherwise stated)
quoted investment carried at fair value through profit and loss II. Investments in government securities
face value in Rupees
As at March 31, 2021 As at March 31, 2020
units Amount units Amount
6.90% Gujarat SDL 2030 100 2,490,000 250.39 - -
5.85% GOI 2030 100 2,500,000 244.45 - -
7.17% GOI 2028 100 2,500,000 261.50 - -
07.02% Maharashtra 2029 100 2,500,000 253.38 - -
total investments in government securities 9,990,000 1,009.72 - -
unquoted investment carried at fair value through profit and loss III. Investments in mutual funds
face value in Rupees
As at March 31, 2021 As at March 31, 2020
units Amount units Amount
SBI Overnight Fund - Direct - Growth - - 157,070 511.06
SBI Liquid Fund - Direct - Growth - - 635,085 1,974.50
ICICI Prudential Overnight Fund - Direct Plan - Growth
- - 2,138,113 230.38
HDFC Liquid - DP - Growth option - - 205,755 803.81
ABSL Money Manager Fund Gr -Direct 870,518 249.99 - -
ABSL Overnight Direct - Growth 179,712 200.01 - -
HDFC Money Market Fund - Direct Plan - Growth
55,890 250.05 - -
Kotak Money Market Fund - Direct Plan - Growth
71,757 249.98 - -
Kotak Liquid Direct Plan Growth 36,068 150.01 - -
SBI Savings Fund - Direct Plan - Growth 7,310,474 249.98 - -
Union Liquid Fund Direct Growth - Direct Plan
100,923 200.04 - -
total investments in mutual funds 8,625,342 1,550.06 3,136,023 3,519.75
Aggregate amount of quoted investments and market value thereof
9,850.86 577.98
Aggregate amount of unquoted investments
1,550.06 3,519.75
11,400.92 4,097.73
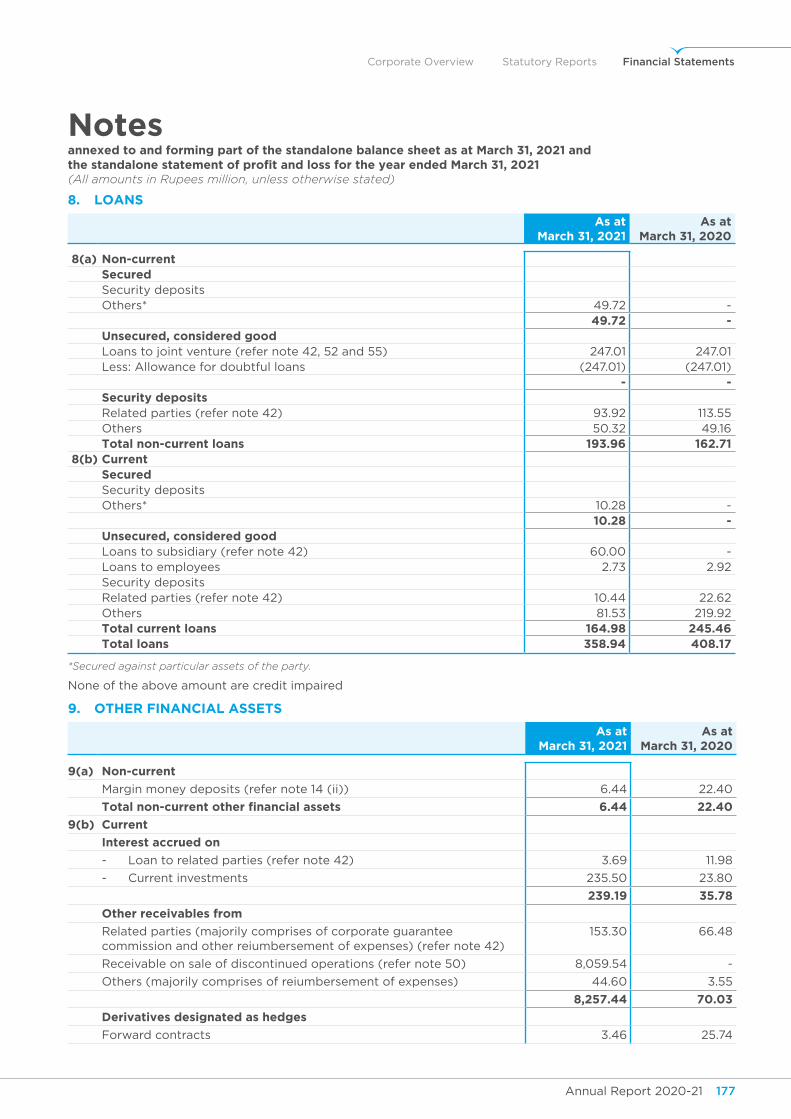
Annual Report 2020-21 177Annual Report 2020-21176
Corporate Overview Statutory Reports Financial Statements
Notesannexed to and forming part of the standalone balance sheet as at March 31, 2021 andthe standalone statement of profit and loss for the year ended March 31, 2021(All amounts in Rupees million, unless otherwise stated)
8. LoAns
As at March 31, 2021
As at March 31, 2020
8(a) non-currentsecuredSecurity depositsOthers* 49.72 -
49.72 - unsecured, considered goodLoans to joint venture (refer note 42, 52 and 55) 247.01 247.01 Less: Allowance for doubtful loans (247.01) (247.01)
- - security depositsRelated parties (refer note 42) 93.92 113.55 Others 50.32 49.16 total non-current loans 193.96 162.71
8(b) currentsecuredSecurity depositsOthers* 10.28 -
10.28 - unsecured, considered goodLoans to subsidiary (refer note 42) 60.00 - Loans to employees 2.73 2.92 Security depositsRelated parties (refer note 42) 10.44 22.62 Others 81.53 219.92 total current loans 164.98 245.46 total loans 358.94 408.17
*Secured against particular assets of the party.
None of the above amount are credit impaired
9. otheR finAnCiAL Assets
As at March 31, 2021
As at March 31, 2020
9(a) non-current
Margin money deposits (refer note 14 (ii)) 6.44 22.40
total non-current other financial assets 6.44 22.40
9(b) current
Interest accrued on
- Loan to related parties (refer note 42) 3.69 11.98
- Current investments 235.50 23.80
239.19 35.78
other receivables from
Related parties (majorily comprises of corporate guarantee commission and other reiumbersement of expenses) (refer note 42)
153.30 66.48
Receivable on sale of discontinued operations (refer note 50) 8,059.54 -
Others (majorily comprises of reiumbersement of expenses) 44.60 3.55
8,257.44 70.03
derivatives designated as hedges
Forward contracts 3.46 25.74
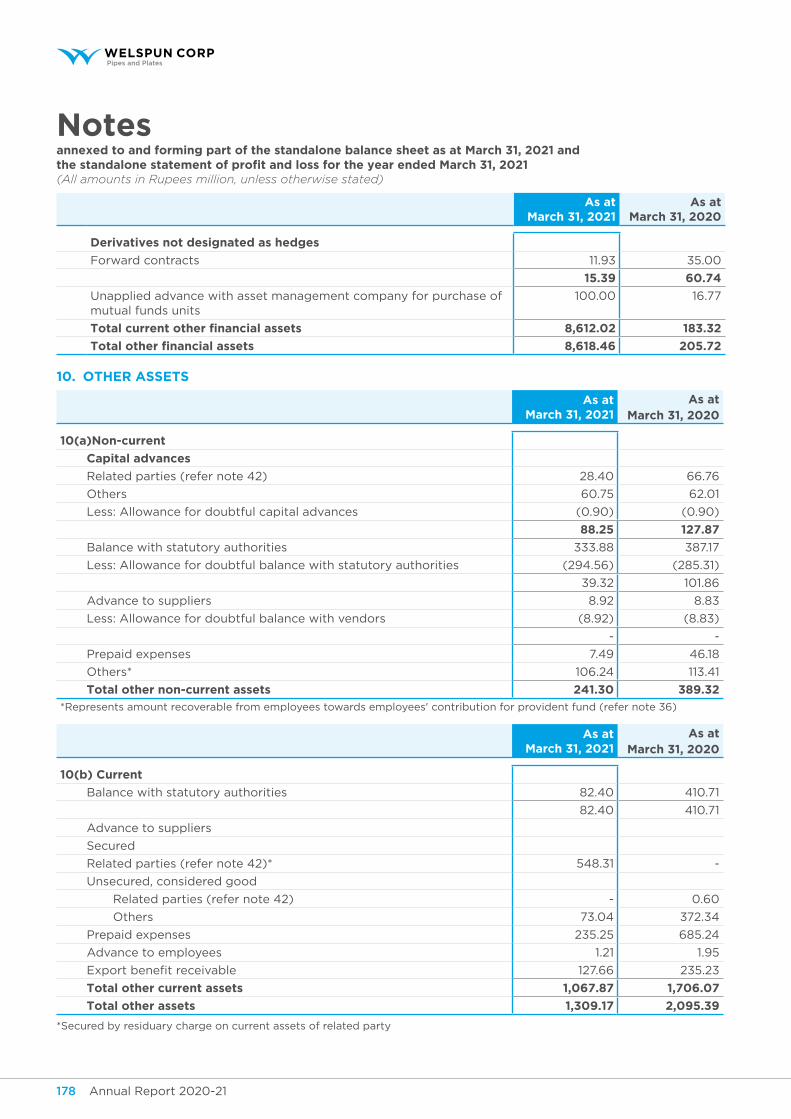
Annual Report 2020-21 179Annual Report 2020-21178
Notesannexed to and forming part of the standalone balance sheet as at March 31, 2021 andthe standalone statement of profit and loss for the year ended March 31, 2021(All amounts in Rupees million, unless otherwise stated)
As at March 31, 2021
As at March 31, 2020
derivatives not designated as hedges
Forward contracts 11.93 35.00
15.39 60.74
Unapplied advance with asset management company for purchase of mutual funds units
100.00 16.77
total current other financial assets 8,612.02 183.32
total other financial assets 8,618.46 205.72
10. otheR Assets
As at March 31, 2021
As at March 31, 2020
10(a)non-current
capital advances
Related parties (refer note 42) 28.40 66.76
Others 60.75 62.01
Less: Allowance for doubtful capital advances (0.90) (0.90)
88.25 127.87
Balance with statutory authorities 333.88 387.17
Less: Allowance for doubtful balance with statutory authorities (294.56) (285.31)
39.32 101.86
Advance to suppliers 8.92 8.83
Less: Allowance for doubtful balance with vendors (8.92) (8.83)
- -
Prepaid expenses 7.49 46.18
Others* 106.24 113.41
total other non-current assets 241.30 389.32
*Represents amount recoverable from employees towards employees' contribution for provident fund (refer note 36)
As at March 31, 2021
As at March 31, 2020
10(b) Current
Balance with statutory authorities 82.40 410.71
82.40 410.71
Advance to suppliers
Secured
Related parties (refer note 42)* 548.31 -
Unsecured, considered good
Related parties (refer note 42) - 0.60
Others 73.04 372.34
Prepaid expenses 235.25 685.24
Advance to employees 1.21 1.95
Export benefit receivable 127.66 235.23
total other current assets 1,067.87 1,706.07
total other assets 1,309.17 2,095.39
*Secured by residuary charge on current assets of related party
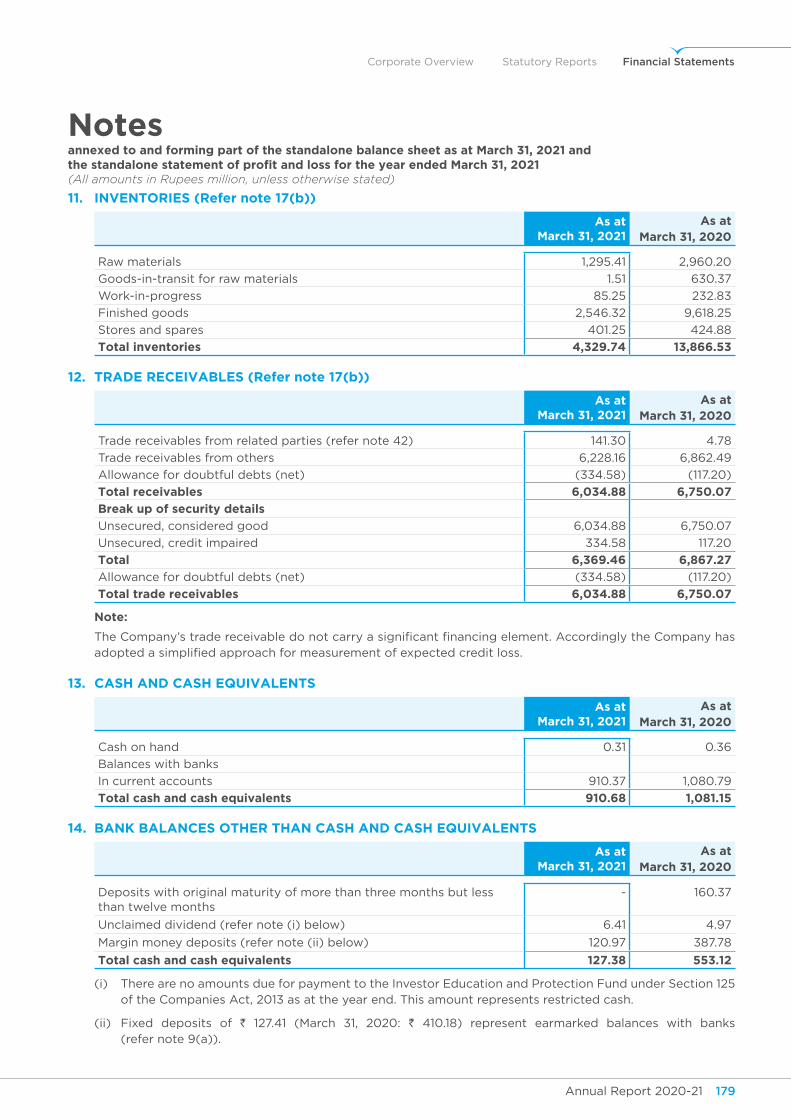
Annual Report 2020-21 179Annual Report 2020-21178
Corporate Overview Statutory Reports Financial Statements
Notesannexed to and forming part of the standalone balance sheet as at March 31, 2021 andthe standalone statement of profit and loss for the year ended March 31, 2021(All amounts in Rupees million, unless otherwise stated)
11. InventoRIes (Refer note 17(b))
As at March 31, 2021
As at March 31, 2020
Raw materials 1,295.41 2,960.20
Goods-in-transit for raw materials 1.51 630.37
Work-in-progress 85.25 232.83
Finished goods 2,546.32 9,618.25
Stores and spares 401.25 424.88
total inventories 4,329.74 13,866.53
12. tRAde ReCeivABLes (Refer note 17(b))
As at March 31, 2021
As at March 31, 2020
Trade receivables from related parties (refer note 42) 141.30 4.78
Trade receivables from others 6,228.16 6,862.49
Allowance for doubtful debts (net) (334.58) (117.20)
total receivables 6,034.88 6,750.07
Break up of security details
Unsecured, considered good 6,034.88 6,750.07
Unsecured, credit impaired 334.58 117.20
total 6,369.46 6,867.27
Allowance for doubtful debts (net) (334.58) (117.20)
total trade receivables 6,034.88 6,750.07
note:
The Company’s trade receivable do not carry a significant financing element. Accordingly the Company has adopted a simplified approach for measurement of expected credit loss.
13. CAsh And CAsh equivALents
As at March 31, 2021
As at March 31, 2020
Cash on hand 0.31 0.36
Balances with banks
In current accounts 910.37 1,080.79
total cash and cash equivalents 910.68 1,081.15
14. BAnK BAlAnces otheR thAn cAsh And cAsh equIvAlents
As at March 31, 2021
As at March 31, 2020
Deposits with original maturity of more than three months but less than twelve months
- 160.37
Unclaimed dividend (refer note (i) below) 6.41 4.97
Margin money deposits (refer note (ii) below) 120.97 387.78
total cash and cash equivalents 127.38 553.12
(i) There are no amounts due for payment to the Investor Education and Protection Fund under Section 125 of the Companies Act, 2013 as at the year end. This amount represents restricted cash.
(ii) Fixed deposits of ` 127.41 (March 31, 2020: ` 410.18) represent earmarked balances with banks (refer note 9(a)).
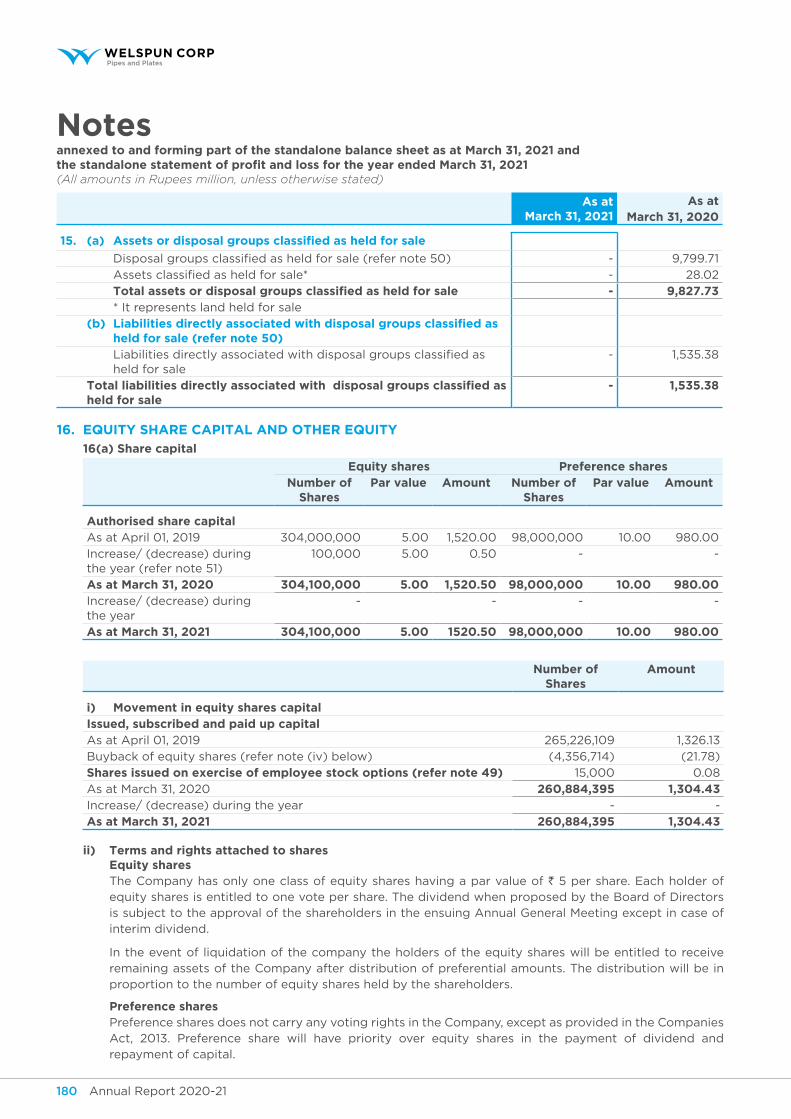
Annual Report 2020-21 181Annual Report 2020-21180
Notesannexed to and forming part of the standalone balance sheet as at March 31, 2021 andthe standalone statement of profit and loss for the year ended March 31, 2021(All amounts in Rupees million, unless otherwise stated)
As at March 31, 2021
As at March 31, 2020
15. (a) Assets or disposal groups classified as held for sale
Disposal groups classified as held for sale (refer note 50) - 9,799.71
Assets classified as held for sale* - 28.02
total assets or disposal groups classified as held for sale - 9,827.73 * It represents land held for sale
(b) Liabilities directly associated with disposal groups classified as held for sale (refer note 50)
Liabilities directly associated with disposal groups classified as held for sale
- 1,535.38
total liabilities directly associated with disposal groups classified as held for sale
- 1,535.38
16. equity shARe CAPitAL And otheR equity
16(a) share capital
equity shares preference shares number of
sharespar value Amount number of
sharespar value Amount
Authorised share capitalAs at April 01, 2019 304,000,000 5.00 1,520.00 98,000,000 10.00 980.00
Increase/ (decrease) during the year (refer note 51)
100,000 5.00 0.50 - -
As at March 31, 2020 304,100,000 5.00 1,520.50 98,000,000 10.00 980.00 Increase/ (decrease) during the year
- - - -
As at March 31, 2021 304,100,000 5.00 1520.50 98,000,000 10.00 980.00
number of shares
Amount
i) movement in equity shares capitalissued, subscribed and paid up capitalAs at April 01, 2019 265,226,109 1,326.13
Buyback of equity shares (refer note (iv) below) (4,356,714) (21.78)
shares issued on exercise of employee stock options (refer note 49) 15,000 0.08
As at March 31, 2020 260,884,395 1,304.43 Increase/ (decrease) during the year - -
As at March 31, 2021 260,884,395 1,304.43
ii) terms and rights attached to shares equity shares
The Company has only one class of equity shares having a par value of ` 5 per share. Each holder of equity shares is entitled to one vote per share. The dividend when proposed by the Board of Directors is subject to the approval of the shareholders in the ensuing Annual General Meeting except in case of interim dividend.
In the event of liquidation of the company the holders of the equity shares will be entitled to receive remaining assets of the Company after distribution of preferential amounts. The distribution will be in proportion to the number of equity shares held by the shareholders.
preference shares Preference shares does not carry any voting rights in the Company, except as provided in the Companies
Act, 2013. Preference share will have priority over equity shares in the payment of dividend and repayment of capital.
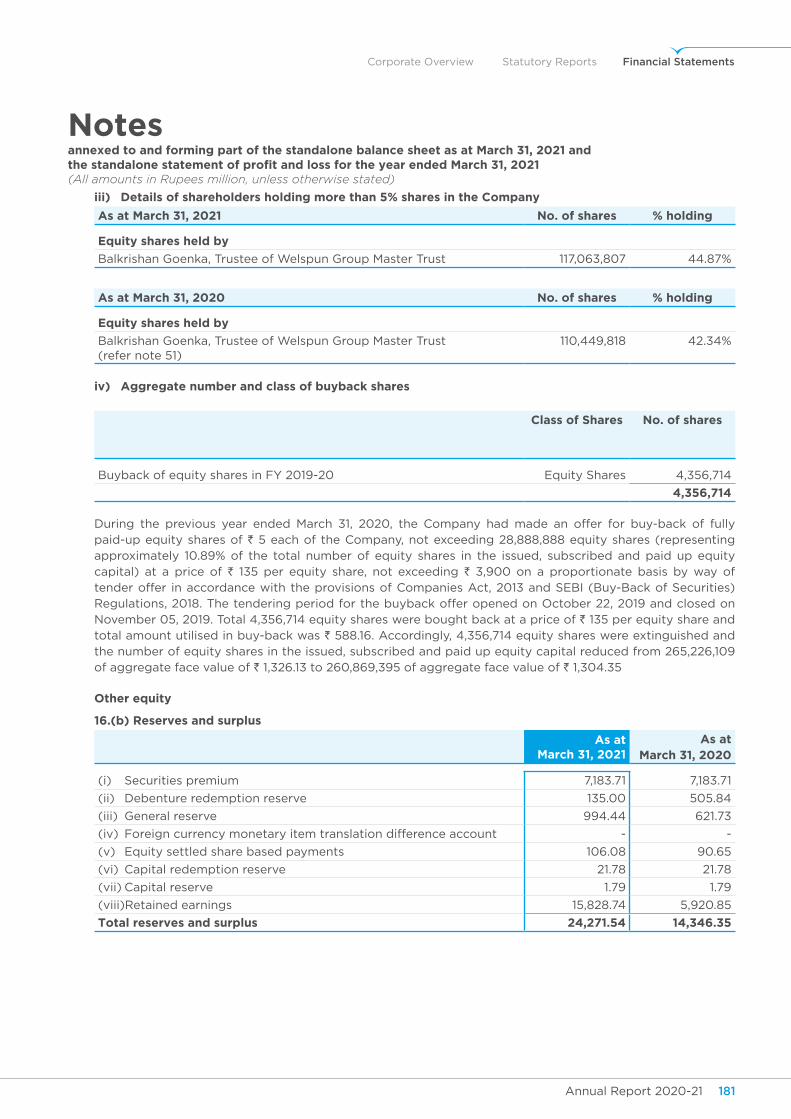
Annual Report 2020-21 181Annual Report 2020-21180
Corporate Overview Statutory Reports Financial Statements
Notesannexed to and forming part of the standalone balance sheet as at March 31, 2021 andthe standalone statement of profit and loss for the year ended March 31, 2021(All amounts in Rupees million, unless otherwise stated)
iii) details of shareholders holding more than 5% shares in the Company
As at March 31, 2021 no. of shares % holding
equity shares held by
Balkrishan Goenka, Trustee of Welspun Group Master Trust 117,063,807 44.87%
As at March 31, 2020 no. of shares % holding
equity shares held by
Balkrishan Goenka, Trustee of Welspun Group Master Trust (refer note 51)
110,449,818 42.34%
iv) Aggregate number and class of buyback shares
class of shares no. of shares
Buyback of equity shares in FY 2019-20 Equity Shares 4,356,714
4,356,714
During the previous year ended March 31, 2020, the Company had made an offer for buy-back of fully paid-up equity shares of ` 5 each of the Company, not exceeding 28,888,888 equity shares (representing approximately 10.89% of the total number of equity shares in the issued, subscribed and paid up equity capital) at a price of ` 135 per equity share, not exceeding ` 3,900 on a proportionate basis by way of tender offer in accordance with the provisions of Companies Act, 2013 and SEBI (Buy-Back of Securities) Regulations, 2018. The tendering period for the buyback offer opened on October 22, 2019 and closed on November 05, 2019. Total 4,356,714 equity shares were bought back at a price of ` 135 per equity share and total amount utilised in buy-back was ` 588.16. Accordingly, 4,356,714 equity shares were extinguished and the number of equity shares in the issued, subscribed and paid up equity capital reduced from 265,226,109 of aggregate face value of ` 1,326.13 to 260,869,395 of aggregate face value of ` 1,304.35
other equity
16.(b) Reserves and surplus
As at March 31, 2021
As at March 31, 2020
(i) Securities premium 7,183.71 7,183.71
(ii) Debenture redemption reserve 135.00 505.84
(iii) General reserve 994.44 621.73
(iv) Foreign currency monetary item translation difference account - -
(v) Equity settled share based payments 106.08 90.65
(vi) Capital redemption reserve 21.78 21.78
(vii) Capital reserve 1.79 1.79
(viii)Retained earnings 15,828.74 5,920.85
total reserves and surplus 24,271.54 14,346.35
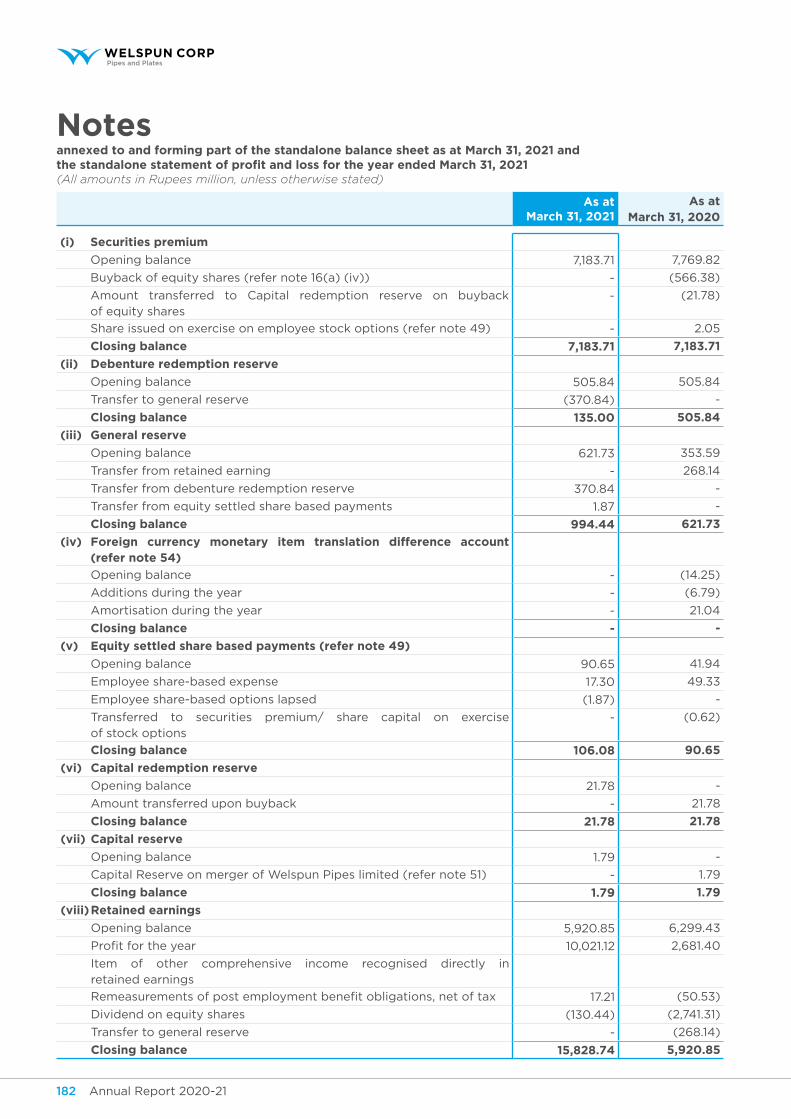
Annual Report 2020-21 183Annual Report 2020-21182
Notesannexed to and forming part of the standalone balance sheet as at March 31, 2021 andthe standalone statement of profit and loss for the year ended March 31, 2021(All amounts in Rupees million, unless otherwise stated)
As at March 31, 2021
As at March 31, 2020
(i) securities premium
Opening balance 7,183.71 7,769.82
Buyback of equity shares (refer note 16(a) (iv)) - (566.38)
Amount transferred to Capital redemption reserve on buyback of equity shares
- (21.78)
Share issued on exercise on employee stock options (refer note 49) - 2.05
closing balance 7,183.71 7,183.71
(ii) debenture redemption reserve
Opening balance 505.84 505.84
Transfer to general reserve (370.84) -
closing balance 135.00 505.84
(iii) general reserve
Opening balance 621.73 353.59
Transfer from retained earning - 268.14
Transfer from debenture redemption reserve 370.84 -
Transfer from equity settled share based payments 1.87 -
closing balance 994.44 621.73
(iv) foreign currency monetary item translation difference account (refer note 54)
Opening balance - (14.25)
Additions during the year - (6.79)
Amortisation during the year - 21.04
closing balance - -
(v) equity settled share based payments (refer note 49)
Opening balance 90.65 41.94
Employee share-based expense 17.30 49.33
Employee share-based options lapsed (1.87) -
Transferred to securities premium/ share capital on exercise of stock options
- (0.62)
closing balance 106.08 90.65
(vi) capital redemption reserve
Opening balance 21.78 -
Amount transferred upon buyback - 21.78
closing balance 21.78 21.78
(vii) capital reserve
Opening balance 1.79 -
Capital Reserve on merger of Welspun Pipes limited (refer note 51) - 1.79
closing balance 1.79 1.79
(viii) Retained earnings
Opening balance 5,920.85 6,299.43
Profit for the year 10,021.12 2,681.40
Item of other comprehensive income recognised directly in retained earnings
Remeasurements of post employment benefit obligations, net of tax 17.21 (50.53)
Dividend on equity shares (130.44) (2,741.31)
Transfer to general reserve - (268.14)
closing balance 15,828.74 5,920.85
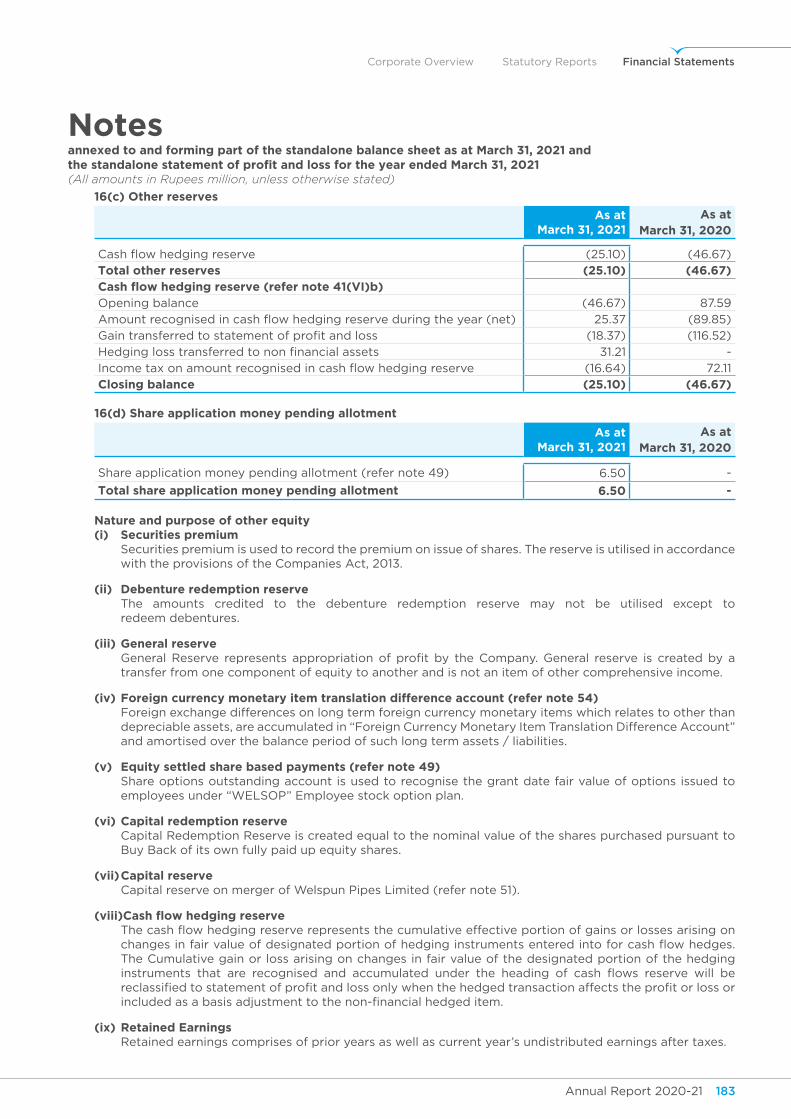
Annual Report 2020-21 183Annual Report 2020-21182
Corporate Overview Statutory Reports Financial Statements
Notesannexed to and forming part of the standalone balance sheet as at March 31, 2021 andthe standalone statement of profit and loss for the year ended March 31, 2021(All amounts in Rupees million, unless otherwise stated)
16(c) other reserves
As at March 31, 2021
As at March 31, 2020
Cash flow hedging reserve (25.10) (46.67)
total other reserves (25.10) (46.67)Cash flow hedging reserve (refer note 41(vi)b)Opening balance (46.67) 87.59
Amount recognised in cash flow hedging reserve during the year (net) 25.37 (89.85)
Gain transferred to statement of profit and loss (18.37) (116.52)
Hedging loss transferred to non financial assets 31.21 -
Income tax on amount recognised in cash flow hedging reserve (16.64) 72.11
closing balance (25.10) (46.67)
16(d) share application money pending allotment
As at March 31, 2021
As at March 31, 2020
Share application money pending allotment (refer note 49) 6.50 -
total share application money pending allotment 6.50 -
nature and purpose of other equity (i) securities premium
Securities premium is used to record the premium on issue of shares. The reserve is utilised in accordance with the provisions of the Companies Act, 2013.
(ii) debenture redemption reserve The amounts credited to the debenture redemption reserve may not be utilised except to
redeem debentures.
(iii) general reserve General Reserve represents appropriation of profit by the Company. General reserve is created by a
transfer from one component of equity to another and is not an item of other comprehensive income.
(iv) foreign currency monetary item translation difference account (refer note 54) Foreign exchange differences on long term foreign currency monetary items which relates to other than
depreciable assets, are accumulated in “Foreign Currency Monetary Item Translation Difference Account” and amortised over the balance period of such long term assets / liabilities.
(v) equity settled share based payments (refer note 49) Share options outstanding account is used to recognise the grant date fair value of options issued to
employees under “WELSOP” Employee stock option plan.
(vi) capital redemption reserve Capital Redemption Reserve is created equal to the nominal value of the shares purchased pursuant to
Buy Back of its own fully paid up equity shares.
(vii) capital reserve Capital reserve on merger of Welspun Pipes Limited (refer note 51).
(viii)Cash flow hedging reserve The cash flow hedging reserve represents the cumulative effective portion of gains or losses arising on
changes in fair value of designated portion of hedging instruments entered into for cash flow hedges. The Cumulative gain or loss arising on changes in fair value of the designated portion of the hedging instruments that are recognised and accumulated under the heading of cash flows reserve will be reclassified to statement of profit and loss only when the hedged transaction affects the profit or loss or included as a basis adjustment to the non-financial hedged item.
(ix) Retained earnings Retained earnings comprises of prior years as well as current year’s undistributed earnings after taxes.
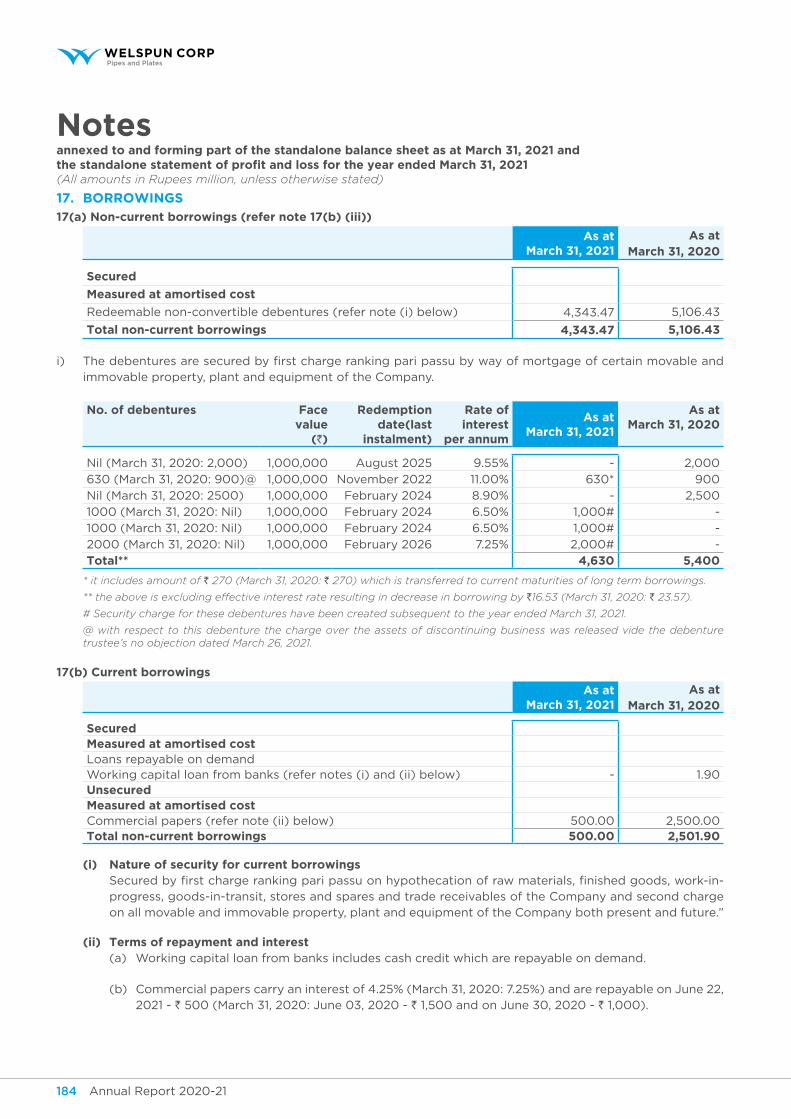
Annual Report 2020-21 185Annual Report 2020-21184
Notesannexed to and forming part of the standalone balance sheet as at March 31, 2021 andthe standalone statement of profit and loss for the year ended March 31, 2021(All amounts in Rupees million, unless otherwise stated)
17. BoRRoWings
17(a) non-current borrowings (refer note 17(b) (iii))
As at March 31, 2021
As at March 31, 2020
secured
measured at amortised cost
Redeemable non-convertible debentures (refer note (i) below) 4,343.47 5,106.43
total non-current borrowings 4,343.47 5,106.43
i) The debentures are secured by first charge ranking pari passu by way of mortgage of certain movable and immovable property, plant and equipment of the Company.
no. of debentures face value
(`)
Redemption date(last
instalment)
Rate of interest
per annum
As at March 31, 2021
As at March 31, 2020
Nil (March 31, 2020: 2,000) 1,000,000 August 2025 9.55% - 2,000
630 (March 31, 2020: 900)@ 1,000,000 November 2022 11.00% 630* 900
Nil (March 31, 2020: 2500) 1,000,000 February 2024 8.90% - 2,500
1000 (March 31, 2020: Nil) 1,000,000 February 2024 6.50% 1,000# -
1000 (March 31, 2020: Nil) 1,000,000 February 2024 6.50% 1,000# -
2000 (March 31, 2020: Nil) 1,000,000 February 2026 7.25% 2,000# -
total** 4,630 5,400
* it includes amount of ` 270 (March 31, 2020: ` 270) which is transferred to current maturities of long term borrowings.
** the above is excluding effective interest rate resulting in decrease in borrowing by `16.53 (March 31, 2020: ` 23.57).
# Security charge for these debentures have been created subsequent to the year ended March 31, 2021.
@ with respect to this debenture the charge over the assets of discontinuing business was released vide the debenture trustee’s no objection dated March 26, 2021.
17(b) Current borrowings
As at March 31, 2021
As at March 31, 2020
securedmeasured at amortised costLoans repayable on demandWorking capital loan from banks (refer notes (i) and (ii) below) - 1.90unsecuredmeasured at amortised costCommercial papers (refer note (ii) below) 500.00 2,500.00 total non-current borrowings 500.00 2,501.90
(i) nature of security for current borrowings Secured by first charge ranking pari passu on hypothecation of raw materials, finished goods, work-in-
progress, goods-in-transit, stores and spares and trade receivables of the Company and second charge on all movable and immovable property, plant and equipment of the Company both present and future.”
(ii) terms of repayment and interest (a) Working capital loan from banks includes cash credit which are repayable on demand.
(b) Commercial papers carry an interest of 4.25% (March 31, 2020: 7.25%) and are repayable on June 22, 2021 - ` 500 (March 31, 2020: June 03, 2020 - ` 1,500 and on June 30, 2020 - ` 1,000).
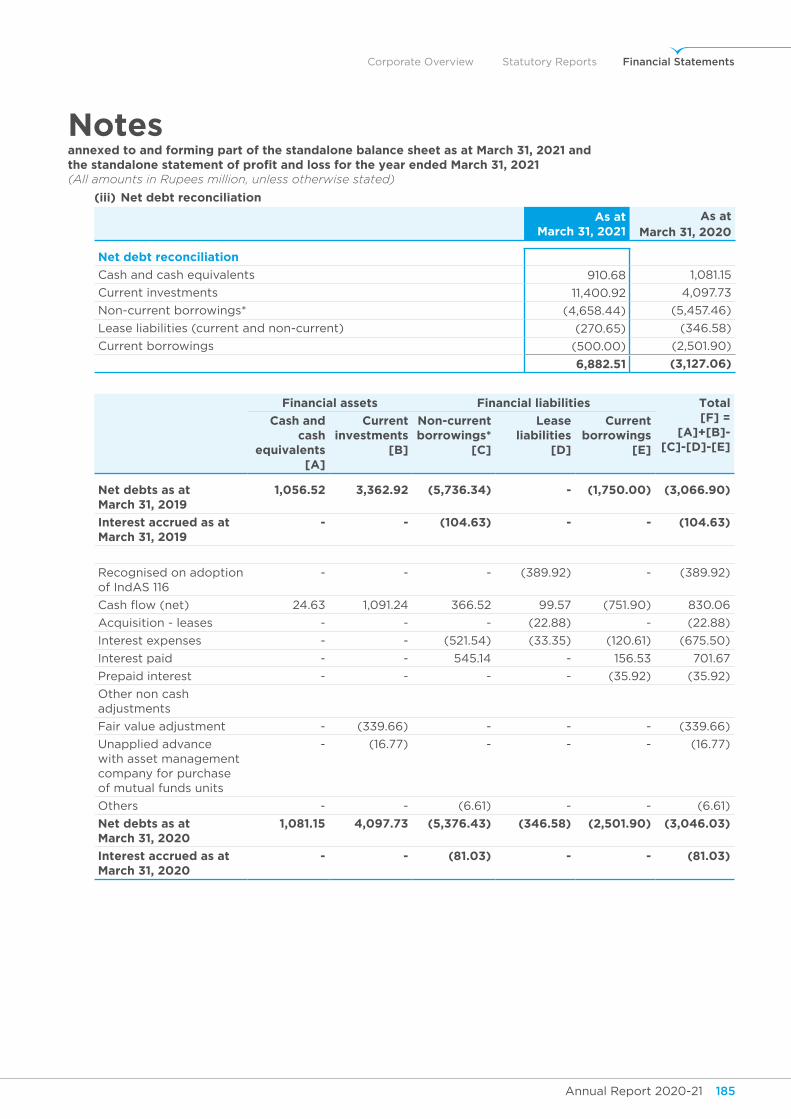
Annual Report 2020-21 185Annual Report 2020-21184
Corporate Overview Statutory Reports Financial Statements
Notesannexed to and forming part of the standalone balance sheet as at March 31, 2021 andthe standalone statement of profit and loss for the year ended March 31, 2021(All amounts in Rupees million, unless otherwise stated)
(iii) net debt reconciliation
As at March 31, 2021
As at March 31, 2020
net debt reconciliation
Cash and cash equivalents 910.68 1,081.15
Current investments 11,400.92 4,097.73
Non-current borrowings* (4,658.44) (5,457.46)
Lease liabilities (current and non-current) (270.65) (346.58)
Current borrowings (500.00) (2,501.90)
6,882.51 (3,127.06)
financial assets financial liabilities total [f] =
[A]+[B]-[c]-[d]-[e]
cash and cash
equivalents [A]
current investments
[B]
non-current borrowings*
[c]
lease liabilities
[d]
current borrowings
[e]
net debts as at March 31, 2019
1,056.52 3,362.92 (5,736.34) - (1,750.00) (3,066.90)
Interest accrued as at March 31, 2019
- - (104.63) - - (104.63)
Recognised on adoption of IndAS 116
- - - (389.92) - (389.92)
Cash flow (net) 24.63 1,091.24 366.52 99.57 (751.90) 830.06
Acquisition - leases - - - (22.88) - (22.88)
Interest expenses - - (521.54) (33.35) (120.61) (675.50)
Interest paid - - 545.14 - 156.53 701.67
Prepaid interest - - - - (35.92) (35.92)
Other non cash adjustments
Fair value adjustment - (339.66) - - - (339.66)
Unapplied advance with asset management company for purchase of mutual funds units
- (16.77) - - - (16.77)
Others - - (6.61) - - (6.61)
net debts as at March 31, 2020
1,081.15 4,097.73 (5,376.43) (346.58) (2,501.90) (3,046.03)
Interest accrued as at March 31, 2020
- - (81.03) - - (81.03)
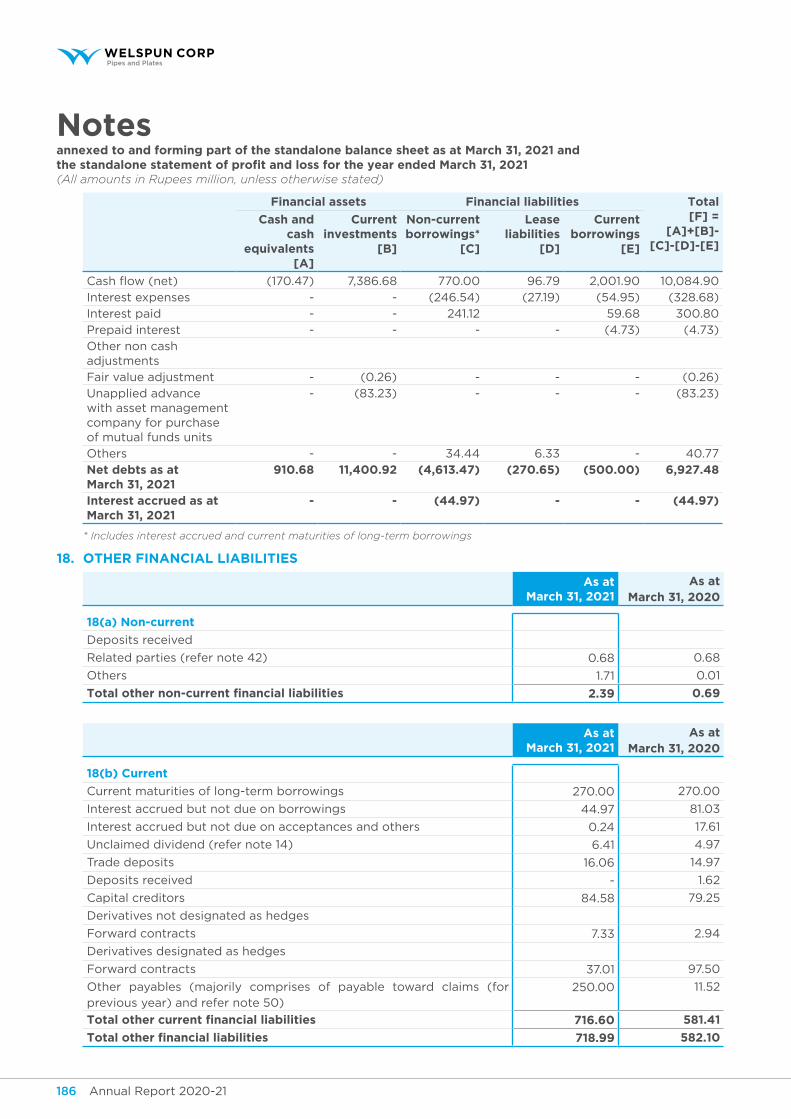
Annual Report 2020-21 187Annual Report 2020-21186
Notesannexed to and forming part of the standalone balance sheet as at March 31, 2021 andthe standalone statement of profit and loss for the year ended March 31, 2021(All amounts in Rupees million, unless otherwise stated)
financial assets financial liabilities total [f] =
[A]+[B]-[c]-[d]-[e]
cash and cash
equivalents [A]
current investments
[B]
non-current borrowings*
[c]
lease liabilities
[d]
current borrowings
[e]
Cash flow (net) (170.47) 7,386.68 770.00 96.79 2,001.90 10,084.90
Interest expenses - - (246.54) (27.19) (54.95) (328.68)
Interest paid - - 241.12 59.68 300.80
Prepaid interest - - - - (4.73) (4.73)
Other non cash adjustments
Fair value adjustment - (0.26) - - - (0.26)
Unapplied advance with asset management company for purchase of mutual funds units
- (83.23) - - - (83.23)
Others - - 34.44 6.33 - 40.77
net debts as at March 31, 2021
910.68 11,400.92 (4,613.47) (270.65) (500.00) 6,927.48
Interest accrued as at March 31, 2021
- - (44.97) - - (44.97)
* Includes interest accrued and current maturities of long-term borrowings
18. otheR finAnCiAL LiABiLities
As at March 31, 2021
As at March 31, 2020
18(a) non-current
Deposits received
Related parties (refer note 42) 0.68 0.68
Others 1.71 0.01
total other non-current financial liabilities 2.39 0.69
As at March 31, 2021
As at March 31, 2020
18(b) Current
Current maturities of long-term borrowings 270.00 270.00
Interest accrued but not due on borrowings 44.97 81.03
Interest accrued but not due on acceptances and others 0.24 17.61
Unclaimed dividend (refer note 14) 6.41 4.97
Trade deposits 16.06 14.97
Deposits received - 1.62
Capital creditors 84.58 79.25
Derivatives not designated as hedges
Forward contracts 7.33 2.94
Derivatives designated as hedges
Forward contracts 37.01 97.50
Other payables (majorily comprises of payable toward claims (for previous year) and refer note 50)
250.00 11.52
total other current financial liabilities 716.60 581.41
total other financial liabilities 718.99 582.10
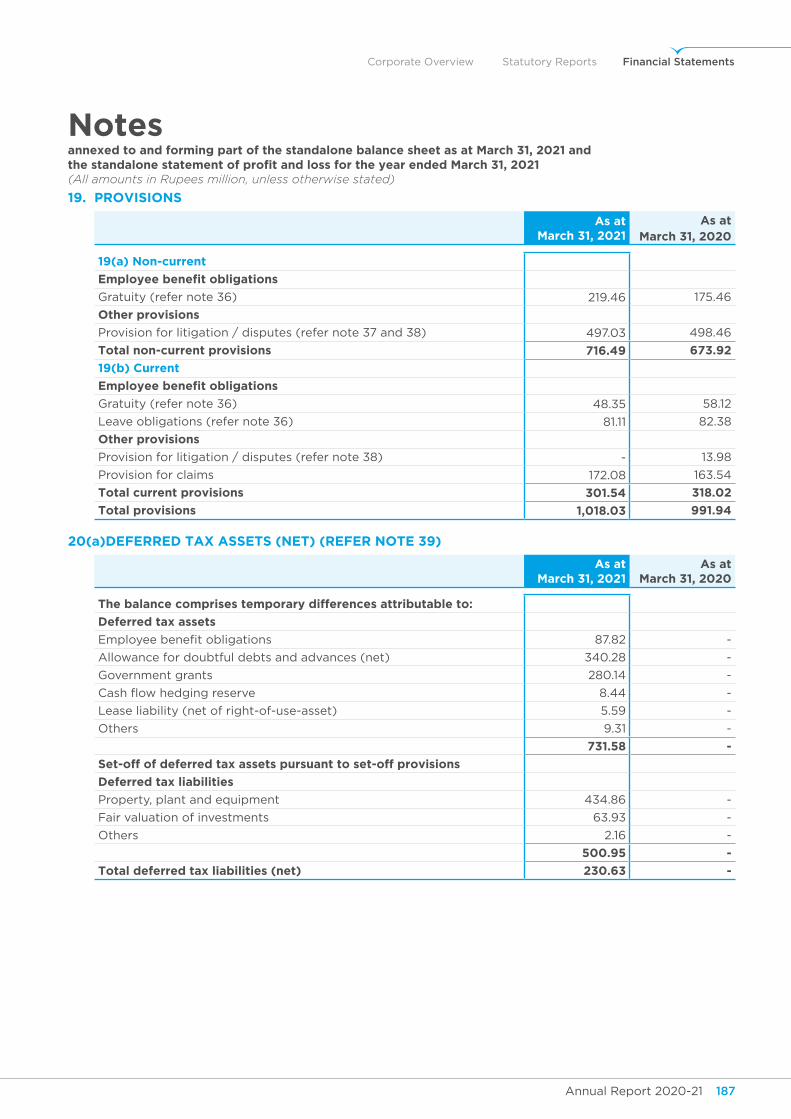
Annual Report 2020-21 187Annual Report 2020-21186
Corporate Overview Statutory Reports Financial Statements
Notesannexed to and forming part of the standalone balance sheet as at March 31, 2021 andthe standalone statement of profit and loss for the year ended March 31, 2021(All amounts in Rupees million, unless otherwise stated)
19. PRovisions
As at March 31, 2021
As at March 31, 2020
19(a) non-current
employee benefit obligations
Gratuity (refer note 36) 219.46 175.46
other provisions
Provision for litigation / disputes (refer note 37 and 38) 497.03 498.46
total non-current provisions 716.49 673.92
19(b) Current
employee benefit obligations
Gratuity (refer note 36) 48.35 58.12
Leave obligations (refer note 36) 81.11 82.38
other provisions
Provision for litigation / disputes (refer note 38) - 13.98
Provision for claims 172.08 163.54
total current provisions 301.54 318.02
total provisions 1,018.03 991.94
20(a)defeRRed tAx Assets (net) (RefeR note 39)
As at March 31, 2021
As at March 31, 2020
the balance comprises temporary differences attributable to:
deferred tax assets
Employee benefit obligations 87.82 -
Allowance for doubtful debts and advances (net) 340.28 -
Government grants 280.14 -
Cash flow hedging reserve 8.44 -
Lease liability (net of right-of-use-asset) 5.59 -
Others 9.31 -
731.58 -
set-off of deferred tax assets pursuant to set-off provisions
deferred tax liabilities
Property, plant and equipment 434.86 -
Fair valuation of investments 63.93 -
Others 2.16 -
500.95 -
total deferred tax liabilities (net) 230.63 -
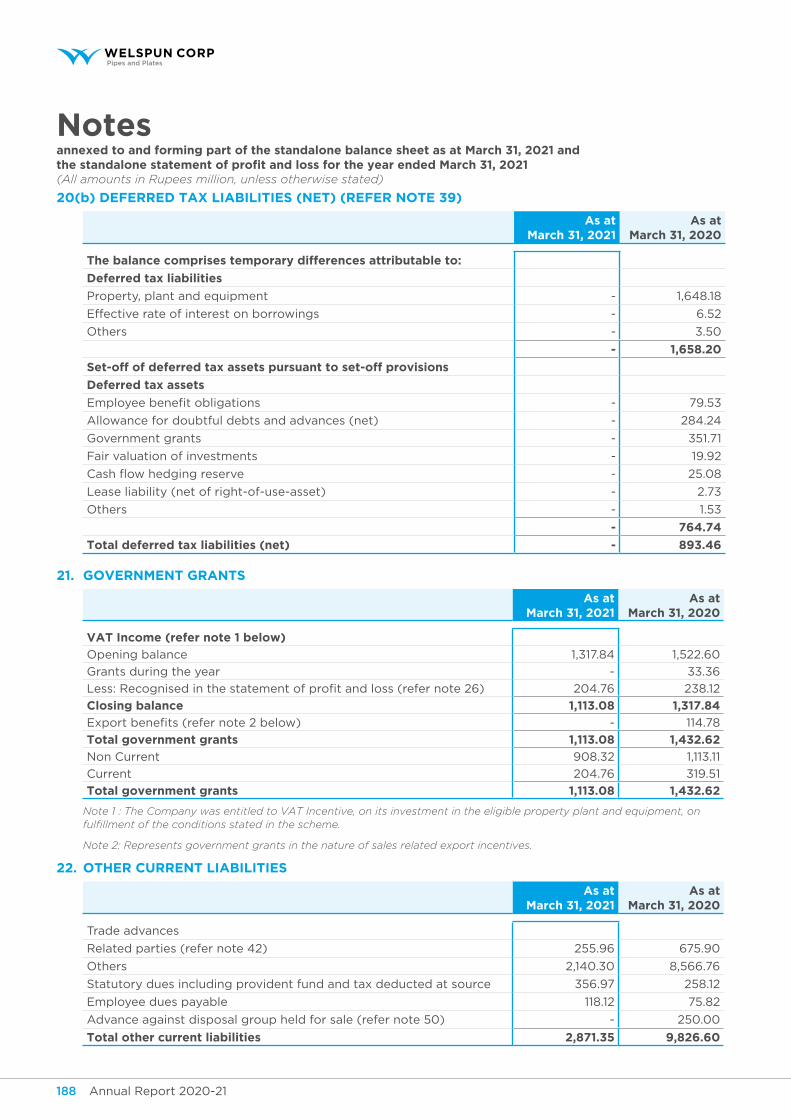
Annual Report 2020-21 189Annual Report 2020-21188
Notesannexed to and forming part of the standalone balance sheet as at March 31, 2021 andthe standalone statement of profit and loss for the year ended March 31, 2021(All amounts in Rupees million, unless otherwise stated)
20(b) defeRRed tAx LiABiLities (net) (RefeR note 39)
As at March 31, 2021
As at March 31, 2020
the balance comprises temporary differences attributable to:
deferred tax liabilities
Property, plant and equipment - 1,648.18
Effective rate of interest on borrowings - 6.52
Others - 3.50
- 1,658.20
set-off of deferred tax assets pursuant to set-off provisions
deferred tax assets
Employee benefit obligations - 79.53
Allowance for doubtful debts and advances (net) - 284.24
Government grants - 351.71
Fair valuation of investments - 19.92
Cash flow hedging reserve - 25.08
Lease liability (net of right-of-use-asset) - 2.73
Others - 1.53
- 764.74
total deferred tax liabilities (net) - 893.46
21. goveRnMent gRAnts
As at March 31, 2021
As at March 31, 2020
vAt Income (refer note 1 below)
Opening balance 1,317.84 1,522.60
Grants during the year - 33.36
Less: Recognised in the statement of profit and loss (refer note 26) 204.76 238.12
closing balance 1,113.08 1,317.84
Export benefits (refer note 2 below) - 114.78
total government grants 1,113.08 1,432.62
Non Current 908.32 1,113.11
Current 204.76 319.51
total government grants 1,113.08 1,432.62
Note 1 : The Company was entitled to VAT Incentive, on its investment in the eligible property plant and equipment, on fulfillment of the conditions stated in the scheme.
Note 2: Represents government grants in the nature of sales related export incentives.
22. otheR CuRRent LiABiLities
As at March 31, 2021
As at March 31, 2020
Trade advances
Related parties (refer note 42) 255.96 675.90
Others 2,140.30 8,566.76
Statutory dues including provident fund and tax deducted at source 356.97 258.12
Employee dues payable 118.12 75.82
Advance against disposal group held for sale (refer note 50) - 250.00
total other current liabilities 2,871.35 9,826.60
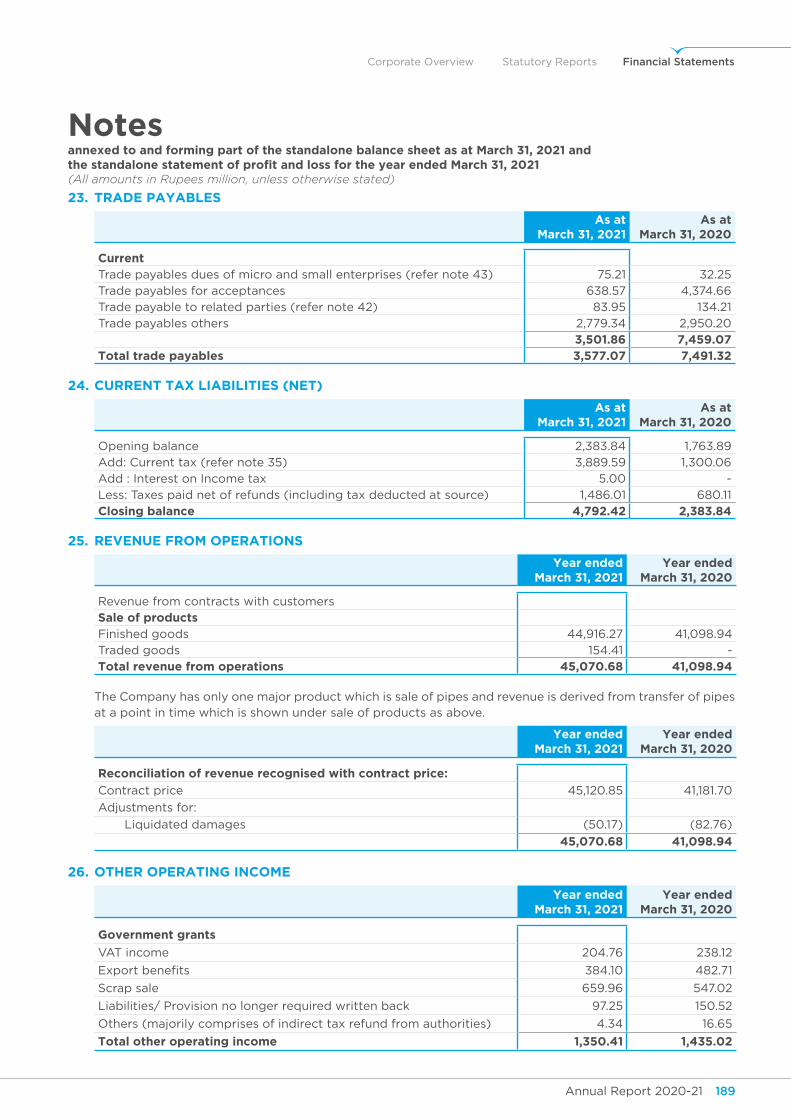
Annual Report 2020-21 189Annual Report 2020-21188
Corporate Overview Statutory Reports Financial Statements
Notesannexed to and forming part of the standalone balance sheet as at March 31, 2021 andthe standalone statement of profit and loss for the year ended March 31, 2021(All amounts in Rupees million, unless otherwise stated)
23. tRAde PAyABLes
As at March 31, 2021
As at March 31, 2020
currentTrade payables dues of micro and small enterprises (refer note 43) 75.21 32.25
Trade payables for acceptances 638.57 4,374.66
Trade payable to related parties (refer note 42) 83.95 134.21
Trade payables others 2,779.34 2,950.20
3,501.86 7,459.07 total trade payables 3,577.07 7,491.32
24. CuRRent tAx LiABiLities (net)
As at March 31, 2021
As at March 31, 2020
Opening balance 2,383.84 1,763.89
Add: Current tax (refer note 35) 3,889.59 1,300.06
Add : Interest on Income tax 5.00 -
Less: Taxes paid net of refunds (including tax deducted at source) 1,486.01 680.11
closing balance 4,792.42 2,383.84
25. Revenue fRoM oPeRAtions
year ended March 31, 2021
year ended March 31, 2020
Revenue from contracts with customers
sale of productsFinished goods 44,916.27 41,098.94
Traded goods 154.41 -
total revenue from operations 45,070.68 41,098.94
The Company has only one major product which is sale of pipes and revenue is derived from transfer of pipes at a point in time which is shown under sale of products as above.
year ended March 31, 2021
year ended March 31, 2020
Reconciliation of revenue recognised with contract price:
Contract price 45,120.85 41,181.70
Adjustments for:
Liquidated damages (50.17) (82.76)
45,070.68 41,098.94
26. otheR oPeRAting inCoMe
year ended March 31, 2021
year ended March 31, 2020
government grants
VAT income 204.76 238.12
Export benefits 384.10 482.71
Scrap sale 659.96 547.02
Liabilities/ Provision no longer required written back 97.25 150.52
Others (majorily comprises of indirect tax refund from authorities) 4.34 16.65
total other operating income 1,350.41 1,435.02

Annual Report 2020-21 191Annual Report 2020-21190
Notesannexed to and forming part of the standalone balance sheet as at March 31, 2021 andthe standalone statement of profit and loss for the year ended March 31, 2021(All amounts in Rupees million, unless otherwise stated)
27. otheR inCoMe
year ended March 31, 2021
year ended March 31, 2020
interest income (refer note 40)
Loans to related party 30.25 26.63
Current investments 280.29 180.21
Fixed deposits 8.26 50.98
Income tax refund 128.47 12.24
Others (mainly comprises of interest earned on sale/ discarding of tangible assets and from customers)
101.77 114.50
dividend income on
Non-current investments 6,184.78 2,745.17
Fair value on early redemption of non-current investments - 101.64
net gain on sale/redemption of
Non-current investments 0.97 4.75
Current investments 487.87 104.69
other non-operating income
Rental income (refer note 47) 32.73 29.40
Net exchange differences 274.81 -
Commission income 192.01 180.60
Allowance for doubtful debt (net) - 21.76
Profit on sale / discarding of tangible assets (Net) 575.35 -
Fair valuation gain on investment (net) 283.78 -
Fair value gain on derivatives - 437.30
Miscellaneous income 2.16 8.51
total other income 8,583.50 4,018.38
28. Cost of MAteRiALs ConsuMed
year ended March 31, 2021
year ended March 31, 2020
Raw materials at the beginning of the year 3,590.57 1,435.02
Add: Purchases 21,707.80 39,732.02
25,298.37 41,167.04
Less : Raw materials at the end of the year 1,296.92 3,590.57
total cost of materials consumed 24,001.45 37,576.47
29. PuRChAses of stoCk-in-tRAde
year ended March 31, 2021
year ended March 31, 2020
Purchases of stock-in-trade 152.22 -
total purchases of stock-in-trade 152.22 -
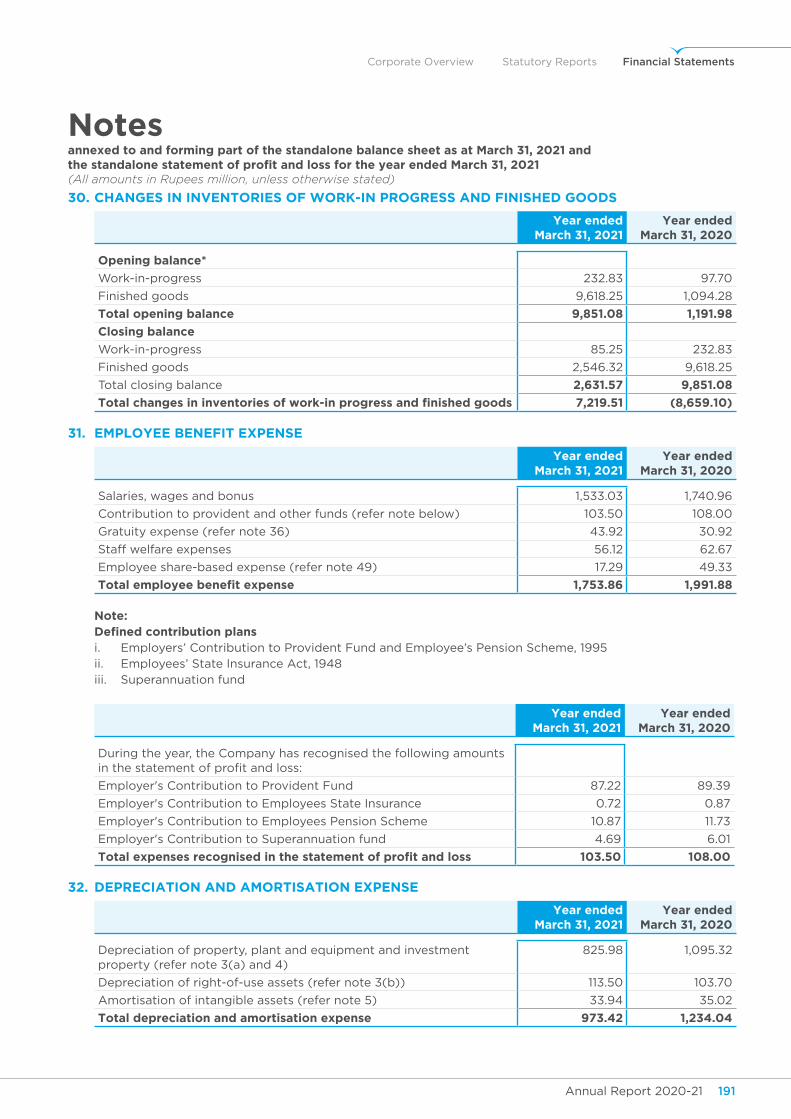
Annual Report 2020-21 191Annual Report 2020-21190
Corporate Overview Statutory Reports Financial Statements
Notesannexed to and forming part of the standalone balance sheet as at March 31, 2021 andthe standalone statement of profit and loss for the year ended March 31, 2021(All amounts in Rupees million, unless otherwise stated)
30. ChAnges in inventoRies of WoRk-in PRogRess And finished goods
year ended March 31, 2021
year ended March 31, 2020
opening balance*
Work-in-progress 232.83 97.70
Finished goods 9,618.25 1,094.28
total opening balance 9,851.08 1,191.98
closing balance
Work-in-progress 85.25 232.83
Finished goods 2,546.32 9,618.25
Total closing balance 2,631.57 9,851.08
total changes in inventories of work-in progress and finished goods 7,219.51 (8,659.10)
31. eMPLoyee Benefit exPense
year ended March 31, 2021
year ended March 31, 2020
Salaries, wages and bonus 1,533.03 1,740.96
Contribution to provident and other funds (refer note below) 103.50 108.00
Gratuity expense (refer note 36) 43.92 30.92
Staff welfare expenses 56.12 62.67
Employee share-based expense (refer note 49) 17.29 49.33
total employee benefit expense 1,753.86 1,991.88
note: defined contribution plans i. Employers’ Contribution to Provident Fund and Employee’s Pension Scheme, 1995 ii. Employees’ State Insurance Act, 1948 iii. Superannuation fund
year ended March 31, 2021
year ended March 31, 2020
During the year, the Company has recognised the following amounts in the statement of profit and loss:
Employer's Contribution to Provident Fund 87.22 89.39
Employer's Contribution to Employees State Insurance 0.72 0.87
Employer's Contribution to Employees Pension Scheme 10.87 11.73
Employer's Contribution to Superannuation fund 4.69 6.01
total expenses recognised in the statement of profit and loss 103.50 108.00
32. dePReCiAtion And AMoRtisAtion exPense
year ended March 31, 2021
year ended March 31, 2020
Depreciation of property, plant and equipment and investment property (refer note 3(a) and 4)
825.98 1,095.32
Depreciation of right-of-use assets (refer note 3(b)) 113.50 103.70
Amortisation of intangible assets (refer note 5) 33.94 35.02
total depreciation and amortisation expense 973.42 1,234.04
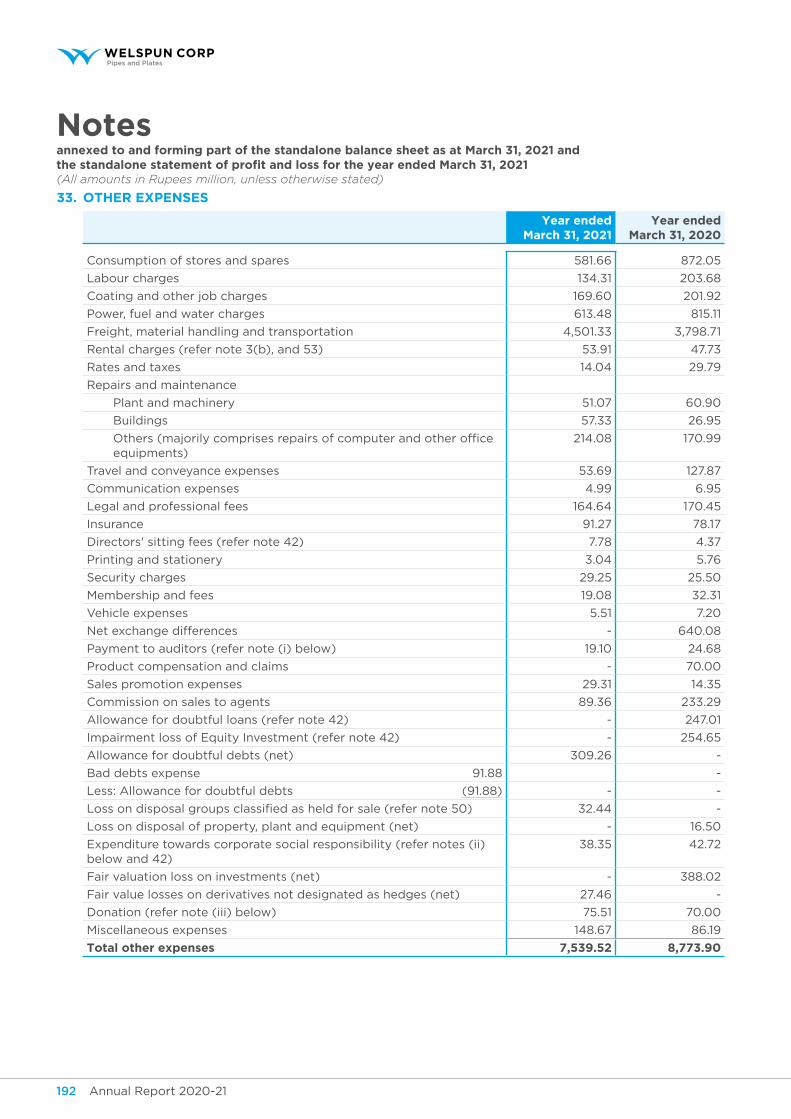
Annual Report 2020-21 193Annual Report 2020-21192
Notesannexed to and forming part of the standalone balance sheet as at March 31, 2021 andthe standalone statement of profit and loss for the year ended March 31, 2021(All amounts in Rupees million, unless otherwise stated)
33. otheR exPenses
year ended March 31, 2021
year ended March 31, 2020
Consumption of stores and spares 581.66 872.05
Labour charges 134.31 203.68
Coating and other job charges 169.60 201.92
Power, fuel and water charges 613.48 815.11
Freight, material handling and transportation 4,501.33 3,798.71
Rental charges (refer note 3(b), and 53) 53.91 47.73
Rates and taxes 14.04 29.79
Repairs and maintenance
Plant and machinery 51.07 60.90
Buildings 57.33 26.95
Others (majorily comprises repairs of computer and other office equipments)
214.08 170.99
Travel and conveyance expenses 53.69 127.87
Communication expenses 4.99 6.95
Legal and professional fees 164.64 170.45
Insurance 91.27 78.17
Directors' sitting fees (refer note 42) 7.78 4.37
Printing and stationery 3.04 5.76
Security charges 29.25 25.50
Membership and fees 19.08 32.31
Vehicle expenses 5.51 7.20
Net exchange differences - 640.08
Payment to auditors (refer note (i) below) 19.10 24.68
Product compensation and claims - 70.00
Sales promotion expenses 29.31 14.35
Commission on sales to agents 89.36 233.29
Allowance for doubtful loans (refer note 42) - 247.01
Impairment loss of Equity Investment (refer note 42) - 254.65
Allowance for doubtful debts (net) 309.26 -
Bad debts expense 91.88 -
Less: Allowance for doubtful debts (91.88) - -
Loss on disposal groups classified as held for sale (refer note 50) 32.44 -
Loss on disposal of property, plant and equipment (net) - 16.50
Expenditure towards corporate social responsibility (refer notes (ii) below and 42)
38.35 42.72
Fair valuation loss on investments (net) - 388.02
Fair value losses on derivatives not designated as hedges (net) 27.46 -
Donation (refer note (iii) below) 75.51 70.00
Miscellaneous expenses 148.67 86.19
total other expenses 7,539.52 8,773.90
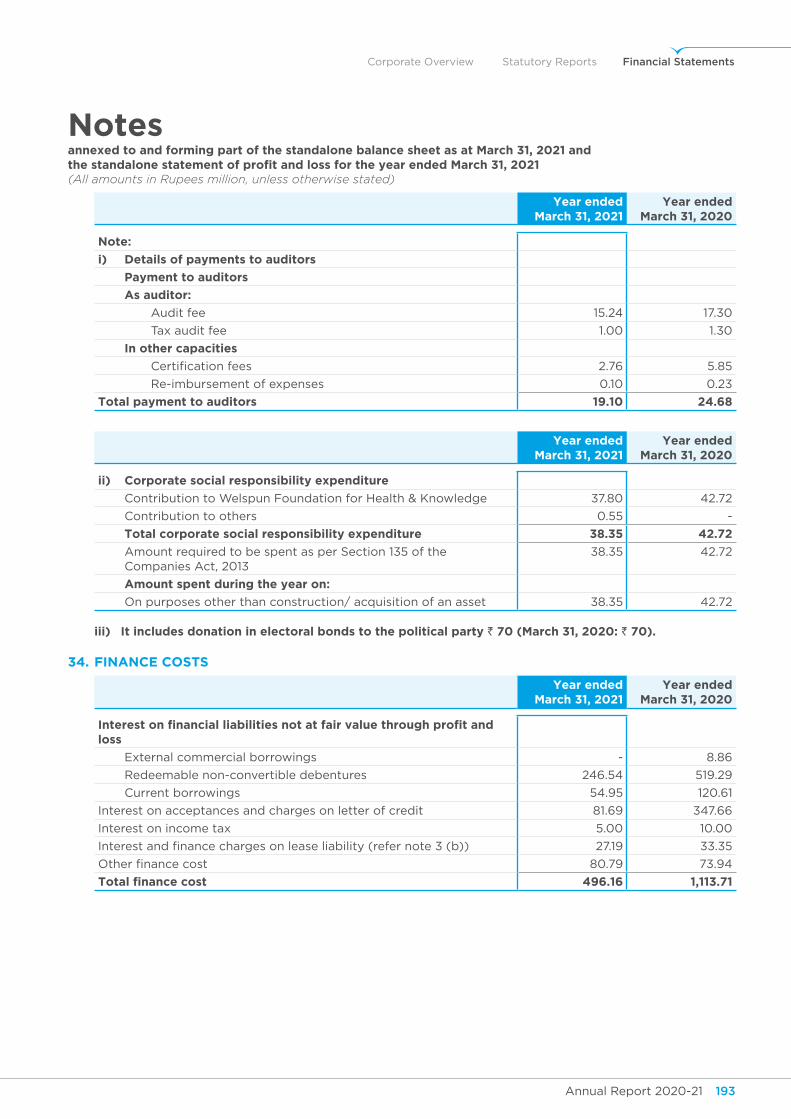
Annual Report 2020-21 193Annual Report 2020-21192
Corporate Overview Statutory Reports Financial Statements
Notesannexed to and forming part of the standalone balance sheet as at March 31, 2021 andthe standalone statement of profit and loss for the year ended March 31, 2021(All amounts in Rupees million, unless otherwise stated)
year ended March 31, 2021
year ended March 31, 2020
note:
i) details of payments to auditors
payment to auditors
As auditor:
Audit fee 15.24 17.30
Tax audit fee 1.00 1.30
In other capacities
Certification fees 2.76 5.85
Re-imbursement of expenses 0.10 0.23
total payment to auditors 19.10 24.68
year ended March 31, 2021
year ended March 31, 2020
ii) corporate social responsibility expenditure
Contribution to Welspun Foundation for Health & Knowledge 37.80 42.72
Contribution to others 0.55 -
total corporate social responsibility expenditure 38.35 42.72
Amount required to be spent as per Section 135 of the Companies Act, 2013
38.35 42.72
Amount spent during the year on:
On purposes other than construction/ acquisition of an asset 38.35 42.72
iii) It includes donation in electoral bonds to the political party ` 70 (March 31, 2020: ` 70).
34. finAnCe Costs
year ended March 31, 2021
year ended March 31, 2020
interest on financial liabilities not at fair value through profit and loss
External commercial borrowings - 8.86
Redeemable non-convertible debentures 246.54 519.29
Current borrowings 54.95 120.61
Interest on acceptances and charges on letter of credit 81.69 347.66
Interest on income tax 5.00 10.00
Interest and finance charges on lease liability (refer note 3 (b)) 27.19 33.35
Other finance cost 80.79 73.94
total finance cost 496.16 1,113.71
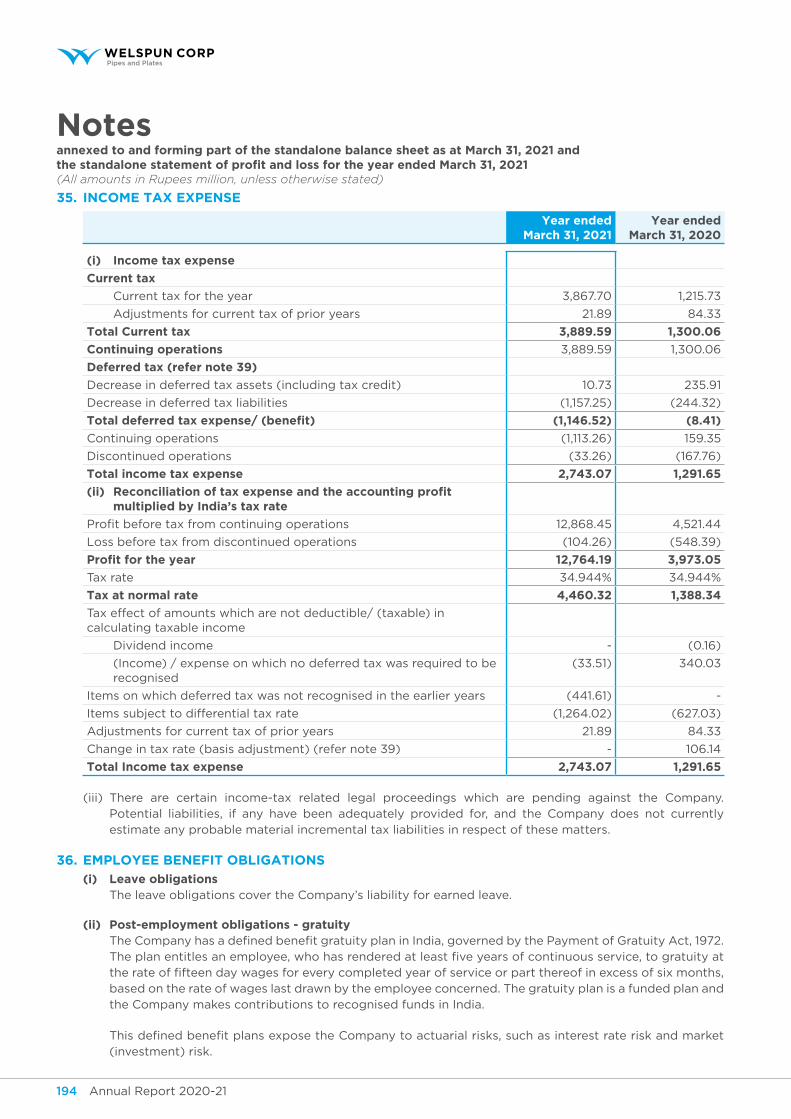
Annual Report 2020-21 195Annual Report 2020-21194
Notesannexed to and forming part of the standalone balance sheet as at March 31, 2021 andthe standalone statement of profit and loss for the year ended March 31, 2021(All amounts in Rupees million, unless otherwise stated)
35. inCoMe tAx exPense
year ended March 31, 2021
year ended March 31, 2020
(i) Income tax expense
current tax
Current tax for the year 3,867.70 1,215.73
Adjustments for current tax of prior years 21.89 84.33
total current tax 3,889.59 1,300.06
continuing operations 3,889.59 1,300.06
deferred tax (refer note 39)
Decrease in deferred tax assets (including tax credit) 10.73 235.91
Decrease in deferred tax liabilities (1,157.25) (244.32)
total deferred tax expense/ (benefit) (1,146.52) (8.41)
Continuing operations (1,113.26) 159.35
Discontinued operations (33.26) (167.76)
total income tax expense 2,743.07 1,291.65
(ii) Reconciliation of tax expense and the accounting profit multiplied by India’s tax rate
Profit before tax from continuing operations 12,868.45 4,521.44
Loss before tax from discontinued operations (104.26) (548.39)
Profit for the year 12,764.19 3,973.05
Tax rate 34.944% 34.944%
tax at normal rate 4,460.32 1,388.34
Tax effect of amounts which are not deductible/ (taxable) in calculating taxable income
Dividend income - (0.16)
(Income) / expense on which no deferred tax was required to be recognised
(33.51) 340.03
Items on which deferred tax was not recognised in the earlier years (441.61) -
Items subject to differential tax rate (1,264.02) (627.03)
Adjustments for current tax of prior years 21.89 84.33
Change in tax rate (basis adjustment) (refer note 39) - 106.14
total Income tax expense 2,743.07 1,291.65
(iii) There are certain income-tax related legal proceedings which are pending against the Company. Potential liabilities, if any have been adequately provided for, and the Company does not currently estimate any probable material incremental tax liabilities in respect of these matters.
36. eMPLoyee Benefit oBLigAtions
(i) leave obligations The leave obligations cover the Company’s liability for earned leave.
(ii) post-employment obligations - gratuity The Company has a defined benefit gratuity plan in India, governed by the Payment of Gratuity Act, 1972.
The plan entitles an employee, who has rendered at least five years of continuous service, to gratuity at the rate of fifteen day wages for every completed year of service or part thereof in excess of six months, based on the rate of wages last drawn by the employee concerned. The gratuity plan is a funded plan and the Company makes contributions to recognised funds in India.
This defined benefit plans expose the Company to actuarial risks, such as interest rate risk and market (investment) risk.
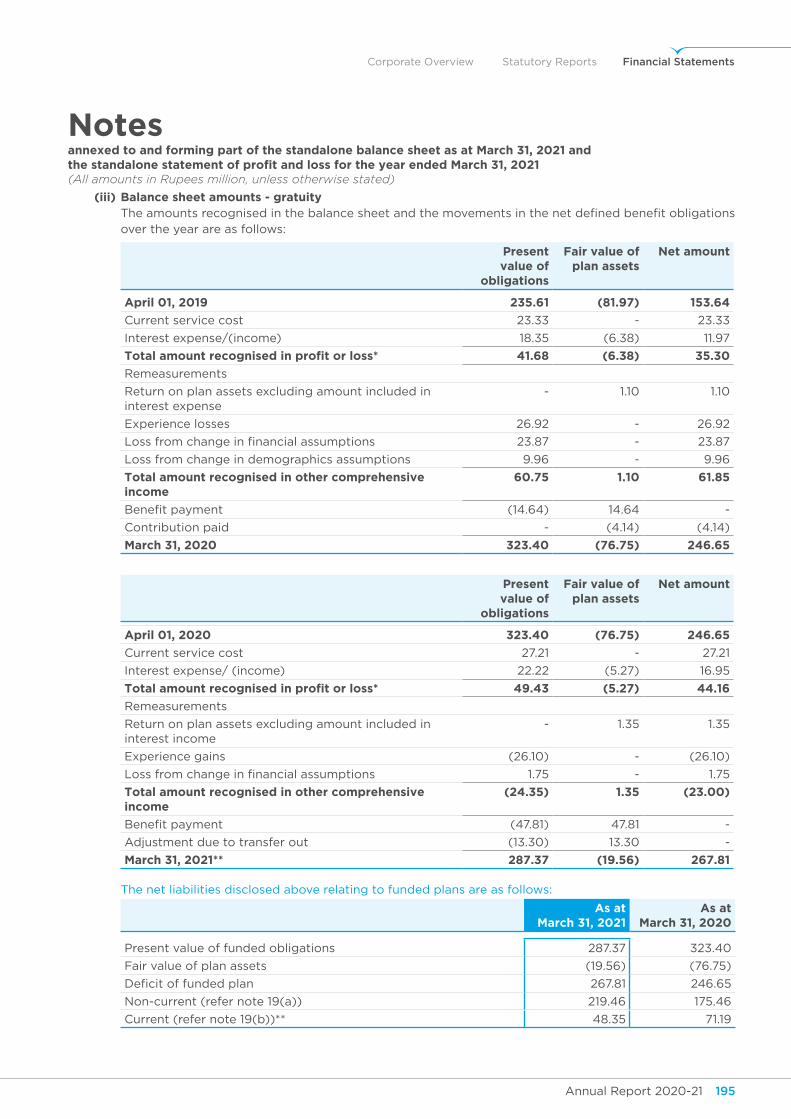
Annual Report 2020-21 195Annual Report 2020-21194
Corporate Overview Statutory Reports Financial Statements
Notesannexed to and forming part of the standalone balance sheet as at March 31, 2021 andthe standalone statement of profit and loss for the year ended March 31, 2021(All amounts in Rupees million, unless otherwise stated)
(iii) Balance sheet amounts - gratuity The amounts recognised in the balance sheet and the movements in the net defined benefit obligations
over the year are as follows:
present value of
obligations
fair value of plan assets
net amount
April 01, 2019 235.61 (81.97) 153.64
Current service cost 23.33 - 23.33
Interest expense/(income) 18.35 (6.38) 11.97
total amount recognised in profit or loss* 41.68 (6.38) 35.30
Remeasurements
Return on plan assets excluding amount included in interest expense
- 1.10 1.10
Experience losses 26.92 - 26.92
Loss from change in financial assumptions 23.87 - 23.87
Loss from change in demographics assumptions 9.96 - 9.96
total amount recognised in other comprehensive income
60.75 1.10 61.85
Benefit payment (14.64) 14.64 -
Contribution paid - (4.14) (4.14)
March 31, 2020 323.40 (76.75) 246.65
present value of
obligations
fair value of plan assets
net amount
April 01, 2020 323.40 (76.75) 246.65
Current service cost 27.21 - 27.21
Interest expense/ (income) 22.22 (5.27) 16.95
total amount recognised in profit or loss* 49.43 (5.27) 44.16
Remeasurements
Return on plan assets excluding amount included in interest income
- 1.35 1.35
Experience gains (26.10) - (26.10)
Loss from change in financial assumptions 1.75 - 1.75
total amount recognised in other comprehensive income
(24.35) 1.35 (23.00)
Benefit payment (47.81) 47.81 -
Adjustment due to transfer out (13.30) 13.30 -
March 31, 2021** 287.37 (19.56) 267.81
The net liabilities disclosed above relating to funded plans are as follows:
As at March 31, 2021
As at March 31, 2020
Present value of funded obligations 287.37 323.40
Fair value of plan assets (19.56) (76.75)
Deficit of funded plan 267.81 246.65
Non-current (refer note 19(a)) 219.46 175.46
Current (refer note 19(b))** 48.35 71.19
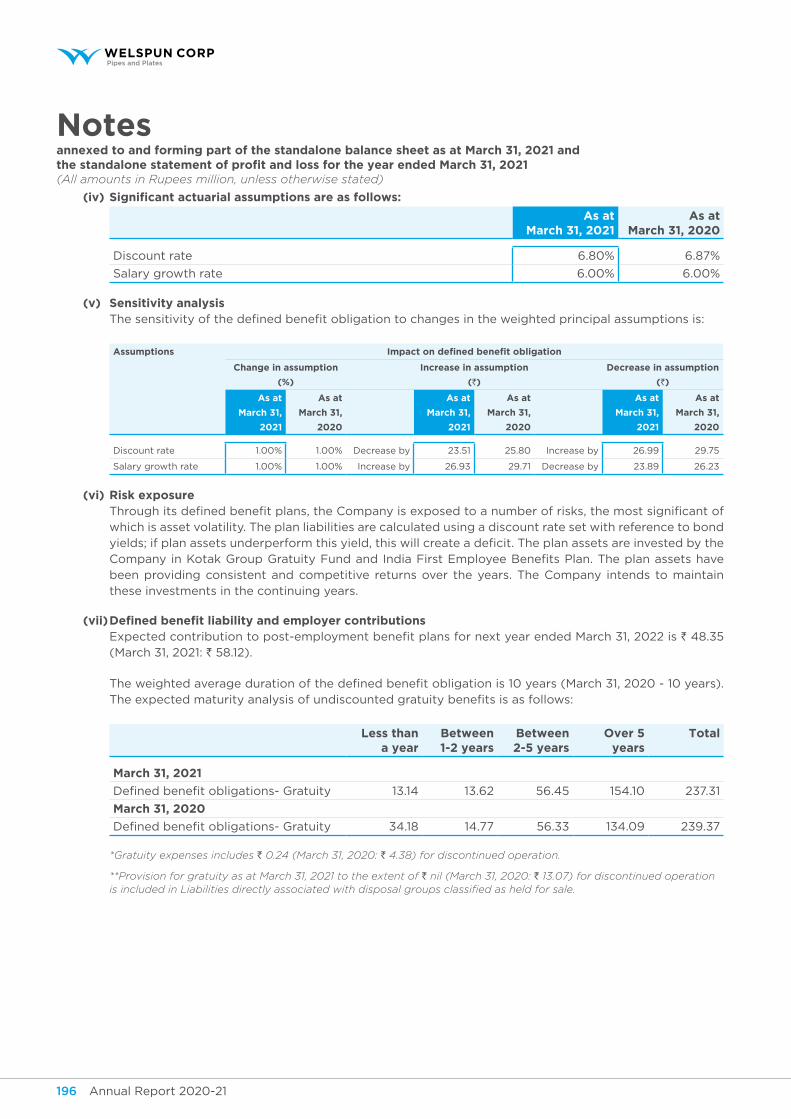
Annual Report 2020-21 197Annual Report 2020-21196
Notesannexed to and forming part of the standalone balance sheet as at March 31, 2021 andthe standalone statement of profit and loss for the year ended March 31, 2021(All amounts in Rupees million, unless otherwise stated)
(iv) significant actuarial assumptions are as follows:
As at March 31, 2021
As at March 31, 2020
Discount rate 6.80% 6.87%
Salary growth rate 6.00% 6.00%
(v) sensitivity analysis The sensitivity of the defined benefit obligation to changes in the weighted principal assumptions is:
Assumptions impact on defined benefit obligation
change in assumption
(%)
Increase in assumption
(`)
decrease in assumption
(`)
As at
March 31,
2021
As at
March 31,
2020
As at
March 31,
2021
As at
March 31,
2020
As at
March 31,
2021
As at
March 31,
2020
Discount rate 1.00% 1.00% Decrease by 23.51 25.80 Increase by 26.99 29.75
Salary growth rate 1.00% 1.00% Increase by 26.93 29.71 Decrease by 23.89 26.23
(vi) Risk exposure Through its defined benefit plans, the Company is exposed to a number of risks, the most significant of
which is asset volatility. The plan liabilities are calculated using a discount rate set with reference to bond yields; if plan assets underperform this yield, this will create a deficit. The plan assets are invested by the Company in Kotak Group Gratuity Fund and India First Employee Benefits Plan. The plan assets have been providing consistent and competitive returns over the years. The Company intends to maintain these investments in the continuing years.
(vii) defined benefit liability and employer contributions Expected contribution to post-employment benefit plans for next year ended March 31, 2022 is ` 48.35
(March 31, 2021: ` 58.12).
The weighted average duration of the defined benefit obligation is 10 years (March 31, 2020 - 10 years). The expected maturity analysis of undiscounted gratuity benefits is as follows:
less than a year
Between 1-2 years
Between 2-5 years
over 5 years
total
March 31, 2021
Defined benefit obligations- Gratuity 13.14 13.62 56.45 154.10 237.31
March 31, 2020
Defined benefit obligations- Gratuity 34.18 14.77 56.33 134.09 239.37
*Gratuity expenses includes ` 0.24 (March 31, 2020: ` 4.38) for discontinued operation.
**Provision for gratuity as at March 31, 2021 to the extent of ` nil (March 31, 2020: ` 13.07) for discontinued operation is included in Liabilities directly associated with disposal groups classified as held for sale.
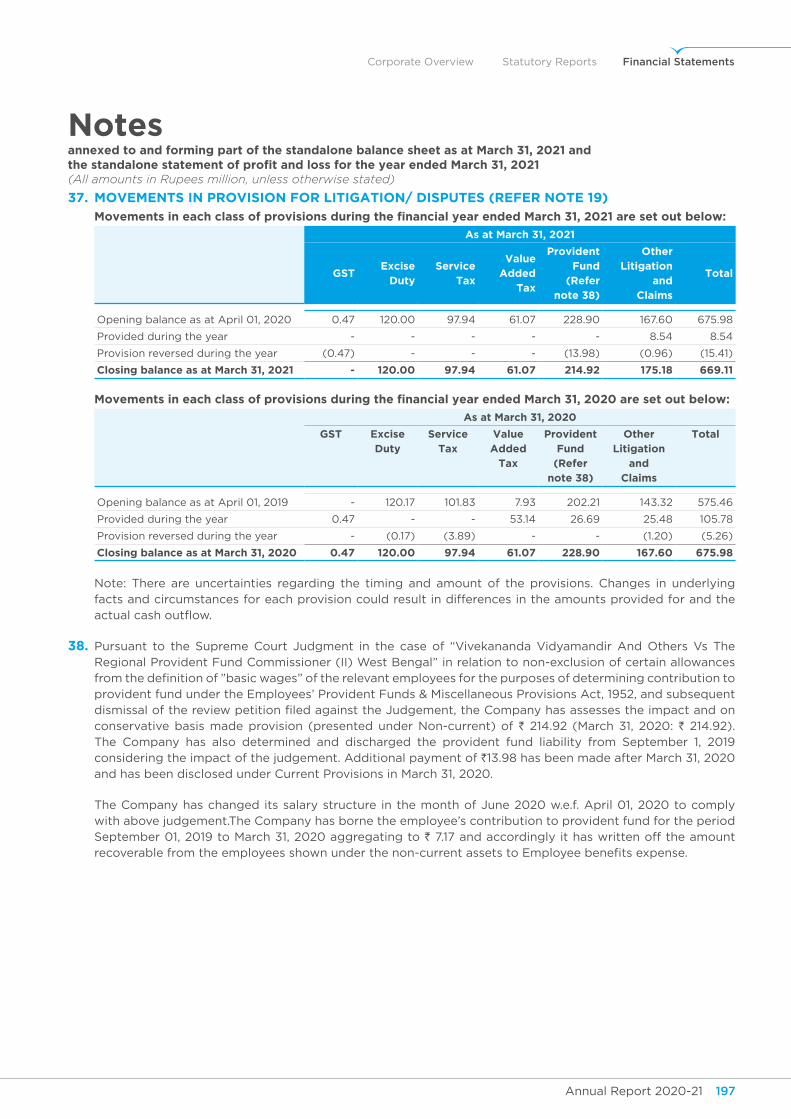
Annual Report 2020-21 197Annual Report 2020-21196
Corporate Overview Statutory Reports Financial Statements
Notesannexed to and forming part of the standalone balance sheet as at March 31, 2021 andthe standalone statement of profit and loss for the year ended March 31, 2021(All amounts in Rupees million, unless otherwise stated)
37. MoveMents in PRovision foR LitigAtion/ disPutes (RefeR note 19)
Movements in each class of provisions during the financial year ended March 31, 2021 are set out below:
As at March 31, 2021
gstexcise
dutyservice
tax
value Added
tax
provident fund
(Refer note 38)
other litigation
and claims
total
Opening balance as at April 01, 2020 0.47 120.00 97.94 61.07 228.90 167.60 675.98
Provided during the year - - - - - 8.54 8.54
Provision reversed during the year (0.47) - - - (13.98) (0.96) (15.41)
Closing balance as at March 31, 2021 - 120.00 97.94 61.07 214.92 175.18 669.11
Movements in each class of provisions during the financial year ended March 31, 2020 are set out below:
As at March 31, 2020
gst excise duty
service tax
value Added
tax
provident fund
(Refer note 38)
other litigation
and claims
total
Opening balance as at April 01, 2019 - 120.17 101.83 7.93 202.21 143.32 575.46
Provided during the year 0.47 - - 53.14 26.69 25.48 105.78
Provision reversed during the year - (0.17) (3.89) - - (1.20) (5.26)
Closing balance as at March 31, 2020 0.47 120.00 97.94 61.07 228.90 167.60 675.98
Note: There are uncertainties regarding the timing and amount of the provisions. Changes in underlying facts and circumstances for each provision could result in differences in the amounts provided for and the actual cash outflow.
38. Pursuant to the Supreme Court Judgment in the case of “Vivekananda Vidyamandir And Others Vs The Regional Provident Fund Commissioner (II) West Bengal” in relation to non-exclusion of certain allowances from the definition of ”basic wages” of the relevant employees for the purposes of determining contribution to provident fund under the Employees’ Provident Funds & Miscellaneous Provisions Act, 1952, and subsequent dismissal of the review petition filed against the Judgement, the Company has assesses the impact and on conservative basis made provision (presented under Non-current) of ` 214.92 (March 31, 2020: ` 214.92). The Company has also determined and discharged the provident fund liability from September 1, 2019 considering the impact of the judgement. Additional payment of `13.98 has been made after March 31, 2020 and has been disclosed under Current Provisions in March 31, 2020.
The Company has changed its salary structure in the month of June 2020 w.e.f. April 01, 2020 to comply with above judgement.The Company has borne the employee’s contribution to provident fund for the period September 01, 2019 to March 31, 2020 aggregating to ` 7.17 and accordingly it has written off the amount recoverable from the employees shown under the non-current assets to Employee benefits expense.
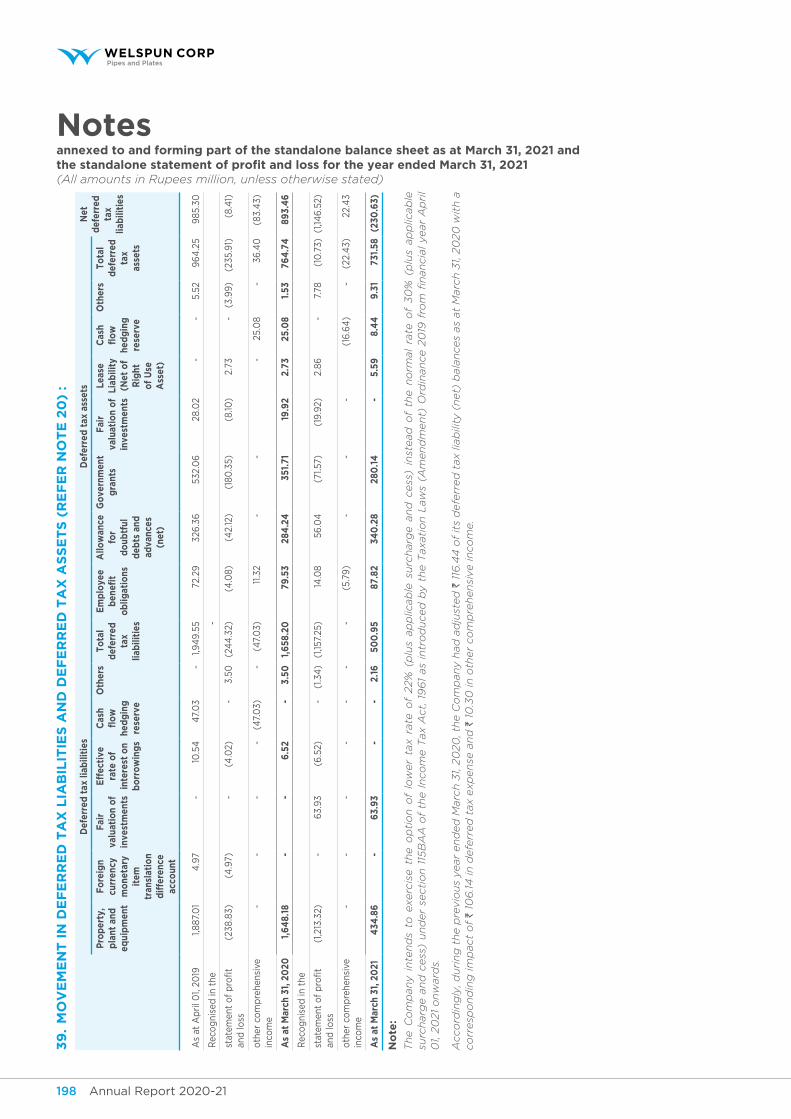
Annual Report 2020-21 199Annual Report 2020-21198
Notesannexed to and forming part of the standalone balance sheet as at March 31, 2021 andthe standalone statement of profit and loss for the year ended March 31, 2021(All amounts in Rupees million, unless otherwise stated)
39
. M
ov
eM
en
t i
n d
ef
eR
Re
d t
Ax
LiA
BiL
itie
s A
nd
de
fe
RR
ed
tA
x A
ss
et
s (
Re
fe
R n
ot
e 2
0)
:
def
erre
d t
ax li
abili
ties
def
erre
d t
ax a
sset
s n
et
def
erre
d
tax
liab
iliti
es
Pro
per
ty,
pla
nt a
nd
equi
pm
ent
fo
reig
n cu
rren
cy
mo
neta
ry
item
tr
ansl
atio
n d
iffe
renc
e ac
coun
t
fai
r va
luat
ion
of
inve
stm
ents
eff
ecti
ve
rate
of
inte
rest
on
bo
rro
win
gs
cas
h fl
ow
he
dg
ing
re
serv
e
oth
ers
tota
l d
efer
red
ta
x lia
bili
ties
em
plo
yee
ben
efit
ob
ligat
ions
Allo
wan
ce
for
do
ubtf
ul
deb
ts a
nd
adva
nces
(n
et)
go
vern
men
t g
rant
sf
air
valu
atio
n o
f in
vest
men
ts
leas
e li
abili
ty
(net
of
Rig
ht
of
use
A
sset
)
cas
h fl
ow
he
dg
ing
re
serv
e
oth
ers
tota
l d
efer
red
ta
x as
sets
As
at A
pri
l 01,
2019
1,8
87.0
1 4
.97
-
10
.54
4
7.0
3 -
1
,94
9.5
5 7
2.29
3
26.3
6
532
.06
2
8.0
2 -
-
5
.52
96
4.2
5 9
85.3
0
Rec
og
nise
d in
the
-
stat
emen
t o
f p
rofit
an
d lo
ss (
238.
83)
(4
.97)
-
(4
.02)
-
3.5
0
(24
4.3
2) (
4.0
8) (
42.
12)
(18
0.3
5) (
8.10
) 2
.73
-
(3.
99
) (
235.
91)
(8.
41)
oth
er c
om
pre
hens
ive
inco
me
-
-
-
-
(4
7.0
3) -
(
47.
03)
11.3
2 -
-
-
2
5.0
8 -
3
6.4
0
(83
.43)
As
at M
arch
31,
20
20 1
,64
8.18
-
-
6
.52
-
3.5
0
1,6
58.2
0
79
.53
284
.24
3
51.7
1 1
9.9
2 2
.73
25.
08
1.5
3 7
64
.74
8
93.
46
Rec
og
nise
d in
the
stat
emen
t o
f p
rofit
an
d lo
ss (
1,213
.32)
-
63.
93
(6
.52)
-
(1.3
4)
(1,1
57.2
5) 1
4.0
8 5
6.0
4
(71
.57)
(19
.92)
2.8
6
-
7.7
8 (
10.7
3)(1
,146
.52)
oth
er c
om
pre
hens
ive
inco
me
-
-
-
-
-
-
-
(5.
79)
-
-
-
(16
.64
) -
(
22.4
3) 2
2.4
3
As
at M
arch
31,
20
21 4
34.8
6
-
63.
93
-
-
2.1
6
50
0.9
5 8
7.82
3
40
.28
280
.14
-
5
.59
8
.44
9
.31
731
.58
(230
.63)
no
te:
Th
e C
om
pan
y i
nte
nd
s to
exerc
ise t
he o
pti
on
of
low
er
tax r
ate
of
22%
(p
lus
ap
plic
ab
le s
urc
harg
e a
nd
cess
) in
stead
of
the n
orm
al
rate
of
30
% (
plu
s ap
plic
ab
le
surc
harg
e a
nd
cess
) u
nd
er
secti
on
115
BA
A o
f th
e I
nco
me T
ax A
ct,
19
61
as
intr
od
uced
by t
he T
axati
on
Law
s (A
men
dm
en
t) O
rdin
an
ce 2
019
fro
m fi
nan
cia
l year
Ap
ril
01, 2
021
on
ward
s.
Acco
rdin
gly
, du
rin
g t
he p
revio
us
year
en
ded
Marc
h 3
1, 2
020
, th
e C
om
pan
y h
ad
ad
just
ed
` 1
16.4
4 o
f it
s d
efe
rred
tax li
ab
ility
(n
et)
bala
nces
as
at
Marc
h 3
1, 2
020
wit
h a
co
rresp
on
din
g im
pact
of
` 10
6.14
in
defe
rred
tax e
xp
en
se a
nd
` 1
0.3
0 in
oth
er
co
mp
reh
en
sive in
co
me.
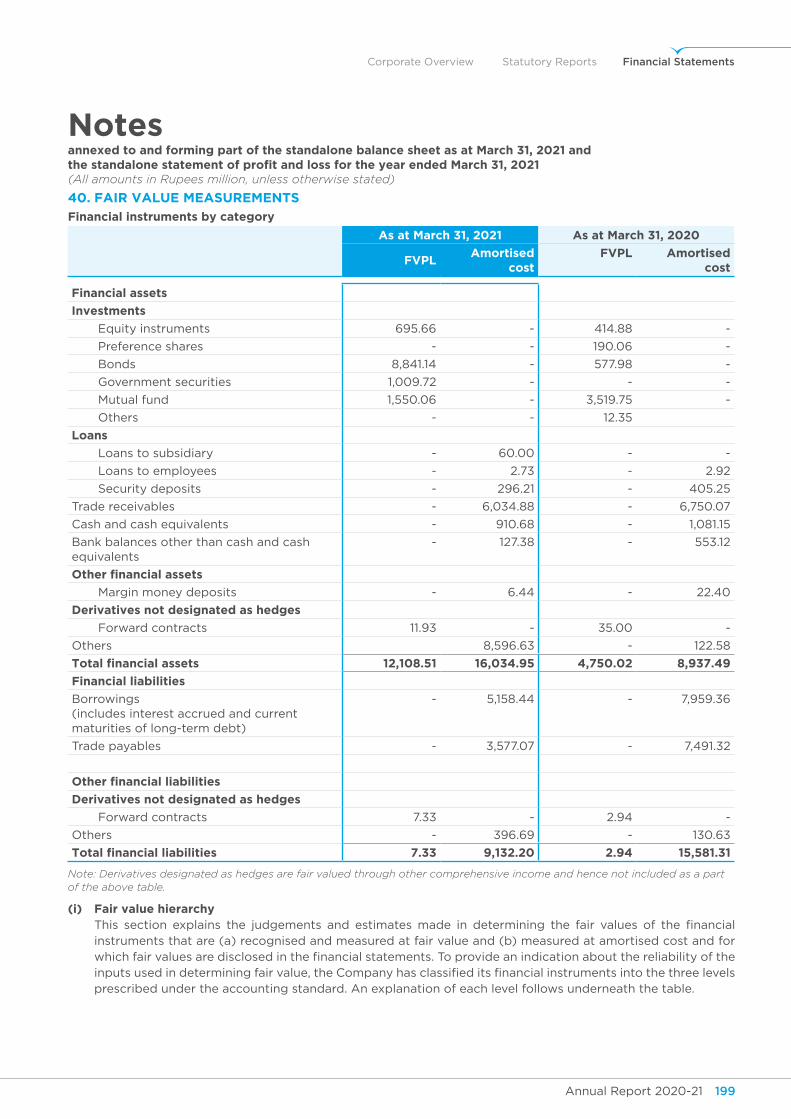
Annual Report 2020-21 199Annual Report 2020-21198
Corporate Overview Statutory Reports Financial Statements
Notesannexed to and forming part of the standalone balance sheet as at March 31, 2021 andthe standalone statement of profit and loss for the year ended March 31, 2021(All amounts in Rupees million, unless otherwise stated)
40. fAiR vALue MeAsuReMents
financial instruments by category
As at March 31, 2021 As at March 31, 2020
fvplAmortised
costfvpl Amortised
cost
financial assets
Investments
Equity instruments 695.66 - 414.88 -
Preference shares - - 190.06 -
Bonds 8,841.14 - 577.98 -
Government securities 1,009.72 - - -
Mutual fund 1,550.06 - 3,519.75 -
Others - - 12.35
loans
Loans to subsidiary - 60.00 - -
Loans to employees - 2.73 - 2.92
Security deposits - 296.21 - 405.25
Trade receivables - 6,034.88 - 6,750.07
Cash and cash equivalents - 910.68 - 1,081.15
Bank balances other than cash and cash equivalents
- 127.38 - 553.12
other financial assets
Margin money deposits - 6.44 - 22.40
derivatives not designated as hedges
Forward contracts 11.93 - 35.00 -
Others 8,596.63 - 122.58
total financial assets 12,108.51 16,034.95 4,750.02 8,937.49
financial liabilities
Borrowings (includes interest accrued and current maturities of long-term debt)
- 5,158.44 - 7,959.36
Trade payables - 3,577.07 - 7,491.32
other financial liabilities
derivatives not designated as hedges
Forward contracts 7.33 - 2.94 -
Others - 396.69 - 130.63
total financial liabilities 7.33 9,132.20 2.94 15,581.31
Note: Derivatives designated as hedges are fair valued through other comprehensive income and hence not included as a part of the above table.
(i) fair value hierarchy This section explains the judgements and estimates made in determining the fair values of the financial
instruments that are (a) recognised and measured at fair value and (b) measured at amortised cost and for which fair values are disclosed in the financial statements. To provide an indication about the reliability of the inputs used in determining fair value, the Company has classified its financial instruments into the three levels prescribed under the accounting standard. An explanation of each level follows underneath the table.
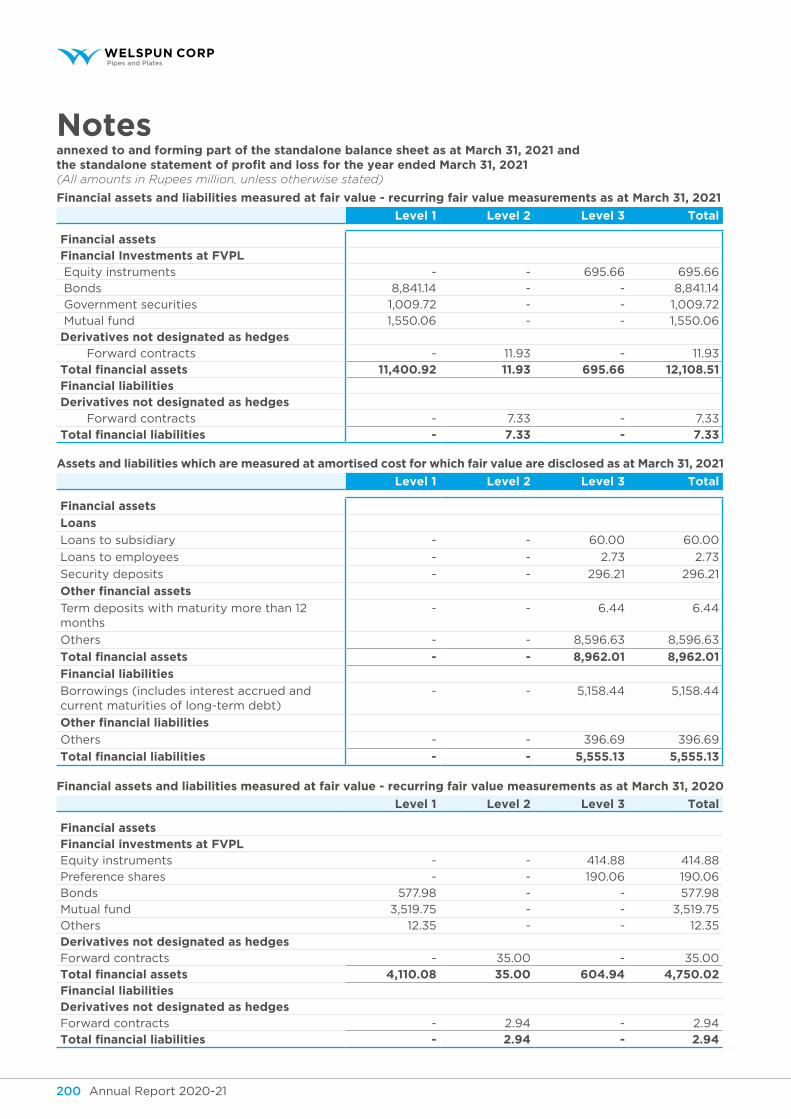
Annual Report 2020-21 201Annual Report 2020-21200
Notesannexed to and forming part of the standalone balance sheet as at March 31, 2021 andthe standalone statement of profit and loss for the year ended March 31, 2021(All amounts in Rupees million, unless otherwise stated)
financial assets and liabilities measured at fair value - recurring fair value measurements as at March 31, 2021
level 1 Level 2 Level 3 total
financial assetsfinancial Investments at fvpl Equity instruments - - 695.66 695.66
Bonds 8,841.14 - - 8,841.14
Government securities 1,009.72 - - 1,009.72
Mutual fund 1,550.06 - - 1,550.06
derivatives not designated as hedges Forward contracts - 11.93 - 11.93
total financial assets 11,400.92 11.93 695.66 12,108.51 financial liabilitiesderivatives not designated as hedges Forward contracts - 7.33 - 7.33
total financial liabilities - 7.33 - 7.33
Assets and liabilities which are measured at amortised cost for which fair value are disclosed as at March 31, 2021
level 1 Level 2 Level 3 total
financial assets
loans
Loans to subsidiary - - 60.00 60.00
Loans to employees - - 2.73 2.73
Security deposits - - 296.21 296.21
other financial assets
Term deposits with maturity more than 12 months
- - 6.44 6.44
Others - - 8,596.63 8,596.63
total financial assets - - 8,962.01 8,962.01
financial liabilities
Borrowings (includes interest accrued and current maturities of long-term debt)
- - 5,158.44 5,158.44
other financial liabilities
Others - - 396.69 396.69
total financial liabilities - - 5,555.13 5,555.13
financial assets and liabilities measured at fair value - recurring fair value measurements as at March 31, 2020
level 1 Level 2 Level 3 total
financial assetsfinancial investments at fvplEquity instruments - - 414.88 414.88
Preference shares - - 190.06 190.06
Bonds 577.98 - - 577.98
Mutual fund 3,519.75 - - 3,519.75
Others 12.35 - - 12.35
derivatives not designated as hedgesForward contracts - 35.00 - 35.00
total financial assets 4,110.08 35.00 604.94 4,750.02 financial liabilitiesderivatives not designated as hedgesForward contracts - 2.94 - 2.94
total financial liabilities - 2.94 - 2.94

Annual Report 2020-21 201Annual Report 2020-21200
Corporate Overview Statutory Reports Financial Statements
Notesannexed to and forming part of the standalone balance sheet as at March 31, 2021 andthe standalone statement of profit and loss for the year ended March 31, 2021(All amounts in Rupees million, unless otherwise stated)
Assets and liabilities which are measured at amortised cost for which fair value are disclosed as at March 31, 2020
level 1 Level 2 Level 3 total
financial assets
loans
Loans to employees - - 2.92 2.92
Security deposits - - 405.25 405.25
other financial assets
Term deposits with maturity more than 12 months
22.40 22.40
Others - - 122.58 122.58
total financial assets - - 553.15 553.15
financial liabilities
Borrowings (includes interest accrued and current maturities of long-term debt)
- - 7,959.36 7,959.36
other financial liabilities
Others - - 130.63 130.63
total financial liabilities - - 8,089.99 8,089.99
The following table provides an analysis of financial instruments that are measured subsequent to initial recognition at fair value, grouped into Level 1 to Level 3, as described below.
Level 1: This hierarchy includes financial instruments measured using quoted prices. This included investment in Standard Chartered Bank PLC Indian Depository Receipt in the year ended March 31, 2020. The Company has bonds, government securities and mutual funds which are traded in active market and falls under level 1.
Level 2: The fair value of financial instruments that are not traded in an active market is determined using valuation techniques which maximise the use of observable market data and rely as little as possible on entity-specific estimates. The Company has derivatives which are not designated as hedges for which all significant inputs required to fair value an instrument falls under level 2.
Level 3: If one or more of the significant inputs is not based on observable market data, the instrument is included in level 3. This is the case for unlisted equity securities and unlisted preference shares.
(ii) valuation technique used to determine fair value Specific valuation techniques used to value financial instruments include:
- investment in Standard Chartered Bank PLC Indian Depository Receipt is valued using the closing price at National Stock Exchange (NSE) at the reporting period.
- the fair value of forward contracts is determined using forward exchange rates prevailing with Authorised Dealers dealing in foreign exchange.
- the use of Net Assets Value (‘NAV’) for valuation of mutual fund investment. NAV represents the price at which the issuer will issue further units and will redeem such units of mutual fund to and from the investors.
- the fair value of quoted bonds and government securities are derived based on the indicative quotes of price and yields prevailing in the market or latest available prices.
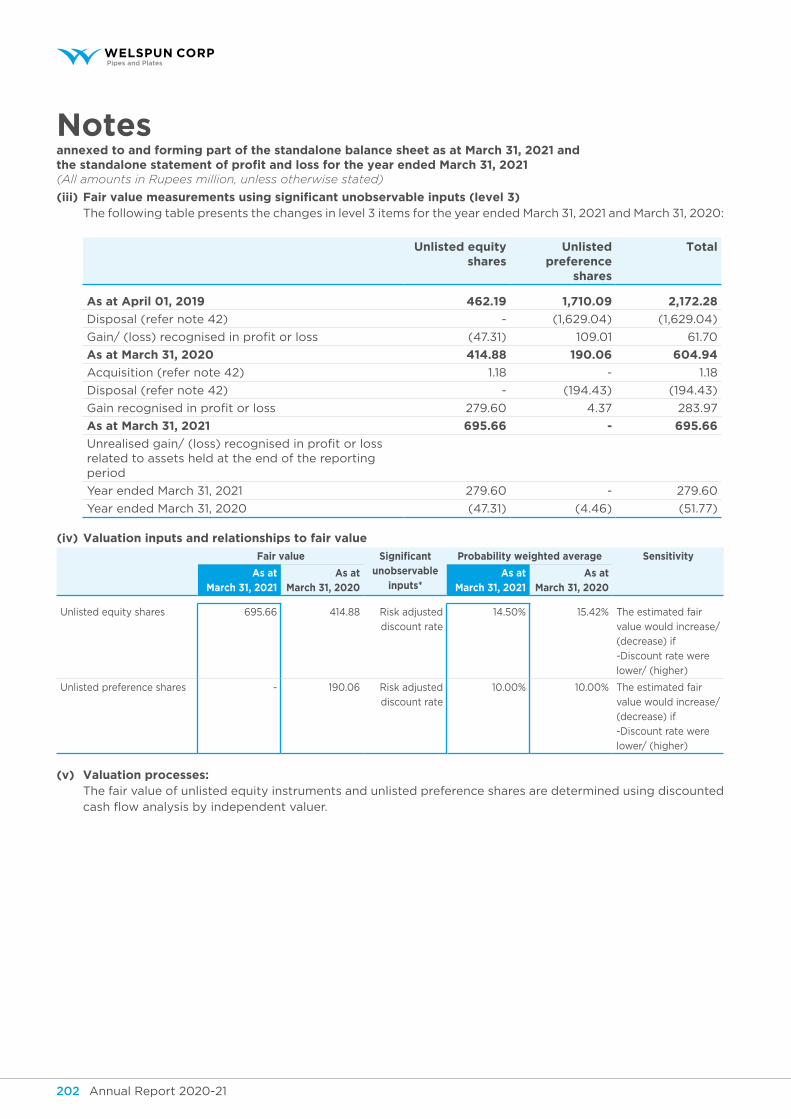
Annual Report 2020-21 203Annual Report 2020-21202
Notesannexed to and forming part of the standalone balance sheet as at March 31, 2021 andthe standalone statement of profit and loss for the year ended March 31, 2021(All amounts in Rupees million, unless otherwise stated)
(iii) fair value measurements using significant unobservable inputs (level 3) The following table presents the changes in level 3 items for the year ended March 31, 2021 and March 31, 2020:
unlisted equity shares
unlisted preference
shares
total
As at April 01, 2019 462.19 1,710.09 2,172.28
Disposal (refer note 42) - (1,629.04) (1,629.04)
Gain/ (loss) recognised in profit or loss (47.31) 109.01 61.70
As at March 31, 2020 414.88 190.06 604.94
Acquisition (refer note 42) 1.18 - 1.18
Disposal (refer note 42) - (194.43) (194.43)
Gain recognised in profit or loss 279.60 4.37 283.97
As at March 31, 2021 695.66 - 695.66
Unrealised gain/ (loss) recognised in profit or loss related to assets held at the end of the reporting period
Year ended March 31, 2021 279.60 - 279.60
Year ended March 31, 2020 (47.31) (4.46) (51.77)
(iv) valuation inputs and relationships to fair value
fair value significant unobservable
inputs*
probability weighted average sensitivity
As at March 31, 2021
As at March 31, 2020
As at March 31, 2021
As at March 31, 2020
Unlisted equity shares 695.66 414.88 Risk adjusted
discount rate
14.50% 15.42% The estimated fair
value would increase/
(decrease) if
-Discount rate were
lower/ (higher)
Unlisted preference shares - 190.06 Risk adjusted
discount rate
10.00% 10.00% The estimated fair
value would increase/
(decrease) if
-Discount rate were
lower/ (higher)
(v) valuation processes: The fair value of unlisted equity instruments and unlisted preference shares are determined using discounted
cash flow analysis by independent valuer.
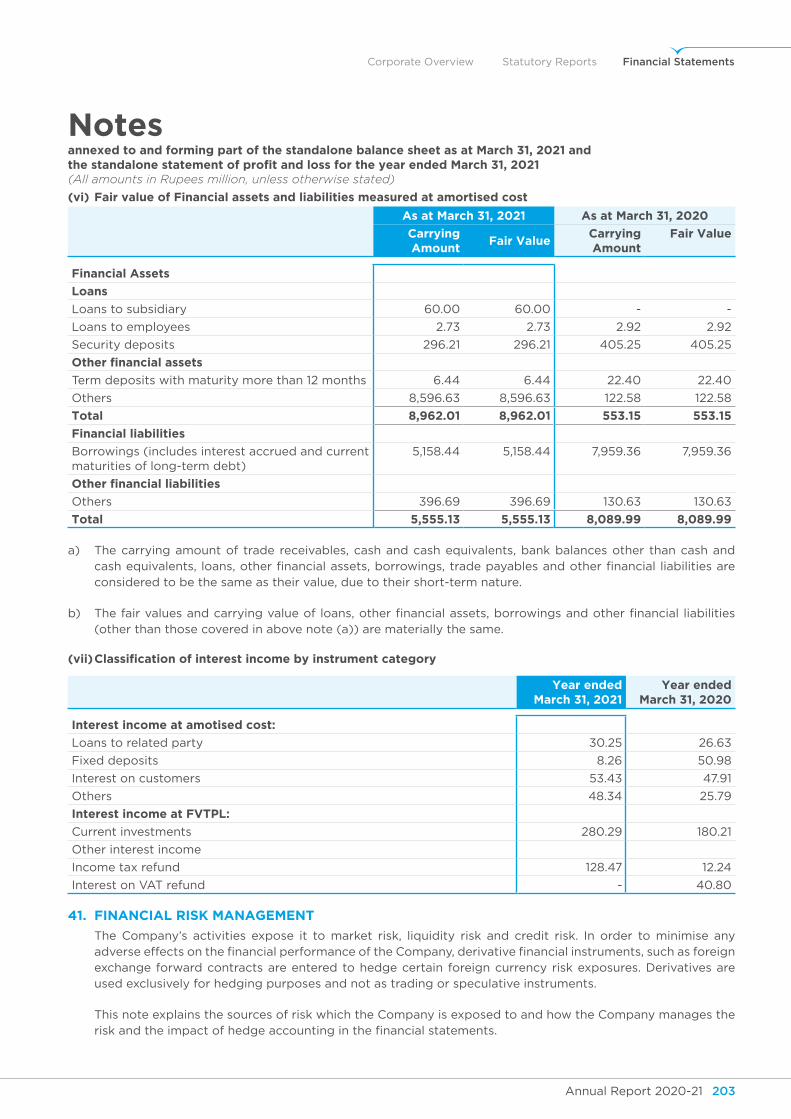
Annual Report 2020-21 203Annual Report 2020-21202
Corporate Overview Statutory Reports Financial Statements
Notesannexed to and forming part of the standalone balance sheet as at March 31, 2021 andthe standalone statement of profit and loss for the year ended March 31, 2021(All amounts in Rupees million, unless otherwise stated)
(vi) fair value of financial assets and liabilities measured at amortised cost
As at March 31, 2021 As at March 31, 2020
carrying Amount
fair valuecarrying Amount
fair value
financial Assets
loans
Loans to subsidiary 60.00 60.00 - -
Loans to employees 2.73 2.73 2.92 2.92
Security deposits 296.21 296.21 405.25 405.25
other financial assets
Term deposits with maturity more than 12 months 6.44 6.44 22.40 22.40
Others 8,596.63 8,596.63 122.58 122.58
total 8,962.01 8,962.01 553.15 553.15
financial liabilities
Borrowings (includes interest accrued and current maturities of long-term debt)
5,158.44 5,158.44 7,959.36 7,959.36
other financial liabilities
Others 396.69 396.69 130.63 130.63
total 5,555.13 5,555.13 8,089.99 8,089.99
a) The carrying amount of trade receivables, cash and cash equivalents, bank balances other than cash and cash equivalents, loans, other financial assets, borrowings, trade payables and other financial liabilities are considered to be the same as their value, due to their short-term nature.
b) The fair values and carrying value of loans, other financial assets, borrowings and other financial liabilities (other than those covered in above note (a)) are materially the same.
(vii) Classification of interest income by instrument category
year ended March 31, 2021
year ended March 31, 2020
Interest income at amotised cost:
Loans to related party 30.25 26.63
Fixed deposits 8.26 50.98
Interest on customers 53.43 47.91
Others 48.34 25.79
Interest income at fvtpl:
Current investments 280.29 180.21
Other interest income
Income tax refund 128.47 12.24
Interest on VAT refund - 40.80
41. fInAncIAl RIsK mAnAgement
The Company’s activities expose it to market risk, liquidity risk and credit risk. In order to minimise any adverse effects on the financial performance of the Company, derivative financial instruments, such as foreign exchange forward contracts are entered to hedge certain foreign currency risk exposures. Derivatives are used exclusively for hedging purposes and not as trading or speculative instruments.
This note explains the sources of risk which the Company is exposed to and how the Company manages the risk and the impact of hedge accounting in the financial statements.
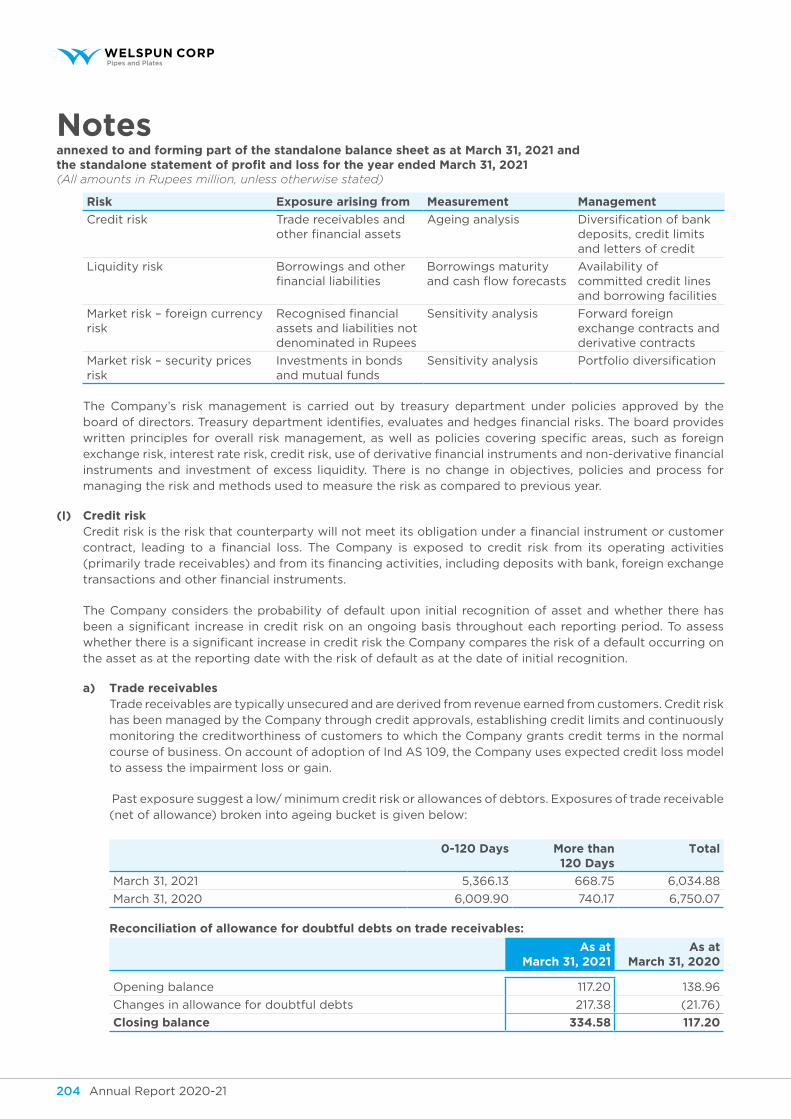
Annual Report 2020-21 205Annual Report 2020-21204
Notesannexed to and forming part of the standalone balance sheet as at March 31, 2021 andthe standalone statement of profit and loss for the year ended March 31, 2021(All amounts in Rupees million, unless otherwise stated)
Risk exposure arising from measurement management
Credit risk Trade receivables and other financial assets
Ageing analysis Diversification of bank deposits, credit limits and letters of credit
Liquidity risk Borrowings and other financial liabilities
Borrowings maturity and cash flow forecasts
Availability of committed credit lines and borrowing facilities
Market risk – foreign currency risk
Recognised financial assets and liabilities not denominated in Rupees
Sensitivity analysis Forward foreign exchange contracts and derivative contracts
Market risk – security prices risk
Investments in bonds and mutual funds
Sensitivity analysis Portfolio diversification
The Company’s risk management is carried out by treasury department under policies approved by the board of directors. Treasury department identifies, evaluates and hedges financial risks. The board provides written principles for overall risk management, as well as policies covering specific areas, such as foreign exchange risk, interest rate risk, credit risk, use of derivative financial instruments and non-derivative financial instruments and investment of excess liquidity. There is no change in objectives, policies and process for managing the risk and methods used to measure the risk as compared to previous year.
(I) credit risk Credit risk is the risk that counterparty will not meet its obligation under a financial instrument or customer
contract, leading to a financial loss. The Company is exposed to credit risk from its operating activities (primarily trade receivables) and from its financing activities, including deposits with bank, foreign exchange transactions and other financial instruments.
The Company considers the probability of default upon initial recognition of asset and whether there has been a significant increase in credit risk on an ongoing basis throughout each reporting period. To assess whether there is a significant increase in credit risk the Company compares the risk of a default occurring on the asset as at the reporting date with the risk of default as at the date of initial recognition.
a) trade receivables Trade receivables are typically unsecured and are derived from revenue earned from customers. Credit risk
has been managed by the Company through credit approvals, establishing credit limits and continuously monitoring the creditworthiness of customers to which the Company grants credit terms in the normal course of business. On account of adoption of Ind AS 109, the Company uses expected credit loss model to assess the impairment loss or gain.
Past exposure suggest a low/ minimum credit risk or allowances of debtors. Exposures of trade receivable (net of allowance) broken into ageing bucket is given below:
0-120 days more than 120 days
total
March 31, 2021 5,366.13 668.75 6,034.88
March 31, 2020 6,009.90 740.17 6,750.07
Reconciliation of allowance for doubtful debts on trade receivables:
As at March 31, 2021
As at March 31, 2020
Opening balance 117.20 138.96
Changes in allowance for doubtful debts 217.38 (21.76)
closing balance 334.58 117.20
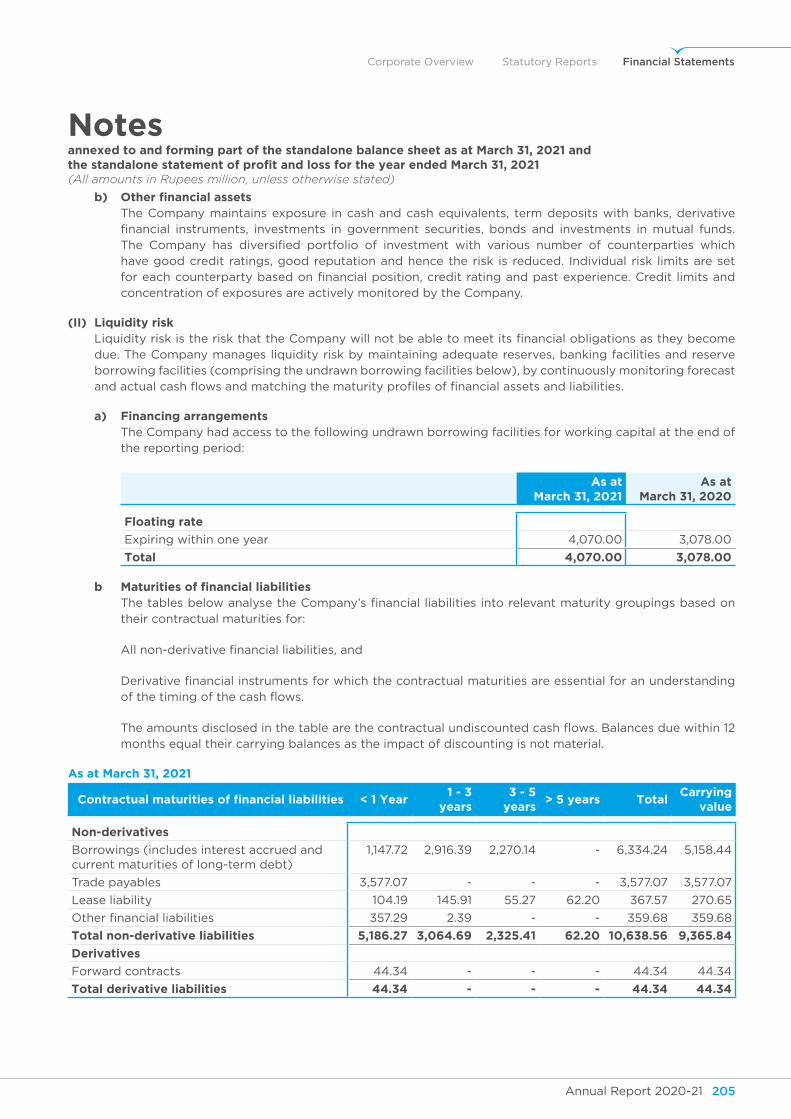
Annual Report 2020-21 205Annual Report 2020-21204
Corporate Overview Statutory Reports Financial Statements
Notesannexed to and forming part of the standalone balance sheet as at March 31, 2021 andthe standalone statement of profit and loss for the year ended March 31, 2021(All amounts in Rupees million, unless otherwise stated)
b) other financial assets The Company maintains exposure in cash and cash equivalents, term deposits with banks, derivative
financial instruments, investments in government securities, bonds and investments in mutual funds. The Company has diversified portfolio of investment with various number of counterparties which have good credit ratings, good reputation and hence the risk is reduced. Individual risk limits are set for each counterparty based on financial position, credit rating and past experience. Credit limits and concentration of exposures are actively monitored by the Company.
(II) liquidity risk Liquidity risk is the risk that the Company will not be able to meet its financial obligations as they become
due. The Company manages liquidity risk by maintaining adequate reserves, banking facilities and reserve borrowing facilities (comprising the undrawn borrowing facilities below), by continuously monitoring forecast and actual cash flows and matching the maturity profiles of financial assets and liabilities.
a) financing arrangements The Company had access to the following undrawn borrowing facilities for working capital at the end of
the reporting period:
As at March 31, 2021
As at March 31, 2020
floating rate
Expiring within one year 4,070.00 3,078.00
total 4,070.00 3,078.00
b Maturities of financial liabilities The tables below analyse the Company’s financial liabilities into relevant maturity groupings based on
their contractual maturities for:
All non-derivative financial liabilities, and
Derivative financial instruments for which the contractual maturities are essential for an understanding of the timing of the cash flows.
The amounts disclosed in the table are the contractual undiscounted cash flows. Balances due within 12 months equal their carrying balances as the impact of discounting is not material.
As at March 31, 2021
Contractual maturities of financial liabilities < 1 year1 - 3
years3 - 5
years> 5 years total
carrying value
non-derivatives
Borrowings (includes interest accrued and current maturities of long-term debt)
1,147.72 2,916.39 2,270.14 - 6,334.24 5,158.44
Trade payables 3,577.07 - - - 3,577.07 3,577.07
Lease liability 104.19 145.91 55.27 62.20 367.57 270.65
Other financial liabilities 357.29 2.39 - - 359.68 359.68
total non-derivative liabilities 5,186.27 3,064.69 2,325.41 62.20 10,638.56 9,365.84
derivatives
Forward contracts 44.34 - - - 44.34 44.34
total derivative liabilities 44.34 - - - 44.34 44.34
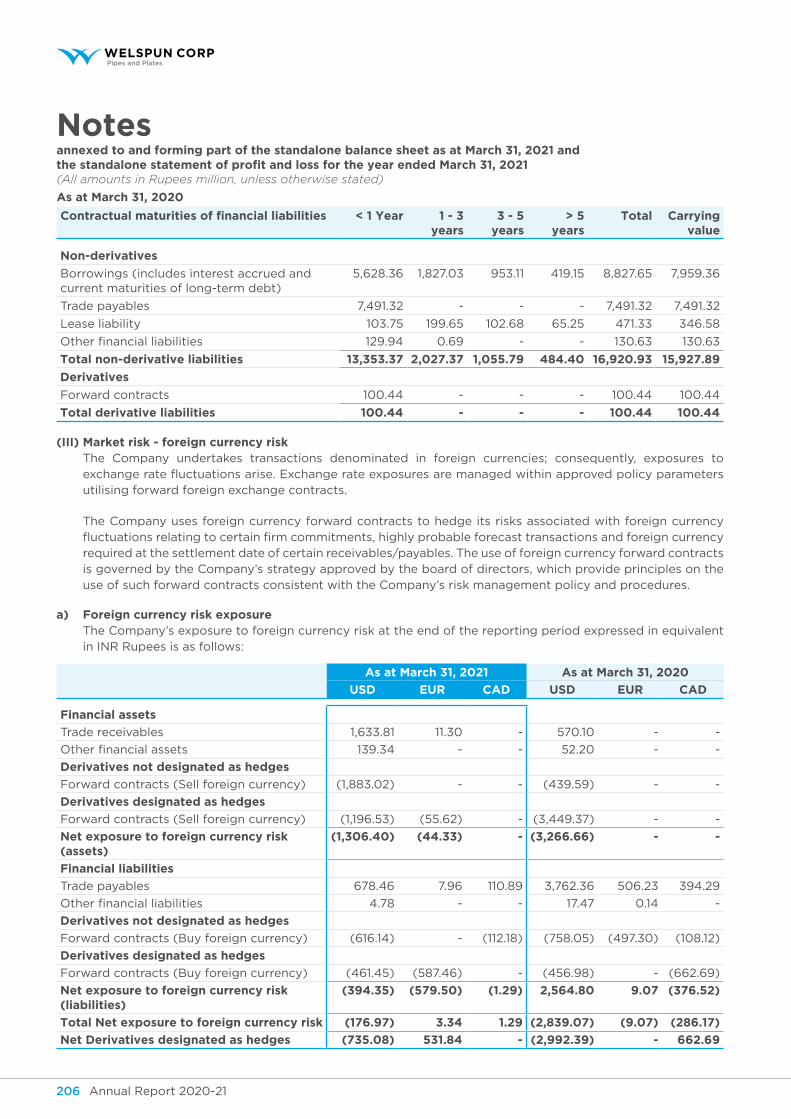
Annual Report 2020-21 207Annual Report 2020-21206
Notesannexed to and forming part of the standalone balance sheet as at March 31, 2021 andthe standalone statement of profit and loss for the year ended March 31, 2021(All amounts in Rupees million, unless otherwise stated)
As at March 31, 2020
Contractual maturities of financial liabilities < 1 year 1 - 3 years
3 - 5 years
> 5 years
total carrying value
non-derivatives
Borrowings (includes interest accrued and current maturities of long-term debt)
5,628.36 1,827.03 953.11 419.15 8,827.65 7,959.36
Trade payables 7,491.32 - - - 7,491.32 7,491.32
Lease liability 103.75 199.65 102.68 65.25 471.33 346.58
Other financial liabilities 129.94 0.69 - - 130.63 130.63
total non-derivative liabilities 13,353.37 2,027.37 1,055.79 484.40 16,920.93 15,927.89
derivatives
Forward contracts 100.44 - - - 100.44 100.44
total derivative liabilities 100.44 - - - 100.44 100.44
(III) market risk - foreign currency risk The Company undertakes transactions denominated in foreign currencies; consequently, exposures to
exchange rate fluctuations arise. Exchange rate exposures are managed within approved policy parameters utilising forward foreign exchange contracts.
The Company uses foreign currency forward contracts to hedge its risks associated with foreign currency fluctuations relating to certain firm commitments, highly probable forecast transactions and foreign currency required at the settlement date of certain receivables/payables. The use of foreign currency forward contracts is governed by the Company’s strategy approved by the board of directors, which provide principles on the use of such forward contracts consistent with the Company’s risk management policy and procedures.
a) foreign currency risk exposure The Company’s exposure to foreign currency risk at the end of the reporting period expressed in equivalent
in INR Rupees is as follows:
As at March 31, 2021 As at March 31, 2020
usd euR cAd usd euR cAd
financial assets
Trade receivables 1,633.81 11.30 - 570.10 - -
Other financial assets 139.34 - - 52.20 - -
derivatives not designated as hedges
Forward contracts (Sell foreign currency) (1,883.02) - - (439.59) - -
derivatives designated as hedges
Forward contracts (Sell foreign currency) (1,196.53) (55.62) - (3,449.37) - -
net exposure to foreign currency risk (assets)
(1,306.40) (44.33) - (3,266.66) - -
financial liabilities
Trade payables 678.46 7.96 110.89 3,762.36 506.23 394.29
Other financial liabilities 4.78 - - 17.47 0.14 -
derivatives not designated as hedges
Forward contracts (Buy foreign currency) (616.14) - (112.18) (758.05) (497.30) (108.12)
derivatives designated as hedges
Forward contracts (Buy foreign currency) (461.45) (587.46) - (456.98) - (662.69)
net exposure to foreign currency risk (liabilities)
(394.35) (579.50) (1.29) 2,564.80 9.07 (376.52)
total net exposure to foreign currency risk (176.97) 3.34 1.29 (2,839.07) (9.07) (286.17)
net derivatives designated as hedges (735.08) 531.84 - (2,992.39) - 662.69
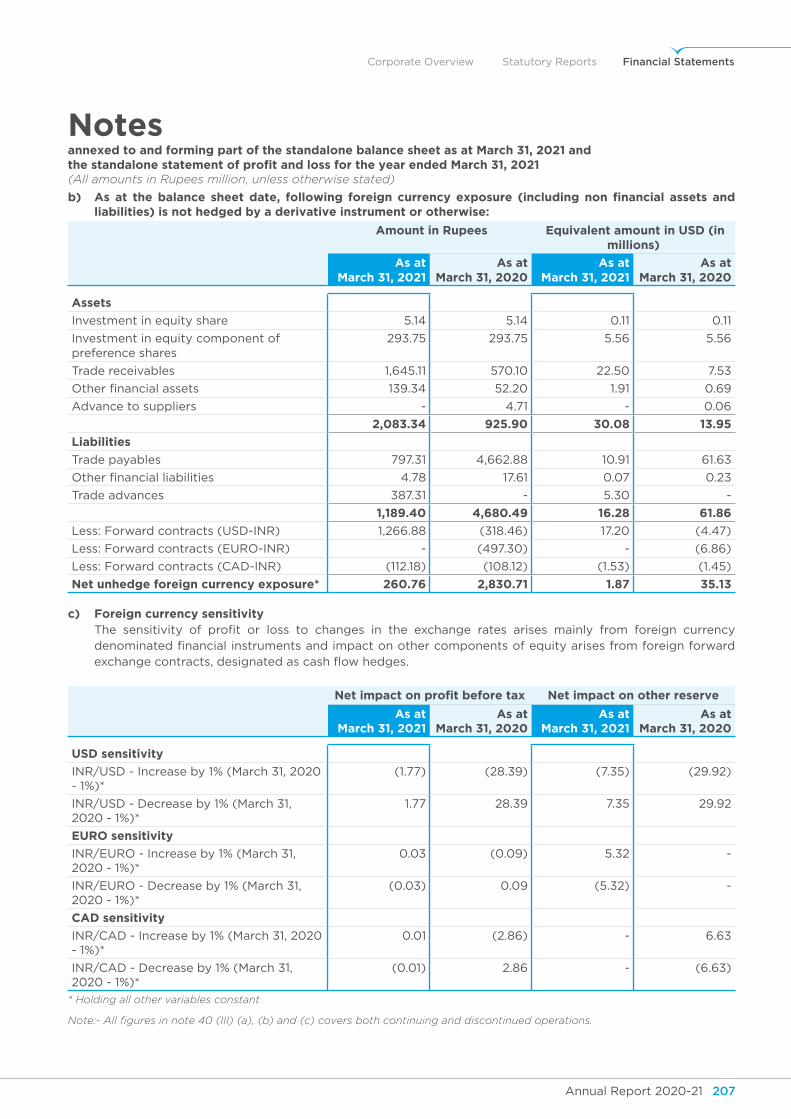
Annual Report 2020-21 207Annual Report 2020-21206
Corporate Overview Statutory Reports Financial Statements
Notesannexed to and forming part of the standalone balance sheet as at March 31, 2021 andthe standalone statement of profit and loss for the year ended March 31, 2021(All amounts in Rupees million, unless otherwise stated)
b) As at the balance sheet date, following foreign currency exposure (including non financial assets and liabilities) is not hedged by a derivative instrument or otherwise:
Amount in Rupees equivalent amount in usd (in millions)
As at March 31, 2021
As at March 31, 2020
As at March 31, 2021
As at March 31, 2020
Assets
Investment in equity share 5.14 5.14 0.11 0.11
Investment in equity component of preference shares
293.75 293.75 5.56 5.56
Trade receivables 1,645.11 570.10 22.50 7.53
Other financial assets 139.34 52.20 1.91 0.69
Advance to suppliers - 4.71 - 0.06
2,083.34 925.90 30.08 13.95
liabilities
Trade payables 797.31 4,662.88 10.91 61.63
Other financial liabilities 4.78 17.61 0.07 0.23
Trade advances 387.31 - 5.30 -
1,189.40 4,680.49 16.28 61.86
Less: Forward contracts (USD-INR) 1,266.88 (318.46) 17.20 (4.47)
Less: Forward contracts (EURO-INR) - (497.30) - (6.86)
Less: Forward contracts (CAD-INR) (112.18) (108.12) (1.53) (1.45)
net unhedge foreign currency exposure* 260.76 2,830.71 1.87 35.13
c) foreign currency sensitivity The sensitivity of profit or loss to changes in the exchange rates arises mainly from foreign currency
denominated financial instruments and impact on other components of equity arises from foreign forward exchange contracts, designated as cash flow hedges.
net impact on profit before tax net impact on other reserve
As at March 31, 2021
As at March 31, 2020
As at March 31, 2021
As at March 31, 2020
usd sensitivity
INR/USD - Increase by 1% (March 31, 2020 - 1%)*
(1.77) (28.39) (7.35) (29.92)
INR/USD - Decrease by 1% (March 31, 2020 - 1%)*
1.77 28.39 7.35 29.92
euRo sensitivity
INR/EURO - Increase by 1% (March 31, 2020 - 1%)*
0.03 (0.09) 5.32 -
INR/EURO - Decrease by 1% (March 31, 2020 - 1%)*
(0.03) 0.09 (5.32) -
cAd sensitivity
INR/CAD - Increase by 1% (March 31, 2020 - 1%)*
0.01 (2.86) - 6.63
INR/CAD - Decrease by 1% (March 31, 2020 - 1%)*
(0.01) 2.86 - (6.63)
* Holding all other variables constant
Note:- All figures in note 40 (III) (a), (b) and (c) covers both continuing and discontinued operations.
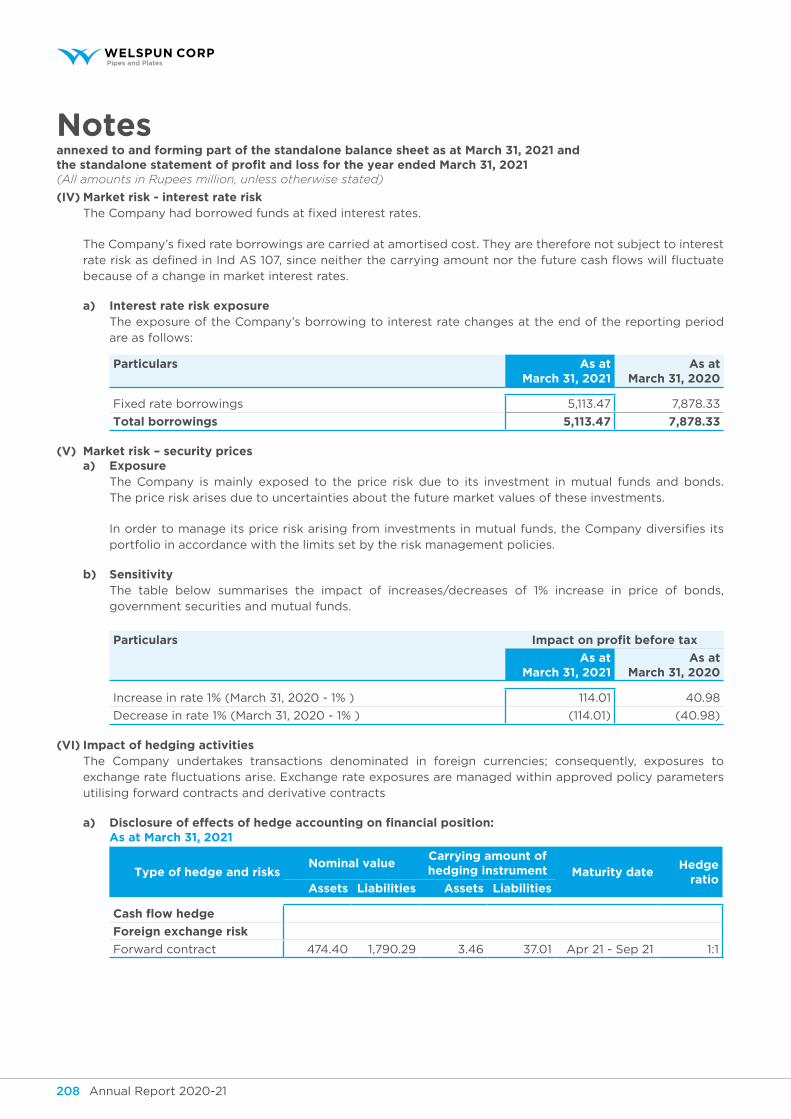
Annual Report 2020-21 209Annual Report 2020-21208
Notesannexed to and forming part of the standalone balance sheet as at March 31, 2021 andthe standalone statement of profit and loss for the year ended March 31, 2021(All amounts in Rupees million, unless otherwise stated)
(Iv) market risk - interest rate risk The Company had borrowed funds at fixed interest rates.
The Company’s fixed rate borrowings are carried at amortised cost. They are therefore not subject to interest rate risk as defined in Ind AS 107, since neither the carrying amount nor the future cash flows will fluctuate because of a change in market interest rates.
a) Interest rate risk exposure The exposure of the Company’s borrowing to interest rate changes at the end of the reporting period
are as follows:
particulars As at March 31, 2021
As at March 31, 2020
Fixed rate borrowings 5,113.47 7,878.33
total borrowings 5,113.47 7,878.33
(v) market risk – security prices a) exposure
The Company is mainly exposed to the price risk due to its investment in mutual funds and bonds. The price risk arises due to uncertainties about the future market values of these investments.
In order to manage its price risk arising from investments in mutual funds, the Company diversifies its portfolio in accordance with the limits set by the risk management policies.
b) sensitivity The table below summarises the impact of increases/decreases of 1% increase in price of bonds,
government securities and mutual funds.
particulars impact on profit before tax
As at March 31, 2021
As at March 31, 2020
Increase in rate 1% (March 31, 2020 - 1% ) 114.01 40.98
Decrease in rate 1% (March 31, 2020 - 1% ) (114.01) (40.98)
(vI) Impact of hedging activities The Company undertakes transactions denominated in foreign currencies; consequently, exposures to
exchange rate fluctuations arise. Exchange rate exposures are managed within approved policy parameters utilising forward contracts and derivative contracts
a) disclosure of effects of hedge accounting on financial position: As at March 31, 2021
type of hedge and risksnominal value
carrying amount of hedging instrument maturity date
hedge ratio
Assets liabilities Assets liabilities
Cash flow hedge
foreign exchange risk
Forward contract 474.40 1,790.29 3.46 37.01 Apr 21 - Sep 21 1:1

Annual Report 2020-21 209Annual Report 2020-21208
Corporate Overview Statutory Reports Financial Statements
Notesannexed to and forming part of the standalone balance sheet as at March 31, 2021 andthe standalone statement of profit and loss for the year ended March 31, 2021(All amounts in Rupees million, unless otherwise stated)
As at March 31, 2020
type of hedge and risks nominal value carrying amount of hedging instrument
maturity date hedge ratio
Assets liabilities Assets liabilities
Cash flow hedge
foreign exchange risk
Forward contract 614.07 3,954.97 25.74 97.50 Apr 20 - Dec 20 1:1
As at March 31, 2021
type of hedge change in the value of hedging
instrument recognised
in other comprehensive
income
hedge ineffectiveness
recognised in profit or loss
Amount reclassified
from cash flow
hedging reserve to profit
or loss
line item affected in
statement of profit and loss because of the reclassification
cash flow hedge
Foreign Exchange Risk 25.37 - (18.37) Revenue
As at March 31, 2020
type of hedge change in the value of hedging
instrument recognised
in other comprehensive
income
hedge ineffectiveness
recognised in profit or loss
Amount reclassified
from cash flow
hedging reserve to profit
or loss
line item affected in
statement of profit and loss because of the reclassification
cash flow hedge
Foreign Exchange Risk (84.50) - (113.84) Revenue
Interest Risk (5.35) - (2.68) Finance Cost
The Company uses forward contracts to hedge its risks associated with foreign currency fluctuations relating to certain firm commitments, highly probable forecast transactions and foreign currency required at the settlement date of certain receivables/payables. The use of forward contracts is governed by the Company’s strategy approved by the board of directors, which provide principles on the use of such forward contracts consistent with the Company’s risk management policy.
The Company’s hedging policy only allows for effective hedge relationships to be established. Hedge effectiveness is determined at the inception of the hedge relationship, and through periodic prospective effectiveness assessments to ensure that an economic relationship exists between the hedged item and hedging instrument. The Company enters into hedge relationships where the critical terms of the hedging instrument match exactly with the terms of the hedged item, and so a qualitative assessment of effectiveness is performed. If changes in circumstances affect the terms of the hedged item such that the critical terms no longer match exactly with the critical terms of the hedging instrument, the Company uses the hypothetical derivative method to assess effectiveness. Ineffectiveness is recognised on a cash flow hedge and net investment hedge where the cumulative change in the designated component value of the hedging instrument exceeds on an absolute basis the change in value of the hedged item attributable to the hedged risk. In hedges of foreign currency forecast sale and purchase transactions, hedges of interest rate risk and hedges of net investment this may arise if:
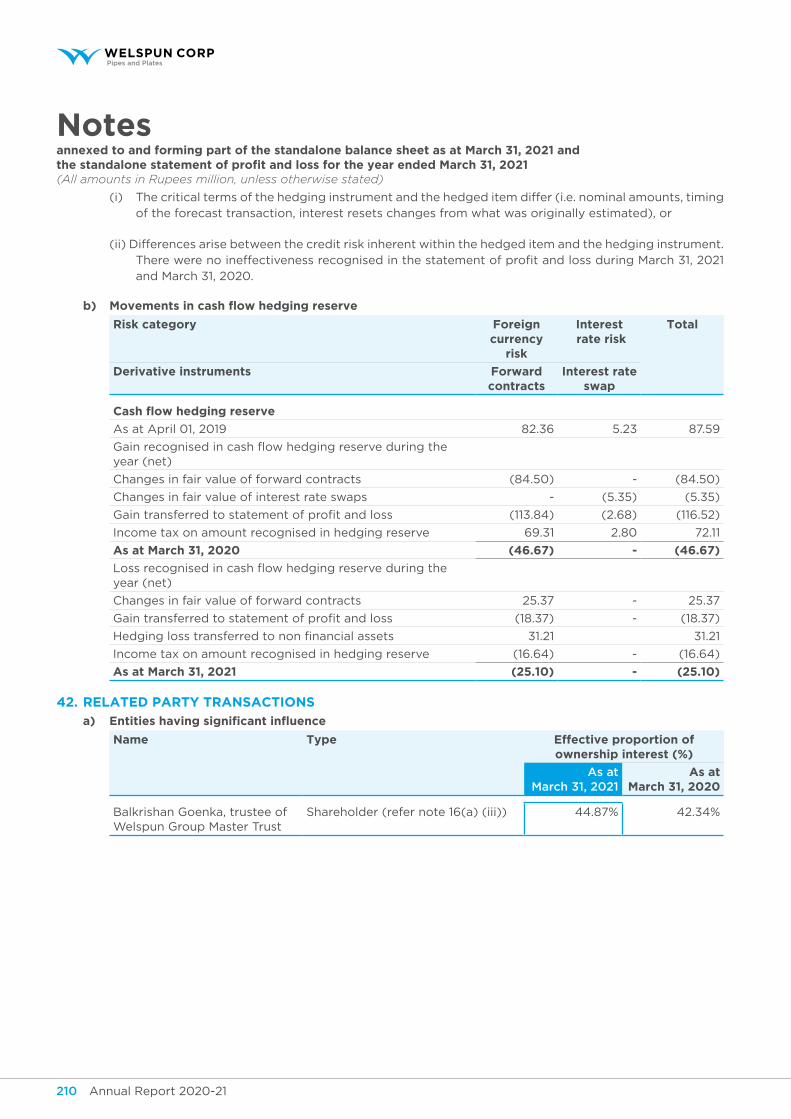
Annual Report 2020-21 211Annual Report 2020-21210
Notesannexed to and forming part of the standalone balance sheet as at March 31, 2021 andthe standalone statement of profit and loss for the year ended March 31, 2021(All amounts in Rupees million, unless otherwise stated)
(i) The critical terms of the hedging instrument and the hedged item differ (i.e. nominal amounts, timing of the forecast transaction, interest resets changes from what was originally estimated), or
(ii) Differences arise between the credit risk inherent within the hedged item and the hedging instrument. There were no ineffectiveness recognised in the statement of profit and loss during March 31, 2021 and March 31, 2020.
b) Movements in cash flow hedging reserve
Risk category foreign currency
risk
Interest rate risk
total
derivative instruments forward contracts
Interest rate swap
Cash flow hedging reserve
As at April 01, 2019 82.36 5.23 87.59
Gain recognised in cash flow hedging reserve during the year (net)
Changes in fair value of forward contracts (84.50) - (84.50)
Changes in fair value of interest rate swaps - (5.35) (5.35)
Gain transferred to statement of profit and loss (113.84) (2.68) (116.52)
Income tax on amount recognised in hedging reserve 69.31 2.80 72.11
As at March 31, 2020 (46.67) - (46.67)
Loss recognised in cash flow hedging reserve during the year (net)
Changes in fair value of forward contracts 25.37 - 25.37
Gain transferred to statement of profit and loss (18.37) - (18.37)
Hedging loss transferred to non financial assets 31.21 31.21
Income tax on amount recognised in hedging reserve (16.64) - (16.64)
As at March 31, 2021 (25.10) - (25.10)
42. ReLAted PARty tRAnsACtions
a) entities having significant influence
name type effective proportion of ownership interest (%)
As at March 31, 2021
As at March 31, 2020
Balkrishan Goenka, trustee of Welspun Group Master Trust
Shareholder (refer note 16(a) (iii)) 44.87% 42.34%
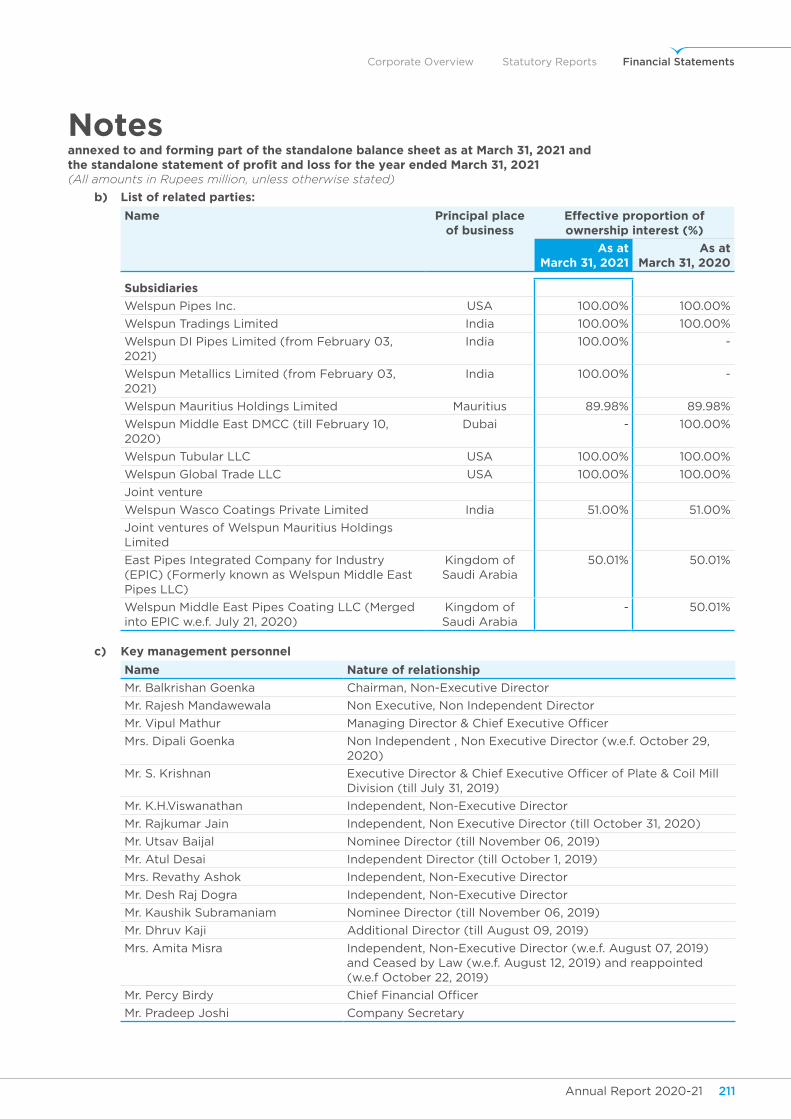
Annual Report 2020-21 211Annual Report 2020-21210
Corporate Overview Statutory Reports Financial Statements
Notesannexed to and forming part of the standalone balance sheet as at March 31, 2021 andthe standalone statement of profit and loss for the year ended March 31, 2021(All amounts in Rupees million, unless otherwise stated)
b) list of related parties:
name principal place of business
effective proportion of ownership interest (%)
As at March 31, 2021
As at March 31, 2020
subsidiaries
Welspun Pipes Inc. USA 100.00% 100.00%
Welspun Tradings Limited India 100.00% 100.00%
Welspun DI Pipes Limited (from February 03, 2021)
India 100.00% -
Welspun Metallics Limited (from February 03, 2021)
India 100.00% -
Welspun Mauritius Holdings Limited Mauritius 89.98% 89.98%
Welspun Middle East DMCC (till February 10, 2020)
Dubai - 100.00%
Welspun Tubular LLC USA 100.00% 100.00%
Welspun Global Trade LLC USA 100.00% 100.00%
Joint venture
Welspun Wasco Coatings Private Limited India 51.00% 51.00%
Joint ventures of Welspun Mauritius Holdings Limited
East Pipes Integrated Company for Industry (EPIC) (Formerly known as Welspun Middle East Pipes LLC)
Kingdom of Saudi Arabia
50.01% 50.01%
Welspun Middle East Pipes Coating LLC (Merged into EPIC w.e.f. July 21, 2020)
Kingdom of Saudi Arabia
- 50.01%
c) Key management personnel
name nature of relationship
Mr. Balkrishan Goenka Chairman, Non-Executive Director
Mr. Rajesh Mandawewala Non Executive, Non Independent Director
Mr. Vipul Mathur Managing Director & Chief Executive Officer
Mrs. Dipali Goenka Non Independent , Non Executive Director (w.e.f. October 29, 2020)
Mr. S. Krishnan Executive Director & Chief Executive Officer of Plate & Coil Mill Division (till July 31, 2019)
Mr. K.H.Viswanathan Independent, Non-Executive Director
Mr. Rajkumar Jain Independent, Non Executive Director (till October 31, 2020)
Mr. Utsav Baijal Nominee Director (till November 06, 2019)
Mr. Atul Desai Independent Director (till October 1, 2019)
Mrs. Revathy Ashok Independent, Non-Executive Director
Mr. Desh Raj Dogra Independent, Non-Executive Director
Mr. Kaushik Subramaniam Nominee Director (till November 06, 2019)
Mr. Dhruv Kaji Additional Director (till August 09, 2019)
Mrs. Amita Misra Independent, Non-Executive Director (w.e.f. August 07, 2019) and Ceased by Law (w.e.f. August 12, 2019) and reappointed (w.e.f October 22, 2019)
Mr. Percy Birdy Chief Financial Officer
Mr. Pradeep Joshi Company Secretary
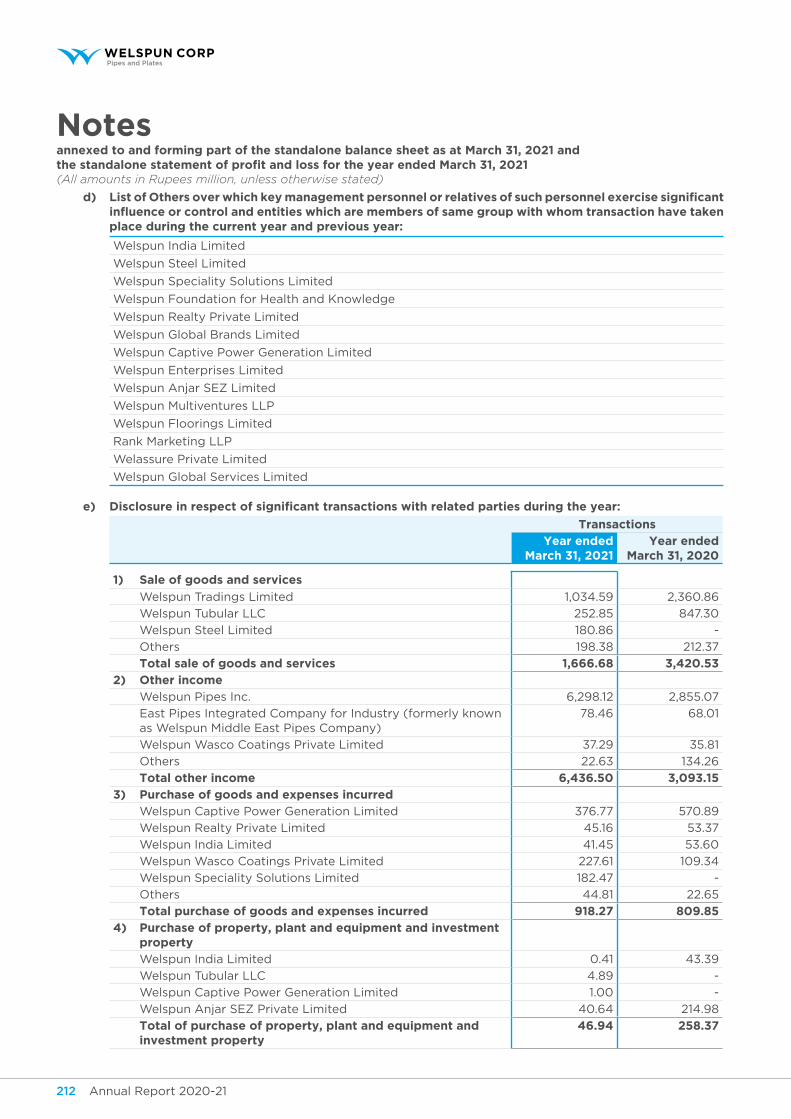
Annual Report 2020-21 213Annual Report 2020-21212
Notesannexed to and forming part of the standalone balance sheet as at March 31, 2021 andthe standalone statement of profit and loss for the year ended March 31, 2021(All amounts in Rupees million, unless otherwise stated)
d) List of others over which key management personnel or relatives of such personnel exercise significant influence or control and entities which are members of same group with whom transaction have taken place during the current year and previous year:
Welspun India Limited
Welspun Steel Limited
Welspun Speciality Solutions Limited
Welspun Foundation for Health and Knowledge
Welspun Realty Private Limited
Welspun Global Brands Limited
Welspun Captive Power Generation Limited
Welspun Enterprises Limited
Welspun Anjar SEZ Limited
Welspun Multiventures LLP
Welspun Floorings Limited
Rank Marketing LLP
Welassure Private Limited
Welspun Global Services Limited
e) disclosure in respect of significant transactions with related parties during the year:
transactions
year ended March 31, 2021
year ended March 31, 2020
1) sale of goods and services
Welspun Tradings Limited 1,034.59 2,360.86
Welspun Tubular LLC 252.85 847.30
Welspun Steel Limited 180.86 -
Others 198.38 212.37
total sale of goods and services 1,666.68 3,420.53
2) other income
Welspun Pipes Inc. 6,298.12 2,855.07
East Pipes Integrated Company for Industry (formerly known as Welspun Middle East Pipes Company)
78.46 68.01
Welspun Wasco Coatings Private Limited 37.29 35.81
Others 22.63 134.26
total other income 6,436.50 3,093.15
3) Purchase of goods and expenses incurred
Welspun Captive Power Generation Limited 376.77 570.89
Welspun Realty Private Limited 45.16 53.37
Welspun India Limited 41.45 53.60
Welspun Wasco Coatings Private Limited 227.61 109.34
Welspun Speciality Solutions Limited 182.47 -
Others 44.81 22.65
total purchase of goods and expenses incurred 918.27 809.85
4) Purchase of property, plant and equipment and investment property
Welspun India Limited 0.41 43.39
Welspun Tubular LLC 4.89 -
Welspun Captive Power Generation Limited 1.00 -
Welspun Anjar SEZ Private Limited 40.64 214.98
total of purchase of property, plant and equipment and investment property
46.94 258.37
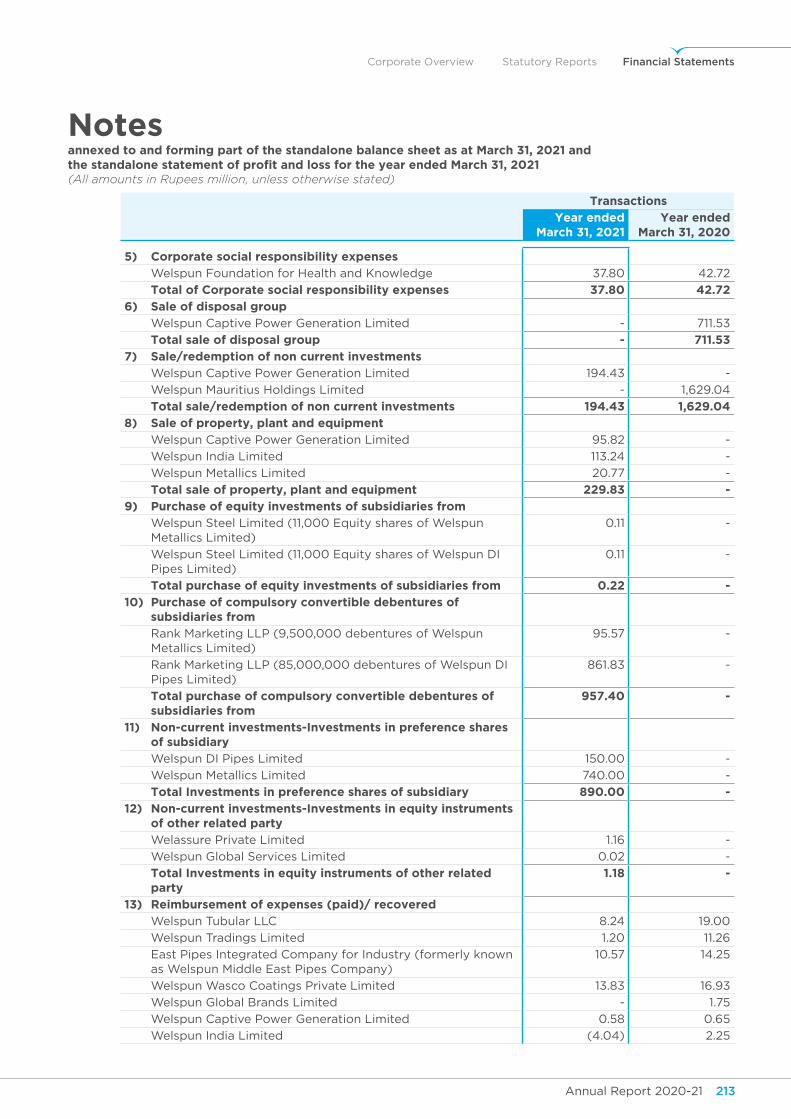
Annual Report 2020-21 213Annual Report 2020-21212
Corporate Overview Statutory Reports Financial Statements
Notesannexed to and forming part of the standalone balance sheet as at March 31, 2021 andthe standalone statement of profit and loss for the year ended March 31, 2021(All amounts in Rupees million, unless otherwise stated)
transactions
year ended March 31, 2021
year ended March 31, 2020
5) Corporate social responsibility expenses
Welspun Foundation for Health and Knowledge 37.80 42.72
total of corporate social responsibility expenses 37.80 42.72
6) sale of disposal group
Welspun Captive Power Generation Limited - 711.53
total sale of disposal group - 711.53
7) sale/redemption of non current investments
Welspun Captive Power Generation Limited 194.43 -
Welspun Mauritius Holdings Limited - 1,629.04
total sale/redemption of non current investments 194.43 1,629.04
8) sale of property, plant and equipment
Welspun Captive Power Generation Limited 95.82 -
Welspun India Limited 113.24 -
Welspun Metallics Limited 20.77 -
total sale of property, plant and equipment 229.83 -
9) Purchase of equity investments of subsidiaries from
Welspun Steel Limited (11,000 Equity shares of Welspun Metallics Limited)
0.11 -
Welspun Steel Limited (11,000 Equity shares of Welspun DI Pipes Limited)
0.11 -
total purchase of equity investments of subsidiaries from 0.22 -
10) Purchase of compulsory convertible debentures of subsidiaries from
Rank Marketing LLP (9,500,000 debentures of Welspun Metallics Limited)
95.57 -
Rank Marketing LLP (85,000,000 debentures of Welspun DI Pipes Limited)
861.83 -
total purchase of compulsory convertible debentures of subsidiaries from
957.40 -
11) non-current investments-Investments in preference shares of subsidiary
Welspun DI Pipes Limited 150.00 -
Welspun Metallics Limited 740.00 -
total Investments in preference shares of subsidiary 890.00 -
12) non-current investments-investments in equity instruments of other related party
Welassure Private Limited 1.16 -
Welspun Global Services Limited 0.02 -
total Investments in equity instruments of other related party
1.18 -
13) Reimbursement of expenses (paid)/ recovered
Welspun Tubular LLC 8.24 19.00
Welspun Tradings Limited 1.20 11.26
East Pipes Integrated Company for Industry (formerly known as Welspun Middle East Pipes Company)
10.57 14.25
Welspun Wasco Coatings Private Limited 13.83 16.93
Welspun Global Brands Limited - 1.75
Welspun Captive Power Generation Limited 0.58 0.65
Welspun India Limited (4.04) 2.25
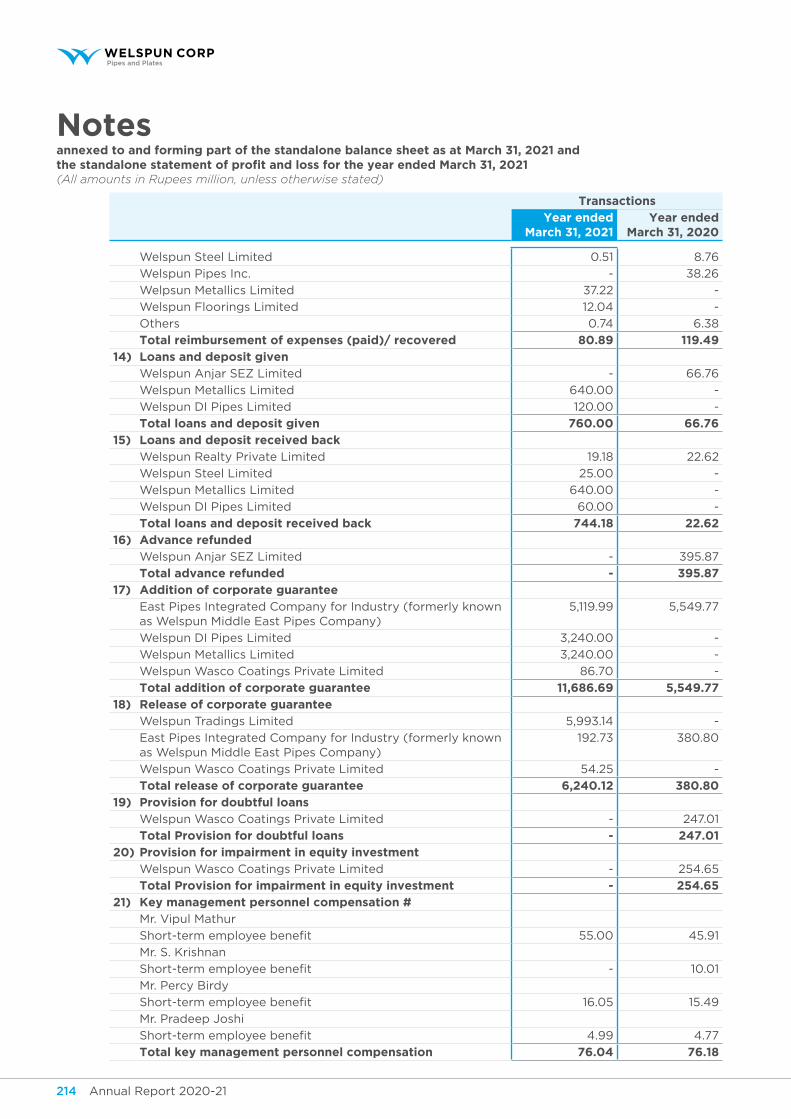
Annual Report 2020-21 215Annual Report 2020-21214
Notesannexed to and forming part of the standalone balance sheet as at March 31, 2021 andthe standalone statement of profit and loss for the year ended March 31, 2021(All amounts in Rupees million, unless otherwise stated)
transactions
year ended March 31, 2021
year ended March 31, 2020
Welspun Steel Limited 0.51 8.76
Welspun Pipes Inc. - 38.26
Welpsun Metallics Limited 37.22 -
Welspun Floorings Limited 12.04 -
Others 0.74 6.38
total reimbursement of expenses (paid)/ recovered 80.89 119.49
14) loans and deposit given
Welspun Anjar SEZ Limited - 66.76
Welspun Metallics Limited 640.00 -
Welspun DI Pipes Limited 120.00 -
total loans and deposit given 760.00 66.76
15) Loans and deposit received back
Welspun Realty Private Limited 19.18 22.62
Welspun Steel Limited 25.00 -
Welspun Metallics Limited 640.00 -
Welspun DI Pipes Limited 60.00 -
total loans and deposit received back 744.18 22.62
16) Advance refunded
Welspun Anjar SEZ Limited - 395.87
total advance refunded - 395.87
17) Addition of corporate guarantee
East Pipes Integrated Company for Industry (formerly known as Welspun Middle East Pipes Company)
5,119.99 5,549.77
Welspun DI Pipes Limited 3,240.00 -
Welspun Metallics Limited 3,240.00 -
Welspun Wasco Coatings Private Limited 86.70 -
total addition of corporate guarantee 11,686.69 5,549.77
18) Release of corporate guarantee
Welspun Tradings Limited 5,993.14 -
East Pipes Integrated Company for Industry (formerly known as Welspun Middle East Pipes Company)
192.73 380.80
Welspun Wasco Coatings Private Limited 54.25 -
total release of corporate guarantee 6,240.12 380.80
19) Provision for doubtful loans
Welspun Wasco Coatings Private Limited - 247.01
total provision for doubtful loans - 247.01
20) Provision for impairment in equity investment
Welspun Wasco Coatings Private Limited - 254.65
total provision for impairment in equity investment - 254.65
21) key management personnel compensation #
Mr. Vipul Mathur
Short-term employee benefit 55.00 45.91
Mr. S. Krishnan
Short-term employee benefit - 10.01
Mr. Percy Birdy
Short-term employee benefit 16.05 15.49
Mr. Pradeep Joshi
Short-term employee benefit 4.99 4.77
total key management personnel compensation 76.04 76.18
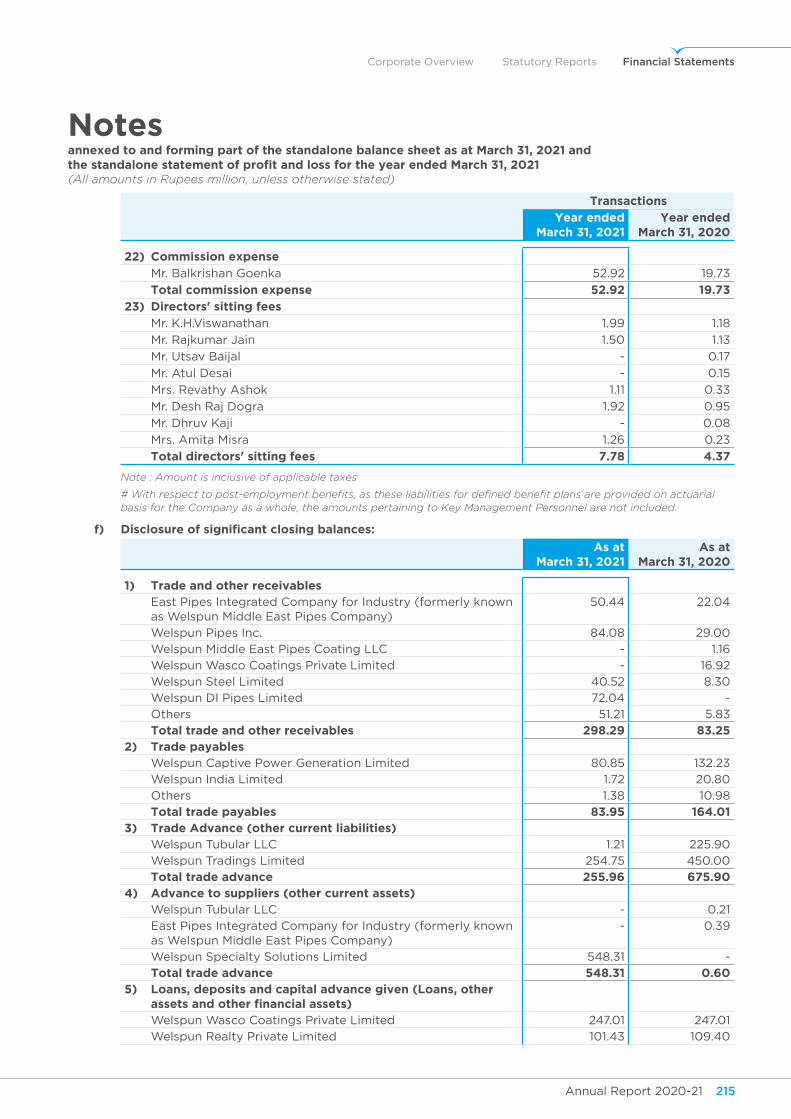
Annual Report 2020-21 215Annual Report 2020-21214
Corporate Overview Statutory Reports Financial Statements
Notesannexed to and forming part of the standalone balance sheet as at March 31, 2021 andthe standalone statement of profit and loss for the year ended March 31, 2021(All amounts in Rupees million, unless otherwise stated)
transactions
year ended March 31, 2021
year ended March 31, 2020
22) Commission expense
Mr. Balkrishan Goenka 52.92 19.73
total commission expense 52.92 19.73
23) directors' sitting fees
Mr. K.H.Viswanathan 1.99 1.18
Mr. Rajkumar Jain 1.50 1.13
Mr. Utsav Baijal - 0.17
Mr. Atul Desai - 0.15
Mrs. Revathy Ashok 1.11 0.33
Mr. Desh Raj Dogra 1.92 0.95
Mr. Dhruv Kaji - 0.08
Mrs. Amita Misra 1.26 0.23
total directors' sitting fees 7.78 4.37
Note : Amount is inclusive of applicable taxes
# With respect to post-employment benefits, as these liabilities for defined benefit plans are provided on actuarial basis for the Company as a whole, the amounts pertaining to Key Management Personnel are not included.
f) disclosure of significant closing balances:
As at March 31, 2021
As at March 31, 2020
1) trade and other receivables East Pipes Integrated Company for Industry (formerly known
as Welspun Middle East Pipes Company) 50.44 22.04
Welspun Pipes Inc. 84.08 29.00
Welspun Middle East Pipes Coating LLC - 1.16
Welspun Wasco Coatings Private Limited - 16.92
Welspun Steel Limited 40.52 8.30
Welspun DI Pipes Limited 72.04 -
Others 51.21 5.83
total trade and other receivables 298.29 83.25 2) trade payables Welspun Captive Power Generation Limited 80.85 132.23
Welspun India Limited 1.72 20.80
Others 1.38 10.98
total trade payables 83.95 164.01 3) trade Advance (other current liabilities) Welspun Tubular LLC 1.21 225.90
Welspun Tradings Limited 254.75 450.00
total trade advance 255.96 675.90 4) Advance to suppliers (other current assets) Welspun Tubular LLC - 0.21
East Pipes Integrated Company for Industry (formerly known as Welspun Middle East Pipes Company)
- 0.39
Welspun Specialty Solutions Limited 548.31 -
total trade advance 548.31 0.60 5) Loans, deposits and capital advance given (Loans, other
assets and other financial assets) Welspun Wasco Coatings Private Limited 247.01 247.01
Welspun Realty Private Limited 101.43 109.40
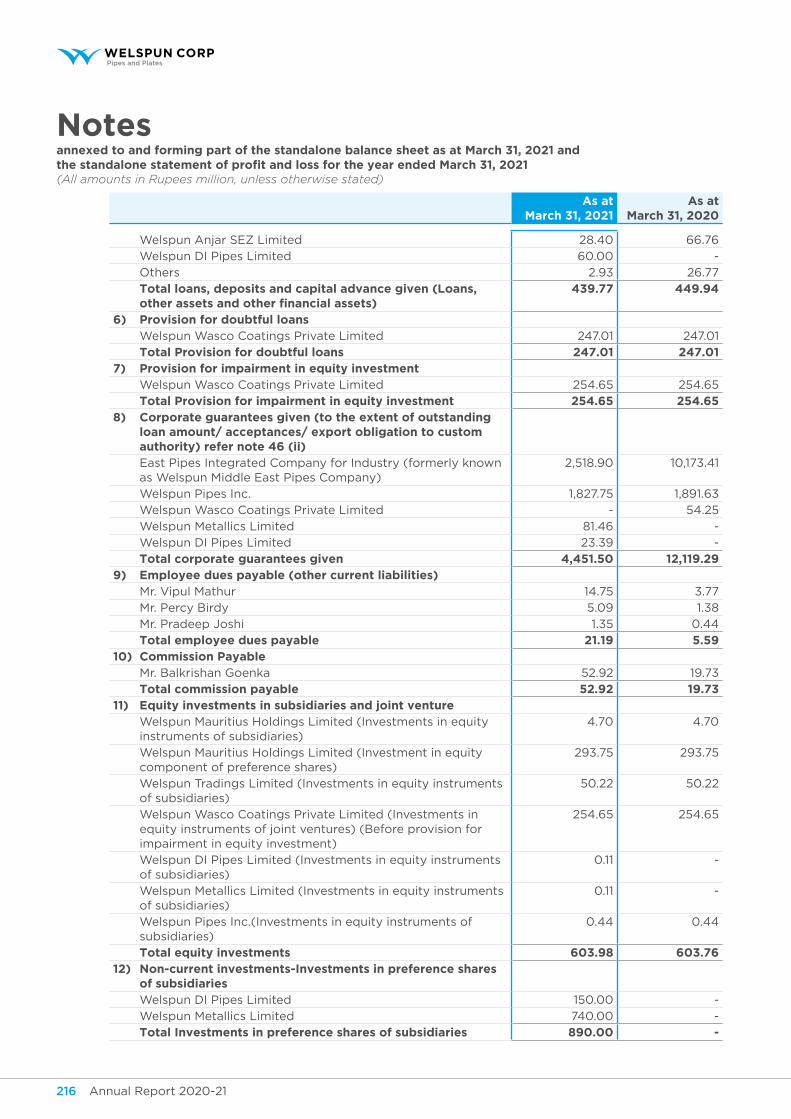
Annual Report 2020-21 217Annual Report 2020-21216
Notesannexed to and forming part of the standalone balance sheet as at March 31, 2021 andthe standalone statement of profit and loss for the year ended March 31, 2021(All amounts in Rupees million, unless otherwise stated)
As at March 31, 2021
As at March 31, 2020
Welspun Anjar SEZ Limited 28.40 66.76
Welspun DI Pipes Limited 60.00 -
Others 2.93 26.77
total loans, deposits and capital advance given (Loans, other assets and other financial assets)
439.77 449.94
6) Provision for doubtful loans Welspun Wasco Coatings Private Limited 247.01 247.01
total provision for doubtful loans 247.01 247.01 7) Provision for impairment in equity investment Welspun Wasco Coatings Private Limited 254.65 254.65
total provision for impairment in equity investment 254.65 254.65 8) Corporate guarantees given (to the extent of outstanding
loan amount/ acceptances/ export obligation to custom authority) refer note 46 (ii)
East Pipes Integrated Company for Industry (formerly known as Welspun Middle East Pipes Company)
2,518.90 10,173.41
Welspun Pipes Inc. 1,827.75 1,891.63
Welspun Wasco Coatings Private Limited - 54.25
Welspun Metallics Limited 81.46 -
Welspun DI Pipes Limited 23.39 -
total corporate guarantees given 4,451.50 12,119.29 9) employee dues payable (other current liabilities) Mr. Vipul Mathur 14.75 3.77
Mr. Percy Birdy 5.09 1.38
Mr. Pradeep Joshi 1.35 0.44
total employee dues payable 21.19 5.59 10) Commission Payable Mr. Balkrishan Goenka 52.92 19.73
total commission payable 52.92 19.73 11) equity investments in subsidiaries and joint venture Welspun Mauritius Holdings Limited (Investments in equity
instruments of subsidiaries) 4.70 4.70
Welspun Mauritius Holdings Limited (Investment in equity component of preference shares)
293.75 293.75
Welspun Tradings Limited (Investments in equity instruments of subsidiaries)
50.22 50.22
Welspun Wasco Coatings Private Limited (Investments in equity instruments of joint ventures) (Before provision for impairment in equity investment)
254.65 254.65
Welspun DI Pipes Limited (Investments in equity instruments of subsidiaries)
0.11 -
Welspun Metallics Limited (Investments in equity instruments of subsidiaries)
0.11 -
Welspun Pipes Inc.(Investments in equity instruments of subsidiaries)
0.44 0.44
total equity investments 603.98 603.76 12) non-current investments-investments in preference shares
of subsidiaries Welspun DI Pipes Limited 150.00 -
Welspun Metallics Limited 740.00 -
total Investments in preference shares of subsidiaries 890.00 -
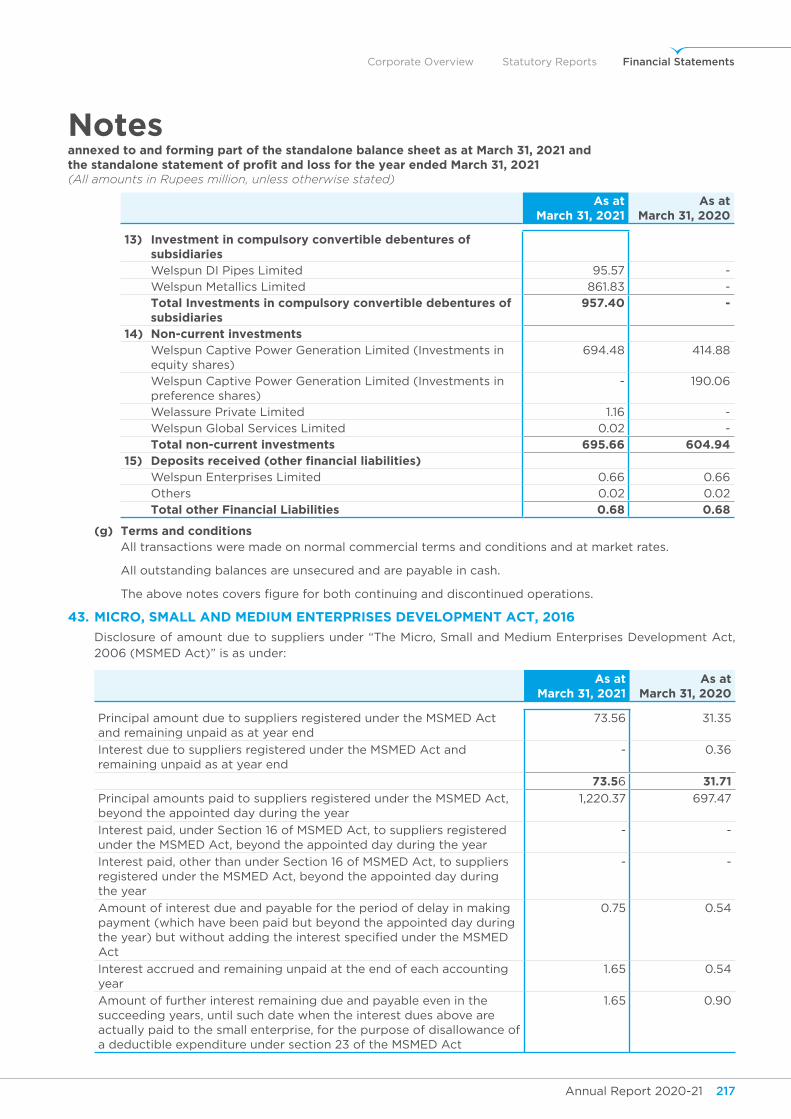
Annual Report 2020-21 217Annual Report 2020-21216
Corporate Overview Statutory Reports Financial Statements
Notesannexed to and forming part of the standalone balance sheet as at March 31, 2021 andthe standalone statement of profit and loss for the year ended March 31, 2021(All amounts in Rupees million, unless otherwise stated)
As at March 31, 2021
As at March 31, 2020
13) investment in compulsory convertible debentures of subsidiaries
Welspun DI Pipes Limited 95.57 -
Welspun Metallics Limited 861.83 -
total Investments in compulsory convertible debentures of subsidiaries
957.40 -
14) non-current investments Welspun Captive Power Generation Limited (Investments in
equity shares) 694.48 414.88
Welspun Captive Power Generation Limited (Investments in preference shares)
- 190.06
Welassure Private Limited 1.16 -
Welspun Global Services Limited 0.02 -
total non-current investments 695.66 604.94 15) deposits received (other financial liabilities) Welspun Enterprises Limited 0.66 0.66
Others 0.02 0.02
total other financial liabilities 0.68 0.68
(g) terms and conditions All transactions were made on normal commercial terms and conditions and at market rates.
All outstanding balances are unsecured and are payable in cash.
The above notes covers figure for both continuing and discontinued operations.
43. MiCRo, sMALL And MediuM enteRPRises deveLoPMent ACt, 2016
Disclosure of amount due to suppliers under “The Micro, Small and Medium Enterprises Development Act, 2006 (MSMED Act)” is as under:
As at March 31, 2021
As at March 31, 2020
Principal amount due to suppliers registered under the MSMED Act and remaining unpaid as at year end
73.56 31.35
Interest due to suppliers registered under the MSMED Act and remaining unpaid as at year end
- 0.36
73.56 31.71
Principal amounts paid to suppliers registered under the MSMED Act, beyond the appointed day during the year
1,220.37 697.47
Interest paid, under Section 16 of MSMED Act, to suppliers registered under the MSMED Act, beyond the appointed day during the year
- -
Interest paid, other than under Section 16 of MSMED Act, to suppliers registered under the MSMED Act, beyond the appointed day during the year
- -
Amount of interest due and payable for the period of delay in making payment (which have been paid but beyond the appointed day during the year) but without adding the interest specified under the MSMED Act
0.75 0.54
Interest accrued and remaining unpaid at the end of each accounting year
1.65 0.54
Amount of further interest remaining due and payable even in the succeeding years, until such date when the interest dues above are actually paid to the small enterprise, for the purpose of disallowance of a deductible expenditure under section 23 of the MSMED Act
1.65 0.90
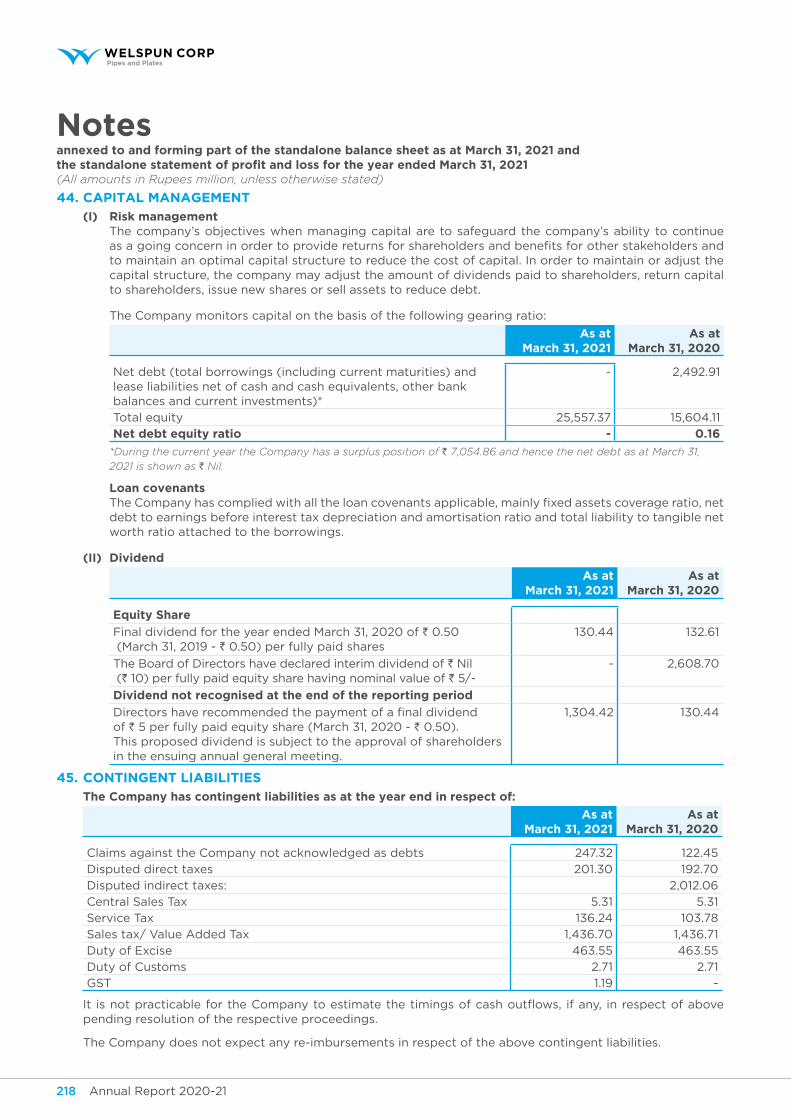
Annual Report 2020-21 219Annual Report 2020-21218
Notesannexed to and forming part of the standalone balance sheet as at March 31, 2021 andthe standalone statement of profit and loss for the year ended March 31, 2021(All amounts in Rupees million, unless otherwise stated)
44. cApItAl mAnAgement
(I) Risk management The company’s objectives when managing capital are to safeguard the company’s ability to continue
as a going concern in order to provide returns for shareholders and benefits for other stakeholders and to maintain an optimal capital structure to reduce the cost of capital. In order to maintain or adjust the capital structure, the company may adjust the amount of dividends paid to shareholders, return capital to shareholders, issue new shares or sell assets to reduce debt.
The Company monitors capital on the basis of the following gearing ratio:
As at March 31, 2021
As at March 31, 2020
Net debt (total borrowings (including current maturities) and lease liabilities net of cash and cash equivalents, other bank balances and current investments)*
- 2,492.91
Total equity 25,557.37 15,604.11
net debt equity ratio - 0.16
*During the current year the Company has a surplus position of ` 7,054.86 and hence the net debt as at March 31,
2021 is shown as ` Nil.
loan covenants The Company has complied with all the loan covenants applicable, mainly fixed assets coverage ratio, net
debt to earnings before interest tax depreciation and amortisation ratio and total liability to tangible net worth ratio attached to the borrowings.
(II) dividend
As at March 31, 2021
As at March 31, 2020
equity share
Final dividend for the year ended March 31, 2020 of ` 0.50 (March 31, 2019 - ` 0.50) per fully paid shares
130.44 132.61
The Board of Directors have declared interim dividend of ` Nil (` 10) per fully paid equity share having nominal value of ` 5/-
- 2,608.70
dividend not recognised at the end of the reporting period
Directors have recommended the payment of a final dividend of ` 5 per fully paid equity share (March 31, 2020 - ` 0.50). This proposed dividend is subject to the approval of shareholders in the ensuing annual general meeting.
1,304.42 130.44
45. Contingent LiABiLities
the company has contingent liabilities as at the year end in respect of:
As at March 31, 2021
As at March 31, 2020
Claims against the Company not acknowledged as debts 247.32 122.45
Disputed direct taxes 201.30 192.70
Disputed indirect taxes: 2,012.06
Central Sales Tax 5.31 5.31
Service Tax 136.24 103.78
Sales tax/ Value Added Tax 1,436.70 1,436.71
Duty of Excise 463.55 463.55
Duty of Customs 2.71 2.71
GST 1.19 -
It is not practicable for the Company to estimate the timings of cash outflows, if any, in respect of above pending resolution of the respective proceedings.
The Company does not expect any re-imbursements in respect of the above contingent liabilities.
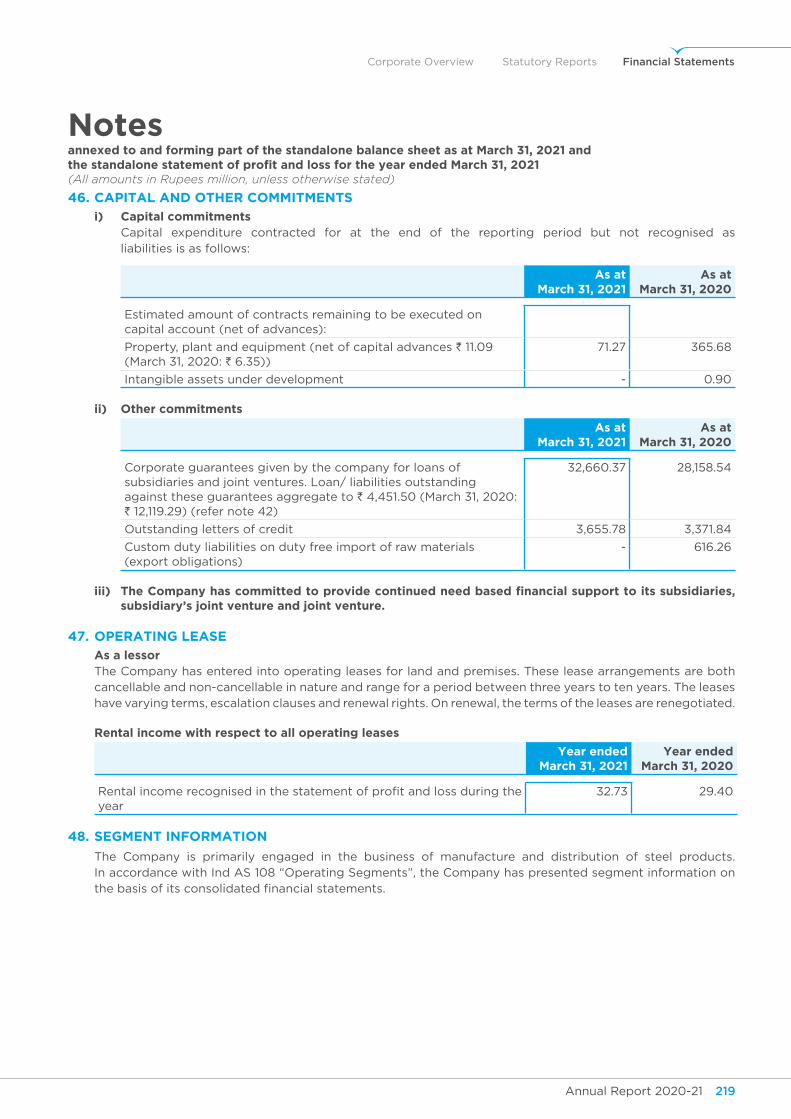
Annual Report 2020-21 219Annual Report 2020-21218
Corporate Overview Statutory Reports Financial Statements
Notesannexed to and forming part of the standalone balance sheet as at March 31, 2021 andthe standalone statement of profit and loss for the year ended March 31, 2021(All amounts in Rupees million, unless otherwise stated)
46. CAPitAL And otheR CoMMitMents
i) capital commitments Capital expenditure contracted for at the end of the reporting period but not recognised as
liabilities is as follows:
As at March 31, 2021
As at March 31, 2020
Estimated amount of contracts remaining to be executed on capital account (net of advances):
Property, plant and equipment (net of capital advances ` 11.09 (March 31, 2020: ` 6.35))
71.27 365.68
Intangible assets under development - 0.90
ii) other commitments
As at March 31, 2021
As at March 31, 2020
Corporate guarantees given by the company for loans of subsidiaries and joint ventures. Loan/ liabilities outstanding against these guarantees aggregate to ` 4,451.50 (March 31, 2020: ` 12,119.29) (refer note 42)
32,660.37 28,158.54
Outstanding letters of credit 3,655.78 3,371.84
Custom duty liabilities on duty free import of raw materials (export obligations)
- 616.26
iii) the Company has committed to provide continued need based financial support to its subsidiaries, subsidiary’s joint venture and joint venture.
47. oPeRAting LeAse
As a lessor The Company has entered into operating leases for land and premises. These lease arrangements are both
cancellable and non-cancellable in nature and range for a period between three years to ten years. The leases have varying terms, escalation clauses and renewal rights. On renewal, the terms of the leases are renegotiated.
Rental income with respect to all operating leases
year ended March 31, 2021
year ended March 31, 2020
Rental income recognised in the statement of profit and loss during the year
32.73 29.40
48. segMent infoRMAtion
The Company is primarily engaged in the business of manufacture and distribution of steel products. In accordance with Ind AS 108 “Operating Segments”, the Company has presented segment information on the basis of its consolidated financial statements.
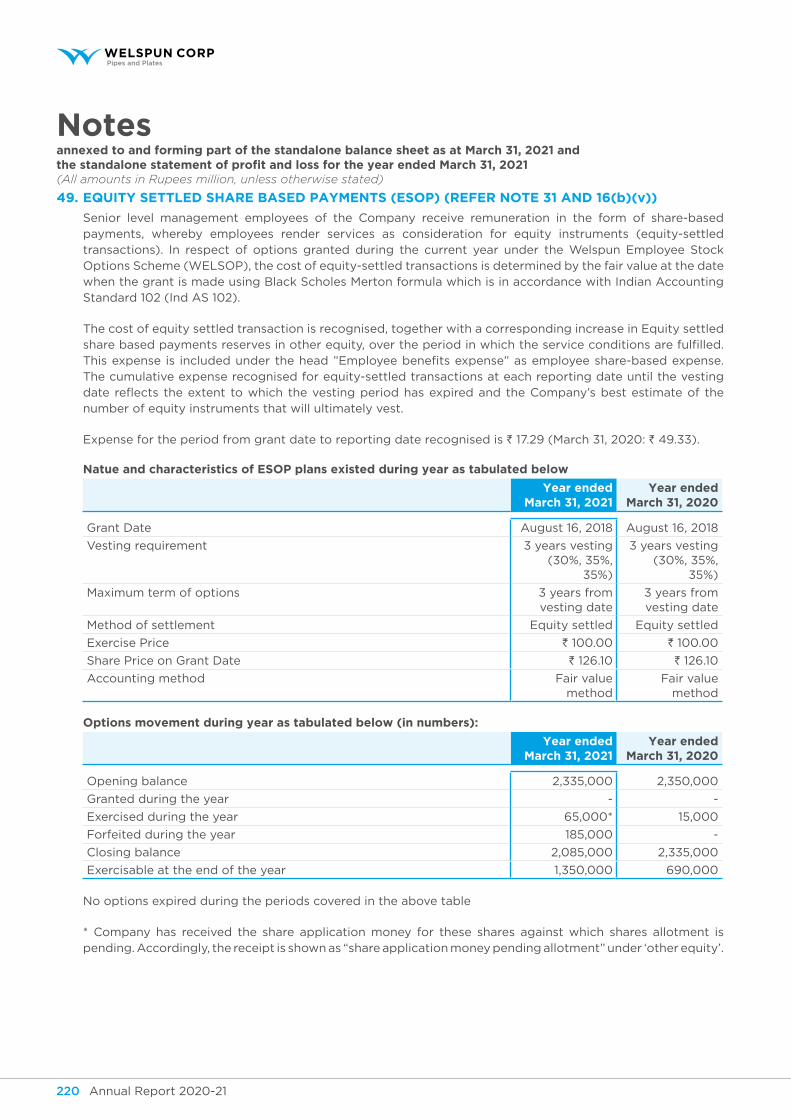
Annual Report 2020-21 221Annual Report 2020-21220
Notesannexed to and forming part of the standalone balance sheet as at March 31, 2021 andthe standalone statement of profit and loss for the year ended March 31, 2021(All amounts in Rupees million, unless otherwise stated)
49. equity settLed shARe BAsed PAyMents (esoP) (RefeR note 31 And 16(b)(v))
Senior level management employees of the Company receive remuneration in the form of share-based payments, whereby employees render services as consideration for equity instruments (equity-settled transactions). In respect of options granted during the current year under the Welspun Employee Stock Options Scheme (WELSOP), the cost of equity-settled transactions is determined by the fair value at the date when the grant is made using Black Scholes Merton formula which is in accordance with Indian Accounting Standard 102 (Ind AS 102).
The cost of equity settled transaction is recognised, together with a corresponding increase in Equity settled share based payments reserves in other equity, over the period in which the service conditions are fulfilled. This expense is included under the head ”Employee benefits expense” as employee share-based expense. The cumulative expense recognised for equity-settled transactions at each reporting date until the vesting date reflects the extent to which the vesting period has expired and the Company’s best estimate of the number of equity instruments that will ultimately vest.
Expense for the period from grant date to reporting date recognised is ` 17.29 (March 31, 2020: ` 49.33).
natue and characteristics of esop plans existed during year as tabulated below
year ended March 31, 2021
year ended March 31, 2020
Grant Date August 16, 2018 August 16, 2018
Vesting requirement 3 years vesting (30%, 35%,
35%)
3 years vesting (30%, 35%,
35%)
Maximum term of options 3 years from vesting date
3 years from vesting date
Method of settlement Equity settled Equity settled
Exercise Price ` 100.00 ` 100.00
Share Price on Grant Date ` 126.10 ` 126.10
Accounting method Fair value method
Fair value method
options movement during year as tabulated below (in numbers):
year ended March 31, 2021
year ended March 31, 2020
Opening balance 2,335,000 2,350,000
Granted during the year - -
Exercised during the year 65,000* 15,000
Forfeited during the year 185,000 -
Closing balance 2,085,000 2,335,000
Exercisable at the end of the year 1,350,000 690,000
No options expired during the periods covered in the above table
* Company has received the share application money for these shares against which shares allotment is pending. Accordingly, the receipt is shown as “share application money pending allotment” under ‘other equity’.
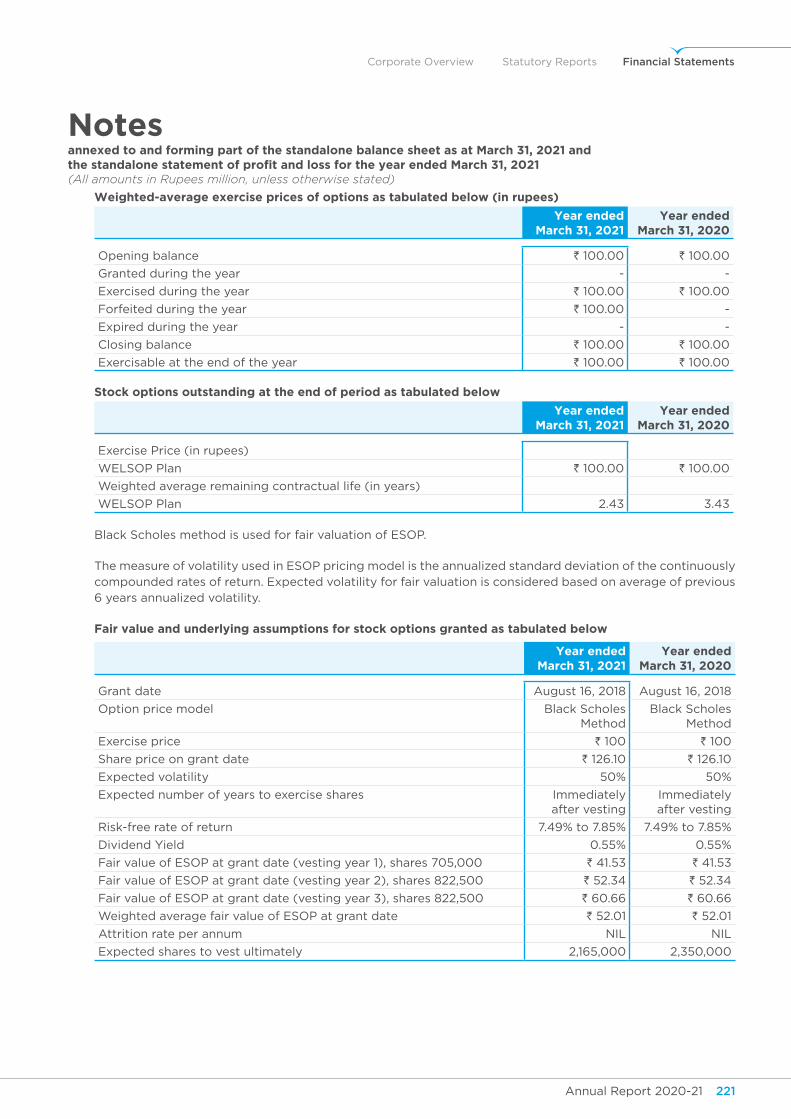
Annual Report 2020-21 221Annual Report 2020-21220
Corporate Overview Statutory Reports Financial Statements
Notesannexed to and forming part of the standalone balance sheet as at March 31, 2021 andthe standalone statement of profit and loss for the year ended March 31, 2021(All amounts in Rupees million, unless otherwise stated)
weighted-average exercise prices of options as tabulated below (in rupees)
year ended March 31, 2021
year ended March 31, 2020
Opening balance ` 100.00 ` 100.00
Granted during the year - -
Exercised during the year ` 100.00 ` 100.00
Forfeited during the year ` 100.00 -
Expired during the year - -
Closing balance ` 100.00 ` 100.00
Exercisable at the end of the year ` 100.00 ` 100.00
stock options outstanding at the end of period as tabulated below
year ended March 31, 2021
year ended March 31, 2020
Exercise Price (in rupees)
WELSOP Plan ` 100.00 ` 100.00
Weighted average remaining contractual life (in years)
WELSOP Plan 2.43 3.43
Black Scholes method is used for fair valuation of ESOP.
The measure of volatility used in ESOP pricing model is the annualized standard deviation of the continuously compounded rates of return. Expected volatility for fair valuation is considered based on average of previous 6 years annualized volatility.
fair value and underlying assumptions for stock options granted as tabulated below
year ended March 31, 2021
year ended March 31, 2020
Grant date August 16, 2018 August 16, 2018
Option price model Black Scholes Method
Black Scholes Method
Exercise price ` 100 ` 100
Share price on grant date ` 126.10 ` 126.10
Expected volatility 50% 50%
Expected number of years to exercise shares Immediately after vesting
Immediately after vesting
Risk-free rate of return 7.49% to 7.85% 7.49% to 7.85%
Dividend Yield 0.55% 0.55%
Fair value of ESOP at grant date (vesting year 1), shares 705,000 ` 41.53 ` 41.53
Fair value of ESOP at grant date (vesting year 2), shares 822,500 ` 52.34 ` 52.34
Fair value of ESOP at grant date (vesting year 3), shares 822,500 ` 60.66 ` 60.66
Weighted average fair value of ESOP at grant date ` 52.01 ` 52.01
Attrition rate per annum NIL NIL
Expected shares to vest ultimately 2,165,000 2,350,000
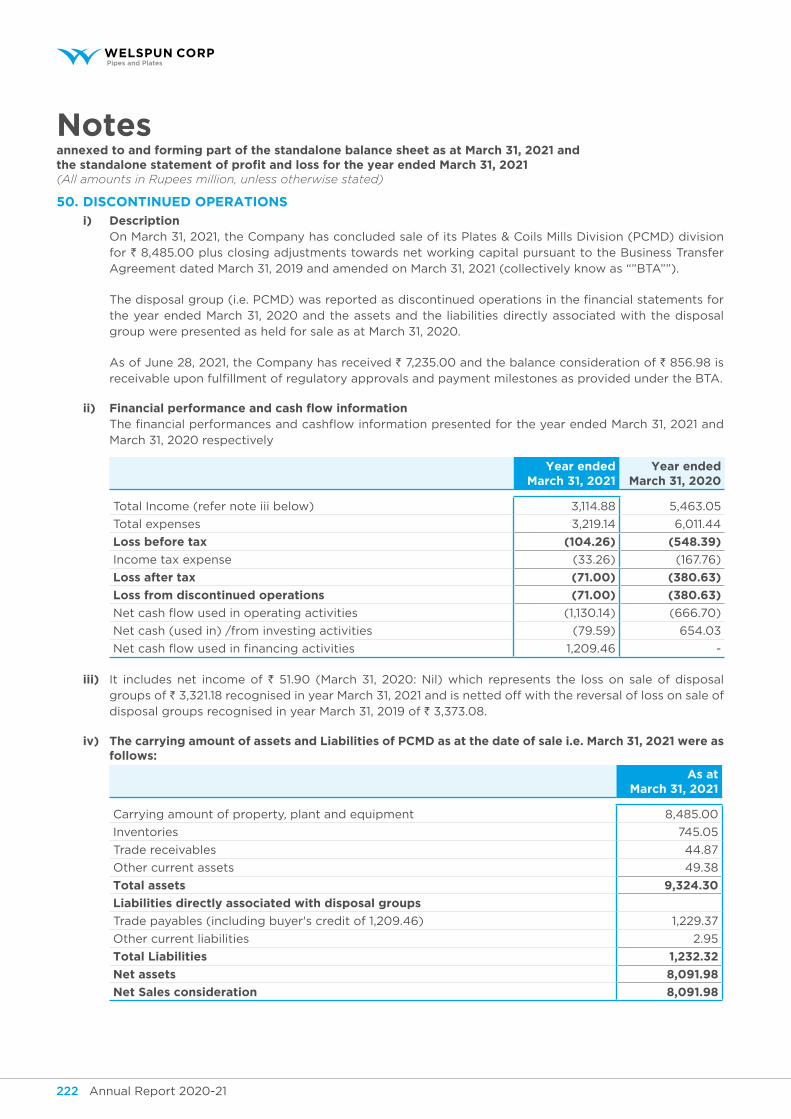
Annual Report 2020-21 223Annual Report 2020-21222
Notesannexed to and forming part of the standalone balance sheet as at March 31, 2021 andthe standalone statement of profit and loss for the year ended March 31, 2021(All amounts in Rupees million, unless otherwise stated)
50. disContinued oPeRAtions
i) description On March 31, 2021, the Company has concluded sale of its Plates & Coils Mills Division (PCMD) division
for ` 8,485.00 plus closing adjustments towards net working capital pursuant to the Business Transfer Agreement dated March 31, 2019 and amended on March 31, 2021 (collectively know as “”BTA””).
The disposal group (i.e. PCMD) was reported as discontinued operations in the financial statements for the year ended March 31, 2020 and the assets and the liabilities directly associated with the disposal group were presented as held for sale as at March 31, 2020.
As of June 28, 2021, the Company has received ` 7,235.00 and the balance consideration of ` 856.98 is receivable upon fulfillment of regulatory approvals and payment milestones as provided under the BTA.
ii) financial performance and cash flow information The financial performances and cashflow information presented for the year ended March 31, 2021 and
March 31, 2020 respectively
year ended March 31, 2021
year ended March 31, 2020
Total Income (refer note iii below) 3,114.88 5,463.05
Total expenses 3,219.14 6,011.44
loss before tax (104.26) (548.39)
Income tax expense (33.26) (167.76)
loss after tax (71.00) (380.63)
loss from discontinued operations (71.00) (380.63)
Net cash flow used in operating activities (1,130.14) (666.70)
Net cash (used in) /from investing activities (79.59) 654.03
Net cash flow used in financing activities 1,209.46 -
iii) It includes net income of ` 51.90 (March 31, 2020: Nil) which represents the loss on sale of disposal groups of ` 3,321.18 recognised in year March 31, 2021 and is netted off with the reversal of loss on sale of disposal groups recognised in year March 31, 2019 of ` 3,373.08.
iv) the carrying amount of assets and Liabilities of PCMd as at the date of sale i.e. March 31, 2021 were as follows:
As at March 31, 2021
Carrying amount of property, plant and equipment 8,485.00
Inventories 745.05
Trade receivables 44.87
Other current assets 49.38
total assets 9,324.30
liabilities directly associated with disposal groups
Trade payables (including buyer's credit of 1,209.46) 1,229.37
Other current liabilities 2.95
total liabilities 1,232.32
net assets 8,091.98
net sales consideration 8,091.98
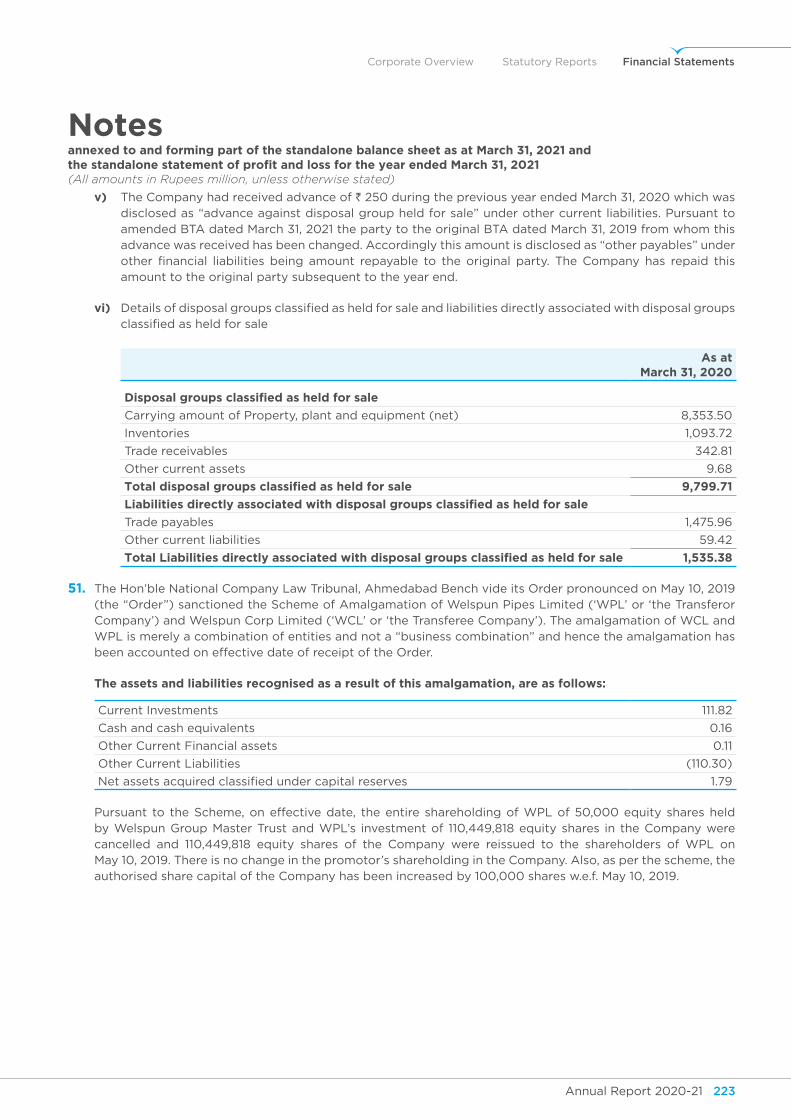
Annual Report 2020-21 223Annual Report 2020-21222
Corporate Overview Statutory Reports Financial Statements
Notesannexed to and forming part of the standalone balance sheet as at March 31, 2021 andthe standalone statement of profit and loss for the year ended March 31, 2021(All amounts in Rupees million, unless otherwise stated)
v) The Company had received advance of ` 250 during the previous year ended March 31, 2020 which was disclosed as “advance against disposal group held for sale” under other current liabilities. Pursuant to amended BTA dated March 31, 2021 the party to the original BTA dated March 31, 2019 from whom this advance was received has been changed. Accordingly this amount is disclosed as “other payables” under other financial liabilities being amount repayable to the original party. The Company has repaid this amount to the original party subsequent to the year end.
vi) Details of disposal groups classified as held for sale and liabilities directly associated with disposal groups classified as held for sale
As at March 31, 2020
disposal groups classified as held for sale
Carrying amount of Property, plant and equipment (net) 8,353.50
Inventories 1,093.72
Trade receivables 342.81
Other current assets 9.68
total disposal groups classified as held for sale 9,799.71
Liabilities directly associated with disposal groups classified as held for sale
Trade payables 1,475.96
Other current liabilities 59.42
total Liabilities directly associated with disposal groups classified as held for sale 1,535.38
51. The Hon’ble National Company Law Tribunal, Ahmedabad Bench vide its Order pronounced on May 10, 2019 (the “Order”) sanctioned the Scheme of Amalgamation of Welspun Pipes Limited (‘WPL’ or ‘the Transferor Company’) and Welspun Corp Limited (‘WCL’ or ‘the Transferee Company’). The amalgamation of WCL and WPL is merely a combination of entities and not a “business combination” and hence the amalgamation has been accounted on effective date of receipt of the Order.
the assets and liabilities recognised as a result of this amalgamation, are as follows:
Current Investments 111.82
Cash and cash equivalents 0.16
Other Current Financial assets 0.11
Other Current Liabilities (110.30)
Net assets acquired classified under capital reserves 1.79
Pursuant to the Scheme, on effective date, the entire shareholding of WPL of 50,000 equity shares held by Welspun Group Master Trust and WPL’s investment of 110,449,818 equity shares in the Company were cancelled and 110,449,818 equity shares of the Company were reissued to the shareholders of WPL on May 10, 2019. There is no change in the promotor’s shareholding in the Company. Also, as per the scheme, the authorised share capital of the Company has been increased by 100,000 shares w.e.f. May 10, 2019.
Annual Report 2020-21 225Annual Report 2020-21224
Notesannexed to and forming part of the standalone balance sheet as at March 31, 2021 andthe standalone statement of profit and loss for the year ended March 31, 2021(All amounts in Rupees million, unless otherwise stated)
52. AssessMent of iMPAiRMent of CARRying vALue of investMents And ReCoveRABiLity of loAns gIven to JoInt ventuRe.
Welspun Wasco Coatings Private Limited (“WWCPL” or “joint venture”) is engaged in providing coating services and other services having operating facility in India.
The Company had investment in equity shares of ` 254.65 (March 31, 2020: ` 254.65) of joint venture carried at cost, as at March 31, 2021. The Company had also granted loans to the joint venture with a carrying value of ` 247.01 (March 31, 2020: ` 247.01) carried at amortised cost, as at March 31, 2021.
Consequent to the negative net worth and continued losses of the joint venture, the Management had assessed the impairment of its investment in joint venture by reviewing the business forecasts of joint venture using discounted cash flow valuation model (the “model”) and noted that provision for impairment of ` 254.65 is required to be made in respect of the investment in joint venture in the year ended March 31, 2020.
The Management had assessed the recoverability of loans granted to joint venture based on expected credit loss model (“ECL”) and had recorded the impairment loss of ` 247.01 in the year ended March 31, 2020. Significant assumptions used in the model are discount rate and terminal growth rate. There is no changes in the impairment loss as at March 31, 2021.
53. ChAnges in ACCounting PoLiCies
indAs 116 This note explains the impact of the adoption of Ind AS 116 Leases on the Company’s financial statements.
As indicated in note 1(b), the Company had adopted Ind AS 116 retrospectively from April 01, 2019, using the modified approach at transition. Accordingly the Company had not restated comparatives for the year ended March 31, 2019, as permitted under as permitted under the specific transition provisions in the standard. The reclassifications and the adjustments arising from the new leasing rules are therefore recognised in the opening balance sheet on April 01, 2019.
On adoption of Ind AS 116, the Company recognised lease liabilities in relation to leases which had previously been classified as ‘operating leases’ under the principles of Ind AS 17 Leases after applying practical expedients for short-term leases and low value assets as detailed in (i) below. These liabilities were measured at the present value of the remaining lease payments, discounted using the lessee’s incremental borrowing rate as of April 01, 2019. The Weighted average lessee’s incremental borrowing rate applied to the lease liabilities on April 01, 2019 was 9.5%.
For leases previously classified as finance leases the entity recognised the carrying amount of the lease asset and lease liability immediately before transition as the carrying amount of the right of use asset and the lease liability respectively at the date of initial application. The measurement principles of Ind AS 116 are only applied after that date.
(i) practical expedients applied In applying Ind AS 116 for the first time, the Company has used the following practical expedients
permitted by the standard:
• applying a single discount rate to a portfolio of leases with reasonably similar characteristics
• relying on previous assessments on whether leases are onerous as an alternative to performing an impairment review-there were no onerous contracts as at April 01, 2019
• accounting for operating leases with a remaining lease term of less than 12 months as at April 01, 2019 as short-term leases
• excluding initial direct costs for the measurement of the right-of-use asset at the date of initial application, and
• using hindsight in determining the lease term where the contract contains options to extend or terminate the lease.
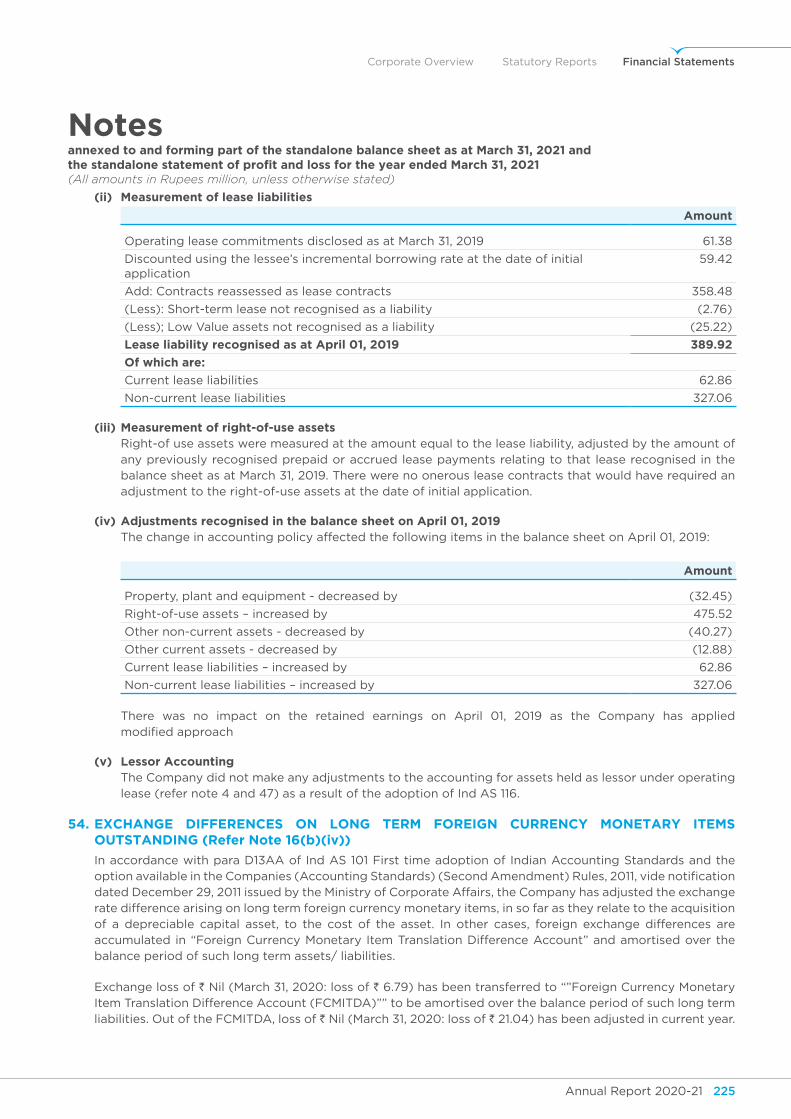
Annual Report 2020-21 225Annual Report 2020-21224
Corporate Overview Statutory Reports Financial Statements
Notesannexed to and forming part of the standalone balance sheet as at March 31, 2021 andthe standalone statement of profit and loss for the year ended March 31, 2021(All amounts in Rupees million, unless otherwise stated)
(ii) measurement of lease liabilities
Amount
Operating lease commitments disclosed as at March 31, 2019 61.38
Discounted using the lessee’s incremental borrowing rate at the date of initial application
59.42
Add: Contracts reassessed as lease contracts 358.48
(Less): Short-term lease not recognised as a liability (2.76)
(Less); Low Value assets not recognised as a liability (25.22)
Lease liability recognised as at April 01, 2019 389.92
of which are:
Current lease liabilities 62.86
Non-current lease liabilities 327.06
(iii) measurement of right-of-use assets Right-of use assets were measured at the amount equal to the lease liability, adjusted by the amount of
any previously recognised prepaid or accrued lease payments relating to that lease recognised in the balance sheet as at March 31, 2019. There were no onerous lease contracts that would have required an adjustment to the right-of-use assets at the date of initial application.
(iv) Adjustments recognised in the balance sheet on April 01, 2019 The change in accounting policy affected the following items in the balance sheet on April 01, 2019:
Amount
Property, plant and equipment - decreased by (32.45)
Right-of-use assets – increased by 475.52
Other non-current assets - decreased by (40.27)
Other current assets - decreased by (12.88)
Current lease liabilities – increased by 62.86
Non-current lease liabilities – increased by 327.06
There was no impact on the retained earnings on April 01, 2019 as the Company has applied modified approach
(v) lessor Accounting The Company did not make any adjustments to the accounting for assets held as lessor under operating
lease (refer note 4 and 47) as a result of the adoption of Ind AS 116.
54. exChAnge diffeRenCes on Long teRM foReign CuRRenCy MonetARy iteMs outstAndIng (Refer note 16(b)(iv))
In accordance with para D13AA of Ind AS 101 First time adoption of Indian Accounting Standards and the option available in the Companies (Accounting Standards) (Second Amendment) Rules, 2011, vide notification dated December 29, 2011 issued by the Ministry of Corporate Affairs, the Company has adjusted the exchange rate difference arising on long term foreign currency monetary items, in so far as they relate to the acquisition of a depreciable capital asset, to the cost of the asset. In other cases, foreign exchange differences are accumulated in “Foreign Currency Monetary Item Translation Difference Account” and amortised over the balance period of such long term assets/ liabilities.
Exchange loss of ` Nil (March 31, 2020: loss of ` 6.79) has been transferred to “”Foreign Currency Monetary Item Translation Difference Account (FCMITDA)”” to be amortised over the balance period of such long term liabilities. Out of the FCMITDA, loss of ` Nil (March 31, 2020: loss of ` 21.04) has been adjusted in current year.
Annual Report 2020-21 227Annual Report 2020-21226
Notesannexed to and forming part of the standalone balance sheet as at March 31, 2021 andthe standalone statement of profit and loss for the year ended March 31, 2021(All amounts in Rupees million, unless otherwise stated)
55. disCLosuRes PuRsuAnt to the ReguLAtion 34(3) ReAd With PARA A of sCheduLe v to seBi Listing ReguLAtions, 2015 (RefeR note 42)
As at March 31, 2021
As at March 31, 2020
maximum amount outstanding during the year
As at March 31, 2021
As at March 31, 2020
loans to joint venture and subsidiaries:
Welspun Wasco Coatings Private Limited (joint venture) (before provision for impairment)
247.01 247.01 247.01 354.11
Welspun DI Pipes Limited (subsidiary)
60.00 - 120.00 -
Welspun Metallics Limited (subsidiary)
- - 640.00 -
56. disCLosuRe PuRsuAnt to seCtion 186 of the CoMPAnies ACt, 2013 foR LoAns And guARAntees given (RefeR note 42):
nature of the transaction (loans and guarantees given)
purpose for which the loans and guarantees is given
year ended March 31, 2021
year ended March 31, 2020
i) loans given and outstanding as at year end (refer note 8(a)):
Welspun Wasco Coatings Private Limited (before impairment)
Working capital and project funding of joint venture
247.01 247.01
Welspun DI Pipes Limited Project funding of subsidiary 60.00 -
307.01 247.01
ii) guarantees (to the extent of outstanding loan/ acceptances/ export obligation to custom authority) refer note 46 (ii):
East Pipes Integrated Company for Industry (formerly known as Welspun Middle East Pipes Company)
Corporate guarantee given for joint venture's debt
2,518.90 10,173.41
Welspun Wasco Coatings Private Limited
Corporate guarantee given to custom authorities for joint venture
- 54.25
Welspun Pipes Inc. Corporate guarantee given for subsidiary's debt
1,827.75 1,891.63
Welspun Metallics Limited Corporate guarantee given for subsidiary's acceptances
81.46 -
Welspun DI Pipes Limited Corporate guarantee given for subsidiary's acceptances
23.39 -
4,451.50 12,119.29
57. The Code on Social Security, 2020 (‘Code’) relating to employee benefits during employment and post-employment benefits received Presidential assent in September 2020. The Code has been published in the Gazette of India. However, the date on which the Code will come into effect has not been notified. The Company is in process of evaluating the financial impact, if any.
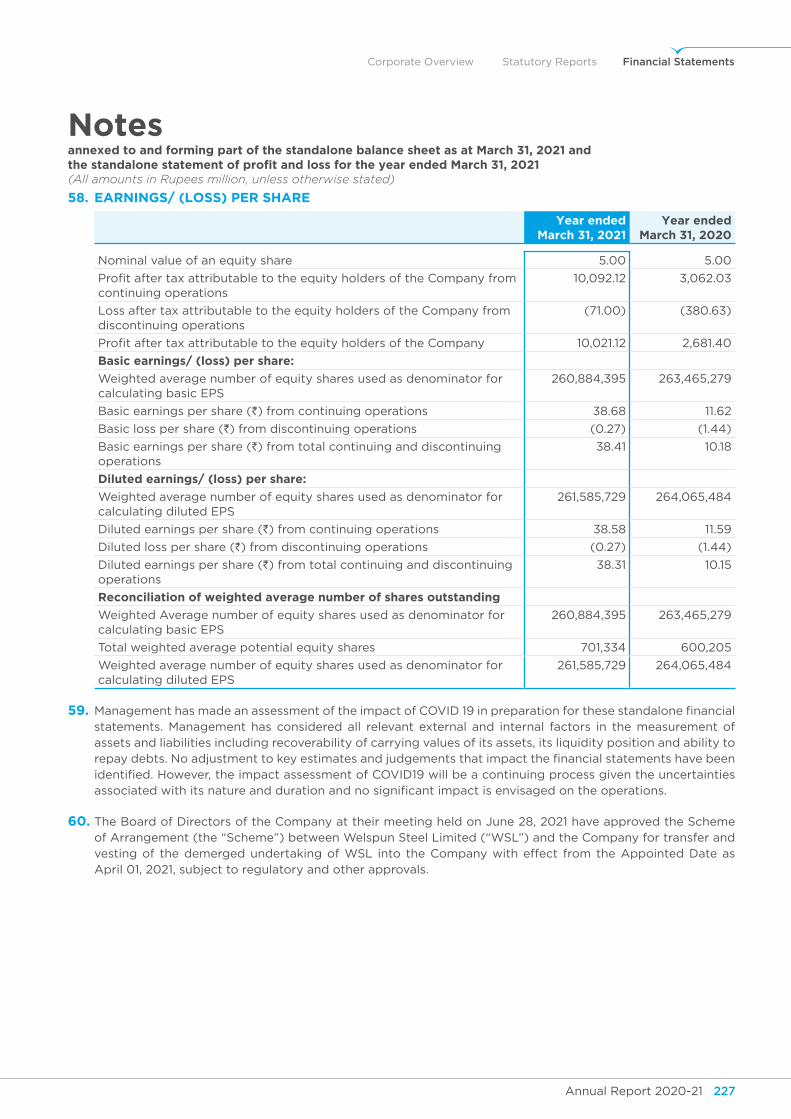
Annual Report 2020-21 227Annual Report 2020-21226
Corporate Overview Statutory Reports Financial Statements
Notesannexed to and forming part of the standalone balance sheet as at March 31, 2021 andthe standalone statement of profit and loss for the year ended March 31, 2021(All amounts in Rupees million, unless otherwise stated)
58. eARnings/ (Loss) PeR shARe
year ended March 31, 2021
year ended March 31, 2020
Nominal value of an equity share 5.00 5.00
Profit after tax attributable to the equity holders of the Company from continuing operations
10,092.12 3,062.03
Loss after tax attributable to the equity holders of the Company from discontinuing operations
(71.00) (380.63)
Profit after tax attributable to the equity holders of the Company 10,021.12 2,681.40
Basic earnings/ (loss) per share:
Weighted average number of equity shares used as denominator for calculating basic EPS
260,884,395 263,465,279
Basic earnings per share (`) from continuing operations 38.68 11.62
Basic loss per share (`) from discontinuing operations (0.27) (1.44)
Basic earnings per share (`) from total continuing and discontinuing operations
38.41 10.18
diluted earnings/ (loss) per share:
Weighted average number of equity shares used as denominator for calculating diluted EPS
261,585,729 264,065,484
Diluted earnings per share (`) from continuing operations 38.58 11.59
Diluted loss per share (`) from discontinuing operations (0.27) (1.44)
Diluted earnings per share (`) from total continuing and discontinuing operations
38.31 10.15
Reconciliation of weighted average number of shares outstanding
Weighted Average number of equity shares used as denominator for calculating basic EPS
260,884,395 263,465,279
Total weighted average potential equity shares 701,334 600,205
Weighted average number of equity shares used as denominator for calculating diluted EPS
261,585,729 264,065,484
59. Management has made an assessment of the impact of COVID 19 in preparation for these standalone financial statements. Management has considered all relevant external and internal factors in the measurement of assets and liabilities including recoverability of carrying values of its assets, its liquidity position and ability to repay debts. No adjustment to key estimates and judgements that impact the financial statements have been identified. However, the impact assessment of COVID19 will be a continuing process given the uncertainties associated with its nature and duration and no significant impact is envisaged on the operations.
60. The Board of Directors of the Company at their meeting held on June 28, 2021 have approved the Scheme of Arrangement (the “Scheme”) between Welspun Steel Limited (“WSL”) and the Company for transfer and vesting of the demerged undertaking of WSL into the Company with effect from the Appointed Date as April 01, 2021, subject to regulatory and other approvals.
Annual Report 2020-21 PBAnnual Report 2020-21228
Notesannexed to and forming part of the standalone balance sheet as at March 31, 2021 andthe standalone statement of profit and loss for the year ended March 31, 2021(All amounts in Rupees million, unless otherwise stated)
61. suBsequent events
The Company has issued debentures which were allotted in the month of February 2021, as on March 31, 2021, the execution of security documents and debenture trust deed were under finalization between the debenture holders, debenture trustee and the Company. The security documents have since been executed and registered with the sub-registrar and the Ministry of Corporate Affairs on May 14, 2021.
62. The figures for the previous year have been regrouped wherever necessary.
for price waterhouse chartered Accountants llp for and on behalf of BoardFirm Registration No: 012754N / N500016
B.K.goenka vipul mathurChairman Managing DirectorDIN No.00270175 and Chief Executive Officer
DIN - 07990476
neeraj sharma percy Birdy pradeep JoshiPartner Chief Financial Officer Company SecretaryMembership No.108391 FCS-4959
Place: Pune Place: MumbaiDate: June 28, 2021 Date: June 28, 2021
Annual Report 2020-21 229Annual Report 2020-21PB
Corporate Overview Statutory Reports Financial Statements
Independent Auditors’ Report
To the Members of Welspun Corp Limited
RepoRt on the AudIt of the consolIdAted fInAncIAl stAtements
opInIon
1. We have audited the accompanying consolidated financial statements of Welspun Corp Limited (hereinafter referred to as the ‘‘Holding Company”) and its subsidiaries (Holding Company and its subsidiaries together referred to as the “Group”) and its joint ventures; (refer note 51 to the attached consolidated financial statements), which comprise the consolidated balance sheet as at March 31, 2021, the consolidated statement of profit and loss (including other comprehensive income), the consolidated statement of changes in equity and the statement of consolidated cash flows for the year then ended, and notes to the consolidated financial statements, including a summary of significant accounting policies and other explanatory information prepared based on the relevant records. (hereinafter referred to as the “consolidated financial statements”).
2. In our opinion and to the best of our information and according to the explanations given to us, the aforesaid consolidated financial statements give the information required by the Companies Act, 2013 (the “Act”) in the manner so required and give a true and fair view in conformity with the accounting principles generally accepted in India, of the consolidated state of affairs of the Group and its joint ventures as at March 31, 2021, of consolidated total comprehensive income
(comprising of profit and other comprehensive income), consolidated changes in equity and its consolidated cash flows for the year then ended.
BAsIs foR opInIon
3. We conducted our audit in accordance with the Standards on Auditing (SAs) specified under section 143(10) of the Act. Our responsibilities under those Standards are further described in the Auditors’ responsibilities for the audit of the consolidated financial statements section of our report. We are independent of the Group and its joint ventures in accordance with the ethical requirements that are relevant to our audit of the consolidated financial statements in India in terms of the Code of Ethics issued by ICAI and the relevant provisions of the Act, and we have fulfilled our other ethical responsibilities in accordance with these requirements. We believe that the audit evidence we have obtained and the audit evidence obtained by the other auditors in terms of their reports referred to in sub-paragraph 14 and 15 of the other matters paragraph below, is sufficient and appropriate to provide a basis for our opinion.
Key AudIt mAtteRs
4. Key audit matters are those matters that, in our professional judgment, were of most significance in our audit of the consolidated financial statements of the current period. This matter was addressed in the context of our audit of the consolidated financial statements as a whole, and in forming our opinion thereon, and we do not provide a separate opinion on this matter.
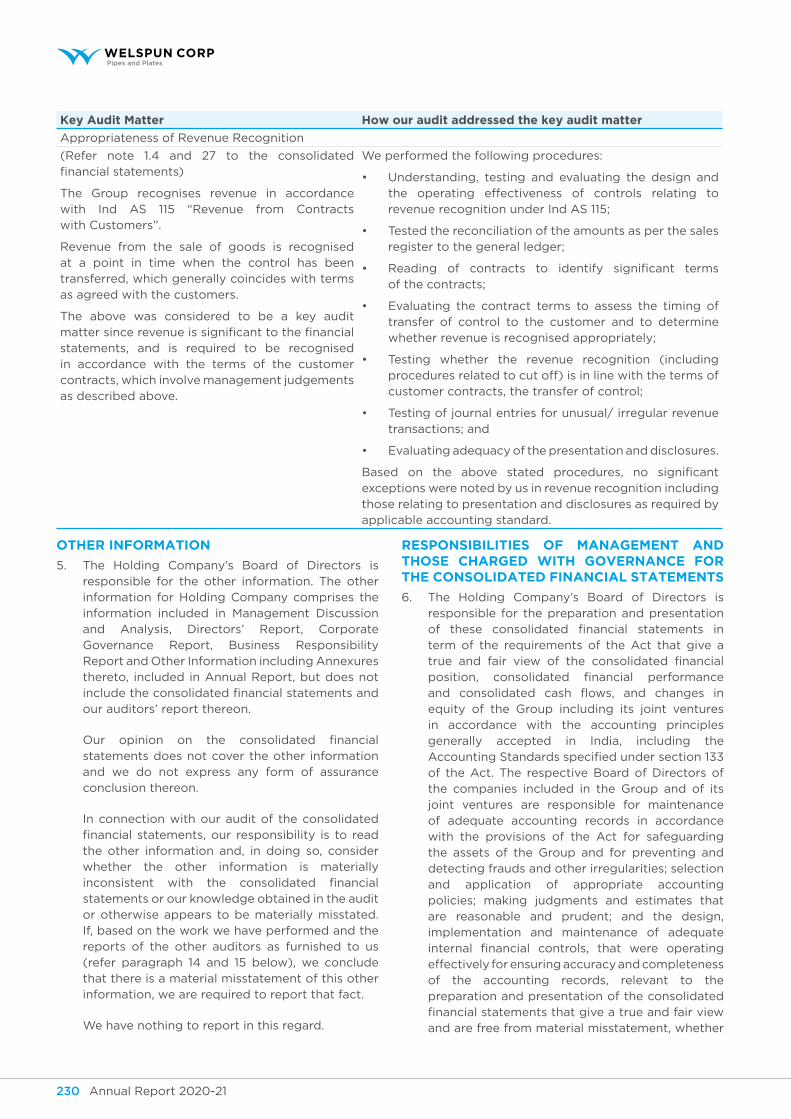
Annual Report 2020-21 231Annual Report 2020-21230
Key Audit matter how our audit addressed the key audit matter
Appropriateness of Revenue Recognition
(Refer note 1.4 and 27 to the consolidated financial statements)
The Group recognises revenue in accordance with Ind AS 115 “Revenue from Contracts with Customers”.
Revenue from the sale of goods is recognised at a point in time when the control has been transferred, which generally coincides with terms as agreed with the customers.
The above was considered to be a key audit matter since revenue is significant to the financial statements, and is required to be recognised in accordance with the terms of the customer contracts, which involve management judgements as described above.
We performed the following procedures:
• Understanding, testing and evaluating the design and the operating effectiveness of controls relating to revenue recognition under Ind AS 115;
• Tested the reconciliation of the amounts as per the sales register to the general ledger;
• Reading of contracts to identify significant terms of the contracts;
• Evaluating the contract terms to assess the timing of transfer of control to the customer and to determine whether revenue is recognised appropriately;
• Testing whether the revenue recognition (including procedures related to cut off) is in line with the terms of customer contracts, the transfer of control;
• Testing of journal entries for unusual/ irregular revenue transactions; and
• Evaluating adequacy of the presentation and disclosures.
Based on the above stated procedures, no significant exceptions were noted by us in revenue recognition including those relating to presentation and disclosures as required by applicable accounting standard.
otheR InfoRmAtIon
5. The Holding Company’s Board of Directors is responsible for the other information. The other information for Holding Company comprises the information included in Management Discussion and Analysis, Directors’ Report, Corporate Governance Report, Business Responsibility Report and Other Information including Annexures thereto, included in Annual Report, but does not include the consolidated financial statements and our auditors’ report thereon.
Our opinion on the consolidated financial statements does not cover the other information and we do not express any form of assurance conclusion thereon.
In connection with our audit of the consolidated financial statements, our responsibility is to read the other information and, in doing so, consider whether the other information is materially inconsistent with the consolidated financial statements or our knowledge obtained in the audit or otherwise appears to be materially misstated. If, based on the work we have performed and the reports of the other auditors as furnished to us (refer paragraph 14 and 15 below), we conclude that there is a material misstatement of this other information, we are required to report that fact.
We have nothing to report in this regard.
ResponsIBIlItIes of mAnAgement And those chARged wIth goveRnAnce foR the consolIdAted fInAncIAl stAtements
6. The Holding Company’s Board of Directors is responsible for the preparation and presentation of these consolidated financial statements in term of the requirements of the Act that give a true and fair view of the consolidated financial position, consolidated financial performance and consolidated cash flows, and changes in equity of the Group including its joint ventures in accordance with the accounting principles generally accepted in India, including the Accounting Standards specified under section 133 of the Act. The respective Board of Directors of the companies included in the Group and of its joint ventures are responsible for maintenance of adequate accounting records in accordance with the provisions of the Act for safeguarding the assets of the Group and for preventing and detecting frauds and other irregularities; selection and application of appropriate accounting policies; making judgments and estimates that are reasonable and prudent; and the design, implementation and maintenance of adequate internal financial controls, that were operating effectively for ensuring accuracy and completeness of the accounting records, relevant to the preparation and presentation of the consolidated financial statements that give a true and fair view and are free from material misstatement, whether
Annual Report 2020-21 231Annual Report 2020-21230
Corporate Overview Statutory Reports Financial Statements
due to fraud or error, which have been used for the purpose of preparation of the consolidated financial statements by the Directors of the Holding Company, as aforesaid.
7. In preparing the consolidated financial statements, the respective Board of Directors of the companies included in the Group and of its joint ventures are responsible for assessing the ability of the Group and of its joint ventures to continue as a going concern, disclosing, as applicable, matters related to going concern and using the going concern basis of accounting unless management either intends to liquidate the Group and its joint ventures or to cease operations, or has no realistic alternative but to do so.
8. The respective Board of Directors of the companies included in the Group and its joint ventures are responsible for overseeing the financial reporting process of the Group and of its joint ventures.
AudItoRs’ ResponsIBIlItIes foR the AudIt of the consolIdAted fInAncIAl stAtements
9. Our objectives are to obtain reasonable assurance about whether the consolidated financial statements as a whole are free from material misstatement, whether due to fraud or error, and to issue an auditors’ report that includes our opinion. Reasonable assurance is a high level of assurance, but is not a guarantee that an audit conducted in accordance with SAs will always detect a material misstatement when it exists. Misstatements can arise from fraud or error and are considered material if, individually or in the aggregate, they could reasonably be expected to influence the economic decisions of users taken on the basis of these consolidated financial statements.
10. As part of an audit in accordance with SAs, we exercise professional judgment and maintain professional skepticism throughout the audit. We also:
• Identify and assess the risks of material misstatement of the consolidated financial statements, whether due to fraud or error, design and perform audit procedures responsive to those risks, and obtain audit evidence that is sufficient and appropriate to provide a basis for our opinion. The risk of not detecting a material misstatement resulting from fraud is higher than for one resulting from error, as fraud may involve collusion, forgery, intentional omissions, misrepresentations, or the override of internal control.
• Obtain an understanding of internal control relevant to the audit in order to design audit procedures that are appropriate in the circumstances. Under section 143(3)(i) of the Act, we are also responsible for expressing our opinion on whether the Holding Company has adequate internal financial controls with reference to financial statements in place and the operating effectiveness of such controls.
• Evaluate the appropriateness of accounting policies used and the reasonableness of accounting estimates and related disclosures made by management.
• Conclude on the appropriateness of management’s use of the going concern basis of accounting and, based on the audit evidence obtained, whether a material uncertainty exists related to events or conditions that may cast significant doubt on the ability of the Group and its joint ventures to continue as a going concern. If we conclude that a material uncertainty exists, we are required to draw attention in our auditors’ report to the related disclosures in the consolidated financial statements or, if such disclosures are inadequate, to modify our opinion. Our conclusions are based on the audit evidence obtained up to the date of our auditors’ report. However, future events or conditions may cause the Group and its joint ventures to cease to continue as a going concern.
• Evaluate the overall presentation, structure and content of the consolidated financial statements, including the disclosures, and whether the consolidated financial statements represent the underlying transactions and events in a manner that achieves fair presentation.
• Obtain sufficient appropriate audit evidence regarding the financial information of the entities or business activities within the Group and its joint ventures to express an opinion on the consolidated financial statements. We are responsible for the direction, supervision and performance of the audit of the financial statements of such entities included in the consolidated financial statements of which we are the independent auditors. For the other entities included in the consolidated financial statements, which have been audited by other auditors, such other auditors remain responsible for the direction, supervision and performance of the audits carried out
Annual Report 2020-21 233Annual Report 2020-21232
by them. We remain solely responsible for our audit opinion.
11. We communicate with those charged with governance of the Holding Company and such other entities included in the consolidated financial statements of which we are the independent auditors regarding, among other matters, the planned scope and timing of the audit and significant audit findings, including any significant deficiencies in internal control that we identify during our audit.
12. We also provide those charged with governance with a statement that we have complied with relevant ethical requirements regarding independence, and to communicate with them all relationships and other matters that may reasonably be thought to bear on our independence, and where applicable, related safeguards.
13. From the matters communicated with those charged with governance, we determine those matters that were of most significance in the audit of the consolidated financial statements of the current period and are therefore the key audit matters. We describe these matters in our auditors’ report unless law or regulation precludes public disclosure about the matter or when, in extremely rare circumstances, we determine that a matter should not be communicated in our report because the adverse consequences of doing so would reasonably be expected to outweigh the public interest benefits of such communication.
otheR mAtteRs
14. The consolidated financial information include the Group’s share of total comprehensive income (comprising of profit and other comprehensive income) of ` 1,339.14 million for the year ended March 31, 2021 as considered in the consolidated financial statements, in respect of 2 joint ventures located outside India whose financial information have not been audited by us. These financial information have been audited by other auditors whose reports have been furnished to us by the other auditors, and our opinion on the consolidated financial statements insofar as it relates to the amounts and disclosures included in respect of these joint ventures and our report in terms of sub-section (3) of Section 143 of the Act including report on other information insofar as it relates to the aforesaid joint ventures, is based solely on the reports of the other auditors.
15. The financial statements of 1 subsidiary located outside India, as included in the consolidated financial statements, which constitute total assets
of ` 2,469.00 million and net assets of ` 276.44 million as at March 31, 2021, total revenue of ` Nil, total comprehensive income (comprising of loss and other comprehensive income) of ` 109.90 million and net cash inflows amounting to ` 11.00 million for the year then ended, have been prepared in accordance with accounting principles generally accepted in its respective country and have been audited by other auditors under generally accepted auditing standards applicable in its respective country. The Holding Company’s management has converted the financial statements of such subsidiary located outside India from the accounting principles generally accepted in its respective country to the accounting principles generally accepted in India. We have audited these conversion adjustments made by the Holding Company’s management. Our opinion in so far as it relates to the balances and affairs of such subsidiary located outside India, including other information, is based on the report of other auditor and the conversion adjustments prepared by the management of the Holding Company and audited by us.
Our opinion on the consolidated financial statements, and our report on other legal and regulatory requirements below, is not modified in respect of the above matters with respect to our reliance on the work done and the reports of the other auditors and the financial statements certified by the Management.
16. As required by Section 143(3) of the Act, we report, to the extent applicable, that:
(a) We have sought and obtained all the information and explanations which to the best of our knowledge and belief were necessary for the purposes of our audit of the aforesaid consolidated financial statements.
(b) In our opinion, proper books of account as required by law relating to preparation of the aforesaid consolidated financial statements have been kept so far as it appears from our examination of those books and the reports of the other auditors.
(c) The Consolidated Balance Sheet, the Consolidated Statement of Profit and Loss (including other comprehensive income), Consolidated Statement of Changes in Equity and the Statement of Consolidated Cash Flows dealt with by this report are in agreement with the relevant books of account and records maintained for the purpose of preparation of the consolidated financial statements.
Annual Report 2020-21 233Annual Report 2020-21232
Corporate Overview Statutory Reports Financial Statements
(d) In our opinion, the aforesaid consolidated financial statements comply with the Accounting Standards specified under Section 133 of the Act.
(e) On the basis of the written representations received from the directors of the Holding Company subsequent to March 31, 2021 taken on record by the Board of Directors of the Holding Company and the reports of the statutory auditors of its subsidiaries and joint venture which are companies incorporated in India, none of the directors of the Holding Company, its subsidiaries and joint venture which are companies incorporated in India is disqualified as on March 31, 2021 from being appointed as a director in terms of Section 164(2) of the Act.
(f) With respect to the adequacy of internal financial controls with reference to financial statements of the Holding Company, its subsidiaries and joint venture, which are companies incorporated in India, and the operating effectiveness of such controls, refer to our separate report in Annexure A.
(g) With respect to the other matters to be included in the Auditors’ Report in accordance with Rule 11 of the Companies (Audit and Auditor’s) Rules, 2014, in our opinion and to the best of our information and according to the explanations given to us:
i. The consolidated financial statements disclose the impact, if any, of pending litigations on the consolidated financial position of the Group and its joint ventures– Refer Note 45 to the consolidated financial statements.
ii. The Group and its joint ventures had long-term contracts as at March 31, 2021,
as applicable, for which there were no material foreseeable losses. The Group and its joint ventures did not have any long-term derivative contracts as at March 31, 2021.
iii. There has been no delay in transferring amounts, required to be transferred, to the Investor Education and Protection Fund by the Holding Company. There were no amounts which were required to be transferred to the Investor Education and Protection Fund by the subsidiaries and joint venture, which are companies incorporated in India, during the year ended March 31, 2021.
iv. The reporting on disclosures relating to Specified Bank Notes is not applicable to the Holding Company, its subsidiaries and joint venture, which are companies incorporated in India for the year ended March 31, 2021.
17. The Holding Company has provided for managerial remuneration in accordance with the requisite approvals mandated by the provisions of Section 197 read with Schedule V to the Act. The subsidiaries and joint venture which are companies incorporated in India, has not paid/ provided for managerial remuneration. Accordingly, the provisions of Clause 3(xi) of the Order are not applicable to the subsidiaries and joint venture which are companies incorporated in India.
for price waterhouse chartered Accountants llpFirm Registration Number: 012754N/N500016
Place: PuneDate: June 28, 2021
neeraj sharmaPartner
Membership Number: 108391UDIN: 21108391AAAAEG6454
Annual Report 2020-21 235Annual Report 2020-21234
Annexure A to Independent Auditors’ ReportReferred to in paragraph 16(f) of the Independent auditors’ report of even date to the members of welspun Corp Limited on the consolidated financial statements for the year ended March 31, 2021
RepoRt on the InteRnAl fInAncIAl contRols wIth RefeRence to fInAncIAl stAtements undeR clAuse (i) of sub section 3 of seCtion 143 of the ACt
1. In conjunction with our audit of the consolidated financial statements of the Holding Company as of and for the year ended March 31, 2021, we have audited the internal financial controls with reference to financial statements of Welspun Corp Limited (hereinafter referred to as the “Holding Company”) and its subsidiaries and joint venture, which are companies incorporated in India, as of that date.
mAnAgement’s ResponsIBIlIty foR InteRnAl fInAncIAl contRols
2. The respective Board of Directors of the Holding Company, its subsidiaries and its joint venture, which are companies incorporated in India, are responsible for establishing and maintaining internal financial controls based on internal control over financial reporting criteria established by the Holding Company considering the essential components of internal control stated in the Guidance Note on Audit of Internal Financial Controls Over Financial Reporting issued by the Institute of Chartered Accountants of India (ICAI)”. These responsibilities include the design, implementation and maintenance of adequate internal financial controls that were operating effectively for ensuring the orderly and efficient conduct of its business, including adherence to the respective company’s policies, the safeguarding of its assets, the prevention and detection of frauds and errors, the accuracy and completeness of the accounting records, and the timely preparation of reliable financial information, as required under the Act.
AudItoRs’ ResponsIBIlIty
3. Our responsibility is to express an opinion on the Holding Company’s internal financial controls with reference to financial statements based on our audit. We conducted our audit in accordance with the Guidance Note on Audit of Internal Financial Controls Over Financial Reporting (the “Guidance Note”) issued by the ICAI and the Standards on Auditing deemed to be prescribed under section 143(10) of the Companies Act, 2013, to the extent applicable to an audit of internal financial controls, both applicable to an audit of internal financial controls and both issued by the ICAI.
Those Standards and the Guidance Note require that we comply with ethical requirements and plan and perform the audit to obtain reasonable assurance about whether adequate internal financial controls with reference to financial statements was established and maintained and if such controls operated effectively in all material respects.
4. Our audit involves performing procedures to obtain audit evidence about the adequacy of the internal financial controls system with reference to financial statements and their operating effectiveness. Our audit of internal financial controls with reference to financial statements included obtaining an understanding of internal financial controls with reference to financial statements, assessing the risk that a material weakness exists, and testing and evaluating the design and operating effectiveness of internal control based on the assessed risk. The procedures selected depend on the auditors’ judgement, including the assessment of the risks of material misstatement of the financial statements, whether due to fraud or error.
5. We believe that the audit evidence we have obtained is sufficient and appropriate to provide a basis for our audit opinion on the Holding Company’s internal financial controls system with reference to financial statements.
meAnIng of InteRnAl fInAncIAl contRols wIth RefeRence to fInAncIAl stAtements
6. A company’s internal financial control with reference to financial statements is a process designed to provide reasonable assurance regarding the reliability of financial reporting and the preparation of financial statements for external purposes in accordance with generally accepted accounting principles. A company’s internal financial control with reference to financial statements includes those policies and procedures that (1) pertain to the maintenance of records that, in reasonable detail, accurately and fairly reflect the transactions and dispositions of the assets of the company; (2) provide reasonable assurance that transactions are recorded as necessary to permit preparation of consolidated financial statements in accordance with generally accepted accounting principles, and that receipts and expenditures of the company are being made only in accordance with authorisations of management
Annual Report 2020-21 235Annual Report 2020-21234
Corporate Overview Statutory Reports Financial Statements
and directors of the company; and (3) provide reasonable assurance regarding prevention or timely detection of unauthorised acquisition, use, or disposition of the company’s assets that could have a material effect on the consolidated financial statements.
InheRent lImItAtIons of InteRnAl fInAncIAl contRols wIth RefeRence to fInAncIAl stAtements
7. Because of the inherent limitations of internal financial controls with reference to financial statements, including the possibility of collusion or improper management override of controls, material misstatements due to error or fraud may occur and not be detected. Also, projections of any evaluation of the internal financial controls with reference to financial statements to future periods are subject to the risk that the internal financial control with reference to financial statements may become inadequate because of changes in conditions, or that the degree of compliance with the policies or procedures may deteriorate.
opInIon
8. In our opinion, the Holding Company, its subsidiaries and its joint venture, which are companies incorporated in India, have, in all material respects, an adequate internal financial controls system with reference to financial statements and such internal financial controls with reference to financial statements were operating effectively as at March 31, 2021, based on the internal control over financial reporting criteria established by the Holding Company considering the essential components of internal control stated in the Guidance Note on Audit of Internal Financial Controls Over Financial Reporting issued by the Institute of Chartered Accountants of India.
for price waterhouse chartered Accountants llpFirm Registration Number: 012754N/N500016
Place: PuneDate: June 28, 2021
neeraj sharmaPartner
Membership Number: 108391 UDIN: 21108391AAAAEG6454
Annexure A to Independent Auditors’ ReportReferred to in paragraph 16(f) of the Independent auditors’ report of even date to the members of welspun Corp Limited on the consolidated financial statements for the year ended March 31, 2021
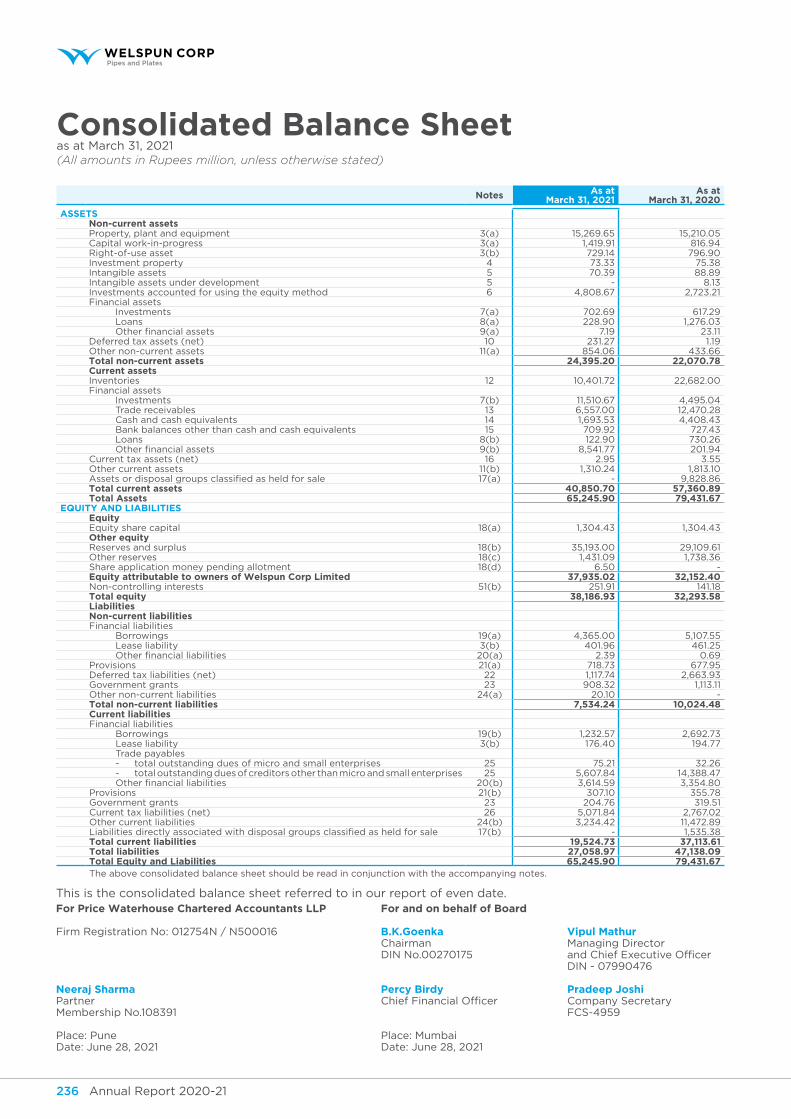
Annual Report 2020-21 237Annual Report 2020-21236
This is the consolidated balance sheet referred to in our report of even date.for price waterhouse chartered Accountants llp for and on behalf of Board
Firm Registration No: 012754N / N500016 B.K.goenka vipul mathurChairman Managing DirectorDIN No.00270175 and Chief Executive Officer
DIN - 07990476
neeraj sharma percy Birdy pradeep JoshiPartner Chief Financial Officer Company SecretaryMembership No.108391 FCS-4959
Place: Pune Place: MumbaiDate: June 28, 2021 Date: June 28, 2021
consolidated Balance sheetas at March 31, 2021(All amounts in Rupees million, unless otherwise stated)
notes As atMarch 31, 2021
As atMarch 31, 2020
Assetsnon-current assetsProperty, plant and equipment 3(a) 15,269.65 15,210.05 Capital work-in-progress 3(a) 1,419.91 816.94 Right-of-use asset 3(b) 729.14 796.90 Investment property 4 73.33 75.38 Intangible assets 5 70.39 88.89 Intangible assets under development 5 - 8.13 Investments accounted for using the equity method 6 4,808.67 2,723.21 Financial assets Investments 7(a) 702.69 617.29 Loans 8(a) 228.90 1,276.03 Other financial assets 9(a) 7.19 23.11 Deferred tax assets (net) 10 231.27 1.19 Other non-current assets 11(a) 854.06 433.66 total non-current assets 24,395.20 22,070.78 current assetsInventories 12 10,401.72 22,682.00 Financial assets Investments 7(b) 11,510.67 4,495.04 Trade receivables 13 6,557.00 12,470.28 Cash and cash equivalents 14 1,693.53 4,408.43 Bank balances other than cash and cash equivalents 15 709.92 727.43 Loans 8(b) 122.90 730.26 Other financial assets 9(b) 8,541.77 201.94 Current tax assets (net) 16 2.95 3.55 Other current assets 11(b) 1,310.24 1,813.10 Assets or disposal groups classified as held for sale 17(a) - 9,828.86 total current assets 40,850.70 57,360.89 total Assets 65,245.90 79,431.67
eQuIty And lIABIlItIesequityEquity share capital 18(a) 1,304.43 1,304.43 other equityReserves and surplus 18(b) 35,193.00 29,109.61 Other reserves 18(c) 1,431.09 1,738.36 Share application money pending allotment 18(d) 6.50 - equity attributable to owners of welspun corp limited 37,935.02 32,152.40 Non-controlling interests 51(b) 251.91 141.18 total equity 38,186.93 32,293.58 liabilitiesnon-current liabilitiesFinancial liabilities Borrowings 19(a) 4,365.00 5,107.55 Lease liability 3(b) 401.96 461.25 Other financial liabilities 20(a) 2.39 0.69 Provisions 21(a) 718.73 677.95 Deferred tax liabilities (net) 22 1,117.74 2,663.93 Government grants 23 908.32 1,113.11 Other non-current liabilities 24(a) 20.10 - total non-current liabilities 7,534.24 10,024.48 current liabilitiesFinancial liabilities Borrowings 19(b) 1,232.57 2,692.73 Lease liability 3(b) 176.40 194.77 Trade payables - total outstanding dues of micro and small enterprises 25 75.21 32.26 - total outstanding dues of creditors other than micro and small enterprises 25 5,607.84 14,388.47 Other financial liabilities 20(b) 3,614.59 3,354.80 Provisions 21(b) 307.10 355.78 Government grants 23 204.76 319.51 Current tax liabilities (net) 26 5,071.84 2,767.02 Other current liabilities 24(b) 3,234.42 11,472.89 Liabilities directly associated with disposal groups classified as held for sale 17(b) - 1,535.38 total current liabilities 19,524.73 37,113.61 total liabilities 27,058.97 47,138.09 total equity and liabilities 65,245.90 79,431.67 The above consolidated balance sheet should be read in conjunction with the accompanying notes.
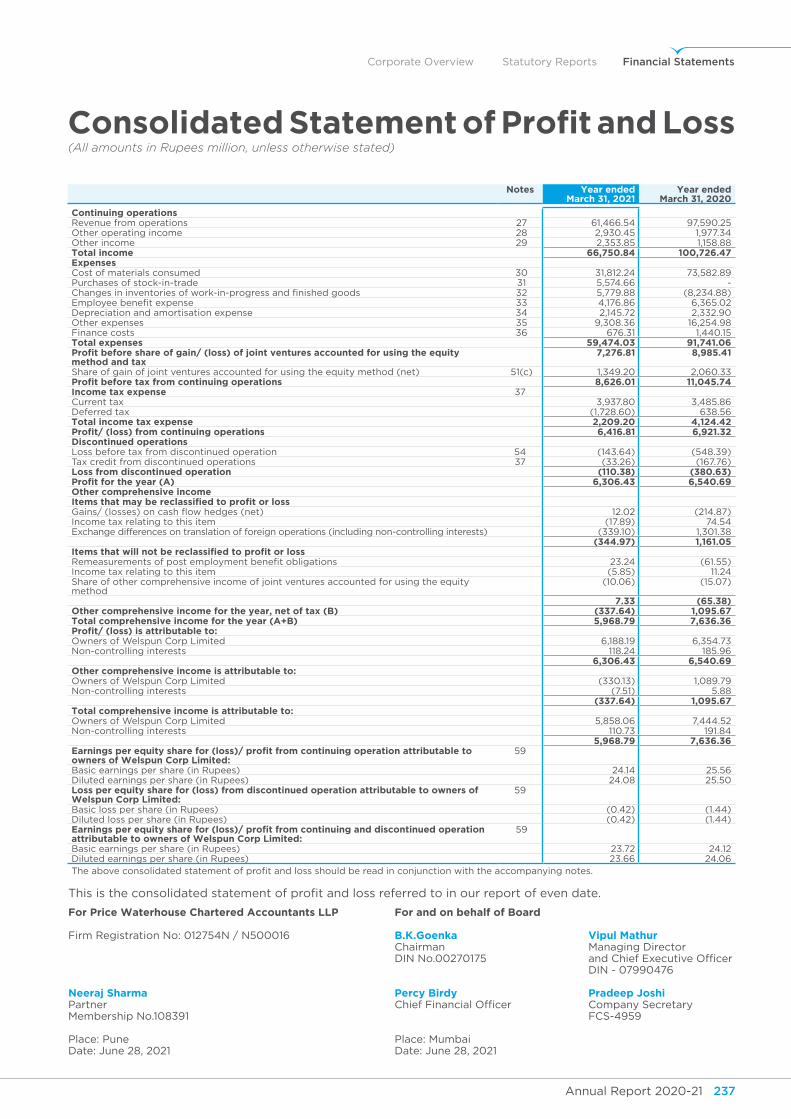
Annual Report 2020-21 237Annual Report 2020-21236
Corporate Overview Statutory Reports Financial Statements
Consolidated statement of Profit and Loss(All amounts in Rupees million, unless otherwise stated)
notes year ended March 31, 2021
year ended March 31, 2020
continuing operationsRevenue from operations 27 61,466.54 97,590.25 Other operating income 28 2,930.45 1,977.34 Other income 29 2,353.85 1,158.88 total income 66,750.84 100,726.47 expensesCost of materials consumed 30 31,812.24 73,582.89 Purchases of stock-in-trade 31 5,574.66 - Changes in inventories of work-in-progress and finished goods 32 5,779.88 (8,234.88)Employee benefit expense 33 4,176.86 6,365.02 Depreciation and amortisation expense 34 2,145.72 2,332.90 Other expenses 35 9,308.36 16,254.98 Finance costs 36 676.31 1,440.15 total expenses 59,474.03 91,741.06 Profit before share of gain/ (loss) of joint ventures accounted for using the equity method and tax
7,276.81 8,985.41
Share of gain of joint ventures accounted for using the equity method (net) 51(c) 1,349.20 2,060.33 Profit before tax from continuing operations 8,626.01 11,045.74 Income tax expense 37Current tax 3,937.80 3,485.86 Deferred tax (1,728.60) 638.56 total income tax expense 2,209.20 4,124.42 Profit/ (loss) from continuing operations 6,416.81 6,921.32 discontinued operationsLoss before tax from discontinued operation 54 (143.64) (548.39)Tax credit from discontinued operations 37 (33.26) (167.76)loss from discontinued operation (110.38) (380.63)Profit for the year (A) 6,306.43 6,540.69 other comprehensive incomeitems that may be reclassified to profit or lossGains/ (losses) on cash flow hedges (net) 12.02 (214.87)Income tax relating to this item (17.89) 74.54 Exchange differences on translation of foreign operations (including non-controlling interests) (339.10) 1,301.38
(344.97) 1,161.05 items that will not be reclassified to profit or lossRemeasurements of post employment benefit obligations 23.24 (61.55)Income tax relating to this item (5.85) 11.24 Share of other comprehensive income of joint ventures accounted for using the equity method
(10.06) (15.07)
7.33 (65.38)other comprehensive income for the year, net of tax (B) (337.64) 1,095.67 total comprehensive income for the year (A+B) 5,968.79 7,636.36 Profit/ (loss) is attributable to:Owners of Welspun Corp Limited 6,188.19 6,354.73 Non-controlling interests 118.24 185.96
6,306.43 6,540.69 other comprehensive income is attributable to:Owners of Welspun Corp Limited (330.13) 1,089.79 Non-controlling interests (7.51) 5.88
(337.64) 1,095.67 total comprehensive income is attributable to:Owners of Welspun Corp Limited 5,858.06 7,444.52 Non-controlling interests 110.73 191.84
5,968.79 7,636.36 earnings per equity share for (loss)/ profit from continuing operation attributable to owners of Welspun Corp Limited:
59
Basic earnings per share (in Rupees) 24.14 25.56 Diluted earnings per share (in Rupees) 24.08 25.50 loss per equity share for (loss) from discontinued operation attributable to owners of Welspun Corp Limited:
59
Basic loss per share (in Rupees) (0.42) (1.44)Diluted loss per share (in Rupees) (0.42) (1.44)earnings per equity share for (loss)/ profit from continuing and discontinued operation attributable to owners of Welspun Corp Limited:
59
Basic earnings per share (in Rupees) 23.72 24.12 Diluted earnings per share (in Rupees) 23.66 24.06 The above consolidated statement of profit and loss should be read in conjunction with the accompanying notes.
This is the consolidated statement of profit and loss referred to in our report of even date.
for price waterhouse chartered Accountants llp for and on behalf of Board
Firm Registration No: 012754N / N500016 B.K.goenka vipul mathurChairman Managing DirectorDIN No.00270175 and Chief Executive Officer
DIN - 07990476
neeraj sharma percy Birdy pradeep JoshiPartner Chief Financial Officer Company SecretaryMembership No.108391 FCS-4959
Place: Pune Place: MumbaiDate: June 28, 2021 Date: June 28, 2021
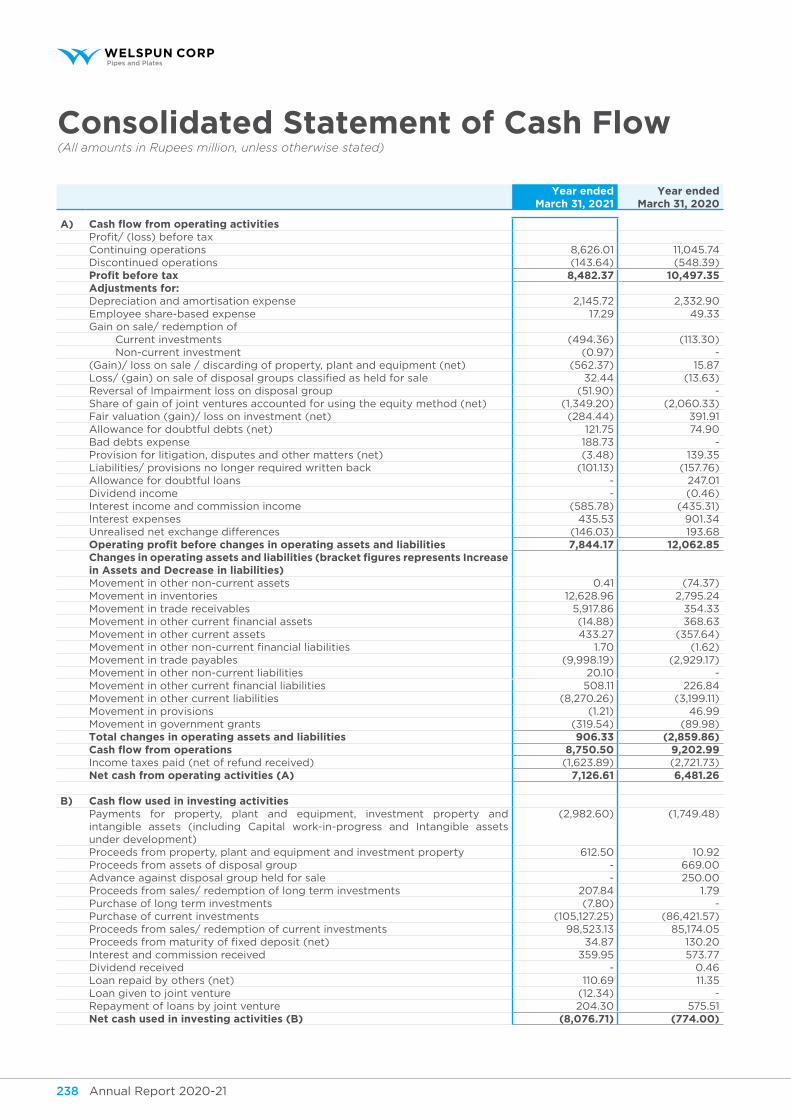
Annual Report 2020-21 239Annual Report 2020-21238
year ended March 31, 2021
year ended March 31, 2020
A) Cash flow from operating activitiesProfit/ (loss) before taxContinuing operations 8,626.01 11,045.74 Discontinued operations (143.64) (548.39)Profit before tax 8,482.37 10,497.35 Adjustments for:Depreciation and amortisation expense 2,145.72 2,332.90 Employee share-based expense 17.29 49.33 Gain on sale/ redemption of Current investments (494.36) (113.30) Non-current investment (0.97) - (Gain)/ loss on sale / discarding of property, plant and equipment (net) (562.37) 15.87 Loss/ (gain) on sale of disposal groups classified as held for sale 32.44 (13.63)Reversal of Impairment loss on disposal group (51.90) - Share of gain of joint ventures accounted for using the equity method (net) (1,349.20) (2,060.33)Fair valuation (gain)/ loss on investment (net) (284.44) 391.91 Allowance for doubtful debts (net) 121.75 74.90 Bad debts expense 188.73 - Provision for litigation, disputes and other matters (net) (3.48) 139.35 Liabilities/ provisions no longer required written back (101.13) (157.76)Allowance for doubtful loans - 247.01 Dividend income - (0.46)Interest income and commission income (585.78) (435.31)Interest expenses 435.53 901.34 Unrealised net exchange differences (146.03) 193.68 operating profit before changes in operating assets and liabilities 7,844.17 12,062.85 Changes in operating assets and liabilities (bracket figures represents increase in Assets and decrease in liabilities)Movement in other non-current assets 0.41 (74.37)Movement in inventories 12,628.96 2,795.24 Movement in trade receivables 5,917.86 354.33 Movement in other current financial assets (14.88) 368.63 Movement in other current assets 433.27 (357.64)Movement in other non-current financial liabilities 1.70 (1.62)Movement in trade payables (9,998.19) (2,929.17)Movement in other non-current liabilities 20.10 - Movement in other current financial liabilities 508.11 226.84 Movement in other current liabilities (8,270.26) (3,199.11)Movement in provisions (1.21) 46.99 Movement in government grants (319.54) (89.98)total changes in operating assets and liabilities 906.33 (2,859.86)Cash flow from operations 8,750.50 9,202.99 Income taxes paid (net of refund received) (1,623.89) (2,721.73)net cash from operating activities (A) 7,126.61 6,481.26
B) Cash flow used in investing activitiesPayments for property, plant and equipment, investment property and intangible assets (including Capital work-in-progress and Intangible assets under development)
(2,982.60) (1,749.48)
Proceeds from property, plant and equipment and investment property 612.50 10.92 Proceeds from assets of disposal group - 669.00 Advance against disposal group held for sale - 250.00 Proceeds from sales/ redemption of long term investments 207.84 1.79 Purchase of long term investments (7.80) - Purchase of current investments (105,127.25) (86,421.57)Proceeds from sales/ redemption of current investments 98,523.13 85,174.05 Proceeds from maturity of fixed deposit (net) 34.87 130.20 Interest and commission received 359.95 573.77 Dividend received - 0.46 Loan repaid by others (net) 110.69 11.35 Loan given to joint venture (12.34) - Repayment of loans by joint venture 204.30 575.51 net cash used in investing activities (B) (8,076.71) (774.00)
consolidated statement of cash flow(All amounts in Rupees million, unless otherwise stated)
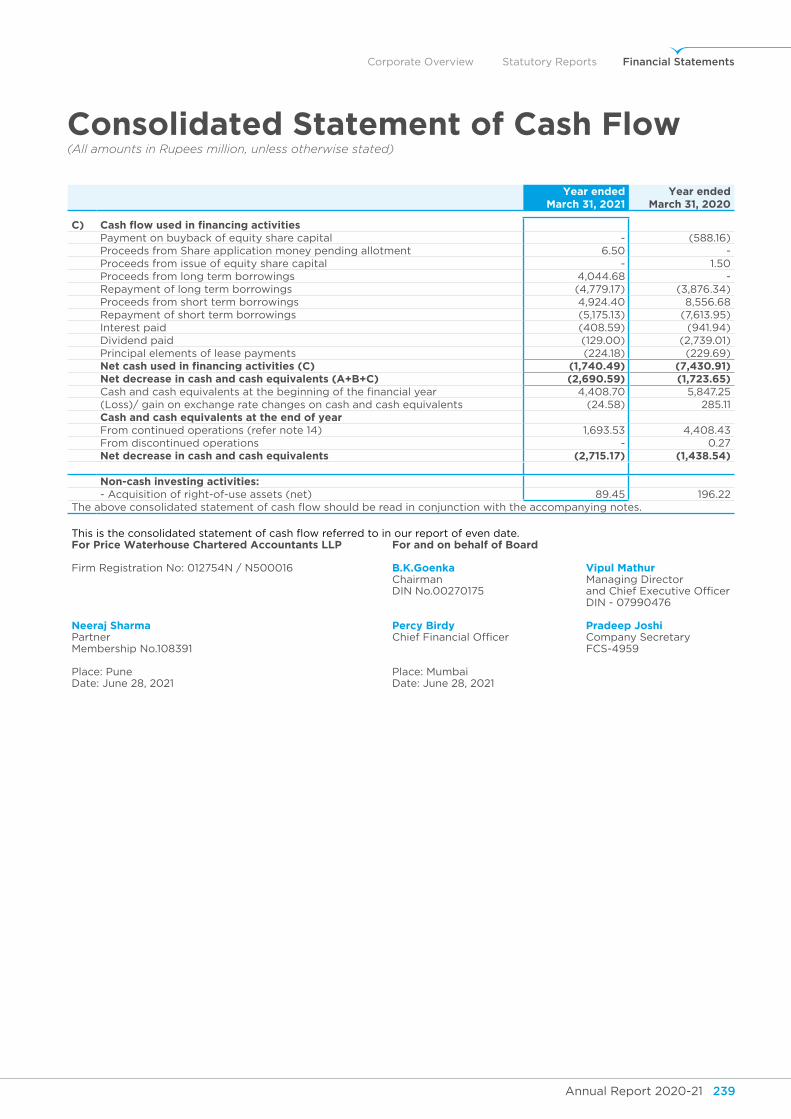
Annual Report 2020-21 239Annual Report 2020-21238
Corporate Overview Statutory Reports Financial Statements
year ended March 31, 2021
year ended March 31, 2020
c) Cash flow used in financing activitiesPayment on buyback of equity share capital - (588.16)Proceeds from Share application money pending allotment 6.50 - Proceeds from issue of equity share capital - 1.50 Proceeds from long term borrowings 4,044.68 - Repayment of long term borrowings (4,779.17) (3,876.34)Proceeds from short term borrowings 4,924.40 8,556.68 Repayment of short term borrowings (5,175.13) (7,613.95)Interest paid (408.59) (941.94)Dividend paid (129.00) (2,739.01)Principal elements of lease payments (224.18) (229.69)net cash used in financing activities (C) (1,740.49) (7,430.91)net decrease in cash and cash equivalents (A+B+c) (2,690.59) (1,723.65)Cash and cash equivalents at the beginning of the financial year 4,408.70 5,847.25 (Loss)/ gain on exchange rate changes on cash and cash equivalents (24.58) 285.11 cash and cash equivalents at the end of yearFrom continued operations (refer note 14) 1,693.53 4,408.43 From discontinued operations - 0.27 net decrease in cash and cash equivalents (2,715.17) (1,438.54)
non-cash investing activities:- Acquisition of right-of-use assets (net) 89.45 196.22
The above consolidated statement of cash flow should be read in conjunction with the accompanying notes.
This is the consolidated statement of cash flow referred to in our report of even date.for price waterhouse chartered Accountants llp for and on behalf of Board
Firm Registration No: 012754N / N500016 B.K.goenka vipul mathurChairman Managing DirectorDIN No.00270175 and Chief Executive Officer
DIN - 07990476
neeraj sharma percy Birdy pradeep JoshiPartner Chief Financial Officer Company SecretaryMembership No.108391 FCS-4959
Place: Pune Place: MumbaiDate: June 28, 2021 Date: June 28, 2021
consolidated statement of cash flow(All amounts in Rupees million, unless otherwise stated)
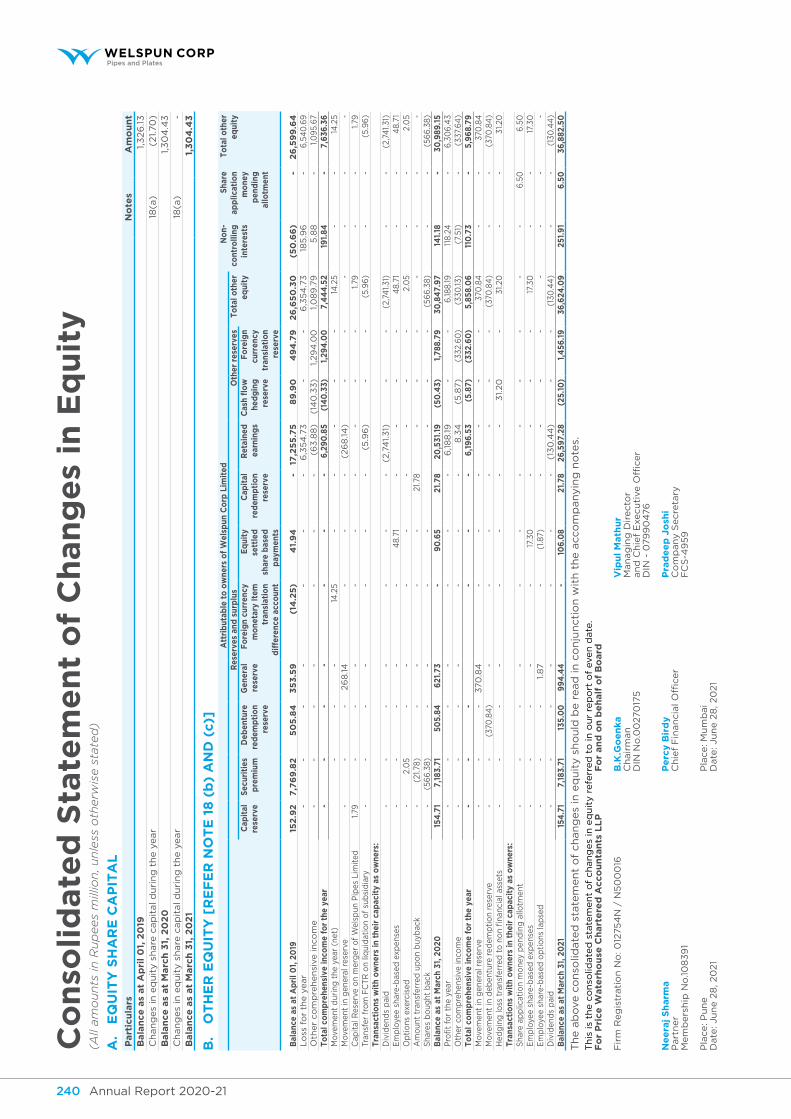
Annual Report 2020-21 241Annual Report 2020-21240 Annual Report 2020-21 241Annual Report 2020-21240
co
nso
lid
ate
d s
tate
me
nt
of
ch
an
ge
s in
eq
uit
y(A
ll am
ou
nts
in
Ru
pees
mill
ion
, un
less
oth
erw
ise s
tate
d)
A.
eQ
uIt
y s
hA
Re
cA
pIt
Al
part
icu
lars
no
tes
Am
ou
nt
Bala
nce
as
at
Ap
ril
01,
20
19 1
,326
.13
C
han
ges
in e
qu
ity s
hare
cap
ital d
uri
ng
th
e y
ear
18(a
) (
21.70
)B
ala
nce
as
at
Marc
h 3
1, 2
02
0 1
,30
4.4
3
Ch
an
ges
in e
qu
ity s
hare
cap
ital d
uri
ng
th
e y
ear
18(a
) -
B
ala
nce
as
at
Marc
h 3
1, 2
02
1 1
,30
4.4
3
B.
ot
he
r e
qu
ity
[r
ef
er
no
te
18
(b
) A
nd
(c)]
Att
rib
utab
le t
o o
wne
rs o
f w
elsp
un c
orp
lim
ited
no
n-
cont
rolli
ng
inte
rest
s
sha
re
app
licat
ion
mo
ney
pen
din
g
allo
tmen
t
to
tal o
ther
eq
uity
R
eser
ves
and
sur
plu
so
ther
res
erve
st
ota
l oth
er
equi
tyc
apit
al
rese
rve
sec
urit
ies
pre
miu
md
eben
ture
re
dem
pti
on
rese
rve
gen
eral
re
serv
ef
ore
ign
curr
ency
m
one
tary
Ite
m
tran
slat
ion
dif
fere
nce
acco
unt
eq
uity
se
ttle
d
shar
e b
ased
p
aym
ents
cap
ital
re
dem
pti
on
rese
rve
Ret
aine
d
earn
ing
sC
ash
flo
w
hed
gin
g
rese
rve
fo
reig
n cu
rren
cy
tran
slat
ion
rese
rve
Bal
ance
as
at A
pri
l 01,
20
19 1
52
.92
7
,76
9.8
2
50
5.8
4
35
3.5
9
(14
.25
) 4
1.9
4
-
17,2
55
.75
8
9.9
0
49
4.7
9
26
,65
0.3
0
(5
0.6
6)
-
26
,59
9.6
4
Lo
ss f
or
the y
ear
-
-
-
-
-
-
-
6,3
54
.73
-
-
6
,35
4.7
3
18
5.9
6
-
6,5
40
.69
O
ther
co
mp
reh
en
sive in
co
me
-
-
-
-
-
-
-
(6
3.8
8)
(14
0.3
3)
1,2
94
.00
1
,08
9.7
9
5.8
8
-
1,0
95.
67
to
tal c
om
pre
hens
ive
inco
me
for
the
year
-
-
-
-
-
-
-
6,2
90
.85
(14
0.3
3) 1
,29
4.0
0
7,4
44
.52
19
1.84
-
7
,636
.36
M
ovem
ent
dur
ing
the
yea
r (n
et)
-
-
-
14
.25
-
-
-
-
-
14
.25
-
-
14
.25
Mov
emen
t in
gen
eral
res
erve
-
-
-
26
8.14
-
-
-
(
26
8.14
) -
-
-
-
-
-
C
apit
al R
eser
ve o
n m
erg
er o
f W
elsp
un P
ipes
Lim
ited
1.7
9
-
-
-
-
-
-
-
-
-
1.7
9
-
-
1.7
9
Tran
sfer
fro
m F
CT
R o
n liq
uid
atio
n o
f su
bsi
dia
ry -
-
-
-
-
-
-
(
5.9
6)
-
-
(5.
96
) -
-
(
5.9
6)
tra
nsac
tio
ns w
ith
ow
ners
in t
heir
cap
acit
y as
ow
ners
:D
ivid
end
s p
aid
-
-
-
-
-
-
-
(2,7
41.
31)
-
-
(2,
741.3
1) -
-
(
2,74
1.31)
Em
plo
yee
shar
e-b
ased
exp
ense
s -
-
-
-
-
4
8.7
1 -
-
-
-
4
8.7
1 -
-
4
8.7
1 O
pti
ons
exe
rcis
ed -
2
.05
-
-
-
-
-
-
-
-
2.0
5 -
-
2
.05
Am
oun
t tr
ansf
erre
d u
po
n b
uyb
ack
-
(21
.78
) -
-
-
-
2
1.78
-
-
-
-
-
-
-
S
hare
s b
oug
ht b
ack
-
(56
6.3
8)
-
-
-
-
-
-
-
(56
6.3
8)
-
-
(56
6.3
8)
Bal
ance
as
at M
arch
31,
20
20 1
54.7
1 7
,183
.71
50
5.84
6
21.7
3 -
9
0.6
5 2
1.78
2
0,5
31.1
9
(50
.43)
1,7
88.7
9
30,8
47.
97
14
1.18
-
3
0,9
89.1
5 P
rofi
t fo
r th
e ye
ar -
-
-
-
-
-
-
6
,18
8.19
-
-
6
,188
.19
118
.24
-
6
,30
6.4
3 O
ther
co
mp
rehe
nsiv
e in
com
e -
-
-
-
-
-
-
8
.34
(
5.8
7)
(33
2.6
0)
(33
0.13
) (
7.51
) -
(
337.
64
)t
ota
l co
mp
rehe
nsiv
e in
com
e fo
r th
e ye
ar -
-
-
-
-
-
6
,19
6.5
3 (
5.87
) (
332.
60
) 5
,858
.06
1
10.7
3 -
5
,96
8.79
M
ovem
ent
in g
ener
al r
eser
ve -
-
-
3
70
.84
-
-
-
-
-
-
3
70.8
4
-
-
370
.84
M
ovem
ent
in d
eben
ture
red
emp
tio
n re
serv
e -
-
(
370
.84
) -
-
-
-
-
-
-
(
370
.84
) -
-
(
370
.84
)H
edg
ing
loss
tra
nsfe
rred
to
no
n fi
nanc
ial a
sset
s -
-
-
-
-
-
-
-
3
1.20
-
3
1.20
-
-
3
1.20
t
rans
acti
ons
wit
h o
wne
rs in
the
ir c
apac
ity
as o
wne
rs:
Sha
re a
pp
licat
ion
mo
ney
pen
din
g a
llotm
ent
-
-
-
-
-
-
-
-
-
-
-
-
6.5
0
6.5
0
Em
plo
yee
shar
e-b
ased
exp
ense
s -
-
-
-
-
1
7.30
-
-
-
-
1
7.30
-
-
1
7.30
E
mp
loye
e sh
are-
bas
ed o
pti
ons
lap
sed
-
-
-
1.8
7
-
(1.8
7) -
-
-
-
-
-
-
-
D
ivid
end
s p
aid
-
-
-
-
-
-
-
(13
0.4
4)
-
-
(13
0.4
4)
-
-
(13
0.4
4)
Bal
ance
as
at M
arch
31,
20
21 1
54.7
1 7
,183
.71
135
.00
9
94
.44
-
1
06
.08
21.
78
26
,59
7.28
(
25.1
0)
1,4
56.1
9
36,6
24.0
9
251
.91
6.5
0
36,8
82.5
0
Th
e a
bo
ve c
on
solid
ate
d s
tate
men
t o
f ch
an
ges
in e
qu
ity s
ho
uld
be r
ead
in
co
nju
ncti
on
wit
h t
he a
cco
mp
an
yin
g n
ote
s.T
his
is
the c
on
solid
ate
d s
tate
men
t o
f ch
an
ges
in e
qu
ity r
efe
rred
to
in
ou
r re
po
rt o
f even
date
.f
or
pri
ce
wate
rho
use
ch
art
ere
d A
cco
un
tan
ts l
lp
fo
r an
d o
n b
eh
alf
of
Bo
ard
Fir
m R
eg
istr
ati
on
No
: 0
1275
4N
/ N
50
00
16B
.K.g
oe
nka
vip
ul
math
ur
Ch
air
man
M
an
ag
ing
Dir
ecto
rD
IN N
o.0
0270
175
an
d C
hie
f E
xecu
tive O
fficer
DIN
- 0
79
90
476
ne
era
j s
harm
ap
erc
y B
ird
y
pra
de
ep
Jo
shi
Part
ner
Ch
ief
Fin
an
cia
l O
fficer
Co
mp
an
y S
ecre
tary
Mem
bers
hip
No
.10
83
91
FC
S-4
95
9
Pla
ce: P
un
eP
lace: M
um
bai
Date
: Ju
ne 2
8, 20
21
Date
: Ju
ne 2
8, 20
21
Annual Report 2020-21 241Annual Report 2020-21240
Corporate Overview Statutory Reports Financial Statements
NotesNotes annexed to and forming part of the consolidated balance sheet as at March 31, 2021and the consolidated statement of profit and loss for the year ended March 31, 2021(All amounts in Rupees million, unless otherwise stated)
Annual Report 2020-21 241Annual Report 2020-21240
geneRAl InfoRmAtIon
Welspun Corp Limited (hereinafter referred to as “WCL” or the “Company” or the “Holding Company”) and its subsidiaries (hereinafter referred to as the “Group”) are engaged in the business of Production and Coating of High Grade Submerged Arc Welded Pipes, Hot Rolled Steel Plates and Coils.
The Company is a public limited company which is listed on the Bombay Stock Exchange (BSE) and the National Stock Exchange (NSE) and is incorporated and domiciled in India. The address of its registered office is “Welspun City”, Village Versamedi, Tal. Anjar, Dist Kutch, Gujarat - 370110, India.
These consolidated financial statements were approved for issue by the Board of Directors on June 28, 2021.
note 1: signifiCAnt ACCounting PoLiCies
This note provides a list of the significant accounting policies adopted in the preparation of these consolidated financial statements. These policies have been consistently applied to all the years presented, unless otherwise stated. The Consolidated Financial Statements (“consolidated financial statements” of the “financial statements”) relate to the Group and its interest in joint ventures.
1.1 BAsIs of pRepARAtIon of fInAncIAl stAtements
a) compliance with Ind As The consolidated financial statements comply
in all material aspects with Indian Accounting Standards (Ind AS) notified under Section 133 of the Companies Act, 2013 (the Act) [Companies (Indian Accounting Standards) Rules, 2015] and other relevant provisions of the Act.
b) historical cost convention The financial statements have been prepared on
the accrual and going concern basis. The financial statements have been prepared on a historical cost basis, except for the following items:
Items measurement basisCertain financial assets and liabilities (including derivatives instruments)
Fair Value
Assets or disposal groups classified as held for sale
Fair value less cost to sell
Share based payments Fair ValueNet defined benefit (asset)/ liability
Fair Value of plan assets less present value of defined benefit obligations
c) Current and non-current classification All assets and liabilities have been classified as
current or non-current as per the Group’s normal operating cycle (i.e. 12 months) and other criteria set out in Schedule III (Division II) to the Act.
d) Recent Accounting pronouncements i) new and amended standards adopted by
the group The Group has applied the following
amendments to Ind AS for the first time for their annual reporting period commencing 1 April 2020:
• Definition of Material – amendments to ind As 1 and ind As 8
Amendments are made to Ind AS 1- Presentation of Financial Statements and Ind AS 8 - Accounting Policies, Changes in Accounting Estimates and Errors, which use a consistent definition of materiality, clarify when information is material and incorporate some of the guidance in Ind AS 1 about immaterial information.
In particular, the amendments clarify:
– that the reference to obscuring information addresses situations in which the effect is similar to omitting or misstating that information, and that an entity assesses materiality in the context of the financial statements as a whole, and
– the meaning of ‘primary users of general purpose financial statements’ to whom those financial statements are directed, by defining them as ‘existing and potential investors, lenders and other creditors’ that must rely on general purpose financial statements for much of the financial information they need.
• Definition of a Business – amendments to ind As 103
The amended definition of a business requires an acquisition to include an input and a substantive process that together significantly contribute to the ability to create outputs. The definition of the term ‘outputs’ is amended to focus on goods and services provided to customers, generating investment income and other income, and it excludes
Annual Report 2020-21 243Annual Report 2020-21242
NotesNotes annexed to and forming part of the consolidated balance sheet as at March 31, 2021and the consolidated statement of profit and loss for the year ended March 31, 2021(All amounts in Rupees million, unless otherwise stated)
returns in the form of lower costs and other economic benefits.
• CoViD-19 related concessions – amendments to Ind As 116
Amendments to Ind AS 116 Leases, provides a practical expedient to apply rent concessions occurring as a direct consequence of the COVID-19 pandemic. Lessee that makes this election shall account for any change in lease payments resulting from the rent concession the same way it would account for the change applying this Standard if the change were not a lease modification.
• interest rate Benchmark reform – amendments to ind As 109 and ind As 107
The amendments made to Ind AS 109 Financial Instruments, and Ind AS 107 Financial Instruments: Disclosures provide certain reliefs in relation to interest rate benchmark reform. The reliefs relate to hedge accounting and have the effect that the reforms should not generally cause hedge accounting to terminate. However, any hedge ineffectiveness should continue to be recorded in the income statement.
The amendments listed above did not have any material impact on Group’s financial statements.
ii) Amended applicable from next financial year
On March 24, 2021, the Ministry of Corporate Affairs (“MCA”) through a notification, amended Schedule III of the Companies Act, 2013. The amendments revise Division I, II and III of Schedule III and are applicable from April 1, 2021. Key amendments relating to Division II which relate to companies whose financial statements are required to comply with Companies (Indian Accounting Standards) Rules 2015 are:
Balance sheet:• Lease liabilities should be separately disclosed
under the head ‘financial liabilities’, duly distinguished as current or non-current.
• Certain additional disclosures in the statement of changes in equity such as changes in
equity share capital due to prior period errors and restated balances at the beginning of the current reporting period.
• Specified format for disclosure of shareholding of promoters.
• Specified format for ageing schedule of trade receivables, trade payables, capital work-in-progress and intangible asset under development.
• If a company has not used funds for the specific purpose for which it was borrowed from banks and financial institutions, then disclosure of details of where it has been used.
• Specific disclosure under ‘additional regulatory requirement’ such as compliance with approved schemes of arrangements, compliance with number of layers of companies, title deeds of immovable property not held in name of company, loans and advances to promoters, directors, key managerial personnel (KMP) and related parties, details of benami property held, certain specified ratios etc.
statement of profit and loss:• Additional disclosures relating to Corporate
Social Responsibility (CSR), undisclosed income and crypto or virtual currency specified under the head ‘additional information’ in the notes forming part of the standalone financial statements.
The amendments are extensive and the Group will evaluate the same to give effect to them as required by law.
1.2 PrinCiPLes of ConsoLiDAtion AnD eQuIty AccountIng
a) subsidiaries Subsidiaries are all entities over which the Group
has control. The Group controls an entity when the Group is exposed to, or has rights to, variable returns from its involvement with the entity and has the ability to affect those returns through its power to direct the relevant activities of the entity. In assessing control, potential voting rights that currently are exercisable are taken into account. The Group re-assesses whether or not it controls an investee if facts and circumstances indicate that there are changes to one or more of the three elements of control.
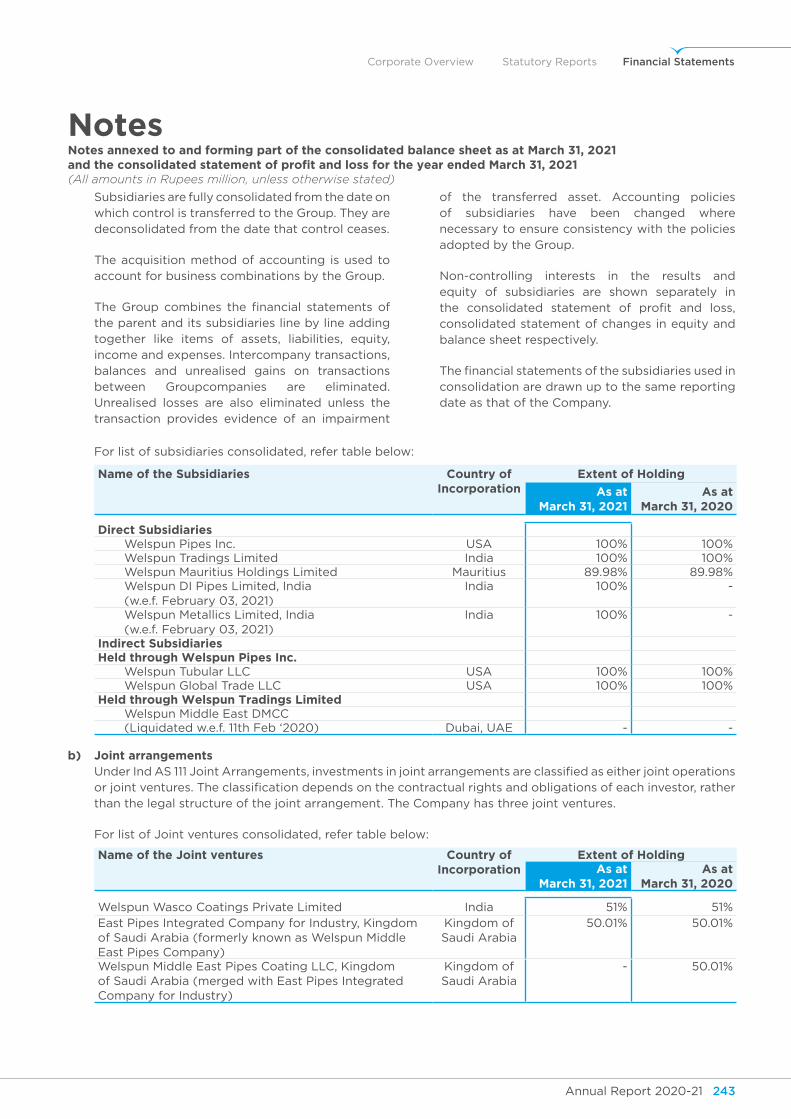
Annual Report 2020-21 243Annual Report 2020-21242
Corporate Overview Statutory Reports Financial Statements
NotesNotes annexed to and forming part of the consolidated balance sheet as at March 31, 2021and the consolidated statement of profit and loss for the year ended March 31, 2021(All amounts in Rupees million, unless otherwise stated)
Subsidiaries are fully consolidated from the date on which control is transferred to the Group. They are deconsolidated from the date that control ceases.
The acquisition method of accounting is used to account for business combinations by the Group.
The Group combines the financial statements of the parent and its subsidiaries line by line adding together like items of assets, liabilities, equity, income and expenses. Intercompany transactions, balances and unrealised gains on transactions between Groupcompanies are eliminated. Unrealised losses are also eliminated unless the transaction provides evidence of an impairment
of the transferred asset. Accounting policies of subsidiaries have been changed where necessary to ensure consistency with the policies adopted by the Group.
Non-controlling interests in the results and equity of subsidiaries are shown separately in the consolidated statement of profit and loss, consolidated statement of changes in equity and balance sheet respectively.
The financial statements of the subsidiaries used in consolidation are drawn up to the same reporting date as that of the Company.
For list of subsidiaries consolidated, refer table below:
name of the subsidiaries country of Incorporation
extent of holding
As at March 31, 2021
As at March 31, 2020
direct subsidiaries Welspun Pipes Inc. USA 100% 100% Welspun Tradings Limited India 100% 100% Welspun Mauritius Holdings Limited Mauritius 89.98% 89.98% Welspun DI Pipes Limited, India
(w.e.f. February 03, 2021)India 100% -
Welspun Metallics Limited, India (w.e.f. February 03, 2021)
India 100% -
Indirect subsidiariesheld through welspun pipes Inc. Welspun Tubular LLC USA 100% 100% Welspun Global Trade LLC USA 100% 100%held through welspun tradings limited Welspun Middle East DMCC (Liquidated w.e.f. 11th Feb ‘2020) Dubai, UAE - -
b) Joint arrangements Under Ind AS 111 Joint Arrangements, investments in joint arrangements are classified as either joint operations
or joint ventures. The classification depends on the contractual rights and obligations of each investor, rather than the legal structure of the joint arrangement. The Company has three joint ventures.
For list of Joint ventures consolidated, refer table below:
name of the Joint ventures country of Incorporation
extent of holdingAs at
March 31, 2021As at
March 31, 2020
Welspun Wasco Coatings Private Limited India 51% 51%East Pipes Integrated Company for Industry, Kingdom of Saudi Arabia (formerly known as Welspun Middle East Pipes Company)
Kingdom of Saudi Arabia
50.01% 50.01%
Welspun Middle East Pipes Coating LLC, Kingdom of Saudi Arabia (merged with East Pipes Integrated Company for Industry)
Kingdom of Saudi Arabia
- 50.01%
Annual Report 2020-21 245Annual Report 2020-21244
NotesNotes annexed to and forming part of the consolidated balance sheet as at March 31, 2021and the consolidated statement of profit and loss for the year ended March 31, 2021(All amounts in Rupees million, unless otherwise stated)
Joint ventures A joint venture is a type of joint arrangement
whereby the parties that have joint control of the arrangement have rights to the net assets of the joint venture. Joint control is the contractually agreed sharing of control of an arrangement, which exists only when decisions about the relevant activities require unanimous consent of the parties sharing control. The financial statements of the joint venture are prepared for the same reporting period as the Group.
Interests in joint ventures are accounted for using the equity method (refer below), after initially being recognised at cost in the consolidated balance sheet.
c) equity method Under the equity method of accounting, the
investments are initially recognised at cost and adjusted thereafter to recognise the Group’s share of the post-acquisition profits or losses of the investee in profit and loss, and the Group’s share of other comprehensive income of the investee in other comprehensive income. Dividends received or receivable from joint ventures are recognised as a reduction in the carrying amount of the investment.
When the Group’s share of losses in an equity-accounted investment equals or exceeds its interest in the entity, including any other unsecured long-term receivables, the Group does not recognise further losses, unless it has incurred obligations or made payments on behalf of the other entity.
The statement of profit and loss reflects the Group’s share of the results of operations of the joint venture. Any change in OCI of those investees is presented as part of the Group’s OCI. In addition, when there has been a change recognised directly in the equity of the joint venture, the Group recognises its share of any changes, when applicable, in the statement of changes in equity.
Unrealised gains on transactions between the Group and its joint ventures are eliminated to the extent of the Group’s interest in these entities. Unrealised losses are also eliminated unless the transaction provides evidence of an impairment of the asset transferred. Accounting policies of equity accounted investees have been changed where necessary to ensure consistency with the policies adopted by the Group.
The carrying amounts of equity accounted investments are tested for impairment.
d) change in ownership Interest The Group treats transactions with non-controlling
interests that do not result in a loss of control as transactions with equity owners of the Group. A change in ownership interest results in an adjustment between the carrying amounts of the controlling and non-controlling interests to reflect their relative interests in the subsidiary. Any difference between the amount of the adjustment to non-controlling interests and any consideration paid or received is recognised within equity.
When the Group ceases to consolidate or equity account for an investment because of a loss of control, joint control, and any retained interest in the entity is remeasured to its fair value with the change in carrying amount recognised in profit or loss. This fair value becomes the initial carrying amount for the purposes of subsequently accounting for the retained interest as a joint venture or financial asset. In addition, any amounts previously recognised in other comprehensive income in respect of that entity are accounted for as if the Group had directly disposed of the related assets or liabilities. This may mean that amounts previously recognised in other comprehensive income are reclassified to profit or loss.
If the ownership interest in a joint venture is reduced but joint control is retained, only a proportionate share of the amounts previously recognised in other comprehensive income are reclassified to profit or loss where appropriate.
1.3 foreign CurrenCy trAnsLAtions
a) functional and presentation currency Items included in the financial statements of each
of the Group’s entities are measured using the currency of the primary economic environment in which the entity operates (the “functional currency’). The consolidated financial statements are presented in Indian rupee (INR), which is Group’s functional and presentation currency.
b) transactions and balances Foreign currency transactions are translated into
the functional currency using the exchange rates at the dates of the transactions. Foreign exchange gains and losses resulting from the settlement of such transactions and from the translation of monetary assets and liabilities denominated in
Annual Report 2020-21 245Annual Report 2020-21244
Corporate Overview Statutory Reports Financial Statements
NotesNotes annexed to and forming part of the consolidated balance sheet as at March 31, 2021and the consolidated statement of profit and loss for the year ended March 31, 2021(All amounts in Rupees million, unless otherwise stated)
foreign currencies at year end exchange rates are generally recognised in profit or loss.
Foreign exchange differences regarded as an adjustment to borrowing costs are presented in the statement of profit and loss, within finance costs. All other foreign exchange gains and losses are presented in the statement of profit and loss on a net basis within other expenses or other income, as applicable.
Non-monetary items that are measured in terms of historical cost in a foreign currency are translated using the exchange rates at the date of initial transaction.
Non-monetary items that are measured at fair value in a foreign currency are translated using the exchange rates at the date when the fair value was determined. Translation differences on assets and liabilities carried at fair value are reported as part of the fair value gain or loss.
Translation differences on assets and liabilities carried at fair value are reported as part of the fair value gain or loss. For example: translation differences on non-monetary assets and liabilities such as equity instruments held at fair value through profit or loss are recognised in profit or loss as part of the fair value gain or loss and translation differences on non-monetary assets such as equity investments classified as FVOCI are recognised in other comprehensive income.
The Group has elected to apply the exemption from the transition date i.e. April 01, 2015 in respect of accounting policy followed for long term foreign currency monetary items. Accordingly, long term foreign currency monetary items in the financial statements have been accounted in accordance with the policy adopted under previous GAAP as given below:
• Foreign exchange differences on account of depreciable assets are adjusted in the cost of depreciable assets and depreciated over the balance life of the assets.
• In other cases, foreign exchange differences are accumulated in “Foreign Currency Monetary Item Translation Difference Account” and amortised over the balance period of such long term assets/ liabilities.
c) group companies The results and financial position of foreign
operations that have a functional currency different from the presentation currency are translated into the presentation currency as follows:
• assets and liabilities are translated at the closing rate at the date of that balance sheet;
• income and expenses are translated at exchange rates prevailing at the dates of transactions. For practical reasons, the Group uses an average rate to translate income and expense items, if the average rate approximates the exchange rates at the dates of transactions; and
• All resulting exchange differences are recognised in other comprehensive income under head Foreign currency translation reserve (FCTR).
1.4 Revenue RecognItIon
a) sale of goods The Group derives revenue principally
from sale of pipes.
The Group recognises revenue when it satisfies a performance obligation in accordance with the provisions of contract with the customer. This is achieved when control of the product has been transferred to the customer, which is generally determined when title, ownership, risk of obsolescence and loss pass to the customer and the Group has the present right to payment, all of which occurs at a point in time upon shipment or delivery of the product. The Group considers freight activities as costs to fulfil the promise to transfer the related products and the customer payments for freight costs are recorded as a component of revenue.
A receivable is recognised when the goods are delivered as this is the point in time that the consideration is unconditional because only the passage of time is required before the payment is due.
In certain customer contracts, freight services are treated as a distinct separate performance obligation and the Group recognises revenue for such services when the performance obligation is completed.
Annual Report 2020-21 247Annual Report 2020-21246
NotesNotes annexed to and forming part of the consolidated balance sheet as at March 31, 2021and the consolidated statement of profit and loss for the year ended March 31, 2021(All amounts in Rupees million, unless otherwise stated)
The Group considers the terms of the contract in determining the transaction price. The transaction price is based upon the amount the Group expects to be entitled to in exchange for transferring of promised goods and services to the customer after deducting incentive programs, included but not limited to discounts, volume rebates, etc.
Revenue is recognized at a determined transaction price when identified performance obligations are satisfied. The bill and hold contracts are entered at the request of the customer. Revenue from bill and hold contracts is recognised at the agreed transaction price (determined price). The price for bill and hold contracts is determined at the time of entering into the transaction and the performance obligation is satisfied when goods have been appropriated towards the sale transaction (the control of asset is transferred to the customer).
Revenue excludes any taxes and duties collected on behalf of the government.
b) sale of services The Group also provides freight services
to its customers.
Revenue from providing freight services is recognised in the accounting period in which the services are rendered.
The related freight costs incurred are included in freight expenses when the Group is acting as principal in the freight arrangement.
Freight services may be considered a separate performance obligation if control of the goods transfers to the customer before goods reach to the agreed place of shipment, but the entity has promised to ship the goods (or arrange for the goods to be shipped). In contrast, if control of a good does not transfer to the customer before goods reach to the agreed place of shipment, freight service is not a promised service to the customer. This is because freight service is a fulfillment activity as the costs are incurred as part of transferring the goods to the customer.
The Group does not have any contracts where in the period between the transfer of the promised goods or services to the customer and payment by the customer exceeds one year. As a consequence, the Group does not adjust any of the transaction prices for the time value of money.
1.5 ContrACt Assets AnD ContrACt lIABIlItIes
When the Group performs a service or transfers a good in advance of receiving consideration, it recognises a contract asset or receivable.
A contract asset is a Group’s right to consideration in exchange for goods or services that the Group has transferred to a customer. If the Group transfers control of goods or services to a customer before the customer pays consideration, the Group records a contract asset when the nature of the Group’s right to consideration for its performance is other than passage of time. A contract asset will be classified as a receivable when the Group’s right to consideration is unconditional (that is, when payment is due only on the passage of time).The Group shall assess a contract asset for impairment in accordance with Ind AS 109. Impairment of a contract asset is measured, presented and disclosed on similar basis as other financial asset in nature of trade receivable within the scope of Ind AS 109. The Group discloses contract assets under “Other Assets”.
The Group recognises a contract liability if the customer’s payment of consideration precedes the Group’s performance. A contract liability is recognised if the Group receives consideration (or if it has the unconditional right to receive consideration) in advance of performance. The Group discloses contract liabilities under “Other Liabilities”.
1.6 segment RepoRtIng
The board of directors of the Company assess the financial performance and position of the Group, and makes strategic decisions. The chief operating decision makers are board of directors of the Company. Operating segments are reported in a manner consistent with the internal reporting provided to the chief operating decision maker.(Refer Note 48)
1.7 goVernMent grAnts
Grants from the government are recognised at their fair value where there is a reasonable assurance that the grant will be received and the Group will comply with all attached conditions.
Export incentives and subsidies are recognized when there is reasonable assurance that the Group will comply with the conditions and the incentive will be received.
Annual Report 2020-21 247Annual Report 2020-21246
Corporate Overview Statutory Reports Financial Statements
NotesNotes annexed to and forming part of the consolidated balance sheet as at March 31, 2021and the consolidated statement of profit and loss for the year ended March 31, 2021(All amounts in Rupees million, unless otherwise stated)
Grants related to assets are government grants whose primary condition is that an entity qualifying for them should purchase, construct or otherwise acquire long-term assets. Grants related to income are government grants other than those related to assets.
Government grants relating to income are deferred and recognised in the profit or loss over the period necessary to match them with the costs that they are intended to compensate and presented either under “other operating revenue” or are deducted in reporting the related expense. The presentation approach is applied consistently to all similar grants.
Government grants relating to the purchase of property, plant and equipment are included in liabilities as “Government grants” and are credited to profit or loss on a straight-line basis over the expected lives of the related assets and presented within “Other operating revenue”. In case of disposal of such property, plant and equipment, related government grants included in the liabilities are written back and charged to the statement of profit and loss.
1.8 inCoMe tAx, DeferreD tAx AnD DiViDenD DistriBution tAx
The Income tax expense or credit for the year is the tax payable on the current year’s taxable income based on the applicable income tax rate for each jurisdiction adjusted by changes in deferred tax assets and liabilities attributable to temporary differences and to unused tax losses.
Current and deferred tax is recognised in the Statement of Profit and Loss except to the extent it relates to items recognised directly in equity or other comprehensive income, in which case it is recognised in equity or other comprehensive income respectively.
a) current income tax Current tax charge is based on taxable profit
for the year. The tax rates and tax laws used to compute the amount are those that are enacted or substantively enacted, at the reporting date in the countries where the Group operates and generates taxable income. Management periodically evaluates positions taken in tax returns with respect to situations in which applicable tax regulation is subject to interpretation. It establishes provisions where appropriate on the basis of amounts expected to be paid to the tax authorities.
Current tax assets and tax liabilities are offset when there is a legally enforceable right to set off current tax assets against current tax liabilities and Group intends either to settle on a net basis, or to realise the asset and settle the liability simultaneously.
b) deferred tax Deferred tax is provided using the liability method
on temporary differences arising between the tax bases of assets and liabilities and their carrying amounts in the consolidated financial statements. Such deferred tax assets and liabilities are computed separately for each taxable entity and for each taxable jurisdiction. However, deferred tax liabilities are not recognized if they arise from the initial recognition of goodwill. Deferred tax is determined using tax rates that have been enacted or substantially enacted by the end of the reporting period and are expected to apply when the related deferred tax assets is realized or deferred tax liability is settled.
Deferred tax are recognised for all deductible temporary difference and unused tax losses only if it is probable that future taxable amounts will be available to utilise those temporary differences and losses.
Deferred income tax is not accounted for if it arises from initial recognition of an asset or liability in a transaction other than a business combination that at the time of the transaction affects neither accounting profit nor taxable profit (tax loss).
Deferred tax liabilities are recognised for taxable temporary differences arising on investments in subsidiaries and interests in jointly controlled entities, except where the Group is able to control the reversal of the temporary difference and it is probable that the temporary difference will not reverse in the foreseeable future.
Deferred tax assets are not recognised for temporary differences between the carrying amount and tax bases of investments in subsidiaries and associates and interest in joint arrangements where it is not probable that the differences will reverse in the foreseeable future and taxable profit will not be available against which the temporary difference can be utilised.
The carrying amount of deferred tax assets is reviewed at each reporting date and adjusted to reflect changes in probability that sufficient
Annual Report 2020-21 249Annual Report 2020-21248
NotesNotes annexed to and forming part of the consolidated balance sheet as at March 31, 2021and the consolidated statement of profit and loss for the year ended March 31, 2021(All amounts in Rupees million, unless otherwise stated)
taxable profits will be available to allow all or part of the asset to be recovered.
Deferred income tax assets and liabilities are off-set against each other and the resultant net amount is presented in the Balance Sheet, if and only when, (a) the Group has a legally enforceable right to set-off the current income tax assets and liabilities, and (b) the Deferred income tax assets and liabilities relate to income tax levied by the same taxation authority.
Current and deferred tax is recognised in profit or loss, except to the extent that it relates to items reconised in other comprehensive income or directly in equity. In this case, the tax is also recognised in other comprehensive income or directly in equity, respectively
c) dividend distribution tax Dividend distribution tax paid on the dividends
is recognised consistently with the presentation of the transaction that creates the income tax consequence. Dividend distribution tax is charged to Statement of Profit and Loss if the dividend itself is charged to statement of profit and loss. If the dividend is recognised in equity, the presentation of dividend distribution tax is recognised in equity.
1.9 LeAses
a) As a lessee The Group leases various leasehold lands, buildings,
vehicles, Plant & machinery and office and other equipments. Rental contracts are typically made for fixed periods of one to ninety-nine years but may have extension options as described in note 3(b). Lease terms are negotiated on an individual basis and contain a wide range of different terms and conditions. The lease agreements do not impose any covenants, but leased assets may not be used as security for borrowing purposes.
Based on the notification released by MCA, Ind AS 116 has been made applicable w.e.f April 01, 2019. From April 01, 2019, leases are recognized as a right-of-use assets and a corresponding lease liability at the date at which the leased assets is available for the use by the Group.
Assets and liabilities arising from a lease are initially measured on a present value basis. Lease liabilities include the net present value of the following lease payments, as applicable:
• fixed payments (including in-substance fixed payments), less any lease incentives receivable.
• variable lease payment that are based on an index or a rate, initially measured using the index or rate as at the commencement date.
• amounts expected to be payable by the Group under residual value guarantees.
• the exercise price of a purchase option if the lessee is reasonably certain to exercise that option, and
• payments of penalties for terminating the lease, if the lease term reflects the lessee exercising that option.
Lease payments to be made under reasonably certain extension options are also included in the measurement of the liability. The lease payments are discounted using the interest rate implicit in the lease. If that rate cannot be readily determined, the lessee’s incremental borrowing rate is used, being the rate that the lessee would have to pay to borrow the funds necessary to obtain an asset of similar value to the right-of-use asset in a similar economic environment with similar terms, security and conditions.
Lease payments are allocated between principal and finance cost. The finance cost is charged to profit or loss over the lease period so as to produce a constant periodic rate of interest on the remaining balance of the liability for each period.
Right-of-use assets are measured at cost comprising the following, wherever applicable:
• the amount of the initial measurement of lease liability
• any lease payments made at or before the commencement date less any lease incentives received
• any initial direct costs, and
• restoration costs.
Right-of-use assets are generally depreciated over the shorter of the asset’s useful life and the lease term (including extension considering reasonable certainty), on a straight-line basis. If the Group is reasonably certain to exercise a purchase option, the right-of-use asset is depreciated over the underlying asset’s useful life.
Annual Report 2020-21 249Annual Report 2020-21248
Corporate Overview Statutory Reports Financial Statements
NotesNotes annexed to and forming part of the consolidated balance sheet as at March 31, 2021and the consolidated statement of profit and loss for the year ended March 31, 2021(All amounts in Rupees million, unless otherwise stated)
Payments associated with short-term leases of equipment and all leases of low-value assets are recognised on a straight-line basis as an expense in profit or loss. Short-term leases are leases with a lease term of 12 months or less. Low-value assets and short term lease assets comprises of dumpsite land, laptops and other office equipements.
b) As a lessor Lease income from operating leases where the
Group is a lessor is recognised in income on a straight-line basis over the lease term. Initial direct cost incurred in obtaining an operating lease are added to the carrying amount of the underlying asset and recognised as expense over the lease term on the same basis as lease income. The respective leased assets are included in the balance sheet based on their nature. The Group did not need to make any adjustments to the accounting for assets held as lessor as a result of adopting the new leasing standard.
1.10 ProPerty, PLAnt AnD equiPMent
Freehold land is carried at historical cost. All other items of property, plant and equipment are stated at historical cost less depreciation. Historical cost includes expenditure that is directly attributable to the acquisition of the items.
Subsequent costs are included in the asset’s carrying amount or recognised as a separate asset, as appropriate, only when it is probable that future economic benefits associated with the item will flow to the Group and the cost of the item can be measured reliably. The carrying amount of any component accounted for as a separate asset is derecognised when replaced. All other repairs and maintenance are charged to profit or loss during the reporting period in which they are incurred.
Cost of Capital Work-in-Progress (‘CWIP’) comprises amount paid towards acquisition of property, plant and equipment outstanding as of each balance sheet date and construction expenditures, other expenditures necessary for the purpose of preparing the CWIP for it intended use and borrowing cost incurred before the qualifying asset is ready for intended use. CWIP is not depreciated until such time as the relevant asset is completed and ready for its intended use.
Depreciation methods, estimated useful lives and residual value
Freehold land is not depreciated. Leasehold improvements are amortised over the shorter of estimated useful life or the related lease term. Depreciation is calculated using the straight-line method to allocate their cost, net of their residual values, over their estimated useful lives as follows:
Assets estimated useful lives (in years)
Buildings
Buildings and land improvements
Ranging between 15 to 39 years
Residential and other buildings
60
Road, fencing, etc.
Ranging between 3 to 15 years
office and other equipments
Office Equipment
Ranging between 3 to 10 years
Computer 3 years except Networking equipment’s which are depreciated over useful life of 5 years
vehicles Ranging between 5 to 8 years
furniture and fixtures
Ranging between 5 to 10 years
These estimated useful lives are in accordance with those prescribed under Schedule II to the Companies Act, 2013 except in respect of plant and machinery wherein the estimated useful lives are different than those under Schedule II to the Companies Act, 2013 based on a technical evaluation done by the Management.
Plant and machinery is depreciated on straight line method over the useful life ranging between 2 years to 40 years which is different than the life prescribed under Schedule II to the Companies Act, 2013 in order to reflect the actual usage of the assets. The estimated useful lives of plant and machinery has been determined based on internal technical advice which considers the nature of the asset, the usage of the asset, expected physical wear and tear, the operating conditions of the asset, anticipated technological changes, etc.
The residual values are not more than 5% of the original cost of the asset.
Annual Report 2020-21 251Annual Report 2020-21250
NotesNotes annexed to and forming part of the consolidated balance sheet as at March 31, 2021and the consolidated statement of profit and loss for the year ended March 31, 2021(All amounts in Rupees million, unless otherwise stated)
An asset’s carrying amount is written down immediately to its recoverable amount if the asset’s carrying amount is greater than its estimated recoverable amount.
Estimated useful lives, residual values and depreciation methods are reviewed annually, taking into account commercial and technological obsolescence as well as normal wear and tear and adjusted prospectively, if appropriate.
Gains and losses on disposals are determined by comparing proceeds with carrying amount. These are included in profit or loss within other income or other expenses, as applicable.
1.11 Investment pRopeRtIes
Property that is held for long-term rental yields or for capital appreciation or both, and that is not occupied by the Group, is classified as Investment property. Investment property is measured initially at its cost, including related transaction costs and where applicable borrowing costs. Subsequent expenditure is capitalised to the asset’s carrying amount only when it is probable that future economic benefits associated with the expenditure will flow to the Group and the cost of the item can be measured reliably. All other repairs and maintenance costs are expensed when incurred. When part of an investment property is replaced, the carrying amount of the replaced part is derecognised.
Investment properties (except freehold land) are depreciated using the straight-line method over their estimated useful lives over a period of thirty years. These estimated useful lives are in accordance with those prescribed under Schedule II to the Companies Act, 2013.
1.12 intAngiBLe Assets
a) goodwill on consolidation: Goodwill on acquisitions of subsidiaries is shown
separately. Goodwill is not amortised but it is tested for impairment annually, or more frequently if events or changes in circumstances indicate that it might be impaired, and is carried at cost less accumulated impairment losses. Gains and losses on the disposal of an entity include the carrying amount of goodwill relating to the entity sold.
Goodwill is allocated to cash-generating units for the purpose of impairment testing. The allocation
is made to those cash-generating units or groups of cash-generating units that are expected to benefit from the business combination in which the goodwill arise. The units or groups of units are identified at the lowest level at which goodwill is monitored for internal management purposes, which in our case are the operating segments.
b) other intangible assets Other intangible assets with finite useful lives
acquired by the Group are measured at cost less accumulated amortisation and accumulated impairment losses. Amortisation is charged on a straight-line basis over the estimated useful lives. The estimated useful life and amortisation method are reviewed at the end of each annual reporting period, with the effect of any changes in the estimate being accounted for on a prospective basis.
c) Amortisation methods and periods Other intangible assets comprise of computer
software which is amortised on a straight-line basis over its expected useful life over a period of three to five years which is based on a technical evaluation done by the Management.
Intangible Asset under Development comprises amount paid towards acquisition/ development of Intangible Assets outstanding as of each balance sheet date and acquisition expenditures, other expenditures necessary for the purpose of preparing the Intangible Asset for it intended use. Intangible Assets under Development is not amortised until such time as the relevant asset is completed and ready for its intended use.
1.13 non-Current Assets (or DisPosAL gRoups) held foR sAle And dIscontInued opeRAtIons
Non-current assets (or disposal groups) are classified as held for sale if their carrying amount will be recovered principally through a sale transaction rather than through continuing use and a sale is considered highly probable. They are measured at the lower of their carrying amount and fair value less costs to sell, except for assets such as deferred tax assets, assets arising from employee benefits, financial assets, which are specifically exempt from this requirement.
An impairment loss is recognised for any initial or subsequent write-down of the asset (or disposal
Annual Report 2020-21 251Annual Report 2020-21250
Corporate Overview Statutory Reports Financial Statements
NotesNotes annexed to and forming part of the consolidated balance sheet as at March 31, 2021and the consolidated statement of profit and loss for the year ended March 31, 2021(All amounts in Rupees million, unless otherwise stated)
groups) to fair value less costs to sell. A gain is recognised for any subsequent increases in fair value less costs to sell of an asset (or disposal groups), but not in excess of any cumulative impairment loss previously recognised. A gain or loss not previously recognised by the date of the sale of the non-current asset (or disposal groups) is recognised at the date of de-recognition.
Non-current assets (including those that are part of disposal groups) are not depreciated or amortised while they are classified as held for sale. Interest and other expenses attributable to liabilities of disposal groups classified as held for sale continue to be recognized.
Non-current assets classified as held for sale and the assets of disposal groups classified as held for sale are presented separately from the other assets in the balance sheet. The liabilities of disposal groups classified as held for sale are presented separately from other liabilities in the balance sheet.
A discontinued operation is a component of the entity that has been disposed of or is classified as held for sale and that represents a separate major line of business or geographical area of operations, is part of a single co-ordinated plan to dispose of such a line of business or are of operations, or is a subsidiary acquired exclusively with a view to resale. The results of discontinued operations are presented separately in the statement of profit and loss.
1.14 ImpAIRment of Assets
Goodwill and intangible assets that have an indefinite useful life are not subject to amortisation and are tested annually for impairment, or more frequently if events or changes in circumstances indicate that they might be impaired. Other assets are tested for impairment whenever events or changes in circumstances indicate that the carrying amount may not be recoverable. An impairment loss is recognised for the amount by which the asset’s carrying amount exceeds its recoverable amount. The recoverable amount is the higher of an asset’s fair value less costs of disposal and value in use. For the purposes of assessing impairment, assets are grouped at the lowest levels for which there are separately identifiable cash inflows which are largely independent of the cash inflows from other assets or groups of assets (cash-generating units).
Non-financial assets other than goodwill that suffered impairment are reviewed for possible reversal of the impairment at the end of each reporting period.
1.15 inVentories
Raw materials, stores and spares, work in progress, traded goods and finished goods
Raw materials, stores and spares, work in progress, traded goods and finished goods are stated at the lower of cost and net realisable value. Cost of raw materials and traded goods comprises cost of purchases on moving weighted average basis. Cost of work-in progress and finished goods comprises direct materials, direct labour and an appropriate proportion of variable and fixed overhead expenditure, the latter being allocated on the basis of normal operating capacity. Cost of inventories also includes all other costs incurred in bringing the inventories to their present location and condition. Costs are assigned to individual items of inventory moving weighted average basis. Costs of purchased inventory are determined after deducting rebates and discounts. Net realisable value is the estimated selling price in the ordinary course of business less the estimated costs of completion and the estimated costs necessary to make the sale.
1.16 Investment In JoInt ventuRes
Investment in joint ventures is carried at cost in the separate financial statements.
1.17 finAnCiAL instruMents
A financial instrument is any contract that gives rise to a financial asset of one entity and a financial liability or equity instrument of another entity.
a) financial assets(i) Classification The Group classifies its financial assets in the
following measurement categories:
• those to be measured subsequently at fair value (either through other comprehensive income, or through profit or loss); and
• those measured at amortised cost.
The classification depends on the entity’s business model for managing the financial assets and the contractual terms of the cash flows.
Annual Report 2020-21 253Annual Report 2020-21252
NotesNotes annexed to and forming part of the consolidated balance sheet as at March 31, 2021and the consolidated statement of profit and loss for the year ended March 31, 2021(All amounts in Rupees million, unless otherwise stated)
For assets measured at fair value, gains and losses will either be recorded in profit or loss or other comprehensive income.
For investments in debt instruments, this will depend on the business model in which the investment is held.
For investments in equity instruments, this will depend on whether the Group has made an irrevocable election at the time of initial recognition to account for the equity investment at fair value through other comprehensive income.
The Group reclassifies debt investments when and only when its business model for managing those assets changes.
(II) measurement At initial recognition, the Group measures a
financial asset at its fair value plus, in the case of a financial asset not at fair value through profit or loss, transaction costs that are directly attributable to the acquisition of the financial asset. Transaction costs of financial assets carried at fair value through profit or loss are expensed in profit or loss.
(i) debt instruments Subsequent measurement of debt instruments
depends on the Group’s business model for managing the asset and the cash flow characteristics of the asset. There are three measurement categories into which the Group classifies its debt instruments:
• Amortised cost: Assets that are held for collection of contractual cash flows where those cash flows represent solely payments of principal and interest are measured at amortised cost. A gain or loss on a debt investment that is subsequently measured at amortised cost and is not part of a hedging relationship is recognised in profit or loss when the asset is derecognised or impaired. Interest income from these financial assets is included in finance income using the effective interest rate method.
• Fair value through other comprehensive income (FVOCI): Assets that are held for collection of contractual cash flows and for selling the financial assets, where the assets’ cash flows represent solely payments of principal and interest, are measured at fair value through other comprehensive
income (FVOCI). Movements in the carrying amount are taken through OCI, except for the recognition of impairment gains or losses, interest income and foreign exchange gains and losses which are recognised in profit and loss. When the financial asset is derecognised, the cumulative gain or loss previously recognised in OCI is reclassified from equity to profit or loss and recognised in other gains/ (losses). Interest income from these financial assets is included in other income using the effective interest rate method.
• Fair value through profit or loss (FVTPL): Assets that do not meet the criteria for amortised cost or FVOCI are measured at fair value through profit or loss. A gain or loss on a debt investment that is subsequently measured at fair value through profit or loss and is not part of a hedging relationship is recognised in profit or loss and presented net in the statement of profit and loss within other income or other expenses (as applicable) in the period in which it arises. Interest income from these financial assets is included in other income.
(ii) equity instruments The Group subsequently measures all equity
investments at fair value. Where the Group’s management has elected to present fair value gains and losses on equity investments in other comprehensive income, there is no subsequent reclassification of fair value gains and losses to profit or loss. Dividends from such investments are recognised in profit or loss as other income when the Group’s right to receive payments is established.
Changes in the fair value of financial assets at fair value through profit or loss are recognised in the statement of profit and loss. Impairment losses (and reversal of impairment losses) on equity investments measured at FVOCI are not reported separately from other changes in fair value.
(iii) impairment of financial assets The Group assesses on a forward looking basis
the expected credit losses associated with its assets carried at amortised cost and FVOCI debt instruments. The impairment methodology applied depends on whether there has been a significant increase in credit risk.
For trade receivables only, the Group applies the simplified approach permitted by Ind AS 109
Annual Report 2020-21 253Annual Report 2020-21252
Corporate Overview Statutory Reports Financial Statements
NotesNotes annexed to and forming part of the consolidated balance sheet as at March 31, 2021and the consolidated statement of profit and loss for the year ended March 31, 2021(All amounts in Rupees million, unless otherwise stated)
Financial Instruments, which requires expected lifetime losses to be recognised from initial recognition of the receivables.
(iV) Derecognition of financial assets A financial asset is derecognised only when
• The Group has transferred the rights to receive cash flows from the financial asset or
• retains the contractual rights to receive the cash flows of the financial asset, but assumes a contractual obligation to pay the cash flows to one or more recipients.
Where the entity has transferred an asset, the Group evaluates whether it has transferred substantially all risks and rewards of ownership of the financial asset. In such cases, the financial asset is derecognised. Where the entity has not transferred substantially all risks and rewards of ownership of the financial asset, the financial asset is not derecognised.
Where the entity has neither transferred a financial asset nor retains substantially all risks and rewards of ownership of the financial asset, the financial asset is derecognised if the Group has not retained control of the financial asset. Where the Group retains control of the financial asset, the asset is continued to be recognised to the extent of continuing involvement in the financial asset.
(v) Income recognition(i) Interest income Interest income from a financial assets is recognized
when it is probable that the economic benefits will flow to the Group and the amount of income can be measured reliably. Interest income is accrued on time basis by reference to principal outstanding and the effective interest rate applicable which is the rate that exactly discounts estimated future cash receipts through the expected life of the financial asset to the gross carrying amount of a financial asset. When calculating the effective interest rate, the Group estimates the expected cash flows by considering all the contractual terms of the financial instrument (for example, prepayment, extension, call and similar options) but does not consider the expected credit losses.
(ii) dividend income Dividend income is recognised in profit or loss only
when the right to receive payment is established, it is probable that the economic benefits associated with the dividend will flow to the Group, and the amount of the dividend can be measured reliably.
(iii) export benefits In case of sale made by the Group as Support
Manufacturer, export benefits arising from Duty Entitlement Pass Book (DEPB), Duty Drawback scheme and Merchandise Export Incentive Scheme (MEIS) are recognised on export of such goods in accordance with the agreed terms and conditions with customers. In case of direct exports made by the Group, export benefits arising from DEPB, Duty Drawback scheme and Merchandise Export Incentive Scheme are recognised on shipment of direct exports.
(vI) cash and cash equivalents Cash and cash equivalents includes cash in hand,
deposits held at call with banks, other short term highly liquid investments with original maturities of three months or less that are readily convertible to known amounts of cash and which are subject to an insignificant risk of changes in value.
For the purpose of the statement of cash flows, cash and cash equivalents is as defined above, net of outstanding bank overdrafts. In the balance sheet, bank overdrafts are shown within borrowings in current liabilities.
(vII) trade receivables Trade Receivables are amounts due from
customers for goods sold or services performed in the ordinary course of business. Trade receivables are recognised initially at the amount of consideration that is unconditional unless they contain significant financing components, when they are recognised at fair value. The Group holds the trade receivables with the objective to collect the contractual cash flows and therefore measures them subsequently at amortised cost using the effective interest method, less loss allowance.
b) financial liabilities(I) measurement Financial liabilities are initially recognised at fair
value, reduced by transaction (in case of financial liability not at fair value through profit or loss), that are directly attributable to the issue of financial liability. After initial recognition, financial liabilities are measured at amortised cost using effective interest method. The effective interest rate is the rate that exactly discounts estimated future cash outflow (including all fees paid, transaction cost, and other premiums or discounts) through the expected life of the financial liability, or, where appropriate, a shorter period, to the net carrying amount on initial recognition. At the time of
Annual Report 2020-21 255Annual Report 2020-21254
NotesNotes annexed to and forming part of the consolidated balance sheet as at March 31, 2021and the consolidated statement of profit and loss for the year ended March 31, 2021(All amounts in Rupees million, unless otherwise stated)
initial recognition, there is no financial liability irrevocably designated as measured at fair value through profit or loss. Liabilities from finance lease agreements are measured at the lower of fair value of the leased asset or present value of minimum lease payments.
(II) derecognition A financial liability is derecognised when the
obligation under the liability is discharged or cancelled or expires. When an existing financial liability is replaced by another from the same lender on substantially different terms, or the terms of an existing liability are substantially modified, such an exchange or modification is treated as the de-recognition of the original liability and the recognition of a new liability. The difference in the respective carrying amounts is recognised in the statement of profit or loss.
(III) Borrowings Borrowings are initially recognised at fair
value, net of transaction costs incurred. Borrowings are subsequently measured at amortised cost. Any difference between the proceeds (net of transaction costs) and the redemption amount is recognised in profit or loss over the period of the borrowings using the effective interest method.
Fees paid on the establishment of loan facilities are recognised as transaction costs of the loan to the extent that it is probable that some or all of the facility will be drawn down. In this case, the fee is deferred until the draw down occurs. To the extent there is no evidence that it is probable that some or all of the facility will be drawn down, the fee is capitalised as a prepayment for liquidity services and amortised over the period of the facility to which it relates.
Borrowings are removed from the balance sheet when the obligation specified in the contract is discharged, cancelled or expired. The difference between the carrying amount of a financial liability that has been extinguished or transferred to another party and the consideration paid, including any non-cash assets transferred or liabilities assumed, is recognised in Statement of profit or loss as other income or other expenses (as applicable).
Where the terms of a financial liability are renegotiated and the entity issues equity instruments to a creditor to extinguish all or part
of the liability (debt for equity swap), a gain or loss is recognised in profit or loss, which is measured as the difference between the carrying amount of the financial liability and the fair value of the equity instruments issued.
Where there is a breach of a material provision of a long-term loan arrangement on or before the end of the reporting period with the effect that the liability becomes payable on demand on the reporting date, the entity does not classify the liability as current, if the lender agreed, after the reporting period and before the approval of the financial statements for issue, not to demand payment as a consequence of the breach.
(Iv) trade and other payables These amounts represent liabilities for goods and
services provided to the Group prior to the end of financial year which are unpaid. Trade and other payables are recognised initially at, their fair value, and subsequently measured at amortised cost using effective interest rate method.
Trade payables includes acceptances arrangements where operational suppliers of goods are paid by Banks while Group continues to recognise the liability till settlement with the Banks.
a) financial guarantee contracts Financial guarantee contracts are recognized
as a financial liability at the time the guarantee is issued. The liability is initially measured at fair value and subsequently at the higher of the amount determined in accordance with Ind AS 37 and amount initially recognized less cumulative amortization, where appropriate. The fair value of guarantee is determined as at the present value of difference in net cash flows between the contractual payments under the debt instrument and the payment that would be required without the guarantee, or the estimated amount that would be payable to a third party for assuming the obligation. Where guarantee in relation to loan or other payables of group companies are provided for no consideration, the fair values are accounted for as contributions and recognized as part of the cost of investment.
b) derivatives and hedging activities In order to hedge its exposure to foreign exchange
and interest rate, the Group enters into forward and interest rate swap contracts and other derivative financial instruments. The Group does not hold derivative financial instruments for speculative purposes.
Annual Report 2020-21 255Annual Report 2020-21254
Corporate Overview Statutory Reports Financial Statements
NotesNotes annexed to and forming part of the consolidated balance sheet as at March 31, 2021and the consolidated statement of profit and loss for the year ended March 31, 2021(All amounts in Rupees million, unless otherwise stated)
Derivatives are initially recognised at fair value on the date a derivative contract is entered into and are subsequently re-measured to their fair value at the end of each reporting period.
The accounting for subsequent changes in fair value depends on whether the derivative is designated as a hedging instrument, and if so, the nature of the item being hedged and the type of hedge relationship designated.
The Group designates their derivatives as hedges of foreign exchange risk associated with the cash flows of highly probable forecast transactions and variable interest rate risk associated with borrowings (cash flow hedges).
The Group documents at the inception of the hedging transaction the economic relationship between hedging instruments and hedged items including whether the hedging instrument is expected to offset changes in cash flows of hedged items. The Group documents its risk management objective and strategy for undertaking various hedge transactions at the inception of each hedge relationship.
The full fair value of a hedging derivative is classified as a non-current asset or liability when the remaining maturity of the hedged item is more than 12 months; it is classified as a current asset or liability when the remaining maturity of the hedged item is less than 12 months.
(i) Cash flow hedges that qualify for hedge accounting
The effective portion of changes in the fair value of derivatives that are designated and qualify as cash flow hedges is recognised in the other comprehensive income in cash flow hedging reserve within equity, limited to the cumulative change in fair value of the hedged item on a present value basis from the inception of the hedge. The gain or loss relating to the ineffective portion is recognised immediately in profit or loss, within other income or other expenses (as applicable).
When forward contracts are used to hedge forecast transactions, the Group generally designates the full change in fair value of the forward contract (including forward points) as the hedging instrument. In such cases, the gains and losses relating to the effective portion of the change in fair value of the entire forward contract are recognised in the cash flow hedging reserve within equity.
Amounts accumulated in equity are reclassified to profit or loss in the periods when the hedged item affects profit or loss.
When a hedging instrument expires, or is sold or terminated, or when a hedge no longer meets the criteria for hedge accounting, any cumulative deferred gain or loss in equity at that time remains in equity until the forecast transaction occurs. When the forecast transaction is no longer expected to occur, the cumulative gain or loss that was reported in equity is immediately reclassified to profit or loss within other income or other expenses (as applicable). If the hedge ratio for risk management purposes is no longer optimal but the risk management objective remains unchanged and the hedge continues to qualify for hedge accounting, the hedge relationship will be rebalanced by adjusting either the volume of the hedging instrument or the volume of the hedged item so that the hedge ratio aligns with the ratio used for risk management purposes. Any hedge ineffectiveness is calculated and accounted for in profit or loss at the time of the hedge relationship rebalancing.
(II) derivatives that are not designated as hedges The Group enters into certain derivative contracts
to hedge risks which are not designated as hedges. Such contracts are accounted for at fair value through profit or loss and are included in other income or other expenses (as applicable).
c) embedded derivatives Derivatives embedded in a host contract that
is an asset within the scope of Ind AS 109 are not separated. Financial assets with embedded derivatives are considered in their entirety when determining whether their cash flows are solely payment of principal and interest.
Derivatives embedded in all other host contract are separated only if the economic characteristics and risks of the embedded derivative are not closely related to the economic characteristics and risks of the host and are measured at fair value through profit or loss. Embedded derivatives closely related to the host contracts are not separated.
d) embedded foreign currency derivatives Embedded foreign currency derivatives are not
separated from the host contract if they are closely related. Such embedded derivatives are closely related to the host contract, if the host contract is not leveraged, does not contain any
Annual Report 2020-21 257Annual Report 2020-21256
NotesNotes annexed to and forming part of the consolidated balance sheet as at March 31, 2021and the consolidated statement of profit and loss for the year ended March 31, 2021(All amounts in Rupees million, unless otherwise stated)
option feature and requires payments in one of the following currencies:
• the functional currency of any substantial party to that contract;
• the currency in which the price of the related good or service that is acquired or delivered is routinely denominated in commercial transactions around the world; and
• a currency that is commonly used in contracts to purchase or sell non-financial items in the economic environment in which the transaction takes place (i.e. relatively liquid and stable currency)
Foreign currency embedded derivatives which do not meet the above criteria are separated and the derivative is accounted for at fair value through profit and loss. The Group currently does not have any such derivatives which are not closely related.
1.18 BorroWing Costs
General and specific borrowing costs that are directly attributable to the acquisition, construction or production of a qualifying asset are capitalised during the period of time that is required to complete and prepare the asset for its intended use or sale. Qualifying assets are assets that necessarily take a substantial period of time to get ready for their intended use or sale. Investment income earned on the temporary investment of specific borrowings pending their expenditure on qualifying assets is deducted from the borrowing costs eligible for capitalisation. Other borrowing costs are expensed in the period in which they are incurred.
1.19 eMPLoyee Benefits
a) short-term obligations Liabilities for wages and salaries, including
non-monetary benefits that are expected to be settled wholly within 12 months after the end of the period in which the employees render the related service are recognised in respect of employees’ services up to the end of the reporting period and are measured at the amounts expected to be paid when the liabilities are settled. The liabilities are presented as current employee benefit obligations in the balance sheet.
b) other long-term employee benefit obligations The liabilities for earned leave are not expected
to be settled wholly within 12 months after the end of the period in which the employees render
the related service. They are therefore measured as the present value of expected future payments to be made in respect of services provided by employees up to the end of the reporting period using the projected unit credit method. The benefits are discounted using the market yields at the end of the reporting period that have terms approximating to the terms of the related obligation. Remeasurements as a result of experience adjustments and changes in actuarial assumptions are recognised in profit or loss.
The obligations are presented as current liabilities in the balance sheet if the entity does not have an unconditional right to defer settlement for at least twelve months after the reporting period, regardless of when the actual settlement is expected to occur.
c) post-employment obligations The Group operates the following
post-employment schemes:
• defined benefit plans such as gratuity; and
• defined contribution plans such as provident fund and superannuation fund.
(i) Defined Benefit Plans gratuity obligations The liability or asset recognised in the balance
sheet in respect of defined benefit gratuity plans is the present value of the defined benefit obligation at the end of the reporting period less the fair value of plan assets. The defined benefit obligation is calculated annually by actuaries using the projected unit credit method.
The present value of the defined benefit obligation denominated in INR is determined by discounting the estimated future cash outflows by reference to market yields at the end of the reporting period on government bonds that have terms approximating to the terms of the related obligation.
The net interest cost is calculated by applying the discount rate to the net balance of the defined benefit obligation and the fair value of plan assets. This cost is included in employee benefit expense in the statement of profit and loss.
Remeasurement gains and losses arising from experience adjustments and changes in actuarial assumptions are recognised in the period in which they occur, directly in other comprehensive income. They are included in retained earnings in the
Annual Report 2020-21 257Annual Report 2020-21256
Corporate Overview Statutory Reports Financial Statements
NotesNotes annexed to and forming part of the consolidated balance sheet as at March 31, 2021and the consolidated statement of profit and loss for the year ended March 31, 2021(All amounts in Rupees million, unless otherwise stated)
statement of changes in equity and in the balance sheet. Remeasurements are not reclassified to profit and loss in the subsequent periods.
Changes in the present value of the defined benefit obligation resulting from plan amendments or curtailments are recognised immediately in profit or loss as past service cost.
(ii) Defined contribution plans(i) Provident Fund, Employee State Insurance
Corporation (ESIC), Pension Fund and other Social Security Funds
The Contribution towards provident fund, ESIC, Pension fund and other Social Security Funds for certain employees is made to the regulatory authorities where the Group has no further obligations. Such benefits are classified as Defined Contribution Schemes as the Group does not carry any further obligations apart from the contributions made on a monthly basis.
(ii) superannuation fund Contribution towards superannuation fund
for certain employees is made to SBI Life Insurance Group where the Group has no further obligations. Such benefits are classified as Defined Contribution Schemes as the Group does not carry any further obligations, apart from contribution made on monthly basis.
d) Bonus plan The Group recognises a liability and an expense for
bonuses. The Group recognises a provision where contractually obliged or where there is a past practice that has created a constructive obligation.
e) equity-settled share-based payments (esop) Equity-settled share-based payments to
employees are measured at the fair value of the options at the grant date.
The fair value of option at the grant date is expensed over the vesting period with a corresponding increase in equity as “Equity settled share based payments”. In case of forfeiture of unvested option, portion of amount already expensed is reversed. In a situation where the vested option forfeited or expires unexercised, the related balance standing to the credit of the “Equity settled share based payments” are transferred to the “Retained Earnings”.
When the options are exercised, the Company issues new equity shares of the Company of ` 5 each fully paid-up. The proceeds received and the related balance standing to credit of the Equity settled share based payments, are credited to share capital (nominal value) and Securities Premium.
1.20 ProVisions, Contingent LiABiLities And contIngent Assets
a) provisions Provisions for legal claims are recognised when
the Group has a present legal or constructive obligation as a result of past events, it is probable that an outflow of resources will be required to settle the obligation and the amount can be reliably estimated. Provisions are not recognised for future operating losses.
Where there are a number of similar obligations, the likelihood that an outflow will be required in settlement is determined by considering the class of obligations as a whole. A provision is recognised even if the likelihood of an outflow with respect to any one item included in the same class of obligations may be small. Provisions are measured at the present value of management’s best estimate of the expenditure required to settle the present obligation at the end of the reporting period. The discount rate used to determine the present value is a pre-tax rate that reflects current market assessments of the time value of money and the risks specific to the liability. The increase in the provision due to the passage of time is recognised as interest expense.
The measurement of provision for restructuring includes only direct expenditures arising from the restructuring, which are both necessarily entailed by the restructuring and not associated with the ongoing activities of the Group.
b) contingent liabilities Contingent liabilities are disclosed when there
is a possible obligation arising from past events the existence of which will be confirmed only by the occurrence or non-occurrence of one or more uncertain future events not wholly within the control of the Group or a present obligation that arises from past events where it is either not probable that an outflow of resources will be required to settle or a reliable estimate of the amount cannot be made.
Annual Report 2020-21 259Annual Report 2020-21258
NotesNotes annexed to and forming part of the consolidated balance sheet as at March 31, 2021and the consolidated statement of profit and loss for the year ended March 31, 2021(All amounts in Rupees million, unless otherwise stated)
c) contingent assets Contingent assets are disclosed, where an inflow
of economic benefits is probable.
1.21 ContriButeD equity
Equity shares are classified as equity. Incremental costs directly attributable to the issue of new shares or options are shown in equity as a deduction, net of tax, from the proceeds.
1.22 DiViDenDs
Provision is made for the amount of any dividend declared, being appropriately authorised and no longer at the discretion of the entity, on or before the end of the reporting period but not distributed at the end of the reporting period.
1.23 eArnings Per shAre
a) Basic earnings per share Basic earnings per share is calculated by dividing:
• the profit attributable to owners of the Group; and
• by the weighted average number of equity shares outstanding during the financial year, adjusted for bonus elements in equity shares issued during the year and excluding treasury shares.
b) diluted earnings per share Diluted earnings per share adjust the figures used
in the determination of basic earnings per share to take into account:
• the after income tax effect of interest and other financing costs associated with dilutive potential equity shares; and
• the weighted average number of additional equity shares that would have been outstanding assuming the conversion of all dilutive potential equity shares.
1.24 rounDing of AMounts
All amounts disclosed in the consolidated financial statements and notes have been rounded off to the nearest Rupees millions (upto two decimals), unless otherwise stated as per the requirement of Schedule III (Division II).
1.25 reCent ACCounting PronounCeMents
There are no other new updates or standards issued through the date of issuance of these financial statements that have not yet been adopted by the Group.
note 2: CritiCAL estiMAtes AnD juDgMents
The preparation of financial statements requires the use of accounting estimates which, by definition, will seldom equal the actual results. Management also needs to exercise judgment in applying the Group’s accounting policies. This note provides an overview of the areas that involved a higher degree of judgment or complexity, and of items which are more likely to be materially adjusted due to estimates and assumptions turning out to be different than those originally assessed. Detailed information about each of these estimates and judgments is included in relevant notes together with information about the basis of calculation for each affected line item in the financial statements.
critical estimates and judgmentsi) estimation of provisions and contingent
liabilities The Group exercises judgment in measuring and
recognising provisions and the exposures to contingent liabilities which is related to pending litigation or other outstanding claims. Judgement is necessary in assessing the likelihood that a pending claim will succeed, or a liability will arise, and to quantify the possible range of the financial settlement. Because of the inherent uncertainty in this evaluation process, actual liability may be different from the originally estimated as provision (Refer Note 40 and Note 45)
ii) estimation of useful life of Property, Plant and equipment
Property, plant and equipment represent a significant proportion of the asset base of the Group. The charge in respect of periodic depreciation is derived after determining an estimate of an asset’s expected useful life and the expected residual value at the end of its life. The useful lives and residual values of Group’s assets are determined by management at the time the asset is acquired and reviewed periodically, including at each financial year end. The lives are based on historical experience with similar assets as well as anticipation of future events, which may impact their life, such as changes in technology (Refer Note 1.10)
iii) estimation of provision for Inventory The Group writes down inventories to net
realisable value based on an estimate of the realisability of inventories. Write downs on inventories are recorded where events or changes in circumstances indicate that the balances may not realised. The identification of write-downs requires the use of estimates of net selling prices
Annual Report 2020-21 259Annual Report 2020-21258
Corporate Overview Statutory Reports Financial Statements
NotesNotes annexed to and forming part of the consolidated balance sheet as at March 31, 2021and the consolidated statement of profit and loss for the year ended March 31, 2021(All amounts in Rupees million, unless otherwise stated)
of the down-graded inventories. Where the expectation is different from the original estimate, such difference will impact the carrying value of inventories and write-downs of inventories in the periods in which such estimate has been changed.
Write-downs of inventories to net realisable value amounted to `35.65 (March 31, 2020: ` 664.96). These were recognised as an expense during the year and included in ‘cost of materials consumed’, ‘changes in inventories of work-in-progress and finished goods’ and ‘other expenses’ in statement of Profit and Loss.
iv) estimation of Defined Benefit obligation The present value of the defined benefit
obligations depends on a number of factors that are determined on an actuarial basis using a number of assumptions. The assumptions used in determining the net cost (income) for post employments plans include the discount rate. Any changes in these assumptions will impact the carrying amount of such obligations.
The Group determines the appropriate discount rate at the end of each year. This is the interest rate that should be used to determine the present value of estimated future cash outflows expected to be required to settle the defined benefit obligations. In determining the appropriate discount rate, the Group considers the interest rates of government bonds of maturity approximating the terms of the related plan liability (Refer Note 39).
v) estimated fair value of financial Instruments The fair value of financial instruments that are not
traded in an active market is determined using
valuation techniques. The Management uses its judgment to select a variety of methods and make assumptions that are mainly based on market conditions existing at the end of each reporting period (Refer Note 42)
vi) Impairment of carrying value of investments and recoverability of loans and other receivables in Investee companies
Determining whether the impairment of carrying value of investments in joint ventures, recoverability of loans to joint ventures including accrued interest and recoverability of other receivables from joint ventures are impaired requires an estimate of the value in use of investments, other receivables and loans (collectively the entities described above are referred as Investee Companies).
In considering the value in use, the board of directors of respective Investee Companies have anticipated the future sales prices, capacity utilisation of plants, operating margins, other expenses, availability of raw materials, discount rates, terminal growth rate, payment of taxes, working capital norms, inflation rate, growth rate of economy and other factors of the underlying businesses / operations of the Investee Companies. Any subsequent changes to the cash flows due to changes in the above mentioned factors could impact the carrying value of investments and recoverability of loans and other receivables in Investee Companies (Refer Note 7 and 51).
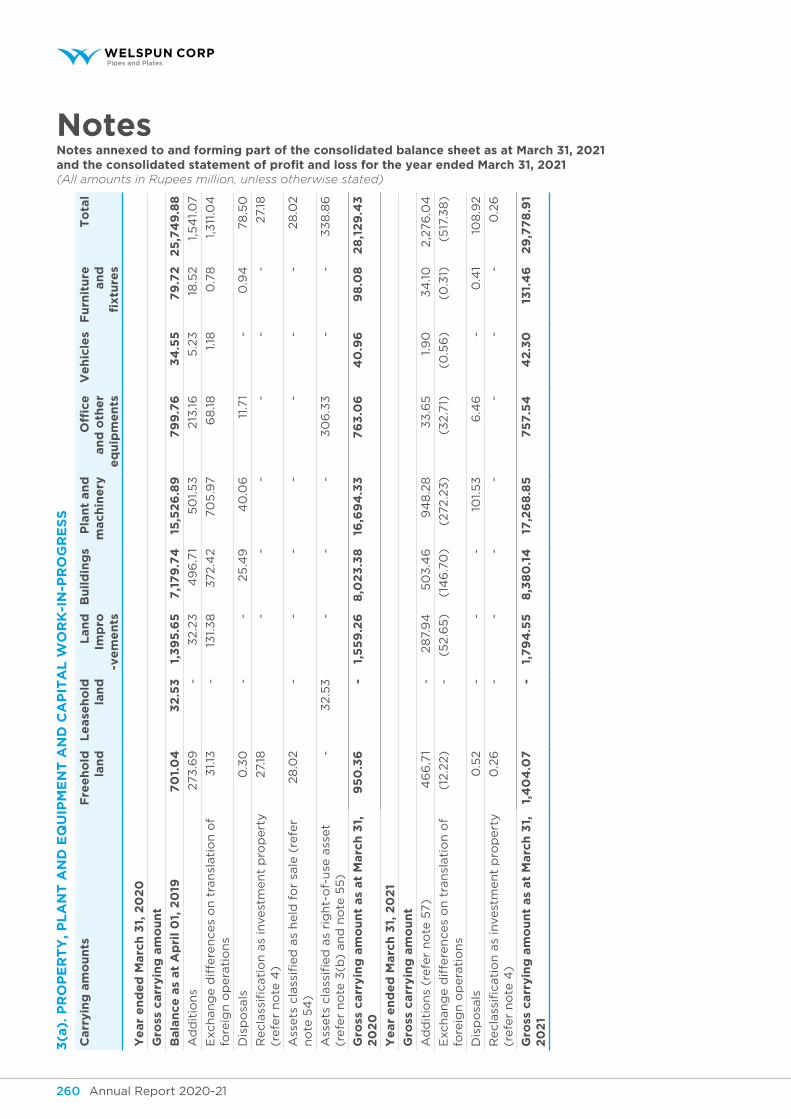
Annual Report 2020-21 261Annual Report 2020-21260
NotesNotes annexed to and forming part of the consolidated balance sheet as at March 31, 2021and the consolidated statement of profit and loss for the year ended March 31, 2021(All amounts in Rupees million, unless otherwise stated)
3(a
). P
ro
Pe
rt
y, P
LA
nt
An
D e
qu
iPM
en
t A
nD
CA
Pit
AL
Wo
rk
-in
-Pr
og
re
ss
carr
yin
g a
mo
un
tsf
ree
ho
ld
lan
d
le
ase
ho
ld
lan
d
lan
d
Imp
ro
-ve
me
nts
Bu
ild
ing
sp
lan
t an
d
mach
ine
ryo
ffice
an
d o
the
r e
qu
ipm
en
ts
ve
hic
les
fu
rnit
ure
an
d
fixtu
res
to
tal
ye
ar
en
de
d M
arc
h 3
1, 2
02
0
gro
ss c
arr
yin
g a
mo
un
t
Bala
nce
as
at
Ap
ril
01,
20
19 7
01.
04
3
2.5
3
1,3
95
.65
7
,17
9.7
4
15
,52
6.8
9
79
9.7
6
34
.55
7
9.7
2
25
,74
9.8
8
Ad
dit
ion
s 2
73
.69
-
3
2.2
3
49
6.7
1 5
01.
53
2
13.16
5
.23
1
8.5
2
1,5
41.0
7
Exch
an
ge d
iffe
ren
ces
on
tra
nsl
ati
on
of
fore
ign
op
era
tio
ns
31.13
-
1
31.
38
3
72.4
2
70
5.9
7
68
.18
1
.18
0
.78
1
,311
.04
Dis
po
sals
0.3
0
-
-
25
.49
4
0.0
6
11.7
1 -
0
.94
7
8.5
0
Recla
ssifi
cati
on
as
invest
men
t p
rop
ert
y
(refe
r n
ote
4)
27.
18
-
-
-
-
-
-
27.
18
Ass
ets
cla
ssifi
ed
as
held
fo
r sa
le (
refe
r n
ote
54
) 2
8.0
2
-
-
-
-
-
-
-
28
.02
Ass
ets
cla
ssifi
ed
as
rig
ht-
of-
use
ass
et
(refe
r n
ote
3(b
) an
d n
ote
55
) -
3
2.5
3
-
-
-
30
6.3
3
-
-
33
8.8
6
gro
ss c
arr
yin
g a
mo
un
t as
at
Marc
h 3
1,
20
20
95
0.3
6
-
1,5
59
.26
8
,02
3.3
8
16
,69
4.3
3
76
3.0
6
40
.96
9
8.0
8
28
,12
9.4
3
ye
ar
en
de
d M
arc
h 3
1, 2
02
1
gro
ss c
arr
yin
g a
mo
un
t
Ad
dit
ion
s (r
efe
r n
ote
57)
46
6.7
1 -
2
87.
94
5
03
.46
9
48
.28
3
3.6
5
1.9
0
34
.10
2
,276
.04
Exch
an
ge d
iffe
ren
ces
on
tra
nsl
ati
on
of
fore
ign
op
era
tio
ns
(12
.22)
-
(5
2.6
5)
(14
6.7
0)
(272.2
3)
(3
2.7
1) (
0.5
6)
(0
.31)
(5
17.3
8)
Dis
po
sals
0.5
2
-
-
-
10
1.5
3
6.4
6
- 0
.41
10
8.9
2
Recla
ssifi
cati
on
as
invest
men
t p
rop
ert
y
(refe
r n
ote
4)
0.2
6
- -
-
-
-
-
-
0
.26
gro
ss c
arr
yin
g a
mo
un
t as
at
Marc
h 3
1,
20
21
1,4
04
.07
-
1
,79
4.5
5
8,3
80
.14
1
7,2
68
.85
7
57
.54
4
2.3
0
13
1.4
6
29
,77
8.9
1
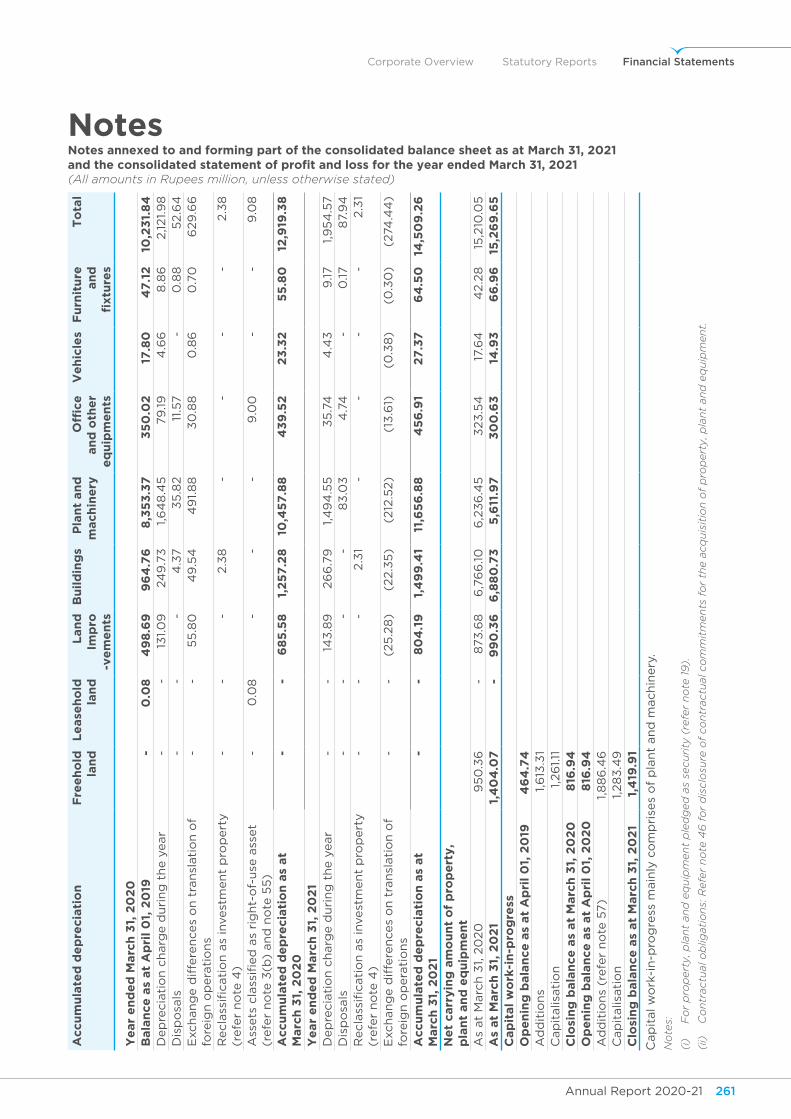
Annual Report 2020-21 261Annual Report 2020-21260
Corporate Overview Statutory Reports Financial Statements
NotesNotes annexed to and forming part of the consolidated balance sheet as at March 31, 2021and the consolidated statement of profit and loss for the year ended March 31, 2021(All amounts in Rupees million, unless otherwise stated)
Accu
mu
late
d d
ep
recia
tio
nf
ree
ho
ld
lan
d
le
ase
ho
ld
lan
d
lan
d
Imp
ro
-ve
me
nts
Bu
ild
ing
sp
lan
t an
d
mach
ine
ryo
ffice
an
d o
the
r e
qu
ipm
en
ts
ve
hic
les
fu
rnit
ure
an
d
fixtu
res
to
tal
ye
ar
en
de
d M
arc
h 3
1, 2
02
0B
ala
nce
as
at
Ap
ril
01,
20
19 -
0
.08
4
98
.69
9
64
.76
8
,35
3.3
7
35
0.0
2
17
.80
4
7.1
2
10
,23
1.8
4
Dep
recia
tio
n c
harg
e d
uri
ng
th
e y
ear
-
-
13
1.0
9
24
9.7
3
1,6
48
.45
7
9.19
4
.66
8
.86
2
,121.
98
D
isp
osa
ls -
-
-
4
.37
35
.82
11.
57
-
0.8
8
52.6
4
Exch
an
ge d
iffe
ren
ces
on
tra
nsl
ati
on
of
fore
ign
op
era
tio
ns
-
-
55
.80
4
9.5
4
49
1.8
8
30
.88
0
.86
0
.70
6
29
.66
Recla
ssifi
cati
on
as
invest
men
t p
rop
ert
y
(refe
r n
ote
4)
-
-
-
2.3
8
-
-
-
-
2.3
8
Ass
ets
cla
ssifi
ed
as
rig
ht-
of-
use
ass
et
(refe
r n
ote
3(b
) an
d n
ote
55
) -
0
.08
-
-
-
9
.00
-
-
9
.08
Accu
mu
late
d d
ep
recia
tio
n a
s at
Marc
h 3
1, 2
02
0 -
-
6
85
.58
1
,25
7.2
8
10
,45
7.8
8
43
9.5
2
23
.32
5
5.8
0
12
,919
.38
ye
ar
en
de
d M
arc
h 3
1, 2
02
1D
ep
recia
tio
n c
harg
e d
uri
ng
th
e y
ear
-
-
14
3.8
9
26
6.7
9
1,4
94
.55
3
5.7
4
4.4
3
9.17
1,9
54
.57
Dis
po
sals
-
-
-
-
83
.03
4
.74
-
0.17
87.
94
R
ecla
ssifi
cati
on
as
invest
men
t p
rop
ert
y
(refe
r n
ote
4)
-
-
-
2.3
1 -
-
-
-
2
.31
Exch
an
ge d
iffe
ren
ces
on
tra
nsl
ati
on
of
fore
ign
op
era
tio
ns
-
-
(25
.28
) (
22.3
5)
(212
.52)
(13
.61)
(0
.38
) (
0.3
0)
(274
.44
)
Accu
mu
late
d d
ep
recia
tio
n a
s at
Marc
h 3
1, 2
02
1 -
-
8
04
.19
1
,49
9.4
1 1
1,6
56
.88
4
56
.91
27
.37
6
4.5
0
14
,50
9.2
6
ne
t carr
yin
g a
mo
un
t o
f p
rop
ert
y,
pla
nt
an
d e
qu
ipm
en
tA
s at
Marc
h 3
1, 2
020
95
0.3
6
-
873
.68
6
,76
6.10
6
,23
6.4
5
323
.54
1
7.6
4
42.2
8
15
,210
.05
A
s at
Marc
h 3
1, 2
02
11,
40
4.0
7
-
99
0.3
6
6,8
80
.73
5
,611
.97
3
00
.63
1
4.9
3
66
.96
1
5,2
69
.65
c
ap
ital
wo
rk-i
n-p
rog
ress
op
en
ing
bala
nce
as
at
Ap
ril
01,
20
19 4
64
.74
A
dd
itio
ns
1,6
13.3
1 C
ap
italis
ati
on
1,2
61.11
C
losi
ng
bala
nce
as
at
Marc
h 3
1, 2
02
0 8
16.9
4
op
en
ing
bala
nce
as
at
Ap
ril
01,
20
20
816
.94
A
dd
itio
ns
(refe
r n
ote
57)
1,8
86
.46
C
ap
italis
ati
on
1,2
83
.49
C
losi
ng
bala
nce
as
at
Marc
h 3
1, 2
02
1 1
,419
.91
Cap
ital w
ork
-in
-pro
gre
ss m
ain
ly c
om
pri
ses
of
pla
nt
an
d m
ach
inery
.
No
tes:
(i)
Fo
r p
rop
ert
y, p
lan
t an
d e
qu
ipm
en
t p
led
ged
as
secu
rity
(re
fer
no
te 1
9).
(ii)
C
on
tractu
al o
blig
ati
on
s: R
efe
r n
ote
46
fo
r d
isclo
sure
of
co
ntr
actu
al co
mm
itm
en
ts f
or
the a
cq
uis
itio
n o
f p
rop
ert
y, p
lan
t an
d e
qu
ipm
en
t.
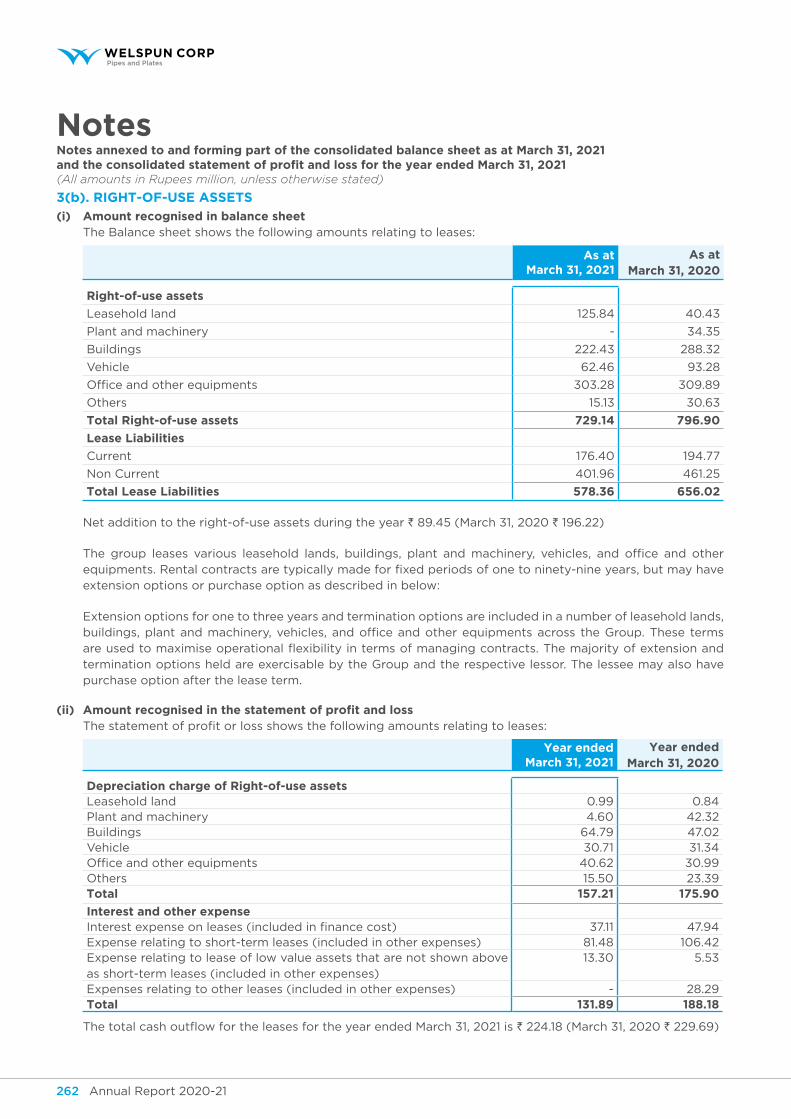
Annual Report 2020-21 263Annual Report 2020-21262
NotesNotes annexed to and forming part of the consolidated balance sheet as at March 31, 2021and the consolidated statement of profit and loss for the year ended March 31, 2021(All amounts in Rupees million, unless otherwise stated)
3(b). RIght-of-use Assets
(i) Amount recognised in balance sheet The Balance sheet shows the following amounts relating to leases:
As at March 31, 2021
As at March 31, 2020
Right-of-use assets
Leasehold land 125.84 40.43
Plant and machinery - 34.35
Buildings 222.43 288.32
Vehicle 62.46 93.28
Office and other equipments 303.28 309.89
Others 15.13 30.63
total Right-of-use assets 729.14 796.90
lease liabilities
Current 176.40 194.77
Non Current 401.96 461.25
total lease liabilities 578.36 656.02
Net addition to the right-of-use assets during the year ` 89.45 (March 31, 2020 ` 196.22)
The group leases various leasehold lands, buildings, plant and machinery, vehicles, and office and other equipments. Rental contracts are typically made for fixed periods of one to ninety-nine years, but may have extension options or purchase option as described in below:
Extension options for one to three years and termination options are included in a number of leasehold lands, buildings, plant and machinery, vehicles, and office and other equipments across the Group. These terms are used to maximise operational flexibility in terms of managing contracts. The majority of extension and termination options held are exercisable by the Group and the respective lessor. The lessee may also have purchase option after the lease term.
(ii) Amount recognised in the statement of profit and loss The statement of profit or loss shows the following amounts relating to leases:
year ended March 31, 2021
year ended March 31, 2020
depreciation charge of Right-of-use assetsLeasehold land 0.99 0.84 Plant and machinery 4.60 42.32 Buildings 64.79 47.02 Vehicle 30.71 31.34 Office and other equipments 40.62 30.99 Others 15.50 23.39 total 157.21 175.90
Interest and other expenseInterest expense on leases (included in finance cost) 37.11 47.94Expense relating to short-term leases (included in other expenses) 81.48 106.42Expense relating to lease of low value assets that are not shown above as short-term leases (included in other expenses)
13.30 5.53
Expenses relating to other leases (included in other expenses) - 28.29total 131.89 188.18
The total cash outflow for the leases for the year ended March 31, 2021 is ` 224.18 (March 31, 2020 ` 229.69)
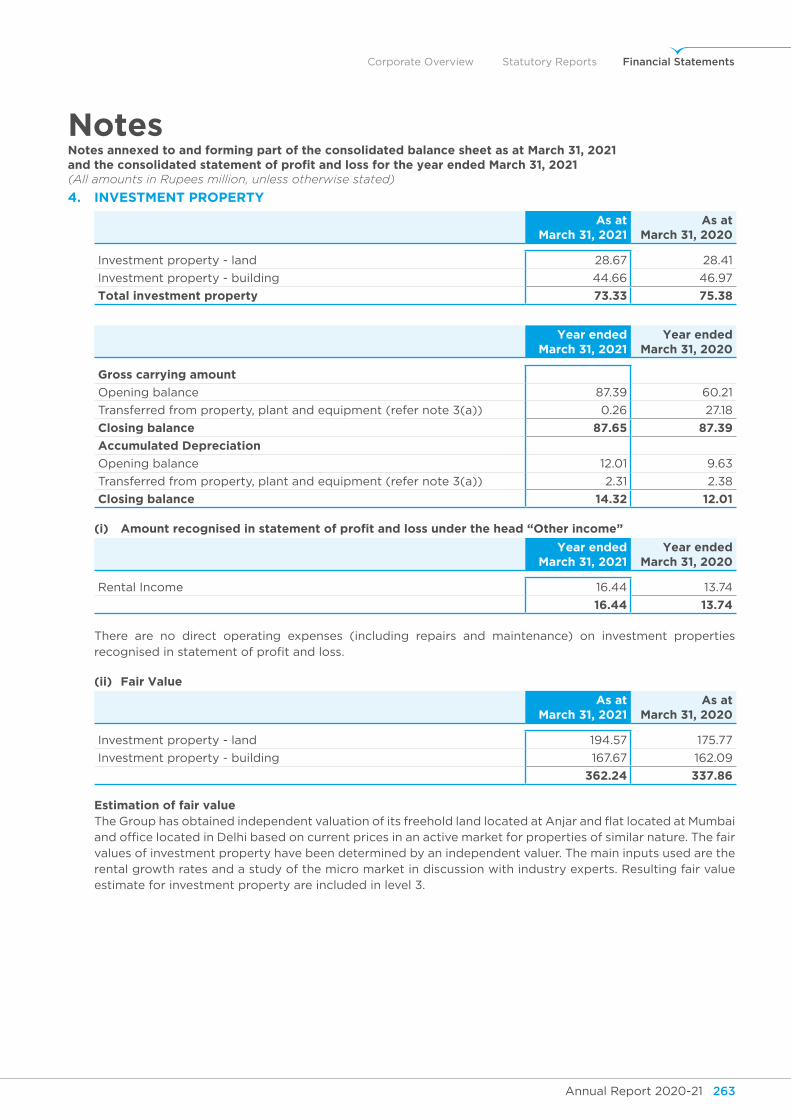
Annual Report 2020-21 263Annual Report 2020-21262
Corporate Overview Statutory Reports Financial Statements
NotesNotes annexed to and forming part of the consolidated balance sheet as at March 31, 2021and the consolidated statement of profit and loss for the year ended March 31, 2021(All amounts in Rupees million, unless otherwise stated)
4. Investment pRopeRty
As at March 31, 2021
As at March 31, 2020
Investment property - land 28.67 28.41
Investment property - building 44.66 46.97
total investment property 73.33 75.38
year ended March 31, 2021
year ended March 31, 2020
gross carrying amount
Opening balance 87.39 60.21
Transferred from property, plant and equipment (refer note 3(a)) 0.26 27.18
closing balance 87.65 87.39
Accumulated depreciation
Opening balance 12.01 9.63
Transferred from property, plant and equipment (refer note 3(a)) 2.31 2.38
closing balance 14.32 12.01
(i) Amount recognised in statement of profit and loss under the head “other income”
year ended March 31, 2021
year ended March 31, 2020
Rental Income 16.44 13.74
16.44 13.74
There are no direct operating expenses (including repairs and maintenance) on investment properties recognised in statement of profit and loss.
(ii) fair value
As at March 31, 2021
As at March 31, 2020
Investment property - land 194.57 175.77
Investment property - building 167.67 162.09
362.24 337.86
estimation of fair value The Group has obtained independent valuation of its freehold land located at Anjar and flat located at Mumbai
and office located in Delhi based on current prices in an active market for properties of similar nature. The fair values of investment property have been determined by an independent valuer. The main inputs used are the rental growth rates and a study of the micro market in discussion with industry experts. Resulting fair value estimate for investment property are included in level 3.
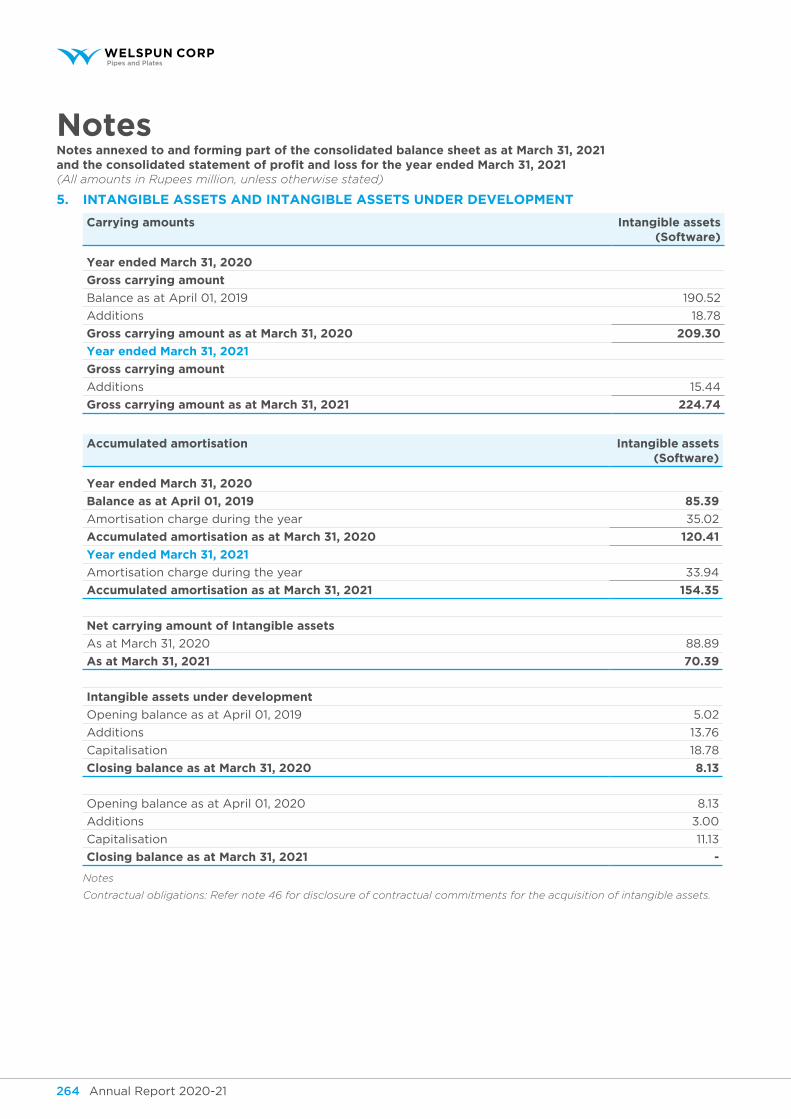
Annual Report 2020-21 265Annual Report 2020-21264
NotesNotes annexed to and forming part of the consolidated balance sheet as at March 31, 2021and the consolidated statement of profit and loss for the year ended March 31, 2021(All amounts in Rupees million, unless otherwise stated)
5. intAngiBLe Assets AnD intAngiBLe Assets unDer DeVeLoPMent
carrying amounts Intangible assets (software)
year ended March 31, 2020
gross carrying amount
Balance as at April 01, 2019 190.52
Additions 18.78
gross carrying amount as at March 31, 2020 209.30
year ended March 31, 2021
gross carrying amount
Additions 15.44
gross carrying amount as at March 31, 2021 224.74
Accumulated amortisation Intangible assets (software)
year ended March 31, 2020
Balance as at April 01, 2019 85.39
Amortisation charge during the year 35.02
Accumulated amortisation as at March 31, 2020 120.41
year ended March 31, 2021
Amortisation charge during the year 33.94
Accumulated amortisation as at March 31, 2021 154.35
net carrying amount of Intangible assets
As at March 31, 2020 88.89
As at March 31, 2021 70.39
Intangible assets under development
Opening balance as at April 01, 2019 5.02
Additions 13.76
Capitalisation 18.78
Closing balance as at March 31, 2020 8.13
Opening balance as at April 01, 2020 8.13
Additions 3.00
Capitalisation 11.13
Closing balance as at March 31, 2021 -
Notes
Contractual obligations: Refer note 46 for disclosure of contractual commitments for the acquisition of intangible assets.
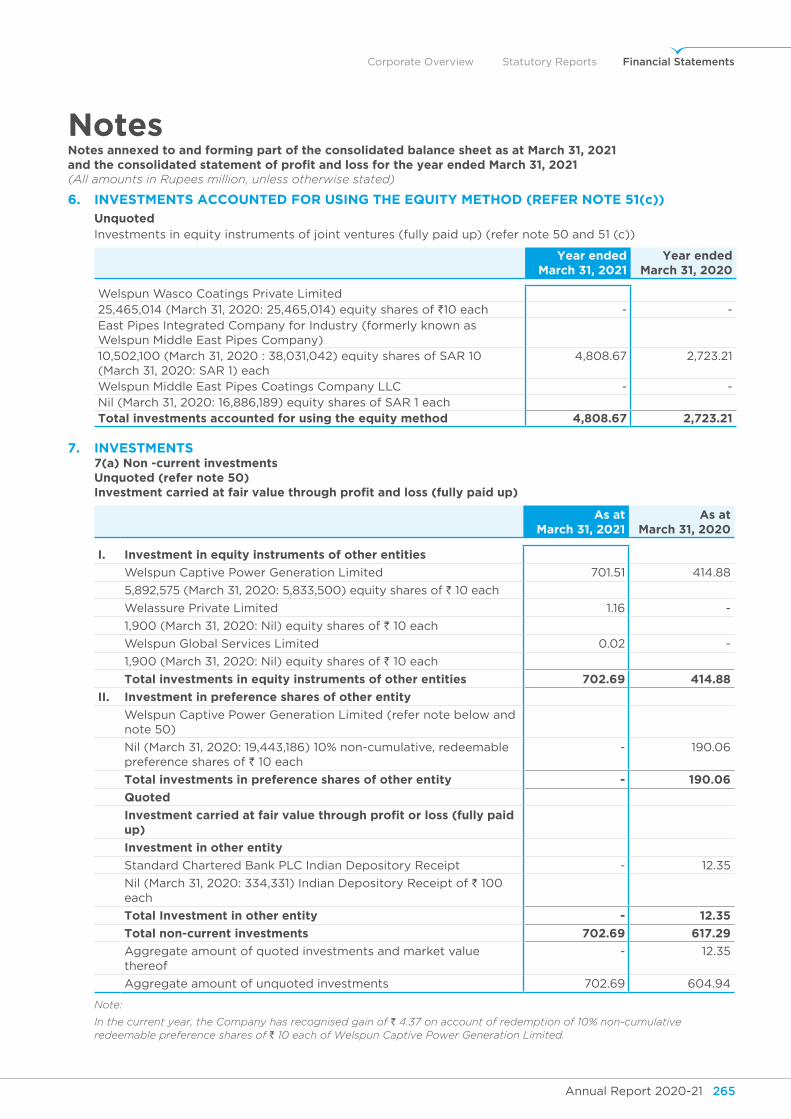
Annual Report 2020-21 265Annual Report 2020-21264
Corporate Overview Statutory Reports Financial Statements
NotesNotes annexed to and forming part of the consolidated balance sheet as at March 31, 2021and the consolidated statement of profit and loss for the year ended March 31, 2021(All amounts in Rupees million, unless otherwise stated)
6. inVestMents ACCounteD for using the equity MethoD (refer note 51(c))
unquoted Investments in equity instruments of joint ventures (fully paid up) (refer note 50 and 51 (c))
year ended March 31, 2021
year ended March 31, 2020
Welspun Wasco Coatings Private Limited 25,465,014 (March 31, 2020: 25,465,014) equity shares of `10 each - -East Pipes Integrated Company for Industry (formerly known as Welspun Middle East Pipes Company)
10,502,100 (March 31, 2020 : 38,031,042) equity shares of SAR 10 (March 31, 2020: SAR 1) each
4,808.67 2,723.21
Welspun Middle East Pipes Coatings Company LLC - - Nil (March 31, 2020: 16,886,189) equity shares of SAR 1 eachtotal investments accounted for using the equity method 4,808.67 2,723.21
7. inVestMents 7(a) non -current investments unquoted (refer note 50) investment carried at fair value through profit and loss (fully paid up)
As at March 31, 2021
As at March 31, 2020
I. Investment in equity instruments of other entities
Welspun Captive Power Generation Limited 701.51 414.88
5,892,575 (March 31, 2020: 5,833,500) equity shares of ` 10 each
Welassure Private Limited 1.16 -
1,900 (March 31, 2020: Nil) equity shares of ` 10 each
Welspun Global Services Limited 0.02 -
1,900 (March 31, 2020: Nil) equity shares of ` 10 each
total investments in equity instruments of other entities 702.69 414.88
II. Investment in preference shares of other entity
Welspun Captive Power Generation Limited (refer note below and note 50)
Nil (March 31, 2020: 19,443,186) 10% non-cumulative, redeemable preference shares of ` 10 each
- 190.06
total investments in preference shares of other entity - 190.06
Quoted
investment carried at fair value through profit or loss (fully paid up)
Investment in other entity
Standard Chartered Bank PLC Indian Depository Receipt - 12.35
Nil (March 31, 2020: 334,331) Indian Depository Receipt of ` 100 each
total Investment in other entity - 12.35
total non-current investments 702.69 617.29
Aggregate amount of quoted investments and market value thereof
- 12.35
Aggregate amount of unquoted investments 702.69 604.94
Note:
In the current year, the Company has recognised gain of ` 4.37 on account of redemption of 10% non-cumulative redeemable preference shares of ` 10 each of Welspun Captive Power Generation Limited.
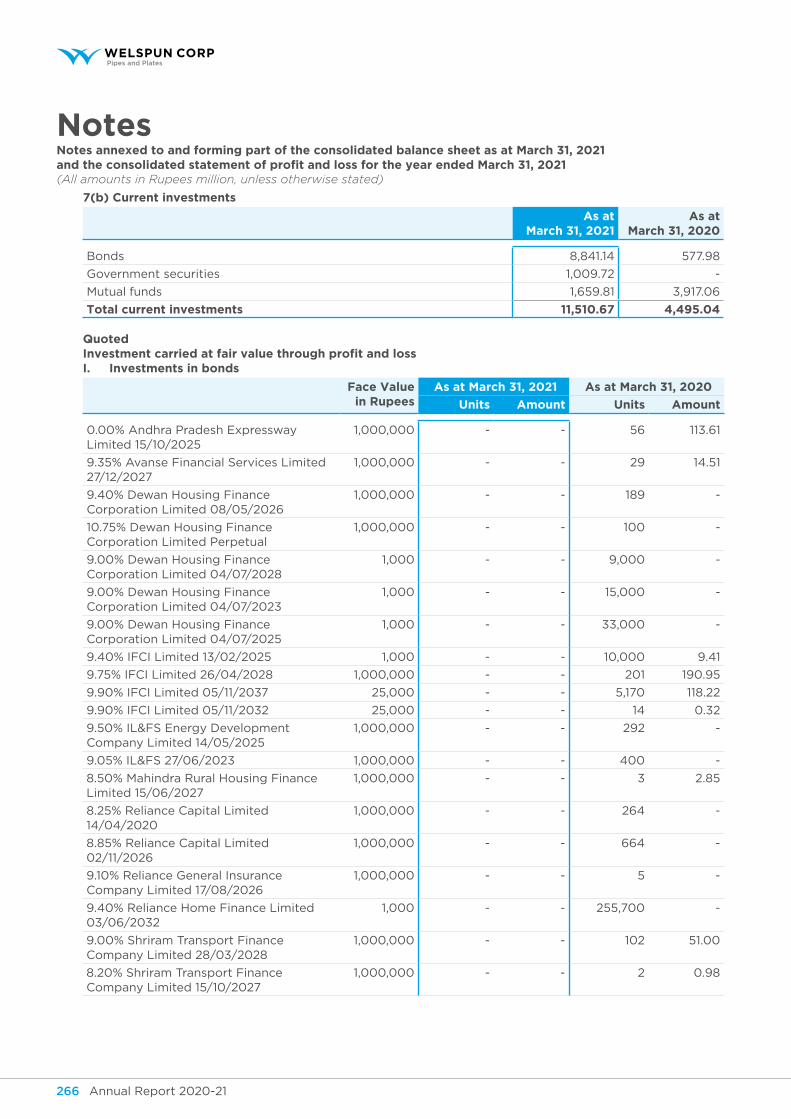
Annual Report 2020-21 267Annual Report 2020-21266
NotesNotes annexed to and forming part of the consolidated balance sheet as at March 31, 2021and the consolidated statement of profit and loss for the year ended March 31, 2021(All amounts in Rupees million, unless otherwise stated)
7(b) Current investments
As at March 31, 2021
As at March 31, 2020
Bonds 8,841.14 577.98
Government securities 1,009.72 -
Mutual funds 1,659.81 3,917.06
total current investments 11,510.67 4,495.04
Quoted investment carried at fair value through profit and loss I. Investments in bonds
face value in Rupees
As at March 31, 2021 As at March 31, 2020
units Amount units Amount
0.00% Andhra Pradesh Expressway Limited 15/10/2025
1,000,000 - - 56 113.61
9.35% Avanse Financial Services Limited 27/12/2027
1,000,000 - - 29 14.51
9.40% Dewan Housing Finance Corporation Limited 08/05/2026
1,000,000 - - 189 -
10.75% Dewan Housing Finance Corporation Limited Perpetual
1,000,000 - - 100 -
9.00% Dewan Housing Finance Corporation Limited 04/07/2028
1,000 - - 9,000 -
9.00% Dewan Housing Finance Corporation Limited 04/07/2023
1,000 - - 15,000 -
9.00% Dewan Housing Finance Corporation Limited 04/07/2025
1,000 - - 33,000 -
9.40% IFCI Limited 13/02/2025 1,000 - - 10,000 9.41
9.75% IFCI Limited 26/04/2028 1,000,000 - - 201 190.95
9.90% IFCI Limited 05/11/2037 25,000 - - 5,170 118.22
9.90% IFCI Limited 05/11/2032 25,000 - - 14 0.32
9.50% IL&FS Energy Development Company Limited 14/05/2025
1,000,000 - - 292 -
9.05% IL&FS 27/06/2023 1,000,000 - - 400 -
8.50% Mahindra Rural Housing Finance Limited 15/06/2027
1,000,000 - - 3 2.85
8.25% Reliance Capital Limited 14/04/2020
1,000,000 - - 264 -
8.85% Reliance Capital Limited 02/11/2026
1,000,000 - - 664 -
9.10% Reliance General Insurance Company Limited 17/08/2026
1,000,000 - - 5 -
9.40% Reliance Home Finance Limited 03/06/2032
1,000 - - 255,700 -
9.00% Shriram Transport Finance Company Limited 28/03/2028
1,000,000 - - 102 51.00
8.20% Shriram Transport Finance Company Limited 15/10/2027
1,000,000 - - 2 0.98
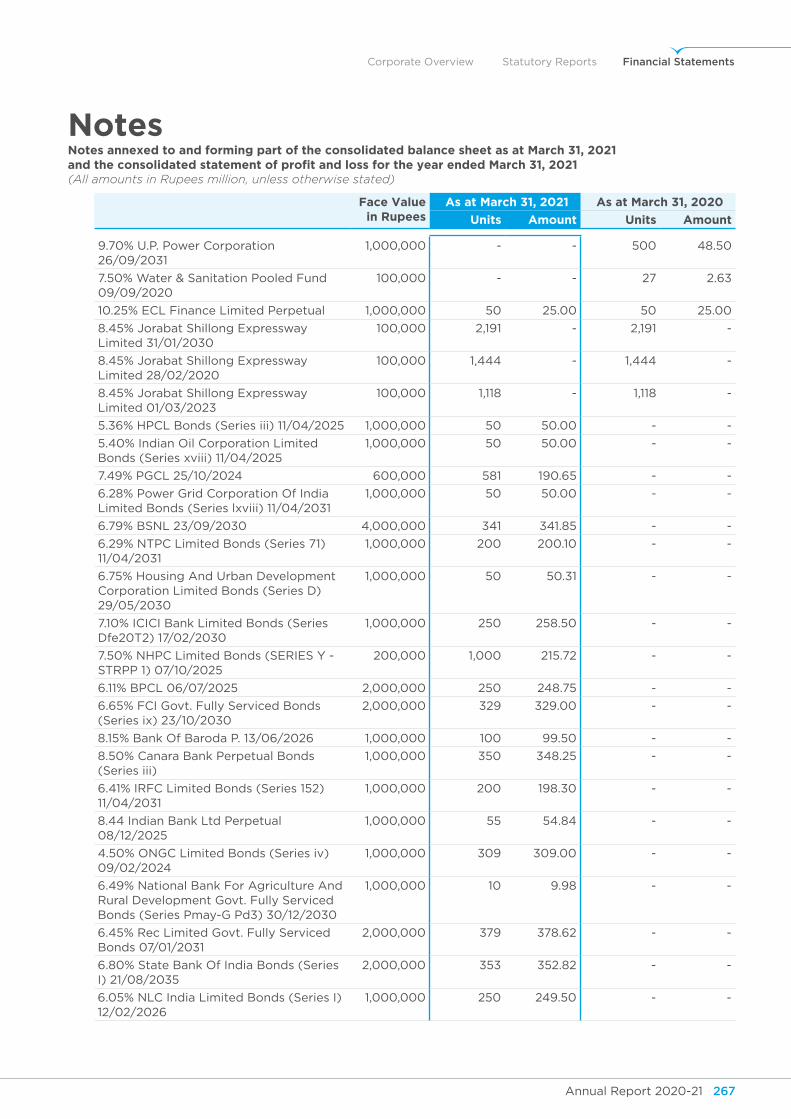
Annual Report 2020-21 267Annual Report 2020-21266
Corporate Overview Statutory Reports Financial Statements
NotesNotes annexed to and forming part of the consolidated balance sheet as at March 31, 2021and the consolidated statement of profit and loss for the year ended March 31, 2021(All amounts in Rupees million, unless otherwise stated)
face value in Rupees
As at March 31, 2021 As at March 31, 2020
units Amount units Amount
9.70% U.P. Power Corporation 26/09/2031
1,000,000 - - 500 48.50
7.50% Water & Sanitation Pooled Fund 09/09/2020
100,000 - - 27 2.63
10.25% ECL Finance Limited Perpetual 1,000,000 50 25.00 50 25.00
8.45% Jorabat Shillong Expressway Limited 31/01/2030
100,000 2,191 - 2,191 -
8.45% Jorabat Shillong Expressway Limited 28/02/2020
100,000 1,444 - 1,444 -
8.45% Jorabat Shillong Expressway Limited 01/03/2023
100,000 1,118 - 1,118 -
5.36% HPCL Bonds (Series iii) 11/04/2025 1,000,000 50 50.00 - -
5.40% Indian Oil Corporation Limited Bonds (Series xviii) 11/04/2025
1,000,000 50 50.00 - -
7.49% PGCL 25/10/2024 600,000 581 190.65 - -
6.28% Power Grid Corporation Of India Limited Bonds (Series lxviii) 11/04/2031
1,000,000 50 50.00 - -
6.79% BSNL 23/09/2030 4,000,000 341 341.85 - -
6.29% NTPC Limited Bonds (Series 71) 11/04/2031
1,000,000 200 200.10 - -
6.75% Housing And Urban Development Corporation Limited Bonds (Series D) 29/05/2030
1,000,000 50 50.31 - -
7.10% ICICI Bank Limited Bonds (Series Dfe20T2) 17/02/2030
1,000,000 250 258.50 - -
7.50% NHPC Limited Bonds (SERIES Y - STRPP 1) 07/10/2025
200,000 1,000 215.72 - -
6.11% BPCL 06/07/2025 2,000,000 250 248.75 - -
6.65% FCI Govt. Fully Serviced Bonds (Series ix) 23/10/2030
2,000,000 329 329.00 - -
8.15% Bank Of Baroda P. 13/06/2026 1,000,000 100 99.50 - -
8.50% Canara Bank Perpetual Bonds (Series iii)
1,000,000 350 348.25 - -
6.41% IRFC Limited Bonds (Series 152) 11/04/2031
1,000,000 200 198.30 - -
8.44 Indian Bank Ltd Perpetual 08/12/2025
1,000,000 55 54.84 - -
4.50% ONGC Limited Bonds (Series iv) 09/02/2024
1,000,000 309 309.00 - -
6.49% National Bank For Agriculture And Rural Development Govt. Fully Serviced Bonds (Series Pmay-G Pd3) 30/12/2030
1,000,000 10 9.98 - -
6.45% Rec Limited Govt. Fully Serviced Bonds 07/01/2031
2,000,000 379 378.62 - -
6.80% State Bank Of India Bonds (Series I) 21/08/2035
2,000,000 353 352.82 - -
6.05% NLC India Limited Bonds (Series I) 12/02/2026
1,000,000 250 249.50 - -
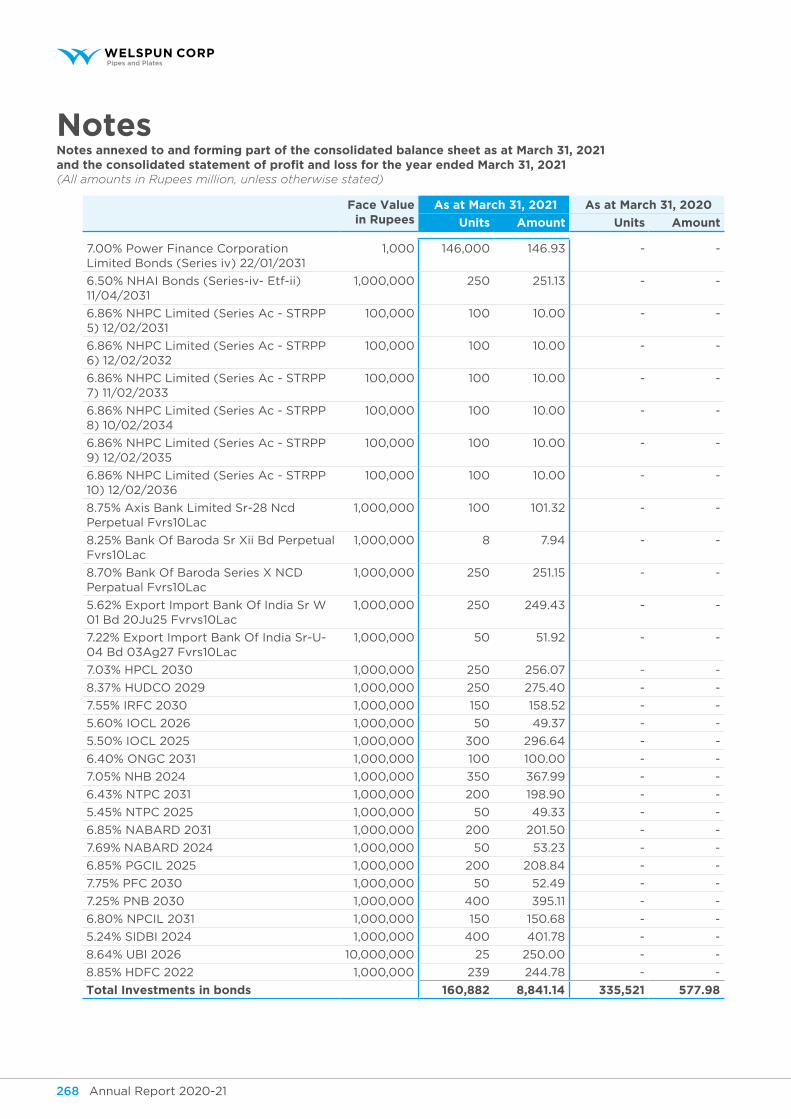
Annual Report 2020-21 269Annual Report 2020-21268
NotesNotes annexed to and forming part of the consolidated balance sheet as at March 31, 2021and the consolidated statement of profit and loss for the year ended March 31, 2021(All amounts in Rupees million, unless otherwise stated)
face value in Rupees
As at March 31, 2021 As at March 31, 2020
units Amount units Amount
7.00% Power Finance Corporation Limited Bonds (Series iv) 22/01/2031
1,000 146,000 146.93 - -
6.50% NHAI Bonds (Series-iv- Etf-ii) 11/04/2031
1,000,000 250 251.13 - -
6.86% NHPC Limited (Series Ac - STRPP 5) 12/02/2031
100,000 100 10.00 - -
6.86% NHPC Limited (Series Ac - STRPP 6) 12/02/2032
100,000 100 10.00 - -
6.86% NHPC Limited (Series Ac - STRPP 7) 11/02/2033
100,000 100 10.00 - -
6.86% NHPC Limited (Series Ac - STRPP 8) 10/02/2034
100,000 100 10.00 - -
6.86% NHPC Limited (Series Ac - STRPP 9) 12/02/2035
100,000 100 10.00 - -
6.86% NHPC Limited (Series Ac - STRPP 10) 12/02/2036
100,000 100 10.00 - -
8.75% Axis Bank Limited Sr-28 Ncd Perpetual Fvrs10Lac
1,000,000 100 101.32 - -
8.25% Bank Of Baroda Sr Xii Bd Perpetual Fvrs10Lac
1,000,000 8 7.94 - -
8.70% Bank Of Baroda Series X NCD Perpatual Fvrs10Lac
1,000,000 250 251.15 - -
5.62% Export Import Bank Of India Sr W 01 Bd 20Ju25 Fvrvs10Lac
1,000,000 250 249.43 - -
7.22% Export Import Bank Of India Sr-U-04 Bd 03Ag27 Fvrs10Lac
1,000,000 50 51.92 - -
7.03% HPCL 2030 1,000,000 250 256.07 - -
8.37% HUDCO 2029 1,000,000 250 275.40 - -
7.55% IRFC 2030 1,000,000 150 158.52 - -
5.60% IOCL 2026 1,000,000 50 49.37 - -
5.50% IOCL 2025 1,000,000 300 296.64 - -
6.40% ONGC 2031 1,000,000 100 100.00 - -
7.05% NHB 2024 1,000,000 350 367.99 - -
6.43% NTPC 2031 1,000,000 200 198.90 - -
5.45% NTPC 2025 1,000,000 50 49.33 - -
6.85% NABARD 2031 1,000,000 200 201.50 - -
7.69% NABARD 2024 1,000,000 50 53.23 - -
6.85% PGCIL 2025 1,000,000 200 208.84 - -
7.75% PFC 2030 1,000,000 50 52.49 - -
7.25% PNB 2030 1,000,000 400 395.11 - -
6.80% NPCIL 2031 1,000,000 150 150.68 - -
5.24% SIDBI 2024 1,000,000 400 401.78 - -
8.64% UBI 2026 10,000,000 25 250.00 - -
8.85% HDFC 2022 1,000,000 239 244.78 - -
total Investments in bonds 160,882 8,841.14 335,521 577.98
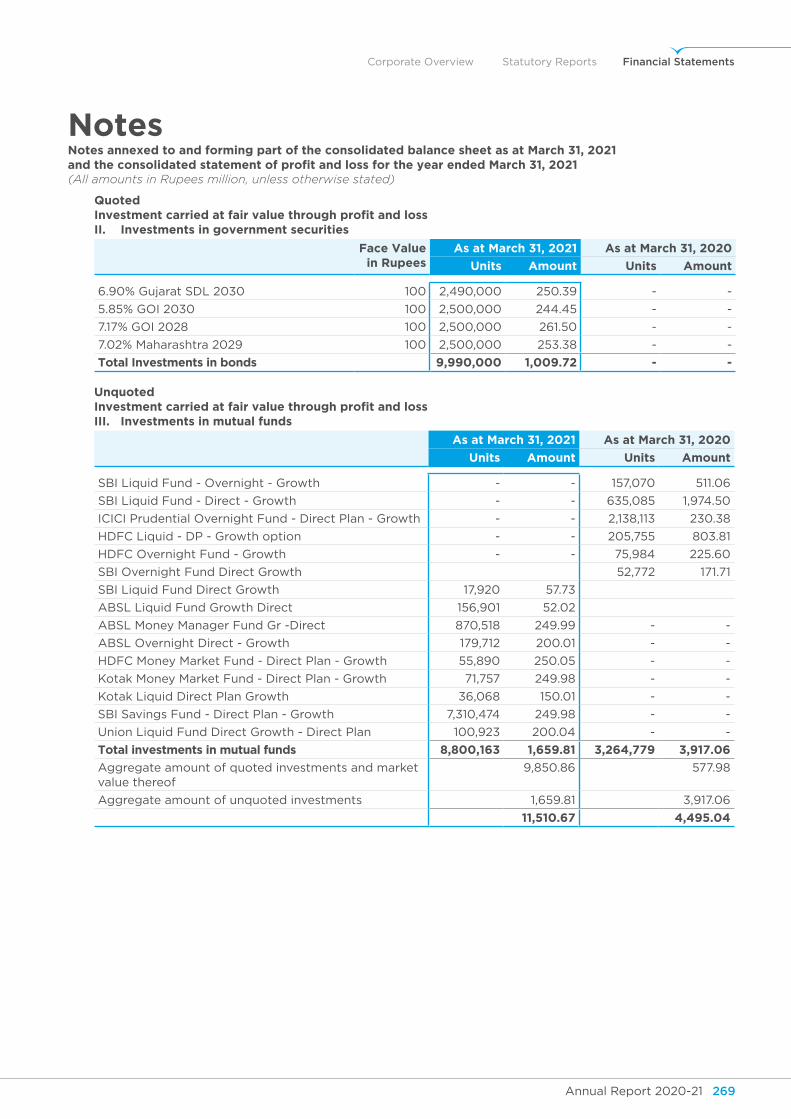
Annual Report 2020-21 269Annual Report 2020-21268
Corporate Overview Statutory Reports Financial Statements
NotesNotes annexed to and forming part of the consolidated balance sheet as at March 31, 2021and the consolidated statement of profit and loss for the year ended March 31, 2021(All amounts in Rupees million, unless otherwise stated)
Quoted investment carried at fair value through profit and loss II. Investments in government securities
face value in Rupees
As at March 31, 2021 As at March 31, 2020
units Amount units Amount
6.90% Gujarat SDL 2030 100 2,490,000 250.39 - -
5.85% GOI 2030 100 2,500,000 244.45 - -
7.17% GOI 2028 100 2,500,000 261.50 - -
7.02% Maharashtra 2029 100 2,500,000 253.38 - -
total Investments in bonds 9,990,000 1,009.72 - -
unquoted investment carried at fair value through profit and loss III. Investments in mutual funds
As at March 31, 2021 As at March 31, 2020
units Amount units Amount
SBI Liquid Fund - Overnight - Growth - - 157,070 511.06
SBI Liquid Fund - Direct - Growth - - 635,085 1,974.50
ICICI Prudential Overnight Fund - Direct Plan - Growth - - 2,138,113 230.38
HDFC Liquid - DP - Growth option - - 205,755 803.81
HDFC Overnight Fund - Growth - - 75,984 225.60
SBI Overnight Fund Direct Growth 52,772 171.71
SBI Liquid Fund Direct Growth 17,920 57.73
ABSL Liquid Fund Growth Direct 156,901 52.02
ABSL Money Manager Fund Gr -Direct 870,518 249.99 - -
ABSL Overnight Direct - Growth 179,712 200.01 - -
HDFC Money Market Fund - Direct Plan - Growth 55,890 250.05 - -
Kotak Money Market Fund - Direct Plan - Growth 71,757 249.98 - -
Kotak Liquid Direct Plan Growth 36,068 150.01 - -
SBI Savings Fund - Direct Plan - Growth 7,310,474 249.98 - -
Union Liquid Fund Direct Growth - Direct Plan 100,923 200.04 - -
total investments in mutual funds 8,800,163 1,659.81 3,264,779 3,917.06
Aggregate amount of quoted investments and market value thereof
9,850.86 577.98
Aggregate amount of unquoted investments 1,659.81 3,917.06
11,510.67 4,495.04
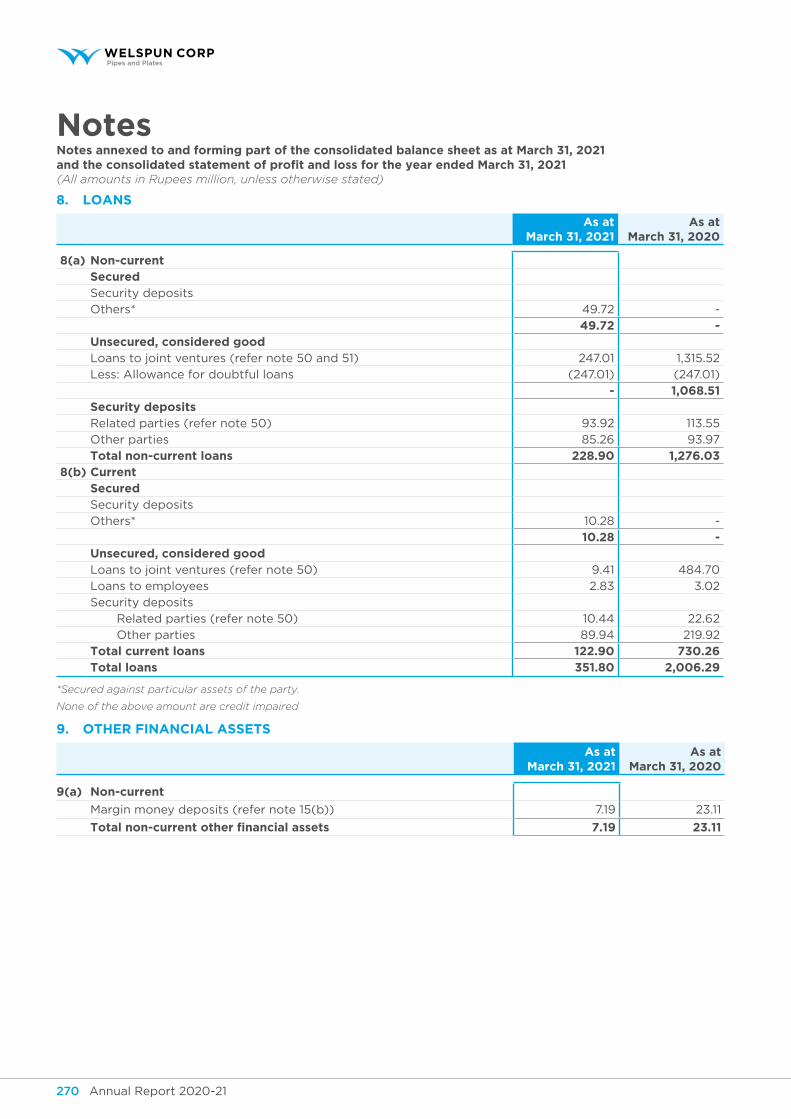
Annual Report 2020-21 271Annual Report 2020-21270
NotesNotes annexed to and forming part of the consolidated balance sheet as at March 31, 2021and the consolidated statement of profit and loss for the year ended March 31, 2021(All amounts in Rupees million, unless otherwise stated)
8. LoAns
As at March 31, 2021
As at March 31, 2020
8(a) non-currentsecuredSecurity deposits
Others* 49.72 -
49.72 - unsecured, considered goodLoans to joint ventures (refer note 50 and 51) 247.01 1,315.52
Less: Allowance for doubtful loans (247.01) (247.01)
- 1,068.51 security depositsRelated parties (refer note 50) 93.92 113.55
Other parties 85.26 93.97
total non-current loans 228.90 1,276.03 8(b) current
securedSecurity deposits
Others* 10.28 -
10.28 - unsecured, considered goodLoans to joint ventures (refer note 50) 9.41 484.70
Loans to employees 2.83 3.02
Security deposits
Related parties (refer note 50) 10.44 22.62
Other parties 89.94 219.92
total current loans 122.90 730.26 total loans 351.80 2,006.29
*Secured against particular assets of the party.
None of the above amount are credit impaired
9. other finAnCiAL Assets
As at March 31, 2021
As at March 31, 2020
9(a) non-current
Margin money deposits (refer note 15(b)) 7.19 23.11
total non-current other financial assets 7.19 23.11
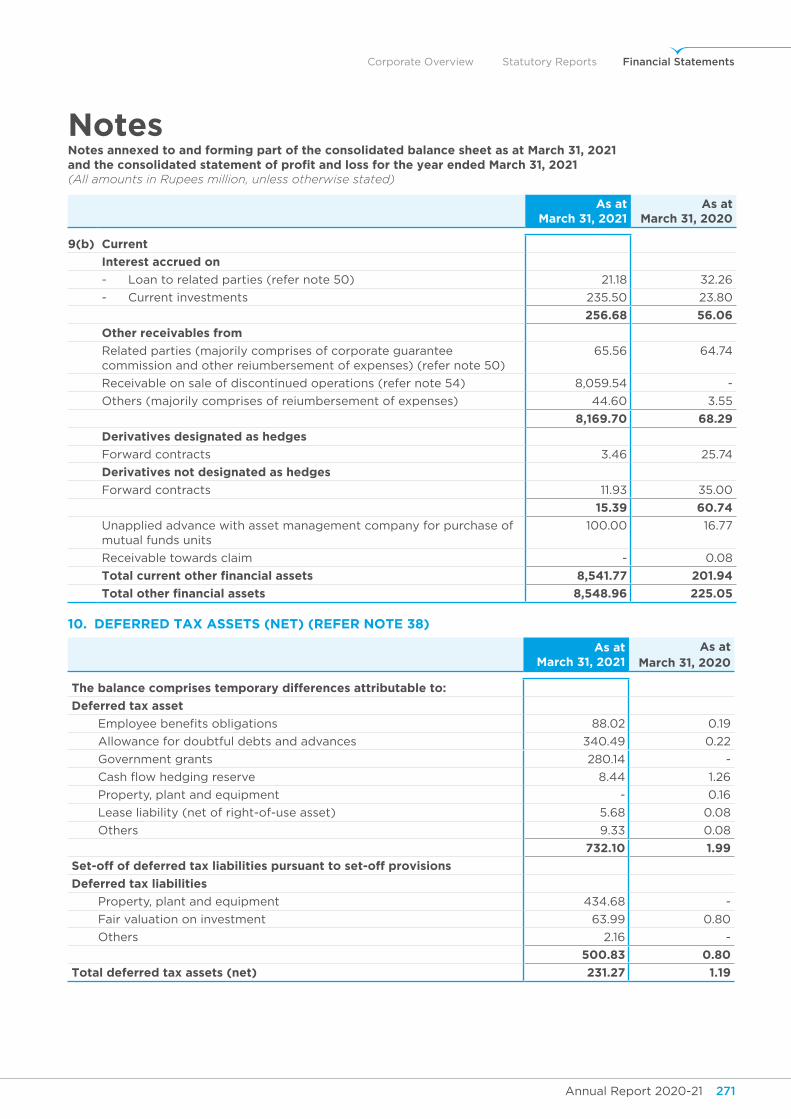
Annual Report 2020-21 271Annual Report 2020-21270
Corporate Overview Statutory Reports Financial Statements
NotesNotes annexed to and forming part of the consolidated balance sheet as at March 31, 2021and the consolidated statement of profit and loss for the year ended March 31, 2021(All amounts in Rupees million, unless otherwise stated)
As at March 31, 2021
As at March 31, 2020
9(b) current
Interest accrued on
- Loan to related parties (refer note 50) 21.18 32.26
- Current investments 235.50 23.80
256.68 56.06
other receivables from
Related parties (majorily comprises of corporate guarantee commission and other reiumbersement of expenses) (refer note 50)
65.56 64.74
Receivable on sale of discontinued operations (refer note 54) 8,059.54 -
Others (majorily comprises of reiumbersement of expenses) 44.60 3.55
8,169.70 68.29
derivatives designated as hedges
Forward contracts 3.46 25.74
derivatives not designated as hedges
Forward contracts 11.93 35.00
15.39 60.74
Unapplied advance with asset management company for purchase of mutual funds units
100.00 16.77
Receivable towards claim - 0.08
total current other financial assets 8,541.77 201.94
total other financial assets 8,548.96 225.05
10. DeferreD tAx Assets (net) (refer note 38)
As at March 31, 2021
As at March 31, 2020
the balance comprises temporary differences attributable to:
deferred tax asset
Employee benefits obligations 88.02 0.19
Allowance for doubtful debts and advances 340.49 0.22
Government grants 280.14 -
Cash flow hedging reserve 8.44 1.26
Property, plant and equipment - 0.16
Lease liability (net of right-of-use asset) 5.68 0.08
Others 9.33 0.08
732.10 1.99
set-off of deferred tax liabilities pursuant to set-off provisions
deferred tax liabilities
Property, plant and equipment 434.68 -
Fair valuation on investment 63.99 0.80
Others 2.16 -
500.83 0.80
total deferred tax assets (net) 231.27 1.19
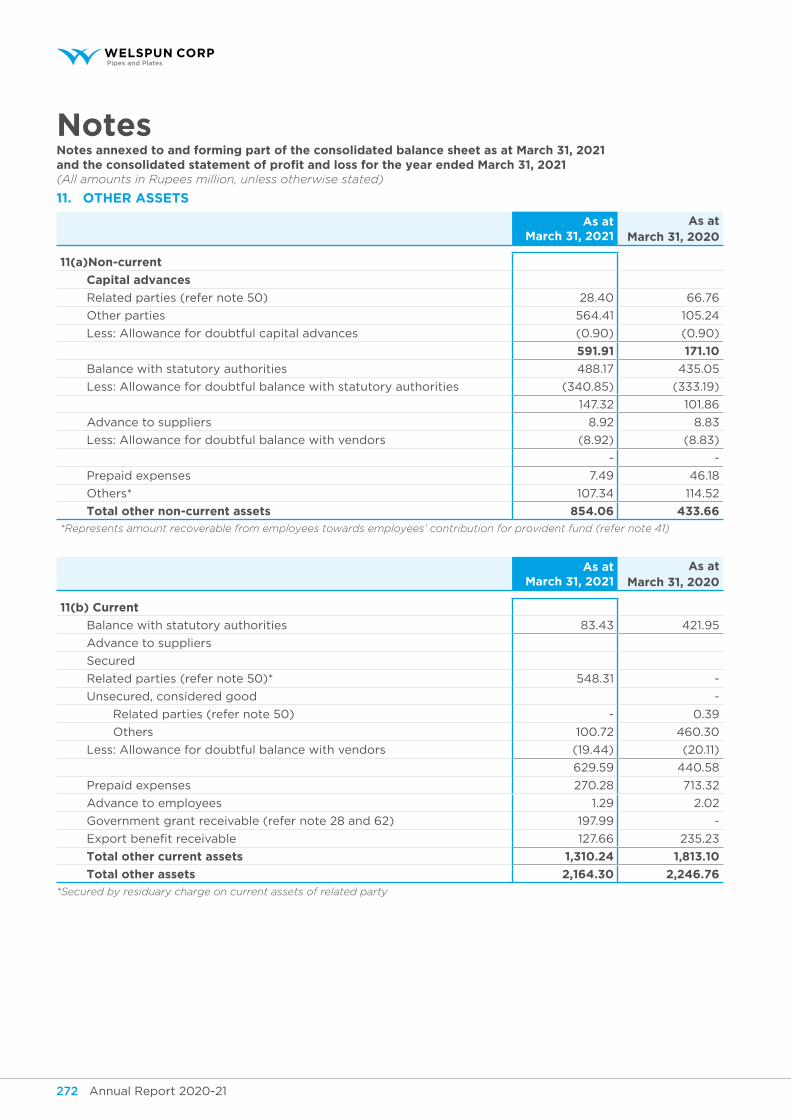
Annual Report 2020-21 273Annual Report 2020-21272
NotesNotes annexed to and forming part of the consolidated balance sheet as at March 31, 2021and the consolidated statement of profit and loss for the year ended March 31, 2021(All amounts in Rupees million, unless otherwise stated)
11. otheR Assets
As at March 31, 2021
As at March 31, 2020
11(a)non-current
capital advances
Related parties (refer note 50) 28.40 66.76
Other parties 564.41 105.24
Less: Allowance for doubtful capital advances (0.90) (0.90)
591.91 171.10
Balance with statutory authorities 488.17 435.05
Less: Allowance for doubtful balance with statutory authorities (340.85) (333.19)
147.32 101.86
Advance to suppliers 8.92 8.83
Less: Allowance for doubtful balance with vendors (8.92) (8.83)
- -
Prepaid expenses 7.49 46.18
Others* 107.34 114.52
total other non-current assets 854.06 433.66
*Represents amount recoverable from employees towards employees’ contribution for provident fund (refer note 41)
As at March 31, 2021
As at March 31, 2020
11(b) current
Balance with statutory authorities 83.43 421.95
Advance to suppliers
Secured
Related parties (refer note 50)* 548.31 -
Unsecured, considered good -
Related parties (refer note 50) - 0.39
Others 100.72 460.30
Less: Allowance for doubtful balance with vendors (19.44) (20.11)
629.59 440.58
Prepaid expenses 270.28 713.32
Advance to employees 1.29 2.02
Government grant receivable (refer note 28 and 62) 197.99 -
Export benefit receivable 127.66 235.23
total other current assets 1,310.24 1,813.10
total other assets 2,164.30 2,246.76
*Secured by residuary charge on current assets of related party
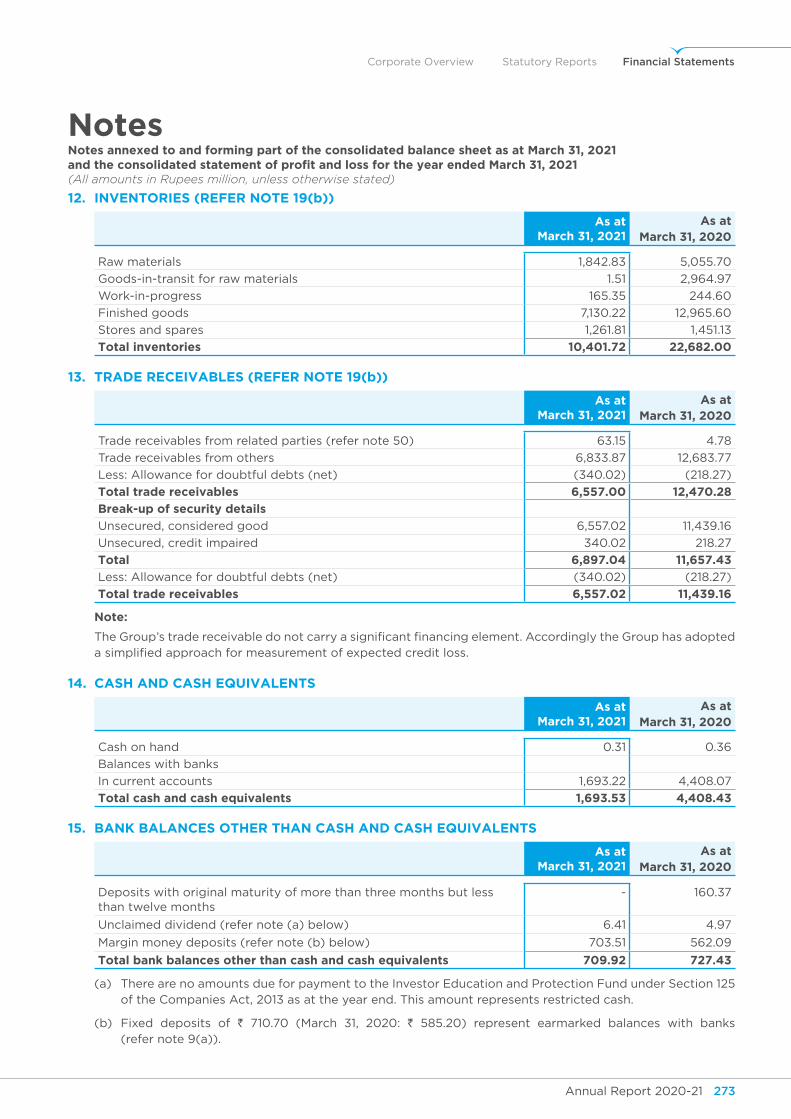
Annual Report 2020-21 273Annual Report 2020-21272
Corporate Overview Statutory Reports Financial Statements
NotesNotes annexed to and forming part of the consolidated balance sheet as at March 31, 2021and the consolidated statement of profit and loss for the year ended March 31, 2021(All amounts in Rupees million, unless otherwise stated)
12. inVentories (refer note 19(b))
As at March 31, 2021
As at March 31, 2020
Raw materials 1,842.83 5,055.70
Goods-in-transit for raw materials 1.51 2,964.97
Work-in-progress 165.35 244.60
Finished goods 7,130.22 12,965.60
Stores and spares 1,261.81 1,451.13
total inventories 10,401.72 22,682.00
13. trADe reCeiVABLes (refer note 19(b))
As at March 31, 2021
As at March 31, 2020
Trade receivables from related parties (refer note 50) 63.15 4.78
Trade receivables from others 6,833.87 12,683.77
Less: Allowance for doubtful debts (net) (340.02) (218.27)
total trade receivables 6,557.00 12,470.28
Break-up of security details
Unsecured, considered good 6,557.02 11,439.16
Unsecured, credit impaired 340.02 218.27
total 6,897.04 11,657.43
Less: Allowance for doubtful debts (net) (340.02) (218.27)
total trade receivables 6,557.02 11,439.16
note:
The Group’s trade receivable do not carry a significant financing element. Accordingly the Group has adopted a simplified approach for measurement of expected credit loss.
14. cAsh And cAsh eQuIvAlents
As at March 31, 2021
As at March 31, 2020
Cash on hand 0.31 0.36
Balances with banks
In current accounts 1,693.22 4,408.07
total cash and cash equivalents 1,693.53 4,408.43
15. BAnk BALAnCes other thAn CAsh AnD CAsh equiVALents
As at March 31, 2021
As at March 31, 2020
Deposits with original maturity of more than three months but less than twelve months
- 160.37
Unclaimed dividend (refer note (a) below) 6.41 4.97
Margin money deposits (refer note (b) below) 703.51 562.09
total bank balances other than cash and cash equivalents 709.92 727.43
(a) There are no amounts due for payment to the Investor Education and Protection Fund under Section 125 of the Companies Act, 2013 as at the year end. This amount represents restricted cash.
(b) Fixed deposits of ` 710.70 (March 31, 2020: ` 585.20) represent earmarked balances with banks (refer note 9(a)).
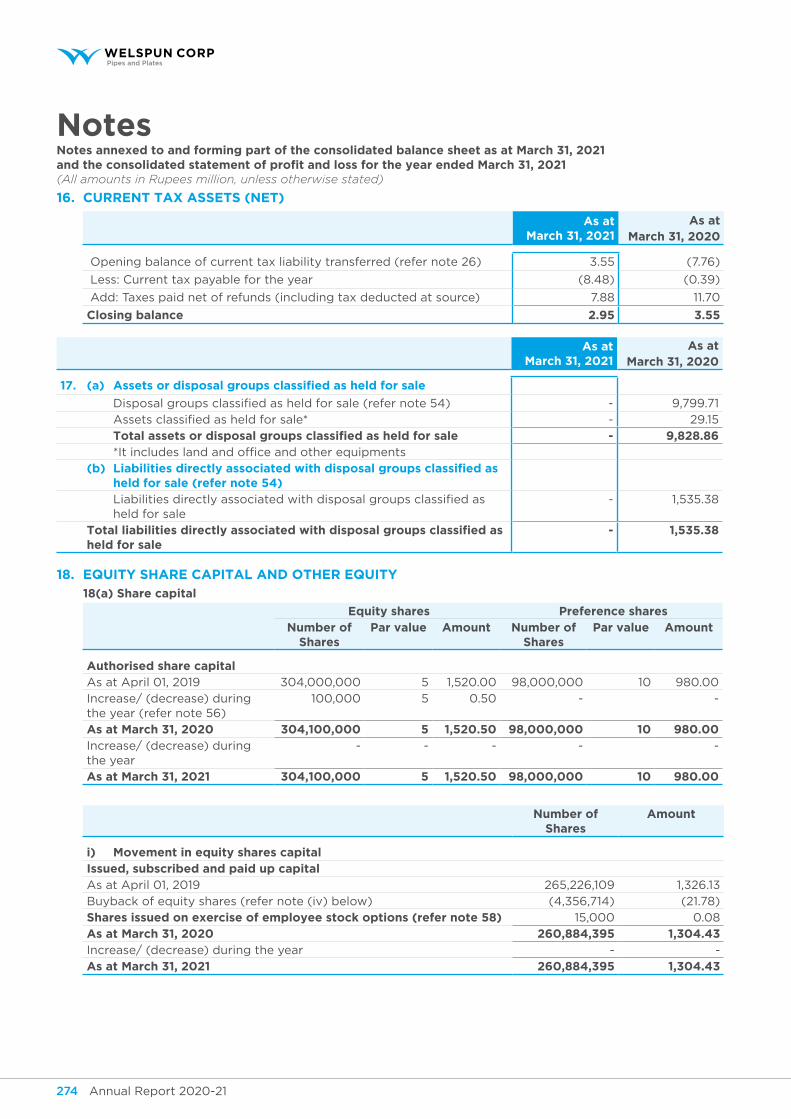
Annual Report 2020-21 275Annual Report 2020-21274
NotesNotes annexed to and forming part of the consolidated balance sheet as at March 31, 2021and the consolidated statement of profit and loss for the year ended March 31, 2021(All amounts in Rupees million, unless otherwise stated)
16. Current tAx Assets (net)
As at March 31, 2021
As at March 31, 2020
Opening balance of current tax liability transferred (refer note 26) 3.55 (7.76)
Less: Current tax payable for the year (8.48) (0.39)
Add: Taxes paid net of refunds (including tax deducted at source) 7.88 11.70
closing balance 2.95 3.55
As at March 31, 2021
As at March 31, 2020
17. (a) Assets or disposal groups classified as held for sale
Disposal groups classified as held for sale (refer note 54) - 9,799.71
Assets classified as held for sale* - 29.15
total assets or disposal groups classified as held for sale - 9,828.86 *It includes land and office and other equipments
(b) Liabilities directly associated with disposal groups classified as held for sale (refer note 54)
Liabilities directly associated with disposal groups classified as held for sale
- 1,535.38
total liabilities directly associated with disposal groups classified as held for sale
- 1,535.38
18. equity shAre CAPitAL AnD other equity
18(a) share capital
equity shares preference shares number of
sharespar value Amount number of
sharespar value Amount
Authorised share capitalAs at April 01, 2019 304,000,000 5 1,520.00 98,000,000 10 980.00
Increase/ (decrease) during the year (refer note 56)
100,000 5 0.50 - -
As at March 31, 2020 304,100,000 5 1,520.50 98,000,000 10 980.00 Increase/ (decrease) during the year
- - - - -
As at March 31, 2021 304,100,000 5 1,520.50 98,000,000 10 980.00
number of shares
Amount
i) movement in equity shares capitalissued, subscribed and paid up capitalAs at April 01, 2019 265,226,109 1,326.13
Buyback of equity shares (refer note (iv) below) (4,356,714) (21.78)
shares issued on exercise of employee stock options (refer note 58) 15,000 0.08
As at March 31, 2020 260,884,395 1,304.43 Increase/ (decrease) during the year - -
As at March 31, 2021 260,884,395 1,304.43
Annual Report 2020-21 275Annual Report 2020-21274
Corporate Overview Statutory Reports Financial Statements
NotesNotes annexed to and forming part of the consolidated balance sheet as at March 31, 2021and the consolidated statement of profit and loss for the year ended March 31, 2021(All amounts in Rupees million, unless otherwise stated)
ii) terms and rights attached to shares equity shares
The Company has only one class of equity shares having a par value of ` 5 per share. Each holder of equity shares is entitled to one vote per share. The dividend when proposed by the board of directors is subject to the approval of the shareholders in the ensuing annual general meeting except in case of interim dividend.
In the event of liquidation of the company the holders of the equity shares will be entitled to receive remaining assets of the company after distribution of preferential amounts. The distribution will be in proportion to the number of equity shares held by the shareholders.
preference shares Preference shares does not carry any voting rights in the company, except as provided in the Companies
Act, 2013. Preference share will have priority over equity shares in the payment of dividend and repayment of capital.
iii) Details of shareholders holding more than 5% shares in the Company
As at March 31, 2021 no. of shares % holding
equity shares held by
Balkrishan Goenka, Trustee of Welspun Group Master Trust (refer note 56)
117,063,807 44.87%
As at March 31, 2020 no. of shares % holding
equity shares held by
Balkrishan Goenka, Trustee of Welspun Group Master Trust (refer note 56)
110,449,818 42.34%
iv) Aggregate number and class of buyback of shares
class of shares no. of shares
Buyback of equity shares in FY 2019-20 Equity Shares 4,356,714
4,356,714
During the previous year ended March 31, 2020, the Company had made an offer for buy-back of fully paid-up equity shares of ` 5 each of the Company, not exceeding 28,888,888 equity shares (representing approximately 10.89% of the total number of equity shares in the issued, subscribed and paid up equity capital) at a price of ` 135 per equity share, not exceeding ` 3,900 on a proportionate basis by way of tender offer in accordance with the provisions of Companies Act, 2013 and SEBI (Buy-Back of Securities) Regulations, 2018. The tendering period for the buyback offer opened on October 22, 2019 and closed on November 05, 2019. Total 4,356,714 equity shares were bought back at a price of ` 135 per equity share and total amount utilised in buy-back was ` 588.16. Accordingly, 4,356,714 equity shares were extinguished and the number of equity shares in the issued, subscribed and paid up equity capital reduced from 265,226,109 of aggregate face value of ` 1,326.13 to 260,869,395 of aggregate face value of ` 1,304.35.
Annual Report 2020-21 277Annual Report 2020-21276
NotesNotes annexed to and forming part of the consolidated balance sheet as at March 31, 2021and the consolidated statement of profit and loss for the year ended March 31, 2021(All amounts in Rupees million, unless otherwise stated)
other equity
18.(b) reserves and surplus
As at March 31, 2021
As at March 31, 2020
(i) Capital reserve 154.71 154.71
(ii) Securities premium 7,183.71 7,183.71
(iii) Debenture redemption reserve 135.00 505.84
(iv) General reserve 994.44 621.73
(v) Foreign currency monetary item translation difference account - -
(vi) Equity settled share based payments 106.08 90.65
(vii) Capital redemption reserve 21.78 21.78
(viii)Retained earnings 26,597.28 20,531.19
total reserves and surplus 35,193.00 29,109.61
As at March 31, 2021
As at March 31, 2020
(i) capital reserve
Opening balance 154.71 152.92
Capital Reserve on merger of Welspun Pipes limited (refer note 56)
- 1.79
closing balance 154.71 154.71
(ii) securities premium
Opening balance 7,183.71 7,769.82
Buyback of equity shares (refer note 18(a) (iv)) - (566.38)
Amount transferred to Capital redemption reserve on buyback of equity shares (refer note 18(a) (iv))
- (21.78)
Share issued on exercise on employee stock options (refer note 58)
- 2.05
closing balance 7,183.71 7,183.71
(iii) debenture redemption reserve
Opening balance 505.84 505.84
Transfer to general reserve (370.84) -
closing balance 135.00 505.84
(iv) general reserve
Opening balance 621.73 353.59
Transfer from retained earning - 268.14
Transfer from debenture redemption reserve 370.84 -
Transfer from equity settled share based payments 1.87 -
closing balance 994.44 621.73
(v) foreign currency monetary item translation difference account (refer note 47)
Opening balance - (14.25)
Additions during the year - (6.79)
Amortisation during the year - 21.04
closing balance - -
Annual Report 2020-21 277Annual Report 2020-21276
Corporate Overview Statutory Reports Financial Statements
NotesNotes annexed to and forming part of the consolidated balance sheet as at March 31, 2021and the consolidated statement of profit and loss for the year ended March 31, 2021(All amounts in Rupees million, unless otherwise stated)
As at March 31, 2021
As at March 31, 2020
(vi) equity settled share based payments (refer note 58)
Opening balance 90.65 41.94
Employee share-based expense 17.30 49.33
Employee share-based options lapsed (1.87) -
Transferred to securities premium/ share capital on exercise of stock options
- (0.62)
closing balance 106.08 90.65
(vii) capital redemption reserve
Opening balance 21.78 -
Amount transferred upon buyback - 21.78
closing balance 21.78 21.78
(viii) Retained earnings
Opening balance 20,531.19 17,255.75
Profit for the year 6,188.19 6,354.73
Items of other comprehensive income recognised directly in retained earnings
Remeasurements of post employment benefit obligations, net of tax
17.39 (50.31)
Share of OCI of joint ventures [excluding share of NCI ` (1.01) (March 31, 2020: ` (1.50))]
(9.05) (13.57)
Dividend on equity shares (130.44) (2,741.31)
Transfer from foreign currency translation reserve on liquidation of subsidiary
- (5.96)
Transfer to general reserve - (268.14)
closing balance 26,597.28 20,531.19
18(c) other reserves
As at March 31, 2021
As at March 31, 2020
(i) Cash flow hedging reserve (25.10) (50.43)
(ii) Foreign currency translation reserve 1,456.19 1,788.79
total other reserves 1,431.09 1,738.36
(i) Cash flow hedging reserve (refer note 43(Vi)b)
Opening balance (50.43) 89.90
Amount recognised in cash flow hedging reserve during the year (net)
25.38 (92.82)
Gain transferred to statement of profit and loss (net) (13.36) (122.05)
Hedging loss transferred to non financial assets 31.20 -
Income tax on amount recognised in cash flow hedging reserve (17.89) 74.54
closing balance (25.10) (50.43)
(ii) foreign currency translation reserve
Opening balance 1,788.79 494.79
Movement during the year (net) [excluding share of NCI ` (6.50) (March 31, 2020: ` 7.38)] (refer note 64)
(332.60) 1,294.00
closing balance 1,456.19 1,788.79
Annual Report 2020-21 279Annual Report 2020-21278
NotesNotes annexed to and forming part of the consolidated balance sheet as at March 31, 2021and the consolidated statement of profit and loss for the year ended March 31, 2021(All amounts in Rupees million, unless otherwise stated)
18(d) share application money pending allotment
As at March 31, 2021
As at March 31, 2020
Share application money pending allotment (refer note 58) 6.50 -
total share application money pending allotment 6.50 -
nature and purpose of other equity (i) capital reserve Capital reserve will be utilised in accordance with the provisions of the Companies Act, 2013.
(ii) securities premium Securities premium is used to record the premium on issue of shares. The reserve is utilised in accordance
with the provisions of the Companies Act, 2013.
(iii) debenture redemption reserve The Companies Act, 2013 requires companies that issue debentures to create a debenture redemption
reserve from annual profits until such debentures are redeemed. The amounts credited to the debenture redemption reserve may not be utilised except to redeem debentures.
(iv) general reserve General Reserve represents appropriation of profit by the Company. General reserve is created by a
transfer from one component of equity to another and is not an item of other comprehensive income.
(v) foreign currency monetary item translation difference account Foreign exchange differences on long term foreign currency monetary items which relates to other than
depreciable assets, are accumulated in “Foreign Currency Monetary Item Translation Difference Account” and amortised over the balance period of such long term assets / liabilities.
(vi) Cash flow hedging reserve The cash flow hedging reserve represents the cumulative effective portion of gains or losses arising on
changes in fair value of designated portion of hedging instruments entered into for cash flow hedges. The cumulating gain or loss arising on changes in the fair value of the designated portion of hedging instruments that are recognised and accumulated under the heading of cash flow reserve will be reclassified to statement of profit and loss only when the hedged transaction affects the profit or loss or included as a basis adjustment to the non-financial hedged item.
(vii) equity settled share based payments (refer note 58) Share options outstanding account is used to recognise the grant date fair value of options issued to
employees under “WELSOP” Employee stock option plan.
(viii)capital redemption reserve Capital Redemption Reserve is created equal to the nominal value of the shares purchased pursuant to
Buy Back of its own fully paid up equity shares.
(ix) foreign currency translation Reserve Exchange differences arising on translation of the foreign operations are recognised in other
comprehensive income as described in accounting policy and accumulated in a separate reserve within equity. The cumulative amount is reclassified to profit or loss when the net investment is disposed-off.
(x) Retained earnings Retained earnings comprises of prior years as well as current year’s undistributed earnings after taxes.
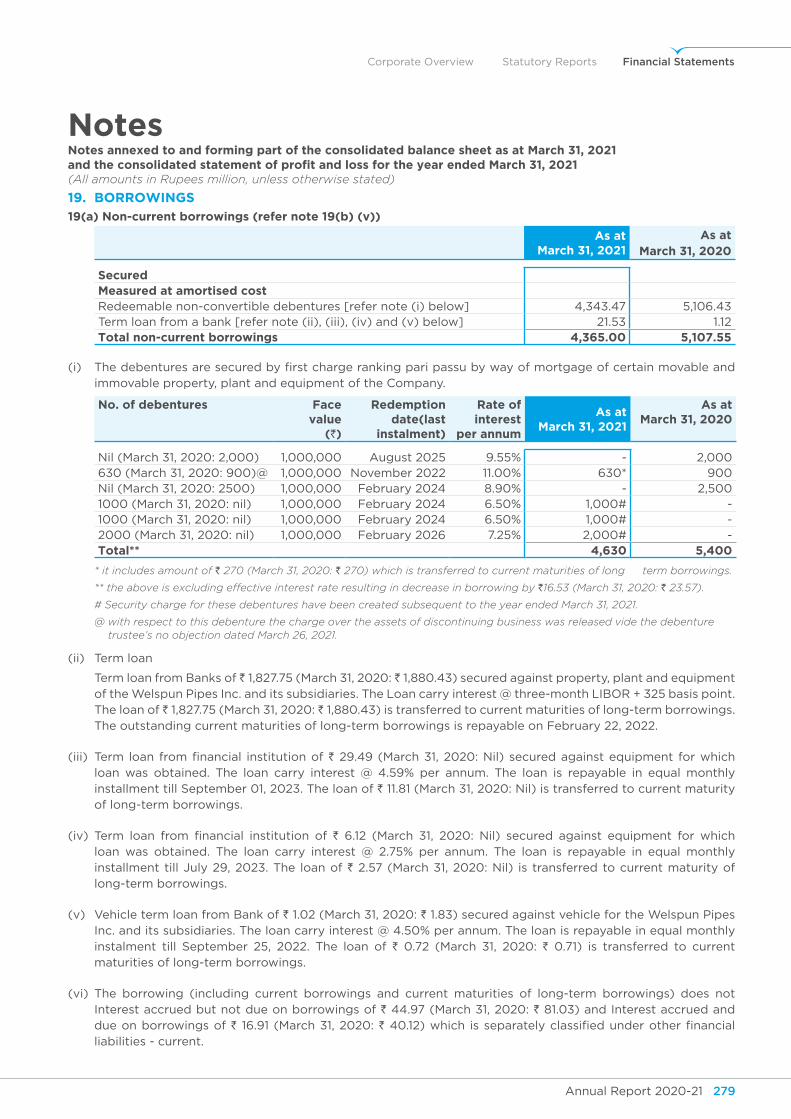
Annual Report 2020-21 279Annual Report 2020-21278
Corporate Overview Statutory Reports Financial Statements
NotesNotes annexed to and forming part of the consolidated balance sheet as at March 31, 2021and the consolidated statement of profit and loss for the year ended March 31, 2021(All amounts in Rupees million, unless otherwise stated)
19. BorroWings
19(a) non-current borrowings (refer note 19(b) (v))
As at March 31, 2021
As at March 31, 2020
securedmeasured at amortised costRedeemable non-convertible debentures [refer note (i) below] 4,343.47 5,106.43 Term loan from a bank [refer note (ii), (iii), (iv) and (v) below] 21.53 1.12 total non-current borrowings 4,365.00 5,107.55
(i) The debentures are secured by first charge ranking pari passu by way of mortgage of certain movable and immovable property, plant and equipment of the Company.
no. of debentures face value
(`)
Redemption date(last
instalment)
Rate of interest
per annum
As at March 31, 2021
As at March 31, 2020
Nil (March 31, 2020: 2,000) 1,000,000 August 2025 9.55% - 2,000 630 (March 31, 2020: 900)@ 1,000,000 November 2022 11.00% 630* 900 Nil (March 31, 2020: 2500) 1,000,000 February 2024 8.90% - 2,500 1000 (March 31, 2020: nil) 1,000,000 February 2024 6.50% 1,000# - 1000 (March 31, 2020: nil) 1,000,000 February 2024 6.50% 1,000# - 2000 (March 31, 2020: nil) 1,000,000 February 2026 7.25% 2,000# - total** 4,630 5,400
* it includes amount of ` 270 (March 31, 2020: ` 270) which is transferred to current maturities of long term borrowings.
** the above is excluding effective interest rate resulting in decrease in borrowing by `16.53 (March 31, 2020: ` 23.57).
# Security charge for these debentures have been created subsequent to the year ended March 31, 2021.
@ with respect to this debenture the charge over the assets of discontinuing business was released vide the debenture trustee’s no objection dated March 26, 2021.
(ii) Term loan
Term loan from Banks of 1,827.75 (March 31, 2020: 1,880.43) secured against property, plant and equipment of the Welspun Pipes Inc. and its subsidiaries. The Loan carry interest @ three-month LIBOR + 325 basis point. The loan of 1,827.75 (March 31, 2020: 1,880.43) is transferred to current maturities of long-term borrowings. The outstanding current maturities of long-term borrowings is repayable on February 22, 2022.
(iii) Term loan from financial institution of ` 29.49 (March 31, 2020: Nil) secured against equipment for which loan was obtained. The loan carry interest @ 4.59% per annum. The loan is repayable in equal monthly installment till September 01, 2023. The loan of ` 11.81 (March 31, 2020: Nil) is transferred to current maturity of long-term borrowings.
(iv) Term loan from financial institution of ` 6.12 (March 31, 2020: Nil) secured against equipment for which loan was obtained. The loan carry interest @ 2.75% per annum. The loan is repayable in equal monthly installment till July 29, 2023. The loan of ` 2.57 (March 31, 2020: Nil) is transferred to current maturity of long-term borrowings.
(v) Vehicle term loan from Bank of ` 1.02 (March 31, 2020: ` 1.83) secured against vehicle for the Welspun Pipes Inc. and its subsidiaries. The loan carry interest @ 4.50% per annum. The loan is repayable in equal monthly instalment till September 25, 2022. The loan of ` 0.72 (March 31, 2020: ` 0.71) is transferred to current maturities of long-term borrowings.
(vi) The borrowing (including current borrowings and current maturities of long-term borrowings) does not Interest accrued but not due on borrowings of ` 44.97 (March 31, 2020: ` 81.03) and Interest accrued and due on borrowings of ` 16.91 (March 31, 2020: ` 40.12) which is separately classified under other financial liabilities - current.
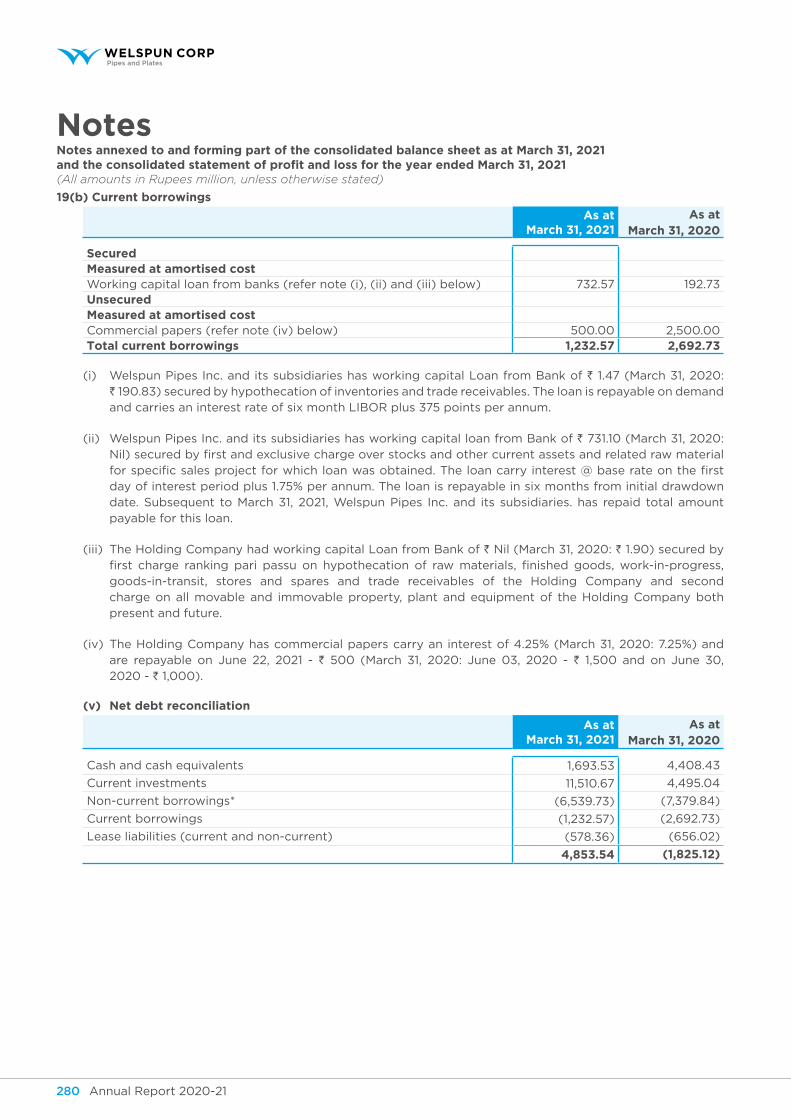
Annual Report 2020-21 281Annual Report 2020-21280
NotesNotes annexed to and forming part of the consolidated balance sheet as at March 31, 2021and the consolidated statement of profit and loss for the year ended March 31, 2021(All amounts in Rupees million, unless otherwise stated)
19(b) Current borrowings
As at March 31, 2021
As at March 31, 2020
securedmeasured at amortised costWorking capital loan from banks (refer note (i), (ii) and (iii) below) 732.57 192.73 unsecuredmeasured at amortised costCommercial papers (refer note (iv) below) 500.00 2,500.00 total current borrowings 1,232.57 2,692.73
(i) Welspun Pipes Inc. and its subsidiaries has working capital Loan from Bank of ` 1.47 (March 31, 2020: ` 190.83) secured by hypothecation of inventories and trade receivables. The loan is repayable on demand and carries an interest rate of six month LIBOR plus 375 points per annum.
(ii) Welspun Pipes Inc. and its subsidiaries has working capital loan from Bank of ` 731.10 (March 31, 2020: Nil) secured by first and exclusive charge over stocks and other current assets and related raw material for specific sales project for which loan was obtained. The loan carry interest @ base rate on the first day of interest period plus 1.75% per annum. The loan is repayable in six months from initial drawdown date. Subsequent to March 31, 2021, Welspun Pipes Inc. and its subsidiaries. has repaid total amount payable for this loan.
(iii) The Holding Company had working capital Loan from Bank of ` Nil (March 31, 2020: ` 1.90) secured by first charge ranking pari passu on hypothecation of raw materials, finished goods, work-in-progress, goods-in-transit, stores and spares and trade receivables of the Holding Company and second charge on all movable and immovable property, plant and equipment of the Holding Company both present and future.
(iv) The Holding Company has commercial papers carry an interest of 4.25% (March 31, 2020: 7.25%) and are repayable on June 22, 2021 - ` 500 (March 31, 2020: June 03, 2020 - ` 1,500 and on June 30, 2020 - ` 1,000).
(v) net debt reconciliation
As at March 31, 2021
As at March 31, 2020
Cash and cash equivalents 1,693.53 4,408.43
Current investments 11,510.67 4,495.04
Non-current borrowings* (6,539.73) (7,379.84)
Current borrowings (1,232.57) (2,692.73)
Lease liabilities (current and non-current) (578.36) (656.02)
4,853.54 (1,825.12)
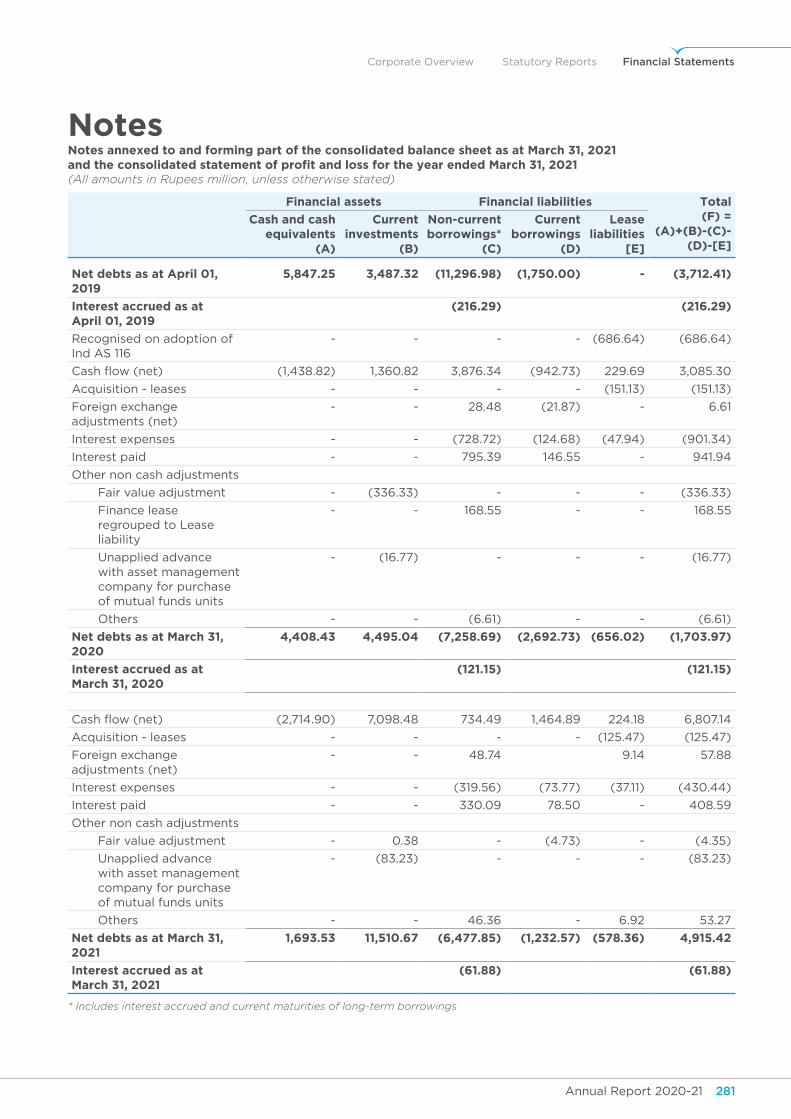
Annual Report 2020-21 281Annual Report 2020-21280
Corporate Overview Statutory Reports Financial Statements
NotesNotes annexed to and forming part of the consolidated balance sheet as at March 31, 2021and the consolidated statement of profit and loss for the year ended March 31, 2021(All amounts in Rupees million, unless otherwise stated)
financial assets financial liabilities total (f) =
(A)+(B)-(c)-(d)-[e]
cash and cash equivalents
(A)
current investments
(B)
non-current borrowings*
(c)
current borrowings
(d)
lease liabilities
[e]
net debts as at April 01, 2019
5,847.25 3,487.32 (11,296.98) (1,750.00) - (3,712.41)
Interest accrued as at April 01, 2019
(216.29) (216.29)
Recognised on adoption of Ind AS 116
- - - - (686.64) (686.64)
Cash flow (net) (1,438.82) 1,360.82 3,876.34 (942.73) 229.69 3,085.30
Acquisition - leases - - - - (151.13) (151.13)
Foreign exchange adjustments (net)
- - 28.48 (21.87) - 6.61
Interest expenses - - (728.72) (124.68) (47.94) (901.34)
Interest paid - - 795.39 146.55 - 941.94
Other non cash adjustments
Fair value adjustment - (336.33) - - - (336.33)
Finance lease regrouped to Lease liability
- - 168.55 - - 168.55
Unapplied advance with asset management company for purchase of mutual funds units
- (16.77) - - - (16.77)
Others - - (6.61) - - (6.61)
net debts as at March 31, 2020
4,408.43 4,495.04 (7,258.69) (2,692.73) (656.02) (1,703.97)
Interest accrued as at March 31, 2020
(121.15) (121.15)
Cash flow (net) (2,714.90) 7,098.48 734.49 1,464.89 224.18 6,807.14
Acquisition - leases - - - - (125.47) (125.47)
Foreign exchange adjustments (net)
- - 48.74 9.14 57.88
Interest expenses - - (319.56) (73.77) (37.11) (430.44)
Interest paid - - 330.09 78.50 - 408.59
Other non cash adjustments
Fair value adjustment - 0.38 - (4.73) - (4.35)
Unapplied advance with asset management company for purchase of mutual funds units
- (83.23) - - - (83.23)
Others - - 46.36 - 6.92 53.27
net debts as at March 31, 2021
1,693.53 11,510.67 (6,477.85) (1,232.57) (578.36) 4,915.42
Interest accrued as at March 31, 2021
(61.88) (61.88)
* Includes interest accrued and current maturities of long-term borrowings
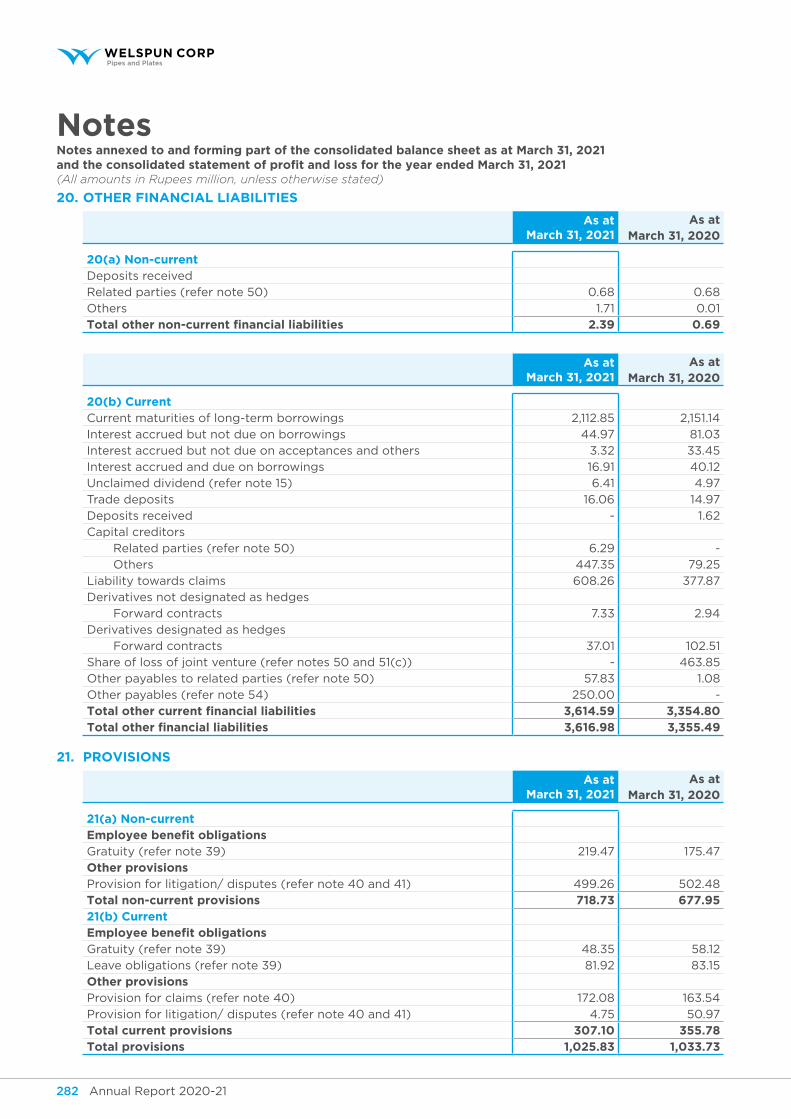
Annual Report 2020-21 283Annual Report 2020-21282
NotesNotes annexed to and forming part of the consolidated balance sheet as at March 31, 2021and the consolidated statement of profit and loss for the year ended March 31, 2021(All amounts in Rupees million, unless otherwise stated)
20. other finAnCiAL LiABiLities
As at March 31, 2021
As at March 31, 2020
20(a) non-currentDeposits received
Related parties (refer note 50) 0.68 0.68
Others 1.71 0.01
total other non-current financial liabilities 2.39 0.69
As at March 31, 2021
As at March 31, 2020
20(b) CurrentCurrent maturities of long-term borrowings 2,112.85 2,151.14
Interest accrued but not due on borrowings 44.97 81.03
Interest accrued but not due on acceptances and others 3.32 33.45
Interest accrued and due on borrowings 16.91 40.12
Unclaimed dividend (refer note 15) 6.41 4.97
Trade deposits 16.06 14.97
Deposits received - 1.62
Capital creditors
Related parties (refer note 50) 6.29 -
Others 447.35 79.25
Liability towards claims 608.26 377.87
Derivatives not designated as hedges
Forward contracts 7.33 2.94
Derivatives designated as hedges
Forward contracts 37.01 102.51
Share of loss of joint venture (refer notes 50 and 51(c)) - 463.85
Other payables to related parties (refer note 50) 57.83 1.08
Other payables (refer note 54) 250.00 -
total other current financial liabilities 3,614.59 3,354.80 total other financial liabilities 3,616.98 3,355.49
21. ProVisions
As at March 31, 2021
As at March 31, 2020
21(a) non-current employee benefit obligations Gratuity (refer note 39) 219.47 175.47
other provisions Provision for litigation/ disputes (refer note 40 and 41) 499.26 502.48
total non-current provisions 718.73 677.95 21(b) Current employee benefit obligations Gratuity (refer note 39) 48.35 58.12
Leave obligations (refer note 39) 81.92 83.15
other provisions Provision for claims (refer note 40) 172.08 163.54
Provision for litigation/ disputes (refer note 40 and 41) 4.75 50.97
total current provisions 307.10 355.78 total provisions 1,025.83 1,033.73
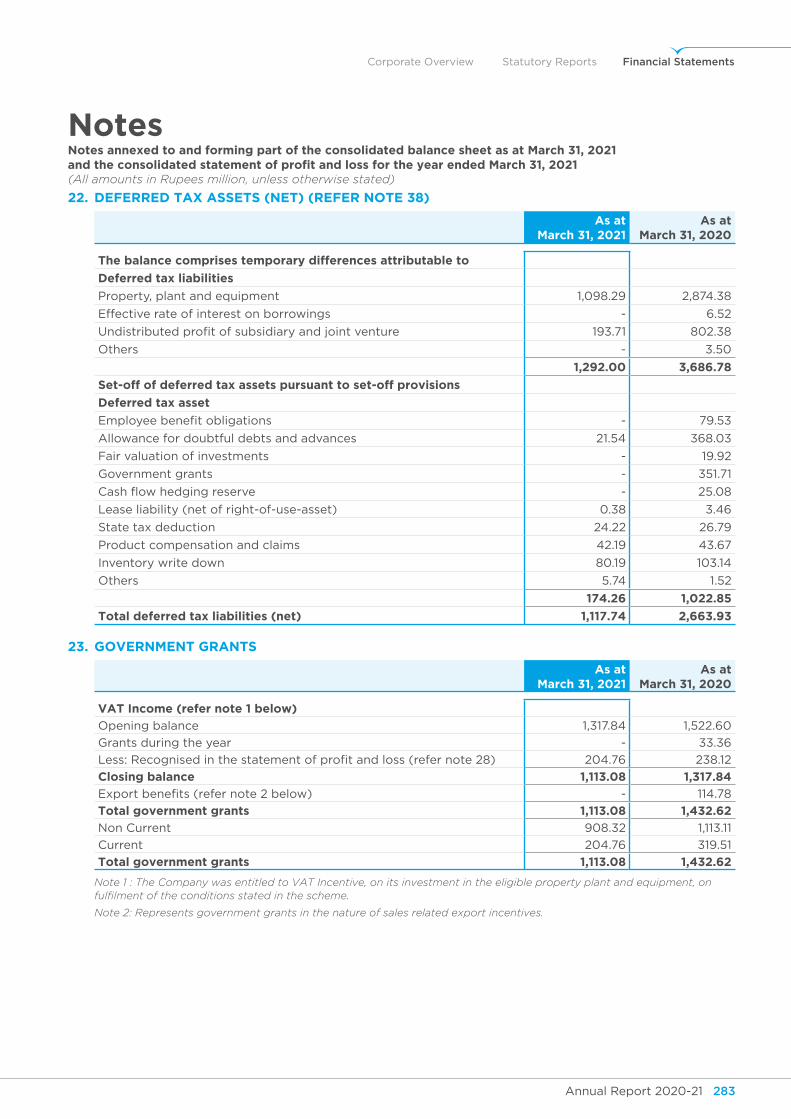
Annual Report 2020-21 283Annual Report 2020-21282
Corporate Overview Statutory Reports Financial Statements
NotesNotes annexed to and forming part of the consolidated balance sheet as at March 31, 2021and the consolidated statement of profit and loss for the year ended March 31, 2021(All amounts in Rupees million, unless otherwise stated)
22. DeferreD tAx Assets (net) (refer note 38)
As at March 31, 2021
As at March 31, 2020
the balance comprises temporary differences attributable to
deferred tax liabilities
Property, plant and equipment 1,098.29 2,874.38
Effective rate of interest on borrowings - 6.52
Undistributed profit of subsidiary and joint venture 193.71 802.38
Others - 3.50
1,292.00 3,686.78
set-off of deferred tax assets pursuant to set-off provisions
deferred tax asset
Employee benefit obligations - 79.53
Allowance for doubtful debts and advances 21.54 368.03
Fair valuation of investments - 19.92
Government grants - 351.71
Cash flow hedging reserve - 25.08
Lease liability (net of right-of-use-asset) 0.38 3.46
State tax deduction 24.22 26.79
Product compensation and claims 42.19 43.67
Inventory write down 80.19 103.14
Others 5.74 1.52
174.26 1,022.85
total deferred tax liabilities (net) 1,117.74 2,663.93
23. goVernMent grAnts
As at March 31, 2021
As at March 31, 2020
vAt Income (refer note 1 below)
Opening balance 1,317.84 1,522.60
Grants during the year - 33.36
Less: Recognised in the statement of profit and loss (refer note 28) 204.76 238.12
closing balance 1,113.08 1,317.84
Export benefits (refer note 2 below) - 114.78
total government grants 1,113.08 1,432.62
Non Current 908.32 1,113.11
Current 204.76 319.51
total government grants 1,113.08 1,432.62
Note 1 : The Company was entitled to VAT Incentive, on its investment in the eligible property plant and equipment, on fulfilment of the conditions stated in the scheme.
Note 2: Represents government grants in the nature of sales related export incentives.
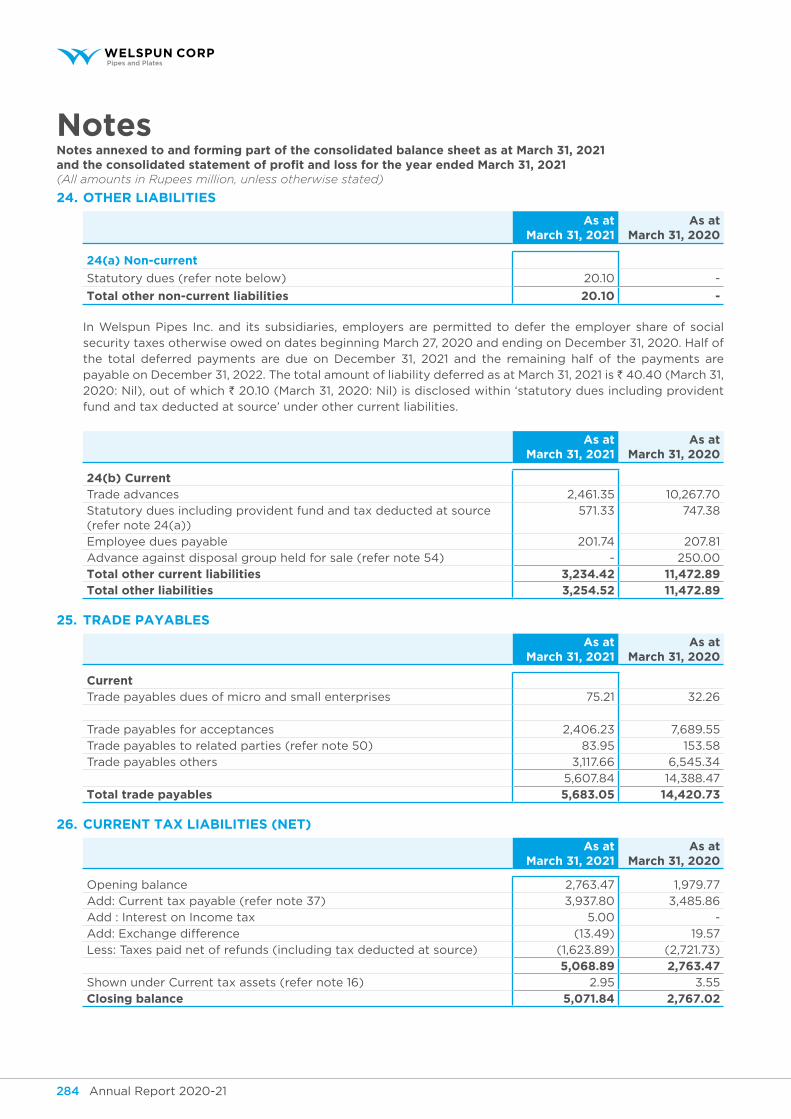
Annual Report 2020-21 285Annual Report 2020-21284
NotesNotes annexed to and forming part of the consolidated balance sheet as at March 31, 2021and the consolidated statement of profit and loss for the year ended March 31, 2021(All amounts in Rupees million, unless otherwise stated)
24. other LiABiLities
As at March 31, 2021
As at March 31, 2020
24(a) non-current
Statutory dues (refer note below) 20.10 -
total other non-current liabilities 20.10 -
In Welspun Pipes Inc. and its subsidiaries, employers are permitted to defer the employer share of social security taxes otherwise owed on dates beginning March 27, 2020 and ending on December 31, 2020. Half of the total deferred payments are due on December 31, 2021 and the remaining half of the payments are payable on December 31, 2022. The total amount of liability deferred as at March 31, 2021 is 40.40 (March 31, 2020: Nil), out of which ` 20.10 (March 31, 2020: Nil) is disclosed within ‘statutory dues including provident fund and tax deducted at source’ under other current liabilities.
As at March 31, 2021
As at March 31, 2020
24(b) Current Trade advances 2,461.35 10,267.70
Statutory dues including provident fund and tax deducted at source (refer note 24(a))
571.33 747.38
Employee dues payable 201.74 207.81
Advance against disposal group held for sale (refer note 54) - 250.00
total other current liabilities 3,234.42 11,472.89 total other liabilities 3,254.52 11,472.89
25. trADe PAyABLes
As at March 31, 2021
As at March 31, 2020
current Trade payables dues of micro and small enterprises 75.21 32.26
Trade payables for acceptances 2,406.23 7,689.55
Trade payables to related parties (refer note 50) 83.95 153.58
Trade payables others 3,117.66 6,545.34
5,607.84 14,388.47
total trade payables 5,683.05 14,420.73
26. Current tAx LiABiLities (net)
As at March 31, 2021
As at March 31, 2020
Opening balance 2,763.47 1,979.77
Add: Current tax payable (refer note 37) 3,937.80 3,485.86
Add : Interest on Income tax 5.00 -
Add: Exchange difference (13.49) 19.57
Less: Taxes paid net of refunds (including tax deducted at source) (1,623.89) (2,721.73)
5,068.89 2,763.47 Shown under Current tax assets (refer note 16) 2.95 3.55
closing balance 5,071.84 2,767.02
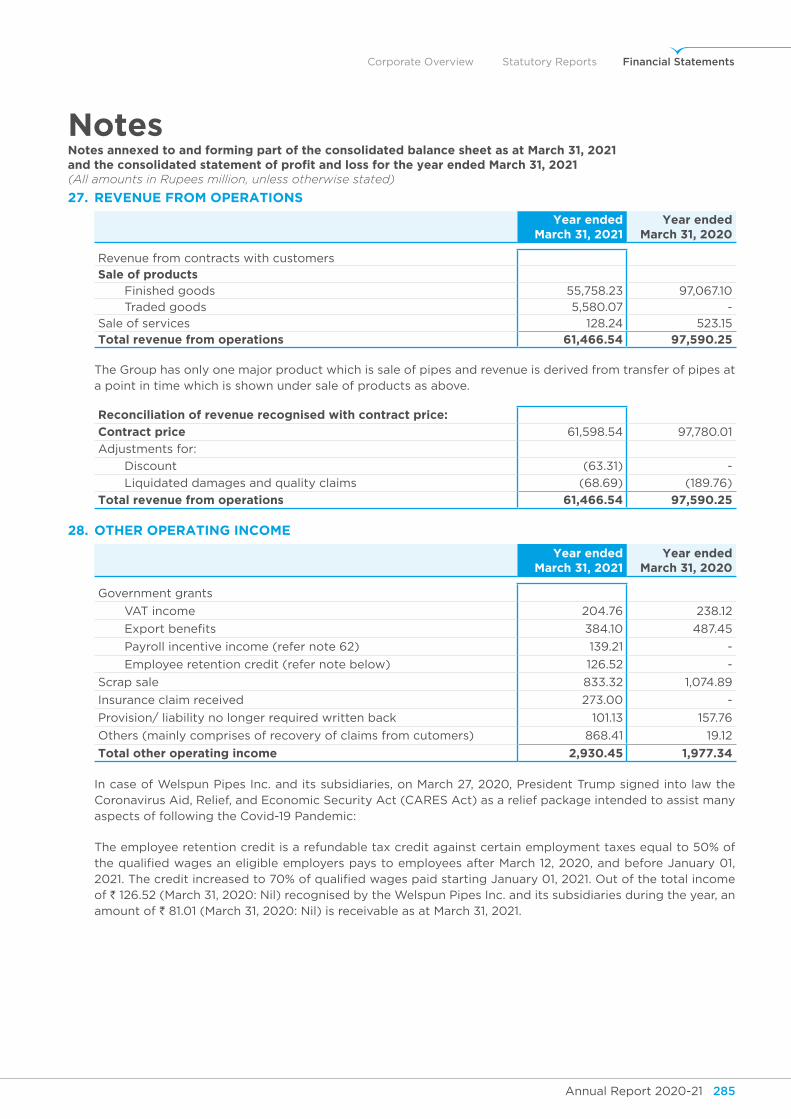
Annual Report 2020-21 285Annual Report 2020-21284
Corporate Overview Statutory Reports Financial Statements
NotesNotes annexed to and forming part of the consolidated balance sheet as at March 31, 2021and the consolidated statement of profit and loss for the year ended March 31, 2021(All amounts in Rupees million, unless otherwise stated)
27. reVenue froM oPerAtions
year ended March 31, 2021
year ended March 31, 2020
Revenue from contracts with customers
sale of products Finished goods 55,758.23 97,067.10
Traded goods 5,580.07 -
Sale of services 128.24 523.15
total revenue from operations 61,466.54 97,590.25
The Group has only one major product which is sale of pipes and revenue is derived from transfer of pipes at a point in time which is shown under sale of products as above.
reconciliation of revenue recognised with contract price:
contract price 61,598.54 97,780.01
Adjustments for:
Discount (63.31) -
Liquidated damages and quality claims (68.69) (189.76)
total revenue from operations 61,466.54 97,590.25
28. other oPerAting inCoMe
year ended March 31, 2021
year ended March 31, 2020
Government grants
VAT income 204.76 238.12
Export benefits 384.10 487.45
Payroll incentive income (refer note 62) 139.21 -
Employee retention credit (refer note below) 126.52 -
Scrap sale 833.32 1,074.89
Insurance claim received 273.00 -
Provision/ liability no longer required written back 101.13 157.76
Others (mainly comprises of recovery of claims from cutomers) 868.41 19.12
total other operating income 2,930.45 1,977.34
In case of Welspun Pipes Inc. and its subsidiaries, on March 27, 2020, President Trump signed into law the Coronavirus Aid, Relief, and Economic Security Act (CARES Act) as a relief package intended to assist many aspects of following the Covid-19 Pandemic:
The employee retention credit is a refundable tax credit against certain employment taxes equal to 50% of the qualified wages an eligible employers pays to employees after March 12, 2020, and before January 01, 2021. The credit increased to 70% of qualified wages paid starting January 01, 2021. Out of the total income of ` 126.52 (March 31, 2020: Nil) recognised by the Welspun Pipes Inc. and its subsidiaries during the year, an amount of ` 81.01 (March 31, 2020: Nil) is receivable as at March 31, 2021.
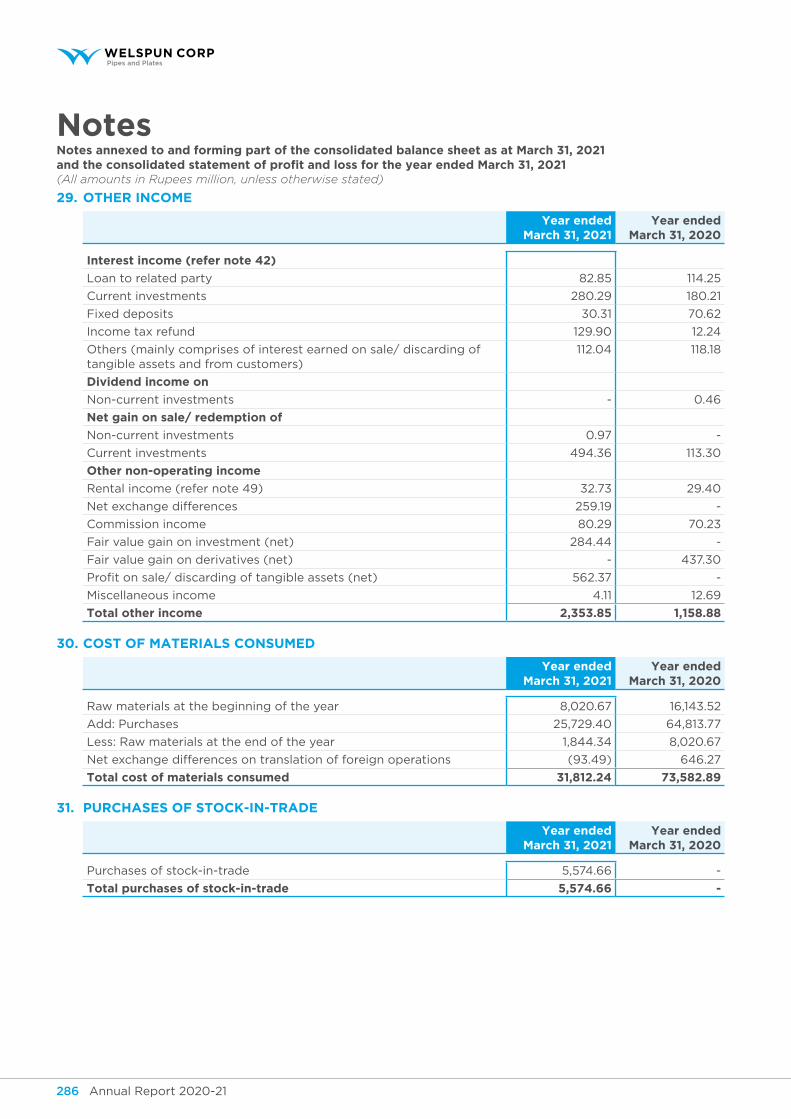
Annual Report 2020-21 287Annual Report 2020-21286
NotesNotes annexed to and forming part of the consolidated balance sheet as at March 31, 2021and the consolidated statement of profit and loss for the year ended March 31, 2021(All amounts in Rupees million, unless otherwise stated)
29. other inCoMe
year ended March 31, 2021
year ended March 31, 2020
interest income (refer note 42)
Loan to related party 82.85 114.25
Current investments 280.29 180.21
Fixed deposits 30.31 70.62
Income tax refund 129.90 12.24
Others (mainly comprises of interest earned on sale/ discarding of tangible assets and from customers)
112.04 118.18
dividend income on
Non-current investments - 0.46
net gain on sale/ redemption of
Non-current investments 0.97 -
Current investments 494.36 113.30
other non-operating income
Rental income (refer note 49) 32.73 29.40
Net exchange differences 259.19 -
Commission income 80.29 70.23
Fair value gain on investment (net) 284.44 -
Fair value gain on derivatives (net) - 437.30
Profit on sale/ discarding of tangible assets (net) 562.37 -
Miscellaneous income 4.11 12.69
total other income 2,353.85 1,158.88
30. Cost of MAteriALs ConsuMeD
year ended March 31, 2021
year ended March 31, 2020
Raw materials at the beginning of the year 8,020.67 16,143.52
Add: Purchases 25,729.40 64,813.77
Less: Raw materials at the end of the year 1,844.34 8,020.67
Net exchange differences on translation of foreign operations (93.49) 646.27
total cost of materials consumed 31,812.24 73,582.89
31. PurChAses of stoCk-in-trADe
year ended March 31, 2021
year ended March 31, 2020
Purchases of stock-in-trade 5,574.66 -
total purchases of stock-in-trade 5,574.66 -
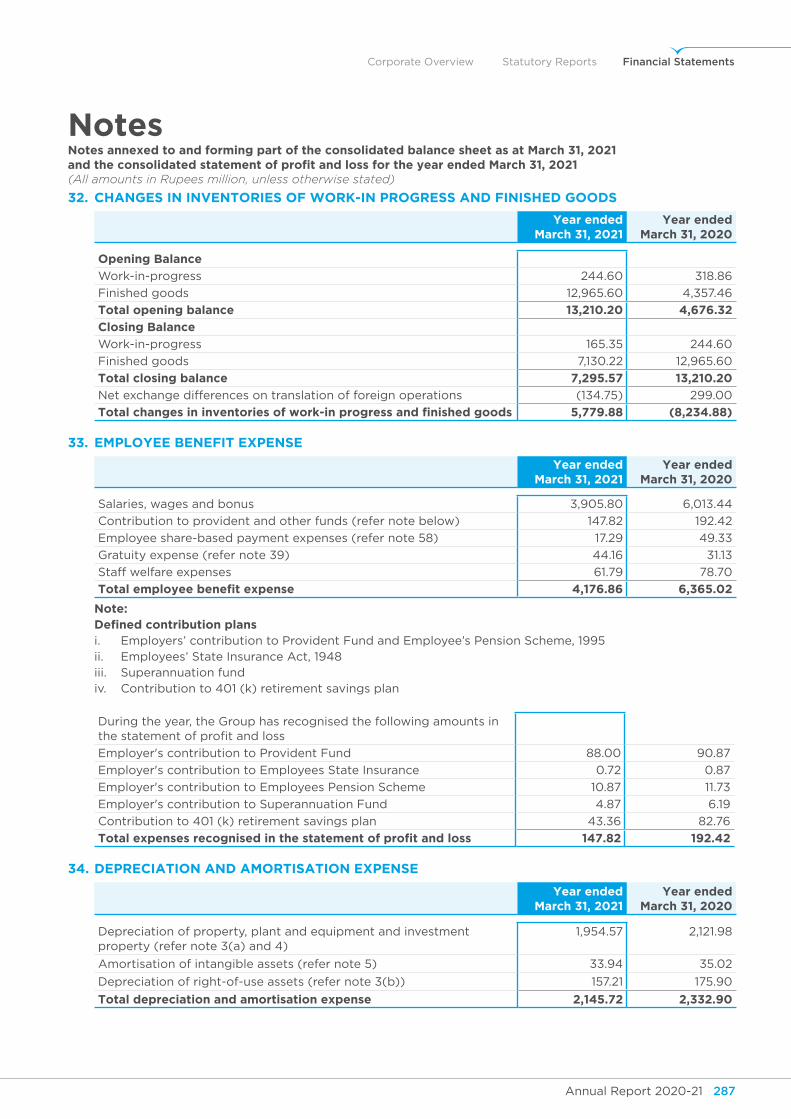
Annual Report 2020-21 287Annual Report 2020-21286
Corporate Overview Statutory Reports Financial Statements
NotesNotes annexed to and forming part of the consolidated balance sheet as at March 31, 2021and the consolidated statement of profit and loss for the year ended March 31, 2021(All amounts in Rupees million, unless otherwise stated)
32. ChAnges in inVentories of Work-in Progress AnD finisheD gooDs
year ended March 31, 2021
year ended March 31, 2020
opening Balance
Work-in-progress 244.60 318.86
Finished goods 12,965.60 4,357.46
total opening balance 13,210.20 4,676.32
closing Balance
Work-in-progress 165.35 244.60
Finished goods 7,130.22 12,965.60
total closing balance 7,295.57 13,210.20
Net exchange differences on translation of foreign operations (134.75) 299.00
total changes in inventories of work-in progress and finished goods 5,779.88 (8,234.88)
33. eMPLoyee Benefit exPense
year ended March 31, 2021
year ended March 31, 2020
Salaries, wages and bonus 3,905.80 6,013.44
Contribution to provident and other funds (refer note below) 147.82 192.42
Employee share-based payment expenses (refer note 58) 17.29 49.33
Gratuity expense (refer note 39) 44.16 31.13
Staff welfare expenses 61.79 78.70
total employee benefit expense 4,176.86 6,365.02
note: Defined contribution plans i. Employers’ contribution to Provident Fund and Employee’s Pension Scheme, 1995 ii. Employees’ State Insurance Act, 1948 iii. Superannuation fund iv. Contribution to 401 (k) retirement savings plan
During the year, the Group has recognised the following amounts in the statement of profit and loss
Employer's contribution to Provident Fund 88.00 90.87
Employer's contribution to Employees State Insurance 0.72 0.87
Employer's contribution to Employees Pension Scheme 10.87 11.73
Employer's contribution to Superannuation Fund 4.87 6.19
Contribution to 401 (k) retirement savings plan 43.36 82.76
total expenses recognised in the statement of profit and loss 147.82 192.42
34. DePreCiAtion AnD AMortisAtion exPense
year ended March 31, 2021
year ended March 31, 2020
Depreciation of property, plant and equipment and investment property (refer note 3(a) and 4)
1,954.57 2,121.98
Amortisation of intangible assets (refer note 5) 33.94 35.02
Depreciation of right-of-use assets (refer note 3(b)) 157.21 175.90
total depreciation and amortisation expense 2,145.72 2,332.90
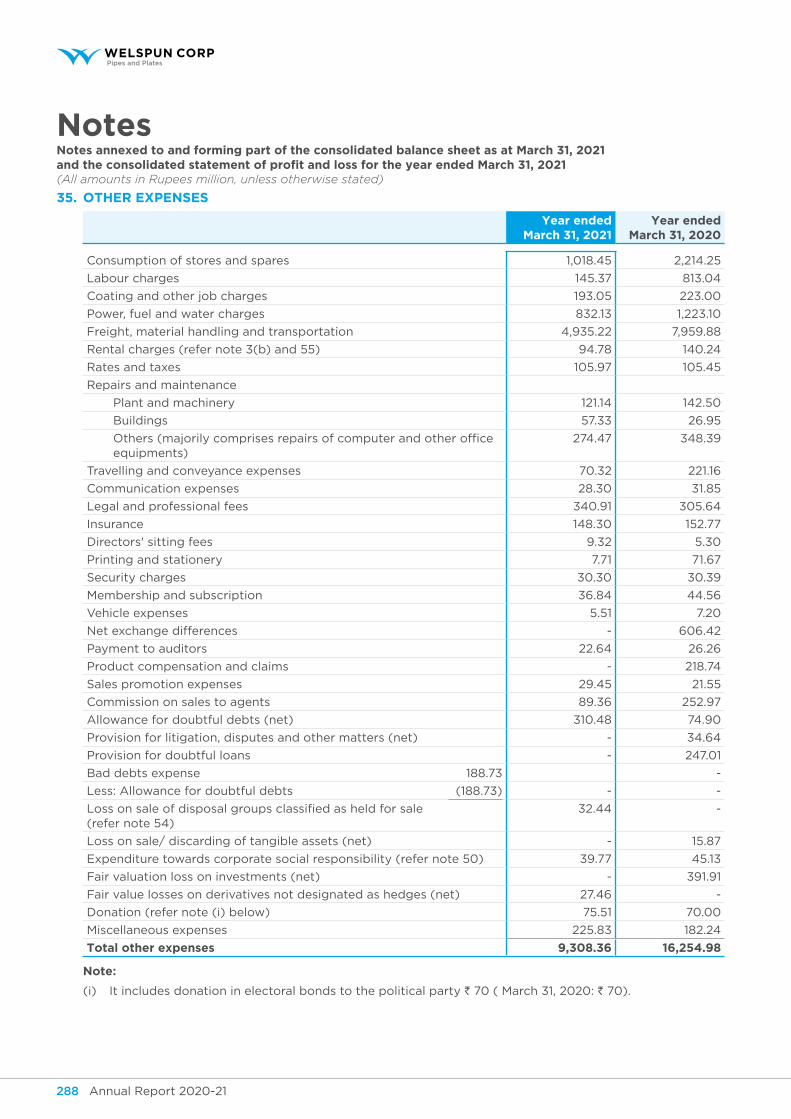
Annual Report 2020-21 289Annual Report 2020-21288
NotesNotes annexed to and forming part of the consolidated balance sheet as at March 31, 2021and the consolidated statement of profit and loss for the year ended March 31, 2021(All amounts in Rupees million, unless otherwise stated)
35. other exPenses
year ended March 31, 2021
year ended March 31, 2020
Consumption of stores and spares 1,018.45 2,214.25
Labour charges 145.37 813.04
Coating and other job charges 193.05 223.00
Power, fuel and water charges 832.13 1,223.10
Freight, material handling and transportation 4,935.22 7,959.88
Rental charges (refer note 3(b) and 55) 94.78 140.24
Rates and taxes 105.97 105.45
Repairs and maintenance
Plant and machinery 121.14 142.50
Buildings 57.33 26.95
Others (majorily comprises repairs of computer and other office equipments)
274.47 348.39
Travelling and conveyance expenses 70.32 221.16
Communication expenses 28.30 31.85
Legal and professional fees 340.91 305.64
Insurance 148.30 152.77
Directors' sitting fees 9.32 5.30
Printing and stationery 7.71 71.67
Security charges 30.30 30.39
Membership and subscription 36.84 44.56
Vehicle expenses 5.51 7.20
Net exchange differences - 606.42
Payment to auditors 22.64 26.26
Product compensation and claims - 218.74
Sales promotion expenses 29.45 21.55
Commission on sales to agents 89.36 252.97
Allowance for doubtful debts (net) 310.48 74.90
Provision for litigation, disputes and other matters (net) - 34.64
Provision for doubtful loans - 247.01
Bad debts expense 188.73 -
Less: Allowance for doubtful debts (188.73) - -
Loss on sale of disposal groups classified as held for sale (refer note 54)
32.44 -
Loss on sale/ discarding of tangible assets (net) - 15.87
Expenditure towards corporate social responsibility (refer note 50) 39.77 45.13
Fair valuation loss on investments (net) - 391.91
Fair value losses on derivatives not designated as hedges (net) 27.46 -
Donation (refer note (i) below) 75.51 70.00
Miscellaneous expenses 225.83 182.24
total other expenses 9,308.36 16,254.98
note:
(i) It includes donation in electoral bonds to the political party ` 70 ( March 31, 2020: ` 70).
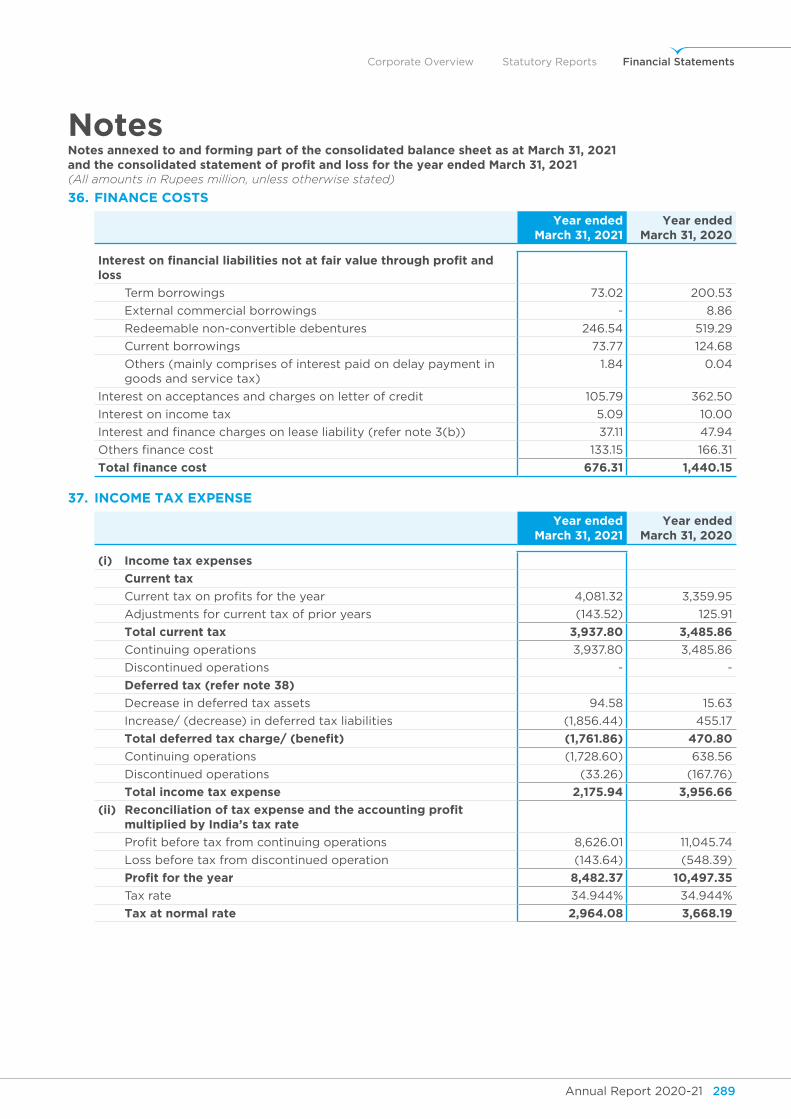
Annual Report 2020-21 289Annual Report 2020-21288
Corporate Overview Statutory Reports Financial Statements
NotesNotes annexed to and forming part of the consolidated balance sheet as at March 31, 2021and the consolidated statement of profit and loss for the year ended March 31, 2021(All amounts in Rupees million, unless otherwise stated)
36. finAnCe Costs
year ended March 31, 2021
year ended March 31, 2020
interest on financial liabilities not at fair value through profit and loss
Term borrowings 73.02 200.53
External commercial borrowings - 8.86
Redeemable non-convertible debentures 246.54 519.29
Current borrowings 73.77 124.68
Others (mainly comprises of interest paid on delay payment in goods and service tax)
1.84 0.04
Interest on acceptances and charges on letter of credit 105.79 362.50
Interest on income tax 5.09 10.00
Interest and finance charges on lease liability (refer note 3(b)) 37.11 47.94
Others finance cost 133.15 166.31
total finance cost 676.31 1,440.15
37. inCoMe tAx exPense
year ended March 31, 2021
year ended March 31, 2020
(i) Income tax expenses
current tax
Current tax on profits for the year 4,081.32 3,359.95
Adjustments for current tax of prior years (143.52) 125.91
total current tax 3,937.80 3,485.86
Continuing operations 3,937.80 3,485.86
Discontinued operations - -
Deferred tax (refer note 38)
Decrease in deferred tax assets 94.58 15.63
Increase/ (decrease) in deferred tax liabilities (1,856.44) 455.17
total deferred tax charge/ (benefit) (1,761.86) 470.80
Continuing operations (1,728.60) 638.56
Discontinued operations (33.26) (167.76)
total income tax expense 2,175.94 3,956.66
(ii) reconciliation of tax expense and the accounting profit multiplied by India’s tax rate
Profit before tax from continuing operations 8,626.01 11,045.74
Loss before tax from discontinued operation (143.64) (548.39)
Profit for the year 8,482.37 10,497.35
Tax rate 34.944% 34.944%
tax at normal rate 2,964.08 3,668.19
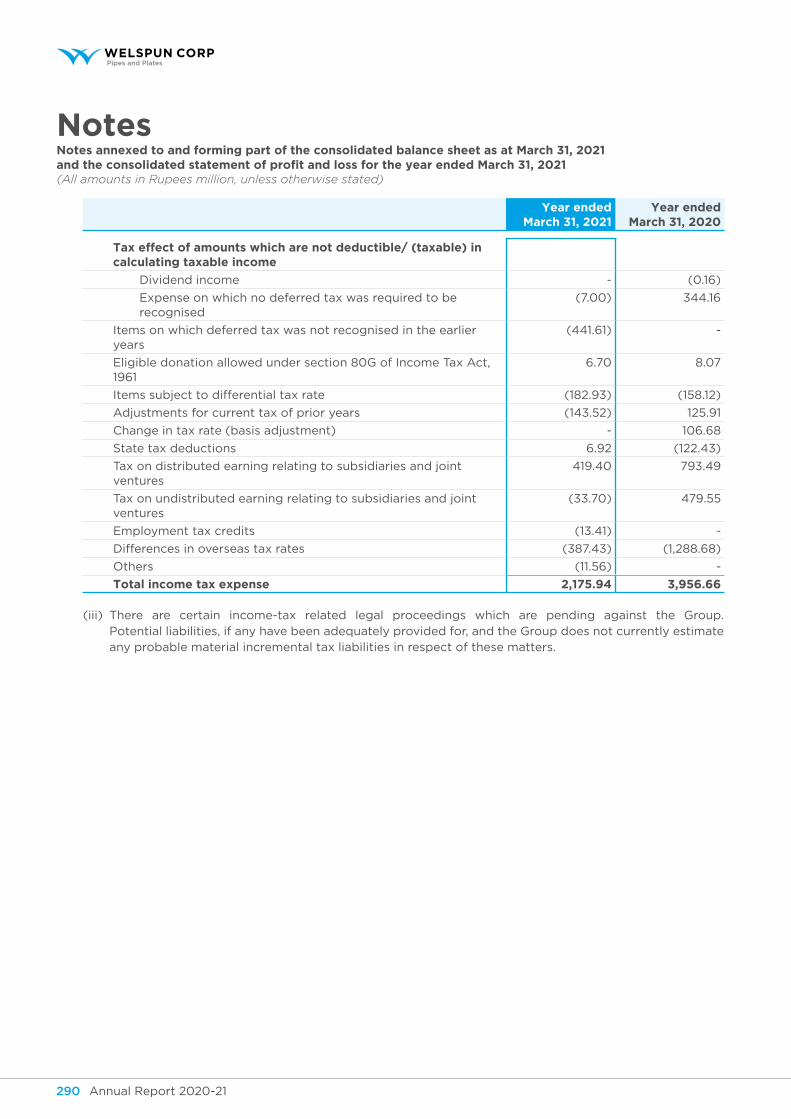
Annual Report 2020-21 291Annual Report 2020-21290
NotesNotes annexed to and forming part of the consolidated balance sheet as at March 31, 2021and the consolidated statement of profit and loss for the year ended March 31, 2021(All amounts in Rupees million, unless otherwise stated)
year ended March 31, 2021
year ended March 31, 2020
tax effect of amounts which are not deductible/ (taxable) in calculating taxable income
Dividend income - (0.16)
Expense on which no deferred tax was required to be recognised
(7.00) 344.16
Items on which deferred tax was not recognised in the earlier years
(441.61) -
Eligible donation allowed under section 80G of Income Tax Act, 1961
6.70 8.07
Items subject to differential tax rate (182.93) (158.12)
Adjustments for current tax of prior years (143.52) 125.91
Change in tax rate (basis adjustment) - 106.68
State tax deductions 6.92 (122.43)
Tax on distributed earning relating to subsidiaries and joint ventures
419.40 793.49
Tax on undistributed earning relating to subsidiaries and joint ventures
(33.70) 479.55
Employment tax credits (13.41) -
Differences in overseas tax rates (387.43) (1,288.68)
Others (11.56) -
total income tax expense 2,175.94 3,956.66
(iii) There are certain income-tax related legal proceedings which are pending against the Group. Potential liabilities, if any have been adequately provided for, and the Group does not currently estimate any probable material incremental tax liabilities in respect of these matters.
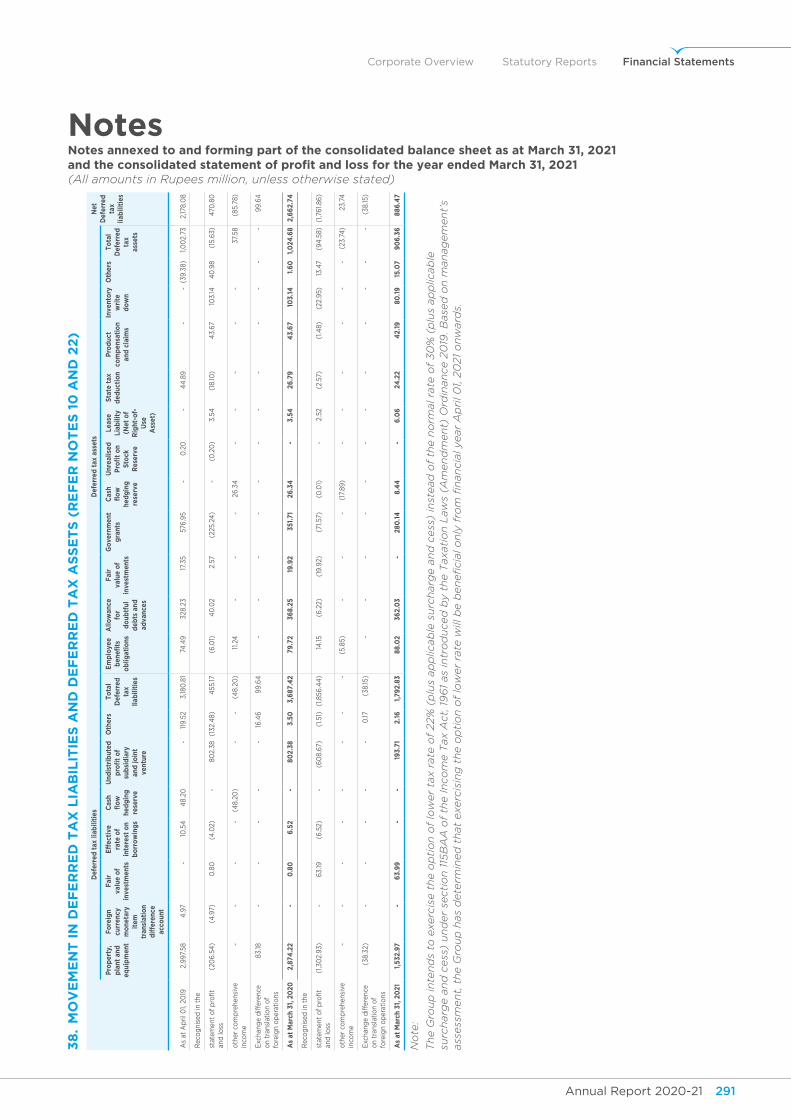
Annual Report 2020-21 291Annual Report 2020-21290
Corporate Overview Statutory Reports Financial Statements
NotesNotes annexed to and forming part of the consolidated balance sheet as at March 31, 2021and the consolidated statement of profit and loss for the year ended March 31, 2021(All amounts in Rupees million, unless otherwise stated)
38
. M
oV
eM
en
t i
n D
ef
er
re
D t
Ax
LiA
BiL
itie
s A
nD
De
fe
rr
eD
tA
x A
ss
et
s (
re
fe
r n
ot
es
10
An
D 2
2)
def
erre
d t
ax li
abili
ties
def
erre
d t
ax a
sset
s n
et
def
erre
d
tax
liab
iliti
es
Pro
per
ty,
pla
nt a
nd
equi
pm
ent
fo
reig
n cu
rren
cy
mo
neta
ry
item
tr
ansl
atio
n d
iffe
renc
e ac
coun
t
fai
r va
lue
of
inve
stm
ents
eff
ecti
ve
rate
of
inte
rest
on
bo
rro
win
gs
cas
h fl
ow
he
dg
ing
re
serv
e
und
istr
ibut
ed
pro
fit
of
sub
sid
iary
an
d jo
int
vent
ure
oth
ers
tota
l d
efer
red
ta
x lia
bili
ties
em
plo
yee
ben
efits
o
blig
atio
ns
Allo
wan
ce
for
do
ubtf
ul
deb
ts a
nd
adva
nces
fai
r va
lue
of
inve
stm
ents
go
vern
men
t g
rant
sc
ash
flo
w
hed
gin
g
rese
rve
unr
ealis
ed
Pro
fit
on
sto
ck
Res
erve
leas
e li
abili
ty
(net
of
Rig
ht-o
f-u
se
Ass
et)
stat
e ta
x d
educ
tio
np
rod
uct
com
pen
sati
on
and
cla
ims
Inve
nto
ry
wri
te
do
wn
oth
ers
tota
l d
efer
red
ta
x as
sets
As
at A
pri
l 01,
2019
2,9
97.5
8 4
.97
-
10
.54
4
8.20
-
1
19.5
2 3
,180
.81
74
.49
3
28.2
3 1
7.35
5
76.9
5 -
0
.20
-
4
4.8
9
-
-
(39
.38)
1,0
02.
73
2,17
8.0
8
Rec
og
nise
d in
the
stat
emen
t o
f p
rofit
an
d lo
ss (
206
.54
) (
4.9
7) 0
.80
(
4.0
2) -
8
02.
38
(132
.48)
455
.17
(6
.01)
40
.02
2.5
7 (
225.
24)
-
(0
.20
) 3
.54
(
18.10
) 4
3.67
1
03.
14
40
.98
(15
.63)
470
.80
oth
er c
om
pre
hens
ive
inco
me
-
-
-
-
(4
8.20
) -
-
(4
8.20
) 1
1.24
-
-
-
2
6.3
4
-
-
-
-
-
37.
58
(85
.78)
Exc
hang
e d
iffer
ence
o
n tr
ansl
atio
n o
f fo
reig
n o
per
atio
ns
83.
18
-
-
-
-
- 1
6.4
6
99
.64
-
-
-
-
-
-
-
-
-
-
-
-
99
.64
As
at M
arch
31,
20
20 2
,874
.22
-
0.8
0
6.5
2 -
80
2.38
3
.50
3,
687
.42
79
.72
36
8.25
1
9.9
2 3
51.7
1 2
6.3
4
-
3.5
4
26
.79
4
3.6
7 1
03.
14
1.6
0
1,0
24.6
8 2,
66
2.74
Rec
og
nise
d in
the
stat
emen
t o
f p
rofit
an
d lo
ss (
1,30
2.9
3) -
6
3.19
(
6.5
2) -
(6
08.
67)
(1.5
1)(1
,856
.44
) 1
4.15
(
6.2
2) (
19.9
2) (
71.5
7) (
0.0
1) -
2
.52
(2.
57)
(1.4
8) (
22.9
5) 1
3.4
7 (
94
.58)
(1,7
61.8
6)
oth
er c
om
pre
hens
ive
inco
me
-
-
-
-
-
-
-
-
(5.
85)
-
-
-
(17
.89
) -
-
-
-
-
-
(
23.7
4)
23.
74
Exc
hang
e d
iffer
ence
o
n tr
ansl
atio
n o
f fo
reig
n o
per
atio
ns
(38
.32)
-
-
-
-
-
0.17
(
38.15
) -
-
-
-
-
-
-
-
-
-
-
-
(
38.15
)
As
at M
arch
31,
20
21 1
,532
.97
-
63.
99
-
-
1
93.
71
2.1
6
1,7
92.
83
88.
02
36
2.0
3 -
2
80.1
4
8.4
4
-
6.0
6
24
.22
42.
19
80
.19
1
5.0
7 9
06
.36
8
86.4
7
No
te:
Th
e G
rou
p in
ten
ds
to e
xerc
ise t
he o
pti
on
of
low
er
tax r
ate
of
22%
(p
lus
ap
plic
ab
le s
urc
harg
e a
nd
cess
) in
stead
of
the n
orm
al ra
te o
f 3
0%
(p
lus
ap
plic
ab
le
surc
harg
e a
nd
cess
) u
nd
er
secti
on
115
BA
A o
f th
e In
co
me T
ax A
ct,
19
61
as
intr
od
uced
by t
he T
axati
on
Law
s (A
men
dm
en
t) O
rdin
an
ce 2
019
. Base
d o
n m
an
ag
em
en
t’s
ass
ess
men
t, t
he G
rou
p h
as
dete
rmin
ed
th
at
exerc
isin
g t
he o
pti
on
of
low
er
rate
will
be b
en
efi
cia
l o
nly
fro
m fi
nan
cia
l year
Ap
ril 0
1, 2
021
on
ward
s.
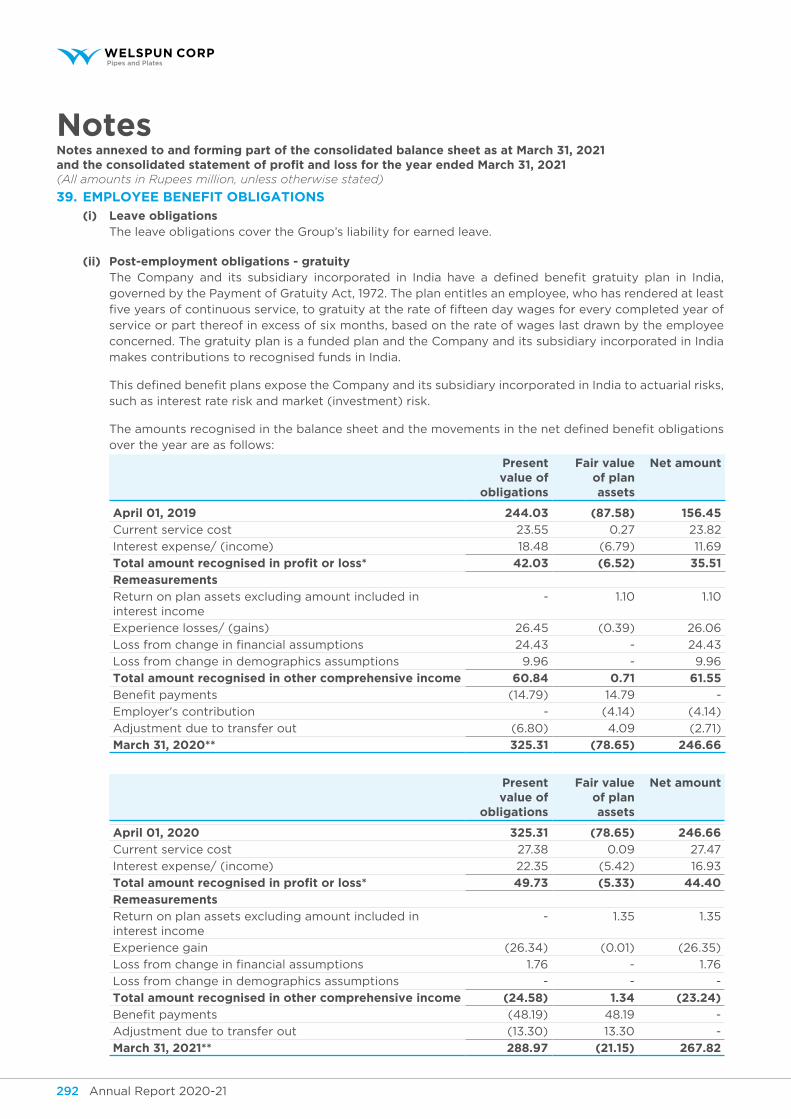
Annual Report 2020-21 293Annual Report 2020-21292
NotesNotes annexed to and forming part of the consolidated balance sheet as at March 31, 2021and the consolidated statement of profit and loss for the year ended March 31, 2021(All amounts in Rupees million, unless otherwise stated)
39. eMPLoyee Benefit oBLigAtions
(i) leave obligations The leave obligations cover the Group’s liability for earned leave.
(ii) post-employment obligations - gratuity The Company and its subsidiary incorporated in India have a defined benefit gratuity plan in India,
governed by the Payment of Gratuity Act, 1972. The plan entitles an employee, who has rendered at least five years of continuous service, to gratuity at the rate of fifteen day wages for every completed year of service or part thereof in excess of six months, based on the rate of wages last drawn by the employee concerned. The gratuity plan is a funded plan and the Company and its subsidiary incorporated in India makes contributions to recognised funds in India.
This defined benefit plans expose the Company and its subsidiary incorporated in India to actuarial risks, such as interest rate risk and market (investment) risk.
The amounts recognised in the balance sheet and the movements in the net defined benefit obligations over the year are as follows:
present value of
obligations
fair value of plan assets
net amount
April 01, 2019 244.03 (87.58) 156.45
Current service cost 23.55 0.27 23.82
Interest expense/ (income) 18.48 (6.79) 11.69
total amount recognised in profit or loss* 42.03 (6.52) 35.51
Remeasurements
Return on plan assets excluding amount included in interest income
- 1.10 1.10
Experience losses/ (gains) 26.45 (0.39) 26.06
Loss from change in financial assumptions 24.43 - 24.43
Loss from change in demographics assumptions 9.96 - 9.96
total amount recognised in other comprehensive income 60.84 0.71 61.55
Benefit payments (14.79) 14.79 -
Employer's contribution - (4.14) (4.14)
Adjustment due to transfer out (6.80) 4.09 (2.71)
March 31, 2020** 325.31 (78.65) 246.66
present value of
obligations
fair value of plan assets
net amount
April 01, 2020 325.31 (78.65) 246.66
Current service cost 27.38 0.09 27.47
Interest expense/ (income) 22.35 (5.42) 16.93
total amount recognised in profit or loss* 49.73 (5.33) 44.40
Remeasurements
Return on plan assets excluding amount included in interest income
- 1.35 1.35
Experience gain (26.34) (0.01) (26.35)
Loss from change in financial assumptions 1.76 - 1.76
Loss from change in demographics assumptions - - -
total amount recognised in other comprehensive income (24.58) 1.34 (23.24)
Benefit payments (48.19) 48.19 -
Adjustment due to transfer out (13.30) 13.30 -
March 31, 2021** 288.97 (21.15) 267.82
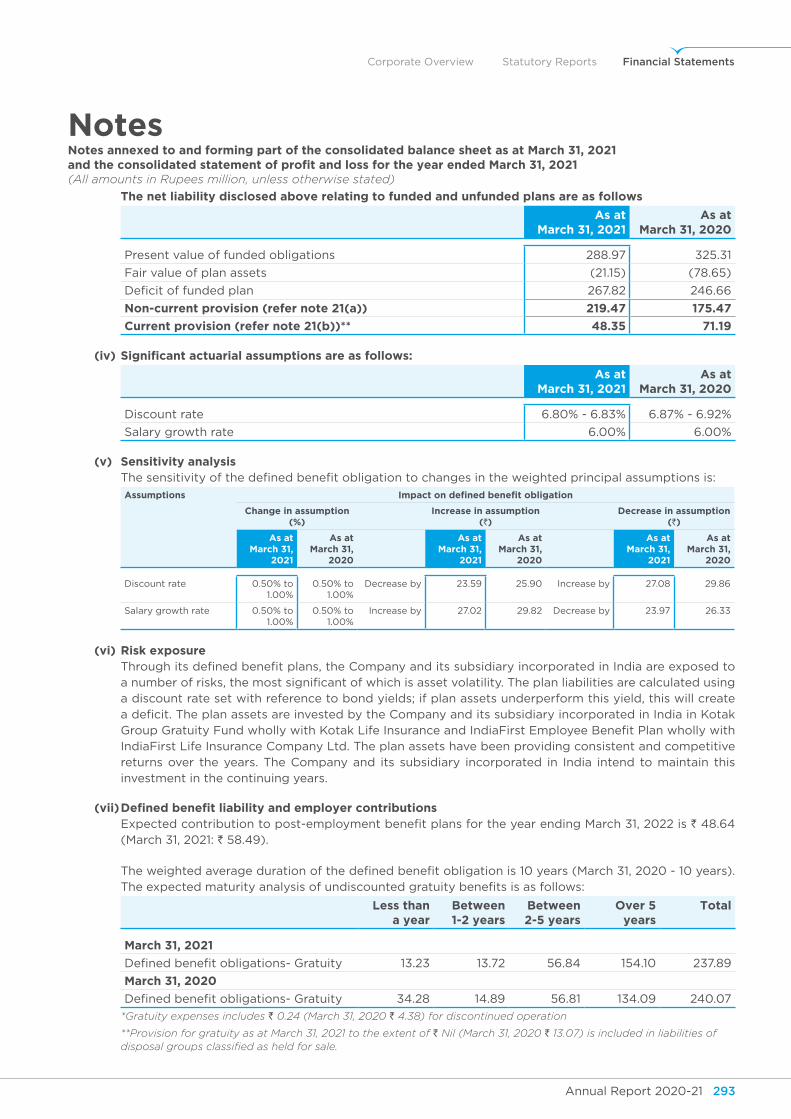
Annual Report 2020-21 293Annual Report 2020-21292
Corporate Overview Statutory Reports Financial Statements
NotesNotes annexed to and forming part of the consolidated balance sheet as at March 31, 2021and the consolidated statement of profit and loss for the year ended March 31, 2021(All amounts in Rupees million, unless otherwise stated)
the net liability disclosed above relating to funded and unfunded plans are as follows
As at March 31, 2021
As at March 31, 2020
Present value of funded obligations 288.97 325.31
Fair value of plan assets (21.15) (78.65)
Deficit of funded plan 267.82 246.66
non-current provision (refer note 21(a)) 219.47 175.47
Current provision (refer note 21(b))** 48.35 71.19
(iv) significant actuarial assumptions are as follows:
As at March 31, 2021
As at March 31, 2020
Discount rate 6.80% - 6.83% 6.87% - 6.92%
Salary growth rate 6.00% 6.00%
(v) sensitivity analysis The sensitivity of the defined benefit obligation to changes in the weighted principal assumptions is:
Assumptions impact on defined benefit obligation
change in assumption (%)
Increase in assumption (`)
decrease in assumption (`)
As at March 31,
2021
As at March 31,
2020
As at March 31,
2021
As at March 31,
2020
As at March 31,
2021
As at March 31,
2020
Discount rate 0.50% to 1.00%
0.50% to 1.00%
Decrease by 23.59 25.90 Increase by 27.08 29.86
Salary growth rate 0.50% to 1.00%
0.50% to 1.00%
Increase by 27.02 29.82 Decrease by 23.97 26.33
(vi) Risk exposure Through its defined benefit plans, the Company and its subsidiary incorporated in India are exposed to
a number of risks, the most significant of which is asset volatility. The plan liabilities are calculated using a discount rate set with reference to bond yields; if plan assets underperform this yield, this will create a deficit. The plan assets are invested by the Company and its subsidiary incorporated in India in Kotak Group Gratuity Fund wholly with Kotak Life Insurance and IndiaFirst Employee Benefit Plan wholly with IndiaFirst Life Insurance Company Ltd. The plan assets have been providing consistent and competitive returns over the years. The Company and its subsidiary incorporated in India intend to maintain this investment in the continuing years.
(vii) Defined benefit liability and employer contributions Expected contribution to post-employment benefit plans for the year ending March 31, 2022 is ` 48.64
(March 31, 2021: ` 58.49).
The weighted average duration of the defined benefit obligation is 10 years (March 31, 2020 - 10 years). The expected maturity analysis of undiscounted gratuity benefits is as follows:
less than a year
Between 1-2 years
Between 2-5 years
over 5 years
total
March 31, 2021
Defined benefit obligations- Gratuity 13.23 13.72 56.84 154.10 237.89
March 31, 2020
Defined benefit obligations- Gratuity 34.28 14.89 56.81 134.09 240.07
*Gratuity expenses includes ` 0.24 (March 31, 2020 ` 4.38) for discontinued operation
**Provision for gratuity as at March 31, 2021 to the extent of ` Nil (March 31, 2020 ` 13.07) is included in liabilities of disposal groups classified as held for sale.
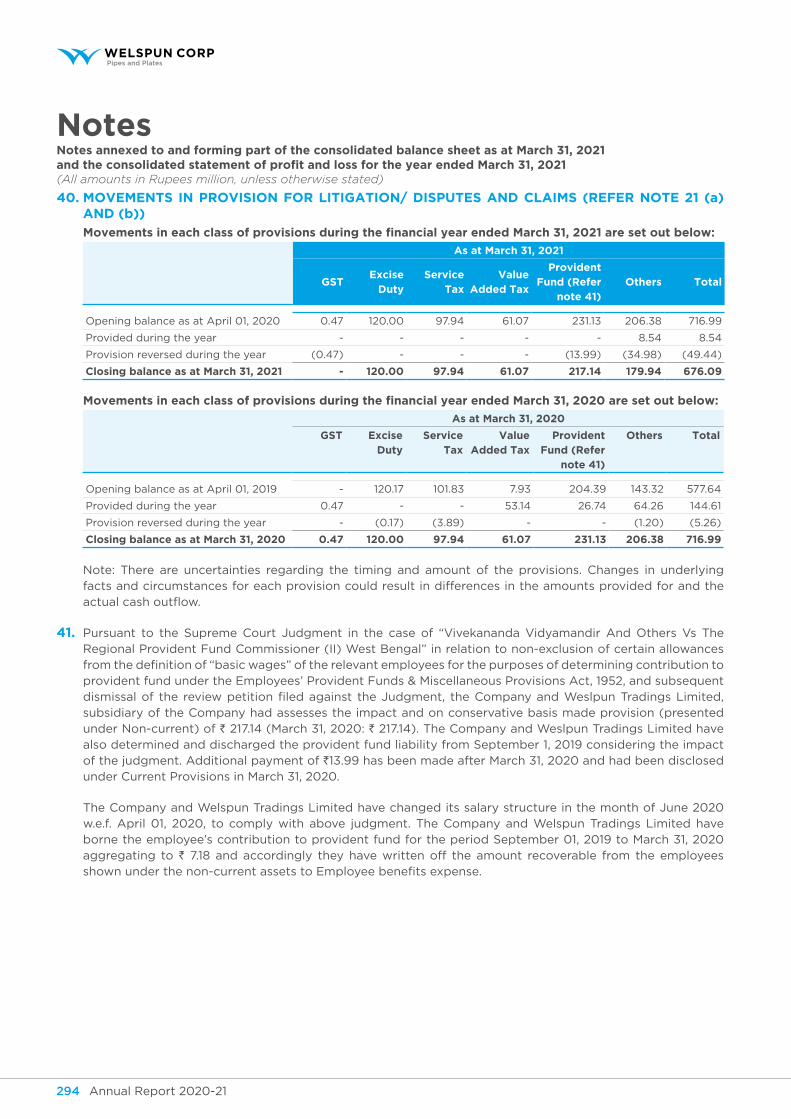
Annual Report 2020-21 295Annual Report 2020-21294
NotesNotes annexed to and forming part of the consolidated balance sheet as at March 31, 2021and the consolidated statement of profit and loss for the year ended March 31, 2021(All amounts in Rupees million, unless otherwise stated)
40. MoVeMents in ProVision for LitigAtion/ DisPutes AnD CLAiMs (refer note 21 (a) And (b))
Movements in each class of provisions during the financial year ended March 31, 2021 are set out below:
As at March 31, 2021
gstexcise
dutyservice
taxvalue
Added tax
provident fund (Refer
note 41)others total
Opening balance as at April 01, 2020 0.47 120.00 97.94 61.07 231.13 206.38 716.99
Provided during the year - - - - - 8.54 8.54
Provision reversed during the year (0.47) - - - (13.99) (34.98) (49.44)
Closing balance as at March 31, 2021 - 120.00 97.94 61.07 217.14 179.94 676.09
Movements in each class of provisions during the financial year ended March 31, 2020 are set out below:
As at March 31, 2020
gst excise duty
service tax
value Added tax
provident fund (Refer
note 41)
others total
Opening balance as at April 01, 2019 - 120.17 101.83 7.93 204.39 143.32 577.64
Provided during the year 0.47 - - 53.14 26.74 64.26 144.61
Provision reversed during the year - (0.17) (3.89) - - (1.20) (5.26)
Closing balance as at March 31, 2020 0.47 120.00 97.94 61.07 231.13 206.38 716.99
Note: There are uncertainties regarding the timing and amount of the provisions. Changes in underlying facts and circumstances for each provision could result in differences in the amounts provided for and the actual cash outflow.
41. Pursuant to the Supreme Court Judgment in the case of “Vivekananda Vidyamandir And Others Vs The Regional Provident Fund Commissioner (II) West Bengal” in relation to non-exclusion of certain allowances from the definition of “basic wages” of the relevant employees for the purposes of determining contribution to provident fund under the Employees’ Provident Funds & Miscellaneous Provisions Act, 1952, and subsequent dismissal of the review petition filed against the Judgment, the Company and Weslpun Tradings Limited, subsidiary of the Company had assesses the impact and on conservative basis made provision (presented under Non-current) of ` 217.14 (March 31, 2020: ` 217.14). The Company and Weslpun Tradings Limited have also determined and discharged the provident fund liability from September 1, 2019 considering the impact of the judgment. Additional payment of `13.99 has been made after March 31, 2020 and had been disclosed under Current Provisions in March 31, 2020.
The Company and Welspun Tradings Limited have changed its salary structure in the month of June 2020 w.e.f. April 01, 2020, to comply with above judgment. The Company and Welspun Tradings Limited have borne the employee’s contribution to provident fund for the period September 01, 2019 to March 31, 2020 aggregating to ` 7.18 and accordingly they have written off the amount recoverable from the employees shown under the non-current assets to Employee benefits expense.
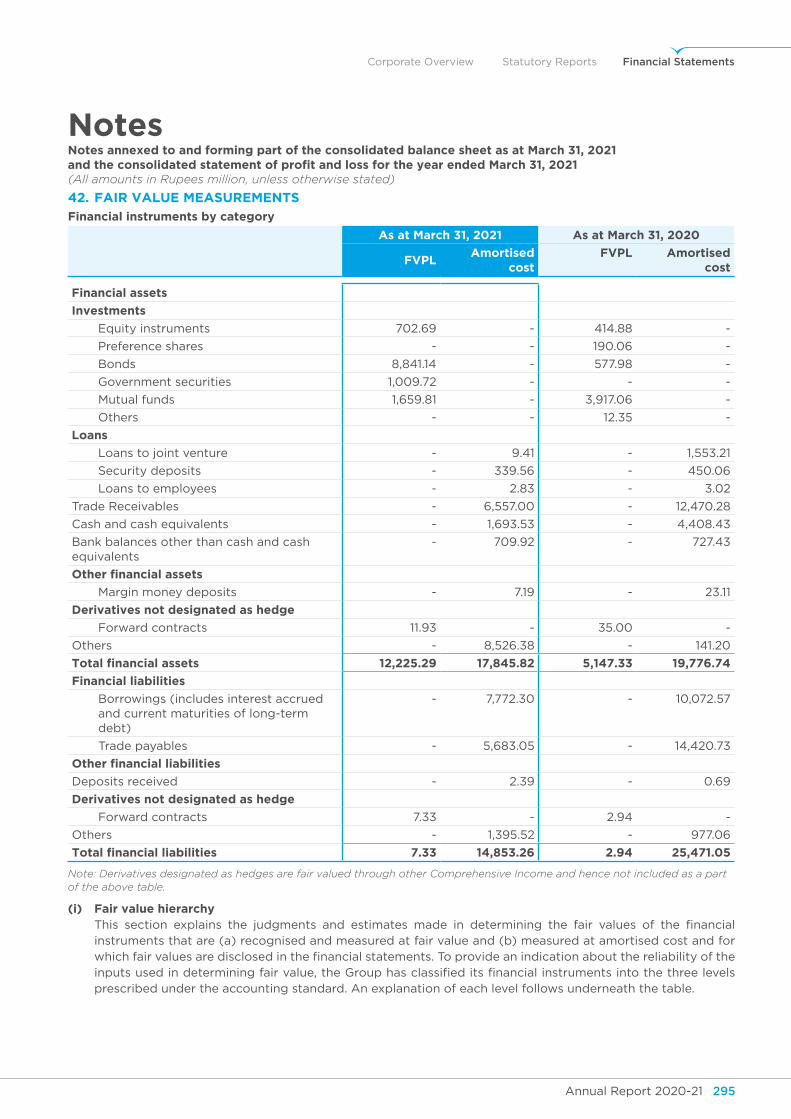
Annual Report 2020-21 295Annual Report 2020-21294
Corporate Overview Statutory Reports Financial Statements
NotesNotes annexed to and forming part of the consolidated balance sheet as at March 31, 2021and the consolidated statement of profit and loss for the year ended March 31, 2021(All amounts in Rupees million, unless otherwise stated)
42. fAir VALue MeAsureMents
financial instruments by category
As at March 31, 2021 As at March 31, 2020
fvplAmortised
costfvpl Amortised
cost
financial assets
Investments
Equity instruments 702.69 - 414.88 -
Preference shares - - 190.06 -
Bonds 8,841.14 - 577.98 -
Government securities 1,009.72 - - -
Mutual funds 1,659.81 - 3,917.06 -
Others - - 12.35 -
loans
Loans to joint venture - 9.41 - 1,553.21
Security deposits - 339.56 - 450.06
Loans to employees - 2.83 - 3.02
Trade Receivables - 6,557.00 - 12,470.28
Cash and cash equivalents - 1,693.53 - 4,408.43
Bank balances other than cash and cash equivalents
- 709.92 - 727.43
other financial assets
Margin money deposits - 7.19 - 23.11
derivatives not designated as hedge
Forward contracts 11.93 - 35.00 -
Others - 8,526.38 - 141.20
total financial assets 12,225.29 17,845.82 5,147.33 19,776.74
financial liabilities
Borrowings (includes interest accrued and current maturities of long-term debt)
- 7,772.30 - 10,072.57
Trade payables - 5,683.05 - 14,420.73
other financial liabilities
Deposits received - 2.39 - 0.69
derivatives not designated as hedge
Forward contracts 7.33 - 2.94 -
Others - 1,395.52 - 977.06
total financial liabilities 7.33 14,853.26 2.94 25,471.05
Note: Derivatives designated as hedges are fair valued through other Comprehensive Income and hence not included as a part of the above table.
(i) fair value hierarchy This section explains the judgments and estimates made in determining the fair values of the financial
instruments that are (a) recognised and measured at fair value and (b) measured at amortised cost and for which fair values are disclosed in the financial statements. To provide an indication about the reliability of the inputs used in determining fair value, the Group has classified its financial instruments into the three levels prescribed under the accounting standard. An explanation of each level follows underneath the table.

Annual Report 2020-21 297Annual Report 2020-21296
NotesNotes annexed to and forming part of the consolidated balance sheet as at March 31, 2021and the consolidated statement of profit and loss for the year ended March 31, 2021(All amounts in Rupees million, unless otherwise stated)
financial assets and liabilities measured at fair value - recurring fair value measurements as at March 31, 2021
level 1 Level 2 Level 3 total
financial assetsfinancial Investments at fvplEquity instruments - - 702.69 702.69
Bonds 8,841.14 - - 8,841.14
Government securities 1,009.72 - - 1,009.72
Mutual fund 1,659.81 - - 1,659.81
derivatives not designated as hedgesForward contracts - 11.93 - 11.93
total financial assets 11,510.67 11.93 702.69 12,225.29 financial liabilitiesderivatives designated not as hedgesForward contracts - 7.33 - 7.33
total financial liabilities - 7.33 - 7.33
Assets and liabilities which are measured at amortised cost for which fair value are disclosed as at March 31, 2021
level 1 Level 2 Level 3 total
financial assets
loans
Loans to joint venture - - 9.41 9.41
Security deposits - - 339.56 339.56
Loans to employees - - 2.83 2.83
other financial assets
Term deposits with maturity more than 12 months
- - 7.19 7.19
Others - - 8,526.38 8,526.38
total financial assets - - 8,885.37 8,885.37
financial liabilities
Borrowings (includes interest accrued and current maturities of long-term debt)
- - 7,772.30 7,772.30
other financial liabilities
Others - - 1,397.91 1,397.91
total financial liabilities - - 9,170.21 9,170.21
financial assets and liabilities measured at fair value - recurring fair value measurements as at March 31, 2020
level 1 Level 2 Level 3 total
financial assetsfinancial Investments at fvplEquity instruments - - 414.88 414.88
Preference Shares - - 190.06 190.06
Bonds 577.98 - - 577.98
Mutual Fund 3,917.06 - - 3,917.06
Others 12.35 - - 12.35
derivatives not designated as hedgesForward contracts - 35.00 - 35.00
total financial assets 4,507.39 35.00 604.94 5,147.33 financial liabilitiesderivatives not designated as hedgesForward contracts - 2.94 - 2.94
total financial liabilities - 2.94 - 2.94
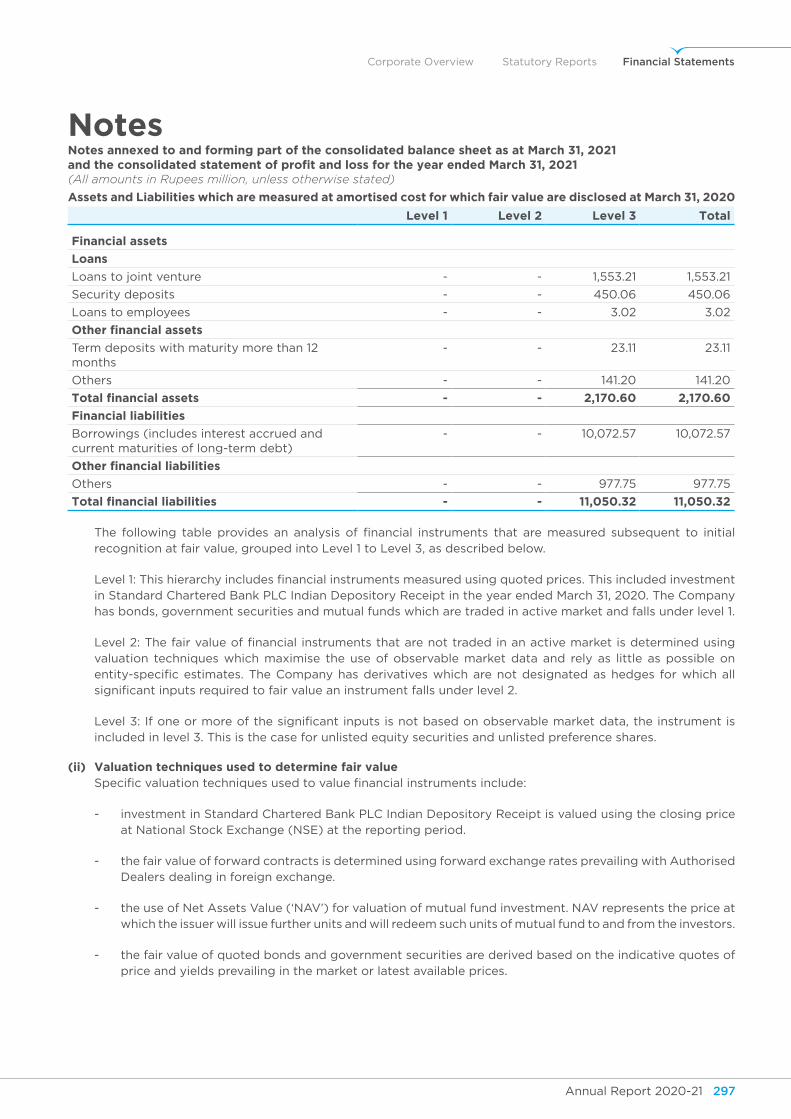
Annual Report 2020-21 297Annual Report 2020-21296
Corporate Overview Statutory Reports Financial Statements
NotesNotes annexed to and forming part of the consolidated balance sheet as at March 31, 2021and the consolidated statement of profit and loss for the year ended March 31, 2021(All amounts in Rupees million, unless otherwise stated)
Assets and Liabilities which are measured at amortised cost for which fair value are disclosed at March 31, 2020
level 1 Level 2 Level 3 total
financial assets
loans
Loans to joint venture - - 1,553.21 1,553.21
Security deposits - - 450.06 450.06
Loans to employees - - 3.02 3.02
other financial assets
Term deposits with maturity more than 12 months
- - 23.11 23.11
Others - - 141.20 141.20
total financial assets - - 2,170.60 2,170.60
financial liabilities
Borrowings (includes interest accrued and current maturities of long-term debt)
- - 10,072.57 10,072.57
other financial liabilities
Others - - 977.75 977.75
total financial liabilities - - 11,050.32 11,050.32
The following table provides an analysis of financial instruments that are measured subsequent to initial recognition at fair value, grouped into Level 1 to Level 3, as described below.
Level 1: This hierarchy includes financial instruments measured using quoted prices. This included investment in Standard Chartered Bank PLC Indian Depository Receipt in the year ended March 31, 2020. The Company has bonds, government securities and mutual funds which are traded in active market and falls under level 1.
Level 2: The fair value of financial instruments that are not traded in an active market is determined using valuation techniques which maximise the use of observable market data and rely as little as possible on entity-specific estimates. The Company has derivatives which are not designated as hedges for which all significant inputs required to fair value an instrument falls under level 2.
Level 3: If one or more of the significant inputs is not based on observable market data, the instrument is included in level 3. This is the case for unlisted equity securities and unlisted preference shares.
(ii) valuation techniques used to determine fair value Specific valuation techniques used to value financial instruments include:
- investment in Standard Chartered Bank PLC Indian Depository Receipt is valued using the closing price at National Stock Exchange (NSE) at the reporting period.
- the fair value of forward contracts is determined using forward exchange rates prevailing with Authorised Dealers dealing in foreign exchange.
- the use of Net Assets Value (‘NAV’) for valuation of mutual fund investment. NAV represents the price at which the issuer will issue further units and will redeem such units of mutual fund to and from the investors.
- the fair value of quoted bonds and government securities are derived based on the indicative quotes of price and yields prevailing in the market or latest available prices.
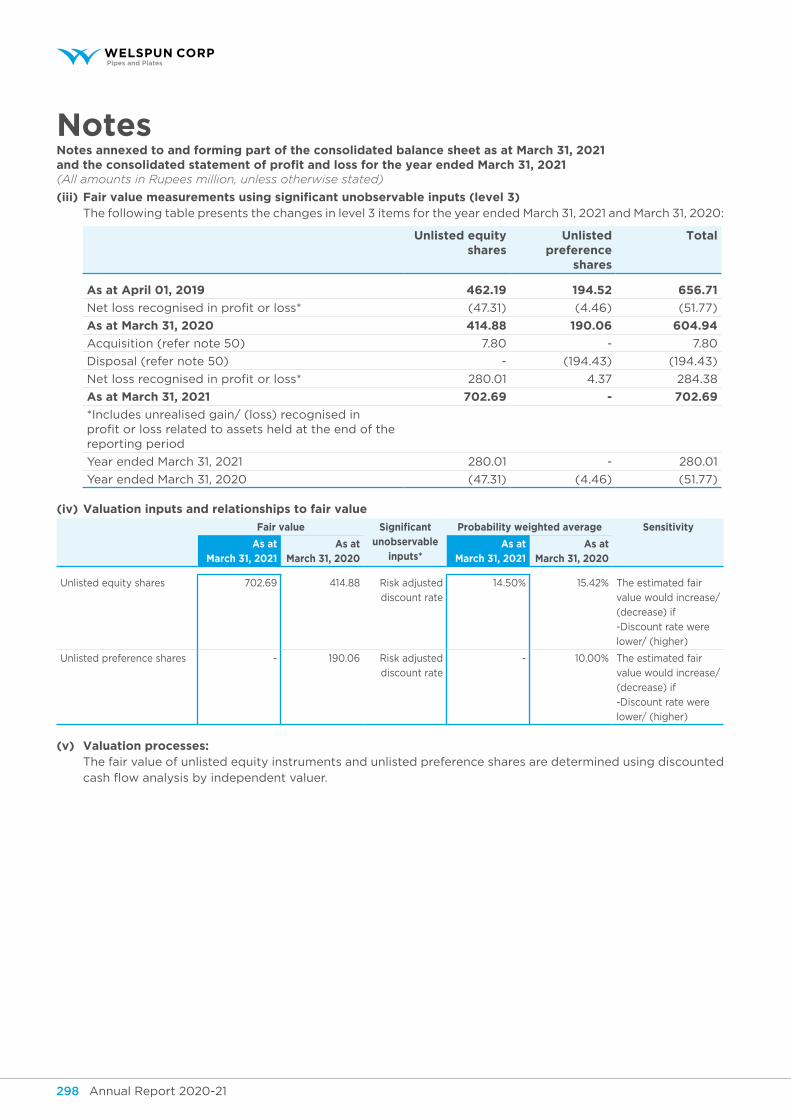
Annual Report 2020-21 299Annual Report 2020-21298
NotesNotes annexed to and forming part of the consolidated balance sheet as at March 31, 2021and the consolidated statement of profit and loss for the year ended March 31, 2021(All amounts in Rupees million, unless otherwise stated)
(iii) fair value measurements using significant unobservable inputs (level 3) The following table presents the changes in level 3 items for the year ended March 31, 2021 and March 31, 2020:
unlisted equity shares
unlisted preference
shares
total
As at April 01, 2019 462.19 194.52 656.71
Net loss recognised in profit or loss* (47.31) (4.46) (51.77)
As at March 31, 2020 414.88 190.06 604.94
Acquisition (refer note 50) 7.80 - 7.80
Disposal (refer note 50) - (194.43) (194.43)
Net loss recognised in profit or loss* 280.01 4.37 284.38
As at March 31, 2021 702.69 - 702.69
*Includes unrealised gain/ (loss) recognised in profit or loss related to assets held at the end of the reporting period
Year ended March 31, 2021 280.01 - 280.01
Year ended March 31, 2020 (47.31) (4.46) (51.77)
(iv) valuation inputs and relationships to fair value
fair value significant unobservable
inputs*
probability weighted average sensitivity
As at March 31, 2021
As at March 31, 2020
As at March 31, 2021
As at March 31, 2020
Unlisted equity shares 702.69 414.88 Risk adjusted
discount rate
14.50% 15.42% The estimated fair
value would increase/
(decrease) if
-Discount rate were
lower/ (higher)
Unlisted preference shares - 190.06 Risk adjusted
discount rate
- 10.00% The estimated fair
value would increase/
(decrease) if
-Discount rate were
lower/ (higher)
(v) Valuation processes: The fair value of unlisted equity instruments and unlisted preference shares are determined using discounted
cash flow analysis by independent valuer.
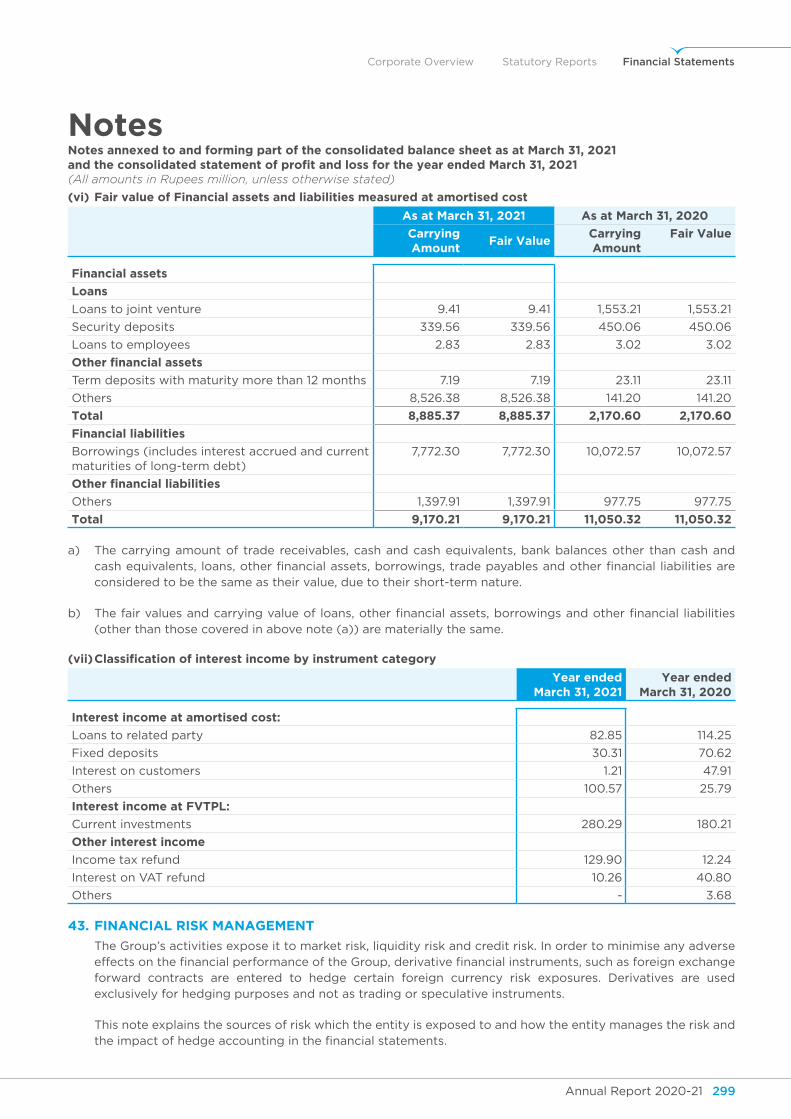
Annual Report 2020-21 299Annual Report 2020-21298
Corporate Overview Statutory Reports Financial Statements
NotesNotes annexed to and forming part of the consolidated balance sheet as at March 31, 2021and the consolidated statement of profit and loss for the year ended March 31, 2021(All amounts in Rupees million, unless otherwise stated)
(vi) fair value of financial assets and liabilities measured at amortised cost
As at March 31, 2021 As at March 31, 2020
carrying Amount
fair valuecarrying Amount
fair value
financial assets
loans
Loans to joint venture 9.41 9.41 1,553.21 1,553.21
Security deposits 339.56 339.56 450.06 450.06
Loans to employees 2.83 2.83 3.02 3.02
other financial assets
Term deposits with maturity more than 12 months 7.19 7.19 23.11 23.11
Others 8,526.38 8,526.38 141.20 141.20
total 8,885.37 8,885.37 2,170.60 2,170.60
financial liabilities
Borrowings (includes interest accrued and current maturities of long-term debt)
7,772.30 7,772.30 10,072.57 10,072.57
other financial liabilities
Others 1,397.91 1,397.91 977.75 977.75
total 9,170.21 9,170.21 11,050.32 11,050.32
a) The carrying amount of trade receivables, cash and cash equivalents, bank balances other than cash and cash equivalents, loans, other financial assets, borrowings, trade payables and other financial liabilities are considered to be the same as their value, due to their short-term nature.
b) The fair values and carrying value of loans, other financial assets, borrowings and other financial liabilities (other than those covered in above note (a)) are materially the same.
(vii) Classification of interest income by instrument category
year ended March 31, 2021
year ended March 31, 2020
interest income at amortised cost:
Loans to related party 82.85 114.25
Fixed deposits 30.31 70.62
Interest on customers 1.21 47.91
Others 100.57 25.79
interest income at fVtPL:
Current investments 280.29 180.21
other interest income
Income tax refund 129.90 12.24
Interest on VAT refund 10.26 40.80
Others - 3.68
43. finAnCiAL risk MAnAgeMent
The Group’s activities expose it to market risk, liquidity risk and credit risk. In order to minimise any adverse effects on the financial performance of the Group, derivative financial instruments, such as foreign exchange forward contracts are entered to hedge certain foreign currency risk exposures. Derivatives are used exclusively for hedging purposes and not as trading or speculative instruments.
This note explains the sources of risk which the entity is exposed to and how the entity manages the risk and the impact of hedge accounting in the financial statements.
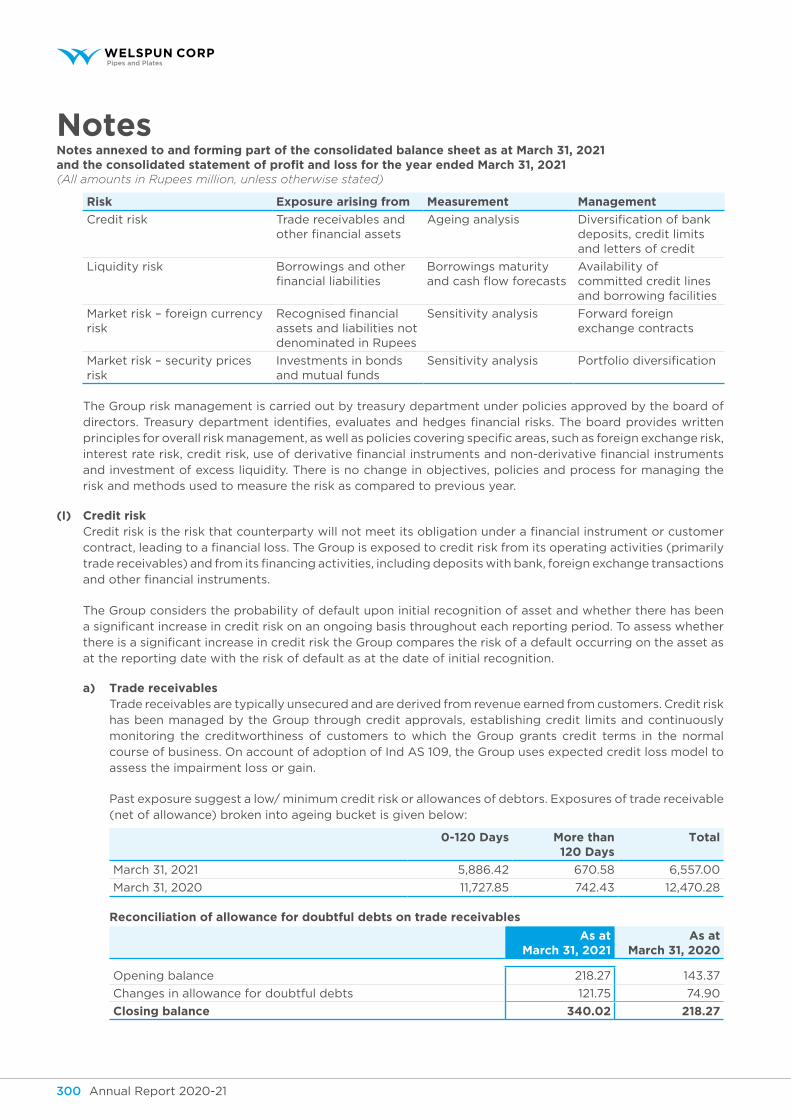
Annual Report 2020-21 301Annual Report 2020-21300
NotesNotes annexed to and forming part of the consolidated balance sheet as at March 31, 2021and the consolidated statement of profit and loss for the year ended March 31, 2021(All amounts in Rupees million, unless otherwise stated)
Risk exposure arising from measurement management
Credit risk Trade receivables and other financial assets
Ageing analysis Diversification of bank deposits, credit limits and letters of credit
Liquidity risk Borrowings and other financial liabilities
Borrowings maturity and cash flow forecasts
Availability of committed credit lines and borrowing facilities
Market risk – foreign currency risk
Recognised financial assets and liabilities not denominated in Rupees
Sensitivity analysis Forward foreign exchange contracts
Market risk – security prices risk
Investments in bonds and mutual funds
Sensitivity analysis Portfolio diversification
The Group risk management is carried out by treasury department under policies approved by the board of directors. Treasury department identifies, evaluates and hedges financial risks. The board provides written principles for overall risk management, as well as policies covering specific areas, such as foreign exchange risk, interest rate risk, credit risk, use of derivative financial instruments and non-derivative financial instruments and investment of excess liquidity. There is no change in objectives, policies and process for managing the risk and methods used to measure the risk as compared to previous year.
(I) credit risk Credit risk is the risk that counterparty will not meet its obligation under a financial instrument or customer
contract, leading to a financial loss. The Group is exposed to credit risk from its operating activities (primarily trade receivables) and from its financing activities, including deposits with bank, foreign exchange transactions and other financial instruments.
The Group considers the probability of default upon initial recognition of asset and whether there has been a significant increase in credit risk on an ongoing basis throughout each reporting period. To assess whether there is a significant increase in credit risk the Group compares the risk of a default occurring on the asset as at the reporting date with the risk of default as at the date of initial recognition.
a) trade receivables Trade receivables are typically unsecured and are derived from revenue earned from customers. Credit risk
has been managed by the Group through credit approvals, establishing credit limits and continuously monitoring the creditworthiness of customers to which the Group grants credit terms in the normal course of business. On account of adoption of Ind AS 109, the Group uses expected credit loss model to assess the impairment loss or gain.
Past exposure suggest a low/ minimum credit risk or allowances of debtors. Exposures of trade receivable (net of allowance) broken into ageing bucket is given below:
0-120 Days more than 120 Days
total
March 31, 2021 5,886.42 670.58 6,557.00
March 31, 2020 11,727.85 742.43 12,470.28
Reconciliation of allowance for doubtful debts on trade receivables
As at March 31, 2021
As at March 31, 2020
Opening balance 218.27 143.37
Changes in allowance for doubtful debts 121.75 74.90
closing balance 340.02 218.27
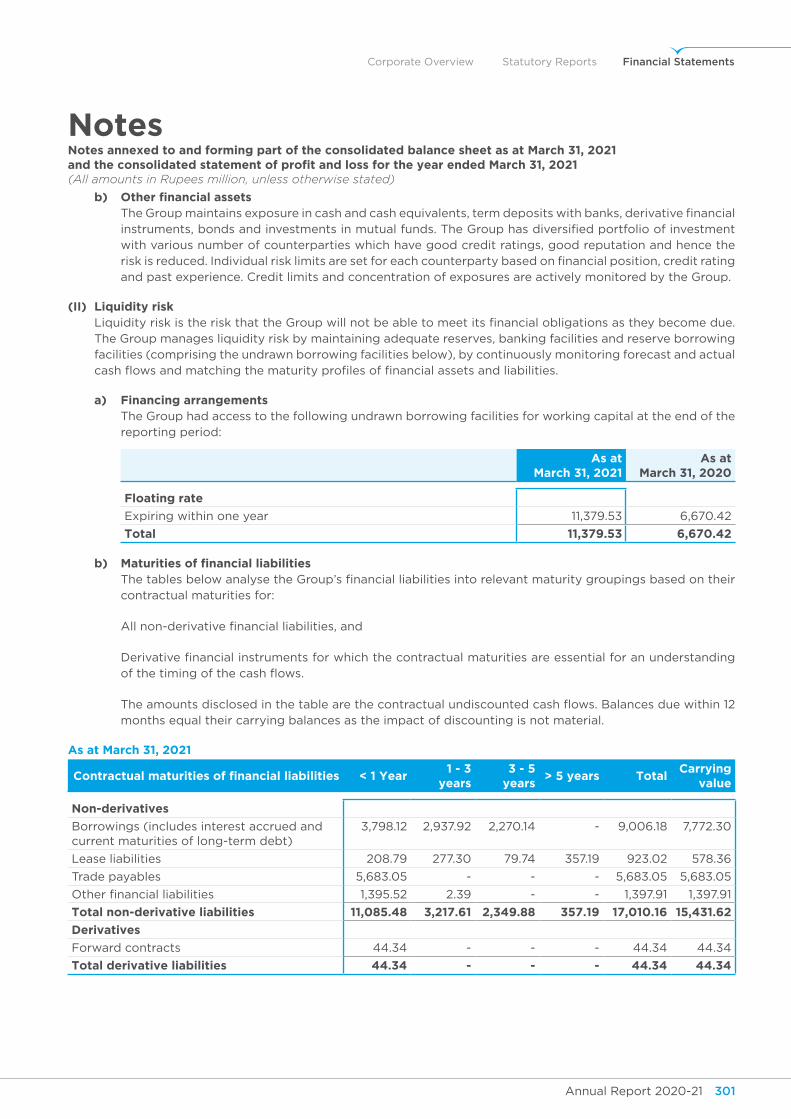
Annual Report 2020-21 301Annual Report 2020-21300
Corporate Overview Statutory Reports Financial Statements
NotesNotes annexed to and forming part of the consolidated balance sheet as at March 31, 2021and the consolidated statement of profit and loss for the year ended March 31, 2021(All amounts in Rupees million, unless otherwise stated)
b) other financial assets The Group maintains exposure in cash and cash equivalents, term deposits with banks, derivative financial
instruments, bonds and investments in mutual funds. The Group has diversified portfolio of investment with various number of counterparties which have good credit ratings, good reputation and hence the risk is reduced. Individual risk limits are set for each counterparty based on financial position, credit rating and past experience. Credit limits and concentration of exposures are actively monitored by the Group.
(II) liquidity risk Liquidity risk is the risk that the Group will not be able to meet its financial obligations as they become due.
The Group manages liquidity risk by maintaining adequate reserves, banking facilities and reserve borrowing facilities (comprising the undrawn borrowing facilities below), by continuously monitoring forecast and actual cash flows and matching the maturity profiles of financial assets and liabilities.
a) financing arrangements The Group had access to the following undrawn borrowing facilities for working capital at the end of the
reporting period:
As at March 31, 2021
As at March 31, 2020
floating rate
Expiring within one year 11,379.53 6,670.42
total 11,379.53 6,670.42
b) Maturities of financial liabilities The tables below analyse the Group’s financial liabilities into relevant maturity groupings based on their
contractual maturities for:
All non-derivative financial liabilities, and
Derivative financial instruments for which the contractual maturities are essential for an understanding of the timing of the cash flows.
The amounts disclosed in the table are the contractual undiscounted cash flows. Balances due within 12 months equal their carrying balances as the impact of discounting is not material.
As at March 31, 2021
Contractual maturities of financial liabilities < 1 year1 - 3
years3 - 5
years> 5 years total
carrying value
non-derivatives
Borrowings (includes interest accrued and current maturities of long-term debt)
3,798.12 2,937.92 2,270.14 - 9,006.18 7,772.30
Lease liabilities 208.79 277.30 79.74 357.19 923.02 578.36
Trade payables 5,683.05 - - - 5,683.05 5,683.05
Other financial liabilities 1,395.52 2.39 - - 1,397.91 1,397.91
total non-derivative liabilities 11,085.48 3,217.61 2,349.88 357.19 17,010.16 15,431.62
derivatives
Forward contracts 44.34 - - - 44.34 44.34
total derivative liabilities 44.34 - - - 44.34 44.34
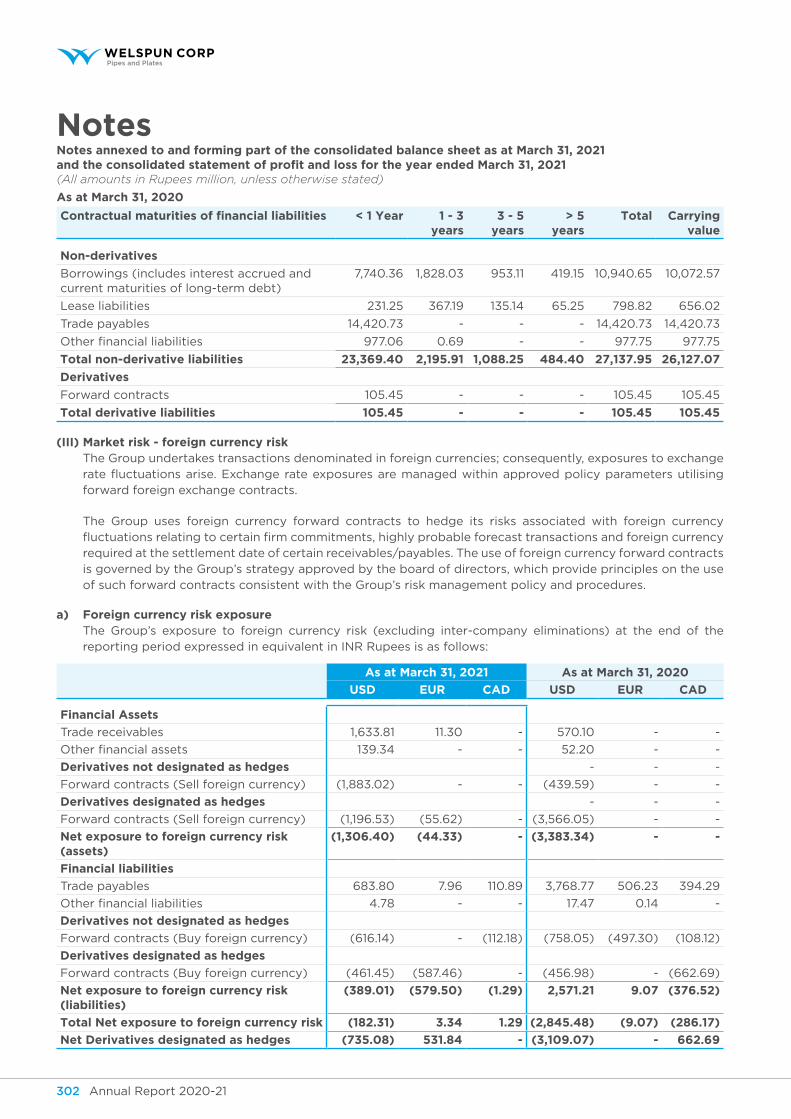
Annual Report 2020-21 303Annual Report 2020-21302
NotesNotes annexed to and forming part of the consolidated balance sheet as at March 31, 2021and the consolidated statement of profit and loss for the year ended March 31, 2021(All amounts in Rupees million, unless otherwise stated)
As at March 31, 2020
Contractual maturities of financial liabilities < 1 year 1 - 3 years
3 - 5 years
> 5 years
total carrying value
non-derivatives
Borrowings (includes interest accrued and current maturities of long-term debt)
7,740.36 1,828.03 953.11 419.15 10,940.65 10,072.57
Lease liabilities 231.25 367.19 135.14 65.25 798.82 656.02
Trade payables 14,420.73 - - - 14,420.73 14,420.73
Other financial liabilities 977.06 0.69 - - 977.75 977.75
total non-derivative liabilities 23,369.40 2,195.91 1,088.25 484.40 27,137.95 26,127.07
derivatives
Forward contracts 105.45 - - - 105.45 105.45
total derivative liabilities 105.45 - - - 105.45 105.45
(III) market risk - foreign currency risk The Group undertakes transactions denominated in foreign currencies; consequently, exposures to exchange
rate fluctuations arise. Exchange rate exposures are managed within approved policy parameters utilising forward foreign exchange contracts.
The Group uses foreign currency forward contracts to hedge its risks associated with foreign currency fluctuations relating to certain firm commitments, highly probable forecast transactions and foreign currency required at the settlement date of certain receivables/payables. The use of foreign currency forward contracts is governed by the Group’s strategy approved by the board of directors, which provide principles on the use of such forward contracts consistent with the Group’s risk management policy and procedures.
a) foreign currency risk exposure The Group’s exposure to foreign currency risk (excluding inter-company eliminations) at the end of the
reporting period expressed in equivalent in INR Rupees is as follows:
As at March 31, 2021 As at March 31, 2020
usd euR cAd usd euR cAd
financial Assets
Trade receivables 1,633.81 11.30 - 570.10 - -
Other financial assets 139.34 - - 52.20 - -
derivatives not designated as hedges - - -
Forward contracts (Sell foreign currency) (1,883.02) - - (439.59) - -
derivatives designated as hedges - - -
Forward contracts (Sell foreign currency) (1,196.53) (55.62) - (3,566.05) - -
net exposure to foreign currency risk (assets)
(1,306.40) (44.33) - (3,383.34) - -
financial liabilities
Trade payables 683.80 7.96 110.89 3,768.77 506.23 394.29
Other financial liabilities 4.78 - - 17.47 0.14 -
derivatives not designated as hedges
Forward contracts (Buy foreign currency) (616.14) - (112.18) (758.05) (497.30) (108.12)
derivatives designated as hedges
Forward contracts (Buy foreign currency) (461.45) (587.46) - (456.98) - (662.69)
net exposure to foreign currency risk (liabilities)
(389.01) (579.50) (1.29) 2,571.21 9.07 (376.52)
total net exposure to foreign currency risk (182.31) 3.34 1.29 (2,845.48) (9.07) (286.17)
net derivatives designated as hedges (735.08) 531.84 - (3,109.07) - 662.69
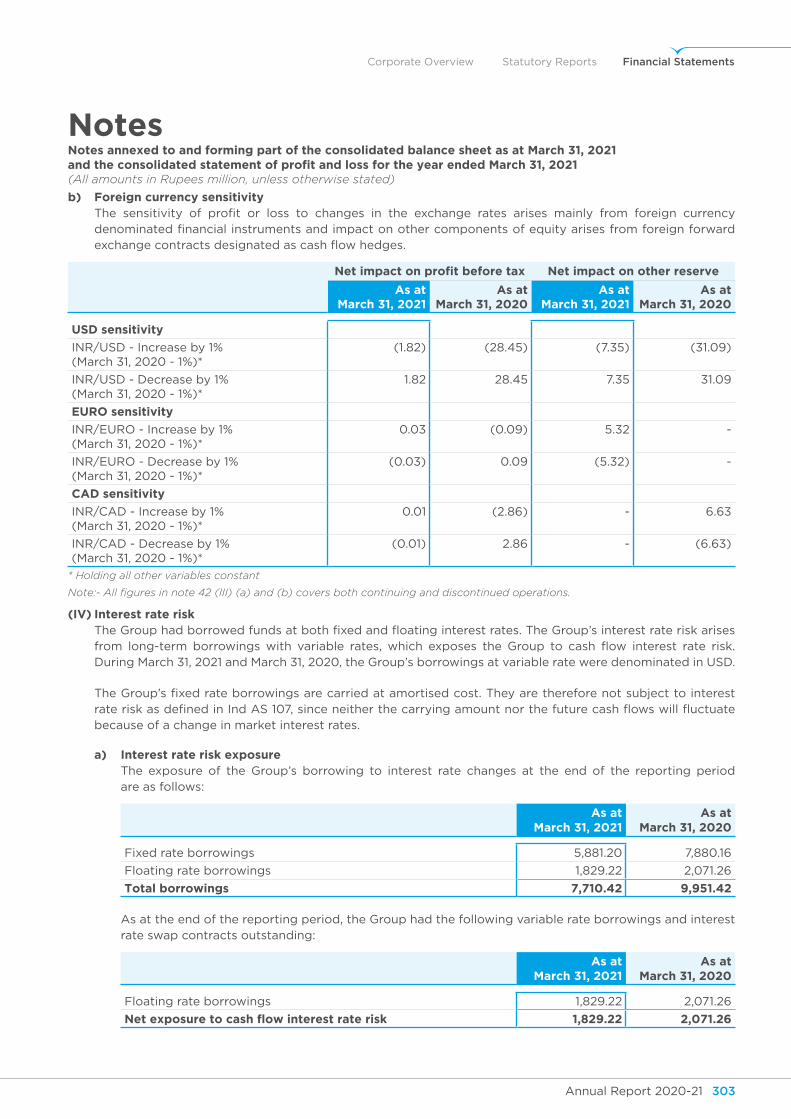
Annual Report 2020-21 303Annual Report 2020-21302
Corporate Overview Statutory Reports Financial Statements
NotesNotes annexed to and forming part of the consolidated balance sheet as at March 31, 2021and the consolidated statement of profit and loss for the year ended March 31, 2021(All amounts in Rupees million, unless otherwise stated)
b) foreign currency sensitivity The sensitivity of profit or loss to changes in the exchange rates arises mainly from foreign currency
denominated financial instruments and impact on other components of equity arises from foreign forward exchange contracts designated as cash flow hedges.
net impact on profit before tax net impact on other reserve
As at March 31, 2021
As at March 31, 2020
As at March 31, 2021
As at March 31, 2020
usd sensitivity
INR/USD - Increase by 1% (March 31, 2020 - 1%)*
(1.82) (28.45) (7.35) (31.09)
INR/USD - Decrease by 1% (March 31, 2020 - 1%)*
1.82 28.45 7.35 31.09
euRo sensitivity
INR/EURO - Increase by 1% (March 31, 2020 - 1%)*
0.03 (0.09) 5.32 -
INR/EURO - Decrease by 1% (March 31, 2020 - 1%)*
(0.03) 0.09 (5.32) -
cAd sensitivity
INR/CAD - Increase by 1% (March 31, 2020 - 1%)*
0.01 (2.86) - 6.63
INR/CAD - Decrease by 1% (March 31, 2020 - 1%)*
(0.01) 2.86 - (6.63)
* Holding all other variables constant
Note:- All figures in note 42 (III) (a) and (b) covers both continuing and discontinued operations.
(Iv) Interest rate risk The Group had borrowed funds at both fixed and floating interest rates. The Group’s interest rate risk arises
from long-term borrowings with variable rates, which exposes the Group to cash flow interest rate risk. During March 31, 2021 and March 31, 2020, the Group’s borrowings at variable rate were denominated in USD.
The Group’s fixed rate borrowings are carried at amortised cost. They are therefore not subject to interest rate risk as defined in Ind AS 107, since neither the carrying amount nor the future cash flows will fluctuate because of a change in market interest rates.
a) Interest rate risk exposure The exposure of the Group’s borrowing to interest rate changes at the end of the reporting period
are as follows:
As at March 31, 2021
As at March 31, 2020
Fixed rate borrowings 5,881.20 7,880.16
Floating rate borrowings 1,829.22 2,071.26
total borrowings 7,710.42 9,951.42
As at the end of the reporting period, the Group had the following variable rate borrowings and interest rate swap contracts outstanding:
As at March 31, 2021
As at March 31, 2020
Floating rate borrowings 1,829.22 2,071.26
net exposure to cash flow interest rate risk 1,829.22 2,071.26
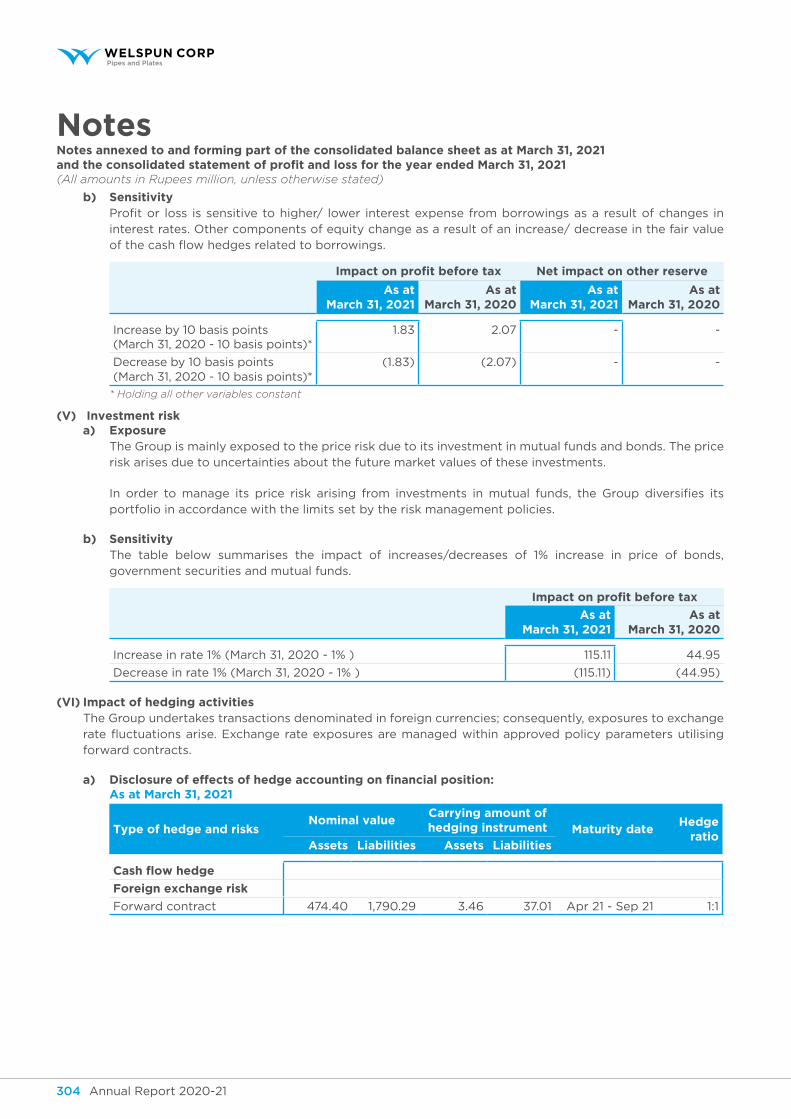
Annual Report 2020-21 305Annual Report 2020-21304
NotesNotes annexed to and forming part of the consolidated balance sheet as at March 31, 2021and the consolidated statement of profit and loss for the year ended March 31, 2021(All amounts in Rupees million, unless otherwise stated)
b) sensitivity Profit or loss is sensitive to higher/ lower interest expense from borrowings as a result of changes in
interest rates. Other components of equity change as a result of an increase/ decrease in the fair value of the cash flow hedges related to borrowings.
impact on profit before tax net impact on other reserve
As at March 31, 2021
As at March 31, 2020
As at March 31, 2021
As at March 31, 2020
Increase by 10 basis points (March 31, 2020 - 10 basis points)*
1.83 2.07 - -
Decrease by 10 basis points (March 31, 2020 - 10 basis points)*
(1.83) (2.07) - -
* Holding all other variables constant
(v) Investment risk a) exposure
The Group is mainly exposed to the price risk due to its investment in mutual funds and bonds. The price risk arises due to uncertainties about the future market values of these investments.
In order to manage its price risk arising from investments in mutual funds, the Group diversifies its portfolio in accordance with the limits set by the risk management policies.
b) sensitivity The table below summarises the impact of increases/decreases of 1% increase in price of bonds,
government securities and mutual funds.
impact on profit before tax
As at March 31, 2021
As at March 31, 2020
Increase in rate 1% (March 31, 2020 - 1% ) 115.11 44.95
Decrease in rate 1% (March 31, 2020 - 1% ) (115.11) (44.95)
(vI) Impact of hedging activities The Group undertakes transactions denominated in foreign currencies; consequently, exposures to exchange
rate fluctuations arise. Exchange rate exposures are managed within approved policy parameters utilising forward contracts.
a) Disclosure of effects of hedge accounting on financial position: As at March 31, 2021
type of hedge and risksnominal value
carrying amount of hedging instrument maturity date
hedge ratio
Assets liabilities Assets liabilities
Cash flow hedge
foreign exchange risk
Forward contract 474.40 1,790.29 3.46 37.01 Apr 21 - Sep 21 1:1
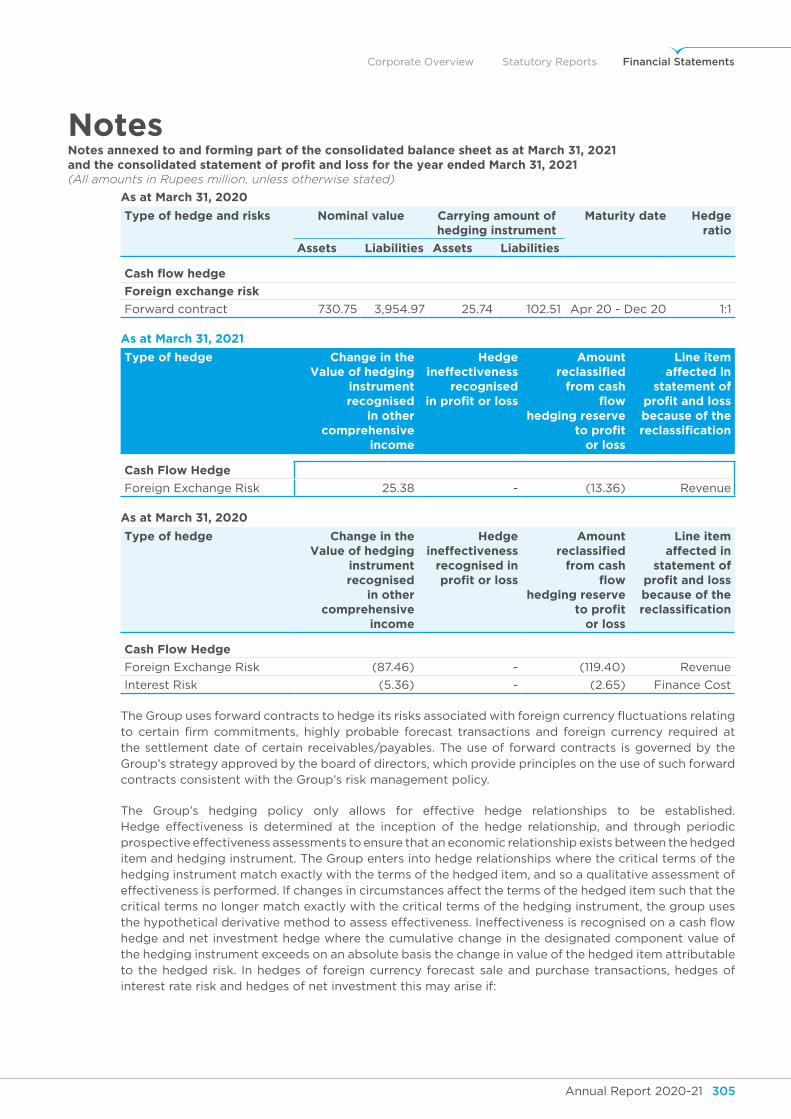
Annual Report 2020-21 305Annual Report 2020-21304
Corporate Overview Statutory Reports Financial Statements
NotesNotes annexed to and forming part of the consolidated balance sheet as at March 31, 2021and the consolidated statement of profit and loss for the year ended March 31, 2021(All amounts in Rupees million, unless otherwise stated)
As at March 31, 2020
type of hedge and risks nominal value carrying amount of hedging instrument
maturity date hedge ratio
Assets liabilities Assets liabilities
Cash flow hedge
foreign exchange risk
Forward contract 730.75 3,954.97 25.74 102.51 Apr 20 - Dec 20 1:1
As at March 31, 2021
type of hedge change in the value of hedging
instrument recognised
in other comprehensive
income
hedge ineffectiveness
recognised in profit or loss
Amount reclassified
from cash flow
hedging reserve to profit
or loss
line item affected in
statement of profit and loss because of the reclassification
cash flow hedge
Foreign Exchange Risk 25.38 - (13.36) Revenue
As at March 31, 2020
type of hedge change in the value of hedging
instrument recognised
in other comprehensive
income
hedge ineffectiveness
recognised in profit or loss
Amount reclassified
from cash flow
hedging reserve to profit
or loss
line item affected in
statement of profit and loss because of the reclassification
cash flow hedge
Foreign Exchange Risk (87.46) - (119.40) Revenue
Interest Risk (5.36) - (2.65) Finance Cost
The Group uses forward contracts to hedge its risks associated with foreign currency fluctuations relating to certain firm commitments, highly probable forecast transactions and foreign currency required at the settlement date of certain receivables/payables. The use of forward contracts is governed by the Group’s strategy approved by the board of directors, which provide principles on the use of such forward contracts consistent with the Group’s risk management policy.
The Group’s hedging policy only allows for effective hedge relationships to be established. Hedge effectiveness is determined at the inception of the hedge relationship, and through periodic prospective effectiveness assessments to ensure that an economic relationship exists between the hedged item and hedging instrument. The Group enters into hedge relationships where the critical terms of the hedging instrument match exactly with the terms of the hedged item, and so a qualitative assessment of effectiveness is performed. If changes in circumstances affect the terms of the hedged item such that the critical terms no longer match exactly with the critical terms of the hedging instrument, the group uses the hypothetical derivative method to assess effectiveness. Ineffectiveness is recognised on a cash flow hedge and net investment hedge where the cumulative change in the designated component value of the hedging instrument exceeds on an absolute basis the change in value of the hedged item attributable to the hedged risk. In hedges of foreign currency forecast sale and purchase transactions, hedges of interest rate risk and hedges of net investment this may arise if:
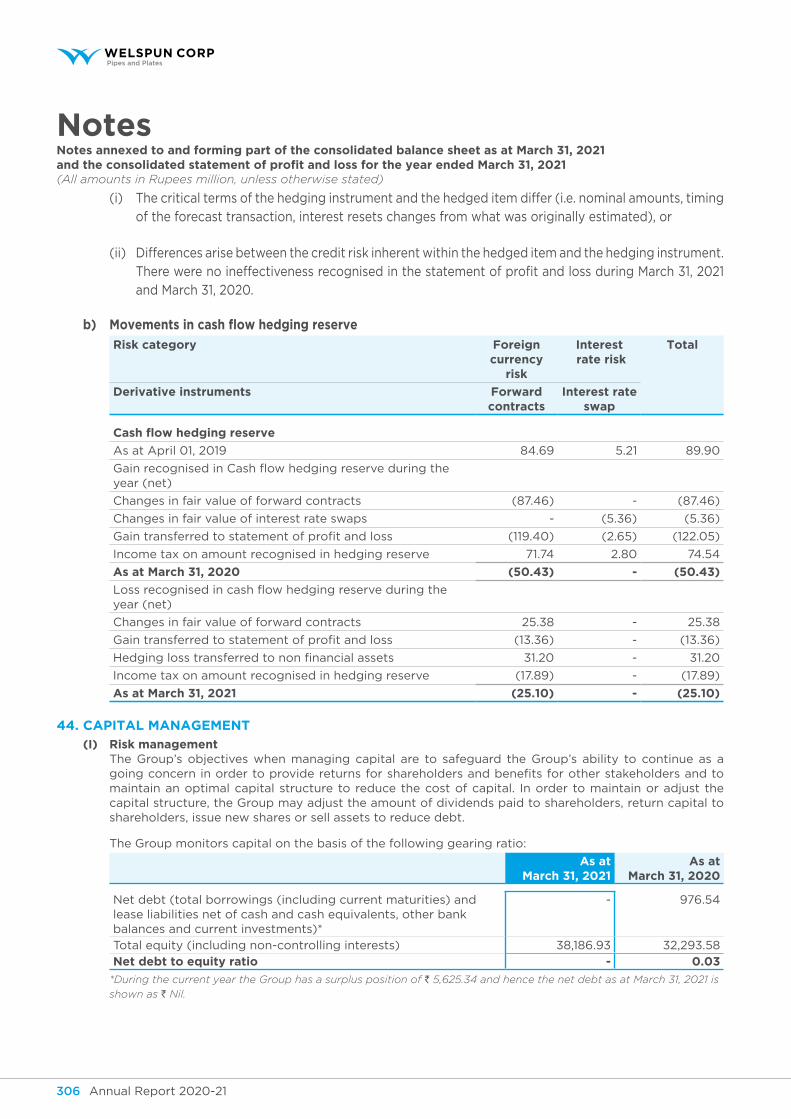
Annual Report 2020-21 307Annual Report 2020-21306
NotesNotes annexed to and forming part of the consolidated balance sheet as at March 31, 2021and the consolidated statement of profit and loss for the year ended March 31, 2021(All amounts in Rupees million, unless otherwise stated)
(i) The critical terms of the hedging instrument and the hedged item differ (i.e. nominal amounts, timing of the forecast transaction, interest resets changes from what was originally estimated), or
(ii) Differences arise between the credit risk inherent within the hedged item and the hedging instrument. There were no ineffectiveness recognised in the statement of profit and loss during March 31, 2021 and March 31, 2020.
b) Movements in cash flow hedging reserve
Risk category foreign currency
risk
Interest rate risk
total
derivative instruments forward contracts
Interest rate swap
Cash flow hedging reserve
As at April 01, 2019 84.69 5.21 89.90
Gain recognised in Cash flow hedging reserve during the year (net)
Changes in fair value of forward contracts (87.46) - (87.46)
Changes in fair value of interest rate swaps - (5.36) (5.36)
Gain transferred to statement of profit and loss (119.40) (2.65) (122.05)
Income tax on amount recognised in hedging reserve 71.74 2.80 74.54
As at March 31, 2020 (50.43) - (50.43)
Loss recognised in cash flow hedging reserve during the year (net)
Changes in fair value of forward contracts 25.38 - 25.38
Gain transferred to statement of profit and loss (13.36) - (13.36)
Hedging loss transferred to non financial assets 31.20 - 31.20
Income tax on amount recognised in hedging reserve (17.89) - (17.89)
As at March 31, 2021 (25.10) - (25.10)
44. cApItAl mAnAgement
(I) Risk management The Group’s objectives when managing capital are to safeguard the Group’s ability to continue as a
going concern in order to provide returns for shareholders and benefits for other stakeholders and to maintain an optimal capital structure to reduce the cost of capital. In order to maintain or adjust the capital structure, the Group may adjust the amount of dividends paid to shareholders, return capital to shareholders, issue new shares or sell assets to reduce debt.
The Group monitors capital on the basis of the following gearing ratio:
As at March 31, 2021
As at March 31, 2020
Net debt (total borrowings (including current maturities) and lease liabilities net of cash and cash equivalents, other bank balances and current investments)*
- 976.54
Total equity (including non-controlling interests) 38,186.93 32,293.58
net debt to equity ratio - 0.03
*During the current year the Group has a surplus position of ` 5,625.34 and hence the net debt as at March 31, 2021 is
shown as ` Nil.
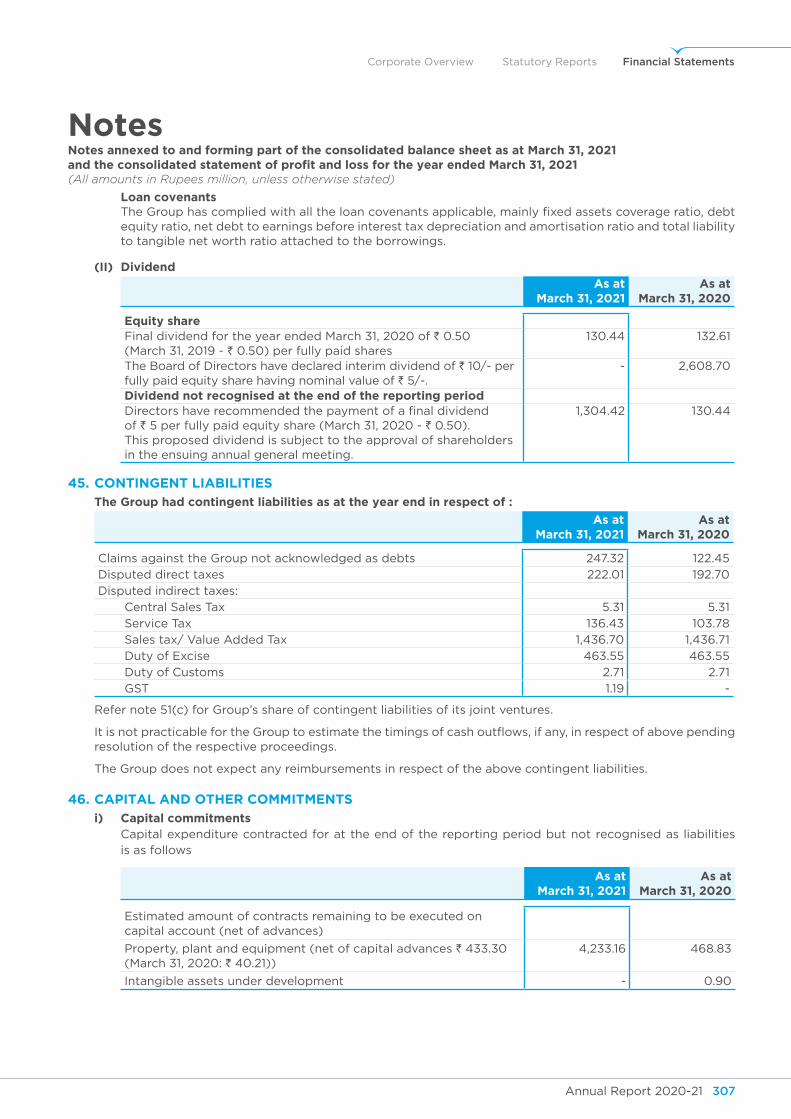
Annual Report 2020-21 307Annual Report 2020-21306
Corporate Overview Statutory Reports Financial Statements
NotesNotes annexed to and forming part of the consolidated balance sheet as at March 31, 2021and the consolidated statement of profit and loss for the year ended March 31, 2021(All amounts in Rupees million, unless otherwise stated)
loan covenants The Group has complied with all the loan covenants applicable, mainly fixed assets coverage ratio, debt
equity ratio, net debt to earnings before interest tax depreciation and amortisation ratio and total liability to tangible net worth ratio attached to the borrowings.
(II) dividend
As at March 31, 2021
As at March 31, 2020
equity shareFinal dividend for the year ended March 31, 2020 of ` 0.50 (March 31, 2019 - ` 0.50) per fully paid shares
130.44 132.61
The Board of Directors have declared interim dividend of ` 10/- per fully paid equity share having nominal value of ` 5/-.
- 2,608.70
dividend not recognised at the end of the reporting periodDirectors have recommended the payment of a final dividend of ` 5 per fully paid equity share (March 31, 2020 - ` 0.50). This proposed dividend is subject to the approval of shareholders in the ensuing annual general meeting.
1,304.42 130.44
45. Contingent LiABiLities
the group had contingent liabilities as at the year end in respect of :
As at March 31, 2021
As at March 31, 2020
Claims against the Group not acknowledged as debts 247.32 122.45
Disputed direct taxes 222.01 192.70
Disputed indirect taxes:
Central Sales Tax 5.31 5.31
Service Tax 136.43 103.78
Sales tax/ Value Added Tax 1,436.70 1,436.71
Duty of Excise 463.55 463.55
Duty of Customs 2.71 2.71
GST 1.19 -
Refer note 51(c) for Group’s share of contingent liabilities of its joint ventures.
It is not practicable for the Group to estimate the timings of cash outflows, if any, in respect of above pending resolution of the respective proceedings.
The Group does not expect any reimbursements in respect of the above contingent liabilities.
46. cApItAl And otheR commItments
i) capital commitments Capital expenditure contracted for at the end of the reporting period but not recognised as liabilities
is as follows
As at March 31, 2021
As at March 31, 2020
Estimated amount of contracts remaining to be executed on capital account (net of advances)
Property, plant and equipment (net of capital advances ` 433.30 (March 31, 2020: ` 40.21))
4,233.16 468.83
Intangible assets under development - 0.90
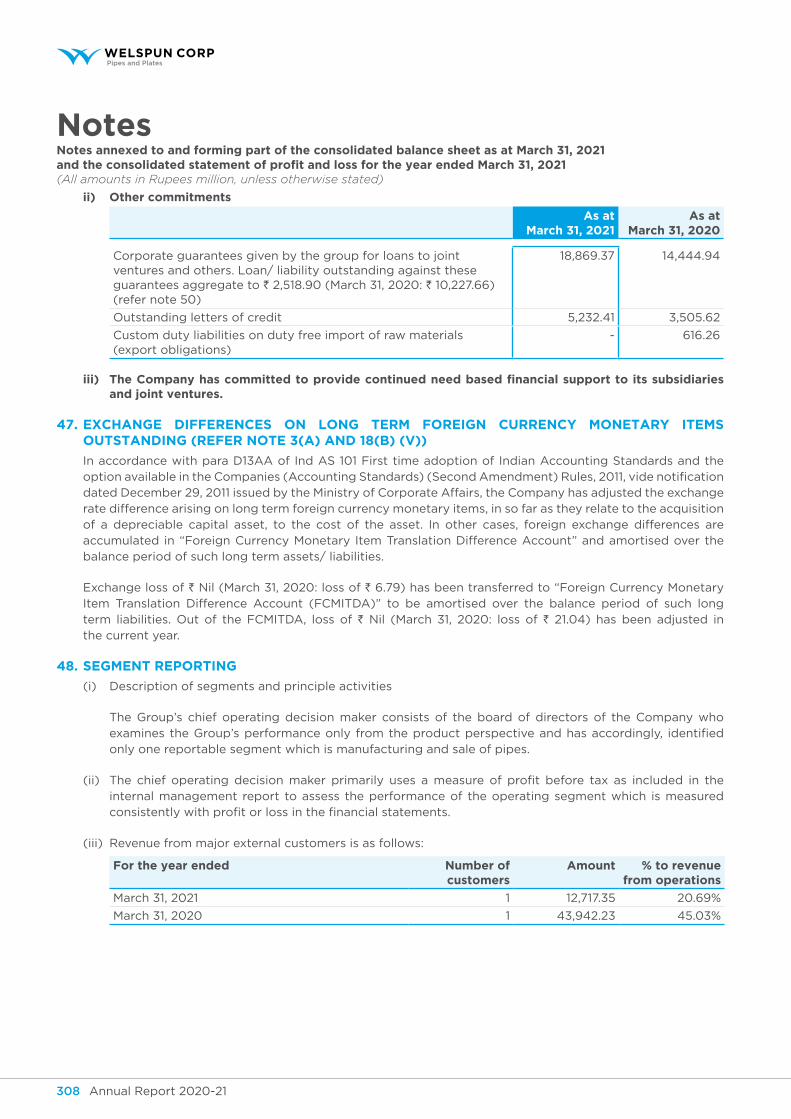
Annual Report 2020-21 309Annual Report 2020-21308
NotesNotes annexed to and forming part of the consolidated balance sheet as at March 31, 2021and the consolidated statement of profit and loss for the year ended March 31, 2021(All amounts in Rupees million, unless otherwise stated)
ii) other commitments
As at March 31, 2021
As at March 31, 2020
Corporate guarantees given by the group for loans to joint ventures and others. Loan/ liability outstanding against these guarantees aggregate to ` 2,518.90 (March 31, 2020: ` 10,227.66) (refer note 50)
18,869.37 14,444.94
Outstanding letters of credit 5,232.41 3,505.62
Custom duty liabilities on duty free import of raw materials (export obligations)
- 616.26
iii) the Company has committed to provide continued need based financial support to its subsidiaries and joint ventures.
47. exChAnge DifferenCes on Long terM foreign CurrenCy MonetAry iteMs outstAnDing (refer note 3(A) AnD 18(B) (V))
In accordance with para D13AA of Ind AS 101 First time adoption of Indian Accounting Standards and the option available in the Companies (Accounting Standards) (Second Amendment) Rules, 2011, vide notification dated December 29, 2011 issued by the Ministry of Corporate Affairs, the Company has adjusted the exchange rate difference arising on long term foreign currency monetary items, in so far as they relate to the acquisition of a depreciable capital asset, to the cost of the asset. In other cases, foreign exchange differences are accumulated in “Foreign Currency Monetary Item Translation Difference Account” and amortised over the balance period of such long term assets/ liabilities.
Exchange loss of ` Nil (March 31, 2020: loss of ` 6.79) has been transferred to “Foreign Currency Monetary Item Translation Difference Account (FCMITDA)” to be amortised over the balance period of such long term liabilities. Out of the FCMITDA, loss of ` Nil (March 31, 2020: loss of ` 21.04) has been adjusted in the current year.
48. segMent rePorting
(i) Description of segments and principle activities
The Group’s chief operating decision maker consists of the board of directors of the Company who examines the Group’s performance only from the product perspective and has accordingly, identified only one reportable segment which is manufacturing and sale of pipes.
(ii) The chief operating decision maker primarily uses a measure of profit before tax as included in the internal management report to assess the performance of the operating segment which is measured consistently with profit or loss in the financial statements.
(iii) Revenue from major external customers is as follows:
for the year ended number of customers
Amount % to revenue from operations
March 31, 2021 1 12,717.35 20.69%
March 31, 2020 1 43,942.23 45.03%
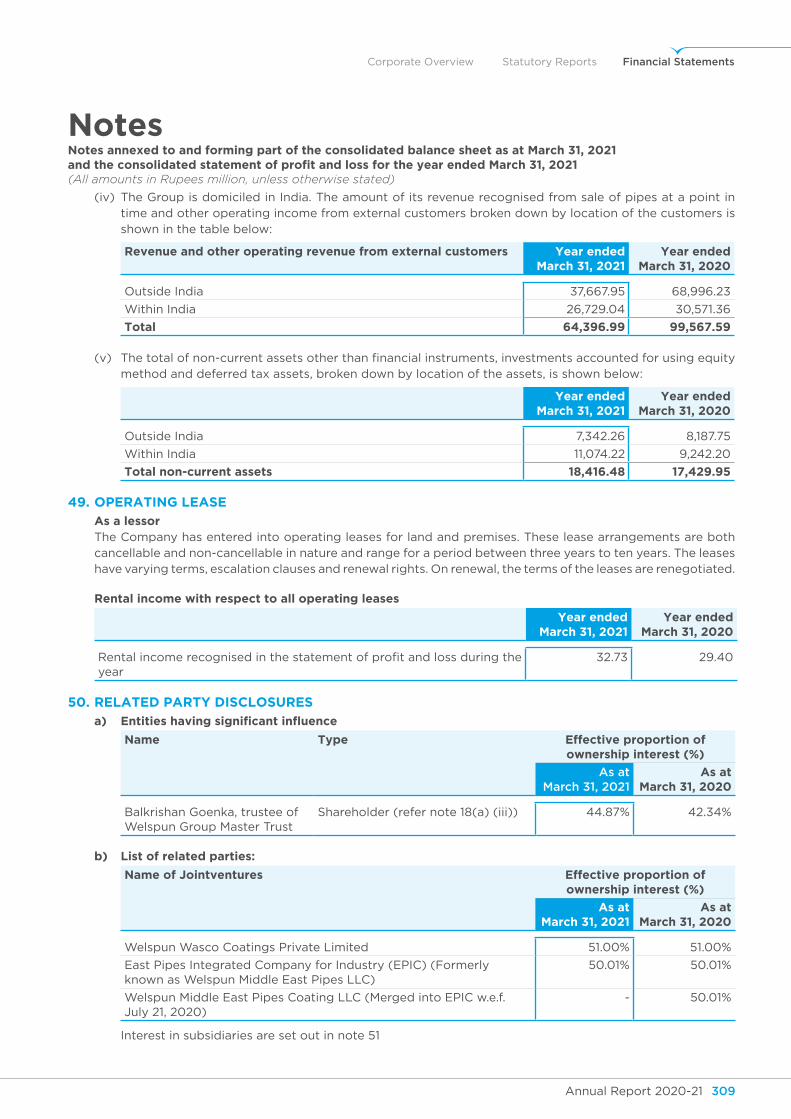
Annual Report 2020-21 309Annual Report 2020-21308
Corporate Overview Statutory Reports Financial Statements
NotesNotes annexed to and forming part of the consolidated balance sheet as at March 31, 2021and the consolidated statement of profit and loss for the year ended March 31, 2021(All amounts in Rupees million, unless otherwise stated)
(iv) The Group is domiciled in India. The amount of its revenue recognised from sale of pipes at a point in time and other operating income from external customers broken down by location of the customers is shown in the table below:
Revenue and other operating revenue from external customers year ended March 31, 2021
year ended March 31, 2020
Outside India 37,667.95 68,996.23
Within India 26,729.04 30,571.36
total 64,396.99 99,567.59
(v) The total of non-current assets other than financial instruments, investments accounted for using equity method and deferred tax assets, broken down by location of the assets, is shown below:
year ended March 31, 2021
year ended March 31, 2020
Outside India 7,342.26 8,187.75
Within India 11,074.22 9,242.20
total non-current assets 18,416.48 17,429.95
49. oPerAting LeAse
As a lessor The Company has entered into operating leases for land and premises. These lease arrangements are both
cancellable and non-cancellable in nature and range for a period between three years to ten years. The leases have varying terms, escalation clauses and renewal rights. On renewal, the terms of the leases are renegotiated.
Rental income with respect to all operating leases
year ended March 31, 2021
year ended March 31, 2020
Rental income recognised in the statement of profit and loss during the year
32.73 29.40
50. reLAteD PArty DisCLosures
a) entities having significant influence
name type effective proportion of ownership interest (%)
As at March 31, 2021
As at March 31, 2020
Balkrishan Goenka, trustee of Welspun Group Master Trust
Shareholder (refer note 18(a) (iii)) 44.87% 42.34%
b) List of related parties:
name of Jointventures effective proportion of ownership interest (%)
As at March 31, 2021
As at March 31, 2020
Welspun Wasco Coatings Private Limited 51.00% 51.00%
East Pipes Integrated Company for Industry (EPIC) (Formerly known as Welspun Middle East Pipes LLC)
50.01% 50.01%
Welspun Middle East Pipes Coating LLC (Merged into EPIC w.e.f. July 21, 2020)
- 50.01%
Interest in subsidiaries are set out in note 51
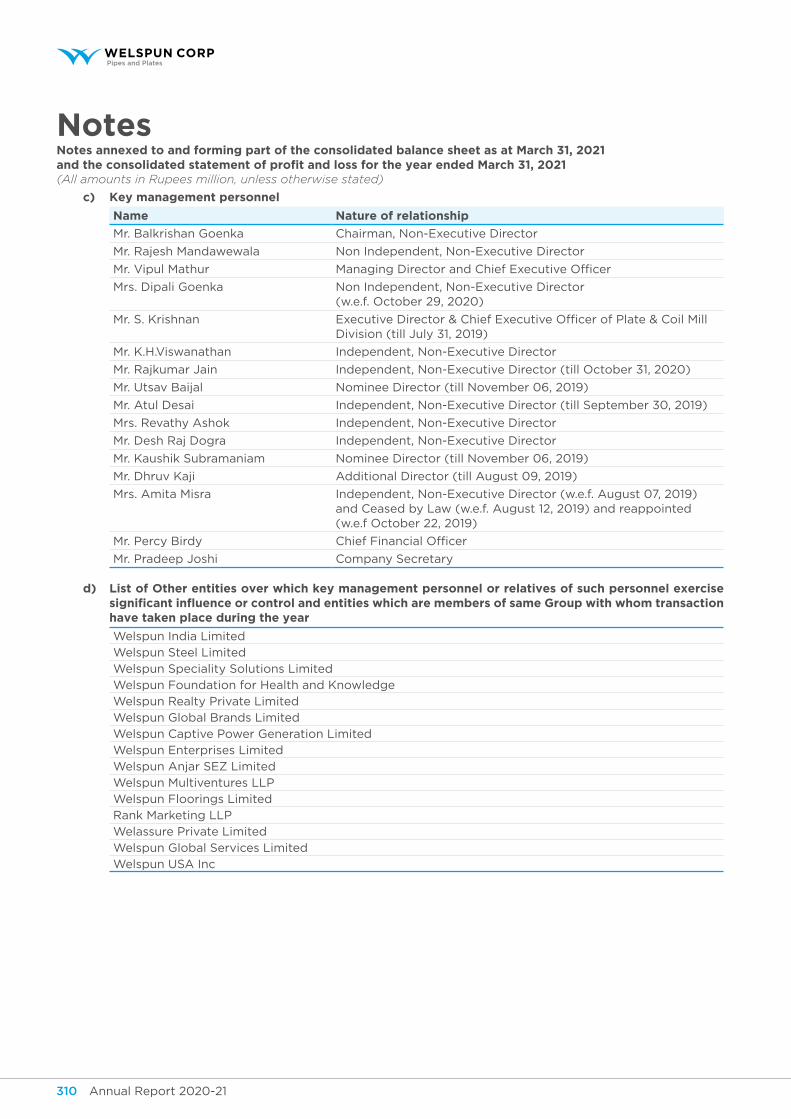
Annual Report 2020-21 311Annual Report 2020-21310
NotesNotes annexed to and forming part of the consolidated balance sheet as at March 31, 2021and the consolidated statement of profit and loss for the year ended March 31, 2021(All amounts in Rupees million, unless otherwise stated)
c) Key management personnel
name nature of relationship
Mr. Balkrishan Goenka Chairman, Non-Executive Director
Mr. Rajesh Mandawewala Non Independent, Non-Executive Director
Mr. Vipul Mathur Managing Director and Chief Executive Officer
Mrs. Dipali Goenka Non Independent, Non-Executive Director (w.e.f. October 29, 2020)
Mr. S. Krishnan Executive Director & Chief Executive Officer of Plate & Coil Mill Division (till July 31, 2019)
Mr. K.H.Viswanathan Independent, Non-Executive Director
Mr. Rajkumar Jain Independent, Non-Executive Director (till October 31, 2020)
Mr. Utsav Baijal Nominee Director (till November 06, 2019)
Mr. Atul Desai Independent, Non-Executive Director (till September 30, 2019)
Mrs. Revathy Ashok Independent, Non-Executive Director
Mr. Desh Raj Dogra Independent, Non-Executive Director
Mr. Kaushik Subramaniam Nominee Director (till November 06, 2019)
Mr. Dhruv Kaji Additional Director (till August 09, 2019)
Mrs. Amita Misra Independent, Non-Executive Director (w.e.f. August 07, 2019) and Ceased by Law (w.e.f. August 12, 2019) and reappointed (w.e.f October 22, 2019)
Mr. Percy Birdy Chief Financial Officer
Mr. Pradeep Joshi Company Secretary
d) list of other entities over which key management personnel or relatives of such personnel exercise significant influence or control and entities which are members of same group with whom transaction have taken place during the year
Welspun India Limited
Welspun Steel Limited
Welspun Speciality Solutions Limited
Welspun Foundation for Health and Knowledge
Welspun Realty Private Limited
Welspun Global Brands Limited
Welspun Captive Power Generation Limited
Welspun Enterprises Limited
Welspun Anjar SEZ Limited
Welspun Multiventures LLP
Welspun Floorings Limited
Rank Marketing LLP
Welassure Private Limited
Welspun Global Services Limited
Welspun USA Inc
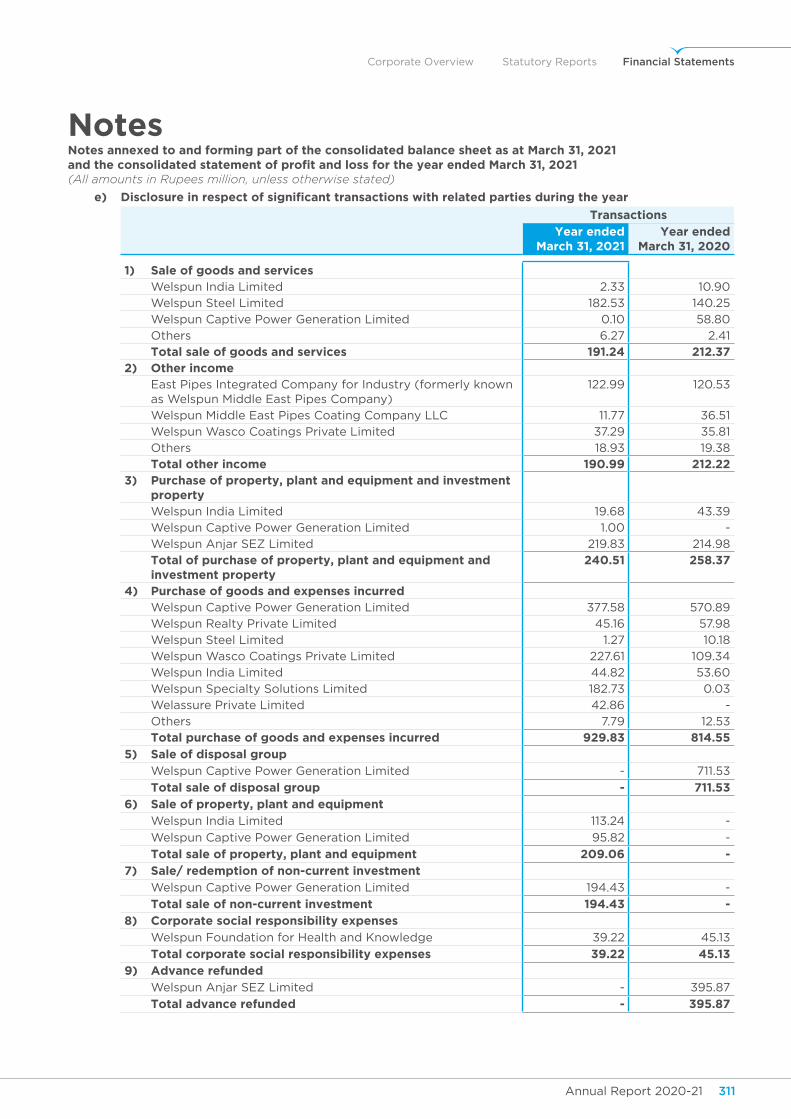
Annual Report 2020-21 311Annual Report 2020-21310
Corporate Overview Statutory Reports Financial Statements
NotesNotes annexed to and forming part of the consolidated balance sheet as at March 31, 2021and the consolidated statement of profit and loss for the year ended March 31, 2021(All amounts in Rupees million, unless otherwise stated)
e) Disclosure in respect of significant transactions with related parties during the year
transactions
year ended March 31, 2021
year ended March 31, 2020
1) sale of goods and services Welspun India Limited 2.33 10.90
Welspun Steel Limited 182.53 140.25
Welspun Captive Power Generation Limited 0.10 58.80
Others 6.27 2.41
total sale of goods and services 191.24 212.37 2) other income East Pipes Integrated Company for Industry (formerly known
as Welspun Middle East Pipes Company) 122.99 120.53
Welspun Middle East Pipes Coating Company LLC 11.77 36.51
Welspun Wasco Coatings Private Limited 37.29 35.81
Others 18.93 19.38
total other income 190.99 212.22 3) Purchase of property, plant and equipment and investment
property Welspun India Limited 19.68 43.39
Welspun Captive Power Generation Limited 1.00 -
Welspun Anjar SEZ Limited 219.83 214.98
total of purchase of property, plant and equipment and investment property
240.51 258.37
4) purchase of goods and expenses incurred Welspun Captive Power Generation Limited 377.58 570.89
Welspun Realty Private Limited 45.16 57.98
Welspun Steel Limited 1.27 10.18
Welspun Wasco Coatings Private Limited 227.61 109.34
Welspun India Limited 44.82 53.60
Welspun Specialty Solutions Limited 182.73 0.03
Welassure Private Limited 42.86 -
Others 7.79 12.53
total purchase of goods and expenses incurred 929.83 814.55
5) sale of disposal group
Welspun Captive Power Generation Limited - 711.53
total sale of disposal group - 711.53
6) sale of property, plant and equipment
Welspun India Limited 113.24 -
Welspun Captive Power Generation Limited 95.82 -
total sale of property, plant and equipment 209.06 -
7) sale/ redemption of non-current investment
Welspun Captive Power Generation Limited 194.43 -
total sale of non-current investment 194.43 -
8) Corporate social responsibility expenses
Welspun Foundation for Health and Knowledge 39.22 45.13
total corporate social responsibility expenses 39.22 45.13
9) Advance refunded
Welspun Anjar SEZ Limited - 395.87
total advance refunded - 395.87
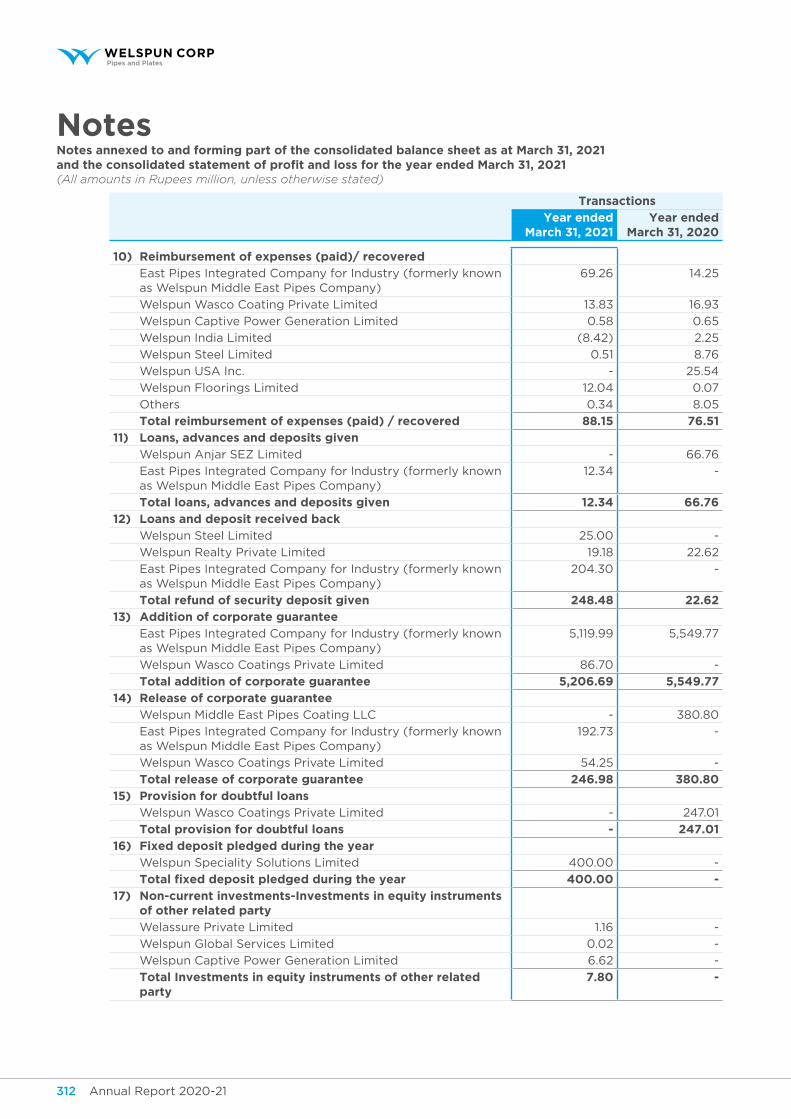
Annual Report 2020-21 313Annual Report 2020-21312
NotesNotes annexed to and forming part of the consolidated balance sheet as at March 31, 2021and the consolidated statement of profit and loss for the year ended March 31, 2021(All amounts in Rupees million, unless otherwise stated)
transactions
year ended March 31, 2021
year ended March 31, 2020
10) reimbursement of expenses (paid)/ recovered
East Pipes Integrated Company for Industry (formerly known as Welspun Middle East Pipes Company)
69.26 14.25
Welspun Wasco Coating Private Limited 13.83 16.93
Welspun Captive Power Generation Limited 0.58 0.65
Welspun India Limited (8.42) 2.25
Welspun Steel Limited 0.51 8.76
Welspun USA Inc. - 25.54
Welspun Floorings Limited 12.04 0.07
Others 0.34 8.05
total reimbursement of expenses (paid) / recovered 88.15 76.51
11) Loans, advances and deposits given
Welspun Anjar SEZ Limited - 66.76
East Pipes Integrated Company for Industry (formerly known as Welspun Middle East Pipes Company)
12.34 -
total loans, advances and deposits given 12.34 66.76
12) Loans and deposit received back
Welspun Steel Limited 25.00 -
Welspun Realty Private Limited 19.18 22.62
East Pipes Integrated Company for Industry (formerly known as Welspun Middle East Pipes Company)
204.30 -
total refund of security deposit given 248.48 22.62
13) Addition of corporate guarantee
East Pipes Integrated Company for Industry (formerly known as Welspun Middle East Pipes Company)
5,119.99 5,549.77
Welspun Wasco Coatings Private Limited 86.70 -
total addition of corporate guarantee 5,206.69 5,549.77
14) Release of corporate guarantee
Welspun Middle East Pipes Coating LLC - 380.80
East Pipes Integrated Company for Industry (formerly known as Welspun Middle East Pipes Company)
192.73 -
Welspun Wasco Coatings Private Limited 54.25 -
total release of corporate guarantee 246.98 380.80
15) Provision for doubtful loans
Welspun Wasco Coatings Private Limited - 247.01
total provision for doubtful loans - 247.01
16) fixed deposit pledged during the year
Welspun Speciality Solutions Limited 400.00 -
total fixed deposit pledged during the year 400.00 -
17) non-current investments-investments in equity instruments of other related party
Welassure Private Limited 1.16 -
Welspun Global Services Limited 0.02 -
Welspun Captive Power Generation Limited 6.62 -
total Investments in equity instruments of other related party
7.80 -
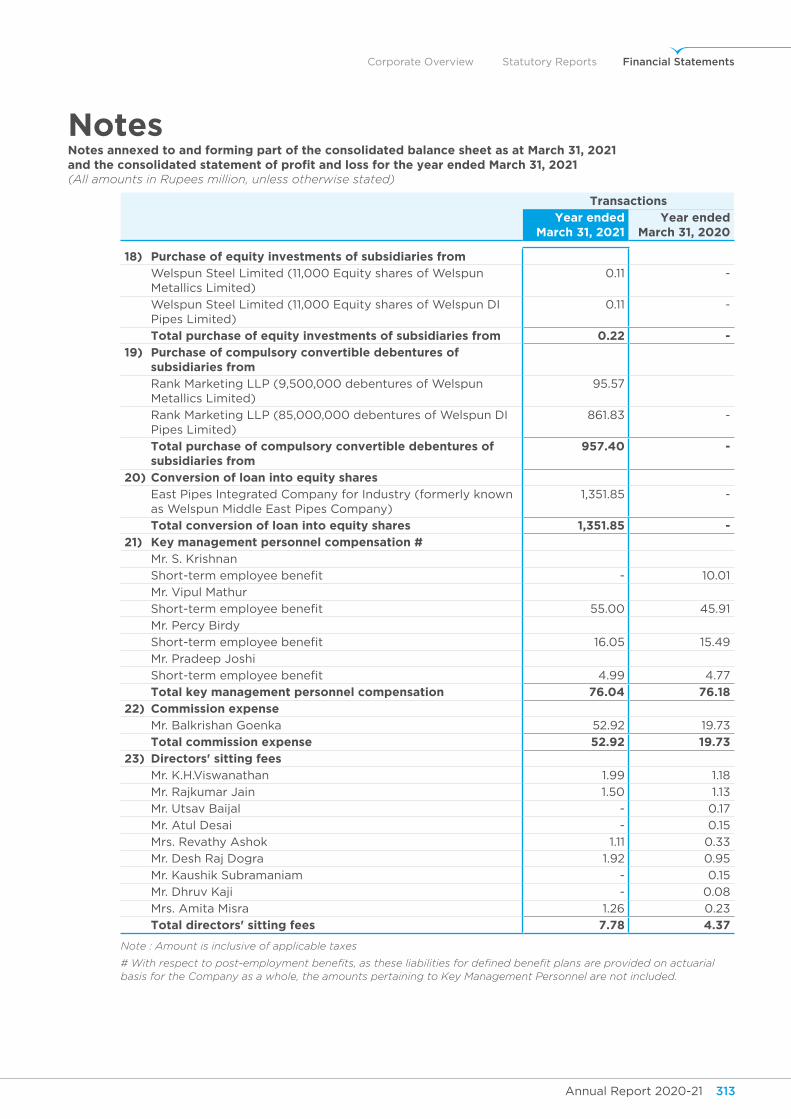
Annual Report 2020-21 313Annual Report 2020-21312
Corporate Overview Statutory Reports Financial Statements
NotesNotes annexed to and forming part of the consolidated balance sheet as at March 31, 2021and the consolidated statement of profit and loss for the year ended March 31, 2021(All amounts in Rupees million, unless otherwise stated)
transactions
year ended March 31, 2021
year ended March 31, 2020
18) Purchase of equity investments of subsidiaries from
Welspun Steel Limited (11,000 Equity shares of Welspun Metallics Limited)
0.11 -
Welspun Steel Limited (11,000 Equity shares of Welspun DI Pipes Limited)
0.11 -
total purchase of equity investments of subsidiaries from 0.22 -
19) Purchase of compulsory convertible debentures of subsidiaries from
Rank Marketing LLP (9,500,000 debentures of Welspun Metallics Limited)
95.57
Rank Marketing LLP (85,000,000 debentures of Welspun DI Pipes Limited)
861.83 -
total purchase of compulsory convertible debentures of subsidiaries from
957.40 -
20) Conversion of loan into equity shares
East Pipes Integrated Company for Industry (formerly known as Welspun Middle East Pipes Company)
1,351.85 -
total conversion of loan into equity shares 1,351.85 -
21) key management personnel compensation #
Mr. S. Krishnan
Short-term employee benefit - 10.01
Mr. Vipul Mathur
Short-term employee benefit 55.00 45.91
Mr. Percy Birdy
Short-term employee benefit 16.05 15.49
Mr. Pradeep Joshi
Short-term employee benefit 4.99 4.77
total key management personnel compensation 76.04 76.18
22) Commission expense
Mr. Balkrishan Goenka 52.92 19.73
total commission expense 52.92 19.73
23) Directors' sitting fees
Mr. K.H.Viswanathan 1.99 1.18
Mr. Rajkumar Jain 1.50 1.13
Mr. Utsav Baijal - 0.17
Mr. Atul Desai - 0.15
Mrs. Revathy Ashok 1.11 0.33
Mr. Desh Raj Dogra 1.92 0.95
Mr. Kaushik Subramaniam - 0.15
Mr. Dhruv Kaji - 0.08
Mrs. Amita Misra 1.26 0.23
total directors' sitting fees 7.78 4.37
Note : Amount is inclusive of applicable taxes
# With respect to post-employment benefits, as these liabilities for defined benefit plans are provided on actuarial basis for the Company as a whole, the amounts pertaining to Key Management Personnel are not included.
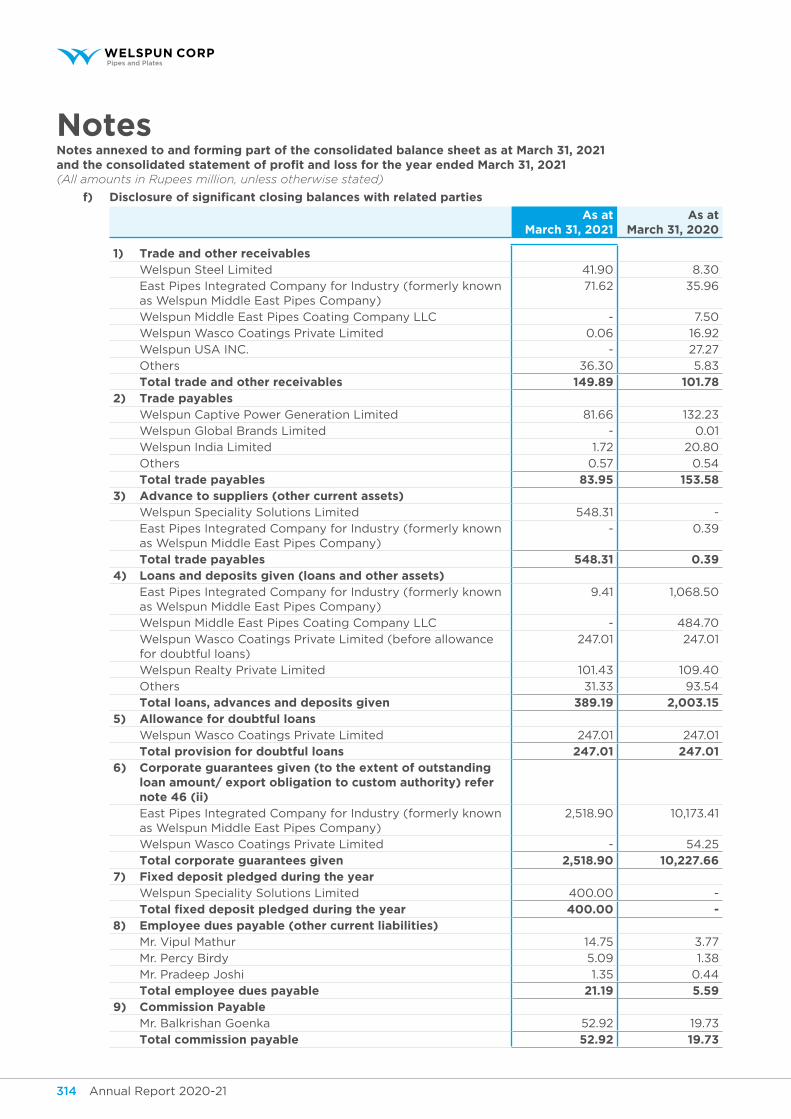
Annual Report 2020-21 315Annual Report 2020-21314
NotesNotes annexed to and forming part of the consolidated balance sheet as at March 31, 2021and the consolidated statement of profit and loss for the year ended March 31, 2021(All amounts in Rupees million, unless otherwise stated)
f) Disclosure of significant closing balances with related parties
As at March 31, 2021
As at March 31, 2020
1) trade and other receivables Welspun Steel Limited 41.90 8.30
East Pipes Integrated Company for Industry (formerly known as Welspun Middle East Pipes Company)
71.62 35.96
Welspun Middle East Pipes Coating Company LLC - 7.50
Welspun Wasco Coatings Private Limited 0.06 16.92
Welspun USA INC. - 27.27
Others 36.30 5.83
total trade and other receivables 149.89 101.78 2) trade payables Welspun Captive Power Generation Limited 81.66 132.23
Welspun Global Brands Limited - 0.01
Welspun India Limited 1.72 20.80
Others 0.57 0.54
total trade payables 83.95 153.58 3) Advance to suppliers (other current assets) Welspun Speciality Solutions Limited 548.31 -
East Pipes Integrated Company for Industry (formerly known as Welspun Middle East Pipes Company)
- 0.39
total trade payables 548.31 0.39 4) loans and deposits given (loans and other assets) East Pipes Integrated Company for Industry (formerly known
as Welspun Middle East Pipes Company) 9.41 1,068.50
Welspun Middle East Pipes Coating Company LLC - 484.70
Welspun Wasco Coatings Private Limited (before allowance for doubtful loans)
247.01 247.01
Welspun Realty Private Limited 101.43 109.40
Others 31.33 93.54
total loans, advances and deposits given 389.19 2,003.15 5) Allowance for doubtful loans Welspun Wasco Coatings Private Limited 247.01 247.01
total provision for doubtful loans 247.01 247.01 6) corporate guarantees given (to the extent of outstanding
loan amount/ export obligation to custom authority) refer note 46 (ii)
East Pipes Integrated Company for Industry (formerly known as Welspun Middle East Pipes Company)
2,518.90 10,173.41
Welspun Wasco Coatings Private Limited - 54.25
total corporate guarantees given 2,518.90 10,227.66 7) fixed deposit pledged during the year Welspun Speciality Solutions Limited 400.00 -
total fixed deposit pledged during the year 400.00 - 8) employee dues payable (other current liabilities) Mr. Vipul Mathur 14.75 3.77
Mr. Percy Birdy 5.09 1.38
Mr. Pradeep Joshi 1.35 0.44
total employee dues payable 21.19 5.59 9) Commission Payable Mr. Balkrishan Goenka 52.92 19.73
total commission payable 52.92 19.73
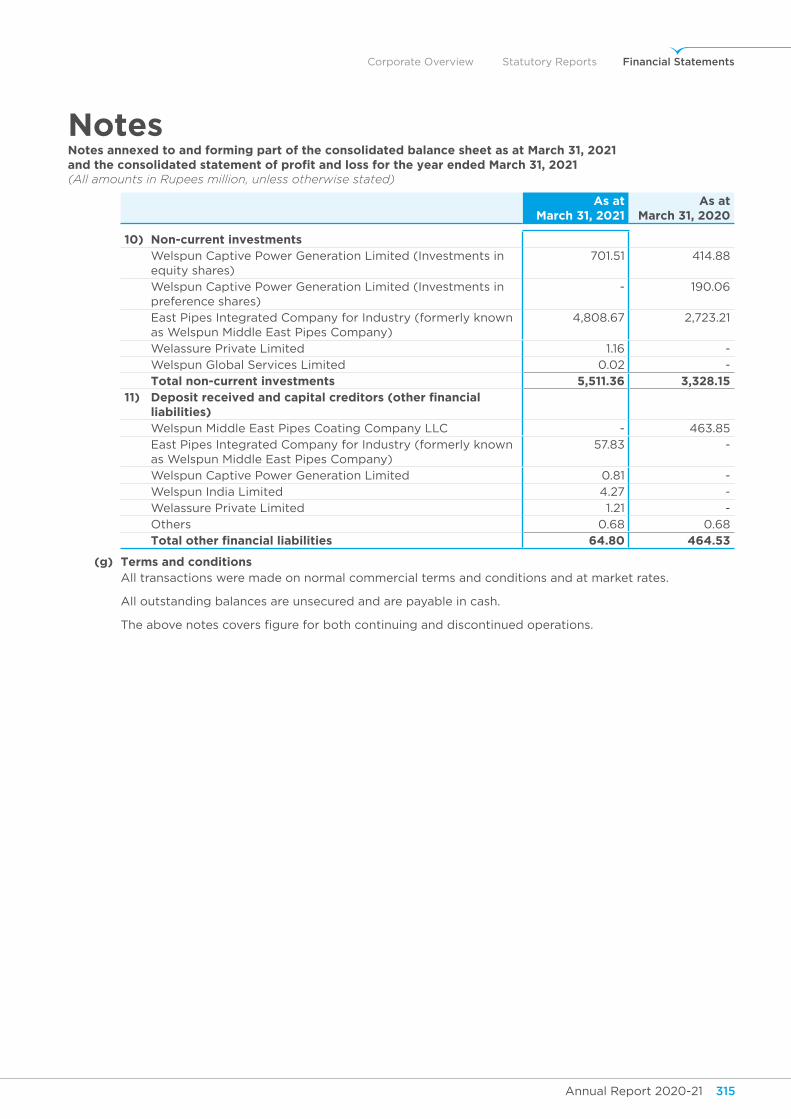
Annual Report 2020-21 315Annual Report 2020-21314
Corporate Overview Statutory Reports Financial Statements
NotesNotes annexed to and forming part of the consolidated balance sheet as at March 31, 2021and the consolidated statement of profit and loss for the year ended March 31, 2021(All amounts in Rupees million, unless otherwise stated)
As at March 31, 2021
As at March 31, 2020
10) non-current investments Welspun Captive Power Generation Limited (Investments in
equity shares) 701.51 414.88
Welspun Captive Power Generation Limited (Investments in preference shares)
- 190.06
East Pipes Integrated Company for Industry (formerly known as Welspun Middle East Pipes Company)
4,808.67 2,723.21
Welassure Private Limited 1.16 -
Welspun Global Services Limited 0.02 -
total non-current investments 5,511.36 3,328.15 11) Deposit received and capital creditors (other financial
liabilities) Welspun Middle East Pipes Coating Company LLC - 463.85
East Pipes Integrated Company for Industry (formerly known as Welspun Middle East Pipes Company)
57.83 -
Welspun Captive Power Generation Limited 0.81 -
Welspun India Limited 4.27 -
Welassure Private Limited 1.21 -
Others 0.68 0.68
total other financial liabilities 64.80 464.53
(g) terms and conditions All transactions were made on normal commercial terms and conditions and at market rates.
All outstanding balances are unsecured and are payable in cash.
The above notes covers figure for both continuing and discontinued operations.
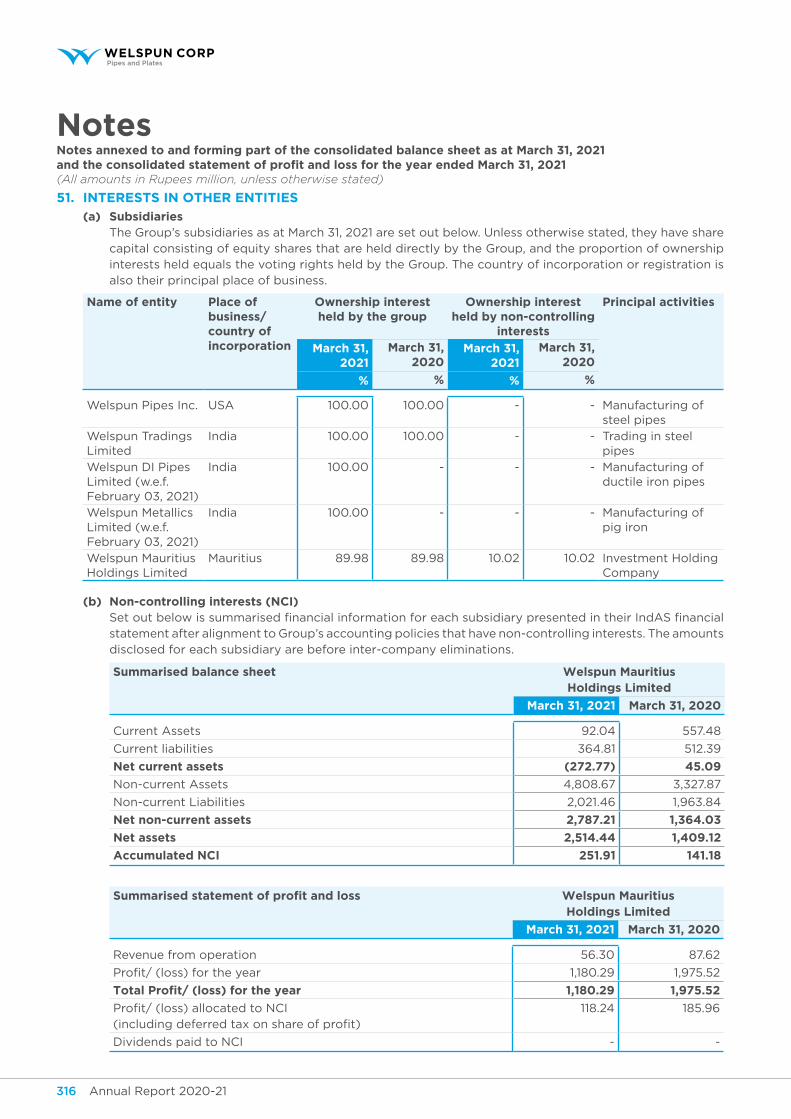
Annual Report 2020-21 317Annual Report 2020-21316
NotesNotes annexed to and forming part of the consolidated balance sheet as at March 31, 2021and the consolidated statement of profit and loss for the year ended March 31, 2021(All amounts in Rupees million, unless otherwise stated)
51. interests in other entities
(a) subsidiaries The Group’s subsidiaries as at March 31, 2021 are set out below. Unless otherwise stated, they have share
capital consisting of equity shares that are held directly by the Group, and the proportion of ownership interests held equals the voting rights held by the Group. The country of incorporation or registration is also their principal place of business.
name of entity place of business/ country of incorporation
ownership interest held by the group
ownership interest held by non-controlling
interests
principal activities
March 31, 2021
March 31, 2020
March 31, 2021
March 31, 2020
% % % %
Welspun Pipes Inc. USA 100.00 100.00 - - Manufacturing of steel pipes
Welspun Tradings Limited
India 100.00 100.00 - - Trading in steel pipes
Welspun DI Pipes Limited (w.e.f. February 03, 2021)
India 100.00 - - - Manufacturing of ductile iron pipes
Welspun Metallics Limited (w.e.f. February 03, 2021)
India 100.00 - - - Manufacturing of pig iron
Welspun Mauritius Holdings Limited
Mauritius 89.98 89.98 10.02 10.02 Investment Holding Company
(b) non-controlling interests (ncI) Set out below is summarised financial information for each subsidiary presented in their IndAS financial
statement after alignment to Group’s accounting policies that have non-controlling interests. The amounts disclosed for each subsidiary are before inter-company eliminations.
summarised balance sheet welspun mauritius holdings limited
March 31, 2021 March 31, 2020
Current Assets 92.04 557.48
Current liabilities 364.81 512.39
net current assets (272.77) 45.09
Non-current Assets 4,808.67 3,327.87
Non-current Liabilities 2,021.46 1,963.84
net non-current assets 2,787.21 1,364.03
net assets 2,514.44 1,409.12
Accumulated ncI 251.91 141.18
summarised statement of profit and loss welspun mauritius holdings limited
March 31, 2021 March 31, 2020
Revenue from operation 56.30 87.62
Profit/ (loss) for the year 1,180.29 1,975.52
total Profit/ (loss) for the year 1,180.29 1,975.52
Profit/ (loss) allocated to NCI (including deferred tax on share of profit)
118.24 185.96
Dividends paid to NCI - -
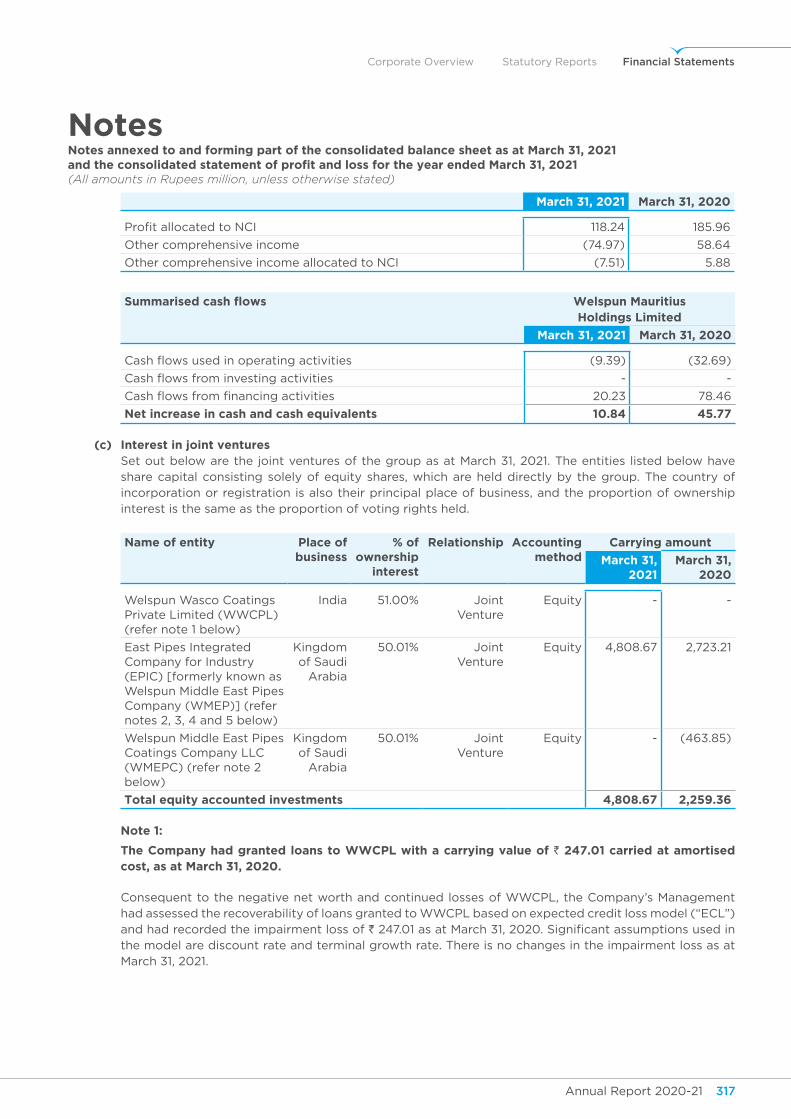
Annual Report 2020-21 317Annual Report 2020-21316
Corporate Overview Statutory Reports Financial Statements
NotesNotes annexed to and forming part of the consolidated balance sheet as at March 31, 2021and the consolidated statement of profit and loss for the year ended March 31, 2021(All amounts in Rupees million, unless otherwise stated)
March 31, 2021 March 31, 2020
Profit allocated to NCI 118.24 185.96
Other comprehensive income (74.97) 58.64
Other comprehensive income allocated to NCI (7.51) 5.88
summarised cash flows welspun mauritius holdings limited
March 31, 2021 March 31, 2020
Cash flows used in operating activities (9.39) (32.69)
Cash flows from investing activities - -
Cash flows from financing activities 20.23 78.46
net increase in cash and cash equivalents 10.84 45.77
(c) Interest in joint ventures Set out below are the joint ventures of the group as at March 31, 2021. The entities listed below have
share capital consisting solely of equity shares, which are held directly by the group. The country of incorporation or registration is also their principal place of business, and the proportion of ownership interest is the same as the proportion of voting rights held.
name of entity place of business
% of ownership
interest
Relationship Accounting method
carrying amount
March 31, 2021
March 31, 2020
Welspun Wasco Coatings Private Limited (WWCPL) (refer note 1 below)
India 51.00% Joint Venture
Equity - -
East Pipes Integrated Company for Industry (EPIC) [formerly known as Welspun Middle East Pipes Company (WMEP)] (refer notes 2, 3, 4 and 5 below)
Kingdom of Saudi
Arabia
50.01% Joint Venture
Equity 4,808.67 2,723.21
Welspun Middle East Pipes Coatings Company LLC (WMEPC) (refer note 2 below)
Kingdom of Saudi
Arabia
50.01% Joint Venture
Equity - (463.85)
total equity accounted investments 4,808.67 2,259.36
note 1:
the company had granted loans to wwcpl with a carrying value of ` 247.01 carried at amortised cost, as at March 31, 2020.
Consequent to the negative net worth and continued losses of WWCPL, the Company’s Management had assessed the recoverability of loans granted to WWCPL based on expected credit loss model (“ECL”) and had recorded the impairment loss of ` 247.01 as at March 31, 2020. Significant assumptions used in the model are discount rate and terminal growth rate. There is no changes in the impairment loss as at March 31, 2021.
Annual Report 2020-21 319Annual Report 2020-21318
NotesNotes annexed to and forming part of the consolidated balance sheet as at March 31, 2021and the consolidated statement of profit and loss for the year ended March 31, 2021(All amounts in Rupees million, unless otherwise stated)
note 2: Merger: The Shareholders of WMEPC signed an agreement on May 14, 2020 to merge its operations and all its
assets, rights, liabilities and obligations with another WMEP, and which is effective from July 21, 2020. As both WMEPC and WMEP are under common control and have the same shareholders holding identical shareholding, there is no consideration and the carrying values of assets and liabilities of WMEPC have been transferred to WMEP on the effective date of merger. Based on the terms of this agreement the shareholding pattern remains identical in WMEP, post merger. This event does not have any material impact on the current year’s consolidated financial statements.
Accordingly, before merger, the investment in WMEP was disclosed under “investments accounted for using the equity method” and investment in WMEPC was disclosed as “share of loss of joint venture”under “other current financial liabilities” in the consolidated financial statement. Post merger the same has been netted off and disclosed as investment in WMEP under “Investments accounted for using the equity method” as at March 31, 2021.
note 3: Listing of shares The Board of Directors of the Company at its meeting held on August 6, 2020 and the shareholders at
their meeting held on August 31, 2020, approved listing of WMEP at the local Stock Exchange, through divestment of 15% (at maximum) of the total issued shares of WMEP held by the Company through its overseas subsidiary, at a pro-rata consideration exceeding USD 30 million along with proportionate shares to be divested by the local partners. The listing and divestment is subject to regulatory approvals in the Kingdom of Saudi Arabia.
note 4: Change in number of shares The shareholders of East Pipe Integrated Company for Industry (formerly known as Welspun Middle East
Pipes Company) in their meeting held on December 28, 2020, has passed a resolution to amend the Articles of Association of the Company related to the capital as follows:
The capital of the company was determined at SAR 210 million, divided into nominal 21,000,000 ordinary in-kind shares in equal value of SAR 10 each.
Share of the Holding Company in this joint venture is 50.01% and accordingly the Investments in equity instruments of joint venture has increased to 10,502,100 shares (March 31, 2020: 38,031,042 shares).
note 5: Change in name WMEP changed its legal name from “Welspun Middle East Pipes Company” to “East Pipes Integrated
Company for Industry” on January 24, 2021.”
(i) summarised financial information for joint ventures The tables below provide summarised financial information of all joint ventures in the Group.
The information disclosed reflects the amounts presented in their IndAS financial statements after alignment to Group’s accounting policies of the relevant joint ventures and not Welspun Corp Limited’s share of those amounts. They have been amended to reflect adjustments made by the entity when using the equity method, including fair value adjustments made at the time of acquisition and modifications for differences in accounting policies.
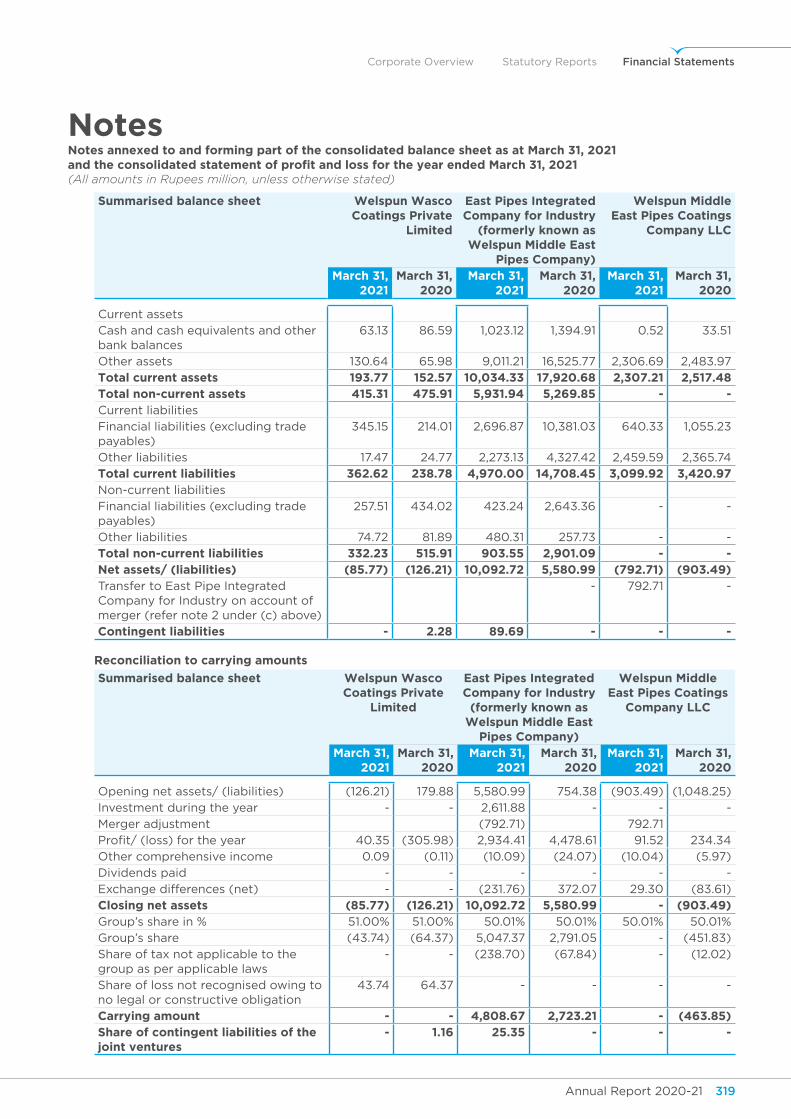
Annual Report 2020-21 319Annual Report 2020-21318
Corporate Overview Statutory Reports Financial Statements
NotesNotes annexed to and forming part of the consolidated balance sheet as at March 31, 2021and the consolidated statement of profit and loss for the year ended March 31, 2021(All amounts in Rupees million, unless otherwise stated)
summarised balance sheet welspun wasco coatings private
limited
east pipes Integrated company for Industry
(formerly known as welspun middle east
pipes company)
welspun middle east pipes coatings
company llc
March 31, 2021
March 31, 2020
March 31, 2021
March 31, 2020
March 31, 2021
March 31, 2020
Current assets
Cash and cash equivalents and other bank balances
63.13 86.59 1,023.12 1,394.91 0.52 33.51
Other assets 130.64 65.98 9,011.21 16,525.77 2,306.69 2,483.97
total current assets 193.77 152.57 10,034.33 17,920.68 2,307.21 2,517.48 total non-current assets 415.31 475.91 5,931.94 5,269.85 - - Current liabilities
Financial liabilities (excluding trade payables)
345.15 214.01 2,696.87 10,381.03 640.33 1,055.23
Other liabilities 17.47 24.77 2,273.13 4,327.42 2,459.59 2,365.74
total current liabilities 362.62 238.78 4,970.00 14,708.45 3,099.92 3,420.97 Non-current liabilities
Financial liabilities (excluding trade payables)
257.51 434.02 423.24 2,643.36 - -
Other liabilities 74.72 81.89 480.31 257.73 - -
total non-current liabilities 332.23 515.91 903.55 2,901.09 - - net assets/ (liabilities) (85.77) (126.21) 10,092.72 5,580.99 (792.71) (903.49)Transfer to East Pipe Integrated Company for Industry on account of merger (refer note 2 under (c) above)
- 792.71 -
contingent liabilities - 2.28 89.69 - - -
Reconciliation to carrying amounts
summarised balance sheet welspun wasco coatings private
limited
east pipes Integrated company for Industry
(formerly known as welspun middle east
pipes company)
welspun middle east pipes coatings
company llc
March 31, 2021
March 31, 2020
March 31, 2021
March 31, 2020
March 31, 2021
March 31, 2020
Opening net assets/ (liabilities) (126.21) 179.88 5,580.99 754.38 (903.49) (1,048.25)
Investment during the year - - 2,611.88 - - -
Merger adjustment (792.71) 792.71
Profit/ (loss) for the year 40.35 (305.98) 2,934.41 4,478.61 91.52 234.34
Other comprehensive income 0.09 (0.11) (10.09) (24.07) (10.04) (5.97)
Dividends paid - - - - - -
Exchange differences (net) - - (231.76) 372.07 29.30 (83.61)
closing net assets (85.77) (126.21) 10,092.72 5,580.99 - (903.49)Group’s share in % 51.00% 51.00% 50.01% 50.01% 50.01% 50.01%
Group’s share (43.74) (64.37) 5,047.37 2,791.05 - (451.83)
Share of tax not applicable to the group as per applicable laws
- - (238.70) (67.84) - (12.02)
Share of loss not recognised owing to no legal or constructive obligation
43.74 64.37 - - - -
carrying amount - - 4,808.67 2,723.21 - (463.85)share of contingent liabilities of the joint ventures
- 1.16 25.35 - - -
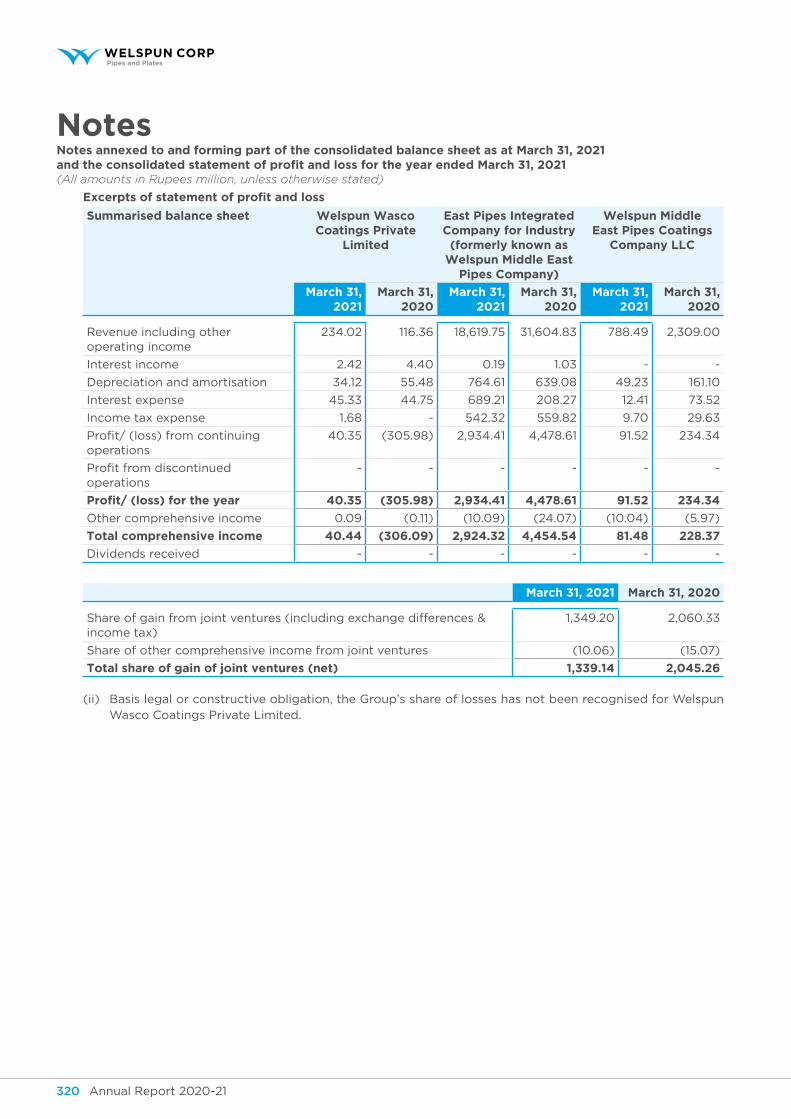
Annual Report 2020-21 321Annual Report 2020-21320
NotesNotes annexed to and forming part of the consolidated balance sheet as at March 31, 2021and the consolidated statement of profit and loss for the year ended March 31, 2021(All amounts in Rupees million, unless otherwise stated)
excerpts of statement of profit and loss
summarised balance sheet welspun wasco coatings private
limited
east pipes Integrated company for Industry
(formerly known as welspun middle east
pipes company)
welspun middle east pipes coatings
company llc
March 31, 2021
March 31, 2020
March 31, 2021
March 31, 2020
March 31, 2021
March 31, 2020
Revenue including other operating income
234.02 116.36 18,619.75 31,604.83 788.49 2,309.00
Interest income 2.42 4.40 0.19 1.03 - -
Depreciation and amortisation 34.12 55.48 764.61 639.08 49.23 161.10
Interest expense 45.33 44.75 689.21 208.27 12.41 73.52
Income tax expense 1.68 - 542.32 559.82 9.70 29.63
Profit/ (loss) from continuing operations
40.35 (305.98) 2,934.41 4,478.61 91.52 234.34
Profit from discontinued operations
- - - - - -
Profit/ (loss) for the year 40.35 (305.98) 2,934.41 4,478.61 91.52 234.34
Other comprehensive income 0.09 (0.11) (10.09) (24.07) (10.04) (5.97)
total comprehensive income 40.44 (306.09) 2,924.32 4,454.54 81.48 228.37
Dividends received - - - - - -
March 31, 2021 March 31, 2020
Share of gain from joint ventures (including exchange differences & income tax)
1,349.20 2,060.33
Share of other comprehensive income from joint ventures (10.06) (15.07)
total share of gain of joint ventures (net) 1,339.14 2,045.26
(ii) Basis legal or constructive obligation, the Group’s share of losses has not been recognised for Welspun Wasco Coatings Private Limited.
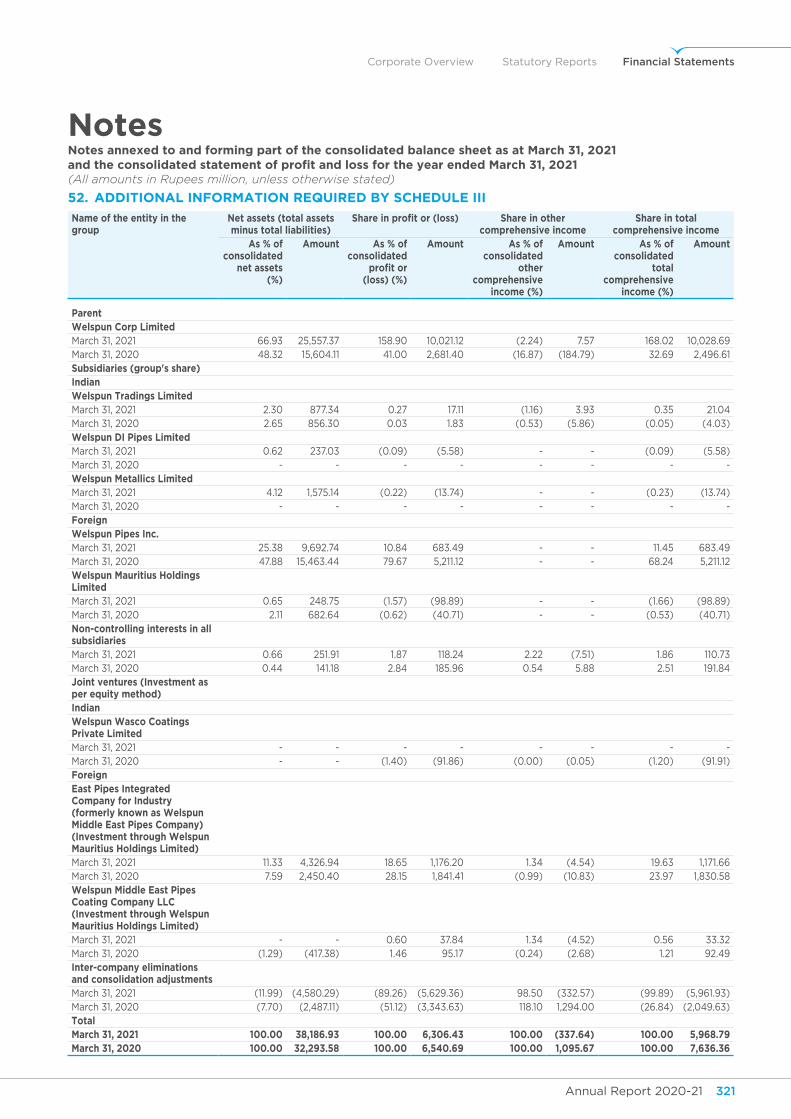
Annual Report 2020-21 321Annual Report 2020-21320
Corporate Overview Statutory Reports Financial Statements
NotesNotes annexed to and forming part of the consolidated balance sheet as at March 31, 2021and the consolidated statement of profit and loss for the year ended March 31, 2021(All amounts in Rupees million, unless otherwise stated)
52. ADDitionAL inforMAtion requireD By sCheDuLe iii
name of the entity in the group
net assets (total assets minus total liabilities)
share in profit or (loss) share in other comprehensive income
share in total comprehensive income
As % of consolidated
net assets (%)
Amount As % of consolidated
profit or (loss) (%)
Amount As % of consolidated
other comprehensive
income (%)
Amount As % of consolidated
total comprehensive
income (%)
Amount
parentwelspun corp limitedMarch 31, 2021 66.93 25,557.37 158.90 10,021.12 (2.24) 7.57 168.02 10,028.69 March 31, 2020 48.32 15,604.11 41.00 2,681.40 (16.87) (184.79) 32.69 2,496.61 subsidiaries (group's share)Indianwelspun tradings limitedMarch 31, 2021 2.30 877.34 0.27 17.11 (1.16) 3.93 0.35 21.04 March 31, 2020 2.65 856.30 0.03 1.83 (0.53) (5.86) (0.05) (4.03)welspun dI pipes limitedMarch 31, 2021 0.62 237.03 (0.09) (5.58) - - (0.09) (5.58)March 31, 2020 - - - - - - - - welspun metallics limited March 31, 2021 4.12 1,575.14 (0.22) (13.74) - - (0.23) (13.74)March 31, 2020 - - - - - - - - foreignwelspun pipes Inc.March 31, 2021 25.38 9,692.74 10.84 683.49 - - 11.45 683.49 March 31, 2020 47.88 15,463.44 79.67 5,211.12 - - 68.24 5,211.12 welspun mauritius holdings limitedMarch 31, 2021 0.65 248.75 (1.57) (98.89) - - (1.66) (98.89)March 31, 2020 2.11 682.64 (0.62) (40.71) - - (0.53) (40.71)non-controlling interests in all subsidiariesMarch 31, 2021 0.66 251.91 1.87 118.24 2.22 (7.51) 1.86 110.73 March 31, 2020 0.44 141.18 2.84 185.96 0.54 5.88 2.51 191.84 Joint ventures (Investment as per equity method)Indianwelspun wasco coatings private limitedMarch 31, 2021 - - - - - - - - March 31, 2020 - - (1.40) (91.86) (0.00) (0.05) (1.20) (91.91)foreigneast pipes Integrated company for Industry (formerly known as welspun middle east pipes company) (Investment through welspun mauritius holdings limited)March 31, 2021 11.33 4,326.94 18.65 1,176.20 1.34 (4.54) 19.63 1,171.66 March 31, 2020 7.59 2,450.40 28.15 1,841.41 (0.99) (10.83) 23.97 1,830.58 welspun middle east pipes coating company llc (Investment through welspun mauritius holdings limited)March 31, 2021 - - 0.60 37.84 1.34 (4.52) 0.56 33.32 March 31, 2020 (1.29) (417.38) 1.46 95.17 (0.24) (2.68) 1.21 92.49 Inter-company eliminations and consolidation adjustmentsMarch 31, 2021 (11.99) (4,580.29) (89.26) (5,629.36) 98.50 (332.57) (99.89) (5,961.93)March 31, 2020 (7.70) (2,487.11) (51.12) (3,343.63) 118.10 1,294.00 (26.84) (2,049.63)totalMarch 31, 2021 100.00 38,186.93 100.00 6,306.43 100.00 (337.64) 100.00 5,968.79 March 31, 2020 100.00 32,293.58 100.00 6,540.69 100.00 1,095.67 100.00 7,636.36
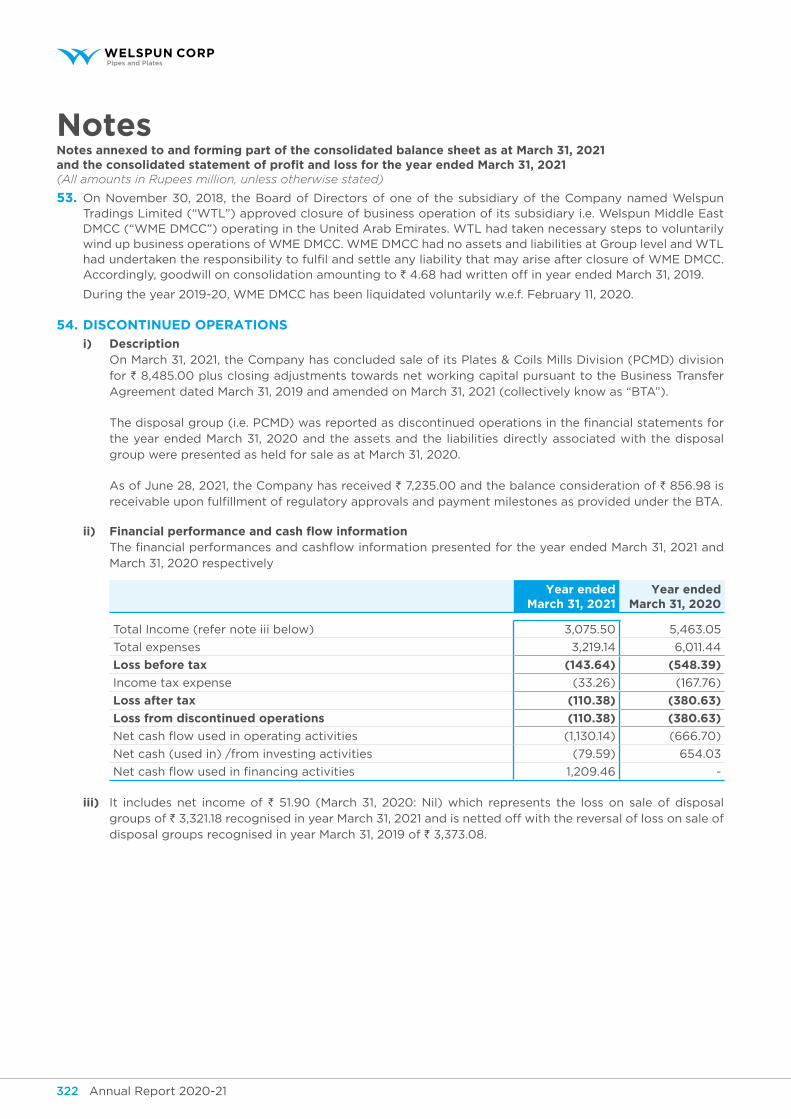
Annual Report 2020-21 323Annual Report 2020-21322
NotesNotes annexed to and forming part of the consolidated balance sheet as at March 31, 2021and the consolidated statement of profit and loss for the year ended March 31, 2021(All amounts in Rupees million, unless otherwise stated)
53. On November 30, 2018, the Board of Directors of one of the subsidiary of the Company named Welspun Tradings Limited (“WTL”) approved closure of business operation of its subsidiary i.e. Welspun Middle East DMCC (“WME DMCC”) operating in the United Arab Emirates. WTL had taken necessary steps to voluntarily wind up business operations of WME DMCC. WME DMCC had no assets and liabilities at Group level and WTL had undertaken the responsibility to fulfil and settle any liability that may arise after closure of WME DMCC. Accordingly, goodwill on consolidation amounting to ` 4.68 had written off in year ended March 31, 2019.
During the year 2019-20, WME DMCC has been liquidated voluntarily w.e.f. February 11, 2020.
54. DisContinueD oPerAtions
i) description On March 31, 2021, the Company has concluded sale of its Plates & Coils Mills Division (PCMD) division
for ` 8,485.00 plus closing adjustments towards net working capital pursuant to the Business Transfer Agreement dated March 31, 2019 and amended on March 31, 2021 (collectively know as “BTA”).
The disposal group (i.e. PCMD) was reported as discontinued operations in the financial statements for the year ended March 31, 2020 and the assets and the liabilities directly associated with the disposal group were presented as held for sale as at March 31, 2020.
As of June 28, 2021, the Company has received ` 7,235.00 and the balance consideration of ` 856.98 is receivable upon fulfillment of regulatory approvals and payment milestones as provided under the BTA.
ii) financial performance and cash flow information The financial performances and cashflow information presented for the year ended March 31, 2021 and
March 31, 2020 respectively
year ended March 31, 2021
year ended March 31, 2020
Total Income (refer note iii below) 3,075.50 5,463.05
Total expenses 3,219.14 6,011.44
loss before tax (143.64) (548.39)
Income tax expense (33.26) (167.76)
loss after tax (110.38) (380.63)
loss from discontinued operations (110.38) (380.63)
Net cash flow used in operating activities (1,130.14) (666.70)
Net cash (used in) /from investing activities (79.59) 654.03
Net cash flow used in financing activities 1,209.46 -
iii) It includes net income of ` 51.90 (March 31, 2020: Nil) which represents the loss on sale of disposal groups of ` 3,321.18 recognised in year March 31, 2021 and is netted off with the reversal of loss on sale of disposal groups recognised in year March 31, 2019 of ` 3,373.08.
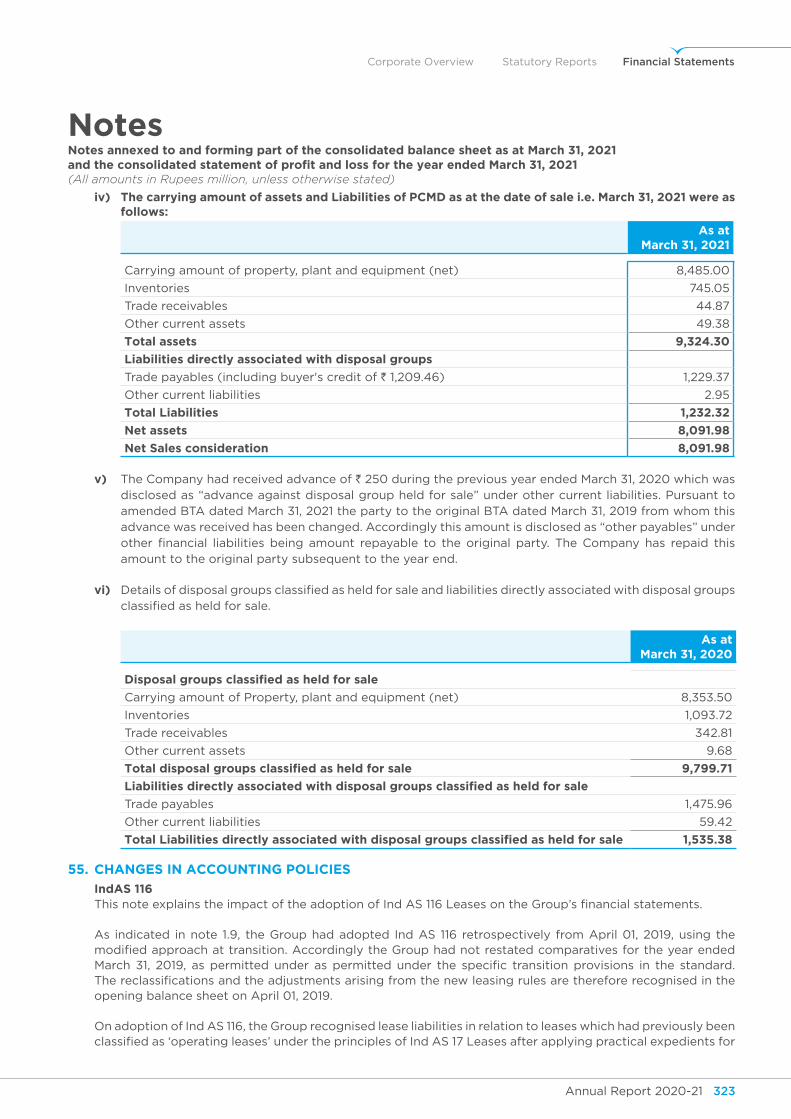
Annual Report 2020-21 323Annual Report 2020-21322
Corporate Overview Statutory Reports Financial Statements
NotesNotes annexed to and forming part of the consolidated balance sheet as at March 31, 2021and the consolidated statement of profit and loss for the year ended March 31, 2021(All amounts in Rupees million, unless otherwise stated)
iv) the carrying amount of assets and Liabilities of PCMD as at the date of sale i.e. March 31, 2021 were as follows:
As at March 31, 2021
Carrying amount of property, plant and equipment (net) 8,485.00
Inventories 745.05
Trade receivables 44.87
Other current assets 49.38
total assets 9,324.30
liabilities directly associated with disposal groups
Trade payables (including buyer's credit of ` 1,209.46) 1,229.37
Other current liabilities 2.95
total liabilities 1,232.32
net assets 8,091.98
net sales consideration 8,091.98
v) The Company had received advance of ` 250 during the previous year ended March 31, 2020 which was disclosed as “advance against disposal group held for sale” under other current liabilities. Pursuant to amended BTA dated March 31, 2021 the party to the original BTA dated March 31, 2019 from whom this advance was received has been changed. Accordingly this amount is disclosed as “other payables” under other financial liabilities being amount repayable to the original party. The Company has repaid this amount to the original party subsequent to the year end.
vi) Details of disposal groups classified as held for sale and liabilities directly associated with disposal groups classified as held for sale.
As at March 31, 2020
Disposal groups classified as held for sale
Carrying amount of Property, plant and equipment (net) 8,353.50
Inventories 1,093.72
Trade receivables 342.81
Other current assets 9.68
total disposal groups classified as held for sale 9,799.71
Liabilities directly associated with disposal groups classified as held for sale
Trade payables 1,475.96
Other current liabilities 59.42
total Liabilities directly associated with disposal groups classified as held for sale 1,535.38
55. ChAnges in ACCounting PoLiCies
IndAs 116 This note explains the impact of the adoption of Ind AS 116 Leases on the Group’s financial statements.
As indicated in note 1.9, the Group had adopted Ind AS 116 retrospectively from April 01, 2019, using the modified approach at transition. Accordingly the Group had not restated comparatives for the year ended March 31, 2019, as permitted under as permitted under the specific transition provisions in the standard. The reclassifications and the adjustments arising from the new leasing rules are therefore recognised in the opening balance sheet on April 01, 2019.
On adoption of Ind AS 116, the Group recognised lease liabilities in relation to leases which had previously been classified as ‘operating leases’ under the principles of Ind AS 17 Leases after applying practical expedients for
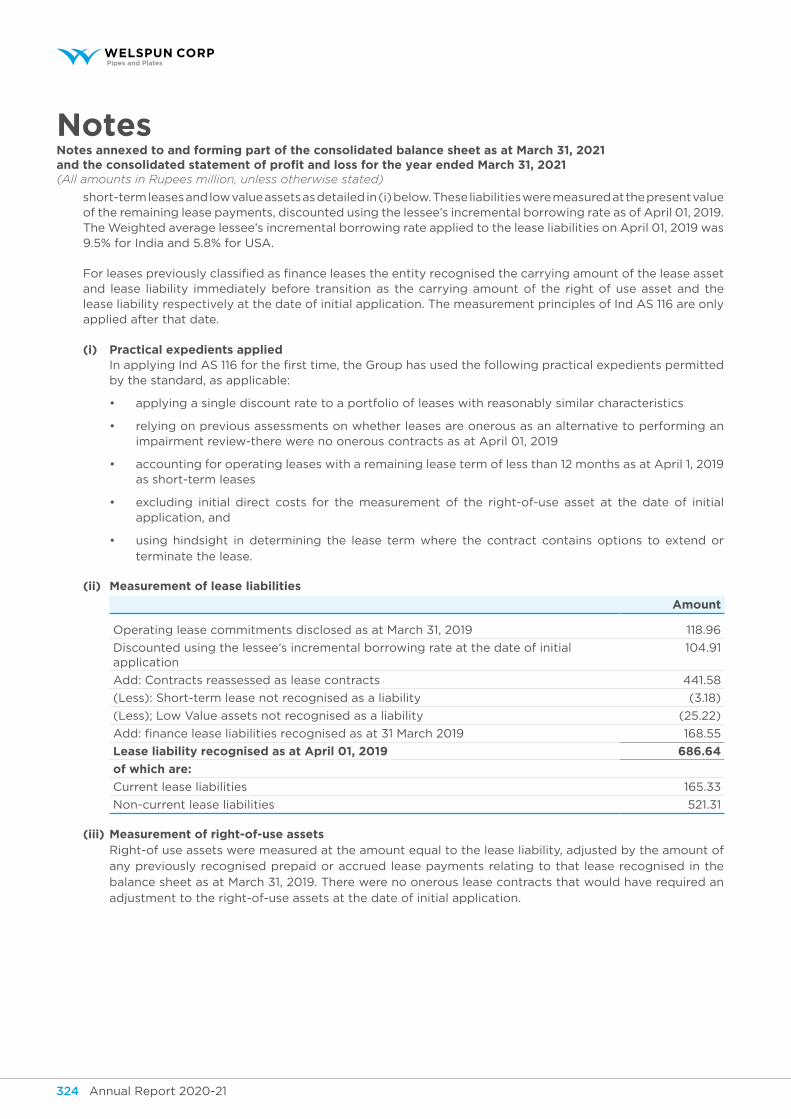
Annual Report 2020-21 325Annual Report 2020-21324
NotesNotes annexed to and forming part of the consolidated balance sheet as at March 31, 2021and the consolidated statement of profit and loss for the year ended March 31, 2021(All amounts in Rupees million, unless otherwise stated)
short-term leases and low value assets as detailed in (i) below. These liabilities were measured at the present value of the remaining lease payments, discounted using the lessee’s incremental borrowing rate as of April 01, 2019. The Weighted average lessee’s incremental borrowing rate applied to the lease liabilities on April 01, 2019 was 9.5% for India and 5.8% for USA.
For leases previously classified as finance leases the entity recognised the carrying amount of the lease asset and lease liability immediately before transition as the carrying amount of the right of use asset and the lease liability respectively at the date of initial application. The measurement principles of Ind AS 116 are only applied after that date.
(i) practical expedients applied In applying Ind AS 116 for the first time, the Group has used the following practical expedients permitted
by the standard, as applicable:
• applying a single discount rate to a portfolio of leases with reasonably similar characteristics
• relying on previous assessments on whether leases are onerous as an alternative to performing an impairment review-there were no onerous contracts as at April 01, 2019
• accounting for operating leases with a remaining lease term of less than 12 months as at April 1, 2019 as short-term leases
• excluding initial direct costs for the measurement of the right-of-use asset at the date of initial application, and
• using hindsight in determining the lease term where the contract contains options to extend or terminate the lease.
(ii) measurement of lease liabilities
Amount
Operating lease commitments disclosed as at March 31, 2019 118.96
Discounted using the lessee’s incremental borrowing rate at the date of initial application
104.91
Add: Contracts reassessed as lease contracts 441.58
(Less): Short-term lease not recognised as a liability (3.18)
(Less); Low Value assets not recognised as a liability (25.22)
Add: finance lease liabilities recognised as at 31 March 2019 168.55
Lease liability recognised as at April 01, 2019 686.64
of which are:
Current lease liabilities 165.33
Non-current lease liabilities 521.31
(iii) measurement of right-of-use assets Right-of use assets were measured at the amount equal to the lease liability, adjusted by the amount of
any previously recognised prepaid or accrued lease payments relating to that lease recognised in the balance sheet as at March 31, 2019. There were no onerous lease contracts that would have required an adjustment to the right-of-use assets at the date of initial application.
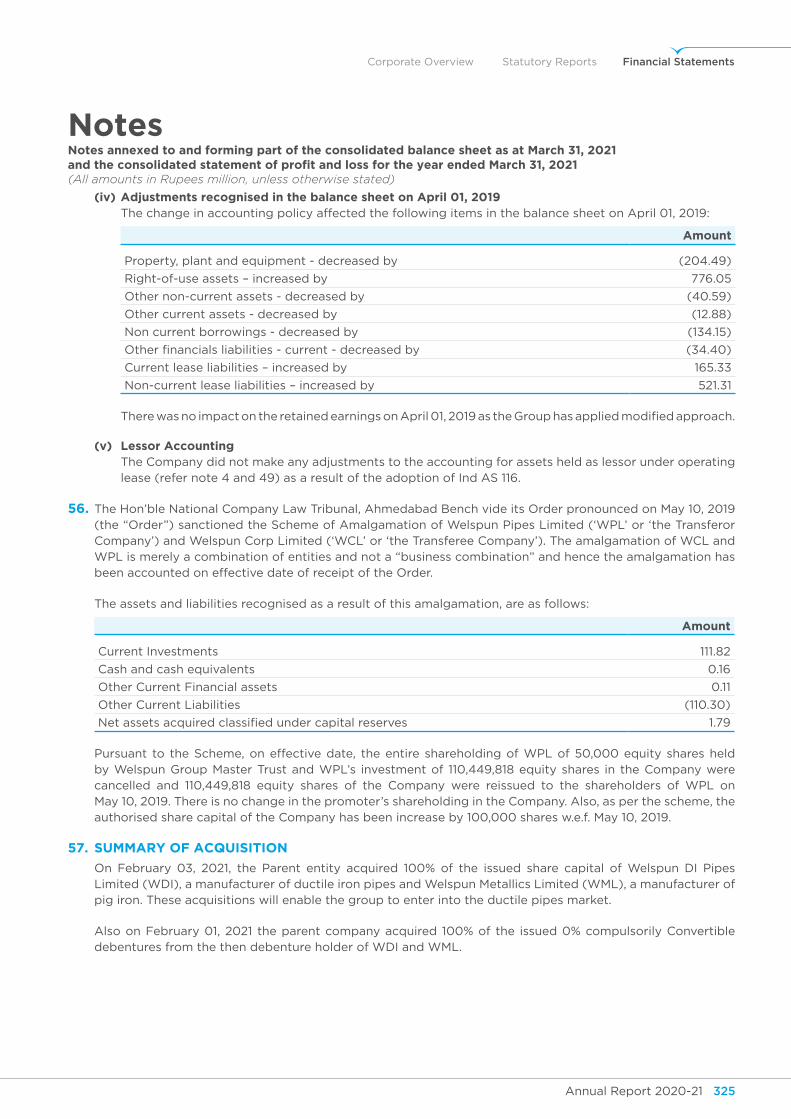
Annual Report 2020-21 325Annual Report 2020-21324
Corporate Overview Statutory Reports Financial Statements
NotesNotes annexed to and forming part of the consolidated balance sheet as at March 31, 2021and the consolidated statement of profit and loss for the year ended March 31, 2021(All amounts in Rupees million, unless otherwise stated)
(iv) Adjustments recognised in the balance sheet on April 01, 2019 The change in accounting policy affected the following items in the balance sheet on April 01, 2019:
Amount
Property, plant and equipment - decreased by (204.49)
Right-of-use assets – increased by 776.05
Other non-current assets - decreased by (40.59)
Other current assets - decreased by (12.88)
Non current borrowings - decreased by (134.15)
Other financials liabilities - current - decreased by (34.40)
Current lease liabilities – increased by 165.33
Non-current lease liabilities – increased by 521.31
There was no impact on the retained earnings on April 01, 2019 as the Group has applied modified approach.
(v) lessor Accounting The Company did not make any adjustments to the accounting for assets held as lessor under operating
lease (refer note 4 and 49) as a result of the adoption of Ind AS 116.
56. The Hon’ble National Company Law Tribunal, Ahmedabad Bench vide its Order pronounced on May 10, 2019 (the “Order”) sanctioned the Scheme of Amalgamation of Welspun Pipes Limited (‘WPL’ or ‘the Transferor Company’) and Welspun Corp Limited (‘WCL’ or ‘the Transferee Company’). The amalgamation of WCL and WPL is merely a combination of entities and not a “business combination” and hence the amalgamation has been accounted on effective date of receipt of the Order.
The assets and liabilities recognised as a result of this amalgamation, are as follows:
Amount
Current Investments 111.82
Cash and cash equivalents 0.16
Other Current Financial assets 0.11
Other Current Liabilities (110.30)
Net assets acquired classified under capital reserves 1.79
Pursuant to the Scheme, on effective date, the entire shareholding of WPL of 50,000 equity shares held by Welspun Group Master Trust and WPL’s investment of 110,449,818 equity shares in the Company were cancelled and 110,449,818 equity shares of the Company were reissued to the shareholders of WPL on May 10, 2019. There is no change in the promoter’s shareholding in the Company. Also, as per the scheme, the authorised share capital of the Company has been increase by 100,000 shares w.e.f. May 10, 2019.
57. suMMAry of ACquisition
On February 03, 2021, the Parent entity acquired 100% of the issued share capital of Welspun DI Pipes Limited (WDI), a manufacturer of ductile iron pipes and Welspun Metallics Limited (WML), a manufacturer of pig iron. These acquisitions will enable the group to enter into the ductile pipes market.
Also on February 01, 2021 the parent company acquired 100% of the issued 0% compulsorily Convertible debentures from the then debenture holder of WDI and WML.
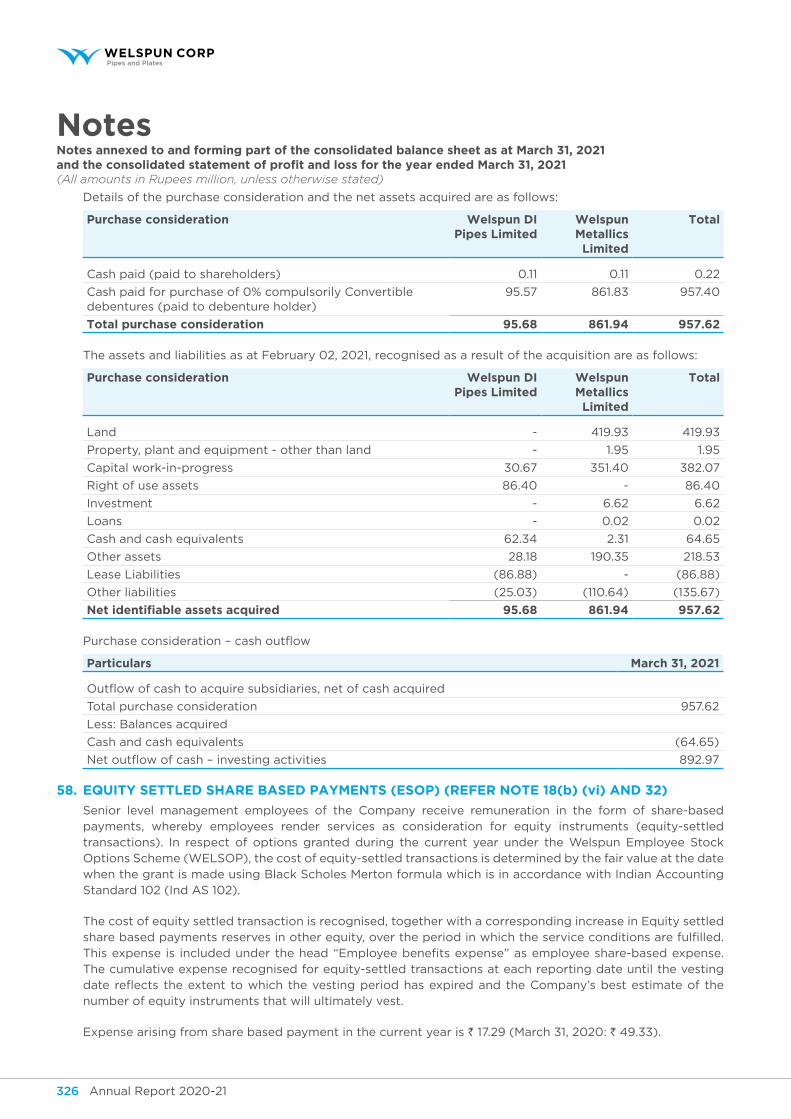
Annual Report 2020-21 327Annual Report 2020-21326
NotesNotes annexed to and forming part of the consolidated balance sheet as at March 31, 2021and the consolidated statement of profit and loss for the year ended March 31, 2021(All amounts in Rupees million, unless otherwise stated)
Details of the purchase consideration and the net assets acquired are as follows:
purchase consideration welspun dI pipes limited
welspun metallics limited
total
Cash paid (paid to shareholders) 0.11 0.11 0.22
Cash paid for purchase of 0% compulsorily Convertible debentures (paid to debenture holder)
95.57 861.83 957.40
total purchase consideration 95.68 861.94 957.62
The assets and liabilities as at February 02, 2021, recognised as a result of the acquisition are as follows:
purchase consideration welspun dI pipes limited
welspun metallics limited
total
Land - 419.93 419.93
Property, plant and equipment - other than land - 1.95 1.95
Capital work-in-progress 30.67 351.40 382.07
Right of use assets 86.40 - 86.40
Investment - 6.62 6.62
Loans - 0.02 0.02
Cash and cash equivalents 62.34 2.31 64.65
Other assets 28.18 190.35 218.53
Lease Liabilities (86.88) - (86.88)
Other liabilities (25.03) (110.64) (135.67)
net identifiable assets acquired 95.68 861.94 957.62
Purchase consideration – cash outflow
particulars March 31, 2021
Outflow of cash to acquire subsidiaries, net of cash acquired
Total purchase consideration 957.62
Less: Balances acquired
Cash and cash equivalents (64.65)
Net outflow of cash – investing activities 892.97
58. equity settLeD shAre BAseD PAyMents (esoP) (refer note 18(b) (vi) AnD 32)
Senior level management employees of the Company receive remuneration in the form of share-based payments, whereby employees render services as consideration for equity instruments (equity-settled transactions). In respect of options granted during the current year under the Welspun Employee Stock Options Scheme (WELSOP), the cost of equity-settled transactions is determined by the fair value at the date when the grant is made using Black Scholes Merton formula which is in accordance with Indian Accounting Standard 102 (Ind AS 102).
The cost of equity settled transaction is recognised, together with a corresponding increase in Equity settled share based payments reserves in other equity, over the period in which the service conditions are fulfilled. This expense is included under the head “Employee benefits expense” as employee share-based expense. The cumulative expense recognised for equity-settled transactions at each reporting date until the vesting date reflects the extent to which the vesting period has expired and the Company’s best estimate of the number of equity instruments that will ultimately vest.
Expense arising from share based payment in the current year is ` 17.29 (March 31, 2020: ` 49.33).
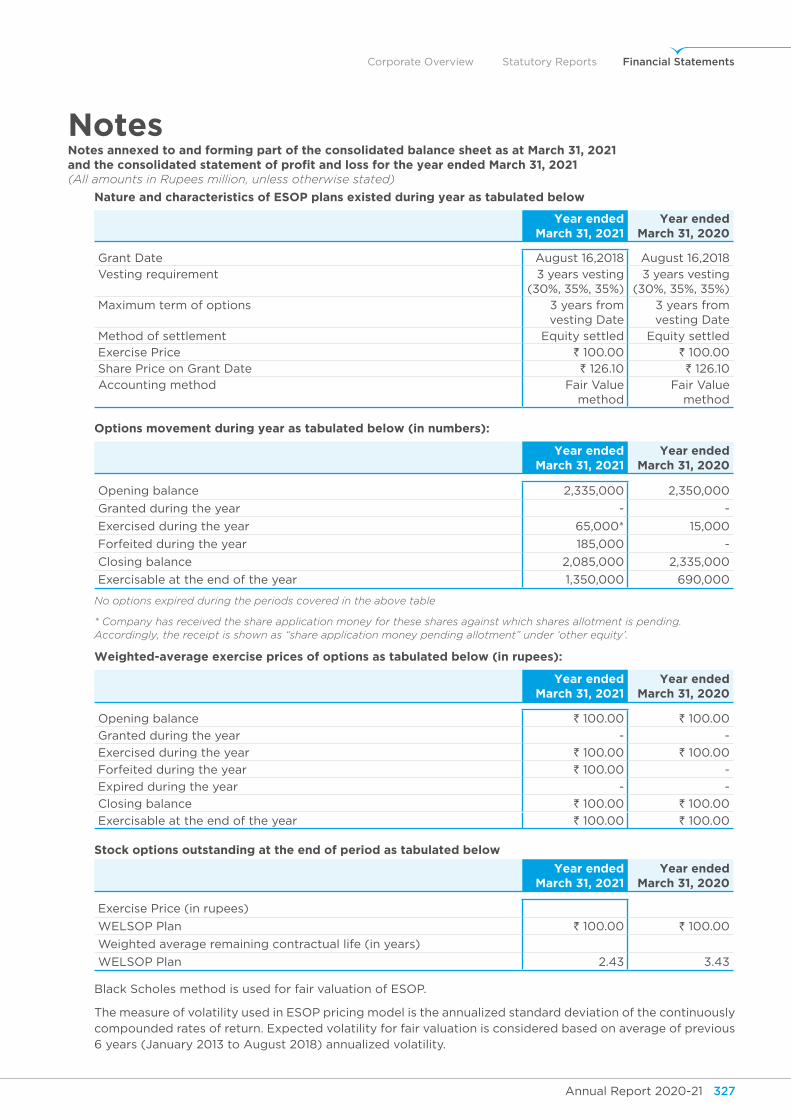
Annual Report 2020-21 327Annual Report 2020-21326
Corporate Overview Statutory Reports Financial Statements
NotesNotes annexed to and forming part of the consolidated balance sheet as at March 31, 2021and the consolidated statement of profit and loss for the year ended March 31, 2021(All amounts in Rupees million, unless otherwise stated)
nature and characteristics of esop plans existed during year as tabulated below
year ended March 31, 2021
year ended March 31, 2020
Grant Date August 16,2018 August 16,2018
Vesting requirement 3 years vesting (30%, 35%, 35%)
3 years vesting (30%, 35%, 35%)
Maximum term of options 3 years from vesting Date
3 years from vesting Date
Method of settlement Equity settled Equity settled
Exercise Price ` 100.00 ` 100.00
Share Price on Grant Date ` 126.10 ` 126.10
Accounting method Fair Value method
Fair Value method
options movement during year as tabulated below (in numbers):
year ended March 31, 2021
year ended March 31, 2020
Opening balance 2,335,000 2,350,000
Granted during the year - -
Exercised during the year 65,000* 15,000
Forfeited during the year 185,000 -
Closing balance 2,085,000 2,335,000
Exercisable at the end of the year 1,350,000 690,000
No options expired during the periods covered in the above table
* Company has received the share application money for these shares against which shares allotment is pending. Accordingly, the receipt is shown as “share application money pending allotment” under ‘other equity’.
Weighted-average exercise prices of options as tabulated below (in rupees):
year ended March 31, 2021
year ended March 31, 2020
Opening balance ` 100.00 ` 100.00
Granted during the year - -
Exercised during the year ` 100.00 ` 100.00
Forfeited during the year ` 100.00 -
Expired during the year - -
Closing balance ` 100.00 ` 100.00
Exercisable at the end of the year ` 100.00 ` 100.00
stock options outstanding at the end of period as tabulated below
year ended March 31, 2021
year ended March 31, 2020
Exercise Price (in rupees)
WELSOP Plan ` 100.00 ` 100.00
Weighted average remaining contractual life (in years)
WELSOP Plan 2.43 3.43
Black Scholes method is used for fair valuation of ESOP.
The measure of volatility used in ESOP pricing model is the annualized standard deviation of the continuously compounded rates of return. Expected volatility for fair valuation is considered based on average of previous 6 years (January 2013 to August 2018) annualized volatility.
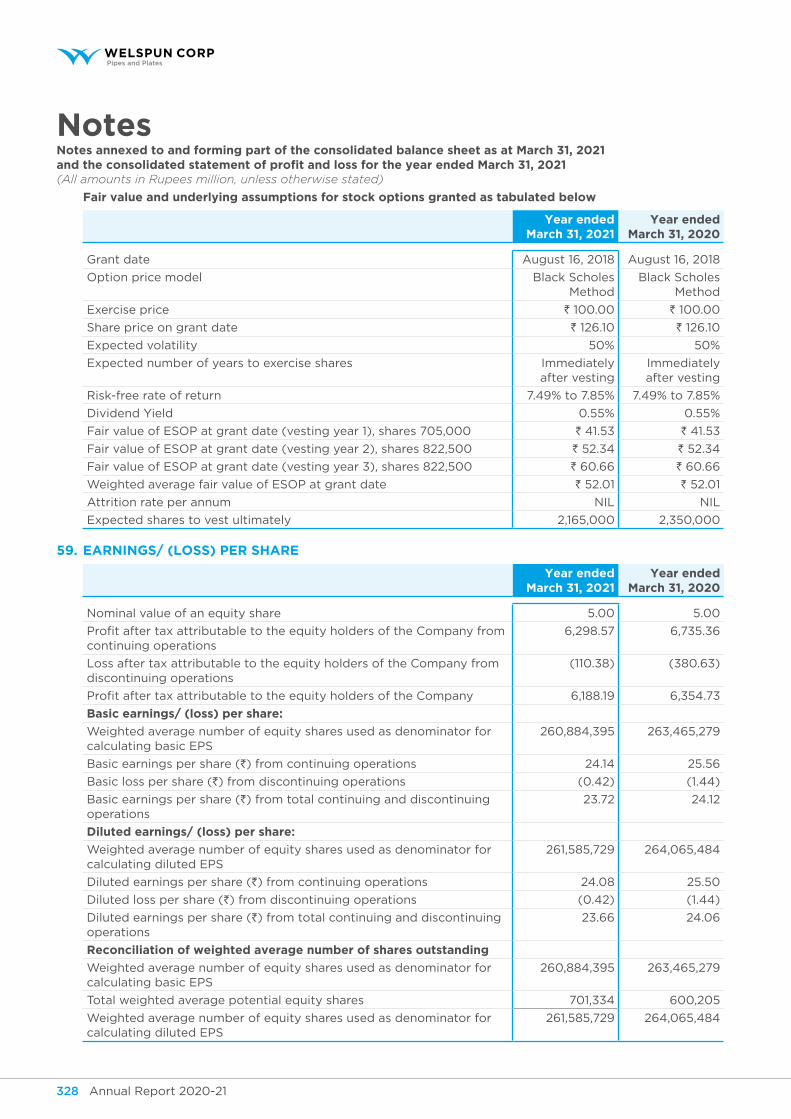
Annual Report 2020-21 329Annual Report 2020-21328
NotesNotes annexed to and forming part of the consolidated balance sheet as at March 31, 2021and the consolidated statement of profit and loss for the year ended March 31, 2021(All amounts in Rupees million, unless otherwise stated)
fair value and underlying assumptions for stock options granted as tabulated below
year ended March 31, 2021
year ended March 31, 2020
Grant date August 16, 2018 August 16, 2018
Option price model Black Scholes Method
Black Scholes Method
Exercise price ` 100.00 ` 100.00
Share price on grant date ` 126.10 ` 126.10
Expected volatility 50% 50%
Expected number of years to exercise shares Immediately after vesting
Immediately after vesting
Risk-free rate of return 7.49% to 7.85% 7.49% to 7.85%
Dividend Yield 0.55% 0.55%
Fair value of ESOP at grant date (vesting year 1), shares 705,000 ` 41.53 ` 41.53
Fair value of ESOP at grant date (vesting year 2), shares 822,500 ` 52.34 ` 52.34
Fair value of ESOP at grant date (vesting year 3), shares 822,500 ` 60.66 ` 60.66
Weighted average fair value of ESOP at grant date ` 52.01 ` 52.01
Attrition rate per annum NIL NIL
Expected shares to vest ultimately 2,165,000 2,350,000
59. eArnings/ (Loss) Per shAre
year ended March 31, 2021
year ended March 31, 2020
Nominal value of an equity share 5.00 5.00
Profit after tax attributable to the equity holders of the Company from continuing operations
6,298.57 6,735.36
Loss after tax attributable to the equity holders of the Company from discontinuing operations
(110.38) (380.63)
Profit after tax attributable to the equity holders of the Company 6,188.19 6,354.73
Basic earnings/ (loss) per share:
Weighted average number of equity shares used as denominator for calculating basic EPS
260,884,395 263,465,279
Basic earnings per share (`) from continuing operations 24.14 25.56
Basic loss per share (`) from discontinuing operations (0.42) (1.44)
Basic earnings per share (`) from total continuing and discontinuing operations
23.72 24.12
Diluted earnings/ (loss) per share:
Weighted average number of equity shares used as denominator for calculating diluted EPS
261,585,729 264,065,484
Diluted earnings per share (`) from continuing operations 24.08 25.50
Diluted loss per share (`) from discontinuing operations (0.42) (1.44)
Diluted earnings per share (`) from total continuing and discontinuing operations
23.66 24.06
Reconciliation of weighted average number of shares outstanding
Weighted average number of equity shares used as denominator for calculating basic EPS
260,884,395 263,465,279
Total weighted average potential equity shares 701,334 600,205
Weighted average number of equity shares used as denominator for calculating diluted EPS
261,585,729 264,065,484
Annual Report 2020-21 329Annual Report 2020-21328
Corporate Overview Statutory Reports Financial Statements
NotesNotes annexed to and forming part of the consolidated balance sheet as at March 31, 2021and the consolidated statement of profit and loss for the year ended March 31, 2021(All amounts in Rupees million, unless otherwise stated)
60. Group’s management has made an assessment of the impact of COVID 19 in preparation for these consolidated financial statements. Group’s management has considered all relevant external and internal factors in the measurement of assets and liabilities including recoverability of carrying values of its assets, its liquidity position and ability to repay debts. No adjustment to key estimates and judgements that impact the consolidated financial statements have been identified. However, the impact assessment of COVID19 will be a continuing process given the uncertainties associated with its nature and duration and no significant impact is envisaged on the operations.
61. The Code on Social Security, 2020 (‘Code’) relating to employee benefits during employment and post-employment benefits received Presidential assent in September 2020. The Code has been published in the Gazette of India. However, the date on which the Code will come into effect has not been notified. The Group is in process of evaluating the financial impact, if any.
62. goVernMent grAnt reCeiVABLe (refer note 11)
Payroll Incentive: Welspun Pipes Inc. and its subsidiaries currently has a financial incentive agreement in place with the Arkansas Economic Development Commission (“AEDC”). The agreement is a ten year agreement dated January 5, 2012 which was initiated in conjunction with Welspun Pipes Inc. and its subsidiaries expansion and building of their small diameter pipe manufacturing plant. The AEDC provides Welspun Pipes Inc. and its subsidiaries with a cash incentive based on the amount of new full-time permanent employees.
In 2013, Welspun Pipes Inc. and its subsidiaries received a USD 4,500,000 (` 329.00) grant from the City of Little Rock (the “City”) to help fund the acquisition of new equipment used in the HFIW plant. The ultimate purpose of the grant is to create employment opportunities for Arkansas residents. Under the terms of the grant, Welspun Pipes Inc.and its subsidiaries will be tested by the City through December 31, 2016 to determine if the job creation required by the grant has taken place. If Welspun Pipes Inc.and its subsidiaries fails to meet the grant’s employment thresholds at any testing date, they will be required to repay the City USD 22,500 (` 1.64) for each unfilled position on that date., with the repayment not to exceed the original USD 4,500,000 (` 329.00) grant received. As of March 31, 2021 and March 31, 2020, Welspun Pipes Inc.and its subsidiaries has met the grant’s employment thresholds and the funds have been received.
During current year AEDC amended limit of create rebate from USD 3,500,000 (` 255.89) to USD 5,500,000 (` 402.11), accordingly Welspun Pipes Inc.and its subsidiaries had applied cash incentives for Calendar year 2019 and 2020.The amount of USD 1,600,000 (` 116.98) (March 31, 2020: Nil) listed under “Government grant receivable” on the consolidated balance sheet represents Welspun Pipes Inc.and its subsidiaries accrual for AEDC incentive benefits till financial year ended March 31, 2021.
63. (a) Impact on current tax due to introduction of franchise tax in texas
In case of Welspun Pipes Inc.and its subsidiaries, franchise tax in Texas was amended retrospectively to include receipts-based economic nexus rule on December 20, 2019 and mandatorily applies to each federal income tax accounting periods ending in 2019 or later. For Texas franchise tax, Welspun Pipes Inc.and its subsidiaries has entered into a Voluntary disclosure agreement with Comptroller of Public Accounts, State of Texas on February 05, 2021, for filing of amended Texas tax returns for 4 years starting from FY 2015-16 to 2018-19. Due date of filing of amended returns of these 4 years and original return for year FY 2019-20 is May 2021. Based on the franchise law in Texas the amount of tax paid by Welspun Pipes Inc.and its subsidiaries in Arkansas can be claimed as refund by paying tax in Texas. For Arkansas Tax, Welspun Pipes Inc.and its subsidiaries has filed Preceding 3 years amended returns from FY 2017-18 to FY 2019-20 based on law of limitation in Arkansas State. Texas Franchise tax is calculated on gross margin at 0.75%, whereas Arkansas tax is calculated on net income at a higher income tax rate i.e. 6.5%. Hence there is a net refund position of ` 149.28 as at March 31, 2021.
(b) subsequent events i] During April 2021, Welspun Pipes Inc.and its subsidiaries, obtained initial approval for ` 2,924.40
working capital term loan with the EXIM Import Bank of India. The note will accrue interest at 1.50% over the six-m LIBOR rate and is set to mature 18 months from the date of first disbursement.
Annual Report 2020-21 331Annual Report 2020-21330
NotesNotes annexed to and forming part of the consolidated balance sheet as at March 31, 2021and the consolidated statement of profit and loss for the year ended March 31, 2021(All amounts in Rupees million, unless otherwise stated)
The note will be guaranteed by the Company. Welspun Pipes Inc.and its subsidiaries has not yet formalized the loan documentation as of the date of the audit report.
ii] During April 2021, Welspun Pipes Inc.and its subsidiaries obtained a ` 1,096.65 working capital term loan with HDFC Bank Limited. The note accrues interest at 1.50% over the six-month LIBOR rate and is set to mature 18 months from the date of first disbursement.
iii] The holding company has issued debentures which were allotted in the month of February 2021, as on March 31, 2021, the execution of security documents and debenture trust deed were under finalisation between the debenture holders, debenture trustee and the holding company. The security documents have since been executed and registered with the sub-registrar and the Ministry of Corporate Affairs on May 14, 2021.
iv] During April 2021, Welspun Metallics Limited (subsidiary of Welspun Corp Limited) has issued following Securites:
i) 11,000,000 10% Convertible, Non-Cumulative, Optionally Redeemable Preference Shares (“CORPS”) (face value of ` 10 each) :
11,000,000 10% Convertible, Non-Cumulative, Optionally Redeemable Preference Shares (“CORPS”) of ` 10/- each fully paid up allotted on April 7, 2021 at a total consideration of ` 110 millions
ii) 30,000,000 10% Convertible, Non-Cumulative, Optionally Redeemable Preference Shares (“CORPS”) (face value of ` 10 each) :
30,000,000 10% Convertible, Non-Cumulative, Optionally Redeemable Preference Shares (“CORPS”) of `10/- each fully paid up allotted on May 06, 2021 at a total consideration of ` 300 millions.
iii) 15,000,000 10% Convertible, Non-Cumulative, Optionally Redeemable Preference Shares (“CORPS”) (face value of ` 10 each):
15,000,000 10% Convertible, Non-Cumulative, Optionally Redeemable Preference Shares (“CORPS”) of ` 10/- each fully paid up allotted on May 10, 2021 at a total consideration of ` 150 millions.”
v] During April 2021, Welspun DI Pipes Limited (subsidiary of Welspun Corp Limited) has issued following Securites:
i) 8,000,000 10% Convertible, Non-Cumulative, Optionally Redeemable Preference Shares (“CORPS”) (face value of ` 10 each) :
8,000,000 10% Convertible, Non-Cumulative, Optionally Redeemable Preference Shares (“CORPS”) of `10/- each fully paid up allotted on April 12, 2021 at a total consideration of ` 80 Millions.
ii) 22,000,000 10% Convertible, Non-Cumulative, Optionally Redeemable Preference Shares (“CORPS”) (face value of ` 10 each):
22,000,000 10% Convertible, Non-Cumulative, Optionally Redeemable Preference Shares (“CORPS”) of ` 10/- each fully paid up allotted on May 17, 2021 at a total consideration of ` 220 Millions.
On May 6, 2021, the holding company has extented the repayment of term loan of Welspun Wasco Coatings Private Limited of ` 247.01 millions which was due in August 2021 and August 2022 to be extended till August 31, 2024 payable in five equal half-yearly instalments starting from August 2022.
Annual Report 2020-21 331Annual Report 2020-21330
Corporate Overview Statutory Reports Financial Statements
NotesNotes annexed to and forming part of the consolidated balance sheet as at March 31, 2021and the consolidated statement of profit and loss for the year ended March 31, 2021(All amounts in Rupees million, unless otherwise stated)
64. foReIgn cuRRency tRAnslAtIon ReseRve
year ended March 31, 2021
year ended March 31, 2020
Exchange differences on translation of foreign operations (339.10) 1,301.38
Attributable to:
Owners of Welspun Corp Limited (332.60) 1,294.00
Non-controlling interests (6.50) 7.38
65. The Board of Directors of the holding company at their meeting held on June 28, 2021 have approved the Scheme of Arrangement (the “Scheme”) between Welspun Steel Limited (“WSL”) and the holding company for transfer and vesting of the demerged undertaking of WSL into the holding company with effect from the Appointed Date as April 01, 2021, subject to regulatory and other approvals.
66. The figures for the previous year have been regrouped wherever necessary.
As per our attached report of even date.
for price waterhouse chartered Accountants llp for and on behalf of BoardFirm Registration No: 012754N / N500016
B.K.goenka vipul mathurChairman Managing DirectorDIN No.00270175 and Chief Executive Officer
DIN - 07990476
neeraj sharma percy Birdy pradeep JoshiPartner Chief Financial Officer Company SecretaryMembership No.108391 FCS-4959
Place: Pune Place: MumbaiDate: June 28, 2021 Date: June 28, 2021

Notes
____________________________________________________________________________________________
____________________________________________________________________________________________
____________________________________________________________________________________________
____________________________________________________________________________________________
____________________________________________________________________________________________
____________________________________________________________________________________________
____________________________________________________________________________________________
____________________________________________________________________________________________
____________________________________________________________________________________________
____________________________________________________________________________________________
____________________________________________________________________________________________
____________________________________________________________________________________________
____________________________________________________________________________________________
____________________________________________________________________________________________
____________________________________________________________________________________________
____________________________________________________________________________________________
____________________________________________________________________________________________
____________________________________________________________________________________________
____________________________________________________________________________________________
____________________________________________________________________________________________
____________________________________________________________________________________________
____________________________________________________________________________________________
_____________________________________________________________________________________________

Welspun Corp Limited
Welspun House, Kamala Mills Compound, Senapati Bapat Marg, Lower Parel, Mumbai 400 013, IndiaTel: +91 22 66136000/24908000Fax: +91 22 24908020/24908021
www.welspuncorp.comMember of Welspun Groupwww.welspun.com
HOME TEXTILES
PIPES AND PLATES
INFRASTRUCTURE
WAREHOUSING
/TheWelspunGroup
/WelspunGroup
/company/welspun-group


