Embed Size (px)
Citation preview

\\server05\productn\C\CPP\7-4\CPP406.txt unknown Seq: 1 29-DEC-08 10:54
TOWARD A NATIONAL ESTIMATE OFPOLICE USE OF NONLETHAL FORCE*
MATTHEW J. HICKMANSeattle University
ALEX R. PIQUEROUniversity of Maryland College Park
JOEL H. GARNERJoint Centers for Justice Studies
Research SummaryDespite frequent calls for national data on police use of force, the liter-ature is dominated by unrepresentative samples from a small numberof primarily urban jurisdictions, inconsistent definitions of force, anddiffering universes for the computation of rates. Among 36 publicationsthat report on the amount of nonlethal force used by the police, ratesvary from 0.1% to 31.8%. To improve our ability to estimate theamount of nonlethal force in the United States, we employ data fromtwo sources: the Police-Public Contact Survey (PPCS) and the Surveyof Inmates in Local Jails (SILJ). Using comparable measures fromthese surveys, we estimate that the police use or threaten to use force in1.7% of all contacts and in 20.0% of all arrests. The PPCS accounts for87% of the total force incidents derived from both surveys. Males,youths, and racial minorities report greater rates of police use of force,but multivariate models highlight the role of potentially provokingbehaviors on the likelihood and severity of force.
* An earlier version of this article was presented at the annual meeting of theWestern Society of Criminology, February 2008. The authors thank Shannan Catalano,Matthew R. Durose, Lauren E. Glaze, and Erica L. Smith at the Bureau of JusticeStatistics for their assistance and comments on earlier versions, and Robin ShepherdEngel and three anonymous reviewers for their comments. Any errors are those of theauthors. Direct correspondence to Matthew J. Hickman, Seattle University, 901 12thAve, Seattle, WA 98122 (e-mail: [email protected]).
CRIMINOLOGY & Public PolicyVolume 7 Number 4 Copyright 2008 American Society of Criminology
563

\\server05\productn\C\CPP\7-4\CPP406.txt unknown Seq: 2 29-DEC-08 10:54
564 HICKMAN ET AL.
Policy ImplicationsImproved estimates from the combined PPCS-SILJ samples supportthe proposition that police use force infrequently and at the lower endof the severity scale. Reported amounts of force vary based on respon-dent race, sex, and age, but greater variation in police use of force isexplained by suspect behavior. The combined PPCS-SILJ sample pro-vides a more representative basis for estimating the rate and correlatesof nonlethal force. State and local estimates from less representativesamples can be interpreted in light of these findings. National estimatescould be improved by devoting sufficient resources to support the col-lection of agency records of both lethal and nonlethal force.
Keywords: police, nonlethal force, measurement, national estimates
In the United States, nearly 18,000 state and local law-enforcementagencies employ more than 730,000 officers who have the legal authorityto deprive citizens of their liberty and use a variety of coercive tactics,which include lethal and nonlethal physical force (Reaves, 2007). Thisauthority is implicit in the police role, and the potential for its explicit useis present in every contact between the police and the public (Skogan andFrydl, 2004). The authorization to use physical force is recognized as thecore element that defines and distinguishes police work from most otherprofessions (Bittner, 1970).
The extent to which the police use (and misuse) their authority to inflictphysical force is a persistent controversy in criminology and in public pol-icy. The traditional focus of this issue has been on deaths caused by policeofficers (Blumberg, 1989; Fyfe, 1978; Geller and Karalas, 1981; Geller andScott, 1992; Reiss, 1980; Robin, 1963; Sherman and Cohn, 1984). Recentscholarly and public policy attention has emphasized the more frequent,but less severe, types of verbal and physical force employed by law en-forcement officers (Adams, 1995; Durose, Smith, and Langan, 2007; Engel,Sobol, and Worden, 2000; Friedrich, 1980; Garner, Buchanan, Schade,Hepburn, Fagan, and Mulcahy, 1995; Pate and Fridell, 1993; Worden,1995).
Democratic policing is concerned primarily with the behavior of thepolice and less so with the behavior of citizens (Bayley, 1996; Manning,2003). In a democracy, it is critical to have mechanisms to monitor andevaluate the police in order to ensure that democratic ideals are beingupheld. Given the centrality of coercive authority in defining the policerole, a paramount concern is the collection of information about thenature and extent of police use of force in the United States (Adams, 1995;Alpert and Fridell, 1992; Fyfe, 1988b, 2002; Geller and Scott, 1992; Geller

\\server05\productn\C\CPP\7-4\CPP406.txt unknown Seq: 3 29-DEC-08 10:54
POLICE USE OF NONLETHAL FORCE 565
and Toch, 1995; Kane, 2007; Klockars, 1995; Matulia, 1982; Pate andFridell, 1993, 1995; Sherman and Langworthy, 1979). Yet local, state, andfederal governments actually collect and report very little informationabout police use of force, much less than about police behavior in general.
This article takes as its point of departure the concern that the nation’sonly systematic, national-level indicator of police use of force—which isthe Police-Public Contact Survey (PPCS) administered by the Bureau ofJustice Statistics (BJS)—underestimates the amount of force because ofthe exclusion of recently incarcerated persons (e.g., Fyfe, 2002). In sodoing, this article provides the first analysis of force experienced by incar-cerated persons at the time of their arrest, as captured in the BJS Surveyof Inmates in Local Jails (SILJ). Our goal is to contribute to the process ofrefining the measurement of police use of force and to present a morecomplete, descriptive portrayal regarding national estimates of police useof nonlethal force.
In the next section, we review the literature reporting rates of physicalforce by police. We then describe both the PPCS and the SILJ in generaland focus in particular on parallel measures of police force from both stud-ies. We combine the two samples and present descriptive statistics andmultivariate models from both the separate and the combined data.Finally, we discuss the implications of our analyses and offer some sugges-tions for the future development of national indicators of nonlethal force.
Literature Review
Research on Nonlethal Force
The research on police use of nonlethal force addresses a variety ofresearch questions about the frequency, types, and levels of force used bythe police as well as about the individual, situational, organizational, andenvironmental correlates of force. Prior reviews of this research (Adams,1995; Garner, Maxwell, and Heraux, 2002; Riksheim and Chermak, 1993;Worden, 1995) have reported little consistency on either the amount ofnonlethal force used or the correlates of nonlethal force. However, thevariation in findings may be caused by the heterogeneity of approachesused in measuring nonlethal force, the sources of data about uses of force,the types of situations studied, the jurisdictions included, and the timeperiod of the study.

\\server05\productn\C\CPP\7-4\CPP406.txt unknown Seq: 4 29-DEC-08 10:54
566 HICKMAN ET AL.
Measuring Nonlethal Force
Although little controversy surrounds what constitutes lethal force, theresearch literature does not agree on what types of police behavior consti-tute nonlethal force. For instance, some determinations of the existence ofnonlethal force rely on expert judgments (Friedrich, 1980), whereas otherstudies use the existence of charges for resisting arrest as a measure offorce (Kavanagh, 1994). More specifically, Lundstrom and Mullan (1987)define nonlethal force as the use of any police weapon, which includes“fists or hands.” Terrill and Mastrofski (2002) include handcuffing,searches, and pat downs in their definition of force. Hickman (2006) mea-sures force indirectly, using official citizen complaints about police use offorce. Finally, Smith (1986) as well as Terrill and Mastrofski (2002) includethreats of arrest (but not arrest itself) in their definitions of force.
Some of this research has moved beyond defining simple dichotomousmeasures of nonlethal force and has attempted to create categorical mea-sures that capture gradations in the severity of different types of nonlethalforce (Alpert and Dunham, 1999; Garner, Schade, Hepburn, andBuchanan, 1995; Klinger, 1995; Terrill and Mastrofski, 2002). None ofthese measures of the force continuum are even roughly equivalent. Gar-ner, Schade et al. (1995) used the continuum of the Phoenix PoliceDepartment, whereas the other studies created their own sets of catego-ries. In addition, Alpert and Dunham’s (1999) categorical measure onlypertains to incidents in which some force is used, and this measure cannotbe used to generate an incident-based rate of force. Similarly, Hickman’s(2006) measure can be used to compute a rate of force per agency or perofficer, but not an incident-based (i.e., arrest or encounter) rate. Whetherthe measures were dichotomous or categorical, Garner et al.’s (2002)review (which includes studies by the same author or those that use datafrom the same sample) of 15 publications found that no two studies usedthe same definition or measure of force. Our updated review (see Appen-dix A) reveals that each author or research team continues to usenoncomparable measures of force.

\\server05\productn\C\CPP\7-4\CPP406.txt unknown Seq: 5 29-DEC-08 10:54
POLICE USE OF NONLETHAL FORCE 567
Sources of Data on Use of Force
We have identified 36 publications that report an incident-based rate offorce. For those studies, Table 1 displays the sources of data used, thetypes of situations studied, the jurisdictions included in the research, andthe dates of data collection.1 We found six sources of data: arrest reports,household surveys, independent observations, police surveys, suspectsurveys, and use-of-force forms. Nearly half (15 of 36) of the publicationsare based on independent observations of the police, 10 are based onsurveys of police officers or arrested suspects, 8 derive data from officialpolice use of force forms, and 3 use household surveys.
Data from independent observers are presumably less biased than self-reports by officers, suspects, or citizens; however, observations are expen-sive, require permission from participating agencies, and tend to be limitedto a small and unrepresentative proportion of beats, shifts, and officerswithin a particular jurisdiction. In addition, most systematic observationalstudies were conducted during the summer months only. Official arrestreports and use-of-force forms typically capture more incidents of policeuses of force over a longer period of time but are dependent on depart-mental definitions of force and on the submission of reports by officers(Pate and Fridell, 1995). Suspect surveys are also expensive and typicallyinvolve interviewing suspects while they are in police custody. Householdsurveys are based on a nationally representative sample of households butare dependent on survey response rates as well as on citizen definitions ofuse of force; also, they do not include the recently arrested or incarceratedpopulations.
These 36 publications varied even more in the types of incidents used tocompute rates of force. Among the 15 studies that used independentobservations, the rate of force was based on five types of incidents: citizenencounters, disputes, police stops, potentially violent mobilizations, andsuspect encounters. Fourteen publications, which mostly used data frompolice surveys, suspect surveys, and use-of-force forms, used arrests as thetype of incident on which to base a rate of force. One study (InternationalAssociation of Police Chiefs [IACP], 2001) based its rate of force on callsfor service. Each of these incident types presents methodological and sub-stantive strengths and weaknesses in computing rates of police use ofnonlethal force. Arrests, stops, and calls for service are presumably easierto identify but may not adequately represent the preferred sample of inci-dents with real potential for violence by or against the police.
1. Some research data files are used in multiple publications in Table 1. In addi-tion, one publication (Garner, Buchanan et al., 1995) includes data on police use-of-force from two sources.

\\server05\productn\C\CPP\7-4\CPP406.txt unknown Seq: 6 29-DEC-08 10:54
568 HICKMAN ET AL.
Table 1. Sources of Data about Police Use of Force
Data source Unit of analysis Jurisdiction(s) Years Publications
Arrest Reports Arrests New York City 1990 Kavanagh, 1994
1999 Langan et al., 2001Household 2002 Durose et al., 2005Surveys Contacts United States 2005 Durose et al., 2007
Citizen Encounters Cincinnati 1997–1998 Frank et al., 2001Disputes Dade County, FL 1985–1986 Fyfe, 1988b; Klinger,
1995Police Stops Savannah, GA 2002 Alpert et al., 2008Potentially Violent New York City 1986 Bayley and Garofalo,Mobilizations 1989
Boston, Chicago, and 1965 Friedrich, 1980Washington, DCRochester, St. Louis, 1977 Smith, 1986; Worden,Tampa/St. Petersburg 1995; Engel et al.,
2000Richmond, VA 1992 Mastrofski, 1997
Engel, 2000; Terrilland Mastrofski, 2002;Terrill, 2003a; Terrilland Reisig, 2003;Paoline and Terrill,2007
Independent Indianapolis and St.Observations Suspect Encounters Petersburg 1996–1997
St. Paul 1985–1986 Lundstrom andMullan, 1987
Phoenix 1994 Garner, Buchanan etal., 1995; Schuck, 2004
Charlotte, Colorado 1996–1997 Garner et al., 2002;Springs, Dallas, St. Schuck and Rabe-Petersburg, San Diego Hemp, 2005City and County
Police Surveys Arrests Southeastern city 2000–2001 Kaminski et al., 2004
Phoenix 1994 Garner, Buchanan etal., 1995; Schuck, 2004
Queensland, Aus. 1999 Edwards, 2000Suspect Surveys Arrests El Salvador 2002 Phillips et al., 2006
Rochester 1973–1979 Croft, 1985Montgomery County, 1993–1999 Hickey and Garner,MD 2002Polk County, FL 1999 Williams and Hester,
2003Seattle 2000 Seattle Police
Department, 2001Arrests Midwestern city 2002–2004 Terrill et al., 2008Citizen Encounters San Antonio, TX 2001–2002 Terrill, 2003b
Polk County, FL 1999 Williams and Hester,2003
Use of Force Midwestern city 2001–2003 Leinfelt, 2005Forms Calls for Service 238 U.S. jurisdictions 1999 IACP, 2001

\\server05\productn\C\CPP\7-4\CPP406.txt unknown Seq: 7 29-DEC-08 10:54
POLICE USE OF NONLETHAL FORCE 569
Twenty publications in Table 1 are based on data from only one jurisdic-tion, and 12 studies are based on data from two to six jurisdictions. Onepublication is based on reports from 238 law enforcement agencies, andanother publication is based on reported uses of force by U.S. immigrationauthorities against individuals deported to El Salvador. Three publicationsare based on a representative sample of U.S. households, and they are theonly studies of police use of nonlethal force to include incidents from ruraland suburban jurisdictions. Although most publications in Table 1 use dataon police use of nonlethal force from the 1990s, some data were collectedas early as 1965, and other data were collected as recently as 2006.
If anything, the categories in Table 1 oversimplify the heterogeneity ofthe available research on the amount of police use of nonlethal force. Inaddition, the unique definitions of force used in each study, as well as thesimple ways we have defined incidents, obscure variation. For example,“suspect encounters” are defined differently within the 10 publicationsthat use that term, and equally dissimilar meanings for behaviors are cap-tured under the term “arrest.” Moreover, Table 1 also uses city andnational labels for jurisdictions when data were often collected from onlyparts of the jurisdiction listed. For details on sample types and sizes, defini-tions of force, and reported rates of force, see Appendix A.
Reported Rates of Police Use of Nonlethal Force
Given the diversity in methods and measures employed by the 36 publi-cations displayed in Table 1, it would be surprising if any similarities wereobserved in the reported rates of police use of nonlethal force. Figure 1displays the rates of physical force reported in these 36 publications. Theserates vary from 0.1% of reported calls to the police in 238 U.S. jurisdic-tions in 1999 (IACP, 2001) to 31.8% of arrests made in a midwestern U.S.city during 2001–2003 (Leinfelt, 2005).
Of the 15 publications that used data from field observations to reportthe amount of force used, the rates of physical force range from 3.4%(Engel, 2000) to 30.0% (Smith, 1986). Most force rates in these publica-tions are computed based on researcher-defined encounters; none arecomputed based on arrests. Of the 10 reports of police use of force derivedfrom surveys of police officers or suspects, the rates of physical forceranged from 14.6% (Lundstrom and Mullan, 1987) to 24.4% (Schuck,2004). One publication (Garner, Buchanan et al., 1995) reports the rate offorce from two sources of data: A survey of police officers generatedslightly greater rates of force (22.4%) than a survey of arrested suspects(20.5%). The rates reported in the survey-based publications are all com-puted using arrests, not encounters. The reported rates of physical force

\\server05\productn\C\CPP\7-4\CPP406.txt unknown Seq: 8 29-DEC-08 10:54
570 HICKMAN ET AL.
among the nine publications that compiled data from official police use-of-force forms vary from 0.08% (IACP, 2001) to 22.4% (Leinfelt, 2005). Mostof these publications reported rates based on arrests, but two studies(Leinfelt, 2005; Williams and Hester, 2003) reported rates based on botharrests and encounters.
Figure 1. Reported Rates of Physical Force in 36 Studies
0% 5% 10% 15% 20% 25% 30% 35%
IACP, 2001Williams and Hester, 2003
Langan et al., 2001Williams and Hester, 2003
Durose et al., 2005Durose et al., 2007
Terrill, 2003bCroft, 1985
Seattle Police Department, 2001Engel et al., 2000
Worden, 1995Alpert et al., 2004
Friedrich, 1980Mastrofski et al., 1996
Hickey and Garner, 2002Bayley and Garofalo, 1989
Engel, 2000Frank et al., 2001
Kaminski et al., 2004Fyfe, 1988b
Lundstrom and Mullan, 1987Klinger, 1996
Garner et al., 2002Kavanagh, 1994
Terrill et al., 2008Schuck and Rabe-Hemp, 2005
Edwards, 2000Phillips et al., 2006
Garner et al., 1995 SPaoline and Terrill, 2007Reisig and Terrill, 2003
Terrill and Mastrofski, 2002Terrill, 2003a
Garner et al., 1995 PLeinfelt, 2005Schuck, 2004
Smith, 1986Leinfelt, 2005
Notes. P = Police Surveys. S = Suspect Interviews.

\\server05\productn\C\CPP\7-4\CPP406.txt unknown Seq: 9 29-DEC-08 10:54
POLICE USE OF NONLETHAL FORCE 571
Nationally Representative Samples
All publications that obtained data on police use of force from observa-tional data, police surveys, and arrestee surveys relied on permission fromthe participating agencies and from the individual officers and arrestees.Although data from arrest reports and official police use-of-force formsare sometimes available through state and local open-records legislation,most of the publications in Table 1 that used these types of data obtainedthem with the permission of the agency or agencies being studied. For thisreason, even if all of these publications had used the same definitions andmeasures of force and had reported similar rates of force, the use of arelatively small number of volunteer jurisdictions limits the likelihood thattheir reported findings regarding the amount of force reasonably could begeneralized to all U.S. jurisdictions.
The lack of national-level data on police use of force is one of the mostsevere criticisms of this entire body of research and a continuing theme inresearch on both lethal and nonlethal use of force. Researchers (Adams,1995; Alpert and Fridell, 1992; Fyfe, 1988a; Geller, 1985; Geller and Scott,1992; Geller and Toch, 1995; Klockars, 1995; Matulia, 1982; Pate andFridell, 1993, 1995; Sherman and Langworthy, 1979) and big-city policechiefs (James, 1991), as well as law enforcement reform advocates (CrimeControl Digest, 1991), have called for expanded databases at both thelocal and national levels on all uses of force, not just lethal force. Withregard to the use of lethal force, Fyfe (2002:99) asserts that it is shamefulthat “we still live in a society in which the best data on police use of forcecome to us not from the government or from scholars, but from the Wash-ington Post.” Kane (2007) argues that departments should adopt datacollection and dissemination not for research purposes, but as a profes-sional standard for policing.
In the early 1990s, Pate and Fridell (1993) explored the scope and depthof existing requirements for reporting use of force within individual lawenforcement agencies, as a basis for a national reporting system. Calls fora national reporting system were enhanced with the 1994 Violent CrimeControl and Law Enforcement Act’s provisions calling on the U.S. Attor-ney General to “acquire data about the use of excessive force by lawenforcement officers” and to “publish an annual summary of the data”(Title XXI, Subtitle D, Section 210402).
Unfortunately, Congress has provided no funds to support this mandate,and the Justice Department has issued no annual summaries of national-level data about police use of force, excessive or otherwise. In anticipationof the congressional mandate, Klockars (1994) drafted for the NationalInstitute of Justice a list of requirements for a reliable and efficient

\\server05\productn\C\CPP\7-4\CPP406.txt unknown Seq: 10 29-DEC-08 10:54
572 HICKMAN ET AL.
national reporting system, but this plan was neither developed nor imple-mented. The implementation of a national reporting system was attemptedand then abandoned after 3 years (IACP, 2001) largely because of a lackof funding to support the system.
The only remnant of the 1994 congressional mandate is the PPCS, whichwas implemented first in 1999 and subsequently in 2002 and 2005. ThePPCS is a supplement to the National Crime Victimization Survey(NCVS), which employs a nationally representative sample of households.Three publications used data from the PPCS to obtain information onpolice use of force (Durose, Smith, and Langan, 2005, 2007; Langan,Greenfeld, Smith, Durose, and Levin, 2001). Of the studies based onsurveys of households, the reported rates of force ranged from 1.6%(Durose et al., 2007) to 0.8% (Langan et al., 2001). These rates are basedon police-public contacts, not on arrests or encounters. Unlike most of thepublications listed in Table 1, those based on household surveys do notdepend on the cooperation of law enforcement agencies or officers. How-ever, the PPCS is not without its critics. Lichtenberg (2007), for example,has provided evidence that the PPCS may underestimate police contacts ingeneral, traffic stops and tickets, DUI arrests, and traffic accidents, whencompared with data from the National Center for State Courts and theUniform Crime Reports. Moreover, Lichtenberg pointed out that all ofthe long-standing criticisms of the NCVS sample exclusions (e.g., Max-field, 1999) also apply to the PPCS because it is an NCVS supplement.
Summary of Existing Research
Despite long-standing support for the collection and reporting ofnational-level data on police use of force, the existing research literature—although extensive and informative for other purposes—does not providea reasonable basis for estimating either the amount of force used by policein the United States or the correlates of force. The highest estimate of theamount of force is more than 30 times greater than the lowest estimate,and the reported rates vary depending on the measure of force used, thetypes of incidents studied, and the jurisdictions included. Publications thatmeasure police use of force typically rely on data from a single jurisdic-tion, and those that collect data from more than one jurisdiction typicallyreport summary findings, not site-specific findings. Excluding publicationsbased on the PPCS, our knowledge about police use of nonlethal forcecomes from about 300 of the 18,000 law enforcement agencies in theUnited States. Only the PPCS provides a nationally representative sampleto study the use of force by the police.

\\server05\productn\C\CPP\7-4\CPP406.txt unknown Seq: 11 29-DEC-08 10:54
POLICE USE OF NONLETHAL FORCE 573
For the purposes of measuring the amount of police use of force, a moresalient criticism of the PPCS sample is that recently incarcerated individu-als are excluded (Fyfe, 2002). Virtually all of these individuals will havehad contact with the police, and most will have been arrested; thus, giventhat their current offenses or career patterns are sufficiently serious towarrant jail time, a substantial proportion will constitute a high-risk popu-lation for police use of force. However, Fyfe did not estimate the size ofthe recently incarcerated population or the extent and nature of the forceused against them. Thus, to some unknown extent, the exclusion ofrecently incarcerated individuals from the PPCS likely results in an under-estimation of police use of force. In the course of providing a refinednational estimate of nonlethal force, this article will empirically assess thiscriticism. In the next section, we describe our data and methods.
Data
As mentioned, we used the PPCS in conjunction with the SILJ. Toensure comparability, we used data from both sources for 2002 (U.S.Department of Justice, 2005, 2006). The NCVS-based sample for the 2002PPCS included 93,410 persons aged 16 years or older, with completedinterviews for 76,910 persons. The sample was weighted to represent anational estimate of about 215.5 million persons aged 16 years or older(see Durose et al., 2005).
The SILJ was a computer-assisted personal interview conducted with anationally representative sample of jail inmates. The inmates wereselected using a two-stage, systematic sample design (James, 2004). A totalof 6,982 interviews were conducted for the 2002 SILJ, with adjustmentsand weighting to represent the population of 631,241 inmates in local jailsas of June 30, 2001. Some inmates were not asked interview questions thatpertained to police use or threat of force at the time of their arrestsbecause they either did not have a controlling offense (i.e., “unconvicted,”n = 1,996) or did not report an offense in earlier interview questions (i.e.,“no offense,” n = 86). Skip patterns in the SILJ interview protocol limitedthe number and types of questions asked of these inmates; as a result, theywere excluded from the analysis reported here. In addition, another 122inmates were excluded because they were not arrested, went in to a policestation voluntarily, or were incarcerated at the time of arrest; thus, theywere not asked interview questions that pertained to police use or threatof force at the time of arrest. These steps reduce the effective (weighted)denominator to 437,768 inmates.

\\server05\productn\C\CPP\7-4\CPP406.txt unknown Seq: 12 29-DEC-08 10:54
574 HICKMAN ET AL.
Probability of Overlap
The SILJ was conducted from January through April of 2002, whereasthe PPCS supplement to the NCVS was conducted during the last 6months of 2002. As such, one cannot rule out the possibility of overlapbetween the two studies (i.e., it is possible that an inmate in the SILJ inter-view sample could have subsequently been released and interviewed aspart of the PPCS sample). To the extent any overlap occurred, forceevents could be double counted. We examine the probability of overlap byexamining the studies’ designs as well as available data on inmate releaseand transfers from the SILJ.
The NCVS follows a rotating panel design. Households are selectedthrough a multistage, stratified random sampling procedure, and they areplaced within one of six rotation groups. Within each rotation group, thereare six panels, in which one panel is interviewed each month. Each rota-tion group is interviewed seven times. After seven interviews, a panel isreplaced with a newly selected panel. (For greater detail on the NCVShistory and design, see Lauritsen and Catalano, 2005). Overlap can occurtwo ways: if an inmate interviewed in the SILJ is released and returns to ahousehold (1) already included in an NCVS panel or (2) newly selected forinclusion in a panel.
Some inmates in local jails were awaiting sentencing, transfer to anotherfacility (such as a prison), or release for their controlling offenses. TheSILJ interview asked inmates whether they had a release date as well asthe month and year of release. About half of the inmates included in thecurrent study (2,318 of 4,778 unweighted interviewees, or 49%) indicatedthat they had a release date, and for most of those inmates (2,063, or43%), the release date was during 2002. Inmates who did not have arelease date were asked for the date of their earliest court appearance andwhether they expected to be released at that time. Thirty-four percent (n =1,624) of the inmates in the current study indicated a court date during2002, and 15% (n = 700) expected to be released at that time. As a result,a total of 58% (n = 2,763) of the interviewees potentially could have beenreleased and subsequently interviewed as part of the PPCS. Based on ourexamination of the study methodologies and available data, we concludedthat the probability of overlap between the SILJ and PPCS interviews wasvery low.

\\server05\productn\C\CPP\7-4\CPP406.txt unknown Seq: 13 29-DEC-08 10:54
POLICE USE OF NONLETHAL FORCE 575
Measurement
All force-related items included in the PPCS and SILJ appear in Appen-dix B. The overall force prevalence items are 5a from the PPCS and 19efrom the SILJ. Both items ask respondents whether police used orthreatened to use force in the most recent face-to-face contact (PPCS) orarrest (SILJ). The type of force used by officers is drawn from items 5b inthe PPCS and 19f in the SILJ. Subcategories of these items that aredirectly comparable include whether officers: (1) pushed or grabbed, (2)kicked or hit, or (3) pointed a gun at the respondent. Both the PPCS andthe SILJ include an item to capture the use or threat of any “other” typeof force. The SILJ has additional items that specify use of dogs, pepperspray, and discharge of firearms. For analytic purposes, these latter itemswere combined in the “other” category. Injury that resulted from the useof force is drawn from items 5e in the PPCS and 19g in the SILJ. Bothitems asked respondents whether they were injured as a result of forceused by officers.
Potentially provoking behaviors are represented by items 8 and 9 in thePPCS and item 19i in the SILJ. Item 8 and the first subcategory of item 9in the PPCS are combined to be comparable with the first three subcatego-ries of item 19i of the SILJ. As a result, a single item from both datasources comprises argument, cursing, insults, verbal threats, disobedience,or interference. Two subcategories in the SILJ item that consists of resis-tance to handcuffing or arrest, as well as resistance to searches, werecombined to be comparable with the PPCS subcategory that indicatedresistance to handcuffing, arrest, or search. Two remaining subcategoriesin both data sources were directly comparable, (i.e., trying to get awayfrom police, pushing, grabbing, and hitting).
Results
Demographic Characteristics and Likelihood of Force
According to the PPCS data, most people who reported experiencingface-to-face contact with the police in 2002 were white (77%), and slightlymore than half were male (Table 2). Arrestees in the PPCS were alsomostly white (59%), and more than three quarters of respondents weremale. In contrast, the corresponding inmate sample had an equivalent pro-portion of whites and blacks (about 38% each) and was mostly male(88%). The PPCS sample was also older than the inmate sample, althougharrestees in the PPCS were younger (median ages were 37 years in thePPCS, 26 years for arrestees, and 31 years in the SILJ).

\\server05\productn\C\CPP\7-4\CPP406.txt unknown Seq: 14 29-DEC-08 10:54
576 HICKMAN ET AL.
Tabl
e 2.
Dem
ogra
phic
Cha
ract
eris
tics
2002
PP
CS
2002
SIL
J
Inm
ates
All
pers
ons
Arr
este
esex
peri
enci
ng p
olic
eex
peri
enci
ng p
olic
eex
peri
enci
ng p
olic
eus
e or
thr
eat
ofP
erso
ns w
ith
use
or t
hrea
tus
e or
thr
eat
Inm
ates
wit
hfo
rce
at t
ime
polic
e co
ntac
tP
erso
ns a
rres
ted
of f
orce
of f
orce
polic
e co
ntac
tof
arr
est
Wei
ghte
dW
eigh
ted
Wei
ghte
dW
eigh
ted
Wei
ghte
dW
eigh
ted
Dem
ogra
phic
sN
umbe
r*P
erce
ntN
umbe
rP
erce
ntN
umbe
rP
erce
ntN
umbe
rP
erce
ntN
umbe
rP
erce
ntN
umbe
rP
erce
nt
Tot
al45
,278
,884
100.
01,
295,
501
100.
066
4,45
810
0.0
248,
848
100.
043
7,76
810
0.0
96,9
6210
0G
ende
rM
ale
23,8
84,6
4952
.81,
012,
070
78.1
520,
178
78.3
221,
126
88.9
386,
404
88.3
90,2
2393
.1Fe
mal
e21
,394
,234
47.2
283,
431
21.9
144,
281
21.7
27,7
2211
.1a
51,3
6511
.76,
739
6.9
Rac
e/H
ispa
nic
orig
inW
hite
34,7
43,4
5276
.776
9,94
459
.437
3,84
756
.312
5,35
650
.416
6,34
538
.029
,975
30.9
Bla
ck4,
966,
388
11.0
307,
915
23.8
172,
658
26.0
73,8
5629
.716
9,98
938
.845
,362
46.8
His
pani
c4,
191,
712
9.3
199,
206
15.4
102,
670
15.5
42,7
4117
.277
,715
17.8
16,8
4617
.4O
ther
rac
e1,
377,
332
3.0
18,4
351.
4a15
,284
2.3a
6,89
62.
8a23
,605
5.4
4,77
94.
9A
ge (
year
s)16
–19
4,31
4,23
19.
521
4,13
016
.515
2,11
822
.966
,764
26.8
31,1
947.
110
,310
10.6
20–2
910
,917
,693
24.1
529,
961
40.9
230,
028
34.6
106,
474
42.8
168,
282
38.4
37,6
3438
.830
–39
9,74
5,29
821
.527
8,81
721
.511
6,77
417
.635
,056
14.1
132,
277
30.2
30,2
8531
.240
–49
9,49
4,71
621
.017
1,19
813
.295
,285
14.3
25,9
8010
.4a
84,8
7419
.415
,845
16.3
50–5
96,
006,
828
13.3
77,5
966.
049
,717
7.5
10,3
714.
2a17
,988
4.1
2,60
02.
760
or
olde
r4,
800,
117
10.6
23,7
991.
8a20
,537
3.1a
4,20
21.
7a3,
153
0.7
288
0.3a
Not
es. P
PC
S da
ta a
re a
dapt
ed f
rom
Dur
ose
et a
l. (2
005)
. Rac
e/H
ispa
nic
orig
in c
ould
not
be
dete
rmin
ed f
or 1
14 (
wei
ghte
d) in
mat
es in
the
SIL
J da
ta.
The
16–
19 y
ears
of
age
cate
gory
inc
lude
s 10
4 (w
eigh
ted)
inm
ates
who
wer
e un
der
age
16.
* D
enot
es t
he u
se o
f w
eigh
ted
esti
mat
es i
n Ta
bles
2,
3, 4
, 5,
6,
7, a
nd 8
. R
aw n
umbe
rs a
re a
vaila
ble
from
the
aut
hors
on
requ
est.
a Est
imat
e ba
sed
on 1
0 or
few
er c
ases
.

\\server05\productn\C\CPP\7-4\CPP406.txt unknown Seq: 15 29-DEC-08 10:54
POLICE USE OF NONLETHAL FORCE 577
Estimates from the 2002 PPCS indicate that about 45.3 million respon-dents aged 16 or older reported face-to-face contacts with police in thatyear, and about 1.5% (664,458 persons) reported experiencing the use orthreat of force by police (beyond handcuffing). About 1.3 million personsreported being arrested, and 19.2% of the arrestees (248,848 persons)reported experiencing the use or threat of force. In comparison with thePPCS data on all contacts, the inmate sample reported experiencing policeuse or threat of force in a larger proportion of contacts more similar tothe PPCS arrestees. The 2002 SILJ data indicate that 22.1% of inmates(96,962) reported experiencing the use or threat of force by police (beyondhandcuffing) at the time of their arrests. This finding would be expected,given that the inmate sample experienced arrest. Combining arrestees inthe PPCS with the SILJ data results in an overall estimate that police useforce in 20.0% of all arrests.
When comparing the demographic characteristics of individuals whoreported experiencing force in both samples, some important differencesbecame apparent. The SILJ force sample contained proportionately moremales (93% vs. 78%), more blacks (47% vs. 26%), less whites (31% vs.56%), and was older (median age in the PPCS force sample was 26 vs. 30in the SILJ sample). The PPCS arrestees were more similar to the SILJsample with regard to gender (89% male), but they were more similar tothe larger PPCS force sample with regard to race (30% black). The PPCSarrestees were younger than the larger PPCS force sample and the SILJforce sample (i.e., the median age among PPCS arrestees was 23).
Importantly, although the magnitudes of the estimates differ across datasources (as would be expected), the differences in the likelihood of report-ing force across demographic characteristics were substantively similarwithin both sets of data (Table 3). That is, males, blacks, and youths weremore likely to report experiencing the use or threat of force in both typesof surveys (i.e., household and inmate).

\\server05\productn\C\CPP\7-4\CPP406.txt unknown Seq: 16 29-DEC-08 10:54
578 HICKMAN ET AL.
Table 3. Demographic Characteristics and Likelihood of ExperiencingPolice Use or Threat of Force
2002 PPCS 2002 SILJ
Percent of inmatesPercent of contacts Percent of arrestees experiencing use orin which force was experiencing use or threat of force at
Demographics used/threatened threat of force time of arrest
Total 1.5 19.2 22.1GenderMale 2.2 21.8 23.3Female 0.7 9.8a 13.1Race/Hispanic originWhite 1.1 16.3 18.0Black 3.5 24.0 26.7Hispanic 2.5 21.5 21.7Other race 1.1a 37.4 20.2Age (years)16–19 3.5 31.2 33.120–29 2.1 20.1 22.430–39 1.2 12.6 22.940–49 1.0 15.2a 18.750–59 0.8 13.4a 14.560 or older 0.4a 17.7a 9.1a
a Estimate based on 10 or fewer cases.
Type of Force Used
As shown in Table 4, the level of force used by police in contactsreported by inmates is arguably greater than that reported in the PPCS forall force contacts and arrestees. Among those inmates who reported theuse or threat of force (beyond handcuffing), most contacts (82%) involvedpushing or grabbing by officers, which is roughly double the percentagereported in the PPCS for all force contacts and is substantially greater thanfor arrestees. The next most common type of force reported was officerspointing guns (46%), which was nearly double the percentage reported inthe PPCS for all force contacts and arrestees.2 Finally, inmates reportedthat more than one third of force contacts included being kicked or hit byofficers (38%), which is greater than four times the percentage reported inthe PPCS for all force contacts and double the percentage for arrestees.
2. A reviewer noted that this estimate is alarmingly high, especially if it refers toall arrests. Keep in mind that the SILJ sample consists of those who have been incarcer-ated and those who reported having guns pointed at them during the arrest process. Thecorresponding percentages for the PPCS are 24% among arrestees and 19% among allforce contacts.

\\server05\productn\C\CPP\7-4\CPP406.txt unknown Seq: 17 29-DEC-08 10:54
POLICE USE OF NONLETHAL FORCE 579
Table 4. Type of Force Used or Threatened2002 PPCS 2002 SILJ
All force contacts Arrestees onlyType of force used orthreatened Number Percent Number Percent Number Percent
Total 664,458 100.0 248,848 100.0 96,962 100.0Pushed or grabbed byofficer(s) 277,433 41.8 146,875 59.0 79,884 82.4Kicked or hit byofficer(s) 54,682 8.2 41,458 16.7 36,684 37.8Officer(s) pointed gun 125,872 18.9 59,082 23.7 44,554 45.9Other type of force 377,628 56.8 123,935 49.8 28,895 29.8
Notes. PPCS data are adapted from Durose et al. (2005). Percents do not sum to 100 becausesome respondents reported more than one type or threat of force. “Other” types of force inSILJ include unleashing of dog(s), use of chemical spray, discharge of firearm(s), and anyother force, and they may not be directly comparable with PPCS data.
Injuries from Force
Table 5 indicates that jail inmates were more likely to report injury frompolice force, as compared with the PPCS. About 45% of inmates whoreported experiencing police force (beyond handcuffing) reported injuryas a result, compared with about 14% of respondents to the PPCS for allforce contacts and 24% of arrestees.3 The larger proportion of force con-tacts that involved injury among inmates is not surprising, given thearguably greater level of force experienced (described above in Table 4).
Table 5. Persons Injured During Force ContactPersons injured during force contact
Number ofSource force contacts Number Percent
PPCS (All force) 664,458 92,268 13.9PPCS (Arrestees) 248,848 58,875 23.7SILJ 91,418a 40,990 44.8
Notes. PPCS data are adapted from Durose et al. (2005).a In total, 5,544 (weighted) inmates with missing data are excluded.
3. A reviewer suggested that the inmates might be embellishing their self-reports.We acknowledge this possibility, but we suggest the estimate is consistent with thegreater level of force reported by these individuals. We also note that rates of forcereported by arrested suspects in Phoenix in 1994 (20.5%) were comparable with therates of force reported by police officers (22.5%) in the same study (Garner, Buchananet al., 1995).

\\server05\productn\C\CPP\7-4\CPP406.txt unknown Seq: 18 29-DEC-08 10:54
580 HICKMAN ET AL.
Conduct During Force Incident
Table 6 presents results with respect to the relationship between theindividuals’ reported conduct and the use of force. More than one third(38%) of jail inmates who stated that they experienced the use or threatof police force (beyond handcuffing) reported behaviors of their ownthat could have potentially provoked officers to use force, comparedwith nearly 27% of PPCS respondents who reported experiencing force.Almost one quarter of both inmates and PPCS respondents reported argu-ing, cursing, insulting, verbally threatening, disobeying, or interfering withofficers. Nearly 16% of inmates described trying to get away from thepolice, compared with approximately 3% of PPCS respondents. Three per-cent of inmates reported pushing, grabbing, or hitting officers, comparedwith less than 1% of PPCS respondents. Finally, 11% of inmates reportedresisting handcuffing, arrest, or searches, compared with nearly 6% ofPPCS respondents.
Those who reported engaging in potentially provoking behaviors weremuch more likely to report experiencing the use or threat of force in bothdata sources (Table 7). In the PPCS data, 22% of those who describedengaging in any such behavior reported experiencing force, compared withnearly 1% among those who did not. Among PPCS arrestees, 44% ofthose who reported engaging in potentially provoking behaviors claimedthey experienced force, compared with 16% among those who did not. Inthe SILJ data, 52% of those who reported engaging in potentially provok-ing behavior recounted experiencing force, compared with approximately17% of those who did not. Trying to get away from the police (41%) andresisting handcuffing, arrest, or search (68%) resulted in a greater likeli-hood of reported force, as compared with other potentially provokingbehaviors, in the PPCS data. Of the behaviors for which there were com-parable categories in the PPCS, pushing, grabbing, or hitting officers(77%) yielded the greatest likelihood of reporting force in the SILJ data.As might be expected, force was used by police in approximately 90% ofincidents in which inmates reported using weapons to threaten or assaultofficers (categorized as “other” in the SILJ data and not directly compara-ble with “other” in the PPCS; see notes in Table 6).

\\server05\productn\C\CPP\7-4\CPP406.txt unknown Seq: 19 29-DEC-08 10:54
POLICE USE OF NONLETHAL FORCE 581
Tabl
e 6.
Con
duct
of
Indi
vidu
al D
urin
g Fo
rce
Inci
dent
2002
PP
CS
2002
SIL
J
Inm
ates
All
pers
ons
Arr
este
esex
peri
enci
ngex
peri
enci
ngex
peri
enci
ngpo
lice
use
orP
erso
ns w
ith
polic
e us
e or
polic
e us
e or
Inm
ates
wit
hth
reat
of
forc
e at
polic
e co
ntac
tP
erso
ns a
rres
ted
thre
at o
f fo
rce
thre
at o
f fo
rce
polic
e co
ntac
tti
me
of a
rres
t
Con
duct
dur
ing
forc
e in
cide
ntN
umbe
rP
erce
ntN
umbe
rP
erce
ntN
umbe
rP
erce
ntN
umbe
rP
erce
ntN
umbe
rP
erce
ntN
umbe
rP
erce
nt
Tota
l45
,278
,884
100.
01,
295,
501
100.
066
4,45
810
0.0
248,
848
100.
043
7,76
810
0.0
96,9
6210
0.0
Non
e of
the
beha
vior
s lis
ted
44,4
86,8
2498
.31,
135,
605
88.9
487,
312
73.3
180,
864
74.3
362,
777
83.7
59,9
6161
.9A
t le
ast
one
type
of b
ehav
ior
792,
060
1.7
141,
804
11.1
177,
146
26.7
62,4
0925
.770
,877
16.3
36,9
6938
.1A
rgue
, cu
rse,
insu
lt,
verb
ally
thre
aten
, di
sobe
y,or
int
erfe
re75
5,37
31.
712
6,50
99.
816
6,14
025
.060
,111
24.7
48,6
1711
.224
,689
25.5
Try
to g
et a
way
from
pol
ice
49,5
330.
117
,031
1.3a
20,2
543.
0a10
,610
4.3a
24,9
725.
815
,154
15.6
Pus
h, g
rab,
or
hit
offi
cer(
s)11
,662
—3,
460
0.3a
3,46
00.
5a3,
460
1.4a
3,96
80.
93,
042
3.1
Res
ist
hand
cuff
,ar
rest
, or
sea
rch
56,5
750.
129
,696
2.3a
38,6
515.
823
,119
9.3a
17,6
084.
110
,712
11.1
Oth
er p
hysi
cal
beha
vior
11,2
35—
00.
03,
071
0.5a
00.
058
80.
1a51
30.
5a
Not
es. P
PC
S da
ta a
re a
dapt
ed f
rom
Dur
ose
et a
l. (2
005)
. Per
cent
age
deta
il be
low
tot
al e
xclu
des
case
s w
ith
mis
sing
dat
a on
con
duct
dur
ing
inci
dent
.R
espo
nden
ts c
ould
rep
ort
mor
e th
an o
ne t
ype
of b
ehav
ior
in b
oth
the
PP
CS
and
the
SIL
J. T
he “
othe
r” c
ateg
ory
in S
ILJ
cons
ists
of
wea
pon
used
to
thre
aten
or
assa
ult
offi
cer(
s) a
nd i
s no
t di
rect
ly c
ompa
rabl
e w
ith
PP
CS
data
.—
Les
s th
an 0
.05%
.a E
stim
ate
base
d on
10
or f
ewer
cas
es.

\\server05\productn\C\CPP\7-4\CPP406.txt unknown Seq: 20 29-DEC-08 10:54
582 HICKMAN ET AL.
Table 7. Conduct of Individual During Force Incident and Likelihood ofExperiencing Police Use or Threat of Force
2002 PPCS 2002 SILJ
Percent of Percent ofPercent of arrestees inmatescontacts in experiencing use experiencing use
Conduct of individual during which force was or threat of or threat of forceforce incident used/threatened force at time of arrest
Total 1.5 19.2 22.1None of the behaviors listed 1.1 15.9 16.5At least one type of behavior 22.4 44.0 52.2Argue, curse, insult, verballythreaten, disobey, or interfere 22.0 47.5 50.8Try to get away from police 40.9a 62.3a 60.7Push, grab, or hit officer(s) 29.7a 100.0a 76.7Resist handcuff, arrest, or search 68.3 77.9a 60.8Other physical behavior 27.3a 0.0 87.2a
a Estimate based on 10 or fewer cases.
National Estimates of Police Use of Nonlethal Force
We next combined the two data sources to arrive at a national estimateof police use of nonlethal force.4 We present two methods: The firstmethod is a simple estimate based on summing the estimates from thePPCS and the SILJ, and the second estimate is based on weighting adjust-ments to a combined data file.5 Using the combined data file, we will alsoproceed with multivariate analyses of predictors of the use or threat offorce by police, as well as the level of force used. The goal is to determinewhether the predictors of force are similar across the PPCS, SILJ, andcombined data.
4. Because data from the PPCS and the SILJ are, of course, nonlethal use-of-force cases, some readers may wish to know about deadly force. According to the FBI’s(2003) Crime in the United States, 339 justifiable homicides by police occurred in thatyear.
5. The PPCS data are weighted to represent the U.S. population aged 16 yearsand older (215,536,780). The SILJ data are weighted to represent the jail population onJune 30, 2001 (631,241). We proportionately adjusted the PPCS weights to accommo-date the jail population as part of the total estimated U.S. population aged 16 years andolder (i.e., the resulting combined data file weights to 215,536,780 persons).

\\server05\productn\C\CPP\7-4\CPP406.txt unknown Seq: 21 29-DEC-08 10:54
POLICE USE OF NONLETHAL FORCE 583
Combining the PPCS and SILJ data by simply adding them togetherresults in an overall estimate of 45.7 million police contacts during 2002,while nearly 1.7% (761,000) of these contacts involved the use or threat offorce by police (Table 8). The adjusted estimate is approximately 45.6 mil-lion contacts with almost 1.7% (759,000) involving the use or threat offorce. Thus, using the combined PPCS and SILJ surveys, these adjust-ments do not affect the rate of force substantially.
The estimate of police use of force derived from the PPCS alone is 1.5%of all contacts; the rate derived from combining the PPCS and SILJ is1.7%. This estimate represents a 13.3% increase and provides the basis foran improved national-level estimate of the amount of force used by thepolice in the United States. Based on survey results from nationally repre-sentative samples of households and jail inmates, we estimate that lawenforcement officers used or threatened to use physical force about760,000 times during 2002.
Our findings support Fyfe’s (2002) concern that the PPCS missessubstantial amounts of force because it does not include incarcerated indi-viduals in its sampling frame. Although the inmate sample comprises onlyabout 1% of all persons who experienced face-to-face police contacts,these inmates account for about 13% of all contacts that involved policeuse of force (beyond handcuffing), and they are clearly more likely toreport having experienced force. As such, they constitute an importantgroup for additional, in-depth analyses of police-citizen interactions.
Table 8. Estimates of Contacts with Police Resulting in Use or Threatof Force in 2002
All police contacts Contacts with forcePercent of contacts
Source Number Percent Number Percent with force
Additive estimateTotal 45,716,652 100 761,420 100 1.7PPCS 45,278,884 99.0 664,458 87.3 1.5SILJ 437,768 1.0 96,962 12.7 22.1Adjusted estimateTotal 45,584,044 100 759,474 100 1.7PPCS 45,146,276 99.0 662,512 87.2 1.5SILJ 437,768 1.0 96,962 12.8 22.1

\\server05\productn\C\CPP\7-4\CPP406.txt unknown Seq: 22 29-DEC-08 10:54
584 HICKMAN ET AL.
Multivariate Analyses
In this section, we examine whether the observed bivariate relationshipsamong gender, race, age, potential provocation, and police use or threat offorce endure in multivariate models. We consider a dichotomous use orthreat of force variable as well as a composite indicator of the severity offorce used. The composite indicator of force is coded to indicate the great-est level of force used by police, as reported in the PPCS and the SILJ.Available categories include pushing/grabbing, kicking/hitting, and point-ing a gun.6 Garner et al. (2002) reported results of an exercise in whichthey asked 503 officers in five police agencies to rank a variety of policebehaviors on a scale from 1 to 100. Corresponding average ranks from thatstudy, as applied to the available categories in the current study, are “pushsuspect” (26.7), “grab suspect” (33.0), “kick suspect” (40.6), “hit suspect”(40.8), and “display handgun” (55.4). These ranks suggest that the order-ing of the available force categories from the PPCS and the SILJ to reflectthe severity of force used is appropriate at least in terms of the severityattached to each behavior by police officers. Garner et al. (2002) alsoweighted arrests in their study by the officer rankings, but we do not incor-porate weights in the current study because the data are limited to onlythree categories of force. The models will be presented with estimates forthe PPCS and SILJ separately and the combined file.
Given the differences between a national household survey and a surveyof inmates, some might argue the comparisons made herein are potentiallyunfair. A more direct comparison, perhaps, would be to limit the PPCSdata to those who reported they were arrested at some point during theincident. The PPCS does include an arrest item, and Durose et al. (2005)reported that nearly 38% of individuals who claimed experiencing the useor threat of force were arrested, but differences by race were not statisti-cally significant (likely because of the small sample size). To investigateany differences by arrestee status (applicable to the PPCS), we also pre-sent models limited to arrestees only.
Results for the first set of models that predict dichotomous use or threatof force are presented in Table 9. As can be observed, the effect of genderis consistent across the three samples: The odds of reporting police use orthreat of force for males are nearly three times the odds for females in thePPCS and combined samples, and approximately twice the odds forfemales in the SILJ sample, while controlling for race, age, and potentialprovocation. Older respondents are significantly less likely to report hav-ing experienced the use or threat of force across all three samples,
6. The “other” force categories in the PPCS and the SILJ are not directly compa-rable and are excluded from subsequent analyses of the severity of force.

\\server05\productn\C\CPP\7-4\CPP406.txt unknown Seq: 23 29-DEC-08 10:54
POLICE USE OF NONLETHAL FORCE 585
although the effect of age is weak. Respondent race has consistent effectsacross the three samples: In contrast to whites, black respondents have thegreatest odds of reporting police use or threat of force, followed by His-panics. Additionally, those persons identified as some “other” race havedecreased odds when compared with whites. In the SILJ data, persons ofthe “other” category have slightly greater odds as compared with whites.
Potentially provoking behaviors were combined in a composite indica-tor coded to indicate the greatest level of potential provocation by citizens,and it was modeled in contrast to the lack of such behavior. Potentiallyprovoking behaviors had strong effects on the likelihood of reporting theuse or threat of force by police. Although all the behaviors increased thelikelihood of reporting the use or threat of force, as compared with theabsence of any potentially provoking behaviors, some behaviors resultedin substantially greater odds of reporting force. In the combined sample,and apart from “other” behaviors, resistance (i.e., resisting arrest, hand-cuffing, or searches) had the strongest effect on the likelihood of reportingthe use or threat of force by police, which was followed by pushing, grab-bing, or hitting officers. Arguing with officers or attempting to get awayfrom officers had similar effects in the overall sample. Among PPCS inter-viewees only, argumentation had stronger effects than attempting to getaway from officers. In the SILJ sample, pushing, grabbing, or hittingofficers had the strongest effect, which was followed by resisting, attempt-ing to get away, and arguing with officers.
Table 9. Logistic Regression Results: Police Use or Threat of ForceCombined sample PPCS only SILJ only
Variable B SE Exp(B) B SE Exp(B) B SE Exp(B)
Male 1.180 .003 3.254 1.120 .003 3.064 .695 .015 2.003Age –.030 .000 .971 –.031 .000 .970 –.007 .000 .993Race (white)Black 1.346 .003 3.840 1.258 .003 3.520 .549 .009 1.731Hispanic .775 .004 2.171 .720 .004 2.054 .282 .012 1.325Other –.187 .008 .829 –.402 .009 .669 .042 .019 1.043*Provocation (none)Argue 2.849 .003 17.277 2.894 .004 18.068 1.430 .012 4.177Get away 2.847 .011 17.231 1.636 .022 5.137 1.887 .016 6.597Resist 5.202 .010 181.702 5.763 .013 318.182 1.952 .017 7.042Push/grab/hit 3.713 .017 4.980 3.324 .021 27.782 3.095 .040 22.097Other behavior 5.252 .030 191.024 5.309 .030 202.087 — — —Constant –4.675 .009 –4.873 .010 –2.267 .026Nagelkerke R2 .20 .19 .16
Notes. All variables significant at p < .001, unless otherwise noted.*p < .05.

\\server05\productn\C\CPP\7-4\CPP406.txt unknown Seq: 24 29-DEC-08 10:54
586 HICKMAN ET AL.
Results for models that predict dichotomous use or threat of force, withPPCS data limited to arrestees only, are presented in Table 10. As mightbe expected, limiting the PPCS to arrestees results in muted effects for theoverall sample that largely mirror those of the SILJ sample. The effects oftrying to get away from officers or pushing, grabbing, and hitting officersare not significant in the PPCS sample when limited to arrestees.
Table 10. Logistic Regression Results: Police Use or Threat of Force(Arrestees Only)
Combined sample PPCS only
Variable B SE Exp(B) B SE Exp(B)
Male .856 .006 2.354 .929 .007 2.531Age –.020 .000 .981 –.023 .000 .977Race (white)Black .603 .005 1.828 .647 .006 1.909Hispanic .350 .006 1.419 .365 .007 1.440Other .320 .013 1.377 .486 .019 1.626Provocation (none)Argue 1.251 .006 3.492 1.195 .007 3.305Get away 1.139 .013 3.123 –19.876 501.533 .000 (n.s.)Resist 2.470 .011 11.828 2.848 .015 17.257Push/grab/hit 3.738 .038 41.996 22.684 684.289 .000 (n.s.)Other behavior — — — — — —Constant –1.722 .015 –1.503 .020Nagelkerke R2 .14 .15
Notes. All variables significant at p < .001, unless otherwise noted. Large standard errors inthe PPCS only model are caused by the small number of cases available when PPCS data arelimited to arrestees.n.s. = not significant.*p < .05.
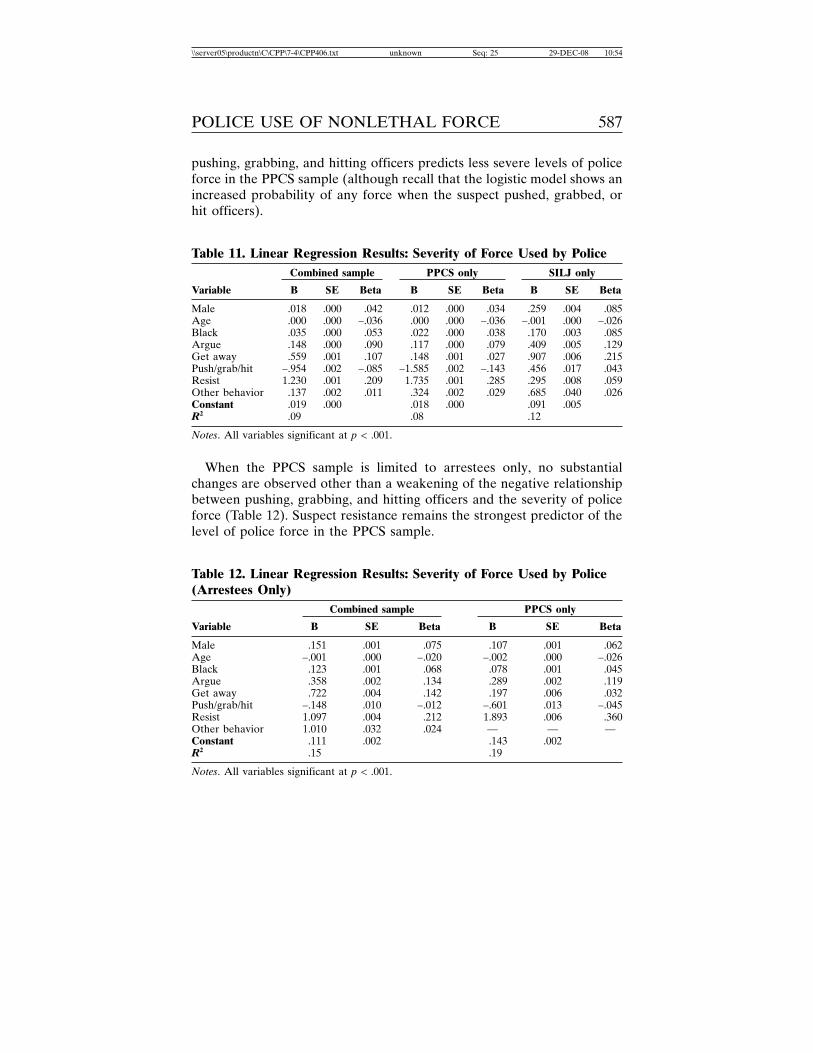
Turning to the severity of force, the effects of gender, age, and race areconsistent across the PPCS and SILJ samples. The effect of suspect resis-tance (i.e., resisting arrest, handcuffing, or searches) is moderate in thePPCS sample, net of demographic variables: When the suspect resists, anestimated 1.7 unit increase in the severity of police force may be expected(Table 11).7 The corresponding effect in the SILJ sample is much weaker.In the SILJ sample, attempts to get away from police result in a nearly 1unit increase in the severity of police force. The results also indicate that
7. In an effort to examine the sensitivity of the regression estimates, we also esti-mated a series of ordinary least squares (OLS) regression models where we logged theoutcome variable in an effort to improve normalization of the distribution, as well as aseries of ordered logistic regression models. In both cases, and with few minor excep-tions, the results were substantively similar to those presented in the text. Results areavailable upon request.
\\server05\productn\C\CPP\7-4\CPP406.txt unknown Seq: 25 29-DEC-08 10:54
POLICE USE OF NONLETHAL FORCE 587
pushing, grabbing, and hitting officers predicts less severe levels of policeforce in the PPCS sample (although recall that the logistic model shows anincreased probability of any force when the suspect pushed, grabbed, orhit officers).
Table 11. Linear Regression Results: Severity of Force Used by PoliceCombined sample PPCS only SILJ only
Variable B SE Beta B SE Beta B SE Beta
Male .018 .000 .042 .012 .000 .034 .259 .004 .085Age .000 .000 –.036 .000 .000 –.036 –.001 .000 –.026Black .035 .000 .053 .022 .000 .038 .170 .003 .085Argue .148 .000 .090 .117 .000 .079 .409 .005 .129Get away .559 .001 .107 .148 .001 .027 .907 .006 .215Push/grab/hit –.954 .002 –.085 –1.585 .002 –.143 .456 .017 .043Resist 1.230 .001 .209 1.735 .001 .285 .295 .008 .059Other behavior .137 .002 .011 .324 .002 .029 .685 .040 .026Constant .019 .000 .018 .000 .091 .005R2 .09 .08 .12
Notes. All variables significant at p < .001.
When the PPCS sample is limited to arrestees only, no substantialchanges are observed other than a weakening of the negative relationshipbetween pushing, grabbing, and hitting officers and the severity of policeforce (Table 12). Suspect resistance remains the strongest predictor of thelevel of police force in the PPCS sample.
Table 12. Linear Regression Results: Severity of Force Used by Police(Arrestees Only)
Combined sample PPCS only
Variable B SE Beta B SE Beta
Male .151 .001 .075 .107 .001 .062Age –.001 .000 –.020 –.002 .000 –.026Black .123 .001 .068 .078 .001 .045Argue .358 .002 .134 .289 .002 .119Get away .722 .004 .142 .197 .006 .032Push/grab/hit –.148 .010 –.012 –.601 .013 –.045Resist 1.097 .004 .212 1.893 .006 .360Other behavior 1.010 .032 .024 — — —Constant .111 .002 .143 .002R2 .15 .19
Notes. All variables significant at p < .001.

\\server05\productn\C\CPP\7-4\CPP406.txt unknown Seq: 26 29-DEC-08 10:54
588 HICKMAN ET AL.
Discussion
Research on the police has generated an immense amount of informa-tion and accumulated knowledge on a wide range of topics (Sherman,1995; Skogan and Frydl, 2004; Weisburd and Braga, 2006). One criticalarea in the body of work describing police behavior is national-level esti-mates of the use of force. This article presents combined estimates fromtwo data sources, the SILJ and the PPCS, in an effort to enhance andrefine national-level data. In so doing, the article took as a point of depar-ture the view of critics of the PPCS—who are likely correct—in suggestingthat force is underestimated because of the exclusion of the recently incar-cerated. Clearly, the recently incarcerated are a group at high risk forpolice use of force (if for no other reason than the fact that they werearrested) and should be included in national estimates of police use offorce.
Several key findings developed from the analysis. First, the analysisdemonstrated that the PPCS accounts for about 87% of the total forceevents derived from both the PPCS and the SILJ data. The inmate samplecomprised just 1% of all contacts but 13% of contacts with reported force.Second, demographic patterns with regard to the likelihood of force aresimilar across the two data sets. Although whites are the most commonrecipients of force in the PPCS (56%) and blacks are most common in theSILJ (47%), when compared against the total police contact populationand inmate population, respectively, blacks are the most likely to reportexperiencing force in either data source, as are males and youths. Thisfinding suggests that, regardless of whether these demographic character-istics are associated with a greater likelihood of behaviors that come to theattention of the police, the data are at least consistent in suggesting thegreater application of force to these demographic groups.
Third, in addition to being much more likely to report having exper-ienced force, the recently incarcerated reported experiencing muchgreater levels of force and were more likely to report injury from force.These findings are not unexpected, given that arrest took place and someunderlying behavior that led to their arrest occurred in the first place. Log-ically, a greater rate of injury would be expected to follow from thegenerally greater levels of force reportedly experienced. Finally, the roleof citizens’ potentially provoking behavior in police use-of-force incidentsis clear in both the PPCS and the SILJ data. Regardless of the fact that theinmates were arrested, those who reported engaging in potentially provok-ing behaviors were much more likely to report being the recipients ofpolice force.

\\server05\productn\C\CPP\7-4\CPP406.txt unknown Seq: 27 29-DEC-08 10:54
POLICE USE OF NONLETHAL FORCE 589
In terms of the severity of police force, a similar pattern has developed.Although gender, age, and race are predictive of the severity of policeforce in expected directions (i.e., males, youths, and blacks are the recipi-ents of more severe levels of force), these demographic variables are fairlyweak in comparison with reported suspect behavior. Specifically, suspectresistance had the strongest effect on the severity of police force in thePPCS sample, with a corresponding weaker effect in the SILJ sample.Attempts to get away from police had the strongest effect on severity offorce in the SILJ sample.
More generally, it is unlikely that researchers will learn much moreabout police use of force from the PPCS in its current form. Given the costof administration, it is increasingly difficult to justify a study that (withregard to the use of force) does little more than periodically document thefact that police use of force is rare. Although some researchers mightargue that the study is congressionally mandated (insofar as Section210402 of the 1994 Crime Act can be interpreted as a mandate for BJS toconduct the PPCS), the reality is that the PPCS is not; Section 210402 onlyrequires the U.S. Attorney General to acquire data about the use of exces-sive force by police. The specific means for acquiring these data are notidentified, which only raises questions about whether the PPCS has suc-ceeded in measuring “excessive force.” The PPCS relies on a perceptualmeasure of excessive force, and some researchers may argue that such ameasure is inadequate. Currently, the SILJ does not include any measureof excessive force (perceptual or otherwise).
The PPCS is more often used in regard to traffic stops (e.g., Engel andCalnon, 2004), and most of the attention given to the PPCS from the newsmedia is in the context of race and traffic stops (although some of this maybe due to media intrigue over the curious interference of Department ofJustice political officials with the release of the 2002 findings, and the sub-sequent removal of the BJS Director for refusing to accept changes to thepress release; see Lichtblau, 2005; Government Accountability Office,2007). Regardless, without a substantial increase in sample size (whichtranslates to a direct increase in cost), researchers cannot delve intogreater detail on police use-of-force issues.
If the goal is to capture rich data on the use of excessive force, thenincreased investment in the SILJ may be a better use of research fundsand researchers’ attention at this point. The recently incarcerated shouldaccount for a relatively large proportion of all police contacts; in its cur-rent form, the SILJ asks inmates about police use of force at the time ofarrest, and not for any prior contacts that did not lead to arrest. As such,the SILJ data are almost certainly an underestimate and should be

\\server05\productn\C\CPP\7-4\CPP406.txt unknown Seq: 28 29-DEC-08 10:54
590 HICKMAN ET AL.
regarded as conservative. (The same criticism applies to the PPCS, how-ever, because it asks citizens about force experienced during their mostrecent contact and not all previous contacts.) Expansion of force-relateditems in the SILJ, such as including consideration of the total number ofpolice contacts and force in the prior 12 months, also would need to beaccompanied with an overall reduction in the number of interview items.However, in contrast to the PPCS, much is yet to be learned from the SILJdata on police use of force. Although beyond the scope of this article, it ispossible to investigate the roles of offense seriousness, drug and alcoholuse, and mental health on police use of force, with the SILJ data.8
An additional improvement would be to devote resources to the collec-tion of administrative records from police departments. The BJS took aninitial step in this direction with the 2003 iteration of the Law Enforce-ment Management and Administrative Statistics (LEMAS) Survey, inwhich data were collected on citizen complaints about police use of force(Hickman, 2006). Although the LEMAS Survey may not be the appropri-ate platform for expanded data collection on officer use of force, a stand-alone data collection would be warranted. It is only through these types ofinvestments that we can fulfill the goal of developing national statistics toimprove documentation of police behavior and fairness in policing.
The use of the PPCS and the SILJ to produce a national-level estimateof police use of nonlethal force furthers the goal of national-level data onall uses of force in the United States. Although we recommend continuingthe statistical surveys on which these estimates are based, our understand-ing of the amount and correlates of police use of force would be improvedif sufficient resources and commitment existed to compile representativesamples of agency records of lethal and nonlethal force.
8. Out of concern for model misspecification, a reviewer suggested that weshould investigate these possibilities. We reestimated the logistic and OLS models forthe SILJ data and included controls for whether the controlling offense was violent innature, whether the individual was using alcohol or drugs at the time of the offense, andwhether the individual had ever been informed by a mental health professional that heor she had any of several listed mental health disorders. Of course, the offense mea-sures do not necessarily translate to the arrest scenario. Nevertheless, the additionalcontrols were significant, but weak, and they did not substantively alter the results ofour original models or the conclusions drawn. Results of these analyses are availablefrom the authors on request. Unfortunately, we cannot perform the same analyses withthe PPCS data because information on mental health status and drug and alcohol useare not collected in the PPCS. Because the SILJ data suggest these avenues of investi-gation might possibly be fruitful, perhaps these variables could be included in a futureiteration of the PPCS.

\\server05\productn\C\CPP\7-4\CPP406.txt unknown Seq: 29 29-DEC-08 10:54
POLICE USE OF NONLETHAL FORCE 591
In the United States, progress has been made toward national reportingsystems for police use of lethal force. In 2007, as part of its Deaths inCustody Reporting Program, the BJS released counts of all arrest-relateddeaths reported by authorities in 40 states, over the 2003–2005 period(Mumola, 2007). Of the 2,002 arrest-related deaths reported, 55% (1,095)deaths were homicides by law enforcement officers. In addition, Karch,Lubell, Friday, Patel, and Williams (2008) report findings for 16 states par-ticipating in the Centers for Disease Control and Prevention’s NationalViolent Death Reporting System in 2005. This system includes deaths from“legal interventions.” With the lack of nationwide coverage and variationin reporting sources and definitions, these two new systems and the FBI’sSupplemental Homicide Reports program do not yet constitute fullydeveloped national reporting systems for police use of lethal force, butthey do have promise and reflect progress toward that goal.
Despite this progress, other nations have developed more completenational reporting systems for police use of force. For example, New Zea-land police currently collect data on all uses of force (Marshall and Shuey,2001). Since 1997, the British Home Office has published statistics ondeaths in custody of the police in England and Wales. In 2002, The BritishPolice Reform Act created the Independent Police Complaints Commis-sion (IPCC) with a statutory duty to investigate any death from policecontact, and they have continued the reporting of police use of lethal force(see IPCC, 2008). The establishment of these national police use-of-forcereporting systems in other countries should provide models for future U.S.efforts, as well as the beginning of cross-national comparisons of police useof force.
References
Adams, Kenneth. 1995. Measuring the prevalence of police abuse of force. In(William A. Geller and Hans Toch, eds.), And justice for all: Understanding andcontrolling police abuse of force. Washington, DC: Police Executive ResearchForum.
Alpert, Geoffrey and Roger Dunham. 1999. The force factor: Use of force andsuspect resistance. In, Use of force by police: Overview of national and local data(NCJ 176330). Washington, DC: Bureau of Justice Statistics.
Alpert, Geoffrey, Roger Dunham, Meghan Stroshine, Katherine Bennett, and JohnMacDonald. 2004. Police officers’ decision making and discretion: Formingsuspicion and making a stop (NCJ 213004). Columbia: University of SouthCarolina.
Alpert, Geoffrey and Lorie Fridell. 1992. Police vehicles and firearms: Instruments ofdeadly force. Prospect Heights, IL: Waveland Press.

\\server05\productn\C\CPP\7-4\CPP406.txt unknown Seq: 30 29-DEC-08 10:54
592 HICKMAN ET AL.
Bayley, David. 1996. Police for the future. New York: Oxford University Press.
Bayley, David and James Garofalo. 1989. The management of violence by policepatrol officers. Criminology, 27:1–23.
Bittner, Egon. 1970. The functions of the police in modern society. Chevy Chase, MD:National Institutes of Mental Health.
Blumberg, Mark. 1989. Controlling police use of deadly force: Assessing two decadesof progress. In (Roger G. Dunham and Geoffrey Alpert, eds.), Critical issues inpolicing: Contemporary readings. Prospect Heights, IL: Waveland Press.
Crime Control Digest. 1991. AELE [Americans for Effective Crime Control] callsfor national reporting system on use of force, police misconduct. Crime ControlDigest, April 1:1.
Croft, Elizabeth. 1985. Police use of force: An empirical analysis. Ph.D. Dissertation.University at Albany, State University of New York.
Durose, Matthew, Erica Smith, and Patrick A. Langan. 2005. Contacts between policeand the public: Findings from the 2002 national survey. Washington, DC: Bureau ofJustice Statistics.
Durose, Matthew, Erica Smith, and Patrick A. Langan. 2007. Contacts between policeand the public, 2005. Washington, DC: Bureau of Justice Statistics.
Edwards, Anne. 2000. Reported use of force by Queensland police: Findings from the1999 Queensland Defendants Survey. Brisbane, Australia: Queensland CriminalJustice Commission.
Engel, Robin. 2000. The effects of supervisory styles on patrol officer behavior.Police Quarterly, 3:262–293.
Engel, Robin and Jennifer Calnon. 2004. Examining the influence of driver’scharacteristics during stops with the police: Results from a national survey. JusticeQuarterly, 21:49–90.
Engel, Robin, James Sobol, and Robert Worden. 2000. Further exploration of thedemeanor hypothesis: The interaction effects of suspects’ characteristics anddemeanor on police behavior. Justice Quarterly, 17:235–258.
Frank, James, Kenneth Novak, and Brad Smith. 2001. Street-level policing inCincinnati: The content of community and traditional policing and the perceptionsof policing agencies. Cincinnati, OH: University of Cincinnati.
Friedrich, Robert. 1980. Police use of force: Individuals, situations, and organizations.The ANNALS of the American Academy of Political and Social Science, 452:82–97.
Fyfe, James. 1978. Shots fired: A typological examination of New York City policefirearms discharges, 1871–1975. Ph.D. Dissertation. School of Criminal Justice,University at Albany, State University of New York.
Fyfe, James. 1988a. Police use of deadly force: Research and reform. JusticeQuarterly, 5:165–207.
Fyfe, James. 1988b. The Metro-Dade Police/Citizen Violence Reduction Project: Finalreport. Washington, DC: Police Foundation.
Fyfe, James. 2002. Too many missing cases: Holes in our knowledge about police useof force. Justice Research and Policy, 4:87–102.

\\server05\productn\C\CPP\7-4\CPP406.txt unknown Seq: 31 29-DEC-08 10:54
POLICE USE OF NONLETHAL FORCE 593
Garner, Joel, John Buchanan, Thomas Schade, John Hepburn, Jeffrey Fagan, andAogan Mulcahy. 1995. Understanding the use of force by and against the police.Newark, NJ: Rutgers University.
Garner, Joel, Christopher Maxwell, and Cedrick Heraux. 2002. Characteristicsassociated with the prevalence and severity of force used by the police. JusticeQuarterly, 19:705–746.
Garner, Joel, Thomas Schade, John Hepburn, and John Buchanan. 1995. Measuringthe continuum of force used by and against the police. Criminal Justice Review,20:146–169.
Geller, William and Kevin Karalas. 1981. Split-second decisions: Shootings of and byChicago police. Chicago, IL: Chicago Law Enforcement Study Group.
Geller, William and Michael Scott. 1992. Deadly force: What we know. Washington,DC: Police Executive Research Forum.
Geller, William and Hans Toch. 1995. Improving our understanding and control ofpolice abuse of force: Recommendations for research and action. In (William A. Gel-ler and Hans Toch, eds.), And justice for all: Understanding and controlling policeabuse of force. Washington, DC: Police Executive Research Forum.
Government Accountability Office. 2007. Bureau of Justice Statistics: Qualityguidelines generally followed for police-public contact surveys, but opportunitiesexist to help assure agency independence (GAO-07-340). Washington, DC: Govern-ment Accountability Office.
Hickey, Edward and Joel Garner. 2002. The rate of force used by the police inMontgomery County, Maryland: A report to the Montgomery County Departmentof the Police and the National Institute of Justice. Shepherdstown, WV: JointCenters for Justice Studies, Inc.
Hickman, Matthew. 2006. Citizen complaints about police use of force. Washington,DC: Bureau of Justice Statistics.
Independent Police Complaints Commission (IPCC). 2008. Deaths during orfollowing police contact: Statistics for England and Wales 2007/08. London, UK:Author.
International Association of Chiefs of Police (IACP). 2001. Police use of force inAmerica 2001. Alexandria, VA: Author.
James, Doris. 2004. Profile of jail inmates, 2002. Washington, DC: Bureau of JusticeStatistics.
James, George. 1991. Police chiefs call for U.S. system to gather data on excessiveforce. New York Times, April 17:A2.
Kaminski, Robert, Clete Digiovanni, and Raymond Downs. 2004. The use of forcebetween the police and persons with impaired judgment. Police Quarterly,7:311–338.
Kane, Robert. 2007. Collect and release data on coercive police actions. Criminology& Public Policy, 6:773–780.
Karch, Debra, Keri Lubell, Jennifer Friday, Nimesh Patel, and Dionne Williams.2008. Surveillance for violent deaths–National Violent Death Reporting System, 16states, 2005. Morbidity and Mortality Weekly Report, April 11.

\\server05\productn\C\CPP\7-4\CPP406.txt unknown Seq: 32 29-DEC-08 10:54
594 HICKMAN ET AL.
Kavanagh, John. 1994. The occurrence of force in arrest encounters. Ph.D.Dissertation. Rutgers University, Newark, NJ.
Klinger, David. 1995. The micro-structure of nonlethal force: Baseline data from anobservational study. Criminal Justice Review, 20:169–186.
Klockars, Carl. 1994. Reducing excessive force: A draft program plan for the NationalInstitute of Justice. Unpublished memorandum.
Klockars, Carl. 1995. A theory of excessive force and its control. In (William A.Geller and Hans Toch, eds.), And justice for all: Understanding and controllingpolice abuse of force. Washington, DC: Police Executive Research Forum.
Langan, Patrick A., Lawrence Greenfeld, Steven Smith, Matthew Durose, and DavidLevin. 2001. Contacts between the police and the public: Findings from the 1999national survey. Washington, DC: Bureau of Justice Statistics.
Lauritsen, Janet L. and Shannan Catalano. 2005. National crime victimizationsurveys. In (Kimberly Kempf-Leonard, ed.), Encyclopedia of social measurement,Vol. 2. Amsterdam, The Netherlands: Elsevier.
Leinfelt, Fredrik. 2005. Predicting use of non-lethal force in a mid-size policedepartment: A longitudinal analysis of the influence of subject and situationalvariables. The Police Journal, 78:285–300.
Lichtblau, Eric. 2005. Profiling report leads to a clash and a demotion. New YorkTimes, August 24:A1.
Lichtenberg, Illya. 2007. Contacts between the police and the public: Three tests ofconvergent validity. Police Practice & Research, 8:47–62.
Lundstrom, Ross and Charles Mullan. 1987. The use of force: One department’sexperience. FBI Law Enforcement Bulletin, 57:6–9.
Manning, Peter. 2003. Policing contingencies. Chicago, IL: University of ChicagoPress.
Marshall, Peter and Ray Shuey. 2001. A strategic evaluation of the New Zealandpolice position concerning the use of force when responding to potentially violentsituations: A review of best practice, policy and training. Wellington: New ZealandPolice.
Mastrofski, Stephan, Jeffrey Snipes, and Anne Supina. 1996. Compliance on demand:The public’s response to specific police request. Journal of Research in Crime andDelinquency, 33:269–305.
Matulia, Kenneth. 1982. A balance of forces: A study of justifiable homicides by thepolice. Gaithersburg, MD: International Association of Chiefs of Police.
Maxfield, Michael. 1999. The national incident-based reporting system: Research andpolicy implications. Journal of Quantitative Criminology, 15:119–149.
Mumola, Christopher. 2007. Arrest-related deaths in the United States, 2003–2005.Washington, DC: Bureau of Justice Statistics.
Paoline, Eugene and William Terrill. 2007. Police education, experience, and the useof force. Criminal Justice and Behavior, 34:179–196.
Pate, Anthony and Lorie Fridell. 1993. Police use of force: Official reports, citizencomplaints, and legal consequences. Washington, DC: Police Foundation.

\\server05\productn\C\CPP\7-4\CPP406.txt unknown Seq: 33 29-DEC-08 10:54
POLICE USE OF NONLETHAL FORCE 595
Pate, Anthony and Lorie Fridell. 1995. Toward the uniform reporting of police use offorce: Results of a national survey. Criminal Justice Review, 20:123–145.
Phillips, Scott, Jacqueline Hagan, and Nestor Rodriguez. 2006. Brutal borders?Examining the treatment of deportees during arrest and detention. Social Forces,85:93–109.
Reaves, Brian. 2007. Census of state and local law enforcement agencies, 2004.Washington, DC: Bureau of Justice Statistics.
Reiss, Albert J. 1980. Controlling police use of deadly force. The ANNALS of theAmerican Academy of Political and Social Science, 452:122–134.
Riksheim, Eric and Steven Chermak. 1993. Causes of police behavior revisited.Journal of Criminal Justice, 21:353–382.
Robin, Gerald. 1963. Justifiable homicide by police officers. Journal of Criminal Law,Criminology, and Police Science, 54:225–231.
Schuck, Amie. 2004. The masking of racial and ethnic disparity in police use ofphysical force: The effects of gender and custody status. Journal of CriminalJustice, 32:557–564.
Schuck, Amie and Cara Rabe-Hemp. 2005. Women police: The use of force by andagainst female officers. Women & Criminal Justice, 16:91–117.
Seattle Police Department. 2001. Use of force by Seattle Police Department officers.Seattle, WA: Author.
Sherman, Lawrence. 1995. The police. In (James Q. Wilson and Joan Petersilia, eds.),Crime. San Francisco, CA: ICS Press.
Sherman, Lawrence and Ellen Cohn. 1984. Citizens killed by big city police,1974–1984. Washington, DC: Crime Control Institute.
Sherman, Lawrence and Robert Langworthy. 1979. Measuring homicide by policeofficers. Journal of Criminal Law and Criminology, 70:546–560.
Skogan, Wesley and Kathleen Frydl. 2004. Fairness and effectiveness in policing: Theevidence. Washington, DC: National Academy Press.
Smith, Douglas. 1986. The neighborhood context of police behavior. In (Albert J.Reiss and Michael H. Tonry, eds.), Communities and crime, Vol. 8. Chicago, IL:University of Chicago Press.
Terrill, William. 2003a. Police use of force and suspect resistance: The micro-processof the police-suspect encounter. Police Quarterly, 6:51–83.
Terrill, William. 2003b. City of San Antonio, Texas police department use of forceanalysis July 1, 2001–December 31, 2002. San Antonio, TX: San Antonio PoliceDepartment.
Terrill, William and Stephen Mastrofski. 2002. Situational and officer baseddeterminants of police coercion. Justice Quarterly, 19:215–248.
Terrill, William, Fredrik Leinfelt, and Dae-Hoon Kwak. 2008. Examining police useof force: A smaller agency perspective. Policing: An International Journal of PoliceStrategies and Management, 31:57–76.
Terrill, William and Michael D. Reisig. 2003. Neighborhood context and police use offorce. Journal of Research in Crime and Delinquency, 40:291–321.

\\server05\productn\C\CPP\7-4\CPP406.txt unknown Seq: 34 29-DEC-08 10:54
596 HICKMAN ET AL.
U.S. Department of Justice, Bureau of Justice Statistics. 2005. Police-Public ContactSurvey, 2002. Ann Arbor, MI: Inter-University Consortium for Political and SocialResearch.
U.S. Department of Justice, Bureau of Justice Statistics. 2006. Survey of inmates inlocal jails, 2002. Ann Arbor, MI: Inter-University Consortium for Political andSocial Research.
U.S. Department of Justice, Federal Bureau of Investigation. 2003. Crime in theUnited States 2002. Washington, DC: Government Printing Office.
Weisburd, David and Anthony A. Braga. 2006. Police innovation: Contrastingperspectives. Cambridge, UK: Cambridge University Press.
Williams, Jimmy and Gary Hester. 2003. Sheriff law enforcement officers and the useof force. Journal of Criminal Justice, 31:373–381.
Worden, Robert. 1995. The “causes” of police brutality: Theory and evidence onpolice use of force. In (William A. Geller and Hans Toch, eds.), And justice for all:Understanding and controlling police abuse of force. Washington, DC: PoliceExecutive Research Forum.
Matthew J. Hickman is an assistant professor in the Department of Criminal Justiceat Seattle University. His general research interests include policing, criminological the-ory, and quantitative research methods. He received his doctoral degree from TempleUniversity.
Alex R. Piquero is a professor in the Department of Criminology & Criminal Justiceand faculty associate of the Maryland Population Research Center at the University ofMaryland College Park. He is also a member of the MacArthur Foundation’s ResearchNetwork on Adolescent Development & Juvenile Justice, an executive counselor withthe American Society of Criminology, and coeditor of the Journal of QuantitativeCriminology. His research interests include criminal careers, criminological theory, andquantitative research methods.
Joel H. Garner is the director of research at the Joint Centers for Justice Studies, Inc.His primary research interests are the effectiveness of criminal justice responses to inti-mate partner violence, police use of force, racial profiling, and methods of researchsynthesis. He received his doctoral degree in political science from The George Wash-ington University.

\\server05\productn\C\CPP\7-4\CPP406.txt unknown Seq: 35 29-DEC-08 10:54
POLICE USE OF NONLETHAL FORCE 597
App
endi
x A
. M
easu
ring
Pol
ice
Use
of
Forc
e ov
er t
he P
ast
Qua
rter
Cen
tury
Bas
eA
utho
r(s)
Sam
ple
Ope
rati
onal
def
init
ion
of p
olic
e us
e of
for
ceFo
rce
cate
gori
esra
te
1,09
1 po
lice-
publ
ic e
ncou
nter
s in
hig
h cr
ime
No
deta
ils p
rovi
ded
exce
pt t
hat
exce
ssiv
epr
ecin
cts
in C
hica
go,
Bos
ton,
and
Was
hing
-fo
rce
was
det
erm
ined
by
judg
men
t of
No
forc
e94
.9%
Frie
dric
h (1
980)
ton,
DC
, in
the
Sum
mer
of
1966
obse
rver
s.E
xces
sive
for
ce5.
1%
“Any
com
puls
ion
by a
pol
ice
offi
cer,
2,39
7 us
e-of
-for
ce r
epor
ts o
ut o
f 12
3,49
1th
roug
h us
e of
phy
sica
l po
wer
, ch
emic
alN
o fo
rce
98.1
%C
roft
(19
85)
arre
sts
in R
oche
ster
fro
m 1
973
to 1
979
mac
e, o
r w
eapo
n.”
Forc
e1.
9%
762
non-
dang
erou
s su
spec
t en
coun
ters
in
60ne
ighb
orho
ods
in R
oche
ster
, St
. L
ouis
, an
dPo
lice
use
forc
e or
thr
eate
n a
susp
ect
wit
hN
o co
erci
on70
.0%
Smit
h (1
986)
Tam
pa/S
t. P
eter
sbur
g, S
umm
er o
f 19
77ar
rest
, su
rvei
llanc
e, o
r ph
ysic
al h
arm
.C
oerc
ion
30.0
%
Lun
dstr
om a
nd M
ul-
11,9
89 c
usto
dy i
ncid
ents
in
St.
Pau
l fr
omA
ny p
olic
e w
eapo
n us
ed i
n an
arr
est,
incl
ud-
No
forc
e85
.4%
lan
(198
7)M
arch
198
5 th
roug
h Fe
brua
ry 1
986
ing
“fis
t or
han
d.”
Forc
e14
.6%
Cat
egor
ies
in c
odeb
ook
incl
ude
firm
voi
ceco
mm
and,
fir
m g
rip,
pai
n co
mpl
ianc
e, b
aton
,N
o fo
rce
2,14
2 po
tent
ially
vio
lent
enc
ount
ers
in t
hree
punc
hing
or
hitt
ing,
nec
k ho
ld,
draw
ing
orFi
rm g
rip
or88
.0%
Fyf
e (1
988b
)di
stri
cts
in D
ade
Cou
nty
from
198
5 to
198
6di
spla
ying
wea
pon,
fir
ing
wea
pon.
mor
e12
.0%
Bay
ley
and
Gar
ofal
o46
7 po
tent
ially
vio
lent
mob
iliza
tion
s in
New
The
for
ce u
sed
by p
olic
e co
nsis
ted
alm
ost
No
forc
e92
.1%
(198
9)Y
ork
Cit
y in
the
Sum
mer
of
1986
excl
usiv
ely
of g
rabb
ing
and
rest
rain
ing.
Phy
sica
l fo
rce
7.9%
Off
icer
s us
e fo
rce
whe
n on
e of
the
arr
est
1,51
2 ar
rest
s in
New
Yor
k B
us T
erm
inal
for
char
ges
invo
lves
the
sus
pect
“re
sist
ing
Oth
er c
harg
es82
.8%
Kav
anag
h (1
994)
1 ye
ar b
egin
ning
Jul
y 19
90ar
rest
.”R
esis
ting
arr
est
17.2
%
Gar
ner,
Buc
hana
n et
Phy
sica
l fo
rce
invo
lves
use
of
seve
real
. (1
995)
[Po
lice
1,58
5 ad
ult
cust
ody
arre
sts
in P
hoen
ix d
urin
gre
stra
ints
, an
y w
eapo
nles
s ta
ctic
, or
any
No
forc
e78
.0%
Surv
eys]
2 w
eeks
in
June
199
4w
eapo
n.P
hysi
cal
forc
e22
.0%

\\server05\productn\C\CPP\7-4\CPP406.txt unknown Seq: 36 29-DEC-08 10:54
598 HICKMAN ET AL.
Gar
ner,
Buc
hana
n et
Phy
sica
l fo
rce
invo
lves
use
of
seve
real
. (1
995)
[Su
spec
t18
5 ad
ult
susp
ects
arr
este
d in
Pho
enix
dur
-re
stra
ints
, an
y w
eapo
nles
s ta
ctic
, or
any
No
forc
e79
.5%
Inte
rvie
ws]
ing
2 w
eeks
in
June
199
4w
eapo
n.P
hysi
cal
forc
e20
.5%
No
forc
e59
.8%
241
non-
traf
fic
disp
utes
in
thre
e di
stri
cts
ofE
xam
ples
inc
lude
d ar
e fi
rm g
rip,
pai
n ho
ld,
Voi
ce c
omm
and
23.2
%K
linge
r (1
995)
Dad
e C
ount
y in
198
5 an
d 19
86ch
oke
hold
, ba
ton,
hit
, or
kic
k.P
hysi
cal
forc
e17
.0%
Rea
sona
ble
forc
e en
com
pass
es “
inst
ance
sw
here
the
off
icer
is
atte
mpt
ing
to m
ake
aci
tize
n co
me
wit
h hi
m,
or i
s at
tem
ptin
g to
1,52
8 su
spec
t en
coun
ters
in
60 n
eigh
bor-
sepa
rate
cit
izen
s w
ho a
re f
ight
ing
or s
imila
rN
o fo
rce
96.1
%ho
ods
in R
oche
ster
, St
. L
ouis
, an
d Ta
mpa
/ac
ts.”
Exc
essi
ve f
orce
enc
ompa
sses
Rea
sona
ble
forc
e2.
4%W
orde
n (1
995)
St.
Pet
ersb
urg,
Sum
mer
of
1977
“ins
tanc
es w
here
the
off
icer
is
kick
ing
ass.
”Im
prop
er f
orce
1.5%
Mas
trof
ski
et a
l.34
6 re
ques
ts f
or c
ompl
ianc
e in
1,6
27 p
olic
eFo
rcef
ul i
nter
vent
ions
inv
olve
a s
earc
h,N
o fo
rce
94.8
%(1
996)
citi
zen
enco
unte
rs i
n R
ichm
ond,
VA
, in
199
2ph
ysic
al f
orce
, or
bra
ndis
hing
a w
eapo
n.Fo
rce
5.2%
Res
pond
ents
ask
whe
ther
“po
lice
used
for
ceto
war
d th
em”
or w
heth
er “
any
rest
rain
t ha
dbe
en u
sed
by p
olic
e.”
Forc
e in
clud
es g
ener
alst
rugg
le,
open
han
d, t
wis
t ar
m o
r w
rist
,cl
osed
fis
t, ki
cked
, el
bow
ed,
knee
d, a
nd u
se1,
005
defe
ndan
ts i
n si
x m
agis
trat
e co
urts
of i
mpl
emen
t, ba
ton,
or
dog.
Tig
ht h
andc
uffs
No
forc
e80
.0%
Edw
ards
(20
00)
duri
ng 1
999
in Q
ueen
slan
d, A
ustr
alia
coun
ted
as u
se o
f fo
rce.
Forc
e20
.0%
Forc
e m
easu
red
as d
icho
tom
ous
vari
able
and
incl
udes
ins
tanc
es i
n w
hich
(1)
an
offi
cer
hit
or s
wun
g at
sus
pect
wit
h a
wea
pon
that
was
not
a gu
n, (
2) u
sed
forc
e to
mak
e th
e1,
506
non-
traf
fic
susp
ects
in
Roc
hest
er,
St.
susp
ect
com
e al
ong,
or
(3)
phys
ical
for
ceN
o fo
rce
96.6
%E
ngel
et
al.
(200
0)L
ouis
, an
d St
. P
eter
sbur
g in
197
7th
at i
nvol
ved
mor
e th
an h
andc
uffi
ng.
Forc
e3.
4%

\\server05\productn\C\CPP\7-4\CPP406.txt unknown Seq: 37 29-DEC-08 10:54
POLICE USE OF NONLETHAL FORCE 599
Forc
e m
easu
re i
nclu
des
firm
gri
p or
non
pain
rest
rain
t, pa
in c
ompl
ianc
e (h
amm
erlo
ck,
wri
stlo
ck,
fing
er g
rip,
car
otid
con
trol
, ba
r1,
509
non-
traf
fic
susp
ects
in
high
cri
me
arm
loc
k),
impa
ct o
r in
capa
cita
tion
met
hods
prec
inct
s in
St.
Pet
ersb
urg
(Sum
mer
199
7)(s
trik
ing
wit
h bo
dy o
r w
eapo
n, m
ace,
tas
er),
No
forc
e91
.0%
Eng
el (
2000
)an
d In
dian
apol
is (
Sum
mer
199
6)or
dra
win
g or
dis
char
ging
a f
irea
rm.
Forc
e9.
0%
Use
of
firm
gri
p, h
andc
uffi
ng,
pain
com
pli-
1,43
1 po
lice-
citi
zen
enco
unte
rs i
n C
inci
nnat
ian
ce t
echn
ique
s, o
r w
eapo
n di
spla
y or
dis
-N
o fo
rce
90.5
%Fr
ank
et a
l. (2
001)
betw
een
Apr
il 1,
199
7 an
d A
pril
30,
1998
char
ge.
Forc
e9.
5%
Def
ines
for
ce a
s “t
hat
amou
nt o
f ef
fort
24,2
71 u
se-o
f-fo
rce
inci
dent
s fr
om 2
38 j
uris
-re
quir
ed b
y po
lice
to c
ompe
l co
mpl
ianc
eN
o fo
rce
99.9
%IA
CP
(20
01)
dict
ions
, 19
95–2
000
from
an
unw
illin
g su
bjec
t.”Fo
rce
.1%
Res
pond
ents
ask
ed i
f th
e po
lice
“use
d or
16,2
59 s
uspe
ct c
onta
cts
in 1
999
Nat
iona
lth
reat
ened
to
use
phys
ical
for
ce a
gain
stN
o fo
rce
99.2
%L
anga
n et
al.
(200
1)C
rim
e V
icti
miz
atio
n Su
rvey
them
.” C
odes
inc
lude
“po
inte
d a
gun.
”Fo
rce
.8%
Com
plet
ion
of a
use
-of-
forc
e fo
rm;
exam
ples
Seat
tle
Polic
e D
epar
t-29
,000
arr
ests
by
Seat
tle
Polic
e D
epar
tmen
tra
nge
from
use
of
hand
s to
dis
char
ging
aN
o fo
rce
97.9
%m
ent
(200
1)du
ring
200
0fi
rear
m.
Forc
e2.
1%
Phy
sica
l fo
rce
invo
lves
use
of
seve
re7,
512
adul
t cu
stod
y ar
rest
s in
six
lar
gere
stra
ints
, an
y w
eapo
nles
s ta
ctic
, or
any
No
forc
e82
.9%
Gar
ner
et a
l. (2
002)
juri
sdic
tion
s du
ring
199
7 an
d 19
98w
eapo
n.Fo
rce
17.1
%
Use
of
wea
ponl
ess
tact
ics
or a
ny w
eapo
n,H
icke
y an
d G
arne
r30
,209
adu
lt c
usto
dy a
rres
ts i
n M
ontg
omer
yw
hich
inc
lude
s a
vehi
cle,
inc
lude
d on
dep
art-
No
forc
e93
.6%
(200
2)C
ount
y, M
D,
from
199
3 to
199
9m
enta
l us
e-of
-for
ce f
orm
.Fo
rce
6.4%

\\server05\productn\C\CPP\7-4\CPP406.txt unknown Seq: 38 29-DEC-08 10:54
600 HICKMAN ET AL.
Forc
e m
easu
red
alon
g a
“con
tinu
um”
that
rang
ed f
rom
lea
st t
o m
ost
harm
to
susp
ect.
Ten
cate
gori
es r
anke
d in
the
fol
low
ing
man
-ne
r: n
one,
com
man
ds,
thre
ats,
pat
dow
ns,
hand
cuff
ing,
fir
m g
rip,
pai
n co
mpl
ianc
e te
ch-
No
forc
e41
.6%
3,11
6 su
spec
t/di
sput
ant
enco
unte
rs i
n hi
ghni
ques
, ta
kedo
wn
man
euve
rs,
stri
kes
wit
hV
erba
l fo
rce
37.4
%Te
rrill
and
Mas
trof
ski
crim
e pr
ecin
cts
in S
t. P
eter
sbur
g (S
umm
erth
e bo
dy,
and
stri
kes
wit
h ex
tern
al m
echa
-R
estr
aint
18.9
%(2
002)
1997
) an
d In
dian
apol
is (
Sum
mer
199
6)ni
sms.
Impa
ct2.
1%
Phy
sica
l fo
rce
invo
lves
a f
irm
gri
p, h
andc
uff-
3,54
4 po
lice
susp
ect
enco
unte
rs i
n hi
gh-
ing,
pai
n co
mpl
ianc
e te
chni
ques
, ta
kedo
wn
crim
e pr
ecin
cts
in S
t. P
eter
sbur
g (S
umm
erm
aneu
vers
, st
rike
s w
ith
hand
s, f
ist
and
No
forc
e79
.0%
Terr
ill (
2003
a)19
97)
and
Indi
anap
olis
(Su
mm
er 1
996)
equi
pmen
t.P
hysi
cal
forc
e21
.0%
Act
ions
tha
t tr
igge
r th
e fi
ling
of a
use
-of-
forc
e fo
rm i
nvol
ve f
orce
abo
ve a
nd b
eyon
d54
,250
arr
ests
in
San
Ant
onio
, T
X,
duri
ngop
en/e
mpt
y ha
nd c
ontr
ol t
echn
ique
s. H
and-
No
forc
e98
.2%
Terr
ill (
2003
b)20
01 a
nd t
he f
irst
hal
f of
200
2cu
ffin
g is
exc
lude
d.P
hysi
cal
forc
e1.
8%
Act
s th
at t
hrea
ten
or i
nflic
t ph
ysic
al h
arm
on s
uspe
cts,
whi
ch i
nclu
de c
omm
and,
No
forc
e42
.0%
3,33
3 po
lice
susp
ect
enco
unte
rs w
ithi
n 80
thre
ats,
pat
dow
ns,
hand
cuff
ing,
fir
m g
rips
,V
erba
l fo
rce
37.0
%Te
rrill
and
Rei
sig
neig
hbor
hood
s in
St.
Pet
ersb
urg
(Sum
mer
pain
com
plia
nce
tech
niqu
es,
stri
kes
wit
h th
eR
estr
aint
s19
.0%
(200
3)19
97)
and
Indi
anap
olis
(Su
mm
er 1
996)
body
, an
d st
rike
s w
ith
exte
rnal
mec
hani
sms.
Impa
ct2.
0%
13,3
07 a
rres
ts i
n Po
lk C
ount
y, F
L S
heri
ff’s
Exi
sten
ce o
f a
prot
ecti
ve a
ctio
n re
port
.N
o fo
rce
99.1
%O
ffic
e du
ring
199
9E
xam
ples
of
forc
e in
clud
ed u
se o
f th
e ha
nd,
Forc
e.9
%W
illia
ms
and
Hes
ter
226,
911
polic
e-ci
tize
n en
coun
ters
in
Polk
chem
ical
age
nts,
can
ines
, le
g re
stra
ints
, an
dN
o fo
rce
99.9
%(2
003)
Cou
nty,
FL
She
riff
’s O
ffic
e du
ring
199
9im
pact
wea
pons
.Fo
rce
.1%
Forc
e is
def
ined
as
the
use
of a
ny p
hysi
cal
103
polic
e st
ops
obse
rved
in
Sava
nnah
, G
A,
coer
cion
and
inc
lude
s su
ch t
acti
cs a
s “c
ome
betw
een
Apr
il 1,
200
2 an
d N
ovem
ber
30,
alon
g ho
lds”
and
the
use
of
pres
sure
poi
nts
No
forc
e95
.2%
Alp
ert
et a
l. (2
004)
2002
but
not
the
use
of h
andc
uffs
.Fo
rce
4.9%

\\server05\productn\C\CPP\7-4\CPP406.txt unknown Seq: 39 29-DEC-08 10:54
POLICE USE OF NONLETHAL FORCE 601
Forc
e de
fine
d as
gre
ater
tha
n a
firm
gri
p2,
049
non-
traf
fic
arre
sts
in a
lar
ge s
outh
east
-in
clud
es o
pen-
hand
tec
hniq
ues,
pun
chin
g,er
n m
unic
ipal
pol
ice
depa
rtm
ent
from
pepp
er s
pray
, us
e of
bat
ons,
nec
k re
stra
ints
,N
o fo
rce
88.5
%K
amin
ski
et a
l. (2
004)
Aug
ust
2000
thr
ough
Feb
ruar
y 20
01ca
nine
s, a
nd p
oint
ing
a fi
rear
m.
Forc
e11
.5%
Phy
sica
l fo
rce
was
def
ined
as
any
arre
st i
nw
hich
the
off
icer
use
d a
seve
re r
estr
aint
, a
1,35
7 ad
ult
arre
sts
in P
hoen
ix,
AZ
, du
ring
2w
eapo
nles
s ta
ctic
, th
reat
ened
the
use
of
aN
o fo
rce
75.6
%Sc
huck
(20
04)
wee
ks i
n Ju
ne 1
994
wea
pon,
or
used
a w
eapo
n.P
hysi
cal
forc
e24
.4%
Res
pond
ents
ask
whe
ther
the
pol
ice
“use
d45
.3 m
illio
n po
lice
publ
ic c
onta
cts
in 2
002
or t
hrea
tene
d to
use
phy
sica
l fo
rce
agai
nst
No
forc
e98
.5%
Dur
ose
et a
l. (2
005)
Nat
iona
l C
rim
e V
icti
miz
atio
n Su
rvey
them
.”Fo
rce
1.5%
3,67
3 po
lice-
citi
zen
enco
unte
rs t
hat
gene
r-at
ed a
use
-of-
forc
e fo
rm i
n a
mid
wes
tern
juri
sdic
tion
dur
ing
Oct
ober
200
1 to
Dec
em-
Han
dcuf
fing
cou
nted
as
no f
orce
. Fo
rce
No
forc
e77
.6%
Lei
nfel
t (2
005)
ber
2003
defi
ned
as t
he p
rese
nce
of a
ny o
ther
for
ce.
Forc
e22
.4%
The
use
of
phys
ical
for
ce f
or t
he p
olic
ein
clud
ed p
olic
e be
havi
ors
such
as
the
use
ofa
seve
re r
estr
aint
(e.
g.,
pron
e cu
ff,
hobb
le,
or b
ody
cuff
), t
he u
se o
f an
y w
eapo
nles
sta
ctic
(e.
g.,
grab
cit
izen
, pr
essu
re h
old,
or
cont
rol
hold
), o
r th
e us
e of
a w
eapo
n (e
.g.,
flas
hlig
ht,
bato
n or
han
dgun
). T
he d
efin
itio
n4,
000
adul
t cu
stod
y ar
rest
s in
Cha
rlot
te,
of u
se o
f ph
ysic
al f
orce
doe
s no
t in
clud
eSc
huck
and
Rab
e-C
olor
ado
Spri
ngs,
Dal
las,
and
St.
Pet
ersb
urg
thre
ats
of p
hysi
cal
forc
e or
dis
play
s of
aN
o fo
rce
81.1
%H
emp
(200
5)du
ring
199
7 an
d 19
98w
eapo
n.Fo
rce
18.9
%
Forc
e m
easu
red
as h
it,
punc
h, s
lap,
kic
k30
0 ar
rest
s by
U.S
. Im
mig
rati
on S
ervi
ce a
ndho
ve,
thro
wn
to g
roun
d, o
r hi
t w
ith
pepp
erN
o fo
rce
80.0
%P
hilli
ps e
t al
. (2
006)
depo
rted
to
El
Salv
ador
, 19
99 t
hrou
gh 2
002
spra
y or
stu
n gu
n.Fo
rce
20.0
%
Res
pond
ents
ask
if
the
polic
e “u
sed
or43
.5 m
illio
n po
lice
publ
ic c
onta
cts
in 2
005
thre
aten
ed t
o us
e ph
ysic
al f
orce
aga
inst
No
forc
e98
.4%
Dur
ose
et a
l. (2
007)
Nat
iona
l C
rim
e V
icti
miz
atio
n Su
rvey
them
.”Fo
rce
1.6%

\\server05\productn\C\CPP\7-4\CPP406.txt unknown Seq: 40 29-DEC-08 10:54
602 HICKMAN ET AL.
Forc
e is
def
ined
as
“act
s th
at t
hrea
ten
orin
flic
t ph
ysic
al h
arm
on
citi
zens
.” V
erba
lfo
rce
invo
lved
ord
ers
or a
com
man
d fo
l-lo
wed
by
a st
atem
ent
of c
onse
quen
ces
for
not
com
plyi
ng.
Phy
sica
l fo
rce
incl
udes
any
phys
ical
res
trai
nt,
pat
dow
ns s
earc
hes,
fir
m3,
356
polic
e su
spec
t en
coun
ters
in
high
grip
s, h
andc
uffi
ng,
pain
com
plia
nce
tech
-N
o fo
rce
42.0
%P
aolin
e an
d Te
rrill
crim
e pr
ecin
cts
in S
t. P
eter
sbur
g (S
umm
erni
ques
, ta
kedo
wn
man
euve
rs,
or i
mpa
ctV
erba
l fo
rce
37.1
%(2
007)
1997
) an
d In
dian
apol
is (
Sum
mer
199
6)m
etho
ds.
Phy
sica
l fo
rce
20.8
%
3,26
4 ci
tize
n su
spec
t en
coun
ters
res
ulti
ng i
nH
andc
uffi
ng c
ount
ed a
s no
for
ce.
Exa
mpl
esan
arr
est
and
a us
e-of
-for
ce f
orm
in
aof
for
ce i
nclu
de m
uscl
ing,
arm
bar
, ta
ser,
No
forc
e82
.0%
Terr
ill e
t al
. (2
008)
mid
wes
tern
jur
isdi
ctio
n, 2
002
thro
ugh
2004
and
wea
pon
use.
Forc
e18
.0%

\\server05\productn\C\CPP\7-4\CPP406.txt unknown Seq: 41 29-DEC-08 10:54
POLICE USE OF NONLETHAL FORCE 603
Appendix B. Force Items in the 2002 PPCS and 2002 SILJ
2002 PPCS
3a. Did you have any contact with a police officer during the last 12months, that is, any time since [DATE] Y/N (N ends interview)
3b. Were any of these contacts with a police officer in person, that is, face-to-face? Y/N (N ends interview)
3c. Did you have more than one face-to-face contact? Y/N (N skips 3d)
3d. How many face-to-face contacts with a police officer did you have dur-ing the last 12 months?
For the rest of the interview, please tell me ONLY about the most recentface-to-face contact you had with the police.
4. Was this contact initiated by the police? Y/N/DK
5a. During this contact, did the police USE or THREATEN TO USEforce against you for any reason? Y/N/DK (N and DK skip to 6)
5b. Did the police officer(s) . . . Actually push or grab you? Actually kickor hit you? Actually point a gun at you? Use or threaten to use any otherforce against you? (specify)
5c. Do you feel any of the force used or threatened against you was exces-sive? Y/N (N skips to 5e)
5d. What force was excessive? (describe)
5e. Were you injured as a result of any force used against you? Y/N
6. During this contact were you arrested? Y/N/DK
7. During this contact were you handcuffed? Y/N/DK
8. At any time during this contact, did you argue with, curse at, insult, orverbally threaten the police? Y/N/DK
9. At any time during this contact, did you . . . Disobey or interfere withthe officer(s)? Try to get away? Push, grab, or hit the officer(s)? Resistbeing handcuffed, arrested, or searched? Physically do anything else?(specify) None of the above

\\server05\productn\C\CPP\7-4\CPP406.txt unknown Seq: 42 29-DEC-08 10:54
604 HICKMAN ET AL.
2002 SILJ
19a. The next few questions are about contact you may have had withpolice at the time of your arrest on [DATE] for [OFFENSE]. At the timeof your arrest, how many police officers were present?
19b. At the time of your arrest on [DATE], did the police officer(s) searchyou, frisk you, or pat you down? (Y/N)
19c. Did the police officer(s) find any of the following items on or nearyou? Illegal weapons; Illegal drugs; Open containers of alcohol, such asbeer or liquor; Stolen property; Other evidence of a crime (specify); None
19d. When you were arrested, were you handcuffed? Y/N
19e. If 19d=Y, Display “Aside from being handcuffed,” Did the policeofficer(s) for any reason use or threaten to use physical force against you,such as grabbing you or threatening to hit you? Y/N (N skips to 19i)
19f. At the time of your arrest did the police officer(s) . . . Push or grabyou; kick you or hit you with their hand or something held in their hand;unleash a police dog that bit you; spray you with a chemical or pepperspray; point a gun at you but not shoot; fire a gun at you; Use some otherform of physical force (specify) Y/N (If all “No” skip to 19i)
19g. Were you injured as a result of (insert responses to 19f)? Y/N (N skipsto 19i)
19h. Did your injuries include . . . Gunshot wound? Broken bones or teethknocked out? Internal injuries? Bruises, black eyes, cuts, scratches,sprains, or swelling? Any other injuries (specify) Y/N
19i. At any time during the arrest, did you . . .Argue with or disobey thepolice officer(s)? Curse at, insult, or call the police officer(s) a name? Saysomething threatening to the police officer(s)? Resist being handcuffed orarrested? Resist being searched or having the vehicle searched? Try toescape by hiding, running away, or engaging in a high-speed chase? Grab,hit, or fight with the police officer(s)? Use a weapon to threaten the policeofficer(s)? Use a weapon to assault the police officer(s)? Y/N


