Embed Size (px)
Citation preview

Tomography of the westernmost Ryukyu subduction zone
and the serpentinization of the fore-arc mantle
Han-Chiang Chou,1,2 Ban-Yuan Kuo,3 Ling-Yun Chiao,4 Dapeng Zhao,5
and Shu-Huei Hung1
Received 3 November 2008; revised 23 July 2009; accepted 5 August 2009; published 1 December 2009.
[1] Three-dimensional tomographic images of the subducting Philippine Sea slab and thefore-arc mantle beneath NE Taiwan and the westernmost Ryukyu were generated in thisstudy. More than 5600 events recorded simultaneously by seismic networks in Taiwanand Japan were relocated for the inversion for variations in VP, VS, and VP/VS. Analysis ofthe trade-off between the data variance reduction and model variance helps to determinethe appropriate strictness for regularization to avoid either overinterpretatioin orunderinterpretation of data. The regularization parameters were also chosen to ensuresuppression of artificial VP/VS anomalies. The subducting slab is characterized by high VP,high VS, and intermediate to low VP/VS. Notable in the mantle wedge is the high VP/VS
anomalies that abut the surface of the subducting slab at depths of 30–80 km. The previouslyidentified positive VP/VS channel connecting the slab and the arc volcano interpreted to be amelt pathway is not reproduced in this study. We convert VS and VP/VS to perturbationsof temperature and serpentinization of the mantle. The slab is cooled by 200�C–400�Crelative to the mantle, in accord with the estimates from theoretical modeling of subduction.The serpentinization reaches �15%, or 2% water content, at 50 km depth in the fore-arcmantle. We interpret the peak serpentinization as hydrated by the water released from thebasalt-eclogite metamorphic reaction in the oceanic crust of the subducting Philippine SeaPlate. The spatial limitation of the present seismic networks in this region with respect tosubduction zone events hinders a full description of the pattern of melting in much of themantle wedge. Resolution tests of the tomographic inversion provide a basis to guideour interpretation to better resolved regions.
Citation: Chou, H.-C., B.-Y. Kuo, L.-Y. Chiao, D. Zhao, and S.-H. Hung (2009), Tomography of the westernmost Ryukyu
subduction zone and the serpentinization of the fore-arc mantle, J. Geophys. Res., 114, B12301, doi:10.1029/2008JB006192.
1. Introduction
[2] The Philippine Sea Plate (PSP) is subducting obliquelybeneath the Eurasian Plate along the Ryukyu trench with thewestern end underlying the island of Taiwan. This frameworkdictates the tectonics of the region. Not only has the PSPmotion brought about the collision between the Luzon arcand the Asian continent [e.g., Teng, 1990], but also thesubduction has nurtured the initiation of the Okinawa trough(OT) [e.g., Lee et al., 1980; Sibuet et al., 1987]. This nascentback-arc opening, in turn, is propagating westward into theNE corner of Taiwan, or the Yilan plain [Yeh et al., 1989;Sibuet et al., 1998] and interacting with the arc-continentcollision in shaping the geology and landscape of northernTaiwan. The collision component of the oblique subductionputs the PSP subducting slab (thereby the Ryukyu slab) under
an E-W compression state at lithospheric depths as mani-fested by earthquake focal mechanisms [Kao et al., 1998].Using data from both the Taiwan Central Weather Bureau(CWB) network and the Japan Meteorological Agency(JMA) network, Chou et al. [2006] relocated thousands ofearthquakes and delineate the double seismic zone in theRyukyu slab from Taiwan 200 km to the east. Theseauthors also quantified the mode of deformation of theslab with folding of a viscoelastic plate under the horizontalcompression.[3] One of the most important elements of a subduction
zone-mantle wedge system is the active volcanic front (VF)directly linked to the ongoing subduction process. At thenortheastern end of the Ryukyu arc, the present-day VF canbe clearly defined by tracing the active volcanoes in southernKyushu, Japan, southwestward, below which the Wadati-Benioff zone (WBZ) reaches about 100 km depth. The spatialcharacter of these volcanoes is consistent with the mantle-wedge dynamic and petrological paradigm [Tatsumi andEggins, 1995]. However, the definition of the active VF inthe westernmost Ryukyu arc is not obvious. The islands ofIriomote and Ishigaki, where JMA stations are located, arepresently inactive and are only 60 km above the WBZ [e.g.,
JOURNAL OF GEOPHYSICAL RESEARCH, VOL. 114, B12301, doi:10.1029/2008JB006192, 2009ClickHere
for
FullArticle
1Institute of Geosciences, National Taiwan University, Taipei, Taiwan.2Also at National Cing-Shuei Senior High School, Taichung, Taiwan.3Institute of Earth Sciences, Academia Sinica, Taipei, Taiwan.4Institute of Oceanography, National Taiwan University, Taipei, Taiwan.5Department of Geophysics, Tohoku University, Sendai, Japan.
Copyright 2009 by the American Geophysical Union.0148-0227/09/2008JB006192$09.00
B12301 1 of 13
Shinjo, 1999]. The present, active VF may lie along a clusterof submerged volcanoes north of these islands, underlain bythe Ryukyu slab below�100 km,with geochemical signaturesaffiliated with subduction [Chung et al., 2000; Shinjo, 1999](Figure 1). This VF lies mostly south of the axis of theOT, butmergeswith it when tracked westward toKueishantao (KST),a 7 ka old andesitic volcano island�10 km offshore from thecoast of the Yilan plain [e.g., Chung et al., 2000; Chu, 2005].The location of the VF is a critical reference in interpretingthe tomographic images of the Ryukyu mantle wedge.[4] This study utilized the CWB-JMA traveltime data with
events relocated by Chou et al. [2006] to image the slab and
the mantle wedge using 3-D seismic tomography. Unlike inJapan where hundreds of land stations are favorably distrib-uted above the subduction zone, most of the westernmostRyukyu slab lie to the east of the high-density Taiwan net-work and is covered only by the JMA stations aligned alongthe Ryukyu arc. This event-station geometry is therefore notoverly favorable for imaging the mantle wedge north of thearc. Nonetheless, the joint network approach offers signifi-cant advantages regarding offshore areas of Taiwan rela-tive to previous efforts based on CWB alone. The Ryukyusubduction zone beneath northern Taiwan was first imagedwith reasonably fidelity by Rau andWu [1995]. Recently, Lin
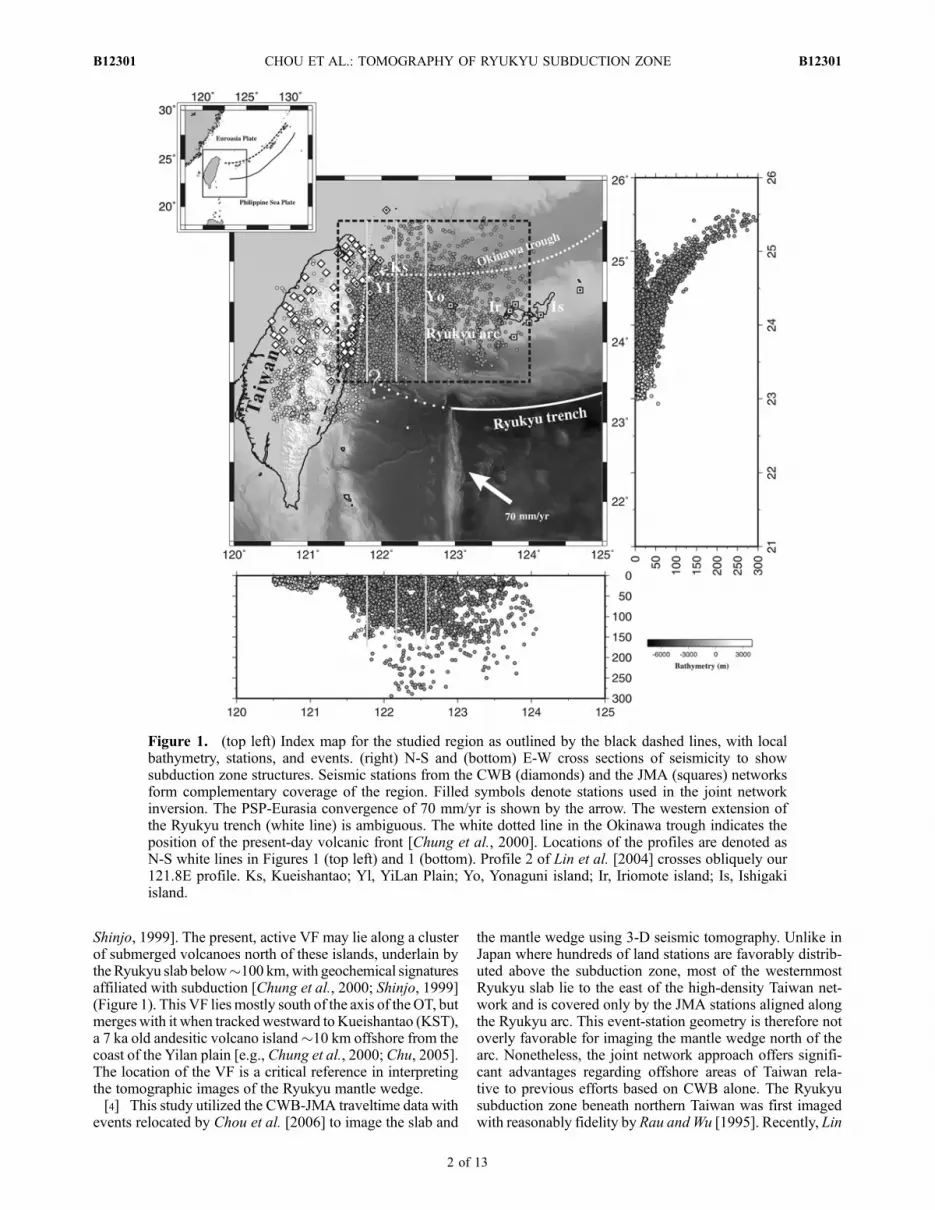
Figure 1. (top left) Index map for the studied region as outlined by the black dashed lines, with localbathymetry, stations, and events. (right) N-S and (bottom) E-W cross sections of seismicity to showsubduction zone structures. Seismic stations from the CWB (diamonds) and the JMA (squares) networksform complementary coverage of the region. Filled symbols denote stations used in the joint networkinversion. The PSP-Eurasia convergence of 70 mm/yr is shown by the arrow. The western extension ofthe Ryukyu trench (white line) is ambiguous. The white dotted line in the Okinawa trough indicates theposition of the present-day volcanic front [Chung et al., 2000]. Locations of the profiles are denoted asN-S white lines in Figures 1 (top left) and 1 (bottom). Profile 2 of Lin et al. [2004] crosses obliquely our121.8E profile. Ks, Kueishantao; Yl, YiLan Plain; Yo, Yonaguni island; Ir, Iriomote island; Is, Ishigakiisland.
B12301 CHOU ET AL.: TOMOGRAPHY OF RYUKYU SUBDUCTION ZONE
2 of 13
B12301
et al. [2004] provided a new model for NE Taiwan usingCWB data, while we show in this paper that a joint networkapproach, despite its uneven aperture toward the east, is help-ful to better constrain the structure beneath the margin ofthe Taiwan network. In a follow-up effort, Lin et al. [2007]extended their model to offshore 124�E by incorporatingJMA and 12-day OBS data. In addition to the difference indata set, this study differs from Lin et al. [2004, 2007] in theinversion strategy and interpretations.[5] In addition to integration of currently available net-
work data, we emphasize the necessity of achieving theappropriate strictness of the imposed regularization. Despitethe impression that the variance reduction versus the modelvariance trade-off analysis is a routine practice, the discus-sions concerning the appropriate resolving power of theadopted data sets of regional tomographic studies tend tobe downplayed by concealing the actual trade-off pattern. It isthus difficult to clarify whether critical features of a certaintomographic model are in fact effects of either overrepresen-tation or underrepresentation or interpretation. Examples ofpossible overinterpretation in previous studies are discussed.
2. Data and Methods
[6] The traveltime data used in this study are the same asthat fromChou et al. [2006] and are described briefly here. Totarget the middle zone between Taiwan and Ryukyu, we firstselected 11 CWB stations near the NE coast of Taiwan and 7westernmost stations of JMA as the basis for traveltime data.Events with magnitude 4 or greater within the area from 23.5to 26.0�N and from 121.5 to 124.0�E registered by at leasttwo stations of each network were selected. This practiceavoids overwhelming of the CWB over the JMA data and thepotential complications resulting from the highly heteroge-neous crust of Taiwan. The final data are selected arrivaltimes reported by both agencies for stations of the jointnetwork. In addition to the data mutually covered by CWBand JMA, a complementary subset of arrival times from theevents well within the CWB network in northern Taiwan wasalso incorporated in the relocation procedure to help illumi-nate the westernmost edge of the subduction configuration.In all, the data set consists of 7672 relocated events with74,403 P wave and 60,952 S wave arrival times.[7] A preliminary joint inversion for the data set was
first executed to determine the hypocentral parameters andthe regional one-dimensional (1-D) VP and VS structures. The1-D velocity structure inversion is undertaken by first invok-ing the projection operator technique that isolates the veloc-ity structure from the hypocentral parameters [Pavlis andBooker, 1980]. The vertical velocity profile so obtained isthen adopted in the subsequent double difference scheme[Waldhauser and Ellsworth, 2000] to relocate all the events.The relocated events better delineate a double-seismic zone,and reveal a fold-like, along-strike deformation of the slabat intermediate depths, possibly rising from impingementwith the Eurasian lithosphere [Chou et al., 2006]. The 1-Dvelocity model is employed as the reference backgroundmodel for the subsequent 3-D tomography experiments.[8] The regional traveltime tomography algorithm of Zhao
et al. [1992] was adopted in this study. Within the arearanging from 23.0 to 26.0�N and from 120.4 to 124.0�E,we constructed a mesh with a horizontal spacing of 0.2� and a
vertical spacing of 10 km from the surface to 100 km depthand 20 km from 100 to 200 km depth. We then invert the Pand S traveltimes for VP and VS perturbations from thereference 1-D velocity models. Moreover, we sort throughthe data set and build a subset of travel times from the event-receiver pairs that provide both P and S arrivals. This subset,consisting of 80% and 98% of the original P and S sets,respectively, is utilized for the construction of the VP/VS
model. Notice that
d VP=VSð ÞVP=VSð Þ ¼
VSdVP � VPdVS
V 2S
� VS
VP
¼ dVP
VP
� dVS
VS
: ð1Þ
That is, the VP/VS anomaly is simply the difference betweenthe VP and VS anomalies in fractional form. In other words,robust patterns of d(VP/VS) perturbations are obtained as longas the constraints invoked to invert for dVP/VP and dVS/VS arecomparable. This is different from formulations that invertthe P and S-P traveltime residuals for the product of d(VP/VS)and the spatially varying VP [e.g.,Walck, 1988], which even-tually involves taking ratios of the two inversions. To us,equation (1) can be graspedmore intuitively and the algebraicsummation of the results from two independent inversions,i.e., dVP/VP and dVS/VS, is less prone to undesired amplifi-cation of the error in each variable than the ratio of twovariables. In the Appendix, we devise experiments using thesame raypath geometries but with travel times generated fromknown synthetic structures so that the spatial resolution canbe evaluated.[9] With extensive inversion experiments examining the
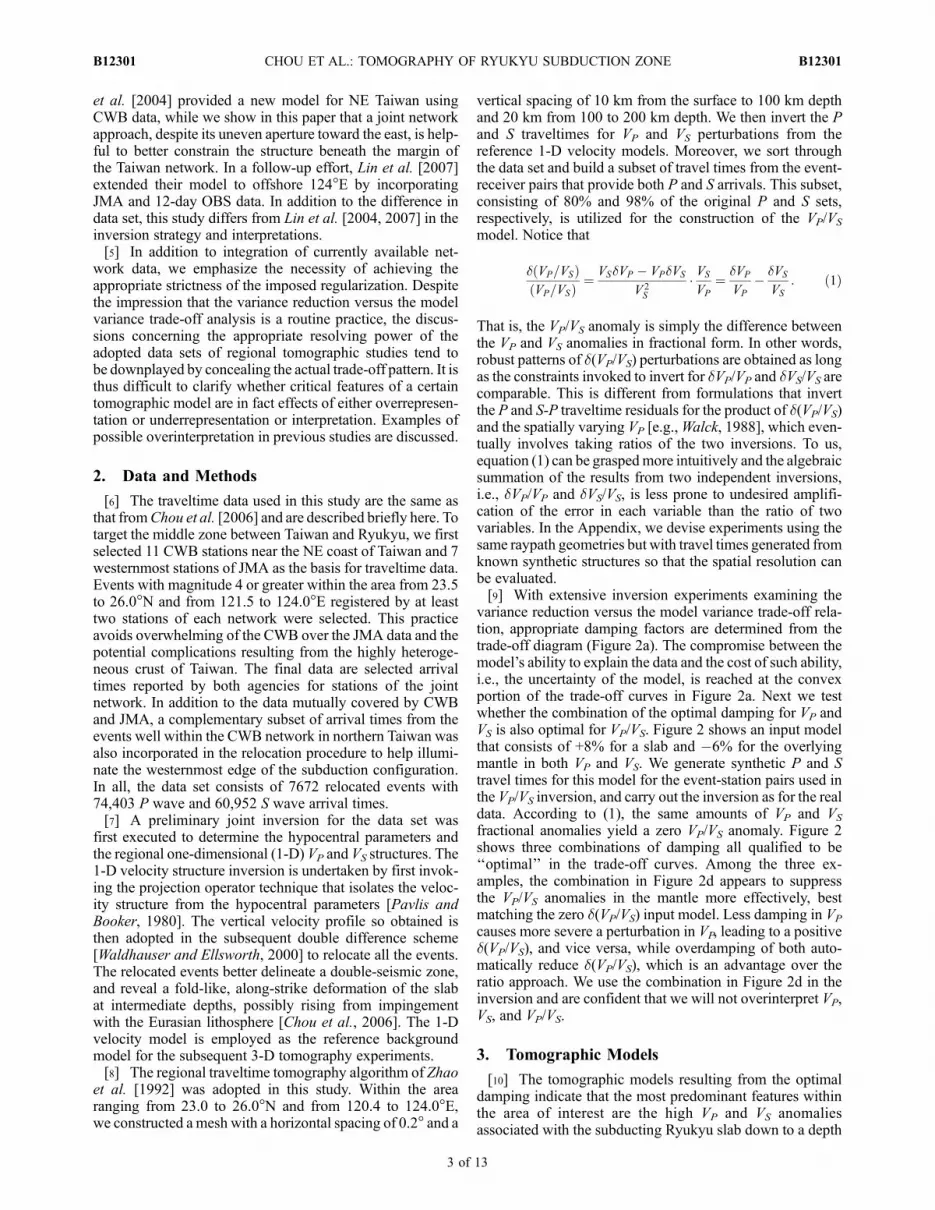
variance reduction versus the model variance trade-off rela-tion, appropriate damping factors are determined from thetrade-off diagram (Figure 2a). The compromise between themodel’s ability to explain the data and the cost of such ability,i.e., the uncertainty of the model, is reached at the convexportion of the trade-off curves in Figure 2a. Next we testwhether the combination of the optimal damping for VP andVS is also optimal for VP/VS. Figure 2 shows an input modelthat consists of +8% for a slab and �6% for the overlyingmantle in both VP and VS. We generate synthetic P and Stravel times for this model for the event-station pairs used inthe VP/VS inversion, and carry out the inversion as for the realdata. According to (1), the same amounts of VP and VS
fractional anomalies yield a zero VP/VS anomaly. Figure 2shows three combinations of damping all qualified to be‘‘optimal’’ in the trade-off curves. Among the three ex-amples, the combination in Figure 2d appears to suppressthe VP/VS anomalies in the mantle more effectively, bestmatching the zero d(VP/VS) input model. Less damping in VP
causes more severe a perturbation in VP, leading to a positived(VP/VS), and vice versa, while overdamping of both auto-matically reduce d(VP/VS), which is an advantage over theratio approach. We use the combination in Figure 2d in theinversion and are confident that we will not overinterpret VP,VS, and VP/VS.
3. Tomographic Models
[10] The tomographic models resulting from the optimaldamping indicate that the most predominant features withinthe area of interest are the high VP and VS anomaliesassociated with the subducting Ryukyu slab down to a depth
B12301 CHOU ET AL.: TOMOGRAPHY OF RYUKYU SUBDUCTION ZONE
3 of 13
B12301
of 150–200 km (Figure 3). We plot the R25 line, whichdelineates the resolving power of 25% as defined in theAppendix, to confine our interpretation in the better resolvedregime. Note R25 does not guarantee ‘‘correct’’ features, butit is an indicator for what features are worth further exami-
nation and what can be disregarded. In this sense only thesubduction zone and the neighboring mantle wedge atshallow depths merit interpretation (Figure 3). In addition,the restoration tests in the Appendix show a resolvable scale
Figure 2. Trade-off tests for VP, VS and VP/VS. (a) Trade-off curves for VP and VS that show compromisebetween model variance and data variance reduction at the convex portion of the curves. The two values ofdamping shown are both optimal for individual velocity but may introduce artifact to the ratio of velocities.(b) Input synthetic structure that mimic an exaggerated subduction zone with known zero d(VP/VS) inboth slab and mantle wedge. Inversion outputs are shown with damping (c) 40–40, (d) 40–60, and (e) 60–60 for VP and VS, respectively. Artificial nonzero d(VP/VS) anomalies are created for Figure 2c, and thecombinations of the parameters for Figures 2d and 2e suppress the artifacts in both slab and mantle wedgebetter.
B12301 CHOU ET AL.: TOMOGRAPHY OF RYUKYU SUBDUCTION ZONE
4 of 13
B12301
of heterogeneity of 10–20 km in much of the mantle in theR25 regime.[11] The three profiles in Figures 3a and 3b represent
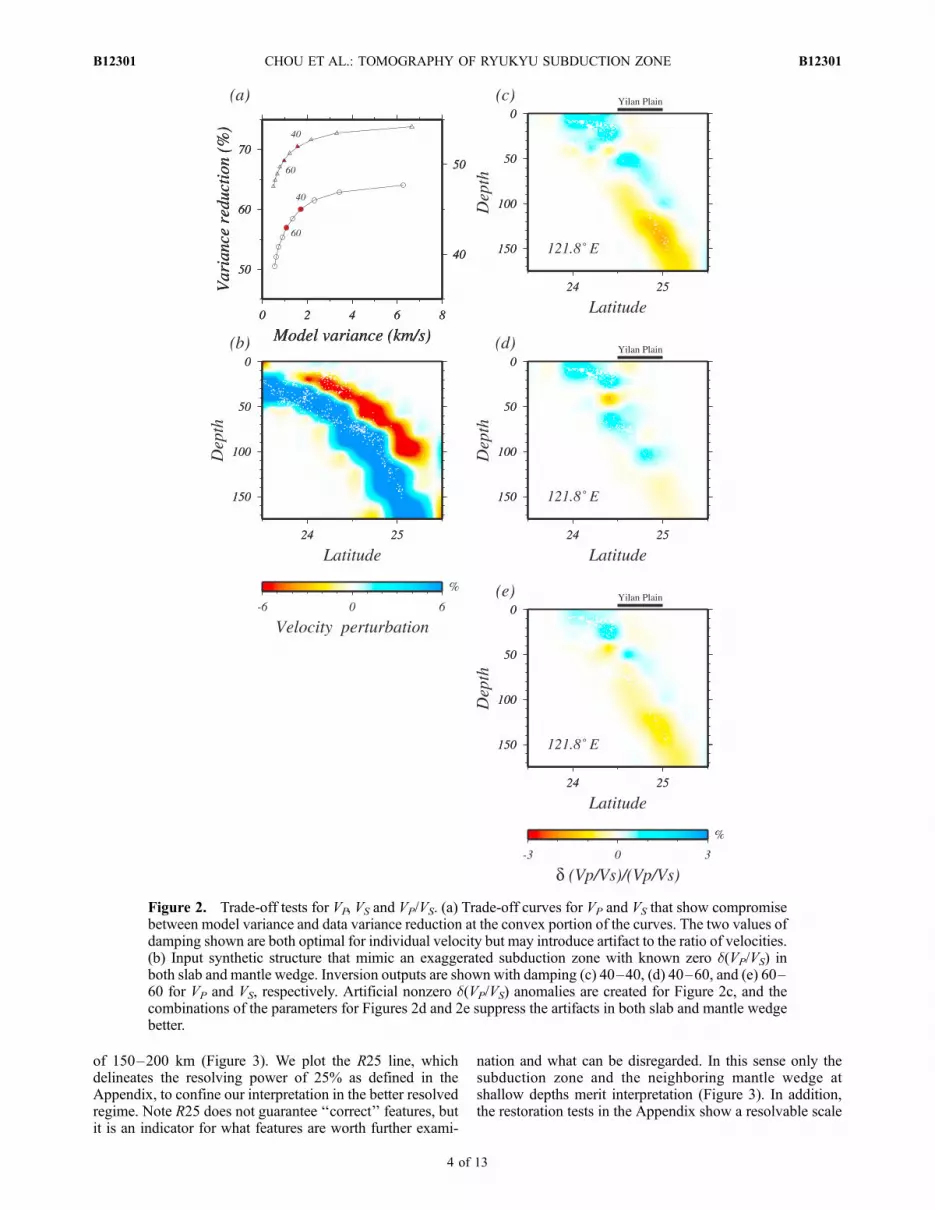
typical images of the subduction zone in our model. In thenearshore profile along 121.8�E the slab is resolved to becontinuous at 2% perturbation from 50 to 100–150 kmdepths. Toward the east the slab image is either discontinuousor only continuous at very weak strength (<1%). The disrup-tion of the slab image by neutral or low velocity anomaliesbelow 100 km in the 122.2�E and 122.6�E profiles may resultfrom errors due to uneven distribution of events and stations,and should not be interpreted as a physical break of the slab.Weakened, positive anomalies appear below 150 km, whereevents exist sparsely (Figure 1). In 121.8�E, there exists anegative anomaly cutting through the shallow segment of theslab at 40–50 km depth beneath 24�N. It is within a broadregion of poor 10 km resolution (Figure A1), and the
maximum is located near the slab surface in correlation withlow seismicity. The strength of this anomaly was solveddifferently for VP and VS, leading to anomalies in VP/VS andthe parameterized models in the next section. At present wedo not have a complete understanding of the origin of thisanomaly and we do not interpret it in this study.[12] In general, the VP and VS anomalies in fractional form
associated with the subduction zone are similar in amplitude,consistent with a thermal origin because the derivatives withrespect to temperature of the two differ only moderately. Inthe 121.8�E profile, strong negative VP and VS anomalies aredistributed beneath or close to the Yilan plain (Figures 3a and3b), and the broad zone of anomaly is avoid of seismicity. Asthe opening of the OT is thought to propagate westward andhas now reached beneath the Yilan plain [Sibuet et al., 1987],the negative anomalies there together with the paucity ofseismicity may imply the presence of the relatively hot lower
Figure 3. Tomographic images of (a) dVP/VP, (b) dVS/VS, and (c) d(VP/VS)/(VP/VS) shown in three verticalcross sections along longitudes 121.8�E, 122.2�E, and 122.6�E, respectively. R25 for VP is plotted (reddotted line) in each profile to illustrate possible limit of the acceptable recovery of the inversion. The blackdotted line is the smoothed slab interface after Chou et al. [2006], and the short dashed line is theextrapolation of this interface to the Ryukyu trench at the surface. Locations of relevant tectonic elementsare annotated on the top of each diagram. Small triangles represent the VF. Note the slab structure is wellresolved only at 121.8�E.
B12301 CHOU ET AL.: TOMOGRAPHY OF RYUKYU SUBDUCTION ZONE
5 of 13
B12301

crust and uppermost mantle in response to the local exten-sional tectonics. Toward the east where the OT opening ismore mature, the correlation of low velocities with the OT isinstead not definitive. This is mainly because the OT andthe VF progressively move outside the northern limit of theCWB-JMA effective coverage area (Figures 1 and 3).[13] Because the subducting slab is supposed to be the
dominant structure, a reliable model should present a rea-sonable slab image, and only when the slab is properlyimaged do other features on the same profile merit interpre-tation. We thereafter focus on profile 121.8�E where the slabis resolved to be continuous with realistic velocity anomalies.The most systematic pattern of the positive VP/VS perturba-tion is its juxtaposition with the subducting slab (Figure 3c).It is striking that the dominant features shift from within theslab in VP and VS to outside the slab in VP/VS. As the synthetictest indicates (Figure 2), the choice of damping for VP andVS suppresses amplification of spurious VP/VS signature,and therefore the presence of such structure in the modelseems warranted. Neutral to negative VP and VS with high,positive VP/VS anomalies in the mantle wedge have beendocumented in subduction zones in Japan [Kamiya andKobayashi, 2000], Cascadia [Zhao et al., 2001], and theAndes [Graeber and Asch, 1999] through tomographicimaging. Lin et al. [2004] also reported low velocities withhighVP/VS underlying NETaiwan in their model that bottomsat 60 km depth. High VP/VS, together with relatively low VP
and VS, has been widely interpreted as indicative of hydrationof themantle or in situ melt retention.Water released from theoceanic crust during descendingmay be absorbed by adjacentmantle peridotite and transform it to serpentinite [Hackeret al., 2003]. This serpentinized layer, if dragged down withthe corner flow, will eventually be dehydrated and may trig-ger water-fluxed partial melting in the wedge [e.g., Hattoriand Guillot, 2003]. If the wedge is hot enough, water dis-charged from the subducted crust may facilitate melting inthe mantle without an intermediate step of serpentinization[Arcay et al., 2005].
4. Serpentinization
4.1. Parameterization
[14] Our tomographic inversion outputs three types ofanomalies, VP, VS, and VP/VS, with only two of them beingindependent parameters. VP/VS is a more effective indicatorof the hydration or melting of a mantle wedge than VP and VS
alone, and it is independent of either VP or VS, but not both. Inthis section we quantify the effects of hydration of the wedgemantle resulting from dehydration of the subducting crustand slab. Major hydrous minerals in peridotite includeserpentine, chlorite, and amphibole. Among these, serpentinedominates the water budget of peridotite [Schmidt and Poli,1998]. In this study, the hydration phenomenon in the fore-arc mantle was parameterized to be the degree of serpentini-zation of the parent peridotite, Q. A 100% serpentinite (Q =100) has 15 wt% water [e.g., Hacker et al., 2003], and Q = 0represents dry peridotite. Water can be provided throughsubduction by (1) sediment compaction, usually at shallowdepths, (2) metamorphic reaction of oceanic crust fromblueschist/greenschist to eclogite facies, and (3) dehydrationof the previously serpentinized slab mantle at greater depths[Hyndman and Peacock, 2003].
[15] We chose VS and VP/VS as the two independentparameters. We take the laboratory measurements of seismicvelocities for peridotite serpentinized to various degrees fromChristensen [1966] and Horen et al. [1996]. Christensen’s[1966] 2 kbar measurementsmergewithHoren et al.’s [1996]room pressure data well, and the VP, VS, and VP/VS all displayfirst order linear relationships with Q. The derivative dlnVS/dQ of�4.84� 10�3 is adopted fromHoren et al. [1996]. Thederivative dln(VP/VS)/dQ of 2.254 � 10�3 is determinedfrom a regression of the combined VP/VS data provided byChristensen [1966] andHoren et al. [1996] with a correlationcoefficient >0.8. These are one of the two sets of partialderivatives for the degree of serpentinization used in thisstudy and are designated as set I parameters.[16] Christensen [2004] noted that the velocities measured
in previous work mainly represent lizardite serpentinite inlower crustal condition rather than antigorite serpentinitestable usually in the fore-arc mantle. Without having theexact data to do regression, we digitizedChristensen’s [2004]Figure 8 and obtained the following partial derivative val-ues for antigorite serpentinite: dlnVS/dQ = �2.59 � 10�3
and dln(VP/VS)/dQ = 0.636 � 10�3. Both coefficients weremuch reduced from their set I counterparts. These partialderivatives are categorized as set II.[17] Another variable to which velocities are sensitive is
temperature. The temperature derivatives are adopted asdlnVS/dT = �1.00 � 10�4 �C�1 and dln(VP/VS)/dT = 2.3 �10�6 �C�1 [Lee, 2003]. All the coefficients are presumablyfunctions of temperature and pressure, but these functions arenot known with higher accuracy and we use their constantforms to transform the tomographic models to tectonicallymore meaningful variables. Conversion of VS andVP/VS to dTand Q can be done by solving the equation
@ lnVS
@T
@ lnVS
@Q@ ln VP=VSð Þ
@T
@ ln VP=VSð Þ@Q
264
375 dT
dQ
� �¼ d lnVS
d ln VP=VSð Þ
� �: ð2Þ
The formulation of (2) assumes that temperature and serpen-tinization are two major independent factors that shape theseismic image of the subduction zone-mantle wedge regime.This is an oversimplification, as other factors, such as com-positions and the presence of crack or melt also influence thevelocities and ratio. Equation (2) can be considered a rotationof the parameter space such that two new parameters areformed by projection from the original two. Because (2) isan exact system, the matrix inversion will map all the errorsin dlnVS and dln(VP/VS) onto dT and dQ.[18] Figures 4a and 4b show dT and Q along 121.8�E
generated with the set I Q parameters. As serpentinizationonly applies to peridotite and the temperature coefficients aretypical of shallow upper mantle conditions, our discussion isrestricted to the mantle portion of the model (e.g., >40 km).First, temperature accounts for most of the velocity variationsrelated to the Ryukyu slab, and dT basically follow the patternof VS. Along the slab, dT falls into the range of �200�C to�400�C (Figure 4a), which is consistent with what sim-ple subduction zone thermal modeling demonstrates in 100–200 km depth range.
B12301 CHOU ET AL.: TOMOGRAPHY OF RYUKYU SUBDUCTION ZONE
6 of 13
B12301

[19] Serpentinization occurs mainly in the fore-arc mantleadjacent to the slab interface (Figure 4b), and those extendingdowndip to outside R25 are not discussed here. Without theserpentinization parameterization in (2), the fore-arc regionwith lowVP andVSwould be determined to be warm. Instead,it is now determined to be normal or low temperature.Although only positive Q makes sense, all signs of Q weretransformed from the right-hand side of (2). An example isthe negative Q at 50 km beneath 24�N (Figure 3). Asdescribed above, we are uncertain about the velocity anoma-lies and therefore reserved about its significance in serpenti-nization. Strictly, (2) should only be applied to quantify theserpentinization in regions where serpentinization is consid-ered realistic and confidently resolved.
[20] Application of the set II parameters yields differentmodels of temperature and serpentinization (Figures 4c and4d). Because of the quadruple reduction of the VP/VS partialfrom that in set I, Q is increased by about fourfold, i.e., to�60%, in the fore-arc mantle. The temperature, however,exhibits a strong minimum in the fore-arc mantle where Q ismaximum, instead of within the slab. The extremely cold forearc may be caused by too high aQwhich entails a VS too lowthat requires decreased temperature to compensate for. Judg-ing which set of parameters is correct is beyond the scope ofthis study, but the set I parameters seem to be preferable interms of its capability to separate dT and Q between the slaband the fore-arc mantle in a way consistent with our funda-mental knowledge of subduction zones [e.g., vanKeken et al.,
Figure 4. (a) Temperature variation and (b) degree of serpentinization in the mantle determined byequation (2) with set I Q partial derivatives for 121.8�E. The slab is cooled by 200�C–400�C from theregional mean. The most significant serpentinization zone is in the fore-arc mantle above the slab interface.Models above 40 km depth are not meaningful and are made faded out to the surface. Negative anomalies atthe shallow segment of the slab, roughly at 24�N, is unknown in origin. The red thin dotted line is R25.(c) Temperature and (d) degree of serpentinization the same as in Figures 4a and 4b, respectively except forset II Q partials. The temperature minimum on the order of �1000�C in the fore arc is unreasonable.
B12301 CHOU ET AL.: TOMOGRAPHY OF RYUKYU SUBDUCTION ZONE
7 of 13
B12301

2002]. These two sets of serpentinization parameters shouldbe tested with other tomographic models.[21] The serpentinization interpretation for mantle wedge
has been invoked elsewhere. In northeast Japan, receiverfunction images suggest the presence of a long serpentinitelayer atop the Pacific slab from 90 to at least 130 km[Kawakatsu and Watada, 2007], while in central Japan local,high VP/VS are found abutting the surface of the slab atshallow depths [Kamiya and Kobayashi, 2000]. Judged fromthe location of the VF, positive Q spreads out in the fore arcalong the slab interface and reaches a maximum at roughly50 km depths. This may be linked to the progressive break-down of hydrous minerals, i.e., lawsonite, chlorite, zoisite,and amphibole in basalt during the basalt-eclogite metamor-phic transformation that releases water to hydrate the mantleimmediately above it [van Keken et al., 2002; Iwamori,2007]. This is reminiscent of the Cascadia mantle wedgewhere reflectivity evidence implies strong serpentinization inthe fore-arc region at depths 30–50 km [Bostock et al., 2002].Geological evidence of the fore-arc serpentinization was alsofound in both oceanic and continental convergent margins[Fryer et al., 1999; Guillot et al., 2000]. In this study, wecannot argue whether serpentinization spreads along the arcbecause of the decreasing resolution of tomography towardthe east.
4.2. Melting
[22] If the temperature is higher than the stability field ofthe hydrous minerals in serpentinite, serpentinization wouldnot occur in the first place. The free water may facilitatewater-fluxed melting at temperatures above water-saturatedsolidus, or escape upward at lower temperatures. This isan intricate dynamic process, which has been the subject ofmuch numerical modeling effort [e.g., van Keken et al., 2002;Peacock et al., 2005; Arcay et al., 2005]. Beneath NE Japan,low VP, VS, and high VP/VS anomalies subparallel to the slabin the mantle wedge were interpreted to be a melt signature[e.g., Zhao et al., 2009] with a melt fraction f of 1–2%[Nakajima et al., 2005]. The serpentinized layer later detailedby Kawakatsu and Watada [2007] in the same region waslocalized between the melt zone and the slab. Technically,degree of melting can be estimated by replacing the partialderivatives for Q with those for f. Examination of the meltmodel ofNakajima et al. [2005] indicates that the signs of thepartials of VS and VP/VS with respect to f are consistent withthe signs of the partials with respect toQ, implying that whatcan be converted to high serpentinization may be convertedto a high melt fraction as well.[23] However, we refrain from addressing the issue of
melting based on two observations. First, the melt zone inNE Japan is in the hot core of the wedge beneath the VF andbeyond, and is at least 50–100 km horizontally away fromthe slab interface. In contrast, in NE Taiwan and the west-ernmost Ryukyu, the well resolved high VP/VS signature isadjacent to the slab and at shallower depths localized in thefore arc. Although the mantle wedge here may be warmernear the edge, there are no present-day volcanic activitiesdocumented above the fore-arc region. Second, the VF here issmall in magnitude compared with the abundant VF activitiesin NE Japan [Sibuet et al., 1998; Chung et al., 2000; Tatsumiand Eggins, 1995; Tamura et al., 2002], implying probablylow melt generation at least at present stage. On the other
hand, the limited aperture of observation does not allow us tosample northward far into the wedge interior to fully depictthe melt distribution. In the present work we attribute the lowVP, VS, and high VP/VS anomaly atop the slab interface toserpentinization of the peridotitic mantle. The pattern andproperties of melting in this region may only be defined in thefuture with a larger-aperture imaging incorporating an OBSarray in the OT.
5. Discussion
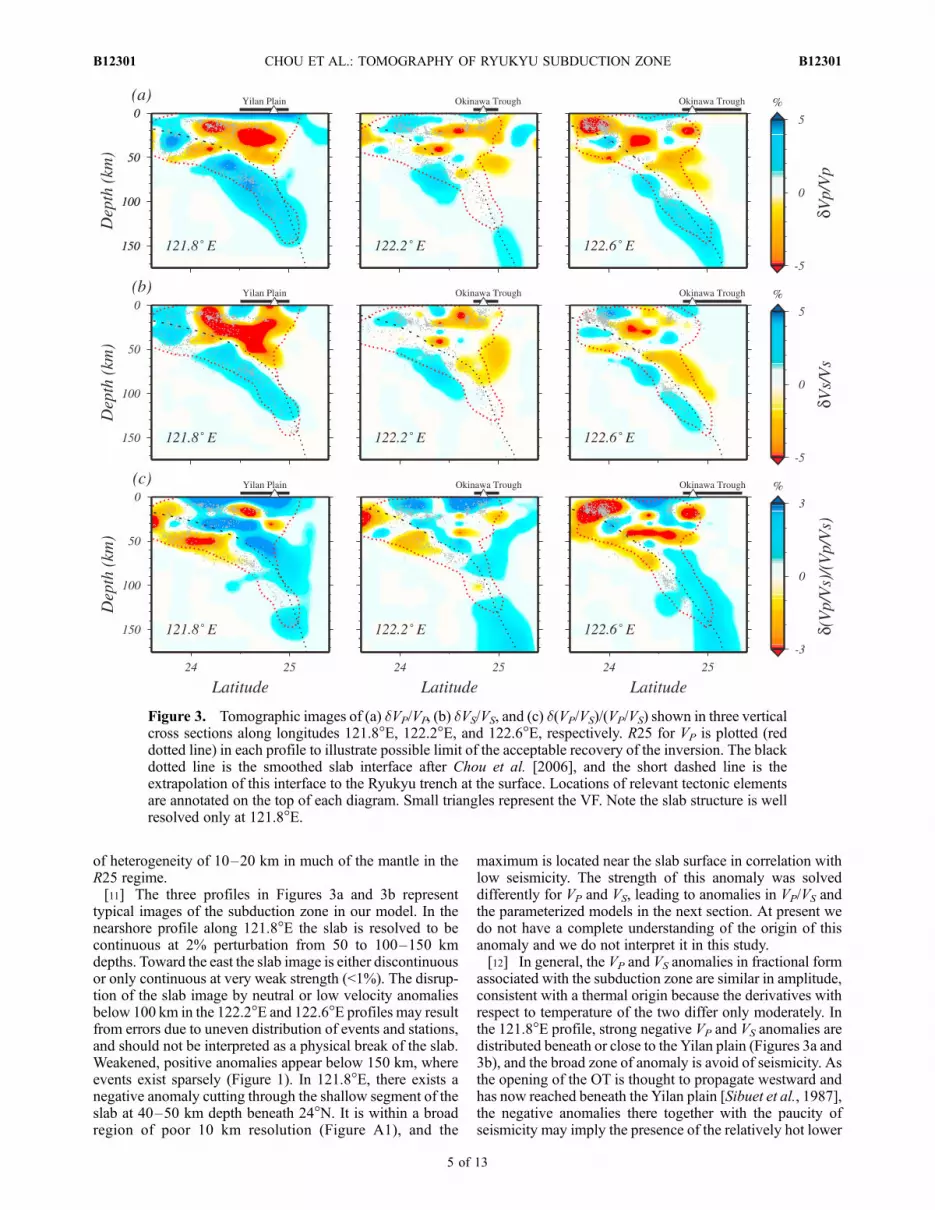
[24] Unlike in Japan, Alaska, and Cascadia, the JMA partof the combined network provides limited aperture to con-strain the mantle wedge north of the subduction zone. Ourstrategy is to present models that do not overrepresent andinflate what the data can possibly offer. The variance reduc-tions of less than 70% and 60% for VP and VS, respectively,are low enough to suppress uncertain, secondary features inthemodel.We do not interpret anything outside the R25 limit,and within the R25 limit we are careful in not overinterpret-ing subtle features whose scale is less than the resolvablescale of heterogeneity. In practice, we are confident more inthe profiles in which the subducting Ryukyu slab is resolvedbetter, i.e., showing continuous high VP and VS anomalies.Profile 121.8�E is an example, and is the focus of the dis-cussion in this study.[25] In a recent tomographic effort, Lin et al. [2004]
obtained a relatively high VP/VS channel rising from the slabinterface at 40 km depth obliquely to the Yilan plain (withKST 15 km away). The presence of the channel is intriguingby itself, but its signature is weak against the average wedgemantle. With the integrated data sets of CWB and JMA anda carefully calibrated VP/VS inversion, we examine whetherthis feature is robust and worth further elaboration. Note therecoverable scale of heterogeneity is approximately 10 km inthis part of the model and the grid spacing is 10 km, which isan adequate parameterization to resolve the melt pathway ofLin et al. [2004].[26] Figure 5 compares the tomographic images of this
study and Lin et al. [2004] in the same vertical slice shown inthe latter. The slab is resolved much better in this study,lending credence to other images. We cannot see any featuressuggestive of a channel structure connecting the slab and thesurface, crossing the corner of the mantle wedge. Throughoutall the profiles, no features alike stand out as an obviousanomaly. We also test using different combinations of damp-ing factors for VP and VS, i.e., taking models in the neigh-borhood of the optimums at the two trade-off curves inFigure 2a. One of them is a model with the VP/VS norm thesame as Lin et al. [2004] in the 2-D slice. While the inclinedhigh VP/VS layer overlying the slab largely remains, featuressuggesting a melt pathway claimed by Lin et al. [2004]cannot be reproduced. In their study, the primary structureof the Ryukyu slab is poorly resolved in the same profilewhere the secondary feature of melt is emphasized.[27] In their most recent work, Lin et al. [2007] combined
CWB, JMA, and OBS data to constrain the velocity structurein the region similar to that of this study but for the upper60 km. Their OBS data, recorded over a period of 12 days,may provide additional constraints on the crustal structure ofthe OT. This advantage, if properly parameterized into theinversion, provides a potential for better imaging the fore arc
B12301 CHOU ET AL.: TOMOGRAPHY OF RYUKYU SUBDUCTION ZONE
8 of 13
B12301

and the slab. Lin et al. [2007] reported the presence of more‘‘channels’’ of melts that feed the VF or the back-arc axisfrom various parts of the slab along the strike. Yet acomparison between Lin et al.’s [2007] study and this studyis not straightforward, because their ‘‘channels’’ are highlyvariable in 3-D and overly subtle, and are very likely beyondthe resolution of our model. Here we do not attempt to traceand connect patchy anomalies into a seemingly continuousstructure and attach significance to them.[28] Our model shows that the serpentinization reaches
15% in the fore arc of the westernmost Ryukyu subductionzone. This is comparable to what is estimated from the VP
anomaly alone [Zhao et al., 2001] and less than the localmaximum Q inferred from a reflectivity result [Bostock etal., 2002] both in the Cascadia subduction zone. Asserpentinite (Q = 100) contains 15 wt% water [e.g., Hackeret al., 2003], the maximum water content in the fore-arcmantle may be 2%, and locally the content may be greaterbecause the tomography heavily damps the variations. Thisamount of bound water may be stable in between theserpentine chlorite dunite field (�6%) and the chloriteharzburgite field (�1.4%) at 50 km depths (�1.5 GPa)and between 500�C and 800�C [Hacker et al., 2003]. Asa reference, this temperature range is lower than the
water-saturated solidus of peridotite, i.e., 900�C–1000�Cat shallow mantle pressures [Kawamoto and Holloway,1997; Grove et al., 2006].[29] A self-consistent scenario with the serpentinization
hypothesis will be that significant water is liberated frombasaltic crust at or below 50 km. This will require a tem-perature range in the oceanic crust which spans the break-down of hydrous minerals that involve abundant waterlosses. However, the 500�C–800�C range mostly spans thelow water content (<1%) eclogite field at 1.5–2 GPa (�50–65 km) [Hacker et al., 2003]. A reasonable conjecture is thatthe temperature of the oceanic crust straddles the blueschist/greenschist-eclogite boundary, i.e., 400�C–500�C between1.5 and 2 GPa [Hacker et al., 2003] so that abundant water(�5%) can be expelled to hydrate the fore-arc mantle. Thetemperatures may increase from below 400 to above 500�Cpassing through this depth range. At 50 km or so, water-saturated solidus for basalt is �650�C [Lambert and Wyllie,1972]. Minor dehydration melting may occur upon zoisite-out reaction at �700�C–750�C, but it is not until >900�Cwhen amphibole breaks down that the crust melts signifi-cantly [Vielzeuf and Schmidt, 2001; Hacker et al., 2003].Although intensive melting seems unlikely, small amount ofmelting of the oceanic crust cannot be fully rejected.
Figure 5. Comparison in VP, VS, and VP/VS between (a) Lin et al. [2004] and (b) this study, along profile 2of the former. See position of profile in Figure 1. Note the primary feature such as the high VP/VS atopthe slab is resolved in both studies despite different shapes, while the secondary feature, the weak, positiveVP/VS anomaly extending obliquely from the slab to the surface in the study by Lin et al. [2004] is notresolved in this study. The slab as the most important structure is better expressed in this study than that inthe study by Lin et al. [2004].
B12301 CHOU ET AL.: TOMOGRAPHY OF RYUKYU SUBDUCTION ZONE
9 of 13
B12301

[30] Geochemical evidence for crust melting in the westernRyukyu subduction zone has not been completely estab-lished. High-Mg andesites, considered as an indicator forslab melting, were reported at Iriomote, a previous VF 13Main age now located at the fore arc, but their geochemicalsignature does not support a subduction zone origin [Shinjo,1999]. However, the recent work on KST (VF) rocks indi-cated that some of the samples contain high-Mg components,implying some degree of slab melt contribution to the arcvolcanoes [Chu, 2005]. The issue is still open and develop-ments on this geochemical front should be closely watched.Numerical modeling, geochemical constraints, and seismo-logical imaging need to be integrated to further the under-standing of melting in the mantle wedge or slab beneath thewesternmost Ryukyu.[31] Can the fore-arc serpentinization be tested in the
future against other observations? Tomography can be im-proved with OBS deployment in the OT, but the samevelocity-based approach likely yields a pattern similar to thatin this study. A critical test can be attained from a seismicattenuation tomography. The low attenuation, or high Qvalue, in the fore-arc mantle beneath Alaska and Cascadiaconstrained by array waveforms is thought to arise from lowtemperature, which agrees with the low heat flowmeasured atthe surface [Schurr et al., 2003; Stachnik et al., 2004]. Both Qmodel and heat flow measurement across the OT are lackingat present and will critically test the serpentinization hypoth-esis in the future.
6. Conclusion
[32] By integrating CWB and JMA data we construct atomographic model for the subduction zone and mantlewedge between the NE Taiwan and the westernmost Ryukyuwith the best resolution near offshore Taiwan. In light of therelatively unfavorable network coverage, we take a conser-vative approach toward both regularizing the inversion andinterpreting the results. The high VP and VS anomaliesassociated with the subducting Ryukyu slab dominates thetomographic images, while the high VP/VS signals above theslab characterize the mantle wedge. The high VP/VS channeldepicted in a previous tomographic effort and interpretedto be a melt pathway feeding the Yilan plain from the slabcannot be reproduced in this study. The slab signature is con-sistent with a temperature anomaly of �200�C to �400�C.Significant anomalies of low VP, VS and high VP/VS appear inthe fore arc of the mantle wedge, south of the present-dayvolcanic front. We interpret this signature as the hydration ofmantle peridotites by the water discharged from the basalt-eclogite metamorphism in the subducted oceanic crust, andparameterize it as percentage of serpentinization using labo-ratory data. Peak serpentinization may reach more than 15%,or 2% water content, in the fore-arc wedge near NE Taiwan.This is a notable departure from previous views whichemphasize the role of melts. To achieve a full imaging ofthe mantle wedge and the melt distribution, expansion of thearray with OBSs in the future is critical.
Appendix A
[33] Nonuniform raypath coverage of most regional trav-eltime tomography studies results in obviously uneven spa-
tial sampling of the velocity perturbations. A conventionalapproach is to perform restoration experiments on simplesynthetic structures such that the spatially varying resolvingpower of the obtained tomographic model can be appraised.[34] In addition to the test on VP/VS illustrated in Figure 2,
we set up a restoration experiment as follow. A synthetic 3Dcheckerboard model with ±6%, fast and slow alternatingvelocity anomalies over the grids of our model, i.e., horizon-tal spacing 0.2� and vertical spacing 10 and 20 km above andbelow 100 km depth, respectively. As a comparison, a modelwith a grid spacing doubled is also performed. Traveltimeresiduals were generated from this model using the raypathsampling identical to the real data. Random errors with zeromean and 0.8 s standard deviation are blended in the synthetictraveltime residuals. Since the geometry of the raypathdistribution is the same as in the real inversions, additionaltrade-off analysis is redundant. That is, we simply adopt thesame damping parameters as the ones for the actual inversion(Figure 2a). Errors and damping are essential for conductinga checkerboard test, which are often missed in previousstudies. It is clear that our damping parameters efficientlyremove potential artifacts from poorly sampled areas at theexpense of losing certain marginal resolving power.Figures A1 and A2 show restoration experiments for thetwo sets of grid spacing. Overall, 10 km resolution dimin-ishes rapidly toward east, while 20 km is maintained better.In the near TW profile, resolvable scale of heterogeneity is10 km in the crust, 10–20 km in the fore-arc mantle, andprobably 20 km in the slab throughout. In the eastern profiles,20 km variation is in general discernable, except degradingwith depth in the slab. The resolution ranges from poorbeneath the VF in most of the profiles to none deep in thewedge.[35] The checkerboard analysis helps to determine the
scale of heterogeneity a model can achieve. To quantifyhow closely to the true value each model parameter isresolved, one needs to establish the resolution matrix, definedas R = Gg
�1G, where Gg�1 is the generalized inverse of the G
matrix in the inversion systemGm = d. If the system is solvedwith a singular value decomposition, R can be easily ob-tained. Usually, nonzeros in R spread over physically neigh-boring grids, ideally with a maximum value at the center grid.The grid with R value of 1 implies that this parameter isindependently resolved and therefore the true model value isrecovered, if no errors in data. The diagonal values of the Rmatrix therefore map out the resolvability at each grid of thetomographic model. In this study the values for the VPmodelare used to represent the overall model resolvability. InFigures A1 and A2, most of the region above 50 km in thewestern end of the model has R values >0.5, where stationcontrol is the best. The VS and VP/VS anomalies interpreted tobe high serpentinization in the fore arc (Figure 3, 121.8�Eprofile) straddles the R � 0.5 contour. The mantle wedgeimmediately next to the slab and largely above 100 kmmakesthe R = 0.25 requirement. We take R = 0.25 (R25) to be thelimit of the resolvable part of the model and the limit of theregion within which anomalies are worth an interpretationwith caution. Because R is determined by the ray geometry apriori to the inversion, R25 should be considered a weak cri-terion, because structures within this limit could be affectedby data errors.
B12301 CHOU ET AL.: TOMOGRAPHY OF RYUKYU SUBDUCTION ZONE
10 of 13
B12301

Figure A1. Checkerboard restoration test. (a and b) Velocities and (c) the values of the diagonal terms ofthe model resolution matrix R for VP. Above 100 km, grid spacing is 0.2� by 0.2� by 10 km in depth, asoutlined by the black dotted lines. Below 100 km, grid spacing is 0.2� by 0.2� by 20 km. The R values arecontoured at 25% and 50% (Figure A1c), and the 25% contour is shown in the velocity Figures A1a andA1b (R25) as red dotted lines. Note the blurring or shifting of adjacent opposite anomalies in some of theprofiles near the margin of the R25 region and in profiles to the east.
B12301 CHOU ET AL.: TOMOGRAPHY OF RYUKYU SUBDUCTION ZONE
11 of 13
B12301

[36] Acknowledgments. We are grateful to K. L. Wang, who helpedto clarify the geochemical background of this study. Discussions with W. T.Liang, S. L. Chung, and S. R. Song are also appreciated. All graphs werecreated using the Generic Mapping Tool package [Wessel and Smith, 1991].This study is supported by the National Science Council of Taiwan, underthe contract NSC 97-2745-M-001-012.
ReferencesArcay, D., E. Tric, and M. P. Doin (2005), Numerical simulations of sub-duction zones: Effects of slab dehydration on the mantle wedge dynam-ics, Phys. Earth Planet. Inter., 149, 133–153, doi:10.1016/j.pepi.2004.08.020.
Bostock, M. G., R. D. Hyndman, S. Rondenay, and S. M. Peacock (2002),An inverted continental Moho and serpentinization of the forearc mantle,Nature, 417, 536–538, doi:10.1038/417536a.
Chou, H. C., B. Y. Kuo, S. H. Hung, L. Y. Chiao, D. Zhao, and Y. M. Wu(2006), The Taiwan-Ryukyu subduction-collision complex: Folding of aviscoelastic slab and the double seismic zone, J. Geophys. Res., 111,B04410, doi:10.1029/2005JB003822.
Christensen, N. I. (1966), Elasticity of ultrabasic rocks, J. Geophys. Res.,71, 5921–5931.
Christensen, N. I. (2004), Serpentinites, peridotites, and seismology, Int.Geol. Rev., 46, 795–816, doi:10.2747/0020-6814.46.9.795.
Chu, C. H. (2005), Generation of high-Mg andesites in the Kueishantaovolcano, the southernmost part of the Okinawa Trough (in Chinese),Master’s thesis, 99 pp., Natl. Taiwan Univ., Taipei.
Chung, S. L., S. L. Wang, R. Shinjo, C. S. Lee, and C. H. Chen (2000),Initiation of arc magmatism in an embryonic continental rifting zone ofthe southernmost part of Okinawa trough, Terra Nova, 12, 225–230,doi:10.1046/j.1365-3121.2000.00298.x.
Fryer, P., C. G. Wheat, and M. J. Mottl (1999), Mariana blueschist mudvolcanism: Implication for conditions within the subduction zone, Geol-ogy, 27, 103–106, doi:10.1130/0091-7613(1999)027<0103:MBMVIF>2.3.CO;2.
Graeber, F. M., and G. Asch (1999), Three-dimensional models of P wavevelocity and P-to-S velocity ratio in the southern central Andes by simul-taneous inversion of local earthquake data, J. Geophys. Res., 104,20,237–20,256, doi:10.1029/1999JB900037.
Grove, T. L., N. Ghatterjee, S. W. Parman, and E. Medard (2006), Theinfluence of H2O on mantle wedge melting, Earth Planet. Sci. Lett., 249,74–89, doi:10.1016/j.epsl.2006.06.043.
Guillot, S., K. H. Hattori, and J. de Sigoyer (2000), Mantle wedge serpen-tinization and exhumation of eclogites: Insights from eastern Ladakh,northwest Himalaya, Geology, 28, 199–202, doi:10.1130/0091-7613(2000)28<199:MWSAEO>2.0.CO;2.
Hacker, B. R., G. A. Abers, and S. M. Peacock (2003), Subduction factory:1. Theoretical mineralogy, densities, seismic wave speeds, and H2O con-tents, J. Geophys. Res., 108(B1), 2029, doi:10.1029/2001JB001127.
Hattori, K. H., and S. Guillot (2003), Volcanic fronts form as a consequenceof serpentinite dehydration in the forearc mantle wedge, Geology, 31,525–528, doi:10.1130/0091-7613(2003)031<0525:VFFAAC>2.0.CO;2.
Horen, H., M. Zamora, and G. Dubuisson (1996), Seismic wave velocities andanisotropy in serpentinized peridotites form Xigaze ophiolite: Abundance
Figure A2. Checkerboard restoration test as in Figure A1 but with grid spacing grids doubled, shownfor selected slices (a) for VP and (b) for VS. The model has adequate resolving power for this scale ofheterogeneity within R25 (red dotted lines) in most of the depths and profiles, but the resolution stilldegrades to the east.
B12301 CHOU ET AL.: TOMOGRAPHY OF RYUKYU SUBDUCTION ZONE
12 of 13
B12301

of serpentine in slow spreading ridge, Geophys. Res. Lett., 23, 9 –12,doi:10.1029/95GL03594.
Hyndman, R. D., and S. M. Peacock (2003), Serpentinization of the forearcmantle, Earth Planet. Sci. Lett., 212, 417–432, doi:10.1016/S0012-821X(03)00263-2.
Iwamori, H. (2007), Transportation of H2O beneath the Japan arcs and itsimplications for global water circulation, Chem. Geol., 239, 182–198,doi:10.1016/j.chemgeo.2006.08.011.
Kamiya, S., and Y. Kobayashi (2000), Seismological evidence for the ex-istence of serpentinized wedge mantle, Geophys. Res. Lett., 27, 819–822,doi:10.1029/1999GL011080.
Kao, H., S.-J. Shen, and K.-F. Ma (1998), Transition from oblique subduc-tion to collision: Earthquakes in the southernmost Ryukyu arc-Taiwanregion, J. Geophys. Res., 103, 7211–7229, doi:10.1029/97JB03510.
Kawakatsu, H., and S. Watada (2007), Seismic evidence for deep-watertransportation in the mantle, Science, 316, 1468–1471, doi:10.1126/science.1140855.
Kawamoto, T., and J. R. Holloway (1997), Melting temperature and partialmelt chemistry of H2O-saturated mantle peridotite to 11 gigapascal,Science, 276, 240–243, doi:10.1126/science.276.5310.240.
Lambert, I. R., and P. J. Wyllie (1972), Melting of gabbro (quartz eclogite)with excess water to 35 kilobars, with geological applications, J. Geol.,80, 693–708, doi:10.1086/627795.
Lee, C. S., G. J. Shor, L. D. Bibee, R. S. Lu, and T. W. C. Hilde (1980),Okinawa trough: Origin of a back-arc basin, Mar. Geol., 35, 219–241,doi:10.1016/0025-3227(80)90032-8.
Lee, C. T. A. (2003), Compositional variation of density and seismic velo-cities in natural peridotites at STP conditions: Implications for seismicimaging of compositional heterogeneities in the upper mantle, J. Geophys.Res., 108(B9), 2441, doi:10.1029/2003JB002413.
Lin, J. Y., S. K. Hsu, and J. C. Sibuet (2004), Melting features along thewestern Ryukyu slab edge (northeast Taiwan): Tomographic evidence,J. Geophys. Res., 109, B12402, doi:10.1029/2004JB003260.
Lin, J. Y., J. C. Sibuet, C. S. Lee, S. K. Hsu, and F. Klingelhoefer (2007),Origin of the southern Okinawa trough volcanism from detailed seismictomography, J. Geophys. Res., 112, B08308, doi:10.1029/2006JB004703.
Nakajima, J., Y. Takei, and A. Hasagawa (2005), Quantitative analysis ofthe inclined low-velocity zone in the mantle wedge of northeastern Japan:A systematic change of melt-filled pore shapes with depth and its impli-cations for melt migration, Earth Planet. Sci. Lett., 234, 59 – 70,doi:10.1016/j.epsl.2005.02.033.
Pavlis, G. L., and J. R. Booker (1980), The mixed discrete-continuousinverse problem; application to the simultaneous determination of earth-quake hypocenters and velocity structure, J. Geophys. Res., 85, 4801–4810, doi:10.1029/JB085iB09p04801.
Peacock, S. M., P. E. van Keken, S. D. Holloway, B. R. Hacker, G. A.Abers, and R. L. Rergason (2005), Thermal structure of the Costa Rica-Nicaragua subduction zone, Phys. Earth Planet. Inter., 149, 187–200,doi:10.1016/j.pepi.2004.08.030.
Rau, R. J., and F. T. Wu (1995), Tomographic imaging of lithosphericstructure under Taiwan, Earth Planet. Sci. Lett., 133, 517 – 532,doi:10.1016/0012-821X(95)00076-O.
Schmidt, M. W., and S. Poli (1998), Experimentally based water budgetsfor dehydrating slabs and consequences for arc magma generation, EarthPlanet. Sci. Lett., 163, 361–379, doi:10.1016/S0012-821X(98)00142-3.
Schurr, B., G. Asch, A. Rietbrock, R. Trumbull, and C. Haberland (2003),Complex patterns of fluid and melt transport in the central Andean sub-duction zone revealed by attenuation tomography, Earth Planet. Sci.Lett., 215, 105–119, doi:10.1016/S0012-821X(03)00441-2.
Shinjo, R. (1999), Geochemistry of high Mg andesites and the tectonicevolution of the Okinawa Trough-Ryukyu arc system, Chem. Geol.,157, 69–88, doi:10.1016/S0009-2541(98)00199-5.
Sibuet, J.-C., et al. (1987), Back-arc extension in the Okinawa trough,J. Geophys. Res., 92, 14,041–14,063, doi:10.1029/JB092iB13p14041.
Sibuet, J.-C., B. Deffontaines, S. Hsu, N. Thareau, J. Le Formal, C. Liu, andthe ACT Party (1998), Okinawa trough backarc basin: Early tectonic andmagmatic evolution, J. Geophys. Res., 103, 30,245–30,267.
Stachnik, J. C., G. A. Abers, and D. H. Christensen (2004), Seismic atten-uation and mantle wedge temperatures in the Alaska subduction zone,J. Geophys. Res., 109, B10304, doi:10.1029/2004JB003018.
Tamura, Y., Y. Tatsumi, D. Zhao, Y. Kido, and H. Shunkuno (2002), Hotfingers in the mantle wedge: New insights into magma genesis in subduc-tion zones, Earth Planet. Sci. Lett., 197, 105–116, doi:10.1016/S0012-821X(02)00465-X.
Tatsumi, Y., and S. Eggins (1995), Subduction Zone Magmatism, 211 pp.,Blackwell, Cambridge, U. K.
Teng, L. (1990), Geotectonic evolution of late Cenozoic arc-continent colli-sion in Taiwan, Tectonophysics, 183, 57–76, doi:10.1016/0040-1951(90)90188-E.
van Keken, P. E., B. Kiefer, and S. M. Peacock (2002), High-resolutionmodels of subduction zones: Implications for mineral dehydration reac-tions and the transport of water into the deep mantle, Geochem. Geophys.Geosyst., 3(10), 1056, doi:10.1029/2001GC000256.
Vielzeuf, D., and M. W. Schmidt (2001), Melting relations in hydroussystems revisited: Application to metapelites, metagreywackes and meta-basalts, Contrib. Mineral. Petrol., 141, 251–267.
Walck, M. (1988), Three-dimensional VP/VS variations for the Coso region,California, J. Geophys. Res. , 93 , 2047 – 2052, doi:10.1029/JB093iB03p02047.
Waldhauser, F., and W. L. Ellsworth (2000), A double-difference earthquakelocation algorithm: Method and application to the northern Hayward fault,Bull. Seismol. Soc. Am., 90, 1353–1368, doi:10.1785/0120000006.
Wessel, J. K., and H. F. Smith (1991), Free software helps map and displaydata, Eos Trans. AGU, 72, 445–446, 441, doi:10.1029/90EO00319.
Yeh, Y. H., C. H. Lin, and S. W. Roecker (1989), A study of upper crustalstructures beneath northeastern Taiwan: Possible evidence of the westernextension of Okinawa trough, Proc. Geol. Soc. China, 32, 139–156.
Zhao, D., A. Hasegawa, and S. Horiuchi (1992), Tomographic imaging ofP and S wave velocity structure beneath northeastern Japan, J. Geophys.Res., 97, 19,909–19,928, doi:10.1029/92JB00603.
Zhao, D., K. Wang, G. C. Rogers, and S. M. Peacock (2001), Tomographicimage of low P velocity anomalies above slab in northern Cascadiasubduction zone, Earth Planets Space, 53, 285–293.
Zhao, D., Z. Wang, N. Umino, and A. Hasegawa (2009), Mapping themantle wedge and interplate thrust zone of the northeast Japan arc, Tec-tonophysics, 467, 89–106, doi:10.1016/j.tecto.2008.12.017.
�����������������������L.-Y. Chiao, Institute of Oceanography, National Taiwan University, P.O.
Box 23-13, Taipei 10617, Taiwan.H.-C. Chou and S.-H. Hung, Institute of Geosciences, National Taiwan
University, No. 1, Sec. 4, Roosevelt Rd., Taipei 10617, Taiwan.B.-Y. Kuo, Institute of Earth Sciences, Academia Sinica, 128 Academia
Rd., Sec. 2, Taipei 11529, Taiwan. ([email protected])D. Zhao, Department of Geophysics, Tohoku University, 6-6 Aoba,
Aramaki, Aoba-ku, Sendai 980-8578, Japan.
B12301 CHOU ET AL.: TOMOGRAPHY OF RYUKYU SUBDUCTION ZONE
13 of 13
B12301


