Embed Size (px)
Citation preview
This is a provisionally accepted manuscript. It may contain errors. The published version may differ from it. Please cite as: Mehr, S. A., Singh, M., Knox, D., Ketter, D. M., Pickens-Jones, D., Atwood, S., Lucas, C., Egner, A., Jacoby, N., Hopkins, E. J., Howard, R. M., Hartshorne, J. K., Jennings, M. V., Simson, J., Bainbridge, C. M., Pinker, S., O'Donnell, T. J., Krasnow, M. M., & Glowacki, L. (forthcoming). Universality and diversity in human song. Science.
Title: Universality and diversity in human song
Authors: Samuel A. Mehr1,2*, Manvir Singh3*, Dean Knox4, Daniel M. Ketter5,6, Daniel Pickens-Jones7,
Stephanie Atwood2, Christopher Lucas8, Nori Jacoby9, Alena A. Egner10, Erin J. Hopkins2, Rhea M.
Howard2, Joshua K. Hartshorne11, Mariela V. Jennings11, Jan Simson2,12, Constance M. Bainbridge2,
Steven Pinker2, Timothy J. O’Donnell13, Max M. Krasnow2, and Luke Glowacki14*
Affiliations: 1Data Science Initiative, Harvard University, Cambridge, MA 02138 USA. 2Department of
Psychology, Harvard University, Cambridge, MA 02138 USA. 3Department of Human Evolutionary
Biology, Harvard University, Cambridge, MA 02138 USA. 4Department of Politics, Princeton University,
Princeton, NJ 08544 USA. 5Eastman School of Music, University of Rochester, Rochester, NY 14604
USA. 6Department of Music, Missouri State University, Springfield, MO 65897 USA. 7Portland, OR
97212 USA. 8Department of Political Science, Washington University in St. Louis, St. Louis, MO 63130
USA. 9Computational Auditory Perception Group, Max Planck Institute for Empirical Aesthetics, 60322
Frankfurt am Main Germany. 10Department of Psychology, University of California Los Angeles, Los
Angeles, CA 90095 USA. 11Department of Psychology, Boston College, Chestnut Hill, MA 02467 USA.
12Department of Psychology, University of Konstanz, 78464 Konstanz, Germany. 13Department of
Linguistics, McGill University, Montreal, QC H3A 1A7 Canada. 14Department of Anthropology,
Pennsylvania State University, State College, PA 16802 USA. *Corresponding author. Email:
[email protected] (S.A.M.); [email protected] (M.S.); [email protected] (L.G)
One sentence summary: Ethnographic text and audio recordings map out universals and variation in
world music.
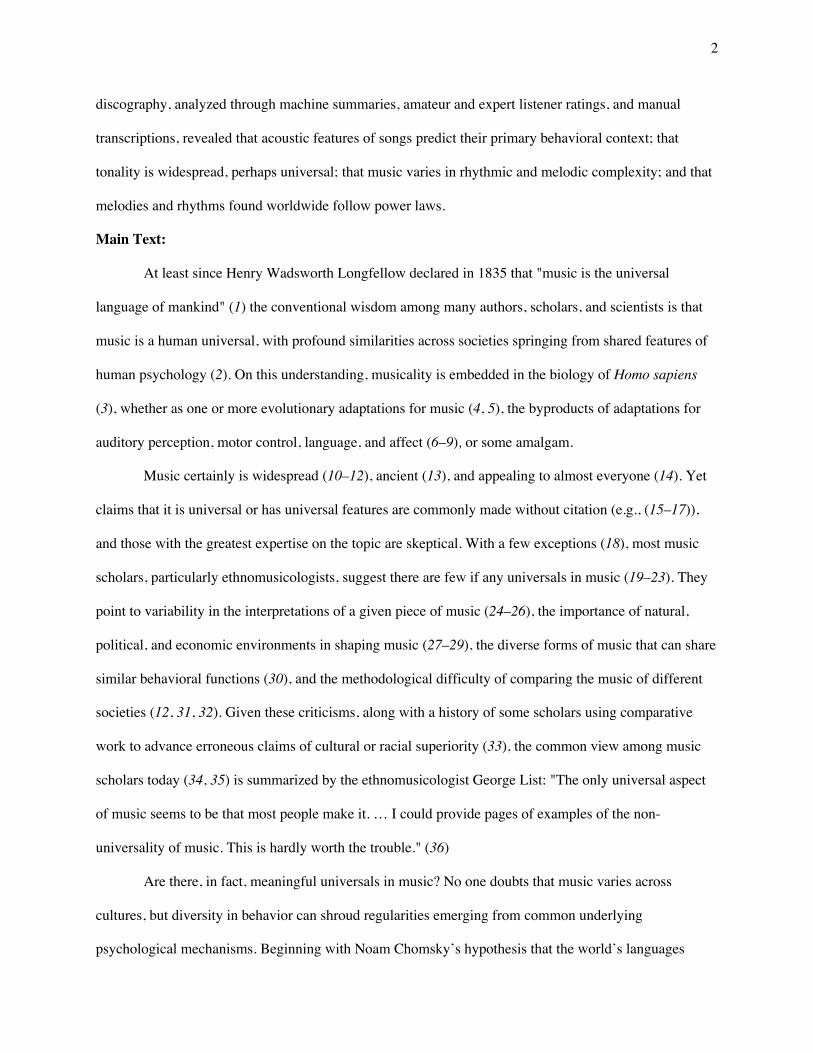
Abstract: What is universal about music, and what varies? We built a corpus of ethnographic text on
musical behavior from a representative sample of the world’s societies, and a discography of audio
recordings. The ethnographic corpus reveals that music appears in every society observed; that music
varies along three dimensions (formality, arousal, religiosity), more within societies than across them; and
that music is associated with certain behavioral contexts such as infant care, healing, dance, and love. The
2
discography, analyzed through machine summaries, amateur and expert listener ratings, and manual
transcriptions, revealed that acoustic features of songs predict their primary behavioral context; that
tonality is widespread, perhaps universal; that music varies in rhythmic and melodic complexity; and that
melodies and rhythms found worldwide follow power laws.
Main Text:
At least since Henry Wadsworth Longfellow declared in 1835 that "music is the universal
language of mankind" (1) the conventional wisdom among many authors, scholars, and scientists is that
music is a human universal, with profound similarities across societies springing from shared features of
human psychology (2). On this understanding, musicality is embedded in the biology of Homo sapiens
(3), whether as one or more evolutionary adaptations for music (4, 5), the byproducts of adaptations for
auditory perception, motor control, language, and affect (6–9), or some amalgam.
Music certainly is widespread (10–12), ancient (13), and appealing to almost everyone (14). Yet
claims that it is universal or has universal features are commonly made without citation (e.g., (15–17)),
and those with the greatest expertise on the topic are skeptical. With a few exceptions (18), most music
scholars, particularly ethnomusicologists, suggest there are few if any universals in music (19–23). They
point to variability in the interpretations of a given piece of music (24–26), the importance of natural,
political, and economic environments in shaping music (27–29), the diverse forms of music that can share
similar behavioral functions (30), and the methodological difficulty of comparing the music of different
societies (12, 31, 32). Given these criticisms, along with a history of some scholars using comparative
work to advance erroneous claims of cultural or racial superiority (33), the common view among music
scholars today (34, 35) is summarized by the ethnomusicologist George List: "The only universal aspect
of music seems to be that most people make it. … I could provide pages of examples of the non-
universality of music. This is hardly worth the trouble." (36)
Are there, in fact, meaningful universals in music? No one doubts that music varies across
cultures, but diversity in behavior can shroud regularities emerging from common underlying
psychological mechanisms. Beginning with Noam Chomsky’s hypothesis that the world’s languages
3
conform to an abstract Universal Grammar (37, 38), many anthropologists, psychologists, and cognitive
scientists have shown that behavioral patterns once considered arbitrary cultural products may exhibit
deeper, abstract similarities across societies which emerge from universal features of human nature. These
include religion (39–41), mate preferences (42), kinship systems (43), social relationships (44, 45),
morality (46, 47), violence and warfare (48–50), and political and economic beliefs (51, 52).
Music may be another example, though it is perennially difficult to study. A recent analysis of the
Garland Encyclopedia of World Music revealed that certain features, such as the use of words, chest
voice, and an isochronous beat, appear in a majority of songs within each of nine world regions (53).
Though it adds to the evidence that music is universal, the analysis has shortcomings: the corpus was
sampled opportunistically, which made generalizations to all of humanity impossible; the musical features
were highly ambiguous, leading to poor interrater reliability; and the analysis studied only the forms of
the societies’ music, not the behavioral contexts in which it is performed, which leaves open key
questions about functions of music and their connection to its forms.
Music perception experiments have begun to address some of these issues. In one, internet users
reliably discriminated dance songs, healing songs, and lullabies sampled from 86 mostly small-scale
societies (54); in another, listeners from the Mafa of Cameroon rated "happy", "sad", and "fearful"
examples of Western music somewhat similarly to Canadian listeners, despite having had limited
exposure to Western music (55); in a third, Americans and Kreung listeners from a rural Cambodian
village were asked to create music that sounded "angry", "happy", "peaceful", "sad", or "scared", and
generated similar melodies to one another (56). These studies suggest that the form of music is
systematically related to its affective and behavioral effects in similar ways across cultures. But they can
only provide provisional clues on which aspects of music, if any, are universal, because the societies,
genres, contexts, and judges are highly limited, and because they too contain little information about
music's behavioral contexts across cultures.
A proper evaluation of claims of universality and variation requires a natural history of music: a
systematic analysis of the features of musical behavior and musical forms across cultures, using scientific
4
standards of objectivity, representativeness, quantification of variability, and controls for data integrity.
We take up this challenge here. We focus on vocal music (hereafter, song) rather than instrumental music
(cf. (57), because it does not depend on technology, has well-defined physical correlates (i.e., pitched
vocalizations; 19), and has been the primary focus of biological explanations for music (4, 5).
Leveraging more than a century of research from anthropology and ethnomusicology, we built
two corpora, which collectively we call the Natural History of Song. The NHS Ethnography is a corpus of
descriptions of song performances, including their context, lyrics, people present, and other details,
systematically assembled from the ethnographic record to representatively sample diversity across
societies. The NHS Discography is a corpus of field recordings of performances of four kinds of song —
dance, healing, love, and lullaby — from an approximately representative sample of human societies,
mostly small-scale. We use the corpora to test five sets of hypotheses about universality and variability in
musical behavior and musical forms.
First, we test whether music is universal by examining the ethnographies of 315 societies, and
then a geographically-stratified pseudorandom sample of them.
Second, we assess how the behaviors associated with song differ among societies. We reduce the
high-dimensional NHS Ethnography annotations to a small number of dimensions of variation while
addressing challenges in the analysis of ethnographic data, such as selective nonreporting. This allows us
to assess how the variation in musical behavior across societies compares with the variation within a
single society.
Third, we test which behaviors are universally or commonly associated with song. We catalogue
20 common but untested hypotheses about these associations, such as religious activity, dance, and infant
care (4, 5, 40, 54, 58–60), and test them after adjusting for sampling error and ethnographer bias,
problems which have bedeviled prior tests.
Fourth, we analyze the musical features of songs themselves, as documented in the NHS
Discography. Since the raw waveform of a song performance is difficult to analyze, we derived four
representations of each one, combining blind human ratings with quantitative analyses. We then applied
5
objective classifiers to these representations to see whether the musical features of a song predict its
association with particular behavioral contexts.
Finally, in exploratory analyses we assess the prevalence of tonality in the world’s songs, show
that variation in their annotations falls along a small number of dimensions, and plot the statistical
distributions of melodic and rhythmic patterns in them.
The main advantages of the NHS corpora are that they sample societies systematically, allowing
findings pertaining to the particular genres analyzed to be generalized with confidence to all of humanity.
Because the NHS Discography does not sample all the world’s musical genres, in most analyses of that
corpus we have refrained from tabulating the overall frequency of specific features (as in previous work
(53)) because such estimates are likely to be biased by the genres sampled (see the discussion in (54)). All
data and materials are publicly available at http://osf.io/jmv3q. We also encourage readers to view and
listen to the corpora interactively via the plots available at http://themusiclab.org/nhsplots.
Music appears in all measured human societies
Is music universal? We first addressed this question by examining the eHRAF World Cultures
database (61, 62), developed and maintained by the Human Relations Area Files organization. It includes
high-quality ethnographic documents from 315 societies, subject-indexed by paragraph. We searched for
text that was tagged as including music (instrumental or vocal) or that contained at least one keyword
identifying vocal music (e.g., "singers").
Music was widespread: the eHRAF ethnographies describe music in 309 of the 315 societies.
Moreover, the remaining 6 (the Turkmen, Dominican, Hazara, Pamir, Tajik, and Ghorbat peoples) do in
fact have music, according to primary ethnographic documents available outside the database (63–68).
Thus music is present in 100% of a large sample of societies, consistent with the claims of writers and
scholars since Longfellow (1, 4, 5, 10, 12, 53, 54, 58–60, 69–73). Given these data, and assuming that the
sample of human societies is representative, the Bayesian 95% posterior credible interval for the
population proportion of human societies that have music, with a uniform prior, is [0.994, 1].
6
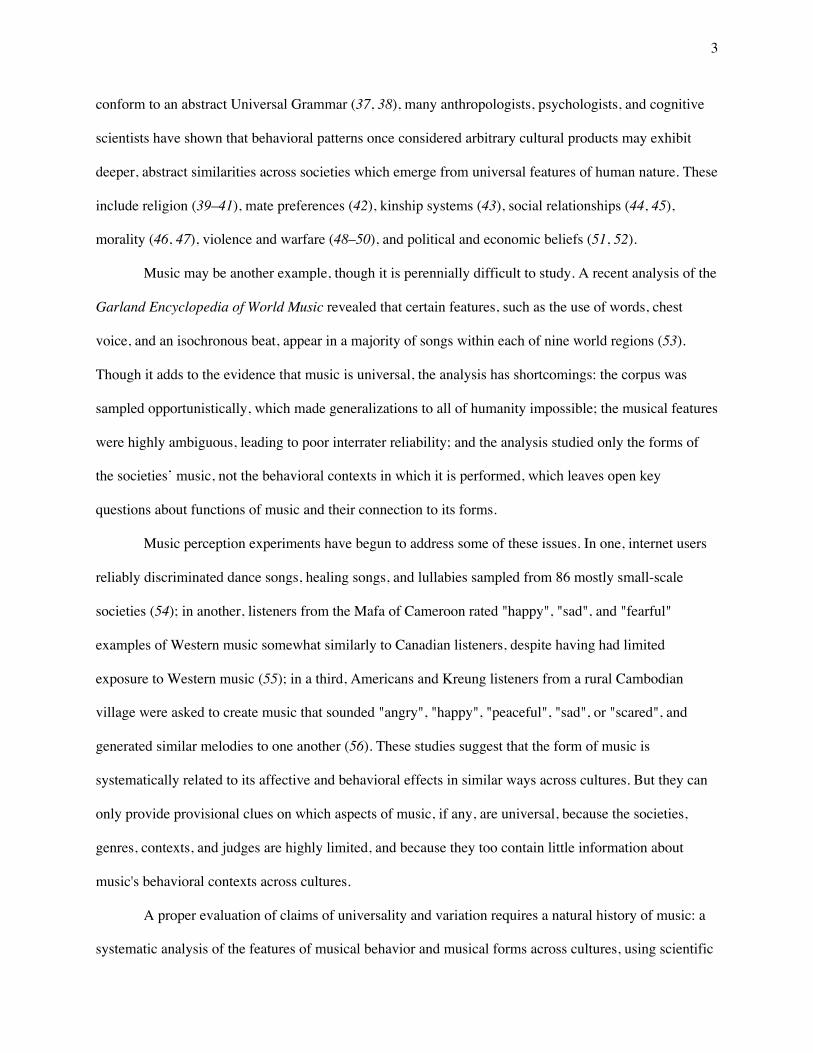
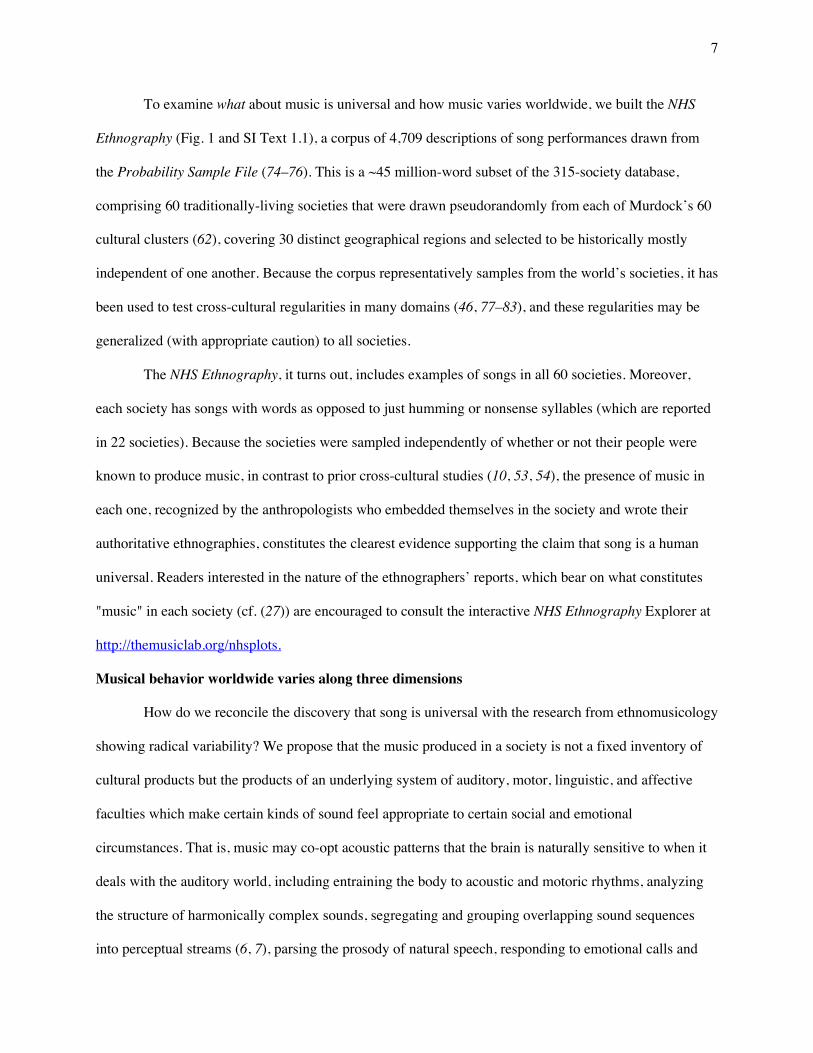
Fig. 1. Design of NHS Ethnography. The illustration depicts the sequence from acts of singing to the ethnography corpus. (A) People produce songs in conjunction with other behavior, which scholars observe and describe in text. These ethnographies are published in books, reports, and journal articles and then compiled, translated, catalogued, and digitized by the Human Relations Area Files organization. We conduct searches of the online eHRAF corpus for all descriptions of songs in the 60 societies of the Probability Sample File (B) and annotate them with a variety of behavioral features. The raw text, annotations, and metadata together form the NHS Ethnography. Codebooks listing all available data are in Tables S1-S6; a listing of societies and locations from which texts were gathered is in Table S12.
7
To examine what about music is universal and how music varies worldwide, we built the NHS
Ethnography (Fig. 1 and SI Text 1.1), a corpus of 4,709 descriptions of song performances drawn from
the Probability Sample File (74–76). This is a ~45 million-word subset of the 315-society database,
comprising 60 traditionally-living societies that were drawn pseudorandomly from each of Murdock’s 60
cultural clusters (62), covering 30 distinct geographical regions and selected to be historically mostly
independent of one another. Because the corpus representatively samples from the world’s societies, it has
been used to test cross-cultural regularities in many domains (46, 77–83), and these regularities may be
generalized (with appropriate caution) to all societies.
The NHS Ethnography, it turns out, includes examples of songs in all 60 societies. Moreover,
each society has songs with words as opposed to just humming or nonsense syllables (which are reported
in 22 societies). Because the societies were sampled independently of whether or not their people were
known to produce music, in contrast to prior cross-cultural studies (10, 53, 54), the presence of music in
each one, recognized by the anthropologists who embedded themselves in the society and wrote their
authoritative ethnographies, constitutes the clearest evidence supporting the claim that song is a human
universal. Readers interested in the nature of the ethnographers’ reports, which bear on what constitutes
"music" in each society (cf. (27)) are encouraged to consult the interactive NHS Ethnography Explorer at
http://themusiclab.org/nhsplots.
Musical behavior worldwide varies along three dimensions
How do we reconcile the discovery that song is universal with the research from ethnomusicology
showing radical variability? We propose that the music produced in a society is not a fixed inventory of
cultural products but the products of an underlying system of auditory, motor, linguistic, and affective
faculties which make certain kinds of sound feel appropriate to certain social and emotional
circumstances. That is, music may co-opt acoustic patterns that the brain is naturally sensitive to when it
deals with the auditory world, including entraining the body to acoustic and motoric rhythms, analyzing
the structure of harmonically complex sounds, segregating and grouping overlapping sound sequences
into perceptual streams (6, 7), parsing the prosody of natural speech, responding to emotional calls and
8
cries, and detecting ecologically salient sounds (8, 9). These faculties may interact with others that
specifically evolved for music (4, 5). Musical idioms and genres differ in which features they
systematically employ (that is, whether and how they impose structure and variation on a song’s rhythm,
melody, timbre, and so on) and which psychological responses they engage (calm, excitement, pathos,
unease), but they all draw from a common suite of psychological responses to sound.
If so, what should be universal about music is not specific melodies or rhythms but clusters of
correlated behaviors, such as slow soothing lullabies sung by a mother to a child or lively rhythmic songs
sung in public by a group of dancers. Restricting discussion in this section to the patterns of behavior
accompanying song (deferring analysis of the musical content to later sections), we asked how musical
behavior varies worldwide, how the variation among songs within societies compares to the variation
between them, and whether or not gaps or anomalies in the patterns of universals and variability are
artifacts of bias in ethnographic reporting.
Reducing the dimensionality of variation in musical behavior
The annotations of the social contexts of music in the database include a wide variety of
annotation types that characterize a broad spectrum of behavioral features (SI Text 1.1). To determine
whether this variation falls along a smaller number of dimensions capturing the principal ways in which
musical behavior varies worldwide, we used an extension of Bayesian principal components analysis
(84), which, in addition to reducing dimensionality, handles missing data in a principled way, and
provides a credible interval for each observation’s coordinates in the resulting space. Each observation in
this case is a “song event”, namely, a description in the NHS Ethnography of a song performance, a
characterization of how a society uses songs, or both.
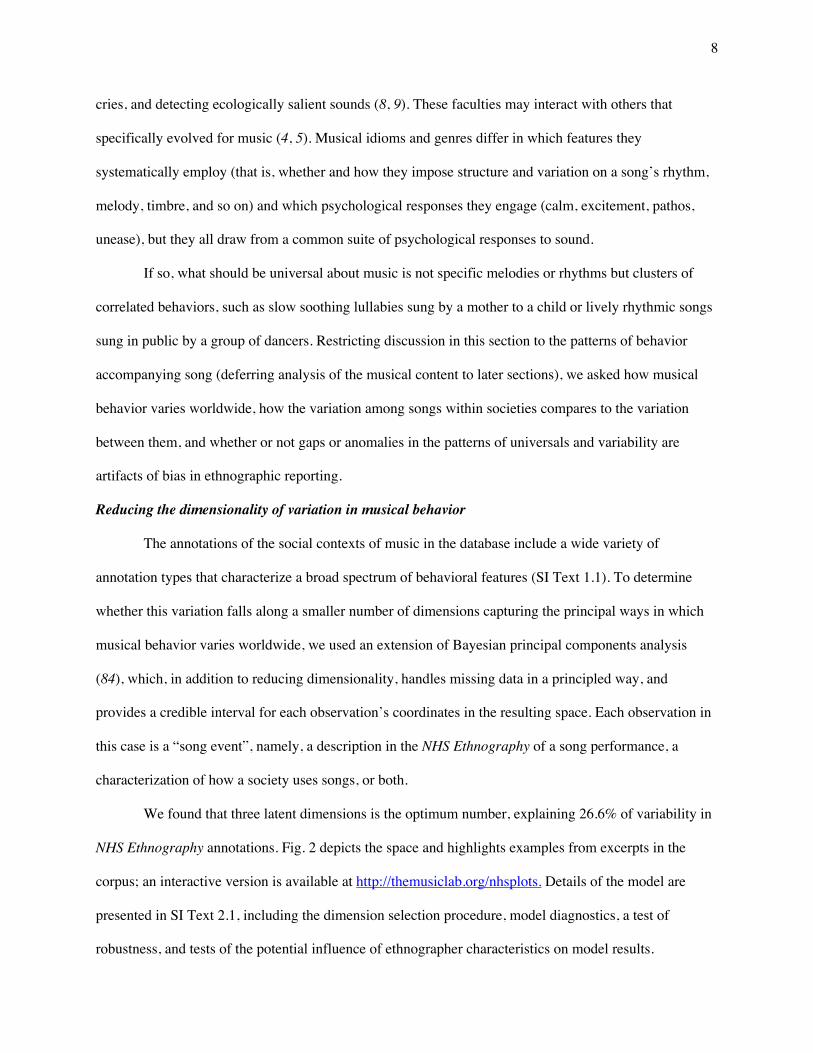
We found that three latent dimensions is the optimum number, explaining 26.6% of variability in
NHS Ethnography annotations. Fig. 2 depicts the space and highlights examples from excerpts in the
corpus; an interactive version is available at http://themusiclab.org/nhsplots. Details of the model are
presented in SI Text 2.1, including the dimension selection procedure, model diagnostics, a test of
robustness, and tests of the potential influence of ethnographer characteristics on model results.
9
Fig. 2. Patterns of variation in the NHS Ethnography. The figure depicts a projection of a subset of the NHS Ethnography onto three principal components (A). Each point represents the posterior mean location of an excerpt, with points colored by which of four types (identified by a broad search for matching keywords and annotations) it falls into: dance (blue), lullaby (green), healing (red), or love (yellow). The geometric centroids of each song type are represented by the diamonds. Excerpts that do not match any single search are not plotted, but can be viewed in the interactive version of this figure at http://themusiclab.org/nhsplots, along with all text and metadata. Selected examples of each song type are presented here (highlighted circles and B, C, D, E). Density plots (F, G, H) show the differences between song types on each dimension. Criteria for classifying song types from the raw text and annotations are presented in Table S17.
What do the three dimensions mean? To interpret the space, we examined annotations that load
highly on each dimension, and to validate this interpretation, we searched for examples at extreme
locations and examined their content. (Loadings are presented in Tables S13-S15; a selection of extreme
examples is given in Table S16.)
The first dimension (which accounts for 15.5% of the total variance, including error noise)
captures variability in the Formality of a song: excerpts high along this dimension describe ceremonial
events involving adults, large audiences, and instruments; excerpts low on it describe informal events
10
with small audiences and children. The second dimension (accounting for 6.2% of the variance) captures
variability in Arousal: excerpts high along this dimension describe lively events with many singers, large
audiences, and dancing; excerpts low on it describe calmer events involving fewer people and less overt
affect, such as people singing to themselves. The third dimension (4.9%) distinguishes Religious events
from secular ones: passages high along the dimension describe shamanic ceremonies, possession, and
funerary songs; passages low on it describe communal events without spiritual content, such as
community celebrations.
To validate whether this dimensional space captured behaviorally relevant differences among
songs, we tested whether we could reliably recover clusters for four distinctive, easily identifiable, and
regularly occurring song types: dance, lullaby, healing, and love (54). We searched the NHS Ethnography
for excerpts that match at least one of the four song types using both keyword searches and human
annotations (Table S17).
We found that, while each song type can appear throughout the space, clear structure is
observable (Fig. 2): the excerpts falling into each song type cluster together. On average, dance songs
(1089 excerpts) occupy the high-Formality, high-Arousal, low-Religiosity region. Healing songs (289
excerpts) cluster in the high-Formality, high-Arousal, high-Religiosity region. Love songs (354 excerpts)
cluster in the low-Formality, low-Arousal, low-Religiosity region. Lullabies (156 excerpts) are the
sparsest category (but see SI Text 2.1.5), and are located mostly in the low-Formality and low-Arousal
regions. An additional 2821 excerpts matched either more than one category or none of the four.
To specify the coherence of these clusters formally, rather than just visually, we asked what
proportion of song events are closer to the centroid of their own song type's location than to any other
song type (SI Text 2.1.6). Overall, 64% of the songs were located closest to the centroid that matched
their own type; under a null hypothesis that song type is unrelated to location, simulated by randomly
shuffling the song labels, only 23.2% would do so (p < .001 according to a permutation test). This result
was statistically significant for three of the four song types (dance: 66%; healing: 74%; love: 62%; ps <
.001) though not for lullabies (39%, p = .425). The matrix showing how many songs of each type were
11
near each centroid is in Table S18. Note that the analyses reported here eliminated variables with high
missingness; a validation model that analyzed the entire corpus yielded similar dimensional structure and
clustering (Figs. S1-S2 and SI Text 2.1.5).
The range of musical behavior is similar across societies
We next examined whether this pattern of variation applies within all societies. Do all societies
take advantage of the full spectrum of possibilities presumably made available by the neural, cognitive,
and cultural systems that underlie music? Alternatively, is there only a single, prototypical song type that
is found in all societies, perhaps reflecting the evolutionary origin of music (love songs, say, if music
evolved as a courtship display; or lullabies, if it evolved as an adaptation to infant care), with the other
types haphazardly distributed or absent altogether, depending on whether the society extended the
prototype through cultural evolution? As a third alternative, do societies fall into discrete typologies, such
as a Dance Culture, or a Lullaby Culture? As still another alternative, do they occupy sectors of the space,
so that there are societies with only arousing songs, or only religious ones, or ones whose songs are
equally formal and vary only by arousal, or vice versa? The data in Fig. 2, which pool song events across
societies, cannot answer such questions.
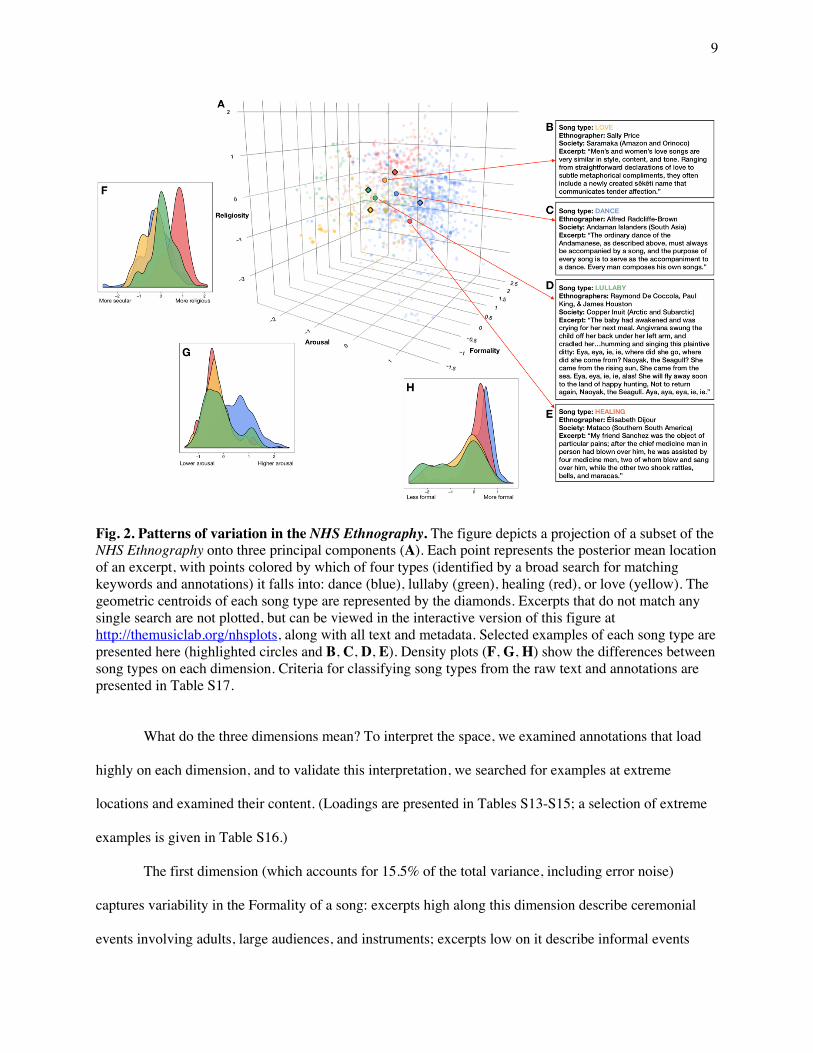
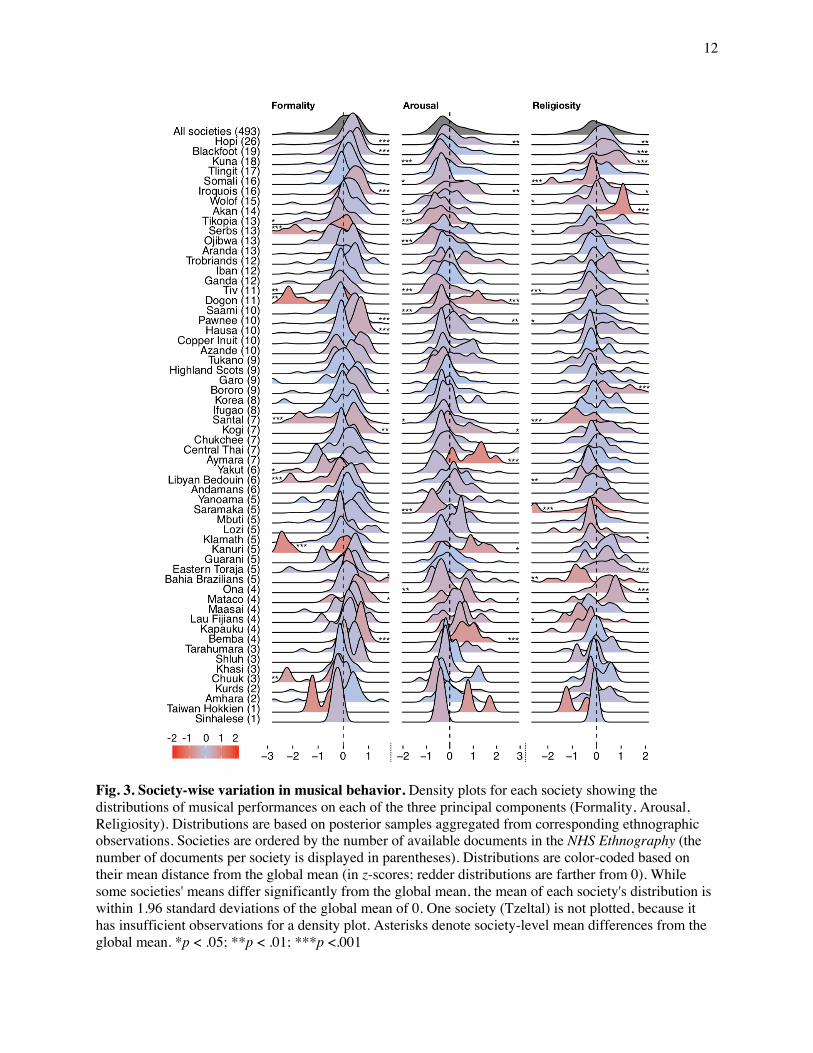
We estimated the variance of each society's scores on each dimension, aggregated across all
ethnographies from that society. This revealed that the distributions of each society's observed musical
behaviors are remarkably similar (Fig. 3), such that a song with "average formality", "average arousal", or
"average religiosity" could appear in any society we studied. This finding is supported by comparing the
global average along each dimension to each society’s mean and standard deviation, which summarizes
how unusual the average song event would appear to members of that society. We found that in every
society, a song event at the global mean would not appear out of place: the global mean always falls
within the 95% confidence interval of every society's distribution (Fig. S3). These results do not appear to
be driven by any bias stemming from ethnographer characteristics such as sex or academic field (Fig. S4
and SI Text 2.1.7), nor are they artifacts of a society being related to other societies in the sample by
12
Fig. 3. Society-wise variation in musical behavior. Density plots for each society showing the distributions of musical performances on each of the three principal components (Formality, Arousal, Religiosity). Distributions are based on posterior samples aggregated from corresponding ethnographic observations. Societies are ordered by the number of available documents in the NHS Ethnography (the number of documents per society is displayed in parentheses). Distributions are color-coded based on their mean distance from the global mean (in z-scores; redder distributions are farther from 0). While some societies' means differ significantly from the global mean, the mean of each society's distribution is within 1.96 standard deviations of the global mean of 0. One society (Tzeltal) is not plotted, because it has insufficient observations for a density plot. Asterisks denote society-level mean differences from the global mean. *p < .05; **p < .01; ***p <.001
13
region, subregion, language family, subsistence type, or location in the Old versus New World (Fig S5
and SI Text 2.1.8).
We also applied a comparison that is common in biological studies of genetic diversity (85) and
that has been performed in a recent cultural-phylogenetic study of music (86). It revealed that typical
within-society variation is approximately six times larger than between-society variation. Specifically, the
ratios of within- to between-society variances were 5.58 for Formality (95% Bayesian credible interval
[4.11, 6.95]); 6.39 [4.72, 8.34] for Arousal; and 6.21 [4.47, 7.94] for Religiosity. Moreover, none of the
180 mean values for the 60 societies over the 3 dimensions deviated from the global mean by more than
1.96 times the standard deviation of that society (Fig. S3 and SI Text 2.1.9).
These findings demonstrate systematic regularities in musical behavior, but they also reveal that
behaviors vary quantitatively across societies — consistent with the longstanding conclusions of
ethnomusicologists. For instance, the Kanuri's observed musical behaviors are estimated to be less formal
than those of any other society, whereas the Akan's are estimated to be the most religious (in both cases,
the behaviors are significantly different from the global mean on average). We do not investigate the
determinants of this variation here, though ethnomusicologists have long recognized the importance of
this question; in fact, some have proposed hypotheses to explain diversity, such as a relation between the
formality of song performances and a society's degree of rigidity (10).
Despite this observed variation, however, a song event of average formality would appear
unremarkable in the Kanuri's distribution of songs, as would a song event of average religiosity in the
Akan. Overall, we find that for each dimension, approximately one-third of all societies' means
significantly differed from the global mean, and approximately half differed from the global mean on at
least one dimension (Fig. 3). But despite variability in societies’ means on each dimension, their
distributions overlap substantially with one another and with the global mean. Moreover, even the outliers
in Fig. 3 appear to represent not genuine idiosyncrasy in some cultures but sampling error: the societies
that differ more from the global mean on some dimension are those with sparser documentation in the
ethnographic record (Fig. S6 and SI Text 2.1.10). To ensure that these results are not artifacts of the
14
statistical techniques employed, we applied them to a structurally analogous dataset of climate features
(e.g., temperature) where latent dimensions are expected to vary across countries (because, for instance,
mean elevation is not universal, and it is related to temperature variation); the results were entirely
different than what we found when analyzing the NHS Ethnography (Figs. S7-S8 and SI Text 2.1.11).
Summary of cross-cultural variation in musical behavior
We find that much of the vast diversity of musical behavior found worldwide fits into three latent
dimensions which capture interpretable features of the songs and the circumstances in which they are
sung. Importantly, these findings are derived from reports of objective features of musical behavior, such
as the time of day, the number of people present, and so on, making it unlikely that they are attributable to
any overall bias in how ethnographers respond to unfamiliar musical idioms. The results suggest that
societies' musical behaviors are largely similar to one another, such that the variability within a society
exceeds the variability between them (all societies have more soothing songs, such as lullabies; more
rousing songs, such as dance tunes; more stirring songs, such as prayers; and other recognizable kinds of
musical performance), and that the appearance of uniqueness in the ethnographic record may reflect
under-reporting. The results also suggest that aspects in which musical behavior is most variable might be
captured by the 73.4% of variability that our model does not explain, that is, dimensions other than
formality, arousal, and religiosity.
Associations between song and behavior, corrected for bias
Various evolutionary theories of music (biological and cultural) have hypothesized that music is
universally produced in distinct behavioral contexts, such as group dancing (5), infant care (4), healing
ceremonies (40), and several others (58–60). These hypotheses have been difficult to validate, however,
because ethnographic descriptions of behavior are subject to several forms of selective nonreporting.
Ethnographers may omit certain kinds of information because of their academic interests (e.g., the author
focuses on farming and not shamanism), implicit or explicit biases (e.g., the author reports less
information about the elderly), lack of knowledge (e.g., the author is unaware of food taboos), or
inaccessibility (e.g., the author wants to report on infant care but is not granted access to infants).
15
While we cannot distinguish among the causes of selective nonreporting, we can discern patterns
of omission in the NHS Ethnography. For example, we find that when the singer’s age is reported, they
are likely to be young, but when the singer’s age is not reported, other cues are statistically present (such
as the fact that a song is ceremonial) which suggest that they are old. Such correlations — between the
absence of certain values of one variable and the reporting of particular values of other variables — were
aggregated into a model of missingness (SI Text 2.1.12) that forms part of the Bayesian principal
component analysis reported in the previous sections.
This allows us to test hypotheses about the contexts with which music is strongly associated
worldwide, while accounting for reporting biases. We compared the frequency with which a particular
behavior appears in text describing song with the estimated frequency with which that behavior appears
across the board, in all the text written by that ethnographer about that society, which can be treated as the
null distribution for that behavior. If a behavior is systematically associated with song, then its frequency
in the NHS Ethnography should exceed its frequency in that null distribution, which we estimate by
randomly drawing the same number of passages from the same documents (full model details are in SI
Text 2.2).
We generated a list of 20 hypotheses about universal or widespread contexts for music (Table 1)
from published work in anthropology, ethnomusicology, and cognitive science (4, 5, 54, 58–60, 83),
together with a survey of nearly 1000 scholars which solicited opinions about which behaviors might be
universally linked to music (SI Text 1.4.1). We then designed two sets of criteria for determining whether
a given passage of ethnography represented a given behavior in this list. The first used human-annotated
identifiers, capitalizing on the fact that every paragraph in the Probability Sample File comes tagged with
one of more than 750 identifiers from the Outline of Cultural Materials (OCM), such as MOURNING,
INFANT CARE, or WARFARE.
The second was needed because some hypotheses corresponded only loosely to the available
OCM identifiers (e.g., "love songs" is only a partial fit to the identifier ARRANGING A MARRIAGE,
and not an exact fit to any other identifier), and still others fit no identifier at all (e.g., "music perceived as
16
art or as a creation" (51)). So we designed a method that examined the text directly. Starting with a small
set of seed words associated with each hypothesis (e.g., "religious", "spiritual", and "ritual", for the
hypothesis that music is associated with religious activity), we used the WordNet lexical database (87) to
automatically generate lists of conceptually related terms (e.g., "rite" and "sacred"). We manually filtered
the lists to remove irrelevant words and homonyms and add relevant keywords that may have been
missed, then conducted word stemming to fill out plurals and other grammatical variants (full lists are in
Table S19). Each method has limitations: automated dictionary methods can erroneously flag a passage
which contains a word that is ambiguous, whereas the human-coded OCM identifiers may miss a relevant
passage, misinterpret the original ethnography, or paint with too broad a brush, applying a tag to a whole
paragraph or to several pages of text. Where the two methods converge, support for a hypothesis is
particularly convincing.
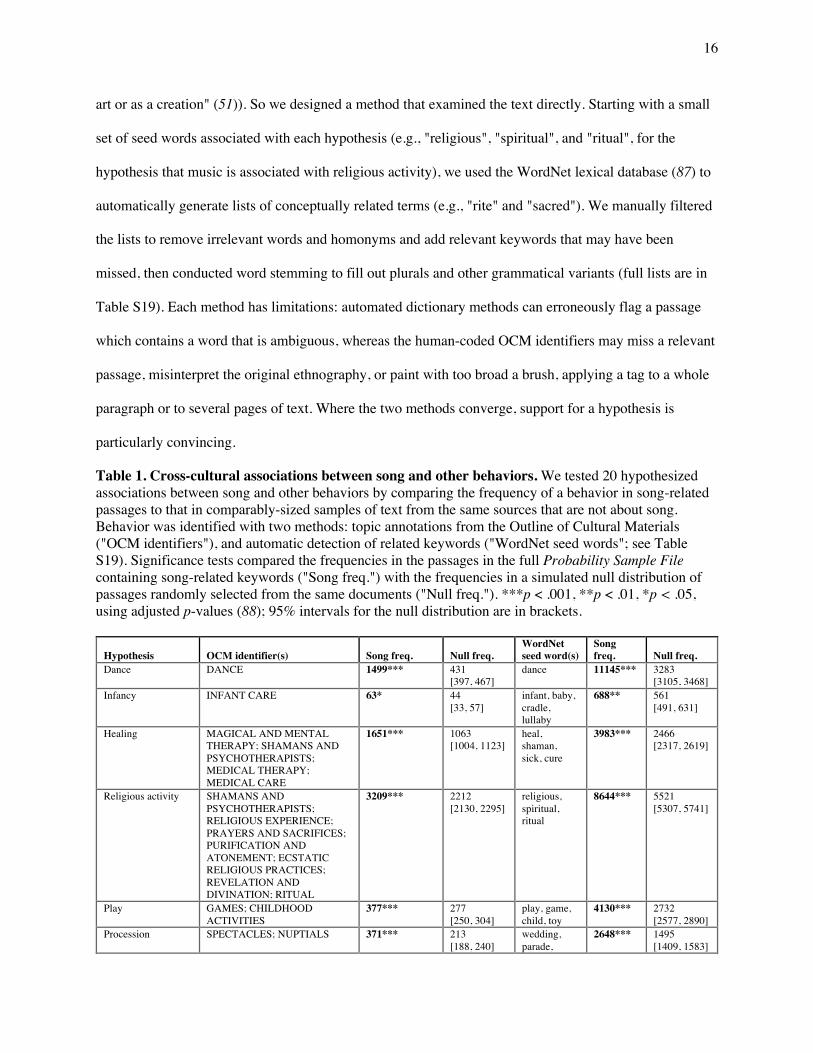
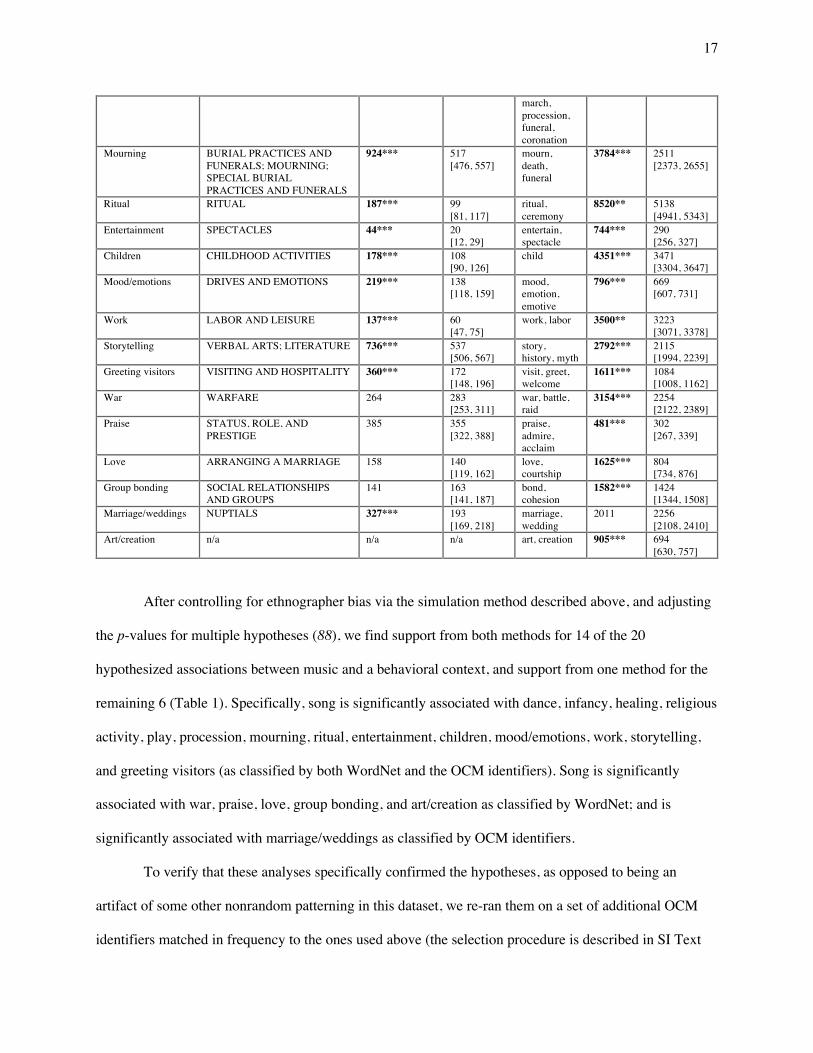
Table 1. Cross-cultural associations between song and other behaviors. We tested 20 hypothesized associations between song and other behaviors by comparing the frequency of a behavior in song-related passages to that in comparably-sized samples of text from the same sources that are not about song. Behavior was identified with two methods: topic annotations from the Outline of Cultural Materials ("OCM identifiers"), and automatic detection of related keywords ("WordNet seed words"; see Table S19). Significance tests compared the frequencies in the passages in the full Probability Sample File containing song-related keywords ("Song freq.") with the frequencies in a simulated null distribution of passages randomly selected from the same documents ("Null freq."). ***p < .001, **p < .01, *p < .05, using adjusted p-values (88); 95% intervals for the null distribution are in brackets.
Hypothesis OCM identifier(s) Song freq. Null freq. WordNet seed word(s)
Song freq. Null freq.
Dance DANCE 1499*** 431 [397, 467]
dance 11145*** 3283 [3105, 3468]
Infancy INFANT CARE 63* 44 [33, 57]
infant, baby, cradle, lullaby
688** 561 [491, 631]
Healing MAGICAL AND MENTAL THERAPY; SHAMANS AND PSYCHOTHERAPISTS; MEDICAL THERAPY; MEDICAL CARE
1651*** 1063 [1004, 1123]
heal, shaman, sick, cure
3983*** 2466 [2317, 2619]
Religious activity SHAMANS AND PSYCHOTHERAPISTS; RELIGIOUS EXPERIENCE; PRAYERS AND SACRIFICES; PURIFICATION AND ATONEMENT; ECSTATIC RELIGIOUS PRACTICES; REVELATION AND DIVINATION; RITUAL
3209*** 2212 [2130, 2295]
religious, spiritual, ritual
8644*** 5521 [5307, 5741]
Play GAMES; CHILDHOOD ACTIVITIES
377*** 277 [250, 304]
play, game, child, toy
4130*** 2732 [2577, 2890]
Procession SPECTACLES; NUPTIALS 371*** 213 [188, 240]
wedding, parade,
2648*** 1495 [1409, 1583]
17
march, procession, funeral, coronation
Mourning BURIAL PRACTICES AND FUNERALS; MOURNING; SPECIAL BURIAL PRACTICES AND FUNERALS
924*** 517 [476, 557]
mourn, death, funeral
3784*** 2511 [2373, 2655]
Ritual RITUAL 187*** 99 [81, 117]
ritual, ceremony
8520** 5138 [4941, 5343]
Entertainment SPECTACLES 44*** 20 [12, 29]
entertain, spectacle
744*** 290 [256, 327]
Children CHILDHOOD ACTIVITIES 178*** 108 [90, 126]
child 4351*** 3471 [3304, 3647]
Mood/emotions DRIVES AND EMOTIONS 219*** 138 [118, 159]
mood, emotion, emotive
796*** 669 [607, 731]
Work LABOR AND LEISURE 137*** 60 [47, 75]
work, labor 3500** 3223 [3071, 3378]
Storytelling VERBAL ARTS; LITERATURE 736*** 537 [506, 567]
story, history, myth
2792*** 2115 [1994, 2239]
Greeting visitors VISITING AND HOSPITALITY 360*** 172 [148, 196]
visit, greet, welcome
1611*** 1084 [1008, 1162]
War WARFARE 264 283 [253, 311]
war, battle, raid
3154*** 2254 [2122, 2389]
Praise STATUS, ROLE, AND PRESTIGE
385 355 [322, 388]
praise, admire, acclaim
481*** 302 [267, 339]
Love ARRANGING A MARRIAGE 158 140 [119, 162]
love, courtship
1625*** 804 [734, 876]
Group bonding SOCIAL RELATIONSHIPS AND GROUPS
141 163 [141, 187]
bond, cohesion
1582*** 1424 [1344, 1508]
Marriage/weddings NUPTIALS 327*** 193 [169, 218]
marriage, wedding
2011 2256 [2108, 2410]
Art/creation n/a n/a n/a art, creation 905*** 694 [630, 757]
After controlling for ethnographer bias via the simulation method described above, and adjusting
the p-values for multiple hypotheses (88), we find support from both methods for 14 of the 20
hypothesized associations between music and a behavioral context, and support from one method for the
remaining 6 (Table 1). Specifically, song is significantly associated with dance, infancy, healing, religious
activity, play, procession, mourning, ritual, entertainment, children, mood/emotions, work, storytelling,
and greeting visitors (as classified by both WordNet and the OCM identifiers). Song is significantly
associated with war, praise, love, group bonding, and art/creation as classified by WordNet; and is
significantly associated with marriage/weddings as classified by OCM identifiers.
To verify that these analyses specifically confirmed the hypotheses, as opposed to being an
artifact of some other nonrandom patterning in this dataset, we re-ran them on a set of additional OCM
identifiers matched in frequency to the ones used above (the selection procedure is described in SI Text
18
2.2.2). They covered a broad swath of topics, including DOMESTICATED ANIMALS, POLYGAMY,
and LEGAL NORMS that were not hypothesized to be related to song (the full list is in Table S20). We
find that only 1 appeared more frequently in song-related paragraphs than in the simulated null
distribution (CEREAL AGRICULTURE; see Table S20 for full results). This contrasts sharply with the
associations reported in Table 1, suggesting that they represent bona fide regularities in the behavioral
contexts of music.
We also performed the OCM analysis on the subsets of societies that fall within each of the world
regions. While many of the results replicate within regions, there is a clear sampling effect, with fewer
significant associations between music and a behavioral context in regions with fewer available
documents that discuss that context (often fewer than 10 instances of an OCM identifier) (Fig. S9).
Mixed-effects models could, in principle, help to mitigate this issue of low power, but ideally these
analyses should be performed on a larger sample of societies, including sets that are historically related to
different degrees, both to strengthen tests of universality and, by applying hierarchical phylogenetic
models (89), to determine whether any of the associations we report was originated by some ancestral
society and culturally transmitted to its descendants.
Universality of musical forms
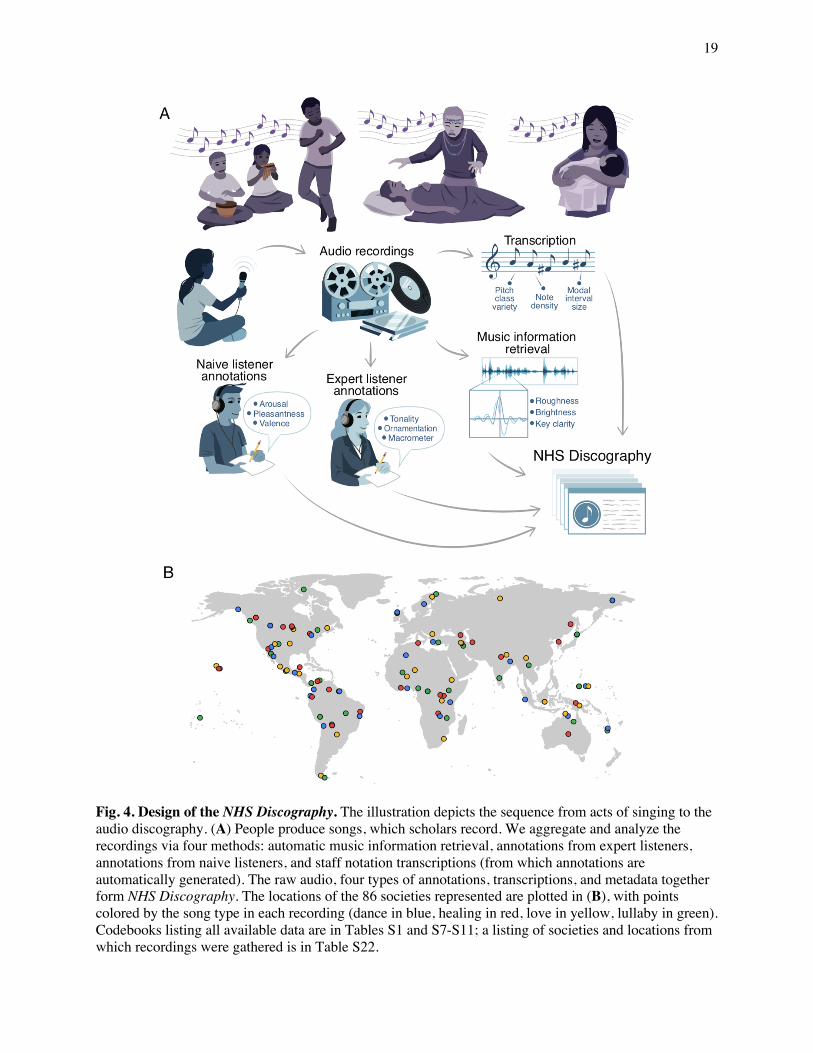
We now turn to the NHS Discography to examine the musical content of songs in four behavioral
contexts, (dance, lullaby, healing, and love; Fig. 4A), selected because each appears in the NHS
Ethnography, is widespread in traditional cultures (59), and exhibits shared features across societies (54).
Using predetermined criteria based on liner notes and supporting ethnographic text (Table S21), and
seeking recordings of each type from each of the 30 geographic regions, we found 118 songs of the 120
possibilities (4 contexts by 30 regions) from 86 societies (Fig. 4B). This coverage underscores the
universality of these four types; indeed, in the two possibilities we failed to find (healing songs from
Scandinavia and from the British Isles), documentary evidence shows that both existed (90, 91) but were
rare by the early 1900s, when collecting field recordings in remote areas became feasible.
19
Fig. 4. Design of the NHS Discography. The illustration depicts the sequence from acts of singing to the audio discography. (A) People produce songs, which scholars record. We aggregate and analyze the recordings via four methods: automatic music information retrieval, annotations from expert listeners, annotations from naive listeners, and staff notation transcriptions (from which annotations are automatically generated). The raw audio, four types of annotations, transcriptions, and metadata together form NHS Discography. The locations of the 86 societies represented are plotted in (B), with points colored by the song type in each recording (dance in blue, healing in red, love in yellow, lullaby in green). Codebooks listing all available data are in Tables S1 and S7-S11; a listing of societies and locations from which recordings were gathered is in Table S22.
20
The data describing each song comprised (a) machine summaries of the raw audio using
automatic music information retrieval techniques, particularly the audio's spectral features (e.g., mean
brightness and roughness, variability of spectral entropy; SI Text 1.2.1); (b) general impressions of
musical features (e.g., whether its emotional valence was happy or sad) by untrained listeners recruited
online from the United States and India (SI Text 1.2.2); (c) ratings of additional music-theoretic features
(e.g., high-level rhythmic grouping structure), similar in concept to previous rating-scale approaches to
analyzing world music (10, 53) from a group of experts, namely 30 musicians that included PhD
ethnomusicologists and music theorists (SI Text 1.2.3); and (d) detailed manual transcriptions, also by
expert musicians, of musical features (e.g., note density of sung pitches; SI Text 1.2.4). To ensure that
classifications were driven only by the content of the music, we excluded, a priori, any variables that
carried explicit or implicit information about the context (54), such as the number of singers audible on a
recording (which indicates that feature of the context explicitly) and a coding of polyphony (which
indicates it implicitly). This exclusion could be complete only in the manual transcriptions, which are
restricted to data on vocalizations; the music information retrieval and naïve listener data are practically
inseparable from contextual information, and the expert listener ratings contain at least a small amount of
it, since despite being told to ignore the context, the experts could still hear some if it, such as
accompanying instruments. The details of how we decided which variables to exclude are in SI Text
2.3.1.
Listeners accurately identify the behavioral contexts of songs
In a previous study, people listened to recordings from the NHS Discography and rated their
confidence in each of six possible behavioral contexts (e.g., "used to soothe a baby"). On average, the
listeners successfully inferred a song’s behavioral context from its musical forms: the songs that were
actually used to soothe a baby (i.e., lullabies) were rated highest as "used to soothe a baby", dance songs
were rated highly as "used for dancing", and so on (54).
We ran a massive conceptual replication (details in SI Text 1.4.2) where 29,357 visitors to the
citizen-science website http://themusiclab.org listened to songs drawn at random from the NHS
21
Discography and were asked to guess what kind of song they were listening to from among 4 alternatives
(yielding 185,832 ratings, i.e., each of the 118 songs rated about 1,500 times). Participants also reported
their musical skill level and degree of familiarity with world music. Listeners guessed the behavioral
contexts with a level of accuracy (42.4%) that is well above chance (25%), showing that the acoustic
properties of a song performance reflect its behavioral context in ways that span human cultures.
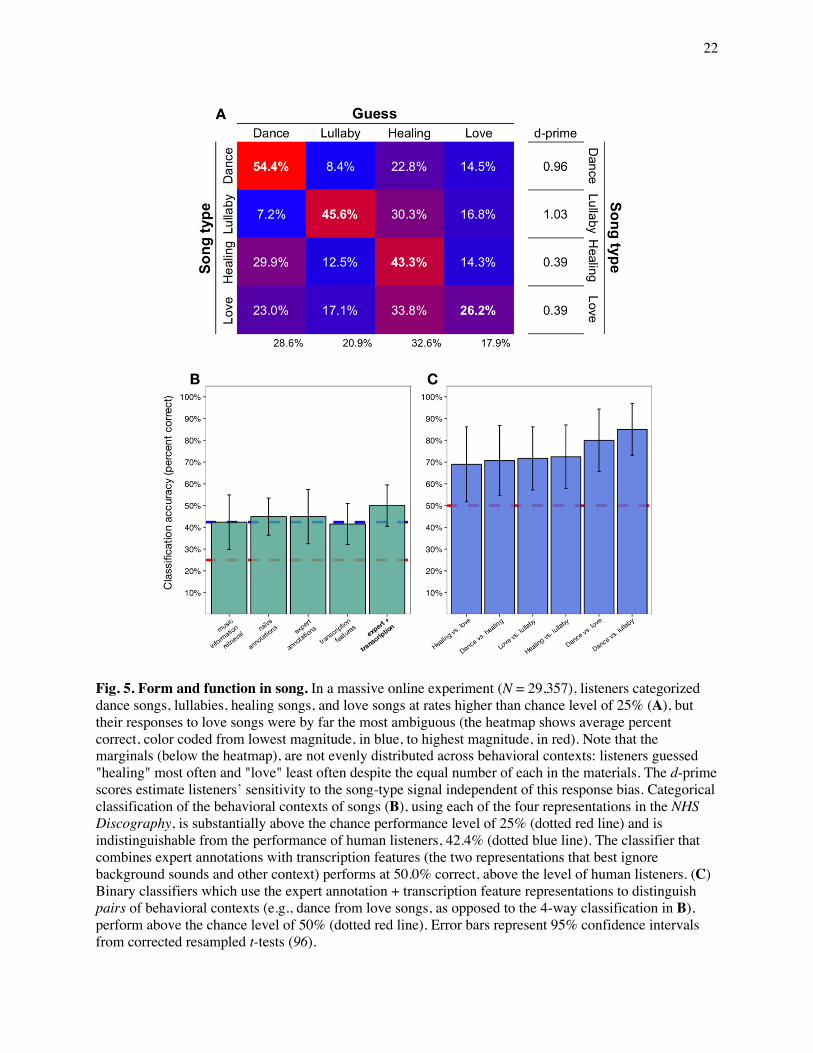
The confusion matrix (Fig. 5A) shows that listeners identified dance songs most accurately
(54.4%), followed by lullabies (45.6%), healing songs (43.3%), and love songs (26.2%), all significantly
above chance (ps < .001). Dance songs and lullabies were the least likely to be confused with each other,
presumably because of their many contrasting features, such as tempo (a possibility we examine below;
see Table 2). The column marginals suggest that the raters were biased toward identifying recordings as
healing songs (32.6%, above their actual proportion of 25%), and away from identifying them as love
songs (17.9%), possibly because healing songs are less familiar to Western and Westernized listeners and
they were overcompensating in identifying examples. As in previous research (54), love songs were least
reliably identified, despite their ubiquity in Western popular music, possibly because they span a wide
range of styles (compare Love Me Tender to Burning Love, to take just one artist). Nonetheless, d-prime
scores (Fig. 5A), which capture the sensitivity to a signal independently of response bias, show that all
behavioral contexts were identified at a rate higher than chance (d’ = 0).
Are accurate identifications of the contexts of culturally unfamiliar songs restricted to listeners
with musical training or exposure to world music? In a regression analysis, we found that participants’
categorization accuracy was statistically related to their self-reported musical skill (F(4,16245) = 2.57, p
= .036) and their familiarity with world music (F(3,16167) = 36.9, p < .001; statistics from linear
probability models), but with small effect sizes: the largest difference was a 4.7 percentage point
advantage for participants who reported they were "somewhat familiar with traditional music" relative to
those who reported that they had never heard it, and a 1.3 percentage point advantage for participants who
reported that they have "a lot of skill" relative to "no skill at all." Moreover, when limiting the dataset to
only those listeners with "no skill at all" or listeners who had "never heard traditional music", mean
22
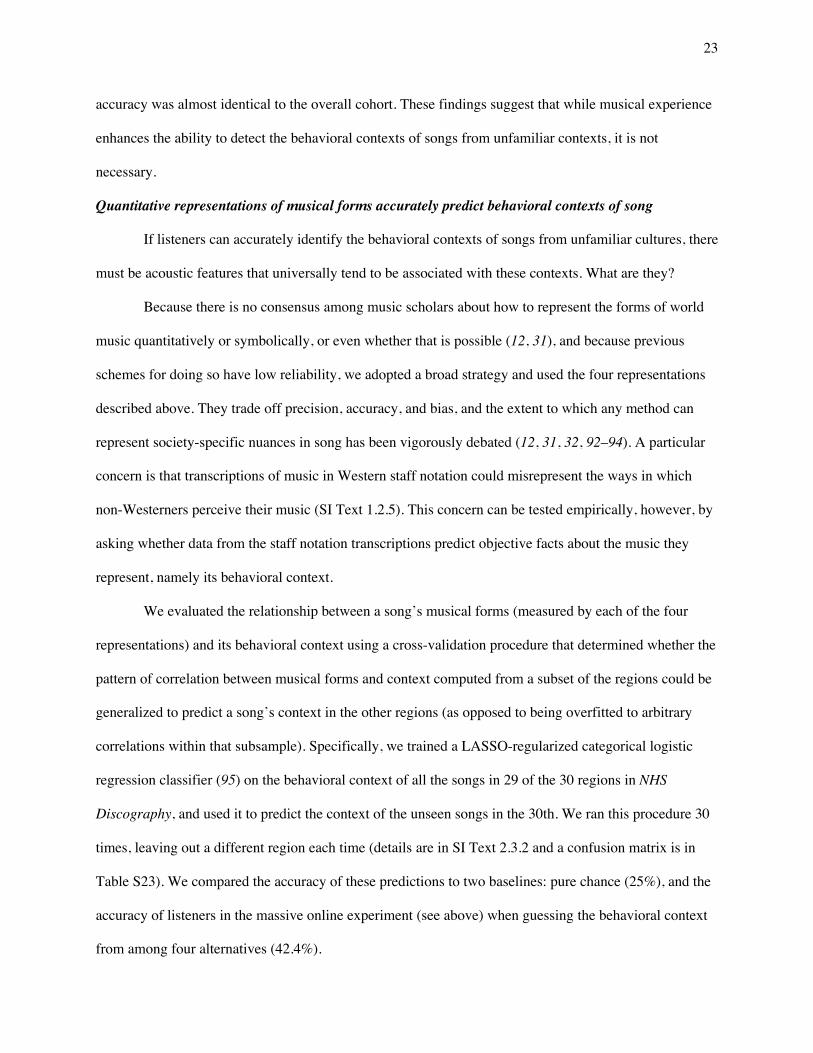
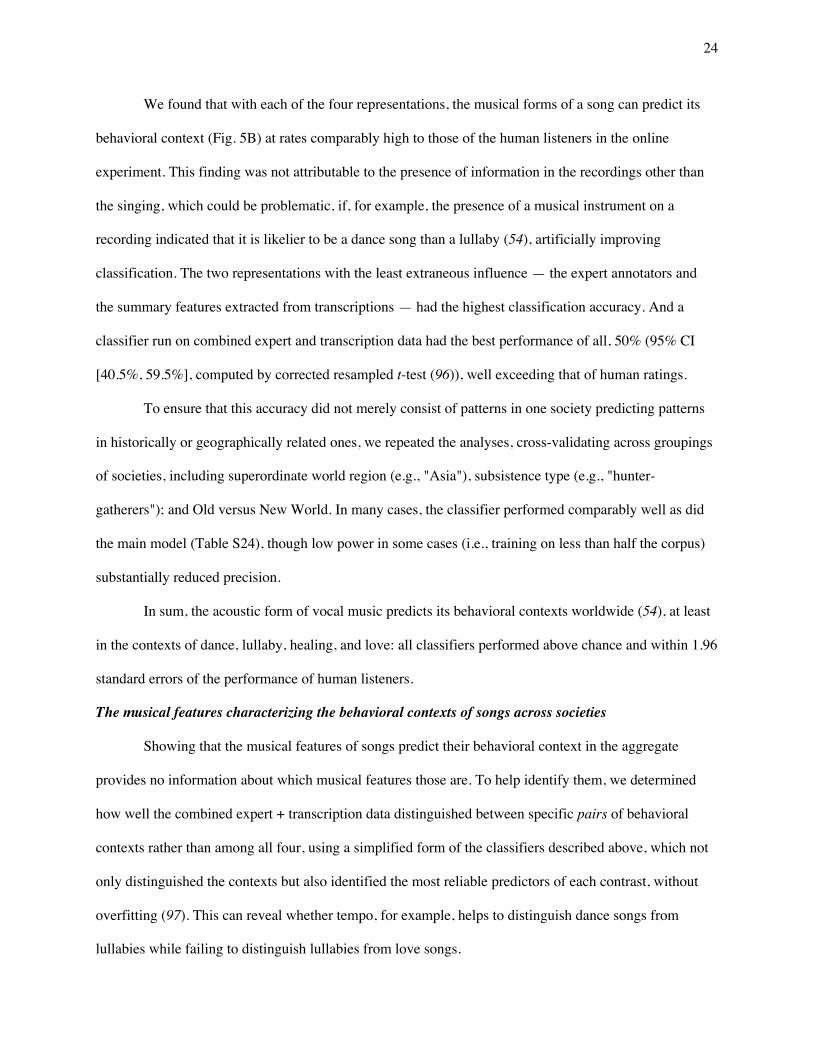
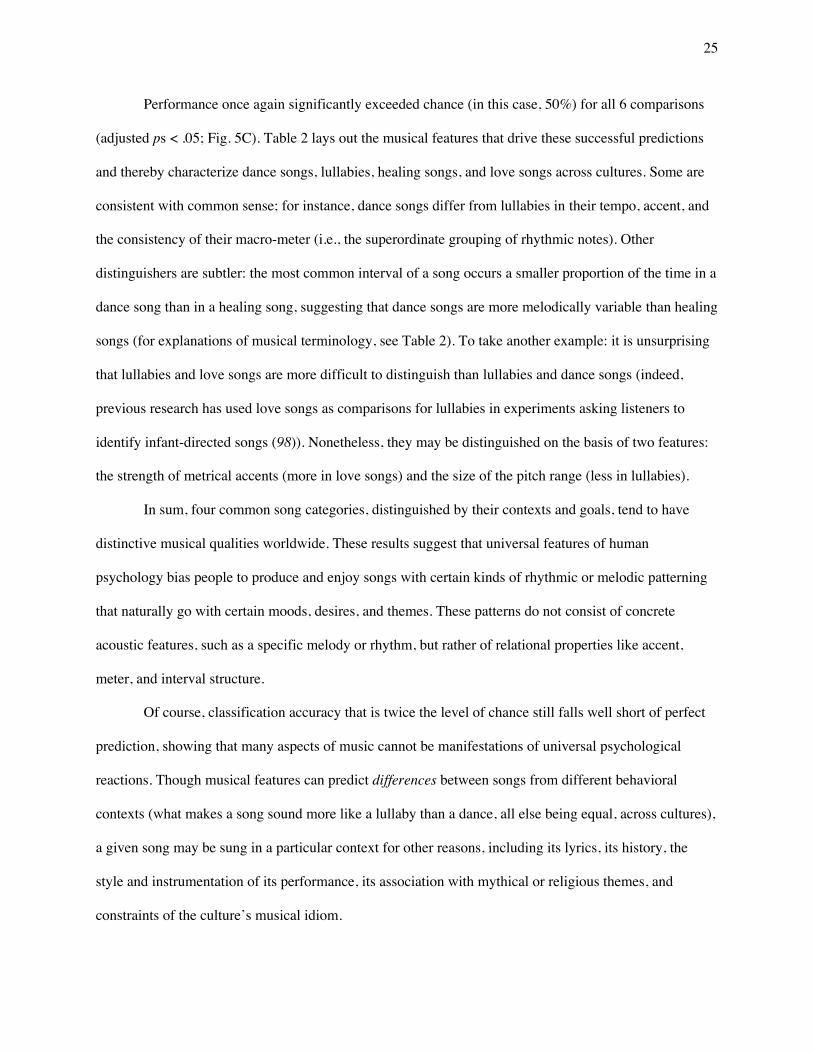
Fig. 5. Form and function in song. In a massive online experiment (N = 29,357), listeners categorized dance songs, lullabies, healing songs, and love songs at rates higher than chance level of 25% (A), but their responses to love songs were by far the most ambiguous (the heatmap shows average percent correct, color coded from lowest magnitude, in blue, to highest magnitude, in red). Note that the marginals (below the heatmap), are not evenly distributed across behavioral contexts: listeners guessed "healing" most often and "love" least often despite the equal number of each in the materials. The d-prime scores estimate listeners’ sensitivity to the song-type signal independent of this response bias. Categorical classification of the behavioral contexts of songs (B), using each of the four representations in the NHS Discography, is substantially above the chance performance level of 25% (dotted red line) and is indistinguishable from the performance of human listeners, 42.4% (dotted blue line). The classifier that combines expert annotations with transcription features (the two representations that best ignore background sounds and other context) performs at 50.0% correct, above the level of human listeners. (C) Binary classifiers which use the expert annotation + transcription feature representations to distinguish pairs of behavioral contexts (e.g., dance from love songs, as opposed to the 4-way classification in B), perform above the chance level of 50% (dotted red line). Error bars represent 95% confidence intervals from corrected resampled t-tests (96).
23
accuracy was almost identical to the overall cohort. These findings suggest that while musical experience
enhances the ability to detect the behavioral contexts of songs from unfamiliar contexts, it is not
necessary.
Quantitative representations of musical forms accurately predict behavioral contexts of song
If listeners can accurately identify the behavioral contexts of songs from unfamiliar cultures, there
must be acoustic features that universally tend to be associated with these contexts. What are they?
Because there is no consensus among music scholars about how to represent the forms of world
music quantitatively or symbolically, or even whether that is possible (12, 31), and because previous
schemes for doing so have low reliability, we adopted a broad strategy and used the four representations
described above. They trade off precision, accuracy, and bias, and the extent to which any method can
represent society-specific nuances in song has been vigorously debated (12, 31, 32, 92–94). A particular
concern is that transcriptions of music in Western staff notation could misrepresent the ways in which
non-Westerners perceive their music (SI Text 1.2.5). This concern can be tested empirically, however, by
asking whether data from the staff notation transcriptions predict objective facts about the music they
represent, namely its behavioral context.
We evaluated the relationship between a song’s musical forms (measured by each of the four
representations) and its behavioral context using a cross-validation procedure that determined whether the
pattern of correlation between musical forms and context computed from a subset of the regions could be
generalized to predict a song’s context in the other regions (as opposed to being overfitted to arbitrary
correlations within that subsample). Specifically, we trained a LASSO-regularized categorical logistic
regression classifier (95) on the behavioral context of all the songs in 29 of the 30 regions in NHS
Discography, and used it to predict the context of the unseen songs in the 30th. We ran this procedure 30
times, leaving out a different region each time (details are in SI Text 2.3.2 and a confusion matrix is in
Table S23). We compared the accuracy of these predictions to two baselines: pure chance (25%), and the
accuracy of listeners in the massive online experiment (see above) when guessing the behavioral context
from among four alternatives (42.4%).
24
We found that with each of the four representations, the musical forms of a song can predict its
behavioral context (Fig. 5B) at rates comparably high to those of the human listeners in the online
experiment. This finding was not attributable to the presence of information in the recordings other than
the singing, which could be problematic, if, for example, the presence of a musical instrument on a
recording indicated that it is likelier to be a dance song than a lullaby (54), artificially improving
classification. The two representations with the least extraneous influence — the expert annotators and
the summary features extracted from transcriptions — had the highest classification accuracy. And a
classifier run on combined expert and transcription data had the best performance of all, 50% (95% CI
[40.5%, 59.5%], computed by corrected resampled t-test (96)), well exceeding that of human ratings.
To ensure that this accuracy did not merely consist of patterns in one society predicting patterns
in historically or geographically related ones, we repeated the analyses, cross-validating across groupings
of societies, including superordinate world region (e.g., "Asia"), subsistence type (e.g., "hunter-
gatherers"); and Old versus New World. In many cases, the classifier performed comparably well as did
the main model (Table S24), though low power in some cases (i.e., training on less than half the corpus)
substantially reduced precision.
In sum, the acoustic form of vocal music predicts its behavioral contexts worldwide (54), at least
in the contexts of dance, lullaby, healing, and love: all classifiers performed above chance and within 1.96
standard errors of the performance of human listeners.
The musical features characterizing the behavioral contexts of songs across societies
Showing that the musical features of songs predict their behavioral context in the aggregate
provides no information about which musical features those are. To help identify them, we determined
how well the combined expert + transcription data distinguished between specific pairs of behavioral
contexts rather than among all four, using a simplified form of the classifiers described above, which not
only distinguished the contexts but also identified the most reliable predictors of each contrast, without
overfitting (97). This can reveal whether tempo, for example, helps to distinguish dance songs from
lullabies while failing to distinguish lullabies from love songs.
25
Performance once again significantly exceeded chance (in this case, 50%) for all 6 comparisons
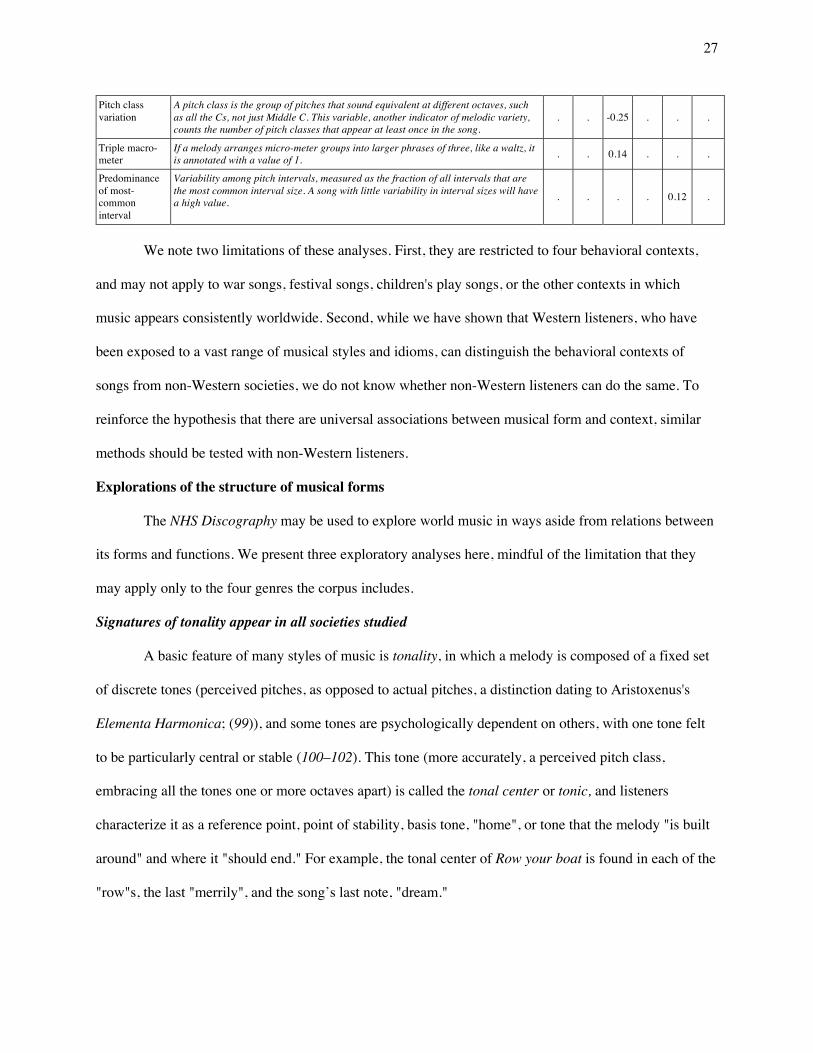
(adjusted ps < .05; Fig. 5C). Table 2 lays out the musical features that drive these successful predictions
and thereby characterize dance songs, lullabies, healing songs, and love songs across cultures. Some are
consistent with common sense; for instance, dance songs differ from lullabies in their tempo, accent, and
the consistency of their macro-meter (i.e., the superordinate grouping of rhythmic notes). Other
distinguishers are subtler: the most common interval of a song occurs a smaller proportion of the time in a
dance song than in a healing song, suggesting that dance songs are more melodically variable than healing
songs (for explanations of musical terminology, see Table 2). To take another example: it is unsurprising
that lullabies and love songs are more difficult to distinguish than lullabies and dance songs (indeed,
previous research has used love songs as comparisons for lullabies in experiments asking listeners to
identify infant-directed songs (98)). Nonetheless, they may be distinguished on the basis of two features:
the strength of metrical accents (more in love songs) and the size of the pitch range (less in lullabies).
In sum, four common song categories, distinguished by their contexts and goals, tend to have
distinctive musical qualities worldwide. These results suggest that universal features of human
psychology bias people to produce and enjoy songs with certain kinds of rhythmic or melodic patterning
that naturally go with certain moods, desires, and themes. These patterns do not consist of concrete
acoustic features, such as a specific melody or rhythm, but rather of relational properties like accent,
meter, and interval structure.
Of course, classification accuracy that is twice the level of chance still falls well short of perfect
prediction, showing that many aspects of music cannot be manifestations of universal psychological
reactions. Though musical features can predict differences between songs from different behavioral
contexts (what makes a song sound more like a lullaby than a dance, all else being equal, across cultures),
a given song may be sung in a particular context for other reasons, including its lyrics, its history, the
style and instrumentation of its performance, its association with mythical or religious themes, and
constraints of the culture’s musical idiom.
26
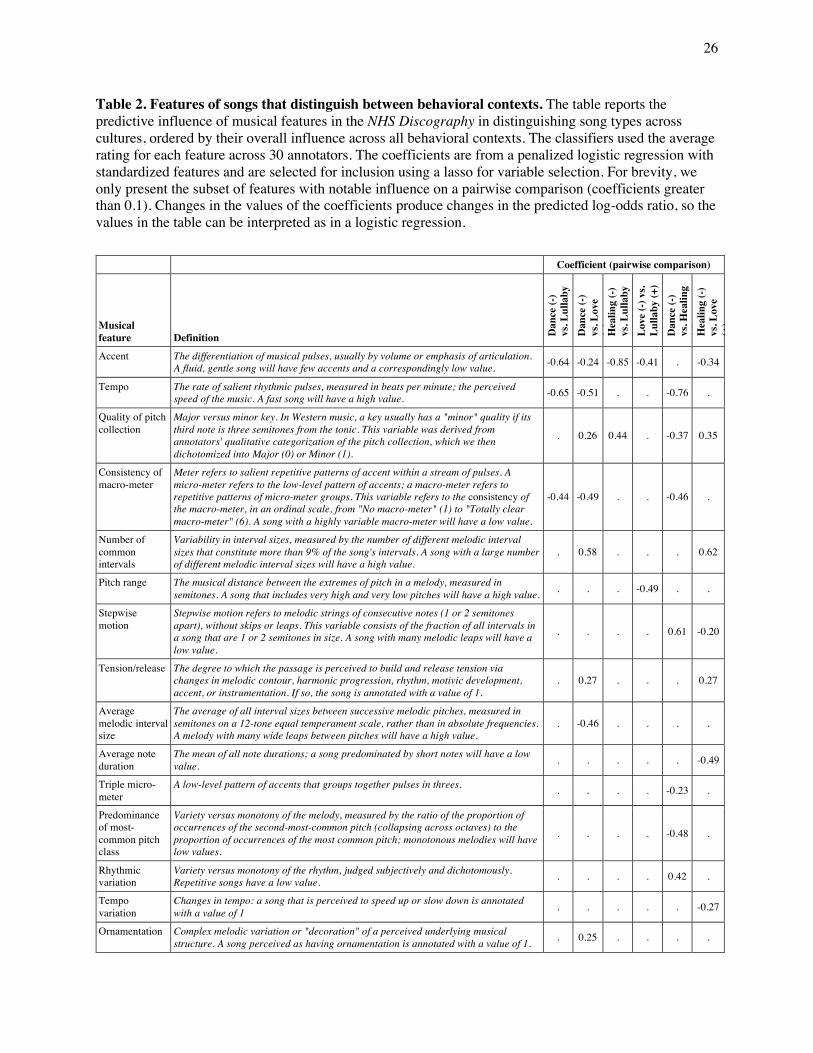
Table 2. Features of songs that distinguish between behavioral contexts. The table reports the predictive influence of musical features in the NHS Discography in distinguishing song types across cultures, ordered by their overall influence across all behavioral contexts. The classifiers used the average rating for each feature across 30 annotators. The coefficients are from a penalized logistic regression with standardized features and are selected for inclusion using a lasso for variable selection. For brevity, we only present the subset of features with notable influence on a pairwise comparison (coefficients greater than 0.1). Changes in the values of the coefficients produce changes in the predicted log-odds ratio, so the values in the table can be interpreted as in a logistic regression.
Coefficient (pairwise comparison)
Musical feature Definition D
ance
(-)
vs. L
ulla
by
(+)
Dan
ce (-
) vs
. Lov
e (+
) H
ealin
g ( -)
vs
. Lul
laby
(+
) Lo
ve (-
) vs.
Lulla
by (+
) D
ance
(-)
vs. H
ealin
g (+
) H
ealin
g ( -)
vs
. Lov
e (+
)
Accent The differentiation of musical pulses, usually by volume or emphasis of articulation. A fluid, gentle song will have few accents and a correspondingly low value. -0.64 -0.24 -0.85 -0.41 . -0.34
Tempo The rate of salient rhythmic pulses, measured in beats per minute; the perceived speed of the music. A fast song will have a high value. -0.65 -0.51 . . -0.76 .
Quality of pitch collection
Major versus minor key. In Western music, a key usually has a "minor" quality if its third note is three semitones from the tonic. This variable was derived from annotators' qualitative categorization of the pitch collection, which we then dichotomized into Major (0) or Minor (1).
. 0.26 0.44 . -0.37 0.35
Consistency of macro-meter
Meter refers to salient repetitive patterns of accent within a stream of pulses. A micro-meter refers to the low-level pattern of accents; a macro-meter refers to repetitive patterns of micro-meter groups. This variable refers to the consistency of the macro-meter, in an ordinal scale, from "No macro-meter" (1) to "Totally clear macro-meter" (6). A song with a highly variable macro-meter will have a low value.
-0.44 -0.49 . . -0.46 .
Number of common intervals
Variability in interval sizes, measured by the number of different melodic interval sizes that constitute more than 9% of the song's intervals. A song with a large number of different melodic interval sizes will have a high value.
. 0.58 . . . 0.62
Pitch range The musical distance between the extremes of pitch in a melody, measured in semitones. A song that includes very high and very low pitches will have a high value. . . . -0.49 . .
Stepwise motion
Stepwise motion refers to melodic strings of consecutive notes (1 or 2 semitones apart), without skips or leaps. This variable consists of the fraction of all intervals in a song that are 1 or 2 semitones in size. A song with many melodic leaps will have a low value.
. . . . 0.61 -0.20
Tension/release The degree to which the passage is perceived to build and release tension via changes in melodic contour, harmonic progression, rhythm, motivic development, accent, or instrumentation. If so, the song is annotated with a value of 1.
. 0.27 . . . 0.27
Average melodic interval size
The average of all interval sizes between successive melodic pitches, measured in semitones on a 12-tone equal temperament scale, rather than in absolute frequencies. A melody with many wide leaps between pitches will have a high value.
. -0.46 . . . .
Average note duration
The mean of all note durations; a song predominated by short notes will have a low value. . . . . . -0.49
Triple micro-meter
A low-level pattern of accents that groups together pulses in threes. . . . . -0.23 .
Predominance of most-common pitch class
Variety versus monotony of the melody, measured by the ratio of the proportion of occurrences of the second-most-common pitch (collapsing across octaves) to the proportion of occurrences of the most common pitch; monotonous melodies will have low values.
. . . . -0.48 .
Rhythmic variation
Variety versus monotony of the rhythm, judged subjectively and dichotomously. Repetitive songs have a low value. . . . . 0.42 .
Tempo variation
Changes in tempo: a song that is perceived to speed up or slow down is annotated with a value of 1 . . . . . -0.27
Ornamentation Complex melodic variation or "decoration" of a perceived underlying musical structure. A song perceived as having ornamentation is annotated with a value of 1. . 0.25 . . . .
27
Pitch class variation
A pitch class is the group of pitches that sound equivalent at different octaves, such as all the Cs, not just Middle C. This variable, another indicator of melodic variety, counts the number of pitch classes that appear at least once in the song.
. . -0.25 . . .
Triple macro-meter
If a melody arranges micro-meter groups into larger phrases of three, like a waltz, it is annotated with a value of 1. . . 0.14 . . .
Predominance of most-common interval
Variability among pitch intervals, measured as the fraction of all intervals that are the most common interval size. A song with little variability in interval sizes will have a high value. . . . . 0.12 .
We note two limitations of these analyses. First, they are restricted to four behavioral contexts,
and may not apply to war songs, festival songs, children's play songs, or the other contexts in which
music appears consistently worldwide. Second, while we have shown that Western listeners, who have
been exposed to a vast range of musical styles and idioms, can distinguish the behavioral contexts of
songs from non-Western societies, we do not know whether non-Western listeners can do the same. To
reinforce the hypothesis that there are universal associations between musical form and context, similar
methods should be tested with non-Western listeners.
Explorations of the structure of musical forms
The NHS Discography may be used to explore world music in ways aside from relations between
its forms and functions. We present three exploratory analyses here, mindful of the limitation that they
may apply only to the four genres the corpus includes.
Signatures of tonality appear in all societies studied
A basic feature of many styles of music is tonality, in which a melody is composed of a fixed set
of discrete tones (perceived pitches, as opposed to actual pitches, a distinction dating to Aristoxenus's
Elementa Harmonica; (99)), and some tones are psychologically dependent on others, with one tone felt
to be particularly central or stable (100–102). This tone (more accurately, a perceived pitch class,
embracing all the tones one or more octaves apart) is called the tonal center or tonic, and listeners
characterize it as a reference point, point of stability, basis tone, "home", or tone that the melody "is built
around" and where it "should end." For example, the tonal center of Row your boat is found in each of the
"row"s, the last "merrily", and the song’s last note, "dream."
28
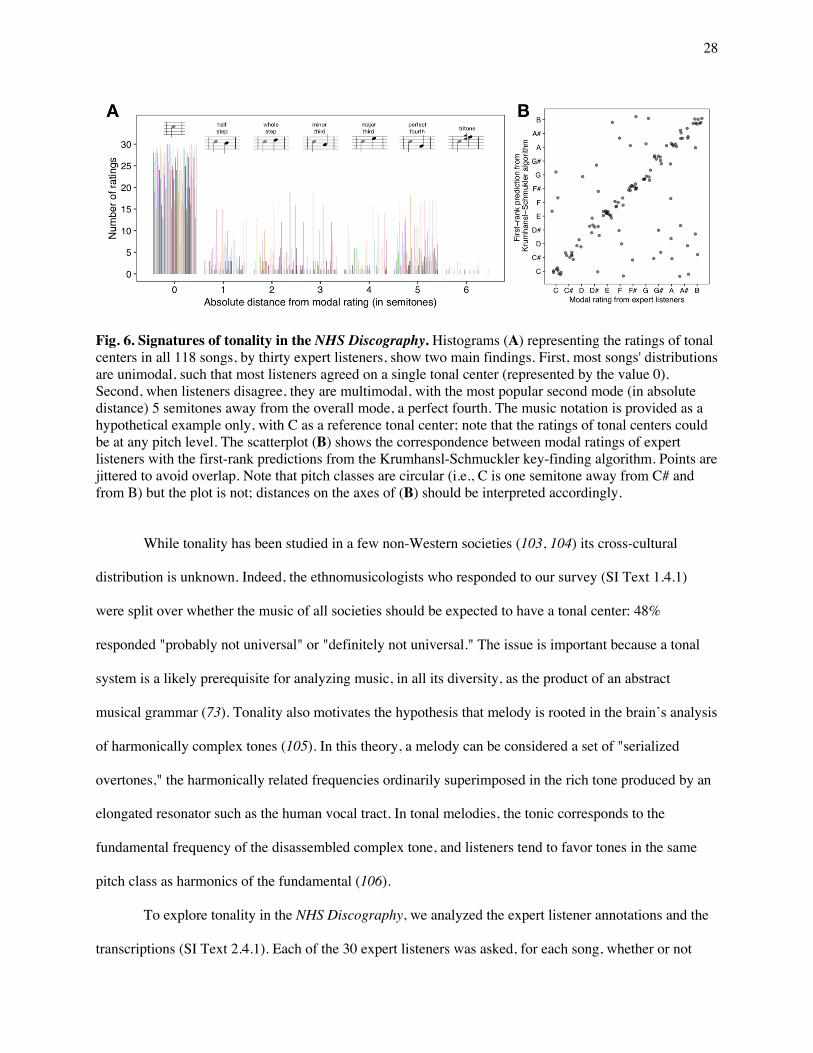
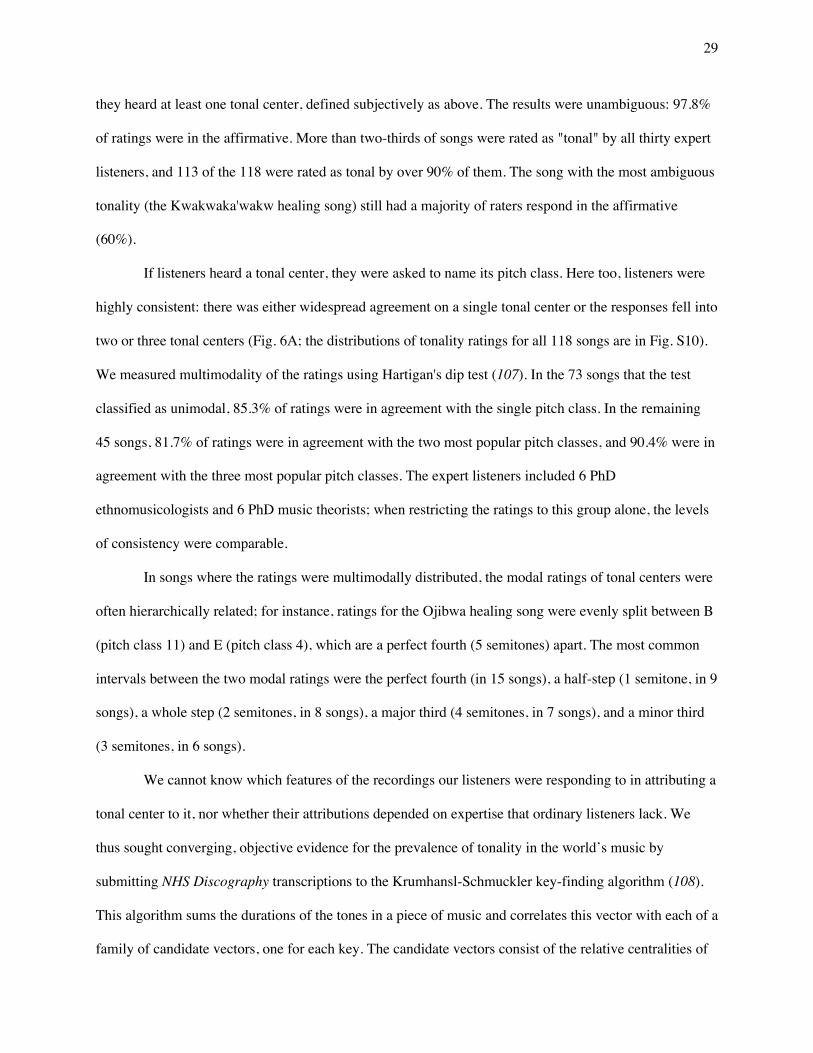
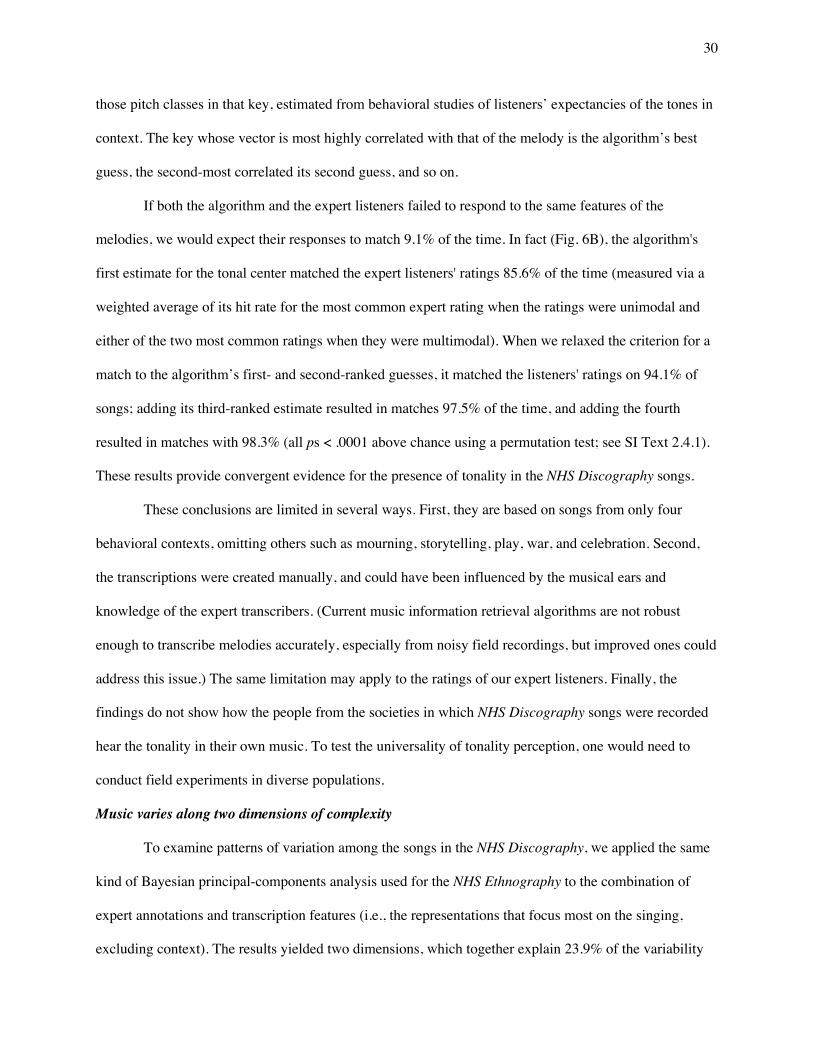
Fig. 6. Signatures of tonality in the NHS Discography. Histograms (A) representing the ratings of tonal centers in all 118 songs, by thirty expert listeners, show two main findings. First, most songs' distributions are unimodal, such that most listeners agreed on a single tonal center (represented by the value 0). Second, when listeners disagree, they are multimodal, with the most popular second mode (in absolute distance) 5 semitones away from the overall mode, a perfect fourth. The music notation is provided as a hypothetical example only, with C as a reference tonal center; note that the ratings of tonal centers could be at any pitch level. The scatterplot (B) shows the correspondence between modal ratings of expert listeners with the first-rank predictions from the Krumhansl-Schmuckler key-finding algorithm. Points are jittered to avoid overlap. Note that pitch classes are circular (i.e., C is one semitone away from C# and from B) but the plot is not; distances on the axes of (B) should be interpreted accordingly.
While tonality has been studied in a few non-Western societies (103, 104) its cross-cultural
distribution is unknown. Indeed, the ethnomusicologists who responded to our survey (SI Text 1.4.1)
were split over whether the music of all societies should be expected to have a tonal center: 48%
responded "probably not universal" or "definitely not universal." The issue is important because a tonal
system is a likely prerequisite for analyzing music, in all its diversity, as the product of an abstract
musical grammar (73). Tonality also motivates the hypothesis that melody is rooted in the brain’s analysis
of harmonically complex tones (105). In this theory, a melody can be considered a set of "serialized
overtones," the harmonically related frequencies ordinarily superimposed in the rich tone produced by an
elongated resonator such as the human vocal tract. In tonal melodies, the tonic corresponds to the
fundamental frequency of the disassembled complex tone, and listeners tend to favor tones in the same
pitch class as harmonics of the fundamental (106).
To explore tonality in the NHS Discography, we analyzed the expert listener annotations and the
transcriptions (SI Text 2.4.1). Each of the 30 expert listeners was asked, for each song, whether or not
29
they heard at least one tonal center, defined subjectively as above. The results were unambiguous: 97.8%
of ratings were in the affirmative. More than two-thirds of songs were rated as "tonal" by all thirty expert
listeners, and 113 of the 118 were rated as tonal by over 90% of them. The song with the most ambiguous
tonality (the Kwakwaka'wakw healing song) still had a majority of raters respond in the affirmative
(60%).
If listeners heard a tonal center, they were asked to name its pitch class. Here too, listeners were
highly consistent: there was either widespread agreement on a single tonal center or the responses fell into
two or three tonal centers (Fig. 6A; the distributions of tonality ratings for all 118 songs are in Fig. S10).
We measured multimodality of the ratings using Hartigan's dip test (107). In the 73 songs that the test
classified as unimodal, 85.3% of ratings were in agreement with the single pitch class. In the remaining
45 songs, 81.7% of ratings were in agreement with the two most popular pitch classes, and 90.4% were in
agreement with the three most popular pitch classes. The expert listeners included 6 PhD
ethnomusicologists and 6 PhD music theorists; when restricting the ratings to this group alone, the levels
of consistency were comparable.
In songs where the ratings were multimodally distributed, the modal ratings of tonal centers were
often hierarchically related; for instance, ratings for the Ojibwa healing song were evenly split between B
(pitch class 11) and E (pitch class 4), which are a perfect fourth (5 semitones) apart. The most common
intervals between the two modal ratings were the perfect fourth (in 15 songs), a half-step (1 semitone, in 9
songs), a whole step (2 semitones, in 8 songs), a major third (4 semitones, in 7 songs), and a minor third
(3 semitones, in 6 songs).
We cannot know which features of the recordings our listeners were responding to in attributing a
tonal center to it, nor whether their attributions depended on expertise that ordinary listeners lack. We
thus sought converging, objective evidence for the prevalence of tonality in the world’s music by
submitting NHS Discography transcriptions to the Krumhansl-Schmuckler key-finding algorithm (108).
This algorithm sums the durations of the tones in a piece of music and correlates this vector with each of a
family of candidate vectors, one for each key. The candidate vectors consist of the relative centralities of
30
those pitch classes in that key, estimated from behavioral studies of listeners’ expectancies of the tones in
context. The key whose vector is most highly correlated with that of the melody is the algorithm’s best
guess, the second-most correlated its second guess, and so on.
If both the algorithm and the expert listeners failed to respond to the same features of the
melodies, we would expect their responses to match 9.1% of the time. In fact (Fig. 6B), the algorithm's
first estimate for the tonal center matched the expert listeners' ratings 85.6% of the time (measured via a
weighted average of its hit rate for the most common expert rating when the ratings were unimodal and
either of the two most common ratings when they were multimodal). When we relaxed the criterion for a
match to the algorithm’s first- and second-ranked guesses, it matched the listeners' ratings on 94.1% of
songs; adding its third-ranked estimate resulted in matches 97.5% of the time, and adding the fourth
resulted in matches with 98.3% (all ps < .0001 above chance using a permutation test; see SI Text 2.4.1).
These results provide convergent evidence for the presence of tonality in the NHS Discography songs.
These conclusions are limited in several ways. First, they are based on songs from only four
behavioral contexts, omitting others such as mourning, storytelling, play, war, and celebration. Second,
the transcriptions were created manually, and could have been influenced by the musical ears and
knowledge of the expert transcribers. (Current music information retrieval algorithms are not robust
enough to transcribe melodies accurately, especially from noisy field recordings, but improved ones could
address this issue.) The same limitation may apply to the ratings of our expert listeners. Finally, the
findings do not show how the people from the societies in which NHS Discography songs were recorded
hear the tonality in their own music. To test the universality of tonality perception, one would need to
conduct field experiments in diverse populations.
Music varies along two dimensions of complexity
To examine patterns of variation among the songs in the NHS Discography, we applied the same
kind of Bayesian principal-components analysis used for the NHS Ethnography to the combination of
expert annotations and transcription features (i.e., the representations that focus most on the singing,
excluding context). The results yielded two dimensions, which together explain 23.9% of the variability
31
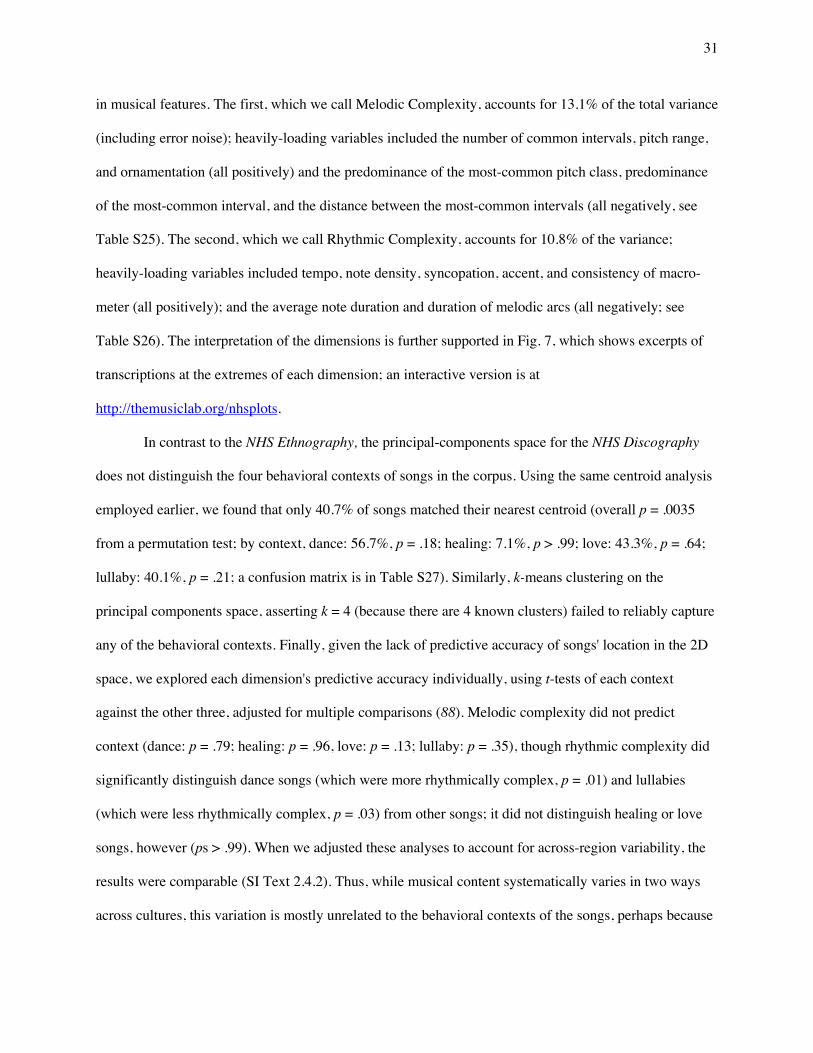
in musical features. The first, which we call Melodic Complexity, accounts for 13.1% of the total variance
(including error noise); heavily-loading variables included the number of common intervals, pitch range,
and ornamentation (all positively) and the predominance of the most-common pitch class, predominance
of the most-common interval, and the distance between the most-common intervals (all negatively, see
Table S25). The second, which we call Rhythmic Complexity, accounts for 10.8% of the variance;
heavily-loading variables included tempo, note density, syncopation, accent, and consistency of macro-
meter (all positively); and the average note duration and duration of melodic arcs (all negatively; see
Table S26). The interpretation of the dimensions is further supported in Fig. 7, which shows excerpts of
transcriptions at the extremes of each dimension; an interactive version is at
http://themusiclab.org/nhsplots.
In contrast to the NHS Ethnography, the principal-components space for the NHS Discography
does not distinguish the four behavioral contexts of songs in the corpus. Using the same centroid analysis
employed earlier, we found that only 40.7% of songs matched their nearest centroid (overall p = .0035
from a permutation test; by context, dance: 56.7%, p = .18; healing: 7.1%, p > .99; love: 43.3%, p = .64;
lullaby: 40.1%, p = .21; a confusion matrix is in Table S27). Similarly, k-means clustering on the
principal components space, asserting k = 4 (because there are 4 known clusters) failed to reliably capture
any of the behavioral contexts. Finally, given the lack of predictive accuracy of songs' location in the 2D
space, we explored each dimension's predictive accuracy individually, using t-tests of each context
against the other three, adjusted for multiple comparisons (88). Melodic complexity did not predict
context (dance: p = .79; healing: p = .96, love: p = .13; lullaby: p = .35), though rhythmic complexity did
significantly distinguish dance songs (which were more rhythmically complex, p = .01) and lullabies
(which were less rhythmically complex, p = .03) from other songs; it did not distinguish healing or love
songs, however (ps > .99). When we adjusted these analyses to account for across-region variability, the
results were comparable (SI Text 2.4.2). Thus, while musical content systematically varies in two ways
across cultures, this variation is mostly unrelated to the behavioral contexts of the songs, perhaps because
32
complexity captures distinctions that are salient to music analysts but not strongly evocative of particular
moods or themes among the singers and listeners themselves.
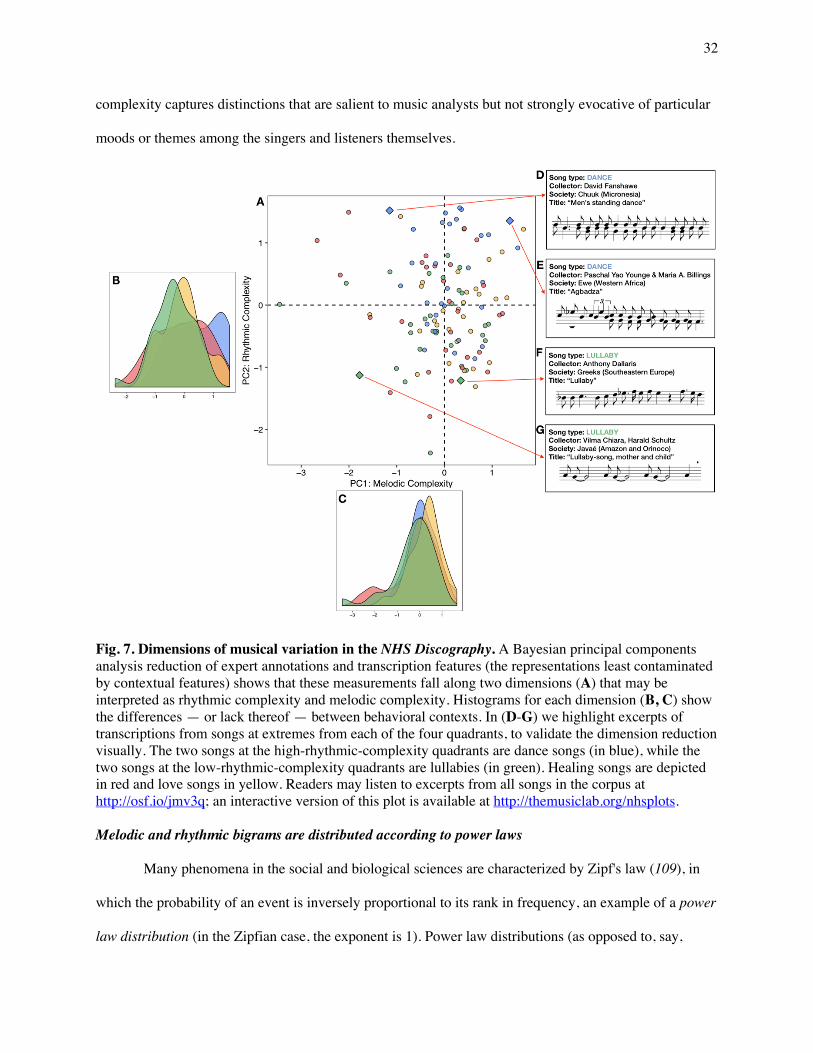
Fig. 7. Dimensions of musical variation in the NHS Discography. A Bayesian principal components analysis reduction of expert annotations and transcription features (the representations least contaminated by contextual features) shows that these measurements fall along two dimensions (A) that may be interpreted as rhythmic complexity and melodic complexity. Histograms for each dimension (B, C) show the differences — or lack thereof — between behavioral contexts. In (D-G) we highlight excerpts of transcriptions from songs at extremes from each of the four quadrants, to validate the dimension reduction visually. The two songs at the high-rhythmic-complexity quadrants are dance songs (in blue), while the two songs at the low-rhythmic-complexity quadrants are lullabies (in green). Healing songs are depicted in red and love songs in yellow. Readers may listen to excerpts from all songs in the corpus at http://osf.io/jmv3q; an interactive version of this plot is available at http://themusiclab.org/nhsplots. Melodic and rhythmic bigrams are distributed according to power laws
Many phenomena in the social and biological sciences are characterized by Zipf's law (109), in
which the probability of an event is inversely proportional to its rank in frequency, an example of a power
law distribution (in the Zipfian case, the exponent is 1). Power law distributions (as opposed to, say,
33
geometric and normal distributions) have two key properties: a small number of highly frequent events
account for the majority of observations, and there are a large number of individually improbable events,
whose probability falls off slowly along a thick tail (110).
In natural language, for example, a few words appear with very high frequency, such as
pronouns, while a great many are rare, such as the names of species of trees, but any sample will
nevertheless tend to contain several rare words (111). A similar pattern is found in the distribution of
colors among paintings in a given period of art history (112). In music, Zipf's law has been observed in
the melodic intervals of Bach, Chopin, Debussy, Mendelssohn, Mozart, and Schoenberg (113–117); in the
loudness and pitch fluctuations in Scott Joplin piano rags (118); in the harmonies (119–121) and rhythms
of classical music (122); and, as Zipf himself noted, in the melodic intervals in Mozart's Bassoon
concerto in B-flat major and in compositions by Chopin, Irving Berlin, and Jerome Kern (109).
We tested whether the presence of power law distributions is a property of music worldwide by
tallying relative melodic bigrams (the number of semitones separating each pair of successive notes) and
relative rhythmic bigrams (the ratio of the durations of each pair of successive notes) for all NHS
Discography transcriptions (see SI Text 2.4.3 for details). The bigrams overlapped, with the second note
of one bigram comprising the first note of the next.
We found that both the worldwide melodic and rhythmic bigram distributions followed power
laws (Fig. 8), and this finding also held worldwide: the fit between the observed bigrams and the best-
fitting power function was high within each region (melodic bigrams: median R2 = 0.97, range 0.92-0.99;
rhythmic bigrams: median R2 = 0.98, range 0.88-0.99). The highest-prevalence bigrams were the simplest.
Among the melodic bigrams (Fig. 8A), three small intervals (unison, major 2nd, and minor 3rd)
accounted for 73% of the observed bigrams; the tritone (6 semitones) was the rarest, accounting for only
0.2%. The prevalence of these particular bigrams is significant: using only unisons, major 2nds, and
minor 3rds, one can construct any melody in a pentatonic scale, a scale found in many cultures (123).
Among the rhythmic bigrams (Fig. 8B), three patterns with simple integer ratios (1:1, 2:1, and 3:1)
accounted for 86% of observed bigrams, while a large and eclectic group of ratios (e.g., 7:3, 11:2)
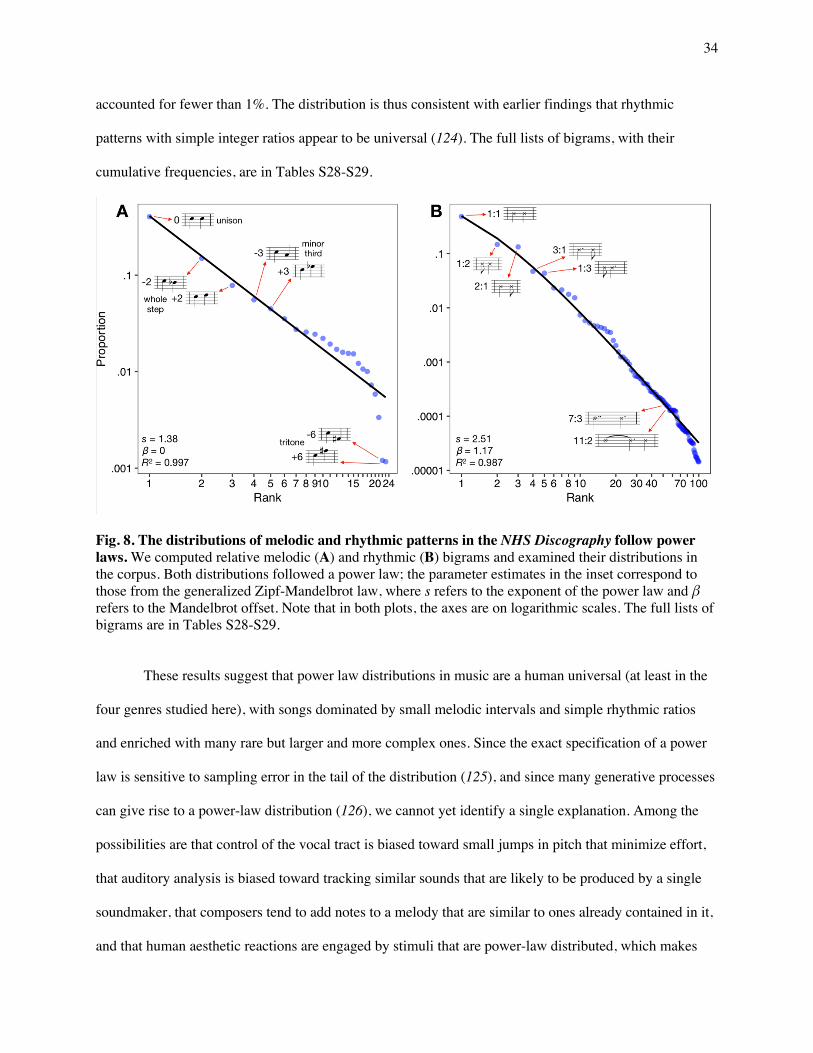
34
accounted for fewer than 1%. The distribution is thus consistent with earlier findings that rhythmic
patterns with simple integer ratios appear to be universal (124). The full lists of bigrams, with their
cumulative frequencies, are in Tables S28-S29.
Fig. 8. The distributions of melodic and rhythmic patterns in the NHS Discography follow power laws. We computed relative melodic (A) and rhythmic (B) bigrams and examined their distributions in the corpus. Both distributions followed a power law; the parameter estimates in the inset correspond to those from the generalized Zipf-Mandelbrot law, where s refers to the exponent of the power law and β refers to the Mandelbrot offset. Note that in both plots, the axes are on logarithmic scales. The full lists of bigrams are in Tables S28-S29.
These results suggest that power law distributions in music are a human universal (at least in the
four genres studied here), with songs dominated by small melodic intervals and simple rhythmic ratios
and enriched with many rare but larger and more complex ones. Since the exact specification of a power
law is sensitive to sampling error in the tail of the distribution (125), and since many generative processes
can give rise to a power-law distribution (126), we cannot yet identify a single explanation. Among the
possibilities are that control of the vocal tract is biased toward small jumps in pitch that minimize effort,
that auditory analysis is biased toward tracking similar sounds that are likely to be produced by a single
soundmaker, that composers tend to add notes to a melody that are similar to ones already contained in it,
and that human aesthetic reactions are engaged by stimuli that are power-law distributed, which makes
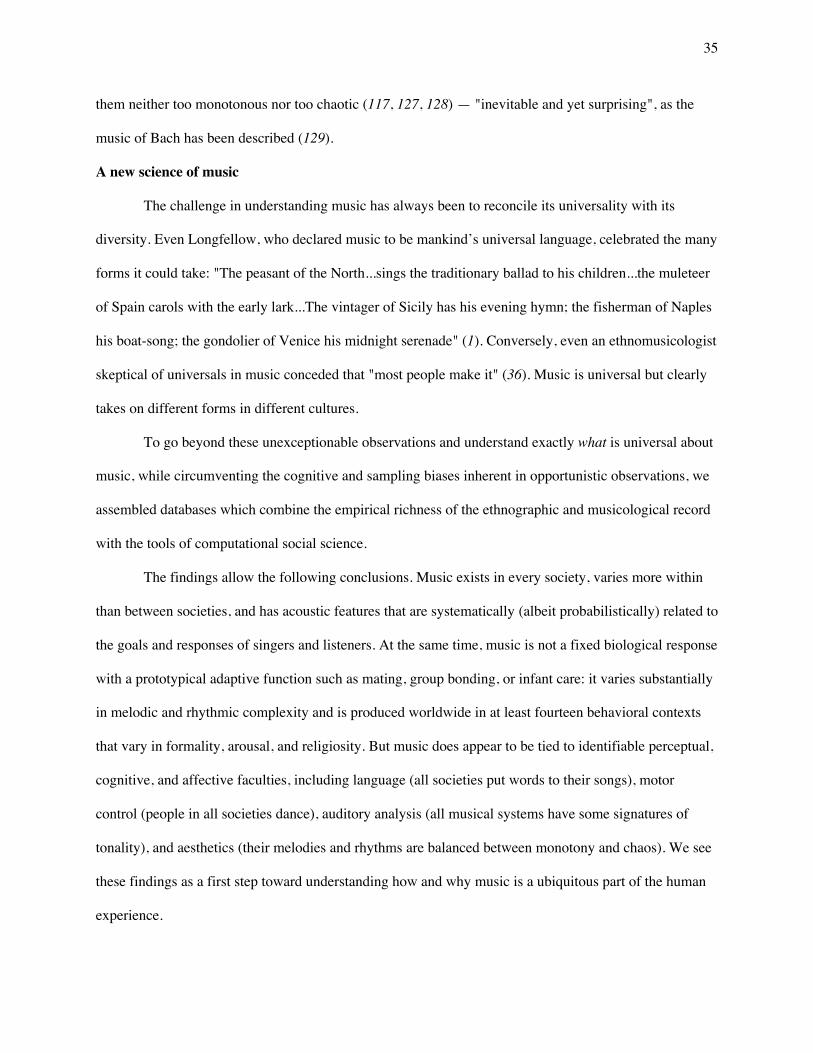
35
them neither too monotonous nor too chaotic (117, 127, 128) — "inevitable and yet surprising", as the
music of Bach has been described (129).
A new science of music
The challenge in understanding music has always been to reconcile its universality with its
diversity. Even Longfellow, who declared music to be mankind’s universal language, celebrated the many
forms it could take: "The peasant of the North...sings the traditionary ballad to his children...the muleteer
of Spain carols with the early lark...The vintager of Sicily has his evening hymn; the fisherman of Naples
his boat-song; the gondolier of Venice his midnight serenade" (1). Conversely, even an ethnomusicologist
skeptical of universals in music conceded that "most people make it" (36). Music is universal but clearly
takes on different forms in different cultures.
To go beyond these unexceptionable observations and understand exactly what is universal about
music, while circumventing the cognitive and sampling biases inherent in opportunistic observations, we
assembled databases which combine the empirical richness of the ethnographic and musicological record
with the tools of computational social science.
The findings allow the following conclusions. Music exists in every society, varies more within
than between societies, and has acoustic features that are systematically (albeit probabilistically) related to
the goals and responses of singers and listeners. At the same time, music is not a fixed biological response
with a prototypical adaptive function such as mating, group bonding, or infant care: it varies substantially
in melodic and rhythmic complexity and is produced worldwide in at least fourteen behavioral contexts
that vary in formality, arousal, and religiosity. But music does appear to be tied to identifiable perceptual,
cognitive, and affective faculties, including language (all societies put words to their songs), motor
control (people in all societies dance), auditory analysis (all musical systems have some signatures of
tonality), and aesthetics (their melodies and rhythms are balanced between monotony and chaos). We see
these findings as a first step toward understanding how and why music is a ubiquitous part of the human
experience.
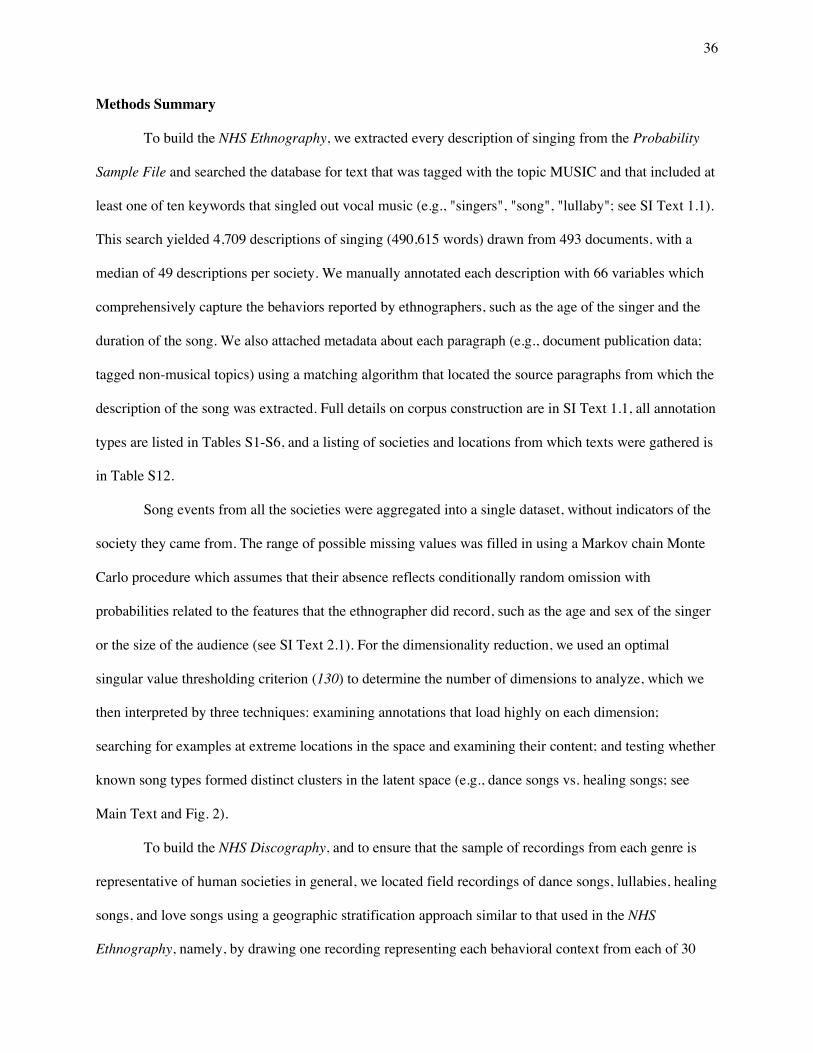
36
Methods Summary
To build the NHS Ethnography, we extracted every description of singing from the Probability
Sample File and searched the database for text that was tagged with the topic MUSIC and that included at
least one of ten keywords that singled out vocal music (e.g., "singers", "song", "lullaby"; see SI Text 1.1).
This search yielded 4,709 descriptions of singing (490,615 words) drawn from 493 documents, with a
median of 49 descriptions per society. We manually annotated each description with 66 variables which
comprehensively capture the behaviors reported by ethnographers, such as the age of the singer and the
duration of the song. We also attached metadata about each paragraph (e.g., document publication data;
tagged non-musical topics) using a matching algorithm that located the source paragraphs from which the
description of the song was extracted. Full details on corpus construction are in SI Text 1.1, all annotation
types are listed in Tables S1-S6, and a listing of societies and locations from which texts were gathered is
in Table S12.
Song events from all the societies were aggregated into a single dataset, without indicators of the
society they came from. The range of possible missing values was filled in using a Markov chain Monte
Carlo procedure which assumes that their absence reflects conditionally random omission with
probabilities related to the features that the ethnographer did record, such as the age and sex of the singer
or the size of the audience (see SI Text 2.1). For the dimensionality reduction, we used an optimal
singular value thresholding criterion (130) to determine the number of dimensions to analyze, which we
then interpreted by three techniques: examining annotations that load highly on each dimension;
searching for examples at extreme locations in the space and examining their content; and testing whether
known song types formed distinct clusters in the latent space (e.g., dance songs vs. healing songs; see
Main Text and Fig. 2).
To build the NHS Discography, and to ensure that the sample of recordings from each genre is
representative of human societies in general, we located field recordings of dance songs, lullabies, healing
songs, and love songs using a geographic stratification approach similar to that used in the NHS
Ethnography, namely, by drawing one recording representing each behavioral context from each of 30
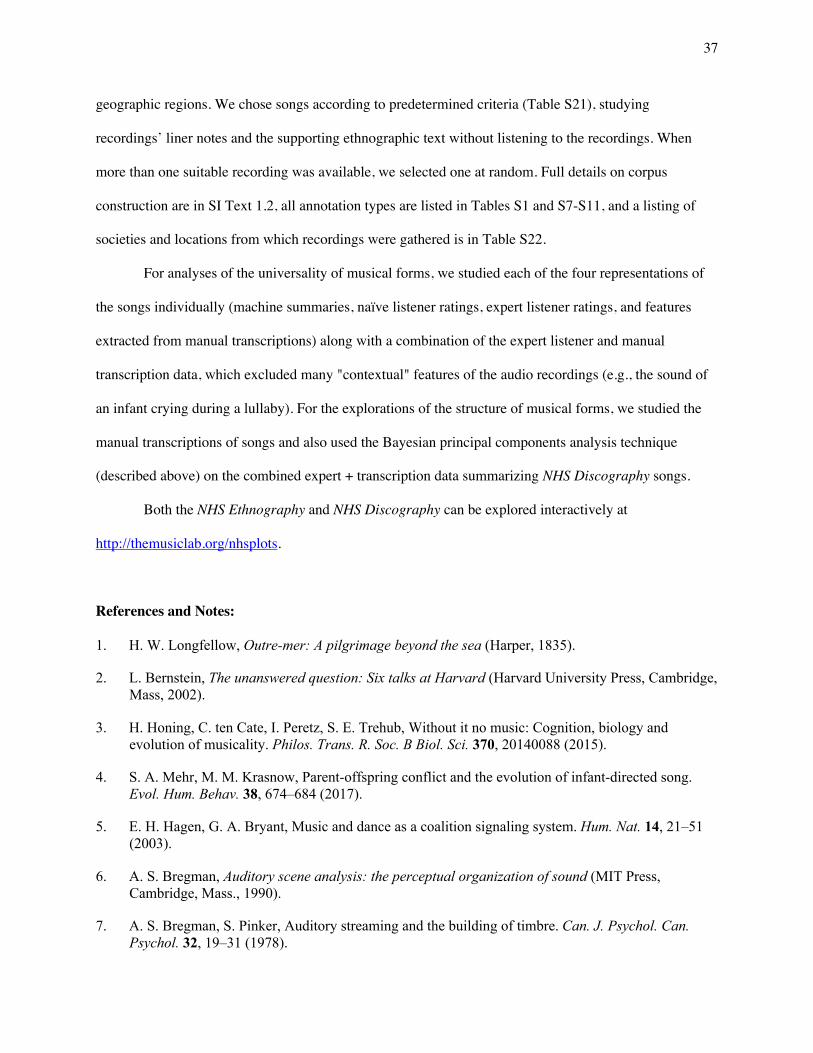
37
geographic regions. We chose songs according to predetermined criteria (Table S21), studying
recordings’ liner notes and the supporting ethnographic text without listening to the recordings. When
more than one suitable recording was available, we selected one at random. Full details on corpus
construction are in SI Text 1.2, all annotation types are listed in Tables S1 and S7-S11, and a listing of
societies and locations from which recordings were gathered is in Table S22.
For analyses of the universality of musical forms, we studied each of the four representations of
the songs individually (machine summaries, naïve listener ratings, expert listener ratings, and features
extracted from manual transcriptions) along with a combination of the expert listener and manual
transcription data, which excluded many "contextual" features of the audio recordings (e.g., the sound of
an infant crying during a lullaby). For the explorations of the structure of musical forms, we studied the
manual transcriptions of songs and also used the Bayesian principal components analysis technique
(described above) on the combined expert + transcription data summarizing NHS Discography songs.
Both the NHS Ethnography and NHS Discography can be explored interactively at
http://themusiclab.org/nhsplots.
References and Notes:
1. H. W. Longfellow, Outre-mer: A pilgrimage beyond the sea (Harper, 1835).
2. L. Bernstein, The unanswered question: Six talks at Harvard (Harvard University Press, Cambridge, Mass, 2002).
3. H. Honing, C. ten Cate, I. Peretz, S. E. Trehub, Without it no music: Cognition, biology and evolution of musicality. Philos. Trans. R. Soc. B Biol. Sci. 370, 20140088 (2015).
4. S. A. Mehr, M. M. Krasnow, Parent-offspring conflict and the evolution of infant-directed song. Evol. Hum. Behav. 38, 674–684 (2017).
5. E. H. Hagen, G. A. Bryant, Music and dance as a coalition signaling system. Hum. Nat. 14, 21–51 (2003).
6. A. S. Bregman, Auditory scene analysis: the perceptual organization of sound (MIT Press, Cambridge, Mass., 1990).
7. A. S. Bregman, S. Pinker, Auditory streaming and the building of timbre. Can. J. Psychol. Can. Psychol. 32, 19–31 (1978).
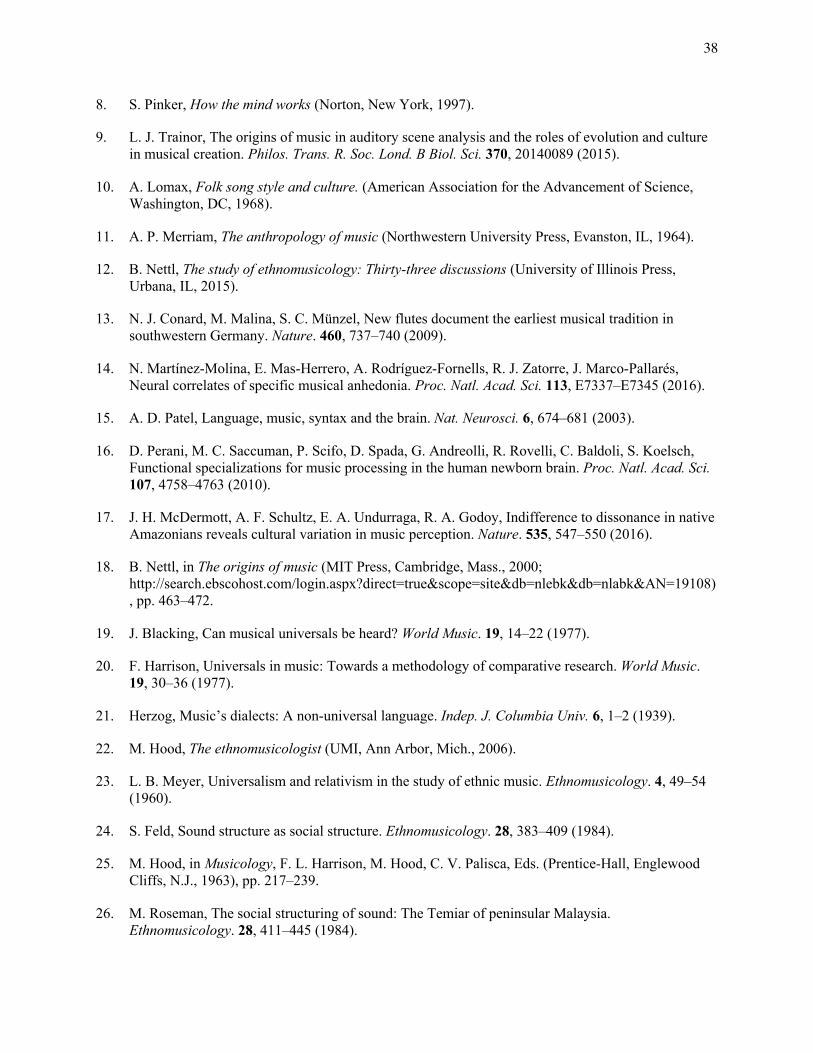
38
8. S. Pinker, How the mind works (Norton, New York, 1997).
9. L. J. Trainor, The origins of music in auditory scene analysis and the roles of evolution and culture in musical creation. Philos. Trans. R. Soc. Lond. B Biol. Sci. 370, 20140089 (2015).
10. A. Lomax, Folk song style and culture. (American Association for the Advancement of Science, Washington, DC, 1968).
11. A. P. Merriam, The anthropology of music (Northwestern University Press, Evanston, IL, 1964).
12. B. Nettl, The study of ethnomusicology: Thirty-three discussions (University of Illinois Press, Urbana, IL, 2015).
13. N. J. Conard, M. Malina, S. C. Münzel, New flutes document the earliest musical tradition in southwestern Germany. Nature. 460, 737–740 (2009).
14. N. Martínez-Molina, E. Mas-Herrero, A. Rodríguez-Fornells, R. J. Zatorre, J. Marco-Pallarés, Neural correlates of specific musical anhedonia. Proc. Natl. Acad. Sci. 113, E7337–E7345 (2016).
15. A. D. Patel, Language, music, syntax and the brain. Nat. Neurosci. 6, 674–681 (2003).
16. D. Perani, M. C. Saccuman, P. Scifo, D. Spada, G. Andreolli, R. Rovelli, C. Baldoli, S. Koelsch, Functional specializations for music processing in the human newborn brain. Proc. Natl. Acad. Sci. 107, 4758–4763 (2010).
17. J. H. McDermott, A. F. Schultz, E. A. Undurraga, R. A. Godoy, Indifference to dissonance in native Amazonians reveals cultural variation in music perception. Nature. 535, 547–550 (2016).
18. B. Nettl, in The origins of music (MIT Press, Cambridge, Mass., 2000; http://search.ebscohost.com/login.aspx?direct=true&scope=site&db=nlebk&db=nlabk&AN=19108), pp. 463–472.
19. J. Blacking, Can musical universals be heard? World Music. 19, 14–22 (1977).
20. F. Harrison, Universals in music: Towards a methodology of comparative research. World Music. 19, 30–36 (1977).
21. Herzog, Music’s dialects: A non-universal language. Indep. J. Columbia Univ. 6, 1–2 (1939).
22. M. Hood, The ethnomusicologist (UMI, Ann Arbor, Mich., 2006).
23. L. B. Meyer, Universalism and relativism in the study of ethnic music. Ethnomusicology. 4, 49–54 (1960).
24. S. Feld, Sound structure as social structure. Ethnomusicology. 28, 383–409 (1984).
25. M. Hood, in Musicology, F. L. Harrison, M. Hood, C. V. Palisca, Eds. (Prentice-Hall, Englewood Cliffs, N.J., 1963), pp. 217–239.
26. M. Roseman, The social structuring of sound: The Temiar of peninsular Malaysia. Ethnomusicology. 28, 411–445 (1984).
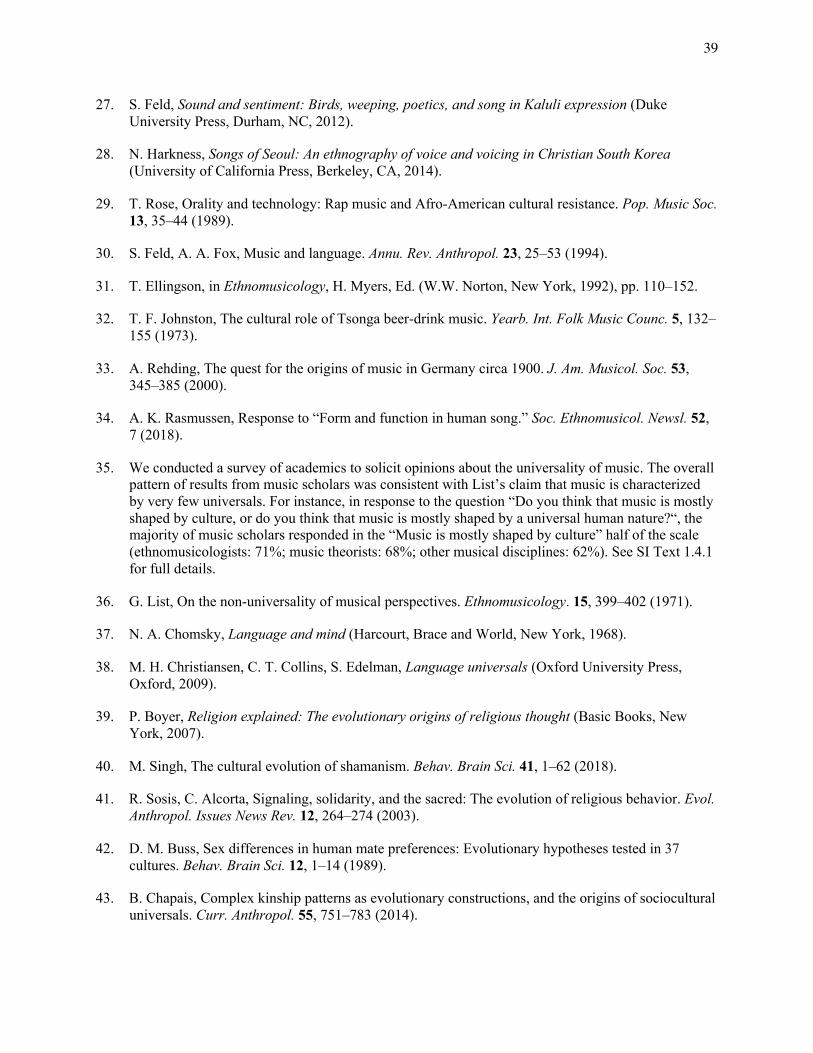
39
27. S. Feld, Sound and sentiment: Birds, weeping, poetics, and song in Kaluli expression (Duke University Press, Durham, NC, 2012).
28. N. Harkness, Songs of Seoul: An ethnography of voice and voicing in Christian South Korea (University of California Press, Berkeley, CA, 2014).
29. T. Rose, Orality and technology: Rap music and Afro‐American cultural resistance. Pop. Music Soc. 13, 35–44 (1989).
30. S. Feld, A. A. Fox, Music and language. Annu. Rev. Anthropol. 23, 25–53 (1994).
31. T. Ellingson, in Ethnomusicology, H. Myers, Ed. (W.W. Norton, New York, 1992), pp. 110–152.
32. T. F. Johnston, The cultural role of Tsonga beer-drink music. Yearb. Int. Folk Music Counc. 5, 132–155 (1973).
33. A. Rehding, The quest for the origins of music in Germany circa 1900. J. Am. Musicol. Soc. 53, 345–385 (2000).
34. A. K. Rasmussen, Response to “Form and function in human song.” Soc. Ethnomusicol. Newsl. 52, 7 (2018).
35. We conducted a survey of academics to solicit opinions about the universality of music. The overall pattern of results from music scholars was consistent with List’s claim that music is characterized by very few universals. For instance, in response to the question “Do you think that music is mostly shaped by culture, or do you think that music is mostly shaped by a universal human nature?“, the majority of music scholars responded in the “Music is mostly shaped by culture” half of the scale (ethnomusicologists: 71%; music theorists: 68%; other musical disciplines: 62%). See SI Text 1.4.1 for full details.
36. G. List, On the non-universality of musical perspectives. Ethnomusicology. 15, 399–402 (1971).
37. N. A. Chomsky, Language and mind (Harcourt, Brace and World, New York, 1968).
38. M. H. Christiansen, C. T. Collins, S. Edelman, Language universals (Oxford University Press, Oxford, 2009).
39. P. Boyer, Religion explained: The evolutionary origins of religious thought (Basic Books, New York, 2007).
40. M. Singh, The cultural evolution of shamanism. Behav. Brain Sci. 41, 1–62 (2018).
41. R. Sosis, C. Alcorta, Signaling, solidarity, and the sacred: The evolution of religious behavior. Evol. Anthropol. Issues News Rev. 12, 264–274 (2003).
42. D. M. Buss, Sex differences in human mate preferences: Evolutionary hypotheses tested in 37 cultures. Behav. Brain Sci. 12, 1–14 (1989).
43. B. Chapais, Complex kinship patterns as evolutionary constructions, and the origins of sociocultural universals. Curr. Anthropol. 55, 751–783 (2014).
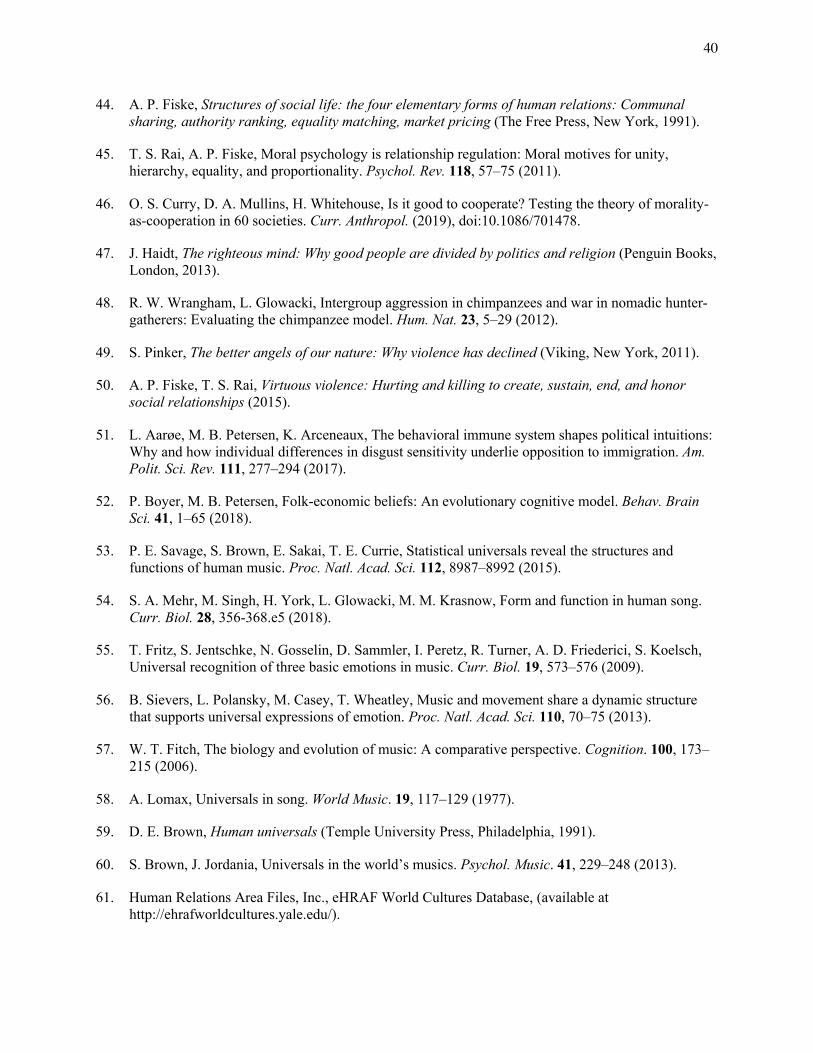
40
44. A. P. Fiske, Structures of social life: the four elementary forms of human relations: Communal sharing, authority ranking, equality matching, market pricing (The Free Press, New York, 1991).
45. T. S. Rai, A. P. Fiske, Moral psychology is relationship regulation: Moral motives for unity, hierarchy, equality, and proportionality. Psychol. Rev. 118, 57–75 (2011).
46. O. S. Curry, D. A. Mullins, H. Whitehouse, Is it good to cooperate? Testing the theory of morality-as-cooperation in 60 societies. Curr. Anthropol. (2019), doi:10.1086/701478.
47. J. Haidt, The righteous mind: Why good people are divided by politics and religion (Penguin Books, London, 2013).
48. R. W. Wrangham, L. Glowacki, Intergroup aggression in chimpanzees and war in nomadic hunter-gatherers: Evaluating the chimpanzee model. Hum. Nat. 23, 5–29 (2012).
49. S. Pinker, The better angels of our nature: Why violence has declined (Viking, New York, 2011).
50. A. P. Fiske, T. S. Rai, Virtuous violence: Hurting and killing to create, sustain, end, and honor social relationships (2015).
51. L. Aarøe, M. B. Petersen, K. Arceneaux, The behavioral immune system shapes political intuitions: Why and how individual differences in disgust sensitivity underlie opposition to immigration. Am. Polit. Sci. Rev. 111, 277–294 (2017).
52. P. Boyer, M. B. Petersen, Folk-economic beliefs: An evolutionary cognitive model. Behav. Brain Sci. 41, 1–65 (2018).
53. P. E. Savage, S. Brown, E. Sakai, T. E. Currie, Statistical universals reveal the structures and functions of human music. Proc. Natl. Acad. Sci. 112, 8987–8992 (2015).
54. S. A. Mehr, M. Singh, H. York, L. Glowacki, M. M. Krasnow, Form and function in human song. Curr. Biol. 28, 356-368.e5 (2018).
55. T. Fritz, S. Jentschke, N. Gosselin, D. Sammler, I. Peretz, R. Turner, A. D. Friederici, S. Koelsch, Universal recognition of three basic emotions in music. Curr. Biol. 19, 573–576 (2009).
56. B. Sievers, L. Polansky, M. Casey, T. Wheatley, Music and movement share a dynamic structure that supports universal expressions of emotion. Proc. Natl. Acad. Sci. 110, 70–75 (2013).
57. W. T. Fitch, The biology and evolution of music: A comparative perspective. Cognition. 100, 173–215 (2006).
58. A. Lomax, Universals in song. World Music. 19, 117–129 (1977).
59. D. E. Brown, Human universals (Temple University Press, Philadelphia, 1991).
60. S. Brown, J. Jordania, Universals in the world’s musics. Psychol. Music. 41, 229–248 (2013).
61. Human Relations Area Files, Inc., eHRAF World Cultures Database, (available at http://ehrafworldcultures.yale.edu/).
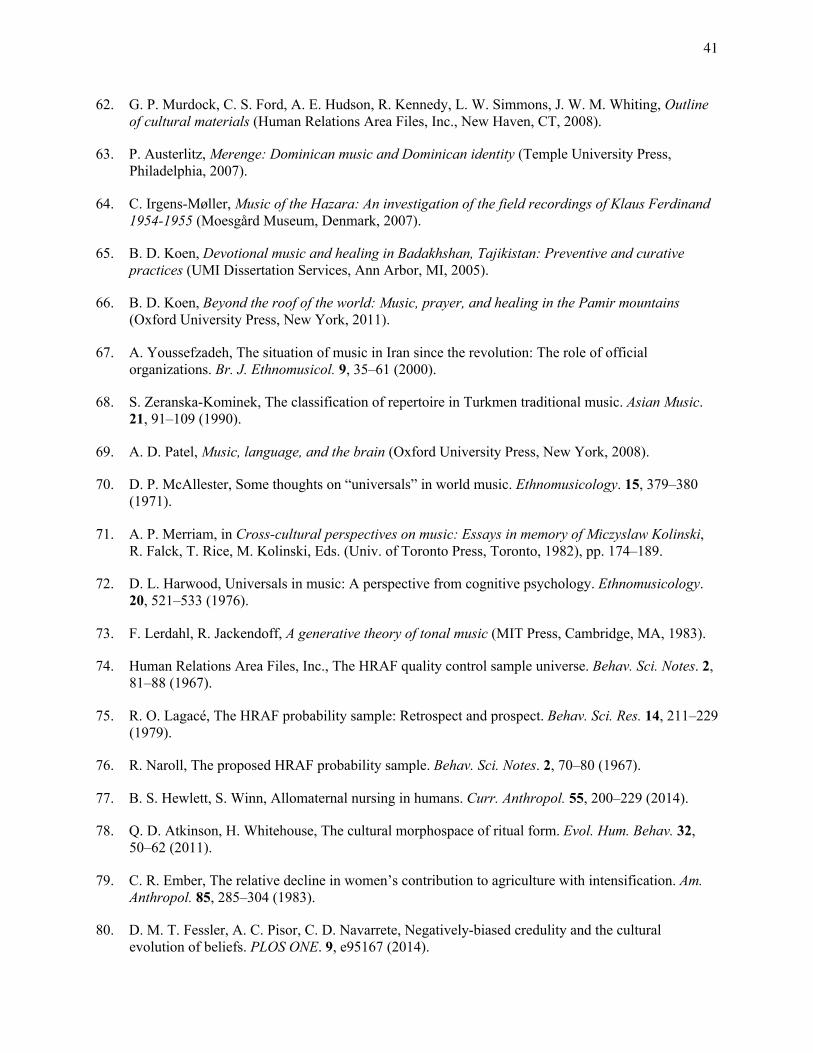
41
62. G. P. Murdock, C. S. Ford, A. E. Hudson, R. Kennedy, L. W. Simmons, J. W. M. Whiting, Outline of cultural materials (Human Relations Area Files, Inc., New Haven, CT, 2008).
63. P. Austerlitz, Merenge: Dominican music and Dominican identity (Temple University Press, Philadelphia, 2007).
64. C. Irgens-Møller, Music of the Hazara: An investigation of the field recordings of Klaus Ferdinand 1954-1955 (Moesgård Museum, Denmark, 2007).
65. B. D. Koen, Devotional music and healing in Badakhshan, Tajikistan: Preventive and curative practices (UMI Dissertation Services, Ann Arbor, MI, 2005).
66. B. D. Koen, Beyond the roof of the world: Music, prayer, and healing in the Pamir mountains (Oxford University Press, New York, 2011).
67. A. Youssefzadeh, The situation of music in Iran since the revolution: The role of official organizations. Br. J. Ethnomusicol. 9, 35–61 (2000).
68. S. Zeranska-Kominek, The classification of repertoire in Turkmen traditional music. Asian Music. 21, 91–109 (1990).
69. A. D. Patel, Music, language, and the brain (Oxford University Press, New York, 2008).
70. D. P. McAllester, Some thoughts on “universals” in world music. Ethnomusicology. 15, 379–380 (1971).
71. A. P. Merriam, in Cross-cultural perspectives on music: Essays in memory of Miczyslaw Kolinski, R. Falck, T. Rice, M. Kolinski, Eds. (Univ. of Toronto Press, Toronto, 1982), pp. 174–189.
72. D. L. Harwood, Universals in music: A perspective from cognitive psychology. Ethnomusicology. 20, 521–533 (1976).
73. F. Lerdahl, R. Jackendoff, A generative theory of tonal music (MIT Press, Cambridge, MA, 1983).
74. Human Relations Area Files, Inc., The HRAF quality control sample universe. Behav. Sci. Notes. 2, 81–88 (1967).
75. R. O. Lagacé, The HRAF probability sample: Retrospect and prospect. Behav. Sci. Res. 14, 211–229 (1979).
76. R. Naroll, The proposed HRAF probability sample. Behav. Sci. Notes. 2, 70–80 (1967).
77. B. S. Hewlett, S. Winn, Allomaternal nursing in humans. Curr. Anthropol. 55, 200–229 (2014).
78. Q. D. Atkinson, H. Whitehouse, The cultural morphospace of ritual form. Evol. Hum. Behav. 32, 50–62 (2011).
79. C. R. Ember, The relative decline in women’s contribution to agriculture with intensification. Am. Anthropol. 85, 285–304 (1983).
80. D. M. T. Fessler, A. C. Pisor, C. D. Navarrete, Negatively-biased credulity and the cultural evolution of beliefs. PLOS ONE. 9, e95167 (2014).
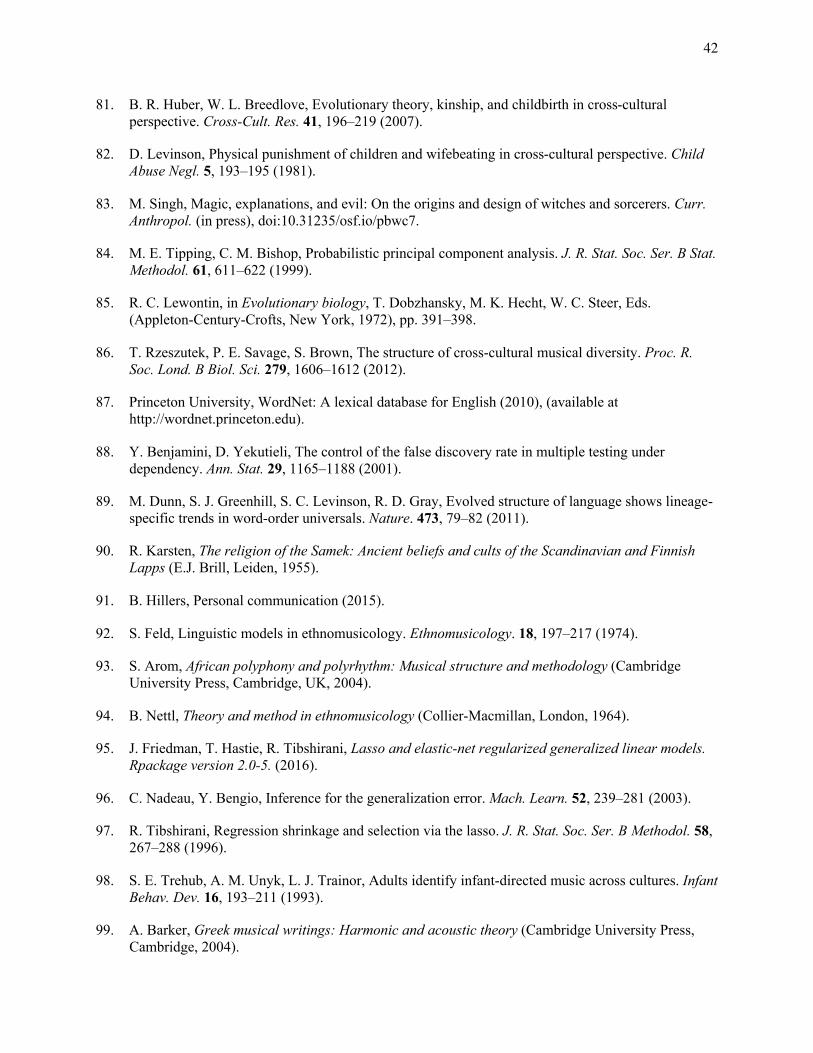
42
81. B. R. Huber, W. L. Breedlove, Evolutionary theory, kinship, and childbirth in cross-cultural perspective. Cross-Cult. Res. 41, 196–219 (2007).
82. D. Levinson, Physical punishment of children and wifebeating in cross-cultural perspective. Child Abuse Negl. 5, 193–195 (1981).
83. M. Singh, Magic, explanations, and evil: On the origins and design of witches and sorcerers. Curr. Anthropol. (in press), doi:10.31235/osf.io/pbwc7.
84. M. E. Tipping, C. M. Bishop, Probabilistic principal component analysis. J. R. Stat. Soc. Ser. B Stat. Methodol. 61, 611–622 (1999).
85. R. C. Lewontin, in Evolutionary biology, T. Dobzhansky, M. K. Hecht, W. C. Steer, Eds. (Appleton-Century-Crofts, New York, 1972), pp. 391–398.
86. T. Rzeszutek, P. E. Savage, S. Brown, The structure of cross-cultural musical diversity. Proc. R. Soc. Lond. B Biol. Sci. 279, 1606–1612 (2012).
87. Princeton University, WordNet: A lexical database for English (2010), (available at http://wordnet.princeton.edu).
88. Y. Benjamini, D. Yekutieli, The control of the false discovery rate in multiple testing under dependency. Ann. Stat. 29, 1165–1188 (2001).
89. M. Dunn, S. J. Greenhill, S. C. Levinson, R. D. Gray, Evolved structure of language shows lineage-specific trends in word-order universals. Nature. 473, 79–82 (2011).
90. R. Karsten, The religion of the Samek: Ancient beliefs and cults of the Scandinavian and Finnish Lapps (E.J. Brill, Leiden, 1955).
91. B. Hillers, Personal communication (2015).
92. S. Feld, Linguistic models in ethnomusicology. Ethnomusicology. 18, 197–217 (1974).
93. S. Arom, African polyphony and polyrhythm: Musical structure and methodology (Cambridge University Press, Cambridge, UK, 2004).
94. B. Nettl, Theory and method in ethnomusicology (Collier-Macmillan, London, 1964).
95. J. Friedman, T. Hastie, R. Tibshirani, Lasso and elastic-net regularized generalized linear models. Rpackage version 2.0-5. (2016).
96. C. Nadeau, Y. Bengio, Inference for the generalization error. Mach. Learn. 52, 239–281 (2003).
97. R. Tibshirani, Regression shrinkage and selection via the lasso. J. R. Stat. Soc. Ser. B Methodol. 58, 267–288 (1996).
98. S. E. Trehub, A. M. Unyk, L. J. Trainor, Adults identify infant-directed music across cultures. Infant Behav. Dev. 16, 193–211 (1993).
99. A. Barker, Greek musical writings: Harmonic and acoustic theory (Cambridge University Press, Cambridge, 2004).
43
100. C. L. Krumhansl, The Cognition of Tonality – as We Know it Today. J. New Music Res. 33, 253–268 (2004).
101. J. H. McDermott, A. J. Oxenham, Music perception, pitch, and the auditory system. Curr. Opin. Neurobiol. 18, 452–463 (2008).
102. R. Jackendoff, F. Lerdahl, The capacity for music: What is it, and what’s special about it? Cognition. 100, 33–72 (2006).
103. M. A. Castellano, J. J. Bharucha, C. L. Krumhansl, Tonal hierarchies in the music of north India. J. Exp. Psychol. Gen. 113, 394–412 (1984).
104. C. L. Krumhansl, P. Toivanen, T. Eerola, P. Toiviainen, T. Järvinen, J. Louhivuori, Cross-cultural music cognition: cognitive methodology applied to North Sami yoiks. Cognition. 76, 13–58 (2000).
105. H. von Helmholtz, The sensations of tone as a physiological basis for the theory of music (Longmans, Green, and Co., London, 1885).
106. D. Cooke, The language of music (Oxford University Press, Oxford, 2001).
107. J. A. Hartigan, P. M. Hartigan, The Dip Test of Unimodality. Ann. Stat. 13, 70–84 (1985).
108. C. L. Krumhansl, Cognitive foundations of musical pitch (Oxford University Press, 2001).
109. G. K. Zipf, Human behavior and the principle of least effort: an introd. to human ecology (Addison-Wesley Pr., Cambridge, Mass., 1949).
110. H. Baayen, Word frequency distributions (Kluwer Academic, Dordrecht, 2001).
111. S. T. Piantadosi, Zipf’s word frequency law in natural language: A critical review and future directions. Psychon. Bull. Rev. 21, 1112–1130 (2014).
112. D. Kim, S.-W. Son, H. Jeong, Large-Scale quantitative analysis of painting arts. Sci. Rep. 4, srep07370 (2014).
113. K. J. Hsü, A. J. Hsü, Fractal geometry of music. Proc. Natl. Acad. Sci. 87, 938–941 (1990).
114. D. H. Zanette, Zipf’s law and the creation of musical context. Music. Sci. 10, 3–18 (2006).
115. H. J. Brothers, Intervallic scaling in the bach cello suites. Fractals. 17, 537–545 (2009).
116. L. Liu, J. Wei, H. Zhang, J. Xin, J. Huang, A statistical physics view of pitch fluctuations in the classical music from Bach to Chopin: Evidence for scaling. PLOS ONE. 8, e58710 (2013).
117. B. Manaris, J. Romero, P. Machado, D. Krehbiel, T. Hirzel, W. Pharr, R. B. Davis, Zipf’s law, music classification, and aesthetics. Comput. Music J. 29, 55–69 (2005).
118. R. F. Voss, J. Clarke, ‘1/ f noise’ in music and speech. Nature. 258, 317 (1975).
119. M. Rohrmeier, I. Cross, in Proceedings of the 10th International Conference on Music Perception and Cognition (2008), p. 9.
44
120. F. C. Moss, M. Neuwirth, D. Harasim, M. Rohrmeier, Statistical characteristics of tonal harmony: A corpus study of Beethoven’s string quartets. PLOS ONE. 14, e0217242 (2019).
121. M. Beltrán del Río, G. Cocho, G. G. Naumis, Universality in the tail of musical note rank distribution. Phys. Stat. Mech. Its Appl. 387, 5552–5560 (2008).
122. D. J. Levitin, P. Chordia, V. Menon, Musical rhythm spectra from Bach to Joplin obey a 1/f power law. Proc. Natl. Acad. Sci. 109, 3716–3720 (2012).
123. T. Van Khe, Is the pentatonic universal? A few reflections on pentatonism. World Music. 19, 76–84 (1977).
124. N. Jacoby, J. H. McDermott, Integer ratio priors on musical rhythm revealed cross-culturally by iterated reproduction. Curr. Biol. 27, 359–370 (2017).
125. A. Clauset, C. R. Shalizi, M. E. J. Newman, Power-Law Distributions in Empirical Data. SIAM Rev. 51, 661–703 (2009).
126. M. Mitzenmacher, A brief history of generative models for power law and lognormal distributions. Internet Math. 1, 226–251 (2004).
127. G. D. Birkhoff, Aesthetic measure (Harvard Univ. Press, Cambridge, Mass, 2013).
128. B. Manaris, P. Roos, D. Krehbiel, T. Zalonis, J. R. Armstrong, in Music data mining (CRC Press, Boca Raton, 2012).
129. M. R. Schroeder, Fractals, chaos, power laws: minutes from an infinite paradise (Dover Publications, Mineola, NY, 2009).
130. D. Donoho, M. Gavish, Minimax risk of matrix denoising by singular value thresholding. Ann. Stat. 42, 2413–2440 (2014).
131. MIMO Consortium, Revision of the Hornbostel-Sachs classification of musical instruments (2011).
132. O. Lartillot, P. Toiviainen, T. Eerola, in Data analysis, machine learning and applications, C. Preisach, H. Burkhardt, L. Schmidt-Thieme, R. Decker, Eds. (Springer Berlin Heidelberg, 2008), pp. 261–268.
133. M. Panteli, E. Benetos, S. Dixon, A computational study on outliers in world music. PLOS ONE. 12, e0189399 (2017).
134. C. Schörkhuber, A. Klapuri, N. Holighaus, M. Dörfler, in Audio Engineering Society Conference: 53rd International Conference: Semantic Audio (Audio Engineering Society, 2014; http://www.aes.org/e-lib/browse.cfm?elib=17112).
135. A. Holzapfel, A. Flexer, G. Widmer, in Proceedings of the Conference on Sound and Music Computing (Sound and music Computing network, 2011; http://urn.kb.se/resolve?urn=urn:nbn:se:kth:diva-193755).
136. M. L. McHugh, Interrater reliability: The kappa statistic. Biochem. Medica. 22, 276–282 (2012).
45
137. C. McKay, I. Fujinaga, in Proceedings of the International Computer Music Conference (2006), pp. 302–305.
138. M. S. Cuthbert, C. Ariza, music21: A toolkit for computer-aided musicology and symbolic music data (2010; http://web.mit.edu/music21/).
139. J. K. Hartshorne, J. de Leeuw, N. Goodman, M. Jennings, T. J. O’Donnell, A thousand studies for the price of one: Accelerating psychological science with Pushkin. Behav. Res. Methods, 1–22 (2019).
140. J. R. de Leeuw, jsPsych: A JavaScript library for creating behavioral experiments in a Web browser. Behav. Res. Methods. 47, 1–12 (2015).
141. M. Gavish, D. L. Donoho, The optimal hard threshold for singular values is \(4/\sqrt {3}\). IEEE Trans. Inf. Theory. 60, 5040–5053 (2014).
142. J. Pagès, Analyse factorielle de données mixtes. Rev. Stat. Appliquée. 52, 93–111 (2004).
143. A. D. Martin, K. M. Quinn, J. H. Park, MCMCpack: Markov Chain Monte Carlo in R. J. Stat. Softw. 42, 1–21 (2011).
144. H. Hammarström, R. Forkel, M. Haspelmath, Glottolog 4.0 (Max Plank Institute for the Science of Human History, Jena, 2019; http://glottolog.org).
145. J. Lawrimore, Dataset description document: Global summary of the month/year dataset, (available at https://www.ncei.noaa.gov/data/gsoy/).
146. T. Hastie, J. Qian, Glmnet vignette (2016; https://web.stanford.edu/~hastie/glmnet/glmnet_beta.html).
147. J. Friedman, T. Hastie, R. Tibshirani, Regularization paths for generalized linear models via coordinate descent. J. Stat. Softw. 33, 1–22 (2010).
We thank the hundreds of anthropologists and ethnomusicologists whose work forms the source material
for all our analyses; the countless people whose music those scholars reported on; and the research
assistants who contributed to the creation of the Natural History of Song corpora and to this research, here
listed alphabetically: Z. Ahmad, P. Ammirante, R. Beaudoin, J. Bellissimo, A. Bergson, M. Bertolo, M.
Bertuccelli, A. Bitran, S. Bourdaghs, J. Brown, L. Chen, C. Colletti, L. Crowe, K. Czachorowski, L.
Dinetan, K. Emery, D. Fratina, E. Galm, S. Gomez, Y-H. Hung, C. Jones, S. Joseph, J. Kangatharan, A.
Keomurjian, H. J. Kim, S. Lakin, M. Laroussini, T. Lee, H. Lee-Rubin, C. Leff, K. Lopez, K. Luk, E.
Lustig, V. Malawey, C. McMann, M. Montagnese, P. Moro, N. Okwelogu, T. Ozawa, C. Palfy, J. Palmer,
46
A. Paz, L. Poeppel, A. Ratajska, E. Regan, A. Reid, R. Sagar, P. Savage, G. Shank, S. Sharp, E. Sierra, D.
Tamaroff, I. Tan, C. Tripoli, K. Tutrone, A. Wang, M. Weigel, J. Weiner, R. Weissman, A. Xiao, F. Xing,
K. Yong, H. York, and J. Youngers. We also thank C. Ember and M. Fischer for providing additional data
from the Human Relations Area Files, and for their assistance using those data; S. Adams, P. Laurence, P.
O’Brien, A. Wilson, the staff at the Archive of World Music at Loeb Music Library (Harvard University),
and M. Graf and the staff at the Archives of Traditional Music (Indiana University) for assistance with
locating and digitizing audio recordings; D. Niles, S. Wadley, and H. Wild for contributing recordings
from their personal collections; S. Collins for producing the NHS Ethnography validity annotations; M.
Walter for assistance with digital processing of transcriptions; J. Hulbert and R. Clarida for assistance
with copyright issues and materials sharing; V. Kuchinov for developing the interactive visualizations; S.
Deviche for contributing illustrations; and the Dana Foundation, whose program "Arts and Cognition" led
in part to the development of this research. Last, we thank A. Rehding, G. Bryant, E. Hagen, H. Gardner,
E. Spelke, M. Tenzer, G. King, J. Nemirow, J. Kagan, and A. Martin for their feedback, ideas, and
intellectual support of this work. Funding: This work was supported by the Harvard Data Science
Initiative (S.A.M.); the National Institutes of Health Director’s Early Independence Award
DP5OD024566 (S.A.M.); the Harvard Graduate School of Education/Harvard University Presidential
Scholarship (S.A.M.); the Harvard University Department of Psychology (S.A.M. and M.M.K.); a
Harvard University Mind/Brain/Behavior Interfaculty Initiative Graduate Student Award (S.A.M. and
M.S.); the National Science Foundation Graduate Research Fellowship Program (M.S.); the Microsoft
Research postdoctoral fellowship program (D.K.); the Washington University Faculty of Arts & Sciences
Dean’s Office (C.L.); the Columbia University Center for Science and Society (N.J.); the Natural
Sciences and Engineering Research Council of Canada (T.J.O); Fonds de Recherche du Québec Société et
Culture (T.J.O); and ANR Labex IAST (L.G.). Author contributions: S.A.M., M.S., and L.G. created
and direct the Natural History of Song project; they oversaw all aspects of this work, including the design
and development of the corpora. S.P., M.M.K., and T.J.O. contributed to the conceptual foundation. D.K.
designed and implemented all analyses, with support from S.A.M. and C.L. S.A.M., D.K., and M.S.
47
designed the static figures and S.A.M. and D.K. created them. C.L. and S.A.M. designed the interactive
figures and supervised their development. S.A.M. recruited and managed all staff, who collected,
annotated, processed, and corrected data and metadata. S.A.M., D.M.K., and D.P-J. transcribed the NHS
Discography into music notation. S.A., A.A.E., E.J.H., and R.M.H. provided key support by contributing
to annotations, background research, and project management. S.A.M., J.K.H., M.V.J., J.S., and C.M.B.
designed and implemented the online experiment at http://themusiclab.org. N.J. assisted with web
scraping, music information retrieval, and initial analyses. S.A.M., M.S., and L.G. designed the overall
structure of the manuscript; S.A.M., M.S., and S.P. led the writing; and all authors edited it
collaboratively. Competing interests: The authors declare no competing interests. Data and materials
availability: All Natural History of Song data and materials are publicly archived at http://osf.io/jmv3q,
with the exception of the full audio recordings in the NHS Discography, which are available via the
Harvard Dataverse, at https://doi.org/10.7910/DVN/SESAO1. All analysis scripts are available at
http://github.com/themusiclab/nhs. Human Relations Area Files data and the eHRAF World Cultures
database are available via licensing agreement at http://ehrafworldcultures.yale.edu; the document- and
paragraph-wise word histograms from the Probability Sample File were provided by the Human Relations
Area Files under a Data Use Agreement. The Global Summary of the Year corpus is maintained by the
National Oceanic and Atmospheric Administration, United States Department of Commerce, and is
publicly available at https://www.ncei.noaa.gov/data/gsoy/.
Supplementary Materials
Supplementary Text
Figures S1-S15
Tables S1-S37
References 131-147
Supplementary Materials for
Universality and diversity in human song
Samuel A. Mehr, Manvir Singh, Dean Knox, Daniel M. Ketter, Daniel Pickens-Jones, Stephanie Atwood, Christopher Lucas, Nori Jacoby, Alena A. Egner, Erin J. Hopkins, Rhea M. Howard,
Joshua K. Hartshorne, Mariela V. Jennings, Jan Simson, Constance M. Bainbridge, Steven Pinker, Timothy J. O’Donnell, Max M. Krasnow, and Luke Glowacki
Correspondence to: [email protected], [email protected], [email protected]
This PDF file includes:
Supplementary Text Figs. S1 to S15 Tables S1 to S37
2
Supplementary Text 1. Design of the corpora This section provides detailed information about how Natural History of Song corpora were built, along with supplementary data collected for this paper. 1.1. NHS Ethnography All text was extracted from the eHRAF World Cultures database, the world’s largest database of primary ethnography (61, 62), using the societies identified in the Probability Sample File (74–76). This resource is a geographically-stratified random sample of societies for which high-quality ethnographies exist and which is designed to reflect the cultural, social, and geographic variation of human culture, including 60 societies from 30 world regions (Fig. 1 and Table S12). The Human Relations Area Files organization, which created and maintains the eHRAF World Cultures database, provided document- and paragraph-wise word histograms with associated metadata as part of a data mining pilot project. In addition to searchable raw text, each paragraph of text in the Probability Sample File is tagged with one or more identifiers from the Outline of Cultural Materials (62). There are over 750 identifiers available, and they refer to many aspects of human behavior (e.g., DECORATIVE ART, MARRIAGE, SPIRITS AND GODS). The process for building NHS Ethnography had four parts. First, a team of primary annotators located every description of song in the Probability Sample File — including descriptions of specific song performances and generic statements about the use of song — by searching within each society’s ethnography for items tagged with the Outline of Cultural Materials identifier MUSIC, for a predetermined series of song-related keywords: SONG SONGS SING SINGS SINGER SINGERS SANG SUNG SINGING LULLABY. For each search result, annotators were instructed to read the target paragraph in context by skimming the previous and subsequent pages (using the Human Relations Area Files user interface), so as to become sufficiently familiar with the text to accurately annotate numerous features of the song performance. The resulting 4,709 descriptions of song isolated from surrounding text (490,615 words; median 90 words per description, interquartile range 49-155; median 7 documents per society, interquartile range 5-11; median 49 descriptions per society, interquartile range 21-102) are the main unit of analysis in the corpus. Second, the primary annotators generated free-text keywords and keyphrases describing behavioral topics of the ethnographic text (e.g., song function: the stated purpose of singing the song, as in "to put the baby to sleep"). Whenever available, they also isolated the translated lyrics of actual song performances. Last, they manually coded each passage with cultural and behavioral variables that ranged from objective facts about singing (e.g., time of day of the performance) to more subjective judgments about behavior (e.g., whether or not a song was performed for a religious function). The set of annotated variables was determined in piloting via an iterative process led by the two anthropologist authors (M.S. and L.G.), who (i) developed a provisional list of variables aimed at capturing as much information as possible about the behavioral context of songs; (ii) coded several sets of passages from ethnographic documents that were not included in the NHS Ethnography; (iii) noted behaviors that were present in ethnography but not accounted for in the variable list, and vice versa; (iv) updated the list of variables before coding new passages; and (v) repeated this process until the list of variables satisfactorily described the reported behaviors. Third, a team of secondary annotators standardized free-text keywords into fixed categories that varied based on each variable. In particular, those keywords describing song trigger (i.e., the event leading up to the singing), function, context, and content were reduced to 85 topics of interest drawn from the master list of Outline of Cultural Materials topics (e.g., LAWS; full list in Table S30). More objective variables were simply re-coded, as with keywords describing the time of day of a song performance which were standardized into a 7-point scale (i.e., from "early morning (0400 to 0700)" to "Night (2200 to 0400)"). We also used outside sources to group variables; keywords describing instruments that were present, for example, were grouped into the Hornbostel-Sachs musical instrument classification scheme
3
(e.g., "Aerophone") (131). The full lists of primary and secondary annotations are in Tables S4 and S5, respectively. Last, we automatically located all paragraphs from which the primary annotators had gathered descriptions of songs so as to collect all Outline of Cultural Materials topics that were tagged in those paragraphs. To ensure the validity of the results, in cases where we did not find an exact match between the cited text and the eHRAF World Cultures text (457 cases, or 9.7% of the dataset), a research assistant read each non-matching excerpt and found its original source; usually the reason for non-matching was the presence of non-English special characters. This corrected all but 23 observations (99.5% of the dataset); the remaining cases were manually corrected by one of us (N.J.). A list of the automatically-extracted annotations is in Table S6. Across all NHS Ethnography data analyzed in this paper, categorical variables were represented by indicator variables for each category. Ordinal variables, such as audience sizes, which corresponded to a range of possible values (e.g., "21-30 listeners"), were quantified using the midpoint of that range. For an assessment of the reliability of NHS Ethnography data, an annotator re-coded 500 observations (11% of the corpus) selected in the following way: (a) 300 observations sampled without replacement and weighted according to the nesting structure of the corpus, i.e., observations within observation groups within documents within cultures (to ensure that the re-coded observations are not dominated by societies that happen to have many observations in the raw data); (b) 100 further observations sampled without replacement with equal weights given to every observation; and (c) 100 further observations that have a large amount of missing data. We computed Cronbach's alphas for each variable. Alphas varied substantially, impacted noticeably by the sparsity of the data; median alpha was 0.774, which was acceptable, and ranged from .43 to 1 across the 40 variables in common across the full NHS Ethnography and the reliability annotation set. 1.2. NHS Discography Field recordings were sourced mainly from the Archive of World Music Collection at Harvard’s Loeb Music Library. We began by searching for available field recordings from the same 60 societies included in NHS Ethnography; when we exhausted available recordings from those societies, we expanded our searches to neighboring societies in the same world subregions (geographical information is in Fig. 4 and Table S22). In cases where regions had few available recordings, we expanded our searches to the WorldCat database and also contacted anthropologists and ethnomusicologists to request unpublished field recordings. In each region, we aimed to find one example of each of four common social contexts of song: dance, healing, love, and lullaby. Using predetermined definitions of each social context from our previous work (Table S21), we studied candidate recordings’ liner notes and supporting ethnographic text to decide whether to include each candidate recording. Inclusion decisions were made by one of three ways: (i) if only a single candidate recording was available that had sufficient documentation, we included it; (ii) if multiple appropriate recordings were available but had varying degrees of ethnographic support, we selected the recording with the most supporting information; and (iii) if multiple recordings were available with substantial ethnographic support, we chose at random. All these decisions were made while unaware of the auditory content of the recording. In 17 cases, only the ethnographer's categorization of the song type was available, without any supporting information. Once a recording had been selected, it was screened to ensure that (i) a voice was audible on the recording (i.e., singing was present); and (ii) that the recording was of sufficiently high fidelity to enable manual transcription. We also collected a number of metadata variables for each recording (Table S7). NHS Discography includes four datasets. The expert listener annotations and transcriptions were created using only the full audio recordings described above; the naïve listener annotations were created using 14-second excerpts drawn at random intervals from each of those recordings, from our previous research (54); and the music information retrieval data were created from both audio types. Each dataset is described below and full codebooks are in Tables S8-S11.
4
1.2.1. Music information retrieval We processed both the full audio recordings and the 14-second excerpts in MATLAB using the MIRtoolbox package (Version 1.7), which provides a variety of standard acoustical features of music performances. We used the mirfeatures function to extract features (e.g., overall RMS power) directly from the entire audio files. We analyzed features for both the full audio of each track and for the 14-second excerpts that naïve listeners heard (SI Text 1.2.2). Other features were extracted by first computing a spectral decomposition of the audio signal to 40 sub-bands, equally spaced in mel scale, and then computing the mean and standard deviation for each variable in each of the sub-bands. See (132) for the exact algorithms used to compute each feature. We also extracted 840 music information retrieval features using the methods of (133), which aim to capture rhythmic, melodic, harmonic, and timbral aspects of the audio, applied only to the 14-second excerpts (since the method is limited to 30-second excerpts). We disabled filtering of non-music segments, since the excerpts contain only music segments. Timbral aspects of the audio were characterized by 20 mel-frequency cepstral coefficients and 20 first-order delta coefficients computed using a window size of 40 ms and a hop size of 5 ms, producing 80 feature values describing timbre. For harmonic content, we computed chromagrams using variable-Q transforms (134) with a 5 ms hop size and 20 cent pitch resolution to allow for microtonality. Harmonic content is described by the mean and standard deviation of chroma vectors using 8-second windows with a 500 ms hop size, producing 120 feature values describing harmony. For rhythmic content, we use the magnitude of the envelopes for each mel band computed using a window size of 40 ms and a hop size of 5 ms. We then compute rhythmic periodicities using a second Fourier transform, with a window size of 8 sesconds and a hop size of 500 ms, averaging the results of the Mellin transform to achieve tempo invariance (135), producing 400 features describing rhythm. Last, we capture 240 melodic features that describe pitch bi-histograms, denoting counts of transitions between pitch classes. The list of all features extracted from both sets of methods is in Table S8. 1.2.2. Naïve listener annotations We used data from our previous work (54) to characterize impressionistic ratings of song features (e.g., "excitement"). One thousand listeners recruited on Amazon Mechanical Turk (half located in the United States and half located in India) each listened to 36 of the 14-second excerpts, drawn at random from the corpus. For each excerpt, they provided up to 5 ratings from a set of 7 musical features (Table S9). They also rated contextual features (e.g., number of singers) but we did not conduct analyses of those variables here. Split-half reliability of these annotations were high (rs = 0.81–0.99). 1.2.3. Expert listener annotations A team of 30 musicians from a variety of backgrounds, including graduate students and faculty in ethnomusicology and music theory, provided ratings of 36 musical variables (Table S10). Each rater listened to the complete corpus and had access to the full audio of each song along with our transcription. If they disagreed with any features in the transcription, they were instructed to use their own intuition in their ratings, rather than follow the transcription. Inter-observer reliability was high (mean Cronbach alpha = .92, range .88–.97; full list is in Table S31), contrasting with previous work (53) using ratings from two expert listeners; there, on 32 features, the median Kappa was .45 (interquartile range .26-.59, range .01-.90), meaning that 75% of the variables coded had "Weak" or worse agreement (136). The difference in reliability across these projects may be because a number of musical features are quite ambiguous, even to expert listeners, but ambiguous ratings approach consensus with a large group of annotators. 1.2.4. Transcriptions A team of three expert musicians transcribed all field recordings in staff notation. Each member was kept unaware of the society and location from which the song was recorded, the social context
5
represented, and of others’ editing decisions: as such, their ideas of, for instance, what types of musical structures are often found in a lullaby, could not influence their transcription decisions. Disagreements were resolved by majority rule, with tie-breaking by consensus. Transcriptions were made with efforts to limit Western influence (e.g., without time or key signatures, beaming, or bar lines) and are available, including interim drafts, at http://osf.io/jmv3q. We processed the transcriptions using the jSymbolic tools (137) available in music21 (138) to provide a variety of summary features (Table S11) which we then edited manually, to maximize validity. Using a predetermined variable selection procedure, we limited the variables for analysis in this paper to those that contained or implied no contextual information (e.g., a variable about polyphony suggests the number of singers, so it was excluded). Ten of the expert listeners (see SI Text 1.2.3) who held a PhD in ethnomusicology, music theory, or both, gave subjective ratings of the accuracy of each transcription. After listening to each full song while following along with our transcription of it, we asked them to answer the following prompt: Think about the audio and the transcription. How ACCURATE is the transcription? We're ONLY talking about pitches and rhythms — don't rate the transcription as inaccurate because it's missing an instrumental break, for instance. Also, keep in mind that singers sometimes rise or fall slowly in pitch, or slow down or speed up. In many cases those things clearly happen, but are not notated in the transcription. This is intentional, so please don't rate the transcription as inaccurate because it leaves out a feature like that. Response options were "Terrible: Basically nothing is accurate"; "Extremely inaccurate"; "Very inaccurate"; "Sort of inaccurate"; "Sort of accurate"; "Very accurate"; "Extremely accurate"; and "Perfect". The overall median rating (weighted by song) was "Very accurate" and the lowest-rated song had a median rating above the midpoint of the scale ("Sort of accurate"). 1.2.5. Tradeoffs in quantitative representations of music In NHS Discography we used four different types of quantitative analysis of world music. These approaches bring with them a number of tradeoffs in terms of their precision, bias, interpretability, and so on. This section is intended to provide a very brief introduction to the various issues in the quantitative or symbolic representation of world music, geared toward readers who are unfamiliar with how music can be analyzed quantitatively. Please note that these topics are treated in much more detail in the ethnomusicology, music information retrieval, music theory, and acoustics literatures; we do not and have not attempted to give a complete overview of these important issues in the space below, nor do we make any claims about the relative value of each of these measures for the study of world music. (i) Music information retrieval aims to provide objective measurements of musical features but at present, the method has difficulty automatically extracting data from noisy, complex recordings like those in NHS Discography, thus delivering mostly surface-level features of the audio. (ii) Feature ratings by naïve listeners can be highly reliable (e.g., in previous work, split-half reliability ranged from r = .81 to r = .99; see ref. 54) but because the listeners generally have no explicit content knowledge, their reporting is somewhat superficial. For instance, they can reliably report a song's tempo on a 6-point scale, but cannot reliably produce a precise estimate of a song's tempo (i.e., in beats per minute). It is also likely that naïve listeners’ perceptions of musical features correlate statistically with their exposure to a given musical idiom, which may influence their rating decisions. (iii) Expert musicians' ratings are also reliable (see SI Text 1.2.3). Given their explicit knowledge, expert musicians can provide more precise reporting on targeted musical features, e.g., degrees of large- and small-scale repetition across different parameters of pitch, rhythm, timbre or articulation; perception of tonal center, etc. An expert’s reporting is likely influenced by their training and cultural background, however (103). (iv) Manual transcriptions encode a variety of ordered information of perceived musical features across a fixed set of musical parameters: pitches, rhythms, and the like. While they are fundamentally subjective in nature — representations of an expert musician’s own experience of music, an issue central
6
to critiques of this method from ethnomusicologists (29, 30) — written transcriptions allow for far more flexibility in analysis than do tabular summaries of musical features. They are also amenable to validation practices in human-annotated features used in cognitive science (e.g., editing decisions based on majority rule). Most importantly, however, transcriptions of vocal music enable the analysis in isolation of the singing in vocal music, in a fashion that none of the above data types can achieve: all non-singing sounds, whether they are accompanying instruments, speech, wails, animals, and so on, are present in the raw audio that forms the basis of each of the other three data types. In the case of MIR, these confounds are included in analyses by definition; in the case of naïve listeners, they are highly likely to influence ratings. Thus, while not without bias, transcriptions provide a unique view of musical performance across societies. 1.3. Supplementary metadata
To enable the integration of Natural History of Song data with other corpora and to facilitate future research, we matched societies in both NHS Ethnography and NHS Discography to existing resources for cross-cultural research, including D-PLACE, Ethnographic Atlas, Human Relations Area Files, Binford Hunter-Gatherers, Standard Cross-Cultural Sample, Contemporary and Historical Reconstruction in the Indigenous Languages of Australia, and Western North American Indian databases. Correspondence information for these databases is in Table S1 and society-level metadata for the NHS Ethnography and NHS Discography are in Tables S2 and S7. 1.4. Additional data collection We conducted two studies to provide additional data for this paper: a survey of academics, to assess current views on universality of music; and a massively crowdsourced web-based song classification task, to provide a benchmark of human performance for the NHS Discography classifiers. Both studies are described below. 1.4.1. Survey of academics We conducted a survey to assess the degree to which current ideas in music scholarship were consistent with the George List quotation included in the Introduction. We recruited 940 scholars (390 female, 439 male, 3 other, 108 did not disclose; age 20-91 years, mean = 46.7, SD = 14.5) born in 56 countries. Of these, 638 self-reported a primary affiliation with at least one musical field (ethnomusicology: N = 206, 84 female, 88 male, 34 did not disclose, mean age 45.6 years, range 23–81; music theory: N = 148, 44 female, 84 male, 1 other, 19 did not disclose, mean age 45.0 years, range 22–86; other musical disciplines: N = 299, 105 female, 149 male, 2 other, 43 did not disclose, mean age 49.9 years, range 21–83) and 302 self-reported a primary affiliation with psychology or cognitive science (160 female, 128 male, 14 did not disclose, mean age 45.1 years, range 20–91). Participants could enter into a drawing for 50 gift cards of $25 value as an incentive to participate. The survey took about 15 minutes to complete. We previously reported data from two questions in this survey (54).
Because interpretations of what "universality" means can vary, and because this was an opt-in survey with a convenience sample, we present these analyses as an impressionistic sketch of current opinion in music scholarship. A more complete and representatively sampled poll of music scholars is necessary for a complete characterization of views in the field.
First, as we previously reported, there are substantial differences across academic fields concerning the degree to which respondents think that listeners can extract meaningful information about a song performance, purely on the basis of a recording of the song. Such a finding would imply the presence of universals in musical content. A full description of the results is in (54); we reproduce the relevant summary text here:
"We asked participants to predict two outcomes of an imaginary experiment wherein people listened to examples of vocal music from all cultures to ever exist: (1) whether or not people would accurately identify the social function of each piece of music on the basis of its form alone,
7
and (2) whether peoples’ ratings would be consistent with one another... The responses differed strikingly across academic fields. Among academics who self-identified as cognitive scientists, 72.9% predicted that listeners would make accurate form-function inferences, and 73.2% predicted that those inferences would be mutually consistent. In contrast, only 28.8% of ethno- musicologists predicted accurate form-function inferences, and 27.8% predicted mutually consistent ratings. Music theorists were more equivocal (50.7% and 52.0%), as were academics in other music disciplines (e.g., composition, music performance, music technology; 59.2% and 52.8%)... In sum, there is substantial disagreement among scholars about the possibility of a form-function link in human song." (54), p. 357
Thus, many music scholars — especially ethnomusicologists — tend to believe that a form-function link does not exist in music. Put another way, these scholars do not believe that listeners unfamiliar with the music of a particular culture could make accurate inferences about its social function; this implies that they do not believe that music shares many features across societies. This result appears specific to musical behavior: when we asked respondents to rate the extent to which naïve raters could judge the function of a non-musical behavior from only observing it, the distribution of responses shifted in the positive direction. Ethnomusicologists were split, with 48.7% predicting accurate judgments — far higher than the 28.8% of ethnomusicologists who predicted success at identifying functions of music. Ratings were higher in the other groups: 73.0% among music theorists, 74.3% among other music scholars, and 86.4% among cognitive scientists.
Second, to assess scholars’ opinions on how culture and shared biology respectively shape music, we asked the following:
Many human behaviors are complicated and vary across different societies, but they also share some features across societies. For instance, languages can sound completely different from one another from society to society but many linguists agree that they always include at least a rudimentary form of grammar. What about music? Do you think that music is mostly shaped by culture, or do you think that music is mostly shaped by a universal human nature?
Respondents used an 8-point scale, from the left anchor (1) "Music is mostly shaped by culture" to the right (8) "Music is mostly shaped by a universal human nature".
The full cohort skewed toward the "shaped by culture" end (median = 3, interquartile range 2–5; significantly lower than the center of the scale, z = 15.2, p < .0001, Wilcoxon signed-rank test), with variability across the four groups of scholars. In ascending order of medians: ethnomusicologists gave the lowest ratings (median = 2, interquartile range 1–3), followed by music theorists (median = 3, interquartile range 2–4), and other music scholars (median = 3, interquartile range 2–5); cognitive scientists gave the highest ratings (median = 4, interquartile range 3–5). Ethnomusicologists' ratings were significantly lower than each of the other 3 groups (comparison to music theorists: z = 4.68, p < .0001; to other music scholars: z = 5.60, p < .0001; to cognitive scientists: z = 8.75, p < .0001; Wilcoxon rank-sum tests). Aggregating across fields, cognitive scientists (median = 4, interquartile range 3–5) gave significantly higher ratings than the the aggregate group of all music scholars (median = 3, interquartile range 2–4; z = 6.94, p < .0001). Third, we examined respondents' predictions about specific universals. We asked the following question to probe opinions about universals in musical behavior:
Around the world, music turns up in conjunction with a variety of different behaviors. However, there is some disagreement among scholars about what behaviors might universally be used with music, and which behaviors might not be universally used with music.
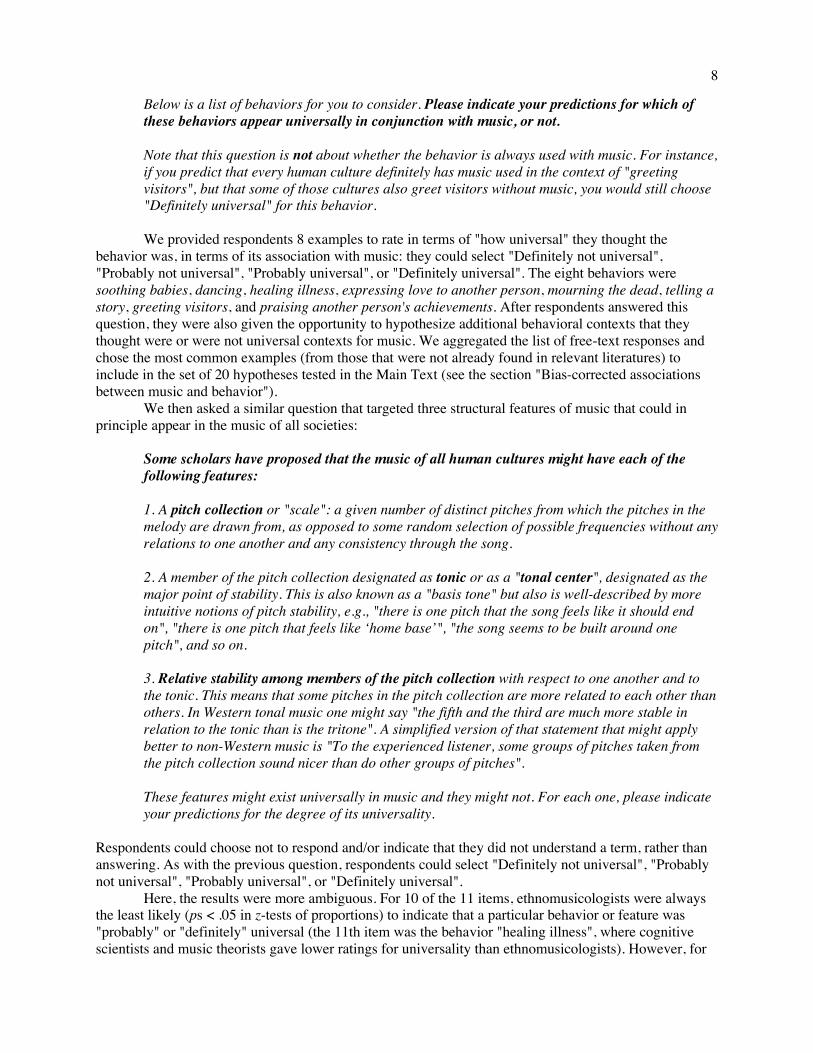
8
Below is a list of behaviors for you to consider. Please indicate your predictions for which of these behaviors appear universally in conjunction with music, or not. Note that this question is not about whether the behavior is always used with music. For instance, if you predict that every human culture definitely has music used in the context of "greeting visitors", but that some of those cultures also greet visitors without music, you would still choose "Definitely universal" for this behavior.
We provided respondents 8 examples to rate in terms of "how universal" they thought the behavior was, in terms of its association with music: they could select "Definitely not universal", "Probably not universal", "Probably universal", or "Definitely universal". The eight behaviors were soothing babies, dancing, healing illness, expressing love to another person, mourning the dead, telling a story, greeting visitors, and praising another person's achievements. After respondents answered this question, they were also given the opportunity to hypothesize additional behavioral contexts that they thought were or were not universal contexts for music. We aggregated the list of free-text responses and chose the most common examples (from those that were not already found in relevant literatures) to include in the set of 20 hypotheses tested in the Main Text (see the section "Bias-corrected associations between music and behavior"). We then asked a similar question that targeted three structural features of music that could in principle appear in the music of all societies:
Some scholars have proposed that the music of all human cultures might have each of the following features: 1. A pitch collection or "scale": a given number of distinct pitches from which the pitches in the melody are drawn from, as opposed to some random selection of possible frequencies without any relations to one another and any consistency through the song. 2. A member of the pitch collection designated as tonic or as a "tonal center", designated as the major point of stability. This is also known as a "basis tone" but also is well-described by more intuitive notions of pitch stability, e.g., "there is one pitch that the song feels like it should end on", "there is one pitch that feels like ‘home base’", "the song seems to be built around one pitch", and so on. 3. Relative stability among members of the pitch collection with respect to one another and to the tonic. This means that some pitches in the pitch collection are more related to each other than others. In Western tonal music one might say "the fifth and the third are much more stable in relation to the tonic than is the tritone". A simplified version of that statement that might apply better to non-Western music is "To the experienced listener, some groups of pitches taken from the pitch collection sound nicer than do other groups of pitches". These features might exist universally in music and they might not. For each one, please indicate your predictions for the degree of its universality.
Respondents could choose not to respond and/or indicate that they did not understand a term, rather than answering. As with the previous question, respondents could select "Definitely not universal", "Probably not universal", "Probably universal", or "Definitely universal". Here, the results were more ambiguous. For 10 of the 11 items, ethnomusicologists were always the least likely (ps < .05 in z-tests of proportions) to indicate that a particular behavior or feature was "probably" or "definitely" universal (the 11th item was the behavior "healing illness", where cognitive scientists and music theorists gave lower ratings for universality than ethnomusicologists). However, for
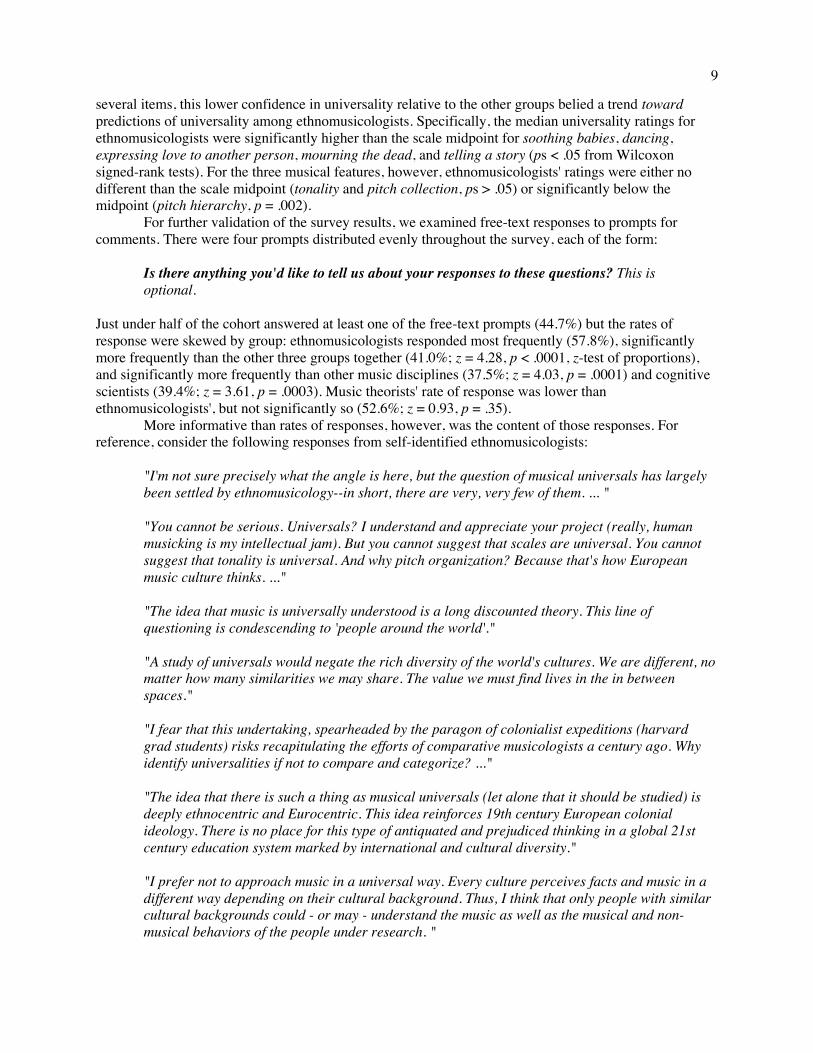
9
several items, this lower confidence in universality relative to the other groups belied a trend toward predictions of universality among ethnomusicologists. Specifically, the median universality ratings for ethnomusicologists were significantly higher than the scale midpoint for soothing babies, dancing, expressing love to another person, mourning the dead, and telling a story (ps < .05 from Wilcoxon signed-rank tests). For the three musical features, however, ethnomusicologists' ratings were either no different than the scale midpoint (tonality and pitch collection, ps > .05) or significantly below the midpoint (pitch hierarchy, p = .002). For further validation of the survey results, we examined free-text responses to prompts for comments. There were four prompts distributed evenly throughout the survey, each of the form: Is there anything you'd like to tell us about your responses to these questions? This is optional. Just under half of the cohort answered at least one of the free-text prompts (44.7%) but the rates of response were skewed by group: ethnomusicologists responded most frequently (57.8%), significantly more frequently than the other three groups together (41.0%; z = 4.28, p < .0001, z-test of proportions), and significantly more frequently than other music disciplines (37.5%; z = 4.03, p = .0001) and cognitive scientists (39.4%; z = 3.61, p = .0003). Music theorists' rate of response was lower than ethnomusicologists', but not significantly so (52.6%; z = 0.93, p = .35). More informative than rates of responses, however, was the content of those responses. For reference, consider the following responses from self-identified ethnomusicologists:
"I'm not sure precisely what the angle is here, but the question of musical universals has largely been settled by ethnomusicology--in short, there are very, very few of them. ... " "You cannot be serious. Universals? I understand and appreciate your project (really, human musicking is my intellectual jam). But you cannot suggest that scales are universal. You cannot suggest that tonality is universal. And why pitch organization? Because that's how European music culture thinks. ..." "The idea that music is universally understood is a long discounted theory. This line of questioning is condescending to 'people around the world'."
"A study of universals would negate the rich diversity of the world's cultures. We are different, no matter how many similarities we may share. The value we must find lives in the in between spaces." "I fear that this undertaking, spearheaded by the paragon of colonialist expeditions (harvard grad students) risks recapitulating the efforts of comparative musicologists a century ago. Why identify universalities if not to compare and categorize? ..." "The idea that there is such a thing as musical universals (let alone that it should be studied) is deeply ethnocentric and Eurocentric. This idea reinforces 19th century European colonial ideology. There is no place for this type of antiquated and prejudiced thinking in a global 21st century education system marked by international and cultural diversity." "I prefer not to approach music in a universal way. Every culture perceives facts and music in a different way depending on their cultural background. Thus, I think that only people with similar cultural backgrounds could - or may - understand the music as well as the musical and non-musical behaviors of the people under research. "
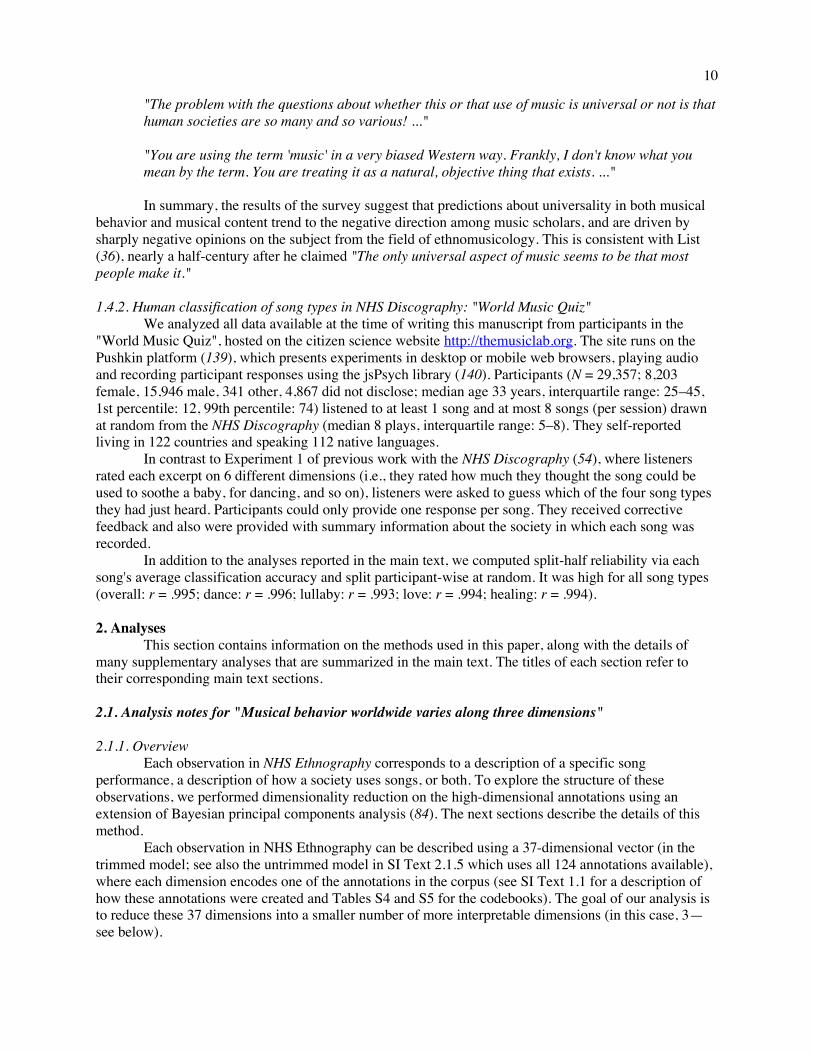
10
"The problem with the questions about whether this or that use of music is universal or not is that human societies are so many and so various! ..."
"You are using the term 'music' in a very biased Western way. Frankly, I don't know what you mean by the term. You are treating it as a natural, objective thing that exists. ..."
In summary, the results of the survey suggest that predictions about universality in both musical behavior and musical content trend to the negative direction among music scholars, and are driven by sharply negative opinions on the subject from the field of ethnomusicology. This is consistent with List (36), nearly a half-century after he claimed "The only universal aspect of music seems to be that most people make it." 1.4.2. Human classification of song types in NHS Discography: "World Music Quiz" We analyzed all data available at the time of writing this manuscript from participants in the "World Music Quiz", hosted on the citizen science website http://themusiclab.org. The site runs on the Pushkin platform (139), which presents experiments in desktop or mobile web browsers, playing audio and recording participant responses using the jsPsych library (140). Participants (N = 29,357; 8,203 female, 15,946 male, 341 other, 4,867 did not disclose; median age 33 years, interquartile range: 25–45, 1st percentile: 12, 99th percentile: 74) listened to at least 1 song and at most 8 songs (per session) drawn at random from the NHS Discography (median 8 plays, interquartile range: 5–8). They self-reported living in 122 countries and speaking 112 native languages. In contrast to Experiment 1 of previous work with the NHS Discography (54), where listeners rated each excerpt on 6 different dimensions (i.e., they rated how much they thought the song could be used to soothe a baby, for dancing, and so on), listeners were asked to guess which of the four song types they had just heard. Participants could only provide one response per song. They received corrective feedback and also were provided with summary information about the society in which each song was recorded. In addition to the analyses reported in the main text, we computed split-half reliability via each song's average classification accuracy and split participant-wise at random. It was high for all song types (overall: r = .995; dance: r = .996; lullaby: r = .993; love: r = .994; healing: r = .994). 2. Analyses This section contains information on the methods used in this paper, along with the details of many supplementary analyses that are summarized in the main text. The titles of each section refer to their corresponding main text sections. 2.1. Analysis notes for "Musical behavior worldwide varies along three dimensions" 2.1.1. Overview Each observation in NHS Ethnography corresponds to a description of a specific song performance, a description of how a society uses songs, or both. To explore the structure of these observations, we performed dimensionality reduction on the high-dimensional annotations using an extension of Bayesian principal components analysis (84). The next sections describe the details of this method. Each observation in NHS Ethnography can be described using a 37-dimensional vector (in the trimmed model; see also the untrimmed model in SI Text 2.1.5 which uses all 124 annotations available), where each dimension encodes one of the annotations in the corpus (see SI Text 1.1 for a description of how these annotations were created and Tables S4 and S5 for the codebooks). The goal of our analysis is to reduce these 37 dimensions into a smaller number of more interpretable dimensions (in this case, 3—see below).
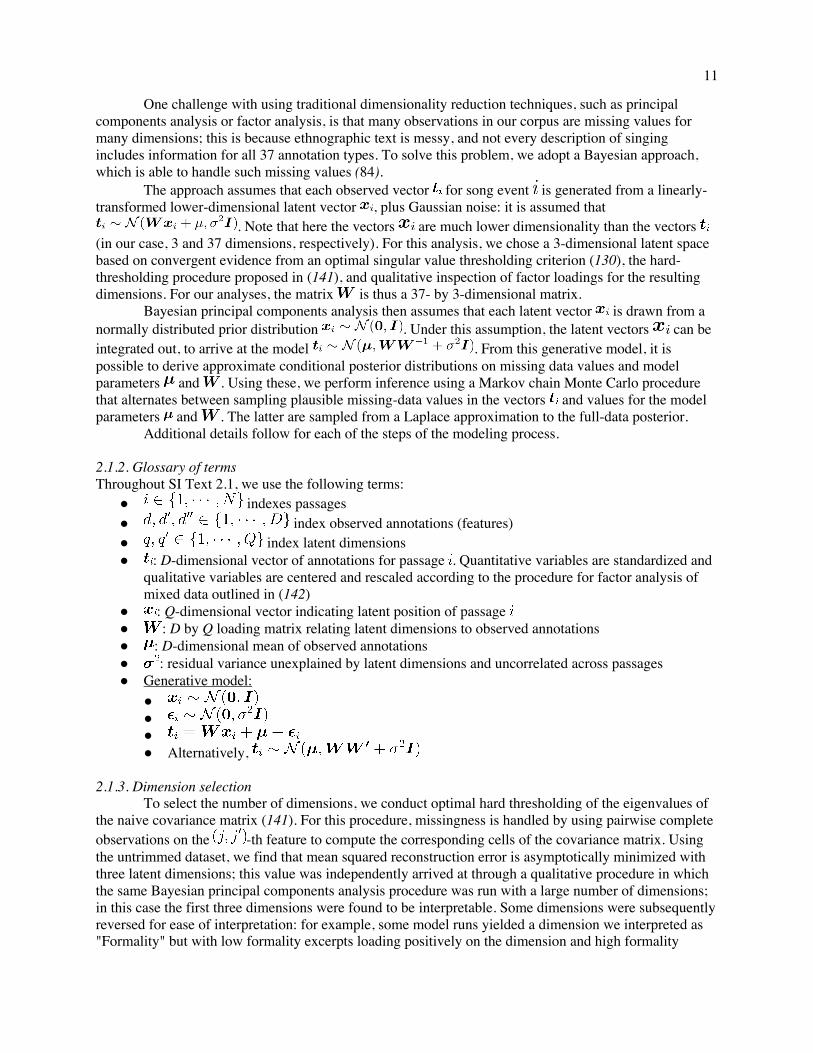
11
One challenge with using traditional dimensionality reduction techniques, such as principal components analysis or factor analysis, is that many observations in our corpus are missing values for many dimensions; this is because ethnographic text is messy, and not every description of singing includes information for all 37 annotation types. To solve this problem, we adopt a Bayesian approach, which is able to handle such missing values (84). The approach assumes that each observed vector for song event is generated from a linearly-transformed lower-dimensional latent vector , plus Gaussian noise: it is assumed that
. Note that here the vectors are much lower dimensionality than the vectors (in our case, 3 and 37 dimensions, respectively). For this analysis, we chose a 3-dimensional latent space based on convergent evidence from an optimal singular value thresholding criterion (130), the hard-thresholding procedure proposed in (141), and qualitative inspection of factor loadings for the resulting dimensions. For our analyses, the matrix is thus a 37- by 3-dimensional matrix. Bayesian principal components analysis then assumes that each latent vector is drawn from a normally distributed prior distribution . Under this assumption, the latent vectors can be integrated out, to arrive at the model . From this generative model, it is possible to derive approximate conditional posterior distributions on missing data values and model parameters and . Using these, we perform inference using a Markov chain Monte Carlo procedure that alternates between sampling plausible missing-data values in the vectors and values for the model parameters and . The latter are sampled from a Laplace approximation to the full-data posterior. Additional details follow for each of the steps of the modeling process. 2.1.2. Glossary of terms Throughout SI Text 2.1, we use the following terms:
● indexes passages ● index observed annotations (features) ● index latent dimensions ● : D-dimensional vector of annotations for passage . Quantitative variables are standardized and
qualitative variables are centered and rescaled according to the procedure for factor analysis of mixed data outlined in (142)
● : Q-dimensional vector indicating latent position of passage ● : D by Q loading matrix relating latent dimensions to observed annotations ● : D-dimensional mean of observed annotations ● : residual variance unexplained by latent dimensions and uncorrelated across passages ● Generative model:
● ● ● ● Alternatively,
2.1.3. Dimension selection To select the number of dimensions, we conduct optimal hard thresholding of the eigenvalues of the naive covariance matrix (141). For this procedure, missingness is handled by using pairwise complete observations on the -th feature to compute the corresponding cells of the covariance matrix. Using the untrimmed dataset, we find that mean squared reconstruction error is asymptotically minimized with three latent dimensions; this value was independently arrived at through a qualitative procedure in which the same Bayesian principal components analysis procedure was run with a large number of dimensions; in this case the first three dimensions were found to be interpretable. Some dimensions were subsequently reversed for ease of interpretation: for example, some model runs yielded a dimension we interpreted as "Formality" but with low formality excerpts loading positively on the dimension and high formality
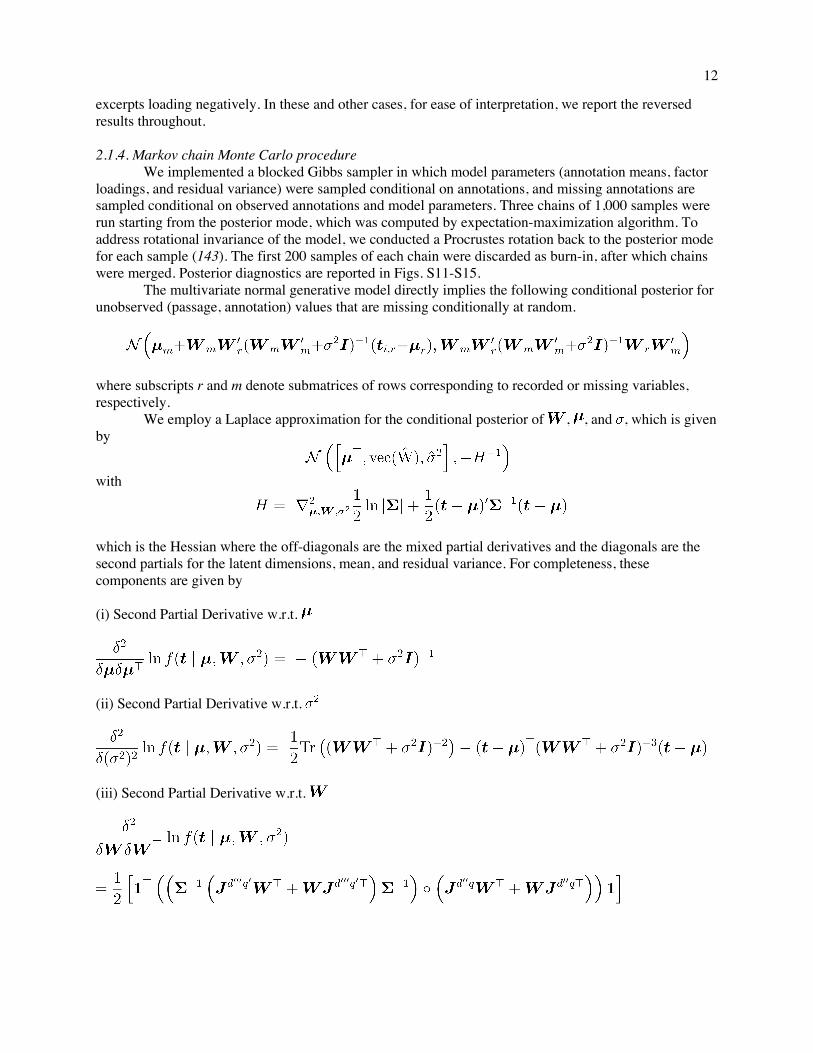
12
excerpts loading negatively. In these and other cases, for ease of interpretation, we report the reversed results throughout. 2.1.4. Markov chain Monte Carlo procedure We implemented a blocked Gibbs sampler in which model parameters (annotation means, factor loadings, and residual variance) were sampled conditional on annotations, and missing annotations are sampled conditional on observed annotations and model parameters. Three chains of 1,000 samples were run starting from the posterior mode, which was computed by expectation-maximization algorithm. To address rotational invariance of the model, we conducted a Procrustes rotation back to the posterior mode for each sample (143). The first 200 samples of each chain were discarded as burn-in, after which chains were merged. Posterior diagnostics are reported in Figs. S11-S15. The multivariate normal generative model directly implies the following conditional posterior for unobserved (passage, annotation) values that are missing conditionally at random.
where subscripts r and m denote submatrices of rows corresponding to recorded or missing variables, respectively. We employ a Laplace approximation for the conditional posterior of , , and , which is given by
with
which is the Hessian where the off-diagonals are the mixed partial derivatives and the diagonals are the second partials for the latent dimensions, mean, and residual variance. For completeness, these components are given by (i) Second Partial Derivative w.r.t.
(ii) Second Partial Derivative w.r.t.
(iii) Second Partial Derivative w.r.t.
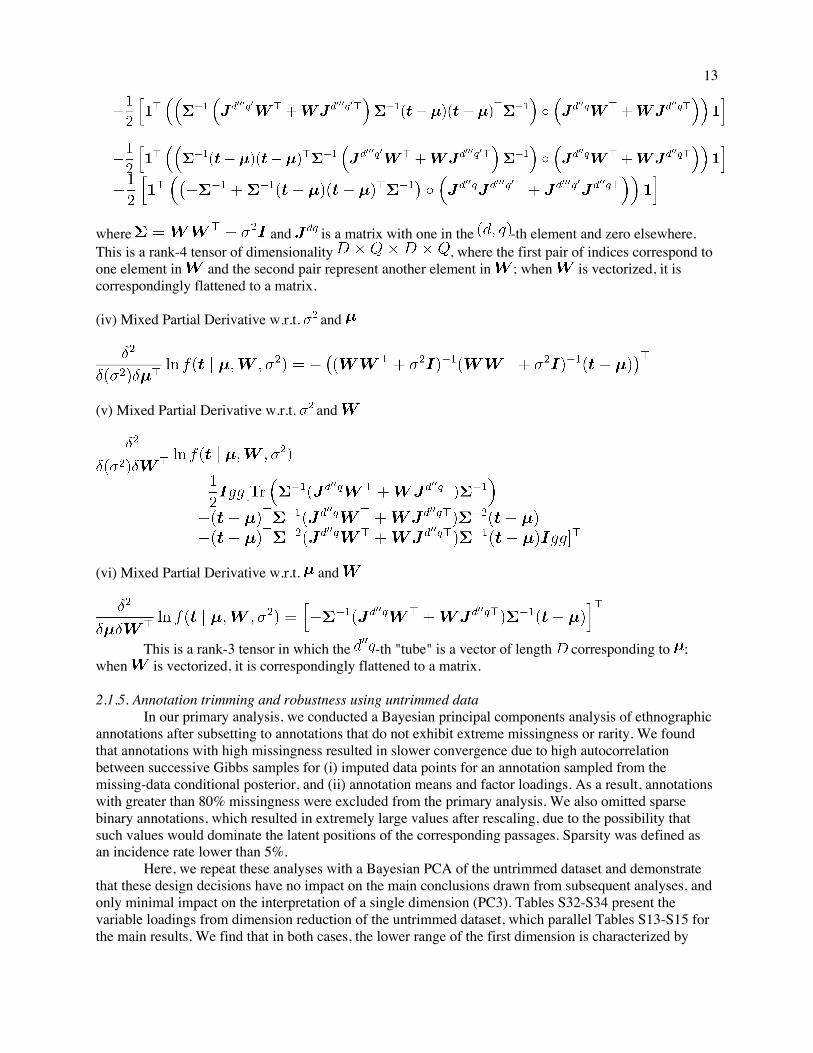
13
where and is a matrix with one in the -th element and zero elsewhere. This is a rank-4 tensor of dimensionality , where the first pair of indices correspond to one element in and the second pair represent another element in ; when is vectorized, it is correspondingly flattened to a matrix. (iv) Mixed Partial Derivative w.r.t. and
(v) Mixed Partial Derivative w.r.t. and
(vi) Mixed Partial Derivative w.r.t. and
This is a rank-3 tensor in which the -th "tube" is a vector of length corresponding to ; when is vectorized, it is correspondingly flattened to a matrix. 2.1.5. Annotation trimming and robustness using untrimmed data In our primary analysis, we conducted a Bayesian principal components analysis of ethnographic annotations after subsetting to annotations that do not exhibit extreme missingness or rarity. We found that annotations with high missingness resulted in slower convergence due to high autocorrelation between successive Gibbs samples for (i) imputed data points for an annotation sampled from the missing-data conditional posterior, and (ii) annotation means and factor loadings. As a result, annotations with greater than 80% missingness were excluded from the primary analysis. We also omitted sparse binary annotations, which resulted in extremely large values after rescaling, due to the possibility that such values would dominate the latent positions of the corresponding passages. Sparsity was defined as an incidence rate lower than 5%. Here, we repeat these analyses with a Bayesian PCA of the untrimmed dataset and demonstrate that these design decisions have no impact on the main conclusions drawn from subsequent analyses, and only minimal impact on the interpretation of a single dimension (PC3). Tables S32-S34 present the variable loadings from dimension reduction of the untrimmed dataset, which parallel Tables S13-S15 for the main results. We find that in both cases, the lower range of the first dimension is characterized by
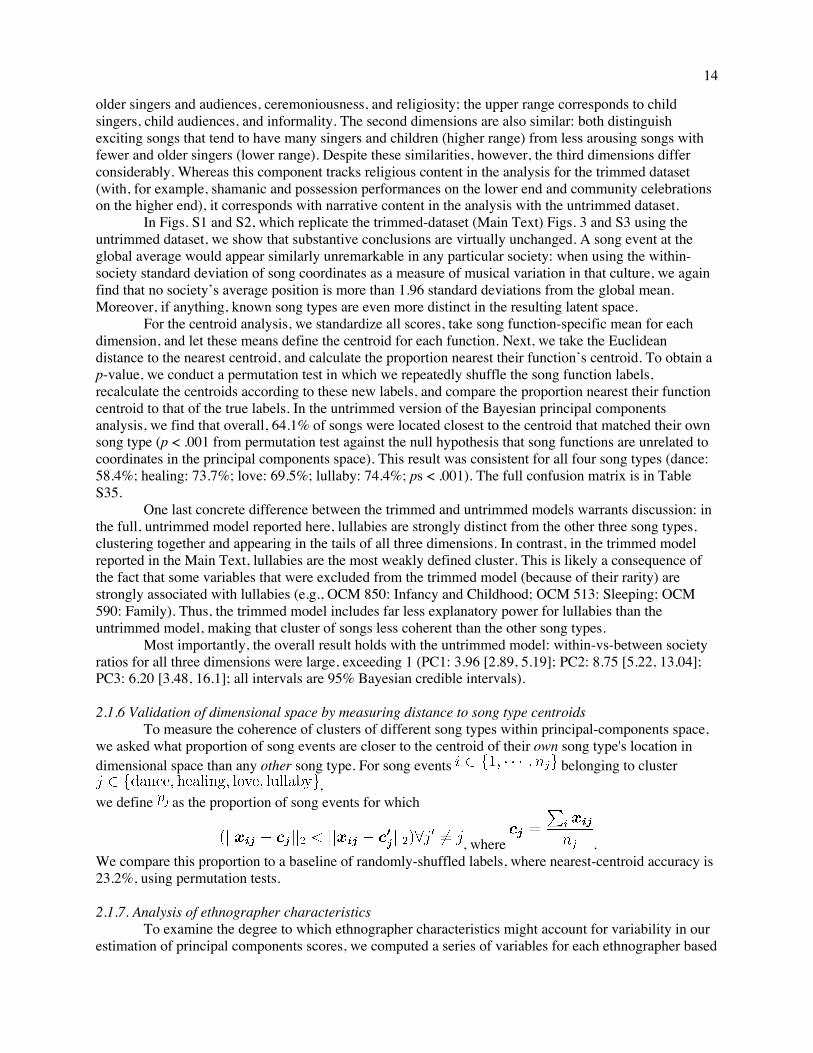
14
older singers and audiences, ceremoniousness, and religiosity; the upper range corresponds to child singers, child audiences, and informality. The second dimensions are also similar: both distinguish exciting songs that tend to have many singers and children (higher range) from less arousing songs with fewer and older singers (lower range). Despite these similarities, however, the third dimensions differ considerably. Whereas this component tracks religious content in the analysis for the trimmed dataset (with, for example, shamanic and possession performances on the lower end and community celebrations on the higher end), it corresponds with narrative content in the analysis with the untrimmed dataset. In Figs. S1 and S2, which replicate the trimmed-dataset (Main Text) Figs. 3 and S3 using the untrimmed dataset, we show that substantive conclusions are virtually unchanged. A song event at the global average would appear similarly unremarkable in any particular society: when using the within-society standard deviation of song coordinates as a measure of musical variation in that culture, we again find that no society’s average position is more than 1.96 standard deviations from the global mean. Moreover, if anything, known song types are even more distinct in the resulting latent space. For the centroid analysis, we standardize all scores, take song function-specific mean for each dimension, and let these means define the centroid for each function. Next, we take the Euclidean distance to the nearest centroid, and calculate the proportion nearest their function’s centroid. To obtain a p-value, we conduct a permutation test in which we repeatedly shuffle the song function labels, recalculate the centroids according to these new labels, and compare the proportion nearest their function centroid to that of the true labels. In the untrimmed version of the Bayesian principal components analysis, we find that overall, 64.1% of songs were located closest to the centroid that matched their own song type (p < .001 from permutation test against the null hypothesis that song functions are unrelated to coordinates in the principal components space). This result was consistent for all four song types (dance: 58.4%; healing: 73.7%; love: 69.5%; lullaby: 74.4%; ps < .001). The full confusion matrix is in Table S35. One last concrete difference between the trimmed and untrimmed models warrants discussion: in the full, untrimmed model reported here, lullabies are strongly distinct from the other three song types, clustering together and appearing in the tails of all three dimensions. In contrast, in the trimmed model reported in the Main Text, lullabies are the most weakly defined cluster. This is likely a consequence of the fact that some variables that were excluded from the trimmed model (because of their rarity) are strongly associated with lullabies (e.g., OCM 850: Infancy and Childhood; OCM 513: Sleeping; OCM 590: Family). Thus, the trimmed model includes far less explanatory power for lullabies than the untrimmed model, making that cluster of songs less coherent than the other song types. Most importantly, the overall result holds with the untrimmed model: within-vs-between society ratios for all three dimensions were large, exceeding 1 (PC1: 3.96 [2.89, 5.19]; PC2: 8.75 [5.22, 13.04]; PC3: 6.20 [3.48, 16.1]; all intervals are 95% Bayesian credible intervals). 2.1.6 Validation of dimensional space by measuring distance to song type centroids To measure the coherence of clusters of different song types within principal-components space, we asked what proportion of song events are closer to the centroid of their own song type's location in dimensional space than any other song type. For song events belonging to cluster
, we define as the proportion of song events for which
, where . We compare this proportion to a baseline of randomly-shuffled labels, where nearest-centroid accuracy is 23.2%, using permutation tests. 2.1.7. Analysis of ethnographer characteristics To examine the degree to which ethnographer characteristics might account for variability in our estimation of principal components scores, we computed a series of variables for each ethnographer based
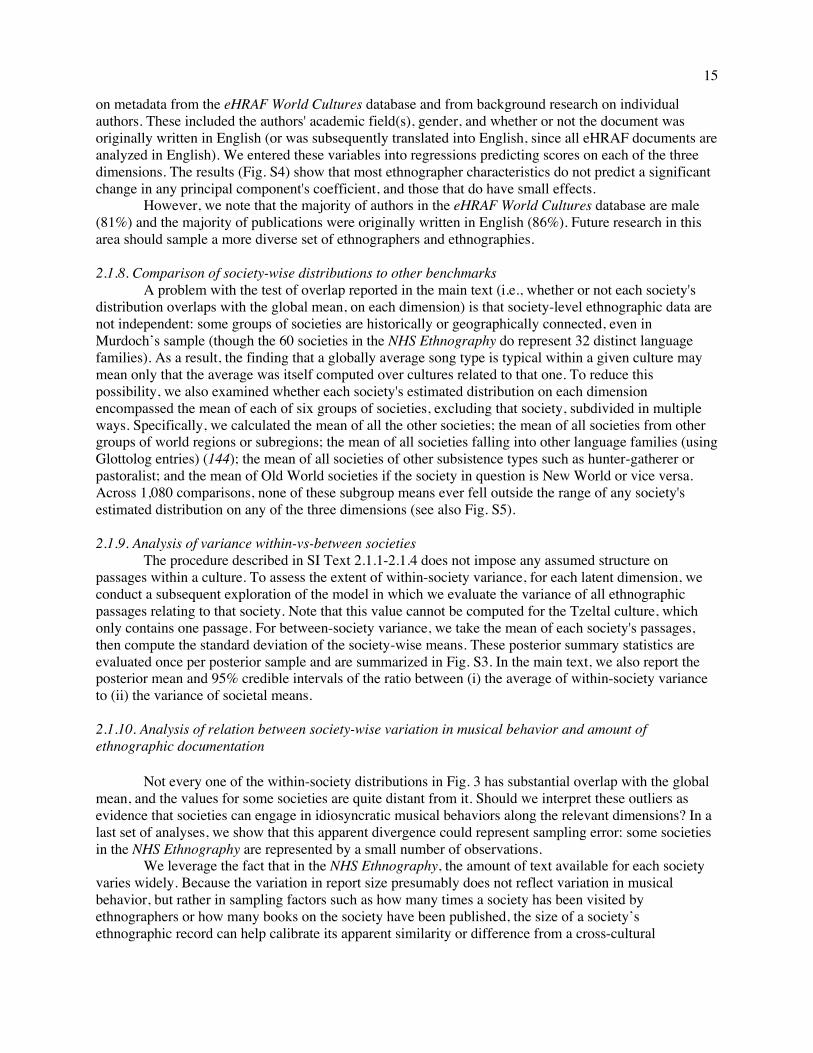
15
on metadata from the eHRAF World Cultures database and from background research on individual authors. These included the authors' academic field(s), gender, and whether or not the document was originally written in English (or was subsequently translated into English, since all eHRAF documents are analyzed in English). We entered these variables into regressions predicting scores on each of the three dimensions. The results (Fig. S4) show that most ethnographer characteristics do not predict a significant change in any principal component's coefficient, and those that do have small effects. However, we note that the majority of authors in the eHRAF World Cultures database are male (81%) and the majority of publications were originally written in English (86%). Future research in this area should sample a more diverse set of ethnographers and ethnographies. 2.1.8. Comparison of society-wise distributions to other benchmarks A problem with the test of overlap reported in the main text (i.e., whether or not each society's distribution overlaps with the global mean, on each dimension) is that society-level ethnographic data are not independent: some groups of societies are historically or geographically connected, even in Murdoch’s sample (though the 60 societies in the NHS Ethnography do represent 32 distinct language families). As a result, the finding that a globally average song type is typical within a given culture may mean only that the average was itself computed over cultures related to that one. To reduce this possibility, we also examined whether each society's estimated distribution on each dimension encompassed the mean of each of six groups of societies, excluding that society, subdivided in multiple ways. Specifically, we calculated the mean of all the other societies; the mean of all societies from other groups of world regions or subregions; the mean of all societies falling into other language families (using Glottolog entries) (144); the mean of all societies of other subsistence types such as hunter-gatherer or pastoralist; and the mean of Old World societies if the society in question is New World or vice versa. Across 1,080 comparisons, none of these subgroup means ever fell outside the range of any society's estimated distribution on any of the three dimensions (see also Fig. S5). 2.1.9. Analysis of variance within-vs-between societies
The procedure described in SI Text 2.1.1-2.1.4 does not impose any assumed structure on passages within a culture. To assess the extent of within-society variance, for each latent dimension, we conduct a subsequent exploration of the model in which we evaluate the variance of all ethnographic passages relating to that society. Note that this value cannot be computed for the Tzeltal culture, which only contains one passage. For between-society variance, we take the mean of each society's passages, then compute the standard deviation of the society-wise means. These posterior summary statistics are evaluated once per posterior sample and are summarized in Fig. S3. In the main text, we also report the posterior mean and 95% credible intervals of the ratio between (i) the average of within-society variance to (ii) the variance of societal means. 2.1.10. Analysis of relation between society-wise variation in musical behavior and amount of ethnographic documentation Not every one of the within-society distributions in Fig. 3 has substantial overlap with the global mean, and the values for some societies are quite distant from it. Should we interpret these outliers as evidence that societies can engage in idiosyncratic musical behaviors along the relevant dimensions? In a last set of analyses, we show that this apparent divergence could represent sampling error: some societies in the NHS Ethnography are represented by a small number of observations. We leverage the fact that in the NHS Ethnography, the amount of text available for each society varies widely. Because the variation in report size presumably does not reflect variation in musical behavior, but rather in sampling factors such as how many times a society has been visited by ethnographers or how many books on the society have been published, the size of a society’s ethnographic record can help calibrate its apparent similarity or difference from a cross-cultural
16
regularity. If musical behavior in societies is arbitrarily variable, then a larger ethnographic record for a divergent society should yield more precise estimates (i.e., with smaller confidence intervals), but its mean should come no closer to the global mean. If the range of musical behavior is largely universal, albeit with variation across societies, then as the size of a society’s ethnographic record increases, its mean should approach the global mean, and its confidence interval should include it. We find support for this second alternative (Fig. S6), suggesting that when a society differs substantially from the global mean on some dimension, it may be an artifact of the ethnographers’ focus and interests. For example, the only example in the corpus of Taiwanese music comes from a single book on a single village, with few descriptions of musical behavior. There is, however, an alternative possibility in which missing observations do reflect a society’s divergence from the global mean rather than sampling error. Perhaps a society has relatively few available documents because it is isolated, and that isolation also explains why the society lacks an allegedly universal feature of musical behavior. If so, then the document drawn from a society with many available documents should be closer to the global mean than the documents drawn from less well-documented (and presumably more isolated) societies. We find no evidence for this pattern: in contrast to the pattern of society-level means, which are closer to the global mean when a society has more documentation, individual document means are uniformly distributed across the range of societies, regardless of the number of documents available in each. This finding is illustrated in Fig. S6, by a comparison of the distributions of document means to society means, and suggests that the appearance of strong deviations from the global mean in societies with few available documents is purely a consequence of undersampling. 2.1.11. Control analysis with climate data As a control analysis, we ran exactly the same Bayesian principal components analysis on the Global Summary of the Year corpus, a dataset of climate features (e.g., average annual temperature, average annual precipitation) collected from over 65,000 weather stations worldwide and maintained by the National Oceanic and Atmospheric Administration (145). The data contain yearly observations for each climate feature nested within weather stations (akin to ethnography observations nested within documents in NHS Ethnography), which are each nested within countries (akin to societies in NHS Ethnography). From this corpus we built a comparison dataset that mirrored the size and structure of NHS Ethnography. We randomly sampled 60 countries' worth of climate data, each with a relatively small number of weather station data; we then randomly sampled 4709 observations from those countries, using a convenience subset of 42 variables from the full corpus. The resulting corpus contains data from 542 weather stations and has substantial missingness. Because climate varies across countries as a function of geography and geology, and is not characterized by universality, a country-level comparison of latent variable distributions should look very different than what we reported in NHS Ethnography, above: country-wise distributions should differ substantially from one another and between-country variation should exceed within-country variation. This is exactly what we found. The country-wise distributions on each of the latent dimensions underlying climate features differed markedly from each other, especially on PC1 and PC2 (Fig. S7), and many countries' average scores on each weather dimension exceeded 1.96 times within-country variability (Fig. S8). The overall ratios of within-country variability to deviation from global mean were far smaller than those found in NHS Ethnography (within- vs. between-society variance ratios, PC1: 0.77, 95% CI [0.67, 0.93]; PC2: 0.88, 95% CI [0.75, 1.08]; PC3: 3.57, 95% CI [2.56, 5.26]). And a larger proportion of countries differed significantly from the global mean (approximately half), with 78% of countries differing from the mean on at least one dimension. These findings demonstrate that the broad cross-cultural similarities found in the analysis of NHS Ethnography data are not an artifact of the analytic strategy used.
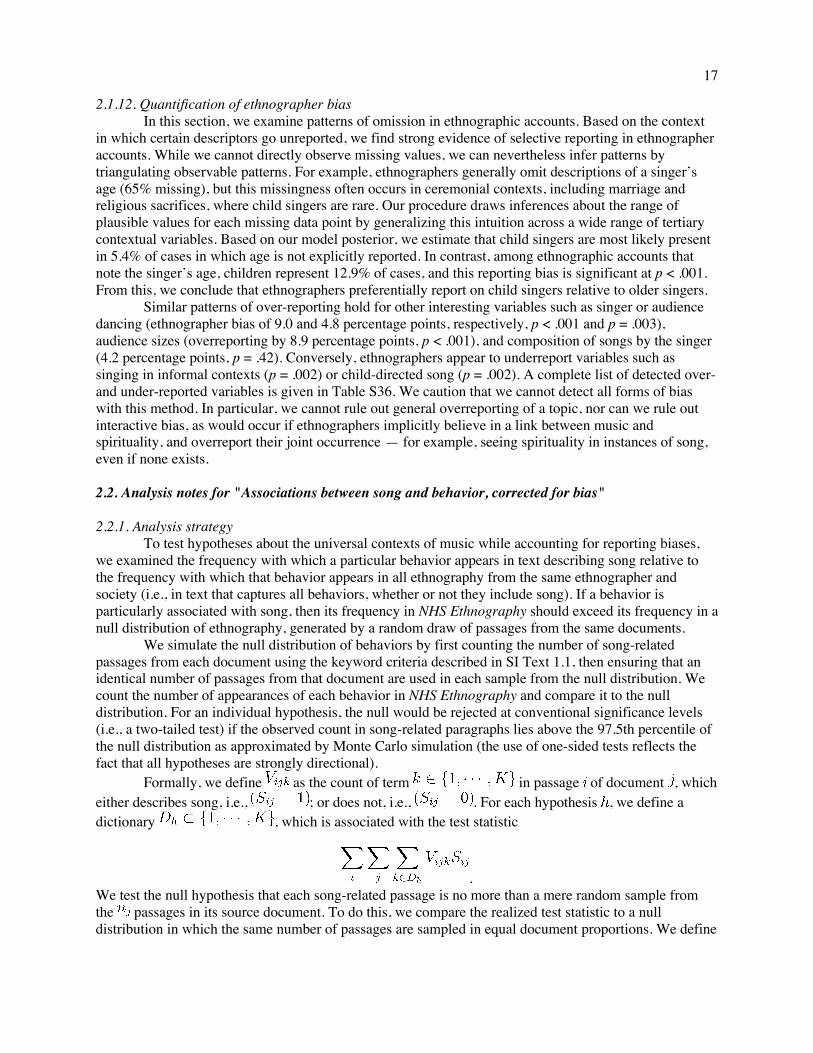
17
2.1.12. Quantification of ethnographer bias In this section, we examine patterns of omission in ethnographic accounts. Based on the context in which certain descriptors go unreported, we find strong evidence of selective reporting in ethnographer accounts. While we cannot directly observe missing values, we can nevertheless infer patterns by triangulating observable patterns. For example, ethnographers generally omit descriptions of a singer’s age (65% missing), but this missingness often occurs in ceremonial contexts, including marriage and religious sacrifices, where child singers are rare. Our procedure draws inferences about the range of plausible values for each missing data point by generalizing this intuition across a wide range of tertiary contextual variables. Based on our model posterior, we estimate that child singers are most likely present in 5.4% of cases in which age is not explicitly reported. In contrast, among ethnographic accounts that note the singer’s age, children represent 12.9% of cases, and this reporting bias is significant at p < .001. From this, we conclude that ethnographers preferentially report on child singers relative to older singers. Similar patterns of over-reporting hold for other interesting variables such as singer or audience dancing (ethnographer bias of 9.0 and 4.8 percentage points, respectively, p < .001 and p = .003), audience sizes (overreporting by 8.9 percentage points, p < .001), and composition of songs by the singer (4.2 percentage points, p = .42). Conversely, ethnographers appear to underreport variables such as singing in informal contexts (p = .002) or child-directed song (p = .002). A complete list of detected over- and under-reported variables is given in Table S36. We caution that we cannot detect all forms of bias with this method. In particular, we cannot rule out general overreporting of a topic, nor can we rule out interactive bias, as would occur if ethnographers implicitly believe in a link between music and spirituality, and overreport their joint occurrence — for example, seeing spirituality in instances of song, even if none exists. 2.2. Analysis notes for "Associations between song and behavior, corrected for bias" 2.2.1. Analysis strategy To test hypotheses about the universal contexts of music while accounting for reporting biases, we examined the frequency with which a particular behavior appears in text describing song relative to the frequency with which that behavior appears in all ethnography from the same ethnographer and society (i.e., in text that captures all behaviors, whether or not they include song). If a behavior is particularly associated with song, then its frequency in NHS Ethnography should exceed its frequency in a null distribution of ethnography, generated by a random draw of passages from the same documents. We simulate the null distribution of behaviors by first counting the number of song-related passages from each document using the keyword criteria described in SI Text 1.1, then ensuring that an identical number of passages from that document are used in each sample from the null distribution. We count the number of appearances of each behavior in NHS Ethnography and compare it to the null distribution. For an individual hypothesis, the null would be rejected at conventional significance levels (i.e., a two-tailed test) if the observed count in song-related paragraphs lies above the 97.5th percentile of the null distribution as approximated by Monte Carlo simulation (the use of one-sided tests reflects the fact that all hypotheses are strongly directional). Formally, we define as the count of term in passage of document , which either describes song, i.e., ; or does not, i.e., . For each hypothesis , we define a dictionary , which is associated with the test statistic
. We test the null hypothesis that each song-related passage is no more than a mere random sample from the passages in its source document. To do this, we compare the realized test statistic to a null distribution in which the same number of passages are sampled in equal document proportions. We define
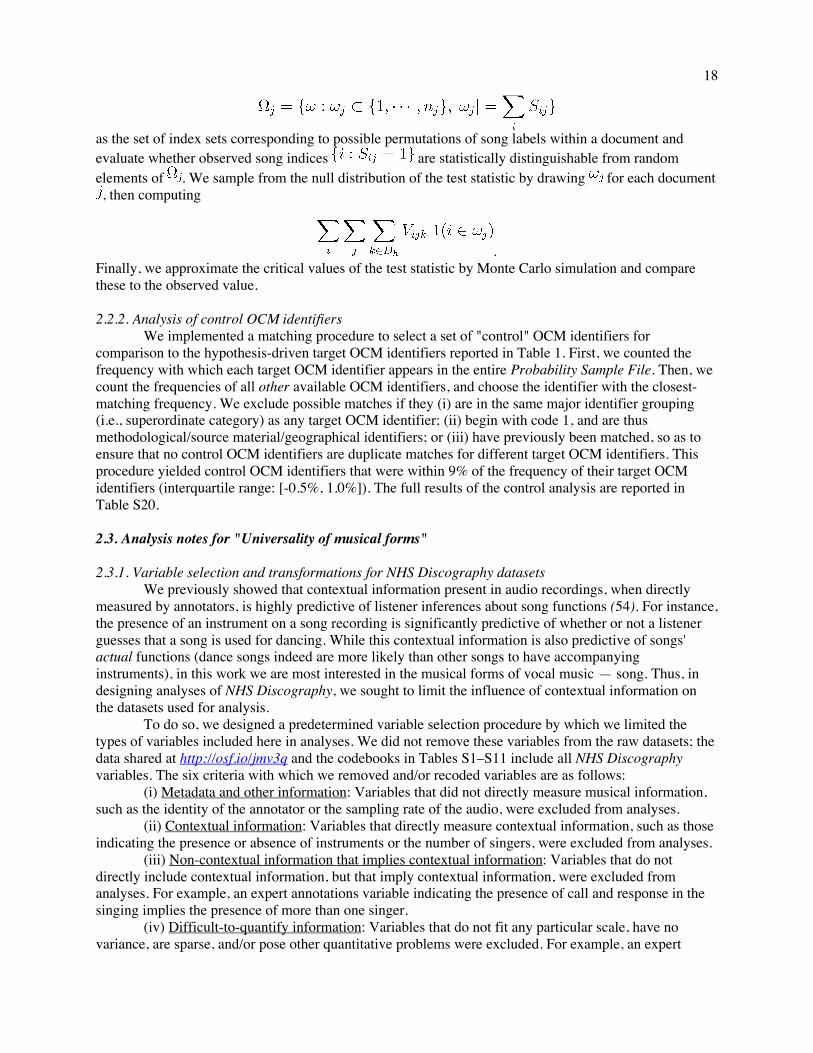
18
as the set of index sets corresponding to possible permutations of song labels within a document and evaluate whether observed song indices are statistically distinguishable from random elements of . We sample from the null distribution of the test statistic by drawing for each document , then computing
. Finally, we approximate the critical values of the test statistic by Monte Carlo simulation and compare these to the observed value. 2.2.2. Analysis of control OCM identifiers We implemented a matching procedure to select a set of "control" OCM identifiers for comparison to the hypothesis-driven target OCM identifiers reported in Table 1. First, we counted the frequency with which each target OCM identifier appears in the entire Probability Sample File. Then, we count the frequencies of all other available OCM identifiers, and choose the identifier with the closest-matching frequency. We exclude possible matches if they (i) are in the same major identifier grouping (i.e., superordinate category) as any target OCM identifier; (ii) begin with code 1, and are thus methodological/source material/geographical identifiers; or (iii) have previously been matched, so as to ensure that no control OCM identifiers are duplicate matches for different target OCM identifiers. This procedure yielded control OCM identifiers that were within 9% of the frequency of their target OCM identifiers (interquartile range: [-0.5%, 1.0%]). The full results of the control analysis are reported in Table S20. 2.3. Analysis notes for "Universality of musical forms" 2.3.1. Variable selection and transformations for NHS Discography datasets We previously showed that contextual information present in audio recordings, when directly measured by annotators, is highly predictive of listener inferences about song functions (54). For instance, the presence of an instrument on a song recording is significantly predictive of whether or not a listener guesses that a song is used for dancing. While this contextual information is also predictive of songs' actual functions (dance songs indeed are more likely than other songs to have accompanying instruments), in this work we are most interested in the musical forms of vocal music — song. Thus, in designing analyses of NHS Discography, we sought to limit the influence of contextual information on the datasets used for analysis. To do so, we designed a predetermined variable selection procedure by which we limited the types of variables included here in analyses. We did not remove these variables from the raw datasets; the data shared at http://osf.io/jmv3q and the codebooks in Tables S1–S11 include all NHS Discography variables. The six criteria with which we removed and/or recoded variables are as follows: (i) Metadata and other information: Variables that did not directly measure musical information, such as the identity of the annotator or the sampling rate of the audio, were excluded from analyses. (ii) Contextual information: Variables that directly measure contextual information, such as those indicating the presence or absence of instruments or the number of singers, were excluded from analyses. (iii) Non-contextual information that implies contextual information: Variables that do not directly include contextual information, but that imply contextual information, were excluded from analyses. For example, an expert annotations variable indicating the presence of call and response in the singing implies the presence of more than one singer. (iv) Difficult-to-quantify information: Variables that do not fit any particular scale, have no variance, are sparse, and/or pose other quantitative problems were excluded. For example, an expert
19
annotations variable indicating the presence of a tonal center was excluded because 97.8% of ratings were in the affirmative. (v) Low-level information: Where available, variables that measured higher-level interpretations of low-level information were used, excluding the low-level versions or recoding them. For example, the transcription summary features dataset includes variables measuring the proportion of melodic intervals of each of 17 sizes. We excluded these variables in favor of analyzing higher-level information, such as the proportion of intervals classified as stepwise motion (one or two semitones in size) or melodic thirds (three or four semitones in size). Similarly, we excluded expert annotations of the identity of the macrometer (e.g., 7-beat groupings), instead recoding the variable into broad categories of "duple", "triple", and "other" macrometer. (vi) Highly redundant information: Whenever a variable was highly overlapping with another variable, we excluded it from analysis. For example, the transcription summary features dataset includes variables measuring both the prevalence of the modal pitch and the prevalence of the modal pitch class; we used only the more parsimonious latter variable in analyses here. Across all NHS Discography data analyzed in this paper, categorical variables were represented by indicator variables for each category. 2.3.2 LASSO classification For categorical classification, we fit a LASSO-regularized multinomial logistic regression with glmnet (95), with standardized features, computing the partial likelihood separately for each song region-fold and selecting lambda from cross validation. For further details on the R implementation, see the glmnet vignette (146). For more general details on the method, see (147). For logistic classification, we compare to a null model of random guessing according to known song proportions. With balanced outcomes (the three song types that are not healing) this is 0.5. In comparisons involving healing, we know the other category is slightly more likely, due to the two missing healing songs, so the reference proportion is 0.5005945. This does not represent a practical difference, so we do not account for it in analyses. We implement a model with glmnet, fitting separate models for all pairwise combinations of song functions, where the model is trained to discriminate between the two song functions in question (e.g., dance vs healing, dance vs love, and so on), limiting the data to songs belonging to one of the two functions in question. In order to calculate a confidence interval, we implement the procedure described in (96). 2.4. Analysis notes for "Explorations of the structure of musical forms" 2.4.1. Analyses of tonality For each song, each of the expert listeners answered "Yes" or "No" to the following question: We're wondering if it sounds as if a particular pitch level is a point of stability; i.e., a "tonal center", "basis tone", or "tonic". Don't worry about technical definitions of tonality to answer this question; instead, use more intuitive definitions: Is there some pitch on which you think the song "should" end? Does some pitch sound like "home"? Is there a particular pitch that sounds like it's where the song is built around? This is a subjective question. Note that we are *not* asking you to generalize to all people from all cultures. Rather, we only care about whether YOU hear a point of stability. To your ears, is a particular pitch level a point of stability in this song? If they answered "Yes", they were then asked: "You specified that there is some pitch level that is the primary point of stability. What is that pitch level?" to which they could respond with any of the 12 pitch classes (C, C#, D, ..., B). Last, they were asked: "Is there a different pitch level that you also hear as a point of stability?"
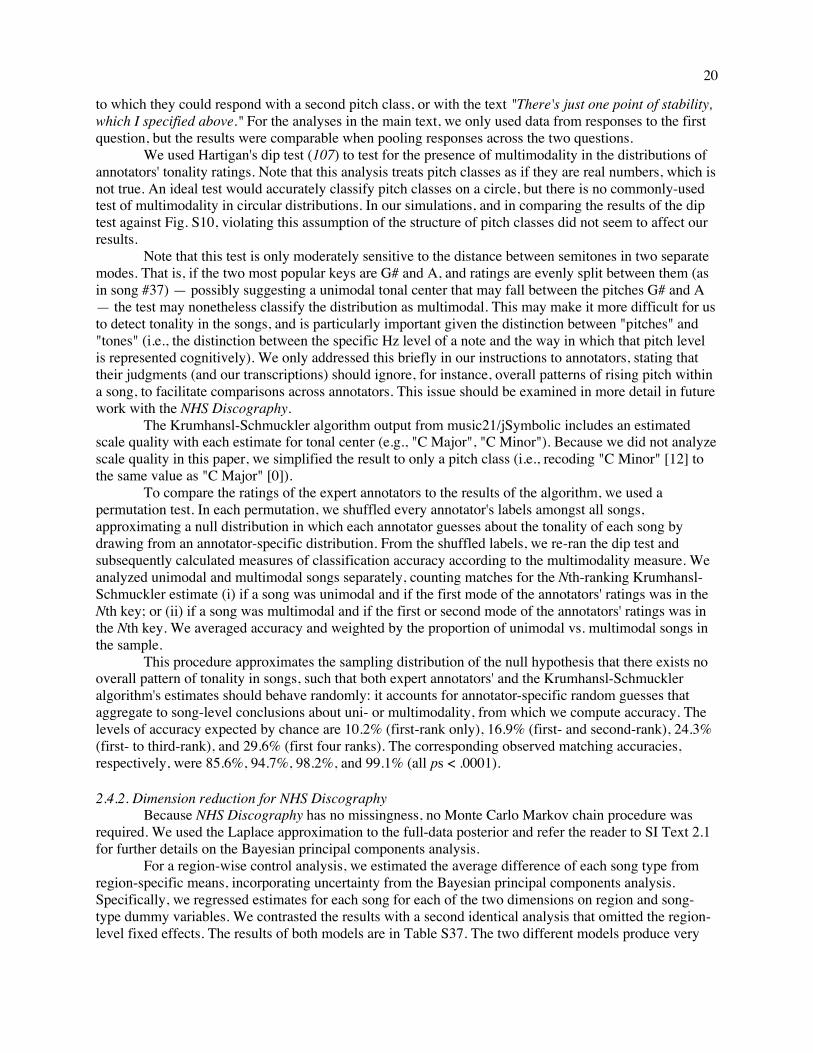
20
to which they could respond with a second pitch class, or with the text "There's just one point of stability, which I specified above." For the analyses in the main text, we only used data from responses to the first question, but the results were comparable when pooling responses across the two questions. We used Hartigan's dip test (107) to test for the presence of multimodality in the distributions of annotators' tonality ratings. Note that this analysis treats pitch classes as if they are real numbers, which is not true. An ideal test would accurately classify pitch classes on a circle, but there is no commonly-used test of multimodality in circular distributions. In our simulations, and in comparing the results of the dip test against Fig. S10, violating this assumption of the structure of pitch classes did not seem to affect our results. Note that this test is only moderately sensitive to the distance between semitones in two separate modes. That is, if the two most popular keys are G# and A, and ratings are evenly split between them (as in song #37) — possibly suggesting a unimodal tonal center that may fall between the pitches G# and A — the test may nonetheless classify the distribution as multimodal. This may make it more difficult for us to detect tonality in the songs, and is particularly important given the distinction between "pitches" and "tones" (i.e., the distinction between the specific Hz level of a note and the way in which that pitch level is represented cognitively). We only addressed this briefly in our instructions to annotators, stating that their judgments (and our transcriptions) should ignore, for instance, overall patterns of rising pitch within a song, to facilitate comparisons across annotators. This issue should be examined in more detail in future work with the NHS Discography. The Krumhansl-Schmuckler algorithm output from music21/jSymbolic includes an estimated scale quality with each estimate for tonal center (e.g., "C Major", "C Minor"). Because we did not analyze scale quality in this paper, we simplified the result to only a pitch class (i.e., recoding "C Minor" [12] to the same value as "C Major" [0]). To compare the ratings of the expert annotators to the results of the algorithm, we used a permutation test. In each permutation, we shuffled every annotator's labels amongst all songs, approximating a null distribution in which each annotator guesses about the tonality of each song by drawing from an annotator-specific distribution. From the shuffled labels, we re-ran the dip test and subsequently calculated measures of classification accuracy according to the multimodality measure. We analyzed unimodal and multimodal songs separately, counting matches for the Nth-ranking Krumhansl-Schmuckler estimate (i) if a song was unimodal and if the first mode of the annotators' ratings was in the Nth key; or (ii) if a song was multimodal and if the first or second mode of the annotators' ratings was in the Nth key. We averaged accuracy and weighted by the proportion of unimodal vs. multimodal songs in the sample. This procedure approximates the sampling distribution of the null hypothesis that there exists no overall pattern of tonality in songs, such that both expert annotators' and the Krumhansl-Schmuckler algorithm's estimates should behave randomly: it accounts for annotator-specific random guesses that aggregate to song-level conclusions about uni- or multimodality, from which we compute accuracy. The levels of accuracy expected by chance are 10.2% (first-rank only), 16.9% (first- and second-rank), 24.3% (first- to third-rank), and 29.6% (first four ranks). The corresponding observed matching accuracies, respectively, were 85.6%, 94.7%, 98.2%, and 99.1% (all ps < .0001). 2.4.2. Dimension reduction for NHS Discography Because NHS Discography has no missingness, no Monte Carlo Markov chain procedure was required. We used the Laplace approximation to the full-data posterior and refer the reader to SI Text 2.1 for further details on the Bayesian principal components analysis. For a region-wise control analysis, we estimated the average difference of each song type from region-specific means, incorporating uncertainty from the Bayesian principal components analysis. Specifically, we regressed estimates for each song for each of the two dimensions on region and song-type dummy variables. We contrasted the results with a second identical analysis that omitted the region-level fixed effects. The results of both models are in Table S37. The two different models produce very
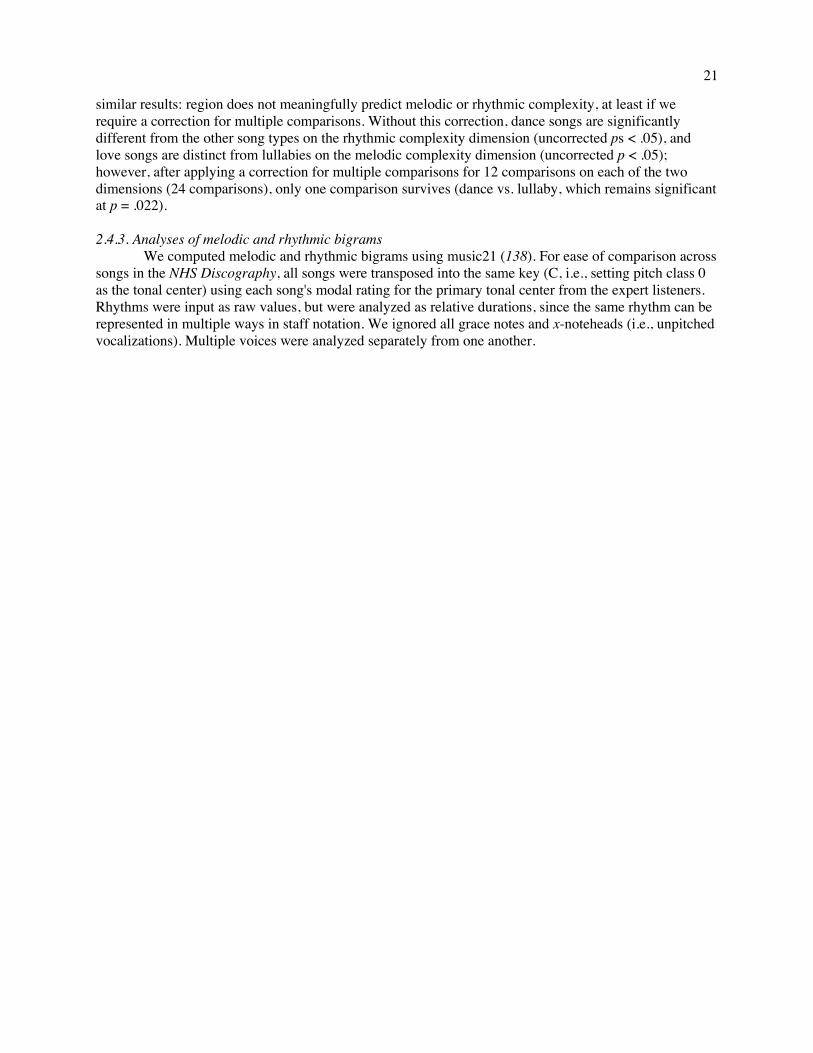
21
similar results: region does not meaningfully predict melodic or rhythmic complexity, at least if we require a correction for multiple comparisons. Without this correction, dance songs are significantly different from the other song types on the rhythmic complexity dimension (uncorrected ps < .05), and love songs are distinct from lullabies on the melodic complexity dimension (uncorrected p < .05); however, after applying a correction for multiple comparisons for 12 comparisons on each of the two dimensions (24 comparisons), only one comparison survives (dance vs. lullaby, which remains significant at p = .022). 2.4.3. Analyses of melodic and rhythmic bigrams We computed melodic and rhythmic bigrams using music21 (138). For ease of comparison across songs in the NHS Discography, all songs were transposed into the same key (C, i.e., setting pitch class 0 as the tonal center) using each song's modal rating for the primary tonal center from the expert listeners. Rhythms were input as raw values, but were analyzed as relative durations, since the same rhythm can be represented in multiple ways in staff notation. We ignored all grace notes and x-noteheads (i.e., unpitched vocalizations). Multiple voices were analyzed separately from one another.
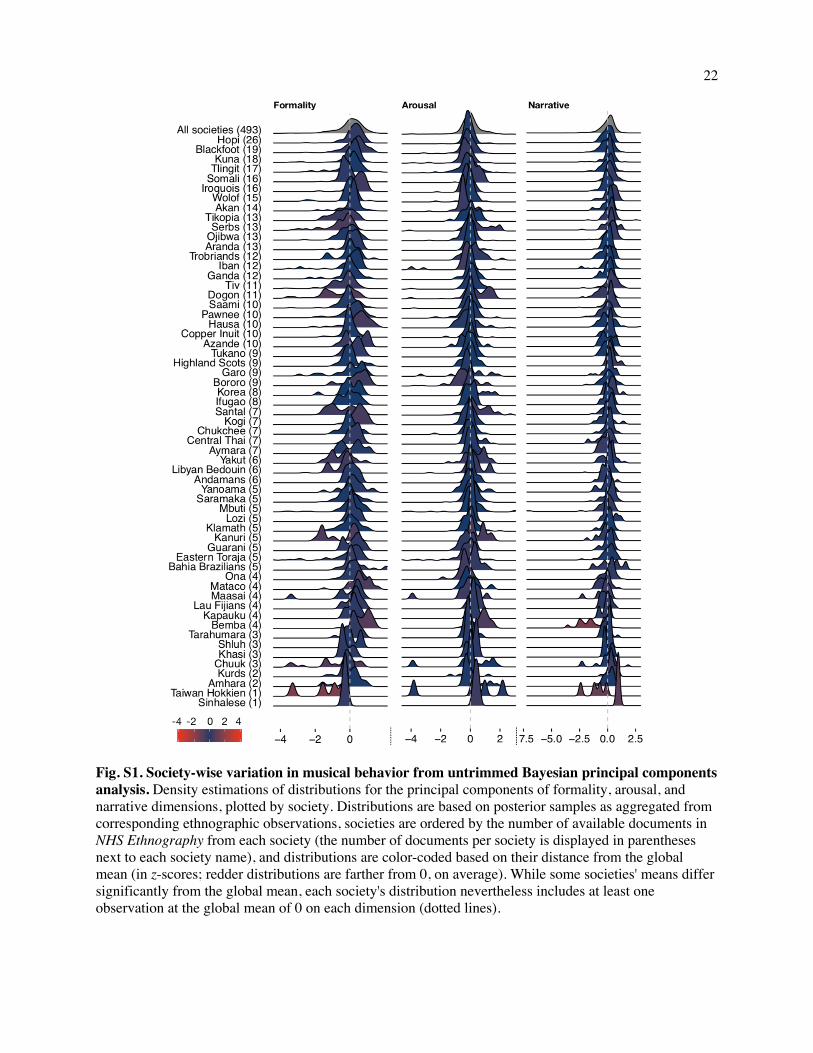
22
Fig. S1. Society-wise variation in musical behavior from untrimmed Bayesian principal components analysis. Density estimations of distributions for the principal components of formality, arousal, and narrative dimensions, plotted by society. Distributions are based on posterior samples as aggregated from corresponding ethnographic observations, societies are ordered by the number of available documents in NHS Ethnography from each society (the number of documents per society is displayed in parentheses next to each society name), and distributions are color-coded based on their distance from the global mean (in z-scores; redder distributions are farther from 0, on average). While some societies' means differ significantly from the global mean, each society's distribution nevertheless includes at least one observation at the global mean of 0 on each dimension (dotted lines).
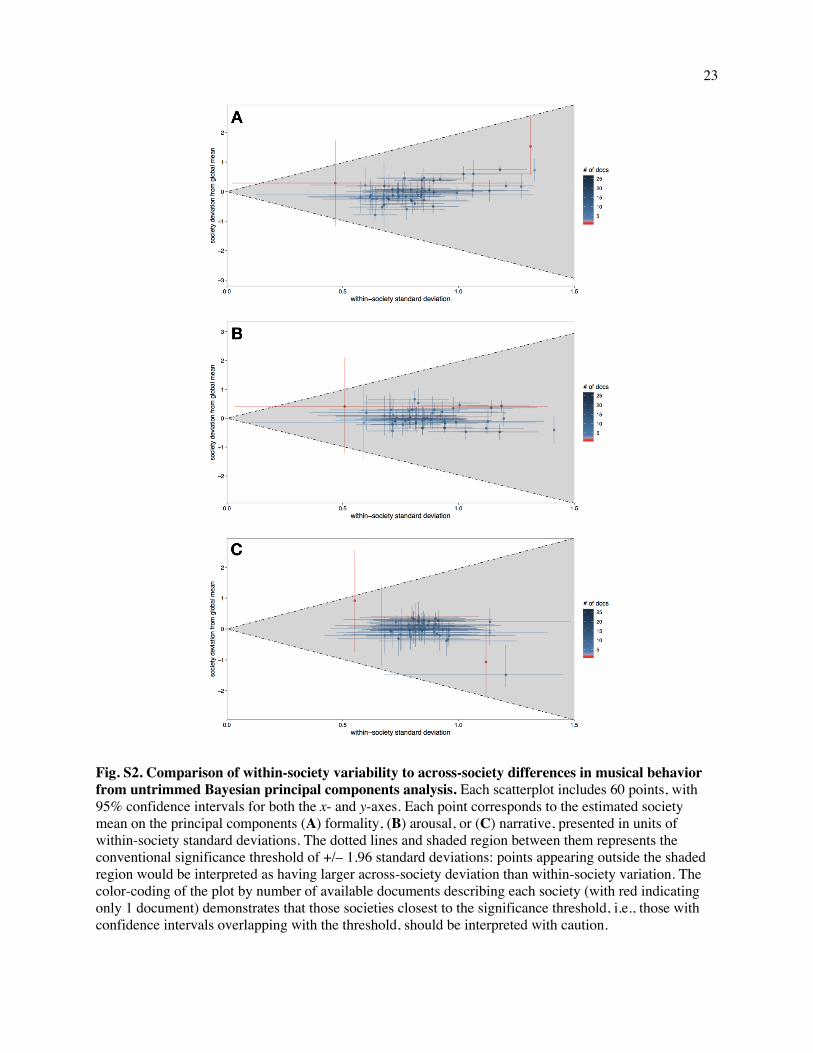
23
Fig. S2. Comparison of within-society variability to across-society differences in musical behavior from untrimmed Bayesian principal components analysis. Each scatterplot includes 60 points, with 95% confidence intervals for both the x- and y-axes. Each point corresponds to the estimated society mean on the principal components (A) formality, (B) arousal, or (C) narrative, presented in units of within-society standard deviations. The dotted lines and shaded region between them represents the conventional significance threshold of +/– 1.96 standard deviations: points appearing outside the shaded region would be interpreted as having larger across-society deviation than within-society variation. The color-coding of the plot by number of available documents describing each society (with red indicating only 1 document) demonstrates that those societies closest to the significance threshold, i.e., those with confidence intervals overlapping with the threshold, should be interpreted with caution.
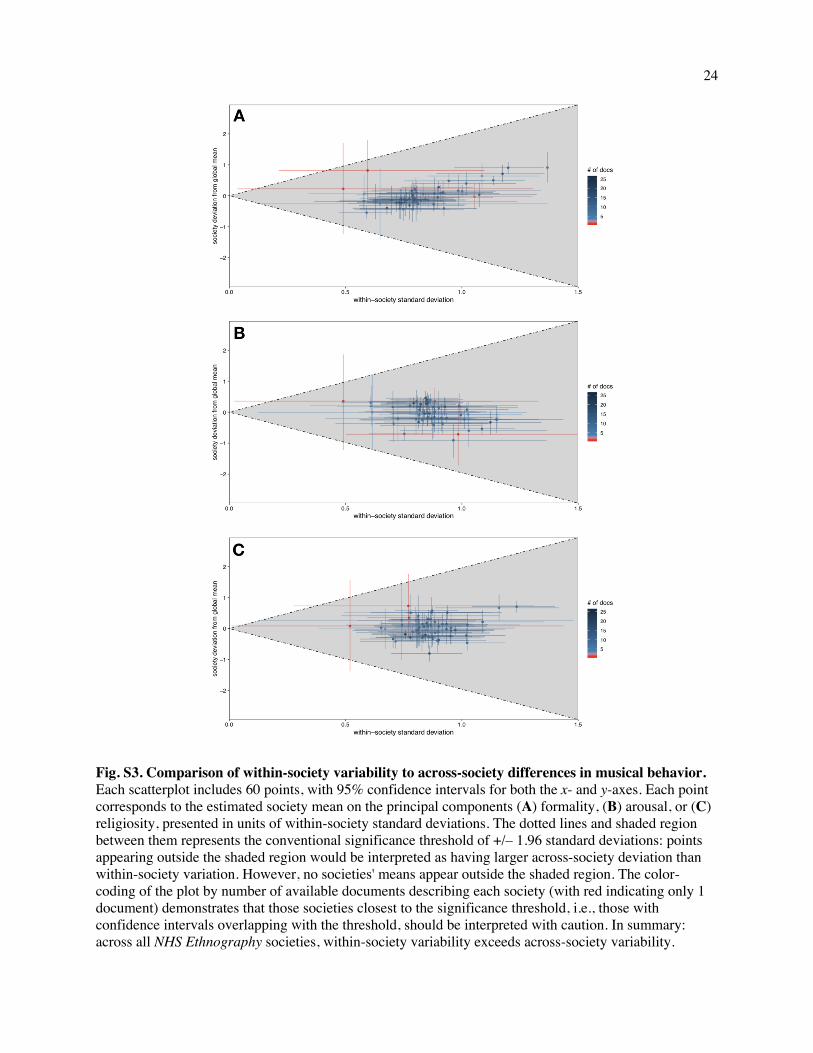
24
Fig. S3. Comparison of within-society variability to across-society differences in musical behavior. Each scatterplot includes 60 points, with 95% confidence intervals for both the x- and y-axes. Each point corresponds to the estimated society mean on the principal components (A) formality, (B) arousal, or (C) religiosity, presented in units of within-society standard deviations. The dotted lines and shaded region between them represents the conventional significance threshold of +/– 1.96 standard deviations: points appearing outside the shaded region would be interpreted as having larger across-society deviation than within-society variation. However, no societies' means appear outside the shaded region. The color-coding of the plot by number of available documents describing each society (with red indicating only 1 document) demonstrates that those societies closest to the significance threshold, i.e., those with confidence intervals overlapping with the threshold, should be interpreted with caution. In summary: across all NHS Ethnography societies, within-society variability exceeds across-society variability.
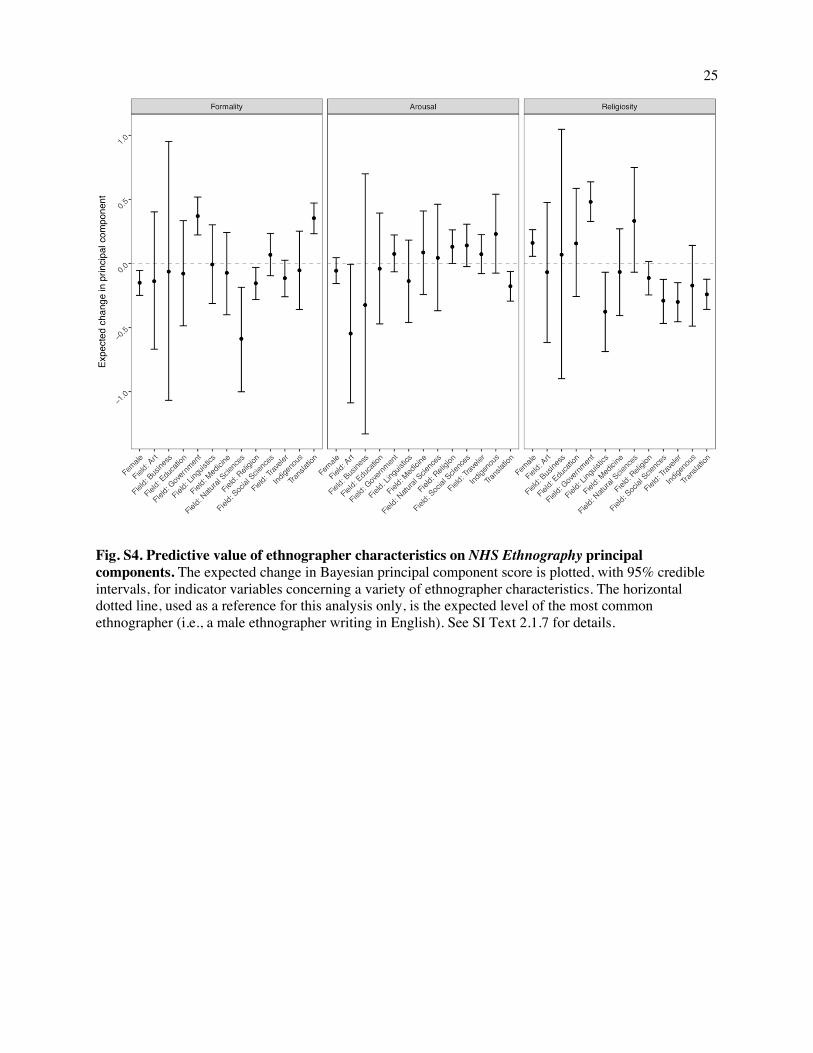
25
Fig. S4. Predictive value of ethnographer characteristics on NHS Ethnography principal components. The expected change in Bayesian principal component score is plotted, with 95% credible intervals, for indicator variables concerning a variety of ethnographer characteristics. The horizontal dotted line, used as a reference for this analysis only, is the expected level of the most common ethnographer (i.e., a male ethnographer writing in English). See SI Text 2.1.7 for details.
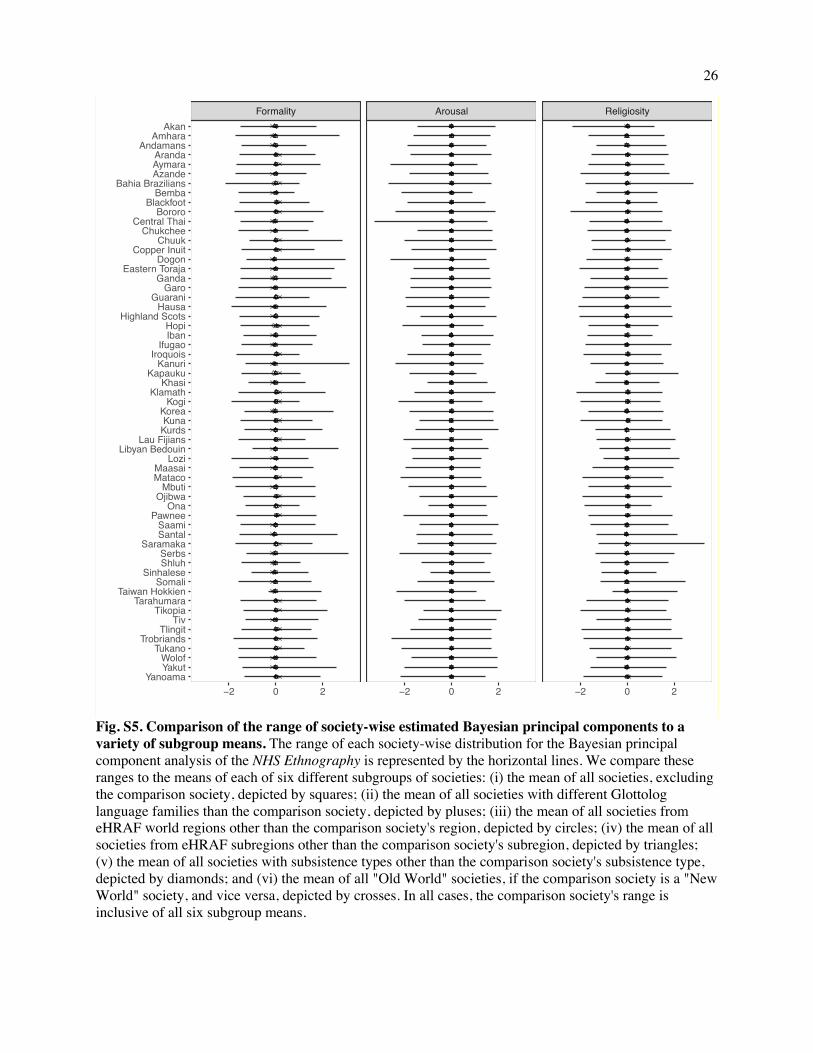
26
Fig. S5. Comparison of the range of society-wise estimated Bayesian principal components to a variety of subgroup means. The range of each society-wise distribution for the Bayesian principal component analysis of the NHS Ethnography is represented by the horizontal lines. We compare these ranges to the means of each of six different subgroups of societies: (i) the mean of all societies, excluding the comparison society, depicted by squares; (ii) the mean of all societies with different Glottolog language families than the comparison society, depicted by pluses; (iii) the mean of all societies from eHRAF world regions other than the comparison society's region, depicted by circles; (iv) the mean of all societies from eHRAF subregions other than the comparison society's subregion, depicted by triangles; (v) the mean of all societies with subsistence types other than the comparison society's subsistence type, depicted by diamonds; and (vi) the mean of all "Old World" societies, if the comparison society is a "New World" society, and vice versa, depicted by crosses. In all cases, the comparison society's range is inclusive of all six subgroup means.
Formality Arousal Religiosity
−2 0 2 −2 0 2 −2 0 2Yanoama
YakutWolof
TukanoTrobriands
TlingitTiv
TikopiaTarahumara
Taiwan HokkienSomali
SinhaleseShluhSerbs
SaramakaSantalSaami
PawneeOna
OjibwaMbuti
MatacoMaasai
LoziLibyan Bedouin
Lau FijiansKurdsKuna
KoreaKogi
KlamathKhasi
KapaukuKanuri
IroquoisIfugao
IbanHopi
Highland ScotsHausa
GuaraniGaro
GandaEastern Toraja
DogonCopper Inuit
ChuukChukchee
Central ThaiBororo
BlackfootBemba
Bahia BraziliansAzandeAymaraAranda
AndamansAmhara
Akan
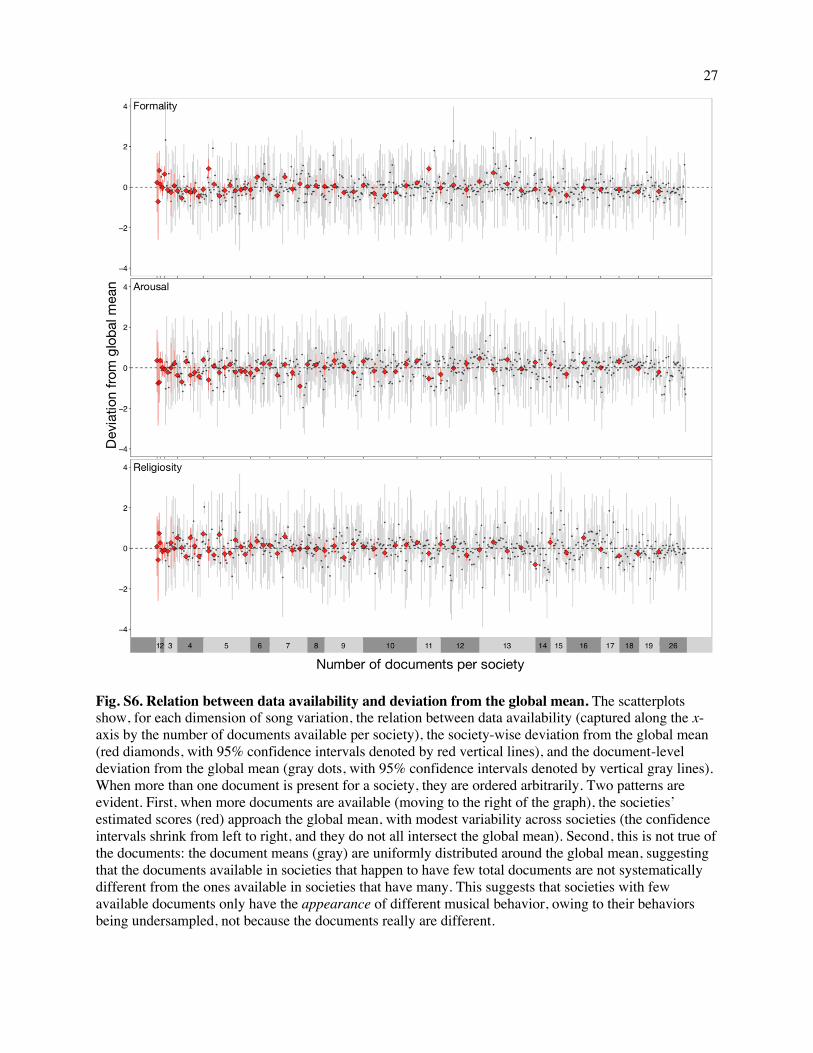
27
Fig. S6. Relation between data availability and deviation from the global mean. The scatterplots show, for each dimension of song variation, the relation between data availability (captured along the x-axis by the number of documents available per society), the society-wise deviation from the global mean (red diamonds, with 95% confidence intervals denoted by red vertical lines), and the document-level deviation from the global mean (gray dots, with 95% confidence intervals denoted by vertical gray lines). When more than one document is present for a society, they are ordered arbitrarily. Two patterns are evident. First, when more documents are available (moving to the right of the graph), the societies’ estimated scores (red) approach the global mean, with modest variability across societies (the confidence intervals shrink from left to right, and they do not all intersect the global mean). Second, this is not true of the documents: the document means (gray) are uniformly distributed around the global mean, suggesting that the documents available in societies that happen to have few total documents are not systematically different from the ones available in societies that have many. This suggests that societies with few available documents only have the appearance of different musical behavior, owing to their behaviors being undersampled, not because the documents really are different.
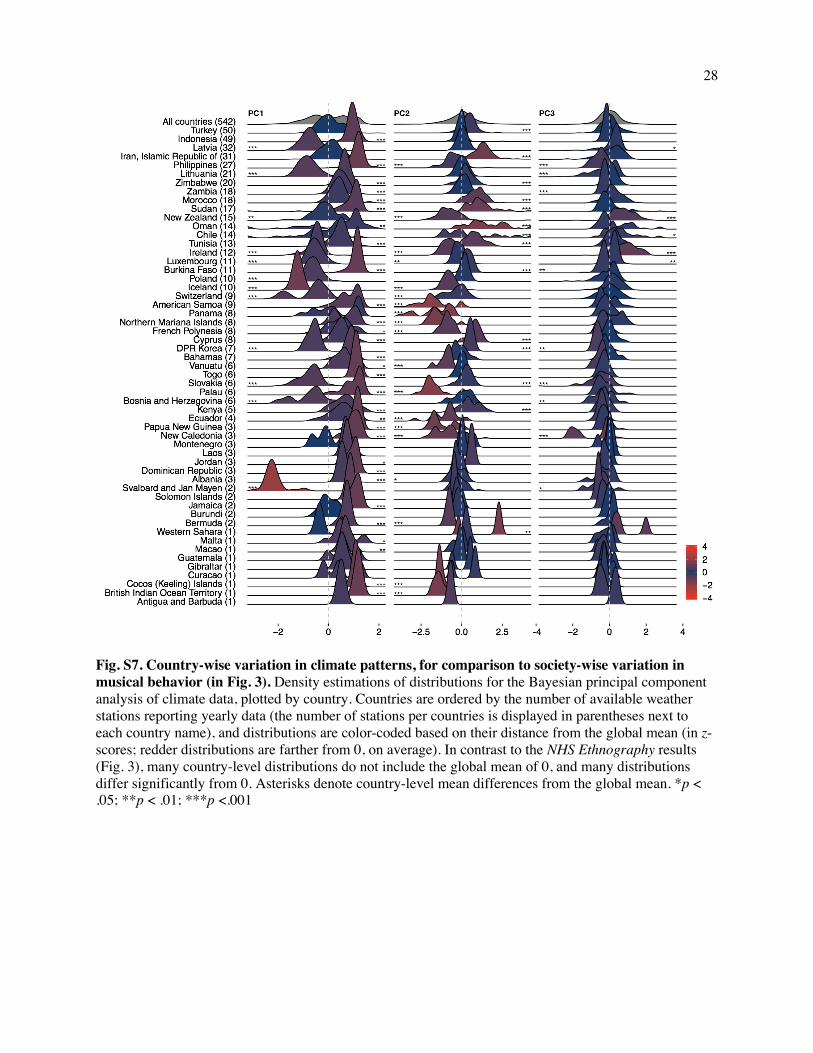
28
Fig. S7. Country-wise variation in climate patterns, for comparison to society-wise variation in musical behavior (in Fig. 3). Density estimations of distributions for the Bayesian principal component analysis of climate data, plotted by country. Countries are ordered by the number of available weather stations reporting yearly data (the number of stations per countries is displayed in parentheses next to each country name), and distributions are color-coded based on their distance from the global mean (in z-scores; redder distributions are farther from 0, on average). In contrast to the NHS Ethnography results (Fig. 3), many country-level distributions do not include the global mean of 0, and many distributions differ significantly from 0. Asterisks denote country-level mean differences from the global mean. *p < .05; **p < .01; ***p <.001
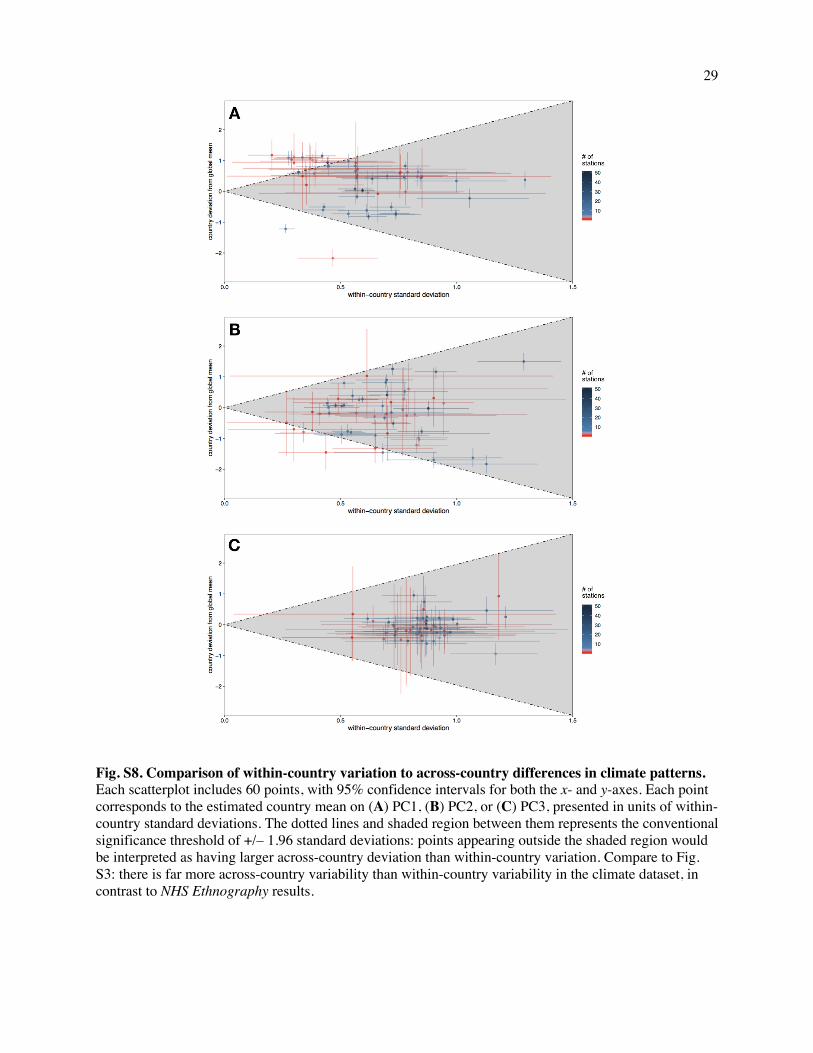
29
Fig. S8. Comparison of within-country variation to across-country differences in climate patterns. Each scatterplot includes 60 points, with 95% confidence intervals for both the x- and y-axes. Each point corresponds to the estimated country mean on (A) PC1, (B) PC2, or (C) PC3, presented in units of within-country standard deviations. The dotted lines and shaded region between them represents the conventional significance threshold of +/– 1.96 standard deviations: points appearing outside the shaded region would be interpreted as having larger across-country deviation than within-country variation. Compare to Fig. S3: there is far more across-country variability than within-country variability in the climate dataset, in contrast to NHS Ethnography results.
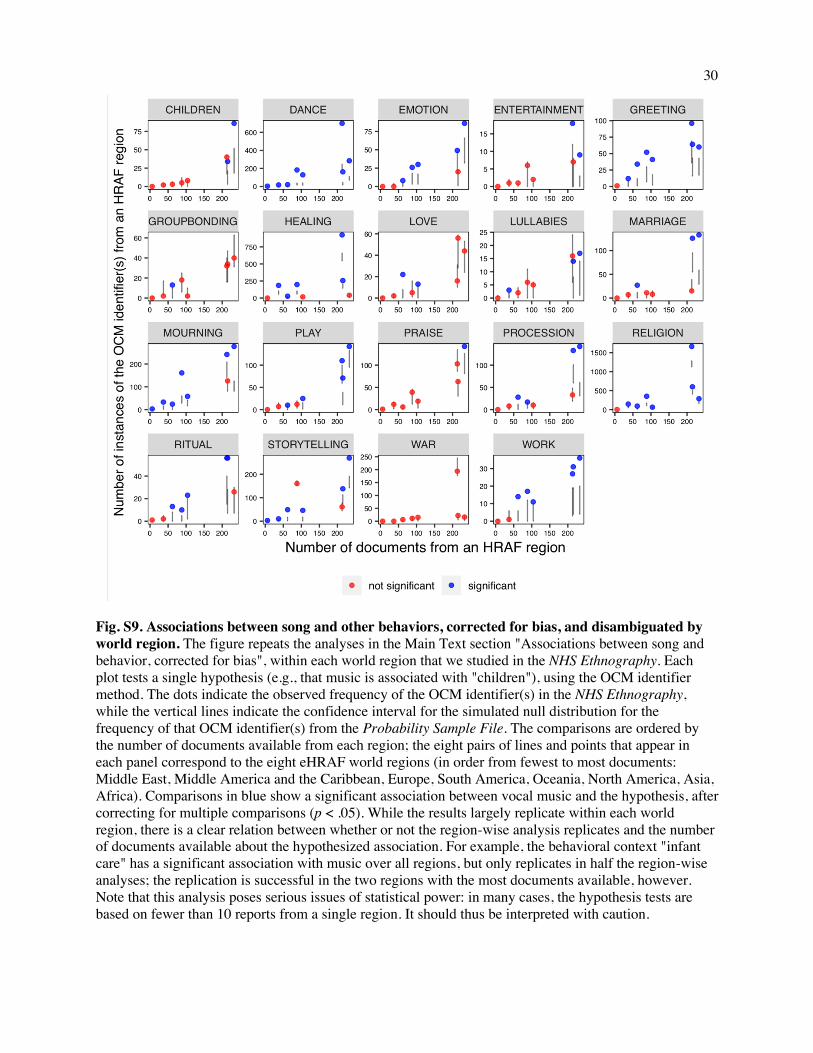
30
Fig. S9. Associations between song and other behaviors, corrected for bias, and disambiguated by world region. The figure repeats the analyses in the Main Text section "Associations between song and behavior, corrected for bias", within each world region that we studied in the NHS Ethnography. Each plot tests a single hypothesis (e.g., that music is associated with "children"), using the OCM identifier method. The dots indicate the observed frequency of the OCM identifier(s) in the NHS Ethnography, while the vertical lines indicate the confidence interval for the simulated null distribution for the frequency of that OCM identifier(s) from the Probability Sample File. The comparisons are ordered by the number of documents available from each region; the eight pairs of lines and points that appear in each panel correspond to the eight eHRAF world regions (in order from fewest to most documents: Middle East, Middle America and the Caribbean, Europe, South America, Oceania, North America, Asia, Africa). Comparisons in blue show a significant association between vocal music and the hypothesis, after correcting for multiple comparisons (p < .05). While the results largely replicate within each world region, there is a clear relation between whether or not the region-wise analysis replicates and the number of documents available about the hypothesized association. For example, the behavioral context "infant care" has a significant association with music over all regions, but only replicates in half the region-wise analyses; the replication is successful in the two regions with the most documents available, however. Note that this analysis poses serious issues of statistical power: in many cases, the hypothesis tests are based on fewer than 10 reports from a single region. It should thus be interpreted with caution.
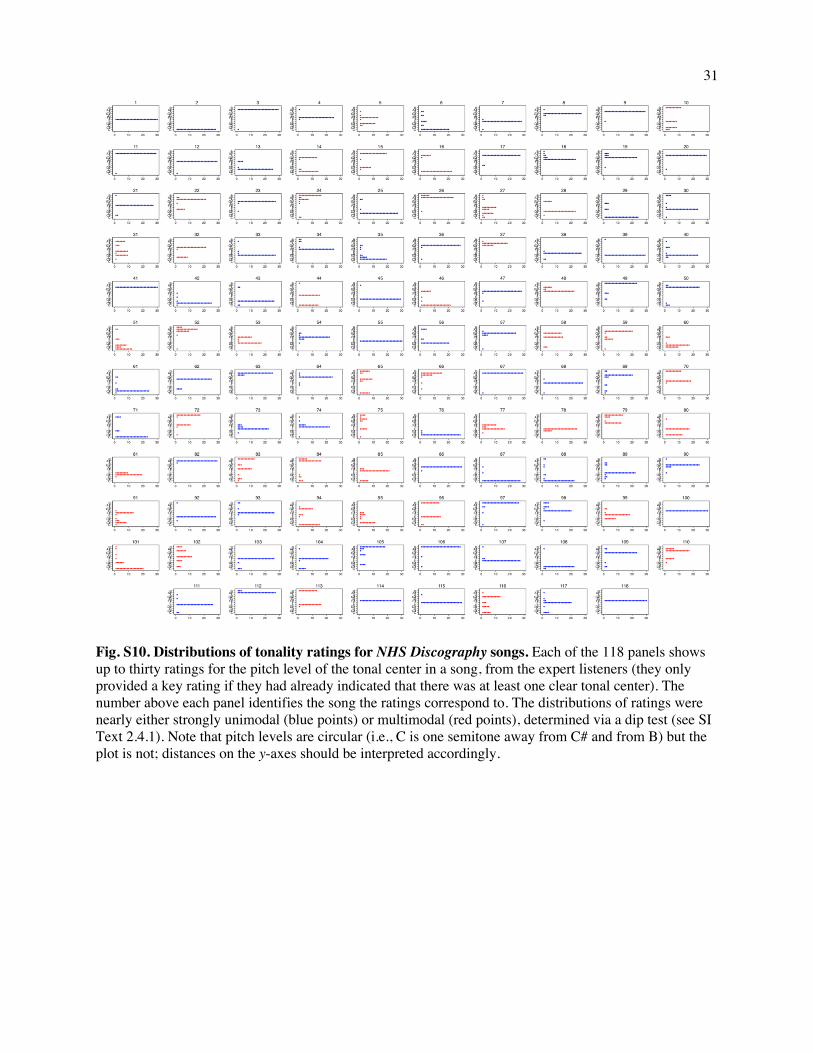
31
Fig. S10. Distributions of tonality ratings for NHS Discography songs. Each of the 118 panels shows up to thirty ratings for the pitch level of the tonal center in a song, from the expert listeners (they only provided a key rating if they had already indicated that there was at least one clear tonal center). The number above each panel identifies the song the ratings correspond to. The distributions of ratings were nearly either strongly unimodal (blue points) or multimodal (red points), determined via a dip test (see SI Text 2.4.1). Note that pitch levels are circular (i.e., C is one semitone away from C# and from B) but the plot is not; distances on the y-axes should be interpreted accordingly.
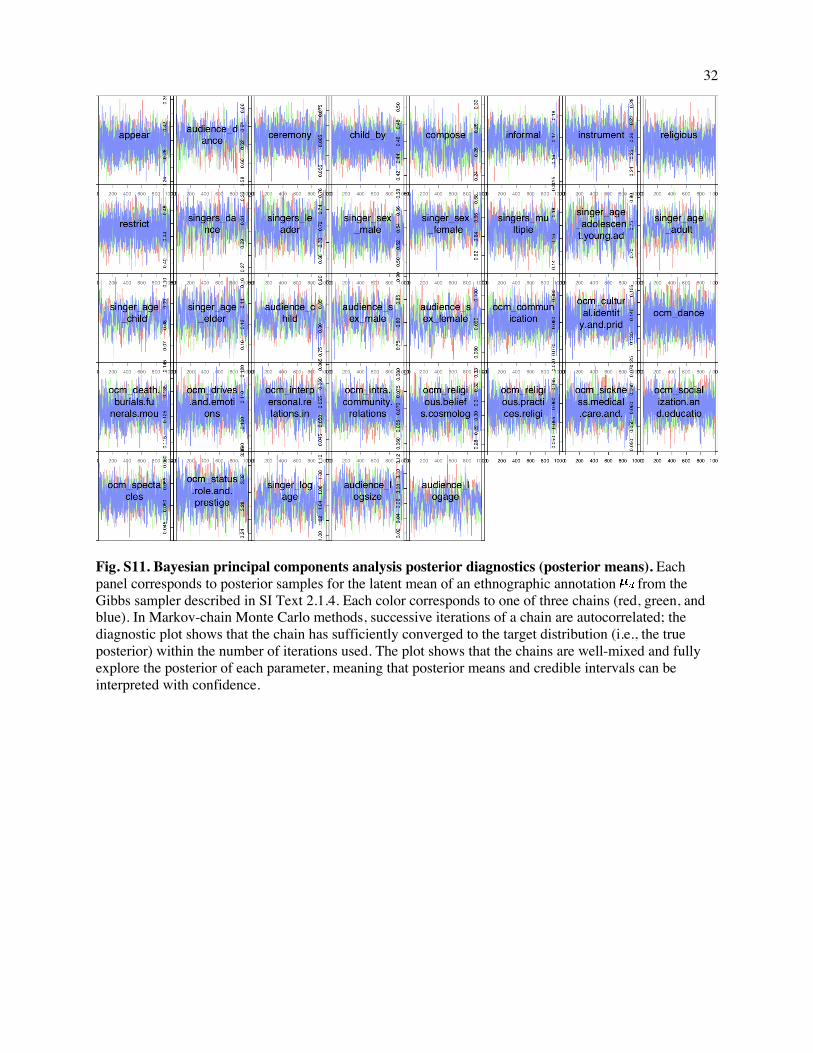
32
Fig. S11. Bayesian principal components analysis posterior diagnostics (posterior means). Each panel corresponds to posterior samples for the latent mean of an ethnographic annotation from the Gibbs sampler described in SI Text 2.1.4. Each color corresponds to one of three chains (red, green, and blue). In Markov-chain Monte Carlo methods, successive iterations of a chain are autocorrelated; the diagnostic plot shows that the chain has sufficiently converged to the target distribution (i.e., the true posterior) within the number of iterations used. The plot shows that the chains are well-mixed and fully explore the posterior of each parameter, meaning that posterior means and credible intervals can be interpreted with confidence.
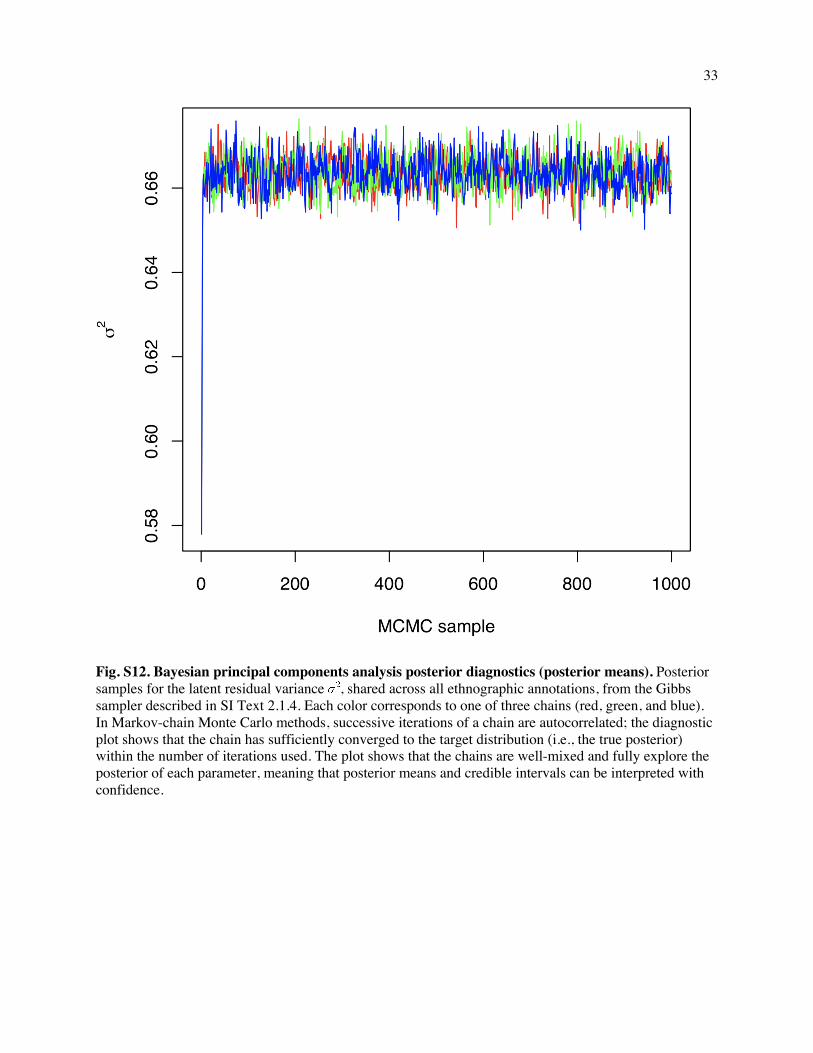
33
Fig. S12. Bayesian principal components analysis posterior diagnostics (posterior means). Posterior samples for the latent residual variance , shared across all ethnographic annotations, from the Gibbs sampler described in SI Text 2.1.4. Each color corresponds to one of three chains (red, green, and blue). In Markov-chain Monte Carlo methods, successive iterations of a chain are autocorrelated; the diagnostic plot shows that the chain has sufficiently converged to the target distribution (i.e., the true posterior) within the number of iterations used. The plot shows that the chains are well-mixed and fully explore the posterior of each parameter, meaning that posterior means and credible intervals can be interpreted with confidence.
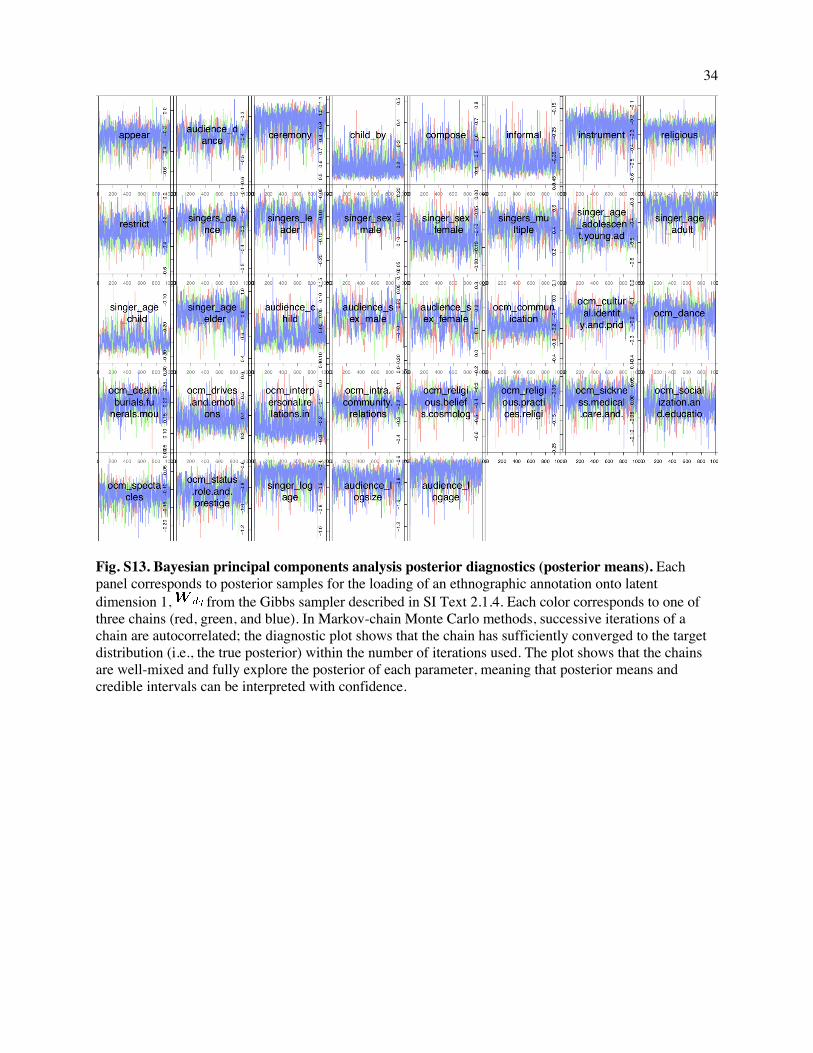
34
Fig. S13. Bayesian principal components analysis posterior diagnostics (posterior means). Each panel corresponds to posterior samples for the loading of an ethnographic annotation onto latent dimension 1, from the Gibbs sampler described in SI Text 2.1.4. Each color corresponds to one of three chains (red, green, and blue). In Markov-chain Monte Carlo methods, successive iterations of a chain are autocorrelated; the diagnostic plot shows that the chain has sufficiently converged to the target distribution (i.e., the true posterior) within the number of iterations used. The plot shows that the chains are well-mixed and fully explore the posterior of each parameter, meaning that posterior means and credible intervals can be interpreted with confidence.
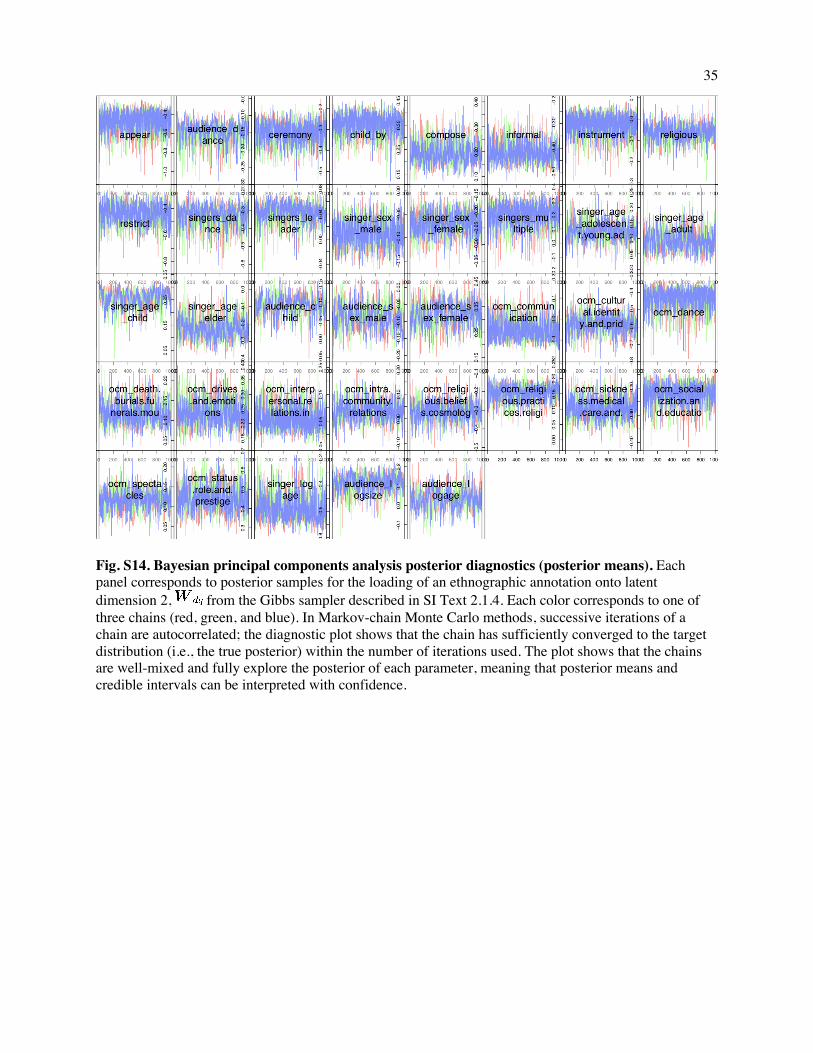
35
Fig. S14. Bayesian principal components analysis posterior diagnostics (posterior means). Each panel corresponds to posterior samples for the loading of an ethnographic annotation onto latent dimension 2, from the Gibbs sampler described in SI Text 2.1.4. Each color corresponds to one of three chains (red, green, and blue). In Markov-chain Monte Carlo methods, successive iterations of a chain are autocorrelated; the diagnostic plot shows that the chain has sufficiently converged to the target distribution (i.e., the true posterior) within the number of iterations used. The plot shows that the chains are well-mixed and fully explore the posterior of each parameter, meaning that posterior means and credible intervals can be interpreted with confidence.
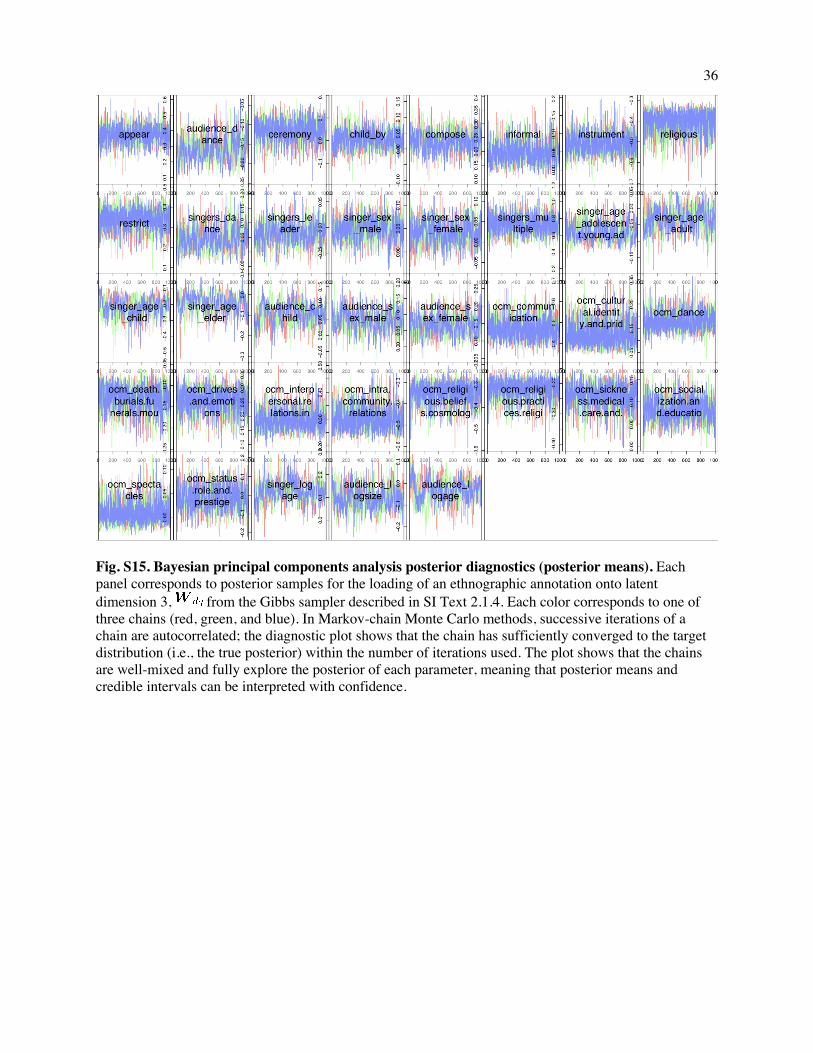
36
Fig. S15. Bayesian principal components analysis posterior diagnostics (posterior means). Each panel corresponds to posterior samples for the loading of an ethnographic annotation onto latent dimension 3, from the Gibbs sampler described in SI Text 2.1.4. Each color corresponds to one of three chains (red, green, and blue). In Markov-chain Monte Carlo methods, successive iterations of a chain are autocorrelated; the diagnostic plot shows that the chain has sufficiently converged to the target distribution (i.e., the true posterior) within the number of iterations used. The plot shows that the chains are well-mixed and fully explore the posterior of each parameter, meaning that posterior means and credible intervals can be interpreted with confidence.
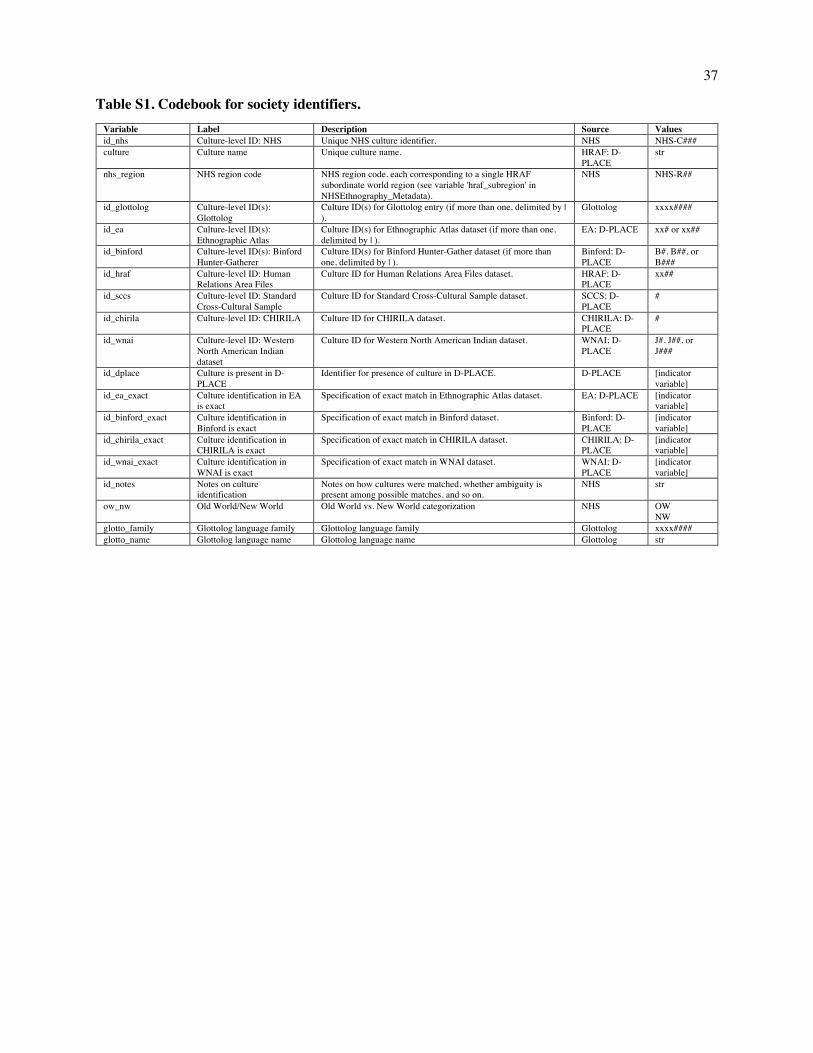
37
Table S1. Codebook for society identifiers.
Variable Label Description Source Values id_nhs Culture-level ID: NHS Unique NHS culture identifier. NHS NHS-C### culture Culture name Unique culture name. HRAF; D-
PLACE str
nhs_region NHS region code NHS region code, each corresponding to a single HRAF subordinate world region (see variable 'hraf_subregion' in NHSEthnography_Metadata).
NHS NHS-R##
id_glottolog Culture-level ID(s): Glottolog
Culture ID(s) for Glottolog entry (if more than one, delimited by | ).
Glottolog xxxx####
id_ea Culture-level ID(s): Ethnographic Atlas
Culture ID(s) for Ethnographic Atlas dataset (if more than one, delimited by | ).
EA; D-PLACE xx# or xx##
id_binford Culture-level ID(s): Binford Hunter-Gatherer
Culture ID(s) for Binford Hunter-Gather dataset (if more than one, delimited by | ).
Binford; D-PLACE
B#, B##, or B###
id_hraf Culture-level ID: Human Relations Area Files
Culture ID for Human Relations Area Files dataset. HRAF; D-PLACE
xx##
id_sccs Culture-level ID: Standard Cross-Cultural Sample
Culture ID for Standard Cross-Cultural Sample dataset. SCCS; D-PLACE
#
id_chirila Culture-level ID: CHIRILA Culture ID for CHIRILA dataset. CHIRILA; D-PLACE
#
id_wnai Culture-level ID: Western North American Indian dataset
Culture ID for Western North American Indian dataset. WNAI; D-PLACE
J#, J##, or J###
id_dplace Culture is present in D-PLACE
Identifier for presence of culture in D-PLACE. D-PLACE [indicator variable]
id_ea_exact Culture identification in EA is exact
Specification of exact match in Ethnographic Atlas dataset. EA; D-PLACE [indicator variable]
id_binford_exact Culture identification in Binford is exact
Specification of exact match in Binford dataset. Binford; D-PLACE
[indicator variable]
id_chirila_exact Culture identification in CHIRILA is exact
Specification of exact match in CHIRILA dataset. CHIRILA; D-PLACE
[indicator variable]
id_wnai_exact Culture identification in WNAI is exact
Specification of exact match in WNAI dataset. WNAI; D-PLACE
[indicator variable]
id_notes Notes on culture identification
Notes on how cultures were matched, whether ambiguity is present among possible matches, and so on.
NHS str
ow_nw Old World/New World Old World vs. New World categorization NHS OW NW
glotto_family Glottolog language family Glottolog language family Glottolog xxxx#### glotto_name Glottolog language name Glottolog language name Glottolog str
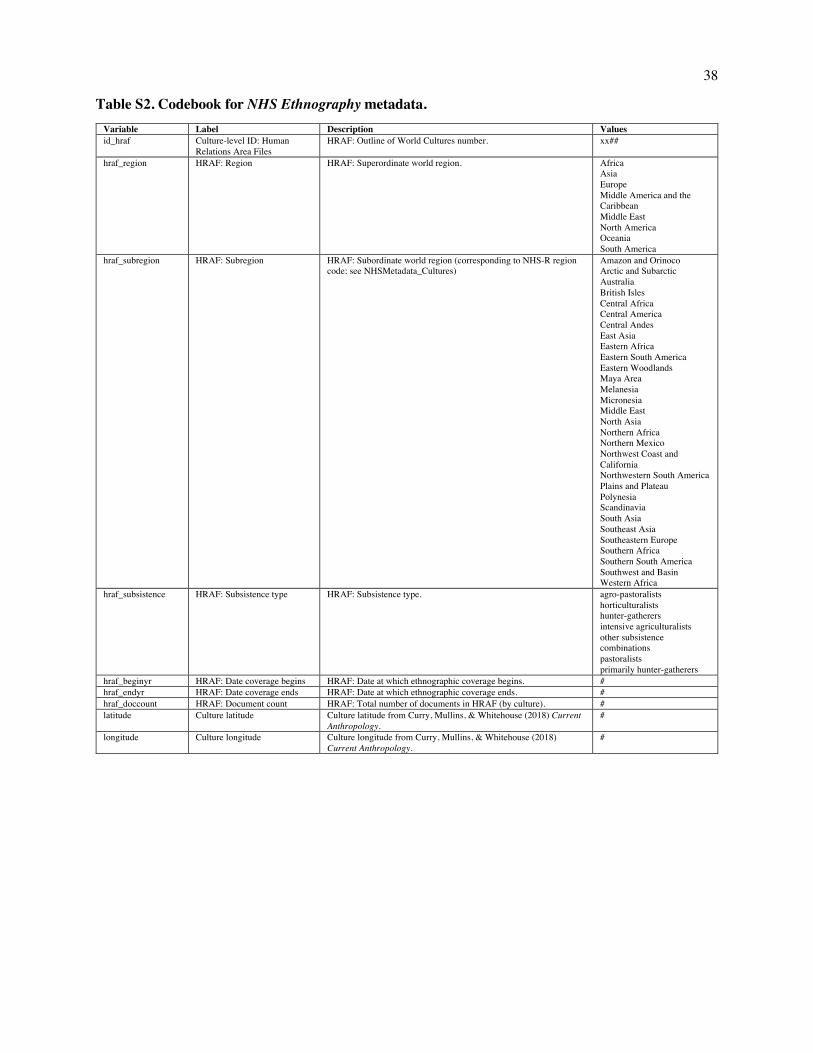
38
Table S2. Codebook for NHS Ethnography metadata.
Variable Label Description Values id_hraf Culture-level ID: Human
Relations Area Files HRAF: Outline of World Cultures number. xx##
hraf_region HRAF: Region HRAF: Superordinate world region. Africa Asia Europe Middle America and the Caribbean Middle East North America Oceania South America
hraf_subregion HRAF: Subregion HRAF: Subordinate world region (corresponding to NHS-R region code; see NHSMetadata_Cultures)
Amazon and Orinoco Arctic and Subarctic Australia British Isles Central Africa Central America Central Andes East Asia Eastern Africa Eastern South America Eastern Woodlands Maya Area Melanesia Micronesia Middle East North Asia Northern Africa Northern Mexico Northwest Coast and California Northwestern South America Plains and Plateau Polynesia Scandinavia South Asia Southeast Asia Southeastern Europe Southern Africa Southern South America Southwest and Basin Western Africa
hraf_subsistence HRAF: Subsistence type HRAF: Subsistence type. agro-pastoralists horticulturalists hunter-gatherers intensive agriculturalists other subsistence combinations pastoralists primarily hunter-gatherers
hraf_beginyr HRAF: Date coverage begins HRAF: Date at which ethnographic coverage begins. # hraf_endyr HRAF: Date coverage ends HRAF: Date at which ethnographic coverage ends. # hraf_doccount HRAF: Document count HRAF: Total number of documents in HRAF (by culture). # latitude Culture latitude Culture latitude from Curry, Mullins, & Whitehouse (2018) Current
Anthropology. #
longitude Culture longitude Culture longitude from Curry, Mullins, & Whitehouse (2018) Current Anthropology.
#
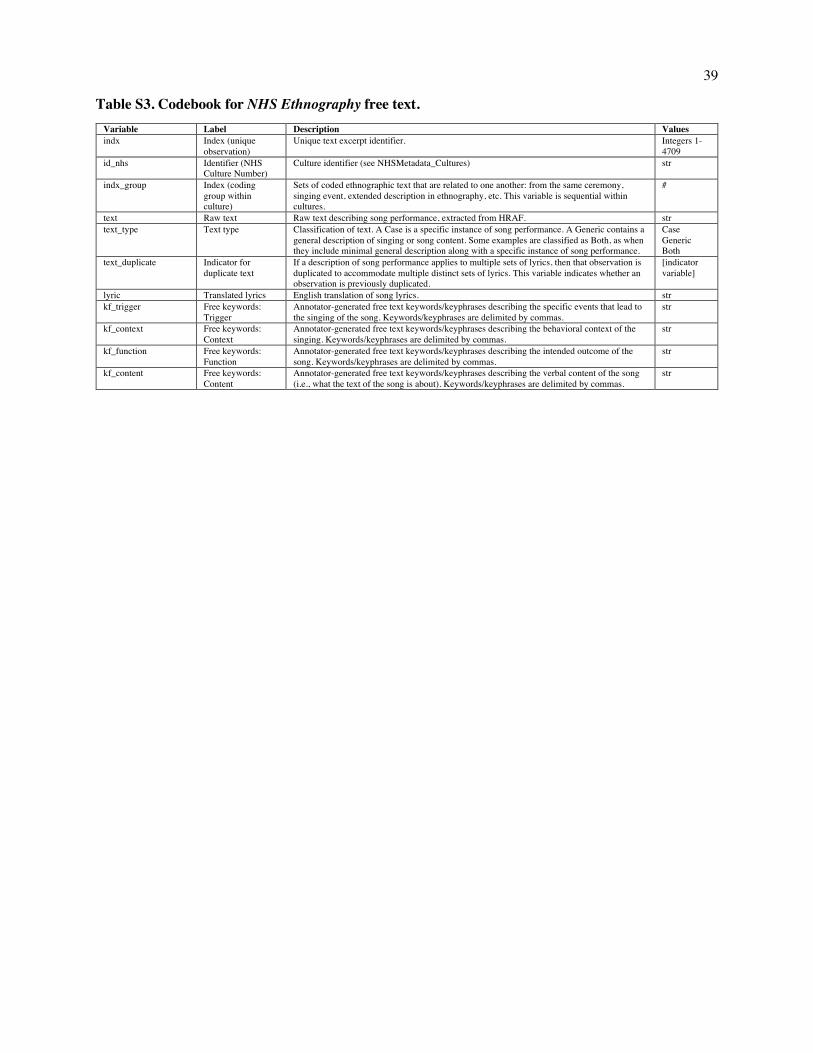
39
Table S3. Codebook for NHS Ethnography free text.
Variable Label Description Values indx Index (unique
observation) Unique text excerpt identifier. Integers 1-
4709 id_nhs Identifier (NHS
Culture Number) Culture identifier (see NHSMetadata_Cultures) str
indx_group Index (coding group within culture)
Sets of coded ethnographic text that are related to one another: from the same ceremony, singing event, extended description in ethnography, etc. This variable is sequential within cultures.
#
text Raw text Raw text describing song performance, extracted from HRAF. str text_type Text type Classification of text. A Case is a specific instance of song performance. A Generic contains a
general description of singing or song content. Some examples are classified as Both, as when they include minimal general description along with a specific instance of song performance.
Case Generic Both
text_duplicate Indicator for duplicate text
If a description of song performance applies to multiple sets of lyrics, then that observation is duplicated to accommodate multiple distinct sets of lyrics. This variable indicates whether an observation is previously duplicated.
[indicator variable]
lyric Translated lyrics English translation of song lyrics. str kf_trigger Free keywords:
Trigger Annotator-generated free text keywords/keyphrases describing the specific events that lead to the singing of the song. Keywords/keyphrases are delimited by commas.
str
kf_context Free keywords: Context
Annotator-generated free text keywords/keyphrases describing the behavioral context of the singing. Keywords/keyphrases are delimited by commas.
str
kf_function Free keywords: Function
Annotator-generated free text keywords/keyphrases describing the intended outcome of the song. Keywords/keyphrases are delimited by commas.
str
kf_content Free keywords: Content
Annotator-generated free text keywords/keyphrases describing the verbal content of the song (i.e., what the text of the song is about). Keywords/keyphrases are delimited by commas.
str
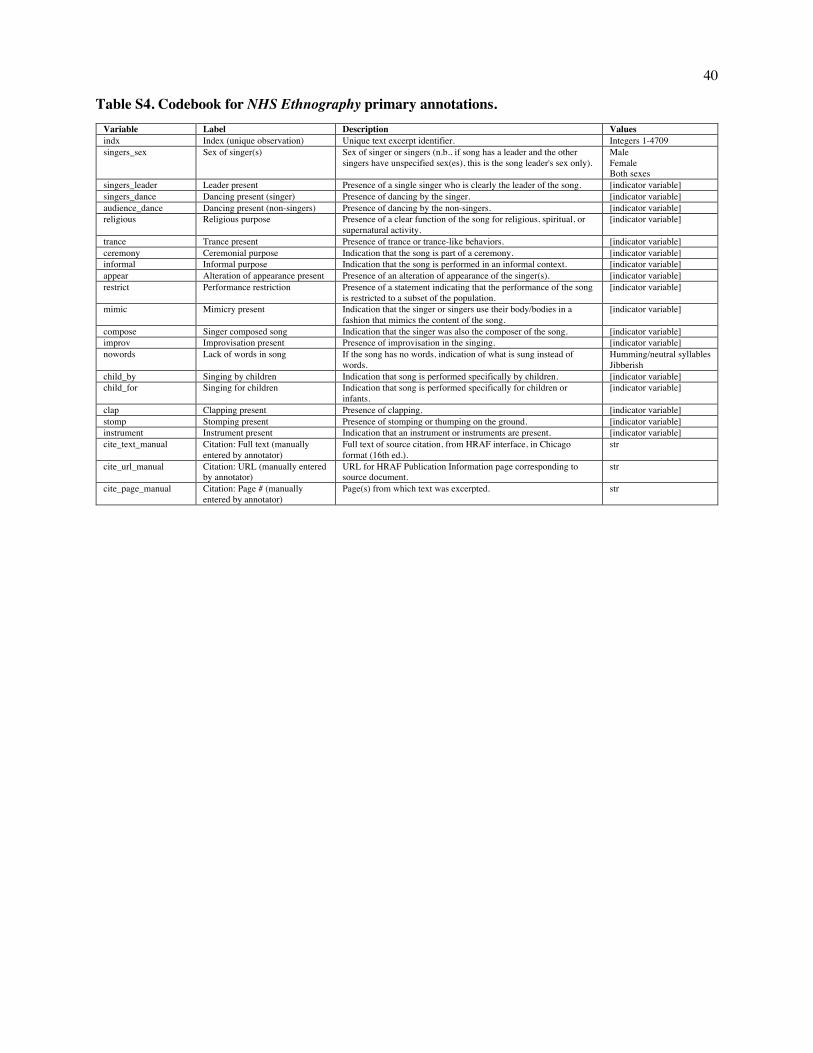
40
Table S4. Codebook for NHS Ethnography primary annotations.
Variable Label Description Values indx Index (unique observation) Unique text excerpt identifier. Integers 1-4709 singers_sex Sex of singer(s) Sex of singer or singers (n.b., if song has a leader and the other
singers have unspecified sex(es), this is the song leader's sex only). Male Female Both sexes
singers_leader Leader present Presence of a single singer who is clearly the leader of the song. [indicator variable] singers_dance Dancing present (singer) Presence of dancing by the singer. [indicator variable] audience_dance Dancing present (non-singers) Presence of dancing by the non-singers. [indicator variable] religious Religious purpose Presence of a clear function of the song for religious, spiritual, or
supernatural activity. [indicator variable]
trance Trance present Presence of trance or trance-like behaviors. [indicator variable] ceremony Ceremonial purpose Indication that the song is part of a ceremony. [indicator variable] informal Informal purpose Indication that the song is performed in an informal context. [indicator variable] appear Alteration of appearance present Presence of an alteration of appearance of the singer(s). [indicator variable] restrict Performance restriction Presence of a statement indicating that the performance of the song
is restricted to a subset of the population. [indicator variable]
mimic Mimicry present Indication that the singer or singers use their body/bodies in a fashion that mimics the content of the song.
[indicator variable]
compose Singer composed song Indication that the singer was also the composer of the song. [indicator variable] improv Improvisation present Presence of improvisation in the singing. [indicator variable] nowords Lack of words in song If the song has no words, indication of what is sung instead of
words. Humming/neutral syllables Jibberish
child_by Singing by children Indication that song is performed specifically by children. [indicator variable] child_for Singing for children Indication that song is performed specifically for children or
infants. [indicator variable]
clap Clapping present Presence of clapping. [indicator variable] stomp Stomping present Presence of stomping or thumping on the ground. [indicator variable] instrument Instrument present Indication that an instrument or instruments are present. [indicator variable] cite_text_manual Citation: Full text (manually
entered by annotator) Full text of source citation, from HRAF interface, in Chicago format (16th ed.).
str
cite_url_manual Citation: URL (manually entered by annotator)
URL for HRAF Publication Information page corresponding to source document.
str
cite_page_manual Citation: Page # (manually entered by annotator)
Page(s) from which text was excerpted. str
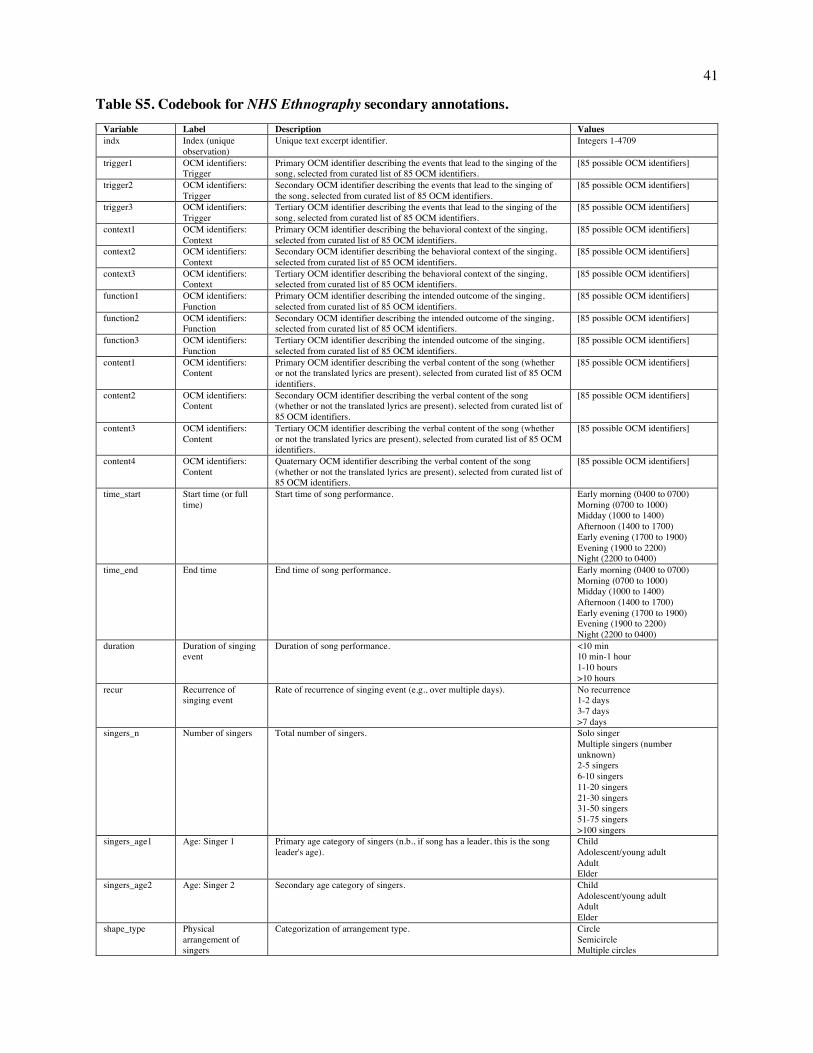
41
Table S5. Codebook for NHS Ethnography secondary annotations.
Variable Label Description Values indx Index (unique
observation) Unique text excerpt identifier. Integers 1-4709
trigger1 OCM identifiers: Trigger
Primary OCM identifier describing the events that lead to the singing of the song, selected from curated list of 85 OCM identifiers.
[85 possible OCM identifiers]
trigger2 OCM identifiers: Trigger
Secondary OCM identifier describing the events that lead to the singing of the song, selected from curated list of 85 OCM identifiers.
[85 possible OCM identifiers]
trigger3 OCM identifiers: Trigger
Tertiary OCM identifier describing the events that lead to the singing of the song, selected from curated list of 85 OCM identifiers.
[85 possible OCM identifiers]
context1 OCM identifiers: Context
Primary OCM identifier describing the behavioral context of the singing, selected from curated list of 85 OCM identifiers.
[85 possible OCM identifiers]
context2 OCM identifiers: Context
Secondary OCM identifier describing the behavioral context of the singing, selected from curated list of 85 OCM identifiers.
[85 possible OCM identifiers]
context3 OCM identifiers: Context
Tertiary OCM identifier describing the behavioral context of the singing, selected from curated list of 85 OCM identifiers.
[85 possible OCM identifiers]
function1 OCM identifiers: Function
Primary OCM identifier describing the intended outcome of the singing, selected from curated list of 85 OCM identifiers.
[85 possible OCM identifiers]
function2 OCM identifiers: Function
Secondary OCM identifier describing the intended outcome of the singing, selected from curated list of 85 OCM identifiers.
[85 possible OCM identifiers]
function3 OCM identifiers: Function
Tertiary OCM identifier describing the intended outcome of the singing, selected from curated list of 85 OCM identifiers.
[85 possible OCM identifiers]
content1 OCM identifiers: Content
Primary OCM identifier describing the verbal content of the song (whether or not the translated lyrics are present), selected from curated list of 85 OCM identifiers.
[85 possible OCM identifiers]
content2 OCM identifiers: Content
Secondary OCM identifier describing the verbal content of the song (whether or not the translated lyrics are present), selected from curated list of 85 OCM identifiers.
[85 possible OCM identifiers]
content3 OCM identifiers: Content
Tertiary OCM identifier describing the verbal content of the song (whether or not the translated lyrics are present), selected from curated list of 85 OCM identifiers.
[85 possible OCM identifiers]
content4 OCM identifiers: Content
Quaternary OCM identifier describing the verbal content of the song (whether or not the translated lyrics are present), selected from curated list of 85 OCM identifiers.
[85 possible OCM identifiers]
time_start Start time (or full time)
Start time of song performance. Early morning (0400 to 0700) Morning (0700 to 1000) Midday (1000 to 1400) Afternoon (1400 to 1700) Early evening (1700 to 1900) Evening (1900 to 2200) Night (2200 to 0400)
time_end End time End time of song performance. Early morning (0400 to 0700) Morning (0700 to 1000) Midday (1000 to 1400) Afternoon (1400 to 1700) Early evening (1700 to 1900) Evening (1900 to 2200) Night (2200 to 0400)
duration Duration of singing event
Duration of song performance. <10 min 10 min-1 hour 1-10 hours >10 hours
recur Recurrence of singing event
Rate of recurrence of singing event (e.g., over multiple days). No recurrence 1-2 days 3-7 days >7 days
singers_n Number of singers Total number of singers. Solo singer Multiple singers (number unknown) 2-5 singers 6-10 singers 11-20 singers 21-30 singers 31-50 singers 51-75 singers >100 singers
singers_age1 Age: Singer 1 Primary age category of singers (n.b., if song has a leader, this is the song leader's age).
Child Adolescent/young adult Adult Elder
singers_age2 Age: Singer 2 Secondary age category of singers. Child Adolescent/young adult Adult Elder
shape_type Physical arrangement of singers
Categorization of arrangement type. Circle Semicircle Multiple circles
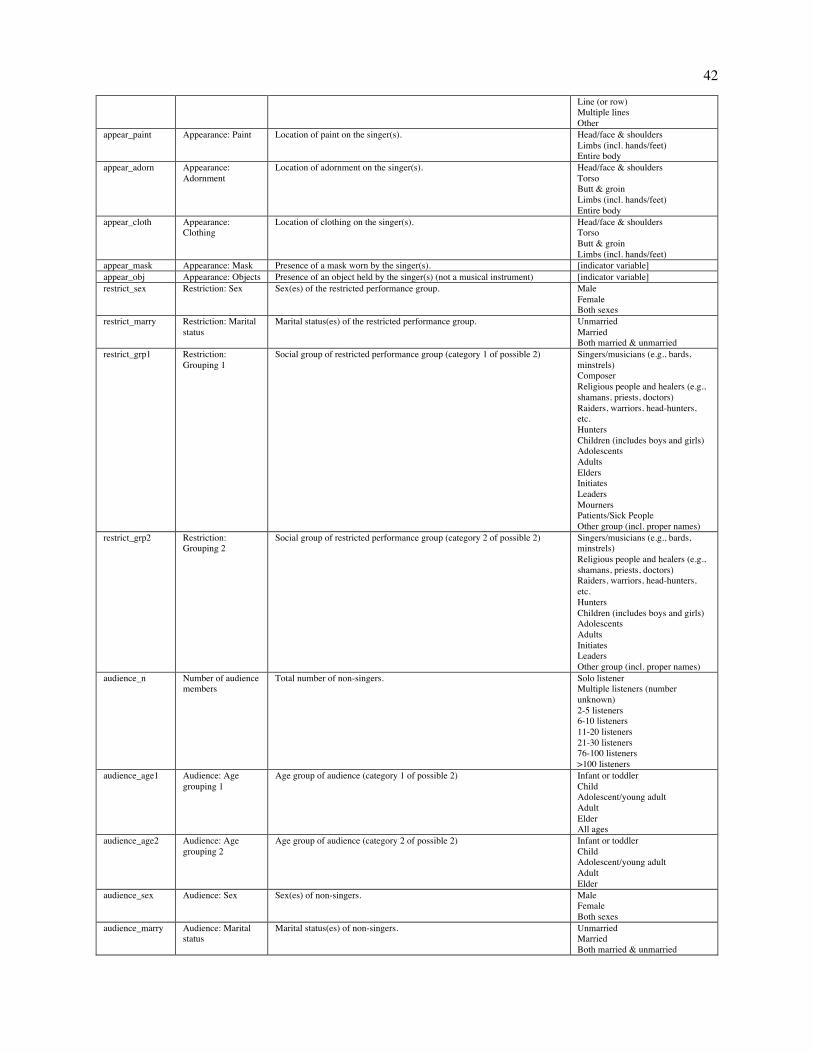
42
Line (or row) Multiple lines Other
appear_paint Appearance: Paint Location of paint on the singer(s). Head/face & shoulders Limbs (incl. hands/feet) Entire body
appear_adorn Appearance: Adornment
Location of adornment on the singer(s). Head/face & shoulders Torso Butt & groin Limbs (incl. hands/feet) Entire body
appear_cloth Appearance: Clothing
Location of clothing on the singer(s). Head/face & shoulders Torso Butt & groin Limbs (incl. hands/feet)
appear_mask Appearance: Mask Presence of a mask worn by the singer(s). [indicator variable] appear_obj Appearance: Objects Presence of an object held by the singer(s) (not a musical instrument) [indicator variable] restrict_sex Restriction: Sex Sex(es) of the restricted performance group. Male
Female Both sexes
restrict_marry Restriction: Marital status
Marital status(es) of the restricted performance group. Unmarried Married Both married & unmarried
restrict_grp1 Restriction: Grouping 1
Social group of restricted performance group (category 1 of possible 2) Singers/musicians (e.g., bards, minstrels) Composer Religious people and healers (e.g., shamans, priests, doctors) Raiders, warriors, head-hunters, etc. Hunters Children (includes boys and girls) Adolescents Adults Elders Initiates Leaders Mourners Patients/Sick People Other group (incl. proper names)
restrict_grp2 Restriction: Grouping 2
Social group of restricted performance group (category 2 of possible 2) Singers/musicians (e.g., bards, minstrels) Religious people and healers (e.g., shamans, priests, doctors) Raiders, warriors, head-hunters, etc. Hunters Children (includes boys and girls) Adolescents Adults Initiates Leaders Other group (incl. proper names)
audience_n Number of audience members
Total number of non-singers. Solo listener Multiple listeners (number unknown) 2-5 listeners 6-10 listeners 11-20 listeners 21-30 listeners 76-100 listeners >100 listeners
audience_age1 Audience: Age grouping 1
Age group of audience (category 1 of possible 2) Infant or toddler Child Adolescent/young adult Adult Elder All ages
audience_age2 Audience: Age grouping 2
Age group of audience (category 2 of possible 2) Infant or toddler Child Adolescent/young adult Adult Elder
audience_sex Audience: Sex Sex(es) of non-singers. Male Female Both sexes
audience_marry Audience: Marital status
Marital status(es) of non-singers. Unmarried Married Both married & unmarried
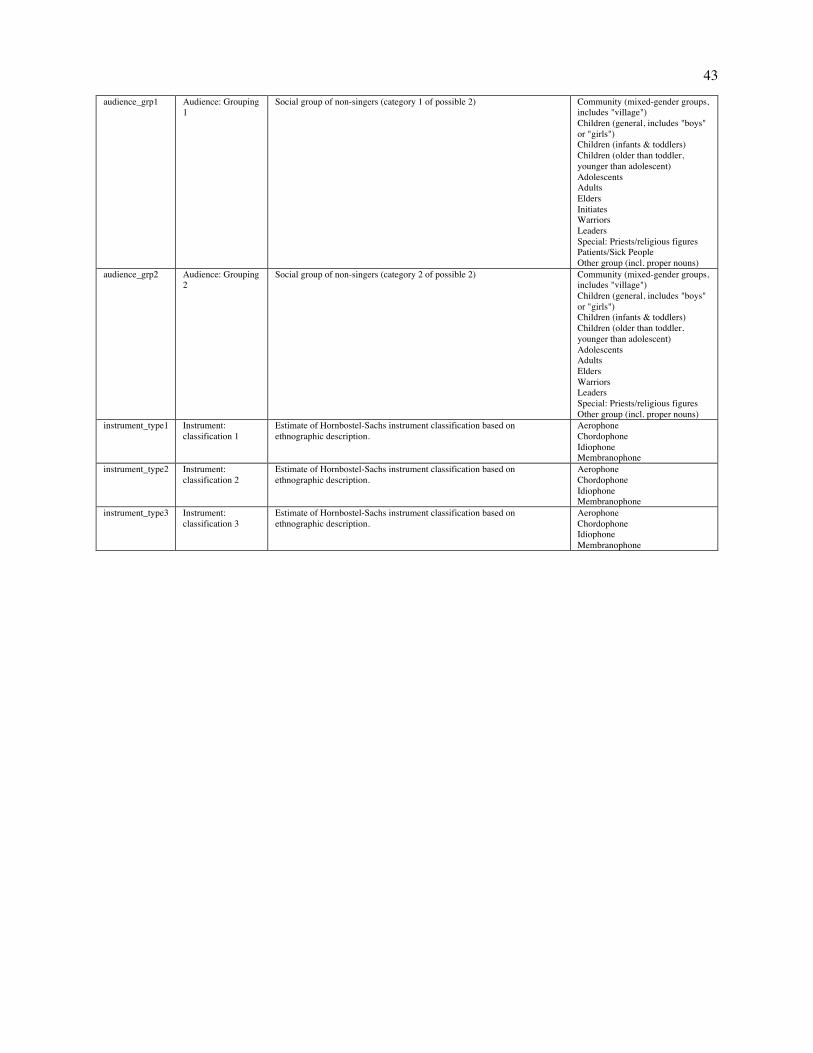
43
audience_grp1 Audience: Grouping 1
Social group of non-singers (category 1 of possible 2) Community (mixed-gender groups, includes "village") Children (general, includes "boys" or "girls") Children (infants & toddlers) Children (older than toddler, younger than adolescent) Adolescents Adults Elders Initiates Warriors Leaders Special: Priests/religious figures Patients/Sick People Other group (incl. proper nouns)
audience_grp2 Audience: Grouping 2
Social group of non-singers (category 2 of possible 2) Community (mixed-gender groups, includes "village") Children (general, includes "boys" or "girls") Children (infants & toddlers) Children (older than toddler, younger than adolescent) Adolescents Adults Elders Warriors Leaders Special: Priests/religious figures Other group (incl. proper nouns)
instrument_type1 Instrument: classification 1
Estimate of Hornbostel-Sachs instrument classification based on ethnographic description.
Aerophone Chordophone Idiophone Membranophone
instrument_type2 Instrument: classification 2
Estimate of Hornbostel-Sachs instrument classification based on ethnographic description.
Aerophone Chordophone Idiophone Membranophone
instrument_type3 Instrument: classification 3
Estimate of Hornbostel-Sachs instrument classification based on ethnographic description.
Aerophone Chordophone Idiophone Membranophone
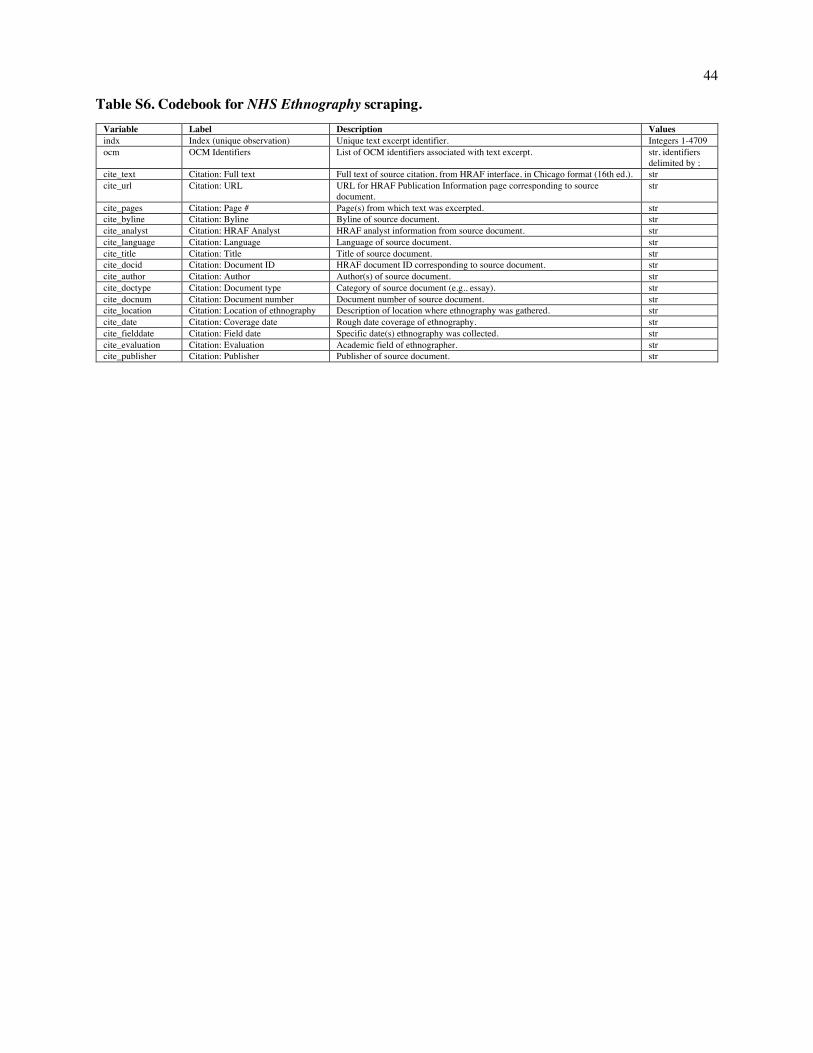
44
Table S6. Codebook for NHS Ethnography scraping.
Variable Label Description Values indx Index (unique observation) Unique text excerpt identifier. Integers 1-4709 ocm OCM Identifiers List of OCM identifiers associated with text excerpt. str, identifiers
delimited by ; cite_text Citation: Full text Full text of source citation, from HRAF interface, in Chicago format (16th ed.). str cite_url Citation: URL URL for HRAF Publication Information page corresponding to source
document. str
cite_pages Citation: Page # Page(s) from which text was excerpted. str cite_byline Citation: Byline Byline of source document. str cite_analyst Citation: HRAF Analyst HRAF analyst information from source document. str cite_language Citation: Language Language of source document. str cite_title Citation: Title Title of source document. str cite_docid Citation: Document ID HRAF document ID corresponding to source document. str cite_author Citation: Author Author(s) of source document. str cite_doctype Citation: Document type Category of source document (e.g., essay). str cite_docnum Citation: Document number Document number of source document. str cite_location Citation: Location of ethnography Description of location where ethnography was gathered. str cite_date Citation: Coverage date Rough date coverage of ethnography. str cite_fielddate Citation: Field date Specific date(s) ethnography was collected. str cite_evaluation Citation: Evaluation Academic field of ethnographer. str cite_publisher Citation: Publisher Publisher of source document. str
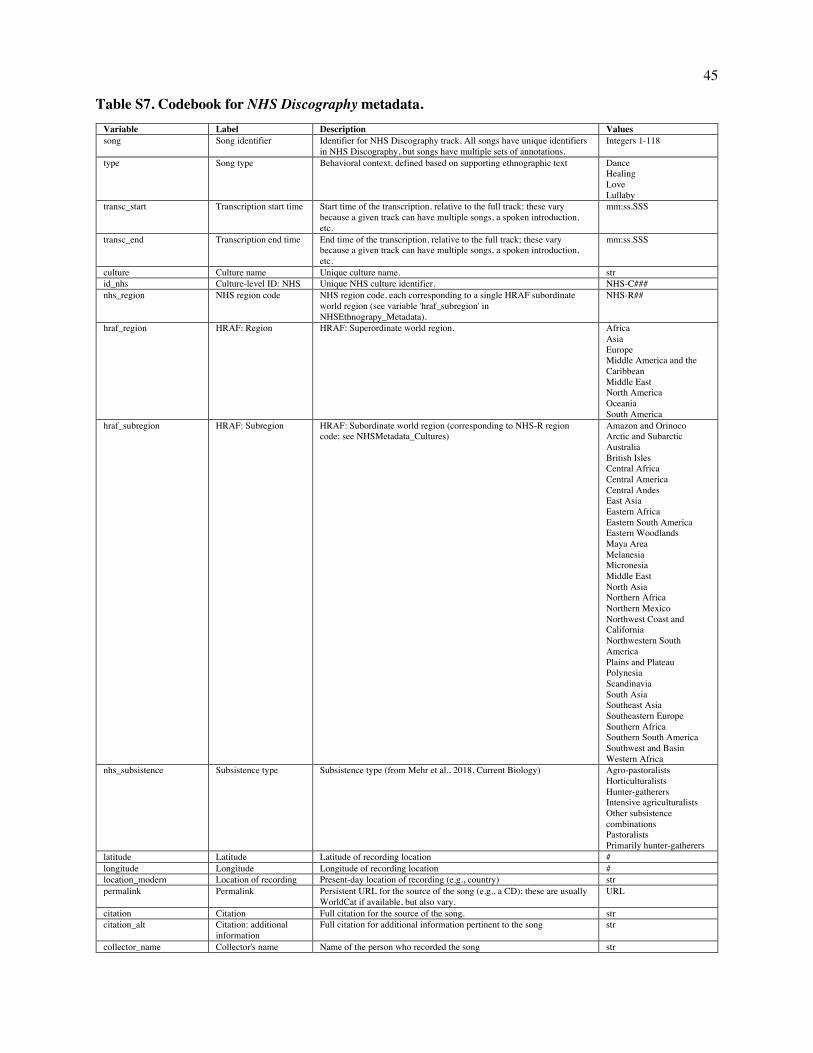
45
Table S7. Codebook for NHS Discography metadata.
Variable Label Description Values song Song identifier Identifier for NHS Discography track. All songs have unique identifiers
in NHS Discography, but songs have multiple sets of annotations. Integers 1-118
type Song type Behavioral context, defined based on supporting ethnographic text Dance Healing Love Lullaby
transc_start Transcription start time Start time of the transcription, relative to the full track; these vary because a given track can have multiple songs, a spoken introduction, etc.
mm:ss.SSS
transc_end Transcription end time End time of the transcription, relative to the full track; these vary because a given track can have multiple songs, a spoken introduction, etc.
mm:ss.SSS
culture Culture name Unique culture name. str id_nhs Culture-level ID: NHS Unique NHS culture identifier. NHS-C### nhs_region NHS region code NHS region code, each corresponding to a single HRAF subordinate
world region (see variable 'hraf_subregion' in NHSEthnograpy_Metadata).
NHS-R##
hraf_region HRAF: Region HRAF: Superordinate world region. Africa Asia Europe Middle America and the Caribbean Middle East North America Oceania South America
hraf_subregion HRAF: Subregion HRAF: Subordinate world region (corresponding to NHS-R region code; see NHSMetadata_Cultures)
Amazon and Orinoco Arctic and Subarctic Australia British Isles Central Africa Central America Central Andes East Asia Eastern Africa Eastern South America Eastern Woodlands Maya Area Melanesia Micronesia Middle East North Asia Northern Africa Northern Mexico Northwest Coast and California Northwestern South America Plains and Plateau Polynesia Scandinavia South Asia Southeast Asia Southeastern Europe Southern Africa Southern South America Southwest and Basin Western Africa
nhs_subsistence Subsistence type Subsistence type (from Mehr et al., 2018, Current Biology) Agro-pastoralists Horticulturalists Hunter-gatherers Intensive agriculturalists Other subsistence combinations Pastoralists Primarily hunter-gatherers
latitude Latitude Latitude of recording location # longitude Longitude Longitude of recording location # location_modern Location of recording Present-day location of recording (e.g., country) str permalink Permalink Persistent URL for the source of the song (e.g., a CD); these are usually
WorldCat if available, but also vary. URL
citation Citation Full citation for the source of the song. str citation_alt Citation: additional
information Full citation for additional information pertinent to the song str
collector_name Collector's name Name of the person who recorded the song str
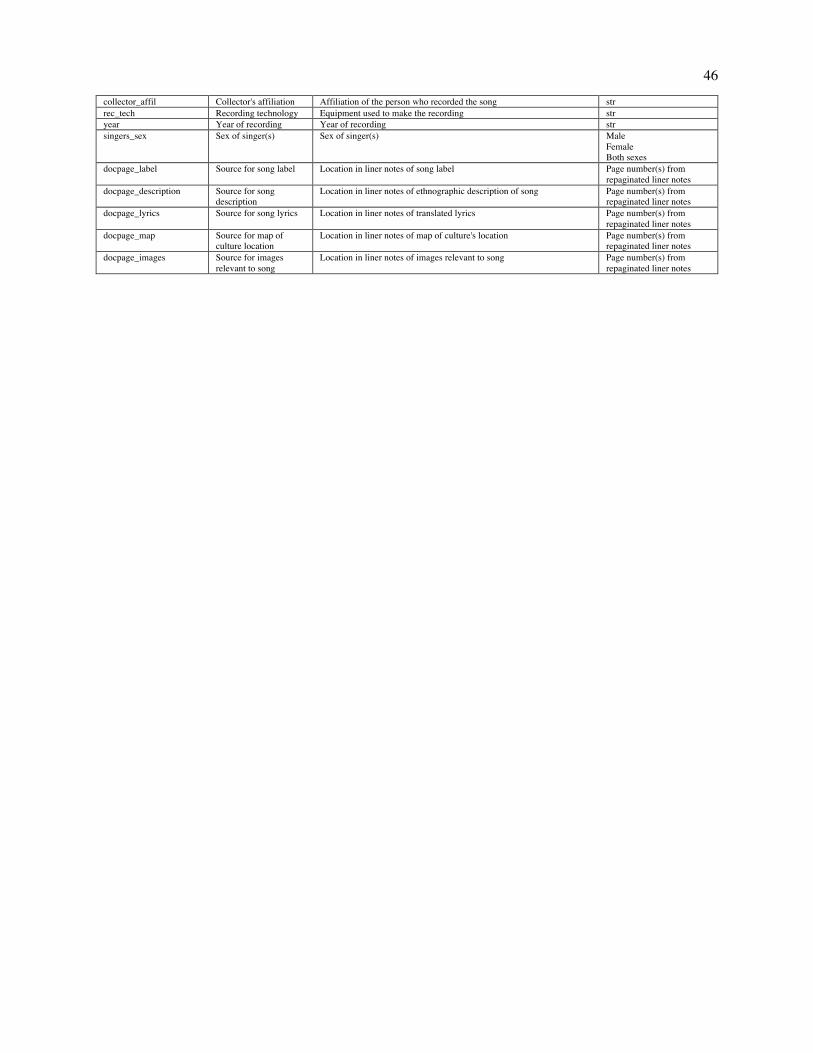
46
collector_affil Collector's affiliation Affiliation of the person who recorded the song str rec_tech Recording technology Equipment used to make the recording str year Year of recording Year of recording str singers_sex Sex of singer(s) Sex of singer(s) Male
Female Both sexes
docpage_label Source for song label Location in liner notes of song label Page number(s) from repaginated liner notes
docpage_description Source for song description
Location in liner notes of ethnographic description of song Page number(s) from repaginated liner notes
docpage_lyrics Source for song lyrics Location in liner notes of translated lyrics Page number(s) from repaginated liner notes
docpage_map Source for map of culture location
Location in liner notes of map of culture's location Page number(s) from repaginated liner notes
docpage_images Source for images relevant to song
Location in liner notes of images relevant to song Page number(s) from repaginated liner notes
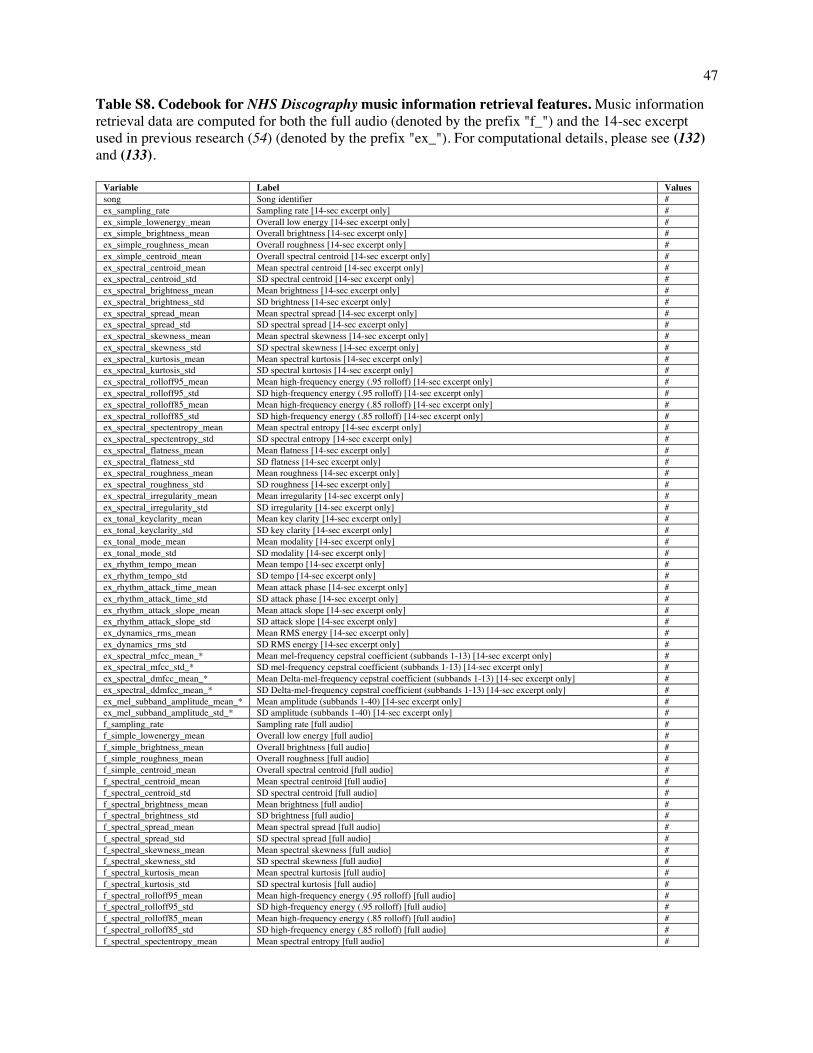
47
Table S8. Codebook for NHS Discography music information retrieval features. Music information retrieval data are computed for both the full audio (denoted by the prefix "f_") and the 14-sec excerpt used in previous research (54) (denoted by the prefix "ex_"). For computational details, please see (132) and (133).
Variable Label Values song Song identifier # ex_sampling_rate Sampling rate [14-sec excerpt only] # ex_simple_lowenergy_mean Overall low energy [14-sec excerpt only] # ex_simple_brightness_mean Overall brightness [14-sec excerpt only] # ex_simple_roughness_mean Overall roughness [14-sec excerpt only] # ex_simple_centroid_mean Overall spectral centroid [14-sec excerpt only] # ex_spectral_centroid_mean Mean spectral centroid [14-sec excerpt only] # ex_spectral_centroid_std SD spectral centroid [14-sec excerpt only] # ex_spectral_brightness_mean Mean brightness [14-sec excerpt only] # ex_spectral_brightness_std SD brightness [14-sec excerpt only] # ex_spectral_spread_mean Mean spectral spread [14-sec excerpt only] # ex_spectral_spread_std SD spectral spread [14-sec excerpt only] # ex_spectral_skewness_mean Mean spectral skewness [14-sec excerpt only] # ex_spectral_skewness_std SD spectral skewness [14-sec excerpt only] # ex_spectral_kurtosis_mean Mean spectral kurtosis [14-sec excerpt only] # ex_spectral_kurtosis_std SD spectral kurtosis [14-sec excerpt only] # ex_spectral_rolloff95_mean Mean high-frequency energy (.95 rolloff) [14-sec excerpt only] # ex_spectral_rolloff95_std SD high-frequency energy (.95 rolloff) [14-sec excerpt only] # ex_spectral_rolloff85_mean Mean high-frequency energy (.85 rolloff) [14-sec excerpt only] # ex_spectral_rolloff85_std SD high-frequency energy (.85 rolloff) [14-sec excerpt only] # ex_spectral_spectentropy_mean Mean spectral entropy [14-sec excerpt only] # ex_spectral_spectentropy_std SD spectral entropy [14-sec excerpt only] # ex_spectral_flatness_mean Mean flatness [14-sec excerpt only] # ex_spectral_flatness_std SD flatness [14-sec excerpt only] # ex_spectral_roughness_mean Mean roughness [14-sec excerpt only] # ex_spectral_roughness_std SD roughness [14-sec excerpt only] # ex_spectral_irregularity_mean Mean irregularity [14-sec excerpt only] # ex_spectral_irregularity_std SD irregularity [14-sec excerpt only] # ex_tonal_keyclarity_mean Mean key clarity [14-sec excerpt only] # ex_tonal_keyclarity_std SD key clarity [14-sec excerpt only] # ex_tonal_mode_mean Mean modality [14-sec excerpt only] # ex_tonal_mode_std SD modality [14-sec excerpt only] # ex_rhythm_tempo_mean Mean tempo [14-sec excerpt only] # ex_rhythm_tempo_std SD tempo [14-sec excerpt only] # ex_rhythm_attack_time_mean Mean attack phase [14-sec excerpt only] # ex_rhythm_attack_time_std SD attack phase [14-sec excerpt only] # ex_rhythm_attack_slope_mean Mean attack slope [14-sec excerpt only] # ex_rhythm_attack_slope_std SD attack slope [14-sec excerpt only] # ex_dynamics_rms_mean Mean RMS energy [14-sec excerpt only] # ex_dynamics_rms_std SD RMS energy [14-sec excerpt only] # ex_spectral_mfcc_mean_* Mean mel-frequency cepstral coefficient (subbands 1-13) [14-sec excerpt only] # ex_spectral_mfcc_std_* SD mel-frequency cepstral coefficient (subbands 1-13) [14-sec excerpt only] # ex_spectral_dmfcc_mean_* Mean Delta-mel-frequency cepstral coefficient (subbands 1-13) [14-sec excerpt only] # ex_spectral_ddmfcc_mean_* SD Delta-mel-frequency cepstral coefficient (subbands 1-13) [14-sec excerpt only] # ex_mel_subband_amplitude_mean_* Mean amplitude (subbands 1-40) [14-sec excerpt only] # ex_mel_subband_amplitude_std_* SD amplitude (subbands 1-40) [14-sec excerpt only] # f_sampling_rate Sampling rate [full audio] # f_simple_lowenergy_mean Overall low energy [full audio] # f_simple_brightness_mean Overall brightness [full audio] # f_simple_roughness_mean Overall roughness [full audio] # f_simple_centroid_mean Overall spectral centroid [full audio] # f_spectral_centroid_mean Mean spectral centroid [full audio] # f_spectral_centroid_std SD spectral centroid [full audio] # f_spectral_brightness_mean Mean brightness [full audio] # f_spectral_brightness_std SD brightness [full audio] # f_spectral_spread_mean Mean spectral spread [full audio] # f_spectral_spread_std SD spectral spread [full audio] # f_spectral_skewness_mean Mean spectral skewness [full audio] # f_spectral_skewness_std SD spectral skewness [full audio] # f_spectral_kurtosis_mean Mean spectral kurtosis [full audio] # f_spectral_kurtosis_std SD spectral kurtosis [full audio] # f_spectral_rolloff95_mean Mean high-frequency energy (.95 rolloff) [full audio] # f_spectral_rolloff95_std SD high-frequency energy (.95 rolloff) [full audio] # f_spectral_rolloff85_mean Mean high-frequency energy (.85 rolloff) [full audio] # f_spectral_rolloff85_std SD high-frequency energy (.85 rolloff) [full audio] # f_spectral_spectentropy_mean Mean spectral entropy [full audio] #
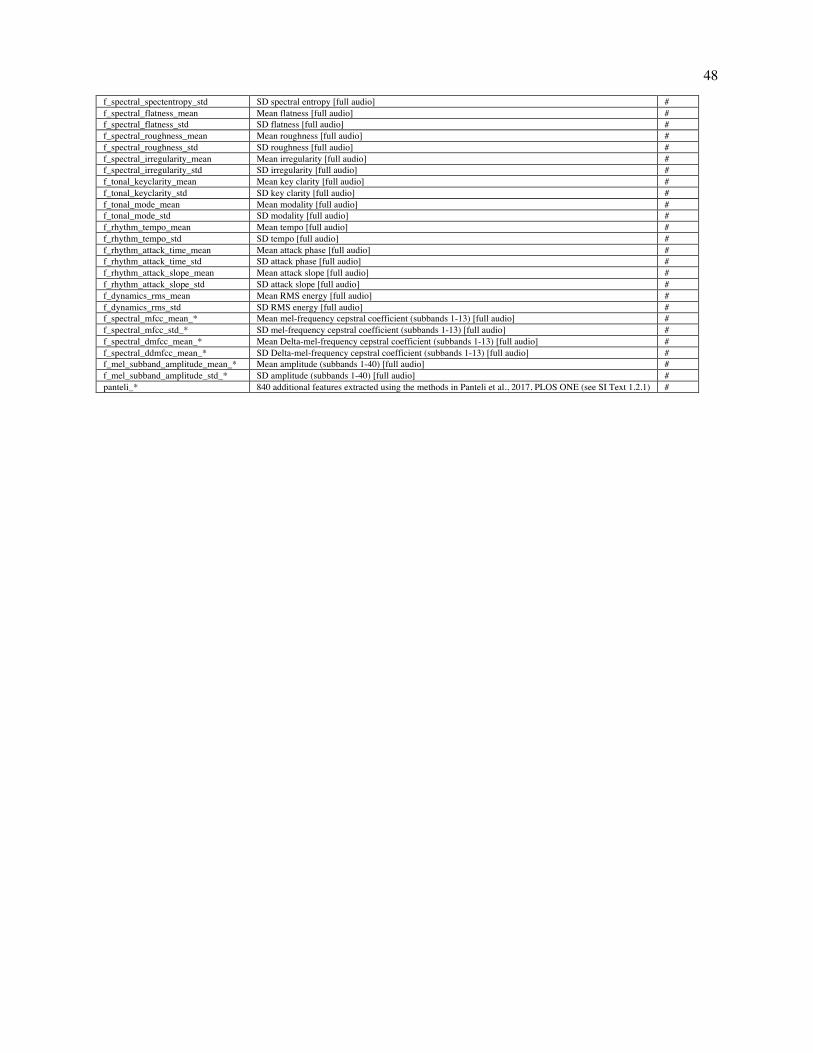
48
f_spectral_spectentropy_std SD spectral entropy [full audio] # f_spectral_flatness_mean Mean flatness [full audio] # f_spectral_flatness_std SD flatness [full audio] # f_spectral_roughness_mean Mean roughness [full audio] # f_spectral_roughness_std SD roughness [full audio] # f_spectral_irregularity_mean Mean irregularity [full audio] # f_spectral_irregularity_std SD irregularity [full audio] # f_tonal_keyclarity_mean Mean key clarity [full audio] # f_tonal_keyclarity_std SD key clarity [full audio] # f_tonal_mode_mean Mean modality [full audio] # f_tonal_mode_std SD modality [full audio] # f_rhythm_tempo_mean Mean tempo [full audio] # f_rhythm_tempo_std SD tempo [full audio] # f_rhythm_attack_time_mean Mean attack phase [full audio] # f_rhythm_attack_time_std SD attack phase [full audio] # f_rhythm_attack_slope_mean Mean attack slope [full audio] # f_rhythm_attack_slope_std SD attack slope [full audio] # f_dynamics_rms_mean Mean RMS energy [full audio] # f_dynamics_rms_std SD RMS energy [full audio] # f_spectral_mfcc_mean_* Mean mel-frequency cepstral coefficient (subbands 1-13) [full audio] # f_spectral_mfcc_std_* SD mel-frequency cepstral coefficient (subbands 1-13) [full audio] # f_spectral_dmfcc_mean_* Mean Delta-mel-frequency cepstral coefficient (subbands 1-13) [full audio] # f_spectral_ddmfcc_mean_* SD Delta-mel-frequency cepstral coefficient (subbands 1-13) [full audio] # f_mel_subband_amplitude_mean_* Mean amplitude (subbands 1-40) [full audio] # f_mel_subband_amplitude_std_* SD amplitude (subbands 1-40) [full audio] # panteli_* 840 additional features extracted using the methods in Panteli et al., 2017, PLOS ONE (see SI Text 1.2.1) #
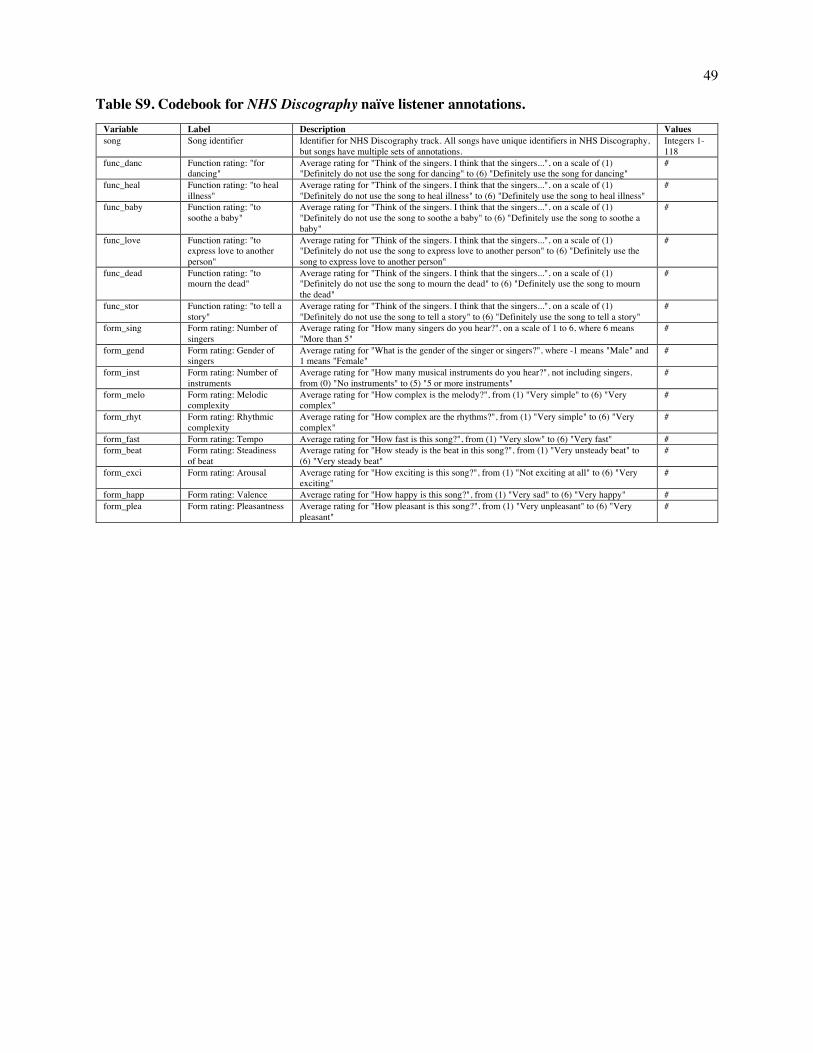
49
Table S9. Codebook for NHS Discography naïve listener annotations.
Variable Label Description Values song Song identifier Identifier for NHS Discography track. All songs have unique identifiers in NHS Discography,
but songs have multiple sets of annotations. Integers 1-118
func_danc Function rating: "for dancing"
Average rating for "Think of the singers. I think that the singers...", on a scale of (1) "Definitely do not use the song for dancing" to (6) "Definitely use the song for dancing"
#
func_heal Function rating: "to heal illness"
Average rating for "Think of the singers. I think that the singers...", on a scale of (1) "Definitely do not use the song to heal illness" to (6) "Definitely use the song to heal illness"
#
func_baby Function rating: "to soothe a baby"
Average rating for "Think of the singers. I think that the singers...", on a scale of (1) "Definitely do not use the song to soothe a baby" to (6) "Definitely use the song to soothe a baby"
#
func_love Function rating: "to express love to another person"
Average rating for "Think of the singers. I think that the singers...", on a scale of (1) "Definitely do not use the song to express love to another person" to (6) "Definitely use the song to express love to another person"
#
func_dead Function rating: "to mourn the dead"
Average rating for "Think of the singers. I think that the singers...", on a scale of (1) "Definitely do not use the song to mourn the dead" to (6) "Definitely use the song to mourn the dead"
#
func_stor Function rating: "to tell a story"
Average rating for "Think of the singers. I think that the singers...", on a scale of (1) "Definitely do not use the song to tell a story" to (6) "Definitely use the song to tell a story"
#
form_sing Form rating: Number of singers
Average rating for "How many singers do you hear?", on a scale of 1 to 6, where 6 means "More than 5"
#
form_gend Form rating: Gender of singers
Average rating for "What is the gender of the singer or singers?", where -1 means "Male" and 1 means "Female"
#
form_inst Form rating: Number of instruments
Average rating for "How many musical instruments do you hear?", not including singers, from (0) "No instruments" to (5) "5 or more instruments"
#
form_melo Form rating: Melodic complexity
Average rating for "How complex is the melody?", from (1) "Very simple" to (6) "Very complex"
#
form_rhyt Form rating: Rhythmic complexity
Average rating for "How complex are the rhythms?", from (1) "Very simple" to (6) "Very complex"
#
form_fast Form rating: Tempo Average rating for "How fast is this song?", from (1) "Very slow" to (6) "Very fast" # form_beat Form rating: Steadiness
of beat Average rating for "How steady is the beat in this song?", from (1) "Very unsteady beat" to (6) "Very steady beat"
#
form_exci Form rating: Arousal Average rating for "How exciting is this song?", from (1) "Not exciting at all" to (6) "Very exciting"
#
form_happ Form rating: Valence Average rating for "How happy is this song?", from (1) "Very sad" to (6) "Very happy" # form_plea Form rating: Pleasantness Average rating for "How pleasant is this song?", from (1) "Very unpleasant" to (6) "Very
pleasant" #
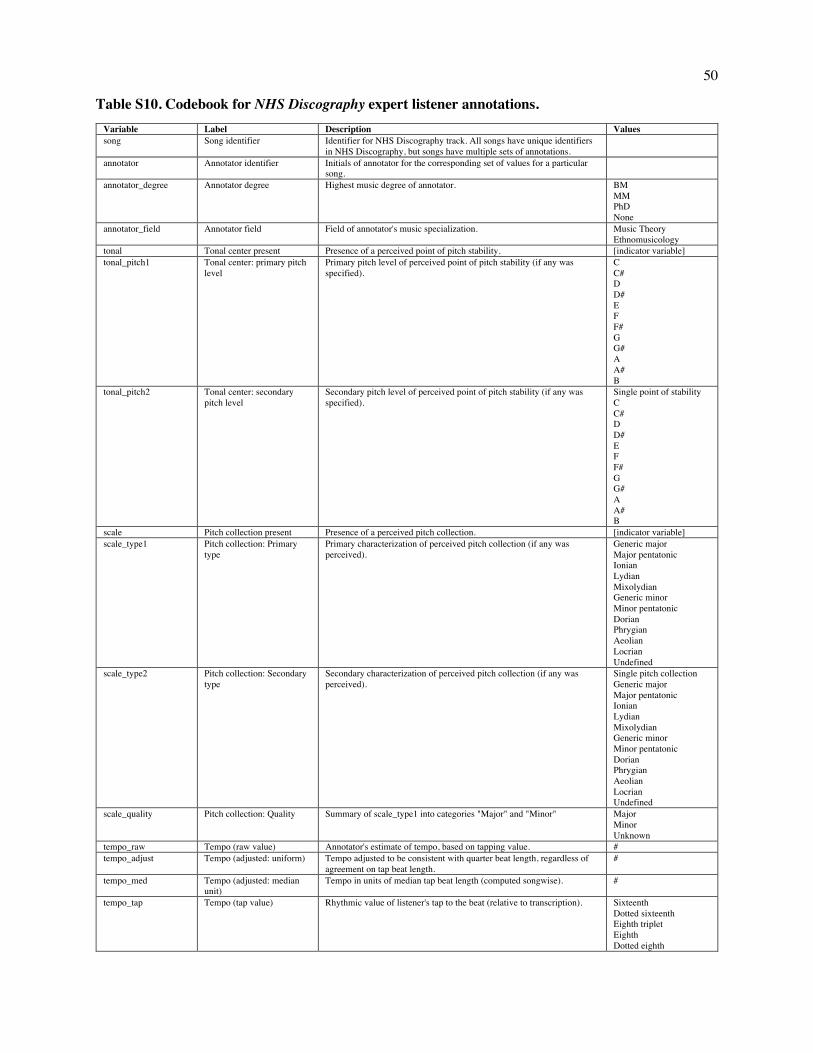
50
Table S10. Codebook for NHS Discography expert listener annotations.
Variable Label Description Values song Song identifier Identifier for NHS Discography track. All songs have unique identifiers
in NHS Discography, but songs have multiple sets of annotations.
annotator Annotator identifier Initials of annotator for the corresponding set of values for a particular song.
annotator_degree Annotator degree Highest music degree of annotator. BM MM PhD None
annotator_field Annotator field Field of annotator's music specialization. Music Theory Ethnomusicology
tonal Tonal center present Presence of a perceived point of pitch stability. [indicator variable] tonal_pitch1 Tonal center: primary pitch
level Primary pitch level of perceived point of pitch stability (if any was specified).
C C# D D# E F F# G G# A A# B
tonal_pitch2 Tonal center: secondary pitch level
Secondary pitch level of perceived point of pitch stability (if any was specified).
Single point of stability C C# D D# E F F# G G# A A# B
scale Pitch collection present Presence of a perceived pitch collection. [indicator variable] scale_type1 Pitch collection: Primary
type Primary characterization of perceived pitch collection (if any was perceived).
Generic major Major pentatonic Ionian Lydian Mixolydian Generic minor Minor pentatonic Dorian Phrygian Aeolian Locrian Undefined
scale_type2 Pitch collection: Secondary type
Secondary characterization of perceived pitch collection (if any was perceived).
Single pitch collection Generic major Major pentatonic Ionian Lydian Mixolydian Generic minor Minor pentatonic Dorian Phrygian Aeolian Locrian Undefined
scale_quality Pitch collection: Quality Summary of scale_type1 into categories "Major" and "Minor" Major Minor Unknown
tempo_raw Tempo (raw value) Annotator's estimate of tempo, based on tapping value. # tempo_adjust Tempo (adjusted: uniform) Tempo adjusted to be consistent with quarter beat length, regardless of
agreement on tap beat length. #
tempo_med Tempo (adjusted: median unit)
Tempo in units of median tap beat length (computed songwise). #
tempo_tap Tempo (tap value) Rhythmic value of listener's tap to the beat (relative to transcription). Sixteenth Dotted sixteenth Eighth triplet Eighth Dotted eighth
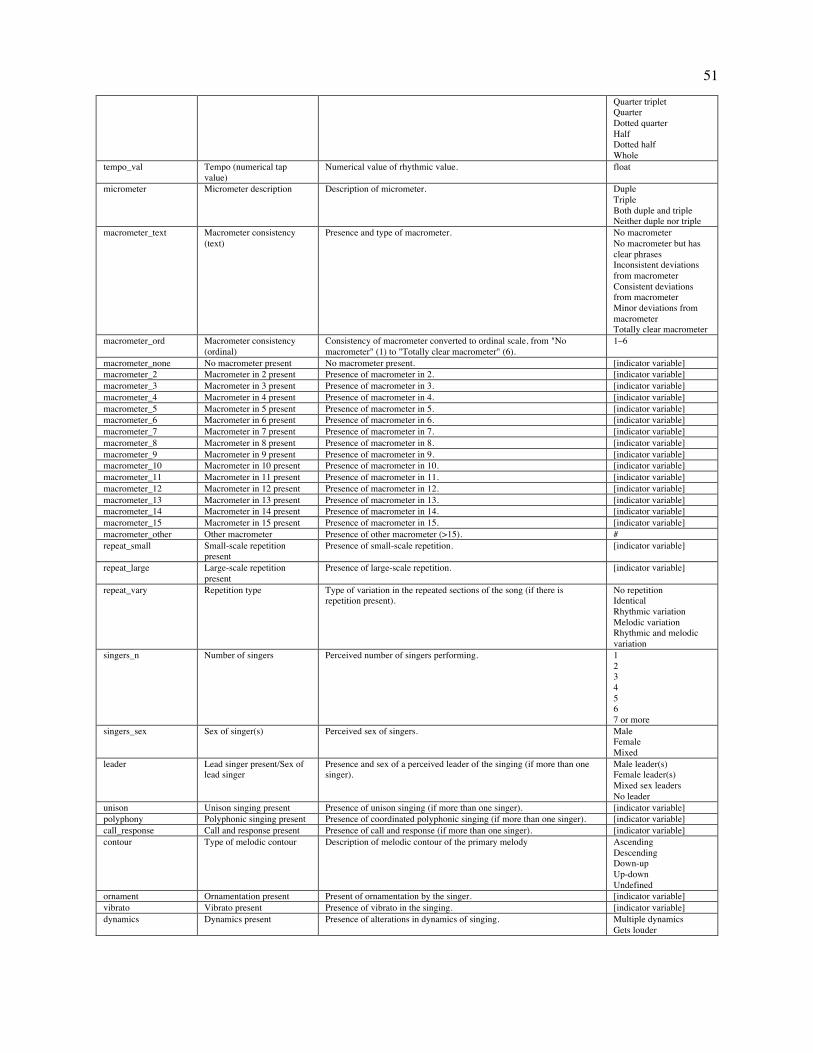
51
Quarter triplet Quarter Dotted quarter Half Dotted half Whole
tempo_val Tempo (numerical tap value)
Numerical value of rhythmic value. float
micrometer Micrometer description Description of micrometer. Duple Triple Both duple and triple Neither duple nor triple
macrometer_text Macrometer consistency (text)
Presence and type of macrometer. No macrometer No macrometer but has clear phrases Inconsistent deviations from macrometer Consistent deviations from macrometer Minor deviations from macrometer Totally clear macrometer
macrometer_ord Macrometer consistency (ordinal)
Consistency of macrometer converted to ordinal scale, from "No macrometer" (1) to "Totally clear macrometer" (6).
1–6
macrometer_none No macrometer present No macrometer present. [indicator variable] macrometer_2 Macrometer in 2 present Presence of macrometer in 2. [indicator variable] macrometer_3 Macrometer in 3 present Presence of macrometer in 3. [indicator variable] macrometer_4 Macrometer in 4 present Presence of macrometer in 4. [indicator variable] macrometer_5 Macrometer in 5 present Presence of macrometer in 5. [indicator variable] macrometer_6 Macrometer in 6 present Presence of macrometer in 6. [indicator variable] macrometer_7 Macrometer in 7 present Presence of macrometer in 7. [indicator variable] macrometer_8 Macrometer in 8 present Presence of macrometer in 8. [indicator variable] macrometer_9 Macrometer in 9 present Presence of macrometer in 9. [indicator variable] macrometer_10 Macrometer in 10 present Presence of macrometer in 10. [indicator variable] macrometer_11 Macrometer in 11 present Presence of macrometer in 11. [indicator variable] macrometer_12 Macrometer in 12 present Presence of macrometer in 12. [indicator variable] macrometer_13 Macrometer in 13 present Presence of macrometer in 13. [indicator variable] macrometer_14 Macrometer in 14 present Presence of macrometer in 14. [indicator variable] macrometer_15 Macrometer in 15 present Presence of macrometer in 15. [indicator variable] macrometer_other Other macrometer Presence of other macrometer (>15). # repeat_small Small-scale repetition
present Presence of small-scale repetition. [indicator variable]
repeat_large Large-scale repetition present
Presence of large-scale repetition. [indicator variable]
repeat_vary Repetition type Type of variation in the repeated sections of the song (if there is repetition present).
No repetition Identical Rhythmic variation Melodic variation Rhythmic and melodic variation
singers_n Number of singers Perceived number of singers performing. 1 2 3 4 5 6 7 or more
singers_sex Sex of singer(s) Perceived sex of singers. Male Female Mixed
leader Lead singer present/Sex of lead singer
Presence and sex of a perceived leader of the singing (if more than one singer).
Male leader(s) Female leader(s) Mixed sex leaders No leader
unison Unison singing present Presence of unison singing (if more than one singer). [indicator variable] polyphony Polyphonic singing present Presence of coordinated polyphonic singing (if more than one singer). [indicator variable] call_response Call and response present Presence of call and response (if more than one singer). [indicator variable] contour Type of melodic contour Description of melodic contour of the primary melody Ascending
Descending Down-up Up-down Undefined
ornament Ornamentation present Present of ornamentation by the singer. [indicator variable] vibrato Vibrato present Presence of vibrato in the singing. [indicator variable] dynamics Dynamics present Presence of alterations in dynamics of singing. Multiple dynamics
Gets louder
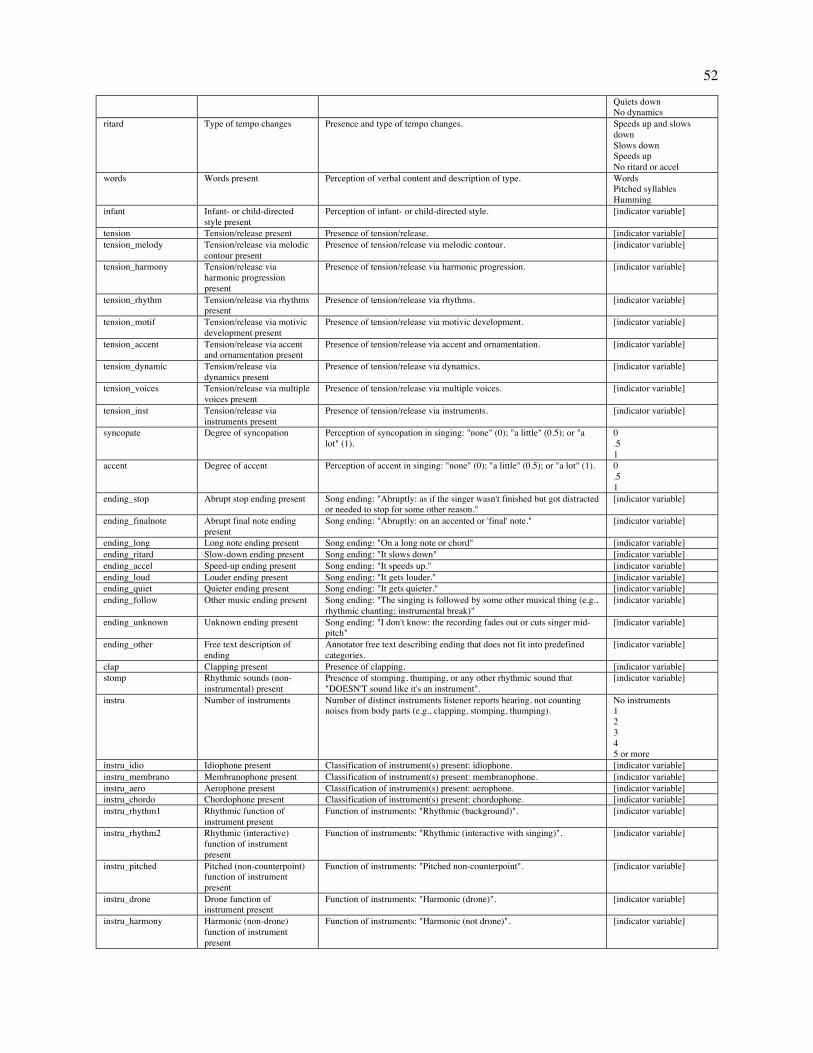
52
Quiets down No dynamics
ritard Type of tempo changes Presence and type of tempo changes. Speeds up and slows down Slows down Speeds up No ritard or accel
words Words present Perception of verbal content and description of type. Words Pitched syllables Humming
infant Infant- or child-directed style present
Perception of infant- or child-directed style. [indicator variable]
tension Tension/release present Presence of tension/release. [indicator variable] tension_melody Tension/release via melodic
contour present Presence of tension/release via melodic contour. [indicator variable]
tension_harmony Tension/release via harmonic progression present
Presence of tension/release via harmonic progression. [indicator variable]
tension_rhythm Tension/release via rhythms present
Presence of tension/release via rhythms. [indicator variable]
tension_motif Tension/release via motivic development present
Presence of tension/release via motivic development. [indicator variable]
tension_accent Tension/release via accent and ornamentation present
Presence of tension/release via accent and ornamentation. [indicator variable]
tension_dynamic Tension/release via dynamics present
Presence of tension/release via dynamics. [indicator variable]
tension_voices Tension/release via multiple voices present
Presence of tension/release via multiple voices. [indicator variable]
tension_inst Tension/release via instruments present
Presence of tension/release via instruments. [indicator variable]
syncopate Degree of syncopation Perception of syncopation in singing: "none" (0); "a little" (0.5); or "a lot" (1).
0 .5 1
accent Degree of accent Perception of accent in singing: "none" (0); "a little" (0.5); or "a lot" (1). 0 .5 1
ending_stop Abrupt stop ending present Song ending: "Abruptly: as if the singer wasn't finished but got distracted or needed to stop for some other reason."
[indicator variable]
ending_finalnote Abrupt final note ending present
Song ending: "Abruptly: on an accented or 'final' note." [indicator variable]
ending_long Long note ending present Song ending: "On a long note or chord" [indicator variable] ending_ritard Slow-down ending present Song ending: "It slows down" [indicator variable] ending_accel Speed-up ending present Song ending: "It speeds up." [indicator variable] ending_loud Louder ending present Song ending: "It gets louder." [indicator variable] ending_quiet Quieter ending present Song ending: "It gets quieter." [indicator variable] ending_follow Other music ending present Song ending: "The singing is followed by some other musical thing (e.g.,
rhythmic chanting; instrumental break)" [indicator variable]
ending_unknown Unknown ending present Song ending: "I don't know: the recording fades out or cuts singer mid-pitch"
[indicator variable]
ending_other Free text description of ending
Annotator free text describing ending that does not fit into predefined categories.
[indicator variable]
clap Clapping present Presence of clapping. [indicator variable] stomp Rhythmic sounds (non-
instrumental) present Presence of stomping, thumping, or any other rhythmic sound that "DOESN'T sound like it's an instrument".
[indicator variable]
instru Number of instruments Number of distinct instruments listener reports hearing, not counting noises from body parts (e.g., clapping, stomping, thumping).
No instruments 1 2 3 4 5 or more
instru_idio Idiophone present Classification of instrument(s) present: idiophone. [indicator variable] instru_membrano Membranophone present Classification of instrument(s) present: membranophone. [indicator variable] instru_aero Aerophone present Classification of instrument(s) present: aerophone. [indicator variable] instru_chordo Chordophone present Classification of instrument(s) present: chordophone. [indicator variable] instru_rhythm1 Rhythmic function of
instrument present Function of instruments: "Rhythmic (background)". [indicator variable]
instru_rhythm2 Rhythmic (interactive) function of instrument present
Function of instruments: "Rhythmic (interactive with singing)". [indicator variable]
instru_pitched Pitched (non-counterpoint) function of instrument present
Function of instruments: "Pitched non-counterpoint". [indicator variable]
instru_drone Drone function of instrument present
Function of instruments: "Harmonic (drone)". [indicator variable]
instru_harmony Harmonic (non-drone) function of instrument present
Function of instruments: "Harmonic (not drone)". [indicator variable]
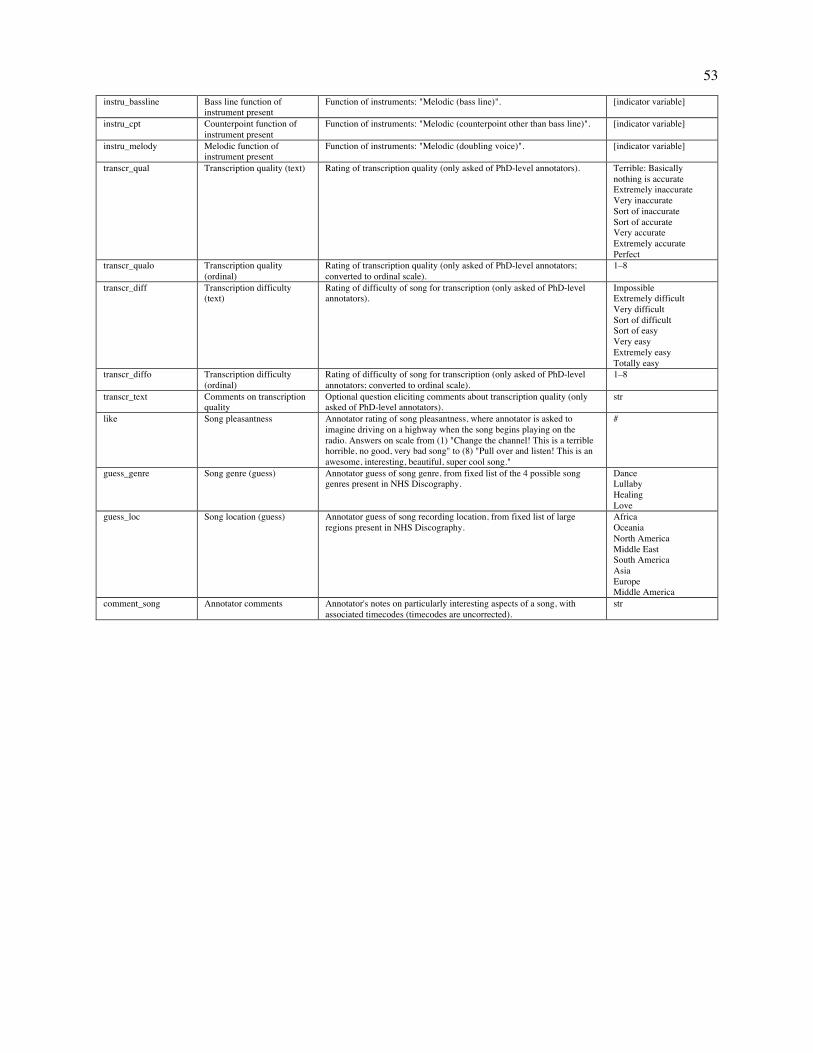
53
instru_bassline Bass line function of instrument present
Function of instruments: "Melodic (bass line)". [indicator variable]
instru_cpt Counterpoint function of instrument present
Function of instruments: "Melodic (counterpoint other than bass line)". [indicator variable]
instru_melody Melodic function of instrument present
Function of instruments: "Melodic (doubling voice)". [indicator variable]
transcr_qual Transcription quality (text) Rating of transcription quality (only asked of PhD-level annotators). Terrible: Basically nothing is accurate Extremely inaccurate Very inaccurate Sort of inaccurate Sort of accurate Very accurate Extremely accurate Perfect
transcr_qualo Transcription quality (ordinal)
Rating of transcription quality (only asked of PhD-level annotators; converted to ordinal scale).
1–8
transcr_diff Transcription difficulty (text)
Rating of difficulty of song for transcription (only asked of PhD-level annotators).
Impossible Extremely difficult Very difficult Sort of difficult Sort of easy Very easy Extremely easy Totally easy
transcr_diffo Transcription difficulty (ordinal)
Rating of difficulty of song for transcription (only asked of PhD-level annotators; converted to ordinal scale).
1–8
transcr_text Comments on transcription quality
Optional question eliciting comments about transcription quality (only asked of PhD-level annotators).
str
like Song pleasantness Annotator rating of song pleasantness, where annotator is asked to imagine driving on a highway when the song begins playing on the radio. Answers on scale from (1) "Change the channel! This is a terrible horrible, no good, very bad song" to (8) "Pull over and listen! This is an awesome, interesting, beautiful, super cool song."
#
guess_genre Song genre (guess) Annotator guess of song genre, from fixed list of the 4 possible song genres present in NHS Discography.
Dance Lullaby Healing Love
guess_loc Song location (guess) Annotator guess of song recording location, from fixed list of large regions present in NHS Discography.
Africa Oceania North America Middle East South America Asia Europe Middle America
comment_song Annotator comments Annotator's notes on particularly interesting aspects of a song, with associated timecodes (timecodes are uncorrected).
str
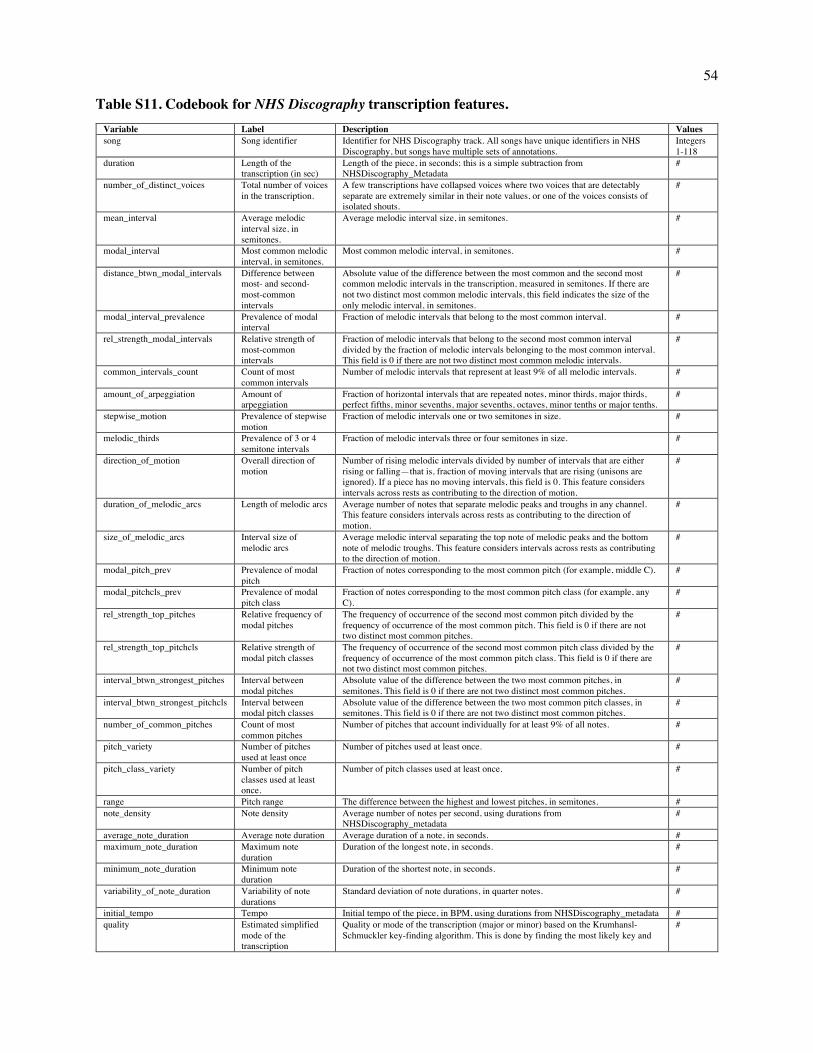
54
Table S11. Codebook for NHS Discography transcription features.
Variable Label Description Values song Song identifier Identifier for NHS Discography track. All songs have unique identifiers in NHS
Discography, but songs have multiple sets of annotations. Integers 1-118
duration Length of the transcription (in sec)
Length of the piece, in seconds; this is a simple subtraction from NHSDiscography_Metadata
#
number_of_distinct_voices Total number of voices in the transcription.
A few transcriptions have collapsed voices where two voices that are detectably separate are extremely similar in their note values, or one of the voices consists of isolated shouts.
#
mean_interval Average melodic interval size, in semitones.
Average melodic interval size, in semitones. #
modal_interval Most common melodic interval, in semitones.
Most common melodic interval, in semitones. #
distance_btwn_modal_intervals Difference between most- and second-most-common intervals
Absolute value of the difference between the most common and the second most common melodic intervals in the transcription, measured in semitones. If there are not two distinct most common melodic intervals, this field indicates the size of the only melodic interval, in semitones.
#
modal_interval_prevalence Prevalence of modal interval
Fraction of melodic intervals that belong to the most common interval. #
rel_strength_modal_intervals Relative strength of most-common intervals
Fraction of melodic intervals that belong to the second most common interval divided by the fraction of melodic intervals belonging to the most common interval. This field is 0 if there are not two distinct most common melodic intervals.
#
common_intervals_count Count of most common intervals
Number of melodic intervals that represent at least 9% of all melodic intervals. #
amount_of_arpeggiation Amount of arpeggiation
Fraction of horizontal intervals that are repeated notes, minor thirds, major thirds, perfect fifths, minor sevenths, major sevenths, octaves, minor tenths or major tenths.
#
stepwise_motion Prevalence of stepwise motion
Fraction of melodic intervals one or two semitones in size. #
melodic_thirds Prevalence of 3 or 4 semitone intervals
Fraction of melodic intervals three or four semitones in size. #
direction_of_motion Overall direction of motion
Number of rising melodic intervals divided by number of intervals that are either rising or falling—that is, fraction of moving intervals that are rising (unisons are ignored). If a piece has no moving intervals, this field is 0. This feature considers intervals across rests as contributing to the direction of motion.
#
duration_of_melodic_arcs Length of melodic arcs Average number of notes that separate melodic peaks and troughs in any channel. This feature considers intervals across rests as contributing to the direction of motion.
#
size_of_melodic_arcs Interval size of melodic arcs
Average melodic interval separating the top note of melodic peaks and the bottom note of melodic troughs. This feature considers intervals across rests as contributing to the direction of motion.
#
modal_pitch_prev Prevalence of modal pitch
Fraction of notes corresponding to the most common pitch (for example, middle C). #
modal_pitchcls_prev Prevalence of modal pitch class
Fraction of notes corresponding to the most common pitch class (for example, any C).
#
rel_strength_top_pitches Relative frequency of modal pitches
The frequency of occurrence of the second most common pitch divided by the frequency of occurrence of the most common pitch. This field is 0 if there are not two distinct most common pitches.
#
rel_strength_top_pitchcls Relative strength of modal pitch classes
The frequency of occurrence of the second most common pitch class divided by the frequency of occurrence of the most common pitch class. This field is 0 if there are not two distinct most common pitches.
#
interval_btwn_strongest_pitches Interval between modal pitches
Absolute value of the difference between the two most common pitches, in semitones. This field is 0 if there are not two distinct most common pitches.
#
interval_btwn_strongest_pitchcls Interval between modal pitch classes
Absolute value of the difference between the two most common pitch classes, in semitones. This field is 0 if there are not two distinct most common pitches.
#
number_of_common_pitches Count of most common pitches
Number of pitches that account individually for at least 9% of all notes. #
pitch_variety Number of pitches used at least once
Number of pitches used at least once. #
pitch_class_variety Number of pitch classes used at least once.
Number of pitch classes used at least once. #
range Pitch range The difference between the highest and lowest pitches, in semitones. # note_density Note density Average number of notes per second, using durations from
NHSDiscography_metadata #
average_note_duration Average note duration Average duration of a note, in seconds. # maximum_note_duration Maximum note
duration Duration of the longest note, in seconds. #
minimum_note_duration Minimum note duration
Duration of the shortest note, in seconds. #
variability_of_note_duration Variability of note durations
Standard deviation of note durations, in quarter notes. #
initial_tempo Tempo Initial tempo of the piece, in BPM, using durations from NHSDiscography_metadata # quality Estimated simplified
mode of the transcription
Quality or mode of the transcription (major or minor) based on the Krumhansl-Schmuckler key-finding algorithm. This is done by finding the most likely key and
#
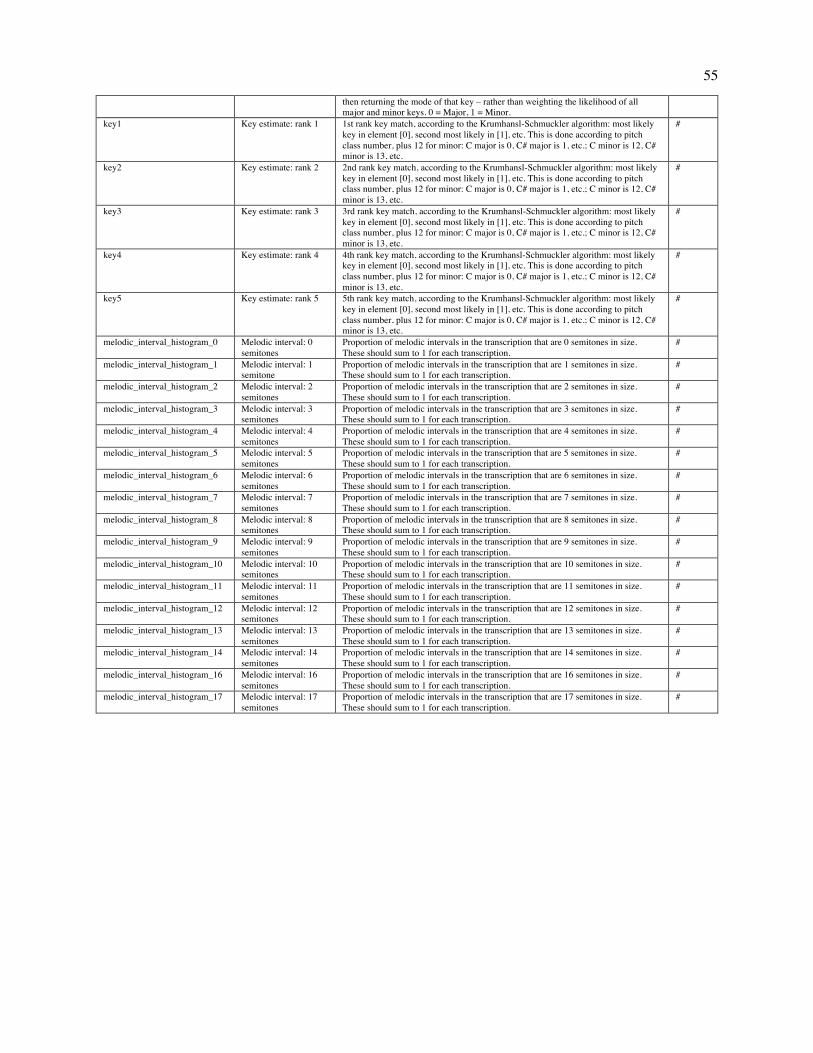
55
then returning the mode of that key – rather than weighting the likelihood of all major and minor keys. 0 = Major, 1 = Minor.
key1 Key estimate: rank 1 1st rank key match, according to the Krumhansl-Schmuckler algorithm: most likely key in element [0], second most likely in [1], etc. This is done according to pitch class number, plus 12 for minor: C major is 0, C# major is 1, etc.; C minor is 12, C# minor is 13, etc.
#
key2 Key estimate: rank 2 2nd rank key match, according to the Krumhansl-Schmuckler algorithm: most likely key in element [0], second most likely in [1], etc. This is done according to pitch class number, plus 12 for minor: C major is 0, C# major is 1, etc.; C minor is 12, C# minor is 13, etc.
#
key3 Key estimate: rank 3 3rd rank key match, according to the Krumhansl-Schmuckler algorithm: most likely key in element [0], second most likely in [1], etc. This is done according to pitch class number, plus 12 for minor: C major is 0, C# major is 1, etc.; C minor is 12, C# minor is 13, etc.
#
key4 Key estimate: rank 4 4th rank key match, according to the Krumhansl-Schmuckler algorithm: most likely key in element [0], second most likely in [1], etc. This is done according to pitch class number, plus 12 for minor: C major is 0, C# major is 1, etc.; C minor is 12, C# minor is 13, etc.
#
key5 Key estimate: rank 5 5th rank key match, according to the Krumhansl-Schmuckler algorithm: most likely key in element [0], second most likely in [1], etc. This is done according to pitch class number, plus 12 for minor: C major is 0, C# major is 1, etc.; C minor is 12, C# minor is 13, etc.
#
melodic_interval_histogram_0 Melodic interval: 0 semitones
Proportion of melodic intervals in the transcription that are 0 semitones in size. These should sum to 1 for each transcription.
#
melodic_interval_histogram_1 Melodic interval: 1 semitone
Proportion of melodic intervals in the transcription that are 1 semitones in size. These should sum to 1 for each transcription.
#
melodic_interval_histogram_2 Melodic interval: 2 semitones
Proportion of melodic intervals in the transcription that are 2 semitones in size. These should sum to 1 for each transcription.
#
melodic_interval_histogram_3 Melodic interval: 3 semitones
Proportion of melodic intervals in the transcription that are 3 semitones in size. These should sum to 1 for each transcription.
#
melodic_interval_histogram_4 Melodic interval: 4 semitones
Proportion of melodic intervals in the transcription that are 4 semitones in size. These should sum to 1 for each transcription.
#
melodic_interval_histogram_5 Melodic interval: 5 semitones
Proportion of melodic intervals in the transcription that are 5 semitones in size. These should sum to 1 for each transcription.
#
melodic_interval_histogram_6 Melodic interval: 6 semitones
Proportion of melodic intervals in the transcription that are 6 semitones in size. These should sum to 1 for each transcription.
#
melodic_interval_histogram_7 Melodic interval: 7 semitones
Proportion of melodic intervals in the transcription that are 7 semitones in size. These should sum to 1 for each transcription.
#
melodic_interval_histogram_8 Melodic interval: 8 semitones
Proportion of melodic intervals in the transcription that are 8 semitones in size. These should sum to 1 for each transcription.
#
melodic_interval_histogram_9 Melodic interval: 9 semitones
Proportion of melodic intervals in the transcription that are 9 semitones in size. These should sum to 1 for each transcription.
#
melodic_interval_histogram_10 Melodic interval: 10 semitones
Proportion of melodic intervals in the transcription that are 10 semitones in size. These should sum to 1 for each transcription.
#
melodic_interval_histogram_11 Melodic interval: 11 semitones
Proportion of melodic intervals in the transcription that are 11 semitones in size. These should sum to 1 for each transcription.
#
melodic_interval_histogram_12 Melodic interval: 12 semitones
Proportion of melodic intervals in the transcription that are 12 semitones in size. These should sum to 1 for each transcription.
#
melodic_interval_histogram_13 Melodic interval: 13 semitones
Proportion of melodic intervals in the transcription that are 13 semitones in size. These should sum to 1 for each transcription.
#
melodic_interval_histogram_14 Melodic interval: 14 semitones
Proportion of melodic intervals in the transcription that are 14 semitones in size. These should sum to 1 for each transcription.
#
melodic_interval_histogram_16 Melodic interval: 16 semitones
Proportion of melodic intervals in the transcription that are 16 semitones in size. These should sum to 1 for each transcription.
#
melodic_interval_histogram_17 Melodic interval: 17 semitones
Proportion of melodic intervals in the transcription that are 17 semitones in size. These should sum to 1 for each transcription.
#
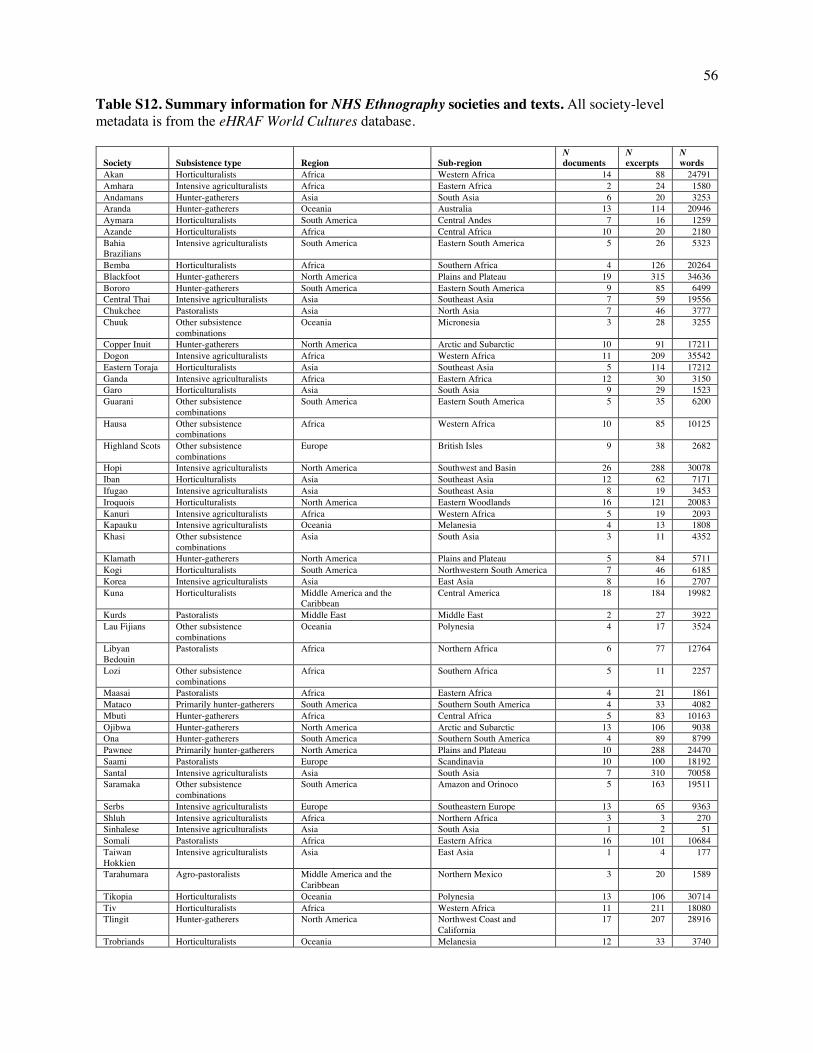
56
Table S12. Summary information for NHS Ethnography societies and texts. All society-level metadata is from the eHRAF World Cultures database.
Society Subsistence type Region Sub-region N documents
N excerpts
N words
Akan Horticulturalists Africa Western Africa 14 88 24791 Amhara Intensive agriculturalists Africa Eastern Africa 2 24 1580 Andamans Hunter-gatherers Asia South Asia 6 20 3253 Aranda Hunter-gatherers Oceania Australia 13 114 20946 Aymara Horticulturalists South America Central Andes 7 16 1259 Azande Horticulturalists Africa Central Africa 10 20 2180 Bahia Brazilians
Intensive agriculturalists South America Eastern South America 5 26 5323
Bemba Horticulturalists Africa Southern Africa 4 126 20264 Blackfoot Hunter-gatherers North America Plains and Plateau 19 315 34636 Bororo Hunter-gatherers South America Eastern South America 9 85 6499 Central Thai Intensive agriculturalists Asia Southeast Asia 7 59 19556 Chukchee Pastoralists Asia North Asia 7 46 3777 Chuuk Other subsistence
combinations Oceania Micronesia 3 28 3255
Copper Inuit Hunter-gatherers North America Arctic and Subarctic 10 91 17211 Dogon Intensive agriculturalists Africa Western Africa 11 209 35542 Eastern Toraja Horticulturalists Asia Southeast Asia 5 114 17212 Ganda Intensive agriculturalists Africa Eastern Africa 12 30 3150 Garo Horticulturalists Asia South Asia 9 29 1523 Guarani Other subsistence
combinations South America Eastern South America 5 35 6200
Hausa Other subsistence combinations
Africa Western Africa 10 85 10125
Highland Scots Other subsistence combinations
Europe British Isles 9 38 2682
Hopi Intensive agriculturalists North America Southwest and Basin 26 288 30078 Iban Horticulturalists Asia Southeast Asia 12 62 7171 Ifugao Intensive agriculturalists Asia Southeast Asia 8 19 3453 Iroquois Horticulturalists North America Eastern Woodlands 16 121 20083 Kanuri Intensive agriculturalists Africa Western Africa 5 19 2093 Kapauku Intensive agriculturalists Oceania Melanesia 4 13 1808 Khasi Other subsistence
combinations Asia South Asia 3 11 4352
Klamath Hunter-gatherers North America Plains and Plateau 5 84 5711 Kogi Horticulturalists South America Northwestern South America 7 46 6185 Korea Intensive agriculturalists Asia East Asia 8 16 2707 Kuna Horticulturalists Middle America and the
Caribbean Central America 18 184 19982
Kurds Pastoralists Middle East Middle East 2 27 3922 Lau Fijians Other subsistence
combinations Oceania Polynesia 4 17 3524
Libyan Bedouin
Pastoralists Africa Northern Africa 6 77 12764
Lozi Other subsistence combinations
Africa Southern Africa 5 11 2257
Maasai Pastoralists Africa Eastern Africa 4 21 1861 Mataco Primarily hunter-gatherers South America Southern South America 4 33 4082 Mbuti Hunter-gatherers Africa Central Africa 5 83 10163 Ojibwa Hunter-gatherers North America Arctic and Subarctic 13 106 9038 Ona Hunter-gatherers South America Southern South America 4 89 8799 Pawnee Primarily hunter-gatherers North America Plains and Plateau 10 288 24470 Saami Pastoralists Europe Scandinavia 10 100 18192 Santal Intensive agriculturalists Asia South Asia 7 310 70058 Saramaka Other subsistence
combinations South America Amazon and Orinoco 5 163 19511
Serbs Intensive agriculturalists Europe Southeastern Europe 13 65 9363 Shluh Intensive agriculturalists Africa Northern Africa 3 3 270 Sinhalese Intensive agriculturalists Asia South Asia 1 2 51 Somali Pastoralists Africa Eastern Africa 16 101 10684 Taiwan Hokkien
Intensive agriculturalists Asia East Asia 1 4 177
Tarahumara Agro-pastoralists Middle America and the Caribbean
Northern Mexico 3 20 1589
Tikopia Horticulturalists Oceania Polynesia 13 106 30714 Tiv Horticulturalists Africa Western Africa 11 211 18080 Tlingit Hunter-gatherers North America Northwest Coast and
California 17 207 28916
Trobriands Horticulturalists Oceania Melanesia 12 33 3740
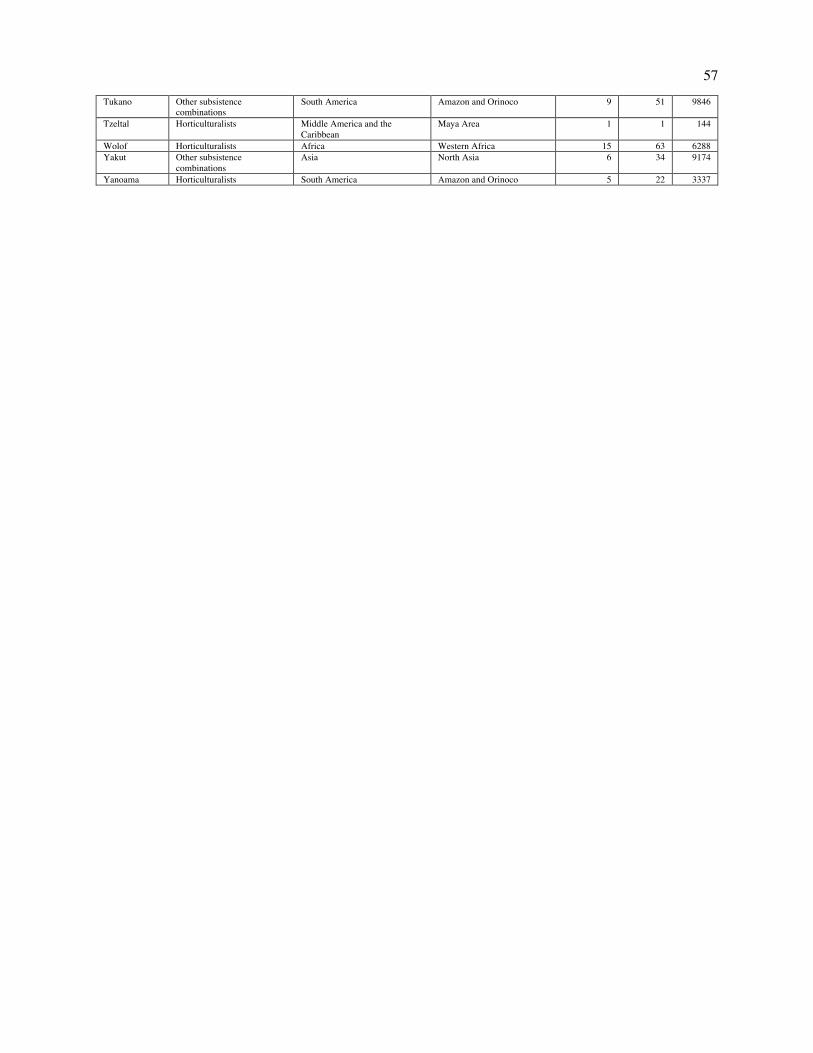
57
Tukano Other subsistence combinations
South America Amazon and Orinoco 9 51 9846
Tzeltal Horticulturalists Middle America and the Caribbean
Maya Area 1 1 144
Wolof Horticulturalists Africa Western Africa 15 63 6288 Yakut Other subsistence
combinations Asia North Asia 6 34 9174
Yanoama Horticulturalists South America Amazon and Orinoco 5 22 3337
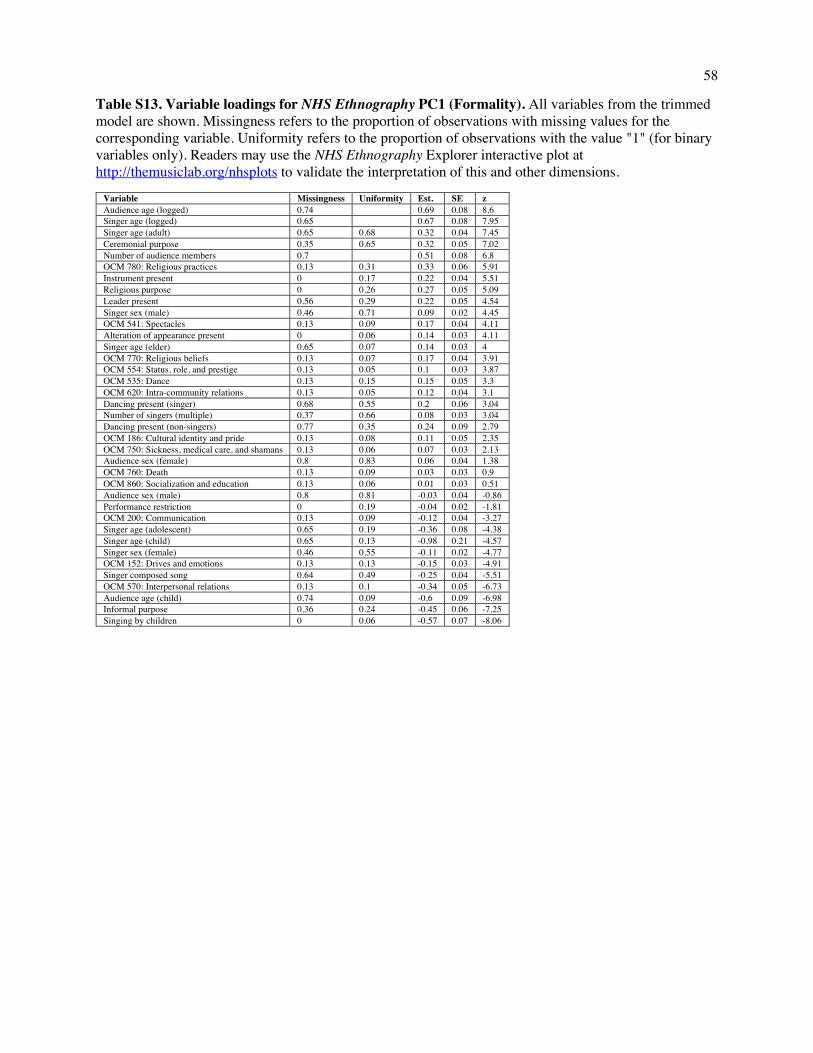
58
Table S13. Variable loadings for NHS Ethnography PC1 (Formality). All variables from the trimmed model are shown. Missingness refers to the proportion of observations with missing values for the corresponding variable. Uniformity refers to the proportion of observations with the value "1" (for binary variables only). Readers may use the NHS Ethnography Explorer interactive plot at http://themusiclab.org/nhsplots to validate the interpretation of this and other dimensions.
Variable Missingness Uniformity Est. SE z Audience age (logged) 0.74 0.69 0.08 8.6 Singer age (logged) 0.65 0.67 0.08 7.95 Singer age (adult) 0.65 0.68 0.32 0.04 7.45 Ceremonial purpose 0.35 0.65 0.32 0.05 7.02 Number of audience members 0.7 0.51 0.08 6.8 OCM 780: Religious practices 0.13 0.31 0.33 0.06 5.91 Instrument present 0 0.17 0.22 0.04 5.51 Religious purpose 0 0.26 0.27 0.05 5.09 Leader present 0.56 0.29 0.22 0.05 4.54 Singer sex (male) 0.46 0.71 0.09 0.02 4.45 OCM 541: Spectacles 0.13 0.09 0.17 0.04 4.11 Alteration of appearance present 0 0.06 0.14 0.03 4.11 Singer age (elder) 0.65 0.07 0.14 0.03 4 OCM 770: Religious beliefs 0.13 0.07 0.17 0.04 3.91 OCM 554: Status, role, and prestige 0.13 0.05 0.1 0.03 3.87 OCM 535: Dance 0.13 0.15 0.15 0.05 3.3 OCM 620: Intra-community relations 0.13 0.05 0.12 0.04 3.1 Dancing present (singer) 0.68 0.55 0.2 0.06 3.04 Number of singers (multiple) 0.37 0.66 0.08 0.03 3.04 Dancing present (non-singers) 0.77 0.35 0.24 0.09 2.79 OCM 186: Cultural identity and pride 0.13 0.08 0.11 0.05 2.35 OCM 750: Sickness, medical care, and shamans 0.13 0.06 0.07 0.03 2.13 Audience sex (female) 0.8 0.83 0.06 0.04 1.38 OCM 760: Death 0.13 0.09 0.03 0.03 0.9 OCM 860: Socialization and education 0.13 0.06 0.01 0.03 0.51 Audience sex (male) 0.8 0.81 -0.03 0.04 -0.86 Performance restriction 0 0.19 -0.04 0.02 -1.81 OCM 200: Communication 0.13 0.09 -0.12 0.04 -3.27 Singer age (adolescent) 0.65 0.19 -0.36 0.08 -4.38 Singer age (child) 0.65 0.13 -0.98 0.21 -4.57 Singer sex (female) 0.46 0.55 -0.11 0.02 -4.77 OCM 152: Drives and emotions 0.13 0.13 -0.15 0.03 -4.91 Singer composed song 0.64 0.49 -0.25 0.04 -5.51 OCM 570: Interpersonal relations 0.13 0.1 -0.34 0.05 -6.73 Audience age (child) 0.74 0.09 -0.6 0.09 -6.98 Informal purpose 0.36 0.24 -0.45 0.06 -7.25 Singing by children 0 0.06 -0.57 0.07 -8.06

59
Table S14. Variable loadings for NHS Ethnography PC2 (Arousal). All variables from the trimmed model are shown. Missingness refers to the proportion of observations with missing values for the corresponding variable. Uniformity refers to the proportion of observations with the value "1" (for binary variables only). Readers may use the NHS Ethnography Explorer interactive plot at http://themusiclab.org/nhsplots to validate the interpretation of this and other dimensions.
Variable Missingness Uniformity Est. SE z OCM 535: Dance 0.13 0.15 0.43 0.06 7.53 Alteration of appearance present 0 0.06 0.3 0.04 7.43 Instrument present 0 0.17 0.3 0.04 7.33 Number of singers (multiple) 0.37 0.66 0.21 0.03 6.62 Leader present 0.56 0.29 0.3 0.05 6.13 OCM 860: Socialization and education 0.13 0.06 0.22 0.04 6.07 Dancing present (singer) 0.68 0.55 0.45 0.07 5.96 Singing by children 0 0.06 0.27 0.05 5.9 Number of audience members (logged) 0.7
0.37 0.06 5.85
Dancing present (non-singers) 0.77 0.35 0.58 0.1 5.67 OCM 780: Religious practices 0.13 0.31 0.2 0.04 5.31 Ceremonial purpose 0.35 0.65 0.15 0.03 5.05 Singer age (child) 0.65 0.13 0.88 0.2 4.45 Performance restriction 0 0.19 0.11 0.02 4.26 Singer sex (female) 0.46 0.55 0.07 0.02 2.96 Audience sex (female) 0.8 0.83 0.08 0.03 2.23 Religious purpose 0 0.26 0.06 0.03 1.87 Audience age (child) 0.74 0.09 0.09 0.05 1.69 OCM 186: Cultural identity and pride 0.13 0.08 0.02 0.04 0.61 OCM 541: Spectacles 0.13 0.09 0 0.03 0.04 Singer sex (male) 0.46 0.71 -0.01 0.02 -0.46 Audience age (logged) 0.74
-0.03 0.05 -0.64
OCM 770: Religious beliefs 0.13 0.07 -0.03 0.03 -0.86 Singer age (adolescent) 0.65 0.19 -0.08 0.06 -1.41 Audience sex (male) 0.8 0.81 -0.06 0.03 -1.77 OCM 620: Intra-community relations 0.13 0.05 -0.09 0.03 -2.57 Singer age (adult) 0.65 0.68 -0.09 0.03 -3.05 OCM 750: Sickness, medical care, and shamans 0.13 0.06 -0.1 0.03 -3.17 Singer age (elder) 0.65 0.07 -0.13 0.04 -3.48 OCM 152: Drives and emotions 0.13 0.13 -0.12 0.03 -4.16 OCM 554: Status, role, and prestige 0.13 0.05 -0.12 0.03 -4.21 OCM 760: Death 0.13 0.09 -0.15 0.04 -4.22 Informal purpose 0.36 0.24 -0.19 0.04 -5.15 Singer composed song 0.64 0.49 -0.24 0.04 -5.49 OCM 570: Interpersonal relations 0.13 0.1 -0.21 0.04 -5.91 Singer age (logged) 0.65
-0.4 0.06 -6.4
OCM 200: Communication 0.13 0.09 -0.26 0.04 -6.83
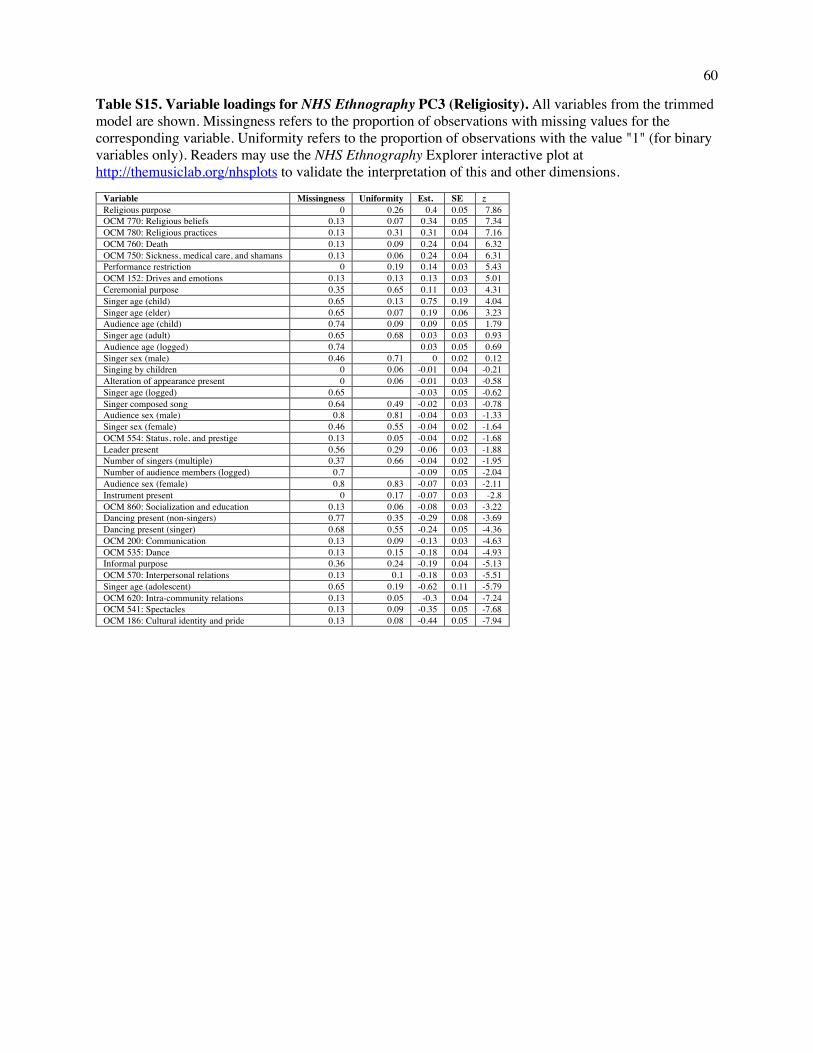
60
Table S15. Variable loadings for NHS Ethnography PC3 (Religiosity). All variables from the trimmed model are shown. Missingness refers to the proportion of observations with missing values for the corresponding variable. Uniformity refers to the proportion of observations with the value "1" (for binary variables only). Readers may use the NHS Ethnography Explorer interactive plot at http://themusiclab.org/nhsplots to validate the interpretation of this and other dimensions.
Variable Missingness Uniformity Est. SE z Religious purpose 0 0.26 0.4 0.05 7.86 OCM 770: Religious beliefs 0.13 0.07 0.34 0.05 7.34 OCM 780: Religious practices 0.13 0.31 0.31 0.04 7.16 OCM 760: Death 0.13 0.09 0.24 0.04 6.32 OCM 750: Sickness, medical care, and shamans 0.13 0.06 0.24 0.04 6.31 Performance restriction 0 0.19 0.14 0.03 5.43 OCM 152: Drives and emotions 0.13 0.13 0.13 0.03 5.01 Ceremonial purpose 0.35 0.65 0.11 0.03 4.31 Singer age (child) 0.65 0.13 0.75 0.19 4.04 Singer age (elder) 0.65 0.07 0.19 0.06 3.23 Audience age (child) 0.74 0.09 0.09 0.05 1.79 Singer age (adult) 0.65 0.68 0.03 0.03 0.93 Audience age (logged) 0.74
0.03 0.05 0.69
Singer sex (male) 0.46 0.71 0 0.02 0.12 Singing by children 0 0.06 -0.01 0.04 -0.21 Alteration of appearance present 0 0.06 -0.01 0.03 -0.58 Singer age (logged) 0.65
-0.03 0.05 -0.62
Singer composed song 0.64 0.49 -0.02 0.03 -0.78 Audience sex (male) 0.8 0.81 -0.04 0.03 -1.33 Singer sex (female) 0.46 0.55 -0.04 0.02 -1.64 OCM 554: Status, role, and prestige 0.13 0.05 -0.04 0.02 -1.68 Leader present 0.56 0.29 -0.06 0.03 -1.88 Number of singers (multiple) 0.37 0.66 -0.04 0.02 -1.95 Number of audience members (logged) 0.7
-0.09 0.05 -2.04
Audience sex (female) 0.8 0.83 -0.07 0.03 -2.11 Instrument present 0 0.17 -0.07 0.03 -2.8 OCM 860: Socialization and education 0.13 0.06 -0.08 0.03 -3.22 Dancing present (non-singers) 0.77 0.35 -0.29 0.08 -3.69 Dancing present (singer) 0.68 0.55 -0.24 0.05 -4.36 OCM 200: Communication 0.13 0.09 -0.13 0.03 -4.63 OCM 535: Dance 0.13 0.15 -0.18 0.04 -4.93 Informal purpose 0.36 0.24 -0.19 0.04 -5.13 OCM 570: Interpersonal relations 0.13 0.1 -0.18 0.03 -5.51 Singer age (adolescent) 0.65 0.19 -0.62 0.11 -5.79 OCM 620: Intra-community relations 0.13 0.05 -0.3 0.04 -7.24 OCM 541: Spectacles 0.13 0.09 -0.35 0.05 -7.68 OCM 186: Cultural identity and pride 0.13 0.08 -0.44 0.05 -7.94
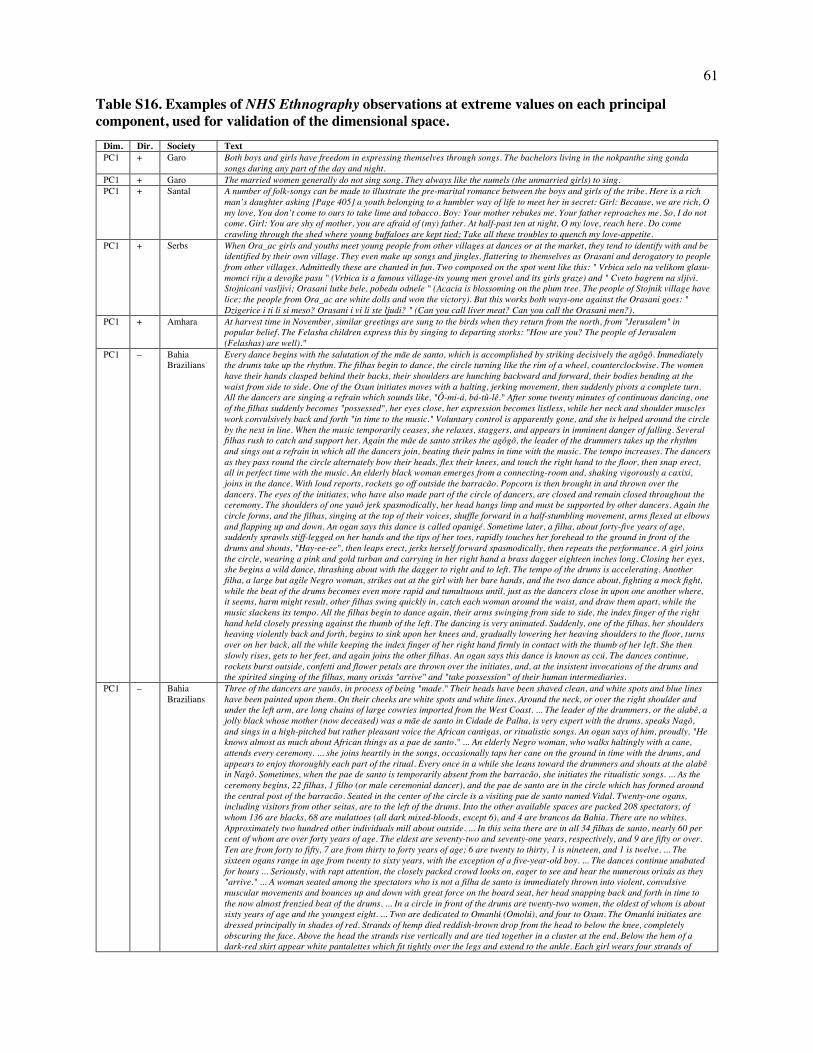
61
Table S16. Examples of NHS Ethnography observations at extreme values on each principal component, used for validation of the dimensional space.
Dim. Dir. Society Text PC1 + Garo Both boys and girls have freedom in expressing themselves through songs. The bachelors living in the nokpanthe sing gonda
songs during any part of the day and night. PC1 + Garo The married women generally do not sing song. They always like the numels (the unmarried girls) to sing. PC1 + Santal A number of folk-songs can be made to illustrate the pre-marital romance between the boys and girls of the tribe. Here is a rich
man’s daughter asking [Page 405] a youth belonging to a humbler way of life to meet her in secret: Girl: Because, we are rich, O my love, You don’t come to ours to take lime and tobacco. Boy: Your mother rebukes me. Your father reproaches me. So, I do not come. Girl: You are shy of mother, you are afraid of (my) father. At half-past ten at night, O my love, reach here. Do come crawling through the shed where young buffaloes are kept tied; Take all these troubles to quench my love-appetite.
PC1 + Serbs When Ora_ac girls and youths meet young people from other villages at dances or at the market, they tend to identify with and be identified by their own village. They even make up songs and jingles, flattering to themselves as Orasani and derogatory to people from other villages. Admittedly these are chanted in fun. Two composed on the spot went like this: " Vrbica selo na velikom glasu-momci riju a devojke pasu " (Vrbica is a famous village-its young men grovel and its girls graze) and " Cveto bagrem na sljivi. Stojnicani vasljivi; Orasani lutke bele, pobedu odnele " (Acacia is blossoming on the plum tree. The people of Stojnik village have lice; the people from Ora_ac are white dolls and won the victory). But this works both ways-one against the Orasani goes: " Dzigerice i ti li si meso? Orasani i vi li ste ljudi? " (Can you call liver meat? Can you call the Orasani men?).
PC1 + Amhara At harvest time in November, similar greetings are sung to the birds when they return from the north, from "Jerusalem" in popular belief. The Felasha children express this by singing to departing storks: "How are you? The people of Jerusalem (Felashas) are well)."
PC1 – Bahia Brazilians
Every dance begins with the salutation of the mãe de santo, which is accomplished by striking decisively the agôgô. Immediately the drums take up the rhythm. The filhas begin to dance, the circle turning like the rim of a wheel, counterclockwise. The women have their hands clasped behind their backs, their shoulders are hunching backward and forward, their bodies bending at the waist from side to side. One of the Oxun initiates moves with a halting, jerking movement, then suddenly pivots a complete turn. All the dancers are singing a refrain which sounds like, "Ô-mi-á, bá-tû-lê." After some twenty minutes of continuous dancing, one of the filhas suddenly becomes "possessed", her eyes close, her expression becomes listless, while her neck and shoulder muscles work convulsively back and forth "in time to the music." Voluntary control is apparently gone, and she is helped around the circle by the next in line. When the music temporarily ceases, she relaxes, staggers, and appears in imminent danger of falling. Several filhas rush to catch and support her. Again the mãe de santo strikes the agôgô, the leader of the drummers takes up the rhythm and sings out a refrain in which all the dancers join, beating their palms in time with the music. The tempo increases. The dancers as they pass round the circle alternately bow their heads, flex their knees, and touch the right hand to the floor, then snap erect, all in perfect time with the music. An elderly black woman emerges from a connecting-room and, shaking vigorously a caxixi, joins in the dance. With loud reports, rockets go off outside the barracão. Popcorn is then brought in and thrown over the dancers. The eyes of the initiates, who have also made part of the circle of dancers, are closed and remain closed throughout the ceremony. The shoulders of one yauô jerk spasmodically, her head hangs limp and must be supported by other dancers. Again the circle forms, and the filhas, singing at the top of their voices, shuffle forward in a half-stumbling movement, arms flexed at elbows and flapping up and down. An ogan says this dance is called opanigé. Sometime later, a filha, about forty-five years of age, suddenly sprawls stiff-legged on her hands and the tips of her toes, rapidly touches her forehead to the ground in front of the drums and shouts, "Hay-ee-ee", then leaps erect, jerks herself forward spasmodically, then repeats the performance. A girl joins the circle, wearing a pink and gold turban and carrying in her right hand a brass dagger eighteen inches long. Closing her eyes, she begins a wild dance, thrashing about with the dagger to right and to left. The tempo of the drums is accelerating. Another filha, a large but agile Negro woman, strikes out at the girl with her bare hands, and the two dance about, fighting a mock fight, while the beat of the drums becomes even more rapid and tumultuous until, just as the dancers close in upon one another where, it seems, harm might result, other filhas swing quickly in, catch each woman around the waist, and draw them apart, while the music slackens its tempo. All the filhas begin to dance again, their arms swinging from side to side, the index finger of the right hand held closely pressing against the thumb of the left. The dancing is very animated. Suddenly, one of the filhas, her shoulders heaving violently back and forth, begins to sink upon her knees and, gradually lowering her heaving shoulders to the floor, turns over on her back, all the while keeping the index finger of her right hand firmly in contact with the thumb of her left. She then slowly rises, gets to her feet, and again joins the other filhas. An ogan says this dance is known as ccú. The dances continue, rockets burst outside, confetti and flower petals are thrown over the initiates, and, at the insistent invocations of the drums and the spirited singing of the filhas, many orixás "arrive" and "take possession" of their human intermediaries.
PC1 – Bahia Brazilians
Three of the dancers are yauôs, in process of being "made." Their heads have been shaved clean, and white spots and blue lines have been painted upon them. On their cheeks are white spots and white lines. Around the neck, or over the right shoulder and under the left arm, are long chains of large cowries imported from the West Coast. ... The leader of the drummers, or the alabê, a jolly black whose mother (now deceased) was a mãe de santo in Cidade de Palha, is very expert with the drums, speaks Nagô, and sings in a high-pitched but rather pleasant voice the African cantigas, or ritualistic songs. An ogan says of him, proudly, "He knows almost as much about African things as a pae de santo." ... An elderly Negro woman, who walks haltingly with a cane, attends every ceremony. ... she joins heartily in the songs, occasionally taps her cane on the ground in time with the drums, and appears to enjoy thoroughly each part of the ritual. Every once in a while she leans toward the drummers and shouts at the alabê in Nagô. Sometimes, when the pae de santo is temporarily absent from the barracão, she initiates the ritualistic songs. ... As the ceremony begins, 22 filhas, 1 filho (or male ceremonial dancer), and the pae de santo are in the circle which has formed around the central post of the barracão. Seated in the center of the circle is a visiting pae de santo named Vidal. Twenty-one ogans, including visitors from other seitas, are to the left of the drums. Into the other available spaces are packed 208 spectators, of whom 136 are blacks, 68 are mulattoes (all dark mixed-bloods, except 6), and 4 are brancos da Bahia. There are no whites. Approximately two hundred other individuals mill about outside. ... In this seita there are in all 34 filhas de santo, nearly 60 per cent of whom are over forty years of age. The eldest are seventy-two and seventy-one years, respectively, and 9 are fifty or over. Ten are from forty to fifty, 7 are from thirty to forty years of age; 6 are twenty to thirty, 1 is nineteen, and 1 is twelve. ... The sixteen ogans range in age from twenty to sixty years, with the exception of a five-year-old boy. ... The dances continue unabated for hours ... Seriously, with rapt attention, the closely packed crowd looks on, eager to see and hear the numerous orixás as they "arrive." ... A woman seated among the spectators who is not a filha de santo is immediately thrown into violent, convulsive muscular movements and bounces up and down with great force on the board seat, her head snapping back and forth in time to the now almost frenzied beat of the drums. ... In a circle in front of the drums are twenty-two women, the oldest of whom is about sixty years of age and the youngest eight. ... Two are dedicated to Omanlú (Omolú), and four to Oxun. The Omanlú initiates are dressed principally in shades of red. Strands of hemp died reddish-brown drop from the head to below the knee, completely obscuring the face. Above the head the strands rise vertically and are tied together in a cluster at the end. Below the hem of a dark-red skirt appear white pantalettes which fit tightly over the legs and extend to the ankle. Each girl wears four strands of
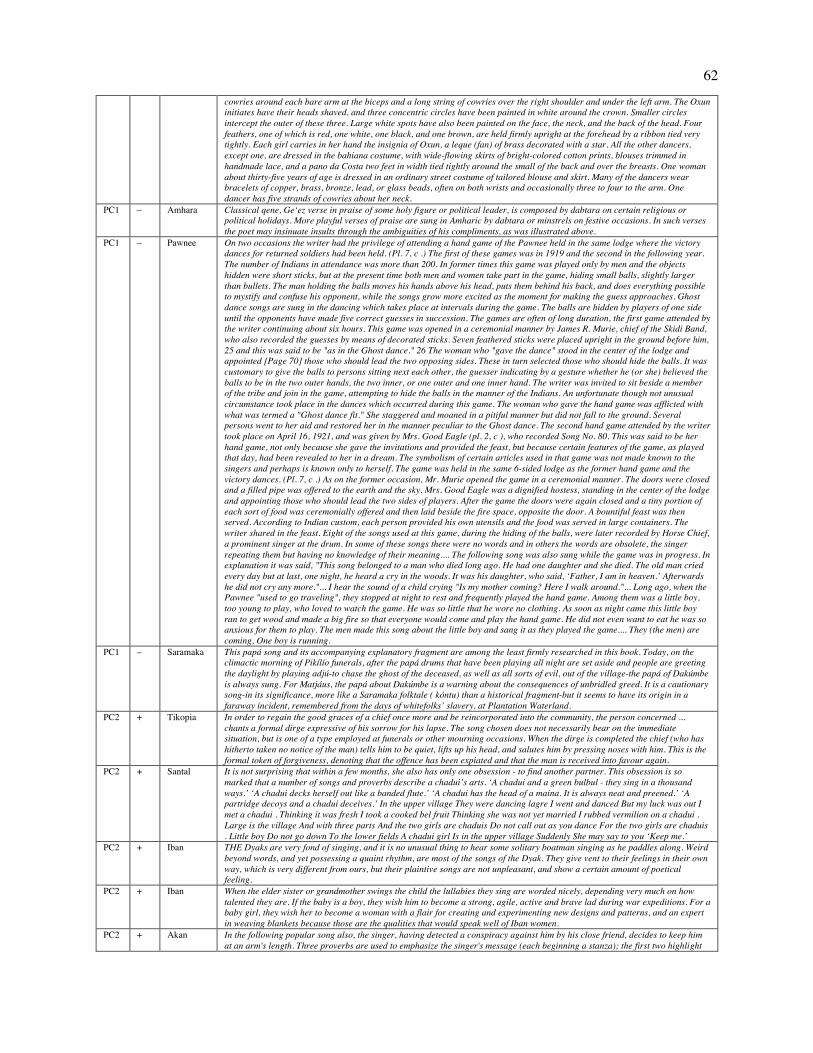
62
cowries around each bare arm at the biceps and a long string of cowries over the right shoulder and under the left arm. The Oxun initiates have their heads shaved, and three concentric circles have been painted in white around the crown. Smaller circles intercept the outer of these three. Large white spots have also been painted on the face, the neck, and the back of the head. Four feathers, one of which is red, one white, one black, and one brown, are held firmly upright at the forehead by a ribbon tied very tightly. Each girl carries in her hand the insignia of Oxun, a leque (fan) of brass decorated with a star. All the other dancers, except one, are dressed in the bahiana costume, with wide-flowing skirts of bright-colored cotton prints, blouses trimmed in handmade lace, and a pano da Costa two feet in width tied tightly around the small of the back and over the breasts. One woman about thirty-five years of age is dressed in an ordinary street costume of tailored blouse and skirt. Many of the dancers wear bracelets of copper, brass, bronze, lead, or glass beads, often on both wrists and occasionally three to four to the arm. One dancer has five strands of cowries about her neck.
PC1 – Amhara Classical qene, Ge‘ez verse in praise of some holy figure or political leader, is composed by dabtara on certain religious or political holidays. More playful verses of praise are sung in Amharic by dabtara or minstrels on festive occasions. In such verses the poet may insinuate insults through the ambiguities of his compliments, as was illustrated above.
PC1 – Pawnee On two occasions the writer had the privilege of attending a hand game of the Pawnee held in the same lodge where the victory dances for returned soldiers had been held. (Pl. 7, c .) The first of these games was in 1919 and the second in the following year. The number of Indians in attendance was more than 200. In former times this game was played only by men and the objects hidden were short sticks, but at the present time both men and women take part in the game, hiding small balls, slightly larger than bullets. The man holding the balls moves his hands above his head, puts them behind his back, and does everything possible to mystify and confuse his opponent, while the songs grow more excited as the moment for making the guess approaches. Ghost dance songs are sung in the dancing which takes place at intervals during the game. The balls are hidden by players of one side until the opponents have made five correct guesses in succession. The games are often of long duration, the first game attended by the writer continuing about six hours. This game was opened in a ceremonial manner by James R. Murie, chief of the Skidi Band, who also recorded the guesses by means of decorated sticks. Seven feathered sticks were placed upright in the ground before him, 25 and this was said to be "as in the Ghost dance." 26 The woman who "gave the dance" stood in the center of the lodge and appointed [Page 70] those who should lead the two opposing sides. These in turn selected those who should hide the balls. It was customary to give the balls to persons sitting next each other, the guesser indicating by a gesture whether he (or she) believed the balls to be in the two outer hands, the two inner, or one outer and one inner hand. The writer was invited to sit beside a member of the tribe and join in the game, attempting to hide the balls in the manner of the Indians. An unfortunate though not unusual circumstance took place in the dances which occurred during this game. The woman who gave the hand game was afflicted with what was termed a "Ghost dance fit." She staggered and moaned in a pitiful manner but did not fall to the ground. Several persons went to her aid and restored her in the manner peculiar to the Ghost dance. The second hand game attended by the writer took place on April 16, 1921, and was given by Mrs. Good Eagle (pl. 2, c ), who recorded Song No. 80. This was said to be her hand game, not only because she gave the invitations and provided the feast, but because certain features of the game, as played that day, had been revealed to her in a dream. The symbolism of certain articles used in that game was not made known to the singers and perhaps is known only to herself. The game was held in the same 6-sided lodge as the former hand game and the victory dances. (Pl. 7, c .) As on the former occasion, Mr. Murie opened the game in a ceremonial manner. The doors were closed and a filled pipe was offered to the earth and the sky. Mrs. Good Eagle was a dignified hostess, standing in the center of the lodge and appointing those who should lead the two sides of players. After the game the doors were again closed and a tiny portion of each sort of food was ceremonially offered and then laid beside the fire space, opposite the door. A bountiful feast was then served. According to Indian custom, each person provided his own utensils and the food was served in large containers. The writer shared in the feast. Eight of the songs used at this game, during the hiding of the balls, were later recorded by Horse Chief, a prominent singer at the drum. In some of these songs there were no words and in others the words are obsolete, the singer repeating them but having no knowledge of their meaning.... The following song was also sung while the game was in progress. In explanation it was said, "This song belonged to a man who died long ago. He had one daughter and she died. The old man cried every day but at last, one night, he heard a cry in the woods. It was his daughter, who said, ‘Father, I am in heaven.’ Afterwards he did not cry any more."... I hear the sound of a child crying "Is my mother coming? Here I walk around."... Long ago, when the Pawnee "used to go traveling", they stopped at night to rest and frequently played the hand game. Among them was a little boy, too young to play, who loved to watch the game. He was so little that he wore no clothing. As soon as night came this little boy ran to get wood and made a big fire so that everyone would come and play the hand game. He did not even want to eat he was so anxious for them to play. The men made this song about the little boy and sang it as they played the game.... They (the men) are coming, One boy is running.
PC1 – Saramaka This papá song and its accompanying explanatory fragment are among the least firmly researched in this book. Today, on the climactic morning of Pikílío funerals, after the papá drums that have been playing all night are set aside and people are greeting the daylight by playing adjú-to chase the ghost of the deceased, as well as all sorts of evil, out of the village-the papá of Dakúmbe is always sung. For Matjáus, the papá about Dakúmbe is a warning about the consequences of unbridled greed. It is a cautionary song-in its significance, more like a Saramaka folktale ( kóntu) than a historical fragment-but it seems to have its origin in a faraway incident, remembered from the days of whitefolks’ slavery, at Plantation Waterland.
PC2 + Tikopia In order to regain the good graces of a chief once more and be reincorporated into the community, the person concerned ... chants a formal dirge expressive of his sorrow for his lapse. The song chosen does not necessarily bear on the immediate situation, but is one of a type employed at funerals or other mourning occasions. When the dirge is completed the chief (who has hitherto taken no notice of the man) tells him to be quiet, lifts up his head, and salutes him by pressing noses with him. This is the formal token of forgiveness, denoting that the offence has been expiated and that the man is received into favour again.
PC2 + Santal It is not surprising that within a few months, she also has only one obsession - to find another partner. This obsession is so marked that a number of songs and proverbs describe a chadui’s arts. ‘A chadui and a green bulbul - they sing in a thousand ways.’ ‘A chadui decks herself out like a banded flute.’ ‘A chadui has the head of a maina. It is always neat and preened.’ ‘A partridge decoys and a chadui deceives.’ In the upper village They were dancing lagre I went and danced But my luck was out I met a chadui . Thinking it was fresh I took a cooked bel fruit Thinking she was not yet married I rubbed vermilion on a chadui . Large is the village And with three parts And the two girls are chaduis Do not call out as you dance For the two girls are chaduis . Little boy Do not go down To the lower fields A chadui girl Is in the upper village Suddenly She may say to you ‘Keep me.’
PC2 + Iban THE Dyaks are very fond of singing, and it is no unusual thing to hear some solitary boatman singing as he paddles along. Weird beyond words, and yet possessing a quaint rhythm, are most of the songs of the Dyak. They give vent to their feelings in their own way, which is very different from ours, but their plaintive songs are not unpleasant, and show a certain amount of poetical feeling.
PC2 + Iban When the elder sister or grandmother swings the child the lullabies they sing are worded nicely, depending very much on how talented they are. If the baby is a boy, they wish him to become a strong, agile, active and brave lad during war expeditions. For a baby girl, they wish her to become a woman with a flair for creating and experimenting new designs and patterns, and an expert in weaving blankets because those are the qualities that would speak well of Iban women.
PC2 + Akan In the following popular song also, the singer, having detected a conspiracy against him by his close friend, decides to keep him at an arm's length. Three proverbs are used to emphasize the singer's message (each beginning a stanza); the first two highlight
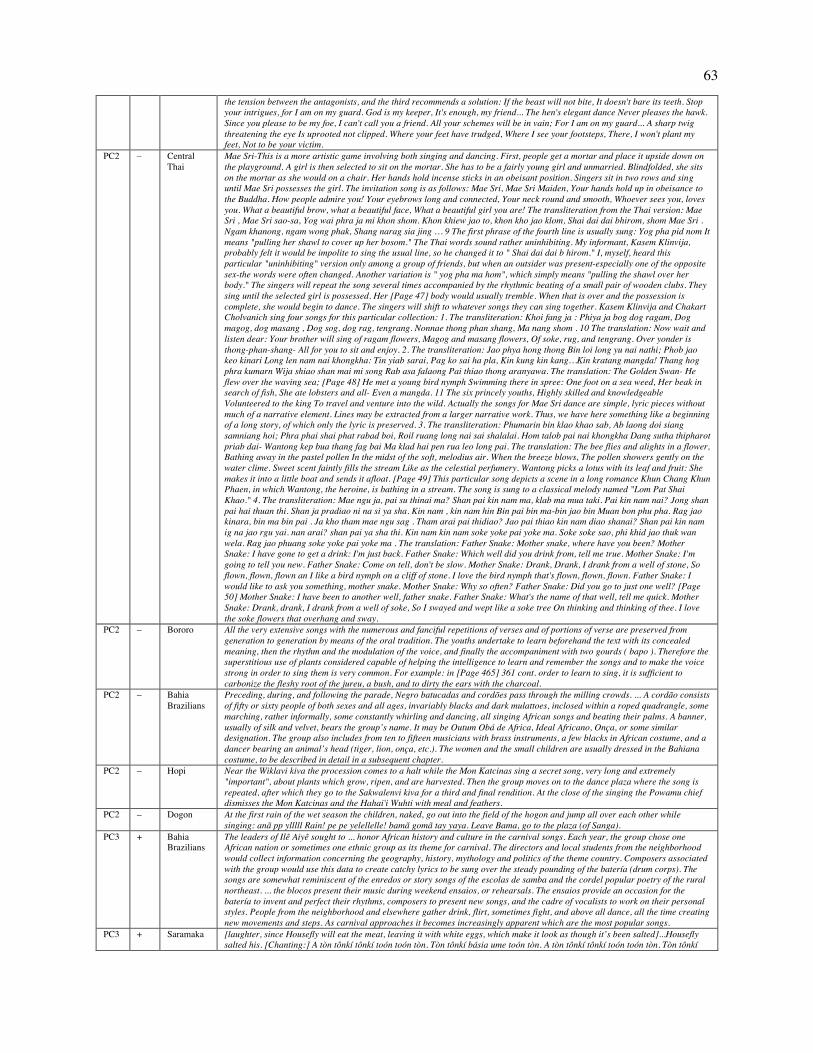
63
the tension between the antagonists, and the third recommends a solution: If the beast will not bite, It doesn't bare its teeth. Stop your intrigues, for I am on my guard. God is my keeper, It's enough, my friend... The hen's elegant dance Never pleases the hawk. Since you please to be my foe, I can't call you a friend. All your schemes will be in vain; For I am on my guard... A sharp twig threatening the eye Is uprooted not clipped. Where your feet have trudged, Where I see your footsteps, There, I won't plant my feet, Not to be your victim.
PC2 – Central Thai
Mae Sri-This is a more artistic game involving both singing and dancing. First, people get a mortar and place it upside down on the playground. A girl is then selected to sit on the mortar. She has to be a fairly young girl and unmarried. Blindfolded, she sits on the mortar as she would on a chair. Her hands hold incense sticks in an obeisant position. Singers sit in two rows and sing until Mae Sri possesses the girl. The invitation song is as follows: Mae Sri, Mae Sri Maiden, Your hands hold up in obeisance to the Buddha. How people admire you! Your eyebrows long and connected, Your neck round and smooth, Whoever sees you, loves you. What a beautiful brow, what a beautiful face, What a beautiful girl you are! The transliteration from the Thai version: Mae Sri , Mae Sri sao-sa, Yog wai phra ja mi khon shom. Khon khiew jao to, khon kho jao klom, Shai dai dai bhirom, shom Mae Sri . Ngam khanong, ngam wong phak, Shang narag sia jing … 9 The first phrase of the fourth line is usually sung: Yog pha pid nom It means "pulling her shawl to cover up her bosom." The Thai words sound rather uninhibiting. My informant, Kasem Klinvija, probably felt it would be impolite to sing the usual line, so he changed it to " Shai dai dai b hirom." I, myself, heard this particular "uninhibiting" version only among a group of friends, but when an outsider was present-especially one of the opposite sex-the words were often changed. Another variation is " yog pha ma hom", which simply means "pulling the shawl over her body." The singers will repeat the song several times accompanied by the rhythmic beating of a small pair of wooden clubs. They sing until the selected girl is possessed. Her [Page 47] body would usually tremble. When that is over and the possession is complete, she would begin to dance. The singers will shift to whatever songs they can sing together. Kasem Klinvija and Chakart Cholvanich sing four songs for this particular collection: 1. The transliteration: Khoi fang ja : Phiya ja bog dog ragam, Dog magog, dog masang , Dog sog, dog rag, tengrang. Nonnae thong phan shang, Ma nang shom . 10 The translation: Now wait and listen dear: Your brother will sing of ragam flowers, Magog and masang flowers, Of soke, rug, and tengrang. Over yonder is thong-phan-shang- All for you to sit and enjoy. 2. The transliteration: Jao phya hong thong Bin loi long yu nai nathi; Phob jao keo kinari Long len nam nai khongkha: Tin yiab sarai, Pag ko sai ha pla, Kin kung kin kang…Kin kratang mangda! Thang hog phra kumarn Wija shiao shan mai mi song Rab asa falaong Pai thiao thong aranyawa. The translation: The Golden Swan- He flew over the waving sea; [Page 48] He met a young bird nymph Swimming there in spree: One foot on a sea weed, Her beak in search of fish, She ate lobsters and all- Even a mangda. 11 The six princely youths, Highly skilled and knowledgeable Volunteered to the king To travel and venture into the wild. Actually the songs for Mae Sri dance are simple, lyric pieces without much of a narrative element. Lines may be extracted from a larger narrative work. Thus, we have here something like a beginning of a long story, of which only the lyric is preserved. 3. The transliteration: Phumarin bin klao khao sab, Ab laong doi siang samniang hoi; Phra phai shai phat rabad boi, Roil ruang long nai sai shalalai. Hom talob pai nai khongkha Dang sutha thipharot priab dai- Wantong kep bua thang fag bai Ma klad hai pen rua leo long pai. The translation: The bee flies and alights in a flower, Bathing away in the pastel pollen In the midst of the soft, melodius air. When the breeze blows, The pollen showers gently on the water clime. Sweet scent faintly fills the stream Like as the celestial perfumery. Wantong picks a lotus with its leaf and fruit: She makes it into a little boat and sends it afloat. [Page 49] This particular song depicts a scene in a long romance Khun Chang Khun Phaen, in which Wantong, the heroine, is bathing in a stream. The song is sung to a classical melody named "Lom Pat Shai Khao." 4. The transliteration: Mae ngu ja, pai su thinai ma? Shan pai kin nam ma, klab ma mua taki. Pai kin nam nai? Jong shan pai hai thuan thi. Shan ja pradiao ni na si ya sha. Kin nam , kin nam hin Bin pai bin ma-bin jao bin Muan bon phu pha. Rag jao kinara, bin ma bin pai . Ja kho tham mae ngu sag . Tham arai pai thidiao? Jao pai thiao kin nam diao shanai? Shan pai kin nam ig na jao rgu yai. nan arai? shan pai ya sha thi. Kin nam kin nam soke yoke pai yoke ma. Soke soke sao, phi khid jao thuk wan wela. Rag jao phuang soke yoke pai yoke ma . The translation: Father Snake: Mother snake, where have you been? Mother Snake: I have gone to get a drink: I'm just back. Father Snake: Which well did you drink from, tell me true. Mother Snake: I'm going to tell you new. Father Snake: Come on tell, don't be slow. Mother Snake: Drank, Drank, I drank from a well of stone, So flown, flown, flown an I like a bird nymph on a cliff of stone. I love the bird nymph that's flown, flown, flown. Father Snake: I would like to ask you something, mother snake. Mother Snake: Why so often? Father Snake: Did you go to just one well? [Page 50] Mother Snake: I have been to another well, father snake. Father Snake: What's the name of that well, tell me quick. Mother Snake: Drank, drank, I drank from a well of soke, So I swayed and wept like a soke tree On thinking and thinking of thee. I love the soke flowers that overhang and sway.
PC2 – Bororo All the very extensive songs with the numerous and fanciful repetitions of verses and of portions of verse are preserved from generation to generation by means of the oral tradition. The youths undertake to learn beforehand the text with its concealed meaning, then the rhythm and the modulation of the voice, and finally the accompaniment with two gourds ( bapo ). Therefore the superstitious use of plants considered capable of helping the intelligence to learn and remember the songs and to make the voice strong in order to sing them is very common. For example: in [Page 465] 361 cont. order to learn to sing, it is sufficient to carbonize the fleshy root of the jureu, a bush, and to dirty the ears with the charcoal.
PC2 – Bahia Brazilians
Preceding, during, and following the parade, Negro batucadas and cordões pass through the milling crowds. ... A cordão consists of fifty or sixty people of both sexes and all ages, invariably blacks and dark mulattoes, inclosed within a roped quadrangle, some marching, rather informally, some constantly whirling and dancing, all singing African songs and beating their palms. A banner, usually of silk and velvet, bears the group’s name. It may be Outum Obá de Africa, Ideal Africano, Onça, or some similar designation. The group also includes from ten to fifteen musicians with brass instruments, a few blacks in African costume, and a dancer bearing an animal’s head (tiger, lion, onça, etc.). The women and the small children are usually dressed in the Bahiana costume, to be described in detail in a subsequent chapter.
PC2 – Hopi Near the Wiklavi kiva the procession comes to a halt while the Mon Katcinas sing a secret song, very long and extremely "important", about plants which grow, ripen, and are harvested. Then the group moves on to the dance plaza where the song is repeated, after which they go to the Sakwalenvi kiva for a third and final rendition. At the close of the singing the Powamu chief dismisses the Mon Katcinas and the Hahai'i Wuhti with meal and feathers.
PC2 – Dogon At the first rain of the wet season the children, naked, go out into the field of the hogon and jump all over each other while singing: anã pp ylllll Rain! pe pe yelellelle! bamã gomã tay yaya. Leave Bama, go to the plaza (of Sanga).
PC3 + Bahia Brazilians
The leaders of Ilê Aiyê sought to ... honor African history and culture in the carnival songs. Each year, the group chose one African nation or sometimes one ethnic group as its theme for carnival. The directors and local students from the neighborhood would collect information concerning the geography, history, mythology and politics of the theme country. Composers associated with the group would use this data to create catchy lyrics to be sung over the steady pounding of the batería (drum corps). The songs are somewhat reminiscent of the enredos or story songs of the escolas de samba and the cordel popular poetry of the rural northeast. ... the blocos present their music during weekend ensaios, or rehearsals. The ensaios provide an occasion for the batería to invent and perfect their rhythms, composers to present new songs, and the cadre of vocalists to work on their personal styles. People from the neighborhood and elsewhere gather drink, flirt, sometimes fight, and above all dance, all the time creating new movements and steps. As carnival approaches it becomes increasingly apparent which are the most popular songs.
PC3 + Saramaka [laughter, since Housefly will eat the meat, leaving it with white eggs, which make it look as though it’s been salted]...Housefly salted his. [Chanting:] A tòn tônkí tônkí toón toón tòn. Tòn tônkí básia ume toón tòn. A tòn tônkí tônkí toón toón tòn. Tòn tônkí
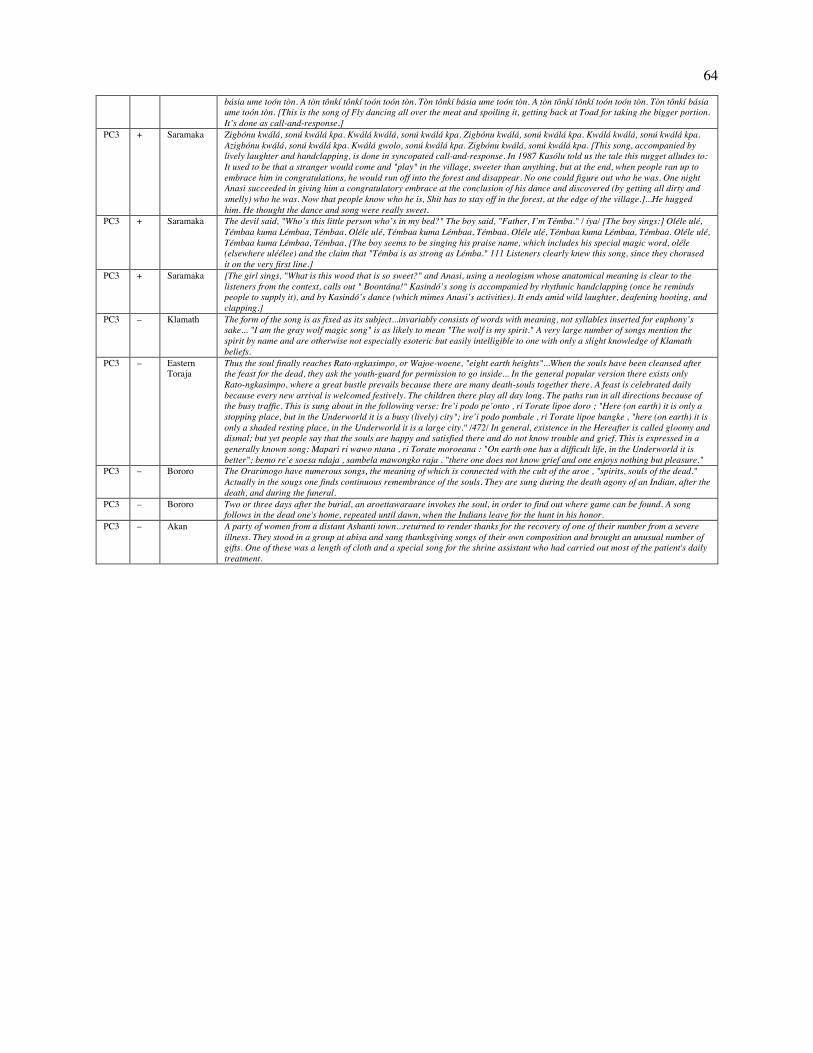
64
básia ume toón tòn. A tòn tônkí tônkí toón toón tòn. Tòn tônkí básia ume toón tòn. A tòn tônkí tônkí toón toón tòn. Tòn tônkí básia ume toón tòn. [This is the song of Fly dancing all over the meat and spoiling it, getting back at Toad for taking the bigger portion. It’s done as call-and-response.]
PC3 + Saramaka Zigbónu kwálá, sonú kwálá kpa. Kwálá kwálá, sonú kwálá kpa. Zigbónu kwálá, sonú kwálá kpa. Kwálá kwálá, sonú kwálá kpa. Azigbónu kwálá, sonú kwálá kpa. Kwálá gwolo, sonú kwálá kpa. Zigbónu kwálá, sonú kwálá kpa. [This song, accompanied by lively laughter and handclapping, is done in syncopated call-and-response. In 1987 Kasólu told us the tale this nugget alludes to: It used to be that a stranger would come and "play" in the village, sweeter than anything, but at the end, when people ran up to embrace him in congratulations, he would run off into the forest and disappear. No one could figure out who he was. One night Anasi succeeded in giving him a congratulatory embrace at the conclusion of his dance and discovered (by getting all dirty and smelly) who he was. Now that people know who he is, Shit has to stay off in the forest, at the edge of the village.]...He hugged him. He thought the dance and song were really sweet.
PC3 + Saramaka The devil said, "Who’s this little person who’s in my bed?" The boy said, "Father, I’m Témba." / íya/ [The boy sings:] Oléle ulé, Témbaa kuma Lémbaa, Témbaa. Oléle ulé, Témbaa kuma Lémbaa, Témbaa. Oléle ulé, Témbaa kuma Lémbaa, Témbaa. Oléle ulé, Témbaa kuma Lémbaa, Témbaa. [The boy seems to be singing his praise name, which includes his special magic word, oléle (elsewhere uléélee) and the claim that "Témba is as strong as Lémba." 111 Listeners clearly knew this song, since they chorused it on the very first line.]
PC3 + Saramaka [The girl sings, "What is this wood that is so sweet?" and Anasi, using a neologism whose anatomical meaning is clear to the listeners from the context, calls out " Boontána!" Kasindó’s song is accompanied by rhythmic handclapping (once he reminds people to supply it), and by Kasindó’s dance (which mimes Anasi’s activities). It ends amid wild laughter, deafening hooting, and clapping.]
PC3 – Klamath The form of the song is as fixed as its subject...invariably consists of words with meaning, not syllables inserted for euphony’s sake... "I am the gray wolf magic song" is as likely to mean "The wolf is my spirit." A very large number of songs mention the spirit by name and are otherwise not especially esoteric but easily intelligible to one with only a slight knowledge of Klamath beliefs.
PC3 – Eastern Toraja
Thus the soul finally reaches Rato-ngkasimpo, or Wajoe-woene, "eight earth heights"...When the souls have been cleansed after the feast for the dead, they ask the youth-guard for permission to go inside... In the general popular version there exists only Rato-ngkasimpo, where a great bustle prevails because there are many death-souls together there. A feast is celebrated daily because every new arrival is welcomed festively. The children there play all day long. The paths run in all directions because of the busy traffic. This is sung about in the following verse: Ire’i podo pe’onto , ri Torate lipoe doro ; "Here (on earth) it is only a stopping place, but in the Underworld it is a busy (lively) city"; ire’i podo pombale , ri Torate lipoe bangke , "here (on earth) it is only a shaded resting place, in the Underworld it is a large city." /472/ In general, existence in the Hereafter is called gloomy and dismal; but yet people say that the souls are happy and satisfied there and do not know trouble and grief. This is expressed in a generally known song: Mapari ri wawo ntana , ri Torate moroeana : "On earth one has a difficult life, in the Underworld it is better"; bemo re’e soesa ndaja , sambela mawongko raja . "there one does not know grief and one enjoys nothing but pleasure."
PC3 – Bororo The Orarimogo have numerous songs, the meaning of which is connected with the cult of the aroe , "spirits, souls of the dead." Actually in the sougs one finds continuous remembrance of the souls. They are sung during the death agony of an Indian, after the death, and during the funeral.
PC3 – Bororo Two or three days after the burial, an aroettawaraare invokes the soul, in order to find out where game can be found. A song follows in the dead one's home, repeated until dawn, when the Indians leave for the hunt in his honor.
PC3 – Akan A party of women from a distant Ashanti town...returned to render thanks for the recovery of one of their number from a severe illness. They stood in a group at abisa and sang thanksgiving songs of their own composition and brought an unusual number of gifts. One of these was a length of cloth and a special song for the shrine assistant who had carried out most of the patient's daily treatment.
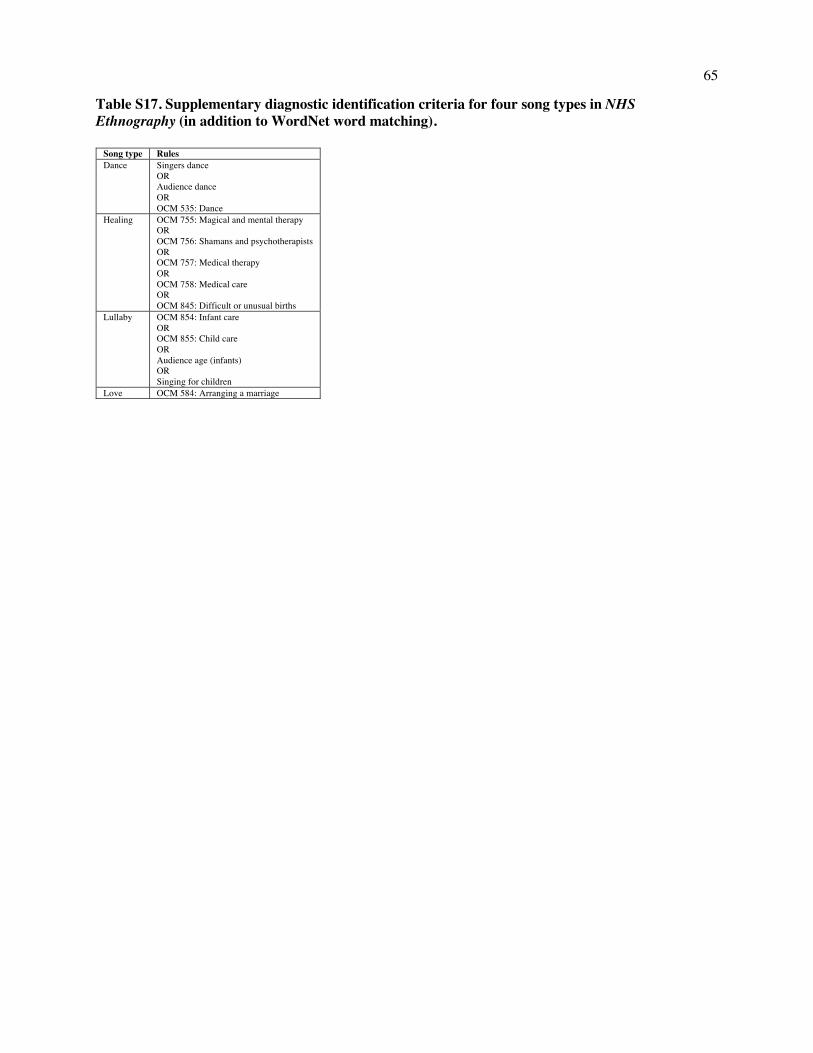
65
Table S17. Supplementary diagnostic identification criteria for four song types in NHS Ethnography (in addition to WordNet word matching).
Song type Rules Dance Singers dance
OR Audience dance OR OCM 535: Dance
Healing OCM 755: Magical and mental therapy OR OCM 756: Shamans and psychotherapists OR OCM 757: Medical therapy OR OCM 758: Medical care OR OCM 845: Difficult or unusual births
Lullaby OCM 854: Infant care OR OCM 855: Child care OR Audience age (infants) OR Singing for children
Love OCM 584: Arranging a marriage
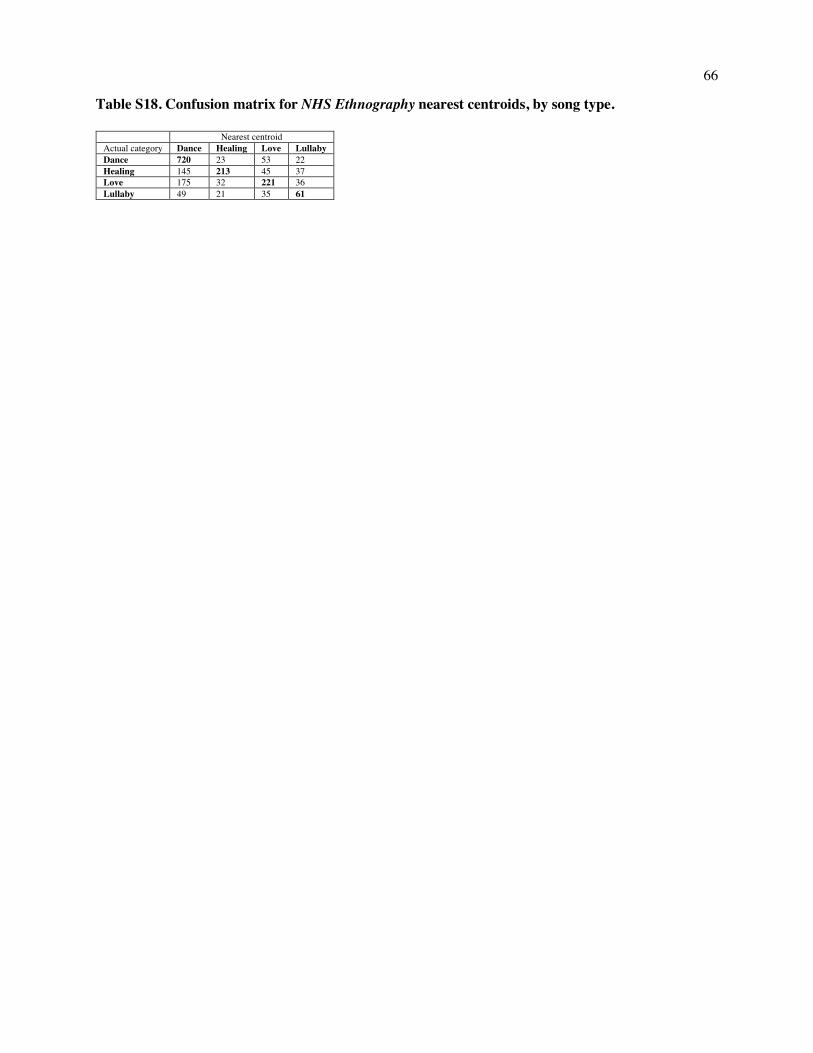
66
Table S18. Confusion matrix for NHS Ethnography nearest centroids, by song type.
Nearest centroid Actual category Dance Healing Love Lullaby Dance 720 23 53 22 Healing 145 213 45 37 Love 175 32 221 36 Lullaby 49 21 35 61
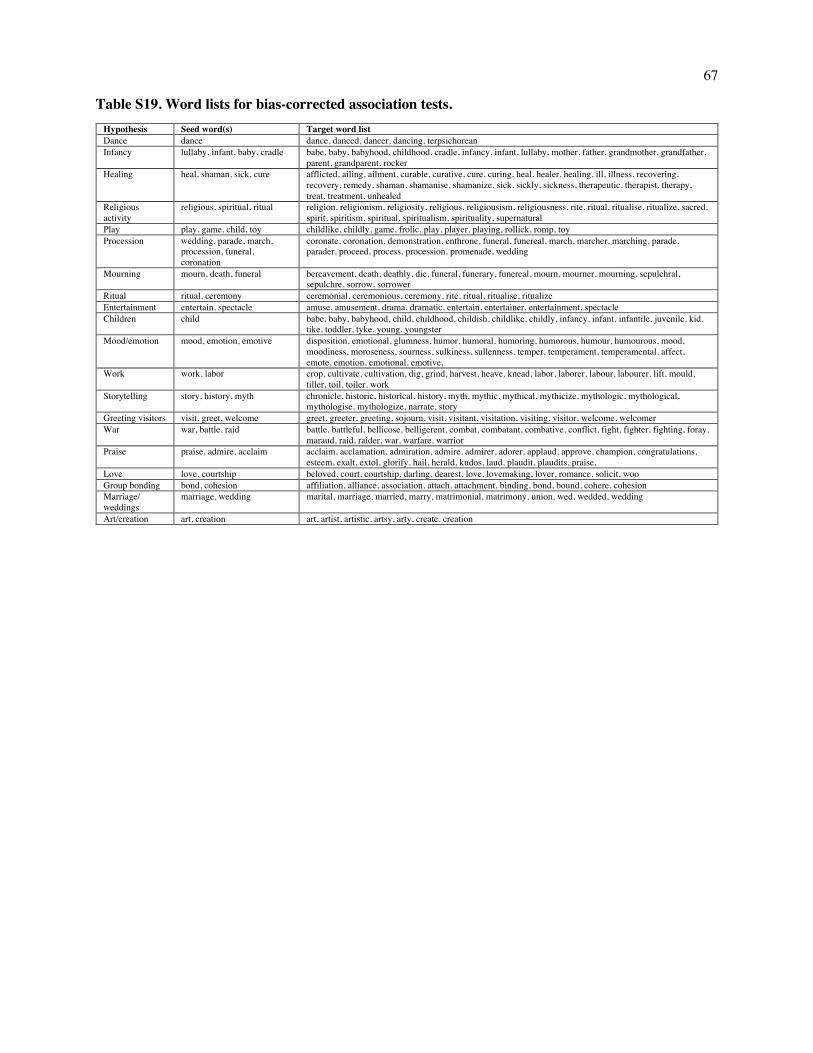
67
Table S19. Word lists for bias-corrected association tests.
Hypothesis Seed word(s) Target word list Dance dance dance, danced, dancer, dancing, terpsichorean Infancy lullaby, infant, baby, cradle babe, baby, babyhood, childhood, cradle, infancy, infant, lullaby, mother, father, grandmother, grandfather,
parent, grandparent, rocker Healing heal, shaman, sick, cure afflicted, ailing, ailment, curable, curative, cure, curing, heal, healer, healing, ill, illness, recovering,
recovery, remedy, shaman, shamanise, shamanize, sick, sickly, sickness, therapeutic, therapist, therapy, treat, treatment, unhealed
Religious activity
religious, spiritual, ritual religion, religionism, religiosity, religious, religiousism, religiousness, rite, ritual, ritualise, ritualize, sacred, spirit, spiritism, spiritual, spiritualism, spirituality, supernatural
Play play, game, child, toy childlike, childly, game, frolic, play, player, playing, rollick, romp, toy Procession wedding, parade, march,
procession, funeral, coronation
coronate, coronation, demonstration, enthrone, funeral, funereal, march, marcher, marching, parade, parader, proceed, process, procession, promenade, wedding
Mourning mourn, death, funeral bereavement, death, deathly, die, funeral, funerary, funereal, mourn, mourner, mourning, sepulchral, sepulchre, sorrow, sorrower
Ritual ritual, ceremony ceremonial, ceremonious, ceremony, rite, ritual, ritualise, ritualize Entertainment entertain, spectacle amuse, amusement, drama, dramatic, entertain, entertainer, entertainment, spectacle Children child babe, baby, babyhood, child, childhood, childish, childlike, childly, infancy, infant, infantile, juvenile, kid,
tike, toddler, tyke, young, youngster Mood/emotion mood, emotion, emotive disposition, emotional, glumness, humor, humoral, humoring, humorous, humour, humourous, mood,
moodiness, moroseness, sourness, sulkiness, sullenness, temper, temperament, temperamental, affect, emote, emotion, emotional, emotive,
Work work, labor crop, cultivate, cultivation, dig, grind, harvest, heave, knead, labor, laborer, labour, labourer, lift, mould, tiller, toil, toiler, work
Storytelling story, history, myth chronicle, historic, historical, history, myth, mythic, mythical, mythicize, mythologic, mythological, mythologise, mythologize, narrate, story
Greeting visitors visit, greet, welcome greet, greeter, greeting, sojourn, visit, visitant, visitation, visiting, visitor, welcome, welcomer War war, battle, raid battle, battleful, bellicose, belligerent, combat, combatant, combative, conflict, fight, fighter, fighting, foray,
maraud, raid, raider, war, warfare, warrior Praise praise, admire, acclaim acclaim, acclamation, admiration, admire, admirer, adorer, applaud, approve, champion, congratulations,
esteem, exalt, extol, glorify, hail, herald, kudos, laud, plaudit, plaudits, praise, Love love, courtship beloved, court, courtship, darling, dearest, love, lovemaking, lover, romance, solicit, woo Group bonding bond, cohesion affiliation, alliance, association, attach, attachment, binding, bond, bound, cohere, cohesion Marriage/ weddings
marriage, wedding marital, marriage, married, marry, matrimonial, matrimony, union, wed, wedded, wedding
Art/creation art, creation art, artist, artistic, artsy, arty, create, creation
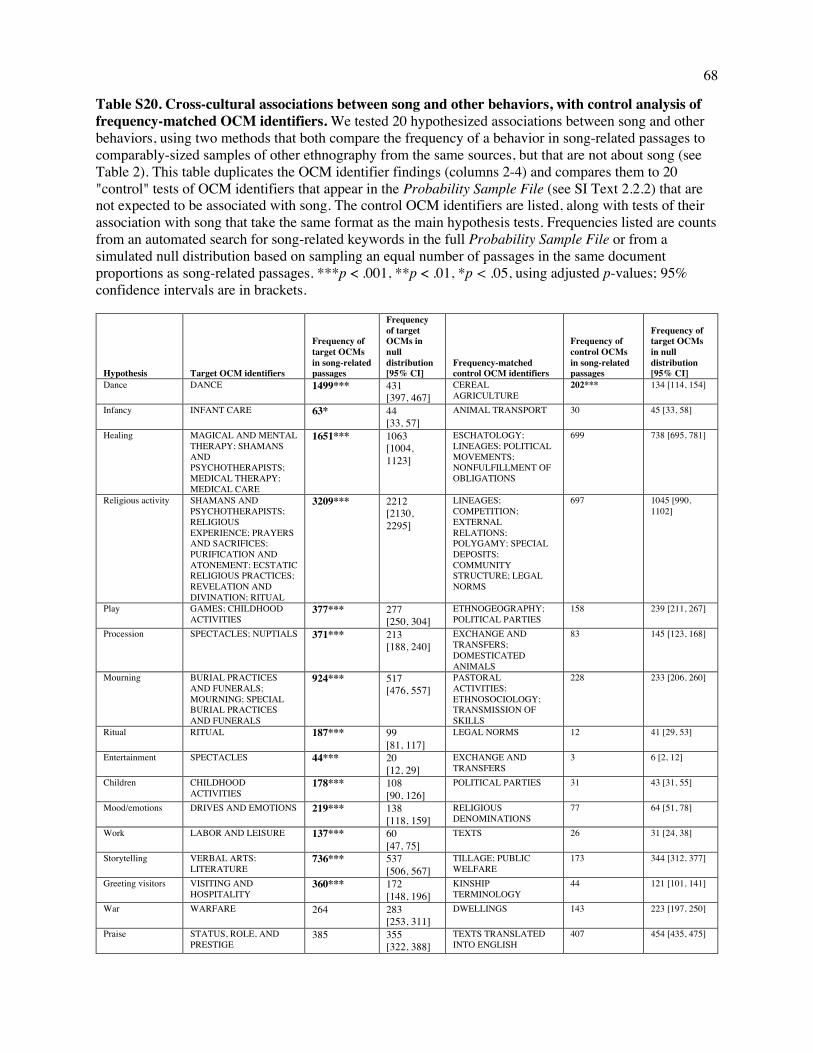
68
Table S20. Cross-cultural associations between song and other behaviors, with control analysis of frequency-matched OCM identifiers. We tested 20 hypothesized associations between song and other behaviors, using two methods that both compare the frequency of a behavior in song-related passages to comparably-sized samples of other ethnography from the same sources, but that are not about song (see Table 2). This table duplicates the OCM identifier findings (columns 2-4) and compares them to 20 "control" tests of OCM identifiers that appear in the Probability Sample File (see SI Text 2.2.2) that are not expected to be associated with song. The control OCM identifiers are listed, along with tests of their association with song that take the same format as the main hypothesis tests. Frequencies listed are counts from an automated search for song-related keywords in the full Probability Sample File or from a simulated null distribution based on sampling an equal number of passages in the same document proportions as song-related passages. ***p < .001, **p < .01, *p < .05, using adjusted p-values; 95% confidence intervals are in brackets.
Hypothesis Target OCM identifiers
Frequency of target OCMs in song-related passages
Frequency of target OCMs in null distribution [95% CI]
Frequency-matched control OCM identifiers
Frequency of control OCMs in song-related passages
Frequency of target OCMs in null distribution [95% CI]
Dance DANCE 1499*** 431 [397, 467]
CEREAL AGRICULTURE
202*** 134 [114, 154]
Infancy INFANT CARE 63* 44 [33, 57]
ANIMAL TRANSPORT 30 45 [33, 58]
Healing MAGICAL AND MENTAL THERAPY; SHAMANS AND PSYCHOTHERAPISTS; MEDICAL THERAPY; MEDICAL CARE
1651*** 1063 [1004, 1123]
ESCHATOLOGY; LINEAGES; POLITICAL MOVEMENTS; NONFULFILLMENT OF OBLIGATIONS
699 738 [695, 781]
Religious activity SHAMANS AND PSYCHOTHERAPISTS; RELIGIOUS EXPERIENCE; PRAYERS AND SACRIFICES; PURIFICATION AND ATONEMENT; ECSTATIC RELIGIOUS PRACTICES; REVELATION AND DIVINATION; RITUAL
3209*** 2212 [2130, 2295]
LINEAGES; COMPETITION; EXTERNAL RELATIONS; POLYGAMY; SPECIAL DEPOSITS; COMMUNITY STRUCTURE; LEGAL NORMS
697 1045 [990, 1102]
Play GAMES; CHILDHOOD ACTIVITIES
377*** 277 [250, 304]
ETHNOGEOGRAPHY; POLITICAL PARTIES
158 239 [211, 267]
Procession SPECTACLES; NUPTIALS 371*** 213 [188, 240]
EXCHANGE AND TRANSFERS; DOMESTICATED ANIMALS
83 145 [123, 168]
Mourning BURIAL PRACTICES AND FUNERALS; MOURNING; SPECIAL BURIAL PRACTICES AND FUNERALS
924*** 517 [476, 557]
PASTORAL ACTIVITIES; ETHNOSOCIOLOGY; TRANSMISSION OF SKILLS
228 233 [206, 260]
Ritual RITUAL 187*** 99 [81, 117]
LEGAL NORMS 12 41 [29, 53]
Entertainment SPECTACLES 44*** 20 [12, 29]
EXCHANGE AND TRANSFERS
3 6 [2, 12]
Children CHILDHOOD ACTIVITIES
178*** 108 [90, 126]
POLITICAL PARTIES 31 43 [31, 55]
Mood/emotions DRIVES AND EMOTIONS 219*** 138 [118, 159]
RELIGIOUS DENOMINATIONS
77 64 [51, 78]
Work LABOR AND LEISURE 137*** 60 [47, 75]
TEXTS 26 31 [24, 38]
Storytelling VERBAL ARTS; LITERATURE
736*** 537 [506, 567]
TILLAGE; PUBLIC WELFARE
173 344 [312, 377]
Greeting visitors VISITING AND HOSPITALITY
360*** 172 [148, 196]
KINSHIP TERMINOLOGY
44 121 [101, 141]
War WARFARE 264 283 [253, 311]
DWELLINGS 143 223 [197, 250]
Praise STATUS, ROLE, AND PRESTIGE
385 355 [322, 388]
TEXTS TRANSLATED INTO ENGLISH
407 454 [435, 475]

69
Love ARRANGING A MARRIAGE
158 140 [119, 162]
NORMAL GARB 80 132 [111, 153]
Group bonding SOCIAL RELATIONSHIPS AND GROUPS
141 163 [141, 187]
EXTERNAL TRADE 68 147 [126, 170]
Marriage/weddings NUPTIALS 327*** 193 [169, 218]
DOMESTICATED ANIMALS
80 139 [117, 161]
Art/creation n/a n/a
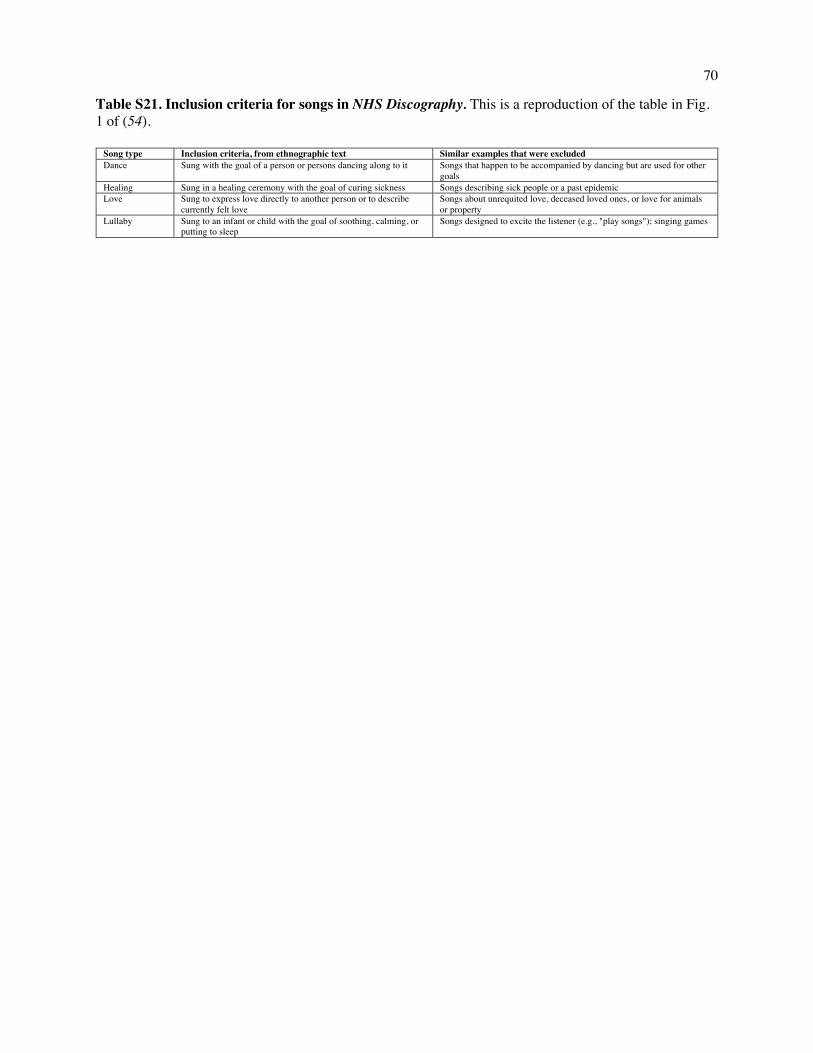
70
Table S21. Inclusion criteria for songs in NHS Discography. This is a reproduction of the table in Fig. 1 of (54).
Song type Inclusion criteria, from ethnographic text Similar examples that were excluded Dance Sung with the goal of a person or persons dancing along to it Songs that happen to be accompanied by dancing but are used for other
goals Healing Sung in a healing ceremony with the goal of curing sickness Songs describing sick people or a past epidemic Love Sung to express love directly to another person or to describe
currently felt love Songs about unrequited love, deceased loved ones, or love for animals or property
Lullaby Sung to an infant or child with the goal of soothing, calming, or putting to sleep
Songs designed to excite the listener (e.g., "play songs"); singing games
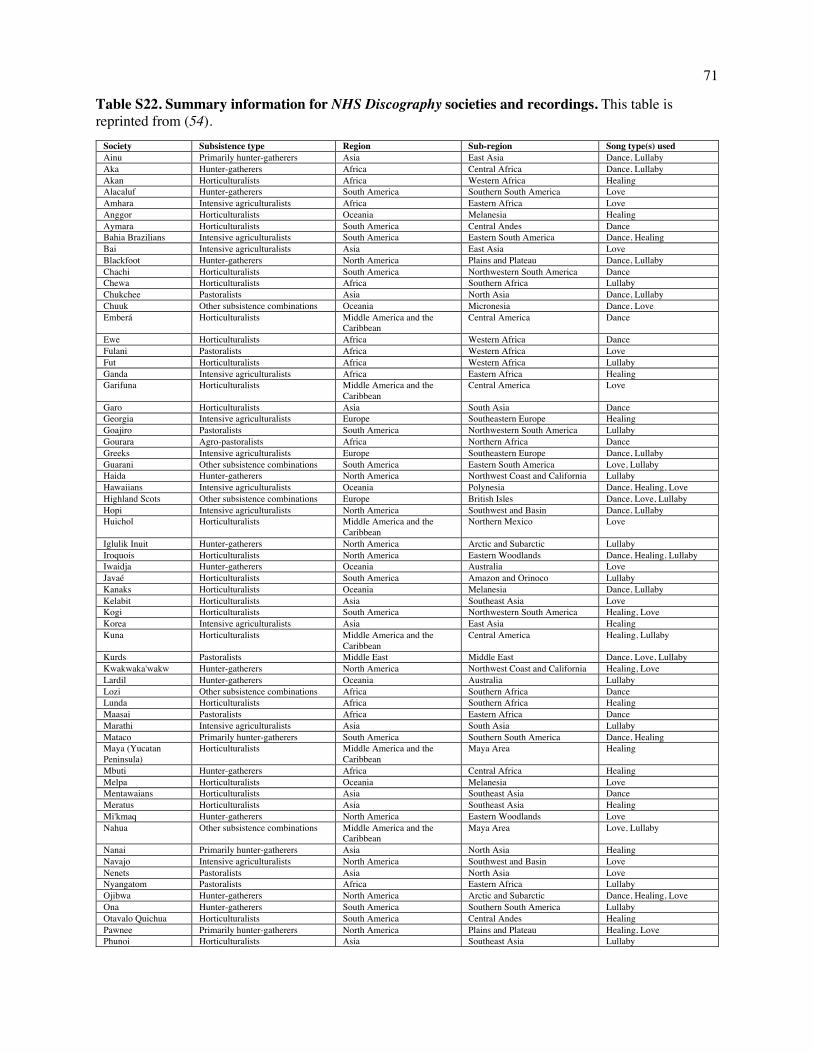
71
Table S22. Summary information for NHS Discography societies and recordings. This table is reprinted from (54).
Society Subsistence type Region Sub-region Song type(s) used Ainu Primarily hunter-gatherers Asia East Asia Dance, Lullaby Aka Hunter-gatherers Africa Central Africa Dance, Lullaby Akan Horticulturalists Africa Western Africa Healing Alacaluf Hunter-gatherers South America Southern South America Love Amhara Intensive agriculturalists Africa Eastern Africa Love Anggor Horticulturalists Oceania Melanesia Healing Aymara Horticulturalists South America Central Andes Dance Bahia Brazilians Intensive agriculturalists South America Eastern South America Dance, Healing Bai Intensive agriculturalists Asia East Asia Love Blackfoot Hunter-gatherers North America Plains and Plateau Dance, Lullaby Chachi Horticulturalists South America Northwestern South America Dance Chewa Horticulturalists Africa Southern Africa Lullaby Chukchee Pastoralists Asia North Asia Dance, Lullaby Chuuk Other subsistence combinations Oceania Micronesia Dance, Love Emberá Horticulturalists Middle America and the
Caribbean Central America Dance
Ewe Horticulturalists Africa Western Africa Dance Fulani Pastoralists Africa Western Africa Love Fut Horticulturalists Africa Western Africa Lullaby Ganda Intensive agriculturalists Africa Eastern Africa Healing Garifuna Horticulturalists Middle America and the
Caribbean Central America Love
Garo Horticulturalists Asia South Asia Dance Georgia Intensive agriculturalists Europe Southeastern Europe Healing Goajiro Pastoralists South America Northwestern South America Lullaby Gourara Agro-pastoralists Africa Northern Africa Dance Greeks Intensive agriculturalists Europe Southeastern Europe Dance, Lullaby Guarani Other subsistence combinations South America Eastern South America Love, Lullaby Haida Hunter-gatherers North America Northwest Coast and California Lullaby Hawaiians Intensive agriculturalists Oceania Polynesia Dance, Healing, Love Highland Scots Other subsistence combinations Europe British Isles Dance, Love, Lullaby Hopi Intensive agriculturalists North America Southwest and Basin Dance, Lullaby Huichol Horticulturalists Middle America and the
Caribbean Northern Mexico Love
Iglulik Inuit Hunter-gatherers North America Arctic and Subarctic Lullaby Iroquois Horticulturalists North America Eastern Woodlands Dance, Healing, Lullaby Iwaidja Hunter-gatherers Oceania Australia Love Javaé Horticulturalists South America Amazon and Orinoco Lullaby Kanaks Horticulturalists Oceania Melanesia Dance, Lullaby Kelabit Horticulturalists Asia Southeast Asia Love Kogi Horticulturalists South America Northwestern South America Healing, Love Korea Intensive agriculturalists Asia East Asia Healing Kuna Horticulturalists Middle America and the
Caribbean Central America Healing, Lullaby
Kurds Pastoralists Middle East Middle East Dance, Love, Lullaby Kwakwaka'wakw Hunter-gatherers North America Northwest Coast and California Healing, Love Lardil Hunter-gatherers Oceania Australia Lullaby Lozi Other subsistence combinations Africa Southern Africa Dance Lunda Horticulturalists Africa Southern Africa Healing Maasai Pastoralists Africa Eastern Africa Dance Marathi Intensive agriculturalists Asia South Asia Lullaby Mataco Primarily hunter-gatherers South America Southern South America Dance, Healing Maya (Yucatan Peninsula)
Horticulturalists Middle America and the Caribbean
Maya Area Healing
Mbuti Hunter-gatherers Africa Central Africa Healing Melpa Horticulturalists Oceania Melanesia Love Mentawaians Horticulturalists Asia Southeast Asia Dance Meratus Horticulturalists Asia Southeast Asia Healing Mi'kmaq Hunter-gatherers North America Eastern Woodlands Love Nahua Other subsistence combinations Middle America and the
Caribbean Maya Area Love, Lullaby
Nanai Primarily hunter-gatherers Asia North Asia Healing Navajo Intensive agriculturalists North America Southwest and Basin Love Nenets Pastoralists Asia North Asia Love Nyangatom Pastoralists Africa Eastern Africa Lullaby Ojibwa Hunter-gatherers North America Arctic and Subarctic Dance, Healing, Love Ona Hunter-gatherers South America Southern South America Lullaby Otavalo Quichua Horticulturalists South America Central Andes Healing Pawnee Primarily hunter-gatherers North America Plains and Plateau Healing, Love Phunoi Horticulturalists Asia Southeast Asia Lullaby
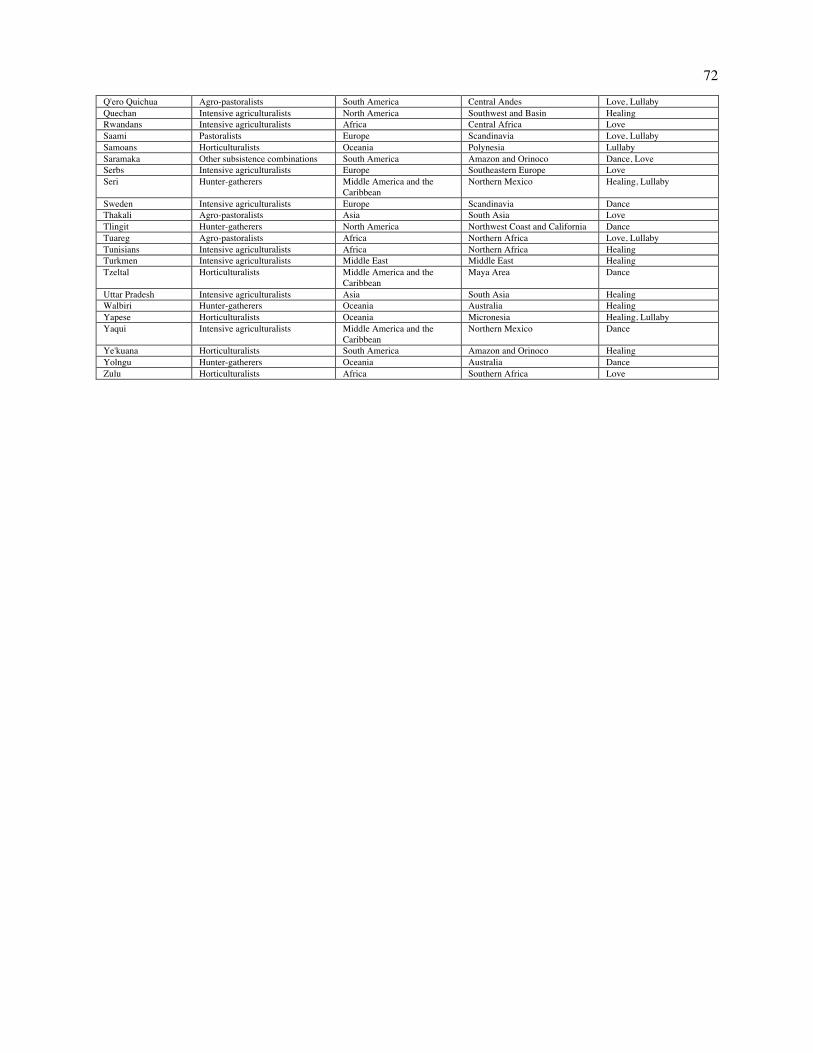
72
Q'ero Quichua Agro-pastoralists South America Central Andes Love, Lullaby Quechan Intensive agriculturalists North America Southwest and Basin Healing Rwandans Intensive agriculturalists Africa Central Africa Love Saami Pastoralists Europe Scandinavia Love, Lullaby Samoans Horticulturalists Oceania Polynesia Lullaby Saramaka Other subsistence combinations South America Amazon and Orinoco Dance, Love Serbs Intensive agriculturalists Europe Southeastern Europe Love Seri Hunter-gatherers Middle America and the
Caribbean Northern Mexico Healing, Lullaby
Sweden Intensive agriculturalists Europe Scandinavia Dance Thakali Agro-pastoralists Asia South Asia Love Tlingit Hunter-gatherers North America Northwest Coast and California Dance Tuareg Agro-pastoralists Africa Northern Africa Love, Lullaby Tunisians Intensive agriculturalists Africa Northern Africa Healing Turkmen Intensive agriculturalists Middle East Middle East Healing Tzeltal Horticulturalists Middle America and the
Caribbean Maya Area Dance
Uttar Pradesh Intensive agriculturalists Asia South Asia Healing Walbiri Hunter-gatherers Oceania Australia Healing Yapese Horticulturalists Oceania Micronesia Healing, Lullaby Yaqui Intensive agriculturalists Middle America and the
Caribbean Northern Mexico Dance
Ye'kuana Horticulturalists South America Amazon and Orinoco Healing Yolngu Hunter-gatherers Oceania Australia Dance Zulu Horticulturalists Africa Southern Africa Love
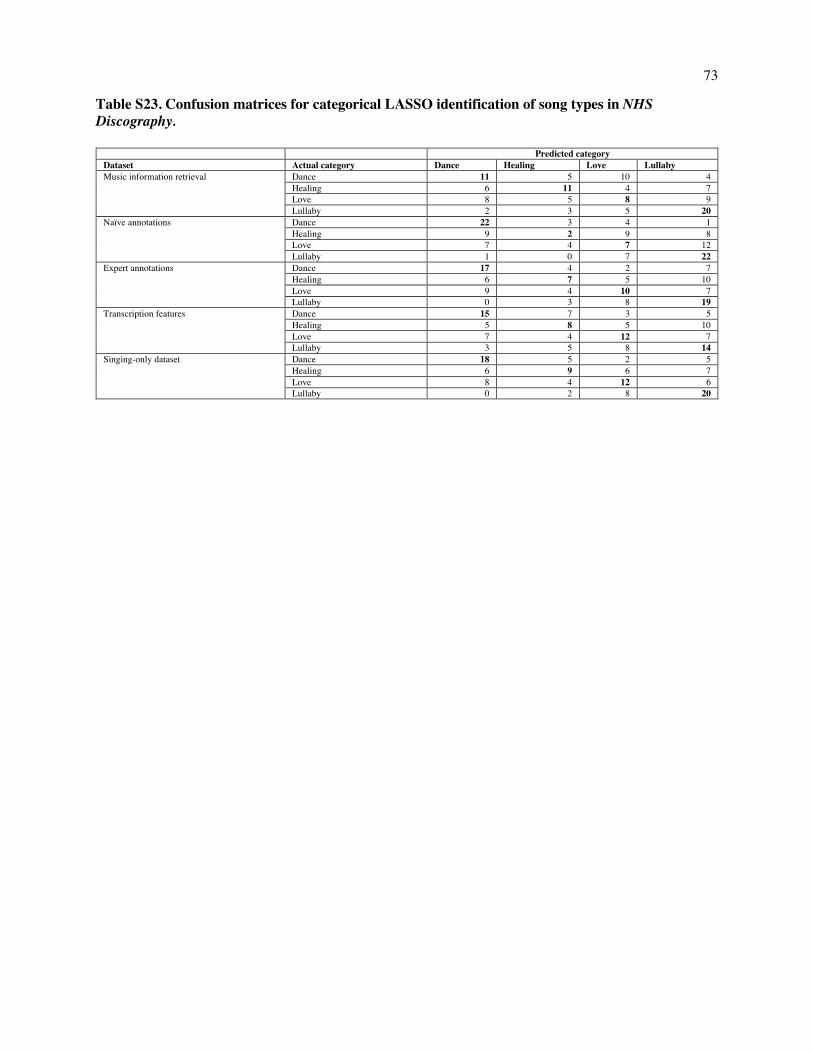
73
Table S23. Confusion matrices for categorical LASSO identification of song types in NHS Discography.
Predicted category Dataset Actual category Dance Healing Love Lullaby Music information retrieval Dance 11 5 10 4
Healing 6 11 4 7 Love 8 5 8 9 Lullaby 2 3 5 20
Naïve annotations Dance 22 3 4 1 Healing 9 2 9 8 Love 7 4 7 12 Lullaby 1 0 7 22
Expert annotations Dance 17 4 2 7 Healing 6 7 5 10 Love 9 4 10 7 Lullaby 0 3 8 19
Transcription features Dance 15 7 3 5 Healing 5 8 5 10 Love 7 4 12 7 Lullaby 3 5 8 14
Singing-only dataset Dance 18 5 2 5 Healing 6 9 6 7 Love 8 4 12 6 Lullaby 0 2 8 20
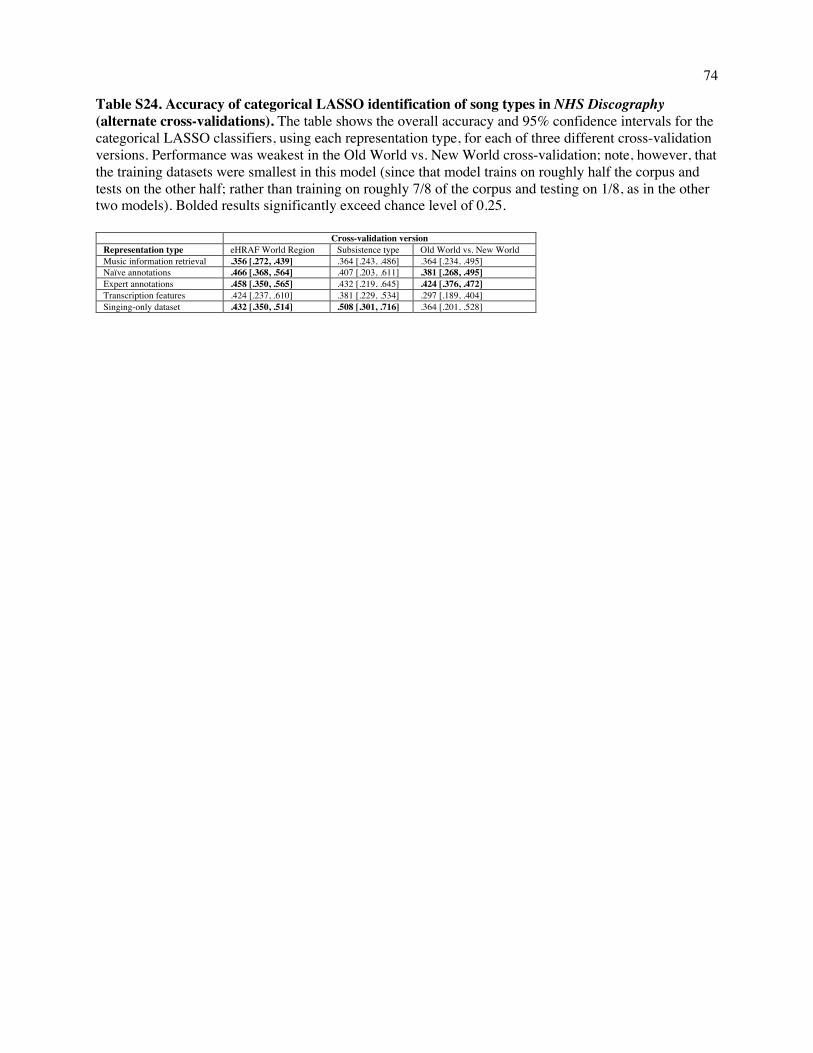
74
Table S24. Accuracy of categorical LASSO identification of song types in NHS Discography (alternate cross-validations). The table shows the overall accuracy and 95% confidence intervals for the categorical LASSO classifiers, using each representation type, for each of three different cross-validation versions. Performance was weakest in the Old World vs. New World cross-validation; note, however, that the training datasets were smallest in this model (since that model trains on roughly half the corpus and tests on the other half; rather than training on roughly 7/8 of the corpus and testing on 1/8, as in the other two models). Bolded results significantly exceed chance level of 0.25.
Cross-validation version Representation type eHRAF World Region Subsistence type Old World vs. New World Music information retrieval .356 [.272, .439] .364 [.243, .486] .364 [.234, .495] Naïve annotations .466 [.368, .564] .407 [.203, .611] .381 [.268, .495] Expert annotations .458 [.350, .565] .432 [.219, .645] .424 [.376, .472] Transcription features .424 [.237, .610] .381 [.229, .534] .297 [.189, .404] Singing-only dataset .432 [.350, .514] .508 [.301, .716] .364 [.201, .528]
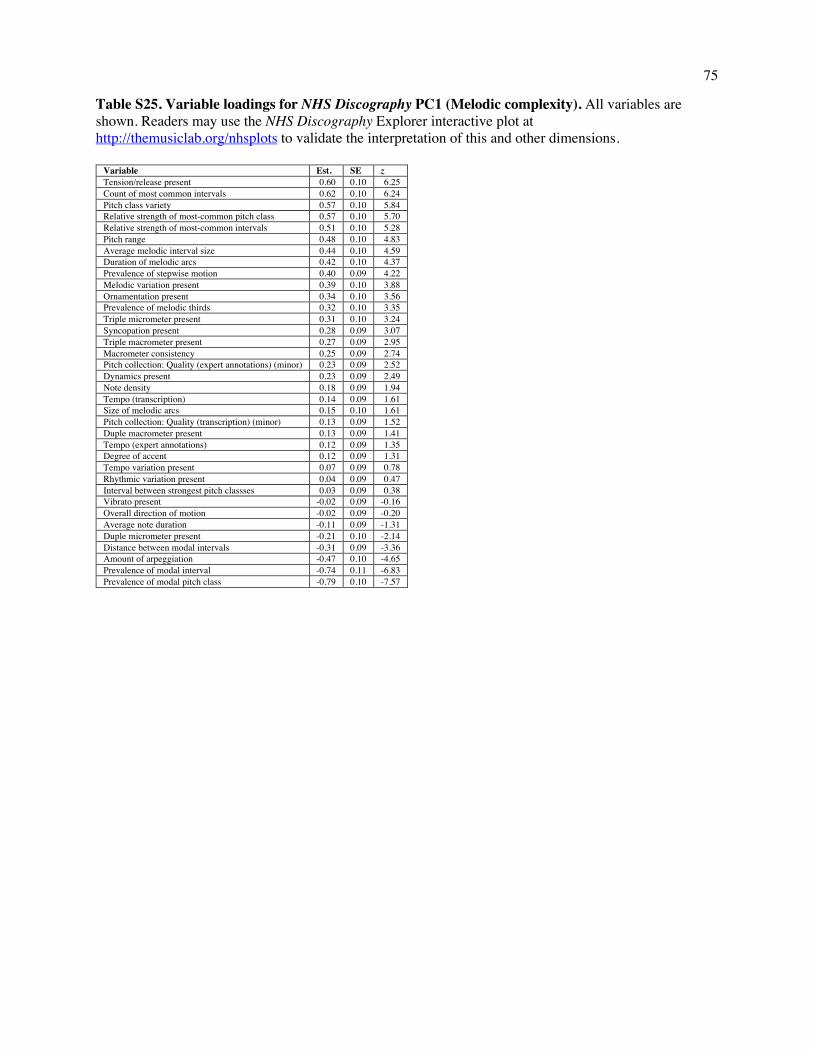
75
Table S25. Variable loadings for NHS Discography PC1 (Melodic complexity). All variables are shown. Readers may use the NHS Discography Explorer interactive plot at http://themusiclab.org/nhsplots to validate the interpretation of this and other dimensions.
Variable Est. SE z Tension/release present 0.60 0.10 6.25 Count of most common intervals 0.62 0.10 6.24 Pitch class variety 0.57 0.10 5.84 Relative strength of most-common pitch class 0.57 0.10 5.70 Relative strength of most-common intervals 0.51 0.10 5.28 Pitch range 0.48 0.10 4.83 Average melodic interval size 0.44 0.10 4.59 Duration of melodic arcs 0.42 0.10 4.37 Prevalence of stepwise motion 0.40 0.09 4.22 Melodic variation present 0.39 0.10 3.88 Ornamentation present 0.34 0.10 3.56 Prevalence of melodic thirds 0.32 0.10 3.35 Triple micrometer present 0.31 0.10 3.24 Syncopation present 0.28 0.09 3.07 Triple macrometer present 0.27 0.09 2.95 Macrometer consistency 0.25 0.09 2.74 Pitch collection: Quality (expert annotations) (minor) 0.23 0.09 2.52 Dynamics present 0.23 0.09 2.49 Note density 0.18 0.09 1.94 Tempo (transcription) 0.14 0.09 1.61 Size of melodic arcs 0.15 0.10 1.61 Pitch collection: Quality (transcription) (minor) 0.13 0.09 1.52 Duple macrometer present 0.13 0.09 1.41 Tempo (expert annotations) 0.12 0.09 1.35 Degree of accent 0.12 0.09 1.31 Tempo variation present 0.07 0.09 0.78 Rhythmic variation present 0.04 0.09 0.47 Interval between strongest pitch classses 0.03 0.09 0.38 Vibrato present -0.02 0.09 -0.16 Overall direction of motion -0.02 0.09 -0.20 Average note duration -0.11 0.09 -1.31 Duple micrometer present -0.21 0.10 -2.14 Distance between modal intervals -0.31 0.09 -3.36 Amount of arpeggiation -0.47 0.10 -4.65 Prevalence of modal interval -0.74 0.11 -6.83 Prevalence of modal pitch class -0.79 0.10 -7.57
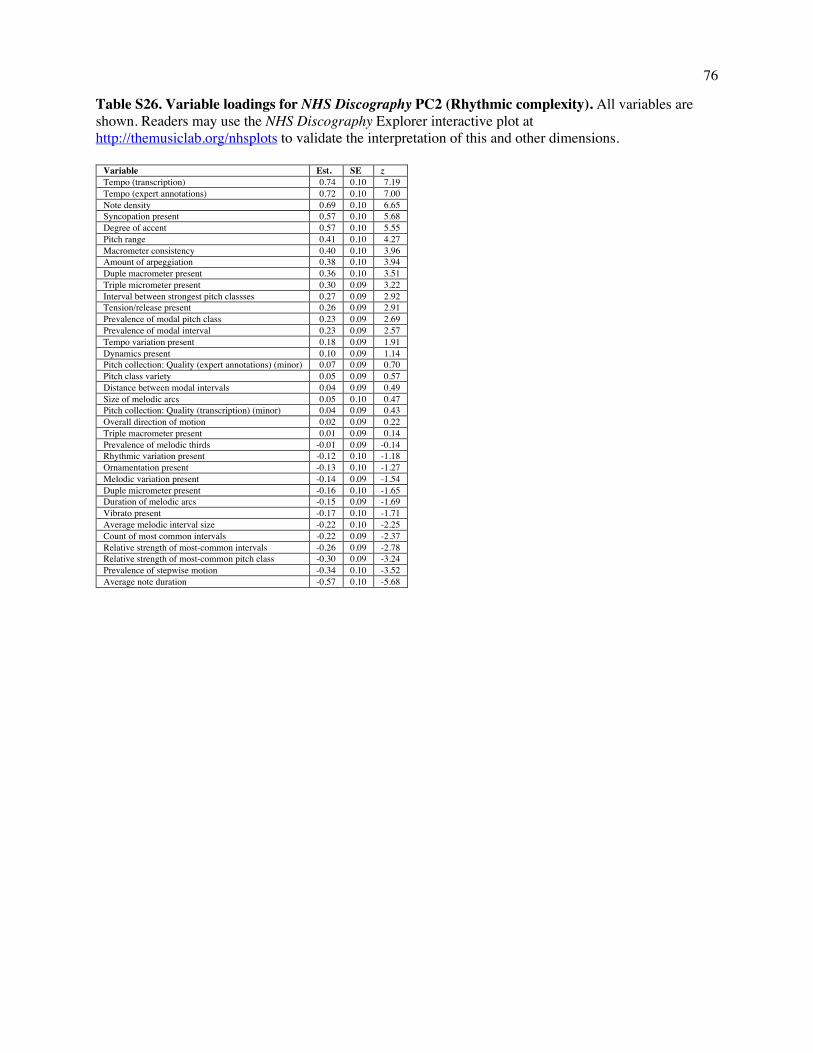
76
Table S26. Variable loadings for NHS Discography PC2 (Rhythmic complexity). All variables are shown. Readers may use the NHS Discography Explorer interactive plot at http://themusiclab.org/nhsplots to validate the interpretation of this and other dimensions.
Variable Est. SE z Tempo (transcription) 0.74 0.10 7.19 Tempo (expert annotations) 0.72 0.10 7.00 Note density 0.69 0.10 6.65 Syncopation present 0.57 0.10 5.68 Degree of accent 0.57 0.10 5.55 Pitch range 0.41 0.10 4.27 Macrometer consistency 0.40 0.10 3.96 Amount of arpeggiation 0.38 0.10 3.94 Duple macrometer present 0.36 0.10 3.51 Triple micrometer present 0.30 0.09 3.22 Interval between strongest pitch classses 0.27 0.09 2.92 Tension/release present 0.26 0.09 2.91 Prevalence of modal pitch class 0.23 0.09 2.69 Prevalence of modal interval 0.23 0.09 2.57 Tempo variation present 0.18 0.09 1.91 Dynamics present 0.10 0.09 1.14 Pitch collection: Quality (expert annotations) (minor) 0.07 0.09 0.70 Pitch class variety 0.05 0.09 0.57 Distance between modal intervals 0.04 0.09 0.49 Size of melodic arcs 0.05 0.10 0.47 Pitch collection: Quality (transcription) (minor) 0.04 0.09 0.43 Overall direction of motion 0.02 0.09 0.22 Triple macrometer present 0.01 0.09 0.14 Prevalence of melodic thirds -0.01 0.09 -0.14 Rhythmic variation present -0.12 0.10 -1.18 Ornamentation present -0.13 0.10 -1.27 Melodic variation present -0.14 0.09 -1.54 Duple micrometer present -0.16 0.10 -1.65 Duration of melodic arcs -0.15 0.09 -1.69 Vibrato present -0.17 0.10 -1.71 Average melodic interval size -0.22 0.10 -2.25 Count of most common intervals -0.22 0.09 -2.37 Relative strength of most-common intervals -0.26 0.09 -2.78 Relative strength of most-common pitch class -0.30 0.09 -3.24 Prevalence of stepwise motion -0.34 0.10 -3.52 Average note duration -0.57 0.10 -5.68
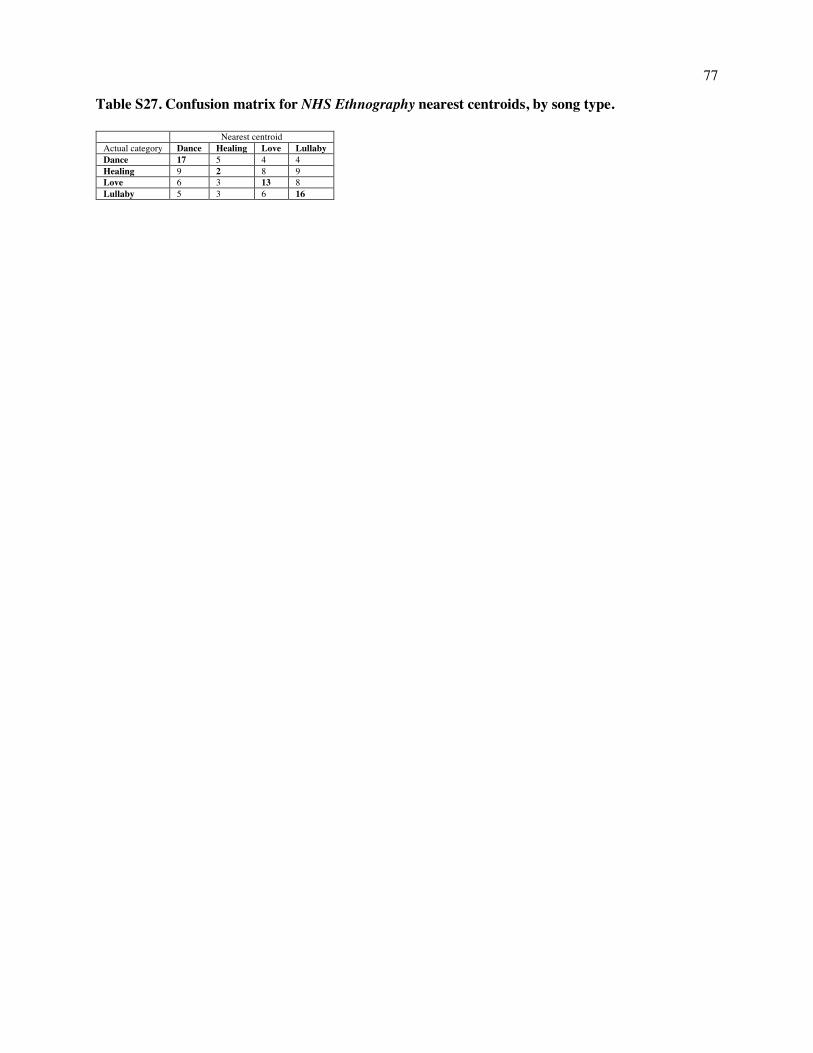
77
Table S27. Confusion matrix for NHS Ethnography nearest centroids, by song type.
Nearest centroid Actual category Dance Healing Love Lullaby Dance 17 5 4 4 Healing 9 2 8 9 Love 6 3 13 8 Lullaby 5 3 6 16
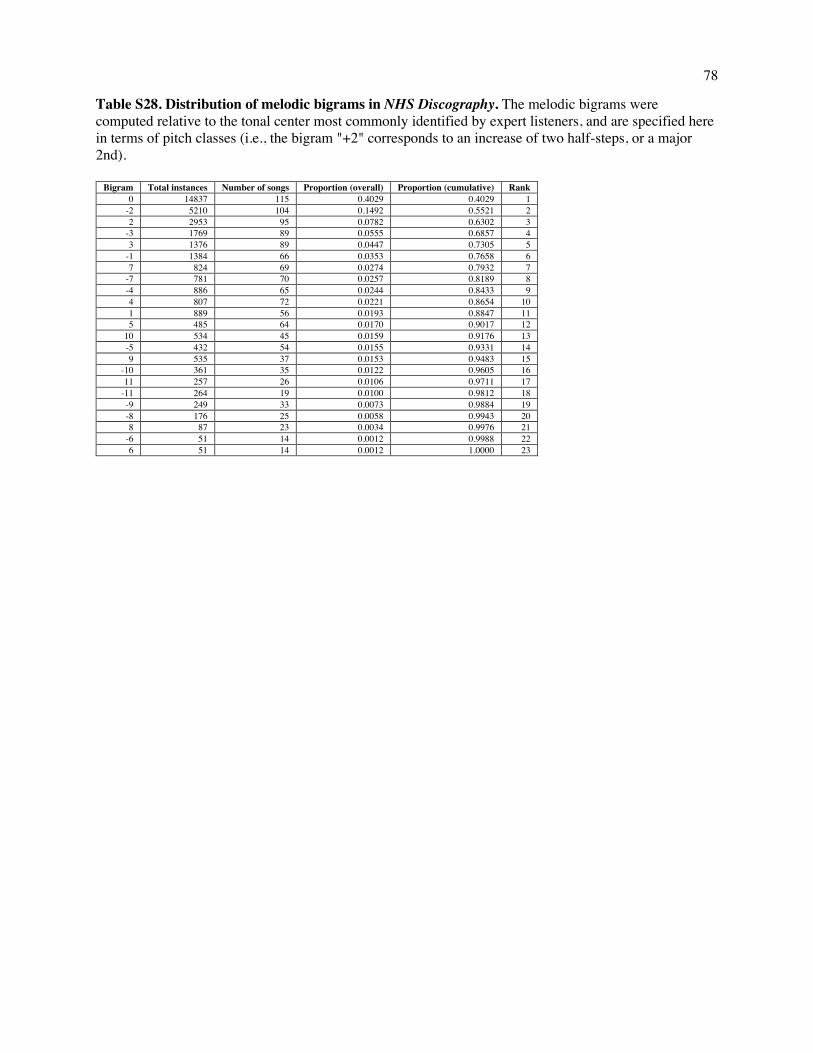
78
Table S28. Distribution of melodic bigrams in NHS Discography. The melodic bigrams were computed relative to the tonal center most commonly identified by expert listeners, and are specified here in terms of pitch classes (i.e., the bigram "+2" corresponds to an increase of two half-steps, or a major 2nd).
Bigram Total instances Number of songs Proportion (overall) Proportion (cumulative) Rank 0 14837 115 0.4029 0.4029 1
-2 5210 104 0.1492 0.5521 2 2 2953 95 0.0782 0.6302 3
-3 1769 89 0.0555 0.6857 4 3 1376 89 0.0447 0.7305 5
-1 1384 66 0.0353 0.7658 6 7 824 69 0.0274 0.7932 7
-7 781 70 0.0257 0.8189 8 -4 886 65 0.0244 0.8433 9 4 807 72 0.0221 0.8654 10 1 889 56 0.0193 0.8847 11 5 485 64 0.0170 0.9017 12
10 534 45 0.0159 0.9176 13 -5 432 54 0.0155 0.9331 14 9 535 37 0.0153 0.9483 15
-10 361 35 0.0122 0.9605 16 11 257 26 0.0106 0.9711 17
-11 264 19 0.0100 0.9812 18 -9 249 33 0.0073 0.9884 19 -8 176 25 0.0058 0.9943 20 8 87 23 0.0034 0.9976 21
-6 51 14 0.0012 0.9988 22 6 51 14 0.0012 1.0000 23
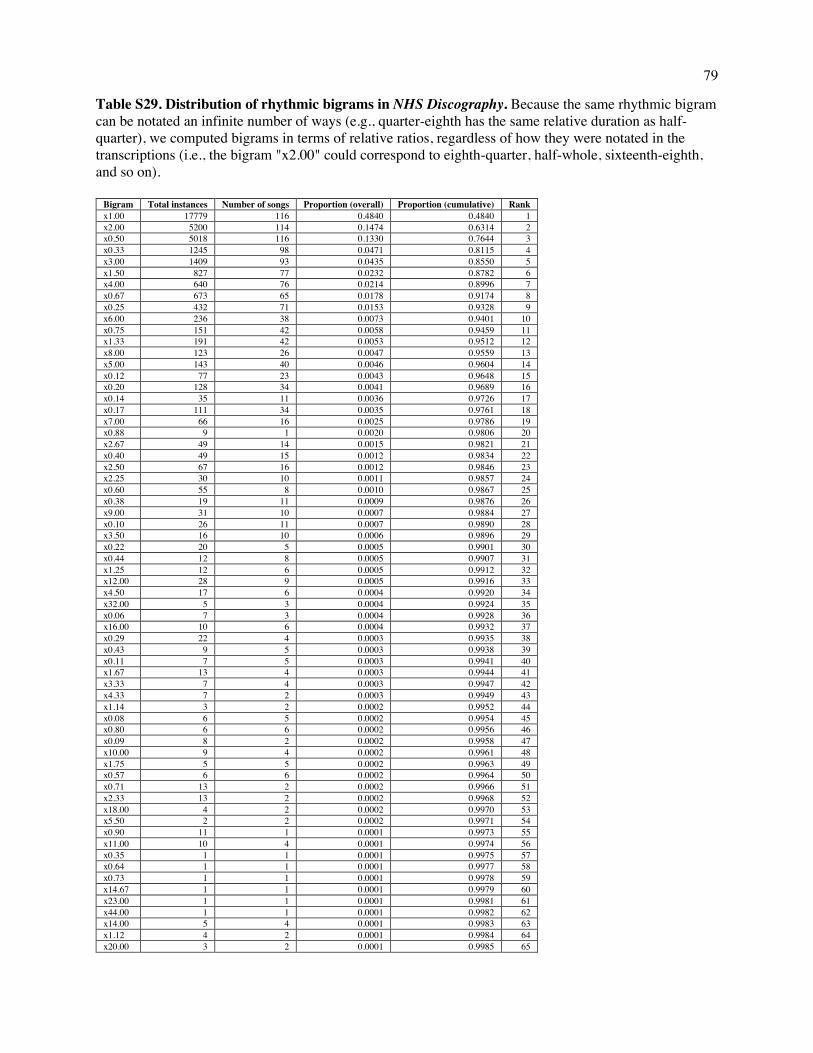
79
Table S29. Distribution of rhythmic bigrams in NHS Discography. Because the same rhythmic bigram can be notated an infinite number of ways (e.g., quarter-eighth has the same relative duration as half-quarter), we computed bigrams in terms of relative ratios, regardless of how they were notated in the transcriptions (i.e., the bigram "x2.00" could correspond to eighth-quarter, half-whole, sixteenth-eighth, and so on).
Bigram Total instances Number of songs Proportion (overall) Proportion (cumulative) Rank x1.00 17779 116 0.4840 0.4840 1 x2.00 5200 114 0.1474 0.6314 2 x0.50 5018 116 0.1330 0.7644 3 x0.33 1245 98 0.0471 0.8115 4 x3.00 1409 93 0.0435 0.8550 5 x1.50 827 77 0.0232 0.8782 6 x4.00 640 76 0.0214 0.8996 7 x0.67 673 65 0.0178 0.9174 8 x0.25 432 71 0.0153 0.9328 9 x6.00 236 38 0.0073 0.9401 10 x0.75 151 42 0.0058 0.9459 11 x1.33 191 42 0.0053 0.9512 12 x8.00 123 26 0.0047 0.9559 13 x5.00 143 40 0.0046 0.9604 14 x0.12 77 23 0.0043 0.9648 15 x0.20 128 34 0.0041 0.9689 16 x0.14 35 11 0.0036 0.9726 17 x0.17 111 34 0.0035 0.9761 18 x7.00 66 16 0.0025 0.9786 19 x0.88 9 1 0.0020 0.9806 20 x2.67 49 14 0.0015 0.9821 21 x0.40 49 15 0.0012 0.9834 22 x2.50 67 16 0.0012 0.9846 23 x2.25 30 10 0.0011 0.9857 24 x0.60 55 8 0.0010 0.9867 25 x0.38 19 11 0.0009 0.9876 26 x9.00 31 10 0.0007 0.9884 27 x0.10 26 11 0.0007 0.9890 28 x3.50 16 10 0.0006 0.9896 29 x0.22 20 5 0.0005 0.9901 30 x0.44 12 8 0.0005 0.9907 31 x1.25 12 6 0.0005 0.9912 32 x12.00 28 9 0.0005 0.9916 33 x4.50 17 6 0.0004 0.9920 34 x32.00 5 3 0.0004 0.9924 35 x0.06 7 3 0.0004 0.9928 36 x16.00 10 6 0.0004 0.9932 37 x0.29 22 4 0.0003 0.9935 38 x0.43 9 5 0.0003 0.9938 39 x0.11 7 5 0.0003 0.9941 40 x1.67 13 4 0.0003 0.9944 41 x3.33 7 4 0.0003 0.9947 42 x4.33 7 2 0.0003 0.9949 43 x1.14 3 2 0.0002 0.9952 44 x0.08 6 5 0.0002 0.9954 45 x0.80 6 6 0.0002 0.9956 46 x0.09 8 2 0.0002 0.9958 47 x10.00 9 4 0.0002 0.9961 48 x1.75 5 5 0.0002 0.9963 49 x0.57 6 6 0.0002 0.9964 50 x0.71 13 2 0.0002 0.9966 51 x2.33 13 2 0.0002 0.9968 52 x18.00 4 2 0.0002 0.9970 53 x5.50 2 2 0.0002 0.9971 54 x0.90 11 1 0.0001 0.9973 55 x11.00 10 4 0.0001 0.9974 56 x0.35 1 1 0.0001 0.9975 57 x0.64 1 1 0.0001 0.9977 58 x0.73 1 1 0.0001 0.9978 59 x14.67 1 1 0.0001 0.9979 60 x23.00 1 1 0.0001 0.9981 61 x44.00 1 1 0.0001 0.9982 62 x14.00 5 4 0.0001 0.9983 63 x1.12 4 2 0.0001 0.9984 64 x20.00 3 2 0.0001 0.9985 65
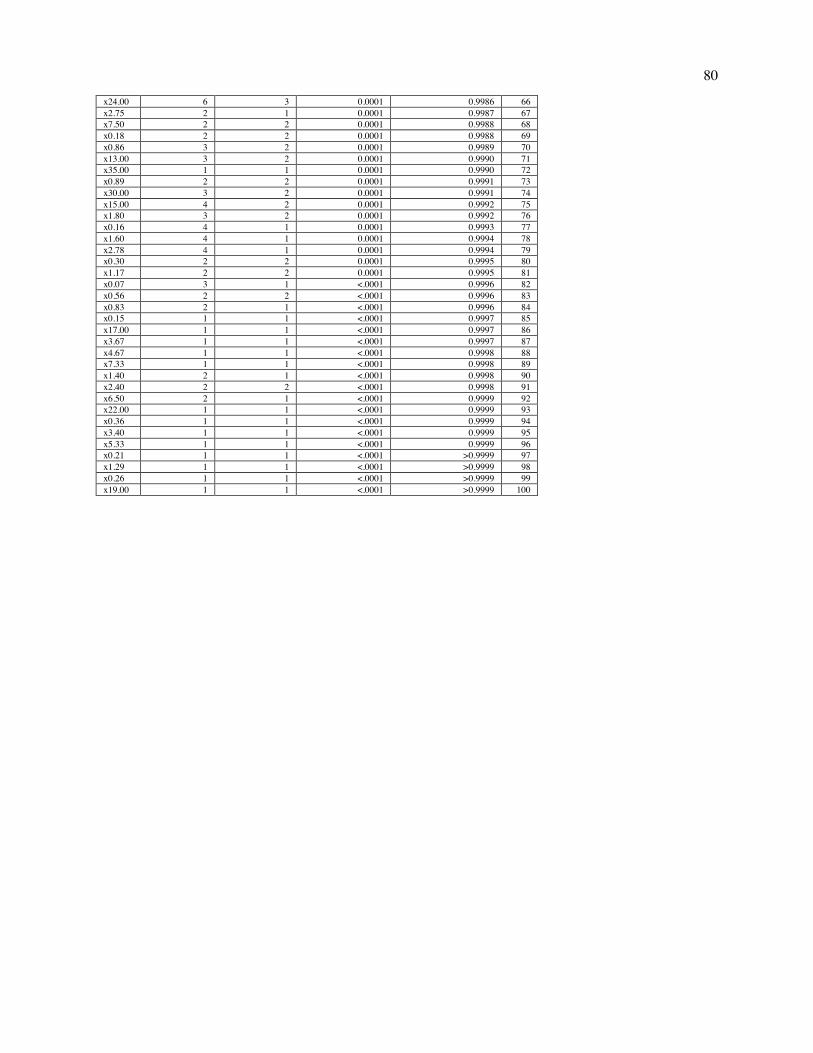
80
x24.00 6 3 0.0001 0.9986 66 x2.75 2 1 0.0001 0.9987 67 x7.50 2 2 0.0001 0.9988 68 x0.18 2 2 0.0001 0.9988 69 x0.86 3 2 0.0001 0.9989 70 x13.00 3 2 0.0001 0.9990 71 x35.00 1 1 0.0001 0.9990 72 x0.89 2 2 0.0001 0.9991 73 x30.00 3 2 0.0001 0.9991 74 x15.00 4 2 0.0001 0.9992 75 x1.80 3 2 0.0001 0.9992 76 x0.16 4 1 0.0001 0.9993 77 x1.60 4 1 0.0001 0.9994 78 x2.78 4 1 0.0001 0.9994 79 x0.30 2 2 0.0001 0.9995 80 x1.17 2 2 0.0001 0.9995 81 x0.07 3 1 <.0001 0.9996 82 x0.56 2 2 <.0001 0.9996 83 x0.83 2 1 <.0001 0.9996 84 x0.15 1 1 <.0001 0.9997 85 x17.00 1 1 <.0001 0.9997 86 x3.67 1 1 <.0001 0.9997 87 x4.67 1 1 <.0001 0.9998 88 x7.33 1 1 <.0001 0.9998 89 x1.40 2 1 <.0001 0.9998 90 x2.40 2 2 <.0001 0.9998 91 x6.50 2 1 <.0001 0.9999 92 x22.00 1 1 <.0001 0.9999 93 x0.36 1 1 <.0001 0.9999 94 x3.40 1 1 <.0001 0.9999 95 x5.33 1 1 <.0001 0.9999 96 x0.21 1 1 <.0001 >0.9999 97 x1.29 1 1 <.0001 >0.9999 98 x0.26 1 1 <.0001 >0.9999 99 x19.00 1 1 <.0001 >0.9999 100
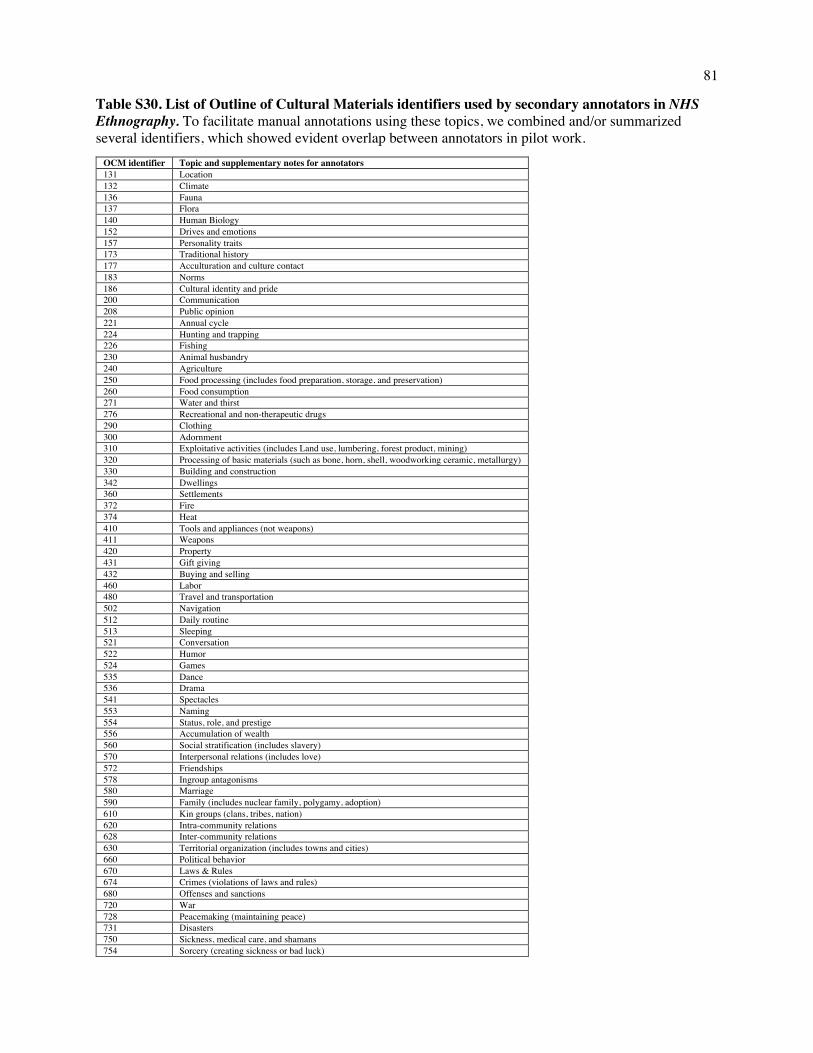
81
Table S30. List of Outline of Cultural Materials identifiers used by secondary annotators in NHS Ethnography. To facilitate manual annotations using these topics, we combined and/or summarized several identifiers, which showed evident overlap between annotators in pilot work.
OCM identifier Topic and supplementary notes for annotators 131 Location 132 Climate 136 Fauna 137 Flora 140 Human Biology 152 Drives and emotions 157 Personality traits 173 Traditional history 177 Acculturation and culture contact 183 Norms 186 Cultural identity and pride 200 Communication 208 Public opinion 221 Annual cycle 224 Hunting and trapping 226 Fishing 230 Animal husbandry 240 Agriculture 250 Food processing (includes food preparation, storage, and preservation) 260 Food consumption 271 Water and thirst 276 Recreational and non-therapeutic drugs 290 Clothing 300 Adornment 310 Exploitative activities (includes Land use, lumbering, forest product, mining) 320 Processing of basic materials (such as bone, horn, shell, woodworking ceramic, metallurgy) 330 Building and construction 342 Dwellings 360 Settlements 372 Fire 374 Heat 410 Tools and appliances (not weapons) 411 Weapons 420 Property 431 Gift giving 432 Buying and selling 460 Labor 480 Travel and transportation 502 Navigation 512 Daily routine 513 Sleeping 521 Conversation 522 Humor 524 Games 535 Dance 536 Drama 541 Spectacles 553 Naming 554 Status, role, and prestige 556 Accumulation of wealth 560 Social stratification (includes slavery) 570 Interpersonal relations (includes love) 572 Friendships 578 Ingroup antagonisms 580 Marriage 590 Family (includes nuclear family, polygamy, adoption) 610 Kin groups (clans, tribes, nation) 620 Intra-community relations 628 Inter-community relations 630 Territorial organization (includes towns and cities) 660 Political behavior 670 Laws & Rules 674 Crimes (violations of laws and rules) 680 Offenses and sanctions 720 War 728 Peacemaking (maintaining peace) 731 Disasters 750 Sickness, medical care, and shamans 754 Sorcery (creating sickness or bad luck)
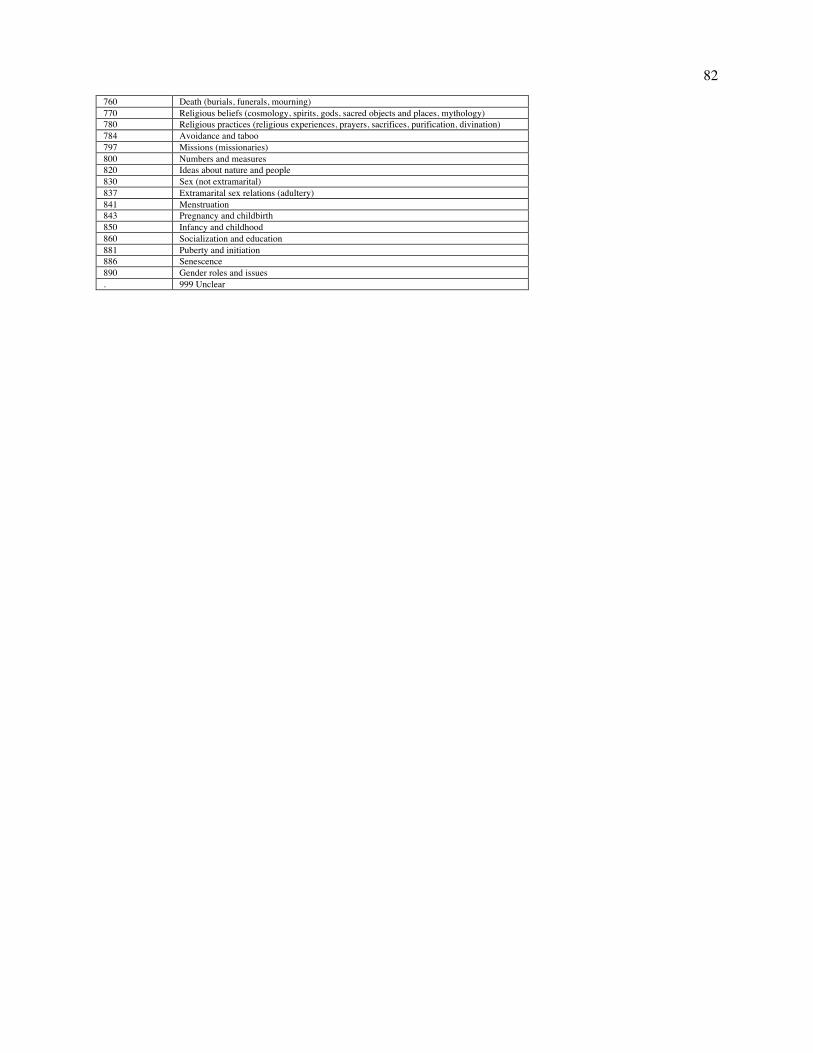
82
760 Death (burials, funerals, mourning) 770 Religious beliefs (cosmology, spirits, gods, sacred objects and places, mythology) 780 Religious practices (religious experiences, prayers, sacrifices, purification, divination) 784 Avoidance and taboo 797 Missions (missionaries) 800 Numbers and measures 820 Ideas about nature and people 830 Sex (not extramarital) 837 Extramarital sex relations (adultery) 841 Menstruation 843 Pregnancy and childbirth 850 Infancy and childhood 860 Socialization and education 881 Puberty and initiation 886 Senescence 890 Gender roles and issues . 999 Unclear
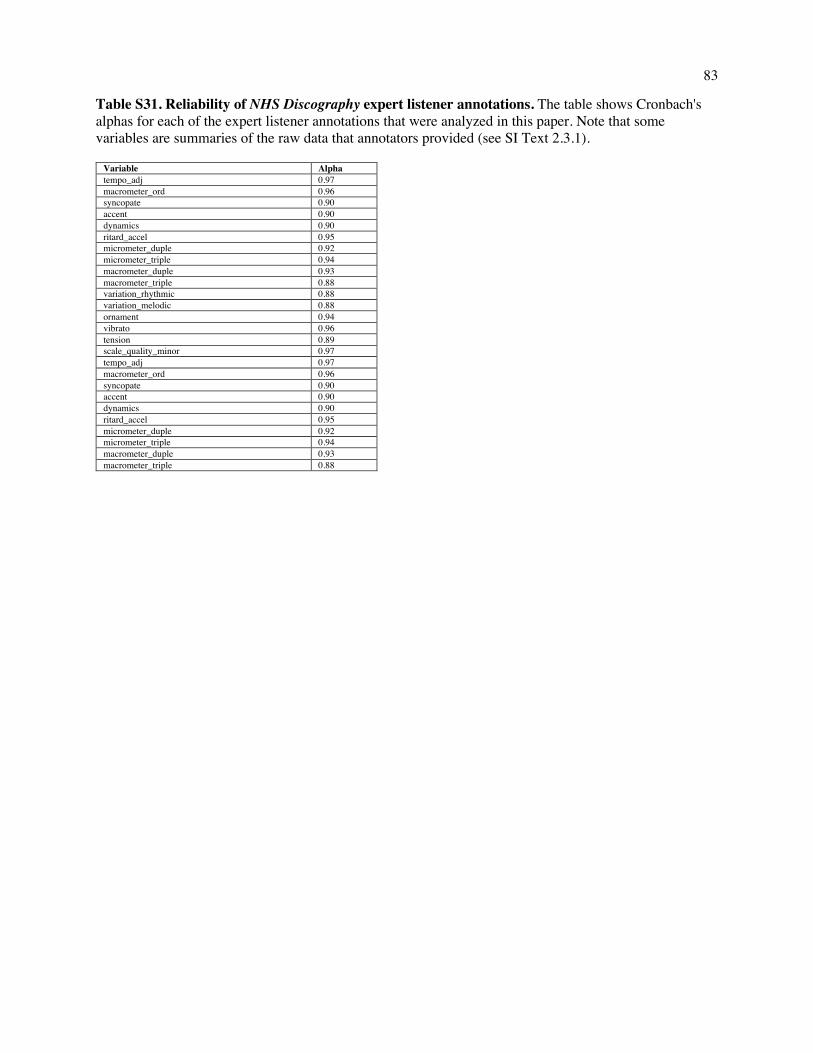
83
Table S31. Reliability of NHS Discography expert listener annotations. The table shows Cronbach's alphas for each of the expert listener annotations that were analyzed in this paper. Note that some variables are summaries of the raw data that annotators provided (see SI Text 2.3.1).
Variable Alpha tempo_adj 0.97 macrometer_ord 0.96 syncopate 0.90 accent 0.90 dynamics 0.90 ritard_accel 0.95 micrometer_duple 0.92 micrometer_triple 0.94 macrometer_duple 0.93 macrometer_triple 0.88 variation_rhythmic 0.88 variation_melodic 0.88 ornament 0.94 vibrato 0.96 tension 0.89 scale_quality_minor 0.97 tempo_adj 0.97 macrometer_ord 0.96 syncopate 0.90 accent 0.90 dynamics 0.90 ritard_accel 0.95 micrometer_duple 0.92 micrometer_triple 0.94 macrometer_duple 0.93 macrometer_triple 0.88
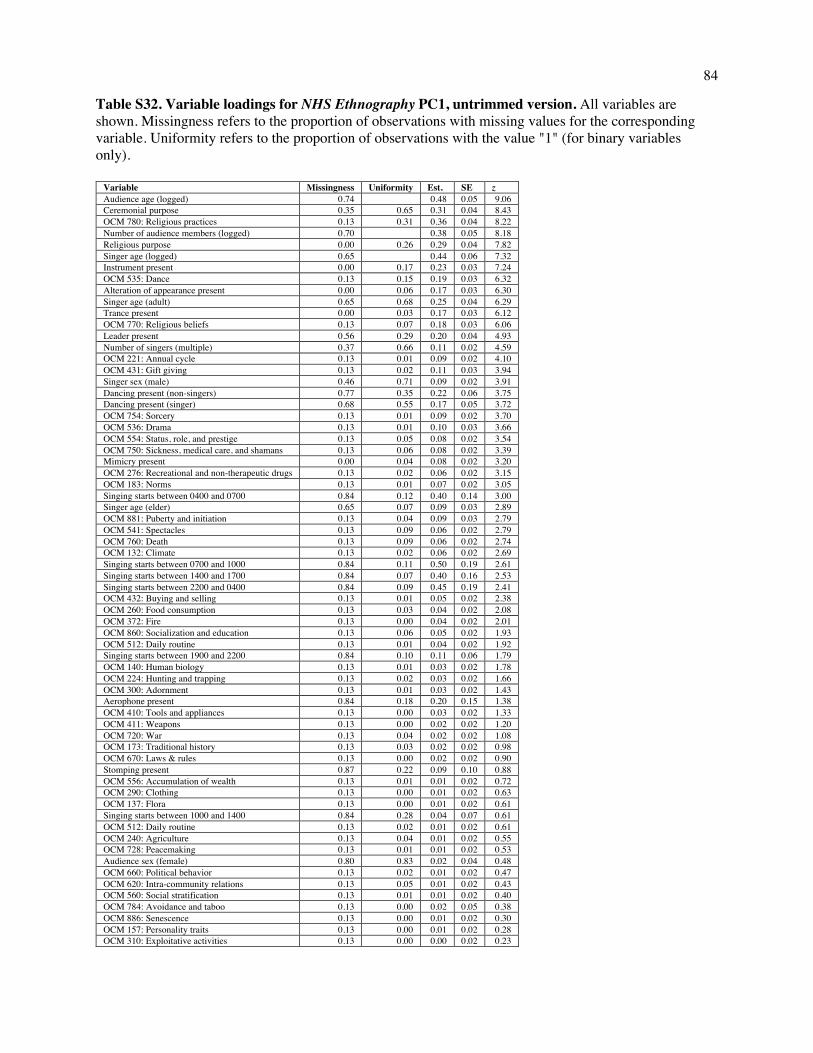
84
Table S32. Variable loadings for NHS Ethnography PC1, untrimmed version. All variables are shown. Missingness refers to the proportion of observations with missing values for the corresponding variable. Uniformity refers to the proportion of observations with the value "1" (for binary variables only).
Variable Missingness Uniformity Est. SE z Audience age (logged) 0.74
0.48 0.05 9.06
Ceremonial purpose 0.35 0.65 0.31 0.04 8.43 OCM 780: Religious practices 0.13 0.31 0.36 0.04 8.22 Number of audience members (logged) 0.70
0.38 0.05 8.18
Religious purpose 0.00 0.26 0.29 0.04 7.82 Singer age (logged) 0.65
0.44 0.06 7.32
Instrument present 0.00 0.17 0.23 0.03 7.24 OCM 535: Dance 0.13 0.15 0.19 0.03 6.32 Alteration of appearance present 0.00 0.06 0.17 0.03 6.30 Singer age (adult) 0.65 0.68 0.25 0.04 6.29 Trance present 0.00 0.03 0.17 0.03 6.12 OCM 770: Religious beliefs 0.13 0.07 0.18 0.03 6.06 Leader present 0.56 0.29 0.20 0.04 4.93 Number of singers (multiple) 0.37 0.66 0.11 0.02 4.59 OCM 221: Annual cycle 0.13 0.01 0.09 0.02 4.10 OCM 431: Gift giving 0.13 0.02 0.11 0.03 3.94 Singer sex (male) 0.46 0.71 0.09 0.02 3.91 Dancing present (non-singers) 0.77 0.35 0.22 0.06 3.75 Dancing present (singer) 0.68 0.55 0.17 0.05 3.72 OCM 754: Sorcery 0.13 0.01 0.09 0.02 3.70 OCM 536: Drama 0.13 0.01 0.10 0.03 3.66 OCM 554: Status, role, and prestige 0.13 0.05 0.08 0.02 3.54 OCM 750: Sickness, medical care, and shamans 0.13 0.06 0.08 0.02 3.39 Mimicry present 0.00 0.04 0.08 0.02 3.20 OCM 276: Recreational and non-therapeutic drugs 0.13 0.02 0.06 0.02 3.15 OCM 183: Norms 0.13 0.01 0.07 0.02 3.05 Singing starts between 0400 and 0700 0.84 0.12 0.40 0.14 3.00 Singer age (elder) 0.65 0.07 0.09 0.03 2.89 OCM 881: Puberty and initiation 0.13 0.04 0.09 0.03 2.79 OCM 541: Spectacles 0.13 0.09 0.06 0.02 2.79 OCM 760: Death 0.13 0.09 0.06 0.02 2.74 OCM 132: Climate 0.13 0.02 0.06 0.02 2.69 Singing starts between 0700 and 1000 0.84 0.11 0.50 0.19 2.61 Singing starts between 1400 and 1700 0.84 0.07 0.40 0.16 2.53 Singing starts between 2200 and 0400 0.84 0.09 0.45 0.19 2.41 OCM 432: Buying and selling 0.13 0.01 0.05 0.02 2.38 OCM 260: Food consumption 0.13 0.03 0.04 0.02 2.08 OCM 372: Fire 0.13 0.00 0.04 0.02 2.01 OCM 860: Socialization and education 0.13 0.06 0.05 0.02 1.93 OCM 512: Daily routine 0.13 0.01 0.04 0.02 1.92 Singing starts between 1900 and 2200 0.84 0.10 0.11 0.06 1.79 OCM 140: Human biology 0.13 0.01 0.03 0.02 1.78 OCM 224: Hunting and trapping 0.13 0.02 0.03 0.02 1.66 OCM 300: Adornment 0.13 0.01 0.03 0.02 1.43 Aerophone present 0.84 0.18 0.20 0.15 1.38 OCM 410: Tools and appliances 0.13 0.00 0.03 0.02 1.33 OCM 411: Weapons 0.13 0.00 0.02 0.02 1.20 OCM 720: War 0.13 0.04 0.02 0.02 1.08 OCM 173: Traditional history 0.13 0.03 0.02 0.02 0.98 OCM 670: Laws & rules 0.13 0.00 0.02 0.02 0.90 Stomping present 0.87 0.22 0.09 0.10 0.88 OCM 556: Accumulation of wealth 0.13 0.01 0.01 0.02 0.72 OCM 290: Clothing 0.13 0.00 0.01 0.02 0.63 OCM 137: Flora 0.13 0.00 0.01 0.02 0.61 Singing starts between 1000 and 1400 0.84 0.28 0.04 0.07 0.61 OCM 512: Daily routine 0.13 0.02 0.01 0.02 0.61 OCM 240: Agriculture 0.13 0.04 0.01 0.02 0.55 OCM 728: Peacemaking 0.13 0.01 0.01 0.02 0.53 Audience sex (female) 0.80 0.83 0.02 0.04 0.48 OCM 660: Political behavior 0.13 0.02 0.01 0.02 0.47 OCM 620: Intra-community relations 0.13 0.05 0.01 0.02 0.43 OCM 560: Social stratification 0.13 0.01 0.01 0.02 0.40 OCM 784: Avoidance and taboo 0.13 0.00 0.02 0.05 0.38 OCM 886: Senescence 0.13 0.00 0.01 0.02 0.30 OCM 157: Personality traits 0.13 0.00 0.01 0.02 0.28 OCM 310: Exploitative activities 0.13 0.00 0.00 0.02 0.23
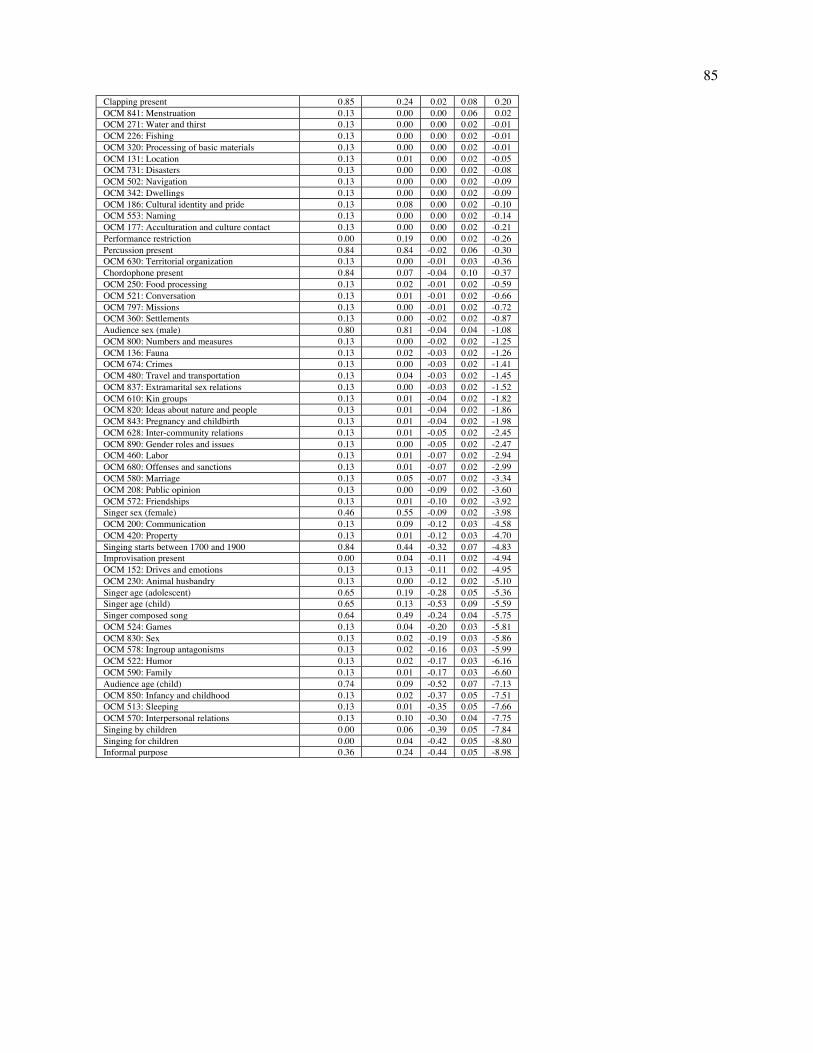
85
Clapping present 0.85 0.24 0.02 0.08 0.20 OCM 841: Menstruation 0.13 0.00 0.00 0.06 0.02 OCM 271: Water and thirst 0.13 0.00 0.00 0.02 -0.01 OCM 226: Fishing 0.13 0.00 0.00 0.02 -0.01 OCM 320: Processing of basic materials 0.13 0.00 0.00 0.02 -0.01 OCM 131: Location 0.13 0.01 0.00 0.02 -0.05 OCM 731: Disasters 0.13 0.00 0.00 0.02 -0.08 OCM 502: Navigation 0.13 0.00 0.00 0.02 -0.09 OCM 342: Dwellings 0.13 0.00 0.00 0.02 -0.09 OCM 186: Cultural identity and pride 0.13 0.08 0.00 0.02 -0.10 OCM 553: Naming 0.13 0.00 0.00 0.02 -0.14 OCM 177: Acculturation and culture contact 0.13 0.00 0.00 0.02 -0.21 Performance restriction 0.00 0.19 0.00 0.02 -0.26 Percussion present 0.84 0.84 -0.02 0.06 -0.30 OCM 630: Territorial organization 0.13 0.00 -0.01 0.03 -0.36 Chordophone present 0.84 0.07 -0.04 0.10 -0.37 OCM 250: Food processing 0.13 0.02 -0.01 0.02 -0.59 OCM 521: Conversation 0.13 0.01 -0.01 0.02 -0.66 OCM 797: Missions 0.13 0.00 -0.01 0.02 -0.72 OCM 360: Settlements 0.13 0.00 -0.02 0.02 -0.87 Audience sex (male) 0.80 0.81 -0.04 0.04 -1.08 OCM 800: Numbers and measures 0.13 0.00 -0.02 0.02 -1.25 OCM 136: Fauna 0.13 0.02 -0.03 0.02 -1.26 OCM 674: Crimes 0.13 0.00 -0.03 0.02 -1.41 OCM 480: Travel and transportation 0.13 0.04 -0.03 0.02 -1.45 OCM 837: Extramarital sex relations 0.13 0.00 -0.03 0.02 -1.52 OCM 610: Kin groups 0.13 0.01 -0.04 0.02 -1.82 OCM 820: Ideas about nature and people 0.13 0.01 -0.04 0.02 -1.86 OCM 843: Pregnancy and childbirth 0.13 0.01 -0.04 0.02 -1.98 OCM 628: Inter-community relations 0.13 0.01 -0.05 0.02 -2.45 OCM 890: Gender roles and issues 0.13 0.00 -0.05 0.02 -2.47 OCM 460: Labor 0.13 0.01 -0.07 0.02 -2.94 OCM 680: Offenses and sanctions 0.13 0.01 -0.07 0.02 -2.99 OCM 580: Marriage 0.13 0.05 -0.07 0.02 -3.34 OCM 208: Public opinion 0.13 0.00 -0.09 0.02 -3.60 OCM 572: Friendships 0.13 0.01 -0.10 0.02 -3.92 Singer sex (female) 0.46 0.55 -0.09 0.02 -3.98 OCM 200: Communication 0.13 0.09 -0.12 0.03 -4.58 OCM 420: Property 0.13 0.01 -0.12 0.03 -4.70 Singing starts between 1700 and 1900 0.84 0.44 -0.32 0.07 -4.83 Improvisation present 0.00 0.04 -0.11 0.02 -4.94 OCM 152: Drives and emotions 0.13 0.13 -0.11 0.02 -4.95 OCM 230: Animal husbandry 0.13 0.00 -0.12 0.02 -5.10 Singer age (adolescent) 0.65 0.19 -0.28 0.05 -5.36 Singer age (child) 0.65 0.13 -0.53 0.09 -5.59 Singer composed song 0.64 0.49 -0.24 0.04 -5.75 OCM 524: Games 0.13 0.04 -0.20 0.03 -5.81 OCM 830: Sex 0.13 0.02 -0.19 0.03 -5.86 OCM 578: Ingroup antagonisms 0.13 0.02 -0.16 0.03 -5.99 OCM 522: Humor 0.13 0.02 -0.17 0.03 -6.16 OCM 590: Family 0.13 0.01 -0.17 0.03 -6.60 Audience age (child) 0.74 0.09 -0.52 0.07 -7.13 OCM 850: Infancy and childhood 0.13 0.02 -0.37 0.05 -7.51 OCM 513: Sleeping 0.13 0.01 -0.35 0.05 -7.66 OCM 570: Interpersonal relations 0.13 0.10 -0.30 0.04 -7.75 Singing by children 0.00 0.06 -0.39 0.05 -7.84 Singing for children 0.00 0.04 -0.42 0.05 -8.80 Informal purpose 0.36 0.24 -0.44 0.05 -8.98
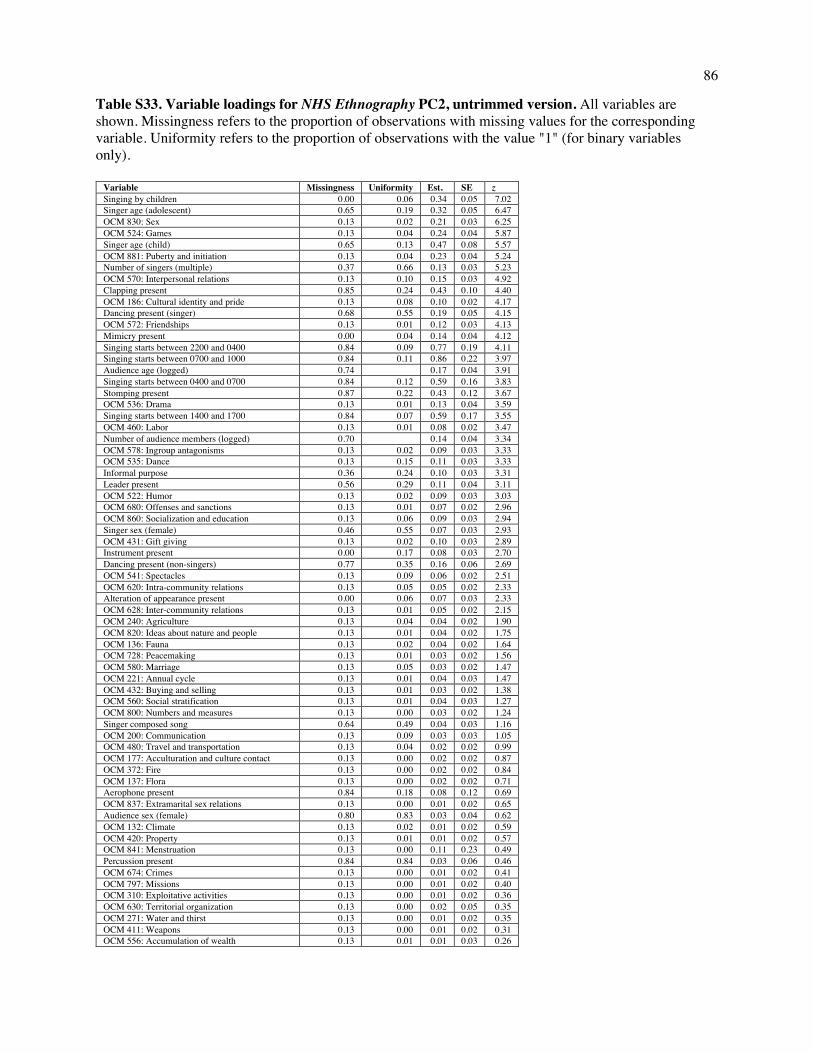
86
Table S33. Variable loadings for NHS Ethnography PC2, untrimmed version. All variables are shown. Missingness refers to the proportion of observations with missing values for the corresponding variable. Uniformity refers to the proportion of observations with the value "1" (for binary variables only).
Variable Missingness Uniformity Est. SE z Singing by children 0.00 0.06 0.34 0.05 7.02 Singer age (adolescent) 0.65 0.19 0.32 0.05 6.47 OCM 830: Sex 0.13 0.02 0.21 0.03 6.25 OCM 524: Games 0.13 0.04 0.24 0.04 5.87 Singer age (child) 0.65 0.13 0.47 0.08 5.57 OCM 881: Puberty and initiation 0.13 0.04 0.23 0.04 5.24 Number of singers (multiple) 0.37 0.66 0.13 0.03 5.23 OCM 570: Interpersonal relations 0.13 0.10 0.15 0.03 4.92 Clapping present 0.85 0.24 0.43 0.10 4.40 OCM 186: Cultural identity and pride 0.13 0.08 0.10 0.02 4.17 Dancing present (singer) 0.68 0.55 0.19 0.05 4.15 OCM 572: Friendships 0.13 0.01 0.12 0.03 4.13 Mimicry present 0.00 0.04 0.14 0.04 4.12 Singing starts between 2200 and 0400 0.84 0.09 0.77 0.19 4.11 Singing starts between 0700 and 1000 0.84 0.11 0.86 0.22 3.97 Audience age (logged) 0.74 0.17 0.04 3.91 Singing starts between 0400 and 0700 0.84 0.12 0.59 0.16 3.83 Stomping present 0.87 0.22 0.43 0.12 3.67 OCM 536: Drama 0.13 0.01 0.13 0.04 3.59 Singing starts between 1400 and 1700 0.84 0.07 0.59 0.17 3.55 OCM 460: Labor 0.13 0.01 0.08 0.02 3.47 Number of audience members (logged) 0.70 0.14 0.04 3.34 OCM 578: Ingroup antagonisms 0.13 0.02 0.09 0.03 3.33 OCM 535: Dance 0.13 0.15 0.11 0.03 3.33 Informal purpose 0.36 0.24 0.10 0.03 3.31 Leader present 0.56 0.29 0.11 0.04 3.11 OCM 522: Humor 0.13 0.02 0.09 0.03 3.03 OCM 680: Offenses and sanctions 0.13 0.01 0.07 0.02 2.96 OCM 860: Socialization and education 0.13 0.06 0.09 0.03 2.94 Singer sex (female) 0.46 0.55 0.07 0.03 2.93 OCM 431: Gift giving 0.13 0.02 0.10 0.03 2.89 Instrument present 0.00 0.17 0.08 0.03 2.70 Dancing present (non-singers) 0.77 0.35 0.16 0.06 2.69 OCM 541: Spectacles 0.13 0.09 0.06 0.02 2.51 OCM 620: Intra-community relations 0.13 0.05 0.05 0.02 2.33 Alteration of appearance present 0.00 0.06 0.07 0.03 2.33 OCM 628: Inter-community relations 0.13 0.01 0.05 0.02 2.15 OCM 240: Agriculture 0.13 0.04 0.04 0.02 1.90 OCM 820: Ideas about nature and people 0.13 0.01 0.04 0.02 1.75 OCM 136: Fauna 0.13 0.02 0.04 0.02 1.64 OCM 728: Peacemaking 0.13 0.01 0.03 0.02 1.56 OCM 580: Marriage 0.13 0.05 0.03 0.02 1.47 OCM 221: Annual cycle 0.13 0.01 0.04 0.03 1.47 OCM 432: Buying and selling 0.13 0.01 0.03 0.02 1.38 OCM 560: Social stratification 0.13 0.01 0.04 0.03 1.27 OCM 800: Numbers and measures 0.13 0.00 0.03 0.02 1.24 Singer composed song 0.64 0.49 0.04 0.03 1.16 OCM 200: Communication 0.13 0.09 0.03 0.03 1.05 OCM 480: Travel and transportation 0.13 0.04 0.02 0.02 0.99 OCM 177: Acculturation and culture contact 0.13 0.00 0.02 0.02 0.87 OCM 372: Fire 0.13 0.00 0.02 0.02 0.84 OCM 137: Flora 0.13 0.00 0.02 0.02 0.71 Aerophone present 0.84 0.18 0.08 0.12 0.69 OCM 837: Extramarital sex relations 0.13 0.00 0.01 0.02 0.65 Audience sex (female) 0.80 0.83 0.03 0.04 0.62 OCM 132: Climate 0.13 0.02 0.01 0.02 0.59 OCM 420: Property 0.13 0.01 0.01 0.02 0.57 OCM 841: Menstruation 0.13 0.00 0.11 0.23 0.49 Percussion present 0.84 0.84 0.03 0.06 0.46 OCM 674: Crimes 0.13 0.00 0.01 0.02 0.41 OCM 797: Missions 0.13 0.00 0.01 0.02 0.40 OCM 310: Exploitative activities 0.13 0.00 0.01 0.02 0.36 OCM 630: Territorial organization 0.13 0.00 0.02 0.05 0.35 OCM 271: Water and thirst 0.13 0.00 0.01 0.02 0.35 OCM 411: Weapons 0.13 0.00 0.01 0.02 0.31 OCM 556: Accumulation of wealth 0.13 0.01 0.01 0.03 0.26
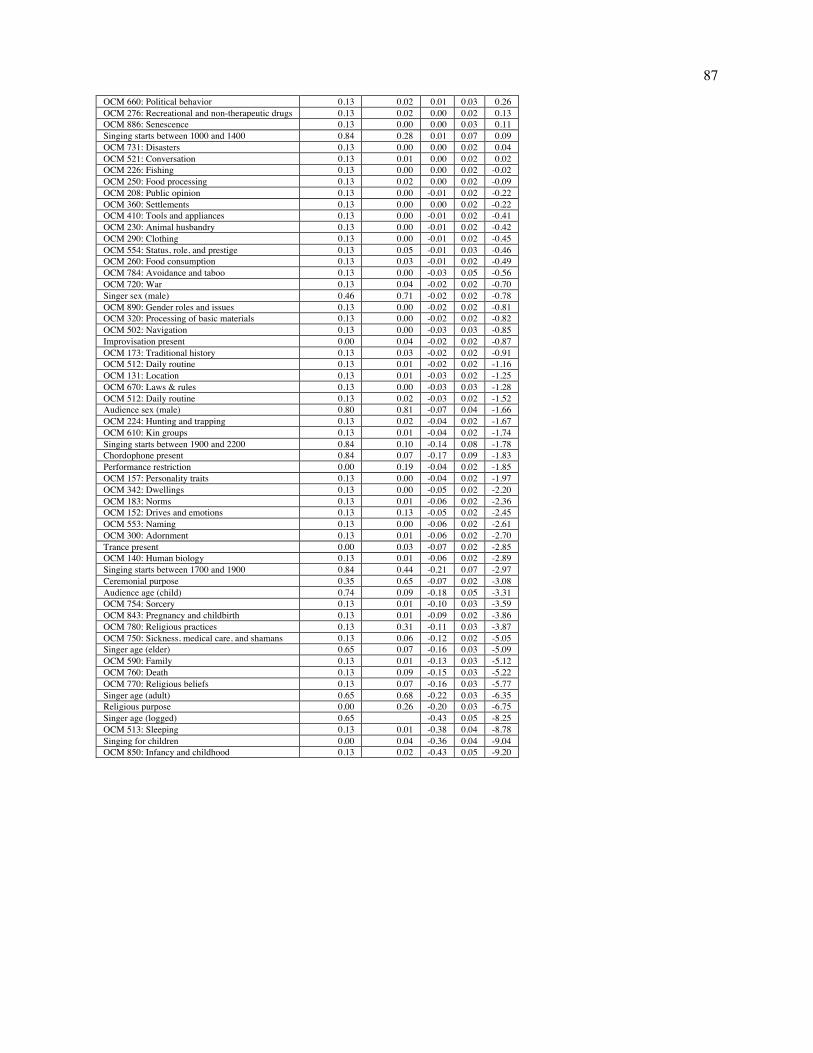
87
OCM 660: Political behavior 0.13 0.02 0.01 0.03 0.26 OCM 276: Recreational and non-therapeutic drugs 0.13 0.02 0.00 0.02 0.13 OCM 886: Senescence 0.13 0.00 0.00 0.03 0.11 Singing starts between 1000 and 1400 0.84 0.28 0.01 0.07 0.09 OCM 731: Disasters 0.13 0.00 0.00 0.02 0.04 OCM 521: Conversation 0.13 0.01 0.00 0.02 0.02 OCM 226: Fishing 0.13 0.00 0.00 0.02 -0.02 OCM 250: Food processing 0.13 0.02 0.00 0.02 -0.09 OCM 208: Public opinion 0.13 0.00 -0.01 0.02 -0.22 OCM 360: Settlements 0.13 0.00 0.00 0.02 -0.22 OCM 410: Tools and appliances 0.13 0.00 -0.01 0.02 -0.41 OCM 230: Animal husbandry 0.13 0.00 -0.01 0.02 -0.42 OCM 290: Clothing 0.13 0.00 -0.01 0.02 -0.45 OCM 554: Status, role, and prestige 0.13 0.05 -0.01 0.03 -0.46 OCM 260: Food consumption 0.13 0.03 -0.01 0.02 -0.49 OCM 784: Avoidance and taboo 0.13 0.00 -0.03 0.05 -0.56 OCM 720: War 0.13 0.04 -0.02 0.02 -0.70 Singer sex (male) 0.46 0.71 -0.02 0.02 -0.78 OCM 890: Gender roles and issues 0.13 0.00 -0.02 0.02 -0.81 OCM 320: Processing of basic materials 0.13 0.00 -0.02 0.02 -0.82 OCM 502: Navigation 0.13 0.00 -0.03 0.03 -0.85 Improvisation present 0.00 0.04 -0.02 0.02 -0.87 OCM 173: Traditional history 0.13 0.03 -0.02 0.02 -0.91 OCM 512: Daily routine 0.13 0.01 -0.02 0.02 -1.16 OCM 131: Location 0.13 0.01 -0.03 0.02 -1.25 OCM 670: Laws & rules 0.13 0.00 -0.03 0.03 -1.28 OCM 512: Daily routine 0.13 0.02 -0.03 0.02 -1.52 Audience sex (male) 0.80 0.81 -0.07 0.04 -1.66 OCM 224: Hunting and trapping 0.13 0.02 -0.04 0.02 -1.67 OCM 610: Kin groups 0.13 0.01 -0.04 0.02 -1.74 Singing starts between 1900 and 2200 0.84 0.10 -0.14 0.08 -1.78 Chordophone present 0.84 0.07 -0.17 0.09 -1.83 Performance restriction 0.00 0.19 -0.04 0.02 -1.85 OCM 157: Personality traits 0.13 0.00 -0.04 0.02 -1.97 OCM 342: Dwellings 0.13 0.00 -0.05 0.02 -2.20 OCM 183: Norms 0.13 0.01 -0.06 0.02 -2.36 OCM 152: Drives and emotions 0.13 0.13 -0.05 0.02 -2.45 OCM 553: Naming 0.13 0.00 -0.06 0.02 -2.61 OCM 300: Adornment 0.13 0.01 -0.06 0.02 -2.70 Trance present 0.00 0.03 -0.07 0.02 -2.85 OCM 140: Human biology 0.13 0.01 -0.06 0.02 -2.89 Singing starts between 1700 and 1900 0.84 0.44 -0.21 0.07 -2.97 Ceremonial purpose 0.35 0.65 -0.07 0.02 -3.08 Audience age (child) 0.74 0.09 -0.18 0.05 -3.31 OCM 754: Sorcery 0.13 0.01 -0.10 0.03 -3.59 OCM 843: Pregnancy and childbirth 0.13 0.01 -0.09 0.02 -3.86 OCM 780: Religious practices 0.13 0.31 -0.11 0.03 -3.87 OCM 750: Sickness, medical care, and shamans 0.13 0.06 -0.12 0.02 -5.05 Singer age (elder) 0.65 0.07 -0.16 0.03 -5.09 OCM 590: Family 0.13 0.01 -0.13 0.03 -5.12 OCM 760: Death 0.13 0.09 -0.15 0.03 -5.22 OCM 770: Religious beliefs 0.13 0.07 -0.16 0.03 -5.77 Singer age (adult) 0.65 0.68 -0.22 0.03 -6.35 Religious purpose 0.00 0.26 -0.20 0.03 -6.75 Singer age (logged) 0.65 -0.43 0.05 -8.25 OCM 513: Sleeping 0.13 0.01 -0.38 0.04 -8.78 Singing for children 0.00 0.04 -0.36 0.04 -9.04 OCM 850: Infancy and childhood 0.13 0.02 -0.43 0.05 -9.20
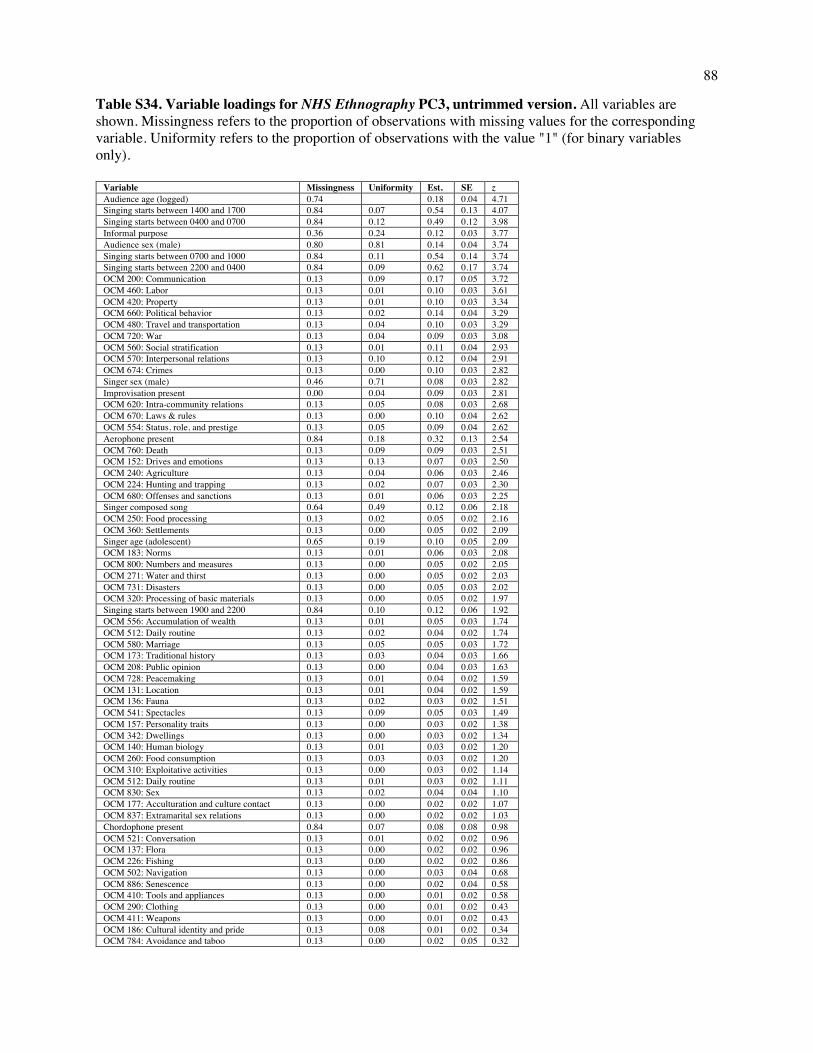
88
Table S34. Variable loadings for NHS Ethnography PC3, untrimmed version. All variables are shown. Missingness refers to the proportion of observations with missing values for the corresponding variable. Uniformity refers to the proportion of observations with the value "1" (for binary variables only).
Variable Missingness Uniformity Est. SE z Audience age (logged) 0.74 0.18 0.04 4.71 Singing starts between 1400 and 1700 0.84 0.07 0.54 0.13 4.07 Singing starts between 0400 and 0700 0.84 0.12 0.49 0.12 3.98 Informal purpose 0.36 0.24 0.12 0.03 3.77 Audience sex (male) 0.80 0.81 0.14 0.04 3.74 Singing starts between 0700 and 1000 0.84 0.11 0.54 0.14 3.74 Singing starts between 2200 and 0400 0.84 0.09 0.62 0.17 3.74 OCM 200: Communication 0.13 0.09 0.17 0.05 3.72 OCM 460: Labor 0.13 0.01 0.10 0.03 3.61 OCM 420: Property 0.13 0.01 0.10 0.03 3.34 OCM 660: Political behavior 0.13 0.02 0.14 0.04 3.29 OCM 480: Travel and transportation 0.13 0.04 0.10 0.03 3.29 OCM 720: War 0.13 0.04 0.09 0.03 3.08 OCM 560: Social stratification 0.13 0.01 0.11 0.04 2.93 OCM 570: Interpersonal relations 0.13 0.10 0.12 0.04 2.91 OCM 674: Crimes 0.13 0.00 0.10 0.03 2.82 Singer sex (male) 0.46 0.71 0.08 0.03 2.82 Improvisation present 0.00 0.04 0.09 0.03 2.81 OCM 620: Intra-community relations 0.13 0.05 0.08 0.03 2.68 OCM 670: Laws & rules 0.13 0.00 0.10 0.04 2.62 OCM 554: Status, role, and prestige 0.13 0.05 0.09 0.04 2.62 Aerophone present 0.84 0.18 0.32 0.13 2.54 OCM 760: Death 0.13 0.09 0.09 0.03 2.51 OCM 152: Drives and emotions 0.13 0.13 0.07 0.03 2.50 OCM 240: Agriculture 0.13 0.04 0.06 0.03 2.46 OCM 224: Hunting and trapping 0.13 0.02 0.07 0.03 2.30 OCM 680: Offenses and sanctions 0.13 0.01 0.06 0.03 2.25 Singer composed song 0.64 0.49 0.12 0.06 2.18 OCM 250: Food processing 0.13 0.02 0.05 0.02 2.16 OCM 360: Settlements 0.13 0.00 0.05 0.02 2.09 Singer age (adolescent) 0.65 0.19 0.10 0.05 2.09 OCM 183: Norms 0.13 0.01 0.06 0.03 2.08 OCM 800: Numbers and measures 0.13 0.00 0.05 0.02 2.05 OCM 271: Water and thirst 0.13 0.00 0.05 0.02 2.03 OCM 731: Disasters 0.13 0.00 0.05 0.03 2.02 OCM 320: Processing of basic materials 0.13 0.00 0.05 0.02 1.97 Singing starts between 1900 and 2200 0.84 0.10 0.12 0.06 1.92 OCM 556: Accumulation of wealth 0.13 0.01 0.05 0.03 1.74 OCM 512: Daily routine 0.13 0.02 0.04 0.02 1.74 OCM 580: Marriage 0.13 0.05 0.05 0.03 1.72 OCM 173: Traditional history 0.13 0.03 0.04 0.03 1.66 OCM 208: Public opinion 0.13 0.00 0.04 0.03 1.63 OCM 728: Peacemaking 0.13 0.01 0.04 0.02 1.59 OCM 131: Location 0.13 0.01 0.04 0.02 1.59 OCM 136: Fauna 0.13 0.02 0.03 0.02 1.51 OCM 541: Spectacles 0.13 0.09 0.05 0.03 1.49 OCM 157: Personality traits 0.13 0.00 0.03 0.02 1.38 OCM 342: Dwellings 0.13 0.00 0.03 0.02 1.34 OCM 140: Human biology 0.13 0.01 0.03 0.02 1.20 OCM 260: Food consumption 0.13 0.03 0.03 0.02 1.20 OCM 310: Exploitative activities 0.13 0.00 0.03 0.02 1.14 OCM 512: Daily routine 0.13 0.01 0.03 0.02 1.11 OCM 830: Sex 0.13 0.02 0.04 0.04 1.10 OCM 177: Acculturation and culture contact 0.13 0.00 0.02 0.02 1.07 OCM 837: Extramarital sex relations 0.13 0.00 0.02 0.02 1.03 Chordophone present 0.84 0.07 0.08 0.08 0.98 OCM 521: Conversation 0.13 0.01 0.02 0.02 0.96 OCM 137: Flora 0.13 0.00 0.02 0.02 0.96 OCM 226: Fishing 0.13 0.00 0.02 0.02 0.86 OCM 502: Navigation 0.13 0.00 0.03 0.04 0.68 OCM 886: Senescence 0.13 0.00 0.02 0.04 0.58 OCM 410: Tools and appliances 0.13 0.00 0.01 0.02 0.58 OCM 290: Clothing 0.13 0.00 0.01 0.02 0.43 OCM 411: Weapons 0.13 0.00 0.01 0.02 0.43 OCM 186: Cultural identity and pride 0.13 0.08 0.01 0.02 0.34 OCM 784: Avoidance and taboo 0.13 0.00 0.02 0.05 0.32
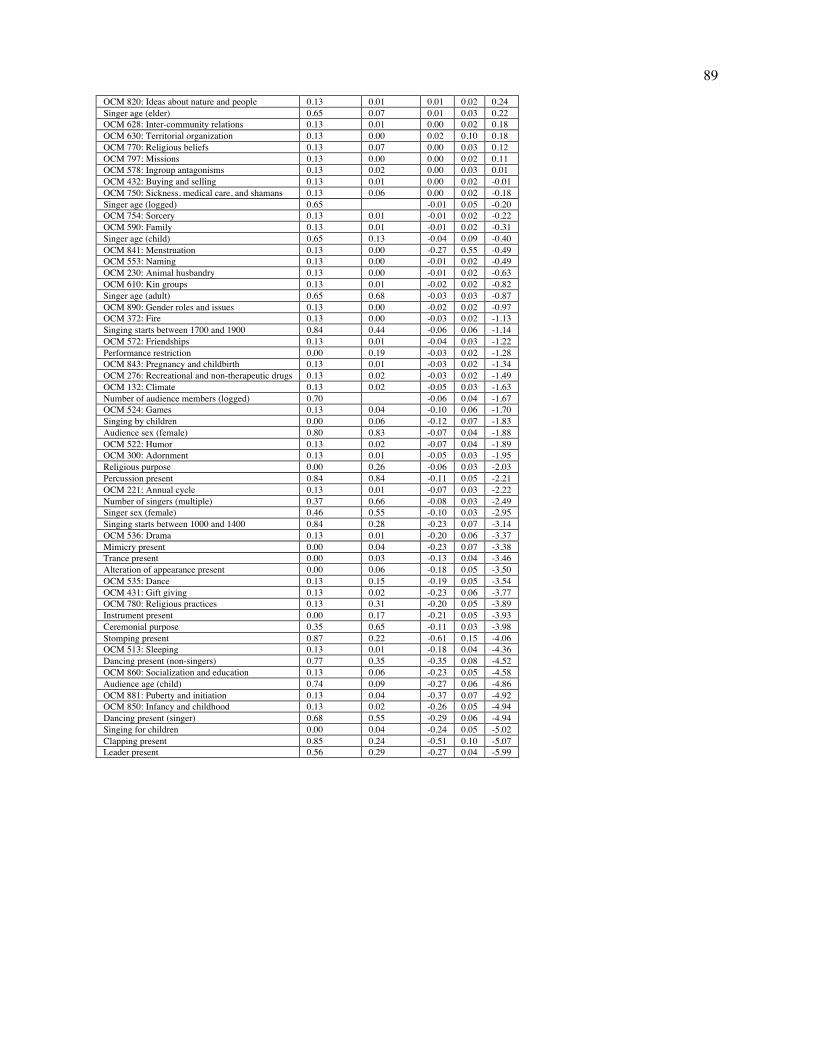
89
OCM 820: Ideas about nature and people 0.13 0.01 0.01 0.02 0.24 Singer age (elder) 0.65 0.07 0.01 0.03 0.22 OCM 628: Inter-community relations 0.13 0.01 0.00 0.02 0.18 OCM 630: Territorial organization 0.13 0.00 0.02 0.10 0.18 OCM 770: Religious beliefs 0.13 0.07 0.00 0.03 0.12 OCM 797: Missions 0.13 0.00 0.00 0.02 0.11 OCM 578: Ingroup antagonisms 0.13 0.02 0.00 0.03 0.01 OCM 432: Buying and selling 0.13 0.01 0.00 0.02 -0.01 OCM 750: Sickness, medical care, and shamans 0.13 0.06 0.00 0.02 -0.18 Singer age (logged) 0.65 -0.01 0.05 -0.20 OCM 754: Sorcery 0.13 0.01 -0.01 0.02 -0.22 OCM 590: Family 0.13 0.01 -0.01 0.02 -0.31 Singer age (child) 0.65 0.13 -0.04 0.09 -0.40 OCM 841: Menstruation 0.13 0.00 -0.27 0.55 -0.49 OCM 553: Naming 0.13 0.00 -0.01 0.02 -0.49 OCM 230: Animal husbandry 0.13 0.00 -0.01 0.02 -0.63 OCM 610: Kin groups 0.13 0.01 -0.02 0.02 -0.82 Singer age (adult) 0.65 0.68 -0.03 0.03 -0.87 OCM 890: Gender roles and issues 0.13 0.00 -0.02 0.02 -0.97 OCM 372: Fire 0.13 0.00 -0.03 0.02 -1.13 Singing starts between 1700 and 1900 0.84 0.44 -0.06 0.06 -1.14 OCM 572: Friendships 0.13 0.01 -0.04 0.03 -1.22 Performance restriction 0.00 0.19 -0.03 0.02 -1.28 OCM 843: Pregnancy and childbirth 0.13 0.01 -0.03 0.02 -1.34 OCM 276: Recreational and non-therapeutic drugs 0.13 0.02 -0.03 0.02 -1.49 OCM 132: Climate 0.13 0.02 -0.05 0.03 -1.63 Number of audience members (logged) 0.70 -0.06 0.04 -1.67 OCM 524: Games 0.13 0.04 -0.10 0.06 -1.70 Singing by children 0.00 0.06 -0.12 0.07 -1.83 Audience sex (female) 0.80 0.83 -0.07 0.04 -1.88 OCM 522: Humor 0.13 0.02 -0.07 0.04 -1.89 OCM 300: Adornment 0.13 0.01 -0.05 0.03 -1.95 Religious purpose 0.00 0.26 -0.06 0.03 -2.03 Percussion present 0.84 0.84 -0.11 0.05 -2.21 OCM 221: Annual cycle 0.13 0.01 -0.07 0.03 -2.22 Number of singers (multiple) 0.37 0.66 -0.08 0.03 -2.49 Singer sex (female) 0.46 0.55 -0.10 0.03 -2.95 Singing starts between 1000 and 1400 0.84 0.28 -0.23 0.07 -3.14 OCM 536: Drama 0.13 0.01 -0.20 0.06 -3.37 Mimicry present 0.00 0.04 -0.23 0.07 -3.38 Trance present 0.00 0.03 -0.13 0.04 -3.46 Alteration of appearance present 0.00 0.06 -0.18 0.05 -3.50 OCM 535: Dance 0.13 0.15 -0.19 0.05 -3.54 OCM 431: Gift giving 0.13 0.02 -0.23 0.06 -3.77 OCM 780: Religious practices 0.13 0.31 -0.20 0.05 -3.89 Instrument present 0.00 0.17 -0.21 0.05 -3.93 Ceremonial purpose 0.35 0.65 -0.11 0.03 -3.98 Stomping present 0.87 0.22 -0.61 0.15 -4.06 OCM 513: Sleeping 0.13 0.01 -0.18 0.04 -4.36 Dancing present (non-singers) 0.77 0.35 -0.35 0.08 -4.52 OCM 860: Socialization and education 0.13 0.06 -0.23 0.05 -4.58 Audience age (child) 0.74 0.09 -0.27 0.06 -4.86 OCM 881: Puberty and initiation 0.13 0.04 -0.37 0.07 -4.92 OCM 850: Infancy and childhood 0.13 0.02 -0.26 0.05 -4.94 Dancing present (singer) 0.68 0.55 -0.29 0.06 -4.94 Singing for children 0.00 0.04 -0.24 0.05 -5.02 Clapping present 0.85 0.24 -0.51 0.10 -5.07 Leader present 0.56 0.29 -0.27 0.04 -5.99
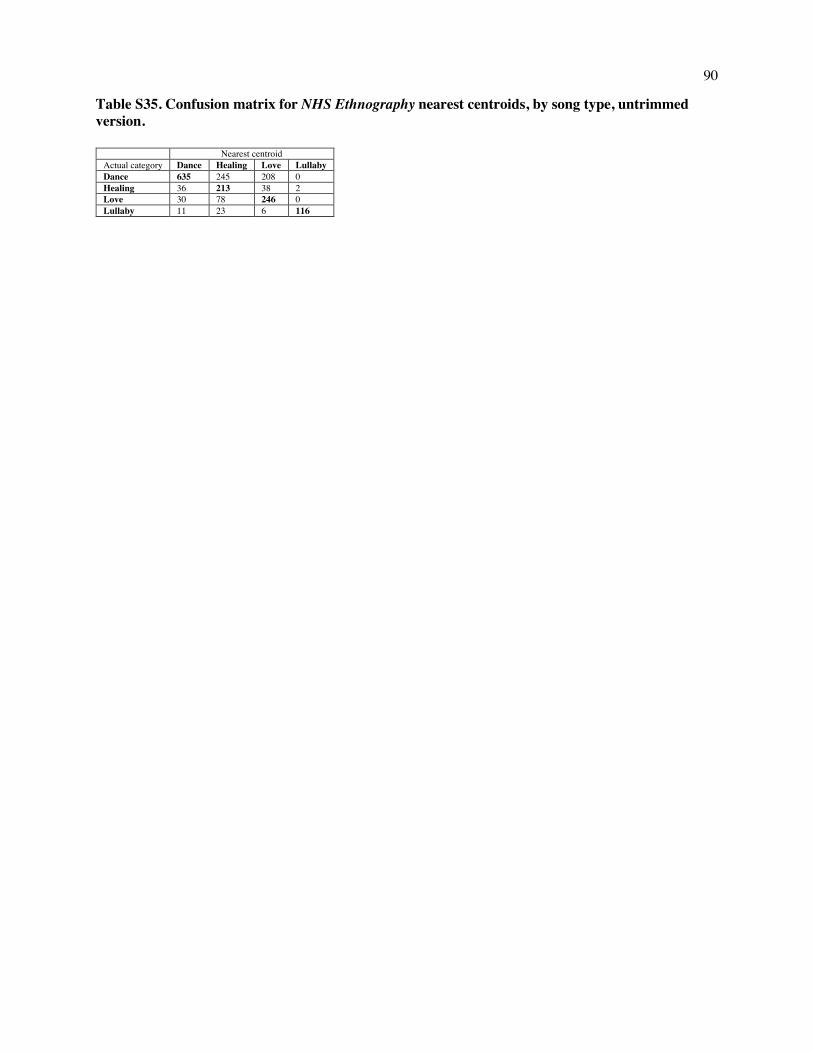
90
Table S35. Confusion matrix for NHS Ethnography nearest centroids, by song type, untrimmed version.
Nearest centroid Actual category Dance Healing Love Lullaby Dance 635 245 208 0 Healing 36 213 38 2 Love 30 78 246 0 Lullaby 11 23 6 116
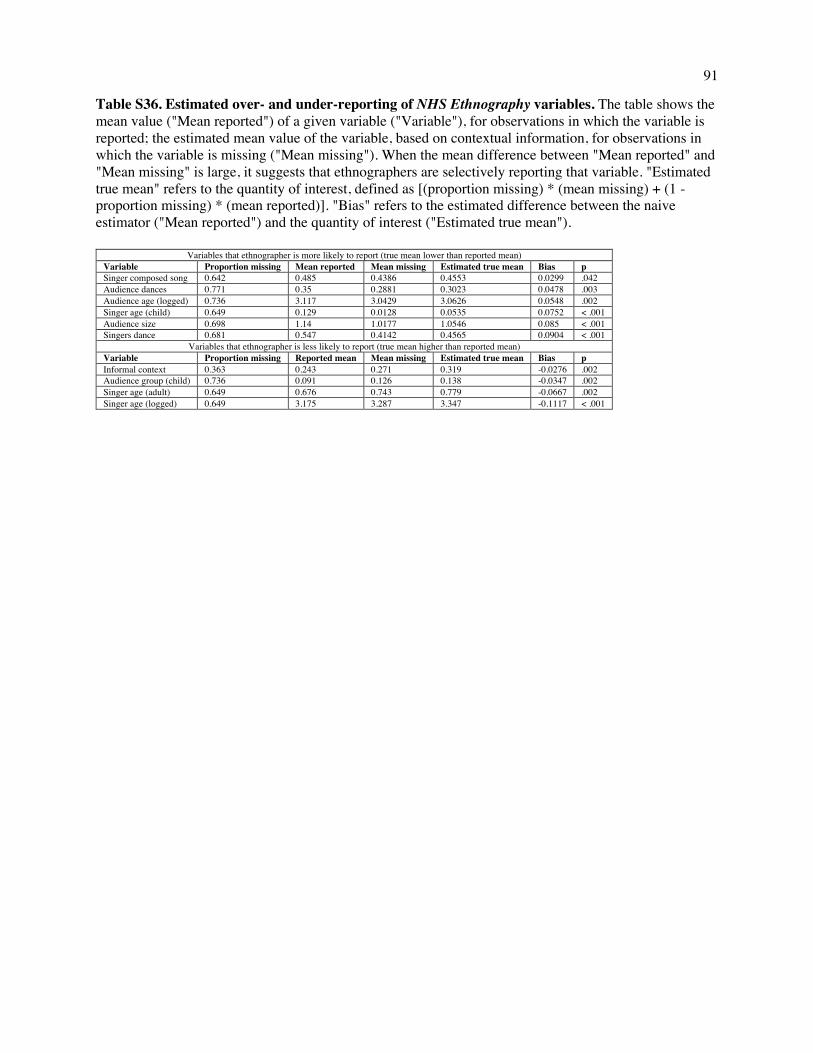
91
Table S36. Estimated over- and under-reporting of NHS Ethnography variables. The table shows the mean value ("Mean reported") of a given variable ("Variable"), for observations in which the variable is reported; the estimated mean value of the variable, based on contextual information, for observations in which the variable is missing ("Mean missing"). When the mean difference between "Mean reported" and "Mean missing" is large, it suggests that ethnographers are selectively reporting that variable. "Estimated true mean" refers to the quantity of interest, defined as [(proportion missing) * (mean missing) + (1 - proportion missing) * (mean reported)]. "Bias" refers to the estimated difference between the naive estimator ("Mean reported") and the quantity of interest ("Estimated true mean").
Variables that ethnographer is more likely to report (true mean lower than reported mean) Variable Proportion missing Mean reported Mean missing Estimated true mean Bias p Singer composed song 0.642 0.485 0.4386 0.4553 0.0299 .042 Audience dances 0.771 0.35 0.2881 0.3023 0.0478 .003 Audience age (logged) 0.736 3.117 3.0429 3.0626 0.0548 .002 Singer age (child) 0.649 0.129 0.0128 0.0535 0.0752 < .001 Audience size 0.698 1.14 1.0177 1.0546 0.085 < .001 Singers dance 0.681 0.547 0.4142 0.4565 0.0904 < .001
Variables that ethnographer is less likely to report (true mean higher than reported mean) Variable Proportion missing Reported mean Mean missing Estimated true mean Bias p Informal context 0.363 0.243 0.271 0.319 -0.0276 .002 Audience group (child) 0.736 0.091 0.126 0.138 -0.0347 .002 Singer age (adult) 0.649 0.676 0.743 0.779 -0.0667 .002 Singer age (logged) 0.649 3.175 3.287 3.347 -0.1117 < .001
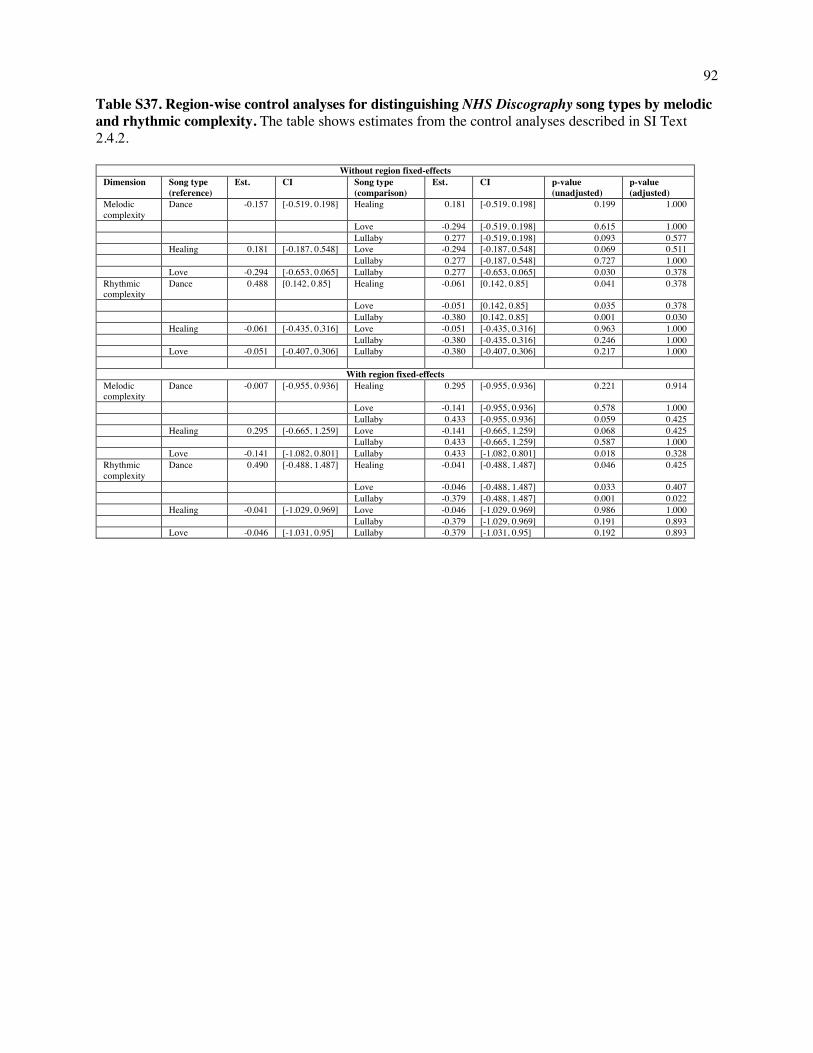
92
Table S37. Region-wise control analyses for distinguishing NHS Discography song types by melodic and rhythmic complexity. The table shows estimates from the control analyses described in SI Text 2.4.2.
Without region fixed-effects Dimension Song type
(reference) Est. CI Song type
(comparison) Est. CI p-value
(unadjusted) p-value (adjusted)
Melodic complexity
Dance -0.157 [-0.519, 0.198] Healing 0.181 [-0.519, 0.198] 0.199 1.000
Love -0.294 [-0.519, 0.198] 0.615 1.000 Lullaby 0.277 [-0.519, 0.198] 0.093 0.577
Healing 0.181 [-0.187, 0.548] Love -0.294 [-0.187, 0.548] 0.069 0.511 Lullaby 0.277 [-0.187, 0.548] 0.727 1.000
Love -0.294 [-0.653, 0.065] Lullaby 0.277 [-0.653, 0.065] 0.030 0.378 Rhythmic complexity
Dance 0.488 [0.142, 0.85] Healing -0.061 [0.142, 0.85] 0.041 0.378
Love -0.051 [0.142, 0.85] 0.035 0.378 Lullaby -0.380 [0.142, 0.85] 0.001 0.030
Healing -0.061 [-0.435, 0.316] Love -0.051 [-0.435, 0.316] 0.963 1.000 Lullaby -0.380 [-0.435, 0.316] 0.246 1.000
Love -0.051 [-0.407, 0.306] Lullaby -0.380 [-0.407, 0.306] 0.217 1.000
With region fixed-effects Melodic complexity
Dance -0.007 [-0.955, 0.936] Healing 0.295 [-0.955, 0.936] 0.221 0.914
Love -0.141 [-0.955, 0.936] 0.578 1.000 Lullaby 0.433 [-0.955, 0.936] 0.059 0.425
Healing 0.295 [-0.665, 1.259] Love -0.141 [-0.665, 1.259] 0.068 0.425 Lullaby 0.433 [-0.665, 1.259] 0.587 1.000
Love -0.141 [-1.082, 0.801] Lullaby 0.433 [-1.082, 0.801] 0.018 0.328 Rhythmic complexity
Dance 0.490 [-0.488, 1.487] Healing -0.041 [-0.488, 1.487] 0.046 0.425
Love -0.046 [-0.488, 1.487] 0.033 0.407 Lullaby -0.379 [-0.488, 1.487] 0.001 0.022
Healing -0.041 [-1.029, 0.969] Love -0.046 [-1.029, 0.969] 0.986 1.000 Lullaby -0.379 [-1.029, 0.969] 0.191 0.893
Love -0.046 [-1.031, 0.95] Lullaby -0.379 [-1.031, 0.95] 0.192 0.893