Embed Size (px)
Citation preview

1
District Report and Tabulation for PRC District Report and Tabulation for PRC District Report and Tabulation for PRC District Report and Tabulation for PRC
Study on Rapid Appraisal of NRHMStudy on Rapid Appraisal of NRHMStudy on Rapid Appraisal of NRHMStudy on Rapid Appraisal of NRHM
THIRUVALLUR
2
Chapter 1. State Profile(Based on the State Schedule)
� Population Characteristics (Block B)
� Status of NRHM Interventions
� Status of Health Infrastructure and Facility Upgradation under
NRHM (Block C)
� RKS (Block D)
� JSY (Block E)
� Financial Mechanism at the State including transfer of Untied
Funds (Block F)
� Survey period for different categories of schedules
� List of facilities covered with names
� Households and Exit Interview Covered
(State profile may be described based on the State schedule. As the schedule will
give snapshot of all facilities in the State, fair copy of filled in schedule may also
be attached with the report)
3
Chapter 2
District Profile Population Characteristics
Tiruvallur district is located in the northern part of Tamil Nadu and very near to the
State capital Chennai. The population of the district was 27 lakhs as per the 2001 census,
this has grown to 34 lakhs by 2008 as per the state estimate. Less than 50% of the
population is rural. The share of Scheduled caste population in the total population is
more than 20%
Status of NRHM interventions
Health infrastructure and facility upgradation under NRHM
There are 303 health sub-centres and 43 PHCs are functioning in the district. All the
PHCs are functioning as 24x7 PHCs. There are no CHCs in the district. However, the
Block level PHCs (BPHC) take the role of CHCs. There are 14 blocks in the district
hence 14 BPHCs functioning. There are three first referral units (FRU) and seven sub-
divisional hospitals. There is one district hospital located at the district head quarters,
Tiruvallur. There are no mobile medical units in the district. Also AYUSH hospital is
not available. There is no uniformity in population size covered. Beerakuppam covers
a population of about 100,000 whereas Minjur covers more than 200,000 population.
Similarly there is wide variation in population coverage among PHCs. PHC Kattur
under Minjur BPHC
One sub-centre is being newly constructed. New buildings are coming up in the
district hospital premises. Apart from these no other new building is under
construction anywhere. Seven sub-centres are functioning under the PHC M.K. Pet.
Out of these only one sub-centre was functioning in a designated building. The
remaining six centres don’t have functional space. All the seven female health
workers have collectively hired a plane in the town Tiruttani to conduct deliveries.
There exists a sub-divisional hospital in this town. This leads to conflict between the
female health workers and the hospital authorities over the conduct of deliveries.
4
The IPHS facility survey has not been done in any of the health facility.
The district hospital is functioning on 24x7 basis and has blood storage, anesthetist
and gynaecologist facilities. It also has new born care unit. There are 77 public
maternity homes in the district. Out of these, 9 function on 24x7 basis. There are 9
other public hospitals run by ESI, Railways etc. all of which function on 24x7 basis.
Information on private hospitals and clinics is not available with the district health
officials.
Availability of Human Resources
The district has 131 sanctioned posts of medical officers in the district and sub-district
hospitals. Only four posts have not been filled up. The speciality wise break up of
medical officers is not available. There are 174 staff nurses in position in the
hospitals. Out of these 57 are in regular position and 117 are on contractual
recruitment. There are 70 ANMs working in these hospitals. In the BPHC specialists
are not available. This hampers these units functioning as referral units for the PHCs
reporting to it.
Rogi Kalyan Samiti
Rogi Kalyan Samiti has been established in the district hospital, sub-district hospitals
and all BPHC/PHCs. RKS does not charge any user fee in this state. The members of
the RKS are mainly hospital staff and a few from other departments. Representatives
of general public is lacking in all the levels of health facilities. Functioning of RKS
needs to be improved.
The untied fund is fully utilized by all levels of health facilities. Some of the sub-
centres under Minjur BPHC were using the money to transport pregnant women to
health facilities in Chennai. Primary Health Centres have improved the environment
with this fund. Cleanliness is also maintained by engaging daily wage workers. The
PHCs and hospitals have now become odor free.
5
Janani Suraksha Yojana
In this district so far no initiation has been taken to implement Janani Suraksha
Yojana under Public Private Partnership initiative. At government facilities, during
2007-08, 44540 deliveries have occurred. The number of women registered for JSY is
11944. Out of this number 11672 have delivered in an institution. The number of
beneficiaries under JSY during the last three years is 8392, 11944 and 3356 in 2006-
07, 2007-08 and the current year 2008-09 respectively. One third of these
beneficiaries belong to SC/ST community.
Financial Mechanism at the district including untied funds
In this district all the vertical health societies created under different programmes have
been merged into a District Health Society. This society has been registered. There is a
common bank account for all programmes in district health society. The funds for the
district are received from the state based on annual action plan. The funds are transferred
electronically by the State. All the 303 sub-centres have operational joint bank account of
VHN and Sarpanch. The untied grant for the financial was transferred to all the 43 PHCs
and 303 HSCs
.
6
District Hospital The district hospital of Tiruvallur district is located in the head quarters town, Tiruvallur.
The hospital is located at the centre of the town. The nearest bus stop is less than half a
kilometer away. The nearest Block PHC (CHC) is located at a distance of 30 kms and
takes about an hour to reach from there. The farthest CHC is located about 120 kms
away and takes about four hours to reach it.
Health facilities at the district hospital covered
Physical infrastructure
The hospital is located on 10 acres of land. There are 232 beds available in it. It is not
located near residential area and necessary environmental clearance has been obtained
from the pollution control board. The hospital building is at present not disable friendly.
However, during the visit to the hospital, it was noticed that a ramp to enable disabled to
move easily was being constructed.
Administrative/Main Block The hospital had waiting space adjacent to each consultation and treatment room. The
other facilities noticed were registration counter, blood bank/blood storage unit, doctor’s
duty room, treatment room, pharmacy, intensive care unit, critical care area and
examination and preparation room. But isolation room, high dependency wards were the
facilities lacking in the hospital.
Hospital services
There was a kitchen in the hospital to take care of the dietary needs of the in patients.
Also there was a medical and general stores located in the hospital. However, there was
no central sterile and supply department (CSSD), hospital laundary or proper ventilation.
For engineering services backup the public works department (PWD) office was there.
For water supply there was an overhead water storage tank with pumping and boosting
arrangement. It enabled round the clock water supply in the hospital. But there was no
water cooler or refrigerator available in the hospital. There was also no provision for fire
fighting. Though there was drainage and sanitation system, water logging was seen in
7
many parts in the hospital premises. It was reported by the workers that the hospital has
become a mosquito breeding ground especially after the monsoon. The bio-medical
waste is segregated in three different bins and disposed off by an outsourced agency.
There were no residential quarters for the medical staff. One quarters was available for
the para medical staff which was occupied by them. There was ample parking space.
Telephone, computers and internet services were available in the hospital. However FAX
machine was not available. The hospital did not have a medical records section and the
disease classification was also not being carried out.
Medical services
Obstetrics & Gynaecology
The hospital had a separate ward with 48 beds for female patients. The bed occupancy
rate was 73% during the 12 months preceding the survey. The total OPD of the O&G
section for the 3 calendar months was 1112. A separate operation theatre was available
for Gynaecology & obstetrics wing. The number of deliveries conducted during the 3
months prior to the survey was 786 and during the year 2007-08 was 2295. Out of these
caesarean section deliveries were 897, assisted deliveries were 30. Services for MTP and
mid trimester abortion were available. Services for family planning operation were
available and during 2007-08 1266 female sterilizations were done. Services for suturing
cervical tear, hysterectomy also were available but no cases were done during the last
year.
Surgical
During the three months proceeding the survey 3115 surgeries were done in the surgical
OPD. The number of surgical IPDs during this period was 34. Surgery services for
emergency (accident & other emergency), abdomen surgery and breast surgery were
available but few numbers of cases were done during the last three months.
Medical section
The medical OPD section of the hospital is one of the busiest sections. More than 50000
female and 48000 male have availed services at medical OPD during the period of three
months preceding the survey. The number of IPD patients during the same period was
8
female 7700 and male 4300. Services for STI (through ICTC) and under NLEP and
pleural aspiration were available in the hospital. However, services for pleural biopsy,
bronchoscopy, lumbar puncture, pericardial tapping, skin scraping for fungus/AFB,
bone marrow biopsy, endoscopic specialised procedures and psychiatry services were not
available at the hospital.
Pediatric section
The number of cases at pediatric OPD during 2007-08 exceeded one lakh, with 50000
female and 51000 male. There were 24 beds designated/identified for newborns available
in the section. The number of pediatric patients admitted during 2007-08 was 910 out of
which 250 were neonates, 250 other infants and 360 children below 5 years. All the
essential services and working equipments were available in this section.
Diagnostic section
The available services in this section were X-ray, ultrasound and ECG.
Laboratory facilities
Nearly 12,000 patients availed services of the laboratory of the hospital during the three
months before the survey. Haematology, urine analysis, stool analysis, sputum analysis,
microbiology, serology and biochemistry are the services available in the hospital. Semen
analysis, CSF analysis, aspirated fluids, PAP smear, split skin smear examination for
leprosy and histopathology were the services not provided by the hospital.
Human resources
The hospital had all the sanctioned posts of Medical and administrative staff. Except for
the post of radiographer all the posts of para medical staff also have been filled up.
Other framework and structural issues
The hospital has established a Rogi Kalyan Samiti and it has been registered. There are
official charges for some procedures and people belonging to BPL/SC/ST were
exempted from the service charges. The exemption is granted based on income
certification by the concerned government authority.

9
User fees is the additional resource generated by the Rogi Kalyan Samiti. The money
generated is retained for local use. Display board has not been put up in hospital showing
number of members and number of meetings of RKS and no feedback mechanism has
been set up.
10
Chapter 3. Community Health Centres/ Block PHCs (Based on CHCs covered) Population covered
As per national norms a CHC will cover a population of 120,000. The selected BPHC
Beerakuppam covered a population of 1,07,255 and the other, Minjur, covered a
population of 2,07,423.
The PHCs are located 2 to 30 kms away from the CHC. The nearest PHC is located 2
kms away from one CHC and 10 kms away from the second CHC. Similarly the farthest
PHC is located at a distance of 18 kms for the first CHC and 30 kms for the second
CHC.
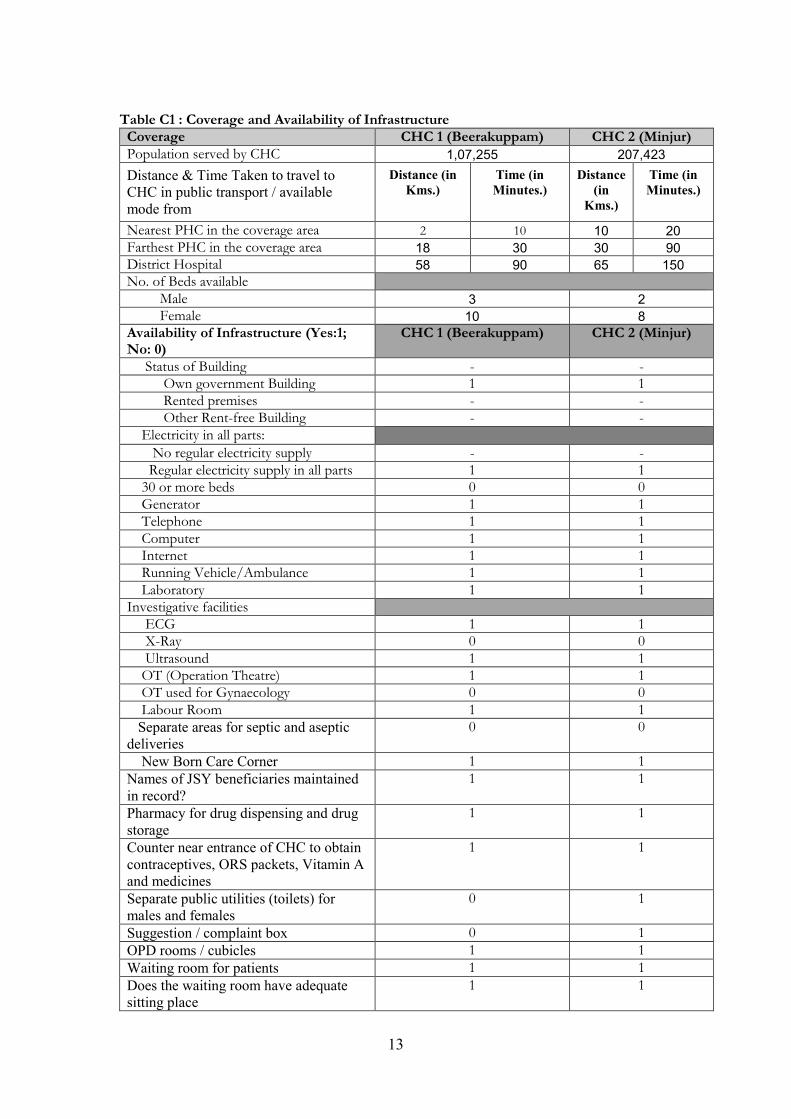
Infrastructure availability
Table C1 describes of the availability of infrastructure in both the CHCs. The
infrastructure availability is fairly good at the CHCs. Except 30 bed facility, X-ray facility,
operation theatre for gynaecological use, separate area for septic and aseptic deliveries,
emergency room/casualty and separate wards for males and females, all other listed
facilities were available in the visited CHCs. However, in one CHC, separate toilets for
males and females and suggestion/ complaint box were not available.
Personnel
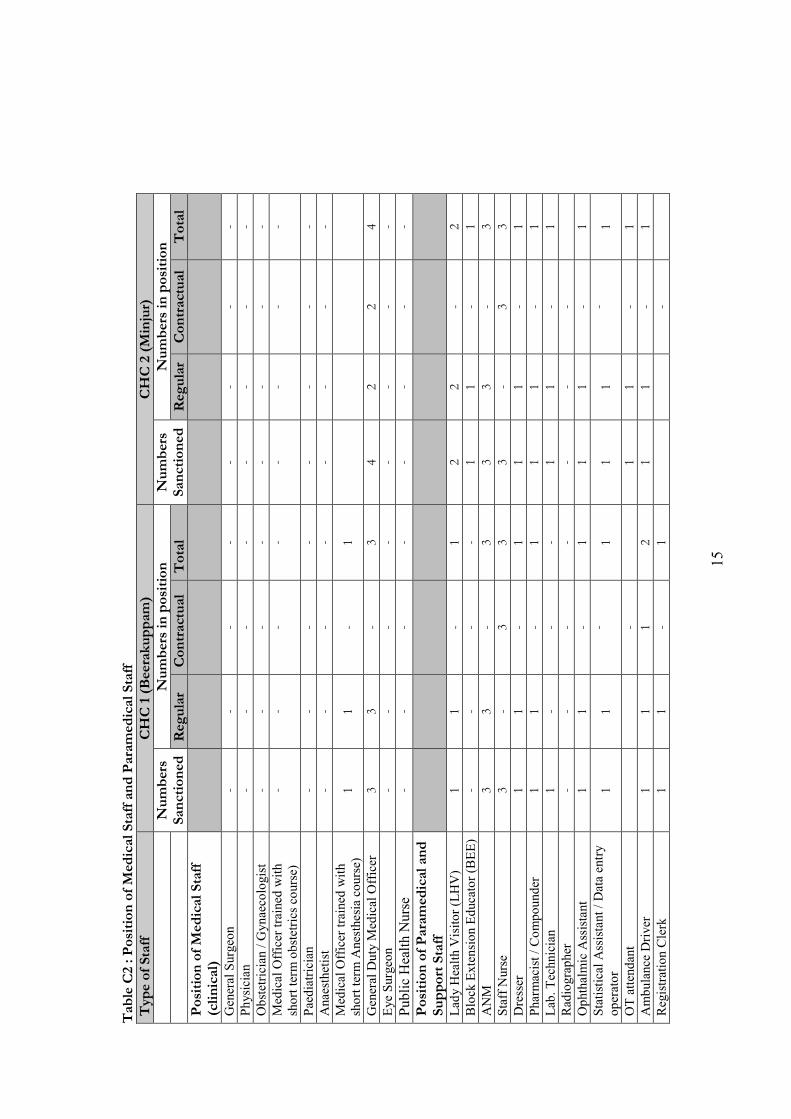
Table C2 lists the position of medical and para medical personnel in the visited CHCs. In
both the CHCs all the sanctioned posts have been filled up. Contractual appointments
have been made in medical officer and staff nurse posts.
Specific services and interventions
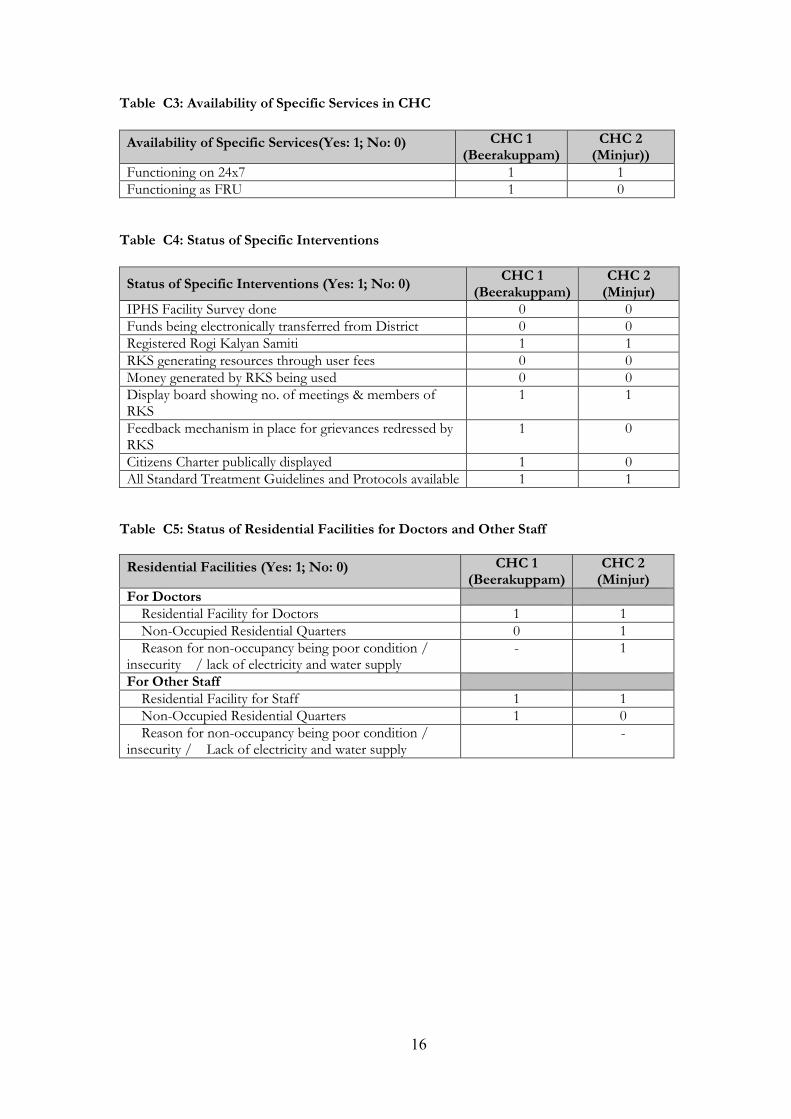
Table C3 provides information on specific services available at CHCs. Both the CHCs
visited were functioning as 24 x 7 CHCs. One CHC was functioning as first referral unit.
Table C4 gives information on the status of specific interventions. In both the CHCs
facility survey under IPHS has not been completed yet. Also funds are not transferred
electronically to both the CHCs. Rogi Kalyan Samiti has been registered under both the
CHCs. However they do not generate any funds through user fees etc. The funds
11
received from other sources are utilized by the Rogi Kalyan Samities of the CHCs. Feed
back mechanism to redress the grievances of the patients is not in place in one CHC.
Similarly citizens charter is also not publicly displayed in one CHC. All standard
treatment guidelines and protocols are available in both the CHCs.
Residential facilities
From Table C5 it may be observed that residential facility for doctors and other staff are
available at both the CHCs But the doctor’s accommodation in one CHC and the
accommodation for other staff in the other CHC are not occupied due to lack of
electricity and for other reasons respectively.
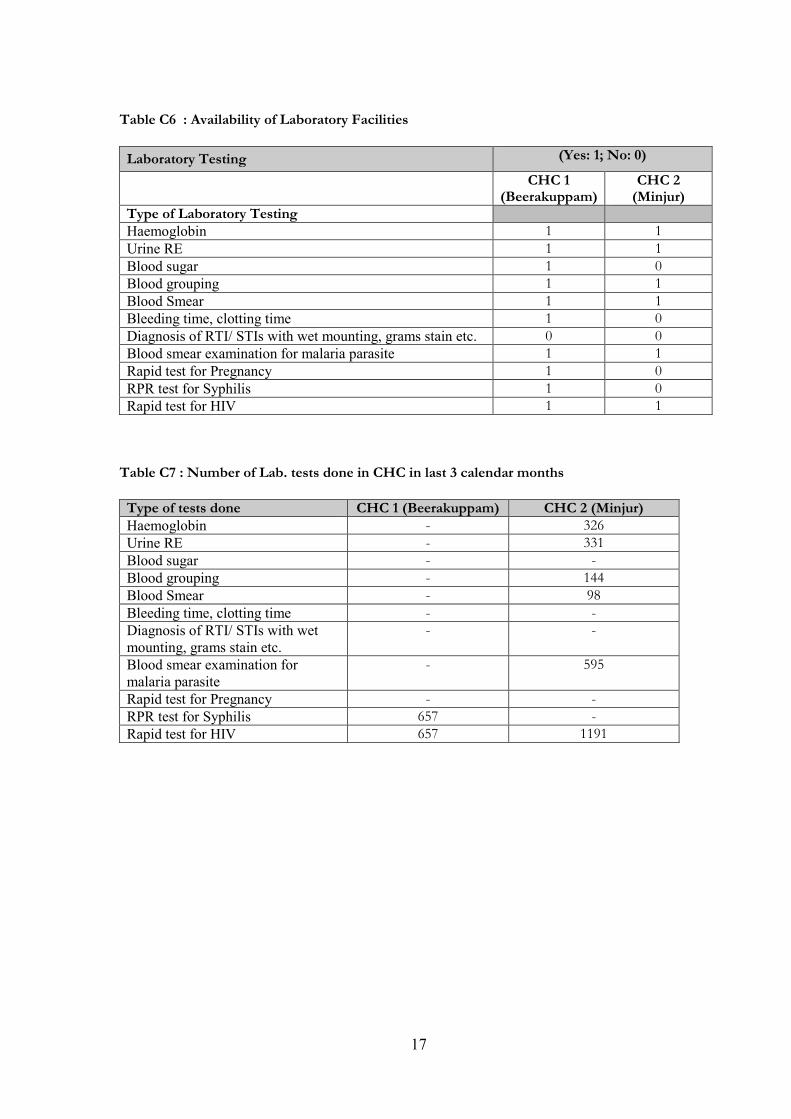
Laboratory facilities and utilization
Table C6 lists the laboratory facilities available at the CHCs. Facility for diagnosing
RTI/STI with wet mounting, grams stain was not available in both the CHCs. Other
facilities that were not available in the second CHC were facility for blood sugar testing,
bleeding time, clotting time, rapid test for pregnancy and RPR test for syphilis.
Though facilities for laboratory tests were available, the first CHC has used the facility
for testing STI/HIV. The other CHC has utilized all the facilities provided (Table C7).
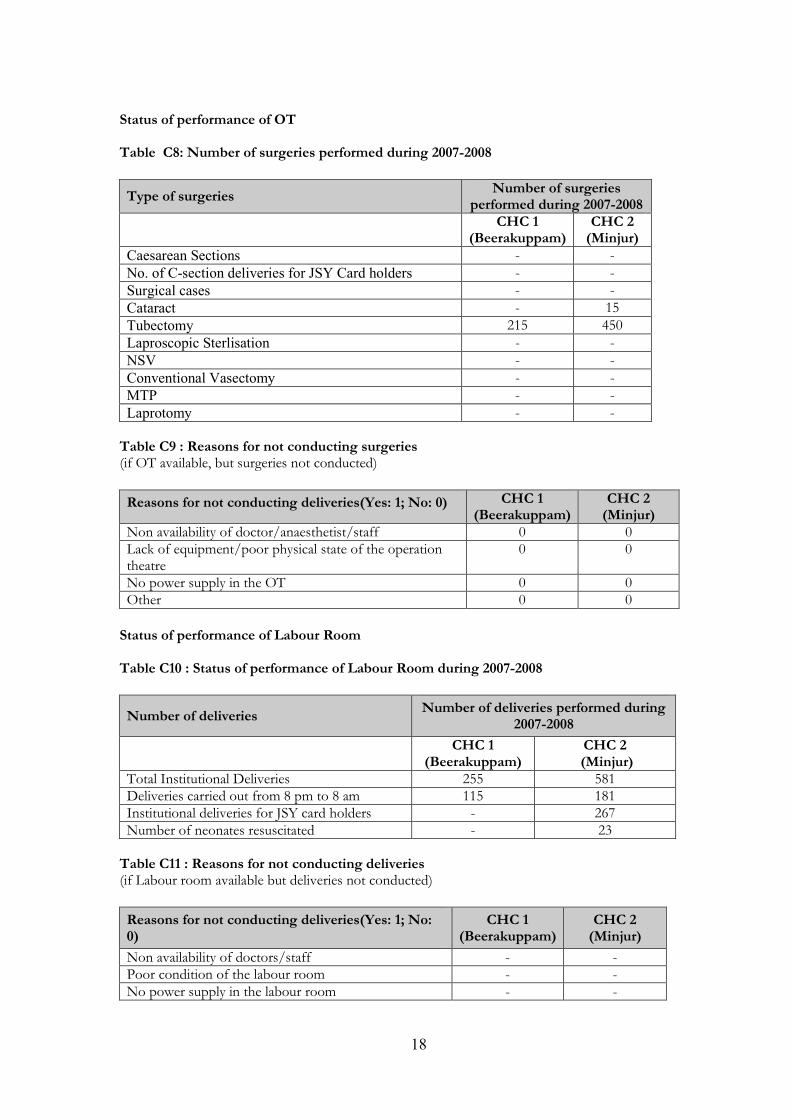
Operation Theatre
From table C8 it may be observed that the operation theatre is mainly used to conduct
tubectomy operations in both the CHCs.
Labour room
Both the CHCs reported deliveries conducted in the labour room of the institution. Out
of this a considerable proportion of the deliveries were conducted during 8 pm to 8 am.
One of the CHCs reported nearly half of the total deliveries conducted at the institution
was of JSY beneficiaries (Table C10).
12
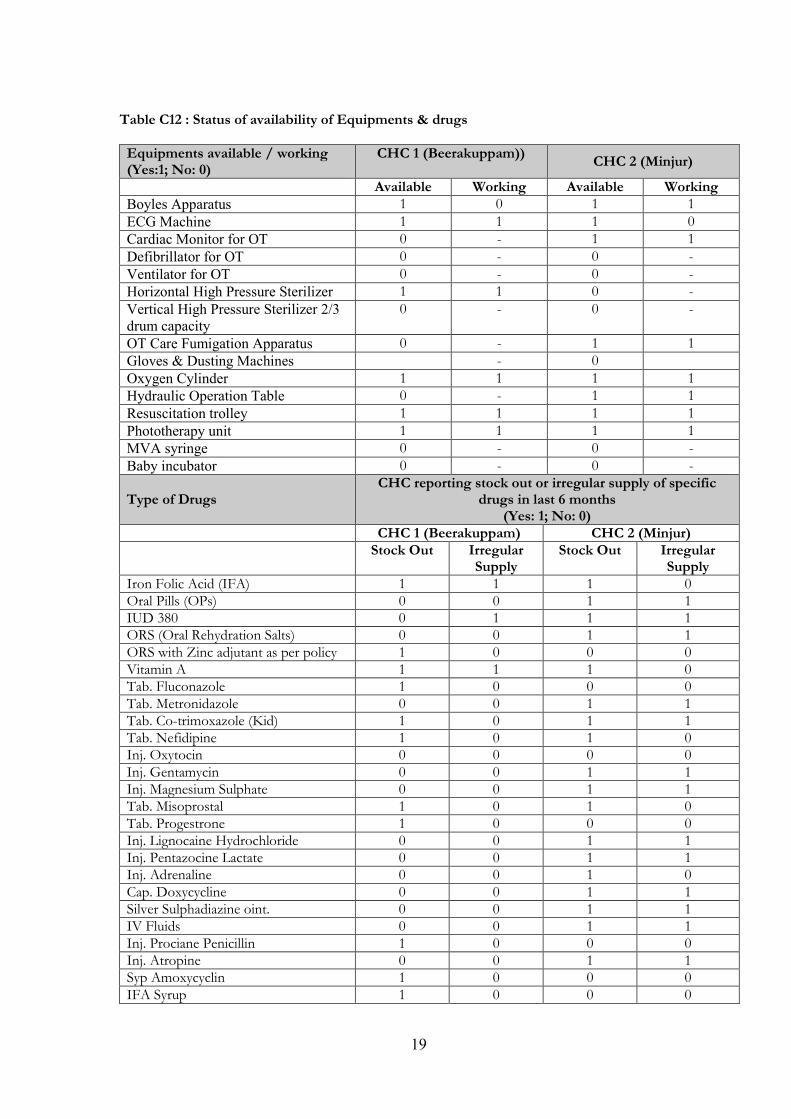
Equipments and drugs
Availability of essential equipments in CHCs is very poor. Out of 14 equipments that
should be available at CHC, eight in one CHC and seven in the other are not available.
Except one in each CHC, the available equipments are in working condition.
Similar to essential equipment availability, availability of essential drugs are also not
satisfactory. Out of 24 drugs listed as essential 11 were out of stock and 3 were supplied
irregularly in the first CHC. In the second CHC, 18 drugs were listed as out of stock out
of which 13 were irregularly supplied in the second CHC.
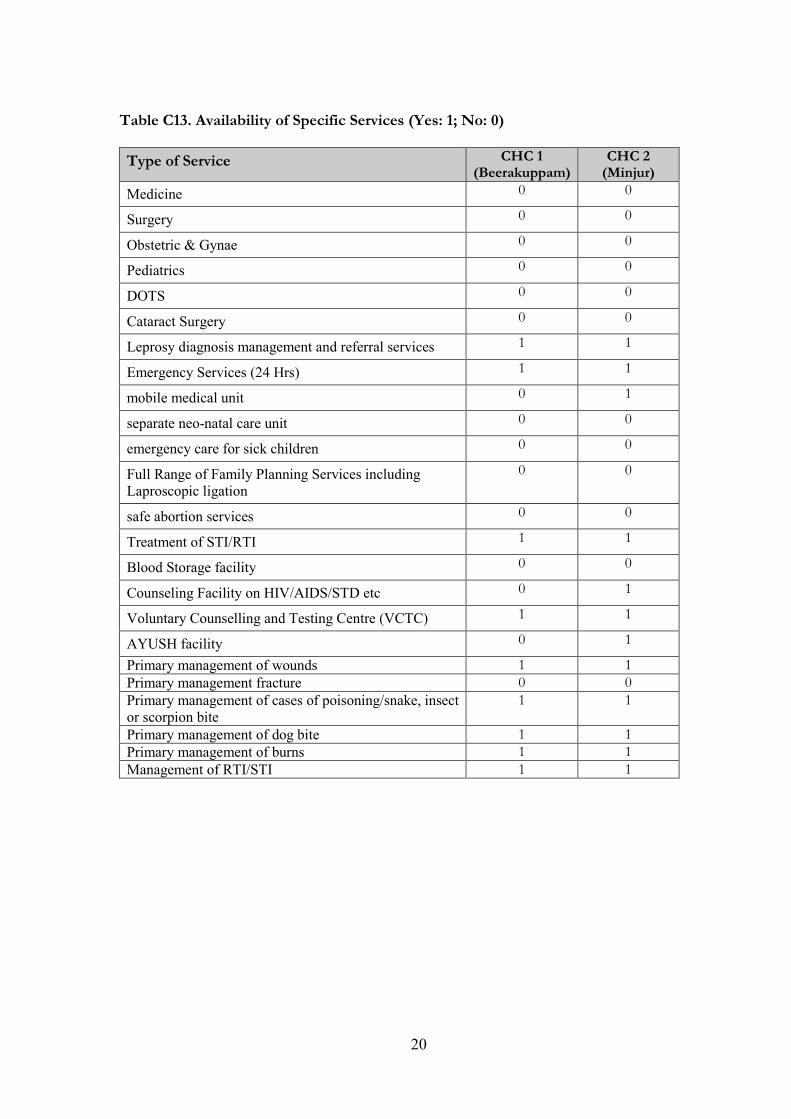
Availability of specific services
There are 24 services that are listed as to be delivered at CHC level. Out of these nine
services and 12 services only were available at the first and second CHC respectively.
Important services such as surgery, obstetric & Gynae,peadiatrics and services under
national programs like DOTS, cataract surgery, emergency care for sick children, full
range of family planning services including laproscopic ligation and safe abortion services
were not available in both the CHCs. (Table C 13).
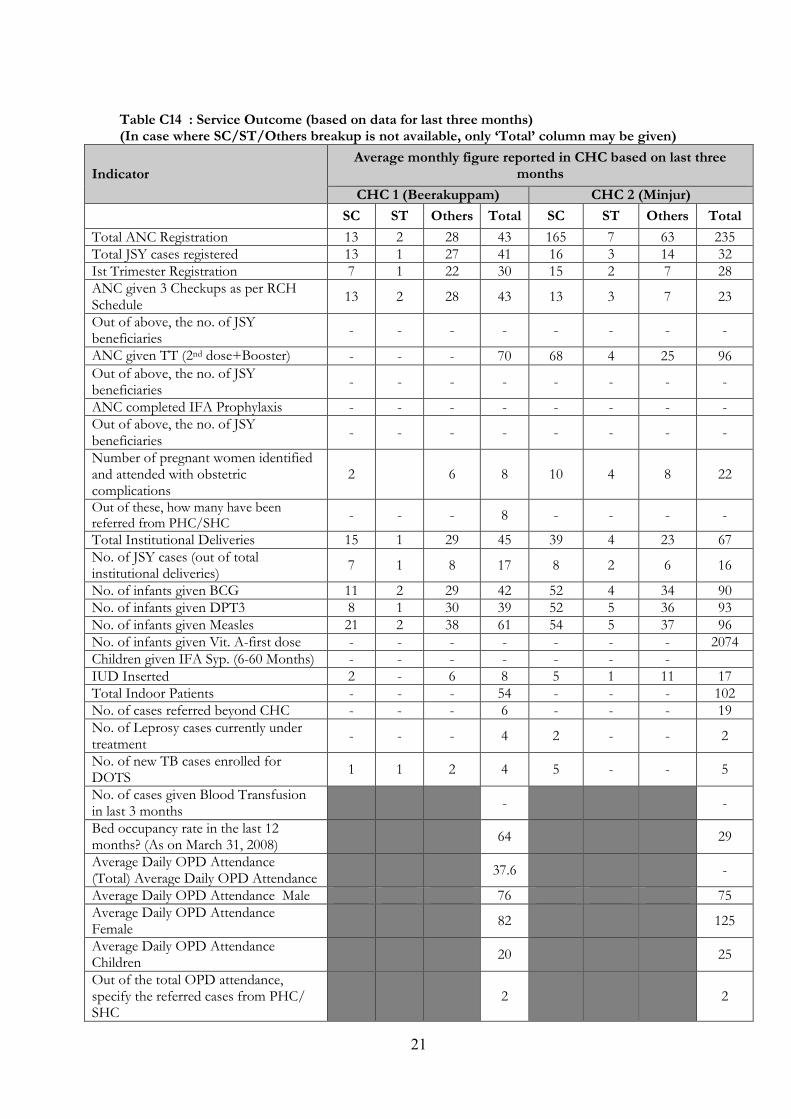
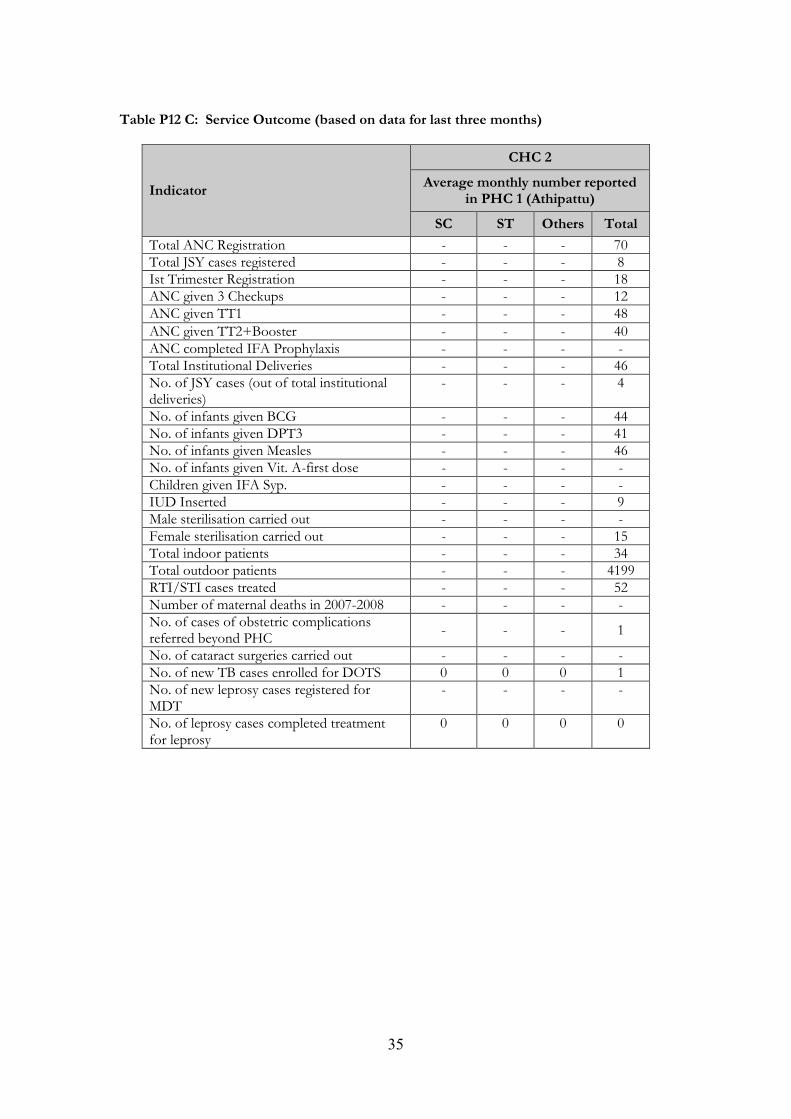
Service outcome
Table C14 describes the outcome of the services provided by the CHCs. Out of the two
CHCs, ANC registration was much lower in the first CHC, comparing the second CHC.
At the same time number registered for JSY, proportion of first trimester registration and
ANC given 3 checkups were high in the first CHC.
13
Table C1 : Coverage and Availability of Infrastructure Coverage CHC 1 (Beerakuppam) CHC 2 (Minjur) Population served by CHC 1,07,255 207,423
Distance & Time Taken to travel to
CHC in public transport / available
mode from
Distance (in
Kms.)
Time (in
Minutes.)
Distance
(in
Kms.)
Time (in
Minutes.)
Nearest PHC in the coverage area 2 10 10 20
Farthest PHC in the coverage area 18 30 30 90
District Hospital 58 90 65 150
No. of Beds available Male 3 2
Female 10 8
Availability of Infrastructure (Yes:1; No: 0)
CHC 1 (Beerakuppam) CHC 2 (Minjur)
Status of Building - - Own government Building 1 1 Rented premises - - Other Rent-free Building - - Electricity in all parts:
No regular electricity supply - - Regular electricity supply in all parts 1 1 30 or more beds 0 0 Generator 1 1 Telephone 1 1 Computer 1 1 Internet 1 1 Running Vehicle/Ambulance 1 1 Laboratory 1 1 Investigative facilities ECG 1 1 X-Ray 0 0 Ultrasound 1 1 OT (Operation Theatre) 1 1 OT used for Gynaecology 0 0 Labour Room 1 1
Separate areas for septic and aseptic
deliveries
0 0
New Born Care Corner 1 1
Names of JSY beneficiaries maintained
in record?
1 1
Pharmacy for drug dispensing and drug
storage
1 1
Counter near entrance of CHC to obtain
contraceptives, ORS packets, Vitamin A
and medicines
1 1
Separate public utilities (toilets) for
males and females
0 1
Suggestion / complaint box 0 1
OPD rooms / cubicles 1 1
Waiting room for patients 1 1
Does the waiting room have adequate
sitting place
1 1
14
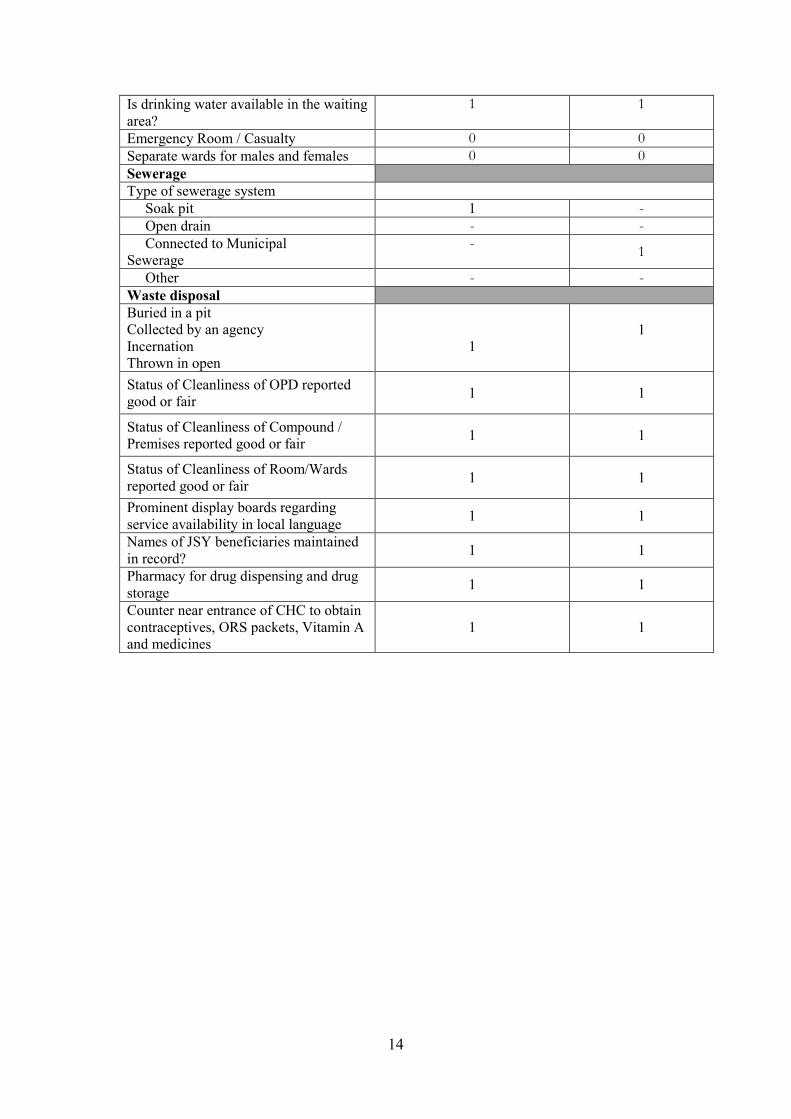
Is drinking water available in the waiting
area?
1 1
Emergency Room / Casualty 0 0
Separate wards for males and females 0 0
Sewerage
Type of sewerage system
Soak pit 1 -
Open drain - -
Connected to Municipal
Sewerage
- 1
Other - -
Waste disposal
Buried in a pit
Collected by an agency
Incernation
Thrown in open
1
1
Status of Cleanliness of OPD reported
good or fair 1 1
Status of Cleanliness of Compound /
Premises reported good or fair 1 1
Status of Cleanliness of Room/Wards
reported good or fair 1 1
Prominent display boards regarding
service availability in local language 1 1
Names of JSY beneficiaries maintained
in record? 1 1
Pharmacy for drug dispensing and drug
storage 1 1
Counter near entrance of CHC to obtain
contraceptives, ORS packets, Vitamin A
and medicines
1 1
15
Table C
2 : Position o
f M
edical Sta
ff and P
ara
med
ical Sta
ff
Typ
e of Sta
ff
CH
C 1 (Bee
rakuppam
) CH
C 2 (M
inju
r)
N
um
ber
s Sanct
ioned
N
um
ber
s in
position
Num
ber
s Sanct
ioned
Num
ber
s in
position
Reg
ular
Contract
ual
Tota
l Reg
ular
Contract
ual
Tota
l Position o
f M
edical Sta
ff
(clinical)
General Surgeon
- -
- -
- -
- -
Physician
- -
- -
- -
- -
Obstetrician / Gynaecologist
- -
- -
- -
- -
Medical Officer trained with
short term obstetrics course)
- -
- -
- -
- -
Paediatrician
- -
- -
- -
- -
Anaesthetist
- -
- -
- -
- -
Medical Officer trained with
short term Anesthesia course)
1 1
- 1
General Duty M
edical Officer
3 3
- 3
4 2
2 4
Eye Surgeon
- -
- -
- -
- -
Public Health Nurse
- -
- -
- -
- -
Position o
f Para
med
ical and
Support S
taff
Lady Health Visitor (LHV)
1 1
- 1
2 2
- 2
Block Extension Educator (BEE)
- -
- -
1 1
- 1
ANM
3 3
- 3
3 3
- 3
Staff Nurse
3 -
3 3
3 -
3 3
Dresser
1 1
- 1
1 1
- 1
Pharmacist / Compounder
1 1
- 1
1 1
- 1
Lab. Technician
1 -
- -
1 1
- 1
Radiographer
- -
- -
- -
-
Ophthalmic Assistant
1 1
- 1
1 1
- 1
Statistical Assistant / Data entry
operator
1 1
- 1
1 1
- 1
OT attendant
-
1 1
- 1
Ambulance Driver
1 1
1 2
1 1
- 1
Registration Clerk
1 1
- 1
-
16
Table C3: Availability of Specific Services in CHC
Availability of Specific Services(Yes: 1; No: 0) CHC 1 (Beerakuppam)
CHC 2 (Minjur))
Functioning on 24x7 1 1 Functioning as FRU 1 0
Table C4: Status of Specific Interventions
Status of Specific Interventions (Yes: 1; No: 0) CHC 1
(Beerakuppam) CHC 2 (Minjur)
IPHS Facility Survey done 0 0 Funds being electronically transferred from District 0 0 Registered Rogi Kalyan Samiti 1 1 RKS generating resources through user fees 0 0 Money generated by RKS being used 0 0 Display board showing no. of meetings & members of RKS
1 1
Feedback mechanism in place for grievances redressed by RKS
1 0
Citizens Charter publically displayed 1 0 All Standard Treatment Guidelines and Protocols available 1 1
Table C5: Status of Residential Facilities for Doctors and Other Staff
Residential Facilities (Yes: 1; No: 0) CHC 1 (Beerakuppam)
CHC 2 (Minjur)
For Doctors Residential Facility for Doctors 1 1 Non-Occupied Residential Quarters 0 1 Reason for non-occupancy being poor condition / insecurity / lack of electricity and water supply
- 1
For Other Staff Residential Facility for Staff 1 1 Non-Occupied Residential Quarters 1 0 Reason for non-occupancy being poor condition / insecurity / Lack of electricity and water supply
-
17
Table C6 : Availability of Laboratory Facilities
Laboratory Testing (Yes: 1; No: 0)
CHC 1 (Beerakuppam)
CHC 2 (Minjur)
Type of Laboratory Testing
Haemoglobin 1 1
Urine RE 1 1
Blood sugar 1 0
Blood grouping 1 1
Blood Smear 1 1
Bleeding time, clotting time 1 0
Diagnosis of RTI/ STIs with wet mounting, grams stain etc. 0 0
Blood smear examination for malaria parasite 1 1
Rapid test for Pregnancy 1 0
RPR test for Syphilis 1 0
Rapid test for HIV 1 1 Table C7 : Number of Lab. tests done in CHC in last 3 calendar months
Type of tests done CHC 1 (Beerakuppam) CHC 2 (Minjur)
Haemoglobin - 326
Urine RE - 331
Blood sugar - -
Blood grouping - 144
Blood Smear - 98
Bleeding time, clotting time - -
Diagnosis of RTI/ STIs with wet
mounting, grams stain etc.
- -
Blood smear examination for
malaria parasite
- 595
Rapid test for Pregnancy - -
RPR test for Syphilis 657 -
Rapid test for HIV 657 1191
18
Status of performance of OT Table C8: Number of surgeries performed during 2007-2008
Type of surgeries Number of surgeries
performed during 2007-2008 CHC 1
(Beerakuppam) CHC 2 (Minjur)
Caesarean Sections - -
No. of C-section deliveries for JSY Card holders - -
Surgical cases - -
Cataract - 15
Tubectomy 215 450
Laproscopic Sterlisation - -
NSV - -
Conventional Vasectomy - -
MTP - -
Laprotomy - - Table C9 : Reasons for not conducting surgeries (if OT available, but surgeries not conducted)
Reasons for not conducting deliveries(Yes: 1; No: 0) CHC 1 (Beerakuppam)
CHC 2 (Minjur)
Non availability of doctor/anaesthetist/staff 0 0 Lack of equipment/poor physical state of the operation theatre
0 0
No power supply in the OT 0 0 Other 0 0
Status of performance of Labour Room Table C10 : Status of performance of Labour Room during 2007-2008
Number of deliveries Number of deliveries performed during
2007-2008
CHC 1 (Beerakuppam)
CHC 2 (Minjur)
Total Institutional Deliveries 255 581 Deliveries carried out from 8 pm to 8 am 115 181 Institutional deliveries for JSY card holders - 267 Number of neonates resuscitated - 23
Table C11 : Reasons for not conducting deliveries (if Labour room available but deliveries not conducted)
Reasons for not conducting deliveries(Yes: 1; No: 0)
CHC 1 (Beerakuppam)
CHC 2 (Minjur)
Non availability of doctors/staff - - Poor condition of the labour room - - No power supply in the labour room - -
19
Table C12 : Status of availability of Equipments & drugs Equipments available / working (Yes:1; No: 0)
CHC 1 (Beerakuppam)) CHC 2 (Minjur)
Available Working Available Working
Boyles Apparatus 1 0 1 1
ECG Machine 1 1 1 0
Cardiac Monitor for OT 0 - 1 1
Defibrillator for OT 0 - 0 -
Ventilator for OT 0 - 0 -
Horizontal High Pressure Sterilizer 1 1 0 -
Vertical High Pressure Sterilizer 2/3
drum capacity
0 - 0 -
OT Care Fumigation Apparatus 0 - 1 1
Gloves & Dusting Machines - 0
Oxygen Cylinder 1 1 1 1
Hydraulic Operation Table 0 - 1 1
Resuscitation trolley 1 1 1 1
Phototherapy unit 1 1 1 1
MVA syringe 0 - 0 -
Baby incubator 0 - 0 -
Type of Drugs CHC reporting stock out or irregular supply of specific
drugs in last 6 months (Yes: 1; No: 0)
CHC 1 (Beerakuppam) CHC 2 (Minjur) Stock Out Irregular
Supply Stock Out Irregular
Supply Iron Folic Acid (IFA) 1 1 1 0 Oral Pills (OPs) 0 0 1 1 IUD 380 0 1 1 1 ORS (Oral Rehydration Salts) 0 0 1 1 ORS with Zinc adjutant as per policy 1 0 0 0 Vitamin A 1 1 1 0 Tab. Fluconazole 1 0 0 0 Tab. Metronidazole 0 0 1 1 Tab. Co-trimoxazole (Kid) 1 0 1 1 Tab. Nefidipine 1 0 1 0 Inj. Oxytocin 0 0 0 0 Inj. Gentamycin 0 0 1 1 Inj. Magnesium Sulphate 0 0 1 1 Tab. Misoprostal 1 0 1 0 Tab. Progestrone 1 0 0 0 Inj. Lignocaine Hydrochloride 0 0 1 1 Inj. Pentazocine Lactate 0 0 1 1 Inj. Adrenaline 0 0 1 0 Cap. Doxycycline 0 0 1 1 Silver Sulphadiazine oint. 0 0 1 1 IV Fluids 0 0 1 1 Inj. Prociane Penicillin 1 0 0 0 Inj. Atropine 0 0 1 1 Syp Amoxycyclin 1 0 0 0 IFA Syrup 1 0 0 0
20
Table C13. Availability of Specific Services (Yes: 1; No: 0)
Type of Service CHC 1 (Beerakuppam)
CHC 2 (Minjur)
Medicine 0 0
Surgery 0 0
Obstetric & Gynae 0 0
Pediatrics 0 0
DOTS 0 0
Cataract Surgery 0 0
Leprosy diagnosis management and referral services 1 1
Emergency Services (24 Hrs) 1 1
mobile medical unit 0 1
separate neo-natal care unit 0 0
emergency care for sick children 0 0
Full Range of Family Planning Services including
Laproscopic ligation
0 0
safe abortion services 0 0
Treatment of STI/RTI 1 1
Blood Storage facility 0 0
Counseling Facility on HIV/AIDS/STD etc 0 1
Voluntary Counselling and Testing Centre (VCTC) 1 1
AYUSH facility 0 1
Primary management of wounds 1 1
Primary management fracture 0 0
Primary management of cases of poisoning/snake, insect
or scorpion bite
1 1
Primary management of dog bite 1 1
Primary management of burns 1 1
Management of RTI/STI 1 1
21
Table C14 : Service Outcome (based on data for last three months) (In case where SC/ST/Others breakup is not available, only ‘Total’ column may be given)
Indicator Average monthly figure reported in CHC based on last three
months
CHC 1 (Beerakuppam) CHC 2 (Minjur) SC ST Others Total SC ST Others Total
Total ANC Registration 13 2 28 43 165 7 63 235 Total JSY cases registered 13 1 27 41 16 3 14 32 Ist Trimester Registration 7 1 22 30 15 2 7 28 ANC given 3 Checkups as per RCH Schedule
13 2 28 43 13 3 7 23
Out of above, the no. of JSY beneficiaries
- - - - - - - -
ANC given TT (2nd dose+Booster) - - - 70 68 4 25 96 Out of above, the no. of JSY beneficiaries
- - - - - - - -
ANC completed IFA Prophylaxis - - - - - - - - Out of above, the no. of JSY beneficiaries
- - - - - - - -
Number of pregnant women identified and attended with obstetric complications
2 6 8 10 4 8 22
Out of these, how many have been referred from PHC/SHC
- - - 8 - - - -
Total Institutional Deliveries 15 1 29 45 39 4 23 67 No. of JSY cases (out of total institutional deliveries)
7 1 8 17 8 2 6 16
No. of infants given BCG 11 2 29 42 52 4 34 90 No. of infants given DPT3 8 1 30 39 52 5 36 93 No. of infants given Measles 21 2 38 61 54 5 37 96 No. of infants given Vit. A-first dose - - - - - - - 2074 Children given IFA Syp. (6-60 Months) - - - - - - - IUD Inserted 2 - 6 8 5 1 11 17 Total Indoor Patients - - - 54 - - - 102 No. of cases referred beyond CHC - - - 6 - - - 19 No. of Leprosy cases currently under treatment
- - - 4 2 - - 2
No. of new TB cases enrolled for DOTS
1 1 2 4 5 - - 5
No. of cases given Blood Transfusion in last 3 months
- -
Bed occupancy rate in the last 12 months? (As on March 31, 2008)
64 29
Average Daily OPD Attendance (Total) Average Daily OPD Attendance
37.6 -
Average Daily OPD Attendance Male 76 75 Average Daily OPD Attendance Female
82 125
Average Daily OPD Attendance Children
20 25
Out of the total OPD attendance, specify the referred cases from PHC/ SHC
2 2
22
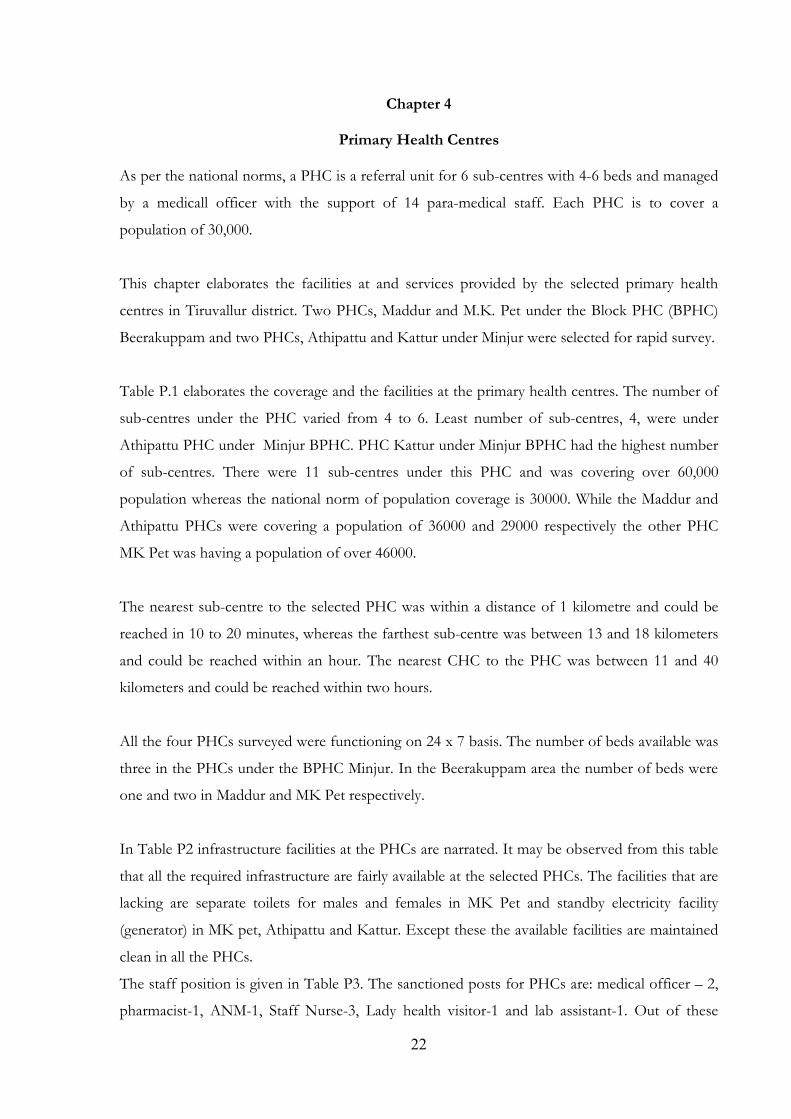
Chapter 4
Primary Health Centres
As per the national norms, a PHC is a referral unit for 6 sub-centres with 4-6 beds and managed
by a medicall officer with the support of 14 para-medical staff. Each PHC is to cover a
population of 30,000.
This chapter elaborates the facilities at and services provided by the selected primary health
centres in Tiruvallur district. Two PHCs, Maddur and M.K. Pet under the Block PHC (BPHC)
Beerakuppam and two PHCs, Athipattu and Kattur under Minjur were selected for rapid survey.
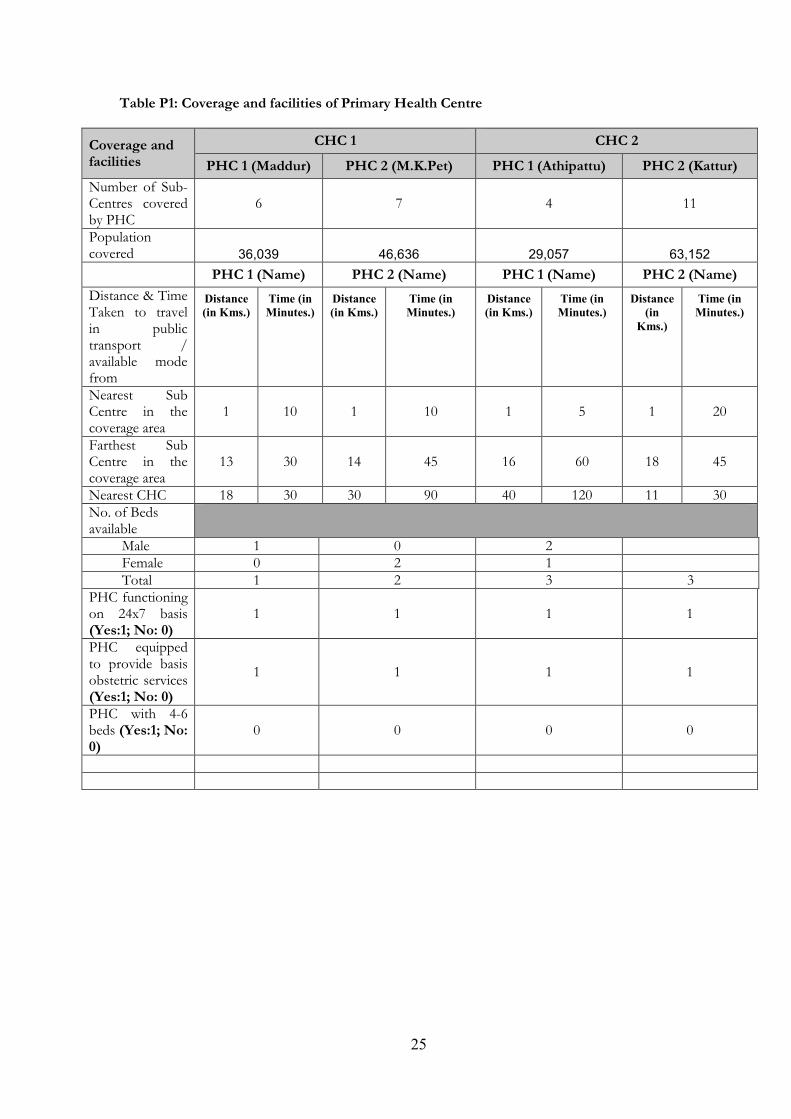
Table P.1 elaborates the coverage and the facilities at the primary health centres. The number of
sub-centres under the PHC varied from 4 to 6. Least number of sub-centres, 4, were under
Athipattu PHC under Minjur BPHC. PHC Kattur under Minjur BPHC had the highest number
of sub-centres. There were 11 sub-centres under this PHC and was covering over 60,000
population whereas the national norm of population coverage is 30000. While the Maddur and
Athipattu PHCs were covering a population of 36000 and 29000 respectively the other PHC
MK Pet was having a population of over 46000.
The nearest sub-centre to the selected PHC was within a distance of 1 kilometre and could be
reached in 10 to 20 minutes, whereas the farthest sub-centre was between 13 and 18 kilometers
and could be reached within an hour. The nearest CHC to the PHC was between 11 and 40
kilometers and could be reached within two hours.
All the four PHCs surveyed were functioning on 24 x 7 basis. The number of beds available was
three in the PHCs under the BPHC Minjur. In the Beerakuppam area the number of beds were
one and two in Maddur and MK Pet respectively.
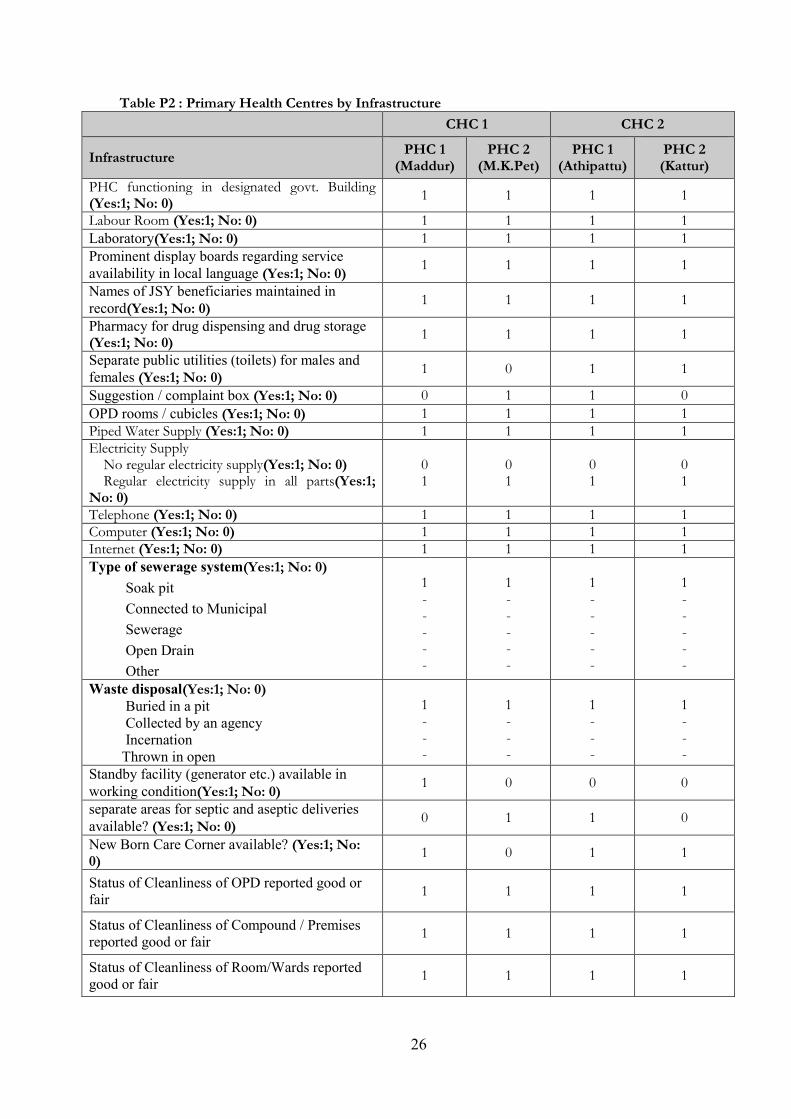
In Table P2 infrastructure facilities at the PHCs are narrated. It may be observed from this table
that all the required infrastructure are fairly available at the selected PHCs. The facilities that are
lacking are separate toilets for males and females in MK Pet and standby electricity facility
(generator) in MK pet, Athipattu and Kattur. Except these the available facilities are maintained
clean in all the PHCs.
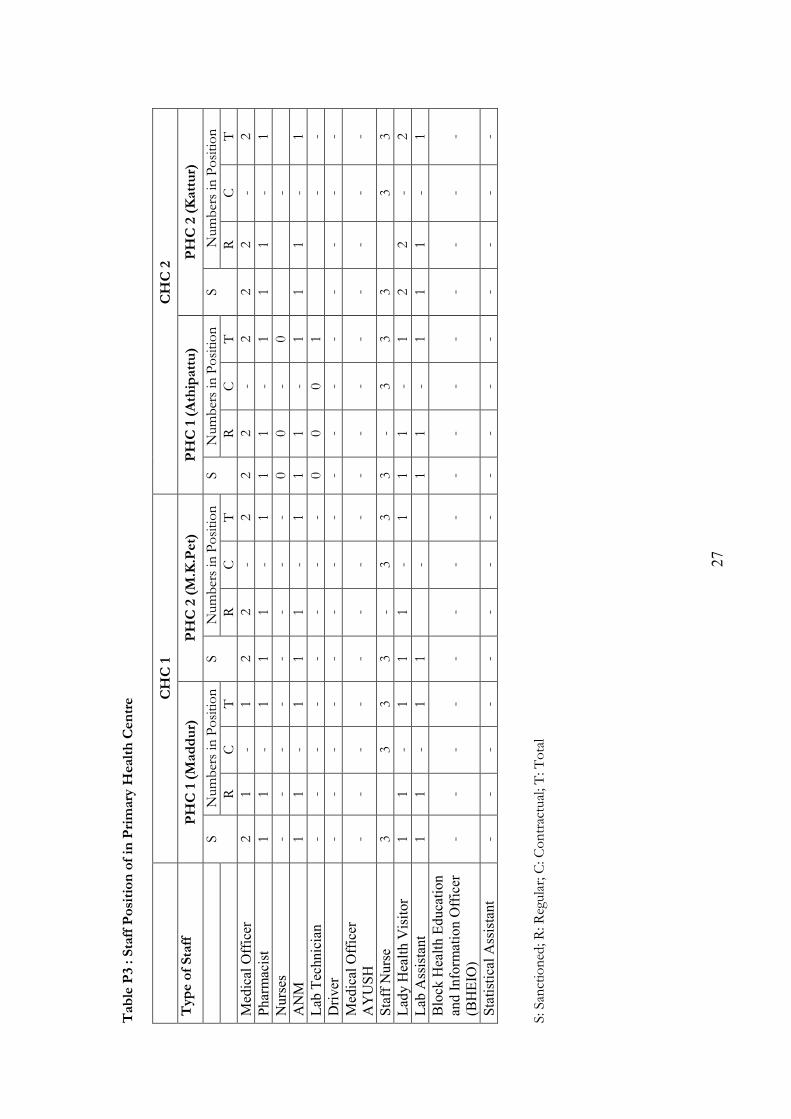
The staff position is given in Table P3. The sanctioned posts for PHCs are: medical officer – 2,
pharmacist-1, ANM-1, Staff Nurse-3, Lady health visitor-1 and lab assistant-1. Out of these
23
posts, one medical officer in Maddur PHC is vaccant. Except this all other posts in all the PHCs
have been filled up. The post of Staff nurse has been filled up on contract basis.
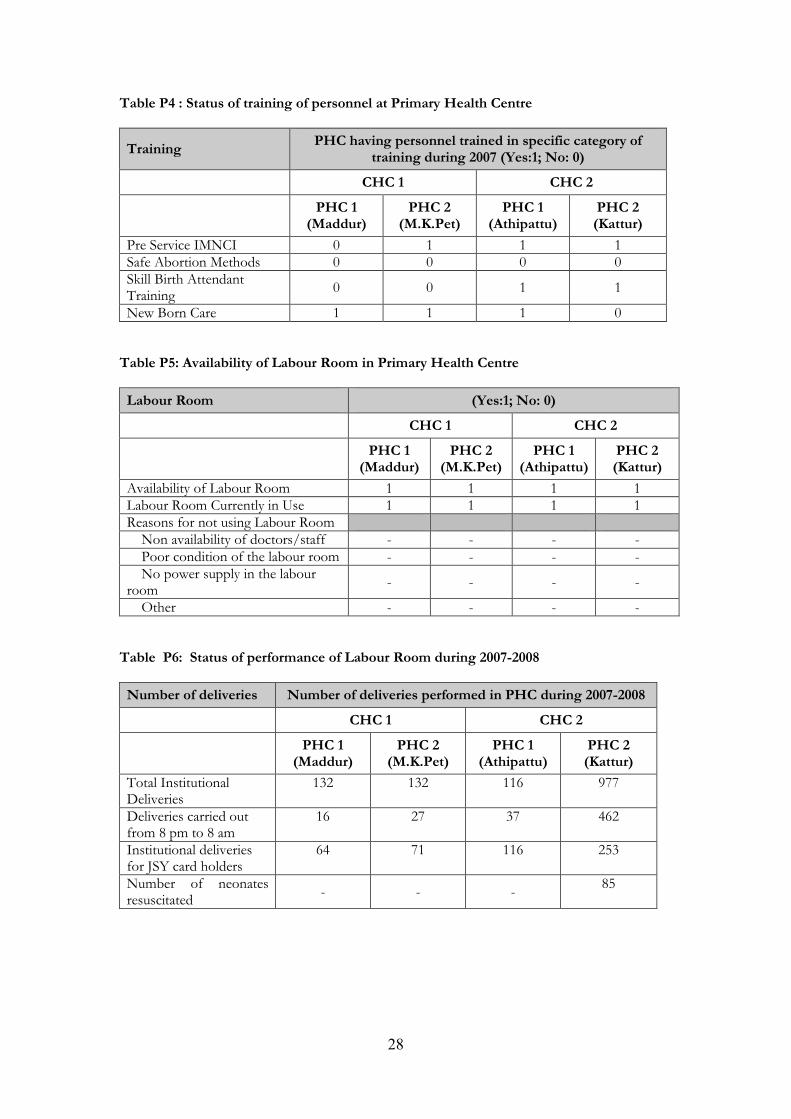
Training is an important component in delivering quality services. Table P4 gives information on
the training undergone by the PHC personnel. Pre-service/IMNCI was not given to the staff in
Maddur PHC during 2007. Training on safe abortion methods was not taken by staff in any of
the PHCs. Also training on skill birth attendant was not given to the staff in the PHCs Maddur
and MK Pet under the Beerakuppam BPHC. New born care training was not given to the staff
of PHC Kattur during 2007.
Tables P5 & P6 give information on labour room and deliveries conducted. All the four PHCs
visited have labour room and are also used. Total institutional deliveries reported in 2007-08 are
132 each in Maddur and MK Pet, 116 in Athipattu and 977 in Kattur. About 15 to 20% of the
deliveries are conducted during 8 pm to 8 am, except in Kattur where more than 50% of the
deliveries are conducted during this period.
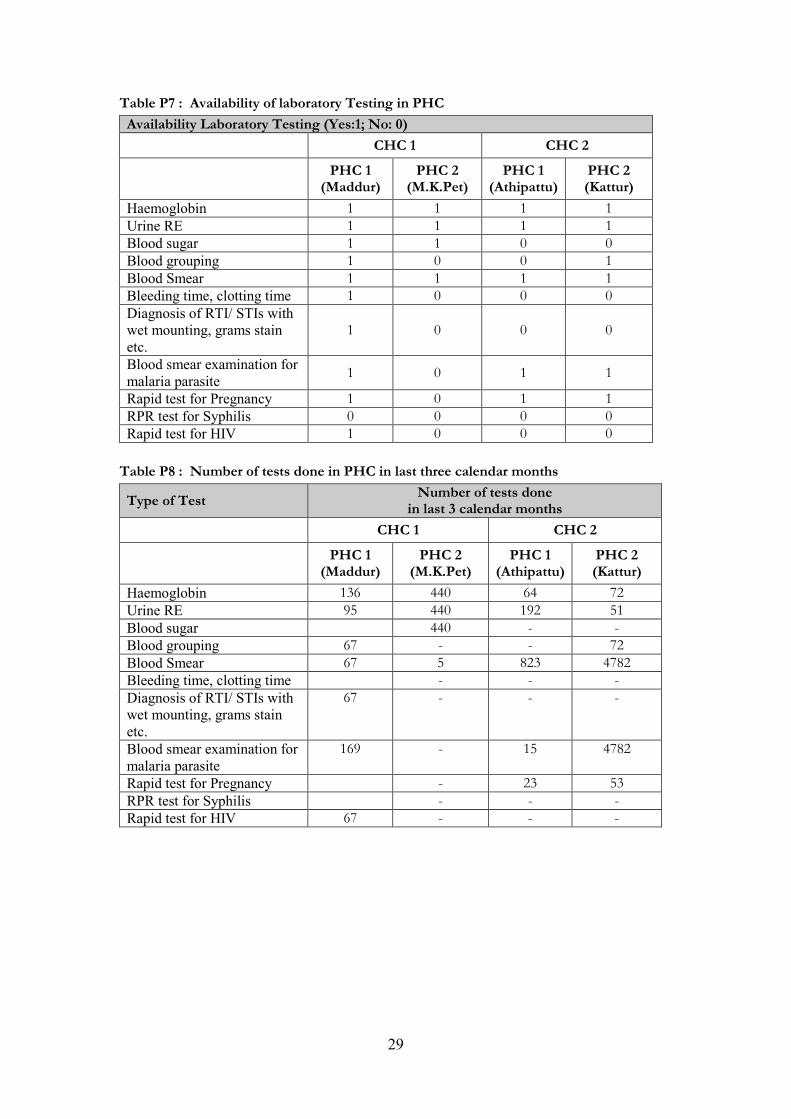
Laboratory facilities at PHC and its use will encourage the patients to utilize the PHC services.
Laboratory services for RTI/STI are poor in the PHCs (Table P7). Facilities for RPR test for
syphilis is not available in any of the PHC. Test for Diagnosis of RTI/STI and Rapid test for
HIV are not done in three of the four PHCs visited. Tests for blood sugar and blood grouping
are not done in two of the four PHCs. Table P8 gives information on number of tests done.
This table indicates that the available facilities are used by the PHCs.
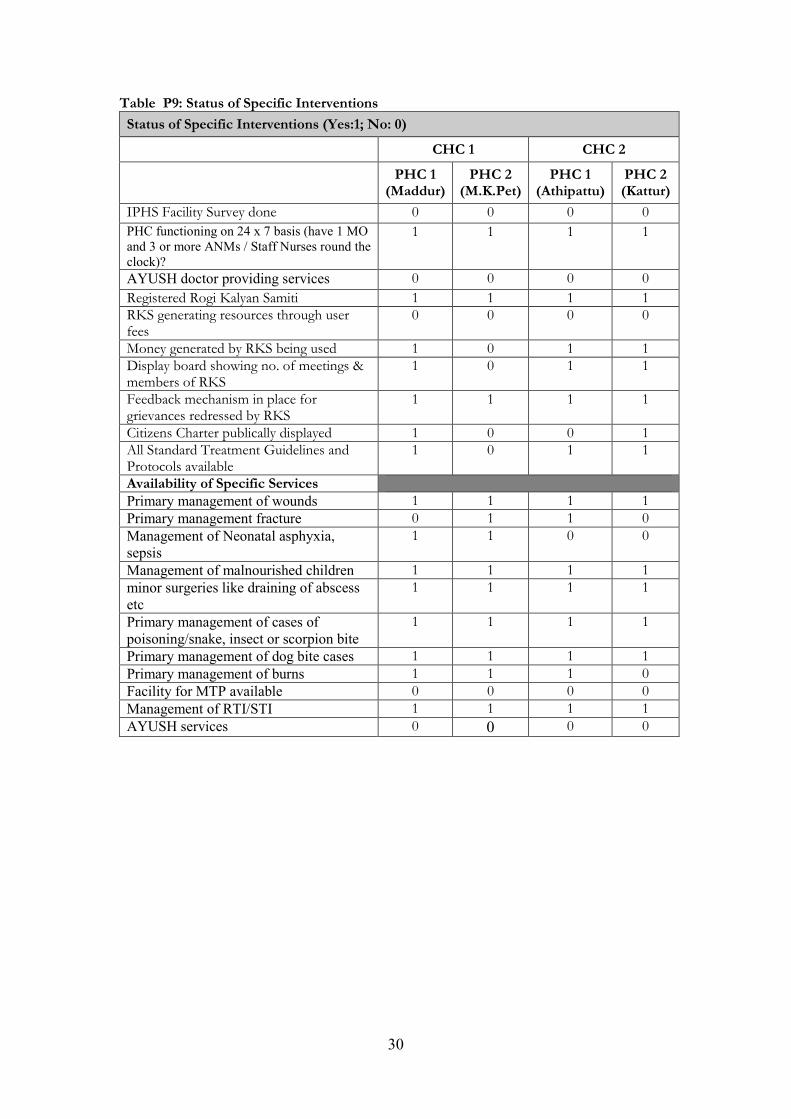
Table P9 describes the status of some specific interventions at PHCs. The IPHS survey has not
been done in any of the PHCs. All the PHCs are functioning as 24x7 PHC. AYUSH doctor was
not available in any of the PHC. Rogi Kalyan Samiti has been formed and registered in all PHCs
but user fees is not charged by any of them. Display board showing number of meetings and
members of RKS was not kept in MK Pet PHC. Feed back mechanism was in place in all PHCs
for redressing grievances by RKS. Citizens charter was not publicly displayed in two of the
PHCs. Except in MK Pet all standard treatment guidelines and protocols were available in all the
other three PHCs.
Services like primary management of wounds, management of malnourished children, minor
surgeries like draining of abscess etc, primary management of cases of poisoning/snake, insect
or scorpion bite, dog bite and management of RTI/STI were available in all PHCs. Facility for
MTP was not available in any of the PHCs. Primary management of fracture and management
24
of neonatal asphyxia, sepsis was not available in two of the four PHCs. Primary management of
burns was not available in Kattur PHC.
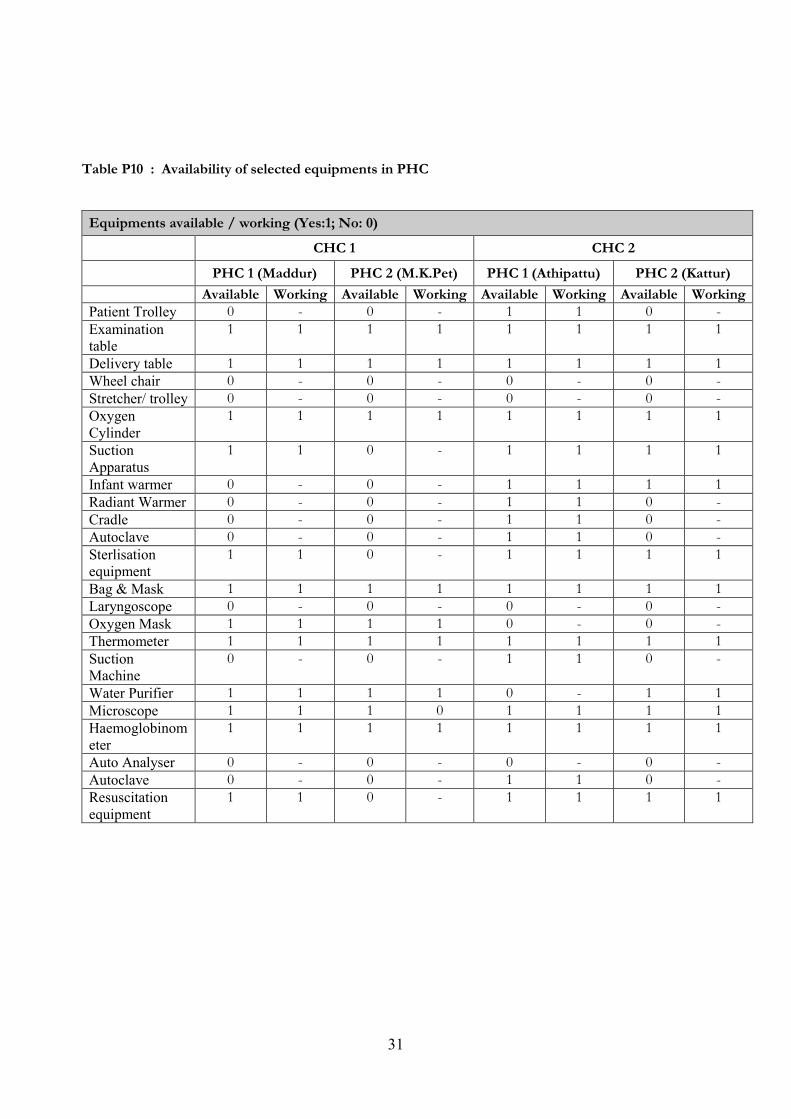
Table P10 gives information on the availability of equipments at PHCs. Examination table,
delivery table, oxygen cylinder, bag & Mask, thermometer, microscope and haemoglobinometer
were the equipments available in all the PHCs. Wheel chair, stretcher/trolley, laryngoscope and
auto analyser were not available in any of the PHCs. Out of the 23 equipments listed, 12 were
available in Maddur, 9 in MK Pet, 17 in Athipattu and 12 in Kattur.
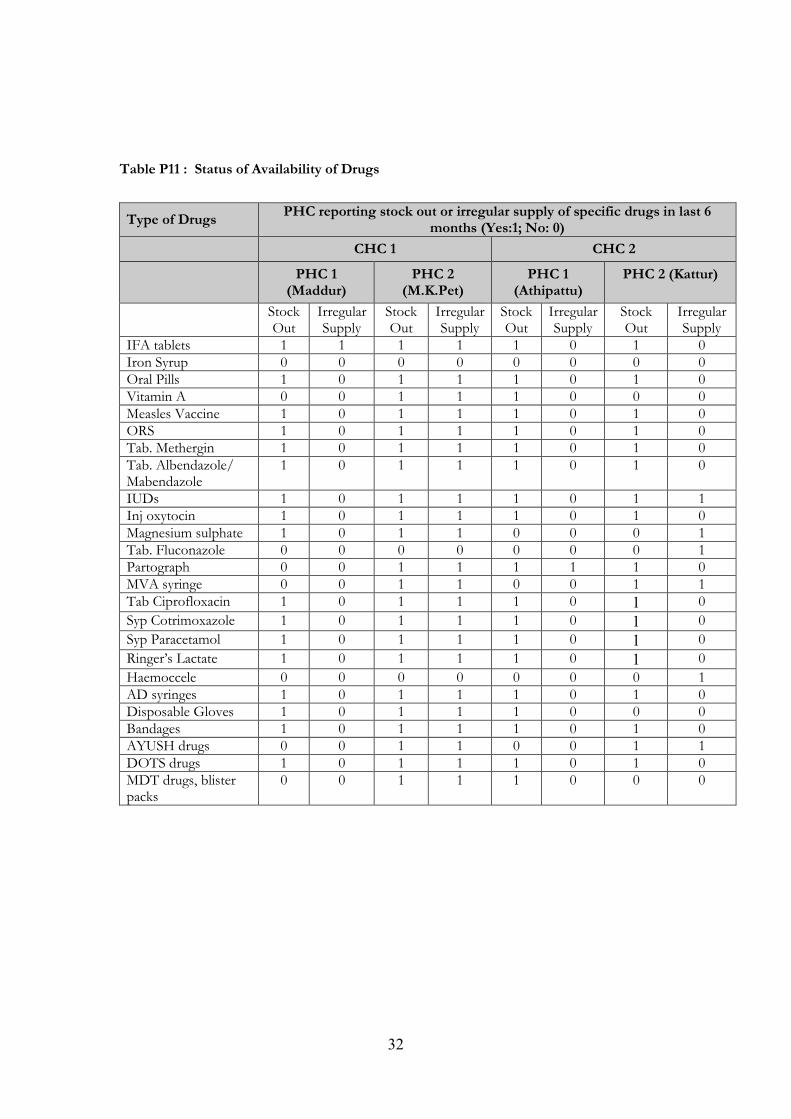
Table P11 describes the status of availability of drugs at PHCs. Most of the listed drugs were out
of stock during the last six months before survey or there was irregular supply of these drugs.
This indicates that drug supply to the PHCs need to be streamlined for smoother functioning of
PHCs.
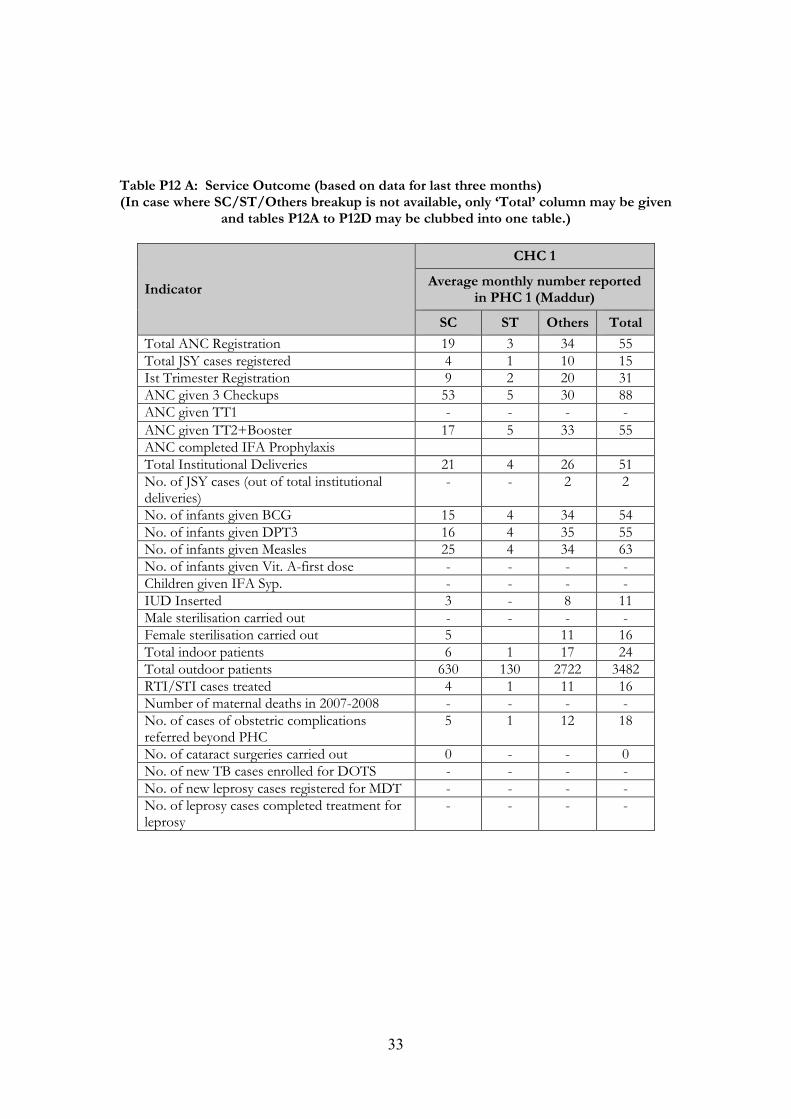
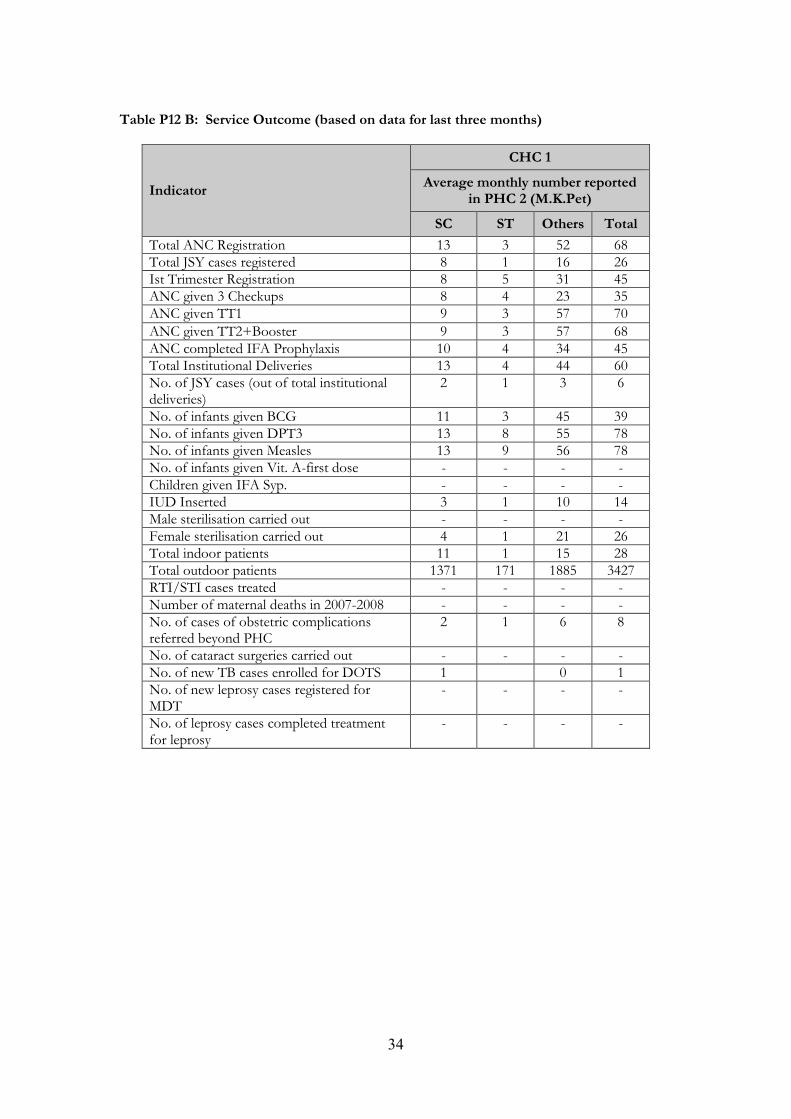
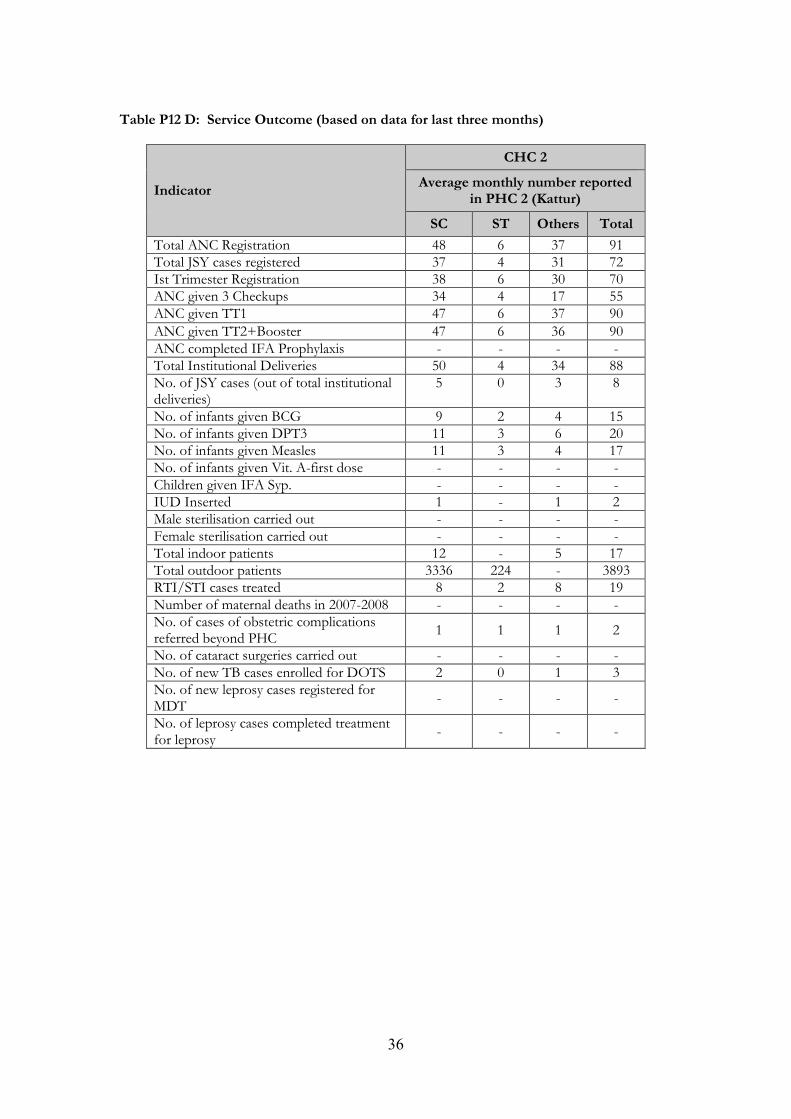
Tables P12A to P12D brings out the outcome of services delivered at the PHCs. The tables
indicate that registration for ANC in the 1st trimester itself is high in these PHCs and the
immunization services were also good. About 10% of the institutional deliveries were of JSY
beneficiaries. There were few beneficiaries for the TB control and leprosy control programme
activities. In Kattur PHC, family planning services seems to be poor as the number of IUD
insertions were only 2 per month and number of sterilizations were nil. Comparing the
population size this PHC is serving, the outcome of the services except for ANC and
Immunization needs improvement.
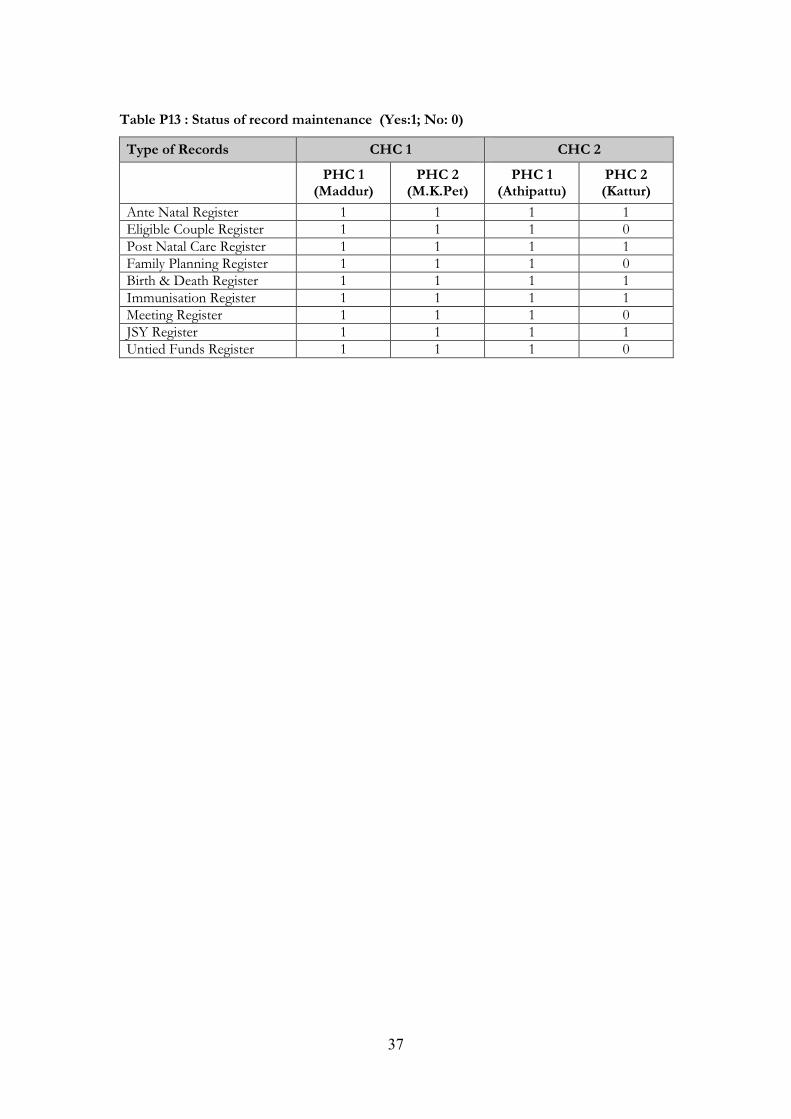
Table P13 is on the maintenance of records at PHC level. All the prescribed records were
maintained by all the PHCs except in Kattur where Eligible couple register, Family Planning
register, meeting register and the Untied funds register were absent/not maintained.
25
Table P1: Coverage and facilities of Primary Health Centre
Coverage and facilities
CHC 1 CHC 2
PHC 1 (Maddur) PHC 2 (M.K.Pet) PHC 1 (Athipattu) PHC 2 (Kattur)
Number of Sub-Centres covered by PHC
6 7 4 11
Population covered 36,039 46,636 29,057 63,152
PHC 1 (Name) PHC 2 (Name) PHC 1 (Name) PHC 2 (Name)
Distance & Time Taken to travel in public transport / available mode from
Distance
(in Kms.)
Time (in
Minutes.)
Distance
(in Kms.)
Time (in
Minutes.)
Distance
(in Kms.)
Time (in
Minutes.)
Distance
(in
Kms.)
Time (in
Minutes.)
Nearest Sub Centre in the coverage area
1 10 1 10 1 5 1 20
Farthest Sub Centre in the coverage area
13 30 14 45 16 60 18 45
Nearest CHC 18 30 30 90 40 120 11 30 No. of Beds available
Male 1 0 2 Female 0 2 1 Total 1 2 3 3 PHC functioning on 24x7 basis (Yes:1; No: 0)
1 1 1 1
PHC equipped to provide basis obstetric services (Yes:1; No: 0)
1 1 1 1
PHC with 4-6 beds (Yes:1; No: 0)
0 0 0 0
26
Table P2 : Primary Health Centres by Infrastructure
CHC 1 CHC 2
Infrastructure PHC 1
(Maddur) PHC 2
(M.K.Pet) PHC 1
(Athipattu) PHC 2 (Kattur)
PHC functioning in designated govt. Building (Yes:1; No: 0)
1 1 1 1
Labour Room (Yes:1; No: 0) 1 1 1 1
Laboratory(Yes:1; No: 0) 1 1 1 1
Prominent display boards regarding service
availability in local language (Yes:1; No: 0) 1 1 1 1
Names of JSY beneficiaries maintained in
record(Yes:1; No: 0) 1 1 1 1
Pharmacy for drug dispensing and drug storage (Yes:1; No: 0)
1 1 1 1
Separate public utilities (toilets) for males and
females (Yes:1; No: 0) 1 0 1 1
Suggestion / complaint box (Yes:1; No: 0) 0 1 1 0
OPD rooms / cubicles (Yes:1; No: 0) 1 1 1 1
Piped Water Supply (Yes:1; No: 0) 1 1 1 1 Electricity Supply No regular electricity supply(Yes:1; No: 0) Regular electricity supply in all parts(Yes:1; No: 0)
0 1
0 1
0 1
0 1
Telephone (Yes:1; No: 0) 1 1 1 1 Computer (Yes:1; No: 0) 1 1 1 1 Internet (Yes:1; No: 0) 1 1 1 1
Type of sewerage system(Yes:1; No: 0)
Soak pit
Connected to Municipal
Sewerage
Open Drain
Other
1 - - - - -
1 - - - - -
1 - - - - -
1 - - - - -
Waste disposal(Yes:1; No: 0) Buried in a pit
Collected by an agency
Incernation
Thrown in open
1 - - -
1 - - -
1 - - -
1 - - -
Standby facility (generator etc.) available in
working condition(Yes:1; No: 0) 1 0 0 0
separate areas for septic and aseptic deliveries
available? (Yes:1; No: 0) 0 1 1 0
New Born Care Corner available? (Yes:1; No: 0)
1 0 1 1
Status of Cleanliness of OPD reported good or
fair 1 1 1 1
Status of Cleanliness of Compound / Premises
reported good or fair 1 1 1 1
Status of Cleanliness of Room/Wards reported
good or fair 1 1 1 1
27
Table P
3 : Sta
ff P
osition o
f in
Prim
ary H
ealth C
entre
CH
C 1
CH
C 2
Typ
e of Sta
ff
PH
C 1 (M
addur)
PH
C 2 (M
.K.P
et)
PH
C 1 (Ath
ipattu)
PH
C 2 (Kattur)
S
Numbers in Position
S Numbers in Position
S Numbers in Position
S Numbers in Position
R
C
T
R
C
T
R
C
T
R
C
T
Medical Officer
2 1
- 1
2 2
- 2
2 2
- 2
2 2
- 2
Pharmacist
1 1
- 1
1 1
- 1
1 1
- 1
1 1
- 1
Nurses
- -
- -
- -
- -
0 0
- 0
-
ANM
1 1
- 1
1 1
- 1
1 1
- 1
1 1
- 1
Lab Technician
- -
- -
- -
- -
0 0
0 1
- -
Driver
- -
- -
- -
- -
- -
- -
- -
- -
Medical Officer
AYUSH
- -
- -
- -
- -
- -
- -
- -
- -
Staff Nurse
3
3 3
3 -
3 3
3 -
3 3
3
3 3
Lady Health Visitor
1 1
- 1
1 1
- 1
1 1
- 1
2 2
- 2
Lab Assistant
1 1
- 1
1
-
1 1
- 1
1 1
- 1
Block Health Education
and Information Officer
(BHEIO)
- -
- -
- -
- -
- -
- -
- -
- -
Statistical Assistant
- -
- -
- -
- -
- -
- -
- -
- -
S: San
ctioned
; R: R
egular; C: C
ontractual; T
: Total
28
Table P4 : Status of training of personnel at Primary Health Centre
Training PHC having personnel trained in specific category of
training during 2007 (Yes:1; No: 0)
CHC 1 CHC 2
PHC 1 (Maddur)
PHC 2 (M.K.Pet)
PHC 1 (Athipattu)
PHC 2 (Kattur)
Pre Service IMNCI 0 1 1 1 Safe Abortion Methods 0 0 0 0 Skill Birth Attendant Training
0 0 1 1
New Born Care 1 1 1 0 Table P5: Availability of Labour Room in Primary Health Centre
Labour Room (Yes:1; No: 0)
CHC 1 CHC 2
PHC 1 (Maddur)
PHC 2 (M.K.Pet)
PHC 1 (Athipattu)
PHC 2 (Kattur)
Availability of Labour Room 1 1 1 1 Labour Room Currently in Use 1 1 1 1 Reasons for not using Labour Room Non availability of doctors/staff - - - - Poor condition of the labour room - - - - No power supply in the labour room
- - - -
Other - - - - Table P6: Status of performance of Labour Room during 2007-2008
Number of deliveries Number of deliveries performed in PHC during 2007-2008
CHC 1 CHC 2
PHC 1 (Maddur)
PHC 2 (M.K.Pet)
PHC 1 (Athipattu)
PHC 2 (Kattur)
Total Institutional Deliveries
132 132 116 977
Deliveries carried out from 8 pm to 8 am
16 27 37 462
Institutional deliveries for JSY card holders
64 71 116 253
Number of neonates resuscitated
- - - 85
29
Table P7 : Availability of laboratory Testing in PHC
Availability Laboratory Testing (Yes:1; No: 0) CHC 1 CHC 2
PHC 1 (Maddur)
PHC 2 (M.K.Pet)
PHC 1 (Athipattu)
PHC 2 (Kattur)
Haemoglobin 1 1 1 1 Urine RE 1 1 1 1 Blood sugar 1 1 0 0 Blood grouping 1 0 0 1 Blood Smear 1 1 1 1 Bleeding time, clotting time 1 0 0 0 Diagnosis of RTI/ STIs with
wet mounting, grams stain
etc.
1 0 0 0
Blood smear examination for
malaria parasite 1 0 1 1
Rapid test for Pregnancy 1 0 1 1 RPR test for Syphilis 0 0 0 0 Rapid test for HIV 1 0 0 0
Table P8 : Number of tests done in PHC in last three calendar months
Type of Test Number of tests done
in last 3 calendar months CHC 1 CHC 2
PHC 1 (Maddur)
PHC 2 (M.K.Pet)
PHC 1 (Athipattu)
PHC 2 (Kattur)
Haemoglobin 136 440 64 72
Urine RE 95 440 192 51
Blood sugar 440 - -
Blood grouping 67 - - 72
Blood Smear 67 5 823 4782
Bleeding time, clotting time - - -
Diagnosis of RTI/ STIs with
wet mounting, grams stain
etc.
67 - - -
Blood smear examination for
malaria parasite
169 - 15 4782
Rapid test for Pregnancy - 23 53
RPR test for Syphilis - - -
Rapid test for HIV 67 - - -
30
Table P9: Status of Specific Interventions
Status of Specific Interventions (Yes:1; No: 0)
CHC 1 CHC 2
PHC 1 (Maddur)
PHC 2 (M.K.Pet)
PHC 1 (Athipattu)
PHC 2 (Kattur)
IPHS Facility Survey done 0 0 0 0
PHC functioning on 24 x 7 basis (have 1 MO
and 3 or more ANMs / Staff Nurses round the
clock)?
1 1 1 1
AYUSH doctor providing services 0 0 0 0
Registered Rogi Kalyan Samiti 1 1 1 1 RKS generating resources through user fees
0 0 0 0
Money generated by RKS being used 1 0 1 1 Display board showing no. of meetings & members of RKS
1 0 1 1
Feedback mechanism in place for grievances redressed by RKS
1 1 1 1
Citizens Charter publically displayed 1 0 0 1 All Standard Treatment Guidelines and Protocols available
1 0 1 1
Availability of Specific Services
Primary management of wounds 1 1 1 1 Primary management fracture 0 1 1 0
Management of Neonatal asphyxia,
sepsis
1 1 0 0
Management of malnourished children 1 1 1 1 minor surgeries like draining of abscess
etc
1 1 1 1
Primary management of cases of
poisoning/snake, insect or scorpion bite
1 1 1 1
Primary management of dog bite cases 1 1 1 1
Primary management of burns 1 1 1 0 Facility for MTP available 0 0 0 0
Management of RTI/STI 1 1 1 1
AYUSH services 0 0 0 0
31
Table P10 : Availability of selected equipments in PHC
Equipments available / working (Yes:1; No: 0)
CHC 1 CHC 2
PHC 1 (Maddur) PHC 2 (M.K.Pet) PHC 1 (Athipattu) PHC 2 (Kattur)
Available Working Available Working Available Working Available Working
Patient Trolley 0 - 0 - 1 1 0 -
Examination
table
1 1 1 1 1 1 1 1
Delivery table 1 1 1 1 1 1 1 1 Wheel chair 0 - 0 - 0 - 0 -
Stretcher/ trolley 0 - 0 - 0 - 0 -
Oxygen
Cylinder
1 1 1 1 1 1 1 1
Suction
Apparatus
1 1 0 - 1 1 1 1
Infant warmer 0 - 0 - 1 1 1 1
Radiant Warmer 0 - 0 - 1 1 0 -
Cradle 0 - 0 - 1 1 0 -
Autoclave 0 - 0 - 1 1 0 -
Sterlisation
equipment
1 1 0 - 1 1 1 1
Bag & Mask 1 1 1 1 1 1 1 1 Laryngoscope 0 - 0 - 0 - 0 -
Oxygen Mask 1 1 1 1 0 - 0 -
Thermometer 1 1 1 1 1 1 1 1
Suction
Machine
0 - 0 - 1 1 0 -
Water Purifier 1 1 1 1 0 - 1 1
Microscope 1 1 1 0 1 1 1 1 Haemoglobinom
eter
1 1 1 1 1 1 1 1
Auto Analyser 0 - 0 - 0 - 0 -
Autoclave 0 - 0 - 1 1 0 -
Resuscitation
equipment
1 1 0 - 1 1 1 1
32
Table P11 : Status of Availability of Drugs
Type of Drugs PHC reporting stock out or irregular supply of specific drugs in last 6
months (Yes:1; No: 0)
CHC 1 CHC 2
PHC 1
(Maddur) PHC 2
(M.K.Pet) PHC 1
(Athipattu) PHC 2 (Kattur)
Stock Out
Irregular Supply
Stock Out
Irregular Supply
Stock Out
Irregular Supply
Stock Out
Irregular Supply
IFA tablets 1 1 1 1 1 0 1 0 Iron Syrup 0 0 0 0 0 0 0 0 Oral Pills 1 0 1 1 1 0 1 0 Vitamin A 0 0 1 1 1 0 0 0 Measles Vaccine 1 0 1 1 1 0 1 0 ORS 1 0 1 1 1 0 1 0 Tab. Methergin 1 0 1 1 1 0 1 0 Tab. Albendazole/ Mabendazole
1 0 1 1 1 0 1 0
IUDs 1 0 1 1 1 0 1 1 Inj oxytocin 1 0 1 1 1 0 1 0 Magnesium sulphate 1 0 1 1 0 0 0 1 Tab. Fluconazole 0 0 0 0 0 0 0 1 Partograph 0 0 1 1 1 1 1 0 MVA syringe 0 0 1 1 0 0 1 1 Tab Ciprofloxacin 1 0 1 1 1 0 1 0
Syp Cotrimoxazole 1 0 1 1 1 0 1 0
Syp Paracetamol 1 0 1 1 1 0 1 0
Ringer’s Lactate 1 0 1 1 1 0 1 0
Haemoccele 0 0 0 0 0 0 0 1 AD syringes 1 0 1 1 1 0 1 0 Disposable Gloves 1 0 1 1 1 0 0 0 Bandages 1 0 1 1 1 0 1 0 AYUSH drugs 0 0 1 1 0 0 1 1 DOTS drugs 1 0 1 1 1 0 1 0 MDT drugs, blister packs
0 0 1 1 1 0 0 0
33
Table P12 A: Service Outcome (based on data for last three months) (In case where SC/ST/Others breakup is not available, only ‘Total’ column may be given
and tables P12A to P12D may be clubbed into one table.)
Indicator
CHC 1
Average monthly number reported in PHC 1 (Maddur)
SC ST Others Total
Total ANC Registration 19 3 34 55 Total JSY cases registered 4 1 10 15 Ist Trimester Registration 9 2 20 31 ANC given 3 Checkups 53 5 30 88 ANC given TT1 - - - -
ANC given TT2+Booster 17 5 33 55 ANC completed IFA Prophylaxis Total Institutional Deliveries 21 4 26 51 No. of JSY cases (out of total institutional deliveries)
- - 2 2
No. of infants given BCG 15 4 34 54 No. of infants given DPT3 16 4 35 55 No. of infants given Measles 25 4 34 63 No. of infants given Vit. A-first dose - - - - Children given IFA Syp. - - - - IUD Inserted 3 - 8 11 Male sterilisation carried out - - - - Female sterilisation carried out 5 11 16 Total indoor patients 6 1 17 24 Total outdoor patients 630 130 2722 3482 RTI/STI cases treated 4 1 11 16 Number of maternal deaths in 2007-2008 - - - - No. of cases of obstetric complications referred beyond PHC
5 1 12 18
No. of cataract surgeries carried out 0 - - 0 No. of new TB cases enrolled for DOTS - - - - No. of new leprosy cases registered for MDT - - - - No. of leprosy cases completed treatment for leprosy
- - - -
34
Table P12 B: Service Outcome (based on data for last three months)
Indicator
CHC 1
Average monthly number reported in PHC 2 (M.K.Pet)
SC ST Others Total
Total ANC Registration 13 3 52 68 Total JSY cases registered 8 1 16 26 Ist Trimester Registration 8 5 31 45 ANC given 3 Checkups 8 4 23 35 ANC given TT1 9 3 57 70
ANC given TT2+Booster 9 3 57 68 ANC completed IFA Prophylaxis 10 4 34 45 Total Institutional Deliveries 13 4 44 60 No. of JSY cases (out of total institutional deliveries)
2 1 3 6
No. of infants given BCG 11 3 45 39 No. of infants given DPT3 13 8 55 78 No. of infants given Measles 13 9 56 78 No. of infants given Vit. A-first dose - - - - Children given IFA Syp. - - - - IUD Inserted 3 1 10 14 Male sterilisation carried out - - - - Female sterilisation carried out 4 1 21 26 Total indoor patients 11 1 15 28 Total outdoor patients 1371 171 1885 3427 RTI/STI cases treated - - - - Number of maternal deaths in 2007-2008 - - - - No. of cases of obstetric complications referred beyond PHC
2 1 6 8
No. of cataract surgeries carried out - - - - No. of new TB cases enrolled for DOTS 1 0 1 No. of new leprosy cases registered for MDT
- - - -
No. of leprosy cases completed treatment for leprosy
- - - -
35
Table P12 C: Service Outcome (based on data for last three months)
Indicator
CHC 2
Average monthly number reported in PHC 1 (Athipattu)
SC ST Others Total
Total ANC Registration - - - 70 Total JSY cases registered - - - 8 Ist Trimester Registration - - - 18 ANC given 3 Checkups - - - 12 ANC given TT1 - - - 48
ANC given TT2+Booster - - - 40 ANC completed IFA Prophylaxis - - - - Total Institutional Deliveries - - - 46 No. of JSY cases (out of total institutional deliveries)
- - - 4
No. of infants given BCG - - - 44 No. of infants given DPT3 - - - 41 No. of infants given Measles - - - 46 No. of infants given Vit. A-first dose - - - - Children given IFA Syp. - - - - IUD Inserted - - - 9 Male sterilisation carried out - - - - Female sterilisation carried out - - - 15 Total indoor patients - - - 34 Total outdoor patients - - - 4199 RTI/STI cases treated - - - 52 Number of maternal deaths in 2007-2008 - - - - No. of cases of obstetric complications referred beyond PHC
- - - 1
No. of cataract surgeries carried out - - - - No. of new TB cases enrolled for DOTS 0 0 0 1 No. of new leprosy cases registered for MDT
- - - -
No. of leprosy cases completed treatment for leprosy
0 0 0 0
36
Table P12 D: Service Outcome (based on data for last three months)
Indicator
CHC 2
Average monthly number reported in PHC 2 (Kattur)
SC ST Others Total
Total ANC Registration 48 6 37 91 Total JSY cases registered 37 4 31 72 Ist Trimester Registration 38 6 30 70 ANC given 3 Checkups 34 4 17 55 ANC given TT1 47 6 37 90
ANC given TT2+Booster 47 6 36 90 ANC completed IFA Prophylaxis - - - - Total Institutional Deliveries 50 4 34 88 No. of JSY cases (out of total institutional deliveries)
5 0 3 8
No. of infants given BCG 9 2 4 15 No. of infants given DPT3 11 3 6 20 No. of infants given Measles 11 3 4 17 No. of infants given Vit. A-first dose - - - - Children given IFA Syp. - - - - IUD Inserted 1 - 1 2 Male sterilisation carried out - - - - Female sterilisation carried out - - - - Total indoor patients 12 - 5 17 Total outdoor patients 3336 224 - 3893 RTI/STI cases treated 8 2 8 19 Number of maternal deaths in 2007-2008 - - - - No. of cases of obstetric complications referred beyond PHC
1 1 1 2
No. of cataract surgeries carried out - - - - No. of new TB cases enrolled for DOTS 2 0 1 3 No. of new leprosy cases registered for MDT
- - - -
No. of leprosy cases completed treatment for leprosy
- - - -
37
Table P13 : Status of record maintenance (Yes:1; No: 0)
Type of Records CHC 1 CHC 2
PHC 1 (Maddur)
PHC 2 (M.K.Pet)
PHC 1 (Athipattu)
PHC 2 (Kattur)
Ante Natal Register 1 1 1 1 Eligible Couple Register 1 1 1 0 Post Natal Care Register 1 1 1 1 Family Planning Register 1 1 1 0 Birth & Death Register 1 1 1 1 Immunisation Register 1 1 1 1 Meeting Register 1 1 1 0 JSY Register 1 1 1 1 Untied Funds Register 1 1 1 0
38
Chapter 5
Sub Centre
A health sub-centre is a peripheral unit serving a population of about 5000. This unit is
managed by MPW(F)/ANM and a MPW (M).
In this chapter facilities available at and services provided by the staff at the selected sub-
centres in Tiruvallur district are discussed. Three sub-cntres from each selected PHCs
were selected for the rapid survey.
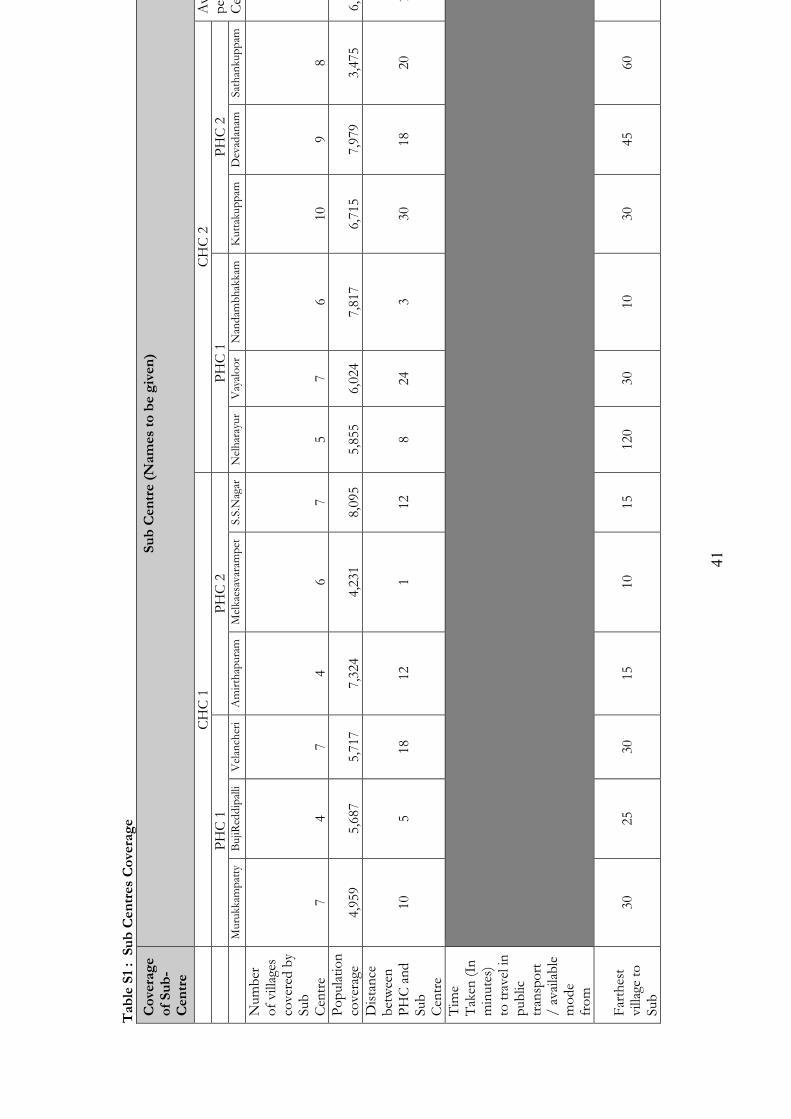
Table S.1 provides information on the coverage by the sub-centres. On average each sub-
centre covered 7 villages. The number of villages covered varied from 4 to 10. Against
the national norm of coverage of 5000 population per sub-centre, the average population
covered by the selected sub-centres was 6,157. The population covered ranged from
3,475 to 8,095. Six out of 12 sub-centres visited covered a population more than 6000
each. Distance between the PHC and the sub-centre was upto 5 kms for 3 sub-centres,
upto 10 kms for 2 and for the rest the distance was above 10 kms. The farthest sub-
centre was at a distance of 30 kms from PHC. The time taken to travel between the
village and its sub-centre varied between 10 minutes and 120 minutes. Except for two
sub-centres the time taken to reach the farthest village was less than 45 minutes. Time
required to reach PHC ranged from 15 minutes to 75 minutes. Similarly the time required
to reach the CHC/ BPHC varied from 20 minutes to 60 minutes.
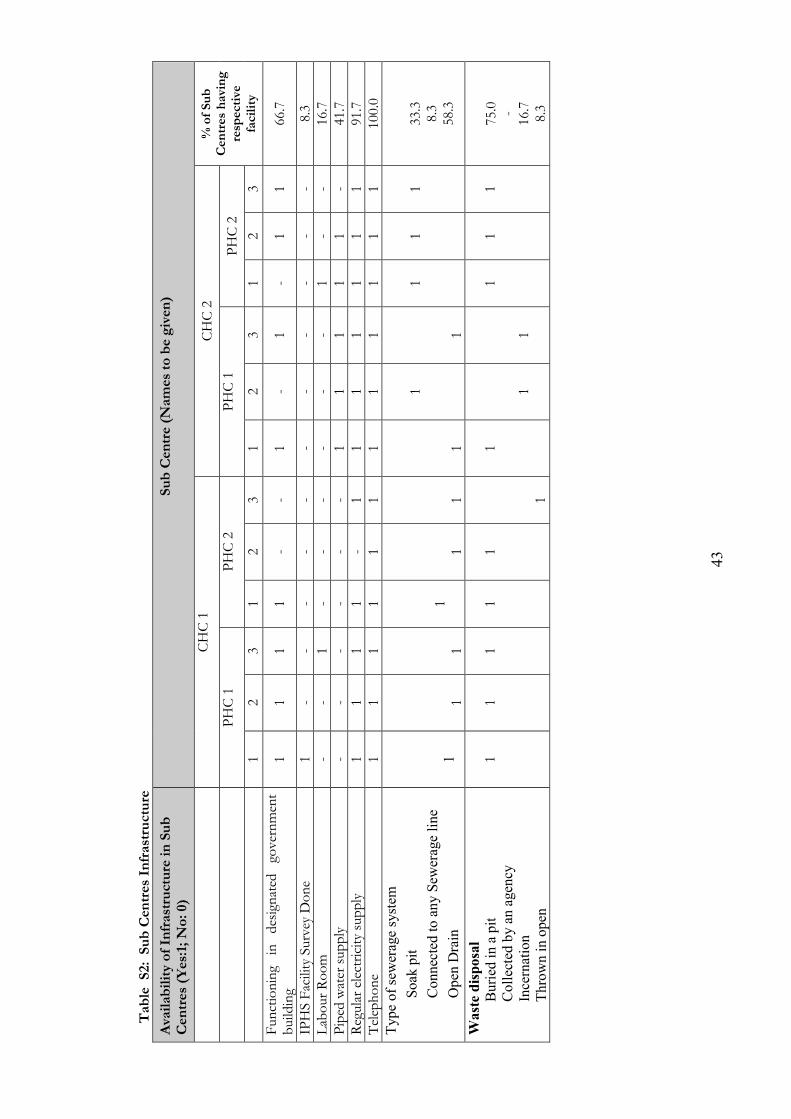
Table S2 describes the infrastructure of the Sub-centres. Two third of the Sub-centres
visited were functioning in designated government building. IPHS facility survey was
reported to have been completed in one sub-centre. Labour room was available in two
sub-centres. Piped water supply was available in 42% of the sub-centres. Sub-centres
under the BPHC Beerakuppam were not provided with piped water connection. Regular
electric supply was available in all but one sub-centres. Telephone connection was
available in all the visited sub-centres. One third of the Sub-centres used soak pit for
disposing sewage and in more than 59% of the sub-centre open drain was the sewage
disposing system. The waste was buried in a pit in 75% of the sub-centres and about
17% sub-centres incernated the waste.
39
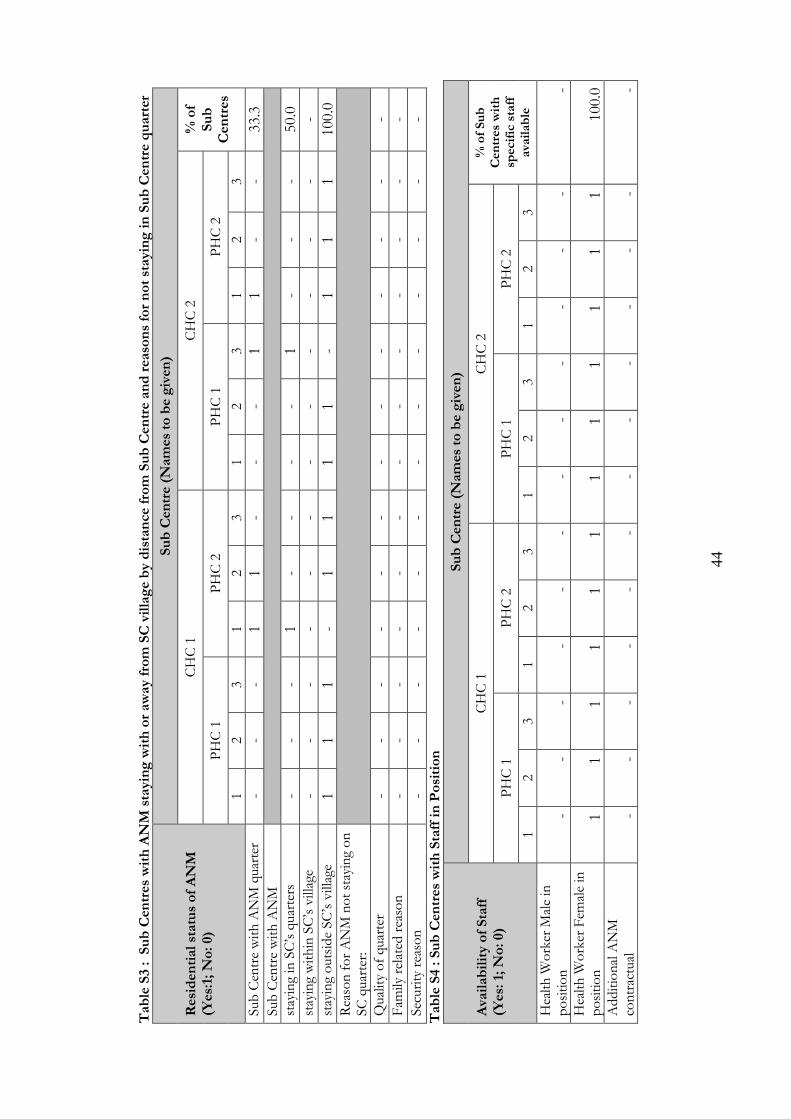
Table S3 & S4 give information on the staff position and availability of ANM/VHN in
the sub-centre area. Female Health Worker (VHN) was available in all the sub-centres
visited. None of these centres had male health worker. ANM quarter was available in
four sub-centres and only in two the female worker was staying. In the remaining 10
places the female worker was staying outing outside the sub-centre village.
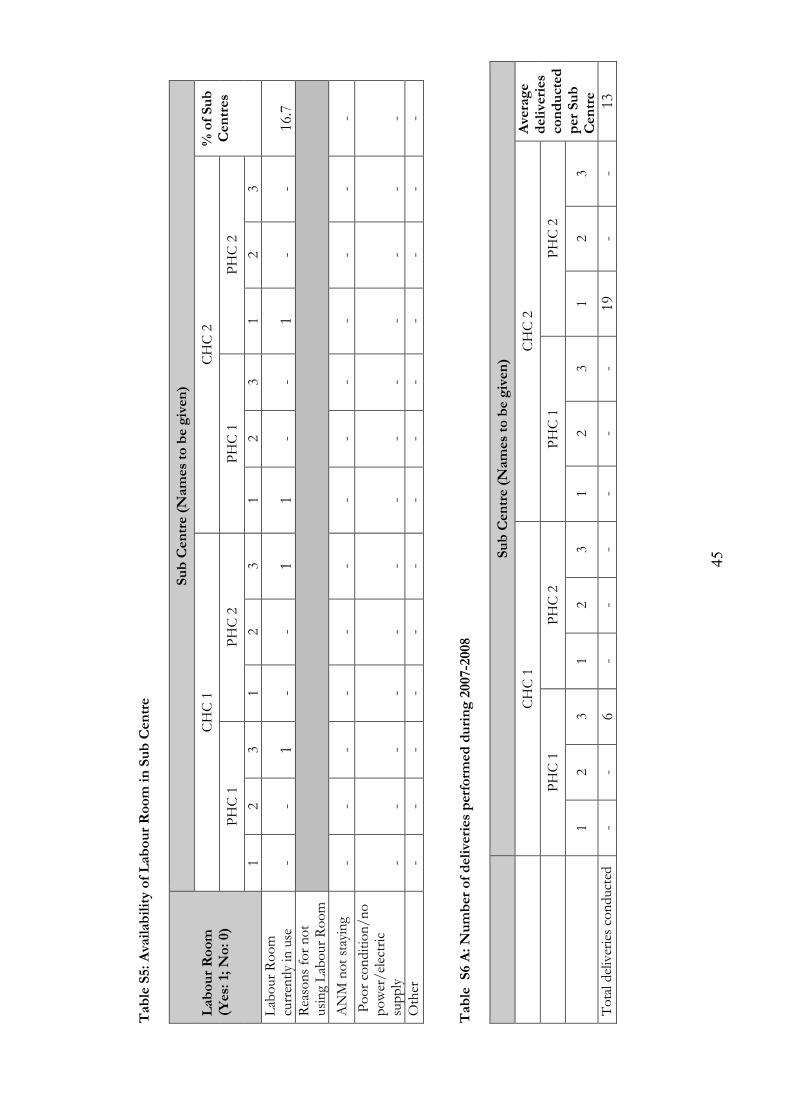
Table S5 gives information on availability of labour room at sub-centre and Tables S6A
and S6B give information on number of deliveries conducted. Labour room was available
in four sub-centres (16.7%). Out of these only in two sub-centres deliveries were
conducted. In the year 2007-08, six deliveries were conducted in one centre and 19 in the
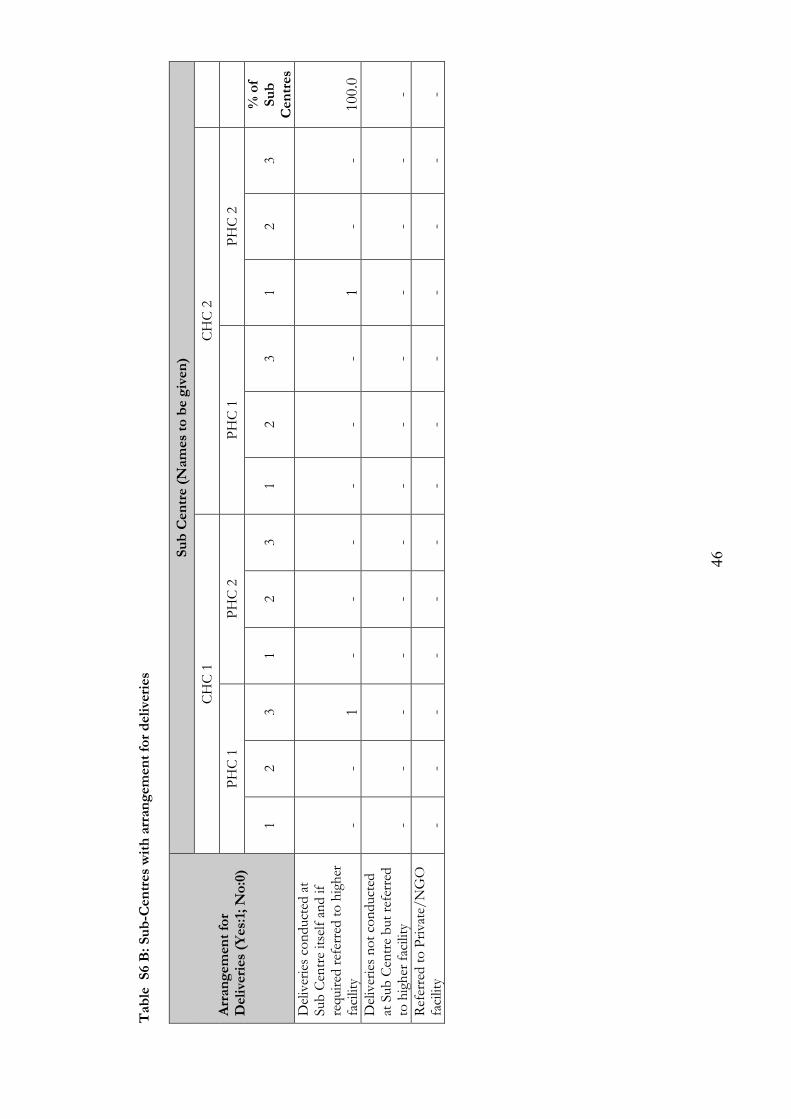
other. Deliveries were conducted at the Sub-centre itself and, if required, were referred to
the higher facility.
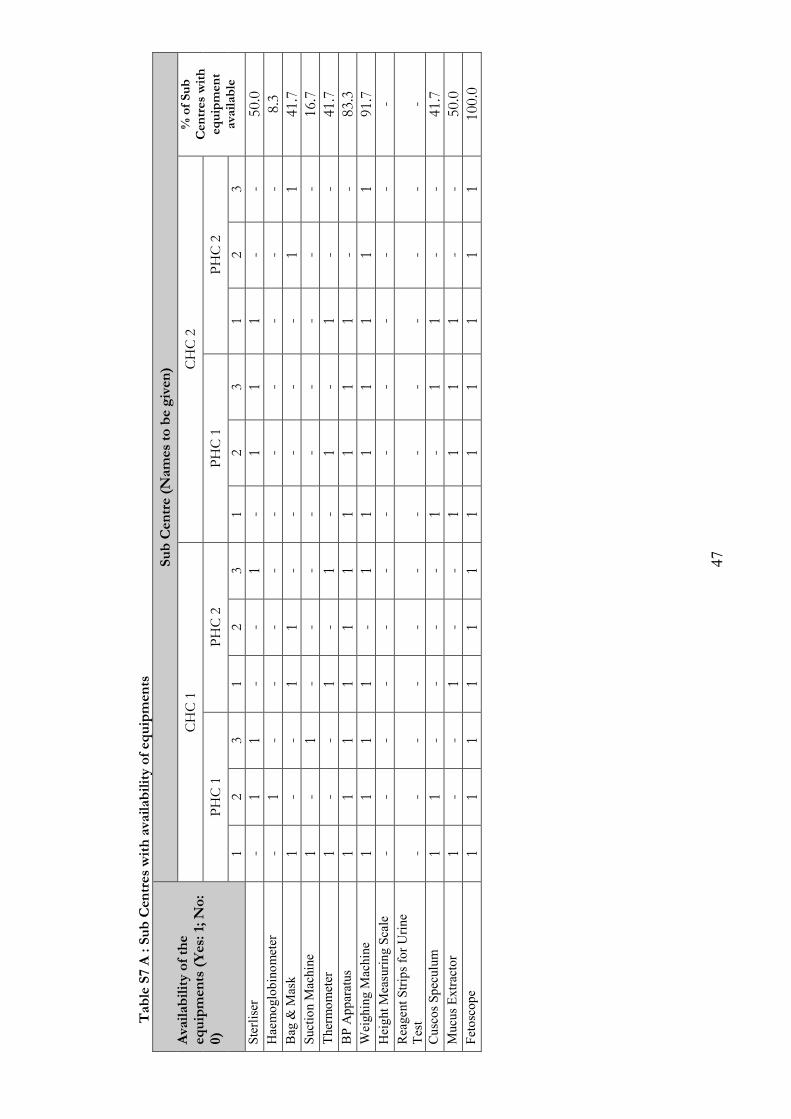
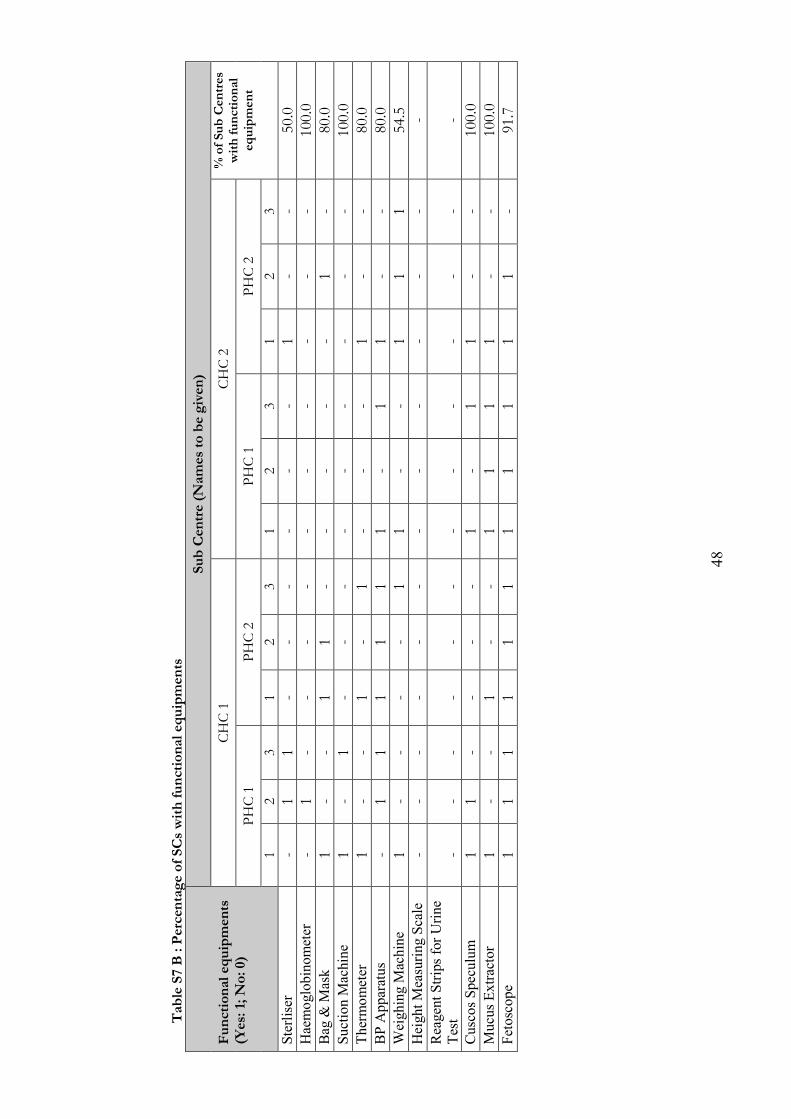
Table S7A and S7B give information on availability of equipments and its functionality.
Fetoscope, weighning machine and BP apparatus were the equipments available in most
of the sub-centres. Sterilizer and mucus extractor were the other equipments available in
50% of the sub-centres visited. Availability of other equipments are poor. Most of the
available equipments were functional, except for sterilizer and weighing machine which
were functional in about 50% of sub-centres where they were available.
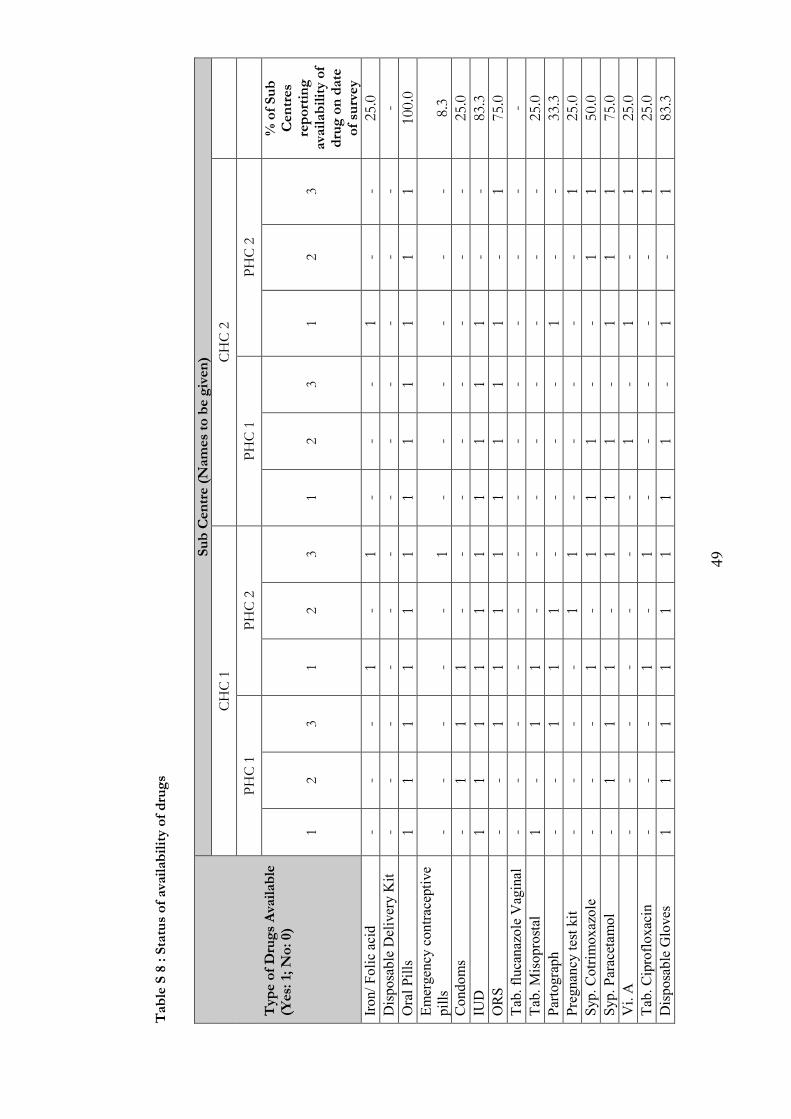
Table S8 describes the availability of drugs. Oral pill was the only drug available in all the
sub-centres. IUD, ORS and paracetamol syrp. were available in 83%, 75% and 75% of
the centres. Disposable gloves were available in 83% of the centres. All other drugs were
available in less than 50% of the centres.
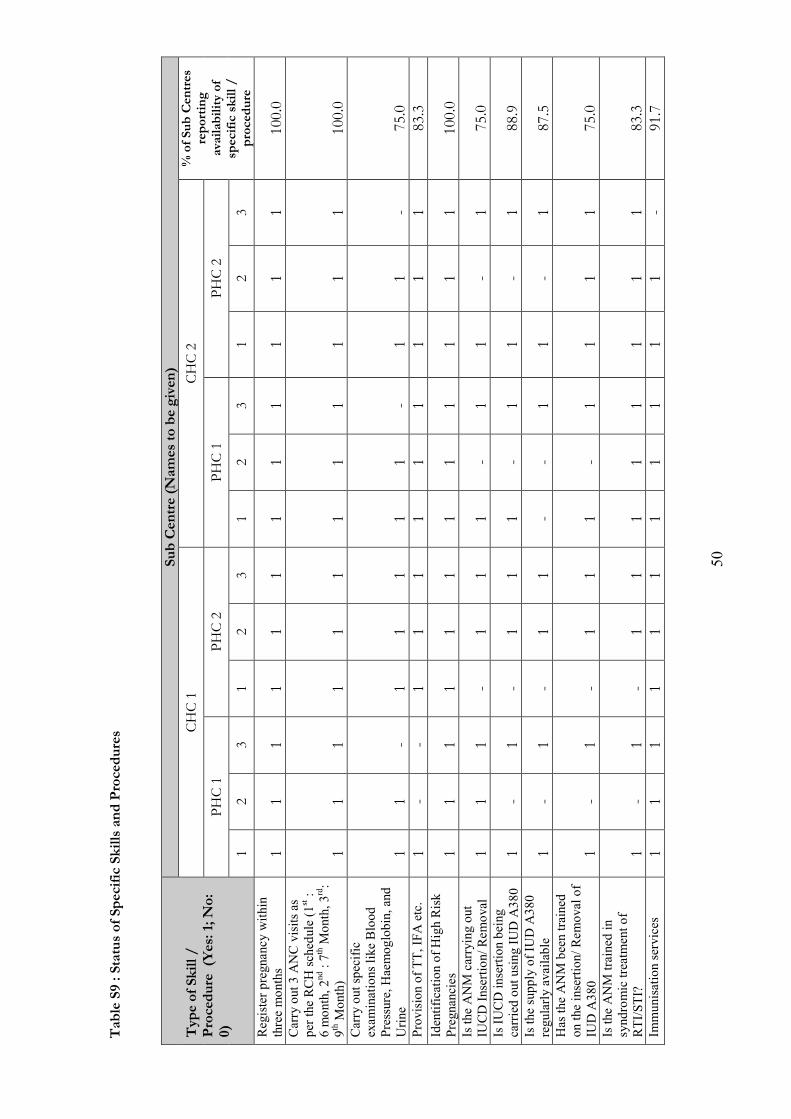
Table S9 is on the type of skills possessed by the female worker. More than 75% of the
workers reported as possessing all the required skills. Carrying out specific examinations
like blood pressure, haemoglobin and urine and IUCD insertion and removal are the
skills need to be developed in about 25% of the health workers.
Table S10 lists the outcome of services delivered at the sub-centre level. On an average,
34 ANCs were registered during the last three months before survey. Out of these 22
were registered in the first trimester itself. Nineteen pregnancies were given 3 ANC visits
as per the RCH schedule. Number of high risk pregnancies detected was four. About 5
pregnancies were referred to the next higher facility. On average of fifteen IUCD
insertions were done during the last 3 months.
40
From Table S11 it may be observed that the record maintenance at the sub-centre level is
good. Except for meeting register (42%), JSY register (75%) and post natal care register
(92%), all the registers were maintained by all the centres.
Tables 12A, 12B and 13 describe awareness and implementation of JSY scheme by the
female health worker. All the health workers were aware of the JSY scheme and the
amount to be given to the beneficiaries. All of them informed that the demand for
institutional deliveries increased after the implementation of the JSY scheme.
The JSY funds were being paid to the beneficiaries by cash (25%) and by cheque (75%).
For 75% of the workers, the time taken to disburse the amount was more than 2 weeks
after birth. About two third of the workers maintained register for recording JSY
expenses.
During the last 3 months the average registration under JSY scheme was 14 cases per
centre. Out of these 13 beneficiaries delivered in a medical institution. The amount
disbursed varied from Rs.1200 to 9,800. Out of the total amount disbursed, major
portion was spent on institutional delivery and the next major expense was on transport
costs.
41
Table S
1 : Sub C
entres
Cove
rage
Cove
rage
of Sub-
Cen
tre
Sub C
entre (N
am
es to b
e given
)
CHC 1
CHC 2
Average
per Sub
Cen
tre
PHC 1
PHC 2
PHC 1
PHC 2
Murukk
ampatty
BujiR
eddipalli
Velan
cheri
Amirthap
uram
Melkaesavaram
pet
S.S.N
agar
Nelharayur
Vayaloor
Nan
dam
bhakkam
Kuttakuppam
Devad
anam
Sathan
kuppam
Number
of villages
covered by
Sub
Cen
tre
7 4
7 4
6 7
5 7
6 10
9
8 Population
coverage
4,95
9 5,68
7 5,71
7 7,32
4 4,23
1 8,09
5 5,85
5 6,02
4 7,81
7 6,71
5 7,97
9 3,47
5 6,15
6.5
Distance
between
PHC and
Sub
Cen
tre
10
5 18
12
1
12
8 24
3
30
18
20
13.4
Tim
e Taken
(In
minutes)
to travel in
public
tran
sport
/ available
mode
from
Farthest
village to
Sub
30
25
30
15
10
15
120
30
10
30
45
60

42
Cen
tre
Sub
Cen
tre to
PHC
30
15
75
30
10
20
30
60
20
60
60
45
Sub
Cen
tre to
CHC
60
45
75
30
60
40
20
30
20
60
20
60
No. o
f ASH
As
working in
the Su
b
Cen
tre
area
- -
- -
- -
- -
- -
- -
43
Table S2: Sub C
entres
Infrastru
cture
Ava
ilability of In
frastru
cture
in Sub
Cen
tres
(Yes
:1; N
o: 0)
Sub C
entre (N
am
es to b
e given
)
CHC 1
CHC 2
% o
f Sub
Cen
tres
having
resp
ective
fa
cility
PHC 1
PHC 2
PHC 1
PHC 2
1
2 3
1 2
3 1
2 3
1 2
3
Functioning
in designated
go
vernmen
t build
ing
1 1
1 1
- -
1 -
1 -
1 1
66.7
IPHS Facility Survey D
one
1 -
- -
- -
- -
- -
- -
8.3
Lab
our Room
- -
1 -
- -
- -
- 1
- -
16.7
Piped
water supply
- -
- -
- -
1 1
1 1
1 -
41.7
Regular electricity supply
1 1
1 1
- 1
1 1
1 1
1 1
91.7
Telep
hone
1 1
1 1
1 1
1 1
1 1
1 1
100.0
Type of sewerage system
Soak pit
Connected to any Sew
erage line
Open Drain
1
1
1
1
1
1
1
1
1
1
1
1
33
.3
8.3
58.3
Wast
e d
isp
osa
l
Buried in a pit
Collected by an agency
Incernation
Thrown in open
1 1
1 1
1 1
1 1
1
1 1
1
75.0
- 16
.7
8.3
44
Table S
3 : Sub C
entres
with A
NM
sta
ying w
ith o
r aw
ay from
SC village by dista
nce
fro
m S
ub C
entre and rea
sons fo
r not staying in S
ub C
entre quarter
Res
iden
tial statu
s of AN
M
(Yes
:1; N
o: 0)
Sub C
entre (N
am
es to b
e given
)
CHC 1
CHC 2
% o
f Sub
Cen
tres
PHC 1
PHC 2
PHC 1
PHC 2
1 2
3 1
2 3
1 2
3 1
2 3
Sub Cen
tre with A
NM quarter
- -
- 1
1 -
- -
1 1
- -
33.3
Sub Cen
tre with A
NM
staying in SC’s quarters
- -
- 1
- -
- -
1 -
- -
50.0
staying within SC’s village
- -
- -
- -
- -
- -
- -
- staying outside SC
’s village
1 1
1 -
1 1
1 1
- 1
1 1
100.0
Reason for ANM not staying on
SC quarter:
Quality of quarter
- -
- -
- -
- -
- -
- -
- Fam
ily related
reason
- -
- -
- -
- -
- -
- -
- Secu
rity reason
- -
- -
- -
- -
- -
- -
- Table S
4 : Sub C
entres
with S
taff in P
osition
Ava
ilability of Sta
ff
(Yes
: 1; N
o: 0)
Sub C
entre (N
am
es to b
e given
)
CHC 1
CHC 2
% o
f Sub
Cen
tres
with
spec
ific sta
ff
ava
ilable
PHC 1
PHC 2
PHC 1
PHC 2
1 2
3 1
2 3
1 2
3 1
2 3
Health W
orker M
ale in
position
- -
- -
- -
- -
- -
- -
- Health W
orker Fem
ale in
position
1 1
1 1
1 1
1 1
1 1
1 1
100.0
Additional A
NM
contractual
- -
- -
- -
- -
- -
- -
-
45
Table S
5: A
vailability of Labour Room
in S
ub C
entre
Labour Room
(Y
es: 1; N
o: 0)
Sub C
entre (N
am
es to b
e given
)
CHC 1
CHC 2
% o
f Sub
Cen
tres
PHC 1
PHC 2
PHC 1
PHC 2
1 2
3 1
2 3
1 2
3 1
2 3
Lab
our Room
curren
tly in use
- -
1 -
- 1
1 -
- 1
- -
16.7
Reasons for not
using Lab
our Room
ANM not staying
- -
- -
- -
- -
- -
- -
- Poor co
ndition/no
power/electric
supply
- -
- -
- -
- -
- -
- -
- Other
- -
- -
- -
- -
- -
- -
- Table S6 A: N
um
ber
of deliver
ies per
form
ed d
uring 200
7-20
08
Sub C
entre (N
am
es to b
e given
)
CHC 1
CHC 2
Ave
rage
deliver
ies
conduct
ed
per
Sub
Cen
tre
PHC 1
PHC 2
PHC 1
PHC 2
1
2 3
1 2
3 1
2 3
1 2
3
Total d
eliveries co
nducted
-
- 6
- -
- -
- -
19
- -
13
46
Table S6 B: Sub-C
entres
with arran
gem
ent fo
r deliver
ies
Arrangem
ent fo
r D
eliver
ies (Y
es:1; N
o:0)
Sub C
entre (N
am
es to b
e given
)
CHC 1
CHC 2
PHC 1
PHC 2
PHC 1
PHC 2
1 2
3 1
2 3
1 2
3 1
2 3
% o
f Sub
Cen
tres
Deliveries co
nducted
at
Sub Cen
tre itself and if
required
referred to higher
facility
- -
1 -
- -
- -
- 1
- -
100.0
Deliveries not co
nducted
at Sub Cen
tre but referred
to higher facility
- -
- -
- -
- -
- -
- -
- Referred to Private/NGO
facility
- -
- -
- -
- -
- -
- -
-
47
Table S
7 A : Sub C
entres
with ava
ilability of eq
uip
men
ts
Ava
ilability of th
e eq
uip
men
ts (Yes
: 1; N
o:
0)
Sub C
entre (N
am
es to b
e given
)
CHC 1
CHC 2
% o
f Sub
Cen
tres
with
equip
men
t ava
ilable
PHC 1
PHC 2
PHC 1
PHC 2
1 2
3 1
2 3
1 2
3 1
2 3
Sterliser
- 1
1 -
- 1
- 1
1 1
- -
50.0
Haemoglobinometer
- 1
- -
- -
- -
- -
- -
8.3
Bag & M
ask
1 -
- 1
1 -
- -
- -
1 1
41.7
Suction M
achine
1 -
1 -
- -
- -
- -
- -
16.7
Thermometer
1 -
- 1
- 1
- 1
- 1
- -
41.7
BP Apparatus
1 1
1 1
1 1
1 1
1 1
- -
83.3
Weighing M
achine
1 1
1 1
- 1
1 1
1 1
1 1
91.7
Height Measuring Scale
- -
- -
- -
- -
- -
- -
- Reagent Strips for Urine
Test
- -
- -
- -
- -
- -
- -
- Cuscos Speculum
1 1
- -
- -
1 -
1 1
- -
41.7
Mucus Extractor
1 -
- 1
- -
1 1
1 1
- -
50.0
Fetoscope
1 1
1 1
1 1
1 1
1 1
1 1
100.0
48
Table S
7 B : P
erce
nta
ge of SCs with funct
ional eq
uip
men
ts
Funct
ional eq
uip
men
ts
(Yes
: 1; N
o: 0)
Sub C
entre (N
am
es to b
e given
)
CHC 1
CHC 2
% o
f Sub C
entres
with funct
ional
equip
men
t
PHC 1
PHC 2
PHC 1
PHC 2
1 2
3 1
2 3
1 2
3 1
2 3
Sterliser
- 1
1 -
- -
- -
- 1
- -
50.0
Haemoglobinometer
- 1
- -
- -
- -
- -
- -
100.0
Bag & M
ask
1 -
- 1
1 -
- -
- -
1 -
80.0
Suction M
achine
1 -
1 -
- -
- -
- -
- -
100.0
Thermometer
1 -
- 1
- 1
- -
- 1
- -
80.0
BP Apparatus
- 1
1 1
1 1
1 -
1 1
- -
80.0
Weighing M
achine
1 -
- -
- 1
1 -
- 1
1 1
54.5
Height Measuring Scale
- -
- -
- -
- -
- -
- -
- Reagent Strips for Urine
Test
- -
- -
- -
- -
- -
- -
- Cuscos Speculum
1 1
- -
- -
1 -
1 1
- -
100.0
Mucus Extractor
1 -
- 1
- -
1 1
1 1
- -
100.0
Fetoscope
1 1
1 1
1 1
1 1
1 1
1 -
91.7
49
Table S
8 : Sta
tus of ava
ilab
ility of dru
gs
Typ
e of D
rugs Ava
ilable
(Yes
: 1; N
o: 0)
Sub C
entre (N
am
es to b
e given
)
CHC 1
CHC 2
PHC 1
PHC 2
PHC 1
PHC 2
1 2
3 1
2 3
1 2
3 1
2 3
% o
f Sub
Cen
tres
re
portin
g
ava
ilability of
dru
g o
n d
ate
of su
rvey
Iron/ Folic acid
- -
- 1
- 1
- -
- 1
- -
25.0
Disposable Delivery Kit
- -
- -
- -
- -
- -
- -
- Oral Pills
1 1
1 1
1 1
1 1
1 1
1 1
100.0
Emergency contraceptive
pills
- -
- -
- 1
- -
- -
- -
8.3
Condoms
- 1
1 1
- -
- -
- -
- -
25.0
IUD
1 1
1 1
1 1
1 1
1 1
- -
83.3
ORS
- -
1 1
1 1
1 1
1 1
- 1
75.0
Tab. flucanazole Vaginal
- -
- -
- -
- -
- -
- -
- Tab. Misoprostal
1 -
1 1
- -
- -
- -
- -
25.0
Partograph
- -
1 1
1 -
- -
- 1
- -
33.3
Pregnancy test kit
- -
- -
1 1
- -
- -
- 1
25.0
Syp. Cotrimoxazole
- -
- 1
- 1
1 1
- -
1 1
50.0
Syp. Paracetam
ol
- 1
1 1
- 1
1 1
- 1
1 1
75.0
Vi. A
- -
- -
- -
- 1
- 1
- 1
25.0
Tab. Ciprofloxacin
- -
- 1
- 1
- -
- -
- 1
25.0
Disposable Gloves
1 1
1 1
1 1
1 1
- 1
- 1
83.3
50
Table S
9 : Sta
tus of Spec
ific S
kills and P
roce
dure
s
Typ
e of Skill /
Pro
cedure
(Y
es: 1; N
o:
0)
Sub C
entre (N
am
es to b
e given
)
CHC 1
CHC 2
% o
f Sub C
entres
re
portin
g
ava
ilability of
spec
ific skill /
pro
cedure
PHC 1
PHC 2
PHC 1
PHC 2
1 2
3 1
2 3
1 2
3 1
2 3
Register pregnancy within
three months
1 1
1 1
1 1
1 1
1 1
1 1
100.0
Carry out 3 ANC visits as
per the RCH schedule (1st :
6 month, 2nd : 7
th M
onth, 3rd:
9th M
onth)
1 1
1 1
1 1
1 1
1 1
1 1
100.0
Carry out specific
examinations like Blood
Pressure, Haemoglobin, and
Urine
1 1
- 1
1 1
1 1
- 1
1 -
75.0
Provision of TT, IFA etc.
1 -
- 1
1 1
1 1
1 1
1 1
83.3
Identification of High Risk
Pregnancies
1 1
1 1
1 1
1 1
1 1
1 1
100.0
Is the ANM carrying out
IUCD Insertion/ Removal
1 1
1 -
1 1
1 -
1 1
- 1
75.0
Is IUCD insertion being
carried out using IUD A380
1 -
1 -
1 1
1 -
1 1
- 1
88.9
Is the supply of IUD A380
regularly available
1 -
1 -
1 1
- -
1 1
- 1
87.5
Has the ANM been trained
on the insertion/ Removal of
IUD A380
1 -
1 -
1 1
1 -
1 1
1 1
75.0
Is the ANM trained in
syndromic treatment of
RTI/STI?
1
- 1
- 1
1 1
1 1
1 1
1 83
.3
Immunisation services
1 1
1 1
1 1
1 1
1 1
1 -
91.7
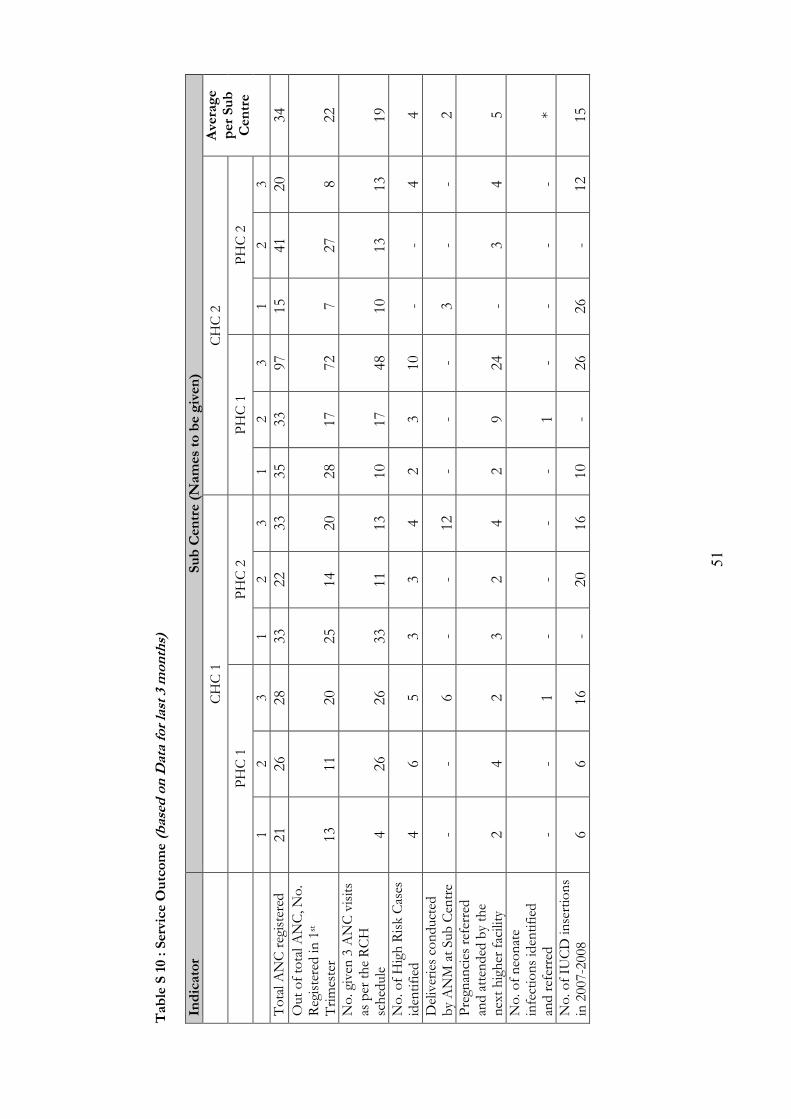
51
Table S
10 : Ser
vice
Outc
om
e (b
ased
on D
ata fo
r last 3 m
onth
s)
In
dicato
r Sub C
entre (N
am
es to b
e given
)
CHC 1
CHC 2
Ave
rage
per
Sub
Cen
tre
PHC 1
PHC 2
PHC 1
PHC 2
1
2 3
1 2
3 1
2 3
1 2
3 Total A
NC registered
21
26
28
33
22
33
35
33
97
15
41
20
34
Out of total A
NC, N
o.
Registered in
1st
Trimester
13
11
20
25
14
20
28
17
72
7 27
8
22
No. g
iven
3 A
NC visits
as per the RCH
sched
ule
4 26
26
33
11
13
10
17
48
10
13
13
19
No. o
f High Risk Cases
iden
tified
4
6 5
3 3
4 2
3 10
-
- 4
4 Deliveries co
nducted
by ANM at Su
b Cen
tre
- -
6 -
- 12
-
- -
3 -
- 2
Pregn
ancies referred
and atten
ded
by the
next higher facility
2 4
2 3
2 4
2 9
24
- 3
4 5
No. o
f neo
nate
infections iden
tified
an
d referred
- -
1 -
- -
- 1
- -
- -
* No. o
f IU
CD in
sertions
in 200
7-20
08
6 6
16
- 20
16
10
-
26
26
- 12
15
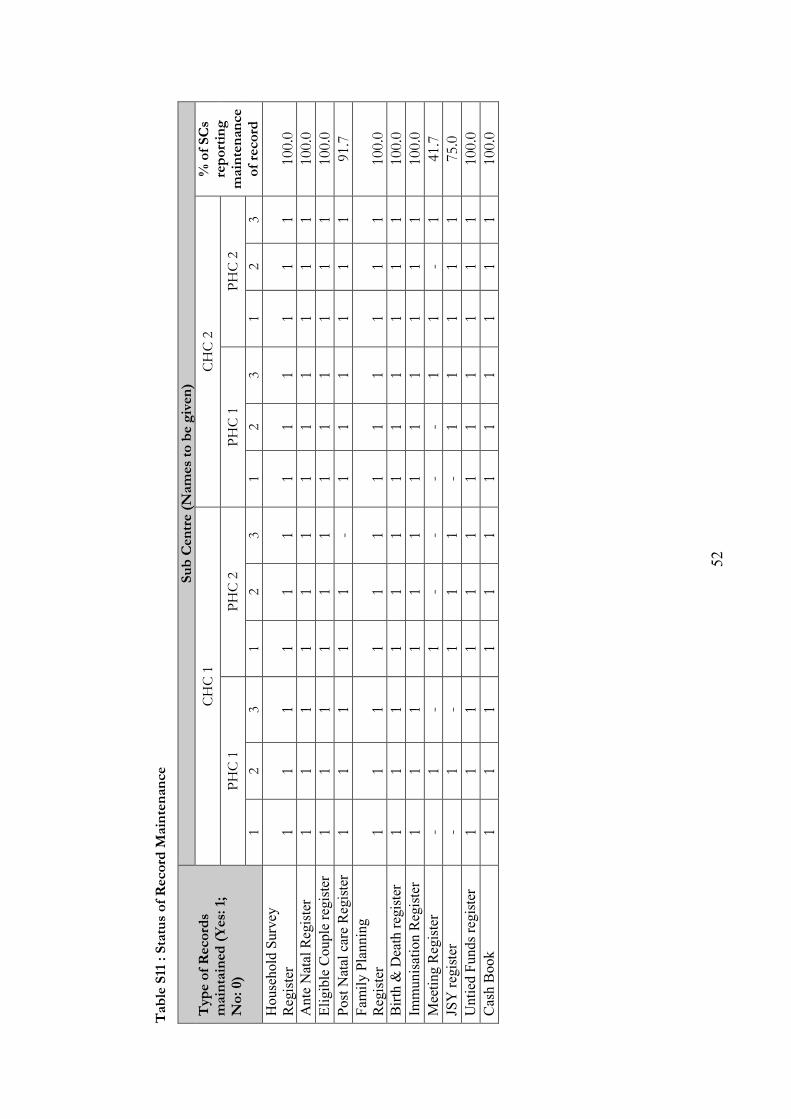
52
Table S
11 : S
tatu
s of Rec
ord
Main
tenan
ce
Typ
e of Rec
ord
s m
ain
tain
ed (Yes
: 1;
No: 0)
Sub C
entre (N
am
es to b
e given
)
CHC 1
CHC 2
% o
f SCs
reportin
g
main
tenan
ce
of re
cord
PHC 1
PHC 2
PHC 1
PHC 2
1 2
3 1
2 3
1 2
3 1
2 3
Household Survey
Register
1 1
1 1
1 1
1 1
1 1
1 1
100.0
Ante Natal Register
1 1
1 1
1 1
1 1
1 1
1 1
100.0
Eligible Couple register
1 1
1 1
1 1
1 1
1 1
1 1
100.0
Post Natal care Register
1 1
1 1
1 -
1 1
1 1
1 1
91.7
Fam
ily Planning
Register
1 1
1 1
1 1
1 1
1 1
1 1
100.0
Birth & Death register
1 1
1 1
1 1
1 1
1 1
1 1
100.0
Immunisation Register
1 1
1 1
1 1
1 1
1 1
1 1
100.0
Meeting Register
- 1
- 1
- -
- -
1 1
- 1
41.7
JSY register
- 1
- 1
1 1
- 1
1 1
1 1
75.0
Untied Funds register
1 1
1 1
1 1
1 1
1 1
1 1
100.0
Cash Book
1 1
1 1
1 1
1 1
1 1
1 1
100.0
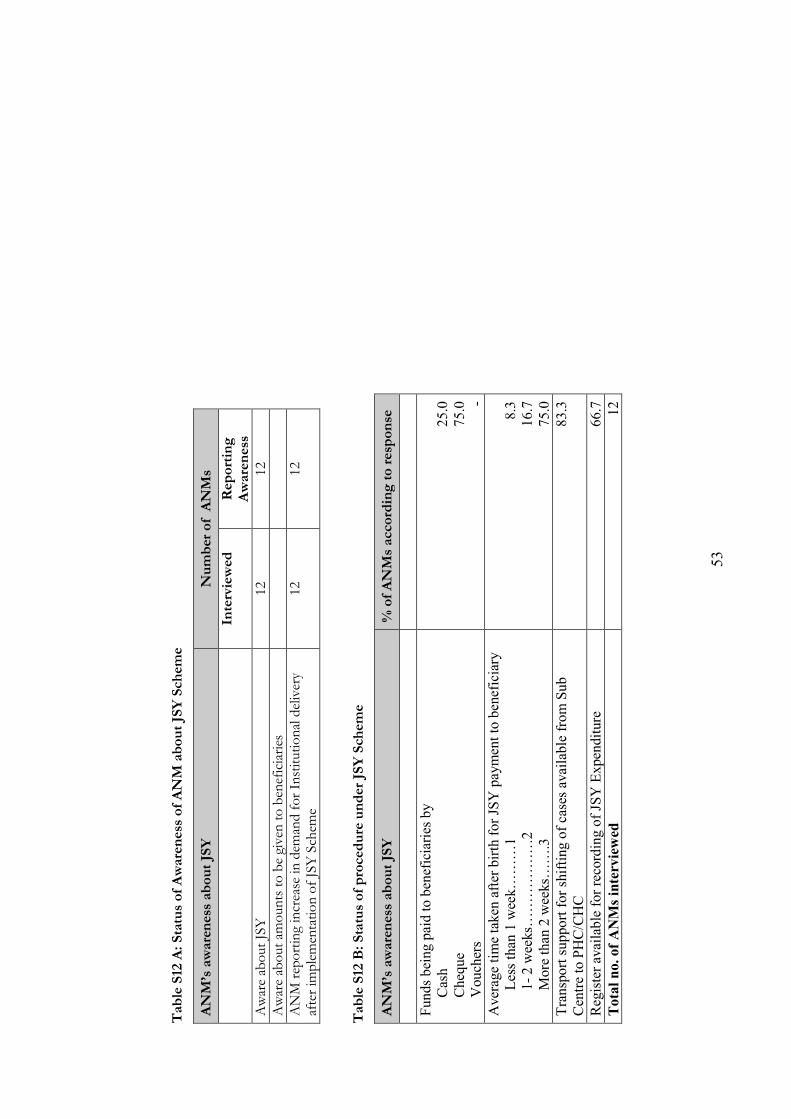
53
Table S
12 A
: Sta
tus of Aware
nes
s of AN
M about JS
Y S
chem
e
Table S
12 B
: Sta
tus of pro
cedure
under
JSY S
chem
e
AN
M’s aware
nes
s about JS
Y
Num
ber
of A
NM
s
In
terv
iewed
Rep
ortin
g
Aware
nes
s Aware ab
out JSY
12
12
Aware ab
out am
ounts to be given to ben
eficiaries
ANM rep
orting increase in
dem
and for Institutional delivery
after im
plemen
tation of JSY Sch
eme
12
12
AN
M’s aware
nes
s about JS
Y
% o
f AN
Ms acc
ord
ing to res
ponse
Funds being paid to beneficiaries by
Cash
Cheque
Vouchers
25.0
75.0 -
Average time taken after birth for JSY payment to beneficiary
Less than 1 week………1
1- 2 weeks…
……………2
M
ore than 2 weeks…
….3
8.3
16.7
75.0
Transport support for shifting of cases available from Sub
Centre to PHC/CHC
83.3
Register available for recording of JSY Expenditure
66.7
Tota
l n
o.
of
A&
Ms
inte
rvie
wed
12
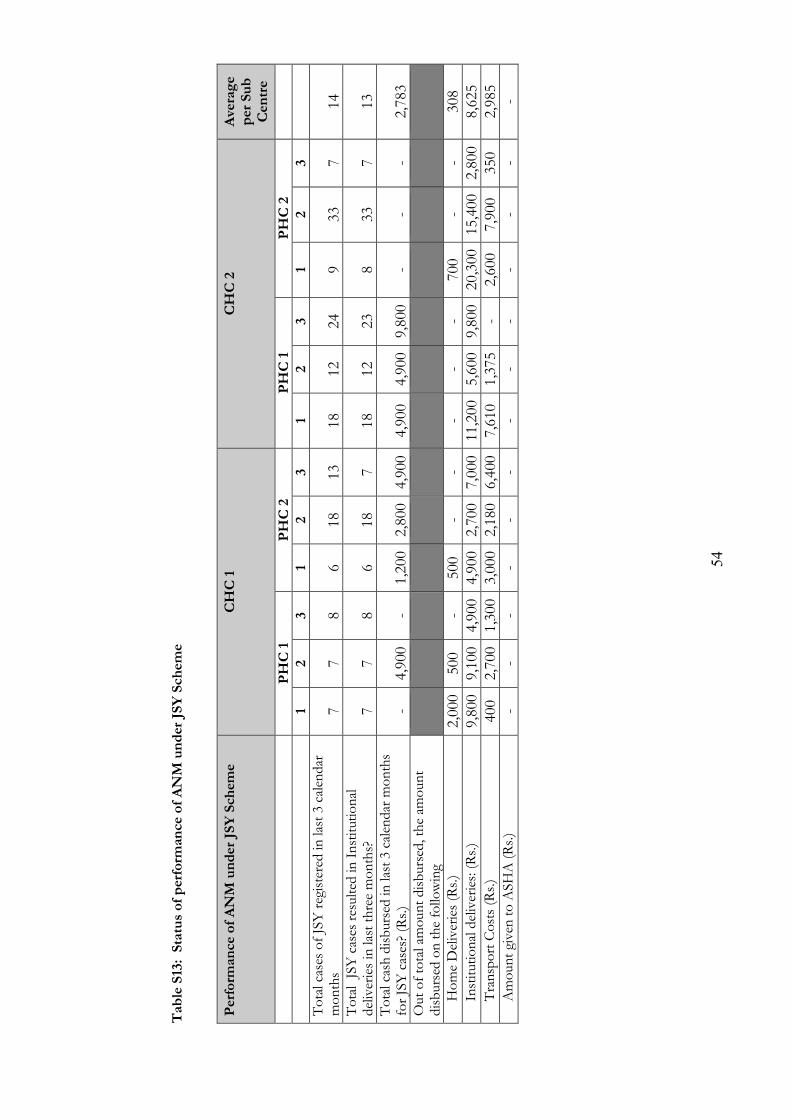
54
Table S
13: Sta
tus of per
form
ance
of AN
M u
nder
JSY S
chem
e
Per
form
ance
of AN
M u
nder
JSY Sch
eme
CH
C 1
CH
C 2
Ave
rage
per
Sub
Cen
tre
PH
C 1
PH
C 2
PH
C 1
PH
C 2
1 2
3 1
2 3
1 2
3 1
2 3
Total cases of JSY registered in
last 3 calen
dar
months
7 7
8 6
18
13
18
12
24
9 33
7
14
Total JSY cases resulted
in Institutional
deliveries in last three months?
7 7
8 6
18
7 18
12
23
8
33
7 13
Total cash disbursed in
last 3 calen
dar m
onths
for JSY cases? (R
s.)
- 4,90
0 -
1,20
0 2,80
0 4,90
0 4,90
0 4,90
0 9,80
0 -
- -
2,78
3 Out of total amount disbursed, the am
ount
disbursed
on the follo
wing
Home Deliveries (R
s.)
2,00
0 50
0 -
500
- -
- -
- 70
0 -
- 30
8 Institutional deliveries: (Rs.)
9,80
0 9,10
0 4,90
0 4,90
0 2,70
0 7,00
0 11
,200
5,60
0 9,80
0 20
,300
15
,400
2,80
0 8,62
5 Transport Costs (R
s.)
400
2,70
0 1,30
0 3,00
0 2,18
0 6,40
0 7,61
0 1,37
5 -
2,60
0 7,90
0 35
0 2,98
5 Amount given to A
SHA (Rs.)
- -
- -
- -
- -
- -
- -
-
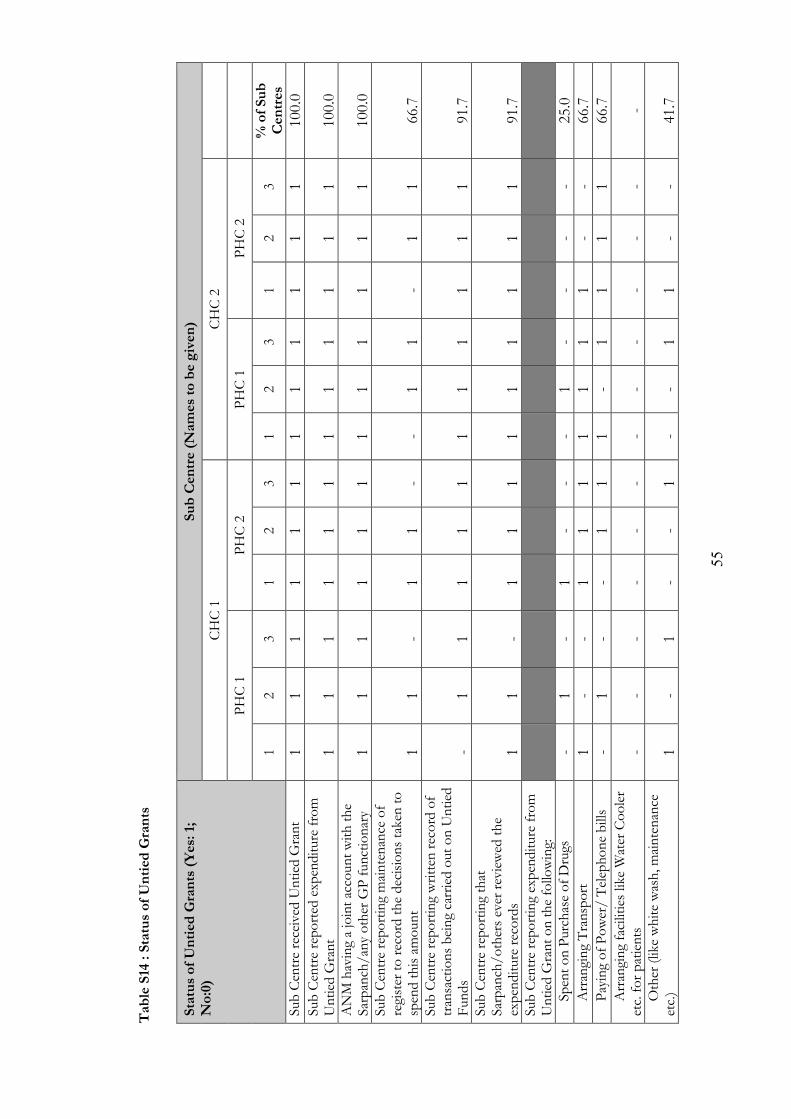
55
Table S
14 : Sta
tus of Untied
Gra
nts
Sta
tus of Untied
Gra
nts (Yes
: 1;
No:0)
Sub C
entre (N
am
es to b
e given
)
CHC 1
CHC 2
PHC 1
PHC 2
PHC 1
PHC 2
1 2
3 1
2 3
1 2
3 1
2 3
% o
f Sub
Cen
tres
Su
b Cen
tre received
Untied
Grant
1 1
1 1
1 1
1 1
1 1
1 1
100.0
Sub Cen
tre reported
exp
enditure from
Untied
Grant
1 1
1 1
1 1
1 1
1 1
1 1
100.0
ANM having a joint acco
unt with the
Sarpan
ch/an
y other G
P functionary
1 1
1 1
1 1
1 1
1 1
1 1
100.0
Sub Cen
tre reporting maintenan
ce of
register to record the decisions taken to
spen
d this amount
1 1
- 1
1 -
- 1
1 -
1 1
66.7
Sub Cen
tre reporting written
record of
tran
sactions being carried out on U
ntied
Funds
- 1
1 1
1 1
1 1
1 1
1 1
91.7
Sub Cen
tre reporting that
Sarpan
ch/others ever reviewed
the
expen
diture records
1 1
- 1
1 1
1 1
1 1
1 1
91.7
Sub Cen
tre reporting expen
diture from
Untied
Grant on the follo
wing:
Sp
ent on Purch
ase of Drugs
- 1
- 1
- -
- 1
- -
- -
25.0
Arran
ging Transport
1 -
- 1
1 1
1 1
1 1
- -
66.7
Paying of Power/ Telep
hone bills
- 1
- -
1 1
1 -
1 1
1 1
66.7
Arran
ging facilities lik
e Water Cooler
etc. for patients
- -
- -
- -
- -
- -
- -
- Other (lik
e white wash, m
aintenan
ce
etc.)
1 -
1 -
- 1
- -
1 1
- -
41.7
56
Chapter 6. Household Characteristics (Based on Household Schedule)
INFORMATION FROM HOUSEHOLDS Characteristics of the respondents Majority (54%) of the respondents were young, below 30 years of age. Only about eight
per cent of the respondents were above 50 years of age. Also, 88% of the respondents
were female. Educational status wise, 31% of respondents were illiterate and 53%
completed at least 5 years of schooling. Ninety one per cent of the respondents were
currently married.
Characteristics of the household Table H.2 describes the characteristics of the households surveyed. Thirty eight per cent
and sixty one per cent of the households belonged respectively to SC/ST and OBC
categories. Majority of the household (97%) followed Hinduism, 2% Christianity and
0.6% Islam.
Out of the 1200 households interviewed, twelve per cent were in the below poverty line
(BPL) status and 29% were in the low standard of living index (SLI) category. Seventeen
per cent of the households possessed own agricultural land or cultivated agricultural land.
Among the amenities, 45% of the households were living in pucca house, 95% had
electricity, 39% used LPG or biogas for cooking, 44% had a mobile phone and 80% had
a black and white or color television. At the same time toilet facility and piped water
supply was available only in 18% and 26% of the households respectively.
Waste disposal Among the interviewed households, ninety three per cent threw the waste in the open.
Rest of the households either buried the waste in a pit or burnt it. Water stagnated
around the house of 31% of the households. Out of these, mosquito breeding was
noticed in 98% cases.(Table H3)
57
System of medicine followed All the households interviewed reported allopathic system of medicine as the preferred
system. The other system popular among the households is ‘Siddha’ system (3%) of
medicine
There is very little variation in these indicators between the households in the sub-centre
village and the other village.
Health facilities Almost all households heard about ANM (VHN), whereas only 7.5% of households in
the sub-centre village and 1.5% of households in the other village heard about male
health worker. Visits by the health worker to the household is few, as about one fourth
of the households only reported that a health worker visited them during the last one
month before the survey. However, more than 56% of the households reported that a
health worker was available when needed. This percentage was 63 for the sub centre
village and 50 for the other village.
When asked about the type of health facility available when required, 38% replied that
private clinic/NGO facility was available. The percentage of households reporting PHC
as the available health facility was 29, 23% in sub-centre villages and 35% in other
villages. However, more than 50% of the households reported ‘others’ as the available
health facility.
For treating serious patients, district/sub-district hospital is depended on by majority of
the households (73%). The next depended place is RMP or private clinic. PHC/CHC as
a place for treating serious patients was reported by less than 20% of the households.
The reported transport used for taking serious patients to the place of treatment was
private vehicle my more than 80% of the households..
NRHM Three fourth of the households have heard about NRHM. Community members (21%)
and Radio/television (15%) are the reported sources of information. More than 75% of
the households reported ‘others’ as the source of information.
58
Presence of village health and sanitation committee is not widely known, only 7% of the
households reported the existence of this committee. Also, only 2% of the households
reported organization of village health nutrition day. More than 90% of the households
were aware of JSY scheme. The major source of informataion was ANM/VHN (68%)
and Anganwad centre (21%).
JSY beneficiaries The number of JSY beneficiaries interviewed was 229. Majority of the beneficiaries were
in the age group of 20-24 years (59%), with parity 2 (62%), OBC (49%)/SC (44%) and
Hindus (99%). In standard of Living category the beneficiaries were equally distributed.
However, only 18% of the beneficiaries were belonging to BPL household.. For 95% of
the beneficiaries the place of last delivery was a health institution.
Registration for JSY The JSY scheme was introduced in Tamil Nadu in the year 2006. The beneficiaries
reported that they were registered when they were pregnant (90%), most of them (89%)
were registered when they were at the stage of 5th month of pregnancy or later. Female
health worker (VHN) was the person with whom got registered (90%). Anganwadi
centre (33%)m Sub-centre (20%) and PHC (23%) are the places where the beneficiaries
got registered for JSY benefit. In Tamil Nadu JSY cards have so far not been issued.
Place of delivery More than 80% of the respondents reported that delivery took place in a government
institution. District/sub-district hospital was the place for majority (54%) respondents.
CHC/PHC accounted for 26% of the deliveries. Eight per cent of the deliveries occurred
at home.
Better care for both mother and child at the institution was the main reason (85%) given
for opting institutional delivery.
Transport to reach health institution Fifteen per cent of the beneficiaries received referral sliips from health personnel to
access delivery services. Average distance traveled to reach the health institution was 21
kms. The mode of travel was private vehicle (71%). The transportation was arranged
59
mostly by others (95%). Beneficiary had money to pay for the transport services (86%).
Average amount spent on transport was Rs.4, whereas average amount received for
transportation under JSY scheme was Rs.191. Only relatives accompanied the beneficiary
to the health institution in majority (97%) of cases.
Facilities at the health institution Average waiting time at the health facility was 16.5 minutes. More than two third of the
beneficiaries (75%) reported normal delivery and 20% caesarian section. Average number
of days spent in the institution before discharge was 5. About 40% of the beneficiaries
had to pay for services at the health centre and the average amount paid was Rs.2787.
Most of the beneficiaries (90%) were satisfied with the services available at the health
facility.
About eight per cent of the beneficiaries reported home delivery and they quoted
convenience and transport not available as reasons for opting home delivery.
Cash incentive Forty nine per cent of the beneficiaries received cash incentives. Average amount
received was Rs.688 and almost all of them received it at one go, much later after the
delivery. Female health worker (72%) and the doctor (22%) were the persons delivered
the benefit. The benefit was received by the beneficiary mainly at PHC (59%) or CHC
(19%). Only five per cent of the beneficiaries reported having faced difficulty in receiving
the incentive. The main difficulty faced was the amount was paid by cheque or were
asked to pay bribe.
Utilization of government health facility in last 6 months About 73% of the households interviewed utilized a government health facility during
the last 6 months. The beneficiaries were in the age group of 20-40 and mostly female
(82%). The literacy level of the beneficiary was fairly distributed with more beneficiaries
from the illiterate category (37%). Ninety eight per cent of the beneficiaries were
currently married. Sixty two per cent belonged to OBC category and one third to SC
category. Majority (97%) of the beneficiaries was Hindu and about twelve per cent
belonged to BPL category.
60
Client satisfaction Fifty nine per cent and 27% of the clients availed services at district/sub-district and
PHC respectively. Seventy per cent of those visited went to the facility to treat minor
ailments. Most of them (82%) reported staff behaviour as courteous. Seventy seven per
cent said their complaints were listened. Ninety one per cent said women patients treated
with privacy and dignity. Seventy seven per cent said patient with chronic illness get
medicines and 17% were not aware of this. Whether the doctor was doing private
practice either during or after hospital hour was not known to 55% of the clients and
38% per cent reported as not practicing. Majority of the clients were satisfied with the
overall services of the government health facility (68%) and with the behaviour of the
staff (64%).
Ninety eight per cent of the clients said user fees was not charged by the government
facility.
Except measles (18%), no major outbreak of diseases like malaria, gasteroenteritis,
jaundice or other diseases occurred in the visited places.
Knowledge on action to be taken for selected diseases The percentage of respondents not aware of prevention methods of diarrhoea was 15%.
Among the knowledge use of safe food and water (75%) and hand washing (41%) were
high. For the question on action required to be taken if a family member has high fever,
93% said they should be taken to the nearest government health facility. About 12% said
the blood should be tested for malaria. Only 13% said home remedies should be tried.
On the question on action required when a family member has persistent cough for more
than two weeks, majority (93%) of the respondents said he/she should be taken to the
government health facility. About 8% said sputum should be tested. To treat persons
with loose motions lasting for more than 24 hours, 43% suggested starting of ORS.
About 29% suggested home remedies. If the child in the family has cough or breathing
problem, 72% of respondents would take the child to the government health facility and
10% would try home remedies.
Awareness about spacing Awareness about the family planning was there with 99% of the respondents. The ideal
gap suggested by the respondents between the 1st and 2nd child was 3 or more years
61
(60%) and 2 years (37%). About 13% of the respondents were not aware of the methods
available for spacing. Among the spacing methods IUD (65%), Oral Pills (53%) and
condom (34%) were the known methods.
Awareness about HIV/AIDS
Ninety three per cent of the respondents have heard about HIV/AIDS. Among the
mode of transmission, unsafe sexual contact (85%), sharing of needles/syringes (67%)
and blood transfusion (43%) were known modes. The major source of information was
television (84%). Among the respondents who have heard about HIV/AIDS only 47%
were aware of the nearby counseling centres (ICTC). Among those aware of the
counseling centre 49% mentioned that it was located at sub-district hospital, 20% at
CHC and a very low percentage (7%) only mentioned it is located in PHC.
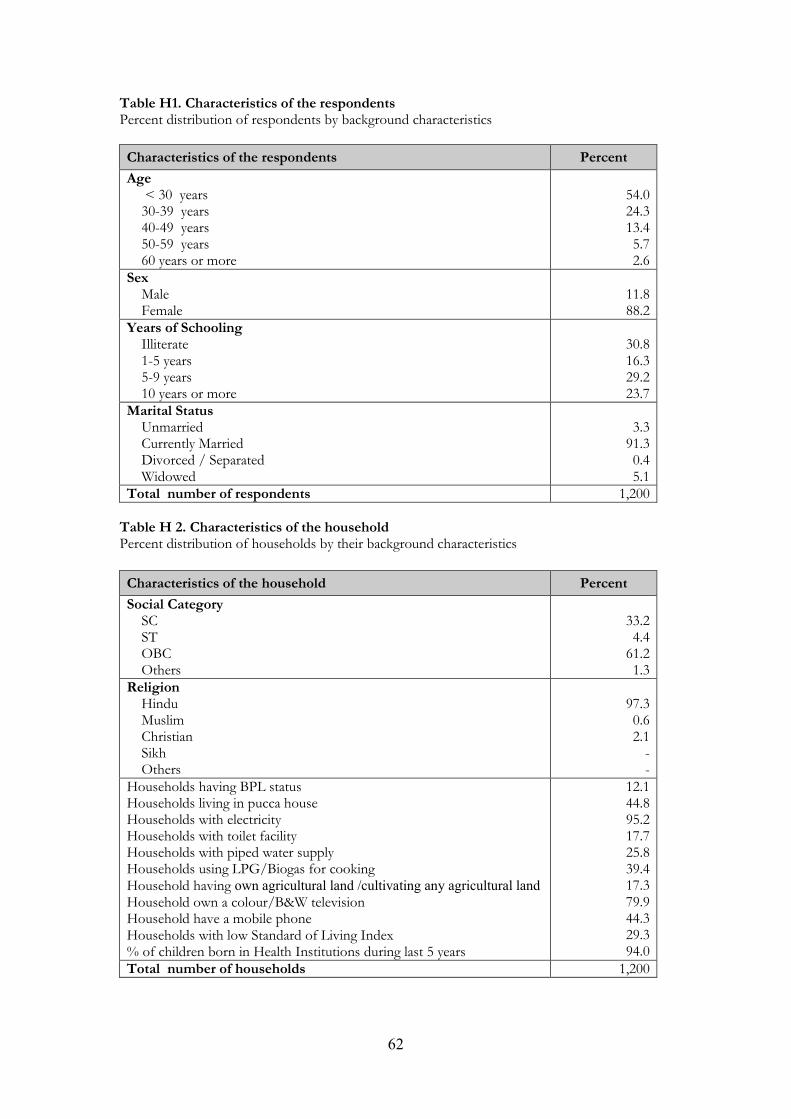
62
Table H1. Characteristics of the respondents Percent distribution of respondents by background characteristics
Characteristics of the respondents Percent
Age < 30 years 30-39 years 40-49 years 50-59 years 60 years or more
54.0 24.3 13.4 5.7 2.6
Sex Male Female
11.8 88.2
Years of Schooling Illiterate 1-5 years 5-9 years 10 years or more
30.8 16.3 29.2 23.7
Marital Status Unmarried Currently Married Divorced / Separated Widowed
3.3 91.3 0.4 5.1
Total number of respondents 1,200 Table H 2. Characteristics of the household Percent distribution of households by their background characteristics
Characteristics of the household Percent
Social Category SC ST OBC Others
33.2 4.4
61.2 1.3
Religion Hindu Muslim Christian Sikh Others
97.3 0.6 2.1 - -
Households having BPL status Households living in pucca house Households with electricity Households with toilet facility Households with piped water supply Households using LPG/Biogas for cooking Household having own agricultural land /cultivating any agricultural land Household own a colour/B&W television Household have a mobile phone Households with low Standard of Living Index % of children born in Health Institutions during last 5 years
12.1 44.8 95.2 17.7 25.8 39.4 17.3 79.9 44.3 29.3 94.0
Total number of households 1,200
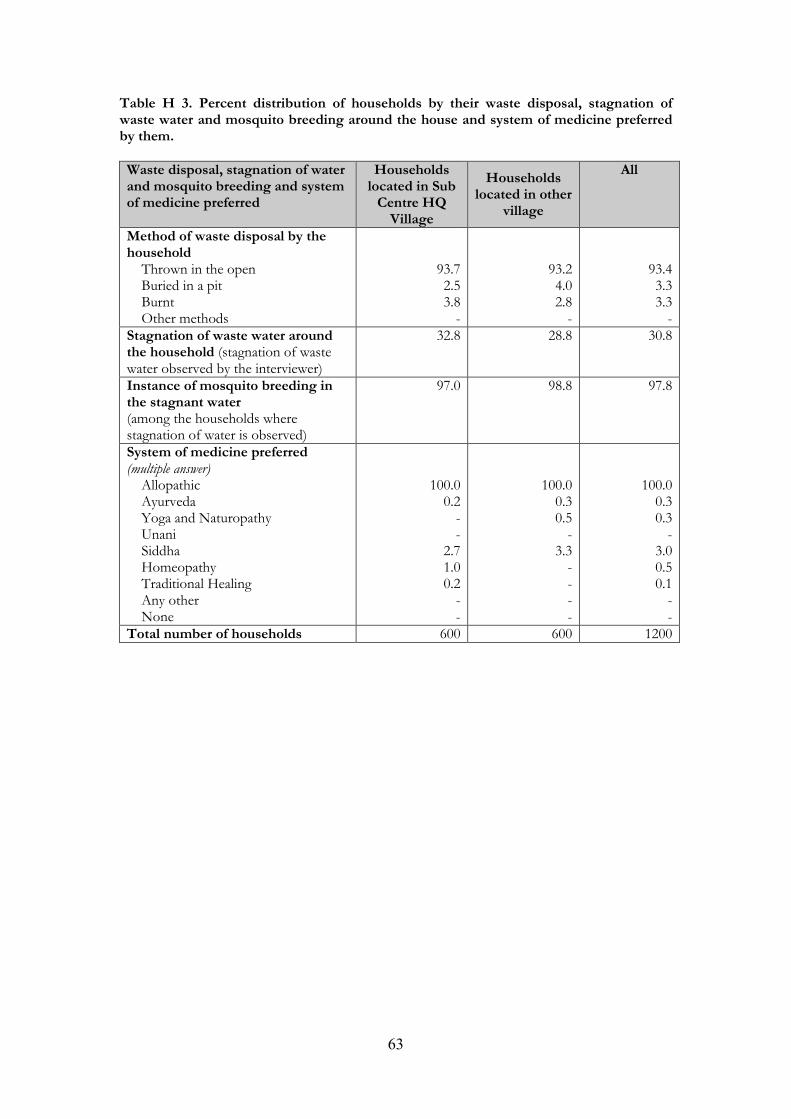
63
Table H 3. Percent distribution of households by their waste disposal, stagnation of waste water and mosquito breeding around the house and system of medicine preferred by them. Waste disposal, stagnation of water and mosquito breeding and system of medicine preferred
Households located in Sub Centre HQ
Village
Households located in other
village
All
Method of waste disposal by the household Thrown in the open Buried in a pit Burnt Other methods
93.7 2.5 3.8 -
93.2 4.0 2.8 -
93.4 3.3 3.3 -
Stagnation of waste water around the household (stagnation of waste water observed by the interviewer)
32.8 28.8 30.8
Instance of mosquito breeding in the stagnant water (among the households where stagnation of water is observed)
97.0 98.8 97.8
System of medicine preferred (multiple answer) Allopathic Ayurveda Yoga and Naturopathy Unani Siddha Homeopathy Traditional Healing Any other None
100.0 0.2 - -
2.7 1.0 0.2 - -
100.0 0.3 0.5 -
3.3 - - - -
100.0 0.3 0.3 -
3.0 0.5 0.1 - -
Total number of households 600 600 1200
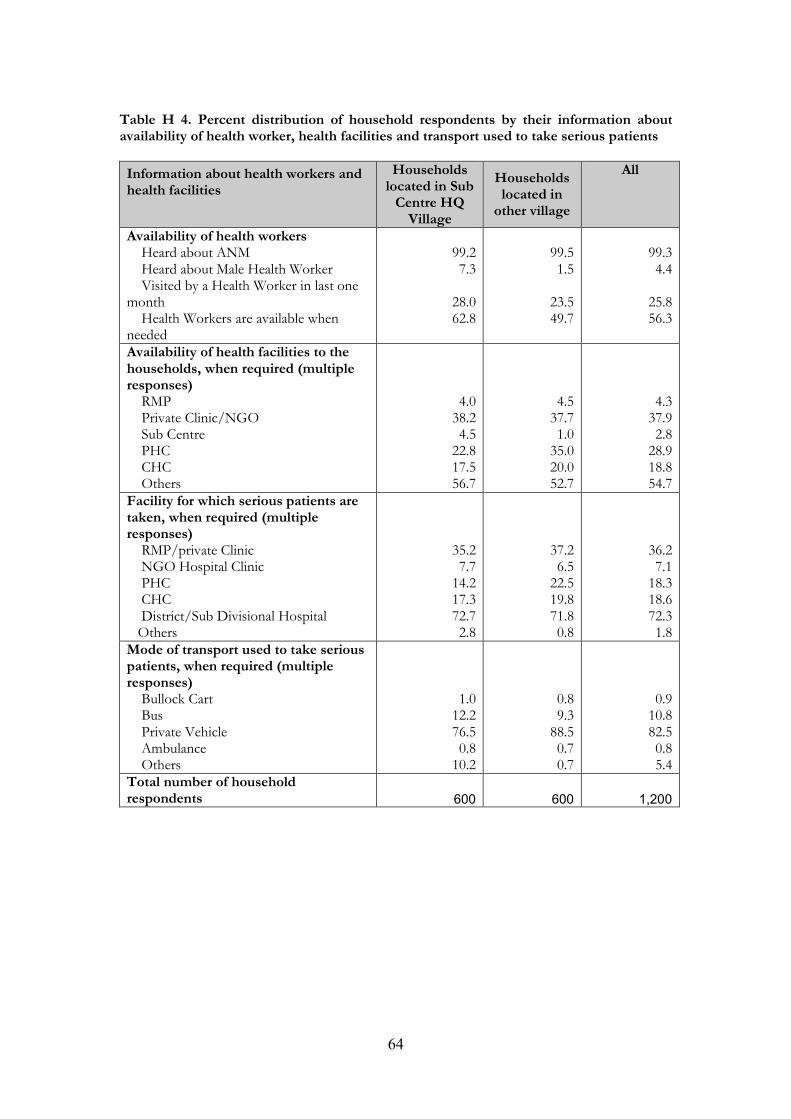
64
Table H 4. Percent distribution of household respondents by their information about availability of health worker, health facilities and transport used to take serious patients
Information about health workers and health facilities
Households located in Sub Centre HQ
Village
Households located in
other village
All
Availability of health workers Heard about ANM Heard about Male Health Worker Visited by a Health Worker in last one month Health Workers are available when needed
99.2 7.3
28.0 62.8
99.5 1.5
23.5 49.7
99.3 4.4
25.8 56.3
Availability of health facilities to the households, when required (multiple responses) RMP Private Clinic/NGO Sub Centre PHC CHC Others
4.0 38.2 4.5
22.8 17.5 56.7
4.5 37.7 1.0
35.0 20.0 52.7
4.3 37.9 2.8
28.9 18.8 54.7
Facility for which serious patients are taken, when required (multiple responses) RMP/private Clinic NGO Hospital Clinic PHC CHC District/Sub Divisional Hospital Others
35.2 7.7
14.2 17.3 72.7 2.8
37.2 6.5
22.5 19.8 71.8 0.8
36.2 7.1
18.3 18.6 72.3 1.8
Mode of transport used to take serious patients, when required (multiple responses) Bullock Cart Bus Private Vehicle Ambulance Others
1.0 12.2 76.5 0.8
10.2
0.8 9.3
88.5 0.7 0.7
0.9 10.8 82.5 0.8 5.4
Total number of household respondents 600 600 1,200
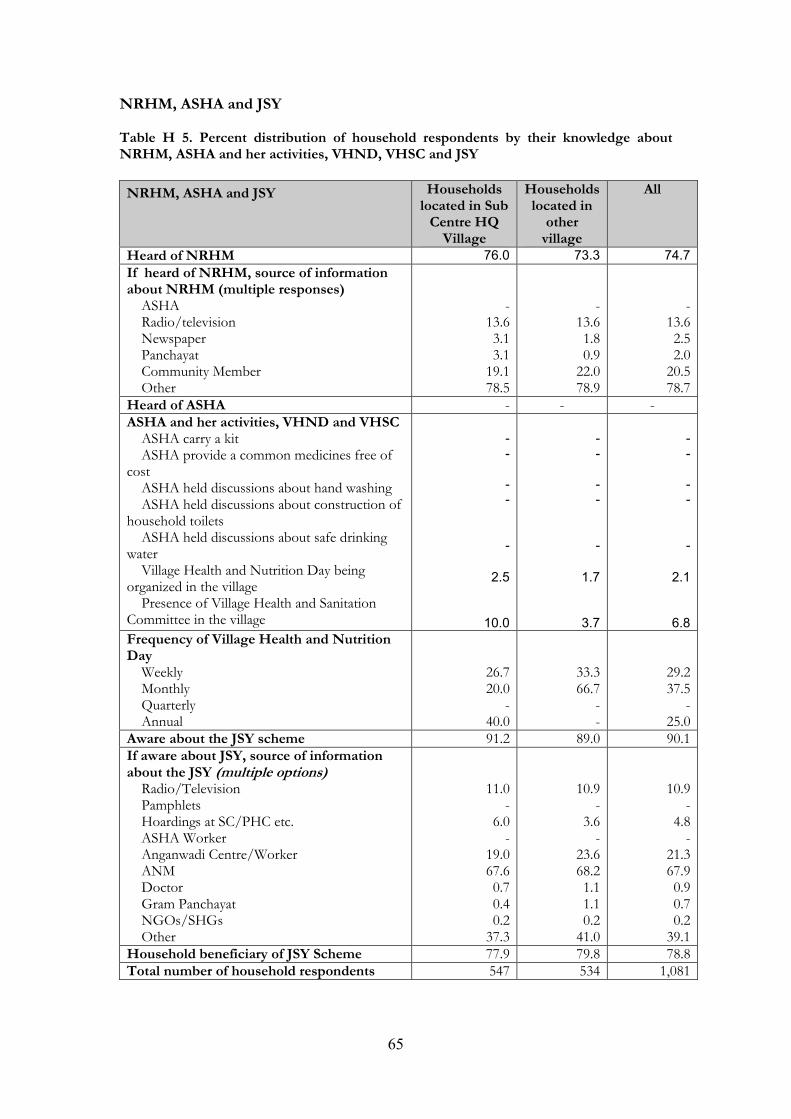
65
NRHM, ASHA and JSY Table H 5. Percent distribution of household respondents by their knowledge about NRHM, ASHA and her activities, VHND, VHSC and JSY
NRHM, ASHA and JSY Households located in Sub Centre HQ
Village
Households located in
other village
All
Heard of NRHM 76.0 73.3 74.7 If heard of NRHM, source of information about NRHM (multiple responses) ASHA Radio/television Newspaper Panchayat Community Member Other
-
13.6 3.1 3.1
19.1 78.5
-
13.6 1.8 0.9
22.0 78.9
-
13.6 2.5 2.0
20.5 78.7
Heard of ASHA - - - ASHA and her activities, VHND and VHSC ASHA carry a kit ASHA provide a common medicines free of cost ASHA held discussions about hand washing ASHA held discussions about construction of household toilets ASHA held discussions about safe drinking water Village Health and Nutrition Day being organized in the village Presence of Village Health and Sanitation Committee in the village
-
-
-
-
-
2.5
10.0
-
-
-
-
-
1.7
3.7
-
-
-
-
-
2.1
6.8 Frequency of Village Health and Nutrition Day Weekly Monthly Quarterly Annual
26.7 20.0
- 40.0
33.3 66.7
- -
29.2 37.5
- 25.0
Aware about the JSY scheme 91.2 89.0 90.1 If aware about JSY, source of information about the JSY (multiple options) Radio/Television Pamphlets Hoardings at SC/PHC etc. ASHA Worker Anganwadi Centre/Worker ANM Doctor Gram Panchayat NGOs/SHGs Other
11.0 -
6.0 -
19.0 67.6 0.7 0.4 0.2
37.3
10.9 -
3.6 -
23.6 68.2 1.1 1.1 0.2
41.0
10.9 -
4.8 -
21.3 67.9 0.9 0.7 0.2
39.1 Household beneficiary of JSY Scheme 77.9 79.8 78.8 Total number of household respondents 547 534 1,081
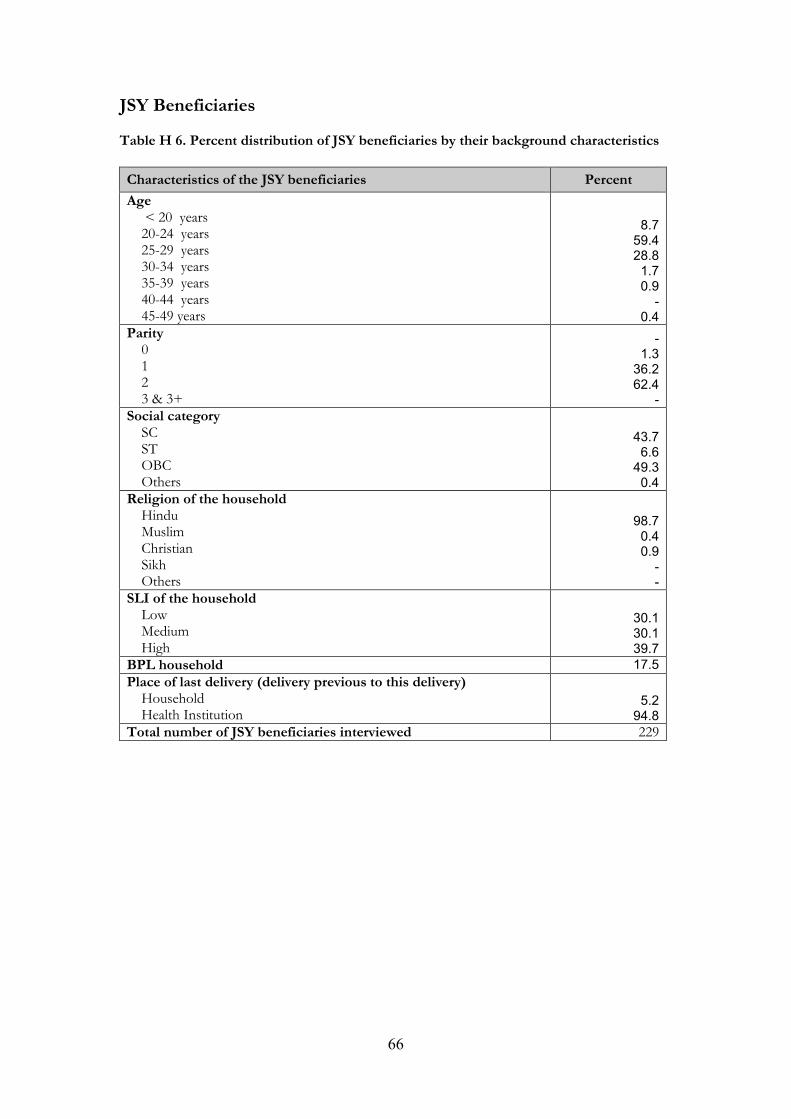
66
JSY Beneficiaries Table H 6. Percent distribution of JSY beneficiaries by their background characteristics
Characteristics of the JSY beneficiaries Percent
Age < 20 years 20-24 years 25-29 years 30-34 years 35-39 years 40-44 years 45-49 years
8.7
59.4
28.8
1.7
0.9
-
0.4
Parity 0 1 2 3 & 3+
-
1.3
36.2
62.4
-
Social category SC ST OBC Others
43.7
6.6
49.3
0.4
Religion of the household Hindu Muslim Christian Sikh Others
98.7
0.4
0.9
-
-
SLI of the household Low Medium High
30.1
30.1
39.7
BPL household 17.5 Place of last delivery (delivery previous to this delivery) Household Health Institution
5.2
94.8
Total number of JSY beneficiaries interviewed 229
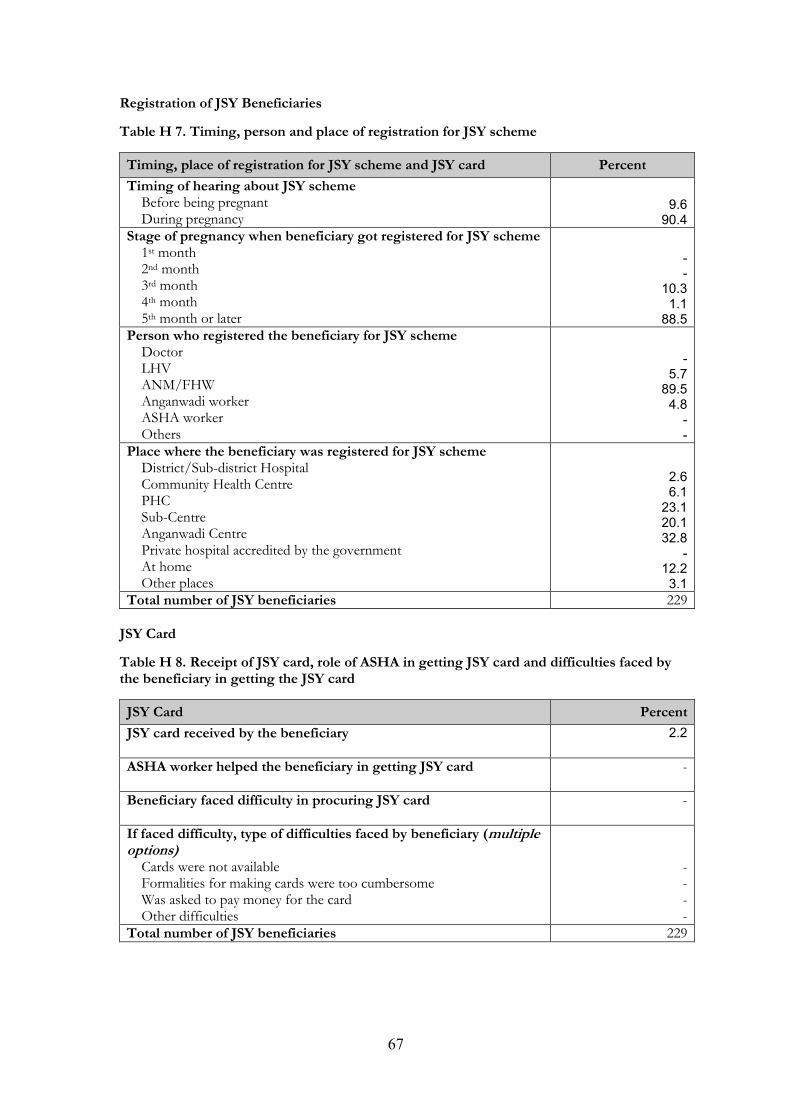
67
Registration of JSY Beneficiaries
Table H 7. Timing, person and place of registration for JSY scheme
Timing, place of registration for JSY scheme and JSY card Percent
Timing of hearing about JSY scheme Before being pregnant During pregnancy
9.6
90.4
Stage of pregnancy when beneficiary got registered for JSY scheme 1st month 2nd month 3rd month 4th month 5th month or later
-
-
10.3
1.1
88.5
Person who registered the beneficiary for JSY scheme Doctor LHV ANM/FHW Anganwadi worker ASHA worker Others
-
5.7
89.5
4.8
-
-
Place where the beneficiary was registered for JSY scheme District/Sub-district Hospital Community Health Centre PHC Sub-Centre Anganwadi Centre Private hospital accredited by the government At home Other places
2.6
6.1
23.1
20.1
32.8
-
12.2
3.1
Total number of JSY beneficiaries 229 JSY Card
Table H 8. Receipt of JSY card, role of ASHA in getting JSY card and difficulties faced by the beneficiary in getting the JSY card
JSY Card Percent
JSY card received by the beneficiary
2.2
ASHA worker helped the beneficiary in getting JSY card
-
Beneficiary faced difficulty in procuring JSY card
-
If faced difficulty, type of difficulties faced by beneficiary (multiple options) Cards were not available Formalities for making cards were too cumbersome Was asked to pay money for the card Other difficulties
- - - -
Total number of JSY beneficiaries 229
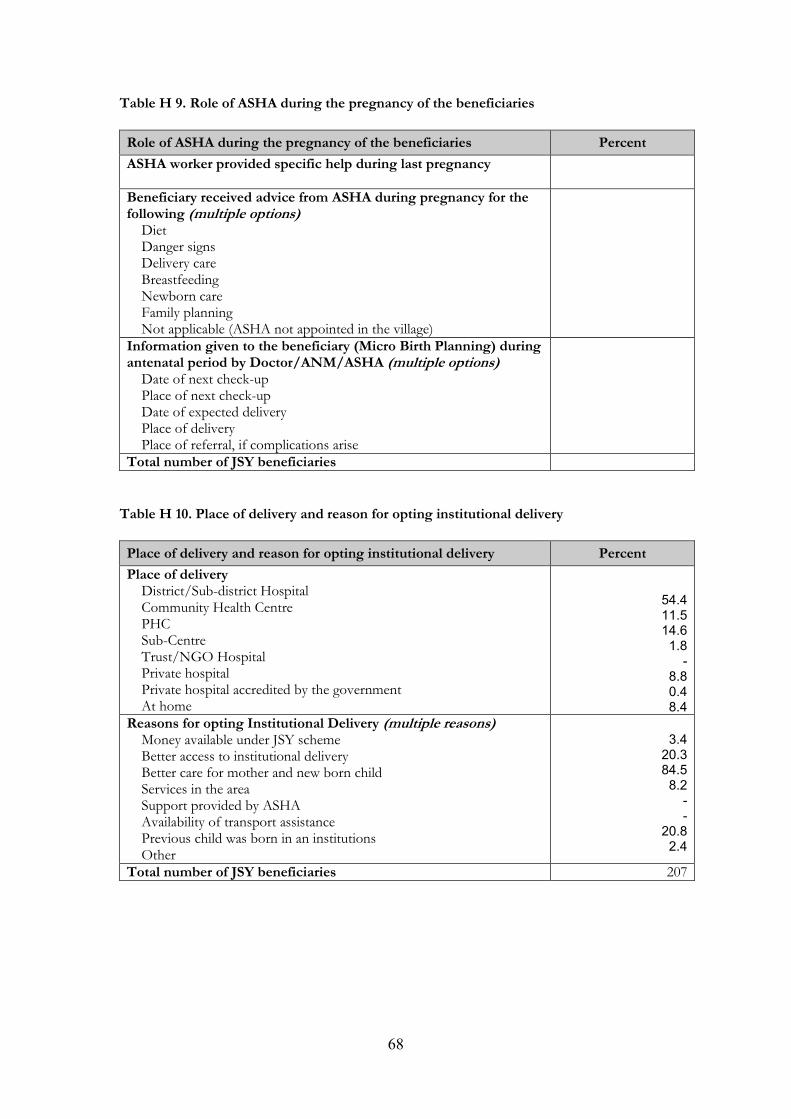
68
Table H 9. Role of ASHA during the pregnancy of the beneficiaries
Role of ASHA during the pregnancy of the beneficiaries Percent
ASHA worker provided specific help during last pregnancy
Beneficiary received advice from ASHA during pregnancy for the following (multiple options) Diet Danger signs Delivery care Breastfeeding Newborn care Family planning Not applicable (ASHA not appointed in the village)
Information given to the beneficiary (Micro Birth Planning) during antenatal period by Doctor/ANM/ASHA (multiple options) Date of next check-up Place of next check-up Date of expected delivery Place of delivery Place of referral, if complications arise
Total number of JSY beneficiaries
Table H 10. Place of delivery and reason for opting institutional delivery
Place of delivery and reason for opting institutional delivery Percent
Place of delivery District/Sub-district Hospital Community Health Centre PHC Sub-Centre Trust/NGO Hospital Private hospital Private hospital accredited by the government At home
54.4
11.5
14.6
1.8
-
8.8
0.4
8.4
Reasons for opting Institutional Delivery (multiple reasons) Money available under JSY scheme Better access to institutional delivery Better care for mother and new born child Services in the area Support provided by ASHA Availability of transport assistance Previous child was born in an institutions Other
3.4
20.3
84.5
8.2
-
-
20.8
2.4
Total number of JSY beneficiaries 207
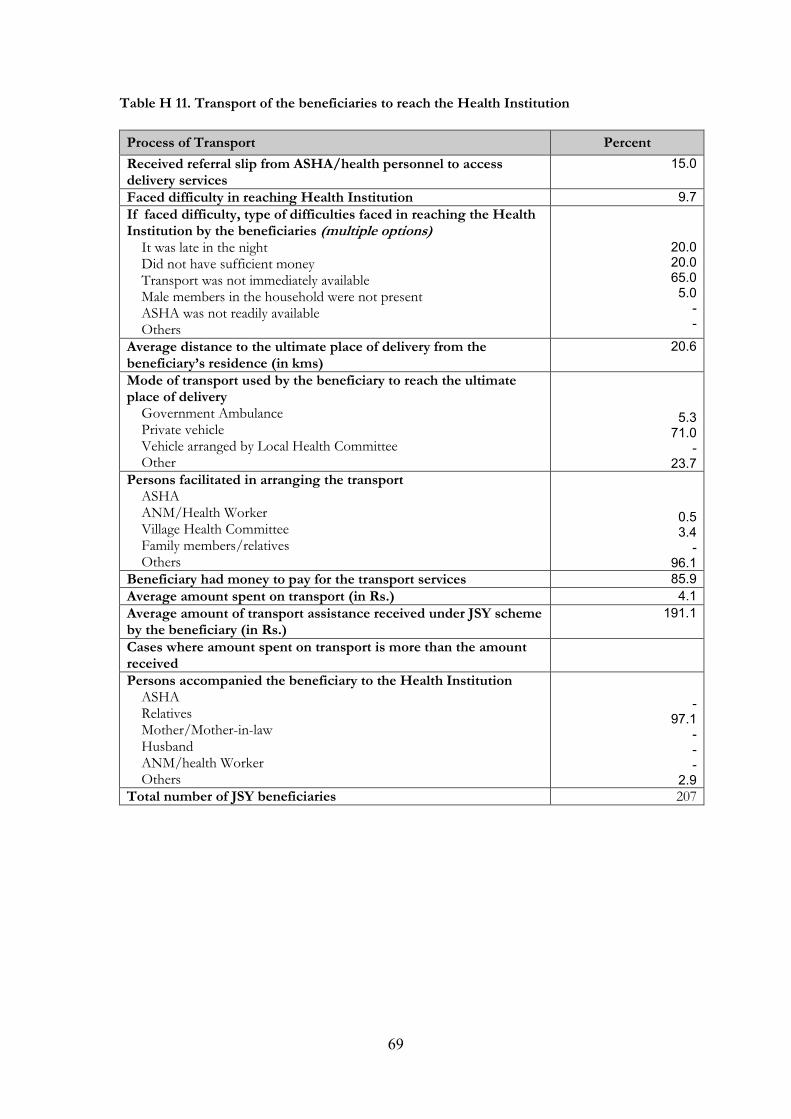
69
Table H 11. Transport of the beneficiaries to reach the Health Institution
Process of Transport Percent
Received referral slip from ASHA/health personnel to access delivery services
15.0
Faced difficulty in reaching Health Institution 9.7 If faced difficulty, type of difficulties faced in reaching the Health Institution by the beneficiaries (multiple options) It was late in the night Did not have sufficient money Transport was not immediately available Male members in the household were not present ASHA was not readily available Others
20.0
20.0
65.0
5.0
-
-
Average distance to the ultimate place of delivery from the beneficiary’s residence (in kms)
20.6
Mode of transport used by the beneficiary to reach the ultimate place of delivery Government Ambulance Private vehicle Vehicle arranged by Local Health Committee Other
5.3
71.0
-
23.7
Persons facilitated in arranging the transport ASHA ANM/Health Worker Village Health Committee Family members/relatives Others
0.5
3.4
-
96.1
Beneficiary had money to pay for the transport services 85.9 Average amount spent on transport (in Rs.) 4.1 Average amount of transport assistance received under JSY scheme by the beneficiary (in Rs.)
191.1
Cases where amount spent on transport is more than the amount received
Persons accompanied the beneficiary to the Health Institution ASHA Relatives Mother/Mother-in-law Husband ANM/health Worker Others
-
97.1
-
-
-
2.9
Total number of JSY beneficiaries 207
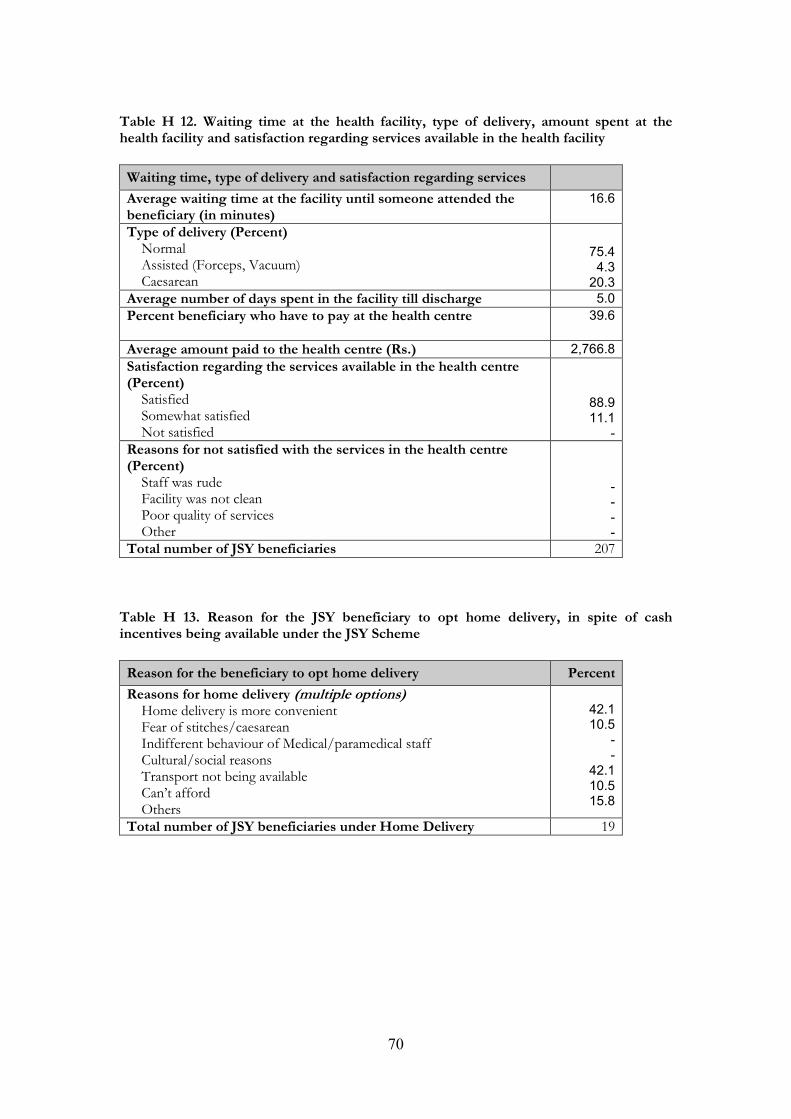
70
Table H 12. Waiting time at the health facility, type of delivery, amount spent at the health facility and satisfaction regarding services available in the health facility
Waiting time, type of delivery and satisfaction regarding services
Average waiting time at the facility until someone attended the beneficiary (in minutes)
16.6
Type of delivery (Percent) Normal Assisted (Forceps, Vacuum) Caesarean
75.4
4.3
20.3
Average number of days spent in the facility till discharge 5.0 Percent beneficiary who have to pay at the health centre
39.6
Average amount paid to the health centre (Rs.) 2,766.8 Satisfaction regarding the services available in the health centre (Percent) Satisfied Somewhat satisfied Not satisfied
88.9
11.1
-
Reasons for not satisfied with the services in the health centre (Percent) Staff was rude Facility was not clean Poor quality of services Other
-
-
-
-
Total number of JSY beneficiaries 207
Table H 13. Reason for the JSY beneficiary to opt home delivery, in spite of cash incentives being available under the JSY Scheme
Reason for the beneficiary to opt home delivery Percent
Reasons for home delivery (multiple options) Home delivery is more convenient Fear of stitches/caesarean Indifferent behaviour of Medical/paramedical staff Cultural/social reasons Transport not being available Can’t afford Others
42.1
10.5
-
-
42.1
10.5
15.8
Total number of JSY beneficiaries under Home Delivery 19
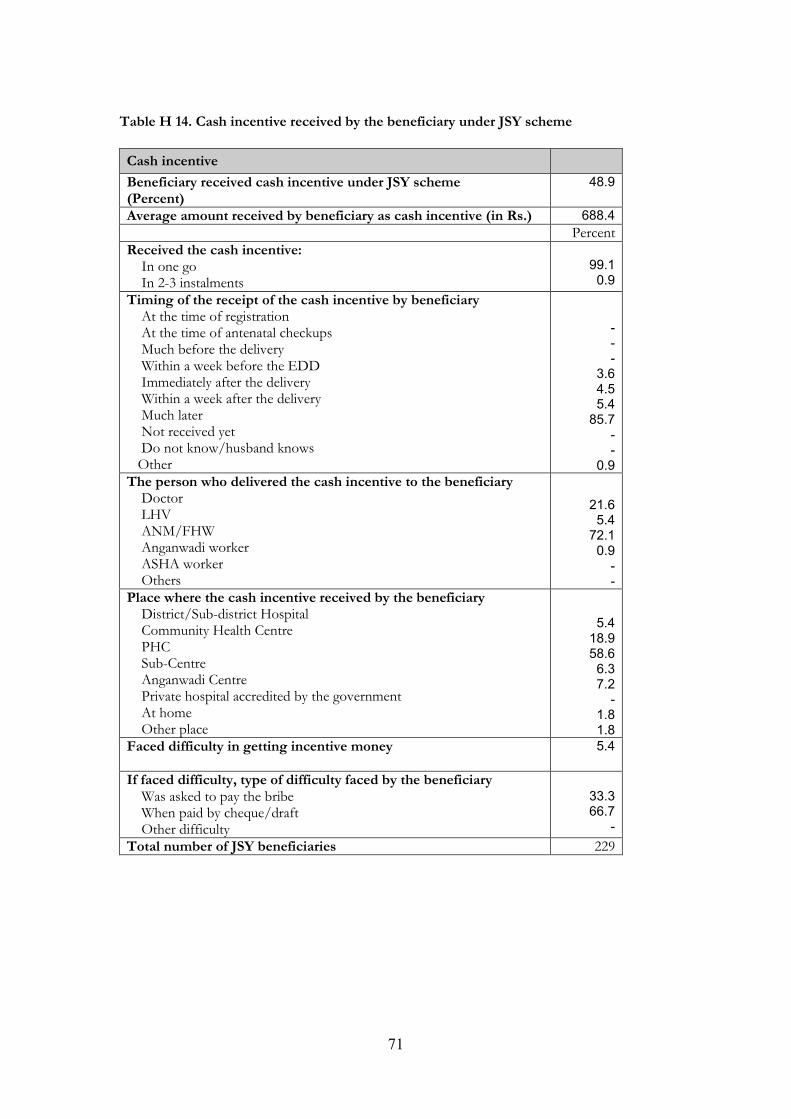
71
Table H 14. Cash incentive received by the beneficiary under JSY scheme
Cash incentive
Beneficiary received cash incentive under JSY scheme (Percent)
48.9
Average amount received by beneficiary as cash incentive (in Rs.) 688.4 Percent Received the cash incentive: In one go In 2-3 instalments
99.1
0.9
Timing of the receipt of the cash incentive by beneficiary At the time of registration At the time of antenatal checkups Much before the delivery Within a week before the EDD Immediately after the delivery Within a week after the delivery Much later Not received yet Do not know/husband knows Other
-
-
-
3.6
4.5
5.4
85.7
-
-
0.9
The person who delivered the cash incentive to the beneficiary Doctor LHV ANM/FHW Anganwadi worker ASHA worker Others
21.6
5.4
72.1
0.9
-
-
Place where the cash incentive received by the beneficiary District/Sub-district Hospital Community Health Centre PHC Sub-Centre Anganwadi Centre Private hospital accredited by the government At home Other place
5.4
18.9
58.6
6.3
7.2
-
1.8
1.8
Faced difficulty in getting incentive money
5.4
If faced difficulty, type of difficulty faced by the beneficiary Was asked to pay the bribe When paid by cheque/draft Other difficulty
33.3
66.7
-
Total number of JSY beneficiaries 229
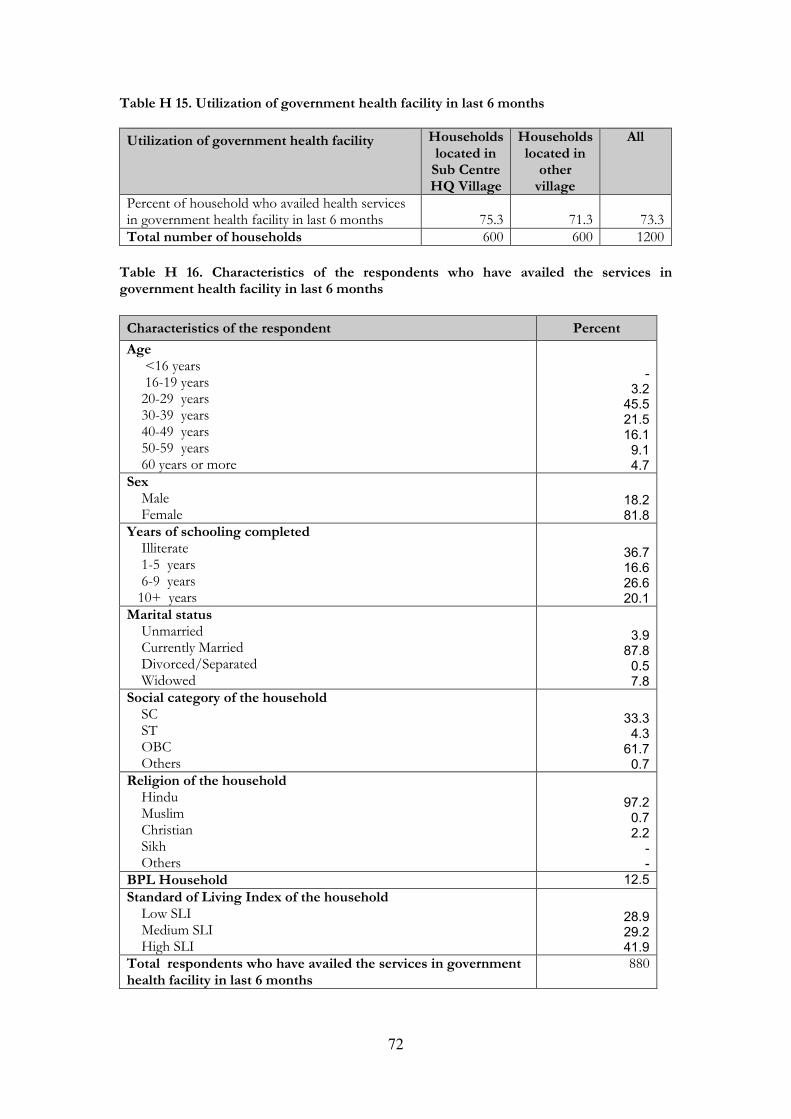
72
Table H 15. Utilization of government health facility in last 6 months
Utilization of government health facility Households located in Sub Centre HQ Village
Households located in
other village
All
Percent of household who availed health services in government health facility in last 6 months
75.3
71.3
73.3
Total number of households 600 600 1200
Table H 16. Characteristics of the respondents who have availed the services in government health facility in last 6 months
Characteristics of the respondent Percent
Age <16 years 16-19 years 20-29 years 30-39 years 40-49 years 50-59 years 60 years or more
-
3.2
45.5
21.5
16.1
9.1
4.7
Sex Male Female
18.2
81.8
Years of schooling completed Illiterate 1-5 years 6-9 years 10+ years
36.7
16.6
26.6
20.1
Marital status Unmarried Currently Married Divorced/Separated Widowed
3.9
87.8
0.5
7.8
Social category of the household SC ST OBC Others
33.3
4.3
61.7
0.7
Religion of the household Hindu Muslim Christian Sikh Others
97.2
0.7
2.2
-
-
BPL Household 12.5 Standard of Living Index of the household Low SLI Medium SLI High SLI
28.9
29.2
41.9
Total respondents who have availed the services in government health facility in last 6 months
880
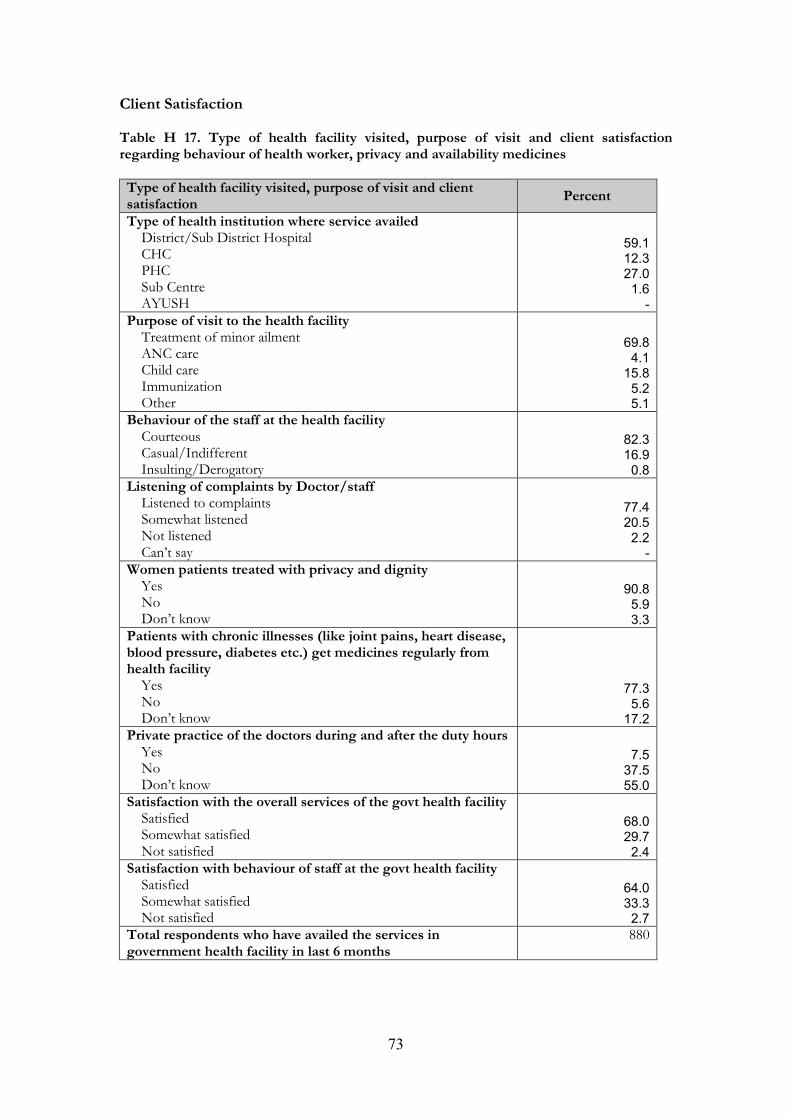
73
Client Satisfaction Table H 17. Type of health facility visited, purpose of visit and client satisfaction regarding behaviour of health worker, privacy and availability medicines Type of health facility visited, purpose of visit and client satisfaction
Percent
Type of health institution where service availed District/Sub District Hospital CHC PHC Sub Centre AYUSH
59.1
12.3
27.0
1.6
-
Purpose of visit to the health facility Treatment of minor ailment ANC care Child care Immunization Other
69.8
4.1
15.8
5.2
5.1
Behaviour of the staff at the health facility Courteous Casual/Indifferent Insulting/Derogatory
82.3
16.9
0.8
Listening of complaints by Doctor/staff Listened to complaints Somewhat listened Not listened Can’t say
77.4
20.5
2.2
-
Women patients treated with privacy and dignity Yes No Don’t know
90.8
5.9
3.3
Patients with chronic illnesses (like joint pains, heart disease, blood pressure, diabetes etc.) get medicines regularly from health facility Yes No Don’t know
77.3
5.6
17.2
Private practice of the doctors during and after the duty hours Yes No Don’t know
7.5
37.5
55.0
Satisfaction with the overall services of the govt health facility Satisfied Somewhat satisfied Not satisfied
68.0
29.7
2.4
Satisfaction with behaviour of staff at the govt health facility Satisfied Somewhat satisfied Not satisfied
64.0
33.3
2.7
Total respondents who have availed the services in government health facility in last 6 months
880
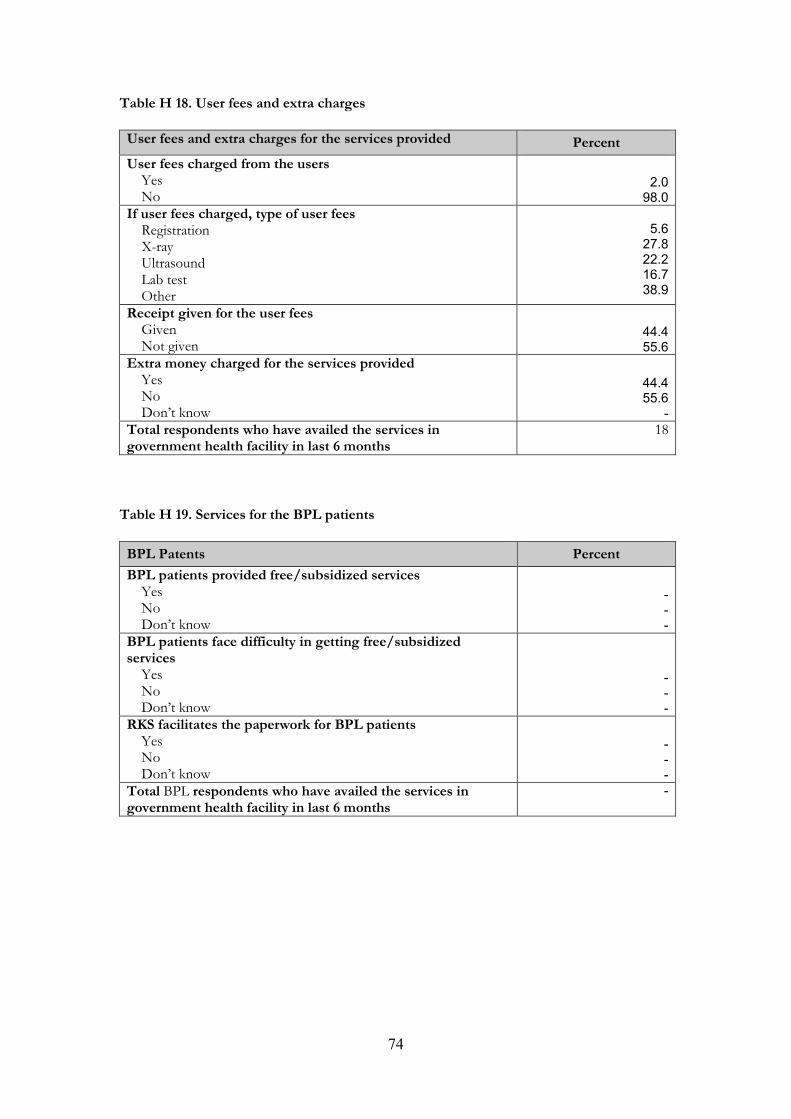
74
Table H 18. User fees and extra charges
User fees and extra charges for the services provided Percent
User fees charged from the users Yes No
2.0
98.0
If user fees charged, type of user fees Registration X-ray Ultrasound Lab test Other
5.6
27.8
22.2
16.7
38.9
Receipt given for the user fees Given Not given
44.4
55.6
Extra money charged for the services provided Yes No Don’t know
44.4
55.6
-
Total respondents who have availed the services in government health facility in last 6 months
18
Table H 19. Services for the BPL patients
BPL Patents Percent
BPL patients provided free/subsidized services Yes No Don’t know
-
-
-
BPL patients face difficulty in getting free/subsidized services Yes No Don’t know
-
-
-
RKS facilitates the paperwork for BPL patients Yes No Don’t know
-
-
-
Total BPL respondents who have availed the services in government health facility in last 6 months
-

75
Table H 20. Outbreak of selected diseases (Malaria, Measles, Gastroenteritis, Jaundice and Other Diseases) in the respondents’ area in the last six months
Outbreak of diseases Percent
Outbreak of Malaria in the last six months Yes No Don’t know
3.1
94.3
2.7
Outbreak of Measles in the last six months Yes No Don’t know
16.2
81.7
2.2
Outbreak of Gastroenteritis in the last six months Yes No Don’t know
0.6
96.4
3.0
Outbreak of Jaundice in the last six months Yes No Don’t know
4.7
92.3
3.0
Outbreak of Any Other Diseases in the last six months Yes No Don’t know
3.6
90.1
6.3
Total number of household respondents 1,200
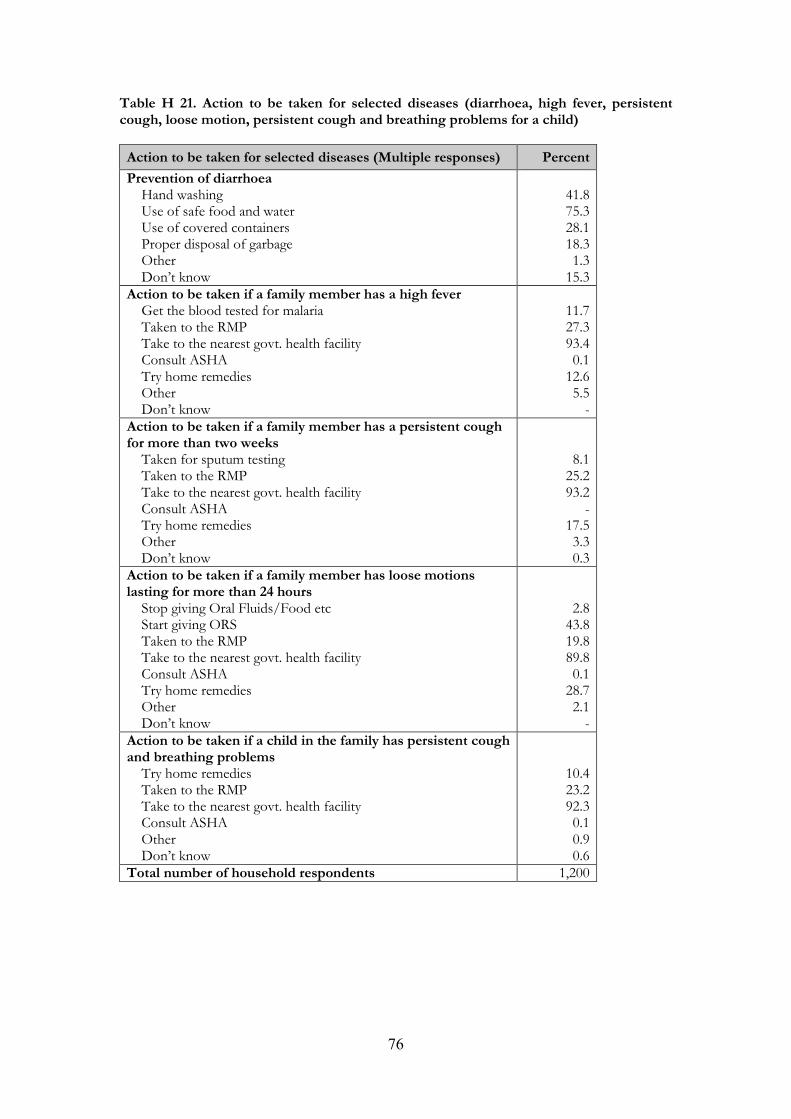
76
Table H 21. Action to be taken for selected diseases (diarrhoea, high fever, persistent cough, loose motion, persistent cough and breathing problems for a child)
Action to be taken for selected diseases (Multiple responses) Percent
Prevention of diarrhoea Hand washing Use of safe food and water Use of covered containers Proper disposal of garbage Other Don’t know
41.8 75.3 28.1 18.3 1.3
15.3 Action to be taken if a family member has a high fever Get the blood tested for malaria Taken to the RMP Take to the nearest govt. health facility Consult ASHA Try home remedies Other Don’t know
11.7 27.3 93.4 0.1
12.6 5.5 -
Action to be taken if a family member has a persistent cough for more than two weeks Taken for sputum testing Taken to the RMP Take to the nearest govt. health facility Consult ASHA Try home remedies Other Don’t know
8.1 25.2 93.2
- 17.5 3.3 0.3
Action to be taken if a family member has loose motions lasting for more than 24 hours Stop giving Oral Fluids/Food etc Start giving ORS Taken to the RMP Take to the nearest govt. health facility Consult ASHA Try home remedies Other Don’t know
2.8 43.8 19.8 89.8 0.1
28.7 2.1 -
Action to be taken if a child in the family has persistent cough and breathing problems Try home remedies Taken to the RMP Take to the nearest govt. health facility Consult ASHA Other Don’t know
10.4 23.2 92.3 0.1 0.9 0.6
Total number of household respondents 1,200
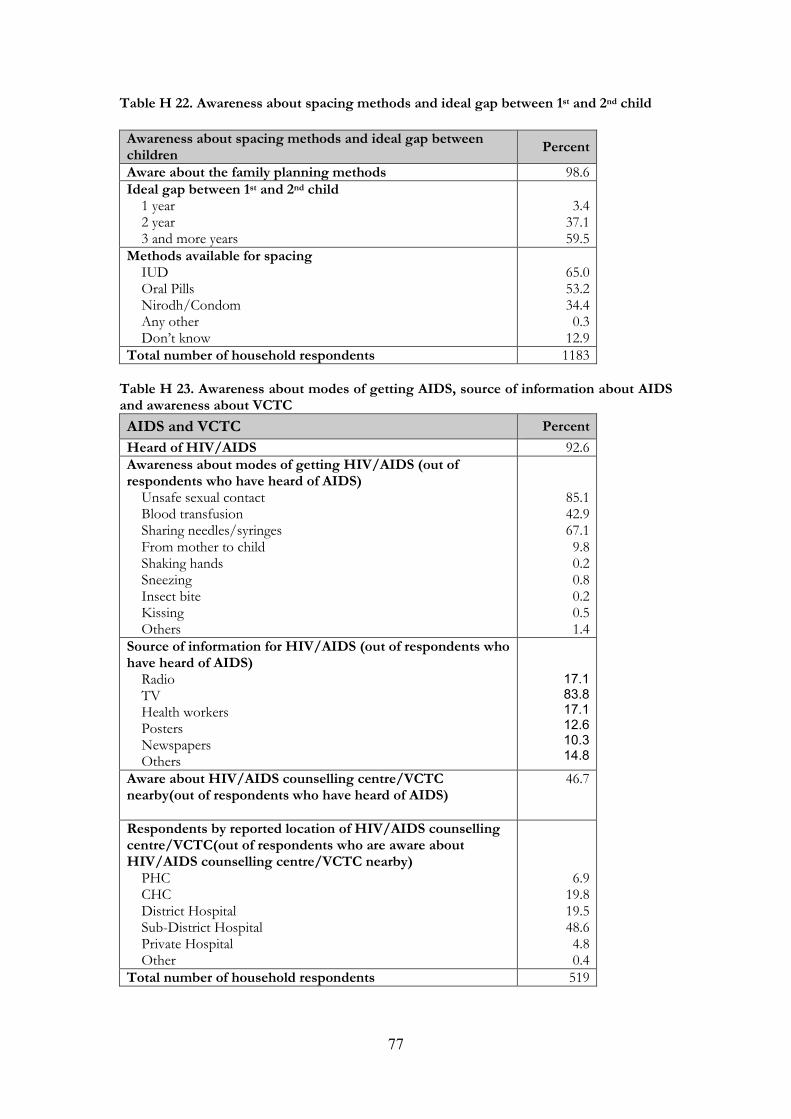
77
Table H 22. Awareness about spacing methods and ideal gap between 1st and 2nd child
Awareness about spacing methods and ideal gap between children
Percent
Aware about the family planning methods 98.6 Ideal gap between 1st and 2nd child 1 year 2 year 3 and more years
3.4 37.1 59.5
Methods available for spacing IUD Oral Pills Nirodh/Condom Any other Don’t know
65.0 53.2 34.4 0.3
12.9 Total number of household respondents 1183
Table H 23. Awareness about modes of getting AIDS, source of information about AIDS and awareness about VCTC
AIDS and VCTC Percent
Heard of HIV/AIDS 92.6 Awareness about modes of getting HIV/AIDS (out of respondents who have heard of AIDS) Unsafe sexual contact Blood transfusion Sharing needles/syringes From mother to child Shaking hands Sneezing Insect bite Kissing Others
85.1 42.9 67.1 9.8 0.2 0.8 0.2 0.5 1.4
Source of information for HIV/AIDS (out of respondents who have heard of AIDS) Radio TV Health workers Posters Newspapers Others
17.1
83.8
17.1
12.6
10.3
14.8
Aware about HIV/AIDS counselling centre/VCTC nearby(out of respondents who have heard of AIDS)
46.7
Respondents by reported location of HIV/AIDS counselling centre/VCTC(out of respondents who are aware about HIV/AIDS counselling centre/VCTC nearby) PHC CHC District Hospital Sub-District Hospital Private Hospital Other
6.9 19.8 19.5 48.6 4.8 0.4
Total number of household respondents 519
78
Chapter 7. Status and Performance of ASHA (Based on ASHA Schedule)
Table A1 Status of ASHA
A. Number of ASHA interviewed in the
district
B. Average population served by ASHAs
interviewed
C. Average number of village / habitations
served by AHSAs covered
D.Percentage of ASHAs by method of
selection
Selected on recommendation of ANM
Selected on recommendation of Gram Pradhan Selected on recommendation of Anganwadi
Worker
Selected by Village Health Committee Previously working as Dai Other E. Percentage of ASHAs undergone training
F. Percentage of ASHAs undergone training by
modules
Module 1
Module 2
Module 3
Module 4
G. Percentage of ASHAs issued ASHA Kit
79
Table A2 Role and Performance of ASHA
A. Percentage of ASHAs who are DOTS
provider
B. Average monthly no. of JSY cases
facilitated in last 3 months by ASHA
C. Average no. of cases handled in last
three months
Children with diarrhea given ORS
Accompanied Institutional deliveries cases
Number of Oral Pills distributed
Number of Malaria Patients given drugs
Number of new pregnancies identified
Number of group meetings like Mahila mandals
arranged
Number of Health & Nutrition days arranged
D. Average money incentive received by an
ASHA on an average during one month
JSY
Sterlisation
VHND Other Total
80
Table A3 Distribution of ASHAs by reported types of difficulties faced and kind
of support required
A. Percentage of ASHAs by types of
difficulties faced in implementing programme activities under NRHM
Funds not available in time
Adequate training is not provided
Delayed supply of drugs
Behaviour of staff in health facilities is not
appropriate
Inadequate facilities for institutional deliveries
B. Reported kind of support require ASHA to
enable her to implement the programme more
effectively
More training is to be arranged for ASHA &
Community members
ASHA should be paid a fixed remuneration
Payments should be made timely
Other
Table A4 Distribution of ASHAs by reported awareness on different aspects
A. Percentage of ASHAs reporting
awareness about
important steps for prevention of diarrhea
Time of initiating Breast Feeding
Age of child till when he/she should be
exclusive breastfed
Amount of cash incentive given under JSY
81
Chapter 8. Role, Awareness and Involvement of Gram Panchayats (Based on Gram Panchayat Schedule)
Involvement Of Gram Panchayat
Twelve gram panchayats (GP) were covered in the survey. This chapter describes the
awreness and involvement of gram panchayat about NRHM.
Average population of the gram panchayat was 4,416. Out of these 1,354 were scheduled
castes and 316 were scheduled tribes. Average number of households was 993, out of
which 299 were scheduled castes and 54 were scheduled tribes. On an average 351 BPL
families were there in the panchayats. More than half of the BPL families belonged to
Scheduled caste (190).
More than 83% of the GP reported regular availability of ANM/VHN. About 42% of
GPs were aware of female health workers tour plan. Seventy five per cent of the GPs
reported timely services by sub-centres to the patients. Six out of 12 GPs reported they
have a role in conducting IEC activities in the villages. Village Health and Sanitation
Committee was reported as existing in 92% of the GPs. However, only 9% reported
regular meeting of VHSC. Eight two per cent of the GPs reported that they received
some benefits from VHSC. Ninety two percent of the GPs are aware of the benefits
under JSY and all the GPs reported NRHM has brought about improvement in their
area. The major reported benefits are funds available for maintenance of sub-centres
(58%), better facilities are available at CHC/PHC (58%), Funds available under JSY
(33%) and Transportation facilities (33%).
Regarding difficulties, non availability of funds in time is the reported major difficulty
(83%). Regarding required improvement, 58% desired that more funds should be made
available for maintenance and effective functioning (58%) and direct control of funds by
the gram panchayat(17%).
82
Table A1 Status of Gram Panchayats Covered
A. Number of Gram Panchayats covered in the district
12
B. Average population of the Gram Panchayat covered
Scheduled Caste 1,354.4 Scheduled Tribe 313.8 Total
4,415.9 C. Average number of Households in the Gram Panchayats covered
Scheduled Caste 298.5 Scheduled Tribe 54.1 Total
992.7 D. Average number of BPL families in the Gram Panchayats covered
Scheduled Caste 190.0 Scheduled Tribe 40.2 Total 351.0
Table A2 Level of awareness and involvement of Gram Panchayats A1. Percentage of Gram Panchayat reporting regular availability of ANM
83.3
A2. Percentage of Gram Panchayat reporting awareness about ANM Tour Plan
B. Percentage of Gram Panchayat reporting timely services provided by Sub Centre to the patients 75.0 C. Percentage of Gram Panchayat reporting role of Gram Panchayat in conducting/finalizing IEC programme in Gram Panchayat 50.0 D. Percentage of Gram Panchayat reporting existence of VHSC in their Gram Panchayat 91.7 E. Percentage of Gram Panchayat reporting regular meetings of VHSC 9.1 F. Percentage of Gram Panchayat reporting Village health Plan been prepared by VHSC - G. Percentage of Gram Panchayat reporting that VHSC has received any Untied Fund 81.8 H. Percentage of Gram Panchayat reporting ASHA workers in position - I. Percentage of Gram Panchayat reporting awareness of the benefits under JSY scheme 91.7 J. Percentage of Gram Panchayat reporting that NRHM brought about any improvement in their area 100.0
83
K. Percentage of Gram Panchayat reporting conduct of IEC activities during last 6 months L. Distribution of Gram Panchayats covered by type improvement reported due to NRHM
Funds available for maintenance of Sub Centres 58.3
Community support is available as ASHA worker -
Funds/facilities are available under JSY 33.3 Better facilities are available for CHCs/PHCs for referred patients
58.3
Transport facilities are available 33.3
Other -
M. Distribution of Gram Panchayats by type of difficulties faced in implementing programme activities under NRHM
Funds not available in time 83.3
Decision making with the community leaders is difficult 8.3
ASHA has not been adequately trained -
Adequate facilities for institutional deliveries not available 16.7
Any other -
M. Distribution of Gram Panchayats by kind of support required to enable them in implementing the programme more effectively
More funds are required for maintenance/ effective functioning 58.3
Gram Panchayat should be given direct control over funds 16.7
More training is to be arranged for ASHA and Community members
-
Any other 33.3
84
Chapter 9.Quality of care and Client Satisfaction (Based on IPD & OPD Exit Interview Schedules) IPD Facilities
IN PATIENTS
Clients’ satisfaction depends on the quality of services rendered at the health facilities. To
assess the quality of the services both indoor patients and out patients were interviewed.
In this section the views of in-patients are summarized. A total number of 33 in-patients
were interviewed in all the health facilities in Tiruvallur district.
Majority of the respondents (70%) were in the age group of 20-29 years and 85% of
them were female. Ninety four per cent of the respondents were currently married and
the rest were widowed. Ninety one per cent of the respondents were from rural areas.
Sixty one per cent of the respondents were interviewed at CHC/BPHC, 30% at the
district hospital and the rest, 9% at PHC.
Fifty five per cent of the respondents were admitted in the facility for undergoing family
planning surgery, 15% each for treating minor ailments and delivery and 6%
accompanied the child who was admitted. The clients at CHC/BPHC were mainly
admitted for undergoing family planning surgery (90%). The purpose of admission in
district hospital is for treating minor illness, delivery or child illness.
Average waiting time for any purpose was the least at PHC and took longer time in the
District hospital. Waiting time to get discharged is the longest among all services. About
the waiting time the respondents opined that, in district hospital the waiting time was too
long for registration, admission to ward, getting services and to get discharged. On the
other hand the waiting time for doctor’s call and doctor’s examination was considered as
appropriate or too short. At CHC/BPHC, waiting time for getting discharged alone was
considered as too long. For getting all other services was considered as appropriate. In
PHC, except for registration waiting time for other services were considered as
appropriate.
The clients are satisfied with the behaviour of the health facility staff as most of them
reported that staff were good or very kind in their behaviour. Only one client admitted in
BPHC reported that the doctor’s behaviour was rude.
85
All the clients have reported that there was privacy at the place of examination in all the
health facilities. Regarding patient-doctor communication, the doctor listened to the
description of the ailments in all health facilities. Except for 2 persons in CHC, doctors
allowed to ask questions and responded to questions in all places. The doctors discussed
about the ailments and talked about the recovery in majority of the cases. However, the
percentage of respondents reporting so was lower for district hospital.
Cleanliness
The respondents were asked to mention the way the health facility was kept clean at
various levels. Fifty per cent of the patients from district hospital said the floor was
cleaned once in a day, another 40% reported it was cleaned more than once a day. Toilets
were cleaned at least once a day and the bed sheets were also changed once a day.
Patient’s uniform was not changed daily in district hospital. In CHC/BPHC too cleaning
of floor and toilets were more frequent, done more than once a day. In PHCs cleaning
was done once in a day. The percentage of patients satisfied with cleaning operation in
district hospital was small, as majority was ‘some what satisfied’ with the cleanliness. In
CHC, the cleanliness seems better, except for changing patient’s uniform and bed sheets,
75% or more were satisfied with the cleanliness. Cleanliness in PHC is also seems better
as one third of the patients were satisfied and the remaining expressing ‘some what
satisfied’ with it.
Crowding
In all health facilities cot was provided immediately on admission. Also the cot was made
available till the time of discharge. However, patients were not fully satisfied with
adequacy of space in the ward and with the ward arrangement, particularly in district
hospital.
Amenities at the health facility
Television, canteen, medical shop, telephone, accommodation for relatives and
ambulance were the amenities reported as available at the district hospital by the patients.
All of them were satisfied with the amenities provided. In CHC and PHC, canteen was
not available Telephone was not available in PHC. Wherever the facilities are available
the patients have expressed their satisfaction with the facility.
86
Continuity of treatment
Patients are generally satisfied with the visit to the health facilities. Only one patient was
not satisfied with the visit to CHC. The dissatisfaction was due to lack of facilities at the
centre. All the patients, except one, was willing to come back to the facility if fallen sick
and all of them said they would recommend the facility to others.
OUT PATIENTS The following section summarizes the characteristics and the satisfaction of the clients
who were out patients in the health facilities.
One fourth and one fifth of the out patients were in the age group 20-25 years and 40-49
years respectively. About 30% of the patients were above 50 years. The patients were
equally distributed between male and female sex. Most of the patients were currently
married (89%) and were from rural area (90%). Out of the 70 patients interviewed, 57%
were contacted at PHC, 29% at CHC and 15% at the district hospital.
The main purpose of visit to the health facility was to get treated minor ailments. About
35% of the respondents at CHC came there to get their child treated. In district hospital
50% of the patients were there to get specialized services like eye care, FP services and
child illness.
Waiting time
At the district hospital the waiting time varied from 10 minutes, for dressing wounds, to
more than 20 minutes, for doctor’s examination. Registration takes about 20 minutes of
time. In CHC the waiting time for any service is about 5 minutes and in PHC it varies
from 3 minutes to 8 minutes. In all places registration takes longer time than for any
other service. Waiting time at the district hospital for any service is considered as too
long by the patients. Waiting time for registration and for getting injection was
considered too long at other places.
87
Behaviour of staff
Behaviour of the doctor and other staff in the health facilities was reported to be good by
the clients. One fifth of the respondents reported that the behaviour of Nursing staff and
dispenser in the district hospital was reasonable. Majority of the patients felt that there
was privacy at the place of examination.
Client-provider interaction
The respondents reported that the doctor patiently heard description of ailment in all the
health facilities. Also he has allowed the patient to ask questions and responded to it. For
three fourth of the patients, the doctor discussed about the ailment. He has talked about
the recovery in all health facilities except the district hospital where only 30% reported
so.
More than 50% of the respondents reported that the doctor in CHC or PHC gave other
advice. This percentage was 10% for the district hospital.
Cleanliness
Twenty per cent of the patients at district hospital reported that the OPD room and the
examination room were clean. About 70% of the patients felt these rooms were fairly
clean. Only 10% felt that dispensary, injection room and dressing room were clean.
Comparing district hospital, CHC and PHC are better maintained. Majority of the
patients visiting these facilities (more than 60%) reported that the rooms in these
facilities were clean.
None of the patient visiting district hospital reported that the rooms were not crowded
and somewhat adequate to accommodate the visiting patients comfortably. On the other
hand a smaller percentage of patients reported the rooms in the CHC and PHC were not
adequate to meet the patient needs.
All the patients who visited the health facilities were either some what satisfied or
satisfied. All of them reported that they will visit the facility again if required and also will
recommend these facilities to others.
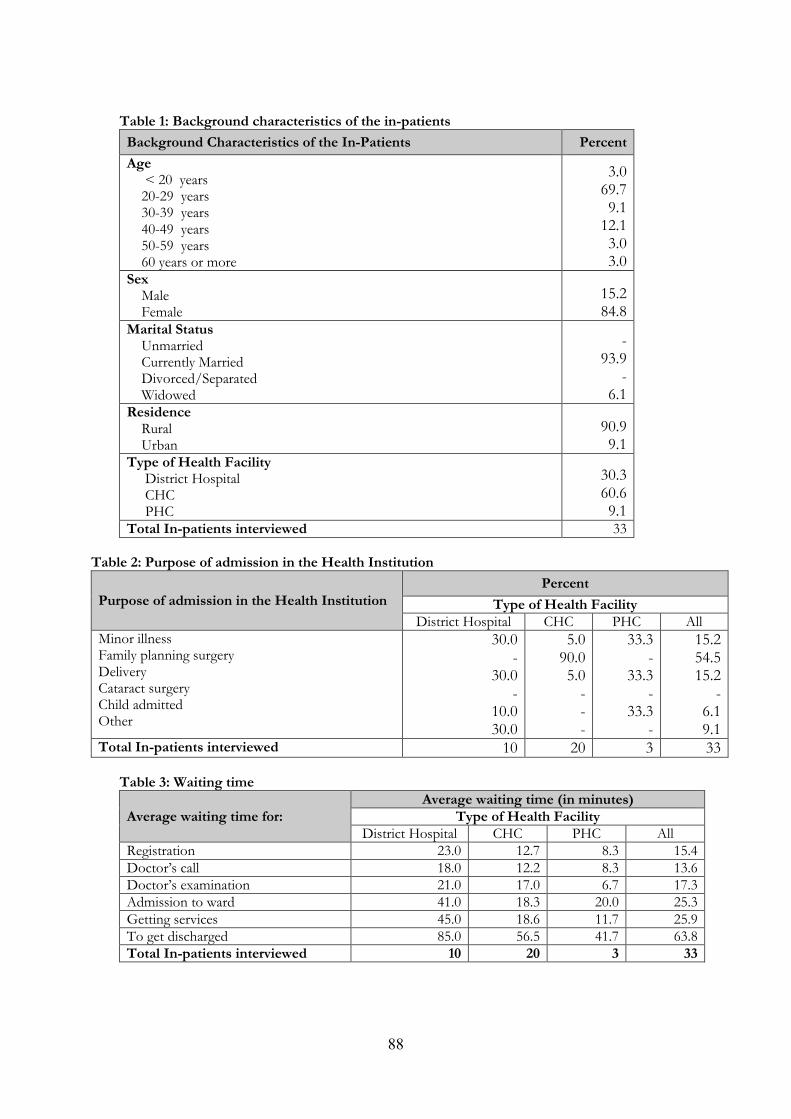
88
Table 1: Background characteristics of the in-patients
Background Characteristics of the In-Patients Percent
Age < 20 years 20-29 years 30-39 years 40-49 years 50-59 years 60 years or more
3.0 69.7 9.1
12.1 3.0 3.0
Sex Male Female
15.2 84.8
Marital Status Unmarried Currently Married Divorced/Separated Widowed
- 93.9
- 6.1
Residence Rural Urban
90.9 9.1
Type of Health Facility District Hospital CHC PHC
30.3 60.6 9.1
Total In-patients interviewed 33
Table 2: Purpose of admission in the Health Institution
Purpose of admission in the Health Institution Percent
Type of Health Facility District Hospital CHC PHC All
Minor illness Family planning surgery Delivery Cataract surgery Child admitted Other
30.0 -
30.0 -
10.0 30.0
5.0 90.0 5.0 - - -
33.3 -
33.3 -
33.3 -
15.2 54.5 15.2
- 6.1 9.1
Total In-patients interviewed 10 20 3 33 Table 3: Waiting time
Average waiting time for: Average waiting time (in minutes)
Type of Health Facility District Hospital CHC PHC All
Registration 23.0 12.7 8.3 15.4 Doctor’s call 18.0 12.2 8.3 13.6 Doctor’s examination 21.0 17.0 6.7 17.3 Admission to ward 41.0 18.3 20.0 25.3 Getting services 45.0 18.6 11.7 25.9 To get discharged 85.0 56.5 41.7 63.8 Total In-patients interviewed 10 20 3 33
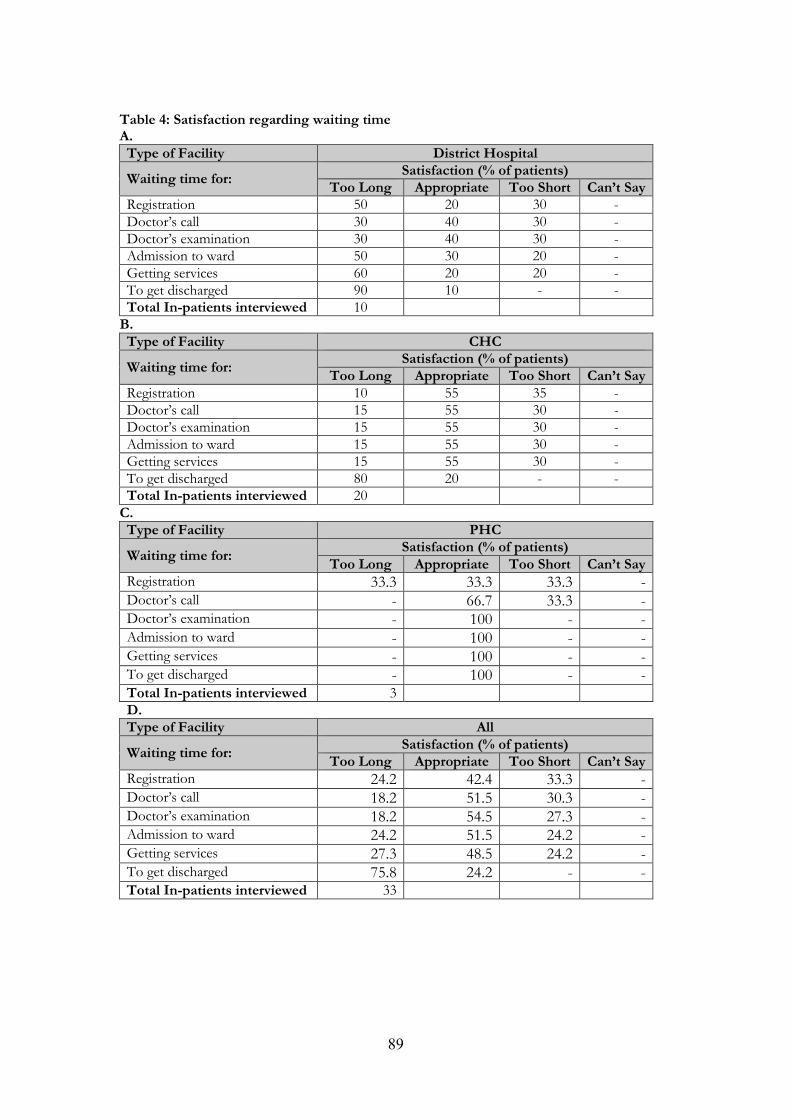
89
Table 4: Satisfaction regarding waiting time A. Type of Facility District Hospital
Waiting time for: Satisfaction (% of patients)
Too Long Appropriate Too Short Can’t Say Registration 50 20 30 - Doctor’s call 30 40 30 - Doctor’s examination 30 40 30 - Admission to ward 50 30 20 - Getting services 60 20 20 - To get discharged 90 10 - - Total In-patients interviewed 10
B. Type of Facility CHC
Waiting time for: Satisfaction (% of patients)
Too Long Appropriate Too Short Can’t Say Registration 10 55 35 - Doctor’s call 15 55 30 - Doctor’s examination 15 55 30 - Admission to ward 15 55 30 - Getting services 15 55 30 - To get discharged 80 20 - - Total In-patients interviewed 20
C. Type of Facility PHC
Waiting time for: Satisfaction (% of patients)
Too Long Appropriate Too Short Can’t Say Registration 33.3 33.3 33.3 - Doctor’s call - 66.7 33.3 - Doctor’s examination - 100 - - Admission to ward - 100 - - Getting services - 100 - - To get discharged - 100 - - Total In-patients interviewed 3 D. Type of Facility All
Waiting time for: Satisfaction (% of patients)
Too Long Appropriate Too Short Can’t Say Registration 24.2 42.4 33.3 - Doctor’s call 18.2 51.5 30.3 - Doctor’s examination 18.2 54.5 27.3 - Admission to ward 24.2 51.5 24.2 - Getting services 27.3 48.5 24.2 - To get discharged 75.8 24.2 - - Total In-patients interviewed 33
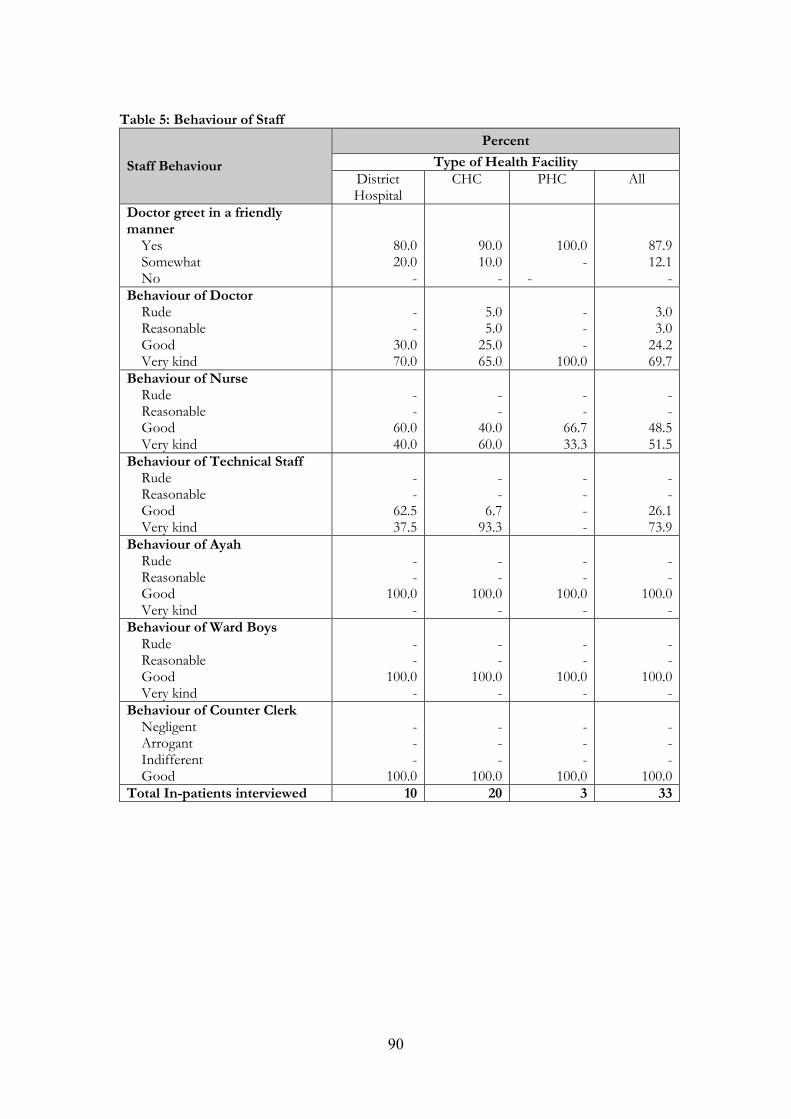
90
Table 5: Behaviour of Staff
Staff Behaviour
Percent
Type of Health Facility District Hospital
CHC PHC All
Doctor greet in a friendly manner Yes Somewhat No
80.0 20.0
-
90.0 10.0
-
100.0 -
-
87.9 12.1
- Behaviour of Doctor Rude Reasonable Good Very kind
- -
30.0 70.0
5.0 5.0
25.0 65.0
- - -
100.0
3.0 3.0
24.2 69.7
Behaviour of Nurse Rude Reasonable Good Very kind
- -
60.0 40.0
- -
40.0 60.0
- -
66.7 33.3
- -
48.5 51.5
Behaviour of Technical Staff Rude Reasonable Good Very kind
- -
62.5 37.5
- -
6.7 93.3
- - - -
- -
26.1 73.9
Behaviour of Ayah Rude Reasonable Good Very kind
- -
100.0 -
- -
100.0 -
- -
100.0 -
- -
100.0 -
Behaviour of Ward Boys Rude Reasonable Good Very kind
- -
100.0 -
- -
100.0 -
- -
100.0 -
- -
100.0 -
Behaviour of Counter Clerk Negligent Arrogant Indifferent Good
- - -
100.0
- - -
100.0
- - -
100.0
- - -
100.0 Total In-patients interviewed 10 20 3 33
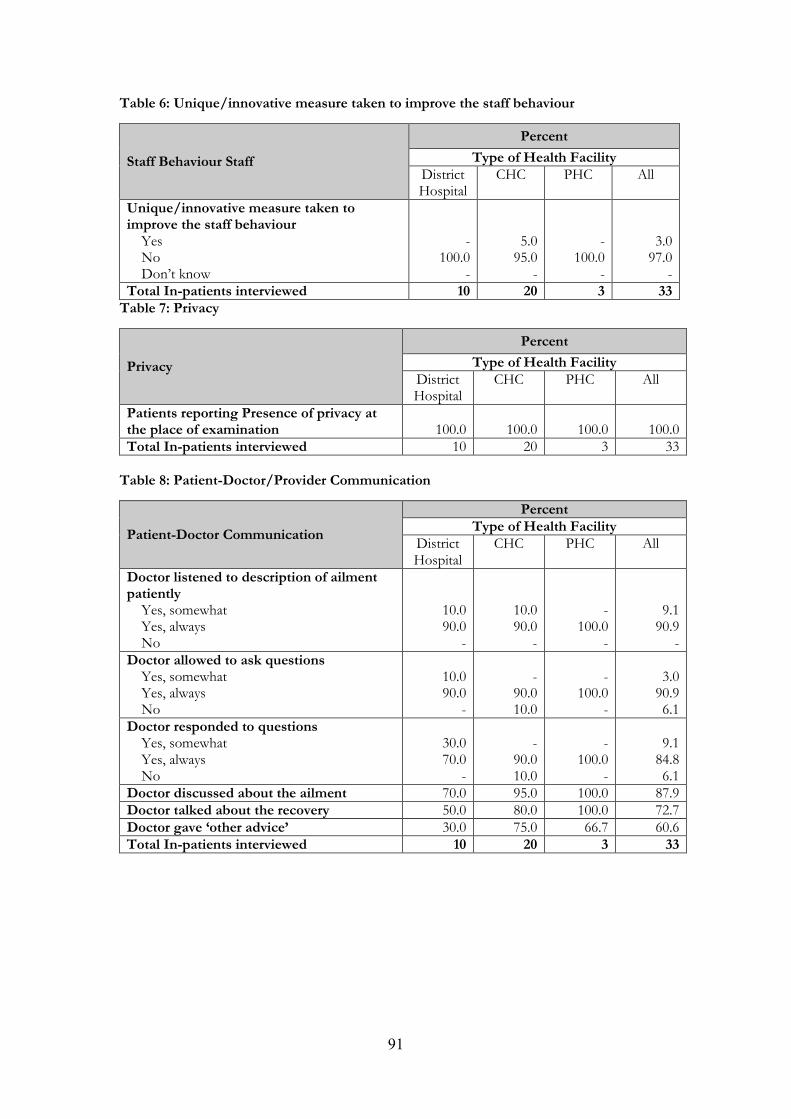
91
Table 6: Unique/innovative measure taken to improve the staff behaviour
Staff Behaviour Staff
Percent
Type of Health Facility District Hospital
CHC PHC All
Unique/innovative measure taken to improve the staff behaviour Yes No Don’t know
- 100.0
-
5.0 95.0
-
- 100.0
-
3.0 97.0
- Total In-patients interviewed 10 20 3 33
Table 7: Privacy
Privacy
Percent
Type of Health Facility District Hospital
CHC PHC All
Patients reporting Presence of privacy at the place of examination 100.0 100.0 100.0 100.0 Total In-patients interviewed 10 20 3 33
Table 8: Patient-Doctor/Provider Communication
Patient-Doctor Communication
Percent Type of Health Facility
District Hospital
CHC PHC All
Doctor listened to description of ailment patiently Yes, somewhat Yes, always No
10.0 90.0
-
10.0 90.0
-
-
100.0 -
9.1 90.9
- Doctor allowed to ask questions Yes, somewhat Yes, always No
10.0 90.0
-
-
90.0 10.0
-
100.0 -
3.0
90.9 6.1
Doctor responded to questions Yes, somewhat Yes, always No
30.0 70.0
-
-
90.0 10.0
-
100.0 -
9.1
84.8 6.1
Doctor discussed about the ailment 70.0 95.0 100.0 87.9 Doctor talked about the recovery 50.0 80.0 100.0 72.7 Doctor gave ‘other advice’ 30.0 75.0 66.7 60.6 Total In-patients interviewed 10 20 3 33
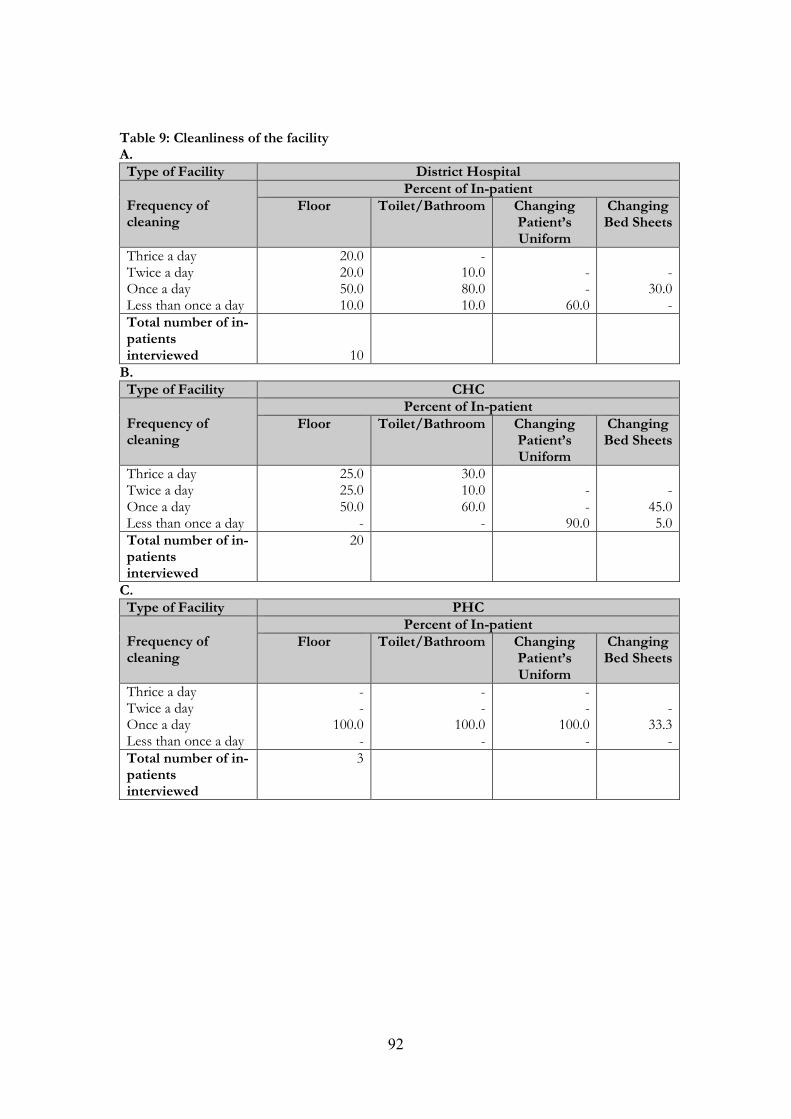
92
Table 9: Cleanliness of the facility A. Type of Facility District Hospital
Frequency of cleaning
Percent of In-patient Floor Toilet/Bathroom Changing
Patient’s Uniform
Changing Bed Sheets
Thrice a day Twice a day Once a day Less than once a day
20.0 20.0 50.0 10.0
- 10.0 80.0 10.0
- -
60.0
-
30.0 -
Total number of in-patients interviewed 10
B. Type of Facility CHC
Frequency of cleaning
Percent of In-patient Floor Toilet/Bathroom Changing
Patient’s Uniform
Changing Bed Sheets
Thrice a day Twice a day Once a day Less than once a day
25.0 25.0 50.0
-
30.0 10.0 60.0
-
- -
90.0
-
45.0 5.0
Total number of in-patients interviewed
20
C. Type of Facility PHC
Frequency of cleaning
Percent of In-patient Floor Toilet/Bathroom Changing
Patient’s Uniform
Changing Bed Sheets
Thrice a day Twice a day Once a day Less than once a day
- -
100.0 -
- -
100.0 -
- -
100.0 -
-
33.3 -
Total number of in-patients interviewed
3
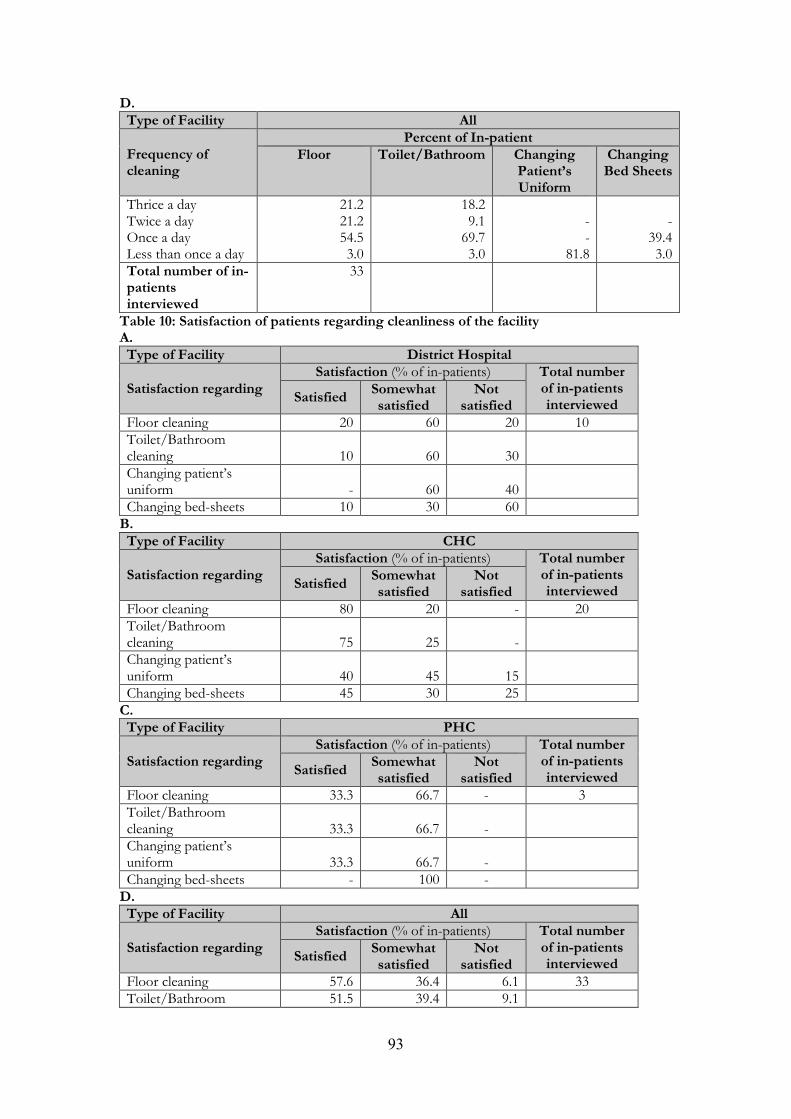
93
D. Type of Facility All
Frequency of cleaning
Percent of In-patient Floor Toilet/Bathroom Changing
Patient’s Uniform
Changing Bed Sheets
Thrice a day Twice a day Once a day Less than once a day
21.2 21.2 54.5 3.0
18.2 9.1
69.7 3.0
-
- 81.8
-
39.4 3.0
Total number of in-patients interviewed
33
Table 10: Satisfaction of patients regarding cleanliness of the facility A. Type of Facility District Hospital
Satisfaction regarding Satisfaction (% of in-patients) Total number
of in-patients interviewed
Satisfied Somewhat satisfied
Not satisfied
Floor cleaning 20 60 20 10 Toilet/Bathroom cleaning 10 60 30
Changing patient’s uniform - 60 40
Changing bed-sheets 10 30 60 B. Type of Facility CHC
Satisfaction regarding Satisfaction (% of in-patients) Total number
of in-patients interviewed
Satisfied Somewhat satisfied
Not satisfied
Floor cleaning 80 20 - 20 Toilet/Bathroom cleaning 75 25 -
Changing patient’s uniform 40 45 15
Changing bed-sheets 45 30 25 C. Type of Facility PHC
Satisfaction regarding Satisfaction (% of in-patients) Total number
of in-patients interviewed
Satisfied Somewhat satisfied
Not satisfied
Floor cleaning 33.3 66.7 - 3 Toilet/Bathroom cleaning 33.3 66.7 -
Changing patient’s uniform 33.3 66.7 -
Changing bed-sheets - 100 - D. Type of Facility All
Satisfaction regarding Satisfaction (% of in-patients) Total number
of in-patients interviewed
Satisfied Somewhat satisfied
Not satisfied
Floor cleaning 57.6 36.4 6.1 33 Toilet/Bathroom 51.5 39.4 9.1
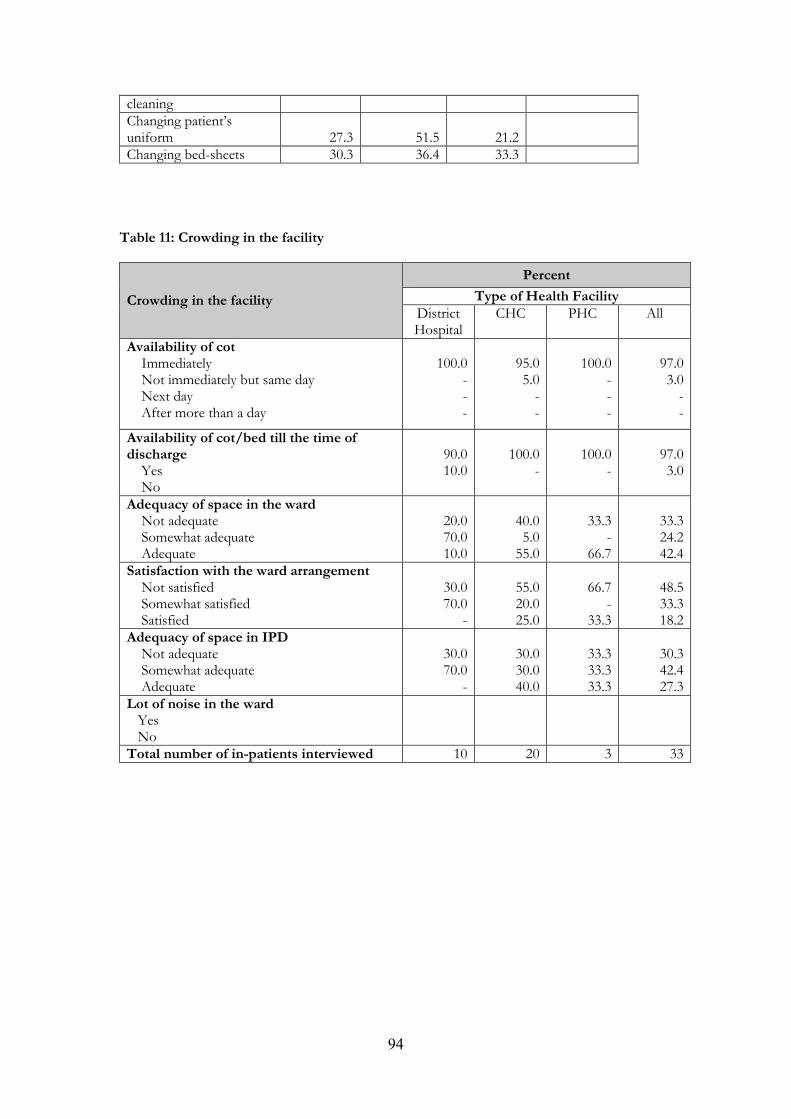
94
cleaning Changing patient’s uniform 27.3 51.5 21.2
Changing bed-sheets 30.3 36.4 33.3 Table 11: Crowding in the facility
Crowding in the facility
Percent
Type of Health Facility District Hospital
CHC PHC All
Availability of cot Immediately Not immediately but same day Next day After more than a day
100.0
- - -
95.0 5.0 - -
100.0
- - -
97.0 3.0 - -
Availability of cot/bed till the time of discharge Yes No
90.0 10.0
100.0
-
100.0
-
97.0 3.0
Adequacy of space in the ward Not adequate Somewhat adequate Adequate
20.0 70.0 10.0
40.0 5.0
55.0
33.3
- 66.7
33.3 24.2 42.4
Satisfaction with the ward arrangement Not satisfied Somewhat satisfied Satisfied
30.0 70.0
-
55.0 20.0 25.0
66.7
- 33.3
48.5 33.3 18.2
Adequacy of space in IPD Not adequate Somewhat adequate Adequate
30.0 70.0
-
30.0 30.0 40.0
33.3 33.3 33.3
30.3 42.4 27.3
Lot of noise in the ward Yes No
Total number of in-patients interviewed 10 20 3 33
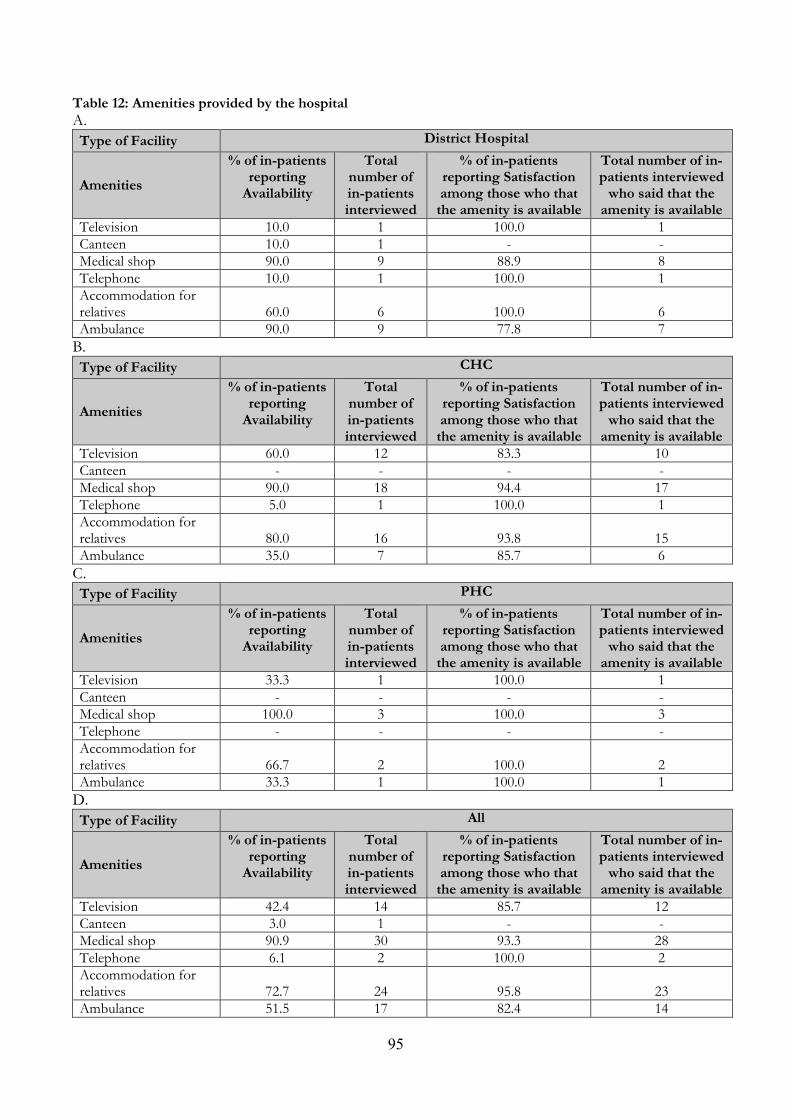
95
Table 12: Amenities provided by the hospital
A.
Type of Facility District Hospital
Amenities
% of in-patients reporting
Availability
Total number of in-patients interviewed
% of in-patients reporting Satisfaction among those who that the amenity is available
Total number of in-patients interviewed who said that the
amenity is available Television 10.0 1 100.0 1 Canteen 10.0 1 - - Medical shop 90.0 9 88.9 8 Telephone 10.0 1 100.0 1 Accommodation for relatives 60.0 6 100.0 6 Ambulance 90.0 9 77.8 7
B.
Type of Facility CHC
Amenities
% of in-patients reporting
Availability
Total number of in-patients interviewed
% of in-patients reporting Satisfaction among those who that the amenity is available
Total number of in-patients interviewed who said that the
amenity is available Television 60.0 12 83.3 10 Canteen - - - - Medical shop 90.0 18 94.4 17 Telephone 5.0 1 100.0 1 Accommodation for relatives 80.0 16 93.8 15 Ambulance 35.0 7 85.7 6
C.
Type of Facility PHC
Amenities
% of in-patients reporting
Availability
Total number of in-patients interviewed
% of in-patients reporting Satisfaction among those who that the amenity is available
Total number of in-patients interviewed who said that the
amenity is available Television 33.3 1 100.0 1 Canteen - - - - Medical shop 100.0 3 100.0 3 Telephone - - - - Accommodation for relatives 66.7 2 100.0 2 Ambulance 33.3 1 100.0 1
D.
Type of Facility All
Amenities
% of in-patients reporting
Availability
Total number of in-patients interviewed
% of in-patients reporting Satisfaction among those who that the amenity is available
Total number of in-patients interviewed who said that the
amenity is available Television 42.4 14 85.7 12 Canteen 3.0 1 - - Medical shop 90.9 30 93.3 28 Telephone 6.1 2 100.0 2 Accommodation for relatives 72.7 24 95.8 23 Ambulance 51.5 17 82.4 14
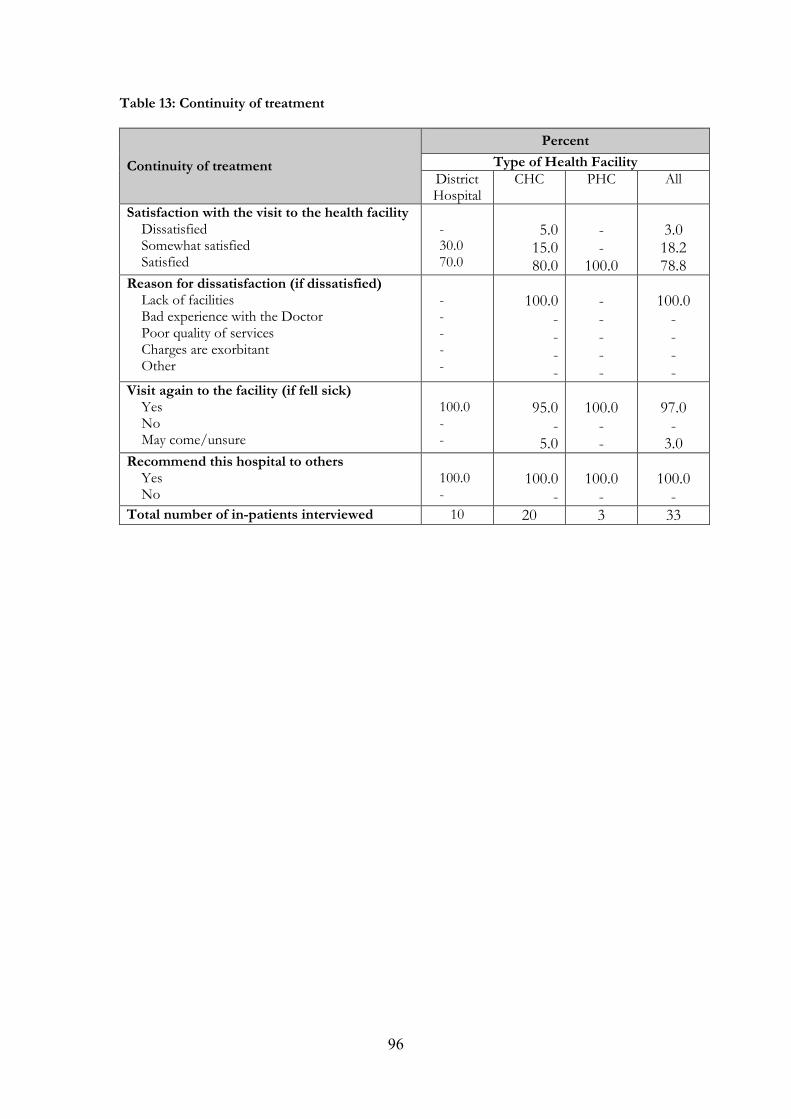
96
Table 13: Continuity of treatment
Continuity of treatment
Percent
Type of Health Facility District Hospital
CHC PHC All
Satisfaction with the visit to the health facility Dissatisfied Somewhat satisfied Satisfied
- 30.0 70.0
5.0 15.0 80.0
- -
100.0
3.0 18.2 78.8
Reason for dissatisfaction (if dissatisfied) Lack of facilities Bad experience with the Doctor Poor quality of services Charges are exorbitant Other
- - - - -
100.0
- - - -
- - - - -
100.0 - - - -
Visit again to the facility (if fell sick) Yes No May come/unsure
100.0 - -
95.0
- 5.0
100.0 - -
97.0 - 3.0
Recommend this hospital to others Yes No
100.0 -
100.0
-
100.0 -
100.0 -
Total number of in-patients interviewed 10 20 3 33
97
OPD Facilities Table 1: Background characteristics of the patients
Background Characteristics of the Out-Patients Percent
Age < 20 years 20-29 years 30-39 years 40-49 years 50-59 years 60 years or more
5.7 25.7 18.6 20.0 18.6 11.4
Sex Male Female
50.0 50.0
Marital Status Unmarried Currently Married Divorced/Separated Widowed
7.1 88.6
- 4.3
Residence Rural Urban
90.0 10.0
Type of Health Facility District Hospital CHC PHC
14.3 28.6 57.1
Total out-patients interviewed 70
98
Table 2: Purpose of visit to the Health Institution
Purpose of visit in the Health Institution
Percent
Type of Health Facility District Hospital
CHC PHC All
Minor Illness
FP Services
Antenatal Care
PNC
Eye Check-up
MDT-DOTs
Child Illness
Other
50.0 10.0
- -
10.0 -
10.0 20.0
65.0 - - - - -
35.0 -
85.0 -
2.5 - - -
10.0 2.5
74.3 1.4 1.4 -
1.4 -
17.1 4.3
Total out-patients interviewed 10 20 40 70
99
Table 3: Waiting time
A. Type of Facility District Hospital
Average waiting time for: No. of patients
availed the service Average waiting time (in minutes)
Registration 10 19.7 Doctor’s examination 10 20.5 Injection 10 14.7 Getting medicines 10 17.4 Dressing 2 10.0 Paying bill - - Total time taken for OPD services
B. Type of Facility CHC
Average waiting time for: No. of patients
availed the service Average waiting time (in minutes)
Registration 20 5.5 Doctor’s examination 20 5.0 Injection 13 5.5 Getting medicines 20 4.3 Dressing - - Paying bill - - Total time taken for OPD services
C. Type of Facility PHC
Average waiting time for: No. of patients
availed the service Average waiting time (in minutes)
Registration 40 8.3 Doctor’s examination 40 8.2 Injection 26 7.5 Getting medicines 40 6.1 Dressing 1 3.0 Paying bill - - Total time taken for OPD services
D. Type of Facility All
Average waiting time for: No. of patients
availed the service Average waiting time (in minutes)
Registration 70 9.1 Doctor’s examination 70 9.0 Injection 49 8.4 Getting medicines 70 7.2 Dressing 3 7.7 Paying bill - - Total time taken for OPD services
100
Table 4: Satisfaction regarding waiting time A. Type of Facility District Hospital
Waiting time for: No. of patients
availed the service
Satisfaction (% of patients)
Too Long Appropriate Too Short Can’t Say Registration 10 50 20 30 - Doctor’s examination 10 40 30 30 - Injection 10 40 30 30 - Getting medicines 10 50 20 30 - Dressing 2 - - 100 - Paying bill - - - - -
B. Type of Facility CHC
Waiting time for: No. of patients
availed the service
Satisfaction (% of patients)
Too Long Appropriate Too Short Can’t Say Registration 20 5 40 55 - Doctor’s examination 20 - 50 50 - Injection 13 7.7 38.5 53.8 - Getting medicines 20 - 50 50 - Dressing - - - - - Paying bill - - - - -
C. Type of Facility PHC
Waiting time for: No. of patients
availed the service
Satisfaction (% of patients)
Too Long Appropriate Too Short Can’t Say Registration 40 10 60 30 - Doctor’s examination 40 7.5 57.5 35 - Injection 26 3.8 61.5 34.6 - Getting medicines 40 2.5 52.5 45 - Dressing 1 - 100 - - Paying bill - - - - -
D. Type of Facility All
Waiting time for: No. of patients
availed the service
Satisfaction (% of patients)
Too Long Appropriate Too Short Can’t Say Registration 70 14.3 48.6 37.1 - Doctor’s examination 70 10 51.4 38.6 - Injection 49 12.2 49 38.8 - Getting medicines 70 8.6 47.1 44.3 - Dressing 3 - 33.3 66.7 - Paying bill - - - - -
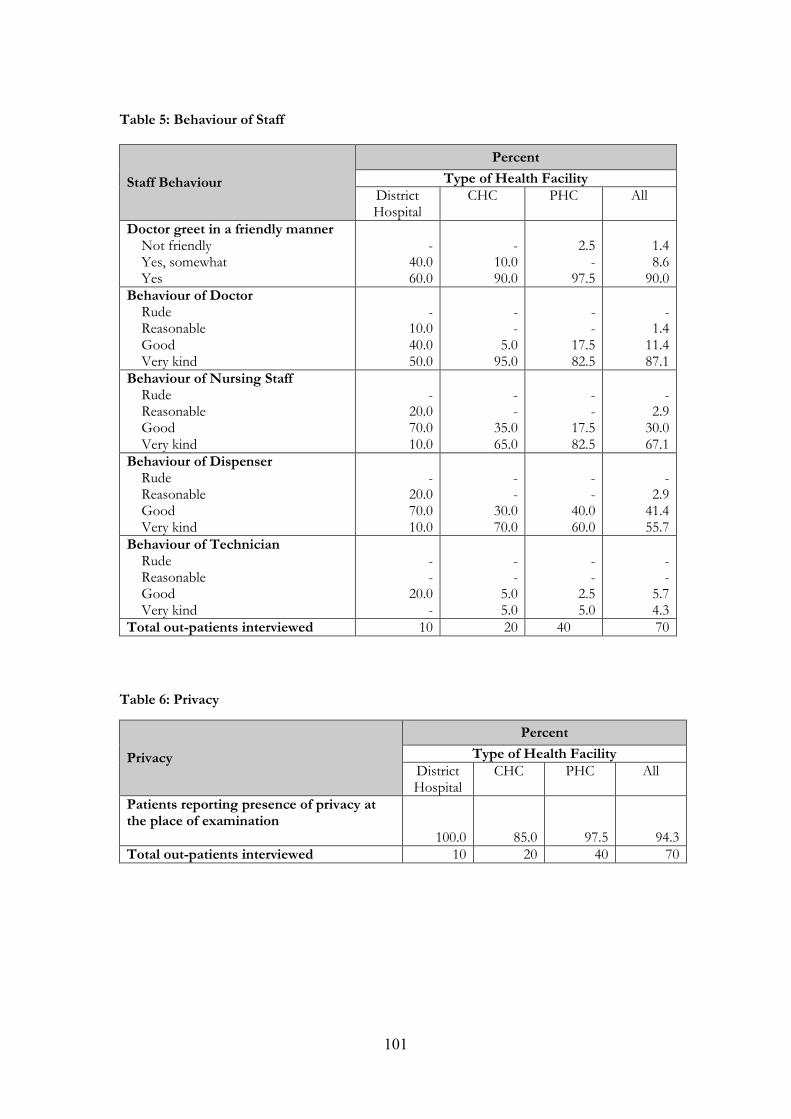
101
Table 5: Behaviour of Staff
Staff Behaviour
Percent
Type of Health Facility District Hospital
CHC PHC All
Doctor greet in a friendly manner Not friendly Yes, somewhat Yes
-
40.0 60.0
-
10.0 90.0
2.5 -
97.5
1.4 8.6
90.0 Behaviour of Doctor Rude Reasonable Good Very kind
-
10.0 40.0 50.0
- -
5.0 95.0
- -
17.5 82.5
-
1.4 11.4 87.1
Behaviour of Nursing Staff Rude Reasonable Good Very kind
-
20.0 70.0 10.0
- -
35.0 65.0
- -
17.5 82.5
-
2.9 30.0 67.1
Behaviour of Dispenser Rude Reasonable Good Very kind
-
20.0 70.0 10.0
- -
30.0 70.0
- -
40.0 60.0
-
2.9 41.4 55.7
Behaviour of Technician Rude Reasonable Good Very kind
- -
20.0 -
- -
5.0 5.0
- -
2.5 5.0
- -
5.7 4.3
Total out-patients interviewed 10 20 40 70
Table 6: Privacy
Privacy
Percent
Type of Health Facility District Hospital
CHC PHC All
Patients reporting presence of privacy at the place of examination 100.0 85.0 97.5 94.3 Total out-patients interviewed 10 20 40 70
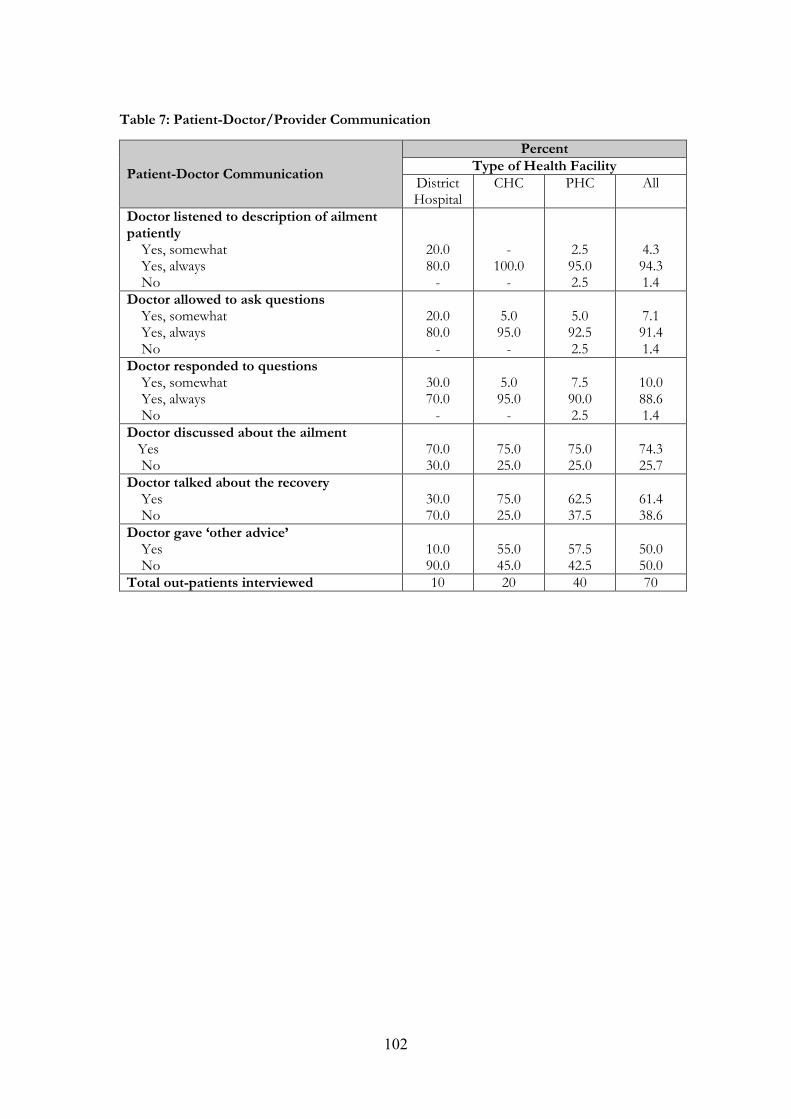
102
Table 7: Patient-Doctor/Provider Communication
Patient-Doctor Communication
Percent Type of Health Facility
District Hospital
CHC PHC All
Doctor listened to description of ailment patiently Yes, somewhat Yes, always No
20.0 80.0 -
-
100.0 -
2.5 95.0 2.5
4.3 94.3 1.4
Doctor allowed to ask questions Yes, somewhat Yes, always No
20.0 80.0 -
5.0 95.0 -
5.0 92.5 2.5
7.1 91.4 1.4
Doctor responded to questions Yes, somewhat Yes, always No
30.0 70.0 -
5.0 95.0 -
7.5 90.0 2.5
10.0 88.6 1.4
Doctor discussed about the ailment Yes No
70.0 30.0
75.0 25.0
75.0 25.0
74.3 25.7
Doctor talked about the recovery Yes No
30.0 70.0
75.0 25.0
62.5 37.5
61.4 38.6
Doctor gave ‘other advice’ Yes No
10.0 90.0
55.0 45.0
57.5 42.5
50.0 50.0
Total out-patients interviewed 10 20 40 70
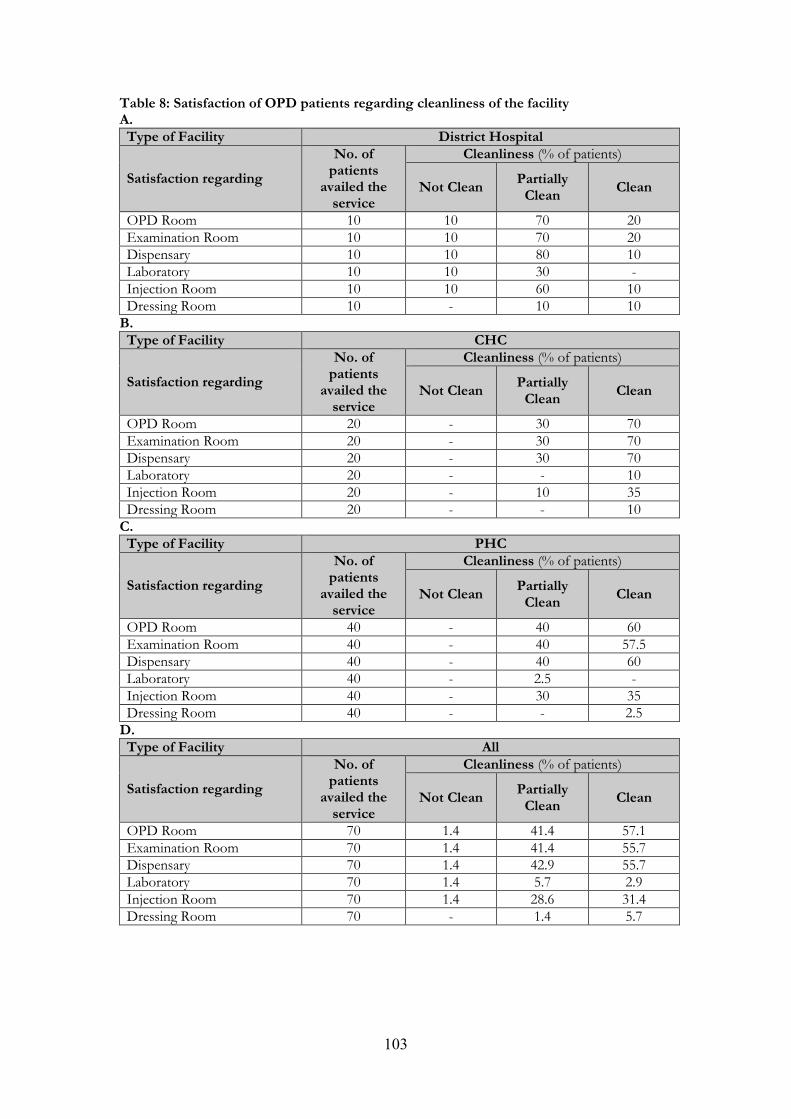
103
Table 8: Satisfaction of OPD patients regarding cleanliness of the facility A. Type of Facility District Hospital
Satisfaction regarding
No. of patients
availed the service
Cleanliness (% of patients)
Not Clean Partially Clean
Clean
OPD Room 10 10 70 20 Examination Room 10 10 70 20 Dispensary 10 10 80 10 Laboratory 10 10 30 - Injection Room 10 10 60 10 Dressing Room 10 - 10 10
B. Type of Facility CHC
Satisfaction regarding
No. of patients
availed the service
Cleanliness (% of patients)
Not Clean Partially Clean
Clean
OPD Room 20 - 30 70 Examination Room 20 - 30 70 Dispensary 20 - 30 70 Laboratory 20 - - 10 Injection Room 20 - 10 35 Dressing Room 20 - - 10
C. Type of Facility PHC
Satisfaction regarding
No. of patients
availed the service
Cleanliness (% of patients)
Not Clean Partially Clean
Clean
OPD Room 40 - 40 60 Examination Room 40 - 40 57.5 Dispensary 40 - 40 60 Laboratory 40 - 2.5 - Injection Room 40 - 30 35 Dressing Room 40 - - 2.5
D. Type of Facility All
Satisfaction regarding
No. of patients
availed the service
Cleanliness (% of patients)
Not Clean Partially Clean
Clean
OPD Room 70 1.4 41.4 57.1 Examination Room 70 1.4 41.4 55.7 Dispensary 70 1.4 42.9 55.7 Laboratory 70 1.4 5.7 2.9 Injection Room 70 1.4 28.6 31.4 Dressing Room 70 - 1.4 5.7
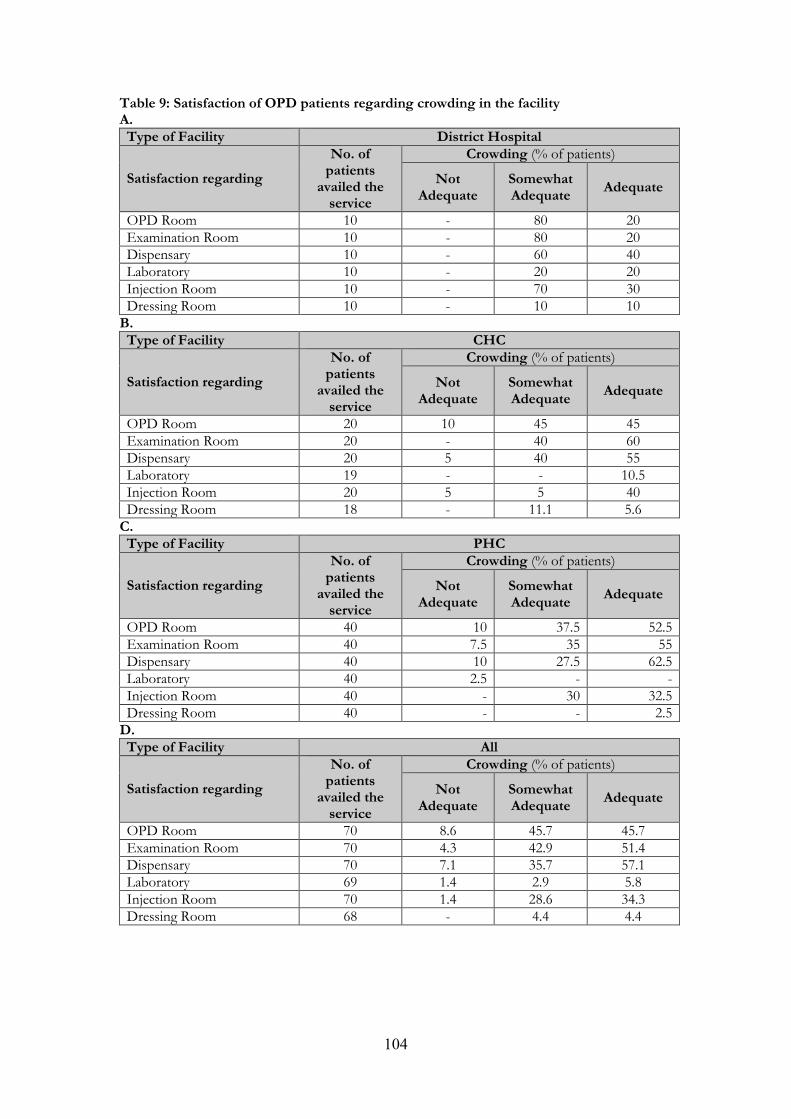
104
Table 9: Satisfaction of OPD patients regarding crowding in the facility A. Type of Facility District Hospital
Satisfaction regarding
No. of patients
availed the service
Crowding (% of patients)
Not Adequate
Somewhat Adequate
Adequate
OPD Room 10 - 80 20 Examination Room 10 - 80 20 Dispensary 10 - 60 40 Laboratory 10 - 20 20 Injection Room 10 - 70 30 Dressing Room 10 - 10 10
B. Type of Facility CHC
Satisfaction regarding
No. of patients
availed the service
Crowding (% of patients)
Not Adequate
Somewhat Adequate
Adequate
OPD Room 20 10 45 45 Examination Room 20 - 40 60 Dispensary 20 5 40 55 Laboratory 19 - - 10.5 Injection Room 20 5 5 40 Dressing Room 18 - 11.1 5.6
C. Type of Facility PHC
Satisfaction regarding
No. of patients
availed the service
Crowding (% of patients)
Not Adequate
Somewhat Adequate
Adequate
OPD Room 40 10 37.5 52.5 Examination Room 40 7.5 35 55 Dispensary 40 10 27.5 62.5 Laboratory 40 2.5 - - Injection Room 40 - 30 32.5 Dressing Room 40 - - 2.5
D. Type of Facility All
Satisfaction regarding
No. of patients
availed the service
Crowding (% of patients)
Not Adequate
Somewhat Adequate
Adequate
OPD Room 70 8.6 45.7 45.7 Examination Room 70 4.3 42.9 51.4 Dispensary 70 7.1 35.7 57.1 Laboratory 69 1.4 2.9 5.8 Injection Room 70 1.4 28.6 34.3 Dressing Room 68 - 4.4 4.4
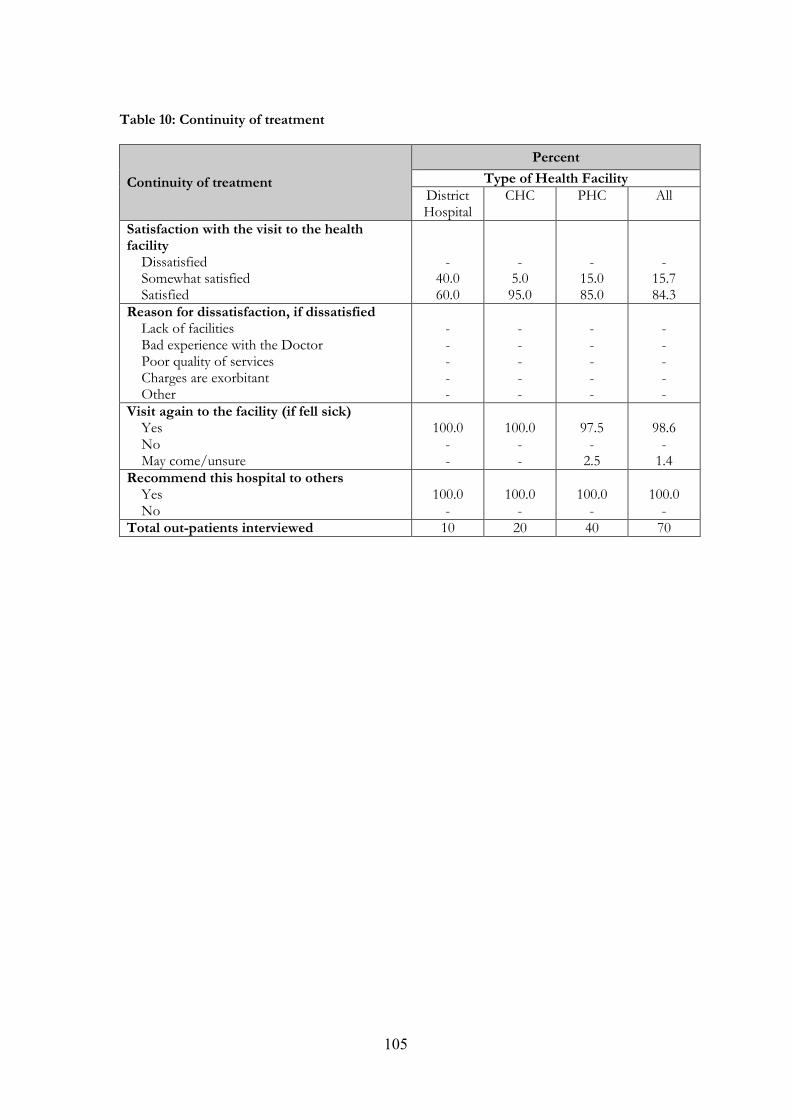
105
Table 10: Continuity of treatment
Continuity of treatment
Percent
Type of Health Facility District Hospital
CHC PHC All
Satisfaction with the visit to the health facility Dissatisfied Somewhat satisfied Satisfied
-
40.0 60.0
- 5.0 95.0
-
15.0 85.0
-
15.7 84.3
Reason for dissatisfaction, if dissatisfied Lack of facilities Bad experience with the Doctor Poor quality of services Charges are exorbitant Other
- - - - -
- - - - -
- - - - -
- - - - -
Visit again to the facility (if fell sick) Yes No May come/unsure
100.0 - -
100.0 - -
97.5 - 2.5
98.6 - 1.4
Recommend this hospital to others Yes No
100.0 -
100.0 -
100.0 -
100.0 -
Total out-patients interviewed 10 20 40 70
106
Glossary of Key Relevant Terms
Sl. &o Abbreviation Full Form
1 AD Syringe Auto Destruct Syringes
2 AEFI Adverse Events Following Immunisation
3 AFB Acid Fast Bacillus
4 AFB- Acid fact Bacillus Usually refers to Tuberculosis bacilli, although organism for
Leprosy is also Acid fast.
5 AMC Annual Maintenance Contract
6 ANC Ante Natal Care
7 ANC completed IFA
prophylaxis
Number of Antenatal cases who have taken Tablet Iron & Folic
Acid for 100 days during pregnancy.
8 ANC given 3 checkups Antenatal cases who have been given three checkups as per
Schedule Ist Check-up at 20-24 weeks, 2nd at 28-32 weeks and
3rd at 36 weeks of pregnancy
9 ANC given TT Number of Antenatal cases given tetanus Toxoid injections(
Sum of 2nd dose and Booster dose )
10 ANM Auxiliary Nurse Midwife
11 APH – (Ante partum
haemorrhage)
Bleeding during pregnancy from 28 weeks onwards till delivery
12 APL Above Poverty Line
13 Aseptic delivery Delivery not contaminated by sepsis/infection. Normal
deliveries are usually aseptic.
14 ASHA Accredited Social Health Activist
15 ASHA Kit Drug and item kit provided to ASHA for daily use.
16 Asphysixia Medical condition resulting from deprivation of oxygen
(hypoxia) to a newborn infant long enough to cause harm.
17 Assisted delivery An assisted delivery is a situation where birth of a child may
have to be assisted using forceps or vacuum extraction. It may
happen in normal delivery or during abnormal presentations like
Breech delivery etc. It may also be required in medical
conditions like preeclampsia etc. 18 Audiometrician A technician trained to carry out tests for hearing using special
equipment. 19 Auto analyser Equipment for carrying out automatic tests in labs.
20 Autoclave Equipment used to sterilise equipments/ dressing material.
21 AV Aids Audio Visual Aids
22 Average daily OPD Calculated by dividing total OPD of the month by available
OPD days (Total No. Of days on which OPD services are
available)
107
Sl. &o Abbreviation Full Form
23 AYUSH Department of Ayurveda, Yoga & Naturopathy, Unani, Siddha
and Homeopathy
24 BCC Behaviour Change Communication
25 Bed occupancy rate To calculate the average occupancy rate for a typical one-year
reporting period, two data item are needed.
(Inpatient Days of Care / Bed Days Available) x 100
These include "Inpatient Days of Care" and "Bed Days
Definitions of these two items are as follows:
Inpatient days of Care: Sum of each daily inpatient census for
the year. To arrive at this total, you would simply add together
each daily census for the 365 days in the year. Other
synonymous terms include "total inpatient service days,"
"occupied bed days," or "census patient days of care."
Bed Days Available: The maximum number of inpatient days of
care that would have been provided if all beds were filled during
the year. If 50 beds were available for use each day during the
year, bed days available would be 50 x 365 = 18,250. If the
number of beds fluctuated throughout the year, bed days
available should reflect this and the calculation would be more
complicated. Other terms used for bed days available include
"potential days," "maximum patient days," or "total inpatient bed
count days."
26 BeMOC Services refer to facilities with following essential services -
1 Parenteral administration of Antibiotic;
2. Parenteral administration of Anticonvulsants;
3. Parenteral administration of Oxytocics;
4. Assisted vaginal delivery;
5. Manual removal of Placenta;
6. Removal of retained products of conception
27 Bio medical waste Any waste, which is generated during the diagnosis, treatment or
immunisation of human beings
28 BITOT’S Spots Bitot's spots are superficial, foamy gray, triangular spots on the
white of the eyeball due to Vitamin A deficiency
29 Blood Smear Examination of blood for different types of cell counts.
30 Blood Storage Unit These are smaller blood storage facilities primarily designed for
FRUs abut may also be located at any CHC, PHC or any other
govt hospital. These units have blood storage capability of 50
units at one time. 31 Bone marrow biopsy Biopsy of bone marrow cells.
32 Boyles Apparatus Equipment for providing anaesthesia and respiratory assistance.
33 BPL Below Poverty Line
108
Sl. &o Abbreviation Full Form
34 Breech presentation Delivery of foetus with feet presentation.
35 Bronchoscopy Examination of bronchi (Lungs) using an instrument –
Bronchoscope. 36 CeMOC Services refer to facilities with all services listed under BeMOC
and also include the following-
1. Availability of blood and blood transfusion facility.
2. Facility for Caesarean section for delivery of foetus in
emergency cases
37 Cervical tear Tear of cervix during delivery.
38 Citizen’s charter It is a document which focuses on rights of citizens with respect
to services to be provided at different levels and in different type
of facilities. It describes level and quality of services which a
citizen can expect and also the people responsible for these
services. 39 Cold Chain This is a temperature controlled supply chain, usually for
temperature sensitive items like vaccines and sera. Different
types of equipment is usually available at various facilities like –
Deep freezer, Ice Lined Refrigerator (ILR), Cold boxes etc.
40 Colony Hospital Health facilities in Urban areas having indoor facilities with
more than 30 Beds.
41 Cradle A cradle (also called a crib) is a small bed, for holding babies in
maternal wards.
42 CSF Cerebral Spinal Fluid
43 CSF Analysis Study (Lab test) of Cerebro Spinal Fluid.
44 DDK Disposable Delivery Kit
45 Disease classification hospital
records.
The system is based on WHO classification manual – ICD -10. It
is a system used to classify diseases and other health problems
which are recorded on many types of health and vital records
including death certificates
46 DMC Designated Microscopic Ccentre
47 DOTS Directly Observed Treatment Strategy
48 DPMU District Program Management Unit
49 DPT 3 Number of infants given 3rd dose of oral DPT vaccine during
routine immunisation.
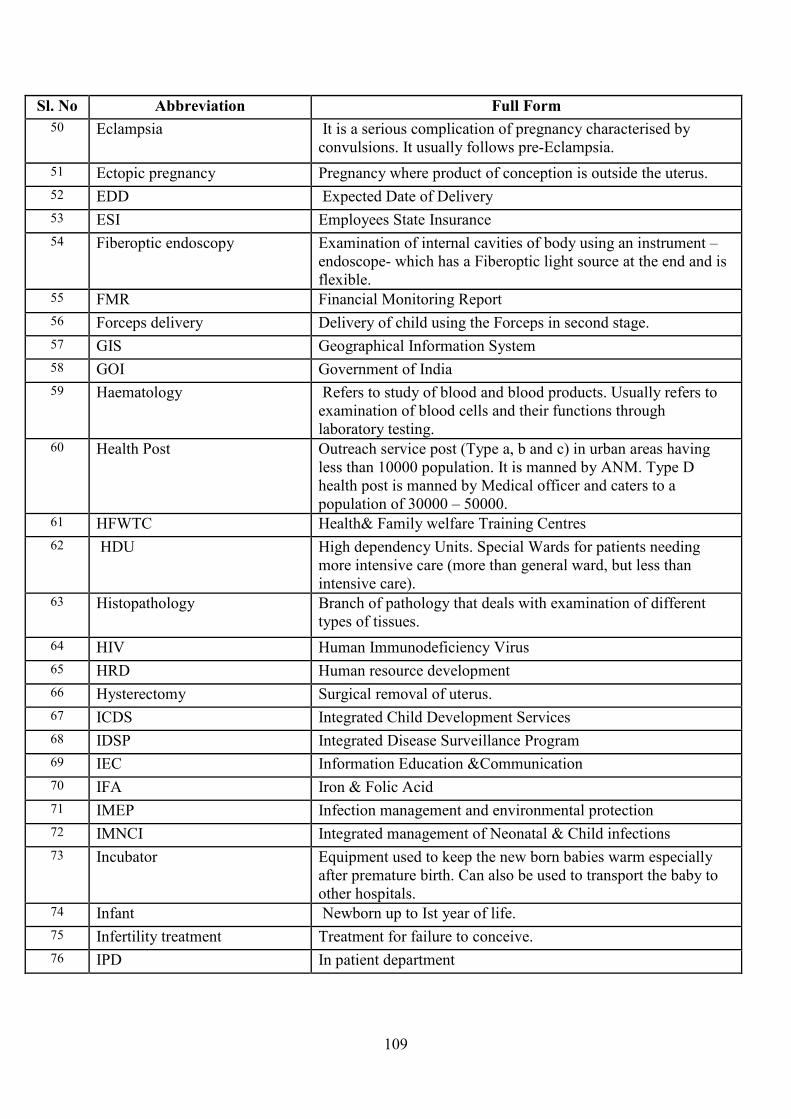
109
Sl. &o Abbreviation Full Form
50 Eclampsia It is a serious complication of pregnancy characterised by
convulsions. It usually follows pre-Eclampsia.
51 Ectopic pregnancy Pregnancy where product of conception is outside the uterus.
52 EDD Expected Date of Delivery
53 ESI Employees State Insurance
54 Fiberoptic endoscopy Examination of internal cavities of body using an instrument –
endoscope- which has a Fiberoptic light source at the end and is
flexible. 55 FMR Financial Monitoring Report
56 Forceps delivery Delivery of child using the Forceps in second stage.
57 GIS Geographical Information System
58 GOI Government of India
59 Haematology Refers to study of blood and blood products. Usually refers to
examination of blood cells and their functions through
laboratory testing. 60 Health Post Outreach service post (Type a, b and c) in urban areas having
less than 10000 population. It is manned by ANM. Type D
health post is manned by Medical officer and caters to a
population of 30000 – 50000. 61 HFWTC Health& Family welfare Training Centres
62 HDU High dependency Units. Special Wards for patients needing
more intensive care (more than general ward, but less than
intensive care). 63 Histopathology Branch of pathology that deals with examination of different
types of tissues.
64 HIV Human Immunodeficiency Virus
65 HRD Human resource development
66 Hysterectomy Surgical removal of uterus.
67 ICDS Integrated Child Development Services
68 IDSP Integrated Disease Surveillance Program
69 IEC Information Education &Communication
70 IFA Iron & Folic Acid
71 IMEP Infection management and environmental protection
72 IMNCI Integrated management of Neonatal & Child infections
73 Incubator Equipment used to keep the new born babies warm especially
after premature birth. Can also be used to transport the baby to
other hospitals. 74 Infant Newborn up to Ist year of life.
75 Infertility treatment Treatment for failure to conceive.
76 IPD In patient department
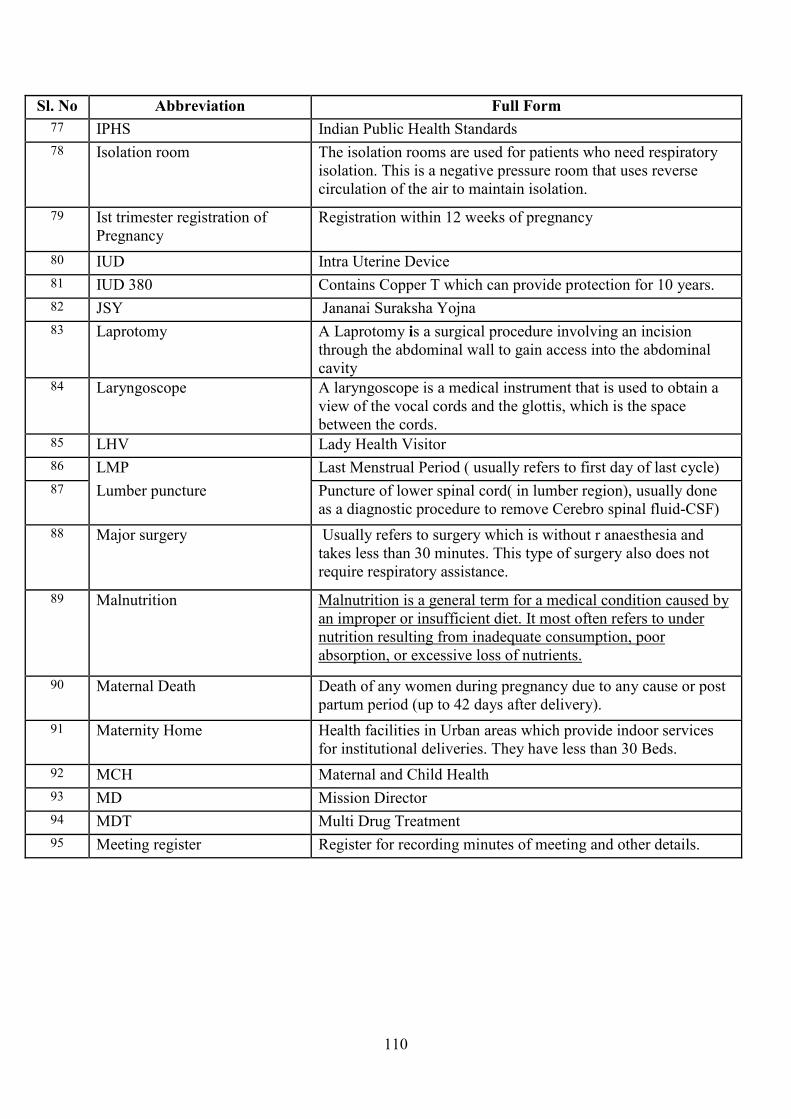
110
Sl. &o Abbreviation Full Form
77 IPHS Indian Public Health Standards
78 Isolation room The isolation rooms are used for patients who need respiratory
isolation. This is a negative pressure room that uses reverse
circulation of the air to maintain isolation.
79 Ist trimester registration of
Pregnancy
Registration within 12 weeks of pregnancy
80 IUD Intra Uterine Device
81 IUD 380 Contains Copper T which can provide protection for 10 years.
82 JSY Jananai Suraksha Yojna
83 Laprotomy A Laprotomy is a surgical procedure involving an incision
through the abdominal wall to gain access into the abdominal
cavity 84 Laryngoscope A laryngoscope is a medical instrument that is used to obtain a
view of the vocal cords and the glottis, which is the space
between the cords. 85 LHV Lady Health Visitor
86 LMP Last Menstrual Period ( usually refers to first day of last cycle)
87 Lumber puncture Puncture of lower spinal cord( in lumber region), usually done
as a diagnostic procedure to remove Cerebro spinal fluid-CSF)
88 Major surgery Usually refers to surgery which is without r anaesthesia and
takes less than 30 minutes. This type of surgery also does not
require respiratory assistance.
89 Malnutrition Malnutrition is a general term for a medical condition caused by
an improper or insufficient diet. It most often refers to under
nutrition resulting from inadequate consumption, poor
absorption, or excessive loss of nutrients.
90 Maternal Death Death of any women during pregnancy due to any cause or post
partum period (up to 42 days after delivery).
91 Maternity Home Health facilities in Urban areas which provide indoor services
for institutional deliveries. They have less than 30 Beds.
92 MCH Maternal and Child Health
93 MD Mission Director
94 MDT Multi Drug Treatment
95 Meeting register Register for recording minutes of meeting and other details.
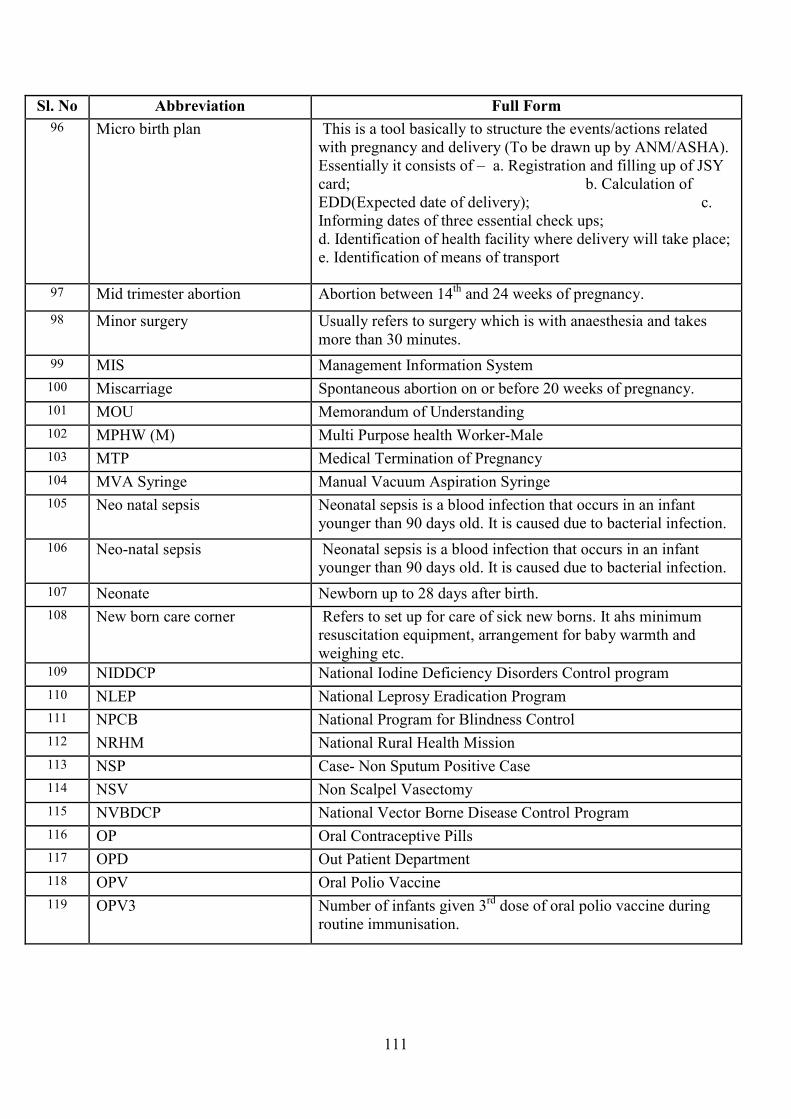
111
Sl. &o Abbreviation Full Form
96 Micro birth plan This is a tool basically to structure the events/actions related
with pregnancy and delivery (To be drawn up by ANM/ASHA).
Essentially it consists of – a. Registration and filling up of JSY
card; b. Calculation of
EDD(Expected date of delivery); c.
Informing dates of three essential check ups;
d. Identification of health facility where delivery will take place;
e. Identification of means of transport
97 Mid trimester abortion Abortion between 14th and 24 weeks of pregnancy.
98 Minor surgery Usually refers to surgery which is with anaesthesia and takes
more than 30 minutes.
99 MIS Management Information System
100 Miscarriage Spontaneous abortion on or before 20 weeks of pregnancy.
101 MOU Memorandum of Understanding
102 MPHW (M) Multi Purpose health Worker-Male
103 MTP Medical Termination of Pregnancy
104 MVA Syringe Manual Vacuum Aspiration Syringe
105 Neo natal sepsis Neonatal sepsis is a blood infection that occurs in an infant
younger than 90 days old. It is caused due to bacterial infection.
106 Neo-natal sepsis Neonatal sepsis is a blood infection that occurs in an infant
younger than 90 days old. It is caused due to bacterial infection.
107 Neonate Newborn up to 28 days after birth.
108 New born care corner Refers to set up for care of sick new borns. It ahs minimum
resuscitation equipment, arrangement for baby warmth and
weighing etc. 109 NIDDCP National Iodine Deficiency Disorders Control program
110 NLEP National Leprosy Eradication Program
111 NPCB National Program for Blindness Control
112 NRHM National Rural Health Mission
113 NSP Case- Non Sputum Positive Case
114 NSV Non Scalpel Vasectomy
115 NVBDCP National Vector Borne Disease Control Program
116 OP Oral Contraceptive Pills
117 OPD Out Patient Department
118 OPV Oral Polio Vaccine
119 OPV3 Number of infants given 3rd dose of oral polio vaccine during
routine immunisation.
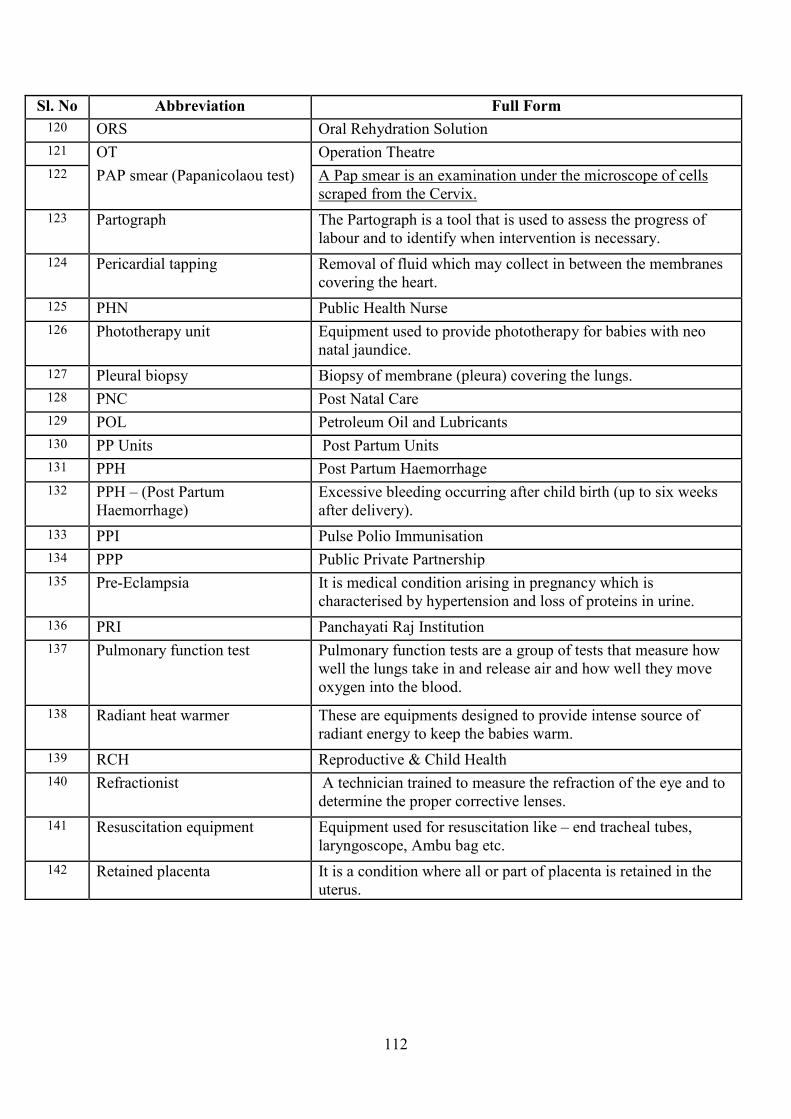
112
Sl. &o Abbreviation Full Form
120 ORS Oral Rehydration Solution
121 OT Operation Theatre
122 PAP smear (Papanicolaou test) A Pap smear is an examination under the microscope of cells
scraped from the Cervix.
123 Partograph The Partograph is a tool that is used to assess the progress of
labour and to identify when intervention is necessary.
124 Pericardial tapping Removal of fluid which may collect in between the membranes
covering the heart.
125 PHN Public Health Nurse
126 Phototherapy unit Equipment used to provide phototherapy for babies with neo
natal jaundice.
127 Pleural biopsy Biopsy of membrane (pleura) covering the lungs.
128 PNC Post Natal Care
129 POL Petroleum Oil and Lubricants
130 PP Units Post Partum Units
131 PPH Post Partum Haemorrhage
132 PPH – (Post Partum
Haemorrhage)
Excessive bleeding occurring after child birth (up to six weeks
after delivery).
133 PPI Pulse Polio Immunisation
134 PPP Public Private Partnership
135 Pre-Eclampsia It is medical condition arising in pregnancy which is
characterised by hypertension and loss of proteins in urine.
136 PRI Panchayati Raj Institution
137 Pulmonary function test Pulmonary function tests are a group of tests that measure how
well the lungs take in and release air and how well they move
oxygen into the blood.
138 Radiant heat warmer These are equipments designed to provide intense source of
radiant energy to keep the babies warm.
139 RCH Reproductive & Child Health
140 Refractionist A technician trained to measure the refraction of the eye and to
determine the proper corrective lenses.
141 Resuscitation equipment Equipment used for resuscitation like – end tracheal tubes,
laryngoscope, Ambu bag etc.
142 Retained placenta It is a condition where all or part of placenta is retained in the
uterus.
113
Sl. &o Abbreviation Full Form
143 RIMS Routine Immunisation Monitoring System
144 RKS Rogi Kalyan Samiti
145 RMP Registered Medical Practitioner
146 RNTCP Revised National Tuberculosis Control Program
147 RPR Test Rapid Plasma Region
148 RTI/STI Reproductive tract infection/Sexually Transmitted Infection
149 SBA Skilled Birth Attendant (Special training course is available for
SBA). 150 Septic delivery Delivery contaminated by infection.
151 SHG Self Help Group
152 SPMU State Program Management Unit
153 STLS Senior Tuberculosis Laboratory Supervisor
154 STS Senior Treatment Supervisor
155 TNSMC Tamil Nadu State Medical Corporation
156 Total ANC Registration Total of all new Antenatal cases registered during the given
period. 157 Ultrasound guided biopsy A biopsy carried out using ultrasound for guidance.
158 VCTC Voluntary counselling and testing centre.
159 Vertical health
programs/societies
These are stand alone health programs which have not been
integrated so far such as – AIDS control program, pulse polio
program etc. These programs have separate funding and
organisation structure 160 VHND Village Health and Nutrition Day
161 VHSC Village Health & Sanitation Committee
162 Wet mount The vaginitis wet mount test is a test to detect an infection of the
vagina.


