Embed Size (px)
Citation preview
CRANFIELD UNIVERSITY
QI QIAO
On-board Visualisation of Machining Tool Paths Generated by
Function Blocks
School of Aerospace, Transport and Manufacturing
(School of Applied Science)
MSc by Research
MSC THESIS
Academic Year: 2013-2014
Supervisor: Dr. Jörn Mehnen, Prof. Ashutosh Tiwari
September 2014

CRANFIELD UNIVERSITY
School of Aerospace, Transport and Manufacturing
(School of Applied Science)
MSc by Research
MSc Thesis
Academic Year 2013-2014
QI QIAO
On-board Visualisation of Machining Tool Paths Generated by
Function Blocks
Supervisor: Dr. Jörn Mehnen, Prof. Ashutosh Tiwari
September 2014
This thesis is submitted in partial fulfilment of the requirements for
the degree of Master of Science
© Cranfield University 2014. All rights reserved. No part of this
publication may be reproduced without the written permission of the
copyright owner.

i
ABSTRACT
A solution for visualising the tool path generated by a function block system is
introduced in this research. It facilitates the real-time monitoring of the behaviour
of function blocks running on-board a CNC controller, and provides interactivity
between the function block system and the shop floor users.
In order to improve computer aided process planning for milling operations, a
distributed function block system is currently being developed by the project
CAPP-4-SEMs (Collaborative and Adaptive Process Planning for Sustainable
Manufacturing Environments). In this system, the function blocks are created in a
Web-based Distributed Process Planning (Web-DPP) system built in a Cloud
environment, and dispatched to CNC controllers to generate complex milling tool
paths. This approach is different from the conventional off-line CAD-CAM-CNC
approach driven by G-code. The ability of a real-time, on-board visualisation of the
behaviour of function blocks is a very important feature for the evaluating and
manipulating the behaviour of function block. It helps the users to understand the
encapsulated process behaviour which the function block system is generating,
and to acquire the confidence that the system is practical and reliable.
The aim of this research is to find a suitable solution to realise the visualisation
for tool paths generated by a system of function block running on a CNC controller.
The existing visualisation methods are researched, compared and selected to fit
the purpose. A number of aspects have been investigated such as the program
language, graphical user interface layout and the practical needs of the shop floor
users. By a requirements survey from industries, the challenging practical needs of
industries are collected, analysed and used for steering the development. An
application with a 3D graphical user interface has been developed and tested. The
developed visualizer is a light weight visualisation tool which is able to run directly
on CNC controllers with Windows (or PC with Windows). It can be connected with
a Cloud environment (optional) for real-time tool path visualisation.
Keywords: visualisation, function block, tool path, on-board, light weight,
real-time, CNC controller


iii
ACKNOWLEDGEMENTS
I would like to express my gratitude to my supervisors, Dr. Jörn Mehnen and
Prof. Ashutosh Tiwari, for their continuous support and guidance. I am also very
grateful to Dr. Nikolaos Tapoglou and Dr. Konstantinos Salonitis for their friendly
help and advice, which have helped me a lot during the research.
Furthermore, I would like to thank Alejandro Muñoz Espiago, Peter Everitt,
Nils-Olov Bäckström, Reinhold Gördes, Zhaojiang Xu, Min Xu, Lijuan Sun and all the
interviewees who participated and completed the questionnaire survey and
interviews. Their support in the research is much appreciated.
Special thanks should go to my sponsor Commercial Aircraft Corporation of
China (COMAC) and China Scholarship Council, as well as my classmates and
colleagues both in Cranfield University and COMAC for their support.
My deepest appreciation goes to my parents Zhongming Qiao and Lihong Zhao,
for their support throughout my entire life.
Thank you all.


v
TABLE OF CONTENTS
ABSTRACT ......................................................................................................... i
ACKNOWLEDGEMENTS................................................................................... iii
LIST OF FIGURES ............................................................................................ vii
LIST OF TABLES ............................................................................................. viii
LIST OF CHARTS .............................................................................................. ix
LIST OF ABBREVIATIONS ................................................................................ x
1. Introduction ............................................................................................... 1
1.1 Background ................................................................................................ 1
1.2 Working Definitions ................................................................................... 2
1.3 Problem Statement ..................................................................................... 4
1.4 Aim & Objectives ........................................................................................ 6
1.5 Thesis Structure ......................................................................................... 7
2. Literature Review ...................................................................................... 9
2.1 Computer Aided Process Planning (CAPP) ................................................... 9
2.2 Function Blocks ........................................................................................ 10
2.3 Web-based Distributed Process Planning .................................................. 13
2.4 Visualisation of Tool Paths ........................................................................ 15
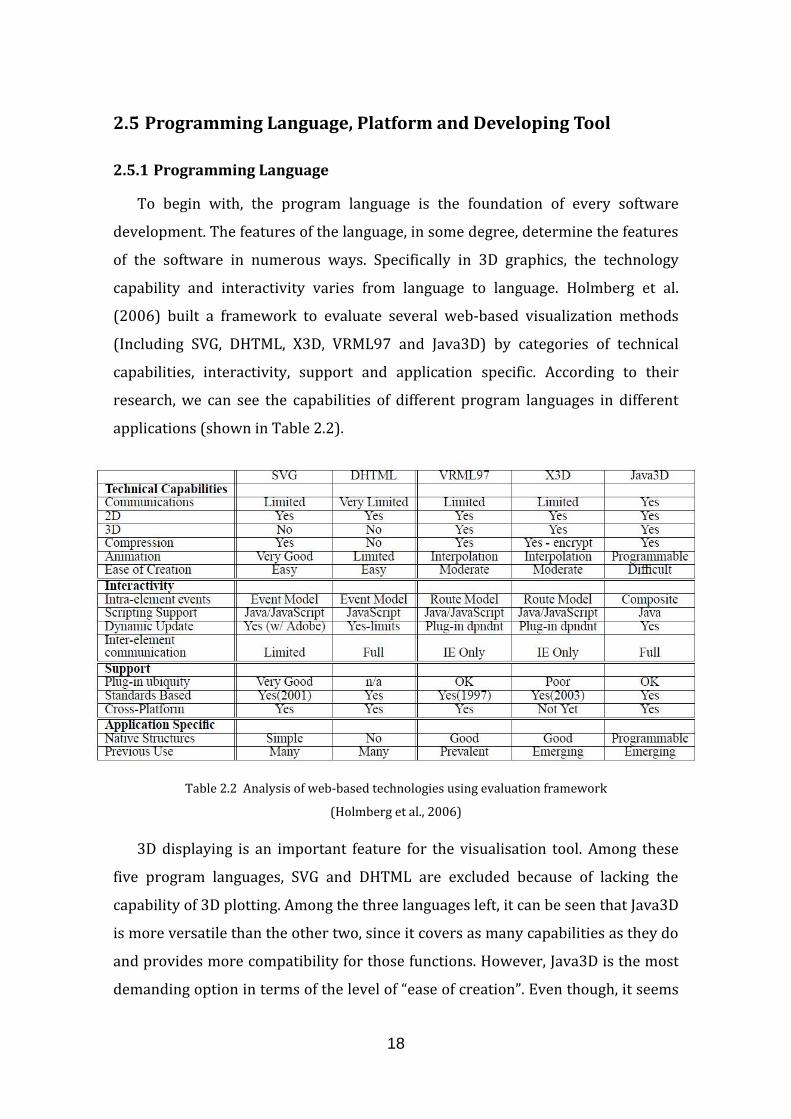
2.5 Programming Language, Platform and Developing Tool ............................. 18
2.5.1 Programming Language ..................................................................... 18
2.5.2 Platform and Developing Tool ............................................................ 20
2.6 Research Gap Analysis .............................................................................. 21
3. Methodology ............................................................................................ 23
4. Requirement Analysis............................................................................. 27
4.1 Questionnaire Survey ............................................................................... 27
4.1.1 Content of the Questionnaire .............................................................. 28
4.1.2 Result Analysis ................................................................................... 29
4.2 Interview ................................................................................................. 37
4.3 Summary ................................................................................................. 37
5. Application Development ....................................................................... 39
5.1 Graphical User Interface (GUI) .................................................................. 39
5.2 Application Program Interface (API) ......................................................... 42
5.2.1 Input Command Formation ................................................................ 42
5.2.2 G-code Translator Interface ................................................................ 44
5.2.3 Cloud Environment Data Exchange Interface ...................................... 45
5.3 Application Structure and Data Flow ......................................................... 45
5.3.1 Application Structure ......................................................................... 45
5.3.2 3D Scene Structure ............................................................................. 49
5.3.3 Data Flow in the Visualizer ................................................................. 50
5.4 Optimisation for Light Weight ................................................................... 51
vi
5.4.1 GUI optimisation ................................................................................ 52
5.4.2 Data Storage optimisation .................................................................. 52
5.5 Summary ................................................................................................. 53
5.5.1 Features Designed for Visualising the Tool Path from Function
Blocks ........................................................................................................ 53
5.5.2 Application Specification .................................................................... 56
6. Validation ................................................................................................. 59
6.1 Visualisation Functions Test ..................................................................... 59
6.2 Implementation Test ................................................................................ 60
6.3 Case Studies ............................................................................................. 62
6.4 Compatibility Test .................................................................................... 63
6.5 Expert Validation ...................................................................................... 63
6.6 Summary ................................................................................................. 66
7. Conclusion ............................................................................................... 67
REFERENCES ................................................................................................. 69
APPENDICES .................................................................................................. 75
vii
LIST OF FIGURES
Figure 1.1 Comparison between typical process and CAPP approach
Figure 2.1 Internal structure of two types of function block
following IEC-61499 (Wang et al., 2009)
Figure 2.2 Function blocks for CNC machine (Wang et al., 2009).
Figure 2.3 Web-DPP execution control (Wang et al., 2012)
Figure 3.1 Methodology
Figure 5.1 GUI develop process
Figure 5.2 GUI of the final visualizer
Figure 5.3 G-code reader dialog
Figure 5.4 Data flow Diagram of the visualizer
Figure 5.5 Components of the GUI
Figure 5.6 Structure of the 3D scene
Figure 6.1 Snapshot in visualisation function test
Figure 6.2 Visualizer running on the controller for implementation test
Figure 6.3 Expert validation sheet example

viii
LIST OF TABLES
Table 2.1 Software for Tool Path Visualisation
Table 2.2 Analysis of web-based technologies using evaluation framework
(Holmberg et al., 2006)
Table 4.1 Coefficients for different categories
Table 4.2 Coefficients defined for every question

ix
LIST OF CHARTS
Chart 4.1 Career Position
Chart 4.2 Specialty Experience
Chart 4.3 Knowledge Level about CAPP
Chart 4.4 Results Weighted Sum of Required Functionalities
Chart 4.5 Results Weighted Sum of CAD Format Preference
Chart 4.6 Results Weighted Sum of Terminal Preference
Chart 4.7 Results Weighted Sum of 3D Operation Preference
Chart 4.8 Results Weighted Sum of UI Preference
x
LIST OF ABBREVIATIONS
API Application Programming Interface
CAD Computer Aided Design
CAM Computer Aided Manufacture
CAPP Computer Aided Process Planning
CAPP-4-SMEs Collaborative and Adaptive Process Planning for Sustainable Manufacturing Environments
CNC Computer Numerical Control
FB Function Block
FBDK Function Block Development Kit
FBRT Function Block Run Time
GUI Graphical User Interface
HMI Human-Machine Interface
IEC International Electro-technical Commission
OOONEIDA An open, object-oriented knowledge economy for intelligent industrial automation
OP Operation Planning
OS Operating System
SP Supervisory Planning
Web-DPP Web-based Distributed Process Planning
1
1. Introduction
1.1 Background
In the world of industry, machining technology is the most fundamental
element of almost every industry, from aerospace to automobile. The machining
business has entered the digital age for a few decades. Computer Numerical
Control (CNC) machines have been equipped in almost every field that needs
precise manufacture. The typical work flow for numerical machining is CAD
(Computer Aided Design) — CAM (Computer Aided Manufacture) — CNC. First, a
precise 3D Model with all the information needed for manufacture is designed in
CAD tool. Then, the model is sent to the next step, the CAM for process planning,
which is usually accomplished by skilled engineers. Commands programed in G-
code (programing language) are generated from CAM system, and dispatched to
the CNC controller. Those codes control the machine executing the process of
manufacture. However, this sequential flow is not able to adapt to changes
efficiently enough. Once the tool path is generated and uploaded into the machine
controller, it can no longer be changed. Any change, such as an accidental tool
brake, tool changes to a similar one with slightly different features, or a slight
modification of the CAD design will lead to a rework of the whole process through
CAM. The tool path needs to be planned again, and G-code requires a re-generation.
The distribution process to the CNC controller also needs to be done again. Those
inflexible modifications and operations are time consuming and not easily finished
within a short time.
New technologies and innovations are emerging. Computer Aided Process
Planning (CAPP) is becoming the cutting edge field of research. Numerous
researches have been carried out to find approaches for automated and adaptive
process planning. A new approach utilizing Function Block (FB) which is defined in
61499-1 (IEC, 2005) has explored a new path of CAPP. Function blocks are able to
deal with real-time information in the situation that dynamic decision making is
required. When encountering different kinds of uncertain problems, the adaptive
control capability of a function block allows it to make a reaction in a responsive
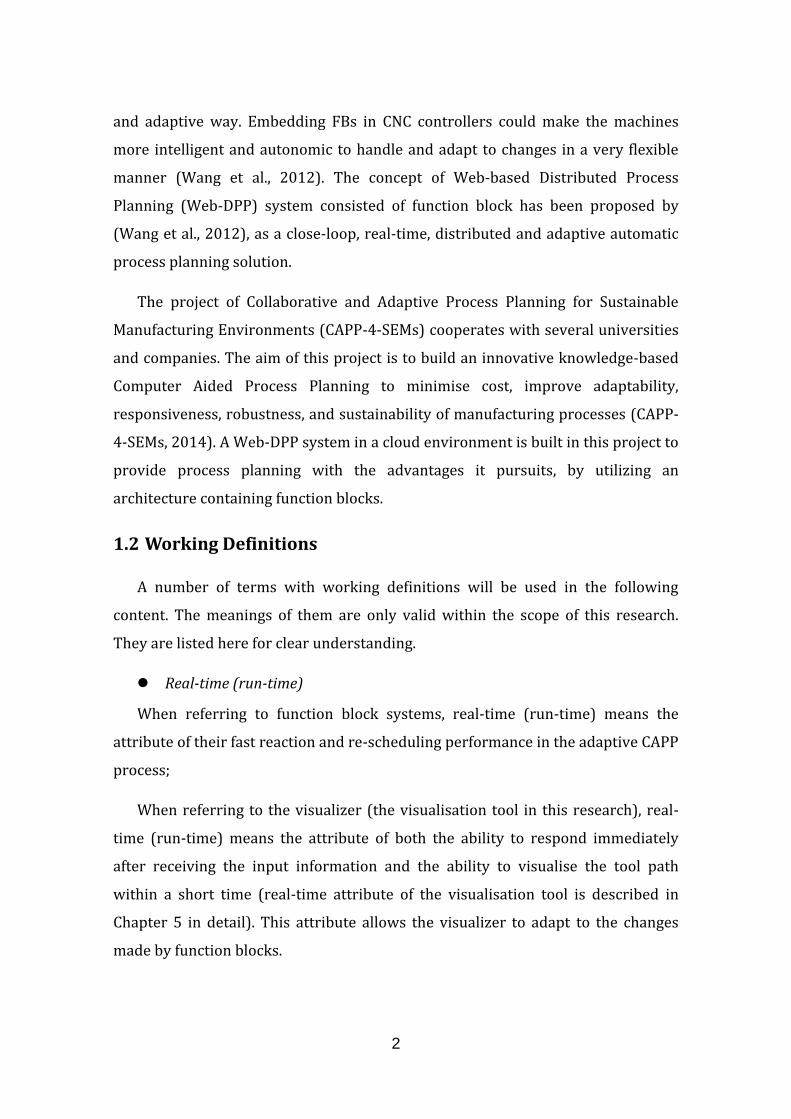
2
and adaptive way. Embedding FBs in CNC controllers could make the machines
more intelligent and autonomic to handle and adapt to changes in a very flexible
manner (Wang et al., 2012). The concept of Web-based Distributed Process
Planning (Web-DPP) system consisted of function block has been proposed by
(Wang et al., 2012), as a close-loop, real-time, distributed and adaptive automatic
process planning solution.
The project of Collaborative and Adaptive Process Planning for Sustainable
Manufacturing Environments (CAPP-4-SEMs) cooperates with several universities
and companies. The aim of this project is to build an innovative knowledge-based
Computer Aided Process Planning to minimise cost, improve adaptability,
responsiveness, robustness, and sustainability of manufacturing processes (CAPP-
4-SEMs, 2014). A Web-DPP system in a cloud environment is built in this project to
provide process planning with the advantages it pursuits, by utilizing an
architecture containing function blocks.
1.2 Working Definitions
A number of terms with working definitions will be used in the following
content. The meanings of them are only valid within the scope of this research.
They are listed here for clear understanding.
Real-time (run-time)
When referring to function block systems, real-time (run-time) means the
attribute of their fast reaction and re-scheduling performance in the adaptive CAPP
process;
When referring to the visualizer (the visualisation tool in this research), real-
time (run-time) means the attribute of both the ability to respond immediately
after receiving the input information and the ability to visualise the tool path
within a short time (real-time attribute of the visualisation tool is described in
Chapter 5 in detail). This attribute allows the visualizer to adapt to the changes
made by function blocks.
3
Off-line (Off-line mode)
In this thesis, off-line describes the work process between CAM system and
CNC controller. Because the data flow in the process is one-way from CAM to CNC,
it is not adaptive when situations requiring re-scheduling of the process plan
happen. It is the contrary to the adaptive feature of function block system, so it is
called “off-line” compared to “real-time”.
On-board
In this thesis, on-board means that the subject is installed and working on a
CNC controller (either function block or the visualizer).
Simulation (animation)
The simulation (animation) in the thesis means displaying the manufacturing
process in the form of 3D animation for the need of users, checking the tool path
for example.
Light weight (visualisation) and heavy weight
In this thesis, light weight means two attributes. The first one is uncomplicated
structure and algorithm within the application, which allows the program to run
fast. The other is less computational resource consumption and less space
occupied on the storage devices. Heavy weight means complicated structure and
algorithm, or more demanding for computational resource and memory space
comparatively.
In the designs of CNC controllers, operating systems and control applications
are commonly customized to allow the controller to achieve the goal of fast and
precise actions. For example, up to 1000 program blocks are required to be
processed within one second for the HAAS controller on ST-10. In order to work at
high speed, computational resource for user applications on the controller is
limited too. The other situation is that the user memory offered by the
manufacturers of controllers is often limited and small compared to personal
computers. For example, the HAAS controller above offers up to 750MB user
memory; the FANUC series 0i controller offers up to 2GB user memory; the
HEIDENHAIN controller CNC PILOT 640 offers up to 1.8GB user memory. These

4
two concepts, “light weight” and “heavy weight”, are based on this on-board
working environment of the visualisation tool, in which there are only limited
computational and storage resources provided.
1.3 Problem Statement
In a Web-DPP system, function blocks control all the process planning work
automatically. During this working process, human involvement is minimised and
human-machine interaction is limited too. As a result, the system behaves like a
black box. Researchers are not able to supervise the process without a friendly
human-machine interface (HMI). The result of the process planning needs to be
confirmed by experts to make sure the tool path is reasonable and reliable. An
application for tool path visualisation would be a reasonable solution for
monitoring and confirming the output of the function block system.
Numerous visualisation tools are ready for use both in academic and
commercial fields. However, most of them only work in an off-line mode (details in
Section 2.4). They are capable of visualising the finished process planning result
(in the form of G-code file representing the tool path) which is generated by CAM
systems. The real-time mode for visualisation, which means visualising the tool
path from a dynamic process planning, is not supported in most of them. As shown
in Figure 1.1, process planning in a function block system works in a different way
from which in traditional CAD-CAM-CNC process. As explained in the background
introduction, the CAD-CAM-CNC process works in a flow, without sufficient
capability for adapting changes efficiently. Once the G-code is generated in a CAM
system, the rest of the manufacturing process follows a sequential one-way, so do
the visualisation tools which work with the CAM system.

5
Figure 1.1 Comparison between typical process and CAPP approach
In the CAPP-4-SMEs approach, function blocks work and adapt the changes
automatically (responding to CNC feedback, temporary change of manufacture
plan or human involvement). The function blocks in both Web-DPP system and the
CNC controller are always processing information, modifying or rebuilding the
process plan whenever needed. They are “on-the-fly”. This difference from CAM-
CNC process requires collecting information and re-planning the process in a real-
time manner. This is the reason why the feature of real-time is important in
visualisation for function block system. The visualizer must keep pace with the
function blocks. It is necessary for the visualisation tool to keep standby and to be
able to process the “flying” information from function block as soon as it is
produced. In order to work fast, being light weight is a vital attribute that the tool
has to possess. Besides, it is better to have the visualisation tool working on the
CNC controller, for the on-board attribute allows it to communicate with function
blocks more efficiently. The internal communications among the components of
Web-DPP system in CAPP-4-SMEs are based in a Cloud environment, so does the
communication between the Web-DPP and CNC controller. In order to cooperate
6
with them, the visualisation tool requires the ability of supporting the Cloud
environment as well.
After investigating the existing visualisation tools and methods, the main target
of this research is to propose a light weight, real-time and on-board solution for
visualising the tool path generated by function blocks running on CNC-machine
controllers. This research is also a subsidiary part of the EU project CAPP-4-SMEs.
The research benefits the project by providing interactivity between the function
block system and the shop floor user.
1.4 Aim & Objectives
Aim
The aim of this research is finding a suitable solution specifically for visualising
the process planning result (tool paths) generated by the function block system in
the manufacturing field involving milling operations.
Objectives
1. Understand and analyse the features of function blocks, CNC controllers
and their current visualisation capabilities
2. Investigate practical industrial requirements for visualisation tools
working with function block systems
3. Investigate existing visualisation methods and propose a suitable solution
for tool paths generated by function block systems
4. Develop a visualisation tool and optimise it based on feedback from
industry users
5. Validation of the visualisation tool through a set of case studies and expert
evaluations
7
1.5 Thesis Structure
The thesis is divided into seven chapters. The first part introduction explains
the overall background and purpose of this research, summarises the research gap,
aim and objectives. Chapter 2 contains a literature review about function blocks,
CAPP, Web-DPP, visualisation of tool path, programming language and platform.
The methodology of this research is introduced in Chapter 3. In Chapter 4, the
collection process of the requirement for the visualizer is described. The designs
and analysis of a questionnaire survey and interviews are explained. The
development process of the application is explained in detail in Chapter 5. Chapter
6 presents the validation procedures and the validation results. The last chapter
summarises the research contribution, conclusion and future work.

9
2. Literature Review
2.1 Computer Aided Process Planning (CAPP)
The developing process of an industrial product contains two critical phases,
design and manufacturing. What connects these two phases is process planning.
Process planning is a significant process, determining a combination of necessary
manufacturing processes and their sequences. The guide line for process planning
is that it should follow the ideas of the designer and aiming to realize the ideal
functionality of the final physical parts while satisfying, both, economic and
competitive goals (Xu et al., 2011). According to Xu et al.(2011), in the domain of
machining processes, the major process planning activities may include
interpretation of design data, selection of machining operations, machine tools,
cutting tools, datum, fixture, and calculation of both cost and production time.
The traditional approach to proceed process-planning is to hand them over to
manufacturing experts. Their experience and practical knowledge, design
specifications and available facilities will be the basis of the planning work they
make. But this approach relies on personal skill and experience. Different expert
may make different plans for the same part.
Computer Aided Process Planning (CAPP) offer a new solution to provide
efficient, adaptive and intelligent process planning. CAPP is a link between CAD
and CAM, which chooses manufacturing operations for producing a certain part
and determines the sequence of them in the combination. The preparation cycle of
a new part or product can be shorten by improving the efficiency and design
quality of the process planning, which CAPP can provide.
Numerous researches about CAPP have been accomplished in the last three
decades. Xu et al. (2011) summarize a category of related technologies in CAPP,
which are: Knowledge-based systems, Neural networks, Genetic algorithms, Fuzzy
set theory/logic, Petri nets, Agent-based technology, Internet-based technology,
STEP-compliant CAPP, Emerging technologies. Researches by Tait (2005) and
Wang (2013) are also in the field CAPP. Applications of CAPP are studied in the

10
researches by Thramboulidis et al. (2007), Peltola et al. (2007), and Lepuschitz et
al. (2009).
The EU project CAPP-4-SMEs, to which this research will contribute, aims at
building an innovative knowledge-based CAPP to minimise cost, improve
adaptability, responsiveness, robustness, and sustainability of manufacturing
processes. In this project, Function Blocks are utilized in a Web-DPP system for
providing the efficient, adaptive and intelligent process planning.
Summary
CAPP provides a new approach for manufacturing process planning, by
improving it in an efficient, adaptive and intelligent way. In the project CAPP-4-
SMEs, function blocks are utilised in the architecture of a Web-DPP system for
CAPP.
2.2 Function Blocks
An International Electro-technical Commission (IEC) standard named IEC
61499-1 define the term of Function Block (FB) for distributed control and
automation. A function block is an independent reusable functional module which
is based on an event-driven model, with distributed, reconfigurable and
programmable features (IEC, 2005). According to IEC-61499, there are two types
of function blocks, basic function blocks and composite function blocks. Figure 2.1
shows the internal structures of a basic (left) and a composite (right) function
blocks.
A basic Function Block is a ‘functional unit of software application’ (Wang et al.,
2012). It can maintain multiple outputs depending on its internal state information.
It contains a manner (execution control chart), with states, transitions and actions,
which invokes the execution of algorithms in response to input events (Ferrarini et
al., 2004). A combination of serious of basic function blocks consists a complex
function block. The basic function blocks are properly organised through event and
data connections in a complex function block. However, there are neither internal
states nor embedded algorithms in a composite function block. The combination of
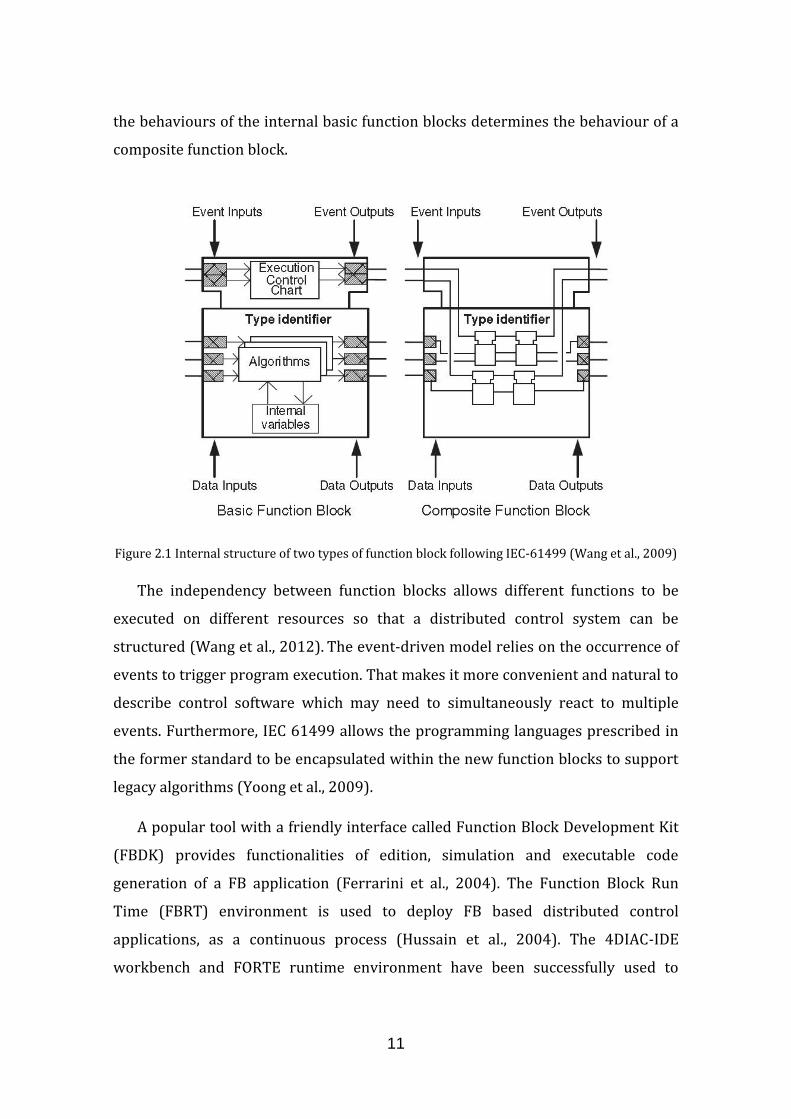
11
the behaviours of the internal basic function blocks determines the behaviour of a
composite function block.
Figure 2.1 Internal structure of two types of function block following IEC-61499 (Wang et al., 2009)
The independency between function blocks allows different functions to be
executed on different resources so that a distributed control system can be
structured (Wang et al., 2012). The event-driven model relies on the occurrence of
events to trigger program execution. That makes it more convenient and natural to
describe control software which may need to simultaneously react to multiple
events. Furthermore, IEC 61499 allows the programming languages prescribed in
the former standard to be encapsulated within the new function blocks to support
legacy algorithms (Yoong et al., 2009).
A popular tool with a friendly interface called Function Block Development Kit
(FBDK) provides functionalities of edition, simulation and executable code
generation of a FB application (Ferrarini et al., 2004). The Function Block Run
Time (FBRT) environment is used to deploy FB based distributed control
applications, as a continuous process (Hussain et al., 2004). The 4DIAC-IDE
workbench and FORTE runtime environment have been successfully used to
12
deploy code to a number of embedded devices, e.g. Digi and PC/104 embedded
controller.
Numerous researches and applications using function block have been
completed. For example, Vyatkin et al. (2005) introduced an application called
OOONEIDA (an open, object-oriented knowledge economy for intelligent industrial
automation), to create a new technological infrastructure for automation
components or products, using ‘reusable portable software modules (function
blocks)’. Hussain et al. (2004) created an application deployed on a network-
enabled controller, on which implemented codes of the IEC 61499 model can be
deployed. Wang et al. (2008) developed an application using function blocks to
plan and control assembly process dynamically.
According to the review written by Vyatkin (2011), the first industrial
deployment of IEC 61499 compliant devices was reported by Tait (2005, in
Vyatkin, 2011) at a meat processing plant in New Zealand. A number of building
management systems, where distributed control and visualisation of the entire
building were implemented using IEC 61499, has reported by NxtControl. The
largest project among those was a training centre building with 19 control devices
controlling about 2500 I/Os (heating, ventilation, air-condition, lighting, etc.) with
IEC 61499. In addition, a number of applications on the use of IEC 61499 in the
process control area are presented by Peltola (2007, in Vyatkin, 2011), Lepuschitz
(2009, in Vyatkin, 2011) and Thramboulidis (2007, in Vyatkin, 2011).
Summary
A Function Block, as defined in IEC 61499-1 for distributed control and
automation, is an independent reusable event-driven functional module with
distributed, reconfigurable and programmable features. It has been widely utilized
for automatic control in both academic research and commercial projects.

13
2.3 Web-based Distributed Process Planning
A web-based and FB-enabled process planning and execution control system
for Web-DPP, in the research of Wang et al. (2012), aims to improve the
performance of machining process planning on dynamic shop floors. A two-layers
architecture is used in the system, supervisory planning (SP) and operation
planning (OP), as shown in Figure 2.2. SP focuses on high-level machining
sequence generation, while OP focuses on machine-specific working step planning
and execution. The main task of Web-DPP is to transform design information into
machining operations and to determine an optimal sequence and parameters for
machining. In addition, it enables adaptive execution control by means of FBs and
two-way information flow for execution monitoring (Wang et al., 2012).
Figure 2.2 Function blocks for CNC machine (Wang et al., 2009).
14
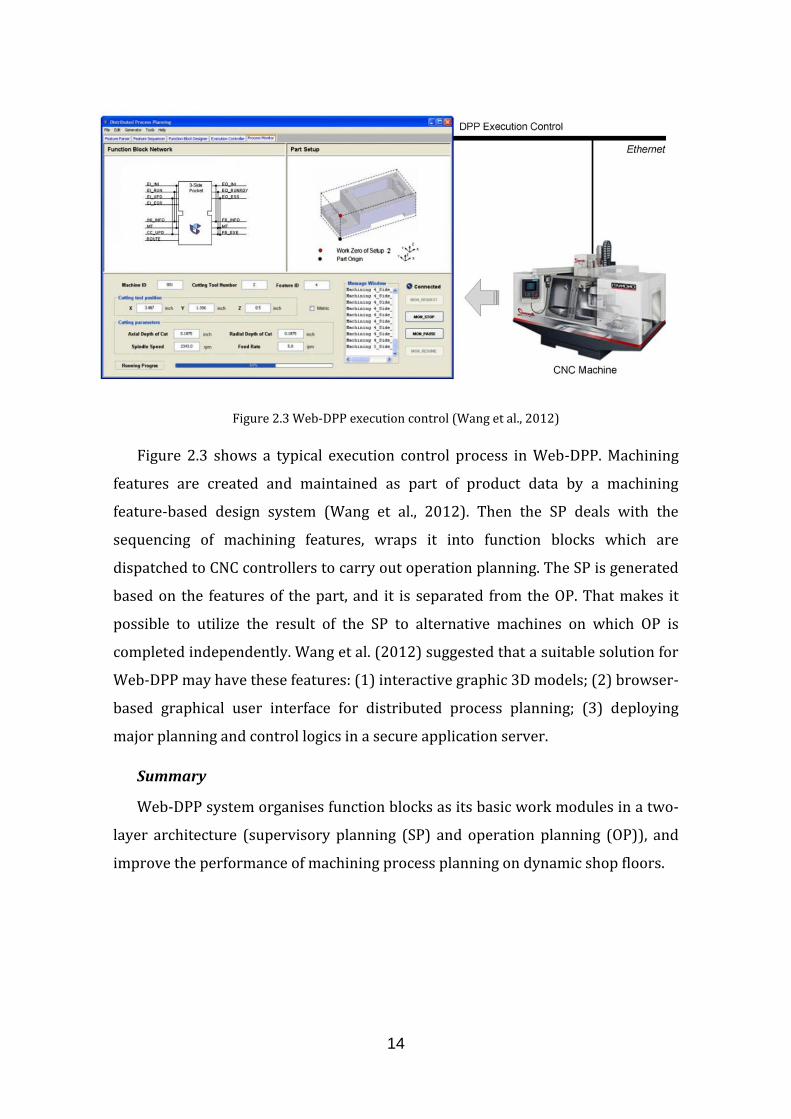
Figure 2.3 Web-DPP execution control (Wang et al., 2012)
Figure 2.3 shows a typical execution control process in Web-DPP. Machining
features are created and maintained as part of product data by a machining
feature-based design system (Wang et al., 2012). Then the SP deals with the
sequencing of machining features, wraps it into function blocks which are
dispatched to CNC controllers to carry out operation planning. The SP is generated
based on the features of the part, and it is separated from the OP. That makes it
possible to utilize the result of the SP to alternative machines on which OP is
completed independently. Wang et al. (2012) suggested that a suitable solution for
Web-DPP may have these features: (1) interactive graphic 3D models; (2) browser-
based graphical user interface for distributed process planning; (3) deploying
major planning and control logics in a secure application server.
Summary
Web-DPP system organises function blocks as its basic work modules in a two-
layer architecture (supervisory planning (SP) and operation planning (OP)), and
improve the performance of machining process planning on dynamic shop floors.
15
2.4 Visualisation of Tool Paths
A tool path is a series of coordinate positions that determine the movement of a
tool during a machining operation. Visualisation of the tool path can provide a
clear view of the operating process before the real one is carried out. Traditionally,
in the CAD-CAM-CNC model, most of the CAM software provides a function of tool
path visualisation and simulation. It helps engineers to debug errors and make
adjustments before the real machining process. However, this function usually
works in an off-line model. It is not possible to re-calculate the visualisation in a
short time when the tool path is changed. These changes of the tool path are
usually caused by a new part design, a new process plan or a tool break, which are
unpredictable and happening even after a very thoughtful process planning. The
purpose of this research is to provide a real-time performance visualisation
solution for adapting the quick behaviour variation of the function block system
which handles the process planning work as introduced in the previous part of the
review.
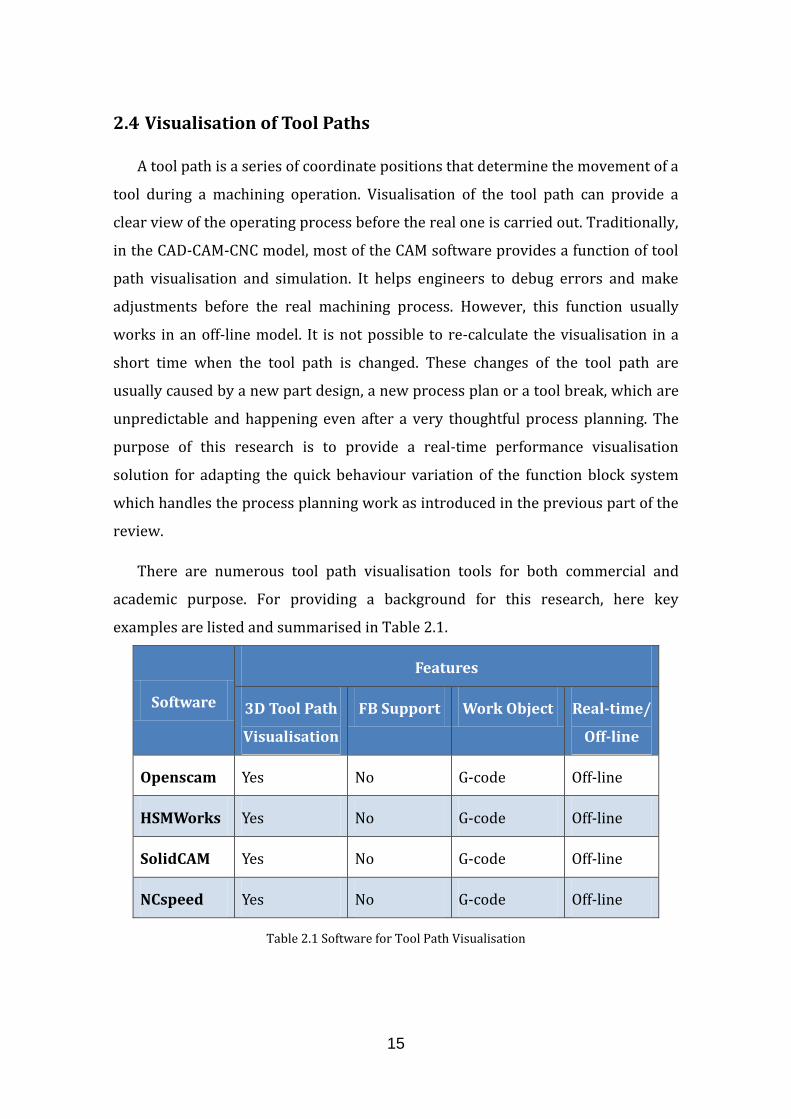
There are numerous tool path visualisation tools for both commercial and
academic purpose. For providing a background for this research, here key
examples are listed and summarised in Table 2.1.
Software
Features
3D Tool Path
Visualisation
FB Support Work Object Real-time/
Off-line
Openscam Yes No G-code Off-line
HSMWorks Yes No G-code Off-line
SolidCAM Yes No G-code Off-line
NCspeed Yes No G-code Off-line
Table 2.1 Software for Tool Path Visualisation

16
As an open-source software, Openscam (Cauldron Development LLC, 2014)
provides fast 3-axis cut-work piece simulation with 3D visualisation; tool path 3D
visualisation; G-Code parsing, simulation, verification and annotation. It can run on
Windows and Linux platforms. The limitation of it is that the simulation only
provides static snapshots of the cutting process. A run-time simulation is not
supported.
Visualisation tools working with CAM systems are more popular approaches
for tool path visualisation. For example, HSMWorks (Autodesk Inc., 2012) is a CAM
tool with a function of tool path simulation developed for SolidWorks. It provides
accurate tool path 3D visualisation for the cutting process utilizing the precise CAD
models, as well as a vivid animation of the process. It works before the stage of
handing over the data from CAM to CNC. So technically speaking, the simulation
function is also an off-line model. Once the data is passed down to the CNC
controller, any changes for the process planning will require a rework of the whole
process, so does the visualisation. From another aspect, this system requires a
demanding 3D calculation to simulate detailed material removal. SolidCAM
(SolidCAM Inc., 2014) is a similar example.
The optimisation tool NCspeed (FORMTEC, 2014) developed by Formtec,
provides optimisation of tool paths. It also provides online visualisation of the
cutting process as one of the functions. Similar to the previously mentioned tools
which work with CAM systems, the visualisation in NCspeed is accurate and
powerful, but relatively resource demanding (online resources included). The
software works between the CAM and CNC process too, and it is not special
designed for real-time tool path visualisation which is able to adapt changes as
soon as possible.
An open-source toolkit for visualisation, called Visualisation Toolkit (VTK)
(Kitware Inc., 2014), is a freely available development tool for 3D computer
graphics, image processing and visualisation. VTK consists of a C++ class library
and several interpreted interface layers including Tcl/Tk, Java, and Python. VTK
has an extensive information visualisation framework and a suite of 3D interaction
17
widgets, and integrates with various databases on GUI toolkits such as Qt and Tk.
VTK is available on Linux, Windows, Mac and Unix platforms. But it is not a
specialised tool for tool path visualisation. It is widely used in scientific
visualisation, and rather precise but resource and time consuming as a
consequence. The various databases on GUI and visualisation methods are useful
references for this research.
Ranges of researches focusing on visualisation solutions have been published
in various fields. Guzman (2010) developed a 3D GUI application to generate and
visualise natural-looking surface models for landscape creation using fractals.
Plessis (2011) developed a real-time 3D GUI application for waste water
management. Hendrix et al. (2004) developed a Java application which can
generate dynamic 2D charts of data structure and adapt the changes on runtime.
Silva et al. (2009) developed a 3D light weight navigation application which runs
on pocket PC (C++ with OpenGL) or mobile phones (Java 3D).
Researches on light weight visualisations are also covered by papers. A
Research of evaluating light weight visualisation 3D graphics formats had been
carried out by Hartman (2009), involving 3DXML, STEP, U3D and JT. Holmberg et
al. (2006) introduced a framework to evaluate several web-based visualization
methods (Inc. SVG, DHTML, X3D, VRML97 and Java3D) in categories of technical
capabilities, interactivity, support and application specific. Ma et al. (2004) present
an interface suite called GODIVA to optimize the I/O processes for large scale of
datasets for easier and faster performance by means of special data caching format.
Summary
As far as the background research reaches, it seems that a ready-to-use
visualisation tool which is specifically designed for the tool path generated by
function block systems has not been seen before in both academic research and
commercial solutions. Solutions which utilise a combination of existing
visualisation methods and a Graphical User Interface (GUI), seems to be a feasible
approach for this research. The knowledge of the papers on light weight
visualisation can be adopted and utilized in the research.
18
2.5 Programming Language, Platform and Developing Tool
2.5.1 Programming Language
To begin with, the program language is the foundation of every software
development. The features of the language, in some degree, determine the features
of the software in numerous ways. Specifically in 3D graphics, the technology
capability and interactivity varies from language to language. Holmberg et al.
(2006) built a framework to evaluate several web-based visualization methods
(Including SVG, DHTML, X3D, VRML97 and Java3D) by categories of technical
capabilities, interactivity, support and application specific. According to their
research, we can see the capabilities of different program languages in different
applications (shown in Table 2.2).
Table 2.2 Analysis of web-based technologies using evaluation framework
(Holmberg et al., 2006)
3D displaying is an important feature for the visualisation tool. Among these
five program languages, SVG and DHTML are excluded because of lacking the
capability of 3D plotting. Among the three languages left, it can be seen that Java3D
is more versatile than the other two, since it covers as many capabilities as they do
and provides more compatibility for those functions. However, Java3D is the most
demanding option in terms of the level of “ease of creation”. Even though, it seems
19
that Java3D is the most suitable of these five so far for this research if there are no
difficulties in handling the language.
Beyond Holmberg’s research, Java3D has several other advantages itself,
especially suitable for function blocks visualisation. Java is a worldwide prevalent
program language, and grows extremely fast in web-based and mobile applications
recently. It is fast and standards-based. It is platform independent, which is an
important feature for this research. As explained in Chapter 1, for faster
communication with on-board FBs, the ideal function of the visualizer would be an
application which runs on the controller of CNC machines. However, in the field of
CNC controllers, there are many manufacturers competing, and each of them has a
series of controller models in their product line. The operation systems on
controllers can be Windows, Linux, MS-DOS or their own systems (e.g. HEROS 5
real-time operating system for HEIDENHAIN controller CNC PILOT 640). A
visualizer developed in Java, with the feature of platform independence, can be
compatible with ranges of controllers when it comes to a mature application. Java
supports deployments on embedded devices, and is optimized for these
circumstances. It can provide high performances on portable devices, relatively
speaking. Those features allow the visualizer to be deployed on different kinds of
devices, such as computers, CNC controllers, servers, portable devices or
embedded systems. Not only these features mentioned but also the prevalent use
of web-based application can make the visualizer more versatile when it is based
on Java. It allows the visualizer to run on any kind of platform on which browsers
are supported. The versatility can be realized in this way for the function block
visualisation we seek in this research.
Another well-known program language for 3D graphics is C++. Numerous
applications are developed based on it, from commercial applications to
entertainment applications like 3D games. There are many 3D engines developed
in C++ with powerful capabilities to show explicit and astonishing virtual reality.
However, in order to do that, massive computational resources, complex
structures and large files are indispensable. C++ is a powerful developing language
for complex visualisation work, and it is well supported for commercial use and

20
standardised development. In comparison, Java3D is more suitable for the light
weight 3D visualisation development for the research purpose we need.
2.5.2 Platform and Developing Tool
In the Web-DBB system, the manufacturing sequence is generated by
supervisory planning (SP). It determines which function blocks should be wrapped
and dispatched to the CNC controller. The function blocks in SP build the operation
planning (OP) with function blocks used for the specific machining operations. The
OP is then installed on the CNC controller for controlling the specific
manufacturing process. The ideal visualisation of the tool path and the behaviour
of the function block should be also working on the controller. Industrial CNC
controllers work with many kinds of operation system, such as Windows, Linux,
MS-DOS and OS designed by the manufacturer of the controller themselves (e.g.
HEROS 5 real-time operating system). In order to realise on-board visualisation,
the visualizer should be functional on all of these operation systems. But at the
stage of research, it only needs to support at least one OS. The versatility could be
gained after future work whenever it is required. Windows from Microsoft is
known as the most popular OS for many years, and numerous computers work
with it in almost everywhere. Additionally, there are also tremendous amount of
applications which support Windows. Developing based on Windows almost needs
no additional knowledge besides that of the developing tool itself, so does the
deployment and testing on the CNC controllers which have Windows. The
developing process and validation can be easily shown on any computer with
Windows too, as it is easy to access for its prevalence. Because of its universality,
Windows is assumed to be the most suitable and easy-to-reach developing
platform for this research.
NetBeans is the official Integrated Development Environment (IDE) for Java 8.
It provides a smart and fast way to develop Java applications with its editors, code
analysers and converters. Especially, the GUI Builder of NetBeans provides an
efficient and smooth drag-and-drop way to design GUI for Java applications, and
automatically takes care of correct spacing and alignment. NetBeans IDE also
21
supports cross-platform. Once it has been written, it can run anywhere from
Windows to Linux to Mac OS. These features of NetBeans IDE make it the suitable
development tool for this research.
2.6 Research Gap Analysis
Based on the literature review above, it seems that a real-time visualisation
which runs on CNC controller for the tool path generated by function block system
has not been designed before. The research gap is proposing a light weight
visualisation solution for real-time situation, with the ability of running on CNC
controllers and data exchanging through a Cloud environment. The visualisation
tool also needs to fulfil the practical needs of the industrial shop floor user.
Windows, Java3D and NetBeans are assumed appropriate platform, language and
tool for developing this visualisation tool.

23
3. Methodology
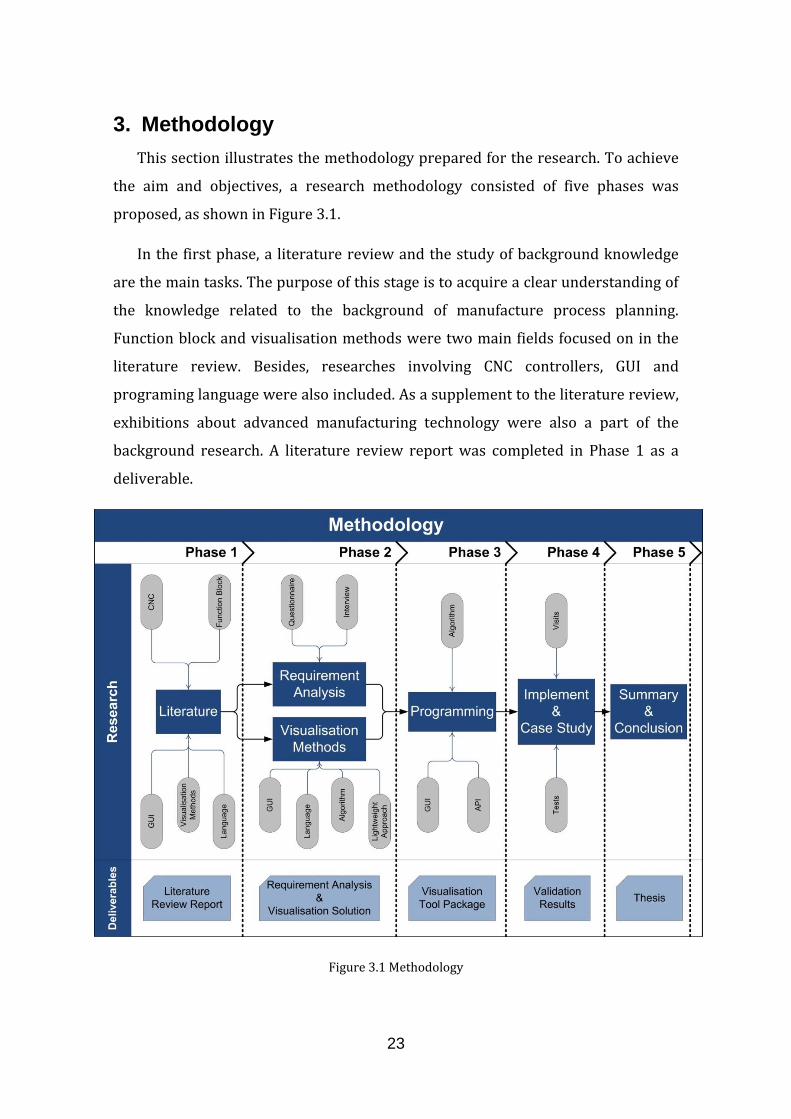
This section illustrates the methodology prepared for the research. To achieve
the aim and objectives, a research methodology consisted of five phases was
proposed, as shown in Figure 3.1.
In the first phase, a literature review and the study of background knowledge
are the main tasks. The purpose of this stage is to acquire a clear understanding of
the knowledge related to the background of manufacture process planning.
Function block and visualisation methods were two main fields focused on in the
literature review. Besides, researches involving CNC controllers, GUI and
programing language were also included. As a supplement to the literature review,
exhibitions about advanced manufacturing technology were also a part of the
background research. A literature review report was completed in Phase 1 as a
deliverable.
Figure 3.1 Methodology
24
Phase 2 contains two parts. The first one was investigating the practical needs
of shop floor users. To achieve that, a questionnaire survey was designed to collect
information from manufacture industries. An interview was planned and done
during the visit of a domestic partner of the project. The information collected was
sorted and analysed for the requirement analysis, which was the first step for
developing a visualisation tool. It was the guideline for designing the application.
The functions needed for visualisation were decided according to the demands.
The other task in this stage was investigating the features of existing visualisation
tools and methods, and choosing suitable programing language, developing
platform, algorithm and visualisation methods for the development of the
application. At the end of this phase, a solution based on rational choices was
summarised for steering the following development as a blueprint in the next stage.
In Phase 3, the first task was learning the programing language chosen in Phase
2. Then the visualisation tool was developed module by module, and tested for
debugging. The toolkit consists of 3 parts in general: the GUI, the visualisation
algorithm and the Application Program Interface (API). The GUI deals with the
interaction with users, and displays the visualisation of the tool path along with
related information. The part of visualisation algorithm is the core of the visualizer,
which contains all the algorithms for the calculation and rendering process of the
entire virtual 3D scene. The API processes the communication between the inside
of visualizer and the outside. After this stage, an application came into shape, and
was ready for implementation and validation.
The main task of Phase 4 was to validate whether the results fulfilled the
purpose of this research. At the beginning, a feasibility case study of the prototype
was carried out. A case was designed to check if the basic functions in the software
were working. In the next step, the same case study was tested by project partner
PowerKut Ltd. UK, from the angle of an industrial user. In the meantime, an
implementation case study was also taken on site for testing the performance of
the visualizer on CNC controller. Comments from the partner, such as comments
about the functionalities, the GUI, the performance and the implementation
process, were collected and summarised for modification and optimisation. When
25
the final version of the visualizer was completed, several experts in the
manufacture business were invited for validating the research. The application, an
introduction of the research and a demonstration video were sent to them by email,
along with validation forms for collecting results and comments.
Finally, in Phase 5 the whole process of this research was summarised in this
thesis. The literature review report, the requirement analysis, the development
process, the introduction of the tool function, and the results of the validation are
concluded in the thesis.

27
4. Requirement Analysis
4.1 Questionnaire Survey
The purpose of this research is to find a solution for visualising the tool path
generated by function block system. As explained in the problem statement in
Chapter 1, the visualisation is mainly for providing interactivity between the
function block system and the shop floor users, by displaying the outcome in
graphic figures (tool path) that reveal the underlying work currently being
processed. What functions and features are needed in the tool for serving this
purpose, is a critical question which needs to be answered before the development.
There are several approaches for data colleting: face-to-face interviews with a
schedule, a telephone interview, postal questionnaires and face-to-face interviews
in a free format (Sapsford et al., 1998). A reasonable way to acquire the
requirement for this research is hearing the voice of the “customers” through a
questionnaire survey, compared to the other approaches. Because postal
questionnaire survey (by email) is easy for reaching out for the industries
wherever they are, and it is efficient in both cost and time for both the researcher
and the responders.
The role of a questionnaire survey is mainly about drawing accurate
information from the respondents (Hague, 1993). To acquire information from the
relevant voices, the targeting population is focused on experts in the manufacture
industries. The participants of the questionnaire survey are employees of the
following company: Asturfeito, Cameco AB, InconTec GmbH, Powerkut, Prodintec,
Formtec and COMAC (introductions about the companies are provided in Appendix
B). A part of them are from the CAPP-4SMEs project and the others are from an
independent company from the project (COMAC, China). All of them are familiar
with the field of manufacturing, and some of them are familiar with the field of
CAPP. By targeting these voices in the survey, the information collected could be
more relevant and better aimed. The sample size of the survey is expected to be 7-
14, meaning 1-2 responds from each company in average. At this size, diversities in
profession, experience and background should be sufficient for this research.
28
Indeed, a large sample size is better for the diversity, but the difficulties for
reaching out and risks of the less relevant voices dominating the sound increase as
consequences.
A semi-structured questionnaire was designed to acquire the information
about the capabilities and features expected for the visualisation of tool path by
function block system. Questions are mainly focused on the functionality and the
GUI of the visualizer. It is expected that both preferred choices among predefined
answers and further requirement beyond the predefined can be collected by this
questionnaire. Then a results analysis based on the choices made in the survey
could reveal the requirement for the visualizer.
4.1.1 Content of the Questionnaire
The questionnaire contains nine questions with choices and one open question.
These questions are focused on three main aspects: the general information,
functionalities expected and the operation convenience.
The first four questions collect the general information of the participants. In
this survey, all the participants are staffs in companies which engage in
manufacture business. But the details of the participants, such as his/her duty,
position, specialty level, knowledge level about project CAPP-4-SMEs, vary from
one to another. This information will affect the way how their answers are
calculated in the result analysis, because it is rational to pay more attention to who
is good at and familiar with the matter. The general information collected will be
helpful to identify which kind of professionals the participants are, and different
combinations of these choices may change the weights of their answers counted in
the result analysis.
The most important question in this questionnaire is designed to collect
information about the functions which the user expect from the visualizer based
on its purpose, such as, visualising the tool path, displaying of the path parameters
and simulation of the cutting process. There are predefined choices listed in each
questions, and an open answer is welcome as well. The expecting outcome of these
29
questions is functions particularly required for function block visualisation by the
users, as well as other functions which they consider necessary. These results are
an important part of the input of the requirement analysis.
The third part of the questionnaire comprises choices of preferences about the
environment of the visualizer and the operation convenience, for understanding
the need of shop floor users. The file format of the 3D model used for visualisation,
the platform which the visualizer runs on, the navigation style of the 3D scene and
the layout of user interface are discussed in these questions.
The last part is an open question. Participants are welcome to list their own
ideas based on individual requirement and thoughts about the visualisation of tool
path generated by function block system. Individual thinking and suggestions are
expected in this question.
The complete questionnaire is presented in the Appendix A. The questionnaire
for COMAC is not presented as it is written in Chinese. The contents are simply
transcripts from the English version.
4.1.2 Result Analysis
Introduction
From the seven companies mentioned above (six project partners and one in
aviation industry), 10 responds were received in total. Based on the answers in the
responds, statistics had been made. From the summary of the general information
(see Chart 4.1-4.3), in every section defined for profession, experience and
background knowledge in the question, there is at least one respondent located,
except “1-2 years” in specialty experience. The sample size and diversity have met
the expectation at the beginning of the questionnaire survey.
The answers are sorted by categories of professions, and each category is
represented by different colours in bar/pie charts to show a clear picture where
the choices are located. The results are weighted according the different
background, specialties and project awareness of each responder. After calculating
the sum of the weighted answers, bar charts are used for displaying the final
30
results. These analysed results will indicate the requirement which the end-users
demand for the tool path visualisation of function block system.
In order to summarise the requirement, coefficients are defined to weight
every choices made by responders. Different combinations of the profession,
experience and background knowledge of the responder may change the
coefficient counted in the result analysis. The more experienced, more awareness
of CAPP and closer to machining operations, the bigger coefficient counted in the
result analysis of certain questions. Identical logics are applied for each question.
In the aspect of profession (P), there are 3 categories: ‘Managing’, ’Engineering’
and ’Technical’; 4 categories of experience (E), 1-2 years, 3-5 years, 6-10 years, 10+
years; 4 categories of knowledge about the project (K), Expert, Good knowledge,
General knowledge, No knowledge. The symbols for the coefficients are shown in
Table 4.1.
Profession Experience Project Knowledge
PM : Managing E1 : 1-3 years KEx : Expert
PE : Engineering E3 : 3-5 years KGo : Good Knowledge
PT : Technical E6: 6-10 years KGe : General Knowledge
E10: 10+ years KNo : No Knowledge
Table 4.1 Coefficients for different categories
For example, “PM, E3, KGo” indicates that the participant is in ‘Managing’ position
with ‘3-5 years’ experience and ‘Good knowledge’ level of CAPP. In the next step of
result analysis, each answer made by one responder is weighted by the product of
“P × E × K” which depending on the choices made for the first 4 questions, and then
added into a sum. The definition of these coefficients for each question helps to
collect the requirement more accurately from the most relevant personals. The
coefficient E and K are defined separately as constants, and coefficient P is defined
individually for each question. The values of the coefficient P, E, K for each
question are shown in Table 4.2. The selection of values for P will be explained
31
later in analysis of the result of each one. Taking the same example mentioned
above, when the participant, who is in ‘Managing’ position with ‘3-5 years’
experience and ‘Good knowledge’ level of CAPP, has chosen “A” in question Q05,
“PM × E3 × KGo = 0.5 × 0.8 × 1 = 0.4” is counted in the total of choice “A” in question
Q05.
Question Profession
Q05 PM = 0.5 PE = 1 PT = 1
Q06 PM = 0.5 PE = 1 PT = 0.5
Q07 PM = 1 PE = 0.8 PT = 1
Q08 PM = 0.5 PE = 0.8 PT = 1
Q09 PM = 0.5 PE = 0.8 PT = 1
Q05-Q09
E1 = 0.5 E3 = 0.8 E6 = 1 E10 = 1.2
KEx = 1.2 KGo = 1 KGe = 0.8 KNo = 0.5
Table 4.2 Coefficients defined for every question
Results Analysis
In the following part, result of every question is shown and analysed
respectively. The total amount responds is 10 in this questionnaire survey. The
sorted results are represented by pie charts (Q01-Q04) and bar charts (weighted
sum in Q05-Q09).
Chart 4.1 shows the distribution of the professions of participants. The portions
of each profession are Engineering 70%, Technical 20% and Managing 10%. The
statistic indicates that the majority of the participants are engineers and
technicians, which is good for the survey. Because of their practical experiences on
the shop floor, the answers from engineers and technicians contribute more in the
weighted result in most of the questions.
32
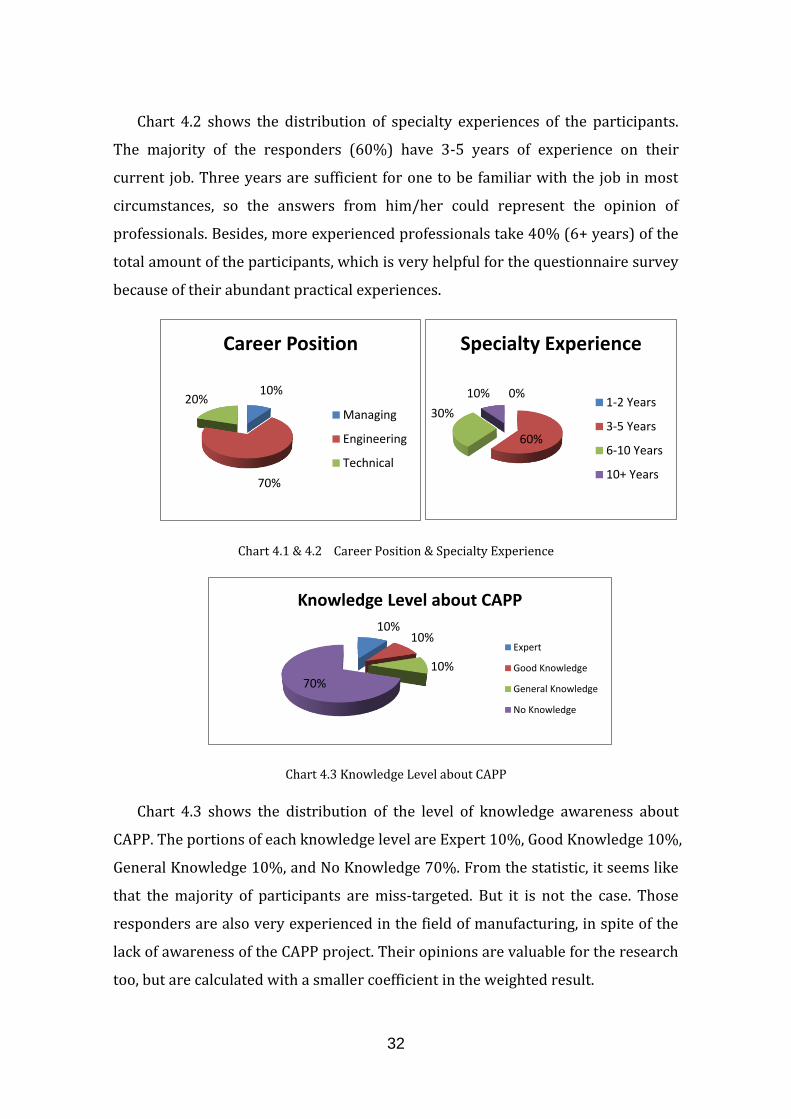
Chart 4.2 shows the distribution of specialty experiences of the participants.
The majority of the responders (60%) have 3-5 years of experience on their
current job. Three years are sufficient for one to be familiar with the job in most
circumstances, so the answers from him/her could represent the opinion of
professionals. Besides, more experienced professionals take 40% (6+ years) of the
total amount of the participants, which is very helpful for the questionnaire survey
because of their abundant practical experiences.
Chart 4.1 & 4.2 Career Position & Specialty Experience
Chart 4.3 Knowledge Level about CAPP
Chart 4.3 shows the distribution of the level of knowledge awareness about
CAPP. The portions of each knowledge level are Expert 10%, Good Knowledge 10%,
General Knowledge 10%, and No Knowledge 70%. From the statistic, it seems like
that the majority of participants are miss-targeted. But it is not the case. Those
responders are also very experienced in the field of manufacturing, in spite of the
lack of awareness of the CAPP project. Their opinions are valuable for the research
too, but are calculated with a smaller coefficient in the weighted result.
10%
70%
20%
Career Position
Managing
Engineering
Technical
0%
60%
30%
10%
Specialty Experience
1-2 Years
3-5 Years
6-10 Years
10+ Years
10% 10%
10%
70%
Knowledge Level about CAPP
Expert
Good Knowledge
General Knowledge
No Knowledge
33
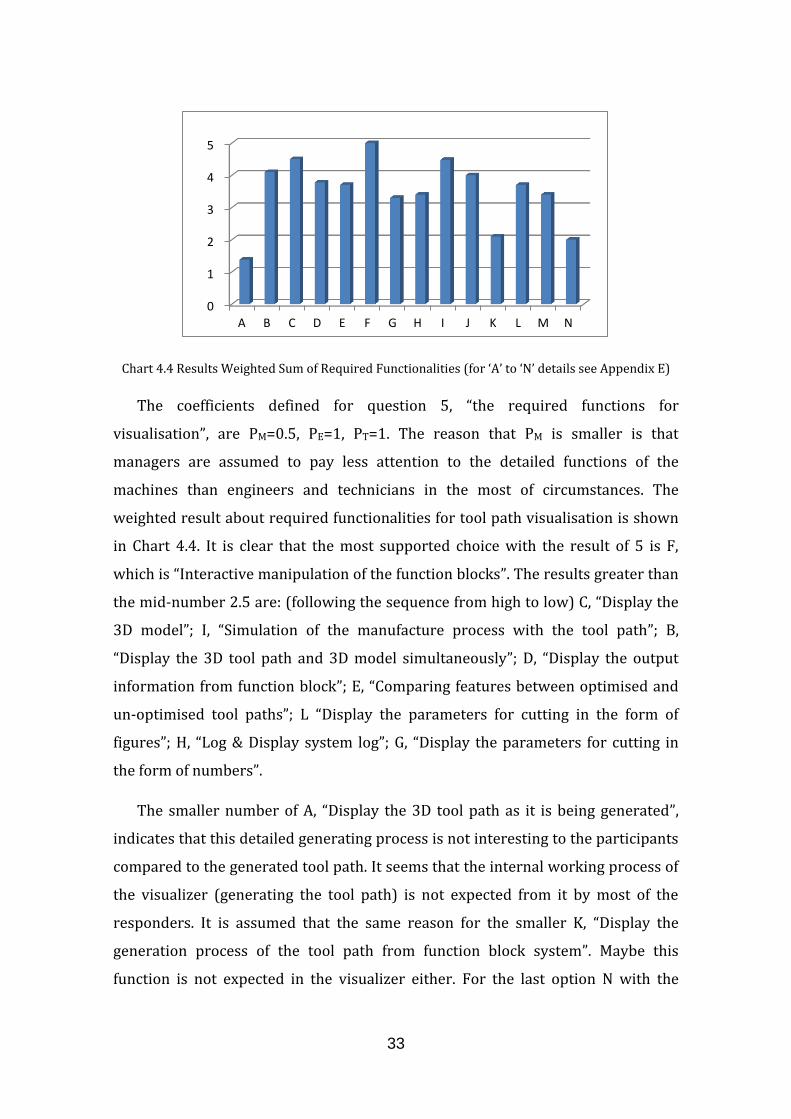
Chart 4.4 Results Weighted Sum of Required Functionalities (for ‘A’ to ‘N’ details see Appendix E)
The coefficients defined for question 5, “the required functions for
visualisation”, are PM=0.5, PE=1, PT=1. The reason that PM is smaller is that
managers are assumed to pay less attention to the detailed functions of the
machines than engineers and technicians in the most of circumstances. The
weighted result about required functionalities for tool path visualisation is shown
in Chart 4.4. It is clear that the most supported choice with the result of 5 is F,
which is “Interactive manipulation of the function blocks”. The results greater than
the mid-number 2.5 are: (following the sequence from high to low) C, “Display the
3D model”; I, “Simulation of the manufacture process with the tool path”; B,
“Display the 3D tool path and 3D model simultaneously”; D, “Display the output
information from function block”; E, “Comparing features between optimised and
un-optimised tool paths”; L “Display the parameters for cutting in the form of
figures”; H, “Log & Display system log”; G, “Display the parameters for cutting in
the form of numbers”.
The smaller number of A, “Display the 3D tool path as it is being generated”,
indicates that this detailed generating process is not interesting to the participants
compared to the generated tool path. It seems that the internal working process of
the visualizer (generating the tool path) is not expected from it by most of the
responders. It is assumed that the same reason for the smaller K, “Display the
generation process of the tool path from function block system”. Maybe this
function is not expected in the visualizer either. For the last option N with the
0
1
2
3
4
5
A B C D E F G H I J K L M N
34
number of 1.8, “3D visualisation options”, perhaps the definition of the item itself is
not clear for the responders to understand what it means.
The detail of the answers from the responders is listed in the Appendix E, so do
those of the following questions.
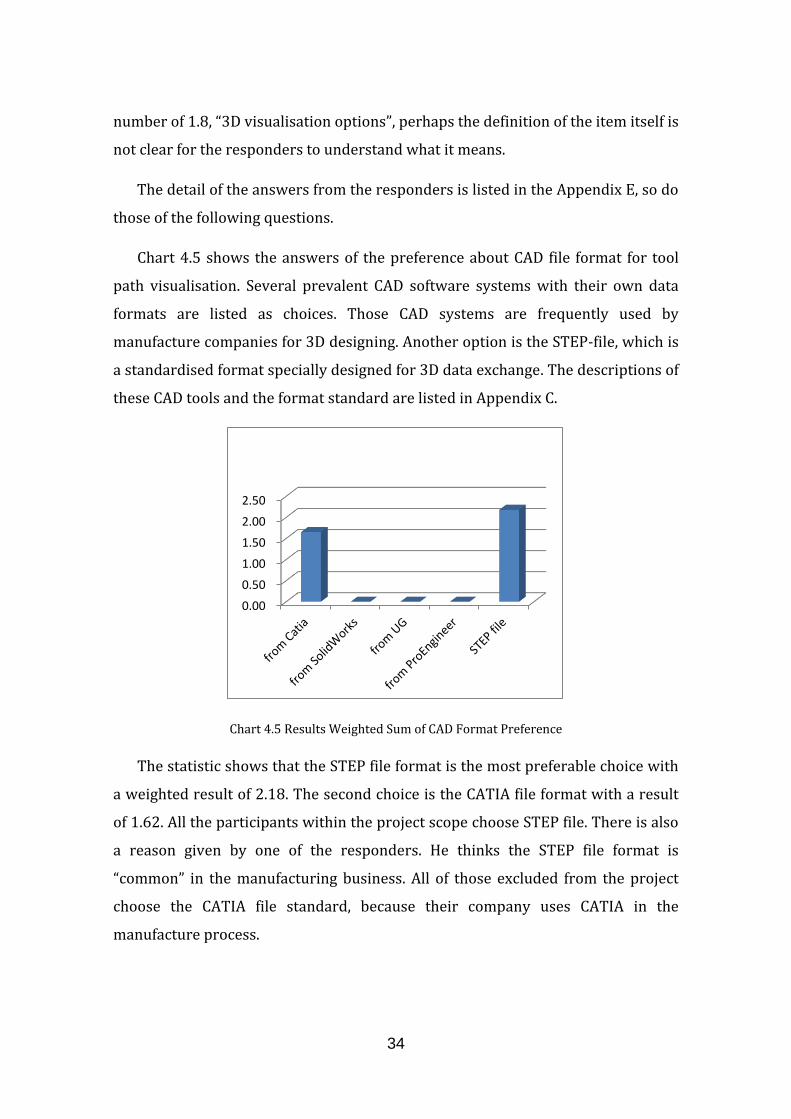
Chart 4.5 shows the answers of the preference about CAD file format for tool
path visualisation. Several prevalent CAD software systems with their own data
formats are listed as choices. Those CAD systems are frequently used by
manufacture companies for 3D designing. Another option is the STEP-file, which is
a standardised format specially designed for 3D data exchange. The descriptions of
these CAD tools and the format standard are listed in Appendix C.
Chart 4.5 Results Weighted Sum of CAD Format Preference
The statistic shows that the STEP file format is the most preferable choice with
a weighted result of 2.18. The second choice is the CATIA file format with a result
of 1.62. All the participants within the project scope choose STEP file. There is also
a reason given by one of the responders. He thinks the STEP file format is
“common” in the manufacturing business. All of those excluded from the project
choose the CATIA file standard, because their company uses CATIA in the
manufacture process.
0.00
0.50
1.00
1.50
2.00
2.50
35
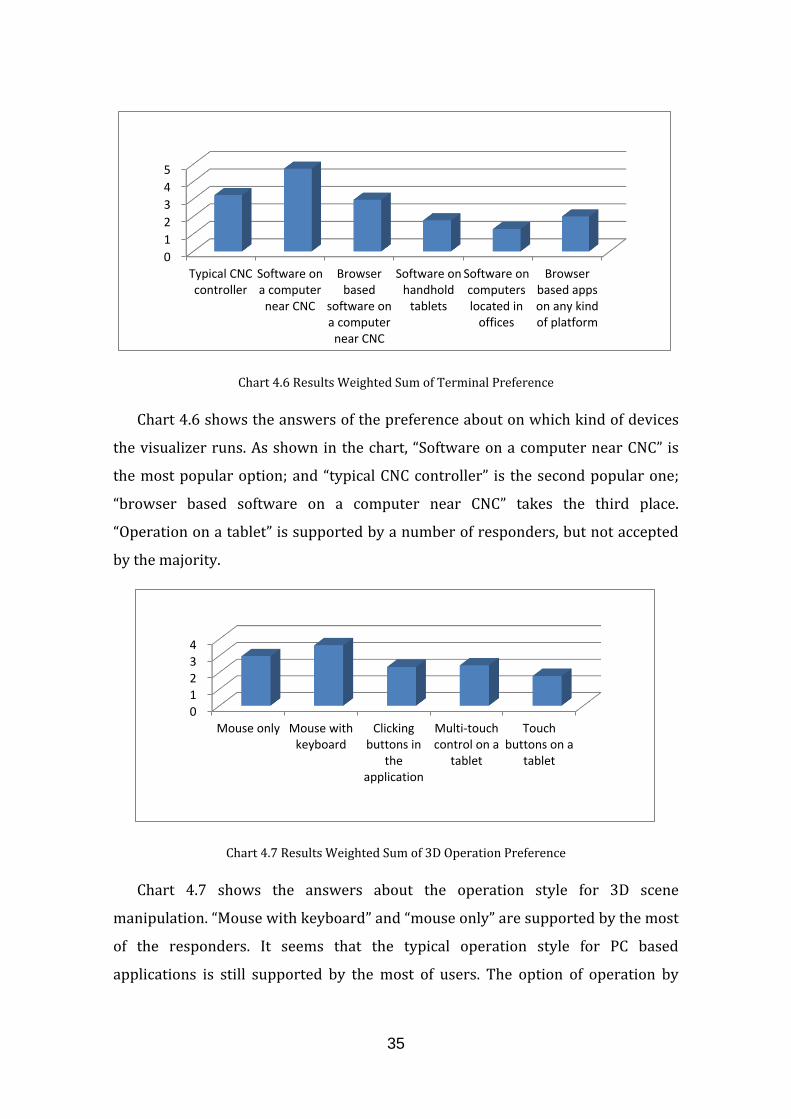
Chart 4.6 Results Weighted Sum of Terminal Preference
Chart 4.6 shows the answers of the preference about on which kind of devices
the visualizer runs. As shown in the chart, “Software on a computer near CNC” is
the most popular option; and “typical CNC controller” is the second popular one;
“browser based software on a computer near CNC” takes the third place.
“Operation on a tablet” is supported by a number of responders, but not accepted
by the majority.
Chart 4.7 Results Weighted Sum of 3D Operation Preference
Chart 4.7 shows the answers about the operation style for 3D scene
manipulation. “Mouse with keyboard” and “mouse only” are supported by the most
of the responders. It seems that the typical operation style for PC based
applications is still supported by the most of users. The option of operation by
0
1
2
3
4
5
Typical CNCcontroller
Software ona computernear CNC
Browserbased
software ona computernear CNC
Software onhandhold
tablets
Software oncomputerslocated in
offices
Browserbased appson any kindof platform
0
1
2
3
4
Mouse only Mouse withkeyboard
Clickingbuttons in
theapplication
Multi-touchcontrol on a
tablet
Touchbuttons on a
tablet
36
touch is also well accepted by quite a number of responders, just slightly behind
the first two. Maybe when the style of mobile control is widespread, the
distribution of the choices will be different.
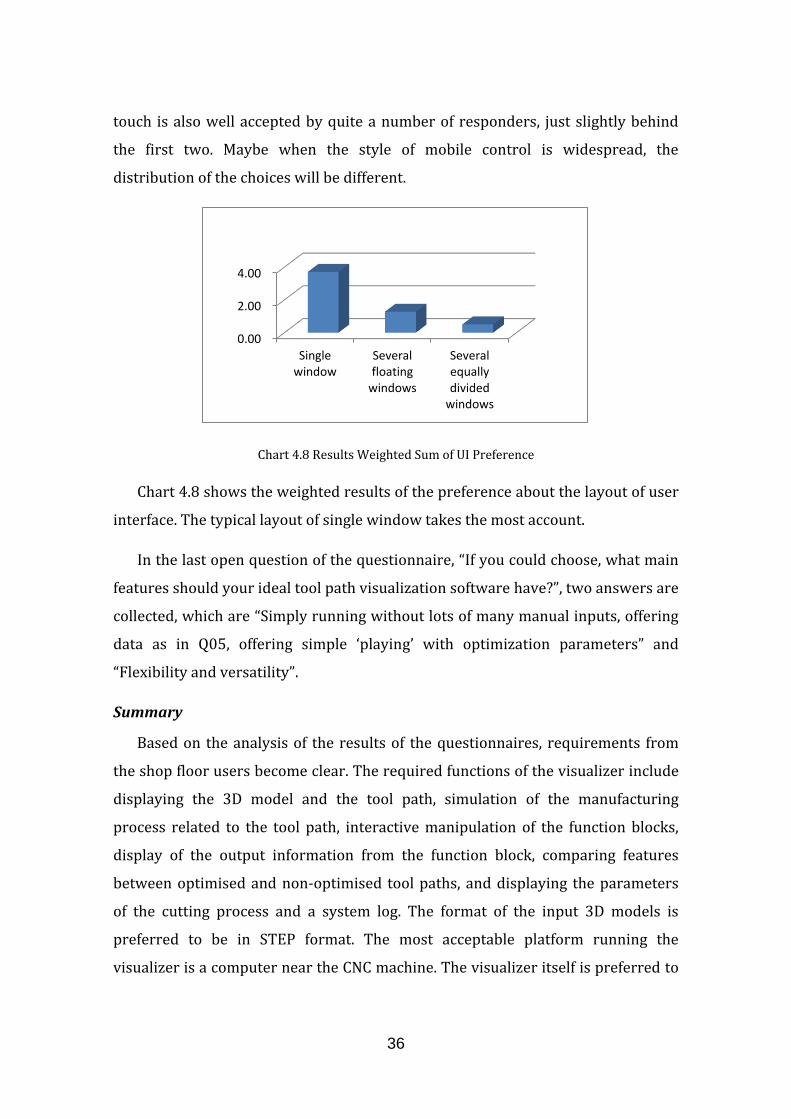
Chart 4.8 Results Weighted Sum of UI Preference
Chart 4.8 shows the weighted results of the preference about the layout of user
interface. The typical layout of single window takes the most account.
In the last open question of the questionnaire, “If you could choose, what main
features should your ideal tool path visualization software have?”, two answers are
collected, which are “Simply running without lots of many manual inputs, offering
data as in Q05, offering simple ‘playing’ with optimization parameters” and
“Flexibility and versatility”.
Summary
Based on the analysis of the results of the questionnaires, requirements from
the shop floor users become clear. The required functions of the visualizer include
displaying the 3D model and the tool path, simulation of the manufacturing
process related to the tool path, interactive manipulation of the function blocks,
display of the output information from the function block, comparing features
between optimised and non-optimised tool paths, and displaying the parameters
of the cutting process and a system log. The format of the input 3D models is
preferred to be in STEP format. The most acceptable platform running the
visualizer is a computer near the CNC machine. The visualizer itself is preferred to
0.00
2.00
4.00
Singlewindow
Severalfloating
windows
Severalequallydivided
windows

37
be designed as a single window application with mouse and keyboard operation
for easy 3D manipulation.
4.2 Interview
A visit to a domestic industrialist, PowerKut Ltd., was arranged after a
prototype of the visualizer was ready for testing. During the visit, unstructured
interviews with the staffs acquired a clearer understanding of the practical
expectations from the software by the users. In the manufacture process in their
company, process planning is made manually through a CAM system. G-code is
generated by the CAM system and loaded into a CNC controller, in this case a
Mazak controller with Windows as operation system (OS). A visualisation function
for the tool path is available in an on-board application. However, this is 2D only
and the view point cannot be changed, likely to cause confusion when the tool path
is complex and overlapping. The technician we spoke mentioned that he would like
to have an on-board 3D tool path visualizer so that he could get a clearer
understanding of the tool path by a 3D representation. Moreover, if the tool path
visualisation is available on the CNC controller, it’s convenience for him to make
the preparation of the manufacture process, as he no longer has to come to CAM
systems for 3D tool path presentations.
In general, all interviewed thought the idea of on-board and light weight
visualisation for tool paths from function blocks could be very helpful for business.
4.3 Summary
In this chapter, the collecting process for the requirements from industrial
users through a questionnaire survey is reviewed. The results of the survey are
analysed and summarised. The information collected from the interviews is also
concluded here.

39
5. Application Development
Thanks to the highly developed computer graphics technology, there are
hundreds of approaches to develop visualisation software and numerous mature
tools developed. However, according to the literature and the research introduced
previously, there is no mature visualisation tool which is able to provide all the
functions we need for tool path visualisation of a function block system. The aim of
this research is to find a suitable visualisation solution especially for function
blocks, so explicit and elaborate selection of visualisation methods which serve the
need of function blocks visualisation precisely are the most important process in
the development. A number of aspects are focused on to build this tool, such as the
layout strategy of GUI, the algorithm for plotting and software structure, the API
and software operating convenience.
5.1 Graphical User Interface (GUI)
According to the result analysis of the questionnaire, the single-window style
is preferred by most of the participants. And the mouse & keyboard style is the
most acceptable way to operate the software. The choices correspond to the most
common scene in a workshop that one can find, which is that single window
applications runs on a PC with ordinary configuration aside a CNC machine. It
seems that it is a reasonable, reliable and cost efficient way to run applications
during the process of manufacturing. Although the trendy concept of using tablet
in a mobile working scheme is also popular according to the questionnaire, which
accounts for 40% of the result of the answer, the traditional way to operate an
application is still the most practical for shop floor users.
The mainstream design style for the control panels of CNC controllers is a
combination of displaying screen with keyboard and buttons. Some of the models
provide the function of mouse through certain devices too. Usually, matrixes of
buttons are placed both in the software interface and on the physical panel in most
of the designs for CNC controllers. Clear and directive allocation of functions of
those buttons makes it easier for technicians to operate the machine. As the
visualizer is designed to be real-time and on-board, it is better to follow this clear
40
and directive style. Buttons for frequently used functions are designed in the user
interface of the visualizer. Considering the possible different operation ways of the
pointing devices on different controllers, complicit operations may not work as
conveniently as they do when using a real mouse. So, operations using mouse as
the input device in the visualizer is restricted down to only two simple ways, click
and drag with button pressed.
For a 3D visualisation tool, the layout of the interface, which displays models
and tool path, is supposed to be directive to provide all the necessary information
for a clear understanding of 3D objects for users. Most of the visualisation
applications provide a single scene which contains all the information about the
virtue world, and allow the users to navigate the view freely in it, such as in
SolidCAM (SolidCAM Inc., 2014), Openscam (Cauldron Development LLC, 2014)
and HSMWorks (Autodesk Inc., 2012). Usually, certain views can be displayed
instead of the main window when it is required, such as front view, top view, side
view, isometric view and custom view. The GUI layouts of mainstream CAM and
CAD applications are similar and proved to be practical. So the GUI layout of the
visualizer in this research is designed following the same style. As this visualizer is
designed for controller on-board use and real-time visualisation, three separate
rendering windows, front, top and side view, are displayed aside the main “scene”
(isometric view) simultaneously in order to provide real-time information and
clearer views of the objects.
In all of the four views, navigation operation is available, allowing the user to
modify the view in the way they want. For the “main scene”, the isometric view of
the virtual world, two kinds of navigation functions are provided. One is driven by
the drag movement of the mouse with either left or right button pressed. It
controls two directions of rotations around Y axis or Z axis. The Y axis and Z axis
refer to the axes in the absolute coordinate system of the virtual 3D world. Up-
down movement controls the rotation around axis Y, and left-right controls the
rotation around axis Z. Arbitrary movement leads to the combination of the effects
made by both up-down and left-right movements. The second way of navigation is
driven by a number of buttons to move the position of the camera in the absolute

41
coordinate system of the virtual 3D world. There are four kinds of movements
designed, along axis X, along axis Y, along axis Z and along a line which links the
origin point of the absolute coordinate system of the virtual 3D world and the
point of view. The view point is able to be move both positive and negative along
those directions (zoom in and out for the last situation). Each click on those
buttons will change the view point (position of the camera) by a certain distance
along corresponding direction. The step (distance) is able to be defined by the user
through a slider below the views. For the other three views, front, top and side
view, only the latter functions by buttons are provided for navigation (except the
zoom in/out).
Figure 5.1 GUI development process
The GUI is developed step by step and forms its final version. The process is
shown in Figure 5.1. The structure of the GUI and the function of each component
will be explained later in details. The final version of the visualisation tool is shown
in Figure 5.2.
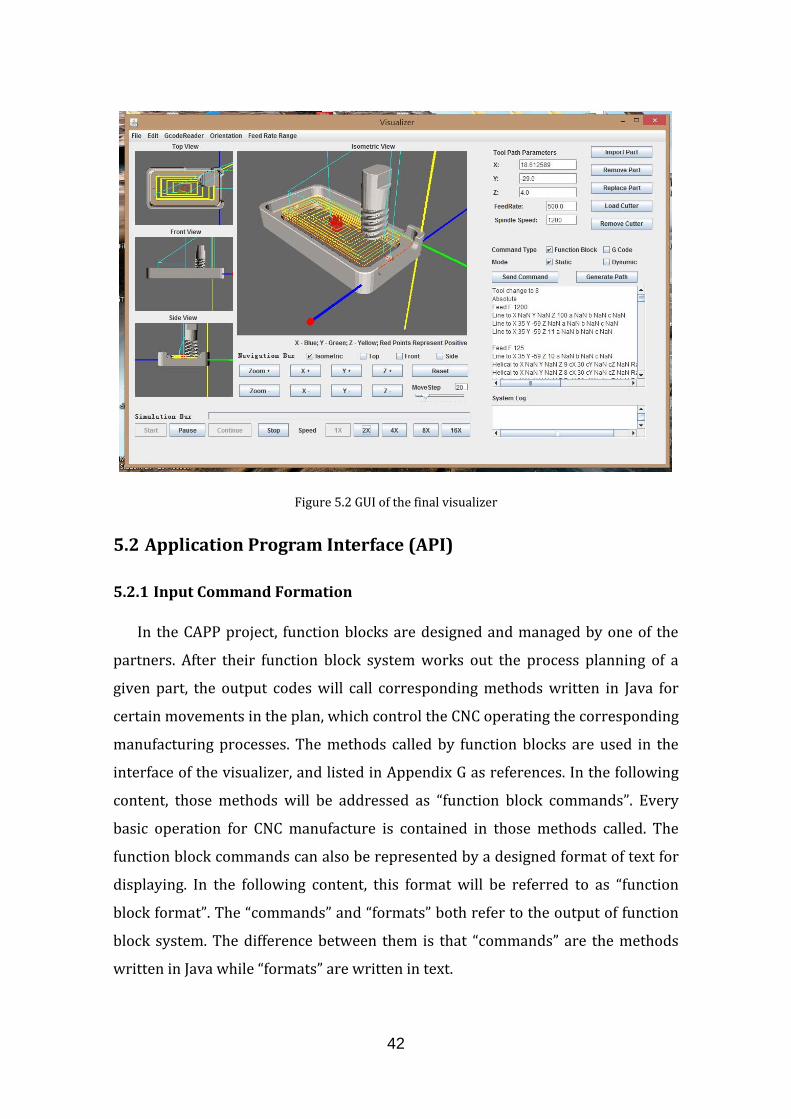
42
Figure 5.2 GUI of the final visualizer
5.2 Application Program Interface (API)
5.2.1 Input Command Formation
In the CAPP project, function blocks are designed and managed by one of the
partners. After their function block system works out the process planning of a
given part, the output codes will call corresponding methods written in Java for
certain movements in the plan, which control the CNC operating the corresponding
manufacturing processes. The methods called by function blocks are used in the
interface of the visualizer, and listed in Appendix G as references. In the following
content, those methods will be addressed as “function block commands”. Every
basic operation for CNC manufacture is contained in those methods called. The
function block commands can also be represented by a designed format of text for
displaying. In the following content, this format will be referred to as “function
block format”. The “commands” and “formats” both refer to the output of function
block system. The difference between them is that “commands” are the methods
written in Java while “formats” are written in text.
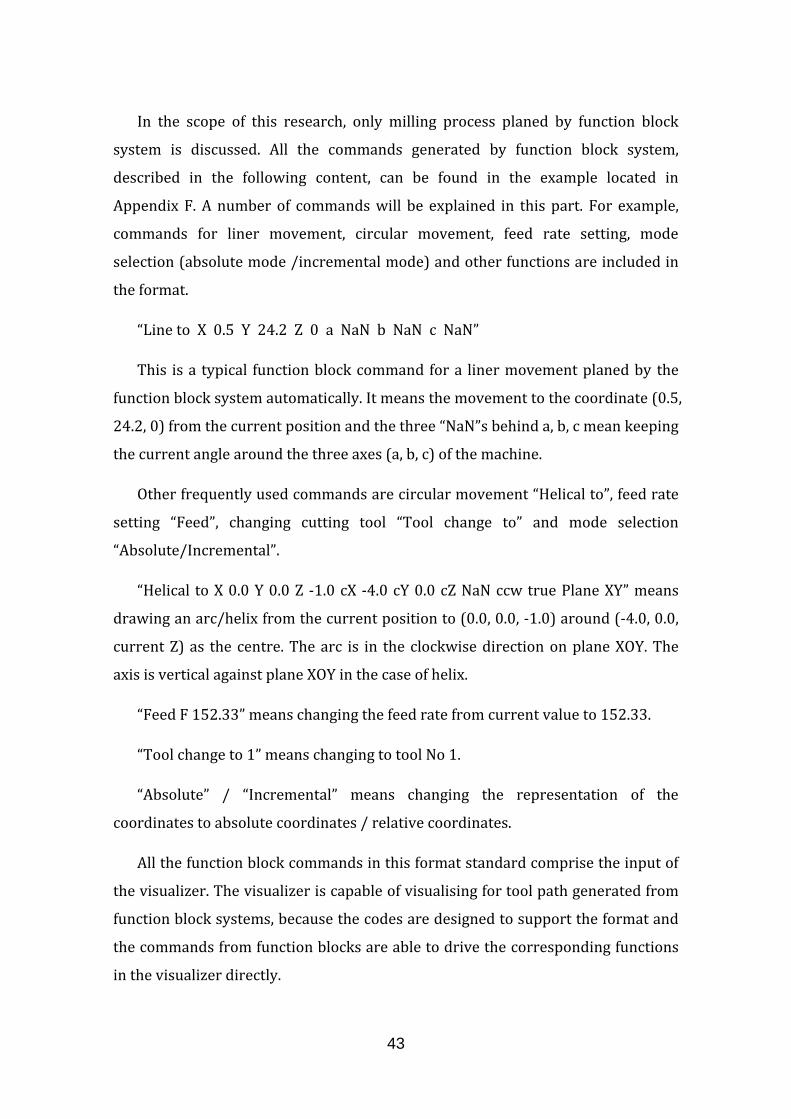
43
In the scope of this research, only milling process planed by function block
system is discussed. All the commands generated by function block system,
described in the following content, can be found in the example located in
Appendix F. A number of commands will be explained in this part. For example,
commands for liner movement, circular movement, feed rate setting, mode
selection (absolute mode /incremental mode) and other functions are included in
the format.
“Line to X 0.5 Y 24.2 Z 0 a NaN b NaN c NaN”
This is a typical function block command for a liner movement planed by the
function block system automatically. It means the movement to the coordinate (0.5,
24.2, 0) from the current position and the three “NaN”s behind a, b, c mean keeping
the current angle around the three axes (a, b, c) of the machine.
Other frequently used commands are circular movement “Helical to”, feed rate
setting “Feed”, changing cutting tool “Tool change to” and mode selection
“Absolute/Incremental”.
“Helical to X 0.0 Y 0.0 Z -1.0 cX -4.0 cY 0.0 cZ NaN ccw true Plane XY” means
drawing an arc/helix from the current position to (0.0, 0.0, -1.0) around (-4.0, 0.0,
current Z) as the centre. The arc is in the clockwise direction on plane XOY. The
axis is vertical against plane XOY in the case of helix.
“Feed F 152.33” means changing the feed rate from current value to 152.33.
“Tool change to 1” means changing to tool No 1.
“Absolute” / “Incremental” means changing the representation of the
coordinates to absolute coordinates / relative coordinates.
All the function block commands in this format standard comprise the input of
the visualizer. The visualizer is capable of visualising for tool path generated from
function block systems, because the codes are designed to support the format and
the commands from function blocks are able to drive the corresponding functions
in the visualizer directly.
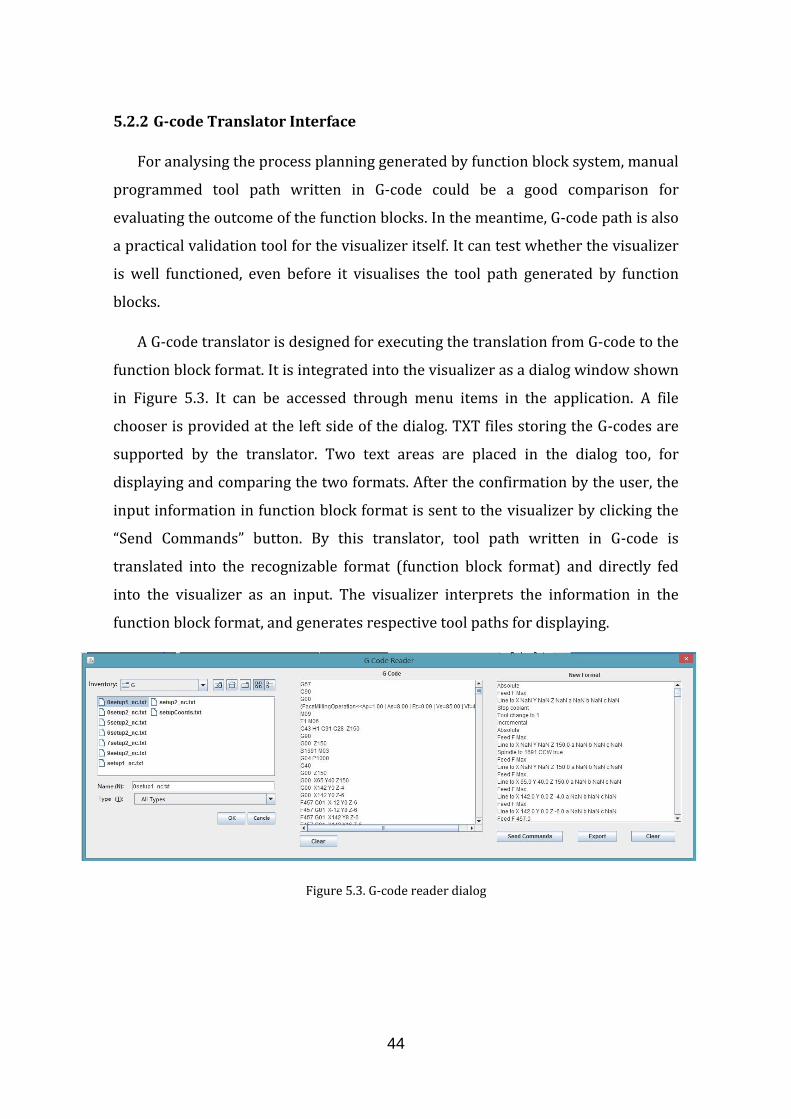
44
5.2.2 G-code Translator Interface
For analysing the process planning generated by function block system, manual
programmed tool path written in G-code could be a good comparison for
evaluating the outcome of the function blocks. In the meantime, G-code path is also
a practical validation tool for the visualizer itself. It can test whether the visualizer
is well functioned, even before it visualises the tool path generated by function
blocks.
A G-code translator is designed for executing the translation from G-code to the
function block format. It is integrated into the visualizer as a dialog window shown
in Figure 5.3. It can be accessed through menu items in the application. A file
chooser is provided at the left side of the dialog. TXT files storing the G-codes are
supported by the translator. Two text areas are placed in the dialog too, for
displaying and comparing the two formats. After the confirmation by the user, the
input information in function block format is sent to the visualizer by clicking the
“Send Commands” button. By this translator, tool path written in G-code is
translated into the recognizable format (function block format) and directly fed
into the visualizer as an input. The visualizer interprets the information in the
function block format, and generates respective tool paths for displaying.
Figure 5.3. G-code reader dialog
45
5.2.3 Cloud Environment Data Exchange Interface
In the Web-DPP system of CAPP-4-SMEs, the entire process planning job is
accomplished by distributed workstations collaboratively. Resources, software and
information are shared within the network. The communication and data exchange
are realised by connections in a Cloud environment. For the real-time work mode
of the visualizer, input information should be dynamically fed into the application,
such as commands which describe the tool path, feedback information of
parameters of the cutting process from CNC machine. Potentially, the controlling
signals for function blocks or CNC machines can be generated by the user through
the visualizer, and then be sent back into the network. Due to the progress of the
project development, the Cloud environment is still in preparing and not ready for
use yet. In order to work with real-time input information, the commands
translation module, tool path rendering module and animation control module are
designed to be able to deal with input data blocks. The work mode can be either
static commands or dynamic commands. The previous means that all the
commands for the tool path is provided entirely at one time, and the latter one
means that a series commands packages are provided to the visualizer
continuously in a certain sequence. After the Cloud environment is set and the port
for data exchange is defined, the real-time working mode of the visualizer can be
realized by minor modifications.
5.3 Application Structure and Data Flow
5.3.1 Application Structure
The main structure of the application comprises three parts, GUI, API and
graphics rendering. As shown in the data flow diagram for the application (Figure
5.4), each part consists of several modules which process the same function
together.
The blue items represent the modules for processing the graphics rendering of
the 3D virtual universe, which contains and displays everything to be visualized.
The “Virtual Universe” module defined the structure of the entire 3D scene. The
46
other six modules control the changes made to the 3D scene. “Model Importer”
controls the importation of the 3D models of the parts and the cutting tools. In the
requirement analysis, it is shown that the format STEP is the most popular one
because it is generic and versatile. However, the importer for decoding the STEP
file is difficult to program during the development. The knowledge of 3D computer
graphics in a certain depth is needed to develop the loader. After a period of time
for searching, it seems that it is difficult to find a ready-for-use STEP file loader too.
So in the code of the visualizer, a native Object loader is substituted as the
replacement of STEP loader. Object file, with the extension of .obj, is a kind of
format which restores information of 3D models. The Object loader is provided in
native Java library. The “Command Reader” reads the commands written in
function block format, translates them into internal commands, and calls those
corresponding methods in the “Command API”. “Data Generator” receives
commands and generates data for every point in the tool path. It calculates all the
information required for tool path rendering and the animation of cutting process,
and stores it within itself. “Path Generator” renders the tool path, with different
colours representing different feed rates. “Animation Controller” is a multi-thread
module which controls the schedule of every frame for the manufacturing process
animation. “Updater” draws data from “Data Generator” and updates a single frame
when called by “Animation Controller”.
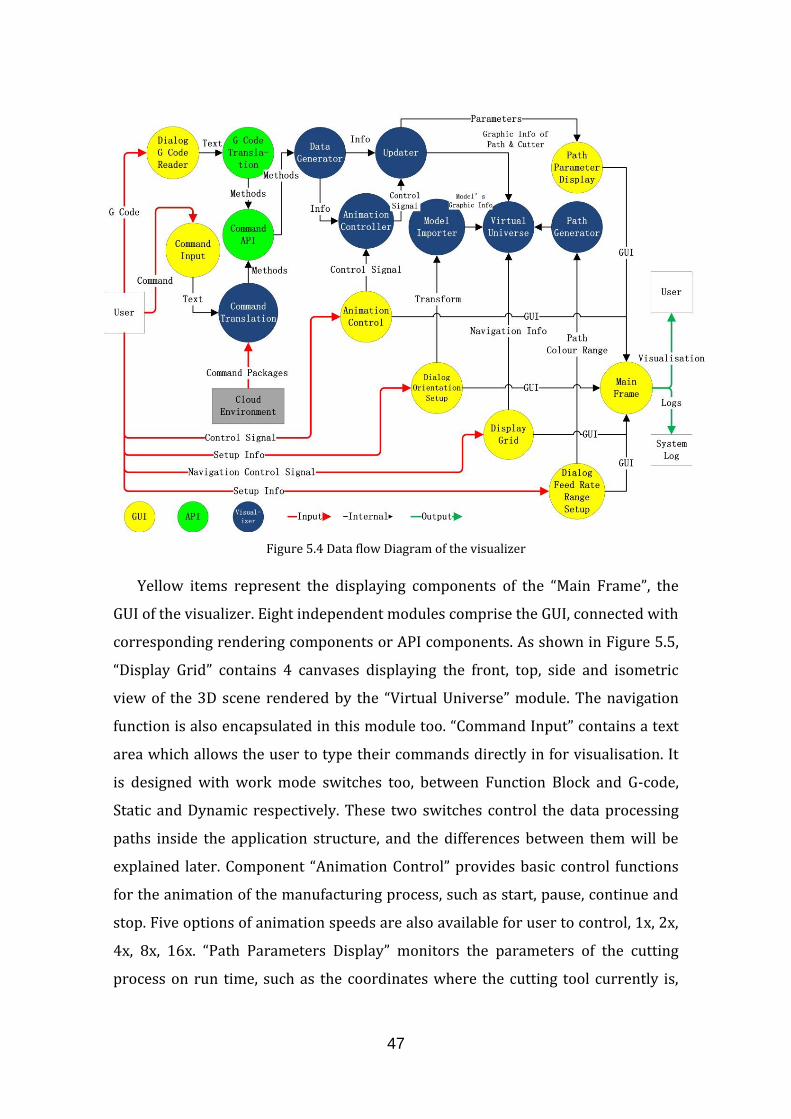
47
Figure 5.4 Data flow Diagram of the visualizer
Yellow items represent the displaying components of the “Main Frame”, the
GUI of the visualizer. Eight independent modules comprise the GUI, connected with
corresponding rendering components or API components. As shown in Figure 5.5,
“Display Grid” contains 4 canvases displaying the front, top, side and isometric
view of the 3D scene rendered by the “Virtual Universe” module. The navigation
function is also encapsulated in this module too. “Command Input” contains a text
area which allows the user to type their commands directly in for visualisation. It
is designed with work mode switches too, between Function Block and G-code,
Static and Dynamic respectively. These two switches control the data processing
paths inside the application structure, and the differences between them will be
explained later. Component “Animation Control” provides basic control functions
for the animation of the manufacturing process, such as start, pause, continue and
stop. Five options of animation speeds are also available for user to control, 1x, 2x,
4x, 8x, 16x. “Path Parameters Display” monitors the parameters of the cutting
process on run time, such as the coordinates where the cutting tool currently is,
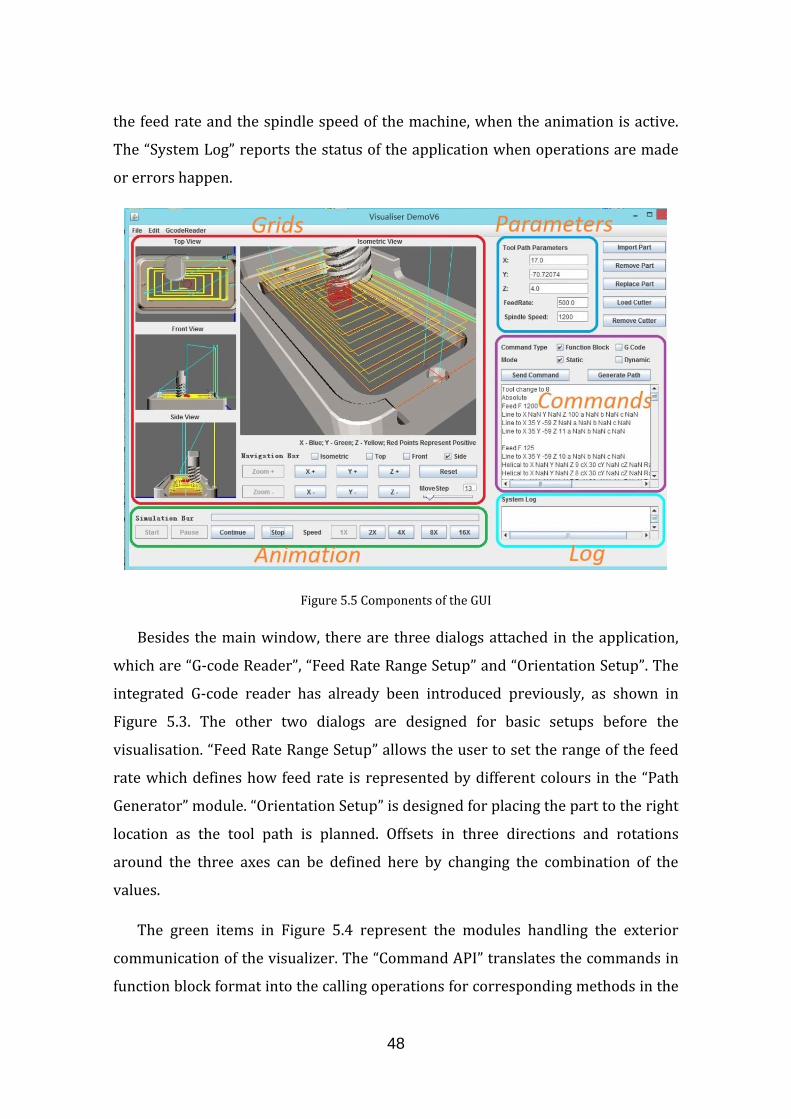
48
the feed rate and the spindle speed of the machine, when the animation is active.
The “System Log” reports the status of the application when operations are made
or errors happen.
Figure 5.5 Components of the GUI
Besides the main window, there are three dialogs attached in the application,
which are “G-code Reader”, “Feed Rate Range Setup” and “Orientation Setup”. The
integrated G-code reader has already been introduced previously, as shown in
Figure 5.3. The other two dialogs are designed for basic setups before the
visualisation. “Feed Rate Range Setup” allows the user to set the range of the feed
rate which defines how feed rate is represented by different colours in the “Path
Generator” module. “Orientation Setup” is designed for placing the part to the right
location as the tool path is planned. Offsets in three directions and rotations
around the three axes can be defined here by changing the combination of the
values.
The green items in Figure 5.4 represent the modules handling the exterior
communication of the visualizer. The “Command API” translates the commands in
function block format into the calling operations for corresponding methods in the
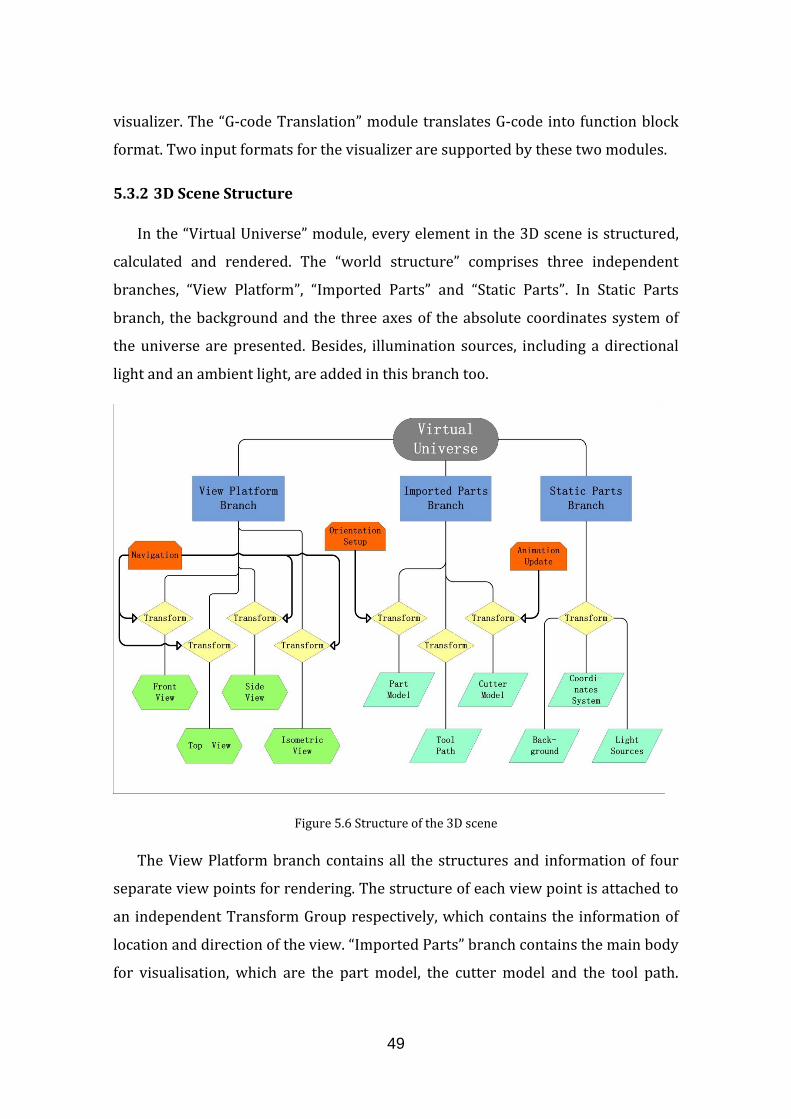
49
visualizer. The “G-code Translation” module translates G-code into function block
format. Two input formats for the visualizer are supported by these two modules.
5.3.2 3D Scene Structure
In the “Virtual Universe” module, every element in the 3D scene is structured,
calculated and rendered. The “world structure” comprises three independent
branches, “View Platform”, “Imported Parts” and “Static Parts”. In Static Parts
branch, the background and the three axes of the absolute coordinates system of
the universe are presented. Besides, illumination sources, including a directional
light and an ambient light, are added in this branch too.
Figure 5.6 Structure of the 3D scene
The View Platform branch contains all the structures and information of four
separate view points for rendering. The structure of each view point is attached to
an independent Transform Group respectively, which contains the information of
location and direction of the view. “Imported Parts” branch contains the main body
for visualisation, which are the part model, the cutter model and the tool path.

50
Similarly, each of them is attached to a Transform Group too. The three orange
cards, “Navigation”, “Orientation Setup” and “Animation Update” represent control
commands for those functions. The control commands are applied on the
corresponding components, and eventually applied on these Transform Groups to
become effective. Further information can be found in “Introduction for Computer
Graphics” by Klawonn, K. (2008), for better understanding of the structure of
Java3D.
5.3.3 Data Flow in the Visualizer
There are three kinds of information in the data flow of the visualizer, input,
output and control. Three ways to feed information into the visualizer, direct
commands input, dynamic input mode and G-code input mode, are designed to
deliver data through different paths. As shown in Figure 5.4, input of direct
information in function block format is acquired by the “Command Input”
component of the GUI. The “Command Reader” receives the information, translates
it into function block commands, and then sends them to the “Command API”. The
second way of input begins with “Dynamic Command Feed”. It receives data from
the Cloud Environment, packs the commands into packages of certain size, and
then sends it to the “Command Reader” for translation. The capability of format
translation in “G-code Reader” makes the third way of input possible. The input
written in G-code is translated into the function block format, and sent to the
“Command API” directly.
All three data flows feed information into the “Command API” eventually. After
it receives the input, it manipulates the corresponding methods in “Data Generator”
to generate the data for visualisation and animation. After calculation, the
generator dispatches path information to “Path Generator”, and send animation
information to “Animation Controller” and “Updater”. Afterwards, all the data is fed
into the “Virtual Universe”. Dynamic images are rendered from it and displayed in
the “Display Grid” as the main output of the visualizer. Another part of output is
the parameters of the tool path when animation is activated. The information
51
about coordinates, feed rate and spindle speed are provided by “Updater” as the
3D graphics are being updated by it.
Control functions are located in several different stages in the feed-calculate-
render process. At the beginning, information from “Feed Rate Range Setup” and
“Orientation Setup” sets the visualisation configuration and original location of the
part model. As the 3D scene is being rendered, commands from “Animation Control”
component make adjustment of the animation process managed by “Animation
Controller”, and navigation commands from “Display Grid” manipulate the
positioning of the four separate views in “Virtual Universe”.
5.4 Optimisation for Light Weight
In order to improve the performance of the visualizer, the application should
be light-weight and less computational resource demanding while running real-
time visualisation. Another restriction which forces the visualizer to be light
weight is the limited resource on both the hardware and the software of the CNC
controller. As introduced in section 1.2, the OS of the controller (Windows, Linux,
MS-DOS or special designed OS like HEROS 5) is usually customised to achieve the
goal of fast and precise performance. In order to work at high speed,
computational resource for user applications on the controller is often limited as
well. Most of the computational resources are allocated for controlling the CNC
machine. The user memory offered by the manufacturers of controllers is
relatively limited and small. From the aspect of hardware, usually the graphic
computation ability of the controller is not very good compared to the graphic
cards on personal computers. On some controller models, certain visualisation
functions are not supported by the hardware.
Considering the restricted working environment and the real-time
performance required for the visualizer, the light weight attribute is vital for both
the application and the research. After the elaborate selection of programing
language, several optimisations have been made to help the visualizer “lose
weight”. Efforts have been made in two ways, GUI optimisation and data storage
optimisation.
52
5.4.1 GUI optimisation
In the 3D scene, text labels represent x, y and z axis are commonly used in
many circumstances. However, additional computational resources are required to
realise the “billboard” effect, which allows the texts to be always facing the
observer in the right direction. Distinct differentiation by representing the axes
with different colours can lose some weight in the rendering process, as they are
static. Red sphere models are added on the axes to show the positive directions.
In the calculation of the tool path, points are defined to draw lines. Curves are
also approximated by series of short lines. In the first demo of the visualizer, each
of those lines is allocated with a node (like the part model in the structure in
Figure 5.6). Each node leads to a series of steps of calculation respectively. It is not
an issue when the tool path is simple and in short length. But as the complexity and
size grow, the data size for the tool path grows rapidly too. In order to help the
visualizer lose some weight in the memory (taking less space), the tool path curves
assigned with same feed rate are integrated into one node in the structure of the
3D scene. In this way, the amount of nodes has been significantly reduces, which
improves the performance of the visualizer and costs less memories.
5.4.2 Data Storage optimisation
The data storage for the tool path was realised through numbers of arrays
(data format in Java) in the beginning of the development. For better compatibility
considering the data size, it is designed heavy and clumsy, which leads to more
consumption of the memory space. The issue has been optimized in the final
version of the application, through two translations of data format. “ArrayList” is a
native class of Java, the size of which is elastic and controllable. It takes more space
than arrays when the size of the format itself is taken account of. In the situation in
which uncertainties present, applying this versatile format makes the memory
consumption more economic. However, it is not suitable for the virtual universe to
refer to. Because that it is necessary to keep the data in the virtual universe as long
as the graphics it represents is in the structure of the scene. In this case, an array
53
will be the most efficient way to keep data. On the contrary, an ArrayList lost its
versatility in this static situation.
The optimisation is to define ArrayLists in the data storage in the initialising
stage of the visualizer. After the exact information of the graphics received, the
data will be transported into an array with the right size, and the ArrayLists will be
emptied. Afterwards, the array will be sent into, stored and referred by the virtual
universe. In the aspect of memory consumption, this optimisation keeps the light-
weight style of the visualizer.
5.5 Summary
In Chapter 5, the whole process of the development of the visualisation tool is
described in every aspect. The layout strategy for the GUI is explained in detail.
The processes which the visualizer works internally and externally have been
explained in the part for API, structure and data flow. Light weight optimisation
has been made in two aspects to reduce the resource consumption.
The development process begins with learning the language of Java, Java3D,
and developing tool NetBeans. Programming skills, which support the whole
developing process of this visualisation tool, are adopted from learning and
practicing. The entire application development is accomplished individually.
In the rest of this part, features specially designed for visualising the tool path
from function block system are concluded into bullet points, and the capability of
the application itself is summarised.
5.5.1 Features Designed for Visualising the Tool Path from Function Blocks
The purpose of this research is to find a suitable solution for visualising the tool
path generated by function block system. A number of features in the visualizer are
specially designed or optimised for the function block visualisation. They are
summarised here.
54
Dynamic Input-Visualise Mode for Real-time
As described in problem statement in Chapter 1, in CAPP approach, function
blocks work and adapt the changes automatically. The function blocks are always
“on-the-fly”, collecting information and re-planning the process in a real-time
manner. The visualizer must keep pace with the function blocks, and be able to
process the “flying” information from function block as soon as it arrives.
The dynamic input-visualise mode introduced in section 5.5.3, is designed to
meet the requirement of real-time for the visualizer. Once a certain amount of
commands from function block system have been received by the visualizer, they
are packed in a bundle and sent to the rendering algorithm for visualisation. This
work mode is able to visualise the changes of tool path shortly after they are made
by function block system. Besides the time cost for visualisation, the size of the
command package also determines the delay of reaction. The performance of the
reaction can be adjusted by changing the package size. The reaction time also
depends on the speed of the communication between visualizer and FB system, as
well as the calculation capability of the CNC controller (or computer).
In one of the case study described in the next chapter, the total time
consumption from receiving the input to finishing the visualisation of a complete
tool path is around 2~3s (on a laptop). It is assumed to react and visualise small
command packages in dynamic mode within one second (on a laptop). A real-time
manner is realized in this research by this dynamic input-visualise mode of the
visualizer.
Light Weight
Considering the real-time performance required and the restricted working
environment, light weight is a vital attribute that the visualisation tool has to
possess. The light weight attribute is pursued in every step of the development.
The selection of Java language, the GUI and data storage structure optimisation are
all following the idea of light weight. In the validation test explained in next
chapter, the visualizer works smoothly and lightly. The average computational
resource consumption of the visualizer is 2.5~5% CPU & 52MB~68MB of memory
55
(on a laptop running Windows 8). These figures are according to the task manager
of Windows, and support the accomplishment of the light weight goal by concrete
evidence. A snapshot is presented in Appendix H. The consumption mentioned
above includes the cost of Java Runtime Environment (“Java Platform SE Binary” in
the snapshot). The actual lean consumption of the visualizer is not able to be
shown by the task manager. It is believed that the consumption will be much
smaller as long as the Java Runtime is supported and included natively in the OS.
On-board
In a Web-DPP system, function blocks responsible for operation planning are at
the bottom of the architecture. They control the operation of CNC machines and
receive adjusting orders from FBs responsible for supervisory planning. In order to
act and react efficiently, the ideal approach is embedding the FBs in the CNC
controller. In order to work with the on-board FBs, the ideal working environment
for the visualizer should be on the CNC controller too. So far, the visualizer is able
to deploy and run on CNC controllers which run Windows as their OS.
Implementation test has been carried out to prove that it is functional on one of
these controllers (Mazatrol Matrix), which will be explained in detail in the next
chapter about validation.
Command Format Support
As explained in the literature review, process planning made by function block
system no longer generates G-code for CNC machine to operate. It generates
commands which directly work in the CNC controller to control the manufacturing
process. These commands are standardized in a uniform format, which is
described in part 5.4.1 (details in Appendix F & G). The “function block format” is
well supported in the visualizer. Every kind of these commands can be directly fed
into the visualizer for visualisation without any translation to other formats. So far
as this research goes, it seems that no other application besides this one can do so.

56
5.5.2 Application Specification
Platform:
Computer installed Windows or CNC controller installed Windows
System requirement:
Java Runtime Environment (JRE) and Java3D Interface natively supported
or installed.
At least 70MB free system memory required for the application. (30MB
estimated for the visualizer itself if Java Runtime Environment is native in
the OS)
At least 6.5MB free space in hard drives or user memory for the files of the
application.
Format for visualisation supported:
Tool path represented in function block format, or in the form of G-code.
Format of 3D model file supported:
Object files with the extension “.obj”.
Function provided:
1. Displaying 3D objects in multiple views (top, front, side & isometric);
2. Importing, removing and replacing function for part model and cutter
model;
3. Tool path plotting according to the input information in both static work
mode and dynamic work mode. Real-time plotting and animation are
supported;
4. Different colours using in tool path sections represent different feed rates.
The range of feed rate can be set up in the dialog of “Feed Rate Range”. The
range is divided equally into 7 sections with 7 colours respectively;
57
5. Navigation operations for controlling the view in the 3D scene, such as
movements along the axis X or Y or Z, zoom in/out referring the origin
point. Views can be adjusted respectively, the movement of each
adjustment is defined in the slider of “Move Step”;
6. Displaying the tool path in function block format. Tool path manually
inputted is supported;
7. Simulation (animation) of the cutting process is provided. Basic functions
like start, pause, continue, stop and speed adjustment are included;
8. Displaying the parameters of the tool path while simulation (animation);
9. Displaying the system log;
10. G-code Reader for translating the source from G-code into function block
format;
11. Orientation setup for adjusting the beginning location and direction of the
part model.

59
6. Validation
In order to validate the visualizer, five phases of validations were arranged
during the research, including basic function test, implementation test, case studies,
compatibility test and expert validation. They were arranged in separated periods
located respectively after each milestone of the application development process.
Firstly after the prototype of the application is finished, a case study for testing the
basic visualisation functions came in. The next phase was an implementation test
on an actual CNC controller, when the application itself and deployment
procedures were finished. Then three more cases were studied. A compatibility
test follows, the visualizer was tested on different platforms (different OS). The last
phase was a research validation by experts from industries, who were the third
party to the research.
6.1 Visualisation Functions Test
The first stage of validation test aims to prove that the core functions of the
visualizer are working correctly. The functions for testing include: 1) 3D model
importation and plotting; 2) tool path plotting; 3) 3D scene navigation; 4) tool path
parameters displaying; 5) cutting process simulation (dynamic 3D plotting). A
specific part (an iPhone case) and a pre-defined tool path (for pocket milling) in
the function block format will be used in the test.
A checklist was prepared to evaluate the first case study.
Test Part: an iPhone case
Test Tool Path: pre-defined milling path of a pocket, involving rough milling
tool and finishing milling with a smaller tool.
Test Computer: Laptop with a mid-level hardware set (Windows 8 installed)
Check List:
The model is imported and plotted correctly
The cutter is imported and plotted correctly

60
The tool path is plotted correctly
The navigation function is sufficient for use
The basic function of cutting process simulation is provided
The parameters of the tool path are displayed correctly
The basic function test was carried out successfully. The snapshot of the test is
shown in Fig. 6.1. All the items in the checklist are matched, the functions were
working correctly.
Figure 6.1 Snapshot in visualisation function test
6.2 Implementation Test
Since the on-board visualisation is a capability expected from the visualizer, the
implementation test on the CNC controller is significant for the validation. Thanks
to the help from PowerKut, the access to a Mazak controller “Mazatrol Matrix”
(customised Windows XP running) is possible for the implementation of the
visualizer. The procedures for installation were summarised in a visit plan to show
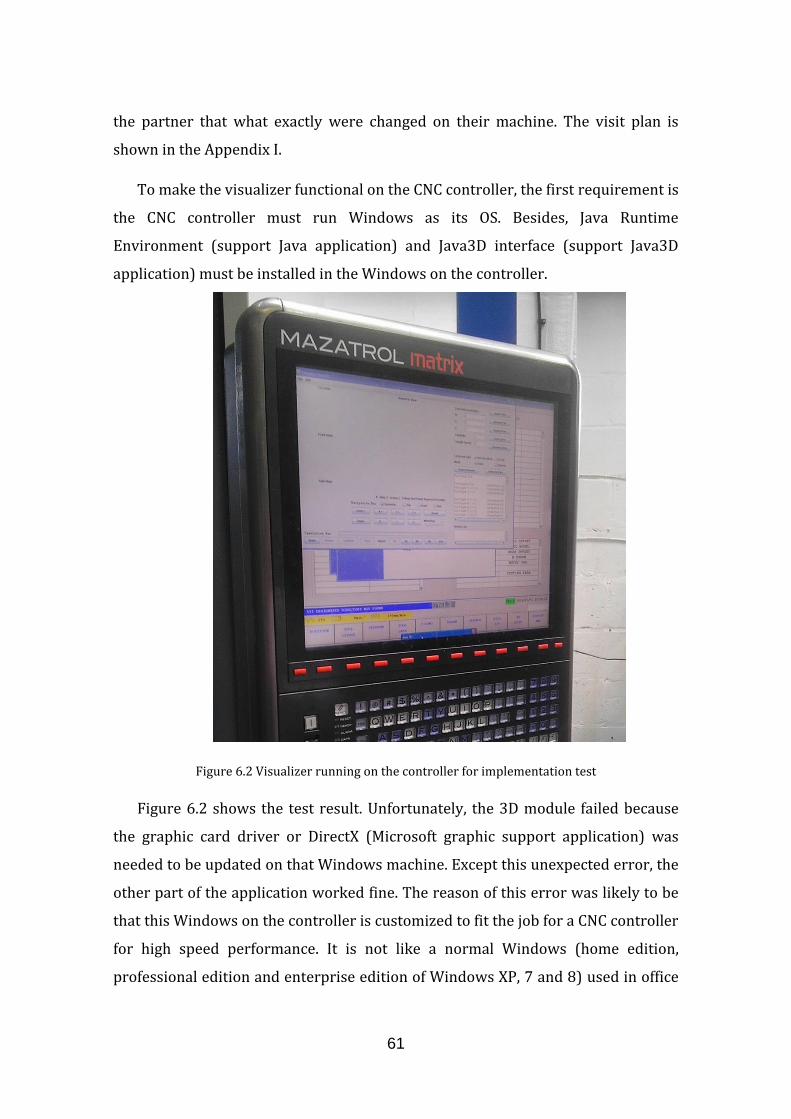
61
the partner that what exactly were changed on their machine. The visit plan is
shown in the Appendix I.
To make the visualizer functional on the CNC controller, the first requirement is
the CNC controller must run Windows as its OS. Besides, Java Runtime
Environment (support Java application) and Java3D interface (support Java3D
application) must be installed in the Windows on the controller.
Figure 6.2 Visualizer running on the controller for implementation test
Figure 6.2 shows the test result. Unfortunately, the 3D module failed because
the graphic card driver or DirectX (Microsoft graphic support application) was
needed to be updated on that Windows machine. Except this unexpected error, the
other part of the application worked fine. The reason of this error was likely to be
that this Windows on the controller is customized to fit the job for a CNC controller
for high speed performance. It is not like a normal Windows (home edition,
professional edition and enterprise edition of Windows XP, 7 and 8) used in office

62
or home, some components are not installed on it (maybe the multi-media support
component). From the aspect of hardware, it is also possible that the graphic card
of the controller was customised too, causing the lack of support for 3D graphics.
There are two approaches to solve this problem. The first one is updating the
graphic card driver and DirectX as it required. The second one is to add local
graphic library in the visualizer itself, rendering the graphics by software
acceleration. It is assumed to be the solution too for the situation that the
hardware does not support 3D graphics at all. After either of these two is done, the
3D part of the visualizer is expected to work as it does on other Windows systems
in the validation tests.
6.3 Case Studies
According to the feedback in the implementation test, the interface and the core
function of the application were modified. New Functions were added, including
orientation setup (adjusting the position of the part), feed rate range setup
(allocating colours for different feed rates), G-code translator (into function block
format). With this version of visualizer, 3 more cases other than the case in basic
function testing were planned. The test platform was the same as described
previously in the basic function test.
In the first case, another part was used for importation for testing the import
function of the visualizer. In the second one, a piece of tool path which was
generated by the function blocks of KTH, in the format of G-code, was imported
through the G-code translator for testing the tool path plotting function. In the last
one, the part “iPhone case” was used again with a different tool path. The function
of tool path plotting, cutting process simulation and colour allocation for different
feed rate were tested in this case.
All of the three case studies were successfully completed. The results
(snapshots) are presented in the Appendix J.
63
6.4 Compatibility Test
Since the visualizer developed in this research is designed to run on Windows
based platforms, its compatibility on different versions of Windows OSs is also an
important feature required. Four versions of Windows were selected for testing,
including the customized Windows XP on the CNC controller, Windows XP,
Windows 7 and Windows 8. Windows 7 and Windows 8 are the most widespread
systems currently. Windows XP is widely used on the computers connected with
CNC machines in industries, especially on old computers with old hardware sets.
There are several other versions excluded from the selection. Windows 95 and 98
are becoming unlikely to be chosen by industry in the trend, because they are very
old. Windows 2000 is also very old and more likely used for servers. Windows
Vista is nearly the same age of Windows 7, but not very popular compared to
Windows 7.
The task for the visualizer in this compatibility test was the same as the last
case described in the previous part, which was the iPhone case with a tool path for
pocket machining, except the test of the customized Windows XP on the CNC
controller. The test on the CNC controller was completed in the implementation
test, and the result is explained in the previous part (section 6.2). The results of the
other tests (snapshots) are presented in Appendix K.
For Windows XP, 7 and 8, the visualizer passed the compatibility test. Every
function worked correctly on those platforms. For the Windows on CNC controller,
it is expected that the 3D rendering process of the visualizer will work after
procedures mentioned previously in the part for implementation test (section 6.2.).
In the compatibility test of Windows XP, virtual machine software (VMplayer by
VMware, as a free software for non-commercial use) was used to simulate the OS,
and the test was successfully passed.
6.5 Expert Validation
For validating the research from an objective angle, experts from manufacture
industries were invited to validate the research. The files needed were emailed to
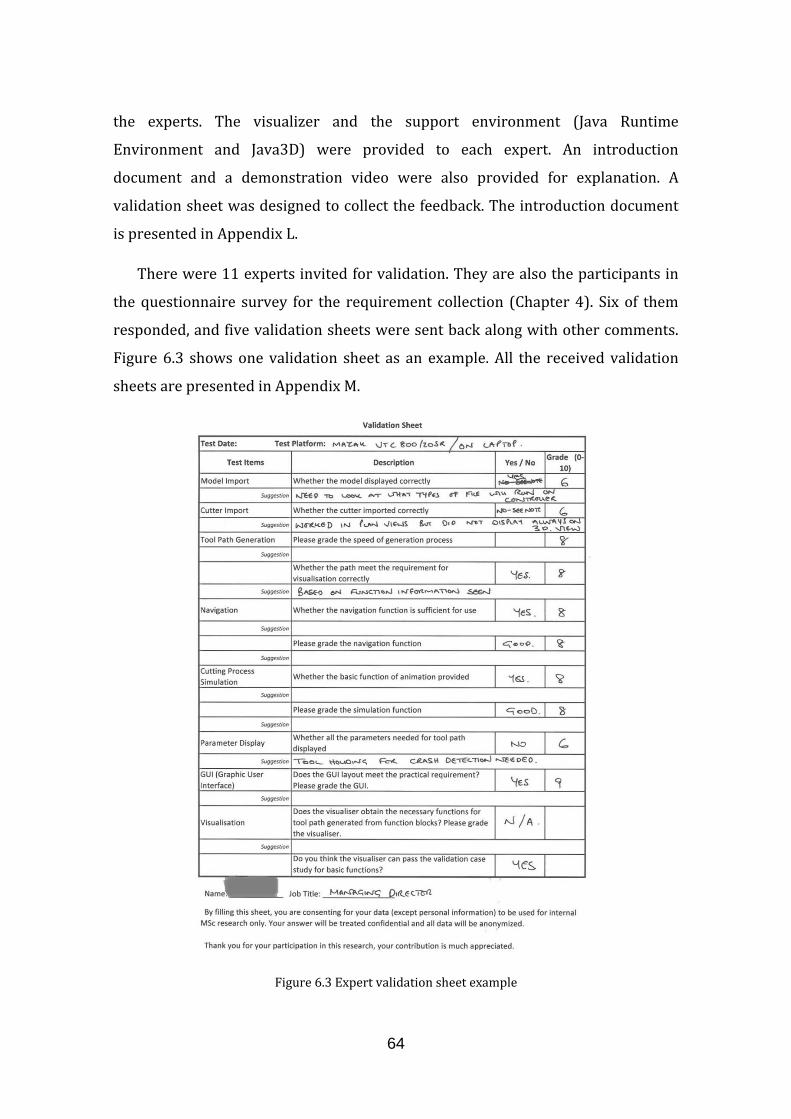
64
the experts. The visualizer and the support environment (Java Runtime
Environment and Java3D) were provided to each expert. An introduction
document and a demonstration video were also provided for explanation. A
validation sheet was designed to collect the feedback. The introduction document
is presented in Appendix L.
There were 11 experts invited for validation. They are also the participants in
the questionnaire survey for the requirement collection (Chapter 4). Six of them
responded, and five validation sheets were sent back along with other comments.
Figure 6.3 shows one validation sheet as an example. All the received validation
sheets are presented in Appendix M.
Figure 6.3 Expert validation sheet example
65
As shown in the figure, a check list about functions of the visualizer was filled
and graded by the expert. Suggestion and comment were given in the blanks below
the relevant aspects.
Generally speaking, all five validation responds agreed that the visualizer, as
the deliverable, had fulfilled the purpose of this research and the industrial
expectations. There were a number of comments and suggestions from the experts
for improving the application, which were mainly focused on the user experience
and expectation.
The following are the summary of the comments:
1. Support more 3D model file formats, and consider the file supported by
CNC controllers.
2. Function of tool hold for crash detection is needed.
3. Use white background colour after loading the model.
4. Use mouse wheel to control the zoom in/out operation.
5. Axial depth of cut and radial depth of cut could be added as parameters of
the tool path.
6. The forward and backward movement control of the animation function
should be provided, and the adjustment of speed can be changed to any
number between 1 and 16.
7. The step which is current running should be displayed.
8. Use G-code text stream as a neutral interface between the visualizer and
external sources.
66
6.6 Summary
The visualizer, as the main deliverable of the research, was validated through
the five phases of validations arranged during the research. It is verified to be a
functional visualisation tool for the tool path generated by function block system.
The visualizer works on platforms with Windows (four versions tested), provides
main functions including tool path plotting and cutting process simulation. It
matches the purpose of this research, which is finding a suitable solution
specifically for visualising the process planning result (tool path) generated from
function block system, in the manufacturing field involving milling operation.
67
7. Conclusion
Research Summary
In this research, a light weight 3D visualisation solution, which is designed for
visualising the tool path generated by function block system, is proposed,
developed and tested. The visualizer developed in this research is different from
the numerous existing tool path visualisation applications which work with CAM
systems, as it works in a real-time behaviour in order to keep pace with function
blocks instead of in an off-line mode with CAM systems. A questionnaire survey
and interviews were carried out for collecting the requirement to ensure that the
practical needs from shop floor users are satisfied. The visualizer is developed
based on Java3D and encapsulated within a 3D graphical user interface with
multiple views. The core capability of the visualizer is directly processing the
process planning by function block system in the form of tool path visualisation. It
is able to adapt to changes following the pace of function block system in a real-
time manner. To facilitate the real-time feature, the visualizer is designed in light
weight style and capable of working on the CNC controllers with Windows
installed.
Contribution
Based on the background research, it is assumed that the visualizer developed
in this research is the first visualisation tool which supports the function block
system in a real-time manner. This visualisation solution provides interactivity
between the function block system and the users through a friendly HMI as a
platform for communication. The output of the function block system, the process
planning, is presented in front of the users in a direct and vivid way. The behaviour
of the function block system in real-time situations can be observed through this
visualisation tool. Once the other way of controlling channel is completed after
derivative future work, the manipulation of the function behaviour will also be
realised through this platform. Then the visualisation tool will became a real
“communication centre” providing the whole function of interactivity between the
“machine” and “human”. The research process is introduced thoroughly. The
68
methodology and the outcome of the research can be adopted for further
researches focusing the visualisation of function blocks.
Conclusion
A light weight real-time 3D visualisation solution, which is designed for
visualising the tool path generated by function block system in the manufacturing
field involving milling operations, is provided in this research.
Limitation
Limitations exist in the current development of the visualizer. Only the format
of Object file (3D model format) is supported by the visualizer currently. According
to the questionnaire survey, the STEP file is the most welcomed format for 3D
model. The visualizer could be more versatile when a STEP file reader is added or
even more formats are supported. The parameters of the tool path displayed in the
interface are not sufficient for advanced users. As suggested by an expert in the
validation process, the axial depth of cut and radial depth of cut could be useful
parameters for describing the tool path as well. More useful functions should be
offered by the visualizer as suggested by experts, such as the navigation for
animation process and collision test between the cutting tool and the part.
Future Work
Future works can be carried out on the exploration of the potentials of
improving the interactivity between the function block system and the user. More
functions can be added into the visualisation tool, such as the manipulation of the
function block behaviour and the comparison between optimised and un-
optimised tool paths. Integrating interactive channels bridging the Web-DPP
system, local function blocks and CNC controller in the visualisation tool might be a
workable direction in the future, for the purpose of providing the “communication
centre” of the CAPP architecture for shop floor use.
69
REFERENCES
Autodesk Inc. (2014) HSMWorks, available at:
http://www.hsmworks.com/ (accessed 11 August 2014)
CAPP-4-SMEs (2014), CAPP-4-SMEs, available at:
http://www.capp-4-smes.eu/ (accessed 11 August 2014)
Cauldron Development LLC (2014), Openscam, available at:
http://openscam.com/ (accessed 11 August 2014)
Ferrarini, L., and Veber, C. (2004), “Implementation approaches for the execution
model of IEC 61499 applications”, Industrial Informatics 2004 INDIN'04 2004
2nd IEEE International Conference, 26 June 2004, Berlin, Germany, IEEE, pp.
612-617, DOI: 10.1109/INDIN.2004.1417418
FORMTEC (2014), NCspeed, available at:
http://www.formtec.de/fs_ncspeed_en.htm (accessed 11 August 2014)
Groover, M. P. (2010), Fundamentals of modern manufacturing: materials, processes
and systems, 4th ed., JOHN WILEY & SONS, United States.
Guzman, J. G. F. (2010), Visualization modelling using fractals and CAD, (MSc thesis),
Cranfield University, Cranfield, Bedford.
Hague, P. (1993), Questionnaire Design, Kogan Page.
Hartman, N. W. (2009), “Evaluating light weight 3D graphics formats for product
visualization and data exchange”, Journal of Applied Science & Engineering
Technology, vol. 3, pp. 39-46, 2009.
Hendrix, T. D., Cross II, J. H., and Barowski, L. A. (2004), “An extensible framework
for providing dynamic data structure visualizations in a light weight IDE”,
Proceedings of the 35th SIGCSE technical symposium on Computer science
education, vol. 36, issue 1, pp. 387-391, 2004,
DOI: 10.1145/971300.971433

70
Holmberg, N., Wünsche, B., and Tempero, E. (2006), “A framework for interactive
web-based visualization”, AUIC '06 Proceedings of the 7th Australasian User
interface conference, vol. 50, pp. 137-144, 2006.
Hussain, T., and Frey, G. (2004), “Developing IEC 61499 compliant distributed
systems with network enabled controllers”, Robotics, Automation and
Mechatronics, 2004 IEEE Conference on (vol. 1), 1-3 December 2004, IEEE,
pp. 507-512, DOI: 10.1109/RAMECH.2004.1438972
International Electrotechnical Commission (2005), "IEC 61499-1: Function Blocks-
Part 1 Architecture", International Standard (vol. 1), IEC, Geneva
Kitware, Inc. (2014), Visualisation Toolkit (VTK), available at:
http://www.vtk.org/ (accessed 11 August 2014)
Klawonn, F. (2008), Introduction for Computer Graphics Using Java2D and 3D, 2nd
ed., Springer-Verlag, London
Lepuschitz, W., and Zoitl, A. (2009), “Integration of a DCS based on IEC 61499 with
Industrial Batch Management Systems”, 13th IFAC Symposium on Information
Control Problems in Manufacturing (vol. 13, part 1), 3-5 June 2009, V.A.
Trapeznikov Institute of Control Sciences, Russia, International Federation of
Automatic Control, pp. 686-691,
DOI: 10.3182/20090603-3-RU-2001.00114
Ma, X., Winslett, M., Norris, J., Jiao, X., and Fiedler, R. (2004), “Godiva: Light weight
data management for scientific visualization applications”, Proceedings of 20th
International Conference, 30 March-2 April 2004, IEEE, pp. 732-743,
DOI: 10.1109/ICDE.2004.1320041
Peltola, J., Christensen, J., Sierla, S., and Koskinen, K. (2007), “A migration path to
IEC 61499 for the batch process industry”, Industrial Informatics, 2007 5th
IEEE International Conference (vol. 2), 23-27 June 2007, Vienna, IEEE, pp. 811-
816, DOI: 10.1109/INDIN.2007.4384878
71
Plessis, K. (2011), Development of 3D interfaces for real-time visualization of piloted
works, (MSc thesis), Cranfield University, Cranfield, Bedford.
Sapsford, R. and Jupp, V. (1998), Data Collection and Analysis, SAGE Publications,
London
Silva, W. B., and Rodrigues, M. A. F. (2009), “A light weight 3D visualization and
navigation system on handheld devices”, Proceedings of the 2009 ACM
symposium on Applied Computing, 9-12 March 2009, Hawaii, ACM,
pp. 162-166, DOI: 10.1145/1529282.1529318
SolidCAM Inc. (2014), SolidCAM, available at: http://www.solidcam.com/us/cam-
solutions/toolpath-solid-verify-machine-simulation/ (accessed 11 August
2014)
Tait, P. (2005), “A path to industrial adoption of distributed control
technology”, Industrial Informatics, 2005, INDIN'05, 3rd IEEE International
Conference, 10-12 August 2005, IEEE, pp. 86-91,
DOI: 10.1109/INDIN.2005.1560357
Thramboulidis, K., Sierla, S., Papakonstantinou, N., and Koskinen, K. (2007), “An
IEC 61499 based approach for distributed batch process control”, Industrial
Informatics, 2007 5th IEEE International Conference (vol. 1), 23-27 June 2007,
Vienna, IEEE, pp. 177-182, DOI: 10.1109/INDIN.2007.4384752
Tlusty, J. (2000), Manufacturing Processes and Equipment, Prentice Hall, Upper
Saddle River, NJ.
Vyatkin, V. V., Christensen, J. H., and Lastra, J. L. M. (2005), “OOONEIDA: an open,
object-oriented knowledge economy for intelligent industrial automation”
Industrial Informatics, IEEE Transactions on, vol. 1, issue 1, pp. 4-17, 2005, DOI:
10.1109/TII.2005.843829.
72
Vyatkin, V. (2011), “IEC 61499 as enabler of distributed and intelligent automation:
State-of-the-art review”, Industrial Informatics, IEEE Transactions on, vol. 7,
issue 4, pp. 768-781, 2011,
DOI: 10.1109/TII.2011.2166785.
Wang, L., Jin, W. and Feng, H. (2006), "Embedding machining features in function
blocks for distributed process planning", International Journal of Computer
Integrated Manufacturing, vol. 19, issue. 5, pp. 443-452, 2006,
DOI: 10.1080/09511920500399060
Wang, L., Keshavarzmanesh, S., and Feng, H. Y. (2008), “Design of adaptive function
blocks for dynamic assembly planning and control”, Journal of Manufacturing
Systems, vol. 27, issue 1, pp. 45-51, 2008,
DOI: 10.1016/j.jmsy.2008.06.003
Wang, L., Feng, H. Y., Song, C., and Jin, W. (2009), “Function block design for
adaptive execution control of job shop machining operations”, International
Journal of Production Research, vol. 47, issue 12, pp. 3413-3434, 2009,
DOI: 10.1080/00207540701666212
Wang, L., Adamson, G., Holm, M., and Moore, P. (2012), “A review of function blocks
for process planning and control of manufacturing equipment”, Journal of
manufacturing systems, vol. 31, issue 3, pp. 269-279, 2012, DOI:
10.1016/j.jmsy.2012.02.004
Wang, L. (2013), “Machine availability monitoring and machining process planning
towards Cloud manufacturing”, CIRP Journal of Manufacturing Science and
Technology, vol. 6, issue 4, pp. 263-273, 2013,
DOI: 10.1016/j.cirpj.2013.07.001
Xu, X., Wang, L., and Newman, S. T. (2011), “Computer-aided process planning–A
critical review of recent developments and future trends”, International
Journal of Computer Integrated Manufacturing, vol. 24, issue 1, pp. 1-31, 2011,
DOI: 10.1080/0951192X.2010.518632

73
Xu, X. M., Li, Y., Sun, J. H., and Wang, S. G. (2012), “Research and development of
open CNC system based on PC and motion controller”, Procedia Engineering,
vol. 29, pp. 1845-1850, 2012, DOI: 10.1016/j.proeng.2012.01.224
Yoong, L. H., Roop, P. S., Vyatkin, V., and Salcic, Z. (2009), “A synchronous approach
for IEC 61499 function block implementation”, Computers, IEEE Transactions
on, vol. 58, issue 12, p. 1599-1614, 2009,
DOI: 10.1109/TC.2009.128


75
APPENDICES
Appendix A Questionnaire
Light Weight Visualization Questionnaire
Introduction
This project aims at helping the user to visualize the behaviour of function blocks
running on CNC machines. The concept of function blocks generating tool paths on-
the-fly at the controller level is new and process critical and, hence a visual feedback to
the user is imperative. The function proposed for the visualization software comprises
tool path visualization, simplified process simulation and FB work process monitoring.
This questionnaire is part of the MSc research project feeding into a larger project
called “CAPP-4-SMEs” which is supported by the EU.
This questionnaire will take about 10 minutes. Thank you for your participation in
this research, your contribution is much appreciated. By participating in this survey, you
are consenting for your data to be used for the purpose stated and for internal MSc
research only. Your answers will be treated confidential and all data will remain
anonymous.
Note: Please write the letter of your choice(s) (e.g. A, B, or C …) in the box or write
your answer on the line below the question. If other, please list it out.
Questions
1. General Information
Q01: What is your position in the company?
Q02: Please, briefly describe your job role.
Q03: How long have you been in this job? [ ]
A. 1-2 years
B. 3-5 years
C. 6-10 years
D. 10+ years
2. Tool path visualization
Q04: How much do you know about CAPP (Computer Aided Process Planning)? [ ]
A. Expert
B. Good knowledge
C. General knowledge
D. No knowledge
76
Q05: Considering Algorithm in Function Blocks as a black box, what kind of
information or parameters do you need to confirm the process condition of the
function blocks, the rationality of the generated tool path and if the CNC is
operating correctly? (Multi-choices) [ ]
A. Display the 3D tool path as it is being generated
B. Display the tool path after is has been generated
C. Display the 3D model
D. Display the 3D tool path and 3D model simultaneously
E. Display the output information from the function block
F. Interactive manipulation of the function blocks
G. Display the parameters for cutting in the form of numbers
H. Display the parameters for cutting in the form of figures (colours or
charts)
I. Simulation of the manufacture process with the tool path
J. Air cut (physical simulation of the manufacture process)
K. Display the generation process of the tool path
L. Comparison features between optimised and un-optimised tool paths
M. Log & Display system log (recording the changes and reactions of the
function blocks)
N. 3D displaying options (model on/off, path on/off etc.)
Others:
Q06: Which data format for 3D model do you prefer for tool path visualization (light
weight prospective), please explain why? [ ]
A. format from Catia
B. format from Solidworks
C. format from UG
D. format from ProEngineer
E. Step files
Other: Reason:
Q07: If you could choose, which terminals running visualization process would you
prefer for checking the work process of your CNC machines? Please explain
your choice briefly. (Multi-choices) [ ]
A. Typical CNC controller
B. Software on a computer near CNC
C. Browser based software on a computer near CNC
77
D. Software on a handhold tablet
E. Software on computers located in offices
F. Browser based apps on any kind of platform
G. Other: Reason:
Q08: Which kind of operation style do you prefer to operate a 3D model or a 3D tool
path? [ ]
A. Mouse only
B. Mouse with keyboard
C. Clicking buttons in the application
D. Multi-touch control on a tablet
E. Touch buttons on a tablet
F. Other:
Q09: What kind of User Interface do you prefer to use? [ ]
A. Single window
B. Several floating windows
C. Several equally divided windows
Other:
Q10: If you could choose, what main features should your ideal tool path
visualization software have?
Thank you very much for your participation

78
Appendix B Company Introduction
Asturfeito, a Spanish industrial company, involves in engineering,
manufacturing and commissioning of capital goods. Its business activities are widespread in countries all around the world: Europe, America and Asia. Asturfeito offers whole process of projects: from design, project management, manufacture, supply, installation and implementation, to thorough quality control of the equipment and its components. Their field of expertise includes: manufacturing engineering, mechanics, hydraulics, pneumatics engineering, machining, welding, assembly and adjustment, verification and functional testing, logistics.
Website: http://www.asturfeito.com/seccion/company (accessed in August, 2014)
COMAC (Commercial Aircraft Corporation of China) is a State-owned company in China, which cooperates widely with aircraft manufacturers and suppliers worldwide. Aircraft design, manufacture, marketing and acquisition of certification are all included. The goal of COMAC is to develop a world-class civil aircraft industry which is safe, economical, comfortable and environmentally friendly. The manufacture department, as an important centre of COMAC, has studied CAPP for more than 10 years. Thus, all the techniques and processes which can improve the performance of manufacture are of interest.
Website: http://english.comac.cc/ (accessed in August, 2014)
Cameco AB is a machine shop located in Sandviken, and was founded in 1993. Their specialty is working in Horizontal 4 and 5-axis machining centers, as well as 3-axis vertical machine and a CNC lathe with driven tools. The company has extensive experience in performing machining of complex work pieces and processing of cast slabs in both steel and aluminium. Their customers are mainly large and medium sized companies in need of machining in CNC machining centers.
Website: http://www.cameco.se/ (accessed in August, 2014)
FORMTEC GmbH (FT) was developed in 1997, supplying services and software development for the CAD-CAM-CNC process chain. The core software NCspeed is able to simulate, verify and optimise tool path for milling machines. It enables manufacturers to adjust the feed rate to optimise machining processes according to the cutting conditions automatically, which can shorten the processing time by 20%.
Website: http://www.formtec.de/index.htm (accessed in August, 2014)

79
InconTec GmbH is a research and innovation company that is active in industry and public research projects. The company was founded in the year 2007 to offer and perform consulting and development services in the areas of requirements analysis, market research, road mapping, proposal support, software specification, design and implementation as well as software integration. InConTec can draw upon many years of long-term relationships to and networks of research partners in national and international academic and industrial R&D fields.
Website: http://www.incontec.de/i00.html (accessed in August, 2014)
PowerKut Limited is a family-run business which designs and manufactures products for the Mining, Rail, Construction, Aerospace, Automotive, Marine, Defence, Nuclear, Plastics and General Engineering sectors of industry. “Engineering Excellence” is the company’s goal (CAPP-4-SMEs, 2012b). It participates in the CAPP-4-SMEs as specialised in tooling, gauging and machined components.
Website: http://www.powerkut.co.uk/ (accessed in August, 2014)
Prodintec is a technology centre specialized in industrial design and production. The mission of Prodintec is to foster the competitiveness of industrial firms by applying technological advances both to their products and to their manufacturing and management processes. Prodintec is a private non-profit entity created in 2004 on the initiative of a group of firms in the region and the Regional Government and forms part of the network of Technology Centres of the Principality of Asturias. PRODINTEC was registered as an Innovation and Technology Centre (no. 99) by the Spanish Ministry of Industry on 27th March 2007.
Website: http://www.prodintec.es/prodintec/en/Home (accessed in August, 2014)
80
Appendix C Description for formats of 3D model
CATIA (Computer Aided Three-dimensional Interactive Application) is a multi-
platform CAD/CAM/CAE commercial software suite developed by the French company Dassault Systèmes. CATIA facilitates the design of electronic, electrical, and distributed systems such as fluid and HVAC systems, all the way to the production of documentation for manufacturing.
SolidWorks is solid modeling CAD software produced by Dassault Systèmes. SolidWorks is currently used by millions of engineers and designers at more than thousands of companies worldwide. SolidWorks solutions cover all aspects of the development process, including 3D design, simulation, electrical design, product data management, technical communication and conceptual design.
NX, formerly known as NX Unigraphics or usually just U-G, is an advanced high-end CAD/CAM/CAE software package developed by Siemens PLM Software. It is used, among other tasks, for: design (parametric and direct solid/surface modelling); engineering analysis (static, dynamic, electro-magnetic, thermal, using the Finite Element Method, and fluid using the finite volume method); manufacturing finished design by using included machining modules.
PTC Creo is a family or suite of design software supporting product design for discrete manufacturers and is developed by PTC. The suite consists of apps, each delivering a distinct set of capabilities for a user role within product development. Creo runs on Microsoft Windows and provides apps for 2D design, 3D CAD parametric feature solid modeling, 3D direct modeling, Finite Element Analysis and simulation, schematic design, technical illustrations, and viewing and visualization. The Creo suite of apps replace and supersede PTC’s products
formerly known as Pro/ENGINEER, CoCreate, and ProductView.
STEP-File is the most widely used data exchange form of STEP. Due to its ASCII structure it is easy to read with typically one instance per line. The format of a STEP-File is defined in ISO 10303-21 Clear Text Encoding of the Exchange Structure. ISO 10303-21 defines the encoding mechanism on how to represent data according to a given EXPRESS schema, but not the EXPRESS schema itself. A STEP-File is also called p21-File and STEP Physical File. The file extensions .stp and .step indicates that the file contain data conforming to STEP Application Protocols while the extension .p21 should be used for all other purposes.
81
Appendix D SEREC Low Risk Project Submission Form & SEREC Approval
Figure D.1 Application form part 1
Figure D.2 Application form part 2
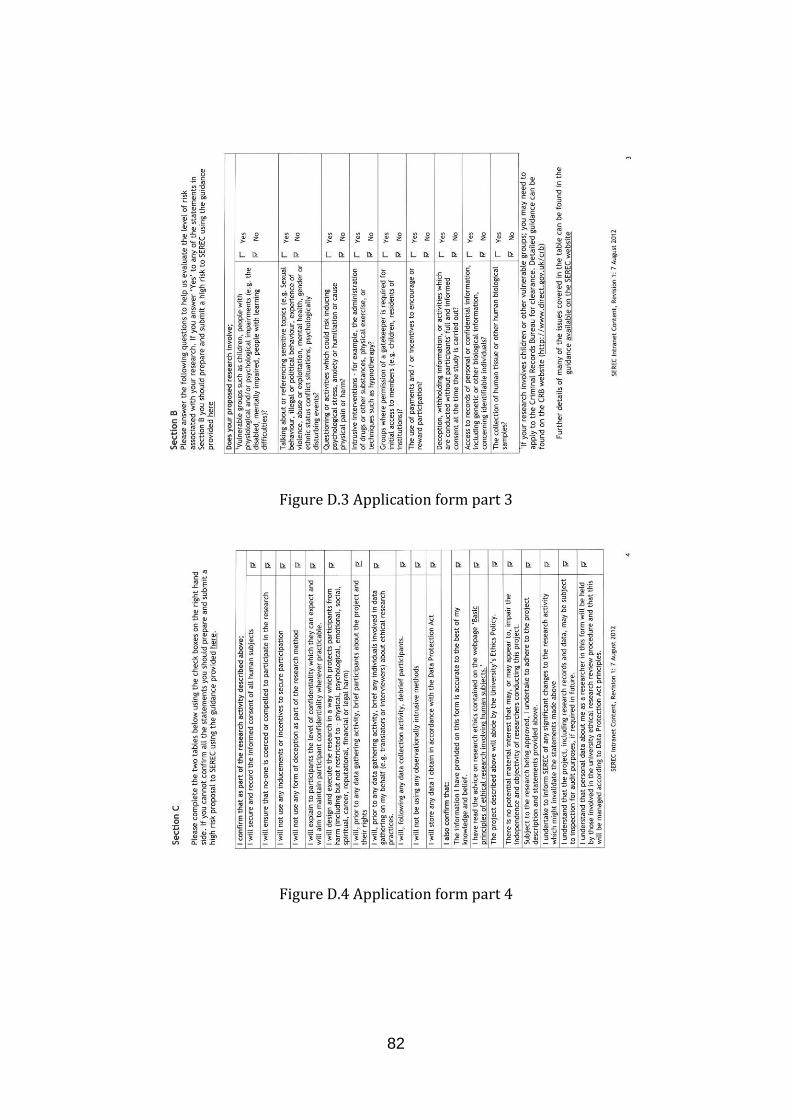
82
Figure D.3 Application form part 3
Figure D.4 Application form part 4

83
Figure D.5 Application form part 5
Figure D.6 Approval email from SEREC
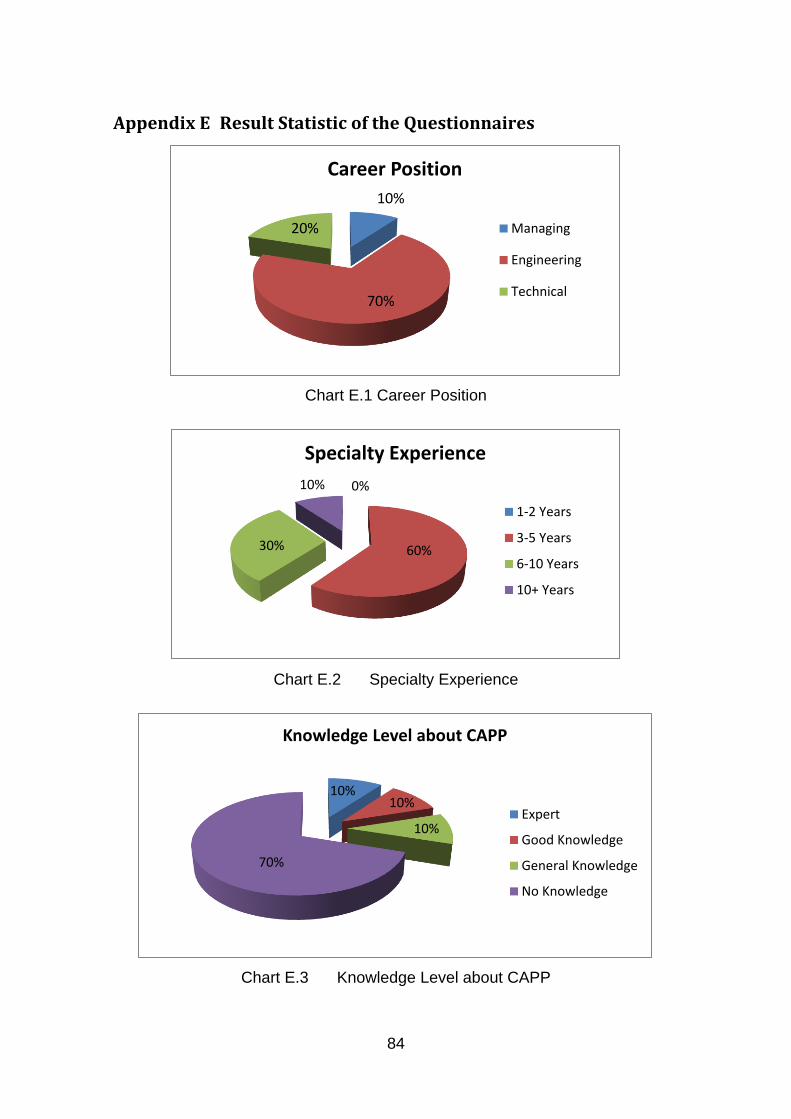
84
Appendix E Result Statistic of the Questionnaires
Chart E.1 Career Position
Chart E.2 Specialty Experience
Chart E.3 Knowledge Level about CAPP
10%
70%
20%
Career Position
Managing
Engineering
Technical
0%
60% 30%
10%
Specialty Experience
1-2 Years
3-5 Years
6-10 Years
10+ Years
10% 10%
10%
70%
Knowledge Level about CAPP
Expert
Good Knowledge
General Knowledge
No Knowledge
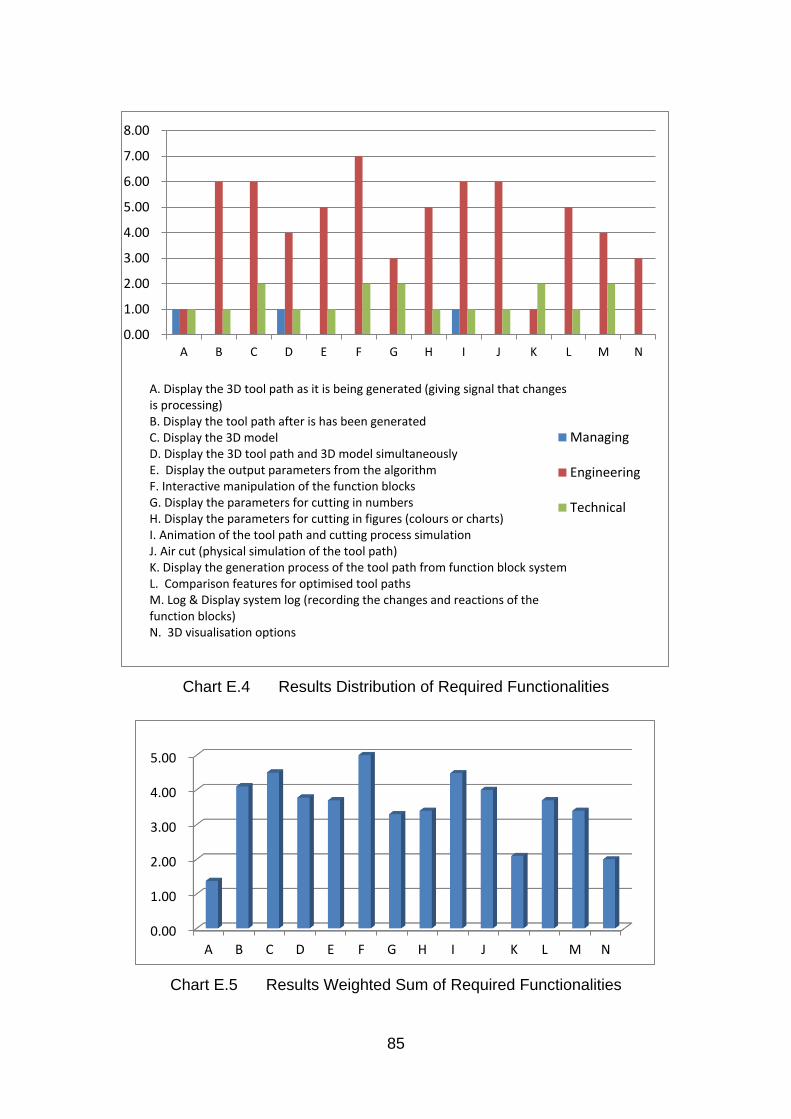
85
Chart E.4 Results Distribution of Required Functionalities
Chart E.5 Results Weighted Sum of Required Functionalities
0.00
1.00
2.00
3.00
4.00
5.00
6.00
7.00
8.00
A B C D E F G H I J K L M N
Managing
Engineering
Technical
A. Display the 3D tool path as it is being generated (giving signal that changes is processing) B. Display the tool path after is has been generated C. Display the 3D model D. Display the 3D tool path and 3D model simultaneously E. Display the output parameters from the algorithm F. Interactive manipulation of the function blocks G. Display the parameters for cutting in numbers H. Display the parameters for cutting in figures (colours or charts) I. Animation of the tool path and cutting process simulation J. Air cut (physical simulation of the tool path) K. Display the generation process of the tool path from function block system L. Comparison features for optimised tool paths M. Log & Display system log (recording the changes and reactions of the function blocks) N. 3D visualisation options
0.00
1.00
2.00
3.00
4.00
5.00
A B C D E F G H I J K L M N
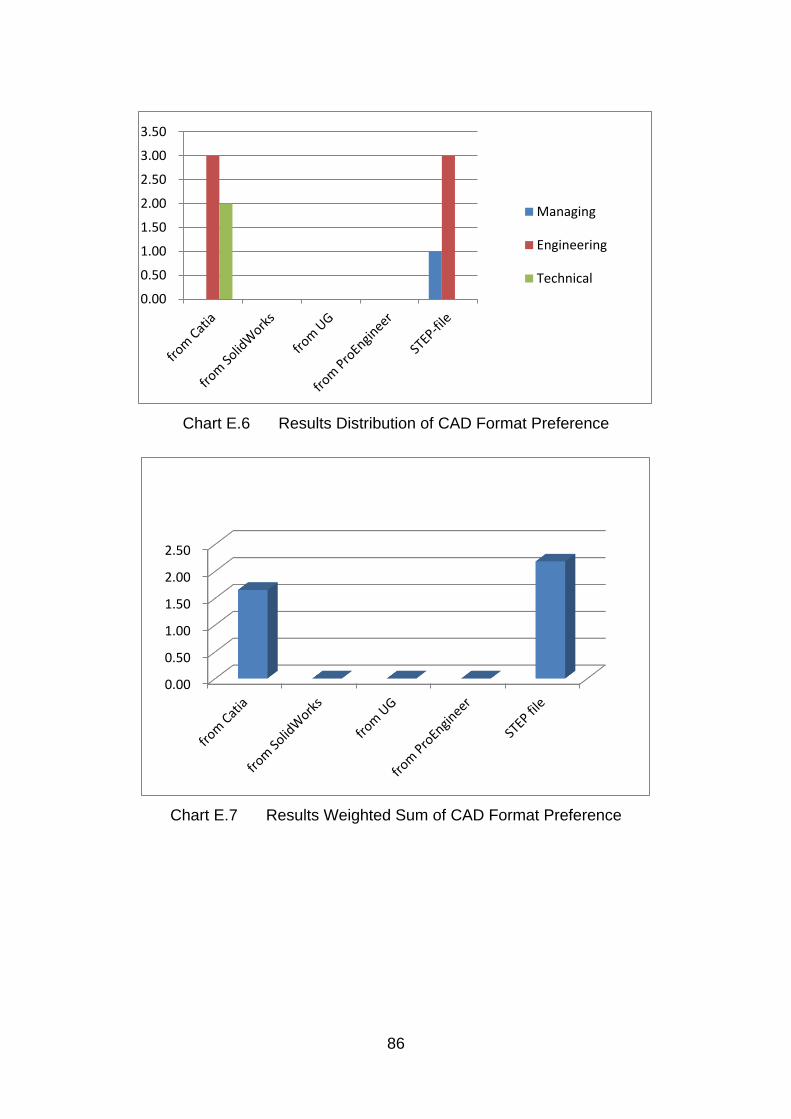
86
Chart E.6 Results Distribution of CAD Format Preference
Chart E.7 Results Weighted Sum of CAD Format Preference
0.00
0.50
1.00
1.50
2.00
2.50
3.00
3.50
Managing
Engineering
Technical
0.00
0.50
1.00
1.50
2.00
2.50
87
Chart E.8 Results Distribution of Terminal Preference
Chart E.9 Results Weighted Sum of Terminal Preference
0.00
1.00
2.00
3.00
4.00
5.00
6.00
7.00
Classic CNCcontrollerinterface
Software ona computernear CNC
Browserbased
software ona computernear CNC
Handholdtablets
Software onoffice
computers
Browserbased apps
Managing Engineering Technical
0.000.501.001.502.002.503.003.504.004.505.00
Classic CNCcontrollerinterface
Softwareon a
computernear CNC
Browserbased
softwareon a
computernear CNC
Handholdtablets
Softwareon office
computers
Browserbased apps
88
Chart E.10 Results Distribution of 3D Operation Preference
Chart E.11 Results Weighted Sum of 3D Operation Preference
0.00
1.00
2.00
3.00
4.00
5.00
6.00
7.00
Mouse only Mouse withkeyboard
Clickingbuttons on
screen
Multi-touchcontrol on a
tablet
Touchbuttons on a
tablet
Managing
Engineering
Technical
0.00
0.50
1.00
1.50
2.00
2.50
3.00
3.50
4.00
Mouse only Mouse withkeyboard
Clickingbuttons on
screen
Multi-touchcontrol on a
tablet
Touchbuttons on a
tablet
89
Chart E.12 Results Distribution of UI Preference
Chart E.13 Results Weighted Sum of UI Preference
0.00
1.00
2.00
3.00
4.00
5.00
6.00
7.00
Single window Several floatingwindows
Several equallydivided windows
Managing
Engineering
Technical
0.00
2.00
4.00
Single window Several floatingwindows
Several equallydivided
windows

90
Appendix F Example of Function Block Format
The following lines are a part of the process planing generated from fuction block system, in the format of the “function block format”. They are tool path for the manufacturing the part “Iphone case” mentioned in the thesis.
Absolute Feed F Max Line to X NaN Y NaN Z NaN a NaN b NaN c NaN Stop coolant Tool change to 1 Incremental Absolute Line to X NaN Y NaN Z 150.0 a NaN b NaN c NaN Spindle to 1691 CCW true Line to X NaN Y NaN Z 150.0 a NaN b NaN c NaN Line to X 65.0 Y 40.0 Z 150.0 a NaN b NaN c NaN Line to X 142.0 Y 0.0 Z -4.0 a NaN b NaN c NaN Line to X 142.0 Y 0.0 Z -6.0 a NaN b NaN c NaN Feed F 457.0 Line to X -12.0 Y 0.0 Z -6.0 a NaN b NaN c NaN Line to X -12.0 Y 8.0 Z -6.0 a NaN b NaN c NaN Line to X 142.0 Y 8.0 Z -6.0 a NaN b NaN c NaN Line to X 142.0 Y 16.0 Z -6.0 a NaN b NaN c NaN Line to X -12.0 Y 16.0 Z -6.0 a NaN b NaN c NaN Line to X -12.0 Y 24.0 Z -6.0 a NaN b NaN c NaN Line to X 142.0 Y 24.0 Z -6.0 a NaN b NaN c NaN Line to X 142.0 Y 32.0 Z -6.0 a NaN b NaN c NaN Line to X -12.0 Y 32.0 Z -6.0 a NaN b NaN c NaN Line to X -12.0 Y 40.0 Z -6.0 a NaN b NaN c NaN Line to X 142.0 Y 40.0 Z -6.0 a NaN b NaN c NaN Line to X 142.0 Y 48.0 Z -6.0 a NaN b NaN c NaN Line to X -12.0 Y 48.0 Z -6.0 a NaN b NaN c NaN Line to X -12.0 Y 56.0 Z -6.0 a NaN b NaN c NaN Line to X 142.0 Y 56.0 Z -6.0 a NaN b NaN c NaN Line to X 142.0 Y 64.0 Z -6.0 a NaN b NaN c NaN Line to X -12.0 Y 64.0 Z -6.0 a NaN b NaN c NaN Line to X -12.0 Y 72.0 Z -6.0 a NaN b NaN c NaN Line to X 142.0 Y 72.0 Z -6.0 a NaN b NaN c NaN Line to X 142.0 Y 80.0 Z -6.0 a NaN b NaN c NaN Line to X -12.0 Y 80.0 Z -6.0 a NaN b NaN c NaN Feed F Max Line to X 65.0 Y 40.0 Z -4.0 a NaN b NaN c NaN Line to X NaN Y NaN Z 150.0 a NaN b NaN c NaN Stop coolant Line to X NaN Y NaN Z 150.0 a NaN b NaN c NaN Spindle to 1691 CCW true Line to X NaN Y NaN Z 150.0 a NaN b NaN c NaN Line to X 65.0 Y 40.0 Z NaN a NaN b NaN c NaN Line to X NaN Y NaN Z -3.5 a NaN b NaN c NaN Feed F 457.0 Line to X NaN Y NaN Z -5.5 a NaN b NaN c NaN Line to X 69.0 Y 40.0 Z -5.5 a NaN b NaN c NaN Incremental Feed F 152.33 Helical to X 0.0 Y 0.0 Z -1.0 cX -4.0 cY 0.0 cZ NaN ccw true Plane XY
91
Helical to X 0.0 Y 0.0 Z -1.0 cX -4.0 cY 0.0 cZ NaN ccw true Plane XY Helical to X 0.0 Y 0.0 Z -1.0 cX -4.0 cY 0.0 cZ NaN ccw true Plane XY Helical to X 0.0 Y 0.0 Z -1.0 cX -4.0 cY 0.0 cZ NaN ccw true Plane XY Helical to X 0.0 Y 0.0 Z -1.0 cX -4.0 cY 0.0 cZ NaN ccw true Plane XY Helical to X 0.0 Y 0.0 Z -1.0 cX -4.0 cY 0.0 cZ NaN ccw true Plane XY Helical to X 0.0 Y 0.0 Z -1.0 cX -4.0 cY 0.0 cZ NaN ccw true Plane XY Helical to X 0.0 Y 0.0 Z -1.0 cX -4.0 cY 0.0 cZ NaN ccw true Plane XY Helical to X 0.0 Y 0.0 Z -0.5 cX -4.0 cY 0.0 cZ NaN ccw true Plane XY Helical to X 0.0 Y 0.0 Z 0.0 cX -4.0 cY 0.0 cZ NaN ccw true Plane XY Feed F Max Line to X -4.0 Y 0.0 Z 0.0 a NaN b NaN c NaN Absolute Line to X 65.0 Y 40.0 Z -12.0 a NaN b NaN c NaN Line to X NaN Y NaN Z -3.5 a NaN b NaN c NaN Stop coolant Line to X NaN Y NaN Z 150.0 a NaN b NaN c NaN Spindle to 1293 CCW true Line to X NaN Y NaN Z 150.0 a NaN b NaN c NaN Line to X 65.0 Y 40.0 Z NaN a NaN b NaN c NaN Line to X 65.0 Y 40.0 Z -12.0 a NaN b NaN c NaN Feed F 213.0 Line to X NaN Y NaN Z -14.0 a NaN b NaN c NaN Line to X 62.0 Y 39.03747 Z -14.0 a NaN b NaN c NaN Line to X 62.0 Y 40.96253 Z -14.0 a NaN b NaN c NaN Line to X 68.0 Y 40.96253 Z -14.0 a NaN b NaN c NaN Line to X 68.0 Y 39.03747 Z -14.0 a NaN b NaN c NaN Line to X 62.0 Y 39.03747 Z -14.0 a NaN b NaN c NaN Line to X 59.0 Y 38.074944 Z -14.0 a NaN b NaN c NaN Line to X 59.0 Y 41.925056 Z -14.0 a NaN b NaN c NaN Line to X 71.0 Y 41.925056 Z -14.0 a NaN b NaN c NaN Line to X 71.0 Y 38.074944 Z -14.0 a NaN b NaN c NaN Line to X 59.0 Y 38.074944 Z -14.0 a NaN b NaN c NaN Line to X 56.0 Y 37.112415 Z -14.0 a NaN b NaN c NaN Line to X 56.0 Y 42.887585 Z -14.0 a NaN b NaN c NaN Line to X 74.0 Y 42.887585 Z -14.0 a NaN b NaN c NaN Line to X 74.0 Y 37.112415 Z -14.0 a NaN b NaN c NaN Line to X 56.0 Y 37.112415 Z -14.0 a NaN b NaN c NaN Line to X 53.0 Y 36.149887 Z -14.0 a NaN b NaN c NaN Line to X 53.0 Y 43.850113 Z -14.0 a NaN b NaN c NaN Line to X 77.0 Y 43.850113 Z -14.0 a NaN b NaN c NaN Line to X 77.0 Y 36.149887 Z -14.0 a NaN b NaN c NaN Line to X 53.0 Y 36.149887 Z -14.0 a NaN b NaN c NaN Line to X 50.0 Y 35.18736 Z -14.0 a NaN b NaN c NaN Line to X 50.0 Y 44.81264 Z -14.0 a NaN b NaN c NaN Line to X 80.0 Y 44.81264 Z -14.0 a NaN b NaN c NaN Line to X 80.0 Y 35.18736 Z -14.0 a NaN b NaN c NaN Line to X 50.0 Y 35.18736 Z -14.0 a NaN b NaN c NaN Line to X 47.0 Y 34.22483 Z -14.0 a NaN b NaN c NaN Line to X 47.0 Y 45.77517 Z -14.0 a NaN b NaN c NaN Line to X 83.0 Y 45.77517 Z -14.0 a NaN b NaN c NaN Line to X 83.0 Y 34.22483 Z -14.0 a NaN b NaN c NaN Line to X 47.0 Y 34.22483 Z -14.0 a NaN b NaN c NaN Line to X 44.0 Y 33.262302 Z -14.0 a NaN b NaN c NaN Line to X 44.0 Y 46.737698 Z -14.0 a NaN b NaN c NaN Line to X 86.0 Y 46.737698 Z -14.0 a NaN b NaN c NaN Line to X 86.0 Y 33.262302 Z -14.0 a NaN b NaN c NaN Line to X 44.0 Y 33.262302 Z -14.0 a NaN b NaN c NaN
92
Line to X 41.0 Y 32.299774 Z -14.0 a NaN b NaN c NaN Line to X 41.0 Y 47.700226 Z -14.0 a NaN b NaN c NaN Line to X 89.0 Y 47.700226 Z -14.0 a NaN b NaN c NaN Line to X 89.0 Y 32.299774 Z -14.0 a NaN b NaN c NaN Line to X 41.0 Y 32.299774 Z -14.0 a NaN b NaN c NaN Line to X 38.0 Y 31.337244 Z -14.0 a NaN b NaN c NaN Line to X 38.0 Y 48.662754 Z -14.0 a NaN b NaN c NaN Line to X 92.0 Y 48.662754 Z -14.0 a NaN b NaN c NaN Line to X 92.0 Y 31.337244 Z -14.0 a NaN b NaN c NaN Line to X 38.0 Y 31.337244 Z -14.0 a NaN b NaN c NaN Line to X 35.0 Y 30.374714 Z -14.0 a NaN b NaN c NaN Line to X 35.0 Y 49.625282 Z -14.0 a NaN b NaN c NaN Line to X 95.0 Y 49.625282 Z -14.0 a NaN b NaN c NaN Line to X 95.0 Y 30.374714 Z -14.0 a NaN b NaN c NaN Line to X 35.0 Y 30.374714 Z -14.0 a NaN b NaN c NaN Line to X 32.0 Y 29.412184 Z -14.0 a NaN b NaN c NaN Line to X 32.0 Y 50.58781 Z -14.0 a NaN b NaN c NaN Line to X 98.0 Y 50.58781 Z -14.0 a NaN b NaN c NaN Line to X 98.0 Y 29.412184 Z -14.0 a NaN b NaN c NaN Line to X 32.0 Y 29.412184 Z -14.0 a NaN b NaN c NaN Line to X 29.0 Y 28.449654 Z -14.0 a NaN b NaN c NaN Line to X 29.0 Y 51.55034 Z -14.0 a NaN b NaN c NaN Line to X 101.0 Y 51.55034 Z -14.0 a NaN b NaN c NaN Line to X 101.0 Y 28.449654 Z -14.0 a NaN b NaN c NaN Line to X 29.0 Y 28.449654 Z -14.0 a NaN b NaN c NaN Line to X 26.0 Y 27.487123 Z -14.0 a NaN b NaN c NaN Line to X 26.0 Y 52.512867 Z -14.0 a NaN b NaN c NaN Line to X 104.0 Y 52.512867 Z -14.0 a NaN b NaN c NaN Line to X 104.0 Y 27.487123 Z -14.0 a NaN b NaN c NaN Line to X 26.0 Y 27.487123 Z -14.0 a NaN b NaN c NaN Line to X 23.0 Y 26.524593 Z -14.0 a NaN b NaN c NaN Line to X 23.0 Y 53.475395 Z -14.0 a NaN b NaN c NaN Line to X 107.0 Y 53.475395 Z -14.0 a NaN b NaN c NaN Line to X 107.0 Y 26.524593 Z -14.0 a NaN b NaN c NaN Line to X 23.0 Y 26.524593 Z -14.0 a NaN b NaN c NaN Line to X 22.3 Y 26.300003 Z -14.0 a NaN b NaN c NaN Line to X 22.3 Y 53.699986 Z -14.0 a NaN b NaN c NaN Line to X 107.7 Y 53.699986 Z -14.0 a NaN b NaN c NaN Line to X 107.7 Y 26.300003 Z -14.0 a NaN b NaN c NaN Line to X 22.3 Y 26.300003 Z -14.0 a NaN b NaN c NaN Line to X 65.0 Y 40.0 Z -12.0 a NaN b NaN c NaN Feed F Max Line to X NaN Y NaN Z -3.0 a NaN b NaN c NaN Stop coolant
93
Appendix G Output Command from Function Blocks
public boolean isSynchronized() {…} public void setIsSynchronized(boolean value) {...} public float getFeedRate() {...} public void setFeedRate(float feedRate) {...} public boolean isDNCSessionOpen() {...} public int getDNCStartTimeout() {...} public void setDNCStartTimeout(int timeOut) {...} public CNCReturn Connect() {...} public CNCReturn Disconnect() {...} public CNCReturn DNCStart() {...} public void ClearNcCodeLog() {...} public String GetNcCode() {...} public void OnNcCodeSending(String command) {...} public void DNCStop() {...} public CNCReturn SendDNC(String command) {...} public CNCReturn SendDNCAsync(String command) {...} public CNCReturn SendDNCSync(String command) {...} public float getSpindleSpeed() {...} public void setSpindleSpeed(float value) {...} public void ApplySpindleSpeed() {...} public void SpindleStop() {...} public void SpindleStop(int spindleNumber) {...} public void SpindleStart(boolean clockwise, int spindleNumber) {...} public void SpindleStart(boolean value) {...} public void SpindleStart() {...} public void CoolantStart() {...} public void CoolantStop() {...} public void CoolantInternalStart() {...} public void CoolantInternalStop() {...} public void ToolPrepare(String toolNo) {...} public void ToolChange(String toolNo) {...} public void GotoTarget(Float x, Float y, Float z, Float a, Float b, Float c) {...} public void GotoTargetLinear(Float x, Float y, Float z, Float a, Float b, Float c) {...} public String getTargetCoordsString(Float x, Float y, Float z, Float a, Float b, Float c) {...} public String getCenterCoordsString(Float cx, Float cy, Float cz, Float r) {...} public void ToolClamp() {...} public void ToolUnclamp() {...} public void DwellWait(int value) {...} public void GoToHelical(Float targetX, Float targetY, Float targetZ, Float centerX, Float centerY, Float centerZ, Float radius, boolean clockWise, CoordsPlain coordsPlain) {...} public void CoordinatesSystemDefine(int coordinatesSystemNumber, Float originX, Float originY, Float originZ, Float originA, Float originB, Float originC) {...} public void setToolDiameterOffset(int toolNumber, float toolRadius) {...}
94
public void ToolDiameterOffsetEnable(boolean shiftLeft) {...} public void ToolDiameterOffsetDisable() {...} public void setToolLengthOffset(String toolNumber, float toolLength) {...} public void ToolLengthOffsetEnable(String toolNumber) {...} public void ToolLengthOffsetEnable(String toolNumber, Float x, Float y, Float z, Float a, Float b, Float c) {...} public void ToolLengthOffsetDisable() {...} public void ToolLengthOffsetAutoEnableOnToolChanges(boolean enable) {...} public boolean isToolLengthOffsetAutoEnableOnToolChanges() {...} public void Pause() {...} public LenghtMeasurementUnits getLenghtMeasurementUnit() {...} public void setLenghtMeasurementUnit(LenghtMeasurementUnits lenghtMeasurementUnit) {...} public void ApplyMeasurementUnits() {...} public void InterpolateCorner(Float nextVertexX, Float nextVertexY) {...} public CoordinatesMode getCoordinatesMode() {...} public void setCoordinatesMode(CoordinatesMode coordinatesMode) {...} public void ApplyCoordinatesMode() {...} public String getCurrrentToolNumber() {...} public void CoordinateSystemActivate(short coordinatesSystemNumber) {...} public boolean isCoordinatesSystemTransformActive() {...} public void coordinatesSystemTransformActivate() {...} public void coordinatesSystemTransformCancel() {...} public void setAxisReverseStatus(String axis, boolean toBeReveresed){...} public boolean getAxisReverseStatus(String axis){...} public boolean isReverseAxesActive(){...} public void reverseAxisActivate(){...} public void reverseAxisCancel(){...} public void limitSpindleSpeed(int i, int i0) {...} public void constantSurfaceSpeedControlActivate(float cuttingSpeed) {...} public void constantSurfaceSpeedControlCancel() {...} public void synchronousFeedActivate() {...} public void synchronousFeedCancel() {...} public void lockAxis(String axis) {...} public void unlockAxis(String axis) {...} public String getTextSoFar() {...} public void setTextSoFar(String TextSoFar) {...} public void setCoordinatesSystemTransform(javax.vecmath.Matrix4d transformationMatrix) {...} public javax.vecmath.Matrix4d getCoordinatesSystemTransform() {...} public void initializeMachineMode(wise.dpp.machinetools.MachineToolMode machineToolMode) {...} public wise.dpp.machinetools.MachineToolMode getMachineMode() {...} public void AirBlowInternalStart() {...} public void AirBlowStart() {...}
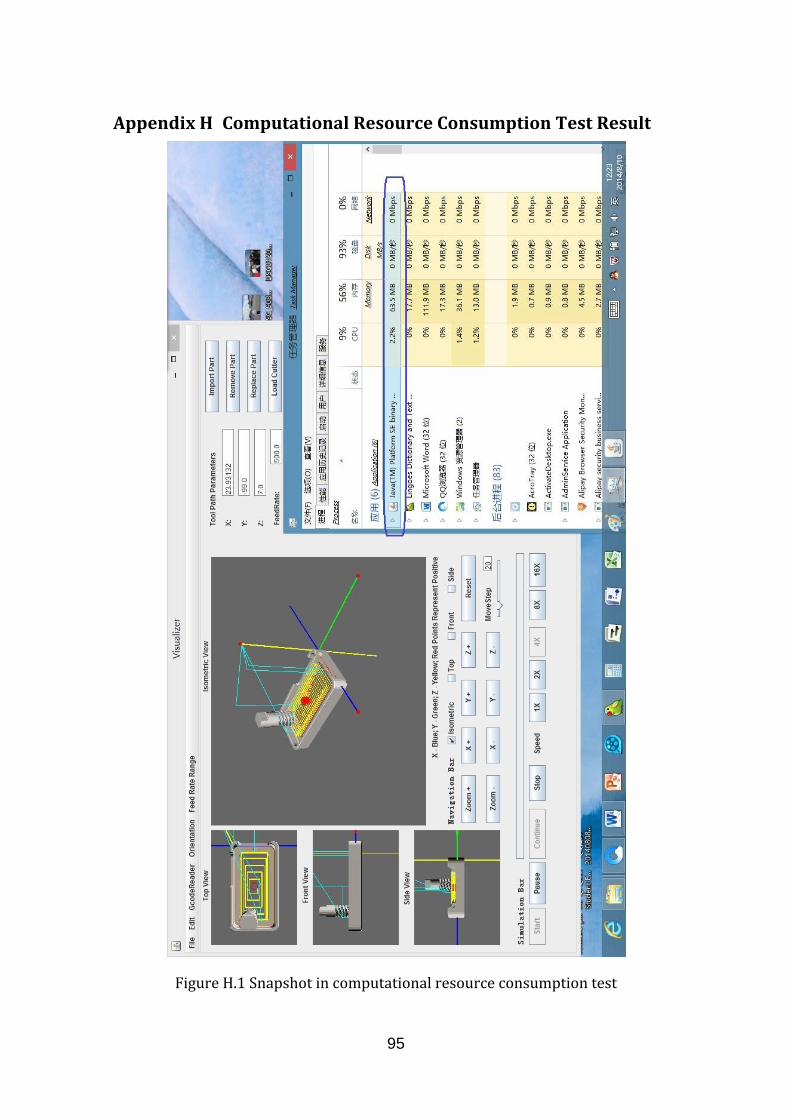
95
Appendix H Computational Resource Consumption Test Result
Figure H.1 Snapshot in computational resource consumption test
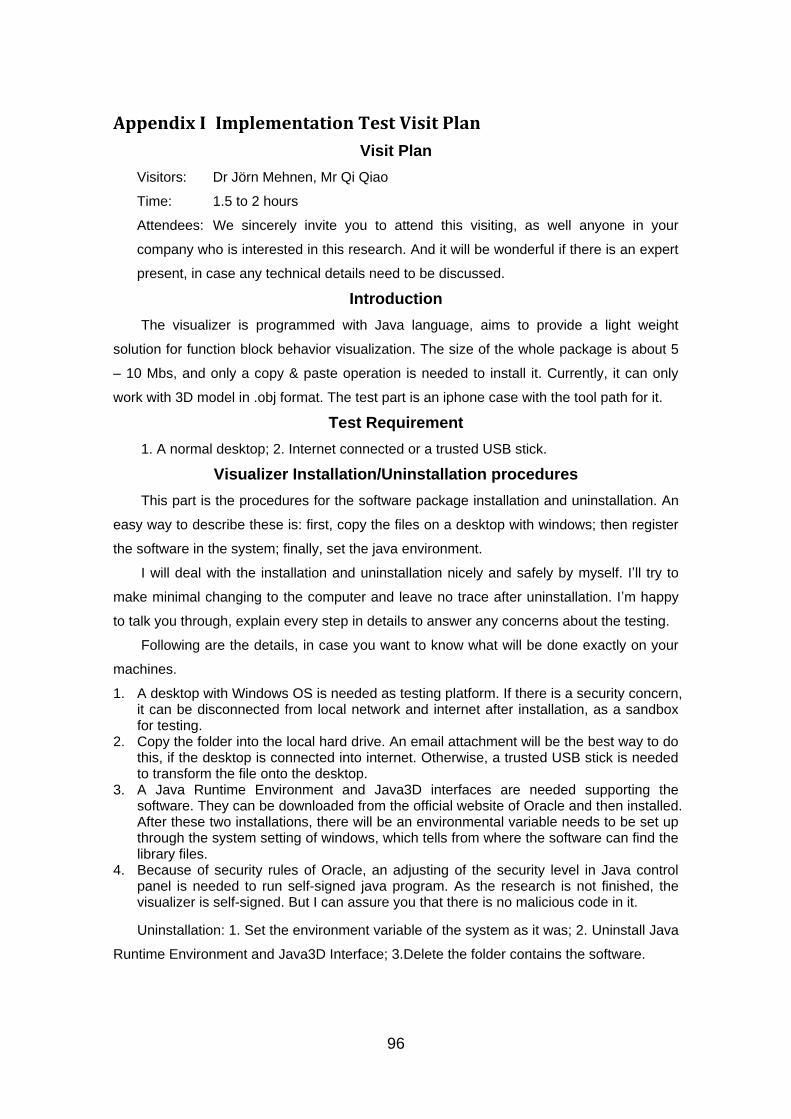
96
Appendix I Implementation Test Visit Plan
Visit Plan
Visitors: Dr Jörn Mehnen, Mr Qi Qiao
Time: 1.5 to 2 hours
Attendees: We sincerely invite you to attend this visiting, as well anyone in your
company who is interested in this research. And it will be wonderful if there is an expert
present, in case any technical details need to be discussed.
Introduction
The visualizer is programmed with Java language, aims to provide a light weight
solution for function block behavior visualization. The size of the whole package is about 5
– 10 Mbs, and only a copy & paste operation is needed to install it. Currently, it can only
work with 3D model in .obj format. The test part is an iphone case with the tool path for it.
Test Requirement
1. A normal desktop; 2. Internet connected or a trusted USB stick.
Visualizer Installation/Uninstallation procedures
This part is the procedures for the software package installation and uninstallation. An
easy way to describe these is: first, copy the files on a desktop with windows; then register
the software in the system; finally, set the java environment.
I will deal with the installation and uninstallation nicely and safely by myself. I’ll try to
make minimal changing to the computer and leave no trace after uninstallation. I’m happy
to talk you through, explain every step in details to answer any concerns about the testing.
Following are the details, in case you want to know what will be done exactly on your
machines.
1. A desktop with Windows OS is needed as testing platform. If there is a security concern, it can be disconnected from local network and internet after installation, as a sandbox for testing.
2. Copy the folder into the local hard drive. An email attachment will be the best way to do this, if the desktop is connected into internet. Otherwise, a trusted USB stick is needed to transform the file onto the desktop.
3. A Java Runtime Environment and Java3D interfaces are needed supporting the software. They can be downloaded from the official website of Oracle and then installed. After these two installations, there will be an environmental variable needs to be set up through the system setting of windows, which tells from where the software can find the library files.
4. Because of security rules of Oracle, an adjusting of the security level in Java control panel is needed to run self-signed java program. As the research is not finished, the visualizer is self-signed. But I can assure you that there is no malicious code in it.
Uninstallation: 1. Set the environment variable of the system as it was; 2. Uninstall Java
Runtime Environment and Java3D Interface; 3.Delete the folder contains the software.
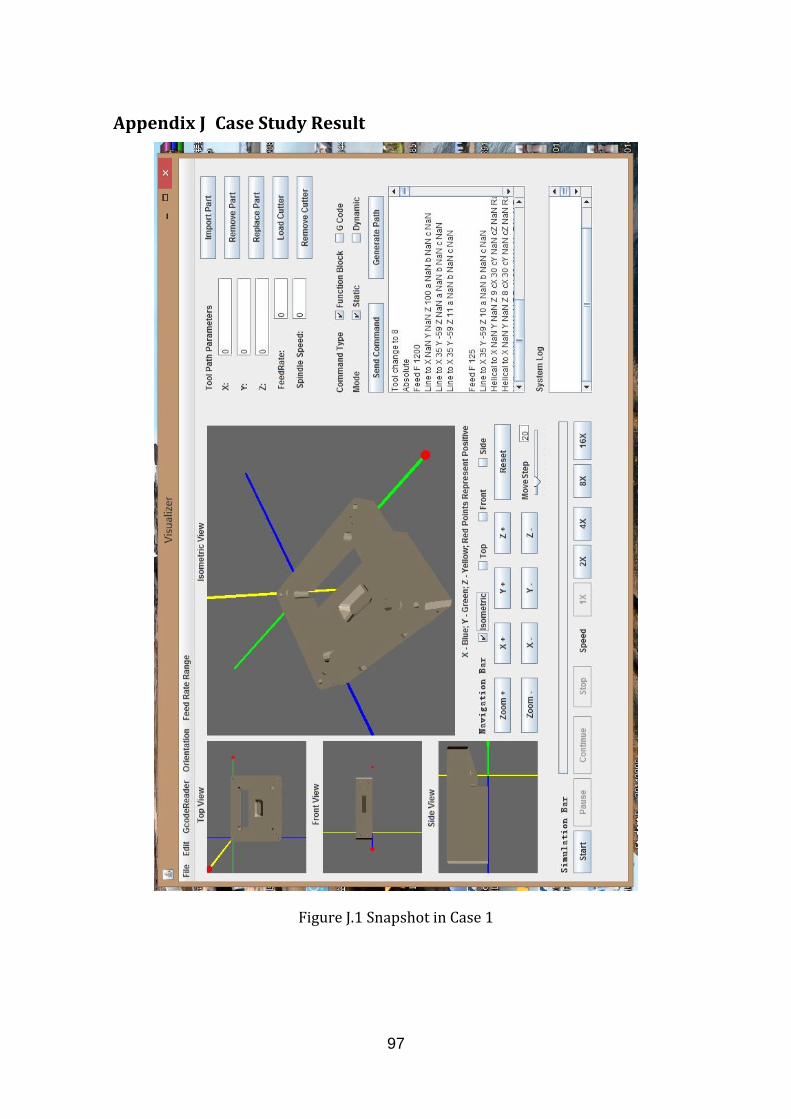
97
Appendix J Case Study Result
Figure J.1 Snapshot in Case 1

98
Figure J.2 Snapshot in Case 2
Tool path used in Case 2 is as the same as listed in Appendix F.

99
Figure J.3 Snapshot in Case 3

100
Appendix K Compatibility Test Result
Figure K.1 Snapshot in capability test on Windows XP
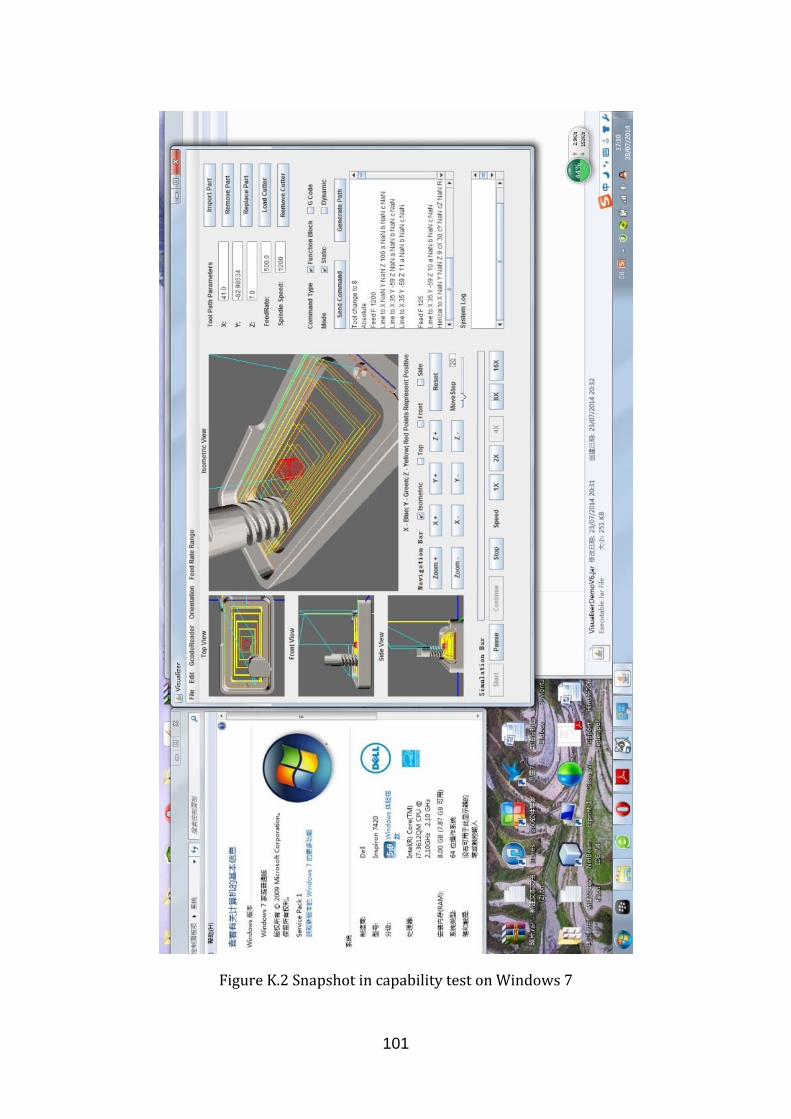
101
Figure K.2 Snapshot in capability test on Windows 7
102
Figure K.3 Snapshot in capability test on Windows 8
103
Appendix L Validation Introduction
Introduction
The visualizer is programmed with Java language, aims to provide a light weight solution
for function block behavior visualization. The size of the whole package is about 5 – 10 Mbs,
and only a copy & paste operation is needed to install it. Currently, it can only work with 3D
model in .obj format. The test part is an iphone case with the tool path for it.
Research Abstract
A solution for visualising the tool path generated from function block system is introduced
in this research. It facilitates the monitoring and manipulating the behaviour of function block
system.
In order to improve computer aided process planning for milling operations, a distributed
function block system is introduced. This system is currently being developed through the EU
project CAPP-4-SMEs (Collaborative and Adaptive Process Planning for Sustainable
Manufacturing Environments). The function blocks are created in a Cloud environment and
dispatched to CNC controllers to generate complex milling tool paths on-board. This approach
is different to the conventional CAD-CAM G-code driven off-line approach. The ability of an on-
board visualisation of the behaviour of function blocks is a very important process for the
validation the function block behaviour. It makes the concept more practical and reliable by
providing a real-time visualisation.
This research aims to find out suitable solutions to realise the visualisation of tool path
generated from function block system. The existing visualisation methods are researched,
compared and selected to fit the purpose. A number of aspects are focused on, such as program
language, graphic user interface optimisation, cloud environment compatibility, and
requirement from shop floor users. An Application with 3D graphic user interface is developed
and tested. Functions for displaying and operating 3D CAD models and tool paths, animation of
the milling process and process parameters monitoring are included in the software. The
developed visualizer is a light-weight visualisation tool which is able to run directly on CNC
controllers with Windows (or PC with Windows). It can be connected with a Cloud
environment (work with servers located around Europe) for real-time tool path visualisation.
Based on a requirement survey from industries, it is developed to fulfil the challenging
practical needs of industrial shop floor users.
Presentation
Bullet points about the research are listed in the presentation file, which is also a review
presentation for the research. The purpose, process and the result of the research is
introduced in it.

104
Validation
Thanks to your contribution in the questionnaire survey, the visualisation tool has been
developed based on that. I’d like to have your feedback after the experience of the application.
It is very important for the validation of the research. How to operate the application is shown
in the demonstration video. Please feel free to bring up any opinion and suggestion on the
validation form provided, and send me a copy of it. Back side of the paper is also available for
writing. It would be perfect that the application is installed and experienced by yourself. If
anything fails the installation, please validate the application according to the video and write
down the unexpected problem on the back of the form. Your contribution to this research is
much appreciated.
Test Requirement
1. A normal desktop with Windows; 2. Internet connected or a trusted USB stick.
List of Files
1. A zip file contains the visualizer (the “dist” folder)
2. Two .obj file (3D model) of a part and a cutter
3. Introduction document
4. Demonstration video
5. A Piece of G-code generated from Function Block system
6. Presentation PowerPoint file
7. Validation form
8. Java Runtime setup files & Java3D setup files
Visualizer Installation/Uninstallation procedures
This part is the procedures for the software package installation and uninstallation. An
easy way to describe these is: first, copy the files on a desktop with windows; then register the
software in the system; finally, set the java environment.
I’m happy to explain every step in details to answer any concerns about the testing. Please
don’t hesitate to contact me when you need any information.
Following are the details, what need to be done exactly on your machines.
1. A desktop with Windows OS is needed as testing platform. I wrote it myself, so I can
assure you no malicious virus contained in code of the visualizer. If there is a security
concern, it is better that the computer is disconnected from local network and
internet during the period, as a sandbox for testing.
2. Copy the folder into the local hard drive. An email attachment will be the best way to
do this, if the desktop is connected into internet. Otherwise, a trusted USB stick is
needed to transform the files onto the desktop.
3. A Java Runtime Environment and Java3D interfaces are needed supporting the
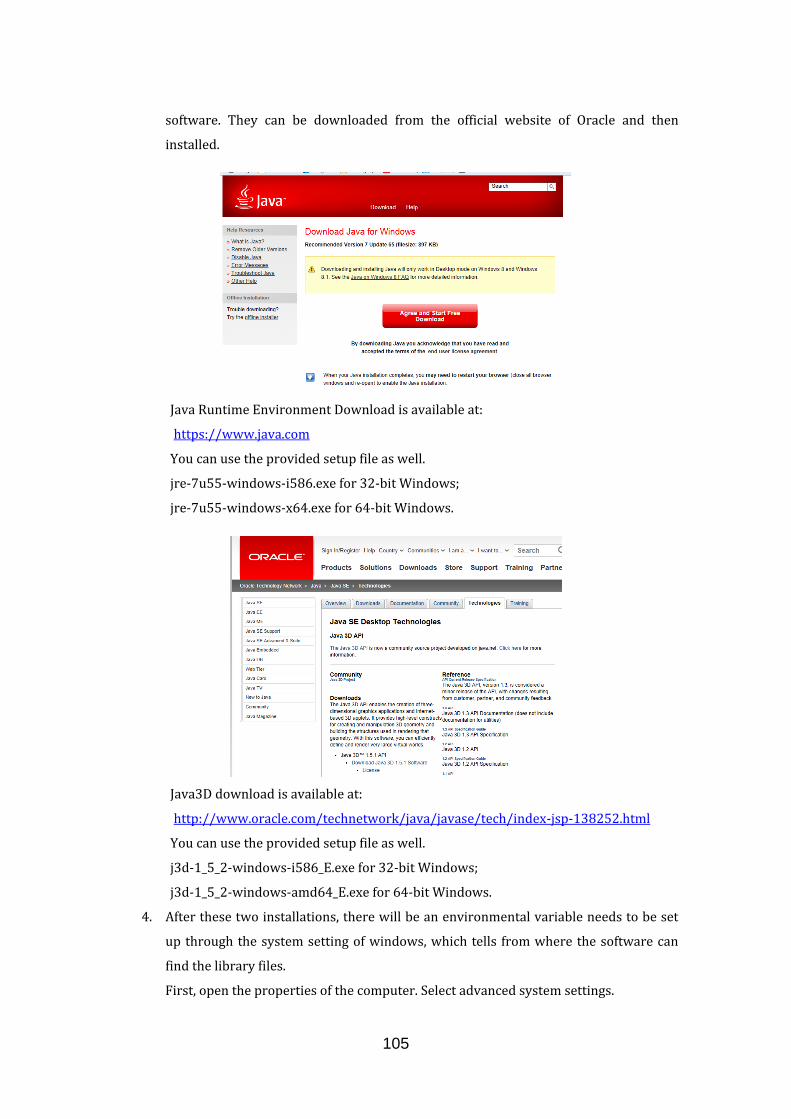
105
software. They can be downloaded from the official website of Oracle and then
installed.
Java Runtime Environment Download is available at:
https://www.java.com
You can use the provided setup file as well.
jre-7u55-windows-i586.exe for 32-bit Windows;
jre-7u55-windows-x64.exe for 64-bit Windows.
Java3D download is available at:
http://www.oracle.com/technetwork/java/javase/tech/index-jsp-138252.html
You can use the provided setup file as well.
j3d-1_5_2-windows-i586_E.exe for 32-bit Windows;
j3d-1_5_2-windows-amd64_E.exe for 64-bit Windows.
4. After these two installations, there will be an environmental variable needs to be set
up through the system setting of windows, which tells from where the software can
find the library files.
First, open the properties of the computer. Select advanced system settings.
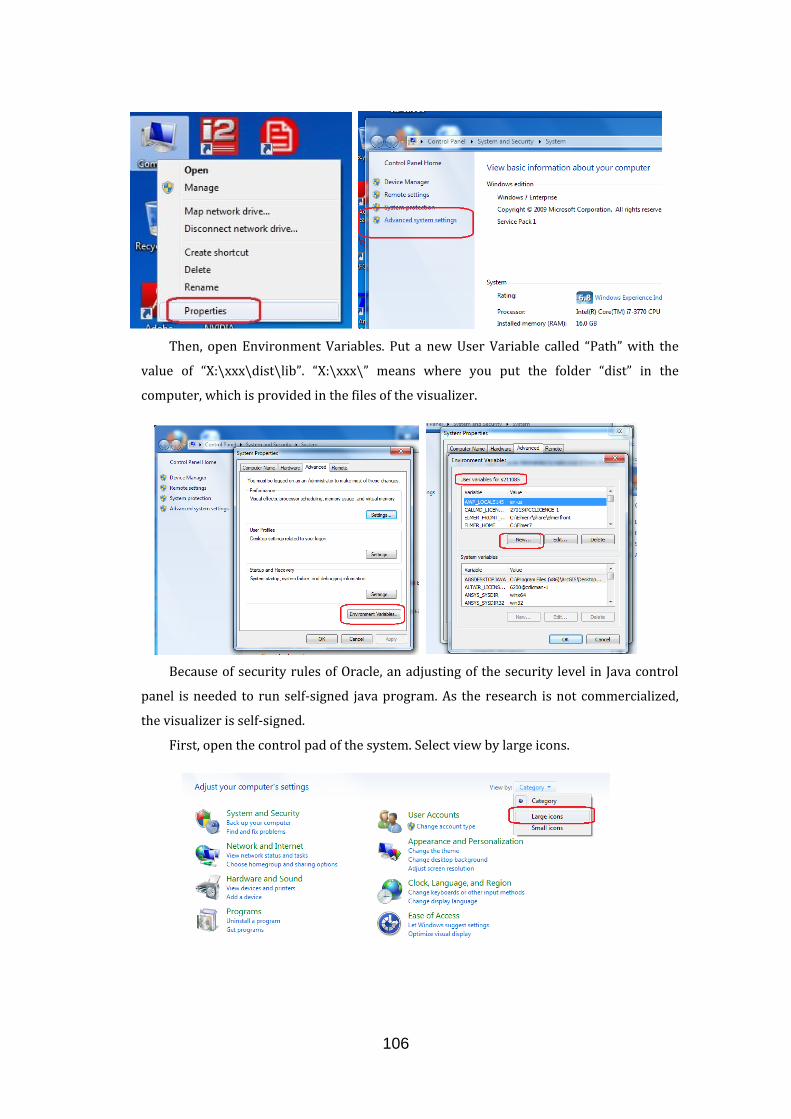
106
Then, open Environment Variables. Put a new User Variable called “Path” with the
value of “X:\xxx\dist\lib”. “X:\xxx\” means where you put the folder “dist” in the
computer, which is provided in the files of the visualizer.
Because of security rules of Oracle, an adjusting of the security level in Java control
panel is needed to run self-signed java program. As the research is not commercialized,
the visualizer is self-signed.
First, open the control pad of the system. Select view by large icons.
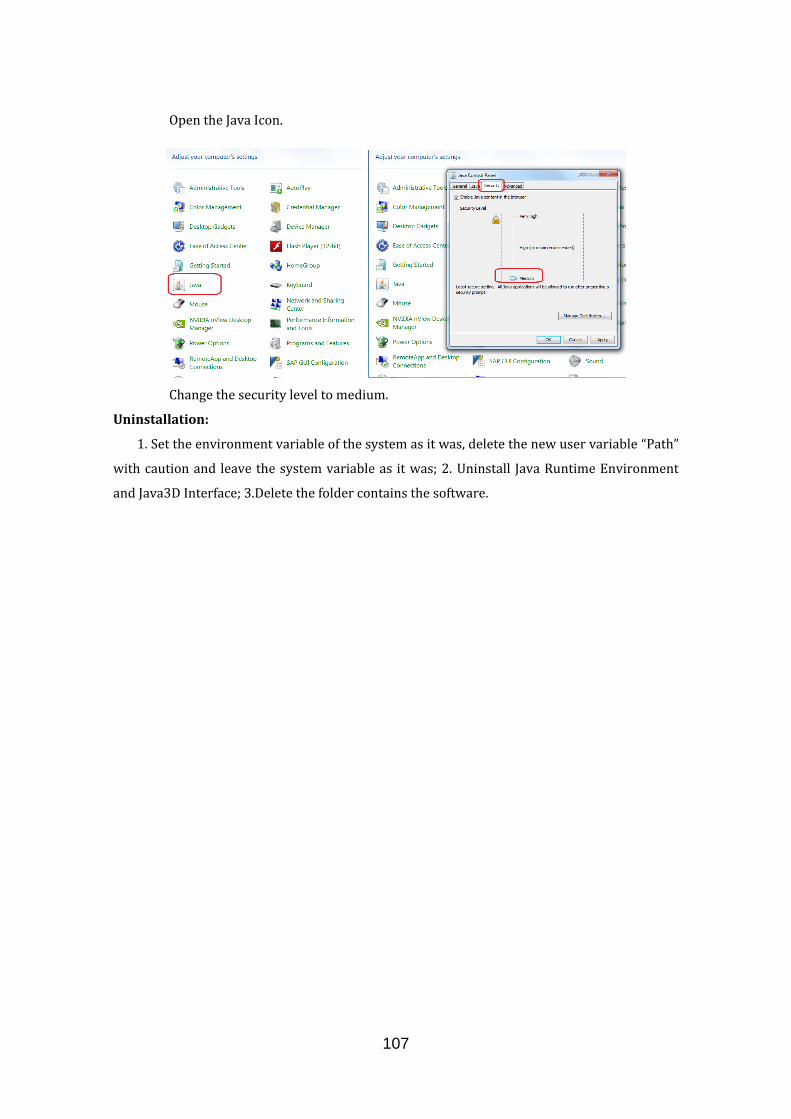
107
Open the Java Icon.
Change the security level to medium.
Uninstallation:
1. Set the environment variable of the system as it was, delete the new user variable “Path”
with caution and leave the system variable as it was; 2. Uninstall Java Runtime Environment
and Java3D Interface; 3.Delete the folder contains the software.
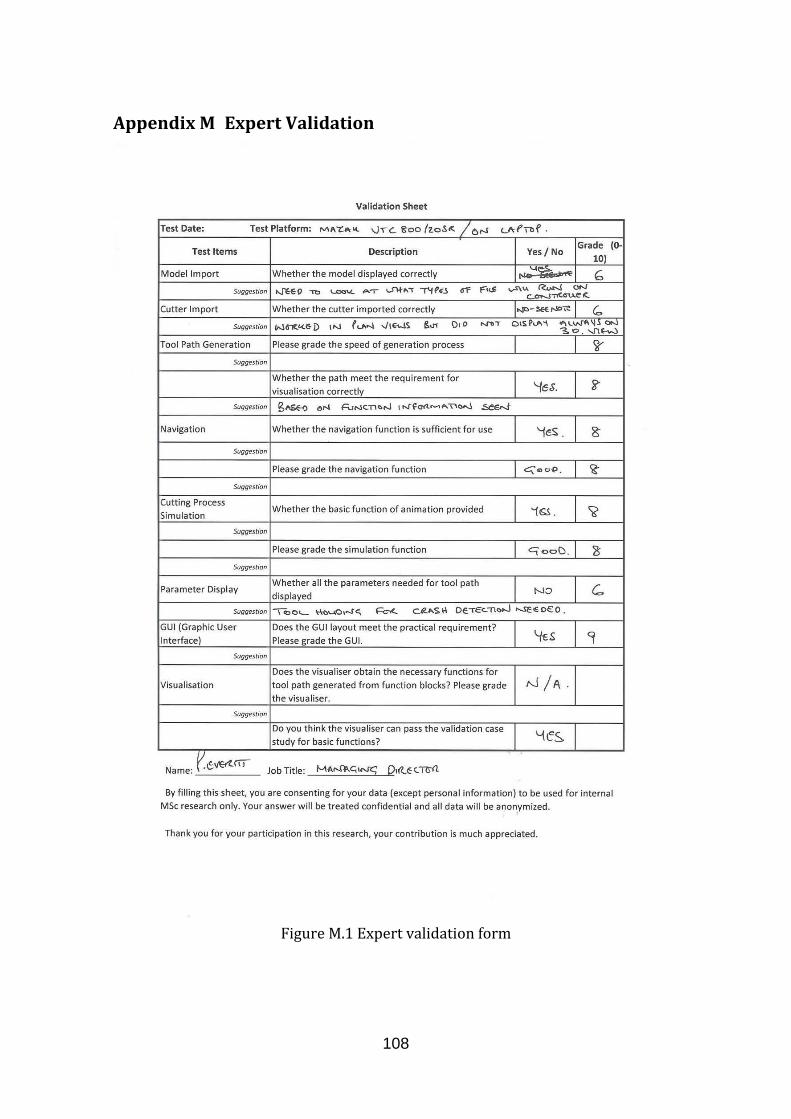
108
Appendix M Expert Validation
Figure M.1 Expert validation form
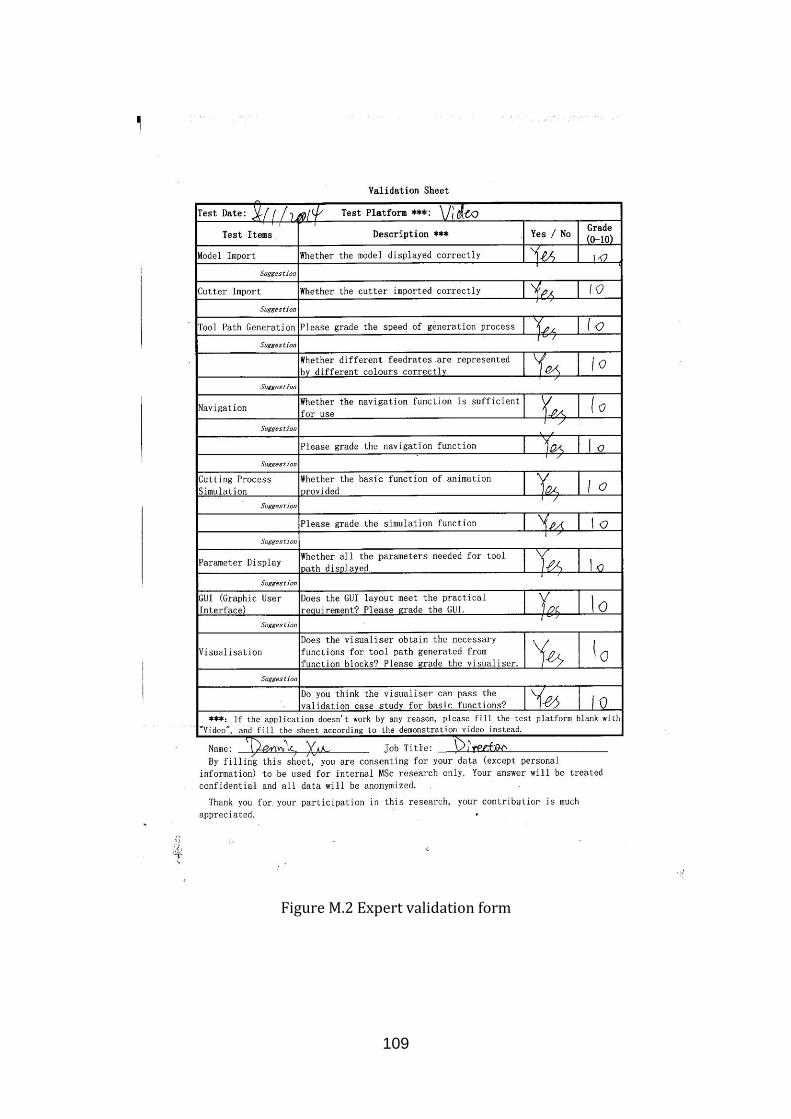
109
Figure M.2 Expert validation form
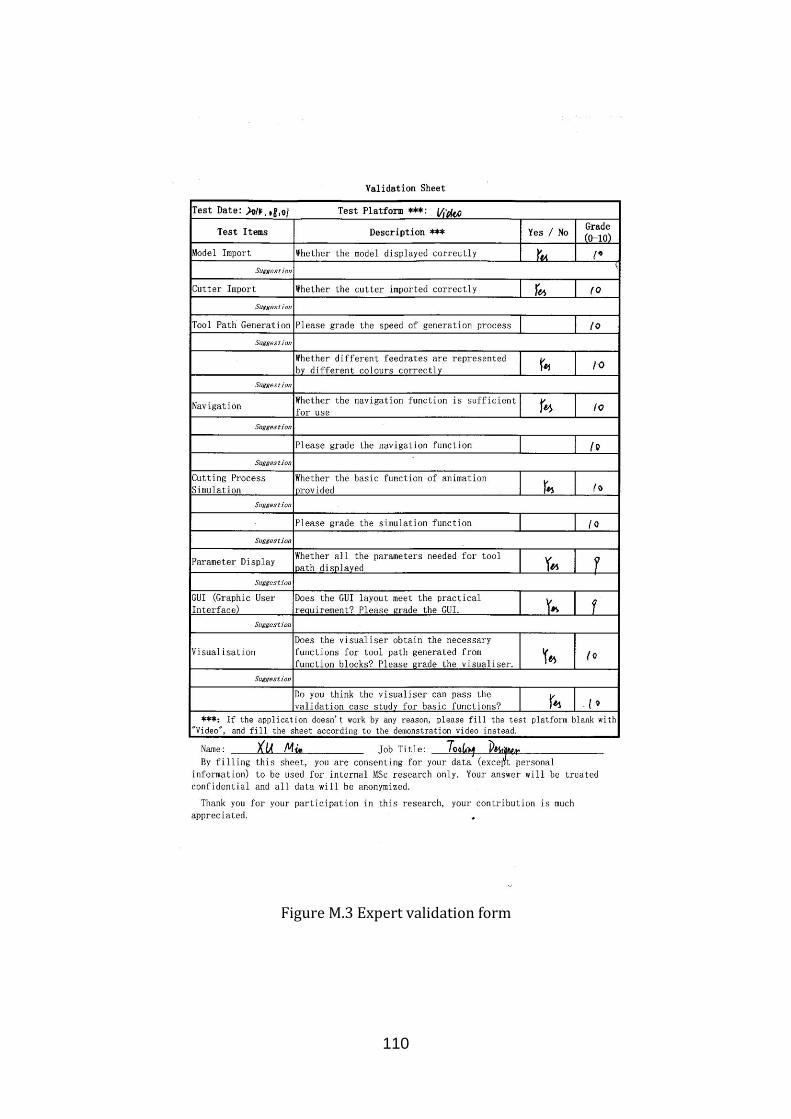
110
Figure M.3 Expert validation form

111
Figure M.4 Expert validation form
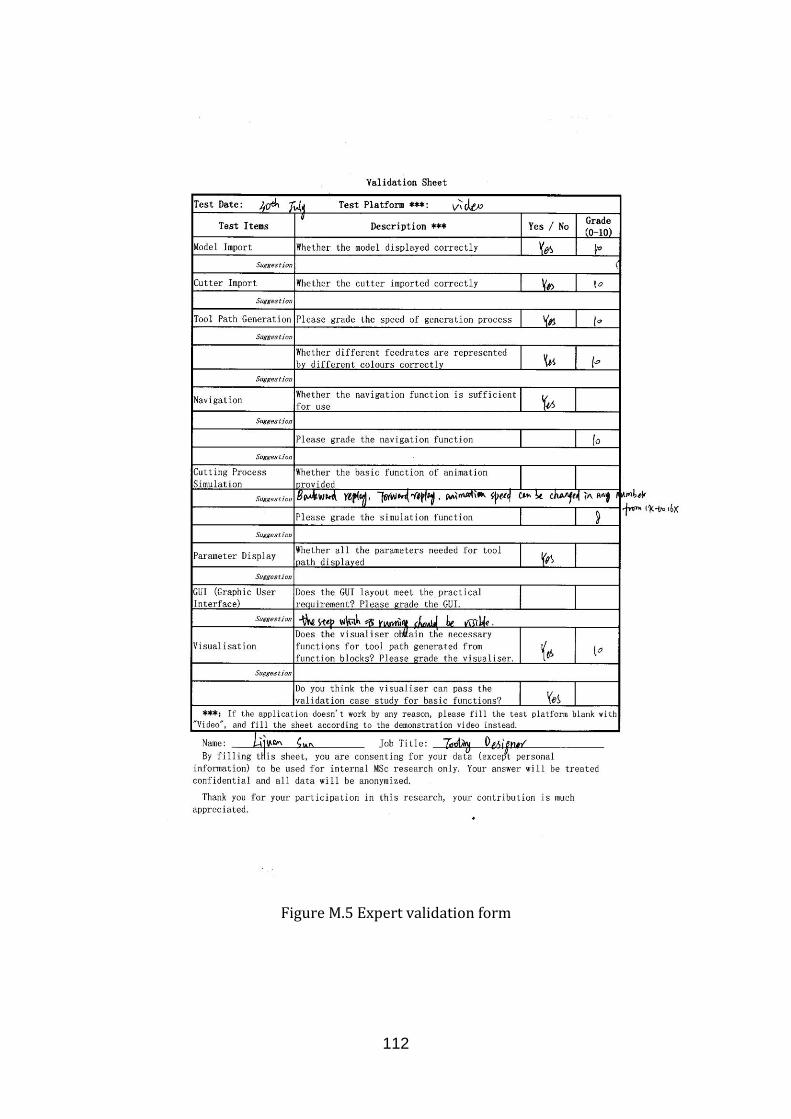
112
Figure M.5 Expert validation form


![[B5] Template](https://img.dokumen.tips/doc/110x75/6314e07dc32ab5e46f0d1371/b5-template.jpg)


