Embed Size (px)
Citation preview
Proceedings of the International School of Physics “Enrico Fermi”Course CLIV, M. Martini, M. Milazzo and M. Piacentini (Eds.)IOS Press, Amsterdam 2004
Thermodynamics for cultural heritage
D. Camuffo
Consiglio Nazionale delle Ricerche, Institute of Atmospheric Sciences and Climate
Padova, Italy
Forward
The reader may find many excellent, classical books of molecular physics [1-3] andthermodynamics [4-6] in the literature, and if he wishes to know more about the atmo-spheric variables (e.g., water vapour pressure, air temperature, wet bulb temperature,dew point, mixing ratio, relative, specific and absolute humidity) the texts used in Atmo-spheric and Industrial Sciences [7-9] and Meteorology [10-22] are of a great advantage. Inthe recent years some studies have been developed to know the decay of materials exposedto environmental factors and these are of great help. We will see that atmospheric waterplays a key role in deterioration, which was often underestimated or misunderstood.
The conservation of cultural heritage is a multidisciplinary problem, which requiresa wide spectrum of knowledge. Only a limited number of physicists are involved in thisfield. This has led to the acceptance and dissemination of popular ideas that may workunder some aspects, but that are not very rigorous, or fully acceptable from the physicalpoint of view. For instance, the relative humidity is often believed to be a propertyof the air, not of the moisture. In the field of conservation somebody believes thatthe temperature of an evaporating wall can drop to a level at which it may generatecondensation. It is known that micropore condensation occurs first in the narrow poresand then in the larger ones. However, somebody supposes that condensation may fill thelarge pores behind the narrow ones without considering that it is impossible to fill withwater a cavity where an air pocket has been entrapped, because the gate is closed by thecondensed water. The list of errors and horrors may continue, but it is not necessary.Briefly, in this field some people has right ideas and others not. This leads to confusion
c© Societa Italiana di Fisica 37
38 D. Camuffo
and beginners risk being lost.For this reason, and to fill a gap existing in the literature, I wrote the book Micro-
climate for Cultural Heritage [23], where the basic physical concepts, the atmosphericvariables and the related material properties are reported, and explained to a multidisci-plinary audience. This has always been done looking at how formulae and concepts aremathematically derived and at their consequences.
It is fundamental to keep in mind which formulae are rigorous and which are onlyapproximations. Only after a sound approach we can draw conclusions and pass tothe correct practical application in the field of conservation. Without this essentialbackground, we risk to destroy and not to preserve our cultural heritage.
Of course, I will not repeat here the book [23] except for a few basic graphs anddefinitions, and I would suggest students and young scientists to look at it first, in casethey do not have the necessary background. At the International School of Physics Iwill synthetically remind what should be already known, giving priority to underliningalternative approaches or how to reach a better understanding. The purpose of theselessons is to look at the physics behind the problems, combining theory with experience,always in view of accurate field measurements or practical applications.
This also offers the opportunity to discuss a more advantageous interpretation of thevapour and the liquid state, with relevant consequences on the relative humidity and itsimpact on artwork conservation.
I do not know whether with these few pages I will be able to fully convince all of thereaders, but I am sure that the reasoning behind the concepts will be highly beneficialto get more precise and more advanced personal ideas.
Part 1: Air and artefact temperature
Kinetic theory of perfect gases. – The temperature (T ) is proportional to the averagekinetic energy (Ek) of the molecules, i.e. 1/2 kT per degree of freedom, i.e.
Ekin =32kT
for a mono-atomic molecule,
Ekin =52kT
for a diatomic molecule(1),
Ekin =72kT
for a three-atom molecule(2).
(1) At usual temperatures when vibrations can be neglected.(2) At usual temperatures when vibrations can be neglected.
Thermodynamics for cultural heritage 39
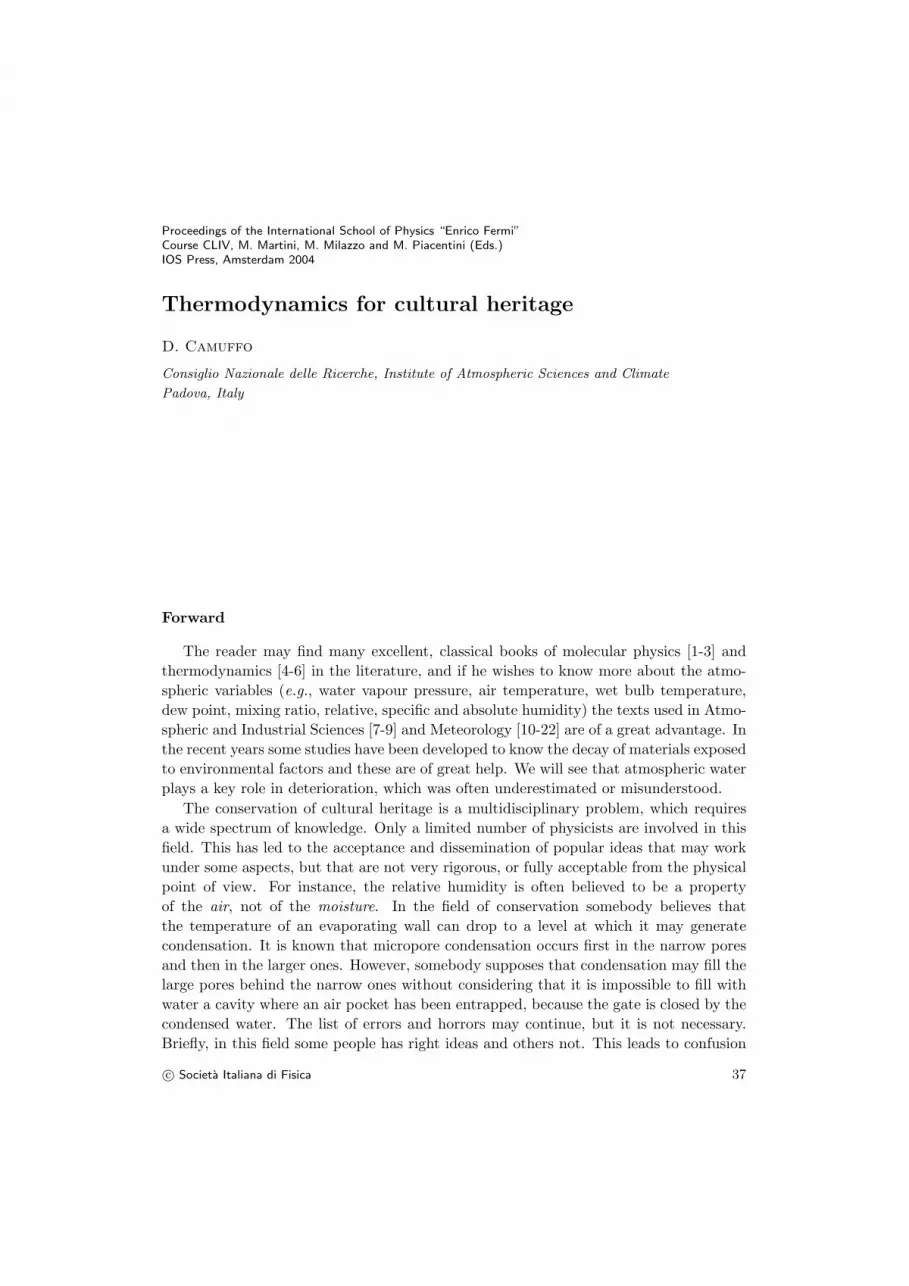
Fig. 1. – Maxwell distribution of particles by velocities. The mode is the most probable velocityvmp. The average value is higher.
For every kind of molecule
Ekin =32kT
if we make reference to the gravity centre and the translation motion (i.e. no rotation).
Equipartition law . – A system of molecules in thermal equilibrium at temperature T
has the mean kinetic energy uniformly distributed among all the degrees of freedom, andfor each degree of freedom of a molecule, it equals kT/2.
In a gas with temperature T , the average translation velocity of the molecules is
vi =√3kT
mi.
However, the gas may be composed of particles with the same mass m, or a mixtureof molecules having different masses mi. In a mixture of gases having the same tem-perature T but different masses m1,m2,m3, . . ., a definite spectrum of individual speedsv1, v2, v3, . . . is expected, one per each mass. Slow and fast particles, with different massand size, will impact upon each other.
In equilibrium, the molecules are distributed by velocities, following the skewed bell-shaped distribution (fig. 1) given by the Maxwell equation, and the most probable velocityvmp is
vmp =
√2kT
m= 0.8vi .
In the Maxwell distribution, the lower limit for the velocity is 0m s−1. In the atmosphere,the upper limit is the escape velocity ve from the Earth, i.e. ve = 1.12 × 10⁴ms−1
(= 28vmp). For nitrogen at T = 300K, vmp = 394m s−1, i.e. faster than the velocity ofsound vs = 344m s−1.
40 D. Camuffo
Real gases and the energy of interaction between particles U . – An apparent paradox.In a perfect gas, with particles having the same mass, all impacts between the particles,and also between particles and walls, are elastic, so that both the momentum and thekinetic energy are preserved.
Under such a hypothesis, the individual velocities would remain unchanged, and amixture of two identical gases, but with different temperatures, would preserve the twoinitial Maxwell distributions, with a resulting bi-modal distribution. This is contrary toexperience.
In addition, no heat would be exchanged between non-interacting particles and walls.In practice, however, we deal with real, not perfect gases. This paradox will disappearafter looking at the difference between a perfect and a real gas.
For a perfect gas, the equation of state is
p =nRT
V.
On the other hand, for a real gas
p =nRT
V+ nB(T ),
where B(T ) > 0 at high T and B(T ) < 0 at low T . B(T ) < 0 means ∂T/∂P > 0, i.e.the gas cools when the gas expands (i.e. the pressure decreases) as in the Joule-Thomsonexperiment.
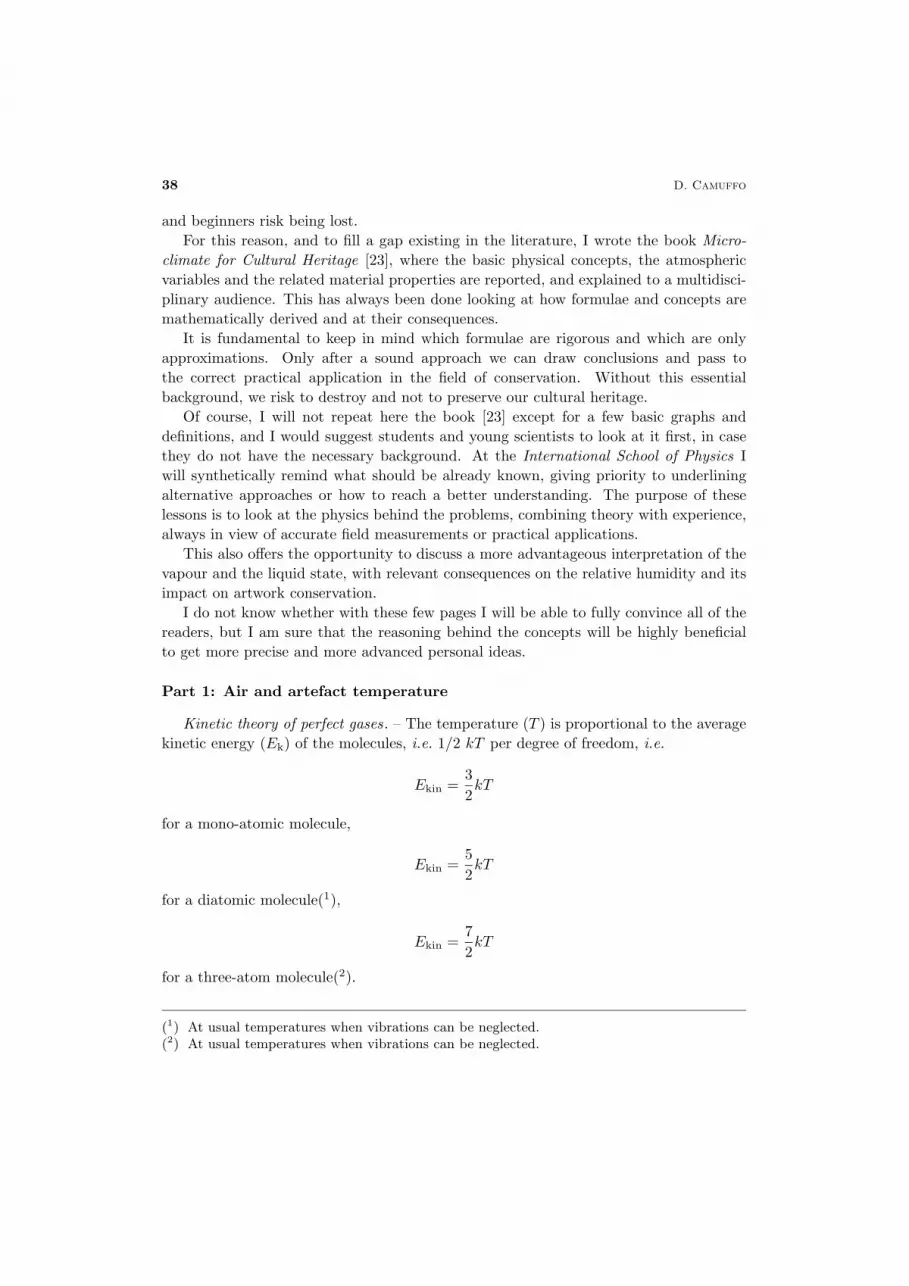
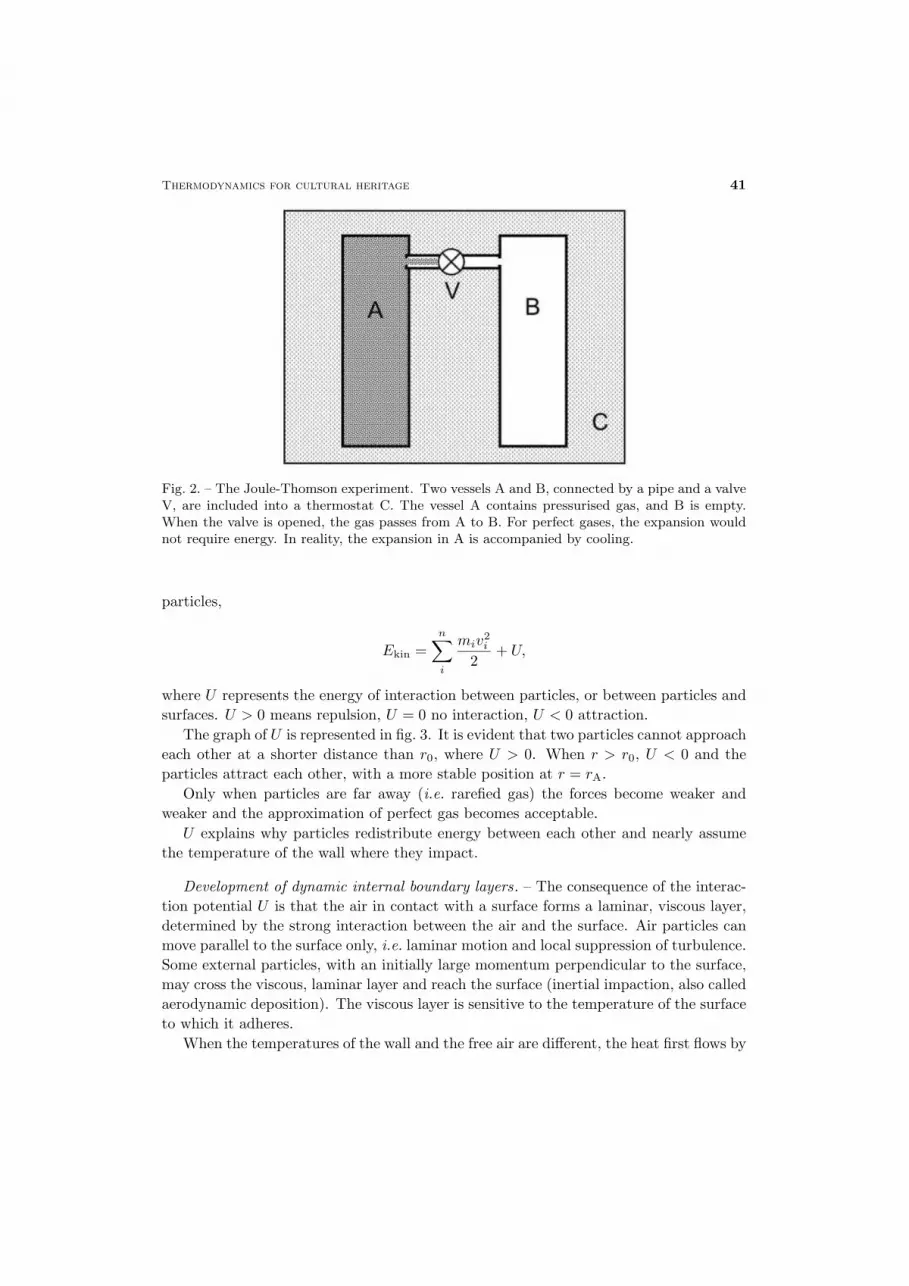
The well-known Joule-Thomson experiment (fig. 2) is constituted of two vessels Aand B, connected to each other, and are included into a thermostat C. Vessel A containspressurised gas, and B is empty. The two vessels are connected together with a pipe anda valve V. When the valve is opened, the gas initially in A passes to B. For perfect gases,the expansion would not require energy. In reality, the expansion in A is accompaniedby cooling.
For an ideal gas, the population of particles would distribute within the allowable vol-ume without work. Therefore, an expansion without work would have occurred withoutany change in the temperature level [5]. The same can be expressed by saying that in aperfect gas the internal energy of the system is independent of the space distribution ofthe particles. However, this is contrary to the actual experience with real gases.
For a perfect gas, the equation of the kinetic energy is
Ekin =n∑i
miv2i
2,
where the sum∑
i is extended to the whole population of n particles.For a real gas, kinetic energy and temperature are affected by interactions between
Thermodynamics for cultural heritage 41
Fig. 2. – The Joule-Thomson experiment. Two vessels A and B, connected by a pipe and a valveV, are included into a thermostat C. The vessel A contains pressurised gas, and B is empty.When the valve is opened, the gas passes from A to B. For perfect gases, the expansion wouldnot require energy. In reality, the expansion in A is accompanied by cooling.
particles,
Ekin =n∑i
miv2i
2+ U,
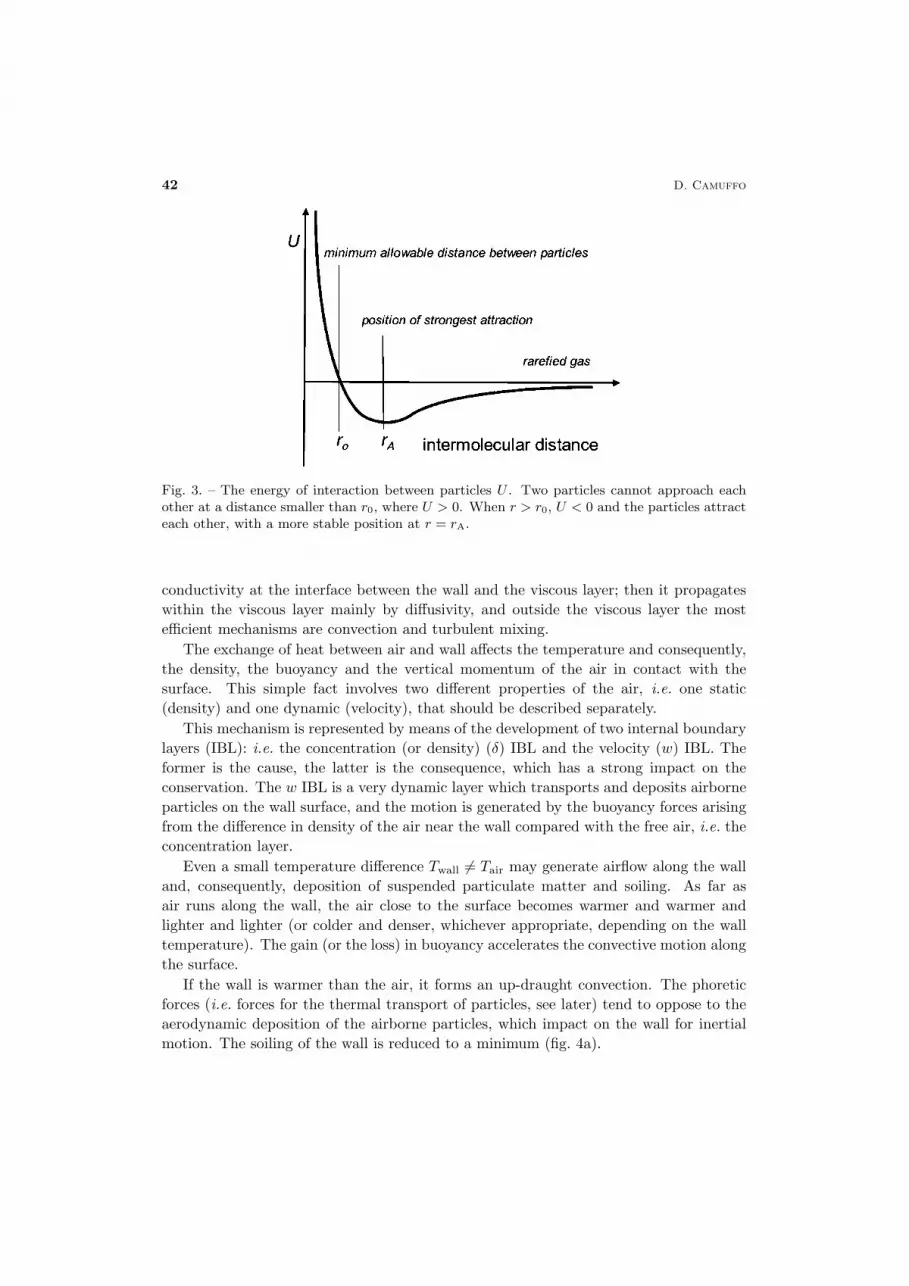
where U represents the energy of interaction between particles, or between particles andsurfaces. U > 0 means repulsion, U = 0 no interaction, U < 0 attraction.
The graph of U is represented in fig. 3. It is evident that two particles cannot approacheach other at a shorter distance than r0, where U > 0. When r > r0, U < 0 and theparticles attract each other, with a more stable position at r = rA.
Only when particles are far away (i.e. rarefied gas) the forces become weaker andweaker and the approximation of perfect gas becomes acceptable.
U explains why particles redistribute energy between each other and nearly assumethe temperature of the wall where they impact.
Development of dynamic internal boundary layers. – The consequence of the interac-tion potential U is that the air in contact with a surface forms a laminar, viscous layer,determined by the strong interaction between the air and the surface. Air particles canmove parallel to the surface only, i.e. laminar motion and local suppression of turbulence.Some external particles, with an initially large momentum perpendicular to the surface,may cross the viscous, laminar layer and reach the surface (inertial impaction, also calledaerodynamic deposition). The viscous layer is sensitive to the temperature of the surfaceto which it adheres.
When the temperatures of the wall and the free air are different, the heat first flows by
42 D. Camuffo
Fig. 3. – The energy of interaction between particles U . Two particles cannot approach eachother at a distance smaller than r0, where U > 0. When r > r0, U < 0 and the particles attracteach other, with a more stable position at r = rA.
conductivity at the interface between the wall and the viscous layer; then it propagateswithin the viscous layer mainly by diffusivity, and outside the viscous layer the mostefficient mechanisms are convection and turbulent mixing.
The exchange of heat between air and wall affects the temperature and consequently,the density, the buoyancy and the vertical momentum of the air in contact with thesurface. This simple fact involves two different properties of the air, i.e. one static(density) and one dynamic (velocity), that should be described separately.
This mechanism is represented by means of the development of two internal boundarylayers (IBL): i.e. the concentration (or density) (δ) IBL and the velocity (w) IBL. Theformer is the cause, the latter is the consequence, which has a strong impact on theconservation. The w IBL is a very dynamic layer which transports and deposits airborneparticles on the wall surface, and the motion is generated by the buoyancy forces arisingfrom the difference in density of the air near the wall compared with the free air, i.e. theconcentration layer.
Even a small temperature difference Twall �= Tair may generate airflow along the walland, consequently, deposition of suspended particulate matter and soiling. As far asair runs along the wall, the air close to the surface becomes warmer and warmer andlighter and lighter (or colder and denser, whichever appropriate, depending on the walltemperature). The gain (or the loss) in buoyancy accelerates the convective motion alongthe surface.
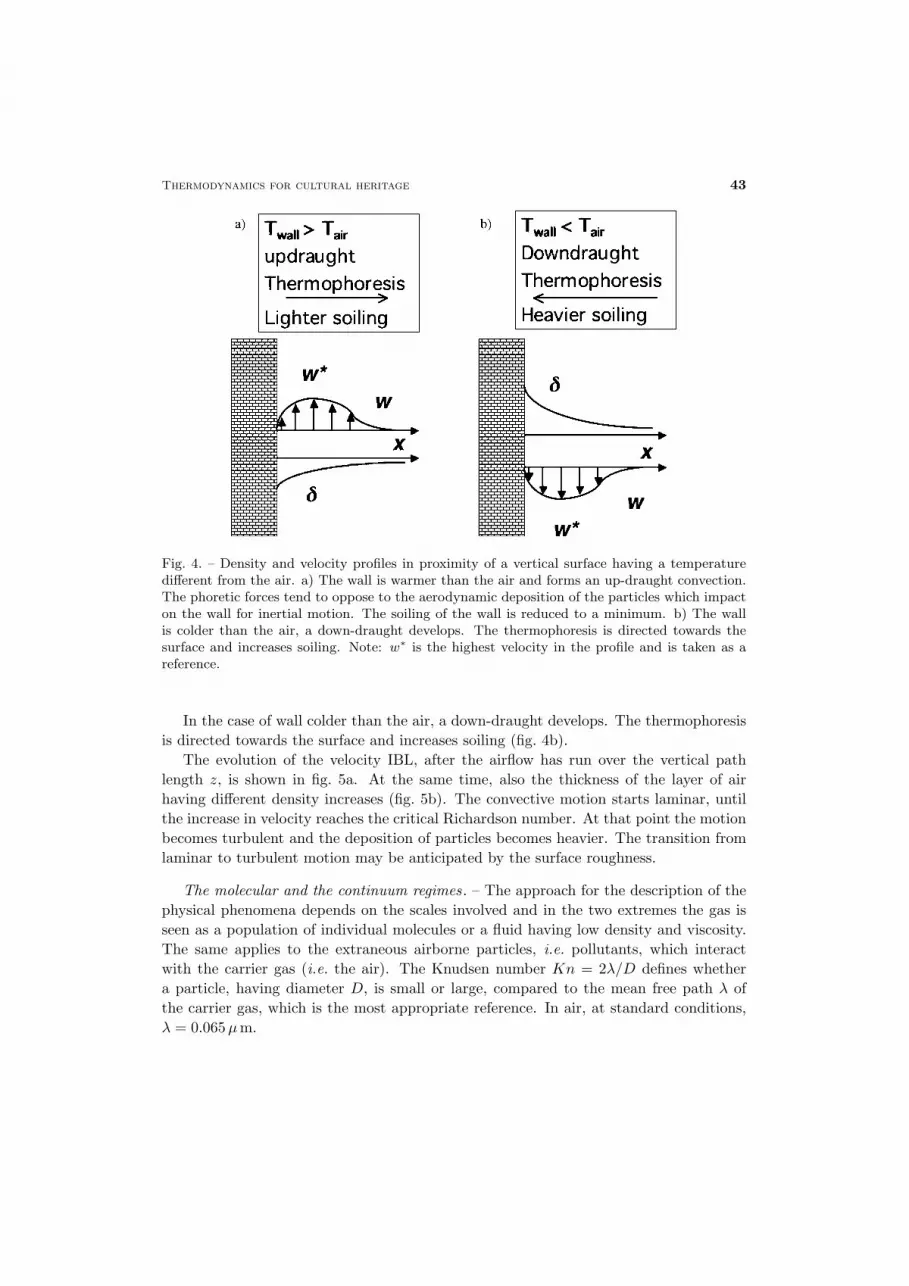
If the wall is warmer than the air, it forms an up-draught convection. The phoreticforces (i.e. forces for the thermal transport of particles, see later) tend to oppose to theaerodynamic deposition of the airborne particles, which impact on the wall for inertialmotion. The soiling of the wall is reduced to a minimum (fig. 4a).
Thermodynamics for cultural heritage 43
Fig. 4. – Density and velocity profiles in proximity of a vertical surface having a temperaturedifferent from the air. a) The wall is warmer than the air and forms an up-draught convection.The phoretic forces tend to oppose to the aerodynamic deposition of the particles which impacton the wall for inertial motion. The soiling of the wall is reduced to a minimum. b) The wallis colder than the air, a down-draught develops. The thermophoresis is directed towards thesurface and increases soiling. Note: w∗ is the highest velocity in the profile and is taken as areference.
In the case of wall colder than the air, a down-draught develops. The thermophoresisis directed towards the surface and increases soiling (fig. 4b).
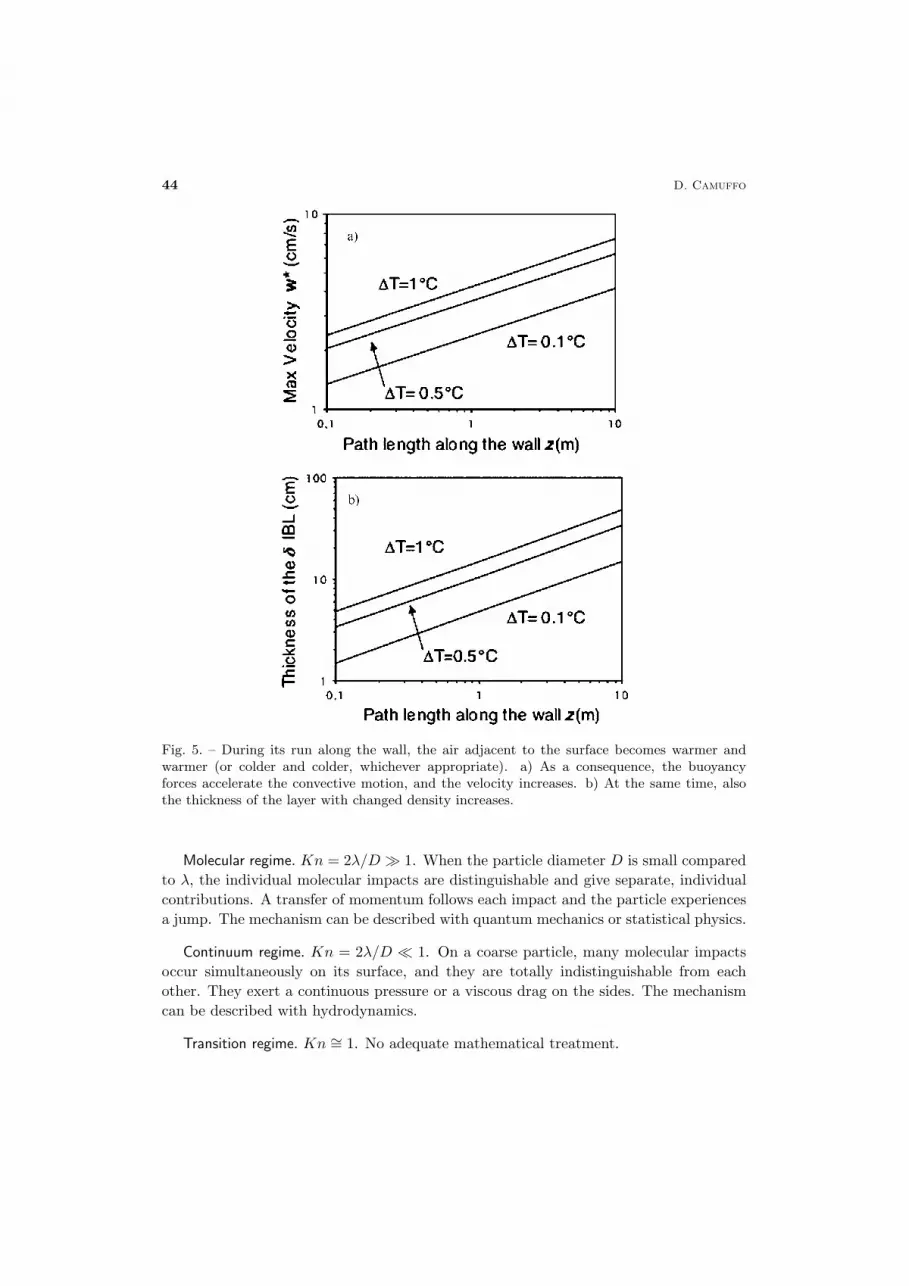
The evolution of the velocity IBL, after the airflow has run over the vertical pathlength z, is shown in fig. 5a. At the same time, also the thickness of the layer of airhaving different density increases (fig. 5b). The convective motion starts laminar, untilthe increase in velocity reaches the critical Richardson number. At that point the motionbecomes turbulent and the deposition of particles becomes heavier. The transition fromlaminar to turbulent motion may be anticipated by the surface roughness.
The molecular and the continuum regimes. – The approach for the description of thephysical phenomena depends on the scales involved and in the two extremes the gas isseen as a population of individual molecules or a fluid having low density and viscosity.The same applies to the extraneous airborne particles, i.e. pollutants, which interactwith the carrier gas (i.e. the air). The Knudsen number Kn = 2λ/D defines whethera particle, having diameter D, is small or large, compared to the mean free path λ ofthe carrier gas, which is the most appropriate reference. In air, at standard conditions,λ = 0.065µm.
44 D. Camuffo
Fig. 5. – During its run along the wall, the air adjacent to the surface becomes warmer andwarmer (or colder and colder, whichever appropriate). a) As a consequence, the buoyancyforces accelerate the convective motion, and the velocity increases. b) At the same time, alsothe thickness of the layer with changed density increases.
Molecular regime. Kn = 2λ/D � 1. When the particle diameter D is small comparedto λ, the individual molecular impacts are distinguishable and give separate, individualcontributions. A transfer of momentum follows each impact and the particle experiencesa jump. The mechanism can be described with quantum mechanics or statistical physics.
Continuum regime. Kn = 2λ/D � 1. On a coarse particle, many molecular impactsoccur simultaneously on its surface, and they are totally indistinguishable from eachother. They exert a continuous pressure or a viscous drag on the sides. The mechanismcan be described with hydrodynamics.
Transition regime. Kn ∼= 1. No adequate mathematical treatment.

Thermodynamics for cultural heritage 45
Fig. 6. – a) Thermophoresis for small particles (molecular regime): individual impacts are domi-nant. A small particle receives more energetic collisions from the warmer side and is consequentlydisplaced towards the colder side. b) Thermophoresis for coarse particles (continuum regime):the tangent viscous drag is dominant. The thermophoretic efficiency increases with the particlesurface roughness and decreases with particle conductivity.
Thermophoresis.
Thermophoresis in the molecular regime. In a temperature gradient, small particles arepushed towards the lower temperature because of the asymmetry of molecular impacts.A small particle is hit by air molecules with individual momentum (pi)h on the partof the warmer air, and minor (pi)c in the colder part (fig. 6a). The statistical effect isthat the particle experiences a net momentum
∑i(pi)h −
∑i(pi)c normal to the particle
which generates a motion. The resulting force, which drives the particle along a temper-ature gradient towards the lower temperature, is called Thermophoretic Force and themechanism Thermophoresis.
Thermophoresis in the continuum regime. In a temperature gradient, coarse particlesare dragged towards the lower temperature. On coarse particles, the normal componentof the momentum is (nearly) compensated, but not the tangential one, especially in thecase of skin friction. On average, air molecules coming from the warmer gas region delivermore tangential momentum than molecules coming from the colder region, and the netresult is a drag with tangential momentum transfer (fig. 6b).
Several formulae exist for the calculation of the thermophoretic velocity of small andlarge particles. Two of the most popular ones are by Pruppacher & Klett [22] and Talbot
46 D. Camuffo
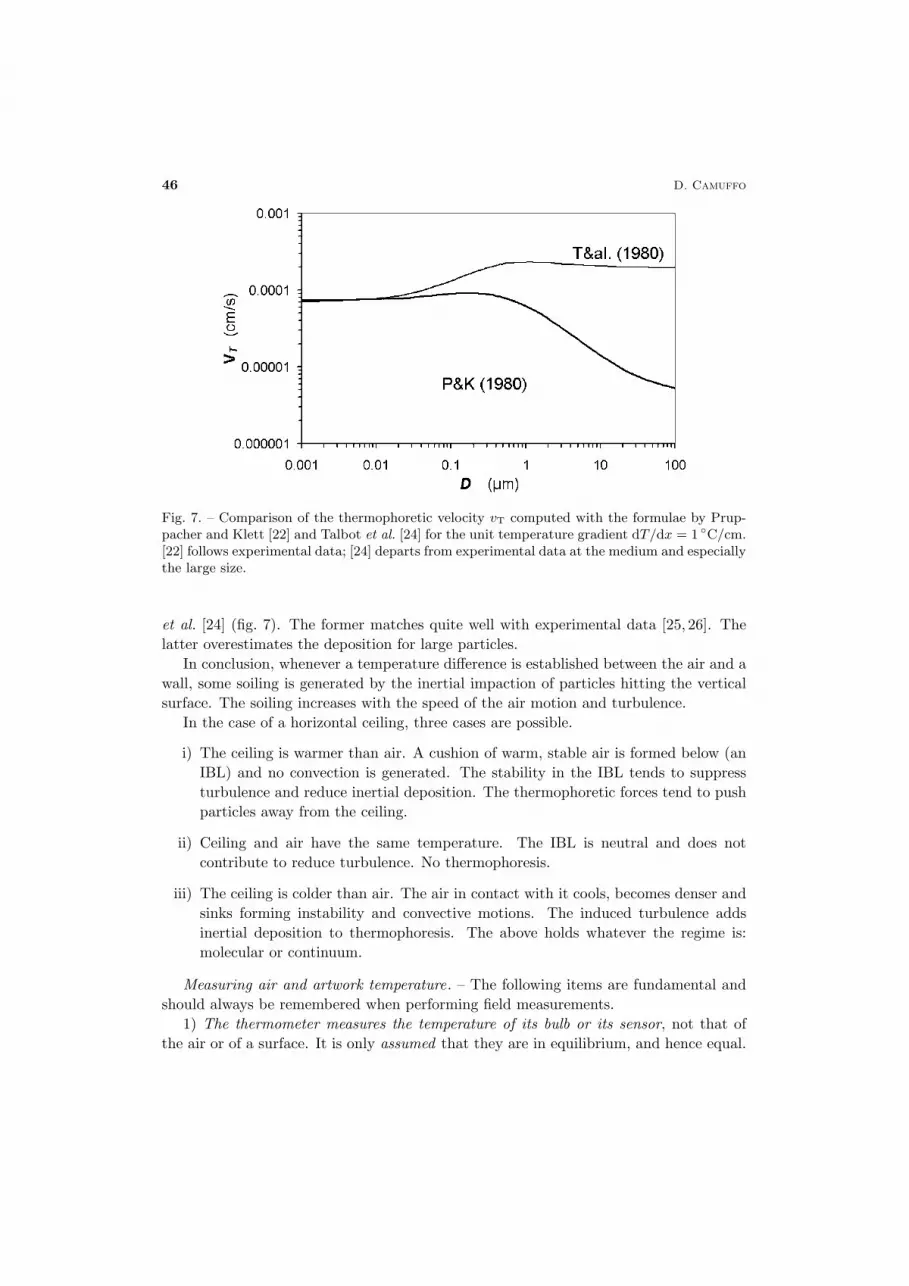
Fig. 7. – Comparison of the thermophoretic velocity vT computed with the formulae by Prup-pacher and Klett [22] and Talbot et al. [24] for the unit temperature gradient dT/dx = 1 ◦C/cm.[22] follows experimental data; [24] departs from experimental data at the medium and especiallythe large size.
et al. [24] (fig. 7). The former matches quite well with experimental data [25, 26]. Thelatter overestimates the deposition for large particles.
In conclusion, whenever a temperature difference is established between the air and awall, some soiling is generated by the inertial impaction of particles hitting the verticalsurface. The soiling increases with the speed of the air motion and turbulence.
In the case of a horizontal ceiling, three cases are possible.
i) The ceiling is warmer than air. A cushion of warm, stable air is formed below (anIBL) and no convection is generated. The stability in the IBL tends to suppressturbulence and reduce inertial deposition. The thermophoretic forces tend to pushparticles away from the ceiling.
ii) Ceiling and air have the same temperature. The IBL is neutral and does notcontribute to reduce turbulence. No thermophoresis.
iii) The ceiling is colder than air. The air in contact with it cools, becomes denser andsinks forming instability and convective motions. The induced turbulence addsinertial deposition to thermophoresis. The above holds whatever the regime is:molecular or continuum.
Measuring air and artwork temperature. – The following items are fundamental andshould always be remembered when performing field measurements.
1) The thermometer measures the temperature of its bulb or its sensor, not that ofthe air or of a surface. It is only assumed that they are in equilibrium, and hence equal.

Thermodynamics for cultural heritage 47
In general, this is not true.2) In the case of the air, the heat capacity of the sensor is orders of magnitude greater
than the specific heat of the air. Every measurement perturbs the original state of themeasurand (uncertainty principle).
3) In the field, the temperature fluctuates continually. Every sensor has a charac-teristic time of response, which introduces a time lag and a smoothing into the output.Hence, thermometers perfectly calibrated in the laboratory, but having different charac-teristic time, give different outputs, i.e. different temperatures.
4) The averaging time should be greater than the characteristic response of the sensor.Statistical laws regulate sampling. Data representative of a certain time interval can beobtained in a number of ways: i) with a fast sensor, by calculating averages; ii) byapplying an exponential decay or a smoothing filter to the data or an electronic circuit;iii) by increasing the heat capacity of the sensor, e.g. by adding a mass of bee wax aroundthe sensor to increase its time of response.
5) We should measure the average kinetic energy of the air, without the contributionof the infrared radiation (IR) from other bodies. It is impossible to remove all the IR,but the sensor should always be shielded with a reflecting (metal) screen.
6) Calibration performed in a bath does not include the IR contribution. Thermome-ters perfectly calibrated in the laboratory, but having different IR reflectivity, give differentoutputs, i.e. different temperatures, in the field.
7) If we want to know the temperature of a surface hit by solar radiation, or havingother exchanges with the air, the contact sensor will shadow the sampling point of thesurface and will produce an inaccurate value (uncertainty principle).
8) In general, the air and the surface temperatures are different and affected bygradients. The choice of representative sampling points is a crucial problem.
Measuring artworks temperature. – A contact sensor needs to be in contact with thesurface by means of a dangerous pressure or being glued to it. Surface temperaturemeasurements made with a contact thermometer are risky for artworks.
For non-metallic surfaces, or heavily oxidised metals, which are good infrared (IR)emitters, infrared non-contact monitoring is possible and preferable.
Polished metals have a low emissivity, but are less delicate. In this case temperaturemonitoring should be performed with contact thermometers.
In principle, artworks should be preserved from any contact with measuring instru-ments. Non-contact monitoring is in principle preferred. Which monitoring?
Remote sensing has generally a low accuracy. Key problems are: surface emissivityε < 1; IR originated by other bodies and reflected from the target surface; sensor andtarget with different temperature; calibration of the sensor over a wide range and lowaccuracy.
Quasi-contact sensor consists of a parabolic metal shield that reflects the externalIR, and concentrates on the sensor both the direct and the diffuse IR emitted from the
48 D. Camuffo
target surface. It is based on the fundamental equation for radiation
Absorbed + Transmitted +Reflected = 1,
where Transmitted = 0.As
Absorbed = Emitted,
in the parabolic cavity
Emitted +Reflected = 1.
Within a blackbody cavity the radiation is either emitted or reflected, i.e. reflectedfrom the same body, within the same cavity. This means that all the radiation present isultimately emitted by the body, and the emissivity ε = 1 by definition of perfect radiator.
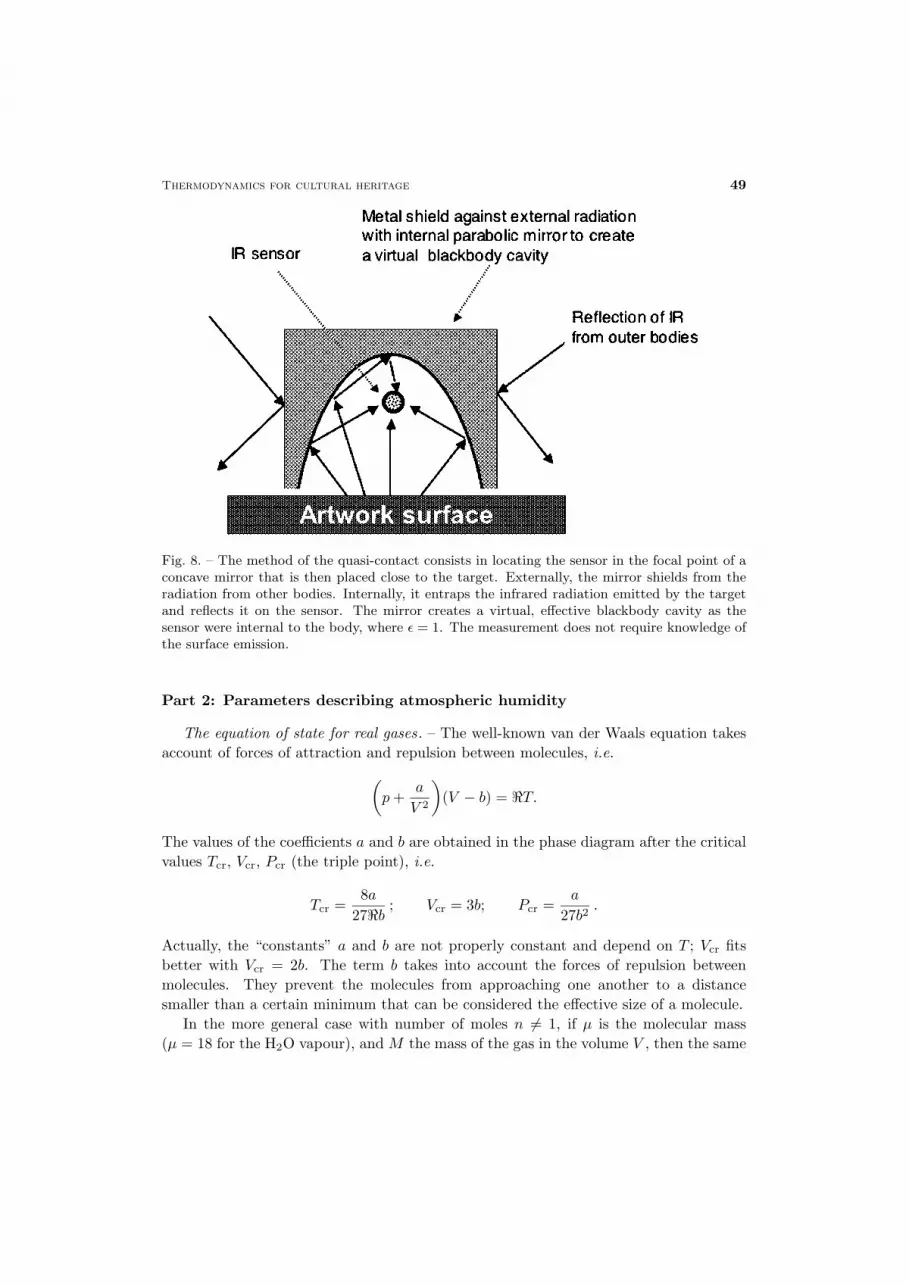
The effective cavity is not obtained by drilling the material; the cavity is simplycreated externally to the actual surface of the body with a concave mirror (fig. 8). Halfof the cavity is composed of the target, and the other half of the mirror, which virtuallyreproduces the missing part of the cavity.
The sensor is located in the focal point of the concave mirror that is then placed closeto the target. Externally, the mirror shields the sensor from the radiation from otherbodies. Internally, all of the infrared radiation emitted by the target remains entrappedwith multiple reflections, the curved mirror reflecting and converging this radiation to thesensor. The external sensor is virtually enclosed in the interior of an effective blackbodycavity, without any contact with the surface.
In practice, the method of the quasi-contact sensor consists in measuring the black-body temperature not with a remote sensing of a surface target (which is always char-acterised by an emissivity ε < 1), but by creating a virtual, effective blackbody cavityas the sensor were internal to the body, where ε = 1. The cavity behaves as a perfectblackbody, and the measurement does not require knowledge of the surface emission.
For instance, by placing a radiometer in front of a bare surface having emissivityε = 0.7, the sensor would be reached by a flux composed by 70% of infrared radiationemitted from the target, and 30% reflected from the target, but originated from otherbodies. With the concave mirror, 100% of the radiation is originated from the surfacewith no external interference (ε = 1).
Accurate temperature measurements are taken with this method, which is being in-cluded in the Italian UNI-NORMAL regulation [27] for measuring the temperature ofnon-metal artworks.
Thermodynamics for cultural heritage 49
Fig. 8. – The method of the quasi-contact consists in locating the sensor in the focal point of aconcave mirror that is then placed close to the target. Externally, the mirror shields from theradiation from other bodies. Internally, it entraps the infrared radiation emitted by the targetand reflects it on the sensor. The mirror creates a virtual, effective blackbody cavity as thesensor were internal to the body, where ε = 1. The measurement does not require knowledge ofthe surface emission.
Part 2: Parameters describing atmospheric humidity
The equation of state for real gases. – The well-known van der Waals equation takesaccount of forces of attraction and repulsion between molecules, i.e.
(p+
a
V 2
)(V − b) = �T.
The values of the coefficients a and b are obtained in the phase diagram after the criticalvalues Tcr, Vcr, Pcr (the triple point), i.e.
Tcr =8a
27�b; Vcr = 3b; Pcr =
a
27b2.
Actually, the “constants” a and b are not properly constant and depend on T ; Vcr fitsbetter with Vcr = 2b. The term b takes into account the forces of repulsion betweenmolecules. They prevent the molecules from approaching one another to a distancesmaller than a certain minimum that can be considered the effective size of a molecule.
In the more general case with number of moles n �= 1, if µ is the molecular mass(µ = 18 for the H2O vapour), and M the mass of the gas in the volume V , then the same
50 D. Camuffo
equation can be rewritten as
(p+
M2
µ2a
V 2
)(V − M
µb
)=
M
µ�T,
i.e. for the H2O vapour:
(e+
a
µ2d2v
)(1− b
µdv
)= dv�T.
The vapour density, i.e. the absolute humidity dv, is a key state variable, representativeof the interactions between particles of real gases and especially vapours.
The van der Waals equation explains that all the molecules exert an attractive forceon each gas layer that is proportional to the density dv of the population. On theother hand, the number of molecules in the layer subjected to the attractive force is alsoproportional to dv. Hence, the extra pressure for mutual attraction is proportional to d2vor to 1/V 2. In the case of vapour, the dependence on this variable is even more relevant,and the particles gas phase is possible only for densities lower than some critical valuesat which saturation is reached. For instance, the transition from the gas to the liquidstate occurs when the temperature drops below the dew point temperature Td that isonly related to the mixing ratio r, i.e. to both dv and T (under isobaric conditions).
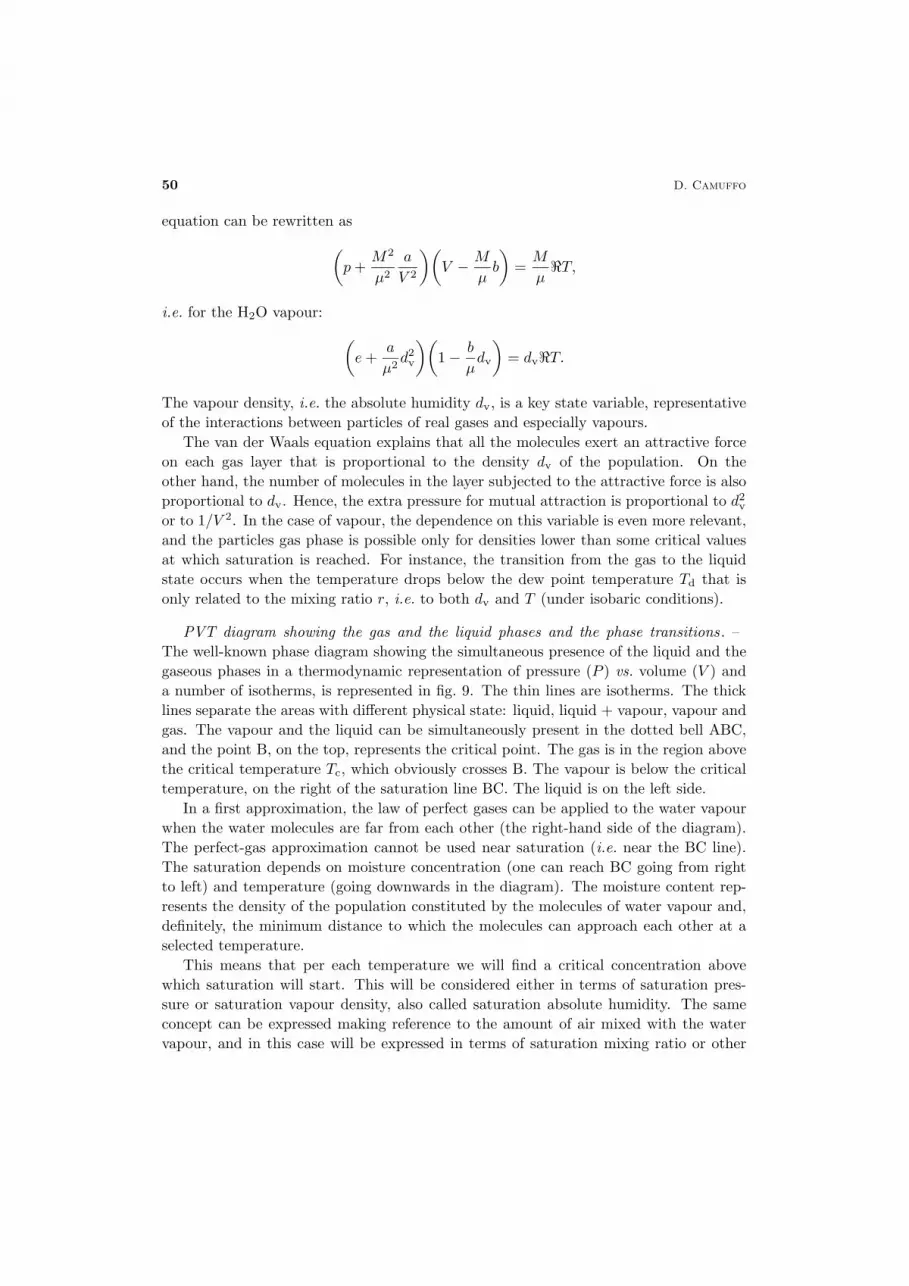
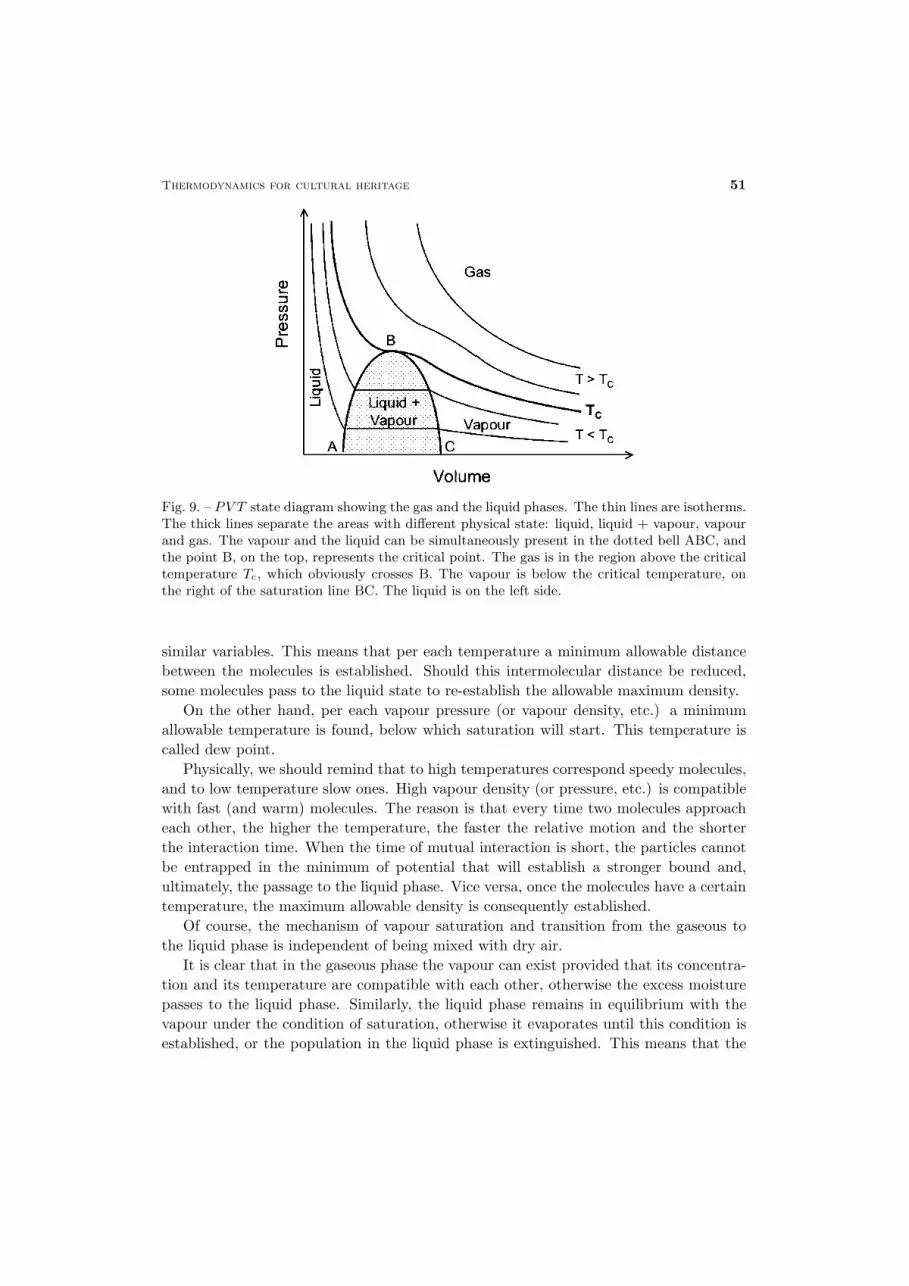
PVT diagram showing the gas and the liquid phases and the phase transitions . –The well-known phase diagram showing the simultaneous presence of the liquid and thegaseous phases in a thermodynamic representation of pressure (P ) vs. volume (V ) anda number of isotherms, is represented in fig. 9. The thin lines are isotherms. The thicklines separate the areas with different physical state: liquid, liquid + vapour, vapour andgas. The vapour and the liquid can be simultaneously present in the dotted bell ABC,and the point B, on the top, represents the critical point. The gas is in the region abovethe critical temperature Tc, which obviously crosses B. The vapour is below the criticaltemperature, on the right of the saturation line BC. The liquid is on the left side.
In a first approximation, the law of perfect gases can be applied to the water vapourwhen the water molecules are far from each other (the right-hand side of the diagram).The perfect-gas approximation cannot be used near saturation (i.e. near the BC line).The saturation depends on moisture concentration (one can reach BC going from rightto left) and temperature (going downwards in the diagram). The moisture content rep-resents the density of the population constituted by the molecules of water vapour and,definitely, the minimum distance to which the molecules can approach each other at aselected temperature.
This means that per each temperature we will find a critical concentration abovewhich saturation will start. This will be considered either in terms of saturation pres-sure or saturation vapour density, also called saturation absolute humidity. The sameconcept can be expressed making reference to the amount of air mixed with the watervapour, and in this case will be expressed in terms of saturation mixing ratio or other
Thermodynamics for cultural heritage 51
Fig. 9. – PV T state diagram showing the gas and the liquid phases. The thin lines are isotherms.The thick lines separate the areas with different physical state: liquid, liquid + vapour, vapourand gas. The vapour and the liquid can be simultaneously present in the dotted bell ABC, andthe point B, on the top, represents the critical point. The gas is in the region above the criticaltemperature Tc, which obviously crosses B. The vapour is below the critical temperature, onthe right of the saturation line BC. The liquid is on the left side.
similar variables. This means that per each temperature a minimum allowable distancebetween the molecules is established. Should this intermolecular distance be reduced,some molecules pass to the liquid state to re-establish the allowable maximum density.
On the other hand, per each vapour pressure (or vapour density, etc.) a minimumallowable temperature is found, below which saturation will start. This temperature iscalled dew point.
Physically, we should remind that to high temperatures correspond speedy molecules,and to low temperature slow ones. High vapour density (or pressure, etc.) is compatiblewith fast (and warm) molecules. The reason is that every time two molecules approacheach other, the higher the temperature, the faster the relative motion and the shorterthe interaction time. When the time of mutual interaction is short, the particles cannotbe entrapped in the minimum of potential that will establish a stronger bound and,ultimately, the passage to the liquid phase. Vice versa, once the molecules have a certaintemperature, the maximum allowable density is consequently established.
Of course, the mechanism of vapour saturation and transition from the gaseous tothe liquid phase is independent of being mixed with dry air.
It is clear that in the gaseous phase the vapour can exist provided that its concentra-tion and its temperature are compatible with each other, otherwise the excess moisturepasses to the liquid phase. Similarly, the liquid phase remains in equilibrium with thevapour under the condition of saturation, otherwise it evaporates until this condition isestablished, or the population in the liquid phase is extinguished. This means that the
52 D. Camuffo
transfer of molecules from the liquid to the vapour phase, or vice versa, is determined bya physical mechanism.
When a molecule of water vapour impacts on the surface of liquid water, it remainsentrapped in the liquid phase, releasing the latent energy corresponding to a changeof potential. However, apart from some casual impacts, a statistically relevant vapour-liquid transition (i.e. condensation) occurs when the vapour pressure (or density, etc.)goes above the saturation limit, or the temperature drops below the dew point, or acombination of the two.
The first idea is that, in the presence of both the liquid and the gas phases, a continu-ous flow of vapour molecules is transferred from the air to the liquid (condensation) andanother goes in the opposite direction (evaporation). In practice, we can recognise onlythe net flux, i.e. the difference between the two. Below saturation the evaporation isdominant and above saturation the condensation occurs. The process continues as far asthe equilibrium is reached, i.e. when the net flux vanishes, just at saturation. This is wellknown, while less known is the reason why, and a possible explanation is here reported.
The liquid state exists only in the presence of an external pressure, either generatedby an atmosphere of dry gases, or its own (saturation) pressure or a mechanical one. Ifthe external pressure is too small, the liquid boils to pass as quickly as possible to thegaseous phase. The phase transition does not only occur at the interface, but also withinthe liquid, where bubbles of vapour are formed.
In the liquid state, H2Omolecules have an intermediate character between the freedomthat characterizes the gas phase and the rigidity of the crystal lattice of ice. Moleculesare still bound to each other, but less strictly than in the solid state. The concept ofa physical structure, when applied to the liquid state, has a slightly different meaningfrom the solid state. In liquids, as a consequence of the ceaseless molecular motions,the long-range molecular order is lost. However, some molecules aggregate to each otherforming extended clusters with a rather ordered structure. The order is limited to theshort range, i.e. clusters of some tens of molecules, which remain bound for a limitedtime. These clusters can slip with respect ot each other, and for this reason the liquidhas not a specific shape, but adapts to the form of the container.
In either the vapour or the liquid phase, H2O molecules have a ceaseless motion, theaverage value being determined by the ambient temperature. However, almost all of themolecules individually depart from the average.
In practice, looking at the bell-shaped distribution of molecules by velocities, thepopulation forming the liquid water is composed of: i) the part near the origin of thedistribution, composed of some slow molecules; ii) the central part of the graph, witha huge number of molecules having a velocity close to the mode, which constitute mostof the liquid; and iii) the final tail with some fast molecules. In the case of a liquid,differences in velocities constitute a problem for keeping a long-term bound. Boundsand clusters can only be established between molecules that move together at the samevelocity or within a narrow range of velocities (the most probable velocities are aroundthe mode) and for the limited period in which the internal departures do not accumulateexceeding differences. The minority of fast molecules cannot remain bound to the major-

Thermodynamics for cultural heritage 53
ity of molecules because of the differences in velocity. The fast ones remain isolated andform a gas-like swarm of molecules freely moving within the liquid and can be consideredvapour inside the liquid. Since they are the most energetic ones, they have the highestprobability of escaping from the liquid in the form of vapour, because they have theenergy (i.e. the latent heat) needed to cross the potential wall when crossing the liquidsurface and changing of state. Within the liquid, these molecules do no longer preservetheir identity, as at every collision with other water molecules they exchange their mo-mentum, energy and role. However, although the individuality of such a population iscontinually exchanged between the molecules, the number of molecules having a certaindegree of freedom, which behave like a gas within the bulk liquid, remains substantiallythe same, being established by the temperature T of the liquid.
By dividing the number of the vapour-like molecules within the liquid (highly depen-dent on T ) by the volume occupied by the liquid (poorly dependent on T ), we recognisethat the density of the vapour-like molecules is determined by the liquid temperature, i.e.by the molecule distribution by velocities. We can also easily extend this concept to thepressure exerted, internally to the liquid, by this gas-like population: things behave assome vapour molecules were dissolved within the liquid, like the ordinary water vapourdissolved into the atmosphere.
Of course, in the bulk liquid, the internal pressure of this gas-like population alwaystends to reach equilibrium with the external vapour, and the driving force is the gradientin pressure across the liquid-gas interface. Should the internal vapour-like pressure bedominant, a flow of vapour molecules would be transferred from the liquid to the atmo-sphere, and vice versa. The net flow is governed by the partial pressure gradient acrossthe interface. At saturation the net flow stops. As a consequence, also the pressuregradient will vanish, and the two pressures will be exactly the same. This means thatthe partial pressure exerted by the vapour-like molecules within the liquid equals thesaturation pressure in the air. Also, the saturation pressure is the maximum reachablepressure at that temperature, both within the air and within the liquid.
As the saturation pressure is regulated by temperature, and the saturation pressureis reached at the dew point (see below), the same concept can be expressed in terms ofvapour temperature, which equals the air temperature, and dew point. We can supposethat the vapour-like molecules within the bulk water are at saturation and that, whateverthe evaporation rate is, the water constitutes a huge reservoir to supply such kind ofmolecules, so that they always remain at saturation. The same can be said in thecase of condensation: a number corresponding to the excess of molecules entering theliquid passes to the liquid phase, leaving the partial pressure of the vapour-like moleculeswithin the liquid unchanged. Therefore, the vapour-like molecules within the liquid areat saturation at the actual temperature T of the liquid; on the other hand, the partialpressure of the vapour molecules in the air reaches the saturation level only when the airtemperature reaches the dew point (Td). Should it be above, the vapour would be over-saturated; below, it would be under-saturated. Therefore, the transition between thetwo phases is regulated by the dew point spread (DPS), i.e. the temperature differenceT − Td.
54 D. Camuffo
When DPS > 0 (i.e. T > Td; e.g., under-saturation in the gaseous phase, or liquid withtemperature above the level needed for equilibrium) the transition is from the liquid to thevapour phase, i.e. evaporation. The liquid requires the latent heat to evaporate molecules,which will pass to a higher energetic level. The air is enriched with new molecules ofwater vapour. In the case of an open environment where the vapour molecules arecontinually dispersed in an infinite space, the evaporation continues indefinitely, or aslong as the water reservoir is finished. In the case of a closed space, the evaporationincreases the density of the H2O molecules in the gaseous phase and lowers the dewpoint, up to the final temperature of the liquid (cooled for the evaporation) when thesaturation equilibrium is reached.
When DPS = 0 the equilibrium is reached and the net flux across the interfacevanishes.
When DPS < 0 (e.g., super-saturation in the gaseous phase, or liquid with tempera-ture below the equilibrium level) the transition is from the gaseous to the liquid phase,i.e. condensation, and this releases energy, passing to a lower energetic level.
Some might be surprised in finding suggested that vapour-like molecules are dispersedwithin the liquid. However, this hypothesis is supported by further evidence and somephenomena can hardly be explained without it.
For instance, ebullition occurs when the partial pressure of the water vapour equalsthe atmospheric pressure. If one supposes that the bulk liquid is composed of moleculesin the liquid phase only, and that the vapour is only external to the liquid, in the air, theebullition can hardly be explained. Why should the liquid inside a pot change behaviourlooking at what happens outside the pot? What is the mechanism that relates theviolent transformation of phase within the liquid with the external pressure of the watervapour? Why should it be identical to the air pressure? The explanation is simplewhen one hypothesises the presence of vapour-like molecules inside the liquid, which arecontinually related to the external (partial) pressure of the vapour. At the boiling point,the (saturation) partial pressure of the vapour in the water equals the pressure of theexternal air. The bulk liquid is not compressed anymore and is not controlled from theexterior by an overwhelming atmospheric pressure. The internal pressure of the vapouris the same and the whole of the liquid tends to be transformed into vapour and betransferred to the air. This violent and chaotic transformation from the liquid to thegaseous phase within the bulk liquid constitutes the ebullition.
Again: why does the ebullition start from the internal surface of the pot and beginswith a characteristic crackling sound? The Kelvin theory for the formation of droplets,bubbles or micropore filling (see below) establishes a relationship between the vapourpartial pressure in equilibrium with a curved meniscus of water and the radius of cur-vature. A plane meniscus is in equilibrium at the ordinary saturation pressure. For apositively curved meniscus, i.e. a droplet, the equilibrium pressure is above the ordinarysaturation level, i.e. super-saturation. On the other hand, for a negatively curved menis-cus, e.g. the meniscus of water into a micropore, or the meniscus of a bubble into water,the equilibrium pressure is below the ordinary saturation level, i.e. under-saturation.
When water approaches the boiling temperature, a number of microbubbles will form,
Thermodynamics for cultural heritage 55
which are initially flat and adherent to the pot surface. This is because the radius ofcurvature of the flat meniscus is extremely large, nearly infinite, in equilibrium with thesaturation pressure. After a short time, new molecules of vapour will feed the microbub-bles which will assume a hemispherical shape with a small, negative, radius of curvature.This situation is unstable because a negatively curved meniscus is in equilibrium with apressure below saturation. The change in the meniscus curvature will displace the vapourfrom a condition of equilibrium to that of excess. This vapour will return dispersed withinthe liquid phase, the microbubbles will collapse and the water will violently invade thespace left empty. Every time a microbubble implodes, the water crashes against the potsurface and emits a burst sound and the result is the typical crackling.
The microbubble can grow only in the case that some air originally dissolved into theliquid water enters the bubble at the early stage, forming a stable configuration. Thisis because the inward pressure of the liquid water, which tends to implode the bubble,is counteracted by the outward pressure of the compressed air pocket. This bubble cangrow, being fed by new vapour molecules and without the possibility of bursting inwards.
Similarly, when some external particles are introduced in water at the boiling point,e.g. NaCl crystals, the size of the crystals is large compared with the size of the meniscusof the microbubbles in which the Kelvin effect [28] is dominant. The crystals will act asnuclei for the formation of bubbles, and a violent ebullition will immediately start.
The key conclusions of this section that will be useful in the following are:
– A population of vapour-like molecules is present within the liquid phase.
– The net transfer of molecules between the two phases, i.e. condensation and evap-oration, is governed by the gradient in vapour pressure at the gas-liquid interface.The same mechanism can be expressed in terms of temperature, below the dewpoint (condensation) or above it (evaporation).
– The saturation pressure within the liquid is governed by the same equation as inthe atmosphere, and is a function of temperature only. At equilibrium, the samesaturation pressure is found both in the gaseous phase external to the liquid, andin the vapour-like molecules inside the liquid.
Which variable is representative of the interactions between moisture and materials?– It is well known that several materials are negatively affected by moisture by differentmechanisms, e.g. H2O molecules are absorbed by hydrophilic materials (e.g. wood, pa-per), or favour oxidations and chemical reactions with metals, limestone, or gaseous orparticulate pollutant (e.g. SO2 to form H2SO4). It would seem logical to expect that theprobability that a water vapour molecule interacts with a material is proportional to theprobability for an H2O molecule to impact on it. This probability is obviously propor-tional to the density of the population of H2O molecules present in air in whatever wayit may be expressed, e.g. in terms of partial pressure, density (= absolute humidity),or proportion of mixing with air (dry air = mixing ratio, humid air = specific humid-ity). This hypothesis would imply that we should expect the same damage when the
56 D. Camuffo
same number of H2O molecules had cumulatively impacted on the artwork surface, irre-spectively after a long-term exposure in a dry atmosphere or after a short exposure indampness. However, this hypothesis is contrary to experience. In a dry atmosphere, ma-terials remain unaffected by chemical reactions, while the opposite occurs in dampness.It is well known that wood swelling for water absorption, moisture content in hydrophilicmaterials, oxidation of metals and other chemical reactions are only related to relativehumidity (RH). The dangerous effects of dampness occur especially in the cold seasonwhen RH is high and absolute humidity (AH) low, whereas they do not occur in drysummer periods when AH is high and RH low.
The fact that this problem cannot be simply tackled in terms of probability of impactwith a vapour molecule physically means: first that not all of the H2O molecules inthe vapour phase behave in the same manner and, second, that there is only an activefraction of vapour that is potentially available for these interactions. RH is an index ofthe saturation level in the moisture and physically shows what fraction of the vapourpopulation is potentially available to pass to the liquid phase and possibly react withmaterials.
The absorption of water in materials and the chemical reactions can only developwith water in the liquid state and not as a (dry) gas. When the relative humidity islow, also the moisture can be considered as a dry gas, practically non-interacting withmaterials or pollutants. When the relative humidity is high, some liquid water forms bycondensation on the deliquescent salts or within micropores. Possibly, the explanation ofthe need for the presence of liquid water is that in the liquid state many water moleculescan approach each other at very small distances, determining a very high dielectricaction and dissolution of aggressive elements. This might favour the kinetics of chemicalreactions.
Relationship between temperature and saturation vapour pressure. – Theoretical ap-proach: Clausius-Clapeyron equation
e′w(T ) = e′0 · exp[L
Rv
(1T0
− 1T
)],
e′0 = 6.11 hPa (saturation vapour pressure at 0 ◦C)T0 = 273KRv = 461 JK−1kg−1 gas constant for water vapour
constant.
Over water: L = Lv = 2.5× 10⁶ J kg−1 ⇒ L/Rv = 5423K.Over ice: L = Ld = 2.83× 10⁶ J kg−1 ⇒ L/Rd = 6134K.Supercooled droplets can exist at temperature from 0◦ to −40 ◦C.The saturation vapour pressure e′w(t) is computed by means of the empirical formula
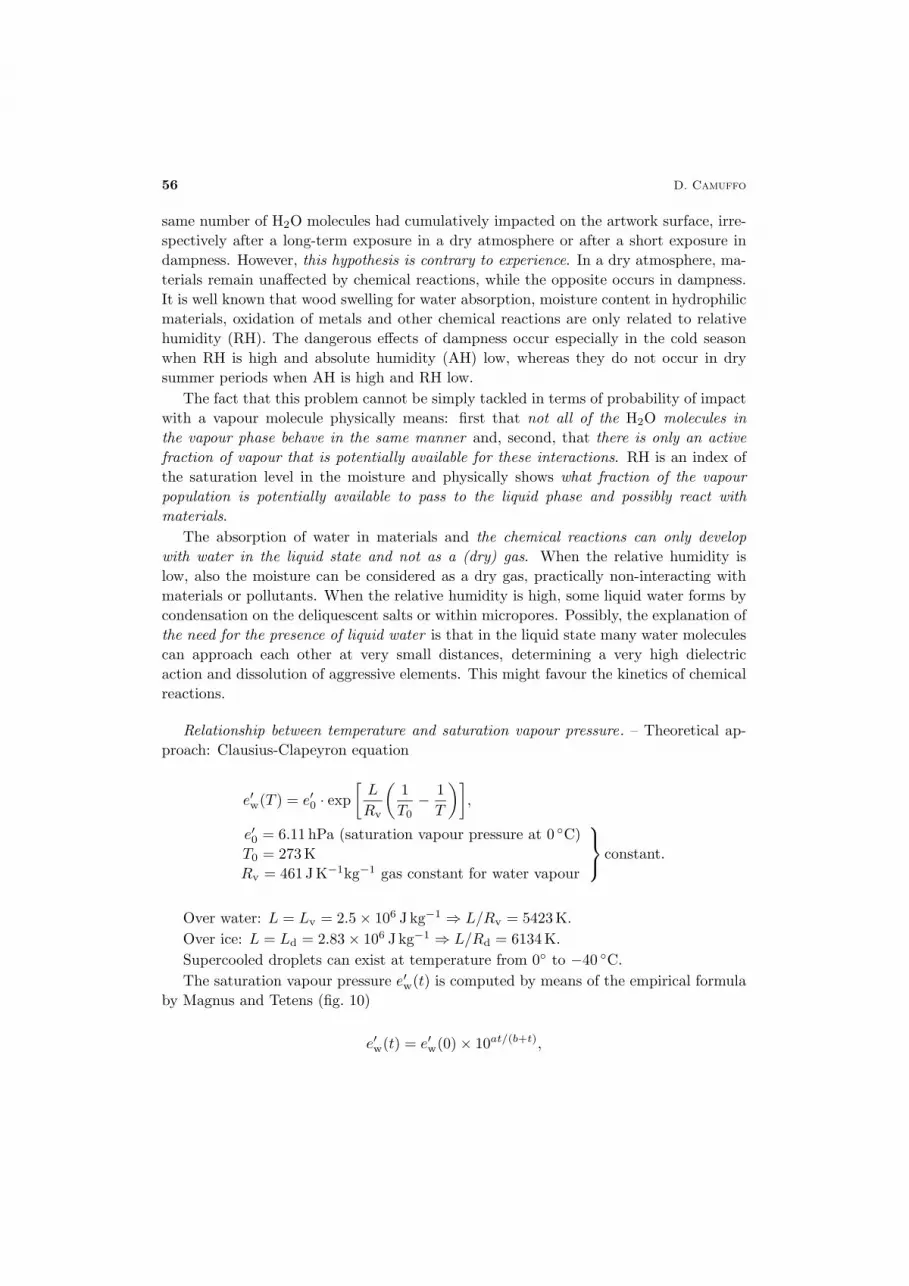
by Magnus and Tetens (fig. 10)
e′w(t) = e′w(0)× 10at/(b+t),
Thermodynamics for cultural heritage 57
Fig. 10. – a) The saturation vapour pressure of moist air, or vapour tension, e′(T ), and thevalues e(T ) corresponding to different levels of relative humidity. b) As in a) but for the verticalscale which is logarithmic. The theoretical thermodynamical solution would be represented bystraight lines in a log paper. The curvature shows how real vapour departs from a perfect gas.
where e′w(0) = 6.112 hPa (1mbar = 1hPa), a = 7.5, b = 237.3 ◦C with reference to water,a = 9.5, b = 265.5 ◦C with reference to ice and t is the temperature in ◦C.
Sonntag [29] has recently re-evaluated the two coefficients: a = 7.65, b = 243.12 ◦Cfor water.
In the real atmosphere, the saturation level is rarely exceeded (supersaturation) bymore than 1%. This variable is dependent on t only.
Dew point: the temperature of condensation. – The dew point temperature Td (or td),commonly termed dew point, is the temperature to which a parcel of moist air should becooled at constant pressure and constant water vapour content in order for saturation tooccur.
It can be alternatively defined as the temperature at which the actual pressure ofthe vapour contained in an air sample equals the saturation pressure, under constantpressure and mixing ratio.
Although it is popularly called dew point of the “air”, it is a property of the vapourthat might be extended to the air sample.
The dew point is the critical temperature around which the transitions between theliquid and the vapour phases change direction. If liquid water and vapour are present inthe same room, and both have the same temperature T , the water molecules will tendto pass from the liquid to the vapour state (evaporation) if T > Td, and in the oppositedirection (condensation) if T < Td. At T = Td, the equilibrium between the two phasesis reached. The air temperature is always T ≥ Td. As opposed, the temperature ofliquids or solids may be higher, equal, or lower.
Evaporation and condensation should be considered from the statistical point of view,
58 D. Camuffo
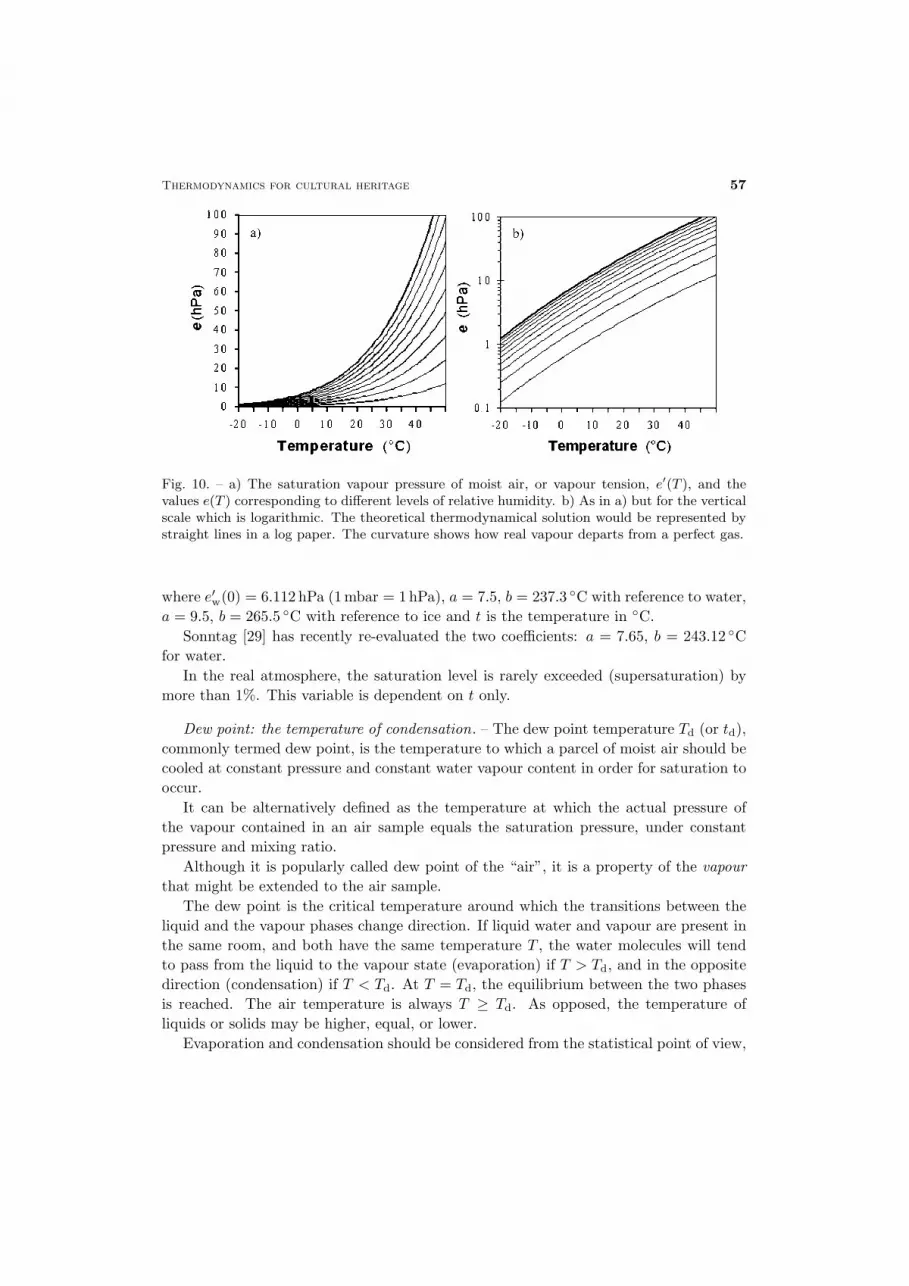
Fig. 11. – An experiment to show that Td is independent of Tair. The experiment is made witha pot half-filled with cold water placed on the fire. External view of the pot (1) fully dewed,(2) half-dewed, (3) completely dry. WL indicates the water level inside.
i.e. they represent the net flux resulting from a balance in which some fast molecules mayescape from the liquid water and other may arrive from the gas phase. In the previoussection we have seen that this flux can be considered as the result of the gradient invapour pressure established across the liquid-air interface.
The air temperature always exceeds the wet bulb temperature Tw (which is relatedto the temperature of evaporation, see below), which always exceeds the dew point, allof these variables being equal when saturation is reached. In formula:
Td ≤ Tw ≤ T.
This means that the temperature of an evaporating surface cannot reach the temperatureof condensation.
In the free air, condensation and evaporation happen at two distinct temperatures.By measuring the surface temperature of a wet wall we can know whether it is condensingbecause it is cold, or is evaporating, e.g., after capillary suction. Td depends only on themoisture content in air expressed in terms of mixing ratio of humid air. Should it beexpressed in terms of absolute humidity, the air temperature should be included as well.
In the atmosphere, the moisture starts to form droplets by condensing on condensa-tion nuclei when the air temperature reaches the dew point, and the relative humiditysaturation. If the condensation nuclei are highly hygroscopic, being formed of deliques-cent salts, the early droplets (mist) may be formed at levels of relative humidity below100%. Condensation on objects surface occurs whenever the temperature of the sur-face drops below the dew point, whatever the air temperature or the relative humiditymay be.
A useful experiment (fig. 11) to show that Td is independent of Tair can be made witha pot of water placed on the gas fire, as follows.
1) Let us place a stainless steel pot, half-filled with cold water, on the flame of a gasfire. Immediately the whole surface is dewing. Td is determined by the combustion ofCH4 which releases H2O.
2) After a few minutes the upper empty half warms above Td and dew disappearsfrom this part. The inside water level (WL) is indicated by the top of the dewed band.
3) Later, the filled half warms too above Td and the dew disappears completely.
Thermodynamics for cultural heritage 59
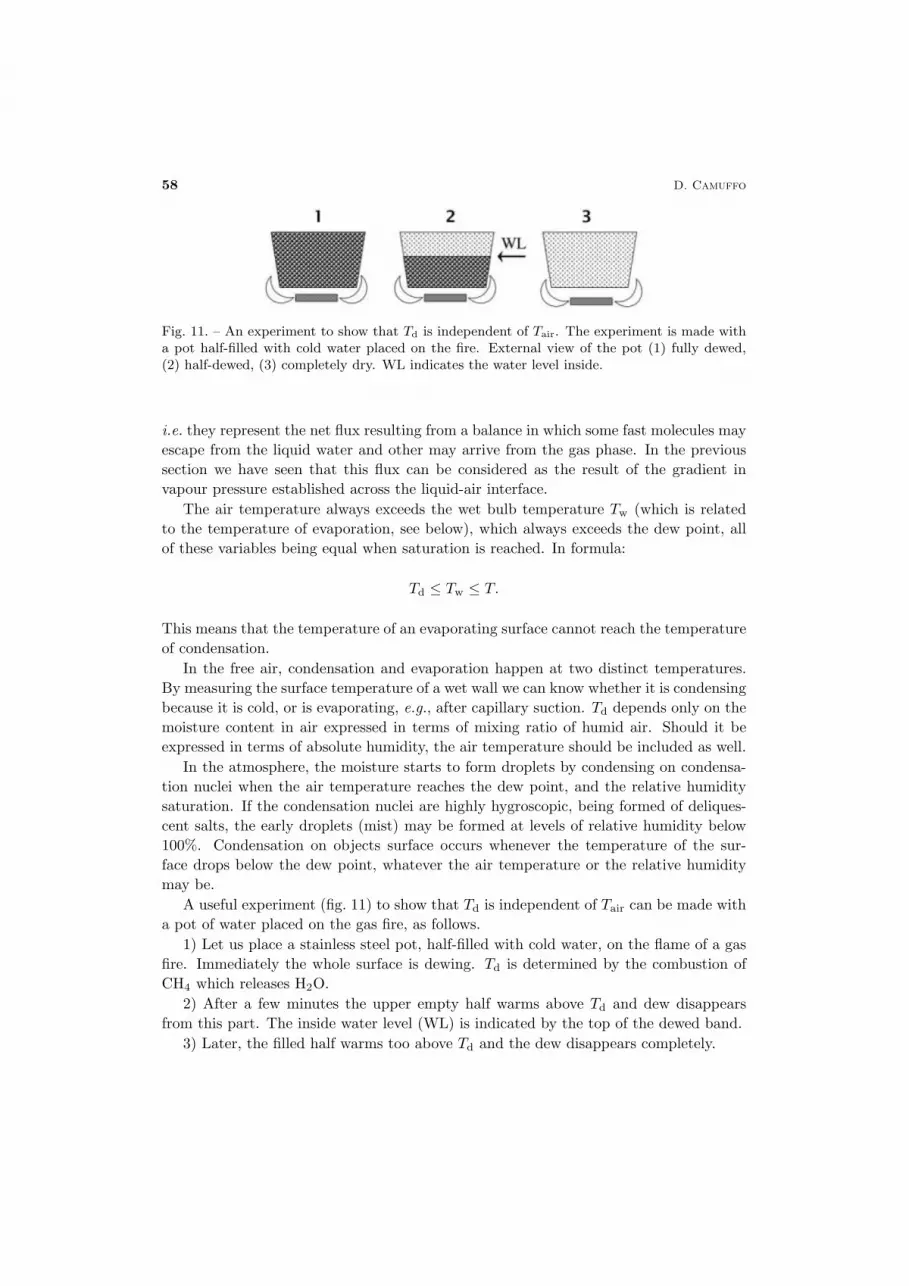
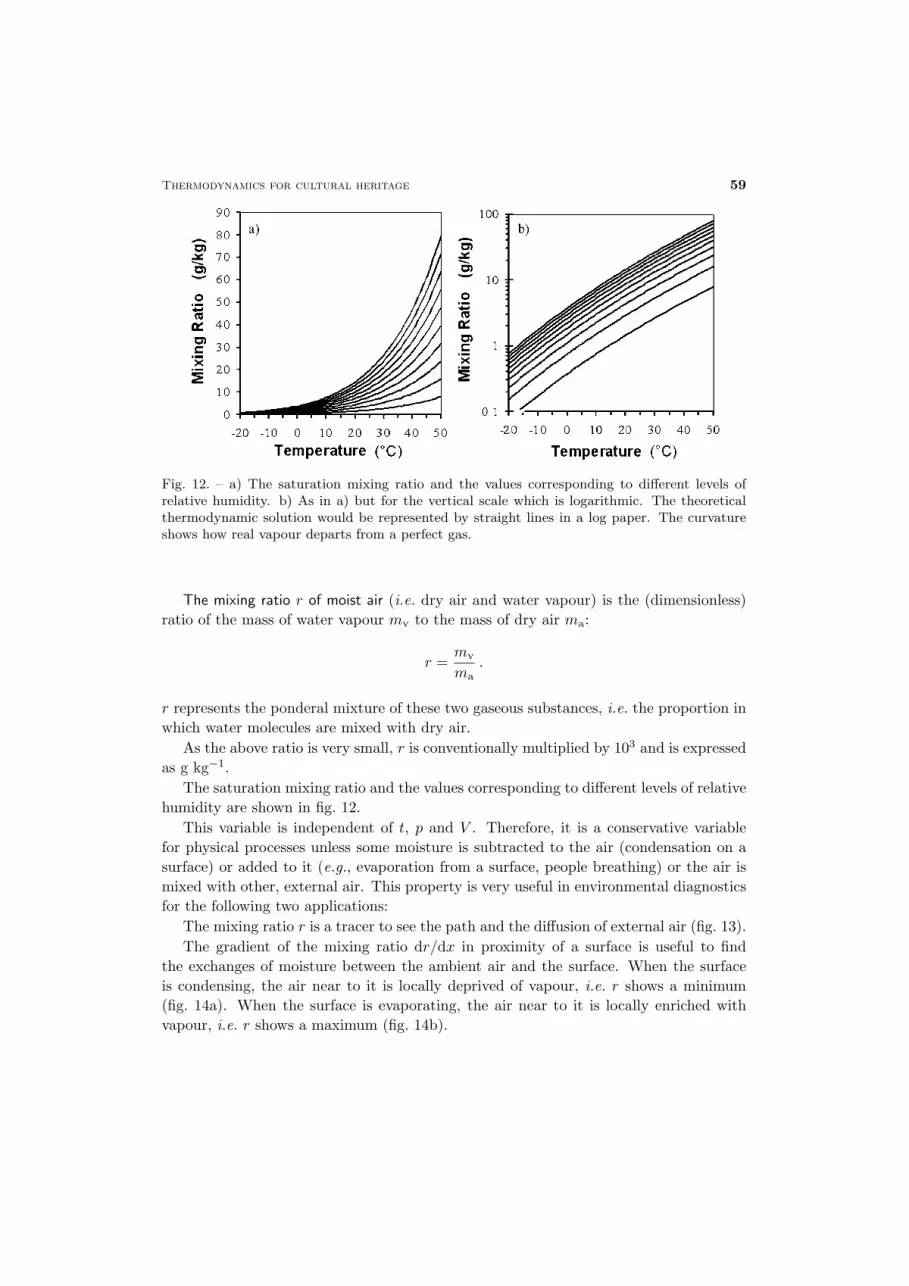
Fig. 12. – a) The saturation mixing ratio and the values corresponding to different levels ofrelative humidity. b) As in a) but for the vertical scale which is logarithmic. The theoreticalthermodynamic solution would be represented by straight lines in a log paper. The curvatureshows how real vapour departs from a perfect gas.
The mixing ratio r of moist air (i.e. dry air and water vapour) is the (dimensionless)ratio of the mass of water vapour mv to the mass of dry air ma:
r =mv
ma.
r represents the ponderal mixture of these two gaseous substances, i.e. the proportion inwhich water molecules are mixed with dry air.
As the above ratio is very small, r is conventionally multiplied by 103 and is expressedas g kg−1.
The saturation mixing ratio and the values corresponding to different levels of relativehumidity are shown in fig. 12.
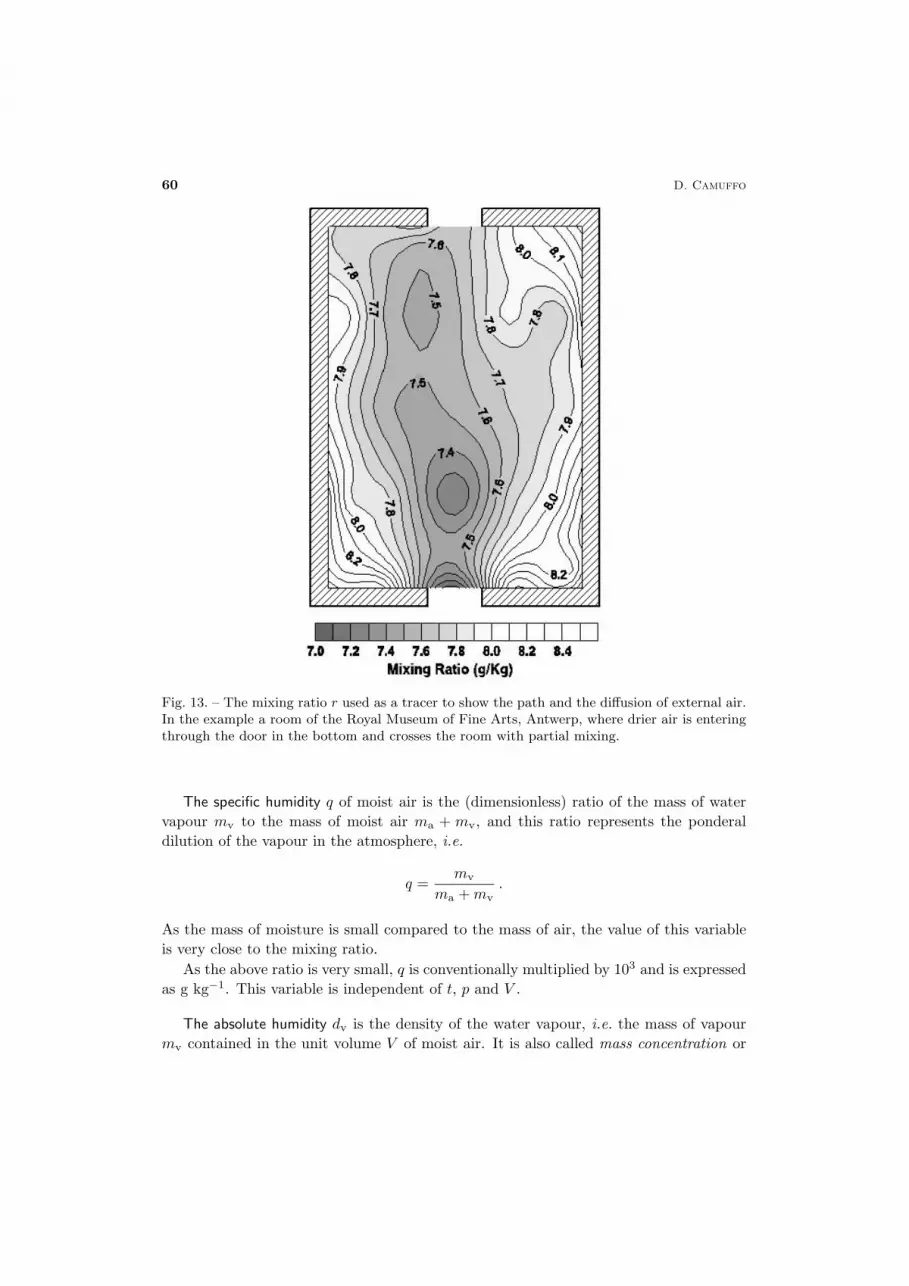
This variable is independent of t, p and V . Therefore, it is a conservative variablefor physical processes unless some moisture is subtracted to the air (condensation on asurface) or added to it (e.g., evaporation from a surface, people breathing) or the air ismixed with other, external air. This property is very useful in environmental diagnosticsfor the following two applications:
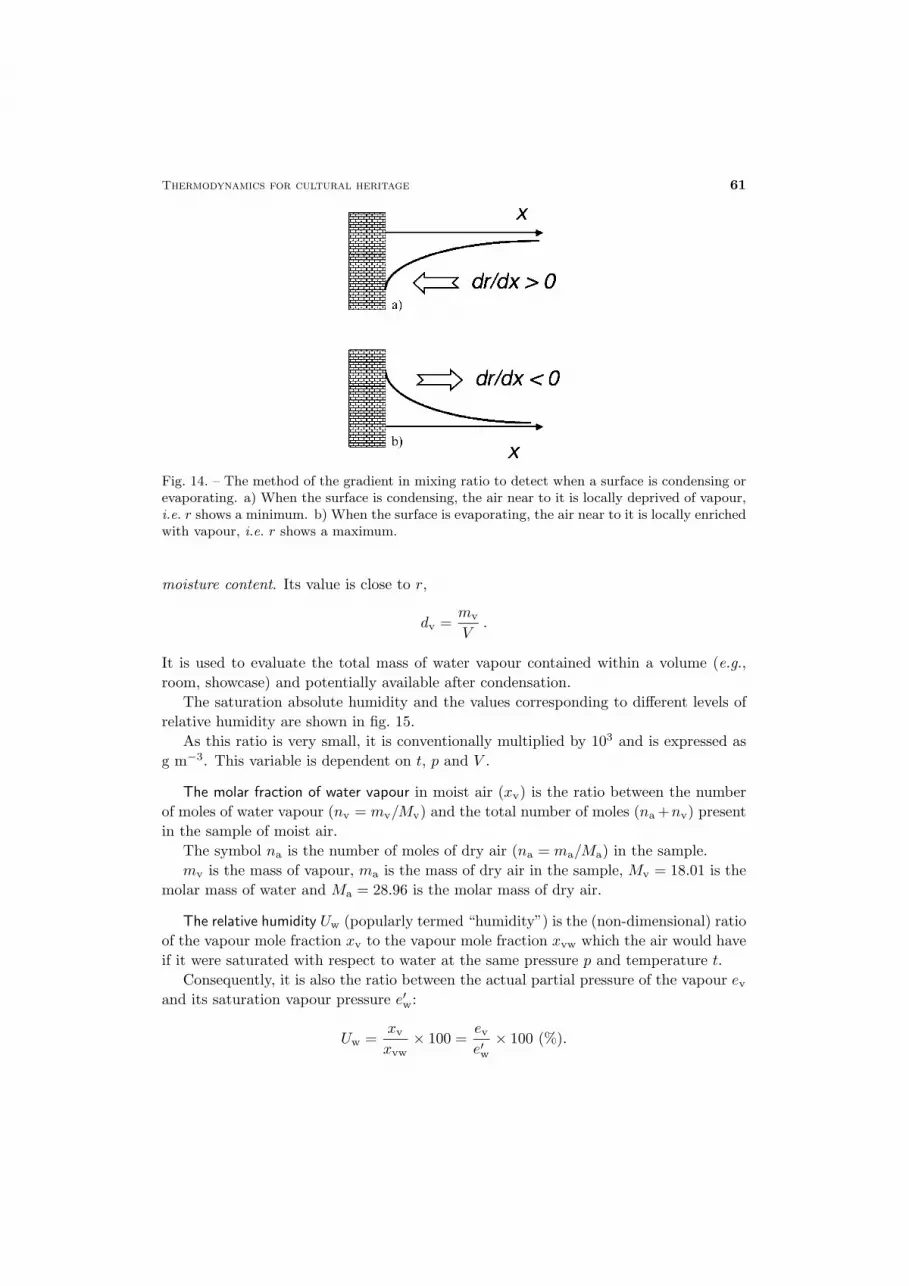
The mixing ratio r is a tracer to see the path and the diffusion of external air (fig. 13).The gradient of the mixing ratio dr/dx in proximity of a surface is useful to find
the exchanges of moisture between the ambient air and the surface. When the surfaceis condensing, the air near to it is locally deprived of vapour, i.e. r shows a minimum(fig. 14a). When the surface is evaporating, the air near to it is locally enriched withvapour, i.e. r shows a maximum (fig. 14b).
60 D. Camuffo
Fig. 13. – The mixing ratio r used as a tracer to show the path and the diffusion of external air.In the example a room of the Royal Museum of Fine Arts, Antwerp, where drier air is enteringthrough the door in the bottom and crosses the room with partial mixing.
The specific humidity q of moist air is the (dimensionless) ratio of the mass of watervapour mv to the mass of moist air ma + mv, and this ratio represents the ponderaldilution of the vapour in the atmosphere, i.e.
q =mv
ma +mv.
As the mass of moisture is small compared to the mass of air, the value of this variableis very close to the mixing ratio.
As the above ratio is very small, q is conventionally multiplied by 103 and is expressedas g kg−1. This variable is independent of t, p and V .
The absolute humidity dv is the density of the water vapour, i.e. the mass of vapourmv contained in the unit volume V of moist air. It is also called mass concentration or
Thermodynamics for cultural heritage 61
Fig. 14. – The method of the gradient in mixing ratio to detect when a surface is condensing orevaporating. a) When the surface is condensing, the air near to it is locally deprived of vapour,i.e. r shows a minimum. b) When the surface is evaporating, the air near to it is locally enrichedwith vapour, i.e. r shows a maximum.
moisture content. Its value is close to r,
dv =mv
V.
It is used to evaluate the total mass of water vapour contained within a volume (e.g.,room, showcase) and potentially available after condensation.
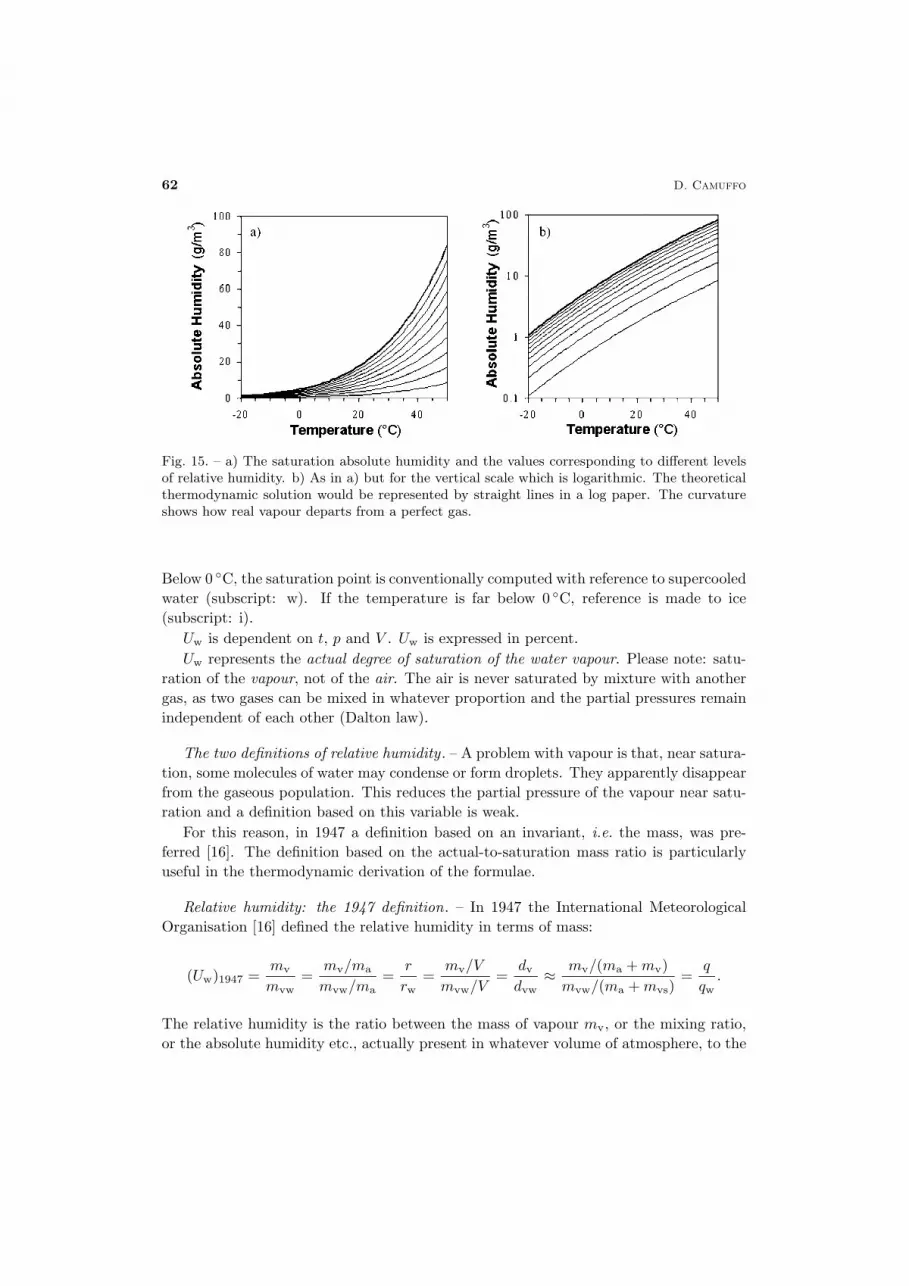
The saturation absolute humidity and the values corresponding to different levels ofrelative humidity are shown in fig. 15.
As this ratio is very small, it is conventionally multiplied by 103 and is expressed asg m−3. This variable is dependent on t, p and V .
The molar fraction of water vapour in moist air (xv) is the ratio between the numberof moles of water vapour (nv = mv/Mv) and the total number of moles (na+nv) presentin the sample of moist air.
The symbol na is the number of moles of dry air (na = ma/Ma) in the sample.mv is the mass of vapour, ma is the mass of dry air in the sample, Mv = 18.01 is the
molar mass of water and Ma = 28.96 is the molar mass of dry air.
The relative humidity Uw (popularly termed “humidity”) is the (non-dimensional) ratioof the vapour mole fraction xv to the vapour mole fraction xvw which the air would haveif it were saturated with respect to water at the same pressure p and temperature t.
Consequently, it is also the ratio between the actual partial pressure of the vapour evand its saturation vapour pressure e′w:
Uw =xvxvw
× 100 =eve′w
× 100 (%).
62 D. Camuffo
Fig. 15. – a) The saturation absolute humidity and the values corresponding to different levelsof relative humidity. b) As in a) but for the vertical scale which is logarithmic. The theoreticalthermodynamic solution would be represented by straight lines in a log paper. The curvatureshows how real vapour departs from a perfect gas.
Below 0 ◦C, the saturation point is conventionally computed with reference to supercooledwater (subscript: w). If the temperature is far below 0 ◦C, reference is made to ice(subscript: i).
Uw is dependent on t, p and V . Uw is expressed in percent.Uw represents the actual degree of saturation of the water vapour. Please note: satu-
ration of the vapour, not of the air. The air is never saturated by mixture with anothergas, as two gases can be mixed in whatever proportion and the partial pressures remainindependent of each other (Dalton law).
The two definitions of relative humidity . – A problem with vapour is that, near satura-tion, some molecules of water may condense or form droplets. They apparently disappearfrom the gaseous population. This reduces the partial pressure of the vapour near satu-ration and a definition based on this variable is weak.
For this reason, in 1947 a definition based on an invariant, i.e. the mass, was pre-ferred [16]. The definition based on the actual-to-saturation mass ratio is particularlyuseful in the thermodynamic derivation of the formulae.
Relative humidity: the 1947 definition. – In 1947 the International MeteorologicalOrganisation [16] defined the relative humidity in terms of mass:
(Uw)1947 =mv
mvw=
mv/ma
mvw/ma=
r
rw=
mv/V
mvw/V=
dvdvw
≈ mv/(ma +mv)mvw/(ma +mvs)
=q
qw.
The relative humidity is the ratio between the mass of vapour mv, or the mixing ratio,or the absolute humidity etc., actually present in whatever volume of atmosphere, to the
Thermodynamics for cultural heritage 63
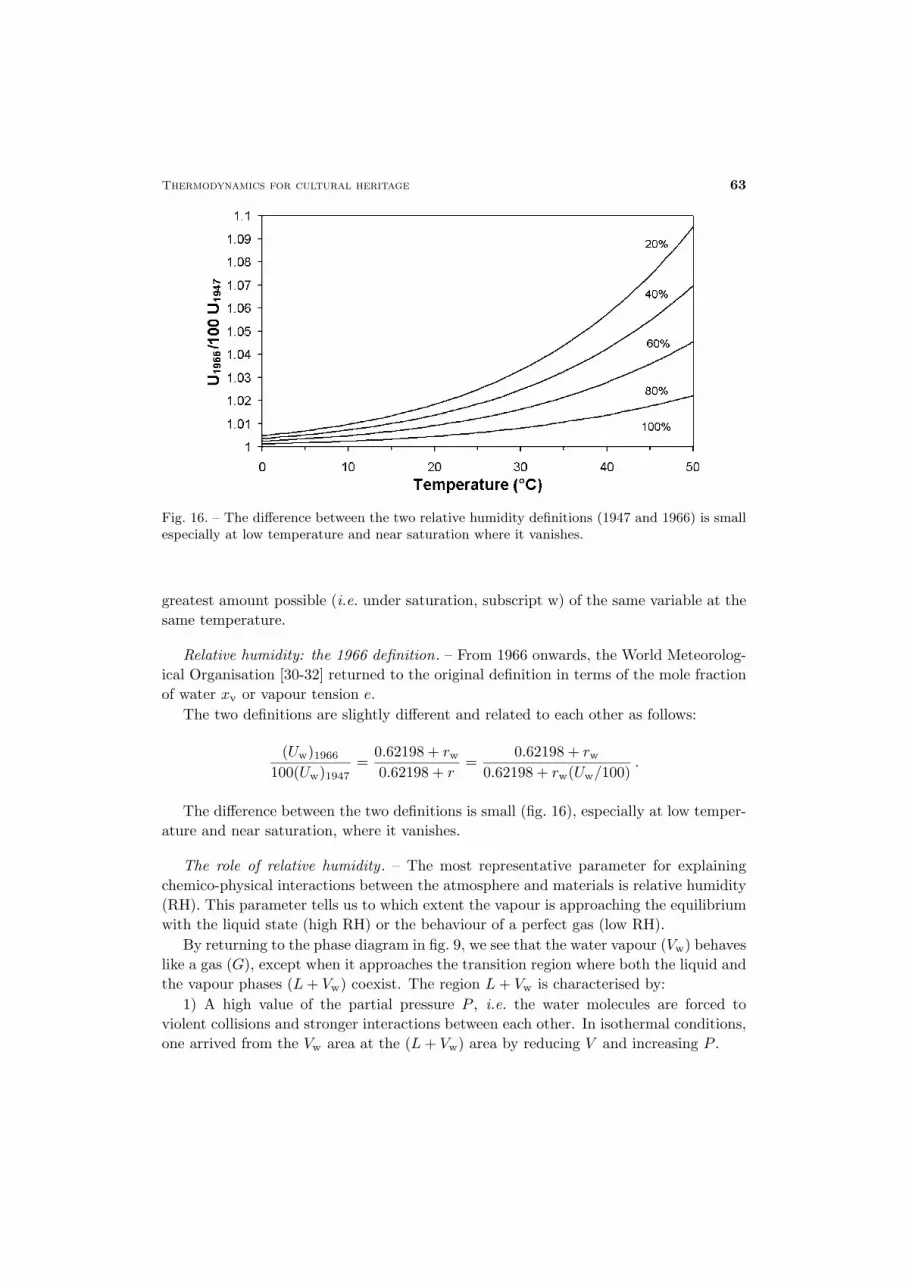
Fig. 16. – The difference between the two relative humidity definitions (1947 and 1966) is smallespecially at low temperature and near saturation where it vanishes.
greatest amount possible (i.e. under saturation, subscript w) of the same variable at thesame temperature.
Relative humidity: the 1966 definition. – From 1966 onwards, the World Meteorolog-ical Organisation [30-32] returned to the original definition in terms of the mole fractionof water xv or vapour tension e.
The two definitions are slightly different and related to each other as follows:
(Uw)1966100(Uw)1947
=0.62198 + rw0.62198 + r
=0.62198 + rw
0.62198 + rw(Uw/100).
The difference between the two definitions is small (fig. 16), especially at low temper-ature and near saturation, where it vanishes.
The role of relative humidity . – The most representative parameter for explainingchemico-physical interactions between the atmosphere and materials is relative humidity(RH). This parameter tells us to which extent the vapour is approaching the equilibriumwith the liquid state (high RH) or the behaviour of a perfect gas (low RH).
By returning to the phase diagram in fig. 9, we see that the water vapour (Vw) behaveslike a gas (G), except when it approaches the transition region where both the liquid andthe vapour phases (L+ Vw) coexist. The region L+ Vw is characterised by:
1) A high value of the partial pressure P , i.e. the water molecules are forced toviolent collisions and stronger interactions between each other. In isothermal conditions,one arrived from the Vw area at the (L+ Vw) area by reducing V and increasing P .
64 D. Camuffo
2) A small value of the volume V , which forces the H2O molecules to closely approacheach other, making interactions easier. In isothermal conditions, one arrived from theVw area at the (L+ Vw) area by reducing V and increasing P .
3) The increase in vapour density can be obtained either by reducing V or by increas-ing the number n of H2O molecules which form the gaseous population.
4) The phase diagram shows that the change of phase from gas (G) to vapour (Vw)may occur only when the temperature T drops below a critical value Tc. The molecularmotions should be slow and with a small kinetic energy. Condensation occurs below aT threshold, when T ≤ Td, and Td = F (V/n; t) = F (dv; t) = F (r). At constant V , onecan arrive from the G or the Vw area at the L + Vw region, by lowering the ambienttemperature.
In conclusion, the change of phase requires a critical combination of some of thefollowing items: high pressure P , high population density (i.e. small V or high n), lowtemperature T .
In our case, the changes in P and V can be neglected, whereas changes in vapourdensity (AH) and temperature T are fundamental.
Key data about the H2O vapour and the minimum volume available for each molecule.– The water molecule is composed of two hydrogen atoms and one oxygen. Oxygen ismore electronegative than hydrogen. As a consequence, the positive charge of H isincompletely shielded by the electrons that will remain for a greater portion of their timein the outer shell of the oxygen atom than in those of the two hydrogen atoms. For thisreason, H2O is an electrical dipole (dipole moment µ = 1.83 · 10−18 e.s.u. cm).
In the H2O molecule, the H-O-H atoms are distributed having the bond angle equalto 104.5◦ and the O-H bond length equal to 0.96 A, so that the bulk size of the moleculeis around 3 A. (Note: 1 A = 10−8 cm.) This size, accurately deduced from studies ofthe infrared spectrum of water vapour, can also be calculated from the gram molecularvolume of liquid water 18 cm−3, divided by the number NA of particles which constitutethe mole, called Avogadro number (NA = 6.022× 10²³mol−1), i.e. 18 cm−3/NA = 30×10−24 cm3 = 30 A
3. The edge (i.e. the diameter of the effective volume occupied by each
molecule) is 3√30 = 3.1 A.
At saturation, the population of water molecules reaches the highest allowable densityat that temperature. At standard atmospheric conditions, T = 273K, P = 1000 hPa,the maximum allowable density (number of molecules in 1m3) δw of water vapour canbe obtained from the simple proportion with what is known for the air
e′
P=
6.111000
=δw
NA/(2.24× 10−2).
Hence, δw = 1.65×10²³m−3 under these conditions, and we will also see which values arereached in the usual range of atmospheric temperature. The minimum effective volumerequired by a molecule of water vapour is 1/δw = 6× 10⁻²⁴m3 = 6× 10⁶ A3. The edge(i.e. the effective diameter) is 1.8× 10² A.
Thermodynamics for cultural heritage 65
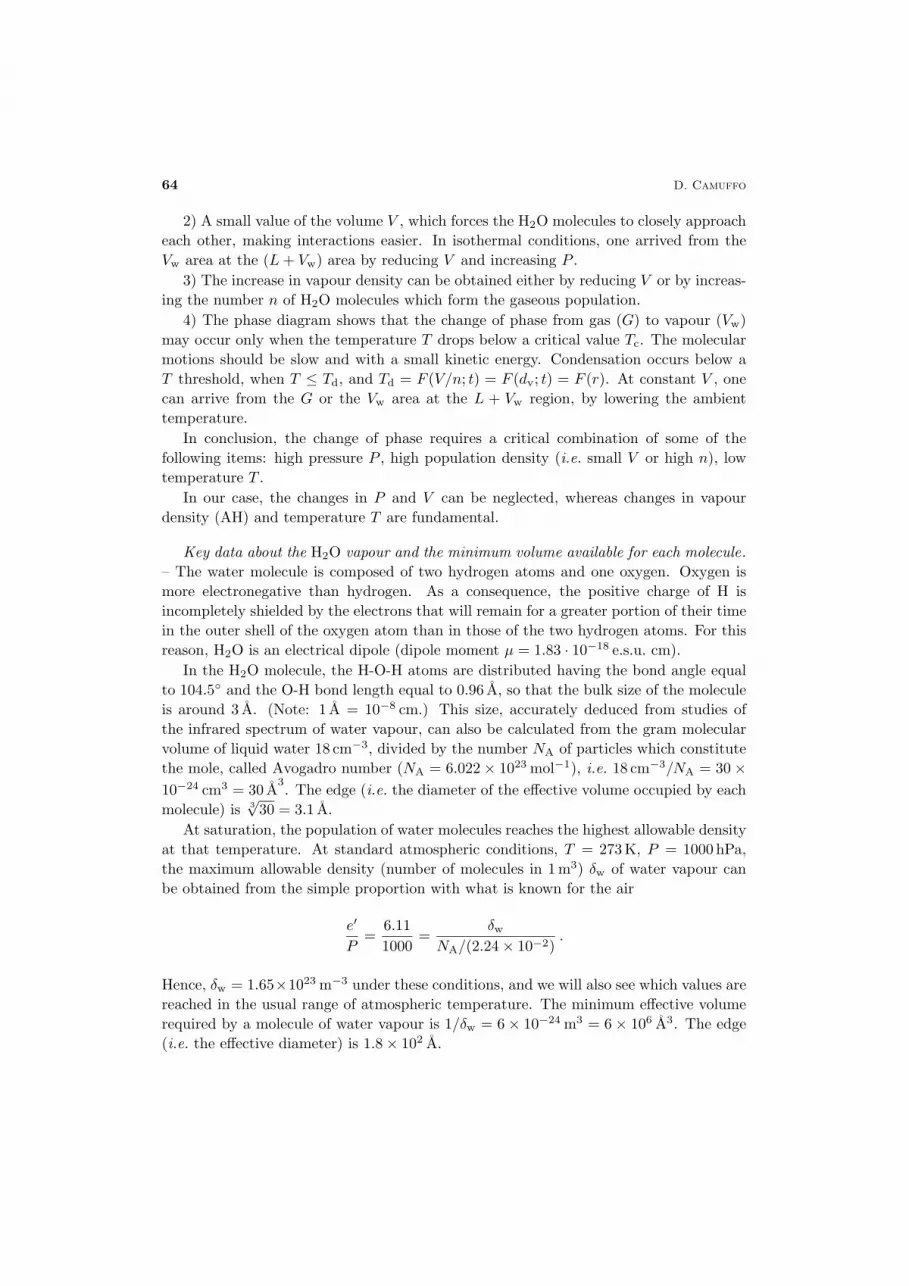
Fig. 17. – Minimum free volume available for each molecule of H2O in the vapour phase (satu-ration).
By the way, the air density, also known as Loschmidt number, is δA = 2.7×1025m−3 =3× 10⁶ A−3; N2 radius = 1.9 A, mean free path λ = 650 A.
The minimum free volume available for each molecule of H2O in the vapour phase atsaturation is easily computed for the general case (fig. 17). The phase transition occurswhen the vapour density reaches a critical value, which depends upon temperature.
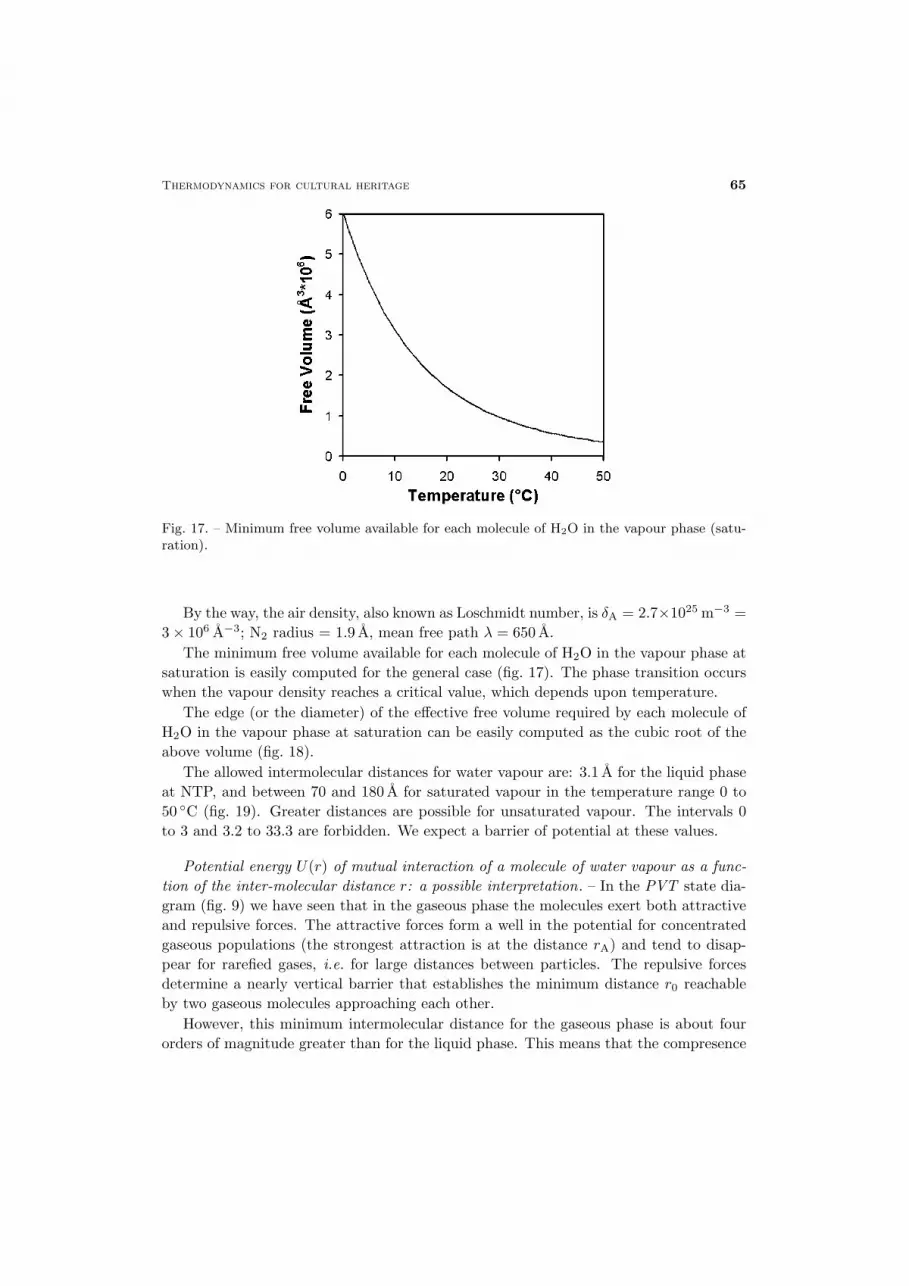
The edge (or the diameter) of the effective free volume required by each molecule ofH2O in the vapour phase at saturation can be easily computed as the cubic root of theabove volume (fig. 18).
The allowed intermolecular distances for water vapour are: 3.1 A for the liquid phaseat NTP, and between 70 and 180 A for saturated vapour in the temperature range 0 to50 ◦C (fig. 19). Greater distances are possible for unsaturated vapour. The intervals 0to 3 and 3.2 to 33.3 are forbidden. We expect a barrier of potential at these values.
Potential energy U(r) of mutual interaction of a molecule of water vapour as a func-tion of the inter-molecular distance r: a possible interpretation. – In the PVT state dia-gram (fig. 9) we have seen that in the gaseous phase the molecules exert both attractiveand repulsive forces. The attractive forces form a well in the potential for concentratedgaseous populations (the strongest attraction is at the distance rA) and tend to disap-pear for rarefied gases, i.e. for large distances between particles. The repulsive forcesdetermine a nearly vertical barrier that establishes the minimum distance r0 reachableby two gaseous molecules approaching each other.
However, this minimum intermolecular distance for the gaseous phase is about fourorders of magnitude greater than for the liquid phase. This means that the compresence
66 D. Camuffo
Fig. 18. – Minimum distance between molecules of H2O in the vapour phase (saturation).
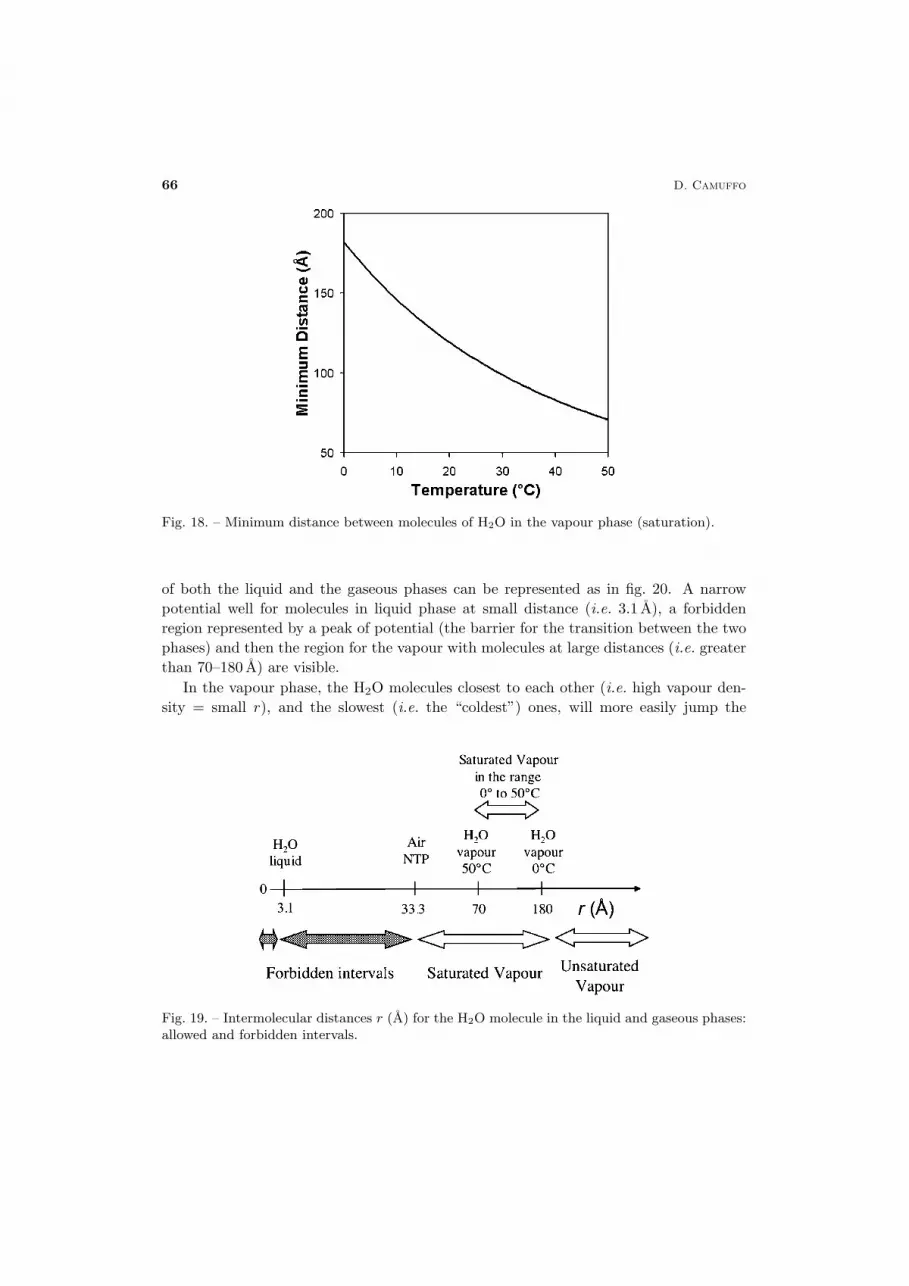
of both the liquid and the gaseous phases can be represented as in fig. 20. A narrowpotential well for molecules in liquid phase at small distance (i.e. 3.1 A), a forbiddenregion represented by a peak of potential (the barrier for the transition between the twophases) and then the region for the vapour with molecules at large distances (i.e. greaterthan 70–180 A) are visible.
In the vapour phase, the H2O molecules closest to each other (i.e. high vapour den-sity = small r), and the slowest (i.e. the “coldest”) ones, will more easily jump the
Fig. 19. – Intermolecular distances r (A) for the H2O molecule in the liquid and gaseous phases:allowed and forbidden intervals.
Thermodynamics for cultural heritage 67
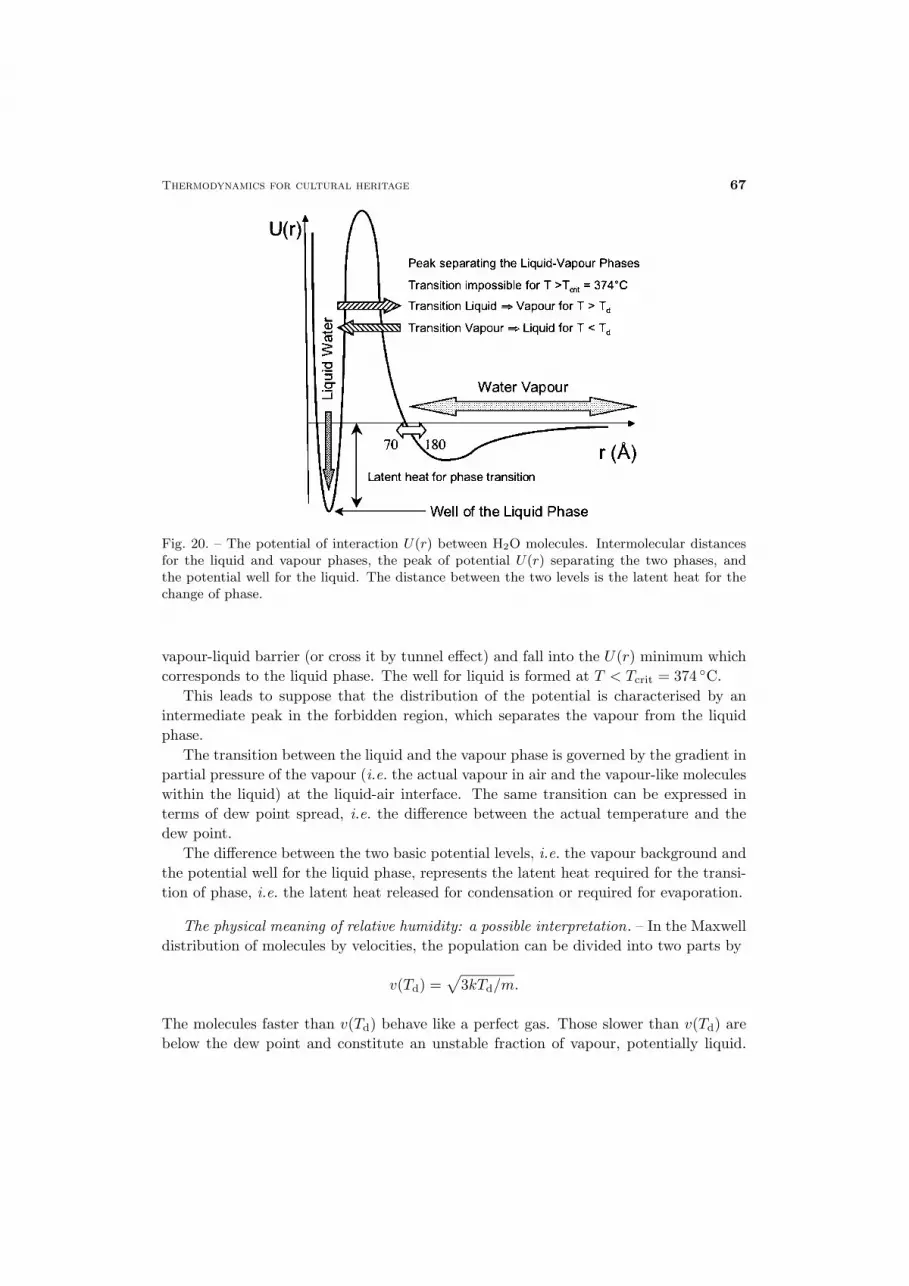
Fig. 20. – The potential of interaction U(r) between H2O molecules. Intermolecular distancesfor the liquid and vapour phases, the peak of potential U(r) separating the two phases, andthe potential well for the liquid. The distance between the two levels is the latent heat for thechange of phase.
vapour-liquid barrier (or cross it by tunnel effect) and fall into the U(r) minimum whichcorresponds to the liquid phase. The well for liquid is formed at T < Tcrit = 374 ◦C.
This leads to suppose that the distribution of the potential is characterised by anintermediate peak in the forbidden region, which separates the vapour from the liquidphase.
The transition between the liquid and the vapour phase is governed by the gradient inpartial pressure of the vapour (i.e. the actual vapour in air and the vapour-like moleculeswithin the liquid) at the liquid-air interface. The same transition can be expressed interms of dew point spread, i.e. the difference between the actual temperature and thedew point.
The difference between the two basic potential levels, i.e. the vapour background andthe potential well for the liquid phase, represents the latent heat required for the transi-tion of phase, i.e. the latent heat released for condensation or required for evaporation.
The physical meaning of relative humidity: a possible interpretation. – In the Maxwelldistribution of molecules by velocities, the population can be divided into two parts by
v(Td) =√3kTd/m.
The molecules faster than v(Td) behave like a perfect gas. Those slower than v(Td) arebelow the dew point and constitute an unstable fraction of vapour, potentially liquid.

68 D. Camuffo
Fig. 21. – Distribution of vapour molecules by velocities (Maxwell distribution). The vapourmolecules faster than v(Td) are gas-like, the slower ones are potentially liquid-like.
These will condense at the first strong interaction, either within a pore (Kelvin effect),or onto a condensation nucleus, or on a hydrophilic surface. When the relative humidityreaches saturation, i.e. RH = 100%, then v(Td) reaches 〈v〉 (fig. 21).
The first physical meaning that can be attributed to the RH is related to this unstablefraction of potentially liquid molecules.
However, this thermodynamic interpretation is only a part of the explanation, be-cause it does not explain the qualitative difference that the vapour undergoes whenv(Td) exceeds 〈v〉, i.e. when the RH passes from values below saturation to values abovesaturation. By simply looking at fig. 21 the only conclusion is that a further small fractionof the molecule population is passed from the gas-like area to the liquid-like one.
The only possible explanation is to remember the results concerning the transitionof the potential barrier between 3 to 70–180 A discussed in the previous section, i.e. aneven small RH displacement around 100% changes the transition from the liquid to thevapour phase to the opposite direction. In practice, when the gradient of vapour pressureacross the liquid-air interface is directed from the liquid to the gas or, which is the same,T > Td, the vapour-liquid barrier U(r) is crossed from the liquid to the vapour phase.The opposite occurs when the vapour pressure gradient is directed from the air to theliquid, i.e. for T < Td.
In conclusion: the distribution of vapour molecules by velocities establishes whichfraction of molecules is potentially liquid- or gas-like. This gives a better idea of the fluxof molecules that will pass from a state to another and its direction, i.e. liquid to vapouror the opposite. This is determined by the partial pressure gradient at the interface or,which is the same, by the thermal level of the vapour in comparison with the dew pointtemperature.
Thermodynamics for cultural heritage 69
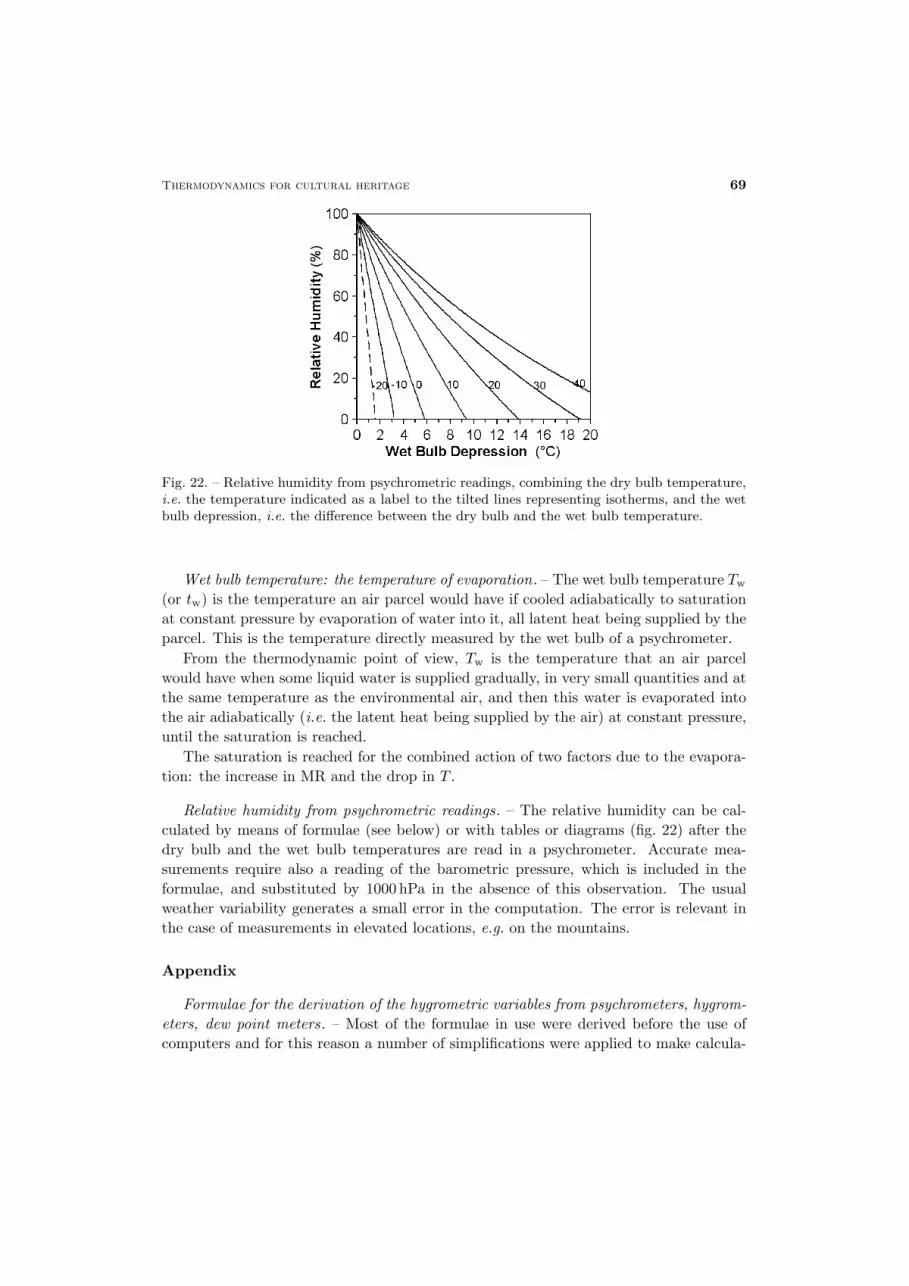
Fig. 22. – Relative humidity from psychrometric readings, combining the dry bulb temperature,i.e. the temperature indicated as a label to the tilted lines representing isotherms, and the wetbulb depression, i.e. the difference between the dry bulb and the wet bulb temperature.
Wet bulb temperature: the temperature of evaporation. – The wet bulb temperature Tw(or tw) is the temperature an air parcel would have if cooled adiabatically to saturationat constant pressure by evaporation of water into it, all latent heat being supplied by theparcel. This is the temperature directly measured by the wet bulb of a psychrometer.
From the thermodynamic point of view, Tw is the temperature that an air parcelwould have when some liquid water is supplied gradually, in very small quantities and atthe same temperature as the environmental air, and then this water is evaporated intothe air adiabatically (i.e. the latent heat being supplied by the air) at constant pressure,until the saturation is reached.
The saturation is reached for the combined action of two factors due to the evapora-tion: the increase in MR and the drop in T .
Relative humidity from psychrometric readings. – The relative humidity can be cal-culated by means of formulae (see below) or with tables or diagrams (fig. 22) after thedry bulb and the wet bulb temperatures are read in a psychrometer. Accurate mea-surements require also a reading of the barometric pressure, which is included in theformulae, and substituted by 1000 hPa in the absence of this observation. The usualweather variability generates a small error in the computation. The error is relevant inthe case of measurements in elevated locations, e.g. on the mountains.
Appendix
Formulae for the derivation of the hygrometric variables from psychrometers, hygrom-eters, dew point meters. – Most of the formulae in use were derived before the use ofcomputers and for this reason a number of simplifications were applied to make calcula-
70 D. Camuffo
tions easier. Nowadays, calculations are fast and the application of a crude formula toa precise instrument is a nonsense. For this reason we will list the accurate formulae toderive the hygrometric variables from the basic observations made with the key instru-ments: psychrometers, hygrometers, dew point meters, thermometers and barometers.Some observers neglect the barometer and substitute 10000 hPa to the atmospheric pres-sure reading. In this case, they obtain an imprecise determination of the hygrometricvariables although they use precise instruments. This is a further reason to rememberthe following list.
Instruments: psychrometer, barometer—inputs for the formulae: t, tw, p.Vapour pressure:
e = 6.112×(10
7.65tw243.12+tw − 1.068× 10⁻⁴p(t− tw)
)(hPa).
Mixing ratio:
r = 3801.5× 107.65tw
243.12+tw − 1.068× 10⁻⁴p(t− tw)
p− 6.112×(10
7.65tw243.12+tw − 1.068× 10⁻⁴p(t− tw)
) (g/kg).
Specific humidity:
q = 3801.5× 107.65tw
243.12+tw − 1.068× 10⁻⁴p(t− tw)
p− 2.310×(10
7.65tw243.12+tw − 1.068× 10⁻⁴p(t− tw)
) (g/kg).
Absolute humidity:
dv = 1344.6× 107.65tw
243.12+tw − 1.068× 10⁻⁴p(t− tw)273.15 + t
(g/m3).
Relative humidity:
Uw = 100× 107.65tw
243.12+tw − 1.068× 10⁻⁴p(t− tw)
107.65t
243.12+t
(%).
Dew point temperature:
td =243.12× ln
(10
7.65tw243.12+tw − 1.068× 10⁻⁴p(t− tw)
)
17.62− ln(10
7.65tw243.12+tw − 1.068× 10⁻⁴p(t− tw)
) (◦C).
Instruments: hygrometer, thermometer, barometer—inputs for the formulae: t, Uw, p.Vapour pressure:
e = 0.06112× 107.65t
243.12+t × Uw (hPa).

Thermodynamics for cultural heritage 71
Mixing ratio:
r = 38.015× 107.65t
243.12+t × Uw
p−(0.06112× 10
7.65t243.12+t × Uw
) (g/kg).
Specific humidity:
q = 38.015× 107.65t
243.12+t × Uw
p− 0.02310×(10
7.65t243.12+t × Uw
) (g/kg).
Absolute humidity:
dv = 13.44× 107.65t
243.12+t
273.15 + t× Uw (g/m3).
Dew point temperature:
td =243.12× ln
(10
7.65243.12+t × Uw
100
)
17.62− ln(10
7.65243.12+t × Uw
100
) (◦C).
Instruments: dew point meter, thermometer, barometer—inputs for the formulae:t, td, p.
Vapour pressure:
e = 6.112× 107.65td
243.12+td (hPa).
Mixing ratio:
r = 3801.5× 107.65td
243.12+td
p− 6.112× 107.65td
243.12+td
(g/kg).
Specific humidity:
q = 3801.5× 107.65td
243.12+td
p− 2.310× 107.65td
243.12+td
(g/kg).
Absolute humidity:
dv = 1344.6× 107.65td
243.12+td
273.15 + t(hPa).
Relative humidity
Uw = 100× 107.65td
243.12+td− 7.65t
243.12+t .

72 D. Camuffo
Fig. 23. – The radius of curvature r of the water meniscus determines a new equilibrium withthe (saturation) partial pressure of water vapour e(r), which is a function of the radius ofcurvature r. a) For a convex surface (e.g., droplets in the free air, or on a hydro-repellentsurface): r > 0. b) For a concave surface (e.g., condensation into micropores, the meniscus in awettable capillary): r < 0.
Part 3: the Kelvin law and the adsorption isotherms
Droplets and pores: how a curved water meniscus changes the equilibrium vapourtension. – The surface layer of liquid water in contact with the air acts as an elasticmembrane (or as a potential), which exerts forces to the bulk liquid. This fact may beexplained in terms of surface tension, which can be described in terms of surface energy,force normal to the liquid-air interface, or potential [22,23,33-36].
This membrane may be flat (the radius of curvature r is infinite), convex (the radiusof curvature r is positive), or concave (the radius of curvature r is negative). It is flatover a large free surface of water, e.g. a glass of water or a lake. It is convex in droplets,and in this case the bulk water is compressed. It is concave in the internal side ofbubbles in water, or in the case of the meniscus of water partially filling micropores;in this case the bulk water is in traction. Suspended droplets in clouds and fog andcondensation in porous materials are two faces of the same thermodynamic phenomenon,but characterised by a different sign of the radius of curvature of the surface membrane(fig. 23).
The relative humidity (colloquial acronym: RH, international symbol in formulae:Uw) in equilibrium with a curved water surface is different from 100% and was calculatedin 1870 by Thomson, later Lord Kelvin [28], by means of the equation
ln(
e(r)e′(∞)
)=
2σVmr�T
,
where σ is the surface tension of water (e.g., σ = 75.6 erg cm−2 at T = 273K andσ = 72.2 erg cm−2 at T = 293K), Vm is the molar volume of the liquid sorbate (i.e.Vm = 18 cm3 for pure water) and � the gas constant. The radius of curvature r is themain parameter. The dependence on the temperature T is modest.
After the definition, the ratio e(r)/e′(∞) represents the equilibrium relative humidityUw(r), and the formula assumes the most popular form of the Kelvin law (fig. 24):
Uw(r) = 100 exp[2σVmr�T
].

Thermodynamics for cultural heritage 73
Fig. 24. – Kelvin law: relative humidity (RH) in equilibrium with a meniscus of water withradius r (µm). As a consequence of the effect of the surface tension, droplets are formed onlyunder supersaturation or in the presence of condensation nuclei; on the other hand, condensationinto micropores may occur at ordinary levels of RH below 100%.
In the case of atmospheric processes such as the formation of droplets in cloud or fog, theradius of the droplet is positive (convex water surface) and supersaturation is requiredfor equilibrium with the curved water surface, i.e. Uw > 100%, and consequently the dewpoint (colloquial acronym: DP, international symbol in formulae: Td) is T < Td. Thesmaller the droplet, the greater the supersaturation required. For this reason, dropletsmay only form by adsorption of water onto some suspended hygroscopic particles, namedcondensation nuclei. When the water vapour condenses upon them, a solution is formedover which the equilibrium vapour pressure is relatively low. In other words, the de-pression formed by the chemical solution compensates the overpressure generated by theconvex meniscus of the droplet. Further moisture will feed by condensation the droplet,which will grow until its weight forces it to fall.
On the contrary, the meniscus of the water into the pores of a material is concave andthe radius of curvature is negative. The RH required for equilibrium is lower than the RHrequired for the well-known saturation in the atmosphere or over a flat water surface. Intopores, the saturation is anticipated at lower RH (Uw < 100%) and T > Td. This makesthe condensation easier especially into the smallest pores. Condensed water may befound in micropores at usual weather conditions, but also in relatively dry environments.The problem of condensation into materials and onto their surface has been extensivelydiscussed [23], so that we will report here a brief summary.
In order to analyse the behaviour of a porous body, made with a complex combinationof pores and necks, with different radii, we must first consider the simple case of “open”and then “internal” pores.
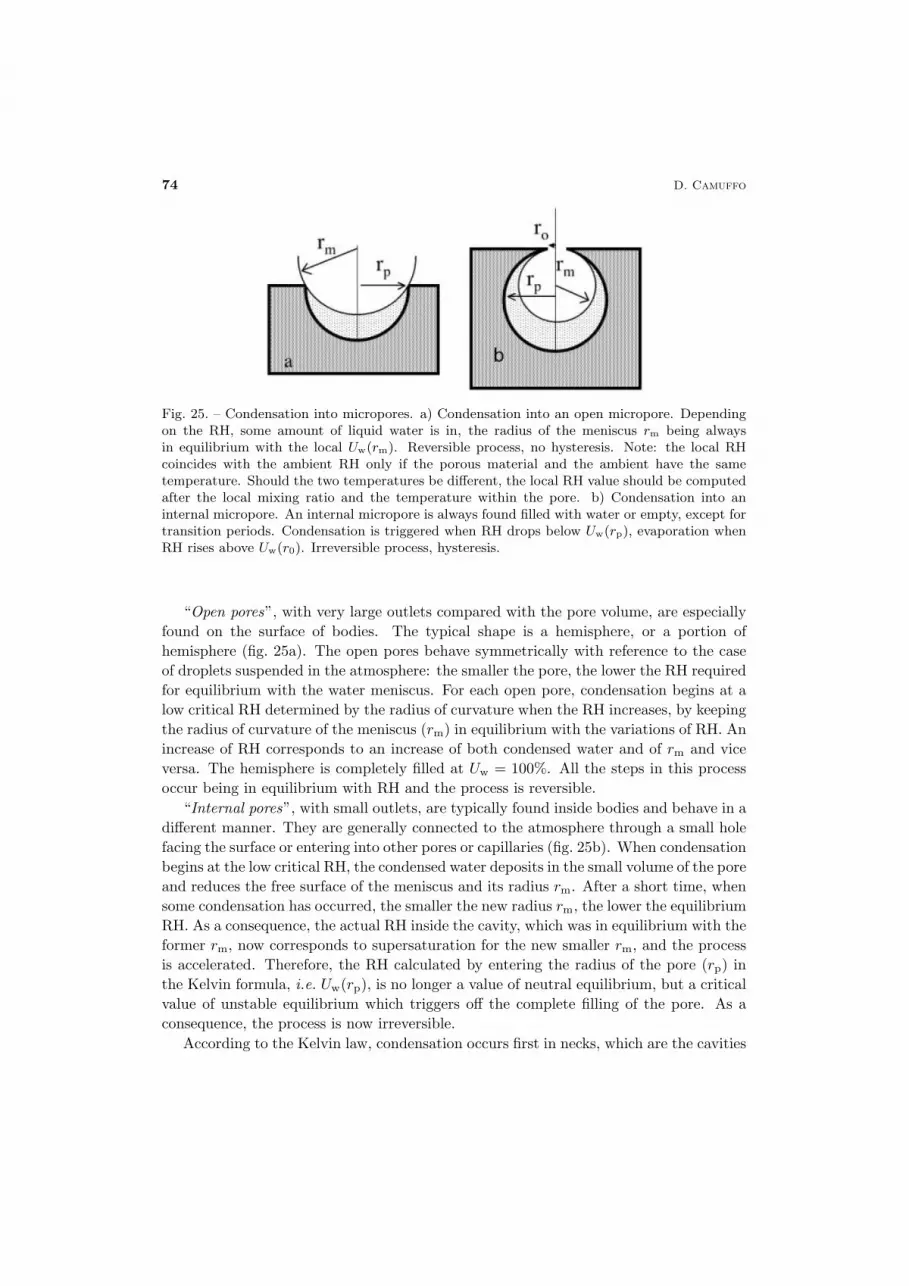
74 D. Camuffo
Fig. 25. – Condensation into micropores. a) Condensation into an open micropore. Dependingon the RH, some amount of liquid water is in, the radius of the meniscus rm being alwaysin equilibrium with the local Uw(rm). Reversible process, no hysteresis. Note: the local RHcoincides with the ambient RH only if the porous material and the ambient have the sametemperature. Should the two temperatures be different, the local RH value should be computedafter the local mixing ratio and the temperature within the pore. b) Condensation into aninternal micropore. An internal micropore is always found filled with water or empty, except fortransition periods. Condensation is triggered when RH drops below Uw(rp), evaporation whenRH rises above Uw(r0). Irreversible process, hysteresis.
“Open pores”, with very large outlets compared with the pore volume, are especiallyfound on the surface of bodies. The typical shape is a hemisphere, or a portion ofhemisphere (fig. 25a). The open pores behave symmetrically with reference to the caseof droplets suspended in the atmosphere: the smaller the pore, the lower the RH requiredfor equilibrium with the water meniscus. For each open pore, condensation begins at alow critical RH determined by the radius of curvature when the RH increases, by keepingthe radius of curvature of the meniscus (rm) in equilibrium with the variations of RH. Anincrease of RH corresponds to an increase of both condensed water and of rm and viceversa. The hemisphere is completely filled at Uw = 100%. All the steps in this processoccur being in equilibrium with RH and the process is reversible.
“Internal pores”, with small outlets, are typically found inside bodies and behave in adifferent manner. They are generally connected to the atmosphere through a small holefacing the surface or entering into other pores or capillaries (fig. 25b). When condensationbegins at the low critical RH, the condensed water deposits in the small volume of the poreand reduces the free surface of the meniscus and its radius rm. After a short time, whensome condensation has occurred, the smaller the new radius rm, the lower the equilibriumRH. As a consequence, the actual RH inside the cavity, which was in equilibrium with theformer rm, now corresponds to supersaturation for the new smaller rm, and the processis accelerated. Therefore, the RH calculated by entering the radius of the pore (rp) inthe Kelvin formula, i.e. Uw(rp), is no longer a value of neutral equilibrium, but a criticalvalue of unstable equilibrium which triggers off the complete filling of the pore. As aconsequence, the process is now irreversible.
According to the Kelvin law, condensation occurs first in necks, which are the cavities

Thermodynamics for cultural heritage 75
with the smallest radius of curvature. When the necks are filled with water, air pocketsremain entrapped in the pores and further condensation is impossible (at least in isother-mal, isobaric conditions). The only possibility for a continuation of the condensation isthat the material cools, as typically occurs during clear nights. The cooling of the airpocket within the cavity, which is closed because the neck is filled with water, leads toa decrease in pressure, which sucks in the water from the neck, making it free. Thismechanism can be repeated several times.
Symmetrically, evaporation from an open pore starts from its outlet, by removingwater from the pore and increasing the radius of the free meniscus. The equilibrium RHgiven by the Kelvin formula becomes greater and greater accordingly, so that the actualRH becomes lower and lower in comparison with the value required for equilibrium. Theevaporation continues till all the liquid water has evaporated. This holds for all of thewater inside the pore, except the first and second molecular layer in contact with thesurface which is attached with a stronger solid-like (e.g., ice-type) bound. Evaporationis triggered on when the RH exceeds a critical level Uw(r0) which is calculated from theradius of curvature of the pore outlet (r0). As the critical level Uw(r0) is lower thanall the RH values in equilibrium with the intermediate steps Uw(rm) when the meniscusincreases its radius rm during the evaporation, also this process is accelerated and isirreversible.
The Kelvin law for different types of meniscus. – This derivation is very general, andthe Kelvin formula can be rewritten for any shape of meniscus, by using the ratio of theincremental values dS/dV of the meniscus surface S and related volume V
ln(Uw(r)100
)=
σVm�T
dSdV
,
e.g., dS/dV = 2/r for a sphere; dS/dV = 1/r for a right circular cylinder or a circulartorus (where r is the radius of the cylinder or the generating circle, respectively; notethat the formula is independent of the cylinder height or torus radius, fig. 26); dS/dV =[(1/r1) + (1/r2)] for ellipsoids with principal radii r1 and r2; dS/dV = [(1/r1)− (1/r2)]for saddles with principal radii r1 and r2; and finally, for a cone of height h, one obtainsdS/dV = 3(2r2 + h2)/(r2h
√r2 + h2).
In some cases the meniscus has a different shape during condensation and evaporation,and this generates hysteresis. The capillary provides an example of this phenomenon.Condensation occurs with water molecules depositing on the internal cylindrical surfaceof the capillary. The result is that the radius of the internal cylindrical surface of themeniscus will decrease until the capillary is completely filled with water (fig. 27a). Thecondensation is of cylindrical type, i.e., dS/dV = 1/r.
Once the cylinder is filled with water, the evaporation can only occur starting fromthe free meniscus of the capillary, which is found on the outlet of the capillary, where aspherical meniscus is formed. The evaporation follows the spherical type, i.e. dS/dV =2/r (fig. 27b).

76 D. Camuffo
Fig. 26. – The Kelvin law for two different types of menisci: spherical (S) and cylindrical (C).
Hysteresis for a different combination of pores. – A porous body may become damp bycondensation as a result of interactions with the environment, either indoor or outdoor.Condensation may occur either on the outer surface of the body or inside the innerporosity. In the latter case the adsorption of water is determined by the size of poresand how they are connected to each other. The general case is composed of aggregatesof pores having different size, connected directly to each other.
Fig. 27. – Condensation-evaporation cycle into a capillary. a) Condensation occurs beginningfrom the inner surface of the capillary and is like a pipe with narrower and narrower emptycore. Cylindrical type, i.e., dS/dV = 1/r. b) Evaporation starts from the free outlet(s) of thecapillary. Spherical type, i.e. dS/dV = 2/r.
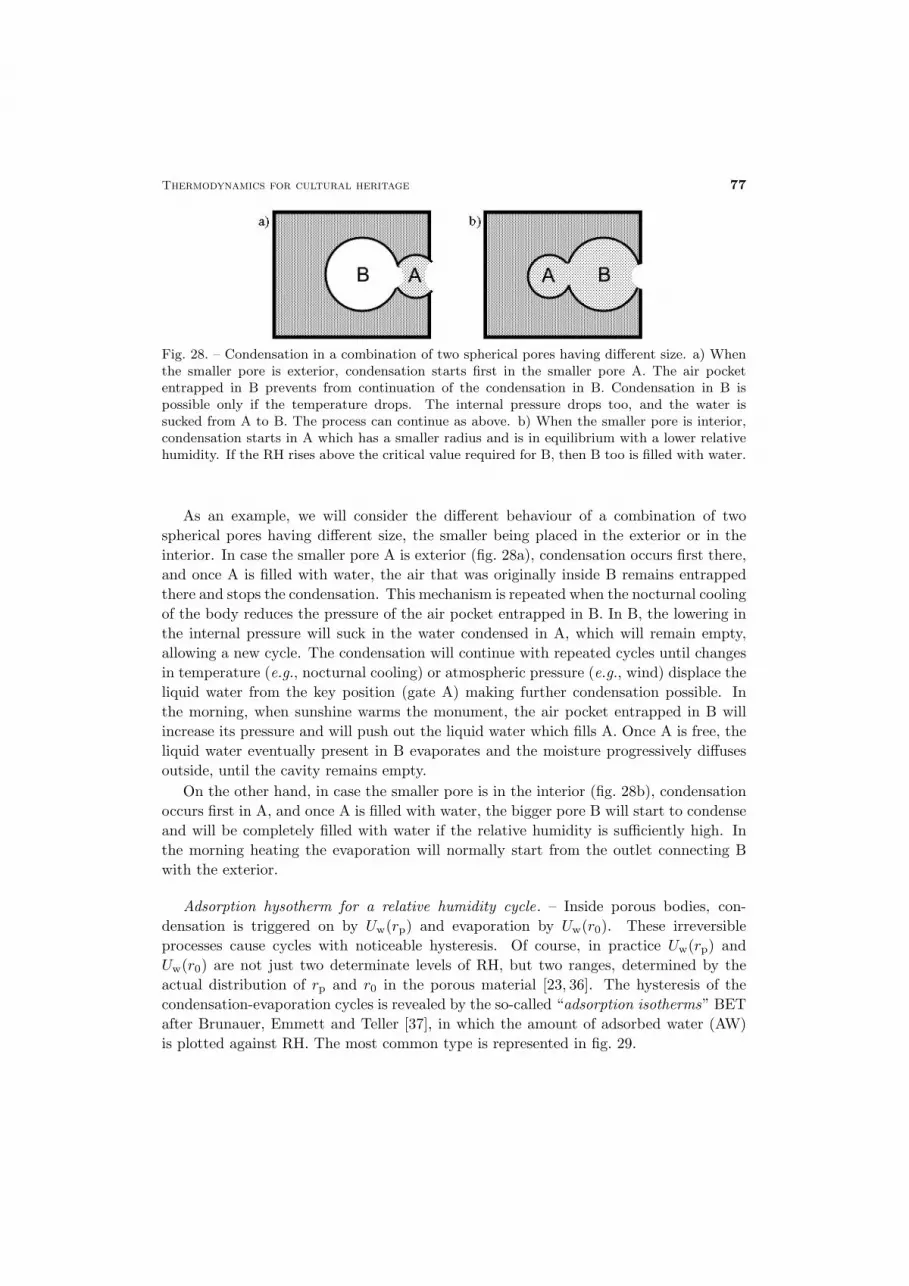
Thermodynamics for cultural heritage 77
Fig. 28. – Condensation in a combination of two spherical pores having different size. a) Whenthe smaller pore is exterior, condensation starts first in the smaller pore A. The air pocketentrapped in B prevents from continuation of the condensation in B. Condensation in B ispossible only if the temperature drops. The internal pressure drops too, and the water issucked from A to B. The process can continue as above. b) When the smaller pore is interior,condensation starts in A which has a smaller radius and is in equilibrium with a lower relativehumidity. If the RH rises above the critical value required for B, then B too is filled with water.
As an example, we will consider the different behaviour of a combination of twospherical pores having different size, the smaller being placed in the exterior or in theinterior. In case the smaller pore A is exterior (fig. 28a), condensation occurs first there,and once A is filled with water, the air that was originally inside B remains entrappedthere and stops the condensation. This mechanism is repeated when the nocturnal coolingof the body reduces the pressure of the air pocket entrapped in B. In B, the lowering inthe internal pressure will suck in the water condensed in A, which will remain empty,allowing a new cycle. The condensation will continue with repeated cycles until changesin temperature (e.g., nocturnal cooling) or atmospheric pressure (e.g., wind) displace theliquid water from the key position (gate A) making further condensation possible. Inthe morning, when sunshine warms the monument, the air pocket entrapped in B willincrease its pressure and will push out the liquid water which fills A. Once A is free, theliquid water eventually present in B evaporates and the moisture progressively diffusesoutside, until the cavity remains empty.
On the other hand, in case the smaller pore is in the interior (fig. 28b), condensationoccurs first in A, and once A is filled with water, the bigger pore B will start to condenseand will be completely filled with water if the relative humidity is sufficiently high. Inthe morning heating the evaporation will normally start from the outlet connecting Bwith the exterior.
Adsorption hysotherm for a relative humidity cycle. – Inside porous bodies, con-densation is triggered on by Uw(rp) and evaporation by Uw(r0). These irreversibleprocesses cause cycles with noticeable hysteresis. Of course, in practice Uw(rp) andUw(r0) are not just two determinate levels of RH, but two ranges, determined by theactual distribution of rp and r0 in the porous material [23, 36]. The hysteresis of thecondensation-evaporation cycles is revealed by the so-called “adsorption isotherms” BETafter Brunauer, Emmett and Teller [37], in which the amount of adsorbed water (AW)is plotted against RH. The most common type is represented in fig. 29.
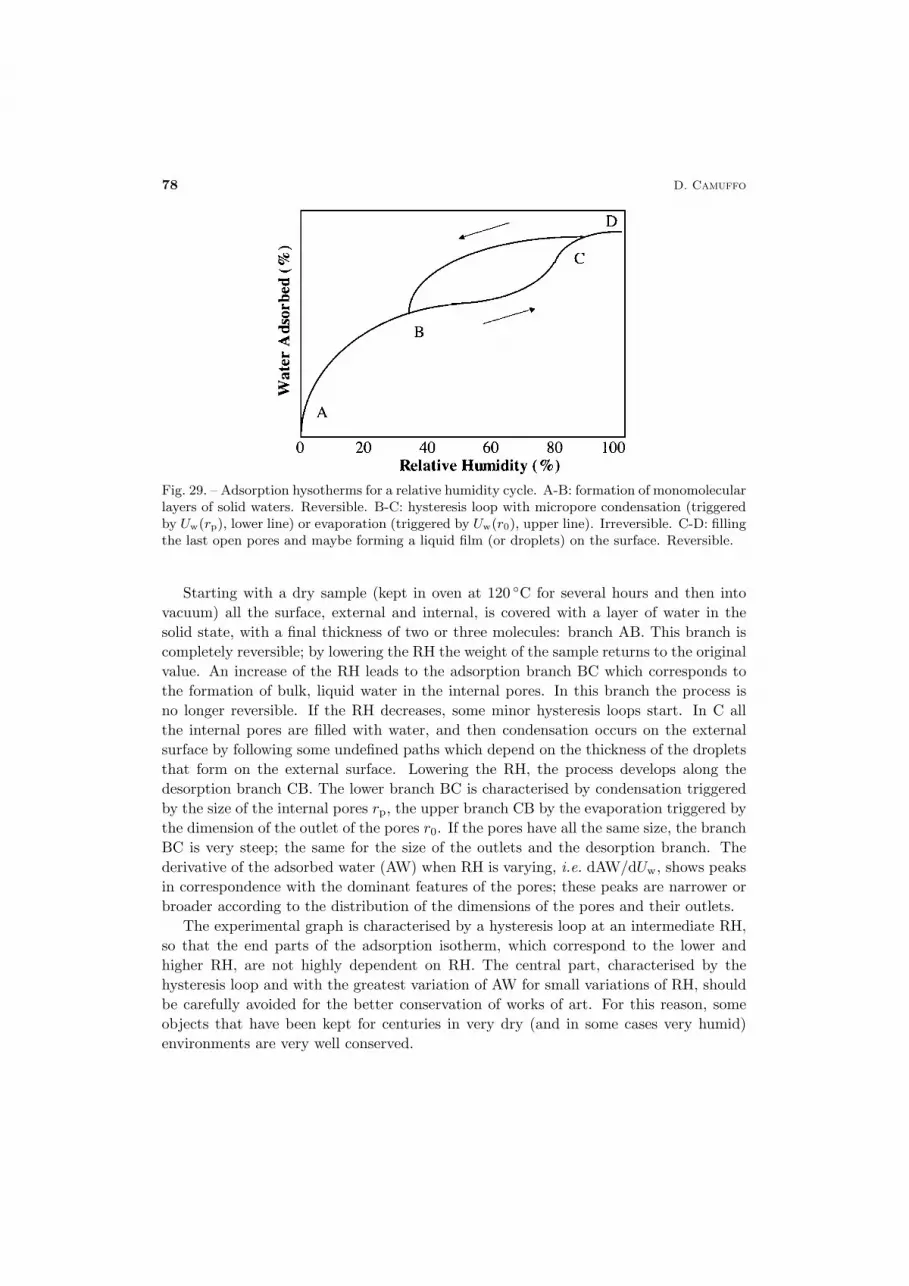
78 D. Camuffo
Fig. 29. – Adsorption hysotherms for a relative humidity cycle. A-B: formation of monomolecularlayers of solid waters. Reversible. B-C: hysteresis loop with micropore condensation (triggeredby Uw(rp), lower line) or evaporation (triggered by Uw(r0), upper line). Irreversible. C-D: fillingthe last open pores and maybe forming a liquid film (or droplets) on the surface. Reversible.
Starting with a dry sample (kept in oven at 120 ◦C for several hours and then intovacuum) all the surface, external and internal, is covered with a layer of water in thesolid state, with a final thickness of two or three molecules: branch AB. This branch iscompletely reversible; by lowering the RH the weight of the sample returns to the originalvalue. An increase of the RH leads to the adsorption branch BC which corresponds tothe formation of bulk, liquid water in the internal pores. In this branch the process isno longer reversible. If the RH decreases, some minor hysteresis loops start. In C allthe internal pores are filled with water, and then condensation occurs on the externalsurface by following some undefined paths which depend on the thickness of the dropletsthat form on the external surface. Lowering the RH, the process develops along thedesorption branch CB. The lower branch BC is characterised by condensation triggeredby the size of the internal pores rp, the upper branch CB by the evaporation triggered bythe dimension of the outlet of the pores r0. If the pores have all the same size, the branchBC is very steep; the same for the size of the outlets and the desorption branch. Thederivative of the adsorbed water (AW) when RH is varying, i.e. dAW/dUw, shows peaksin correspondence with the dominant features of the pores; these peaks are narrower orbroader according to the distribution of the dimensions of the pores and their outlets.
The experimental graph is characterised by a hysteresis loop at an intermediate RH,so that the end parts of the adsorption isotherm, which correspond to the lower andhigher RH, are not highly dependent on RH. The central part, characterised by thehysteresis loop and with the greatest variation of AW for small variations of RH, shouldbe carefully avoided for the better conservation of works of art. For this reason, someobjects that have been kept for centuries in very dry (and in some cases very humid)environments are very well conserved.
Thermodynamics for cultural heritage 79
At every humidity level, hydrophilic materials always contain adsorbed water, and theactual amount depends on the past history of the humidity cycle (hysteresis). Materialsshould be ideally preserved in the RH interval where dAW/dUw = min, i.e. in the intervalwhere the imbalances in RH generate the smallest impact on their structure.
Allowed microclimate variability (T and RH thresholds) for artworks. – However,we should make a distinction between the conservation of materials and real artworks.Artworks are in general complex structures, often composed of more than one singlehomogeneous piece or even material, with a number of mechanical constraints and asym-metric dimensional changes, which reduce the allowable humidity changes. In addition,when an artwork is relatively recent, before the decay becomes important, it may resistto temperature and humidity changes, up to a certain limit value, that can be assumedas a threshold for conservation. In the long run, materials lose their resistance and thethreshold lowers and lowers.
At this point, the past history of each artwork has the major relevance as the mi-croclimate may cause the material to undergo irreversible changes as a response to theexternal forcing and as a function of its intrinsic characteristics.
As far as the conservation is concerned, the specific problems of each individual art-work and the interactions between the environment and the artefact are much morerelevant than knowing the average properties of the materials themselves and establish-ing hypothetical well-being intervals, i.e. allowed ranges for RH and T .
In the case of artworks sensitive to temperature and humidity changes, or constitutedof one or more materials with complex behaviour, or which have been conditioned by theirpast history (e.g., wood), the best temperature and RH intervals for conservation cannotbe determined theoretically or in the laboratory. The best conditions are simply the valuesto which the artwork has adapted over the course of the centuries. This microclimate isthe only one compatible with the complex structure, and any change may cause dramaticconsequences.
Artworks should be preserved in the same microclimate in which they have been keptfor a long time if this microclimate has been proved not to be harmful. The naturalvariability of the environment where the artefact was preserved can be graphically rep-resented by dividing the room daily and seasonal cycles in temperature and RH by smallintervals, and then looking at the frequency of the occurrence of these cycles per eachinterval of variability. One obtains a skewed, bell-shaped distribution, the mode (i.e. thepeak) of which being the most frequent, i.e. the typical, cycle. It is clear that the artefacthas survived to this variability, although some injuries (i.e. micro- or macro-cracks) havebeen caused by the widest cycles. Maybe the artefact was initially not resistant to thecycles typical of a certain environment, but in this case it has broken its structure insome parts to create the necessary degrees of freedom to allow the dimensional changes.Briefly, the artwork, although damaged, has become compatible to its environment andits variability.
These considerations are useful in establishing the allowed threshold for environmentalvariability in temperature and RH. The variability from zero to slightly after the mode is

80 D. Camuffo
absolutely safe, because either the artwork is compatible or it has adapted to this rangeof variability with strategic breaks. The widest cycles found in the distribution shouldbe considered with attention, as they may fall in the risk area in the case the artefactpresents some micro- or macroscopic crack. Should it be still perfectly preserved, thelargest variations would still constitute a risk area because the internal tensions whichhave been accumulated with the large cycles might have been dissipated just in timebefore the damage had occurred, or the cumulative effect has been modest, or it had apositive synergism with other unknown factors. Therefore, the area behind the mode upto mid tail is poorly known and we should pay attention to potential risk. The responseof the artwork to environmental variations in the extreme part of the tail is unknownand at risk, especially in case some signs of decay are present.
A conservator should clearly keep in mind this fact when a restoration is necessary,in order to avoid the risk of removing the degree of variability created by the artefact,which will be soon damaged to adapt once again to the same environmental variability.A restoration not aware of the environmental variability is equivalent to masking theeffect without having removed the cause of damage.
The microclimate conditions can be improved by attenuating or eliminating changes,e.g. diurnal cycles, fluctuations, or gradients.
If the original microclimate has to be changed, a specific study must be carried outto evaluate the adaptation of the artwork to the new conditions, taking into account thepast conditions and the response of the object.
If an artwork has been made recently, or its past environmental conditions are un-known, and it should be transferred to a new environment, or the local microclimateshould be changed, in this case the compatibility and the possible impact of the newmicroclimate must be studied, looking at the physical and chemical characteristics of theartwork.
In the case in which we need to change the microclimate in which an artwork hasbeen preserved, the change must be performed at a very slow rate in order to allowa very gradual adaptation to the new environmental conditions. It is also necessary tocontinually verify whether the artwork can adapt to these new conditions without havingbeen damaged. It is thus possible to stop the change at the very first onset of damage.
In the case of displacement of artworks for restoration, travelling exhibitions or thelike, the original microclimate must be preserved as accurately as possible. This is thecase for both transport and storage.
Part 4: Impact of moisture on materials
Nocturnal and morning condensation. – Dew is the condensation of water vapour ona surface whose temperature is reduced by radiative cooling to below the dew point ofthe clear air in contact with it. Condensation may be found in form either of a filmof liquid water (hydrophilic materials) or droplets (hydro-repellent materials). Duringcondensation, initially minute droplets may adjoin, forming larger ones and eventually athin water film. In the case of porous, hydrophilic materials, the water is immediately
Thermodynamics for cultural heritage 81
absorbed inside and condensation is not visible by the naked eye. Condensation onhistorical buildings and monuments is important because it provides the water necessaryto develop a number of deterioration mechanisms, but is hardly known. The monumentsurface may face a number of different directions, and not only the simplest case ofthe vertical to which the maximum infrared loss corresponds. It is true that a surfacecovered with a film of water behaves like a black body, but in the case of hygroscopicmaterials the water is immediately transferred to the interior and the response may differwith surface emissivity, thermal response and inertia. Condensation is not always visiblebecause it may be partly or totally absorbed by porous materials: this makes field testsand experimental techniques more complicated. In the case of monuments, only non-destructive analyses can be performed. In terms of damage, the chemical and biologicalconsequences of condensation may be even worse than the physical ones, making a simplecause-effect relationship difficult.
The radiant intensity I(θ) (i.e. the flux per unit solid angle) emitted in any directionfrom a unit radiating surface varies as the cosine of the angle θ between the normal tothe surface and the direction of the radiation (Lambert law), i.e.
I(θ) = I(0) cos θ.
A consequence of the Lambert law is that identical surfaces differently exposed, even if incontact with air at the same temperature, reach different temperature levels as a resultof the different radiative balance. In fact, a horizontal surface, which faces a clear sky,has a negative radiative balance and the surface temperature lowers and lowers. On theother hand, a vertical surface, which faces a nearly infinite atmospheric thickness, has anull balance and its temperature remains in equilibrium with the air.
Monument condensation is strongly dependent upon surface exposure because of theheat that is lost by IR radiation. Surfaces facing the sky lose more heat, thus favouringcondensation. On the other hand, vertical surfaces have a nearly null net radiativeflux and tend to remain in thermal equilibrium with the air at the same height, andvery little condensation occurs. Therefore, water available for nocturnal condensationdiminishes when the surface departs from the horizontal, and reaches a minimum, orvanishes, with vertical surfaces. For this reason, horizontal surfaces, which collect manycoarse particles deposited by gravitational settling, are the most exposed to chemicalreactions of the pollutants activated by dew. The same holds for biological growth andbiodegradation, for the wider collection of nutrients, sporae and water. Vertical surfacesare less exposed to this risk, except when they are very porous, or rough, or frequentlywetted by rain.
Experiments carried out in the field and in a controlled chamber [38] proved that theactual amount of condensed water Mw is proportional to the mixing ratio r, the negativedifference between surface temperature Ts and dew point Td, the duration of the timeof permanence (TOP) of the surface temperature below the dew point, and is related to
82 D. Camuffo
the ventilation:
Mw = C(V )r × (Td − Ts)× TOP,
where C(V ) is a proportionality coefficient that varies with the ventilation speed V . Instill air C(0) = 0.194; in stirred air, C(4) = 0.756. If, in a rough approximation for lightventilation, a linear relationship is assumed, then C(V ) = (0.194 + 0.140V ). The abovevalue holds if the equation is calculated with the practical units Mw: mg cm−2, r: gkg−1, Td: ◦C, Tp: ◦C, TOP: h and V : m s−1.
As the formula is composed of variables with linear relationships, in the case of envi-ronmental variability, it can be expressed either as a function of average values or as anintegral of the instantaneous values of the individual functions.
On clear nights, the temperature of horizontal surfaces facing the sky may drop up to5 ◦C below the air temperature, and possibly also 2–3 ◦C below the dew point. Should thisoccur, condensation in building structures facing the sky would reach some 20mg cm−2
per night, equivalent to a film of water 0.2mm thick. This amount, observed in fieldtests and obtained experimentally in a simulation chamber, is in agreement with the dewvalues found in the literature for grass in rural sites and for irrigation purposes.
The seasonal trend of night-time condensation showed that the maximum amount ofwater condensed per night occurs in autumn, with the more abundant concentration ofmoisture in the air. The maximum amount of water condensed per month is found inthe summer-autumn period, with the higher frequency of clear nights in summer.
In the early morning, condensation is possible on monuments that have high thermalinertia for the following reason. The nocturnal temperature inversion has not beencompletely eroded yet and the sunshine heats the soil and forces some evaporation.The moisture remains entrapped in the inversion layer and the concentration of watermolecules in the air rises, increasing the MR and, consequently, the DP. Monuments witha large inertia tend to have a memory of their past colder temperature whilst the DP ofthe moist air is rising, and eventually becomes higher than the monument temperature.At this point, condensation starts to form and the deposition rate increases with thedifference between the dew point and the temperature of the monument surface. Thegreater the monument thermal inertia, the greater this difference and the longer andfaster the condensation rate. Morning condensation is in the same order of magnitudeas nocturnal deposition of water by condensation on horizontal surfaces.
Heavy condensation occurs especially in spring when moist, warm air meets coldmonuments which still preserve a memory of the past cold season.
Role of moisture and condensation on weathering and decay of cultural heritage. –When the relative humidity (RH) is high, some water molecules pass from the air to hy-drophilic materials where they are absorbed or adsorbed(3), and vice versa when the RH
(3) Absorption = weak bond, physiosorption or physical molecular layering. Adsorption =strong bond, chemisorption.

Thermodynamics for cultural heritage 83
is low. Humidity is necessary, but high humidity levels or repeated cycles are dangerousfor conservation. In some cases, like chemical reaction with pollutants or microbiologicalcolonisation, attention should be paid to the total time of wetness. In other cases, whichinvolve dimensional changes or internal tensions, the repetition of cycles is even moredangerous because of the cumulative effect in the long run. In some hydrophilic materi-als (e.g., wood, ivory, paper, parchment, leather, clay), the exchange of moisture inducesdimensional changes: swelling for gain of molecules and added mass, and shrinking forloss of water. In case a new moisture cycle starts before the material has relaxed andhas returned close to the original conditions, the new forcing adds to the existing inter-nal tensions. The resulting cumulative effect may be extremely dangerous. Of course,dimensional changes in materials are possible only in case the water molecule is weaklyor strongly bound to the material structure (e.g., wood). If the water simply fills emptyspaces in pores of a material that does not form special bounds (e.g., porous bronze), nodimensional changes can be observed. Condensation is a regular daily source of water,which acts in different ways to perform decay.
The most dangerous cycles generated by moisture are the condensation-evaporationcycles, which make liquid water available or generate repeated dimensional changes (e.g.,swelling and shrinking), or cause leaching, e.g. in glass, or mobilise soluble salts withformation of efflorescences and weakening of the internal crystalline structure, or dissolveand re-crystallise soluble salts with mechanical pressure exerted on the structure, orinduce metamorphic changes in hydrated minerals with expansion and contraction.
Also dangerous are freezing-thawing cycles in cold areas. It should be noted, however,that the Kelvin effect can be applied to the ice too, so that microdroplets and microporesfreeze below zero; the smallest ones may remain with liquid, supercooled water up to−40 ◦C.
A wet surface captures all the particles colliding on it (for this reason it is calleda “black surface”) and for this reason the deposition/accumulation rate of gases andparticulate matter is increased.
The chemical weathering by activation of pollutants (e.g., oxidation, sulphation, for-mation of black crusts) occurs with a fast kinetics only in the presence of liquid water.Under dry conditions the kinetics is so slow that the weathering has no practical rele-vance. In some special cases, e.g. highly hydrophilic gases, or porous materials whichhave a moisture content related to the ambient relative humidity, the transformationprogresses with the RH level, and also RH cycles may be dangerous.
Biological decay is also related to the presence of water (or high levels of relativehumidity, which means liquid water available in the micropores), which offers favourableconditions for bio-organisms, e.g. fungi and algae.
Many humidity cycles are generated by the heating system, especially when it operatesonly during business times. When the heating is on, the RH drops to very low, dangerouslevels (fig. 30a). Sometimes, the drops in RH are counteracted with the supply of moisturewhen the heating is operating. However, a net balance is not easy. The rendering onwalls is hydrophilic and absorbs, or gives back moisture to the air. Near the emissionoutlets the concentration of moisture is often high, and low far from the outlets, because
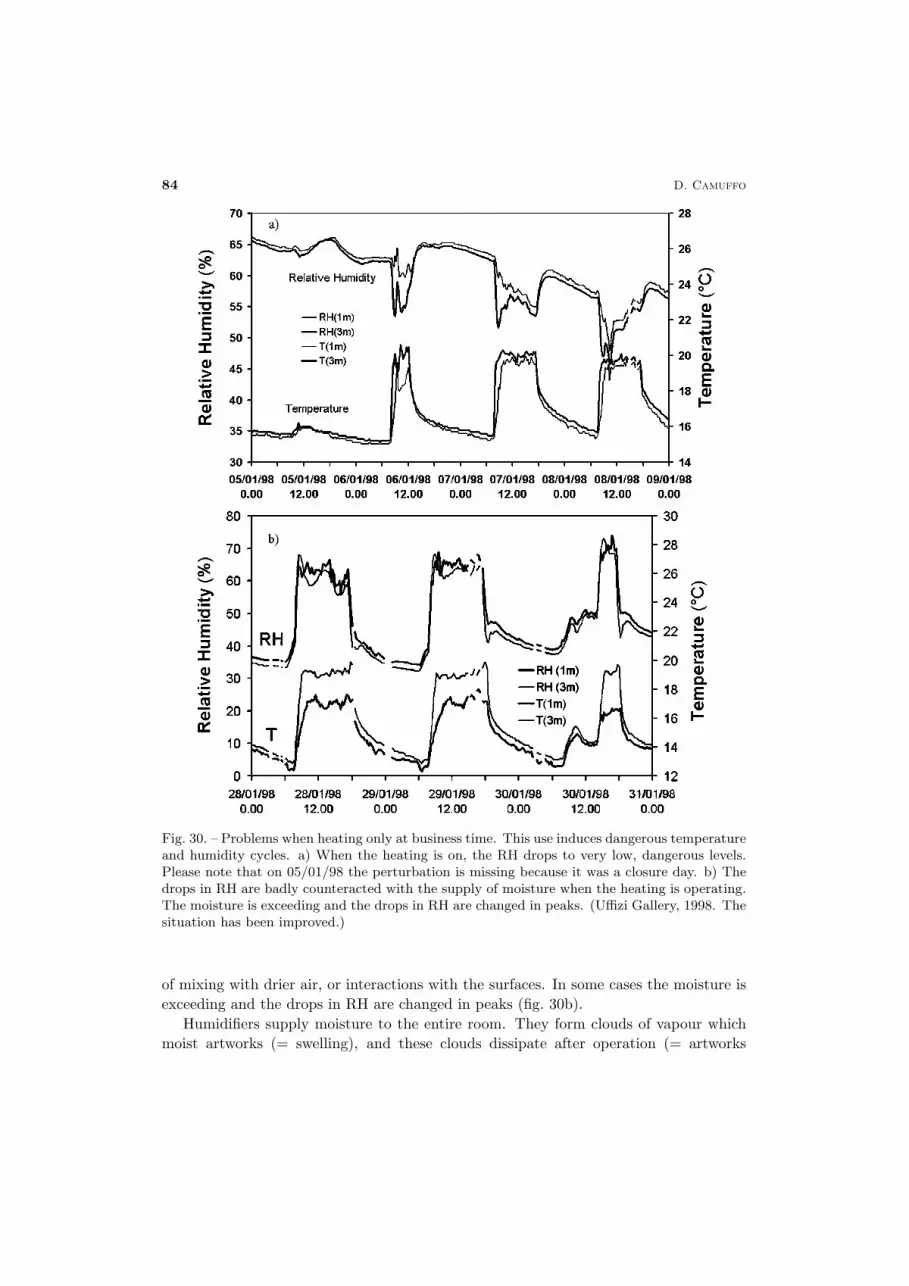
84 D. Camuffo
Fig. 30. – Problems when heating only at business time. This use induces dangerous temperatureand humidity cycles. a) When the heating is on, the RH drops to very low, dangerous levels.Please note that on 05/01/98 the perturbation is missing because it was a closure day. b) Thedrops in RH are badly counteracted with the supply of moisture when the heating is operating.The moisture is exceeding and the drops in RH are changed in peaks. (Uffizi Gallery, 1998. Thesituation has been improved.)
of mixing with drier air, or interactions with the surfaces. In some cases the moisture isexceeding and the drops in RH are changed in peaks (fig. 30b).
Humidifiers supply moisture to the entire room. They form clouds of vapour whichmoist artworks (= swelling), and these clouds dissipate after operation (= artworks
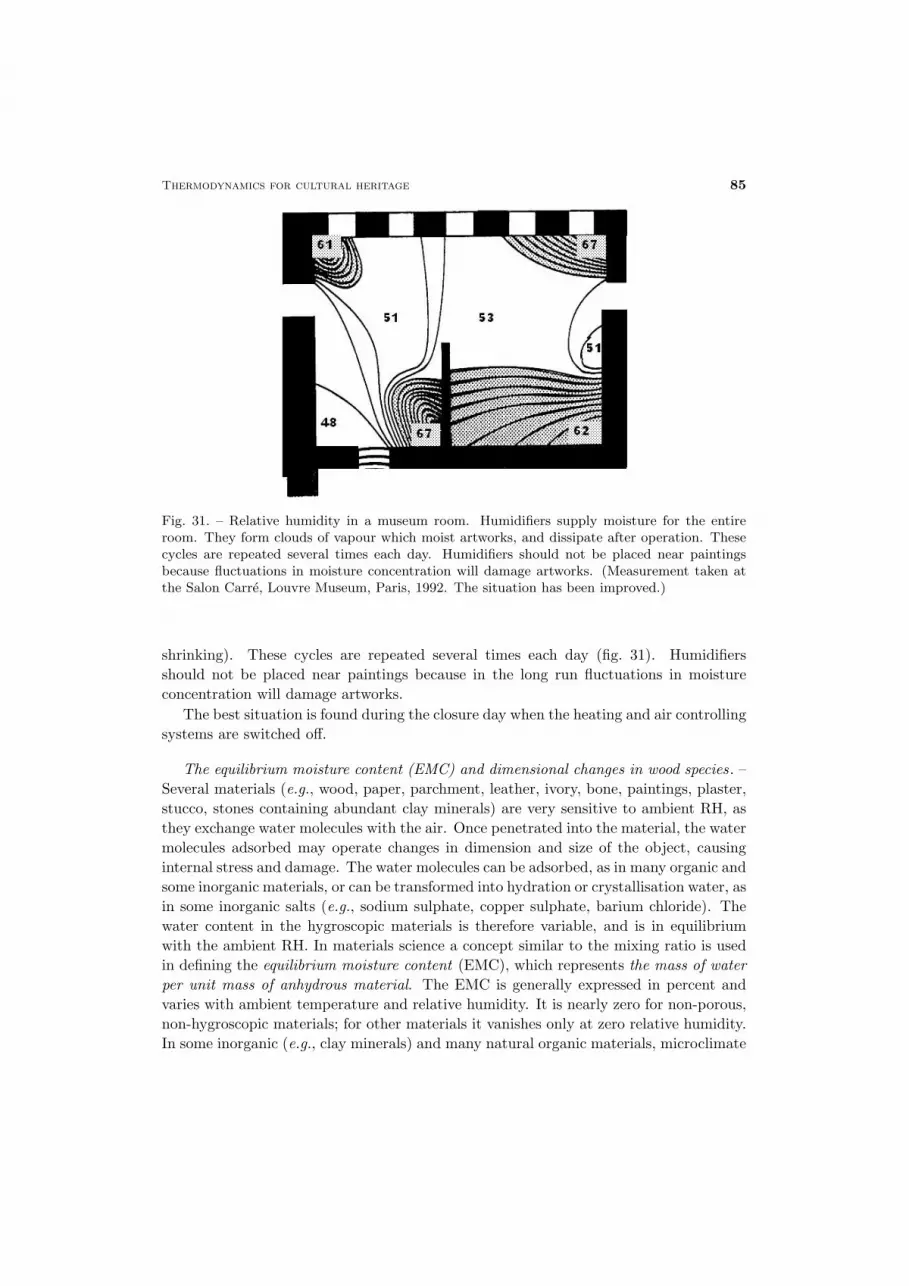
Thermodynamics for cultural heritage 85
Fig. 31. – Relative humidity in a museum room. Humidifiers supply moisture for the entireroom. They form clouds of vapour which moist artworks, and dissipate after operation. Thesecycles are repeated several times each day. Humidifiers should not be placed near paintingsbecause fluctuations in moisture concentration will damage artworks. (Measurement taken atthe Salon Carre, Louvre Museum, Paris, 1992. The situation has been improved.)
shrinking). These cycles are repeated several times each day (fig. 31). Humidifiersshould not be placed near paintings because in the long run fluctuations in moistureconcentration will damage artworks.
The best situation is found during the closure day when the heating and air controllingsystems are switched off.
The equilibrium moisture content (EMC) and dimensional changes in wood species. –Several materials (e.g., wood, paper, parchment, leather, ivory, bone, paintings, plaster,stucco, stones containing abundant clay minerals) are very sensitive to ambient RH, asthey exchange water molecules with the air. Once penetrated into the material, the watermolecules adsorbed may operate changes in dimension and size of the object, causinginternal stress and damage. The water molecules can be adsorbed, as in many organic andsome inorganic materials, or can be transformed into hydration or crystallisation water, asin some inorganic salts (e.g., sodium sulphate, copper sulphate, barium chloride). Thewater content in the hygroscopic materials is therefore variable, and is in equilibriumwith the ambient RH. In materials science a concept similar to the mixing ratio is usedin defining the equilibrium moisture content (EMC), which represents the mass of waterper unit mass of anhydrous material. The EMC is generally expressed in percent andvaries with ambient temperature and relative humidity. It is nearly zero for non-porous,non-hygroscopic materials; for other materials it vanishes only at zero relative humidity.In some inorganic (e.g., clay minerals) and many natural organic materials, microclimate
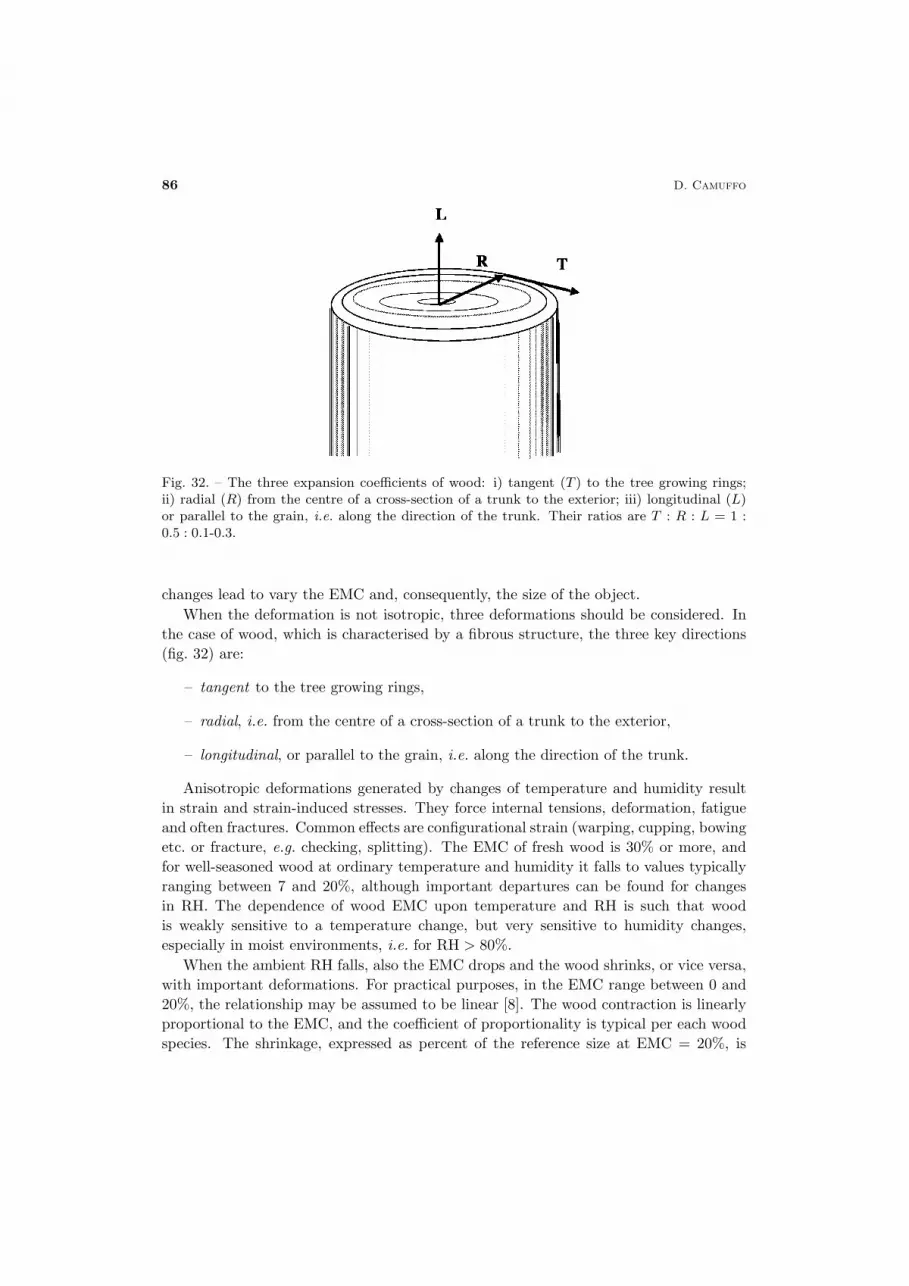
86 D. Camuffo
Fig. 32. – The three expansion coefficients of wood: i) tangent (T ) to the tree growing rings;ii) radial (R) from the centre of a cross-section of a trunk to the exterior; iii) longitudinal (L)or parallel to the grain, i.e. along the direction of the trunk. Their ratios are T : R : L = 1 :0.5 : 0.1-0.3.
changes lead to vary the EMC and, consequently, the size of the object.When the deformation is not isotropic, three deformations should be considered. In
the case of wood, which is characterised by a fibrous structure, the three key directions(fig. 32) are:
– tangent to the tree growing rings,
– radial, i.e. from the centre of a cross-section of a trunk to the exterior,
– longitudinal, or parallel to the grain, i.e. along the direction of the trunk.
Anisotropic deformations generated by changes of temperature and humidity resultin strain and strain-induced stresses. They force internal tensions, deformation, fatigueand often fractures. Common effects are configurational strain (warping, cupping, bowingetc. or fracture, e.g. checking, splitting). The EMC of fresh wood is 30% or more, andfor well-seasoned wood at ordinary temperature and humidity it falls to values typicallyranging between 7 and 20%, although important departures can be found for changesin RH. The dependence of wood EMC upon temperature and RH is such that woodis weakly sensitive to a temperature change, but very sensitive to humidity changes,especially in moist environments, i.e. for RH > 80%.
When the ambient RH falls, also the EMC drops and the wood shrinks, or vice versa,with important deformations. For practical purposes, in the EMC range between 0 and20%, the relationship may be assumed to be linear [8]. The wood contraction is linearlyproportional to the EMC, and the coefficient of proportionality is typical per each woodspecies. The shrinkage, expressed as percent of the reference size at EMC = 20%, is
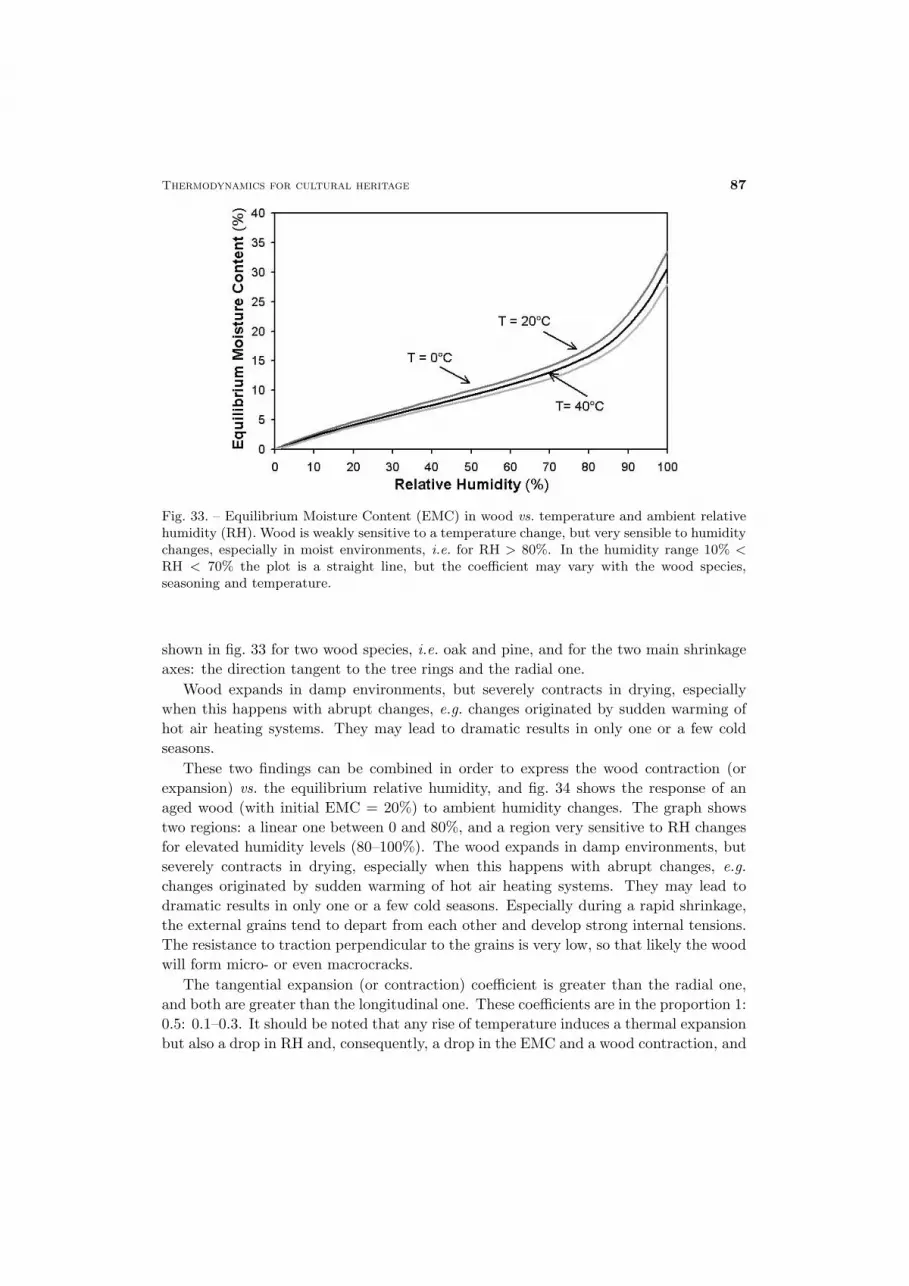
Thermodynamics for cultural heritage 87
Fig. 33. – Equilibrium Moisture Content (EMC) in wood vs. temperature and ambient relativehumidity (RH). Wood is weakly sensitive to a temperature change, but very sensible to humiditychanges, especially in moist environments, i.e. for RH > 80%. In the humidity range 10% <RH < 70% the plot is a straight line, but the coefficient may vary with the wood species,seasoning and temperature.
shown in fig. 33 for two wood species, i.e. oak and pine, and for the two main shrinkageaxes: the direction tangent to the tree rings and the radial one.
Wood expands in damp environments, but severely contracts in drying, especiallywhen this happens with abrupt changes, e.g. changes originated by sudden warming ofhot air heating systems. They may lead to dramatic results in only one or a few coldseasons.
These two findings can be combined in order to express the wood contraction (orexpansion) vs. the equilibrium relative humidity, and fig. 34 shows the response of anaged wood (with initial EMC = 20%) to ambient humidity changes. The graph showstwo regions: a linear one between 0 and 80%, and a region very sensitive to RH changesfor elevated humidity levels (80–100%). The wood expands in damp environments, butseverely contracts in drying, especially when this happens with abrupt changes, e.g.changes originated by sudden warming of hot air heating systems. They may lead todramatic results in only one or a few cold seasons. Especially during a rapid shrinkage,the external grains tend to depart from each other and develop strong internal tensions.The resistance to traction perpendicular to the grains is very low, so that likely the woodwill form micro- or even macrocracks.
The tangential expansion (or contraction) coefficient is greater than the radial one,and both are greater than the longitudinal one. These coefficients are in the proportion 1:0.5: 0.1–0.3. It should be noted that any rise of temperature induces a thermal expansionbut also a drop in RH and, consequently, a drop in the EMC and a wood contraction, and
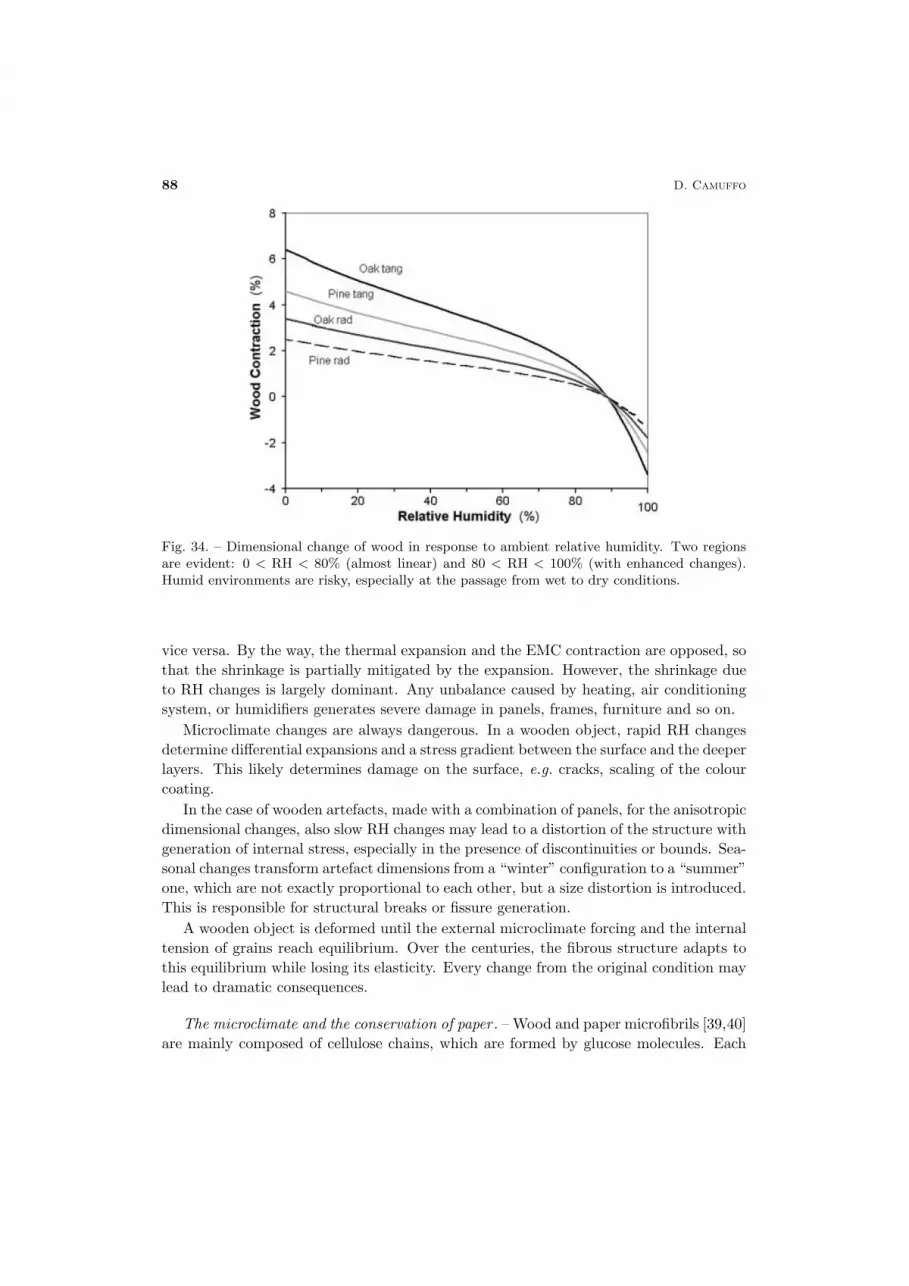
88 D. Camuffo
Fig. 34. – Dimensional change of wood in response to ambient relative humidity. Two regionsare evident: 0 < RH < 80% (almost linear) and 80 < RH < 100% (with enhanced changes).Humid environments are risky, especially at the passage from wet to dry conditions.
vice versa. By the way, the thermal expansion and the EMC contraction are opposed, sothat the shrinkage is partially mitigated by the expansion. However, the shrinkage dueto RH changes is largely dominant. Any unbalance caused by heating, air conditioningsystem, or humidifiers generates severe damage in panels, frames, furniture and so on.
Microclimate changes are always dangerous. In a wooden object, rapid RH changesdetermine differential expansions and a stress gradient between the surface and the deeperlayers. This likely determines damage on the surface, e.g. cracks, scaling of the colourcoating.
In the case of wooden artefacts, made with a combination of panels, for the anisotropicdimensional changes, also slow RH changes may lead to a distortion of the structure withgeneration of internal stress, especially in the presence of discontinuities or bounds. Sea-sonal changes transform artefact dimensions from a “winter” configuration to a “summer”one, which are not exactly proportional to each other, but a size distortion is introduced.This is responsible for structural breaks or fissure generation.
A wooden object is deformed until the external microclimate forcing and the internaltension of grains reach equilibrium. Over the centuries, the fibrous structure adapts tothis equilibrium while losing its elasticity. Every change from the original condition maylead to dramatic consequences.
The microclimate and the conservation of paper . – Wood and paper microfibrils [39,40]are mainly composed of cellulose chains, which are formed by glucose molecules. Each

Thermodynamics for cultural heritage 89
glucose unit possesses three hydroxyl groups, which have an affinity for water. Whenwater is absorbed, it will be retained between the cellulose chains, displacing them. Thefirst consequence is the increase of the size of the material and the decrease of its strengthfor the attenuation of the hydrogen bounds and the van der Waals intermolecular forces.The second consequence is that a slow but progressive hydrolysis of cellulose is produced,which breaks the bounds between the glucose units, breaking the cellulose chain into anumber of shorter and weaker chains, with a depolymerisation mechanism. The thirdconsequence is oxidation, or chemical degradation, especially in modern paper (i.e. aftermid 19th century) which is made from wood pulp and contains several acidic elements.The damage is particularly severe in the presence of atmospheric pollutants and especiallyozone. In addition, when paper is stored in a humid environment, it releases sulphuricacid that accelerates the deterioration. The last but not least consequence of dampnessis biodeterioration.
Not only dampness, but also dryness affects the molecular structure. Paper has astructure that is weaker compared to wood and is more sensitive to humidity changes.Moderate cold and dry is better for storage and conservation, but makes paper brittle.Moderate humidity causes the absorption of a number of water molecules, which ensuremobility to the cellulose chains, increasing flexibility, and this environmental conditionis better for use. Therefore, when a book is consulted, it should pass from a cold, drystorage to an intermediate transition climate, and then to the reading room which shouldbe moister to make paper more elastic and warmer, and to be more comfortable for thereader. For this reason, the choice of the RH may change according to the use. Differenthumidity limits are suggested in the literature, e.g. the interval from 45 to 65% RH.
Also the collagen in parchment is arranged with chains of molecules with problemssimilar to those discussed for cellulose in paper, and extreme dryness or wetness mayirreversibly alter the structural composition. Water is also absorbed by textiles (cotton,linen, wool and silk) with the result of weakening the material and fading the colours.
The problem of church heating . – When churches are heated with the traditionalsystems, the sudden sporadic heating (fig. 35a) generates a drop in relative humidity(fig. 35b). The drop in RH reflects on the EMC of the bodies in equilibrium, startingfrom the surface and the outer layers. A heavy evaporation is forced from paintings oncanvas and other artworks with a low thermal capacity which reach equilibrium in a shorttime, but some evaporation may be forced also on the outer layers of the other bodies,even from structures with high thermal inertia (e.g., wall rendering).
When only a few people are present, the peak in the temperature causes a drop inthe relative humidity, which in turn forces evaporation from walls and ceiling. If themasonry is damp, this involves the mobilisation of soluble salts and formation of surfaceefflorescences.
When the church is crowded, the moisture released by breathing and transpirationraises the dew point above the temperature of the structures with large thermal inertia(e.g., marble columns, thick walls and ceiling). The excess of moisture condenses on thecold surface of frescoes and decorations (fig. 36), with dramatic consequences.

90 D. Camuffo
Fig. 35. – Effect of the sudden sporadic heating in churches. In spite of the supply of moisturefrom people, the peaks in temperature cause drops in relative humidity. Paintings on canvasand other artefacts, with low thermal inertia, dehydrate and shrink.
Fig. 36. – Moisture from breathing increases both the mixing ratio and the dew point. Thisexcess moisture condenses on frescoes, marble, walls, ceiling and all of the other structures whichhave a high thermal inertia. The major peaks in this graph are related to Eve and ChristmasServices.
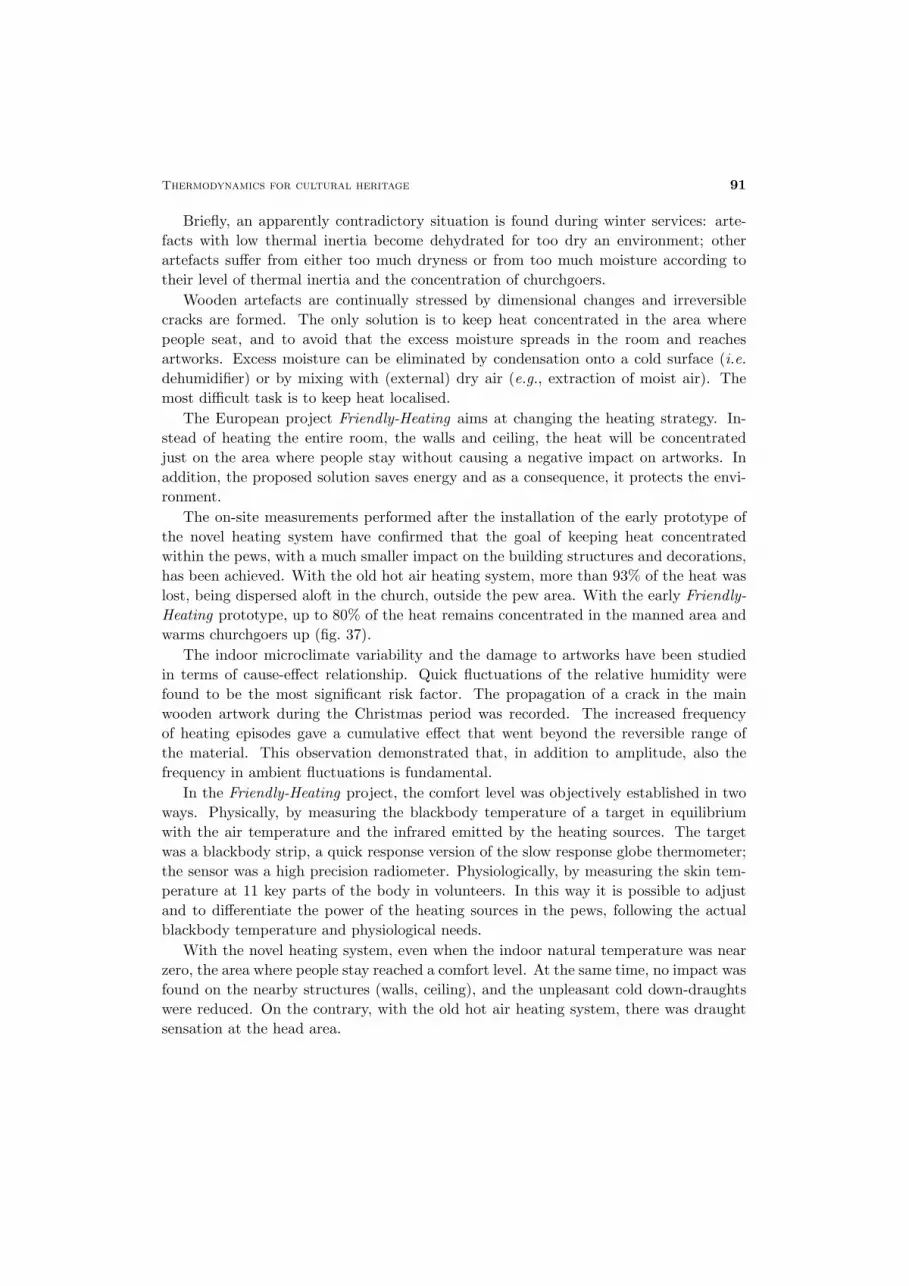
Thermodynamics for cultural heritage 91
Briefly, an apparently contradictory situation is found during winter services: arte-facts with low thermal inertia become dehydrated for too dry an environment; otherartefacts suffer from either too much dryness or from too much moisture according totheir level of thermal inertia and the concentration of churchgoers.
Wooden artefacts are continually stressed by dimensional changes and irreversiblecracks are formed. The only solution is to keep heat concentrated in the area wherepeople seat, and to avoid that the excess moisture spreads in the room and reachesartworks. Excess moisture can be eliminated by condensation onto a cold surface (i.e.dehumidifier) or by mixing with (external) dry air (e.g., extraction of moist air). Themost difficult task is to keep heat localised.
The European project Friendly-Heating aims at changing the heating strategy. In-stead of heating the entire room, the walls and ceiling, the heat will be concentratedjust on the area where people stay without causing a negative impact on artworks. Inaddition, the proposed solution saves energy and as a consequence, it protects the envi-ronment.
The on-site measurements performed after the installation of the early prototype ofthe novel heating system have confirmed that the goal of keeping heat concentratedwithin the pews, with a much smaller impact on the building structures and decorations,has been achieved. With the old hot air heating system, more than 93% of the heat waslost, being dispersed aloft in the church, outside the pew area. With the early Friendly-Heating prototype, up to 80% of the heat remains concentrated in the manned area andwarms churchgoers up (fig. 37).
The indoor microclimate variability and the damage to artworks have been studiedin terms of cause-effect relationship. Quick fluctuations of the relative humidity werefound to be the most significant risk factor. The propagation of a crack in the mainwooden artwork during the Christmas period was recorded. The increased frequencyof heating episodes gave a cumulative effect that went beyond the reversible range ofthe material. This observation demonstrated that, in addition to amplitude, also thefrequency in ambient fluctuations is fundamental.
In the Friendly-Heating project, the comfort level was objectively established in twoways. Physically, by measuring the blackbody temperature of a target in equilibriumwith the air temperature and the infrared emitted by the heating sources. The targetwas a blackbody strip, a quick response version of the slow response globe thermometer;the sensor was a high precision radiometer. Physiologically, by measuring the skin tem-perature at 11 key parts of the body in volunteers. In this way it is possible to adjustand to differentiate the power of the heating sources in the pews, following the actualblackbody temperature and physiological needs.
With the novel heating system, even when the indoor natural temperature was nearzero, the area where people stay reached a comfort level. At the same time, no impact wasfound on the nearby structures (walls, ceiling), and the unpleasant cold down-draughtswere reduced. On the contrary, with the old hot air heating system, there was draughtsensation at the head area.
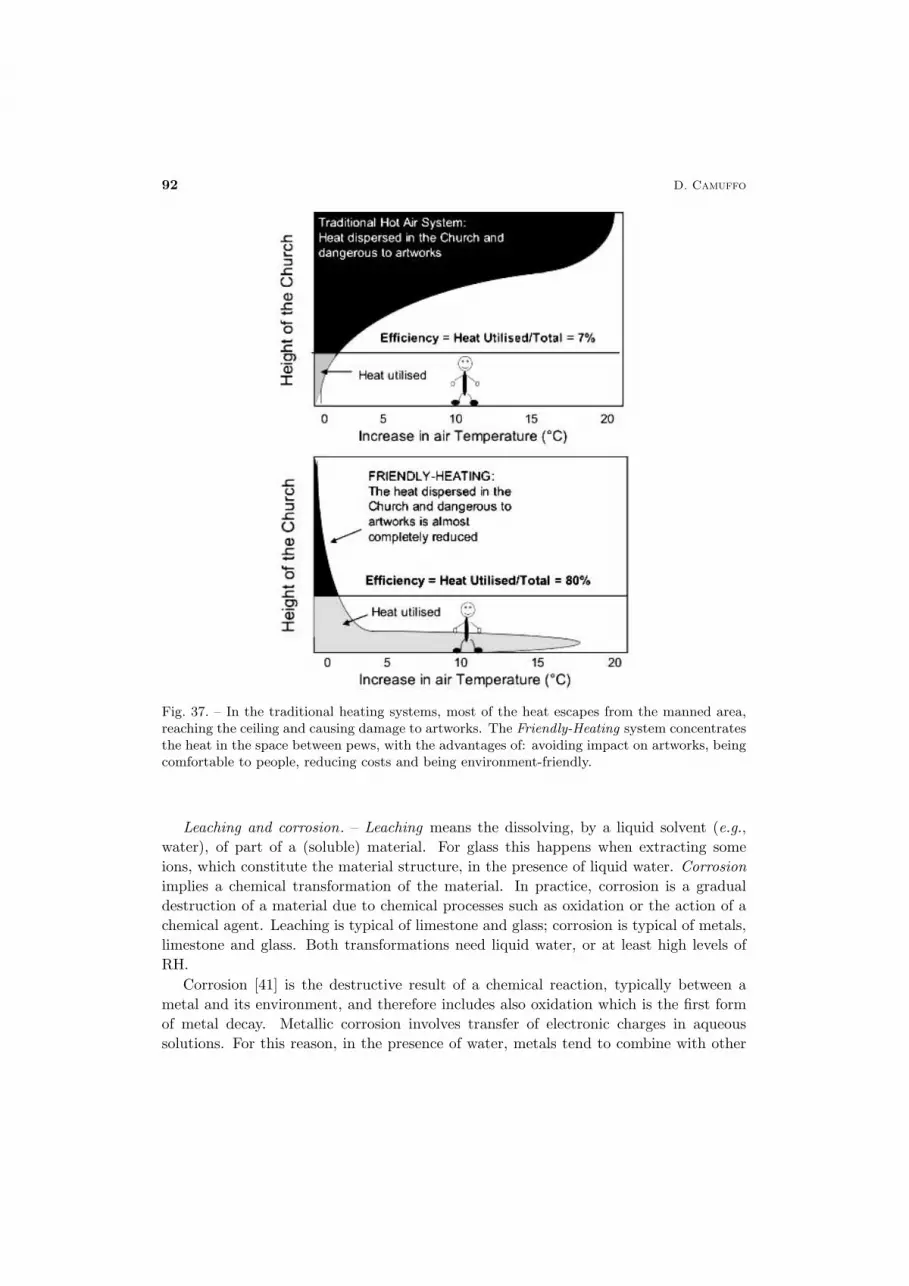
92 D. Camuffo
Fig. 37. – In the traditional heating systems, most of the heat escapes from the manned area,reaching the ceiling and causing damage to artworks. The Friendly-Heating system concentratesthe heat in the space between pews, with the advantages of: avoiding impact on artworks, beingcomfortable to people, reducing costs and being environment-friendly.
Leaching and corrosion. – Leaching means the dissolving, by a liquid solvent (e.g.,water), of part of a (soluble) material. For glass this happens when extracting someions, which constitute the material structure, in the presence of liquid water. Corrosionimplies a chemical transformation of the material. In practice, corrosion is a gradualdestruction of a material due to chemical processes such as oxidation or the action of achemical agent. Leaching is typical of limestone and glass; corrosion is typical of metals,limestone and glass. Both transformations need liquid water, or at least high levels ofRH.
Corrosion [41] is the destructive result of a chemical reaction, typically between ametal and its environment, and therefore includes also oxidation which is the first formof metal decay. Metallic corrosion involves transfer of electronic charges in aqueoussolutions. For this reason, in the presence of water, metals tend to combine with other
Thermodynamics for cultural heritage 93
Fig. 38. – Leaching of soda lime glass. At pH < 9, the radicals H+ or H3O+ originated from
water and interactions with SiO2 will substitute Na+ and Ca2+ ions in the glass structure, byleaching, or forming a silica layer (SL, hydrogenated glass) (redrawn after [44]).
chemical compounds, and return in a form similar to the natural minerals from whichthey are extracted, making the energy required for their extraction free.
For glass [42-44] the situation is complex, as there are several types of glass anddeterioration mechanisms. Chemical solutions (and the pH of the attacking solution)may provoke chemical changes on the surface, which may then spread to the wholeof the glass. Water originated by condensation or with rainfall, or simply by vapouradsorption, is necessary for the replacement by protons of the diffusing alkali ions andsubsequent hydration of the silica network. Radicals derived from water molecules maydiffuse inside the glass, especially in the presence of tiny cracks, and may substitutesodium and potassium carbonate, which are deliquescent. The mechanism is composedof ion exchange and alkali extraction (fig. 38). At pH < 9, the radicals H+ or H3O+
originated from water and interactions with SiO2 will substitute Na+ and Ca2+ ions inthe glass structure, by leaching, or forming a silica layer (hydrogenated glass).
In dry condition, or under the action of solar radiation, the loss of water absorbedcauses dehydration. For this reason, humidity cycles are dangerous, also in the absenceof pollution.
Damage caused by water on stones. – Rainfall, or the water supplied by condensationmay cause dissolution of the matrix of the material, and the ions dissolved in the liquidwater can migrate in the interior of the stone. When evaporation occurs on the surface,the water molecules escape from the porous material, causing a local accumulation of the
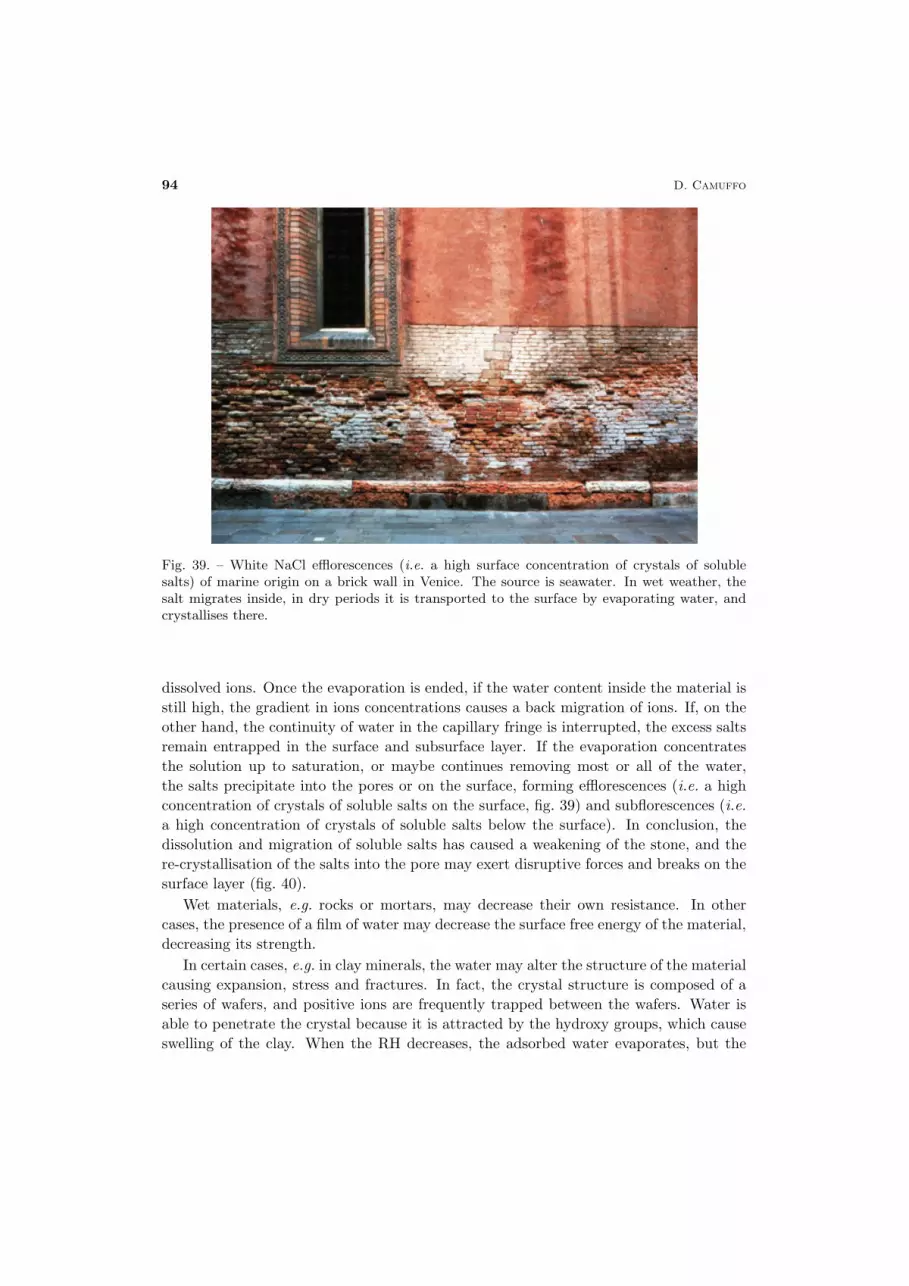
94 D. Camuffo
Fig. 39. – White NaCl efflorescences (i.e. a high surface concentration of crystals of solublesalts) of marine origin on a brick wall in Venice. The source is seawater. In wet weather, thesalt migrates inside, in dry periods it is transported to the surface by evaporating water, andcrystallises there.
dissolved ions. Once the evaporation is ended, if the water content inside the material isstill high, the gradient in ions concentrations causes a back migration of ions. If, on theother hand, the continuity of water in the capillary fringe is interrupted, the excess saltsremain entrapped in the surface and subsurface layer. If the evaporation concentratesthe solution up to saturation, or maybe continues removing most or all of the water,the salts precipitate into the pores or on the surface, forming efflorescences (i.e. a highconcentration of crystals of soluble salts on the surface, fig. 39) and subflorescences (i.e.a high concentration of crystals of soluble salts below the surface). In conclusion, thedissolution and migration of soluble salts has caused a weakening of the stone, and there-crystallisation of the salts into the pore may exert disruptive forces and breaks on thesurface layer (fig. 40).
Wet materials, e.g. rocks or mortars, may decrease their own resistance. In othercases, the presence of a film of water may decrease the surface free energy of the material,decreasing its strength.
In certain cases, e.g. in clay minerals, the water may alter the structure of the materialcausing expansion, stress and fractures. In fact, the crystal structure is composed of aseries of wafers, and positive ions are frequently trapped between the wafers. Water isable to penetrate the crystal because it is attracted by the hydroxy groups, which causeswelling of the clay. When the RH decreases, the adsorbed water evaporates, but the
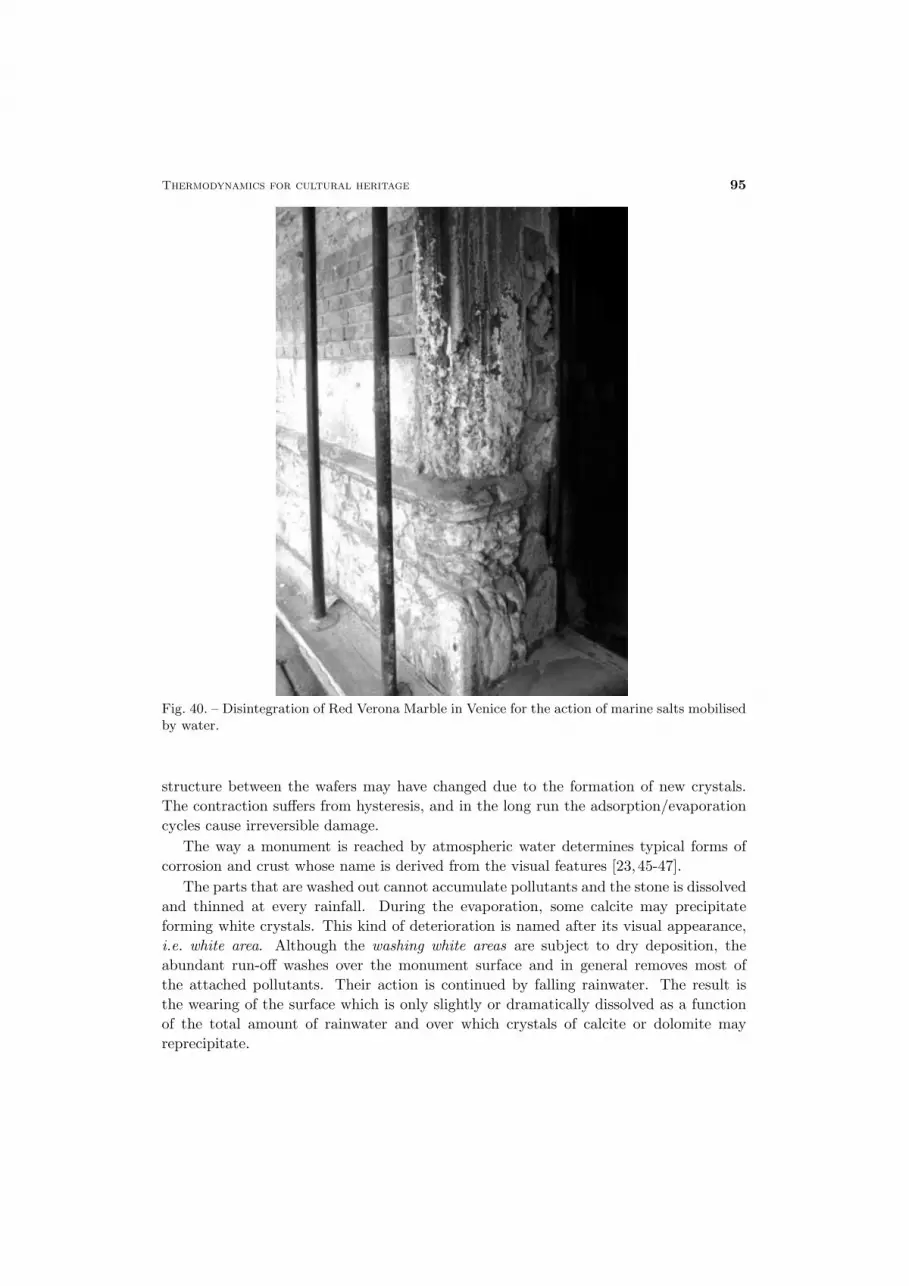
Thermodynamics for cultural heritage 95
Fig. 40. – Disintegration of Red Verona Marble in Venice for the action of marine salts mobilisedby water.
structure between the wafers may have changed due to the formation of new crystals.The contraction suffers from hysteresis, and in the long run the adsorption/evaporationcycles cause irreversible damage.
The way a monument is reached by atmospheric water determines typical forms ofcorrosion and crust whose name is derived from the visual features [23,45-47].
The parts that are washed out cannot accumulate pollutants and the stone is dissolvedand thinned at every rainfall. During the evaporation, some calcite may precipitateforming white crystals. This kind of deterioration is named after its visual appearance,i.e. white area. Although the washing white areas are subject to dry deposition, theabundant run-off washes over the monument surface and in general removes most ofthe attached pollutants. Their action is continued by falling rainwater. The result isthe wearing of the surface which is only slightly or dramatically dissolved as a functionof the total amount of rainwater and over which crystals of calcite or dolomite mayreprecipitate.
96 D. Camuffo
The parts shielded from washout accumulate pollutants (and black particles). Inthe presence of some water, and by reacting with the stone substrate, the pollutantsmay form ugly and dangerous black crusts. In practice, the black crusts are stuffedwith many black carbonaceous particles that, in addition to carbon, contain CaCO3,sulphur, several other elements and many catalysers. The carbonaceous black particlesare like small absorbing sponges and can absorb gaseous pollutants and water vapourfrom the atmosphere. Every time they are soaked by rainwater, by combining theircalcium carbonate with the sulphuric acid they form, they produce gypsum crystals thatgrow on them and assume the appearance of a chestnut husk. As the same reaction occursalso on the limestone of the monument, whenever the carbonaceous particles are soakedby rainfall, they form an aggressive acidic solution that may cross the crust and reachthe stone underneath, reacting with it. All of these gypsum needles, either generatedfrom these particles, or from the stone, cross each other entrapping new black particlesand forming a thicker and thicker black crust. This cycle may repeat hundreds of timesper year. An essential element for the formation of these crusts is the presence of blackcarbonaceous particles that were typically formed by the combustion of oil and coal andhave been one of the most important deterioration factors in the 20th century in Europe.Now the use of methane and more refined oils has generated new particles, and the newsoot seems to be less dangerous for monuments.
The parts of monuments shielded from rainwater or percolation, e.g. under porticoes,accumulate the particles deposited there, but in the absence of liquid water the chemicalreaction is so slow that in practice reaction products cannot be detected. The pollutantsdeposited there remain loose. After gentle brushing, the surface returns as it was. Theseareas are called grey areas.
Dampness and humidity favour biological life and biological weathering; this negativephenomenon becomes greater and greater when the duration, or the frequency, of thetime of wetness increase.
The mechanisms of biodeterioration are not simply restricted to clearly evident pati-nas, pitting or other corrosion damages. The absorption of corrosive and nutritionalatmospheric pollutants is even increased by the presence of sticky biofilms. This way,the stone colonising microflora accelerates passively the reaction rate of biochemical in-duced corrosion processes and, as a consequence, influences the formation of crusts astheir final result.
On stones exposed to low air pollution, biodeterioration might be more or less evident,e.g. for the presence of multicoloured photosynthetic algae, cyanobacteria or lichens. Inhighly polluted areas it might be possible that microbial infections are not easy to detect,although bacterial or fungal microfilms are present. One of the most common effects ispitting due to lichen colonisation over the past centuries.
∗ ∗ ∗Most of the results obtained over the years have been reached thanks to the support
of the European Commission obtained with a number of contracts concerning the con-servation of stones and historical buildings, the unsound use of modern technology in
Thermodynamics for cultural heritage 97
museums (AER) and FRIENDLY-HEATING (www.isac.cnr.it/friendly-heating/),making human comfort compatible with conservation of cultural heritage preserved inchurches. A support was also derived by CNR, Finalised Project Cultural Heritage andAgenzia 2001.
REFERENCES
[1] Matveev A. N., Molecular Physics (Mir, Moscow) 1985.
[2] Kikoin A. and Kikoin I., Molecular Physics (Mir, Moscow) 1978.
[3] Sivuchin D. V., Corso di Fisica Generale, Vol. 2 (Mir, Moscow) 1986.
[4] Plank M., Treatise on Thermodynamics (Dover, New York) 1926.
[5] Fermi E., Termodinamica (Boringhieri, Torino) 1958.
[6] Iribarne J. V. and Godson W. L., Atmospheric Thermodynamics (Reidel, Dordrecht)1986.
[7] Harrison L. P., in Humidity and Moisture, Measurement and Control in Science andIndustry, Vol. 3, Fundamentals and Standards, edited by Wexler A. (Rehinold, NewYork) 1965, pp. 3-69.
[8] Summit R. and Slicker A., Handbook of Material Science, Vol. IV, Wood (CRC Press,Boca Raton, Florida) 1980.
[9] Clifford J., in Water, a Comprehensive Treatise, Vol. 5, Water in Disperse Systems,edited by Franks F. (Plenum, New York) 1981.
[10] Belinski V. A., Dynamic Meteorology (Ogiz, Moscow) 1948.
[11] Petterssen S.,Weather Analysis and Forecasting, Vol. II (McGraw-Hill, New York) 1956.
[12] Byers H. R., General Meteorology (McGraw-Hill, New York) 1959.
[13] Byers H. R., Elements of Cloud Physics (University of Chicago Press, Chicago) 1965.
[14] Byers H. R., General Meteorology (McGraw-Hill, New York) 1974.
[15] Huschke R. E., Glossary of Meteorology (American Meteorological Society, Boston) 1959.
[16] List R. J., Smithsonian Meteorological Tables, Vol. 114 (Smithsonian Institution Press,Washington D.C.) 1966.
[17] Matveev L. T., Physics of the Atmosphere (Israel Program for Scientific Translations,Jerusalem) 1967.
[18] Houghton D. D., Handbook of Applied Meteorology (Wiley, New York) 1985.
[19] Parker S. P., Meteorology Source Book (McGraw-Hill, New York) 1988.
[20] Saucier W. J., Principles of Meteorological Analysis (Dover, New York) 1989.
[21] UK Meteorological Office, Meteorological Glossary (HMSO, London) 1991.
[22] Pruppacher H. R. and Klett J. D., Microphysics of Clouds and Precipitation (Kluwer,Dordrecht) 2000.
[23] Camuffo D., Microclimate for Cultural Heritage (Elsevier, Amsterdam) 1998.
[24] Talbot L., Cheng R. K., Schefer R. W. and Willis D. R., J. Fluid Mech., 1014(1980) 737.
[25] Sehmel G., Atmos. Environ., 14 (1980) 983.
[26] Prodi F. and Tampieri F., Pageoph., 120 (1982) 286.
[27] Uni-Normal, Cultural Heritage - Measuring Temperature of Cultural Heritage Objects.Field measurement of the air temperature and the surface temperature of objects (UNI,Milan) 2003.
[28] Thomson W. (Lord Kelvin), Proc. R. Soc. Edinburgh, 7 (1870) 63.
[29] Sonntag D., Z. Meteorol., 40 (1990) 340.

98 D. Camuffo
[30] WMO, International Meteorological Vocabulary, No. 182 TP 91 (World MeteorologicalOrganisation, Geneva) 1966.
[31] WMO, Guide to Meteorological Instruments and Methods of Observation, No. 14 (WorldMeteorological Organisation, Geneva) 1983.
[32] WMO, General Meteorological Standards and Recommended Practices, No. 49 (WorldMeteorological Organisation, Geneva) 1988.
[33] Gregg S. J. and Sing K. S. W., Adsorption, Surface Area and Porosity (Academic Press,London) 1967.
[34] Mason B. J., The Physics of Clouds (Clarendon Press, Oxford) 1971.[35] Mikhail R. S. and Robens E., Microstructure and Thermal Analysis of Solid Surfaces
(Wiley, New York) 1983.[36] Camuffo D., Water, Air Soil Pollut., 21 (1984) 151.[37] Brunauer S., The Adsorption of Gases and Vapors (Princeton University Press,
Princeton) 1945.[38] Camuffo D. and Giorio R., Boundary Layer Meteorol., 107 (2003) 665.[39] Copede M., La carta e il suo degrado (Nardini, Florence) 1991.[40] Richardson B. A., Wood Preservation (E & FN Spon - Chapman & Hall, London) 1993.[41] Jones D. A., Principles and Prevention of Corrosion (Prentice Hall, Upper Saddle River,
N.J.) 1996.[42] Newton R. and Davison S., Conservation of Glass (Butterworths, London) 1989.[43] Libourel G., Strepenich J., Barbey P. and Caussidon M., in Le Materiau Vitreux:
Verre et Vitraux, edited by Lefevre R. A. and Pallot-Frossard I. (Edipuglia, Bari)1998, pp. 75-89.
[44] Verita M., in Le Materiau Vitreux: Verre et Vitraux, edited by Lefevre R. A. andPallot-Frossard I. (Edipuglia, Bari) 1998, pp. 53-73.
[45] Camuffo D., Del Monte M., Sabbioni C. and Vittori O., Atmos. Environ., 16 (1982)2253.
[46] Camuffo D., Del Monte M. and Sabbioni C., Water, Air Soil Pollut., 18 (1983) 351.[47] Camuffo D., Atmos. Environ., 18 (1984) 2273.


