Embed Size (px)
Citation preview

arX
iv:1
004.
2790
v2 [
astr
o-ph
.CO
] 2
0 A
pr 2
010
The XMM-Newton Wide-Field Survey in the COSMOS field
(XMM-COSMOS): demography and multiwavelength properties
of obscured and unobscured luminous AGN
M. Brusa1, F. Civano2, A. Comastri3, T. Miyaji4,5, M. Salvato6,7,8, G. Zamorani 3, N.
Cappelluti1,9, F. Fiore10, G. Hasinger6, V. Mainieri11, A. Merloni7,1, A. Bongiorno1, P.
Capak12, M. Elvis2, R. Gilli3, H. Hao2, K. Jahnke13, A.M. Koekemoer14, O. Ilbert15, E. Le
Floc’h16, E. Lusso17,3, M. Mignoli3, E. Schinnerer13, J.D. Silverman18, E. Treister19, J.D.
Trump20, C. Vignali17,3, M. Zamojski12, T. Aldcroft2, H. Aussel21, S. Bardelli3, M.
Bolzonella3, A. Cappi3, K. Caputi22, T. Contini23, A. Finoguenov1, A. Fruscione2, B.
Garilli24, C.D. Impey20, A. Iovino25, K. Iwasawa3, P. Kampczyk26, J. Kartaltepe19,25, J.P.
Kneib27, C. Knobel26, K. Kovac26, F. Lamareille23, J-F. Leborgne23, V. Le Brun27, O. Le
Fevre27, S.J. Lilly26, C. Maier26, H.J. McCracken28, R. Pello23, Y-J Peng26, E.
Perez-Montero26, L. de Ravel27, D. Sanders12, M. Scodeggio24, N.Z. Scoville8, M. Tanaka11,
Y. Taniguchi29, L. Tasca24,27, S. de la Torre27, L. Tresse27, D. Vergani3, E. Zucca3
⋆Based on data collected at: the NASA/ESA Hubble Space Telescope, obtained at the Space Telescope
Science Institute, which is operated by AURA Inc, under NASA contract NAS 5-26555; the Subaru Telescope,
which is operated by the National Astronomical Observatory of Japan; the European Southern Observatory,
Chile, under Large Program 175.A-0839; Kitt Peak National Observatory, Cerro Tololo Inter-American
Observatory, and the National Optical Astronomy Observatory, which are operated by the Association of
Universities for Research in Astronomy, Inc. (AURA) under cooperative agreement with the National Science
Foundation; and the Canada-France-Hawaii Telescope operated by the National Research Council of Canada,
the Centre National de la Recherche Scientifique de France and the University of Hawaii.

– 2 –
1Max-Planck-Institut fur extraterrestrische Physik, Giessenbachstrasse 1, D–85748 Garching bei
Munchen, Germany
2Harvard-Smithsonian Center for Astrophysics, 60 Garden Street, Cambridge, MA 02138
3INAF – Osservatorio Astronomico di Bologna, via Ranzani 1, I–40127 Bologna, Italy
4Instituto de Astronomıa, Universidad Nacional Autonoma de Mexico, Ensenada, Mexico (mailing ad-
dress: PO Box 439027, San Ysidro, CA, 92143-9024, USA)
5Center for Astrophysics and Space Sciences, University of California at San Diego, Code 0424, 9500
Gilman Drive, La Jolla, CA 92093, USA
6IPP - Max-Planck-Institute for Plasma Physics, Boltzmannstrasse 2, D-85748, Garching, Germany
7Excellence Cluster Universe, Boltzmannstrasse 2, D-85748, Garching bei Muenchen, Germany
8California Institute of Technology, 1201 East California blvd, Pasadena, 91125, CA
9University of Maryland, Baltimore County, 1000 Hilltop Circle, Baltimore, MD 21250, USA
10INAF – Osservatorio Astronomico di Roma, via Frascati 33, Monteporzio-Catone (Roma), I-00040, Italy
11European Southern Observatory, Karl-Schwarzschild-str. 2, 85748 Garching bei Munchen, Germany
12Spitzer Science Center, California Institute of Technology, MC 220-6, 1200 East California Boulevard,
Pasadena, CA 91125
13Max-Planck-Institut fr Astronomie, Konigstuhl 17, D-69117 Heidelberg, Germany
14Space Telescope Science Institute, 3700 San Martin Drive, Baltimore, MD 21218, USA
15Laboratoire d’Astrophysique de Marseille, BP 8, Traverse du Siphon, 13376 Marseille Cedex 12, France
16Laboratoire AIM, CEA/DSM - CNRS - Universite Paris Diderot, DAPNIA/Service d’Astrophysique,
Bat. 709, CEA-Saclay, F-91191 Gif-sur- Yvette Cedex, France
17Dipartimento di Astronomia, Universita di Bologna, via Ranzani 1, 40127, Bologna, Italy
18Institute for the Physics and Mathematics of the Universe (IPMU), University of Tokyo, Kashiwanoha
5-1-5, Kashiwa, Chiba 277-8568, Japan
19Institute for Astronomy, University of Hawaii, 2680 Woodlawn Drive, Honolulu, HI 96822
20Steward Observatory, University of Arizona, 933 North Cherry Avenue, Tucson, AZ 85 721
21Institut d’Astrophysique de Paris, UMR7095 CNRS, Universite Pierre & Marie Curie, 98 bis boulevard
Arago, 75014 Paris, France
22SUPA Institute for Astronomy, The University of Edinburgh, Royal Observatory, Blackford Hill, Edin-
burgh EH9 3HJ, UK
23Observatoire Midi-Pyrenees, Laboratoire d’Astrophysique (UMR 5572), 14 avenue E. Belin, F-31400
Toulouse, France
24INAF IASF - Milano, via Bassini 15, 20133 Milano, Italy

– 3 –
ABSTRACT
We report the final optical identifications of the medium-depth (∼ 60 ksec),
contiguous (2 deg2) XMM-Newton survey of the COSMOS field. XMM-Newton
has detected ∼ 1800 X-ray sources down to limiting fluxes of ∼ 5 × 10⁻¹⁶,
∼ 3×10⁻¹⁵, and ∼ 7×10⁻¹⁵ erg cm−2 s−1 in the 0.5-2 keV, 2-10 keV and 5-10 keV
bands, respectively (∼ 1× 10⁻¹⁵, ∼ 6× 10⁻¹⁵, and ∼ 1× 10⁻¹⁴ erg cm−2 s−1, in
the three bands, respectively, over 50% of the area). The work is complemented
by an extensive collection of multi-wavelength data from 24µm to UV, available
from the COSMOS survey, for each of the X–ray sources, including spectroscopic
redshifts for ∼> 50% of the sample, and high-quality photometric redshifts for the
rest. The XMM and multiwavelength flux limits are well matched: 1760 (98%)
of the X-ray sources have optical counterparts, 1711 (∼ 95%) have IRAC coun-
terparts, and 1394 (∼ 78%) have MIPS 24 µm detections. Thanks to the redshift
completeness (almost 100%) we were able to constrain the high-luminosity tail
of the X–ray luminosity function confirming that the peak of the number density
of logLX > 44.5 AGN is at z∼ 2. Spectroscopically-identified obscured and un-
obscured AGN, as well as normal and starforming galaxies, present well-defined
optical and infrared properties. We devised a robust method to identify a sam-
ple of ∼ 150 high redshift (z> 1), obscured AGN candidates for which optical
spectroscopy is not available. We were able to determine that the fraction of the
obscured AGN population at the highest (LX > 1044 erg s−1) X–ray luminosity is
∼ 15−30% when selection effects are taken into account, providing an important
observational constraint for X–ray background synthesis. We studied in detail
the optical spectrum and the overall spectral energy distribution of a prototypical
Type 2 QSO, caught in a stage transitioning from being starburst dominated to
AGN dominated, which was possible to isolate only thanks to the combination
of X-ray and infrared observations.
Subject headings: surveys — galaxies: active — X-rays: galaxies — X-rays:
25National Optical Astronomy Observatory, 950 North Cherry Avenue, Tucson, AZ 85 721
26Department of Physics, ETH Zurich, CH-8093 Zurich, Switzerland
27Laboratoire d’Astrophysique de Marseille, Traverse du Siphon, F-13376 Marseille, France
28Observatoire de Paris, LERMA, 61 Avenue de l’Observatoire, 75014 Paris, France
29Physics Department, Graduate School of Science and Engineering, Ehime University, 2-5 Bunkyo-cho,
Matsuyama, Ehime 790-8577. Japan

– 4 –
general — X-rays: diffuse background
1. Introduction
First introduced to explain the properties we observe today in normal galaxies such as
their color bimodality (Blanton et al. 2003, Bell et al. 2004, Faber et al. 2007) and the so-
called local scaling relations (Ferrarese & Merrit 2000, Gebahrdt et al. 2000, Gultekin et al.
2009), the existence of a “feedback” between the accreting Super Massive Black Hole (SMBH)
and the host galaxy in which it resides ultimately challenged our understanding of Active
Galactic Nuclei (AGN). Indeed, the widely accepted scenario of galaxy-AGN coevolution
(e.g. Silk & Rees 1998, Fabian & Iwasawa 1999, Granato et al. 2004, Di Matteo et al.
2005, Menci et al. 2008) points towards a physical coupling responsible for the self-regulated
SMBH and galaxy growth. In particular, according to the theoretical scenario emerging from
extensive semi-analytical models and hydrodynamics simulations, a key event in the SMBH
vs. host galaxy co-evolution is represented by the highly obscured AGN phase, when large
quantities of gas driven to the center in the merger of two disk galaxies were available to
efficiently feed and obscure the growing black hole and build galaxy stellar mass through
significant episodes of star formation. This phase ends when strong winds and shocks from
the central AGN heat the interstellar medium, blowing away the dust and gas, thus cleaning
the line of sight and inhibiting further star-formation (see e.g. Granato et al. 2004, Di
Matteo et al. 2005; Croton et al. 2006; Sijacki et al. 2007; Menci et al. 2008; Hopkins et al.
2008).
In this general framework for merger-induced AGN feedback, capable of passing numer-
ous observational tests (e.g., Sanders et al. 1988, Hopkins et al. 2006, Veilleux et al. 2009),
the differences between “obscured” and “unobscured” AGN are no longer and uniquely de-
scribed under a geometrical unification model (in which they are simply related to orientation
effects, Antonucci & Miller 1985, Antonucci 1993, Urry & Padovani 1995), but can be inter-
preted as due to the fact that the same objects are observed in different evolutionary phases.
This hypothesis is consistent with the finding, mainly from X–ray surveys, that absorption
is much more common at low luminosities (see e.g. Ueda et al. 2003, la Franca et al. 2005,
Maiolino et al. 2007, Hasinger 2008) and, possibly, at high redshift (La Franca et al. 2005;
Ballantyne et al. 2006; Treister & Urry 2006; Hasinger 2008). The luminosity and redshift
dependence of the obscuring fraction may be naturally linked to the AGN radiative power
(related to the intrinsic X–ray luminosity, see e.g. Lawrence & Elvis 1982) which is able
to ionize and expel gas (more common at high-z) and dust from the nuclear regions, nicely
fitting the current framework of AGN formation and evolution sketched above (see, for ex-

– 5 –
ample, Hopkins et al. 2006). The complete picture is likely to be more complex, depending
on many other parameters such as the BH mass, the Eddington ratio, the star formation
activity in the host galaxy and, in particular, the timescales associated with the AGN duty
cycle activity.
A correct and complete identification of unobscured, obscured and highly obscured AGN
at all redshifts (and especially in the z=1-3 interval, where most of the feedback is expected
to happen) is therefore crucial for a comprehensive understanding of the still little explored
phase of the common growth of SMBHs and their host galaxies. While it is relatively
straightforward to select unobscured AGN from optical multicolor surveys (e.g. Richards
et al. 2002) and/or from spectroscopic samples (e.g. the VVDS survey, Gavignaud et al.
2006, Bongiorno et al. 2007), the most efficient, reddening independent method to select
obscured, type–2 AGN is the presence of luminous X-ray emission (L[2−10keV ] > 1042 erg s−1)
and hard X-ray colors (see Brandt & Hasinger 2005 for a review). Indeed, hard (2-10 keV)
X-ray nuclear emission is an almost unambiguous mark of the presence of an AGN, given the
extremely small contamination from star-formation induced emission at these luminosities
and frequencies. Combined with the fact that hard X-rays are not seriously affected by
obscuration due to neutral gas along the line of sight (up to NH ∼ 1023 cm−2), it is clear
that hard X-ray selection is the most effective method to uncover unobscured to moderate
obscured AGN and study in detail their demographics (see Comastri & Brusa 2008; Brandt
& Alexander 2010 for a review).
Since the launch in 1999 of both the XMM–Newton and Chandra satellites, a large (>
30) number of surveys covering a wide fraction of the area vs. depth plane (see Fig. 1 in
Brandt & Hasinger 2005; see also Hickox 2009) have been performed, and our understanding
of AGN properties and evolution has received a major boost. Thanks to vigorous programs of
multiwavelength follow-up campaigns, sensitive X–ray observations turned out to be highly
efficient in unveiling weak and/or ”elusive” accreting black holes, in a variety of otherwise
non-active galaxies (i.e. not recognized as AGN from the optical spectra or continuum
emission), such as (among others): X–ray Bright Optically Normal Galaxies (XBONG, e.g.
Comastri et al. 2002, Severgnini et al. 2003, Civano et al. 2007), Extremely Red Objects
(e.g. Alexander et al. 2002, Brusa et al. 2005, Severgnini et al. 2005), Sub Millimeter
Galaxies (e.g. Alexander et al. 2005, Laird et al. 2009), high-z starforming systems (e.g.
Daddi et al. 2007, Fiore et al. 2008, 2009, Treister et al. 2009b), Lyman Break Galaxies
(LBG, e.g. Brandt et al. 2002, Nandra et al. 2002, Aird et al. 2008). In many of these cases,
the AGN responsible for the X-ray emission is overwhelmed at longer wavelength by the host
galaxy light and/or the obscuration might be connected to processes within the host galaxy
itself, such as the presence of dust lanes or starburst disks (see e.g. Martinez-Sansigre et
al. 2005, Ballantyne et al. 2006, Ballantyne 2008, Hopkins et al. 2009). This suggests that

– 6 –
the accretion activity (especially in high-redshift sources) can be unambiguously revealed
thanks to the presence of a strong X–ray emission (see e.g. discussion in Brusa et al. 2009)
and, therefore, the combination of both X-ray and optical classifications, coupled with the
multiwavelength analysis, can be crucial to fully assess the nature of the candidate AGN.
The high level of completeness in redshift determination for a large number of X–ray
selected AGN (up to a few thousands) has made possible a robust determination of the
luminosity function and evolution of unobscured and mildly obscured AGN which turned
out to be luminosity dependent: the space density of bright QSOs (LX > 1044 erg s−1) peaks
at z∼ 2–3, to be compared with the z∼0.7–1 peak of lower luminosity Seyfert galaxies (Ueda
et al. 2003; Hasinger et al. 2005; La Franca et al. 2005, Silverman et al. 2008; Ebrero et al.
2009, Yencho et al. 2009). Based on the Ueda et al. (2003) work, Marconi et al. (2004) and
Merloni (2004) were the first to propose that SMBH undergo a “anti–hierarchical” evolution,
in the form of a differential growth (earlier and faster for more massive black holes). This
anti–hierarchical behavior observed in AGN evolution (similar to that observed in normal
galaxies, e.g. Cowie et al. 1996) provided an important and independent confirmation that
the formation and evolution of SMBH and their host galaxies are likely different aspects of
the same astrophysical process. It should be noted that the Luminosity Dependent Density
Evolution (LDDE) parameterization, corresponding to a strong downsizing, has been recently
questioned by Aird et al.(2010). Their preferred model for the evolution of the XLF is a
luminosity and density evolution model (LADE), where the shift in the redshift peak of AGN
space density as function of X–ray luminosity is much weaker than in LDDE models.
A full characterization of the AGN bolometric luminosity function can be obtained
only exploring the entire area vs. flux plane (e.g. combining samples from deep and large
area surveys) and adopting different AGN selection methods (X–ray vs. optical vs. infrared).
Nevertheless, it seems plausible that the blow-out phase associated with the obscured growth
represents a relatively short, but very powerful, episode in the QSO lifetime. For this rea-
son, the probability to detect rare and luminous X–ray events is maximized by large area
surveys and, in particular, by hard X–ray observations (to cope with obscuration effects)
and associated deep multiwavelength coverage.
The XMM–Newton wide-field survey in the COSMOS field (hereinafter: XMM-COSMOS,
Hasinger et al. 2007) is an important step forward in addressing the topics described above.
The ∼ 2 deg2 area of the HST/ACS COSMOS Treasury program (Scoville et al. 2007a,b;
Koekemoer et al. 2007) has been surveyed with XMM–Newton for a total of ∼1.55 Ms during
AO3, AO4 and AO6 cycles of XMM observations (Cappelluti et al. 2007, Cappelluti et al.
2009, hereafter C09). XMM-COSMOS provides an unprecedently large sample of point-like
X-ray sources (∼> 1800), detected over a large, contiguous area, with complete ultraviolet to
– 7 –
mid-infrared (including Spitzer data) and radio coverage, and extensive spectroscopic follow–
up granted through the zCOSMOS (Lilly et al. 2007; 2009) and Magellan/IMACS (Trump
et al. 2007; 2009) projects. The excellent multiband photometry available in this area allows
a robust photometric redshift estimate for the faint sources not reachable by optical spec-
troscopy, thus allowing a virtually complete sample of X-ray sources. The XMM-COSMOS
project is described in Hasinger et al. (2007), while the X–ray point source catalog and counts
from the complete XMM-COSMOS survey are presented in a companion paper (C09). The
present paper, which extends the work presented by Brusa et al. 2007 (hereiafter B07) on the
optical identifications of the X–ray point sources in the XMM-COSMOS survey, discusses the
multiwavelength properties of this large sample of X-ray selected AGN. Several works have
already appeared in the literature and are based on this catalog, or on previous versions of
it, e.g.: the derivation of AGN photometric redshifts (Salvato et al. 2009); the IMACS AGN
spectroscopic campaign (Trump et al. 2009); the clustering properties of spectroscopically
confirmed AGN (Gilli et al. 2009); the space density of high-redshift QSOs (Brusa et al.
2009); the host galaxies properties of AGN in COSMOS (Gabor et al. 2009); the on-going
and co-evolving starformation and AGN activity at z< 0.8 (Silverman et al. 2009a); the
environments of AGN within the galaxies density field (Silverman et al. 2009b); the relation
of the X–ray and optical emission in BL AGN (Lusso et al. 2010).
The paper is organized as follows: Section 2 presents the multiwavelength datasets
drawn from the COSMOS survey and used in the paper; Section 3 describes the method
used to identify the X-ray sources and its statistical reliability; the XMM-COSMOS multi-
wavelength catalog is presented in Section 4, while Section 5 reports the redshift information
for the X-ray sources. The number density evolution of luminous XMM-COSMOS sources is
presented in Section 6. Section 7 describes the X–ray to optical and near infrared properties
of the identified population and of the obscured AGN candidates, while in Section 8 we dis-
cuss the obscured AGN fraction as a function of the X–ray luminosity. Section 9 presents the
spectrum and SED of a prototype obscured QSO at z∼ 1.6, and in Section 10 we summarize
the most important results. Throughout the paper, we adopt the cosmological parameters
H0 = 70 km s−1 Mpc−1, Ωm=0.3 and ΩΛ=0.7 (Spergel et al. 2003). In quoting magnitudes,
the AB system will be used, unless otherwise stated.
2. Multiwavelength Datasets
2.1. X–ray
The catalogue used in this work includes 1848 point–like sources above a given threshold
with a maximum likelihood detection algorithm in at least one of the soft (0.5–2 keV), hard

– 8 –
(2–10 keV) or ultra-hard (5–10 keV) bands down to nominal limiting fluxes of ∼ 5×10⁻¹⁶,
∼ 3×10⁻¹⁵ and ∼ 7×10⁻¹⁵ erg cm−2 s−1, respectively (i.e., the flux of the faintest source
detected in the band, see C09). The adopted likelihood threshold corresponds to a probability
∼ 4.5 × 10⁻⁵ that a catalog source is a spurious background fluctuation (see Cappelluti et
al. 2007 and C09 for more details). In the present analysis we used the source list created
from 53 out of the 55 XMM-COSMOS fields; for the additional 65, faint sources detected
when the pointings obtained in AO6 are included, the identification is not completed yet.
For this reason, the number of XMM-COSMOS sources is slightly lower than that discussed
in C09. Twenty-six faint sources in our catalog are coincident with diffuse XMM sources in
the catalog by Finoguenov et al. (2009). These sources are flagged as “possibly extended”
in the pointlike catalog and are excluded from the following analysis. The inner part of the
COSMOS field has been imaged for a total of 1.8 Ms by Chandra (Elvis et al. 2009), with 36
pointings of ∼ 50 ks each in a 6x6 array. The mosaic covers an area of ∼ 0.92 deg2 (about
half of the XMM-COSMOS field) down to a limiting flux of ∼ 2 × 10⁻¹⁶ erg cm−2 s−1 in
the soft band and ∼ 7.3 × 10⁻¹⁶ erg cm−2 s−1 in the hard band, i.e. 3-4 times deeper than
XMM-COSMOS. Of the 1822 XMM-sources, 945 (51.9%) have been observed by Chandra
with an exposure larger than 30 ks, and 875 of them are present in the C-COSMOS point-
like source catalog (Elvis et al. 2009, Puccetti et al. 2009). Of the 70 sources not recovered
by Chandra, more than half are in regions with relatively low exposure (between 30 and
50 ks) and are detected at faint XMM fluxes, mostly in the hard band (∼< 6 × 10⁻¹⁵ erg
cm−2 s−1). The remainder are either sources with only hard XMM detections (14) or, after
a visual inspection, they can be associated with spurious sources (15), consistent with the
expected fraction of spurious sources in the XMM-COSMOS field (see Elvis et al. 2009).
Twenty-five of the 875 XMM-COSMOS sources with Chandra detection (2.8%) are resolved
in two different Chandra sources, lying at distances between 2 and 10 arcsec from each other
and therefore being likely blurred in the XMM large PSF (see discussion in C091). We
will further discard these 25 sources in the following analysis. The XMM-COSMOS sample
presented in this catalog consists therefore of 1797 X-ray sources, 850 with Chandra detection
(47.3%). In the following, we use the subarcsec accurate Chandra positions to control-check
the optical/NIR identifications proposed in Section 3, and to assess the reliability of the
proposed identifications.
1The twenty-five XMM-COSMOS sources with two Chandra counterparts are listed here for completeness.
XID numbers refer to column 1 in the Cappelluti et al. 2009 catalog table: #35, #82, #131, #208, #215,
#307, #336, #354, #365, #380, #384, #419, #2591, #2618, #5141, #5208, #5355, #5556, #10764,
#31163, #53328, #54468, #60133, #60275, # 5210

– 9 –
2.2. Optical, near infrared and Spitzer photometry
As we will describe in the next Section, the XMM-COSMOS catalog has been cross-
correlated with an updated version of the optical multiband catalog of Capak et al. 2007
(“optical catalog” hereafter), the CFHT/K band catalog (Mc Cracken et al. 2010, “K-band
catalog” hereafter), the IRAC catalog (Sanders et al. 2007, Ilbert et al. 2009, “IRAC
catalog” hereafter) and the 24 µm MIPS catalog (Le Floc’h et al. 2009, “MIPS catalog”
hereafter). The optical catalog2 contains about 1.5 million objects detected in at least one of
the Subaru bands (b,v,g,r,i,z) down to an AB magnitude limit of ∼ 27. The K-band catalog
contains about 5×10⁵ galaxies detected at a S/N>5 down to K(AB)=23.5 (see details in
Mc Cracken et al. 2010). The IRAC catalog contains about 4×10⁵ objects detected in
the 3.6 micron (IRAC channel 1) band and it is 90% complete at > 1µJy (AB=23.9). For
each source in the IRAC catalog, the photometry from all the other IRAC channels is also
reported. The MIPS catalog, obtained in Cycles 2 and 3, has very accurate photometry
(Sanders et al. 2007). The catalog has been cleaned of spurious sources (mostly asteroids,
Le Floc’h et al. 2009) and contains ∼ 50000 sources. In the XMM-COSMOS area there are
∼ 36000 sources detected with a signal to noise > 5 (implying a 24µm flux limit of 80µJy).
We also matched the X-ray counterparts with the 70 µm MIPS catalog (Frayer et al. 2009,
Kartaltepe et al. 2010) which contains ∼ 1500 sources down to ∼ 4 mJy, and with the VLA
COSMOS catalog (∼ 2400 sources at a limiting flux of ∼ 50µJy/beam , Schinnerer et al.
2007, Bondi et al. 2008).
3. Identification of X-ray sources
We have matched a counterpart to each of the 1797 X-ray sources as follows.
• First, we associated the X-ray positions to the optical ones (I-band) using the statistical
method described in B07 (the “likelihood ratio technique”, Sutherlands & Saunders
2publicly available at:
http://irsa.ipac.caltech.edu/data/COSMOS/tables/ib.
The detection image, I band mask, and SExtractor settings for the optical catalog were significantly modified
from the version presented in Capak at al 2007, which is now superseeded. All point-like sources brighter
than 17th magnitude were modeled and subtracted from the detection image. This allowed the de-blending
contrast to be set at a higher value, thus significantly decreasing the number of spurious sources without
missing objects around bright sources and significantly reducing the number of close pairs blendings. In
addition to lowering the contrast parameter, several of the detection parameters were adjusted to decrease
the number of noise peaks at the faint end of the catalog. The combination of the change in background,
de-blending, and detection results in small changes in the centroid and flux for some sources.

– 10 –
1992, Ciliegi et al. 2003) in order to isolate the most obvious associations, and, at
the same time, to pick up problematic cases (i.e. sources with 2 or more different
counterparts with comparable likelihood or sources too faint to be identified). The
method calculates the probability that a source is the correct association by weighting
the information on the X–ray to optical distance, the surface density of (possible)
false coincidence background objects and the brightness of the chosen counterpart (see
B07 for other details). We divided the sources in three different classes: “reliable id”,
“ambiguous id” (comprising mostly 2 relatively bright sources with similar probability
of being the correct optical counterpart) and “not identified” (comprising mostly faint
or undetected sources for which the association is not statistically significant). Roughly,
the 1797 sources were split into the three classes with the following percentages: 80%,
10%, 10%, respectively, in agreement with the analysis reported in B07 that was limited
to a subsample (∼ 700 sources, 40%) of the complete XMM-COSMOS sample.
• Then, we cross-correlated the optical positions with the K-band and IRAC catalogs.
We created I-band (using ACS data in the inner 1.7 deg2 area, the Subaru I-band
data elsewhere), K-band and IRAC (3.6µm and 8.0µm) 20′′x20′′ cutouts around each
of the 1797 X-ray positions and visually checked the correctness of the optical/IR
matches. Most of the “not identified” sources turned out to be associated to bright,
isolated K-band or IRAC counterparts and therefore were moved into the “reliable id”
sample. However, the diversity of the SED of objects in the sky led a large number
of sources showing up in the IR, adding ambiguity to some of the proposed “reliable”
associations. The distribution of the sources in the three classes after the correlation
with the K-band and IRAC catalogs is: 1458 sources (81.3%) in the “reliable ID” class,
319 sources (17.7%) in the “ambiguous ID” class and 20 sources (0.9%) in the “not
identified” class.
3.1. Chandra-XMM matches and position
Chandra subarcsecond accurate X-ray positions are available for 850 of the 1797 XMM-
COSMOS sources (see Sect 2). Of these 850 objects, 712 were in the “reliable ID” class
(83.7%), 135 (15.9%) were in the “ambiguous ID” class, and the remaining 3 were “not
identified” (0.4%). The lower percentage of not identified sources in the Chandra detected
subsample can be due to the fact that many of the objects in this class might be spurious
XMM sources and therefore not even detected by Chandra (see also discussion in Elvis et
al. 2009). Indeed, many of the sources without an optical id have a faint XMM flux, close
to the detection limit.
– 11 –
Of the 712 objects in the class of “reliable ID”, Chandra pointed to a counterpart
different from the one proposed in 12 cases (1.7%, Figure 1, upper left panel). This fraction
is lower for the brightest (flux limited, see below) sample (1.3%) and rises up to∼ 6% for
the faintest sources. Among the 135 sources in the “ambiguous ID” class, in 114/135 cases
(84.4%) Chandra points to one of the two proposed associations (Figure 1, upper right panel),
choosing the primary identifications in 50% of the cases and the secondary in the remaining
half. For the remaining 21 objects (15.6%) the Chandra information was not good enough
to solve the ambiguity in the identification (Figure 1, lower left panel). Finally, all of the
3 “not identified” XMM sources were associated with a Chandra source at a large distance
(> 5′′) from the XMM position and coincident with a relatively bright optical counterpart
(Figure 1, lower right panel). We incorporated the Chandra information in our ID process
and, at the end, we were able to reliably identify 1577 XMM sources (87.7%); we still classify
as “ambiguous ID” 203 sources (11.3%) and we could not identify 17 sources (1.0%). If we
use the 1.7% of wrong identifications obtained above as an estimate of the failure rate of
the likelihood ratio technique applied to the XMM-COSMOS data, we estimate that ∼12-13
sources out of the 747 sources in the “reliable ID” class without Chandra coverage can still
be associated with a wrong counterpart.
To maximize the completeness over a well defined large area and, at the same time, keep
selection effects under control, we further defined a subsample of sources detected above the
limiting fluxes corresponding to a sky coverage of more than 1 deg2 in at least one of the
three X–ray energy ranges considered, namely: 1×10⁻¹⁵ erg cm−2 s−1, 6×10⁻¹⁵ erg cm−2
s−1, and 1×10⁻¹⁴ erg cm−2 s−1, in the 0.5–2 keV, 2–10 keV or 5–10 keV bands, respectively
(see also Table 2 in C09). This subsample includes 1651 X–ray sources, that will be used
in the following to investigate the multiwavelength properties of XMM counterparts (see
Section 7). The combination of area and depth is similar to the one of the sample studied
by Silverman et al. (2008, see their Fig. 8) in the Chandra Multiwavelength Project survey
(ChaMP, Kim et al. 2007); the main difference is given by the considerably higher redshift
completeness obtained in COSMOS thanks to the much deeper coverage in the optical and
near IR bands and the systematic use of photometric redshifts (see below). This drastically
limits the need for substantial corrections for incompleteness (see discussion in Silverman
et al. 2008). When imposing the limiting flux thresholds, the breakdown of the objects in
the three classes is as follows: 1465 “reliable ID” (88.7%), 175 “ambiguous” (10.6%) and
11 (0.7%) “not identified”. A summary of the identification process and the breakdown in
the classes of “reliable ID”, “ambiguous ID” and “not ID”, before and after the Chandra
control-check, and before and after the inclusion of thresholds in X-ray fluxes is reported in
Table 1.

– 12 –
Table 1. Summary of optical identification of point-like XMM sources
sample Total sources Reliablea (%) Ambiguousb (%) unidentified (%)
Chandra area 850 712 (83.8%) 135 (15.9%) 3 (0.3%)
(before Chandra check)
Chandra area 850 829 (97.5%) 21 (2.5%) 0 (0.%)
(after Chandra check)
XMM-COSMOS area 1797 1458 (81%) 319 (18%) 20 (1.0%)
(before Chandra check)
XMM-COSMOS area 1797 1577 (87.7%) 203 (11.3%) 17 (1.0%)
(after Chandra check)
XMM-COSMOS area 1651 1465 (88.7%) 175 (10.6%) 11 (0.7%)
(after flux thresholds)
aWe classified as “reliable” those sources for which the multiwavelength analysis consis-
tenly point to the same counterpart, expected to be correct in 98% of the cases (see Section 3
for details).
bWe classified as “ambiguous” those sources for which the multiwavelength analysis didn’t
allow us to reliably associate a unique counterpart to the X–ray sources; for these objects,
two sources with comparable likelihood are present in the X–ray error-box. See Section 3
for details.

– 13 –
200 400 600
XID 376 XID 376 XID 376
200 400 600
XID 89 XID 89
-0.02 -0.01 0 0.01 0.02 0.03 0.04
XID 5338 XID 5338
-0.01 0 0.01 0.02 0.03
XID 53751 XID 53751
Fig. 1.— HST/ACS cutouts showing four examples of the use of C-COSMOS data in the pro-
cess of identifying XMM-COSMOS sources (see Section 3.1). (upper left): the C-COSMOS
position pointed to a counterpart different from the proposed (“reliable”) one; (upper right):
the C-COSMOS position pointed to one of the possible counterparts (“ambiguous” class);
(lower left): the C-COSMOS position doesn’t help in choosing a counterpart in the ambigu-
ous class; (lower right): the C-COSMOS position helped in choosing the correct counterpart
for sources in the “not identified” class. In all four examples shown, the left image is the
ACS cutout and the right image is the Chandra cutout. The size of the cutouts is ∼ 12”. In
all the cutouts, the XMM position is marked by the large, 5” radius cyan circle; the Chandra
position by a smaller, 1.5” radius white circle; and the candidate counterpart(s) from the
XMM alone analysis with a green, 1” radius, circle. The scale bars below the upper cutouts
represent a logaritmic scale of the X–ray counts, while, as a comparison, the scale bars below
the bottom panels represent the scale of the HST/ACS emission.
4. The XMM-COSMOS multiwavelength catalog
The photometry at different wavelengths (except MIPS) has been cross-correlated with
the positions of the XMM-COSMOS counterparts (see Section 3) using a 0.5′′ radius, and

– 14 –
all the matches have been visually inspected, in order to remove false associations or include
obvious matches at larger distances (> 0.5”). A significant number of sources (∼ 10%) of
the XMM-COSMOS counterparts turned out to be associated with blended objects in the
IRAC catalog (e.g. the IRAC source is a clear blend of two different objects). Therefore, the
photometry in the four different IRAC bands has been re-extracted at the position of the
XMM-COSMOS counterparts, using a PSF fitting routine, allowing us a better determination
of the fluxes for these blended IRAC sources. The MIPS catalog has been cross-correlated
with the IRAC positions of the XMM-COSMOS counterparts using a radius of 2.5′′ and
all the matches have been validated through a visual inspection. At the end, 1760 (98%)
sources in the XMM-COSMOS sample have associated entries from the “optical catalog”,
1745 (97%) have photometry from the “K-band catalog”, 1711 (95%) sources have IRAC
3.6µm photometry retrieved from the “IRAC catalog” or re-extracted at the position of the
optical counterparts, and 1394 (∼ 78%) have 24µm MIPS counterparts. Only two sources
(XID 5120 and XID 556) have no associated photometry in any of the optical or infrared
catalogs used. Both of them are close to bright stars (I< 16).
Table 2 lists the basic properties of the complete XMM-COSMOS counterpart sample:
XMM-COSMOS IAU designation (column 1); the XMM-COSMOS identifier number (from
C09, column 2); the coordinates of the optical/IR counterpart (J2000, column 3 and 4); the
X–ray fluxes in the soft, hard and ultra-hard bands (from C09; columns 5,6, and 7, respec-
tively); a flag identifying the sources included in the flux-limited sample (column 8); the
X–ray hardness ratio, HR, defined as HR=(H-S)/(H+S) where H are the hard band counts
and S the soft band counts, respectively (column 9); the Chandra-COSMOS identifier num-
ber (from Elvis et al. 2009, column 10); the flag for the optical identification, according to
the classes described in Table 1 (column 11); the identifier number from Capak et al. (2007)
catalog3 (column 12); the identifier number as reported in the optical catalog and in Ilbert et
al. (2009) (column 13); the r-band and I-band magnitudes (from Capak et al. 2007; column
14 and 15); the K-band magnitude (from Mc Cracken et al. 2010; column 16); the magni-
tudes in the four IRAC channels (from Ilbert et al. 2009; columns 17-20); the MIPS 24µm
magnitude (from Le Floc’h et al. 2009; column 21); the spectroscopic redshift (see Section 5;
column 22); the spectroscopic classification according to the classes outlined in Section 5.1
(column 23); the origin of the spectroscopic redshift, with relevant notes (column 24); the
photometric redshift (from Salvato et al. 2009; column 25). In case of ambiguous sources, all
the possible counterparts of the XMM-COSMOS sources are listed. Table 2 is also available
in ASCII format at the link: http://www.mpe.mpg.de/XMMCosmos/xmm53 release/.
3The Capak et al. (2007) photometric catalog is available at IRSA, at the link:
http://irsa.ipac.caltech.edu/data/COSMOS/tables/photometry/cosmos phot 20060103.tbl.gz

– 15 –
Fig. 2.— Histograms of the flux distributions for the soft (0.5-2 keV, 1545 sources; left),
hard (2-10 keV, 1078 sources; middle) and ultra-hard (5-10 keV, 246 sources; right) samples.
The vertical line shows the flux at which the sky coverage is 1 deg2 (with 1465, 925 and
221 soft, hard, and ultra-hard sources respectively). The blue histograms show the flux
distributions for the subsamples of sources with spectroscopic redshift, including 780, 565
and 178 sources in the soft, hard and ultra-hard band, at fluxes higher than the adopted
thresholds, respectively.
The distribution of the X-ray to optical distances and of the I-band magnitudes for the
XMM-COSMOS counterpart sample, derived considering the first counterpart listed in Table
2 for the 203 sources with an “ambiguous” counterpart, are very similar to those reported
in B07. More specifically, about 90% of the reliable optical counterparts have an X–ray to
optical separation (∆(X − O)) smaller than 3′′ which is better than the ∼ 80% found in
XMM–Newton data of comparable depth (see e.g. Fiore et al. 2003, hereinafter F03, Della
Ceca et al. 2005, Loaring et al. 2005). The improvement is likely given by the combination
of the accurate astrometry of the positions of the X-ray sources (tested with simulations in
Cappelluti et al. 2007), the full exploitation of the multiwavelength catalog (optical and
infrared) for the identification process, and the availability of Chandra accurate positions.
The majority of the XMM-COSMOS counterparts (∼68%) have optical (IAB) magnitudes
in the range 20 < IAB <24, with a median magnitude of IAB = 21.98 (with dispersion of
1.35), and two symmetric tails at fainter and brighter magnitudes. The median magnitude
of optical counterparts is slightly fainter than, but still consistent with, the median value
presented by B07. The above mentioned distributions do not change if we make a different
choice for the optical counterpart of the 203 “ambiguous” sources, i.e. the second most likely
optical counterpart is considered instead. As an example, the median optical magnitude
would be IAB = 21.96 (with dispersion 1.36). The same applies to other quantities (e.g.
K-band magnitudes, photometric redshifts etc.). Therefore, from a statistical point of view,

– 16 –
the multiwavelength properties discussed in this paper can be considered representative of
the overall X-ray point source population, at the sampled X–ray fluxes.
5. Spectroscopic and photometric redshifts and source breakdown
Good quality spectroscopic redshifts for the proposed counterparts are available from
Magellan/IMACS and MMT observation campaigns (∼ 530 objects, Trump et al. 2007,
2009), from the VIMOS/zCOSMOS bright project (∼ 500 objects, Lilly et al. 2009), from
the VIMOS/zCOSMOS faint project (∼ 80 objects, Lilly et al. 2007) or were already
present either in the SDSS survey catalog (∼ 100 objects, Adelman-McCarthy et al. 2005,
Kauffman et al. 20034) or in the literature (∼ 95 objects, Prescott et al. 2006). Additional
∼ 40 objects have redshifts from ongoing spectroscopic campaigns designed to target high-
redshift, faint objects with the DEIMOS instrument at KeckII telescope (PI: P. Capak, M.
Salvato, N. Scoville). In summary, a total of 890 unique, good-quality spectroscopic redshifts
are available for XMM-COSMOS sources, 852 when the XMM-COSMOS flux limited sample
is considered, corresponding to a substantial fraction (∼ 52%, 852/1651) of the sample
investigated in this paper.
Figure 2 shows the flux distributions in the soft, hard and ultra-hard bands, respec-
tively, for the entire X–ray source population (black histograms) and for the subsample with
spectroscopic identifications (blue histograms). The vertical line shows the flux at which
the sky coverage is 1deg2 (with 1465, 925 and 221 soft, hard, and ultra-hard sources respec-
tively). The spectroscopic completeness increases with the energy band considered: it is
∼ 53% (780/1465) in the soft band, ∼ 61% (565/925) in the hard band, while the highest
percentage is reached in the ultra-hard band (178/221, ∼ 80%). The high spectroscopic
completeness in the ultra-hard sample reflects the fact that the sources are detected at
bright fluxes and, therefore, associated on average to bright optical counterparts (median
IAB ∼ 20.7, to be compared to the median magnitude of the entire sample, IAB ∼ 22, see
Section 4) therefore favoring the spectroscopic follow-up.
Photometric redshifts for all the XMM–COSMOS sources have been obtained exploiting
the COSMOS multiwavelength database and are presented in Salvato et al. (2009). Since
the large majority of the XMM–COSMOS sources are AGN, in addition to the standard
photometric redshift treatments for normal galaxies, a new set of SED templates has been
adopted, together with a correction for long–term variability and luminosity priors for point-
4These sources have been retrieved from the NED, NASA Extragalactic Database and from the SDSS
archive.

– 17 –
0
5
10
15
20
25
30
35
40
0 0.5 1 1.5 2 2.5 3 3.5 4 4.50
5
10
15
20
25
30
35
40
0 0.5 1 1.5 2 2.5 3 3.5 4 4.5
Fig. 3.— (Left panel): Redshift distribution of the extragalactic XMM-COSMOS counter-
parts in ∆z=0.05. Open histogram = all sources for which a spectroscopic or photometric
redshift is available (1670); filled histogram = sources with measured spectroscopic redshift
(844). (Right panel): Source breakdown of the spectroscopic sample (open histogram) in 3
different classes (solid histograms) based on the combined optical and X–ray classification
(upper-left: BL AGN; upper-right: NL AGN; lower-left: non-AGN; see text for details).
The lower-right panel shows the distribution of the sources with photometric redshifts only
(cyan histogram) and, as a comparison, the redshift distribution for the high-z obscured
AGN candidates discussed in Section 7. The redshift bin in all the panels is ∆z=0.05.
like sources (see Salvato et al. 2009 for further details). Thanks also to the availability of
the intermediate band Subaru filters (Taniguchi et al. 2007), crucial in picking up emission
lines (see also Wolf et al. 2004), we were able, for the first time for an AGN sample,
to obtain photometric redshift accuracy comparable to that achieved for inactive galaxies
(σ∆z/(1+z) ∼ 0.015 and ∼ 5% outliers) at I∼<22.5. At fainter magnitudes (22.5 < I < 24.5)
the dispersion increases to σ∆z/(1+z) ≃ 0.023 with ∼ 10% outliers, still remarkably good for
an AGN sample. A photometric redshift is available for all but 31 (24) objects out of 1797
(1651) objects in the complete (flux-limited) XMM-COSMOS counterpart sample. About
half of them do not have wide multiband photometry, being detected only in the IRAC and
K bands. The remaining half are affected by severe blending problems in the IR making the
photo-z estimate unreliable.

– 18 –
Considering the spectroscopic and photometric sample, we have an almost 100% com-
pleteness in redshift for the XMM-COSMOS sources: only 28 sources do not have a pho-
tometric or spectroscopic measured redshift (21, i.e. less than 1.3%, in the flux limited
sample).
The left panel of Figure 3 shows, as an open histogram, the redshift distribution of the
objects in the XMM-COSMOS counterpart sample. Only extragalactic sources are consid-
ered here. The black solid histogram shows the distribution of the objects with available
spectroscopic redshifts. The redshift distribution shows prominent peaks at various redshifts
(z∼ 0.12, z∼ 0.36, z∼ 0.95, z∼ 1.2, z∼ 2.1), both in the spectroscopic and photometric
subsamples. In particular, the structure at z∼ 0.36 is the one with the highest overdensity
with respect to a smooth distribution, being present over many wavelengths in the COSMOS
field (see Lilly et al. 2009), and is likely responsible for the excess signal observed in the
clustering amplitude of X–ray sources around rp ∼ 5 − 15h−1 Mpc described in details in
Gilli et al. (2009).
The XMM-COSMOS counterpart sample has 46 spectroscopically confirmed galactic
stars. Additional 53 objects are classified as stars on the basis of the inspection of the
optical finding charts and/or the observed spectral energy distribution, for which the best-
fit solution is obtained with a stellar template (see Salvato et al. 2009). Overall, 99 objects
are classified as stars, making up the 5.5% of the entire XMM-COSMOS counterpart sample
(6.5% when the soft sample is considered), in agreement with results from other large area
X–ray surveys at similar limiting fluxes (e.g., Covey et al. 2009 from the Champ Extended
Stellar Survey, Chess). We refer to a paper in preparation (Stelzer et al. 2010) for a detailed
analysis of the stars contents in XMM-COSMOS.
5.1. Spectroscopic breakdown
For the purposes of the present paper we divided the extragalactic sources with available
optical spectra in the XMM-COSMOS counterpart sample into three classes, on the basis of
a combined X–ray and optical classification (see also Szokoly et al. 2004). A more detailed
analysis of the optical spectra will be presented in future papers, based also on more complete
data that are rapidly being accumulated from on-going projects.
• Broad line AGN (BL AGN or AGN 1 hereafter): all the objects having at least one
broad (FWHM> 2000 km s−1) optical emission line in the available spectrum (421
sources, 416 in the flux limited sample);

– 19 –
Fig. 4.— (Left panel): Luminosity-redshift plane for the sources with spectroscopic redshift
detected in the soft band. Blue circles are AGN 1, red circles are AGN 2, green circles are
“normal” galaxies (see Section 5.1 for the definition). The continuous line represents the
completeness limit in the sample. (Right panel): The same as left panel, for the hard band
sample.
• Non-broad line AGN (NL AGN or AGN 2 hereafter): all the objects with unre-
solved, high-ionization emission lines, exhibiting line ratios indicating AGN activity,
and, when high-ionization lines are not detected, or the observed spectral range does
not allow to construct line diagnostics, objects without broad-line in the optical spec-
tra and with rest–frame hard X–ray luminosity in excess than 2×1042 erg s−1 typical
of AGN (370 sources, 344 in the flux limited sample; about 1/3 from line diagnostics;
see below for details);

– 20 –
• “Normal” galaxies: all the objects with unresolved emission lines consistent with
spectra of starforming galaxies or with a typical galaxy spectrum showing only absorp-
tion lines, and with rest–frame hard X–ray luminosity smaller than 2×1042 erg s−1, or
undetected in the hard band (53 sources, 49 in the flux limited sample);
The choice of using a combination of X-ray and optical criteria in the classification
was motivated by the fact that both obscured and unobscured AGN can be misclassified in
spectroscopic studies, given that the host galaxy light may over-shine the nuclear emission
(as in the cases of the XBONG; Moran et al. 2002, Comastri et al. 2002, Severgnini et al.
2003, Civano et al. 2007). Moreover, at high redshift (z> 0.5), the observed wavelength
range does not allow one to construct the standard line ratio diagnostics (BPT Diagrams,
Baldwin, Phillips and Terlevich, 1981, Kewley et al. 2001) used to distinguish between
starforming and Type 2 AGN at lower redshifts (z< 0.5), where a more accurate classification
is usually possible (see, e.g., discussion in Bongiorno et al. 2010 for the zCOSMOS Type
2 AGN sample). We chose a luminosity threshold of 2×1042 erg s−1 in the hard band5
to discriminate between star formation processes and accretion processes as responsible for
the X–ray emission, following two arguments: i) the most powerful local, starburst galaxy,
NGC 3256 has a 2-10 keV luminosity lower than this value (∼ 5 × 1041 erg s−1, see Moran
et al. 1988); ii) following Ranalli, Comastri & Setti (2003), this luminosity level can be
due to stellar processes only in objects with SFR larger than ∼400 M⊙ yr−1 (> 2000 M⊙
yr−1 for luminosities larger than 1043 erg s−1, typical of the large majority of our objects).
Furthermore, given the flux sensitivity of the XMM-COSMOS survey (solid line in Figure
4), objects less luminous than 2×1042 erg s−1 cannot be detected at redshift z∼> 0.5 (see also
next section), where optical spectroscopic classification starts to become problematic.
The right panel of Figure 3 shows the spectroscopic breakdown of the extragalactic
sample in the three classes reported above (upper-left, upper-right, and lower-left quadrants,
respectively). We also show the redshift distribution of the sources for which only photo-
metric redshifts are available (lower-right quadrant). Among the spectroscopically identified
sample, BL AGN make up ∼> 50% in both the soft and hard subsamples, and more than 60%
in the ultra-hard sample. The higher fraction of BL AGN in the ultra-hard sample is mainly
due to the shallower sensitivity of XMM at energies > 5 keV, which limits the detection
to the brigthest flux / luminosities where the fraction of obscured AGN is lower (see also
Section 8). The contribution of non-AGN sources (normal galaxies and stars) is maximum in
the soft sample (∼ 12%, 97 objects are classified in these two classes), decreases to ∼ 3% in
5When a source is detected only in the soft band the corresponding luminosity threshold used is 1042 erg
s−1.
– 21 –
the hard band (16 objects classified as stars or non-AGN) and only two sources are classified
in these two classes in the ultra-hard band.
Figure 4 shows the luminosity-redshift plane for the sources with spectroscopic redshift
detected in the soft (left panel) and in the hard band (right panel), respectively. Different
colors refer to different AGN or galaxy classes as detailed above. Among the sources in the
XMM-COSMOS sample with spectroscopic redshifts, only 64 (12) of the objects classified as
NL AGN are located at z> 1 (z>2), to be compared with 350 (124) in the BL AGN sample.
This is mostly due to the fact that high-redshift NL AGN are optically faint (typically
I∼ 23 − 24) and have not been targeted yet with dedicated spectroscopic campaigns (see
also Eckart et al. 2006, Caccianiga et al. 2008, Stalin et al. 2010).
6. Number Density Evolution
The high completeness in optical identifications of the XMM-COSMOS sample and the
availability of spectroscopic and photometric redshifts allows us to estimate the number den-
sities of AGN as a function of luminosity and redshift. A discussion of the X-ray luminosity
function is beyond the scope of this paper; a comprehensive analysis using XMM-COSMOS
and C-COSMOS data, combined with archival data, will be the subject of a future paper
(Miyaji et al. in prep.). In this section, we compare our first estimates of the number
density evolution of the most luminous AGN population, for which XMM-COSMOS can be
considered reasonably complete, with other recent measurements. In this analysis, we use
the traditional∑
1/Va estimator (Avni & Bahcall 1980).
In calculating the binned number density evolution we considered only the subsample
of sources detected in the hard (2-10 keV) band and included in the flux limited sample (925
sources at Sx = 6×10⁻¹⁵ erg s−1 cm−2; see Section 5 and Figure 2). We limited the analysis
to sources that have ID-class “reliable” or “ambiguous” (Table 1). As discussed in Section 4,
the statistical properties of the “primary” counterparts of those in the “ambiguous” class are
very similar to those of the secondary objects in the same class. Thus, we use the primary
identifications for the “ambiguous” class objects. In calculating the available volume Va, we
have used the curve of the hard-band survey solid angle versus flux limit from C09, calibrated
with extensive simulations and reproducing the observed logN-logS distribution (Cappelluti
et al. 2007; C09).
Using the hardness ratio (HR) between the soft and hard band count rates and the
XMM-EPIC energy response functions, we have estimated the absorption column density
(NH) of each source. If the AGN was not detected in the soft band, the upper limit was

– 22 –
Fig. 5.— The number density evolution from the XMM-COSMOS AGN in the luminosity
range logLX=44.5-47 and in the redshift range z=1-3 (black squares), compared with recent
results from Aird et al. (2010; open circles/black solid lines), Ebrero et al. (2009; pink
dot-dashed curves), Silverman et al. (2008; red dotted curves). The green dot-long-dashed
curve represents the expectation of XRB synthesis models from Gilli et al. (2007).
used instead. In calculating NH, we have assumed a Γ = 1.8 power-law for the unabsorbed
spectrum. If the HR were softer than the Γ = 1.8 intrinsic power-law, we have set NH = 0
and used the Γ calculated from the HR. The derived NH values are in good agreement with
those of the full X-ray spectroscopic analysis of bright XMM-Newton sources in the sample
(Mainieri et al. 2007, Mainieri et al. in preparation). The NH estimates have been used to
derive de-absorbed X–ray luminosities.

– 23 –
The available volumes Va have been calculated with K-corrections assuming the above
spectrum, folded with the hard band response curve of the XMM-Newton EPIC detectors
(pn + 2 MOS). Binning in luminosity has been made using the de-absorbed luminosities in
the rest-frame 2-10 keV. The sizes of the redshift bins have been determined adaptively such
that there are 20 objects in each bin. If the 20 objects bin is smaller than ∆z=0.2 or larger
than 0.9, these minimum and maximum sizes are used. The last two redshift bins have been
adjusted manually such that they contain approximately the same number of objects.
The results are presented in Figure 5, where the number density of XMM-COSMOS
sources with logLX = 44.5 − 47 erg s−1 is plotted versus the redshift (black squares). In
the calculation of the space density we limited the redshift interval to z=3, where the LX
corresponds to a 2-10 keV flux above our limit (see right panel of Figure 4). In the same
figure we plot the data points obtained from the AEGIS survey by Aird et al. (2010; black
circles at z< 1.2 red circles at z> 2), along with their best fit luminosity function (solid
black curve). We also plot the number density evolution for the XLF models from Ebrero
et al. (2009; pink dot-dashed curve), and Silverman et al. (2008; red dotted curve), and the
expectations from XRB synthesis models (Gilli et al. 2007; green dot-long-dashed curve).
The XMM-COSMOS and Aird et al. (2010) datapoints at z> 2 are consistent within ∼ 2σ
and the difference between the models can be ascribed to the way in which the models are
fit to the data. The XMM-COSMOS data points seem to favor a higher redshift (z∼ 2) peak
for the space density of luminous quasars, more consistent with an LDDE parameterization
(represented by the Ebrero et al. 2009 and Silverman et al. 2008 curves, though different in
the details; see also Yencho et al. 2009), than with the lower redshift peak expected from the
LADE model recently proposed by Aird et al. (2010), which is a factor of 2.5 lower than our
points at z ∼ 2.5. In particular, the number density evolution reproduced by XRB synthesis
models (Gilli et al. 2007) accounts for both the COSMOS and the Aird et al. (2010) points
to within the error bars.
7. Luminous Obscured AGN
In this section we discuss the strategy adopted to build a sample of luminous (logLX > 44
erg s−1) obscured AGN at moderate to high redshifts (1∼< z ∼< 2.5), fully exploiting the
photometric and spectroscopic information presented in the previous sections. In particular,
we make use of the high spectroscopic redshift completeness at relatively bright fluxes, and
the availability of spectral classifications, to assess the reliability/robustness of color-color
diagrams and flux ratios as diagnostics of the presence of an obscured AGN, i.e. objects for
which the optical nuclear emission is blocked (no broad lines in the optical spectra) and/or

– 24 –
characterized by substantial (logNH ∼> 21.5) X–ray obscuration. We will then apply these
diagnostics to select and study the fainter sources for which only photometric redshifts are
available. The devised method may complement systematic studies based on SED fitting,
allowing one to efficiently isolate luminous, obscured AGN at high-z for more detailed follow-
up analyses. All the statistical properties, correlation analyses and figures will be presented
for the flux limited sample of 1651 sources, since it is less affected by incompleteness, and
we expect a lower fraction (1.3%) of wrong identifications (see Section 3.1). We further
exclude from the analysis the 11 sources in this sample for which we are not able to provide
a reliable identification from our multiwavelength analysis (see Section 3 and 3.1). The
multiwavelength properties of fainter X–ray detected AGN (F0.5−2KeV ∼< 10−15 erg cm−2
s−1) will be investigated in the framework of the C-COSMOS survey (Civano et al. in
preparation).
7.1. Selection and sample construction
A proper source classification (AGN vs. starburst vs. passive galaxy) should ideally be
obtained via a complete analysis of its emission over the entire electromagnetic spectrum,
using both spectroscopic (e.g. emission line widths and ratios, see e.g. Bongiorno et al.
2010) and photometric (SED, Lusso et al. 2010, Elvis et al. 2010) observables. However,
a complete source characterization is difficult to obtain even in fields where the best and
deepest imaging and spectroscopic campaigns have been obtained, such as the COSMOS
field. A reliable information (at least in a statistical sense) can be obtained through the
analysis of the emission in bands where differences between nuclear and star formation
emission are emphasized. In particular, the combination of observed-frame mid-infrared,
near infrared and X–ray to optical flux ratios has been exploited recently in the literature to
isolate obscured AGN (see, e.g., F03, Martinez-Sansigre et al. 2005, 2006, Fiore et al. 2008,
Donley et al. 2008, Dey et al. 2008). We will apply in the following several multiwavelength
diagnostics in order to study the properties of the most obscured sources in the XMM-
COSMOS sample.

– 25 –
7.1.1. X–ray to optical and optical to near infrared colors (X/O and R−K)
Since the first source identification campaigns of hard X–rays surveys, a class of sources
with high (> 10) X-ray-to-optical flux ratio (X/O6; Hornschemeier et al. 2001, Alexander
et al. 2001; Giacconi et al. 2001; F03; Koekemoer et al. 2004; Eckart et al. 2006) has
been found. This value of X/O is significantly higher than the average value observed for
optically and soft X–ray selected AGN (Maccacaro et al. 1988). Later studies (e.g. Perola
et al. 2004, Civano, Comastri & Brusa 2005) found that the high-X/O sources tend also to
be obscured in the X-rays, with column densities of the order of 1022 − 1023 cm−2, and that
sources with X/O> 10 selected at bright fluxes (F2−10 ∼> 10−14 erg cm−2 s−1) are candidate
high-luminosity obscured quasars. Also, these sources are detected preferentially at z> 1
and characterized on average by red optical to near infrared colors (R−K ∼> 5, in the Vega
system) pointing towards a strong link between X–ray detected Extremely Red Objects and
Type 2 Quasars (Alexander et al. 2002; Mignoli et al. 2004, Brusa et al. 2005, Severgnini
et al. 2005, Georgantopoulos, Georgakakis & Akylas 2006).
The upper panels in Figure 6 show the X/O value as a function of the 2-10 keV X–
ray luminosity, separately for the XMM-COSMOS sources spectroscopically identified as BL
AGN (312 objects, left) and NL AGN (244 objects, right), detected in the 2-10 keV flux
limited sample (925 sources). The numbers in the top (bottom) left of each panel give the
number of objects in the different samples above (below) the dashed lines which correspond
to the thresholds of X/O> 10. For the objects above the dashed lines also the percentages
to the entire subsamples have been reported.
A strong correlation between the X/O ratio and the observed X–ray luminosity for AGN
2 has been discovered by the first massive identifications campaigns in Chandra and XMM-
Newton surveys (e.g., F03, Eckart et al. 2006), and it is related to the fact that the X–ray
luminosity is less affected by absorption than the optical luminosity. The same correlation is
also present in the XMM-COSMOS sample (upper right panel of Fig. 6). The dashed line is
the original F03 relation, the solid line is the relation which describes our data: the slope is
the same, while the zeropoint is different. This is mostly due to: i) the optical bands used in
the X/O parameter, R-band, having slightly different filter curves, and ii) most important,
the average magnitude of the spectroscopically identified sample being fainter for the XMM-
COSMOS sample with respect to the sample used in F03. On the contrary, objects in the
AGN 1 sample (upper-left quadrant) do not present such a trend.
6We define X/O=f2−10keV /fr−band, where the R–band flux is computed by converting r-band magnitudes
into monochromatic fluxes and then multiplying them by the width of the r-band filter (Zombeck 1990)

– 26 –
The lower panels of Figure 6 show the X/O vs. the 2-10 keV X–ray luminosity for the
sources with photometric redshifts, separately for the objects with a best-fit SED template
of unobscured quasars (model numbers SED from 19 to 30 in Salvato et al. 2009; left panel;
see also Lusso et al. 2010) and for sources best-fit with a galaxy-dominated template (model
numbers SED < 19 in Salvato et al. 2009; right panel). The sources in the lower right panel
of Fig. 6 show a correlation of the X/O vs. the X-ray luminosity similar to that present for
the AGN 2 sample, albeit with a somewhat larger scatter and higher normalization. The
fact that sources at fainter optical magnitudes (as it is the case for the sources in the photo-z
sample) have a higher normalization of the X/O vs. LX relation is obviously expected and
was already pointed out by Barger et al. (2005). The large and deep COSMOS spectroscopic
database allows us to test this variation using a suitably large (∼ 70) sample of faint (R > 23)
sources. When the sources with spectroscopic redshifts fainter than R = 23 are considered
(plotted for comparison with red symbols in the lower right panel of Fig. 6), they show the
same higher normalization of the X/O vs. LX relation. The observed correlation between
X/O and X–ray luminosity is due to the fact that, while the nuclear AGN X-ray luminosity
can span several decades, the host galaxy R-band luminosity (which dominates the optical
emission in obscured sources) has a much smaller scatter, less than one decade (see also
Treister et al. 2005). At fainter magnitudes, lower luminosity host galaxies are starting to
be detected, moving the points towards higher X/O values. In addition to these selection
effects, it is important to note that moving the SED of a moderately obscured or Compton
Thick AGN (see, e.g., Franceschini et al. 2000) to progressively higher redshifts the K–
corrections in the optical and X–ray band work in opposite directions. The shape of the
hard X–ray spectrum is responsible for a strong K–correction which “boosts” the X–ray flux
and favors the detection of high redshift sources. Conversely, the weak rest–frame optical–
UV emission is shifted in the R band explaining the extremely faint optical magnitudes. As a
consequence, the optical to X–ray flux ratio changes in a non–linear way (see also discussion
in Comastri, Brusa, Mignoli 2003) and this can explain the higher normalization observed
for the fainter sources.
Figure 7 shows the R − K color (Vega system) as a function of the 2-10 keV X–ray
luminosity, separately for the XMM-COSMOS sources spectroscopically identified as BL
AGN and NL AGN detected in the 2-10 keV flux limited sample. The numbers in the top
(bottom) left of each panel give the number of objects in the different samples above (below)
the dashed lines which correspond to the thresholds of R − K > 5. The fraction of AGN
2 with high X/O and/or red R − K colors is considerably higher than the corresponding
fraction for BL AGN (e.g. about 7.5% of AGN 2 have R − K > 5 while only ∼ 0.9%
of the BL AGN have the same red color). When the dependence of the R − K color on
the X–ray luminosity for the NL AGN sample is considered, there is evidence for a trend

– 27 –
where high-luminosity sources have redder colors than low-luminosity sources (right panel
of Fig. 7). The median R −K color for the high luminosity sample (LX > 1043.5 erg s−1) is
〈R −K〉 = 4.17 (0.53 dispersion), while it is 〈R −K〉 = 3.47 (0.62 dispersion) for the low-
luminosity sample (LX < 1043.5 erg s−1). This correlation is mostly driven by redshift effects,
the median redshifts of the two subsamples being z=0.93 and z=0.57, respectively. On the
other hand, lower luminosity (lower-redshift) BL AGN are slightly redder, as it is clear from
the left panel of Figure 7. In particular, the median R − K color for the high luminosity
sample (LX > 1044 erg s−1) is ∠R −K〉=2.58 (0.68 dispersion; similar to the average value
of R −K colors obtained from optically selected, bright quasars, Barkhouse & Hall 2001),
while it is 〈R−K〉=3.04 (0.55 dispersion) for the low-luminosity sample (LX < 1044 erg s−1).
The probability that the two distributions are drawn from the same parent population is
5.5×10⁻⁷ according to a Kolmogornov-Smirnov test. Given that the main difference of the
two samples is the average redshift (the low-luminosity sample being at considerably lower
redshift, z< 1, than the high-luminosity sample, z∼ 2), the most likely explanation of the
observed diversity is that, at low redshift, the host galaxy dominates the rest-frame optical
emission (as sampled by the R and K bands). These objects also present on average an
extended morphology (as derived from ACS analysis, see Gabor et al. 2009) and are similar
to the “extended BL AGN” presented in B07.
The left panel of Figure 8 shows the two obscured AGN indicators discussed above
plotted one against the other, e.g., the X/O ratio versus the R − K color (see also Brusa
et al. 2005). In addition to the spectroscopically identified population (plotted as colored
symbols) we also report as crosses the sources without spectroscopic redshifts for the whole
XMM-COSMOS catalog. In the region with R−K > 5 and X/O> 10 we have 105 sources,
16 with spectroscopic redshifts and 13 of them classified as AGN 2. The high rest-frame, 2-10
keV X–ray luminosities (logLX ∼> 43.5 erg s−1), further classifies these sources as quasars.
For the remaining 89 sources, only photometric redshifts are available.
7.1.2. Mid-infrared to optical flux ratio
Recently, the combination of high MIPS 24µm to optical flux ratio and red near infrared
to optical colors has been proven to be very efficient in selecting high-redshift starforming
galaxies (Yan et al. 2005, Houck et al. 2005) and heavily absorbed, possibly Compton Thick
AGN (see Fiore et al. 2008, 2009, Dey et al. 2008, Daddi et al. 2007, Sacchi et al. 2009).
Given the high X–ray column density, most of these sources may remain undetected even in
the deepest X–ray exposures and their AGN nature can be unvealed only through stacking

– 28 –
analysis (Daddi et al. 2007, Fiore et al. 2008, 2009, Lanzuisi et al. 2009). However, the
X–ray detected population may constitute the most-luminous and slightly less absorbed tail
of this heavily absorbed AGN population (see also discussion in Fiore et al. 2008).
The right panel of Figure 8 shows the ν24F24/νRFR value versus the R-3.6 color for all the
sources with MIPS detection in the XMM-COSMOS counterpart sample (the symbols have
the same meaning as before). There are 137 sources with ν24F24/νRFR > 10 and R-3.6≥ 4 (a
similar criterion has been introduced by Yan et al. 2007); 64 of them are in common with the
sample isolated on the basis of their combined high X/O and R−K colors (Section 7.1.1).
Among the remaining 73 objects, ten sources have spectroscopic redshifts and classifications
available: 2 of them are classified as AGN 1 and the remaining 8 are classified as AGN 2
from our combined optical and X-ray classification. For 63 sources no spectroscopic redshift
information is available.
In the following, we will refer to the sample of the 152 sources (89+63) without spec-
troscopic redshifts selected on the basis of their high X/O and/or ν24F24/νRFR ratio, and
red optical to near infrared colors as the “high-z obscured AGN candidates”. When the
spectroscopically identified population only is considered, these criteria appear to be robust
in selecting obscured AGN: only about 20% (5/25) of the sources satisfying these selection
criteria are classified as AGN1, while in the XMM-COSMOS flux limited sample the fraction
of AGN 1 over the total AGN1+AGN2 makes up ∼ 55%. Photometric redshifts are available
for 150/152 sources. The redshift distribution for these high-z obscured AGN candidates is
plotted in the bottom right of right panel of Fig. 3 (yellow histogram). This distribution
does not change if we consider only the 64 sources in common between the two selections
presented in 7.1.1 and 7.1.2. The vast majority of these sources lie at z=1-3.
7.2. Hardness ratio and X–ray obscuration
We explore in the following the X–ray properties of the high-z candidate obscured AGN
and compare them with those of the entire XMM-COSMOS sample. When the number of
counts in a source is inadequate to perform a spectral fit, a widely used tool to study the
spectral properties of an X-ray source is the hardness ratio HR (see the description of Table 2
in Section 4 for the definition and, e.g., Della Ceca et al. 2004, Mainieri et al. 2007). Mainieri
et al. (2007) showed that the HR and the column density of the sources derived from spectral
analysis are quite well correlated, and that 90% of the sources with column densities larger
than 1022 cm−2 have HR> −0.3. The results in Mainieri et al. (2007) have been obtained for

– 29 –
the subsample of the XMM-COSMOS counterparts described in B07; given that the redshift
distribution does not significantly differ from the one of the present sample (see Fig. 5 in B07
and Fig. 3 in this paper), we can rely on the HR−NH calibration as described in Manieri et
al. (2007). On the other hand, however, only about 50% of the sources with HR> −0.3 have
NH > 1022 cm−2. In order to create a cleaner sample of obscured AGN from an HR selection,
and to compare with previous results (e.g. Hasinger 2008), we use in the following a more
conservative limit of HR= −0.2 to distinguish between obscured and unobscured objects.
Above this threshold, ∼ 80% of the sources have NH > 1022 cm−2.
Figure 9 shows the HR distribution, normalized to the total number of sources, for the
entire XMM-COSMOS counterparts in the flux limited sample (1640), the AGN 1 sample
(416), the AGN 2 sample (344), and the high-z obscured AGN candidates, as isolated in
Section 7.1. As it is clear from the normalized distributions, the relative fraction of hard
sources increases from top to bottom: in particular, the fraction of sources with HR> −0.2
in the AGN 1 sample is only ∼ 10%, while it rises to 45% in the AGN 2 sample and up to
53% in the high–z obscured AGN candidates sample (80/152). The median values of the HR
in the three different classes are HR= −0.49 for the BL AGN, HR= −0.29 for the NL AGN,
and HR= −0.17 for the high–z obscured AGN candidates.
The average HR values of the two obscured AGN samples (NL AGN and high-z obscured
AGN candidates) are not directly comparable, given that the average redshifts of the two
samples are different (with median values of 〈z〉 = 0.73 and 〈z〉 = 1.72, respectively) and
the NH-HR relation is redshift dependent. In addition, it is worth to note that, if the NL
AGN sample is significantly contaminated by misclassified low-luminosity BL AGN for which
the broad line emission is diluted in the host galaxy light (see section 7.1 and next section
7.4), the average HR value may be contaminated too, resulting in an average softer value
than the intrinsic one. However, it is also worth to point out that the redshift effect works
against hard HR at high-z and, therefore, the fact that high-z obscured AGN candidates
are harder than NL AGN confirms the efficiency of the proposed selection in picking up the
most obscured sources.
7.3. IRAC color-color diagrams and color indices
Since the advent of the Spitzer satellite, several color-color diagrams based on the com-
bination of flux ratios from the four different IRAC channels have been widely used to classify
infrared sources and isolate obscured AGN missed in optical and near infrared surveys (Lacy
et al. 2004, Stern et al. 2005, Hatziminaouglou et al. 2005, Barmby et al. 2006).

– 30 –
Figure 10 shows the IRAC color-color diagram (as initially proposed by Stern et al. 2005)
for the sources in the XMM-COSMOS counterpart sample. For this analysis only sources
with IRAC detection in all the four bands and with good determination of the photometry
(i.e. not in masked region, with error < 25% of the IRAC flux) are considered, for a total
of 1326 objects. Panel (a) shows the distribution in this diagram of the spectroscopically
identified population, for the three different categories described in Section 5.1: 380 AGN
1 (blue circles), 296 AGN 2 (red circles), 37 normal galaxies (green circles). The locus at
[5.8]-[8.0]> 1 and [3.6]-[4.5]< 0 mainly selects X–ray sources which are expected to be low
redshift normal and star forming galaxies (see also discussion in Feruglio et al. 2008). The
dashed lines isolate the wedge for the selection of luminous quasars, originally proposed in
Stern et al. (2005). While 90% of the BL AGN are successfully recovered from the IR
selection, and reassuringly almost all (95%) of the normal galaxies detected in the X–rays
lie indeed outside the wedges, only 48% of the X–ray selected non-broad line AGN lie within
the Stern’s wedge. Similar results can be obtained using IRAC-based color-selection wedges
different from the specific one proposed by Stern et al. (2005), e.g. those proposed by Lacy
et al. (2004) or Hatziminaoglou et al. (2005). This analysis confirms that purely IRAC
based criteria are not optimally designed to select AGN in which the host galaxy dominates
the near-infrared energy (e.g. lower-luminosity AGN), and/or AGN obscured in the IRAC
bands, and therefore may miss a significant fraction of the low-luminosity, obscured AGN
population. Most of non-broad line AGN outside the wedge are, indeed, moderate luminosity
objects at intermediate redshifts (z< 1, see also Cardamone et al. 2008, Georgantopoulos et
al. 2008, Brusa et al. 2009), in which the host galaxy light dominates the IR emission.
Panel (b) shows the same diagram for the population with photometric redshifts only
(572 sources). Superimposed as yellow circles are the high-z obscured AGN candidates
isolated through the exploitation of the multiwavelength properties described in the previous
sections. The vast majority (80%) of the high-z obscured AGN candidates would have been
isolated also through the IRAC selection, confirming that these sources are luminous AGN,
with the NIR/MIR emission dominated by the central engine. However, at the limiting
fluxes of the IRAC COSMOS survey the contamination from high-redshift (z> 1) normal
and starforming galaxies in the Stern et al. (2005) wedge starts to become important (see
discussion in Sajina et al. 2005) and the selection criterion would become efficient only when
combined with an additional criterion (in this case, the X–ray emission).
It is interesting to note that a non negligible fraction (∼ 18%) of the high-z obscured
AGN candidates lie at [3.6]-[4.5]> 0 (∼ 0.25) and [5.8]-[8.0]< 0, and would be missed by
IRAC selections based on AGN SED templates, like the one proposed by Stern et al. (2005).
As a comparison, the fraction of objects satisfying the same selection for the spectroscopically

– 31 –
identified population is only∼ 5%. This locus is where both star-forming and normal galaxies
colors at z∼ 1− 3 are expected (see Barmby et al. 2006). Therefore, in our X–ray selected
AGN sample, also this locus is populated by objects where the host galaxy dominates and/or
the AGN is obscured up to 8 micron (∼ 2.5 micron rest-frame). Given the high inferred X-ray
luminosity (LX ∼> 1043.5 erg s−1), this also means that these objects should have a luminous
(and massive) host, in agreement with the results of Mignoli et al. (2004), Severgnini et al.
(2005), and others.
The IRAC broad band color ([3.6]-[8.0]) can be used to disentangle sources with an
infrared-rising (red) SED, e.g. AGN, power-law dominated sources, and sources with an
inverted (blue) infrared SED, with more flux at shorter wavelengths than at longer wave-
lengths, e.g. normal galaxies at low-z (see also discussion in Barmby et al. 2006). Sources
with a flat luminosity per given wavelength range (λfλ=constant) have [3.6]-[8.0]∼ 0.86.
Figure 11 shows the distribution of the [3.6]-[8.0] color for the entire XMM-COSMOS pop-
ulation (black histogram), the AGN 1 sample (blue shaded histogram), the AGN 2 sample
(red shaded histogram) and the high-z obscured AGN candidates sample (yellow shaded
histogram). AGN 1 populate the red power-law part of the distribution, as expected, with
a median value of 〈[3.6] − [8.0]〉 = 1.46 (0.34 dispersion). On the contrary, the XMM-
COSMOS sample of spectroscopically identified AGN 2 (limited mainly at z< 1 and to
moderate luminosity objects) preferentially show IRAC colors consistent with an inverted
power-law, i.e. in the host galaxy dominated regime (the median value of the distribution is
〈[3.6] − [8.0]〉 = 0.65 and a wider dispersion, 0.55) The probability that the 2 distributions
are drawn from the same parent population is < 10−7 according to a KS test. The high-z ob-
scured AGN candidates set in between the 2 spectroscopically selected samples, around the
median value 〈[3.6]− [8.0]〉 = 1.28 (0.55 dispersion), with only ∼ 25% of the sources having
[3.6]-[8.0]< 0.865. This is a further confirmation that the devised strategy is efficiently in
selecting luminous AGN with red power-law (i.e. AGN dominated) SED but elusive in the
optical bands.
8. Luminosity dependence of the obscured AGN fraction
The large sample of X–ray sources in XMM-COSMOS can be used to explore the lu-
minosity dependence of the obscured AGN fraction. In Figure 12 we plot the fraction of
obscured AGN (defined as the fraction of objects classified as NL AGN over the total num-
ber of AGN sources) in different luminosity bins for the spectroscopically identified hard
X–ray selected XMM-COSMOS sample (open squares). This fraction is a strong function of
the X–ray luminosity, being almost 90% at LX ∼ 1042 erg s−1 and < 10% at LX ∼ 1045 erg
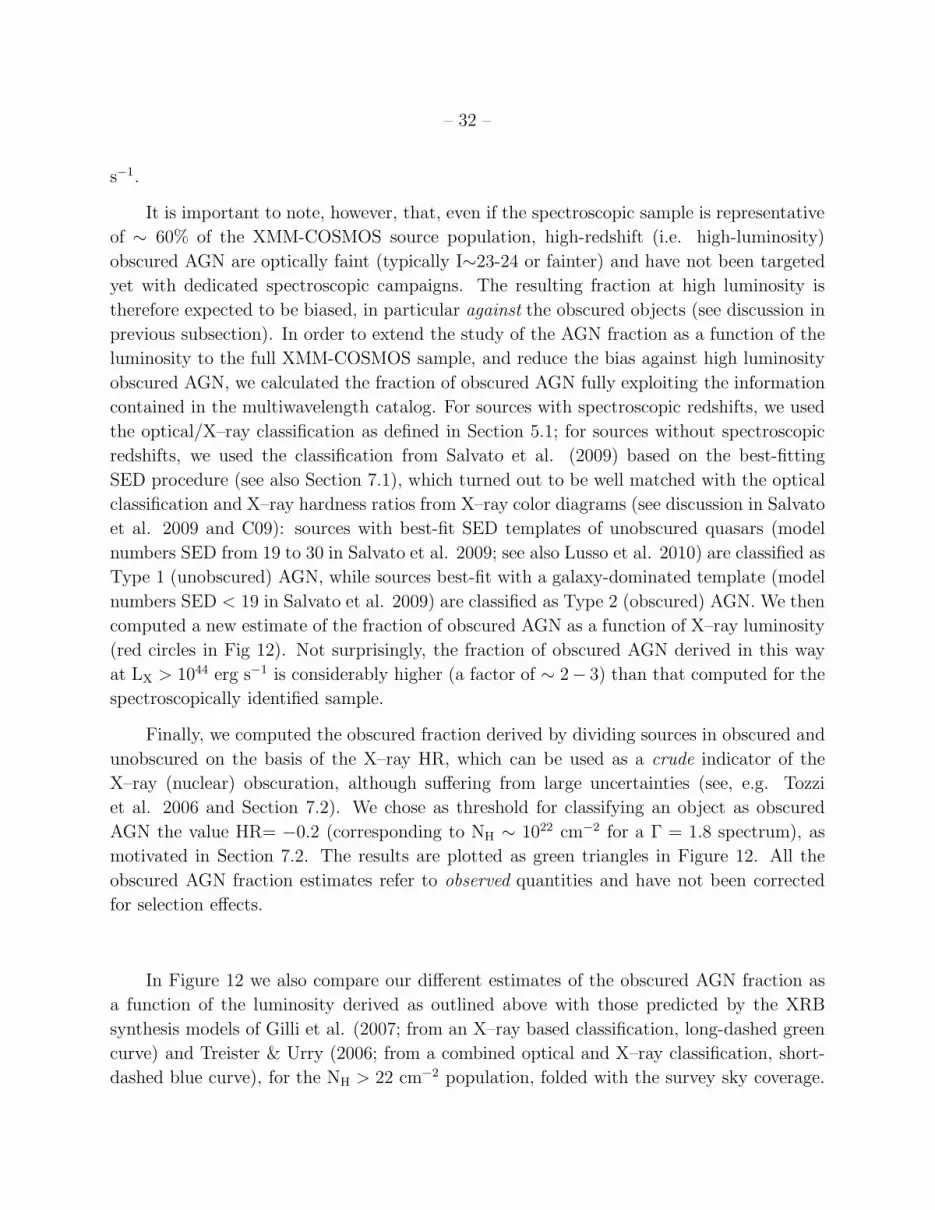
– 32 –
s−1.
It is important to note, however, that, even if the spectroscopic sample is representative
of ∼ 60% of the XMM-COSMOS source population, high-redshift (i.e. high-luminosity)
obscured AGN are optically faint (typically I∼23-24 or fainter) and have not been targeted
yet with dedicated spectroscopic campaigns. The resulting fraction at high luminosity is
therefore expected to be biased, in particular against the obscured objects (see discussion in
previous subsection). In order to extend the study of the AGN fraction as a function of the
luminosity to the full XMM-COSMOS sample, and reduce the bias against high luminosity
obscured AGN, we calculated the fraction of obscured AGN fully exploiting the information
contained in the multiwavelength catalog. For sources with spectroscopic redshifts, we used
the optical/X–ray classification as defined in Section 5.1; for sources without spectroscopic
redshifts, we used the classification from Salvato et al. (2009) based on the best-fitting
SED procedure (see also Section 7.1), which turned out to be well matched with the optical
classification and X–ray hardness ratios from X–ray color diagrams (see discussion in Salvato
et al. 2009 and C09): sources with best-fit SED templates of unobscured quasars (model
numbers SED from 19 to 30 in Salvato et al. 2009; see also Lusso et al. 2010) are classified as
Type 1 (unobscured) AGN, while sources best-fit with a galaxy-dominated template (model
numbers SED < 19 in Salvato et al. 2009) are classified as Type 2 (obscured) AGN. We then
computed a new estimate of the fraction of obscured AGN as a function of X–ray luminosity
(red circles in Fig 12). Not surprisingly, the fraction of obscured AGN derived in this way
at LX > 1044 erg s−1 is considerably higher (a factor of ∼ 2− 3) than that computed for the
spectroscopically identified sample.
Finally, we computed the obscured fraction derived by dividing sources in obscured and
unobscured on the basis of the X–ray HR, which can be used as a crude indicator of the
X–ray (nuclear) obscuration, although suffering from large uncertainties (see, e.g. Tozzi
et al. 2006 and Section 7.2). We chose as threshold for classifying an object as obscured
AGN the value HR= −0.2 (corresponding to NH ∼ 1022 cm−2 for a Γ = 1.8 spectrum), as
motivated in Section 7.2. The results are plotted as green triangles in Figure 12. All the
obscured AGN fraction estimates refer to observed quantities and have not been corrected
for selection effects.
In Figure 12 we also compare our different estimates of the obscured AGN fraction as
a function of the luminosity derived as outlined above with those predicted by the XRB
synthesis models of Gilli et al. (2007; from an X–ray based classification, long-dashed green
curve) and Treister & Urry (2006; from a combined optical and X–ray classification, short-
dashed blue curve), for the NH > 22 cm−2 population, folded with the survey sky coverage.

– 33 –
In the luminosity range logLX = 43.5 − 44.5 erg s−1, i.e. around L∗ luminosity for the
XMM-COSMOS sample sources, the two predictions are broadly consistent with each other
and with the observed estimates derived from the HR and from the combined (spectroscopic
plus SED) optical classification. At low luminosities (logLX < 43 erg s−1), optically-based
classifications seem to yield higher obscured AGN fractions. Similarly, XRB models pre-
dictions largely differ: the Gilli et al. (2007) curve well trace the X–ray based estimate of
the obscured AGN fraction, while the Treister & Urry (2006) model predictions are closer
to the estimate from optical classification7. This reflects the paucity of BL AGN in the
XMM-COSMOS sample at low-L (logLX < 43 erg s−1, see Figure 6 and 7) and might be
due, at least in part, to the effect of the host galaxy contribution in the observed spectral
range. Indeed, broad lines signatures from low-luminosity AGN may get diluted in the host
galaxy emission (see discussion in Caccianiga et al. 2007, Civano et al. 2007), and this effect
is likely to be important at low Eddington ratios and at low luminosities (Hopkins et al.,
2009). At higher X–ray luminosities (logLX > 44.5 erg s−1) both models overpredict the
observed obscured fraction by a factor of ∼ 2− 3.
The luminosity dependence of the obscured AGN fraction can also explain why low-
luminosity AGN lie preferentially outside the IRAC selection wedges populated by spectro-
scopically selected unobscured quasars: the lower the luminosity, the higher is the percentage
of obscured sources and therefore on average the higher is the contribution from host galaxy
on the observed SED and colors, which eventually drives the galaxies outside the selection
wedges (see, e.g., Sajina et al. 2005, Barmby et al. 2006, Georgantopulos et al. 2008).
9. A prototypical Obscured QSO at z = 1.59
An enhancement in the bolometric luminosity and column density, coupled with a low B-
band luminosity (and therefore red optical to near infrared colors, and high X/O and MIPS/O
flux ratios), as well as strong outflows from AGN and/or stellar winds are predicted for
objects that are experiencing a transition from being starburst dominated to AGN dominated
by most recent models of AGN galaxy coevolution (Menci et al. 2008, Hopkins et al. 2008,
see also Narayanan et al. 2009).
7At variance with Treister et al. 2009a, for the open squares we use only a spectroscopic classification.
However, we note that the hybrid classification in Treister et al. (2009a) is used only for sources at z< 0.5,
which translates to LX < 1042.5 erg s−1 at the limiting flux of XMM-COSMOS sources, and LX < 1043 erg
s−1 at the limiting flux of the ECDFS sample, i.e. the first two bins in Fig. 12. The results at higher X–ray
luminosities (LX > 1043 erg s−1) can therefore be considered comparable.

– 34 –
Almost by definition, most of the high-z obscured AGN candidates isolated Section 7 are
expected to be undergoing this peculiar phase of their evolution. The most extreme object
in the spectroscopically identified sample which satisfies the selection criteria described in
Section 7 is XID 2028 (z=1.592), marked with a magenta star in the previous diagnostics
(Fig. 6, Fig. 7 and Fig. 8). This is the object with the reddest optical color (R −K=6.46)
and the second highest X–ray to optical (logX/O=1.79) flux ratio in the spectroscopically
identified sample. The high X–ray luminosity (LX) ∼ 1045 erg s−1, 2-10 keV) and the high
column density derived from the spectral analysis (logNH = 22.0± 0.1 cm−2, Mainieri et al.
in preparation8) classify this object as an obscured Type 2 Quasar. The high mid–infrared
to optical flux ratio (ν24F24/νRFR > 50) further classifies XID 2028 as a Dust Obscured
Galaxy (DOG, see Dey et al. 2008; Fiore et al. 2008).
The optical spectrum for this source was obtained with DEIMOS (in MOS mode) at
the Keck-II telescope (Faber et al. 2003) on Jan 8, 2008 under mostly clear conditions with
seeing of ∼ 1”. The data were collected with the 830l/mm grating tilted to 8300A and the
OG550 blocker, with a resolution of 2.5 A. The spectra were dithered ±2” along the slit
to remove ghosting (internal reflections) from the 830l/mm grating. Each exposure was 20
minutes for a total of 2.6 hours. The spectrum (5500-10000 A) is shown in the left panel
of Fig. 13. It presents a red, host-galaxy dominated continuum superimposed with high-
ionization narrow emission lines typical of obscured AGN (e.g. [NeV] λλ3426,3346 doublet),
starburst indicators (e.g. [OII] λ3727), and MgII λ2798 and MgI λ2852 lines in absorption.
The redshift z=1.592 has been derived from the [OII] emission line and it is consistent (within
0.1%) with that measured from the other 3 emission lines visible in the spectrum. The inset
in the left panel of Figure 13 shows a zoom of the spectrum (black = unbinned data, red
=smoothed data, with a 15 pixel boxcar) around the Mg absorption complex. The MgII and
MgI absorption lines are slightly blueshifted with respect to the systemic velocity defined by
[OII] (dashed lines in the inset) indicating the possible presence of outflows in the system
(see, e.g., Weiner et al. 2009). The measured offset (∼ 6A) implies a velocity of ∼300 km/s
when the uncertainties in the wavelength scale and in the redshift measurements (∼ 3.A)
are taken into account. Although we cannot uniquely assess which is the process which
drives the outflowing material, due to the concomitant presence of high star formation and
AGN activity in this system, it is interesting to note that the value observed for XID 2028
is slightly larger than what is generally observed for star formation driven outflows (∼ 150
km s−1, Shapley et al. 2003).
8In Mainieri et al. (2007) this object has been assigned a lower redshift, z=0.784, on the basis of a lower-
quality optical spectrum available at that time. The higher redshift translates in a higher column density
than the one reported in Mainieri et al. 2007, Log NH = 21.83

– 35 –
The SFR derived from the [OII] emission applying the low redshift calibration (Kenni-
cutt et al. 1998) is ∼103M⊙/year. XID 2028 is the highest-redshift X–ray selected Type 2
Quasar detected in the 70 micron survey of the COSMOS field (Kartaltepe et al. 2010). The
high 70 micron flux implies an infrared luminosity greater than 1013 L⊙, further classifying
this source as a HyLIRG (Hyper Luminous Infrared Galaxy, Sanders et al. 1988), with a
SFR of few×103 M⊙/year, in agreement, within a factor of 2-3, with the one estimated from
the optical spectrum. However, this value is likely to be an upper limit given that the [OII]
emission and the 70 µm emission (which at the redshift of the source corresponds to the
rest-frame ∼ 25µm emission) can be severely contaminated by AGN activity (see discussions
in Silverman et al. 2009a, Daddi et al. 2007b).
The broad-band SED (70 µm Spitzer to UV, including the GALEX points retrieved
from Zamojski et al. 2007) of XID 2028 is reported in Figure 14. The left panel shows
the XID 2028 SED with superimposed the template of Mkn 231, a well known Compton
Thick AGN-ULIRG system (red curve) and the template of an Elliptical galaxy (2 Gyr
old, blue curve) both taken from Polletta et al. (2007). The sum of the above templates
(black) is shown in order to illustrate that the SED of XID 2028 is likely to be the result
of the combination of a massive, luminous, host galaxy which dominates the optical light
(M∗ ∼ 5 × 10¹¹ M⊙, assuming M/L=0.22 from Ilbert et al. 2010), with a starburst/AGN
component, seen unblocked in the IR bands. The composite AGN/starburst nature of this
source is also revealed in optical morphology. The right panel of Figure 13 shows the high
resolution HST/ACS image cutout centered on XID 2028. From the image, a point-like
nucleus is clearly visibile, likely responsible for the X–ray emission, as well as a residual
diffuse component (i.e. the host galaxy or a merger remnant).
The SED of XID 2028 is shown again in the right panel of Figure 14, this time su-
perimposed with a numerical (representative) SED resulting from the models for the z∼2
DOG population published by Narayanan et al. (2009). Apart for a scaling of the overall
normalization of the system (0.66 dex higher), this template reproduces almost perfectly
the observed datapoints. The stellar mass used as input parameter of the numerical models
ranges from M∗ ∼ 4.7 − 5.3 × 10¹¹ M⊙, almost coincident with the value derived from the
SED fitting. The input MBH is also available from the simulations, and it ranges from 7×10⁸
to 109 M⊙.
The bolometric luminosity can be estimated from the X-ray emission assuming an ap-
propriate bolometric correction (Elvis et al. 1994 or more recently Lusso et al. 2010), and it
is of the order of ∼ 2×1046 erg s−1, consistent with the bolometric luminosity obtained from
the overall observed SED (dominated by the IR emission). Assuming that for XID 2028 the
energy is released in a radiatively efficient way (L/LEdd ∼ 0.1−1), as expected for objects in

– 36 –
the transitioning phase described above, it is therefore possible to derive the BH mass under
the Eddington limited accretion scenario. This translates into a BH mass of the order of
∼ 108−109 M⊙, in agreement with what can be inferred from the host galaxy mass assuming
the local MBH−MBulge relation and its evolution (Gultekin et al . 2009, Merloni et al. 2010,
Jahnke et al. 2009), and within the range of the input BH mass assumed in the numerical
SED simulations.
A comparison between the broad band properties of XID 2028 with those of other lumi-
nous, obscured quasars reported in the literature shows some similarities, but also remarkable
differences. The SED of other X–ray selected luminous obscured quasars (e.g. Mainieri et
al. 2005, Severgnini et al. 2006, Le Floc’h et al. 2007, Pozzi et al. 2007, Vignali et al.
2009) shows evidences favoring the presence of a massive starburst component and obscured
accretion, with similar optical and X-ray spectra. However, we also note that the optical
spectrum of XID 2028 is quite different from that of the high-z, Type 2 QSO prototype
CXO 202 discovered in the CDFS (Norman et al. 2002, at z=3.7). In the Norman et al.
(2002) object the optical spectrum is dominated by narrow emission line with almost no
underlying continuum, while the host galaxy contribution is clearly visible and dominant in
XID 2028. However, CXO 202 is at much higher redshift than XID 2028, and it is therefore
well possible that XID 2028 would show some of the same high-ionization lines and less
continuum were it at higher redshift (and viceversa). Also, the different level of obscuration
(∼ 1022 cm−2 for XID 2028 vs. > 1024 cm−2 for CXO 202) may cause the differences we
see in the optical spectra. In any case, the observations above highlight the power of a full
multiwavelength approach to fully characterize a key phase in AGN evolution.
10. Conclusions
We presented the catalog of optical and infrared identifications for ∼1800 X–ray sources
detected in the XMM-COSMOS survey. This catalog comprises the totality of the XMM
sources presented in C09, with the exception of 65 faint sources (∼3%) detected in two addi-
tional fields obtained in AO6. The optical/IR matches with the X–ray positions were driven
by the Chandra subarcsec centroids, when available, or estimated through statistical meth-
ods already successfully tested in different XMM and Chandra fields (see B07, Cardamomone
et al. 2008). For each source, a flag on the reliability of the X–ray to optical/infrared asso-
ciation is provided, classifying the counterparts as “reliable” (87.7%), “ambiguous” (11.3%)
and “not identified” (1%; see Table 1). For sources with two possible associations both
entries are reported in the associated catalog (Table 2). The availability of Chandra data
allowed us also to quantify the reliability of the likelihood ratio technique when applied to

– 37 –
XMM sources matched to deep optical and infrared images, which turned out to be very
high (∼> 98.5%, see Section 3.1).
Along with the positions of the optical counterparts we publish a wealth of multiwave-
length information, from 24µm to X–ray (see Section 4 and Table 2), most notably a collec-
tion of all the available spectroscopic redshifts (∼ 900) obtained through different programs
ongoing in the COSMOS field (see Section 5 for details). To maximize the completeness
over a well defined large area and, at the same time, keep selection effects under control, for
the multiwavelength analysis presented in this paper we further considered the subsample
of 1640 identified sources detected above the limiting fluxes corresponding to a coverage of
more than 1 deg2 in at least one of the three X–ray energy ranges considered (see Section
3.1). The multiwavelength properties of the fainter X–ray sources are investigated in a much
greater detail in the framework of the C-COSMOS survey (Elvis et al. 2009, Civano et al.
in prep.).
The spectroscopic completeness in the soft (0.5-2 keV) and hard (2-10 keV) subsamples
is ∼50% and ∼60%, respectively, remarkably high for identification campaigns of X–ray
sources, to be compared with the spectroscopic completeness in the AEGIS survey (40% in
the 2-10 keV band, see Aird et al. 2010); in the X-Bootes survey (∼50%, Ryan Hickox,
private communication; see also Murray et al. 2005; Kenter et al. 2005); and in the CDFS
2Ms sample (< 50%, Luo et al. 2008, Luo et al. 2010). By far, the highest spectroscopic
completeness is for the sources detected in the ultra-hard (5-10 keV) band, where it reaches
∼ 80%: for the first time, XMM-COSMOS provides a statistically significant sample (221)
of sources detected at > 5 keV with a very high spectroscopic breakdown at fluxes. As a
comparison, the Beppo-SAX HELLAS survey had a 50% completeness (71/147) at higher
X-ray fluxes (> 3× 10⁻¹⁴ erg cm−2 s−1, Vignali PhD thesis), while the XMM-HBSS has an
almost complete (97%) spectroscopic information, but it is limited to 62 sources at fluxes
> 7× 10⁻¹⁴ erg cm−2 s−1 (Della Ceca et al. 2008).
For the sources without spectroscopic redshifts, accurate photometric redshifts (down
to σ(∆z/(1 + z)) ∼ 0.01 at I< 22.5) are available (Salvato et al. 2009), allowing an almost
100% complete sample of X–ray sources with redshift information. This, coupled with the
large number of objects, allowed us to sample with an unprecedented statistic the high
luminosity tail of the X–ray luminosity function. The present data allow us to derive the
AGN space density as obtained by the COSMOS survey over a relatively broad redshift range
(z∼ 1–3) and luminosity interval (LogLX = 44.5− 47). We compared the COSMOS results
with those discussed in recent papers (Ebrero et al. 2009; Yencho et al. 2009; Aird et al.
2010) combining data from different surveys and covering in a fairly homogeneous way the
luminosity redshift plane. Our results suggest that at high luminosities (logLX > 44.5) the

– 38 –
AGN number density peaks at z∼ 2− 2.5, in good agreement with LDDE parameterization
of the above mentioned XLF.
We investigated the dependence of the X–ray to optical flux ratio versus the X–ray
luminosity for BL AGN and NL AGN, and sources with photometric redshifts only. The
normalization of the correlation between X/O and X–ray luminosity for the obscured AGN
increases going from the spectroscopically identified sample to the objects with only photo-
metric redshifts available (i.e., towards fainter magnitudes; see Figure 6). The well-known
relation between the X/O and the X–ray luminosity (F03; Barger et al. 2005) for obscured
AGN is mostly driven by the fact that, while the nuclear AGN X-ray luminosity can span
several decades (depending on the BH mass and on the accretion rate), the host galaxy R-
band luminosity (which dominates the optical emission in obscured sources) has a moderate
scatter, around the MBH −MBulge relation, i.e., depending only on the BH mass.
We then studied the dependence of the R − K color on the X–ray luminosity and we
found an opposite behavior for BL AGN and NL AGN in our sample. For NL AGN there is
evidence for a trend where high-luminosities sources have redder colors than low-luminosity
sources (see Figure 7). This correlation is most likely due to redshift effects, given that
the R − K color of normal and star forming galaxies increases up to redshift z∼ 2. On
the contrary, while high-luminosity BL AGN show a median R − K color consistent with
that observed in optically selected samples (Barkhouse & Hall 2001), lower luminosity BL
AGN show a median R −K color statistically different (redder) from the one observed for
the higher-luminosity ones (see Figure 7). This difference in the R −K colors for high and
low luminosity sources is likely due to the contribution of the host galaxies in the latter
sample. We conclude that X–ray surveys are effective in isolating also unobscured objects
otherwise missed by optical multicolor surveys, with preselection on the basis of optical
colors and pointlike emission (see also similar conclusions obtained on BL AGN samples
from pure spectroscopic selection, Bongiorno et al. 2007). However, the effect of host galaxy
contribution may play an important role in getting the correct classification of the nuclear
source.
The large body of COSMOS multiwavelength data allowed us to devise a robust method
to build a sizable sample of luminous obscured AGN candidates at z > 1 among the still
spectroscopically unidentified population, and control the selection effects (see Section 7.1.1
and 7.1.2). In total, we ended up with a robust sample of ∼ 150 objects with photometric
redshifts information, and multicolor properties consistent with those of luminous, obscured
quasars at z> 1. This sample should not be considered complete with respect to the X–ray
selected, high-z obscured AGN population, but can be considered as representative of the
average properties of this class of sources. We compared the average X–ray hardness ratio of

– 39 –
the high-z obscured AGN candidate sample with the ones derived for the spectroscopically
identified samples (Section 7.2). We found that the average HR for this sample, HR=
−0.17, is considerably higher than that derived for spectroscopically classified NL AGN
(HR= −0.29), further confirming that a red observed R−K color (R−K ∼> 5) coupled with
high X/O or ν24F24/νRFR ratios, is a good indicator for both optical and moderate X–ray
obscuration in high-luminosity sources (see also Maiolino et al. 2006).
For the vast majority (75-80%) of the high-z obscured AGN candidates the AGN com-
ponent is visible in the near-IR (roughly corresponding to the rest frame ∼ 1− 3µm range),
where the dust reprocessed emission is expected to dominate the observed SED. These sources
would have been selected on the basis of IRAC colors only (see Fig. 10 and Fig. 11, and Sec-
tion 7.3). However, at the limiting fluxes of the IRAC COSMOS survey the contamination
from non-AGN objects within the selection wedge starts to become important, and the se-
lection criterion would become efficient only when combined with an additional criterion (in
this case, the X–ray emission).
We studied the fraction of obscured AGN in the XMM-COSMOS sample as a function of
the 2-10 keV X–ray luminosity, and discussed the differences between optical (spectroscopic
and photometric) and X–ray classifications. We confirmed that the fraction decreases with
increasing luminosity (see Section 8 and Fig. 12), for both the spectroscopically identified
and the full sample. At LX ∼> 1044 erg s−1, the obscured AGN fraction is of the order of
25-30% in the logLX = 44 − 44.5 bin and ∼ 15 − 20% in the logLX = 44.5 − 45 bin, about
a factor of 2-3 lower than the predictions from the Gilli et al. (2007) and Treister & Urry
(2006) models. At lower-luminosities, the optical and X–ray classifications largely differ (see
green triangles and squares at logLX < 43 erg s−1 in Figure 12). This may be related, at
least in part, to host galaxy dilution of the intrinsic AGN spectrum, which is expected to be
important at low Eddington ratios and at low luminosities (Hopkins et al., 2009).
We studied in detail the SED and the spectral properties of XID 2028, that we consider
the prototype of an obscured QSO at high-z (z=1.592) caught in a transition stage from
being starburst dominated to AGN dominated, which was possible to isolate only thanks to
the combination of X-ray and infrared observations. XID 2028 is one of the brightest XMM-
COSMOS sources, with an unabsorbed X–ray luminosity LX ∼ 1045 erg s−1 and significant
X–ray absorption (NH ∼ 1022), i.e. a Type 2 QSO. The optical spectrum of this source
presents strong AGN emission lines ([NeV] doublet) consistent with our selection method.
Moreover, evidence of outflowing material at a velocity of ∼ 300 km s−1 (see Figure 13) is also
clearly detected from the blueshifted MgI and MgII complex absorption. The X–ray, optical
and infrared properties and band ratios of XID 2028 are very similar to those predicted by
the above mentioned models, and the overall SED is best represented by numerical templates

– 40 –
resulting from the models published by Narayanan et al. (2009) to describe z∼ 2 DOG (see
Fig. 14, right panel).
XID 2028 is the brightest object for which such a detailed analysis can be conducted
in the XMM-COSMOS catalog. However, as demonstrated in Section 7, it is reasonable
to assume that a large fraction of the sources among the high-z obscured AGN candidates
share the same properties, although at lower X–ray (LX ∼> 1044 erg s−1) and bolometric
luminosities. Most of these sources are well within the reach of the Herschel (Pilbratt 2005)
instruments between 75 and 500 µm, which in the GT project in the COSMOS field will
reach limiting fluxes of few mJy. Such longer wavelength observations can greatly help in
separating nuclear activity and star formation, and assessing the real bolometric output of
obscured AGN. Further investigations, as for example, direct infrared spectroscopy with X-
Shooter@VLT (D’Odorico et al. 2004) or LUCIFER@LBT (Mandel et al. 2007) may be
crucial in confirming the nature of these candidates.
This work is based on observations obtained with XMM-Newton, an ESA Science Mis-
sion with instruments and contributions directly funded by ESA Member States and the USA
(NASA). In Germany, the XMM-Newton project is supported by the Bundesministerium fur
Wirtschaft und Technologie/Deutsches Zentrum fur Luft- und Raumfahrt (BMWI/DLR,
FKZ 50 OX 0001), the Max-Planck Society and the Heidenhain-Stiftung. Part of this work
was supported by the Deutsches Zentrum fur Luft– und Raumfahrt, DLR project num-
bers 50 OR 0207 and 50 OR 0405. In Italy, the XMM-COSMOS project is supported
by PRIN/MIUR under grant 2006-02-5203, ASI-INAF grants I/023/05/00, I/088/06 and
ASI/COFIS/WP3110,I/026/07/0. This work was supported in part by NASA Chandra
grant number GO7-8136A (FC, ME, AF, HH). TM acknowledges support from CONACyT
83564 DGAPA/PAPIIT IN10209 to IA-UNAM as well as the NASA ADP (NNX07AT02G)
grant to UCSD. GH and MS ackwnoledge a contribution from the Leibniz Prize of the
Deutsche Forschungsgemeinschaft under the grant HA 1850/28-1. NC and AF were par-
tially supported from a NASA grant NNX07AV03G to UMBC. KJ is supported by the
Emmy Noether-Programme of the German Science Foundation DFG. ET is supported by
the National Aeronautics and Space Administration through Chandra Postdoctoral Fellow-
ship Award Number PF8-90055. We thank James Aird and Jacobo Ebrero for sending us
machine-readable tables of their X-ray luminosity functions, Desika Narayanan for help with
his model SEDs, and Ryan Hickox for providing unpublished information about the XBootes
survey. We gratefully thank Nick Wright for a carefully reading of the manuscript. This
work is based in part on observations obtained with MegaPrime/MegaCam, a joint project
of CFHT and CEA/DAPNIA, at the Canada-France-Hawaii Telescope (CFHT), and on data
products produced at TERAPIX data centre located at the Institut d’Astophysique de Paris.

– 41 –
This research has made use of the Keck Observatory Archive (KOA), which is operated by the
W. M. Keck Observatory and the NASA Exoplanet Science Institute (NExScI), under con-
tract with the National Aeronautics and Space Administration. We gratefully acknowledge
the contribution of the entire COSMOS collaboration; more information on the COSMOS
survey is available at http://www.astro.caltech.edu/~cosmos. This research has made
use of the NASA/IPAC Extragalactic Database (NED) and the SDSS spectral archive. Fi-
nally, we thank the anonympus referee for detailed and constructive comments to the first
version of this paper.
REFERENCES
Adelman-McCarthy, J.K., Agueros, M.A., Allam, S.S. et al., 2006, ApJS, 162, 38
Aird, J., Nandra, K., Georgakakis, A., Laird, E. S., Steidel, C. C., Sharon, C., 2008, MNRAS,
387, 883
Aird, J., Nandra, K., Laird, E.S., et al., 2010, MNRAS, 401, 2531
Alexander, D.M., Brandt, W. N., Hornschemeier, A.E., Garmire, G.P., Schneider, D.P.,
Bauer, F.E., & Griffiths, R.E., 2001, AJ, 122, 2156
Alexander, D.M., Vignali, C., Bauer, F.E., Brandt, W.N., Hornschemeier, A.E., Garmire,
G.P., Schneider, D.P., 2002, AJ, 123, 1149
Alexander,D.M., Bauer, F.E., Chapman, S.C. et al. 2005, ApJ, 632, 736
Antonucci, R.R, & Miller, J.S., 1985, ApJ, 297, 621
Antonucci, R.R, 1993, ARA&A, 31, 473
Avni Y., Bahcall J.N. 1980, ApJ235, 694
Baldwin, J.A., Philips M.M., & Terlevich, R., 1981, PASP, 93, 5
Ballantyne, D. R. 2008, ApJ, 685, 787
Ballantyne, D. R., Everett, J. E., & Murray, N. 2006, ApJ, 639, 740
Barger, A.J., Cowie, L. L., Mushotzky, R., et al. 2005, AJ, 129, 578
Barkhouse, W.A., & Hall, P.B., 2001, AJ, 121, 2843
Barmby, P., Alonso-Herrero, A., Donley, J.L., et al., 2006, ApJ, 642, 126
– 42 –
Bell, E. F., Wolf, C., Meisenheimer, K., Rix, H.-W., Borch, A., Dye, S., Kleinheinrich, M.,
Wisotzki, L., & McIntosh, D. H. 2004, ApJ, 608, 752
Blanton, M. R., Hogg, D. W., Bahcall, N. A., et al., 2003, ApJ, 594, 186
Bondi, M., Ciliegi, P., Schinnerer, E., Smolcic, V., Jahnke, K., Carilli, C., Zamorani, G.,
2008, ApJ, 681, 1129
Bongiorno, A., Zamorani, G., Gavignaud, I., et al., 2007, A&A, 472, 443
Bongiorno, A., et al. 2010, A&A, 510, 56
Brandt, N.W. & Hasinger, G., 2005, ARAA, 43, 827
Brandt, N.W., Hornschemeier, A.E., Schneider, D.P., Alexander, D.M., Bauer, F.E.,
Garmire, G.P., Vignali, C., 2001, ApJ, 558, L5
Brandt, N.W., & Alexander, D.M., 2010, Proceedings of the National Academy of Sciences,
arXiv:1001.5054
Brusa, M., Comastri, A., Daddi, E., et al. 2005, A&A, 432, 69
Brusa, M., Zamorani, G., Comastri, A., et al., 2007 (B07), ApJS, 172, 353
Brusa, M., Comastri, A., Gilli, R., et al., 2009, ApJ, 693, 8
Brusa, M., Fiore, F., et al., 2009, A&A, 507, 1277
Caccianiga, A., Severgnini, P., Della Ceca, R., Maccacaro, T., Carrera, F.J., Page, M.J.,
2007, A&A, 470, 557
Caccianiga A., Severgnini P., Della Ceca R., et al., 2008, A&A, 477, 735
Capak, P., et al. 2007, ApJS, 172, 99
Cappelluti, N., Hasinger, G., Brusa, M., et al., 2007, ApJS, 172, 341
Cappelluti, N., Brusa, M., Hasinger, G., et al., 2009 (C09), A&A, 497, 635
Cardamone, C., Urry, C.M., Damen, M., van Dokkum, P., Treister, E., Labbe, I., Virani,
S.N., Lira, P., Gawiser, E., 2008, ApJ, 680, 130
Ciliegi, P., Zamorani, G., Hasinger, G., Lehmann, I., Szokoly, G., & Wilson, G. 2003, A&A,
398, 901

– 43 –
Civano, F., Mignoli, Comastri, A., Brusa, M., 2005, MNRAS, 358, 693
Civano, F., Mignoli, M., Comastri, A., Vignali, C., Fiore, F., Pozzetti, L., Brusa, M., La
Franca, F., Matt, G., Puccetti, S., Cocchia, F., 2007, A&A, 476, 1223
Cocchia, F., Fiore, F., Vignali, C. et al. 2007, A&A in press, astro-ph/0612023
Comastri, A., Mignoli, M., Ciliegi, P., et al., 2002, ApJ, 571, 771
Comastri, A., Brusa, M., Mignoli, M., 2003, AN, 324, 28
Comastri, A., & Brusa, M., 2008, AN, 329, 122
Covey, K. R., et al., 2008, ApJS, 178, 339
Cowie, L.L., Songaila, A., Hu, E.M., Cohen, J.G., 1996, AJ, 112, 839
Croton D. J., Springel, V., White, S. D., et al. 2006, MNRAS, 367, 864
Daddi, E., Alexander, D.M., Dickinson, M., et al. 2007a, ApJ, 670, 173
Daddi, E., Dickinson, M., Morrison, G., et al. 2007b, ApJ, 670, 156
Della Ceca, R., Maccacaro, T., Caccianiga, A., et al., 2004, A&A, 428, 383
Della Ceca, R., Caccianiga, A., Severgnini, P., Maccacaro, T., Brunner, H., Carrera, F.J.,
Cocchia, F., Mateos, S., Page, M.J., Tedds, J.A., 2008, A&A, 487, 119
Dey, A., Soifer, B.T., Desai, V., et al. 2008, ApJ, 677, 943
Di Matteo, T., Springel, V., & Hernquist, L., 2005, Nature, 433, 604
D’Odorico S., Andersen M. I., Conconi P., et al. 2004, SPIE, 5492, 220
Donley, J.L., Rieke, G.H., Perez-Gonzalez, P.G., Barro, G., 2008, ApJ, 687, 111
Ebrero, J., et al. 2009, A&A, 493, 55
Eckart, M.E., Stern, D., Helfand, D.J., et al., 2006, ApJS, 156, 35
Elvis, M., Wilkes, B.J., McDowell, J.C., et al. 1994, ApJS, 95, 1
Elvis, M., Civano, F., Vignali, C., et al., 2009, ApJS, 184, 158
Faber, S. M., Willmer, C. N. A., Wolf, C., et al., 2007, ApJ, 665, 265
Fabian, A.C. & Iwasawa, K., 1999, MNRAS, 303, L34

– 44 –
Ferrarese, L., & Merrit, D., 2000, ApJ, 539, L9
Feruglio, C., Fiore, F., La Franca, F., et al., 2008, A&A, 448, 417
Finoguenov, A., Guzzo, L., Hasinger, G., et al. 2007, ApJS, 172, 182
Fiore, F., Brusa, M., Cocchia, F. et al. 2003 (F03), A&A, 409, 79
Fiore, F., Grazian A., Santini P., et al. 2008, ApJ, 692, 74
Fiore, F., Puccetti S., Brusa M., et al. 2009, ApJ, 693, 447
Franceschini, A., Bassani, L., Cappi, M., Granato, G.L., Malaguti, G., Palazzi, E., Persic,
M., 2000, A&A, 393, 410
Frayer, D. T., Sanders, D. B., Surace, J. A., et al., 2009, AJ, 138, 1261
Frayer, D.,
Gabor, J.M., Impey, C.D., Jahnke, K., et al., 2009, ApJ, 691, 705
Gavignaud, I., Bongiorno, A., Paltani, S., et al., 2006, A&A, 457, 79
Gebhardt, K., Kormendy, J., Ho, L., et al. 2000, ApJ, 543, L5
Gehrels, N., 1986, ApJ, 303, 336
Georgantopoulos, I., Georgakakis, A, & Akylas, A., 2006, A&A, 466, 823
Georgantopoulos, I., Georgakakis, A., Rowan-Robinson, M., Rovilos, E., 2008, A&A, 484,
671
Giacconi, R., Rosati, P., Tozzi, P., et al. 2002, ApJ, 551, 624
Gilli, R., Comastri, A., & Hasinger, G. 2007, A&A, 463, 79
Gilli, R., Zamorani, G., Miyaji, T., et al., 2009, A&A, 494, 33
Granato, G.L., De Zotti, G., Silva, L., Bressan, A., Danese, L. 2004, ApJ, 600, 580
Gultekin, K., Richstone, D. O., Gebhardt, K., et al., 2009, ApJ, 698, 198
Hasinger, G., Miyaji, T., & Schmidt, M., 2005, A&A, 441, 417
Hasinger, G., Cappelluti, N., Brunner, H. et al., 2007, ApJS, 172, 29
Hasinger, G. 2008, A&A, 490, 905

– 45 –
Hatzminiaoglou, E., Perez-Fournon, I., Polletta, M., et al. 2005, AJ, 129, 1198
Hickox, R., Jones, C., Forman, W.R. et al. 2009, ApJ, 696, 891
Hickox, R., 2009, Chandra Newsletter cover article, Winter 2009, arXiv:0904.3543
Hopkins, P.F., Hernquist, L. Cox, T.J., Di Matteo, T., Robertson, B., Springel, V., 2006,
ApJS, 163, 1
Hopkins, P.F., Hernquist, L., Cox, T.J., Keres, D., 2008 ApJS, 175, 365
Hopkins, P. F., Hickox, R., Quataert, E., & Hernquist, L. 2009, MNRAS, 398, 333
Hornschemeier, A.E., Brandt, W.N., Garmire, G.P., et al., 2001, ApJ, 554, 742
Houck, J.R., Soifer, B.T., Weedman, D., et al., 2005, ApJ, 622, L105
Jahnke, K., Bongiorno, A., Brusa, et al. 2009, ApJ, 706, L215
Kartaltepe, J., et al., 2010, ApJ, 709, 572
Kauffmann, G., Heckman, T., Tremonti, C., et al., 2003, MNRAS, 346, 1055
Kennicutt, R. C., Jr. 1998, ARA&A, 36, 189
Kenter, A., Murray, S. S., Forman, W. R., et al. 2005, ApJS, 161, 9
Kewley, L.J., Dopita, M.A., Sutherland, R.S., Heisler, C.A., Trevena, J., 2001, ApJ, 556,
121
Kim, M., Kim, D.W., Wilkes, B.J., et al., 2007, ApJS, 169, 401
Koekemoer, A. M., Alexander, D.M., Bauer, F.E. et al. 2004, ApJ, 600, L123
Koekemoer, A. M., et al., 2007, ApJS, 172, 196
Ilbert, O., Capak, P., Salvato, M. et al., 2009, ApJ 690, 1236
Ilbert, O., Salvato, M., Le Floc’h, E. et al., 2010, ApJ 709, 644
Lacy, M., Storrie-Lombardi, L.J., Sajina, A., et al. 2004, ApJS, 154, 166
Laird, E., Nandra, K., Pope, A., Scott, D., 2010, MNRAS, 401, 2763
La Franca F., Fiore F., Comastri A., et al., 2005, ApJ, 635, 864
La Franca, F., & Cristiani, S. 1997, AJ, 113, 1517

– 46 –
Lanzuisi, G., Piconcelli, E., Fiore, F., Feruglio, C., Vignali, C., Salvato, M., Gruppioni, C.,
2009, A&A, 498, 67
Lawrence, A., & Elvis, M., 1982, ApJ, 256, 410
Le Floc’h, E., Willmer, C.N.A., Noeske, K., et al., 2007, ApJ, 660, L65
Le Floc’h, E., Aussel, H., Ilbert, O., et al., 2009, ApJ, 703, 222
Lilly, S.J., Le Fevre, O., Renzini, A., et al., 2007, ApJS, 172, 70
Lilly, S.J., Le Brun, V., Maier, C., et al., 2009, ApJS, 184, 218
Lira, P., et al., 2002, MNRAS, 330, 259
Loaring, N.S., Dwelly, T., Page, M.J, et al. 2005, MNRAS, 362, 1371
Luo, B., Bauer, F.E., Brandt, W.N., et al., 2008, ApJS, 179, 19
Luo, B., et al., 2010, ApJS, submitted
Lusso, E., Comastri, A., Vignali, C., et al., 2010, A&A, 512, 34
Maccaccaro, T., Gioia, I.M., Wolter, A., Zamorani, G., Stocke, J.T., 1988, ApJ, 326, 680
Mainieri, V., Rigopoulou, D., Lehmann, I., Scott, S., Matute, I., Almaini, O., Tozzi, P.,
Hasinger, G., Dunlop, J. S., 2005, MNRAS, 356, 1571
Mainieri, V., Hasinger, G., Cappelluti, N., et al., 2007, ApJS, 172, 368
Maiolino, R., Mignoli, M., Pozzetti, L., et al., 2006, A&A, 445, 457
Mandel H., Seifert W., Lenzen R., et al., 2007, AN, 328, 626
Marconi, A., Risaliti, G., Gilli, R., Hunt, L.K., Maiolino, R., & Salvati, M., 2004, MNRAS,
351, 169
Martinez-Sansigre, A., Rawlings, S., Lacy, M., Fadda, D., Marleau, F. R., Simpson, C.,
Willott, C. J., & Jarvis, M. J. 2005, Nature, 436, 666
Martinez-Sansigre, A., Rawlings, S., Lacy, M., Fadda, D., Jarvis, M. J., Marleau, F. R.,
Simpson, C., & Willott, C. J. 2006, MNRAS, 370, 1479
McCracken, H., Capak, P., Salvato, M., et al. 2010, ApJ, 708, 202
Menci N., Fiore, F., Puccetti, S. Cavaliere, A. 2008, ApJ, 686, 219

– 47 –
Merloni, A., 2004, MNRAS, 353, 1035
Merloni, A., Bongiorno, A., Bolzonella, M., et al., 2010, ApJ, 708, 137
Mignoli, M., Pozzetti, L., Comastri, A., et al. 2004, A&A, 418, 827
Miyaji, T., Hasinger, G., & Schmidt, M. 2001, A&A, 369, 49
Moran, E.C., Filippenko, A. V., & Chornock, R., 2002, ApJ, 579, L71
Murray, S.S., Kenter, A., Forman, W.R., et al. 2005, ApJS 161, 1
Narayanan, D., Dey, A., Hayward, C.C., et al. 2009, MNRAS, 400, 1919
Norman, C., Hasinger, G., Giacconi, R., et al., 2002, ApJ, 571, 218
Perola, G.C., Puccetti, S., Fiore, F., et al. 2004, A&A, 421, 491
Pilbratt G., 2005, SPIE, 4850, 586
Polletta, M., Tajer, M., Maraschi, L. et al. 2007, ApJ, 663, 81
Pope, A., Bussman, R.S., Dey, A., et al. 2008, ApJ, 689, 127
Pozzi, F., Vignali, C., Comastri, A., et al., 2007, A&A, 468, 603
Prescott, Impey, C.M., Cool, R. J.; Scoville, N.Z., 2006, ApJ, 644, 100
Puccetti, S., Vignali, C., Cappelluti, N., et al., 2009, ApJS, 185, 586
Richards, G. T., Fan, X., Newberg, H. J., et al., 2002, AJ, 123, 2945
Sacchi, N., La Franca, F., Feruglio, C., et al., 2009, ApJ, 703, 1778
Sajina, A., Lacy, M., Scott, D., 2005, ApJ, 621, 256
Salvato, M., Hasinger, G., Ilbert, O., et al., 2009, ApJ, 690, 1250
Sanders, D.B., Soifer, B.T., Elias, J.H., Neugebauer, G., Matthews, K., 1988, ApJ, 328, 35
Sanders, D., Salvato, M., Aussel, H., et al., 2007, ApJS, 172, 86
Schinnerer, E., Smolcic, V., Carilli, C., et al. 2007, ApJS, 172, 46
Scoville, N., Aussel, H., Brusa, M. et al. 2007a, ApJS, 172, 1S

– 48 –
Scoville, N.Z., Abraham, R.G., Aussel, H., et al., 2007b, ApJS, this volume,
astro-ph/0612306
Severgnini, P., Caccianiga, A., Braito, V., et al. 2003, A&A, 406, 483
Severgnini, P., Della Ceca, R., Braito, V., et al., 2005, A&A, 431, 87
Severgnini P., Caccianiga A., Braito V., et al. 2006, A&A, 451, 859
Shapley, A. E., Steidel, C. C.; Pettini, M., Adelberger, K. L., 2003, ApJ, 588, 65
Sijacki, D., Springel, V., Di Matteo, T., Hernquist, L., 2007, MNRAS, 380, 877
Silk, J. & Rees, M., 1998, A&A, 331, L1
Silverman, J.D., Green, P.J., Barkhouse, W.A., et al., 2008, ApJ, 679, 118
Silverman, J.D., Lamareille, F., Maier, C., et al., 2009, ApJ, 696, 396
Silverman, J.D., Kovac, K., Knobel, C., et al., 2009, ApJ, 695, 171
Simpson, 2005
Spergel, D.N., Verde, L., Peiris, H.V., et al. 2003, ApJS, 148, 175
Stalin C. S., Petitjean P., Srianand R., Fox A. J., Coppolani F., & Schwope A., 2010,
MNRAS, 401, 294
Stern, D., Eisenhardt, P., Gorjian, V., et al., 2005, ApJ, 631, 163
Sutherland, W. & Saunders, W. 1992, MNRAS, 259, 413
Szokoly, G.P., Bergeron, J., Hasinger, G., et al. 2004, ApJS, 155, 271
Taniguchi, Y., Scoville, N.Z., Murayama, T., et al., 2007, ApJS, 172, 9
Tozzi, P., Gilli, R., Mainieri, V., et al., 2006, A&A, 451, 457
Treister, E., et al., 2005, ApJ, 621, 104
Treister, E., & Urry, C.M., 2006, ApJ 652L, 79
Treister, E., Virani, S., Gawiser, E., et al., 2009a, ApJ 693, 1713
Treister, E., Cardamone, C., Schawinski, K., et al., 2009b, ApJ 706, 535
Trump, J.R., Impey, C.D., McCarthy, P.J., et al. 2007, ApJS, 172, 383

– 49 –
Trump, J.R., Impey, C.D., Elvis, M., et al. 2009, ApJ, 696, 1195
Ueda, Y., Akiyama, M., Ohta, K., & Miyaji, T., 2003, ApJ598, 886
Urry, C.M., & Padovani, P., 1995, PASP, 107, 803
Veilleux, S., Rupke, D. S. N., Kim, D.-C., et al., 2009, ApJS, 182, 628
Vignali, C., 2001, PhD Thesis
Vignali, C., Comastri, A., Fiore, F., & La Franca, F. 2001, A&A, 370, 900
Vignali, C., Pozzi, F., Fritz, J., et al., 2009, MNRAS, 395, 2189
Yan, L., Chary, R., Armus, L., Teplitz, H., Helou, G., Frayer, D., Fadda, D., Surace, J.,
Choi, P., 2005, ApJ, 628, 604
Yan, L., Sakina, A., Fadda D., Choi P., Armus, L., Helou, G., Teplitz, H., Frayer, D., Surace,
J., 2007, ApJ, 658, 778
Yencho, B., Barger, A.J., Trouille, L., Winter, L.M., 2009, ApJ, 698, 380
Weiner, B. J., Coil, A. L., Prochaska, J. X., et al., 2009, ApJ, 692, 187
Wolf, C., Meisenheimer, K., Kleinheinrich, M., et al., 2004, A&A, 421, 913
Zamojski, M. A., Schiminovich, D., Rich, R. M., et al., 2007, ApJS, 172, 468
Zombeck, M.V., 1990, Handbook of Space Astronomy and Astrophysics, 249, 1314
This preprint was prepared with the AAS LATEX macros v5.2.

– 50 –
BL AGN log(X/O)>1: 21 (6.7%)
log(X/O)<1: 291
NL AGN log(X/O)>1: 36(14.8%)
log(X/O)<1: 208
Photo-z, Type 1 log(X/O)>1: 32(34.0%)
log(X/O)<1: 61
Photo-z, Type 2log(X/O)>1: 165 (65.0%)
log(X/O)<1: 89
Fig. 6.— Upper panels: X/O vs. the deabsorbed rest-frame hard X-ray luminosity for the
sources classified as BL AGN (left, blue circles) and for the sources classified as AGN 2 (right,
red circles). The dashed diagonal line marks the F03 relation between the X/O and the 2-10
keV luminosity for obscured AGN. The solid line marks the best fit relation obtained for
the XMM-COSMOS sample (see text for details). The magenta star marks the position in
this diagram of XID 2028 (see Section 8). Lower panels: X/O vs. the rest-frame hard X-ray
luminosity for the sources with photometric redshifts and classified from the analysis of the
spectral energy distribution as AGN dominated (left) and as galaxies dominated (right). As
red circles, we also plot the spectroscopically identified AGN 2 (taken from the upper panel)
with faint optical magnitudes (R > 23). The solid line marks the best fit relation obtained
for the XMM-COSMOS spectroscopic sample of NL AGN (see upper panel) The numbers
in the top (bottom) left of each quadrant give the number of objects in the BL and AGN
2 samples above (below) the dashed lines; for the objects above the dashed lines also the
percentages have been reported.

– 51 –
Fig. 7.— Left panel: R−K vs. the rest-frame hard X-ray luminosity for the sources classified
as BL AGN (left, blue circles) and for the sources classified as AGN 2 (right, red circles).
The magenta star marks the position in this diagram of XID 2028 (see Section 8). The
numbers in the top (bottom) left of each panel give the number of objects in the BL and
AGN 2 samples above (below) the dashed lines; for the objects above the dashed lines also
the percentages have been reported.

– 52 –
Fig. 8.— Left panel: the X–ray to optical flux ratio (X/O) plotted against the R − K
color (Vega magnitude, in order to be immediately comparable with other R −K selection
criteria used in the literature) for the BL AGN sample (blue circles); the AGN 2 sample (red
circles); and the sources with only photometric redshifts (crosses). The solid lines mark the
selection for high-z obscured AGN candidate used in this work (R−K >= 5 and X/O> 10).
Right panel: the ratio of the 24µm flux over the R-band flux versus the R-3.6µm color (AB
magnitudes). The solid lines mark the selection criteria for high-z obscured AGN candidates
used in this work (R-3.6>= 4 and ν24F24/νRFR > 10). In both panels, the magenta star
marks the position of XID 2028 (see Section 8 for details).

– 53 –
Fig. 9.— HR distribution normalized to the total number of sources in each sample for a)
the whole XMM-COSMOS flux limited sample (1640 objects); b) the AGN 1 sample (414
objects); c) the AGN 2 sample (337 objects); and d) the high-z obscured AGN candidate as
isolated from the previous figures (152 objects). The line at HR= −0.2 marks the threshold
used in this paper to divide obscured and unobscured AGN on a purely X–ray based calssi-
fication. Sources detected only in the soft (0.5-2 keV) or hard (2-10 keV) band are plotted
at values of HR= −1 and HR=1, respectively.

– 54 –
-1 0 1 2
-0.5
0
0.5
1
-1 0 1 2
Fig. 10.— Panel (a): Stern color-color diagram for the spectroscopically identified sample.
Symbols and colors as in previous figures. Panel (b): Stern color-color diagram for the
sources with only photometric redshifts (∼ 600 sources, crosses) and for the high-z obscured
AGN candidates (∼ 150 sources, yellow points)

– 55 –
Fig. 11.— The distribution of the [3.6]-[8.0] color for the XMM-COSMOS counterparts,
shown separately for the entire extragalactic sample (black), the AGN 1 sample (blue), the
AGN 2 sample (red) and the high-z obscured AGN candidates sample (yellow). The dashed
line at [3.6]-[8.0]=0.856 marks the division between “blue” and “red” power-law sources.

– 56 –
Fig. 12.— Ratio of obscured to total AGN as a function of hard X–ray luminosity. The open
squares with error bars show the obscured fraction computed from the sources in the 2-10
keV sample with spectroscopic information (∼ 550 objects). The red filled circles represent
the fraction obtained for the full 2-10 keV sample, where the classification in obscured and
unobscured sources is made on the combination of spectroscopic information and the best
fit SED template from sources without spectroscopic redshifts (∼ 900 objects). The green
triangles mark the fraction computed when a purely X–ray selection (based on the HR) is
adopted. The green short-dashed and blue long-dashed lines represent the predictions on
the fraction of AGN with NH > 1022 cm−2 from the XRB synthesis models by Gilli et al.
(2007) and Treister & Urry (2006), respectively. Errors are 1 σ, calculated following Gehrels
(1986).

– 57 –
XID 2028ACS FW814
2"
Fig. 13.— Left panel: observed frame Keck spectrum of XID 2028, with superimposed the
various emission and absorption lines (dotted vertical lines, as labeled); the inset shows the
zoom on the MgII and MgI lines. The black curve shows the unbinned data, while the red
curve shows the smoothed spectrum (boxcar of 15). The vertical dashed lines show the
expected positions of the absorption lines at the redshift derived from the O[II] emission
line. Right panel: HST/ACS image centered around XID 2028.

– 58 –
Fig. 14.— SED from the radio to the UV (GALEX) of XID 2028. In the left panel, the
red line is the SED of Mrk 231 while the blue line is the SED of an elliptical galaxy 2 Gyr
old (both SEDs are from Polletta et al. 2007). The black line is the sum of the two SEDs
combined in order to provide a good representation of the SED of XID 2028. In the right
panel, the black template is taken from Narayanan et al. (2009). See text for details.

–59
–
Table 2. Basic properties of the XMM-COSMOS counterpartsa
IAU Name XID RA DEC S0.5−2 S2−10 S5−10 flag HR CHID flagID ID(Capak) ID(Ilbert) r I K 3.6µm 4.5µm 5.8µm
deg deg cgs cgs cgs AB AB AB AB AB AB
XMMC 150.10515+1.98082 1 150.10521 1.981183 139.00 228.00 122.00 1 -0.50 358 1 1268521 786683 19.24 19.12 18.21 17.49 17.20 16.89
XMMC 149.73919+2.22053 2 149.73896 2.220675 105.00 211.00 107.00 1 -0.42 329 1 1695261 1054439 20.34 19.96 19.00 18.23 17.93 17.47
XMMC 149.76154+2.31849 3 149.76148 2.318458 150.00 258.00 142.00 1 -0.49 440 1 2072529 1290981 19.39 18.67 17.39 17.08 16.88 16.61
XMMC 149.74418+2.24948 4 149.74389 2.249753 78.40 159.00 95.60 1 -0.41 418 1 1688156 1048950 18.51 16.90 17.02 17.31 17.49 17.55
XMMC 149.82819+2.16421 5 149.82793 2.164360 72.80 148.00 75.40 1 -0.42 320 1 1709129 1063264 19.90 19.47 18.75 18.15 17.78 17.35
XMMC 150.17978+2.11015 6 150.17978 2.110380 38.20 60.80 28.70 1 -0.53 42 1 1236435 767213 19.31 18.34 17.95 18.03 17.91 17.85
XMMC 150.52108+2.62525 7 150.52096 2.625412 96.60 189.00 101.00 1 -0.44 -99 1 2277781 1418792 20.35 18.94 18.07 17.73 17.62 17.43
XMMC 150.05383+2.58967 8 150.05378 2.589671 57.80 54.00 19.40 1 -0.69 142 1 2362650 1472056 19.29 18.79 18.20 17.22 16.89 16.53
XMMC 149.91983+2.32747 9 149.91976 2.327460 28.30 47.00 22.20 1 -0.51 499 1 2030952 1265494 20.50 20.07 19.47 18.89 18.36 17.88
XMMC 149.91261+2.20032 10 149.91244 2.200366 27.20 22.10 10.90 1 -0.72 446 1 1660949 1032058 20.88 20.39 19.37 18.72 18.50 18.22
aOnly a portion of the table is shown here for guidance regarding the form and content of the catalog.
The entire table is available in electronic form at http://www.mpe.mpg.de/XMMCosmos/xmm53 release/xmm53fields table all.dat.
The full table contains 25 columns of information on 1797 sources. The information on the possible second counterpart for the sources in the “ambiguous” ID class are listed at the end of the table.
The catalog README file is available at http://www.mpe.mpg.de/XMMCosmos/xmm53 release/
NOTES– Col. [1]: XMM-COSMOS IAU designation; Col. [2]: XMM-COSMOS identifier number (from Cappelluti et al. 2009); Col. [3-4]: coordinates of the optical/IR counterpart (J2000); Col. [5-7]: X–ray fluxes in the
Col. [8]: flag identifying the sources included in the flux limited sample (1) or not (0); Col. [9]: X–ray hardness ratio, HR; Col. [10]: Chandra-COSMOS identifier number (from Elvis et al. 2009); Col. [11]: flag for the optical
Sources flagged with “1” are the “reliable” counterparts; sources flagged with “2” are the ambiguous counterparts (in this case the positions and basic properties of both candidate counterparts are listed); sources flagged with
Col. [12]: identifier number from Capak et al. (2007) catalog; Col. [13]: identifier number from the Ilbert et al. (2009) catalog; Col. [14-15]: the r-band and I-band magnitudes (AB system, from Capak et al. 2007); Col.
2010); Col. [17-20]: magnitudes in the four IRAC channels (AB; from Ilbert et al. 2009); Col. [21]: MIPS 24µm magnitude (AB, from Le Floc’h et al. 2009); Col. [22]: Spectroscopic redshift (see Section 5); Col. [23]: Sp
Section 5.1: 1 = BL AGN; 2 = NL AGN; 3 = normal/starforming galaxy; Col. [24]: Origin of the spectroscopic redshifts, with relevant notes when needed. The code for the source of the spectroscopic redshift is the following:
runs (Trump et al. 2007; 2009); 5 = zCOSMOS 20k catalog (Lilly et al. 2007); 6 = zCOSMOS faint 4.5k catalog; 7 = Keck runs; Col. [25]: photometric redshift (from Salvato et al. 2009)


![The [O ii ] λ3727 Luminosity Function and Star Formation Rate at z ≈ 1.2 in the COSMOS 2 Square Degree Field and the Subaru Deep Field](https://img.dokumen.tips/doc/110x75/634f7cda0ca35926a709140b/the-o-ii-l3727-luminosity-function-and-star-formation-rate-at-z-12-in-the.jpg)


