Embed Size (px)
Citation preview
l ’t took more than seven years of haggling, but on December 15, 1993,in Geneva, Switzerland, negotiators representing 117 countries
¯ reached consensus on the contents of the Final Act of the UruguayRound, the most comprehensive international trade agreement in history.Launched in Punta del Este, Uruguay, in 1986, the Uruguay Round ofmultilateral trade negotiations covered more issues and involved morecountries than any previous round. Its Final Act prescribes, among otherthings, that tariffs on industrial products be reduced by an average ofmore than one-third, that trade in agricultural goods be progressivelyliberalized, and that a new body, the World Trade Organization, beestablished both to facilitate the implementation of multilateral tradeagreements such as the Final Act and to serve as a forum for futurenegotiations.
The Final Act is a formidable document, entailing more than 26,000pages of technical language and detail. The chief purpose of this article isto summarize and assess in nontechnical language the main results of theUruguay Round as recorded in that Act, in the belief that comprehensionof such a major trade agreement is too important to be left to the tradenegotiators alone) Some estimates of the consequences of the agreementfor world trade and income are also presented. A subsequent article willoffer an evaluation of sectoral and geographic economic impacts withinthe United States.
Norman S. Fieleke
Vice President and Economist, FederalReset’re Bank of Boston. Rachel Cononiprovided valuable research assistance.
I. Liberalization of Trade inIndustrial Products
Agreements to liberalize trade in industrial products include reduc-tions in tariffs and removal of quantitative restrictions.

Tariff Reductions
The breadth of the commitments made to reducetariffs differs among the advanced countries, the de-veloping countries, and the four "transition" countriesthat participated in the Uruguay Round (the CzechRepublic, Poland, Romania, and the Slovak Republic,all transiting from centrally planned to market econ-omies). The advanced countries agreed to reducetariffs on industrial imports amounting to 64 percentof the total value of their imports of such products;18 percent of their industrial imports were alreadyduty-free under commitments made prior to theRound. By comparison, the developing countriesagreed to lower their tariffs on about one-third of theirindustrial imports, and the participating transitioncountries on three-quarters of theirs. Tariff reductionsare to be completed by the year 2000 except for certainsensitive sectors such as textiles, for which the reduc-tions must be completed by 2005.
The depth of the proffered tariff reductions mat-ters as much as the breadth. Overall, the advancedcountries pledged to lower their tariffs on h~dustrialgoods from an average of 6.3 percent to 3.8 percent,a reduction of 40 percent. Moreover, as reported inTable 1, the proportion of industrial imports theyadmit duty-free is to rise sharply, from 20 to 44percent, while the proportion facing tariffs above 15percent should decline somewhat, from 7 to 5 percent.
For the developing cotmtries, the share of theirindustrial imports admitted free of duty is scheduledto rise slightly, from 39 to 42 percent, while theproportion encumbered by tariffs above 15 percentwill diminish from 43 to 38 percent. The high share ofduty-free imports is attributable primarily to the largeamount of duty-free imports entering Hong Kong andSingapore.
In evaluating the tariff reductions outlined inTable 1, one should bear in mind that moderatepercentage declines in high tariffs may well precipitategreater price reductions on imports, and thus greaterincreases in imports, than do large percentage declinesin low tariffs. For instance, a 20 percent reduction ina 35 percent tariff could bring about a 5 percent dropin price (inclusive of the tariff), while a 50 percentreduction in a 4 percent tariff would be expected tocause a price decline of no more than 2 percent.2 Thus,the decrease in the share of developing country im-ports facing tariffs exceeding 35 percent is worthy ofnote.
By the same token, the 22 percent reductionpromised by the advanced countries on their imports
Table 1Pre- and Post-Uruguay Round TariffProfiles for hnports of Industrial Products,by Country G_~OU~_-
ImportsBillions Percentage Distribution
Tariffs by of U.S.Country Group Dollarsb Pre-UR Post-URAdvanced Economies
Total 736.9 100 100Duty-free~ 149.5 20 440.1 --5.0% 304.3 4I 325.1--10.0% 176.8 24 1510.1--15.0% 51.5 7 515.1 --35.0% 45.1 6 4Over 35% 9.8 1 1
Developing EconomiesTotal 350.5 1 O0 1 O0
Duty-free~ 137.3 39 420.1--5.0% 20.5 6 55.1--10.0% 28.1 8 1010.1--15.0% 14.4 4 515.1--35.0% 96.6 28 30Over 35% 53.6 15 8
Transition EconomiesTotal 34.7 100 100
Duty-freec 4.6 13 160.1--5.0% 9.5 27 375.1--10.0% 9.5 27 3510.1--15.0% 7.5 22 715.1--35.0% 3.4 10 4Over 35% 0.2 0 0
~Excludes items for which duties are not available in ad valorem terms,since these items cannot be distributed by duty ranges, and also petro-leum.UData are primarily for 1989 or 1989 and are for imports from sourcesreceiving MFN or generalized system of preferences treatment, excludingimports from free trade area partners and imports under contractualpreferential arrangements.~Figures refer to tariff lines which were duty-free prior to the UruguayRound, including those that were fully bound, partially bound or unbound.Note: Detail may not add to totals shown because of rounding.Source: General Agreement on Tariffs and Trade. "The Results of theUruguay Round of Multilateral Trade Negotiations" (Geneva: November1994).
~ Tl~is article draws upon a number of sources, but relies mostheavily on the following two: General Agreement on Tariffs andTrade, "The Results of the Uruguay Round of Multilateral TradeNegotiations" (Geneva: November 1994); and U.S. InternationalTrade Commission, The Year in Trade: Operation of the Trade Agree-ments Program, 45tli report (Wasliington, D.C.: USITC publication2769, June 1994).
2 In the first case, for example, a 20 percent reduction wouldlower the tariff from 35 percent to 28 percent. If the price withoutany tariff were, say, $1.00, then the price includh~g the tariff couldwell fall from $1.35 to $1.28 as the tariff dropped, a price reductionof 5 percent.
4 May/June 1995 New England Economic Review
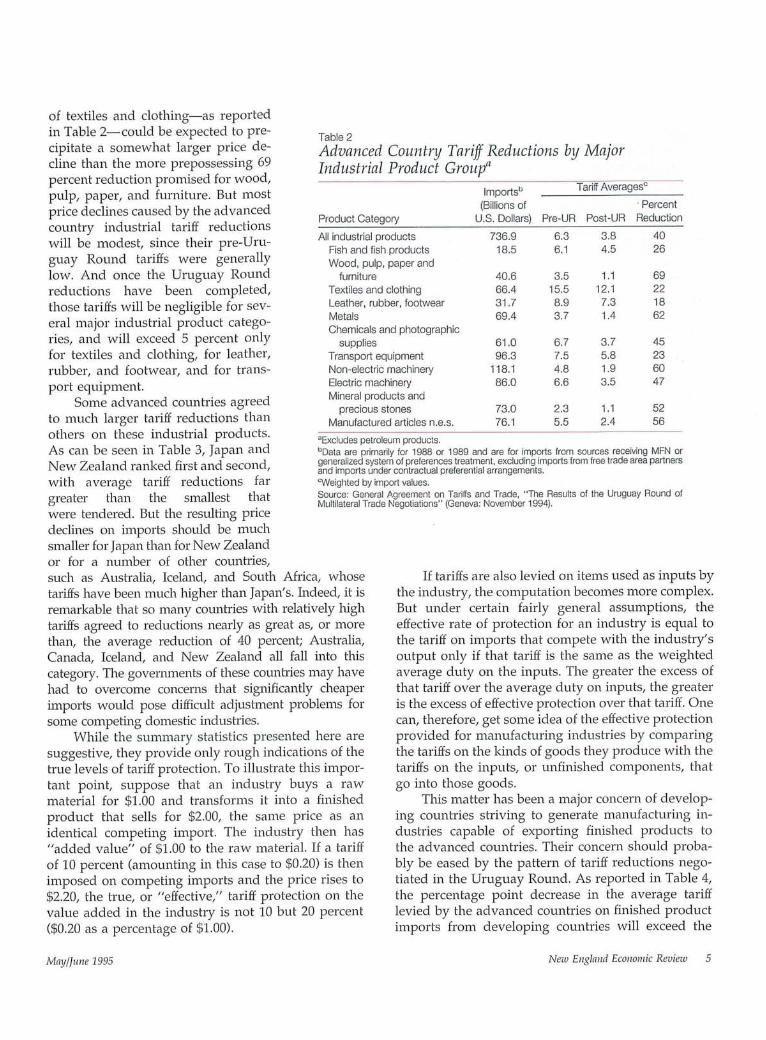
of textiles and clothing--as reportedin Table 2--could be expected to pre-cipitate a somewhat larger price de-cline than the more prepossessing 69percent reduction promised for wood,pulp, paper, and furniture. But mostprice declines caused by the advancedcountry industrial tariff reductionswill be modest, since their pre-Uru-guay Round tariffs were generallylow. And once the Uruguay Roundreductions have been completed,those tariffs will be negligible for sev-eral major industrial product catego-ries, and will exceed 5 percent onlyfor textiles and clothing, for leather,rubber, and footwear, and for trans-port equipment.
Some advanced countries agreedto much larger tariff reductions thanothers on these industrial products.As can be seen in Table 3, Japan andNew Zealand ranked first and second,with average tariff reductions fargreater than the smallest thatwere tendered. But the resulting pricedeclines on hnports should be muchsmaller for Japan than for New Zealandor for a number of other cotmtTies,such as Australia, Iceland, and South Africa, whosetariffs have been much higher than Japan’s. Indeed, it isremarkable that so many com~tries with relatively hightariffs agreed to reductions nearly as great as, or morethan, the average reduction of 40 percent; Australia,Canada, Iceland, and New Zealand all fall into thiscategory. The governments of these cotmtries may havehad to overcome concerns that significantly cheaperimports wotdd pose difficult adjustment problems forsome competing domestic industries.
While the summary statistics presented here aresuggestive, they provide only rough indications of thetrue levels of tariff protection. To illustrate this impor-tant point, suppose that an industry buys a rawmaterial for $1.00 and transforms it into a finishedproduct that sells for $2.00, the same price as anidentical competing import. The industry then has"added value" of $1.00 to the raw material. If a tariffof 10 percent (amounting in this case to $0.20) is thenimposed on competing imports and the price rises to$2.20, the true, or "effective," tariff protection on thevalue added in the industry is not 10 but 20 percent($0.20 as a percentage of $1.00).
Table 2Advanced Count~ Tariff Reductions by MajorIndustrial Product Group~
Product Category
All industrial productsFish and fish productsWood, pulp, paper and
furniture 40.6Textiles and clothing 66.4Leather, rubber, footwear 31.7Metals 69.4Chemicals and photographic
supplies 61.0Transport equipment 96.3Non-electric machinery 118.1Electric machinery 86.0Mineral products and
precious stones 73.0Manufactured articles n.e.s. 76.1
~Excludes petroleum products.
importsb Tarilf Averagesc
(Billions of ¯ PercentU.S. Dollars) Pre-UR Post-UR Reduction
736.9 6.3 3.8 4018.5 6.1 4.5 26
3.5 1.1 6915.5 12.1 228.9 7.3 183.7 1.4 62
6.7 3.7 457.5 5.8 234.8 1.9 606.6 3.5 47
2.3 1.1 525.5 2.4 56
bData are primarily for 1988 or 1989 and are for imports from sources receiving MFN orgeneralized system of preferences treatment, excluding imports from free trade area partnersand imports under contractual preferential arrangements,Weighted by import values.Source: General Agreement on Tariffs and Trade, "The Results of the Uruguay Round ofMultilateral Trade Negotiations" (Geneva: November 1994).
If tariffs are also levied on items used as inputs bythe industry, the computation becomes more complex.But under certain fairly general assumptions, theeffective rate of protection for an industry is equal tothe tariff on imports that compete with the industry’soutput only if that tariff is the same as the weightedaverage duty on the inputs. The greater the excess ofthat tariff over the average duty on inputs, the greateris the excess of effective protection over that tariff. Onecan, therefore, get some idea of the effective protectionprovided for manufacturing industries by comparingthe tariffs on the kinds of goods they produce with thetariffs on the inputs, or unfinished components, thatgo into those goods.
This matter has been a major concern of develop-ing countries striving to generate manufacturing in-dustries capable of exporting finished products tothe advanced countries. Their concern should proba-bly be eased by the pattern of tariff reductions nego-tiated in the Uruguay Round. As reported in Table 4,the percentage point decrease in the average tarifflevied by the advanced countries on finished productimports from developing countries will exceed the
May/June 1995 New England Economic Review 5
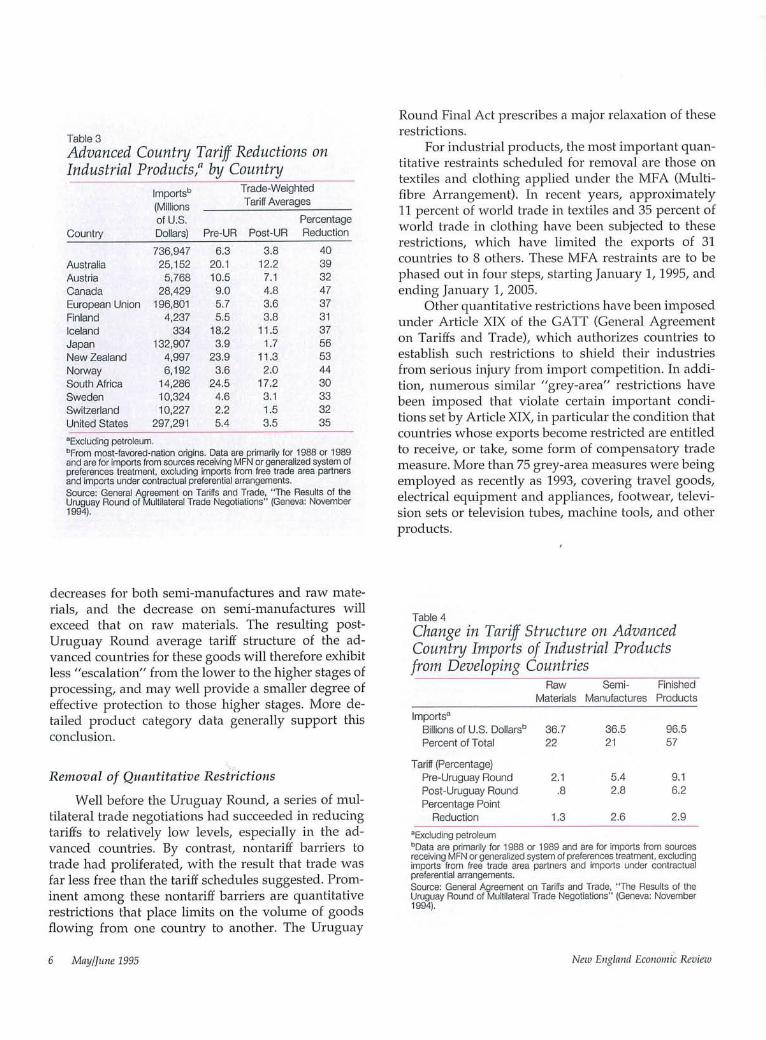
Table 3Advanced Country Tariff Reductions onIndustrial Products,~ by Country
importsb Trade-Weighted
(Millions Tariff Averagesof U.S. Percentage
Country Dollars) Pre-UR Post-UR Reduction
736,947 6.3 3.8 40Australia 25,152 20.1 12.2 39Austria 5,768 10.5 7.1 32Canada 28,429 9.0 4.8 47European Union 196,801 5.7 3.6 37Finland 4,237 5.5 3.8 31Iceland 334 18.2 11.5 37Japan 132,907 3.9 1.7 56New Zealand 4,997 23.9 11.3 53Norway 6,192 3.6 2.0 44South Africa 14,286 24.5 17.2 30Sweden 10,324 4.6 3.1 33Switzerland 10,227 2.2 1.5 32United States 297,291 5.4 3.5 35’~Excluding petroleum.bFrom most-favored-nation origins. Data are primarily for 1988 or 1989and are for imports from sources receiving MFN or generalized system ofpreferences treatment, excluding imports from free trade area partnersand imports under contractual preferential arrangements.Source: General Agreement on Tariffs and Trade, "The Results of theUruguay Round of Multilateral Trade Negotiations" (Geneva: November1994).
Round Final Act prescribes a major relaxation of theserestrictions.
For industrial products, the most important quan-titative restraints scheduled for removal are those ontextiles and clothing applied under the MFA (Multi-fibre Arrangement). In recent years, approximately11 percent of world trade in textiles and 35 percent ofworld trade in clothing have been subjected to theserestrictions, which have limited the exports of 31countries to 8 others. These MFA restraints are to bephased out in four steps, starting January 1, 1995, andending January 1, 2005.
Other quantitative restrictions have been imposedunder Article XIX of the GATT (General Agreementon Tariffs and Trade), which authorizes countries toestablish such restrictions to shield their industriesfrom serious injury from import competition. In addi-tion, numerous similar "grey-area" restrictions havebeen imposed that violate certain important condi-tions set by Article XIX, in particular the condition thatcountries whose exports become restricted are entitledto receive, or take, some form of compensatory trademeasure. More than 75 grey-area measures were beingemployed as recently as 1993, covering travel goods,electrical equipment and appliances, footwear, televi-sion sets or television tubes, machine tools, and otherproducts.
decreases for both semi-manufactures and raw mate-rials, and the decrease on semi-manufactures willexceed that on raw materials. The resulting post-Uruguay Round average tariff structure of the ad-vanced countries for these goods will therefore exhibitless "escalation" from the lower to the higher stages ofprocessing, and may well provide a smaller degree ofeffective protection to those higher stages. More de-tailed product category data generally support thisconclusion.
Removal of Quantitative Restrictions
Well before the Uruguay Rotmd, a series of mul-tilateral trade negotiations had succeeded in reducingtariffs to relatively low levels, especially in the ad-vanced countries. By contrast, nontariff barriers totrade had proliferated, with the result that trade wasfar less free than the tariff schedules suggested. Prom-inent among these nontariff barriers are quantitativerestrictions that place limits on the volume of goodsflowing from one country to another. The Uruguay
Table 4Change in Tariff Structure on AdvancedCountry Imports of Industrial Productsl~’om Developing Countries
Raw Semi- FinishedMaterials Manufactures Products
ImportsaBillions of U.S. Dollarsb 36.7 36.5 96.5Percent of Total 22 21 57
Tariff (Percentage)Pre-Uruguay Round 2.1 5.4 9.1Post-Uruguay Round .8 2.8 6.2Percentage Point
Reduction 1.3 2.6 2.9aExcluding petroleumbData are primarily for 1988 or 1989 and are for imports from sourcesreceiving MFN or generalized system of preferences treatment, excludingimports from free trade area partners and imports under contractualpreferential arrangements.Source: General Agreement on Tariffs and Trade, "The Results of theUruguay Round of Multilateral Trade Negotiations" (Geneva: November1994).
6 May/June 1995 New England Economi~ Review
The Final Act provides for the termination ofrestrictions taken under Article XIX not later thaneight years after the date on which they were insti-tuted or January 1, 2000, whichever comes later;comparable restrictions introduced in the future are tobe maintained no longer than eight years. In addition,grey-area restraints must be either conformed to stan-dards of the Final Act or eliminated by January 1,1999--except that one such restraint may be main-tained by each country until December 31, 1999,provided the country whose exports are restrictedagrees.
II. Liberalization of Trade inAgricultural Products
Trade in agricnltural products has been subjectedto more varied and extensive government interventionthan trade in industrial products, and the agreementsincorporated in the Final Act reflect that difference.
Tat~ff Reductions
While tariffs on agricultural products are notuncommon, a substantial share of agricultural prod-ucts have been protected from international competi-tion by nontariff barriers such as quantitative restric-tions and bans, variable import levies, minimumimport prices, and discretionary import licensing. TheFinal Act requires that these nontariff barriers gener-ally be converted into tariffs estimated to afford anequivalent degree of protection--a procedure knownas "tariffication." Thereafter, all advanced countrytariffs on agricultural goods are to be reduced by anaverage of 36 percent by the year 2000, with eachindividual tariff declining by at least 15 percent. Fordeveloping country tariffs, the comparable averagereduction is 24 percent by 2004, with each tariffdeclining by at least 10 percent. No agricultural tariffreductions are required on the part of developingcountries considered to be "least developed."
The advanced countries account for about t~vo-thirds of world imports of agricultural products. Asindicated in Table 5, their simple (or unweighted)average tariff reductions by product group range froma low of 26 percent for dairy products to a high of48 percent for flowers, plants, and vegetable materialsas well as for the miscellaneous category, "otheragrictfltural products." For all products collectively,the 37 percent decrease slightly exceeds the 36 percenttarget.
Table 5Advanced Country hnports and TariffReductions on Agricultural Products
Imports~ Percentage(Millions of Reduction
Product Category U.S. Dollars) in Tariffs
All agricultural products 84,240 37Coffee, tea, cocoa, mate 9,136 35Fruits and vegetables 14,575 36Oilseeds, fats and oils 12,584 40Other agricultural products 15,585 48Animals and products 9,596 32Beverages and spirits 6,608 38Flowers, plants, vegetable
materials 1,945 48Tobacco 3,086 36Spices and cereal
preparations 2,767 35Sugar 1,730 30Grains 5,310 39Dairy products 1,317 26
~Data are primarily for 1988 or 1989 and are for imports from sourcesreceiving MFN or generalized system of preferences treatment, excludingimports from free trade area partners and imports under contractualpreferential arrangements.Source: General Agreement on Tariffs and Trade, "The Results of theUruguay Round of Multilateral Trade Negotiations" {Geneva: November1994).
Other Liberalization Measures
In addition to the foregoing tariff reductions, theFinal Act prescribes measures to ensure that agricul-tural products will have access to import markets upto certain minimal levels. Furthermore, negotiatorsagreed to make substantial reductions in both domes-tic and export subsidies.
The agreements on subsidies will enhance worldcompetition in agricultural products. In the advancedcountries, domestic subsidies to agricultural produc-ers are to be lowered, with certain exceptions, by 20percent by the year 2000 from the levels prevailingduring the period 1986-88. For developing countries,the corresponding reduction is 13 percent by 2004(although no reduction is required by the least devel-oped). Among the subsidies exempted from thesereductions are direct payments to limit production.
With respect to export subsidies, in the advancedcountries budgetary outlays for such subsidies are tobe decreased by 36 percent, and the quantities ofsubsidized exports by 21 percent, for specified prod-ucts by the year 2000 from the levels prevailingbetween 1986 and 1990. For developing countries,
May/June 1995 New England Economic Review 7
the corresponding reductions are 24 percent for out-lays and 14 percent for quantities by the year 2004(with, again, no reductions required of the least de-veloped).
These reductions are significant, but fall far shortof eliminating all agricultural subsidies that impedefree competition. More specifically, domestic subsidiesare to decrease from $197 billion to $162 billion. Exportsubsidies, largely for wheat, beef, coarse grains, dairyproducts, and sugar, are to decrease from $22.5 billionto $14.5 billion, with one-half of the reduction attrib-utable to the European Union.
III. Liberalization of Trade in Services
The Uruguay Round is the first multilateral tradenegotiation to reach a comprehensive agreement oninternational trade in services, ranging over suchvaried activities as accounting to tourism. The agree-ment covers not only cross-border trade in services(such as U.S. television broadcasts to Canada), but alsoevery other means by which services can be interna-tionally traded, including: (1) services supplied fromone territory to a consumer from another territory(such as New York hospital services to a citizen ofSaudi Arabia); (2) services supplied by a person of oneterritory within the territory of another (such as con-sulting services provided by a U.S. citizen in Moscow);and (3) services supplied from an organization basedin one territory to another territory through a subor-dinate organization abroad (such as financial servicessupplied by Citicorp USA through a Citicorp branchin another country).
Because service transactions have become a sub-stantial component of ~vorld trade, their inclusion inthe negotiations and the Final Act is a noteworthy feat.Cross-border trade alone in services accounts forroughly 20 percent of world trade in goods andservices, and trade in services has been growing morerapidly than that in goods. The agreelnents on servicesinclude commitments on both general principles andspecific service sectors.
The general principles, or goals, agreed for tradein services are similar to those long accepted inagreements relating to trade in goods. They includenational treatment, most-favored-nation treatment,transparency, and progressive liberalization.
National treatment means that a country treatsforeign services and service suppliers no less favor-ably than its national services and suppliers, whilemost-favored-nation (MFN) treatment means that a
country treats services and service suppliers of aforeign country no less favorably than it treats thoseof any other foreign country. Transparency requiresthat relevant government policies on services be pub-lished. Progressive liberalization involves bindingcommitments on agreed liberalization measures, ren-dering the process of liberalization irreversible andlaying the basis for future rounds of negotiation.
In addition to endorsing the foregoing generalprinciples, each Uruguay Round participant countrypresented a schedule detailing its specific commit-ments for the various service sectors and indicatingthe extent to which it will apply the general principlesto each sector. Among other things, the schedules limitparticular barriers to trade in services--barriers suchas restrictions on the number of service suppliers, onpeople employed, and on the total value or quantity ofservice transactions. All such schedules were includedin the Final Act.
Because service transactions havebecome a substantial componentof world trade, their inclusion
in the negotiations and the FinalAct is a noteworthy feat.
Measuring reductions in barriers to services tradeis much more difficult than measuring reductions intariffs. Typically, services barriers take the form ofrather imponderable discriminatory regulations or ob-stacles limiting the provision of services by foreigners.Moreover, detailed, internationally comparable dataon services imports are not available.
In the absence of better measures, a few statisticson the number of countries makh~g commitments insome important sectors may convey the flavor of whatwas accomplished. Most such commitments "bind,"or guarantee, the current degree of access for foreignsuppliers, while the others enlarge that access. Thus,commitments were scheduled by 67 countries in thebusiness services sector (embracing legal, accounting,medical, computer, management consulting, andmany related business services), by 52 countries in"value-added" (as distinguished from "basic") tele-communications, and by more than 40 countries in theair transport sector. By contrast, only 13 countries--
8 May/June 1995 New England Economic Review

including just 2 advanced countries--made commit-ments in audiovisual services, and the numerouscommitments made in financial services (in bankingand insurance) may be withdrawn unless furthernegotiations resolve disagreements in that sector byJuly 1, 1995.
IV. Strengthening the InternationalRules, Procedures, and InstitutionsGoverning World Trade
The worth of all the foregoing commitmentsdepends not only on those commitments and theirobservance, but also on rules limiting alternativeforms of protection. For example, a lower tariff may beof little value to a foreign supplier if the importingcountry rejects many of the foreign supplier’s goodsfor allegedly failing to meet health or safety or envi-ronmental standards. Therefore, the Final Act incor-porates provisions to strengthen the rules, procedures,and institutions that have been used both (1) to limitsuch alternative protective devices and (2) to resolvedisputes over the interpretation of the Final Act itself.Some of the matters these provisions address havealready been outlined in passages discussing theMFA, grey-area restrictions, agriculture, MFN, andnational treatment. This section briefly summarizesthe remaining matters treated by these provisions.
competition from the dumped goods. But antidump-ing measures, as employed, have often been criticizedas being unfair trade practices themselves, capriciousand overly zealous in nature.
Although the Final Act will not--and shouldnot--allay all such criticism, it does make clearer therules and procedures to be followed by governmentsin conducting investigations of alleged dumping andin determining whether injurious dumping has oc-curred. Thus, among other things, investigating gov-ernments now must provide interested trade partnerswith full notice of an investigation and the right topresent evidence, must apply certain specified stan-dards in determining injury, and must remove withinfive years any antidumping duty that is imposedunless a determination is made that, ;vithout the duty,dtunping and injury wo~fld probably continue or recur.
The worth of tariff reductions andremoval of quantitative
restrictions depends not onlyon those commitments and
their observance, but also onrules limiting alternative
forms of protection.Trade in Goods
With respect to trade in goods, the Final Actincludes provisions strengthening the regulation ofthe following potential non-tariff barriers: customsvaluation, preshipment inspection, rules of origin,import licensing procedures, subsidies and counter-vailing duty measures, antidumping procedures, tech-nical barriers, safeguards, and sanitary and phytosani-tary measures (dealing with matters such as pest anddisease control and food safety). For all of these, theFinal Act prescribes guidelines that subscribing gov-ernments must follow to make their policies andprocedures clear (or "transparent") and predictable,with due process for affected exporters.
A noteworthy example is afforded by the provi-sions dealing with antidumping duties. "Dumping"of merchandise into a market by an exporter has longbeen considered an "unfair" trade practice, and coun-tries have commonly reacted to it with antidumpingduties if they judged their domestic industries to beseriously injured, or threatened with serious injury, by
Other provisions deal with certain trade-distort-ing requirements that countries sometimes impose onenterprises, such as requirements that an enterpriseuse or purchase products of domestic origin or that itlimit its use or purchase of imports according to theamount of its output that is exported. Such .require-ments must now be eliminated by advanced countriesby January 1, 1997, by developing countries by Janu-ary 1, 2000, and by least developed countries byJanuary 1, 2002.
Intellectual Property
Through such devices as patents and copyrights,governments have long endeavored to protect theownership rights of inventors, writers, and other pro-ducers of intellectual property. However, the nature ofthose endeavors has varied widely from country tocountry, and no multilateral system of principles andrules has existed to discipline international trade in
May/June 1995 New England Economic Review 9
counterfeit items. Concern with this state of affairs hasintensified with the growing role of intellectual prop-erty and the increasing ease with which it can betransmitted across national boundaries.
The Final Act addresses this concern. With lim-ited exceptions, subscribers to the Act are required totreat nationals of trading partners on the same basis(the MFN principle), and also to provide for nationaltreatment, with regard to the protection of intellectualproperty. Encompassed in the concept of intellectualproperty rights are patents, copyright and relatedrights (including rights for computer programs, databases, sound recordings and films), trademarks andservice marks, industrial designs, layout-design ofintegrated circuits, and geographical indications (in-cluding appellations of origin). Patent protection is toextend for 20 years for all inventions, whether ofproducts or processes, in nearly all branches of tech-nology.
Governments have longendeavored to protect the
ownership rights of inventors,writers, and other producers of
intellectual property, but nomultilateral system of principles
and rules has existed todiscipline international trade
in counterfeit items.
Moreover, governments must offer proceduresand remedies under their domestic law by whichforeign holders of intellectual property rights caneffectively enforce their rights. These provisions onintellectual property are to be put into effect withintransition periods of varying length--generally byJanuary 1, 1996, by advanced economies; by January 1,2000, by developing and transition economies; and byJanuary 1, 2006, by the least developed economies.
Monitoring and Enforce~nent
In 1989 a Trade Policy Review Body (TPRB) wasestablished on a provisional basis under the GeneralAgreement on Tariffs and Trade and charged with
monitoring, and publishing reviews of, the currenttrading policies of countries belonging to the GATT.Such reviews help to insure that multilateral tradeagreements are observed. Under the Final Act, thisreview procedure, which covers all subscribing coun-tries, acquires a permanent status.
Adherence to trade agreements cannot be en-sured merely by such a review procedure. Thus, amultilateral enforcement process known as disputesettlement has long been available, and this processhas been considerably strengthened under the FinalAct. First, in place of the separate dispute settlementprocedures used under different trade agreements inthe past, the Act establishes a single system under aDispute Settlement Body. Second, a negative consen-sus of that Body (a unanimous consensus againstproceeding) is now required to halt the dispute settle-ment process from adjudicating a claim alleging that atrade agreement has been violated. Third, to assurethe legal quality of rulings issued by the panels thatadjudicate disputes, the Act provides for an AppellateBody to hear appeals of those rulings.
Once a violation has been found, the custom hasbeen first to direct the offending country to cease anddesist. However, rather than cease and desist, thecountry has the alternative of providing a mutuallyagreed concession (such as a reduction of its tariffs) tocompensate for its continuing violation. If no agree-ment can be reached on compensation, the countrybringing the complaint may be authorized to retaliate(for example, by raising its tariffs a specified amounton imports from the offending country).
The World Trade Otxanization
One of the chief results of the Uruguay Round isthe establishment of the World Trade Organization(WTO), which replaced the legal system of the GATT.Its assigned tasks are as follows: to provide a forumfor multilateral trade negotiations and a frameworkfor implementing their results, including, first andforemost, the results of the Uruguay Round; to admin-ister the trade policy review and dispute settlementmechanisms; and to cooperate with the InternationalMonetary Fund and the World Bank group of agencies.
The WTO commenced operations on January 1,1995, with 81 member countries and territories andnearly 50 more in a position to join in the near future.The initial membership accounted for more than 90percent of international trade in goods and services.The organization is headed by a Ministerial Confer-ence that meets at least once every two years, while a
10 May/June 1995 New England Economic Review
General Council oversees its day-to-day operations.All members of the WTO are members of the Minis-terial Conference and the General Council.
Each member country has one vote, and themajority required to approve a proposal depends onthe issue under consideration. Thus, as already noted,a (unanimous) consensus is required to halt a disputesettlement proceeding. A three-quarters majority ofWTO members is required to adopt an interpretationof the agreements on goods, services, and intellectualproperty. A two-thirds majority of the members mayapprove amendments to the agreements, except thatunanimity is required for amendments that change therights and obligations of members. Other proposalsmay be adopted either by consensus of those presentor by simple majority of votes cast.
Plurilateral Agreements
In addition to the foregoing multilateral agree-ments, to which all Final Act subscribers accede,the Act includes several "plurilateral" agreementsadopted by only some of the subscribers. Adherents toa plurilateral agreement are obliged to offer the bene-fits of the agreement to each other, but have no suchobligation to non-adherents. Such agreements covergovernment procurement, civil aircraft, bovine meat,and certain dairy products.
Trade liberalization is undertakennot for its own sake but toimprove living standards.
Most important for trade liberalization is theagreement on government procurement, which ex-tends the scope of international competition for gov-ernment contracts into the procurement of services(including construction services), procurement bypublic utilities, and procurement by government bod-ies below the central level, such as states, provinces,departments, and prefectures. Contracts below certainspecified values are not covered. The basic principle isnational treatment: Foreign suppliers, goods, and ser-vices must be treated no less favorably in governmentprocurement than national suppliers, goods, and ser-vices. Thus, foreign suppliers must be given the samecommercial opportm~ity to bid for and secure a gov-
ernment contract as domestic suppliers. At this writ-ing, participants in the agreement will include Can-ada, the European Union, Hong Kong, Israel, Japan,(South) Korea, Norway, Switzerland, and the UnitedStates.
V. Effects on Trade and Income ofLiberalizing Trade in Goods
What do all these agreements add up to? After all,trade liberalization is undertaken not for its own sakebut to improve living standards. As trade barrierscome do~vn, countries will be stimulated to channelmore of their resources into those activities they carryon relatively most efficiently in the world economy,thereby enlarging total exports, income, and invest-ment. Evaluating the quantitative impact of the agree-ments is very difficult, however, given their breadthand the number of countries involved. The difficulty isgreatest for the agreements dealing with matters otherthan trade in goods, partly because of the nature ofthe agreements (including the nature of the barriersto be relaxed) and partly because of the paucity ofrelevant data.
For the trade in goods, some fairly sophisticatedestimates have been published, in spite of the difficul-ties-estimates of the effects of the agreements onboth trade and income. Among the most recent andcomprehensive are estimates issued by the GATTSecretariat in November, 1994, summarized here inTables 6 to 9.~ As all the agreed trade liberalizationsshould have been instituted by 2005, the estimatesindicate how much greater (or, in some cases, lower)trade and income are expected to be by 2005 than theywould have been if no Uruguay Round had occurred.In each table the estimated effect varies with theversion of the estimating model employed or, moreprecisely, with the underlying assumptions about thenature of competition and returns to scale of produc-tion or about the investment of income gains. (Theseassumptions are spelled out in the notes to the tables.)
As reported in Table 6, by 2005 the volume ofworld merchandise trade is expected to be about 9percent to 24 percent above the level it would haveattained in the absence of the Uruguay Round. By farthe greatest percentage gains are predicted for cloth-
3 The estimates were derived from a computable general equi-librium model linking together: (1) industries (within economies)from lower to higher stages of processing, subject to constraints onthe supply of land, labor, and capital; and (2) the economiesthemselves.
May/June 1995 New England Economic Review 11
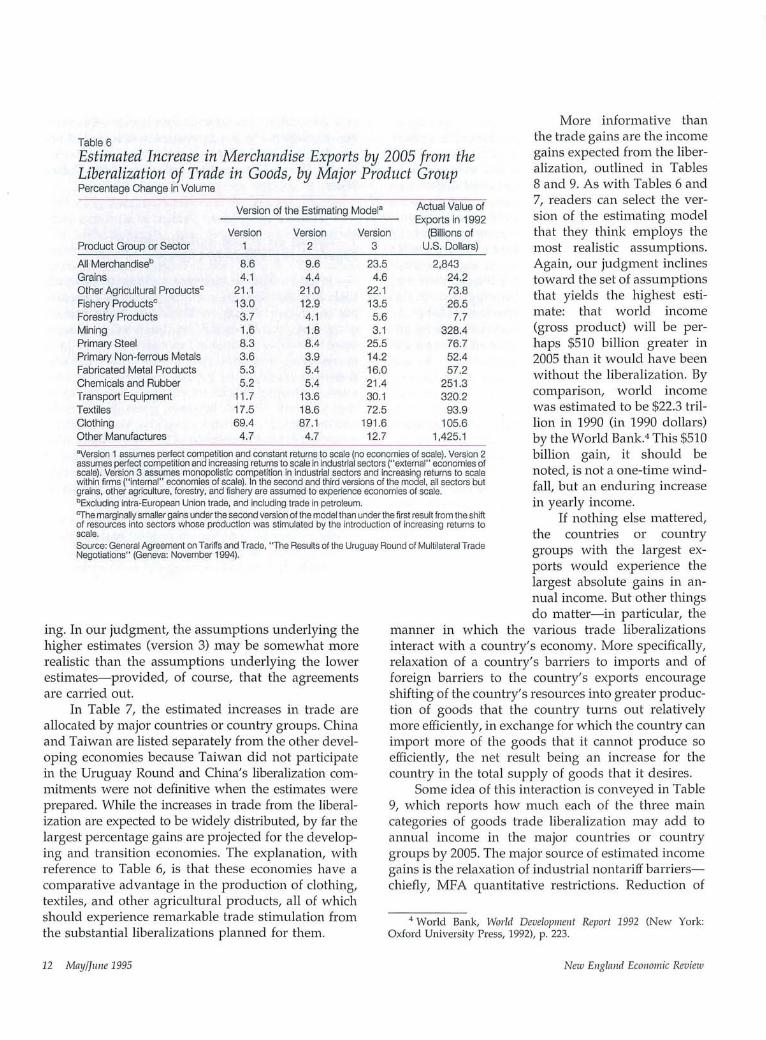
Table 6Estimated Increase in Merchandise Exports by 2005 from theLiberalization of Trade in Goods, by Major Product GroupPercentage Change in Volume
Version of the Estimating ModeP Actual Value ofExports in 1992
Version Version Version (Billions ofProduct Group or Sector 1 2 3 U,S. Dollars)
All Merchandiseb 8.6 9,6 23,5 2,843Grains 4,1 4,4 4,6 24.2Other Agricultural Productsc 21.1 21.0 22.1 73,8Fishery Products° 13.0 12.9 13.5 26,5Forestry Products 3.7 4,1 5.6 7.7Mining 1.6 1.8 3,1 328.4Primary Steel 8,3 8,4 25,5 76.7Primary Non-ferrous Metals 3,6 3,9 14,2 52.4Fabricated Metal Products 5.3 5.4 16.0 57,2Chemicals and Rubber 5.2 5.4 21.4 251,3Transport Equipment 11.7 13.6 30.1 320.2Textiles 17.5 18,6 72.5 93.9Clothing 69,4 87,1 191.6 105.6Other Manufactures 4.7 4.7 12.7 1,425.1aVersion 1 assumes perfect competition and constant returns to scale {no economies of scale). Version 2assumes perfect competition and increasing returns to scale in industrial sectors ("external" economies ofscale). Version 3 assumes monopolistic competition in industrial sectors and increasing returns to scalewithin firms ("internal" economies of scale). In the second and third versions of the model, all sectors butgrains, other agriculture, forestry, and fishery are assumed to experience economies of scale.bExcluding intra-European Union trade, and including trade in petroleum.CThe marginally smaller gains under the second version of the model than under the first result from the shiftof resources into sectors whose production was stimulated by the introduction of increasing returns toscale.Source: General Agreement on Tariffs and Trade, "The Results of the Uruguay Round of Multilateral TradeNegotiations" (Geneva: November 1994).
ing. In our judgment, the assumptions underlying thehigher estimates (version 3) may be somewhat morerealistic than the assumptions underlying the lowerestimates--provided, of course, that the agreementsare carried out.
In Table 7, the estimated increases in trade areallocated by major countries or country groups. Chinaand Taiwan are listed separately from the other devel-oping economies because Taiwan did not participatein the Uruguay Rotmd and China’s liberalization com-mitments were not definitive when the estimates wereprepared. While the increases in trade from the liberal-ization are expected to be widely distributed, by far thelargest percentage gains are projected for the develop-ing and transition economies. The explanation, withreference to Table 6, is that these economies have acomparative advantage in the production of clothing,textiles, and other agricultural products, all of whichshould experience remarkable trade stimulation fromthe substantial liberalizations planned for them.
More informative thanthe trade gains are the incomegains expected from the liber-alization, outlined in Tables8 and 9. As with Tables 6 and7, readers can select the ver-sion of the estimating modelthat they think employs themost realistic assumptions.Again, our judgment inclinestoward the set of assumptionsthat yields the highest esti-mate: that world income(gross product) will be per-haps $510 billion greater in2005 than it would have beenwithout the liberalization. Bycomparison, world incomewas estimated to be $22.3 tril-lion in 1990 (in 1990 dollars)by the World Bank.4 This $510billion gain, it should benoted, is not a one-time wind-fall, but an enduring increasein yearly income.
If nothing else mattered,the countries or countrygroups with the largest ex-ports would experience thelargest absolute gains in an-nual income. But other thingsdo matter--in particular, the
manner in which the various trade liberalizationsinteract with a country’s economy. More specifically,relaxation of a country’s barriers to imports and offoreign barriers to the country’s exports encourageshifting of the country’s resources into greater produc-tion of goods that the country turns out relativelymore efficiently, in exchange for which the country canimport more of the goods that it cannot produce soefficiently, the net result being an increase for thecountry in the total supply of goods that it desires.
Some idea of this interaction is conveyed in Table9, which reports how much each of the three maincategories of goods trade liberalization may add toannual income in the major countries or countrygroups by 2005. The major source of estimated incomegains is the relaxation of industrial nontariff barriers--chiefly, MFA quantitative restrictions. Reduction of
4 World Bank, World Development Report 1992 (New York:Oxford University Press, 1992), p. 223.
12 May/June 1995 New England Economic Review
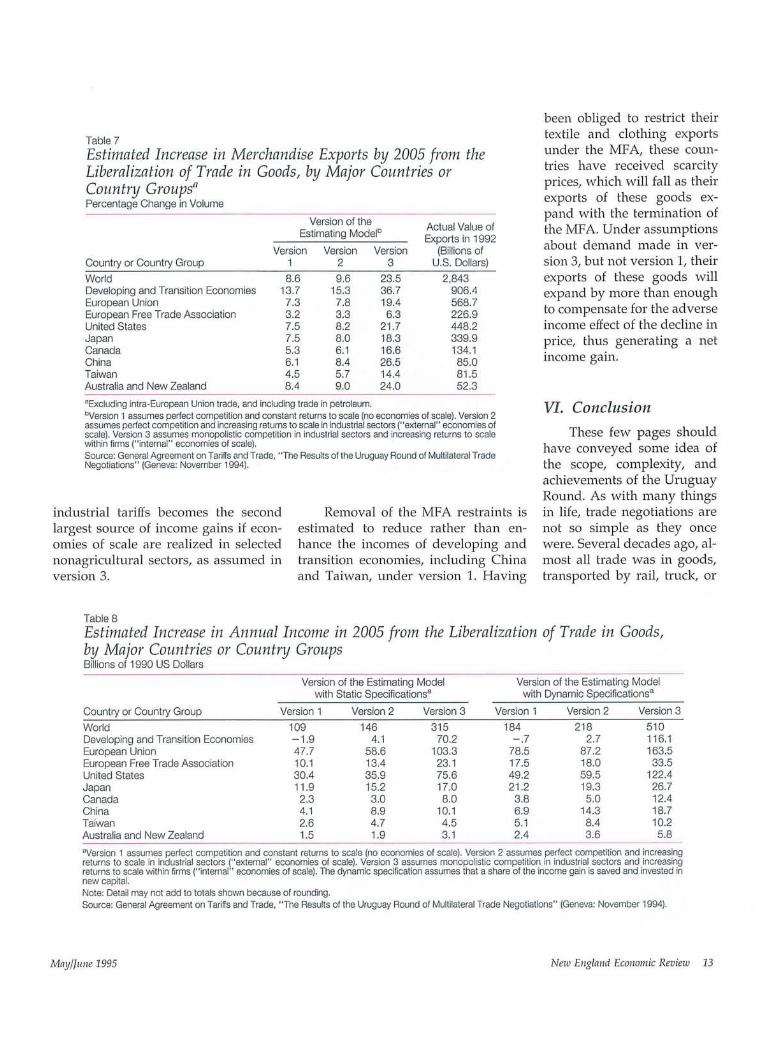
Table 7Estimated Increase in Merchandise Exports by 2005 from theLiberalization of Trade in Goods, by Major Countries orCount~7 Groups~Percentage Change in Volume
Version of the Actual Value ofEstimating Modelb Exports in 1992Version Version Version (Billions of
Country or Country Group 1 2 3 U.S. Dollars)World 8.6 9.6 23.5 2,843Developing and Transition Economies 13.7 15,3 36.7 906,4European Union 7,3 7.8 19.4 568,7European Free Trade Association 3.2 3.3 6.3 226.9United States 7.5 8,2 21,7 448.2Japan 7,5 8,0 18.3 339.9Canada 5.3 6.1 16.6 134.1China 6.1 8.4 26.5 85,0Taiwan 4.5 5.7 14.4 81,5Australia and New Zealand 8.4 9,0 24.0 52.3aExcluding intra-European Union trade, and including trade in petroleum.~Version 1 assumes perfect competition and constant returns to scale (no economies of scale). Version 2assumes perfect competition and increasing returns to scale in industrial sectors ("external" economies ofscale). Version 3 assumes monopolistic competition in industrial sectors and increasing returns to scalewithin firms ("internal" economies of scale).Source: General Agreement on Tarilfs and Trade, "The Results of the Uruguay Round of Multilateral TradeNegotiations" (Geneva: November 1994).
industrial tariffs becomes the secondlargest source of income gains if econ-omies of scale are realized in selectednonagricultural sectors, as assumed inversion 3.
Removal of the MFA restraints isestimated to reduce rather than en-hance the incomes of developing andtransition economies, including Chinaand Taiwan, under version 1. Having
been obliged to restrict theirtextile and clothing exportsunder the MFA, these coun-tries have received scarcityprices, which will fall as theirexports of these goods ex-pand with the termination ofthe MFA. Under assumptionsabout demand made in ver-sion 3, but not version 1, theirexports of these goods willexpand by more than enoughto compensate for the adverseincome effect of the decline inprice, thus generating a netincome gain.
VI. Conclusion
These few pages shouldhave conveyed some idea ofthe scope, complexity, andachievements of the UruguayRound. As with many thingsin life, trade negotiations arenot so shnple as they oncewere. Several decades ago, al-most all trade was in goods,transported by rail, truck, or
Table 8Estimated Increase in Annual Income in 2005 from the Liberalization of Trade in Goods,by Major Countries or Country GroupsBillions of 1990 US Dollars
Version of the Estimating Modelwith Static Specificationsa
Version of the Estimating Modelwith Dynamic Specificationsa
Country or Country Group Version 1 Version 2 Version 3 Version 1 Version 2 Version 3World 109 146 315 184 218 510Developing and Transition Economies - 1.9 4.1 70.2 -.7 2.7 116.1European Union 47.7 58.6 103.3 78.5 87.2 163.5European Free Trade Association 10.1 13.4 23.1 17.5 18.0 33.5United States 30.4 35.9 75.6 49.2 59.5 122.4Japan 11.9 15.2 17.0 21.2 19.3 26.7Canada 2.3 3.0 8.0 3.8 5.0 12.4China 4.1 8.9 10.1 6.9 14.3 18.7Taiwan 2.6 4.7 4.5 5.1 8.4 10.2Australia and New Zealand 1.5 1.9 3.1 2.4 3.6 5.8
aVersion 1 assumes perlect competition and constant returns to scale (no economies of scale), Version 2 assumes perfect competition and increasingreturns to scale in industrial sectors ("external" economies of scale). Version 3 assumes monopolistic competition in industrial sectors and increasingreturns to scale within firms ("internal" economies of scale). The dynamic specification assumes that a share of the income gain is saved and invested innew capital.Note: Detail may not add to totals shown because of rounding.Source: General Agreement on Tariffs and Trade, "The Results of the Uruguay Round of Multilateral Trade Negotiations" (Geneva: November 1994).
May/June 1995 Nezo England Economic Review 13
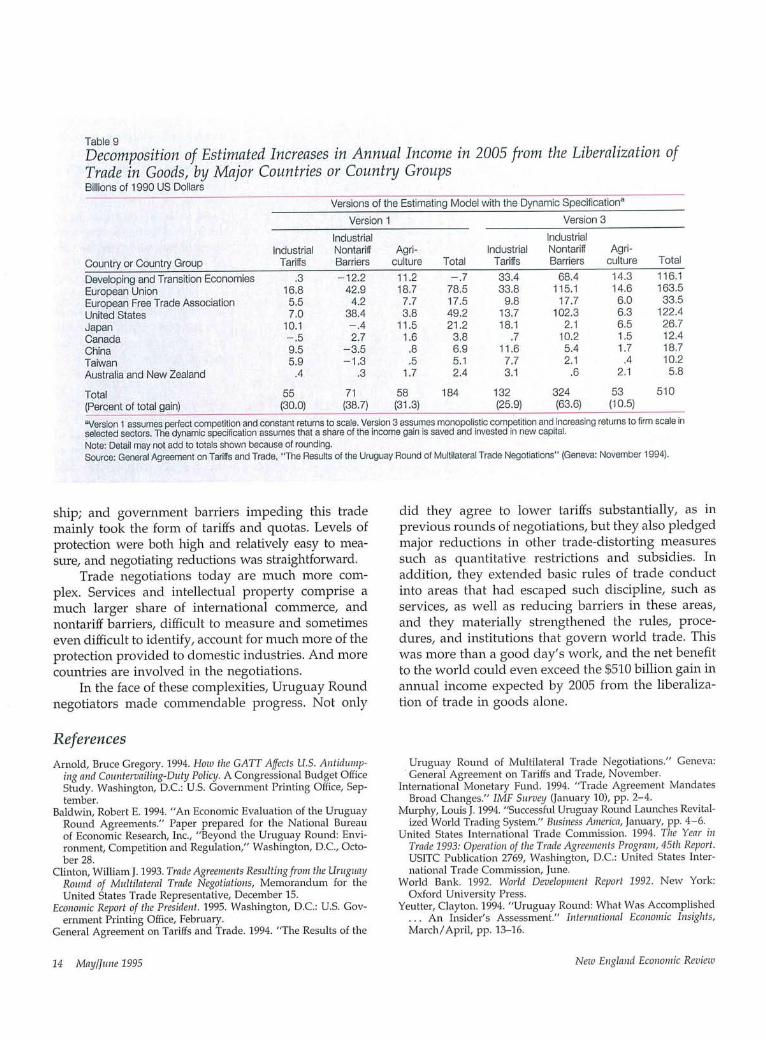
Table 9Decomposition of Estimated Increases in Annual Income in 2005 from the Liberalization ofTrade in Goods, by Major Countries or Country GroupsBillions of 1990 US Dollars
Versions of the Estimating Model with the Dynamic Specification~
Version 1 Version 3Industrial Industrial
Industrial Nontariff Agri- Industrial Nontariff Agri-Country or Country Group Tariffs Barriers culture Total Tariffs Barriers culture Total
Developing and Transition Economies .3 -12.2 11.2 -.7 33.4 68.4 14.3 116.1European Union 16.8 42.9 18.7 78.5 33.8 115,1 14.6 163.5European Free Trade Association 5,5 4.2 7.7 17.5 9.8 17,7 6.0 33.5United States 7.0 38.4 3.8 49.2 13.7 102.3 6.3 122.4Japan 10.1 -.4 11.5 21.2 18.1 2.1 6.5 26.7Canada -.5 2.7 1.6 3.8 .7 10.2 1.5 12.4China 9.5 -3.5 .8 6.9 11.6 5.4 1.7 18.7Taiwan 5.9 -1.3 .5 5.1 7.7 2.1 .4 10.2Australia and New Zealand .4 .3 1.7 2.4 3.1 .6 2.1 5.8
Total 55 71 58 184 132 324 53 510
(Percent of total gain) (30.0) (38.7) (31.3) (25.9) (63.6) (10.5)
aVersion 1 assumes perfect competition and constant returns to scale. Version 3 assumes monopolistic competition and increasing returns to firm scale inselected sectors. The dynamic specification assumes that a share of the income gain is saved and invested in new capital.Note: Detail may not add to totals shown because of rounding.Source: General Agreement on Tad~s and Trade, "The Results of the Uruguay Round of Multilateral Trade Negotiations" (Geneva: November 1994).
ship; and government barriers impeding this trademainly took the form of tariffs and quotas. Levels ofprotection were both high and relatively easy to mea-sure, and negotiating reductions was straightforward.
Trade negotiations today are much more com-plex. Services and intellectual property comprise amuch larger share of international commerce, andnontariff barriers, difficult to measure and sometimeseven difficult to identify, account for much more of theprotection provided to domestic industries. And morecountries are involved in the negotiations.
In the face of these complexities, Uruguay Roundnegotiators made commendable progress. Not only
ReferencesArnold, Bruce Gregory. 1994. How the GATT Affects U.S. Antidump-
ing and Countervailing-Duty Policy. A Congressional Budget OfficeStudy. Washington, D.C.: U.S. Government Printing Office, Sep-tember.
Baldwin, Robert E. 1994. "An Economic Evaluation of the UruguayRound Agreements." Paper prepared for the National Bureauof Economic Research, Inc., "Beyond the Uruguay Round: Envi-ronment, Competition and Regulation," Washington, D.C., Octo-ber 28.
Clinton, William J. 1993. Trade Agreements Resulting from the UruguayRound of Multilateral Trade Negotiations, Memorandum for theUnited States Trade Representative, December 15.
Economic Report of the President. 1995. Washington, D.C.: U.S. Gov-ernment Printing Office, February.
General Agreement on Tariffs and Trade. 1994. "The Results of the
did they agree to lower tariffs substantially, as inprevious rounds of negotiations, but they also pledgedmajor reductions in other trade-distorting measuressuch as quantitative restrictions and subsidies. Inaddition, they extended basic rules of trade conductinto areas that had escaped such discipline, such asservices, as well as reducing barriers in these areas,and they materially strengthened the rules, proce-dures, and institutions that govern world trade. Thiswas more than a good day’s work, and the net benefitto the world could even exceed the $510 billion gain inannual income expected by 2005 from the liberaliza-tion of trade in goods alone.
Uruguay Round of Multilateral Trade Negotiations." Geneva:General Agreement on Tariffs and Trade, November.
International Monetary Fm~d. 1994. "Trade Agreement MandatesBroad Changes." IMF Survey (January 10), pp. 2-4.
Murphy, Louis J. 1994. "Successful Uruguay Round Launches Revital-ized World Trading System." Basiness America, January, pp. 4-6.
United States International Trade Commission. 1994. The Year inTrade 1993: Operation of the Trade Agreements Program, 45th Report.USITC Publication 2769, Washington, D.C.: United States Inter-national Trade Commission, June.
World Bank. 1992. World Development Report 1992. New York:Oxford University Press.
Yeutter, Clayton. 1994. "Uruguay Round: What Was Accomplished... An Insider’s Assessment." International Economic Insights,March/April, pp. 13-16.
14 May/June 1995 New England Economic Review


![[Res.vn]new round up](https://img.dokumen.tips/doc/110x75/635f4651cdabb5e9220a09b6/resvnnew-round-up.jpg)


