Embed Size (px)
Citation preview

Journal of Banking & Finance 34 (2010) 116–126
Contents lists available at ScienceDirect
Journal of Banking & Finance
journal homepage: www.elsevier .com/locate / jbf
The S&P500 index effect reconsidered: Evidence from overnight and intradaystock price performance and volume
Konstantina Kappou, Chris Brooks *, Charles WardICMA Centre, University of Reading, UK
a r t i c l e i n f o a b s t r a c t
Article history:Received 20 April 2009Accepted 13 July 2009Available online 15 July 2009
JEL classification:G10G14
Keywords:Index effectS&P500Market efficiencyPrice pressure
0378-4266/$ - see front matter � 2009 Elsevier B.V. Adoi:10.1016/j.jbankfin.2009.07.008
* Corresponding author. Tel.: +44 118 378 7809; faE-mail addresses: Konstantina.Kappou@googlemai
rdg.ac.uk (C. Brooks), [email protected] (
This study focuses on S&P500 inclusions and deletions, examining the impact of potential overnight priceadjustment after the announcement of an S&P500 index change. We find evidence of a significant over-night price change that diminishes the returns available to speculators although there are still profitsavailable from the first day after announcement until a few days after the actual event. More importantly,observing the tick-by-tick stock price performance and volume effects on the key days during the eventwindow for the first time, we find evidence of consistent trading patterns during trading hours. A sepa-rate analysis of NASDAQ and NYSE listed stocks allows for a detailed examination of the price and volumeeffect at an intra-day level. We find that index funds appear to cluster their rebalancing activities near toand after the close on the event date, suggesting that they are more concerned with tracking error thanprofit.
� 2009 Elsevier B.V. All rights reserved.
1 Academic research has supported this statement for more than 20 years. Theabnormal return reported between announcement and event of an index change has
1. Introduction
Over the last 20 years, index funds have become extremely pop-ular, with total worldwide explicitly indexed assets estimated toexceed $1 trillion. When ‘‘trackers” follow a benchmark index,their investment decisions are not based on fundamental analysis.Instead, they make the necessary portfolio adjustments only to re-duce tracking error, which ensures that such funds will prefer in-dex member stocks to non-members. Thus the deletion of anexisting member-firm from a widely followed benchmark has asignificant implication for fund managers. For pure index trackers,the only reason, apart from changing cash flows, for trading stockswill be index composition reviews.
The ‘‘index effect” refers to the price pressure that is observedwhen a stock is added to or deleted from an index. If the index iswidely tracked, then profits can be made by buying (selling) theshares of the added (deleted) firm ahead of index funds and selling(buying) them at a later stage, when index fund demand (supply) issatisfied. The more money is tied to the index, the more index port-folio managers will be involved in trading the underlying stocksaround index recomposition. Index trackers ensure that demandwill increase for added stocks and will reduce for deleted stocks.
ll rights reserved.
x: +44 118 931 4741.l.com (K. Kappou), C.Brooks@C. Ward).
For many years, ‘‘buying additions and selling deletions” has beena lucrative strategy for investors not involved in index tracking.1
This study examines the impact of potential overnight priceadjustment after the announcement of an S&P500 index additionas well as the impact on the prices and volumes of the stocks ona tick-by-tick basis. A separate analysis is conducted for additionsand deletions and also for NASDAQ listed versus NYSE listed stocks.Previous studies have mainly concentrated on close-to-closeabnormal returns and showed that there is a significant price in-crease between the close on the announcement day and the closeon the day after. However, the purchase of the added stock cannotbe made at the close of trading on the announcement day becausethe information is released to the market after the close. The firsttrading opportunity arises in the morning of the first day afterannouncement, when the stock usually opens at a considerableprice increase, resulting in lower actual trading profits; our studyinvestigates this issue in detail.
The following analysis differs from previous studies in fourimportant areas. First, the results involve not only close-to-close
ranged between 3% and 8% depending on the time period studied (Harris and Gurel,1986; Beneish and Whaley, 1996; Malkiel and Radisich, 2001; Chen et al., 2004).Standard and Poor’s analysts have also reported evidence of significant abnormalreturns during periods of recomposition of the main indices (S&P 500, S&P MidCap400 and S&P SmallCap 600) – see Bos (2000).

K. Kappou et al. / Journal of Banking & Finance 34 (2010) 116–126 117
abnormal returns but also overnight and open-to-close returns.Second, the tick-by-tick stock price performances and trading vol-umes of the added stocks are examined for the first time for theyears 1999 and 2000. This analysis enables us to provide a moredetailed picture of the objectives and actions of index fund manag-ers and arbitrageurs. Third, NYSE and NASDAQ samples are exam-ined separately to determine the impact of trading venue on theindex effect.2 Finally, we make use of a more recent and longerrun of data on index additions than was available in previousstudies.
The remainder of this study is organized as follows. Section twoprovides a brief description of the major stock selection criteriaand the announcement policies of the Standard and Poor’s IndexCommittee. Section three presents a brief summary of previous rel-evant studies associated with S&P500 index changes and the pre-vailing hypotheses that lie behind the companies’ post-eventperformance. Section four examines the stock performance afteraddition by using overnight and open-to close data and section fiveprovides results using tick-by-tick abnormal returns. Section sixpresents an analysis of the index effect at the intra-day level andsection seven examines the intra-day index effect of a deletionssample. Section eight concludes.
2. Index tracking and the S&P500
The S&P500 is a value-weighted index that reflects the marketvalue of all 500 component US stocks relative to a particular baseperiod. The selection and management of the index is determinedby the Standard and Poor’s Index Committee. Changes in indexcomposition are mainly caused by member companies effectivelyceasing to exist in their current form through mergers, takeovers,restructuring or bankruptcies. According to a statement by Stan-dard and Poor’s, candidate firms are ‘‘monitored carefully and thecriteria for inclusion are highly stringent”. After screening candi-date companies, an S&P500 Replacement Pool is created that con-tains at least 10 companies. The prevailing company from this Poolis chosen whenever a new entry to the index is required followingthe deletion of another company. The selection process for S&P500membership does not simply refer to a typical quantitative rankingsystem based on market capitalisation. Therefore, it is difficult forinstitutional investors and fund managers to anticipate thechanges. This is in contrast with the procedures that operate formost other major indices. In general, but not exclusively, S&Pmember companies have the largest market value in their sectorand are chosen to represent their industry in the US market. Theselection process entails an examination of the firm’s trading activ-ity, such as public float3 and turnover ratios, to ensure high liquidityand to reduce the probability of deviations from the ‘‘fair” stockprice.
Standard and Poor’s changed their announcement policy twice –in September 1976 and more recently in October 1989. The latterchange was made in order to alleviate the price pressure on theannouncement date that occurred prior to this when index inclu-sion took place immediately the day after announcement. Changesare now pre-announced an average of five days before the event.The period from the announcement date to the effective date offerstime for institutional investors and index fund managers to adjust
2 This separation may be particularly important where trading volumes areconcerned since there is evidence that volumes are considerably over-estimated onthe NASDAQ, although in a complex way, so that a simple adjustment forcomparability is not possible – see Anderson and Dyl (2005).
3 In March 2004, Standard and Poor’s announced that it would convert all major USindices to a float-adjusted basis and in September 2004, it released details of themethodology used for the free-float calculation. In March 2005, S&P500 became half-float adjusted and in September 2005, full-float adjusted.
their holdings. The announcement, which takes place after the mar-ket close, reveals the name of the firm that will be added (deleted)and the exact date that the event will take place.4 In some instances,however, only the name of the firm and not the exact date of theevent is announced.
3. Previous literature
The period during which a change in index composition occursconstitutes a useful laboratory for testing the Efficient MarketHypothesis (EMH). According to the semi-strong form of theEMH, the market’s historical knowledge of abnormal returns for in-dex additions (deletions) will drive the security’s price up (down)to its expected addition (deletion)-day value on the day after theannouncement (Cusick, 2002). The profits from buying the stockon the day after the announcement and selling it on the effectivedate should be fully eliminated and the change in the security’sprice should happen overnight.
Numerous studies show that the index effect results in stockprice behavior during the event period that appears inconsistentwith the EMH. Consequently, a number of hypotheses have beenproposed to justify this performance. These are the Price PressureHypothesis (see Harris and Gurel, 1986; Woolridge and Ghosh,1986; Malkiel and Radisich, 2001), the Imperfect Substitutes/Downward-Sloping Demand Curve for Stocks Hypothesis (Shleifer,1986; Denis et al., 2003), the Liquidity Cost Hypothesis (Mikkelsonand Partch, 1985; Amihud and Mendelson, 1986), the InformationContent/Index Member Certification Hypothesis (Jacques, 1988;Dhillon and Johnson, 1991), and the Market Segmentation/InvestorRecognition Hypothesis (Chen et al., 2004). Their main differencesconcern whether the stock price or volume change is temporary orpermanent after the event, what kind of information is revealed byan addition or deletion, and what are the main issues for stock andinvestor behavior. While the number of papers examining whetherthese hypotheses receive empirical support is large, with theexception of three, all consider only close-to-close returns. Such re-search arguably presents a misleading picture of the profitability oftrading on changes in index composition since these profits cannotbe realized by investors.
Beneish and Whaley (1996, 1997) are the first to examine close-to-open returns to measure the extent of overnight performancethat is consistent with market efficiency using index inclusions un-der both the old and new regimes. The overnight pressure underthe old policy was expected to be larger since there was no intervalbetween announcement and event. The major part of the abnormalclose-to-close return of added stocks under the old announcementpolicy was caused overnight (4.37%) and the open-to-close abnor-mal return of the following day was �0.62% leaving no profitabletrading opportunities. Under the new announcement policy, how-ever, an abnormal return that is significant but substantially smal-ler in magnitude occurs overnight (2.46%) with an insignificant(positive) open-to-close return the next day (0.6%).
Open-to-close returns are also examined by Cusick (2002), whofinds evidence of an increase in market efficiency through time,and a decrease in the trading profit available to arbitrageurs whobuy additions and sell deletions. By using the size of the overnightabnormal return from the close on the announcement date untilthe following morning as a proxy for investors’ interest, he showsthat the potential trading profits available have decreased overtime. His main conclusion is that investors’ interest will outweigh
4 We would like to thank Milvia Luckenbach and Srikant Dash from Standard andPoor’s Corporation for providing information concerning the new announcemenpolicy.
t

118 K. Kappou et al. / Journal of Banking & Finance 34 (2010) 116–126
the increase in indexing and the available trading profit will dimin-ish through time.
No previous studies on the S&P500 index effect employ tick-by-tick data. The methodology used in this work to obtain intra-dayabnormal returns is similar to that of Wood et al. (1985), whoexamine the return characteristics of trades at the micro level,although not relating specifically to the index effect. In the caseof S&P500 inclusions, new information is released overnight andincreased trading volume is expected at the beginning of the dayafter announcement. According to Easley and O’Hara (1992), bid-ask spreads should widen upon the occurrence of large block trans-actions to reflect the uncertainty of the future price equilibriumand therefore, high standard deviations of intraday returns shouldalso be expected. However, inclusions are events that require sig-nificant index fund rebalancing, and specialists as well as marketmakers can afford to tighten their spreads in the short run due toincreased volumes (Beneish and Whaley, 1996). In any case, theU-shaped pattern of return variation may not be pronounced sincesignificant trading activity is likely to occur throughout the wholetrading day and the evidence of increased liquidity found in previ-ous studies (Edmister et al., 1996; Erwin and Miller, 1998) will notadversely affect trading costs.
4. The overnight and open-to-close effect
4.1. Data and methodology
Stock opening and closing prices are obtained from ThomsonDatastream. There are insufficient data for the benchmark openingprices before the year 1993 and therefore, firms that were added tothe S&P500 before that year are not examined; the final samplecontains 266 stock additions to the S&P500 for the period 1993–2002. Of these stocks, 188 are traded on the NYSE and 78 on theNASDAQ. The abnormal open-to-close return (OTC) for each firmis obtained by subtracting the benchmark return from the open-to-close performance of the stock. The same approach is repeatedfor calculating close-to-close abnormal returns (CTC) from theannouncement day (AD) close until AD+1 close. The overnight per-formance is then derived by subtracting the open-to-close perfor-mance from the close-to-close performance:
ARCTCit ¼ RCTCit � RCTCmt ð1ÞAROTCit ¼ ROTCit � ROTCmt ð2ÞOVRit ¼ ARCTCit � AROTCit ð3Þ
where, in the case of the first day after the S&P press release, RCTCit
and RCTCmt are the close-to-close returns between AD and AD+1 forthe stock and the S&P500 respectively, ROTCit and ROTCmt are theopen-to-close returns between AD+1 open and AD+1 close for thestock and the benchmark respectively, ARCTCit, AROTCit are the abnor-mal close-to-close and open-to-close returns for each stock respec-
Table 1Close-to-close, open-to-close and overnight average daily firm performance between AD a
Days AD AD+1 AD+2 AD+3 AD+4
Close-to-closeAR (%) 0.40 4.06 0.33 0.60 0.60t-stat 1.67 16.30 1.66 2.48 2.36
Open-to-CloseAR (%) 0.12 �0.83 0.19 0.20 0.22t-stat 0.68 �4.50 1.05 0.92 0.91
OvernightAR (%) 0.28 4.89 0.14 0.40 0.38t-stat 1.98 19.69 1.30 2.56 3.42
Notes: Figures in bold denote statistics that are significant at the 5% level or better.
tively, and OVRit is the overnight (non-tradable) abnormal returnbetween AD close and AD+1 open for each firm. This method is re-peated for the key days during the event window until the day afterthe effective index change (ED+1). Returns are constructed in theircontinuously compounded form (i.e. log price relatives) throughoutthis study.
4.2. Results
4.2.1. The whole sampleTable 1 presents the close-to-close, open-to-close and overnight
data between announcement date and effective date with theircorresponding t-statistics. On the day of announcement (AD), theopen-to-close return is insignificant, indicating no pre-emptivetrading of the future index change. Moreover, despite the 4.06%abnormal return from the close of trading on AD to the close onAD+1, it is clear that there are no trading opportunities on AD+1because the open to close return is significantly negative at the1% level (�0.83%). The overnight performance averages 4.89% onAD+1 (significantly different from zero at the 1% level), indicatingthat market makers have very positive expectations concerningadded firms. The overnight performance is also positive and signif-icant every day up to and including AD+5 (except for AD+2 where itis positive but not significant) as well as on ED; thereafter, the re-turns on ED+1 and ED+2 both represent statistically significantreversals.
Table 2 repeats the above analysis but the sample is now di-vided into two different sub-periods, for the years 1993–1997and 1998–2002. Additions to and deletions from the S&P500 havebecome more frequent over the more recent period, and thereforethe sample of firms added to the index during the latter period islarger (88 firms in the earlier sub-period and 178 firms in the laterone). The firms added during the first sub-period experience anovernight price increase of 3.89% after the close on AD and a fur-ther marginal and insignificant price increase of 0.02% betweenAD+1 open and AD+1 close. By contrast, in the more recent sub-period, the overnight return between AD close and AD+1 open is5.38%, with a highly significant negative return of �1.25% fromthe open until the close the day after (AD+1).
The evening of the ED is the last point where the S&P500 has itsold composition, and index fund managers will have alreadystarted rebalancing their portfolios (the new composition and divi-sor adjustment of the S&P500 index are based on ED closingprices). The close-to-close abnormal return between ED-1 and EDis significantly different from zero when considering the wholesample or either sub-period. However, the ED open-to-close returnremains insignificantly different from zero for the recent periodsub-sample, showing that index fund demand does not appear todrive price patterns. It is also worth noting that in the more recentsub-period, the AD+1 close-to-close price increase is higher,although the ED close-to-close price increase is lower. In other
nd ED+3, 1993–2002.
AD+5 ED ED+1 ED+2 ED+3
0.59 2.18 �0.96 �0.52 �0.781.41 6.57 �4.05 �2.64 �3.62
0.00 0.64 �0.36 �0.32 �0.620.01 2.39 �1.96 �1.78 �3.22
0.59 1.54 �0.60 �0.20 �0.162.98 7.79 �4.70 �2.59 �1.47

Table 2Close-to-close, open-to-close and overnight average daily firm performance between AD and ED+1 over two different sub-periods.
Days AD AD+1 AD+2 AD+3 AD+4 AD+5 ED ED+1
Panel A: 1993–1997Close-to-closeAR (%) �0.05 3.91 0.41 0.03 0.27 0.60 3.10 �0.79t-stat �0.21 10.74 1.75 0.11 1.18 1.36 6.51 �3.45
Open-to-CloseAR (%) 0.02 0.02 0.16 0.10 0.11 0.38 1.49 �0.37t-stat 0.09 0.07 0.71 0.40 0.42 1.06 4.40 �1.74
OvernightAR (%) �0.07 3.89 0.25 �0.07 0.16 0.22 1.61 �0.42t-stat �0.81 12.58 2.21 �0.79 0.79 0.74 4.13 �3.67
Panel B: 1998–2002Close-to-closeAR (%) 0.62 4.13 0.28 0.89 0.84 0.59 1.73 �1.04t-stat 1.85 12.69 1.05 2.60 2.07 1.02 4.00 �3.11
Open-to-CloseAR (%) 0.17 �1.25 0.20 0.25 0.31 �0.17 0.23 �0.36t-stat 0.71 �5.07 0.82 0.83 0.81 �0.29 0.63 �1.41
OvernightAR (%) 0.45 5.38 0.08 0.64 0.53 0.76 1.50 �0.68t-stat 2.21 16.27 0.57 3.10 3.75 2.98 6.67 �3.77
Notes: Figures in bold denote statistics that are significant at the 5% level or better.
Table 3Close-to-close, open-to-close and overnight average daily firm performance between AD and ED+1 for NASDAQ and NYSE listed stocks, 1993–2002.
Days AD AD+1 AD+2 AD+3 AD+4 AD+5 ED ED+1
Panel A: NASDAQ StocksClose-to-closeAR (%) 0.00 4.70 0.13 1.17 1.94 1.24 3.53 �1.48t-stat 0.00 8.47 0.33 1.99 2.88 1.46 4.23 �2.16
Open-to-CloseAR (%) �0.28 �1.95 0.17 �0.09 1.34 �0.10 1.05 �0.33t-stat �0.70 �5.28 0.46 �0.16 2.17 �0.10 1.61 �0.70
OvernightAR (%) 0.28 6.65 �0.04 1.26 0.60 1.34 2.48 �1.15t-stat 1.45 12.24 �0.16 2.86 2.35 2.99 5.55 �3.16
Panel B: NYSE StocksClose-to-closeAR (%) 0.55 3.86 0.42 0.37 0.09 0.22 1.65 �0.77t-stat 1.97 14.41 1.80 1.41 0.38 0.46 5.11 �4.03
Open-to-CloseAR (%) 0.27 �0.34 0.20 0.26 �0.21 �0.04 0.48 �0.37t-stat 1.47 �1.70 0.93 1.19 �0.89 �0.10 1.73 �2.07
OvernightAR (%) 0.28 4.20 0.22 0.11 0.32 0.26 1.17 �0.40t-stat 1.51 16.45 2.23 0.61 2.45 1.34 5.61 �3.98
Notes: Figures in bold denote statistics that are significant at the 5% level or better.
K. Kappou et al. / Journal of Banking & Finance 34 (2010) 116–126 119
words, the abnormal return premium has shifted towards theannouncement date. This can be attributed to a potential increasein the number of arbitrageurs through time (since the ‘‘S&P Game”has become more widely known and the number and financialpower of hedge funds has grown enormously) who may be tryingto make a profit by buying the stock ahead of index funds. It couldbe also attributed to an increase in market efficiency,5 where par-ticipants are aware of the positive addition effect and thus driveprices up immediately after the announcement date instead of onthe event date.
5 The t-statistic for the difference across the two sub-samples in the overnightperformance between AD close and AD+1 open is statistically significant and higherfor the recent sub-sample.
To conclude, according to the above findings, even if the AD+1close-to-close abnormal return is eliminated, there are still someprofitable trading opportunities beyond AD+1 until the date ofthe actual event. The results thus far are consistent with those ofBeneish and Whaley (1996 and 2002) and Cusick (2002).
4.2.2. The overnight effect: NASDAQ listed versus NYSE listed stocksThe NYSE and NASDAQ exchanges are very different in the way
that they operate. The former is a specialist market, where alltrades occur in a physical place (the NYSE trading floor), whereasthe latter is a dealer market that is based on a telecommunicationsnetwork. Christie and Schultz (1994), and Bessembinder and Kauf-man (1997) have shown the prevalence of the NYSE as a more effi-cient and less costly exchange. The exchanges also differ in the
120 K. Kappou et al. / Journal of Banking & Finance 34 (2010) 116–126
types of the securities that are traded. Stocks listed on the NYSE ex-change are typically ‘‘blue chips” – i.e., established companies,whereas stocks listed on the NASDAQ are usually considered topossess significant growth opportunities but with higher levels ofrisk.
An important advantage of the NYSE is that the market is cen-tralized and the specialist can more easily handle any liquidityproblems. On the other hand, the NASDAQ exchange is relativelydecentralized and has greater market depth due to the increasedcompetition among dealers and to the direct trading that takesplace between market participants in the event of demand or sup-ply shocks. LaPlante and Muscarella (1997) showed that the NYSEprovides greater liquidity to the market than the NASDAQ in thecase of large block trades. Chung et al. (2008) also suggest that spe-cialists make faster quote adjustments towards equilibriumspreads on the NYSE than they do on the NASDAQ. Inferencesabout the differences between the two exchanges can be moreaccurately made when comparing open-to-close data, where actualtrading is taking place, rather than the close-to-close data used inprevious studies.
Table 3 presents the average daily performance of NASDAQ andNYSE listed stocks separately. Even if on a close-to-close basis, theexchanges seem to produce different average abnormal stock re-turns on the first trading day after the announcement, and mostof the difference occurs overnight. In particular, the level of over-night abnormal return for the NASDAQ sample between AD closeand AD+1 open is 6.65% on average, relative to 4.20% for the NYSEsample. This difference is significant at the 1% level (t-statis-tic = 4.63). It would thus appear that investors perceive a NASDAQstock inclusion to be more positive news than the addition of aNYSE stock. The exchange effect is confirmed by the open-to-closedata, showing an advantage of the specialist market. This resultechoes that of Elliott and Warr (2003), who use daily data to inves-tigate differences in the index effect across the two markets. NYSEstocks experience a positive open-to-close abnormal return of only0.48% relative to a figure of 1.05% for NASDAQ stocks on the eventday. This discrepancy could arise from differential levels of trans-action costs as well as differing levels of liquidity of NASDAQ ver-sus NYSE added stocks.6 The overnight abnormal return between EDclose and ED+1 open is significantly negative for both NASDAQ andNYSE stocks (�1.15% and �0.4% respectively) and statistically differ-ent for the two samples (t-statistic = 2.69, with the NASDAQ sub-sample realising a larger price reversal).
7 The SPDR (SPY) fund is an ETF (Exchange Traded Fund) that holds all thecomponents of the S&P500 index.
8 The more liquid firms cover every second during the reference time and in somecases, there is more than one trade per second which occurred at the same price. Toovercome this, for those particular seconds, the total number of shares traded at the
5. The tick-by-tick performance of the stocks that are added tothe S&P500 index
5.1. Data and methodology: the trade and quote (TAQ) database
The TAQ database contains intraday transactions data for allsecurities listed on the New York Stock Exchange (NYSE), the NAS-DAQ National Market System (NMS) as well as the American StockExchange (AMEX). This analysis uses the reported trades on eachday within the event window for firms added to or deleted fromthe S&P500, but tick-by-tick data are only employed for the years1999 and 2000. The final sample consists of 91 added firms (withdeletions discussed in Section 7). In estimating tick-by-tick abnor-mal returns, the S&P500 index cannot be used directly as a bench-mark because intraday index changes are significantly lessfrequent than the intraday changes of the added stocks. The closest
6 In fact, spreads on NASDAQ stocks are comparable with those of NYSE stocks formost of the trading day, averaging 7–10 bps (basis points), but NYSE spreads widenconsiderably to over 100 basis points at the close, while those of the NASDAQ remainat around 10 bps. The issue of transactions costs will be discussed in detail in Section6.
substitute for the S&P500 index that is traded as a stock and is alsovery liquid is the ‘‘SPIDER” (SPY) fund.7 All the trades recorded oneach day are collected from the TAQ Database for the sample of firmsand for the SPY.
Each firm that was added to the index differs from others in thesample in terms of liquidity and the number of trades recorded. Toallow for this, we adopt a reference time in seconds from 09.30 to16.00. The recorded trades (one series for the prices and one seriesfor the number of shares) for each firm are then allocated accord-ing to their reported times.8 The interval selected for analysis is5 min and therefore, the intraday price and volume performance be-tween 09.30 and 16.00 for each stock has 78 observations per day. Inorder to compress the reference time in seconds into 5-min intervals,in the case of firms with more than one reported trade per 5 min, thesum of the reported quantities of shares over that interval is used asthe number of shares traded, and the last reported price is used asthe price over that interval.9 In the case where the firm has not re-ported any trades over a 5-min interval, the sum of the number ofshares traded in that interval is zero and the price for that intervalis the same as that of the previous one. The same approach is em-ployed to obtain tick-by-tick prices of the SPIDER (SPY) index fund.Logarithmic returns are then obtained for each stock and for theSPY by taking the differences of the log prices over 5-min intervals,consistent with the method of Wood et al. (1985). Abnormal returnsare then derived by taking the difference between the stock returnand the benchmark return for all 78 observations each day:
ARi;j ¼ Ri;j � RSPY;j ð4Þ
where Ri and RSPY are the interval returns during the trading hoursfor each stock i and for the SPY respectively and ARi,j is the abnormalstock return for each interval j.
In order to measure the intraday trading volume during eachday within the event window, the number of shares traded per5-min interval is expressed as a percentage of the total sharestraded each day for each firm to allow a comparison among firmsof different liquidities. These percentages are then averaged acrossfirms for each interval and are free of any bias that might have oc-curred due to the differences in the total absolute trading volumesof the stocks. This approach may reveal the timing of index fundrebalancing.
5.2. Results
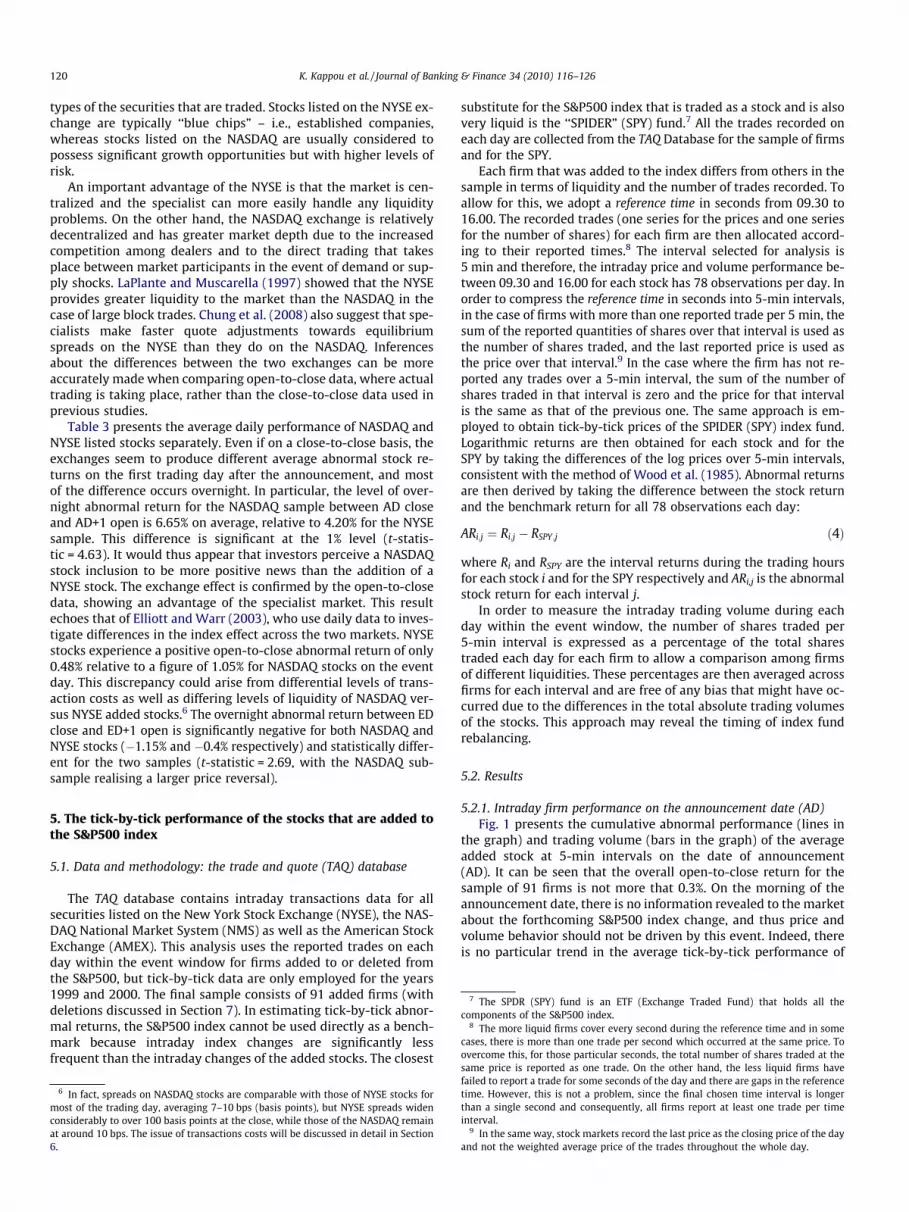
5.2.1. Intraday firm performance on the announcement date (AD)Fig. 1 presents the cumulative abnormal performance (lines in
the graph) and trading volume (bars in the graph) of the averageadded stock at 5-min intervals on the date of announcement(AD). It can be seen that the overall open-to-close return for thesample of 91 firms is not more that 0.3%. On the morning of theannouncement date, there is no information revealed to the marketabout the forthcoming S&P500 index change, and thus price andvolume behavior should not be driven by this event. Indeed, thereis no particular trend in the average tick-by-tick performance of
same price is reported as one trade. On the other hand, the less liquid firms havefailed to report a trade for some seconds of the day and there are gaps in the referencetime. However, this is not a problem, since the final chosen time interval is longerthan a single second and consequently, all firms report at least one trade per timeinterval.
9 In the same way, stock markets record the last price as the closing price of the dayand not the weighted average price of the trades throughout the whole day.

0.0%
0.5%
1.0%
1.5%
2.0%
2.5%
3.0%
3.5%
4.0%
4.5%
5.0%
9:30 10:30 11:30 12:30 13:30 14:30 15:30
announcement date (AD)
per
cen
tag
e vo
lum
e
-6.0%
-5.0%
-4.0%
-3.0%
-2.0%
-1.0%
0.0%
1.0%
per
cen
tag
e ab
no
rmal
ret
urn
Fig. 1. Tick-by-tick cumulative abnormal performance and number of shares traded over each 5-min interval expressed as a percentage of the total daily volume of theaverage added stock on AD.
K. Kappou et al. / Journal of Banking & Finance 34 (2010) 116–126 121
the stocks, and prices may be driven only by the correspondingmarket tick-by-tick trend.
To check whether there is any anticipation of the S&P press re-lease (that will be posted after the close of trading), we also showthe volumes over the trading day in Fig. 1. For a typical trading day,a higher volume is expected over the first few minutes after themarket opening as well as over the last few minutes before themarket close and usually, intraday volumes trace out a ‘‘smilepattern” (Wood et al., 1985). The average volume observed overthe last 5 min of the AD, expressed as a percentage of the total dai-ly volume, is high relative to the rest of the day. Investors whowere actually capable of buying the added stock before the ADclose due to this potential leakage could enjoy a highly significantabnormal return until the next day’s close. Those who did not buythe stock by AD close will have to suffer the huge overnight priceincrease and buy the next day (AD+1) at a higher price.
5.2.2. Intraday firm performance on the first day after announcement(AD+1)
Since the average stock price reverses during the day (see Table1), it is worth checking whether there is an optimal time to buy thestock, i.e. when the lowest price level occurs on average. Fig. 2 pre-sents the tick-by-tick cumulative performance and trading volumeof the average added stock on the first day after announcement. Itcan be seen that the price experiences a continuous negative trend,losing part of the overnight price increase. Under the assumptionthat arbitrageurs and other market participants have realized thatthe price drops monotonically during AD+1, they should wait and
0.0%0.5%1.0%
1.5%2.0%2.5%3.0%3.5%
4.0%4.5%5.0%
9:30 10:30 11:30 12:30
first day after ann
per
cen
tag
e vo
lum
e
Fig. 2. Cumulative abnormal performance and number of shares traded over each 5-minstock on AD+1.
buy the stock at the market close. However, according to the vol-ume levels presented in Fig. 2, it is evident that high trading activ-ity occurs at the opening price. This is reasonable given theovernight price change of almost 5% (reported in Section 4), an in-crease which is statistically significant and therefore, market par-ticipants may assume a reversal within the day and start sellingthe stock short at the opening.
Fig. 2 also shows how the total daily volume is allocated to the5-min intervals between 09.30 and 16.00 on AD+1. Indeed, there isselling pressure at the market open and during the first half hour,because volume figures are at their highest levels relative to totaldaily trading, and the price decreases. The stock price of the firmthat will soon be added to the index seems to partially lose its sig-nificant overnight increase during the first day after the revisionannouncement. In Section 4, it was shown that the overall open-to-close return for that day is significant. The buy side of thesetrades may be provided by participants who aim to hold the addedstock over the long run. The best time to buy the stock is a fewminutes before the close, when the price is at its lowest level. How-ever, since the stock opens at a considerably higher level than thatof the previous close, one could enhance the tradable return byshort selling the stock at the open on AD+1, then buying it backagain at the close of trading when it hits its lowest level, and finallytaking a long position in the stock until the event date (ED).
To complete the AD+1 intraday analysis, we examine firmslisted on the NASDAQ and NYSE exchanges separately. On the firstday after announcement, the cumulative abnormal intraday per-formance of NASDAQ listed stocks is slightly worse than that of
13:30 14:30 15:30
ouncement (AD+1)
-6.0%
-5.0%
-4.0%
-3.0%
-2.0%
-1.0%
0.0%
1.0%
per
cen
tag
e ab
no
rmal
ret
urn
interval expressed as a percentage of the total daily volume of the average added

122 K. Kappou et al. / Journal of Banking & Finance 34 (2010) 116–126
the NYSE listed stocks. The pattern observed is, however, the same(Fig. 3), and there is no obvious exchange effect. This difference,especially towards the close of the trading day, may be attributedto the fact that NASDAQ listed stocks have stronger overnight per-formances than stocks listed on the NYSE (as reported in Section 4),and therefore the AD+1 price reversal is more for the former thanthe latter.
5.2.3. Intraday firm performance on the event date (ED)The date where the change in the S&P500 re-composition be-
comes effective is the most important one in terms of index fundrebalancing. The change takes place after the close of trading onED and therefore, index fund managers have to complete their pur-chases as close to the stock’s closing price as possible if they wishto minimize their tracking errors. If they postpone part of theirinvestment in the added stock until next day’s morning, then theybear the risk of realizing a substantial tracking error, since theovernight price change may be considerable.
Fig. 4 presents the tick-by-tick performance and trading volumeof the average added stock on the event date (ED) until 18:30. Thegraph shows that the stock price falls during the day until aroundlunchtime, but closes at a positive level. There is no apparent buy-ing pressure until 12.00, but after that time, the price has a positivetrend until the close, and becomes volatile over the last hour. Thestock price reaches its highest level (which is marginally up) at themarket close. There are two possible explanations for this result.The first is that index funds might have started their purchases ear-lier by choosing to potentially enhance their portfolio returns at
-3.0%
-2.5%
-2.0%
-1.5%
-1.0%
-0.5%
0.0%
0.5%
1.0%
1.5%
2.0%
9:30 10:30 11:30 12
first day after annou
per
cent
age
abno
rmal
retu
rn
NASDAQ NYSE
Fig. 3. Tick-by-tick cumulative abnormal performance of
0.0%
5.0%
10.0%
15.0%
20.0%
25.0%
30.0%
35.0%
9:30 10:30 11:30 12:30 13:30event day (E
per
cent
age
volu
me
Fig. 4. Cumulative abnormal performance of the average added stock and number of svolume on ED.
the possible expense of tracking error. The second explanation isthat the market is no longer adding value to the stock, since it ral-lied from the date of announcement until the event and hence, theopen-to-close return on the ED is close to zero. Index fund manag-ers can now buy from arbitrageurs without upwardly affecting theprice.
The trading volume on that date is also of great interest. Fig. 4confirms that index funds are completing their purchases a fewminutes before and after the close. The volume reported over thefirst 5 min after the close, expressed as a percentage of the totalvolume for that day, is almost 20%. It is worth noting that the vol-ume figures are very smooth throughout the day and that tradingat the market opening is no heavier than usual. Volume figures be-come significantly high only for the last two intervals before theclose and the first two after. Taking into account that overall trad-ing volume is 16 times higher than that of a typical day, the num-bers become even more extreme. There is strong evidence thatmost index funds are waiting to buy the added stock as close to16:00 as possible, and hence that they are most concerned withtracking error.
When we separate the sample appropriately, we find that theNYSE and NASDAQ sub-samples behave differently. As expected,the NASDAQ stocks’ prices are driven up by more than 1.5% onan open-to-close basis, while NYSE firms close down 1%. The per-formance of the NYSE firms is not even affected by the increasedvolume during the last 10 min and the average return remains atnegative levels (relative to the market opening) throughout theevent day (Fig. 5). The tick-by-tick analysis therefore confirms that
:30 13:30 14:30 15:30
ncement (AD+1)
the average NASDAQ vs. NYSE added stock on AD+1.
14:30 15:30 16:30 17:30D)
-3.5%
-3.0%
-2.5%
-2.0%
-1.5%
-1.0%
-0.5%
0.0%
per
cent
age
abno
rmal
retu
rn
hares traded over each 5-min interval expressed as a percentage of the total daily

-3.0%
-2.5%
-2.0%
-1.5%
-1.0%
-0.5%
0.0%
0.5%
1.0%
1.5%
2.0%
9:30 10:30 11:30 12:30 13:30 14:30 15:30
event date (ED)
per
cent
age
abno
rmal
retu
rn
NASDAQ NYSE
Fig. 5. Tick-by-tick cumulative abnormal performance of the average NASDAQ vs. NYSE added stock on the ED.
0.0%0.5%1.0%1.5%2.0%2.5%3.0%3.5%4.0%4.5%5.0%
9:30 10:30 11:30 12:30 13:30 14:30 15:30
first day after the event (ED+1)
per
cent
age
volu
me
-6.0%
-5.0%
-4.0%
-3.0%
-2.0%
-1.0%
0.0%
1.0%
per
cent
age
abno
rmal
retu
rn
Fig. 6. Tick-by-tick average cumulative firm abnormal performance of the average added stock and number of shares traded over each 5-min interval expressed as apercentage of the total daily volume on ED+1.
K. Kappou et al. / Journal of Banking & Finance 34 (2010) 116–126 123
from an arbitrageur’s perspective, NASDAQ stocks might be moreprofitable.
The event date is the last profitable day for long non-indextrackers who are trading the added stocks, since the close-to-closereturns reported after that day are significantly negative. Not onlyis the price pressure exhausted by the event date, but there arethree consecutive and significant close-to-close price reversals onED+1, ED+2 and ED+3. These reversals can be exploited by sellingthe stock short, a strategy that will be explained in detail in the fol-lowing section.
5.2.4. Intraday firm performance after the event (ED+1, ED+2, andED+3)
On the first day after the event, the average added firm experi-ences a continuous price drop. The volumes at the beginning of theday are high, perhaps indicating that index fund rebalancing maystill be occurring or that arbitrageurs are continuing to unwindtheir positions. However, the price does not seem to be positively
Table 4Gross and net profits from trading index inclusions, 1993–2002.
AD+1 open-to-close
AD+1 to ED close-to-close
ED to ED+3 close-to-close
Total
Gross return �0.83% 3.75% �2.26% 6.84%Trading Costs 0.52% 0.62% 0.60% 1.74%Net return �0.31% 3.13% �1.66% 5.10%
Mean difference test (H0: net return = 0)t-statistic
(p-value)�1.67(0.0956)
5.93(0.0000)
�3.89(0.0001)
6.83(0.0000)
affected by index fund demand. Fig. 6 presents the cumulativeintraday firm performance on the first day after the event, in con-junction with the volumes that occurred at each interval. Over thefirst 10 min of the trading day, almost 9% of the total trading oc-curs. The exchange effect, on the other hand, appears irrelevanton that date and hence the analysis is not presented here.
The close-to-close abnormal return remains significant andmarginally negative on ED+2 and ED+3, as can be seen from Table1. The added stocks behave differently across the NYSE and NAS-DAQ samples. However, this difference does not allow us to inferfirm conclusions about further index fund trading behavior andhence it is not reported.10 In addition, beyond ED+3, the perfor-mance of the stock depends mostly on the corresponding overallmarket performance and the price patterns start to look similar tothose reported in Fig. 1 where AD is examined.
6. An analysis of the intra-day index effect
This section will determine the profits that are available fromtrading the added stocks, using the 266 firms added to theS&P500 index over the years 1993–2002, and taking into accountclose-to-close, open-to-close, overnight and abnormal returns. Ta-ble 4 presents a summary of the gross and net profits that can bemade during S&P500 index addition events based on the abnormalreturn levels that were found in Section 4. The timing of buyingand selling stocks will be based on the high frequency analysis pre-
10 Results for the tick-by-tick stock price and volume performance for the secondand third day after the event, as well as other analysis described but not presented,are available from the authors upon request.

Table 5Close-to-close, open-to-close and overnight average daily firm performance between AD and ED+3 for deletions.
Days AD AD+1 AD+2 AD+3 AD+4 AD+5 ED ED+1 ED+2 ED+3
Close-to-closeAR (%) �2.45 �7.43 �2.10 �0.96 �1.02 2.01 �3.86 1.10 2.02 �1.05t-stat �0.85 �7.23 �1.93 �0.60 �1.68 0.24 �1.96 0.74 1.62 �0.74
Open-to-CloseAR (%) �1.69 �0.44 �2.57 �1.57 �1.37 4.00 �3.93 0.05 1.37 �1.43t-stat �0.63 �0.63 �2.24 �1.13 �1.92 0.59 �2.23 0.03 1.26 �1.17
OvernightAR (%) �0.76 �6.99 0.47 0.61 0.35 �1.99 0.07 1.05 0.65 0.38t-stat �1.02 �6.95 1.19 1.86 1.03 �1.30 0.05 0.98 1.27 0.42
Notes: Figures in bold denote statistics that are significant at the 5% level or better.
3 The number of days between announcement and event varies among the addedrms, averaging 5.06 days. We now describe how the cumulative abnormal returnetween AD+1 and ED is calculated, since there are two possible methods. The first is
calculate the cumulative return and divide it by the number of days in the intervalom AD+1 to ED, to obtain the average rest-of-the-window daily abnormal return forach stock. Then this average daily abnormal return should be multiplied by theverage interval length of 4.06 days (because AD+1 is not included). The sum of allese returns divided by the number of additions will give the final estimate of the
verage cumulative abnormal return. The second and simpler way to calculate anverage return is to take the sum of the cumulative realised returns for each firm fromD+1 close to ED close and divide it by the number of firms. This method does notccount for the differences in the interval lengths. However, when both methods aremployed, the results are not significantly different and therefore, only the results
124 K. Kappou et al. / Journal of Banking & Finance 34 (2010) 116–126
sented in Section 5. The strategy involves three basic steps: First,being short the added stock from the open of the first day afterthe announcement until the close, since the tick by tick resultsshowed that the lowest price level was at the market close. Second,the reversal of the position until the close of the event date andthird, being short the stock again from the close of the event dateuntil the close of the third day after the event. Our approach totesting the profitability of trading index additions is similar in spir-it to, but slightly more complex than, that employed by Beneishand Whaley (1997) and Cusick (2002). By calculating the abnormalreturns of newly included stocks over the event period, we obtain apercentage profit identical to that which would follow from buyingthe stock and simultaneously short selling the index (through fu-tures or exchange traded funds). In our case, the strategy also in-volves buying the index and short selling the stock at theappropriate points during the event window.
The net figures presented in Table 4 allow for transactions costs.In general, S&P500 stocks are very liquid, and in particular, duringS&P500 rebalancing periods where a great deal of index fund trad-ing occurs, spreads become even tighter as liquidity spikes onthose days (Edmister et al., 1996). The findings of Erwin and Miller(1998) also suggest a significant decrease in both relative andabsolute bid-ask spreads. Beneish and Whaley (1996) argue thatthis decrease should be expected since the specialist will be com-fortable in reducing the spread given that trading volumes duringthe event are very high, and also, index funds will act to reducespreads as they are likely to place limit orders.
Our strategy involves transactions at the open and the close ofthe market, but the quotes reported in the TAQ database for thesetimes differ significantly from those reported throughout theremainder of the day. For example, the bid ask spread as a percent-age of the mid-price is 45 bps on average if calculated at the close,and only 12 bps if calculated during the day.11 Our strategy involvesthree round-trip transactions (sell + buy, buy + sell, sell + buy). Theadditional costs of short selling will vary from one stock to another,although they can be as low as 20–40 bps per year.12
The trading costs in Table 4 are calculated individually for eachfirm based on the bid-ask spreads for the stocks at the times theproposed trades would have taken place and on the costs of theoff-setting positions in the SPIDER at that time, and these costsare then subtracted from the gross returns for each firm to obtainnet returns. These net returns are then averaged across the stocksto form an overall net profitability for the strategy. The mean dif-ference test reported assesses whether the average net returns
11 The fall in bid-ask spreads through the day from the market open is related to theclustering of prices at round numbers towards the start of the day – see Ohta (2006).
12 We do not have data on the separate costs of short selling for each firm over oursample period and so, following many other studies such as that by Li et al. (2008),these costs are not considered. Hence the proposed trading strategy and the profits itis able to generate will be limited to some extent by short sale costs and constraints.
are significantly different from zero after allowing for transactionscosts calculated in this way.
From Table 4, it can be seen that the first part of the tradableabnormal return is �0.31% after transactions costs, which is justsignificant at the 10% level.13 The cumulative abnormal return fromAD+1 close to ED close that constitutes the second part of the strat-egy is 3.13% net and is highly significant. Finally, a short position inthe stock from ED close until ED+3 close will result in another highlysignificant net profit of 1.66%. The total tradable net profit is 5.1% onaverage. Our abnormal return (gross trading profit) is slightly largerthan that reported by Beneish and Whaley (1997) of 5.45% becausewe allow for short selling of the stock at some points during theevent window, whereas they assume that a long stock – short indexstrategy prevails throughout.14,15 It is also worth mentioning thatthe negative intraday return of AD+1 represents the price correctionafter the large overnight performance from AD close to AD+1 open.The positive overnight return (non-tradable) between AD close andAD+1 open tended to increase through time, as did the price reversalon the next day (AD+1 open-to-close). Therefore, the profits cap-tured from selling the stock at the AD+1 opening and buying it backat the AD+1 close would also have increased through time.
7. The intra-day index effect for deleted stocks
There are relatively few studies regarding the stocks deletedfrom the S&P500 index because of the difficulty in constructing apure sample which is unbiased with respect to other events. Forexample, if a firm is about to declare bankruptcy, it will eventuallyneed to be deleted from the index, but its performance thereafterwill be affected by two factors – a deletion effect and a bankruptcyeffect. The same applies to takeovers and mergers which are simi-lar firm-specific events.16 Studies that examine the impact of
om the simpler (second) method are reported.4 Their sample periods are 1989–1995 and 1989–1999 respectively compared withe period 1993–2002 used in this study, and this difference may also partially
xplain the variation in results.5 The ‘‘up tick” short selling rule that formerly applied to US securities was
bolished in July 2007 although it applied during our sample period.6 See Dutta and Jog (2009) and the references therein for a very recent discussion ofe impact of mergers and acquisitions on stock prices.
1
fibtofreathaaAaefr
1
the
1
a1
th

0.0%
5.0%
10.0%
15.0%
20.0%
25.0%
30.0%
35.0%
9:30 10:30 11:30 12:30 13:30 14:30 15:30 16:30 17:30
event day (ED)
per
cent
age
volu
me
-3.5%
-3.0%
-2.5%
-2.0%
-1.5%
-1.0%
-0.5%
0.0%
per
cent
age
abno
rmal
retu
rn
Fig. 7. Intraday cumulative abnormal return and trading volume at 5-min intervals for the deletions sample on ED.
K. Kappou et al. / Journal of Banking & Finance 34 (2010) 116–126 125
deletions are small both in number and in sample size investigated:Goetzman and Garry (1986), seven deletions; Harris and Gurel(1986), 13 deletions; and Lynch and Mendenhall (1997), 15 dele-tions. The broad consensus of this literature is that the index effectis even more pronounced and more permanent for deletions thanadditions. This study now repeats the above analysis to investigatethe intra-day price and volume effects around S&P500 index compo-sition changes on a sample of 19 ‘‘pure” deletions (not resulting frommergers, takeovers or bankruptcy) during the years 1999–2000.
The close to close abnormal return of the average deleted stockon the first day after announcement is �7.43% (Table 5) on a close-to-close basis, although almost all of this occurs overnight. As thetable shows, significant returns take place on AD+1 and ED. Onday ED+2, there is a price reversal of 2.02% (on a close to close ba-sis), which is marginally significant. We now present the intradayperformance of the deletions sample on the key days in the eventwindow. To obtain our tick by tick results, we use the same meth-odology as for the additions sample. Due to the limited number offirms, results for days following AD+2 but before the effective datewill not be presented. We focus mainly on the AD, which may re-veal whether there is any evidence of anticipation of the announce-ment, AD+1, where information is first released to the market, ED,where index funds should act to match the closing price of the de-leted stock at 16:00, and ED+1, where the S&P500 is first tradingunder its new composition.
7.1. Intraday price and volume performance on the announcementdate
On the announcement date, the average deleted stock experi-ences a negative intraday return of �1.69%. There is no clearevidence of anticipation of the event. The volume figures aresmile-shaped, indicating no intensive trading at any point duringthe day apart from at the opening and the close, a pattern whichis common during a typical trading day for any stock.17
7.2. Intraday price and volume performance on AD+1
The stocks experience an average intraday (open to close) re-turn of �0.44%, which is much smaller in magnitude than the over-night price change of �6.99% and gives a total close to close returnof �7.43%. Interestingly, almost all of the price fall during the trad-ing day occurs with the first hour. Trading volumes are quite highduring the first half an hour and then they stabilise for the rest ofthe day.
17 The results for this date are not shown but are available from the authors onrequest.
7.3. Intraday price and volume performance on the effective date (ED)and on ED+1
The most important result is the performance on the event date,at the close of which the S&P500 changes composition. As Fig. 7shows, the stock price is volatile until the early afternoon whenit trends downwards. By the close, the price has fallen by 3.93%on average. As for the additions sample, the volume figures confirmthat index funds wait until the close to sell the deleted stock. Theyappear unwilling to sell at an earlier stage, even if the price contin-ues to fall. The maximum volume occurs around 16:00, and thisinterval represents 35% of the total daily volume. In this figure,we also report volume until 18:30, which indicates evidence of sig-nificant after market hours trading or late reporting; nothing likethis degree of after hours trading occurs on any other day duringthe event period.
During the first day where the S&P actually trades in its newcomposition (ED+1), volumes for the newly deleted stocks returnto their normal U-shapes, apart from increased trading by around10% of the daily volume during the first 10 min. This could poten-tially relate to further index fund rebalancing that was not com-pleted at the previous day’s close. The average cumulativeabnormal return rebounds, albeit very modestly (+0.05% over thewhole day).18
8. Conclusions
The first part of this study disaggregates close-to-close abnor-mal returns into overnight and open-to-close abnormal returns,showing that the close-to-close positive effect observed one dayafter the announcement of addition cannot be traded. However,profitable trading opportunities occur between the first day afterannouncement and the date of the actual event. The overnightprice change seems to have increased over time, indicating animprovement in the level of market efficiency and a decrease inthe profits available to arbitrageurs. In addition, the event dateabnormal return caused mainly by index fund rebalancing hasdiminished over time, because most of the positive effect of beingadded to the S&P500 index is reflected in the stock price in advanceof the actual event.
The second part of this study examines the tick-by-tick perfor-mance of the firms that were added to the S&P500 index over theyears 1999–2000. To summarize the main findings of this analysis,the intraday stock price movements on AD appear to be randombecause information about the future index change has not been
18 The results for this date are not shown but are available from the authors onrequest.

126 K. Kappou et al. / Journal of Banking & Finance 34 (2010) 116–126
released to the market at that time. However, a relatively high vol-ume is observed over the last 5 min of this trading day, indicating apotential leakage of information before the S&P press release. Dur-ing the trading hours of the first day after announcement (AD+1),the stock experiences a price drop without reversing at all, abehavior perhaps best explained by an overshoot in the overnightprice increase that occurred between AD close and AD+1 open.
It is also worth noting the huge trading volume that occurs overthe last 10 min on the event date, which constitutes the last possi-ble opportunity for index fund managers to rebalance their portfo-lios before the change becomes effective. This abnormal volumelevel provides evidence that most index funds seek to rebalancetheir portfolios as close to 16:00 as possible, and that they are con-cerned with tracking error. This finding is in contrast to the partingconjecture of Beneish and Whaley (1997), who suggest that indexfunds are rebalancing increasingly early after the announcement asthey become more mindful of the price impacts of arbitrageurs.However, this increase in volume is not accompanied by a price in-crease, perhaps showing that other market participants, especiallyarbitrageurs, are unwinding their long positions in the added stock.Therefore, there is enough supply to satisfy index fund demand.After the event date, there is no further price pressure and thestock price drops significantly on both an open-to-close and anovernight basis.
This study also examines a sample of pure deletions using intra-day data, with the key findings mirroring those of the additions.While there is a fall in the price of to-be-deleted stocks followingthe announcement, most of this occurs overnight between ADand AD+1 and hence is not tradable. There is a further large pricefall on the effective day, with most of the day’s trading volumehappening around the close.
From the tick-by-tick analysis, the optimal strategy for tradingthe added stock is to sell it short on AD+1 at the market openand to buy it back at the close. At the same time, a further long po-sition in the stock should be taken at AD+1 close until the close ofED. Finally, a further short position should be taken in the stock be-tween ED close and ED+3 close. The profits from these trades are allstatistically significant and total almost 7% in gross terms and over5% after transactions costs. Numerous researchers have docu-mented, based on daily price series, a perceived reduction overtime in the index effect as an increased number of investors tryto take advantage of it.19 We argue that this masks the profits thatare available to arbitrageurs who are willing to trade on an intra-dai-ly basis. While index funds persist in favoring accurate tracking overprofitability, arbitrageurs will continue to benefit.
Acknowledgements
We are grateful to two anonymous referees for useful com-ments that considerably re-shaped and improved this paper. Wewould also like to thank S&P Corporation for providing informationon the announcement and effective dates of S&P500 inclusions. Weare grateful to Carol Alexander, Ron Bird, Peter Corvi, Anca Dimi-triu, Alfonso Dufour, Alan Goodacre, Apostolos Katsaris, Salih Nef-tci, Jacques Pezier, and Paul Woolley for their comments. This workwas also improved by helpful comments from the Trading Team atCredit Suisse. The usual disclaimer applies. This paper was origi-nally submitted to Professor Giorgio Szego on 20 June 2007 andwas revised twice prior to submission through EES.
19 Ding et al. (2009) show that the flow of capital into hedge funds has depressedabsolute returns, as an increasing amount of money has chased a limited number ofarbitrage opportunities.
References
Amihud, Y., Mendelson, H., 1986. Asset pricing and the bid-ask spread. Journal ofFinancial Economics 17, 223–249.
Anderson, A.-M., Dyl, E.A., 2005. Market structure and trading volume. Journal ofFinancial Research 28, 115–131.
Beneish, M., Whaley, R., 1996. An anatomy of the ‘‘S&P game”: the effects ofchanging the rules. Journal of Finance 51, 1909–1930.
Beneish, M., Whaley, R., 1997. A scorecard from the S&P game: can I play? Journal ofPortfolio Management 23, 16–23.
Beneish, M., Whaley, R., 2002. S&P500 index replacements: a new game in town.Journal of Portfolio Management 29, 51–60.
Bessembinder, H., Kaufman, H., 1997. A comparison of trade execution costs forNYSE and NASDAQ listed stocks. Journal of Financial and Quantitative Analysis32, 287–310.
Bos, R., 2000. Event study: quantifying the effect of being added to an S&P index.Standard and Poor’s Corporation Report, September.
Chen, H., Noronha, G., Singal, V., 2004. The price response to the S&P 500 additionsand deletions: evidence of asymmetry and a new explanation. Journal ofFinance 59, 1901–1929.
Christie, W., Schultz, P., 1994. Why do NASDAQ market makers avoid odd-eighthquotes? Journal of Finance 49, 1813–1840.
Chung, K.H., Chuwonganant, C., Jiang, J., 2008. The dynamics of quote adjustments.Journal of Banking and Finance 32, 2390–2400.
Cusick, P., 2002. Price effects of addition or deletion from the Standard and Poor’s500 index: evidence of increasing market efficiency. Financial Markets,Institutions and Instruments 11, 349–383.
Denis, D., McConnell, J., Ovtchinnikov, A., Yu, Y., 2003. S&P500 index additions andearning expectations. Journal of Finance 58, 1821–1840.
Dhillon, U., Johnson, H., 1991. Changes in the S&P500 list. Journal of Business 64,75–85.
Ding, B., Shawky, H.A., Tian, J., 2009. Liquidity shocks and the relative performanceof hedge fund strategies. Journal of Banking and Finance 33, 883–891.
Dutta, S., Jog, V., 2009. The long-term performance of acquiring firms: a re-examination of an anomaly. Journal of Banking and Finance 33, 1400–1412.
Easley, D., O’Hara, M., 1992. Time and the process of security price adjustment.Journal of Finance 47, 577–604.
Edmister, R., Graham, S., Pirie, W., 1996. Trading cost expectations: evidence fromS&P500 index replacement stock announcements. Journal of Economics andFinance 20, 75–85.
Elliot, W.B., Warr, R.S., 2003. Price pressure on the NYSE and NASDAQ: evidencefrom S&P500 index changes. Financial Management 32, 85–99.
Erwin, G., Miller, J., 1998. The liquidity effects associated with addition of a stock tothe S&P500 index: evidence from bid/ask spreads. The Financial Review 33,131–146.
Goetzmann, W., Garry, M., 1986. Does delisting affect stock price? Financial AnalystJournal 42, 64–69.
Harris, L., Gurel, E., 1986. Price and volume effects associated with changes in theS&P500 list: new evidence for the existence of price pressures. Journal ofFinance 41, 815–829.
Jacques, W., 1988. The S&P500 membership anomaly, or would you join this club?Financial Analysts Journal 44, 73–75.
LaPlante, M., Muscarella, C., 1997. Do institutions receive comparable execution inthe NYSE and NASDAQ markets? A transaction study of block trades. Journal ofFinancial Economics 45, 97–134.
Li, X., Miffre, J., Brooks, C., O’Sullivan, N., 2008. Momentum profits and time-varyingunsystematic risk. Journal of Banking and Finance 32, 541–558.
Lynch, A., Mendenhall, R., 1997. New evidence on stock price effects associated withchanges in the S&P 500 index. Journal of Business 70, 351–383.
Malkiel, B., Radisich, A., 2001. The growth of index funds and the pricing of equitysecurities. Journal of Portfolio Management 27, 9–21.
Mikkelson, H., Partch, M., 1985. Stock price effects and costs of secondarydistributions. Journal of Financial Economics 14, 165–194.
Ohta, W., 2006. An analysis of the intraday patterns in price clustering on the TokyoStock Exchange. Journal of Banking and Finance 20, 1023–1039.
Shleifer, A., 1986. Do demand curves for stocks slope down? Journal of Finance 41,579–590.
Woolridge, R., Ghosh, C., 1986. Institutional trading and security prices: the case ofchanges in the composition of the S&P500 index. Journal of Financial Research9, 13–24.
Wood, R., McInish, T., Ord, K., 1985. An investigation of transactions data for NYSEstocks. Journal of Finance 40, 723–739.


