Embed Size (px)
Citation preview
Preventive Medicine 67 (2014) 295–302
Contents lists available at ScienceDirect
Preventive Medicine
j ourna l homepage: www.e lsev ie r .com/ locate /ypmed
The status of men's health in Asia
Chirk Jenn Ng a,⁎, Chin Hai Teo a, Christopher Chee Kong Ho b, Wei Phin Tan c, Hui Meng Tan a
a Department of Primary Care Medicine, Faculty of Medicine, University of Malaya, Kuala Lumpur 50603, Malaysiab Department of Surgery, Faculty of Medicine, National University of Malaysia, Bangi 43600, Selangor, Malaysiac Department of Surgery, Thomas Jefferson University Hospital, 111 S 11th St, Philadelphia, PA, United States
⁎ Corresponding author at: Department of Primary CareUniversity of Malaya, 50603 Kuala Lumpur, Malaysia142204126 (Mobile); fax: +60 379577941.
E-mail address: [email protected] (C.J. Ng).
http://dx.doi.org/10.1016/j.ypmed.2014.08.0070091-7435/© 2014 Elsevier Inc. All rights reserved.
a b s t r a c t
a r t i c l e i n f oAvailable online 9 August 2014
Keywords:Men's healthAsiaLife expectancyMortalityNon-communicable diseasesRisk factorsIncome
Objectives. This study aims to compare health status and its risk factors between men and women who arefrom countries of different income status in Asia.
Method.Wehave included 47 Asian countries and 2 regions in this study. Life expectancy,mortality rate fromcommunicable disease, non-communicable disease and injuries, the prevalence of non-communicable diseasesrisk factors and their trends were extracted from the WHO and respective governmental database. Subgroupanalysis was performed based on country income groups.
Results. Overall, men have shorter life expectancy and higher mortality rates compared to women. Men fromhigher-income countries lived longer compared to men from lower-income countries. There is a wide variationof male life expectancy in upper and lower middle income countries. The mean systolic blood pressure, fasting
blood glucose and body mass index in Asia have also increased over the years.Conclusion. This study confirms that Asian men have poorer health compared towomen besides the growingconcerns onNCD risk factors. The findings from this study calls for a concerted effort to find solutions in address-ing men's health problems in Asia.
© 2014 Elsevier Inc. All rights reserved.
Introduction
Men are known to have a shorter life expectancy and higher mortal-ity compared to women (Lynch, 2013; Wang et al., 2013; White andHolmes, 2006; White et al., 2014). This could be attributed to menindulging in higher risk-taking behaviors, reluctance to seek help forprevention and during illness and the lack of male-focused healthsystem (Addis and Mahalik, 2003; Byrnes et al., 1999; Cordier andWilson, 2013; Lynch, 2013; Tan et al., 2007; White and Holmes, 2006).In addition, men's health reports from Australia, Canada and Europefound significant variations in men's health status within and acrossdifferent countries (AIHW, 2013; Bilsker et al., 2010; EC, 2011), whichcould be due to the differences in genetic as well as socio-economicfactors. (NCIN and Cancer Research UK, 2009; White et al., 2011).
Asia is rapidly developing both economically and socially. In recentyears, more Asian countries are achieving a higher bracket in terms ofsocioeconomic status, andmany are adopting a lifestyle similar towest-ern countries (Tong et al., 2011; Wassener, 2013). However, communi-cable andnon-communicable diseases are on the rise in Asia (Wassener,2013).While people from higher-income countries are achieving betterhealth status, countries from the middle- and lower-income group
Medicine, Faculty of Medicine,. Tel.: +60 379492306, +60
continue to face higher disease burden, possibly attributed to financialconstraints (Orach, 2009; WHO, 2000). The changing disease patternand rising healthcare cost have a huge impact on overall populationhealth, particularly in men, who have poorer health than women tobegin with (Doyal, 1995; Rahman and Liu, 2000).
The recently published Asian Men's Health Report found that men'shealth status is poorer compared towomen and it varies across differentcountries and regions in Asia (Tan et al., 2013). This study summarizedthe key findings from the report and aimed to explain the variation inmen's health status across Asia based on country income status. Wehope our findings will serve as the first step toward identifying and ad-dressing gaps in men's health in Asia.
Materials and methods
Selection of countries in Asia
We obtained the lists of member countries in Asia from the WHO and CIAdatabases (CIA, 2013; WHO, 2013a). Although Hong Kong and Taiwan werenot part of the databases, we decided to include them in view of their uniquemen's health status and they were not included in the data from China. Thefinal list comprised 47 countries and two regions.
Health indicators
The population health indicators included in this study were as follows: lifeexpectancy at birth; mortality rate attributed to communicable diseases, non-

Table 1List of diseases under each cause of death category.
Causes of death
Communicable diseases Tuberculosis, STD, HIV, diarrhoeal diseases, childhood-cluster diseases, meningitis, Hepatitis B and C, malaria, tropical-cluster diseases,leprosy, dengue, Japanese encephalitis, trachoma, intestinal nematode infections, lower and upper respiratory infections and otitis media
Non-communicable diseases Malignant neoplasms, diabetes mellitus, endocrine disorders, neuropsychiatric conditions, sense organ diseases, cardiovasculardiseases, respiratory diseases, digestive diseases, genitourinary diseases, skin diseases, musculoskeletal diseases, congenital anomaliesand oral conditions
Injuries Road traffic accidents, poisonings, fall, fires, drownings, other unintentional injuries, self-inflicted injuries, violence and war
296 C.J. Ng et al. / Preventive Medicine 67 (2014) 295–302
communicable diseases and injuries (Table 1); the prevalence of risk factors fornon-communicable diseases (alcohol, current smokers, physical inactivity, obe-sity, high cholesterol, raised blood pressure and blood glucose); and the trend ofcardiovascular disease (CVD) risk factors between 1980 and 2009 (mean systol-ic blood pressure, mean fasting blood glucose level, mean total cholesterol leveland mean body mass index (BMI)).
Data extraction
We used theWorld Health Organization (WHO) Global Health ObservatoryData Repository as the key reference source in this paper (WHO, 2013b). It con-tains the most comprehensive and updated data comparing health status be-tween men and women across a range of medical conditions and countries inAsia. As for Hong Kong and Taiwan, we used the regional government databasesas they were not included in the WHO database (Republic of China (Taiwan),2011; The Government of Hong Kong Special Administrative Region, 2011).
Data analysis
Microsoft Excel 2010 and Statistical Package for Social Science 21were usedto analyze the data. Age-standardizedmortality rate was used as it allows com-parison between countries after adjusting for the population age. Subgroupanalysiswas performed based on sex and incomegroups (gross national incomeper capita: low bUSD 1,035; lowermiddle USD 1,035–USD 4,085; uppermiddleUSD 4,085–USD 12,615; high N USD 12,615) (The World Bank, 2013). The
Fig. 1. Comparison of life expectancy between men and w
comparisons of the overall prevalence of the CVD risk factors between conti-nents (Asia, Europe, USA and world) and between income groups were made.They were calculated based on the average prevalence of all the countries inthe respective continents and income groups. Similarly, the mean systolicblood pressure, fasting blood glucose, total cholesterol and BMI in Asiawere cal-culated based on the average values of the 47 countries over the 30-yearduration.
Results
Life expectancy at birth
Men have shorter life expectancy compared to women across allcountries and regions in Asia except for Kuwait and Qatar (Fig. 1). Wefound that men from higher-income countries lived longer than thosefrom the lower-income group. However, the life expectancy of menfrom upper and lower middle income countries varied widely.
Mortality attributed to communicable, non-communicable diseasesand injuries
Regardless of the type of disease (communicable, non-communicablediseases or injuries), men have a higher mortality rate compared to
omen across different income groups in Asia (2011).
565.4
471.6
454.0
311.6
298.1
266.8
247.7
103.3
422.3
337.0
334.9
328.0
302.3
238.6
232.2
217.0
182.7
152.3
131.9
88.9
82.4
79.7
52.9
48.3
191.9
166.9
166.4
126.8
86.8
83.9
76.5
66.8
65.5
48.9
42.7
40.0
79.8
73.7
54.8
52.2
51.4
44.7
41.9
33.4
30.1
24.4
13.8
- 100.0 200.0 300.0 400.0 500.0 600.0
AfghanistanCambodiaMyanmar
NepalBangladesh
North KoreaTajikistan
Kyrgyzstan
Timor-LesteBhutan
PakistanLaos
IndiaIndonesia
YemenPhilippines
Viet NamIraq
UzbekistanMongoliaSri LankaArmeniaGeorgia
Syria
MalaysiaTurkmenistan
ThailandKazakhstan
RussiaAzerbaijan
MaldivesIran
JordanLebanon
ChinaTurkey
SingaporeSaudi Arabia
United Arab EmiratesJapan
BahrainBrunei Darussalam
KuwaitSouth Korea
IsraelQatarOman
Age-standardized mortality rate per 100,000
Females
Males
Hig
hIn
com
eLo
w In
com
eLo
wer
mid
dle
Inco
me
Upp
er m
iddl
e In
com
e
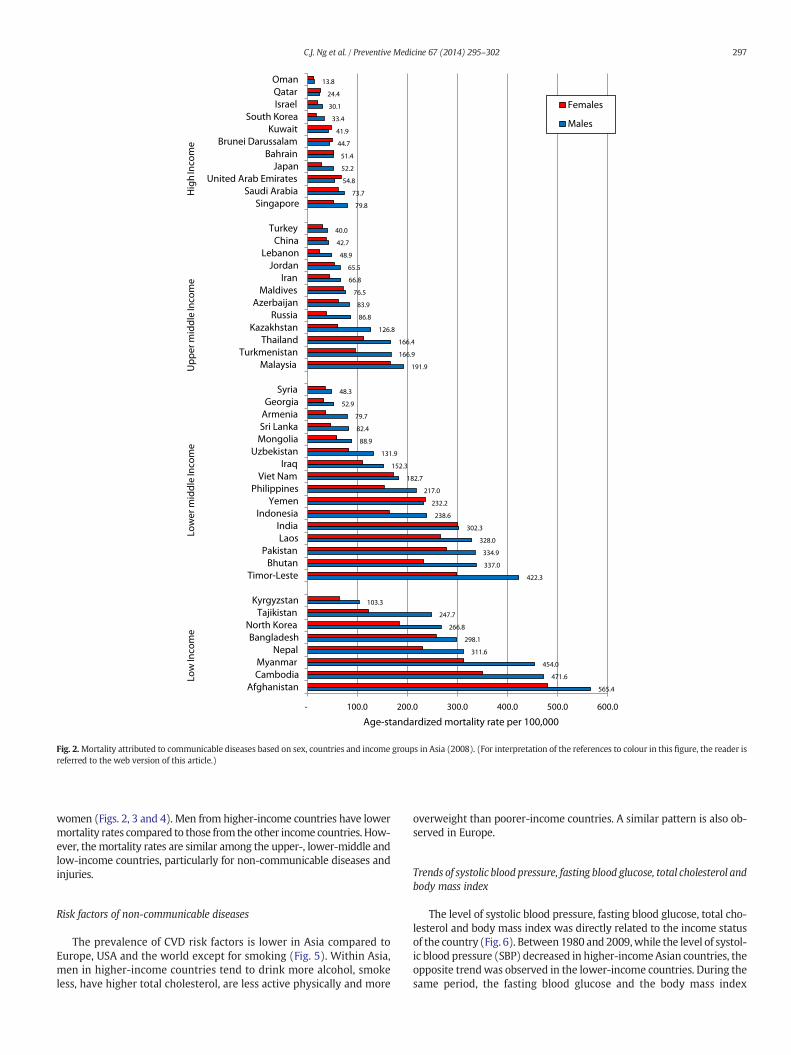
Fig. 2.Mortality attributed to communicable diseases based on sex, countries and income groups in Asia (2008). (For interpretation of the references to colour in this figure, the reader isreferred to the web version of this article.)
297C.J. Ng et al. / Preventive Medicine 67 (2014) 295–302
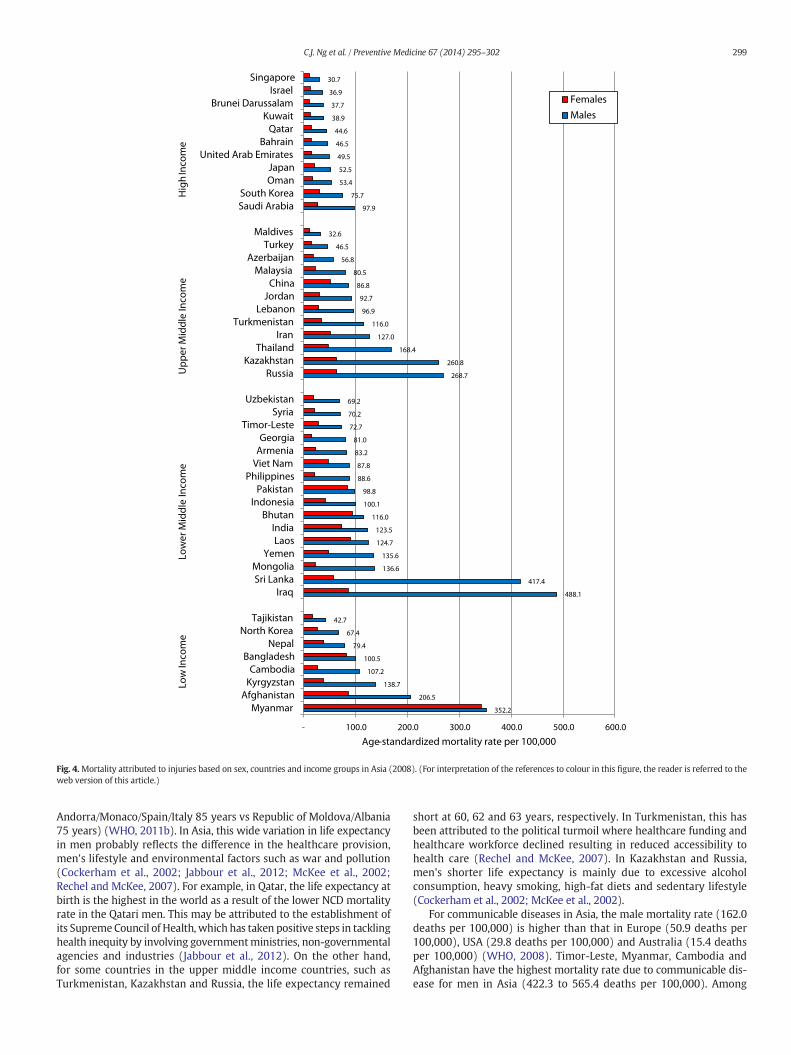
women (Figs. 2, 3 and 4). Men from higher-income countries have lowermortality rates compared to those from the other income countries. How-ever, themortality rates are similar among the upper-, lower-middle andlow-income countries, particularly for non-communicable diseases andinjuries.
Risk factors of non-communicable diseases
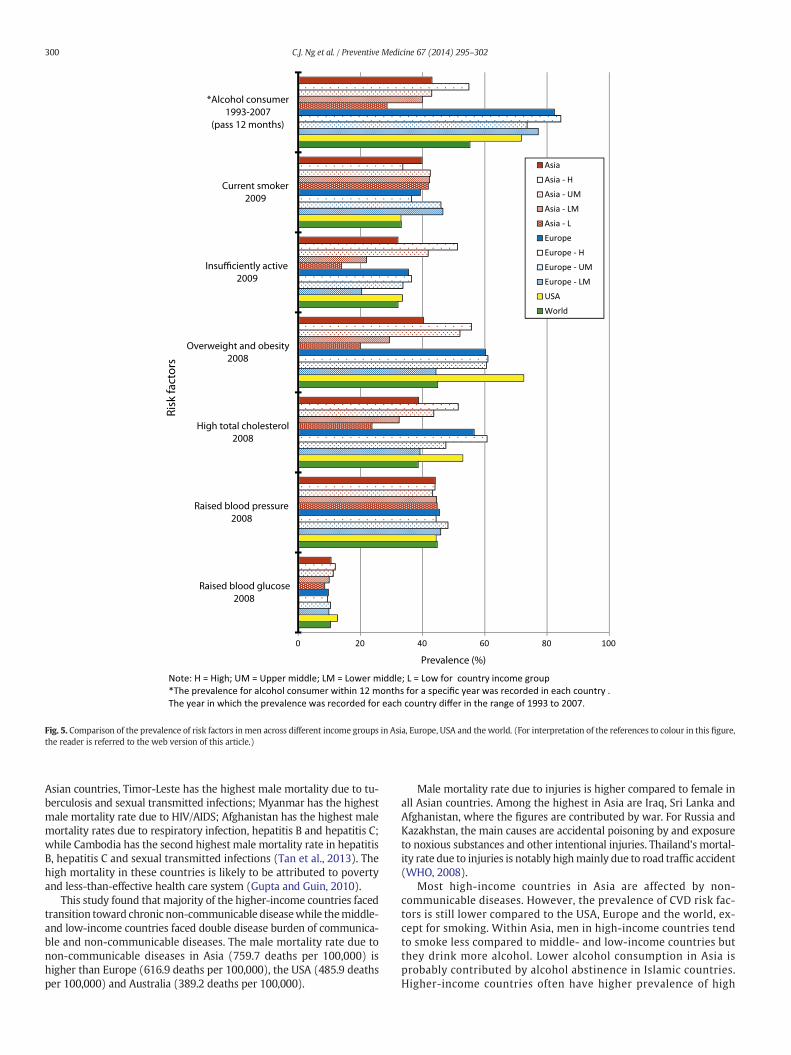
The prevalence of CVD risk factors is lower in Asia compared toEurope, USA and the world except for smoking (Fig. 5). Within Asia,men in higher-income countries tend to drink more alcohol, smokeless, have higher total cholesterol, are less active physically and more
overweight than poorer-income countries. A similar pattern is also ob-served in Europe.
Trends of systolic blood pressure, fasting blood glucose, total cholesterol andbody mass index
The level of systolic blood pressure, fasting blood glucose, total cho-lesterol and body mass index was directly related to the income statusof the country (Fig. 6). Between1980 and 2009,while the level of systol-ic blood pressure (SBP) decreased in higher-incomeAsian countries, theopposite trendwas observed in the lower-income countries. During thesame period, the fasting blood glucose and the body mass index

1,275.3
1,083.8
962.1
755.6
751.2
711.0
675.4
644.4
1,166.8
938.3
889.7
875.5
872.7
855.6
801.0
793.0
784.8
781.4
765.6
762.7
735.9
717.0
706.2
649.6
1,265.8
1,179.7
1,120.1
999.7
846.3
811.3
730.6
712.5
686.5
675.0
621.9
611.4
756.7
752.1
629.6
529.5
476.9
446.2
395.0
394.2
384.2
365.2
359.1
- 200.0 400.0 600.0 800.0 1,000.0 1,200.0 1,400.0
AfghanistanKyrgyzstanCambodiaMyanmar
BangladeshNepal
TajikistanNorth Korea
ArmeniaUzbekistan
YemenGeorgia
MongoliaLaos
BhutanIndia
IraqSri LankaPakistan
IndonesiaSyria
PhilippinesViet Nam
Timor-Leste
KazakhstanTurkmenistan
RussiaAzerbaijan
JordanThailandLebanon
TurkeyChina
IranMaldivesMalaysia
OmanSaudi Arabia
BahrainBrunei Darussalam
South KoreaUnited Arab Emirates
IsraelKuwait
SingaporeQatarJapan
Age-standardized mortality rate per 100,000
FemalesMales
Hig
hIn
com
eLo
w In
com
eLo
wer
mid
dle
Inco
me
Upp
er m
iddl
e In
com
e
Fig. 3.Mortality attributed to non-communicable diseases based on sex, countries and income groups inAsia (2008). (For interpretation of the references to colour in thisfigure, the readeris referred to the web version of this article.)
298 C.J. Ng et al. / Preventive Medicine 67 (2014) 295–302
continued to rise for all income countries while the total cholesterollevel decreased over time.
Discussion
This study confirms that, in Asia, men have a shorter life expec-tancy and higher mortality due to communicable diseases, non-communicable diseases and injuries compared to women. This discrep-ancy is particularly between higher- and lower-income countries. Thereis also a rising trend for most of the cardiovascular risk factors, particu-larly in the middle-income countries.
Overall, Asian men have a shorter life expectancy (70 years) com-pared to those in Europe (72 years) and USA (76 years) (WHO,
2011b). However, there is a wide variation in life expectancy across dif-ferent income groups in Asia. For instance, the life expectancy of menfrom Singapore and Hong Kong (80 years) is comparable to the averagelife expectancy of men from high-income countries in the world(78 years) (WHO, 2011a). On the other hand, men from low-incomecountries, such as Afghanistan, Cambodia and Myanmar, have one ofthe shortest life expectancy in the world.
The difference between the highest and the lowest life expectancy ofmen in Asia (24 years; Qatar 83 years vs Afghanistan 59 years) is largerthan that of Europe (17 years; San Marino 82 years vs Ukraine65 years) (WHO, 2011b). This pattern is also observed in women,which showed a difference of 26 year in Asia (Hong Kong 87 years vsAfghanistan 61 years) and 10 years in Europe (Switzerland/France/
352.2
206.5
138.7
107.2
100.5
79.4
67.4
42.7
488.1
417.4
136.6
135.6
124.7
123.5
116.0
100.1
98.8
88.6
87.8
83.2
81.0
72.7
70.2
69.2
268.7
260.8
168.4
127.0
116.0
96.9
92.7
86.8
80.5
56.8
46.5
32.6
97.9
75.7
53.4
52.5
49.5
46.5
44.6
38.9
37.7
36.9
30.7
- 100.0 200.0 300.0 400.0 500.0 600.0
MyanmarAfghanistan
KyrgyzstanCambodia
BangladeshNepal
North KoreaTajikistan
IraqSri Lanka
MongoliaYemen
LaosIndia
BhutanIndonesia
PakistanPhilippines
Viet NamArmeniaGeorgia
Timor-LesteSyria
Uzbekistan
RussiaKazakhstan
ThailandIran
TurkmenistanLebanon
JordanChina
MalaysiaAzerbaijan
TurkeyMaldives
Saudi ArabiaSouth Korea
OmanJapan
United Arab EmiratesBahrain
QatarKuwait
Brunei DarussalamIsrael
Singapore
Age-standardized mortality rate per 100,000
FemalesMales
Low
Inco
me
Low
er M
iddl
e In
com
eU
pper
Mid
dle
Inco
me
Hig
hIn
com
e
Fig. 4.Mortality attributed to injuries based on sex, countries and income groups in Asia (2008). (For interpretation of the references to colour in this figure, the reader is referred to theweb version of this article.)
299C.J. Ng et al. / Preventive Medicine 67 (2014) 295–302
Andorra/Monaco/Spain/Italy 85 years vs Republic of Moldova/Albania75 years) (WHO, 2011b). In Asia, this wide variation in life expectancyin men probably reflects the difference in the healthcare provision,men's lifestyle and environmental factors such as war and pollution(Cockerham et al., 2002; Jabbour et al., 2012; McKee et al., 2002;Rechel and McKee, 2007). For example, in Qatar, the life expectancy atbirth is the highest in the world as a result of the lower NCD mortalityrate in the Qatari men. This may be attributed to the establishment ofits SupremeCouncil of Health, which has taken positive steps in tacklinghealth inequity by involving governmentministries, non-governmentalagencies and industries (Jabbour et al., 2012). On the other hand,for some countries in the upper middle income countries, such asTurkmenistan, Kazakhstan and Russia, the life expectancy remained
short at 60, 62 and 63 years, respectively. In Turkmenistan, this hasbeen attributed to the political turmoil where healthcare funding andhealthcare workforce declined resulting in reduced accessibility tohealth care (Rechel and McKee, 2007). In Kazakhstan and Russia,men's shorter life expectancy is mainly due to excessive alcoholconsumption, heavy smoking, high-fat diets and sedentary lifestyle(Cockerham et al., 2002; McKee et al., 2002).
For communicable diseases in Asia, the male mortality rate (162.0deaths per 100,000) is higher than that in Europe (50.9 deaths per100,000), USA (29.8 deaths per 100,000) and Australia (15.4 deathsper 100,000) (WHO, 2008). Timor-Leste, Myanmar, Cambodia andAfghanistan have the highest mortality rate due to communicable dis-ease for men in Asia (422.3 to 565.4 deaths per 100,000). Among
0 20 40 60 80 100
Raised blood glucose2008
Raised blood pressure2008
High total cholesterol2008
Overweight and obesity2008
Insufficiently active2009
Current smoker2009
*Alcohol consumer1993-2007
(pass 12 months)
Prevalence (%)
Risk
fact
ors
AsiaAsia - HAsia - UM
Asia - LMAsia - LEuropeEurope - HEurope - UMEurope - LM
USAWorld
Note: H = High; UM = Upper middle; LM = Lower middle; L = Low for country income group*The prevalence for alcohol consumer within 12 months for a specific year was recorded in each country . The year in which the prevalence was recorded for each country differ in the range of 1993 to 2007.
Fig. 5. Comparison of the prevalence of risk factors inmen across different income groups in Asia, Europe, USA and the world. (For interpretation of the references to colour in this figure,the reader is referred to the web version of this article.)
300 C.J. Ng et al. / Preventive Medicine 67 (2014) 295–302
Asian countries, Timor-Leste has the highest male mortality due to tu-berculosis and sexual transmitted infections; Myanmar has the highestmale mortality rate due to HIV/AIDS; Afghanistan has the highest malemortality rates due to respiratory infection, hepatitis B and hepatitis C;while Cambodia has the second highest male mortality rate in hepatitisB, hepatitis C and sexual transmitted infections (Tan et al., 2013). Thehigh mortality in these countries is likely to be attributed to povertyand less-than-effective health care system (Gupta and Guin, 2010).
This study found that majority of the higher-income countries facedtransition toward chronic non-communicable diseasewhile themiddle-and low-income countries faced double disease burden of communica-ble and non-communicable diseases. The male mortality rate due tonon-communicable diseases in Asia (759.7 deaths per 100,000) ishigher than Europe (616.9 deaths per 100,000), the USA (485.9 deathsper 100,000) and Australia (389.2 deaths per 100,000).
Male mortality rate due to injuries is higher compared to female inall Asian countries. Among the highest in Asia are Iraq, Sri Lanka andAfghanistan, where the figures are contributed by war. For Russia andKazakhstan, the main causes are accidental poisoning by and exposureto noxious substances and other intentional injuries. Thailand's mortal-ity rate due to injuries is notably highmainly due to road traffic accident(WHO, 2008).
Most high-income countries in Asia are affected by non-communicable diseases. However, the prevalence of CVD risk fac-tors is still lower compared to the USA, Europe and the world, ex-cept for smoking. Within Asia, men in high-income countries tendto smoke less compared to middle- and low-income countries butthey drink more alcohol. Lower alcohol consumption in Asia isprobably contributed by alcohol abstinence in Islamic countries.Higher-income countries often have higher prevalence of high

High IncomeUpper middle incomeLower middle incomeLow income
125
127
129
131
133
135
Syst
olic
blo
od p
ress
ure
(mm
Hg)
Systolic blood pressure
5.25.35.45.55.65.75.85.9
Fast
ing
bloo
d gl
ucos
e(m
mol
/L)
Fasting blood glucose
2021222324252627
BMI (
kg/m
2 )
Year
BMI 4
4.5
5
5.5
Tota
l cho
lest
erol
leve
l (m
mol
/L)
Total cholesterol level
Fig. 6. Trends of systolic blood pressure, fasting blood glucose, total cholesterol and bodymass index by income groups in Asia from 1980 to 2009. (For interpretation of the references tocolour in this figure, the reader is referred to the web version of this article.)
301C.J. Ng et al. / Preventive Medicine 67 (2014) 295–302
total cholesterol and obesity, and this is contributed by their sedentarylifestyle and dietary factor (Tong et al., 2011). The drop in themean sys-tolic blood pressure in high-income countries might be contributed bywider anti-hypertensive drugs used, whichmay not be readily availablein the lower-income countries (Danaei et al., 2011). Comparing tolower-income nations, people in high-income countries tend consumemore added sugars and fats, which subsequently lead to higher meanBMI for high-income countries (Drewnowski, 2003).
This study has a few limitations. Although we extracted data fromthe WHO database, the quality of data reported by individual countrymay vary. Some of the data might not be updated and there is a limitto trend data. Summarizing the prevalence of risk factors in Asiaby using a simple average might not accurately reflect the distribu-tion of data across Asia. In addition, the use of arbitrary criteria forBMI ≥ 25 kg/m2 (Asia: ≥23 kg/m2) may not be appropriate for theAsian population.
Conclusions
This is the first study that systematically documents the status ofmen's health in Asia which confirms that Asian men have a shorter lifeexpectancy and higher mortality compared to Asian women. Thesefindings are consistent with those found in the rest of the world. Wefound that in Asia, men in the middle-income countries are facing a
double disease crisis and there is a rising trend in cardiovascular risk fac-tors. This imposes a significant healthcare burden which calls for a con-certed effort to find solutions to address men's health issues in Asia.
Conflict of interest
The authors declare that there is no conflict of interest.
Acknowledgment
The authors confirmed that there is no funding received in thisstudy.
References
Addis, M.E.,Mahalik, J.R., 2003. Men, masculinity, and the contexts of help seeking. Am.Psychol. 58, 5–14.
AIHW, 2013. The Health of Australia's Males: 25 Years and Over. [Online] Australia Insti-tute of Health & Welfare, Canberra, (Available: http://www.health.gov.au/internet/main/publishing.nsf/Content/male-policy 2013]).
Bilsker, D.,Goldenberg, L.,Davison, J., 2010. A Roadmap to Men's Health: Current Status,Research, Policy & Practice. Men's Health Initiative of British Columbia, Vancouver.
Byrnes, J.P.,Miller, D.C., Schafer, W.D., 1999. Gender differences in risk taking: a meta-analysis. Psychol. Bull. 125, 367.
CIA, 2013. The World Factbook [Online]. Central Intelligence Unit, (Available: https://www.cia.gov/library/publications/the-world-factbook/ [Accessed Dec 5 2013]).

302 C.J. Ng et al. / Preventive Medicine 67 (2014) 295–302
Cockerham,W.C.,Snead, M.C.,Dewaal, D.F., 2002. Health lifestyles in Russia and the social-ist heritage. J. Health Soc. Behav. 43, 42–55.
Cordier, R.,Wilson, N.J., 2013. Community-based Men's Sheds: promoting male health,wellbeing and social inclusion in an international context. Health Promot. Int. 1–11http://dx.doi.org/10.1093/heapro/dat033.
Danaei, G., Finucane, M.M., Lu, Y., et al., 2011. National, regional, and global trends infasting plasma glucose and diabetes prevalence since 1980: systematic analysis ofhealth examination surveys and epidemiological studies with 370 country-yearsand 2.7 million participants. Lancet 378, 31–40.
Doyal, L., 1995. What Makes Women Sick: Gender and the Political Economy of Health,New Jersey. Rutgers university press.
Drewnowski, A., 2003. Fat and sugar: an economic analysis. J. Nutr. 133, 838S–840S.EC, 2011. The State of Men's Health in Europe: Extended Report. [Online] The European
Commission, Luxembourg, (Available: http://ec.europa.eu/health/population_groups/docs/men_health_extended_en.pdf 2013]).
Gupta, I., Guin, P., 2010. Communicable diseases in the South-East Asia Region of theWorld Health Organization: towards a more effective response. Bull. World HealthOrgan. 88, 199–205.
Jabbour, S.,Giacaman, R.,Yamout, R.,Khawaja, M.,Nuwayhid, I., 2012. Public health in theArab World. Cambridge University Press, Cambridge.
Lynch, W., 2013. Men's health in Australia. Trends Urol. Men's Health 4, 7–10.Mckee, M., Healy, J., Falkingham, J., 2002. Health care in central Asia. Open University
Press, Buckingham.Ncin and Cancer Research UK, 2009. Cancer Incidence and Survival byMajor Ethnic Group,
England, 2002–2006. National Cancer Intelligence Network and Cancer Research, UK.Orach, C.G., 2009. Health equity: challenges in low income countries. Afr. Health Sci. 9
(Suppl. 2), S49–S51.Rahman, M.O., Liu, J., 2000. Gender differences in functioning for older adults in rural
Bangladesh. The impact of differential reporting? J. Gerontol. A Biol. Sci. Med. Sci. 55,M28–M33.
Rechel, B., Mckee, M., 2007. The effects of dictatorship on health: the case ofTurkmenistan. BMC Med. 5, 21.
Republic of China (Taiwan), 2011. Life expectancy at birth [Online]. Ministry ofHealth and Welfare, Republic of China (Taiwan), (Available: http://www.mohw.gov.tw/EN/Ministry/Statistic_P.aspx?f_list_no=474&fod_list_no=3522&doc_no=28141 [Accessed September 18 2013]).
Tan, H.M.,Low, W.Y.,Ng, C.J., et al., 2007. Prevalence and correlates of erectile dysfunction(ED) and treatment seeking for ED in Asian Men: the Asian Men's Attitudes to LifeEvents and Sexuality (MALES) study. J. Sex Med. 4, 1582–1592.
Tan, H.M.,Ng, C.J.,Ho, C.C.K.,Teo, C.H., 2013. Asian Men's Health Report. Malaysian Men'sHealth Initiative, Kuala Lumpur.
The Government of Hong Kong Special Administrative Region, 2011. Demographics: Ex-pectation of life at birth [Online]. The Government of Hong Kong Special Administra-tive Region, (Available: http://www.censtatd.gov.hk/hkstat/sub/so160.jsp [AccessedSeptember 15 2013]).
The World Bank, 2013. Country and Lending Groups [Online]. The World Bank, (Available:http://data.worldbank.org/about/country-classifications/country-and-lending-groups.[Accessed May 8 2013]).
Tong, S.F.,Ho, C.,Tan, H.M., 2011. Managing the aging man in Asia: a review. Int. J. Urol. 18,32–42.
Wang, H., Schumacher, A.E., Levitz, C.E.,Mokdad, A.H.,Murray, C.J., 2013. Left behind:widening disparities for males and females in US county life expectancy, 1985–2010.Popul. Health Metrics 11, 8.
Wassener, B., 2013. Asian Economies Encounter Stiff Winds. The New York Times.White, A.,Holmes, M., 2006. Patterns of mortality across 44 countries among men and
women aged 15–44 years. J. Men's Health Gend. 3, 139–151.White, A., Sousa, B.D.,Visser, R.D., et al., 2011. Men's health in Europe. J. Men's Health 8,
192–201.White, A.,Mckee, M.,De Sousa, B., et al., 2014. An examination of the association between
premature mortality and life expectancy amongmen in Europe. Eur. J. Pub. Health 24,673–679.
WHO, 2000. The World Health Report. World Health Organization (WHO), Geneva.WHO, 2008. Disease and Injury Country Estimates, 2008: By Sex by Country [Online].
World Health Organization, (Available: http://apps.who.int/gho/data/node.main.1005?lang=en [Accessed October 5 2013]).
WHO, 2011a. Life expectancy at Birth by Country. [Online] Global Health ObservatoryData Repository: World Health Organization, (Available: http://apps.who.int/gho/data/node.main.688?lang=en [Accessed October 10 2013]).
WHO, 2011b. Life expectancy: Life expectancy byWHO region [Online]. World Health Or-ganization, (Available: http://apps.who.int/gho/data/view.main.690?lang=en[Accessed November 11 2013]).
WHO, 2013a. Alphabetical List of WHO Member States [Online]. World Health Organisa-tion, (Available: http://www.who.int/choice/demography/by_country/en/ [AccessedDec 5 2013]).
WHO, 2013b. Global Health Observatory Data Repository [Online]. World Health Organi-zation, (Available: http://apps.who.int/gho/data/view.main` [Accessed Dec 7 2013]).


