Embed Size (px)
Citation preview
This article appeared in a journal published by Elsevier. The attachedcopy is furnished to the author for internal non-commercial researchand education use, including for instruction at the authors institution
and sharing with colleagues.
Other uses, including reproduction and distribution, or selling orlicensing copies, or posting to personal, institutional or third party
websites are prohibited.
In most cases authors are permitted to post their version of thearticle (e.g. in Word or Tex form) to their personal website orinstitutional repository. Authors requiring further information
regarding Elsevier’s archiving and manuscript policies areencouraged to visit:
http://www.elsevier.com/authorsrights

Author's personal copy
Review Article
The state of inland fisheries in Ethiopia: a synopsis withupdated estimates of potential yield
Gashaw Tesfaye *, Matthias Wolff
Leibniz Zentrum fur Marine Tropenokologie (ZMT), Fahrenheitstraße 6, 28359 Bremen, Germany
Contents
1. Introduction . . . . . . . . . . . . . . . . . . . . . . . . . . . . . . . . . . . . . . . . . . . . . . . . . . . . . . . . . . . . . . . . . . . . . . . . . . . . . . . . . . . . . . . . 201
2. Materials and methods . . . . . . . . . . . . . . . . . . . . . . . . . . . . . . . . . . . . . . . . . . . . . . . . . . . . . . . . . . . . . . . . . . . . . . . . . . . . . . . 202
2.1. Sources used for the review. . . . . . . . . . . . . . . . . . . . . . . . . . . . . . . . . . . . . . . . . . . . . . . . . . . . . . . . . . . . . . . . . . . . . . 202
2.2. The extent of inland waters. . . . . . . . . . . . . . . . . . . . . . . . . . . . . . . . . . . . . . . . . . . . . . . . . . . . . . . . . . . . . . . . . . . . . . 202
2.3. Use of empirical models for potential yield estimates . . . . . . . . . . . . . . . . . . . . . . . . . . . . . . . . . . . . . . . . . . . . . . . . . 202
3. Results . . . . . . . . . . . . . . . . . . . . . . . . . . . . . . . . . . . . . . . . . . . . . . . . . . . . . . . . . . . . . . . . . . . . . . . . . . . . . . . . . . . . . . . . . . . . 204
3.1. Production potential. . . . . . . . . . . . . . . . . . . . . . . . . . . . . . . . . . . . . . . . . . . . . . . . . . . . . . . . . . . . . . . . . . . . . . . . . . . . 204
Ecohydrology & Hydrobiology 14 (2014) 200–219
A R T I C L E I N F O
Article history:
Received 2 December 2013
Accepted 12 May 2014
Available online 2 June 2014
Keywords:
Aquatic resources
Ethiopia
Fish
Market chain
Potential yield
Socioeconomics
A B S T R A C T
This study reviews fisheries and management practices and provides estimates of the
present and potential fish yield of Ethiopian inland fisheries. Published and unpublished
sources were used, 28 years of fisheries data were analyzed and empirical models were
applied to estimate potential yield. Ethiopian waters hold about 180 fish species, some
freshwater shrimps and crabs, commercially important microalgae and a diverse
vegetation, all together of great economic and socio-cultural values. Fisheries provide
economic support directly and indirectly to about half a million people and serve as source
of affordable protein for many households. Our estimate of potential yield
(94,500 t yr�1 + 5.2% distributed as 73,100 t yr�1 + 3.3% for lentic and about
21,400 t yr�1 + 11.9% for lotic ecosystems) is far above the current yield levels, suggesting
substantial scope for fisheries expansion. Nevertheless, some lakes already show signs of
overfishing of target species, while others appear to have growing or stable fisheries. As
yet, no ornamental fishery occurs in the country and the potential of indigenous fish
species for ornamental fish trade needs to be evaluated. Management follows the
traditional command and control approach and it seems that there is a general lack of
awareness and scientific information on the fisheries. Major challenges of the fisheries are
high post-harvest loss, lack of stringent sanitary and phytosanitary standards for assuring
good quality products, and overfishing of valuable fish species in some lakes. Thus,
continuous fisheries monitoring and yield assessment are urgently needed as is research
directed toward unexploited water bodies and species.
� 2014 Published by Elsevier Urban & Partner Sp. z o.o. on behalf of European Regional
Centre for Ecohydrology of Polish Academy of Sciences.
* Corresponding author. Tel.: +49 17671657904; fax: +49 4212380030.
E-mail addresses: [email protected], [email protected] (G. Tesfaye), [email protected] (M. Wolff).
Contents lists available at ScienceDirect
Ecohydrology & Hydrobiology
jo ur n al ho mep ag e: www .e lsev ier . c om / loc ate /ec o hyd
http://dx.doi.org/10.1016/j.ecohyd.2014.05.001
1642-3593/� 2014 Published by Elsevier Urban & Partner Sp. z o.o. on behalf of European Regional Centre for Ecohydrology of Polish Academy of Sciences.

Author's personal copy
3.2. Historical trend in fisheries production. . . . . . . . . . . . . . . . . . . . . . . . . . . . . . . . . . . . . . . . . . . . . . . . . . . . . . . . . . . . . 204
3.3. Production by water bodies . . . . . . . . . . . . . . . . . . . . . . . . . . . . . . . . . . . . . . . . . . . . . . . . . . . . . . . . . . . . . . . . . . . . . . 205
3.4. Production by species . . . . . . . . . . . . . . . . . . . . . . . . . . . . . . . . . . . . . . . . . . . . . . . . . . . . . . . . . . . . . . . . . . . . . . . . . . 205
4. Discussion . . . . . . . . . . . . . . . . . . . . . . . . . . . . . . . . . . . . . . . . . . . . . . . . . . . . . . . . . . . . . . . . . . . . . . . . . . . . . . . . . . . . . . . . . 206
4.1. Fish production. . . . . . . . . . . . . . . . . . . . . . . . . . . . . . . . . . . . . . . . . . . . . . . . . . . . . . . . . . . . . . . . . . . . . . . . . . . . . . . . 206
4.2. Fish diversity . . . . . . . . . . . . . . . . . . . . . . . . . . . . . . . . . . . . . . . . . . . . . . . . . . . . . . . . . . . . . . . . . . . . . . . . . . . . . . . . . 208
4.3. Commercially important fish species . . . . . . . . . . . . . . . . . . . . . . . . . . . . . . . . . . . . . . . . . . . . . . . . . . . . . . . . . . . . . . 208
4.4. Other aquatic resources . . . . . . . . . . . . . . . . . . . . . . . . . . . . . . . . . . . . . . . . . . . . . . . . . . . . . . . . . . . . . . . . . . . . . . . . . 210
4.5. Fish processing and marketing . . . . . . . . . . . . . . . . . . . . . . . . . . . . . . . . . . . . . . . . . . . . . . . . . . . . . . . . . . . . . . . . . . . 210
4.6. Socio-economic significance of the fishery . . . . . . . . . . . . . . . . . . . . . . . . . . . . . . . . . . . . . . . . . . . . . . . . . . . . . . . . . . 211
4.7. Fisheries policies . . . . . . . . . . . . . . . . . . . . . . . . . . . . . . . . . . . . . . . . . . . . . . . . . . . . . . . . . . . . . . . . . . . . . . . . . . . . . . 212
4.8. Fisheries management practices . . . . . . . . . . . . . . . . . . . . . . . . . . . . . . . . . . . . . . . . . . . . . . . . . . . . . . . . . . . . . . . . . . 213
5. Conclusions . . . . . . . . . . . . . . . . . . . . . . . . . . . . . . . . . . . . . . . . . . . . . . . . . . . . . . . . . . . . . . . . . . . . . . . . . . . . . . . . . . . . . . . . 213
Acknowledgements . . . . . . . . . . . . . . . . . . . . . . . . . . . . . . . . . . . . . . . . . . . . . . . . . . . . . . . . . . . . . . . . . . . . . . . . . . . . . . . . . . 214
References . . . . . . . . . . . . . . . . . . . . . . . . . . . . . . . . . . . . . . . . . . . . . . . . . . . . . . . . . . . . . . . . . . . . . . . . . . . . . . . . . . . . . . . . . 218
1. Introduction
Ethiopia is an agrarian country where agricultureremains the dominant sector of the economy, contributingabout 43% of the GDP, 85% of employment and 90% of totalexport earnings, as well as providing about 70% of the rawmaterials for the industrial sector (Demese et al., 2010).However, the country has been food insecure for more thanthree decades despite its great potential for expandingagricultural production and productivity. Persistentdroughts, inappropriate agricultural policies, low andinappropriate technologies, pre- and post-harvest losses,poor and inadequate infrastructure, limited skilled man-power and limited credit opportunities are the mainreasons for this poor state of affairs (Mulat et al., 2004).Agriculture in Ethiopia is considered here in its broadestdefinition to include crops, livestock, fisheries, forestry andnatural resource management. The country is wellendowed with enormous cultivable land, livestock andfishery resources, which are largely untapped yet couldboost the economy and improve the livelihoods of the ruralpeople that depend on agriculture. The Ministry ofAgriculture (MoA) thus considers the fishery subsectoras one of the potential intervention areas to achieve theobjective of enhancing food security, employment andprovide alternative sources of income to improve thelivelihoods of rural people in a sustainable manner.
Ethiopia has been a landlocked country since 1993, soits fishery comes exclusively from inland water bodiesincluding lakes, rivers, streams, reservoirs and substantialwetlands that are of great socio-economic, ecological andscientific importance. Fishing has been the main source ofprotein supply for many Ethiopians particularly for thosewho are residing in the vicinity of major water bodies likerivers in the Gambella region, Rift Valley lakes and LakeTana. Modern fishing techniques were introduced in the1980s and 1990s, with fisheries development programs bythe Ethiopian Orthodox church and later by the LakeFisheries Development Project financed by EEC (thepresent EU).
Research on the aquatic resources started in the early20th century (Boulenger, 1904) and was mostly donethrough short expeditions by European travelers and short-term residents. Ethiopian scientists became increasingly
involved after the 1970s (Shibru, 1973; Getachew, 1980;Shibru and Fisha, 1981). Studies were focused on thedescription of the water bodies, limnological features oflakes and reservoirs (Amha and Wood, 1982; Kassahun andAmha, 1984; Melaku et al., 1988; Wood and Talling, 1988;Seyoum et al., 1991; Kebede et al., 1994; Tudorancea et al.,1999; Tudorancea and Taylor, 2002; Zinabu, 2002; Brook,2003; Adamneh et al., 2008), the biology of few fish species(Getachew, 1987; Eyualem and Getachew, 1992; Zenebe,1999; Wudneh, 1998; Demeke and Elias, 1997; Gashaw andZenebe, 2008), fish diversity and ecology (Shibru, 1973;Shibru and Fisha, 1981; Abebe and Stiassny, 1998; Eshete,2003; Golubtsov and Mina, 2003; Golubtsov et al., 2004;Golubtsov and Darkov, 2008; Golubtsov and Redeat, 2010)and preliminary estimates of fish production potentials(Mebrat, 1993; Breuil, 1995; FAO, 2003).
Most of the information in the literature on the fishproduction potential of the country is not consistent,however, and in parts even contradictory. Most of theestimates did not include the potential of small waterbodies and in some cases even the rivers were notconsidered. However, small water bodies are importantfor a number of reasons, and deserve more attention fromfishery planners and developers as they are relatively easyto manage and could be a potential source of protein andemployment in places where both are in short supply(Haight, 1990 as cited by Marshall and Maes, 1994). Theycan also be easily integrated with other agriculturalactivities without incurring significant additional costsand even improving the overall farm activities.
In this review, we thus try to give a more completepicture considering all water bodies, and also includingthe newly constructed reservoirs for irrigation develop-ment and hydropower generation. Moreover, it is stilldifficult to find comprehensive information about thestate of the fishery and management practices inEthiopia. Thus, the main purpose of this study is toreview the dispersed information on the state of thefishery and its resources, the potential of fish production,and the present value and management practices of theinland fisheries. The second purpose is to examine themajor challenges for fisheries development. The studyconcludes with suggested options for effective andsustainable management.
G. Tesfaye, M. Wolff / Ecohydrology & Hydrobiology 14 (2014) 200–219 201
Author's personal copy
2. Materials and methods
2.1. Sources used for the review
A range of literature sources about the fishery resourcesin Ethiopia was used for this review including journalarticles (29), books and book chapters (10), workshopproceedings (4), FAO reports (14), bulletins (2), legaldocuments (3), unpublished reports including PhD dis-sertations (14), and from the Internet. Information wasreviewed on catch composition, temporal trends andspatial differences in harvest rates, estimates of potentialproduction, processing techniques, marketing and socio-economic aspects, management, and legal and regulatoryframeworks. Information on the extent of water resourceswas also updated using the literature sources. Twenty-eight years of fisheries data (from 1983 to 2010) wereanalyzed to evaluate the state of the fishery. The fishproduction (catch) data and values were obtained from theMinistry of Agriculture (MoA). Data consistency was alsochecked by using FAO reports (Breuil, 1995) and fish catchstatistics1 (as FAO usually receives the data from the sameministry). The Ministry collects the data through theregional Bureau of Agriculture (BOA), which collects datafrom each water body by their fisheries staff at the districtlevel.
2.2. The extent of inland waters
The country has 12 river basins with a mean annualflow (runoff) estimated as 122 billion m3 (Awulachewet al., 2007) and a total length of all rivers estimated as8065 km (Table 1). All the rivers are international but noperennial flow crosses into the Ethiopian river drainagesystem (NWDR, 2004). Rivers Awash and Omo-Gibeterminate into Lakes Abbe and Turkana, which are sharedby Ethiopia with Djibouti and Kenya, respectively. TheBaro-Akobo basin connects to the White Nile. The BlueNile originates from Lake Tana joins the White Nile atKartum, the capital of Sudan and forms the great Nile Riverwhich crosses Egypt and flows into the MediterraneanSea.
The country has also many lakes and reservoirs, and anumber of small water bodies and large floodplain areasdistributed throughout the country and covering a totalsurface area of about 13,637 km2 (Table 2), which is about1.2% of the total land surface area. The major lakes andrivers are shown in Fig. 1. Small water bodies include lakesand manmade reservoirs or micro-dams, ponds andirrigation canals with an area of less than 10 km2 andswamps and floodplains as described by Marshall andMaes (1994). However, many of these water bodies are notexplored and several of them are unknown to scientists.Tesfaye (1990) listed a total of 58 major lakes and marshesin Ethiopia including Eriteria, whereas Leykun (2003)listed a total of 73 Ethiopian wetlands with their location.In the present review, a total of 106 lakes, major reservoirs
and swamp areas were listed with their geographiclocation, altitude and, where available, surface area, meanand maximum depth, and specific regions were given inthe absence of geographic coordinate information (AnnexI). However, with regard to the water bodies surface areas,a wide variety of figures were reported. Greboval et al.(1994) reported the surface area of major lakes andreservoirs to be 8800 km2, whereas Breuil (1995) reported7400 km2. FAO (2003) also reported 7334 km2 for majorlakes and reservoirs, and gave a rough estimate of smallwater bodies as 275 km2. Another estimate by Schroederand John (1993) was given 13,699 km2 but includes thewater bodies of Eritrea. Similarly, the total river lengthwas reported to be 7000 km (Breuil, 1995) and 7185 km(FAO, 2003).
These water bodies tend to be rich in fishery resourcesand diverse vegetation, and have been used for variouspurposes including irrigation development, drinking watersupply, electric power generation, mineral extraction,fishery development and transportation.
2.3. Use of empirical models for potential yield estimates
Empirical models have been used in Asian and Africanlakes, reservoirs and rivers for estimating the potentialfish yield over many years. These models seek to predictcomplex biological effects from simple environmentalparameters (Marshall, 1984). Yield predictions have beenbased on a lake’s mean depth (Fryer and Iles, 1972 as citedby Marshall, 1984), on its morpho-edaphic index (MEI),which relates lake fertility to total dissolved solids(Henderson and Welcomme, 1974), on primary produc-tion (Oglesby, 1977), total phosphorus (Hanson andLeggett, 1982) or its surface area (Youngs and Heimbugh,1982; Marshall, 1984; Crul, 1992). Such methods havebeen widely used particularly in Africa, where fisheriesdata are not readily available, since they are simple, quickand cost effective. However, these estimates should beconsidered with great caution and as Marshall (1985)
Table 1
List of major rivers with their length within the limits of Ethiopia.
No. Name of
river
Length
(km)
References
1 Baro 285 BABMP (1990)
2 Akobo 203 BABMP (1990)
3 Gillo 252 BABMP (1990)
4 Alwero 321 BABMP (1990)
5 Pibor 96 BABMP (1990)
6 Blue Nile
(Abay)
800 FAO (2003) and NWDR (2004)
7 Awash 1200 FAO (2003) and NWDR (2004)
8 Wabishebele 1000 FAO (2003) and NWDR (2004)
9 Genale 480 FAO (2003) and NWDR (2004)
10 Omo 760 FAO (2003) and NWDR (2004)
11 Tekeze 608 FAO (2003) and NWDR (2004)
12 Mereb 440 FAO (2003) and NWDR (2004)
13 Angerib 220 FAO (2003) and NWDR (2004)
14 Miscellaneous
small rivers
1400 FAO (2003)
Total 8065
1 Yearbook of Fishery Statistics Summary tables: Yearbook of Fishery
Statistics Summary tables: ftp://ftp.fao.org/FI/STAT/summary/default.
htm.
G. Tesfaye, M. Wolff / Ecohydrology & Hydrobiology 14 (2014) 200–219202

Author's personal copy
suggested, a mean of several predictions (based ondifferent models) would appear most useful in providingrealistic estimates.
Fish catch in rivers are known to be related to riverlength (km) and catchment area (km2). Welcomme (1974,1985) found a good correlation between drainage basinarea of the river system in km2 and the catch obtained fromit for 20 rivers under tropical conditions mainly from
Africa. He used the following equation (excluding catchesfrom large flooded areas):
Catch ðt yr�1Þ ¼ 0:03 basin area0:97 ðr ¼ 0:91Þ (1)
And the equation relating catch (t) to main channel length(km) was:
Catch ðt yr�1Þ ¼ 0:0032 length1:98 ðr ¼ 0:90Þ (2)
Table 2
Summary of production potential estimates of different water bodies in Ethiopia.
Water bodies Area (km2) Length (km) Potential yield estimates (t yr�1)
Literature Present studye Mean Per unit area (t km�2)c
or length (t km�1)d
Major lakes 7740 23,342b
47,400a
37,346–41,177 39,262 5.8 � 0.6c
Major Reservoirs 1447 4399b
4100a
7698–8059 7879 6 � 0.6c
Small water bodies 4450 1952b 25,678–26,314 25,996 4.1 � 0.4c
Rivers – 8065 21,788b 18,855–23,954 21,405 2.4 � 0.9d
Total 13,637 8065 51,481b
51,500a
89,577–99,504 94,541
a Breuil (1995).b FAO (2003).c Mean yield per unit area (t km�2) with standard deviation (Annex IIa–d).d Yield per unit river length (t km�1) with standard deviation (Annex IIa–d).e See Annex IIa–d for individual estimates and the method used.
Fig. 1. Map showing the major lakes and rivers in Ethiopia.
G. Tesfaye, M. Wolff / Ecohydrology & Hydrobiology 14 (2014) 200–219 203
Author's personal copy
Fish catch in floodplains was related to floodplain area(km2) and Crul (1992) developed the following equationfrom 25 tropical floodplains, of which 14 were fromAfrica:
Catch ðt yr�1Þ ¼ 8:78 floodplain area0:90 ðr ¼ 0:93Þ (3)
Marshall (1984) and Crul (1992) modeled the totalproduction of a lake or reservoir based on its area. Crul’smodel was derived from large data sets of 46 lakes and 25reservoirs all situated in Africa. This is the most up to dateand widely-used model, given below:
Yt ¼ 8:32 � A0:92o ðR2 ¼ 0:93Þ (4)
where Yt is the total yield in tons per year (t yr�1), R2
coefficient of determination and Ao is the lake area in km2.We used Crul’s (1992) model to estimate potential yield assurface area is the only available morphometric factor formost water bodies and as it has been confirmed to be a betterpredictor of yield than other morphometric factors likedepth and volume. Crul also evaluated conductivity, latitudeand altitude (commonly used as indicator of climate) as asecond independent variable next to area in a multipleregression analysis and reported that these variables did notresult in a significant reduction in the variance (Crul, 1992).He also noted that volume explained 82% of the variance ofthe catch, but it did not appear to be a good predictor of totalcatch, as the model overestimated yields in deep lakes andunderestimated yields in shallow lakes.
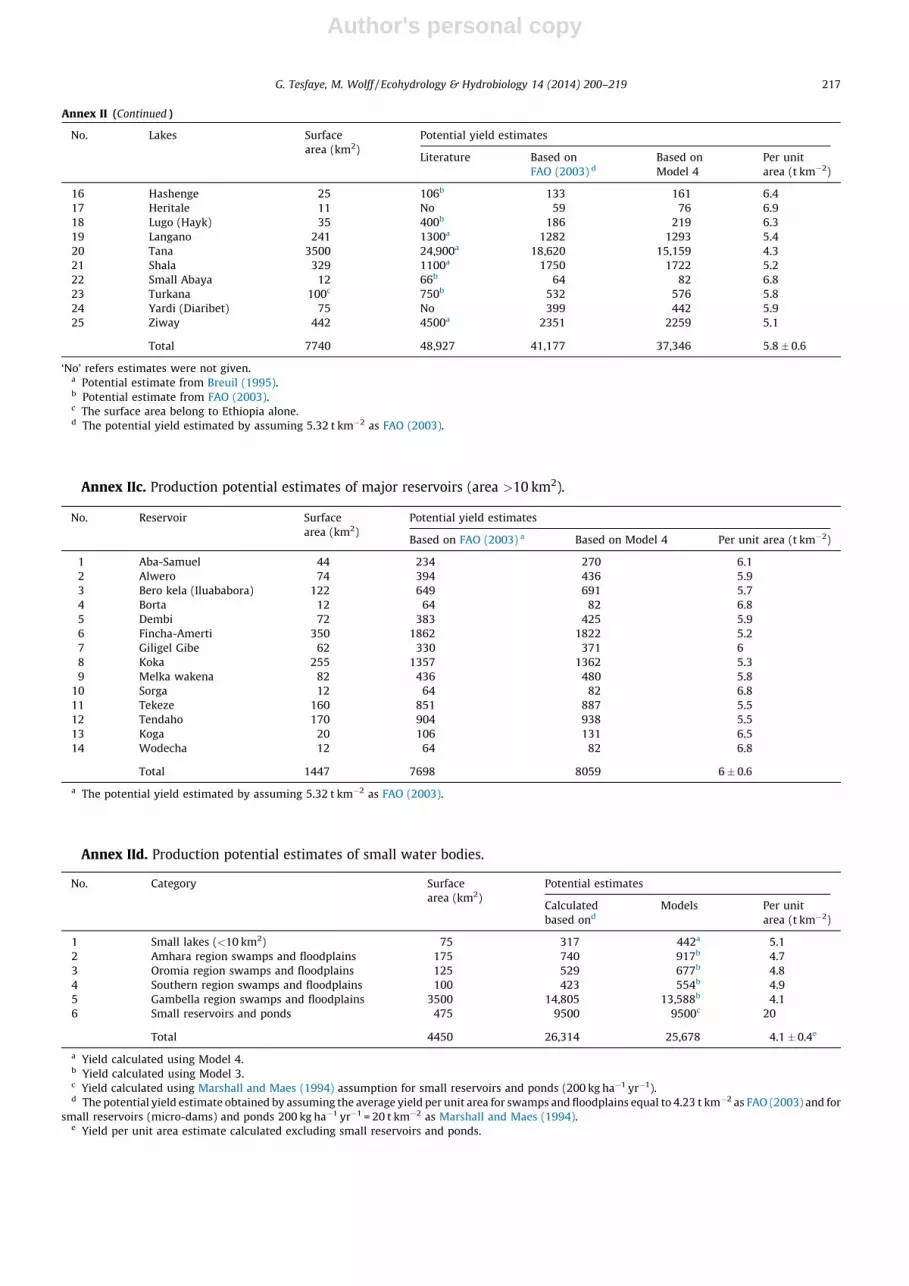
FAO (2003) calculated the overall potential of majorreservoirs by assuming an average yield per unit area of5.32 t km�2. The potential yield of swamps and floodplainareas were also calculated using the productivity estimatesof 4.23 t km�2 and using 200 kg ha�1 yr�1 for smallreservoirs as reported by (Marshall and Maes, 1994). Weused the same productivity values and recalculated thepotential yield using the updated list of water bodies andtheir corresponding surface areas.
3. Results
3.1. Production potential
The different methods employed here for potentialyield estimates for similar water bodies provide values in asimilar range especially for major reservoirs and smallwater bodies (Annex IIb–d). The resulting estimates ofpotential yield for lentic ecosystems (lakes, reservoirs andsmall water bodies) range from 70,722 to 75,550 t yr�1
with a mean of about 73,100 t yr�1. For the lotic ecosystem(riverine fishery) the estimate ranges from 18,855 to23,954 t yr�1 with a mean of about 21,400 t yr�1. There-fore, our estimates for overall potential yield range from89,577 to 99,504 t yr�1 with a mean of about 94,500 t yr�1.Our values are more similar to previous studies for theriverine fishery (Table 2).
3.2. Historical trend in fisheries production
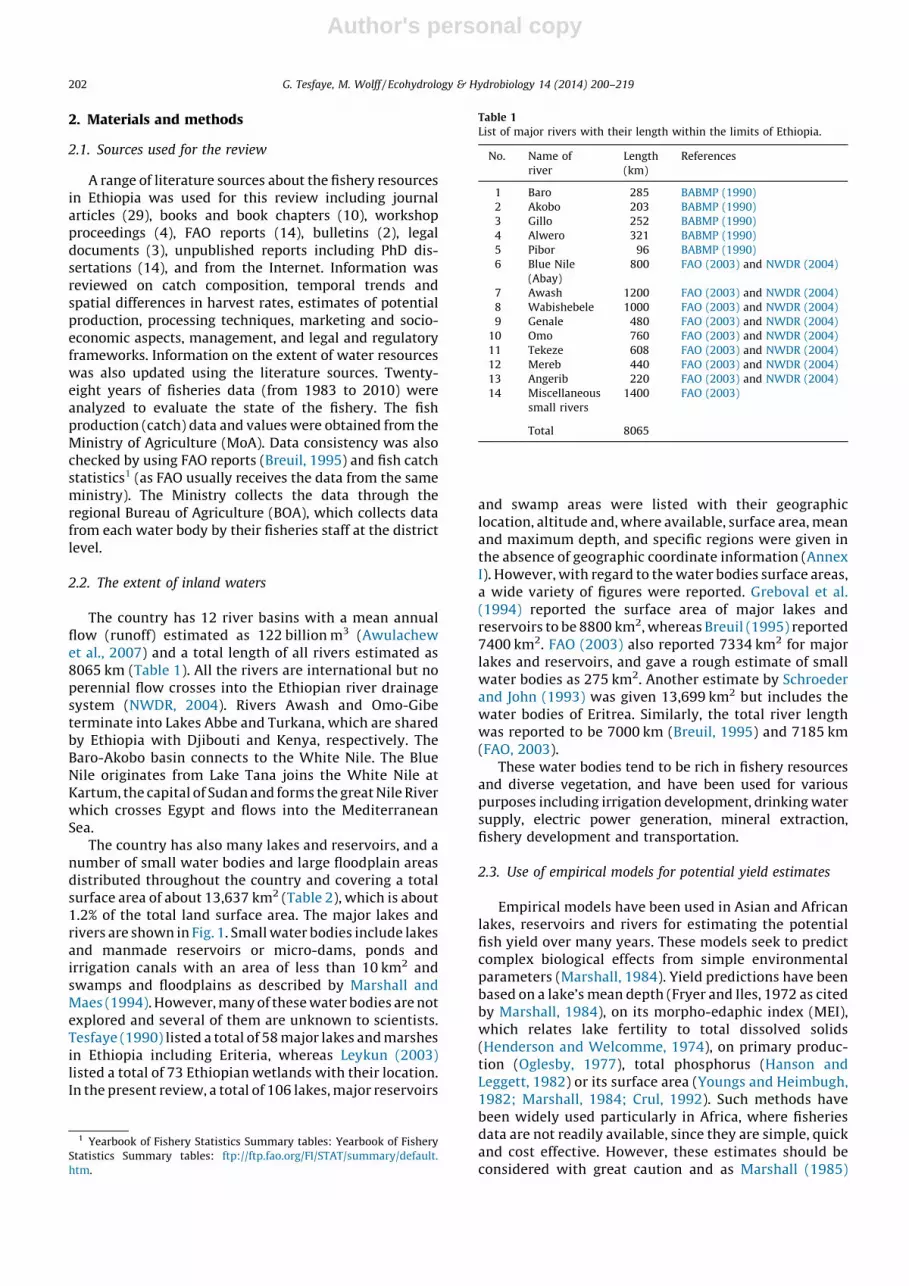
In Ethiopia, fisheries are mainly artisanal and have beenused for subsistence until the 1990s, when they becamecommercialized mainly in the Rift Valley lakes, particularlyin Lakes Koka, Ziway, Langano, Awassa, Abaya and Chamo,and Lake Tana. This was mainly supported by Non-governmental Organizations (NGO) like the EthiopianOrthodox Church – Development and Inter-church AidCommission (EOC/DICAC) and the EEC by providing inputsand transfer of technologies. But there has been alsosubsistence fishing in the Lake Tana basin and Blue Nile,Baro-Akobo and Omo-Turkana river basins but their catchvolumes have never been reported. As seen in Fig. 2, thereported fish production of the country was 3500 t in 1983,15,681 t in the year 2000 and 18,058 t in 2010, althoughthe real catches probably exceed these figures. The figuressuggest that catches have increased more than fivefoldover the past three decades. Generally, there was anincreasing trend in the 1980s and 1990s but catches were
0
2000
4000
6000
8000
10000
12000
14000
16000
18000
20000
0
2000
4000
6000
8000
10000
12000
14000
16000
18000
20000
1983
1984
1985
1986
1987
1988
1989
1990
1991
1992
1993
1994
1995
1996
1997
1998
1999
2000
2001
2002
2003
2004
2005
2006
2007
2008
2009
2010
Val
ue ($
)
Pro
duct
ion
(t)
Production Val ue
Fig. 2. The level of capture fisheries production and value of production from 1983–2010.
Source: Data from MoA.
G. Tesfaye, M. Wolff / Ecohydrology & Hydrobiology 14 (2014) 200–219204

Author's personal copy
low from 2002 to 2006 compared with the figures from1998 to 2001. They increased again as of 2006 (Fig. 2).
3.3. Production by water bodies
Except for some remote and inaccessible waterbodies, subsistence fishing is basically carried out inany water body. On the other hand, commercial (scale)fisheries are mainly concentrated in the central RiftValley lakes Koka, Ziway, Langano and Awassa, thesouthern Rift Valley lakes Abaya, Chamo and Turkana,and the Northern Lakes Tana and South Wollo Lakes Lugo(Hyiq) and Ardibo. However, most of the riverine fisheryis being exploited for subsistence and the exceptionmight be Baro River, where small scale commercialfisheries are developing (Hussien et al., 2010). Thus, mostof the reported capture fisheries production comes fromthe aforementioned lakes and their level of contributionto the total fish production for the period between 1999and 2009 are given in Fig. 3. Most of these lakes areimportant for tilapia, catfish and Barbus fisheries. LakesAbaya and Chamo are also the main source of Nile perch,Bagrus and Labeo species, and Lake Koka and Ziway forcommon carp and crucian carp, respectively.
Among these lakes, Chamo, Ziway and Tana provide thehighest catches and contribute about 65% of the totalannual average catch for the period from 1999 to 2009(Fig. 4). Lake Abaya, the second largest lake in Ethiopia(1162 km2) contributed only 8%. Lakes Awassa, Koka andLangano were found to be equally important andcontributed 7% each to the total production. Unlike otherlakes, production was declining in Lakes Chamo and Ziwayover the years (Fig. 3) probably due to high fishing pressurein the two lakes. Lake Tana, the largest lake in Ethiopia(3500 km2) was reported to be under fished (Wudneh,1998) and still shows an increasing trend, exceeding theproduction level of Lake Ziway since 2005 and reaching the
historical catch peak of Lake Chamo in 2000. Lakes Abayaand Turkana also show an increasing trend. Lake Awassawas also reported to be in the state of overfishing(Reintjens and Wudneh, 1998) but the decline was notas pronounced as for Chamo and Ziway.
3.4. Production by species
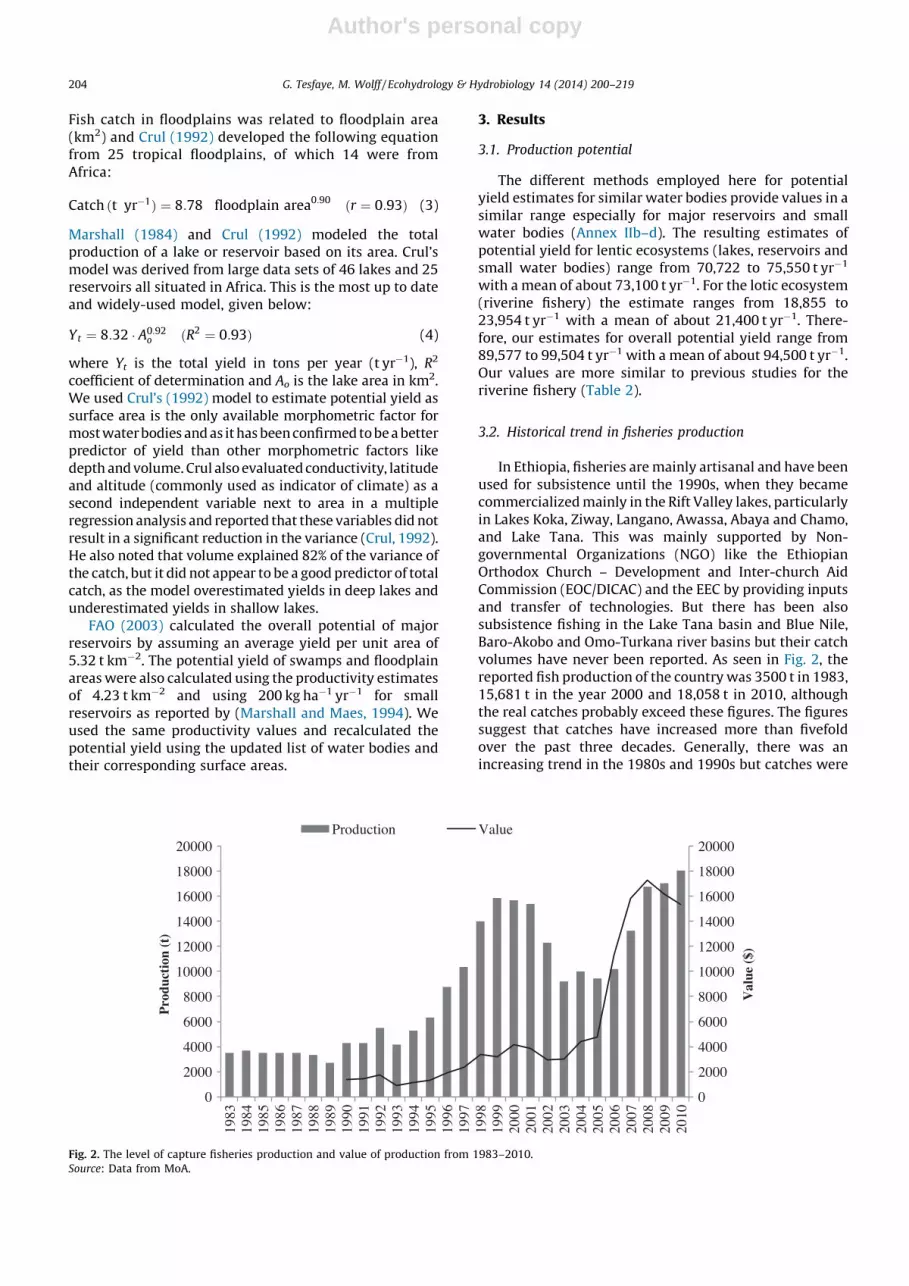
The landing statistics showed that much of theproduction has been contributed by tilapia, followed bycatfish, Labeo, Nile perch and Barbus species. Tilapiacontributed on average more than 6600 t annually whichis about 50% of the annual average catch for the period1998–2010 (Figs. 5 and 6).
However, tilapia showed a declining trend until 2005but started increasing as of 2006. Catfish was formerly the
Fig. 3. The fish production trend in major lakes for the period from 1999–2009.
Graph adapted from data given in Hussien (2010).
Abaya8%
Chamo29%
Awas sa7%Langano
7%
Ziway19%
Koka7%
S/well o la kes2%
Tana17%
Turkana4%
Fig. 4. Percentage contribution of the major lakes to the average annual
catch from 1999–2009.
G. Tesfaye, M. Wolff / Ecohydrology & Hydrobiology 14 (2014) 200–219 205
Author's personal copy
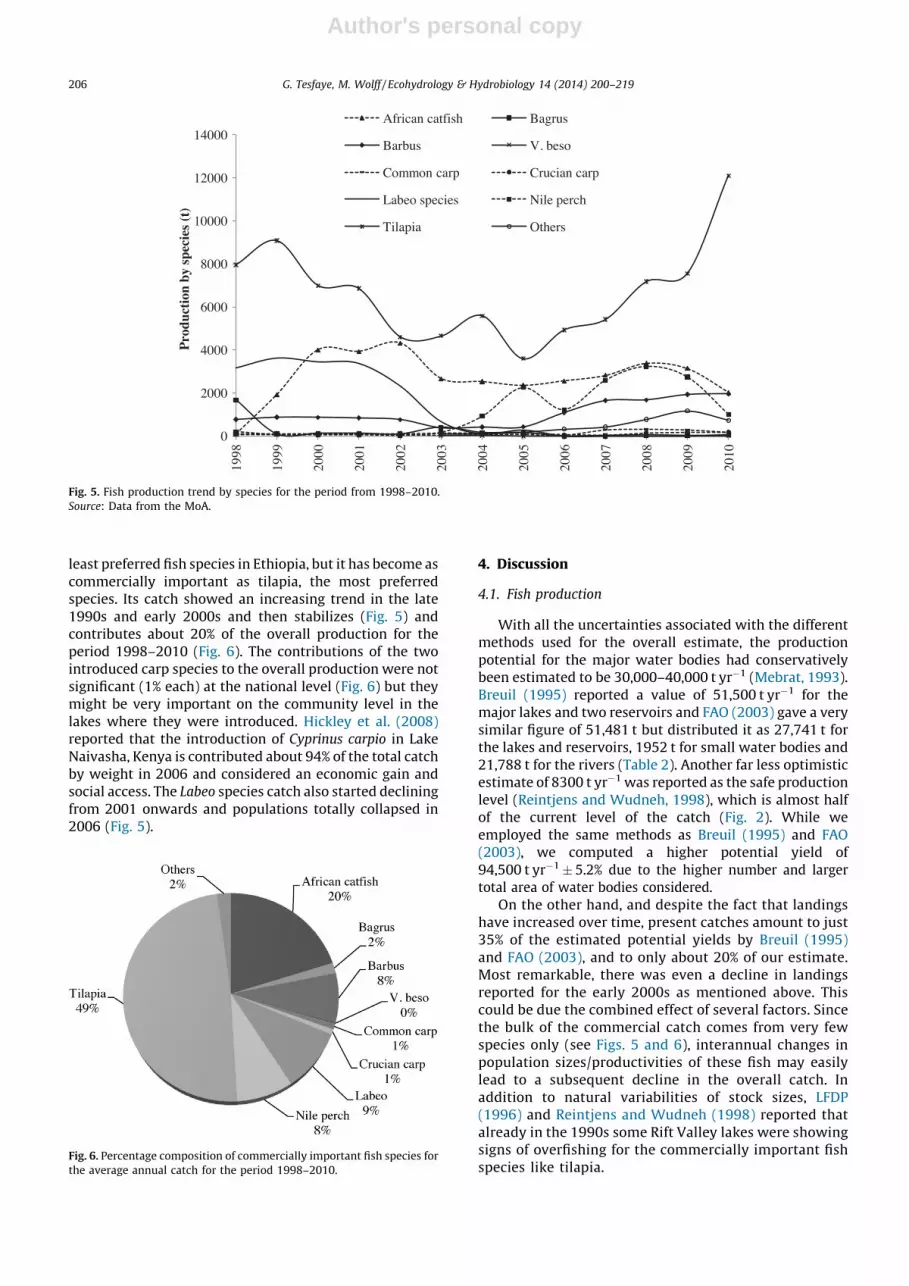
least preferred fish species in Ethiopia, but it has become ascommercially important as tilapia, the most preferredspecies. Its catch showed an increasing trend in the late1990s and early 2000s and then stabilizes (Fig. 5) andcontributes about 20% of the overall production for theperiod 1998–2010 (Fig. 6). The contributions of the twointroduced carp species to the overall production were notsignificant (1% each) at the national level (Fig. 6) but theymight be very important on the community level in thelakes where they were introduced. Hickley et al. (2008)reported that the introduction of Cyprinus carpio in LakeNaivasha, Kenya is contributed about 94% of the total catchby weight in 2006 and considered an economic gain andsocial access. The Labeo species catch also started decliningfrom 2001 onwards and populations totally collapsed in2006 (Fig. 5).
4. Discussion
4.1. Fish production
With all the uncertainties associated with the differentmethods used for the overall estimate, the productionpotential for the major water bodies had conservativelybeen estimated to be 30,000–40,000 t yr�1 (Mebrat, 1993).Breuil (1995) reported a value of 51,500 t yr�1 for themajor lakes and two reservoirs and FAO (2003) gave a verysimilar figure of 51,481 t but distributed it as 27,741 t forthe lakes and reservoirs, 1952 t for small water bodies and21,788 t for the rivers (Table 2). Another far less optimisticestimate of 8300 t yr�1 was reported as the safe productionlevel (Reintjens and Wudneh, 1998), which is almost halfof the current level of the catch (Fig. 2). While weemployed the same methods as Breuil (1995) and FAO(2003), we computed a higher potential yield of94,500 t yr�1� 5.2% due to the higher number and largertotal area of water bodies considered.
On the other hand, and despite the fact that landingshave increased over time, present catches amount to just35% of the estimated potential yields by Breuil (1995)and FAO (2003), and to only about 20% of our estimate.Most remarkable, there was even a decline in landingsreported for the early 2000s as mentioned above. Thiscould be due the combined effect of several factors. Sincethe bulk of the commercial catch comes from very fewspecies only (see Figs. 5 and 6), interannual changes inpopulation sizes/productivities of these fish may easilylead to a subsequent decline in the overall catch. Inaddition to natural variabilities of stock sizes, LFDP(1996) and Reintjens and Wudneh (1998) reported thatalready in the 1990s some Rift Valley lakes were showingsigns of overfishing for the commercially important fishspecies like tilapia.
0
2000
4000
6000
8000
10000
12000
14000
1998
1999
2000
2001
2002
2003
2004
2005
2006
2007
2008
2009
2010
Pro
duct
ion
by s
peci
es (
t)
Africa n catfish Bagrus
Barbus V. beso
Comm on carp Crucia n carp
Labeo species Nile perch
Tilapia Others
Fig. 5. Fish production trend by species for the period from 1998–2010.
Source: Data from the MoA.
Fig. 6. Percentage composition of commercially important fish species for
the average annual catch for the period 1998–2010.
G. Tesfaye, M. Wolff / Ecohydrology & Hydrobiology 14 (2014) 200–219206
Author's personal copy
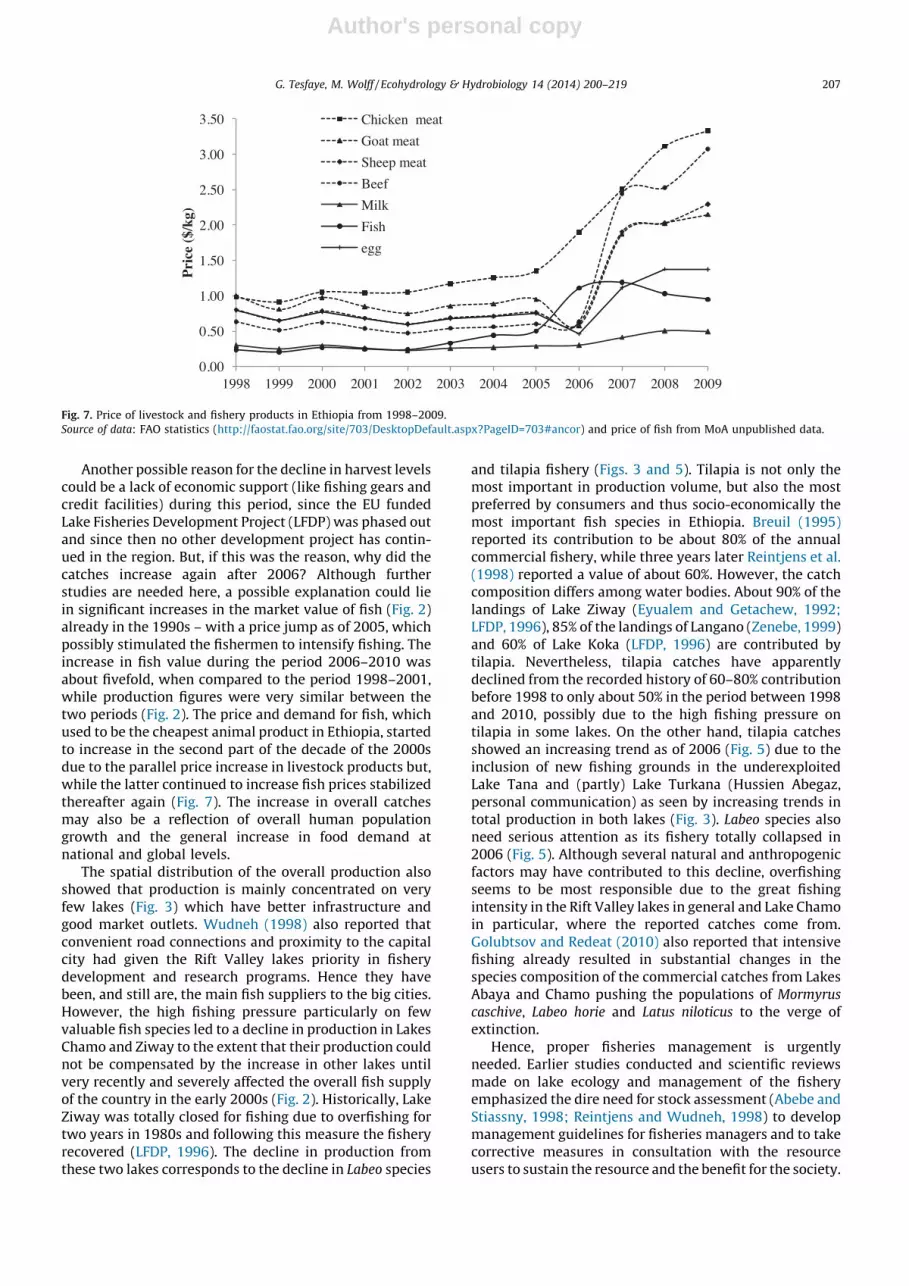
Another possible reason for the decline in harvest levelscould be a lack of economic support (like fishing gears andcredit facilities) during this period, since the EU fundedLake Fisheries Development Project (LFDP) was phased outand since then no other development project has contin-ued in the region. But, if this was the reason, why did thecatches increase again after 2006? Although furtherstudies are needed here, a possible explanation could liein significant increases in the market value of fish (Fig. 2)already in the 1990s – with a price jump as of 2005, whichpossibly stimulated the fishermen to intensify fishing. Theincrease in fish value during the period 2006–2010 wasabout fivefold, when compared to the period 1998–2001,while production figures were very similar between thetwo periods (Fig. 2). The price and demand for fish, whichused to be the cheapest animal product in Ethiopia, startedto increase in the second part of the decade of the 2000sdue to the parallel price increase in livestock products but,while the latter continued to increase fish prices stabilizedthereafter again (Fig. 7). The increase in overall catchesmay also be a reflection of overall human populationgrowth and the general increase in food demand atnational and global levels.
The spatial distribution of the overall production alsoshowed that production is mainly concentrated on veryfew lakes (Fig. 3) which have better infrastructure andgood market outlets. Wudneh (1998) also reported thatconvenient road connections and proximity to the capitalcity had given the Rift Valley lakes priority in fisherydevelopment and research programs. Hence they havebeen, and still are, the main fish suppliers to the big cities.However, the high fishing pressure particularly on fewvaluable fish species led to a decline in production in LakesChamo and Ziway to the extent that their production couldnot be compensated by the increase in other lakes untilvery recently and severely affected the overall fish supplyof the country in the early 2000s (Fig. 2). Historically, LakeZiway was totally closed for fishing due to overfishing fortwo years in 1980s and following this measure the fisheryrecovered (LFDP, 1996). The decline in production fromthese two lakes corresponds to the decline in Labeo species
and tilapia fishery (Figs. 3 and 5). Tilapia is not only themost important in production volume, but also the mostpreferred by consumers and thus socio-economically themost important fish species in Ethiopia. Breuil (1995)reported its contribution to be about 80% of the annualcommercial fishery, while three years later Reintjens et al.(1998) reported a value of about 60%. However, the catchcomposition differs among water bodies. About 90% of thelandings of Lake Ziway (Eyualem and Getachew, 1992;LFDP, 1996), 85% of the landings of Langano (Zenebe, 1999)and 60% of Lake Koka (LFDP, 1996) are contributed bytilapia. Nevertheless, tilapia catches have apparentlydeclined from the recorded history of 60–80% contributionbefore 1998 to only about 50% in the period between 1998and 2010, possibly due to the high fishing pressure ontilapia in some lakes. On the other hand, tilapia catchesshowed an increasing trend as of 2006 (Fig. 5) due to theinclusion of new fishing grounds in the underexploitedLake Tana and (partly) Lake Turkana (Hussien Abegaz,personal communication) as seen by increasing trends intotal production in both lakes (Fig. 3). Labeo species alsoneed serious attention as its fishery totally collapsed in2006 (Fig. 5). Although several natural and anthropogenicfactors may have contributed to this decline, overfishingseems to be most responsible due to the great fishingintensity in the Rift Valley lakes in general and Lake Chamoin particular, where the reported catches come from.Golubtsov and Redeat (2010) also reported that intensivefishing already resulted in substantial changes in thespecies composition of the commercial catches from LakesAbaya and Chamo pushing the populations of Mormyrus
caschive, Labeo horie and Latus niloticus to the verge ofextinction.
Hence, proper fisheries management is urgentlyneeded. Earlier studies conducted and scientific reviewsmade on lake ecology and management of the fisheryemphasized the dire need for stock assessment (Abebe andStiassny, 1998; Reintjens and Wudneh, 1998) to developmanagement guidelines for fisheries managers and to takecorrective measures in consultation with the resourceusers to sustain the resource and the benefit for the society.
0.00
0.50
1.00
1.50
2.00
2.50
3.00
3.50
1998 199 9 200 0 200 1 200 2 200 3 200 4 200 5 200 6 200 7 200 8 200 9
Pri
ce (
$/kg
)
Chic ken meat
Goat meat
Shee p meat
Beef
Milk
Fish
egg
Fig. 7. Price of livestock and fishery products in Ethiopia from 1998–2009.
Source of data: FAO statistics (http://faostat.fao.org/site/703/DesktopDefault.aspx?PageID=703#ancor) and price of fish from MoA unpublished data.
G. Tesfaye, M. Wolff / Ecohydrology & Hydrobiology 14 (2014) 200–219 207
Author's personal copy
4.2. Fish diversity
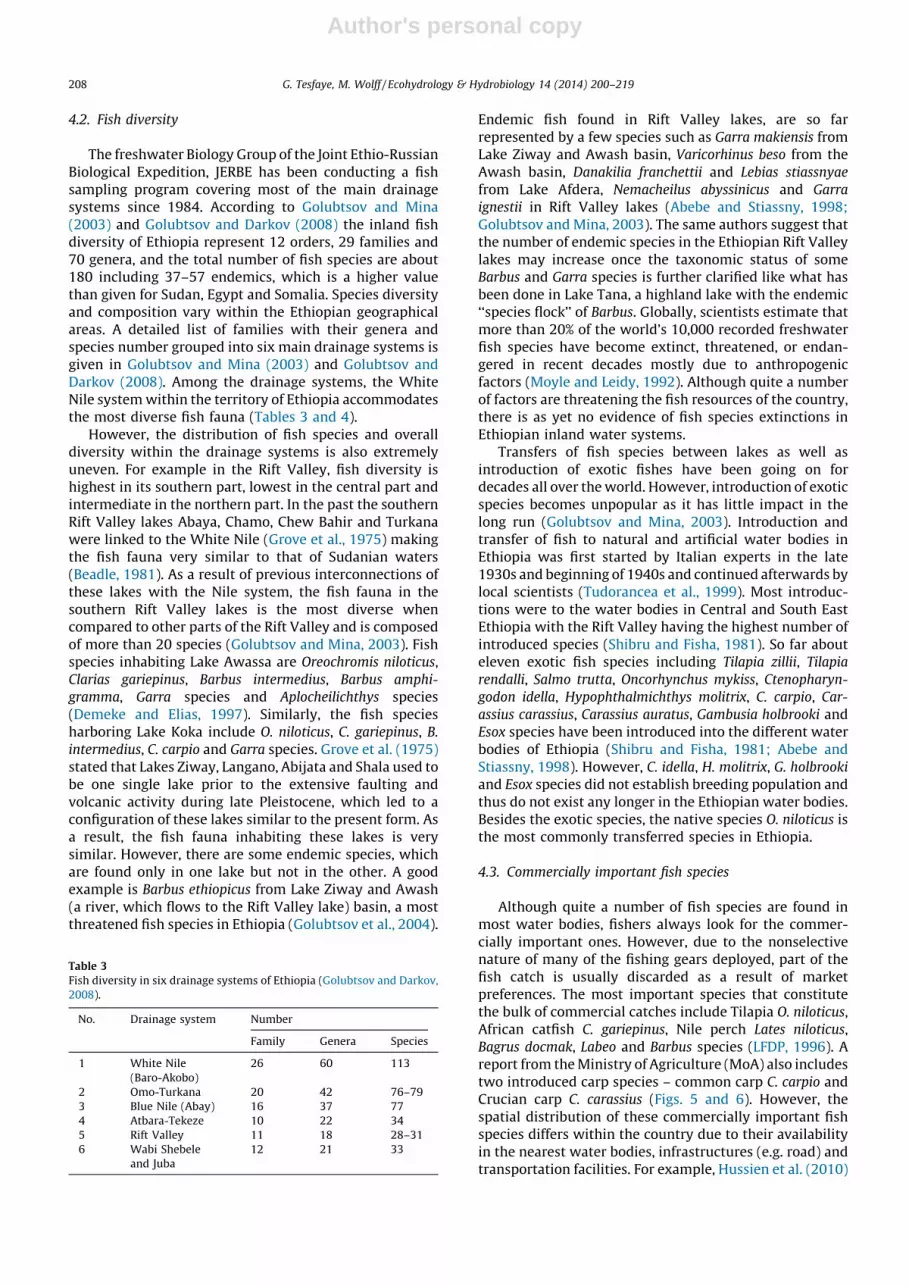
The freshwater Biology Group of the Joint Ethio-RussianBiological Expedition, JERBE has been conducting a fishsampling program covering most of the main drainagesystems since 1984. According to Golubtsov and Mina(2003) and Golubtsov and Darkov (2008) the inland fishdiversity of Ethiopia represent 12 orders, 29 families and70 genera, and the total number of fish species are about180 including 37–57 endemics, which is a higher valuethan given for Sudan, Egypt and Somalia. Species diversityand composition vary within the Ethiopian geographicalareas. A detailed list of families with their genera andspecies number grouped into six main drainage systems isgiven in Golubtsov and Mina (2003) and Golubtsov andDarkov (2008). Among the drainage systems, the WhiteNile system within the territory of Ethiopia accommodatesthe most diverse fish fauna (Tables 3 and 4).
However, the distribution of fish species and overalldiversity within the drainage systems is also extremelyuneven. For example in the Rift Valley, fish diversity ishighest in its southern part, lowest in the central part andintermediate in the northern part. In the past the southernRift Valley lakes Abaya, Chamo, Chew Bahir and Turkanawere linked to the White Nile (Grove et al., 1975) makingthe fish fauna very similar to that of Sudanian waters(Beadle, 1981). As a result of previous interconnections ofthese lakes with the Nile system, the fish fauna in thesouthern Rift Valley lakes is the most diverse whencompared to other parts of the Rift Valley and is composedof more than 20 species (Golubtsov and Mina, 2003). Fishspecies inhabiting Lake Awassa are Oreochromis niloticus,Clarias gariepinus, Barbus intermedius, Barbus amphi-
gramma, Garra species and Aplocheilichthys species(Demeke and Elias, 1997). Similarly, the fish speciesharboring Lake Koka include O. niloticus, C. gariepinus, B.
intermedius, C. carpio and Garra species. Grove et al. (1975)stated that Lakes Ziway, Langano, Abijata and Shala used tobe one single lake prior to the extensive faulting andvolcanic activity during late Pleistocene, which led to aconfiguration of these lakes similar to the present form. Asa result, the fish fauna inhabiting these lakes is verysimilar. However, there are some endemic species, whichare found only in one lake but not in the other. A goodexample is Barbus ethiopicus from Lake Ziway and Awash(a river, which flows to the Rift Valley lake) basin, a mostthreatened fish species in Ethiopia (Golubtsov et al., 2004).
Endemic fish found in Rift Valley lakes, are so farrepresented by a few species such as Garra makiensis fromLake Ziway and Awash basin, Varicorhinus beso from theAwash basin, Danakilia franchettii and Lebias stiassnyae
from Lake Afdera, Nemacheilus abyssinicus and Garra
ignestii in Rift Valley lakes (Abebe and Stiassny, 1998;Golubtsov and Mina, 2003). The same authors suggest thatthe number of endemic species in the Ethiopian Rift Valleylakes may increase once the taxonomic status of someBarbus and Garra species is further clarified like what hasbeen done in Lake Tana, a highland lake with the endemic‘‘species flock’’ of Barbus. Globally, scientists estimate thatmore than 20% of the world’s 10,000 recorded freshwaterfish species have become extinct, threatened, or endan-gered in recent decades mostly due to anthropogenicfactors (Moyle and Leidy, 1992). Although quite a numberof factors are threatening the fish resources of the country,there is as yet no evidence of fish species extinctions inEthiopian inland water systems.
Transfers of fish species between lakes as well asintroduction of exotic fishes have been going on fordecades all over the world. However, introduction of exoticspecies becomes unpopular as it has little impact in thelong run (Golubtsov and Mina, 2003). Introduction andtransfer of fish to natural and artificial water bodies inEthiopia was first started by Italian experts in the late1930s and beginning of 1940s and continued afterwards bylocal scientists (Tudorancea et al., 1999). Most introduc-tions were to the water bodies in Central and South EastEthiopia with the Rift Valley having the highest number ofintroduced species (Shibru and Fisha, 1981). So far abouteleven exotic fish species including Tilapia zillii, Tilapia
rendalli, Salmo trutta, Oncorhynchus mykiss, Ctenopharyn-
godon idella, Hypophthalmichthys molitrix, C. carpio, Car-
assius carassius, Carassius auratus, Gambusia holbrooki andEsox species have been introduced into the different waterbodies of Ethiopia (Shibru and Fisha, 1981; Abebe andStiassny, 1998). However, C. idella, H. molitrix, G. holbrooki
and Esox species did not establish breeding population andthus do not exist any longer in the Ethiopian water bodies.Besides the exotic species, the native species O. niloticus isthe most commonly transferred species in Ethiopia.
4.3. Commercially important fish species
Although quite a number of fish species are found inmost water bodies, fishers always look for the commer-cially important ones. However, due to the nonselectivenature of many of the fishing gears deployed, part of thefish catch is usually discarded as a result of marketpreferences. The most important species that constitutethe bulk of commercial catches include Tilapia O. niloticus,African catfish C. gariepinus, Nile perch Lates niloticus,Bagrus docmak, Labeo and Barbus species (LFDP, 1996). Areport from the Ministry of Agriculture (MoA) also includestwo introduced carp species – common carp C. carpio andCrucian carp C. carassius (Figs. 5 and 6). However, thespatial distribution of these commercially important fishspecies differs within the country due to their availabilityin the nearest water bodies, infrastructures (e.g. road) andtransportation facilities. For example, Hussien et al. (2010)
Table 3
Fish diversity in six drainage systems of Ethiopia (Golubtsov and Darkov,
2008).
No. Drainage system Number
Family Genera Species
1 White Nile
(Baro-Akobo)
26 60 113
2 Omo-Turkana 20 42 76–79
3 Blue Nile (Abay) 16 37 77
4 Atbara-Tekeze 10 22 34
5 Rift Valley 11 18 28–31
6 Wabi Shebele
and Juba
12 21 33
G. Tesfaye, M. Wolff / Ecohydrology & Hydrobiology 14 (2014) 200–219208

Author's personal copy
reported more than 20 commercially important fishspecies in the Gambella region (Table 5) but most of thesespecies are not well supplied to the big cities where fishfetches relatively good price.
Apart from fishing for food, there is as yet no other useof Ethiopian fish species and ornamental fishery has notdeveloped yet despite the high fish species diversity inmost river systems and lakes. This is surprising sinceornamental fish trade generates millions of dollarsannually and employs several thousand people worldwide(Pelicicie and Agostinho, 2005). Moreover, except for the
small scale ornamental fish breeding and rearing activitiesin the National Fisheries and other Aquatic Life ResearchCenter located in Sebeta, which serve mainly as source ofthe introduced ornamental fish species (gold fish C.
auratus) and as a demonstration site, no studies haveevaluated the potential of indigenous fish species forornamental fish trade. Considering the great success ofother tropical countries, ornamental fishery would appearas a possible new economic alternative that could help toreduce the level of poverty in the country. Fishing forfishmeal preparation is also nonexistent in Ethiopia.
Table 4
Fish family diversity in the White Nile system within the limits of Ethiopian (Golubtsov and Darkov, 2008).
No. Family Common name Genera Species
1 Amphiliidae Loach catfishes 2 2
2 Anabantidae Climbing gouramies 2 3
3 Bagridae Bagrid catfishes 1 2
4 Balitoridae African stony loach 1 1
5 Centropomidae Nileperch 1 1
6 Channidae Snakehead 1 1
7 Characidae Characins 4 7
8 Cichlidae Cichlids 4 5
9 Citharinidae Abeles 1 2
10 Claroteidae Claroteid catfishes 3 4
11 Clariidae Airbreathing catfishes 2 5
12 Cromeriidae Naked shellear 1 1
13 Cyprinidae Carps 7 21
14 Distichodontidae Purus 4 9
15 Gymnarchidae Aba 1 1
16 Malapteruridae Electric catfishes 1 2
17 Mormyridae Elephantfishes 8 15
18 Mochokidae Squeakers 5 15
19 Notopteridae African knifefishes 1 1
20 Nothobranchiidae African rivulines 2 3
21 Osteoglossidae African bonytongue 1 1
22 Poeciliidae Poeciliids 1 2
23 Polypteridae Bichirs 1 2
24 Protopteridae African lungfish 1 1
25 Schilbeidae Schilbeid catfishes 3 5
26 Tetraodontidae Puffer 1 1
Total 60 113
Table 5
Commercially important fish species in the Gambella region (Hussien et al., 2010).
No. Genera Scientific name Local (Anywa) name Common name
1 Citharinus C. citharus; C. latus Abel
2 Malapterurus M. electricus Adaenga/Adinga Electric fish
3 Clarias C. gariepinus Aguwella Catfish
4 Mormyrus M. kannume; M. niloticus Dolo
5 Mormyrops M. anguilloides Dolo
6 Hippopotamyrus H. harringtoni Dolo/Auaeyt
7 Lates Lates niloticus Gur Nile perch
8 Distichodus D. niloticus Puro
9 Bagrus B. docmak; B. bajad Udoora/Adwera
10 Polypterus P. bichir Uduwella/Udeela
11 Synodontis S. frontosus; S. clarias, etc. Ukok
12 Labeo L. horie Ukura
13 Barbus Barbus spp. Ukura
14 Auchenoglanis A. occidentalis Ukul
15 Heterotis H. niloticus Uluak/Uloek
16 Oreochromis O. niloticus Uredo Tilapia
17 Sarotherodon S. galilaeus Uredo Tilapia
18 Gymnarchus G. niloticus Wit/Uit
19 Hydrocynus H. forskahlii Weari Tiger fish
G. Tesfaye, M. Wolff / Ecohydrology & Hydrobiology 14 (2014) 200–219 209

Author's personal copy
4.4. Other aquatic resources
As the terrestrial counterpart, the aquatic environmentshave both renewable and none-renewable resources.Minerals like salt and soda are among none renewableresources’ being exploited in some lakes and traditionalgold mining is also being practiced in some rivers. Sincethis paper focuses on the renewable (biological) resourcesof the aquatic environment, further information on thesenon-renewable resource are not provided here. The aquaticecosystems provides a home for many groups of organismsincluding phytoplankton, zooplankton, insects, fish,amphibians, reptiles, birds, mammals, and aquatic plants– thus biota from lower to higher trophic levels of theecosystem. These diverse groups of organisms haveenormous ecological, socio-economic and esthetic values.
In Ethiopia, fish is the only aquatic resource being wellrecognized and exploited. Other exploitable resources likefreshwater crabs and shrimps are poorly known. Fewstudies showed the presence of fresh water crabs andshrimps in the Nile system. Cumberlidge (2009) reportedthat Ethiopia (although not species rich) has both wide-spread and endemic freshwater crabs (Potamonautidae)and shrimps (Atyidae, Palaeomonidae). The same authoralso stated that among the family Potamonautidae thespecies Potamonautes antheus, Potamonautes berardi, Pota-
monautes ignestii and Potamonautes niloticus are endemic tothe Nile River basin. The rivers draining the Ethiopianhighlands in the Blue Nile region of western Ethiopia hosttwo large endemic species of fresh water crabs: P. antheus
(Colosi 1920) and P. ignestii (Parisi 1923) as cited by Chace(1942) and Cumberlidge (1998, 2009). However, none of thespecies are exploited for human consumption, mainly due tolack of awareness and scientific information.
Another unexploited aquatic resource of great econom-ic potential is the commercially important microalgaeknown as Spirulina. The species Spirulina platensis andSpirulina maxima renamed as Arthrospira platensis
(=Arthrospira fusiformis) and Arthrospira maxima, respec-tively are well known for their nutrition benefits tohumans (Belay et al., 1993). A. fusiformis is a major algalspecies in the Ethiopian Rift Valley lakes Aranguade, Chituand Kilotes and generally Spirulina thrives in alkaline lakeswhere it is difficult or impossible for other microorganismsto survive (Kebede and Ahlgren, 1996). Countries like USA,China, Thailand and India are producing Spirulina atcommercial scales with the USA as the leading producer.China reported production of 41,570 tons in 2004, whichcorresponds to a value of $16.6 million (Habib et al., 2008).The same authors also reported that Spirulina appears tohave considerable potential for development, especially asa small-scale crop for nutritional enhancement, livelihooddevelopment and environmental mitigation. Having thisimportant species in the natural environment and theavailability of soda and alkaline lakes coupled with thetropical climate, the Ethiopian Rift Valley appears as apotential region for small scale as well as large scaleSpirulina production.
The lakes tend to be also rich in diverse wetland plantsespecially papyrus reeds, which are used to construct littlecanoes for artisanal fishing. Asfaw (2009) also reported
that the Ethiopian riverine environments and wetlands arehome to numerous wild edible plants. The wetland plantsare also used for many socio-cultural activities like usingreeds for ceremonies, making craft materials and formedicinal purposes, house construction, animal feeds,temporary crop gardening huts and establishing coffee andtree nurseries (Afework, 2003).
4.5. Fish processing and marketing
Fish is a highly perishable product, a factor that forcesthe fishers to sell their catch at low price either directly tothe consumers, or the middlemen or to the fish factoryowner. Alverson et al. (1994) reported an estimate of totalworld post-harvest loss of about 30% of the total worldcatches. Losses in African countries were considered asmuch as 40% of the annual catch (FAO, 1998). The situationin Ethiopia is probably not very different from these figures(Tigabu et al., 2007).
Although Ethiopian consumers have preference towhole fresh fish, different traditional processing andpreservation techniques exist (Breuil, 1995). Drying offish is usually performed at remote fishing sites andwhenever the demand for fish becomes low. Fishers makea strip of the fish fillet and hang it on drying racks or stringsin the open air for 2–3 days depending on the weather.Dried fish locally called ‘quanta’ is mostly produced in theArba Minch, Gambella and Lake Tana areas, while they justsale fresh either whole fish, gutted or fillet in other regions.However, except for the Fish Production and MarketingCorporation now Enterprise (FPMC/E), post-harvest han-dling, processing, transportation and storage conditions bythe fishers and middlemen were found to be very poor andunhygienic, which leads to high post-harvest loss (Tigabuet al., 2007; Hussien et al., 2010).
FPMC has been monopolizing the fish market for morethan fifteen years, which allows the Corporation todetermine the producers’ price (at the landing sites) at avery low level (Breuil, 1995), while the price for consumersare high. For instance, FPMC was buying tilapia in LakesZiway, Awassa and Abaya-Chamo with only 0.5, 0.35 and1.75 Birr/kg in 1990, whereas in the informal market priceswere at 0.7, 1.20 and 3.20, respectively (Breuil, 1995). Whilethe price of fish in the market has significantly increasedduring the past decade (e.g. tilapia fillet costs 50–75 Birr/kgdepending on fillet size (indirectly size of the fish) in 2011),the producers (fishers) still get very low prices.
Other forms of traditional processing and preservationtechniques like smoking and salting are not commonlypracticed by the fishers. The fishers usually sell whole freshfish without adding value, whereas FPME and other privatetraders partly process their fish into either filleted or gutted,skinned (for Barbus species in Lake Tana) and frozen beforethe product is delivered to the market (Gordon et al., 2007).FPME also practiced smoking as a means of preservation andvalue adding techniques. Canning has also been practiced bythe state owned Ethiopian Meat Corporation (EMC) incollaboration with FPMC (Breuil, 1995).
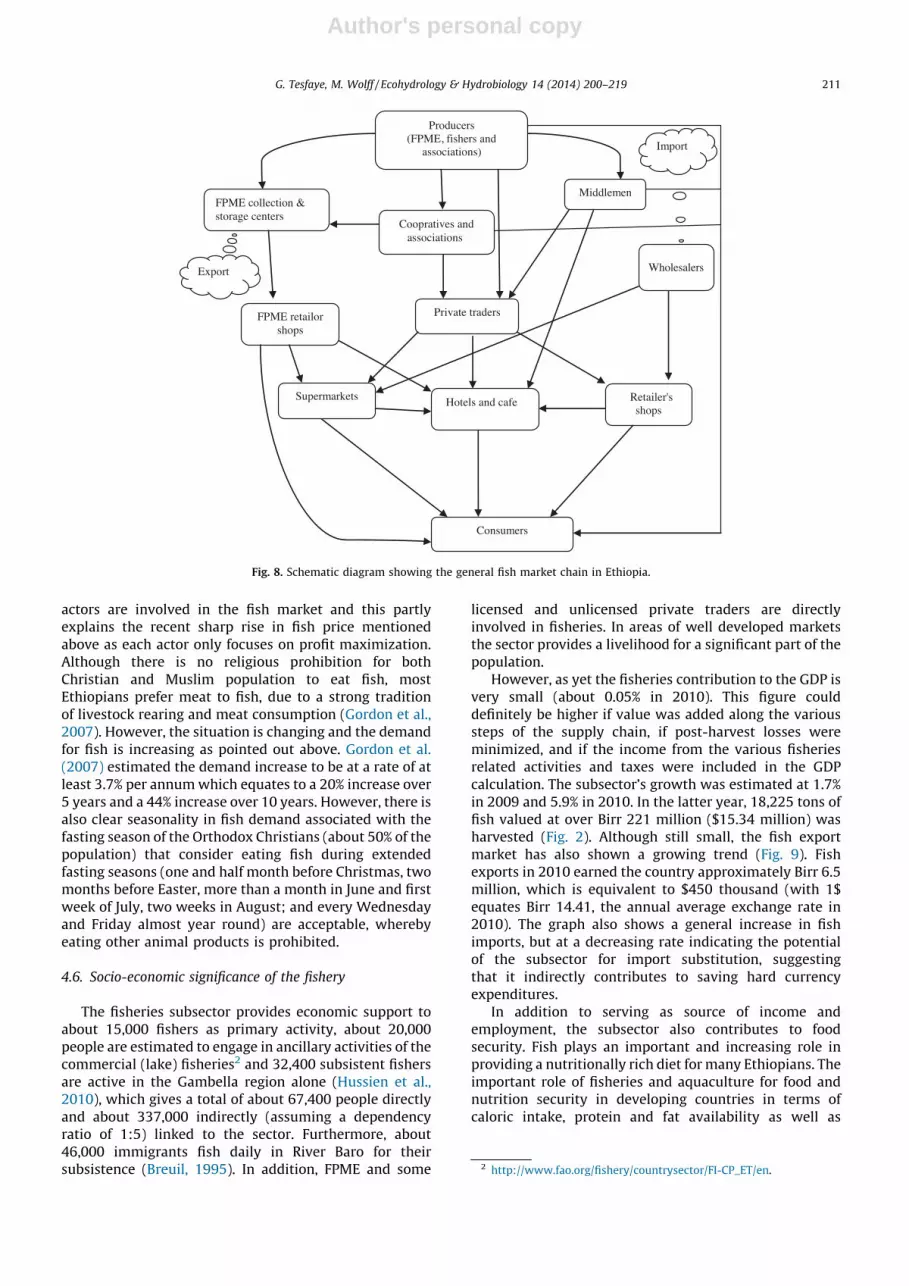
The fish market chain differs from state to state. Ageneral scheme of fish marketing and distributionchannels is given in Fig. 8. As shown, many different
G. Tesfaye, M. Wolff / Ecohydrology & Hydrobiology 14 (2014) 200–219210
Author's personal copy
actors are involved in the fish market and this partlyexplains the recent sharp rise in fish price mentionedabove as each actor only focuses on profit maximization.Although there is no religious prohibition for bothChristian and Muslim population to eat fish, mostEthiopians prefer meat to fish, due to a strong traditionof livestock rearing and meat consumption (Gordon et al.,2007). However, the situation is changing and the demandfor fish is increasing as pointed out above. Gordon et al.(2007) estimated the demand increase to be at a rate of atleast 3.7% per annum which equates to a 20% increase over5 years and a 44% increase over 10 years. However, there isalso clear seasonality in fish demand associated with thefasting season of the Orthodox Christians (about 50% of thepopulation) that consider eating fish during extendedfasting seasons (one and half month before Christmas, twomonths before Easter, more than a month in June and firstweek of July, two weeks in August; and every Wednesdayand Friday almost year round) are acceptable, wherebyeating other animal products is prohibited.
4.6. Socio-economic significance of the fishery
The fisheries subsector provides economic support toabout 15,000 fishers as primary activity, about 20,000people are estimated to engage in ancillary activities of thecommercial (lake) fisheries2 and 32,400 subsistent fishersare active in the Gambella region alone (Hussien et al.,2010), which gives a total of about 67,400 people directlyand about 337,000 indirectly (assuming a dependencyratio of 1:5) linked to the sector. Furthermore, about46,000 immigrants fish daily in River Baro for theirsubsistence (Breuil, 1995). In addition, FPME and some
licensed and unlicensed private traders are directlyinvolved in fisheries. In areas of well developed marketsthe sector provides a livelihood for a significant part of thepopulation.
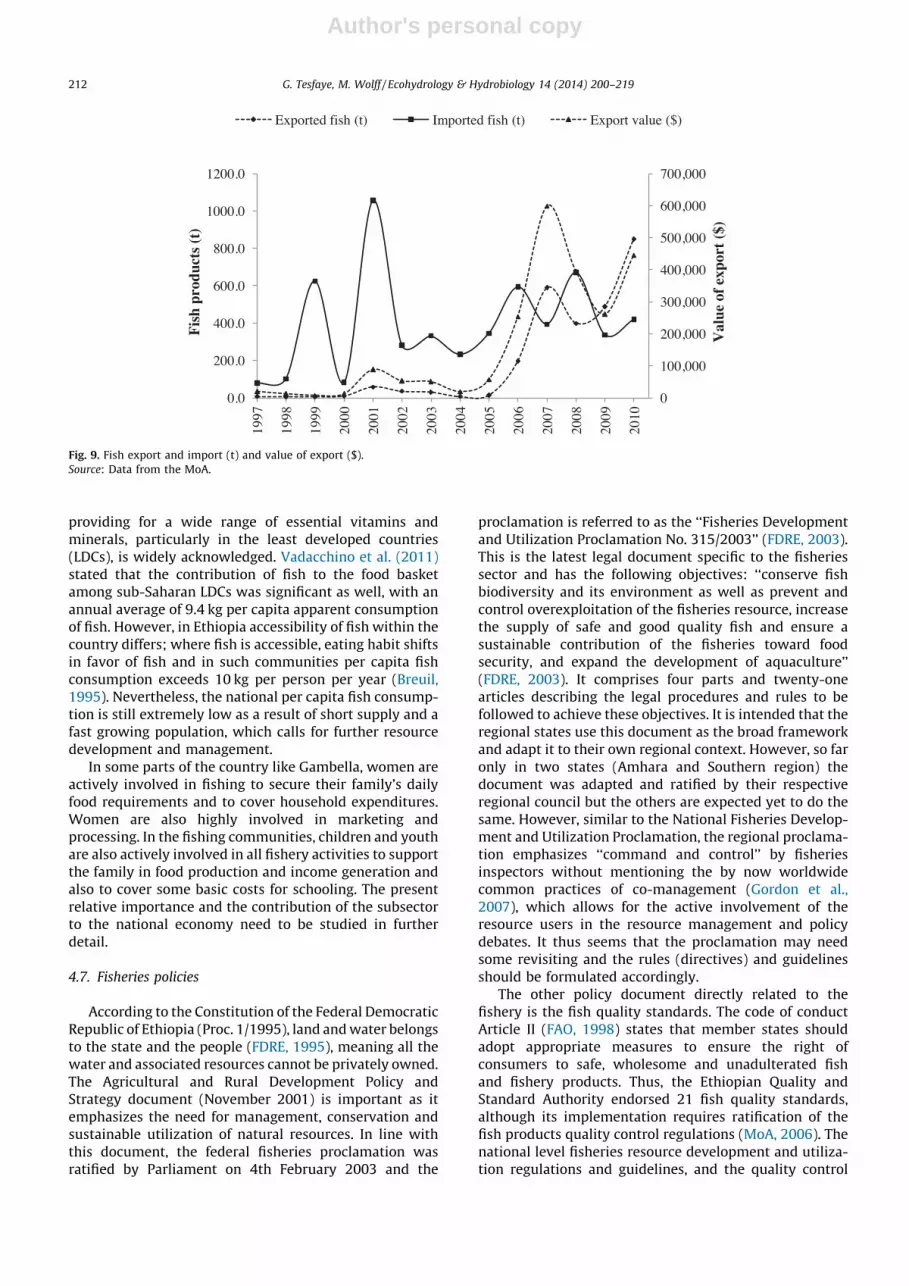
However, as yet the fisheries contribution to the GDP isvery small (about 0.05% in 2010). This figure coulddefinitely be higher if value was added along the varioussteps of the supply chain, if post-harvest losses wereminimized, and if the income from the various fisheriesrelated activities and taxes were included in the GDPcalculation. The subsector’s growth was estimated at 1.7%in 2009 and 5.9% in 2010. In the latter year, 18,225 tons offish valued at over Birr 221 million ($15.34 million) washarvested (Fig. 2). Although still small, the fish exportmarket has also shown a growing trend (Fig. 9). Fishexports in 2010 earned the country approximately Birr 6.5million, which is equivalent to $450 thousand (with 1$equates Birr 14.41, the annual average exchange rate in2010). The graph also shows a general increase in fishimports, but at a decreasing rate indicating the potentialof the subsector for import substitution, suggestingthat it indirectly contributes to saving hard currencyexpenditures.
In addition to serving as source of income andemployment, the subsector also contributes to foodsecurity. Fish plays an important and increasing role inproviding a nutritionally rich diet for many Ethiopians. Theimportant role of fisheries and aquaculture for food andnutrition security in developing countries in terms ofcaloric intake, protein and fat availability as well as
Import
WholesalersExport
Producers(FPME, fis hers a nd
associations)
Retailer'sshops
Hotels and cafeSup ermarkets
Pri vate traders
Middle men
FPME retailor shop s
Coopratives a nd associations
Con sumers
FPME collec tion & storage ce nters
Fig. 8. Schematic diagram showing the general fish market chain in Ethiopia.
2 http://www.fao.org/fishery/countrysector/FI-CP_ET/en.
G. Tesfaye, M. Wolff / Ecohydrology & Hydrobiology 14 (2014) 200–219 211
Author's personal copy
providing for a wide range of essential vitamins andminerals, particularly in the least developed countries(LDCs), is widely acknowledged. Vadacchino et al. (2011)stated that the contribution of fish to the food basketamong sub-Saharan LDCs was significant as well, with anannual average of 9.4 kg per capita apparent consumptionof fish. However, in Ethiopia accessibility of fish within thecountry differs; where fish is accessible, eating habit shiftsin favor of fish and in such communities per capita fishconsumption exceeds 10 kg per person per year (Breuil,1995). Nevertheless, the national per capita fish consump-tion is still extremely low as a result of short supply and afast growing population, which calls for further resourcedevelopment and management.
In some parts of the country like Gambella, women areactively involved in fishing to secure their family’s dailyfood requirements and to cover household expenditures.Women are also highly involved in marketing andprocessing. In the fishing communities, children and youthare also actively involved in all fishery activities to supportthe family in food production and income generation andalso to cover some basic costs for schooling. The presentrelative importance and the contribution of the subsectorto the national economy need to be studied in furtherdetail.
4.7. Fisheries policies
According to the Constitution of the Federal DemocraticRepublic of Ethiopia (Proc. 1/1995), land and water belongsto the state and the people (FDRE, 1995), meaning all thewater and associated resources cannot be privately owned.The Agricultural and Rural Development Policy andStrategy document (November 2001) is important as itemphasizes the need for management, conservation andsustainable utilization of natural resources. In line withthis document, the federal fisheries proclamation wasratified by Parliament on 4th February 2003 and the
proclamation is referred to as the ‘‘Fisheries Developmentand Utilization Proclamation No. 315/2003’’ (FDRE, 2003).This is the latest legal document specific to the fisheriessector and has the following objectives: ‘‘conserve fishbiodiversity and its environment as well as prevent andcontrol overexploitation of the fisheries resource, increasethe supply of safe and good quality fish and ensure asustainable contribution of the fisheries toward foodsecurity, and expand the development of aquaculture’’(FDRE, 2003). It comprises four parts and twenty-onearticles describing the legal procedures and rules to befollowed to achieve these objectives. It is intended that theregional states use this document as the broad frameworkand adapt it to their own regional context. However, so faronly in two states (Amhara and Southern region) thedocument was adapted and ratified by their respectiveregional council but the others are expected yet to do thesame. However, similar to the National Fisheries Develop-ment and Utilization Proclamation, the regional proclama-tion emphasizes ‘‘command and control’’ by fisheriesinspectors without mentioning the by now worldwidecommon practices of co-management (Gordon et al.,2007), which allows for the active involvement of theresource users in the resource management and policydebates. It thus seems that the proclamation may needsome revisiting and the rules (directives) and guidelinesshould be formulated accordingly.
The other policy document directly related to thefishery is the fish quality standards. The code of conductArticle II (FAO, 1998) states that member states shouldadopt appropriate measures to ensure the right ofconsumers to safe, wholesome and unadulterated fishand fishery products. Thus, the Ethiopian Quality andStandard Authority endorsed 21 fish quality standards,although its implementation requires ratification of thefish products quality control regulations (MoA, 2006). Thenational level fisheries resource development and utiliza-tion regulations and guidelines, and the quality control
0
100,000
200,000
300,000
400,000
500,000
600,000
700,000
0.0
200.0
400.0
600.0
800.0
1000.0
1200.0
1997
1998
1999
2000
2001
2002
2003
2004
2005
2006
2007
2008
2009
2010
Val
ue o
f exp
ort
($)
Fis
h pr
oduc
ts (
t)
Exporte d fish (t) Importe d f ish (t) Expo rt val ue ($)
Fig. 9. Fish export and import (t) and value of export ($).
Source: Data from the MoA.
G. Tesfaye, M. Wolff / Ecohydrology & Hydrobiology 14 (2014) 200–219212
Author's personal copy
regulations were submitted to the Council of Ministries forofficial endorsement (MoA, 2006; Gordon et al., 2007).
There are also other more general policy documentsand legislations related to the environment and waterresources, animal and animal product quality and market-ing. The Environmental Impacts Assessment Proclamation(No. 299/2002) was issued to assess possible impacts ofprojects on the environment prior to their approval andimplementations; Animal, Animal Products and By-pro-ducts Marketing Development Authority EstablishmentProclamation (Nos. 117/1998 and 198/2000) and AnimalDiseases Prevention and Control Proclamation (No. 267/2002) are also related directly or indirectly to fisheries(BOMOSA, 2009). However, the implementation of thepolicies seems to be still at very low level as some of theRift Valley lakes already show declining trends in catchesdue to overfishing, while others still seem to be under-fished and many of the water bodies have not even startedto develop any fishery.
4.8. Fisheries management practices
FAO (1995) defined fisheries management as ‘‘theintegrated process of information gathering, analysis,planning, decision-making, allocation of resources, andformulation and enforcement of fishery regulations bywhich the fishery management authority controls thepresent and future fishing activities, in order to ensure thecontinued productivity of the living resources’’, whichimplies to regulate the exploitation of the biomass to thelevel that the resource remains sustained. With a similarconcept the MoA has been trying to manage the fisheriesresources and on the basis of the National FisheriesDevelopment and Utilization Proclamation No. 315/2003,different management measures have been implementedto regulate the fisheries.
According to Hussien (2010), management measureslike prohibition of destructive gears such as poisonous andexplosive gears of any type are fully in place; meshregulation including both twine and mesh size, anddimension of the net need to be standardized and adjustedto the needs and requirements of individual fish species;some area and seasonal closure have been implementedand reserve (park) area have been declared. Area andseasonal closure refers to a protection of those parts of thelake where the target species are known to breed, whereasa reserve area is permanently closed for fishing. However,the latter was only possible where a national park and afishery share the same lake and thus, the portion of the lakeclaimed by the park is restricted from fishing and serves asa reserve area for the fishery itself. An example could beNech Sar National Park, which also includes parts of thelakes Chamo and Abaya. Lake Ziway was also closed forfishing in the years 1986 and 1987 (LFDP, 1996).
Moreover, fishery experts at the district level also triedto monitor the type of fishing gear and mesh size that thefishermen deployed and took some measures. Hussien(2010) reported that beach seines have been banned insome lakes as has the use of monofilament nets. However,the Monitoring, Control and Surveillance (MCS) system areoften constrained by limited capacity in terms of qualified
personnel, availability of budget and logistics for fieldwork, which somehow affects regular data collection.Gordon et al. (2007) also pointed out that there arecapacity constraints relating to data collection on LakeTana. Fishery associations and cooperatives are alsoinvolved in the management process. However, they oftenlack sufficient capital (including access to credit) topurchase fishing gears (Gordon et al., 2007) and have alsono saving culture which makes them weak organizationsand very sensitive to changes in product availability andmarket price fluctuations. They are forced to use low costfishing materials like papyrus reeds to make canoes, whichlimit the fishers to go further offshore, and in some casesmake the fisher use spears and other traditional gears,which have adverse effect on fish populations.
Despite the use of all these regulatory measures, somelakes already show clear signs of overexploitation. Thiscould imply that the management methods that areimplemented are either inappropriate or lack efficientenforcement. Generally, this traditional centralized or top-down management approach has failed in many parts ofthe world and a new more flexible and participatoryapproach, called co-management is becoming popular andsuccessful case studies and detailed explanations could befound in Pomeroy (2004) and Kundu et al. (2010). It allowssharing the responsibility of the government and theresource users in decision making processes and imple-mentation of management strategies, and increases senseof ownership and equity.
5. Conclusions
In this review, empirical studies to estimate Ethiopia’sfish harvest potential were revisited and estimates wereupdated based on the most recent enumeration of thedifferent types of water bodies and their surface areas. Ourestimate of 94,500 t yr�1� 5.2% distributed as73,100 t yr�1� 3.3% for lentic (lakes, reservoirs and smallwater bodies) and of about 21,400 t yr�1� 11.9% for the loticecosystems (riverine fishery) is higher by about 83% thanprevious estimates due to the larger number of water bodiesconsidered including the newly constructed reservoirs forirrigation development and hydropower generation. Despitethe uncertainties associated to our and previous estimates,the present updated estimate is considered useful as an initialmanagement target.
In Ethiopia, the fishery exclusively comes from inlandwater bodies and is mainly both artisanal and subsistence.Despite the existence of high fish diversity, only few fishspecies are targeted and constitute the bulk of thecommercial catches. The current production is still farbelow the estimated potential yield, which suggests scopefor further expansion of the fishery. However, some of thefished lakes already show signs of overfishing of thecommercial target species, while others exhibit increasingcatch levels, or conditions of rather stable catches.Fisheries assessment thus needs to be done for eachimportant water body separately to estimate the actuallevel of fishing and to optimize management measures forthe sustainable use of the water bodies’ resources. For thispurpose Maximum Sustainable Yield (MSY) and Maximum
G. Tesfaye, M. Wolff / Ecohydrology & Hydrobiology 14 (2014) 200–219 213
Author's personal copy
Economic Yield (MEY) levels need to be calculated for thetarget resources in the different water bodies. It issuggested here to prioritize research on economicallyimportant case study areas in different water body types(lakes, reservoirs, rivers) in order to provide baselineinformation for more meaningful extrapolations to otherwater bodies of similar characteristic and to understandthe forces that drive the dynamics of the fisheries in theseareas. While a sustainable and economically optimized useof the presently harvested resources needs to be theprimary goal for research, there are also unexploitedpotential resources such as freshwater shrimps and crabs,commercially important microalgae (Spirulina) and orna-mental fish, whose commercial potential needs to beassessed. Since ornamental fish trade generates millions ofdollars and employs several thousand people worldwide, itseems imperative to evaluate the potential of indigenousfish species for ornamental fish trade as a possible neweconomic alternative for the country.
While the potential for further fisheries developmentand other uses of the inland waters of Ethiopia appearslarge, the subsector has as yet been unable to realize its fullpotential due to several limitations: (1) there is a lack ofawareness and scientific information with regard to thestate of the fishery in the different areas of the country andmonitoring, control and surveillance systems are notefficient; (2) fishermen are poorly organized, lack accessto credit facilities and rely on simple fishing technologies;(3) the market system is ineffective and product prices arestrongly determined by FPME and few traders; (4)environmental degradation of the water bodies (eutrophi-cation, contamination) continues at a fast rate and invasiveaquatic weeds make boating and fishing almost impossiblein some water bodies. An important further problem is thehigh post-harvest loss (about 40%) and a lack of stringentsanitary and phytosanitary standards and product qualitycontrol regulations.
The management in place follows the traditionalcommand and control (top-down) approach rather thanthe recent widely accepted co-management approach. Fora further efficient development of the fishing sector and formanagement and enforcement of rules to become moreefficient, a participatory approach appears promisingthrough which relevant stakeholders should be involvedin the development process and in the elaboration offisheries policies. Generally, Ethiopia as a least developedcountry, should consider its fishery as an importantintervention area to curb malnutrition and enhance foodsecurity in terms of caloric intake, protein and fatavailability as well as providing for a wide range ofessential vitamins and minerals. The sector moreoverprovides substantial employment and an alternativesource of income for many poor people, thereby improvingthe livelihoods of the society.
Conflict of interest
None declared.
Financial disclosure
None declared.
Acknowledgments
We thank Mr. Hussien Abegaz, Fisheries Officer in theExtension Directorate of the Ministry of Agriculture (MoA)for providing fishery statistics and other valuable infor-mation. Mr. Demeke Nigussie and Mr. Degefie Tibebe arealso greatly acknowledged for their assistance to producethe map of Ethiopian river basins with its major lakes andrivers. We are also grateful for the anonymous reviewersand editors comments which improved the manuscriptsubstantially.
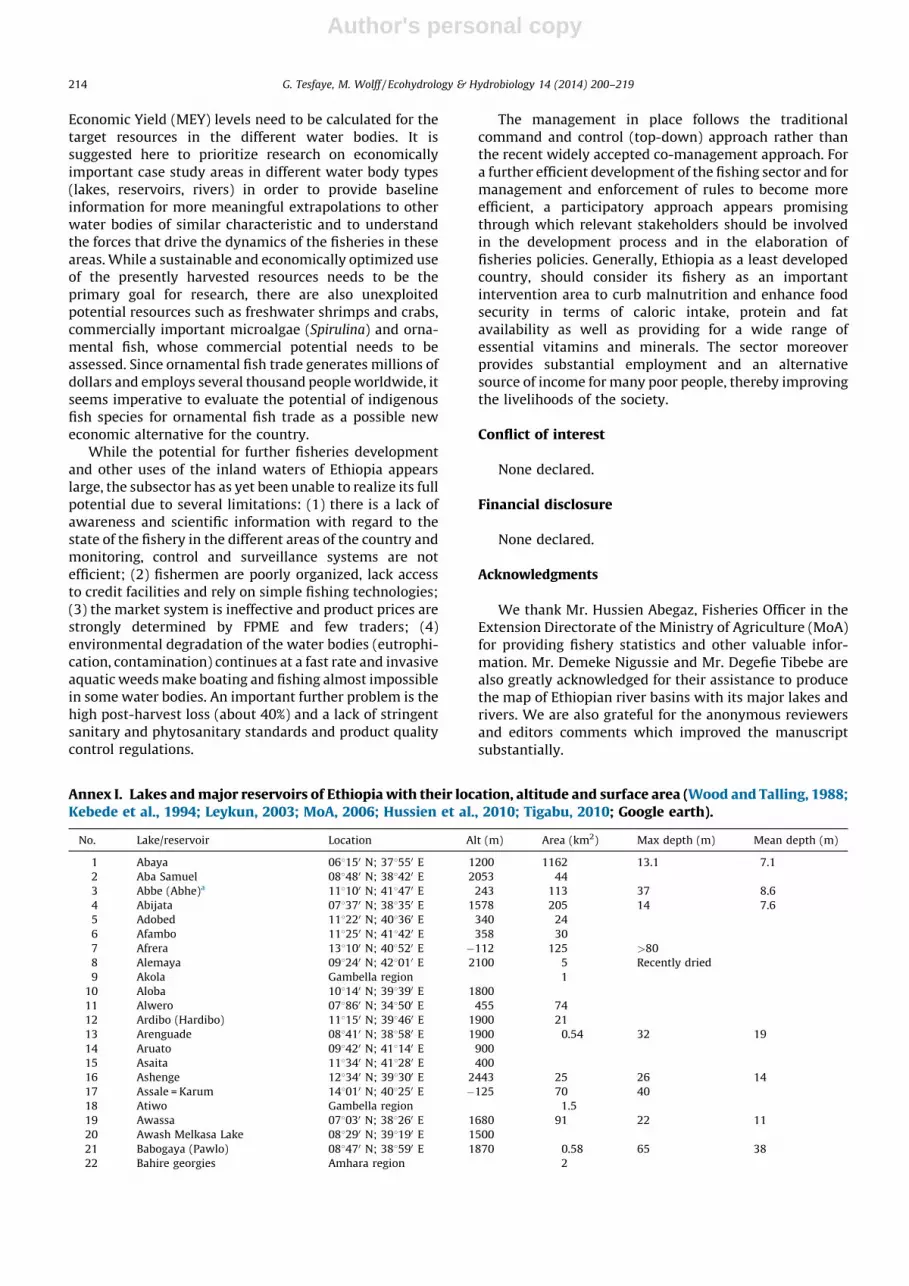
Annex I. Lakes and major reservoirs of Ethiopia with their location, altitude and surface area (Wood and Talling, 1988;Kebede et al., 1994; Leykun, 2003; MoA, 2006; Hussien et al., 2010; Tigabu, 2010; Google earth).
No. Lake/reservoir Location Alt (m) Area (km2) Max depth (m) Mean depth (m)
1 Abaya 068150 N; 378550 E 1200 1162 13.1 7.1
2 Aba Samuel 088480 N; 388420 E 2053 44
3 Abbe (Abhe)a 118100 N; 418470 E 243 113 37 8.6
4 Abijata 078370 N; 388350 E 1578 205 14 7.6
5 Adobed 118220 N; 408360 E 340 24
6 Afambo 118250 N; 418420 E 358 30
7 Afrera 138100 N; 408520 E �112 125 >80
8 Alemaya 098240 N; 428010 E 2100 5 Recently dried
9 Akola Gambella region 1
10 Aloba 108140 N; 398390 E 1800
11 Alwero 078860 N; 348500 E 455 74
12 Ardibo (Hardibo) 118150 N; 398460 E 1900 21
13 Arenguade 088410 N; 388580 E 1900 0.54 32 19
14 Aruato 098420 N; 418140 E 900
15 Asaita 118340 N; 418280 E 400
16 Ashenge 128340 N; 398300 E 2443 25 26 14
17 Assale = Karum 148010 N; 408250 E �125 70 40
18 Atiwo Gambella region 1.5
19 Awassa 078030 N; 388260 E 1680 91 22 11
20 Awash Melkasa Lake 088290 N; 398190 E 1500
21 Babogaya (Pawlo) 088470 N; 388590 E 1870 0.58 65 38
22 Bahire georgies Amhara region 2
G. Tesfaye, M. Wolff / Ecohydrology & Hydrobiology 14 (2014) 200–219214

Author's personal copy
Annex I (Continued )
No. Lake/reservoir Location Alt (m) Area (km2) Max depth (m) Mean depth (m)
23 Bale Mountain lakes 068500 N; 398510 E 4000 5
24 Barachet Lake 088170 N; 398030 E 1800
25 Basaka (Metehara) 088550 N; 398520 E 980 40 11 6
26 Beda 098550 N; 408230 E 609 18
27 Bero kela (Iluababora) Oromia region 122
28 Billi’uli 118500 N; 418450 E 100
29 Bishan waqa 078180 N; 358160 E 1398 2.5
30 Bishoftu 088440 N; 388590 E 1867 0.93 87 55
31 Borta Oromia region 12
32 Boyo lake and swamp 078300 N; 388020 E 1900 130
33 Budamada-Tido-Ameda Lakes 078040 N 388060 E 1550
34 Chamo 058500 N; 378450 E 1110 551 13 6
35 Chew Bahir 048450 N; 368500 E 520 308
36 Chitu 078240 N; 388250 E 1540 0.8 20.5
37 Chomen 098300 N; 378170E 2000
38 Dabashi 078080 N; 388550 E 1680
39 Dalay 108080 N; 408300 E 565 4.1
40 Debhile 098200 N; 408060 E 800
41 Dalol (Humigebet) 138570 N; 408300 E �130 30
42 Dendy 088500 N; 388050 E 2836 8 51 29
43 Denbi 068580 N; 358300 E 1273 72
44 Deneba 118040 N; 408530 E 400
45 Dipa’a 058110 N; 368160 E 400
46 Dire 098090 N; 388560 E 2558
47 Dukahini 088550 N; 388450 E 1800
48 Dunkaga 098400 N; 408150 E 1000
49 Ellen 088230 N; 388 590 E 1598 2
50 Etosha Lakes 078550 N; 398 190 E 3200
51 Fogera Swamps 128050 N; 378500 E 2500
52 Fincha-Amerti 098300 N; 378170 E 2000 350
53 Gamari 118320 N; 418400 E 339 70
54 Gargori 118450 N; 418300 E 400
55 Garner 068560 N; 348290 E 500
56 Gefersa 098040 N; 388370 E 2589
57 Gefu 118220 N; 418280 E 400
58 Gesi 078340 N; 348110 E 440
59 Gewani Swamps 098550 N; 408320 E 1500
60 Gin Mulu Gambella region 1.8
61 Giuletti 138180 N; 418020 E �80
62 Hara Gebaya 118500 N; 398500 E 2600
63 Giligel Gibe 78480 N; 378160 E 1671 62
64 Golbo 118240 N; 398360 E 1894 3
65 Gudra 108540 N; 378130 E 2352 1.4 2.5
66 Heritale 098550 N; 408250 E 600 11
67 Kaddabasa 108150 N; 408300 E 600
68 Kemisse Swamps 108420 N; 398500 E 1400
69 Hora = Biete Mengist 088450 N; 388590 E 1850 1.03 38 17
70 Kilole (Kilotes) 088480 N; 388050 E 2000 0.77 6.5 2.6
71 Koga 118360 N; 378170 E 2020 20
72 Koka 088260 N; 398100 E 1660 255 14 9
73 Kuriftu 088460 N; 398000 E 1879 0.5 6 2
74 Laido-Debado 98330 N; 408120 E 750 3.5
75 Langano 078350 N; 388450 E 1582 241 48 17
76 Lay-bahir 108570 N; 388160 E 3265 2
77 Legedadi 098040 N; 388580 E 2455
78 Loma 118580 N; 408570 E 400
79 Lugo (Hayk) 118200 N; 398430 E 1900 35 88 37
80 Mago 058430 N; 368160 E 600
81 Maibahir Amhara region 2
82 Melikawakena 078090 N; 398250 E 2300 82
83 Mey Igiri 108590 N; 398390 E 2500 1.5
84 Ota Lake 098380 N; 408190 E 800
85 Shalla 078280 N; 388300 E 1558 329 266 87
86 Small Abaya (Abay) 078550 N; 388220 E 1850 12
87 Sorga Oromia region 12
88 Suwata 118250 N; 418390 E 367 7
89 Tach-bahir 108570 N; 388160 E 3258 2
90 Tana 128000 N; 378200 E 1806 3500 14 9
91 Tata 078390 N; 348110 E 422 1.85
92 Tekeze 138200 N; 388440 E 1050 160
93 Tefki Swamps 088500 N; 388350 E 2700
G. Tesfaye, M. Wolff / Ecohydrology & Hydrobiology 14 (2014) 200–219 215

Author's personal copy
Annex I (Continued )
No. Lake/reservoir Location Alt (m) Area (km2) Max depth (m) Mean depth (m)
94 Tehiyo 118390 N; 418300 E 250
95 Temren 078570 N; 388040 E 2900
96 Tendaho 118400 N; 408570 E 400 170 53 11
97 Terba Amhara region 3
98 Turkanaa 048350 N; 368040 E 365 100 120 33
99 Wagaan Lakes and Swamps 088000 N; 348000 E 400
100 Wedecha 088560 N; 398000 E 2420 12
101 Weyito 058250 N; 368530 E 520
102 Wonchi 088530 N; 378540 E 2885 5.5 82
103 Yardi (Diaribet) 108130N; 408300 E 562 75
104 Zangana 108540 N; 368580 E 2700 1 166
105 Ziqualla 088320 N; 388520 E 2747 0.5
106 Ziway 088000 N; 388500 E 1636 442 7 2.5
Note: Altitude with minus sign indicates below sea level and the rest refers above sea level.aLakes shared with neighboring countries but the indicated area refers only the area belonging to Ethiopia alone.
Annex II. Fish production potential estimates of different inland water bodies of Ethiopia.
Annex IIa. Fish production potential estimates of major rivers.
No. Rivers Catchment
area (km2)
River length within
Ethiopia (km)
Potential yield estimates
Literature Model 1 Model 2 Per unit
length (t km�1)
1 Baro 38,400 285 916a 839 232 2.3
2 Akobo 21,890 203 653a 487 119 2.1
3 Gillo 13,050 252 810a 295 182 1.7
4 Alwero 8098 321 1032a 185 294 1.6
5 Pibor 4300 96 309a 100 27 1.5
6 Blue Nile 176,000 800 2133b 3675 1792 3.2
7 Awash 112,696 1200 4800b 2385 3999 3.1
8 Wabishebele 202,697 1000 3333b 4215 2787 3.4
9 Genale 171,042 480 768b 3575 652 3.5
10 Omo 79,000 760 1925b 1690 1619 2.3
11 Tekeze 82,350 608 1232b 1759 1041 2.2
12 Mereb 5900 440 645b 136 549 1
13 Angerib 23,812 220 161b 528 139 1.3
14 Miscellaneous
small rivers
196,259 1400 6533b 4085 5426 3.8
Total 1,135,494 8065 25,250 23,954 18,855 2.4 � 0.9
Average 21,405
a Potential estimates from Hussien et al. (2010).b Potential estimates from FAO (2003).
Annex IIb. Production potential estimates of major lakes (area >10 km2).
No. Lakes Surface
area (km2)
Potential yield estimates
Literature Based on
FAO (2003) d
Based on
Model 4
Per unit
area (t km�2)
1 Abaya 1162 9800a 6182 5497 4.7
2 Abbe 113c No 601 644 5.7
3 Abijata 205 1700a 1091 1114 5.4
4 Adobed 24 No 128 155 6.5
5 Afambo 30 No 160 190 6.3
6 Afrera 125 No 665 707 5.7
7 Ardibo 21 No 112 137 6.5
8 Assale (Asahle) 70 No 372 415 5.9
9 Awassa 91 600a 484 528 5.8
10 Beseka (Metehara) 40 205b 213 248 6.2
11 Boyo 130 No 692 733 5.6
12 Chamo 551 3500a 2931 2767 5
13 Chew Bahir 308 No 1639 1620 5.3
14 Dalol (Humigebet) 30 No 160 190 6.3
15 Gamari 70 No 372 415 5.9
G. Tesfaye, M. Wolff / Ecohydrology & Hydrobiology 14 (2014) 200–219216
Author's personal copy
Annex II (Continued )
No. Lakes Surface
area (km2)
Potential yield estimates
Literature Based on
FAO (2003) d
Based on
Model 4
Per unit
area (t km�2)
16 Hashenge 25 106b 133 161 6.4
17 Heritale 11 No 59 76 6.9
18 Lugo (Hayk) 35 400b 186 219 6.3
19 Langano 241 1300a 1282 1293 5.4
20 Tana 3500 24,900a 18,620 15,159 4.3
21 Shala 329 1100a 1750 1722 5.2
22 Small Abaya 12 66b 64 82 6.8
23 Turkana 100c 750b 532 576 5.8
24 Yardi (Diaribet) 75 No 399 442 5.9
25 Ziway 442 4500a 2351 2259 5.1
Total 7740 48,927 41,177 37,346 5.8 � 0.6
‘No’ refers estimates were not given.a Potential estimate from Breuil (1995).b Potential estimate from FAO (2003).c The surface area belong to Ethiopia alone.d The potential yield estimated by assuming 5.32 t km�2 as FAO (2003).
Annex IIc. Production potential estimates of major reservoirs (area >10 km2).
No. Reservoir Surface
area (km2)
Potential yield estimates
Based on FAO (2003) a Based on Model 4 Per unit area (t km�2)
1 Aba-Samuel 44 234 270 6.1
2 Alwero 74 394 436 5.9
3 Bero kela (Iluababora) 122 649 691 5.7
4 Borta 12 64 82 6.8
5 Dembi 72 383 425 5.9
6 Fincha-Amerti 350 1862 1822 5.2
7 Giligel Gibe 62 330 371 6
8 Koka 255 1357 1362 5.3
9 Melka wakena 82 436 480 5.8
10 Sorga 12 64 82 6.8
11 Tekeze 160 851 887 5.5
12 Tendaho 170 904 938 5.5
13 Koga 20 106 131 6.5
14 Wodecha 12 64 82 6.8
Total 1447 7698 8059 6 � 0.6
a The potential yield estimated by assuming 5.32 t km�2 as FAO (2003).
Annex IId. Production potential estimates of small water bodies.
No. Category Surface
area (km2)
Potential estimates
Calculated
based ond
Models Per unit
area (t km�2)
1 Small lakes (<10 km2) 75 317 442a 5.1
2 Amhara region swamps and floodplains 175 740 917b 4.7
3 Oromia region swamps and floodplains 125 529 677b 4.8
4 Southern region swamps and floodplains 100 423 554b 4.9
5 Gambella region swamps and floodplains 3500 14,805 13,588b 4.1
6 Small reservoirs and ponds 475 9500 9500c 20
Total 4450 26,314 25,678 4.1 � 0.4e
a Yield calculated using Model 4.b Yield calculated using Model 3.c Yield calculated using Marshall and Maes (1994) assumption for small reservoirs and ponds (200 kg ha�1 yr�1).d The potential yield estimate obtained by assuming the average yield per unit area for swamps and floodplains equal to 4.23 t km�2 as FAO (2003) and for
small reservoirs (micro-dams) and ponds 200 kg ha�1 yr�1 = 20 t km�2 as Marshall and Maes (1994).e Yield per unit area estimate calculated excluding small reservoirs and ponds.
G. Tesfaye, M. Wolff / Ecohydrology & Hydrobiology 14 (2014) 200–219 217

Author's personal copy
References
Abebe, G., Stiassny, M.L.J., 1998. The freshwater biodiversity crisis: thecase of the Ethiopian fish fauna. SINET: Ethiop. J. Sci. 21, 207–230.
Adamneh, D., Herzig, A., Jersabek, C.D., Zenebe, T., 2008. Abundance,species composition and spatial distribution of planktonic rotifersand crustaceans in Lake Ziway (Rift Valley, Ethiopia). Int. Rev. Hydro-biol. 93 (2) 210–226.
Afework, H., 2003. Wetlands research in south-western Ethiopia: theexperience of the Ethiopian Wetlands Research Programme. In:Abebe, Y.D., Geheb, K. (Eds.), Wetlands of Ethiopia, Proceedings ofSeminar on the Resources and Status of Ethiopia’s Wetlands. IUCNEastern Africa Regional Office, Nairobi, Kenya, pp. 37–48.
Amha, B., Wood, R.B., 1982. Limnological aspects of an algal bloom onLake Chamo in Gamo gofa Administrative Region of Ethiopia in 1978.SINET: Ethiop. J. Sci. 5, 1–19.
Asfaw, Z., 2009. The future of wild food plants in southern Ethiopia:ecosystem conservation coupled with enhancement of the roles ofkey social groups. Acta Hortic. 806, 701–707.
Awulachew, S.B., Yilma, A.D., Loulseged, M., Loiskandl, W., Ayana, M.,Alamirew, T., 2007. Water resources and irrigation development inEthiopia. Working Paper No. 123 International Water ManagementInstitute, Colombo, Sri Lanka 78 pp.
Alverson, D.L., Freeberg, M.H., Pope, J.G., Muravaski, S.A., 1994. A globalassessment of fisheries by-catch and discards. FAO Fish. Tech. Pap. No.339, pp. 233.
BABMP, 1990. Baro-Akobo Basin Master plan study report, vol. II. Ministryof Water Resource, Addis Ababa, Ethiopia.
Beadle, L.C., 1981. The Inland Water of Tropical Africa: An Introduction toTropical Limnology, 2nd ed. Longman, London.
Belay, A., Yoshimichi, O., Miyakawa, K., Shimamatsu, H., 1993. Currentknowledge on potential health benefits of Spirulina. J. Appl. Phycol. 5,235–241.
BOMOSA, 2009. Report on existing aquaculture institutional environmentin Eastern Africa, http://www.bomosa.org/.
Boulenger, G.A., 1904. Report on the fishes collected by Mr. Oscar Neu-mann and Baron Carlo von Erlanger in Galla land and SouthernEthiopia. Proc. Zool. Soc. Lond. 2 (2) 328–334.
Breuil, C., 1995. Review on the fisheries and aquaculture sector: Ethiopia.FAO Fisheries Circular No. 890 FAO, Rome 29 pp.
Brook, L., 2003. Ecological changes in two Ethiopian lakes caused bycontrasting human intervention. Limnologia 33, 44–53.
Chace, F.A., 1942. Scientific results of a fourth expedition to forested areasin Eastern Africa. Decapoda: Crustacea. Bull. Mus. Comp. Zool. 91 (3)52.
Crul, R.C.M., 1992. Models for estimating potential fish yields of Africaninland waters. CIFA Occasional Paper No. 16 FAO, Rome 22 pp.
Cumberlidge, N., 1998. The African and Madagascan freshwater crabs inthe Zoologische Staatssammlung, Munich (Crustacea, Decapoda, Bra-chyura, Potamoidea). SPIXIANA 21 (3) 193–214.
Cumberlidge, N., 2009. Freshwater crabs and shrimps (Crustacea: Dec-apoda) of the Nile Basin. In: Dumont, H.J. (Ed.), The Nile: Origin,Environments, Limnology and Human Use. Springer, Netherlands, pp.547–561.
Demeke, A., Elias, D., 1997. Diet composition, length–weight relationshipand condition factor of Barbus species Ruppell, 1836 in lake Awassa,Ethiopia. SINET: Ethiop. J. Sci. 20 (1) 13–30.
Demese, C., Berhanu, A., John, M., 2010. Ethiopia’s Agricultural SectorPolicy and Investment Framework from 2010–2020. Ministry ofAgriculture, Addis Ababa, Ethiopia.
Eshete, D., 2003. The small barbs of Lake Tana. (Ph.D. thesis)ExperimentalZoology Group, Wageningen University, The Netherlands 180 pp.
Eyualem, A., Getachew, T., 1992. Seasonal changes in the nutritionalstatus of Oreochromis niloticus L. (Pisces: Cichlidae) in lake Ziway,Ethiopia. Arch. Hydrobiol. 124, 109–122.
FAO, 1995. Report of the Expert Consultation on Guidelines for Responsi-ble Fisheries Management, Wellington, New Zealand, 23–27 January1995. FAO Fisheries Report No. 519 100 pp.
FAO, 1998. Responsible fish utilization. Technical Guidelines for Respon-sible Fisheries No. 7 Rome.
FAO, 2003. Information on fisheries management in the Federal Demo-cratic Republic of Ethiopia, http://www.fao.org/fi/fcp/en/ETH/body.htm.
FDRE, 1995. Constitution of the Federal Democratic Republic of EthiopiaProclamation No. 1/1995 Addis Ababa, Ethiopia.
FDRE, 2003. Fisheries Development and Utilization Proclamation No. 315/2003 Federal Negarit Gazeta, Addis Ababa, Ethiopia.
Gashaw, T., Zenebe, T., 2008. Length–weight relationship, Fulton’s condi-tion factor and Size at first maturity of tilapia, Oreochromis niloticus L.
in Lakes Koka, Ziway and Langano (Ethiopian Rift Valley). Ethiop. J.Biol. Sci. 7 (2) 139–157.
Getachew, T., 1980. A limnological study of Lake Chelekleka. SINET:Ethiop. J. Sci. 3, 143–152.
Getachew, T., 1987. Food, nutrition and digestive efficiency in Oreochro-mis niloticus L. (Pisces: Cichlidae) in Lake Awassa, Ethiopia (Ph.D.thesis)University of Waterloo, Waterloo, Canada 109 pp.
Grove, A.T., Alayne, S.F., Goudie, A.S., 1975. Former Lake levels andclimatic change in Rift Valley of southern Ethiopia. Geogr. J. 141,177–202.
Golubtsov, A.S., Mina, M.V., 2003. Fish species diversity in the maindrainage systems of Ethiopia: current state of knowledge and re-search prospective. Ethiop. J. Nat. Resour. 5 (2) 281–318.
Golubtsov, A.S., Darkov, A.A., 2008. A review of fish diversity in the maindrainage systems of Ethiopia. In: Pavlov, S.D., Dgebuadze, Yu.Yu.,Darkov, A.A., Golubtsov, S.A., Mina, V.M. (Eds.), Ecological and Fau-nistic Studies in Ethiopia. KMK Scientific Press Ltd., Moscow, pp. 69–102.
Golubtsov, A.S., Redeat, H., 2010. Fish faunas of the Chamo-Abaya andChew Bahir basins in southern portion of the Ethiopian Rift Valley:origin and prospects for survival. Aquat. Ecosyst. Health Manage. 13(1) 47–55.
Golubtsov, A.S., Dimmick, W.W., Habteselassie, R., 2004. Threatenedfishes of the world: Barbus ethiopicus Z. (Cyprinidae). Environ. Biol.Fish. 70, 1–66.
Gordon, A., Sewmehon, D., Melaku, T., 2007. Marketing systems for fishfrom Lake Tana, Ethiopia: opportunities for improved marketing andlivelihoods. Improving Productivity and Market Success of EthiopianFarmers Project, Working Paper No. 2 ILRI, Nairobi, Kenya 49 pp.
Greboval, D., Bellemans, M., Fryd, M., 1994. Fisheries characteristics of theshared lakes of the East African Rift. CIFA Technical Paper No. 24 FAO,Rome.
Habib, M.A.B., Parvin, M., Huntington, T.C., Hasan, M.R., 2008. A review onculture, production and use of Spirulina as food for humans and feedsfor domestic animals and fish. FAO Fisheries and Aquaculture CircularNo. 1034 FAO, Rome 33 pp.
Hanson, J.M., Leggett, W.C., 1982. Empirical prediction of fish biomass andyield. Can. J. Fish. Aquat. Sci. 39 (2) 257–263.
Henderson, H.F., Welcomme, R.L., 1974. Relation entre la production,l’indice Morpho-Edaphique et le nombre de pecheurs des pecheriesdes eaux continentales d’Afrique(The relationship of yield to Morpho-Edaphic index and numbers of fishermen in African inland fisheries.CIFA Occas. Pap./Doc. Occas. CPCA, 1). 19 pp. (Engl. Sum.).
Hickley, P., Muchiri, S.M., Britton, J.R., Boar, R.R., 2008. Economic gainversus ecological damage from the introduction of non-native fresh-water fish: case studies from Kenya. Open Fish Sci. J. 1, 36–46. Openaccess: http://bentham.org/open/tofishsj/openaccess2.htm.
Hussien, A., 2010. National Fishery and Aquaculture overview. CountryReport KOICA Training Program on Fishery Technology & Policy forAfrican Countries, June 24–August 21, 2010 Busan, South Korea.
Hussien, A., Gashaw, T., Abebe, C., 2010. The Riverine Fishery Resource inGambella Regional State. Ethiopian Institute of Agricultural Research,Addis Ababa, Ethiopia 78 pp.
Kassahun, W., Amha, B., 1984. Species composition and seasonal abun-dance of zooplankton in two Ethiopian rift valley lakes – lakes Abiataand Langano. Hydrobiologia 113, 129–136.
Kebede, E., Ahlgren, G., 1996. Optimum growth conditions and lightutilization efficiency of Spirulina platensis (=Arthrospira fusiformis)from Lake Chitu, Ethiopia. Hydrobiologia 332, 99–109.
Kebede, E., Zinabu, G.-M., Ahlgren, I., 1994. The Ethiopian Rift valley lakes:chemical characteristics of a salinity–alkalinity series. Hydrobiologia288, 1–12.
Kundu, R., Aura, C.M., Muchiri, S.M., Njiru, J.M., Ojuok, J.E., 2010. Difficul-ties of fishing at Lake Naivasha, Kenya: is community participation inmanagement the solution? Lakes Reserv.: Res. Manage. 15, 15–23.
Leykun, A., 2003. The distribution and status of Ethiopian wetlands: anoverview. In: Abebe, Y.D., Geheb, K. (Eds.), Wetlands of Ethiopia,Proceedings of Seminar on the Resources and Status of Ethiopia’sWetlands. IUCN Eastern Africa Regional Office, Nairobi, Kenya, pp.12–17.
LFDP, 1996. Lake management plans. Lake Fisheries Development Project,Working Paper No. 23 Ministry of Agriculture, Addis Ababa, Ethiopia31 pp.
Marshall, B.E., 1984. Towards predicting ecology and fish yields in Africanreservoirs from pre-impoundment physico-chemical data. CIFA Tech.Pap./Doc. Tech. CPCA, 12 36 pp.
Marshall, B.E., 1985. Limnology and fisheries management in Zimbabwe.Verh. Internat. Verein. Limnol. 22, 2671–2675.
Marshall, B., Maes, M., 1994. Small water bodies and their fisheries insouthern Africa. CIFA Tech. Pap. No. 29 FAO, Rome 68 pp.
G. Tesfaye, M. Wolff / Ecohydrology & Hydrobiology 14 (2014) 200–219218

Author's personal copy
Mebrat, A., 1993. Overview of the fishery sector in Ethiopia. In: Proceed-ings of the National Seminar on Fisheries Policy and Strategy, AddisAbaba, Ethiopia, 22–25 June 1993. FAO, Rome, pp. 45–53.
Melaku, M., Tudorancea, C., Baxter, R.M., 1988. Some limnological obser-vations on two Ethiopian hydroelectric reservoirs: Koka (Shewaadministrative district) and Finchaa (Welega administrative district).Hydrobiologia 157, 47–55.
MoA, 2006. Fishery Resource Development Guide Plan. Ministry of Agri-culture, Addis Ababa, Ethiopia 33 pp. (in Amharic).
Moyle, P.B., Leidy, R.A., 1992. Loss of biodiversity in aquatic ecosystems:evidence from fish faunas. In: Fiedler, P.L., Jain, S.K. (Eds.), ConservationBiology: The Theory and Practice of Nature Conservation, Preservationand Management. Chapman and Hall, New York, pp. 127–169.
Mulat, D., Fantu, G., Tadele, F., 2004. Agricultural development in Ethio-pia: are there alternatives to food aid? Monograph, 76 pp.
NWDR, 2004. National Water Development Report for Ethiopia. UN-WATER/WWAP/2006/7 Addis Ababa, Ethiopia, 284 pp.
Oglesby, R.T., 1977. Relationships of fish yield to Lake Phytoplanktonstanding crop, production and morphoedaphic factors. J. Fish. Res.Board Can. 34 (12) 2271–2279.
Pelicicie, F.M., Agostinho, A.A., 2005. Perspectives on ornamental fisheriesin the upper Parana River floodplain, Brazil. Fish. Res. 72, 109–119.
Pomeroy, R.S., 2004. Devolution and Fisheries Co-management. ICLARM,Manila 62 pp.
Reintjens, D., Wudneh, T., 1998. Fisheries management – a review of thecurrent status and research needs in Ethiopia. SINET: Ethiop. J. Sci. 21(2) 231–266.
Reintjens, D., Mengistu, T., Wudneh, T., 1998. Fisheries development inEthiopia – which way now? Eur. Comm. Fish. Bull. 11 (1) 20–22.
Schroeder, A., John, G., 1993. Supplementary Environmental Assessmentfor Locust and Grasshopper Control in Ethiopia. USAID Mission toEthiopia, Addis Ababa, Ethiopia, 218 pp.
Seyoum, M., Green, J., Fernando, C.H., 1991. Species composition, distri-bution and seasonal dynamics of Rotifera in a rift valley lake inEthiopia (Lake Awassa). Hydrobiologia 209, 203–214.
Shibru, T., 1973. Fresh Water Fishes of Ethiopia. Haile Selassie I University,Addis Ababa.
Shibru, T., Fisha, H.-M., 1981. Introduction and transplantation of fresh-water fish species in Ethiopia. SINET: Ethiop. J. Sci. 4, 69–72.
Tesfaye, H., 1990. The conservation status of wetlands and waterfowl inEthiopia. In: Paper Presented to IWRP Workshop. Uganda, 3–12March 1990, 18 pp.
Tigabu, Y., 2010. Stocking based fishery enhancement programs in Ethio-pia. Ecohydrol. Hydrobiol. 10 (2–4) 241–246.
Tigabu, Y., Abera, D., Ahmed, M., 2007. Kinds and levels of post harvestlosses of fish and possible ways to reduce loss in Lake Ziway. Proc.Ethiop. Soc. Anim. Prod. 15, 143–150.
Tudorancea, C., Taylor, W.D., 2002. The Ethiopian Rift Valley Lakes. Back-huys, Leiden, Netherlands.
Tudorancea, C., Zinabu, G.-M., Elias, D., 1999. Limnology in Ethiopia. In:Wetzel, R.D., Gopal, B. (Eds.), Limnology in Developing Countries.International Association of Theoretical and Applied Limnology (SIL),New Delhi, India, pp. 63–118.
Vadacchino, L., De Young, C., Brown, D., 2011. The fisheries and aquacul-ture sector in national adaptation programmes of action: importance,vulnerabilities and priorities. FAO Fisheries and Aquaculture CircularNo. 1064 FAO, Rome 60 pp.
Welcomme, R.L., 1974. Some general and theoretical considerations onthe fish production of African rivers. CIFA Occas. Pap. No. 3 26 pp.
Welcomme, R.L., 1985. River fisheries. FAO Fish Tech. Pap. No. 262 330 pp.Wood, R.B., Talling, J.F., 1988. Chemical and algal relationship in a salinity
series of Ethiopian inland waters. Hydrobiologia 158, 29–67.Wudneh, T., 1998. Biology and management of fish stocks in Bahir Dar
Gulf, Lake Tana, Ethiopia. (Ph.D. thesis)Wageningen AgriculturalUniversity, The Netherlands 144 pp.
Youngs, W.D., Heimbugh, D.G., 1982. Another consideration of the mor-pho-edaphic index. Trans. Am. Fish. Soc. 111, 151–153.
Zenebe, T., 1999. The nutritional status and digestibility of Oreochromisniloticus L. diet in Lake Langano, Ethiopia. Hydrobiologia 416, 97–106.
Zinabu, G.-M., 2002. The Ethiopian Rift Valley lakes: major threats andstrategies for conservation. In: Tudorancea, C., Taylor, W.D. (Eds.),Ethiopian Rift Valley Lakes. Backhuys, Leiden, The Netherlands, pp.259–271.
G. Tesfaye, M. Wolff / Ecohydrology & Hydrobiology 14 (2014) 200–219 219