Embed Size (px)
Citation preview

THE SPATIAL DIMENSION OF URBAN POVERTY (Paper presented at the MacArthur Research Network on Inequality and Economic
Performance and Instituto Futuro Brasil, meeting at IBMEC in Rio de Janeiro, November 19th-20th, 2004)
Haroldo Torres, Sandra Gomes,
Eduardo Marques e Maria Paula Ferreira1
Introduction
This article presents some recent results of researches carried out at the Centre
for Metropolitan Studies (CEM/Cebrap) and converges to the idea that there is a
spatial dimension of urban poverty.2 Space seems to be a constitutive element of
poverty in metropolitan regions since the existence of segregated areas contributes
to an intergenerational reproduction of poverty. In areas that concentrate poverty,
for example, school performance tends to be worst because students have to attend
to schools together with fellows that also have low socio-economic background
(César and Soares, 2001). Areas with high concentration of poverty present
different implications to poverty reduction strategies because it interferes in the
economic performance of individuals who live in, reducing their future chances of
finding a job in the labour market, for example.
The existence of residential segregation exerts particular influence on the
opportunities of poorest groups living in large cities as it isolates them from
broader social and economic circuits, therefore significantly reducing their
possibilities of social interaction and mobility. As a consequence, the study of the
processes that produce (and reproduce) poverty in metropolitan areas should bring
the spatial organization of the city to the centre of public action on poverty
1 Haroldo Torres is PhD in social sciences and a researcher at the Centre for Metropolitan Studies (Cem/Cebrap),
Sandra Gomes is a doctorate student of Political Science (University of São Paulo) and a researcher at the Centre for Metropolitan Studies (Cem/Cebrap). Eduardo Marques is PhD in social sciences, a professor at the Department of Political Science (University of São Paulo) and a researcher at the Centre for Metropolitan Studies (Cem/Cebrap). Maria Paula Ferreira is a Statistician and Head of the Methodology and Quantitative Methods Division at Fundação Seade. 2 It is worth noting that most of the analyses presented here were based on data organized within a Geographic Information System (GIS) that have been developed and organized by the Centre for Metropolitan Studies (www.centrodametropole.org.br).

Centro de Estudos da Metrópole/CEBRAP
2
alleviation. The main objective of this article is to present evidence of theses
arguments.3
This paper is organized in four sections, besides this introduction, and a
conclusion. In the first section, we present some of the conceptual issues involved
in this discussion so as to specify our understanding on metropolitan poverty. In
the second section, we present a socio-economic typology of the different
neighbourhoods of the Metropolitan Region of São Paulo, identifying the most
segregated areas. The third section presents empirical results showing that the
probability of young people to conclude secondary education is not only function
of their socio-economic level but also a function of the type of area these
individuals live in. The fourth section presents a similar exercise concerning the
chances of being unemployed, the distribution of formal jobs and the levels of
payment according to different types of area. In the end, we summarize the main
findings and their consequences for public policies.
3 A more detailed approach of these issues can be found in Marques and Torres (2004).

Centro de Estudos da Metrópole/CEBRAP
3
1. The spatial dimension of poverty
Urban poverty is a controversial issue. This is a theme full of ideological
contents and intransigent disputes among political actors. This is because the
social recognition of poverty ends up defining the distribution of benefits as well
as the definition of the costs involved in order to finance this sort of policies.
A first problem is concerned with measuring poverty. The most common way of
measuring poverty levels within a region has been the adoption of a poverty line
(Rocha, 1996 e 2000 and Hoffman, 2000). This analytical option responds to the
possibility of making ample comparisons. Poverty lines are normally defined as
absolute or relative (Mingione, 1999). They might be defined within a national
scope or in regional terms. In this last case, it takes into consideration the different
costs of living among different localities or regions. Rocha (2003), for example,
presents a range of regional poverty lines for Brazil. For the Metropolitan Region
of São Paulo (MRSP), the poverty line – in terms of per capita family income –
was calculated in 1,24 Minimum Wages in 1999 or R$ 168,00 in 19994. According
to this kind of approach, the MRSP would have 6,4 million poor people in 1999 or
something around 39% of the total population (Rocha, 2003).5
Another way of understanding urban poverty is related to the idea of “multiple
dimensions of poverty”. They could not be captured only by poverty lines and that
should be, in reality, incorporated in the analyses that aim to understand in a
broader perspective (Mingione, 1996). The idea behind this concept is that poverty
cannot be defined exclusively in terms of material need for survival. Rather, it
should take into account the individuals that, although might be able to survive
with an income above the minimum, do not have access to the most important
4 One monthly minimum wage in 1999 (R$ 136,00) corresponded to around U$ 75 according to the average
exchange rate in 1999 (Banco Central do Brasil). 5 Although they might be useful for regional or international comparative studies, poverty lines are very controversial.
Among one of the problems is the issue of not being able to consider non-monetary forms of income and access to services which are very important for survival strategies of disadvantaged social groups.

Centro de Estudos da Metrópole/CEBRAP
4
benefits in urban societies, such as education, a basic sewage system, health,
culture and social integration (Mingione, 1999).6
The ‘multiple dimensions’ idea allow us to integrate to this issue with urban
differentials concerning the access to public services, characteristic of the
peripheral areas of Brazilian cities. Even though this idea is not completely absent
in the poverty line debate, its integration is, say, quite topic7, mostly because it is
difficult to incorporate these dimensions in wide comparisons of a quantitative
nature. Finally, this idea allows the incorporation of families that might be living
above the limits of survival but that could be living in situations of extreme
vulnerability when a negative event occurs (such as unemployment, illnesses etc.).8
A third and very interesting way of dealing analytically with poverty is related
to the idea of assets, first presented by Moser (1998). She asserts that families
living in the worst social conditions have always been defined by the elements that
they do not possess rather than by the assets that they in fact held (physical, human
and social capitals). From this point of view, the study of poverty should focus on
the analysis of the assets available to a specific family or community and on the
situations that might create “social vulnerability” as a consequence of the fragile
way these assets are managed. Therefore, social vulnerability is defined as a
situation in which there is a great “susceptibility to downward social mobility”
(Filgueiras, 1998). The most relevant strategy, thus, to combat local poverty
6 In this sense, poverty is a multidimensional phenomenon which is difficult to be captured by a single synthetic index,
therefore demanding a complex analytical strategy. We will return to this discussion later on. 7 In Rocha (2203), these dimensions appear in the last chapter of the book which presents an overall view of the main
elements discussed in the literature. The geographical dimension, by the way, is also highlighted in this chapter. In the body of the book, however, this dimension is used in the sense of regional differences (Northeastern, southeastern regions of Brazil) or differences among the main metropolis. She does not incorporate, though, the intra-urban scale. It is true that some of this emphasis is limited by the maximum desegregation possible of the data she uses, although there is also a matter of focus as the segregation patterns within an urban space are not even mentioned as a relevant dimension.
8 In other words, instead of a unique form of poverty, we can observe various and distinct forms associated to a set of different social characteristics connected to the age structure, family composition, insertion in the labour market etc. The spatial distribution of these forms of poverty increases (even more) the complexity of this phenomenon as it creates different levels of access to propriety and services and opportunities among social groups. A detail study of these elements allows us to discuss countless arguments presented by the literature on social-spatial structure of cities as well as being able to define a kind of “social conjecture” of the São Paulo metropolis.

Centro de Estudos da Metrópole/CEBRAP
5
situations would be to facilitate the use of a full range of assets available to a
given population.
Elaborating from the proposition presented by Moser, Kaztman (1999) suggests
that the relation between assets and family vulnerability is mediated by the
“opportunity structure” – regarding the role of the market, the State and the
community – that are available in a specific location. A relatively poor area, for
example, might have important forms of access to the local labour market, raising
the chances of the local population social mobility in the long term.9 In the same
sense, a community of specialized manual workers, for instance, might become
more vulnerable when there are technological changes or a process of de-
industrialization that transforms their specific knowledge (human capital as an
asset) redundant (Kaztman, 1999). In other words, these authors understand
vulnerability as a dynamic category referred to the difficulties that some social
groups might present during the process of adjustment to changes of an exogenous
kind, such as the ones in the labour market and/or in the public policies.10
Besides all that, we also believe that another two elements should be
incorporated in this debate: residential segregation and the social network of a
given community. Segregation – understood as the degree of residential distance
among different social groups – indicates whether the assets controlled by a family
might or might not be successfully used to activate the structure of opportunities
available to this society. Although the effects of segregation will present different
levels of intensity depending on the area of the city, it is reasonable to suppose
that in the most segregated regions there will be a limitation of “outside” contacts
9 This is the case, for example, of a Favela (“shanty town”) called Paraisópolis which is located near to the rich
neighbourhood area named Morumbi, in São Paulo. The majority of the inhabitants of this Favela work as domestic workers and in the civil construction in the Morumbi area (Almeida e D´Andrea, 2004).
10 An important part of the dynamics one can see in the North-American ghettos and especially in the French quartiers dificiles, expresses this situation: although the access to policies and basic services are practically universal in these places (at least in comparison to Brazil), the access to markets is still as restricted as in the past, restricting considerably social mobility. See Wacquant (1996a and 2000) and other articles included in Mingione (1996).

Centro de Estudos da Metrópole/CEBRAP
6
that might restrict the opportunities for social mobility and help to perpetuate the
situations of poverty and vulnerability. 11
The effect of the social network is similar, despite the fact that it tends to be
much more dynamic than segregation. In this case, the arguments favouring the
importance of social networks and the assets converge to the literature that
discusses the role of social capital (Lin, 1999 and Sunkel, 2003), understood as the
“content of certain social relations that combine trust attitudes with reciprocity and
cooperation conducts” (Durston, 2003: 147). These networks would be
fundamental not only to stimulate the connections within low income communities
but especially to build bridges that could reach the outside of that community and
would enhance easier ways of solving everyday life problems, besides being
helpful to promote social mobility and opportunities (Briggs, 2001). Hence, in the
same sense as discussed before concerning the case of segregation, the existence
and formation of social networks have a strong influence on the way the available
assets in a given community might be used.
The processes of residential segregation and social inequalities are connected to
each other and produce a separation of social groups in the space, besides an
unequal distribution of the benefits from urbanization. The combined result of all
these processes is a superposition of problems and a reduction of the opportunity
levels in specific parts of the city (Massey & Denton, 1993). As we will see below,
social indicators of poor individuals living in poor, peripheral areas are
systematically worse when compared to other individuals with similar social
characteristics but who live in areas that are mostly inhabited by wealthier groups.
This suggests that poverty presents important spatial dimensions, a point that we
explore in more detail next.
11 With respect to this point, the perspectives for the São Paulo case are not very optimistic. Torres (2004) shows that
there has been an important increase in the level of residential separation between the rich and the poor (segregation) in São Paulo from 1991 to 2000, measured by the dissimilarity index.

Centro de Estudos da Metrópole/CEBRAP
7
2. The distribution of social groups in the São Paulo
In order to analyse empirically the spatial dimension of poverty we started by
constructing a typology of áreas de ponderação (“weighting areas”) within a GIS
database of the Metropolitan Region of São Paulo (MRSP).12 This typology was
first developed by Marques (2004). That article analysed the distribution of the
social indicators in all those areas and concluded – through a factor analysis - that
the whole set of original variables (race, education, income, migration origin, etc.)
could be described and replaced almost completely by two of the variables:
average household income and rate of population rate growth between 1991 to
2000. The combination of these two variables delimited 10 different groups of
areas, according to their average indicators. The descriptive characteristics of
these groups are presented in table 1 and map 1, below.
Table 1: Summary of the group’s characteristics
Source: Marques (2004).
12 The metropolitan region analyzed here involves 21 municipalities (cities), the most important ones in demographic
terms. They form a conurbation proper. These 21 municipalities correspond to 91,4% of the total population of the MRSP, which totalled, in 2000, 17,9 million inhabitants. The ‘areas de ponderação’ (‘weighting areas’) correspond to the smallest territorial division for the results of the sample of the 2000 Demographic Census, IBGE.
13 The Brazilian Bureau of the Census (IBGE) classifies the individual answers concerning skin color (race) in 5 categories. “Pardo” would be a choice somehow between “black” and “white”.
Groups Population Main Characteristics
1 3,130,249 Very poor, very low levels of schooling, many blacks, ‘pardos’13 and recent migrants from the Northeast, awful urban conditions and a very high rate of demographic growth (1991-2000)
2 2,519,271 Very poor, very low levels of schooling, many blacks, ‘pardos’ and recent migrantsfrom the Northeast, bad urban conditions and high rate of demographic growth
3 1,516,073 Very poor, very low levels of schooling, many women as sole head of the householdand low levels of schooling, average urban conditions and no demographic growth
4 1,019,352 Poor lower middle class with low levels of schooling, urban conditions and high demographic rates
5 1,735,361 Lower middle class, few black, ‘pardos’ or migrant population, good urbanconditions and slow demographic growth
6 3,321,056 Lower middle class, few black, ‘pardos’ or migrant population, good urbanconditions and no demographic growth
7 1,468,915 Middle class, few black, ‘pardos’ or migrant population and no demographic growth
8 826,933 Higher middle class, few black, ‘pardos’ or migrant population and negative rates ofdemographic growth (loosing population)
10 683,159 Upper class very few black, ‘pardos’ or migrant population and negative rates ofdemographic growth
11 162,895 Upper class with high presence of young individuals as household heads, very fewblack, ‘pardos’ or migrant population and positive rates of demographic growth
Total 16,383,264

Centro de Estudos da Metrópole/CEBRAP
8
Map 1: Typology of Areas
In order to simplify the analysis, these ten types of area were re-aggregated into
three new groups. The first one is formed by the ‘peripheral’ areas of the
metropolis and includes groups number 1, 2 e 3, presenting, in general, high levels
of poverty, low levels of schooling and precarious urban conditions. It is important
to notice that this group is not present in the central area of the metropolis, being
located, in general terms, in the external fringe of the city. The second set includes
groups 4 to 7 and is formed by “middle class” areas, i.e., presents an intermediary
socio-economic profile. The third set involves the ‘elite’ areas, which can be
identified as where high-income families live (groups 8, 9 and 10). This condensed
form (with tree types) will be used in the analyses that follow.
Centro de Estudos da Metrópole/CEBRAP
9
3. Evidences of the effects of segregation
3.1 Effects on schooling
The issue at stake here is whether ecological elements linked to the place of
residence might influence school performance of individuals. As we will present
later, the literature that discusses the relation between social inequality and years
of schooling explain the phenomenon emphasizing individual characteristics
connected to socio-economic conditions of the family as well as factors associated
with the school. We use here data from the 2000 Demographic Census, the sample
results, which for the city of São Paulo is formed by 10% of all household units.
The information in this section of the article, therefore, is restricted to the city of
São Paulo. As a statistical model, we adopted a logistic regression14, assuming as
the dependent variable the information on the conclusion (or not) of secondary
school for people aged 18 to 1915.
From the available literature we selected a set of potentially explicative
variables related to individual and neighbourhood characteristics (Barros et all,
2001). As discussed before, the idea here is that the conclusion of secondary
school would be explainable not only by particular characteristics of an individual
(income, parents’ years of schooling, etc.) but also by the characteristics of the
neighbourhood that the individual lives. We assumed as neighbourhood units the
‘areas de ponderação’ (from onwards ‘AP’).
The explicative variables representing individual and family characteristics
tested in this model are analogous to the ones used by Barros et all (2001): gender,
race, length of time living in the city, household income, years of schooling of the
14 This model is commonly used when the dependent variable is dichotomic, relating the probabilities of a given event
to happen or not to happen. We have considered in the hypothesis tests, the scheme of simple aleatory sample, following the IBGE recommendation (Fundação IBGE 2002). We used SPSS software.
15 In 2000, according to the Demographic Census data, 46% of the people between 18 and 19 years old had completed the secondary school in the city of São Paulo. You are expected to have completed the secondary level of schooling in Brazil when you are 17 years old.

Centro de Estudos da Metrópole/CEBRAP
10
mother and the father. On the other hand, other variables related to the
neighbourhood aspect were also tested.16
We opted by the variable “type of AP”, which uses the three different types
presented in the previous section (poor, middle class and rich). The results of the
model, obtained after statistical tests, can be expressed by eight dimensions
considered significant: race in two categories (‘white’ and ‘oriental’ versus ‘black’
and ‘pardos’); gender, length of time living in the city (less than 3 years or more
than 3 years); household income in three classes (less than 3 minimum wages,
more than 3 up to 10 minimum wages and over 10 minimum wages); years of
schooling of the mother; years of schooling of the father; type of AP
(peripheral/poor, middle class or rich) and percentage of people living in the city
of São Paulo for more than 3 years in the AP.17
It is interesting to notice that some ‘ecological’ variables did not enter the
model, in particular the ones related to the conditions of the local schools (number
of students by teacher and number of computers) and the ones related to risk
situations for the young (homicide and teenage pregnancy). The exclusion of the
variables representing the infrastructure of schools suggests that the process of
universal access to schools is, in fact, taking place (at least in São Paulo) as the
schools located in the areas where the youngsters presented the worst school
performance are equally equipped and so the number of teachers per student. On
the other hand, the exclusion of the variables representing juvenile risks is quite
16 The tested variables for the AP were: percentage of people living for more that 3 years in the city of São Paulo,
homicide rates among 15 to 20 years old men, percentage of life births among mothers aged between 10 and 19, percentage of black people, rate of population growth between 1991 and 2000, average number of students per teacher in the elementary schools, number of students per employees working in the elementary schools, number of students per computer available in the elementary schools, type of AP, considering the classification presented earlier.
17 The majority of the explicative variables were expressed by indicator variables that assumed values 0 and 1, 0 indicates the reference category. The specified reference categories are: race (blacks and ‘pardos’); gender (masculine); length of time residing in SP (less than 3 years); household income (less than 3 minimum wages); place of residence (poor areas).

Centro de Estudos da Metrópole/CEBRAP
11
surprising. Our hypothesis is that their effects might have been eliminated by the
effects of other variables, such as the different types of APs.18
From the point of view of its statistical adjustment, the model was considered
adequate, classifying 69% of the observations correctly. Among the individuals
that did not complete secondary school, the percentage of correct classification
was 75% and 61% among the ones that had completed, with variables and signals
consistent to the ones observed in the literature. 19 We present, in table 2, a
summary of the observed results.
Table 2. Results from the Logistic Regression Model
Variables Coefficient Standard Error
Descriptive Level
Odds Ratio
Marginal Effect
Household income above 10 minimum 1,095 0,060 0,000 2,989 0,266Household income between 3-10 0,544 0,0583 0,000 1,722 0,132Gender: women 0,747 0,029 0,000 2,110 0,181More than 3 years living in the city 0,595 0,123 0,000 1,814 0,144White or oriental 0,459 0,034 0,000 1,582 0,111Resident of the rich areas 0,339 0,058 0,022 1,404 0,082Resident of the middle class areas 0,076 0,034 0,024 1,079 0,018Mother’s years of schooling** 0,071 0,005 0,000 1,074 0,017Father’s years of schooling** 0,060 0,004 0,000 1,062 0,015Percentage of people living for over 3 0,050 0,010 0,000 1,051 0,012Constant 8,037 0,57 0,00
Source: Fundação IBGE. 2000 Demographic Census. Authors’ calculations. * Household income in minimum wages of July 2000 (R$ 151,00). ** In this case, the odds ratio and the marginal effect refer to the increase of one year of schooling.
Concerning the explanation related to the probabilities of completing secondary
education in the city of São Paulo, we obtained the following hierarchal variables
according to the odds ratio:20
18 In fact, the typology of the areas used here is strongly related to other social dynamics, as the ones connected to
race. In this case, the variable related to the proportion of blacks and ‘pardos’ in the APs, for example, introduces a high degree of multicolinearity in the model when this typology is considered.
19 This classification was obtained by the estimated probability in the model of completing the secondary school. The “cut point” used was 50%, a value very close to the observed in the population (46%).
20 This hierarchy is based on the values of the odds ratio, which is the most commonly used measure to indicate the level of importance of a given variable.

Centro de Estudos da Metrópole/CEBRAP
12
• Household income, with the odds ratio increasing as the income
raises;
• The gender of the individual, with clear advantage for women;
• The mother and father’s years of schooling. In this case, the odds
ratio measures the impact of each additional year of schooling. Thus, for
example, though the odds ratio is only 1,074 for an additional year of
schooling of the mother, the odds ratio for an individual that have a mother
who studied for 11 years (i.e., completed secondary school) in comparison to
an individual whose mother studied for only 4 years is 1,646;
• Length of time living in the city, being the odds ratio for people born
in the city or living there for more than 3 years higher compared to
individuals living for less than 3 years. However, the recent migrants
represent only 2% of the studied population, which transforms this result less
relevant from the point of view of the argument developed here;
• Race, with clear advantage for whites and Orientals;
• The type of AP (‘áreas de ponderação’), with the odds ratio higher
for middle class and rich areas compared to peripheral/poor areas. As
expected, the most striking advantage is for rich areas in comparison to poor
areas;
• The proportion of recent migrants in the area of residence.
In other words, individual variables and ecological variables are both important
to explain the probability of completing secondary school, although the ecological
variables present a less significant contribution. On average, we can see that the
most well-off inhabitants of the city present a probability of completing secondary
school 0,266 (or 26,6%) higher. For the intermediary class of income the increase
is 13,2%. Among the remaining variables, we can observe that being a woman
raises the probability of completing secondary school to 18,1%, living in the city
for more than 3 years raises to 14,4%, being white raises 11,1% of the chances and

Centro de Estudos da Metrópole/CEBRAP
13
living in a rich area raises the probability of completing secondary school to 8,2%
in comparison to individuals living in poor/peripheral areas.
In order to explore more the argument concerning the influence of the type of
area that an individual lives on the chances of completing secondary school, we
present in the tables below, the average probabilities of completing this level of
schooling according to different cross tabs of income, gender and area of
residence. In this exercise, we included the four most important explicative
dimensions. We did not incorporate the variable “years of residence in the city of
São Paulo” because the individuals living for less than 3 years represents a very
small population group (2%).
Table 3. Probabilities of 18-19 years old individuals to complete secondary
school, estimated according to income and area of residence. City of São Paulo, 2000.
Type of area that the individual lives
Household income less
than 3 minimum
wages
Household income between
3 and 10 minimum
Household income above 10 minimum
wages
Total
Probabilities Peripheral/poor areas 0,261 0,378 0,513 0,431 Middle class areas 0,275 0,396 0,532 0,450 Elite areas 0,331 0,460 0,597 0,516 Total 0,276 0,397 0,533 -
Distribution of the Population (%) Peripheral/poor areas 63,9 52,7 22,4 38,7 Middle class areas 34,0 43,7 55,6 48,7 Elite areas 2,1 3,6 22,0 12,6 Total 100,0 100,0 100,0 100,0
Source: Fundação IBGE. Censo Demográfico 2000. Author’s calculations.
The first thing we would like to notice, from table 3, is that while a young
person living in a poor/peripheral area with a monthly household income of less
than 3 minimum wages presents 0,261 (or 26,1%) probability of completing
secondary school, an individual with the same level of income but living in a rich
area has a probability of 33,1% to complete this level of schooling between 18 and
19 years old. Furthermore, the differential among the different types of areas is

Centro de Estudos da Metrópole/CEBRAP
14
valid for all levels of income that we might consider. In other words,
independently of the level of income, to live in a peripheral area imply on an
additional disadvantage in terms of completing secondary school. An observer who
discusses this problem only from this kind of differential might argue that,
although there are differences, they do not seem to be very impressive. However,
we can add to the same elements presented before the race dimension (Table 4).
Table 4. Probabilities of 18-19 years old individuals to complete secondary
school, estimated according to race, income and area of residence. City of São Paulo, 2000.
Race and place of residence of the individuals
Household income under 3 minimum
wages
Household income between 3 and 10
minimum
Household income above 10 minimum
wages
% of the
population Probability % of the population Probability % of the
population Probability
Whites and Orientals Peripheral/poor areas 59,2 0,288 46,4 0,410 17,4 0,547 Middle class areas 38,3 0,303 48,8 0,429 56,7 0,566 Elite areas 2,6 0,362 4,7 0,494 25,8 0,629 Total 100,0 - 100,0 - 100,0 - Blacks and ‘Pardos’ Peripheral/poor areas 69,7 0,203 62,0 0,305 44,9 0,433 Middle class areas 29,0 0,216 36,1 0,322 50,0 0,451 Elite areas 1,4 0,264 1,9 0,382 5,1 0,517 Total 100,0 - 100,0 - 100,0 -
Source: Fundação IBGE. Censo Demográfico 2000. Author’s calculations.
We can observe (table 4) that while the odds ratio of a young black person
living in a peripheral area with an income of less than 3 minimum wages to
compete secondary school in only of 20,3%, a young white man with the same
level of income but living in a rich area has a probability of 36,2%, therefore
almost doubling their chances. In other words, these dimensions sum up. A poor
black person living in poor areas has less chances than a poor black living in a rich
area and even less chances than a poor white living either in the periphery or in
central areas.

Centro de Estudos da Metrópole/CEBRAP
15
Analogously, when we introduce the gender dimension, we notice that these
phenomena overlap (table 5). Poor man living in the periphery has also less
chances of completing secondary school (19,9% probability) than poor women
living in poor areas (34,4%) and even less than poor women living in richer area
(42,4%).
Table 5. Probabilities of 18 to 19 years old individuals of completing secondary school, estimated according to gender, income and area of
residence. (city of São Paulo)
Gender and place of residence
Household income of less than 3
minimum wages
Household income between 3 and 10
minimum
Household income above 10 minimum
wages
% of the
population Probability % of the population Probability % of the
population Probability
Women Peripheral/poor areas 64,4 0,344 52,4 0,474 21,7 0,610 Middle class areas 33,7 0,361 43,9 0,493 55,6 0,628 Elite areas 1,9 0,424 3,7 0,559 22,6 0,687 Total 100,0 - 100,0 - 100,0 - Men Peripheral/poor areas 63,5 0,199 53,0 0,299 23,1 0,426 Middle class areas 34,2 0,211 43,5 0,315 55,5 0,444 Elite areas 2,3 0,258 3,5 0,375 21,5 0,510 Total 100,0 - 100,0 - 100,0 - Source: Fundação IBGE. Censo Demográfico 2000. Author’s calculations.
In summary, gender, race and place of residence significantly contributes -
besides income and the parent’s years of schooling - to explain worse school
performances in the city of São Paulo. Relations of this kind can be observed in all
income levels and in all types of area considered here. In fact, when we consider
only the group of young poor black man (18 to 19 years old) living in the
periphery, we can see that the probability of completing secondary school is only
15,2%, therefore forming the group of individuals with the least probability of
completing this level of schooling. On the other hand, equally poor women but
whites and living in central areas present higher chances, approximately 46%,
placing them close to the average for the population.

Centro de Estudos da Metrópole/CEBRAP
16
In other words, although the income and parent’s years of schooling are
important, they do not exhaust the explanation regarding educational inequalities.
In the case of São Paulo, there are other intervenient factors in the explanation of
the probabilities of completing secondary school that are related to gender, race
and place of residence. Such elements present important consequences for
educational public policies.
From the point of view of the discussion in this article, these results show that
the variables related to the place of residence have substantial statistical
significance. The probability of a young man residing in the periphery to complete
secondary school is significantly lower compared to a young man living in central
areas, even when they present similar socio-economic characteristics. In other
words, the socio-spatial segregation – especially when it is combined with the
effects of gender and race – is substantially important from the point of view of
school performance.
It is possible to argue that this result could be explained by the effects of school
characteristics on the students performance (which we are not able to measure with
the available census data) as Soares et all (2001) suggests. After all, an area with a
high concentration of individuals of a low socio-economic status tends to be
strongly related to a high concentration of poor people and lower school
performance. However, the characteristics of the place of residence and the schools
located in these areas cannot be separated analytically as they are both part of the
same residential segregation dynamic.
In fact, although the assumption that people who live in the peripheral areas of
the city study, necessarily, in schools in the peripheries has not been proven here,
it is a very plausible assumption if we understand the concept of spatial friction
derived from the economic geography (Diniz, 1996). Distance implies substantial
costs of transport, particularly in a metropolis like São Paulo where the distances
are large, the traffic heavy and the public collective transport slow. In a few words,
the most plausible process is the following: to live in segregate poor areas imply

Centro de Estudos da Metrópole/CEBRAP
17
access to schools that have a large concentration of poor and blacks which, in turn,
implies worse school performance.
Regarding this last point, there are also arguments around the effects of
belonging to a certain group or community on the school or economic performance
of an individual. The idea is that there are different processes in operation, such as
the influence of friends and colleagues (‘peer group effect’) and the influence
exerted by adults on the choices made by the youngsters (‘role model effect’)
(Durlauf, 2001). According to this argument, the issue at stake is: to what extent
the proximity of a youngster to a gang might, for example, affect his school
performance? Typically, these two effects characterize what the economists call
externalities, namely, the way in which an external event to an individual (in this
case, the group that he belongs) affects their economic performance.21
Unfortunately, we do not have direct empirical evidences concerning the impact
of these “group affiliation effects” on school performance. Researches of this
nature are complex and part of the available evidences in the international
literature on this respect is based on ethnographic results (Durlauf, 2001). Strictly
speaking, it is impossible, with quantitative data as the ones used here, to separate
the effects produced directly by the school from the ones produced by
neighbourhood relations or by belonging to a given community or group. In reality,
the most probable thing is that theses dimensions are strongly connected.
Nonetheless, the available data clearly shows that – along with gender and race
– living in segregated areas does make a substantial difference concerning the
chances of completing secondary school. This reinforces the argument that the
educational policy, in order to promote educational equality, should consider the
characteristics of different groups and/or areas where the school is located,
21 In a way, this kind of results is a problem for the models that try to explain socio-economic performance based on
individual characteristics: “My belief is that underlying the new interest in group memberships among economists is a feeling that one cannot explain the levels of socio-economic deprivation and self-destructive behavior associated with inner cities in a framework that embodies the neoclassical assumptions of rationality, preferences defined exclusively over commodities, and complete markets for borrowing and lending. Put differently, the standard neoclassical assumptions seem better suited for explaining socio-economic success than socio-economic failure” (Durlauf, 2001: 392).

Centro de Estudos da Metrópole/CEBRAP
18
therefore lessening the impact that these elements have on the educational
performance of the local population.
3.2 Effects on the labour market
If the previous section seem to show the influence of the place of residence on
the level of schooling of young men, what effects it would produce on the chances
of being unemployed?22 The results presented in table 6 give us reasons to believe
that residential segregation is an important variable to explain unemployment
independent of the social group we are analysing.
Table 6. Open unemployment rate by year and social groups according to the
place of residence of the individual, City of São Paulo (PED, 1990-2000)
Rich Districts
Middle class
Districts
Poor Districts
Gap (poor-elite)
YEAR 1990 4,81 6,99 8,94 4,14 1991 5,04 7,60 9,64 4,61 1992 6,06 8,89 11,05 4,99 1993 5,05 8,39 10,51 5,45 1994 5,34 8,71 10,45 5,11 1995 5,09 8,86 10,39 5,30 1996 5,97 9,83 11,25 5,28 1997 6,09 10,00 11,92 5,84 1998 7,49 11,33 13,78 6,29 1999 7,25 11,78 13,59 6,34 2000 6,74 10,36 12,83 6,09 Variation (2000-1990) 1,93 3,37 3,88
GENDER (average of the period 1990/2000) Men 5,21 7,53 9,05 3,84 Women 6,66 11,67 14,77 8,10 Gap (man-women) 1,46 4,15 5,72
(Continues)
22 This section explores is based on data from the “Survey on Employment and Unemployment” (PED), various years,
(Fundação Seade/Dieese), the 2000 Demographic Census and the “Annual Recording of Social Information – Formal Employment, 2000” (RAIS) produced by the Brazilian Ministry of Labour. In order to test how the unemployment rate is distributed among different places of residence, we used the same typology of areas presented in section 2.

Centro de Estudos da Metrópole/CEBRAP
19
(Cont.)
Rich Districts
Middle class
Districts
Poor Districts
Gap (poor-elite)
RACE White 5,85 8,60 10,52 4,67 Black 6,95 11,51 12,81 5,86 “Pardo” 6,78 11,20 12,44 5,67 Oriental 3,76 4,56 6,11 2,36 Gap (blacks-oriental) 3,19 6,95 6,70
LEVEL OF SCHOOLING (average of the period 1990/2000) Illiterate 6,07 7,33 8,25 2,18 Uncompleted Primary School 6,92 10,46 11,73 4,81 Completed Primary School (8 years) 7,72 10,70 12,55 4,82 Uncompleted Secondary School 12,06 14,48 16,69 4,63 Completed Secondary School (11 years) 6,89 8,01 9,88 2,99 Uncompleted Further Education 9,16 7,61 6,99 -2,18 Completed Further Education 3,24 3,32 3,64 0,40 Gap (Complete primary – complete further) 4,48 7,38 8,90 Gap (incomplete secondary - complete further) 8,81 11,17 13,05
Source: PED, 1990 to 2000 (Dieese-Seade).
The open unemployment rate throughout the 1990s was consistently higher for
the individuals living in the districts classified as poor, followed by the middle
class ones. For example, while the unemployment rate among the people living in
rich areas was 6,7% in 2000, for the individuals living in poor areas the rate was
almost doubled, 12,8%, and for the ones living in middle class areas was slightly
lower: 10,4%.
Moreover, through the 1990s, the gap between the unemployment rate among
the population living in rich areas and poor areas increased. In other words, the
unemployment rose more intensively among the residents of poor areas than among
the ones living in richer areas. For example, while in the rich areas the growth of
the unemployment rate from 1990 to 2000 was 2 points, in the poor areas the
increase in unemployment was 3.9 points. Thus, although it is true that
unemployment rose for the whole of the population in the past decade, this was a
Centro de Estudos da Metrópole/CEBRAP
20
phenomenon that impacted the population living in poor, segregated areas more
intensively.
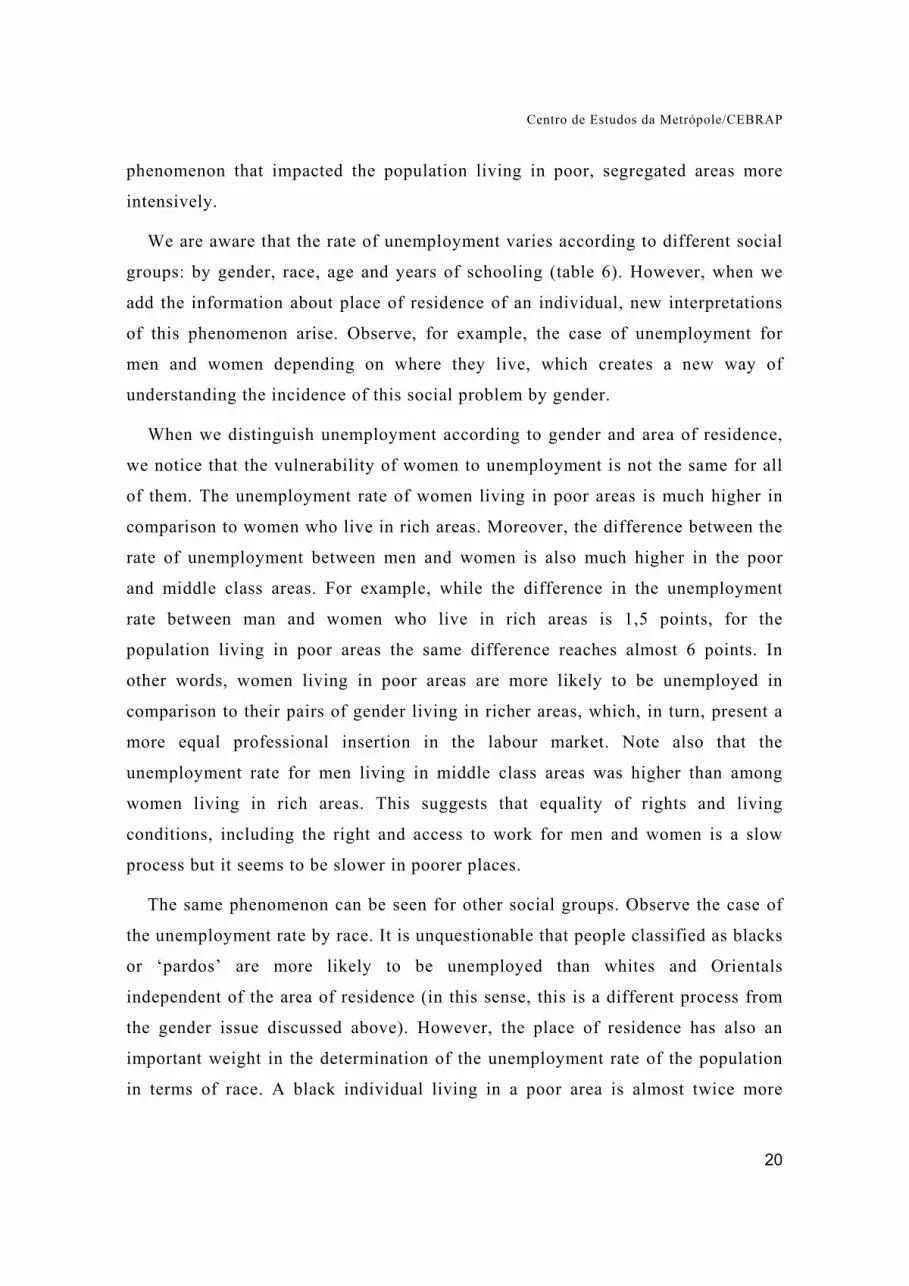
We are aware that the rate of unemployment varies according to different social
groups: by gender, race, age and years of schooling (table 6). However, when we
add the information about place of residence of an individual, new interpretations
of this phenomenon arise. Observe, for example, the case of unemployment for
men and women depending on where they live, which creates a new way of
understanding the incidence of this social problem by gender.
When we distinguish unemployment according to gender and area of residence,
we notice that the vulnerability of women to unemployment is not the same for all
of them. The unemployment rate of women living in poor areas is much higher in
comparison to women who live in rich areas. Moreover, the difference between the
rate of unemployment between men and women is also much higher in the poor
and middle class areas. For example, while the difference in the unemployment
rate between man and women who live in rich areas is 1,5 points, for the
population living in poor areas the same difference reaches almost 6 points. In
other words, women living in poor areas are more likely to be unemployed in
comparison to their pairs of gender living in richer areas, which, in turn, present a
more equal professional insertion in the labour market. Note also that the
unemployment rate for men living in middle class areas was higher than among
women living in rich areas. This suggests that equality of rights and living
conditions, including the right and access to work for men and women is a slow
process but it seems to be slower in poorer places.
The same phenomenon can be seen for other social groups. Observe the case of
the unemployment rate by race. It is unquestionable that people classified as blacks
or ‘pardos’ are more likely to be unemployed than whites and Orientals
independent of the area of residence (in this sense, this is a different process from
the gender issue discussed above). However, the place of residence has also an
important weight in the determination of the unemployment rate of the population
in terms of race. A black individual living in a poor area is almost twice more

Centro de Estudos da Metrópole/CEBRAP
21
vulnerable to unemployment in comparison to a (also) black individual who lives
in a rich area. The individuals classified as Orientals are the least vulnerable to
unemployment.
Being the variable ‘years of schooling’ a good proxy to the income level of
individuals in Brazil, this variable allow us to check whether unemployment is
only a matter of income or years of schooling. As one can see from table 6, this
does not seem to be the case. Observe the case of people in the ‘Uncompleted
Primary School’ category (or less than 8 years of schooling) who live in different
areas of the city. While unemployment reaches around 7% of the workers with
“Uncompleted Primary School” living in rich areas, the same figure jumps to
almost 12% of the individuals with the same level of schooling but living in a poor
area or almost 11% for the individuals living in middle class areas. Note that this
phenomenon occurs for all levels of schooling since we can observe that
independent of the years of schooling, the unemployment rate grows as the
individuals live further from the richer areas.23
Given these results, we ask ourselves what could explain a higher vulnerability
to unemployment concerning the individuals (with similar socio-economic
backgrounds) who live in poor areas. Part of the explanation might be related to a
low demand for jobs in the poorer places. We investigate this point in more detail
below. On the other hand, other important aspects that we do not explore here refer
to the costs (time and money) of transport in the metropolis and also the possible
connection between the place where an individual lives and the opportunity
structure available to him including the quality of the social relations that are
established in the different areas.
Although it seems to us a plausible hypothesis to investigate we do not have
available data to measure these effects. But the basic idea seems to make sense.
Imagine, for example, an individual who lives in a poor/peripheral community with
a high number of unemployed people. There are reasons to believe that the chances
23 It is interesting to notice that the unemployment rate for people with a “completed college/university degree” presents little variation among the different areas. In fact, as the access to this level of schooling in Brazil is still pretty much restricted, we can say that this group of the population presents higher chances of being employed comparatively.

Centro de Estudos da Metrópole/CEBRAP
22
of this individual to find a job will be smaller in an environment that combines
higher competition for a job and less connections from employed people that might
inform about a job.
We now observe whether the number of jobs available in a certain area might be
connected to the level of local unemployment. In order to measure this, we work
here with the RAIS database, organized by the Brazilian Ministry of Labour which
presents the total number of formally hired employees in all registered companies
in the MRSP in the year 2000.24
We must note before continuing that the observation of the distribution of the
formally registered employees cannot be taken as representative of all the
employment available in a given area as in Brazil since the number of informal
jobs is quite high. For example, in 2000 according to the sample results of the
Demographic Census, something around 22% of all employed people (i.e. people
working regularly and receiving salaries every month) was working informally.
This figure would be much higher if we had excluded the workers from the public
sector who are normally formally hired. Besides that, informal work relations are
also more common among low skilled workers. For example, while only 13% of
workers with a college/university degree are informally hired, this figure jumps to
30% if an individual has studied for less than 8 years (Gomes & Amitrano, 2004).
However, because in Brazil a formally registered employment means access to a
series of benefits and guarantees (including a future pension), we believe that
observing the distribution of formal employment in the space becomes even more
relevant as a strategy of overcoming poverty in a metropolis.
24 The RAIS (“Annual Recording of Social Information – Formal Employment”) is an administrative registry organized
by the Brazilian Ministry of Labour in which all public and private companies have to declare yearly different sort of information about their formally registered employees. The geocoding process of this database was based on the digital cartography of the ‘central registry of companies’ (IBGE, 2000) made available by the centre for metropolitan studies/Cebrap. Only the existent companies in both databases (RAIS and CCE/IBGE) were included in this analyzes.

Centro de Estudos da Metrópole/CEBRAP
23
The MRSP had, in 2000, 4,477,060 formal jobs (public and private sectors)25.
However, the spatial distribution of the formal jobs in the space was very
heterogeneous, not only in the region as a whole but also inside each of the
Municipalities, as it can be seen in Map 226.
In order to compare the supply of jobs among the different areas, we divided the
total amount of jobs in a given area by the number of economically active
population (EAP) living in the same area. As a result, the central areas of the cities
that form the MRSP tended to present the highest concentration of formal jobs. As
it can be seen in Map 2, there is an important concentration of formal employment
in the central areas of industrialized cities, such as the ABC area (Southeast), the
south of Guarulhos (Northeast), the northeast of Osasco (West) and the city of São
Paulo (Centre).
25 The data refers to 33 Municipalities in the MRSP, involving something around 8.9 million of economically active
population (EAP). Among them, around 7.1 million were considered occupied according to the 2000 Demographic Census (IBGE). Thus, the absolute number of unemployed people amounted to 1.7 million.
26 In order to minimize the effects of “borders” within intra-urban contiguous areas, we adopted the calculation of a moving average in Map 2. The calculation took into account the sum of jobs within in a 3km radius from the central point of each area, using for this, techniques available in a GIS.

Centro de Estudos da Metrópole/CEBRAP
24
Map 2: Distribution of formal employment – Metropolitan Region of São Paulo, 2000
Source: Authors’ elaboration from RAIS/MTE (2000) and IBGE (2000).
Concerning the areas with the smallest number of formal jobs and that are dense
in terms of population calls the attention an area involving more than one
municipality in the extreme East of the city of São Paulo, presenting clear spatial
continuities to the southeast of Guarulhos, Itaquaquecetuba city and part of two
municipalities in the ABC area: Mauá and Ribeirão Pires. This part of the city of
São Paulo presents an extreme absence of formal jobs. For example, if we sum all
economically active population (EAP) living in only three of the districts in that
part of the city of São Paulo (Cidade Tiradentes, Lajeado and Itaim Paulista), we
will find that there are something around 9,800 formal jobs for an EAP of 270,000.
In other words, an average of 0.04 formal jobs per residents. This sort of
phenomenon is also seen in other poor areas of the city of São Paulo, as in the
North (Brasilândia) and South (Jardim Ângela, Capão Rendondo).

Centro de Estudos da Metrópole/CEBRAP
25
Let’s give another example in order to clarify the difference. If we take the
number of formal jobs offered in the following richer districts: Morumbi, Butantã,
Pinheiros, Vila Mariana, Moema, Jardim Paulista and Santo Amaro (all very rich
neighbourhoods), we will find approximately 280,000 EAP living in these areas (a
figure, by the way, very close to the number used in the example above for the
poor areas) but with a number of formal jobs amounting to 623,000 or 2.24 formal
jobs per resident.
Given these discrepancies, we observe if there is any relation between the
number of jobs offered in a given area and the rate of unemployment of the
residents of the same area (graph 1). The idea is the following: if the spatial
distribution of the unemployment rate has absolutely nothing to do with the
number of local formal jobs, we will be able to say, for sure, that the number of
jobs in a certain area does not interfere with the probability of an individual being
unemployed. Note that there are two different sources of information for the two
axes: formal employment derives from the RAIS database and the unemployment
rate from the Demographic Census.
Graph 1: Unemployment rate and formal jobs in the ‘weighting areas’ by social group – Metropolitan Region of São Paulo, 2000
Source: Author’s elaboration from RAIS (2000) and IBGE (2000).

Centro de Estudos da Metrópole/CEBRAP
26
The results could not have been more impressive. The areas with lower levels of
unemployment are also the areas with the highest number of formal jobs and the
opposite is also true for all cities in the MRSP. The only exception is a large area
to the south of São Bernardo do Campo city. The reason is a great amount of
companies of large and medium size along important motorways that connect São
Paulo to the port of Santos (Vias Anchieta and Imigrantes), including, for example,
Volkswagen, in areas with low population density.
Various aspects could be highlighted from the observation of this graph and the
previous map. First, we can say that not only the population living in poor areas of
the MRSP presents higher levels of unemployment in comparison to the other two
groups but they live, at the same time, in areas which the number of formal jobs is
also smaller. On the other hand, in the rich areas the situation is more pulverized:
the individuals live in areas with higher and lower levels of formal jobs, although
they live in areas in a smaller concentration of unemployed people. Even though
these results are referred to areas, the data suggest that the spatial concentration
concerning the number of formal employment in the MRSP might be one of the
determinants of the economic performance of individuals27.
This data shows that there are areas inside the MRSP in which there is a
complete absence of local formal jobs. They are intra-urban spaces, densely
populated, where the local micro-economic dynamic is very poor, either because
they are areas with a high concentration of unemployed people or because there are
few formal jobs available locally. When we know that the formal jobs are normally
better remunerated and linked to other benefits, the situation becomes even more
dramatic. Given this picture, it is difficult to imagine how long it would take for
the economy to improve the number of local jobs that could benefit the locals and
maybe re-vitalize economically these areas without the interference of the State,
even if the economy was growing in a stable way.
27 Part of the more pulverized situation found in the rich areas might also be related to districts that present a high
level of social heterogeneity as it is, for example, the case of the Vila Andrade district that has one of the most expensives land values of the city of São Paulo (Morumbi) and is contiguous to the largest favela (slum) of the city (Paraisópolis).

Centro de Estudos da Metrópole/CEBRAP
27
From the point of view of our discussion here and based on the empirical results
found up to now, it is not only the smaller number of local formal jobs (and a
higher concentration of unemployed people living in the same area) that might
interfere with the chances of a poor individual living in a poor area of the MRSP to
find a job and, therefore, rising the chances of overcoming the poverty condition.
Further investigation of the kind of job available in the different areas has showed
that the wages in the poorest areas are also smaller.
While the average remuneration (in 2000 minimum wages – MW) of formally
hired workers was 4.3 in the companies located in the poor areas, the average
wages in the rich areas was 7.2 (and in the middle class areas 5.2)28. One might
argue that this is because the type of jobs offered in the rich areas, because of the
nature of the job, would demand more educated workers, therefore, interfering
with the average remuneration found in the rich areas. However, this is not
confirmed by analysing the data presented in table 7.
28 In July 2000, the national minimum wage was fixed at R$ 151,00 or approximately U$ 83 according to the average
exchange rate of 2000 (Banco Central do Brasil).

Centro de Estudos da Metrópole/CEBRAP
28
Table 7. Average remuneration* of formally hired workers by years of schooling, sector of economic activity and average size of the companies, according to the type of area where the company is located. MRSP, 2000.
Types of Areas Poor areas
Middle class areas Rich areas Total
YEARS OF SCHOOLING OF THE EMPLOYEES Uncompleted Primary School 3,64 3,93 4,29 3,86 Completed Primary School (8 years) 3,73 4,10 4,67 4,02 Completed Secondary School (11 years) 4,72 5,32 6,49 5,23 Uncompleted Further Education 7,32 8,16 10,03 8,09 Completed Further Education 10,71 12,54 16,19 12,29
SECTOR OF ECONOMIC ACTIVITY Industrial Sector 4,65 5,36 7,89 5,40 Services 4,06 5,17 7,43 5,02 Trade and Commerce 3,40 3,92 5,48 3,90 Civil Construction 3,46 3,8 4,94 3,84 Public Administration 6,39 8,81 13,48 10,29
AVERAGE SIZE OF THE COMPANY Between 1 and 4 employees 4,41 3,15 --- 4,16 5 and 9 employees 3,69 4,22 5,11 4,10
10 and 14 employees 4,47 5,82 7,02 5,75 15 and 49 employees 6,14 6,91 9,26 6,96 More than 50 employees 6,63 6,88 10,33 7,20 Total 4,71 5,36 7,25 5,35 *in minimum wages of 2000. Source: RAIS, 2000 (MTE).
It is true that average remuneration grows along with the years of schooling.
While formally registered workers with uncompleted primary school received, on
average, 3.9 MW in 2000, the ones with completed college/university degree get a
salary three times higher: 12.3 MW. However, the remuneration varies also
according to the area in which the job is offered. Whilst the average wages of a
worker with uncompleted primary school is 3.6 MW in the poor areas, another
worker with the same level of schooling but working in a rich area, earns 4.3 MW.
Besides that, the differential in the wages of workers according to where they work
is even higher for those with complete or incomplete college degree. What is

Centro de Estudos da Metrópole/CEBRAP
29
noticeable is that the remuneration differential varies according to the place the
company is established for all levels of schooling.
Another possible argument would say that maybe the reason is a lower number
of industrial jobs, presenting on average better wages. Yet, the data available at the
moment do not sustain such argument. Although the number of formal jobs is
much smaller in the poor areas (around 10% of all formal jobs), the industrial job
is the second most important sector employing people: 22% of all formal industrial
jobs in the MRSP are located in the poor areas. Besides that, when we distribute
the average remuneration by sector of economic activity, the differentials are kept
the same for all types of activities (table 7), including the public administration
(which, by the way, has only 1% of all its jobs in poor areas) and civil construction
(intense in low skilled workers). The same results were found for all other sector
of economic activity. Moreover, when we control the results by the size of the
company, we find similar outcomes. Although it is true that the larger the
organization is, the higher the wages are, the differentials depending on the
location of the company are still the same ones found before.29
In sum, what we can say about the labour market in the MRSP is that the
population living in the poorest areas coexist with higher rates of unemployment
that are spatially correlated to a lower number of local formal jobs and of the jobs
available the remuneration is also smaller. In order to increase the chances of
getting a job, poor individuals who live in areas with a small number of local jobs
have to bear the costs of transport (monetary or non-monetary ones) to more
central areas. Moreover, these individuals are living in ‘communities’ that present
a higher number of unemployed people and also a higher concentration of people
with low levels of schooling (in a decade that presented a higher selectivity of the
labour force concerning the level of schooling, see Gomes & Amitrano, 2004), all
factors that also have an impact on the chances of individuals to get a job and,
therefore, increasing the chances of overcoming poverty.
29 The only exception is the companies between 1 and 4 employees. The most likely reason is that the owner of a
“one-employee” company ‘gives to herself’ a higher salary.
Centro de Estudos da Metrópole/CEBRAP
30
4. Consequences: the case for the adoption of spatial strategies for social
policies
The results presented in the previous sections give us reasons to believe that
social policies for metropolitan areas should incorporate in their drawing and
strategy of implementation the characteristics of the territories where the
population live. The argument favouring the adoption of spatial strategies for
social policies acknowledges the existence of strong “negative externalities” when
living in neighbourhoods with a high concentration of poverty (Durlauf, 2001).
This means that individuals or families with similar socio-economic characteristics
will have different opportunities depending on the area they live. For example, the
probability of getting a formal, registered job is smaller because there is a low
proportion of individuals who are employed in the formal sector, therefore
reducing the possibilities of an individual to find a job by activating their social
relations network (discussed in section 3). Besides all that, in many cases the
population living in poor areas tends to be more exposed to other sort of risks, as
the ones related to a precarious sewage system, instability concerning property
rights and violence.
Although this accumulation of basic social problems is not complete, as it was
seen by the 1970s literature on urban sociology, there are still some areas of the
metropolitan regions of Brazil that are extremely exposed to an intense
accumulation of risks and negative situations which can be seen very clearly when
we analyse in more detail some of the so-called “hyper-peripheries” (Torres &
Marques, 2002). In other words, one of the most dramatic challenges concerning
social policies in metropolitan areas is to be able to transform these “negative
externalities” into positive ones, i.e., eliminating the factors that make the
characteristics of a place of residence determinant in the reproduction of poverty.30
30 Part of this sort of argument can be found in the urban sociology literature known as ‘area studies’ (Glennester et
all, 1999).

Centro de Estudos da Metrópole/CEBRAP
31
In this sense, the adoption of spatial strategies for social policies presents two
main angles31. From one perspective, such a proposition means to incorporate
spatial logics to traditional social policies – such as educational, health – which
should have a specific format in places with a high concentration of poverty. This
is the case of some existent programs as the “Health Family” program (PSF), for
example, where a doctor and trained community members visit regularly all
households in a certain neighbourhood. From a second perspective, it is also
possible to think about the adoption of integrated policies that would deal with
specific problematic areas, involving simultaneously actions from different
Secretariats and bureaucratic agencies, therefore raising the chances of improving
life conditions in a given locality in an effective manner. Initiatives like this can
be observed, for example, in some housing projects of re-urbanization of favelas32.
However, the State will only be able to implement this sort of policies if it can
correctly comprehend the processes that produce the already built environments
and if state agencies can count with a detailed description of the spatial
distribution of these elements in the urban space. In order to execute both tasks, it
is necessary to gather enough knowledge about the distribution of the social groups
in the space as well as a set of precise concepts able to describe reality.
We believe that the dominant comprehension about urban poverty, the
peripheries, segregation and socio-spatial inequalities in Brazil sometimes leads to
the execution of inefficient and badly targeted public policies, even when the
interests and the decisions for such initiatives exist. The problem lies in the fact
that the hegemonic vision tends to see the peripheries as socially homogenous
places. This is related to the consideration of a unified, one-dimensional and
31 Note that when we are talking about incorporating spatial dimensions in social policies we are not referring
necessarily to policies focused on the federative entities, as the States and Municipalities. We are also talking about territorial detailed cuts, as districts, neighbourhoods and census tracts within a metropolitan area. Strictly speaking, in metropolitan areas this cut has to be necessarily intra-urban. This argument makes sense in a country with a growing degree of urbanization and where over 40% of the whole population live in urban conglomerates with more than 1 million inhabitants, making necessary to disaggregate the public action into smaller spatial units.
32 New social policies, such as the ones in the Mexican program “Oportunidades” have combined, in an interesting way, operational initiatives of an individual character with spatial dimensions, which deserve the attention from the point of view of Brazilian policies, especially when we are talking about metropolitan regions. See www.progresa.gob.mx.

Centro de Estudos da Metrópole/CEBRAP
32
perfectly cumulative process of poverty production. As a consequence, the
predominant vision tends to prescribe general distributive policies for all
peripheral, poor spaces. Considering the stock of social problems accumulated in
those areas and the fiscal limitations of the State, some policies tend to be lost in
the face of evident insufficiency of what is done and the irrelevance of the
initiatives considering what should (or could) have been done instead.
These elements are important, especially when we know that in places such as
São Paulo the ‘poor among the poor’ tend to become invisible or impossible to find
even if there is well-intentioned public policies (Torres, 2002) not only because
they are normally less organized and present more difficulties to organize
themselves and express their demands or needs but also because the actual
administrative routine of state agencies hardly ever can distinct them. This might
be due to prejudices among some technical communities (Marques, 2000). But we
believe that most of the time this problem is caused by ‘ontological’ reasons,
connected to the nature of the public policies: the persons who are excluded from
the public policies are rarely target, or – in other words - not considered as part of
the demand (Torres, 2002).
Alternatively, we must develop detailed studies about segregation and spatial
inequalities that can be appropriated and used by the public authorities. The
policies, then, would be able to consider the diverse (and different) existent needs
in the peripheral spaces. Moreover, if these capacities are developed we will be
able to build spatial strategies for social policies and improve the operational
aspects of the policies that try to interfere with the role of segregation patterns.
Bibliography
ALMEIDA, R. e D’ANDREA T. 2004. “Vulnerabilidade e mecanismos de inclusão social na favela de Paraisópolis, São Paulo”. In: MARQUES, E. e TORRES, H. (org.) São Paulo: segregação, pobreza e desigualdades sociais. São Paulo: Ed. Senac, no prelo.
ANDRADE, R.; PALOMO, A. e MARTÍNEZ, L. “Geographic Isolation and Labor Markets in Rural El Salvador”. BEHRMAN, J., GAVIRIA, A. e

Centro de Estudos da Metrópole/CEBRAP
33
SZÉKELY, M. (org.). Who´s In and Who´s Out, Social Exclusion in Latin America. Washighton, D.C.: Inter-American Development Bank, 2003.
ARBACHE, J. “Pobreza e mercados no Brasil”. In: CEPAL. Pobreza e Mercados no Brasil: uma análise de iniciativas de políticas públicas. Brasília: CEPAL/DFID, 2003.
ARRETCHE, M. “Uma contribuição para fazermos políticas sociais menos ingênuas”. In: Barreira, M. e Carvalho, M. (orgs.). Tendências e Perspectivas na Avaliação de Políticas e Programas Sociais. São Paulo: IEE/PUC, 2001.
ARRIAGADA, C. Pobreza en América Latina: Nuevos escenarios e desafíos de políticas para el hábitat urbano. In: CEPAL – Série Medio Ambiente de Dessarrollo, n. 27, 2000.
BARROS, R. e CARVALHO, M. Utilizando o cadastro único para construir indicadores sociais. Rio de Janeiro: IPEA (mimeo), 2002.
BARROS, R. e FOGUEL, M. “Focalização dos gastos públicos sociais e erradicação da pobreza no Brasil”. In: Henrique, R. (org). Desigualdade e Pobreza no Brasil. IPEA, Rio de Janeiro, 2000.
BARROS, Ricardo Paes et all Determinantes do desempenho educacional no Brasil. In: IPEA: Textos para discussão 834. Rio de Janeiro, IPEA, 2001.
BELTRÃO, Kaizô I., Camarano, A.A. e Kanzo, S. Ensino fundamental: diferenças regionais. In: Revista Brasileira de Estudos de População, v.19, n.2, 2002, pp. 135-158.
BRUECKNER, J.; THISSE, J.-F. e ZENOU, Y. “Local Labor Markets, Job Matching and Urban Location”. International Economic Review, Volume 43, Issue 1, Page 155-171, Feb 2002
CÉSAR, C. e SOARES, J. Desigualdades acadêmicas induzidas pelo contexto escolar. In: Revista Brasileira de Estudos de População, v.18, n.1/2, 2001, pp. 97-110.
DURLAUF, S. The membership theory of poverty: the role of group affiliations in determing socio-economic outcomes. In: Danziger, S. H. e Haverman, R.H. Understanding poverty. New York, Russell Sage, 2001, pp. 392-416.
FERGUNSON, R. “Community Revitalization, Jobs, and the Well-being of the Inner-city poor”. Danziger, S. e Haverman, R. (org.) Understanding Poverty. New York: Russell Sage, 2001.
FERNANDES, R. e PAZZELO, E. Avaliação de Políticas Sociais: Incentivos Adversos, Focalização e Impacto. São Paulo: FEA-USP (mimeo), 2002.
FERRÃO, M.E. et all. O SAEB – Sistema nacional de avaliação da educação básica: objetivos, características e contribuições na investigação da escola eficaz. In: Revista Brasileira de Estudos de População, v.18, n.1/2, 2001, pp.111-130.
FERREIRA, M. P. “Grupos de distritos homogêneos segundo condições de vida”. Documento de trabalho – metodologia. São Paulo: Centro de estudos da metrópole, mimeo.

Centro de Estudos da Metrópole/CEBRAP
34
FIGUEIREDO, A. et all. Proposta de constituição de uma rede de avaliação de políticas sociais. Brasília: Ipea (mimeo), 2003.
FILGUEIRAS, F. 1998. “Una Mirada Crítica Al “Assets-Vulnerability Approach - Orígenes, aplicaciones y posibles innovaciones”. Santiago, CEPAL, novembro, documento de trabalho.
FUNDAÇÃO IBGE. Documentação dos microdados da amostra. Censo Demográfico 2000. Rio de Janeiro, IBGE, 2002.
GLENNESTER, H., LUPTON, R., NODEN, P. e POWER, A. “Poverty, social exclusion and neighbourhood: studying the area bases of social exclusion”. CASE Paper 22, Center for Analysis of Social Exclusion/LSE, Londres, March 1999, pp. 1-46.
GOFFMAN, E. Interaction ritual: essays on face-to-face behaviour. New York, Anchor Books, 1967.
GUIMARÃES, N. “Desemprego. Abordagens Institucional e Biográfica. Uma comparação Brasil, França, Japão”. Relatório final do auxílio apresentado ao CNPq, São Paulo, fevereiro de 2003.
GUIMARÃES, N. “Por uma sociologia do desemprego”. Revista Brasileira de Ciências Sociais, São Paulo, Anpocs, nº 50, outubro de 2002.
GOMES, Sandra & AMITRANO, Cláudio. “Local de moradia na metrópole e vulnerabilidade ao (emprego e) desemprego”. In: MARQUES, E. & TORRES, H. (orgs.) São Paulo: segregação, pobreza e desigualdades sociais. São Paulo: Ed. Senac, no prelo, 2004. KAZTMAN, R. La dimensión espacial en las políticas de la superación de la
pobreza urbana. Montevideo: mimeo, 1999. KRAVDAL, O. The problematic estimation of “imitation effects” in
multilevel models. In: Demographic Research, v.9, 2003, pp. 25-40. (http://www.demographic-research.org)
LAVINAS, L. Combater a pobreza estimulando a freqüência escolar: o estudo de caso do programa bolsa-escola do Recife. In: Dados, vol. 43, no. 3, 2000.
LEITE, P. e SILVA D. Análise da situação ocupacional de crianças e adolescentes nas regiões Sudeste e Nordeste do Brasil utilizando informações da PNAD 1991. In: Revista Brasileira de Estudos de População, v.19, n.2, 2002, pp.47-63.
MADEIRA, F. A trajetória das meninas nos setores populares: escola, trabalho ou reclusão. In: Madeira F. Quem mandou nascer mulher? São Paulo, Record, 1997, pp.45-133.
MARQUES, E. e BITAR, S. “Grupos sociais no espaço paulistano”. Novos Estudos Cebrap, Nº 64, novembro, pp. 123-131, 2002.
MARQUES, E. e TORRES, H. (org.) São Paulo: segregação, pobreza e desigualdades sociais. São Paulo: Ed. Senac, 2004, no prelo.
Centro de Estudos da Metrópole/CEBRAP
35
MARQUES, E. “Espaço e grupos sociais na virada do século XXI”. In: MARQUES, E. e TORRES, H. (org.) São Paulo: segregação, pobreza e desigualdades sociais. São Paulo: Ed. Senac, 2004, no prelo.
MARQUES, E. Estado e redes sociais: Permeabilidade e coesão nas políticas urbanas no Rio de Janeiro. Rio de Janeiro: Revan/Fapesp, 2000.
MINGIONE, E. Urban poverty in the advanced industrial world: concepts, analysis and debates. In: MINGIONE, Enzo (org.) Urban poverty and the underclass. Nova York, Blackwell, 1999. MOSER, C. “The asset vulnerability framework: reassessing Urban Poverty
Reduction Strategies” In: World Development, Vol. 26, No 1, 1998. NEGRI, J., CASTRO, P., SOUZA, N. e ARBACHE, J. “Mercado Formal de
Trabalho: Comparação entre os Microdados da RAIS e da PNAD”. Texto para Discussão/IPEA, Brasília, nº 840, novembro 2001.
PED (Pesquisa de Emprego e Desemprego). Convênio SEADE-DIEESE. Questionário Suplementar SEADE/CEM “Mobilidade Ocupacional”.
PUTNAM, R. Bowling Alone: the collapse and revival of American community, New York, Touchstone, 2000.
ROCHA, S. Pobreza no Brasil: afinal, de que se trata? Rio de Janeiro: FGV Editora, 2003.
SABATINI, F., CÁCERES, G. e CERDA, J. “Segregación residencial em lãs principales ciudades chilenas: tendencias de lãs três ultimas décadas y posibles cursos de accion”. Paper apresentado no seminário sobre estrutura social e segregação espacial – São Paulo, Rio de Janeiro e Paris, 28 e 29 de junho de 2004.
SANTOS, W. dos. Cidadania e justiça. Rio de Janeiro: Ed. Campus, 1979. SEADE Índice Paulista de Responsabilidade Social. São Paulo, Seade/
Assembléia Legislativa do Estado de São Paulo, 2001. SEN, A. Inequality reexamined. New York: Russel Sage Foundation, 1992. SHIELDS, M. e SWENSON, D. “Regional Labor Markets: The Relationship
Between Industry Level Employment an In-commuting in Pennsylvania Counties” The journal of Regional Analysis & Policy, 30:2. 2000.
SOARES, J.F. et all. Fatores explicativos do desempenho em lígua portuguesa e matemática: a evidência do SAEB-99. Brasília, INEP, 2001 (mimeo).
TILLY, Charles Durable Inequality. Los Angeles, University of California Press, 1999.
TORRES, H.; MARQUES, E., FERREIRA, M. e BITAR, S. “Pobreza e Espaço: padrões de segregação em São Paulo”. In: Estudos Avançados, vol. 17, Nº 47, p. 97-128, 2003.
TORRES, H. e GOMES, S. “Desigualdade Educacional e Segregação Social na Grande São Paulo”, São Paulo. In: Novos Estudos Cebrap, nº 64, novembro 2002, pp. 132-140.

Centro de Estudos da Metrópole/CEBRAP
36
TORRES, H. e MARQUES, E. “Reflexões sobre a hiperferiferia: novas e velhas faces da pobreza no entorno metropolitano”. In: Revista Brasileira de Estudos Urbanos e Regionais, No 4, 2002.
TORRES, H. Segregação residencial e políticas públicas: São paulo na década de 1990. Revista Brasileira de Ciências Sociais, n.54, 2004.
TORRES, H. Social policies for the urban poor: the role of population information. UNFPA Country Support Team for Latin America and the Caribbean - Working Papers Series CST/ LAC Nº 24, 2002.
YIENGER, J. Housing discrimination and residential segregation as causes of poverty. In: Danziger, S. H. e Haverman, R.H. Understanding poverty. New York, Russell Sage, 2001 pp. 359-391.
ZALUAR, A. “As mulheres e a direção do consumo doméstico (estudo dos papéis familiares nas classes populares urbanas)”. In: Almeida, M. et all (orgs.). Colcha de retalhos: estudos sobre a família no Brasil. São Paulo: Brasiliense, p.159-82, 1982.


