Embed Size (px)
Citation preview

arX
iv:1
007.
4492
v2 [
astr
o-ph
.CO
] 27
Jul
201
0Astronomy & Astrophysicsmanuscript no. AA15165 c© ESO 2010July 28, 2010
The Sloan Great Wall. Rich clusters.M. Einasto1, E. Tago1, E. Saar1, P. Nurmi2, I. Enkvist1, P. Einasto1, P. Heinamaki2,3, L.J. Liivamagi1, E. Tempel1,4, J.
Einasto1, V.J. Martınez5, J. Vennik1, and P. Pihajoki2
1 Tartu Observatory, 61602 Toravere, Estonia2 Tuorla Observatory, University of Turku, Vaisalantie 20, Piikkio, Finland3 Finnish Centre of Astronomy with ESO (FINCA), University ofTurku, Vaisalantie 20, Piikkio, Finland4 Institute of Physics, Tartu University, Tahe 4, 51010 Tartu, Estonia5 Observatori Astronomic, Universitat de Valencia, Apartat de Correus 22085, E-46071 Valencia, Spain
Received 2010/ Accepted...
ABSTRACT
Aims. We present the results of the study of the substructure and galaxy content of ten rich clusters of galaxies in three differentsuperclusters of the Sloan Great Wall, the richest nearby system of galaxies (hereafter SGW).Methods. We determine the substructure in clusters using the ’Mclust’ package from the ’R’ statistical environment and analysetheir galaxy content with information about colours and morphological types of galaxies. We analyse the distribution of the peculiarvelocities of galaxies in clusters and calculate the peculiar velocity of the first ranked galaxy.Results. We show that five clusters in our sample have more than one component; in some clusters the different components alsohave different galaxy content. In other clusters there are distinct components in the distribution of the peculiar velocities ofgalaxies.We find that in some clusters with substructure the peculiar velocities of the first ranked galaxies are high. All clustersin our samplehost luminous red galaxies; in eight clusters their number exceeds ten. Luminous red galaxies can be found both in the central areasof clusters and in the outskirts, some of them have high peculiar velocities. About 1/3 of the red galaxies in clusters are spirals. Thescatter of colours of red ellipticals is in most clusters larger than that of red spirals. The fraction of red galaxies in rich clusters in thecores of the richest superclusters is larger than the fraction of red galaxies in other very rich clusters in the SGW.Conclusions. The presence of substructure in rich clusters, signs of possible mergers and infall, and the high peculiar velocities ofthe first ranked galaxies suggest that the clusters in our sample are not yet virialized. We present merger trees of dark matter haloes inan N-body simulation to demonstrate the formation of present-day dark matter haloes via multiple mergers during their evolution. Insimulated dark matter haloes we find a substructure similar to that in observed clusters.
Key words. Cosmology: large-scale structure of the Universe; Galaxies: clusters: general
1. Introduction
Most galaxies in the Universe are located in groups and clustersof galaxies, which in turn reside in larger systems – in superclus-ters of galaxies or in filaments crossing underdense regionsbe-tween superclusters. According to the Cold Dark Matter model,groups and clusters of galaxies form hierarchically through themerging of smaller systems (Loeb 2008; Knebe & Muller 2000,and references therein). The timescale of the evolution of groupsdepends on their global environment (Tempel et al. 2009). Asaresult, the properties of groups depend on the environment wherethey are embedded, richer and more luminous groups are locatedin a higher-density environment than poor, less luminous groups(Einasto et al. 2003a,b, 2005; Berlind et al. 2006). An under-standing of the properties and evolutionary state of groupsandclusters of galaxies in different environments, and of the proper-ties of galaxies in them is important for the study of groups andclusters, as well as for the study of the properties and evolutionof galaxies and larger structures – superclusters of galaxies.
Detailed knowledge of properties of clusters of galaxies isalso needed for comparison of observations with N-body calcu-lations of the formation and evolution of cosmic structures.
Galaxies and galaxy systems form because of initial densityperturbations of different scales. Perturbations of a scale of about
Send offprint requests to: M. Einasto
100h−1 Mpc1 give rise to the largest superclusters. The largestand richest superclusters, which may contain several tens of rich(Abell) clusters, are the largest coherent systems in the Universewith characteristic dimensions of up to 100h−1 Mpc. At largescales a dynamical evolution takes place at a slower rate, and therichest superclusters have retained the memory of the initial con-ditions of their formation, and of the early evolution of structure(Kofman et al. 1987). Rich superclusters have high density coresthat are absent in poor superclusters (Einasto et al. 2007b). Thecore regions of the richest superclusters may contain merging X-ray clusters (Rose et al. 2002; Bardelli et al. 2000; Belsoleet al.2004). The formation of rich superclusters had to begin earlierthan that of the smaller structures; they are the sites of earlystar and galaxy formation (e.g. Mobasher et al. 2005), and thefirst places where systems of galaxies form (e.g. Venemans etal.2004; Ouchi et al. 2005).
Among the richest galaxy systems, the Sloan Great Wall,which is the richest system of galaxies in the nearby Universe(Vogeley et al. 2004; Gott et al. 2005; Nichol et al. 2006), de-serves special attention. The SGW consists of several rich andpoor superclusters connected by lower density filaments ofgalaxies, representing a variety of global environments from thehigh density core of the richest supercluster in the SGW to alower density poor supercluster at the edge of the SGW. The su-
1 h is the Hubble constant in units of 100 km s−1 Mpc−1.

2 M. Einasto et al.: The Sloan Great Wall.
perclusters in the SGW differ in morphology and galaxy content,which suggests that their formation and evolution has been dif-ferent (Einasto et al. 2010, in preparation, hereafter E10).
Our aim in the present paper is to study the properties ofthe richest clusters of galaxies in the SGW. Our clusters comefrom all the superclusters in the SGW so that we can comparethe dynamical state and galaxy content of the richest clusters indifferent environments, from the high-density core of the richestsupercluster to clusters in a poor supercluster in the extension ofthe SGW.
The present-day dynamical state of clusters of galaxies de-pends on their formation history. One indicator of the former orongoing mergers between groups and clusters is the presenceofsubstructure in clusters (Knebe & Muller 2000, and referencestherein). The substructure affects the estimates of several clus-ter characteristics, the dynamical mass and mass-to-lightratioamong others (see Biviano et al. 2006, for a review). Mergersalso affect the properties of galaxies in clusters. The well-knownmorphology density relation tells that early type, red galaxiesare located in clusters (in the central areas) while late type, bluegalaxies can preferentially be found outside of rich clusters, orin the outskirts of clusters (Einasto et al. 1974; Dressler 1980;Butcher & Oemler 1978; Einasto & Einasto 1987). An old ques-tion is whether the properties of galaxies depend on the clus-tercentric radius or on the local density of galaxies in clusters,or on both (Whitmore & Gilmore 1991; Huertas-Company et al.2009; Park & Choi 2009; Park & Hwang 2009). The study ofsubstructure in clusters and of galaxy populations in differentsubstructures helps us to understand the role of environmentaleffects on galaxy populations in clusters.
To search for substructure in clusters we use theMclustpackage (Fraley & Raftery 2006) fromR, an open-sourcefree statistical environment developed under the GNU GPL(Ihaka & Gentleman 1996,http://www.r-project.org).One of our aims in this paper is to explore the possibilities ofMclust for the study of substructure in galaxy clusters.
Another indicator of substructure in clusters is the deviationof the distribution of the peculiar velocities of galaxies in clus-ters (the velocities of galaxies with respect to the clustercentre)from Gaussian. We use several tests to analyse this distribution.
In virialized clusters the galaxies follow the cluster poten-tial well. If so, we would expect that the first ranked galax-ies in clusters lie at the centres of groups (group haloes) andhave low peculiar velocities (Ostriker & Tremaine 1975; Merritt1984; Malumuth 1992). Therefore the peculiar velocity of thefirst ranked galaxies in clusters is also an indication of thedy-namical state of the cluster (Coziol et al. 2009).
Thus, in the present paper we search for subclusters in richclusters of the SGW, analyse the peculiar velocities of galaxiesin clusters, and the peculiar velocities of the first ranked galaxies.We study the galaxy content of substructures, using informationabout colours, luminosities, and morphological types of galax-ies.
We compare our results with an N-body simulation and showhalo merger trees to demonstrate the formation of present-dayhaloes via multiple mergers during their evolution.
2. Data
We use the data from the seventh data release of the Sloan DigitalSky Survey (Adelman-McCarthy et al. 2008; Abazajian et al.2009). We choose a subsample of these data from the SGW re-gion: 150 ≤R.A.≤ 220, −4 ≤ δ ≤ 8, with the distance limits150 ≤ Dc ≤ 300h−1 Mpc. This region fully covers the SGW
and also includes several poor superclusters in the foregroundand background of the SGW, filaments which connect the SGWwith these superclusters, and underdense regions between super-clusters and filaments. In this region there are 27113 galaxies inthe MAIN SDSS galaxy sample.
Our next step is to determine groups of galaxies. We next de-scribe the sample selection and the compilation of the groupcat-alogue; for details we refer to Tago et al. (2010). After correctionof the galaxy magnitudes for galactic extinction we use the dataabout galaxies with the apparentr magnitudes 12.5 ≤ r ≤ 17.77.In addition, we have found duplicates due to repeated spec-troscopy for a number of galaxies in the DAS Main galaxy sam-ple, which had to be excluded in order to avoid false group mem-bers. We count as duplicate entries the galaxies which have aprojected separation of less than 5 kpc. We excluded from oursample those duplicate entries with spectra of lower accuracy.If both duplicates had a large value of the redshift confidenceparameter (zconf> 0.99), we excluded the fainter duplicate.
We corrected the redshifts of galaxies for the motion rel-ative to the CMB and computed the co-moving distancesDc
(Martınez & Saar 2002) of galaxies using the standard cosmo-logical parameters: the matter densityΩm = 0.27, and the darkenergy densityΩΛ = 0.73.
We determined groups of galaxies using the friends-of-friends cluster analysis method introduced by Turner & Gott(1976); Zeldovich et al. (1982); Huchra & Geller (1982), andmodified by us. A galaxy belongs to a group of galaxies ifthis galaxy has at least one group member galaxy closer thana linking length. In a flux-limited sample the density of galax-ies slowly decreases with distance. To take this selection effectproperly into account when constructing a group catalogue froma flux-limited sample, we rescaled the linking length with dis-tance. As a result, the maximum sizes in the sky projection andvelocity dispersions of our groups are similar at all distances.This shows that the distance-dependent selection effects havebeen properly taken into account, and that groups in our cata-logue form a homogeneous sample suitable for statistical stud-ies. However, there are exceptions: data about extremely poorgroups with less than four member galaxies are not reliable.Inaddition, there are four exceptionally rich systems in our cat-alogue with more than 300 member galaxies, which all cor-respond to well-known nearby Abell clusters (A1656 (Coma),A2151/2152 (Hercules), A2197/2199 and A1367. As we see be-low, the clusters analysed in the present study do not belongtothese exceptions.
In the group catalogue the first ranked galaxy of a group isdefined as the most luminous galaxy in ther-band. We use thisdefinition also in the present paper.
The T10 group catalogue is available inelectronic form at the CDS via anonymousftp to cdsarc.u-strasbg.fr (130.79.128.5) or viahttp://cdsweb.u-strasbg.fr/cgi-bin/qcat?J/A+A/.
To select the galaxies and galaxy systems belonging to theSGW the next step was to calculate the luminosity density fieldof galaxies.
To calculate a density field, at first we convert the spatial po-sitions of galaxies into spatial densities. The standard approachfor that is to use kernel densities; we use theB3 box spline
B3(x) =112
(
|x− 2|3 − 4|x− 1|3 + 6|x|3 + 4|x+ 1|3 + |x+ 2|3)
.
We define theB3 box spline kernel of a widthh as
K(1)B (x; h)δ = B3(x/h)(δ/h),

M. Einasto et al.: The Sloan Great Wall. 3
R.A.
Dec
.
1
2
34
5678
9
10
220 210 200 190 180 170 160 150
−4
0
4
8
Fig. 1. Distribution of groups with at least four member galaxies inthe Sloan Great Wall region. Black circles correspond to thegroups in the SGW, grey circles to the groups in the field. Circle sizes are proportional to a group’s size in the sky. Crosses show thelocation of rich clusters, and numbers are their ID numbers from Table 1.
whereδ is the grid step. This kernel differs from zero only inthe intervalx ∈ [−2h; 2h]. The three-dimensional kernel func-tion K(3)
B is given by the direct product of three one-dimensionalkernels:
K(3)B (r; h)δ ≡ K(1)
3 (x; h)δK(1)3 (y; h)δK
(1)3 (z; h)δ,
where r ≡ x, y, z. Although this is a direct product, it isisotropic to a good degree. For a detailed description we refer toEinasto et al. (2007b), E10 and Liivamagi et al. 2010 (in prepa-ration).
The k-correction for the SDSS galaxies was calcu-lated with the KCORRECT algorithm (Blanton et al. 2003a;Blanton & Roweis 2007). We also acceptedM⊙ = 4.53 (in therphotometric system). The evolution correctione was found ac-cording to Blanton et al. (2003b). With the velocity and radialdispersions from the group catalogue by T10 we supressed thecluster-finger redshift distortions.
We also have to consider the luminosities of the galaxies thatlie outside the observational window of the survey. Assumingthat every galaxy is a visible member of a density enhancement(a group or cluster), we estimate the amount of unobserved lu-minosity and weigh each galaxy accordingly:
Lw =WL(d) Lobs. (1)
HereWL(d) is a distance-dependent weight:
WL(d) =
∫ ∞
0L F(L)dL
∫ L2(d)
L1(d)L F(L)dL
, (2)
whereF(L) is the luminosity function andL1(d) andL2(d) arethe luminosity window limits at a distanced.
In our final flux-limited group catalogue the richness ofgroups rapidly decreases at distancesD > 300h−1 Mpc due toselection effects. At small distances,D < 100h−1 Mpc, the lu-minosity weights are large owing to the absence of very brightgalaxies. At the distance limits used to define our sample theselection effects are small.
The densities were calculated on a cartesian grid based onthe SDSSη, λ coordinate system because it allowed the most ef-ficient placing of the galaxy sample cone into a box. We choosethe kernel widthh = 8h−1 Mpc. This kernel differs from zerowithin the distance 16h−1 Mpc, but significantly so only in-side the 8h−1 Mpc radius. We calculated thex, y, andz coor-dinates using theλ andη coordinates as follows:x = −Rsinλ,
y = Rcosλ cosη, andz= Rcosλ sinη, whereR is the distance ofthe galaxy. Before extracting superclusters we applied theDR7mask assembled by Arnalte-Mur ((Martınez et al. 2009) to thedensity field and converted the densities into units of mean den-sity. The mean density is the average over all pixel values insidethe mask. The mask is designed to follow the edges of the survey,and the galaxy distribution inside the mask is considered homo-geneous. The details of this procedure will be given in Liivamagiet al., 2010 (in preparation).
Next we created a set of density contours by choosing a den-sity threshold and defined the connected volumes above a cer-tain density threshold as superclusters. Different threshold den-sities correspond to different supercluster catalogues. In order tochoose proper density levels to determine the SGW and the in-dividual superclusters which belong to the SGW, we analysedthe density field superclusters at a series of density levels. As aresult we used the density levelD = 4.9 to determine the indi-vidual superclusters in the SGW.
The richest superclusters in the SGW are the superclustersSCl 126 and the supercluster SCl 111 (we use the ID num-bers of the superclusters from the catalogue of superclusters byEinasto et al. (2001)). The supercluster SCl 126 also includesthe supercluster SCl 136 from the Einasto et al. (2001) cata-logue. The core of the supercluster SCl 126 contains severalrich X-ray clusters of galaxies (Belsole et al. 2004; Einasto et al.2007b). The supercluster SCl 126 is the richest in the SGW witha very high density core, its morphology resembles a very richand high-density multibranching filament (Einasto et al. 2007b,2008, E10). The supercluster SCl 111 is the second in richnessin the SGW and consists of three concentrations of rich clustersconnected by filaments of galaxies (a “multispider” morphol-ogy, see Einasto et al. 2007b). Poor superclusters from the low-density extension of the SGW belong to the supercluster SCl 91in the Einasto et al. (2001) catalogue. These superclustersrepre-sent different global environments in the SGW. For details aboutindividual superclusters in the SGW we refer to E10.
Then we selected rich clusters from the SGW for our studyas follows. First, we selected all clusters of galaxies in the SGWwith at least 75 member galaxies, altogether 7 clusters. We addedto this sample a cluster which corresponds to the Abell clus-ter A1773, an X-ray cluster (Bohringer et al. 2004). This clus-ter has 74 member galaxies in our catalogue. We also addedto our analysis two clusters from the core region of the super-cluster SCl 126, A1650 with 48 member galaxies and A1658with 29 member galaxies. Both of them are X-ray clusters
4 M. Einasto et al.: The Sloan Great Wall.
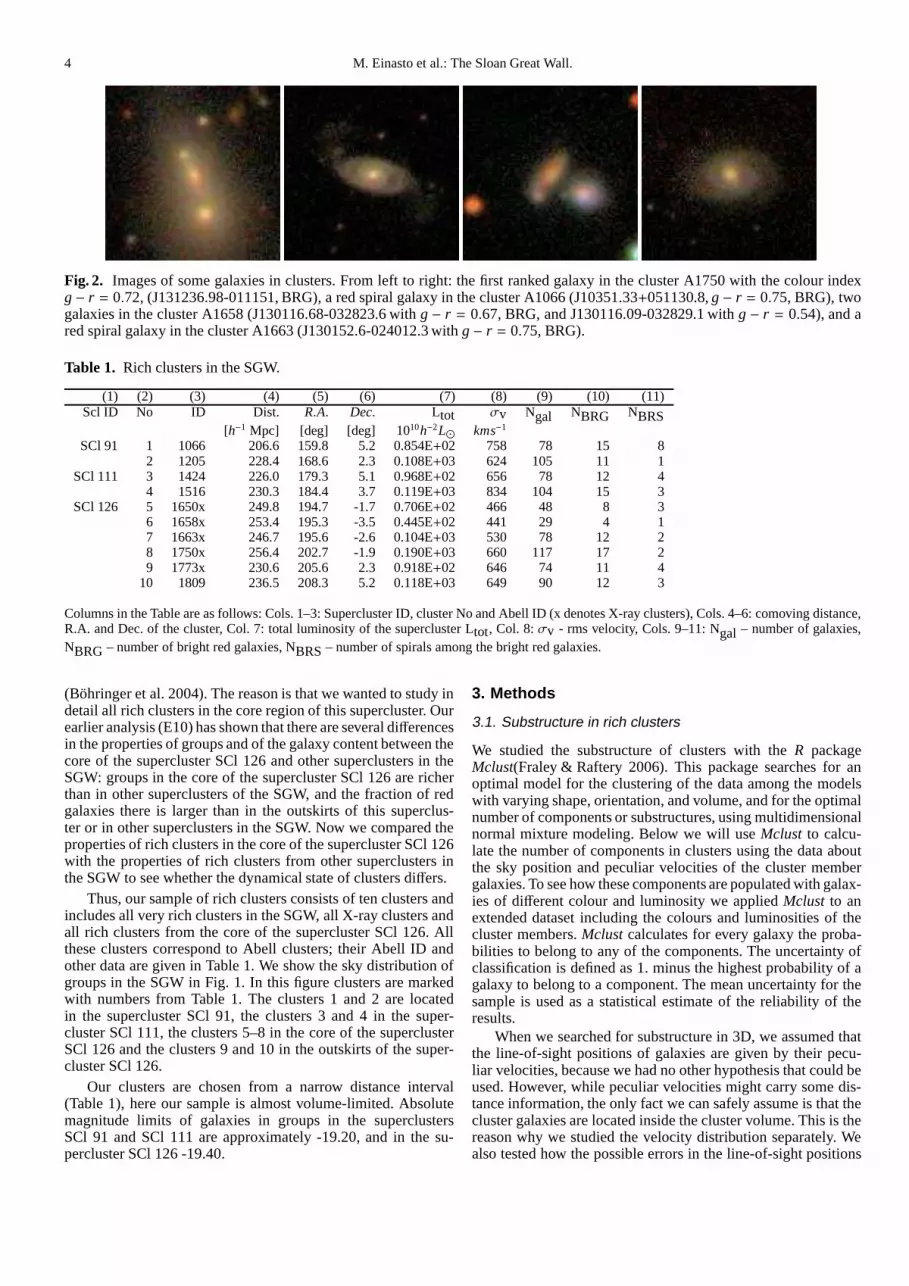
Fig. 2. Images of some galaxies in clusters. From left to right: the first ranked galaxy in the cluster A1750 with the colour indexg− r = 0.72, (J131236.98-011151, BRG), a red spiral galaxy in the cluster A1066 (J10351.33+051130.8,g− r = 0.75, BRG), twogalaxies in the cluster A1658 (J130116.68-032823.6 withg− r = 0.67, BRG, and J130116.09-032829.1 withg− r = 0.54), and ared spiral galaxy in the cluster A1663 (J130152.6-024012.3with g− r = 0.75, BRG).
Table 1. Rich clusters in the SGW.
(1) (2) (3) (4) (5) (6) (7) (8) (9) (10) (11)Scl ID No ID Dist. R.A. Dec. Ltot σv Ngal NBRG NBRS
[h−1 Mpc] [deg] [deg] 1010h−2L⊙ kms−1
SCl 91 1 1066 206.6 159.8 5.2 0.854E+02 758 78 15 82 1205 228.4 168.6 2.3 0.108E+03 624 105 11 1
SCl 111 3 1424 226.0 179.3 5.1 0.968E+02 656 78 12 44 1516 230.3 184.4 3.7 0.119E+03 834 104 15 3
SCl 126 5 1650x 249.8 194.7 -1.7 0.706E+02 466 48 8 36 1658x 253.4 195.3 -3.5 0.445E+02 441 29 4 17 1663x 246.7 195.6 -2.6 0.104E+03 530 78 12 28 1750x 256.4 202.7 -1.9 0.190E+03 660 117 17 29 1773x 230.6 205.6 2.3 0.918E+02 646 74 11 4
10 1809 236.5 208.3 5.2 0.118E+03 649 90 12 3
Columns in the Table are as follows: Cols. 1–3: SuperclusterID, cluster No and Abell ID (x denotes X-ray clusters), Cols.4–6: comoving distance,R.A. and Dec. of the cluster, Col. 7: total luminosity of the supercluster Ltot, Col. 8:σv - rms velocity, Cols. 9–11: Ngal – number of galaxies,NBRG – number of bright red galaxies, NBRS– number of spirals among the bright red galaxies.
(Bohringer et al. 2004). The reason is that we wanted to study indetail all rich clusters in the core region of this supercluster. Ourearlier analysis (E10) has shown that there are several differencesin the properties of groups and of the galaxy content betweenthecore of the supercluster SCl 126 and other superclusters in theSGW: groups in the core of the supercluster SCl 126 are richerthan in other superclusters of the SGW, and the fraction of redgalaxies there is larger than in the outskirts of this superclus-ter or in other superclusters in the SGW. Now we compared theproperties of rich clusters in the core of the supercluster SCl 126with the properties of rich clusters from other superclusters inthe SGW to see whether the dynamical state of clusters differs.
Thus, our sample of rich clusters consists of ten clusters andincludes all very rich clusters in the SGW, all X-ray clusters andall rich clusters from the core of the supercluster SCl 126. Allthese clusters correspond to Abell clusters; their Abell IDandother data are given in Table 1. We show the sky distribution ofgroups in the SGW in Fig. 1. In this figure clusters are markedwith numbers from Table 1. The clusters 1 and 2 are locatedin the supercluster SCl 91, the clusters 3 and 4 in the super-cluster SCl 111, the clusters 5–8 in the core of the superclusterSCl 126 and the clusters 9 and 10 in the outskirts of the super-cluster SCl 126.
Our clusters are chosen from a narrow distance interval(Table 1), here our sample is almost volume-limited. Absolutemagnitude limits of galaxies in groups in the superclustersSCl 91 and SCl 111 are approximately -19.20, and in the su-percluster SCl 126 -19.40.
3. Methods
3.1. Substructure in rich clusters
We studied the substructure of clusters with theR packageMclust(Fraley & Raftery 2006). This package searches for anoptimal model for the clustering of the data among the modelswith varying shape, orientation, and volume, and for the optimalnumber of components or substructures, using multidimensionalnormal mixture modeling. Below we will useMclust to calcu-late the number of components in clusters using the data aboutthe sky position and peculiar velocities of the cluster membergalaxies. To see how these components are populated with galax-ies of different colour and luminosity we appliedMclust to anextended dataset including the colours and luminosities ofthecluster members.Mclust calculates for every galaxy the proba-bilities to belong to any of the components. The uncertaintyofclassification is defined as 1. minus the highest probabilityof agalaxy to belong to a component. The mean uncertainty for thesample is used as a statistical estimate of the reliability of theresults.
When we searched for substructure in 3D, we assumed thatthe line-of-sight positions of galaxies are given by their pecu-liar velocities, because we had no other hypothesis that could beused. However, while peculiar velocities might carry some dis-tance information, the only fact we can safely assume is thatthecluster galaxies are located inside the cluster volume. This is thereason why we studied the velocity distribution separately. Wealso tested how the possible errors in the line-of-sight positions

M. Einasto et al.: The Sloan Great Wall. 5
Table 2. Dynamical properties of rich clusters.
(1) (2) (3) (4) (5) (6) (7) (8) (9) (10) (11)Scl ID No ID Ncomp vpec vrpec pSW k pk sk psk
SCl 91 1 1066 1 -312 0.41 0.074 2.34 0.139 -0.243 0.5282 1205 5 49 0.08 0.247 2.37 0.099 -0.069 0.841
SCl 111 3 1424 2 -825 1.26 0.173 2.51 0.387 0.383 0.3394 1516 1 -58 0.07 0.535 2.84 0.948 -0.292 0.403
SCl 126 5 1650x 1 -189 0.41 0.110 2.80 0.946 0.563 0.2636 1658x 1 -463 1.05 0.937 2.37 0.583 0.048 0.9367 1663x 2 -841 1.59 0.372 2.57 0.493 -0.228 0.5628 1750x 5 -724 1.10 0.115 2.51 0.243 -0.265 0.4229 1773x 1 -76 0.12 0.572 3.24 0.436 -0.083 0.835
10 1809 2 -115 0.18 0.802 2.73 0.780 0.053 0.887
Columns in the Table are as follows: 1–3: Supercluster ID, cluster No and Abell ID, Col. 4: number of components, Col. 5: peculiar velocity ofthe first ranked galaxy (kms−1), Col. 6: normalised peculiar velocity of the first ranked galaxy, vpec/σv; Col. 7: p-value of the Shapiro-Wilk test,Cols. 8 and 9: kurtosisk and thep-valuepk for kurtosis for the peculiar velocities, Cols. 10 and 11: skewnessskand thep-valuepsk for skewnessfor the peculiar velocities.
Table 3. Galaxy populations in rich clusters.
(1) (2) (3) (4) (5) (6) (7) (8) (9) (10) (11)Scl ID No ID (g− r)mean Fred Fell Frs slopered SDred SDEred SDSred
SCl 91 1 1066 0.73 0.73 0.36 0.58 -0.024 0.043 0.024 0.0532 1205 0.68 0.62 0.38 0.45 -0.012 0.030 0.027 0.033
SCl 111 3 1424 0.73 0.71 0.44 0.49 -0.007 0.046 0.033 0.0574 1516 0.76 0.85 0.56 0.34 -0.018 0.032 0.032 0.033
SCl 126 5 1650x 0.78 0.94 0.56 0.40 -0.010 0.039 0.036 0.0426 1658x 0.74 0.83 0.58 0.29 -0.026 0.029 0.031 0.0247 1663x 0.75 0.83 0.49 0.43 -0.007 0.037 0.032 0.0428 1750x 0.78 0.91 0.62 0.33 -0.013 0.042 0.041 0.0469 1773x 0.73 0.77 0.53 0.41 -0.011 0.040 0.032 0.048
10 1809 0.75 0.84 0.51 0.43 -0.015 0.029 0.027 0.032
Columns in the Table are as follows: Cols. 1–3: SuperclusterID, cluster No and Abell ID, Col. 4: (g− r)mean– the meang− r colour of galaxies,Cols. 5–11: fraction of red galaxies, fraction of elliptical galaxies, fraction of spirals among red galaxies, and the slope and the rms scatter of thered sequence in the colour – magnitude diagram (the scatter of all red galaxies, and that of red ellipticals and red spirals).
of galaxies affect the results ofMclustrandomly shuffling the pe-culiar velocities of galaxies 1000 times and searching eachtimefor the substructure withMclust. The number of the componentsfound byMclust remained unchanged, which demonstrated thatthe results ofMclustare robust.
To analyse the distribution of the peculiar velocities of galax-ies in clusters we used several 1D tests. We tested the hy-pothesis about the Gaussian distribution of the peculiar veloc-ities of galaxies in clusters with the Shapiro-Wilk normality test(Shapiro 1965). We used this test because it is considered thebest for small samples. We also calculated the kurtosis and theskewness of the peculiar velocity distributions, and used theseto test for the normality of the distributions with the Anscombe-Glynn test for the kurtosis (Anscombe & Glynn 1983) and withthe D’Agostino test for the skewness (D’Agostino 1970), us-ing theR packagemomentsby L. Komsta and F. Novomestky(http://www.r-project.org).
The distribution of the peculiar velocities of galaxies in clus-ters can be quantified with the usual normal mixture models(e.g. Ashman et al. (1994); Boschin et al. (2006); Barrena etal.(2007). In theRenvironment there is a suitable package to studythese mixture models, calledflexmix (Leisch 2004).Flexmixfits a user-specified number of Gaussians to the velocity data.
However, subclusters in clusters sometimes do not differ in pe-culiar velocities, and in some clusters the tails of the velocitydistribution are not well determined byflexmix. Thus we fittedthe distributions of the peculiar velocities with normal mixturemodels ourselves, taking into account the substructure informa-tion provided byMclust and by the 3D distribution of galaxiesthat we will show below.
The data characterizing the clusters’ dynamical state aregiven in Table 2, where we present the number of components inclusters determined byMclust, the peculiar velocities of the firstranked galaxies, the results of the Shapiro-Wilk test, the kurtosisand skewness, and their normality testp-values for the peculiarvelocity distributions.
3.2. Galaxy populations in rich clusters
To analyse the galaxy content of clusters, we used theg−r colourof galaxies and their absolute magnitude in ther-bandMr . Wedivided the galaxies by colour into the red and blue populationsusing the colour limitg− r = 0.7 (red galaxies haveg− r ≥ 0.7)and excluded from the analysis the galaxies withg − r > 0.95(such a high value indicates possible errors in photometry,oftendue to overlapping images of galaxies). This limit depends on the

6 M. Einasto et al.: The Sloan Great Wall.
luminosity of galaxies; because there are no very faint galaxiesin our sample, we will use this simple approach. We calculatedthe fraction of red galaxies in clusters, the mean colour of thecluster, and the rms scatter and slope of the red sequence in thecluster colour-magnitude diagram (for all galaxies, for red ellip-ticals, and for red spirals).
We also studied the population of bright red galaxies (BRGs,the galaxies that have the GALAXYRED flag in the SDSSdatabase) in the clusters. The BRGs are nearby (z < 0.15, cut I)LRGs (Eisenstein et al. 2001). Because Eisenstein et al. (2001)warn that the sample of nearby LRGs may be contaminated bygalaxies of lower luminosity, we choose to call them BRGs. TheBRGs are similar to the LRGs at higher redshifts. Nearby brightred galaxies do not form an approximately volume-limited pop-ulation (Eisenstein et al. 2001) but they are yet the most brightand the most red galaxies in the SGW region (see also E10).
We determined the morphological type of galaxies in clusterswith the SDSS visual tools. Following the classification used inthe ZOO project (Lintott et al. 2008), we denote elliptical galax-ies as of type 1, spiral galaxies of type 4, those galaxies whichshow a signs of merging or other disturbancies as of type 6.Types 2 and 3 mark clockwise and anti-clockwise spiral galaxieswith visible spiral arms. Fainter galaxies, for which the morpho-logical type is difficult to determine, are of type 5. We calculatethe fraction of elliptical galaxies and of red spirals in clusters. Aword of caution is needed: faint galaxies are sometimes difficultto classify reliably. Some red galaxies classified as spirals mayactually be S0 galaxies. We present images of some galaxies inclusters in Fig. 2. All these galaxies are classified as BRGs (anexception is a blue galaxy in the third image from the left, whichmay be interacting with a companion galaxy).
The data for cluster galaxy populations are given in Table 3.Images of all galaxies in our clusters are shown on the web pagehttp://www.aai.ee/∼maret/SGWcl.html,
In the following analysis of individual rich clusters wepresent for each cluster the sky distribution of galaxies alongwith the density contours, the 3D vizualisation plot of galaxies(to generate these figures, we used theR packagescatterplot3Dby Ligges & Machler (2003)), the histograms of the peculiarve-locities for galaxies of a different morphological type and for theBRGs, and the colour-magnitude diagrams. We have added theGaussians for the components to the histograms of the peculiarvelocities of all galaxies. For some clusters we include additionalfigures to show their substructure.
In the figures of the sky distribution of galaxies in clustersthe2D density contours are calculated withMclust for clusters withmore than one component, and with theRpackageKernsmoothfor clusters with one component only.
4. Results
4.1. Clusters in the superclusters SCl 111 and SCl 91
4.1.1. The cluster A1066
The first rich cluster we study is the cluster A1066, which islocated in the supercluster SCl 91. Figure 3 (left panel) showsthat the 2D density contours of this cluster are quite smoothel-lipsoids. According toMclust, this cluster consists of one com-ponent, the mean uncertainty of the classification is 1.89 · 10−2.However, the 3D distribution of galaxies in this cluster Fig. 3(right panel) is complex – the shape resembles an hourglass,where some galaxies with negative peculiar velocities formaseparate component.
A1066.RA
A10
66.D
ec.
ESBRG1st rank
159.4 159.6 159.8 160 160.2
4.8
5
5.2
5.4
5.6
159.4 159.6 159.8 160.0 160.2 160.4−20
00−
1000
0
100
0 2
000
4.64.8
5.05.2
5.45.6
5.86.0
R.A.
Dec
.v(pe
c)
Fig. 3. 2D and 3D view of the cluster A1066 (SCl 91). Open cir-cles correspond to elliptical galaxies, crosses – to spiralgalaxies,filled circles to BRGs, and a star to the first ranked galaxy in thecluster.
A1066.RA
A10
66.D
ec
159.6 159.8 160.0 160.2
5.0
5.2
5.4
5.6
A1066.RA
A10
66.v
pec
159.6 159.8 160.0 160.2−2000
−1000
0.0
1000
2000
Fig. 4. Left panel shows R.A. vs. Dec., the right panel R.A. vs.peculiar velocities of galaxies (inkms−1) in the cluster A1066.Different symbols correspond to three different velocity com-ponents (see text), ellipses show the covariances of the compo-nents.
v(pec)(km/s)
−2000 −1000 0.0 1000 20000.0
0.05
0.10
P
v(pec)(km/s)
F
E
−2000 −1000 0.0 1000 20000
5
10
v(pec)(km/s)
F
S
−2000 −1000 0.0 1000 20000
5
10
v(pec)(km/s)
F
BRG
−2000 −1000 0.0 1000 20000
5
10
Fig. 5. Distribution of the peculiar velocities of galaxies in thecluster A1066. Top down: all galaxies, elliptical galaxies, spiralgalaxies (the grey histogram shows the red spirals), and BRGs. Pdenotes the probability histogram, F the galaxy number counts.The small dash in the upper panel indicates the peculiar velocityof the first ranked galaxy.
Figure 4, a so-called classification plot produced byMclust,shows three components in the distribution of the peculiar ve-locities of galaxies. The peculiar velocities with negative val-ues correspond to the lower part of the “hourglass”. The leftpanel of this figure shows that the different components in ve-locity are not separated in the sky distribution, which is whyMclustdetermines one component only for this cluster as givenin Table 2. We see three components in the distribution of thepeculiar velocities of galaxies in this cluster, and thep-value of
M. Einasto et al.: The Sloan Great Wall. 7
Mr
g −
r
ESBRG
−23.0 −22.0 −21.0 −20.0 −19.00.2
0.4
0.6
0.8
1.0
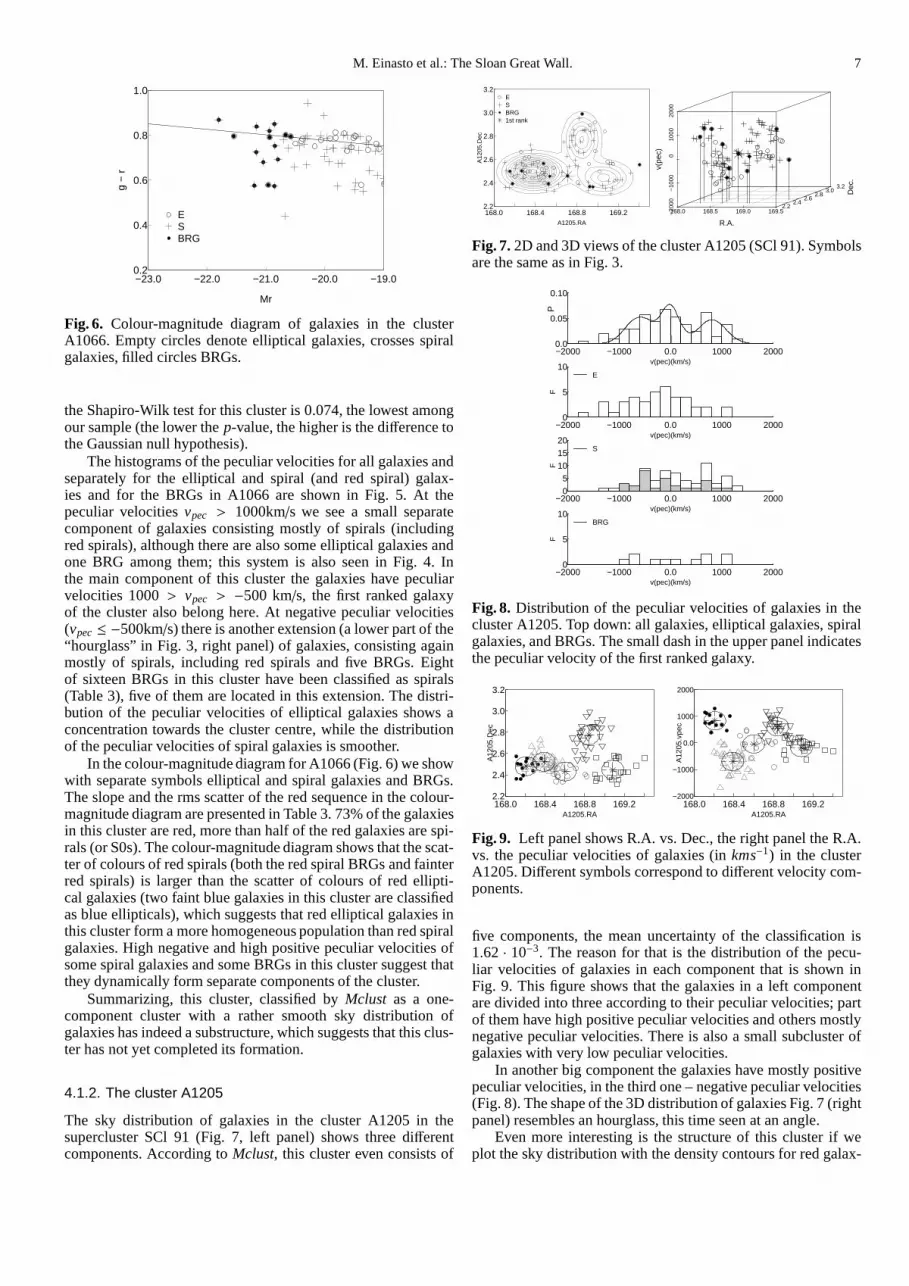
Fig. 6. Colour-magnitude diagram of galaxies in the clusterA1066. Empty circles denote elliptical galaxies, crosses spiralgalaxies, filled circles BRGs.
the Shapiro-Wilk test for this cluster is 0.074, the lowest amongour sample (the lower thep-value, the higher is the difference tothe Gaussian null hypothesis).
The histograms of the peculiar velocities for all galaxies andseparately for the elliptical and spiral (and red spiral) galax-ies and for the BRGs in A1066 are shown in Fig. 5. At thepeculiar velocitiesvpec > 1000km/s we see a small separatecomponent of galaxies consisting mostly of spirals (includingred spirals), although there are also some elliptical galaxies andone BRG among them; this system is also seen in Fig. 4. Inthe main component of this cluster the galaxies have peculiarvelocities 1000> vpec > −500 km/s, the first ranked galaxyof the cluster also belong here. At negative peculiar velocities(vpec≤ −500km/s) there is another extension (a lower part of the“hourglass” in Fig. 3, right panel) of galaxies, consistingagainmostly of spirals, including red spirals and five BRGs. Eightof sixteen BRGs in this cluster have been classified as spirals(Table 3), five of them are located in this extension. The distri-bution of the peculiar velocities of elliptical galaxies shows aconcentration towards the cluster centre, while the distributionof the peculiar velocities of spiral galaxies is smoother.
In the colour-magnitude diagram for A1066 (Fig. 6) we showwith separate symbols elliptical and spiral galaxies and BRGs.The slope and the rms scatter of the red sequence in the colour-magnitude diagram are presented in Table 3. 73% of the galaxiesin this cluster are red, more than half of the red galaxies arespi-rals (or S0s). The colour-magnitude diagram shows that the scat-ter of colours of red spirals (both the red spiral BRGs and fainterred spirals) is larger than the scatter of colours of red ellipti-cal galaxies (two faint blue galaxies in this cluster are classifiedas blue ellipticals), which suggests that red elliptical galaxies inthis cluster form a more homogeneous population than red spiralgalaxies. High negative and high positive peculiar velocities ofsome spiral galaxies and some BRGs in this cluster suggest thatthey dynamically form separate components of the cluster.
Summarizing, this cluster, classified byMclust as a one-component cluster with a rather smooth sky distribution ofgalaxies has indeed a substructure, which suggests that this clus-ter has not yet completed its formation.
4.1.2. The cluster A1205
The sky distribution of galaxies in the cluster A1205 in thesupercluster SCl 91 (Fig. 7, left panel) shows three differentcomponents. According toMclust, this cluster even consists of
A1205.RA
A12
05.D
ec
ESBRG1st rank
168.0 168.4 168.8 169.22.2
2.4
2.6
2.8
3.0
3.2
168.0 168.5 169.0 169.5−20
00−
1000
0
100
0 2
000
2.22.4
2.62.8
3.03.2
R.A.
Dec
.
v(pe
c)
Fig. 7. 2D and 3D views of the cluster A1205 (SCl 91). Symbolsare the same as in Fig. 3.
v(pec)(km/s)
−2000 −1000 0.0 1000 20000.0
0.05
0.10
P
v(pec)(km/s)
F
E
−2000 −1000 0.0 1000 20000
5
10
v(pec)(km/s)
F
S
−2000 −1000 0.0 1000 200005
101520
v(pec)(km/s)
F
BRG
−2000 −1000 0.0 1000 20000
5
10
Fig. 8. Distribution of the peculiar velocities of galaxies in thecluster A1205. Top down: all galaxies, elliptical galaxies, spiralgalaxies, and BRGs. The small dash in the upper panel indicatesthe peculiar velocity of the first ranked galaxy.
A1205.RA
A12
05.D
ec
168.0 168.4 168.8 169.22.2
2.4
2.6
2.8
3.0
3.2
A1205.RA
A12
05.v
pec
168.0 168.4 168.8 169.2−2000
−1000
0.0
1000
2000
Fig. 9. Left panel shows R.A. vs. Dec., the right panel the R.A.vs. the peculiar velocities of galaxies (inkms−1) in the clusterA1205. Different symbols correspond to different velocity com-ponents.
five components, the mean uncertainty of the classification is1.62 · 10−3. The reason for that is the distribution of the pecu-liar velocities of galaxies in each component that is shown inFig. 9. This figure shows that the galaxies in a left componentare divided into three according to their peculiar velocities; partof them have high positive peculiar velocities and others mostlynegative peculiar velocities. There is also a small subcluster ofgalaxies with very low peculiar velocities.
In another big component the galaxies have mostly positivepeculiar velocities, in the third one – negative peculiar velocities(Fig. 8). The shape of the 3D distribution of galaxies Fig. 7 (rightpanel) resembles an hourglass, this time seen at an angle.
Even more interesting is the structure of this cluster if weplot the sky distribution with the density contours for red galax-

8 M. Einasto et al.: The Sloan Great Wall.
A1205.RA
A12
05.D
ec
red1st rank
168.0 168.4 168.8 169.22.2
2.4
2.6
2.8
3.0
3.2
Fig. 10. Distribution of red galaxies (filled circles) in the clusterA1205. The star denotes the first ranked galaxy.
Mr
g −
r
ESBRG
−23.0 −22.0 −21.0 −20.0 −19.00.2
0.3
0.4
0.5
0.6
0.7
0.8
0.9
Fig. 11. Colour-magnitude diagram of galaxies in the clusterA1205. Empty circles denote elliptical galaxies, crosses spiralgalaxies, filled circles BRGs.
ies only (Fig. 10). This figure shows that one component in thiscluster mostly consists of red galaxies (there are both ellipticaland spiral galaxies among them, compare Fig. 7, left panel andFig. 10).
The first ranked galaxy in this cluster is located almost at thecentre of the sky distribution and has a very low peculiar velocity(the lowest among the clusters in our sample, see Table 2).
The histograms of the peculiar velocities of galaxies inA1205 in Fig. 8 show a large fraction of red spirals with neg-ative peculiar velocites, which belong to the component with redgalaxies. Some BRGs are also located there; in addition, we seeseveral BRGs in other components, even at the edges of the clus-ter (Fig. 7). The peculiar velocities of galaxies from the threedifferent components seen in the sky distribution partly overlap,so these components are not very clearly seen in the histograms.
In the colour-magnitude diagram for the A1205 (Fig. 11) wesee a bimodal distribution of galaxies, where the red and bluesequences are both clearly seen. This cluster has the largest frac-tion of blue galaxies in our sample (32%). The colour-magnitudediagram shows that the scatter of colours of red spirals is largerthan the scatter of colours of red elliptical galaxies (the rms scat-ters are 0.033 and 0.027, correspondingly, for red spirals andfor red ellipticals), although the difference is not as pronouncedas in the cluster A1066. In this cluster there are four faint bluegalaxies classified as blue ellipticals.
The presence of substructures in this cluster, which are popu-lated by galaxies of different properties, suggests that the clusterA1205 consists of at least three merging components.
A1424.RA
A14
24.D
ec
ESBRG1st rank
178.8 179 179.2 179.4 179.64.6
4.8
5
5.2
5.4
178.6 178.8 179.0 179.2 179.4 179.6 179.8−20
00−
1000
0
100
0 2
000
4.64.8
5.05.2
5.45.6
R.A.
Dec
.
v(pe
c)
Fig. 12. 2D and 3D views of the cluster A1424 (SCl 111).Symbols are the same as in Fig. 3.
A1424.RA
A14
24.D
ec
E1st rank
178.8 179 179.2 179.4 179.64.6
4.8
5
5.2
5.4
A1424.RA
A14
24.D
ec
S1st rank
178.8 179 179.2 179.4 179.64.6
4.8
5
5.2
5.4
Fig. 13. Sky distribution of elliptical (left) and spiral (right)galaxies in the cluster A1424. The 2D density contours are cal-culated using the data about elliptical or spiral galaxies,respec-tively. Filled circles in the left panel denote elliptical galaxies, inthe right panel spiral galaxies. The star denotes the first rankedgalaxy.
4.1.3. The cluster A1424
The next cluster under study, the cluster A1424, is located in thesecond rich supercluster in the SGW, SCl 111. The sky distri-bution of galaxies in this cluster (Fig. 12, left panel) shows twocomponents also confirmed byMclust. The mean uncertainty ofthe classification of galaxies in the cluster A1424 is 2.92 · 10−4.
The 3D distribution of galaxies (Fig. 12, right panel) showsthat in one of these components galaxies have mostly positivepeculiar velosities. Figure 13 shows that according to the skydistribution of galaxies in the cluster A1424, the componentsas delineated by elliptical and spiral galaxies are different – thetwo components are more clearly separated in the distribution ofspiral galaxies.
The distribution of the peculiar velocities of galaxies in thecluster A1424 (Fig. 14) has a minimum near the clusters cen-tre, which is seen in the distribution of the peculiar velocitiesof both elliptical and spiral galaxies. The elliptical galaxies aremore concentrated towards the centre of the cluster than thespi-ral galaxies, which is why the distribution of the peculiar veloci-ties is smoother. In the same time, the distribution of the peculiarvelocities of red spirals also shows two separate components.The BRGs are mostly located in the component with smallerright ascensions, several of which are spirals. The first rankedgalaxy of this cluster is located almost in the centre of thiscom-ponent.
In this cluster 73% of all galaxies are red. In the colour-magnitude diagram (Fig. 15) the scatter of red spiral galaxies isabout two times larger than the scatter of red elliptical galaxies(the rms scatters are 0.033 and 0.057, correspondingly, forredellipticals and for red spirals). This is caused by galaxiesin theouter parts of the cluster; it is possible that these galaxies haveonly recently joined the cluster.

M. Einasto et al.: The Sloan Great Wall. 9
v(pec)(km/s)
−2000 −1000 0.0 1000 20000.0
0.05
0.10
P
v(pec)(km/s)
F
E
−2000 −1000 0.0 1000 20000
5
10
v(pec)(km/s)
F
S
−2000 −1000 0.0 1000 20000
5
10
v(pec)(km/s)
F
BRG
−2000 −1000 0.0 1000 20000
5
10
Fig. 14. Distribution of the peculiar velocities of galaxies in thecluster A1424. Top down: all galaxies, elliptical galaxies, spiralgalaxies, and BRGs. The small dash in the upper panel indicatesthe peculiar velocity of the first ranked galaxy.
Mr
g −
r
ESBRG
−23.0 −22.0 −21.0 −20.0 −19.00.2
0.4
0.6
0.8
1.0
Fig. 15. Colour-magnitude diagram for galaxies in the clusterA1424. Empty circles denote elliptical galaxies, crosses spiralgalaxies, filled circles BRGs.
A1516.RA
A15
16.D
ec
ESBRG1st rank
184.0 184.2 184.4 184.6 184.83.2
3.4
3.6
3.8
4.0
183.8 184.0 184.2 184.4 184.6 184.8−20
00−
1000
0
100
0 2
000
3.23.4
3.63.8
4.04.2
R.A.
Dec
.
v(pe
c)
Fig. 16. 2D and 3D views of the cluster A1516 (SCl 111).Symbols are the same as in Fig. 3.
4.1.4. The cluster A1516
The cluster A1516 is located in the high-density core of the su-percluster SCl 111. The sky distribution of galaxies in thisclus-ter shows very regular contours (Fig. 16, left panel). Accordingto Mclust, this cluster has one component, the mean uncertaintyof the classification of galaxies is 7.71 · 10−4.
The 3D distribution of galaxies shows that in the sky galaxieswith negative peculiar velocities are mostly located in thecentralpart of the cluster (Fig. 16, right panel, and Fig. 17), wherethey
A1516.RA
A15
16.D
ec
184.0 184.2 184.4 184.6 184.83.2
3.4
3.6
3.8
4.0
A1516.RA
A15
16.v
pec
184.0 184.2 184.4 184.6 184.8−2000
−1000
0.0
1000
2000
Fig. 17. Left panel shows R.A. vs. Dec., the right panel the R.A.vs. the peculiar velocities of galaxies (inkms−1) in the clusterA1516. Different symbols correspond to different velocity com-ponents.
v(pec)(km/s)
−2000 −1000 0.0 1000 20000.0
0.05
0.10
P
v(pec)(km/s)
F
E
−2000 −1000 0.0 1000 20000
5
10
v(pec)(km/s)F
S
−2000 −1000 0.0 1000 20000
5
10
v(pec)(km/s)
FBRG
−2000 −1000 0.0 1000 20000
5
10
Fig. 18. Distribution of the peculiar velocities of galaxies in thecluster A1516. Top down: all galaxies, elliptical galaxies, spiralgalaxies, and BRGs. The small dash in the upper panel indicatesthe peculiar velocity of the first ranked galaxy.
form an extension with the outer parts delineated mostly by spi-ral galaxies. This component is seen also in Fig. 18. Accordingto the peculiar velocities, the elliptical galaxies in thiscompo-nent are concentrated towards the centre of the cluster. Thereis another peak in the distribution of the peculiar velocities ofelliptical galaxies closer to the cluster centre; a signature of apast merger? The distribution of the peculiar velocities ofspiralgalaxies is less peaky. The distribution of the peculiar velocitiesof red spiral galaxies shows a concentration at the centre, at lowpeculiar velocites. There is also a small subcluster of galaxieswith high positive peculiar velocities. The gradient of thepecu-liar velocities of galaxies in A1516 hints that this clustermay berotating. With one exception, BRGs populate central parts of thecluster, and the first ranked galaxy of the cluster has a very lowpeculiar velocity,vpec = 58 km/s. Thep-value of the Shapiro-Wilk test is 0.535, which confirms the Gaussian distributionofthe peculiar velocities of galaxies in this cluster.
The colour-magnitude diagram in Fig. 19 shows that thescatter of colours of red ellipticals and red spirals is almost equal.The fraction of red galaxies in this cluster is very high (85%,Table 3), only 3 of 15 BRGs in this cluster are classified as spi-rals.

10 M. Einasto et al.: The Sloan Great Wall.
Mr
g −
r
ESBRG
−23.0 −22.0 −21.0 −20.0 −19.00.2
0.4
0.6
0.8
1.0
Fig. 19. Colour-magnitude diagram of galaxies in the clusterA1516. Empty circles denote elliptical galaxies, crosses spiralgalaxies, filled circles BRGs.
A1650.RA
A16
50.D
ec
ESBRG1st rank
194.2 194.4 194.6 194.8 195 195.2−2.2
−2
−1.8
−1.6
−1.4
−1.2
194.3 194.4 194.5 194.6 194.7 194.8 194.9 195.0−15
00−
1000
−50
0
0 5
00 1
000
150
0
−2.2−2.0−1.8−1.6−1.4−1.2−2.2
R.A.
Dec
.
v(pe
c)
Fig. 20. 2D and 3D views of the cluster A1650. Symbols are thesame as in Fig. 3.
4.2. Clusters in the core of the supercluster SCl 126
4.2.1. The cluster A1650
The first cluster we study in the core of the supercluster SCl 126is the cluster A1650, an X-ray cluster (Bohringer et al. 2004;Udomprasert 2004). This cluster is the second-poorest cluster inour sample with only 48 member galaxies in our catalogue. Thesky distribution of galaxies in this cluster (Fig. 20, left panel)shows two concentrations. The 3D view and the velocity his-tograms of galaxies of different type (Fig. 20, right panel, andFig. 21) show an almost separate component of galaxies withpositive peculiar velocities, all but one galaxies in this com-ponent are elliptical. In the sky distribution this component islocated almost in the centre of the cluster, thusMclust, usingthe data about all the galaxies, finds that this cluster consists ofone component, with the mean uncertainty of the classification0.008. Red spiral galaxies and BRGs (with one exception) popu-late the main component of the cluster. Udomprasert (2004) de-scribes this cluster as a compact X-ray source, possibly locatedat a cold spot in the CMB.
However, the sky distribution of only elliptical or only spiralgalaxies (Fig. 22) clearly shows two components in the distribu-tion of elliptical and spiral galaxies, in both cases in a differentmanner. Thus we approximated the distribution of the peculiarvelocities of galaxies with three Gaussians. These are better seenin the distribution of the peculiar velocities of elliptical galax-ies. The distribution of the peculiar velocities of spiral galax-ies is different. There is one spiral galaxy only in one compo-nent, which has the highest peculiar velocity in this component.Mclustconfirms the components in the distribution of ellipticaland spiral galaxies. The first ranked galaxy of this cluster is lo-cated at the edge of the elliptical galaxy component, but in the
v(pec)(km/s)vel.d
<−
den
sity
(vel
, bw
= 1
.0)
−2000 −1000 0.0 1000 20000.0
0.10
0.20
P
v(pec)(km/s)
F
E
−2000 −1000 0.0 1000 20000
5
10
v(pec)(km/s)
F
S
−2000 −1000 0.0 1000 20000
5
10
v(pec)(km/s)
F
BRG
−2000 −1000 0.0 1000 20000
5
10
Fig. 21. Distribution of the peculiar velocities of galaxies in thecluster A1650. Top down: all galaxies, elliptical galaxies, spiralgalaxies, and BRGs. The small dash in the upper panel indicatesthe peculiar velocity of the first ranked galaxy.
A1650.RA
A16
50.D
ec
E1st rank
194.2 194.4 194.6 194.8 195 195.2−2.2
−2
−1.8
−1.6
−1.4
−1.2
A1650.RA
A16
50.D
ec
S1st rank
194.2 194.4 194.6 194.8 195 195.2−2.2
−2
−1.8
−1.6
−1.4
−1.2
Fig. 22. Distribution of elliptical (left panel) and spiral (rightpanel) galaxies in the cluster A1650. Filled circles in leftpaneldenote elliptical galaxies, in right panel they show spiralgalax-ies. The star is the first ranked galaxy.
centre of one spiral galaxy component; the peculiar velocity ofthe first ranked galaxyvpec= −189 km/s.
The fraction of red galaxies in this cluster is very high, somespiral galaxies are also red. Owing to the small number of galax-ies in this cluster the high fraction of red galaxies is only ap-proximate. The first ranked galaxy in this cluster is also a redspiral galaxy, as seen in the colour-magnitude diagram (Fig. 23).In this diagram the rms scatter of colours of the red sequenceis0.036 for red ellipticals and 0.042 for red spirals.
Our analysis hints at a possibility that this cluster consistsof two main components, some galaxies belong to a third sub-group with high positive peculiar velocities. Because of the smallnumber of galaxies in this cluster our results about substructuresshould be taken as a suggestion only.
4.2.2. The cluster A1658
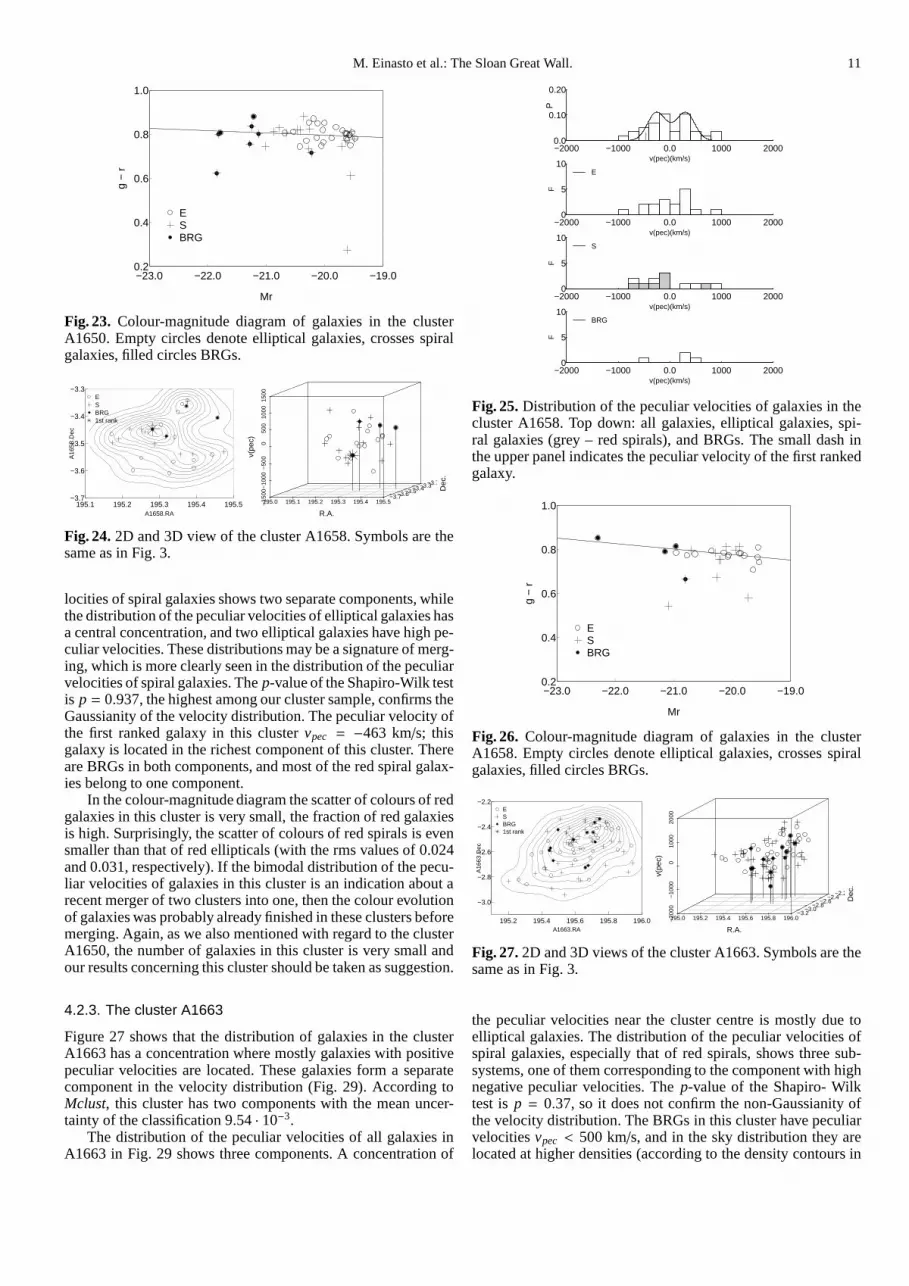
The next cluster we study in the core of the supercluster SCl 126is the cluster A1658, the poorest cluster in our sample with only29 member galaxies. The sky distribution of galaxies in thisclus-ter (Fig. 24, left panel) shows three irregularly located concen-trations. According toMclust, using the data about all the galax-ies, this cluster has one component, the mean uncertainty oftheclassification of galaxies is less than 10−5.
The distribution of the peculiar velocities of galaxies inA1658 is shown in Fig. 25. The distribution of the peculiar ve-
M. Einasto et al.: The Sloan Great Wall. 11
Mr
g −
r
ESBRG
−23.0 −22.0 −21.0 −20.0 −19.00.2
0.4
0.6
0.8
1.0
Fig. 23. Colour-magnitude diagram of galaxies in the clusterA1650. Empty circles denote elliptical galaxies, crosses spiralgalaxies, filled circles BRGs.
A1658.RA
A16
58.D
ec
ESBRG1st rank
195.1 195.2 195.3 195.4 195.5−3.7
−3.6
−3.5
−3.4
−3.3
195.0 195.1 195.2 195.3 195.4 195.5−15
00−
1000
−50
0
0 5
00 1
000
150
0
−3.7−3.6−3.5−3.4−3.3−3.7
R.A.
Dec
.
v(pe
c)
Fig. 24. 2D and 3D view of the cluster A1658. Symbols are thesame as in Fig. 3.
locities of spiral galaxies shows two separate components,whilethe distribution of the peculiar velocities of elliptical galaxies hasa central concentration, and two elliptical galaxies have high pe-culiar velocities. These distributions may be a signature of merg-ing, which is more clearly seen in the distribution of the peculiarvelocities of spiral galaxies. Thep-value of the Shapiro-Wilk testis p = 0.937, the highest among our cluster sample, confirms theGaussianity of the velocity distribution. The peculiar velocity ofthe first ranked galaxy in this clustervpec = −463 km/s; thisgalaxy is located in the richest component of this cluster. Thereare BRGs in both components, and most of the red spiral galax-ies belong to one component.
In the colour-magnitude diagram the scatter of colours of redgalaxies in this cluster is very small, the fraction of red galaxiesis high. Surprisingly, the scatter of colours of red spiralsis evensmaller than that of red ellipticals (with the rms values of 0.024and 0.031, respectively). If the bimodal distribution of the pecu-liar velocities of galaxies in this cluster is an indicationabout arecent merger of two clusters into one, then the colour evolutionof galaxies was probably already finished in these clusters beforemerging. Again, as we also mentioned with regard to the clusterA1650, the number of galaxies in this cluster is very small andour results concerning this cluster should be taken as suggestion.
4.2.3. The cluster A1663
Figure 27 shows that the distribution of galaxies in the clusterA1663 has a concentration where mostly galaxies with positivepeculiar velocities are located. These galaxies form a separatecomponent in the velocity distribution (Fig. 29). According toMclust, this cluster has two components with the mean uncer-tainty of the classification 9.54 · 10−3.
The distribution of the peculiar velocities of all galaxiesinA1663 in Fig. 29 shows three components. A concentration of
v(pec)(km/s)
−2000 −1000 0.0 1000 20000.0
0.10
0.20
P
v(pec)(km/s)
F
E
−2000 −1000 0.0 1000 20000
5
10
v(pec)(km/s)
F
S
−2000 −1000 0.0 1000 20000
5
10
v(pec)(km/s)
F
BRG
−2000 −1000 0.0 1000 20000
5
10
Fig. 25. Distribution of the peculiar velocities of galaxies in thecluster A1658. Top down: all galaxies, elliptical galaxies, spi-ral galaxies (grey – red spirals), and BRGs. The small dash inthe upper panel indicates the peculiar velocity of the first rankedgalaxy.
Mr
g −
r
ESBRG
−23.0 −22.0 −21.0 −20.0 −19.00.2
0.4
0.6
0.8
1.0
Fig. 26. Colour-magnitude diagram of galaxies in the clusterA1658. Empty circles denote elliptical galaxies, crosses spiralgalaxies, filled circles BRGs.
A1663.RA
A16
63.D
ec
ESBRG1st rank
195.2 195.4 195.6 195.8 196.0
−3.0
−2.8
−2.6
−2.4
−2.2
195.0 195.2 195.4 195.6 195.8 196.0−20
00−
1000
0
100
0 2
000
−3.2−3.0
−2.8−2.6
−2.4−2.2
R.A.
Dec
.
v(pe
c)
Fig. 27. 2D and 3D views of the cluster A1663. Symbols are thesame as in Fig. 3.
the peculiar velocities near the cluster centre is mostly due toelliptical galaxies. The distribution of the peculiar velocities ofspiral galaxies, especially that of red spirals, shows three sub-systems, one of them corresponding to the component with highnegative peculiar velocities. Thep-value of the Shapiro- Wilktest isp = 0.37, so it does not confirm the non-Gaussianity ofthe velocity distribution. The BRGs in this cluster have peculiarvelocitiesvpec < 500 km/s, and in the sky distribution they arelocated at higher densities (according to the density contours in

12 M. Einasto et al.: The Sloan Great Wall.
A1663.RA
A16
63.D
ec
195.2 195.4 195.6 195.8 196.0
−3.0
−2.8
−2.6
−2.4
−2.2
A1663.RA
A16
63.v
pec
195.2 195.4 195.6 195.8 196.0−2000
−1000
0.0
1000
2000
Fig. 28. Left panel shows R.A. vs. Dec., the right panel theR.A. vs. peculiar velocities of galaxies (inkms−1) in the clusterA1663. Different symbols correspond to different velocity com-ponents.
v(pec)(km/s)
−2000 −1000 0.0 1000 20000.0
0.05
0.10
P
v(pec)(km/s)
F
E
−2000 −1000 0.0 1000 20000
5
10
v(pec)(km/s)
F
S
−2000 −1000 0.0 1000 20000
5
10
v(pec)(km/s)
F
BRG
−2000 −1000 0.0 1000 20000
5
10
Fig. 29. Distribution of the peculiar velocities of galaxies in thecluster A1663. Top down: all galaxies, elliptical galaxies, spiralgalaxies, and BRGs. The small dash in the upper panel indicatesthe peculiar velocity of the first ranked galaxy.
Mr
g −
r
ESBRG
−23.0 −22.0 −21.0 −20.0 −19.00.2
0.4
0.6
0.8
1.0
Fig. 30. Colour-magnitude diagram of galaxies in the clusterA1663. Empty circles denote elliptical galaxies, crosses spiralgalaxies, filled circles BRGs.
Fig. 27, where the first ranked galaxy is also located. The firstranked galaxy in this cluster has a high negative peculiar veloc-ity (vpec = −841 km/s), suggesting that this cluster is not viri-alized yet. Burgett et al. (2004) suggest from the data from the2dFGRS that the velocity gradient in this cluster is an indicationthat the cluster may be rotating.
The fraction of red galaxies in the cluster A1663 is high,83%, and 43% of red galaxies are spirals. In the colour-
A1750.RA
A17
50.D
ec
ESBRG1st rank
202.0 202.2 202.4 202.6 202.8 203.0 203.2−2.6
−2.4
−2.2
−2.0
−1.8
−1.6
−1.4
1
2
3
4
5
201.8 202.0 202.2 202.4 202.6 202.8 203.0 203.2−20
00−
1000
0
100
0 2
000
−2.6−2.4
−2.2−2.0
−1.8−1.6
−1.4−2.6
R.A.
Dec
.v(pe
c)
Fig. 31. 2D and 3D views of the cluster A1750. Symbols are thesame as in Fig. 3.
magnitude diagram the red and blue galaxies in this cluster areclearly separated. The scatter of colours of red galaxies inthecluster A1663 is larger than in the cluster A1658, with the rmsvalue 0.037, and the scatter of colours of red ellipticals islargerthan that of red spirals (with the rms values of 0.032 and 0.042,correspondingly).
4.2.4. The cluster A1750
The next cluster, which is the richest cluster in our sample with117 member galaxies in our group catalogue, is the well-knownbinary merging Abell cluster A1750.
Mclust determined even five components in this cluster. InFig. 31 (left panel) we mark them with numbers in an increasingorder of the right ascencion. The mean uncertainty of the classi-fication of galaxies in the cluster A1750 is 9.8 · 10−3.
The 3D distribution of galaxies in this cluster (Fig. 31, rightpanel) shows two almost separate components. In one of themmost galaxies have negative peculiar velocities with a meanvaluevpec = −600 km/s. This component, marked as compo-nent 4 in the left panel of Fig. 31, is well seen in the classifi-cation diagram generated withMclust, Fig. 32. The first rankedgalaxy of the cluster A1750 is also located in this componentand has the peculiar velocityvpec = −724 km/s. In Fig. 2 (leftpanel) we show an image of the first ranked galaxy in this clus-ter. This galaxy, a BRG, is embedded in a common red halo withits nearest companion galaxy which is the second in brightnessin this cluster. These galaxies may form a merging system. Thehistograms of the peculiar velocites (Fig. 33) show that this com-ponent is better seen in the distribution of spiral galaxiesthan inthe distribution of elliptical galaxies. Some BRGs are alsolo-cated in component 4.
In Fig. 31 the 2D density contours show that the sky den-sity of galaxies in the cluster A1750 is the highest in component3. The mean peculiar velocity of galaxies in this component isvpec= −72 km/s. Several BRGs are located here.
In another component, component 5, galaxies have positivepeculiar velocities,vpec= 612 km/s. There are two BRGs in thiscomponent, and some elliptical and spiral galaxies.
In two components, 1 and 2, the mean peculiar velocity ofgalaxies is almost equal,vpec≈ 220 km/s, and the 2D density ofgalaxies decreases in these components as we move farther awayfrom component 3 with a high 2D galaxy density. Figure 31shows that also some BRGs are located in these components,in the outer parts of the cluster.
The distribution of the peculiar velocites of red spiral galax-ies (Fig. 33) follows that of all spirals (of course, most spirals inthis cluster are red).
The fraction of red galaxies in this cluster is very high (91%),and the rms scatter of colours of red elliptical and red spiralgalaxies is almost equal, about 0.04. The colours of galaxies in

M. Einasto et al.: The Sloan Great Wall. 13
A1750.RA
A17
50.D
ec
202.0 202.4 202.8 203.2−2.6
−2.4
−2.2
−2.0
−1.8
−1.6
−1.4
A1750.RA
A17
50.v
pec
202.0 202.4 202.8 203.2−2000
−1000
0.0
1000
2000
Fig. 32. Left panel shows R.A. vs. Dec., the right panel theR.A. vs. peculiar velocities of galaxies (inkms−1) in the clusterA1750. Different symbols correspond to different velocity com-ponents.
v(pec)(km/s)
−2000 −1000 0.0 1000 20000.0
0.05
0.10
P
v(pec)(km/s)
F
E
−2000 −1000 0.0 1000 200005
101520
v(pec)(km/s)
F
S
−2000 −1000 0.0 1000 20000
5
10
v(pec)(km/s)
F
BRG
−2000 −1000 0.0 1000 20000.0
5
10
Fig. 33. Distribution of the peculiar velocities of galaxies in thecluster A1750. Top down: all galaxies, elliptical galaxies, spiralgalaxies, and BRGs.
Mr
g −
r
ESBRG
−23.0 −22.0 −21.0 −20.0 −19.00.4
0.5
0.6
0.7
0.8
0.9
1.0
Fig. 34. Colour-magnitude diagram of galaxies in the clusterA1750. Empty circles denote elliptical galaxies, crosses spiralgalaxies, filled circles BRGs.
different components are rather similar. In this respect the clus-ter A1750 differs from the cluster A1205, where one componentconsists mostly of red galaxies.
The structure of the cluster A1750 has been analysed in sev-eral other studies using optical and X-ray data (Donnelly etal.2001; Belsole et al. 2004; Burgett et al. 2004; Hwang & Lee2009). The comparison of substructures shows that our compo-nent 3 coincides with the component C by Hwang & Lee (2009).Belsole et al. (2004) finds an X-ray peak at this location and sug-
A1773.RA
A17
73.D
ec.
ESBRG1st rank
205.2 205.4 205.6 205.8 206.0
2.0
2.2
2.4
2.6
205.0 205.2 205.4 205.6 205.8 206.0 206.2−20
00−
1000
0
100
0 2
000
1.82.0
2.22.4
2.62.8
R.A.
Dec
.
v(pe
c)
Fig. 35. 2D and 3D views of the cluster A1773. Symbols are thesame as in Fig. 3.
gest that this component suffered a merger or interaction in thepast 1–2 Gyrs. Our component 4 is the same as the one deter-mined by Hwang & Lee (2009) as component N, who suggestthat the components 3 and 4 have started interacting. Component4 coincides with another X-ray peak determined by Belsole etal.(2004). These are the same components denoted as Core and Cin Burgett et al. (2004), and as the NW and SW components inDonnelly et al. (2001). Our components 1 and 2 correspond toa sparse component S by Hwang & Lee (2009), Belsole et al.(2004) shows an X-ray source in this direction. Hwang & Lee(2009) suggest that there has been past interaction betweenthecomponents 1, 2, and 3. The component E in Hwang & Lee(2009) corresponds approximately to our component 5, and mayhave interacted in the past with both the components 3 and 4.Hwang & Lee did not find significant differences between thegalaxy colours in different components, similar to our study.
Thus in the cluster A1750 our analysis reveals a similar sub-structure to that found in other studies.
4.3. The cluster A1773 in the outskirts of the superclusterSCl 126
The next cluster in our sample is the X-ray cluster A1773, themember of the supercluster SCl 126, which is located in the out-skirts of the supercluster. The sky distribution of galaxies in thiscluster is irregular, especially in the outer regions (Fig.35, leftpanel). The 3D distribution of galaxies (Fig. 35, right panel)shows a component or tail of mostly elliptical galaxies andBRGs with negative peculiar velocities. The histograms of thepeculiar velocities (Fig. 36) confirm that the brightest galaxiesin this cluster have mostly negative peculiar velocities. Theyare located in one part of the sky distribution (see Fig. 35, leftpanel).The first ranked galaxy of the cluster is also locatedhere,but has only a low peculiar velocity (vpec= −76 km/s). However,this subsystem of galaxies does not form a completely separatecomponent; accordingMclust, this cluster has one componentwith the mean uncertainty of the classification 0.041. The distri-bution of the peculiar velocities of spiral galaxies in thisclusteris smoother than that of elliptical galaxies.
The fraction of red galaxies in the A1773 is 0.67 only. Thescatter of colours of red ellipticals is smaller than that ofred spi-rals (with the rms values of 0.032 and 0.047, correspondingly,see Table 3 and Fig. 37). If galaxies with negative peculiar ve-locities have only recently joined this cluster they have probablyfinished their colour evolution before joining the main cluster.
4.4. The cluster A1809 in the outskirts of the superclusterSCl 126
The last cluster in our sample is the cluster A1809 in the out-skirts of the supercluster SCl 126. The sky distribution of galax-

14 M. Einasto et al.: The Sloan Great Wall.
v(pec)(km/s)
−2000 −1000 0.0 1000 20000.0
0.05
0.10
P
v(pec)(km/s)
F
E
−2000 −1000 0.0 1000 20000
5
10
v(pec)(km/s)
F
S
−2000 −1000 0.0 1000 20000
5
10
v(pec)(km/s)
F
BRG
−2000 −1000 0.0 1000 20000
5
10
Fig. 36. Distribution of the peculiar velocities of galaxies in thecluster A1773. Top down: all galaxies, elliptical galaxies, spiralgalaxies, and BRGs. The small dash in the upper panel indicatesthe peculiar velocity of the first ranked galaxy.
Mr
g −
r
ESBRG
−23.0 −22.0 −21.0 −20.0 −19.00.2
0.4
0.6
0.8
1.0
Fig. 37. Colour-magnitude diagram of galaxies in the clusterA1773. Empty circles denote elliptical galaxies, crosses spiralgalaxies, filled circles BRGs.
A1809.RA
A18
09.D
ec
207.8 208.0 208.2 208.4 208.6 208.84.8
5.0
5.2
5.4
5.6ESBRG1st rank
207.8 208.0 208.2 208.4 208.6 208.8 209.0−20
00−
1000
0
100
0 2
000
4.85.0
5.25.4
5.6
R.A.
Dec
.
v(pe
c)
Fig. 38. 2D and 3D views of the cluster A1809. Symbols are thesame as in Fig. 3.
ies in this cluster (Fig. 38, left panel) shows that this cluster con-sists of two components in the sky.Mclust also confirms thatthis cluster consists of two components with the mean uncer-tainty of classification 1.3 · 10−2. In the main component of thecluster galaxies are concentrated in the center, and most BRGsof the cluster are also located here. The other component con-tains mostly loosely located spiral galaxies; there are also twoelliptical galaxies and three BRGs, two of them located betweenthis and the main component of the cluster. However, a word ofcaution is needed - in the poor component the number of galax-
v(pec)(km/s)
−2000 −1000 0.0 1000 20000.0
0.05
0.10
P
v(pec)(km/s)
F
E
−2000 −1000 0.0 1000 200005
101520
v(pec)(km/s)
F
S
−2000 −1000 0.0 1000 20000
5
10
v(pec)(km/s)
F
BRG
−2000 −1000 0.0 1000 20000.0
5
10
Fig. 39. Distribution of the peculiar velocities of galaxies in thecluster A1809. Top down: all galaxies, elliptical galaxies, spiralgalaxies, and BRGs. The small dash in the upper panel indicatesthe peculiar velocity of the first ranked galaxy.
Mr
g −
r
ESBRG
−23.0 −22.0 −21.0 −20.0 −19.00.4
0.5
0.6
0.7
0.8
0.9
1.0
Fig. 40. Colour-magnitude diagram of galaxies in the clusterA1809. Empty circles denote elliptical galaxies, crosses spiralgalaxies, filled circles BRGs.
ies is small, 17, the galaxies here are loosely distributed;it ispossible that these galaxies cannot be considered as forming areliable separate component. The 3D distribution of galaxies inthe cluster A1809 (Fig. 38, right panel) and the distribution ofthe peculiar velocities of galaxies (Fig. 39) show that in the maincomponent of the cluster the galaxies have a bimodal distributionof the peculiar velocities, which is best seen in the distributionfor spiral galaxies. The velocity histograms show that someel-liptical and spiral galaxies form a tail in the distributionof thepeculiar velocities with high (vpec > 1000 km/s) values of thepeculiar velocities. The distribution of the peculiar velocities ofred spiral galaxies follows those of all spirals. The velocity dis-persion of the BRGs in this cluster is small, these galaxies areconcentrated near the centre of the cluster. The distribution ofthe peculiar velocities of galaxies suggests that this cluster hasformed by merging of two groups, and the third one (the poorcomponent in the cluster A1809) is perhaps still infalling.
The fraction of red galaxies in the cluster A1809 is 0.84,similar to that in the clusters in the core of the supercluster.The scatter of colours of red ellipticals and red spirals (with therms values of 0.029 and 0.032, correspondingly, see Table 3 and
M. Einasto et al.: The Sloan Great Wall. 15
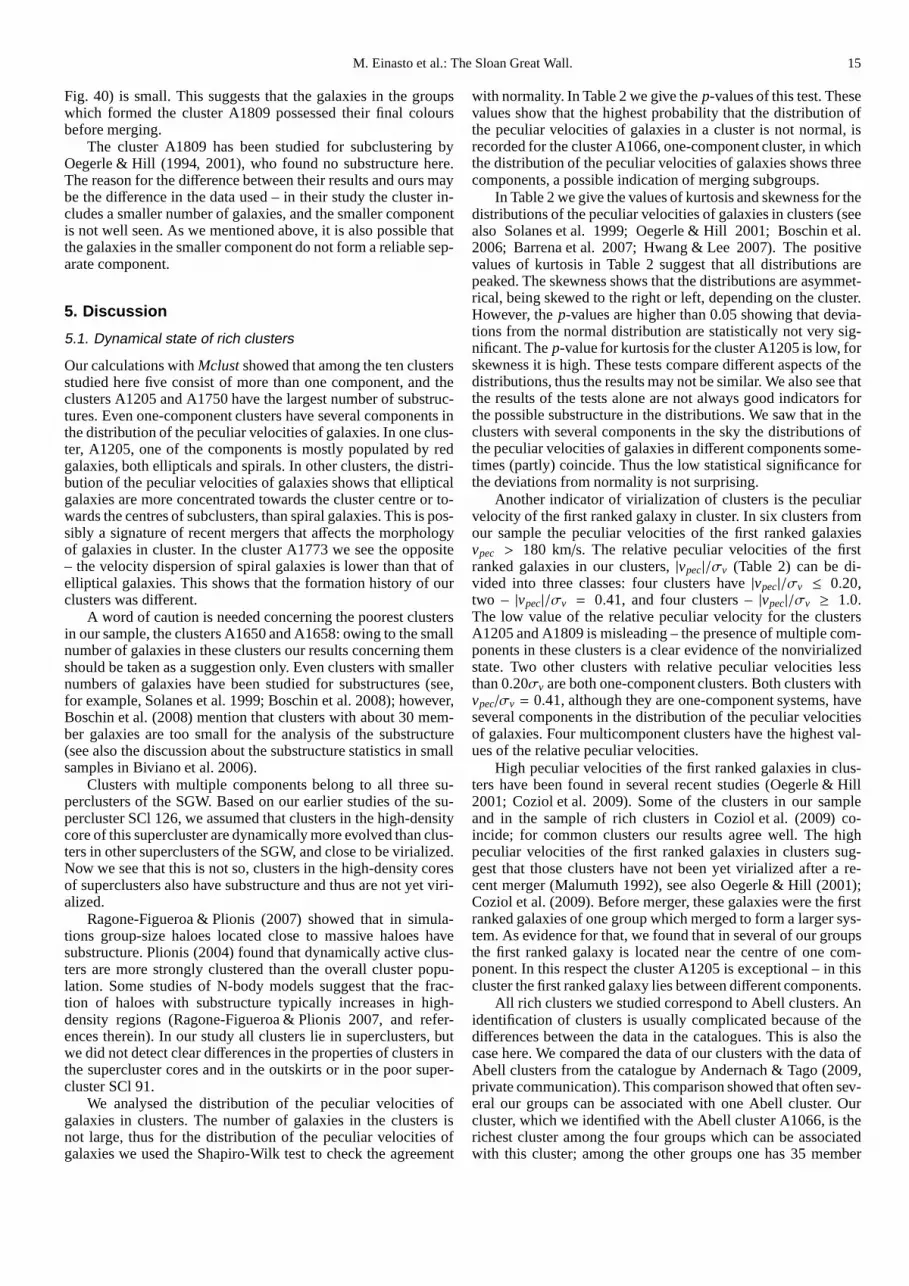
Fig. 40) is small. This suggests that the galaxies in the groupswhich formed the cluster A1809 possessed their final coloursbefore merging.
The cluster A1809 has been studied for subclustering byOegerle & Hill (1994, 2001), who found no substructure here.The reason for the difference between their results and ours maybe the difference in the data used – in their study the cluster in-cludes a smaller number of galaxies, and the smaller componentis not well seen. As we mentioned above, it is also possible thatthe galaxies in the smaller component do not form a reliable sep-arate component.
5. Discussion
5.1. Dynamical state of rich clusters
Our calculations withMclustshowed that among the ten clustersstudied here five consist of more than one component, and theclusters A1205 and A1750 have the largest number of substruc-tures. Even one-component clusters have several components inthe distribution of the peculiar velocities of galaxies. Inone clus-ter, A1205, one of the components is mostly populated by redgalaxies, both ellipticals and spirals. In other clusters,the distri-bution of the peculiar velocities of galaxies shows that ellipticalgalaxies are more concentrated towards the cluster centre or to-wards the centres of subclusters, than spiral galaxies. This is pos-sibly a signature of recent mergers that affects the morphologyof galaxies in cluster. In the cluster A1773 we see the opposite– the velocity dispersion of spiral galaxies is lower than that ofelliptical galaxies. This shows that the formation historyof ourclusters was different.
A word of caution is needed concerning the poorest clustersin our sample, the clusters A1650 and A1658: owing to the smallnumber of galaxies in these clusters our results concerningthemshould be taken as a suggestion only. Even clusters with smallernumbers of galaxies have been studied for substructures (see,for example, Solanes et al. 1999; Boschin et al. 2008); however,Boschin et al. (2008) mention that clusters with about 30 mem-ber galaxies are too small for the analysis of the substructure(see also the discussion about the substructure statisticsin smallsamples in Biviano et al. 2006).
Clusters with multiple components belong to all three su-perclusters of the SGW. Based on our earlier studies of the su-percluster SCl 126, we assumed that clusters in the high-densitycore of this supercluster are dynamically more evolved thanclus-ters in other superclusters of the SGW, and close to be virialized.Now we see that this is not so, clusters in the high-density coresof superclusters also have substructure and thus are not yetviri-alized.
Ragone-Figueroa & Plionis (2007) showed that in simula-tions group-size haloes located close to massive haloes havesubstructure. Plionis (2004) found that dynamically active clus-ters are more strongly clustered than the overall cluster popu-lation. Some studies of N-body models suggest that the frac-tion of haloes with substructure typically increases in high-density regions (Ragone-Figueroa & Plionis 2007, and refer-ences therein). In our study all clusters lie in superclusters, butwe did not detect clear differences in the properties of clusters inthe supercluster cores and in the outskirts or in the poor super-cluster SCl 91.
We analysed the distribution of the peculiar velocities ofgalaxies in clusters. The number of galaxies in the clustersisnot large, thus for the distribution of the peculiar velocities ofgalaxies we used the Shapiro-Wilk test to check the agreement
with normality. In Table 2 we give thep-values of this test. Thesevalues show that the highest probability that the distribution ofthe peculiar velocities of galaxies in a cluster is not normal, isrecorded for the cluster A1066, one-component cluster, in whichthe distribution of the peculiar velocities of galaxies shows threecomponents, a possible indication of merging subgroups.
In Table 2 we give the values of kurtosis and skewness for thedistributions of the peculiar velocities of galaxies in clusters (seealso Solanes et al. 1999; Oegerle & Hill 2001; Boschin et al.2006; Barrena et al. 2007; Hwang & Lee 2007). The positivevalues of kurtosis in Table 2 suggest that all distributionsarepeaked. The skewness shows that the distributions are asymmet-rical, being skewed to the right or left, depending on the cluster.However, thep-values are higher than 0.05 showing that devia-tions from the normal distribution are statistically not very sig-nificant. Thep-value for kurtosis for the cluster A1205 is low, forskewness it is high. These tests compare different aspects of thedistributions, thus the results may not be similar. We also see thatthe results of the tests alone are not always good indicatorsforthe possible substructure in the distributions. We saw thatin theclusters with several components in the sky the distributions ofthe peculiar velocities of galaxies in different components some-times (partly) coincide. Thus the low statistical significance forthe deviations from normality is not surprising.
Another indicator of virialization of clusters is the peculiarvelocity of the first ranked galaxy in cluster. In six clusters fromour sample the peculiar velocities of the first ranked galaxiesvpec > 180 km/s. The relative peculiar velocities of the firstranked galaxies in our clusters,|vpec|/σv (Table 2) can be di-vided into three classes: four clusters have|vpec|/σv ≤ 0.20,two – |vpec|/σv = 0.41, and four clusters –|vpec|/σv ≥ 1.0.The low value of the relative peculiar velocity for the clustersA1205 and A1809 is misleading – the presence of multiple com-ponents in these clusters is a clear evidence of the nonvirializedstate. Two other clusters with relative peculiar velocities lessthan 0.20σv are both one-component clusters. Both clusters withvpec/σv = 0.41, although they are one-component systems, haveseveral components in the distribution of the peculiar velocitiesof galaxies. Four multicomponent clusters have the highestval-ues of the relative peculiar velocities.
High peculiar velocities of the first ranked galaxies in clus-ters have been found in several recent studies (Oegerle & Hill2001; Coziol et al. 2009). Some of the clusters in our sampleand in the sample of rich clusters in Coziol et al. (2009) co-incide; for common clusters our results agree well. The highpeculiar velocities of the first ranked galaxies in clusterssug-gest that those clusters have not been yet virialized after are-cent merger (Malumuth 1992), see also Oegerle & Hill (2001);Coziol et al. (2009). Before merger, these galaxies were thefirstranked galaxies of one group which merged to form a larger sys-tem. As evidence for that, we found that in several of our groupsthe first ranked galaxy is located near the centre of one com-ponent. In this respect the cluster A1205 is exceptional – inthiscluster the first ranked galaxy lies between different components.
All rich clusters we studied correspond to Abell clusters. Anidentification of clusters is usually complicated because of thedifferences between the data in the catalogues. This is also thecase here. We compared the data of our clusters with the data ofAbell clusters from the catalogue by Andernach & Tago (2009,private communication). This comparison showed that oftensev-eral our groups can be associated with one Abell cluster. Ourcluster, which we identified with the Abell cluster A1066, istherichest cluster among the four groups which can be associatedwith this cluster; among the other groups one has 35 member

16 M. Einasto et al.: The Sloan Great Wall.
galaxies, others are pairs of galaxies. Other clusters fromthe cat-alogue by Andernach & Tago (2009) can be associated with onerich cluster and one to four poor groups with up to five membergalaxies. This also confirms the presence of substructure inrichclusters.
The cluster A1750 has been studied for substructure by otherauthors, too. We showed above that the components found inthis cluster by us coincide well with those found in other stud-ies. We found an especially good agreement between our resultsand those by Hwang & Lee (2009), who used used a∆ - test(Dressler & Shectman 1988) to determine the substructure inthecluster A1750. This shows thatMclust, probably applied here forthe first time for the purpose to find substructure in galaxy clus-ters, gives results in agreement with other methods.
The good agreement with other studies also supports ourchoice of the parameters for the friend-of-friend algorithm forgroup definition and suggests that in our catalogue groups withsubstructure are real groups and not complexes of small groupsartificially linked together by an unreasonable choice of linkingparameters. This example supports our opinion that in the T10the linking parameters were chosen reasonably.
An increasing number of studies have recentlyshown the presence of substructure in rich clusters(Solanes et al. 1999; Oegerle & Hill 2001; Burgett et al.2004; Boschin et al. 2006; Barrena et al. 2007; Hwang & Lee2007; Aguerri & Sanchez-Janssen 2010) and in poor clusters(Boschin et al. 2008); Vennik & Hopp (2009) found a sub-structure also in poor groups. Tovmassian & Plionis (2009)studied the properties of poor groups from the SDSS surveyand showed that many groups of galaxies presently are not ina dynamical equilibrium but at various stages of virialization.Niemi et al. (2007) showed that a significant fraction of nearbygroups of galaxies are not gravitationally-bound systems.Thisis important because the masses of observed groups are oftenestimated assuming that groups are bound.
The presence of substructure in rich clusters, signs of possi-ble mergers, infall, or rotation suggests that the rich clusters inour sample are not yet virialized. The high frequency of theseclusters tells us that mergers between groups and clusters arecommon – galaxy groups continue to grow. In high-density re-gions groups and clusters of galaxies form early and could bemore evolved dynamically (Tempel et al. 2009), but here againthe possibility of mergers is high, thus groups and clustersinhigh-density regions are still assembling.
5.2. Galaxy populations in rich clusters
The study of the galaxy content of the rich clusters showed inagreement with our earlier study (Einasto et al. 2008) that thefraction of red galaxies in clusters from the core of the super-cluster SCl 126 is very high,Fred > 0.8. However, this is as largeas the fraction of red galaxies in the cluster A1809 from the out-skirts of this supercluster, as well as in the cluster A1516 fromthe supercluster SCl 111. We plot the fractions of red galaxiesin clusters and the fractions of elliptical galaxies in Fig.41. Thisfigure shows that the fraction of elliptical galaxies in clusters isproportional to the fraction of red galaxies. At the same timethe luminosities of clusters vary strongly, i.e. the fraction of redgalaxies in clusters from our sample does not correlate wellwiththe luminosity of clusters. In our earlier studies we found thatthe fraction of red galaxies is the highest in clusters in thecoresof rich superclusters, both for low- and high-luminosity clusters(Einasto et al. 2007a).
F(red)
F(e
ll)
0.6 0.7 0.8 0.9 1.00.3
0.4
0.5
0.6
0.7
Fig. 41. Fractions of red galaxies and elliptical galaxies for ourclusters. Symbol sizes are proportional to the luminosity of clus-ters.
We found that approximately 1/3 of red galaxies are spi-rals. Recent results of the Galaxy ZOO project (Masters et al.2009) showed that indeed a large fraction of red galaxies arespirals, and almost all massive galaxies are red independently oftheir morphological type. The colour-magnitude diagrams showthat in some clusters (A1066, A1205, A1424) the scatter of thecolours of red spirals is larger than the scatter of the colours ofred ellipticals, suggesting that red ellipticals form a more homo-geneous population than red spirals.
The number of BRGs in our clusters varies from fourin A1658, which is the poorest cluster in our sample, to17 in the richest cluster, A1750. Some BRGs are spirals.BRGs can be found both in the central areas and in the out-skirts of clusters. The result that BRGs lie in clusters is con-sistent with the strong small- scale clustering of the LRGs(Zehavi et al. 2005; Eisenstein et al. 2005; Blake et al. 2008)that has been interpreted in the framework of the halo occu-pation model, where more massive haloes host a larger num-ber of LRGs (van den Bosch et al. 2008; Zheng et al. 2008;Tinker et al. 2009; Watson et al. 2010).
The colours of galaxies in cluster environment may be af-fected by many factors. Colours may reach their observed val-ues during a merging event when galaxies are affected by pro-cesses in the cluster environment (Berrier et al. 2009). Forex-ample, galaxies may be moved to the red sequence through thequenching of star formation in blue galaxies in the cluster envi-ronment (Bower et al. 1998; Ruhland et al. 2009; Bamford et al.2009; Skelton et al. 2009). As evidence for that we found thatinsome of the clusters in our study the scatter of colours of galax-ies is large, probably due to merging of components that affectsthe colours of galaxies.
At the same time Tinker et al. (2009) mention in the analy-sis of the distribution of distant red galaxies in the halo modelframework that distant red galaxies must have formed theirstars before they become satellites in haloes. This is possible ifthese galaxies were members of poorer groups before the groupsmerged into a richer one. We also find that in some clusters therange of red colours of galaxies is very small although theseclusters consisted of several (probably merging) components.Probably in these cases the galaxies have finished their colourevolution in small groups before merging.
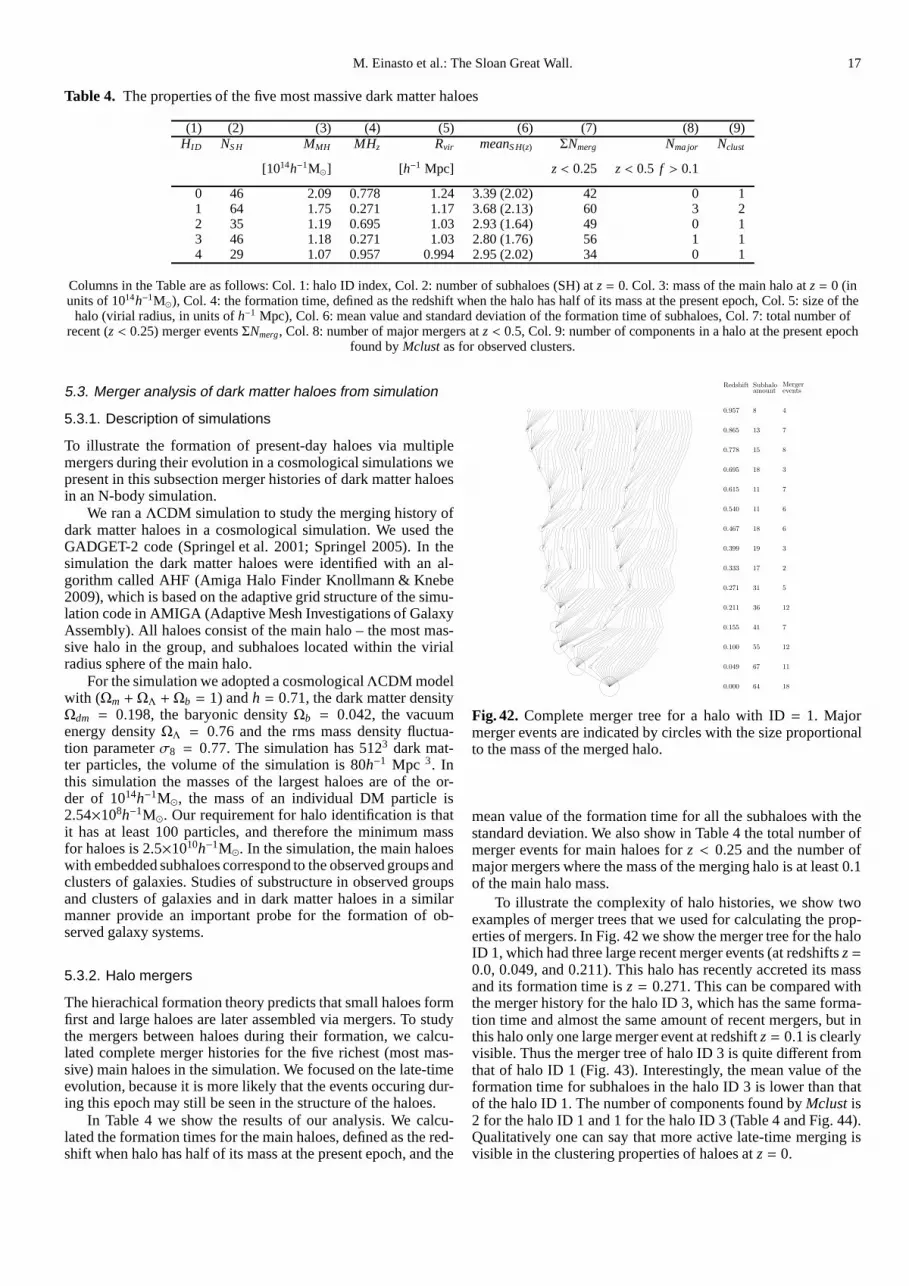
M. Einasto et al.: The Sloan Great Wall. 17
Table 4. The properties of the five most massive dark matter haloes
(1) (2) (3) (4) (5) (6) (7) (8) (9)HID NS H MMH MHz Rvir meanS H(z) ΣNmerg Nma jor Nclust
[1014h−1M⊙] [h−1 Mpc] z< 0.25 z< 0.5 f > 0.1
0 46 2.09 0.778 1.24 3.39 (2.02) 42 0 11 64 1.75 0.271 1.17 3.68 (2.13) 60 3 22 35 1.19 0.695 1.03 2.93 (1.64) 49 0 13 46 1.18 0.271 1.03 2.80 (1.76) 56 1 14 29 1.07 0.957 0.994 2.95 (2.02) 34 0 1
Columns in the Table are as follows: Col. 1: halo ID index, Col. 2: number of subhaloes (SH) atz= 0. Col. 3: mass of the main halo atz= 0 (inunits of 1014h−1M⊙), Col. 4: the formation time, defined as the redshift when thehalo has half of its mass at the present epoch, Col. 5: size of the
halo (virial radius, in units ofh−1 Mpc), Col. 6: mean value and standard deviation of the formation time of subhaloes, Col. 7: total number ofrecent (z< 0.25) merger eventsΣNmerg, Col. 8: number of major mergers atz< 0.5, Col. 9: number of components in a halo at the present epoch
found byMclustas for observed clusters.
5.3. Merger analysis of dark matter haloes from simulation
5.3.1. Description of simulations
To illustrate the formation of present-day haloes via multiplemergers during their evolution in a cosmological simulations wepresent in this subsection merger histories of dark matter haloesin an N-body simulation.
We ran aΛCDM simulation to study the merging history ofdark matter haloes in a cosmological simulation. We used theGADGET-2 code (Springel et al. 2001; Springel 2005). In thesimulation the dark matter haloes were identified with an al-gorithm called AHF (Amiga Halo Finder Knollmann & Knebe2009), which is based on the adaptive grid structure of the simu-lation code in AMIGA (Adaptive Mesh Investigations of GalaxyAssembly). All haloes consist of the main halo – the most mas-sive halo in the group, and subhaloes located within the virialradius sphere of the main halo.
For the simulation we adopted a cosmologicalΛCDM modelwith (Ωm + ΩΛ + Ωb = 1) andh = 0.71, the dark matter densityΩdm = 0.198, the baryonic densityΩb = 0.042, the vacuumenergy densityΩΛ = 0.76 and the rms mass density fluctua-tion parameterσ8 = 0.77. The simulation has 5123 dark mat-ter particles, the volume of the simulation is 80h−1 Mpc 3. Inthis simulation the masses of the largest haloes are of the or-der of 1014h−1M⊙, the mass of an individual DM particle is2.54×108h−1M⊙. Our requirement for halo identification is thatit has at least 100 particles, and therefore the minimum massfor haloes is 2.5×10¹⁰h−1M⊙. In the simulation, the main haloeswith embedded subhaloes correspond to the observed groups andclusters of galaxies. Studies of substructure in observed groupsand clusters of galaxies and in dark matter haloes in a similarmanner provide an important probe for the formation of ob-served galaxy systems.
5.3.2. Halo mergers
The hierachical formation theory predicts that small haloes formfirst and large haloes are later assembled via mergers. To studythe mergers between haloes during their formation, we calcu-lated complete merger histories for the five richest (most mas-sive) main haloes in the simulation. We focused on the late-timeevolution, because it is more likely that the events occuring dur-ing this epoch may still be seen in the structure of the haloes.
In Table 4 we show the results of our analysis. We calcu-lated the formation times for the main haloes, defined as the red-shift when halo has half of its mass at the present epoch, and the
0.000
0.049
0.100
0.155
0.211
0.271
0.333
0.399
0.467
0.540
0.615
0.695
0.778
0.865
0.957
64
67
55
41
36
31
17
19
18
11
11
18
15
13
8
18
11
12
7
12
5
2
3
6
6
7
3
8
7
4
Redshift Subhaloamount
Mergerevents
Fig. 42. Complete merger tree for a halo with ID= 1. Majormerger events are indicated by circles with the size proportionalto the mass of the merged halo.
mean value of the formation time for all the subhaloes with thestandard deviation. We also show in Table 4 the total number ofmerger events for main haloes forz < 0.25 and the number ofmajor mergers where the mass of the merging halo is at least 0.1of the main halo mass.
To illustrate the complexity of halo histories, we show twoexamples of merger trees that we used for calculating the prop-erties of mergers. In Fig. 42 we show the merger tree for the haloID 1, which had three large recent merger events (at redshiftsz=0.0, 0.049, and 0.211). This halo has recently accreted its massand its formation time isz = 0.271. This can be compared withthe merger history for the halo ID 3, which has the same forma-tion time and almost the same amount of recent mergers, but inthis halo only one large merger event at redshiftz= 0.1 is clearlyvisible. Thus the merger tree of halo ID 3 is quite different fromthat of halo ID 1 (Fig. 43). Interestingly, the mean value of theformation time for subhaloes in the halo ID 3 is lower than thatof the halo ID 1. The number of components found byMclust is2 for the halo ID 1 and 1 for the halo ID 3 (Table 4 and Fig. 44).Qualitatively one can say that more active late-time merging isvisible in the clustering properties of haloes atz= 0.
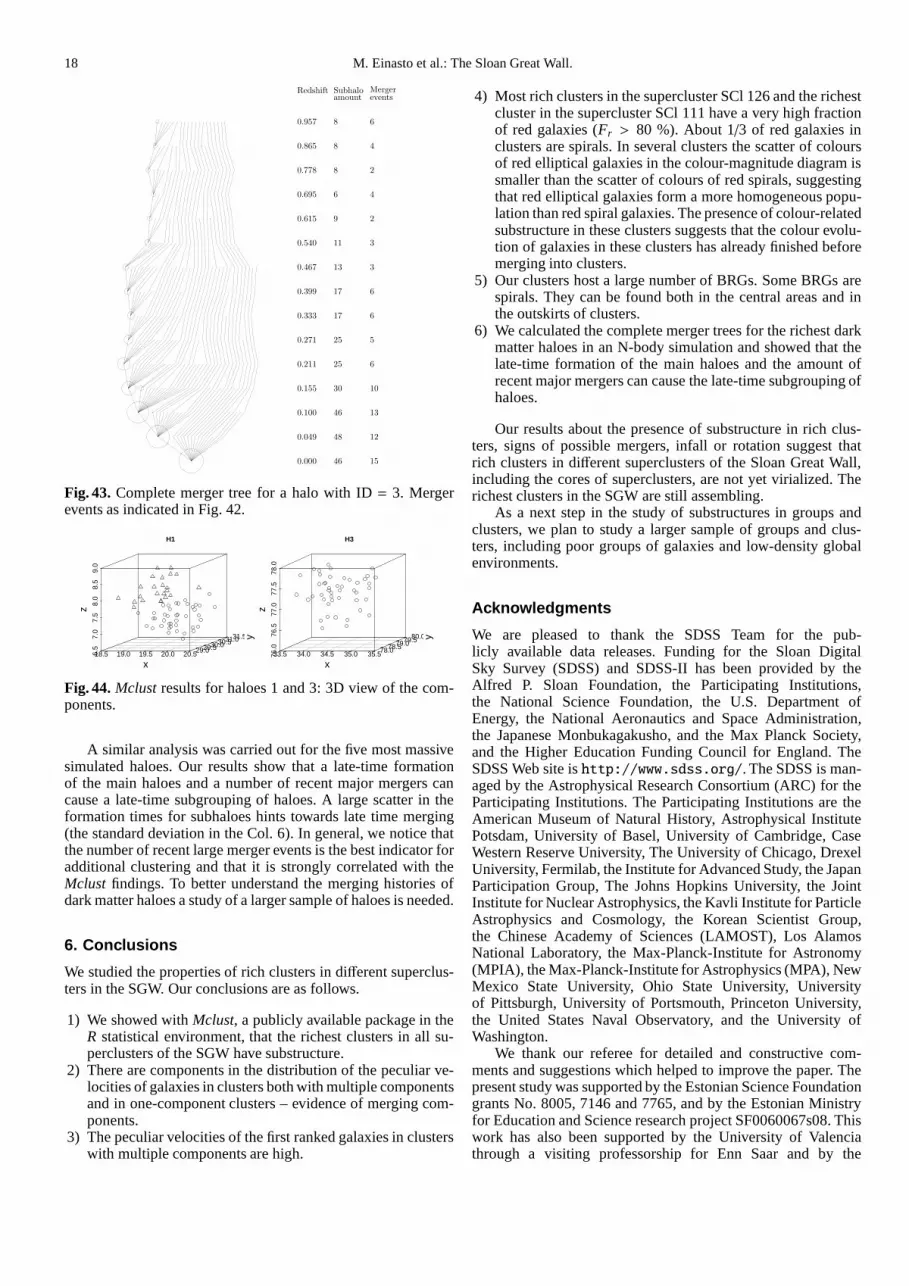
18 M. Einasto et al.: The Sloan Great Wall.
0.000
0.049
0.100
0.155
0.211
0.271
0.333
0.399
0.467
0.540
0.615
0.695
0.778
0.865
0.957
46
48
46
30
25
25
17
17
13
11
9
6
8
8
8
15
12
13
10
6
5
6
6
3
3
2
4
2
4
6
Redshift Subhaloamount
Mergerevents
Fig. 43. Complete merger tree for a halo with ID= 3. Mergerevents as indicated in Fig. 42.
H1
18.5 19.0 19.5 20.0 20.56.5
7.0
7.5
8.0
8.5
9.0
29.029.530.030.531.031.5
x
y
z
H3
33.5 34.0 34.5 35.0 35.576.0
76.5
77.0
77.5
78.0
78.078.579.079.580.0
x
y
z
Fig. 44. Mclust results for haloes 1 and 3: 3D view of the com-ponents.
A similar analysis was carried out for the five most massivesimulated haloes. Our results show that a late-time formationof the main haloes and a number of recent major mergers cancause a late-time subgrouping of haloes. A large scatter in theformation times for subhaloes hints towards late time merging(the standard deviation in the Col. 6). In general, we noticethatthe number of recent large merger events is the best indicator foradditional clustering and that it is strongly correlated with theMclust findings. To better understand the merging histories ofdark matter haloes a study of a larger sample of haloes is needed.
6. Conclusions
We studied the properties of rich clusters in different superclus-ters in the SGW. Our conclusions are as follows.
1) We showed withMclust, a publicly available package in theR statistical environment, that the richest clusters in all su-perclusters of the SGW have substructure.
2) There are components in the distribution of the peculiar ve-locities of galaxies in clusters both with multiple componentsand in one-component clusters – evidence of merging com-ponents.
3) The peculiar velocities of the first ranked galaxies in clusterswith multiple components are high.
4) Most rich clusters in the supercluster SCl 126 and the richestcluster in the supercluster SCl 111 have a very high fractionof red galaxies (Fr > 80 %). About 1/3 of red galaxies inclusters are spirals. In several clusters the scatter of coloursof red elliptical galaxies in the colour-magnitude diagramissmaller than the scatter of colours of red spirals, suggestingthat red elliptical galaxies form a more homogeneous popu-lation than red spiral galaxies. The presence of colour-relatedsubstructure in these clusters suggests that the colour evolu-tion of galaxies in these clusters has already finished beforemerging into clusters.
5) Our clusters host a large number of BRGs. Some BRGs arespirals. They can be found both in the central areas and inthe outskirts of clusters.
6) We calculated the complete merger trees for the richest darkmatter haloes in an N-body simulation and showed that thelate-time formation of the main haloes and the amount ofrecent major mergers can cause the late-time subgrouping ofhaloes.
Our results about the presence of substructure in rich clus-ters, signs of possible mergers, infall or rotation suggestthatrich clusters in different superclusters of the Sloan Great Wall,including the cores of superclusters, are not yet virialized. Therichest clusters in the SGW are still assembling.
As a next step in the study of substructures in groups andclusters, we plan to study a larger sample of groups and clus-ters, including poor groups of galaxies and low-density globalenvironments.
Acknowledgments
We are pleased to thank the SDSS Team for the pub-licly available data releases. Funding for the Sloan DigitalSky Survey (SDSS) and SDSS-II has been provided by theAlfred P. Sloan Foundation, the Participating Institutions,the National Science Foundation, the U.S. Department ofEnergy, the National Aeronautics and Space Administration,the Japanese Monbukagakusho, and the Max Planck Society,and the Higher Education Funding Council for England. TheSDSS Web site ishttp://www.sdss.org/. The SDSS is man-aged by the Astrophysical Research Consortium (ARC) for theParticipating Institutions. The Participating Institutions are theAmerican Museum of Natural History, Astrophysical InstitutePotsdam, University of Basel, University of Cambridge, CaseWestern Reserve University, The University of Chicago, DrexelUniversity, Fermilab, the Institute for Advanced Study, the JapanParticipation Group, The Johns Hopkins University, the JointInstitute for Nuclear Astrophysics, the Kavli Institute for ParticleAstrophysics and Cosmology, the Korean Scientist Group,the Chinese Academy of Sciences (LAMOST), Los AlamosNational Laboratory, the Max-Planck-Institute for Astronomy(MPIA), the Max-Planck-Institute for Astrophysics (MPA),NewMexico State University, Ohio State University, Universityof Pittsburgh, University of Portsmouth, Princeton University,the United States Naval Observatory, and the University ofWashington.
We thank our referee for detailed and constructive com-ments and suggestions which helped to improve the paper. Thepresent study was supported by the Estonian Science Foundationgrants No. 8005, 7146 and 7765, and by the Estonian Ministryfor Education and Science research project SF0060067s08. Thiswork has also been supported by the University of Valenciathrough a visiting professorship for Enn Saar and by the
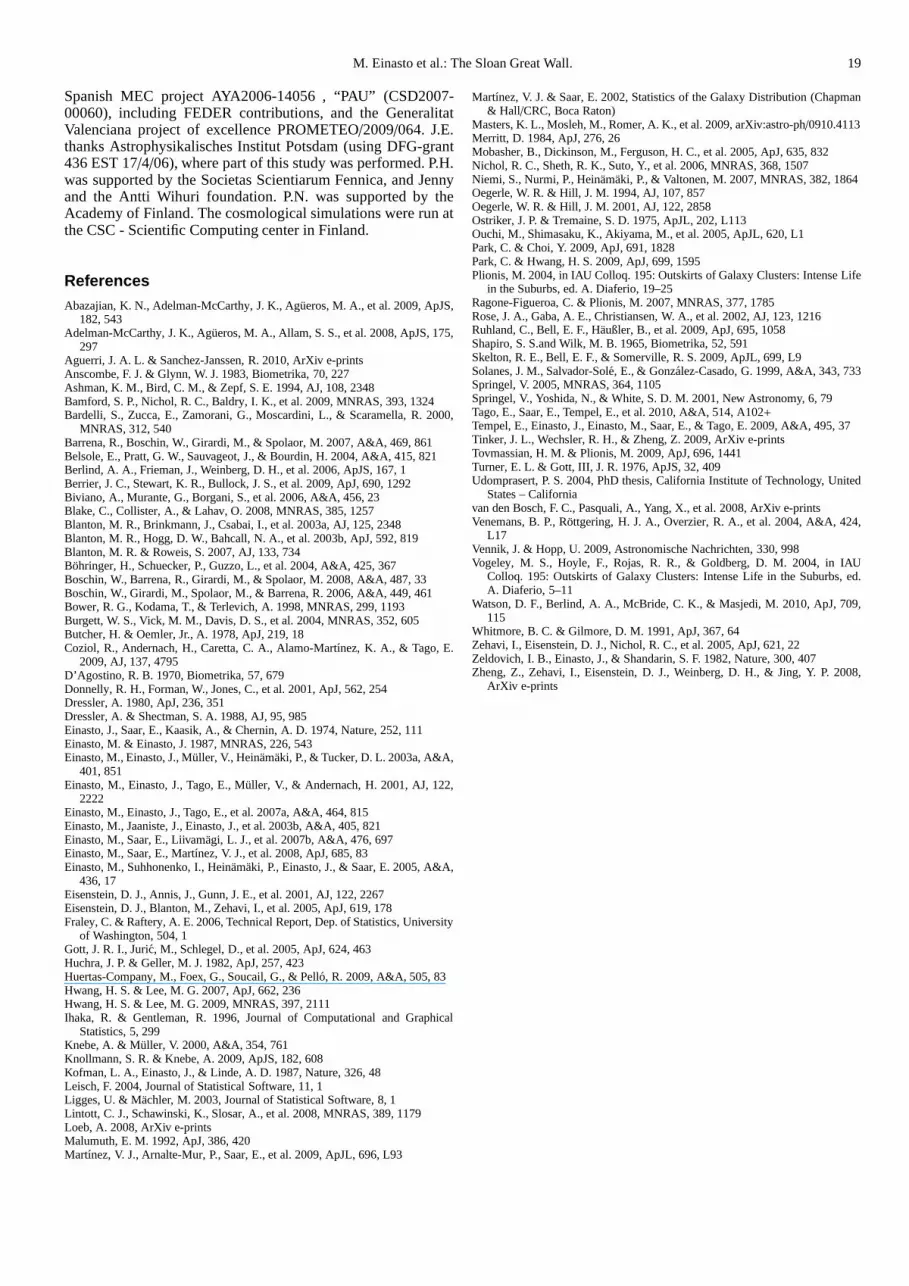
M. Einasto et al.: The Sloan Great Wall. 19
Spanish MEC project AYA2006-14056 , “PAU” (CSD2007-00060), including FEDER contributions, and the GeneralitatValenciana project of excellence PROMETEO/2009/064. J.E.thanks Astrophysikalisches Institut Potsdam (using DFG-grant436 EST 17/4/06), where part of this study was performed. P.H.was supported by the Societas Scientiarum Fennica, and Jennyand the Antti Wihuri foundation. P.N. was supported by theAcademy of Finland. The cosmological simulations were run atthe CSC - Scientific Computing center in Finland.
ReferencesAbazajian, K. N., Adelman-McCarthy, J. K., Agueros, M. A.,et al. 2009, ApJS,
182, 543Adelman-McCarthy, J. K., Agueros, M. A., Allam, S. S., et al. 2008, ApJS, 175,
297Aguerri, J. A. L. & Sanchez-Janssen, R. 2010, ArXiv e-printsAnscombe, F. J. & Glynn, W. J. 1983, Biometrika, 70, 227Ashman, K. M., Bird, C. M., & Zepf, S. E. 1994, AJ, 108, 2348Bamford, S. P., Nichol, R. C., Baldry, I. K., et al. 2009, MNRAS, 393, 1324Bardelli, S., Zucca, E., Zamorani, G., Moscardini, L., & Scaramella, R. 2000,
MNRAS, 312, 540Barrena, R., Boschin, W., Girardi, M., & Spolaor, M. 2007, A&A, 469, 861Belsole, E., Pratt, G. W., Sauvageot, J., & Bourdin, H. 2004,A&A, 415, 821Berlind, A. A., Frieman, J., Weinberg, D. H., et al. 2006, ApJS, 167, 1Berrier, J. C., Stewart, K. R., Bullock, J. S., et al. 2009, ApJ, 690, 1292Biviano, A., Murante, G., Borgani, S., et al. 2006, A&A, 456,23Blake, C., Collister, A., & Lahav, O. 2008, MNRAS, 385, 1257Blanton, M. R., Brinkmann, J., Csabai, I., et al. 2003a, AJ, 125, 2348Blanton, M. R., Hogg, D. W., Bahcall, N. A., et al. 2003b, ApJ,592, 819Blanton, M. R. & Roweis, S. 2007, AJ, 133, 734Bohringer, H., Schuecker, P., Guzzo, L., et al. 2004, A&A, 425, 367Boschin, W., Barrena, R., Girardi, M., & Spolaor, M. 2008, A&A, 487, 33Boschin, W., Girardi, M., Spolaor, M., & Barrena, R. 2006, A&A, 449, 461Bower, R. G., Kodama, T., & Terlevich, A. 1998, MNRAS, 299, 1193Burgett, W. S., Vick, M. M., Davis, D. S., et al. 2004, MNRAS, 352, 605Butcher, H. & Oemler, Jr., A. 1978, ApJ, 219, 18Coziol, R., Andernach, H., Caretta, C. A., Alamo-Martınez, K. A., & Tago, E.
2009, AJ, 137, 4795D’Agostino, R. B. 1970, Biometrika, 57, 679Donnelly, R. H., Forman, W., Jones, C., et al. 2001, ApJ, 562,254Dressler, A. 1980, ApJ, 236, 351Dressler, A. & Shectman, S. A. 1988, AJ, 95, 985Einasto, J., Saar, E., Kaasik, A., & Chernin, A. D. 1974, Nature, 252, 111Einasto, M. & Einasto, J. 1987, MNRAS, 226, 543Einasto, M., Einasto, J., Muller, V., Heinamaki, P., & Tucker, D. L. 2003a, A&A,
401, 851Einasto, M., Einasto, J., Tago, E., Muller, V., & Andernach, H. 2001, AJ, 122,
2222Einasto, M., Einasto, J., Tago, E., et al. 2007a, A&A, 464, 815Einasto, M., Jaaniste, J., Einasto, J., et al. 2003b, A&A, 405, 821Einasto, M., Saar, E., Liivamagi, L. J., et al. 2007b, A&A, 476, 697Einasto, M., Saar, E., Martınez, V. J., et al. 2008, ApJ, 685, 83Einasto, M., Suhhonenko, I., Heinamaki, P., Einasto, J.,& Saar, E. 2005, A&A,
436, 17Eisenstein, D. J., Annis, J., Gunn, J. E., et al. 2001, AJ, 122, 2267Eisenstein, D. J., Blanton, M., Zehavi, I., et al. 2005, ApJ,619, 178Fraley, C. & Raftery, A. E. 2006, Technical Report, Dep. of Statistics, University
of Washington, 504, 1Gott, J. R. I., Juric, M., Schlegel, D., et al. 2005, ApJ, 624, 463Huchra, J. P. & Geller, M. J. 1982, ApJ, 257, 423Huertas-Company, M., Foex, G., Soucail, G., & Pello, R. 2009, A&A, 505, 83Hwang, H. S. & Lee, M. G. 2007, ApJ, 662, 236Hwang, H. S. & Lee, M. G. 2009, MNRAS, 397, 2111Ihaka, R. & Gentleman, R. 1996, Journal of Computational andGraphical
Statistics, 5, 299Knebe, A. & Muller, V. 2000, A&A, 354, 761Knollmann, S. R. & Knebe, A. 2009, ApJS, 182, 608Kofman, L. A., Einasto, J., & Linde, A. D. 1987, Nature, 326, 48Leisch, F. 2004, Journal of Statistical Software, 11, 1Ligges, U. & Machler, M. 2003, Journal of Statistical Software, 8, 1Lintott, C. J., Schawinski, K., Slosar, A., et al. 2008, MNRAS, 389, 1179Loeb, A. 2008, ArXiv e-printsMalumuth, E. M. 1992, ApJ, 386, 420Martınez, V. J., Arnalte-Mur, P., Saar, E., et al. 2009, ApJL, 696, L93
Martınez, V. J. & Saar, E. 2002, Statistics of the Galaxy Distribution (Chapman& Hall /CRC, Boca Raton)
Masters, K. L., Mosleh, M., Romer, A. K., et al. 2009, arXiv:astro-ph/0910.4113Merritt, D. 1984, ApJ, 276, 26Mobasher, B., Dickinson, M., Ferguson, H. C., et al. 2005, ApJ, 635, 832Nichol, R. C., Sheth, R. K., Suto, Y., et al. 2006, MNRAS, 368,1507Niemi, S., Nurmi, P., Heinamaki, P., & Valtonen, M. 2007, MNRAS, 382, 1864Oegerle, W. R. & Hill, J. M. 1994, AJ, 107, 857Oegerle, W. R. & Hill, J. M. 2001, AJ, 122, 2858Ostriker, J. P. & Tremaine, S. D. 1975, ApJL, 202, L113Ouchi, M., Shimasaku, K., Akiyama, M., et al. 2005, ApJL, 620, L1Park, C. & Choi, Y. 2009, ApJ, 691, 1828Park, C. & Hwang, H. S. 2009, ApJ, 699, 1595Plionis, M. 2004, in IAU Colloq. 195: Outskirts of Galaxy Clusters: Intense Life
in the Suburbs, ed. A. Diaferio, 19–25Ragone-Figueroa, C. & Plionis, M. 2007, MNRAS, 377, 1785Rose, J. A., Gaba, A. E., Christiansen, W. A., et al. 2002, AJ,123, 1216Ruhland, C., Bell, E. F., Haußler, B., et al. 2009, ApJ, 695,1058Shapiro, S. S.and Wilk, M. B. 1965, Biometrika, 52, 591Skelton, R. E., Bell, E. F., & Somerville, R. S. 2009, ApJL, 699, L9Solanes, J. M., Salvador-Sole, E., & Gonzalez-Casado, G.1999, A&A, 343, 733Springel, V. 2005, MNRAS, 364, 1105Springel, V., Yoshida, N., & White, S. D. M. 2001, New Astronomy, 6, 79Tago, E., Saar, E., Tempel, E., et al. 2010, A&A, 514, A102+Tempel, E., Einasto, J., Einasto, M., Saar, E., & Tago, E. 2009, A&A, 495, 37Tinker, J. L., Wechsler, R. H., & Zheng, Z. 2009, ArXiv e-printsTovmassian, H. M. & Plionis, M. 2009, ApJ, 696, 1441Turner, E. L. & Gott, III, J. R. 1976, ApJS, 32, 409Udomprasert, P. S. 2004, PhD thesis, California Institute of Technology, United
States – Californiavan den Bosch, F. C., Pasquali, A., Yang, X., et al. 2008, ArXiv e-printsVenemans, B. P., Rottgering, H. J. A., Overzier, R. A., et al. 2004, A&A, 424,
L17Vennik, J. & Hopp, U. 2009, Astronomische Nachrichten, 330,998Vogeley, M. S., Hoyle, F., Rojas, R. R., & Goldberg, D. M. 2004, in IAU
Colloq. 195: Outskirts of Galaxy Clusters: Intense Life in the Suburbs, ed.A. Diaferio, 5–11
Watson, D. F., Berlind, A. A., McBride, C. K., & Masjedi, M. 2010, ApJ, 709,115
Whitmore, B. C. & Gilmore, D. M. 1991, ApJ, 367, 64Zehavi, I., Eisenstein, D. J., Nichol, R. C., et al. 2005, ApJ, 621, 22Zeldovich, I. B., Einasto, J., & Shandarin, S. F. 1982, Nature, 300, 407Zheng, Z., Zehavi, I., Eisenstein, D. J., Weinberg, D. H., & Jing, Y. P. 2008,
ArXiv e-prints


