Embed Size (px)
Citation preview
Ta
Ga
b
a
ARRA
KPPAB
1
scythamtwmiti
oS
0d
Accident Analysis and Prevention 41 (2009) 692–702
Contents lists available at ScienceDirect
Accident Analysis and Prevention
journa l homepage: www.e lsev ier .com/ locate /aap
he role of the built environment in explaining relationships between perceivednd actual pedestrian and bicyclist safety
ihyoug Cho a,∗, Daniel A. Rodríguez a, Asad J. Khattak b
Carolina Transportation Program, Department of City and Regional Planning, University of North Carolina, Chapel Hill, NC, United StatesDepartment of Civil & Environmental Engineering, Old Dominion University, Norfolk, VA, United States
r t i c l e i n f o
rticle history:eceived 13 August 2008eceived in revised form 10 March 2009ccepted 23 March 2009
eywords:edestrian safetyerceived crash riskctual crash riskuilt environment
a b s t r a c t
While the conventional approach to safety planning has emphasized crash analysis with police-reportedcrash information, transportation professionals increasingly recognize the importance of proactivelyidentifying potential crash risk and considering environmental characteristics. In a proactive approach,individuals’ perception of crash risk provides important information in identifying potential crash risk.As built environment characteristics influence the levels of pedestrian and bicycle safety, this studyexamined how perceived and actual crash risk are related with each other and with respect to builtenvironmental characteristics. Our results showed that residents who live in low density-single residen-tial neighborhoods are more likely to perceive their neighborhood as dangerous relative to residents ofcompact, mixed-use neighborhoods even though the latter exhibited higher actual crash rates. The results
of path analyses confirmed that a simultaneous but opposite relationship exists between perceived andactual crash risks. Our results indicate that higher actual crash risk increases perceived crash risk, whilehigher perceived crash risk is negatively associated to actual crash rates. Consequently, low density andnon-mixed land uses increase individuals perception of crash risk, and increased perception of risk andunfriendly environment for pedestrian and bikers reduces actual crash rates as a result of behavioralchanges. From a policy standpoint, more attention and proactive interventions are desirable in suburbanith hi
areas beyond the areas w. Introduction
Although pedestrian and bicycle fatalities have dropped sub-tantially over the last decade, still more than 5000 pedestrians andyclists are killed and 110,000 are injured in crashes in the US everyear (NHTSA, 2006). Development patterns in the US continueo favor automobile-oriented travel, even as planners and publicealth professionals continue to emphasize pedestrian and bicyclectivity as desirable for a healthy and sustainable urban environ-ent. Despite their limited number, alternative urban forms like
ransit-oriented developments, new urbanist neighborhoods andalkable communities continue to grow in popularity. Such com-unities are intended to support more active lifestyles. Yet, the
mpact of these new neighborhood designs on the actual safety ofheir residents and visitors, particularly those traveling or recreat-ng by bicycle or by walking, is not clear.
∗ Corresponding author at: Department of City and Regional Planning, Universityf North Carolina, Chapel Hill, CB 3140, Room 319, Chapel Hill, NC 27599-3140, Unitedtates. Tel.: +1 919 914 7537; fax: +1 919 962 5206.
E-mail address: [email protected] (G. Cho).
001-4575/$ – see front matter. Published by Elsevier Ltd.oi:10.1016/j.aap.2009.03.008
gh crash rates, as some of these areas have high-perceived risks.Published by Elsevier Ltd.
Mostly driven by planners and engineers, actual crashes ofpedestrians and cyclists have been studied with respect to thebuilt environment with the aim to identify possible interventionsor to control for potential confounding. Safety-planning initiativesbased on actual crash data have been reactive in nature sinceplanning processes heavily rely on analysis of prior crash data.However, more recent approaches like safety-conscious planningand context-sensitive solutions increasingly emphasize proactiveand comprehensive approach in transportation safety planning.The system-wide and comprehensive approach for safety plan-ning considers all aspects of transportation including the planningcontext and perception environment – not only engineering modi-fication and actual crash information (Meyer, 2005). Self-reportedor perceived pedestrian and bicyclist safety have been more fre-quently studied by health professionals interested in explainingwhether perceived safety explains walking and bicycling behav-iors. Beyond its ability to explain travel choices, perceived safetyincreasingly plays an important role in proactive safety planning,
because it provides critical information for understanding individ-uals’ travel behaviors and identifying potentially high crash-riskareas (Schneider et al., 2004).Despite the importance of actual and perceived crash risk, littleis known about how perceived and actual crash risks are related

s and P
wifpeaawtadieIttc
aabiawreawttadsap
2
aetieloswmp(csta
bagtKlpmei
G. Cho et al. / Accident Analysi
ith each other and with respect to built environmental character-stics. Key to improve our understanding of human behavior, andor the formulation of policy responses to enhance the safety ofedestrian and bicyclists, is a deeper knowledge about how builtnvironment characteristics, perceptions of crash risk for pedestri-ns and cyclists, and actual risk interact. This should help advocatesnd professionals in targeting interventions aimed at encouragingalking and bicycling and at enhancing the safety of users of the
ransportation system. The emphasis on the built environment askey factor explaining perceived and actual risks stretches the tra-itional 4E framework for prevention of pedestrian and bicyclist
njuries: enforcement of traffic safety laws, education of travelers,ngineering treatments and encouragement (Retting et al., 2003).t responds to an ecological view of injury prevention in whichhe built environment is viewed as an intermediate factor that,ogether with macro-, interpersonal-, and individual-level factors,ontributes to explaining safety outcomes.
This study seeks to understand crash risk from both reactivend proactive viewpoint, which considers perceived crash risks important information for explaining actual crashes and lookseyond locations which have high crash concentrations. We exam-
ne the association between the built environment and perceivednd actual crash risk for pedestrians and bicyclists, determininghether actual crash risk mediates the environment-perceived
isk relationship and whether perceived crash risk mediates thenvironment-actual risk relationship. In examining these associ-tions and possible mediations, we explore the neighborhoodshich people perceive are safe for walking and bicycling, whether
hose neighborhoods actually are safe for walking and bicycling, andhe role played by the built environment in explaining perceivednd actual safety. In the next section, we review prior research andevelop a conceptual framework. Section 3 summarizes the mea-ures and methods used. Section 4 presents results, followed bydiscussion in Section 5. Finally conclusions and implications areresented.
. Prior evidence and conceptual framework
Environmental exposures influence the levels of pedestriannd bike safety. Much research on the association between builtnvironment features and actual crash rates tends to focus on iden-ifying road features that increase or decrease crash risk. The intents to identify treatments or interventions to reduce crashes (Rettingt al., 2003). Garder (2004) found that pedestrian crashes wereower in two-lane streets than wider streets due to the lower speedf vehicles. Lee and Abdel-Aty (2005) reported that roadway lightignificantly reduced the severity of pedestrian injuries. Indeed,hen built environments are modified with treatments such asodern roundabouts, multi-way stop sign control or pedestrian
rompting devices, the frequency of pedestrian crashes decreasesBrude and Larsson, 2000; Persaud et al., 1997). Furthermore, andonsistent with the views of traffic calming proponents, expo-ure of pedestrians and bicycles has been shown to increase oncehese treatments are implemented (Herrstedt, 1992; Morrison etl., 2004).
Other built environment characteristics like land use also haveeen shown to be associated with actual crashes. Uses of landnd development intensity influence pedestrian and vehicle trafficeneration (Moudon et al., 1997). As a result, there is a poten-ial for conflict between pedestrian and vehicle traffic. Clifton andreamer-Fults (2007) found that transit access, commercial uses of
and, and high population density were positively associated withedestrian crashes around public schools that included 116 ele-entary, 23 middle and 24 senior high schools. Similarly, LaScala
t al. (2001) found that pedestrian collisions occurred more oftenn areas with higher population and cross-street densities, while
revention 41 (2009) 692–702 693
others have reported higher risk of collisions between older pedes-trians and vehicles in marled crosswalks (Koepsell et al., 2002).Alcohol availability in neighborhoods or regions also affects thepedestrian and bike crashes. LaScala’s (2000, 2001) studies showedthat alcohol-involved pedestrian collisions occurred more often inareas with greater bar densities and greater population, and Nolandand Quddus (2004) pointed out more serious pedestrian injurieswere positively associated with percent of local roads and per capitaexpenditure on alcohol.
By contrast to the studies examining actual crashes, there is apaucity of research focusing on the association between built envi-ronments and perceived crash risk. As part of studies examiningthe built environment and physical activity, perceived crash riskhas been negatively associated with living in a neighborhood thatsupports walking (Brown et al., 2007; Cerin et al., 2007), and walk-able neighborhoods frequently have proximity to community trails(Abildso et al., 2007), high residential density, mixing of varioususes of land, and high street connectivity (Cervero and Kockelman,1997; Cerin et al., 2007; Frank et al., 2005; Rodriguez et al., 2006;Leslie et al., 2005).
Despite the paucity of research examining the associationbetween built environments and perceived crash risk in safety plan-ning, professionals increasingly recognize the need for consideringperception of crash risk and neighborhood context, because actualcrash data only provide an accident frequency and severity compar-ison, but do not provide any information related to the nature of thesafety problem itself (Kononov et al., 2007). Relatively new conceptsof safety planning such as safety conscious planning or contextsensitive solution emphasize the need to account for comprehen-sive aspects of transportation – not only engineering modificationand actual crash information but also planning context and percep-tion of environment (Meyer, 2005). As a part of diagnostic analysis,Kononov et al. (2007) pointed out safety planning should bringthe perception of roadway safety in line with reality of safety.Schneider et al. (2004) also proposed that we can take a proactiveapproach that avoids an accident “waiting to happen” by consider-ing perceived crash risk. The study pointed out that high actual butlow perceived crash-risk indicated problems of built environmentssince they hindered proper awareness of crash risk. Meanwhile lowactual but high-perceived crash risk implies potential danger ofcrash, so that proactive interventions are desirable.
Prior research has suggested that the gap between perceivedand actual crash risk can be the result of limited rationality inunderstanding actual information (Simon, 1957), limited ability toprocess environmental cues regarding safety (Duncan et al., 1999),and behavioral factors like behavioral adjustments as suggested by“constrained behavior” (Ferraro, 1996) and risk homeostasis (Wardand Wilde, 1996; Wilde, 1998). More broadly, a similar chasm existswhen perceived and actual safety from crime have been examined(McGinn et al., 2008; Hoehner et al., 2005, and Kirtland et al., 2003)and in describing perceived and objective built environment char-acteristics like density, walkability, and land use mix around one’shome (Moudon et al., 2005; McGinn et al., 2007, 2008; Kirtland etal., 2003).
In terms of crash risk, Austin et al. (1995) conducted a parentalsurvey in order to identify locations of safety concern on children’sroutes to school. The results showed that unsafe locations identi-fied in parental comments did not closely correspond to reportedaccident locations. Schneider et al. (2004) used spatial analysistechniques combined with regression models to understand fac-tors associated with perceived and actual pedestrian crash risks.
They found that people perceived a lower risk near universitylibraries, stadiums, and academic buildings, despite the occurrenceof crashes. Incomplete sidewalks were associated with greater per-ceived pedestrian crash risk. Duncan et al. (1999) used Delphimethods to determine unsafe places based on visible characteristics
6 and P
ohac
efna(bmp
rpcvcrchbadooif
Hcr
Hcc
F(ceTbfa
3
3
g
94 G. Cho et al. / Accident Analysis
f built environments. The study reported that even professionalsad difficulty in correctly perceiving unsafe places for pedestriansnd bikers. The difference between perceived and actual crash riskould be affected by the characteristics of built environments.
Associations between perceived and actual risks have beenxamined for the driving population. Perceived crash risk isrequently understood as a level of awareness, so that proper aware-ess toward a prospective risk allows individuals to avoid theccident risk (Slovic, 1987). However, Ulleberg and Rundmo’s study2003) found no evidence of associations between risky drivingehaviors and risk perception, and risky driving behaviors wereore closely associated with the driver’s personality than with
erceived risks.Although there is some ambiguity in the findings from prior
esearch, we identified three commonalities of interest to theresent study. First, there is a considerable gap between per-eived safety and the actual risk of pedestrian/bicyclist-motorehicle involved crashes. Second, the built environment is asso-iated, directly and perhaps indirectly, with levels of actual crashisk and with levels of perceived crash risk. Proximity to commer-ial land uses and high population densities are associated withigher number of crashes because they increase pedestrian andicyclist exposure. Yet, individuals may perceive such high densitynd mixed-use neighborhoods as more safe or walkable than lowensity, single use neighborhoods, regardless of the actual numberf crashes. And third, the causal paths and the relative contributionsf the built environment and perceived (actual) risk in explain-
ng actual (perceived) risk have not been studied in an integratedashion. As a result, our study tests two hypotheses:
1. The association between the built environment and perceivedrash risk for pedestrians and bicyclists is mediated by actual crashisk.
2. The association between the built environment and actualrash risk for pedestrian and bicyclists is mediated by perceivedrash risk.
The conceptual model to test our hypotheses is presented inig. 1. The aim is to test empirically the mediating effect of actualperceived) risks on the relationship between environment and per-eived (actual) crash risk, thereby isolating the direct effect of thenvironment on actual (perceived) risks from the indirect effect.he conceptual model also allows for a simultaneous relationshipetween perceived and actual risk, thereby creating indirect paths
rom the built environment to both risk outcomes (perceived andctual).
. Methods
.1. Study area and participant recruitment
We focused on five Community Analysis Zones (CAZs) in Mont-omery County, MD in the Washington, DC, metropolitan area.
Fig. 1. Conceptual diagram of study.
revention 41 (2009) 692–702
Montgomery County contains a wide variety of built environmentsranging from exurban areas to highly urbanized, transit-orientedareas. In addition, Montgomery County possesses a large portionof the available GIS data that is essential for quantifying the char-acteristics of built environments. According to the 2006 AmericanCommunity Survey, Montgomery County had 922,000 residents,with $87,600 average household income.
To identify our five recruitment areas, each of the 318 CAZsused by Montgomery County for community planning were char-acterized according to their development characteristics (densityof population, employment, open space and housing), motorizedactivity (proximity to bus and rail, population percentage tak-ing transit commuting to work in 2000, and roadway and busroute density), and pedestrian infrastructure (sidewalk connec-tivity, sidewalk coverage and population percentage walking orcycling to work in 2000). A built environment score was thenused as a basis to classify zones into one of three types of builtenvironments using factor and cluster analysis: high (30 zones),middle (135 zones) and low (153 zones) supportive of walking(Young and Rodriguez, 2005). Two zones were then selected atrandom from the high group, two from the middle group andone from the low group. Only one low-walkability zone wasincluded, because such zones (by definition) cover a larger landarea (average 1720 acres) relative to urban (average 167 acres) andsuburban areas (average 415 acres), thus requiring substantiallygreater resources for field data collection. Table 1 below providessummary statistics of each of the factors for the urban, subur-ban, and exurban CAZs in the County as classified by the clusteranalysis.
Using methods of matched sampling for causal inference (Rubin,2006), we recruited participants living in the two high walkabil-ity areas and contrasted them with other participants with similardemographic characteristics in areas believed to be less supportiveof walking behaviors in the other three areas. This carefully planneddesign allows for testing relationships that may not be testableunder random sampling of area residents. It aims to maximizeheterogeneity across exposures (environments), while maintain-ing homogeneity of participant characteristics. Approximately halfof individuals were recruited through randomly mailed postcardsand direct telephone calls. Other participants were recruited usingnon-random methods by identifying streets in our study areas andgoing door to door, or by asking existing respondents whether theyknew of others living in the study areas who may be interested inparticipating.
3.2. Description of measures
Four sets of measures are used in this research. Consistent withFig. 1, we rely on measures of perceived risk from traffic, actualcrash risk, and of the neighborhood built environment. Previousstudies have shown the relevance of demographic characteristicsin explaining differences in risk perception. Younger adults over-estimated driving ability and underestimated the probability of acrash (Kuiken and Twisk, 2001; Fuller et al., 2006). At the same time,older adults underestimated age-related losses on physiologicalperformance (Holland and Rabbitt, 1992) and tried to cross-roadsin dangerous situations (Oxley et al., 2005). DeJoy (1992) foundthat young males considered risky behavior less likely to resultin an accident than did young females. Schneider et al. (2004)point out that individual-level factors like the ability to judge dis-tance and speed, visual capabilities, and the physical ability may
play a role in determining safety perceptions. Furthermore, genderhas been repeatedly reported in risk studies. Byrnes et al. (1999)reviewed over 150 articles on gender differences in risk percep-tion and concluded that males are more likely to take risks thanfemale participants. As a result, we also include individual’s demo-
G. Cho et al. / Accident Analysis and Prevention 41 (2009) 692–702 695
Table 1Mean values for built environment characteristics, community analysis zones in Montgomery County, MD (N = 318).
Units Urban Suburban Exurban Total
Population density Population/acre 11.70 9.06 2.21 6.01Housing unit density Housing units/acre 6.10 3.50 0.94 2.51Employment density Number of jobs/acre 38.32 6.04 1.54 6.92Park density Number of parks/acre 0.01 0.01 0.00 0.00Roadway density Centerline miles/acre 0.03 0.03 0.01 0.02Bus route density Centerline miles/acre 0.03 0.02 0.00 0.01Transit commuting Percent commuting 25.4% 15.7% 6.2% 12.0%Proximity to subway station Binary 0.93 0.03 0.01 0.10Proximity to commuter rail Binary 0.17 0.03 0.02 0.04Sidewalk density Sidewalk miles/acre 0.03 0.03 0.00 0.02Sidewalk coverage Sidewalk miles/centerline miles 0.94 1.10 0.31 0.71Pedestrian and bicycle commuting Percent commuting 7.4% 2.5% 1.3% 2.4%
ath d
gc
ihcccama
3
wdirm
•
•
•
•
•
•
participant-specific neighborhoods, the mean number of crasheswas 11.5, ranging from 0 to 48 SD (12.9). Without actual multimodalcounts of travelers to characterize exposure, an approximation isto rely on population density (Ewing et al., 2003; Lucy, 2003). To
Fig. 2. P
raphic characteristics in our model to account for their potentialonfounding effects.
The specific empirical model to be tested in this study is shownn Fig. 2. The numbers in Fig. 2 indicate the effect of (1) neighbor-ood compactness on actual crash risk, (2) mixed land use on actualrash risk, (3) path condition on actual crash risk, (4) neighborhoodompactness on perceived crash risk, (5) mixed land use on per-eived crash risk, (6) path condition on perceived crash risk, (7)ge on perceived crash risk, (8) gender on perceived crash risk, (9)arital status on perceived crash risk, (10) perceived crash risk on
ctual crash risk, and (11) actual crash risk on perceived crash risk.
.2.1. Perceived and actual pedestrian crash riskPerceived risks for pedestrians and bicyclists were measured
ith a questionnaire including on perceived neighborhood safetyeveloped by the Neighborhood Quality of Life Study and described
n Saelens et al. (2003). A total of six questions were selected toepresent perceived risk of pedestrians and bicyclists, with psycho-
etric data available only for the first three questions:
There is so much traffic along the street you live on that it makesit difficult or unpleasant to walk in my neighborhood.There is so much traffic along nearby streets that it makes it dif-ficult or unpleasant to walk in my neighborhood.The crosswalks in your neighborhood help walkers feel safe cross-ing busy streets.
Your neighborhood is safe enough so that you would let a 10-year-old child walk around your block.Considering traffic and road conditions, it is safe to ride a bike inor near your neighborhood.If you were to bicycle in your neighborhood you would feel safefrom cars while riding.iagram.
Response categories for each question were scaled from 1(strongly disagree) to 4 or 5 (strongly agree), with higher scoresindicating a more favorable value of the environmental character-istic. Neighborhoods were defined as the area within a 20-min walkor 1-mile radius from the participant’s home, assuming the averagewalking speed of 2.72 mph used in transportation planning (TRB,2000).
Test–retest reliability1 for the questions ranges from 0.44 to 0.59(Saelens et al., 2003). Together, the questions represent the gen-eral concept of perceived crash risk rather than each measuringindependent risk factors. In order to derive a single indicator forperceived crash risk, we summed the Likert scale responses to thesix questions. When appropriate, scales were inverted so that lowervalues represented lower perceived risk and higher values repre-sented higher perceived risk. The mean perceived risk was 12.5,ranging from 6 (safe) to 25 (risky) (SD 3.8).
Actual pedestrian and bicycle crash data were provided by theNational Study Center for Trauma and EMS at the University ofMaryland reported by police between January 2000 and Decem-ber 2002. They contain information regarding the specific locations,injury level, and demographic information of those involved in thecrash. During this time period there were a total of 1559 crashes inthe entire county, 43 of which involved fatalities. In terms of the
1 The test–retest reliability of a survey instrument is estimated by performingthe same survey with the same respondents at different moments of time. Saelens’study used intra-class correlation coefficients to measure reliability between firstand second surveys.

6 and P
ielrtbT7
3
apf2adoP(
cirtroAaomipasctf
TB
D
D
L
S
P
B
96 G. Cho et al. / Accident Analysis
mprove our exposure measure, we considered also the number ofmployees as it also generates and attracts travel activity. To calcu-ate person-specific crash rates, we summed the number of crashes,egardless of injury level, occurring within a radius of 0.5 miles fromhe geocoded home location of each participant and divided themy the total residents and employees within the same circular area.he mean crash rate per 1000 persons was 2.3, ranging from 0 to.31 (SD 2.1).
.2.2. Built environmentWe used secondary GIS data and primary data through a street
udit to characterize the built environment. Secondary data includeopulation, street location, use of land, and transit routes. Due to
requent limitations in secondary data (Day et al., 2006; Pikora et al.,002), all road segments within one mile of each participant wereudited by foot by study staff using the pedestrian environmentata scan (PEDS) instrument. PEDS collects detailed informationn pedestrian facilities, road attributes and the street environment.EDS has been shown to have adequate psychometric propertiesClifton et al., 2007).
Given the wide variety of built environment data collected, ahallenging task is to measure environments in ways that are mean-ngful to their relationship with actual and perceived safety. Weely on Handy et al.’s (2002) dimensions of the built environmento define density, land use mix, street connectivity, street scale andegional structure. We excluded the category of aesthetic qualitiesf neighborhoods given the limited reliability of data assessing it.total of 13 variables from secondary data sources and eight vari-
bles collected via the neighborhood audit were considered. Eachf these belongs to one of five dimensions of the built environ-ents identified a priori, as shown in Table 2. Audit segments were
ncorporated with a scheme weighing the segments closer to thearticipant’s home more heavily than the segments that are further
way. Segments were weighted by the inverse distance between theegment’s midpoint and each participant’s home. This approachonforms to our expectation that environmental conditions closero one’s home are more important than conditions further awayrom home.able 2uilt environment measures and sources.
omain Variable description M
ensityNet population density PeLot coverage Bu
and use mixCervero dissimilarity index SeEntropy index M
CeHerfindahl index Su
(0
treet connectivity
Effective walking area PrRoad density RoIntersection density #Connected ratio #Sidewalk density Si
ath Condition
Path maintenance GBuffers FeSidewalk width FeSidewalk completeness/continuity CoSidewalk connectivity #
Path materialAdiBr
Crosswalks OCrossaid Yi
ovw
us transitBus stop density #Bus transit service intensity ToBus transit destination diversity #
revention 41 (2009) 692–702
3.2.3. Individual-level informationWe included individual-level data to control for various indi-
vidual and family factors that influence perceived and actual crashrisks. Frequently, socio-economic characteristics work as influentialconfounding factors of perceived risk levels (Mesch, 2000). Partic-ipants’ age, sex, and marital status were included.
3.3. Analytical methods
Our analytical approach was first to conduct an exploratory fac-tor analysis of built environment variables to reduce them to a lowernumber of variables representing their underlying dimensions.Then, we included the predicted factor scores in a non-recursivepath analysis model to examine the two hypotheses. We detail eachstep next.
3.3.1. Exploratory factor analysis of built environmentcharacteristics
Built environment characteristics are likely to be highly spa-tially correlated. Given the limited number of participants in thestudy, it is useful to condense these variables into a smaller setof variables that remove redundancy and correlation in the data(Song and Knaap, 2007). Factor analysis is a widely used method tocharacterize correlated built environment elements (Ewing et al.,2003; Handy et al., 2005; Song and Knaap, 2007). We used STATASE 9.0 to extract the factors using the maximum likelihood methodand to produce factor scores useful in the next step of the analy-sis. The estimated factor scores can be interpreted as the meansof distributions of factors scores given the manifest built envi-ronment attributes (Bartholomew, 2007). For the purposes of thisexploratory factor analysis all variables were treated as continu-ous.
3.3.2. Path analysisPath analysis, a special case of structural equation modeling, is
a flexible and effective statistical modeling technique that enablestests of hypothetical models about mediator, moderator and latent
easurement Source
rsons per developed land area GISilding footprint area divided by lot area GIS
e Cervero and Kockelman (1997) GISeasure of mixed land uses (0–1), 1 is even distribution. Seervero and Kockelman (1997)
GIS
m of squares of the percentages of each type of land uses–10,000), 10,000 is a single use.
GIS
oportion of circle area covered by network distance buffer GISads per unit of area GISof intersections per unit of area GISof intersections divided by # of intersections plus cul-de-sacs GISdewalk length along roads per unit of area GIS
ood (1), poor (0) Auditnce, hard buffer trees, landscaping or grass (1) else (0) Auditet (continuous) Auditmplete (1), incomplete (0) Auditof connection Audit
sphalt-no gravel-no dirt, Concrete-no gravel (gravel = 0)-nort) or
Audit
icks-no gravel-no dirt (1) else (0)ne or more (1), none (0) Auditeld to paddles, pedestrian signal, median/traffic island,erpass/underpass, pedestrian crossing street sign, flashingarning, or share the road warning sign (1) else (0)
Audit
of bus stops per unit of area GIStal peak-period buses per hour GISof different bus routes GIS
G. Cho et al. / Accident Analysis and Prevention 41 (2009) 692–702 697
Table 3Factor loading matrix and descriptive statistics.
Neighborhood compactness Mixed use Path condition
Net population density 0.925Lot coverage 0.919Effective walking area 0.667Road density 0.841 −0.474Intersection density 0.935Connected ratio 0.878Bus stop density 0.748Bus transit service intensity 0.832Bus transit destination diversity 0.687Cervero dissimilarity −0.828Herfindahl index for all major usesa −0.936Entrophy index for all major usesa 0.946Crosswalks 0.570 0.557Crossing aids 0.598 0.560Sidewalk density 0.607 0.649Path condition/maintenance 0.573Buffers 0.652Sidewalk width 0.936Sidewalk completeness/continuity 0.960Sidewalk connectivity 0.914Path material 0.956Eigenvalue 7.78 6.65 2.35Cronbach’s alpha 0.942 0.913 0.916
Note: factor loadings < 0.40 are left blank.al, com
vtmtop
bmscatwacaTpus
4
22toworA5hht
suburban or exurban areas yields a negative loading of “road den-sity” over mixed-use factor. The size of blocks determines the lengthof roads. Since the sizes of non-residential blocks in suburban or
a All major uses indicate eight land use codes in GIS. They are residentition and vacant uses.
ariables (Bruijn et al., 2006). Path analysis involves testing hypo-hetical models that describe the explanatory relationships among
anifest variable (Masse et al., 2002), and therefore it is well-suitedo the needs of our study to test the mediating effects of actual riskn the relationship between built environment characteristics anderceived crash risk, and vice versa.
In addition to identifying coefficients summarizing associationsetween variables, the application of path analysis allows us toake global assessments of model fit by quantifying the corre-
pondence between the predicted covariances and the observedovariances (Buhi et al., 2007). Although there is no unanimouslyccepted fit measure for path analyses in the context of struc-ural equation modeling, we use two measures of model fit. First,e use the root mean square error of approximation (RMSEA),measure of the discrepancy between predicted and observed
ovariances per degree of freedom. A smaller RMSEA representsbetter model fit. Second, we use the Tucker–Lewis Index (TLI).
his measure indicates how much better the model fits the sam-le data than a null model considering model parsimony. Wesed the LISREL statistical software to conduct the path analy-is.
. Results
A total of 293 individuals enrolled in the study between January005 and September 2006. Among the 293 individuals recruited,49 completed all survey questions regarding perceived pedes-rian and bicycle safety, so subsequent analyses rely on these 249bservations. On average, 80.4% of participants were white, 63.2%ere female, 54.4% were married, and 49.2% had household income
f $100,000 or more. Average age of study participants was 49.6,anging from 18 to 90 years. By comparison, according to the 2006
merican Community Survey, 61.8% of county residents were white,1.8% were female, 55.3% were married, and 43.3% had medianousehold income of $100,000 or more. Recruited participants thusad slightly higher incomes and were more likely to be white thanhe county population.mercial, office, industrial, institutional, park and recreation, transporta-
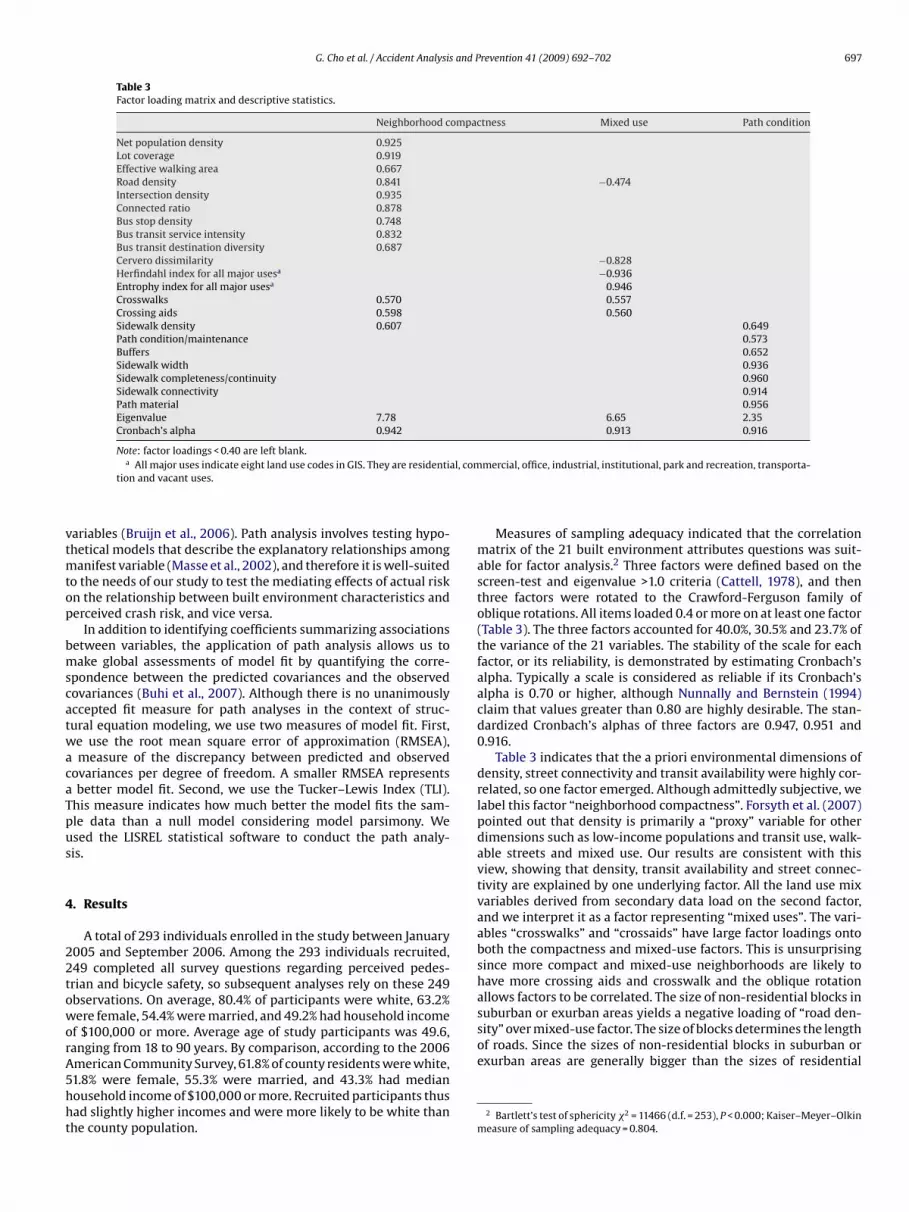
Measures of sampling adequacy indicated that the correlationmatrix of the 21 built environment attributes questions was suit-able for factor analysis.2 Three factors were defined based on thescreen-test and eigenvalue >1.0 criteria (Cattell, 1978), and thenthree factors were rotated to the Crawford-Ferguson family ofoblique rotations. All items loaded 0.4 or more on at least one factor(Table 3). The three factors accounted for 40.0%, 30.5% and 23.7% ofthe variance of the 21 variables. The stability of the scale for eachfactor, or its reliability, is demonstrated by estimating Cronbach’salpha. Typically a scale is considered as reliable if its Cronbach’salpha is 0.70 or higher, although Nunnally and Bernstein (1994)claim that values greater than 0.80 are highly desirable. The stan-dardized Cronbach’s alphas of three factors are 0.947, 0.951 and0.916.
Table 3 indicates that the a priori environmental dimensions ofdensity, street connectivity and transit availability were highly cor-related, so one factor emerged. Although admittedly subjective, welabel this factor “neighborhood compactness”. Forsyth et al. (2007)pointed out that density is primarily a “proxy” variable for otherdimensions such as low-income populations and transit use, walk-able streets and mixed use. Our results are consistent with thisview, showing that density, transit availability and street connec-tivity are explained by one underlying factor. All the land use mixvariables derived from secondary data load on the second factor,and we interpret it as a factor representing “mixed uses”. The vari-ables “crosswalks” and “crossaids” have large factor loadings ontoboth the compactness and mixed-use factors. This is unsurprisingsince more compact and mixed-use neighborhoods are likely tohave more crossing aids and crosswalk and the oblique rotationallows factors to be correlated. The size of non-residential blocks in
exurban areas are generally bigger than the sizes of residential
2 Bartlett’s test of sphericity �2 = 11466 (d.f. = 253), P < 0.000; Kaiser–Meyer–Olkinmeasure of sampling adequacy = 0.804.

698 G. Cho et al. / Accident Analysis and Prevention 41 (2009) 692–702
Table 4Summary statistics of variables (N = 249).
Variable Mean STD Minimum Maximum
Built environment characteristics ofneighborhoods
Compactness 0.00 1.00 −2.56 1.98Mixed use 0.00 1.00 −2.34 2.14Path condition 0.00 1.00 −2.88 5.22
Participants’ demographic characteristicsAge 49.58 14.45 18 90Gender 0.63 0.46 0 1
C
bia“
am(sa
fitwamtmmpetf
s
eioambi
TP
P
12345678911RT
Marriage
rash riskActual riskPerceived risk
locks, a lower value of road density contributes the higher scoresn the land use mix factor. The third factor contained seven vari-bles, mostly related to the audit variables. We label this factorpath condition”.
Based on the results of exploratory factor analysis, we estimatedstandardized factor score for each of three factors. The three esti-ated factor scores, age, sex (male: 0, female: 1), and marital status
married: 1, unmarried: 0) were used in the path analysis. Table 4hows summary statistics of the independent and dependent vari-bles in the model.
Table 5 shows the results of three models. Consistent with therst hypothesis, the first model shows results assuming causa-
ion from perceived risk to actual risk (path 10 in Fig. 2) and testshether the perceived risk mediates the environment-actual risk
ssociation. Consistent with the second hypotheses, the secondodel shows results assuming causation flowing from actual risk
o perceived risk (path 11 in Fig. 2), and tests whether actual riskediates the environment-perceived risk association. The thirdodel assumes a simultaneous relationship between actual and
erceived crash risks, with actual risk acting as a mediator of thenvironment-perceived risk association, and vice versa. It tests bothhe first and second hypothesis in a single model, while allowingor the simultaneity between actual and perceived risk.
Comparisons of the three models suggest that the model ofimultaneous causation fits best.
Browne and Cudeck (2003) suggest that reasonable fitting mod-ls have RMSEA in the range of 0.05 to 0.08, while the TLI values recommended to be above 0.90 (Hu and Bentler, 1998). Thether two models that consider one-way causation between actual
nd perceived risk yield unacceptable model fit. Thus, in terms ofodel fit, the results support the presence of a simultaneous effectetween actual and perceived crash risk. As a result, we focus ournterpretation on the coefficients from the simultaneous model.
able 5ath analysis results (N = 249).
ath Perceived to actual causation Actual
Estimate t Value Estima
0.73 21.9*** 0.740.4 0.53*** 0.40.02 11.59 0.020.27 4.37*** 0.11
−0.1 −1.56 −0.19−0.01 −0.13 −0.01
0.07 1.23 0.060.23 3.66*** 0.250.12 1.85* 0.13
0 0.04 1.271 0.22MSEA 0.119LI 0.68
* p < 0.10.** p < 0.05.
*** p < 0.01
0.54 0.50 0 1
2.30 2.06 0 7.3112.49 3.80 6 25
In examining the relationship between the built environmentand actual pedestrian and bicycle crash risk (paths 1–3 in Fig. 2), wefound that more compact neighborhoods (p < 0.01) and neighbor-hoods with higher mixture of land uses (p < 0.01) were associatedwith higher crash rates, with neighborhood compactness being thestrongest predictor. However, walking path condition in neighbor-hoods was not related to crash risk. Paths 4–9 in Fig. 2 depictassociations between built environment and individual-level fac-tors, and perceived crash risk. The coefficients in Table 5 show thatneighborhood compactness (p < 0.05) and mixed land uses (p < 0.05)were related to lower perceived crash risk. As before, the condi-tion of paths was not related to perceived crash risk. This meansthat residents who live in low density-single residential neighbor-hoods are more likely to perceive their neighborhood as dangerous.Among the individual-level factors, age was not associated withperceived crash risk, but consistent with other studies (Byrnes etal., 1999; Daigneault et al., 2002) males (p < 0.01) and single indi-viduals (p < 0.10) perceived lower risk than females and marriedindividuals.
The association between actual and perceived risk showed thatactual risk positively affected perceived risk (path 11, p < 0.01), whileperceived risk showed a negative association with actual crashrisk (path 10, p < 0.05). Although our results suggest a reciprocalrelationship between perceived and actual crash risk, we cannotconclude this unambiguously. There may be an ecological fallacy inassuming that individual risk perceptions influence neighborhood-level crash rates. Individuals with high perception of risk may beavoiding the risky areas or may be being more careful in those areas,and with individuals in neighborhoods having like perceptions, the
overall crash rate might be lower. Other explanations for the asso-ciation also exist. For example, it may be that individuals that aremore aware about traffic safety may be more likely to live in safeneighborhoods.to perceived causation Simultaneous causation
te t Value Estimate t Value
22.9*** 0.86 12.27***
11.49*** 0.35 6.91***
0.48 0.01 −0.041.02 −0.98 −2.09**
−2.41*** −0.77 −2.93**
−0.18 −0.03 −0.381.02 −0.02 −0.334.01*** 0.38 3.79***
1.91* 0.15 1.69*
−0.46 −2.17**
1.92* 1.69 2.68***
0.108 0.0720.73 0.89
G. Cho et al. / Accident Analysis and Prevention 41 (2009) 692–702 699
Table 6Direct, indirect, and total effects.
Actual risk Perceived risk
Direct Indirect Total Direct Indirect Total
Actual risk – – – 1.69 *** −0.74 0.95 ***
Perceived risk −0.46 ** 0.2 −0.26 *** – – –Compactness 0.86 *** −0.12 ** 0.74 *** −0.98 ** 1.24 *** 0.26 ***
Land use 0.35 *** 0.05 0.4 *** −0.77 *** 0.68 *** −0.1 **
Path condition 0.01 0.01 0.01 −0.03 0.01 −0.02Age – 0.01 0.01 −0.02 0.01 −0.01Gender – −0.1 *** −0.1 *** 0.38 *** −0.17 * 0.21 ***
Marriage – −0.04 * −0.04 * 0.15 * −0.06 0.08 *
ecoarcTtte
bofcsrpdhlnareaoa
5
rtbccbapwtpnu
fcB
* p < 0.10** p < 0.05.
*** p < 0.01.
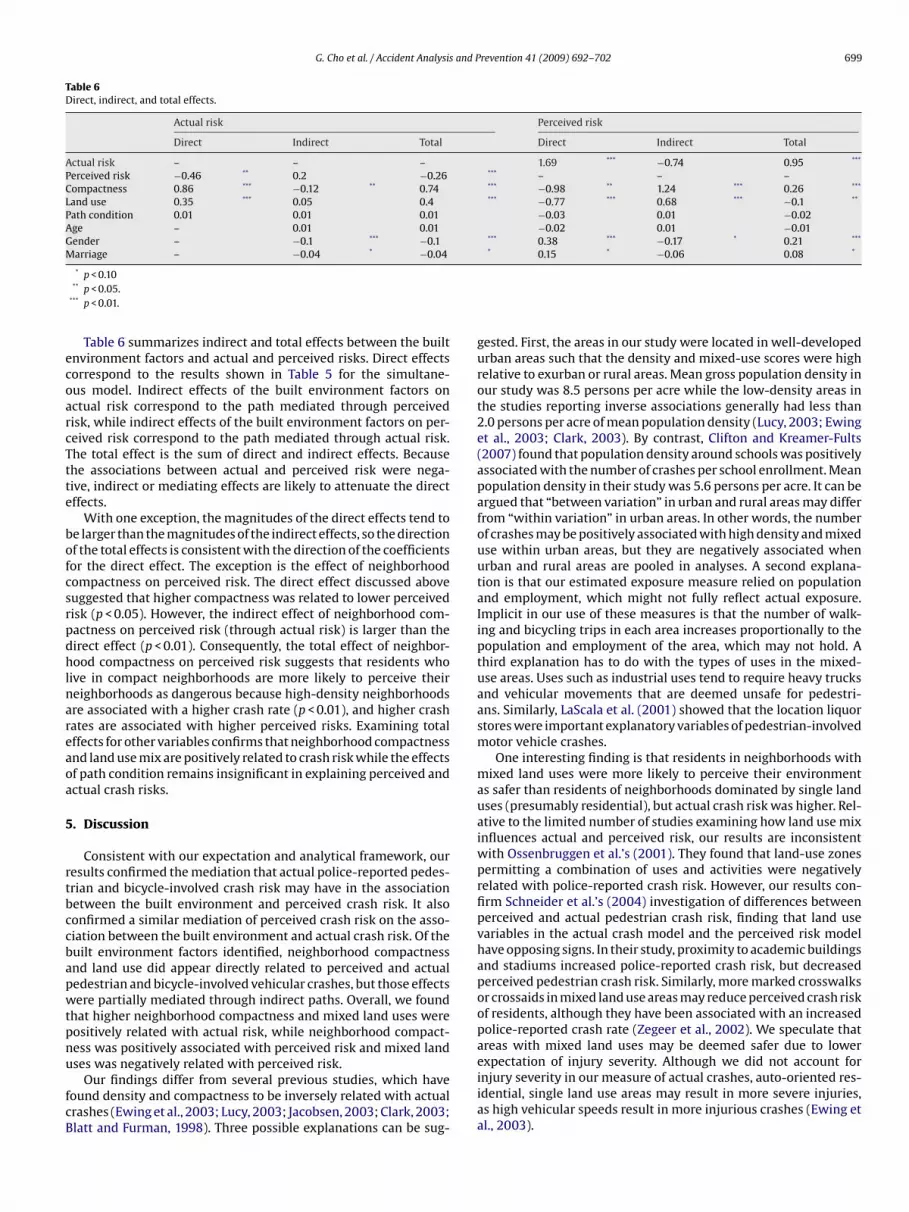
Table 6 summarizes indirect and total effects between the builtnvironment factors and actual and perceived risks. Direct effectsorrespond to the results shown in Table 5 for the simultane-us model. Indirect effects of the built environment factors onctual risk correspond to the path mediated through perceivedisk, while indirect effects of the built environment factors on per-eived risk correspond to the path mediated through actual risk.he total effect is the sum of direct and indirect effects. Becausehe associations between actual and perceived risk were nega-ive, indirect or mediating effects are likely to attenuate the directffects.
With one exception, the magnitudes of the direct effects tend toe larger than the magnitudes of the indirect effects, so the directionf the total effects is consistent with the direction of the coefficientsor the direct effect. The exception is the effect of neighborhoodompactness on perceived risk. The direct effect discussed aboveuggested that higher compactness was related to lower perceivedisk (p < 0.05). However, the indirect effect of neighborhood com-actness on perceived risk (through actual risk) is larger than theirect effect (p < 0.01). Consequently, the total effect of neighbor-ood compactness on perceived risk suggests that residents who
ive in compact neighborhoods are more likely to perceive theireighborhoods as dangerous because high-density neighborhoodsre associated with a higher crash rate (p < 0.01), and higher crashates are associated with higher perceived risks. Examining totalffects for other variables confirms that neighborhood compactnessnd land use mix are positively related to crash risk while the effectsf path condition remains insignificant in explaining perceived andctual crash risks.
. Discussion
Consistent with our expectation and analytical framework, ouresults confirmed the mediation that actual police-reported pedes-rian and bicycle-involved crash risk may have in the associationetween the built environment and perceived crash risk. It alsoonfirmed a similar mediation of perceived crash risk on the asso-iation between the built environment and actual crash risk. Of theuilt environment factors identified, neighborhood compactnessnd land use did appear directly related to perceived and actualedestrian and bicycle-involved vehicular crashes, but those effectsere partially mediated through indirect paths. Overall, we found
hat higher neighborhood compactness and mixed land uses wereositively related with actual risk, while neighborhood compact-ess was positively associated with perceived risk and mixed land
ses was negatively related with perceived risk.Our findings differ from several previous studies, which haveound density and compactness to be inversely related with actualrashes (Ewing et al., 2003; Lucy, 2003; Jacobsen, 2003; Clark, 2003;latt and Furman, 1998). Three possible explanations can be sug-
gested. First, the areas in our study were located in well-developedurban areas such that the density and mixed-use scores were highrelative to exurban or rural areas. Mean gross population density inour study was 8.5 persons per acre while the low-density areas inthe studies reporting inverse associations generally had less than2.0 persons per acre of mean population density (Lucy, 2003; Ewinget al., 2003; Clark, 2003). By contrast, Clifton and Kreamer-Fults(2007) found that population density around schools was positivelyassociated with the number of crashes per school enrollment. Meanpopulation density in their study was 5.6 persons per acre. It can beargued that “between variation” in urban and rural areas may differfrom “within variation” in urban areas. In other words, the numberof crashes may be positively associated with high density and mixeduse within urban areas, but they are negatively associated whenurban and rural areas are pooled in analyses. A second explana-tion is that our estimated exposure measure relied on populationand employment, which might not fully reflect actual exposure.Implicit in our use of these measures is that the number of walk-ing and bicycling trips in each area increases proportionally to thepopulation and employment of the area, which may not hold. Athird explanation has to do with the types of uses in the mixed-use areas. Uses such as industrial uses tend to require heavy trucksand vehicular movements that are deemed unsafe for pedestri-ans. Similarly, LaScala et al. (2001) showed that the location liquorstores were important explanatory variables of pedestrian-involvedmotor vehicle crashes.
One interesting finding is that residents in neighborhoods withmixed land uses were more likely to perceive their environmentas safer than residents of neighborhoods dominated by single landuses (presumably residential), but actual crash risk was higher. Rel-ative to the limited number of studies examining how land use mixinfluences actual and perceived risk, our results are inconsistentwith Ossenbruggen et al.’s (2001). They found that land-use zonespermitting a combination of uses and activities were negativelyrelated with police-reported crash risk. However, our results con-firm Schneider et al.’s (2004) investigation of differences betweenperceived and actual pedestrian crash risk, finding that land usevariables in the actual crash model and the perceived risk modelhave opposing signs. In their study, proximity to academic buildingsand stadiums increased police-reported crash risk, but decreasedperceived pedestrian crash risk. Similarly, more marked crosswalksor crossaids in mixed land use areas may reduce perceived crash riskof residents, although they have been associated with an increasedpolice-reported crash rate (Zegeer et al., 2002). We speculate thatareas with mixed land uses may be deemed safer due to lower
expectation of injury severity. Although we did not account forinjury severity in our measure of actual crashes, auto-oriented res-idential, single land use areas may result in more severe injuries,as high vehicular speeds result in more injurious crashes (Ewing etal., 2003).
7 and P
ehitothbwhcl(wat
nfiicdsia
vcsllawipcmbwie
capoiuw2otpcutv
5
oaob
00 G. Cho et al. / Accident Analysis
The mismatch between perceived and actual crash risk can bexplained in terms of behavioral changes to avoid exposures toigh-perceived risk areas, or increased caution and alertness when
n these areas. To further examine this explanation, we used addi-ional walking data collected for the same study. Participants filledut a travel diary over a 7-day period in which they recorded theirravel mode and where the travel occurred (in home neighbor-ood, in work/school neighborhood, or elsewhere). The associationetween neighborhood perceived safety risk and the number ofalking trips taken by the participant in the neighborhood couldelp determine whether avoidance behaviors were present. If per-eption were negatively associated to walking, this would confirmower walking among those having higher safety risk perceptionsalthough cause and effect cannot be established). If the associationere non-existent (or positive) we would reject the null hypothesis
nd consider therefore that individuals are equally exposed withinhe neighborhood, but perhaps acting more carefully.
The Pearson correlation between perceived safety risk and theumber of walking trips is −0.1478, significant at a 99% level of con-dence. Adjusting for the same demographic confounders included
n the path model (but not the built environment mediators) in aount regression model, the negative association remains at stan-ard levels of confidence (results not shown). Thus, our evidence isupportive of the view that, on average, individuals may be avoid-ng the areas with high-perceived risk. Despite this, it is possiblelso that some individuals continue to use the areas more carefully
The asymmetry between perceived and actual crash risk pro-ides important information for crash prevention. Using theonventional or reactive approach, safety planning interventionsuch as education or engineering have been emphasized when theevel of actual crash risk was higher than perceived risk becauseow perceived risk relative to actual risk indicated individuals’ lowwareness of crash (Ward and Wilde, 1996; Wilde, 1998). Mean-hile, high-perceived risk relative to actual crash risk delivers an
mportant message with regards to the proactive approach. Sinceeople tend to avoid walking or bicycling activities or do so moreautiously when they perceive their neighborhood as dangerous,anifest crash data may underestimate potential risk of the neigh-
orhoods. In the context of our study areas, proactive interventionsith appropriate education, enforcement measures and engineer-
ng in low density, suburban areas may be desirable along with thevaluation for actual and perceived risk.
The simultaneous relationship between perceived and actualrash risk suggests similar interpretations. Our model indicates thatctual crash risks increases perceived crash risk while increases inerceived crash risk are inversely related with actual crash rates. Inther words, individuals with high perception of risk tend to live
n less compact neighborhoods with exclusively residential landse. Since low density and non-mixed land use largely discouragealking and bicycling activities (Frank et al., 2005; Handy et al.,
002), manifest crash data indicates low crash risk, but residentsf those neighborhoods are still aware of potential crash risk. Fur-hermore simultaneous but opposite relationships between themrovides a clue for explaining why perceived risk often does notorresponds with actual crash. Low density and non-mixed landses increase risk perception, and such environmental characteris-ics reduce actual crash risk as a result of behavioral changes, andice versa.
.1. Limitations and future studies
The asymmetric relationship between perceived and actual riskspens interesting opportunities for further research. Schneider etl.’s (2004) assertion of exposure avoidance is a plausible formf constrained behavior. Yet, another embodiment of constrainedehavior is that pedestrians and bicyclists are more alert while
revention 41 (2009) 692–702
traveling on these perceivably more dangerous roads. The lat-ter explanation is consistent with Slovic’s (1987) assertion thatperceived crash risk indicates a level of awareness and higherawareness reduces actual crash risk. Unfortunately our data doesnot allow us to identify which explanation is driving the associa-tions detected. This speaks to the need of proper theories to explainnon-motorized travel behavior, even though pedestrian and bicycletravel is receiving increased research attention. We hope our studyhelps to build a cornerstone for further discussion and research inregard to the association between perceived and actual crash riskfor non-motorized travel.
We estimated three factors using factor analysis used theirscores in path analysis. This two-step process can reveal the associa-tion between three built environment factors and actual/perceivedcrash risks and allows us to test for the mediation effects of interest.However, if the interest is in identifying individual built environ-ment variables and their relationship to perceived or actual crashrisks, then a structural equation model would be more promising.To achieve this, however, larger sample sizes are required sincenumber of parameters to be estimated increases with model com-plexity. By contrast, if the simultaneity between perceived andobjective crash risk is of interest, two- and three-stage least squaresequations may be useful approaches to capture the interdepen-dence between the two risk variables. The path analysis used inthis research was a comprise that allowed us to consider mediationroles of the risk variables and their simultaneous relationships.
One other limitation of how simultaneity between perceivedand actual crash risk was modeled, is that we cannot construe therelationship solely as reciprocal causation. In our study actual crashrisk is a variable describing a neighborhood, while perceived risk ismeasured at individual level. Furthermore, there is a data limitationthat also constrains our interpretation of the simultaneous relation-ship between perceived and actual risk: more than a three-yeargap between when participants reported perceived risks and whenactual crash rates were measured. This gap is important becausesafety perceptions are likely to form over a long period of times,possibly punctuated by significant crash events. In practical terms,and given the stochasticity in crash occurrences, it means that ourmeasure of actual risk has considerable noise or randomness.
Other data limitations include our measure of exposure, whichrelies on population and employment is limited due to resourceconstraints. It is probable that the indicator may under- or over-estimates the level of exposure. Developing a valid and reliableindicator of actual crash risk would be a promising research topicin safety. Similarly, neighborhood compactness and mixed land usewere significant built environment characteristics affecting actualand perceived crash risks. But they do not account for how particu-lar land uses, such as liquor stores, can influence pedestrian crashes.Similarly, architectural or aesthetic features of built environmentswere not considered. Studies in crime risk have long investigatedthe effect of those characteristics on risk perception toward crimes,and have found maintenance or arrangement of buildings affectedfear of crime (Schweitzer et al., 1999). Future studies need to con-sider more detailed attributes of built environments. Lack of data,a relatively small sample sizes and the spatial covariation amongfeatures make it difficult to incorporate these characteristics intostatistical models.
6. Conclusions
In this study we hypothesized that actual police-reported pedes-
trian and bicycle-involved crash risk has a mediating effect onthe association between built environment and perceived crashrisk. We also examine whether perceived crash risk mediates theenvironment-actual crash risk association. Our results confirmedboth hypotheses. Actual risks mediate the built environment-
s and P
ptpscrw
pwMtteoowta
tfTppdttAtahrpciemsiail2boec
A
RaCoDar
R
A
A
G. Cho et al. / Accident Analysi
erceived risk relationship, and that perceived risks also mediatehe built-environment-actual risk relationship. The mediation rolelayed by both risk perceptions and actual risks are the result of theimultaneous relationship between safety perceptions and actualrash risk. As expected, actual crash risk increases perceived crashisk while increases in perceived crash risk are inversely relatedith actual crash rates.
A plethora of research has examined associations betweenerceived or actual traffic safety and behavioral outcomes likealking and cycling (Owen et al., 2004; Saelens and Handy, 2008;cCormack et al., 2004). Our findings lend support to why objec-
ive and perceived measures of the environment have been foundo have independent effects on levels of physical activity (McGinnt al., 2008). Furthermore, our results suggest that ignoring actualr perceived traffic safety, or failing to account for the simultane-us relationship between them, will likely yield biased associationshen examining physical activity behaviors. Future research must
ake into account the simultaneous relationship through the use ofppropriate statistical models and specifications.
From a policy standpoint, the relationships detected betweenhe built environment and actual and perceived risk provide use-ul information for transport planners, city planners and engineers.wo of the three built environment factors, neighborhood com-actness and mixed land use were positively related with actualedestrian and bicycle-involved vehicular crash rates. Yet, resi-ents were more likely to perceive their neighborhood as dangerouso walk when they lived in areas that were not compact andhat were dominated by single land uses, presumably residential.lthough conventional safety planning has emphasized interven-
ions in urbanized areas with high actual crash risk, more attentionnd proactive intervention are desirable in suburban areas becauseigh-perceived risk relative to actual crash risk imply potentialisk (or at least provide a good reason to examine the reasons forerceived risk further). Since perceived and actual traffic safetyoncerns have been shown to be positively associated with walk-ng behaviors (McGinn et al., 2007; Owen et al., 2004; Humpelt al., 2004; Forster et al., 2004), our results suggest that pro-otional efforts and physical projects that reassure residents of
uburban areas of the safety of those areas are likely to yield promis-ng benefits by encouraging them to engage in additional walkingnd bicycling. Furthermore, as more individuals walk and bicyclen these suburban areas, it is possible that motorists may be lessikely to collide with a person as awareness increases (Jacobsen,003). Our results contribute to understanding the role that theuilt environment plays in safety outcomes and in the formationf perceptions around those outcomes. Additional theoretical andmpirical models need to be developed to explain and better elu-idate the relationships identified.
cknowledgments
Preparation of this article was supported by grants from theobert Wood Johnson Foundation Active Living Research programnd the Southeastern Transportation Center. We are grateful to thearolina Transportation Program at the University of North Car-lina at Chapel Hill and the Transportation Research Institute at Oldominion University for their support in completing this study. Weppreciate the detailed comments received from the anonymouseviewers.
eferences
bildso, C., Zizzi, S., Abildso, L., Steele, J., Gordon, P., 2007. Built environment andpsychosocial factors associated with trail proximity and use. American Journalof Health Behavior 31 (4), 374–383.
ustin, K., Tight, M., Kirby, H., 1995. An Advanced System for the Study of Children’sSafety on the Journeys To and From School, vol. 2A, No. 3. VTI Conference No. 4A.
revention 41 (2009) 692–702 701
Bartholomew, D., 2007. Three faces of factor analysis. In: Cudeck, R., MacCallum, R.(Eds.), Factor Analysis at 100: Historical Developments and Future Directions.Lawrence Publications, Manhwah, NJ, pp. 9–21.
Blatt, J., Furman, S., 1998. Residence location of drivers involved in fatal crashes.Accident Analysis and Prevention 30, 705–711.
Brown, B., Werner, C., Amburgey, J., Caitlin, S., 2007. Walkable route perceptions andphysical features. Environment and Behavior 39 (1), 34–61.
Browne, M., Cudeck, R., 2003. Alternative ways of assessing model fit. In: Bollen, K.,Long, J. (Eds.), Testing Structural Models. Sage Publications, Newbury Park, CA,pp. 136–162.
Brude, U., Larsson, J., 2000. What roundabout design provides the highest possiblesafety? Nordic Road Transport Research 12, 17–21.
Bruijn, G., Kremers, S., Lensvelt-Mulders, G., de Vries, H., van Mechelen, W., Wrug,J., 2006. Modeling individual and physical environmental factors with ado-lescent physical activity. American Journal of Preventive Medicine 30, 507–512.
Buhi, E., Goodson, P., Neilands, T., 2007. Structural equation modeling: a primer forhealth behavior researchers. American Journal of Health Behavior 31, 74–85.
Byrnes, J., Miller, D., Schafer, W., 1999. Gender differences in risk taking: a meta-analysis. Psychological Bulletin 125, 367–383.
Cattell, R.B., 1978. The Scientific Use of Factor Analysis in Behavioral and Life Sciences.Plenum, New York.
Cerin, E., Macfarlanea, D., Koa, H., Cheung-A, K., 2007. Measuring perceived neigh-bourhood walkability in Hong Kong. Cities 24 (3), 209–217.
Cervero, R., Kockelman, K., 1997. Travel demand and the 3Ds: density, diversity anddesign. Transportation Research D 2 (3), 199–219.
Clark, D., 2003. Effect of population density on mortality after motor vehicle colli-sions. Accident Analysis and Prevention 35, 965–971.
Clifton, K., Kreamer-Fults, K., 2007. An examination of the environmental attributesassociated with pedestrian–vehicular crashes near public schools. AccidentAnalysis and Prevention 39, 708–715.
Clifton, K., Livi, A., Rodriguez, D., 2007. Development and testing of an audit for thepedestrian environment. Landscape Architecture & Urban Planning 80, 95–110.
Daigneault, G., Joly, P., Frigon, J., 2002. Links previous convictions or accidents and therisk of subsequent accidents of older drivers. Accident Analysis and Prevention34 (2), 257–261.
Day, K., Boarnet, M., Alfonzo, M., Forsyth, A., 2006. The Irvine-Minnesota inventoryto measure built environments: development. American Journal of PreventiveMedicine 30, 144–152.
DeJoy, D., 1992. An examination of gender differences in traffic accident risk percep-tion. Accident Analysis and Prevention 24 (3), 237–246.
Duncan, C., Khattak, A., Hughes, R., 1999. The perceived effectiveness of sidewalksand other pedestrian safety treatments as countermeasures for hit-along-roadway crashes. In: Presented at 81st Annual Transportation Research BoardMeeting, on TRB CD-ROM, Washington, DC.
Ewing, R., Schmid, T., Killingsworth, R., Zlot, A., Raudenbush, S., 2003. Relationshipbetween urban sprawl and physical activity, obesity, and morbidity. AmericanJournal of Health Promotion 18 (1), 47–57.
Ferraro, K., 1996. Fear of crime: interpreting victimization risk. Contemporary Soci-ology 25 (2), 246–247.
Forsyth, A., Oakes, M., Schmitz, K., Hearst, M., 2007. Does residential density increasewalking and other physical activity? Urban Studies 44, 679–697.
Forster, C., Hillsdon, M., Thorogood, M., 2004. Environmental perception and walkingin English adults. Journal of Epidemiology and Community Health 58, 924–928,2004.
Frank, L., Schmid, T., Sallis, J., Chapman, J., Saelens, B., 2005. Linking objectivelymeasured physical activity with objectively measured urban form: findingsfrom SMARTRAQ. American Journal of Preventive Medicine 28 (Suppl 2),117–125.
Fuller, R., Bates, H., Gormley, M., Hannigan, B., 2006. Inappropriate high speed: whodoes it and why? Behavioural Research in Road Safety. Sixteenth Seminar.
Garder, P., 2004. The impact of speed and other variables on pedestrian safety inMaine. Accident Analysis and Prevention 36, 533–542.
Handy, S., Boarnet, M., Ewing, R., Killingsworth, R., 2002. How the built environmentaffects physical activity – views from planning. American Journal of PreventiveMedicine 23, 64–73.
Handy, S., Cao, X., Mokhtarian, P., 2005. Correlation or causality between the builtenvironment and travel behavior? Evidence from Northern California. Trans-portation Research Part D 10, 427–444.
Herrstedt, L., 1992. Traffic calming design – a speed management method – DanishExperiences on environmentally adapted through roads. Accident Analysis andPrevention 24 (1), 3–16.
Hoehner, C., Brennan Ramirez, L., Elliott, M., Handy, S., Brownson, R., 2005. Per-ceived and objective environmental measures and physical activity among urbanadults. American Journal of Preventive Medicine 28 (Suppl. 2), 105–116.
Holland, C., Rabbitt, P., 1992. People’s awareness of their age-related sensory andcognitive deficits and the implications for road safety. Application of CognitivePsychology 6, 217–231.
Hu, L., Bentler, P., 1998. Fit indices in covariance structure modeling: sensitiv-ity to under-paramerterized model misspecification. Psychological Methods 3,
425–453.Humpel, N., Marshall, A., Leslie, E., Bauman, A., Owen, N., 2004. Change in neighbor-hood walking are related to changes in perception of environmental attributes.Annals of Behavioral Medicine 27, 60–67.
Jacobsen, P., 2003. Safety in numbers: more walkers and bicyclists, safer walking andbicycling. Injury Prevention 9, 205–209.
7 and P
K
K
K
K
L
L
L
L
L
M
M
M
M
M
M
M
M
M
NN
N
02 G. Cho et al. / Accident Analysis
irtland, K., Porter, D., Addy, C., Neet, M., Williams, J., Sharpe, P., Neff, L., Kimsey,D., Ainsworth, B., 2003. Environmental measures of physical activity supportsperception versus reality. American Journal of Preventive Medicine 24, 323–331.
oepsell, T., McCloskey, L., Wolf, M., Moudon, A., Buchner, D., Kraus, J., Patterson, M.,2002. Crosswalk markings and the risk of pedestrian-motor vehicle collisionsin older pedestrians. The Journal of the American Medical Association 288 (17),2136–2143.
ononov, J., Allery, B., Znamenacek, Z., 2007. Safety planning study of urban freeways:proposed methodology and review of case history. Transportation ResearchRecord 2019, 146–155.
uiken, M., Twisk, D., 2001. Safe Driving and the Training of Calibration. SWOVInstitute for Road Safety Research, Leidschendam, The Netherlands.
aScala, E., Gerber, D., Gruenewald, P., 2000. Demographic and environmental cor-relates of pedestrian injury collisions: a spatial analysis. Accidient Analysis andPrevention 32, 651–658.
aScala, E., Johnson, F., Gruenewald, P., 2001. Neighborhood characteristics ofalcohol-related pedestrian injury collisions: a geostatistical analysis. PreventionScience 2, 123–134.
ee, C., Abdel-Aty, M., 2005. Comprehensive analysis of vehicle–pedestrian crashesat intersections in Florida. Accident Analysis and Prevention 37, 775–786.
eslie, E., Saelens, B., Owen, N., Bauman, A., Coffee, N., Hugo, G., 2005. Residents’perceptions of walkability attributes in objectively different neighbourhoods: apilot study. Health and Place 11 (3), 227–236.
ucy, W., 2003. Mortality risk associated with leaving home: recognizing therelevance of the built environment. American Journal of Public Health 93,1564–1569.
asse, L., Dassa, C., Gauvin, L., Giles-Corti, B., Motl, R., 2002. Emerging measure-ment and statistical methods in physical activity research. American Journal ofPreventive Medicine 23 (Suppl. 2), 44–55.
cCormack, G., Giles-Corti, B., Lange, A., Smith, T., Martin, K., Pikora, T., 2004. Anupdate of recent evidence of the relationship between objective and self-reportmeasures of the physical environment and physical activity behaviours. Journalof Science and Medicine in Sport 7 (Suppl. 1), 81–92.
cGinn, A., Evenson, K., Herring, A., Huston, S., Rodriguez, D., 2007. Exploring asso-ciations between physical activity and perceived and objective measures of thebuilt environment. Journal of Urban Health 84 (2), 162–184.
cGinn, A., Evenson, K., Herring, A., Huston, S., Rodriguez, D., 2008. The associationof perceived and objectively measured crime with physical activity: a cross-sectional analysis. Journal of Physical Activity and Health 5 (1), 117–131.
esch, G., 2000. Perceptions of risk, lifestyle activities, and fear of crime, deviantbehavior. Deviant behavior 21, 47–62.
eyer, M., 2005. Linking safety-conscious planning and context-sensitive solutions.ITE Journal, 18–23.
oudon, A., Hess, P., Snyder, M., Stanilov, K., 1997. Effects of site design andpedestrian travel in mixed-use, medium-density environments. TransportationResearch Record 1578, 48–55.
oudon, A., Lee, C., Cheadle, A., Collier, C., Johnson, D., Schmid, T., Weather, R., 2005.Cycling and the built environment, a US perspective. Transportation ResearchPart D 10 (3), 245–261.
orrison, D., Thomson, H., Petticrew, M., 2004. Evaluation of the health effects of a
neighbourhood traffic calming scheme. Journal of Epidemiology and CommunityHealth 58 (10), 837–840.HTSA pedestrian and bike fact sheet, 2006.oland, R., Quddus, M., 2004. Analysis of pedestrian and bicycle casualties with
regional panel data. Transportation Research Record 1897, 28–33.unnally, J., Bernstein, I., 1994. Psychometric Theory, 3rd ed. McGraw-Hill, New York.
revention 41 (2009) 692–702
Ossenbruggen, P., Pendharkar, J., Ivan, J., 2001. Roadway safety in rural and smallurbanized areas. Accident Analysis and Prevention 33, 485–498.
Owen, N., Humpel, N., Leslie, E., Bauman, A., Sallis, J., 2004. Understanding environ-mental influences on walking: review and research agenda. American Journal ofPreventive Medicine 27 (1), 67–76.
Oxley, J., Ihsen, E., Fildes, B., Charlton, J., Dayc, R., 2005. Crossing roads safely: anexperimental study of age differences in gap selection by pedestrians. AccidentAnalysis and Prevention 37, 962–971.
Persaud, B., Hauer, E., Retting, R., Vallurupalli, R., Mucsi, K., 1997. Crash reductionsrelated to traffic signal removal in Philadelphia. Accident Analysis and Preven-tion 29, 803–810.
Pikora, T., Bull, F., Jamrozik, K., Knuiman, M., Giles-Corti, B., Donovan, R., 2002.Developing a reliable audit instrument to measure the physical environmentfor physical activity. American Journal of Preventive Medicine 23 (3), 187–194.
Retting, R., Ferguson, S., McCartt, A., 2003. A review of evidence-based trafficengineering measures designed to reduce pedestrian–motor vehicle crashes.American Journal of Public Health 93, 1456–1463.
Rodriguez, D., Khattak, A., Evenson, K., 2006. Can new urbanism encourage physicalactivity? Comparing a new urbanist neighborhood with conventional suburbs.Journal of the American Planning Association 72 (1), 43–54.
Rubin, D., 2006. Causal inference through potential outcomes and principal stratifi-cation: application to studies with “censoring” due to death. Statistical Science21, 299–309.
Saelens, B., Sallis, J., Black, J., Chen, D., 2003. Neighborhood-based differences inphysical activity: an environment scale evaluation. American Journal of PublicHealth 93, 1552–1558.
Saelens, B., Handy, S., 2008. Built environment correlates of walking: a review.Medicine and Science in Sports and Exercise 40, 550–566.
Schneider, R., Rynznar, R., Khattak, A., 2004. An accident waiting to happen: a spatialapproach to proactive pedestrian planning. Accident Analysis and Prevention 36,193–211.
Schweitzer, J., Kim, J., Mackin, J., 1999. The impact of the built environment on crimeand fear of crime in urban neighborhoods. Journal of Urban Technology 6, 59–73.
Simon, H., 1957. A Behavioral Model of Rational Choice, in Models of Man, Social andRational: Mathematical Essays on Rational Human Behavior in a Social Setting.New York.
Slovic, P., 1987. Perception of risk. Science 236, 280–285.Song, Y., Knaap, G., 2007. Quantitative classification of neighbourhoods: the neigh-
bourhoods of new single-family homes in the Portland metropolitan area.Journal of Urban Design 12, 1–24.
Transportation Research Board, 2000. Highway Capacity Manual. National AcademyPress, Washington, D.C.
Ulleberg, P., Rundmo, T., 2003. Personality, attitudes and risk perception as predic-tors of risky driving behaviour among young drivers. Safety Science 41, 427–443.
Ward, N., Wilde, G., 1996. Driver approach behaviour at an experimental investi-gation of a risk perception and behavioural compensation hypothesis. SafetyScience 22, 63–75.
Wilde, G., 1998. Risk homeostasis theory: an overview. Injury Prevention 4, 89–91.Young, H., Rodriguez, D., 2005. Using Census Data to Examine the Pedestrian
Friendliness of the Built Environment. Paper presented at the Census Data forTransportation Planning: Preparing for the Future, Irvine, CA.
Zegeer, C., Stewart, J., Huang, H., 2002. Safety effects of marked vs. unmarkedcrosswalks at uncontrolled locations: executive summary and recommendedguidelines, FHWA-RD-01-075. U.S. Department of Transportation, Federal High-way Administration.


