Embed Size (px)
Citation preview
THE RELATIONSHIP BETWEEN EXECUTIVE COMPENSATION AND FINANCIAL
PERFORMANCE OF INSURANCE COMPANIES IN KENYA
ERICK KIPKORIR TARUS
A Research Project submitted to the Graduate School in partial fulfillment for the
requirement of the Degree of master of business administration of Egerton University
Egerton University
September 2014
ii
DECLARATION AND APPROVAL
DECLARATION
This research project is my original work and has not been presented for an award of degree or
diploma in any university or Institution.
_____________________ __________________
Signature Date
ERICK KIPKORIR TARUS
Name
CM11/00586/10
APPROVAL
This research project has been submitted for examination with our approval as university
supervisors:
_____________________ __________________
Signature Date
Mr. Kefah Aboko Basweti
Name
Lecturer: Egerton University.
Department of Accounting, Finance and Management Science
_____________________ __________________
Signature Date
Mr. Richard Bitange Nyaoga
Name
Lecturer: Egerton University.
Department of Accounting, Finance and Management Science

iii
COPYRIGHT
@ 2014 Erick Kipkorir Tarus
No part of this project may be reproduced, stored, retrieved, or transmitted in any form without
prior permission of the author or Egerton University.
All rights reserved

iv
ACKNOWLEDGEMENT
I give thanks to Almighty God who gave me the strength, good health and energy to work
through this project. Special thanks to my supervisors Mr. Kefah Aboko Basweti and Mr.
Richard Bitange Nyaoga for their comments, suggestions, encouragements and guidance
throughout this research making it successful. Special thanks to Egerton University for allowing
me pursue the degree. I also thank staff at IRA research department for their great help during
data collection. All other people whom I have not mentioned, and who contributed towards the
success of this project in one way or the other. Thank you very much and God bless you.

v
DEDICATION
To my wife and daughter
vi
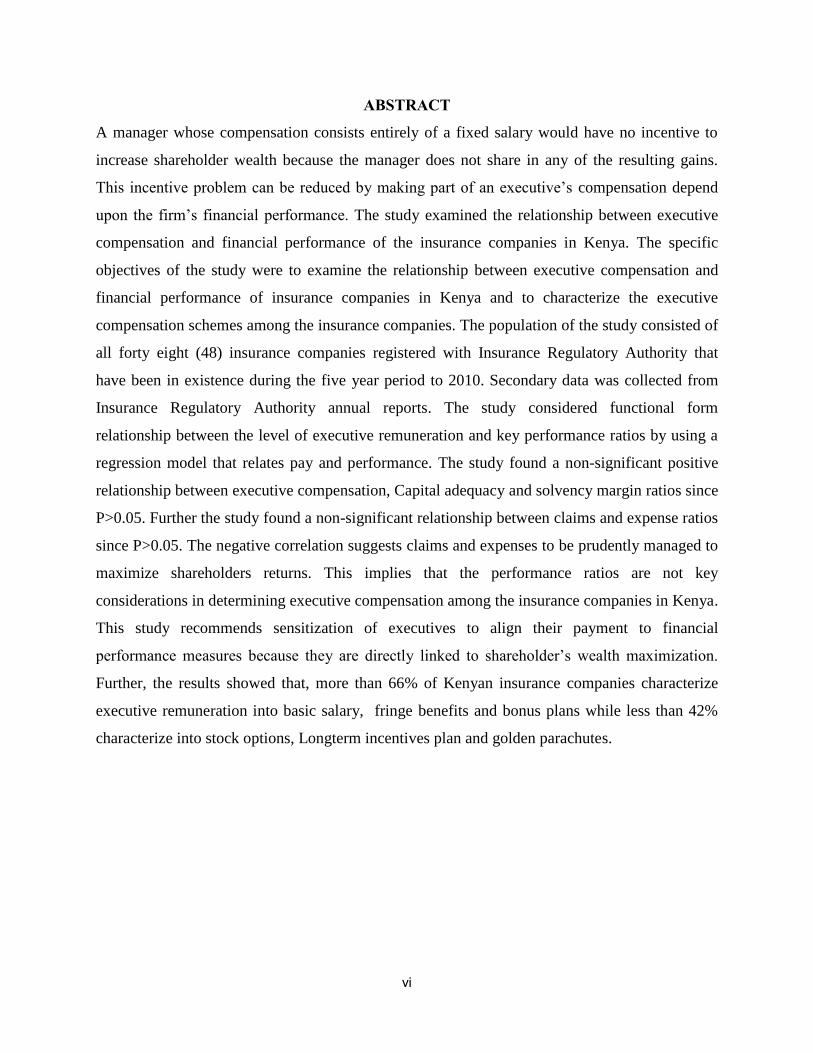
ABSTRACT
A manager whose compensation consists entirely of a fixed salary would have no incentive to
increase shareholder wealth because the manager does not share in any of the resulting gains.
This incentive problem can be reduced by making part of an executive’s compensation depend
upon the firm’s financial performance. The study examined the relationship between executive
compensation and financial performance of the insurance companies in Kenya. The specific
objectives of the study were to examine the relationship between executive compensation and
financial performance of insurance companies in Kenya and to characterize the executive
compensation schemes among the insurance companies. The population of the study consisted of
all forty eight (48) insurance companies registered with Insurance Regulatory Authority that
have been in existence during the five year period to 2010. Secondary data was collected from
Insurance Regulatory Authority annual reports. The study considered functional form
relationship between the level of executive remuneration and key performance ratios by using a
regression model that relates pay and performance. The study found a non-significant positive
relationship between executive compensation, Capital adequacy and solvency margin ratios since
P>0.05. Further the study found a non-significant relationship between claims and expense ratios
since P>0.05. The negative correlation suggests claims and expenses to be prudently managed to
maximize shareholders returns. This implies that the performance ratios are not key
considerations in determining executive compensation among the insurance companies in Kenya.
This study recommends sensitization of executives to align their payment to financial
performance measures because they are directly linked to shareholder’s wealth maximization.
Further, the results showed that, more than 66% of Kenyan insurance companies characterize
executive remuneration into basic salary, fringe benefits and bonus plans while less than 42%
characterize into stock options, Longterm incentives plan and golden parachutes.
vii
TABLE OF CONTENTS
DECLARATION AND APPROVAL -------------------------------------------------------------------- ii
COPYRIGHT ------------------------------------------------------------------------------------------------ iii
ACKNOWLEDGEMENT -------------------------------------------------------------------------------- iv
DEDICATION ------------------------------------------------------------------------------------------------ v
ABSTRACT -------------------------------------------------------------------------------------------------- vi
TABLE OF CONTENTS ---------------------------------------------------------------------------------- vii
LIST OF TABLES ------------------------------------------------------------------------------------------- x
LIST OF FIGURES ---------------------------------------------------------------------------------------- xi
LIST OF ABBREVIATIONS ---------------------------------------------------------------------------- xii
CHAPTER ONE --------------------------------------------------------------------------------------------- 1
INTRODUCTION ------------------------------------------------------------------------------------------- 1
1.1 Background of the study --------------------------------------------------------------------------- 1
1.2 Statement of the problem--------------------------------------------------------------------------- 2
1.3 The main objective of the Study ------------------------------------------------------------------ 3
1.4 Specific objectives of the study ------------------------------------------------------------------- 3
1.5 Hypothesis of the study ----------------------------------------------------------------------------- 3
1.6 Importance of the study ---------------------------------------------------------------------------- 3
1.7 Justification of the study --------------------------------------------------------------------------- 4
1.8 Scope of the study ----------------------------------------------------------------------------------- 4
1.9 Limitation of the study ----------------------------------------------------------------------------- 4
1.10 Operational definitions of terms ------------------------------------------------------------------ 5
CHAPTER TWO -------------------------------------------------------------------------------------------- 6
LITERATURE REVIEW ---------------------------------------------------------------------------------- 6
2.0 Introduction ------------------------------------------------------------------------------------------ 6
2.1 Financial Systems in Kenya ----------------------------------------------------------------------- 6
2.2 History of Insurance in Kenya --------------------------------------------------------------------- 6
2.3 The Role of Insurance to Growth and Development ------------------------------------------- 7
2.4 Agency Problem ------------------------------------------------------------------------------------- 8
2.5 Kinds of Agency Conflicts ------------------------------------------------------------------------- 9
viii
2.6 Mitigation against Agency Problem ------------------------------------------------------------- 10
2.7 Corporate Governance ----------------------------------------------------------------------------- 12
2.8 The main Components of Executive Compensation pay ------------------------------------- 13
2.9 Problems with Pay Components ----------------------------------------------------------------- 14
2.10 Financial Performance Evaluation. -------------------------------------------------------------- 15
2.11 The CAMEL rating system ----------------------------------------------------------------------- 16
2.12 Empirical Studies. ---------------------------------------------------------------------------------- 18
CHAPTER THREE ---------------------------------------------------------------------------------------- 25
RESEARCH METHODOLOGY ------------------------------------------------------------------------ 25
3. 0 Introduction ----------------------------------------------------------------------------------------- 25
3. 1 Research Design ------------------------------------------------------------------------------------ 25
3. 2 Population of the Study ---------------------------------------------------------------------------- 25
3. 3 Sample size ------------------------------------------------------------------------------------------ 25
3. 4 Data Collection ------------------------------------------------------------------------------------- 25
3. 5 Data Analysis --------------------------------------------------------------------------------------- 25
3. 6 Data presentation ----------------------------------------------------------------------------------- 26
CHAPTER FOUR ------------------------------------------------------------------------------------------ 27
DATA ANALYSIS, RESULTS AND DISCUSSIONS ---------------------------------------------- 27
4. 0 Introduction ----------------------------------------------------------------------------------------- 27
4. 1 The relationship ------------------------------------------------------------------------------------ 27
4. 2 Analysis of Variance ------------------------------------------------------------------------------- 29
4. 3 Model Summary ------------------------------------------------------------------------------------ 30
4. 4 Regression coefficients ---------------------------------------------------------------------------- 31
4. 5 Executive Compensation Schemes -------------------------------------------------------------- 33
CHAPTER FIVE-------------------------------------------------------------------------------------------- 36
SUMMARY, CONCLUSION AND RECOMMENDATION ------------------------------------- 36
5.1 Introduction ----------------------------------------------------------------------------------------- 36
5.2 Summary of findings ------------------------------------------------------------------------------ 36
5.3 Conclusion of the study --------------------------------------------------------------------------- 37
ix
5.4 Recommendation for further research ----------------------------------------------------------- 37
REFERENCES ---------------------------------------------------------------------------------------------- 38
APPENDICES ----------------------------------------------------------------------------------------------- 43
Appendix One: Registered Insurance Companies with respective years of Incorporation. ----- 43
Appendix Two: Key Ratios for the year 2006. -------------------------------------------------------- 44
Appendix Three: Key Ratios for the year 2007 ------------------------------------------------------- 45
Appendix Four: Key Ratios for the year 2008 --------------------------------------------------------- 46
Appendix Six: Key Ratios for the year 2010 ---------------------------------------------------------- 49
Appendix seven: Mean financial performance ratios ------------------------------------------------- 51
Appendix eight: CAMEL-S Model as adopted in the study ----------------------------------------- 52
Appendix eight: Research data collection sheet. ------------------------------------------------------ 53
Appendix ten: Research project work plan ------------------------------------------------------------ 54
x
LIST OF TABLES
Table 4.1: Descriptive Statistics of key performance ratios and executive compensation. .......... 27
Table 4.2: Correlations results ...................................................................................................... 28
Table 4.3: Results of ANOVA ...................................................................................................... 30
Table 4.4: Model Summary in the insurance industry .................................................................. 30
Table 4.5: Unstandardized and standardized Coefficients (a) ...................................................... 31
Table 4.6: Position of respondent ................................................................................................. 33
Table 4.7: Components of executive remuneration schemes........................................................ 34

xi
LIST OF FIGURES
Figure 2.1: The relationship between executive compensation and financial performance. ........... 23
Figure 4. 1: Histogram of regression standardized residuals…………………………….………32
Figure 4. 2: Normal P-Pplot for Regression standardized residual .............................................. 32
Figure 4. 3: Components of executive remuneration in insurance companies in Kenya .............. 34

xii
LIST OF ABBREVIATIONS
ANOVA -Analysis of Variance
CEO -Chief Executive Officer
COMESA -Common Market for Eastern and Southern Africa.
CRSP -Center for Research in Security Prices
EVA -Economic Value Added
FTSE - Financial Times and the London Stock Exchange
GDP -Gross Domestic Product
IRA -Insurance Regulatory Authority
ISO - Incentive Stock Options.
NOPAT -Net Operating Profit after Tax
NQSO -Nonqualified Stock Option.
NSE -Nairobi Securities Exchange
OECD -Organization for Economic Co-operation and Development
PM -Profit Margin
ROA -Return on Assets
ROE -Return on Equity
S&P -Standard and Poor‘s
SERP -Supplemental Executive Retirement Plans
SPSS -Statistical Package for the Social Sciences
WACC -Weighted Average Cost of Capital
1
CHAPTER ONE
INTRODUCTION
1.1 Background of the study
Executives who are improperly compensated may not have the incentive to perform in the best
interest of shareholders, which can be costly to the shareholders. The level of executive
compensation and its relationship to firm financial performance are central issues in a generally
heated debate among legislators, corporate directors, economists, financial journalist and
compensation professionals (Lambert and Larcker, 1985).
The common proposition underlying executive compensation is that in order to motivate
executives to spend effort and work for the best interest of the shareholders, compensation
contracts should include some form of incentive component (Murphy, 1998). Such an incentive
component should establish a link between executive compensation and the performance of the
firm they manage. Shareholders are mainly interested in maximizing their wealth. Executive
compensation can be used as an effective instrument for creating value for shareholders by
improving their firm performance (El Akremi et al 2001).
Remuneration to executives serves as an incentive that affects decisions made and strategies
adopted by an executive, both of which affect firm performance. It has a motivational effect and
is an indicator of value for executives. It is a means for executives to realize rewards for their
efforts. In corporate context, executives participate in the firm’s profitability. Therefore, when
executive makes sound decisions and engages in profitable strategies, the executive and the
organization realize financial enrichment (Finkelstein and Boyd, 1998).
Chief Executive Officer (CEO) has responsibilities as a communicator, decision maker, leader,
and manager. The officer oversees the company’s strategy and operations therefore requiring
compensation for the work. It is the responsibility of the compensation committee of the board
of directors to design executive compensation contracts (Murphy, 1998). The right
compensation should be the minimum amount it takes to attract and retain a qualified individual.
The plan should be designed to motivate the executive to perform in accordance with the
company’s objectives and risk tolerance (Lambert and Larcker, 1985).
The separation of ownership from management creates agency problems in corporation. Agency
problems arise in the form of time horizon and risk aversion. Managers may adopt the short term
2
decision horizon and maximize current period performance. Shareholders wealth maximization
is more closely linked to corporate long term profitability, than to short term profitability.
Therefore they would prefer that managers take a long term decision horizon (Gupta, 2011).
The risk aversion problem arises when managers are paid only fixed salary and management
performance is not tied to firm performance. Fixed salaries may motivate managers to prefer safe
projects because they expect no incremental from the success of risky projects but could lose
their jobs if such projects fail. Shareholders would prefer managers to be less risk-averse and to
accept projects with greater risk, and correspondingly greater expected payoff, to increase
shareholder wealth. To better align the interests of owners and managers, corporations adopt a
wide variety of executive compensation plans. Performance plans lengthen the managers'
decision horizon by rewarding them on the achievement of certain accounting-based measures
over a long period performance (Gupta, 2011). Executive compensation packages generally
include a mix of short-term and long term incentives. The compensation plans include salary,
annual bonus, perquisites, stock options, restricted shares, golden parachutes, gratuity, and
pension (Murphy, 1998).
Insurance companies comprise of complex set of contracts among policy holders, stockholders,
and managers. Substantive disagreements are likely to exist within these classes of claimholders
with respect to time preference and opinions concerning what constitute the best corporate
policies for the firm to follow. Agency problems and their attendance cost do arise when both
parties to the agency relationship are self-interested and it is costly to write and enforce the
contracts (Garven, 1987). In the context of agency theory, management incentive compensation
plans are viewed as an important means of reducing the inherent conflicts (Lambert and Larcker,
1985). Firms in insurance industry face the same agency problems just like other firms in other
industries. Therefore this study sought to examine the relationship between executive
compensation and financial performance of insurance companies in Kenya.
1.2 Statement of the problem
Good compensation schemes motivate managers to make expenditure decisions that maximize
shareholders wealth. A manager whose compensation consists entirely of a fixed salary would
have no incentive to increase shareholder wealth because he does not share in any of the
resulting gains (Murphy, 1998). This incentive problem can be reduced by making part of an
executive’s compensation depend upon the firm’s financial performance. Lambert and Larcker,
3
(1985) concluded that compensation schemes really do matter in the sense that executives
responds predictably to the incentives built in to their compensation contracts. Furthermore they
noted that changes in compensation plans affect executive decision making in ways consistent
with agency theory. Ozkan (2007) found a positive and significant link between CEO cash
compensation and firm performance. He also noted a positive but not significant relationship
between total compensation and firm performance. Kajola (2008), found a positive and
significant relationship between Profit Margins and chief executive status. Fahd Al-Heizan
(2001) found a significant relationship between market value per share and the percentage of
stock options granted to the total number of shares outstanding. He also noted less significant
relationship between market value per share and stock based compensation. However, (Aduda
and Musyoka, 2011) found a statistically negative non-significant relationship between executive
compensation and performance of commercial banks in Kenya. Fernandez, (2005), found out
that company performance is not significantly related to executive compensation. In view of the
above conflicting findings, this study was set out to evaluate the relationship between executive
compensation and financial performance of insurance companies in Kenya.
1.3 The main objective of the Study
The main objective of the study was to examine the relationship between executive
compensation and financial performance of insurance companies in Kenya.
1.4 Specific objectives of the study
1) To examine the relationship between executive compensation and financial performance
of insurance companies in Kenya.
2) To characterize executive compensation schemes among the insurance companies in
Kenya.
1.5 Hypothesis of the study
There is no statistically significant relationship between executive compensation and the firm’s
financial performance.
1.6 Importance of the study
The findings will be of practical relevance to researchers, and investors interested in the industry
fundamentals. For academicians and researchers, the study will form part of reference materials
for further research on how best to reward chief executive officers in order to maximize
4
shareholders wealth. Learning institutions will use the findings to conduct their learning courses
in executive compensation plans. Compensation levels affect the shareholders perception of the
firm and therefore suggesting if the business executive is competent and deserving that pay. This
will help investors make informed decisions on how and where to invest their funds. The study
will provide important financial information to new policyholders before signing contracts. This
study will also contribute to the ongoing debate on the examination of the relationship that exists
between CEO compensation structures and firm performance. It is hoped that the evidence would
serve as important quantitative information into the cauldron of policy as well as add to the
existing body of empirical literature from a developing financial market such as that of Kenya.
1.7 Justification of the study
The motivation of the present study stems from the fact that despite various empirical studies on
executive compensation, no currently identifiable research that has been done on insurance
industry in Kenya. Aduda and Musyoka (2011) evaluated the relationship between executive
compensation and firm performance in Kenyan banking industry. Ongore et al (2011) examined
the implications of firm ownership identity and managerial discretion on financial performance
for listed companies at Nairobi Stock Exchange. The need for a study of this kind is even more
important in an environment like Kenya’s, which is characterized by growing calls for effective
corporate governance in the insurance sector. Therefore this study sought to fill the existing gap
by evaluating the relationship between executive compensation and financial performance of
insurance companies in Kenya.
1.8 Scope of the study
The study focused on executive compensation and financial performance of insurance companies
registered with IRA from year 2006 to 2010 in Kenya.
1.9 Limitation of the study
The major limitation of the study is that, it considers only firms financial measure of
performance and not non-financial measure of performance. Secondly, management
remuneration considered to directly fall within boards emoluments were used as a proxy for
executive compensation since components are classified information hence the findings may not
be generalized.
5
1.10 Operational definitions of terms
A chief executive officer: This is the chief executive officer of the corporation and
holder of the title and so named in the corporation's annual
report.
Firm financial performance: This is a subjective measure of how well a firm can use
assets from its primary mode of business to generate
revenues. This has been captured through the use of key
ratios as applied by Insurance Regulatory Authority to
measure performance.
Insurance: This is an undertaking by insurer to indemnify insured
person against loss in respect of a certain risk to which the
object of the insurance may be exposed, paying a sum of
money upon the happening of a certain event.
Executive compensation: The total pay an executive officer received from a
corporation. Remuneration considered to directly falling
within boards emoluments were used as a proxy for
executive compensation.
Agency relationship: This is where principal contracts an agent to perform on his
behalf a service and then delegates decisions making
authority to that agent. Stakeholders (principals) engage the
services of chief executive officers (agents) delegating
decision making to the agents. This eventually gives rise to
agency problems and their attendance costs.
6
CHAPTER TWO
LITERATURE REVIEW
2.0 Introduction
This chapter covers financial systems in Kenya, history of insurance, the role of insurance in the
economy, agency problem, types of conflicts in insurance companies, mitigation against agency
problem, corporate governance, components of executive compensation plans, financial
performance evaluation, models in evaluating financial soundness and empirical studies.
2.1 Financial Systems in Kenya
Financial system in Kenya is segmented and dualistic in structure. It comprises two sectors,
namely the banking and non-banking sectors. The banking consists of central bank and
commercial banks. The non-banking commercial sector includes other financial institutions,
insurance companies, pension funds and other non-monitory institutions. The insurance sector
covers re-insurance and insurance companies, insurance brokers, medical insurance providers,
insurance agents, loss assessors, insurance investigators, loss adjusters, surveyors and claims
settlement agents. Kenya’s financial systems are relatively well developed and diversified though
major structural impediments prevent it from reaching its full potential (Beck and Fuchs, 2004).
2.2 History of Insurance in Kenya
The concept of insurance and particularly the social insurance programmes dealing with socio-
economic problems has been around Africa for a long time. Members of a community pooled
together resources to create a social insurance fund. The premiums ranged from material to
moral support or other payments in kind. From the fund, drawings were made out to support the
few unfortunate members exposed to perils. (Tsoukatos et al 2004).
The substantial investments by British needed some form of protection against various risk
exposures. British insurers established agency offices to service the colony’s insurance needs.
Prosperity in the colony soon justified expansion of these agencies to branch networks with more
autonomy, and expertise to service the growing insurance needs. By independence in 1963, most
branches had been transformed to fully fledge insurance companies (Tsoukatos et al 2004).
The IRA was established in 2006 as a government agency tasked with the regulation, supervision
and development of the insurance industry in Kenya. The body is also mandated to assist in the
administration of the insurance Act Cap 487 Laws of Kenya. IRA also provides advice to the
7
government on insurance policy issues. The authority is in charge of supervision of insurance
companies, brokers and agents, assessors and adjusters and health management organizations
According to the authority, Kenya’s insurance industry has flourished since 1963, and up to now
it has forty eight (48) registered insurance companies, 10 transacting composite insurance
businesses, 27 transacting general business insurance, 9 transacting life insurances, and 2
reinsurance companies (IRA, 2010).
2.3 The Role of Insurance to Growth and Development
The insurance industry serves a number of valuable economic functions that are largely distinct
from other types of financial intermediaries. The indemnification and risk pooling properties of
insurance facilitate commercial transactions and the provision of credit by mitigating losses.
They provide financial coverage of the loss that an individual is expected to suffer due to
unforeseen events, and hence reduces the impact of certain event. They reimburse the financial
cost of a particular event against the premium they collect from people who purchases the policy
from them. They allow people to share their liability by pooling the individual risk and help them
reduce the chances of facing financial devastation. The availability of insurance enables risk
averse individuals and entrepreneurs to undertake higher risk, higher return activities than they
would do in the absence of insurance, promoting higher productivity and growth (Brainard,
2008).
Insurance companies also provide life insurance policies to compensate for burial cost, replace
lost income and pay off debt for bereaved families. Therefore, insurance companies help reduce
the risk to uncertainty of death and secure the family members of the deceased. They also
provide health insurance to reduce cost of illness by pooling the risk of illness. Pooling risks with
other people is a wise decision because no one knows what their health will be, and how much
they will have to spend to get the treatment (Beck and Webb, 2003).
The net result of well-functioning insurance markets should be better pricing of risk, greater
efficiency in the overall allocation of capital and mix of economic activities, and higher
productivity. Importantly, these unique functions of insurance should be complementary to
banking and financial sector deepening more broadly. Insurance facilitates credit transactions
such as the purchase of homes and cars and business operations, while depending in turn on
well-functioning payment systems and robust investment opportunities (Brainard, 2008).
8
2.4 Agency Problem
Agency theory predicts that the misalignment of interests between shareholders and managers
could lead to agency problems, like, managers engaging in activities for their own benefits rather
than the benefits of the firm’s shareholders (Jensen and Meckling, 1976). Executive
compensation plans borrows heavily from agency problem. It aims at resolving the principal-
agent conflict since it aligns the interest of chief executive officers to those of shareholders.
Agency theory focuses attention on the separation of ownership from control in corporations.
The design of executive compensation is viewed not only as an instrument for addressing the
agency problem between managers and shareholders but also as part of the agency problem itself
(Bebchuk and Fried, 2003).
Management incentive compensation plans are viewed as means of reducing potential conflicts
of interest between management and shareholders. An effective compensation program can add
value to the firm by improving the alignment of management incentives with stockholder
interest. Since the objective of corporation shareholders is to maximize wealth; agency theory
predicts that chief executive officers compensation policies will depend on changes in
shareholder wealth (Jensen and Murphy, 1990).
Firms are legal fictions which serve as a nexus for a set of contracting relationship among
various stakeholders. These contracts define a set of agency relationship under which principal
engage agents to perform their service on their behalf, a decision which invariably delegates
some decision making authority to the agent (Jensen and Meckling, 1976).
Regardless of whether the firm is organized as a stock or mutual company, it is characterized by
three major functions which are allocated across various claimholders; the managerial function,
the ownership or risk bearing function, and the customer or policy holder function. The three
functions are vested to three distinct claimants; managers, shareholders and policy holders. In the
stock company, the mangers are viewed as the agents of shareholders while the shareholders are
viewed as the agents of policy holders. In the mutual companies, the ownership or risk bearing
and the customer or policyholders function are carried out by policyholders. Therefore the
principal or agent relationship that is of interest is that which exist between policyholders and
managers (Mayers and Smith, 1986).
9
2.5 Kinds of Agency Conflicts
The most apparent conflict of interest is between stockholder and policyholders. Incentive
conflicts between conflicts between policyholders and stockholders should be more severe with
long tern than with shirt term policies. Thus in lines of insurance where long term policies are
more important, there are more opportunities to change dividend, investment, or financing policy
to the detriment of the policyholders. While the stockholders’ actions are partially controlled by
the policyholders’ option to cancel the policy, these are less effective disciplining mechanisms
the greater the ex-ante advantage of long term policies. Therefore the costs of this conflict
between policyholders and stockholders can be reduced with mutual ownership, and thus mutual
should have a comparative advantage in longer-term policies (Garven, 1987).
The second important conflict that arises is between managers and stockholders. Contract
structures limit risks undertaken by most agents through contractual specifications of payoffs that
are either fixed or vary with specific measures of performance. Conflicts arise between managers
and residual claimants when risk bearing is separated from management. This conflict can be
reduced by restricting their ownership to one or more of the major decisions agents which
ensures that such decision agents bear the wealth effects of their decisions and therefore reduces
the agency costs associated with outside ownership of residual claims (Fama and Jensen, 1983).
Agency theory suggests that, in imperfect labor and capital markets, managers will seek to
maximize their own utility at the expense of corporate shareholders. The utility maximizing
agent has an incentive to expropriate resources from the firm in the form of perquisites and less
effort which both lead to destruction of value to shareholders (Jensen and Meckling, 1976).
Agents have the ability to operate in their own self-interest rather than in the best interests of the
firm because of asymmetric information. Managers know better than shareholders whether they
are capable of meeting the shareholders' objectives and uncertainty for example myriad factors
contribute to final outcomes, and it may not be evident whether the agent directly caused a given
outcome, positive or negative (Garven, 1987).
Managers have undiversified portfolios while shareholders can diversify their portfolios and thus
eliminate all unsystematic risk specific to the insurer. Risk-averse managers bypass profitable
opportunities most preferred by firm's shareholders. Outside investors recognize that the firm
will make decisions contrary to their best interests. Accordingly, will discount the prices they are
willing to pay for the firm's securities (Bamberg et al, 1987).
10
Agency conflicts are potentially quite significant in large corporations because the firm's
managers generally own only a small percentage of the common stock. Therefore, shareholder
wealth maximization could be subordinated to an assortment of other managerial goals.
Managers may have a fundamental objective of maximizing the size of the firm. By creating a
large, rapidly growing firm, executives increase their own prestige, esteem and power. They
pursue diversification at the expense of the shareholders who can easily diversify their individual
portfolios simply by buying shares in other companies (Jensen and Meckling, 1976).
2.6 Mitigation against Agency Problem
There are two polar positions for dealing with shareholder-manager agency conflicts. In one
extreme the firm's managers are compensated entirely on the basis of stock price changes.
Agency costs will be low because managers have great incentives to maximize shareholder
wealth. It would be extremely difficult, however, to hire talented managers under these
contractual terms because the firm's earnings would be affected by economic events that are not
under managerial control. At the other extreme, stockholders could monitor every managerial
action, but this would be extremely costly and inefficient. The optimal solution is tying executive
compensation to performance with little monitoring (Fama 1980).
Firms employ performance shares, which are shares of stock given to executives on the basis of
performances as defined by financial measures such as earnings per share, return on assets,
return on equity, and stock price changes. Incentive-based compensation plans, are designed to
offer executives incentives to take actions that will enhance shareholder wealth. These plans also
help companies attract and retain managers with confidence to risk their financial future on their
own abilities, which should lead to better performance (Lambert and Larcker, 1985).
Market participants find ways to mitigate agency problem. In the case of simple tasks,
monitoring by the principal may be enough. Unfortunately, many tasks are too complex to be
monitored effectively by the principal. Enforcement costs are borne by principal to monitor
contract compliance and costs borne by agents to bond their behavior. Both parties write and
enforce contracts that minimize the agency cost since one or both can thereby be made better off.
However, contracts are unlikely to be perfectly enforced; residual losses arise when contracts are
optimally but imperfectly enforced (Jensen and Meckling, 1976).
11
Fama and Jensen (1983) argued that if contracting is costly, then, the firm’s contract structure
will have an important effect on its cost function. Therefore the company’s structure adopted by
any given insurer will be determined endogenously along with its investment, underwriting and
dividend policies. Mayers and Smith (1987) suggested that there are incentive conflicts between
policyholders and stockholders over investments, underwriting and dividend decisions, and
between owners and managers over investment policy. Due to the high monitoring cost, the
shareholders are left with the option to construct contracts based on surrogate measures of
performance that align executives and shareholders objectives (Fahd Al-Heizan, 2001).
Corporate governance mitigates the agency problem and restrains managers’ incentives to further
their own interests at the expense of the shareholders. The institutional investors have the clout,
to exert considerable influence over a firm's operations. They can meet with a firm's management
and offer suggestions regarding the firm's operations. They can also sponsor a proposal to be
voted on at the annual stockholders' meeting, even if the proposal is opposed by management
(Vishny and Shleifer, 1986).
Agency theory posits an inherent moral hazard in principal-agent relations that gives rise to
agency costs. Agents can adopt creative accounting that give favorable accounting results and
which may maximize their own wealth under compensation and reward incentive schemes. An
effective audit committee reduces this incentive problem as it enhances the quality and
credibility of annual audited financial statements, safeguarding and advancing the interests of
shareholders (Fama and Jensen 1983).
The introduction of insurance guarantees funds eliminate or reduce the risks that claims will be
paid and therefore mitigates the incentive conflicts between policyholders and stockholders. It is
therefore in the self-interest of the stockholders to provide policyholders with guarantees against
the appropriative behavior if such guarantees are less costly than the agency problems (Garven,
1987). Reinsurance provides an important mechanism for guarantee. Use of equity and
contractual limitations of dividends and investment policy and a bonding mechanism provide for
guarantees (Mayers and Smith, 1986).
The threat of a hostile takeover when a firm's stock is undervalued, threat of firing due to poor
performance, legislation, voluntarily abiding to code of good practice disciplines managerial
behavior and induces managers to attempt to maximize shareholder value (Pandey, 2005).
12
2.7 Corporate Governance
Corporate governance is about structures, policies and processes through which an entity is
managed and controlled. Through strengthening of these structures, insurers are able to promote
corporate fairness, transparency and accountability (Shleifer and Vishny, 1997). Corporate
governance recognizes that insurer has to be flexible and responsive to developments affecting
its operations in making timely decisions, while at the same time being transparent and having
appropriate systems, controls and limits to ensure that powers are not unduly concentrated and
are used in the best interest of the insurer and its stakeholders (He and Sommer, 2011).
Corporate governance framework promotes the development, implementation and effective
oversight of policies that clearly define and support objectives. It defines the roles and
responsibilities of persons accountable for the management and oversight of an insurer by
clarifying who possesses legal duties and powers to act on behalf of the insurer. It sets
requirements relating to how significant decisions and actions are taken and documented. It also
provides for appropriate communication, in matters relating to the management, conduct and
oversight of the insurer to stakeholders. Lastly, it provides for corrective actions to be taken for
non-compliance to governance systems (Doherty and Smetters, 1993).
Remuneration practices are part of sound corporate governance of an insurer. The remuneration
policy is neither intended to unduly restrict nor reduce an insurer’s ability to attract and retain
skilled talent by prescribing any particular form or level of individual remuneration. Rather, it
aim to promote the alignment of remuneration policies with the long term interests of insurers to
avoid excessive risk taking, thereby promoting sound governance. The standard and guidance
apply to the supervision of remuneration policies and practices, especially where variable
remuneration is used, taking into account the nature, scale and complexity of the insurers
business (Eckles et al 2011).
Executives can be overpaid and be protected from poor performance diminishing the relationship
between executive pay and financial performance. Managerial power and influence play a major
role in shaping executive pay, and in ways that end up imposing significant costs on stakeholders
(Bebchuk and Fried, 2005). When corporate governance is weak, managers have a greater
influence on the amount and composition of their own compensation. Chief executive officers
can be overpaid because of their influence over the board of directors (Sigler, 2011).
13
2.8 The main Components of Executive Compensation pay
Despite substantial heterogeneity in pay practices, most executive compensation schemes contain
five basic components. These are base salary, annual bonus, payouts from long and short term
incentive plans, restricted options grants, and restricted stock grants. Additionally, they often
receive contributions to defined-benefit pension plans, various perquisites, and, in case of their
departure, severance payments (Murphy, 1998). Rewards are monetary, non-monetary, and
psychological payments that an organization provides for its executives. They are designed to
attract new employees to the organization, elicit good work performance, and maintain
commitment to the organization (Sigler, 2011).
Base salary is the fixed component of the compensation package. It is the value that the
organizations attributes to a position and are typically based on competitive levels within the
relevant labor market and may vary within a set range based on performance. While job
evaluation is typically used to set employee pay in organizations, executive base salaries are
influenced by the opinion of the compensation committees. Base salaries for CEOs are typically
determined through competitive benchmarking, based on industry-specific surveys or market
peers (Jensen and Murphy, 1990a).
Executives devote substantial attention to the salary determination process because base salaries
typically guarantee minimum increases in base salaries for the subsequent years. Most
components of compensation plans are measured relative to base salary levels. Target bonuses,
for example, are typically expressed as a percentage of base salary, while option grants are
expressed as a multiple of base salary. Defined pension benefits and severance arrangements also
depend on salary levels (Murphy, 1998).
Short term bonuses and or incentives are one of the variable elements of the total compensation
package. Annual bonuses/incentives are typically awarded based on the employees’
contributions, in conjunction with the organization’s financial performance, payable in cash or a
combination of cash and stock. Bonuses tend to be discretionary, whereas incentive awards are
determine by a formula. Long term incentives are tied to performance periods that may run from
three to five years or may be granted to career wealth accumulation. They can also be paid in
cash or stock based (Lambert et al, 1991).
14
Perquisites and supplemental benefits are variable components that provide executive with
additional benefits. The benefits differ by officer and between companies (Lambert and Larcker,
1985). Golden parachute are composed of lucrative benefits given to top executives in the event
that a company is taken over by another firm that results in the loss of their job. Last but not
least, fringe benefits are retirement plans, life insurance and health insurance, health-club
membership, travel reimbursements, paid holidays and vacations, education
reimbursement, childcare and assistance reimbursement, cafeteria plans, employee discounts and
personal use of a company owned vehicle. These supplemental executive plans are non-qualified
for tax purposes and can take a variety of different forms, including defined benefits based on
credited years of service and company performance (Murphy, 1998).
2.9 Problems with Pay Components
Pay component entice executives to engage in activities that produce problems for the firm. Cash
bonuses tied to accounting numbers may motivate executive to manipulate the timing of
revenues and expenses to maximize their compensation. It focuses executives on short term
performance which may be detrimental to the long term health of the firm. Rewarding top
management with different forms of stock compensation may not tie the executive’s efforts to
company performance closely enough. The stock price may rise or fall from market forces and
not from moves of the company’s executives. This is especially true with stock options. The
manager can become wealthy by being in the right place at the right time and not by the merits of
his performance. This could actually offer a disincentive to work hard if the stock price rises
regardless of effort. Problems may also occur if the stock price declines after executive stock
options are issued putting the options being way out of the money (Sigler, 2011).
A significant interest in executive compensation and corporate governance can be observed due
to the prevailing collapses of well-known firms and the accusation of reward for failure and a
lack of accountability. It can be argued that if used appropriate without excesses or fraudulent
actions, it can bond executives to owners’ enhancing shareholders wealth. On the other hand, the
dysfunction of the corporate mechanism can impoverish managerial entrenchment and moral
hazard. The huge amounts of executive pays drive the corporate governance to erosion sending
the message that executive spend shareholders money lavishly and without the appropriate
supervision (Bebchuk and Fried, 2003).
15
2.10 Financial Performance Evaluation.
The relative importance of various factors used to measure the performance of agents should be
related to how well each measure informs the principal about the agent’s actual performance
(Lambert and Larcker, 1987). A number of different ratios are often calculated in strategic or
financial planning to infer corporate performance. Careful analysis of a combination of these
ratios may help distinguish between firms that will eventually fail and those that will continue to
survive. Ratios specifically used in analyzing insurers include the combined and operating ratios,
underwriting ratios, capital adequacy ratios and solvency ratios (Gupta, 2005).
2.10.1 Capital adequacy ratio.
Financial capital is of essence to any viable business but the peculiar nature of insurance
business situates capital more in the context of underwriting capacity. This standard is devised
in an attempt to measure the strength of insurance companies. Strength means the ability to
withstand normal insurance underwriting and investment risks. The premium-surplus ratio
measure of strength is a tool for the policyholder and is only a measure of leverage in
the eyes of the stockholder. In other words, a stockholder should prefer a higher
premium-surplus ratio, while a policyholder might prefer a lower ratio as it indicates a more
heavily capitalized and stronger insurer (Onaolapo et al, 2012).
Policyholders’ surplus is a function of the total amount of paid-in capital and surplus, the
rate of growth of the insurance company, the underwriting profit margin achieved, the
adequacy of the loss reserves, and to a large extent, the amount of money invested in
stocks and year- end level of the stock market. The rationale for using policyholders’
surplus rather than stock- holders’ equity is that, equity is locked up. Which is to say that
come a catastrophe or an economic upheaval, equity cannot be released without selling the
birthright of a company. The premium-surplus ratio measure of strength is a tool for the
policy- holder and is only a measure of leverage in the eyes of the stockholder. In other
words, a stockholder should prefer a higher premium-surplus ratio, while a policyholder
might prefer a lower ratio as it indicates a more heavily capitalized and stronger insurer.
(Cummins et al 1995).
16
2.10.2 Underwriting Ratios
The underwriting expense ratio measures operational efficiency in underwriting. The ratios
represents the percentage of a company’s net premiums earned that went toward underwriting
expenses such as commissions / acquisition, claims cost, claims handling. Commission ratio
measures how much of the premium is being paid out to obtain the business. Commission
payments are usually paid as a percentage of written premiums. Underwriting expense ratio is an
important determinant of overall profitability, and insurers attempt to set premium rates at levels
adequate to generate profits. The measure tells how much of the premiums being used for the
expenses of administration (other than claims), underwriting proposals, marketing, agency
support and product design. The underwriting ratios are added to create a combined ratio which
measures total underwriting outgoings for each unit of premium income. The ratio will indicate
underwriting loss or profit per unit of gross premium charged to policyholders (Cummins et al
1995).
2.10.3 Solvency Margins
Solvency corresponds to insurance ability to pay claims. An insurer is insolvent if its assets are
not adequate (over indebtedness) or cannot be disposed of in time (illiquidity) to pay the claims
arising. The Solvency Margin Ratio (SMR) is calculated by taking Available Solvency Margin
(ASM) divided by Required Solvency Margin (RSM) as a percentage. Solvency margin is the
amount by which the assets of an insurer exceed its liabilities, and will form part of the insurer’s
shareholder’s funds (Gour and Gupta, 2012).
2.11 The CAMEL rating system
Rating is the intended to determine the relative financial strength of firms in an industry, which
could build trust among consumers, promote better corporate governance, competitive
advantage, transparency and better company image (Yakob et al 2004). The objective of the
CAMEL-S is to help the insurance regulators supervise companies’ financial soundness. The
model establishes a rating system that is more comprehensive, transparent and reliable for
insurance companies that can be accessed by the public (Hsiao 2009). It incorporates analysis of
both quantitative (financial ratios) and qualitative values (subjective elements) driving insurers
operations (Rehm, 2011).
17
The model takes into account the managerial, financial operational and compliance aspects of
insurers. It identifies those that are troubled as well as those that have deficiencies in certain
CAMEL components. The five appraisal components that form the CAMEL rating system are
capital adequacy, asset quality, management quality, earnings and liquidity. A sixth component
was added in 1997, sensitivity to market risk. Each component is allocated with a value from one
to five where one indicates the best. The components cannot be applied singularly as any
movement or decision on one element will definitely affect the others. The ratings provide
numerical ranking indicating soundness of the institution as assigned by regulator (Hsiao 2009).
Capital adequacy in the model evaluates whether an insurer provides sufficient capital to meet
obligation. An insurer who has sufficient capital usually is considered having less chance to
default. Regulators require that insurers have to satisfy fixed minimum capital adequacy
requirements to operate. The capital strength relative to the risks taken will determine the overall
strength of its ability to pay claims in the future (Rehm, 2011). Capital serves as an insurer’s
cushion in absorbing expected and unexpected losses thus companies with robust capitalization
levels are more capable of shouldering losses arising from claims. This implies a strong ability to
pay claims (Shiu 2008).
Asset quality represents all the assets of the insurer, current and fixed, loan portfolio,
investments and real estate owned as well as off balance sheet transactions (Hsiao and Wang
2009). Assets-liability mismatch in terms of maturities exposes the insurer to reinvestments,
refinancing and market value risk (Black and Skipper, 2000). In the standard CAMELS
framework, asset quality is assessed according to the level, distribution, and severity of classified
assets, the adequacy of valuation reserves and the demonstrated ability to administer and collect
premiums (Sarker, 2005). Poor assets quality can lead to institutional failure because assets
liability mismatch in terms of maturity exposes the insurer to reinvestments, refinancing and
market value risk (Hsiao 2009).
Management is the most qualitative and subjective, and cannot be reflected in the financial
statements (Gasbarro et al 2002). It shows how well the company’s board of director’s functions,
including the diversity of its technical expertise, its independence from management, and its
ability to make decisions flexibly and effectively. Management control culture and efficient
computer personnel and systems are also very crucial (Hsiao, 2005).
18
Earnings is defined as net gains from operations from which dividends to policyholders must be
subtracted since they are normal part of insurance practice. Capital gains or losses on
investments funds should also be factored in, since they reflect financial results of the companies
in a given year. Supervisors, analysts and investors will through the extent of profitability
evaluate the periodic financial success of an insurer and examine an insurer’s performance
ability to employ assets to generate returns. The more profitable the insurer is, the higher the
business continuity and financial strength (Shiu, 2008). A company should adopt a long-range
outlook, since the earnings on any block of policies are not known until final contract expires
which largely affects ability to settle claims (Wright, 1992).
Insurers’ liquidity is considered an ability to respond quickly to operational cash (Yakob et al
2004). Current liquidity ratio is a significant indicator of solvency and the stability of liquidity
ratio is an essential assessment of corporate solvency. Hsiao (2009) asserts that insolvent
probability is correlated to fewer liquid assets and incase of mass surrenders of policies owing to
loss of confidence by policyholders, liquidity risk increases (Kelliher et al 2005). This reduces
ability of insure to generate sufficient financial resources to meet their payments commitments.
Insurers with a high degree of liquidity are expected to have a high business continuity and
financial strength (Shiu, 2006).
Sensitivity to market risk is assessed by the degree to which changes in market prices, notably
interest rates, exchange rates, commodity prices, and equity prices adversely affect an insurer’s
earnings and capital (Hsiao 2009). This come in the form of sensitivity of the financial institution’s
net earnings or the economic value of its capital to changes in interest rates under various scenarios
and stress environments. Actual or potential volatility of earnings or capital because of any changes
in market valuation of trading portfolios or financial instruments, and lastly, ability of management
to identify, measure, monitor and control interest rate risk as well as price and foreign exchange risk
where applicable and material to an institution (Sarker, 2005).
2.12 Empirical Studies.
El Akremi et al, (2001), studied compensation strategies for Chief Executive Officers (CEO)
from various economic, political and symbolic perspectives. The results suggest that agency
theory offers a priori the most solid explanation of CEO compensation because of the links
observed between the control exercised by the Principal, the intensity of short-term incentives
and the sensitivity of direct pay to performance. They noted that a balance of power between
19
board members and top executives seems to be a determining factor in the determination of the
structure and management of CEO compensation. Further they reiterated that the political
perspective remains coherent with agency theory by supposing that CEOs can be tempted to
make use of their privileged position concerning compensation decisions.
Fernandes, (2005) examined the relationship between compensation and firm performance of
companies listed in the Portuguese Stock Exchange. He found out that compensation is not
related to shareholders wealth, nor do shareholders have any mechanism to influence it. The
results suggest that very few companies have what is really considered an independent director
that looks after shareholders’ interests. The results suggested that company performance is not
significantly related to executive compensation.
Bebchuk and Fried (2003) provided an overview of the main theoretical elements and empirical
underpinnings of a managerial power approach to executive compensation. They concluded that
managerial power and rent extraction play an important role in executive compensation and have
significant implications on corporate governance. They noted that, the extent to which
managerial influence can move compensation arrangements away from optimal contracting
outcomes depends on the extent to which market participants recognize the problems. Boards of
listed companies with dispersed ownership cannot bargain at arm’s length with managers. As a
result, managers wield substantial influence over their own pay arrangements, and they have an
interest in reducing the saliency of the amount of their pay and the extent to which that pay is de-
coupled from managers’ performance. This way it is seen that managers have the power to
design their pay.
Evans and Evans, (2000) examined the link between Economic Value Added as a measure of
firm performance and the form of executive compensation of 209 to try and provide evidence
supporting incentive compensation. Based on agency theory, they found out that, equity based
pay was positively linked to EVA, supporting the contention that where an executive has
significant investment in the company the division between owners and management is
minimized and agency costs are reduced. In contrast, they noted that CEO cash pay was not
significantly associated with EVA.
20
Hill and Yablon (2002) discussed a number of scandals and developments relating to executive
remuneration in Australia. They argued that segregation of executive remuneration from other
areas of corporate law may lead to dangerous tunnel vision. They considered ways in which
management’s positional conflict of interest, particularly in the area of disclosure, may interact
with the goals of contemporary performance-based pay schemes. Their study found that,
performance-based pay assumes that markets and appropriately designed remuneration contracts
can constrain executives, forcing them to act as if they had the shareholders’ interests at heart.
Fahlenbrach and Stulz, (2010) investigated whether bank performance during the credit crisis
was related to chief executive officer (CEO) incentives before the crisis. Based on their evidence,
lack of alignment of bank CEO incentives with shareholder interests could not be blamed for the
credit crisis or for the performance of banks during that crisis. They noted that, there was no
evidence that banks with CEOs whose incentives were less well aligned with the interests of
their shareholders performed worse during the crisis. Banks where CEOs had better incentives in
terms of the dollar value of their stake performed significantly worse than banks where CEOs
had poorer incentives. Neither cash bonus nor stock options had an adverse impact on bank
performance during the crisis. CEOs with better incentives to maximize shareholder wealth took
risks that other CEOs did not. These poor outcomes are not evidence of CEOs acting in their own
interest at the expense of shareholder wealth.
Fahd Al-Heizan (2001) employed the agency theory framework to empirically investigate the
relationship between executive risk sharing and the firm‘s stock performance. His study tried to
answer the question of whether or not using risk sharing contracts motivate executives to
increase shareholder value. Regression analysis showed a significant relationship between
market value per share and the percentage of stock options granted to the total number of shares
outstanding. Further a less significant relationship was also found between market value per
share and stock based compensation.
Gao and Shrieves (2002), studied how the components of compensation influence earnings
management behavior. They found strong evidence that compensation contract design influence
earnings management, and that the influences of the various compensation components appear to
be largely predictable on a presumption that managers behave opportunistically by exploiting
timing options embedded in some components of the compensation contracts.
21
Aduda and Musyoka (2011) examined the relationship between executive compensation and firm
performance on commercial banks listed at the Nairobi Stock Exchange. He found out that
accounting measures of performance are not key considerations in determining executive
compensation among the banks in Kenya and that size is a key criterion in determining executive
compensation as it was significantly but negatively related to compensation. The negative
correlation suggests the capping of executive compensation to ensure maximization of returns to
shareholders.
Pava and Krausz (1996) examined the association between corporate social responsibility and
financial performance in Netherlands. They used 53 firms identified by Council on Economic
Priorities as being socially responsible and another 53 firms as control sample where they
compared their performance over time. In addition they compared the performance of the two
groups in two times period, 1985-1987 and 1989-1991. They compared the financial
performance based on market based measures, accounting based measures, measure of risk, and
other firm specific characteristics. They found that, firms perceived to have met social
responsibility criteria generally have financial performance at least on a par if not better than
other firms.
Mang’unyi (2011) explored ownership structure and corporate governance and its effects on
Kenyan banks performance. He found out that there was no significant difference between type
of ownership and financial performance, and between banks ownership structure and corporate
governance practices. He further found out that there was significant difference between
corporate governance and financial performance of banks. However, foreign-owned banks had
slightly better performance than domestically-owned banks.
Coleman (2007) examined the effect of corporate governance on firm performance by using both
market and accounting based performance measures. The results provide evidence that, large and
independent boards enhance firm value and that combining the positions of CEO and board chair
has a negative impact on firm performance. He found out that CEO’s tenure in office enhances
firm’s profitability while board activity intensity affects profitability negatively. The size of audit
committees and the frequency of their meetings have positive influence on market based
performance measures and that institutional shareholding enhances market value of firms.
22
Ongore et al (2011) studied interrelationships between ownership identity and managerial
discretion, and their impact on financial performance as measured by Return on Assets, Return
on Equity and Dividend Yield. The results showed significant positive relationship between
managerial discretion and performance. They noted a significant negative relationship between
government ownership and firm performance.
Kajola, (2008) found a positive and significant relationship between ROE and board size, a
positive and significant relationship between ROE and chief executive status, no significant
relationship between ROE, board composition and audit committee, a positive and significant
relationship between profit margin and chief executive status, and finally no significant
relationship between profit margin and board size, board composition and audit committee.
Ozkan (2007) examined the link between cash and equity-based components of CEO
compensation and performance. The results indicated a positive and significant link between
CEO cash compensation and performance however the link between total compensation and
performance was positive but not significant. Their findings also suggest that larger firms pay
their CEOs higher compensation, which can be interpreted as reflecting their demand for higher
quality CEO talent.
23
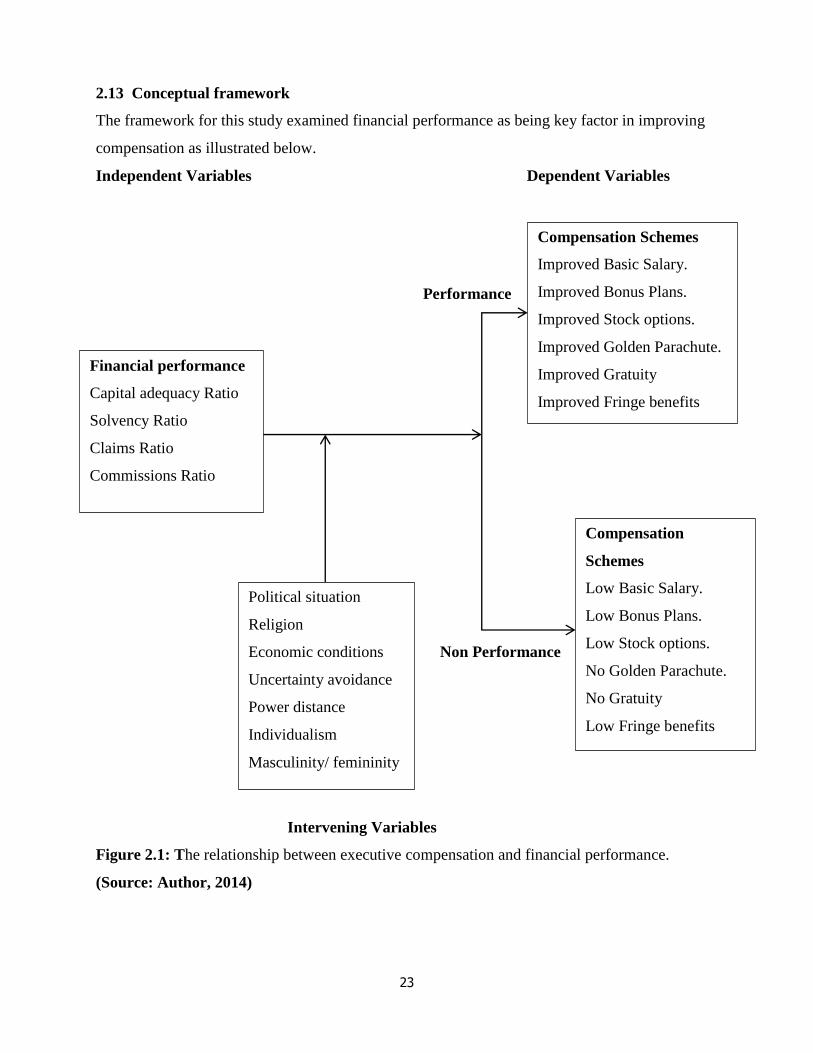
2.13 Conceptual framework
The framework for this study examined financial performance as being key factor in improving
compensation as illustrated below.
Independent Variables Dependent Variables
Performance
Non Performance
Intervening Variables
Figure 2.1: The relationship between executive compensation and financial performance.
(Source: Author, 2014)
Compensation Schemes
Improved Basic Salary.
Improved Bonus Plans.
Improved Stock options.
Improved Golden Parachute.
Improved Gratuity
Improved Fringe benefits
Compensation
Schemes
Low Basic Salary.
Low Bonus Plans.
Low Stock options.
No Golden Parachute.
No Gratuity
Low Fringe benefits
Financial performance
Capital adequacy Ratio
Solvency Ratio
Claims Ratio
Commissions Ratio
Political situation
Religion
Economic conditions
Uncertainty avoidance
Power distance
Individualism
Masculinity/ femininity
24
According to the framework in figure 2.1, financial performance constitutes the independent
variable while compensation schemes are the dependent variables. Financial performance was
measured through the key ratios published by the insurance companies. Financial performance is
expected to result in improved compensation schemes and vice versa. Intervening variables have
an effect on the relationship between the variables.
The conceptual framework statistically link pay and performance in insurance industry. It depicts
the relationship between compensation and performance when the firm has a bad year compared
to when the firm has a good year. CEOs are entrusted with control of vast resources and assets
therefore, it is important to structure compensation contracts such that the CEO has proper
incentives to work in the shareholders’ interests, which presumably are to maximize firm value.
25
CHAPTER THREE
RESEARCH METHODOLOGY
3. 0 Introduction
This chapter covers research design, population and sample, data collection, analysis and
presentation.
3. 1 Research Design
The study adopted a causal research design by examining the relationship between executive
compensation and financial performance among the insurance companies. Causal Research
explores the effect of one thing on another and more specifically, the effect of one variable on
another (Aduda and Musyoka, 2011).
3. 2 Population of the Study
The target population comprised of the insurance companies in Kenya (see appendix one). There
are forty eight (48) registered insurance companies in Kenya as at end of 2010. The analysis
period of this study covered the years from 2006 to 2010.
3. 3 Sample size
Given the small number of insurance companies in Kenya, the study deemed a complete analysis
most suitable. Therefore a census study of the forty eight (48) companies was undertaken.
3. 4 Data Collection
The study employed both secondary and primary data. Secondary data was collected from the
annual reports of Insurance Regulatory Authority of Kenya. The primary data was collected
through use of structured data sheet that capture the components of compensation components.
3. 5 Data Analysis
Key performance ratios and executive compensation were collected from IRA annual reports
from year 2006 to 2010 (see appendix two to six). Mean financial performance ratios were
calculated to combine all the five year period (see appendix seven). A multiple regression model
was used to identify the relationship between executive compensation and financial performance
of insurance companies using statistical package for the social sciences (SPSS) version 12.
26
The analysis begun by examining the basic features of the data using the descriptive statistics as
a starting point to describe what's going on in the data (see table 4.1). Analysis was done using
Pearson correlation to measure the association and strength (see table 4.2). ANOVA was also
used to test for homogeneity of the sum of the variation due to regression and residual (see table
4.3). P-value was used to prove or disprove the null hypothesis based on its significance.
Autocorrelation was measured by Durbin Watson statistics (see table 4.4). The study adopted
Moore (1994) regression model to examine relationship. In analyzing the relationship, this study
applied the method as used by Hsiao (2009) analyzing insolvency prediction using CAMEL-S
model (see appendix eight).
Y = α+ β1X1+β2X2+β3X3+β4X4+µ
Where: Y = Executive compensation, α = Intercept, X1 = Capital Adequacy Ratio, X2 = Solvency
Ratio, X3 = Incurred Claims Ratio, X4 = Expense Ratio, µ = Prediction error. In this case the
independent variables are key ratios that are used by IRA in assessing financial performance.
Regression model has been used in other studies like Sigler (2011), Ozkan (2007), Murphy
(2011), Lambert and Larker (1985) and Aduda and Musyoka (2011) in analysis of pay-
performance relationships.
3. 6 Data presentation
The study presented collected and analyzed data in tables and figures.
27
CHAPTER FOUR
DATA ANALYSIS, RESULTS AND DISCUSSIONS
4. 0 Introduction
This chapter presents the data analysis, findings and discussion of the results with reference to
the specific objectives. The first objective of this study was to examine the relationship between
executive compensation and financial performance of insurance companies in Kenya. The study
also characterizes the compensation packages in order to assess the packages mostly preferred.
4. 1 The relationship between executive compensation and financial performance
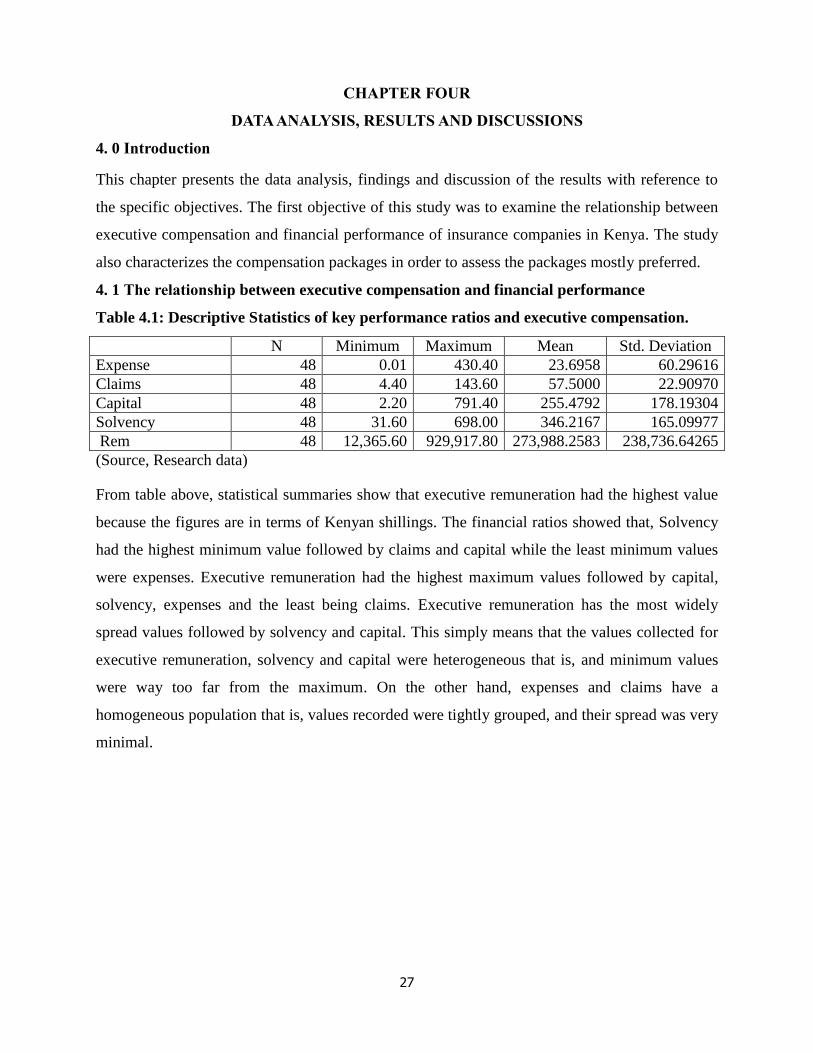
Table 4.1: Descriptive Statistics of key performance ratios and executive compensation.
(Source, Research data)
From table above, statistical summaries show that executive remuneration had the highest value
because the figures are in terms of Kenyan shillings. The financial ratios showed that, Solvency
had the highest minimum value followed by claims and capital while the least minimum values
were expenses. Executive remuneration had the highest maximum values followed by capital,
solvency, expenses and the least being claims. Executive remuneration has the most widely
spread values followed by solvency and capital. This simply means that the values collected for
executive remuneration, solvency and capital were heterogeneous that is, and minimum values
were way too far from the maximum. On the other hand, expenses and claims have a
homogeneous population that is, values recorded were tightly grouped, and their spread was very
minimal.
N Minimum Maximum Mean Std. Deviation
Expense 48 0.01 430.40 23.6958 60.29616
Claims 48 4.40 143.60 57.5000 22.90970
Capital 48 2.20 791.40 255.4792 178.19304
Solvency 48 31.60 698.00 346.2167 165.09977
Rem 48 12,365.60 929,917.80 273,988.2583 238,736.64265
28
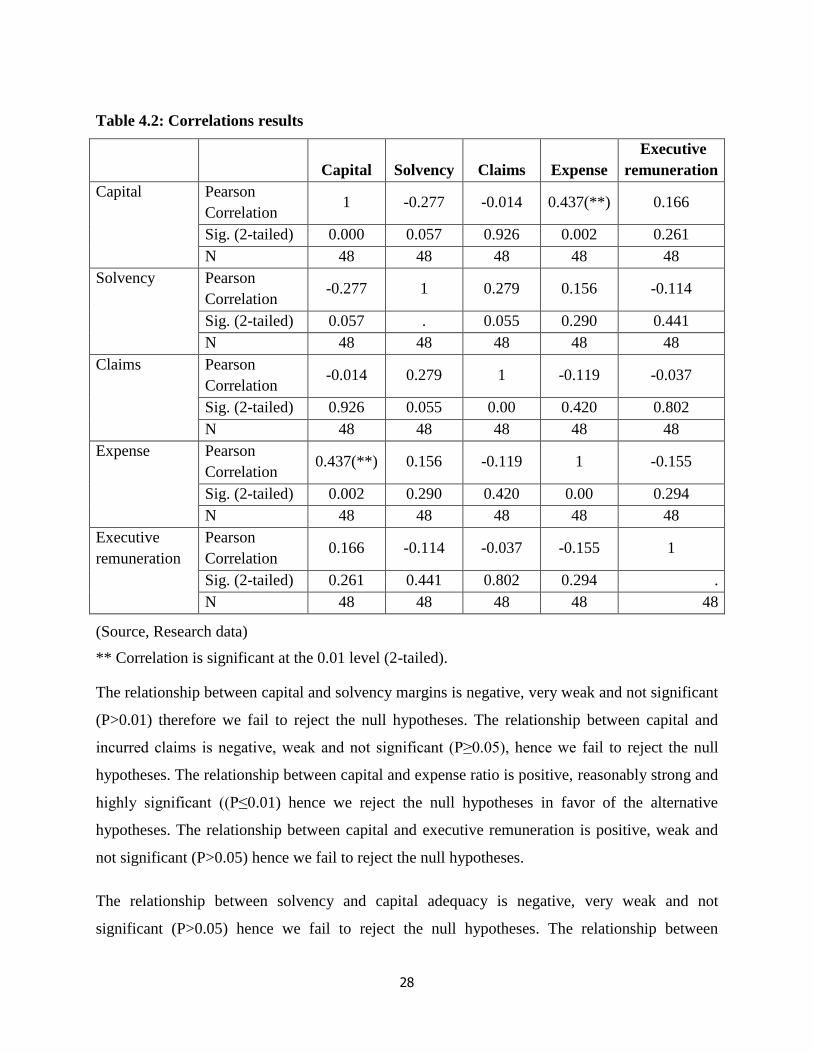
Table 4.2: Correlations results
Capital Solvency Claims Expense
Executive
remuneration
Capital Pearson
Correlation 1 -0.277 -0.014 0.437(**) 0.166
Sig. (2-tailed) 0.000 0.057 0.926 0.002 0.261
N 48 48 48 48 48
Solvency Pearson
Correlation -0.277 1 0.279 0.156 -0.114
Sig. (2-tailed) 0.057 . 0.055 0.290 0.441
N 48 48 48 48 48
Claims Pearson
Correlation -0.014 0.279 1 -0.119 -0.037
Sig. (2-tailed) 0.926 0.055 0.00 0.420 0.802
N 48 48 48 48 48
Expense Pearson
Correlation 0.437(**) 0.156 -0.119 1 -0.155
Sig. (2-tailed) 0.002 0.290 0.420 0.00 0.294
N 48 48 48 48 48
Executive
remuneration
Pearson
Correlation 0.166 -0.114 -0.037 -0.155 1
Sig. (2-tailed) 0.261 0.441 0.802 0.294 .
N 48 48 48 48 48
(Source, Research data)
** Correlation is significant at the 0.01 level (2-tailed).
The relationship between capital and solvency margins is negative, very weak and not significant
(P>0.01) therefore we fail to reject the null hypotheses. The relationship between capital and
incurred claims is negative, weak and not significant (P≥0.05), hence we fail to reject the null
hypotheses. The relationship between capital and expense ratio is positive, reasonably strong and
highly significant ((P≤0.01) hence we reject the null hypotheses in favor of the alternative
hypotheses. The relationship between capital and executive remuneration is positive, weak and
not significant (P>0.05) hence we fail to reject the null hypotheses.
The relationship between solvency and capital adequacy is negative, very weak and not
significant (P>0.05) hence we fail to reject the null hypotheses. The relationship between
29
solvency and expense ratio is positive, weak and not significant (P≥0.05) hence we fail to reject
the null hypotheses. The relationship between solvency and executive remuneration is negative,
weak and not significant (P>0.05) hence we fail to reject the null hypotheses and conclude that
there is no relationship between solvency and executive remuneration.
The relationship between claims and capital adequacy is negative, very weak and not significant
(P≥0.05) hence we fail to reject the null hypotheses in favor of the alternative. The relationship
between claims and solvency margins is positive, weak and not significant (P≥0.05) hence we
fail to reject the null hypotheses in favor of the alternative. The relationship between claims and
expense ratio is negative, very weak and not significant (P≥0.05) therefore we fail to reject the
null hypotheses in favor of the alternative. The relationship between claims and executive
remuneration is negative, very weak and not significant (P≥0.05) therefore we fail to reject the
null hypotheses and conclude that there is no relationship between claims and executive
remuneration.
The relationship between expense and capital adequacy is positive, reasonably strong and highly
significant ((P≤0.01) therefore we reject the null hypotheses. The relationship between expense
and solvency margins is positive, weak and not significant (P≥0.05) therefore we fail to reject the
null hypotheses. The relationship between expense and incurred claims is negative, very weak
and not significant (P≥0.05) therefore we fail to reject the null hypothesis. The relationship
between expense and executive remuneration is negative, very weak and not significant (P≥0.05)
hence we fail to reject the null hypotheses and conclude that there is no relationship between
expense ratio and executive remuneration.
The results of the tests have shown a non-significant relationship between executive
remuneration and financial performance. This means the data doesn’t provide concrete evidence
against the null hypotheses.
4. 2 Analysis of Variance
ANOVA model for testing relationship between executive compensation and financial
performance of insurance companies in Kenya (N=48)
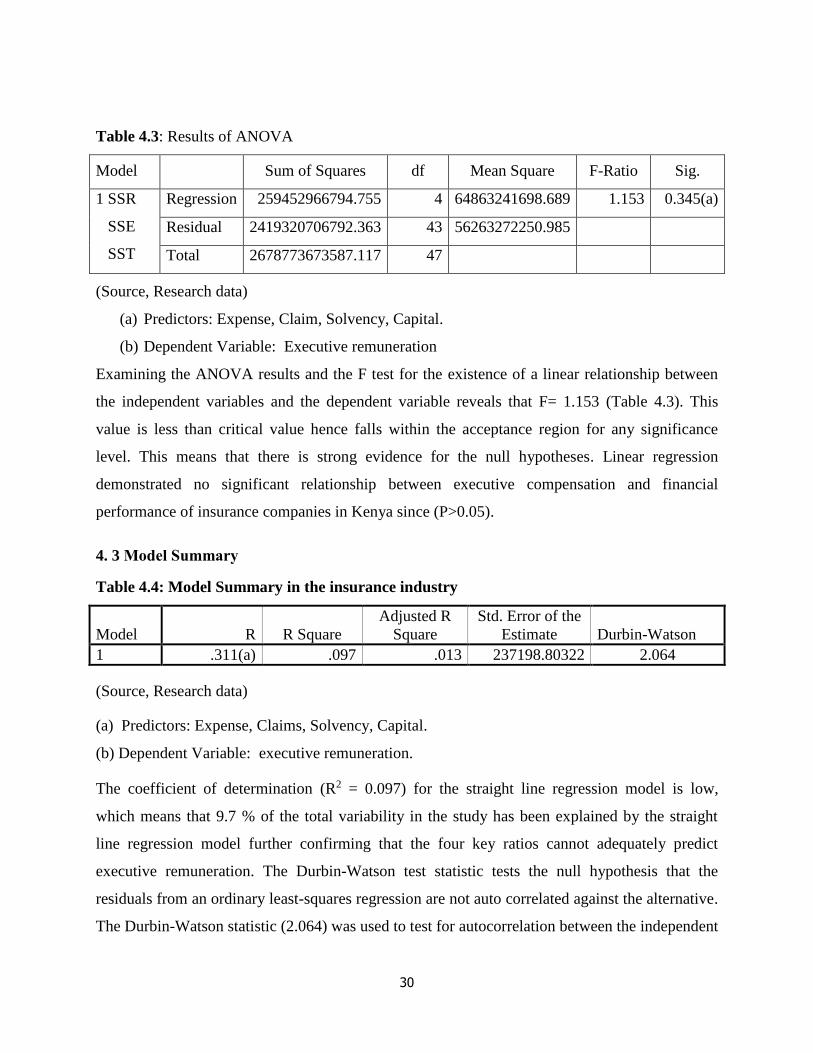
30
Table 4.3: Results of ANOVA
Model Sum of Squares df Mean Square F-Ratio Sig.
1 SSR
SSE
SST
Regression 259452966794.755 4 64863241698.689 1.153 0.345(a)
Residual 2419320706792.363 43 56263272250.985
Total 2678773673587.117 47
(Source, Research data)
(a) Predictors: Expense, Claim, Solvency, Capital.
(b) Dependent Variable: Executive remuneration
Examining the ANOVA results and the F test for the existence of a linear relationship between
the independent variables and the dependent variable reveals that F= 1.153 (Table 4.3). This
value is less than critical value hence falls within the acceptance region for any significance
level. This means that there is strong evidence for the null hypotheses. Linear regression
demonstrated no significant relationship between executive compensation and financial
performance of insurance companies in Kenya since (P>0.05).
4. 3 Model Summary
Table 4.4: Model Summary in the insurance industry
Model R R Square
Adjusted R
Square
Std. Error of the
Estimate Durbin-Watson
1 .311(a) .097 .013 237198.80322 2.064
(Source, Research data)
(a) Predictors: Expense, Claims, Solvency, Capital.
(b) Dependent Variable: executive remuneration.
The coefficient of determination (R2 = 0.097) for the straight line regression model is low,
which means that 9.7 % of the total variability in the study has been explained by the straight
line regression model further confirming that the four key ratios cannot adequately predict
executive remuneration. The Durbin-Watson test statistic tests the null hypothesis that the
residuals from an ordinary least-squares regression are not auto correlated against the alternative.
The Durbin-Watson statistic (2.064) was used to test for autocorrelation between the independent
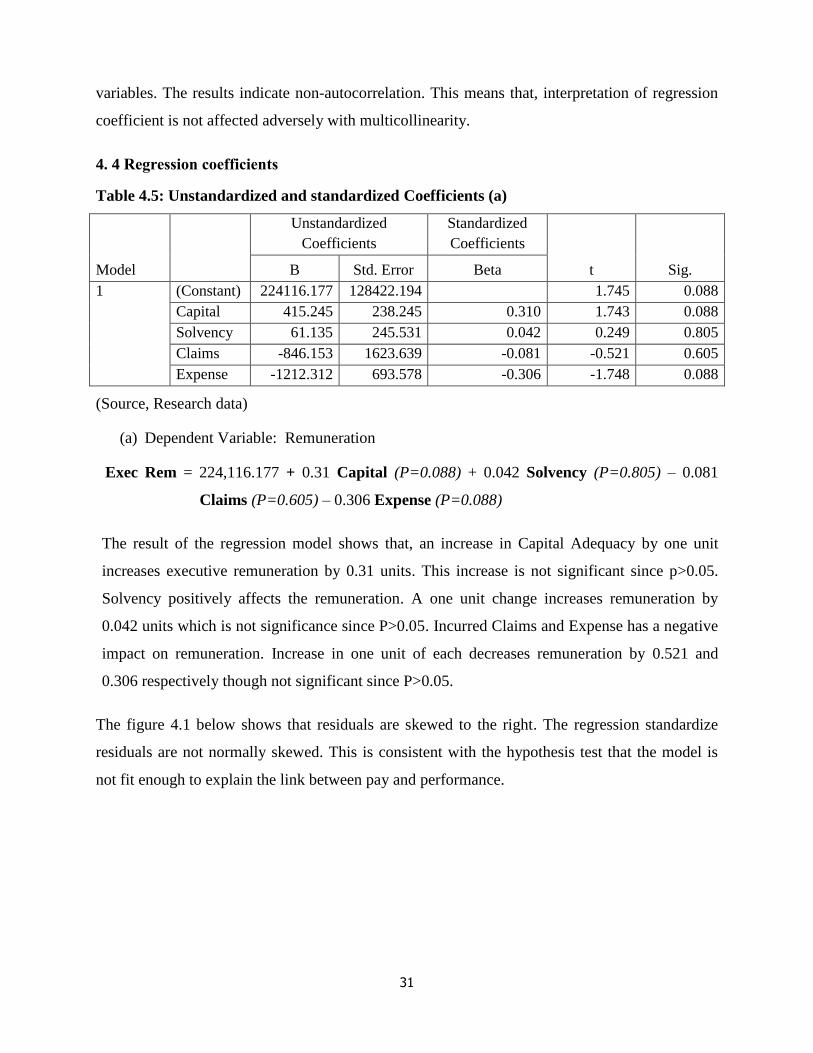
31
variables. The results indicate non-autocorrelation. This means that, interpretation of regression
coefficient is not affected adversely with multicollinearity.
4. 4 Regression coefficients
Table 4.5: Unstandardized and standardized Coefficients (a)
Model
Unstandardized
Coefficients
Standardized
Coefficients
t Sig. B Std. Error Beta
1 (Constant) 224116.177 128422.194 1.745 0.088
Capital 415.245 238.245 0.310 1.743 0.088
Solvency 61.135 245.531 0.042 0.249 0.805
Claims -846.153 1623.639 -0.081 -0.521 0.605
Expense -1212.312 693.578 -0.306 -1.748 0.088
(Source, Research data)
(a) Dependent Variable: Remuneration
Exec Rem = 224,116.177 + 0.31 Capital (P=0.088) + 0.042 Solvency (P=0.805) – 0.081
Claims (P=0.605) – 0.306 Expense (P=0.088)
The result of the regression model shows that, an increase in Capital Adequacy by one unit
increases executive remuneration by 0.31 units. This increase is not significant since p>0.05.
Solvency positively affects the remuneration. A one unit change increases remuneration by
0.042 units which is not significance since P>0.05. Incurred Claims and Expense has a negative
impact on remuneration. Increase in one unit of each decreases remuneration by 0.521 and
0.306 respectively though not significant since P>0.05.
The figure 4.1 below shows that residuals are skewed to the right. The regression standardize
residuals are not normally skewed. This is consistent with the hypothesis test that the model is
not fit enough to explain the link between pay and performance.
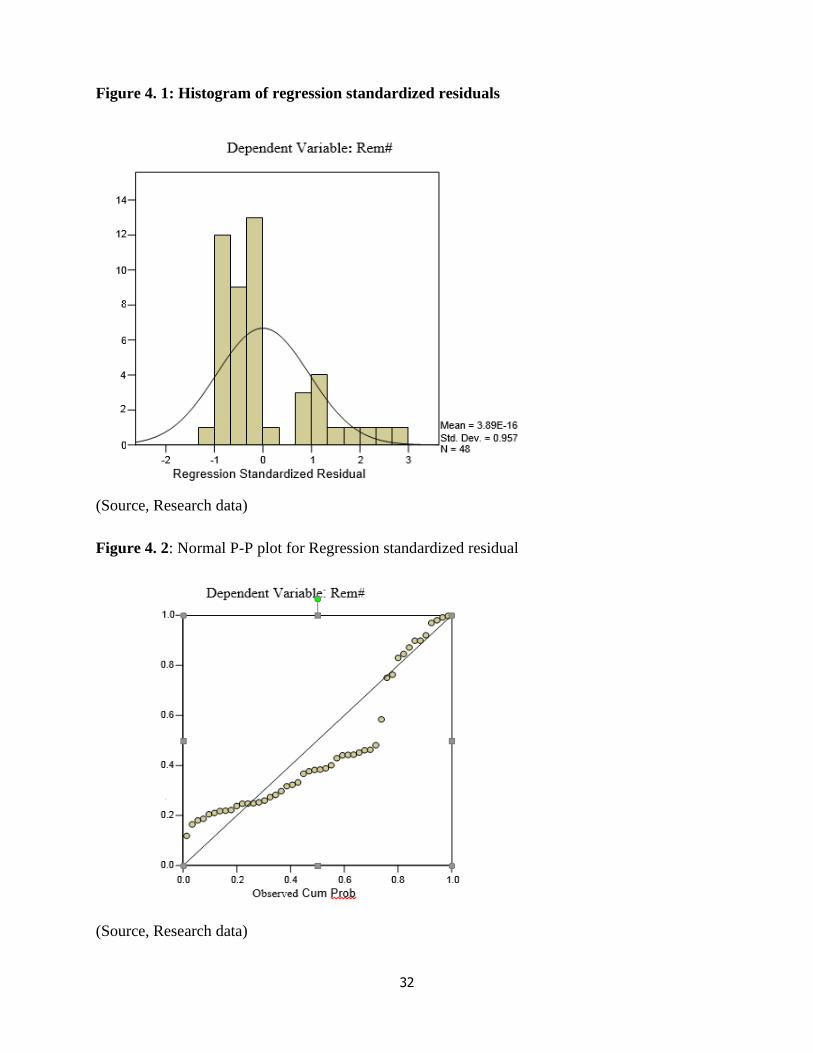
32
Figure 4. 1: Histogram of regression standardized residuals
(Source, Research data)
Figure 4. 2: Normal P-P plot for Regression standardized residual
(Source, Research data)
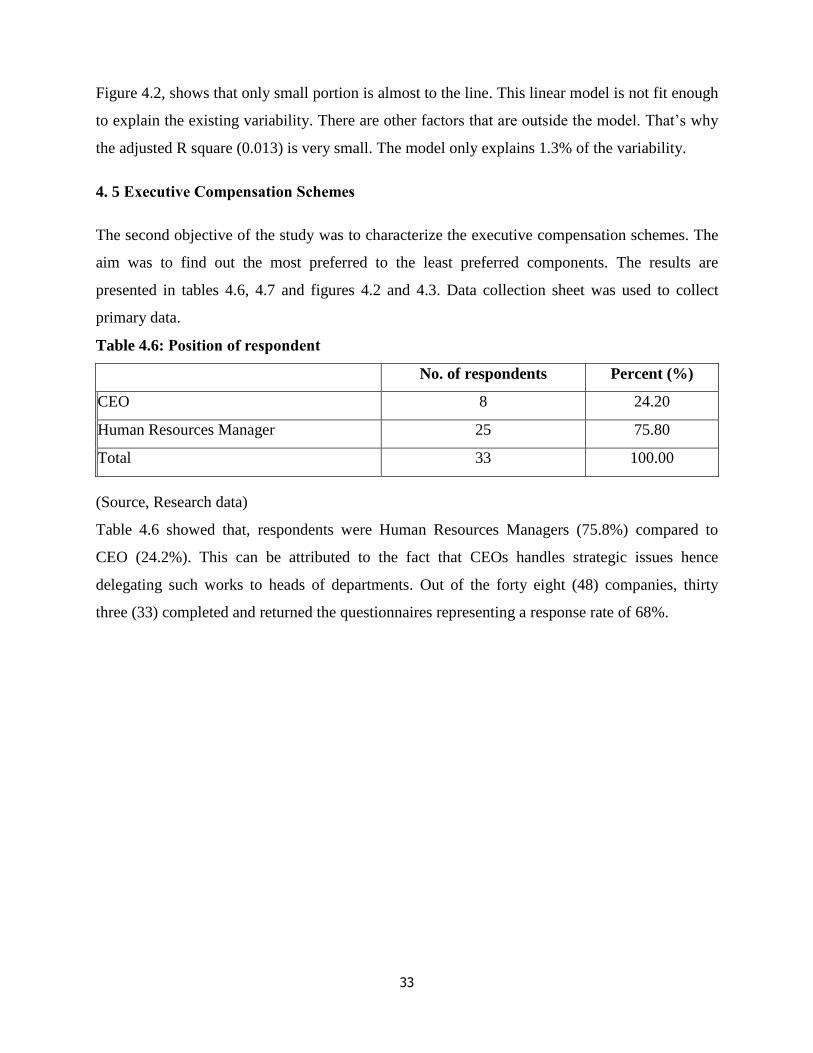
33
Figure 4.2, shows that only small portion is almost to the line. This linear model is not fit enough
to explain the existing variability. There are other factors that are outside the model. That’s why
the adjusted R square (0.013) is very small. The model only explains 1.3% of the variability.
4. 5 Executive Compensation Schemes
The second objective of the study was to characterize the executive compensation schemes. The
aim was to find out the most preferred to the least preferred components. The results are
presented in tables 4.6, 4.7 and figures 4.2 and 4.3. Data collection sheet was used to collect
primary data.
Table 4.6: Position of respondent
No. of respondents Percent (%)
CEO 8 24.20
Human Resources Manager 25 75.80
Total 33 100.00
(Source, Research data)
Table 4.6 showed that, respondents were Human Resources Managers (75.8%) compared to
CEO (24.2%). This can be attributed to the fact that CEOs handles strategic issues hence
delegating such works to heads of departments. Out of the forty eight (48) companies, thirty
three (33) completed and returned the questionnaires representing a response rate of 68%.
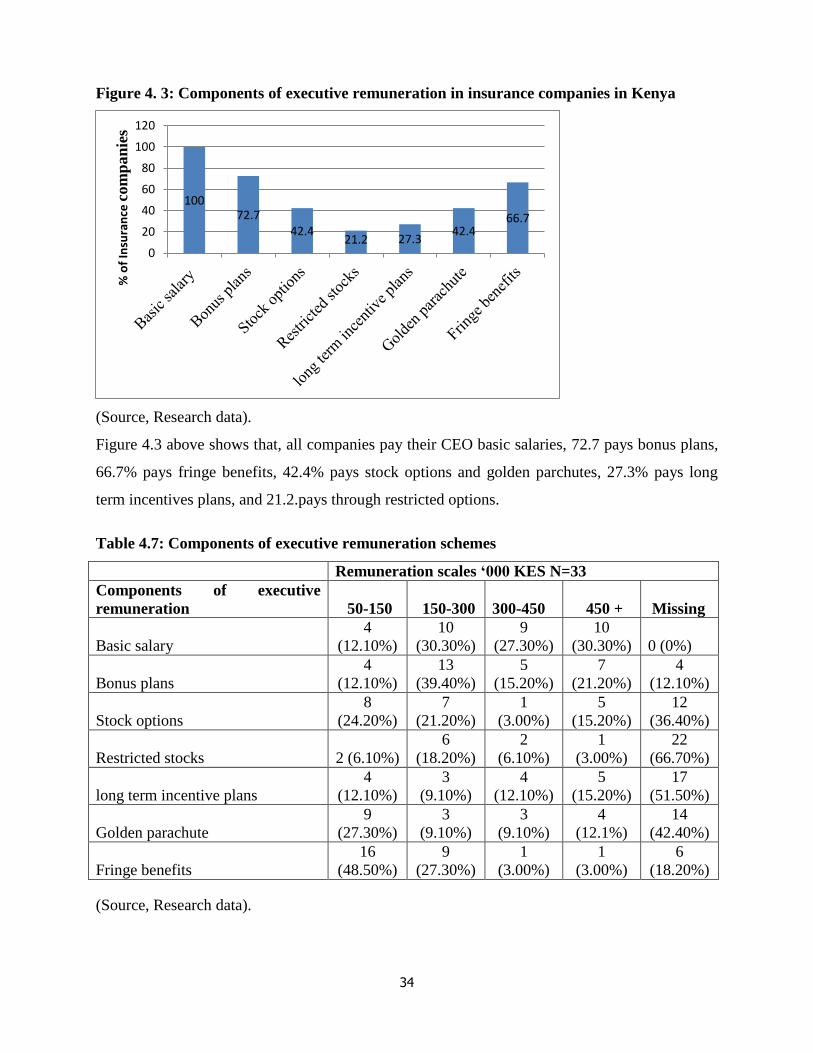
34
Figure 4. 3: Components of executive remuneration in insurance companies in Kenya
(Source, Research data).
Figure 4.3 above shows that, all companies pay their CEO basic salaries, 72.7 pays bonus plans,
66.7% pays fringe benefits, 42.4% pays stock options and golden parchutes, 27.3% pays long
term incentives plans, and 21.2.pays through restricted options.
Table 4.7: Components of executive remuneration schemes
Remuneration scales ‘000 KES N=33
Components of executive
remuneration 50-150 150-300 300-450 450 + Missing
Basic salary
4
(12.10%)
10
(30.30%)
9
(27.30%)
10
(30.30%) 0 (0%)
Bonus plans
4
(12.10%)
13
(39.40%)
5
(15.20%)
7
(21.20%)
4
(12.10%)
Stock options
8
(24.20%)
7
(21.20%)
1
(3.00%)
5
(15.20%)
12
(36.40%)
Restricted stocks 2 (6.10%)
6
(18.20%)
2
(6.10%)
1
(3.00%)
22
(66.70%)
long term incentive plans
4
(12.10%)
3
(9.10%)
4
(12.10%)
5
(15.20%)
17
(51.50%)
Golden parachute
9
(27.30%)
3
(9.10%)
3
(9.10%)
4
(12.1%)
14
(42.40%)
Fringe benefits
16
(48.50%)
9
(27.30%)
1
(3.00%)
1
(3.00%)
6
(18.20%)
(Source, Research data).
10072.7
42.421.2 27.3
42.466.7
0
20
40
60
80
100
120%
of
Insu
ran
ce c
om
pan
ies

35
Table 4.7 above shows that, 12% of the insurance companies pay their CEO a basic salary of
between Kshs. 50,000 and Kshs 150,000 shillings compared to 88% who pay a basic salary more
than Kshs 150,000. Most insurance companies (76%) allocate their CEOs with a fringe benefits
ranging from Ksh 50,000 to Kshs. 300,000.
36
CHAPTER FIVE
SUMMARY, CONCLUSION AND RECOMMENDATION
5.1 Introduction
This chapter covers detailed explanation of the findings of each objective as well as the
conclusions of the study. Recommendations for practice and for further research are also
presented here.
5.2 Summary of findings
The study’s main objective was to examine the relationship between executive compensation and
financial performance. This study employs the agency theory framework to empirically investigate
the relationship between executive compensation and the financial performance. It tries to answer the
question of whether or not using compensation schemes contracts motivate executives to increase
shareholder value.
The study found a non-significant but positive relationship between capital adequacy ratio and
executive remuneration. Therefore in order to attract and enjoy the potential opportunities offered by
the provision of adequate capital in the insurance industry, attention should be paid to overall size of
capital requirements as a basis for creating a supportive and enabling business support system that
foster financial performance.
The study found a positive relationship between solvency and executive remuneration though not
significant. Solvency means ability to meet financial obligation on time. This implies that assets and
liabilities should not be treated as independent aspects and much more attention needs to be focused
on the uncertainties and on the company’s resilience in the face of such uncertainties. The study also
found out that, claims ratio and expense ratio had a negative relationship with executive
remuneration. The negative correlation suggests claims and expenses should be prudently
managed to maximize shareholders returns.
The study’s second objective was to characterize the executive compensation schemes from the
most preferred to the least preferred components. The study found out that, more than 66% of
Kenyan insurance companies characterize executive remuneration into basic salary, fringe
benefits and bonus plans while less than 42% characterize into stock options, Longterm
incentives plan and golden parachutes.
37
5.3 Conclusion of the study
The study finds non-significant relationship between executive compensation and financial
performance. This provides support for the hypothesis of the study that there is no statistically
significant relationship between executive remuneration and financial performance of insurance
companies. Since p-value is greater than 0.05, we therefore fail to reject the null hypothesis and
conclude that there is no significant relationship between executive compensation and financial
performance. Insurance companies should incorporate their compensation structure with the use
of incentives plans that motivate the CEO to take actions that increase shareholders wealth. The
plans ties executive compensation to performance with little monitoring reducing agency
problem. It attracts and retains managers with confidence to risk their financial future on their
own abilities leading to maximization of shareholders wealth. Further in order to maintain the
social order and prepare for future market liberalization, apart from strengthening management
abilities, more attention will be given to capital structure and capital management as well as
adopting risk based management practices. In considering the investment function, emphasize
should be put on relevance of asset- liability management as well as adopting solvency
modernization initiatives including policyholder protection and loss absorbency.
5.4 Recommendation for further research
Further research can be done to test how the concept of complexity influences compensation
contracts despite strong theoretical ground and compensation consultants’ inclusion of
complexity in job evaluation work. Further, a study can be done on the relationship between
executive remuneration and firm value of listed companies. The current research examined the
relationship of executive remuneration and financial performance. Other research might extend
the analysis to effect of firm size on executive remuneration. Other line of future research might
try to examine the relationship between executive remuneration and return on equity and return
on assets as measures of firm performance.
38
REFERENCES
Aduda J. and Musyoka L. (2011) ‘The relationship between executive compensation and firm
performance in the Kenyan banking sector’ Journal of Accounting and Taxation Vol. 3(6),
Pp. 130-139.
Bamberg, Giinter, and Klaus Spremann, (1987) ‘Agency Theory, Information, and Incentives’
Berlin: Springer-Verlag, enotes
Bebchuk L. A. and Fried J. M. (2003) ‘Executive Compensation as an Agency Problem’ Journal
of Economic Perspectives Vol. 17, Number 3 Pp 71–92
Bebchuk L.A and Fried J.M. (2005) ‘Pay without Performance: Overview of the Issues’ Journal
of Applied Corporate Finance Volume 17, Issue 4.
Beck T. and Fuchs M. (2004) Structural Issues in the Kenyan Financial Systems: Improving
Competition and Access’ World Bank policy Working paper 3363.
Beck T, and Webb I, (2003), ‘Economic and Institutional Determinants of Life Insurance
Consumption across Countries,’ World Bank Economic Review, Vol. 17(1), pp. 51-88.
Boyd B. (1994) ‘Board control and CEO compensation’ Strategic Management Journal Volume
15, Pp 335- 344.
Black K Jr. and Skipper H. D. jr. (2000) ‘Life and Health Insurance’ 13th Edition. Prentice Hall,
New Jersey.
Brainard L. (2008) ‘what is the role of insurance in economic development?’ Zurich Government
and Industry Affairs. 124935A01.indd 13.
Brickley J., Coles J., and Jarrell G. (1997) ‘Leadership structure: separating the CEO and
chairman of the board’ Journal of Corporate Finance volume 3, Pp 189-220.
Coleman A. K. (2007) ‘Corporate Governance and Firm Performance in Africa: A Dynamic
Panel Data Analysis’ University of Ghana Business School, Legon.
Cummins D.J and Danzon P.M. (1997) ‘Price, Financial Quality, and Capital Flows in Insurance
Markets’ Journal of Financial Intermediation Vol. 6, Pp. 3–38 Article No. Jf 960205
Cummins D. J, Harrington S. E. and Klein R. (1995)’ Insolvency Experience, Risk-Based Capital
and Prompt Corrective Action in Property-Liability Insurance’ Working Paper Series,
Wharton financial institutions center.
Donghui L., Fariborz M., Nguyen P., and Wee T, (2007) ‘The Demand for Life Insurance in
OECD Countries’ Journal of Risk & Insurance, Vol. 74, No. 3. Pp 32-56
39
Doherty N., and Smetters K., (2005) Moral Hazard in Reinsurance Markets, Journal of Risk and
Insurance Vol. 72(3) pp 375-391
Eckles D. L., Halek M., Sommer W. (2011) ‘Earning Smoothing, Executive Compensation and
Corporate Governance: Evidence from the property- Liability Insurance’ Industry’ Journal
of Risk and Insurance Vol. 78(3) pp. 761-790.
El Akremi A., Roussel P., and Trepo G. (2001) ‘CEO compensation strategies: Consequences on
the structure and management of executive pay’ Working paper.
Evans J. and Evans R. (1999) ‘An Empirical Investigation of EVA and Executive Compensation’
Curtin University of Technology, Australia.
Fahd Al-Heizan O (2001) ‘An Empirical Investigation of the Relationship between Executive
Risk Sharing and Corporate Performance’ http://hdl.handle.net/123456789/5846
Fahlenbrach R. and Stulz R.M. (2010) Bank CEO Incentives and the Credit Crisis Fisher
College of Business Working Paper Series no. 2009-13
Fama E. F. and Jensen M.C. (1984) Organizational Forms and Investment Decisions, Journal of
Financial Economics Vol. 14 Pp 101-119
Fama E.F. and Jensen M. C. (1983) ‘Agency problems and residual claims’ Journal of Law and
Economics Vol. 26
Fama, E.F. (1980) ‘Agency problems and the theory of the firm’. Journal of Political economy
Vol. 88(2) pp 288-307
Fernandes N. (2005) ‘Board Compensation and Firm Performance: The Role of “Independent”
Board Members Finance’ Working Paper N°. 104/2005
Finkelstein S. and D’aveni, R. (1994) ‘CEO duality as a double-edged sword: How boards of
directors balance entrenchment avoidance and unity of command’ Academy of Management
Journal Vol. 37(5) Pp 1079-1108.
Finkelstein S. and Hambrick D (1988) ‘Chief Executive Compensation: a Synthesis and
Reconciliation’ Strategic Management Journal Vol. 9, pp. 543-558.
Finkelstein S., Boyd B. (1998) ‘The role of managerial discretion in the setting of CEO
compensation’ Academy of Management Journal. Vol. 41(2) Pp 179-200.
Foster G, (1986) ‘Financial Statement Analysis’ 2nd Edition, Prentice-Hall, New Jersey
Gasbarro D., Sadguna I., Zumwalt J. K. (2002) ‘ The changing relationship between CAMEL
rating and bank soundness during the Indonesian banking crisis’ Review of Qualitative
Finance and Accounting Vol. 19(3) pp 247-260
40
Gao P. and Shrieves R. E. (2002) ‘Earnings Management and Executive compensation: a Case of
Overdose of Option and Underdose of Salary’ Working Paper Northwestern University
Garven J. R. (1987) ‘On the Application of Finance Theory to the Insurance firms’ Journal of
Financial Services Research Vol.1 No. 1 Pp 57-76
Gour B., Gupta M.C.A. (2012) ‘Review on Solvency Margin in Indian Insurance Companies’
International Journal of Recent Research and Review, Vol. II, ISSN 2277 – 8322
Gupta A. (2011) ‘Financial Accounting for Management: An Analytical
Perspective’ ISBN 9788131754528 Pearson Education
Gupta P. K. (2006) ‘Fundamentals of Insurance’ Himalaya Publishing House, Mumbai.
Hill J and Yablon C.M. (2002) ‘Corporate Governance and Executive Remuneration:
Rediscovering Managerial Positional Conflict’ Working Paper Number 03-02
He E., and Sommer D.W. (2011) CEO turnover and ownership Structure: Evidence from the US
Property/ Liability Insurance Industry, Journal of Risk and Insurance, Vol. 78(3) pp673-701.
Holmstrom B. (1979) ‘Moral hazard and observebility’ Bell Journal of Economic Vol. 10, Pp.
74-91.
Hsiao S. H., (2009) ‘A Study of Insolvency Prediction and Efficient Classification approach for
Life Insurers--Taiwan example’ Leader University, Taiwan
Hsiao S H and Wang T J (2009) ‘A study of financial insolvency prediction model for life
insurance’ Journal of expert systems and application Vol. 36 pp 6100-6107.
Insurance Regulatory Authority (2010) Annual report, at www.ira.org (Accessed May 2012)
Jensen M. C. and Meckling W. H. (1976) ‘Theory of the Firm: Managerial Behavior, Agency
Costs and Ownership Structure’ Journal of Financial Economics Pp 305-360
Jensen M.C., and Murphy K. J. (1990)‘Performance pay and top management incentives’
Journal of Political Economy Vol. 98(2) pp 225-264.
Kajola, S. O. (2008) ‘Corporate Governance and Firm Performance: The Case of Nigerian Listed
Firms’ European Journal of Economics, Finance and Administrative Sciences Issue 14.
Kelliher P.O., Bartlett D., L., Chaplin M., Dowd K., O’Brien C., (2005) Liquidity management
in UK Life Insurance’ Economic and Social Research Council Discussion paper
Kidombo H.J. (2007), ‘Human Resource Strategic Orientation, Organizational Commitment and
firm Performance Private Manufacturing Firms in Kenya’ PhD Thesis, University of Nairobi
41
Lambert R A and Larcker D F (1985) ‘Golden Parachutes, Executive decision making, and
shareholder wealth’ Journal of Accounting and Research Vol. 7(1-3) pp 179-203
Lambert R. A, Larcker D. F. and Weigelt K. (1991). ‘How sensitive is executive compensation
to organizational size’ Strategic Management Journal Vol. 12, Pp.395-402.
Lambert R. A., Larcker D. F., Verrecchia R. E. (1991) ‘Portfolio Considerations in Valuing
Executive Compensation’. Journal of Accounting and Research Vol. 29(1) pp 129-49
Ligon J. A. and Cather D. A. (1997) ‘The informational value of insurance purchases: Evidence
from the property-liability insurance’ Journal of Banking & Finance Volume 21, Issue 7.
Lin Y. and Grace M. F. (2007) ‘Household Life Cycle Protection: Life Insurance Holdings, , and
Portfolio Implications’ Journal of Risk and Insurance Volume 74, Issue 1
Mang’unyi E. E. (2011) ‘Ownership Structure and Corporate Governance and Its Effects on
Performance: A Case of Selected Banks in Kenya’ International Journal of Business
Administration Vol. 2, No. 3
Mayers D and Smith C W (1986) Ownership Structure and Control: The Mutualization of Stock
Life Insurance Companies, Journal of Financial Economics Vol. 16, Pp 73– 98
Mayers, David and Smith, (1982) ‘On the Corporate Demand for Insurance’ Journal of Business,
Vol. 55, Pp. 281-296.
Moore, David S (1994) An Introduction to the Basic Practice of Statistics, America: Freeman
Murphy K. J. (1998) ‘Executive Compensation’ Handbook for labor economics, Volume 3,
North Holland.
Onaolapo A., Obasan K A, Soyebo Y A, (2012) ‘A Qualitative Analysis of the Impact of Capital
Adequacy on Managerial Effectiveness: A Case Study of Selected Insurance Firms in
Nigeria. American Journal of Business and Management Vol. 1, No. 3 PP 108-112.
Ongore V. O., K’Obonyo P. O., M. Ogutu, (2011) ‘Implications of Firm Ownership Identity and
Managerial Discretion on Financial Performance: Empirical Evidence from Nairobi Stock
Exchange’ International Journal of Humanities and Social Science Vol. 1 No. 13
Ozkan N. (2007) CEO ‘Compensation and Firm Performance: An Empirical Investigation of UK
Panel Data’ Journal of Economic Literature
Pandey I. M. (2005) ‘Financial Management Tenth Edition’ Vikas Publishing House PVT LTD.
Park S. C. and Lemaire J. (2011) ‘The Impact of Culture on the Demand for Non-Life Insurance’
Insurance and Risk Management Working Paper No.2
42
Pava M. L and Krausz, J. (1996) ‘The association between corporate social-responsibility and
financial performance’ Journal of Business Ethics. Vol. 15, issue 3. Pp. 321
Sanda A., Mikailu S., Garba T. (2005) ‘Corporate governance mechanisms and firm financial
performance in Nigeria’ African Economic Research Consortium, Research Paper No.149
Sarker, A. A. (2005) ‘CAMEL Rating System in the Context of Islamic Banking: A Proposed ‘S’
for Shariah Framework’ Journal of Islamic Economics and Finance, Vol.1 Pp. 78-84.
Shiu Y. M. (2006) ‘ Corporate Liquidity: Evidence from the United Kingdom Life Insurance
Industry’ Applied Economics Letters 13: 993-998.
Shiu Y.M. (2008) ‘Determinants of Financial Strength Ratings: Evidence from the Lloyd’s
Market’ Department of Business Administration, National Cheng Kung University.
Rehm B A (2001) ‘CAMEL’S Data show downturn’s rooting ‘98’ Journal of American Banker
Vol. 166(56) pp 231-270
Siegel A. F. (2002) ‘Practical business statistics’ Fifth edition, Mc Graw-Hill. Irwin.
Sigler K. J. (2011) ‘CEO Compensation and Company Performance’ Business and Economics
Journal, Volume-31.
Shleifer A., and Vishny R., A survey of Corporate Governance, Journal of Finance, Vol. 52(2)
pp 737-783
Tosi H., Werner S., Katz J. and Gomez-Mejia L. (2000). ‘A meta-analysis of executive
compensation studies’ Journal of Management Vol.26, Pp 301-339.
Trochim W. M. K. (2006) Research Methods Knowledge Base. Available at
www.socialresearchmethods.net/2012/02/17.
Tsoukatos E., Marwa S., Randa G. K.(2004) ‘Diagnosis and Improvement of Service Quality in
the Insurance Industries of Greece and Kenya’ Archives of Economic History, 16(2), 93-115
Vishny R. W. and Shleifer A. (1986), ‘Large Shareholders and Corporate Control’. The Journal
of Political Economy, Vol. 94, No. 3, Part 1. Pp. 461-488.
Wright K., M., (1992) ‘The life Insurance Industry in the United States: An Analysis of
Economic and Regulatory issues. Country Economics Department of World Bank policy
Research Paper No. 857
Yakob R., Yusop Z., Radam A.,Ismail N., (2004) ‘ Camel Rating Approach to assess the
Insurance Operators Financial Strength’ Journal of Ecomoincs Vol.46(2) pp 3-15
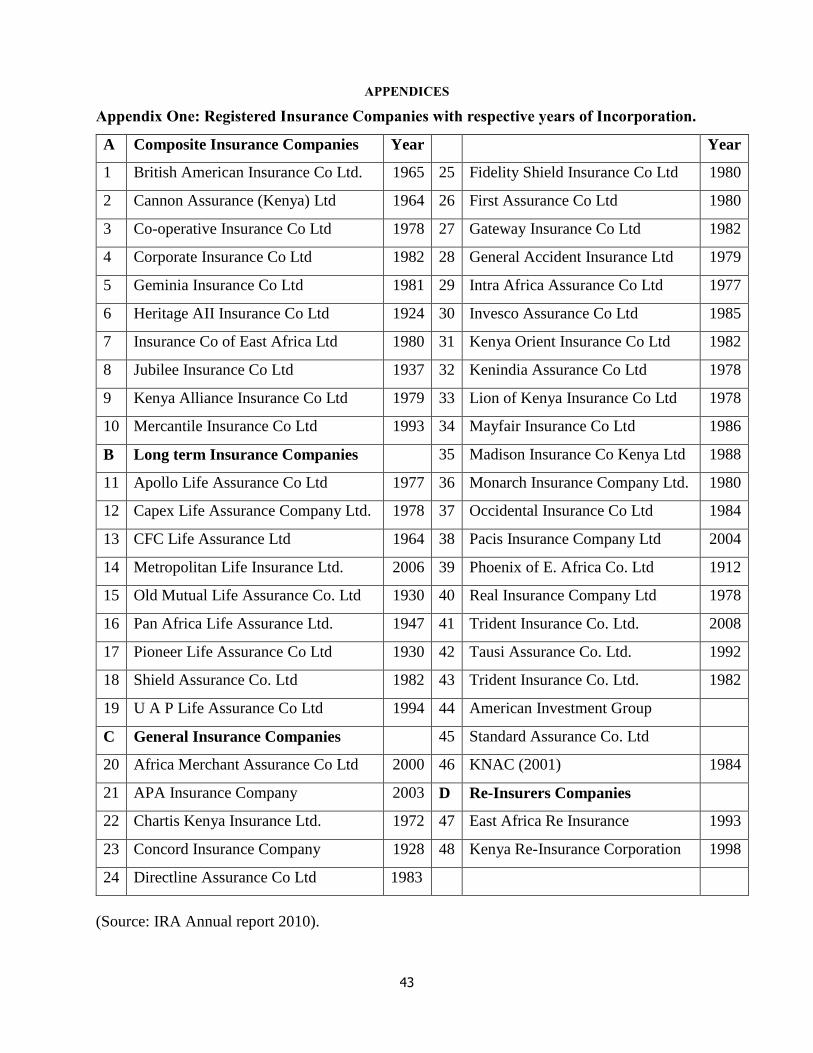
43
APPENDICES
Appendix One: Registered Insurance Companies with respective years of Incorporation.
A Composite Insurance Companies Year Year
1 British American Insurance Co Ltd. 1965 25 Fidelity Shield Insurance Co Ltd 1980
2 Cannon Assurance (Kenya) Ltd 1964 26 First Assurance Co Ltd 1980
3 Co-operative Insurance Co Ltd 1978 27 Gateway Insurance Co Ltd 1982
4 Corporate Insurance Co Ltd 1982 28 General Accident Insurance Ltd 1979
5 Geminia Insurance Co Ltd 1981 29 Intra Africa Assurance Co Ltd 1977
6 Heritage AII Insurance Co Ltd 1924 30 Invesco Assurance Co Ltd 1985
7 Insurance Co of East Africa Ltd 1980 31 Kenya Orient Insurance Co Ltd 1982
8 Jubilee Insurance Co Ltd 1937 32 Kenindia Assurance Co Ltd 1978
9 Kenya Alliance Insurance Co Ltd 1979 33 Lion of Kenya Insurance Co Ltd 1978
10 Mercantile Insurance Co Ltd 1993 34 Mayfair Insurance Co Ltd 1986
B Long term Insurance Companies 35 Madison Insurance Co Kenya Ltd 1988
11 Apollo Life Assurance Co Ltd 1977 36 Monarch Insurance Company Ltd. 1980
12 Capex Life Assurance Company Ltd. 1978 37 Occidental Insurance Co Ltd 1984
13 CFC Life Assurance Ltd 1964 38 Pacis Insurance Company Ltd 2004
14 Metropolitan Life Insurance Ltd. 2006 39 Phoenix of E. Africa Co. Ltd 1912
15 Old Mutual Life Assurance Co. Ltd 1930 40 Real Insurance Company Ltd 1978
16 Pan Africa Life Assurance Ltd. 1947 41 Trident Insurance Co. Ltd. 2008
17 Pioneer Life Assurance Co Ltd 1930 42 Tausi Assurance Co. Ltd. 1992
18 Shield Assurance Co. Ltd 1982 43 Trident Insurance Co. Ltd. 1982
19 U A P Life Assurance Co Ltd 1994 44 American Investment Group
C General Insurance Companies 45 Standard Assurance Co. Ltd
20 Africa Merchant Assurance Co Ltd 2000 46 KNAC (2001) 1984
21 APA Insurance Company 2003 D Re-Insurers Companies
22 Chartis Kenya Insurance Ltd. 1972 47 East Africa Re Insurance 1993
23 Concord Insurance Company 1928 48 Kenya Re-Insurance Corporation 1998
24 Directline Assurance Co Ltd 1983
(Source: IRA Annual report 2010).
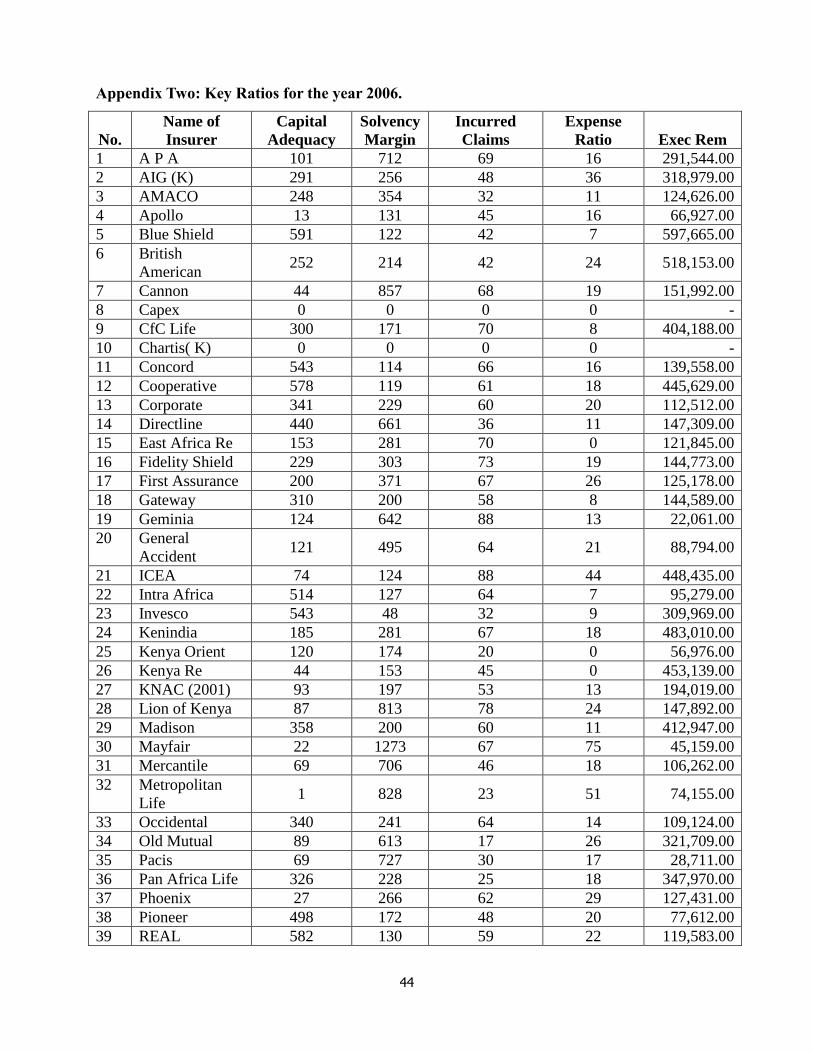
44
Appendix Two: Key Ratios for the year 2006.
No.
Name of
Insurer
Capital
Adequacy
Solvency
Margin
Incurred
Claims
Expense
Ratio Exec Rem
1 A P A 101 712 69 16 291,544.00
2 AIG (K) 291 256 48 36 318,979.00
3 AMACO 248 354 32 11 124,626.00
4 Apollo 13 131 45 16 66,927.00
5 Blue Shield 591 122 42 7 597,665.00
6 British
American 252 214 42 24 518,153.00
7 Cannon 44 857 68 19 151,992.00
8 Capex 0 0 0 0 -
9 CfC Life 300 171 70 8 404,188.00
10 Chartis( K) 0 0 0 0 -
11 Concord 543 114 66 16 139,558.00
12 Cooperative 578 119 61 18 445,629.00
13 Corporate 341 229 60 20 112,512.00
14 Directline 440 661 36 11 147,309.00
15 East Africa Re 153 281 70 0 121,845.00
16 Fidelity Shield 229 303 73 19 144,773.00
17 First Assurance 200 371 67 26 125,178.00
18 Gateway 310 200 58 8 144,589.00
19 Geminia 124 642 88 13 22,061.00
20 General
Accident 121 495 64 21 88,794.00
21 ICEA 74 124 88 44 448,435.00
22 Intra Africa 514 127 64 7 95,279.00
23 Invesco 543 48 32 9 309,969.00
24 Kenindia 185 281 67 18 483,010.00
25 Kenya Orient 120 174 20 0 56,976.00
26 Kenya Re 44 153 45 0 453,139.00
27 KNAC (2001) 93 197 53 13 194,019.00
28 Lion of Kenya 87 813 78 24 147,892.00
29 Madison 358 200 60 11 412,947.00
30 Mayfair 22 1273 67 75 45,159.00
31 Mercantile 69 706 46 18 106,262.00
32 Metropolitan
Life 1 828 23 51 74,155.00
33 Occidental 340 241 64 14 109,124.00
34 Old Mutual 89 613 17 26 321,709.00
35 Pacis 69 727 30 17 28,711.00
36 Pan Africa Life 326 228 25 18 347,970.00
37 Phoenix 27 266 62 29 127,431.00
38 Pioneer 498 172 48 20 77,612.00
39 REAL 582 130 59 22 119,583.00
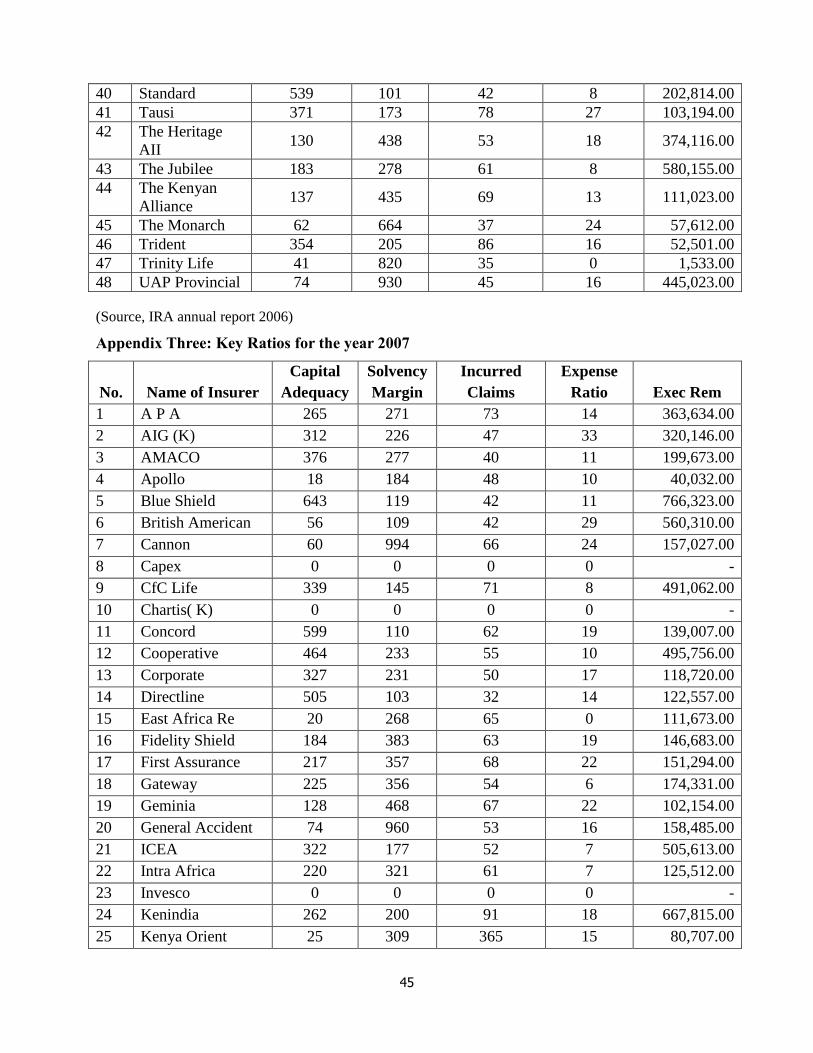
45
40 Standard 539 101 42 8 202,814.00
41 Tausi 371 173 78 27 103,194.00
42 The Heritage
AII 130 438 53 18 374,116.00
43 The Jubilee 183 278 61 8 580,155.00
44 The Kenyan
Alliance 137 435 69 13 111,023.00
45 The Monarch 62 664 37 24 57,612.00
46 Trident 354 205 86 16 52,501.00
47 Trinity Life 41 820 35 0 1,533.00
48 UAP Provincial 74 930 45 16 445,023.00
(Source, IRA annual report 2006)
Appendix Three: Key Ratios for the year 2007
No. Name of Insurer
Capital
Adequacy
Solvency
Margin
Incurred
Claims
Expense
Ratio Exec Rem
1 A P A 265 271 73 14 363,634.00
2 AIG (K) 312 226 47 33 320,146.00
3 AMACO 376 277 40 11 199,673.00
4 Apollo 18 184 48 10 40,032.00
5 Blue Shield 643 119 42 11 766,323.00
6 British American 56 109 42 29 560,310.00
7 Cannon 60 994 66 24 157,027.00
8 Capex 0 0 0 0 -
9 CfC Life 339 145 71 8 491,062.00
10 Chartis( K) 0 0 0 0 -
11 Concord 599 110 62 19 139,007.00
12 Cooperative 464 233 55 10 495,756.00
13 Corporate 327 231 50 17 118,720.00
14 Directline 505 103 32 14 122,557.00
15 East Africa Re 20 268 65 0 111,673.00
16 Fidelity Shield 184 383 63 19 146,683.00
17 First Assurance 217 357 68 22 151,294.00
18 Gateway 225 356 54 6 174,331.00
19 Geminia 128 468 67 22 102,154.00
20 General Accident 74 960 53 16 158,485.00
21 ICEA 322 177 52 7 505,613.00
22 Intra Africa 220 321 61 7 125,512.00
23 Invesco 0 0 0 0 -
24 Kenindia 262 200 91 18 667,815.00
25 Kenya Orient 25 309 365 15 80,707.00
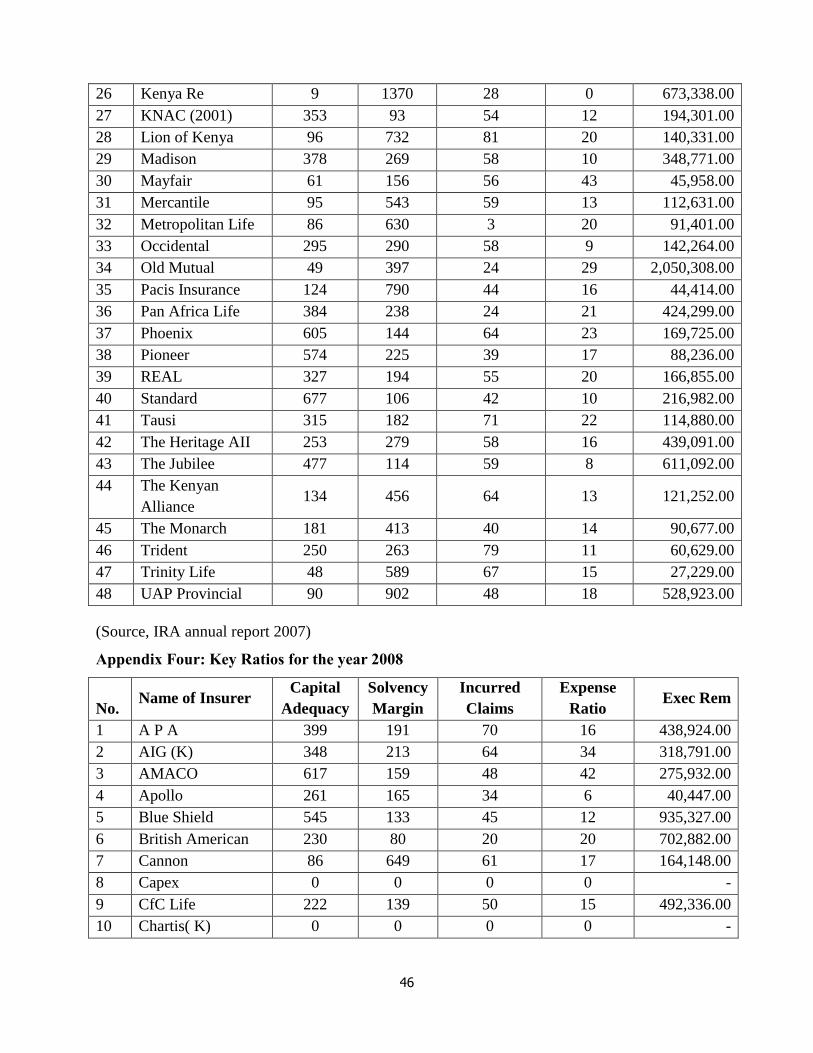
46
26 Kenya Re 9 1370 28 0 673,338.00
27 KNAC (2001) 353 93 54 12 194,301.00
28 Lion of Kenya 96 732 81 20 140,331.00
29 Madison 378 269 58 10 348,771.00
30 Mayfair 61 156 56 43 45,958.00
31 Mercantile 95 543 59 13 112,631.00
32 Metropolitan Life 86 630 3 20 91,401.00
33 Occidental 295 290 58 9 142,264.00
34 Old Mutual 49 397 24 29 2,050,308.00
35 Pacis Insurance 124 790 44 16 44,414.00
36 Pan Africa Life 384 238 24 21 424,299.00
37 Phoenix 605 144 64 23 169,725.00
38 Pioneer 574 225 39 17 88,236.00
39 REAL 327 194 55 20 166,855.00
40 Standard 677 106 42 10 216,982.00
41 Tausi 315 182 71 22 114,880.00
42 The Heritage AII 253 279 58 16 439,091.00
43 The Jubilee 477 114 59 8 611,092.00
44 The Kenyan
Alliance 134 456 64 13 121,252.00
45 The Monarch 181 413 40 14 90,677.00
46 Trident 250 263 79 11 60,629.00
47 Trinity Life 48 589 67 15 27,229.00
48 UAP Provincial 90 902 48 18 528,923.00
(Source, IRA annual report 2007)
Appendix Four: Key Ratios for the year 2008
No. Name of Insurer
Capital
Adequacy
Solvency
Margin
Incurred
Claims
Expense
Ratio Exec Rem
1 A P A 399 191 70 16 438,924.00
2 AIG (K) 348 213 64 34 318,791.00
3 AMACO 617 159 48 42 275,932.00
4 Apollo 261 165 34 6 40,447.00
5 Blue Shield 545 133 45 12 935,327.00
6 British American 230 80 20 20 702,882.00
7 Cannon 86 649 61 17 164,148.00
8 Capex 0 0 0 0 -
9 CfC Life 222 139 50 15 492,336.00
10 Chartis( K) 0 0 0 0 -
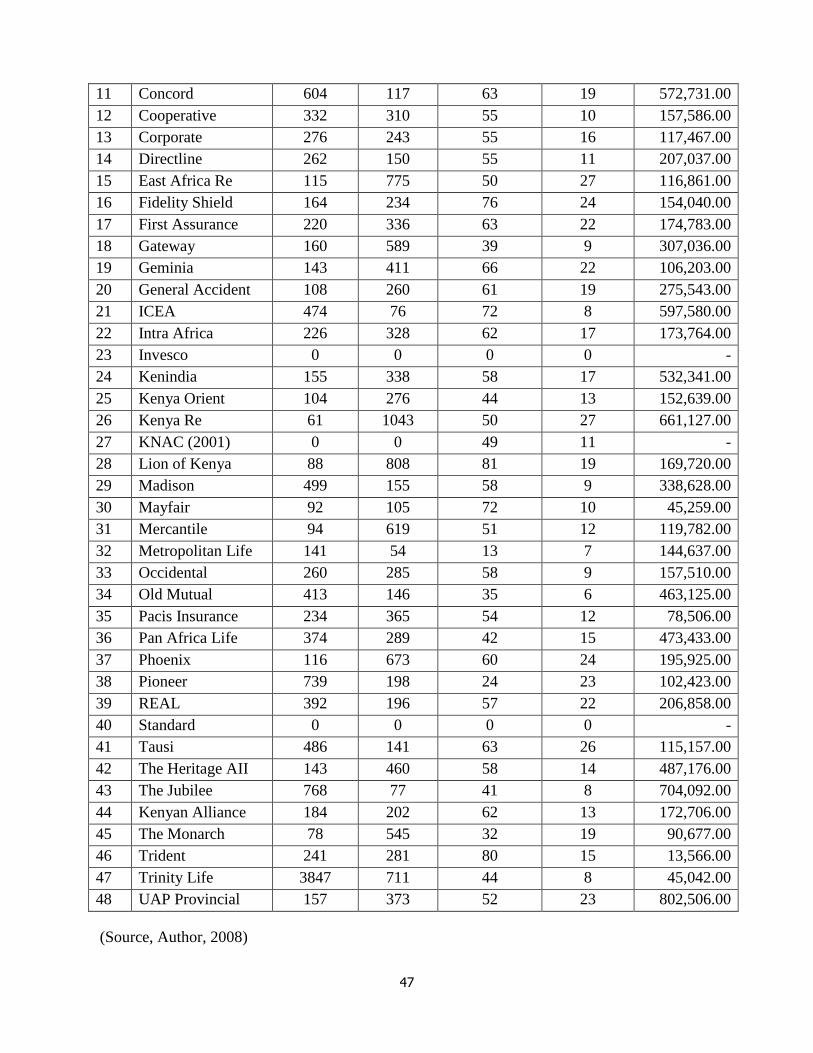
47
11 Concord 604 117 63 19 572,731.00
12 Cooperative 332 310 55 10 157,586.00
13 Corporate 276 243 55 16 117,467.00
14 Directline 262 150 55 11 207,037.00
15 East Africa Re 115 775 50 27 116,861.00
16 Fidelity Shield 164 234 76 24 154,040.00
17 First Assurance 220 336 63 22 174,783.00
18 Gateway 160 589 39 9 307,036.00
19 Geminia 143 411 66 22 106,203.00
20 General Accident 108 260 61 19 275,543.00
21 ICEA 474 76 72 8 597,580.00
22 Intra Africa 226 328 62 17 173,764.00
23 Invesco 0 0 0 0 -
24 Kenindia 155 338 58 17 532,341.00
25 Kenya Orient 104 276 44 13 152,639.00
26 Kenya Re 61 1043 50 27 661,127.00
27 KNAC (2001) 0 0 49 11 -
28 Lion of Kenya 88 808 81 19 169,720.00
29 Madison 499 155 58 9 338,628.00
30 Mayfair 92 105 72 10 45,259.00
31 Mercantile 94 619 51 12 119,782.00
32 Metropolitan Life 141 54 13 7 144,637.00
33 Occidental 260 285 58 9 157,510.00
34 Old Mutual 413 146 35 6 463,125.00
35 Pacis Insurance 234 365 54 12 78,506.00
36 Pan Africa Life 374 289 42 15 473,433.00
37 Phoenix 116 673 60 24 195,925.00
38 Pioneer 739 198 24 23 102,423.00
39 REAL 392 196 57 22 206,858.00
40 Standard 0 0 0 0 -
41 Tausi 486 141 63 26 115,157.00
42 The Heritage AII 143 460 58 14 487,176.00
43 The Jubilee 768 77 41 8 704,092.00
44 Kenyan Alliance 184 202 62 13 172,706.00
45 The Monarch 78 545 32 19 90,677.00
46 Trident 241 281 80 15 13,566.00
47 Trinity Life 3847 711 44 8 45,042.00
48 UAP Provincial 157 373 52 23 802,506.00
(Source, Author, 2008)
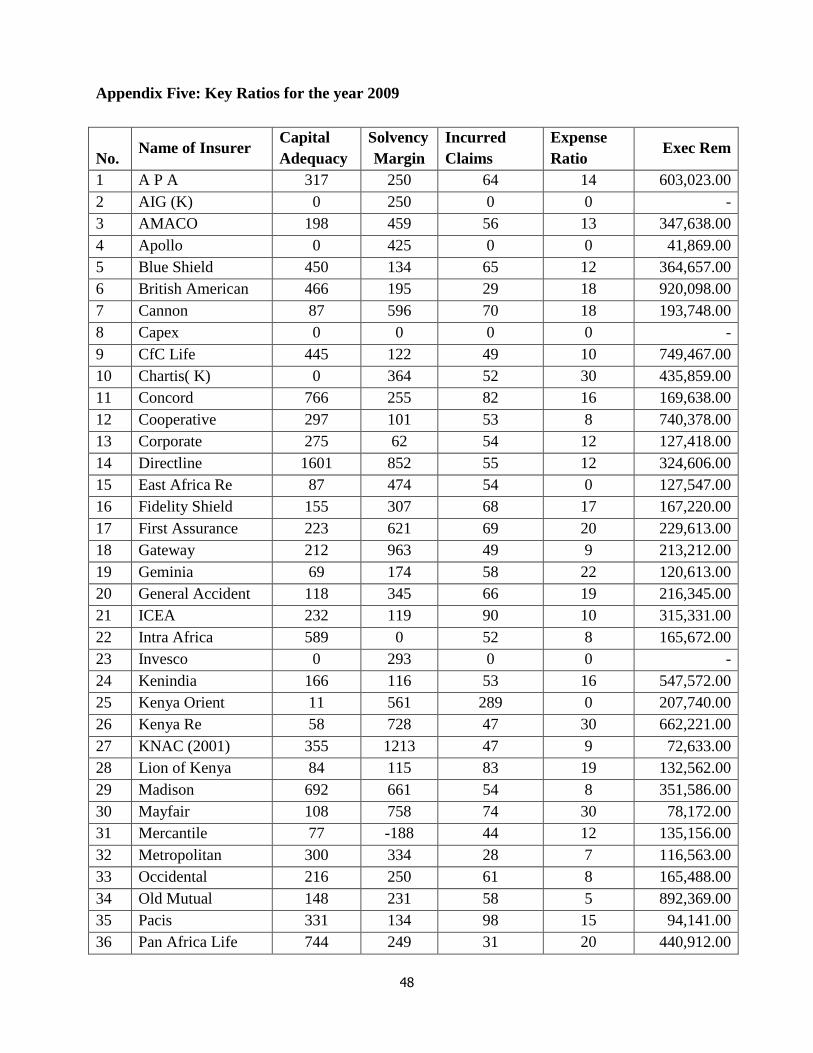
48
Appendix Five: Key Ratios for the year 2009
No. Name of Insurer
Capital
Adequacy
Solvency
Margin
Incurred
Claims
Expense
Ratio Exec Rem
1 A P A 317 250 64 14 603,023.00
2 AIG (K) 0 250 0 0 -
3 AMACO 198 459 56 13 347,638.00
4 Apollo 0 425 0 0 41,869.00
5 Blue Shield 450 134 65 12 364,657.00
6 British American 466 195 29 18 920,098.00
7 Cannon 87 596 70 18 193,748.00
8 Capex 0 0 0 0 -
9 CfC Life 445 122 49 10 749,467.00
10 Chartis( K) 0 364 52 30 435,859.00
11 Concord 766 255 82 16 169,638.00
12 Cooperative 297 101 53 8 740,378.00
13 Corporate 275 62 54 12 127,418.00
14 Directline 1601 852 55 12 324,606.00
15 East Africa Re 87 474 54 0 127,547.00
16 Fidelity Shield 155 307 68 17 167,220.00
17 First Assurance 223 621 69 20 229,613.00
18 Gateway 212 963 49 9 213,212.00
19 Geminia 69 174 58 22 120,613.00
20 General Accident 118 345 66 19 216,345.00
21 ICEA 232 119 90 10 315,331.00
22 Intra Africa 589 0 52 8 165,672.00
23 Invesco 0 293 0 0 -
24 Kenindia 166 116 53 16 547,572.00
25 Kenya Orient 11 561 289 0 207,740.00
26 Kenya Re 58 728 47 30 662,221.00
27 KNAC (2001) 355 1213 47 9 72,633.00
28 Lion of Kenya 84 115 83 19 132,562.00
29 Madison 692 661 54 8 351,586.00
30 Mayfair 108 758 74 30 78,172.00
31 Mercantile 77 -188 44 12 135,156.00
32 Metropolitan 300 334 28 7 116,563.00
33 Occidental 216 250 61 8 165,488.00
34 Old Mutual 148 231 58 5 892,369.00
35 Pacis 331 134 98 15 94,141.00
36 Pan Africa Life 744 249 31 20 440,912.00
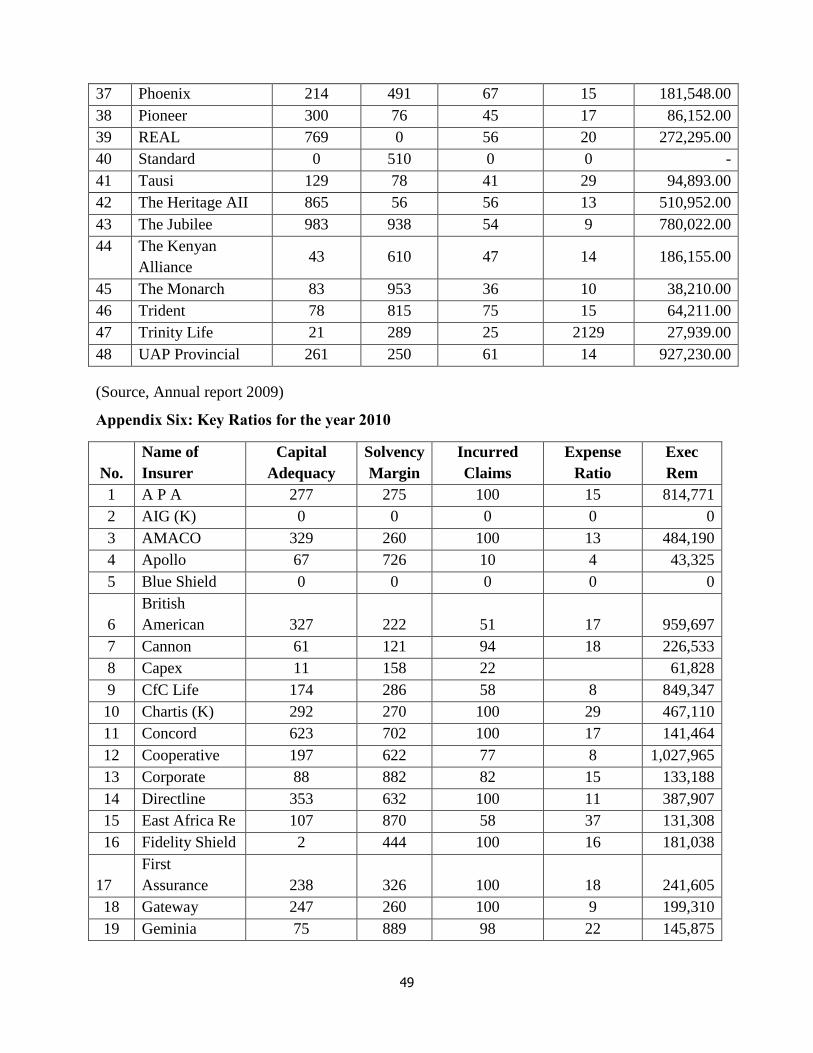
49
37 Phoenix 214 491 67 15 181,548.00
38 Pioneer 300 76 45 17 86,152.00
39 REAL 769 0 56 20 272,295.00
40 Standard 0 510 0 0 -
41 Tausi 129 78 41 29 94,893.00
42 The Heritage AII 865 56 56 13 510,952.00
43 The Jubilee 983 938 54 9 780,022.00
44 The Kenyan
Alliance 43 610 47 14 186,155.00
45 The Monarch 83 953 36 10 38,210.00
46 Trident 78 815 75 15 64,211.00
47 Trinity Life 21 289 25 2129 27,939.00
48 UAP Provincial 261 250 61 14 927,230.00
(Source, Annual report 2009)
Appendix Six: Key Ratios for the year 2010
No.
Name of
Insurer
Capital
Adequacy
Solvency
Margin
Incurred
Claims
Expense
Ratio
Exec
Rem
1 A P A 277 275 100 15 814,771
2 AIG (K) 0 0 0 0 0
3 AMACO 329 260 100 13 484,190
4 Apollo 67 726 10 4 43,325
5 Blue Shield 0 0 0 0 0
6
British
American 327 222 51 17 959,697
7 Cannon 61 121 94 18 226,533
8 Capex 11 158 22
61,828
9 CfC Life 174 286 58 8 849,347
10 Chartis (K) 292 270 100 29 467,110
11 Concord 623 702 100 17 141,464
12 Cooperative 197 622 77 8 1,027,965
13 Corporate 88 882 82 15 133,188
14 Directline 353 632 100 11 387,907
15 East Africa Re 107 870 58 37 131,308
16 Fidelity Shield 2 444 100 16 181,038
17
First
Assurance 238 326 100 18 241,605
18 Gateway 247 260 100 9 199,310
19 Geminia 75 889 98 22 145,875
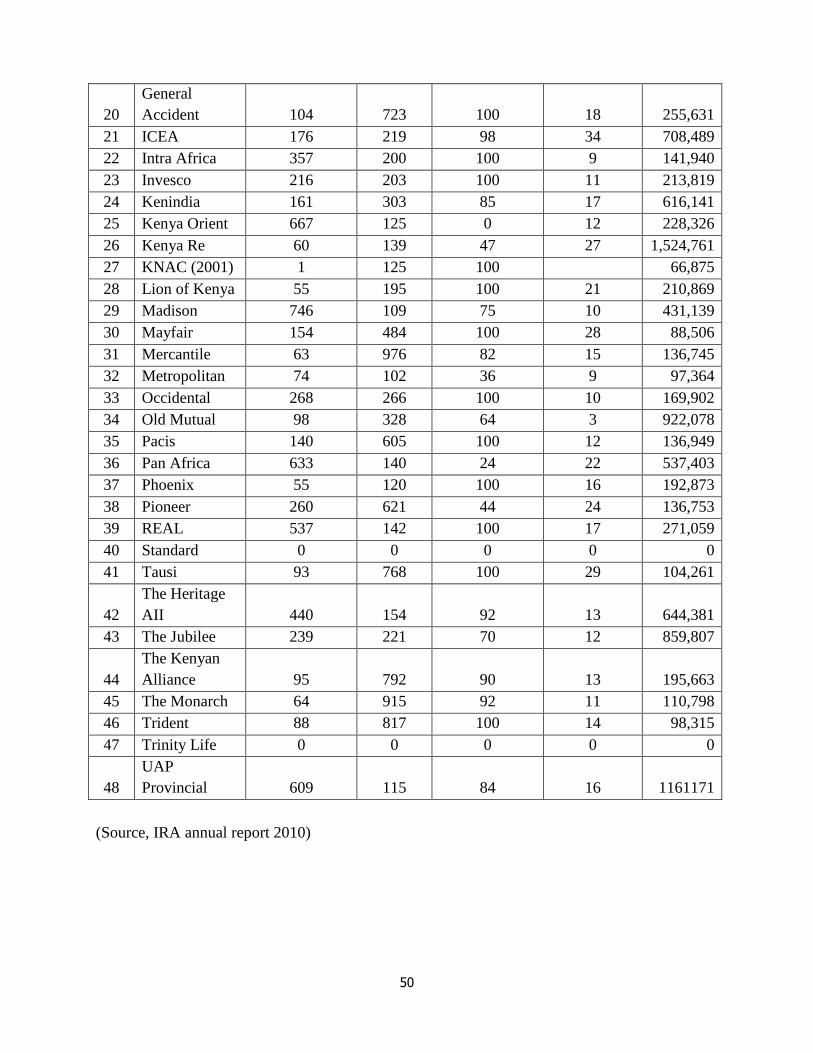
50
20
General
Accident 104 723 100 18 255,631
21 ICEA 176 219 98 34 708,489
22 Intra Africa 357 200 100 9 141,940
23 Invesco 216 203 100 11 213,819
24 Kenindia 161 303 85 17 616,141
25 Kenya Orient 667 125 0 12 228,326
26 Kenya Re 60 139 47 27 1,524,761
27 KNAC (2001) 1 125 100
66,875
28 Lion of Kenya 55 195 100 21 210,869
29 Madison 746 109 75 10 431,139
30 Mayfair 154 484 100 28 88,506
31 Mercantile 63 976 82 15 136,745
32 Metropolitan 74 102 36 9 97,364
33 Occidental 268 266 100 10 169,902
34 Old Mutual 98 328 64 3 922,078
35 Pacis 140 605 100 12 136,949
36 Pan Africa 633 140 24 22 537,403
37 Phoenix 55 120 100 16 192,873
38 Pioneer 260 621 44 24 136,753
39 REAL 537 142 100 17 271,059
40 Standard 0 0 0 0 0
41 Tausi 93 768 100 29 104,261
42
The Heritage
AII 440 154 92 13 644,381
43 The Jubilee 239 221 70 12 859,807
44
The Kenyan
Alliance 95 792 90 13 195,663
45 The Monarch 64 915 92 11 110,798
46 Trident 88 817 100 14 98,315
47 Trinity Life 0 0 0 0 0
48
UAP
Provincial 609 115 84 16 1161171
(Source, IRA annual report 2010)
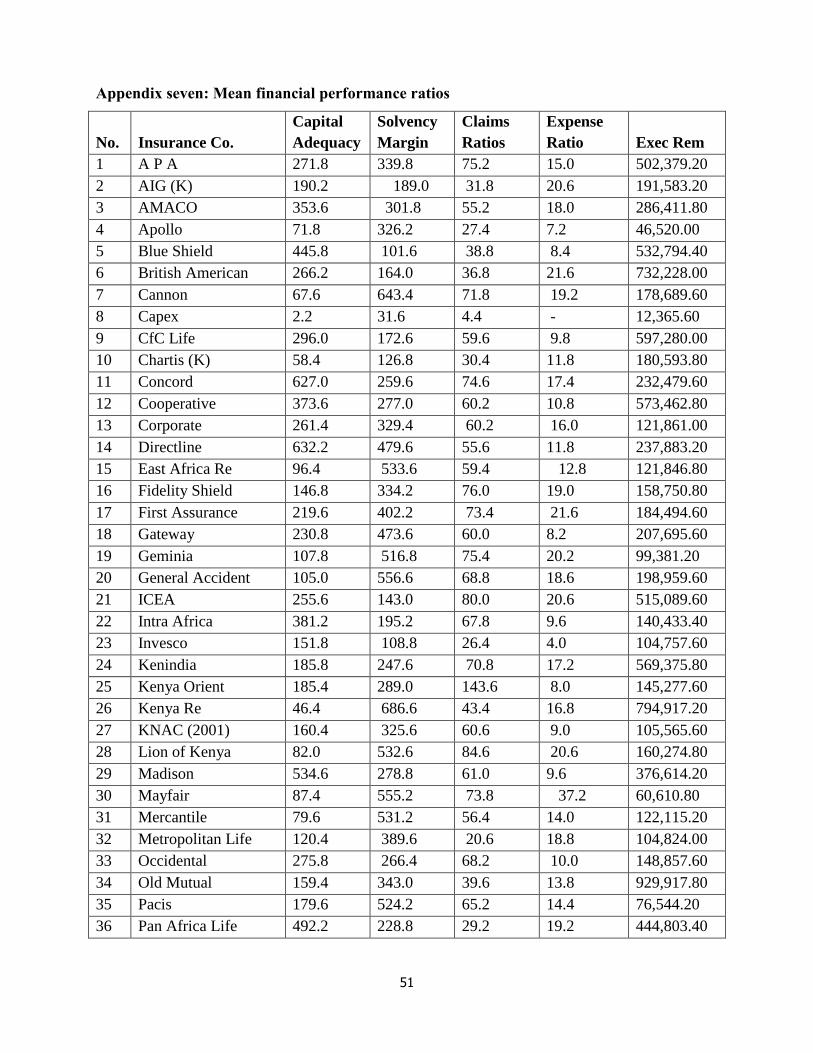
51
Appendix seven: Mean financial performance ratios
No.
Insurance Co.
Capital
Adequacy
Solvency
Margin
Claims
Ratios
Expense
Ratio
Exec Rem
1 A P A 271.8 339.8 75.2 15.0 502,379.20
2 AIG (K) 190.2 189.0 31.8 20.6 191,583.20
3 AMACO 353.6 301.8 55.2 18.0 286,411.80
4 Apollo 71.8 326.2 27.4 7.2 46,520.00
5 Blue Shield 445.8 101.6 38.8 8.4 532,794.40
6 British American 266.2 164.0 36.8 21.6 732,228.00
7 Cannon 67.6 643.4 71.8 19.2 178,689.60
8 Capex 2.2 31.6 4.4 - 12,365.60
9 CfC Life 296.0 172.6 59.6 9.8 597,280.00
10 Chartis (K) 58.4 126.8 30.4 11.8 180,593.80
11 Concord 627.0 259.6 74.6 17.4 232,479.60
12 Cooperative 373.6 277.0 60.2 10.8 573,462.80
13 Corporate 261.4 329.4 60.2 16.0 121,861.00
14 Directline 632.2 479.6 55.6 11.8 237,883.20
15 East Africa Re 96.4 533.6 59.4 12.8 121,846.80
16 Fidelity Shield 146.8 334.2 76.0 19.0 158,750.80
17 First Assurance 219.6 402.2 73.4 21.6 184,494.60
18 Gateway 230.8 473.6 60.0 8.2 207,695.60
19 Geminia 107.8 516.8 75.4 20.2 99,381.20
20 General Accident 105.0 556.6 68.8 18.6 198,959.60
21 ICEA 255.6 143.0 80.0 20.6 515,089.60
22 Intra Africa 381.2 195.2 67.8 9.6 140,433.40
23 Invesco 151.8 108.8 26.4 4.0 104,757.60
24 Kenindia 185.8 247.6 70.8 17.2 569,375.80
25 Kenya Orient 185.4 289.0 143.6 8.0 145,277.60
26 Kenya Re 46.4 686.6 43.4 16.8 794,917.20
27 KNAC (2001) 160.4 325.6 60.6 9.0 105,565.60
28 Lion of Kenya 82.0 532.6 84.6 20.6 160,274.80
29 Madison 534.6 278.8 61.0 9.6 376,614.20
30 Mayfair 87.4 555.2 73.8 37.2 60,610.80
31 Mercantile 79.6 531.2 56.4 14.0 122,115.20
32 Metropolitan Life 120.4 389.6 20.6 18.8 104,824.00
33 Occidental 275.8 266.4 68.2 10.0 148,857.60
34 Old Mutual 159.4 343.0 39.6 13.8 929,917.80
35 Pacis 179.6 524.2 65.2 14.4 76,544.20
36 Pan Africa Life 492.2 228.8 29.2 19.2 444,803.40
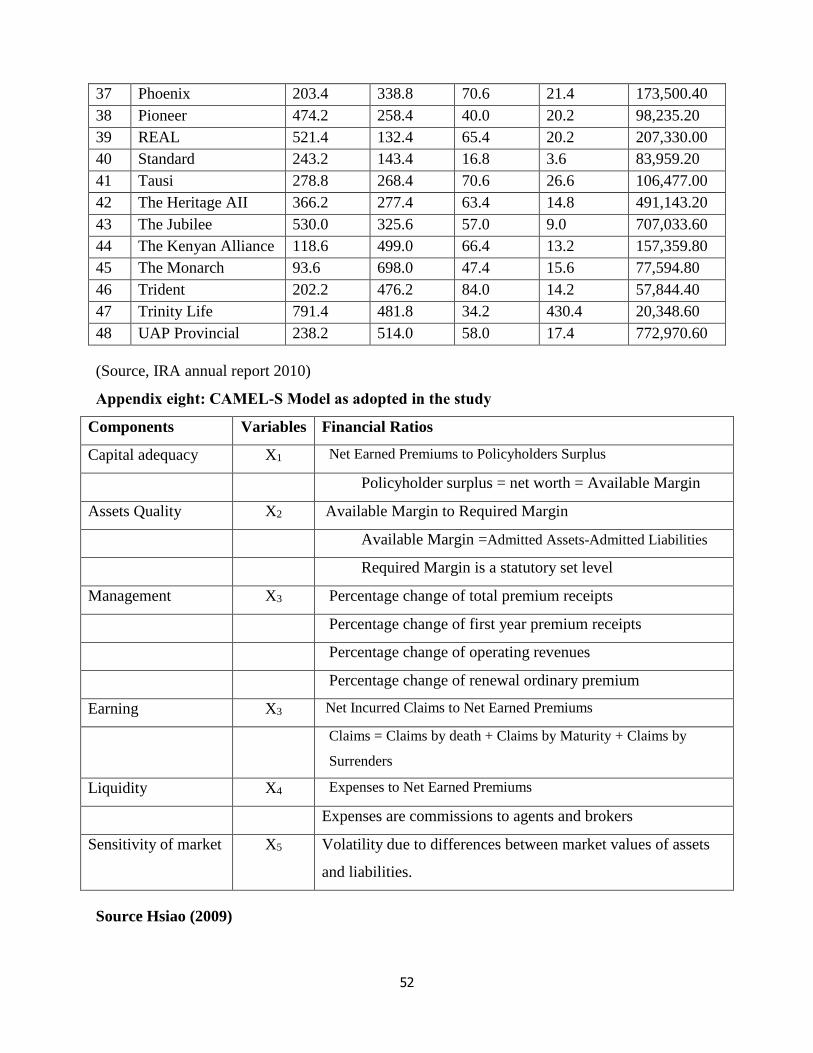
52
37 Phoenix 203.4 338.8 70.6 21.4 173,500.40
38 Pioneer 474.2 258.4 40.0 20.2 98,235.20
39 REAL 521.4 132.4 65.4 20.2 207,330.00
40 Standard 243.2 143.4 16.8 3.6 83,959.20
41 Tausi 278.8 268.4 70.6 26.6 106,477.00
42 The Heritage AII 366.2 277.4 63.4 14.8 491,143.20
43 The Jubilee 530.0 325.6 57.0 9.0 707,033.60
44 The Kenyan Alliance 118.6 499.0 66.4 13.2 157,359.80
45 The Monarch 93.6 698.0 47.4 15.6 77,594.80
46 Trident 202.2 476.2 84.0 14.2 57,844.40
47 Trinity Life 791.4 481.8 34.2 430.4 20,348.60
48 UAP Provincial 238.2 514.0 58.0 17.4 772,970.60
(Source, IRA annual report 2010)
Appendix eight: CAMEL-S Model as adopted in the study
Components Variables Financial Ratios
Capital adequacy X1 Net Earned Premiums to Policyholders Surplus
Policyholder surplus = net worth = Available Margin
Assets Quality X2 Available Margin to Required Margin
Available Margin =Admitted Assets-Admitted Liabilities
Required Margin is a statutory set level
Management X3 Percentage change of total premium receipts
Percentage change of first year premium receipts
Percentage change of operating revenues
Percentage change of renewal ordinary premium
Earning X3 Net Incurred Claims to Net Earned Premiums
Claims = Claims by death + Claims by Maturity + Claims by
Surrenders
Liquidity X4 Expenses to Net Earned Premiums
Expenses are commissions to agents and brokers
Sensitivity of market X5 Volatility due to differences between market values of assets
and liabilities.
Source Hsiao (2009)

53
Appendix eight: Research data collection sheet.
You have been identified for participation in the study on characterization of CEO compensation
in insurance companies in Kenya. The information you give is considered confidential and will
be used for research purposes only. Thank you for your cooperation.
1. Position of respondent in insurance company (tick applicable)
1. □ CEO
2. □ Human Resources Management
2. Select the components of CEO remuneration in your insurance company ( tick where
applicable)
1. □ Basic salary
2. □ Bonus plans
3. □ Stock options
4. □ Restricted stocks
5. □ Long-term incentive plans
6. □ Golden parachute
7. □ Fringe benefits
Please specify the type of fringe benefit------------------------
3. Please tick the appropriate remuneration range in the table below
Component range in Kenya Shillings (KSh)
CEO compensation
component
50,000 to
150,000
150,000 to
300,000
300,000 to
450,000
450,000 and
above
1.Basic salary
2.Bonus plans
3.Stock options
4.Restricted stocks
5.Golden parachutes
6.Fringe benefit
Other , specify--------

54
Appendix ten: Research project work plan
Period
Task
Sept
2012 -
Feb 2013
Jan-
Feb
2013
Mar -
July
2013
Aug-
Oct
2013
Nov -
Feb
2014
Mar-
July
2014
Aug –
Oct
2014
Nov-
Dec
2014
Proposal
writing
Proposal
defense
Correction
and
Submission
Data
collection
and analysis
Project
writing
Project
Defense and
correction
Submission
of thesis to
graduate
school
Graduation


