Embed Size (px)
Citation preview
Vaccine 20 (2002) 1316–1330
The potential cost-effectiveness of acellular pertussis boostervaccination in England and Wales
W. John Edmundsa,b,∗, Marc Brissona,b, Alessia Melegaroa,c, Nigel J. Gayaa Immunisation Division, PHLS Communicable Disease Surveillance Centre, 61 Collindale Avenue, London NW9 5EQ, UK
b Department of Economics, City University, London EC1V 0HB, UKc Department of Biological Sciences, University of Warwick, Coventry CV4 7AL, UK
Received 26 July 2001; received in revised form 31 October 2001; accepted 6 November 2001
Abstract
A cost-effectiveness analysis of the introduction of acellular pertussis booster doses at either 4 or 15 years of age was performed. Atransmission dynamic model was used to predict the level of indirect protection in those too young to be vaccinated. Multivariate sensitivityanalyses were performed. In England and Wales there are an estimated 35,000 general practitioner (GP) consultations, 5500 inpatientdays, and nine deaths annually attributable to pertussis, despite high levels of coverage for the primary course (∼95%). Around 80% ofthe bed-days and 90% of the deaths occur in those too young to be immunised (<3 months of age). The introduction of acellular boosterdoses at 4 years is expected to reduce morbidity and mortality in the younger age groups by 40–100%, and at 15 years by 0–100%. Fromthe perspective of the health care provider, roughly 50% of the simulations result in a cost per life-year gained of less than £10,000 forvaccination at 4 years, the corresponding proportion for vaccination at 15 years being only 35%. Apart from the degree of indirect protectionthe model was most sensitive to the discount rate, the price of the vaccine, and the mortality rate. Significant uncertainty remains regardingthe epidemiology of pertussis and the impact of booster doses. Nevertheless, the introduction of acellular boosters, particularly at 4 years,has the potential to be cost-effective in the UK. © 2002 Elsevier Science Ltd. All rights reserved.
Keywords: Economic evaluation; Pertussis; Acellular vaccine
1. Introduction
Pertussis, or whooping cough, is an acute disease primar-ily resulting from infection withBordetella pertussis or oc-casionallyB. parapertussis. Typical symptoms of pertussisinclude paroxysmal cough lasting between 2 and 4 weeks,perhaps accompanied by an inspiratory whoop, and/or post-tussive vomiting, cyanosis and apnoea. Complications ofpertussis infection are most likely to occur in infants andinclude pneumonia, seizures and encephalopathy.
The introduction of widespread whole-cell pertussisvaccination in the UK in the 1950s resulted in a dramatic de-cline in the reported incidence of pertussis associated mor-bidity and mortality [1]. Although, the reported incidence ofpertussis has been lower during the past decade than in anytime previously (Fig. 1 and [1]), pertussis continues to bethe cause of significant morbidity and mortality in childrentoo young to be fully protected, despite the introduction, in1990, of an accelerated diphtheria–tetanus–pertussis (DTP)
∗ Corresponding author. Tel.:+44-20-8200-6868x4410;fax: +44-20-8200-7868.
E-mail address: [email protected] (W.J. Edmunds).
vaccination schedule (2,3,4 months as opposed to the pre-vious 3, 5 and 10 months schedule). In addition, there isincreasing awareness that pertussis infection in adults andolder children may also have a significant detrimental ef-fect on public health and result in considerable costs to thehealth service and wider economy [2–9]. The advent ofacellular pertussis vaccines, which are less reactogenic thanwhole-cell vaccines when given to older children [10], of-fers the possibility of reducing pertussis associated diseasein older children and adults and, more importantly, reducinginfection in the youngest age groups via herd immunity [9].
Although, there have been a number of economic analy-ses of primary immunisation with pertussis vaccine [11–15]there are no published studies on the additional costs andbenefits arising from adding acellular booster doses onto anexisting highly effective infant immunisation programme (arecent Canadian study assessed replacing whole cell withacellular vaccine [16]). This study aims to estimate the cur-rent health and economic burden of pertussis-associated dis-ease and to determine the potential cost-effectiveness ofintroducing acellular pertussis vaccine booster doses intothe immunisation schedule of a typical developed country(namely, England and Wales).
0264-410X/02/$ – see front matter © 2002 Elsevier Science Ltd. All rights reserved.PII: S0264-410X(01)00473-X
W.J. Edmunds et al. / Vaccine 20 (2002) 1316–1330 1317
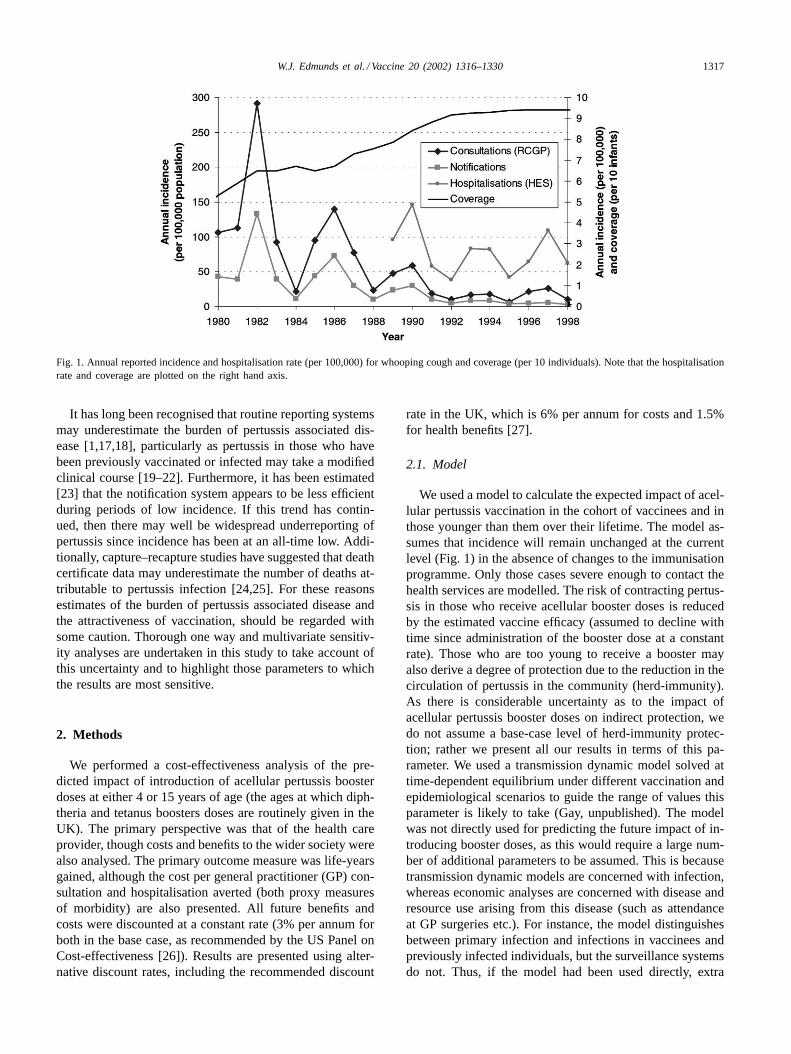
Fig. 1. Annual reported incidence and hospitalisation rate (per 100,000) for whooping cough and coverage (per 10 individuals). Note that the hospitalisationrate and coverage are plotted on the right hand axis.
It has long been recognised that routine reporting systemsmay underestimate the burden of pertussis associated dis-ease [1,17,18], particularly as pertussis in those who havebeen previously vaccinated or infected may take a modifiedclinical course [19–22]. Furthermore, it has been estimated[23] that the notification system appears to be less efficientduring periods of low incidence. If this trend has contin-ued, then there may well be widespread underreporting ofpertussis since incidence has been at an all-time low. Addi-tionally, capture–recapture studies have suggested that deathcertificate data may underestimate the number of deaths at-tributable to pertussis infection [24,25]. For these reasonsestimates of the burden of pertussis associated disease andthe attractiveness of vaccination, should be regarded withsome caution. Thorough one way and multivariate sensitiv-ity analyses are undertaken in this study to take account ofthis uncertainty and to highlight those parameters to whichthe results are most sensitive.
2. Methods
We performed a cost-effectiveness analysis of the pre-dicted impact of introduction of acellular pertussis boosterdoses at either 4 or 15 years of age (the ages at which diph-theria and tetanus boosters doses are routinely given in theUK). The primary perspective was that of the health careprovider, though costs and benefits to the wider society werealso analysed. The primary outcome measure was life-yearsgained, although the cost per general practitioner (GP) con-sultation and hospitalisation averted (both proxy measuresof morbidity) are also presented. All future benefits andcosts were discounted at a constant rate (3% per annum forboth in the base case, as recommended by the US Panel onCost-effectiveness [26]). Results are presented using alter-native discount rates, including the recommended discount
rate in the UK, which is 6% per annum for costs and 1.5%for health benefits [27].
2.1. Model
We used a model to calculate the expected impact of acel-lular pertussis vaccination in the cohort of vaccinees and inthose younger than them over their lifetime. The model as-sumes that incidence will remain unchanged at the currentlevel (Fig. 1) in the absence of changes to the immunisationprogramme. Only those cases severe enough to contact thehealth services are modelled. The risk of contracting pertus-sis in those who receive acellular booster doses is reducedby the estimated vaccine efficacy (assumed to decline withtime since administration of the booster dose at a constantrate). Those who are too young to receive a booster mayalso derive a degree of protection due to the reduction in thecirculation of pertussis in the community (herd-immunity).As there is considerable uncertainty as to the impact ofacellular pertussis booster doses on indirect protection, wedo not assume a base-case level of herd-immunity protec-tion; rather we present all our results in terms of this pa-rameter. We used a transmission dynamic model solved attime-dependent equilibrium under different vaccination andepidemiological scenarios to guide the range of values thisparameter is likely to take (Gay, unpublished). The modelwas not directly used for predicting the future impact of in-troducing booster doses, as this would require a large num-ber of additional parameters to be assumed. This is becausetransmission dynamic models are concerned with infection,whereas economic analyses are concerned with disease andresource use arising from this disease (such as attendanceat GP surgeries etc.). For instance, the model distinguishesbetween primary infection and infections in vaccinees andpreviously infected individuals, but the surveillance systemsdo not. Thus, if the model had been used directly, extra
1318 W.J. Edmunds et al. / Vaccine 20 (2002) 1316–1330
age-dependent parameters would be required to translate pri-mary and secondary infections into cases of disease severeenough to contact the health services. Furthermore, thereis some debate as to the epidemiological initial conditions(since the introduction of the accelerated schedule in 1990there may have been an increase in primary vaccine fail-ures and an increase in circulation of pertussis) that affectsthe predictions for the future incidence of pertussis. The ap-proach adopted (solving at post-immunisation equilibrium)avoids the problem that the dynamic results are dependenton alternative starting points. Note that the model is sensitiveto alternative mixing patterns, which have to be assumed, asthere are currently no direct measures of these mixing pat-terns [28]. Thus, we used the model under a wide varietyof scenarios to provide a range of values for the degree ofprotection afforded to younger individuals from the intro-duction of acellular booster doses. Details of these scenariosare given in Appendix A. The range obtained (∼35–100%)is in broad agreement with the results of a modelling exer-cise of the impact of adult booster doses in the US [29] andwith observational studies of the effect of primary vaccina-tion of infants on the incidence of pertussis in the parentsand younger siblings of the vaccinees [30]. Based on thedynamic results of the model we assumed that the indirectprotection occurs after a delay of 5 years on average (thatis, there is no protection until 5 years after the introduction
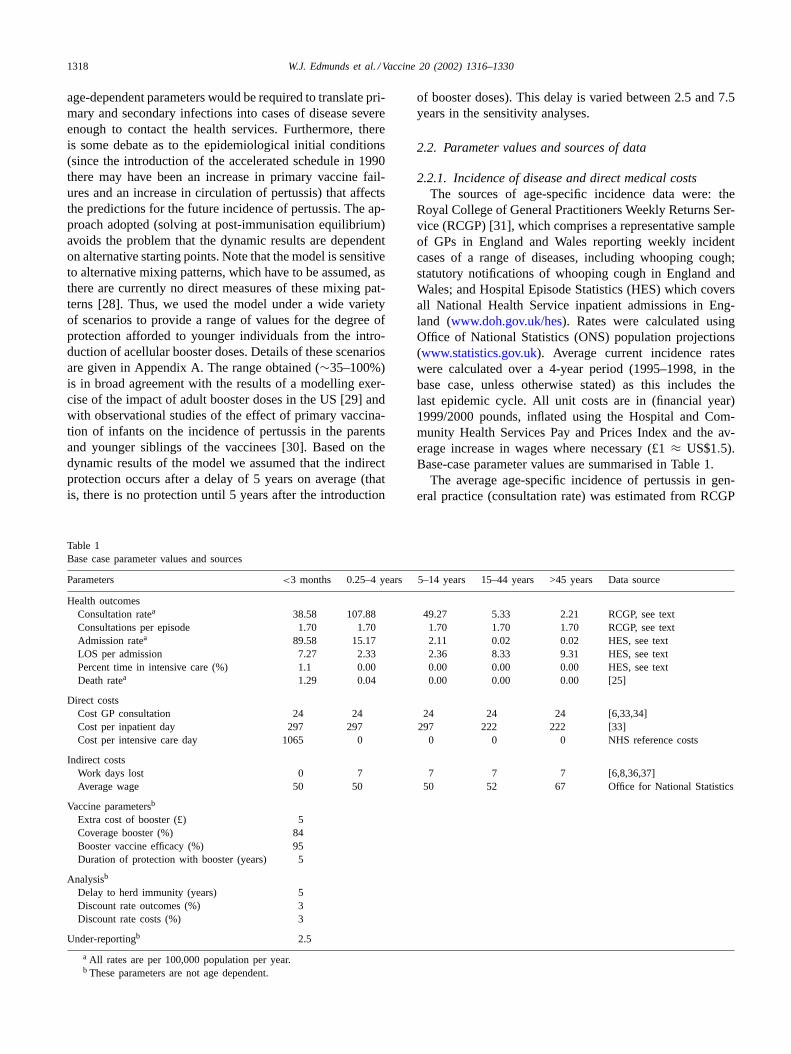
Table 1Base case parameter values and sources
Parameters <3 months 0.25–4 years 5–14 years 15–44 years >45 years Data source
Health outcomesConsultation ratea 38.58 107.88 49.27 5.33 2.21 RCGP, see textConsultations per episode 1.70 1.70 1.70 1.70 1.70 RCGP, see textAdmission ratea 89.58 15.17 2.11 0.02 0.02 HES, see textLOS per admission 7.27 2.33 2.36 8.33 9.31 HES, see textPercent time in intensive care (%) 1.1 0.00 0.00 0.00 0.00 HES, see textDeath ratea 1.29 0.04 0.00 0.00 0.00 [25]
Direct costsCost GP consultation 24 24 24 24 24 [6,33,34]Cost per inpatient day 297 297 297 222 222 [33]Cost per intensive care day 1065 0 0 0 0 NHS reference costs
Indirect costsWork days lost 0 7 7 7 7 [6,8,36,37]Average wage 50 50 50 52 67 Office for National Statistics
Vaccine parametersb
Extra cost of booster (£) 5Coverage booster (%) 84Booster vaccine efficacy (%) 95Duration of protection with booster (years) 5
Analysisb
Delay to herd immunity (years) 5Discount rate outcomes (%) 3Discount rate costs (%) 3
Under-reportingb 2.5
a All rates are per 100,000 population per year.b These parameters are not age dependent.
of booster doses). This delay is varied between 2.5 and 7.5years in the sensitivity analyses.
2.2. Parameter values and sources of data
2.2.1. Incidence of disease and direct medical costsThe sources of age-specific incidence data were: the
Royal College of General Practitioners Weekly Returns Ser-vice (RCGP) [31], which comprises a representative sampleof GPs in England and Wales reporting weekly incidentcases of a range of diseases, including whooping cough;statutory notifications of whooping cough in England andWales; and Hospital Episode Statistics (HES) which coversall National Health Service inpatient admissions in Eng-land (www.doh.gov.uk/hes). Rates were calculated usingOffice of National Statistics (ONS) population projections(www.statistics.gov.uk). Average current incidence rateswere calculated over a 4-year period (1995–1998, in thebase case, unless otherwise stated) as this includes thelast epidemic cycle. All unit costs are in (financial year)1999/2000 pounds, inflated using the Hospital and Com-munity Health Services Pay and Prices Index and the av-erage increase in wages where necessary (£1≈ US$1.5).Base-case parameter values are summarised in Table 1.
The average age-specific incidence of pertussis in gen-eral practice (consultation rate) was estimated from RCGP
W.J. Edmunds et al. / Vaccine 20 (2002) 1316–1330 1319
figures over the period 1995–1998. The RCGP does not re-port a specific incidence rate for those less than 3 monthsof age. To estimate this we calculated the ratio of RCGP tonotification rates in under 1-year-olds in 1999 and appliedthis to the average notification rate in the under 3 monthsof age. The incidence of pertussis was lower in the previ-ous epidemic cycle, i.e. 1991–1994 (Fig. 1). We took theage-specific incidence as recorded by RCGP over this pe-riod as being the lower bound of future incidence (assumingno change in vaccination policy), and took an equivalent in-crease as representing the upper bound. To account for pos-sible under-reporting of pertussis by GP based surveillancesystems [1,17,18,23], we examined the relationship betweenincidence as recorded by the RCGP system and statutorynotifications (Fig. 1). We found that between 1979 and 1993the annual incidence recorded via RCGP was almost exactlydouble that recorded by the notification system (estimatedcoefficient= 2.06, R2 = 96%). Since it has been reportedthat during an epidemic approximately 1/5th of cases recog-nised by GPs are notified [17], we assume, in the base case,that the incidence of new cases consulting their GP is 2.5times that recorded in the RCGP data set. Incidence esti-mates were based on the RCGP system rather than the no-tification system, as the latter appears to have declined inefficiency (since 1994 the average ratio of consultations tonotifications has increased to 3.9, though the ratio of RCGPincidence to hospitalisations has remained fairly constant).Assuming that the RCGP system does not under-report per-tussis gives us our lower bound. As an upper bound we as-sume that the real rate of consultation for pertussis is 13.7times higher than that recorded by the RCGP system. Thisupper bound was derived as follows: Miller et al. [2] inves-tigated individuals who presented at general practice witha cough using cell culture and serological techniques dur-ing 1996–1997 and estimated the incidence of pertussis tobe 330 per 100,000 per year (13.7 times the national raterecorded by RCGP spotter practices during that period). Theaverage number of GP consultations per episode was as-sumed to be 1.7 [32]. The average cost per GP consultation(£18) was taken from standard sources [33]. The averagenumber of treatment courses per case was reported to be 2.2for adolescent and adult cases of whooping cough in Canada[6]. In this study, 42% of cases received erythromycin, 42%received clarithromycin and 8% azithromycin, and the av-erage number of courses of antibiotic was 1.1 per patient.Additionally, the authors report that 17% were prescribeda �2-adrenergic aerosol, 10% were prescribed other bron-chodilators (assumed here to be Ipratropium Bromide), 21%a corticosteroid aerosol and 2% an oral corticosteroid. As-suming that prescribing practice is equivalent in the UK,then the average treatment cost per case of pertussis seenin general practice would be £10.23 [34]. As the averagenumber of consultations per episode is 1.7, then the averagetreatment cost per consultation is £10.23/1.7 = £6. Aver-age treatment costs were varied by±25% in the sensitivityanalyses.
Age-specific hospitalisation rates and average lengths ofstay were estimated from HES data. Data were availablefrom April 1989 to March 1998. Any inpatient spell with adiagnostic code for whooping cough (International Classifi-cation of Diseases, Ninth Revision, ICD-9 code 0339 untilthe end of March 1995 and ICD-10 code A379 since then)entered in any of the seven diagnostic fields was regarded asbeing due to pertussis. The data were cleaned for possibleduplicates and the last episode of each hospitalisation waskept after sorting the data for date of birth, postcode, sexand date of admission. This allowed the calculation of theaverage length of stay by age for all the patients admitted tothe hospital during the 10 years that were considered. Theaverage age-specific hospitalisation rates observed during1991–1994 were taken as the lower bound, and an equiv-alent increase was taken as an upper bound for the futurenumber of hospitalisations in the absence of further changesto the immunisation schedule. The variance in the averagelength of stay by age group was estimated over the period1994–1998. The overall number of days spent on intensivecare was available from HES for financial years 1997–1998and 1998–1999. In total, there were 96 days spent on paedi-atric intensive care by patients under 3 months of age (1.1%of the total number of inpatient days). Only 1 day was spentin intensive care for all other patients with a primary diagno-sis of whooping cough over this 2-year period. The averagecost per inpatient day for paediatric cases not in intensivecare was taken to be £297 and £222 for adult cases [33]. Theaverage cost per day on paediatric intensive care was takento be £1065 (www.doh.gov.uk/nhsexec/refcosts.htm). Theseunit costs were varied by±25% in the sensitivity analyses.
There is considerable evidence of under-reporting of per-tussis deaths [24]. A recent capture–recapture analysis ofHES statistics, ONS data and the Public Health LaboratoryService Enhanced Pertussis Surveillance database suggestedthat over a 5 and a half-year period 46 deaths from pertus-sis occurred (95% confidence interval 37–71): 88% in thosefewer than 3 months of age. This gives an estimated 9 deathsper year (our base-case estimate). In the uncertainty analy-sis we assume that the annual number of deaths is Poissondistributed with a mean of nine. In the univariate sensitivityanalysis we take as a lower bound on mortality the lower95% confidence interval of the annual number of deaths [25].Early deaths from pertussis were assumed to lose the aver-age life expectancy for individuals of that age (calculatedusing ONS mortality data).
We assume that coverage for acellular pertussis boosterswill be 84% [35] and that 95% of those who receive a dosewill be initially protected. We further assume that this pro-tection declines at a constant rate, lasting, on average, 5 years(in the base case), varied between 2.5 and 10 years in the sen-sitivity analyses. We assume that the inclusion of acellularpertussis vaccine in a combined preparation with diphtheriaand tetanus results in no additional vaccine associated ad-verse events [10], and no additional delivery costs. The ad-ditional cost of the acellular pertussis component is assumed
1320 W.J. Edmunds et al. / Vaccine 20 (2002) 1316–1330
to be £5 per dose. Assuming 15% wastage, then the cost percourse of vaccine becomes £5.75 in the base case. Again,this unit cost was varied by±25% in the sensitivity analyses.
2.2.2. Indirect costsAlthough data are lacking on the indirect costs of per-
tussis in the UK some information is available from otherindustrialised countries. Pichichero and Treanor [36] esti-mated that the average period of adult absenteeism causedby children with pertussis was 7.2 days in an affluent areaof New York State, whereas Mark and Granstrom [37] es-timated that the average period of adult absenteeism percase was 8.1 days in Sweden. Thomas et al. [8], report thatnotified adult cases who reported cough result in an averageof 6.6 workdays lost per case, which compares with 7 days(plus an additional 0.25 days for relatives) for adolescentand adult cases in Canada [6]. Note that all of these studieswere of classical pertussis—the entrance criteria were cul-ture confirmed [6,36,37], or notified cases [8,36], or casesthat conform to a clinical case-definition [6], or a combi-nation of these [6,36]. Thus, they probably represent themore severe cases. For this reason, we assume that theseindirect costs apply only to those cases that are recognisedand reported by a physician. This assumption is relaxed inthe sensitivity analysis. We assume that the average periodof absenteeism is 7 days for both adult and childhood cases(except cases in the under 3 months, which we assumedo not result in absenteeism). We further assume that thisabsenteeism results in productivity losses to the economyequal to the length of absenteeism multiplied by the averagedaily wage for females aged 25–34 years (£50) for cases inchildren, and the average adult wage for other cases (£52for those aged less than 45 years and £62 for older individ-uals (www.statistics.gov.uk)). In the sensitivity analyses theaverage productivity loss per case is varied by±25%.
2.3. Univariate and multivariate sensitivity analyses
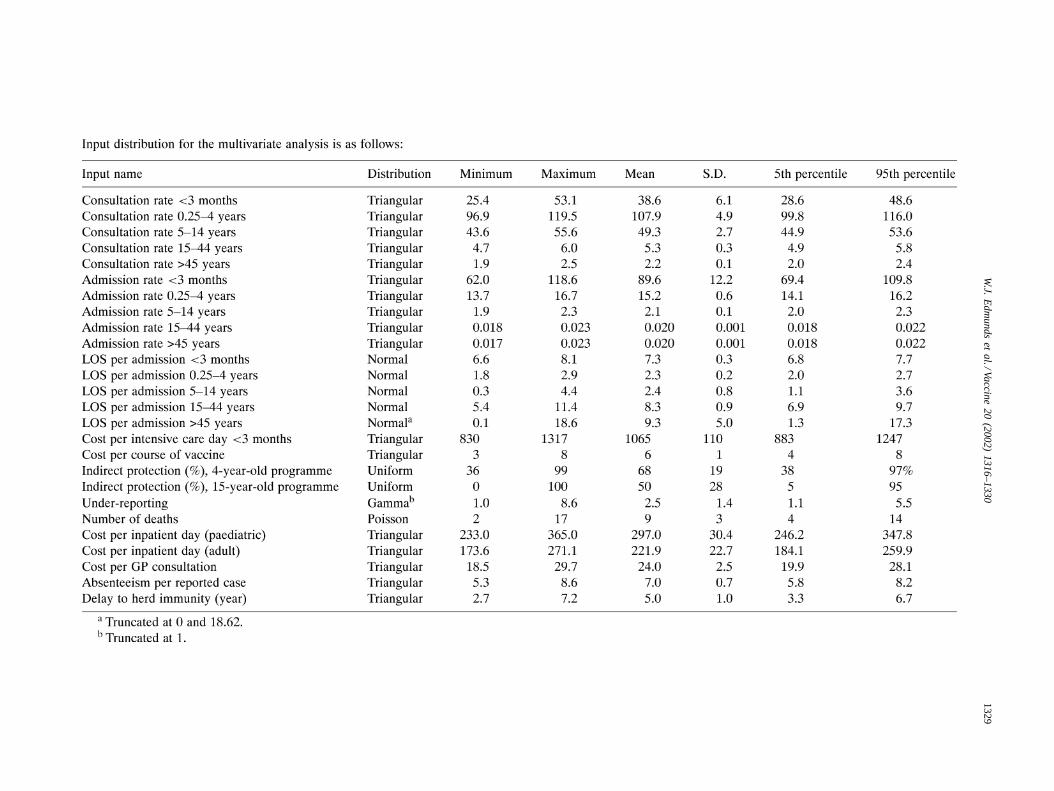
Univariate sensitivity analyses were performed for allvariables. In addition, the sensitivity of the model output tovariation in input parameters was explored by performinga probabilistic multivariate sensitivity analysis (uncertaintyanalysis). Here, we assume that the parameter values in-putted into the model are drawn from a probability distribu-tion (see Appendix A for the assumptions regarding thesedistributions). We further assume that the input parametervalues are independent of each other with the exception ofhospitalisation and GP consultation rates, which are highlycorrelated (partial correlation coefficient(PCC) = 0.85,based on the results from surveillance data, see Fig. 1), andthe incidence between age groups which were also assumedto be highly correlated (PCC= 0.95, based on the resultsfrom surveillance data). The model was run 1000 times us-ing Latin Hypercube Sampling for input parameter valuesto generate a distribution of the outcome variables (cost perlife-year gained from the health care provider and societal
perspectives) using @risk Version 4 (Palisade Corporation,New York) running within Microsoft Excel. Relationshipsbetween different input parameter values and the modelresults were then explored by regression analysis and byestimating correlation coefficients. A full list of parame-ter values and the assumed input distributions is given inAppendix A.
3. Results
3.1. Estimated current burden of pertussis
Under our base-case assumptions there are an estimated35,000 GP consultations annually for pertussis in Englandand Wales and 1165 hospitalisations, which result in over5500 inpatient days. Of these, 45 days are spent on paediatricintensive care wards (almost all of which occur in childrenunder 3 months of age). This youngest age group makes uproughly one third of the hospitalisations, but nearly 4/5thsof the days spent in hospital and 90% of the deaths. Theestimated nine deaths that occur annually result in an averageof 688 undiscounted life-years lost from each birth cohort.
The annual cost to the health service of these cases ofpertussis is estimated to be £2.6 million under our base-caseassumptions (90% of the results of our simulations withno changes to vaccine policy ranged between £1.79 and£3.2 million), of which roughly half is due to cases in infantsunder 3 months of age. One-third of the total cost to thehealth service is estimated to be due to GP consultations, theremainder of the costs falling to the hospital sector. Under thebase-case assumptions the total annual cost due to intensivecare is estimated to be only about £48,000 per annum (<2%of total costs). Absenteeism from pertussis is estimated tocost the wider economy a further £7.14 million annually,under our base-case scenario (90% range £3.0–16.4 millionper annum).
3.2. Predicted cost-effectiveness of booster doses
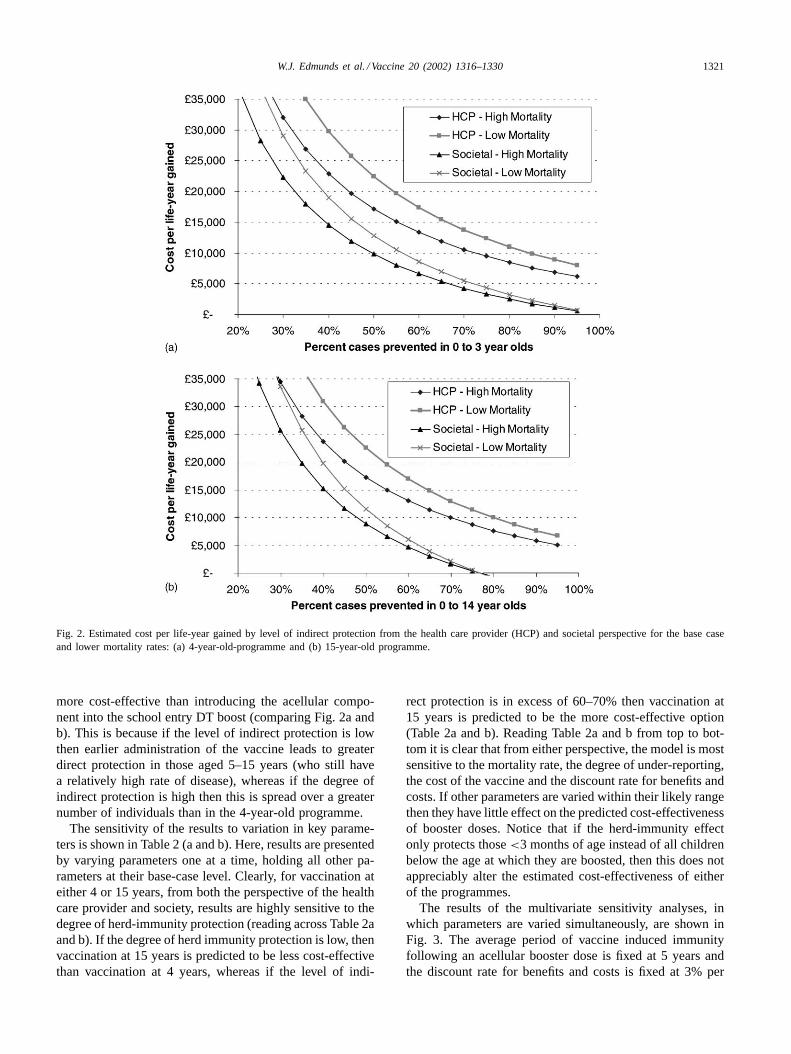
Fig. 2 shows the predicted cost per life-year gained fromthe health care provider and societal perspectives, utilisingour base-case estimate of the incidence and under-reportingof pertussis, for different assumptions regarding pertussisattributable mortality, and assuming different levels of indi-rect protection in those too young to receive a booster doseof vaccine. Results are presented for vaccination at 4 years(Fig. 2a) and 15 years of age (Fig. 2b). Clearly, the higherthe degree of indirect protection and the higher the mortalityrate for pertussis, the lower the cost per life-year gained (themore cost-effective the programme appears). At lower levelsof indirect protection, vaccination at 15 years appears to beslightly less cost-effective than vaccination at 4 years of age,but for higher levels of indirect protection the model pre-dicts that incorporating acellular pertussis vaccine into theschool-leaving Tetanus–Diphtheria boost would be slightly
W.J. Edmunds et al. / Vaccine 20 (2002) 1316–1330 1321
Fig. 2. Estimated cost per life-year gained by level of indirect protection from the health care provider (HCP) and societal perspective for the base caseand lower mortality rates: (a) 4-year-old-programme and (b) 15-year-old programme.
more cost-effective than introducing the acellular compo-nent into the school entry DT boost (comparing Fig. 2a andb). This is because if the level of indirect protection is lowthen earlier administration of the vaccine leads to greaterdirect protection in those aged 5–15 years (who still havea relatively high rate of disease), whereas if the degree ofindirect protection is high then this is spread over a greaternumber of individuals than in the 4-year-old programme.
The sensitivity of the results to variation in key parame-ters is shown in Table 2 (a and b). Here, results are presentedby varying parameters one at a time, holding all other pa-rameters at their base-case level. Clearly, for vaccination ateither 4 or 15 years, from both the perspective of the healthcare provider and society, results are highly sensitive to thedegree of herd-immunity protection (reading across Table 2aand b). If the degree of herd immunity protection is low, thenvaccination at 15 years is predicted to be less cost-effectivethan vaccination at 4 years, whereas if the level of indi-
rect protection is in excess of 60–70% then vaccination at15 years is predicted to be the more cost-effective option(Table 2a and b). Reading Table 2a and b from top to bot-tom it is clear that from either perspective, the model is mostsensitive to the mortality rate, the degree of under-reporting,the cost of the vaccine and the discount rate for benefits andcosts. If other parameters are varied within their likely rangethen they have little effect on the predicted cost-effectivenessof booster doses. Notice that if the herd-immunity effectonly protects those<3 months of age instead of all childrenbelow the age at which they are boosted, then this does notappreciably alter the estimated cost-effectiveness of eitherof the programmes.
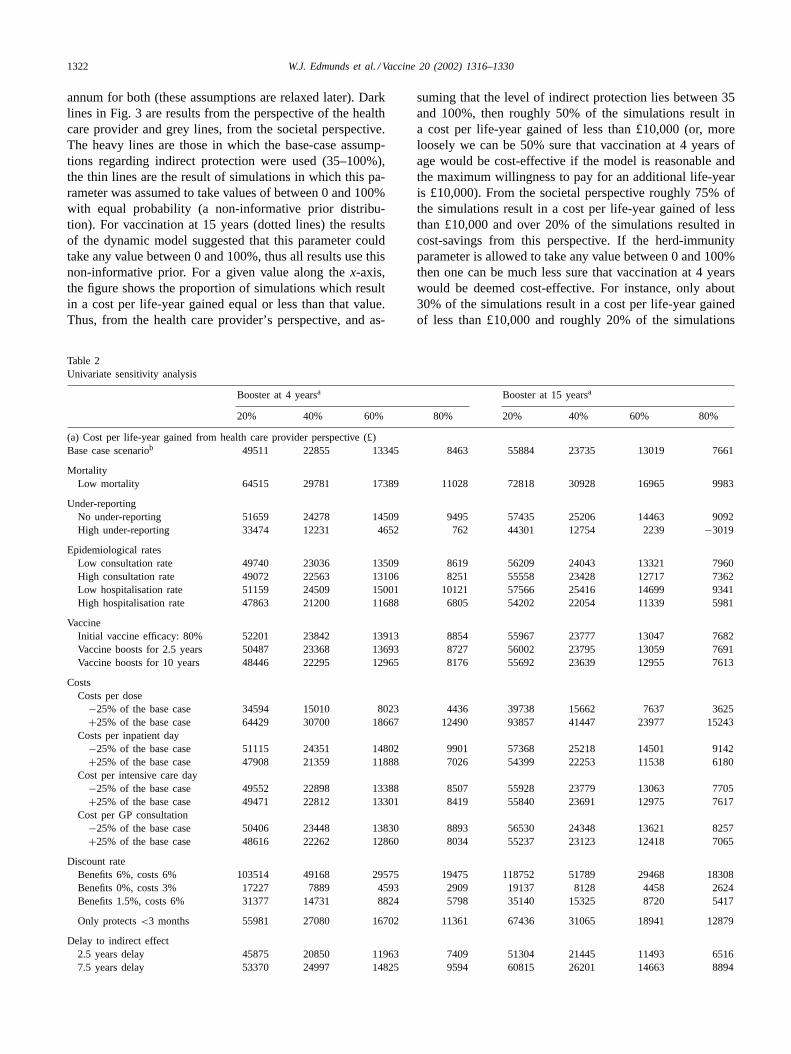
The results of the multivariate sensitivity analyses, inwhich parameters are varied simultaneously, are shown inFig. 3. The average period of vaccine induced immunityfollowing an acellular booster dose is fixed at 5 years andthe discount rate for benefits and costs is fixed at 3% per
1322 W.J. Edmunds et al. / Vaccine 20 (2002) 1316–1330
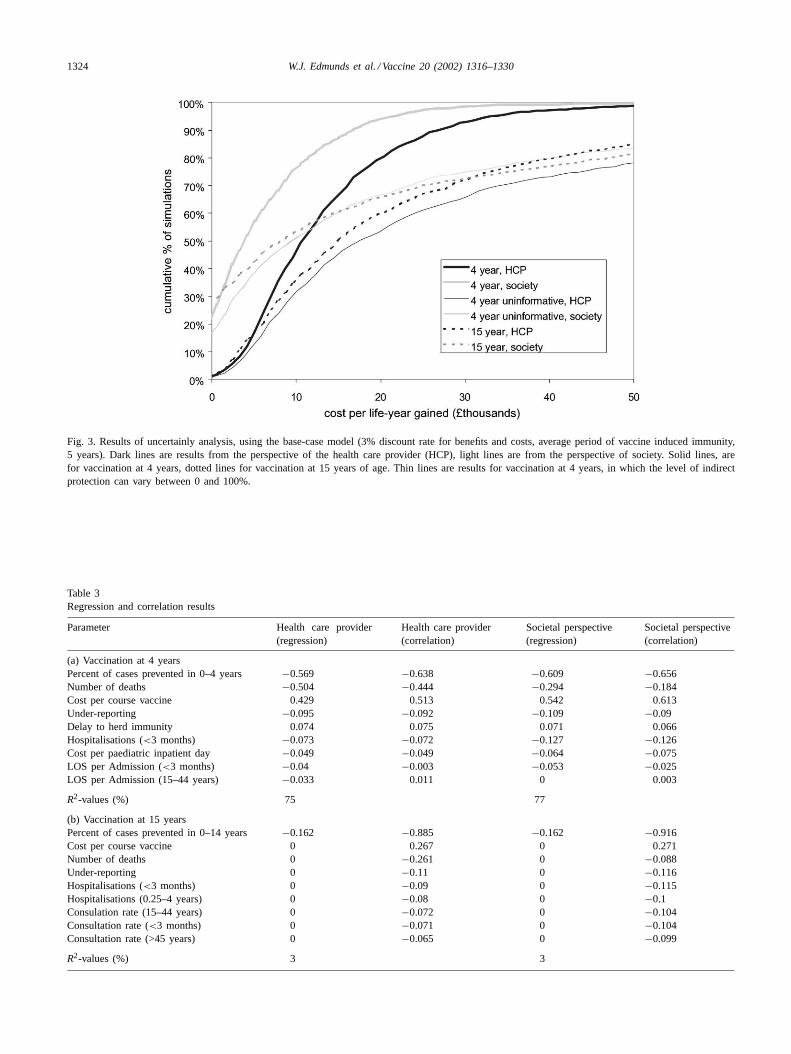
annum for both (these assumptions are relaxed later). Darklines in Fig. 3 are results from the perspective of the healthcare provider and grey lines, from the societal perspective.The heavy lines are those in which the base-case assump-tions regarding indirect protection were used (35–100%),the thin lines are the result of simulations in which this pa-rameter was assumed to take values of between 0 and 100%with equal probability (a non-informative prior distribu-tion). For vaccination at 15 years (dotted lines) the resultsof the dynamic model suggested that this parameter couldtake any value between 0 and 100%, thus all results use thisnon-informative prior. For a given value along thex-axis,the figure shows the proportion of simulations which resultin a cost per life-year gained equal or less than that value.Thus, from the health care provider’s perspective, and as-
Table 2Univariate sensitivity analysis
Booster at 4 yearsa Booster at 15 yearsa
20% 40% 60% 80% 20% 40% 60% 80%
(a) Cost per life-year gained from health care provider perspective (£)Base case scenariob 49511 22855 13345 8463 55884 23735 13019 7661
MortalityLow mortality 64515 29781 17389 11028 72818 30928 16965 9983
Under-reportingNo under-reporting 51659 24278 14509 9495 57435 25206 14463 9092High under-reporting 33474 12231 4652 762 44301 12754 2239 −3019
Epidemiological ratesLow consultation rate 49740 23036 13509 8619 56209 24043 13321 7960High consultation rate 49072 22563 13106 8251 55558 23428 12717 7362Low hospitalisation rate 51159 24509 15001 10121 57566 25416 14699 9341High hospitalisation rate 47863 21200 11688 6805 54202 22054 11339 5981
VaccineInitial vaccine efficacy: 80% 52201 23842 13913 8854 55967 23777 13047 7682Vaccine boosts for 2.5 years 50487 23368 13693 8727 56002 23795 13059 7691Vaccine boosts for 10 years 48446 22295 12965 8176 55692 23639 12955 7613
CostsCosts per dose
−25% of the base case 34594 15010 8023 4436 39738 15662 7637 3625+25% of the base case 64429 30700 18667 12490 93857 41447 23977 15243
Costs per inpatient day−25% of the base case 51115 24351 14802 9901 57368 25218 14501 9142+25% of the base case 47908 21359 11888 7026 54399 22253 11538 6180
Cost per intensive care day−25% of the base case 49552 22898 13388 8507 55928 23779 13063 7705+25% of the base case 49471 22812 13301 8419 55840 23691 12975 7617
Cost per GP consultation−25% of the base case 50406 23448 13830 8893 56530 24348 13621 8257+25% of the base case 48616 22262 12860 8034 55237 23123 12418 7065
Discount rateBenefits 6%, costs 6% 103514 49168 29575 19475 118752 51789 29468 18308Benefits 0%, costs 3% 17227 7889 4593 2909 19137 8128 4458 2624Benefits 1.5%, costs 6% 31377 14731 8824 5798 35140 15325 8720 5417
Only protects<3 months 55981 27080 16702 11361 67436 31065 18941 12879
Delay to indirect effect2.5 years delay 45875 20850 11963 7409 51304 21445 11493 65167.5 years delay 53370 24997 14825 9594 60815 26201 14663 8894
suming that the level of indirect protection lies between 35and 100%, then roughly 50% of the simulations result ina cost per life-year gained of less than £10,000 (or, moreloosely we can be 50% sure that vaccination at 4 years ofage would be cost-effective if the model is reasonable andthe maximum willingness to pay for an additional life-yearis £10,000). From the societal perspective roughly 75% ofthe simulations result in a cost per life-year gained of lessthan £10,000 and over 20% of the simulations resulted incost-savings from this perspective. If the herd-immunityparameter is allowed to take any value between 0 and 100%then one can be much less sure that vaccination at 4 yearswould be deemed cost-effective. For instance, only about30% of the simulations result in a cost per life-year gainedof less than £10,000 and roughly 20% of the simulations
W.J. Edmunds et al. / Vaccine 20 (2002) 1316–1330 1323
Table 2 (Continued)
Booster at 4 yearsa Booster at 15 yearsa
20% 40% 60% 80% 20% 40% 60% 80%
(b) Cost per life-year gained from societal perspective (£)Base case scenarioa 36941 14568 6586 2489 46869 15201 4645 −633
MortalityLow mortality 48135 18982 8581 3243 61072 19807 6052 −825
Under-reportingNo under-reporting 38395 15492 7321 3127 47977 16229 5647 355High under-reporting 21281 4215 −1873 −4999 35528 4461 −5895 −11073
Epidemiological ratesLow consultation rate 37891 15303 7244 3107 48245 16497 5914 623High consultation rate 35058 13342 5595 1618 45493 13905 3375 −1890Low hospitalisation rate 38636 16256 8271 4173 48581 16911 6355 1076High hospitalisation rate 35245 12879 4900 804 45157 13490 2934 −2344
VaccineInitial vaccine efficacy: 80% 42069 16885 8068 3575 47232 15382 4766 −543Vaccine boosts for 2.5 years 40560 16471 7877 3466 47383 15458 4816 −505Vaccine boosts for 10 years 32944 12466 5160 1410 46032 14782 4365 −843
CostsCosts per dose
−25% of the base case 22024 6723 1264 −1538 30723 7128 −737 −4670+25% of the base case 51858 22413 11908 6515 63015 23274 10027 3403
Costs per inpatient day−25% of the base case 38545 16063 8043 3926 48354 16683 6126 848+25% of the base case 35337 13072 5129 1051 45385 13718 3163 −2115
Cost per intensive care day−25% of the base case 36982 14610 6629 2532 46913 15245 4689 −589+25% of the base case 36900 14525 6542 2445 46825 15157 4601 −677
Cost per GP consultation−25% of the base case 37836 15161 7071 2918 47516 15814 5246 −37+25% of the base case 36046 13975 6101 2059 46223 14588 4043 −1229
Work days lost−25% of the base case 40084 16640 8275 3982 49123 17334 6738 1440+25% of the base case 33798 12496 4896 995 44616 13067 2551 −2707
Discount rateBenefits 6%, costs 6% 79780 33591 16938 8354 102423 36361 14340 3330Benefits 0%, costs 3% 12853 5028 2267 855 16050 5205 1591 −217Benefits 1.5%, costs 6% 24183 10064 5053 2487 30308 10760 4243 985
Only protects<3 months 45728 21662 13020 8572 66351 30522 18579 12607
Delay to indirect effect2.5 years delay 33889 12885 5426 1604 42358 12945 3141 −17617.5 years delay 40179 16365 7828 3438 51727 17630 6264 581
a Percent of cases prevented in younger children.b Base case: initial vaccine efficacy: 95%; duration of protection: 5 years; cost per inpatient day: 297 (<15 years); 222 (≥15 years); cost per GP
consultation: 24; cost per intensive care: 1065 (<3 months.); both discount rates: 3%; work days lost: 7days for reported cases; delay to indirect protection:5 years.
result in a cost per life-year gained in excess of £50,000(from the health care providers perspective). The modelresults suggest that it is much less certain that vaccinationat 15 years would be deemed cost-effective. For instance,only about 35% of simulations result in a cost per life-yeargained of less than £10,000. This is primarily due to theuncertainty in the likely level of indirect protection (notethe similarity between the results for vaccination at 15years and those for vaccination at 4 years when the herd
immunity parameter is allowed to vary between 0 and100%).
It is possible to explore the sensitivity of the results tovariation in the input parameters using regression and cor-relation analysis. These are more powerful techniques thanscrutinising Table 2 as they allow quantification of the sen-sitivity of the results to variation in input parameters. Table3a lists those variables that are significantly different fromzero for vaccination at 4 years with the base-case model (the
1324 W.J. Edmunds et al. / Vaccine 20 (2002) 1316–1330
Fig. 3. Results of uncertainly analysis, using the base-case model (3% discount rate for benefits and costs, average period of vaccine induced immunity,5 years). Dark lines are results from the perspective of the health care provider (HCP), light lines are from the perspective of society. Solid lines, arefor vaccination at 4 years, dotted lines for vaccination at 15 years of age. Thin lines are results for vaccination at 4 years, in which the level of indirectprotection can vary between 0 and 100%.
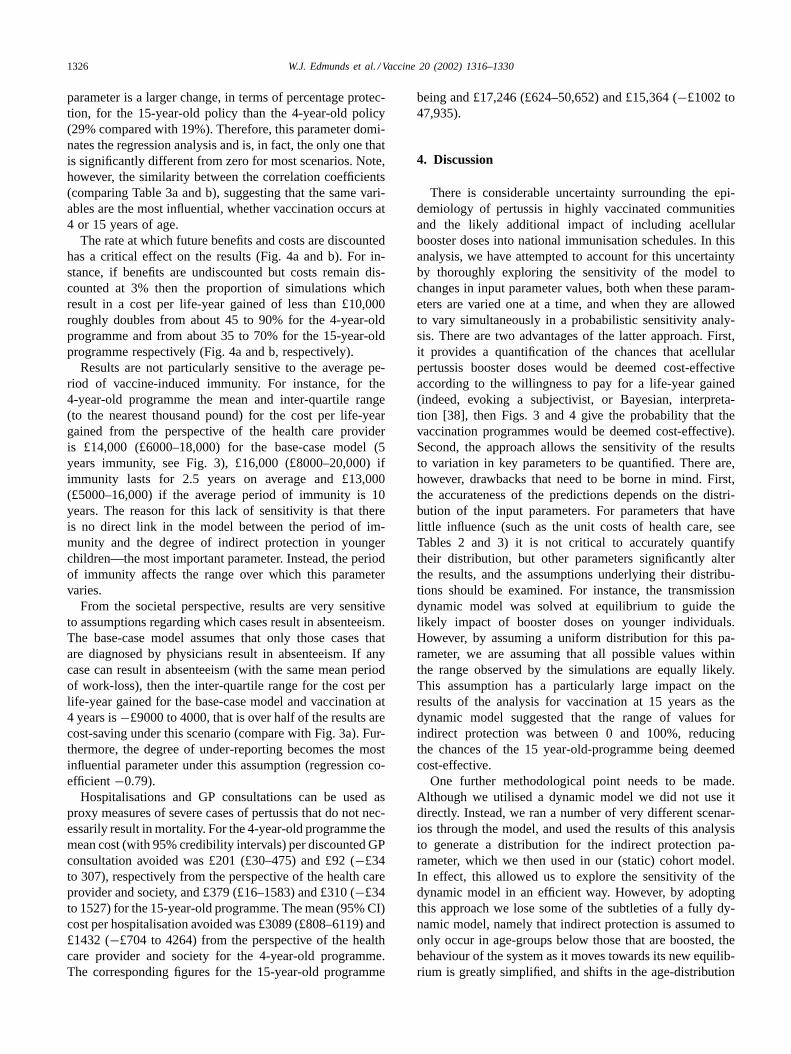
Table 3Regression and correlation results
Parameter Health care provider(regression)
Health care provider(correlation)
Societal perspective(regression)
Societal perspective(correlation)
(a) Vaccination at 4 yearsPercent of cases prevented in 0–4 years −0.569 −0.638 −0.609 −0.656Number of deaths −0.504 −0.444 −0.294 −0.184Cost per course vaccine 0.429 0.513 0.542 0.613Under-reporting −0.095 −0.092 −0.109 −0.09Delay to herd immunity 0.074 0.075 0.071 0.066Hospitalisations (<3 months) −0.073 −0.072 −0.127 −0.126Cost per paediatric inpatient day −0.049 −0.049 −0.064 −0.075LOS per Admission (<3 months) −0.04 −0.003 −0.053 −0.025LOS per Admission (15–44 years) −0.033 0.011 0 0.003
R2-values (%) 75 77
(b) Vaccination at 15 yearsPercent of cases prevented in 0–14 years −0.162 −0.885 −0.162 −0.916Cost per course vaccine 0 0.267 0 0.271Number of deaths 0 −0.261 0 −0.088Under-reporting 0 −0.11 0 −0.116Hospitalisations (<3 months) 0 −0.09 0 −0.115Hospitalisations (0.25–4 years) 0 −0.08 0 −0.1Consulation rate (15–44 years) 0 −0.072 0 −0.104Consultation rate (<3 months) 0 −0.071 0 −0.104Consultation rate (>45 years) 0 −0.065 0 −0.099
R2-values (%) 3 3
W.J. Edmunds et al. / Vaccine 20 (2002) 1316–1330 1325
average period of immunity following booster vaccinationequal to 5 years, and 3% discount rate) and their estimatedregression and correlation coefficients. Table 3b shows theregression and correlation coefficients for vaccination at 15years of age and lists the nine parameters with the largestabsolute correlation coefficients. The regression analysis re-lates a one standard deviation change in each parameter to aunit change in the results (in terms of thousands of poundsper life-year gained). That is, the units for the input vari-ables are normalised to each other. Once again, it is clear thatthe most important parameters are the proportion of chil-
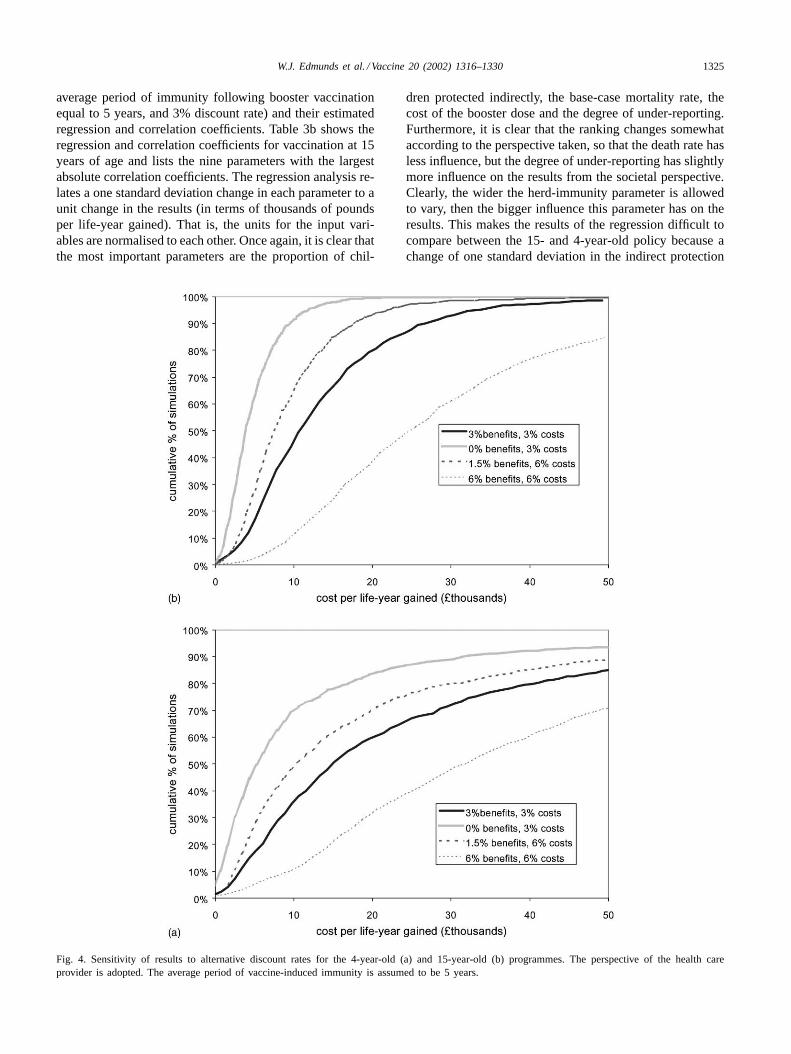
Fig. 4. Sensitivity of results to alternative discount rates for the 4-year-old (a) and 15-year-old (b) programmes. The perspective of the health careprovider is adopted. The average period of vaccine-induced immunity is assumed to be 5 years.
dren protected indirectly, the base-case mortality rate, thecost of the booster dose and the degree of under-reporting.Furthermore, it is clear that the ranking changes somewhataccording to the perspective taken, so that the death rate hasless influence, but the degree of under-reporting has slightlymore influence on the results from the societal perspective.Clearly, the wider the herd-immunity parameter is allowedto vary, then the bigger influence this parameter has on theresults. This makes the results of the regression difficult tocompare between the 15- and 4-year-old policy because achange of one standard deviation in the indirect protection
1326 W.J. Edmunds et al. / Vaccine 20 (2002) 1316–1330
parameter is a larger change, in terms of percentage protec-tion, for the 15-year-old policy than the 4-year-old policy(29% compared with 19%). Therefore, this parameter domi-nates the regression analysis and is, in fact, the only one thatis significantly different from zero for most scenarios. Note,however, the similarity between the correlation coefficients(comparing Table 3a and b), suggesting that the same vari-ables are the most influential, whether vaccination occurs at4 or 15 years of age.
The rate at which future benefits and costs are discountedhas a critical effect on the results (Fig. 4a and b). For in-stance, if benefits are undiscounted but costs remain dis-counted at 3% then the proportion of simulations whichresult in a cost per life-year gained of less than £10,000roughly doubles from about 45 to 90% for the 4-year-oldprogramme and from about 35 to 70% for the 15-year-oldprogramme respectively (Fig. 4a and b, respectively).
Results are not particularly sensitive to the average pe-riod of vaccine-induced immunity. For instance, for the4-year-old programme the mean and inter-quartile range(to the nearest thousand pound) for the cost per life-yeargained from the perspective of the health care provideris £14,000 (£6000–18,000) for the base-case model (5years immunity, see Fig. 3), £16,000 (£8000–20,000) ifimmunity lasts for 2.5 years on average and £13,000(£5000–16,000) if the average period of immunity is 10years. The reason for this lack of sensitivity is that thereis no direct link in the model between the period of im-munity and the degree of indirect protection in youngerchildren—the most important parameter. Instead, the periodof immunity affects the range over which this parametervaries.
From the societal perspective, results are very sensitiveto assumptions regarding which cases result in absenteeism.The base-case model assumes that only those cases thatare diagnosed by physicians result in absenteeism. If anycase can result in absenteeism (with the same mean periodof work-loss), then the inter-quartile range for the cost perlife-year gained for the base-case model and vaccination at4 years is−£9000 to 4000, that is over half of the results arecost-saving under this scenario (compare with Fig. 3a). Fur-thermore, the degree of under-reporting becomes the mostinfluential parameter under this assumption (regression co-efficient−0.79).
Hospitalisations and GP consultations can be used asproxy measures of severe cases of pertussis that do not nec-essarily result in mortality. For the 4-year-old programme themean cost (with 95% credibility intervals) per discounted GPconsultation avoided was £201 (£30–475) and £92 (−£34to 307), respectively from the perspective of the health careprovider and society, and £379 (£16–1583) and £310 (−£34to 1527) for the 15-year-old programme. The mean (95% CI)cost per hospitalisation avoided was £3089 (£808–6119) and£1432 (−£704 to 4264) from the perspective of the healthcare provider and society for the 4-year-old programme.The corresponding figures for the 15-year-old programme
being and £17,246 (£624–50,652) and £15,364 (−£1002 to47,935).
4. Discussion
There is considerable uncertainty surrounding the epi-demiology of pertussis in highly vaccinated communitiesand the likely additional impact of including acellularbooster doses into national immunisation schedules. In thisanalysis, we have attempted to account for this uncertaintyby thoroughly exploring the sensitivity of the model tochanges in input parameter values, both when these param-eters are varied one at a time, and when they are allowedto vary simultaneously in a probabilistic sensitivity analy-sis. There are two advantages of the latter approach. First,it provides a quantification of the chances that acellularpertussis booster doses would be deemed cost-effectiveaccording to the willingness to pay for a life-year gained(indeed, evoking a subjectivist, or Bayesian, interpreta-tion [38], then Figs. 3 and 4 give the probability that thevaccination programmes would be deemed cost-effective).Second, the approach allows the sensitivity of the resultsto variation in key parameters to be quantified. There are,however, drawbacks that need to be borne in mind. First,the accurateness of the predictions depends on the distri-bution of the input parameters. For parameters that havelittle influence (such as the unit costs of health care, seeTables 2 and 3) it is not critical to accurately quantifytheir distribution, but other parameters significantly alterthe results, and the assumptions underlying their distribu-tions should be examined. For instance, the transmissiondynamic model was solved at equilibrium to guide thelikely impact of booster doses on younger individuals.However, by assuming a uniform distribution for this pa-rameter, we are assuming that all possible values withinthe range observed by the simulations are equally likely.This assumption has a particularly large impact on theresults of the analysis for vaccination at 15 years as thedynamic model suggested that the range of values forindirect protection was between 0 and 100%, reducingthe chances of the 15 year-old-programme being deemedcost-effective.
One further methodological point needs to be made.Although we utilised a dynamic model we did not use itdirectly. Instead, we ran a number of very different scenar-ios through the model, and used the results of this analysisto generate a distribution for the indirect protection pa-rameter, which we then used in our (static) cohort model.In effect, this allowed us to explore the sensitivity of thedynamic model in an efficient way. However, by adoptingthis approach we lose some of the subtleties of a fully dy-namic model, namely that indirect protection is assumed toonly occur in age-groups below those that are boosted, thebehaviour of the system as it moves towards its new equilib-rium is greatly simplified, and shifts in the age-distribution
W.J. Edmunds et al. / Vaccine 20 (2002) 1316–1330 1327
of infection are lost. Indeed, a number of the model sim-ulations resulted in an increase in the number of primaryinfections in adults. In this instance, however, these sub-tleties have a minimal impact on the predicted impact ofintroducing booster doses, as the system quickly moves toa new equilibrium, and the rate of infection in adults has anegligible impact on the overall cost-effectiveness of vacci-nation (particularly from the perspective of the health careprovider).
The use of life-years gained as the primary outcome mea-sure means that the impact of acellular booster doses onpertussis morbidity is ignored. To partially offset this prob-lem the cost per hospitalisation and GP consultation avoidedwere also calculated. The results of these analyses helpreaffirm that vaccination at 4 years is more likely to becost-effective than vaccination at 15 years, and that vacci-nation at 4 years may be cost-effective (roughly £3000 perhospitalisation avoided).
Results from the societal perspective should be viewedwith more caution than those from the perspective of thehealth care provider. This is because data were lackingfrom the UK on indirect costs associated with whoopingcough, the model may have overestimated the effect ofbooster doses in older age groups (see above), the resultsare highly dependent on assumptions regarding the impactof less clinically apparent pertussis on absenteeism, and theinfluence of short-term absenteeism on productivity losshas not been clearly established [39]. If anything, resultspresented here are likely to underestimate the societal im-pact of booster doses, as we assumed that only cases whichare severe enough to be clinically recognised as pertussisresult in work-loss, and we ignore any impact on lost leisuretime.
Unfortunately most of the base-case model results are inthe range in which the threshold value for a cost per life-yeargained is likely to lie, thus it is not possible to draw anystrong conclusions regarding the cost-effectiveness of acel-lular booster doses from the perspective of the health careprovider. For instance, the inter-quartile range of results forvaccination of 4-year-olds is £6000–18,000 (£5000–12,000for the recommended discount rate in the UK—Fig. 4).Although no national guidelines are currently available forthe maximum amount that decision makers are prepared topay for an additional life-year gained, regional guidelinesare available from the early 1990s [40]. These state thatif the evidence for effectiveness is good, then programmesresulting in a cost per life-year gained of up to £20,000were “recommended”. Given that the evidence for the ef-fectiveness of acellular booster doses is weak a reasonablethreshold value may be around £10,000, almost exactlythe median value obtained from the base-case simulations(Figs. 3 and 4).
Further work is required to allow a more definite conclu-sion regarding the cost-effectiveness of booster doses. Theresults of this analysis clearly show which parameters aremost important: the average number of deaths from pertus-
sis; the proportion of cases that would be prevented (par-ticularly the proportion of cases in those under 3 months);the discount rate for future health benefits; and the vaccineprice. The latter two (the discount rate and vaccine price)can be regarded as being externally given, or at least partlyunder the control of the decision makers. Hence, researchshould be focussed on the first two factors. Further data,either through time, or from epidemiologically similar areaswould help improve the precision of our estimates of thecurrent pertussis associated mortality rate. Improved esti-mates of the degree of indirect protection are likely to bemuch more difficult to obtain. Further modelling work isclearly required as this is the only way in which the impactof acellular boosters can be assessed before the vaccine isintroduced. This could be supplemented by comparativeepidemiological studies in countries that have introducedacellular booster doses (though the variability in pertus-sis vaccination histories [41] means that such studies aredifficult to interpret). Whilst these initiatives are likely toimprove our estimates of the cost-effectiveness of theseprogrammes, significant uncertainty will remain. Thus,any future analysis will also need to be framed in similarterms.
Acknowledgements
We thank Natasha Crowcroft and Elizabeth Miller foradvice and for providing the results of unpublished studiesand Pauline Kaye for data extraction. The study was fundedby a grant from the Medical Research Council (grant no.G9818303).
Appendix A. Input parameter value distributions
We used a deterministic age-structured transmission dy-namic model of pertussis infection to estimate the degree ofprotection in those too young to be boosted. The model sub-divides the population into seven age groups, with eight epi-demiological sub-groups within each age group. The naturalcycle of pertussis, as described in the model is as follows(where capital letters denote the names of state variables).Individuals are born Susceptible become Infectious at anage-dependent rate (the force of infection), and then passinto the Fully Immune class. This immunity gradually wanesover time, and individuals pass into the Susceptible to Boost-ing class. If they are exposed when in this class they becomeboosted into the Fully Immune class once more. If they arenot exposed, then they gradually pass into the Susceptibleto Mild Infection class. If they are now exposed, they thenpass through the Mild Infectious class into the Fully Immuneclass once more. Mildly infectious individuals are less in-fectious than on primary exposure. Vaccination is accountedfor by adding two further classes: the Vaccinated class, intowhich individuals initially pass when vaccinated (in some
1328 W.J. Edmunds et al. / Vaccine 20 (2002) 1316–1330
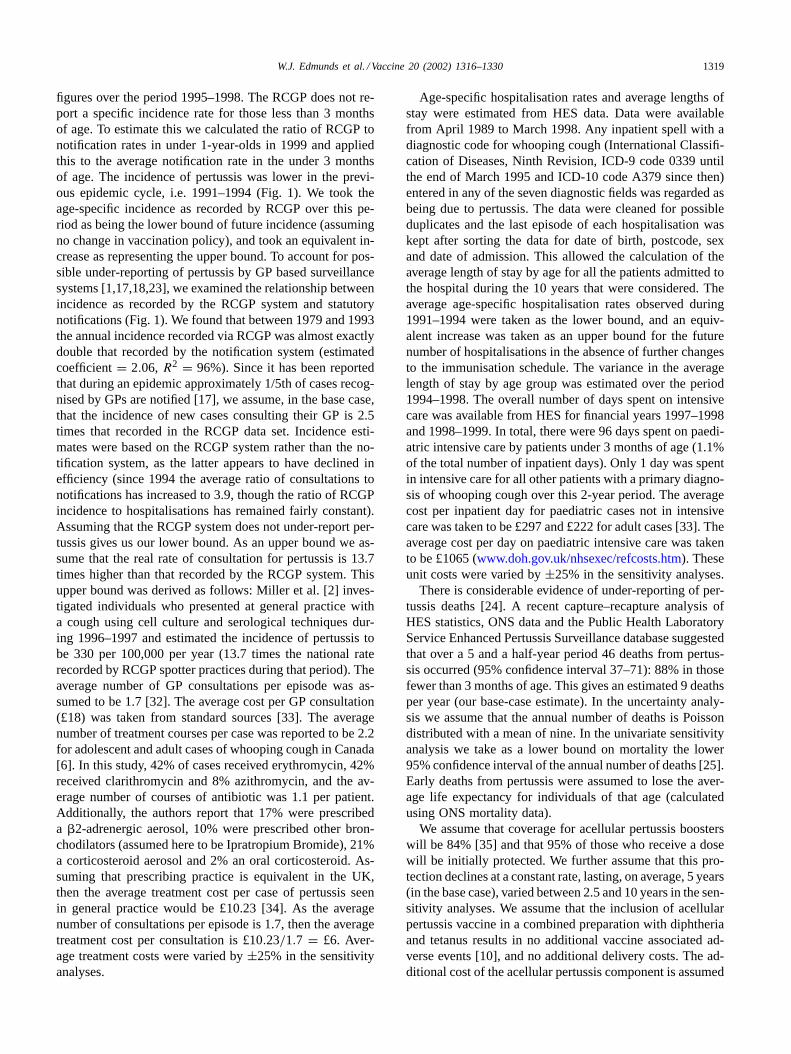
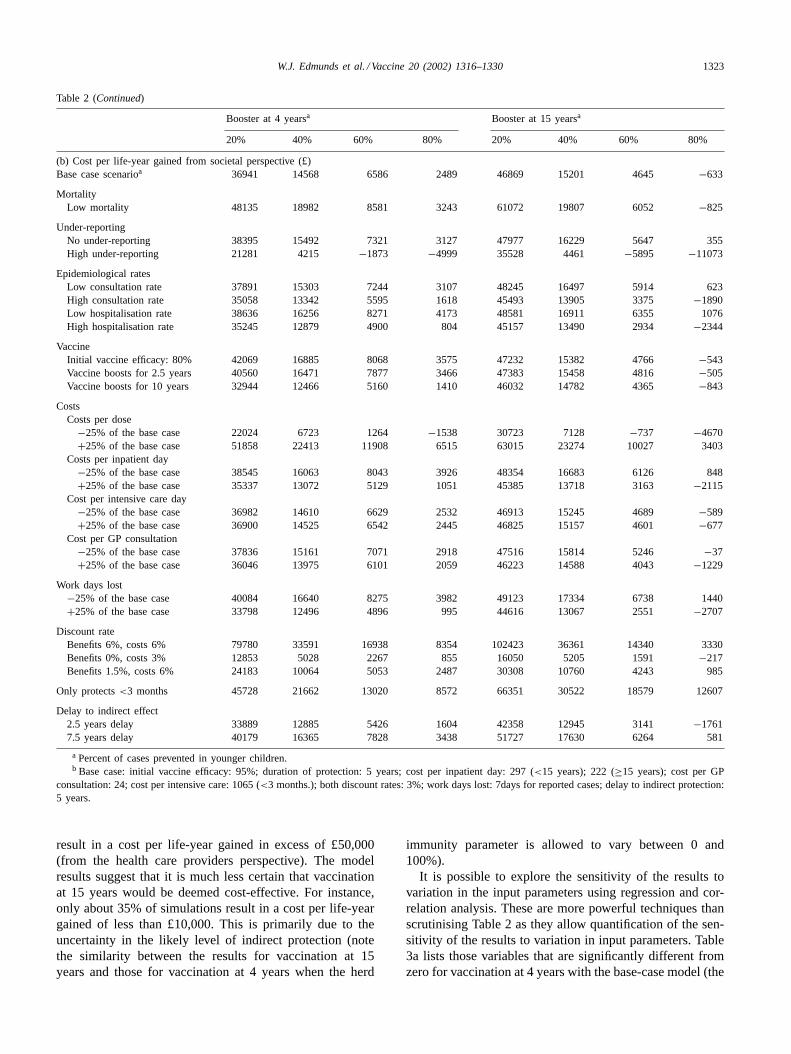
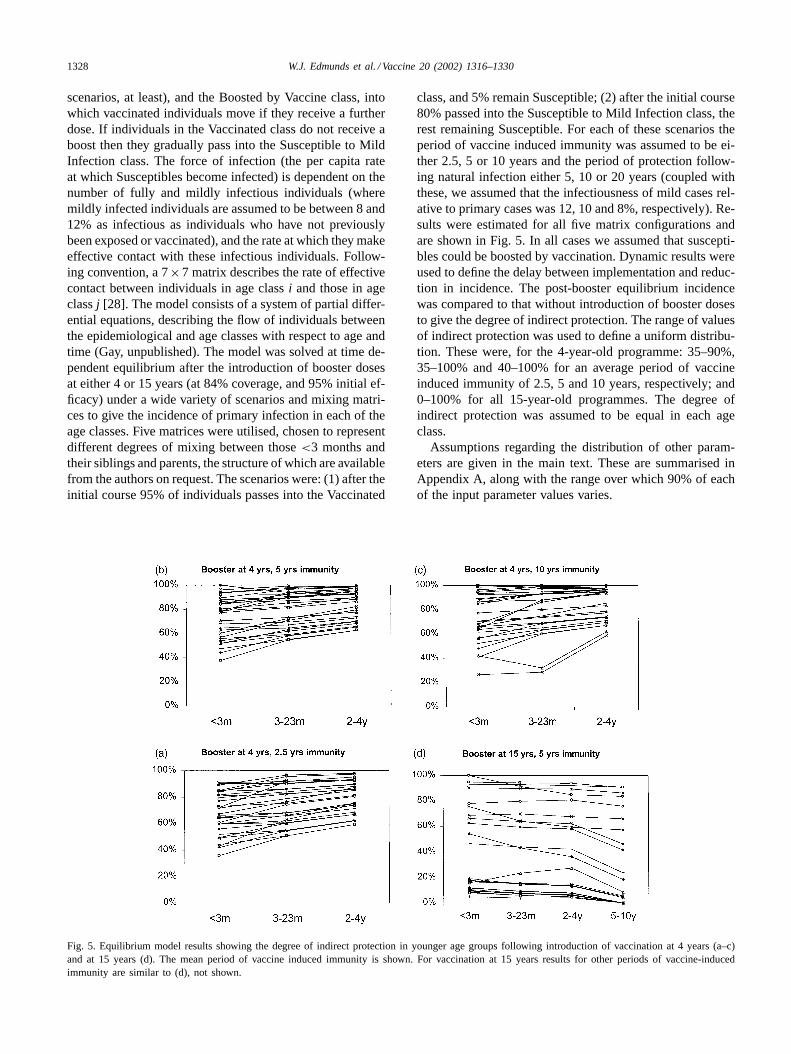
scenarios, at least), and the Boosted by Vaccine class, intowhich vaccinated individuals move if they receive a furtherdose. If individuals in the Vaccinated class do not receive aboost then they gradually pass into the Susceptible to MildInfection class. The force of infection (the per capita rateat which Susceptibles become infected) is dependent on thenumber of fully and mildly infectious individuals (wheremildly infected individuals are assumed to be between 8 and12% as infectious as individuals who have not previouslybeen exposed or vaccinated), and the rate at which they makeeffective contact with these infectious individuals. Follow-ing convention, a 7×7 matrix describes the rate of effectivecontact between individuals in age classi and those in ageclassj [28]. The model consists of a system of partial differ-ential equations, describing the flow of individuals betweenthe epidemiological and age classes with respect to age andtime (Gay, unpublished). The model was solved at time de-pendent equilibrium after the introduction of booster dosesat either 4 or 15 years (at 84% coverage, and 95% initial ef-ficacy) under a wide variety of scenarios and mixing matri-ces to give the incidence of primary infection in each of theage classes. Five matrices were utilised, chosen to representdifferent degrees of mixing between those<3 months andtheir siblings and parents, the structure of which are availablefrom the authors on request. The scenarios were: (1) after theinitial course 95% of individuals passes into the Vaccinated
Fig. 5. Equilibrium model results showing the degree of indirect protection in younger age groups following introduction of vaccination at 4 years (a–c)and at 15 years (d). The mean period of vaccine induced immunity is shown. For vaccination at 15 years results for other periods of vaccine-inducedimmunity are similar to (d), not shown.
class, and 5% remain Susceptible; (2) after the initial course80% passed into the Susceptible to Mild Infection class, therest remaining Susceptible. For each of these scenarios theperiod of vaccine induced immunity was assumed to be ei-ther 2.5, 5 or 10 years and the period of protection follow-ing natural infection either 5, 10 or 20 years (coupled withthese, we assumed that the infectiousness of mild cases rel-ative to primary cases was 12, 10 and 8%, respectively). Re-sults were estimated for all five matrix configurations andare shown in Fig. 5. In all cases we assumed that suscepti-bles could be boosted by vaccination. Dynamic results wereused to define the delay between implementation and reduc-tion in incidence. The post-booster equilibrium incidencewas compared to that without introduction of booster dosesto give the degree of indirect protection. The range of valuesof indirect protection was used to define a uniform distribu-tion. These were, for the 4-year-old programme: 35–90%,35–100% and 40–100% for an average period of vaccineinduced immunity of 2.5, 5 and 10 years, respectively; and0–100% for all 15-year-old programmes. The degree ofindirect protection was assumed to be equal in each ageclass.
Assumptions regarding the distribution of other param-eters are given in the main text. These are summarised inAppendix A, along with the range over which 90% of eachof the input parameter values varies.
W.J.
Edm
undset
al./Vaccine20
(2002)1316–1330
1329
1330 W.J. Edmunds et al. / Vaccine 20 (2002) 1316–1330
References
[1] Fine PEM, Clarkson JA. Distribution of immunity to pertussis in thepopulation of England and Wales. J Hyg (Cambridge) 1984;92:21–36.
[2] Miller E, Fleming DM, Ashworth LAE, Mabbett DA, Vurdien JE,Elliott TSJ. Serological evidence of pertussis in patients presentingwith cough in general practice in Birmingham. Commun Dis PublicHealth 2000;3:132–4.
[3] Wright SW, Edwards KM, Decker MD, Zeldin MH. Pertussisinfection in adults with persistent cough. JAMA 1995;273:1044–6.
[4] Guris D, Strebel PM, Bardenheier B, et al. Changing epidemiology ofpertussis in the United States: increasing reported incidence amongadolescents and adults, 1990–1996. Clin Infect Dis 1999;28:1230–7.
[5] Nennig ME, Shinefield HR, Edwards KM, Black SB, Fireman BH.Prevalence and incidence of adult pertussis in an urban population.JAMA 1996;275:1672–4.
[6] De Serres G, Shadmani R, Duval B, et al. Morbidity of pertussis inadolescents and adults. J Infect Dis 2000;182:174–9.
[7] Maclean DW. Adults with pertussis. J R Coll Gen Pract 1982;32:298–300.
[8] Thomas PF, McIntyre PB, Jalaludin BB. Survey of pertussismorbidity in adults in western Sydney. Med J Aust 2000;173:74–6.
[9] Beard SM, Finn A. Do we need to boost pertussis immunizationwithin the existing UK vaccination schedule? J Public Health Med2000;22:349–56.
[10] Miller E, Waight P, Laurichesse H, et al. Immunogenicity andreactogenicity of acellular diphtheria/tetanus/pertussis vaccines givenas a pre-school booster: effect of simultaneous administration ofMMR. Vaccine 19;3904–11.
[11] Koplan JP, Schoenbaum SC, Weinstein MC, Fraser DW. Pertussisvaccine—an analysis of benefits, risks and costs. N Engl J Med1979;301:906–11.
[12] Hinman AR, Koplan JP. Pertussis. JAMA 1984;251:3109–13.[13] Tormans G, Van Doorslaer E, van Damme P, Clara P, Schmitt
HJ. Economic evaluation of pertussis prevention by whole-cell andacellular vaccine in Germany. Eur J Pediatr 1998;157:395–401.
[14] Beutels P, Bonanni P, Tormans G, Canale F, Crovari PC. Aneconomic evaluation of universal pertussis vaccination in Italy.Vaccine 1999;17:2400–9.
[15] Ekwueme DU, Strebel PM, Hadler SC, et al. Economic evaluationof use of diphtheria, tetanus, and acellular pertussis vaccine ordiphtheria, tetanus and whole-cell pertussis vaccine in the UnitedStates, 1997. Arch Pediatr Adolesc Med 2000;154:797–803.
[16] Iskedjian M, Einarson TR, O’Brien BJ, et al. Economic evaluation ofa new acellular vaccine for pertussis in Canada. Pharmacoeconomics19; 551–63.
[17] Jenkinson D. Whooping cough: what proportion of cases is notifiedin an epidemic. BMJ 1983;287:185–6.
[18] Evans MR. Undernotification of whooping cough. BMJ1995;310:1331.
[19] Jenkinson D. Natural course of 500 cases of whooping cough: ageneral practice population study. BMJ 1995;310:299–302.
[20] Long SS, Welkon CJ, Clark JL. Widespread silent transmissionof pertussis in families: antibody correlations of infection andsymptomatology. J Infect Dis 1990;161:480–6.
[21] Long SS, Lischner HW, Deforest A, Clark JL. Serologic evidenceof subclinical pertussis in immunized children. Pediatr Infect Dis J1990;9:700–5.
[22] Srugo I, Benilevi D, Madeb R, et al. Pertussis infection in fullyvaccinated children in day-care centers. Israel Emerg Infect Dis2000;6:526–9.
[23] Clarkson JA, Fine PEM. The efficacy of measles and pertussisnotification in England and Wales. Int J Epidemiol 1985;14:153–68.
[24] Van Buynder PG, Owen D, Vurdien JE, Andrews NJ, Matthews RC,Miller E. Bordetella pertussis surveillance in England and Wales:1995–1997. Epidemiol Infect 1999;123:403–11.
[25] Crowcroft NS, Andrews N, Rooney C, Brisson M, Miller E. Medicalcertificates of cause of death underestimate deaths from pertussis.Arch Dis Child, in press.
[26] Weinstein MC, Siegel JE, Gold MR, Kamlet MS, Russell LB.Recommendations of the panel of cost-effectiveness in health andmedicine. JAMA 1996;276:1253–8.
[27] Department of Health. Policy appraisal and health. London:Department of Health, 1995.
[28] Anderson RM, May RM. Infectious diseases of humans: dynamicsand control. Oxford: Oxford University Press, 1991.
[29] Hethcote HW. Simulations of pertussis epidemiology in the UnitedStates: effect of adult booster vaccinations. Math Biosci 1999;158:47–73.
[30] Trollfors B, Taranger J, Lagergard T, et al. Immunization of childrenwith pertussis toxoid decreases spread of pertussis within the family.Pediatr Infect Dis J 1998;17:196–9.
[31] Fleming DM. Weekly returns service of the Royal College of GeneralPractitioners. Comm Dis Public Health 1999;2:96–100.
[32] Fleming, DM, Ross AM. Royal College of General PractitionersWeekly Returns Service Report for 1999.
[33] Netten A, Dennett J. Unit costs of health and social care 1999.Canterbury: Personal Social Services Research Unit, 1999.
[34] British Medical Association, Royal Pharmaceutical Society of GreatBritain. British National Formulary 39, 2000.
[35] Anonymous. COVER programme: January to March 2000—vaccination coverage statistics for children up to 5 years of age inthe United Kingdom. Commun Dis. Rep. 2000;10:223–4.
[36] Pichichero ME, Treanor J. Economic impact of pertussis. ArchPediatr Adolesc Med 1997;151:35–40.
[37] Mark A, Granstrom M. Impact of pertussis on the afflicted child andfamily. Pediatr Infect Dis J 1992;11:554–7.
[38] Spiegelhalter DJ, Myles JP, Jones DR, Abrams KR. Bayesian methodsin health technology assessment: a review. Health Technol Assess2000;4(38):5–15.
[39] Koopmanschap MA, Rutten FFH, van Ineveld BM, van Roijen L.The friction cost method for measuring indirect costs of disease. JHealth Econ 1995;14:171–89.
[40] Stevens A, Colin-Jones D, Gabbay J. Quick and clean: authoritativehealth technology assessment for local health care contracting. HealthTrends 1995;27:37–42.
[41] Levy-Bruhl D, Pebody R, Veldhuijzen I, Valenciano M,Osborne K. The European sero-epidemiology network: pertussisvaccination programme characteristics in eight European countries.Eurosurveillance 1998;3:107–10.


