Embed Size (px)
Citation preview
EffEcts of climatE on DEnguE outbrEak
Vol 44 No. 4 July 2013 613
Correspondence: Tasnim Hasan, School of Medicine, University of Western Sydney, Locked Bag 1797, Penrith NSW 2751, Australia.E-mail: [email protected]
THE EFFECTS OF CLIMATE VARIABLES ON THE OUTBREAK OF DENGUE IN QUEENSLAND 2008-2009
Tasnim Hasan and Hilary Bambrick
School of Medicine, University of Western Sydney, Penrith NSW, Australia
Abstract. Outbreaks of dengue occur in Queensland, Australia nearly every summer. In 2008-2009, there was an unusually large, protracted outbreak of dengue, comprised of 1,200 cases. We investigated the weather variables and their contribution to the 2008-2009 dengue outbreak in Queensland. Case data were obtained from the Communicable Disease Branch of Queensland Health for 2000-2010 for the towns of Cairns and Townsville. Monthly weather data (rainfall, maximum temperature, minimum temperature) and Southern Oscillation Index (SOI) was obtained from the Bureau of Meteorology (BOM). We used a negative binomial model to test associations between these variables and dengue. Lagged models were also created for one, two and three months. Our models suggest all weather variables but not the SOI were associated with dengue in both Cairns and Townsville, without a lag (p<0.01). No significant lag was seen with the weather variables. Rainfall and temperature preceding the 2008-2009 outbreak were also not significantly different (p<0.01) from other years. Short-term (non-lagged) weather variables were associated with the number of dengue cases in Cairns and Townsville. No lag was seen and no association was seen between the SOI and the number of dengue cases, which suggests there may be limited potential to predict large dengue outbreaks using climate variability. The large outbreak in 2008-2009 may have been driven by other, non-weather factors in addition to the immediate weather effect.Keywords: dengue, climate, outbreak, Queensland, Australia
INTRODUCTION
Dengue infection is a disease spread among humans by the bite of the mosquito vector Aedes aegypti (Halstead, 1988). Den-gue belongs to the Flavivirus family; there are four different serotypes (Halstead, 1988). Dengue infection is endemic to all tropical countries. Infection usually causes a febrile illness but in severe cases can cause hemorrhage, shock and death (Halstead, 1988).
Dengue has been found to occur during periods of increased temperature (Chowell and Sachez, 2006; Halide and Ridd, 2008; Chen et al, 2010), increased humidity (Tipayamongkholgul et al, 2009; Chen et al, 2010), increased rainfall (Halide and Ridd, 2008; Chen et al, 2010) and de-creased evaporation (Chowell and Sachez, 2006). Outbreaks often occur after a lag of few weeks to a few months from weather variables (Chowell and Sachez, 2006; Chen et al, 2010). Stochastic studies show weather variables, such as temperature and humidity, influence dengue vector characteristics by affecting the life-cycle of Aedes aegypti mosquitoes (Strickman and
southEast asian J trop mED public hEalth
614 Vol 44 No. 4 July 2013
Kittayapong, 2002; Barbazan et al, 2008; Morales Vargas et al, 2010).
Studies from Australia have also linked weather variables with dengue outbreaks (Hu et al, 2010). In Australia, dengue occurs in Queensland and the Northern Territory, where the climate is tropical (Russell et al, 2009). Australian annual dengue rates are usually around 0-2 per 100,000; however, there have been higher rates in recent years (NNDSS, 2011). Rates in Queensland and the North-ern Territory are up to 20 per 100,000 in outbreak years (NNDSS, 2011). Most cases occur between February and May. There is no gender preference for dengue infec-tion and the majority of cases occur in the 15-65 year old age group (NNDSS, 2011).
In this study we examined the as-sociations between a number of weather variables and dengue infection incidence to determine whether an outbreak in 2008-2009 may have been associated with anomalous weather variables. The out-break took place in Queensland, Australia and was comprised of approximately 1,200 reported cases.
MATERIALS AND METHODS
Ethical approval to conduct the study was obtained from the University of West-ern Sydney Human Ethics Committee. The following weather data were obtained from the Bureau of Meteorology (BOM) in monthly intervals from 1999-2010 (Octo-ber 2010): rainfall, mean maximum tem-perature and mean minimum temperature and the Southern Oscillation Index (SOI). These variables were used because other studies had linked these variables with dengue infection outbreaks.
Data regarding dengue outbreaks was obtained from the Communicable Disease Branch of Queensland Health for 2000-
2010 (earliest reliable records to present). There were 3,301 notified cases of den-gue during that period. Line record data included the following variables: month and year of infection, age group of the patient (0-14, 14-64, 65+ years), sex of the patient, place of acquisition (overseas or locally) and health service district [Towns-ville, Cairns and Hinterland (henceforth referred to as Cairns), and other].
Of the 3,301 cases, those contracted outside Townsville and Cairns and those acquired overseas were eliminated from this study. The remainder were comprised of 1,868 cases, 1,601 of these occurred in Cairns and 267 occurred in Townsville. During 2008-2009 there were 1,200 local acquired dengue cases in Queensland, of whom 964 were from Cairns and 108 were from Townsville.
Population estimates for the years 2000-2010 were obtained for the Cairns and Townsville health service districts (dengue data is recorded by health dis-trict). A population growth rate of 1.48% per annum (Harper et al, 2004) was re-ported for Townsville and 3% per annum for Cairns (Queensland Health, 2011).
The data from 2000 - 2010 were ana-lyzed to determine yearly and monthly trends for weather, dengue cases, sex differences, age distribution and by loca-tion (Townsville and Cairns). The data for 2008-2010 (the period of the dengue outbreak) were analyzed for trends.
SPSS was used to create negative bi-nomial models for the interaction between weather variables (rainfall, minimum and maximum temperature and SOI) and dengue infections for 2000-2010. Another model was created to determine the rela-tionship between dengue cases and the combined effect of rainfall and maximum temperature. Lag models were created by lagging the weather variable by one, two
EffEcts of climatE on DEnguE outbrEak
Vol 44 No. 4 July 2013 615
or three months from the dengue data.
RESULTS
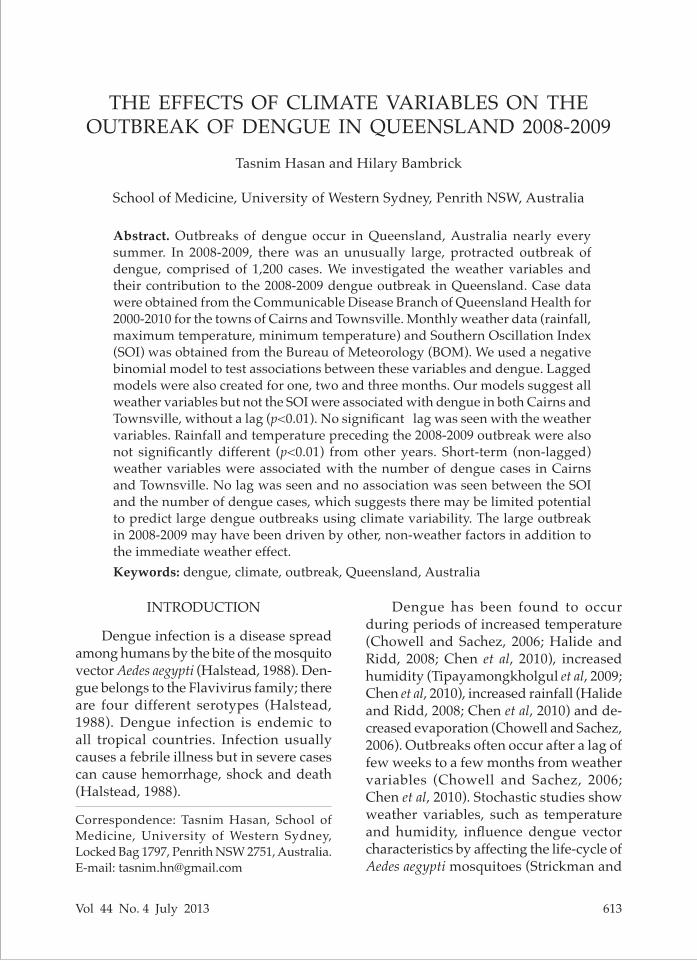
Weather dataLooking at the rainfall
and temperature trends for 1999-2010 (Fig 1a and 1b), there were yearly peaks between November and February. There was an increasing trend in rainfall but not temperature over the years. There was an especially prominent peak in rainfall in 2009, which coincided with the current outbreak of interest. Southern Oscillation Index
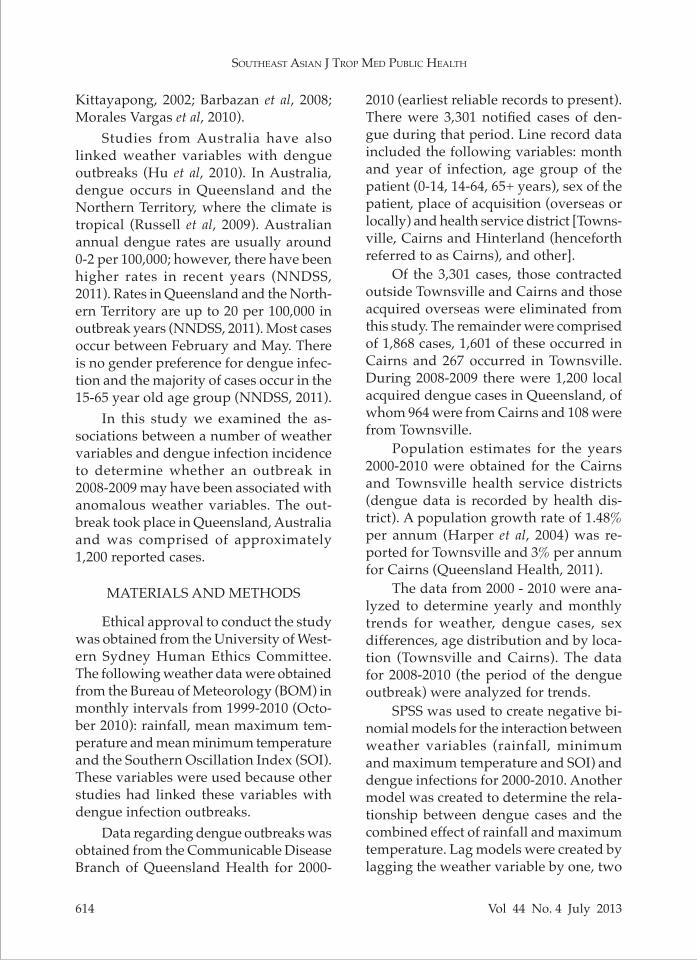
As expected the SOI data variation was cyclic (Fig 2). There were pro-longed periods of both positive and negative varia-tions in the SOI often over periods greater than one year; however, there was no fixed pattern observable.Dengue data
There were 1,868 cases of dengue reported during 2000-2010 with 1,601 occur-ring in Cairns and 267 in
1a
1b
Year
Year
Tem
pera
ture
(Cel
sius
)Te
mpe
ratu
re (C
elsi
us)
Fig 2–Southern Oscillation Index for 1999-2010.
Fig 1–Monthly climate data: (1a) for Cairns during 1999-2010 and (1b) for Townsville during 1990-2010.
Rai
nfal
l (m
m)
Rai
nfal
l (m
m)
Year
SO
I
Townsville. Of the 1,601 cases, 885 were female, 981 were male and in 2 cases the sex was not reported. The difference be-tween sexes was statistically significant (p<0.01). In terms of age, the 15-64 year old age group had the greatest number of cases.
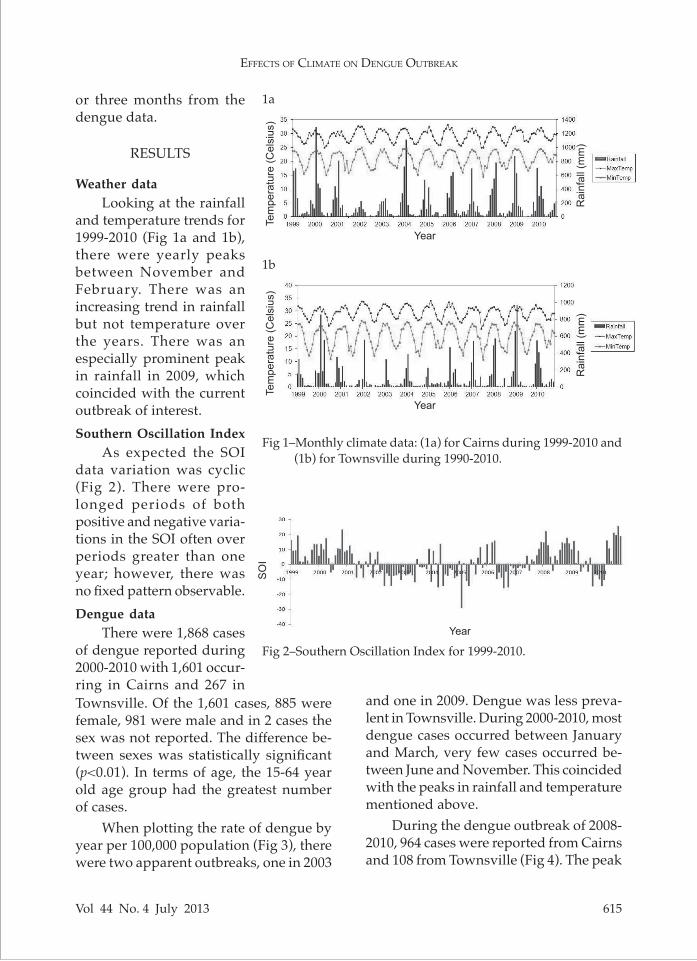
When plotting the rate of dengue by year per 100,000 population (Fig 3), there were two apparent outbreaks, one in 2003
and one in 2009. Dengue was less preva-lent in Townsville. During 2000-2010, most dengue cases occurred between January and March, very few cases occurred be-tween June and November. This coincided with the peaks in rainfall and temperature mentioned above.
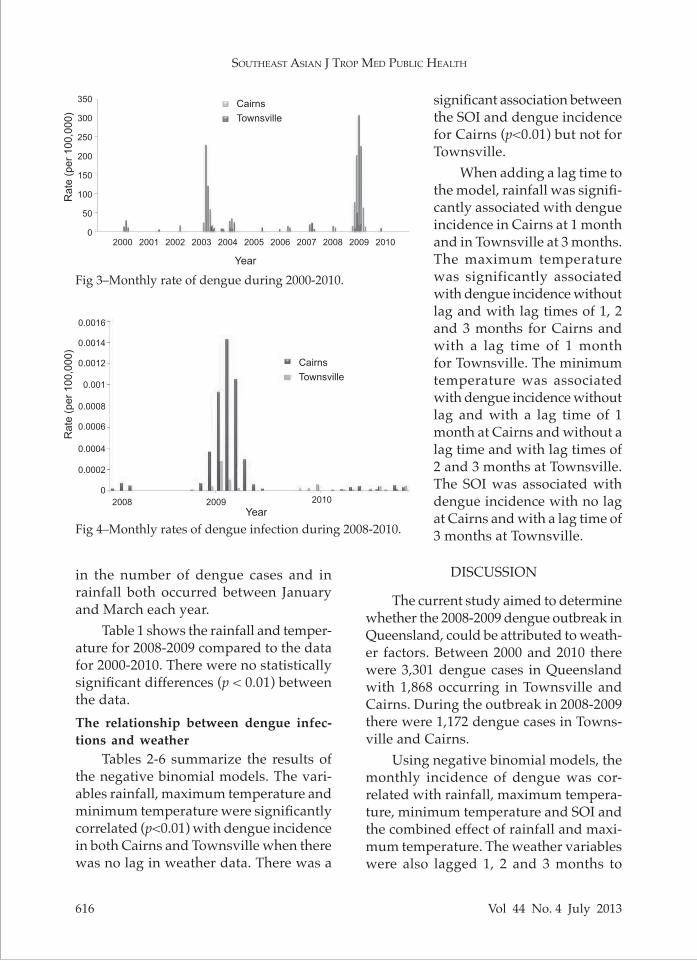
During the dengue outbreak of 2008-2010, 964 cases were reported from Cairns and 108 from Townsville (Fig 4). The peak
southEast asian J trop mED public hEalth
616 Vol 44 No. 4 July 2013
in the number of dengue cases and in rainfall both occurred between January and March each year.
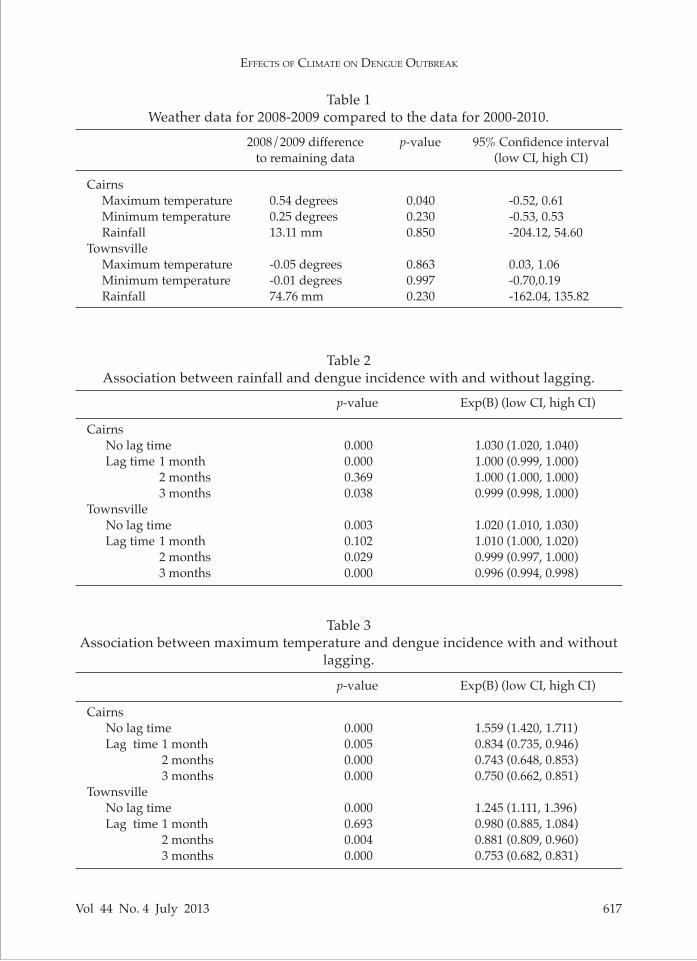
Table 1 shows the rainfall and temper-ature for 2008-2009 compared to the data for 2000-2010. There were no statistically significant differences (p < 0.01) between the data.The relationship between dengue infec-tions and weather
Tables 2-6 summarize the results of the negative binomial models. The vari-ables rainfall, maximum temperature and minimum temperature were significantly correlated (p<0.01) with dengue incidence in both Cairns and Townsville when there was no lag in weather data. There was a
DISCUSSION
The current study aimed to determine whether the 2008-2009 dengue outbreak in Queensland, could be attributed to weath-er factors. Between 2000 and 2010 there were 3,301 dengue cases in Queensland with 1,868 occurring in Townsville and Cairns. During the outbreak in 2008-2009 there were 1,172 dengue cases in Towns-ville and Cairns.
Using negative binomial models, the monthly incidence of dengue was cor-related with rainfall, maximum tempera-ture, minimum temperature and SOI and the combined effect of rainfall and maxi-mum temperature. The weather variables were also lagged 1, 2 and 3 months to
350
300
250
200
150
100
50
02000 2001 2002 2003 2004 2005 2006 2007 2008 2009 2010
0.0016
0.0014
0.0012
0.001
0.0008
0.0006
0.0004
0.0002
02008 2009 2010
Rat
e (p
er 1
00,0
00)
Rat
e (p
er 1
00,0
00)
Year
Year
CairnsTownsville
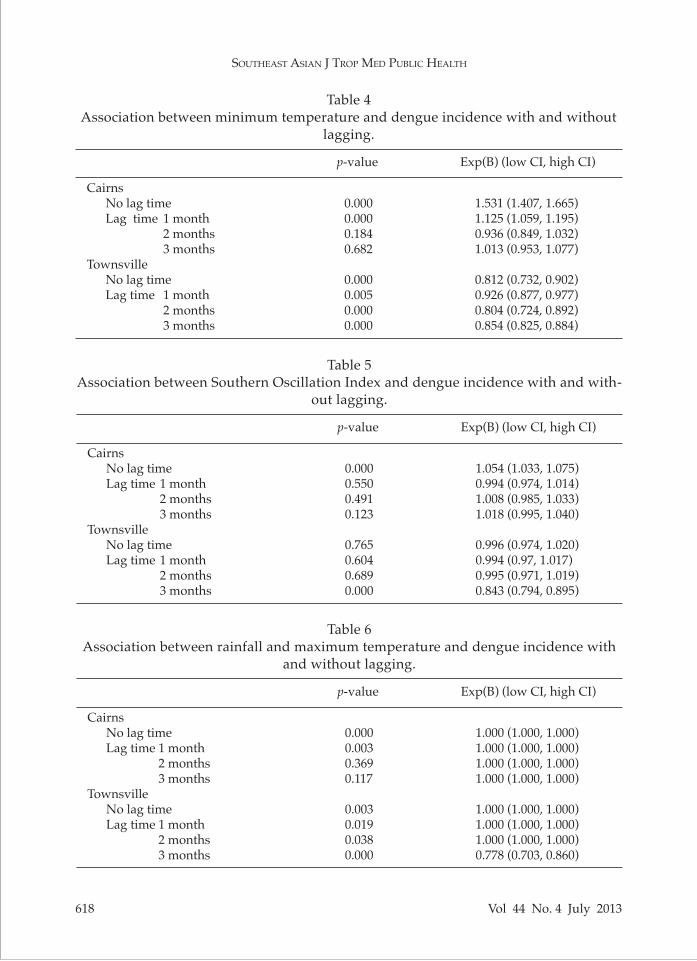
significant association between the SOI and dengue incidence for Cairns (p<0.01) but not for Townsville.
When adding a lag time to the model, rainfall was signifi-cantly associated with dengue incidence in Cairns at 1 month and in Townsville at 3 months. The maximum temperature was significantly associated with dengue incidence without lag and with lag times of 1, 2 and 3 months for Cairns and with a lag time of 1 month for Townsville. The minimum temperature was associated with dengue incidence without lag and with a lag time of 1 month at Cairns and without a lag time and with lag times of 2 and 3 months at Townsville. The SOI was associated with dengue incidence with no lag at Cairns and with a lag time of 3 months at Townsville.
Fig 3–Monthly rate of dengue during 2000-2010.
Fig 4–Monthly rates of dengue infection during 2008-2010.
CairnsTownsville
EffEcts of climatE on DEnguE outbrEak
Vol 44 No. 4 July 2013 617
Table 1Weather data for 2008-2009 compared to the data for 2000-2010.
2008/2009 difference p-value 95% Confidence interval to remaining data (low CI, high CI)
Cairns Maximum temperature 0.54 degrees 0.040 -0.52, 0.61 Minimum temperature 0.25 degrees 0.230 -0.53, 0.53 Rainfall 13.11 mm 0.850 -204.12, 54.60 Townsville Maximum temperature -0.05 degrees 0.863 0.03, 1.06 Minimum temperature -0.01 degrees 0.997 -0.70,0.19 Rainfall 74.76 mm 0.230 -162.04, 135.82
Table 2Association between rainfall and dengue incidence with and without lagging.
p-value Exp(B) (low CI, high CI)
Cairns No lag time 0.000 1.030 (1.020, 1.040) Lag time 1 month 0.000 1.000 (0.999, 1.000) 2 months 0.369 1.000 (1.000, 1.000) 3 months 0.038 0.999 (0.998, 1.000)Townsville No lag time 0.003 1.020 (1.010, 1.030) Lag time 1 month 0.102 1.010 (1.000, 1.020) 2 months 0.029 0.999 (0.997, 1.000) 3 months 0.000 0.996 (0.994, 0.998)
Table 3Association between maximum temperature and dengue incidence with and without
lagging.
p-value Exp(B) (low CI, high CI)
Cairns No lag time 0.000 1.559 (1.420, 1.711) Lag time 1 month 0.005 0.834 (0.735, 0.946) 2 months 0.000 0.743 (0.648, 0.853) 3 months 0.000 0.750 (0.662, 0.851)Townsville No lag time 0.000 1.245 (1.111, 1.396) Lag time 1 month 0.693 0.980 (0.885, 1.084) 2 months 0.004 0.881 (0.809, 0.960) 3 months 0.000 0.753 (0.682, 0.831)
southEast asian J trop mED public hEalth
618 Vol 44 No. 4 July 2013
Table 5Association between Southern Oscillation Index and dengue incidence with and with-
out lagging.
p-value Exp(B) (low CI, high CI)
Cairns No lag time 0.000 1.054 (1.033, 1.075) Lag time 1 month 0.550 0.994 (0.974, 1.014) 2 months 0.491 1.008 (0.985, 1.033) 3 months 0.123 1.018 (0.995, 1.040)Townsville No lag time 0.765 0.996 (0.974, 1.020) Lag time 1 month 0.604 0.994 (0.97, 1.017) 2 months 0.689 0.995 (0.971, 1.019) 3 months 0.000 0.843 (0.794, 0.895)
Table 6Association between rainfall and maximum temperature and dengue incidence with
and without lagging.
p-value Exp(B) (low CI, high CI)
Cairns No lag time 0.000 1.000 (1.000, 1.000) Lag time 1 month 0.003 1.000 (1.000, 1.000) 2 months 0.369 1.000 (1.000, 1.000) 3 months 0.117 1.000 (1.000, 1.000)Townsville No lag time 0.003 1.000 (1.000, 1.000) Lag time 1 month 0.019 1.000 (1.000, 1.000) 2 months 0.038 1.000 (1.000, 1.000) 3 months 0.000 0.778 (0.703, 0.860)
Table 4Association between minimum temperature and dengue incidence with and without
lagging.
p-value Exp(B) (low CI, high CI)
Cairns No lag time 0.000 1.531 (1.407, 1.665) Lag time 1 month 0.000 1.125 (1.059, 1.195) 2 months 0.184 0.936 (0.849, 1.032) 3 months 0.682 1.013 (0.953, 1.077)Townsville No lag time 0.000 0.812 (0.732, 0.902) Lag time 1 month 0.005 0.926 (0.877, 0.977) 2 months 0.000 0.804 (0.724, 0.892) 3 months 0.000 0.854 (0.825, 0.884)
EffEcts of climatE on DEnguE outbrEak
Vol 44 No. 4 July 2013 619
determine if any of the weather variables were associated with an increase in den-gue incidence. Peaks in dengue were seen in the summer, during January to March. Rainfall and temperature peaks were seen during November to March.
The 2008-2009 weather data did not differ significantly from the other years. Using a negative binomial model looking at the data during 2000-2010, all weather variables correlated significantly (p < 0.01) with dengue incidence except the SOI in Townsville, when there was no lag in weather data. Several relationships were noted in the lagged models; however no consistent patterns were present. The cur-rent study adds to the growing evidence that dengue occurs in warm and humid climates.
Similar studies of dengue incidence, outbreaks and weather variables have been conducted over the past ten to fif-teen years. In the current study, rainfall was significantly correlated with dengue incidence without a lag in both Cairns and Townsville. Rainfall has also been found to correlate with dengue without a lag period in other studies (Chowell and Sa-chez, 2006; Hurtado-Diaz et al, 2007; Jury, 2008; Diaz-Quijano et al, 2008). Stochastic studies have also shown that the dengue vector, Aedes aegypti proliferates in wet conditions (Chadee, 2009).
However, when studying the effect of a lag on dengue incidence and rainfall, the only significant correlation (p>0.01) was at one month in Cairns and at three months in Townsville. In other studies a correlation was seen with a lag time of five to twenty weeks (Hii et al, 2009), seven weeks (Depradine and Lovell, 2004), three months (Chen et al, 2010), one to six months (Halide and Ridd, 2008), and at one and two months (Johansson et al,
2009). However, correlation was most sig-nificant with no lag time, similar to other studies (Hurtado-Diaz et al, 2007; Jury, 2008; Diaz-Quijano et al, 2008).
Both minimum and maximum tem-peratures were significantly correlated with dengue incidence without a lag in our study. Maximum and minimum temperatures were also correlated with dengue incidence without a lag time in another study (Chowell and Sachez, 2006). Other studies have looked at average temperature (instead of maximum and minimum temperature) and have also found a correlation with dengue incidence without a lag (Bangs et al, 2006; Hurtado-Diaz et al, 2007; Dibo et al, 2008; Johansson et al, 2009). These studies are similar to our study in that they looked at monthly data for temperature and dengue incidence despite looking at average temperature. Further studies show temperature is im-portant in mosquito size and in the egg to larvae cycle (Strickman and Kittayapong, 2002). Rainfall and temperature are impor-tant factors affecting dengue incidence.
Maximum temperature was signifi-cantly associated with dengue incidence for all lag times of one, two and three months for both Cairns and Townsville except with a lag time of one month in Townsville and minimum temperature was significantly associated with dengue incidence for all lag times of one, two and three months in Townsville and for one month in Cairns. In other studies, minimum temperature has been found to be significant at one month (Chowell and Sachez, 2008) and four to fifteen weeks (Depradine and Lovell, 2004). A maximum temperature has been found to be signifi-cant at lag time of three to twelve weeks (Depradine and Lovell, 2004). Average temperature was found to be significant
southEast asian J trop mED public hEalth
620 Vol 44 No. 4 July 2013
with a lag time of three months (Chen et al, 2010), one to six months (Halide and Ridd, 2008), and at one and two months (Johansson et al, 2009). For weekly data, temperature was found to be significant at a lag time of five to sixteen weeks (Hii et al, 2009). It can be concluded that tem-perature is an important factor associ-ated with dengue incidence, but there is significant variation in the lag time. This suggests short term weather variables are important in predicting outbreaks of den-gue, but long term changes in climate can-not always predict outbreaks of dengue.
There was no consistent relationship between dengue incidence and the SOI. The SOI was only significant in Cairns with no lag time and in Townsville with three months lag time. Other studies have evaluated different indicators for the El Niño Southern Oscillation (ENSO) instead of the SOI. Unlike the current study, the relationship between ENSO and dengue incidence has been shown to be stronger (Hales et al, 1999; Cazelles et al, 2005) with a lag of sixteen to twenty weeks (Hurtado-Diaz et al, 2007; Diaz-Quijano et al, 2008) and one to eleven weeks (Tipayamong- kholgul et al, 2009). A decrease in the SOI (ie, warmer conditions over Australia) has been associated with increases in monthly dengue cases with a lag time of three to twelve months in Queensland (Hu et al, 2010). That study is similar to our study, in that they collected the monthly SOI from the BOM and the monthly dengue incidence; however, the lag period in their study was greater than in our study. Per-haps in our study, the SOI lag time was not sufficient to determine the relation-ship between dengue and SOI. Only one study found the link between ENSO and dengue to be weak (Johansson et al, 2009).
The combined effect of rainfall and maximum temperature was found to
be significantly associated with dengue incidence in both Cairns and Towns-ville without a lag time and with a one month lag time, but was also significant in Townsville at a lag of three months. Most other studies have not looked at the combined effect of temperature and rainfall. It is possible that dengue occurs during periods of increased rainfall but only with increased temperature. Looking at different lag times for different weather variables may be a way to determine the strongest relationship between dengue and weather.
The 2008-2009 weather variables were not significantly different (p<0.01) from previous years. This suggests that although the dengue outbreak of interest occurred in the warmer months of the year we cannot say longer term climate changes were responsible for this out-break. Weather variables are important for driving dengue outbreak, but other factors may have contributed to this outbreak.
One limitation of our study was that it used population estimates in our nega-tive binomial model, since exact estimates were unavailable. The retrospective na-ture of the study was also a limitation; however the majority of studies in this field use retrospective data due to long time frames. Future studies may be im-proved by varying temperature, rainfall and SOI further lag times.
In summary, anomalies in weather variables are important for causing in-creases in dengue incidence. Weather changes precede dengue outbreaks by only short periods of time (one to three months). Although, there were no sig-nificant differences between the 2008-2009 weather variables and the other years which could account for the outbreak, our results suggests an overall relationship between weather anomalies and dengue
EffEcts of climatE on DEnguE outbrEak
Vol 44 No. 4 July 2013 621
incidence. Being aware of this is important to curb outbreaks of dengue before they arise. Other causes of dengue outbreak also need to be studied to determine the exact dynamics of dengue outbreaks.
ACKNOWLEDGEMENTS
Notification data were provided by the Epidemiology, Surveillance and Re-search Unit, Queensland Health. We wish to thank Sanja Lujic, biostatistician at the School of Medicine, UWS for her statistical advice. Funding was not required for this research. All authors had full access to all of the data in the study.
REFERENCES
Bangs M, Larasati R, Corwin A, Wuryadi S. Climatic factors associated with epidemic dengue in Palembang, Indonesia: implica-tions of short-term meteorological events on virus transmission. Southeast Asian J Trop Med Public Health 2006; 37: 1103-16.
Barbazan P, Tuntaprasart W, Souris M, et al. Assessment of a new strategy, based on Aedes aegypti (L.) pupal productivity, for the surveillance and control of dengue transmission in Thailand. Ann Trop Med Parasitol 2008; 102: 161-71.
Cazelles B, Chavez M, McMichael A, Hales S. Nonstationary influence of El Nino on the synchronous dengue epidemics in Thai-land. PLoS Med 2005; 2: e106
Chadee D. Dengue cases and Aedes aegypti indices in Trinidad, West Indies. Acta Trop 2009; 112: 174-80.
Chen S, Liao C, Chio C, Chou H, You S, Cheng Y. Lagged temperature effect with mosquito transmission potential explains dengue variability in southern Taiwan: Insights from a statistical analysis. Sci Total Environ 2010; 408: 4069-75.
Chowell G, Sachez F. Climate-based descriptive models of dengue fever: the 2002 epidemic in Colima, Mexico. J Environ Health 2006;
68: 40-4, 55.Depradine C, Lovell E. Climatological vari-
ables and the incidence of Dengue fever in Barbados. Int J Environ Health Res 2004; 14: 429-41.
Diaz-Quijano F, Gonzalez-Rangel A, Gomez-Capacho A, Espindola-Gomez R, Mar-tinez-Vega R, Villar-Centeno L. Rainfall and acute febrile syndrome in a dengue-endemic area. Rev Salud Publica (Bogota) 2008; 10: 250-9.
Dibo M, Chierotti A, Ferrari M, Mendonca A, Chiaravalloti Neto F. Study of the relation-ship between Aedes (Stegomyia) aegypti egg and adult densities, dengue fever and cli-mate in Mirassol, state of Sao Paulo, Brazil. Mem Inst Oswaldo Cruz 2008; 103: 554-60.
Hales S, Weinstein P, Souares Y, Woodward A. El Nino and the dynamics of vector borne disease transmission. Environ Health Per-spect 1999; 107: 99-102
Halide H, Ridd P. A predictive model for Den-gue Hemorrhagic Fever epidemics. Int J Environ Health Res 2008; 18: 253-65.
Halstead S. Pathogenesis of dengue: Chal-lenges to molecular biology. Science 1988; 239: 476-81.
Harper C, Cardona M, Bright M, et al. Health determinants Queensland 2004. Brisbane: Public Health Services, Queensland Health, 2004. Chapter 6, Townsville health service district.
Hii Y, Rocklov J, Ng N, Tang C, Pang F, Sauer-born R. Climate variability and increase in intensity and magnitude of dengue incidence in Singapore. Glob Health Action 2009; 2.
Hu W, Clements A, Williams G, Tong S. Dengue fever and El Nino/Southern Oscillation in Queensland, Australia: a time series predictive model. Occup Environ Med 2010; 67: 307-11.
Hurtado-Diaz M, Riojas-Rodriguez H, Rothen-berg S, Gomez-Dantes H, Cifuentes E. Short communication: Impact of climate variability on incidence of dengue in Mex-ico. Trop Med Int Health 2007; 12: 1327-37.
southEast asian J trop mED public hEalth
622 Vol 44 No. 4 July 2013
Johansson M, Cummings D, Glass D. Multi-year climate variability and dengue–El Nino southern oscillation, weather, and dengue incidence in Puerto Rico, Mexico and Thailand: a longitudinal data analysis. PLoS Med 2009; 6: e1000168.
Jury MR. Climate influences on dengue epi-demics in Puerto Rico. Int J Environ Health Res 2008; 18: 323-34.
Morales Vargas R, Ya-Umphan P, Phumala-Morales N, Komalamisra N, Dujardin J. Climate associated size and shape changes in Aedes aegypti (Diptera: Culicidae) popu-lations from Thailand. Infect Genet Evol 2010; 10: 580-5.
National Notifiable Diseases Surveillance Sys-tem (NNDSS). Notification rate for dengue virus infection, Australia, in the period of 1991 to 2010 and year-to-date notifications for 2011 [Online]. Canberra: Department of Health and Aging, 2011 June. [Cited 2011
Jul 30]. Available from: URL: http://www9.health.gov.au/cda/source/Rpt_3.cfm
Queensland Health [Internet]. Brisbane: The State of Queensland. Cairns and Hinterland health service district, 2011 June. [Cited 2011 Jul 30]. Available from: URL: http://www.health.qld.gov.au/cairns_hinterland/
Russell R, Currie B, Lindsay M, Mackenzie J, Ritchie S, Whelan P. Dengue and climate change in Australia: predictions for the future should incorporate knowledge from the past. Med J Aust 2009; 190: 265-9.
Strickman D, Kittayapong P. Dengue and its vectors in Thailand: introduction to the study and seasonal distribution of Aedes larvae. Am J Trop Med Hyg 2002; 67: 247-59.
Tipayamongkholgul M, Fang C, Klinchan S, Liu C, King C. Effects of the El Niño-southern oscillation on dengue epidemics in Thailand, 1996-2005. BMC Public Health 2009; 9: 422.


