Embed Size (px)
Citation preview

The Norwegian minke whale DNA register: a data base
monitoring commercial harvest and trade of whale products
Kevin A Glover1, Tore Haug2, Nils Øien1, Lars Walløe3, Lotta Lindblom2, Bjørghild B Seliussen1 &
Hans J Skaug1,4
1Institute of Marine Research, PO Box 1870, Nordnes, N-5817 Bergen, Norway; 2Institute of Marine Research, PO Box
6404, N-9294 Tromsø, Norway; 3Institute of Basic Medical Sciences, PO Box 1103, Blindern, N-0317 Oslo, Norway;4Department of mathematics, University of Bergen, N-5008 Bergen, Norway
Introduction 314
Specification of the NMDR 315
General organization and responsibility 315
Overview of the hunt and collection of tissue samples 316
DNA analyses 320
Data quality 320
Application of the register 322
Statistical power of identification 322
Checking meat sold on the Norwegian market 324
Export of whale products 324
Scientific research arising from the NMDR 325
Discussion 325
Future of the NMDR – looking to human DNA data bases and SNPs 325
Individual-based DNA registers: challenges and opportunities 326
Abstract
The application of genetics for the management of natural resources is expanding,
and within this field, DNA registers will play an increasing role. The Norwegian
minke whale DNA register, established in 1996, was designed primarily as a control
system to detect any attempts at illegal trade of products derived from other stocks of
minke whale, or other whale species, under cover of the legal Norwegian harvest
originating from the Northeast Atlantic. The register contains genetic data for 7644
of 7751 whales landed in the period 1997–2010. Profiles are established from
sequencing part of the mtDNA control region, analysis of 10 STRs and a sex-
determining marker. Probabilities of genotypes matching between two randomly
selected whales are 6.0)04 and 3.0)08 for five and eight of the STR loci, respectively.
This permits verification of traded whale products via match to the register. The
register has also been used in a number of ad hoc scientific studies resulting through
the accumulation of genetic, demographic and biological data. Here, we review the
register’s logistics, specifications and evaluate the potential to apply similar registers
to control the exploitation of other marine species.
Keywords CITES, data base, fisheries genetics, forensic, IWC, whales, wildlife
register
Correspondence:
Kevin A Glover, Insti-
tute of Marine Re-
search, PO Box 1870,
Nordnes, N-5817
Bergen, Norway
Tel.:
+00 47 55 23 63 57
E-mail: kevin.glover
@imr.no
Received 24 Apr 2011
Accepted 26 Oct 2011
F I S H and F I S H E R I E S , 2012, 13, 313–332
� 2011 Blackwell Publishing Ltd DOI: 10.1111/j.1467-2979.2011.00447.x 313
Conclusions 329
Acknowledgements 329
References 329
Supporting Information 332
Introduction
As the human population continues to expand, an
increasing strain is being placed on the world’s
natural resources, challenging biodiversity. Turning
to the world’s fisheries, which make a significant
contribution to human protein consumption, com-
mercial harvest has left a legacy of over-exploita-
tion. It is estimated that 85% of the world’s fisheries
are considered fully exploited, over-exploited,
depleted or recovering from depletion (FAO 2010).
To complicate management of these important
resources further, there are significant challenges
associated with by-catch (Harrington et al. 2005;
Diamond and Beukers-Stewart 2011; Lewison et al.
2011). Furthermore, illegal, unreported and unreg-
ulated (IUU) fishing is estimated to be globally worth
between 10 and 23.5 billion USD annually (Agnew
et al. 2009). In the future, greater regulation of both
legal and IUU fishing will be required to ensure
sustainable exploitation of the world’s fisheries.
Molecular genetic data have been widely imple-
mented to describe and identify populations and
management units within fisheries (Hauser and
Carvalho 2008; Waples et al. 2008; Reiss et al.
2009). In some cases, this has also provided the
ability to give management advice, although direct
translation of genetic data into fishery policy has not
been without its challenges (Waples et al. 2008; Reiss
et al. 2009). DNA methods have also been developed
for the identification of commercial fish and seafood
species (reviewed by Rasmussen and Morrissey
2008), and to improve compliance, traceability and
enforcement within fisheries (reviewed by Ogden
2008) and aquaculture (reviewed by Glover 2010).
These developments mirror the increasing trend of
monitoring illegal use of natural resources in general
(Gavin et al. 2010) and increasing focus on applying
genetic data to address issues of illegal harvest and
trade of wildlife (Manel et al. 2002; Baker 2008;
Ogden et al. 2009; Alacs et al. 2010; Ogden 2010).
DNA registers may be broadly defined as orga-
nized collections of genetic data, can accommodate
data generated by various types of molecular
markers, may include biological and demographic
information, and be implemented to address a
diverse range of questions. For the specific purpose
of wildlife and fisheries management, DNA registers
may play a monitoring and enforcement role
(Palsbøll et al. 2006; Baker 2008; Ogden 2008;
Ogden et al. 2009), and can provide capability to
accurately identify unknown sample(s) to specific
individuals, families, populations and species. For
regulation and law-enforcement in wildlife and
fisheries, the majority of DNA forensic challenges
deal with species identification (Ogden et al. 2009;
Tobe and Linacre 2010; Wilson-Wilde et al. 2010).
This challenge is often met by sequencing well-
characterized genes, for example cytochrome
c oxidase I (COI) which is used for ‘DNA barcoding’
species (Hebert et al. 2003), then searching large
public data bases such as GenBank for a close or
direct match. Going beyond species identification,
data bases of allele frequency data at multiple loci
for several or more populations (Shaklee et al. 1999;
Seeb et al. 2007) can permit the identification of
unknown individuals to population of origin using
statistical approaches (reviewed by Hansen et al.
2001; Manel et al. 2002, 2005; Ball et al. 2011).
Individual genetic assignment to population of
origin has identified poaching (Withler et al. 2004;
Wasser et al. 2007), illegal translocations (Frantz
et al. 2006), fishing competition fraud (Primmer
et al. 2000) and even ownership of fish-farm escap-
ees (Glover et al. 2008, 2010a). Finally, at the
narrowest end of the scale, registers of individual
samples, for example taken in a regulated fishery or
hunt, may be established to check for legality of
captured individuals later sold/distributed in the
market via direct match mis-match to the register
(Palsbøll et al. 2006).
The common minke whale occurring in the
Atlantic ocean, Balaenopthera acutorostrata acutoro-
strata, is a small (typical adult size 6–8 m total
length) baleen whale that is presumed to undertake
seasonal migrations from tropical regions where
they breed and overwinter to Arctic regions in the
summer months in the search of abundant food
(Jonsgard 1951, 1966). During this time of the
year, they are mainly limited to continental shelf
The Norwegian minke whale DNA register K A Glover et al.
314 � 2011 Blackwell Publishing Ltd, F I S H and F I S H E R I E S , 13, 313–332

areas although they are also found in offshore deep-
water areas, and their distribution is more or less
continuous from the eastern and central parts of the
North Atlantic to West Greenland (Horwood 1990;
Donovan 1991). These whales are abundant, and
the numbers in the Northeast Atlantic have been
estimated at 107 205 based upon mathematical
modelling from sighting survey data (Skaug et al.
2004). The development of modern whaling of the
species started in the Northeast Atlantic in the
1920s, and the exploitation of the species by
Norwegian fishermen escalated after 1945, reach-
ing its peak in the 1950s with annual catches of
some 3500 animals (Jonsgard 1951; Christensen
and Øien 1990). The initial Norwegian hunt
targeted the Northeast Atlantic stock, whereas the
area around the Jan Mayen island (belonging to the
Central Atlantic stock) was included in the 1960s
(Christensen and Øien 1990). From 1959, Norwe-
gian exploitation of minke whales decreased
because of national harvest regulations (Øien et al.
1987; Christensen and Øien 1990). International
regulations with quotas were introduced in all areas
by the International Whaling Commission (IWC) in
1976 (Øien et al. 1987), and an international
moratorium for all whaling was laid down by the
IWC, taking effect from 1987. Norway issued a
reservation against this moratorium but also halted
whaling in the period 1988 to 1993 because of
uncertainty regarding the stock situation. When
harvest was once again reinstated, annual quotas
were calculated using the Revised Management
Procedure (RMP) developed by the IWC (Skaug
et al. 2004), which uses catch history and the most
recent abundance estimates from the sighting sur-
veys as the basic input data (IWC 1999).
Shortly after Norway re-instated commercial har-
vest of minke whales in the Northeast Atlantic, a
DNA register, hereon referred to as the Norwegian
minke whale DNA register (NMDR), was established
by Bjørnar Olaisen and Berit M. Dupuy at the
Institute of Forensic Medicine at the University of
Oslo, Norway (RMI) (Olaisen 1997). The primary
objective of the register was to develop a control
system to detect any attempts at illegal trade of
products derived from other stocks of minke whale,
or other whale species, under cover of the legal
Norwegian harvest and trade of Northeast Atlantic
minke whale (Olaisen 1997; Anon. 1998). In short,
by having an individual genetic profile for all legally
captured whales, any suspicion of illegal harvest of
minke and/or other whale species would be possible
to examine by direct match to the register. Therefore,
a mis-match would suggest illegal harvest/trade.
Soon after its establishment, the NMDR register
was checked by an international group of scientists
(Palsbøll et al. 2006), who verified that meat
purchased on the Norwegian market was legal
(i.e. matched samples in the register) and that the
genotypes established from two stranded minke
whales sampled in Denmark were excluded (i.e. not
falsely identified to the register). The NMDR has
subsequently been discussed in several review
articles (e.g. Baker 2008; Ogden et al. 2009; Alacs
et al. 2010), and a number of scientific articles
using data from the register have been published
(see the section Research arising from the NMDR).
Nevertheless, despite the fact that the NMDR has
been operated for nearly 15 years, and possibly
represents the only operational individual-based
DNA register for a CITES listed species that is
commercially harvested, its specifications, methods
and logistics have never been presented. Therefore,
the aim of this paper is to review the NMDR and
how it interacts with commercial whaling.
Specification of the NMDR
General organization and responsibility
The NMDR is owned and managed by the Norwe-
gian Directorate of Fisheries (NDF) who are also
responsible for overseeing that the commercial
harvest of minke whales under Norwegian quota
is conducted according to the conditions and
regulations laid down nationally. Together with
commercial hunters and other governmental
research institutions, the NMDR is run in a coor-
dinated manner where all participants have a role
to play in the process (Fig. 1).
When the NMDR was first established in 1996,
the Institute of Marine Research in Tromsø (IMRt)
was given responsibility for organizing practical
details surrounding the register including supplying
necessary tissue sampling equipment for all boats
involved in whaling, long-term storage of tissue
samples sent in by whalers after the season,
organization of the biological data recorded on
captured whales (Table 1) and finally, preparation
of subsets of tissue samples ready for DNA analysis.
Once tissue samples are prepared by IMRt, they are
sent to the molecular genetics laboratory for DNA
analysis. This occurs once the hunting season has
ended, and all available remote sensor data and log
The Norwegian minke whale DNA register K A Glover et al.
� 2011 Blackwell Publishing Ltd, F I S H and F I S H E R I E S , 13, 313–332 315

books have been validated. While the time elapse
between cessation of the hunting season and start of
genetic analyses varies from year to year, at present,
there is a delay of 8–12 weeks before DNA samples
are sent to the analytical laboratory. Upon comple-
tion of DNA analyses, the responsible molecular
genetics laboratory sends quality-checked data back
to the NDF who store the data in the register. This
cycle of activity is repeated each season.
The annual commercial hunt of minke whales in
Norway starts in April and continues through to
August or September (exact timing varies yearly).
Whale meat is sold within Norway as seasonal fresh
produce, i.e. immediately upon landing, or as frozen
product which may enter the market for up to
several years. Thus, for fresh and quickly marketed
frozen products, there is a period in which meat is
available in the market, but the register is not
updated. The register is therefore only able to
provide an ad hoc monitoring and enforcement.
Nevertheless, the supply chain from boat to con-
sumer is characterized by few levels and companies
(Fig. 2), offering the ability to track meat ‘back-
wards’ into the supply chain if necessary.
Overview of the hunt and collection of tissue
samples
The commercial harvest of minke whales in Norway
is based on application of the Revised Management
Procedure (RMP) developed and implemented by the
International Whaling Commission’s (IWC) Scien-
tific Committee (SC). The RMP allocates catch
quotas to specific management areas. There are five
such management areas (IWC 2010) within the
region of interest to Norwegian whalers (Fig. 3).
In the period 1996–2010, the number of boats
actively involved in the yearly hunt varied between
18 and 34, showing a general decline in the past
5 years. In this period, the annual catch has varied
from 388 to 647 individuals, with the average
number of whales captured by boat per year increas-
ing and ranging from 12.5 to 26. The annual quota is
set for a 5-year period at a time. Within such periods,
unused quotas from the first year(s) are transferrable,
which has meant that the annual quota in the 1996–
2010 period has ranged from 435 to 1286. Signif-
icantly, the annual quota has never been taken.
Boats engaged in whaling have licences issued by
the NDF and must fulfil a range of other criteria laid
down by the Norwegian food safety authority and
Norwegian Maritime Directorate (not detailed here).
All vessels are equipped with a trip recorder
consisting of a tamper-proof automated sensor
system to independently monitor the whaling
activities onboard. The system includes logging
time and position by an independent GPS and
collects data from sensors placed in the boat,
including the cannon. Sensors are configured and
calibrated individually for each vessel, making it
Commercial whalersTissue samples, deck-
sheet, fishing log book, remote sensor data
IMRt:Registering/storingsamples, sampling equipment, Cross-
checking deck-sheet and log book, biological data
Tissue samples, deck-sheet
IMRb:DNA analyses, Quality
control
Sub-setofssue
samples
NDFOwn register, overall
responsibility, give whalingpermits
NDFFishing log-book, Remote
sensor data
Quality controlled gene c data
Legislaon
and regulaon
Sampling equipment
Biologicaland catchdata
Figure 1 Relationships between the Norwegian Directorate of Fisheries (NDF) who own and manage the register, the
Institute of Marine Research (IMR) who conduct all practical work for the register, and the private companies
licensed to conduct whaling under Norwegian quota.
The Norwegian minke whale DNA register K A Glover et al.
316 � 2011 Blackwell Publishing Ltd, F I S H and F I S H E R I E S , 13, 313–332

Ta
ble
1E
xer
tfr
om
the
No
rweg
ian
min
ke
wh
ale
DN
Are
gis
ter
(NM
DR
).
Purc
hased
sam
ple
sA
vaila
ble
data
from
indiv
idualm
atc
hed
inth
eN
MD
R
Sam
ple
Location
Date
IDR
Lm
IDV
IDW
Captu
red
Tim
eL
GS
ex
Fsex
(L)
Blu
bber
GP
S
1S
trandkaie
nF
isk,
Berg
en
1.1
11001306
10
86
30.0
5.1
01230
836
430
F46,
150,
45
Know
n
2R
em
a1000,
Berg
en
2.1
11001321
10
821
11.0
6.1
00601
811
390
F47,
150,
38
Know
n
3B
unnpris,
Berg
en
2.1
10901240
10
45
36
24.0
6.0
91740
810
400
FF
(76)
40,
180,
30
Know
n
4F
iskekro
ken,
Asane
2.1
11001020
10
65
21
3.0
7.1
01805
800
390
MN
/A34,
140,
35
Know
n
5N
eptu
nF
isk,
Sotr
a2.1
11001132
10
244
7.0
6.1
01620
900
420
FF
(42)
45,
180,
45
Know
n
6M
eny,
Fylli
ngsdale
n2.1
11001150
10
262
13.0
6.1
01220
840
400
F50,
160,
50
Know
n
7Ic
a-M
axi,
Bæ
rum
1.1
10901223
10
45
19
20.0
6.0
91134
680
360
F40,
130,
30
Know
n
81
Meny,
Bæ
rum
2.1
10801023
10
45
24
7.0
6.0
81806
850
430
FF
(71)
40,
180,
35
Know
n
9U
ltra
,B
æru
m2.1
11001342
10
56
18
4.0
6.1
00940
825
385
F?
(25)
35,
140,
35
Know
n
10
Rem
a1000,
Lø
renskog
2.1
10901283
10
56
19
7.0
6.0
92230
790
360
F35,
140,
40
Know
n
IDR
=offi
cia
lN
MD
Rsam
ple
num
ber,
Lm
=N
o.
of
ST
Rdis
pla
yin
gexact
genoty
pin
gm
atc
hbetw
een
purc
hased
meat
and
identified
whale
inD
NA
regis
ter,
IDV
=V
esselID
,ID
W=
whale
num
ber
for
that
indiv
idualo
nth
atvesseli
nth
atyear,
Captu
red
=date
ofcaptu
re,T
ime
=exacttim
eofcaptu
re,L
=w
hale
tota
lle
ngth
incm
,G
=w
hale
girth
incm
,S
ex
=sex
ofw
hale
,F
sex
=sex
offo
ste
r(f
oste
rto
tal
length
incm
),B
lubber
=th
ickness
ofblu
bber
inm
mm
easure
ddors
alb
ehin
dblo
whole
,behin
ddors
alfi
n,la
tera
labove
flip
per,
respectively
,G
PS
=captu
relo
cation
know
nvia
GP
Ssensor
(notre
veale
d).
Data
are
illustr
ate
dfo
r10
ofth
e25
sam
ple
spurc
hased
from
Norw
egia
nshops
in2010
and
2011,
genoty
ped,
then
matc
hed
toits
entr
yin
the
regis
ter.
Deta
ilsfo
rall
25
whale
sare
availa
ble
onlin
e(D
ata
S3).
1T
his
indiv
idualdid
not
have
aD
NA
pro
file
inth
eD
NA
regis
ter,
but
was
identified
thro
ugh
trackin
gback
inth
esupply
chain
(see
applic
ation
of
the
regis
ter
for
deta
ils).
The Norwegian minke whale DNA register K A Glover et al.
� 2011 Blackwell Publishing Ltd, F I S H and F I S H E R I E S , 13, 313–332 317

possible to unequivocally determine firing of the
cannon, misses, hauling of the whale on deck and
other operational activities, by evaluating the com-
bination of sensor data values. The trip recorder
unit is sealed and equipped with backup batteries
and automatic restarting functions to follow any
system interruptions. In this way, the trip recorder
makes an effective provider of control data for the
manually submitted logbooks.
Prior to the start of each season, all whaling boats
are sent two equipment boxes (four for boats that
usually have a large catch) for taking tissue samples
upon which the DNA register is based. These
equipment boxes, known as box A and B, are
duplicates and contain a catch record sheet which is
in addition to the boats standard fishing log book,
sampling instructions and pre-labelled tubes con-
taining alcohol (A1-35 and B1-35) into which the
tissue samples are taken. A full description of these
boxes contents, including documents translated to
English, are available (Data S1).
When a whale is captured, it is winched onto the
boats deck while at sea, ready for flensing. Up to and
including the year 2004, whale inspectors (persons
employed by the NDF) were placed on each boat
throughout the hunting season to monitor the
hunt. These inspectors were able to and in most
cases assisted the whalers in taking the muscle
tissue samples which are subsequently used for
DNA analysis. Since termination of the inspector
system, whalers themselves have been responsible
for taking the tissue samples. In most cases, the
tissue sample for DNA analysis is taken prior to
flensing. A muscle tissue sample is placed into each
of the A and B tubes while the catch record sheet
and the boats fishing log book are completed.
Biological data are recorded from the whale
(Table 1), and if the captured whale is a pregnant
female, the length of the foetus is recorded and
tissue samples are collected (the foetus sample goes
into its own series connected to the mothers DNA
register number).
Whaling boats (18)Catch registered with
autori es, ssue samplesfor DNA analysis
Producers A (5)P d f h l
Producers B (7)Produc on of whale
Produc on of whalemeat purchased from
vessels
mea rom own vessel(s)and purchased from
other vessels
Wholesalers (10´s)Trading whale meat
Export
Commercial outlets(100´s)
Shops, restuarants,internet, diverse traders
Consumer
Figure 2 Logistics from whaling boat to commercial market showing approximate number of companies/units involved
in each step.
The Norwegian minke whale DNA register K A Glover et al.
318 � 2011 Blackwell Publishing Ltd, F I S H and F I S H E R I E S , 13, 313–332
The large tubes supplied in box A and B for tissue
collection permit whalers from having to deal with
standard laboratory type tubes (i.e. 1.5–2 mL),
which are more likely to be lost or damaged on a
commercial vessel. These also reduce the likelihood
of whalers taking too much muscle relative to the
tube size (thus compromising DNA quality). Fur-
thermore, the relatively large muscle samples col-
lected permits extraction of the final tissue sample for
DNA isolation from the middle of the sample. This
reduces the potential for intersample contamination
when they take tissue samples (for example, small
remains of meat/blood from previous whale on the
knife used to cut samples from the next whale).
Due to the fact that hunting minke whales is
dependent on stable weather conditions permitting
the sighting of individual animals, catches are very
patchy, with many days resulting in no catch, while
on ideal days, the most effective boats may capture
low double-figure numbers of whales. At no stage,
however, are two whales winched onto a boat at the
same time. This permits collection of tissue samples
and recording biological data one whale at a time,
thus reducing opportunity for mixing samples. Once
the season is finished, the A box is sent to the IMRt
(Fig. 1). The B box is retained on the vessel until the
A box has arrived at IMRt, upon which time the
B box is also sent to IMRt to prepare it for re-use in
the next season.
When samples have arrived at IMRt, catch record
sheets, fishing log books and remote sensor data are
cross-examined to verify the catch. Once completed,
a subsample of muscle is excised from each sample,
transferred to a new tube (containing ethanol) and
sent to IMRb for genetic analyses. In this process,
each whale is given a unique ID number that
identifies the whale in the register where also
information about vessel, time (year, month, date
and hours) and position of capture, sex, and length
of the whale can be found (Table 1). The remaining
muscle sample from each whale is stored at IMRt
indefinitely.
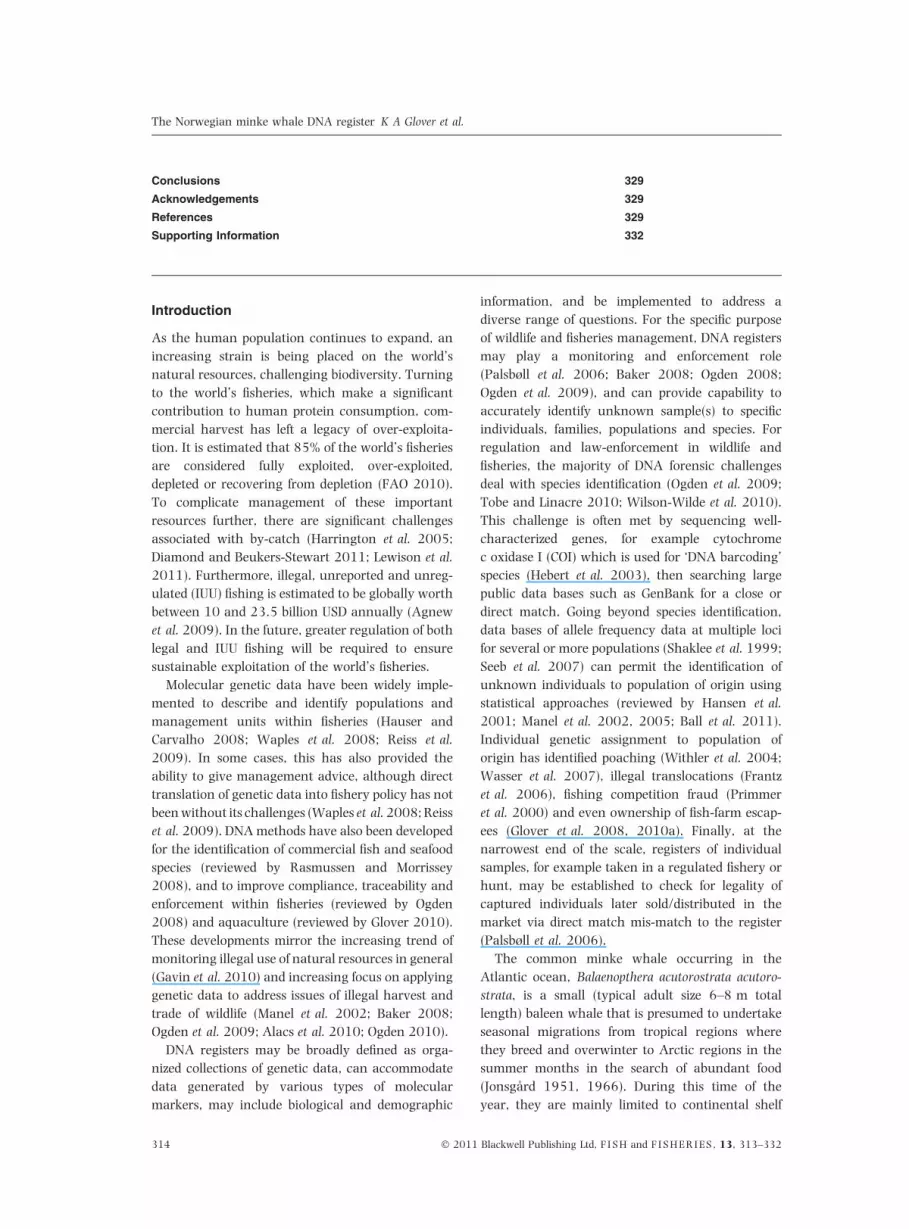
Figure 3 Map showing the five Revised Management Procedure management (RMP) areas, locations of 25 whale samples
purchased from shops in the present study (filled stars) and their capture positions identified through DNA match in
the Norwegian minke whale DNA register (NMDR) (filled circles). Management area ES = of the Svalbard-Bear Island
area, EB = the eastern Barents Sea, EW = the Norwegian Sea and coastal zones off North Norway, including the Lofoten
area, EN = the North Sea, CM = the western Norwegian Sea-Jan Mayen area.
The Norwegian minke whale DNA register K A Glover et al.
� 2011 Blackwell Publishing Ltd, F I S H and F I S H E R I E S , 13, 313–332 319

DNA analyses
Initial specifications for the DNA analyses upon
which the NMDR are based were established by the
RMI in Oslo in the mid-1990s (Olaisen 1997) and
were evaluated by the IWC working group on the
proposed specifications for a Norwegian DNA data
base register for minke whales (Anon. 1998).
Current specifications of the analyses, including
the analytical protocol, reagents and amplification
conditions, are presented (Data S2).
To provide individual whale recognition within
the register, it was decided that an approach similar
to newly developed human DNA registers should be
implemented. Thus, each whale’s profile was to be
established from the analysis of 10 polymorphic
STR loci, sequencing an approximately 300-bp
segment from the mtDNA control region and
analysing a sex-differentiating marker. The ratio-
nale for diverse marker types was that the STRs and
the sex marker would offer statistical capacity for
individual whale identification. This is similar to the
National DNA data base operated in UK (NDNAD)
where a combination of STR loci and a sex marker
are used (Gill et al. 2006; Tucker et al. 2010). In
addition, mtDNA sequencing was included in the
NMDR to provide species identification and, poten-
tially, assist in identification of population genetic
structure of the species for management purposes.
When the NMDR was first established, availability
of genetic markers and level of analytical technol-
ogy was limited. Consequently, STR markers, iso-
lated from other baleen whale species, were chosen
to start the register (Olaisen 1997). These markers
have been faithfully used throughout the registers
existence. This represents one of the registers
strengths, despite the fact that there are now a
larger range of markers available to be used for this
species.
Sequencing reads the genetic code directly and
thus does not require calibration to compare data
within and among laboratories. STR DNA markers
on the other hand are analysed by quantifying the
migration of PCR amplified STR alleles on a gel or in
a polymer-filled capillary, relative to labelled DNA
fragments of known size (called the size-standard).
This process requires the establishment of an allele
sizing system (often referred to as an allele ladder or
bins), which is usually produced by analysing a set
of samples and then determining bin positions. For
the NMDR, the initial calibration was conducted by
the RMI through the analysis of 338 whales taken
from the catch in 1996. To assist with allele size
designation and calibration of bins, the true size of
some alleles for all markers was determined by allele
specific sequencing, although this has not been used
to verify true size of all alleles including alleles added
subsequently.
The molecular genetic analyses upon which the
NMDR are based where first conducted by a
laboratory in Canada (catches for 1997–2002
analysed in the period 2000–03). Later, analyses
were conducted by two separate laboratories in
Iceland (catch 2003–05 then 2006), and since
2007, the analyses have been conducted by IMRs
molecular genetics laboratory located in Bergen
(IMRb). All laboratories were required to pass a
calibration and blind test prior to starting analyses
(see Data quality below).
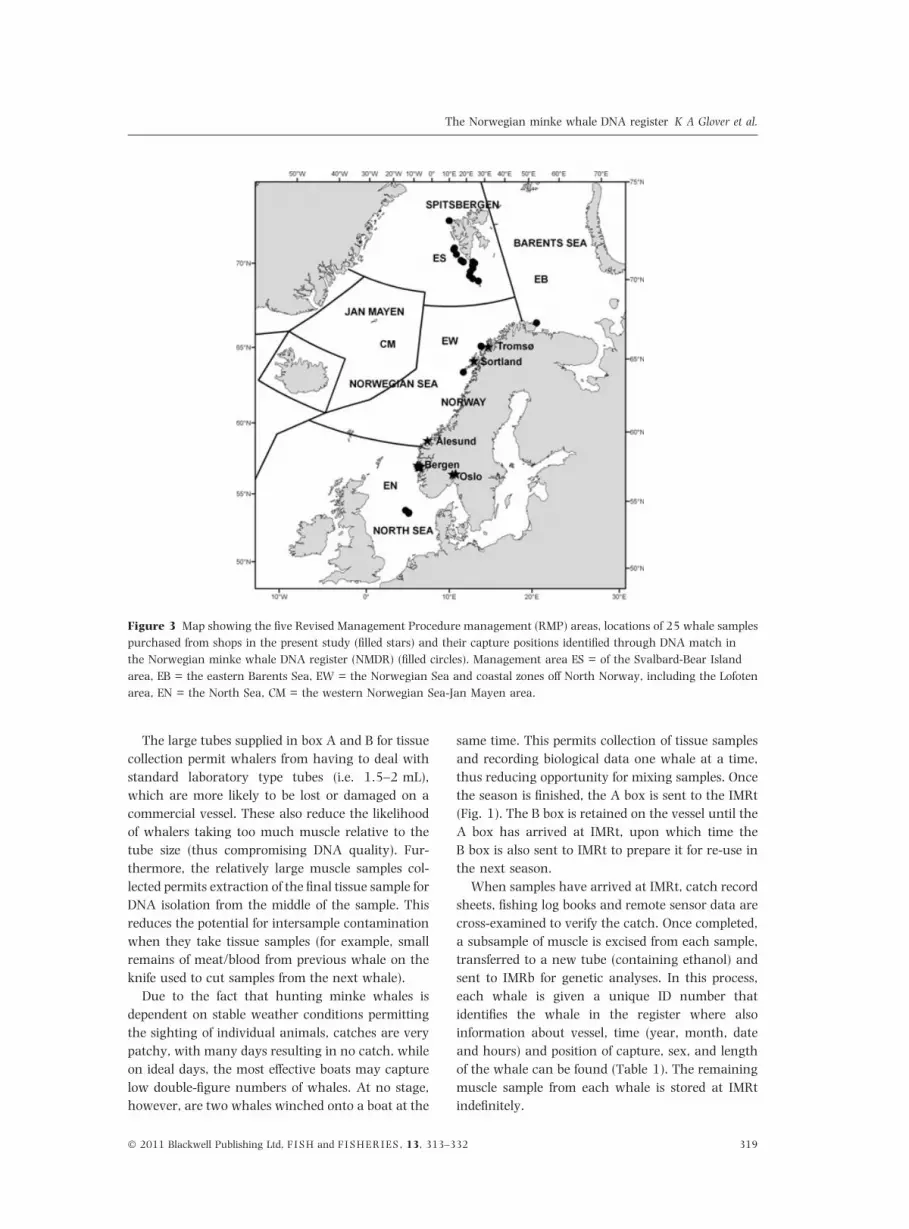
The flow of work relating to the laboratory
analyses, as conducted by IMRb, is presented
(Fig. 4). The primary elements involve registration,
which includes both ‘duplication’ of tissue samples
for analysis series 1 and 2, and giving each sample a
unique number permitting quick identification of
DNA plate and tissue box. DNA is isolated in 96-well
format, and each plate includes ‡2 blank cells. All
samples are genotyped in series 1 and 2; then,
following quality checks of sequences by looking at
chromatograms and aligning sequences, and frag-
ment analysis by inspection of automatically size-
determined PCR amplicons (the latter by two
persons), the results from series 1 and 2 are cross-
checked to each other, once again by two persons.
Previous to IMRb taking responsibility for the
analyses, other laboratories have not duplicated all
STR analyses for both isolates. Instead, the second
DNA isolation included amplification of one marker
from each multiplex in addition to the mtDNA
sequencing in reverse direction. Duplication of all
fragment analyses as implemented by IMRb allows
for both cross-checking for potential sample mix ups
and an internal evaluation of genotyping errors and
technical artefacts. No discrepancy between analy-
sis series is permitted before data are delivered to the
register. In the rare case where a specific sample
gives a consistent and un-resolvable discrepancy,
this sample may be submitted to the register with an
additional comment.
Data quality
All laboratories, involved in conducting the genetic
analyses upon which the NMDR is based, were first
The Norwegian minke whale DNA register K A Glover et al.
320 � 2011 Blackwell Publishing Ltd, F I S H and F I S H E R I E S , 13, 313–332
sent a set of samples to calibrate the STR markers to
(up to 100 previously genotyped individuals). After
calibration, these laboratories were tested for accu-
racy of allele sizing by blind analysis of at least 20
known samples. Despite using different laboratory
equipment that required the use of slightly different
analytical protocols among laboratories (i.e. the
conversion from gel to capillary-based sequencing
and fragment analysis equipment occurred in the
period these analyses were conducted), all labora-
tories passed this calibration and blind test of
20 samples with the exception of one homozy-
gote–heterozygote discrepancy. This was observed
for a 216-bp 217-bp heterozygote observed at the
locus GATA417 by IMRb but incorrectly scored as a
217 homozygote by previous laboratories. This
marker has subsequently been shown to display
the highest genotyping error rate in the register
(Haaland et al. 2011).
STR loci are notoriously challenging to calibrate
among laboratories (Pasqualotto et al. 2007; Baric
et al. 2008; de Valk et al. 2009), display genotyping
errors (Bonin et al. 2004; Hoffman and Amos 2005;
Pompanon et al. 2005), and markers isolated from
All data cross checked in excel by two persons
DNA isolation 1
Tissue samples received in laboratory. All samples registered, given unique number
DNA isolation 2
Sequencing quality controlDo all samples fulfill critera 1–3:1. >50% overlap between F and R
sequences2. Entire fragment sequenced3. No sequencing discrepencies
Yes. Sequencingcomplete
Sequencing 1 (forward)
Sequencing 2 (reverse)
Microsatellite + sex marker analysis 1
Microsatellite + sex marker analysis 2
Quality controlchromatogram +
alignment
Quality controlchromatogram +
alignment
Quality control in Genemapper
Quality control in Genemapper
Fragment quality controlDo all samples fulfill ctiteria 1–3:1. All markers genotyped2. ≥50% markers genotyped in both
isolates3. No genotyping discrepancies
Yes. Fragment analysis
complete
No. Some samplesviolate points 1–3.Re-
runs needed
No. Some samplesviolate points 1–3.
Reruns needed
Data entered in NMDR
Figure 4 Work-flow for molecular genetic analyses conducted at the Institute of Marine Research in Bergen (IMRb)
who have been responsible for analyses in the period 2007-present.
The Norwegian minke whale DNA register K A Glover et al.
� 2011 Blackwell Publishing Ltd, F I S H and F I S H E R I E S , 13, 313–332 321

other species are often more prone to technical
challenges such as null alleles. Given the above
challenges exhibited by STRs, and that the NMDR
has changed analytical laboratories several times,
evaluation of data quality is important. This was
recently addressed through the blind re-analysis of
20 randomly selected whales from each of the
yearly catches in the period 1997–2008 (Haaland
et al. 2011). From the successful re-analysis of 234
samples (six samples dropped out in re-analysis),
these authors reported 31 genotyping discrepancies
between entry in the register and re-analysis, giving
an average error rate of 0.013 per locus. These
authors did not reveal any systematic shifts in allele
sizing, and the error rate decreased with time
suggesting increasing genotyping quality. Of the
31 discrepancies, 18 represented false allele size
calls (eight of which were single base pairs while 10
were >1 bp), 10 represented false homozygotes and
three represented false heterozygotes. Thus, it was
concluded that the calibration and blind-control
protocol each new laboratory overtaking the regis-
ter was required to conduct was effective in avoid-
ing any systematic drift in allele size over time as
a result of changing apparatus and reagents.
Furthermore, these authors documented that the
observed low error rate would not detract from the
registers’ primary individual identification function
as this could be accounted for in the match mis-
match to entries and that tissue and DNA storage
permit re-analysis of close matches in case this is
required.
Data quality in the register, as documented
above, is also indirectly confirmed by the fact that
the number of alleles observed in the entire register
for the 10 STR loci quickly reached a plateau after
the first years, and only six new alleles were
observed in the period 2003–10, despite analyses
being conducted in four separate laboratories dur-
ing this period (Fig. 5).
Application of the register
Statistical power of identification
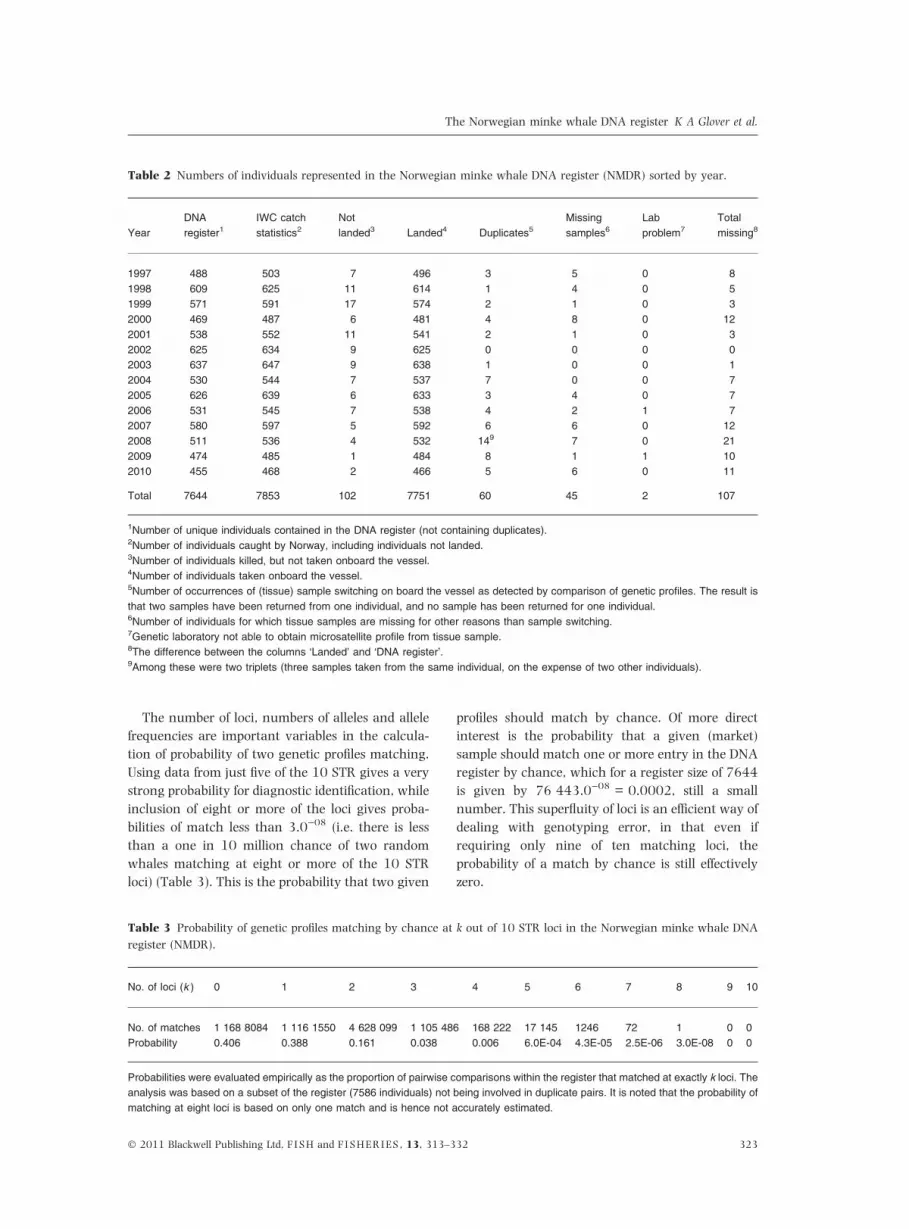
From a total of 7751 whales landed in the period
1997–2010, a total of 7644 individuals have their
tissue samples and DNA profiles organized within
the NMDR (Table 2). Of the 107 whales landed (i.e.
entering the Norwegian market), but lacking DNA
profiles, missing DNA profiles are almost exclusively
caused by the whaling boat ‘forgetting’ to take the
sample at sea, in addition to mixing of samples on
the boat so that one whale was analysed twice at
the expense of another individual. This ranges from
0 to 19 whales’ missing profiles per year. While
there was at first no increase in the frequency of
unsampled whales upon termination of the whaling
inspector system at the end of the 2004 season, the
period 2007–10 showed a distinct albeit small
increase. Nevertheless, the register contains 98.7%
of the whales, which have potentially reached the
Norwegian market, offering a comprehensive oppor-
tunity to monitor and control trade of whale meat.
Number of whales genotyped
Cum
ulat
ive
num
ber o
f alle
les
100
110
120
130
140
150
160
0 1000 2000 3000 4000 5000 6000 7000 8000
Lab. 1. 1997-2002 Lab. 2. 2003 -2005 Lab. 3. 2006 Lab. 4. 2007-2010+
Figure 5 Cumulative number of
alleles observed for ten STR loci
pooled in the Norwegian minke
whale DNA register (NMDR) in the
period 1997 (initiation) to the
2010 (present).
The Norwegian minke whale DNA register K A Glover et al.
322 � 2011 Blackwell Publishing Ltd, F I S H and F I S H E R I E S , 13, 313–332
The number of loci, numbers of alleles and allele
frequencies are important variables in the calcula-
tion of probability of two genetic profiles matching.
Using data from just five of the 10 STR gives a very
strong probability for diagnostic identification, while
inclusion of eight or more of the loci gives proba-
bilities of match less than 3.0)08 (i.e. there is less
than a one in 10 million chance of two random
whales matching at eight or more of the 10 STR
loci) (Table 3). This is the probability that two given
profiles should match by chance. Of more direct
interest is the probability that a given (market)
sample should match one or more entry in the DNA
register by chance, which for a register size of 7644
is given by 76 443.0)08 = 0.0002, still a small
number. This superfluity of loci is an efficient way of
dealing with genotyping error, in that even if
requiring only nine of ten matching loci, the
probability of a match by chance is still effectively
zero.
Table 2 Numbers of individuals represented in the Norwegian minke whale DNA register (NMDR) sorted by year.
Year
DNA
register1
IWC catch
statistics2
Not
landed3 Landed4 Duplicates5
Missing
samples6
Lab
problem7
Total
missing8
1997 488 503 7 496 3 5 0 8
1998 609 625 11 614 1 4 0 5
1999 571 591 17 574 2 1 0 3
2000 469 487 6 481 4 8 0 12
2001 538 552 11 541 2 1 0 3
2002 625 634 9 625 0 0 0 0
2003 637 647 9 638 1 0 0 1
2004 530 544 7 537 7 0 0 7
2005 626 639 6 633 3 4 0 7
2006 531 545 7 538 4 2 1 7
2007 580 597 5 592 6 6 0 12
2008 511 536 4 532 149 7 0 21
2009 474 485 1 484 8 1 1 10
2010 455 468 2 466 5 6 0 11
Total 7644 7853 102 7751 60 45 2 107
1Number of unique individuals contained in the DNA register (not containing duplicates).2Number of individuals caught by Norway, including individuals not landed.3Number of individuals killed, but not taken onboard the vessel.4Number of individuals taken onboard the vessel.5Number of occurrences of (tissue) sample switching on board the vessel as detected by comparison of genetic profiles. The result is
that two samples have been returned from one individual, and no sample has been returned for one individual.6Number of individuals for which tissue samples are missing for other reasons than sample switching.7Genetic laboratory not able to obtain microsatellite profile from tissue sample.8The difference between the columns ‘Landed’ and ‘DNA register’.9Among these were two triplets (three samples taken from the same individual, on the expense of two other individuals).
Table 3 Probability of genetic profiles matching by chance at k out of 10 STR loci in the Norwegian minke whale DNA
register (NMDR).
No. of loci (k ) 0 1 2 3 4 5 6 7 8 9 10
No. of matches 1 168 8084 1 116 1550 4 628 099 1 105 486 168 222 17 145 1246 72 1 0 0
Probability 0.406 0.388 0.161 0.038 0.006 6.0E-04 4.3E-05 2.5E-06 3.0E-08 0 0
Probabilities were evaluated empirically as the proportion of pairwise comparisons within the register that matched at exactly k loci. The
analysis was based on a subset of the register (7586 individuals) not being involved in duplicate pairs. It is noted that the probability of
matching at eight loci is based on only one match and is hence not accurately estimated.
The Norwegian minke whale DNA register K A Glover et al.
� 2011 Blackwell Publishing Ltd, F I S H and F I S H E R I E S , 13, 313–332 323

Checking meat sold on the Norwegian market
Samples of whale meat purchased on the Norwe-
gian market in 1999 and 2000 were checked by an
international group who found no evidence of illicit
trade (Palsbøll et al. 2006). However, no routine
checking of whale products in the Norwegian
market has been conducted. This is primarily
because there has been no reason to suspect illegal
harvest in this period. This is a consequence of the
fact that the harvest is strictly regulated in several
forms (i.e. remote sensor data and inspectors
onboard in the early stages) and, not least, that
the annual quota has always exceeded the annual
catch which means that there are few incentives to
conduct illegal harvest. Nevertheless, to validate the
register’s continuing function, a total of 25 whale
meat samples, from a range of outlets (Fig. 3), were
purchased in 2010 and 2011 and analysed here.
These samples were genotyped for STRs according
to the standard protocol for the NMDR (Data S2).
The resulting genetic profile for these samples was
then checked against the DNA register for all
samples in the period 1997–2010.
Twenty-four of the 25 samples matched at all loci
to single whales in the register (Table 1; Data S3).
Most of the samples originated from whales cap-
tured in 2010 (17), although some samples from
both 2009 (4) and 2008 (3) were found on the
market. Meat from the harvest in 2007, or earlier
seasons, which would be past the permitted sale by
date of 3 years, was not found.
A single whale product, purchased from a super-
market chain outlet located in the east of Norway
(sample 8 in Table 1 and Data S3), did not match
any whale in the register (closest match was a
whale captured in 1997 where only six of ten STR
loci matched). At the outset, a sample purchased in
the market that fails to match directly with a sample
in the register could reflect evidence of illicit trade.
However, missing samples (Table 2) make this more
complicated. Over the period 2007–10, the propor-
tion of missing samples was (12 + 19 + 10 + 11)/
(592 + 532 + 484 + 466) = 52/2074 = 0.025
(Table 2). From the binomial law, it follows that the
probability of all market samples out of 25 should be
contained in the DNA register is only 0.34, i.e.
finding one or more missing sample is a likely event
(P = 0.66).
To investigate further the sample of whale meat
not matching to any profile in the register, the
NMDR was inspected for samples captured by the
company selling this unmatched sample. The com-
pany selling this specific product trade only in meat
from their own whaling vessel. Further investiga-
tion revealed that their vessel failed to take a DNA
sample from one individual in 2008 (their only
‘missing sample’ in the period 2005–10 from over
250 whales captured). It was concluded very
probable that the purchased meat came from the
whale captured in 2008 where the DNA sample was
not taken. This is due to the fact that the sex
reported by the vessel and as revealed by the genetic
analyses matched, none of the other meat pur-
chased from this company deviated from the regis-
ter, the company had meat of this harvest year/age
in the market (two of the three other identified
samples from 2008 were purchased from this
supplier), the company does not trade meat from
other whaling boats (and no evidence to the
contrary was found here), and the company
reported that they had sold meat to this specific
commercial outlet.
Export of whale products
2008 marked the first year that Norwegian com-
panies conducted international trade of whale
products since the NMDR was established. In total,
whale products for human consumption have been
exported from <50 individuals harvested in the
period 2008–10. This has been conducted by a
limited number of companies in strict regulation of
the NDF who issued the export licence. In addition
to meeting food regulation criteria required for
export, the legitimacy of these whales was docu-
mented by presenting all genetic data together with
the whale meat that was sent for export. This was
addressed in the form of official papers from the NDF
detailing whale number in the NMDR and its
genotypic data supplied by the IMRb. Thus, the
legitimacy of the whale meat exported from Norway
to Japan was checked by Norway prior to export
and by Japan upon entry. Clearly, so long as only
meat from whales where a DNA profile exists are
exported, international trade of whale products
would not be subject to the missing sample
challenges observed for monitoring meat traded on
the domestic market.
It is possible for other laboratories or independent
third parties to monitor and control international
trade of whale products even though interlaborato-
ry calibration for STR analyses is challenging
(Pasqualotto et al. 2007; Baric et al. 2008; de Valk
The Norwegian minke whale DNA register K A Glover et al.
324 � 2011 Blackwell Publishing Ltd, F I S H and F I S H E R I E S , 13, 313–332

et al. 2009). This could be done by other laborato-
ries calibrating as was successfully done in the case
of the NMDR (Haaland et al. 2011) or by creating
an allelic ladder from known samples as conducted
when the NMDR was checked by an independent
international laboratory (Palsbøll et al. 2006).
Scientific research arising from the NMDR
In addition to its primary function of monitoring
commercial trade of whaling derived products, data
included in the NMDR have been used in a series of
scientific studies conducted ad hoc (Table 4). Several of
these were only possible owing to the existence of the
register and result from the accumulation of biolog-
ical, demographic and genetic data over time. In
addition to studies listed, the register is actively being
used for a variety of studies including population
genetic analyses, genetic mark-recapture, migration
behaviour, studies of relatedness among individual
and demographic structure in the population.
Time-series data sets represent a major resource
to understand a range of processes. In the future,
it is likely that this sort of data will permit an
increasing number of studies where the long-term
dynamics of the population(s) can be studied
in demographic and genetic context. Given tissue
and DNA storage, there is for example the
possibility in the future to start matching these
biological data to large suites of single nucleotide
polymorphism markers (SNPs), to understand
greater how the demographics and genetics are
linked.
Discussion
Future of the NMDR – looking to human DNA data
bases and SNPs
The NMDR is expected to exist as a control system
for the legal capture of minke whales under
Norwegian quota for the foreseeable future. It is
Table 4 Summary of published scientific studies where data from the Norwegian minke whale DNA register (NMDR)
formed the basis of the study.
Data used from register Main results Reference
mtDNA, micro, bio, catch Genetic assignment techniques permitted the first documentation
of Balaenopthera bonaerensis (Antarctic minke) in the Arctic and the
first documentation of hybridization between minke whale species
(Glover et al. 2010b)
Micro, catch Individual sample match to register permitted identification of
minke whale offal in the stomach of Greenland shark (Somniosus
microcephalus). Linked the whale(s) and shark(s) in space and
time
(Leclerc et al. 2011)
Micro Re-analysis of samples from 1996 to 2008 permitted further
elucidation of STR genotyping errors when combined with mixed
models and documented genotyping quality in register
(Haaland et al. 2011)
mtDNA, micro Analysis of 20 samples purchased on Norwegian market, and two
stranded whales in Denmark tested the register’s function.
(Palsbøll et al. 2006)
mtDNA, micro, bio, catch Mother and foetus DNA profiles compared to infer (half of)
father’s profile. This paternal profile was subsequently matched
against the NMDR, and a small number of fathers were identified.
(Skaug and Øien 2005)
mtDNA, micro, bio, catch The NMDR (years 1997–2002) was screened for pairs of closely
related individuals. In total, 21 pairs were inferred. One female
was common to three pairs, having a parent–offspring
relationship to each of the three other individuals, yielding
information about promiscuity in minke whales.
(Skaug et al. 2008, 2010)
mtDNA, micro, bio, catch Population genetic studies with focus on testing IWC hypotheses
about stock structure.
(IWC 2009a)
mtDNA = analysis of mtDNA, micro = analysis of STR data including sex marker, bio = use of biological data (weight length etc.),
catch = use of catch data (position, time).
The Norwegian minke whale DNA register K A Glover et al.
� 2011 Blackwell Publishing Ltd, F I S H and F I S H E R I E S , 13, 313–332 325

therefore not a question if the register is continued
but rather an issue about how it is continued.
Single nucleotide polymorphisms (SNPs) are
being projected as the new class of genetic marker
that may overtake STR analyses for all but a small
range of highly specialized uses (Seeb et al. 2011).
The rapid development in new generation sequenc-
ing technologies permitting the identification of
large resources of SNPs in non-human and non-
model organisms (Hudson 2008; Garvin et al.
2010), in addition to the rapid development of
semi-automated genotyping technologies, is helping
to drive these attentions. Nevertheless, despite the
fact that most disciplines within human genetics are
considerably more advanced than for other species,
human DNA forensic data bases are still based upon
STRs and not SNPs. For example, the UK National
DNA data base (UK NDNAD) is built upon a single
multiplex of 10 STR loci and the amelogenin sex
marker (see Cotton et al. 2000), and the Federal
Bureau of Investigation combined DNA index sys-
tem (CODIS) includes a set of 13 STR loci and the
amelagenin sex marker (Budowle et al. 1998). The
transition from STR to SNP loci has not occurred
thus far despite the fact that validated forensic
panels of SNPs exist for humans (Dixon et al. 2005;
Kidd et al. 2006; Pakstis et al. 2007; Pomeroy et al.
2009) and that the forensic science community
appears to regularly re-evaluate this situation (Gill
2001; Gill et al. 2004; Amorim and Pereira 2005).
However, many of the arguments for maintaining
STR analyses as opposed to converting to SNPs for
human data bases are linked specifically to the
nature of these data bases and would not be
relevant for a transition in the NMDR. This is
because human DNA registers contain huge
amounts of data for highly robust and validated
and highly efficient STR multiplexes, and many of
tissue/DNA samples have not been stored, thus
prohibiting re-analysis with SNPs, re-analysis would
in any case be highly resource demanding, and that
mixtures of tissues are not effectively addressed by
biallelic markers. However, unlike human DNA
data bases where persons breaking the law may be
at large for decades following a crime (permitting
start of a cold-case), whale meat is not expected to
be stored and enter the commercial market for more
than ‘a few years’. Consequently, it would be
possible for the NMDR to complete a transition
from STRs to SNP markers without necessitating
re-analysis of the previous samples. Furthermore,
given that the NMDR is based upon three STR
multiplexes, in addition to mtDNA analyses via
sequencing in both directions, the time to analyse
any given set of samples is considerably higher for
the NMDR than for a human register largely based
upon a single multiplex amplification of all STR
markers. Consequently, production and establish-
ment of SNP multiplexes including mtDNA SNPs,
which could be species specific, could potentially
replace and considerably improve analytical time
and cost for the NMDR. For other marine species
where a similar type of register is established to
monitor a strictly controlled fishery or harvest, it is
likely that SNPs represent the most appropriate
marker class of genetic marker upon which to base
the register.
Individual-based DNA registers: challenges and
opportunities
There are a wide range of technical, logistical, legal
and economic issues linked with establishing and
operating any DNA register. For example, the
budget relating to the collection, registration, stor-
age and genetic analysis of samples in the NMDR is
approximately 500 000 USD annually. Looking at
DNA registers for monitoring trade of fisheries and
wildlife products in general, some of the challenges
have been previously discussed (e.g. Palsbøll et al.
2006; Baker 2008; Ogden et al. 2009; Alacs et al.
2010). In addition, challenges linked with the
application of a DNA register for wildlife forensic
applications, such as the documentation required in
connection with the chain of custody of ‘suspect
samples’ and validation of marker robustness in
highly degraded tissues, have been addressed (e.g.
Ogden et al. 2009). Here, we concentrate on points
linked with the implementation of a DNA register
for the specific purpose of individual identification
against a register of legally sampled individuals to
monitor harvest and trade.
Two major logistical challenges have been iden-
tified through operation of the NMDR. These include
missing DNA profiles for whales that have been
captured legally and entered the domestic market,
and, the fact that the register is only ‘updated’ and
thus fully operation once the products have entered
the market.
At the outset, a sample not matching any profile
in the register may indicate illegal harvest and from
this, the obvious defence argument would be to
blame the missing sample. However, as previously
discussed (Palsbøll et al. 2006), so long as the
The Norwegian minke whale DNA register K A Glover et al.
326 � 2011 Blackwell Publishing Ltd, F I S H and F I S H E R I E S , 13, 313–332

number of missing samples is not too high, and it is
possible to permit ad hoc verification of movements
of such samples into the market if necessary (Fig. 2),
then it is likely to be possible to detect any such
attempts of fraud. Sampling ‘backwards’ in the
supply chain could reveal if there are several or just
one missing samples present in the supplier’s
products and/or to verify trade routes. This individ-
ual sample tracking approach has been successfully
used to link two ends of a supply chain for a blue
whale (Balaenoptera musculus) traded in a Japanese
market (Cipriano and Palumbi 1999).
While viable, it is not ideal to have to apply an ad
hoc approach to adjust for missing samples in an
individual-based register as described earlier. Fur-
thermore, the problem of missing samples is likely to
represent a challenge experienced by all individual-
based DNA registers and is not unique to the NMDR.
However, where licences for partaking in the fishery
or hunt are required, as is the case for the
commercial harvest of minke whales in Norway,
the opportunity to fine companies for each sample
they fail to take, and revoke permits upon repeat-
edly failing to take tissue samples of some whales
exists. This could be used as a way to reduce the
frequency of missing samples. An alternative
approach could be to implement a system whereby
tissue samples are presented upon landing.
At the present, the quality-checked data for any
seasons catch are entered into the NMDR at least
6 months after the time at which this meat is
available in the market as fresh or frozen product.
The delay between harvest and updated register is
due to the fact that samples are only sent to IMRt
ready for entry in the register once the season has
ended, and all samples are collated, in addition to
the laboratory analytical time (months). Therefore,
any attempts to detect illegal trade would represent
an ad hoc approach similar to the spot-checks
reported here, and as conducted previously (Pals-
bøll et al. 2006). Clearly, if samples were presented
and registered at the time of landing as indicated
above, this would not only help alleviate the
likelihood for missing samples, it also offers the
potential to speed up the rate at which each whale
entered the register, so long as samples were
registered and analysed as and when they came in.
However, while this could in principle work, it
would cause a great strain on all persons involved
in the register as this would mean that staff and
facilities would have to be on stand-by during the
whole season. The unpredictable catch, influenced
by weather and other factors, would lead to dead
periods followed by intense periods where the
majority of the samples suddenly arrive. In addi-
tion to strain on the staff involved, this would also
challenge the quality checks of remote sensor data
and fishing log books as conducted at the end
of each season prior to samples being sent for DNA
analysis (Fig. 1). It is therefore questionable
whether such an approach would be viable for
the NMDR, especially given that the low number of
operators and companies involved in the logistics
of trading whale meat on the Domestic Norwegian
market (Fig. 2) does permit ad hoc sampling to
monitor and potentially identify evidence of illegal
Table 5 Interaction between some of the key attributes of the commercial Norwegian minke whale harvest, and the
operation of an individual-based DNA register to monitor and regulate harvest and trade.
Attribute Consequence
Low to moderate harvest size (N ) Relatively simple logistics for collection and analysis of samples, including data storage
High economic value per-unit
harvested
Favourable genotyping unit per harvest unit cost. Thus economically feasible maintenance
of an individual sample-based DNA register
Strictly regulated harvest High degree of compliance of whalers associated with the hunt to adhere to regulations, fill
out additional catch forms and take samples for analyses
Few boats involved in harvest Relatively simple logistics for administration, regulation and enforcement of the hunt and
register
Limited and well-defined market
including supply chain
Good opportunity to actively monitor the market and potentially unveil illegal harvest and
trade. Results in higher potential for compliance and thus a more sustainable harvest
CITES listed species A non-economic-based incentive for implementing a DNA register as part of a sustainable
harvest
The Norwegian minke whale DNA register K A Glover et al.
� 2011 Blackwell Publishing Ltd, F I S H and F I S H E R I E S , 13, 313–332 327

trade. Nevertheless, use of genetic data in ‘real-
time’ fisheries management is achieved in some
regions, and if samples were analysed as and when
they arrived in, potentially combined with freezing
meat and only releasing it into the market once
the register is updated, could be solutions for other
harvests (see below).
Some of the key elements characterizing the
commercial hunt for minke whales in Norway, and
how these influence viability of the NMDR itself, are
listed (Table 5). There are several important attri-
butes linked with the minke whale hunt that make
establishment and operation of a DNA register for
the primary purpose of individual sample identifica-
tion feasible. Firstly, the commercial harvest of
minke whales is highly regulated, whales have a
high commercial and ecological value per unit, and
a moderate number of individuals are captured each
season. In addition, the low number of companies
involved in the harvest itself, and the well-defined
supply chain and commercial market (Fig. 2), per-
mits good opportunity to both monitor and regulate.
Together, these contribute to the registers logistical
and economic viability to monitor and regulate the
harvest. It is likely that DNA registers with the
primary purpose to track individual samples, as for
the NMDR, will only be viable if many of these key
characteristics are present or there are mitigating
characteristics. For example, the application of DNA
registers to monitor individual samples for a low per-
unit value species that are potentially harvested in
their millions, from geographically broad regions, by
a wide range of countries and companies, traded
through extensive networks, as is the case for the
majority of fish species commercially harvested in
the world’s oceans, is not going to be viable in the
foreseeable future. Naturally, the use of genetic tools
in the regulation of fisheries falling into this category
is, and will continue to be, of upmost importance in
the future given that most of the worlds fisheries are
overfished and or recovering from over-exploitation
(FAO 2010), and the major global challenges with
IUU fishing (Agnew et al. 2009). However, regula-
tion of such fisheries using genetic data will need to
be based upon species identifications for semi-
processed or fully processed products (Rasmussen
and Morrissey 2008) and establishing data bases
over populations to regulate population and poten-
tially geographical site of exploitation (Ogden 2008;
Stokstad 2010).
Whales and other marine mammals are exploited
by a range of countries for various reasons, includ-
ing aboriginal, commercial and scientific. At the
present, around 1500 individuals of baleen whales
caught annually for these purposes (IWC 2009b). In
addition, several thousand animals are caught
through directed catches of small cetaceans as well
as in many fisheries involving cetacean by-catch
problems. While parts of this harvest is strictly
regulated, such as the commercial exploitation of
minke whales in Norway as described here, chal-
lenges experienced by the fin-fish fishing communi-
ties such as IUU fishing (Ainsworth and Pitcher
2005; Agnew et al. 2009) and by-catch (Harring-
ton et al. 2005; Diamond and Beukers- Stewart
2011; Lewison et al. 2011) also exist for some
whaling operations. For example, genetic monitor-
ing of fish markets in Asia where whales harvested
from by-catch and scientific whaling are traded has
revealed significant evidence of unreported exploi-
tation of species (Baker et al. 2006), in addition to
underreporting in the number of harvested individ-
uals (Dalebout et al. 2002; Baker et al. 2007;
Lukoschek et al. 2009). Clearly, the individual
whale register approach outlined in the present
article has the ability to be implemented into many
of these harvesting operations. In turn, this could
assist in the legitimization of sustainable whaling,
especially if the registers to be established were
transparent and validated by a panel of interna-
tional scientists.
Although the range of limitations associated with
implementing DNA registers to monitor individual
samples may limit their applicability to many com-
mercial fin-fish fisheries, their implementation will
not necessarily be limited to commercial exploitation
of whales. There are a number of fish species that
have high commercial or ecological value and that
are in need of better regulation. For example, there is
growing demand to increase the use of DNA-based
methods for the monitoring and regulation of
exploitation of sharks and rays that are in sharp
decline (Shivji et al. 2002, 2005; Clarke et al. 2006;
Dulvy et al. 2008). Furthermore, many fish from the
suborder Scombroidei (tunas, mackerels and billfish)
display challenging fisheries management problems,
not least for the highly valued bluefin tuna (Thunus
thynnus) (MacKenzie et al. 2009; Kurota et al. 2010;
Vinas et al. 2011; Webster 2011). There is clearly
potential to implement DNA registers to monitor
individual samples captured in some of these directly
or indirectly targeted fisheries, which in turn may
permit the successful sustainable exploitation of
some of these species.
The Norwegian minke whale DNA register K A Glover et al.
328 � 2011 Blackwell Publishing Ltd, F I S H and F I S H E R I E S , 13, 313–332
For species that are exploited at very low levels
(either directly or as part of a harvest following
mortal by-catch), population-based assignments
may not be possible, especially if the genetic baseline
is incomplete and/or complicated. Here, DNA reg-
isters monitoring trade in individual samples may
offer the only ability to monitor commercial exploi-
tation and verify legitimacy of highly valued prod-
ucts.
Conclusions
The NMDR register, which has been operated in the
period 1997-present, possibly represents the only
fully operational DNA register implemented to
monitor the commercial exploitation of a marine
species, at the individual sample level. The close
interaction of the NMDR, regulatory authorities
(NDF) and the whalers themselves provides an
example of how a highly regulated marine harvest
can be conducted, in addition to how an individual-
based DNA register can be implemented to monitor
and control the sustainable harvest of marine
resources. While not without operational and
logistical challenges, the experiences gained
through operation of the NMDR clearly illustrate
that DNA registers to track individual samples are
viable. Furthermore, they may serve an important
preventative effect to IUU exploitation. Where some
of the basic conditions are met (Table 5), there is
potential for implementing similar registers to
strictly regulate the sustainable harvest of other
important marine species. Given the rapidly increas-
ing numbers of SNP markers in non-model organ-
isms, rapid ongoing developments in genotyping
throughput and the continued decrease in genotyp-
ing costs, the list of species which such an approach
is viable will expand in the future.
Acknowledgements
We would like to acknowledge Anne G. S. Eide for
conducting laboratory work for the 25 whales
tested within and analysis of the 2010 year class.
We would like to acknowledge Dr Andy J. Hopwood
from the Forensic Science Service in UK for discus-
sions regarding human DNA registers. We acknowl-
edge helpful discussion on earlier drafts of this
manuscript with Hild Ynnesdal from the Norwegian
Directorate of Fisheries. The editor and three anon-
ymous referees are acknowledged for constructive
criticism on earlier drafts of this manuscript.
References
Agnew, D.J., Pearce, J., Pramod, G. et al. (2009) Estimating
the worldwide extent of illegal fishing. PLoS ONE 4,
e4570, doi:10.1371/journal.pone.0004570.
Ainsworth, C.H. and Pitcher, T.J. (2005) Estimating illegal,
unreported and unregulated catch in British Columbia’s
marine fisheries. Fisheries Research 75, 40–55.
Alacs, E.A., Georges, A., FitzSimmons, N.N. and Robertson,
J. (2010) DNA detective: a review of molecular
approaches to wildlife forensics. Forensic Science Medicine
and Pathology 6, 180–194.
Amorim, A. and Pereira, L. (2005) Pros and cons in the
use of SNPs in forensic kinship investigation: a compar-
ative analysis with STRs. Forensic Science International
150, 17–21.
Anon. (1998) Report of the working group on proposed
specifications for a Norwegian DNA database register for
minke whales. Report of the International Whaling Com-
mission 48, 287–288.
Baker, C.S. (2008) A truer measure of the market: the
molecular ecology of fisheries and wildlife trade. Molec-
ular Ecology 17, 3985–3998.
Baker, C.S., Lukoschek, V., Lavery, S. et al. (2006)
Incomplete reporting of whale, dolphin and porpoise
‘bycatch’ revealed by molecular monitoring of Korean
markets. Animal Conservation 9, 474–482.
Baker, C.S., Cooke, J.G., Lavery, S. et al. (2007) Estimating
the number of whales entering trade using DNA
profiling and capture-recapture analysis of market
products. Molecular Ecology 16, 2617–2626.
Ball, M.C., Finnegan, L.A., Nette, T., Broders, H.G. and
Wilson, P.J. (2011) Wildlife forensics: ‘‘supervised’’
assignment testing can complicate the association of
suspect cases to source populations. Forensic Science
International-Genetics 5, 50–56.
Baric, S., Monschein, S., Hofer, M., Grill, D. and Dalla
Via, J. (2008) Comparability of genotyping data
obtained by different procedures an inter-laboratory
survey. Journal of Horticultural Science & Biotechnology
83, 183–190.
Bonin, A., Bellemain, E., Eidesen, P.B., Pompanon, F.,
Brochmann, C. and Taberlet, P. (2004) How to track
and assess genotyping errors in population genetics
studies. Molecular Ecology 13, 3261–3273.
Budowle, B., Moretti, T.R., Niezgoda, S.J. and Brown, B.L.
(1998) CODIS and PCR-based short tandem repeat loci:
law enforcement tools. In: Second European Symposium on
Human Identification. Promega corporation, Madison, pp.
73–88.
Christensen, I. and Øien, N. (1990) Operational patterns of
the Norwegian minke whale fishery. Report of the
International Whaling Commission 40, 343–347.
Cipriano, F. and Palumbi, S.R. (1999) Genetic tracking of a
protected whale. Nature 397, 307–308.
Clarke, S.C., McAllister, M.K., Milner- Gulland, E.J. et al.
(2006) Global estimates of shark catches using trade
The Norwegian minke whale DNA register K A Glover et al.
� 2011 Blackwell Publishing Ltd, F I S H and F I S H E R I E S , 13, 313–332 329

records from commercial markets. Ecology Letters 9,
1115–1126.
Cotton, E.A., Allsop, R.F., Guest, J.L. et al. (2000) Valida-
tion of the AMPFlSTR (R) SGM Plus (TM) system for use
in forensic casework. Forensic Science International 112,
151–161.
Dalebout, M.L., Lento, G.M., Cipriano, F., Funahashi, N. and
Baker, C.S. (2002) How many protected minke whales
are sold in Japan and Korea? A census by microsatellite
DNA profiling Animal Conservation 5, 143–152.
Diamond, B. and Beukers- Stewart, B.D. (2011) Fisheries
discards in the North Sea: waste of resources or a
necessary evil? Reviews in Fisheries Science 19, 231–245.
Dixon, L.A., Murray, C.M., Archer, E.J., Dobbins, A.E.,
Koumi, P. and Gill, P. (2005) Validation of a 21-locus
autosomal SNP multiplex for forensic identification
purposes. Forensic Science International 154, 62–77.
Donovan, G.P. (1991) Distribution of sightings of minke
whales in the North Atlantic. Appendix 5. Report of the
International Whaling Commission 41, 150–151.
Dulvy, N.K., Baum, J.K., Clarke, S. et al. (2008) You can
swim but you can’t hide: the global status and conser-
vation of oceanic pelagic sharks and rays. Aquatic
Conservation-Marine and Freshwater Ecosystems 18,
459–482.
FAO (2010) The State of Worlds Fisheries and Aquaculture
2010. Food and Agriculture Organization of the United
Nations, Rome.
Frantz, A.C., Pourtois, J.T., Heuertz, M. et al. (2006) Genetic
structure and assignment tests demonstrate illegal trans-
location of red deer (Cervus elaphus) into a continuous
population. Molecular Ecology 15, 3191–3203.
Garvin, M.R., Saitoh, K. and Gharrett, A.J. (2010) Appli-
cation of single nucleotide polymorphisms to non-model
species: a technical review. Molecular Ecology Resources
10, 915–934.
Gavin, M.C., Solomon, J.N. and Blank, S.G. (2010)
Measuring and monitoring illegal use of natural
resources. Conservation Biology 24, 89–100.
Gill, P. (2001) An assessment of the utility of single
nucleotide polymorphisms (SNPs) for forensic purposes.
International Journal of Legal Medicine 114, 204–210.
Gill, P., Werrett, D.J., Budowle, B. and Guerrieri, R. (2004)
An assessment of whether SNPs will replace STRs in
national DNA databases. Science & Justice 44, 51–53.
Gill, P., Fereday, L., Morling, N. and Schneider, P.M.
(2006) The evolution of DNA databases – recommen-
dations for new European STR loci. Forensic Science
International 156, 242–244.
Glover, K.A. (2010) Forensic identification of fish farm
escapees: the Norwegian experience. Aquaculture Envi-
ronment Interactions 1, 1–10.
Glover, K.A., Skilbrei, O.T. and Skaala, O. (2008) Genetic
assignment identifies farm of origin for Atlantic salmon
Salmo salar escapees in a Norwegian fjord. Ices Journal of
Marine Science 65, 912–920.
Glover, K.A., Hansen, M.M., Lien, S., Als, T.D., Hoyheim,
B. and Skaala, O. (2010a) A comparison of SNP and STR
loci for delineating population structure and performing
individual genetic assignment. Bmc Genetics 11, 12.
Glover, K.A., Kanda, N., Haug, T. et al. (2010b) Migration
of Antarctic Minke Whales to the Arctic. PLoS ONE 5,
e15197, doi:10.1371/journal.pone.0015197.
Haaland, Ø.A., Glover, K.A., Seliussen, B.B. and Skaug,
H.J. (2011) Genotyping errors in a calibrated DNA -
register: implications for identification of individuals.
Bmc Genetics 12, 36.
Hansen, M.M., Kenchington, E. and Nielsen, E.E. (2001)
Assigning individual fish to population using microsat-
ellite DNA markers. Fish and Fisheries 2, 93–112.
Harrington, J.M., Myers, R.A. and Rosenberg, A.A. (2005)
Wasted fishery resources: discarded by-catch in the USA.
Fish and Fisheries 6, 350–361.
Hauser, L. and Carvalho, G.R. (2008) Paradigm shifts in
marine fisheries genetics: ugly hypotheses slain by
beautiful facts. Fish and Fisheries 9, 333–362.
Hebert, P.D.N., Cywinska, A., Ball, S.L. and DeWaard, J.R.
(2003) Biological identifications through DNA barcodes.
Proceedings of the Royal Society of London Series
B-Biological Sciences 270, 313–321.
Hoffman, J.I. and Amos, W. (2005) Microsatellite geno-
typing errors: detection approaches, common sources
and consequences for paternal exclusion. Molecular
Ecology 14, 599–612.
Horwood, J. (1990) Biology and Exploitation of the Minke
Whale. CRC Press Inc., Boca Raton, FL. 238 pp.
Hudson, M.E. (2008) Sequencing breakthroughs for
genomic ecology and evolutionary biology. Molecular
Ecology Resources 8, 3–17.
IWC (1999) The revised management proceedure (RMP)
for baleen whales. Journal of Cetacean Research and
Management 1(Suppl.), 251–258.
IWC (2009a) Annex 1. Working group on stock definition.
Journal of Cetacean Research and Management 11, 248–
257.
IWC (2009b) Annual Report of the International Whaling
Commission 2008. International Whaling Commission,
Cambridge, p. 188.
IWC (2010) Report of the sub-committee on the revised
management procedure (RMP). Journal of Cetacean
Research and Management 11(Suppl. 2), 114–134.
Jonsgard, A. (1951) Studies on the little piked whale or
minke whale. Norsk Hvalfangst-Tidende 5, 210–233.
Jonsgard, A. (1966) The distribution of Balaenopteridae in
the North Atlantic Ocean. In: Whales, Dolphins and
Porpoises (ed. K.S. Norris). University of California Press,
Berkely, p. 114–124.
Kidd, K.K., Pakstis, A.J., Speed, W.C. et al. (2006) Devel-
oping a SNP panel for forensic identification of individ-
uals. Forensic Science International 164, 20–32.
Kurota, H., Hiramatsu, K., Takahashi, N., Shono, H., Itoh,
T. and Tsuji, S. (2010) Developing a management
The Norwegian minke whale DNA register K A Glover et al.
330 � 2011 Blackwell Publishing Ltd, F I S H and F I S H E R I E S , 13, 313–332

procedure robust to uncertainty for southern bluefin
tuna: a somewhat frustrating struggle to bridge the gap
between ideals and reality. Population Ecology 52, 359–
372.
Leclerc, L.M., Lydersen, C., Haug, T., Glover, K.A., Fisk,
A.T. and Kovaks, K.M. (2011) Greenland sharks (Som-
niosus microcephalus) scavenge offal from minke (Balae-
noptera acutorostrata) whaling operations in Svalbard
(Norway). Polar Research, doi: 10.3402/polar.v30i0.
7342.
Lewison, R.L., Soykan, C.U., Cox, T. et al. (2011) Ingredi-
ents for addressing the challenges of fisheries bycatch.
Bulletin of Marine Science 87, 235–250.
Lukoschek, V., Funahashi, N., Lavery, S., Dalebout, M.L.,
Cipriano, F. and Baker, C.S. (2009) High proportion of
protected minke whales sold on Japanese markets is
due to illegal, unreported or unregulated exploitation.
Animal Conservation 12, 385–395.
MacKenzie, B.R., Mosegaard, H. and Rosenberg, A.A.
(2009) Impending collapse of bluefin tuna in the
northeast Atlantic and Mediterranean. Conservation
Letters 2, 25–34.
Manel, S., Berthier, P. and Luikart, G. (2002) Detecting
wildlife poaching: identifying the origin of individuals
with Bayesian assignment tests and multilocus geno-
types. Conservation Biology 16, 650–659.
Manel, S., Gaggiotti, O.E. and Waples, R.S. (2005)
Assignment methods: matching biological questions
with appropriate techniques. Trends in Ecology & Evolu-
tion 20, 136–142.
Ogden, R. (2008) Fisheries forensics: the use of DNA tools
for improving compliance, traceability and enforcement
in the fishing industry. Fish and Fisheries 9, 462–472.
Ogden, R. (2010) Forensic science, genetics and wildlife
biology: getting the right mix for a wildlife DNA forensics
lab. Forensic Science Medicine and Pathology 6, 172–179.
Ogden, R., Dawnay, N. and McEwing, R. (2009) Wildlife
DNA forensics – bridging the gap between conservation
genetics and law enforcement. Endangered Species
Research 9, 179–195.
Øien, N., Jørgensen, T. and Øritsland, T. (1987) A stock
assessment for northeast Atlantic minke whales. Report
of the International Whaling Commission 37, 225–236.
Olaisen, B. (1997) Proposed specifications for a Norwegian
DNA database register for minke whales. Report to the
scientific committee of the International Whaling Com-
mission SC/49/NA1.
Pakstis, A.J., Speed, W.C., Kidd, J.R. and Kidd, K.K. (2007)
Candidate SNPs for a universal individual identification
panel. Human Genetics 121, 305–317.
Palsbøll, P.J., Berube, M., Skaug, H.J. and Raymakers, C.
(2006) DNA registers of legally obtained wildlife and
derived products as means to identify illegal takes.
Conservation Biology 20, 1284–1293.
Pasqualotto, A.C., Denning, D.W. and Anderson, M.J.
(2007) A cautionary tale: lack of consistency in allele
sizes between two laboratories for a published multilocus
microsatellite typing system. Journal of Clinical Microbi-
ology 45, 522–528.
Pomeroy, R., Duncan, G., Sunar-Reeder, B. et al. (2009) A
low-cost, high-throughput, automated single nucleotide
polymorphism assay for forensic human DNA applica-
tions. Analytical Biochemistry 395, 61–67.
Pompanon, F., Bonin, A., Bellemain, E. and Taberlet, P.
(2005) Genotyping errors: causes, consequences and
solutions. Nature Reviews Genetics 6, 847–859.
Primmer, C.R., Koskinen, M.T. and Piironen, J. (2000) The
one that did not get away: individual assignment using
microsatellite data detects a case of fishing competition
fraud. Proceedings of the Royal Society B-Biological
Sciences 267, 1699–1704.
Rasmussen, R.S. and Morrissey, M.T. (2008) DNA-Based
methods for the identification of commercial fish and
seafood species. Comprehensive Reviews in Food Science
and Food Safety 7, 280–295.
Reiss, H., Hoarau, G., Dickey-Collas, M. and Wolff, W.J.
(2009) Genetic population structure of marine fish:
mismatch between biological and fisheries management
units. Fish and Fisheries 10, 361–395.
Seeb, L.W., Antonovich, A., Banks, A.A. et al. (2007)
Development of a standardized DNA database for Chi-
nook salmon. Fisheries 32, 540–552.
Seeb, J.E., Carvalho, G., Hauser, L., Naish, K., Roberts, S.
and Seeb, L.W. (2011) Single-nucleotide polymorphism
(SNP) discovery and applications of SNP genotyping in
nonmodel organisms. Molecular Ecology Resources 11,
1–8.
Shaklee, J.B., Beacham, T.D., Seeb, L. and White, B.A.
(1999) Managing fisheries using genetic data: case
studies from four species of Pacific salmon. Fisheries
Research 43, 45–78.
Shivji, M.S., Clarke, S., Pank, M., Natanson, L., Kohler, N.
and Stanhope, M. (2002) Genetic identification of
pelagic shark body parts for conservation and trade
monitoring. Conservation Biology 16, 1036–1047.
Shivji, M.S., Chapman, D.D., Pikitch, E.K. and Raymond,
P.W. (2005) Genetic profiling reveals illegal interna-
tional trade in fins of the great white shark, Carcharodon
carcharias. Conservation Genetics 6, 1035–1039.
Skaug, H.J. and Øien, N. (2005) Genetic tagging of male
North Atlantic minke whales through comparison of
maternal and foetal DNA-profiles. Journal of Cetacean
Research and Management 7, 113–117.
Skaug, H.J., Oien, N., Schweder, T. and Bothun, G. (2004)
Abundance of minke whales (Balaenoptera acutorostrata)
in the Northeast Atlantic: variability in time and space.
Canadian Journal of Fisheries and Aquatic Sciences 61,
870–886.
Skaug, H.J., Berube, M., Rew, M.B. and Palsbøll, P. (2008)
Genetic analyses reveal promiscuous mating in female
minke whales, Balaenopthera acutorostrata. Journal of
Cetacean Research and Management 9, 249–251.
The Norwegian minke whale DNA register K A Glover et al.
� 2011 Blackwell Publishing Ltd, F I S H and F I S H E R I E S , 13, 313–332 331

Skaug, H.J., Berube, M. and Palsbøll, P. (2010) Detecting
dyads of related individuals in large collections of DNA-
profiles by controlling the false discovery rate. Molecular
Ecology Resources 10, 693–700.
Stokstad, E. (2010) To fight illegal fishing, forensic DNA
gets local. Science 330, 1468–1469.
Tobe, S.S. and Linacre, A. (2010) DNA typing in wildlife
crime: recent developments in species identification.
Forensic Science Medicine and Pathology 6, 195–206.
Tucker, V.C., Hopwood, A.J., Sprecher, C.J. et al. (2010)
Developmental validation of the Powerplex1 ESI 16 and
Powerplex1 ESI 17 systems: STR multiplexes for the new
European standard. Forensic Science International: Genet-
ics 5, 436–448.
de Valk, H.A., Meis, J., Bretagne, S. et al. (2009) Interlab-
oratory reproducibility of a microsatellite-based typing
assay for Aspergillus fumigatus through the use of allelic
ladders: proof of concept. Clinical Microbiology and
Infection 15, 180–187.
Vinas, J., Gordoa, A., Fernandez-Cebrian, R., Pla, C.,
Vahdet, U. and Araguas, R.M. (2011) Facts and
uncertainties about the genetic population structure of
Atlantic bluefin tuna (Thunnus thynnus) in the Mediter-
ranean. Implications for fishery management. Reviews in
Fish Biology and Fisheries 21, 527–541.
Waples, R.S., Punt, A.E. and Cope, J.M. (2008) Integrating
genetic data into management of marine resources:
how can we do it better? Fish and Fisheries 9, 423–
449.
Wasser, S.K., Mailand, C., Booth, R. et al. (2007) Using
DNA to track the origin of the largest ivory seizure since
the 1989 trade ban. Proceedings of the National Academy
of Sciences of the United States of America 104, 4228–
4233.
Webster, D.G. (2011) The irony and the exclusivity of Atlantic
bluefin tuna management. Marine Policy 35, 249–251.
Wilson-Wilde, L., Norman, J., Robertson, J., Sarre, S. and
Georges, A. (2010) Current issues in species identifica-
tion for forensic science and the validity of using the
cytochrome oxidase I (COI) gene. Forensic Science Med-
icine and Pathology 6, 233–241.
Withler, R.E., Candy, J.R., Beacham, T.D. and Miller, K.M.
(2004) Forensic DNA analysis of Pacific salmonid
samples for species and stock identification. Environmen-
tal Biology of Fishes 69, 275–285.
Supporting Information
Additional Supporting Information may be found in
the online version of this article:
Data S1. Equipment and instructions sent to
commercial whalers for taking tissue samples to be
used in the Norwegian minke whale DNA register
(NMDR).
Data S2. Laboratory protocol for genetic analy-
ses conducted at the Institute of Marine Research
(IMR), in Bergen.
Data S3. Exert from the Norwegian minke whale
DNA register (NMDR). Data is illustrated for 25
samples purchased from Norwegian shops in 2010
and 2011, genotyped, then matched to its entry in
the register.
Please note: Wiley-Blackwell are not responsible
for the content or functionality of any supporting
materials supplied by the authors. Any queries
(other than missing material) should be directed to
the corresponding author for the article.
The Norwegian minke whale DNA register K A Glover et al.
332 � 2011 Blackwell Publishing Ltd, F I S H and F I S H E R I E S , 13, 313–332