Embed Size (px)
Citation preview
The NBA, Exit Discrimination, andCareer Earnings
The NBA, Exit Discrimination, and Career Earnings
HA HOANG and DAN RASCHER*
The purpose of this article is threefold. First, it complements the many wage dis-crimination studies by examining exit discrimination in the NBA using a deca-de’s worth of data (the 1980s). White players have a 36 percent lower risk ofbeing cut than black players,ceteris paribus, translating into an expected careerlength of 7.5 seasons for an apparently similar player who is white and 5.5 sea-sons for the same player who is black. Second, the career earnings effect of exitdiscrimination in the 1980s is larger ($808,000) than the career earnings effectof wage discrimination ($329,000). Third, our data are consistent with thehypothesis that customer racial discrimination is the reason for the observed exitdiscrimination.
Introduction
Within the literature on labor market discrimination, most researchershave focused on the conditions under which otherwise identical workersreceive different wages.1 Yet, in addition to such wage discrimination,Becker (1971) notes that employment discrimination also can occur at thepoints of job entry, promotion, and exit. Workers can be denied opportuni-ties at each part of the labor market process that result in differentiallife-time earnings. This study focuses onexit discrimination, defined as the
69
*The authors’affiliations are, respectively, Weatherhead School of Management, Case Western ReserveUniversity, Cleveland, OH 44106-7235, and LECG, Inc., Emeryville, CA 94608 and University of SanFrancisco, San Francisco, CA 94117. We would like to thank Robert McCormick and Robert Tollison forplayer race data, Stacy Lomeli for data entry, and Clair Brown, Ken Chay, Marta Elvira, David Feller, WallyHendricks, Ted Keeler, Terry Kennedy, David Levine, Richard Parkin, Paul Staudohar, Barry Staw, JimmyTorrez, and participants at the Labor Seminar at U.C. Berkeley and the WEAI Conference in Seattle, WA,July 1997, for helpful comments. However, the usual caveat applies. Direct correspondence to Ha Hoang.
1 See Cain (1986) for a review.
INDUSTRIAL RELATIONS, Vol. 38, No. 1 (January 1999). ©1999 Regents of the University of CaliforniaPublished by Blackwell Publishers, 350 Main Street, Malden, MA 02148, USA, and 108 Cowley Road,
Oxford, OX4 1JF, UK.
involuntary dismissal of workers based on the preferences of employers,coworkers, or customers. Because it provides fine-grained measures ofindividual productivity, we examine exit discrimination among black andwhite players in the National Basketball Association (NBA). Using salarydata from the league, we show that, in fact, the effect of exit discrimina-tion on career earnings is greater than that due to wage discrimination.
While attention to promotion and hiring discrimination has been long-standing, the focus on exit discrimination has only recently received theo-retical and empirical attention.2 In an analysis of current population statis-tics (CPS) tenure supplements for 1983, 1987, and 1991, Diebold,Neumark, and Polsky (1994) showed that there was a decline in the reten-tion rates of black relative to white workers, whereas all other subgroupsexperienced no such declines. According to Swinnerton and Wial (1995),retention, as a function of tenure, has an inverted-U shape for both blackand white workers and for workers in nonprofessional services, a cate-gory that includes the entertainment industry. Their study covers the1979–1991 period and uses the CPS tenure supplements from 1979, 1981,1983, 1987, and 1991.3
While the results are suggestive, one difficulty that these studies face isan inability to distinguish empirically between voluntary and involuntaryjob separation. This is critical because, unlike involuntary quits, voluntaryquits may not be the result of discriminatory employers, coworkers, orcustomers but rather are based on differing preferences. Hence we turn tothe sports labor market to focus solely on the effects of involuntary turn-over. Because of the extremely high opportunity costs of quitting theNBA, turnover among professional basketball players is predominantlyinvoluntary. Kahn (1991) states that “considering the high incomesearned by professional athletes, it seems likely that much turnover amongthem is involuntary.”4
Another more general criticism of empirical studies of discriminationin the labor market is the difficulty of operationalizing individual abilityor productivity. A similar shortcoming of empirical analyses in this areahas been the omission of critical but difficult to measure characteristics
70 / HA HOANG AND DAN RASCHER
2 See Brown et al. (1997, chap. 2) for a recent review of quit behavior studies.3 This is consistent with our findings of a U-shapedunconditionalhazard function for NBA players.
However, as shown in Figure 1, when we estimated the hazard functionconditionalon productivity, theshape changed significantly. Swinnerton and Wial (1995) do not perform this type of analysis.
4 If some turnover is voluntary, one might expect to find higher retirement rates for whites. Whites wouldbe more likely to quit because of greater employment opportunities inside and outside the sport. If there is adifference in quit rates, we argue that a greater tendency for voluntary retirement among white players islikely to bias our effects downward, thereby providing a conservative test of exit discrimination.
that are related to worker productivity (Allison, 1983). An omitted vari-able such as “quality of prior work experience,” for example, can inflatethe differential effect of race or sex on earnings, hiring, promotion, or exitrates. In light of these difficulties, the availability of detailed performancemeasures in sports alleviates the problem of biased results due to mis-measurement or correlation of errors with race and can get us closer to astate of the world where, in Becker’s terms, a “taste for discrimination”can be discerned between different racial groups of otherwise equal abil-ity (Becker, 1971).
For these reasons, many researchers have turned to the sports labormarket in order to test for evidence of discrimination. In a number ofsports, evidence for wage discrimination by race has been found.5 In par-ticular, Kahn (1991), in a survey of the literature, found that the wage gapin basketball is between 11 percent and 25 percent against black players.Brown, Spiro, and Keenan (1991), and Kahn and Sherer (1988) bothexamined wage and entry discrimination in the NBA. No entry effect wasfound, but tests of a differential wage effect were significant. Extendingthis literature, our study enables a comparison to be made between thecareer earnings effect of wage and exit discrimination.
Similarly, Jiobu (1988) determined that black baseball players had sig-nificantly higher exit rates than their white counterparts from 1971 to1985.6 He used race, age, playing position, and three measures of totalcareer performance to examine exit discrimination. No numerical inter-pretation is offered regarding the extent of exit discrimination, no reasonfor it is analyzed, and no effect on career earnings is mentioned.
With explicit attention to exit discrimination, Johnson and Marple(1973) found that white benchwarmers had longer careers than blackbenchwarmers in the NBA using data from the 1970 season. They rankplayers based on points scored per game and use a comparison of meansby race. No other controls are included. Because of the methodologyused, the amount of discrimination is difficult to determine in their study.
We extend these studies by gathering better productivity data (eightannual measures of performance for eleven seasons) as well as more
The NBA, Exit Discrimination, and Career Earnings/ 71
5 See Hill and Spellman (1984) and Cymrot (1983) for baseball; Kahn and Sherer (1988), Koch and Van-der Hill (1988), Wallace (1988), and Brown, Spiro, and Keenan (1991) for basketball; Mogull (1973) andKahn (1992) for football; and Walsh etal. (1988) and Jones and Walsh (1988) for hockey.
6 Sam Jethroe, the 1950 Major League Baseball National League Rookie of the Year, alleged that racialdiscrimination had shortened his career. On October 4, 1996, a federal court ruled the claim was barred bythe statute of limitations (Contra Costa Times, October 6, 1996). The relevance is that he is not eligible forpension benefits because his career was not long enough. Another baseball example comes from an articlein theSan Francisco Chronicleon April 15, 1997. Black players believe that “the average black player ismore likely to be released in favor of a white player of relatively equal skills.”
extensive information on alternative factors that could affect the decisionto retain players: injuries, trades, team record, and draft number. We alsoemploy the more methodologically appropriate technique of event-historyanalysis to test for differential exit rates for black versus white players.Additionally, the effect on career earnings is assessed along with analysesthat suggest customer preferences play an important role.
As Kahn (1991) noted in his survey of the literature, there was evidenceof customer or fan preferences as a determinant of some forms of dis-crimination in the NBA. Kahn and Sherer (1988) show that fan attendanceis affected by team racial composition. Having more white players on ateam results in greater turnout. Brown, Spiro, and Keenan (1991) reportthat there is evidence of “geographical sorting by race”; i.e., there is ahigh correlation between the racial composition of teams and their corre-sponding cities. A deeper look into customer discrimination by Burdekinand Idson (1991) reveals that not only is higher attendance associatedwith increases in the percentage of white players on a team but that thematching of team to city racial composition also increases attendance, atthe margin.
Customer-based discrimination has received little attention becausefew goods could be identified as being white or black produced. Hencemuch of the focus has been on employer and coworker discrimination aslikely sources of the disparities in wages and income levels that areobserved between blacks and whites in the general labor market (Cain,1986). Kahn (1991) argued, however, that customer discrimination maybe more prevalent in sports than in the general labor market because pro-fessional sports are in the public eye, where there is contact between fansand players. In a context where the majority of employees are black, hehypothesized that fans place a premium on watching white players.Indeed, he suggested that this premium may have increased as the totalpercentage of whites in the league decreased from approximately 42 per-cent in the early 70s to roughly 20 percent in the 1980s. Following thework of Burdekin and Idson (1991), we test a model of customer discrimi-nation by examining the influence of team racial composition on fanattendance. We test a longer period of time, control for the autocorrelationpresent in these types of data, and add an index of the availability of sub-stitute products that is shown to be an important determinant of thedemand for NBA contests.
The rest of the article is organized as follows: The development of atheory of customer-driven exit discrimination is included in the secondsection. The next section contains the event-history analysis of exit ratesin the NBA. The estimate of expected career length, its effects on career
72 / HA HOANG AND DAN RASCHER
earnings, and a test of customer discrimination appear in the fourth sec-tion. A summary of the results and their implications constitutes thefinal section.
Theory
The standard theory of discrimination asserts that competition mayremove coworker or employer wage discrimination but not customerdiscrimination. Further, customer discrimination is more likely to occurin service industries (where there is consumer-producer contact) than inmanufacturing, all else equal. Because consumers knowexactlywho theproducers are, the NBA epitomizes this aspect of a service industry.Given the significant body of evidence showing wage discrimination inthe NBA, the purpose of this section is to develop a theory of customerdiscrimination that allows for both wage and exit discrimination tocoexist. Suppose (1) that customers demand a combination of talent andwhite players because of their desire to see winning teams and their dis-crimination against black players. Further, assume (2) that the pool ofavailable talent with sufficient skill is becoming increasingly black.Thus there are two opposing forces at work that lead to an optimalnumber of black players on a team, assuming a diminishing marginalrevenue product of the number of white players on a team. First, employas many black players as possible to capitalize on their relative abun-dance. Second, employ as many white players as possible to satisfy cus-tomer preferences.
For a typical NBA team, letQ = Q(T, nw), whereQ is the demand for thegames played by this team.T is total team talent and is defined asT = nwTw
+ nbTb, wherenw andnb are the number of white and black players on theteam, respectively, andTw andTb are their average talent levels. Further,N, the total number of players on the team, is fixed by the league and isdefined asN = nw + nb. The argumentnw is in the demand function becauseit represents the fans’ preferences for watching white players.
An owner chooses the amount of talent and team racial compositionthat maximizes profits “πi. Explicitly, ”πi = PQ(T, nw) – (wwnwTw + wbnbTb),whereP is the ticket price and is assumed constant andww andwb are thewhite and black wage per unit of talent, respectively. The resulting equi-librium condition is
(1)
The NBA, Exit Discrimination, and Career Earnings/ 73
w T w T MRP T T MRPw w b b T w b nw− = − +a f
MRPT [defined as ] is the marginal revenue product of talentand is assumed to be positive but decreasing. [defined as
is the marginal revenue product of the fraction of white play-ers on the team and is assumed to be positive and decreasing up to a cer-tain nw. This is the effect of including the first exogenous factor into themodel; fans discriminate based on race.7
As Kahn (1991) indicates, there is a wage gap, ranging from 11 percentto 25 percent, that favors white players in the NBA. Equation (1) showsthat there is a white wage premium that comes directly from customerpreferences for white players. In other words, a white player of compara-ble ability to a black player receives an income in excess of the blackincome [i.e., (ww – wb)T] by an amount equal to the effect that their racehas on the attendance decisions of fans In equilibrium, the ownerhires the number of white players that causes Eq. (1) to be true.
To satisfy the fans, there is a minimum number of white players on ateam. The second assumption, that the pool of quality available talentis becoming increasingly black, causes the annual replacement ofplayers with rookies to occur mostly among black players. The whiteplayers have longer careers simply because there are fewer qualifiedwhite rookies to replace them, whereas the black players are con-stantly being cycled in and out of the league.8 The exit discriminationis caused by the biased preferences of fans (assumption 1) but isheightened by the fact that the pool of available rookies is mostlyblack and increasing (assumption 2).9
This theory, like any other, is dependent on its assumptions. The fourthsection tests the validity of assumption 1. For assumption 2, we note thatthe percentage of players drafted who are black has grown from 58 per-cent to 80 percent over the last two decades, which is in line with the
74 / HA HOANG AND DAN RASCHER
MRPnw
∂ ∂Q nwa f]
7 It is possible that the demand maximizing number of white players on a team is greater thanN, the totalnumber of players on the team. This depends on the magntitude of the marginal attendance decisions ofwhite and black fans.
8 When there are a lot of white players on a team, as was the case in the early 70s, the replacement of awhite player with a black player has little effect on attendance and thus wages. As the team approaches thecritical minimum number of white players, each white player represents a larger proportion of the whiteplayers on the team, and his removal has a larger effect on attendance and therefore wages. Counter to whatmight be expected, the real effects of discrimination are likely to beincreasingin the NBA as the transitionto the equilibrium occurs.
9 The theory also predicts that the team racial composition may affect the hazard rate in one of two ways.Black players on a team with many black players might have an increased chance of being fired because theteam is approaching the critical minimum number of white players. On the other hand, a particular blackplayer on a team with many black players may be less likely to be the one who is replaced from the pool ofavailable talent. Thus the direction of the effect is indeterminant.
MRPnw.
nw*
P Q T∂ ∂a f
growth in the percentage of college players who are black.10 Thus the poolof qualified talent has become increasingly black.11
If the two assumptions are true empirically, what are their implicationsfor the data analysis that follows? The theory distinguishes between thefollowing two hypotheses. The null hypothesis is that if performance isthe sole criterion that earnings and employment decisions are based on,then there should be no difference between wages and hazard rates acrossraces.12 The alternative hypothesis is that if race matters, wages will belower and hazard rates will be higher for black players as compared withequally talented white players.
Exit Discrimination
The Data. The sample includes all players selected in the first tworounds of the 1980–1986 NBA draft.13 We restricted the sample to thosewho received a contract and played at least 1 year in the NBA. Of thosewho were excluded, 53 players did not receive a contract and 1 playerplayed in Europe only to return to the NBA for 1 year. We followed theremaining 275 players’ careers until they were cut from the league or untilthe 1990–1991 season, the last year for which data were obtained. Duringthe time frame of this study, 184 of the 275 players in this sample wereeventually cut from the league.
Using player photographs available from theOfficial NBA Guide(1980–1991), we coded the race of each player in the sample; 51 of the275 players are white. In addition, player position, performance statistics,
The NBA, Exit Discrimination, and Career Earnings/ 75
10 In 1993, black athletes formed 27.5 percent of the division I athletes (all sports, not just basketball), upfrom 23.6 percent in 1986 (Blum, 1995).
11Although it is beyond the scope of this study, it is important to understand the causes for the increase inthe number of blacks in the pool of available talent. Harry Edwards suggests that it “began with the integra-tion of blacks into mainstream professional sports,” which continues today, but is further urged along by themedia’s “elevation of black professional athletes to the status of role models/heroes/celebrities and theblack community’s association of these images with making it” (Edwards, 1994). “The almost universalperception that sport, among all American institutions, offers African-Americans unique socioeconomicand career advancement opportunities has prompted black parents to be four times more likely than whiteparents to view their children’s participation in sport not as mere recreation, but as a start down the road to aprofessional sports career. Similarly, black parents are more likely than white parents to see their children’ssports participation as a potential economic mobility vehicle for the entire family” (Edwards, 1992).
12 In a race-blind world, would be zero, a larger proportion of the players in the league would beblack, and wages would be based solely on talent. This implies that the number of teams with only blackplayers should be lower in the discrimination than in the null setting. Given our data, the expected numberof all-black teams is about 5.4, whereas the actual number is 4, so the sign is as expected, but the differenceis not statistically significant.
13 Players who were selected beyond the second round were rarely offered contracts. In 1989, the NBAitself finally narrowed down the number of rounds to two.
MRPn w
number of games played, team record, and detailed information on playerinjuries and trades were collected fromThe Official NBA Encyclopedia(1989) andThe Sports Encyclopedia(1991).
Player position is included as a control variable in order to account forthe relative scarcity and greater difficulty that teams face in replacingtheir taller players. Because taller players typically occupy the center andforward positions, we divided players into two positions: center/forwardand guard (the reference category). We expect centers and forwards tohave a lower risk of exiting than the guards, who are generally smaller.
Scoring, assists, steals, rebounding, and blocks are used as measures ofeach player’s ability on the court. Since these performance statistics maydepend on how much playing time a player receives, the performancemeasures are divided by the number of minutes played during the season.The number of games played during the regular season is also included asa separate control. Free throw shooting and field goal shooting are enteredas percentages and serve as additional measures of scoring ability.
A player’s performance and the length of his career may be affected bythe occurrence of injuries. A dummy variable,injury, accounts for thepresence of any one of 14 types of injury or illness. The extent of theinjury is controlled for by combining it with games played.
A possible influence on a player’s career length is the likelihood ofbeing traded, which is measured by the number of trades during hiscareer. Most player trades occur during the interim season as playersbecome free agents and teams try to rebuild their roster and vie for futuretop draft picks. The effect of being traded was analyzed along with thesubsequent year’s performance on the rate of exit. The direction of theeffect is not clear because trades could breathe new life into a player’scareer if the player is sent to a team that has a greater need for his services.However, being traded also can signal a player’s declining ability, therebyleading to a decrease in playing time on the new team.
Team record, expressed as the percentage of games won during theregular season, is included. Because poorly performing teams oftenundergo major roster changes in order to improve their performance,players might be at greater risk for being cut as losing teams attempt torebuild.
A player’s draft number is the order in which a player was taken in theNBA draft. It is included in the analysis as a measure of a team’s financialcommitment to a player and as a measure of the player’s expected futureperformance; earlier draft picks receive larger salaries in their contractsand are expected to be top performers. These contracts represent a sunkcost incurred by the drafting team that have been shown to affect career
76 / HA HOANG AND DAN RASCHER

length such that, controlling for performance and other factors, playerswho were picked earlier in the draft were found to have a significantlylower risk of being cut from the league (Staw and Hoang, 1995). Conse-quently, we include draft order in this analysis and expect to replicate thisfinding.
Because the risk of being cut from the NBA can be expected to changewith the number of years (seasons) a player has already spent in theleague, tenure in the NBA is also included. The tenure “clock” stopped,however, for some players who left to play for teams in Europe, since per-formance measures are not available for those years. The clock restartedwhen they returned to the NBA.
Methods.Examining survival in the NBA poses several challenges tostandard regression techniques. First, there is no satisfactory way of han-dling right-censored cases, i.e., the group of players for which the event ofbeing cut from the league is not observed within the time period of thestudy. Conducting a logistic regression on a categorical dependent vari-able that distinguishes those who were cut and those who were not cutwould retain information from both groups. However, logistic regressionis unsatisfying because it cannot incorporate the effect of duration or timespent in the state prior to the occurrence of the event. The effect of dura-tion, measured by length of tenure in the NBA, is particularly importantbecause we would expect that a player’s risk of exiting will change thelonger he remains in the league.
Finally, ordinary regression techniques are problematic because theycannot easily incorporate changes in the values of the explanatory vari-ables over time. Creating performance variables for every year spent inthe league for up to 12 years would be very cumbersome and introduceproblems of multicollinearity.
In order to address each of these challenges, we use event-historyanalysis to examine how race influences the risk of being cut from theNBA. The model of the survival process using this framework wouldexplicitly include (1) both those who were and were not cut from theleague, (2) information on duration, and (3) explanatory variables that canvary over time.
The dependent variable in event-history analysis is the hazard rate. Thehazard rateis interpreted as the probability of exiting the NBA during thetime intervalt to t + ∆t, given that the individual is at risk for being cut attime t (Petersen, 1995). Dividing the probability by∆t and letting∆t → 0give us the more precise formulation of the hazard rate expressed as aninstantaneous rate of transition:
The NBA, Exit Discrimination, and Career Earnings/ 77
(2)
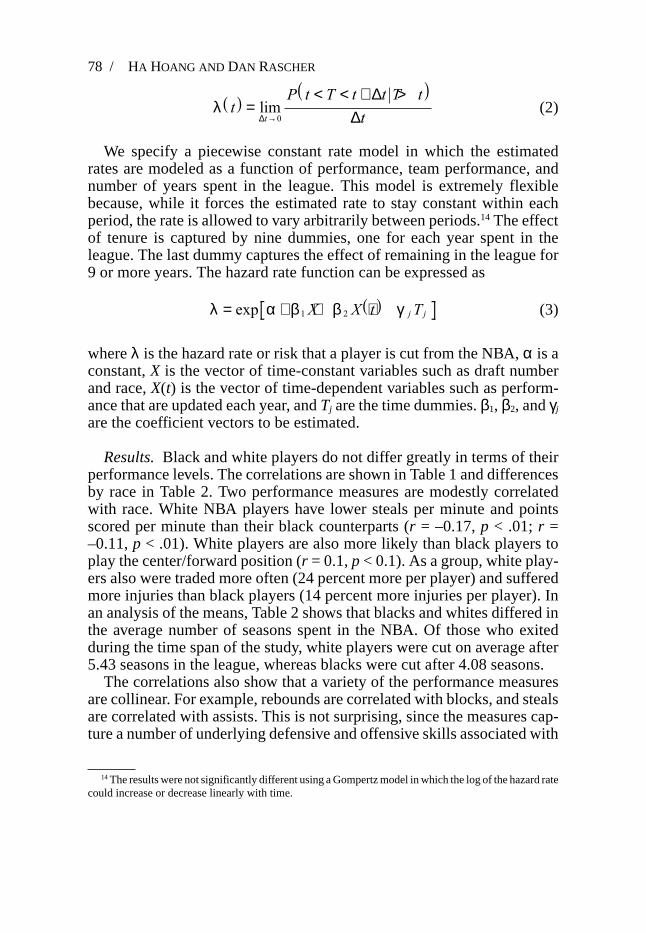
We specify a piecewise constant rate model in which the estimatedrates are modeled as a function of performance, team performance, andnumber of years spent in the league. This model is extremely flexiblebecause, while it forces the estimated rate to stay constant within eachperiod, the rate is allowed to vary arbitrarily between periods.14 The effectof tenure is captured by nine dummies, one for each year spent in theleague. The last dummy captures the effect of remaining in the league for9 or more years. The hazard rate function can be expressed as
(3)
whereλ is the hazard rate or risk that a player is cut from the NBA,α is aconstant,X is the vector of time-constant variables such as draft numberand race,X(t) is the vector of time-dependent variables such as perform-ance that are updated each year, andTj are the time dummies.β1, β2, andγj
are the coefficient vectors to be estimated.
Results.Black and white players do not differ greatly in terms of theirperformance levels. The correlations are shown in Table 1 and differencesby race in Table 2. Two performance measures are modestly correlatedwith race. White NBA players have lower steals per minute and pointsscored per minute than their black counterparts (r = –0.17,p < .01; r =–0.11,p < .01). White players are also more likely than black players toplay the center/forward position (r = 0.1,p < 0.1). As a group, white play-ers also were traded more often (24 percent more per player) and sufferedmore injuries than black players (14 percent more injuries per player). Inan analysis of the means, Table 2 shows that blacks and whites differed inthe average number of seasons spent in the NBA. Of those who exitedduring the time span of the study, white players were cut on average after5.43 seasons in the league, whereas blacks were cut after 4.08 seasons.
The correlations also show that a variety of the performance measuresare collinear. For example, rebounds are correlated with blocks, and stealsare correlated with assists. This is not surprising, since the measures cap-ture a number of underlying defensive and offensive skills associated with
78 / HA HOANG AND DAN RASCHER
14The results were not significantly different using a Gompertz model in which the log of the hazard ratecould increase or decrease linearly with time.
λ α β β γ= + + +exp 1 2X X t Tj ja f
λ tP t T t t T t
tta f b g
=< < + >
→lim∆
∆∆0

TABLE1
MEANS, STANDARD DEVIATIONS, AND CORRELATIONS OFINDEPENDENTVARIABLES (N = 1455)
Intercorrelation
Meaj hn SD 1 2 3 4 5 6 7 8 9 10 11 112 13 14
1 Center/forward 0.70 0.46 1.00
2 Free throws 71.74 15.00 −0.19b 1.00
3 Field goals 46.63 7.79 0.15b 0.20b 1.00
4 Assists 0.09 0.07 −0.67b 0.29b −0.02 1.00
5 Rebounds 0.18 0.08 0.58b −0.24b 0.26b −0.53b 1.00
6 Steals 0.04 0.02 −0.33b 0.07c 0.00 0.40b −0.08b 1.00
7 Blocks 0.02 0.02 0.42b −0.19b 0.15b −0.38b 0.50b −0.22b 1.00
8 Points scored 0.43 0.14 0.05 0.41b 0.41b 0.04 0.00 0.14b −0.09b 1.00
9 Injury 0.08 0.27 0.00 −0.03 −0.10b 0.00 −0.01 −0.05 −0.02 −0.03 1.00
10 Trade 0.15 0.36 0.01 −0.02 −0.09b −0.03 −0.06c −0.01 −0.06c −0.12b −0.02 1.00
11 Games 63.52 22.69 0.00 0.39b 0.44b 0.11b 0.07b 0.03 0.08b 0.29b −0.30b −0.15b 1.00c
12 Team record 49.45 14.37 0.06 0.01 0.09b −0.02 0.02 −0.02 0.04 0.06c −0.04 −0.09b 0.07b 1.00
13 Draft number 17.96 12.16 −0.04 −0.16b −0.16b −0.04 −0.06c 0.07b −0.05c −0.34b −0.05 0.09b −0.26b −0.03b 1.00
14 Tenurea 3.94 2.46 0.03 0.13b 0.04 0.02 −0.03 −0.08b −0.01 0.10b 0.09b 0.17b 0.06c 0.10 −0.17b 1.00
15 Race 0.22 0.41 0.10b 0.08b 0.01 −0.05c 0.05c −0.17b 0.00 −0.11b − 0.01 0.01 0.01 0.06a 0.01 0.05
a Time dummies are converted to a continuous variable.b p < .01, two-tailed.c p < .05, two-tailed.

the different positions on a team. Centers and forwards, for instance, havehigher rebounds per minute and blocks per minute than the other posi-tions (r =.58,p < .01, two-tailed test;r = .42,p < .01, two-tailed test).
While the relationships across the performance measures are to beexpected, multicollinearity presents two problems for the subsequentevent-history analysis. First, standard errors of the performance measuresare likely to be inflated, thereby leading to a higher probability of incor-rectly accepting the null hypothesis of no effect (a type II error). Anotherconsequence of multicollinearity is the sensitivity of the estimates and thestandard errors to changes in the model. In our analyses, we found that theinjury variable became significant, while the trade variable became insig-nificant when the number of games played was included in the analysis.Because of the high collinearity, the effects of trade and injury should beinterpreted with caution. Despite the problem of multicollinearity, how-ever, we decided to include all the measures in the event-history analysisin order to conduct the most conservative test of player race as a predictorof exit rates.
The results of the event-history analysis using the piecewise constantrate model appear in Table 3. In the total sample, 184 players were cutfrom the league. Therefore, the annual proportional hazard rate for drop-ping out of the NBA was 0.13. The full model with control variables and
80 / HA HOANG AND DAN RASCHER
TABLE 2
COMPARISON OFEXPLANATORY VARIABLES BY PLAYER RACE
Blacks Whites
TotalsNumber of players 224 51Percentage of center forwards 67% 78%Percentage of guards 33% 22%
MeansFree throw percentage 0.71 0.74Field goal percentage 0.47 0.47Assists/minute 0.10 0.09Rebounds/minute 0.18 0.19Steals/minute 0.04 0.03Blocks/minute 0.02 0.02Points/minute 0.44 0.40Winning percentage of team 48.98 51.09Draft number 17.88 18.22Percent black on team 0.76 0.68Games played 63.42 63.86Instances of being injured 0.41 0.47Instances of being traded 0.76 1.00Tenurea 4.08 5.43
a Mean tenure of players who were cut (not right-censored).
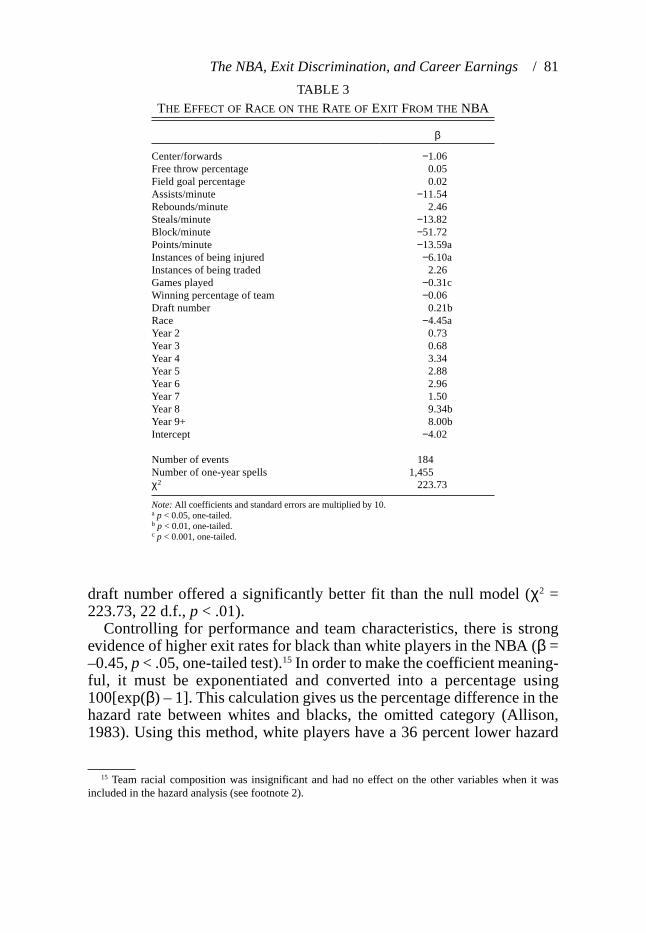
draft number offered a significantly better fit than the null model (χ2 =223.73, 22 d.f.,p < .01).
Controlling for performance and team characteristics, there is strongevidence of higher exit rates for black than white players in the NBA (β =–0.45,p < .05, one-tailed test).15 In order to make the coefficient meaning-ful, it must be exponentiated and converted into a percentage using100[exp(β) – 1]. This calculation gives us the percentage difference in thehazard rate between whites and blacks, the omitted category (Allison,1983). Using this method, white players have a 36 percent lower hazard
The NBA, Exit Discrimination, and Career Earnings/ 81
TABLE 3
THE EFFECT OFRACE ON THE RATE OF EXIT FROM THE NBA
β
Center/forwards −1.06Free throw percentage 0.05Field goal percentage 0.02Assists/minute −11.54Rebounds/minute 2.46Steals/minute −13.82Block/minute −51.72Points/minute −13.59aInstances of being injured −6.10aInstances of being traded 2.26Games played −0.31cWinning percentage of team −0.06Draft number 0.21bRace −4.45aYear 2 0.73Year 3 0.68Year 4 3.34Year 5 2.88Year 6 2.96Year 7 1.50Year 8 9.34bYear 9+ 8.00bIntercept −4.02
Number of events 184Number of one-year spells 1,455χ2 223.73
Note:All coefficients and standard errors are multiplied by 10.a p < 0.05, one-tailed.b p < 0.01, one-tailed.c p < 0.001, one-tailed.
15 Team racial composition was insignificant and had no effect on the other variables when it wasincluded in the hazard analysis (see footnote 2).

FIGURE 1Estimated Hazard Rate for Black and White Players
FIGURE 2Survival Functions for Black and White Players (with standard errors)
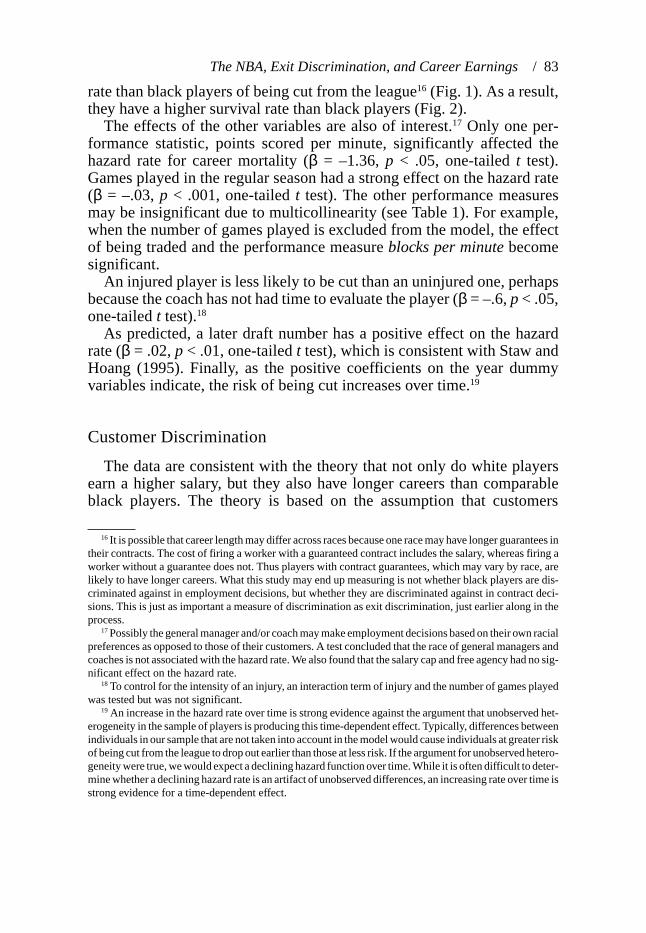
rate than black players of being cut from the league16 (Fig. 1). As a result,they have a higher survival rate than black players (Fig. 2).
The effects of the other variables are also of interest.17 Only one per-formance statistic, points scored per minute, significantly affected thehazard rate for career mortality (β = –1.36,p < .05, one-tailedt test).Games played in the regular season had a strong effect on the hazard rate(β = –.03,p < .001, one-tailedt test). The other performance measuresmay be insignificant due to multicollinearity (see Table 1). For example,when the number of games played is excluded from the model, the effectof being traded and the performance measureblocks per minutebecomesignificant.
An injured player is less likely to be cut than an uninjured one, perhapsbecause the coach has not had time to evaluate the player (β = –.6,p < .05,one-tailedt test).18
As predicted, a later draft number has a positive effect on the hazardrate (β = .02,p < .01, one-tailedt test), which is consistent with Staw andHoang (1995). Finally, as the positive coefficients on the year dummyvariables indicate, the risk of being cut increases over time.19
Customer Discrimination
The data are consistent with the theory that not only do white playersearn a higher salary, but they also have longer careers than comparableblack players. The theory is based on the assumption that customers
The NBA, Exit Discrimination, and Career Earnings/ 83
16It is possible that career length may differ across races because one race may have longer guarantees intheir contracts. The cost of firing a worker with a guaranteed contract includes the salary, whereas firing aworker without a guarantee does not. Thus players with contract guarantees, which may vary by race, arelikely to have longer careers. What this study may end up measuring is not whether black players are dis-criminated against in employment decisions, but whether they are discriminated against in contract deci-sions. This is just as important a measure of discrimination as exit discrimination, just earlier along in theprocess.
17Possibly the general manager and/or coach may make employment decisions based on their own racialpreferences as opposed to those of their customers. A test concluded that the race of general managers andcoaches is not associated with the hazard rate. We also found that the salary cap and free agency had no sig-nificant effect on the hazard rate.
18 To control for the intensity of an injury, an interaction term of injury and the number of games playedwas tested but was not significant.
19 An increase in the hazard rate over time is strong evidence against the argument that unobserved het-erogeneity in the sample of players is producing this time-dependent effect. Typically, differences betweenindividuals in our sample that are not taken into account in the model would cause individuals at greater riskof being cut from the league to drop out earlier than those at less risk. If the argument for unobserved hetero-geneity were true, we would expect a declining hazard function over time. While it is often difficult to deter-mine whether a declining hazard rate is an artifact of unobserved differences, an increasing rate over time isstrong evidence for a time-dependent effect.
prefer watching white players. The following tests suggest the presence ofcustomer prejudice.
All else being equal, employer discrimination would lead to a teamracial composition that represents the racial preferences of the team deci-sion makers: the owner, the general manager, and the coach. On the otherhand, the preferences of the fans would determine the team racial makeupif customer discrimination existed. To distinguish between employer andcustomer discrimination, the relationship between the race of the decisionmaker (approximated by coach and general manager race), the race ofpotential fans (approximated by city racial composition), and the racialcomposition of the team is analyzed.20
Following Burdekin and Idson (1991), we examine whether the racialcomposition of the basketball teams in turn affects fan attendance.Because fan turnout is an important source of revenue, we focus on atten-dance in order to show that management must be concerned with bothteam performance and team racial composition in order to maximizeticket revenue.21
Data and Methods.In the first analysis, the percentage of white play-ers on each team is modeled as a function of the percentage of whites liv-ing in the metropolitan area of the stadium, the race of the coach, and therace of the general manager. Information on the racial composition ofeach team was provided by Robert McCormick and Robert Tollison, whoused the names listed on team rosters to identify the players using theOfficial NBA Guideand theOfficial NBA Register.
The racial composition of the city was defined as the percent of theStandard Metropolitan Statistical Area (SMSA) that was white in the areain which the team was located. SMSA data were obtained from the 1980and 1990 Census. Because the percentage white changed little from thefirst point of observation to the second (the maximum difference wasMiami, which saw a 3.6 percent rise in its black population), city racialcomposition was imputed for 1980–1989 with 1980 SMSA data, whilethe remaining years were imputed with 1990 SMSA data. Hence much ofthe variation explained by the SMSA data was constrained to be acrossteams rather than within teams. The race of the coach and general man-ager were obtained from theOfficial NBA Guide.
In the second analysis, fan attendance is modeled as a function of theratio of the racial composition of the team to that in the surrounding city,
84 / HA HOANG AND DAN RASCHER
20 All owners except one were white during this time period.21 Reported ticket price data are fairly uniform across teams.
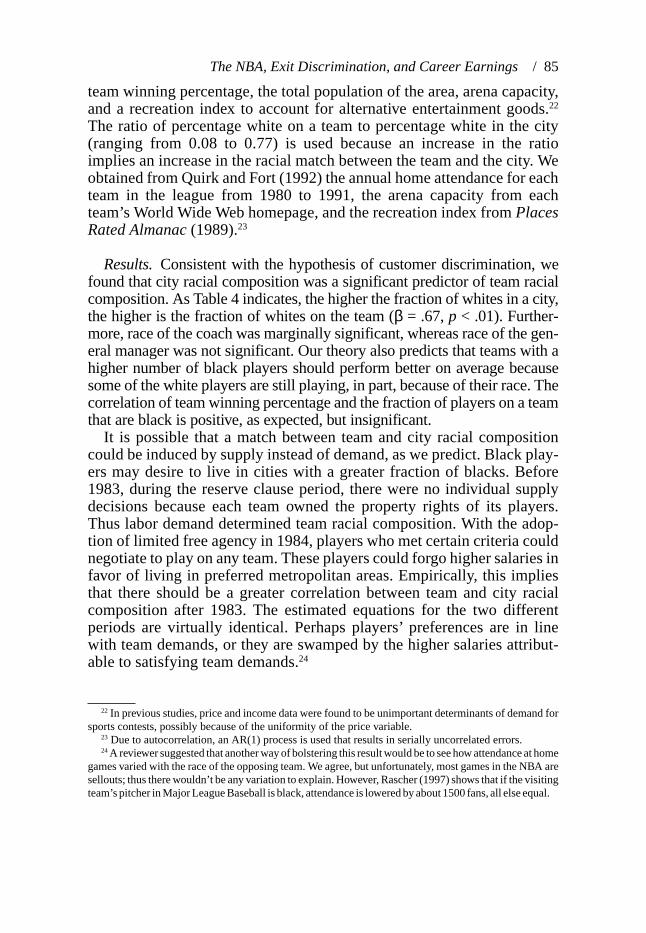
team winning percentage, the total population of the area, arena capacity,and a recreation index to account for alternative entertainment goods.22
The ratio of percentage white on a team to percentage white in the city(ranging from 0.08 to 0.77) is used because an increase in the ratioimplies an increase in the racial match between the team and the city. Weobtained from Quirk and Fort (1992) the annual home attendance for eachteam in the league from 1980 to 1991, the arena capacity from eachteam’s World Wide Web homepage, and the recreation index fromPlacesRated Almanac(1989).23
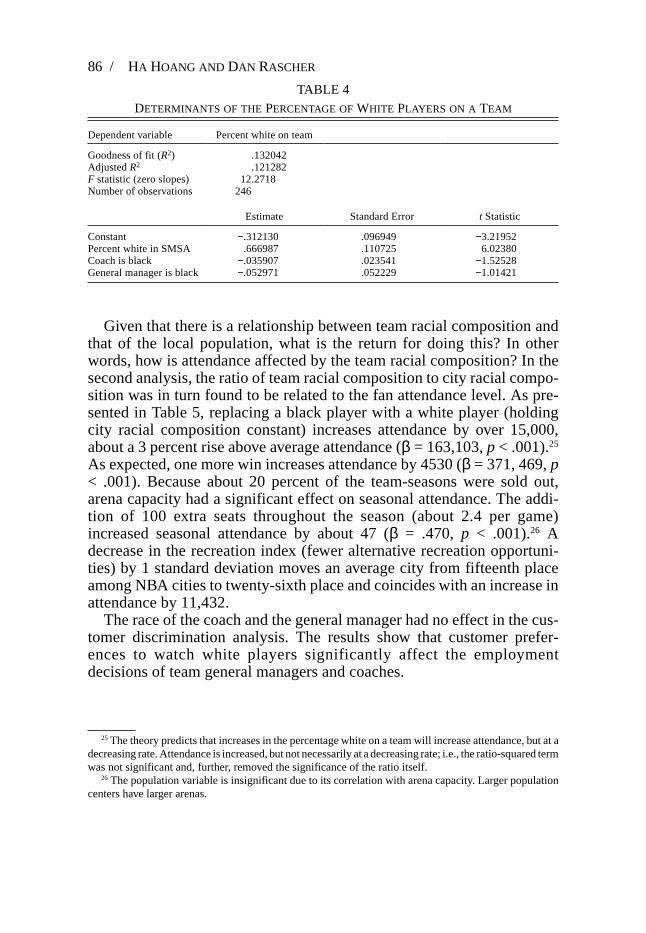
Results.Consistent with the hypothesis of customer discrimination, wefound that city racial composition was a significant predictor of team racialcomposition. As Table 4 indicates, the higher the fraction of whites in a city,the higher is the fraction of whites on the team (β = .67,p < .01). Further-more, race of the coach was marginally significant, whereas race of the gen-eral manager was not significant. Our theory also predicts that teams with ahigher number of black players should perform better on average becausesome of the white players are still playing, in part, because of their race. Thecorrelation of team winning percentage and the fraction of players on a teamthat are black is positive, as expected, but insignificant.
It is possible that a match between team and city racial compositioncould be induced by supply instead of demand, as we predict. Black play-ers may desire to live in cities with a greater fraction of blacks. Before1983, during the reserve clause period, there were no individual supplydecisions because each team owned the property rights of its players.Thus labor demand determined team racial composition. With the adop-tion of limited free agency in 1984, players who met certain criteria couldnegotiate to play on any team. These players could forgo higher salaries infavor of living in preferred metropolitan areas. Empirically, this impliesthat there should be a greater correlation between team and city racialcomposition after 1983. The estimated equations for the two differentperiods are virtually identical. Perhaps players’ preferences are in linewith team demands, or they are swamped by the higher salaries attribut-able to satisfying team demands.24
The NBA, Exit Discrimination, and Career Earnings/ 85
22 In previous studies, price and income data were found to be unimportant determinants of demand forsports contests, possibly because of the uniformity of the price variable.
23 Due to autocorrelation, an AR(1) process is used that results in serially uncorrelated errors.24A reviewer suggested that another way of bolstering this result would be to see how attendance at home
games varied with the race of the opposing team. We agree, but unfortunately, most games in the NBA aresellouts; thus there wouldn’t be any variation to explain. However, Rascher (1997) shows that if the visitingteam’s pitcher in Major League Baseball is black, attendance is lowered by about 1500 fans, all else equal.
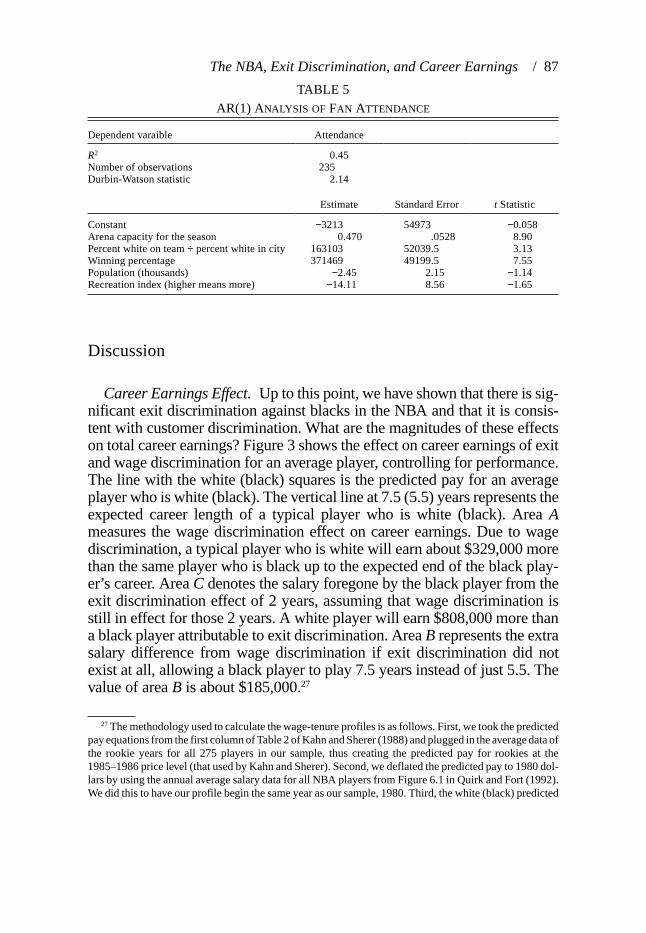
Given that there is a relationship between team racial composition andthat of the local population, what is the return for doing this? In otherwords, how is attendance affected by the team racial composition? In thesecond analysis, the ratio of team racial composition to city racial compo-sition was in turn found to be related to the fan attendance level. As pre-sented in Table 5, replacing a black player with a white player (holdingcity racial composition constant) increases attendance by over 15,000,about a 3 percent rise above average attendance (β = 163,103,p < .001).25
As expected, one more win increases attendance by 4530 (β = 371, 469,p< .001). Because about 20 percent of the team-seasons were sold out,arena capacity had a significant effect on seasonal attendance. The addi-tion of 100 extra seats throughout the season (about 2.4 per game)increased seasonal attendance by about 47 (β = .470, p < .001).26 Adecrease in the recreation index (fewer alternative recreation opportuni-ties) by 1 standard deviation moves an average city from fifteenth placeamong NBA cities to twenty-sixth place and coincides with an increase inattendance by 11,432.
The race of the coach and the general manager had no effect in the cus-tomer discrimination analysis. The results show that customer prefer-ences to watch white players significantly affect the employmentdecisions of team general managers and coaches.
86 / HA HOANG AND DAN RASCHER
TABLE 4
DETERMINANTS OF THEPERCENTAGE OFWHITE PLAYERS ON A TEAM
Dependent variable Percent white on team
Goodness of fit (R2) .132042AdjustedR2 .121282F statistic (zero slopes) 12.2718Number of observations 246
Estimate Standard Error t Statistic
Constant −.312130 .096949 −3.21952Percent white in SMSA .666987 .110725 6.02380Coach is black −.035907 .023541 −1.52528General manager is black −.052971 .052229 −1.01421
25 The theory predicts that increases in the percentage white on a team will increase attendance, but at adecreasing rate. Attendance is increased, but not necessarily at a decreasing rate; i.e., the ratio-squared termwas not significant and, further, removed the significance of the ratio itself.
26 The population variable is insignificant due to its correlation with arena capacity. Larger populationcenters have larger arenas.
Discussion
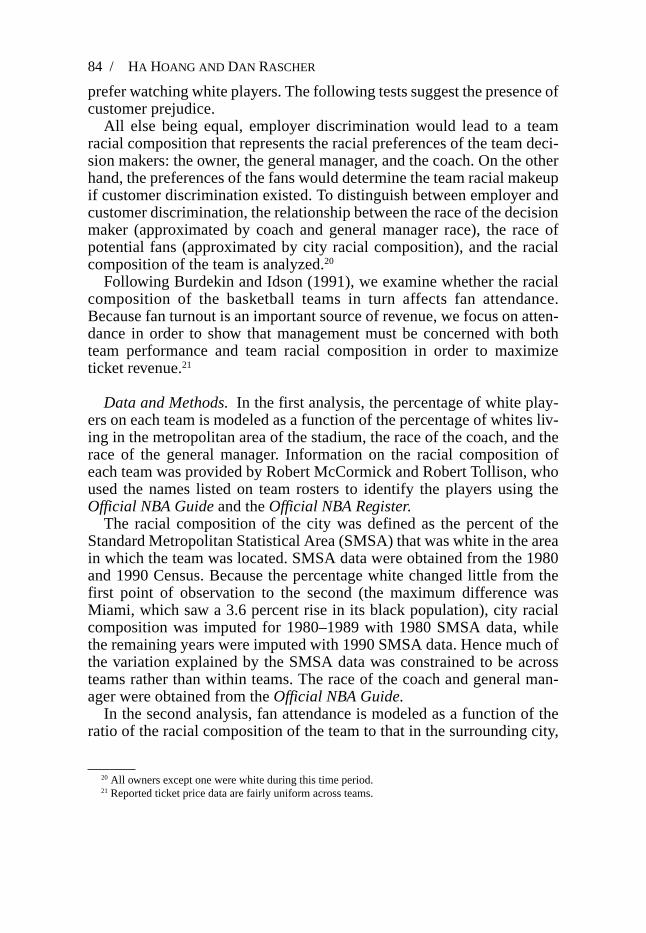
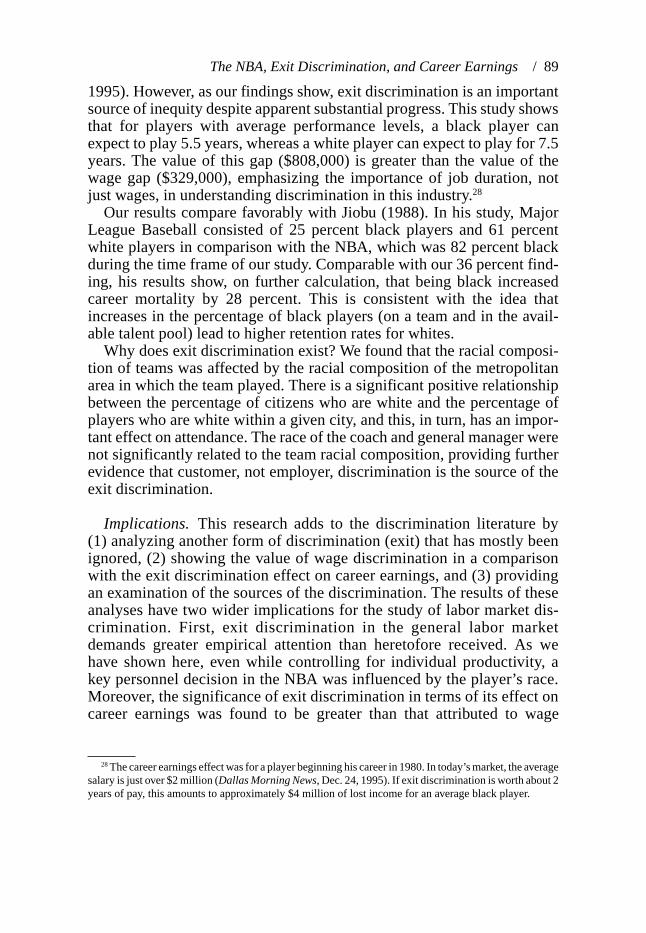
Career Earnings Effect.Up to this point, we have shown that there is sig-nificant exit discrimination against blacks in the NBA and that it is consis-tent with customer discrimination. What are the magnitudes of these effectson total career earnings? Figure 3 shows the effect on career earnings of exitand wage discrimination for an average player, controlling for performance.The line with the white (black) squares is the predicted pay for an averageplayer who is white (black). The vertical line at 7.5 (5.5) years represents theexpected career length of a typical player who is white (black). AreaAmeasures the wage discrimination effect on career earnings. Due to wagediscrimination, a typical player who is white will earn about $329,000 morethan the same player who is black up to the expected end of the black play-er’s career. AreaC denotes the salary foregone by the black player from theexit discrimination effect of 2 years, assuming that wage discrimination isstill in effect for those 2 years. A white player will earn $808,000 more thana black player attributable to exit discrimination. AreaB represents the extrasalary difference from wage discrimination if exit discrimination did notexist at all, allowing a black player to play 7.5 years instead of just 5.5. Thevalue of areaB is about $185,000.27
The NBA, Exit Discrimination, and Career Earnings/ 87
TABLE 5
AR(1) ANALYSIS OF FAN ATTENDANCE
Dependent varaible Attendance
R2 0.45Number of observations 235Durbin-Watson statistic 2.14
Estimate Standard Error t Statistic
Constant −3213 54973 −0.058Arena capacity for the season 0.470 .0528 8.90Percent white on team÷ percent white in city 163103 52039.5 3.13Winning percentage 371469 49199.5 7.55Population (thousands) −2.45 2.15 −1.14Recreation index (higher means more) −14.11 8.56 −1.65
27 The methodology used to calculate the wage-tenure profiles is as follows. First, we took the predictedpay equations from the first column of Table 2 of Kahn and Sherer (1988) and plugged in the average data ofthe rookie years for all 275 players in our sample, thus creating the predicted pay for rookies at the1985–1986 price level (that used by Kahn and Sherer). Second, we deflated the predicted pay to 1980 dol-lars by using the annual average salary data for all NBA players from Figure 6.1 in Quirk and Fort (1992).We did this to have our profile begin the same year as our sample, 1980. Third, the white (black) predicted

For NBA players beginning their career in 1980, exit discriminationhad a larger effect on career earnings ($808,000) than the more widelynoted finding of wage discrimination (329,000). Overall, wage and exitdiscrimination together costs black players more than $1 million in relin-quished wages. Furthermore, if career length is a factor in determiningpostcareer earnings, $808,000 is an underestimate of the lifetime effect ofexit discrimination. A shortened career affords less endorsement and bas-ketball-related opportunities after the playing days are over.
Summary.On the surface, the labor market in professional sportswould appear to be one of the least likely arenas in which to find racialdiscrimination. It has been almost half a century, for example, sinceChuck Cooper became the first black basketball player to cross the colorbarrier by signing with the Boston Celtics. Since that time, blacks havemade significant inroads into professional sports. Black players havecome to constitute roughly 80 percent of the NBA, and the 13 highest paidplayers in the league were black in 1995 (Dallas Morning News, Dec. 24,
88 / HA HOANG AND DAN RASCHER
pay comes from setting the race variable to 1 (0) in the Kahn and Sherer model. This gives us the first twopoints on the graph (the points above zero tenure). Fourth, the same calculations are repeated for the 1-yearveteran measures using the next year’s performance statistics, setting the tenure variable to 1 and using thecorrect measure of NBA wage inflation, which averaged about 13 percent per season throughout the 1980s.This method takes all the players of a certain vintage, places the beginning of their careers at 1980, and cre-ates a standard player. Then we vary the race and measure predicted pay, controlling for on-the-courtproductivity.
FIGURE 3A Comparison of the Effect of Wage and Exit Discrimination on Career Earnings
1995). However, as our findings show, exit discrimination is an importantsource of inequity despite apparent substantial progress. This study showsthat for players with average performance levels, a black player canexpect to play 5.5 years, whereas a white player can expect to play for 7.5years. The value of this gap ($808,000) is greater than the value of thewage gap ($329,000), emphasizing the importance of job duration, notjust wages, in understanding discrimination in this industry.28
Our results compare favorably with Jiobu (1988). In his study, MajorLeague Baseball consisted of 25 percent black players and 61 percentwhite players in comparison with the NBA, which was 82 percent blackduring the time frame of our study. Comparable with our 36 percent find-ing, his results show, on further calculation, that being black increasedcareer mortality by 28 percent. This is consistent with the idea thatincreases in the percentage of black players (on a team and in the avail-able talent pool) lead to higher retention rates for whites.
Why does exit discrimination exist? We found that the racial composi-tion of teams was affected by the racial composition of the metropolitanarea in which the team played. There is a significant positive relationshipbetween the percentage of citizens who are white and the percentage ofplayers who are white within a given city, and this, in turn, has an impor-tant effect on attendance. The race of the coach and general manager werenot significantly related to the team racial composition, providing furtherevidence that customer, not employer, discrimination is the source of theexit discrimination.
Implications. This research adds to the discrimination literature by(1) analyzing another form of discrimination (exit) that has mostly beenignored, (2) showing the value of wage discrimination in a comparisonwith the exit discrimination effect on career earnings, and (3) providingan examination of the sources of the discrimination. The results of theseanalyses have two wider implications for the study of labor market dis-crimination. First, exit discrimination in the general labor marketdemands greater empirical attention than heretofore received. As wehave shown here, even while controlling for individual productivity, akey personnel decision in the NBA was influenced by the player’s race.Moreover, the significance of exit discrimination in terms of its effect oncareer earnings was found to be greater than that attributed to wage
The NBA, Exit Discrimination, and Career Earnings/ 89
28The career earnings effect was for a player beginning his career in 1980. In today’s market, the averagesalary is just over $2 million (Dallas Morning News, Dec. 24, 1995). If exit discrimination is worth about 2years of pay, this amounts to approximately $4 million of lost income for an average black player.
discrimination. More generally, translating the effect into dollar termsunderscores the importance of examining disparities inlifetimeearningsbetween racial or gender groups.
To be sure, the sports context provides a relatively pure case for thestudy of exit discrimination. Isolating the effects of involuntary exit fromvoluntary exits will be an important next step in extending this work to thebroader labor market context. Another challenge for future research willbe to examine how exit discrimination is affected by otherex anteprocesses, including hiring and the structure of promotion ladders withinan organization (Baron, Davis-Blake, and Bielby, 1986).
A second implication of this work is that customer preferences orprejudices may be an important determinant of labor market discrimina-tion. While we focus on exit, race is likely to be an important factor atthe points of entry and promotion when there is consumer-producer con-tact. For example, the race of the service provider may be important injudgments about the quality of customer service and may in turn influ-ence hiring decisions. In the case of the NBA, preferences for whitesmay be based on the greater entertainment value that fans receive fromwatching a white versus a black player. Our results provide evidence insupport of Kahn’s (1991b) model that shows that customer discrimina-tion can persist in markets where there is contact between consumer andproducer. The results of this study suggest that workers in the entertain-ment and service industries are particularly vulnerable to customerdiscrimination.
REFERENCES
Allison, Paul D. 1983.Event History Analysis: Regression for Longitudinal Event Data.London:Sage Publications.
Baron, James, Alison Davis-Blake, and William T. Bielby. 1986. “The Structure of Opportunity:How Promotion Ladders Vary Within and Among Organizations.”Administrative ScienceQuarterly31 (June): 248–273.
Becker, Gary. 1971.The Economics of Discrimination2d. ed. Chicago: University of ChicagoPress.
Blum, Debra E. 1995. “Proportion of Black Athletes Rises at NCAA’s Division I Iinstitutions.”Chronicle of Higher Education41 (22, Feb 10):A36.
Brown, C., Y. Nakata, M. Reich, and L. Ulman. 1997.Work, Learning and Earning: Employmentand Pay Systems in the U.S. and Japan.Oxford, England: Oxford University Press.
Brown, Eleanor, Richard Spiro, and Diane Keenan. 1991. “Wage and Nonwage Discrimination inProfessional Basketball: Do Fans Affect It?”American Journal of Economics and Sociology50 (3): 333–44.
Burdekin, Richard C. K., and Todd L. Idson. 1991. “Customer Preferences, Attendances and theRacial Structure of Professional Basketball Teams.”Applied Economics23:179–86.
Cain, Glen. 1986. “The Economic Analysis of Labor Market Discrimination: A Survey.” InHand-book of Labor Economics, ed. by O. Ashenfelter and R. Layard. Amsterdam: North-Holland,pp. 693–785.
90 / HA HOANG AND DAN RASCHER
Cymrot, Donald J. 1983. “Migration Trends and Earnings of Free Agents in Major League Base-ball, 1976–1979.”Economic Inquiry21 (4, October): 545–56.
Diebold, Francis X., David Neumark, and Daniel Polsky. 1994. “Job Stability in the United States.”Working paper no. 4859, National Bureau of Economic Research, Cambridge, MA.
Edwards, Harry. 1992. “Are We Putting Too Much Emphasis on Sports? (Blacks in Sports: TheNext 45 Years).”Ebony47 (10, August):128.
Edwards, Harry. 1994. “Black Youths’ Commitment to Sports Achievement: A Vvirtue-Turned-Tragic-Turned-Virtue.”Sport85 (7, July):86.
Fort, Rodney, and James Quirk. 1995. “Cross-Subsidization, Incentives, and Outcomes in Profes-sional Team Sports Leagues.”Journal of Economic Literature33(3):1265–99.
Hill, James Richard, and William Spellman. 1984. “Pay Discrimination in Baseball: Data from theSeventies.”Industrial Relations23 (1, Winter): 103–12.
Hollander, Zander, and Alex Sachre. 1989.The Official NBA Encyclopedia.New York: VillardBooks.
Jiobu, Robert M. 1988. “Racial Inequality in a Public Arena: The Case of Professional Baseball.”Social Forces67 (2, December): 524–34.
Johnson, Norris R., and David P. Marple. 1973. “Racial Discrimination in Professional Basketball:An Empirical Test.”Sociological Focus6 (4, Fall): 6–18.
Jones, J. C. H., and William D. Walsh. 1988. “Salary Determination in the National HockeyLeague: The Effects of Skills, Franchise Characteristics, and Discrimination.”Industrialand Labor Relations Review41 (4, July): 592–604.
Kahn, Lawrence M. 1991. “Discrimination in Professional Sports: A Survey of the Literature.”In-dustrial and Labor Relations Review44 (3, April):395–418.
Kahn, Lawrence M. 1992. “The Effects of Race on Professional Football Players’Compensation.”Industrial and Labor Relations Review,45 (2, January):295–310.
Kahn, Lawrence M., and Peter D., Sherer. 1988. “Racial Differences in Professional BasketballPlayers Compensation.”Journal of Labor Economics6 (1, January):40–61.
Koch, James V., and C. Warren Vander Hill. 1988. “Is There Discrimination in the ‘Black Man’sGame’?”Social Science Quarterly69 (1, March):83–94.
Mogull, Robert G. 1973. “Football Salaries and Race: Some Empirical Evidence.”Industrial Rela-tions12 (1, February):109–12.
Neft, David, and Richard Cohen. 1991.The Sports Encyclopedia: Pro Basketball, 4th ed. NewYork: St. Martin’s.
Official NBA Guide.Annual. St. Louis, MO: Sporting News.Official NBA Register.Annual. St. Louis, MO: Sporting News.Petersen, Trond. 1995. “Analysis of Event Hhistories.” InHandbook of Statistical Modeling for the
Social and Behavioral Sciences, ed. by Gerhard Arminger, Clifford C. Clogg, and MichaelE. Sobel. New York: Plenum Press.
Places Rated Almanac.1989. Englewood Cliffs, NJ: Prentice-Hall.Quirk, James P., and Rodney Fort. 1992.Pay Dirt: The Business of Professional Team Sports.
Princeton, NJ: Princeton University Press.Rascher, Daniel. 1997. “Organization and Outcomes: A Study of Professional Sports Leagues.”
Ph.D. dissertation, U.C. Berkeley Economics Department.Staw, Barry, and Ha Hoang. 1995. “Sunk Costs in the NBA: Why Draft Order Affects Playing Time
and Survival in Professional Basketball.”Administrative Science Quarterly40: 474–94.Swinnerton, Kenneth A., and Howard Wial. 1995. “Is Job Stability Declining in the U.S. Econ-
omy?” Industrial and Labor Relations Review48 (2, January):293–305.Wallace, Michael. 1988. “Labor Market Structure and Salary Determination Among Professional
Basketball Players.”Work and Occupations15 (3, August):294–312.Walsh, William D., Marc Lavoie, Gilles Grenier, and Serge Coulombe. 1992. “The Entry Problem
of Francophones in the National Hockey League: A Systemic Interpretation.”CanadianPublic Policy18 (4, December):443–69.
The NBA, Exit Discrimination, and Career Earnings/ 91


