Embed Size (px)
Citation preview
Journal of Molecular Structure (Theo&m), 256 (1992) 175-165 Elsevier Science Publishers B.V., Amsterdam
175
The molecular electrostatic potential and drug design
Gerard Pepe”, Didier Siri” and Jean-Pierre Fleboulb
VNRS-CRMC2’, Campus Luminy, Case 913,13288 Marseille Ceder 9 (France) bGERCTOP, Universitti d’Aix-Marseille II, 27 bd Jean Moulin, 13388 Marseille Ceden 5 (France)
(Received 28 June 1991)
Abstract
The molecular electrostatic potential (MEP) is now a classical tool in chemical activity anal- ysis, especially in drug design. In this paper we discuss, from different MEP applications in drug studies, significant results obtained over the last few years. This analysis led us to define how the MEP can be used in drug design, and the limits of its application, whatever the accuracy of the method used to calculate it.
INTRODUCTION
The molecular electrostatic potential (MEP ) computed on an isolated mol- ecule can be considered as a reactivity index, as was shown by Scrocco and Tomasi [ 1,2] and Politzer and Truhlar [ 31. The problem in such a calculation is to know the active conformation, its electronic state (neutral or charged) and the tautomeric form when tautomerism is possible.
Complementary details concerning the use of MEP in the study of biochem- ical phenomena can be found in other papers [ 4,5].
Molecules must be in the correct orientations and appropriate conforma- tions to be in a good situation to interact. This reaction path, named the rec- ognition step, is often essential in drug-receptor interactions. If we want to describe the interaction of a molecule with its receptor in terms of quantum chemistry, it is necessary to know at least the 3D-structure of the drug and the active site of the receptor. In most cases, particularly for neuroactive com- pounds, the receptor is often a transmembranar protein, the structure of which is unknown. In order to establish a probable reaction mechanism or a probable reaction path, it is necessary to have an accurate structure of the receptor’s
Correspondence to: G. P&e, CNRS-CRMCB, Campus Luminy, Case 913,13266 Marseille Cedex 9, France. ‘Laboratoire propre du CNRS associd aux Universiffi d’Aix-Marseille II et III.
0166-1260/92/$05.00 0 1992 Elsevier Science Publishers B.V. All rights reserved.
176
active site. Unfortunately, for physical reasons the degree of resolution of a macromolecule is inversely proportional to its size, which means that the struc- ture of the biological receptor for neuroactive compounds will never be defined at a sufficient level of accuracy for such a determination.
The information available comprises the drug activity, the topological struc- ture of the molecule and sometimes the 3D geometry determined from X-ray analysis. However, the last data, if not available, can be obtained from calcu- lations (usually molecular mechanics calculations).
When two molecules are approaching in order to react, the principal com- ponent of the interaction energy is coulombic. This energy is essential for ori- entation of the molecules in order to put them in a favourable position before reacting. This reaction step corresponds to the kinetic step and the MEP plays an important role at the entropy level. When the molecules are very close, before considering the other components of the interaction energy, the MEP is perturbed and is different from the MEP of the isolated molecule. Polari- zation, charge transfer and dispersion contributions to the energy perturbation can be greater than the coulombic energy, and the final step of a reaction can- not be described only by the electrostatic energy. However, if there is no bond cleavage and bond formation during this reaction step, the stability of the com- plex formed by the drug and the active site of the receptor can be related to the extreme MEP values, and in this case these values can express the drug activity.
THE MEP CALCULATION
The electrostatic potential of a molecule having an electrostatic density function p(r) at any point r is given by
V(r)=C(ZA/IRA-rl - I
p(r’)dr’/]r’-r]) (1)
where 2, is the charge of the nucleus A. The first term, which is positive, represents the contribution of the nuclei; the second term is negative and gives the contribution of the electrons. This formula shows clearly that the MEP depends on the molecular geometry in addition to its electronic state.
The first term of eqn. (1) can be calculated exactly, whereas the remaining term is obtained from a quantum mechanics function at a given level of ap- proximation (Hartree-Fock or SCF wave functions). The quality of the func- tion can be tested by comparison of the MEP with the experimental values given by diffraction techniques [ 6-101.
The quantum chemical method of obtaining an accurate MEP can only be used for small molecules or for molecular fragments.
One way of overcoming this difficulty is to compute the MEPs of small pieces of the macromolecule and to superimpose them [ 11-141. Hydrogen atoms are put on the broken bonds in order to complete the fragment stereochemically.
177
Another procedure consists of using a many-centre multipole expansion, not only for a more efficient computational scheme, but also to justify, and possibly apply, a monopole approximation [ 21. In the monopole approximation, the potential V(r) is given as a summation of point charges centred on points, according to some physically meaningful criterion
(2)
If V(r) and the points RA are given, it is always possible to determine a set of qA’s which satisfies eqn. (2) as accurately as possible. In most cases, the wave function in coordinate space is not known, as happens with most semi-empir- ical methods of quantum chemistry, so the approximation of eqn. (2) must be used in the right-left direction. Optimal charges must be determined in order to be able to calculate the MEP in the monopole approximation in such a simple way.
A good representation of the MEP can be obtained if a large number of accurate point charges located in the molecular space, and not limited to the positions of the atoms, are available.
In order to visualize the MEP, net Mulliken charges computed with accurate quantum chemical techniques, usually STO-3G wave functions with the pro- gram GAUSSIAN a13 [ 151, are often used to compute the MEP with eqn. (2).
Therefore, it will be interesting to know if net atomic charges obtained from more empirical methods can lead to a meaningful MEP. (Because of the for- malism of the function in eqn. (2)) in order to make sense, the MEP must not be computed too close to the atoms’ centres, because an atom or an ion cannot penetrate under the van der Waals surface, which is generally chosen as the lower space limit for the MEP calculation. )
A simplified method [ 161 of obtaining net atomic charges and the validity of the MEP obtained in such a way have been discussed in a previous paper [171.
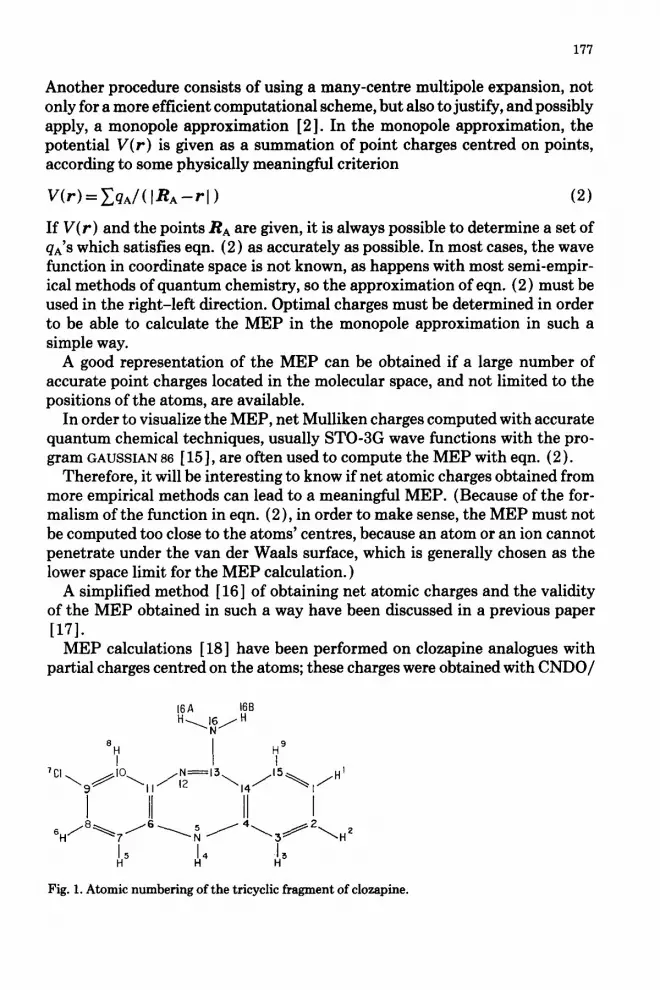
MEP calculations [ 181 have been performed on clozapine analogues with partial charges centred on the atoms; these charges were obtained with CNDO/
16A 166
“q/H
*II I
1C’\,//‘o,,,/~=‘3\,,/15\\I/H’
Fig. 1. Atomic numbering of the tricyclic fragment of clozapine.

178
TABLE 1
Net atomic charges computed by different methods for the tricyclic fragment of clozapine
Atom” CNDO/B STG-3G LS-Fitb Del F@
C(l) - 148 -684 H(1) -46 667 C(2) 343 -553 H(2) -93 691 C(3) -421 -736 H(3) 12 692 C(4)d 1542 1247 N(5)d - 2528 - 4044 H(4)d 1216 2127 C(6)d 951 981 C(7) -224 - 606 H(5) 7 718 C(8) -30 -629
H(6) 95 803 C(9)d 927 358 Cl(7)d - 1901 - 1523 C(l0) - 286 -573
H(8) 145 871 C(ll)d 980 923 N(12)d -2561 -3104 C(13)d 2667 2638 C(14) -611 -302 C(15) 236 -522
H(9) -75 721 N(16)d - 2434 - 4296 H(16A)d 1112 2017 H(16B)d 1124 2116
- 1073 -215 738 214
-506 -214 709 214
-1106 - 178 674 216
2545 941 - 5651 -4041
2928 1953 1776 968
- 1499 -184 1007 216
- 1662 -286 1120 210 2586 2410
- 2385 - 2224 - 2519 -270
1340 211 3234 1785
- 6600 - 3443 7754 2702
- 1999 211 -71 -225 520 213
-8316 - 5550 3182 2182 3275 2182
“Atomic numbering shown in Fig. 1. bLeast squares fit with an ab initio MEP [ 181. “Calculated with Del FU method and corrected as indicated in ref. 17. dThe strongest charges are located on the same atoms, with the same sign, in all four methods.
2, STO-3G basis set and derived from a least squares fit performed on ab initio MEPs. Although atomic point charges differ substantially from method to method, the MEPs are very similar. This result is related to the fact that in all methods the strongest charges are located on the same atoms, and have the same sign (Fig. 1, Table 1). Several authors have shown good correspondence between MEPs computed by ab initio and semi-empirical methods. Strong analogies exist between MEPs computed with AM1 [ 191 and ab initio (STO- 3G, 6-31G and 6-31G*) wave functions. Calculations performed on salicyl- amides [20] indicate no variation of the MEPs; when the basis set used to calculate ab initio wave functions is extended, the STO-3G level is a good approximation.

179
Calculations on y-aminobutyric acid [ 211 indicate good agreement between the MEPs computed by CND0/2 and STO-3G methods, for these drugs. Elec- trostatic forces are predominant in the recognition step when the molecules are not too close for their mutual perturbation to be neglected, so the relative positions of the extreme MEP values are much more important than the ab- solute values; this remains true, whatever method is used to generate the MEP.
THE MEP REPRESENTATION
The most common way of visualizing the MEP is as several 2dimensional slices of isopotential curves. This representation can only be used on small flat molecules, not on macromolecules, and it is not practical for studying inter- molecular interactions, or for treating large numbers of molecules to establish numerical comparisons. In these cases, the MEP is usually computed and dis- played on the van der Waals surface, or on the part of this surface accessible to the solvent [22], with the MEP values related to the point density, or to some coded colours [ 231.
In order to compute and display the MEP rapidly for large numbers of mol- ecules, and to establish relationships between this result and the drug activity, we have developed the program MOLPOT [ 241. The program also produces a diagram characteristic of the molecular conformation. Applications of this program have been described in previous papers [ 25,261.
THE ELECTRONIC STATE OF THE MOLECULE AND THE MEP
Charged molecules
A large number of drug molecules, and most neuroactive compounds, are similar to classic neurotransmitters in carrying a protonable nitrogen atom [ 251. In the synapse, the physiological pH is slightly basic and induces proton- ation of the molecule. The cation is obviously solvated, which does not corre- spond to the state of the molecule in a vacuum. The problem is to know what electronic state must be chosen in order to obtain useful values of the MEP. From a fundamental point of view, we admit the MEP has to be considered in the recognition step, when the molecules are not very close and the cation is surrounded by a solvation shell which is modifying the MEP. This solvent effect can be simulated by a counter-ion or by a distance-dependent dielectric constant [ 171. The drug activity can also be related to the stability of the complex formed between the drug and the receptor active site (if there is no bond formation or bond cleavage in the interacting step of the reaction) so, in this case, the MEP values for a solvated molecule cannot be considered.
However, quantitative structure-activity relationships (QSARs) performed on Hz-receptor agonists of histamine [27 1, in neutral form or as cations, in-
180
2.
0
2.
0.
2.
0
i 5
.F ,o
H
d
3
5-
2 !O a
5--
1
O--
5__
‘0 -
08 H
ANGLE IN GREE
5 2.!
5 OS
$ 2.t
3 OS
2 2.!
1 OS
j-
I-
/ j-
3-
/
5_
\
I-
\
.
H H
s A- 2
1 u ANGLE IN DEGREES
0 50 100 150 200 250 300 350 0 50 100 150 200 250 300 3
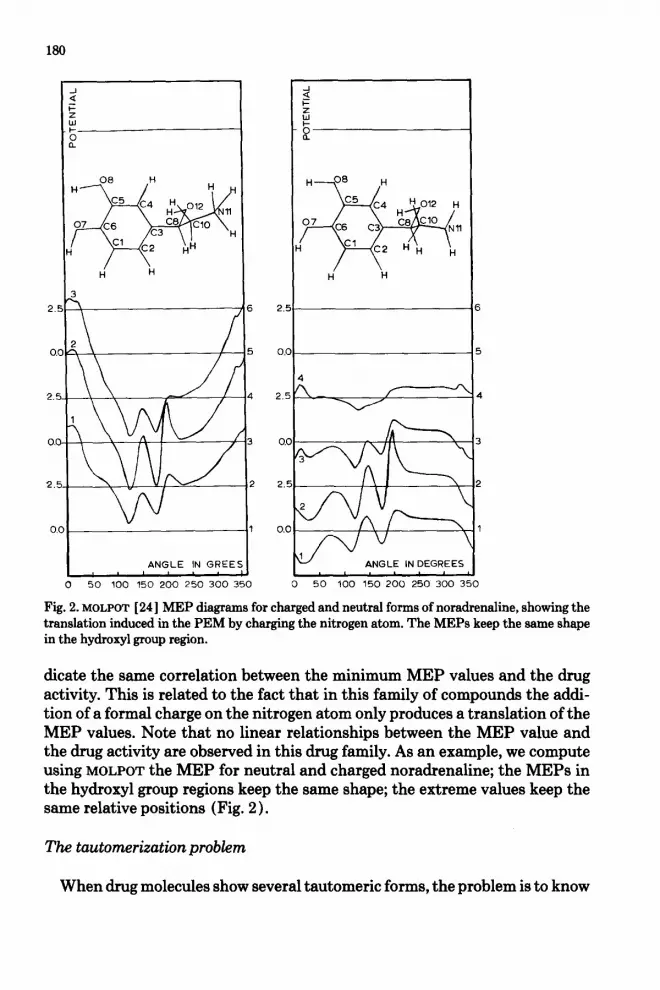
Fig. 2. MOLPOT [24] MEP diagrams for charged and neutral forms of noradrenaline, showing the translation induced in the PEM by charging the nitrogen atom. The MEPs keep the same shape in the hydroxyl group region.
dicate the same correlation between the minimum MEP values and the drug activity. This is related to the fact that in this family of compounds the addi- tion of a formal charge on the nitrogen atom only produces a translation of the MEP values. Note that no linear relationships between the MEP value and the drug activity are observed in this drug family. As an example, we compute using MOLPOT the MEP for neutral and charged noradrenaline; the MEPs in the hydroxyl group regions keep the same shape; the extreme values keep the same relative positions (Fig. 2 ) .
The tautomerization problem
When drug molecules show several tautomeric forms, the problem is to know
181
on what form the MEP must be computed. Generally, calculations are per- formed on the more stable form [ 27,281 in order to find correlations between the MEP and the drug activity. Nevertheless, if the different tautomeric forms exist in the physiological medium, it is not obvious that the more stable form is the more active one, and for this reason it is better to try to find relationships between the MEPs computed on all existing forms.
The conformational problem
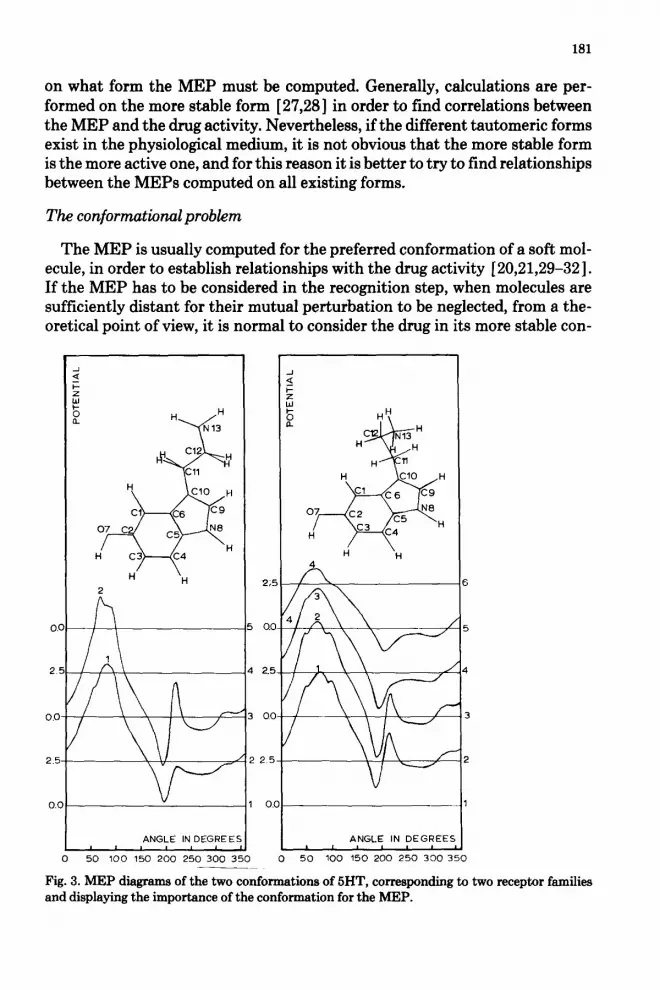
The MEP is usually computed for the preferred conformation of a soft mol- ecule, in order to establish relationships with the drug activity [ 20,21,29-321. If the MEP has to be considered in the recognition step, when molecules are sufficiently distant for their mutual perturbation to be neglected, from a the- oretical point of view, it is normal to consider the drug in its more stable con-
2
ANGLE IN DEGREE! .
50 100 150 200 250 300 3
25
2.5
ANGLE IN DEGREE!
50 100 150 200 250 300 3
Fig. 3. MEP diagrams of the two conformations of 5HT, corresponding to two receptor families and displaying the importance of the conformation for the MEP.
182
formation, which will correspond to the lowest activation energy. In a previous work [ 261 on tricyclic antidepressant drugs, we systematically studied the con- formations of these molecules, in order to understand the origin of their sed- ative or psychotonic activity. That work showed that the activity was related to the existence in the synapse of a preferred conformation, corresponding to the more stable conformation of the neurotransmitter; however, with certain drug molecules it was not possible to establish such a correspondence. There- fore, for these molecules, it is necessary to admit a conformational fit during the interaction step, sometimes involving the receptor active site. For these last compounds it will obviously be difficult to find relationships between the MEP and the activity, because the active conformation can be strained.
In this work, a systematic conformational analysis of the tricyclic antide- pressant drugs and the classic neurotransmitters, we have found the existence of at least two families of structurally different 5HT receptors. In order to point out the importance of the conformation on the MEP, we display in Fig. 3 the characteristic MEP diagrams of the serotonine conformation corresponding to each receptor family.
QSAR STUDIES BETWEEN THE MEP AND THE ACTIVITY OF DRUG MOLECULES
In most cases, the MEP is used as a qualitative rather than a quantitative reactivity index. By the concept of the complementarity of envelope and MEP for a stable or metastable complex, it is usual that the position of the extreme MEP values will determine the activity, and the difference in activity between molecules will be related to the degree of correspondence between these enti- ties in the complex; after this fit has been obtained, the MEP values could be related to some activity parameters.
In a previous work [ 251 on tricyclic neuroactive compounds, we showed that the positions of the extreme MEP values on the molecular envelope were the determinant characteristic for discriminating between the neuroleptic or antidepressant activity of these analogous molecules.
To establish QSAR between the MEP and the biological activity of a drug, it is necessary to define a measure of this parameter, which is very difficult because the observation of the therapeutic effect of a drug depends on both the patient and the therapist.
QSAR studies performed on phenylethylamine derivatives [ 281 showed good correlation between the MEP values and the affinity of these molecules to- wards /I-adrenergic receptors, the activity of these molecules being determined by the production of cyclic adenosine monophosphate. This correlation was related to the presence of a minimum MEP value in the neighbourhood of the hydroxyl groups on the phenyl ring. In the case of these molecules, there is no bond formation or bond cleavage in the complex formed between the drug and
183
the receptor active site; the stability of the complex between these entities is directly proportional to the MEP values.
The toxicities of dibenzo-p-dioxins [ 331, flat molecules without conforma- tional or electronic problems, were studied in relation to their MEP values. In this family of compounds, the topological position and the extreme MEP val- ues are important for the biological activity; it is interesting to note the absence of any systematic correlation between the toxicity of these molecules and their aryl hydrocarbon hydroxylase induction, which emphasizes the problem of choosing an activity parameter to correlate with the MEP.
In order to establish a relationship between the MEP and the activity of serotonine (5HT) derivatives, Weinstein et al. [ 34,351 defined an electrostatic orientation vector, related to the minimal MEP positions, which is a topologic characteristic of the molecules. The same concept used by other authors [ 361 on phenothiazine dopaminergic antagonist was completed by the energy of the lowest unoccupied molecular orbital in order to find correlations between ac- tivities and the MEP values. Through these examples, we see that there is not generally an obvious correlation between the MEP values and drug activity (an entity difficult to quantify). In contrast, the concept of complementarity of envelopes and MEP seems to give good qualitative prediction of drug activ- ity. The position of the extreme MEP values seems to be a very discriminating factor related to drug activities. Consequently, in most cases MEPs calculated with good atomic point charges [ 171 will be of sufficient accuracy for such an analysis.
CONCLUSION
The analysis of the use of MEPs in drug design over the last few years leads us to draw some meaningful conclusions.
In most cases, the MEP is more a qualitative than a quantitative tool, and the position of the extreme MEP values is more important than the MEP values themselves for establishing a correlation with drug activity. For this reason, it is not necessary to use very sophisticated methods to generate the MEP: accurate Mulliken atomic charges are of sufficient accuracy for such a calculation. When electronic or conformational problems exist, calculations can be performed on the most stable form of the molecule, which is compatible with the fact the MEP must be considered in the recognition step of the reac- tion. Nevertheless, the MEP can also be related to the stability of the complex formed between the drug and its receptor; a conformational fit can be induced in the last step of the reaction, in which case it is not possible to define the MEP extreme values positions for the corresponding conformation.
Sometimes QSAR can be established between the MEP values and the drug activity. However the results obtained are questionable, because of the arbi- trariness of the MEP position chosen to establish correlation with the drug
184
activity, and the difficulty of defining the parameter used to quantify this activity.
REFERENCES
1
2 3
4 5
E. Scrocco and J. Tomasi, in Topics in Current Chemistry, New Concepts II, No. 42, Sprin- ger-Verlag, Berlin, 1973, pa 95. E. Scrocco and J. Tomasi, Adv. Quantum Chem., 11 (1978) 115. P. Politzer and D.G. Truhlar (Eds.), Chemical Applications of Atomic and Molecular Elec- trostatic Potentials, Plenum, New York, 1981. P. Politzer, P.R. Laurence and K. Jayasuriya, Environ. Health Perspect., 61 (1985) 191. D. Hadzi, M. Hodoscek, D. Kocjan, T. SoImajer and F. Avbelj, Croat. Chem. Acta, 57 (1984) 1065.
6 7
8
9
10
11 12 13 14 15
16 17 18 19 20 21 22 23 24 25
J. Bentley, J. Chem. Phys., 70 (1979) 159. M. Fink and R.A. Bonham, in P. Politzer and D.G. TruhIar (Eds.), Chemical Applications of Atomic and Molecular Electrostatic Potentials, Plenum, New York, 1981, p. 93. D.G. TruhIar, in P. Politzer and D.G. TruhIar (Eds.), Chemical Applications of Atomic and Molecular Electrostatic Potentials, Plenum, New York, 1981, p. 123. M.A. Sparkman and R.F. Stewart, in P. Politzer and D.G. Truhiar (Eds.), Chemical Appli- cations of Atomic and Molecular Electrostatic Potentials, Plenum, New York, 1981, p. 407. G. Moss and P. Coppens, in P. Politzer and D.G. TruhIar (Eds.), Chemical Applications of Atomic and Molecular Electrostatic Potentials, Plenum, New York, 1981, p. 427. A. Goldblum, D. Perahia and A. Pullman, Int. J. Quantum Chem., 15 (1979) 121. B. Pullman, D. Perahia and D. Cauchy, Nucleic Acids Res., 6 (1979) 3821. A. Pullman, C. Zakrzewska and D. Perahia, Int. J. Quantum Chem., 16 (1979) 395. J.R. Rabinowitz and S.B. Little, Int. J. Quantum Chem., 13 (1986) 9. M.J. Frisch, J.S. Binkley, H.B. Schiegel, K. Raghavachari, C.F. Melius, R.L. Martin, J.J.P. Stewart, F.W. Bobrowicz, C.M. Rohlfing, L.R. Kahn, D.J. DeFrees, R. Seeger, R.A. White- side, D.J. Fox, E.M. Fleuder and J.A. Pople, GAUSSIAN 86, Carnegie-Mellon Quantum Chem- istry Publishing Unit, Pittsburgh, PA, 1984. G. Del I%& J. Chem. Sot., 40 (1958) 31. G. P&e, B. Serres, D. Laporte, G. Del % and C. Minichino, J. Theor. Biol., 115 (1985) 571. H.P. Weber, T. Lybrand, U. Singh and P. Kollman, J. Mol. Graphics, 4 (1986) 56. F.J. Luque and M. Orozco, Chem. Phys. I.&t., 168 (1990) 269. U. Norinder and T. Hogberg, Acta Pharm., 2 (1989) 75. D. Majumdar and S. Guha, J. Mol. Struct. (Theochem), 180 (1988) 125. M.C. Connolly, Science, 221 (1983) 709. C. Thomson, D. Higgins and C. Edge, J. Mol. Graphics, 6 (1988) 171. G. Pepe, J. Mol. Graphics, 7 (1989) 233. G. P&e, J.P. Reboul, B. Cristau and Y. Oddon, Eur. J. Med. Chem. Chim. Ther., 21 (1986) 339.
26 27
28 29
G. PBpe, J.P. Reboul and Y. Oddon, Eur. J. Med. Chem. Chim. Ther., 24 (1989) 1. J.F. Luque, F. Sanz, F. Ilias, R. P0upIanaandY.G. Smeyers, Eur. J. Med. Chem. Chim. Ther., 23 (1988) 7. T. Sohnajer, M. Hodoscek, D. Hadzi and I. Lukovits, Quant. Struct. Act. Relat., 3 (1984) 51. B. Testa, H. Van de Waterbeemd and P.A. Carrupt, J. Mol. Struct. (Theochem), 134 (1986) 351.
30

185
3 1 P.J.M. Van Gaien, H.W.Th. Van Vlijmen, A.P. Ijzerman and W. Soudijn, J. Med. Chem., 33 (1990) 1708.
32 J. Gynther, H. Konschin, H. Tylli and J. Rouvinen, Acta Pharm. Nord., 1 (1990) 45. 33 J.S. Murray and P. Politzer, Theor. Chim. Acta, 72 (1987) 607. 34 H. Weinstein, D. Chou, S. Kang, C.L. Johnson and J.P. Green, Int. J. Quantum Chem. QSB,
3 (1976) 135. 35 H. Weinstein and R. Osman, Int. J. Quantum Chem. QSB., 4 (1977) 253. 36 A. Boudon, J. Szymoniak and J.R. Chrdtien, Eur. J. Med. Chem. Chim. Ther., 23 (1988)
365.