Embed Size (px)
Citation preview
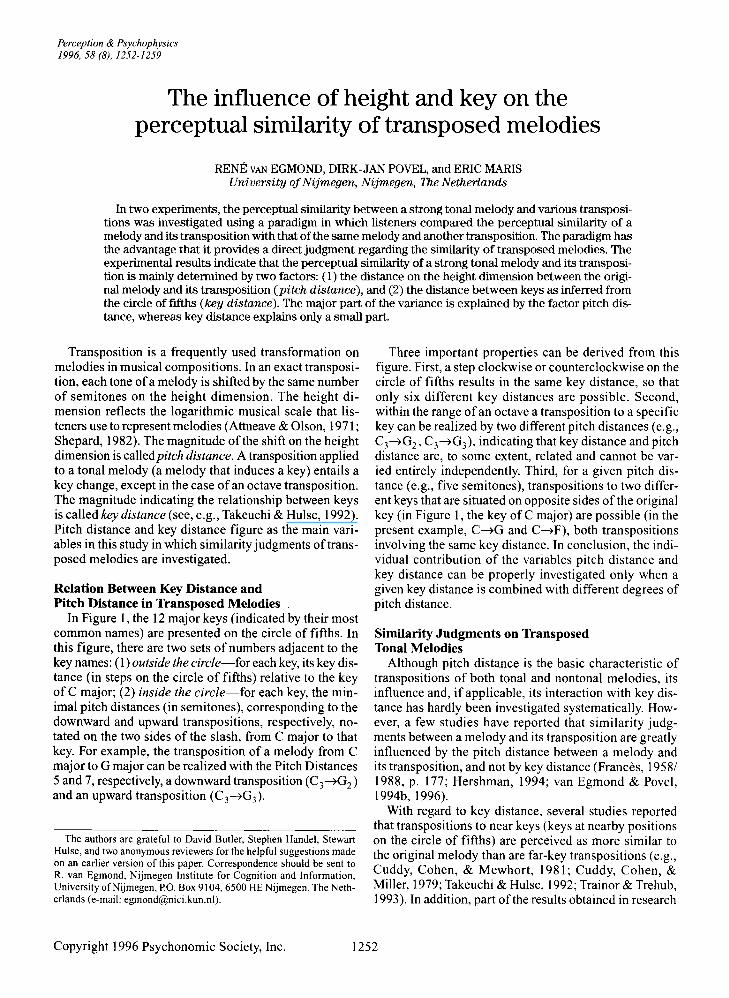
Perception & Psychophysics1996,58 (8), 1252-1259
The influence of height and key on theperceptual similarity of transposed melodies
RENE VAN EGMOND, DIRK-JAN POVEL, and ERIC MARISUniversity ofNijmegen, Nijmegen, The Netherlands
In two experiments, the perceptual similarity between a strong tonal melody and various transpositions was investigated using a paradigm in which listeners compared the perceptual similarity of amelody and its transposition with that of the same melody and another transposition. The paradigm hasthe advantage that it provides a direct judgment regarding the similarity of transposed melodies. Theexperimental results indicate that the perceptual similarity of a strong tonal melody and its transposition is mainly determined by two factors: (1) the distance on the height dimension between the original melody and its transposition (pitch distance), and (2) the distance between keys as inferred fromthe circle of fifths (key distance). The major part of the variance is explained by the factor pitch distance, whereas key distance explains only a small part.
Transposition is a frequently used transformation onmelodies in musical compositions. In an exact transposition, each tone ofa melody is shifted by the same numberof semitones on the height dimension. The height dimension reflects the logarithmic musical scale that listeners use to represent melodies (Attneave & Olson, 1971;Shepard, 1982). The magnitude of the shift on the heightdimension is called pitch distance. A transposition appliedto a tonal melody (a melody that induces a key) entails akey change, except in the case ofan octave transposition.The magnitude indicating the relationship between keysis called key distance (see, e.g., Takeuchi & Hulse, 1992).Pitch distance and key distance figure as the main variables in this study in which similarity judgments oftransposed melodies are investigated.
Relation Between Key Distance andPitch Distance in Transposed Melodies
In Figure 1, the 12 major keys (indicated by their mostcommon names) are presented on the circle of fifths. Inthis figure, there are two sets of numbers adjacent to thekey names: (1) outside the circle-for each key, its key distance (in steps on the circle of fifths) relative to the keyof C major; (2) inside the circle-for each key, the minimal pitch distances (in semitones), corresponding to thedownward and upward transpositions, respectively, notated on the two sides of the slash, from C major to thatkey. For example, the transposition of a melody from Cmajor to G major can be realized with the Pitch Distances5 and 7, respectively, a downward transposition (C3~G2)and an upward transposition (C3~G3)'
The authors are grateful to David Butler, Stephen Handel, StewartHulse, and two anonymous reviewers for the helpful suggestions madeon an earlier version of this paper. Correspondence should be sent toR. van Egmond, Nijmegen Institute for Cognition and Information,University of Nijmegen, P.O.Box 9104,6500 HE Nijmegen, The Netherlands (e-mail: [email protected]).
Three important properties can be derived from thisfigure. First, a step clockwise or counterclockwise on thecircle of fifths results in the same key distance, so thatonly six different key distances are possible. Second,within the range ofan octave a transposition to a specifickey can be realized by two different pitch distances (e.g.,C3~G2' C3~G3)' indicating that key distance and pitchdistance are, to some extent, related and cannot be varied entirely independently. Third, for a given pitch distance (e.g., five semitones), transpositions to two different keys that are situated on opposite sides of the originalkey (in Figure 1, the key of C major) are possible (in thepresent example, C~G and C~F), both transpositionsinvolving the same key distance. In conclusion, the individual contribution of the variables pitch distance andkey distance can be properly investigated only when agiven key distance is combined with different degrees ofpitch distance.
Similarity Judgments on TransposedTonal Melodies
Although pitch distance is the basic characteristic oftranspositions of both tonal and nontonal melodies, itsinfluence and, if applicable, its interaction with key distance has hardly been investigated systematically. However, a few studies have reported that similarity judgments between a melody and its transposition are greatlyinfluenced by the pitch distance between a melody andits transposition, and not by key distance (Frances, 1958/1988, p. 177; Hershman, 1994; van Egmond & Povel,1994b,1996).
With regard to key distance, several studies reportedthat transpositions to near keys (keys at nearby positionson the circle of fifths) are perceived as more similar tothe original melody than are far-key transpositions (e.g.,Cuddy, Cohen, & Mewhort, 1981; Cuddy, Cohen, &Miller, 1979; Takeuchi & Hulse, 1992; Trainor & Trehub,1993). In addition, part of the results obtained in research
Copyright 1996 Psychonomic Society, Inc. 1252

Figure 1. The circle of fifths representing the 12 major keys.On the outside of the circle, key distance relative to the key ofC major is presented. Inside the circle, for each key, two pitch distances left and right of the slash are presented corresponding toa downward pitch shift and an upward shift, respectively, fromC major to that key.
on transposition is obscured by two confounding factors,discussed below.
One factor concerns the fact that key distance effectsdepend on how strongly a melody actually induces a keyin the listener. One might assume logically that key distance effects would depend on how strongly a melody actually induces a key in the listener. Several characteristicsin melodic sequences have been shown to playa role in keyinduction: (1) the presence of the tones ofa diatonic scale(Bartlett & Dowling, 1980; Dowling, 1978, 1991; Krum-
3
2
4
Key-distance
o1 1
~~B 7/5 0 5/7 '" 2
~ DI 2/10 10/2 \
& 9 13 Pitch-distance 3 19 A
\ 4/8 8/4 )
~ 11/1 1/11/E
~ 6/6 B 4
"--F#/Q,~5 5
6
Combination 1I I
Cadence Standard Transposition 1
3
SIMILARITY OF TRANSPOSED MELODIES 1253
hansl, 1990), (2) the presence of rare intervals, such asthe tritone (Brown & Butler, 1981; Butler, 1983, 1989),(3) the order ofthe tones (Bartlett & Dowling, 1980; Bharucha, 1984b; Brown, Butler, & Jones, 1994; Deutsch,1984), and (4) the underlying harmony (Croonen, 1991;Croonen & Kop, 1989; Cuddy et al., 1981).
A second factor is related to the possibility that a transposition may be perceived as a shift on the scale of theoriginal melody, which will be referred to as a tonal transposition. A tonal transposition may either be exact (sameinterval structure) or inexact (changed interval structure). For example, if the sequence C-D-E (in the key ofC) is shifted to G-A-B, this transposition-having thesame interval structure as the original melody-may beperceived as a tonal transposition within the original keyof C instead ofa transposition involving a key change toG. However, if the sequence C-D-E is shifted to E-F-G,the interval structure changes, resulting in an inexacttonal transposition. Both exact and inexact tonal transpositions are perceptually similar to the original melody(Bartlett & Dowling, 1980; Dewitt & Crowder, 1986;Dowling, 1978, 1986; van Egmond & Povel, 1996). Insome cases, tonal transpositions, which do not yield achange in key, have been used to provide evidence concerning key-distance effects (Takeuchi & Hulse, 1992;van Egmond & Povel, 1994a).
To avoid the discussed interactions, we used in thisstudy only strong tonal melodies and transpositions thatcannot be interpreted as tonal transpositions. The perceptual similarity between a strong tonal melodic sequenceand various transpositions is studied by systematicallyvarying the factors pitch distance and key distance. To studythis perceptual similarity we have chosen a similaritycomparison paradigm, in which subjects compared twoconsecutive combinations of two melodies and indicatedin which combination the melodies were more similar (seeFigure 2). As shown in the figure, the combinations comprise the same standard melody but different transpositions, while both combinations are preceded by the same
Pair
Combination 2I I
Cadence Standard Transposition 2
Start Respons
11--750 1500 750 2500 500 2500 2000 1500 750 2500 500 2500
t (ms)..Figure 2. Display of the paradigm used in the experiments. A pair consists of two combinations that contain the same
standard melody but different transpositions (comparison melodies). Standard melodies are preceded by a V-I cadence.Numbers indicate the duration of the different parts and pauses in a trial (in milliseconds).

1254 VAN EGMOND, POVEL, AND MARIS
cadence to induce the key of the standard melody. A pairthus consists of two uniquely coupled combinations.
We believe that this paradigm, which has not been usedbefore for studying transpositions, has a distinct advantage over the standard-comparison paradigm often usedin transposition studies (Bartlett & Dowling, 1980; Cuddyet aI., 1979; Dewitt & Crowder, 1986; Dowling, 1978;Frances, 1958/1988, p. 177; Hershman, 1994; Takeuchi& Hulse, 1992; Trainor & Trehub, 1993; van Egmond &Povel, 1994b). In the latter paradigm (in which the comparison melody may be either transposed or not), a subject indicates whether the standard and comparison melodies are identical. To make the task not completelytrivial, part of the comparison melodies (often 50%) isaltered by substituting one tone for another (the "lures").As a result, this paradigm is only able to indicate howtranspositions interfere with the subject's judgment ofthe structural identity of the melodies-that is, it provides only indirect information regarding the effect oftransposition on the perceived similarity. Moreover, theintroduction of an altered tone introduces an additionalvariable that may strongly influence a listener's judgment, depending on the position ofthe altered tone in themelody and the type of (diatonic or chromatic) alteration(see, e.g., Bharucha, 1984a; Trainor & Trehub, 1994; vanEgmond & Povel, 1996). In contrast, the similarity comparison paradigm used in this study does not have to introduce lures (and, consequently, an additional variable)but obtains a direct estimate ofthe similarity between different transpositions that are created by manipulating thevariable(s) under investigation.
EXPERIMENT 1
The perceptual similarity between a strong tonal melody and various transpositions was studied. Transposition factors pitch distance and key distance were variedindependently, as far as possible, by combining threepitch distances with three key distances.
MethodSubjects
Twenty subjects-graduate and undergraduate students of theUniversity of Nijmegen-participated in the experiment. Fifteensubjects received course credits, and 5 were volunteers. The medianage of the subjects was 24 years. None of the subjects were professional musicians, and none had received formal musical ear training. All of them had played or were playing an instrument for several years, with an average of 6 years.
ApparatusStimulus presentation and response collection were managed
by a special program written on an Atari 1040 STf computer. Thesounds were presented using a Roland Rhodes 760 synthesizer controlled by the Atari computer through MIDI (Musical InstrumentDigital Interface). The melodies were presented using a harpsichord sound (Harpsichord 3) and the cadence using a piano sound(Acoustical Piano I). The different instruments were used to facilitate the distinction between melody and cadence. The relative loudness ofthe two instruments was left to the standard setting of the de-
vice. The stimuli were presented through a loudspeaker (Kawai,KM20) at a comfortable listening level that could be adjusted by thesubjects.
StimuliCadence and standard melody. The cadence preceding the stan
dard melody consisted ofa V-I chord progression constructed usingstandard voice-leading rules (see, e.g., Aldwell & Schachter, 1989).Because the goal was to study how perceived similarity varied withthe transposition factors pitch distance and key distance, it was decided to keep the structure of the original melody constant-that is,to use only one standard melody. The standard melody (see Figure 3) had the following characteristics: (I) all major diatonic scaletones occurred in it, and (2) it had a strong tonal structure.
The first characteristic guarantees that, irrespective of the key towhich the melody is transposed, all elements of the new key are present. The second characteristic was added to enhance key induction, as discussed in the introduction. The melody used can be conceived of as a sequence of broken chords (I-II-V-I) and is basedon the characteristics of strong tonal melodies, as described byCuddy et al. (1981).
Comparison melodies. The transpositions (comparison melodies) were constructed by combining three pitch distances withthree key distances in the following way. A (default) upward transposition to the positions 1,3, and 5 steps clockwise on the circle offifths (e.g., from the key ofC to G, A, and B, respectively) resultedin three pitch distances: 7,9, and II, respectively. Two additionalpitch distances for each key distance were obtained by shifting thedefault transposition one octave up and one octave down. Figure 4shows a complete description of the used pitch distances and keydistances. Each transposition is thus characterized by a given changein key (factor key distance) and by a given shift in height (factorpitch distance).
Pairs of standard and comparison melodies. Each standardmelody plus a transposition (Combination I in Figure 2) was combined with the same standard melody and all other transpositions(Combination 2 in Figure 2). With these nine stimuli, combinationof a standard and a transposition, 36 pairs were formed. Each ofthese pairs was presented twice in two successive sessions; thus, thesubjects received 72 trials. The order of presentation of the trialsand the order of the two combinations within a trial were randomized per subject.
ProcedureThe subject's task was to indicate in which combination he/she
perceived the transposition as more similar to the standard (see Figure 2). After each trial, the subject could choose either to answerimmediately or to repeat the trial (the number ofrepetitions was leftto the subject). Before starting the experiment proper, the subjectswere familiarized with the procedure using six practice trials. Nofeedback was given during these trials. The subjects answered byclicking the mouse on buttons appearing on the screen.
In each trial, the key for cadence and standard melody was randomly selected out of 12 possible keys, with the first tone of thestandard melody ranging from G4 to F#5. The lowest tone (tonic) ofthe cadence was always two octaves below the lowest tone of the
~-IFigure 3. The standard melody (presented in the key of C
major) used in Experiments 1 and 2. The melody is based on thechordal progression I-lI-V-I.

SIMILARITY OF TRANSPOSED MELODIES 1255
Results
Fourteen subjects scored a consistency higher than50%, and they were included in the final analysis. Thepreference scores of these subjects were analyzed usingthe BTL model, resulting in scale values for each transposition. A chi-square goodness-of-fit test shows that theBTL model for these data cannot be rejected [X2(28) =29.4, P = .39].
ofcomparative judgment ofThurstone (1927) and amounts to a onedimensional Thurstonian analysis with a logistic distribution. TheBTL model yields a scale value (b i ) for each stimulus estimated bymeans ofthe method ofleast squares. To explain the application ofthe BTL model in the analysis of preference scores, we use an example of three stimuli presented in Table I. The table comprises different subtables (matrices), in which rows are indicated with j andcolumns with).
The cells in the first matrix in Table 1 present the number oftimes(Fi ) stimulus i is preferred over stimulus) for 100 hypothetical subjects. In the second matrix, the "observed" preference proportions(Pi)} are derived by dividing Fi) by the number of measurements perpair (N = 100), resulting in a number between 0 and I. This proportion corresponds to the chance that stimulus i will be preferredover). For i =i, it is assumed that Pij = .50.
The BTL model assumes the following relation between Pi) andthe difference between the scale values (bi-bj ) to be obtained:
I
In the BTL model, the difference between the scale values (bi-bj ) ,
also indicated as Bi)' is computed using the inverse of Equation I:
P')Bi) = b, - bj = In I-p ..
I)
The differences between the scale values (Bi) are presented in thethird matrix of Table I. The scale values (b;) are then derived bysumming rows and dividing this sum by the number ofstimuli. Forevery stimulus, this results in Bi • = b, - b, in which b, is the scalevalue of stimulus i, and b is the mean ofall scale values. The meanof the row,Bi ., thus equals the scale value of stimulus i i~ terms ofits deviation from the mean of all scale values. Because b is a constant and scale values are unique up to a translation, b can be takento be zero, and, thus, the mean of the rows equals the scale values.
To determine the tenability ofthe model, a matrix of predicted values tb, - bj ) is composed by subtracting all scale values from eachother. Using Equation I, the predicted values (b, - bj ) are then transformed into predicted preference proportions (1fi) . The observed andpredicted proportions are used in a chi-square goodness-of-fit test[in this case, yielding x2(1} = 0.55,p = .46]. A nonsignificant valueofchi-square means that the observed and predicted proportions donot differ significantly and, consequently, indicates that the use ofthe BTL model is appropriate.
KD PD
IStandard
I
1 0I 7
-12I
I I12
5I I 19
StandardII
30
9-12I I
I I12
3I I 21
StandardII
5 0 11-12
I I
I I12
1I I 23
Figure 4. A graphical display of the transpositions used in Experiment 1. The default direction is indicated with a 0; the othertwo transpositions are indicated with -12 and +12, respectively,indicating the downward and upward octave shift. For each transposition, key distance (KD) and pitch distance (PD) are given.
standard. The key of the comparison melody was, of course, variedrelative to the selected key for the standard melody.
Timing and order of cadences, standard. and comparison melodies are shown in Figure 2. The timing was determined in such away that no conflict could occur with the (implied) meter of the original melody (see Figure I). A trial began 750 msec after a start button was pressed. Only the interonset interval (101) of the tones wascontrolled; the decay in tone amplitude during the 101 was left tothe default setting of the synthesizer. The tones of the cadences hadan 101of750 msec. Between cadence and standard was a pause of750 msec. All tones of standard and comparison melodies had an101of 250 msec. Between standard and comparison melodies wasa pause of 500 msec, and between Comparison Melody I and thenext cadence was a pause of2,000 msec.
Method of AnalysisConsistency percentage. For each pair (combinations of stan
dard and transposition melodies), a preference score was obtainedon the basis of the individual judgments (preferences). Becauseeach pair was judged twice, a consistency measure could be derivedfor each subject, indicating the percentage of pairs that were judgedthe same when offered the second time. Thus, if a subject scored 100%consistency, he/she gave exactly the same answer to all the pairs.Those subjects that had a consistency score equal to or lower than50% were discarded from further analysis.
Analysis ofpreference scores using the Bradley-Terry-Lucemodel. To analyze the preference scores, we used the model developed by Bradley and Terry (1952) and Luce (1959), which we willrefer to as the BTL model. The BTL model is a variant of the model
Pi) = I +e-(bi-b) . (I)
Table 1Example of the Use of the BTL Model With Three Stimuli (I, 2, and 3) and for 100 Hypothetical Subjects
Scale Values
Stimuli 2 3 I 2 3 1 2 3 Sum b, 1 2 3 1 2 3
I 80 90 .50 .80 .90 0 1.39 2.20 3.59 1.20 0 1.49 2.09 .50 .82 .892 20 62 .20 .50 .62 -1.39 0 0.49 -0.90 -0.30 -1.49 0 0.60 .18 .50 .653 10 38 .10.38 .50 -2.20 -0.49 0 -2.69 -0.90 -2.09 -0.60 0 .11.35 .50
Note-The table contains several subtables (matrices) describing the relation betweenstimuli i and). 0j' the number of times stimulus i was preferred over stimulus}; Pi}' the observed preference proportion: b, -b), the difference between the scale values; b., the scale values; 1fij' the predicted preference proportion.

1256 VAN EGMOND, POVEL, AND MARIS
1.0 Parameter: key distance The coefficients of both pitch distance and key distance are negative, indicating that an increase in pitch distance or key distance results in a decrease of similarity.
Experiment 2 used the same paradigm and the samestandard melody as were used in Experiment I, but different transpositions were included. The transpositionfactors key distance and pitch distance were each variedat five levels, and each key distance was selected at twodifferent positions on the circle offifths: one clockwise(e.g., C~G) and one counterclockwise (e.g., C~F)that is, transpositions were made to both sharp and flatkeys. Furthermore, pitch distance was restricted in such amanner that, for each key distance, the minimum possible pitch distance was obtained. This minimized the effect of pitch distance on key distance, enabling an unbiased assessment of the key distance effect.
Discussion
The presented analysis has shown that both factorssignificantly affect the perceived similarity of standardand transposed melodies, although the contribution ofthefactor pitch distance is far greater than that of the factorkey distance. Pitch distance explains 95.4% of the variance; key distance explains only 3.36%. These findingsconfirm earlier studies that also reported a major influence of pitch distance on the perceived similarity, whenthis factor and key distance are varied (see Frances, 1958/1988, p. 177; Hershman, 1994; van Egmond & Povel,1994b). The findings also indicate that when a melody istransposed to a specific key (e.g., C~G), perceived similarity is greatly dependent on whether the transpositionis upward (C3~G3) or downward (C3~G2)' Althoughkey distance is only a minor factor in this study, its effectis in the expected direction: an increase in key distance isaccompanied by a decrease in perceived similarity.
Because, in Experiment 1, the factor pitch distance wasvaried at nine different levels and the factor key distanceat only three different levels, it might be argued that thelistener's judgment has mainly been influenced by themore salient factor pitch distance. To obtain a more bal~nced view of the importance of the factor key distance,III Experiment 2, we increased the number of levels ofthe variable key distance while keeping the variation ofpitch distance minimal.
EXPERIMENT 2
MethodSubjects
Twenty-six subjects-graduate and undergraduate students ofthe University of Nijmegen-participated in the experiment. The 26subjects received payment for their participation (an amount inDutch guilders equivalent to US $5). The median age ofthe subjectswas 24 years. None of the subjects were professional musicians,and none had received formal musical ear training. All of them hadplayed or were playing an instrument for several years, with an average of 6.5 years.
252015105
-1.0 +----r-..---,----.-.,...----r--....,o
0.5 5 3 1...... ..... • 1'".t>~ \,·C ftl. ...
0.01~fi.i fIl
g 1
-0.5 \,Pitch distance
(semi tones)
Figure 5. Similarity measures (scale values) obtained in Experiment 1. Similarity is plotted against pitch distance. The keydistance values of the stimuli are printed near the data points.The connection lines are added to improve readability only.
Figure 5 shows for each transposition the perceived similarity (in scale values) as a function of pitch distance.The graph shows a strong relation between similarity andpitch distance-similarity decreasing with increasing pitchdistance. The key-distance values ofthe transpositions areindic.at~d ~ear the data points in the graph. Comparing!he similarity scores for the three key distances, a trendIS found to judge transpositions to a near key (Key Distance 1) as more similar than those to a far key (Key Dist~~ce 5), with Key Distance 3 taking an intermediate posinon. However, the difference between Key Distances 3and 5 is larger than the difference between Key Distances1 and 3 for Pitch Distances 9 and 21.
Pitch distance and key distance are practically uncorrelated (r = .0711). The correlation between pitch distance and similarity is - .977 (p = .0001), and the correlation between key distance and similarity is - .255(p = .51). Pitch distance is the first variable used in theregression analysis, because this factor has the strongestrelation (the highest correlation) with similarity.
Multiple regression performed on the scale valuestaking into account the independent variables pitch distance and key distance, confirms the relations inferredfrom the graph. The results of the multiple regressionanalysis show that the total amount ofexplained varianceis 98.9% [F(2,6) = 26l,p = .0001), of which 95.4%[F(l,6) = 487, P « .001] is attributable to pitch distanceand 3.36% [given by the semipartial coefficient of det~rmination, F(l,?) = 17.8, P < .01] is attributable to keydistance, The estImated regression function is
similarity = .69 + (- .05 pitch distance- .045 key distance).
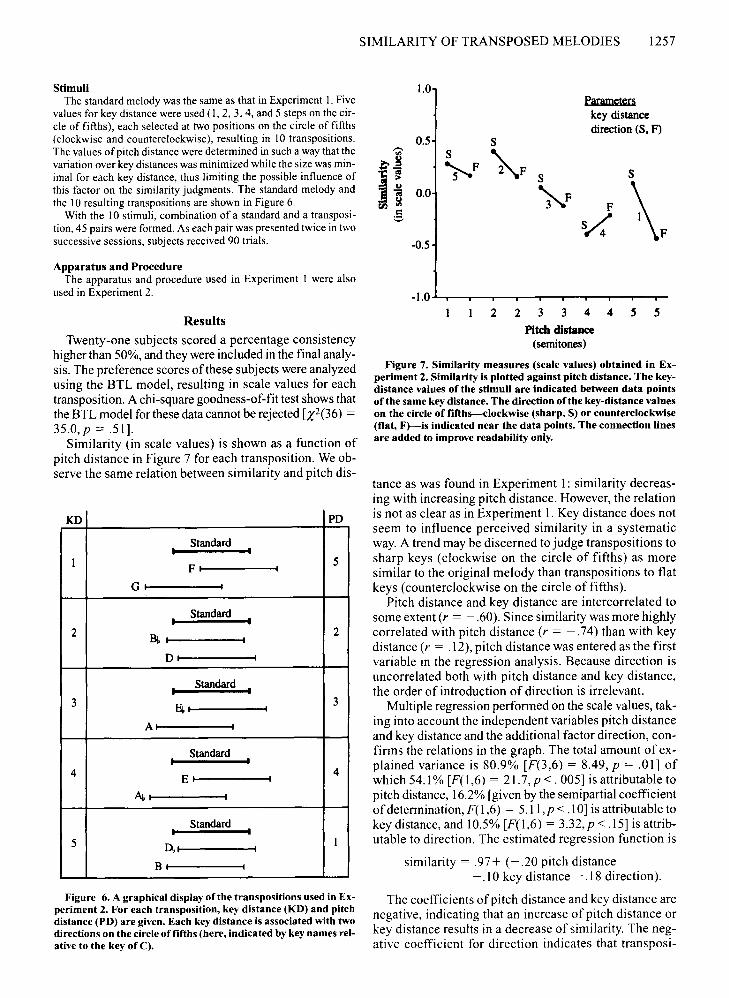
StimuliThe standard melody was the same as that in Experiment 1. Five
values for key distance were used (1,2, 3, 4, and 5 steps on the circle of fifths), each selected at two positions on the circle of fifths(clockwise and counterclockwise), resulting in 10 transpositions.The values of pitch distance were determined in such a way that thevariation over key distances was minimized while the size was minimal for each key distance, thus limiting the possible influence ofthis factor on the similarity judgments. The standard melody andthe 10 resulting transpositions are shown in Figure 6.
With the 10 stimuli, combination of a standard and a transposition, 45 pairs were formed. As each pair was presented twice in twosuccessive sessions, subjects received 90 trials.
Apparatus and ProcedureThe apparatus and procedure used in Experiment 1 were also
used in Experiment 2.
Results
Twenty-one subjects scored a percentage consistencyhigher than 50%, and they were included in the final analysis. The preference scores ofthese subjects were analyzedusing the BTL model, resulting in scale values for eachtransposition. A chi-square goodness-of-fit test shows thatthe BTL model for these data cannot be rejected [X2(36) =
35.0,p = .51].Similarity (in scale values) is shown as a function of
pitch distance in Figure 7 for each transposition. We observe the same relation between similarity and pitch dis-
KD PD
StandardI I
I FI I 5
01 I
StandardII
28~ I 2I
DI I
StandardII
3 &1 3I
AI I
StandardI I
4EI I
4
Al.. I
StandardI I
5 1\1 II
81 I
Figure 6. A graphical display ofthe transpositions used in Experiment 2. For each transposition, key distance (KD) and pitchdistance (PD) are given. Each key distance is associated with twodirections on the circle of fifths (here, indicated by key names relative to the key of C).
SIMILARITY OF TRANSPOSED MELODIES 1257
1.0Parameters
key distancedirection (S. F)
0.5 S,...,S
~F'".t'8
~F-C'aS S
ti 0.0 ~F \FfI) '" FgS~
-0.5
-1.0........,.----.----,-~~--r-__,_-~--r-r_
223 344 5 5
Pitch distance(semitones)
Figure 7. Similarity measures (scale values) obtained in Experiment 2. Similarity is plotted against pitch distance. The keydistance values ofthe stimuli are indicated between data pointsofthe same key distance. The direction of the key-distance valueson the circle offifths-clockwise (sharp, S) or counterclockwise(flat, F}-is indicated near the data points. The connection linesare added to improve readability only.
tance as was found in Experiment I: similarity decreasing with increasing pitch distance. However, the relationis not as clear as in Experiment I. Key distance does notseem to influence perceived similarity in a systematicway. A trend may be discerned to judge transpositions tosharp keys (clockwise on the circle of fifths) as moresimilar to the original melody than transpositions to flatkeys (counterclockwise on the circle offi fths).
Pitch distance and key distance are intercorrelated tosome extent (r = - .60). Since similarity was more highlycorrelated with pitch distance (r = -.74) than with keydistance (r = .12), pitch distance was entered as the firstvariable in the regression analysis. Because direction isuncorrelated both with pitch distance and key distance,the order of introduction of direction is irrelevant.
Multiple regression performed on the scale values, taking into account the independent variables pitch distanceand key distance and the additional factor direction, confirms the relations in the graph. The total amount of explained variance is 80.9% [F(3,6) = 8.49, p = .01] ofwhich 54.1% [F(l,6) = 21.7, P < . 005] is attributable topitch distance, 16.2% [given by the semipartial coefficientofdetermination, F(l,6) = 5.11,p < .10] is attributable tokey distance, and 10.5% [F(l,6) = 3.32, p < .15] is attributable to direction. The estimated regression function is
similarity = .97+ (- .20 pitch distance-.10 key distance - .18 direction).
The coefficients ofpitch distance and key distance arenegative, indicating that an increase of pitch distance orkey distance results in a decrease of similarity. The negative coefficient for direction indicates that transposi-

1258 VAN EGMOND, paVEL, AND MARIS
tions to sharp keys are perceived as more similar than aretranspositions to flat keys.
DiscussionAnalysis of the results of Experiment 2 shows that
pitch distance is the only factor that significantly affectsthe perceived similarity of standard and transposed melodies. The contribution of the factor pitch distance to theexplained variance in Experiment 2 was, however, smallerthan that in Experiment 1 (54.1% vs. 95.4%). This decrease is understandable, since the variation ofpitch distance was minimal in Experiment 2.
Although not significant, the contribution of the factorkey distance was much higher in Experiment 2 than inExperiment 1 (16.2% vs. 3.6%). Inspection of Figure 7reveals no systematic relation between key distance andperceived similarity: only for Key Distances 2, 3, and 4did we see the expected decrease in similarity, but the similarity measure associated with Key Distance I was toolow, and that for Key Distance 5 was too high. At present,we do not have an explanation for this phenomenon. Butifthis finding appears to be replicable, it casts doubt on theassumed inverse relation between key distance (as represented by the circle of fifths) and perceptual similarity.
Also, the third factor varied in Experiment 2, direction (i.e., the selection of sharp or flat keys), appeared notto be significant in the multiple regression analysis. Direction explains 10.5% ofthe variance. The graph in Figure 7 shows a trend to judge transpositions to sharp keysas more similar to the original melody than are transpositions to flat keys. This holds for four of the five keydistances used; for Key Distance 4, the reverse effect wasfound. Especially for Key Distance I, the transpositionto the sharp key (e.g., C~G) was greatly preferred overthat to the flat key (e.g., C~F). This preference mayhave been the result of the average listener's adaptationto the common practice in music to modulate to the dominant rather than to the subdominant (Rosen, 1976, p. 33;Schoenberg, 1922/1978, p. 166). A similar effect whentransposing to the dominant or subdominant has also beenreported in studies by Cuddy and Thompson (1992) andThompson and Cuddy (1989).
SUMMARY AND CONCLUSIONS
The combined results of the two experiments may besummarized as follows. Given a tonal melody that stronglyinduces a key, the similarity between various transpositions and this melody is determined mainly by pitch distance. Key distance and direction on the circle offifths areless important variables that explain only a small part ofthe variance. The degree ofvariance explained by the factor key distance increases slightly when the variation ofpitch distance is minimized (as was done in Experiment 2),but it is statistically not significant. This main effect ofpitch distance was also confirmed by another study inwhich the perceived similarity between a (different) melody and the exact and inexact transpositions ofthat melody
was investigated using the similarity paradigm (van Egmond & Povel, 1996).
Thus, the results presented in this study are in contrastwith those ofprevious studies that reported effects ofkeydistance in the judgment of transposed melodies (e.g.,Cuddy et aI., 1981; Cuddy et aI., 1979; Takeuchi & Hulse,1992; Trainor & Trehub, 1993). Since these previous studies all used a standard-comparison paradigm with lures,one might suppose that the results of the present studywere mainly due to the different experimental paradigmused. We do not believe this to be the case, because a number of earlier studies, using a standard-comparison paradigm in which pitch distance was varied, also showed arelatively large effect of pitch distance in judging transpositions (Frances, 1958/1988, p. 177; Hershman, 1994;van Egmond & Povel, 1994b). In van Egmond and Povel(1994b), a major diatonic scale was transposed to all majorkeys using upward and downward transpositions. It wasfound that the perceived similarity was affected by pitchdistance, and not by key distance. Furthermore, the results showed that only the size, and not the direction, ofthepitch shift affects the recognition. For example, a transposition with a pitch shift -11 (e.g., from C major toD~ major) affected the recognition score to the same extent as did the pitch shift +II (from C major to B major).
As we have argued in the introduction, the variableskey distance and pitch distance are, to some extent, interdependent. Thus, in order to obtain insight into the individual contribution of these two variables in the recognition of transpositions, key distance variation must becombined with different levels of pitch distance. Previous studies have usually varied key distance without considering the concomitant pitch distance. Such studiesfound that key distance is the predominant factor in determining the perceived similarity of transpositions. Onthe other hand, the results of the present study and thoseof van Egmond and Povel (1996), in which key distanceand pitch distance are systematically varied, indicate thatthe perceptual similarity oftransposed melodies is mainlydetermined by pitch distance and only to a small extentby key distance. It may be concluded that both factors playa role in the perception of transposed melodies, but theirexact interaction is still not quite clear. Therefore, in future research, we plan to study the interaction of the variables pitch distance, key distance, direction on the circleof fifths, and the tonal strength of melodies in more detail using the similarity paradigm employed in this study.
REFERENCES
ALDWELL, E., & SCHACHTER, C. (1989). Harmony and voice leading(2nd ed.). San Diego, CA: Harcourt Brace Jovanovich.
ATTNEAVE, E, & OLSON, R. (1971). Pitch as a medium: A new approachto psychophysical scaling. American Journal ofPsychology, 84, 147166.
BARTLETT, J. C., & DOWLING, W.J. (1980). Recognition of transposedmelodies: A key-distance effect in developmental perspective. Journal ofExperimental Psychology: Human Perception & Performance,6, SOl-SIS.
BHARUCHA, J. J. (l984a). Anchoring effects in music: The resolution ofdissonance. Cognitive Psychology, 16,485-518.

SIMILARITY OF TRANSPOSED MELODIES 1259
BHARUCHA, J. J. (I 984b). Event hierarchies, tonal hierarchies, and assimilation: A reply to Deutsch and Dowling. Journal ofExperimental Psychology: General, 113,421-425.
BRADLEY, R. A., & TERRY, M. E. (1952). Rank analysis of incompleteblock designs: I. The method of paired comparison. Biometrika, 39,324-335.
BROWN, H., & BUTLER, D. (1981). Diatonic trichords as minimal tonalcue-cells. In Theory Only,S, 39-55.
BROWN, H., BUTLER, D., & JONES, M. R. (1994). Musical and temporalinfluences on key identification. Music Perception, 14, 371-407.
BUTLER, D. (1983). The initial identification of tonal centers in music.In D. R. Rogers & 1. A. Sloboda (Eds.), The acquisition ofsymbolicskills (pp. 251-262). New York: Plenum.
BUTLER, D. (1989). Describing the perception of tonality in music: Acritique of the tonal hierarchy theory and a proposal for a theory ofintervallic rivalry. Music Perception, 6, 219-242.
CROONEN,W. L. M. (1991). Recognition of tone series containing tonictriads. Music Perception, 9, 231-250.
CROONEN, W. L. M., & Kop, P. E M. (1989). Tonality, tonal scheme,and contour in delayed recognition of tone sequences. Music Perception, 7, 49-68.
CUDDY, L. L., COHEN, A. J., & MEWHORT, D. 1. (1981). Perception ofstructure in short melodic sequences. Journal ofExperimental Psychology: Human Perception & Performance, 7, 869-883.
CUDDY, L. L., COHEN, A. L., & MILLER, J. (1979). Melody recognition:The experimental application of musical rules. Canadian Journal ofPsychology, 33, 148-156.
CUDDY, L. L., & THOMPSON, W. E (1992). Asymmetry ofperceived keymovement in chorale sequences: Converging evidence from a probetone analysis. Psychological Research, 54, 51-59.
DEUTSCH, D. (1984). Two issues concerning tonal hierarchies: Commenton Castellano, Bharucha, and Krumhansl. Journal ofExperimentalPsychology: General, 113,413-416.
DEWITT, L. A., & CROWDER, R. G. (1986). Recognition of novel melodies after brief delays. Music Perception, 3, 259-274.
DoWLING, W. J. (1978). Scale and contour: Two components ofa theoryofmernory for melodies. Psychological Review, 85, 341-345.
DOWLING, W. J. (1986). Context effects on melody recognition: Scalestep versus interval representation. Music Perception, 3, 281-296.
DOWLING, W. J. (1991). Tonal strength and melody recognition afterlong and short delays. Perception & Psychophysics, 50, 305-313.
FRANcEs, R. (1988). The perception ofmusic (W. 1. Dowling, Trans.).Hillsdale, NJ: Erlbaum. (Original work published in 1958)
HERSHMAN, D. P. (1994). Key distance effects in ecological contexts. InI. Del.iege (Ed.), Proceedings of the 3rd International Conferencefor Music Perception and Cognition (pp. 243-244). Liege: Universityof Liege.
KRUMHANSL, C. L. (1990). Cognitivefoundations ofmusical pitch. NewYork: Oxford University Press.
LUCE,R. D. (1959). Individual choice behavior: A theoretical analysis.New York: Wiley.
ROSEN, C. (1976). The classical style (rev. ed.). London: Faber & Faber.SCHOENBERG, A. (1978). Theory ofharmony (R. E. Carter, Trans.).
London: Faber & Faber. (Original work published in 1922)SHEPARD, R. N. (1982). Geometrical approximations to the structure of
musical pitch. Psychological Review, 89, 305-333.TAKEUCHI, A. H., & HULSE, S. H. (1992). Key distance effects in
melody recognition reexamined. Music Perception, 10, 1-24.THOMPSON, W. E, & CUDDY, L. L. (1989). Sensitivity to key change in
chorale sequences: A comparison ofsingle voices and four-voice harmony. Music Perception, 7,151-168.
THURSTONE, L. L. (1927). A law of comparative judgment. Psychological Review, 34, 273-286.
TRAINOR, L. J., & TREHUB, S. E. (1993). Musical context effects in infants and adults: Key distance. Journal ofExperimental Psychology:Human Perception & Performance, 19,615-626.
TRAINOR, L. J., & TREHUB, S. E. (1994). Key membership and impliedharmony in Western tonal music: Developmental perspectives. Perception & Psychophysics, 56,125-132.
VAN £eMOND, R., & POVEL, D. J. (I 994a). Factors in the recognition oftransposed melodies: A reply to Takeuchi and Hulse. Music Perception, 12, 137-142.
VAN £eMOND, R., & POVEL, D. 1.(I 994b). Similarity judgments on transposed melodies as a function ofoverlap and key-distance. In I. Del.iege(Ed.), Proceedings of the 3rd International Conference for MusicPerception and Cognition (pp. 219-220). Liege: University of Liege.
VAN EGMOND, R., & POVEL, D. 1. (1996). Perceived similarity of exactand inexact transpositions. Acta Psychologica, 92, 283-295.
(Manuscript received May 9, 1995;revision accepted for publication February 20, 1996.)


