Embed Size (px)
Citation preview
Journal of Hydrology (2007) 338, 237–250
ava i lab le a t www.sc iencedi rec t . com
journal homepage: www.elsevier .com/ locate / jhydrol
The impact of climate change on spatially varyinggroundwater recharge in the grand river watershed(Ontario)
Mikko I. Jyrkama *, Jon F. Sykes
Department of Civil Engineering, University of Waterloo, Waterloo, Ont., Canada N2L 3G1
Received 26 July 2006; received in revised form 16 February 2007; accepted 22 February 2007
00do
*
KEYWORDSGroundwater recharge;Climate change;Numerical modelling;Groundwatermanagement
22-1694/$ - see front mattei:10.1016/j.jhydrol.2007.02
Corresponding author. TelE-mail address: mjyrkama
r ª 200.036
.: +1 519@uwater
Summary Understanding the process of groundwater recharge is fundamental to themanagement of groundwater resources. Quantifying the future evolution of recharge overtime requires not only the reliable forecasting of changes in key climatic variables, butalso modelling their impact on the spatially varying recharge process.
This paper presents a physically based methodology that can be used to characterizeboth the temporal and spatial effect of climate change on groundwater recharge. Themethod, based on the hydrologic model HELP3, can be used to estimate potential ground-water recharge at the regional scale with high spatial and temporal resolution. In thisstudy, the method is used to simulate the past conditions, with 40 years of actual weatherdata, and future changes in the hydrologic cycle of the Grand River watershed. The impactof climate change is modelled by perturbing the model input parameters using predictedchanges in the regions climate.
The results of the study indicate that the overall rate of groundwater recharge is pre-dicted to increase as a result of climate change. The higher intensity and frequency ofprecipitation will also contribute significantly to surface runoff, while global warmingmay result in increased evapotranspiration rates. Warmer winter temperatures willreduce the extent of ground frost and shift the spring melt from spring toward winter,allowing more water to infiltrate into the ground. While many previous climate changeimpact studies have focused on the temporal changes in groundwater recharge, our resultssuggest that the impacts can also have high spatial variability.ª 2007 Elsevier B.V. All rights reserved.
7 Elsevier B.V. All rights reserved.
888 4567x38222; fax: +1 519 725 4834.loo.ca (M.I. Jyrkama).
238 M.I. Jyrkama, J.F. Sykes
Introduction
Changes in future climate will alter regional hydrologic cy-cles and subsequently impact the quantity and quality ofregional water resources (Gleick, 1989). While climatechange affects surface water resources directly throughchanges in the major long-term climate variables such asair temperature, precipitation, and evapotranspiration,the relationship between the changing climate variablesand groundwater is more complicated and difficult toquantify. Groundwater resources are related to climatechange through the direct interaction with surface waterresources, such as lakes and rivers, and indirectly throughthe recharge process. Therefore, quantifying the impact ofclimate change on groundwater resources requires not onlyreliable forecasting of changes in the major climatic vari-ables, but also accurate estimation of groundwaterrecharge.
Accurate spatial and temporal characterization ofgroundwater recharge can be difficult, however, due toits dependence on a multitude of physical factors such asland use and hydrogeological heterogeneity (Lerneret al., 1990). Groundwater recharge can also be signifi-cantly impacted by snowmelt and frozen soil conditionsin northern climates, and furthermore be complicated bythe issue of scale.
Quantifying the input (i.e., recharge) to the groundwa-ter system is critical for developing an effective wa-tershed management strategy that will ensure theprotection of groundwater resources not only from cli-mate change, but also from other stresses such as urban-ization (Robins, 1998). Understanding recharge is alsonecessary to properly assess aquifer vulnerability to con-tamination, since the transport of most groundwater con-taminants, with the exception of density drivencontaminants such as DNAPLs, to saturated aquifers oc-curs in the aqueous phase as part of the recharge process(Foster, 1998). This is especially important in areas wherethe underlying aquifers are exploited extensively fordrinking water purposes.
Assessing the impact of climate change on groundwaterresources requires a physically based approach for estimat-ing groundwater recharge. The method must not only ac-count for temporal variations in the climatic variables andtheir impact on the hydrologic cycle, but also consider thespatial variation of surface and subsurface properties acrossthe study area.
Many climate change studies have focused on model-ling the temporal change in the hydrologic processesand ignored or relied on average spatial characteristicsdue to model limitations or coarse discretization schemes.The objective of this paper is to present a physicallybased methodology that can be used to characterize notonly the temporal impact, but also the spatial effect ofclimate change on groundwater recharge. The method isbased on the hydrologic software package HELP3 coupledwith a geographic information system (GIS). The methodis used in an example application to simulate the pastconditions and possible future changes in thehydrologic cycle of the Grand River watershed in Ontario,Canada.
Background
Groundwater recharge
Groundwater recharge is part of the vadose zone soil waterbudget, which is driven by precipitation. Depending on therainfall intensity, temperature, and ground surface cover,the precipitated water is subjected to various processessuch as interception, evaporation, and surface runoff. Aportion of the water may also infiltrate into the soil, whereit may be taken up by the plant roots and subsequently tran-spired through the vegetation canopy. The remaining waterwill continue percolating deeper into the soil column, even-tually becoming groundwater recharge when crossing thewater table into the saturated groundwater zone.
Groundwater recharge is affected by many complexparameters and processes, which themselves are influencedby many factors. Precipitation is affected by climatic fac-tors such as wind and temperature, resulting in a very com-plex and dynamic distribution. Vegetation influencesrecharge through the processes of interception and transpi-ration, and other less commonly characterized, yet poten-tially significant processes such as stemflow andthroughfall (Le Maitre et al., 1999; Taniguchi et al.,1996). Arguably, these processes are very difficult to quan-tify since they are dependent on a multitude of climaticparameters, such as intensity and duration of rainfall, tem-perature, and wind speed, as well as the physical character-istics of the individual plants (Larcher, 1983). Plant rootsalso play an important role in the recharge process not onlyby enabling plants to draw water from deep in the vadosezone (and even from the saturated zone) thereby reducingthe amount of percolating water that reaches the water ta-ble, but also be creating preferential flow paths and chan-nels that aid water flow through the soil profile (Le Maitreet al., 1999).
The process of percolation is controlled by the hydraulicproperties of the soils which are very sensitive to the mois-ture content and pressure head distributions. A smallchange in the volumetric water content can often changethe hydraulic conductivity by several orders of magnitude.In addition, the soils in the unsaturated zone rarely exhibithomogeneous properties, often consisting of layered sands,silts, and clays, resulting in non-uniform moisture distribu-tions. Instability in the wetting front and subtle changes inthe permeability structure can also lead to flow fingering(Kung, 1990; Selker et al., 1992). Even in relatively homoge-neous materials, the unpredictable occurrence of preferredpathways due to plant roots, cracks and fissures, compli-cates the hydraulic characterization of soils in the unsatu-rated zone (Simmers, 1990). Large variations in rechargecan also occur, even across uniform soils, due to topogra-phy, resulting in depression-focused recharge (e.g. Freezeand Banner, 1970; Schuh et al., 1993). Shallow groundwaterlevels also influence the recharge process by limiting theamount of water entering the ground.
The presence of a snowpack and/or a frozen soil layerwill also have a significant impact on the recharge process.Similar to rainfall, the spatial and temporal distribution ofsnow accumulation is very complex, and even further com-plicated by its high sensitivity to temperature and wind
The impact of climate change on spatially varying groundwater recharge in the grand river watershed(Ontario) 239
velocities (i.e., drifting) (Deng et al., 1994). The presenceand extent of a frost layer influences the rate and distribu-tion of the infiltrating snowmelt (Johnsson and Lundin,1991; Kane and Stein, 1983; Granger et al., 1984; Engel-mark, 1988; Black and Miller, 1990). Predicting the evolu-tion of the frozen soil layer is very difficult because of itsdependence on several factors such as temperature, theduration of freezing temperatures, snow depth at theground surface, and initial soil water content (Daniel andStaricka, 2000). Modelling unsaturated zone flow in a sea-sonally (or permanently) frozen environment is clearly verychallenging.
Finally, recharge rates can be extensively impacted byhuman activities such as urbanization, which influence therates through increased impervious cover; leakage fromwater distribution systems, sewers, and septic tanks; andover-irrigation of parks and lawns (Lerner, 2002).
Estimation of groundwater recharge requires modellingof the interaction between all of the important processesin the hydrologic cycle, such as infiltration, surface run-off, evapotranspiration, snowmelt, and groundwater levelvariations. The quantitative description of the hydrologicprocesses may become very complicated, however, dueto the high uncertainty and complexity in the underlyingphysical parameters. Modelling of natural systems is com-plicated further by the issue of scale. Addressing thescale problem not only requires appropriate model dis-cretization for the representation of the underlying hydro-logic processes, but it also demands conformity betweenthe scale of the input parameters and the modellingframework.
Modelling the impact of climate change ongroundwater recharge
Various hydrologic models have been used to study the im-pact of climate change on surface and groundwater re-sources (e.g., Vaccaro, 1992; Wilkinson and Cooper, 1993;Gureghian et al., 1994; Cooper et al., 1995; Bobba et al.,1997; Bouraoui et al., 1999; Rosenberg et al., 1999; Kirshen,2002; Croley and Luukkonen, 2003; Loaiciga, 2003; Eckhardtand Ulbrich, 2003; Allen et al., 2004; Brouyere et al., 2004;Hanson and Dettinger, 2005; Krysanova et al., 2005; Scibekand Allen, 2006). The hydrological effects of climate changeare commonly evaluated by estimating the sensitivity ofmodel outputs, such as streamflow hydrographs or soil mois-ture contents, to hypothetical changes in the magnitude andtemporal distribution of model inputs such as precipitationand temperature. In addition to discrete perturbations,however, the results inferred from general circulation mod-els (GCMs) have also been used to predict the effects of cli-mate change on regional hydrology.
In one of the early studies, Vaccaro (1992) investigatedthe degree of variability in climate and its impact on futurerecharge predictions in a basin in the northwestern UnitedStates. In addition to historical records, climate predictionsfrom the synthetic weather generator WGEN (Richardsonand Wright, 1984) and three GCMs were considered alongwith two different land use conditions. The results of thestudy indicated that the variability in annual recharge wasless under the GCM conditions than using the historic data.
Bouraoui et al. (1999) developed a methodology to disag-gregate the outputs of large scale GCMs for use in hydrologicmodels and investigated the impact of doubling atmosphericCO2 on groundwater recharge in a watershed in France. Theresults of the study indicated that recharge would decreasein the basin due to an increase in atmospheric CO2.
Rosenberg et al. (1999) studied the impact of climatechange on the water yield and groundwater recharge ofthe Ogallala aquifer in the central United States. Three dif-ferent GCMs were used to predict changes in the future cli-mate due to anticipated changes in temperature and CO2
concentrations. The study found that recharge was reducedunder all scenarios, ranging up to 77%, depending on thesimulation conditions.
Kirshen (2002) used the groundwater model MODFLOW tostudy the impact of global warming on a highly permeableaquifer in the northeastern United States. Groundwater re-charge was estimated using a separate model based on pre-cipitation and potential evapotranspiration. Bothhypothetical and GCM-predicted changes to the inputparameters were used, resulting in higher, no different,and significantly lower recharge rates and groundwater ele-vations, depending on the climate scenario used.
In another MODFLOW study, Croley and Luukkonen (2003)investigated the impact of climate change on groundwaterlevels in Lansing, Michigan. The groundwater recharge rateswere based on an empirical streamflow model which wascalibrated using the results from two GCMs. The results ofthe study indicated that the simulated steady-state ground-water levels were generally predicted to increase or de-crease due to climate change, depending on the GCM used.
Eckhardt and Ulbrich (2003) investigated the impact ofclimate change on groundwater recharge and streamflowin a small catchment in Germany. The input parameters intheir hydrologic model were adjusted based on simulationsfrom five different GCMs. The results of the study indicatedthat more precipitation will fall as rain in winter due to in-creased temperatures, resulting in higher recharge andstreamflow in January and February. They also found thatthe increase in recharge from the snowmelt in March disap-pears, while recharge and streamflow were shown to bepotentially reduced in the summer months.
Loaiciga (2003) studied a karst aquifer in south-centralTexas and considered the impact of climate change not onlyon streambed recharge, but also on pumping rates (i.e.groundwater use). The impact of climate change on thestreambed recharge was estimated using runoff scaling fac-tors based on the ratio of historical and future streamflowspredicted from linked general and regional climate models.The study concluded that the rise in groundwater use asso-ciated with predicted population growth would pose a high-er threat to the aquifer than climate change.
Allen et al. (2004) and Scibek and Allen (2006) used Vi-sual MODFLOW to study the impact of climate change ontwo small aquifers in western Canada and the United States.Results from a GCM were downscaled and used to constructthree climate scenarios. The recharge boundary conditionsfor the groundwater models were estimated using VisualHELP. The temporal impact of climate change was modelledby changing the inputs to a stochastic weather generatorbased on each climate scenario. Recharge was estimatedspatially using a rasterized approach resulting in 64 unique
240 M.I. Jyrkama, J.F. Sykes
recharge zones. Further adjustments to the spatial rechargeestimates were also made for one of the aquifers based onan interpolated precipitation gradient. The results of thestudy indicated only a minor impact from climate changeon recharge and groundwater levels at both study areas.
Brouyere et al. (2004) investigated the impact of climatechange on a chalky groundwater basin in Belgium using theresults from three GCMs with an integrated hydrologicalmodel. Two scenarios showed decreases in groundwater lev-els, while one of the models showed no significant change.
Understanding the impact of climate change is most cru-cial for studies concerned with the storage and containmentof high-level nuclear waste. Due to the slow decay of manytransuranic waste products, modelling efforts must be con-cerned with changes in boundary conditions over very longperiods of time. However, predictions of climate changeare highly uncertain even for shorter periods such as thenext century, making the predictions for the next ten- tohundred-thousand years extremely uncertain.
YuccaMountain in Nevada is being evaluated as a potentialsite for high-level nuclearwaste disposal in theUnited States.Because the proposed repository is to be located within thedeep unsaturated zone, estimating rates of groundwater re-charge at the site is critically important (Flint et al., 2002).Gureghian et al. (1994) studied the impact of climate changeon the groundwater recharge rate at Yucca Mountain using aquasi-linear formofRichards’ equation. Theyused twodiffer-ent climatic variation models for temperature and precipita-tion over the next ten thousand years based onrecommendations by a panel of experts. The results of thestudy indicate minimal differences between the two climatemodels on the overall movement of the wetting front.
In summary, climate change is likely to have an impact onfuture recharge rates and hence on the underlying groundwa-ter resources. The impact may not necessarily be a negativeone, as evidenced by some of the investigations. Quantifyingthe impact is difficult, however, and is subject to uncertain-ties present in the future climate predictions. Simulationsbased on general circulation models (GCMs) have yieldedmixed and conflicting results, raising questions about theirreliability in predicting future hydrologic conditions.
Groundwater recharge is influenced not only by hydro-logic processes, but also by the physical characteristics ofthe land surface and soil profile. Many climate change stud-ies have focused on modelling the temporal changes in thehydrologic processes and ignored the spatial variability of
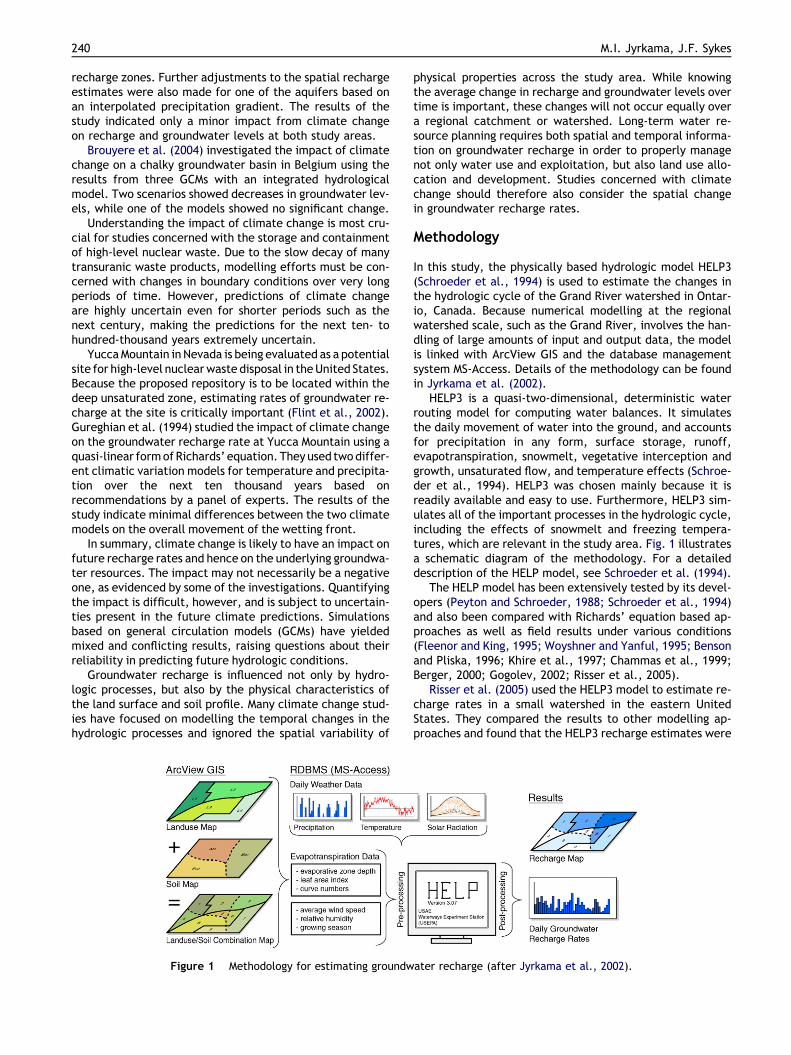
Figure 1 Methodology for estimating groundw
physical properties across the study area. While knowingthe average change in recharge and groundwater levels overtime is important, these changes will not occur equally overa regional catchment or watershed. Long-term water re-source planning requires both spatial and temporal informa-tion on groundwater recharge in order to properly managenot only water use and exploitation, but also land use allo-cation and development. Studies concerned with climatechange should therefore also consider the spatial changein groundwater recharge rates.
Methodology
In this study, the physically based hydrologic model HELP3(Schroeder et al., 1994) is used to estimate the changes inthe hydrologic cycle of the Grand River watershed in Ontar-io, Canada. Because numerical modelling at the regionalwatershed scale, such as the Grand River, involves the han-dling of large amounts of input and output data, the modelis linked with ArcView GIS and the database managementsystem MS-Access. Details of the methodology can be foundin Jyrkama et al. (2002).
HELP3 is a quasi-two-dimensional, deterministic waterrouting model for computing water balances. It simulatesthe daily movement of water into the ground, and accountsfor precipitation in any form, surface storage, runoff,evapotranspiration, snowmelt, vegetative interception andgrowth, unsaturated flow, and temperature effects (Schroe-der et al., 1994). HELP3 was chosen mainly because it isreadily available and easy to use. Furthermore, HELP3 sim-ulates all of the important processes in the hydrologic cycle,including the effects of snowmelt and freezing tempera-tures, which are relevant in the study area. Fig. 1 illustratesa schematic diagram of the methodology. For a detaileddescription of the HELP model, see Schroeder et al. (1994).
The HELP model has been extensively tested by its devel-opers (Peyton and Schroeder, 1988; Schroeder et al., 1994)and also been compared with Richards’ equation based ap-proaches as well as field results under various conditions(Fleenor and King, 1995; Woyshner and Yanful, 1995; Bensonand Pliska, 1996; Khire et al., 1997; Chammas et al., 1999;Berger, 2000; Gogolev, 2002; Risser et al., 2005).
Risser et al. (2005) used the HELP3 model to estimate re-charge rates in a small watershed in the eastern UnitedStates. They compared the results to other modelling ap-proaches and found that the HELP3 recharge estimates were
ater recharge (after Jyrkama et al., 2002).
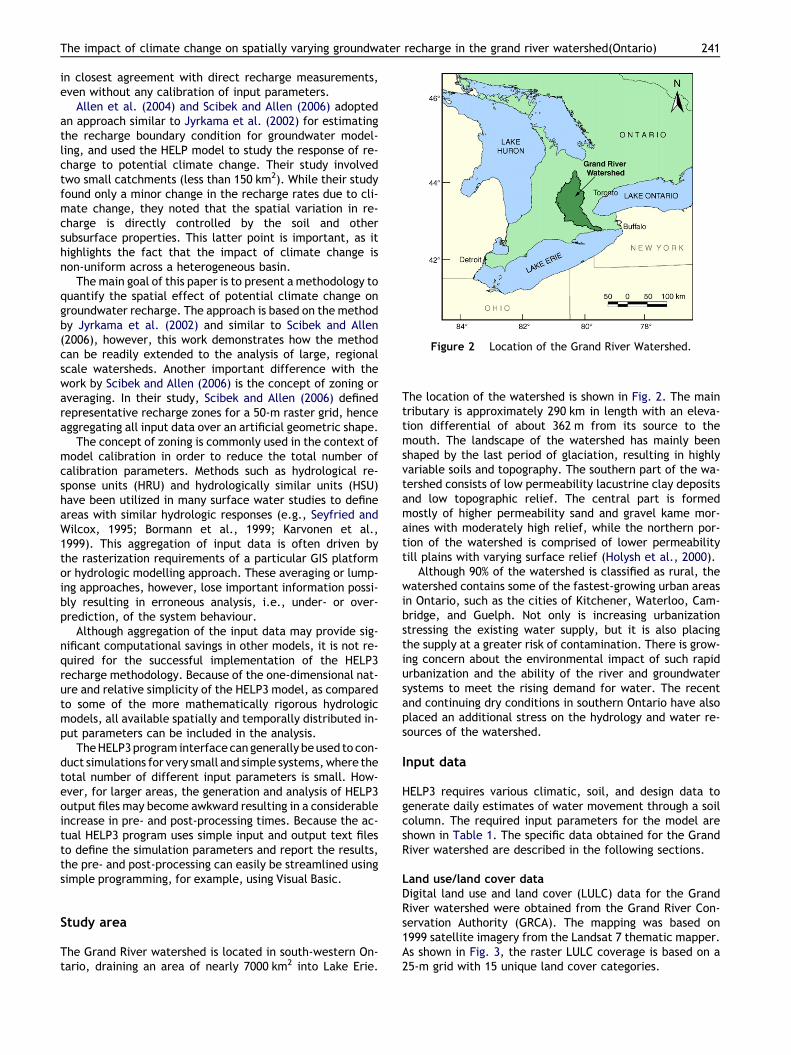
Figure 2 Location of the Grand River Watershed.
The impact of climate change on spatially varying groundwater recharge in the grand river watershed(Ontario) 241
in closest agreement with direct recharge measurements,even without any calibration of input parameters.
Allen et al. (2004) and Scibek and Allen (2006) adoptedan approach similar to Jyrkama et al. (2002) for estimatingthe recharge boundary condition for groundwater model-ling, and used the HELP model to study the response of re-charge to potential climate change. Their study involvedtwo small catchments (less than 150 km2). While their studyfound only a minor change in the recharge rates due to cli-mate change, they noted that the spatial variation in re-charge is directly controlled by the soil and othersubsurface properties. This latter point is important, as ithighlights the fact that the impact of climate change isnon-uniform across a heterogeneous basin.
The main goal of this paper is to present a methodology toquantify the spatial effect of potential climate change ongroundwater recharge. The approach is based on the methodby Jyrkama et al. (2002) and similar to Scibek and Allen(2006), however, this work demonstrates how the methodcan be readily extended to the analysis of large, regionalscale watersheds. Another important difference with thework by Scibek and Allen (2006) is the concept of zoning oraveraging. In their study, Scibek and Allen (2006) definedrepresentative recharge zones for a 50-m raster grid, henceaggregating all input data over an artificial geometric shape.
The concept of zoning is commonly used in the context ofmodel calibration in order to reduce the total number ofcalibration parameters. Methods such as hydrological re-sponse units (HRU) and hydrologically similar units (HSU)have been utilized in many surface water studies to defineareas with similar hydrologic responses (e.g., Seyfried andWilcox, 1995; Bormann et al., 1999; Karvonen et al.,1999). This aggregation of input data is often driven bythe rasterization requirements of a particular GIS platformor hydrologic modelling approach. These averaging or lump-ing approaches, however, lose important information possi-bly resulting in erroneous analysis, i.e., under- or over-prediction, of the system behaviour.
Although aggregation of the input data may provide sig-nificant computational savings in other models, it is not re-quired for the successful implementation of the HELP3recharge methodology. Because of the one-dimensional nat-ure and relative simplicity of the HELP3 model, as comparedto some of the more mathematically rigorous hydrologicmodels, all available spatially and temporally distributed in-put parameters can be included in the analysis.
TheHELP3program interface can generally beused to con-duct simulations for very small and simple systems,where thetotal number of different input parameters is small. How-ever, for larger areas, the generation and analysis of HELP3output files may become awkward resulting in a considerableincrease in pre- and post-processing times. Because the ac-tual HELP3 program uses simple input and output text filesto define the simulation parameters and report the results,the pre- and post-processing can easily be streamlined usingsimple programming, for example, using Visual Basic.
Study area
The Grand River watershed is located in south-western On-tario, draining an area of nearly 7000 km2 into Lake Erie.
The location of the watershed is shown in Fig. 2. The maintributary is approximately 290 km in length with an eleva-tion differential of about 362 m from its source to themouth. The landscape of the watershed has mainly beenshaped by the last period of glaciation, resulting in highlyvariable soils and topography. The southern part of the wa-tershed consists of low permeability lacustrine clay depositsand low topographic relief. The central part is formedmostly of higher permeability sand and gravel kame mor-aines with moderately high relief, while the northern por-tion of the watershed is comprised of lower permeabilitytill plains with varying surface relief (Holysh et al., 2000).
Although 90% of the watershed is classified as rural, thewatershed contains some of the fastest-growing urban areasin Ontario, such as the cities of Kitchener, Waterloo, Cam-bridge, and Guelph. Not only is increasing urbanizationstressing the existing water supply, but it is also placingthe supply at a greater risk of contamination. There is grow-ing concern about the environmental impact of such rapidurbanization and the ability of the river and groundwatersystems to meet the rising demand for water. The recentand continuing dry conditions in southern Ontario have alsoplaced an additional stress on the hydrology and water re-sources of the watershed.
Input data
HELP3 requires various climatic, soil, and design data togenerate daily estimates of water movement through a soilcolumn. The required input parameters for the model areshown in Table 1. The specific data obtained for the GrandRiver watershed are described in the following sections.
Land use/land cover dataDigital land use and land cover (LULC) data for the GrandRiver watershed were obtained from the Grand River Con-servation Authority (GRCA). The mapping was based on1999 satellite imagery from the Landsat 7 thematic mapper.As shown in Fig. 3, the raster LULC coverage is based on a25-m grid with 15 unique land cover categories.
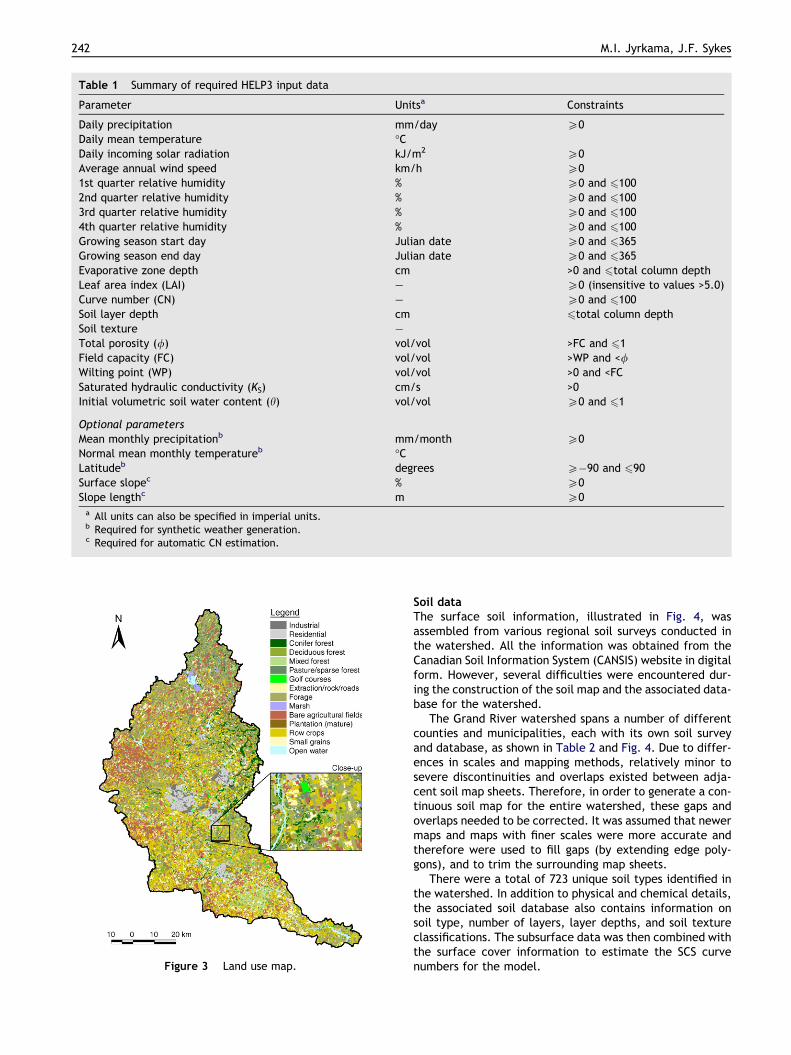
Table 1 Summary of required HELP3 input data
Parameter Unitsa Constraints
Daily precipitation mm/day P0Daily mean temperature �CDaily incoming solar radiation kJ/m2 P0Average annual wind speed km/h P01st quarter relative humidity % P0 and 61002nd quarter relative humidity % P0 and 61003rd quarter relative humidity % P0 and 61004th quarter relative humidity % P0 and 6100Growing season start day Julian date P0 and 6365Growing season end day Julian date P0 and 6365Evaporative zone depth cm >0 and 6total column depthLeaf area index (LAI) – P0 (insensitive to values >5.0)Curve number (CN) – P0 and 6100Soil layer depth cm 6total column depthSoil texture –Total porosity (/) vol/vol >FC and 61Field capacity (FC) vol/vol >WP and </Wilting point (WP) vol/vol >0 and <FCSaturated hydraulic conductivity (KS) cm/s >0Initial volumetric soil water content (h) vol/vol P0 and 61
Optional parametersMean monthly precipitationb mm/month P0Normal mean monthly temperatureb �CLatitudeb degrees P�90 and 690Surface slopec % P0Slope lengthc m P0a All units can also be specified in imperial units.b Required for synthetic weather generation.c Required for automatic CN estimation.
Figure 3 Land use map.
242 M.I. Jyrkama, J.F. Sykes
Soil dataThe surface soil information, illustrated in Fig. 4, wasassembled from various regional soil surveys conducted inthe watershed. All the information was obtained from theCanadian Soil Information System (CANSIS) website in digitalform. However, several difficulties were encountered dur-ing the construction of the soil map and the associated data-base for the watershed.
The Grand River watershed spans a number of differentcounties and municipalities, each with its own soil surveyand database, as shown in Table 2 and Fig. 4. Due to differ-ences in scales and mapping methods, relatively minor tosevere discontinuities and overlaps existed between adja-cent soil map sheets. Therefore, in order to generate a con-tinuous soil map for the entire watershed, these gaps andoverlaps needed to be corrected. It was assumed that newermaps and maps with finer scales were more accurate andtherefore were used to fill gaps (by extending edge poly-gons), and to trim the surrounding map sheets.
There were a total of 723 unique soil types identified inthe watershed. In addition to physical and chemical details,the associated soil database also contains information onsoil type, number of layers, layer depths, and soil textureclassifications. The subsurface data was then combined withthe surface cover information to estimate the SCS curvenumbers for the model.
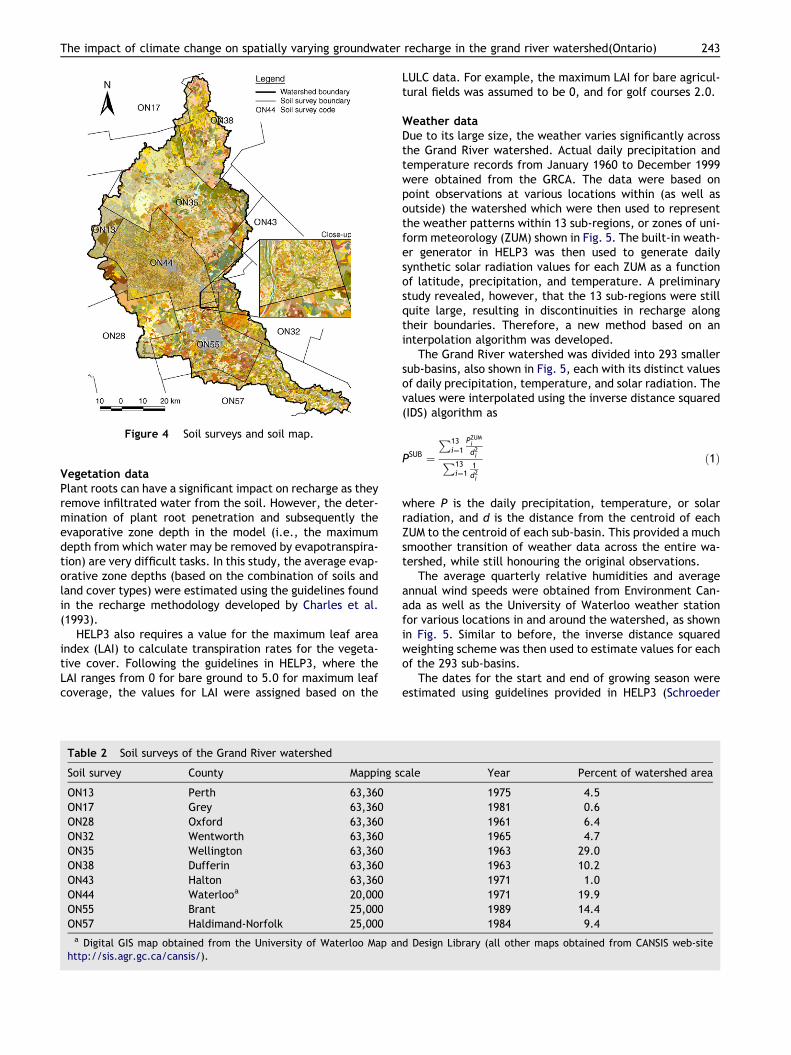
Figure 4 Soil surveys and soil map.
The impact of climate change on spatially varying groundwater recharge in the grand river watershed(Ontario) 243
Vegetation dataPlant roots can have a significant impact on recharge as theyremove infiltrated water from the soil. However, the deter-mination of plant root penetration and subsequently theevaporative zone depth in the model (i.e., the maximumdepth from which water may be removed by evapotranspira-tion) are very difficult tasks. In this study, the average evap-orative zone depths (based on the combination of soils andland cover types) were estimated using the guidelines foundin the recharge methodology developed by Charles et al.(1993).
HELP3 also requires a value for the maximum leaf areaindex (LAI) to calculate transpiration rates for the vegeta-tive cover. Following the guidelines in HELP3, where theLAI ranges from 0 for bare ground to 5.0 for maximum leafcoverage, the values for LAI were assigned based on the
Table 2 Soil surveys of the Grand River watershed
Soil survey County Mapping s
ON13 Perth 63,360ON17 Grey 63,360ON28 Oxford 63,360ON32 Wentworth 63,360ON35 Wellington 63,360ON38 Dufferin 63,360ON43 Halton 63,360ON44 Waterlooa 20,000ON55 Brant 25,000ON57 Haldimand-Norfolk 25,000a Digital GIS map obtained from the University of Waterloo Map an
http://sis.agr.gc.ca/cansis/).
LULC data. For example, the maximum LAI for bare agricul-tural fields was assumed to be 0, and for golf courses 2.0.
Weather dataDue to its large size, the weather varies significantly acrossthe Grand River watershed. Actual daily precipitation andtemperature records from January 1960 to December 1999were obtained from the GRCA. The data were based onpoint observations at various locations within (as well asoutside) the watershed which were then used to representthe weather patterns within 13 sub-regions, or zones of uni-form meteorology (ZUM) shown in Fig. 5. The built-in weath-er generator in HELP3 was then used to generate dailysynthetic solar radiation values for each ZUM as a functionof latitude, precipitation, and temperature. A preliminarystudy revealed, however, that the 13 sub-regions were stillquite large, resulting in discontinuities in recharge alongtheir boundaries. Therefore, a new method based on aninterpolation algorithm was developed.
The Grand River watershed was divided into 293 smallersub-basins, also shown in Fig. 5, each with its distinct valuesof daily precipitation, temperature, and solar radiation. Thevalues were interpolated using the inverse distance squared(IDS) algorithm as
PSUB ¼
P13i¼1
PZUMi
d2iP13i¼1
1d2i
ð1Þ
where P is the daily precipitation, temperature, or solarradiation, and d is the distance from the centroid of eachZUM to the centroid of each sub-basin. This provided a muchsmoother transition of weather data across the entire wa-tershed, while still honouring the original observations.
The average quarterly relative humidities and averageannual wind speeds were obtained from Environment Can-ada as well as the University of Waterloo weather stationfor various locations in and around the watershed, as shownin Fig. 5. Similar to before, the inverse distance squaredweighting scheme was then used to estimate values for eachof the 293 sub-basins.
The dates for the start and end of growing season wereestimated using guidelines provided in HELP3 (Schroeder
cale Year Percent of watershed area
1975 4.51981 0.61961 6.41965 4.71963 29.01963 10.21971 1.01971 19.91989 14.41984 9.4
d Design Library (all other maps obtained from CANSIS web-site
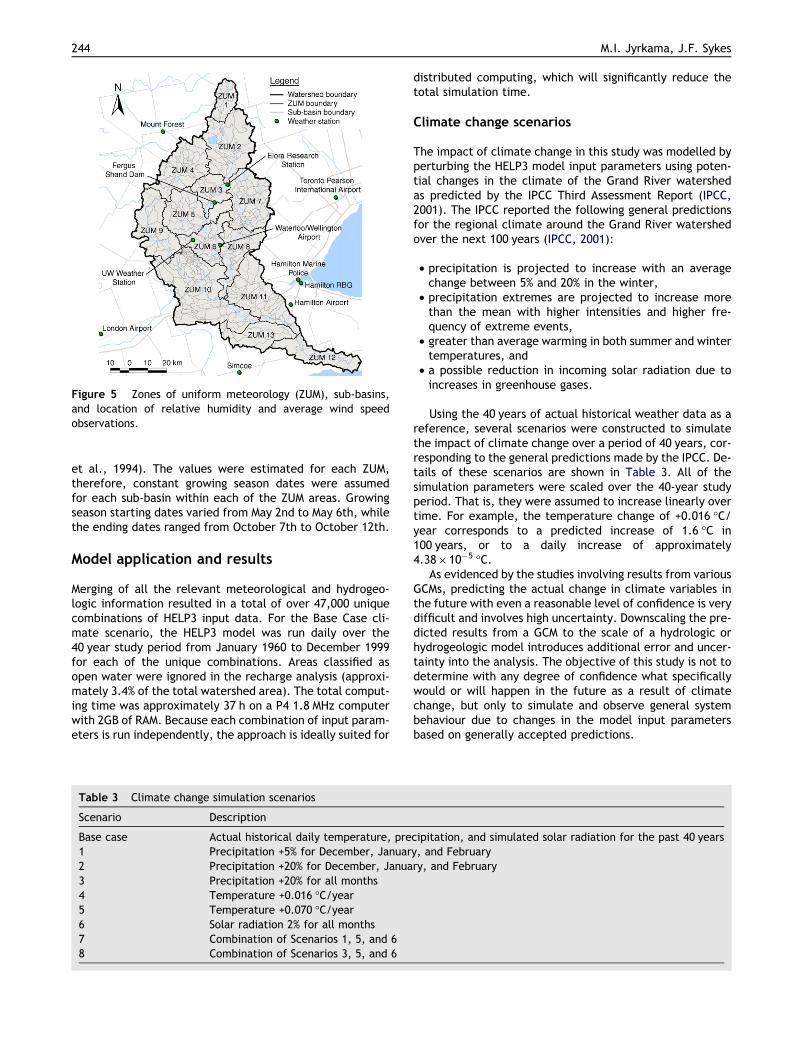
Figure 5 Zones of uniform meteorology (ZUM), sub-basins,and location of relative humidity and average wind speedobservations.
244 M.I. Jyrkama, J.F. Sykes
et al., 1994). The values were estimated for each ZUM,therefore, constant growing season dates were assumedfor each sub-basin within each of the ZUM areas. Growingseason starting dates varied from May 2nd to May 6th, whilethe ending dates ranged from October 7th to October 12th.
Model application and results
Merging of all the relevant meteorological and hydrogeo-logic information resulted in a total of over 47,000 uniquecombinations of HELP3 input data. For the Base Case cli-mate scenario, the HELP3 model was run daily over the40 year study period from January 1960 to December 1999for each of the unique combinations. Areas classified asopen water were ignored in the recharge analysis (approxi-mately 3.4% of the total watershed area). The total comput-ing time was approximately 37 h on a P4 1.8 MHz computerwith 2GB of RAM. Because each combination of input param-eters is run independently, the approach is ideally suited for
Table 3 Climate change simulation scenarios
Scenario Description
Base case Actual historical daily temperature, pre1 Precipitation +5% for December, Januar2 Precipitation +20% for December, Janua3 Precipitation +20% for all months4 Temperature +0.016 �C/year5 Temperature +0.070 �C/year6 Solar radiation 2% for all months7 Combination of Scenarios 1, 5, and 68 Combination of Scenarios 3, 5, and 6
distributed computing, which will significantly reduce thetotal simulation time.
Climate change scenarios
The impact of climate change in this study was modelled byperturbing the HELP3 model input parameters using poten-tial changes in the climate of the Grand River watershedas predicted by the IPCC Third Assessment Report (IPCC,2001). The IPCC reported the following general predictionsfor the regional climate around the Grand River watershedover the next 100 years (IPCC, 2001):
• precipitation is projected to increase with an averagechange between 5% and 20% in the winter,
• precipitation extremes are projected to increase morethan the mean with higher intensities and higher fre-quency of extreme events,
• greater than average warming in both summer and wintertemperatures, and
• a possible reduction in incoming solar radiation due toincreases in greenhouse gases.
Using the 40 years of actual historical weather data as areference, several scenarios were constructed to simulatethe impact of climate change over a period of 40 years, cor-responding to the general predictions made by the IPCC. De-tails of these scenarios are shown in Table 3. All of thesimulation parameters were scaled over the 40-year studyperiod. That is, they were assumed to increase linearly overtime. For example, the temperature change of +0.016 �C/year corresponds to a predicted increase of 1.6 �C in100 years, or to a daily increase of approximately4.38 · 10�5 �C.
As evidenced by the studies involving results from variousGCMs, predicting the actual change in climate variables inthe future with even a reasonable level of confidence is verydifficult and involves high uncertainty. Downscaling the pre-dicted results from a GCM to the scale of a hydrologic orhydrogeologic model introduces additional error and uncer-tainty into the analysis. The objective of this study is not todetermine with any degree of confidence what specificallywould or will happen in the future as a result of climatechange, but only to simulate and observe general systembehaviour due to changes in the model input parametersbased on generally accepted predictions.
cipitation, and simulated solar radiation for the past 40 yearsy, and Februaryry, and February
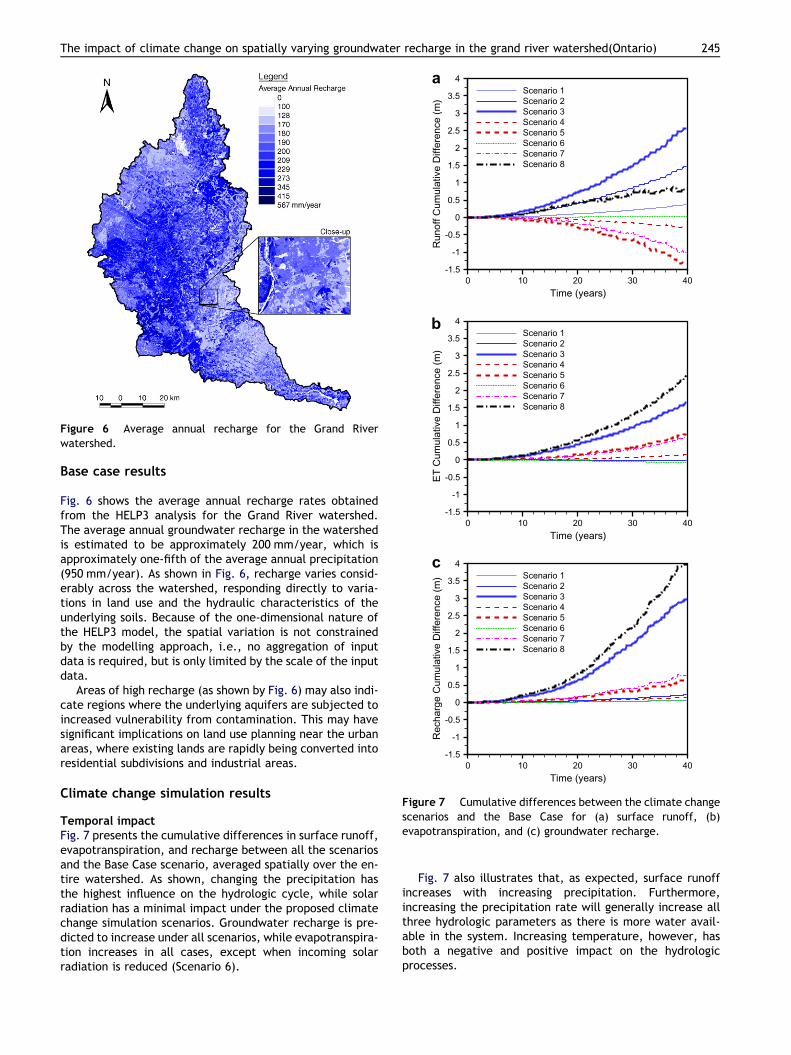
Figure 6 Average annual recharge for the Grand Riverwatershed.
Time (years)
Run
off C
umul
ativ
e D
iffer
ence
(m)
0 10 20 30 40-1.5
-1
-0.5
0
0.5
1
1.5
2
2.5
3
3.5
4Scenario 1Scenario 2Scenario 3Scenario 4Scenario 5Scenario 6Scenario 7Scenario 8
Time (years)
ET C
umul
ativ
e D
iffer
ence
(m)
0 10 20 30 40-1.5
-1
-0.5
0
0.5
1
1.5
2
2.5
3
3.5
4Scenario 1Scenario 2Scenario 3Scenario 4Scenario 5Scenario 6Scenario 7Scenario 8
Time (years)
Rec
harg
e C
umul
ativ
e D
iffer
ence
(m)
0 10 20 30 40-1.5
-1
-0.5
0
0.5
1
1.5
2
2.5
3
3.5
4Scenario 1Scenario 2Scenario 3Scenario 4Scenario 5Scenario 6Scenario 7Scenario 8
Figure 7 Cumulative differences between the climate changescenarios and the Base Case for (a) surface runoff, (b)evapotranspiration, and (c) groundwater recharge.
The impact of climate change on spatially varying groundwater recharge in the grand river watershed(Ontario) 245
Base case results
Fig. 6 shows the average annual recharge rates obtainedfrom the HELP3 analysis for the Grand River watershed.The average annual groundwater recharge in the watershedis estimated to be approximately 200 mm/year, which isapproximately one-fifth of the average annual precipitation(950 mm/year). As shown in Fig. 6, recharge varies consid-erably across the watershed, responding directly to varia-tions in land use and the hydraulic characteristics of theunderlying soils. Because of the one-dimensional nature ofthe HELP3 model, the spatial variation is not constrainedby the modelling approach, i.e., no aggregation of inputdata is required, but is only limited by the scale of the inputdata.
Areas of high recharge (as shown by Fig. 6) may also indi-cate regions where the underlying aquifers are subjected toincreased vulnerability from contamination. This may havesignificant implications on land use planning near the urbanareas, where existing lands are rapidly being converted intoresidential subdivisions and industrial areas.
Climate change simulation results
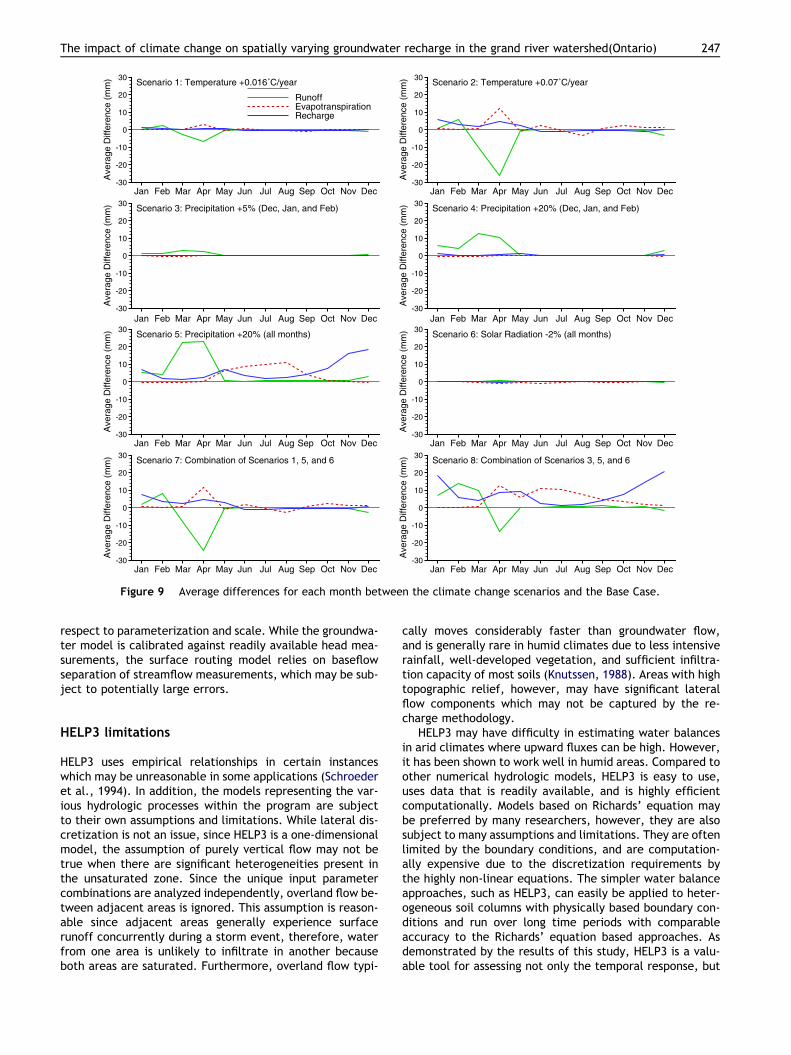
Temporal impactFig. 7 presents the cumulative differences in surface runoff,evapotranspiration, and recharge between all the scenariosand the Base Case scenario, averaged spatially over the en-tire watershed. As shown, changing the precipitation hasthe highest influence on the hydrologic cycle, while solarradiation has a minimal impact under the proposed climatechange simulation scenarios. Groundwater recharge is pre-dicted to increase under all scenarios, while evapotranspira-tion increases in all cases, except when incoming solarradiation is reduced (Scenario 6).
Fig. 7 also illustrates that, as expected, surface runoffincreases with increasing precipitation. Furthermore,increasing the precipitation rate will generally increase allthree hydrologic parameters as there is more water avail-able in the system. Increasing temperature, however, hasboth a negative and positive impact on the hydrologicprocesses.
246 M.I. Jyrkama, J.F. Sykes
As demonstrated by Scenarios 4 and 5 in Fig. 7a, temper-ature has a significant influence on the runoff process. Thecumulative surface runoff decreases with increasing tem-perature mainly due to a reduced period of ground frost.Similar to the results by Eckhardt and Ulbrich (2003), war-mer winter temperatures allow precipitation to fall as rainrather than snow, thereby reducing runoff by decreasingthe amount of water stored in the snowpack, and increasinggroundwater recharge through increased infiltration. As ex-pected, evapotranspiration rates are also increased overtime by warmer temperatures (see Fig. 7b).
The overall cumulative watershed water budget for theBase Case over the 40-year study period amounts to approx-imately 36.5 m of precipitation, 8.4 m of surface runoff,20.4 m of evapotranspiration, and 7.5 m of potential re-charge. Therefore, comparing the results of Scenarios 7and 8, the relative overall impact of climate change rangesfrom �12% to +10% for surface runoff, +3% to +12% forevapotranspiration, and +10% to +53% for groundwater re-charge, depending on the scenario used.
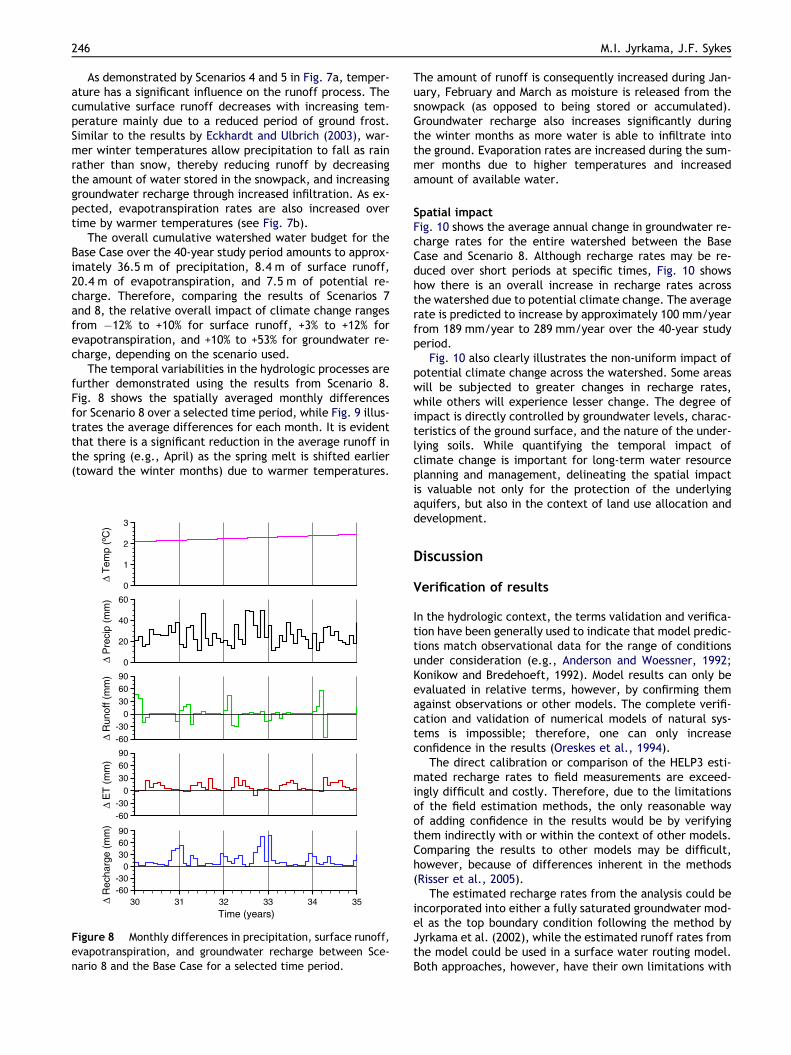
The temporal variabilities in the hydrologic processes arefurther demonstrated using the results from Scenario 8.Fig. 8 shows the spatially averaged monthly differencesfor Scenario 8 over a selected time period, while Fig. 9 illus-trates the average differences for each month. It is evidentthat there is a significant reduction in the average runoff inthe spring (e.g., April) as the spring melt is shifted earlier(toward the winter months) due to warmer temperatures.
Δ P
reci
p (m
m)
0
20
40
60
Δ R
unof
f (m
m)
-60-30
0306090
Δ E
T (
mm
)
-60-30
0306090
Time (years)
Δ R
echa
rge
(mm
)
30 31 32 33 34 35-60-30
0306090
Δ T
emp
(ºC
)
0
1
2
3
Figure 8 Monthly differences in precipitation, surface runoff,evapotranspiration, and groundwater recharge between Sce-nario 8 and the Base Case for a selected time period.
The amount of runoff is consequently increased during Jan-uary, February and March as moisture is released from thesnowpack (as opposed to being stored or accumulated).Groundwater recharge also increases significantly duringthe winter months as more water is able to infiltrate intothe ground. Evaporation rates are increased during the sum-mer months due to higher temperatures and increasedamount of available water.
Spatial impactFig. 10 shows the average annual change in groundwater re-charge rates for the entire watershed between the BaseCase and Scenario 8. Although recharge rates may be re-duced over short periods at specific times, Fig. 10 showshow there is an overall increase in recharge rates acrossthe watershed due to potential climate change. The averagerate is predicted to increase by approximately 100 mm/yearfrom 189 mm/year to 289 mm/year over the 40-year studyperiod.
Fig. 10 also clearly illustrates the non-uniform impact ofpotential climate change across the watershed. Some areaswill be subjected to greater changes in recharge rates,while others will experience lesser change. The degree ofimpact is directly controlled by groundwater levels, charac-teristics of the ground surface, and the nature of the under-lying soils. While quantifying the temporal impact ofclimate change is important for long-term water resourceplanning and management, delineating the spatial impactis valuable not only for the protection of the underlyingaquifers, but also in the context of land use allocation anddevelopment.
Discussion
Verification of results
In the hydrologic context, the terms validation and verifica-tion have been generally used to indicate that model predic-tions match observational data for the range of conditionsunder consideration (e.g., Anderson and Woessner, 1992;Konikow and Bredehoeft, 1992). Model results can only beevaluated in relative terms, however, by confirming themagainst observations or other models. The complete verifi-cation and validation of numerical models of natural sys-tems is impossible; therefore, one can only increaseconfidence in the results (Oreskes et al., 1994).
The direct calibration or comparison of the HELP3 esti-mated recharge rates to field measurements are exceed-ingly difficult and costly. Therefore, due to the limitationsof the field estimation methods, the only reasonable wayof adding confidence in the results would be by verifyingthem indirectly with or within the context of other models.Comparing the results to other models may be difficult,however, because of differences inherent in the methods(Risser et al., 2005).
The estimated recharge rates from the analysis could beincorporated into either a fully saturated groundwater mod-el as the top boundary condition following the method byJyrkama et al. (2002), while the estimated runoff rates fromthe model could be used in a surface water routing model.Both approaches, however, have their own limitations with
Scenario 3: Precipitation +5% (Dec, Jan, and Feb)
Ave
rage
Diff
eren
ce (
mm
)
Jan Feb Mar Apr May Jun Jul Aug Sep Oct Nov Dec-30
-20
-10
0
10
20
30
Ave
rage
Diff
eren
ce (
mm
)
Jan Feb Mar Apr May Jun Jul Aug Sep Oct Nov Dec-30
-20
-10
0
10
20
30
RunoffEvapotranspirationRecharge
Scenario 1: Temperature +0.016˚C/year Scenario 2: Temperature +0.07˚C/year
Ave
rage
Diff
eren
ce (
mm
)
Jan Feb Mar Apr May Jun Jul Aug Sep Oct Nov Dec-30
-20
-10
0
10
20
30
Scenario 4: Precipitation +20% (Dec, Jan, and Feb)
Ave
rage
Diff
eren
ce (
mm
)
Jan Feb Mar Apr May Jun Jul Aug Sep Oct Nov Dec-30
-20
-10
0
10
20
30
Scenario 5: Precipitation +20% (all months)
Ave
rage
Diff
eren
ce (
mm
)
Jan Feb Mar Apr Mar Jun Jul Aug Sep Oct Nov Dec-30
-20
-10
0
10
20
30Scenario 6: Solar Radiation -2% (all months)
Ave
rage
Diff
eren
ce (
mm
)
Jan Feb Mar Apr May Jun Jul Aug Sep Oct Nov Dec-30
-20
-10
0
10
20
30
Scenario 7: Combination of Scenarios 1, 5, and 6
Ave
rage
Diff
eren
ce (
mm
)
Jan Feb Mar Apr May Jun Jul Aug Sep Oct Nov Dec-30
-20
-10
0
10
20
30Scenario 8: Combination of Scenarios 3, 5, and 6
Ave
rage
Diff
eren
ce (
mm
)
Jan Feb Mar Apr May Jun Jul Aug Sep Oct Nov Dec-30
-20
-10
0
10
20
30
Figure 9 Average differences for each month between the climate change scenarios and the Base Case.
The impact of climate change on spatially varying groundwater recharge in the grand river watershed(Ontario) 247
respect to parameterization and scale. While the groundwa-ter model is calibrated against readily available head mea-surements, the surface routing model relies on baseflowseparation of streamflow measurements, which may be sub-ject to potentially large errors.
HELP3 limitations
HELP3 uses empirical relationships in certain instanceswhich may be unreasonable in some applications (Schroederet al., 1994). In addition, the models representing the var-ious hydrologic processes within the program are subjectto their own assumptions and limitations. While lateral dis-cretization is not an issue, since HELP3 is a one-dimensionalmodel, the assumption of purely vertical flow may not betrue when there are significant heterogeneities present inthe unsaturated zone. Since the unique input parametercombinations are analyzed independently, overland flow be-tween adjacent areas is ignored. This assumption is reason-able since adjacent areas generally experience surfacerunoff concurrently during a storm event, therefore, waterfrom one area is unlikely to infiltrate in another becauseboth areas are saturated. Furthermore, overland flow typi-
cally moves considerably faster than groundwater flow,and is generally rare in humid climates due to less intensiverainfall, well-developed vegetation, and sufficient infiltra-tion capacity of most soils (Knutssen, 1988). Areas with hightopographic relief, however, may have significant lateralflow components which may not be captured by the re-charge methodology.
HELP3 may have difficulty in estimating water balancesin arid climates where upward fluxes can be high. However,it has been shown to work well in humid areas. Compared toother numerical hydrologic models, HELP3 is easy to use,uses data that is readily available, and is highly efficientcomputationally. Models based on Richards’ equation maybe preferred by many researchers, however, they are alsosubject to many assumptions and limitations. They are oftenlimited by the boundary conditions, and are computation-ally expensive due to the discretization requirements bythe highly non-linear equations. The simpler water balanceapproaches, such as HELP3, can easily be applied to heter-ogeneous soil columns with physically based boundary con-ditions and run over long time periods with comparableaccuracy to the Richards’ equation based approaches. Asdemonstrated by the results of this study, HELP3 is a valu-able tool for assessing not only the temporal response, but
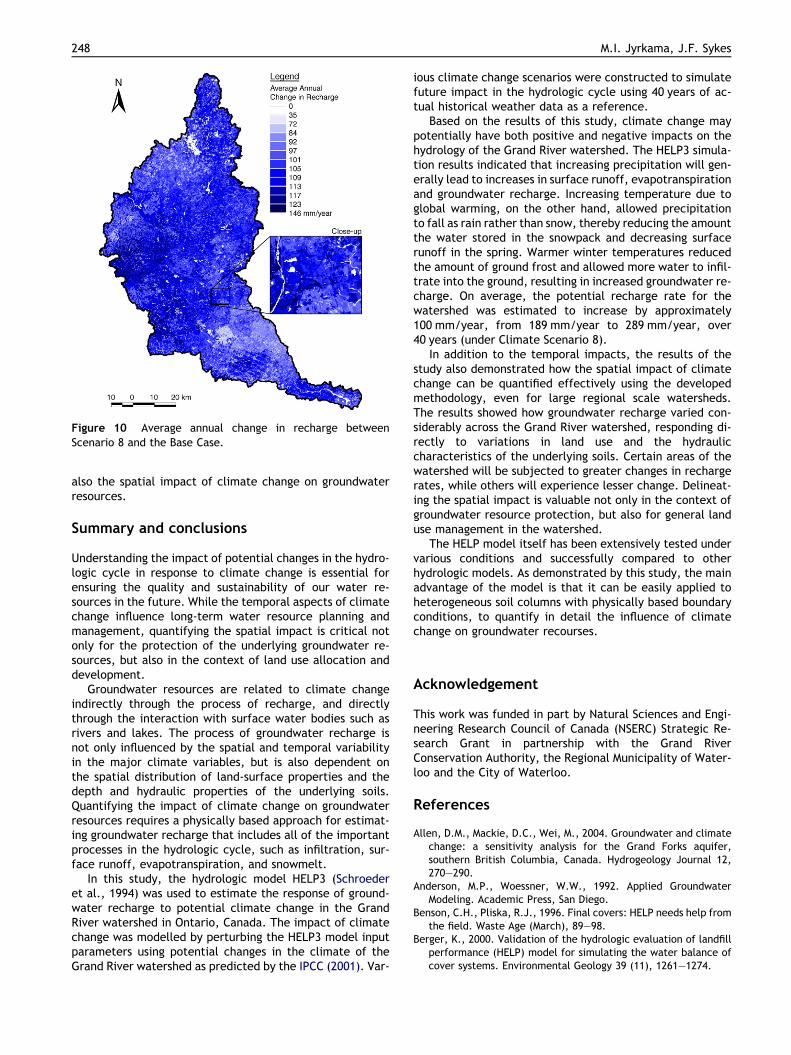
Figure 10 Average annual change in recharge betweenScenario 8 and the Base Case.
248 M.I. Jyrkama, J.F. Sykes
also the spatial impact of climate change on groundwaterresources.
Summary and conclusions
Understanding the impact of potential changes in the hydro-logic cycle in response to climate change is essential forensuring the quality and sustainability of our water re-sources in the future. While the temporal aspects of climatechange influence long-term water resource planning andmanagement, quantifying the spatial impact is critical notonly for the protection of the underlying groundwater re-sources, but also in the context of land use allocation anddevelopment.
Groundwater resources are related to climate changeindirectly through the process of recharge, and directlythrough the interaction with surface water bodies such asrivers and lakes. The process of groundwater recharge isnot only influenced by the spatial and temporal variabilityin the major climate variables, but is also dependent onthe spatial distribution of land-surface properties and thedepth and hydraulic properties of the underlying soils.Quantifying the impact of climate change on groundwaterresources requires a physically based approach for estimat-ing groundwater recharge that includes all of the importantprocesses in the hydrologic cycle, such as infiltration, sur-face runoff, evapotranspiration, and snowmelt.
In this study, the hydrologic model HELP3 (Schroederet al., 1994) was used to estimate the response of ground-water recharge to potential climate change in the GrandRiver watershed in Ontario, Canada. The impact of climatechange was modelled by perturbing the HELP3 model inputparameters using potential changes in the climate of theGrand River watershed as predicted by the IPCC (2001). Var-
ious climate change scenarios were constructed to simulatefuture impact in the hydrologic cycle using 40 years of ac-tual historical weather data as a reference.
Based on the results of this study, climate change maypotentially have both positive and negative impacts on thehydrology of the Grand River watershed. The HELP3 simula-tion results indicated that increasing precipitation will gen-erally lead to increases in surface runoff, evapotranspirationand groundwater recharge. Increasing temperature due toglobal warming, on the other hand, allowed precipitationto fall as rain rather than snow, thereby reducing the amountthe water stored in the snowpack and decreasing surfacerunoff in the spring. Warmer winter temperatures reducedthe amount of ground frost and allowed more water to infil-trate into the ground, resulting in increased groundwater re-charge. On average, the potential recharge rate for thewatershed was estimated to increase by approximately100 mm/year, from 189 mm/year to 289 mm/year, over40 years (under Climate Scenario 8).
In addition to the temporal impacts, the results of thestudy also demonstrated how the spatial impact of climatechange can be quantified effectively using the developedmethodology, even for large regional scale watersheds.The results showed how groundwater recharge varied con-siderably across the Grand River watershed, responding di-rectly to variations in land use and the hydrauliccharacteristics of the underlying soils. Certain areas of thewatershed will be subjected to greater changes in rechargerates, while others will experience lesser change. Delineat-ing the spatial impact is valuable not only in the context ofgroundwater resource protection, but also for general landuse management in the watershed.
The HELP model itself has been extensively tested undervarious conditions and successfully compared to otherhydrologic models. As demonstrated by this study, the mainadvantage of the model is that it can be easily applied toheterogeneous soil columns with physically based boundaryconditions, to quantify in detail the influence of climatechange on groundwater recourses.
Acknowledgement
This work was funded in part by Natural Sciences and Engi-neering Research Council of Canada (NSERC) Strategic Re-search Grant in partnership with the Grand RiverConservation Authority, the Regional Municipality of Water-loo and the City of Waterloo.
References
Allen, D.M., Mackie, D.C., Wei, M., 2004. Groundwater and climatechange: a sensitivity analysis for the Grand Forks aquifer,southern British Columbia, Canada. Hydrogeology Journal 12,270–290.
Anderson, M.P., Woessner, W.W., 1992. Applied GroundwaterModeling. Academic Press, San Diego.
Benson, C.H., Pliska, R.J., 1996. Final covers: HELP needs help fromthe field. Waste Age (March), 89–98.
Berger, K., 2000. Validation of the hydrologic evaluation of landfillperformance (HELP) model for simulating the water balance ofcover systems. Environmental Geology 39 (11), 1261–1274.
The impact of climate change on spatially varying groundwater recharge in the grand river watershed(Ontario) 249
Black, P.B., Miller, R.D., 1990. Hydraulic conductivity and unfrozenwater content of air-free frozen silt. Water Resources Research26, 323–329.
Bobba, A.G., Singh, V.P., Jeffries, D.S., Bengtsson, L., 1997.Application of a watershed runoff model to north-east PondRiver, Newfoundland: to study water balance and hydrologicalcharacteristics owing to atmospheric change. HydrologicalProcesses 11 (12), 1573–1593.
Bormann, H., Diekkruger, B., Renschler, C., Richter, O., 1999.Regionalization concept for the prediction of large-scale waterfluxes. In: Diekkruger, B., Kirkby, M.J., Schroder, U. (Eds.),Proceedings of the Conference on Regionalization in Hydrology.IAHS Publication No. 254, 1999, pp. 13–22.
Bouraoui, F., Vachaud, G., Li, L.Z.X., Le Treut, H., Chen, T., 1999.Evaluation of the impact of climate changes on water storageand groundwater recharge at the watershed scale. ClimateDynamics 15, 153–161.
Brouyere, S., Carabin, G., Dassargues, A., 2004. Climate changeimpacts on groundwater resources: modelled deficits in a chalkyaquifer, Geer Basin, Belgium. Hydrogeology Journal 12, 123–134.
Chammas, G.A., Geddis, M., McCaulou, D.R., 1999.A comparison oftwo models for simulating the water balance of soil covers undersemi-arid conditions. In: Proceedings of the National Meeting ofthe American Society for Surface Mining and Reclamation, vol. 2,pp. 688–695.
Charles, E.G., Behroozi, J., Schooley, J., Hoffman, J.L., 1993. Amethod for evaluating ground water recharge areas in NewJersey. NJ Geological Survey Report GSR-32.
Cooper, D.M., Wilkinson, W.B., Arnell, N.W., 1995. The effects ofclimate changes on aquifer storage and river baseflow. Hydro-logical Sciences Journal/Journal des Sciences Hydrologiques 40(5), 615–632.
Croley II, T.E., Luukkonen, C.L., 2003. Potential effects of climatechange on ground water in Lansing, Michigan. Journal of theAmerican Water Resources Association 39 (1), 149–163.
Daniel, J.A., Staricka, J.A., 2000. Frozen soil impact on groundwater–surface water interaction. Journal of the AmericanWater Resources Association 36 (1), 151–160.
Deng, Y., Flerchinger, G.N., Cooley, K.R., 1994. Impacts of spatiallyand temporally varying snowmelt on subsurface flow in amountainous watershed: 2. Subsurface processes. HydrologicalSciences Journal/Journal des Sciences Hydrologiques 39 (5),521–534.
Eckhardt, K., Ulbrich, U., 2003. Potential impacts of climatechange on groundwater recharge and streamflow in a centralEuropean low mountain range. Journal of Hydrology 284,244–252.
Engelmark, H., 1988. Rates of infiltration into frozen and unfrozenfine sand. Canadian Journal of Earth Sciences 25, 343–347.
Fleenor, W.E., King, I.P., 1995. Identifying limitations on use of theHELP model. In: Dunn R.J., Singh, U.P. (Eds.), Landfill Closures.Environmental Protection and Land Recovery. ASCE, Geotechni-cal Special Publication 53, pp. 121–138.
Flint, A.L., Flint, L.E., Kwicklis, E.M., Fabryka-Martin, J.T., Bod-varsson, G.S., 2002. Estimating recharge at Yucca Mountain,Nevada, USA: comparison of methods. Hydrogeology Journal 10,180–204.
Foster, S.S.D., 1998. Groundwater recharge and pollution vulnera-bility of British aquifers: a critical overview. In: Robins, N.S. (Ed.),Groundwater Pollution, Aquifer Recharge and Vulnerability.Geological Society, London, Special Publications 130,pp. 7–22.
Freeze, R.A., Banner, J., 1970. The mechanism of natural ground-water recharge and discharge 2. Laboratory column experimentsand field measurements. Water Resources Research 6, 138–155.
Gleick, P.H., 1989. Climate change, hydrology, and waterresources. Reviews of Geophysics 27 (3), 329–344.
Gogolev, M.I., 2002. Assessing groundwater recharge with twounsaturated zone modeling technologies. Environmental Geol-ogy 42, 248–258.
Granger, R.J., Gray, D.M., Dyck, G.E., 1984. Snowmelt infiltrationto frozen prairie soils. Canadian Journal of Earth Sciences 21,669–677.
Gureghian, A.B., DeWispelare, A.R., Sagar, B., 1994. Sensitivity andprobabilistic analyses of the impact of climatic conditions on theinfiltration rate in a variably saturated multilayered geologicmedium. In: Proceedings of the Fifth International Conferenceon High Level Radioactive Waste Management. American NuclearSociety, pp. 1622–1633.
Hanson, R.T., Dettinger, M.D., 2005. Ground water/surface waterresponses to global climate simulations, Santa Clara-CalleguasBasin, Ventura, California. Journal of the American WaterResources Association 41 (3), 517–536.
Holysh, S., Pitcher, J., Boyd, D., 2000. Regional groundwatermapping: an assessment tool for incorporating groundwater intothe planning process. Grand River Conservation Authority Report.
Intergovernmental Panel on Climate Change (IPCC), 2001. IPCCThird Assessment Report – Climate Change 2001: The ScientificBasis. Cambridge University Press, Cambridge, UK.
Johnsson, H., Lundin, L., 1991. Surface runoff and soil waterpercolation as affected by snow and soil Frost. Journal ofHydrology 122, 141–159.
Jyrkama, M.I., Sykes, J.F., Normani, S.D., 2002. Recharge estima-tion for transient ground water modeling. Ground Water 40 (6),638–648.
Kane, D.L., Stein, J., 1983. Water movement into seasonally frozensoils. Water Resources Research 19, 1547–1557.
Karvonen, T., Koivusalo, H., Jauhiainen, M., Palko, J., Weppling,K., 1999. A hydrological model for predicting runoff fromdifferent land use areas. Journal of Hydrology 217, 253–265.
Khire, M.V., Benson, C.H., Bosscher, P.J., 1997. Water balancemodeling of earthen final covers. Journal of Geotechnical andGeoenvironmental Engineering 123, 744–754.
Kirshen, P.H., 2002. Potential impacts of global warming ongroundwater in Eastern Massachusetts. Journal of WaterResources Planning and Management 128 (3), 216–226.
Knutssen, G., 1988. Humid and arid zone groundwater recharge – acomparative analysis. In: Simmers, I. (Ed.), Estimation ofNatural Groundwater Recharge (Proceedings of the NATOAdvanced Research Workshop, Antalya, Turkey, March 1987),NATO ASI Series C, vol. 222. D. Reidel Publication Company,Dordrecht, pp. 493–504.
Konikow, L.F., Bredehoeft, J.D., 1992. Groundwater models cannotbe validated. Advances in Water Resources 15, 75–83.
Krysanova, V., Hattermann, F., Habeck, A., 2005. Expected changesin water resources availability and water quality with respect toclimate change in the Elbe River basin (Germany). NordicHydrology 36 (4-5), 321–333.
Kung, K.-J.S., 1990. Preferential flow in a sandy vadose zone, 2,mechanisms and implications. Geoderma 46, 51–58.
Larcher, W., 1983. Physiological Plant Ecology. Springer-Verlag,Berlin.
Le Maitre, D.C., Scott, D.F., Colvin, C., 1999. A review ofinformation on interactions between vegetation and groundwa-ter. Water South Africa 25 (2), 137–152.
Lerner, D., Issar, A.S., Simmers, I. (Eds.), 1990. GroundwaterRecharge: a Guide to Understanding and Estimating NaturalRecharge. Heise, Hannover.
Lerner, D.N., 2002. Identifying and quantifying urban recharge: areview. Hydrogeology Journal 10, 143–152.
Loaiciga, H.A., 2003. Climate change and ground water. Annals ofthe Association of American Geographers 93 (1), 30–41.
Oreskes, N., Shrader-Frechette, K., Belitz, K., 1994. Verification,validation, and confirmation of numerical models in earthsciences. Science 263, 641–646.
250 M.I. Jyrkama, J.F. Sykes
Peyton, R.L., Schroeder, P.R., 1988. Field verification of HELPmodel for landfills. Journal of Environmental Engineering 114(2), 247–269.
Richardson, C.W., Wright, D.A., 1984. WGEN: a model for gener-ating daily weather variables. ARS-8. Agricultural ResearchService, US Department of Agriculture.
Risser, D.W., Gburek, W.J., Folmar, G.J., 2005. Comparison ofmethods for estimating ground-water recharge and base flow ata small watershed underlain by fractured bedrock in the EasternUnited States. US Geological Survey Scientific InvestigationsReport 2005-5038.
Robins, N.S. (Ed.), 1998. Ground-water Pollution Aquifer Rechargeand Vulnerability. Geological Society, London, Special Publica-tions 130, pp. 107–115.
Rosenberg, N.J., Epstein, D.J., Wang, D., Vail, L., Srinivasan, R.,Arnold, J.G., 1999. Possible impacts of global warming on thehydrology of the Ogallala Aquifer Region. Climatic Change 42,677–692.
Schroeder, P.R., Dozier, T.S., Zappi, P.A., McEnroe, B.M., Sjo-strom, J.W., Peyton, R.L., 1994. The Hydrologic Evaluation ofLandfill Performance (HELP) Model: Engineering Documentationfor Version 3. EPA/600/R-94/168b, US Environmental ProtectionAgency Office of Research and Development, Washington, DC.
Schuh, W.M., Meyer, R.F., Sweeney, M.D., Gardner, J.C., 1993.Spatial variation of root-zone and shallow dose-zone drainage ona loamy glacial till in a sub-humid climate. Journal of Hydrology148, 27–60.
Scibek, J., Allen, D.M., 2006. Comparing modelled responses of twohigh-permeability unconfined aquifers to predicted climatechange. Global and Planetary Change 50, 50–62.
Selker, J.S., Parlange, J.-Y., Steenhuis, T., 1992. Fingered flow intwo dimensions, 2, predicting finger moisture profile. WaterResources Research 28 (9), 2523–2528.
Seyfried, M.S., Wilcox, B.P., 1995. Scale and the nature of spatialvariability: field examples having implications for hydrologicmodeling. Water Resources Research 31 (1), 173–184.
Simmers, I., 1990. Part I: Aridity, groundwater recharge and waterresources management. In: Lerner, D., Issar, A.S., Simmers, I.(Eds.), Groundwater recharge: a guide to understanding andestimating natural recharge. Heise, Hannover.
Taniguchi, M., Tsujimura, M., Tanaka, T., 1996. Significance ofstemflow in groundwater recharge 1: evaluation of the stemflowcontribution to recharge using a mass balance approach.Hydrological Processes 10 (1), 71–80.
Vaccaro, J.J., 1992. Sensitivity of groundwater recharge estimatesto climate variability and change, Columbia Plateau, Washing-ton. Journal of Geophysical Research 97 (D3), 2821–2833.
Wilkinson, W.B., Cooper, D.M., 1993. Response of idealized aqui-fer/river systems to climate change. Hydrological SciencesJournal 38 (5), 379–389.
Woyshner, M.R., Yanful, E.K., 1995. Modelling and field mea-surements of water percolation through an experimental soilcover on mine tailings. Canadian Geotechnical Journal 32,601–609.