Embed Size (px)
Citation preview
eScholarship provides open access, scholarly publishingservices to the University of California and delivers a dynamicresearch platform to scholars worldwide.
Department of Economics, UCSDUC San Diego
Title:The Impact of 401(k) Plans on Retirement
Author:Friedberg, Leora, University of Virginiawebb, anthony, Center for Retirement Research at Boston College
Publication Date:11-01-2000
Series:Recent Work
Permalink:http://escholarship.org/uc/item/2jr5w8b9
Keywords:defined contribution plans, retirement patterns
Abstract:In 1993 38.9 million people were covered by a 401(k) plan, up from 7.1 million in 1983. The rapidgrowth of 401(k) and other defined contribution pension plans may alter retirement patterns ofolder workers. Previous research showed that the spread of defined benefit plans, with sharpage-related incentives first discouraging and later encouraging retirement, contributed to the earlyretirement trend of past decades. Defined contribution plans differ along several dimensions,especially in their smooth rate of pension wealth accrual. We use data from the Health andRetirement Study to show that retirement patterns have begun to change as defined contributionplans have spread. Our estimates indicate that the financial incentives in defined benefit pensionslead people to retire almost two years earlier on average, compared to people with definedcontribution plans.
Copyright Information:All rights reserved unless otherwise indicated. Contact the author or original publisher for anynecessary permissions. eScholarship is not the copyright owner for deposited works. Learn moreat http://www.escholarship.org/help_copyright.html#reuse
2000-30
UNIVERSITY OF CALIFORNIA, SAN DIEGO
DEPARTMENT OF ECONOMICS
THE IMPACT OF 401(K) PLANS ON RETIREMENT
BY
LEORA FRIEDBERG
AND
ANTHONY WEBB
DISCUSSION PAPER 2000-30NOVEMBER 2000
THE IMPACT OF 401(K) PLANS ON RETIREMENT
Leora Friedberg
University of Virginiaand NBER
Anthony Webb
University of California, San Diego
November 2000
ABSTRACT
In 1993 38.9 million people were covered by a 401(k) plan, up from 7.1 million in 1983.The rapid growth of 401(k) and other defined contribution pension plans may alterretirement patterns of older workers. Previous research showed that the spread of definedbenefit plans, with sharp age-related incentives first discouraging and later encouragingretirement, contributed to the early retirement trend of past decades. Defined contributionplans differ along several dimensions, especially in their smooth rate of pension wealthaccrual. We use data from the Health and Retirement Study to show that retirementpatterns have begun to change as defined contribution plans have spread. Our estimatesindicate that the financial incentives in defined benefit pensions lead people to retirealmost two years earlier on average, compared to people with defined contribution plans.
JEL Codes: H31, J26, J32, J60
We would like to thank Courtney Coile, Vince Crawford, Daniel Dulitzky, Marjorie Flavin, AlanGustman, Ted Groves, Jon Gruber, Jim Poterba, and participants of the UCSD Applied EconomicsSeminar, NBER 2000 Summer Institute, and MIT Public Economics Lunch for very helpfulcomments. We are grateful to Vince Crawford, Cathy Liebowitz, and Bob Peticolas for enormoushelp with obtaining and/or explaining the HRS pension data.
Friedberg: Department of Economics 114 Rouss Hall, University of Virginia, P.O. Box 400182,Charlottesville, VA 22903-4182, [email protected]. Webb: Department of Economics 0508,University of California-San Diego, 9500 Gilman Drive, La Jolla, CA 92093-0508,[email protected].
Typical private pensions have changed dramatically in the last twenty-five years.
The pension from a traditional defined benefit plan is computed as a function of a
worker’s salary and is paid until death. In contrast, the pension from a 401(k) or other
defined contribution plans depends strictly on contributions accumulated in an account.
The number of people with a 401(k) plan jumped from 7.1 million in 1983 to 38.9 million
in 1993. The overall proportion of employees listing DC plans as their primary pension
rose from 13% in 1975 to 33% in 1988 and 42% in 1993. The proportion covered by a
defined benefit (DB) plan declined similarly, from 55% among employees aged 35 and
over in 1983 to 30% in 1995.1
Earlier studies suggest that the spread of DB plans from the 1950s to 1970s
contributed to the striking decline in American retirement ages. Provisions in DB plans
governing vesting and length of service cause pension wealth to accrue discontinuously,
sometimes sharply so. The resulting age-related incentives first encourage and later
discourage staying in the job and have been found to influence retirement by perhaps as
much or more than Social Security. This was observed in data from a few large firms,
and later in a nationally representative survey from the early 1980s.2
Retirement ages have stabilized since the early 1980s, though the break from past
trends has received little attention. The dramatic change in pension arrangements may
have begun to alter retirement patterns. Pension wealth in 401(k) and other DC plans
accrues smoothly. If the design of DB pensions affects retirement, then the age-neutral
accruals in DC plans should reduce DB-induced spikes in retirement ages. Other
differences in portability, annuitization, and risk characteristics between DB and DC
plans may also be important. Lastly, voluntary contributions are allowed in most DC
plans, introducing a possible source of endogeneity when studying behavioral effects.
In this study we analyze the impact of 401(k) and other DC plans on retirement.
Our approach is essentially quasi-experimental, comparing retirement responses to
incentives in DB plans with retirement under neutral DC plans. We offer some
additional extensions to the literature on private pensions. We show that the measures of
pension accrual crucial for understanding DB pensions do not adequately describe DC
1 EBRI (1996), and authors’ computations from the Survey of Consumer Finances.2 Stock and Wise (1990a), Lumsdaine, Stock, and Wise (1992), Samwick (1998).
2
plans. We also employ new data from the nationally representative, longitudinal Health
and Retirement Study. The HRS began in 1992 and offers detailed employer-provided
descriptions of pension plans.3
Our estimates indicate that financial incentives in DB pensions lead people to
retire almost two years earlier, on average, compared to people with DC plans and
holding other characteristics constant. After controlling for the differences in incentives,
pension type does not have an independent effect on retirement. Simulations based on
our estimates suggest that changes in pension coverage since 1983 have raised the
median retirement age by between two and four months, and a further increase of
between two and five months can be expected as younger workers covered primarily by
DC plans age in coming years. The uncertainty in the simulations arises from difficulties
in pinpointing trends in coverage from sometimes conflicting self-reported pension data.
While our work builds on previous research that treats pension type as exogenous,
we recognize that workers may sort into firms endogenously, based on pension
characteristics or on firm characteristics correlated with pensions. Clark and McDermed
(1990) argued that legislative changes explain the expansion of DC coverage.
Nevertheless, while DC plans spread among firms of all types, the speed varied with firm
size and industry. We have found that DC coverage in the Survey of Consumer Finances
expanded much more among young workers, presumably with shorter tenure. We
therefore include controls for job tenure, firm size, and industry, and these do not alter the
empirical influence of pension characteristics. The reason is that we find little difference
in observable characteristics between workers of different pension types in the HRS.
Workers with no pensions are very different, though, and we exclude them from our
analysis. Our evidence suggests, therefore, that pension type is not strongly correlated
with individual retirement preferences at this time.
The rest of this paper is organized as follows. In Section I, we formally outline
how differences between DB and DC pensions may influence retirement, and in Section
II we document the growth in 401(k) plans. In Section III we describe the data and show
3 Coile and Gruber (2000) used the HRS to analyze Social Security incentives, and some of their resultsinclude private pensions, joint with Social Security. They modeled DC pensions in the traditional waydeveloped in the DB pension literature.
3
raw statistics on pensions and retirement. We present the estimation results in Section IV
and summarize our findings in Section V.
I. PENSIONS AND RETIREMENT
Retirement ages fell over most of this century, though life expectancy and health
of older workers improved dramatically. The spread of DB pensions may have
contributed to the early retirement trend, since they include strong incentives to retire at
older ages. Since the early 1980s, retirement ages have actually stabilized. Little
evidence has been offered to explain the recent shift in behavior, however.4
A. The Impact of pensions on retirement
We show here how pension design can affect retirement. Later we discuss the
potential endogeneity of pension design.
(1) The retirement decision. A pension is a form of compensation deferred until a
worker reaches a certain age or tenure and leaves his or her job. Each period a worker
decides whether to stay in the job or leave (retire).5 He or she weighs the utility of
retiring from the job now or of staying and deciding next period whether to retire. The
value of this decision Vt can be written as
Vt = V (Rt) (1)
where Rt equals one if the decision is to retire and zero if the decision is to stay on the
job. Suppose that the value of staying in the job this period is
V(0) = u (Wt) + β Et [Vt+1 ] (2)
the sum of utility from the wage Wt received this period and the discounted value of
facing the retirement decision next period.6 Suppose that the value of retiring is
V(1) = uR (Pt , Ω) (3)
4 Costa (1998) reported that labor force participation rates fell from 58% to less than 20% between 1930and 1990 among men aged 65+ and from 82% to 67% between 1940 and 1990 among men aged 55-64.Quinn (1998) showed that retirement rates have leveled off over the last 15 years.5 This framework may apply to quits at any age, if leaving a job is irreversible. Similarly, older workersmay choose to take another job rather than retiring completely. These issues can be incorporated into theframework, but they do not alter the qualitative impact of pensions.6 The discount rate lies between zero and one and reflects the rate of time preference and mortality risk,which is assumed fixed for simplicity.
4
which depends on pension wealth Pt and on an outside option worth Ω. The outside
option could be leisure or another job and is assumed to be fixed, for ease of analysis.
A key factor is the evolution of pension benefits as the date of retirement changes.
The way in which pension wealth accrues varies with pension type and a worker’s tenure.
• Delaying retirement may substantially raise long-term benefits, so pension wealth
accrual is large at some future date, though small today. That raises Vt+1, Vt+2 , …,
encouraging later retirement. This pattern corresponds to incentives in DB plans at
younger ages.
• Delaying retirement may not alter future pension benefits. Then, the foregone income
makes pension wealth accrual negative, encouraging earlier retirement. This pattern
generally arises in DB plans after eligibility for full benefits.7
• Future pension benefits may increase steadily when retirement is delayed. Then, the
incentive to retire depends on the rate of pension wealth accrual. This pattern occurs in
DC plans.
(2) DB pension wealth accrual. If a person retires at age t, DB pension wealth can be
written as
DB tP =
∑ δ
θ+=
120
t st st-s ) t,q( p
)(11
E (4)
Pension wealth equals the expected discounted value of pension benefit flows p received
each period after the pension commences at age q ≥ t.8 Benefits are discounted to time t
by the probability of survival δ and a time discount rate θ. Thus, the value of the pension
depends crucially on the retirement date t.
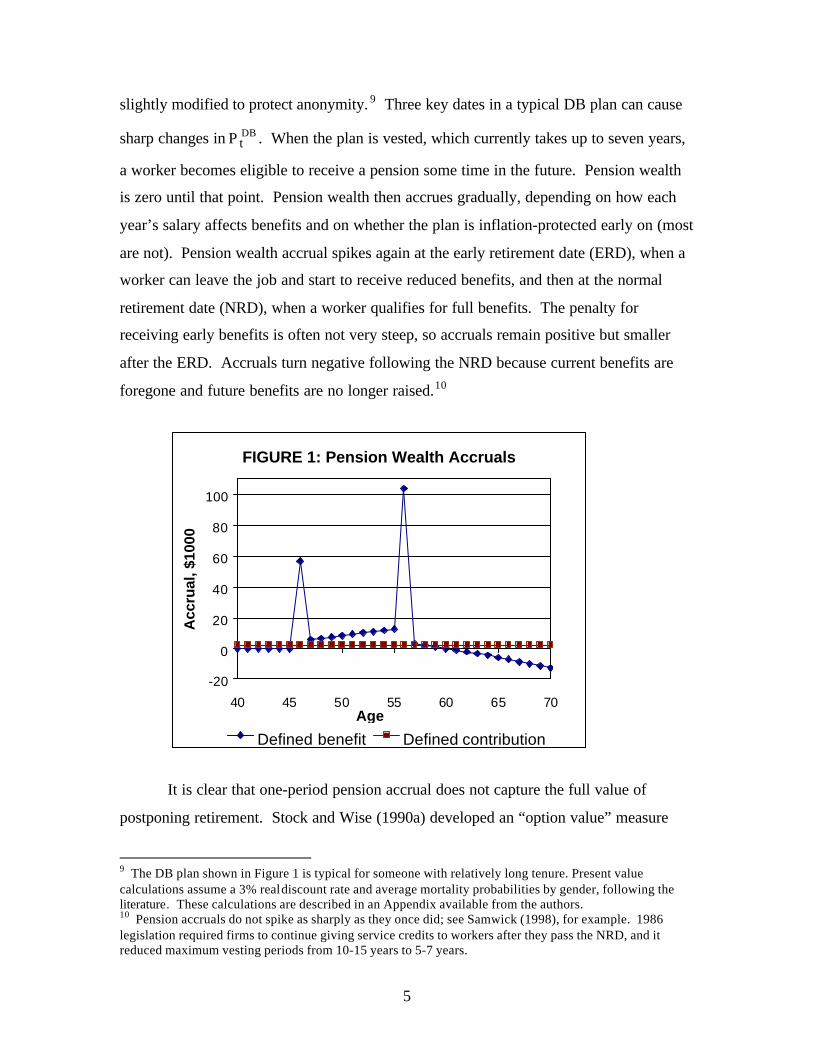
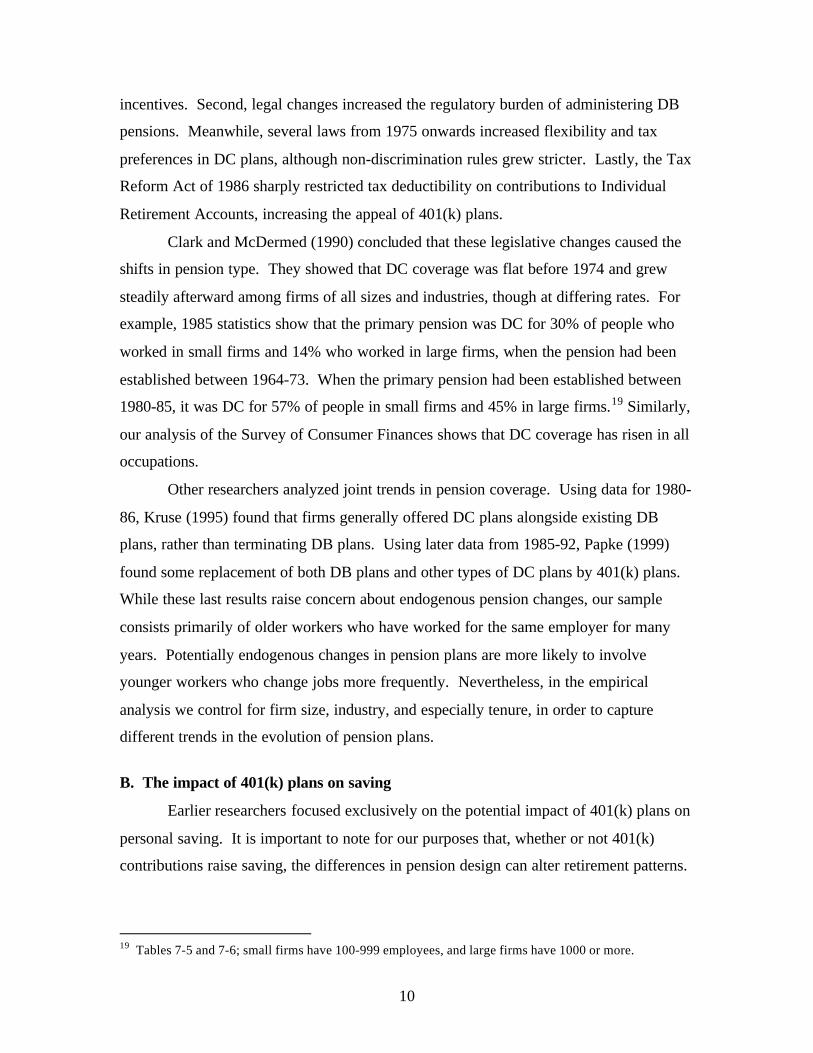
Figure 1 shows DB pension wealth accrual,
θ+ tP 1
1 - Pt-1, as the retirement age
t changes. The pension accruals are computed from a sample plan from the HRS that was
7 The spikes in pension accrual in typical DB plans were documented in a series of papers by Kotlikoff andWise (1985, 1987, 1989) and Stock and Wise (1990a, 1990b).8 A person who quits may not be eligible to receive benefits until later. However, the decision of when tostart receiving benefits after becoming eligible is less interesting than it is with Social Security. After aworker quits, most private pensions offer no gain for postponing benefits after initial eligibility.
5
slightly modified to protect anonymity. 9 Three key dates in a typical DB plan can cause
sharp changes in DB tP . When the plan is vested, which currently takes up to seven years,
a worker becomes eligible to receive a pension some time in the future. Pension wealth
is zero until that point. Pension wealth then accrues gradually, depending on how each
year’s salary affects benefits and on whether the plan is inflation-protected early on (most
are not). Pension wealth accrual spikes again at the early retirement date (ERD), when a
worker can leave the job and start to receive reduced benefits, and then at the normal
retirement date (NRD), when a worker qualifies for full benefits. The penalty for
receiving early benefits is often not very steep, so accruals remain positive but smaller
after the ERD. Accruals turn negative following the NRD because current benefits are
foregone and future benefits are no longer raised.10
FIGURE 1: Pension Wealth Accruals
-20
0
20
40
60
80
100
40 45 50 55 60 65 70Age
Acc
rual
, $10
00
Defined benefit Defined contribution
It is clear that one-period pension accrual does not capture the full value of
postponing retirement. Stock and Wise (1990a) developed an “option value” measure
9 The DB plan shown in Figure 1 is typical for someone with relatively long tenure. Present valuecalculations assume a 3% real discount rate and average mortality probabilities by gender, following theliterature. These calculations are described in an Appendix available from the authors.10 Pension accruals do not spike as sharply as they once did; see Samwick (1998), for example. 1986legislation required firms to continue giving service credits to workers after they pass the NRD, and itreduced maximum vesting periods from 10-15 years to 5-7 years.
6
that reflects the increment to utility from postponing retirement and gaining access to
future accruals. Coile and Gruber (2000) introduced a simpler measure for the “peak
difference” of pension wealth accrual
θ+ − mtm P )1(
1- Pt-1, where real pension wealth
reaches its maximum Pm in future year m. They showed that the peak value measure
isolates the key incentives influencing retirement.
(3) DC pension wealth accrual. DC plans function very differently. DC pension wealth
is measured simply as the market value of current assets.11 The gain to DC pension
wealth each period is the return on the initial balance plus this year’s contributions from
the employee and employer.
An additional year of work always raises pension wealth, even if contributions are
zero, so the peak-value measure of DB pension accrual is not meaningful. This is
apparent in the pension accruals shown in Figure 1 from a sample DC plan, again slightly
modified from the HRS. There are, nonetheless, two key dates in DC pension wealth
accrual. First, some DC plans have vesting dates of up to five years. Second, 401(k)
funds can be withdrawn without a penalty beginning at age 59 ½, which may induce
some workers to retire.
Only a portion of DC pension accruals constitute an incentive to delay retirement.
Employer contributions will cease at retirement, and access to a tax-deferred savings
vehicle may cease.12 In contrast, existing assets will generate returns regardless of
retirement. Also, voluntary contributions may be assumed to replace other personal
saving and thus are likely to depend on retirement intentions – an important point because
voluntary contributions generate some of the cross-sectional variation in pension accrual.
Therefore, we try omitting potentially endogenous voluntary contributions from measures
of DC pension accrual when we estimate the impact of pensions on retirement.
11 It should also include the present value of future tax relief, arising because asset returns are not taxeduntil withdrawal. We will follow the literature in omitting this component, which requires assumptionsabout future marginal tax rates and the timing of withdrawals.12 The extent of tax relief from IRAs depends on household income and contribution limits.
7
B. Summary of key differences between pensions
(1) DC pension wealth accrues smoothly. DB pension accruals swing sharply as
workers age. If DB pensions influence the timing of retirement, then the growth in DC
plans will alter retirement patterns. We hypothesize that retirement hazards will
generally smooth out and retirement will be delayed, though we test for a new liquidity-
induced jump around age 59 ½.
(2) Voluntary contributions are a component of DC pension wealth. These may be
endogenous with retirement plans. In our empirical work we examine whether voluntary
contributions affect estimates of the influence of DC pension wealth.
(3) DC pensions have shorter vesting periods. Taking a new job has grown more
attractive to older workers, since new jobs are now more likely to offer a DC pension
instead of a DB pension. DC pensions generally have shorter vesting periods; 30-35%
vest immediately and another 20% vest in four years or less, according to Mitchell
(1999), while virtually all DB pensions take five years to vest. Quick vesting in DC plans
raises effective compensation for people who expect to retire fully a few years later.
Therefore, in the empirical analysis we distinguish between people who leave their
pensioned job for another job and those who leave for full retirement.
(4) DC plans are typically not annuitized. A DB plan with actuarially equivalent
present value is worth more than a DC plan to risk-averse people who lack a strong
bequest motive. Less than 20% of DC plans offer the option to annuitize after retirement,
so assets might be exhausted before death. 13 DC plans may therefore discourage early
retirement. On the other hand, a DC plan is worth more to people with a bequest motive.
To capture differences like these, we allow distinct effects on retirement of different
types pension wealth. However, we lack sufficient information on annuitization options
in DC plans in order to identify the direct impact on retirement.
(5) The risk characteristics of DB and DC pension accruals differ. The DB rate of
return depends on earnings growth before retirement and on inflation after retirement.
The DC rate of return depends on portfolio choices and yields. Differences between
expected and realized rates of return may alter retirement plans. For example, people
who invested their 401(k) assets in equities may have earned unexpectedly high returns
13 Brown, Mitchell, Poterba, and Warshawsky (1999).
8
and could retire early. Again, allowing different effects of pension types may capture this
distinction, though we lack detailed information on DC investment choices.
C. What determines pension plan design?
Lazear (1986) summarized a broad theory of deferred compensation. DB
pensions help solve contracting problems between workers and firms. Firms want to
reduce mobility because hiring is costly or because new workers need firm-specific
training. Workers cannot commit to stay with the firm, however. Both a rising wage
profile and back-weighted pension accruals serve as a bond inducing workers to stay.
Later on, though, rising wages may exceed the marginal productivity of older workers,
and age discrimination rules or other social conventions make it difficult to fire or demote
them. DB pension provisions help encourage retirement at an appropriate age.
While intuitively appealing, this explanation offers little insight about DC
pensions. Government regulation has played a key role in this regard. Legal changes,
described in the next section, have reduced the flexibility of firms to use pensions to
provide optimal long-term incentives and have made DC plans more appealing.
We recognize that pension plan design may be endogenous, nonetheless.
Differences in the value of firm-specific training, for example, could influence pensions,
and workers may sort into firms with different pensions in a way that is correlated with
their own productivity, retirement preferences, etc. However, we do not believe it is
feasible to estimate the determinants of pension design. A single empirical paper, by
Filer and Honig (1996), allowed for endogenous DB pension design. The authors
estimated a joint model of a plan’s DB early retirement date and a person’s own
retirement age. They failed to find convincing exclusion restrictions for the early
retirement date, however.14
Nevertheless, we will try to address concerns about endogenous sorting. We
show that older workers with different pensions types are quite similar. We also control
for firm size, industry, and especially tenure, suggested by earlier research as key
14 They used macroeconomic variables (unemployment, inflation) at the hiring date to identify the impactof the pension retirement age on retirement. These variables did not have a statistically significant impacton the pension, however, so the estimation was essentially identified from nonlinear functional form.
9
determinants of pension type; none of these variables influence the estimated effect of
pension characteristics on retirement.
II. THE HISTORY OF PENSION PLANS
Defined benefit pensions used to be typical, but policy changes since 1974 have
made them less appealing to employers. Defined contribution 401(k) plans, named after
a section of the U.S. income tax code, have grown increasingly popular since then.
A. Changes in the regulation of pensions
Laws passed early in the twentieth century, and again in 1940, spurred the growth
in DB pensions. Numerous legal changes since 1974, however, have made DB plans less
appealing, while making DC plans simpler. For example, the 1974 Employee Retirement
Income Security Act (ERISA) established a maximum pension vesting period of 10-15
years. Vesting had been unregulated, and the ERISA standards were met previously by
only 19% of plans.15 ERISA also initiated a trend of increasingly strict funding standards
and reporting requirements.
401(k) plans were written into the tax code in 1978 and clarifying regulations
issued in 1981. 401(k) plans are the most common of several types of DC pensions.16
Employees can direct part of their pre-tax pay into a 401(k) account, and employers often
match the contribution up to a fixed amount.17 While contributions to a 401(k) are
voluntary, they are often mandatory in other types of DC plans. Accumulated funds are
taxed upon withdrawal, and they may be withdrawn when a worker leaves the firm.
Funds withdrawn before age 59 ½ and not rolled over into another qualified account
incur an additional 10% tax penalty. 18
The regulatory changes that began in 1974 had several effects. First, many of the
changes had the intent of increasing workers’ claims to future benefits after leaving a job.
This reduced the capacity of employers to use DB pensions to design optimal long-term
15 Ippolito (1988).16 Other DC plans include money purchase plans, profit sharing plans, target benefit plans, simplifiedemployee pensions, and employee stock ownership plans.17 Employees can generally contribute up to the minimum of 25% of pay or $10,500 in the year 2000. Thesum of employee and employer contributions cannot exceed the minimum of 25% of pay or $30,000.18 Some firms allow employees to borrow against their 401(k) balances. Mitchell (1999) found that abouthalf of medium and large firms offering 401(k) plans allowed this option.
10
incentives. Second, legal changes increased the regulatory burden of administering DB
pensions. Meanwhile, several laws from 1975 onwards increased flexibility and tax
preferences in DC plans, although non-discrimination rules grew stricter. Lastly, the Tax
Reform Act of 1986 sharply restricted tax deductibility on contributions to Individual
Retirement Accounts, increasing the appeal of 401(k) plans.
Clark and McDermed (1990) concluded that these legislative changes caused the
shifts in pension type. They showed that DC coverage was flat before 1974 and grew
steadily afterward among firms of all sizes and industries, though at differing rates. For
example, 1985 statistics show that the primary pension was DC for 30% of people who
worked in small firms and 14% who worked in large firms, when the pension had been
established between 1964-73. When the primary pension had been established between
1980-85, it was DC for 57% of people in small firms and 45% in large firms.19 Similarly,
our analysis of the Survey of Consumer Finances shows that DC coverage has risen in all
occupations.
Other researchers analyzed joint trends in pension coverage. Using data for 1980-
86, Kruse (1995) found that firms generally offered DC plans alongside existing DB
plans, rather than terminating DB plans. Using later data from 1985-92, Papke (1999)
found some replacement of both DB plans and other types of DC plans by 401(k) plans.
While these last results raise concern about endogenous pension changes, our sample
consists primarily of older workers who have worked for the same employer for many
years. Potentially endogenous changes in pension plans are more likely to involve
younger workers who change jobs more frequently. Nevertheless, in the empirical
analysis we control for firm size, industry, and especially tenure, in order to capture
different trends in the evolution of pension plans.
B. The impact of 401(k) plans on saving
Earlier researchers focused exclusively on the potential impact of 401(k) plans on
personal saving. It is important to note for our purposes that, whether or not 401(k)
contributions raise saving, the differences in pension design can alter retirement patterns.
19 Tables 7-5 and 7-6; small firms have 100-999 employees, and large firms have 1000 or more.
11
The controversy has arisen because conventional theory suggests an ambiguous
effect of tax-preferred IRAs and 401(k) on personal saving. The weight of empirical
evidence suggests, nevertheless, that a substantial portion of 401(k) contributions
represents new saving. Poterba, Venti, and Wise (1995, 1998) showed that workers in
firms offering 401(k) plans accumulated more financial assets over time than workers in
firms not offering 401(k) plans. Engen, Gale, and Scholz (1994, 1996), however,
presented other results suggesting that 401(k) savers look like people who would save in
any case. More recently, Webb (2000) has used the new Health and Retirement Study to
study the question. Among older workers with DB plans in 1992, those who were also
eligible for 401(k) plans accumulated significantly more between 1992 and 1998,
especially if they started with high assets.
These findings have led researchers to propose less conventional explanations for
a positive savings effect from 401(k)s. Thaler (1994) discussed psychologically-based
behavioral saving models. Laibson, Repetto, and Tobacman (1998) modeled an agent
with a hyperbolic discount rate. The tax penalty on early withdrawal helps commit the
agent to a long-term saving plan. Behavioral explanations also underlie evidence from
Bayer, Bernheim, and Scholz (1996) that workplace education programs raise 401(k)
contributions; and evidence from Madrian and Shea (2000) that the employer’s choice of
default 401(k) contributions affects the savings response.
III. DATA
A. The Health and Retirement Study
The new Health and Retirement Study (HRS) is a detailed longitudinal survey of
over 7,600 households with household heads born between 1931 and 1941. The HRS
began in 1992 and re-surveys people every two years, with data now available from the
first four waves.20 The HRS reports unprecedented detail about household and job
characteristics as people retire. For people who said they had a pension and gave
permission, the HRS contacted employers to get information about the pension. The
HRS also asked for permission to obtain Social Security earnings records. The pension
and Social Security data is available only on a restricted basis, together with a program to
20 Data released from the third and fourth waves are still preliminary.
12
compute private pension wealth at all ages. We have written a similar program to
calculate Social Security wealth. 21
Gustman and Steinmeier (1999) studied the quality of the pension data. In the
first wave, 65% of workers who reported a pension in their current job were matched to
their pension data.22 Match failures generally arose either because the person refused
permission to the HRS to contact their employer, or because the employer did not
respond to HRS queries. The authors found that some observable variables significantly
affect the probability of a match, but they have relatively little explanatory power.23
Matches are significantly more likely among people with more education, in firms with
100 or more employees, in non-manufacturing firms, and with more valuable self-
reported pensions; and matches are less likely among people with over $1 million in
assets and over $100,000 in annual earnings. In our judgment we lack sufficient
information to impute pension data or control for selection due to match failure, so we
omit people without matched pension data.
For people who say they have a pension, employer data is used to determine
whether they have only DB plans, only DC plans, or else both types or combined plans.
We classify people as having a DB plan if their employer offers one, since participation is
rarely voluntary. We classify them as having a DC plan if their employer offers one and
they participate in it. The reason we focus on participation rather than eligibility is that
the HRS did not contact employers of people who said they had no pension, so we cannot
determine eligibility for part of the sample.24 This might bias the results if, for example,
people who intend to retire later do not contribute to their 401(k); we address concerns
21 We use earnings records and current rules to compute the present value of Social Security benefits.However, we have not made additional assumptions to compute dependent and survivor benefits, which aretaken by spouses when these exceed their own retirement benefits.22 Since the match rate for pensions from earlier jobs was only 35%, we are not using that data.23 The authors estimated the likelihood of getting pension data from the current employer. The probit hada pseudo R-squared of 0.1164.24 Thus, we observe people who are eligible non-participants when they tell the HRS they have a pension,but not when they tell them they have no pension. Using different data, Poterba, Venti, and Wise (1995)estimated the exogenous effect of 401(k) eligibility on saving, rather than the endogenous effect of 401(k)participation. The closest we could come to their approach is to limit the sample to people with a DB planand compare people who are additionally eligible or not for a DC plan; Webb (2000) does this to analyzesaving. However, that does not offer much leverage to determine differences in retirement, where the idealis to compare people with and without DB pensions.
13
about endogenous participation to the extent we can by estimating a specification that
omits voluntary DC contributions of participants.
Employers report the parameters that determine DB pension wealth, such as the
vesting and retirement ages and the relationship between salary, tenure, and benefits. DC
plan balances are not reported by employers, so DC pension wealth is inferred from the
current voluntary contribution rate reported by individuals and matching contributions
reported by employers. Gustman and Steinmeier found that people often did a poor job
of describing their pensions, but that they provide important information about DC plan
balances. A comparison of DC balances reported by individuals with balances inferred
from employer reports revealed discrepancies – mean individual-reported balances were
on average lower when there were voluntary contributions, but not otherwise. Gustman
and Steinmeier attributed this to a tendency for rising voluntary contributions over time;
nevertheless, they recommended using the data inferred from employer reports because
of wide discrepancies in individually reported pension wealth. 25
B. Characteristics of workers and pensions
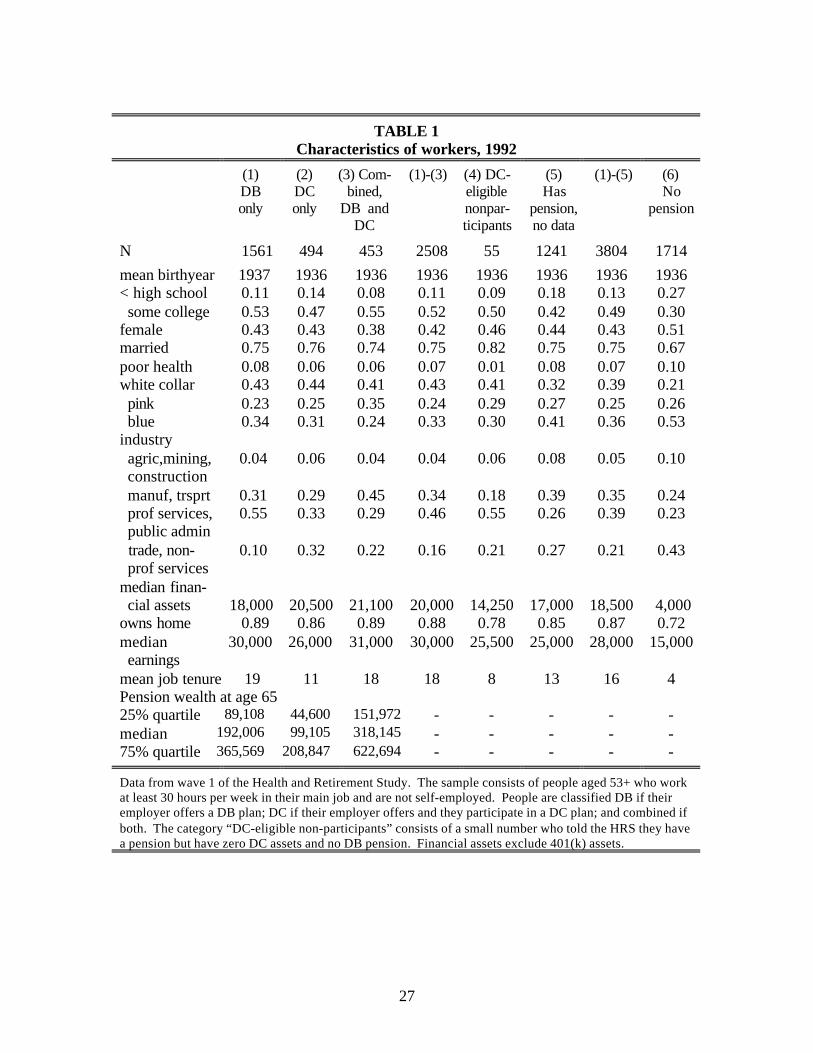
Table 1 compares the characteristics of workers with different types of pensions
in the first wave in 1992. We focus on 2508 full-time employees aged 53 and over in
1992 who have a DB plan or who have a DC plan in which they participate.26 Among
them, 62% have only DB plans, 20% have only DC plans, and 18% have both types or a
combination plan. 27
People with different types of pensions are quite similar, except in three
dimensions. First, people with only a DC plan have much shorter job tenure, with an
average of 11 years, compared to 18-19 for the others. This may in part reflect the spread
of DC plans in new jobs. Second, pension wealth differs systematically across plans.
People with combined plans have the most valuable pensions, with median projected
25 Alternatively, Gustman and Steinmeier proposed a correction to the employer-reported plan values,based on a regression of the ratio of self-reported to employer-reported values on the log of the employer-reported value and its square. We will try using this correction in a future draft.26 This sample is much larger than in earlier studies on private pensions. Most researchers used data on oneor a few firms, while Samwick (1998) had a sample of 520 employees from the 1983 SCF. Full-time hoursare defined as 30 or more per week. We exclude ages 51 and 52 because of computing limitations; also,they would add little information, since few retire or reach key swings in pension accrual.
14
wealth of $318,145 if they retire at age 65. This is actually higher than the sum of the
median stand-alone DB plan, worth $192,006, and the median stand-alone DC plan,
worth $99,105. Third, 55% of individuals with stand-alone DB plans are employed in
professional or related services or public administration, compared with 29-33% of those
with DC or combined plans. Controlling for these differences in tenure, pension wealth,
and industry, however, does not affect the estimated effect of pension type on retirement.
In spite of the sharp differences in pension wealth, people with different pensions
are otherwise strikingly similar. Median non-pension financial assets lie in the range of
$18-21,100 across pension types, and median earnings lie in the range of $26-31,000.
Mean age is the same. Education and occupation differ, but not by a great deal. The
proportion that attended college is 53% among people with DB plans only, 47% among
people with DC plans, and 55% among people with combination plans. Differences in
education do not correspond directly to occupation. People with DB or DC plans only
are similarly distributed across white collar (professional and managerial), pink collar
(clerical and sales), and blue collar jobs. People with combined plans are more likely to
be in pink collar jobs and less likely to be in white or blue collar jobs.
Another 1241 people reported having a pension but were not matched to their
pension data. They are somewhat less educated and more likely to be in blue collar jobs.
1714 people reported having no pension. They are even less skilled and are substantially
poorer. We omit both groups from the analysis because we do not feel confident
explaining who has a pension or who has pension data.
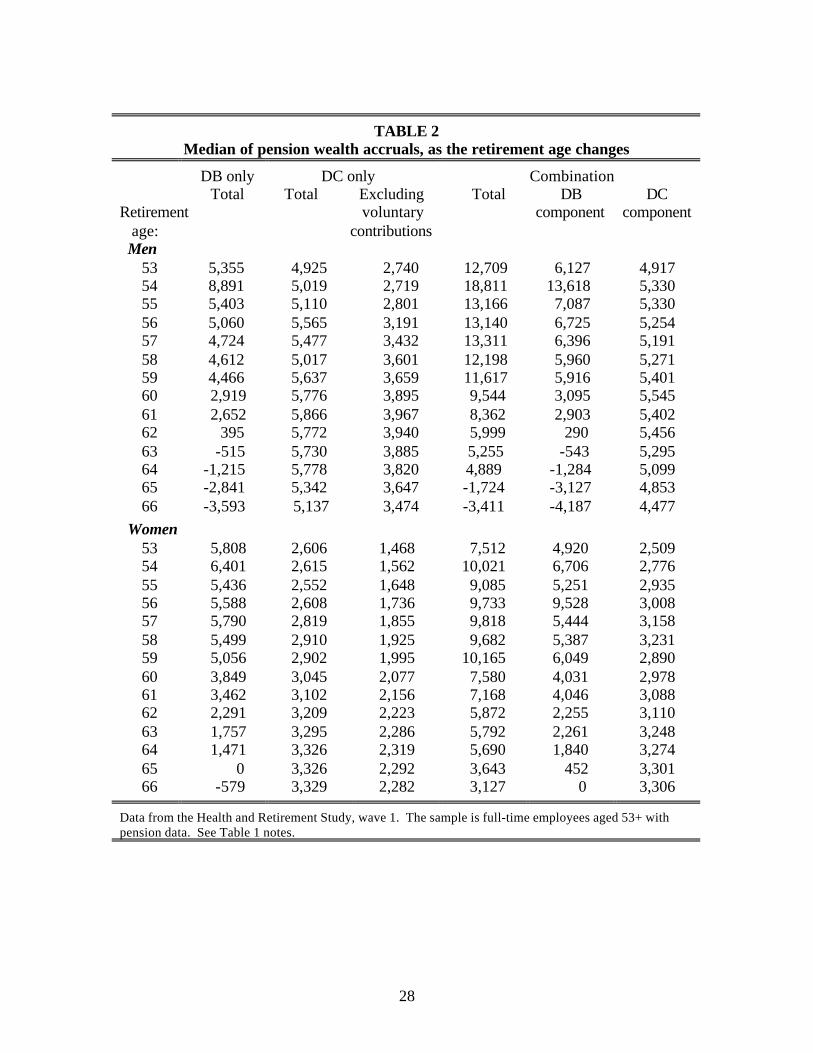
As expected, DC pension accruals are very smooth. In Table 2 the median of
pension accruals for men is consistently around $5-6,000, regardless of retirement age.
Median accruals are around $3,000 when voluntary contributions are excluded. Women
with DC plans have lower levels of voluntary and mandatory contributions.
In contrast, the median DB pension accrual is highest between ages 54 and 55,
when the early retirement date is reached in many plans. Many plans reach their peak
value between ages 60 and 65. The median accrual turns rapidly negative after age 62,
when many plans begin to pass their normal retirement date. DB accruals are more
27 The proportions with DB and combined plans differ from Gustman and Steinmeier because of our focuson DC participation, rather than eligibility, as described earlier.
15
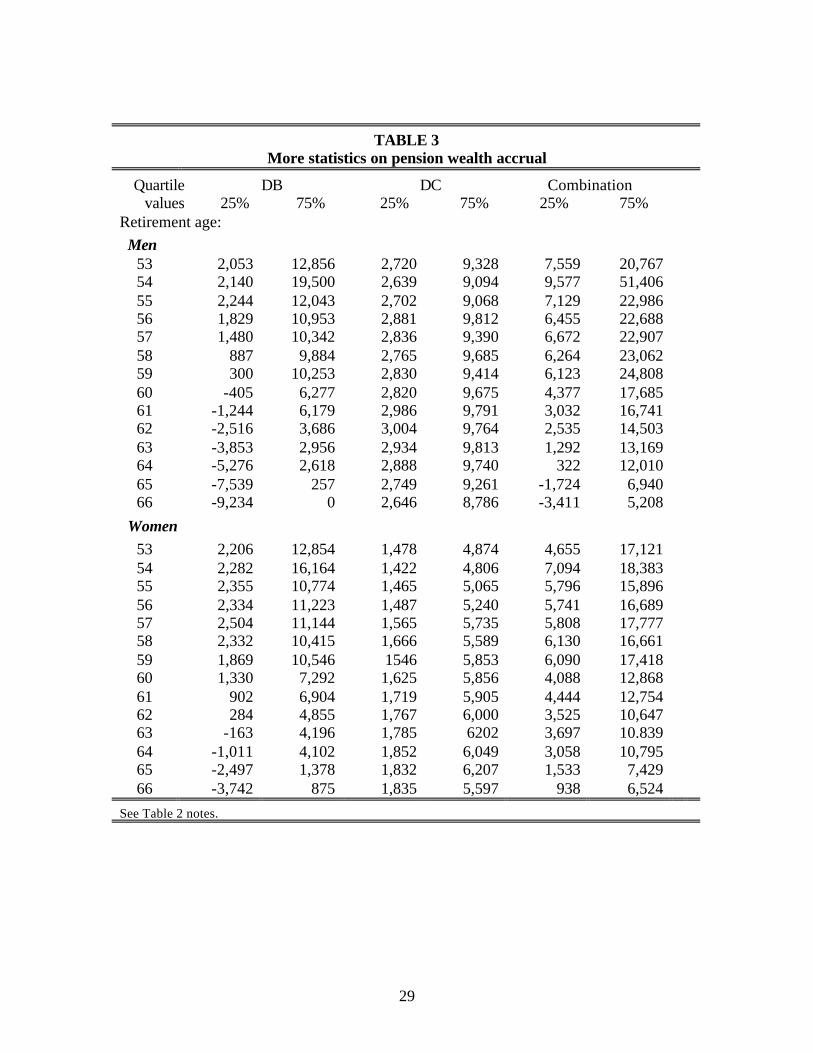
dispersed than DC accruals, as shown in Table 3. Women with DB plans experience
positive pension accrual at later ages because they have shorter job tenure. Patterns of
accrual in the DB and DC components of combined plans resemble those of stand-alone
plans.
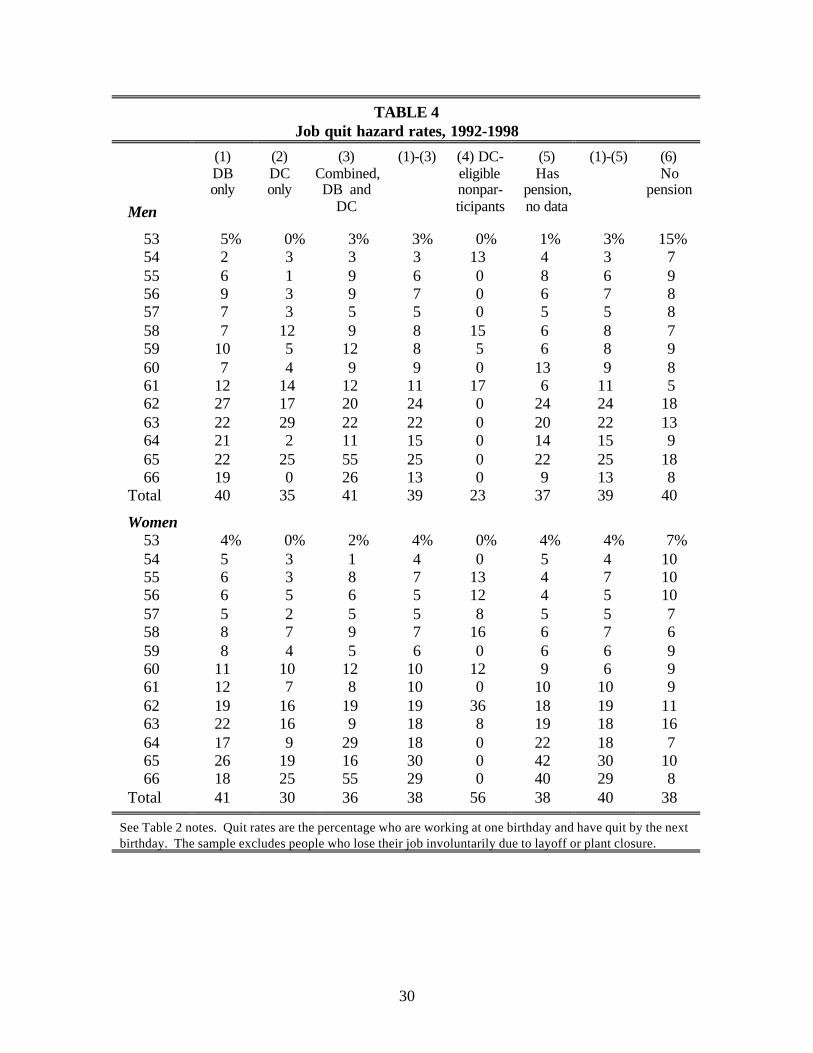
Table 4 shows hazard rates of quits between 1992 and 1998. 39% of the people in
our sample left their 1992 job by 1998, when they had reached ages 57-67. Both men
and women with DB or combined plans quit at higher rates than those with only a DC
plan. At ages 55-59, 4.1% with a DB plan and 4.5% with a combined plan leave their job
each year, on average, compared to 2.0% with a DC plan. At ages 60-62 the statistics
were 11.9% with a DB plan, 8.9% with a combined plan, and 6.3% with a DC plan. This
key difference emerges in the estimation results below.
IV. ESTIMATING THE IMPACT OF PENSIONS ON RETIREMENT
Descriptive statistics confirm that both pension wealth accrual paths and
retirement patterns vary with pension type. This section reports estimates of the impact
of different pension types on retirement.
A. Estimation strategy
The dependent variable is a binary indicator for whether a full-time employee
voluntarily leaves a pensioned job. Our main results focus on those who retire
completely; we show results later for people who take a new job. We identify the precise
age at which an individual quits and pool observations from 1992 to 1998, excluding
departures due to layoffs or plant closure.28 We focus initially on people who retire fully
and then consider people who quit and take a new job. We estimate probit models with
Huber-White standard errors and use the HRS-provided person level analysis weights to
make the estimates nationally representative.
We allow each pension type to have a different effect on retirement. We use the
peak difference measure of pension accrual (peak minus current pension wealth, or zero
if the person has passed the peak), introduced by Coile and Gruber. We allow separate
28 We use survey responses to identify the age when retirement occurred and match it to pension accrual atthat age. In contrast, Gustman and Steinmeier (1999) tracked changes in employment status from wave towave and use pension accrual applicable at that wave; these may not strictly coincide.
16
effects of the peak difference of pension wealth of DB plans and of the DB component of
combined plans. Similarly, we allow separate effects of pension wealth of DB plans, DC
plans, and the DB and DC components of combined plans. We normalize these financial
variables by earnings.29 We experiment with indicators for age relative to the peak value
and early and normal retirement dates in DB plans. We also include indicators for
employers who offer a temporary early retirement “window plan” or who match
employee contributions.
We control for a variety of other influences on retirement. These include Social
Security wealth and peak difference in wealth; detailed measures of health insurance
coverage; and non-pension financial assets and home ownership, to capture wealth
effects. We control for employer size, industry, tenure, occupation, and education. In
addition, we include a control for people who say they never want to retire or have no
retirement plans, and dummies for recent hospitalizations, gender, marital status, race,
and age.
B. Estimation results
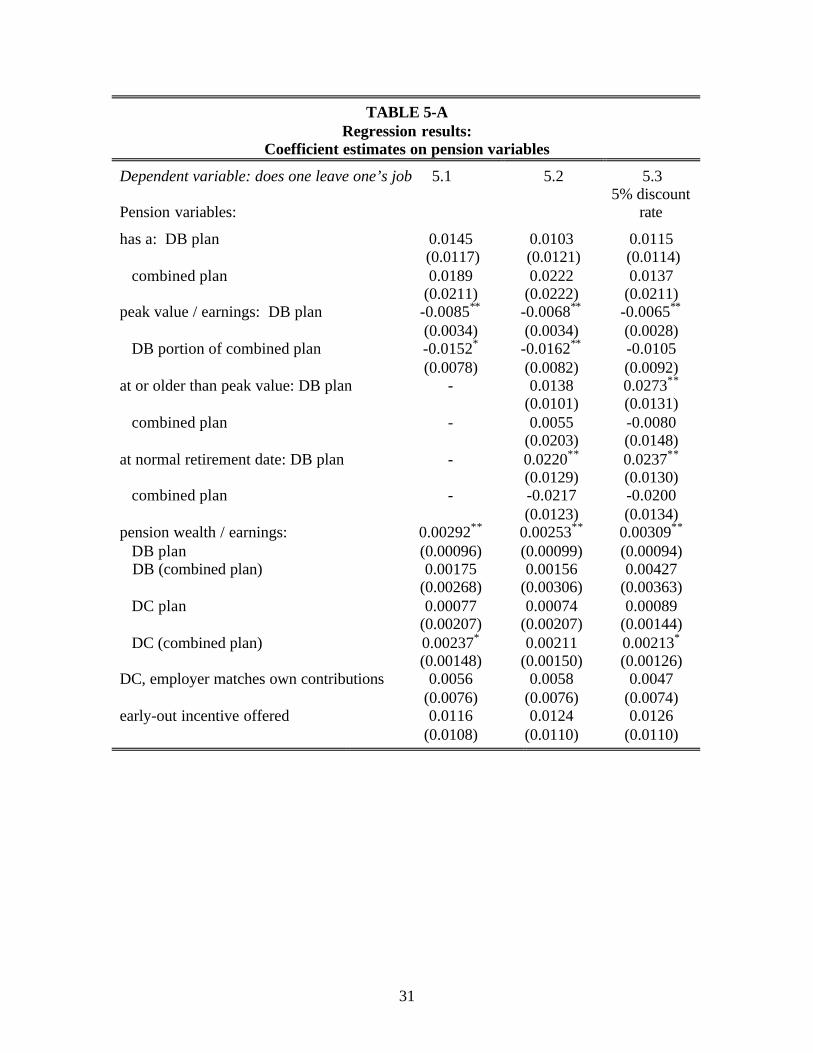
Table 5A-C report marginal effects from probit estimates for several
specifications. The dependent variable is whether a person leaves his or her 1992 job and
retires between one birthday and the next, so a positive coefficient indicates a higher
probability. The basic specification 5.1 follows the literature by including pension wealth
and a measure of pension accrual. Our preferred specification in 5.2 adds dummies for
being at or past the age of peak pension wealth and the pension’s normal retirement date.
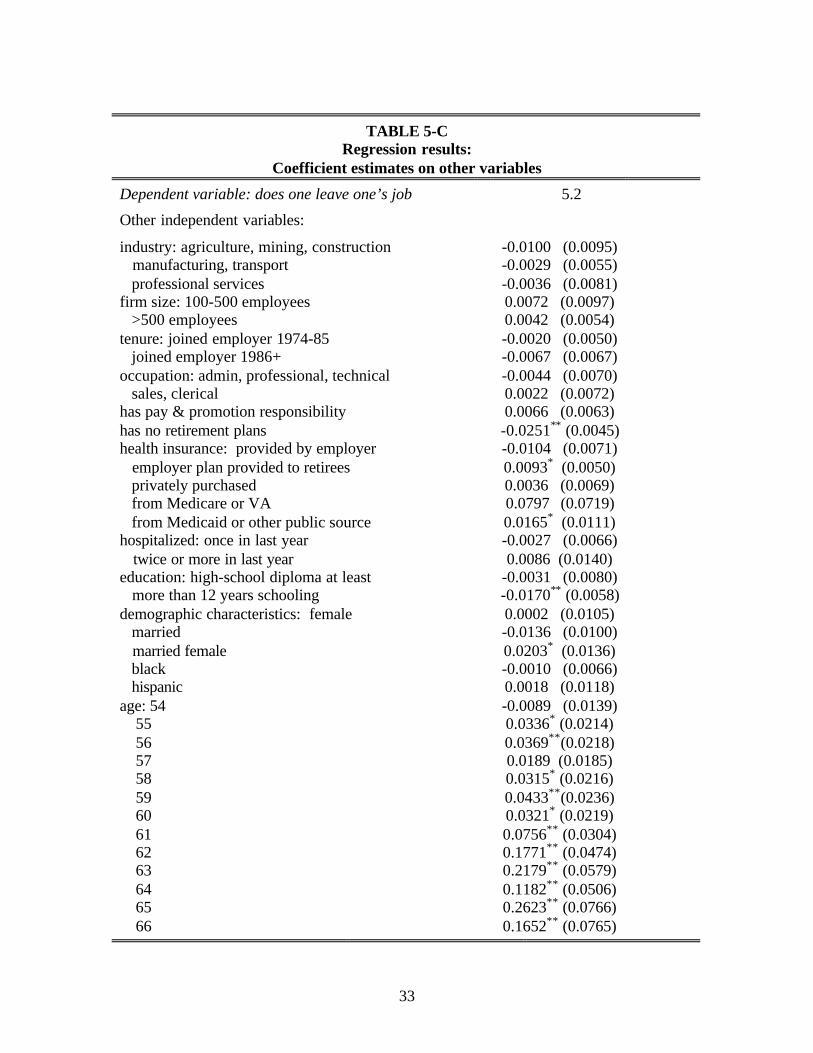
The control variables have the same qualitative impact on retirement found in a
long line of previous research. The retirement hazard rises with age, especially after 60.
Higher financial assets are associated with significantly earlier retirement, so that
doubling financial wealth (which has a mean of $37,182) raises the hazard by about a half
percentage point. People with zero financial assets tend to retire earlier as well, possibly
reflecting liquidity constraints among people with pensions. When an employer provides
health insurance for workers but not retirees, a worker is about a percentage point less
29 Samwick (1998) discussed scaling pension accruals by earnings in order to compare retirementincentives across workers. The “option-value” measure of pension accrual which he used in the estimation
17
likely to quit. People with more education are less likely to quit, as are married men,
while married women are more likely. Some of these variables fall short of statistical
significance, but the estimates should grow more precise as the sample ages. It is
important to note that industry, job tenure, and firm size do not significantly affect
retirement, though they are related to pension type.
We find that both private and public pension accruals influence retirement. In our
preferred specification in 5.2, peak difference is significant at 5% for people with DB
plans and with combined plans. The difference in the estimates across pension type is not
statistically significant. Having the mean value of peak difference reduces the retirement
hazard by 0.7 percentage points for ages 55-59, or a 15% reduction compared to the
observed hazard at that age.
The peak difference measure is not economically meaningful after pension wealth
peaks. Therefore, we add dummy variables in 5.2 to capture the disincentive effect of
declining pension wealth, and these improve the fit of the estimation. We experimented
with controls for being at or older than peak pension value or the pension’s early or
normal retirement date. The dummy variable for at or older than peak value is close to
significant for DB people, though highly insignificant for combined people. This is not
surprising as relatively few people with combined plans have reached peak value in this
sample.30
Including dummies for being at the early or normal retirement dates tests whether
institutional factors, along with financial incentives, affect retirement. We found no
spike in retirement at the early retirement date (ERD) when people can first receive
benefits. The ERD generally comes at an early age, often 55, when we observe few
retirements. On the other hand, being at the normal retirement date (NRD) significantly
raises quits among DB people; it lowers quits among combined people, though not
significantly. Different reactions to the NRD by pension type seem to arise because the
NRD occurs earlier in some stand-alone DB plans and thus is more likely to have been
reached in this sample. The NRD is 60 or younger in 35% of stand-alone DB plans,
compared to 21% of combined plans. One reason is the greater proportion of stand-alone
implicitly weighs pension income and earnings. Earnings do not significantly affect retirement whenincluded separately in our estimation.
18
DB plans in professional services and public administration; these plans have an earlier
average NRD. Nevertheless, controlling for industry did not affect the estimation results.
Taken together, these findings suggest that institutional factors and social norms
involving the NRD play a role for people with stand-alone DB plans, which tend to have
an earlier NRD.
To continue, we allow the effect of pension wealth to vary by pension type. We
find a significant and positive, though relatively small, effect of DB wealth on DB people
and of DC wealth on combined people. The coefficients on the other pension wealth
variables have similar magnitudes but are not statistically significant. Samwick (1998)
and Coile and Gruber (2000) also found weak effects of pension wealth.
Other pension characteristics do not have a significant impact. Notably, the
dummies for pension type are not significant, so the impact of different pension plans is
captured in the differences in accrual and wealth patterns. We found no evidence of a
spike in retirement for DC people at ages 59 and 60, when withdrawals no longer suffer
tax penalties. Indicators for employers matching employee contributions to DC plans or
offering early retirement “window plans” were not statistically significant.
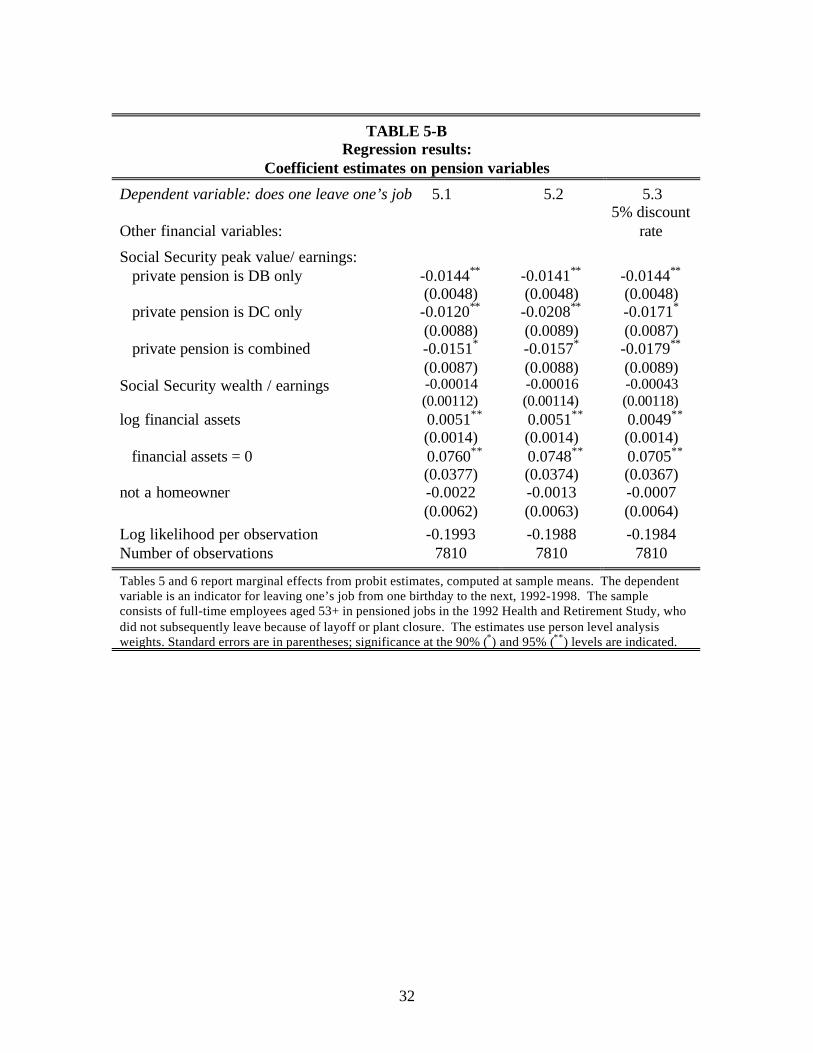
As with private pensions, Social Security incentives significantly affect
retirement. Social Security peak difference reduces the retirement hazard by as much as
1.2 percentage points at younger ages, evaluated at the mean for each age; the impact is
similar to peak difference in combined plans and greater than in DB plans.31 We allowed
the effect of Social Security accruals to vary by private pension type; different coefficient
estimates might indicate that people with DB and DC plans respond differently to
pension incentives. However, the response was very similar regardless of private pension
type.
In sum, the estimates demonstrate that differences in pension accrual patterns alter
retirement, as we hypothesized. Sharp DB pension accruals induce earlier retirement,
compared to smooth DC accruals. The next section discusses some additional
30 The median age of peak value is 63 for DB people and 64 for combined people, at a discount rate of 3%.31 Estimates from Coile and Gruber (2000) also suggest that workers in the HRS respond as much or moreto Social Security as to private pensions. Their estimated effect of peak difference fell when they summedvalues for private pensions to values for Social Security. The results from the HRS contrast with Samwick(1998). In his data from the mid-1980s, private pensions had a stronger effect than Social Security.
19
specifications, and the final section discusses aggregate effects of the spread of DC
pensions on retirement.
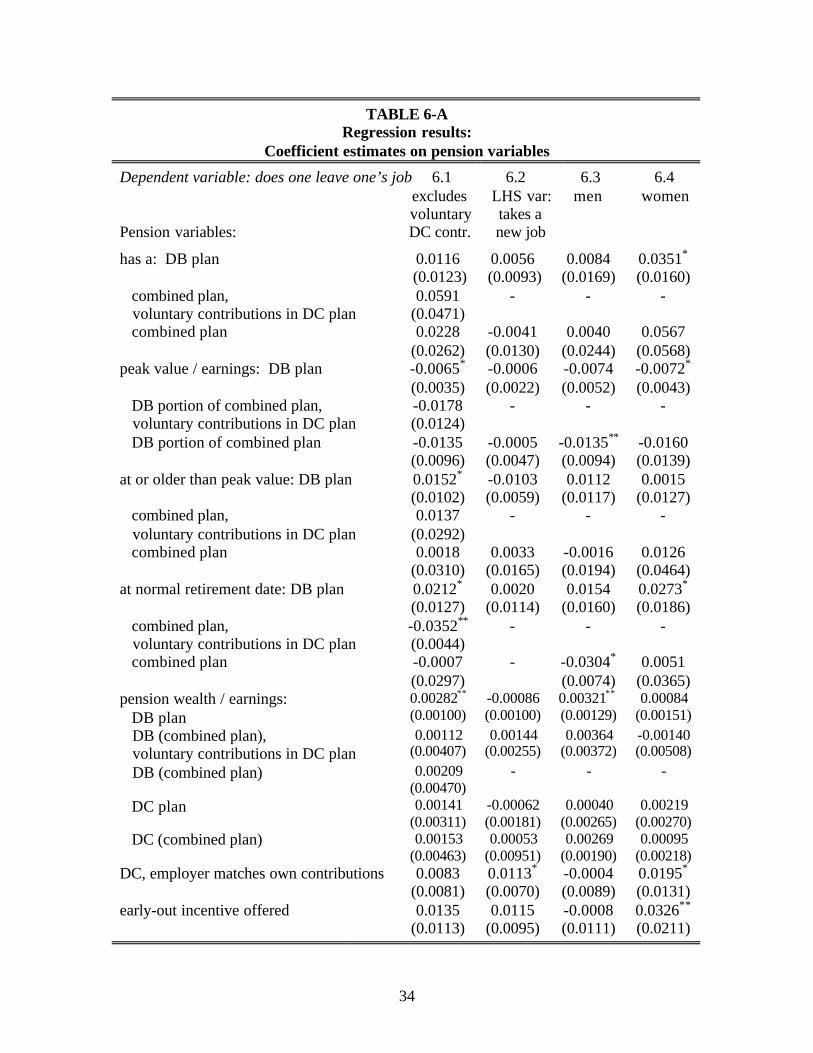
C. Additional specifications
This section reviews additional results shown in Tables 5 and 6. We try using a
different discount rate, excluding voluntary DC contributions, estimating the impact of
pensions on people taking a new job, and separating the sample by gender.
In 5.3 we experiment with a discount rate of 5%, rather than 3%, in case people
behave relatively impatiently. A higher discount rate reduces the present value of future
pension accruals and hence the age of peak value. Since we observe low retirement
hazards at younger ages, using a higher discount rate reduces the magnitude and
significance of the peak difference variables, and it increases those of the variables
measuring being at or past peak present value.
A concern is that endogenous voluntary DC contributions explain retirement
patterns of people with DC pensions. The HRS data does not distinguish between
voluntary and compulsory contributions, however. We tried subtracting all employee
contributions when plan rules allow for voluntary contributions. When this measure of
voluntary DC contributions is omitted in 6.1, the impact of DC pension wealth declines
slightly and loses significance (though it was also insignificant in 5.2). DB variables
continue to have the same effect, whether or not someone has voluntary contributions in a
DC plan. These results show that later retirement by people with DC plans is not
explained by endogenous voluntary contributions; as before, we see that DB pension
accruals induce their earlier retirement.
73% of quits in this sample result in retirement. In 6.2, the dependent variable is
defined as a job change instead of retirement and retirees are omitted. The pension
variables are now insignificant, suggesting that a fuller understanding of job changes
must await an investigation of the new jobs taken by those who quit.32
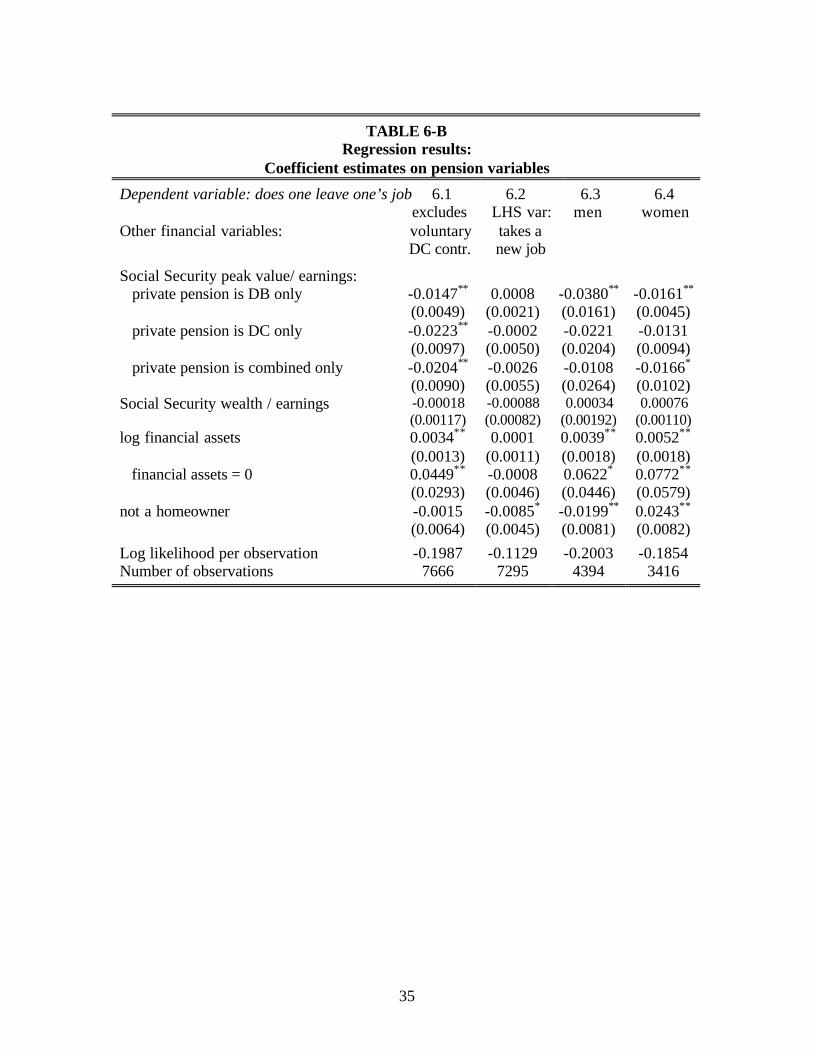
Lastly, retirement patterns differ somewhat for men in 6.3 and women in 6.4. The
influence of peak difference is of a similar magnitude by gender, but pension wealth has
smaller effects for women. Women have a stronger reaction to the DB normal retirement
32 The HRS has not collected pension data from new employers after the first wave.
20
date, which accounts for its significance in the regressions in Table 5. As discussed
earlier, these differences seem to arise because DB plans in some sectors (especially
professional services and public administration) have an earlier average NRD which is
more likely to have been reached, and women are more likely to work in those sectors.
Lastly, simply having a DB plan leads women to retire earlier. Women are clearly
affected by many differences in career paths, only some of which are captured by
differences in pension wealth. This subject is beginning to receive closer attention from
researchers as the HRS sample ages.33
D. The aggregate impact of the spread of 401(k) plans
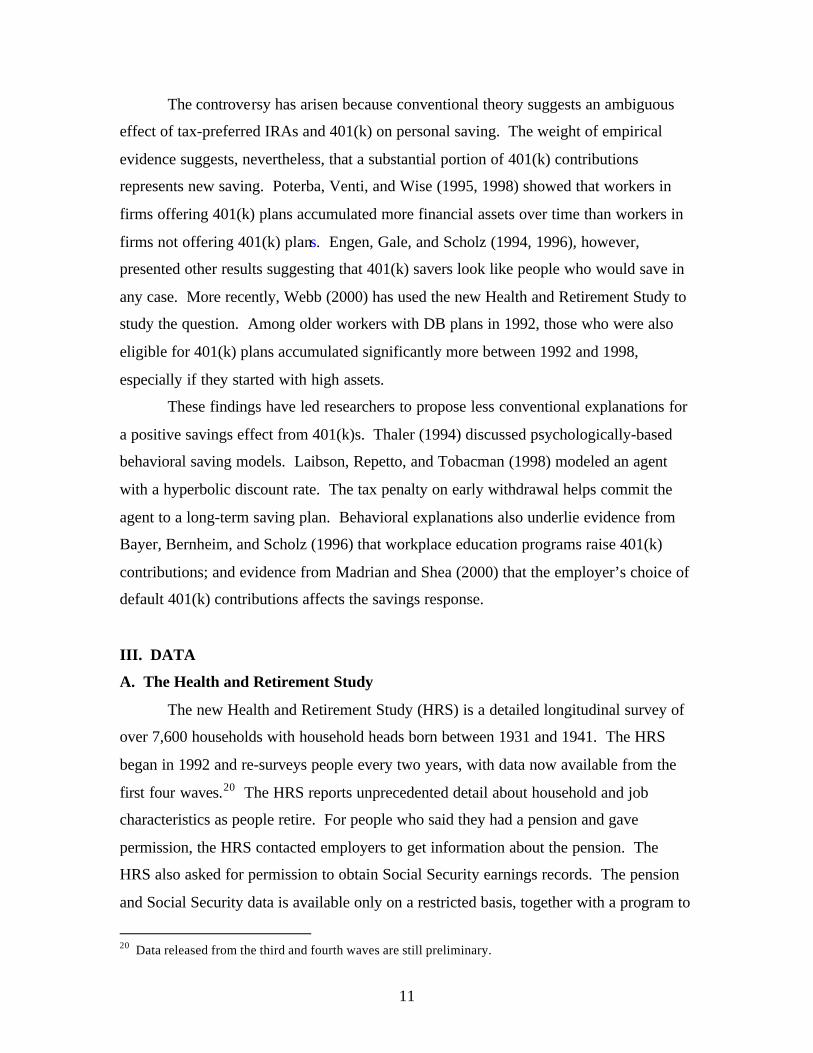
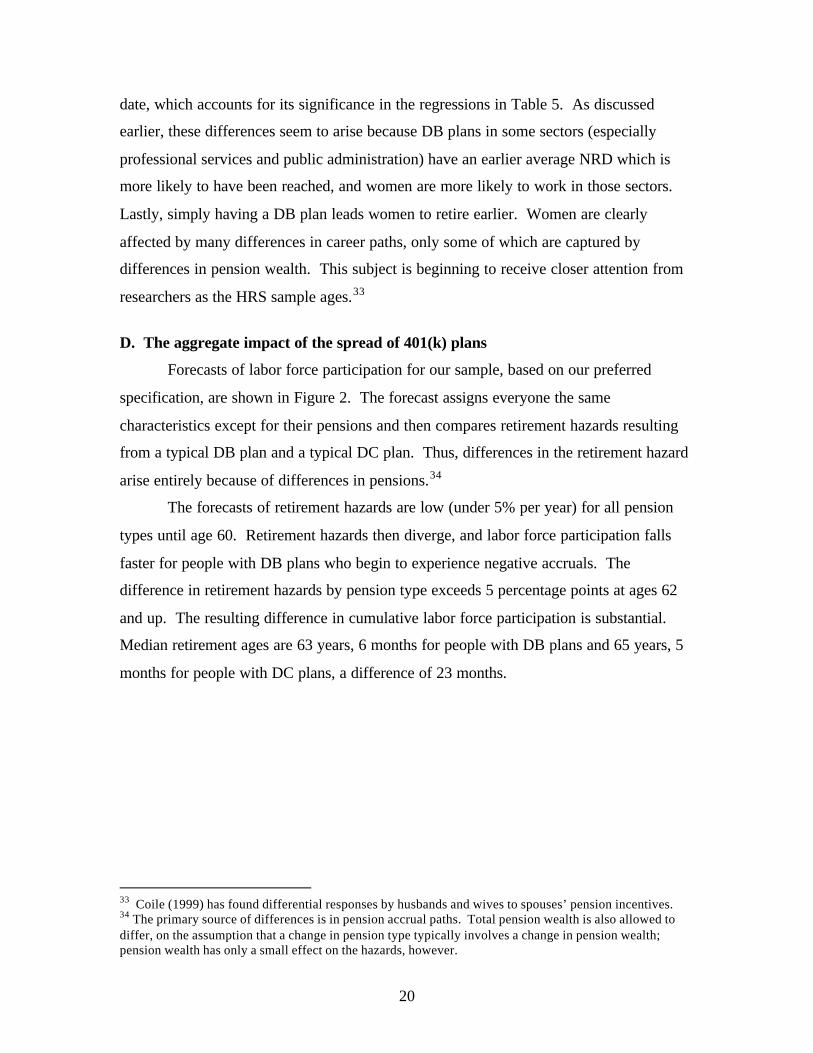
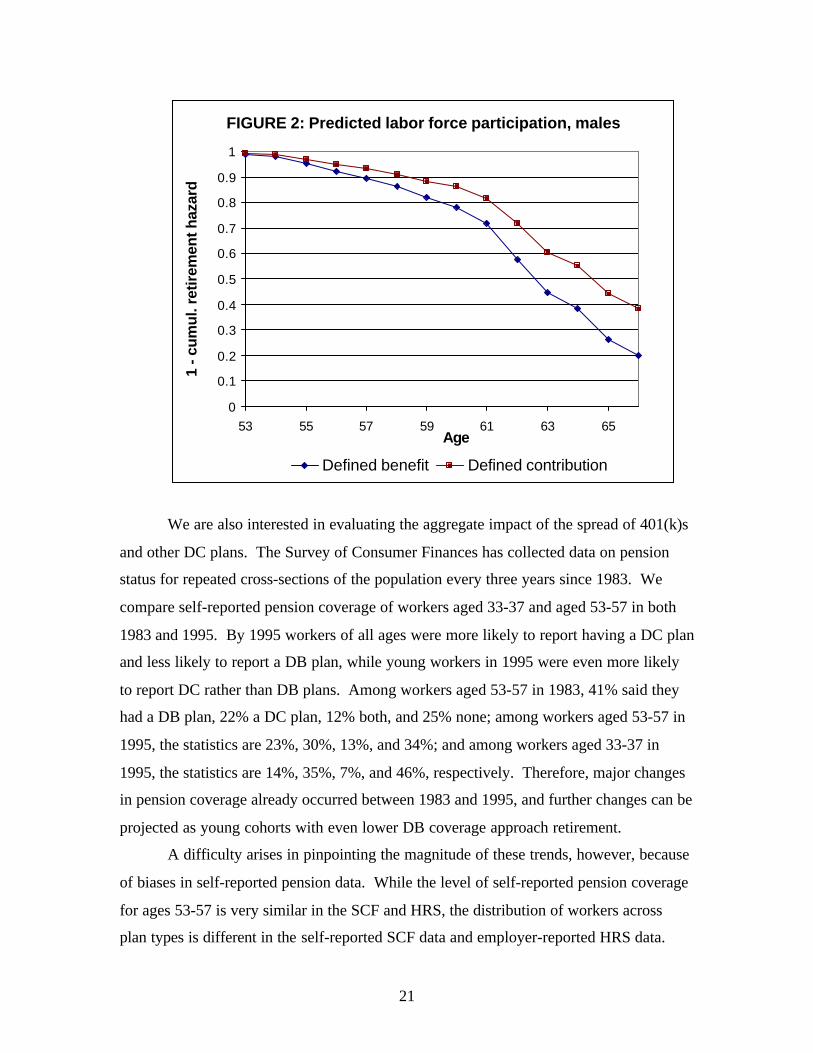
Forecasts of labor force participation for our sample, based on our preferred
specification, are shown in Figure 2. The forecast assigns everyone the same
characteristics except for their pensions and then compares retirement hazards resulting
from a typical DB plan and a typical DC plan. Thus, differences in the retirement hazard
arise entirely because of differences in pensions.34
The forecasts of retirement hazards are low (under 5% per year) for all pension
types until age 60. Retirement hazards then diverge, and labor force participation falls
faster for people with DB plans who begin to experience negative accruals. The
difference in retirement hazards by pension type exceeds 5 percentage points at ages 62
and up. The resulting difference in cumulative labor force participation is substantial.
Median retirement ages are 63 years, 6 months for people with DB plans and 65 years, 5
months for people with DC plans, a difference of 23 months.
33 Coile (1999) has found differential responses by husbands and wives to spouses’ pension incentives.34 The primary source of differences is in pension accrual paths. Total pension wealth is also allowed todiffer, on the assumption that a change in pension type typically involves a change in pension wealth;pension wealth has only a small effect on the hazards, however.
21
FIGURE 2: Predicted labor force participation, males
0
0.1
0.2
0.3
0.4
0.5
0.6
0.7
0.8
0.9
1
53 55 57 59 61 63 65Age
1 - c
umul
. ret
irem
ent h
azar
d
Defined benefit Defined contribution
We are also interested in evaluating the aggregate impact of the spread of 401(k)s
and other DC plans. The Survey of Consumer Finances has collected data on pension
status for repeated cross-sections of the population every three years since 1983. We
compare self-reported pension coverage of workers aged 33-37 and aged 53-57 in both
1983 and 1995. By 1995 workers of all ages were more likely to report having a DC plan
and less likely to report a DB plan, while young workers in 1995 were even more likely
to report DC rather than DB plans. Among workers aged 53-57 in 1983, 41% said they
had a DB plan, 22% a DC plan, 12% both, and 25% none; among workers aged 53-57 in
1995, the statistics are 23%, 30%, 13%, and 34%; and among workers aged 33-37 in
1995, the statistics are 14%, 35%, 7%, and 46%, respectively. Therefore, major changes
in pension coverage already occurred between 1983 and 1995, and further changes can be
projected as young cohorts with even lower DB coverage approach retirement.
A difficulty arises in pinpointing the magnitude of these trends, however, because
of biases in self-reported pension data. While the level of self-reported pension coverage
for ages 53-57 is very similar in the SCF and HRS, the distribution of workers across
plan types is different in the self-reported SCF data and employer-reported HRS data.
22
Our comparison of HRS self-reported and employer-reported data indicates that much of
the difference between the SCF and the HRS employer-reported data can be attributed to
a tendency of workers to mis-classify DB pensions as DC or combined, a reporting bias
also found by Gustman and Steinmeier. The resulting uncertainty about true changes in
pension coverage led us to consider a range of estimates of past and projected changes.
Another potential source of uncertainty arises because our estimation did not
include workers without a pension. Our analysis suggests that there has been at most a
small decline in overall pension coverage from 1983-1995, and that coverage is likely to
remain similar in coming years. It follows that our estimates are not significantly
affected by assumptions regarding the effects of changes in overall pension coverage.
Depending on the assumptions, DB coverage among those approaching retirement
in 1995 might have fallen 7-19 percentage points since 1983, with DC coverage rising 1-
12 points. Our simulations suggest that these changes have resulted in an increase of two
to four months in the median retirement age between 1983 and 1995, holding all else
constant. Future DB coverage for the cohort aged 33-37 in 1995 might be 9-29
percentage points lower than for the cohort aged 53-57, while future DC coverage might
be 9-27 points higher. Thus, when the current young cohort approaches retirement, they
will have substantially lower DB and higher DC pension coverage, while the proportion
with both DB and DC plans should remain fairly constant. Our simulations suggest that
this will raise the median retirement age by two to five months.
These forecasts follow directly from the estimates discussed above. Having a DB
or a combined plan reduces the median retirement age by about 23 months. Thus, if DB
and combined plan coverage is projected to fall by about 20 percentage points, that points
to an increase in the median retirement of about 4 ½ months.
V. CONCLUSIONS
Earlier researchers focused exclusively on the impact of 401(k) plans on personal
saving. We have found substantial changes in retirement patterns among workers in the
new Health and Retirement Study, resulting from the spread of 401(k) and other DC
plans. These arise because of major differences in the accrual of pension wealth.
Pension wealth in DC plans accrues smoothly, while pension wealth in traditional DB
23
plans spikes sharply at some points and turns negative at older ages. After controlling
carefully for these differences in financial incentives, we show that pension type does not
have an independent effect on retirement.
While we expected to find smoother retirement rates for workers with DC plans
compared to workers with DB plans, we could not predict a priori whether that would
lead to earlier or later retirement, on average. Our results show that workers with DC
plans are retiring significantly later. Retirement patterns are similar until around age 60,
when a significant proportion of workers with DB plans begin to experience negative
accruals. For the next several years, their retirement hazards are 5-6 percentage points
higher, on average, than they are for people with DC plans. While we are concerned
about endogenous selection into jobs with different pensions, we have found that older
workers with different types of pensions have quite similar observable characteristics,
and controlling for variables that may relate to selection does not alter the estimation
results.
Thus, the spread DC pensions help explain why the average retirement age has
stabilized since the early 1980s. It may also lead to later retirement in years to come, as
younger workers who are more likely to have 401(k) and other DC pensions approach
retirement.
24
REFERENCES
Bayer, Patrick, B. Douglas Bernheim, and John Karl Scholz. 1996. “The Effects ofFinancial Education in the Workplace: Evidence from a Survey of Employers.” NBERWorking Paper No. 5655.
Brown, Jeffrey, Olivia Mitchell, James Poterba, and Mark Warshawsky. 1999. “TaxingRetirement Income: Nonqualified Annuities and Distributions from Qualified Accounts.”NBER Working Paper No. 7268.
Clark, Robert, and Ann McDermed. 1990. The Choice of Pension Plans in a ChangingRegulatory Environment. Washington DC: The AEI Press.
Coile, Courtney. 1999. “Retirement Incentives and Couples’ Retirement Decisions.”Manuscript, Massachusetts Institute of Technology.
Coile, Courtney, and Jonathan Gruber. 2000. “Social Security and Retirement.” NBERWorking Paper No. 7830.
Costa, Dora. 1998. The Evolution of Retirement: An American History, 1880-1990.Chicago: The University of Chicago Press.
Employee Benefit Research Institute. 1996. “Fundamentals of Employee BenefitPrograms.” Washington, Fifth Edition.
Engen, Eric, William Gale, and John Karl Scholz. 1994. “Do Saving Incentives Work?”Brookings Papers on Economic Activity 1: 85-151.
Engen, Eric, William Gale, and John Karl Scholz. 1996. “The Illusory Effects of SavingIncentives on Saving.” Journal of Economic Perspectives 10 (4): 113-138.
Filer, Randall, and Marjorie Honig. 1996. “A Model of Endogenous Pensions inRetirement Behavior.” Manuscript, Hunter College.
Gustman, Alan, and Thomas Steinmeier. 1999. “What People Don’t Know About TheirPensions and Social Security: An Analysis Using Linked Data From the Health andRetirement Study.” NBER Working Paper No. 7368.
Ippolito, Richard. 1988. “A Study of the Regulatory Impact of the Employee RetirementIncome Security Act.” Journal of Law and Economics April: 85-126.
Kotlikoff, Laurence, and David Wise. 1985. “Labor Compensation and the Structure ofPrivate Pension Plans: Evidence for Contractual versus Spot Labor Markets,” inPensions, Labor, and Individual Choice, D. Wise, ed. Chicago: University of ChicagoPress, 55-85.
25
Kotlikoff, Laurence, and David Wise. 1987. “The Incentive Effects of Private PensionPlans,” in Issues in Pension Economics, Z. Bodie, J. Shoven, and D. Wise, eds. Chicago:University of Chicago Press, 283-339
Kotlikoff, Laurence, and David Wise. 1989. “Employee Retirement and a Firm’sPension Plan,” in The Economics of Aging, D. Wise, ed. Chicago: University of ChicagoPress, 279-330.
Kruse, Douglas. 1995. “Pension Substitution in the 1980s: Why the Shift towardDefined Contribution?” Industrial Relations 34 (2): 218-241.
Laibson, David, Andrea Repetto, and Jeremy Tobacman. 1998. “Self-Control andSaving for Retirement.” Brookings Papers on Economic Activity No. 1: 91-196.
Lazear, Edward P. 1986. “Retirement from the Labor Force.” In Handbook of LaborEconomics, Volume 1, edited by O. Ashenfelter and R. Layard. New York: ElsevierScience Publishers.
Lumsdaine, Robin, James Stock, and David Wise. 1992. “Three Models of Retirement:Computational Complexity Versus Predictive Validity,” in Topics in the Economics ofAging, D. Wise, ed. Chicago: University of Chicago Press.
Madrian, Brigitte, and Dennis Shea. 2000. “The Power of Suggestion: Inertia in 40l(k)Participation and Savings Behavior.” Manuscript, Graduate School of Business,University of Chicago.
Mitchell, Olivia. 1999. “New Trends in Pension Benefit and Retirement Provisions.”NBER Working Paper No. 7381.
Papke, Leslie. 1999. “Are 401(k) Plans Replacing Other Employer-provided Pensions?Evidence from Panel Data.” Journal of Human Resources 34 (2): 346-368.
Poterba, James, Steve Venti, and David Wise. 1995. “Do 401(k) Contributions CrowdOut Other Personal Saving.” Journal of Public Economics 58: 1-32.
Poterba, James, Steve Venti, and David Wise. 1998. “Personal Retirement SavingPrograms and Asset Accumulation: Reconciling the Evidence.” In Frontiers in theEconomics of Aging, edited by D. Wise. Chicago: University of Chicago Press, pp. 23-124.
Quinn, Joseph. 1998. “New Paths to Retirement.” Working Paper No. 424, BostonCollege.
Samwick, Andrew. 1998. “New Evidence on Pensions, Social Security, and the Timingof Retirement.” Journal of Public Economics 70: 207-36.
26
Stock, James, and David Wise. 1990a. “Pensions, the Option Value of Work, andRetirement.” Econometrica 58 (5): 1151-80.
Stock, James, and David Wise. 1990b. “The Pension Inducement to Retire: An OptionValue Analysis,” in Issues in the Economics of Aging, D. Wise, ed. Chicago: Universityof Chicago Press.
Thaler, Richard. 1994. “Psychology and Savings Policies.” American Economic Review84: 186-192.
Webb, Anthony. 2000. “The Effects of 401(k) Eligibility on Household AssetHoldings”. Chapter One, Ph.D. thesis. University of California, San Diego.
27
TABLE 1Characteristics of workers, 1992
(1)DBonly
(2)DConly
(3) Com-bined,
DB andDC
(1)-(3) (4) DC-eligiblenonpar-ticipants
(5)Has
pension,no data
(1)-(5) (6)No
pension
N 1561 494 453 2508 55 1241 3804 1714mean birthyear 1937 1936 1936 1936 1936 1936 1936 1936< high school 0.11 0.14 0.08 0.11 0.09 0.18 0.13 0.27 some college 0.53 0.47 0.55 0.52 0.50 0.42 0.49 0.30female 0.43 0.43 0.38 0.42 0.46 0.44 0.43 0.51married 0.75 0.76 0.74 0.75 0.82 0.75 0.75 0.67poor health 0.08 0.06 0.06 0.07 0.01 0.08 0.07 0.10white collar 0.43 0.44 0.41 0.43 0.41 0.32 0.39 0.21 pink 0.23 0.25 0.35 0.24 0.29 0.27 0.25 0.26 blue 0.34 0.31 0.24 0.33 0.30 0.41 0.36 0.53industry agric,mining, construction
0.04 0.06 0.04 0.04 0.06 0.08 0.05 0.10
manuf, trsprt 0.31 0.29 0.45 0.34 0.18 0.39 0.35 0.24 prof services, public admin
0.55 0.33 0.29 0.46 0.55 0.26 0.39 0.23
trade, non- prof services
0.10 0.32 0.22 0.16 0.21 0.27 0.21 0.43
median finan- cial assets 18,000 20,500 21,100 20,000 14,250 17,000 18,500 4,000owns home 0.89 0.86 0.89 0.88 0.78 0.85 0.87 0.72median earnings
30,000 26,000 31,000 30,000 25,500 25,000 28,000 15,000
mean job tenure 19 11 18 18 8 13 16 4Pension wealth at age 6525% quartile 89,108 44,600 151,972 - - - - -median 192,006 99,105 318,145 - - - - -75% quartile 365,569 208,847 622,694 - - - - -
Data from wave 1 of the Health and Retirement Study. The sample consists of people aged 53+ who workat least 30 hours per week in their main job and are not self-employed. People are classified DB if theiremployer offers a DB plan; DC if their employer offers and they participate in a DC plan; and combined ifboth. The category “DC-eligible non-participants” consists of a small number who told the HRS they havea pension but have zero DC assets and no DB pension. Financial assets exclude 401(k) assets.
28
TABLE 2Median of pension wealth accruals, as the retirement age changes
DB only DC only Combination
Retirement age:
Total Total Excludingvoluntary
contributions
Total DBcomponent
DCcomponent
Men 53 5,355 4,925 2,740 12,709 6,127 4,917 54 8,891 5,019 2,719 18,811 13,618 5,330 55 5,403 5,110 2,801 13,166 7,087 5,330 56 5,060 5,565 3,191 13,140 6,725 5,254 57 4,724 5,477 3,432 13,311 6,396 5,191 58 4,612 5,017 3,601 12,198 5,960 5,271 59 4,466 5,637 3,659 11,617 5,916 5,401 60 2,919 5,776 3,895 9,544 3,095 5,545 61 2,652 5,866 3,967 8,362 2,903 5,402 62 395 5,772 3,940 5,999 290 5,456 63 -515 5,730 3,885 5,255 -543 5,295 64 -1,215 5,778 3,820 4,889 -1,284 5,099 65 -2,841 5,342 3,647 -1,724 -3,127 4,853 66 -3,593 5,137 3,474 -3,411 -4,187 4,477
Women 53 5,808 2,606 1,468 7,512 4,920 2,509 54 6,401 2,615 1,562 10,021 6,706 2,776 55 5,436 2,552 1,648 9,085 5,251 2,935 56 5,588 2,608 1,736 9,733 9,528 3,008 57 5,790 2,819 1,855 9,818 5,444 3,158 58 5,499 2,910 1,925 9,682 5,387 3,231 59 5,056 2,902 1,995 10,165 6,049 2,890 60 3,849 3,045 2,077 7,580 4,031 2,978 61 3,462 3,102 2,156 7,168 4,046 3,088 62 2,291 3,209 2,223 5,872 2,255 3,110 63 1,757 3,295 2,286 5,792 2,261 3,248 64 1,471 3,326 2,319 5,690 1,840 3,274 65 0 3,326 2,292 3,643 452 3,301 66 -579 3,329 2,282 3,127 0 3,306
Data from the Health and Retirement Study, wave 1. The sample is full-time employees aged 53+ withpension data. See Table 1 notes.
29
TABLE 3More statistics on pension wealth accrual
Quartile DB DC Combinationvalues 25% 75% 25% 75% 25% 75%
Retirement age: Men
53 2,053 12,856 2,720 9,328 7,559 20,76754 2,140 19,500 2,639 9,094 9,577 51,40655 2,244 12,043 2,702 9,068 7,129 22,98656 1,829 10,953 2,881 9,812 6,455 22,68857 1,480 10,342 2,836 9,390 6,672 22,90758 887 9,884 2,765 9,685 6,264 23,06259 300 10,253 2,830 9,414 6,123 24,80860 -405 6,277 2,820 9,675 4,377 17,68561 -1,244 6,179 2,986 9,791 3,032 16,74162 -2,516 3,686 3,004 9,764 2,535 14,50363 -3,853 2,956 2,934 9,813 1,292 13,16964 -5,276 2,618 2,888 9,740 322 12,01065 -7,539 257 2,749 9,261 -1,724 6,94066 -9,234 0 2,646 8,786 -3,411 5,208
Women53 2,206 12,854 1,478 4,874 4,655 17,12154 2,282 16,164 1,422 4,806 7,094 18,38355 2,355 10,774 1,465 5,065 5,796 15,89656 2,334 11,223 1,487 5,240 5,741 16,68957 2,504 11,144 1,565 5,735 5,808 17,77758 2,332 10,415 1,666 5,589 6,130 16,66159 1,869 10,546 1546 5,853 6,090 17,41860 1,330 7,292 1,625 5,856 4,088 12,86861 902 6,904 1,719 5,905 4,444 12,75462 284 4,855 1,767 6,000 3,525 10,64763 -163 4,196 1,785 6202 3,697 10.83964 -1,011 4,102 1,852 6,049 3,058 10,79565 -2,497 1,378 1,832 6,207 1,533 7,42966 -3,742 875 1,835 5,597 938 6,524
See Table 2 notes.
30
TABLE 4Job quit hazard rates, 1992-1998
Men
(1)DBonly
(2)DConly
(3)Combined,DB and
DC
(1)-(3) (4) DC-eligiblenonpar-ticipants
(5)Has
pension,no data
(1)-(5) (6)No
pension
53 5% 0% 3% 3% 0% 1% 3% 15%54 2 3 3 3 13 4 3 755 6 1 9 6 0 8 6 956 9 3 9 7 0 6 7 857 7 3 5 5 0 5 5 858 7 12 9 8 15 6 8 759 10 5 12 8 5 6 8 960 7 4 9 9 0 13 9 861 12 14 12 11 17 6 11 562 27 17 20 24 0 24 24 1863 22 29 22 22 0 20 22 1364 21 2 11 15 0 14 15 965 22 25 55 25 0 22 25 1866 19 0 26 13 0 9 13 8
Total 40 35 41 39 23 37 39 40
Women53 4% 0% 2% 4% 0% 4% 4% 7%54 5 3 1 4 0 5 4 1055 6 3 8 7 13 4 7 1056 6 5 6 5 12 4 5 1057 5 2 5 5 8 5 5 758 8 7 9 7 16 6 7 659 8 4 5 6 0 6 6 960 11 10 12 10 12 9 6 961 12 7 8 10 0 10 10 962 19 16 19 19 36 18 19 1163 22 16 9 18 8 19 18 1664 17 9 29 18 0 22 18 765 26 19 16 30 0 42 30 1066 18 25 55 29 0 40 29 8
Total 41 30 36 38 56 38 40 38
See Table 2 notes. Quit rates are the percentage who are working at one birthday and have quit by the nextbirthday. The sample excludes people who lose their job involuntarily due to layoff or plant closure.
31
TABLE 5-ARegression results:
Coefficient estimates on pension variables
Dependent variable: does one leave one’s job 5.1 5.2 5.3
Pension variables:5% discount
rate
has a: DB plan 0.0145 (0.0117)
0.0103 (0.0121)
0.0115 (0.0114)
combined plan 0.0189(0.0211)
0.0222(0.0222)
0.0137(0.0211)
peak value / earnings: DB plan -0.0085**
(0.0034)-0.0068**
(0.0034)-0.0065**
(0.0028) DB portion of combined plan -0.0152*
(0.0078)-0.0162**
(0.0082)-0.0105(0.0092)
at or older than peak value: DB plan - 0.0138(0.0101)
0.0273**
(0.0131) combined plan - 0.0055
(0.0203)-0.0080(0.0148)
at normal retirement date: DB plan - 0.0220**
(0.0129)0.0237**
(0.0130) combined plan - -0.0217
(0.0123)-0.0200(0.0134)
pension wealth / earnings: DB plan
0.00292**
(0.00096)0.00253**
(0.00099)0.00309**
(0.00094) DB (combined plan) 0.00175
(0.00268)0.00156
(0.00306)0.00427
(0.00363) DC plan 0.00077
(0.00207)0.00074
(0.00207)0.00089
(0.00144) DC (combined plan) 0.00237*
(0.00148)0.00211
(0.00150)0.00213*
(0.00126)DC, employer matches own contributions 0.0056
(0.0076)0.0058
(0.0076)0.0047
(0.0074)early-out incentive offered 0.0116
(0.0108)0.0124
(0.0110)0.0126
(0.0110)
32
TABLE 5-BRegression results:
Coefficient estimates on pension variables
Dependent variable: does one leave one’s job 5.1 5.2 5.3
Other financial variables:5% discount
rate
Social Security peak value/ earnings: private pension is DB only -0.0144**
(0.0048)-0.0141**
(0.0048)-0.0144**
(0.0048) private pension is DC only -0.0120**
(0.0088)-0.0208**
(0.0089)-0.0171*
(0.0087) private pension is combined -0.0151*
(0.0087)-0.0157*
(0.0088)-0.0179**
(0.0089)Social Security wealth / earnings -0.00014
(0.00112)-0.00016(0.00114)
-0.00043(0.00118)
log financial assets 0.0051**
(0.0014) 0.0051**
(0.0014) 0.0049**
(0.0014) financial assets = 0 0.0760**
(0.0377) 0.0748**
(0.0374) 0.0705**
(0.0367)not a homeowner -0.0022
(0.0062)-0.0013(0.0063)
-0.0007(0.0064)
Log likelihood per observation -0.1993 -0.1988 -0.1984Number of observations 7810 7810 7810
Tables 5 and 6 report marginal effects from probit estimates, computed at sample means. The dependentvariable is an indicator for leaving one’s job from one birthday to the next, 1992-1998. The sampleconsists of full-time employees aged 53+ in pensioned jobs in the 1992 Health and Retirement Study, whodid not subsequently leave because of layoff or plant closure. The estimates use person level analysisweights. Standard errors are in parentheses; significance at the 90% (*) and 95% (**) levels are indicated.
33
TABLE 5-CRegression results:
Coefficient estimates on other variables
Dependent variable: does one leave one’s job 5.2
Other independent variables:
industry: agriculture, mining, construction -0.0100 (0.0095) manufacturing, transport -0.0029 (0.0055) professional services -0.0036 (0.0081)firm size: 100-500 employees 0.0072 (0.0097) >500 employees 0.0042 (0.0054)tenure: joined employer 1974-85 -0.0020 (0.0050) joined employer 1986+ -0.0067 (0.0067)occupation: admin, professional, technical -0.0044 (0.0070) sales, clerical 0.0022 (0.0072)has pay & promotion responsibility 0.0066 (0.0063)has no retirement plans -0.0251** (0.0045)health insurance: provided by employer -0.0104 (0.0071) employer plan provided to retirees 0.0093* (0.0050) privately purchased 0.0036 (0.0069) from Medicare or VA 0.0797 (0.0719) from Medicaid or other public source 0.0165* (0.0111)hospitalized: once in last year -0.0027 (0.0066) twice or more in last year 0.0086 (0.0140)education: high-school diploma at least -0.0031 (0.0080) more than 12 years schooling -0.0170** (0.0058)demographic characteristics: female 0.0002 (0.0105) married -0.0136 (0.0100) married female 0.0203* (0.0136) black -0.0010 (0.0066) hispanic 0.0018 (0.0118)age: 54 -0.0089 (0.0139) 55 0.0336* (0.0214) 56 0.0369**(0.0218) 57 0.0189 (0.0185) 58 0.0315* (0.0216) 59 0.0433**(0.0236) 60 0.0321* (0.0219) 61 0.0756** (0.0304) 62 0.1771** (0.0474) 63 0.2179** (0.0579) 64 0.1182** (0.0506) 65 0.2623** (0.0766) 66 0.1652** (0.0765)
34
TABLE 6-ARegression results:
Coefficient estimates on pension variables
Dependent variable: does one leave one’s job 6.1 6.2 6.3 6.4
Pension variables:
excludesvoluntaryDC contr.
LHS var:takes anew job
men women
has a: DB plan 0.0116 (0.0123)
0.0056 (0.0093)
0.0084(0.0169)
0.0351*
(0.0160) combined plan, voluntary contributions in DC plan
0.0591(0.0471)
- - -
combined plan 0.0228(0.0262)
-0.0041(0.0130)
0.0040(0.0244)
0.0567(0.0568)
peak value / earnings: DB plan -0.0065*
(0.0035)-0.0006(0.0022)
-0.0074(0.0052)
-0.0072*
(0.0043) DB portion of combined plan, voluntary contributions in DC plan
-0.0178(0.0124)
- - -
DB portion of combined plan -0.0135(0.0096)
-0.0005(0.0047)
-0.0135**
(0.0094)-0.0160(0.0139)
at or older than peak value: DB plan 0.0152*
(0.0102)-0.0103(0.0059)
0.0112(0.0117)
0.0015(0.0127)
combined plan, voluntary contributions in DC plan
0.0137(0.0292)
- - -
combined plan 0.0018(0.0310)
0.0033(0.0165)
-0.0016(0.0194)
0.0126(0.0464)
at normal retirement date: DB plan 0.0212*
(0.0127)0.0020
(0.0114)0.0154
(0.0160)0.0273*
(0.0186) combined plan, voluntary contributions in DC plan
-0.0352**
(0.0044)- - -
combined plan -0.0007(0.0297)
- -0.0304*
(0.0074)0.0051
(0.0365)pension wealth / earnings: DB plan
0.00282**
(0.00100)-0.00086(0.00100)
0.00321**
(0.00129)0.00084
(0.00151) DB (combined plan), voluntary contributions in DC plan
0.00112(0.00407)
0.00144(0.00255)
0.00364(0.00372)
-0.00140(0.00508)
DB (combined plan) 0.00209(0.00470)
- - -
DC plan 0.00141(0.00311)
-0.00062(0.00181)
0.00040(0.00265)
0.00219(0.00270)
DC (combined plan) 0.00153(0.00463)
0.00053(0.00951)
0.00269(0.00190)
0.00095(0.00218)
DC, employer matches own contributions 0.0083(0.0081)
0.0113*
(0.0070)-0.0004(0.0089)
0.0195*
(0.0131)early-out incentive offered 0.0135
(0.0113)0.0115
(0.0095)-0.0008(0.0111)
0.0326**
(0.0211)
35
TABLE 6-BRegression results:
Coefficient estimates on pension variables
Dependent variable: does one leave one’s job 6.1 6.2 6.3 6.4
Other financial variables:excludesvoluntaryDC contr.
LHS var:takes anew job
men women
Social Security peak value/ earnings: private pension is DB only -0.0147**
(0.0049)0.0008
(0.0021)-0.0380**
(0.0161)-0.0161**
(0.0045) private pension is DC only -0.0223**
(0.0097)-0.0002(0.0050)
-0.0221(0.0204)
-0.0131(0.0094)
private pension is combined only -0.0204**
(0.0090)-0.0026(0.0055)
-0.0108(0.0264)
-0.0166*
(0.0102)Social Security wealth / earnings -0.00018
(0.00117)-0.00088(0.00082)
0.00034(0.00192)
0.00076(0.00110)
log financial assets 0.0034**
(0.0013)0.0001
(0.0011)0.0039**
(0.0018)0.0052**
(0.0018) financial assets = 0 0.0449**
(0.0293)-0.0008(0.0046)
0.0622*
(0.0446)0.0772**
(0.0579)not a homeowner -0.0015
(0.0064)-0.0085*
(0.0045)-0.0199**
(0.0081)0.0243**
(0.0082)Log likelihood per observation -0.1987 -0.1129 -0.2003 -0.1854Number of observations 7666 7295 4394 3416


