Embed Size (px)
Citation preview
Lewandowski, Piotr; Park, Albert; Schotte, Simone
Working Paper
The Global Distribution of Routine and Non-RoutineWork
IZA Discussion Papers, No. 13384
Provided in Cooperation with:IZA – Institute of Labor Economics
Suggested Citation: Lewandowski, Piotr; Park, Albert; Schotte, Simone (2020) : The GlobalDistribution of Routine and Non-Routine Work, IZA Discussion Papers, No. 13384, Institute ofLabor Economics (IZA), Bonn
This Version is available at:http://hdl.handle.net/10419/223826
Standard-Nutzungsbedingungen:
Die Dokumente auf EconStor dürfen zu eigenen wissenschaftlichenZwecken und zum Privatgebrauch gespeichert und kopiert werden.
Sie dürfen die Dokumente nicht für öffentliche oder kommerzielleZwecke vervielfältigen, öffentlich ausstellen, öffentlich zugänglichmachen, vertreiben oder anderweitig nutzen.
Sofern die Verfasser die Dokumente unter Open-Content-Lizenzen(insbesondere CC-Lizenzen) zur Verfügung gestellt haben sollten,gelten abweichend von diesen Nutzungsbedingungen die in der dortgenannten Lizenz gewährten Nutzungsrechte.
Terms of use:
Documents in EconStor may be saved and copied for yourpersonal and scholarly purposes.
You are not to copy documents for public or commercialpurposes, to exhibit the documents publicly, to make thempublicly available on the internet, or to distribute or otherwiseuse the documents in public.
If the documents have been made available under an OpenContent Licence (especially Creative Commons Licences), youmay exercise further usage rights as specified in the indicatedlicence.
DISCUSSION PAPER SERIES
IZA DP No. 13384
Piotr LewandowskiAlbert ParkSimone Schotte
The Global Distribution of Routine and Non-Routine Work
JUNE 2020
Any opinions expressed in this paper are those of the author(s) and not those of IZA. Research published in this series may include views on policy, but IZA takes no institutional policy positions. The IZA research network is committed to the IZA Guiding Principles of Research Integrity.The IZA Institute of Labor Economics is an independent economic research institute that conducts research in labor economics and offers evidence-based policy advice on labor market issues. Supported by the Deutsche Post Foundation, IZA runs the world’s largest network of economists, whose research aims to provide answers to the global labor market challenges of our time. Our key objective is to build bridges between academic research, policymakers and society.IZA Discussion Papers often represent preliminary work and are circulated to encourage discussion. Citation of such a paper should account for its provisional character. A revised version may be available directly from the author.
Schaumburg-Lippe-Straße 5–953113 Bonn, Germany
Phone: +49-228-3894-0Email: [email protected] www.iza.org
IZA – Institute of Labor Economics
DISCUSSION PAPER SERIES
ISSN: 2365-9793
IZA DP No. 13384
The Global Distribution of Routine and Non-Routine Work
JUNE 2020
Piotr LewandowskiIBS and IZA
Albert ParkHKUST Institute for Emerging Market Studies and IZA
Simone SchotteUNU-WIDER
ABSTRACT
IZA DP No. 13384 JUNE 2020
The Global Distribution of Routine and Non-Routine Work*
Studies of the effects of technology and globalization on employment and inequality
commonly assume that occupations are identical around the world in the job tasks they
require. To relax this assumption, we develop a regression-based methodology to predict the
country-specific routine task intensity (RTI) of occupations based on survey data collected
in 46 low-, middle- and high-income countries. We find that within the same occupation
jobs in low- and middle-income countries are more routine intensive than in high-income
countries. We attribute these differences mainly to lower technology use in less-developed
countries. Using predicted country-specific RTI measures for 87 countries that together
employ more than 2.5 billion workers, we find that from 2000 to 2017 the shift away
from routine work and towards non-routine work in low- and middle-income countries
was much slower than in the high-income countries. The gap in average RTI increased and
high-income countries remain the dominant provider of non-routine work. In contrast,
assuming that occupations are identical around the world significantly overestimates the
role of non-routine tasks in low- and middle-income countries and leads to an implausible
conclusion that they have become the dominant supplier of non-routine work.
JEL Classification: J21, J23, J24
Keywords: de-routinization, economic development, global division of labour, task content of jobs, skills
Corresponding author:Piotr LewandowskiInstitute for Structural Research (IBS)Wiśniowa 40B/802-520 WarsawPoland
E-mail: [email protected]
* We thank Adam Bielski and Karol Madoń for excellent research assistance. We also thank participants of the LISER-
IAB Conference on Digital Transformation and the Future of Work for their insightful comments. We acknowledge
support from UNU-WIDER, and the Hong Kong Research Grants Council General Research Fund [16504217]. This
study is reproduced here with full acknowledgement of UNU-WIDER, Helsinki. The study was originally published
under the UNU-WIDER project The changing nature of work and inequality, which is part of a larger research project
on Inequalities – measurement, implications, and influencing change. The usual disclaimers apply. All errors are our
own.
2
1. Introduction Over the past decade, there has been an explosion of interest in understanding how the twin forces of trade and technology are shaping the nature of work around the world. A rapidly growing body of research has focused on studying the evolution of the task content of jobs – investigating patterns over time and across countries (Acemoglu and Autor, 2011; Autor, 2013; Firpo et al., 2011) – and assessing the relative importance of demand- and supply-side drivers from the nature of task changes. This approach has been particularly useful given that data on technology use are lacking from most labor force surveys. In developed countries, the relative share of routine-intensive jobs – both cognitive and manual – has declined while the relative share of non-routine jobs, especially those involving cognitive tasks, has increased, contributing to rising wage polarization (Autor et al., 2003; Goos et al., 2014; Spitz-Oener, 2006).
In previous research, the task content of jobs, namely the role of routine vs. non-routine and cognitive vs. manual tasks, is typically measured at the occupation level. Because information on the specific task content of different occupations has not been systematically collected in most countries, most existing studies use the US O*NET occupational task data to analyze task demand in countries around the world (Apella and Zunino, 2018; Arias et al., 2014; Du and Park, 2018; Hardy et al., 2018; Lewandowski et al., 2020). This research, however, requires the assumption that the task content of each occupation is identical everywhere in the world to that of the USA Especially for less-developed countries, this assumption may be problematic, given large differences in labor productivity, technology adoption, and skills supply (Eden and Gaggl, 2020; Hsieh and Klenow, 2010). Theory suggests that tasks are endogenously assigned by employers based on the demand and supply of different skills and given available technologies (Acemoglu and Autor, 2011; Autor and Handel, 2013). As a consequence, we should expect that specific occupations utilize different skill sets and perform different tasks in low-, middle-, and high-income countries. In particular, poorer countries may specialize in routine tasks and richer countries may specialize in non-routine tasks (Grossman and Rossi-Hansberg, 2008).
Corroborating this concern, Lewandowski et al. (2019) presented evidence of substantial differences in the task content of work within occupations across countries. In particular, they found that sector and country differences in technology use, workers’ skills, and globalization (measured by foreign value-added (FVA) share) all influence the task content of workers, even when they have the same occupation. Lo Bello et al. (2019) also showed that jobs in low- and middle-income countries are more routine intensive than in high-income countries. Lewandowski et al. (2019) relied on adult skill use survey data collected in 46 countries which include low-, middle-, and high-income economies. However, these survey data are (as yet) unavailable for several large emerging economies, including, for instance, Argentina, Brazil, Bangladesh, India, Nigeria, and South Africa. As a result, they are not sufficient to fully quantify the global allocation of routine and non-routine work, or to test whether de-routinization of work and wage polarization have occurred in low- and middle-income countries to an extent comparable with developed economies.
This paper makes two main contributions. First, we develop a regression-based methodology to predict the country-specific task content of each occupation in a large number of countries around the world. Building upon earlier work (Lewandowski et al., 2019), we show that in countries with lower levels of economic and technological development, workers tend to perform more routine-intensive tasks compared to those in more advanced countries, even within the same occupations. These within-occupation across-country gaps are

3
sizable. Accounting for cross-country differences between occupations creates a more nuanced and accurate picture of the nature of work in low- and middle-income countries.
Our second contribution is to present new evidence on the patterns and evolution of the global distribution of routine and non-routine work since the early 2000s. To this end, we merge country-specific occupational task measures with employment structure data for 87 countries from 2000 to 2017. Our country sample includes 25 low- or lower middle-income countries, 24 upper middle-income countries, and 38 high-income countries. In 2017, the countries in our sample jointly accounted for over 2.5 billion workers, equivalent to approximately 75% of global employment. We analyze the changing distribution of tasks over time, both holding country-occupation routine task intensity (henceforth RTI) fixed over time, and by allowing the task content of occupations to evolve over time.
We find that in low- or lower middle-income countries, the average RTI has hovered around the same level over the past two decades. This contrasts with the results obtained under the assumption that occupations are identical around the world, which show a reallocation of labor away from routine and towards non-routine work in all country groups. Moreover, when accounting for cross-country differences in occupational tasks, we find that the gap in country-level RTI between the high-income countries and low- and lower middle-income countries has been much larger than suggested using O*NET. Moreover, this gap has increased over time. We show that it can be attributed to both between-occupation effects – poorer countries exhibit higher employment shares of routine-intensive occupations – and within-occupation effects – in poorer countries occupations require more routine tasks. Finally, we show that the assumption that occupations are identical around the world leads to an implausible finding that, between the early 2000s and the middle 2010s, low- and middle-income countries became the dominant supplier of non-routine work. Accounting for cross-country within-occupation differences in tasks allows us to conclude that the high-income countries remain the dominant provider of non-routine workers, while routine work remains concentrated in low- and middle-income countries.
The remainder of this paper is structured as follows. In the second section we outline our methodology for defining occupational task content measures using survey data and predicting them for countries with no required survey data available. We also describe the method to combine task data with the employment data in countries around the world. In the third section, we present the predicted differences in the task content of comparable occupations – across countries at various levels of development, and over time. In the fourth section, we describe the evolution of the RTI of jobs in countries at various development levels and characterize the global allocation of routine and non-routine work. The fifth section concludes.
2. Methodology for predicting routine task intensity 2.1 Measurement of the country-specific task content of jobs using survey data
The starting point of our analysis is to use the harmonized task content measures developed by Lewandowski et al. (2019) to calculate country-specific average RTI by occupation in 46 countries covered by large-scale surveys spanning developed and developing countries. The survey data come from three sources: the OECD’s Programme for the International Assessment of Adult Competencies (PIAAC) (OECD 2014, 2017, 2019), covering a set of high- or middle-income countries, the World Bank’s Skills toward Employment and Productivity (STEP) surveys (World Bank 2016a, 2016b, 2018), conducted in middle- and low-income countries, and the China Urban
4
Labor Survey (CULS) collected by the Institute of Population and Labor Economics of Chinese Academy of Social Science (2017) which included a module based on STEP (the full list of countries is presented in Appendix A).
Lewandowski et al. (2019) used the US PIAAC data to define survey-based measures of non-routine cognitive analytical, non-routine cognitive interpersonal, routine cognitive, and manual tasks which are consistent with the widely used Acemoglu and Autor (2011) measures based on the O*NET data. The definitions of their measures are shown in Table 1. By applying the same definitions to workers in all countries covered by the PIAAC, STEP, and CULS surveys, Lewandowski et al. (2019) obtained worker-specific measurements that can be aggregated to describe country-level differences in job tasks. We use the same definitions.
Table 1. Survey task items from US PIAAC selected to calculate task content measures consistent with O*NET occupation task measures
Task content Non-routine cognitive analytical Non-routine cognitive
interpersonal Routine cognitive Manual
Task items
Solving problems Reading news
(at least once a month) Reading professional journals
(at least once a month) Programming
(any frequency)
Supervising others Making speeches or giving presentations
(any frequency)
Changing order of tasks – reversed (not able)
Filling out forms (at least once a month)
Making speeches or giving presentations –
reversed (never)
Physical tasks
Note: The cut-offs for the “yes” dummy are in parentheses. See Lewandowski et al. (2019) for more detail on the full wording of questions, the definitions of cut-offs, and the criteria for selecting task items. Source: Lewandowski et al. (2019).
Following previous literature (Autor and Dorn, 2009, 2013; Goos et al., 2014), we also define a measure of relative RTI using the following formula:
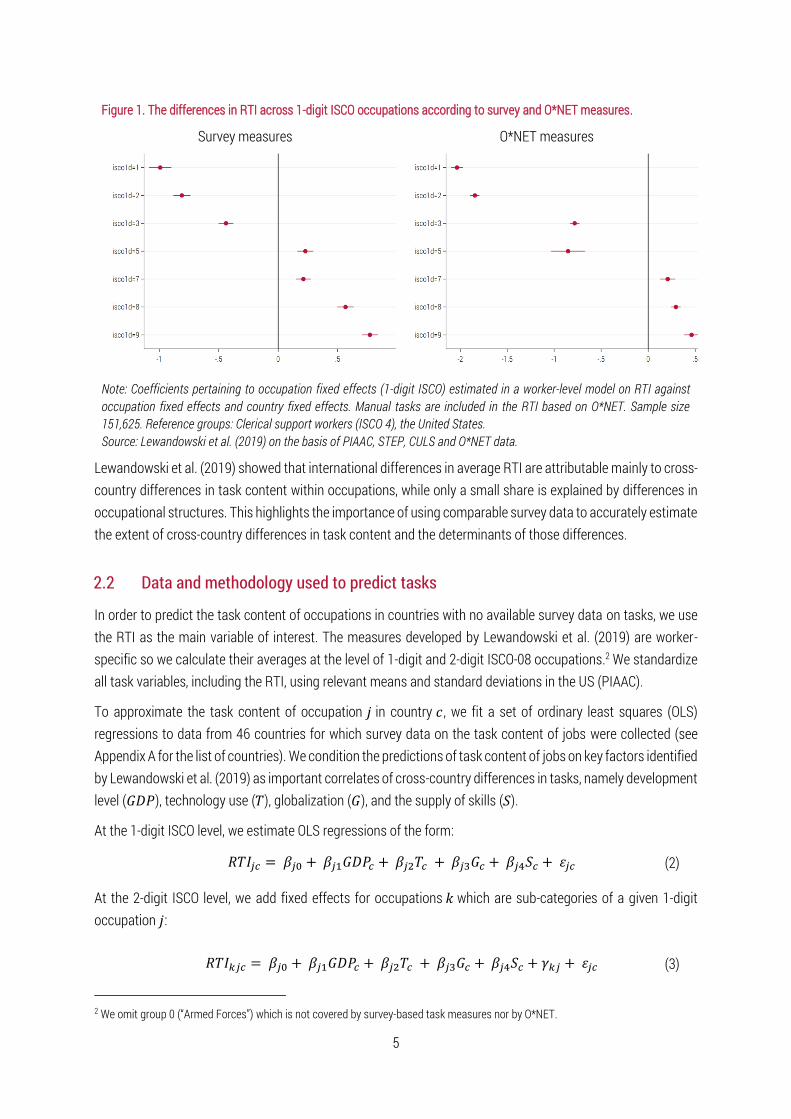
whereby 𝑟𝑐𝑜𝑔 , 𝑛𝑟𝑎𝑛𝑎𝑙𝑦𝑡𝑖𝑐𝑎𝑙 and 𝑛𝑟𝑝𝑒𝑟𝑠𝑜𝑛𝑎𝑙 are routine cognitive, non-routine cognitive analytical, and non-routine cognitive personal task levels, respectively.1 Our definition omits manual tasks because the survey data do not distinguish between routine and non-routine manual tasks, and the available manual task measure is not entirely comparable across countries (Lewandowski et al., 2019). Nonetheless, the survey-based RTI measure successfully captures the routine nature of work, even for manual jobs. For example, the RTI among plant and machine operators and assemblers (ISCO 8), who perform highly routine jobs according to the RTI based on O*NET which accounts for manual routine tasks, is also high according to the survey measure (Figure 1). Workers in high-skill occupations (ISCO 1-3) perform, on average, less routine-intensive tasks, while workers in middle- and low-skill occupations (ISCO 4-5, ISCO 7-9) perform more routine-intensive tasks (Figure 1), which is consistent with the occupational patterns using the O*NET measures. The survey-based measure also shows that tasks performed by sales and service workers (ISCO 5) around the world are on average slightly more routine than tasks performed by clerical support workers (ISCO 4, a reference group), contrary to O*NET measures (Figure 1).
1 For each task, the lowest score in the sample is added to the scores of all individuals, plus 0.1, to avoid non-positive values in the logarithm.
𝑅𝑇𝐼 = ln(𝑟𝑐𝑜𝑔) − ln(𝑛𝑟𝑎𝑛𝑎𝑙𝑦𝑡𝑖𝑐𝑎𝑙+𝑛𝑟𝑝𝑒𝑟𝑠𝑜𝑛𝑎𝑙
2), (1)
5
Figure 1. The differences in RTI across 1-digit ISCO occupations according to survey and O*NET measures.
Survey measures O*NET measures
Note: Coefficients pertaining to occupation fixed effects (1-digit ISCO) estimated in a worker-level model on RTI against occupation fixed effects and country fixed effects. Manual tasks are included in the RTI based on O*NET. Sample size 151,625. Reference groups: Clerical support workers (ISCO 4), the United States. Source: Lewandowski et al. (2019) on the basis of PIAAC, STEP, CULS and O*NET data.
Lewandowski et al. (2019) showed that international differences in average RTI are attributable mainly to cross-country differences in task content within occupations, while only a small share is explained by differences in occupational structures. This highlights the importance of using comparable survey data to accurately estimate the extent of cross-country differences in task content and the determinants of those differences.
2.2 Data and methodology used to predict tasks
In order to predict the task content of occupations in countries with no available survey data on tasks, we use the RTI as the main variable of interest. The measures developed by Lewandowski et al. (2019) are worker-specific so we calculate their averages at the level of 1-digit and 2-digit ISCO-08 occupations.2 We standardize all task variables, including the RTI, using relevant means and standard deviations in the US (PIAAC).
To approximate the task content of occupation 𝑗 in country 𝑐 , we fit a set of ordinary least squares (OLS) regressions to data from 46 countries for which survey data on the task content of jobs were collected (see Appendix A for the list of countries). We condition the predictions of task content of jobs on key factors identified by Lewandowski et al. (2019) as important correlates of cross-country differences in tasks, namely development level (𝐺𝐷𝑃), technology use (𝑇), globalization (𝐺), and the supply of skills (𝑆).
At the 1-digit ISCO level, we estimate OLS regressions of the form:
At the 2-digit ISCO level, we add fixed effects for occupations 𝑘 which are sub-categories of a given 1-digit occupation 𝑗:
2 We omit group 0 (“Armed Forces”) which is not covered by survey-based task measures nor by O*NET.
𝑅𝑇𝐼𝑗𝑐 =𝛽𝑗0 +𝛽𝑗1𝐺𝐷𝑃𝑐 +𝛽𝑗2𝑇𝑐 + 𝛽𝑗3𝐺𝑐 + 𝛽𝑗4𝑆𝑐 + 𝜀𝑗𝑐 (2)
𝑅𝑇𝐼𝑘𝑗𝑐 =𝛽𝑗0 +𝛽𝑗1𝐺𝐷𝑃𝑐 +𝛽𝑗2𝑇𝑐 + 𝛽𝑗3𝐺𝑐 + 𝛽𝑗4𝑆𝑐 + 𝛾𝑘𝑗 + 𝜀𝑗𝑐 (3)

6
We measure the development level by gross domestic product (GDP) per capita (in $ PPP (purchasing power parity), natural logarithm). Our preferred proxy measure for technology use is the number of internet users per 100 inhabitants, as this is available for the largest set of countries. We quantify globalization with a measure of specialization in global value chains (GVCs) proposed by Wang et al. (2017): the share of FVA in the production of final goods.3 We also interact this measure with GDP per capita (log) in order to account for the possibility that globalization reduces routine tasks in rich countries and increases them in poor countries. Finally, we measure skill supply with the average years of schooling obtained from the World Development Indicators database (World Bank 2020). All variables are demeaned using the unweighted average in the sample of countries with survey data.
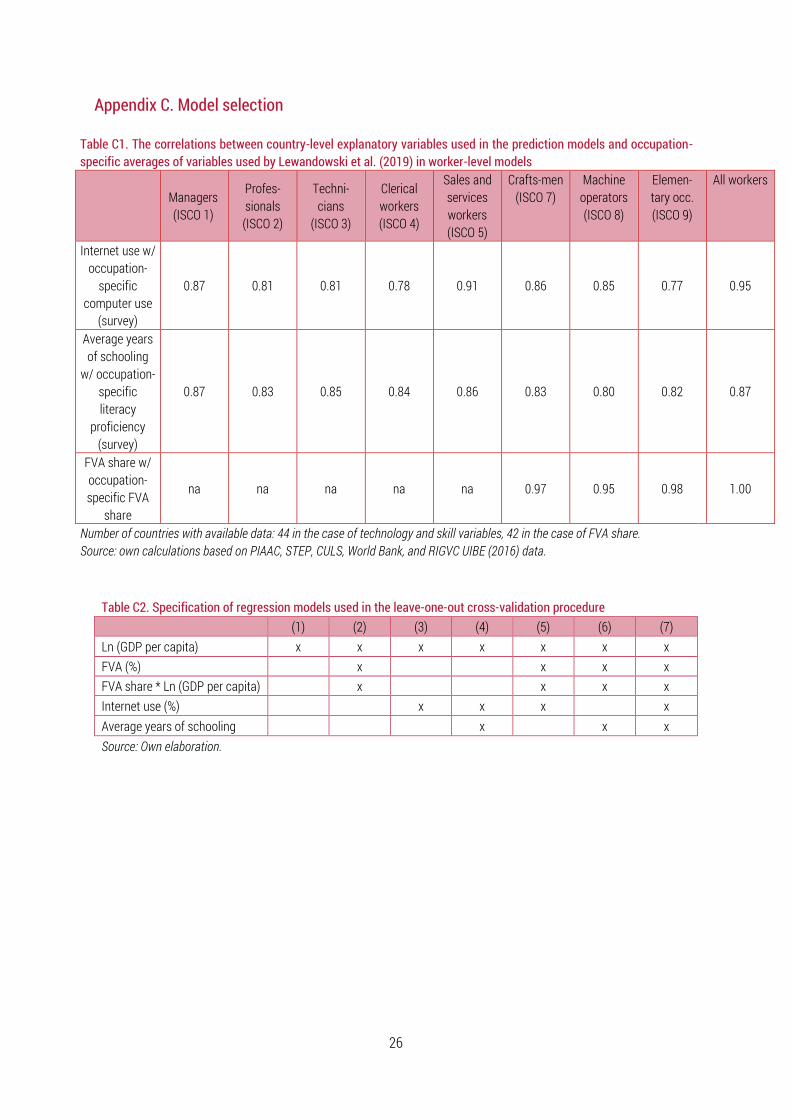
The development and globalization variables are identical to those used by Lewandowski et al. (2019). However, the technology and skill supply variables used by Lewandowski et al. (2019) are not available for countries not covered by the survey data. We use different variables which are available for a large number of countries and which are highly correlated with the relevant variables used by Lewandowski et al. (2019). The correlation between the average years of schooling and the average proficiency in literacy skills is 0.87, and correlation between the average years of schooling and the occupation-specific literacy proficiency ranges from 0.80 to 0.87 (across 44 countries with available data, see Table C1 in Appendix C). The correlation between the share of internet users and the share of workers who use computers at work is 0.94 and the correlation between the share of internet users and the occupation-specific literacy proficiency ranges from 0.77 to 0.91 (44 countries, Table C1).4
We allow the task content within occupations to vary across countries (given their endowments) as a function of changes in technology, globalization, development, and skills. The task content of occupations may be expected to change gradually over time in relation to the country’s overall endowments (Autor et al., 2003; Spitz-Oener, 2006) and will likely not be reactive to short-term business cycle fluctuations. Thus, to fit the regression model, we take averages of the explanatory variables for the 2011-2016 period since the vast majority of STEP/PIAAC/CULS survey data were collected during this period. We use globalization variables from 2011 as more recent data are not available.
In order to assess the relative importance of particular factors in predicting cross-country differences in tasks, for each occupation 𝑗 we decompose the variance of RTI at the country level 𝑅𝑇𝐼̅̅ ̅̅
�̅�𝑐 using the covariance-based decomposition proposed by Morduch and Sicular (2002). Formally, the contribution of a variable, 𝑝, to the variance of 𝑅𝑇𝐼̅̅ ̅̅
�̅�𝑐 is defined as follows:
3 The data on GVC participation come from the RIGVC UIBE (2016) database. We use the backward linkage-based measure, defined as the FVA share in production of final goods and services (Wang et al., 2017). We use the variables based on data from the Global Trade Analysis Project. The latest year available is 2011. We merge the RIGVC UIBE (2016) data with our data at the country level. The RIGVC UIBE (2016) data are not available for Macedonia. 4 The correlation between the share of internet users and ICT capital stock per worker (Eden and Gaggl, 2020), is 0.78, but the share of internet users is available for many more countries (192 vs. 69).
𝜎𝑗𝑝 =𝑐𝑜𝑣(𝛽𝑝�̅�𝑐
𝑝,𝑅𝑇𝐼̅̅ ̅̅ ̅𝑗𝑐)
𝑣𝑎𝑟(𝑅𝑇𝐼̅̅ ̅̅ ̅𝑗𝑐), (4)
7
Next, in order to account for intertemporal changes in the task content of occupations between 2000 and 2017, we assume that the estimated cross-country relationships between the RTI and explanatory variables hold over time. Such assumption is required as no survey data on workers’ tasks were collected before 2011. We use the estimated equation (1) to predict the country-specific RTI in 2001-2005, using the averages of explanatory variables across this period, except for the globalization variable, which is available only for 2004. Having calculated the predictions for two periods, we apply a weighted average to combine the task content measures based on the 2001-2005 and 2011-2016 predictions for each country and occupation. From 2000 to 2002, we use task measures based on the RTI predicted for 2001-2005; for any year t in the period 2003-2017, we assign
a weight 2017−𝑡14
to RTI based on the RTI predicted for 2001-2005, and a weight 𝑡−200314
to the RTI predicted for
2011-2016.
In order to quantify changes in task content under the assumption that occupations are identical around the world, we use O*NET 2003 and 2017 releases to calculate the Acemoglu and Autor (2011) RTI measure.5 We use the 2003 O*NET as our baseline measure. To create the O*NET RTI that accounts for changes of task content of occupations over time, we use the same weighted average approach as for the survey and predicted task measures. Finally, to isolate the differences which stem from country-specific measurement, rather than from methodological differences, we also use the occupational RTI based on the US PIAAC survey.
In order to convert all RTI measures to the ISCO-88 classification, we use the crosswalk prepared on the basis of European Working Conditions Survey data (Eurofound, 2020).
2.3 Methodology of merging tasks with employment data
Having predicted the occupation-specific RTI in various countries, we merge the RTI values with ILOSTAT data on employment structures by occupation between 2000 and 2017 (International Labour Organization 2020). Our sample includes 87 countries that meet two data conditions: all explanatory variables described above are available, and at least two years of employment data are provided in the ILOSTAT.6 Our sample includes approximately 2.5 billion workers in 2015-2017, which corresponds to about 75% of total global employment in this period. Our models are estimated for countries that are covered by the survey data, of which the majority are high- or upper middle-income countries. In order to avoid extrapolating beyond the range of values used to build the model, we exclude from our sample nine economies with a GDP per capita level below Kenya ($2687 PPP, on average, between 2011 and 2016), the poorest country in our PIAAC/STEP sample. For presentation purposes, we split our country sample into four income groups: low-income or lower middle-income countries (25), upper middle-income countries (24), lower high-income countries (17) and top high-income countries (21) – see Table B1 in Appendix B.
5 The O*NET data were initially collected from occupation analysts; this information is updated annually by ongoing surveys of workers and occupation experts. On average, 614 O*NET occupations were updated between 2003 and 2018. The O*NET-SOC 2010 taxonomy includes 1110 occupational titles, 974 of which represent O*NET data-level occupations. We calculate the O*NET RTI measures at two points in time, using the 2003 and 2017 data release. In line with the approach used to account for changes over time in the country-specific task content measures, for each year, the aggregate O*NET RTI is calculated as the moving average of the two measures. 6 Of the countries covered by the ILOSTAT data, we omit seven oil exporting countries, five countries classified as tax havens (according to Financial Secrecy Index for 2011) and six small island states or overseas territories.
8
We calculate the average RTI in a given country and year as a weighted average of the country-specific RTI across occupations, using occupation employment shares as weights. For countries covered by the survey data, we use occupation-specific average RTIs calculated as described in section 2.1. For the remaining countries, we use predicted values estimated in line with the regression framework presented in section 2.2. Whenever possible, we use data at the 2-digit occupation level. However, we use 1-digit level data if the employment structure at the two-digit level is not available in the survey data or in the ILOSTAT data, or if the share of workers unclassified at the 2-digit occupation level exceeds 5% in a given year.7 We also use predicted RTI values at the 1-digit level for ISCO 6 (skilled agricultural, forestry, and fishery workers) for all countries, because the sample sizes in ISCO6 are small in some countries covered by STEP, which is an urban survey. We use either ISCO-08 or ISCO-88, depending on the classification available in the ILOSTAT data for a given year and country.8 In order to convert all RTI measures to the ISCO-88 classification, we use the crosswalk prepared for the European Working Conditions Survey data.
For each task measure, we standardize the measure using the relevant mean and standard deviation in the USA so that 0 reflects the US average in the year 2000 and 1 reflects standard deviations in the US.9
In order to analyze to what extent the cross-country differences in task values can be attributed to differences in occupational structures, and to what extent to differences in occupation-specific task values, we apply a shift-share decomposition. For each task measure we decompose the difference between the average task content level in a given country group 𝑐, 𝑅𝑇𝐼𝑐𝑖 , and the average in top high-income countries, 𝑅𝑇𝐼𝑖, into the between-occupation, 𝐵𝑂𝑐𝑖 , within-occupation, 𝑊𝑂𝑐
𝑖 , and interaction,𝐼𝑁𝑇𝑐𝑖 , terms. Formally:
whereby:
• 𝑟𝑡𝑖𝑗,𝑐𝑖 and 𝑟𝑡𝑖𝑗𝑖 are the average values of task content 𝑖for workers in occupation 𝑗 in country group 𝑐,
and in top high-income countries, respectively; • 𝛼𝑗,𝑐
𝑖 and 𝛼𝑗𝑖 are the shares of workers in occupation 𝑗 in total employment in country 𝑐, and in top high-income countries, respectively; and
• 𝐼𝑆𝐶𝑂 is the set of 1-digit ISCO-08 occupations.
7 If the share of workers unclassified at the 1-digit occupation level exceeds 5%, we omit such year. 8 ISCO-08 is used, by and large, from year 2011 on. 9 Following Acemoglu and Autor (2011), we use survey weights (at the 3-digit Standard Occupational Classification level) from the US 2000 census for the standardization of O*NET tasks. However, to ensure consistency with the ILOSTAT data we use in our cross-country study, we adjusted the census weights (at the 1-digit level) to match the occupational structure in the ILOSTAT data for the USA in 2000.
(𝑅𝑇𝐼𝑐𝑖 − 𝑅𝑇𝐼𝑖) = ( ∑ 𝛼𝑗,𝑐𝑟𝑡𝑖𝑗,𝑐
𝑖 − ∑ 𝛼𝑗𝑟𝑡𝑖𝑗𝑖
𝑗∈𝐼𝑆𝐶𝑂
) =
𝑗∈𝐼𝑆𝐶𝑂
𝐵𝑂𝑐𝑖 +𝑊𝑂𝑐
𝑖 + 𝐼𝑁𝑇𝑐𝑖 (5)
𝐵𝑂𝑐𝑖 = ∑ 𝑟𝑡𝑖𝑗
𝑖(𝛼𝑗,𝑐 − 𝛼𝑗)
𝑗∈𝐼𝑆𝐶𝑂
(6)
𝐵𝑂𝑐𝑖 = ∑ 𝑟𝑡𝑖𝑗
𝑖(𝛼𝑗,𝑐 − 𝛼𝑗)
𝑗∈𝐼𝑆𝐶𝑂
(7)
𝐼𝑁𝑇𝑐𝑖 = ∑ (𝛼𝑗,𝑐 − 𝛼𝑗)(𝑟𝑡𝑖𝑗,𝑐
𝑖 − 𝑟𝑡𝑖𝑗𝑖)
𝑗∈𝐼𝑆𝐶𝑂
(8)
9
Finally, we use the task measures merged with employment data to quantify the global allocation of routine and non-routine work. To this aim, we calculate the global distribution of RTI (weighted by total employment across all countries and occupations in our sample) at the end of our study period.10 We define the threshold for the non-routine jobs as the 25th percentile of that distribution, and classify as non-routine all jobs with the RTI value below it. We define the threshold for the routine jobs as the 75th percentile of that distribution, and classify as routine all jobs with the RTI value above it. We apply these thresholds both at the beginning and at the end of our study period. This ensures that the definition of routine and non-routine jobs is consistent over time. Next, we calculate the shares of particular country groups in total, routine and non-routine employment in each period. We conduct this analysis using both our country-specific occupational task measures and the O*NET task measures, which allows us to quantify how much the role of non-routine tasks in low- and middle-income countries is overestimated under the assumption that occupations are identical around the world.
3. Predicting the country-specific routine task intensity of occupations 3.1 Model selection and estimation results
In the first step, we estimate separate regressions for each 1-digit occupation. We select the following models: ▪ For ISCO1 to ISCO5 the model that controls for development level, technology, and skills; ▪ For ISCO6 (agriculture) the model that controls for development level; and ▪ For ISCO 7 to ISCO 9 the model that controls for development level, globalization, technology, and skills.
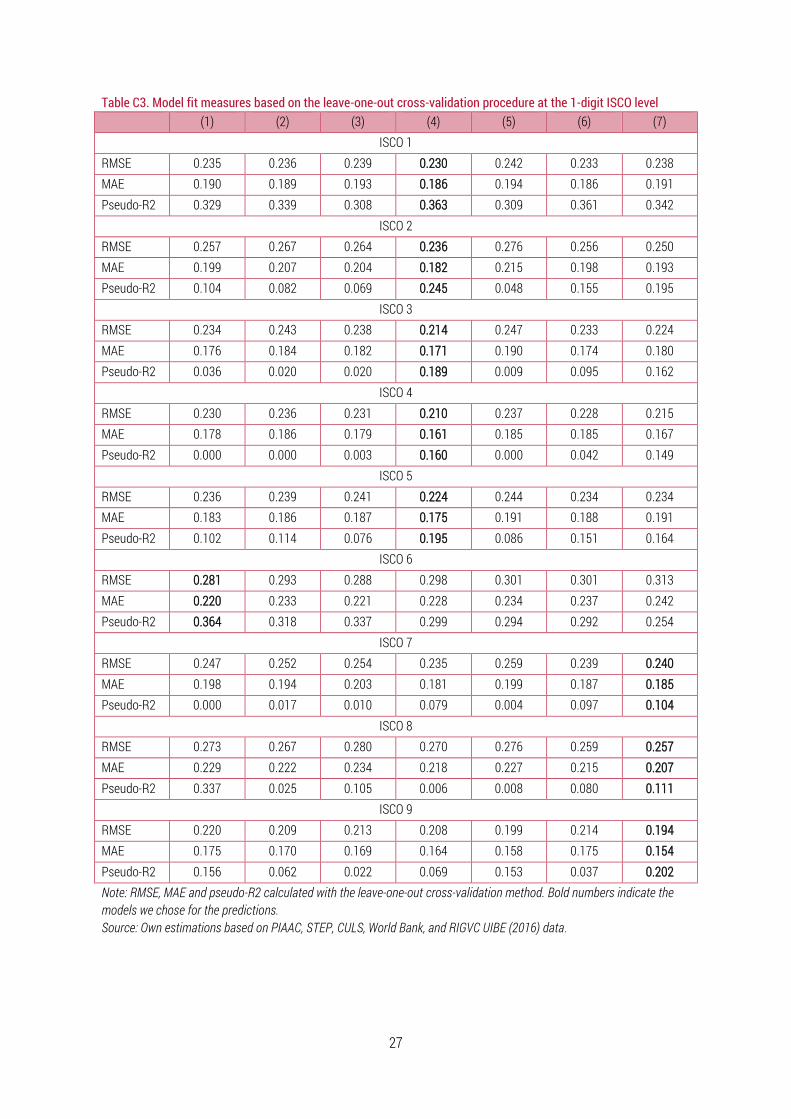
For each occupation, we select the best model from a set of seven alternatives which differ in explanatory variables (see Table C2 in Appendix C). We use two model selection criteria. First, we select models that fit the data best, in particular, that have the highest predictive power based on the leave-one-out cross-validation (LOOCV).11 The chosen models exhibit the lowest root mean square errors, the lowest mean absolute errors, and the highest pseudo-R2 (with two exceptions) among all alternatives considered for each occupation (Table C3 in the Appendix C). 12 Second, the specifications are consistent with the occupation-specific regressions estimated at a worker level by Lewandowski et al. (2019). The differences in RTI among workers in high-skilled (ISCO 1-3) and middle-skilled (ISCO 4-5) occupations are related to the differences in technology use, skills, and development level (Table 2). In particular, countries with higher technology use exhibit lower RTI. In the case of low-skilled occupations (ISCO 7-9) these differences are also related to globalization: in poorer countries higher specialization in the GVCs is associated with the higher RTI of jobs, while the opposite is true in the richer countries (Table 2). Once we control for technology use, the coefficient on (log) GDP per capita is positive (but in most cases insignificant), similar to the worker-level estimates in Lewandowski et al. (2019). The coefficients
10 As a starting point, we use the 2000 employment data, and for countries lacking 2000 data, we use the earliest available data. The end point is 2017, and for countries lacking 2017 employment data, we use the most recent available data. If a country has no data available before 2005, or from 2014 on, we do not include it in this analysis. 11 We use the command LOOCV by Barron (2014) in STATA. From the full sample of N country observations, each model specification is repeatedly estimated N-1 times leaving out one country at a time and fitting the model using the remaining N-1 observations. The resulting parameters are used to predict the value of the dependent variable for the country that has been excluded from the sample and the prediction error is calculated to assess the goodness-of-fit. 12 The pseudo-R2 is the square of the correlation coefficient of the predicted and observed values of the dependent variable.

10
pertaining to the supply of skills are positive. This suggests that the cross-country relationship between skill supply and RTI may be associated with differences between occupational structures rather than differences within occupations.13 In the case of agricultural workers (ISCO 6) we condition RTI only on development level.14
Table 2. The estimated occupation-specific models at the 1-digit ISCO level
Managers (ISCO 1)
Profes-sionals (ISCO 2)
Techni-cians
(ISCO 3)
Clerical workers (ISCO 4)
Sales and services workers (ISCO 5)
Agricul-tural
workers (ISCO 6)
Crafts-men
(ISCO 7)
Machine oper- ators
(ISCO 8)
Elemen-tary occ. (ISCO 9)
Ln (GDP per capita)
-0.015 0.116 0.125 0.243** 0.072 -0.308*** 0.175 0.244** 0.002 (0.102) (0.104) (0.096) (0.095) (0.101) (0.056) (0.109) (0.117) (0.093)
FVA share 1.160** 1.614*** 0.619 (0.526) (0.563) (0.451)
FVA share * Ln (GDP per capita)
-0.568 -0.958 1.043 (0.883) (0.945) (0.756)
Internet use -1.036** -1.521*** -1.384*** -1.334*** -1.182*** -1.407*** -1.468*** -0.814** (0.427) (0.436) (0.399) (0.395) (0.420) (0.455) (0.487) (0.390)
Average years of schooling
0.024 0.061** 0.064** 0.080*** 0.047 0.046 0.066** 0.085*** (0.029) (0.030) (0.027) (0.027) (0.029) (0.030) (0.032) (0.025)
Constant -0.651*** -0.488*** -0.128*** 0.283*** 0.534*** 0.470*** 0.523*** 0.867*** 1.076*** (0.032) (0.033) (0.030) (0.030) (0.032) (0.041) (0.034) (0.036) (0.029)
Observations 46 46 46 46 46 44 45 45 45
Adjusted R2 0.431 0.326 0.259 0.219 0.261 0.404 0.224 0.234 0.271 Note: *** p<0.01, ** p<0.05, * p<0.1. Standard errors in parentheses. We use standardized weights that give each country equal weight. Source: Own estimations based on PIAAC, STEP, CULS, World Bank, and RIGVC UIBE (2016) data.
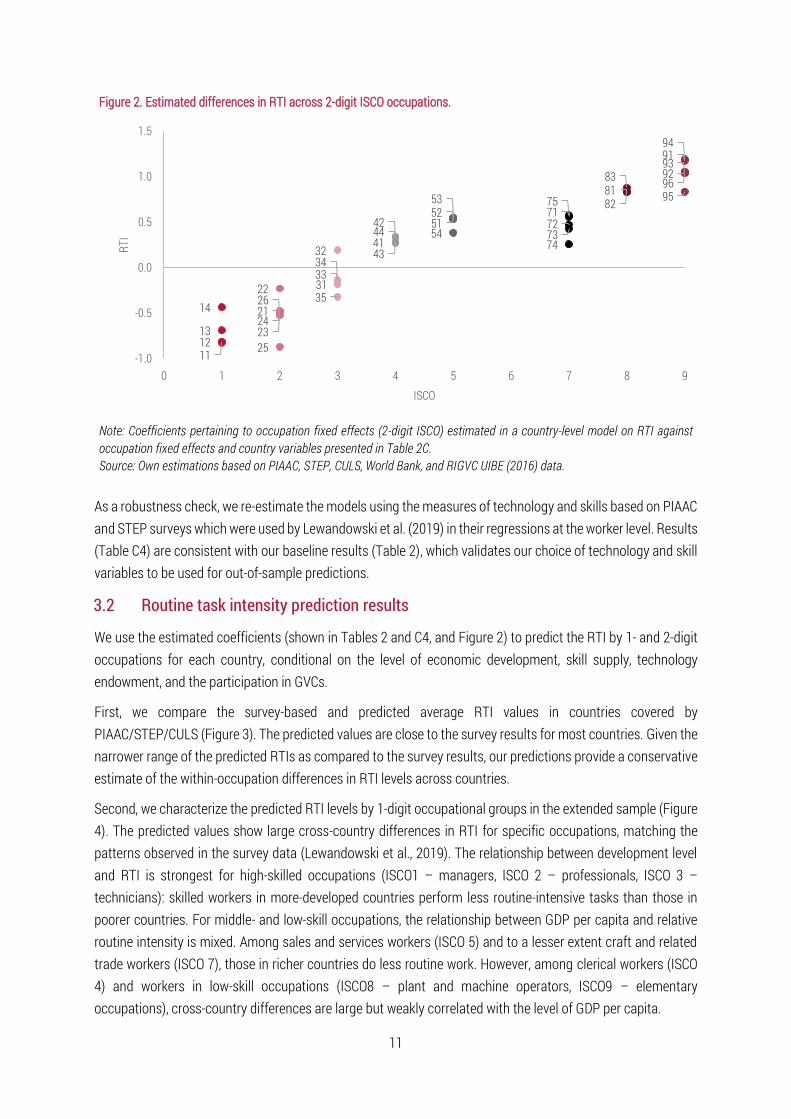
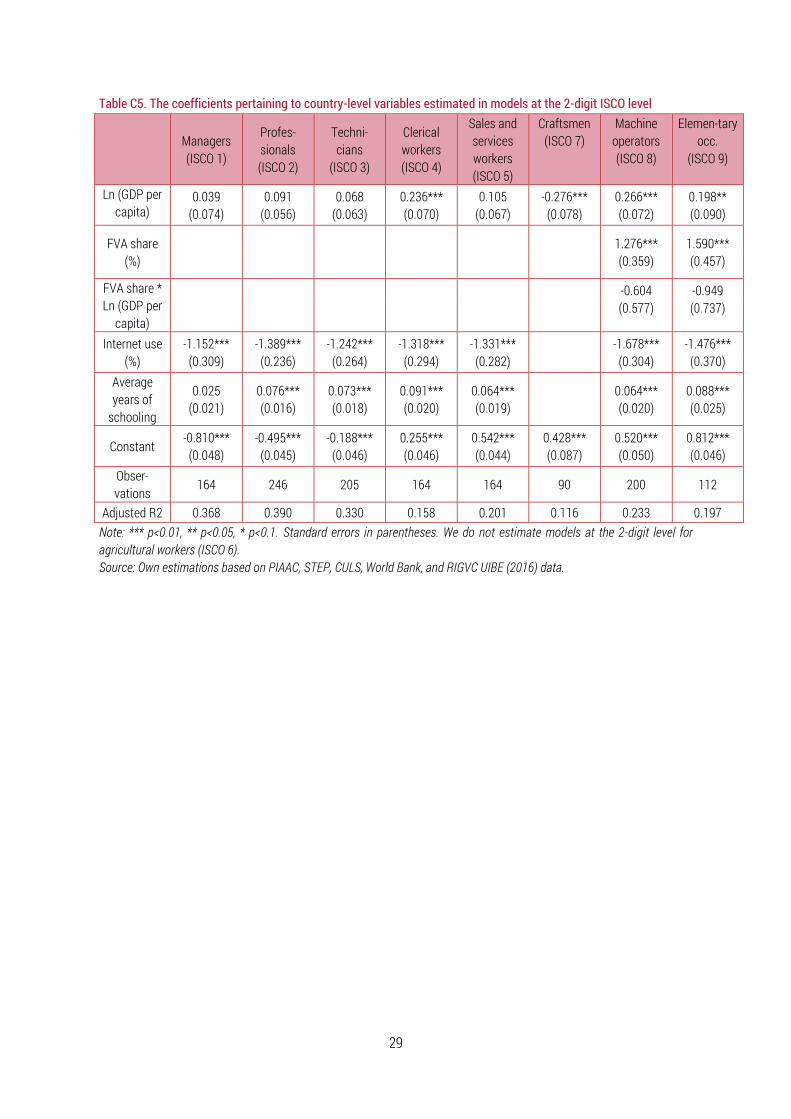
Next, we estimate model (3) separately for each set of 2-digit occupations grouped at the corresponding 1-digit level. We use the same explanatory variables as earlier and add dummies for the 2-digit subgroups. The coefficients on explanatory variables are virtually identical to the ones obtained in the regressions at the 1-digit level (Table C5 in Appendix C). The estimates of 2-digit occupation subgroups (Figure 2) show that there is a moderate heterogeneity among the subgroups of a particular 1-digit ISCO occupation, especially for high-skilled occupations (ISCO1-3).15 We do not estimate the 2-digit models for agricultural workers (ISCO 6) as the coding of occupational subgroups 61 to 63 in the PIAAC and STEP data is inconsistent.16
13 Lewandowski et al. (2019) find a similar effect in regressions estimated at the country-sector level. However, at a worker level they find a negative relationship between individual skill supply and RTI, which suggests that within countries and sectors workers with higher skill proficiency perform less routine-intensive tasks. 14 This occupational group is not studied by Lewandowski et al. (2019) at all. 15 We also interacted these occupational dummies with demeaned log GDP per capita, without substantial improvement in fit – results are available upon request. 16 In countries such as Bolivia or Kenya, all ISCO 6 are assigned to occupations ISCO 61 or 63 occupations (no workers are assigned to ISCO 62), while in countries such as Greece, Italy, Japan, Macedonia, Republic of Korea, United States, and Slovakia, all ISCO 6 workers are assigned to occupations ISCO 61 or 62 (no workers are assigned to ISCO 63). In countries such as Belgium, Germany, and Israel, all ISCO 6 workers are assigned to occupations ISCO 61 (no workers are assigned to ISCO 62 or 63).
11
Figure 2. Estimated differences in RTI across 2-digit ISCO occupations.
Note: Coefficients pertaining to occupation fixed effects (2-digit ISCO) estimated in a country-level model on RTI against occupation fixed effects and country variables presented in Table 2C. Source: Own estimations based on PIAAC, STEP, CULS, World Bank, and RIGVC UIBE (2016) data.
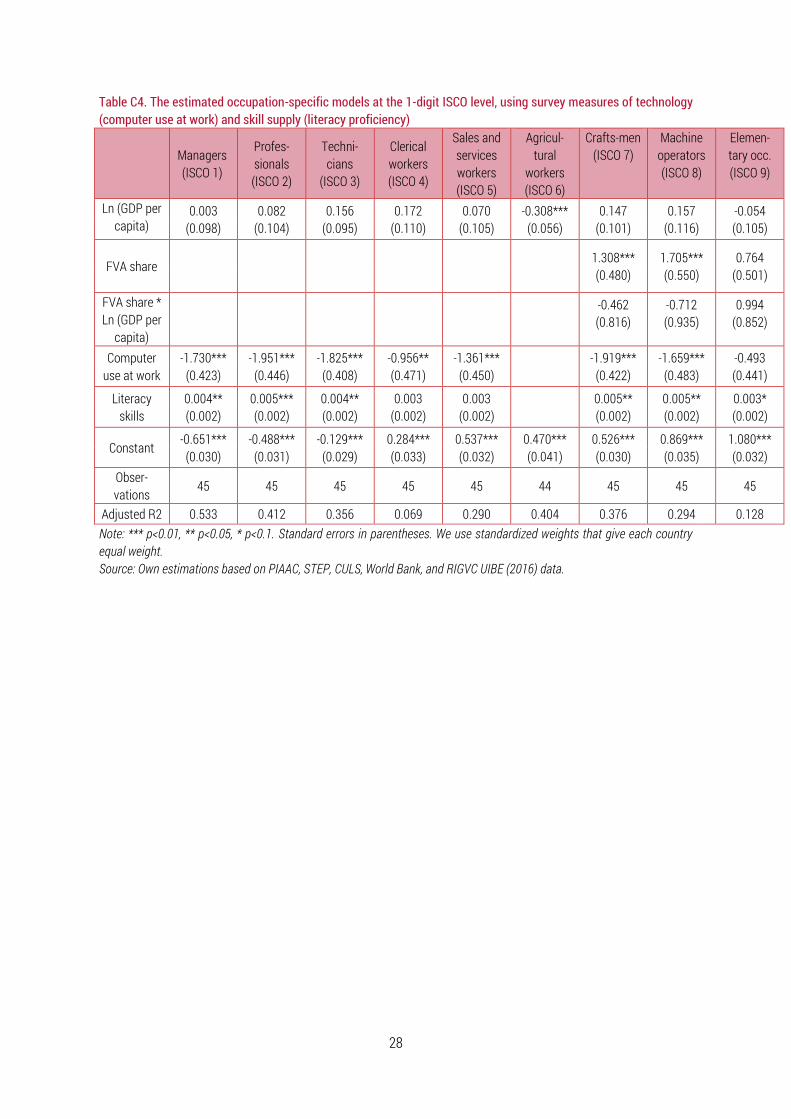
As a robustness check, we re-estimate the models using the measures of technology and skills based on PIAAC and STEP surveys which were used by Lewandowski et al. (2019) in their regressions at the worker level. Results (Table C4) are consistent with our baseline results (Table 2), which validates our choice of technology and skill variables to be used for out-of-sample predictions.
3.2 Routine task intensity prediction results
We use the estimated coefficients (shown in Tables 2 and C4, and Figure 2) to predict the RTI by 1- and 2-digit occupations for each country, conditional on the level of economic development, skill supply, technology endowment, and the participation in GVCs.
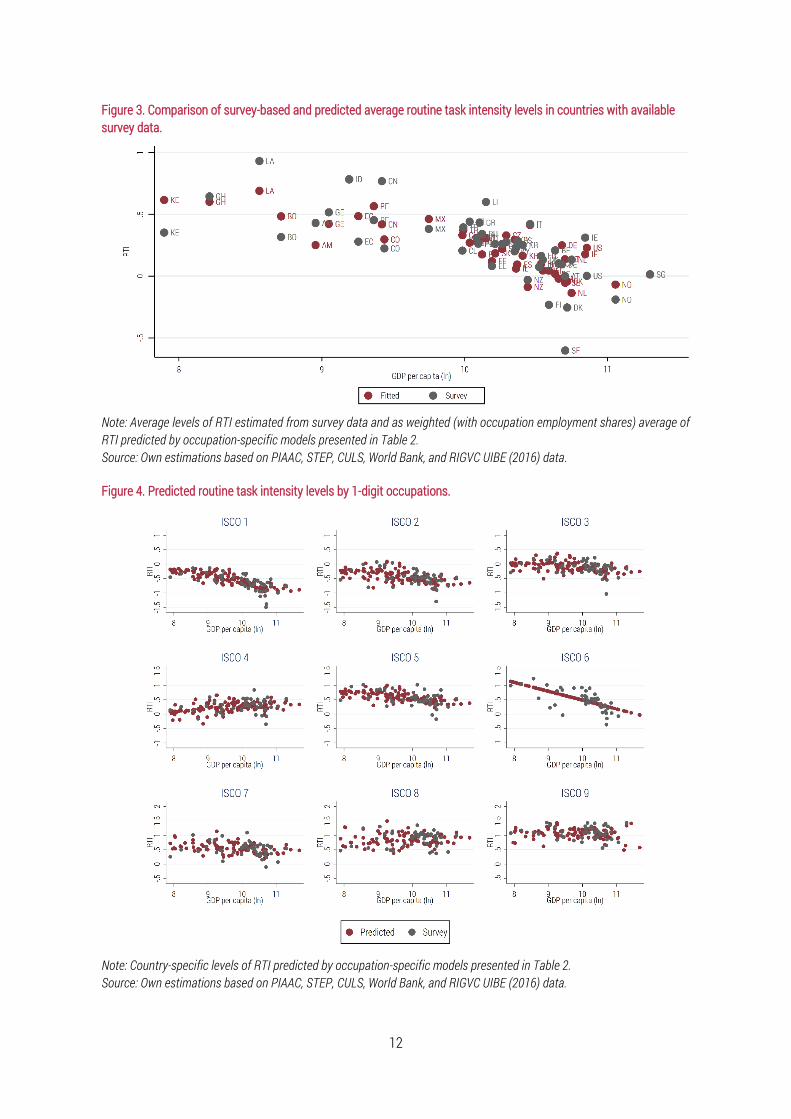
First, we compare the survey-based and predicted average RTI values in countries covered by PIAAC/STEP/CULS (Figure 3). The predicted values are close to the survey results for most countries. Given the narrower range of the predicted RTIs as compared to the survey results, our predictions provide a conservative estimate of the within-occupation differences in RTI levels across countries.
Second, we characterize the predicted RTI levels by 1-digit occupational groups in the extended sample (Figure 4). The predicted values show large cross-country differences in RTI for specific occupations, matching the patterns observed in the survey data (Lewandowski et al., 2019). The relationship between development level and RTI is strongest for high-skilled occupations (ISCO1 – managers, ISCO 2 – professionals, ISCO 3 – technicians): skilled workers in more-developed countries perform less routine-intensive tasks than those in poorer countries. For middle- and low-skill occupations, the relationship between GDP per capita and relative routine intensity is mixed. Among sales and services workers (ISCO 5) and to a lesser extent craft and related trade workers (ISCO 7), those in richer countries do less routine work. However, among clerical workers (ISCO 4) and workers in low-skill occupations (ISCO8 – plant and machine operators, ISCO9 – elementary occupations), cross-country differences are large but weakly correlated with the level of GDP per capita.
111213
14 21
22
2324
25
2631
32
3334
35
41
42
43
44515253
54
71727374
758182
83
919293
94
9596
-1.0
-0.5
0.0
0.5
1.0
1.5
0 1 2 3 4 5 6 7 8 9
RTI
ISCO
12
Figure 3. Comparison of survey-based and predicted average routine task intensity levels in countries with available survey data.
Note: Average levels of RTI estimated from survey data and as weighted (with occupation employment shares) average of RTI predicted by occupation-specific models presented in Table 2. Source: Own estimations based on PIAAC, STEP, CULS, World Bank, and RIGVC UIBE (2016) data.
Figure 4. Predicted routine task intensity levels by 1-digit occupations.
Note: Country-specific levels of RTI predicted by occupation-specific models presented in Table 2. Source: Own estimations based on PIAAC, STEP, CULS, World Bank, and RIGVC UIBE (2016) data.
13
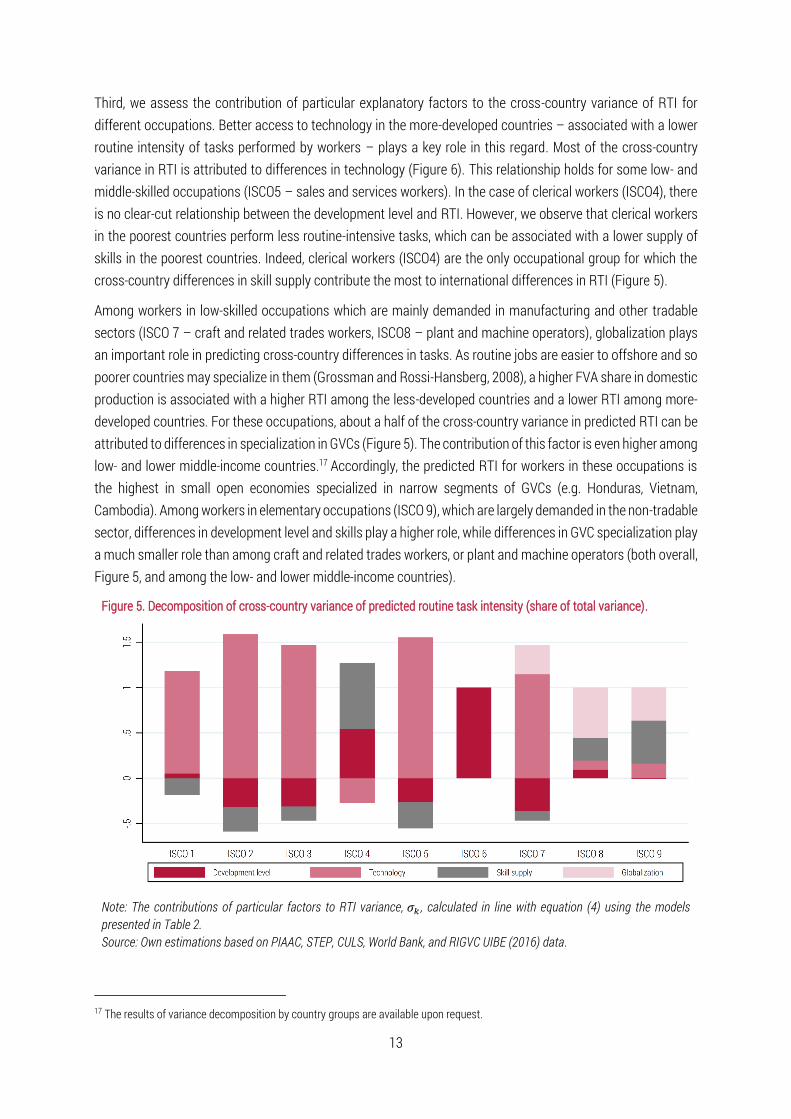
Third, we assess the contribution of particular explanatory factors to the cross-country variance of RTI for different occupations. Better access to technology in the more-developed countries – associated with a lower routine intensity of tasks performed by workers – plays a key role in this regard. Most of the cross-country variance in RTI is attributed to differences in technology (Figure 6). This relationship holds for some low- and middle-skilled occupations (ISCO5 – sales and services workers). In the case of clerical workers (ISCO4), there is no clear-cut relationship between the development level and RTI. However, we observe that clerical workers in the poorest countries perform less routine-intensive tasks, which can be associated with a lower supply of skills in the poorest countries. Indeed, clerical workers (ISCO4) are the only occupational group for which the cross-country differences in skill supply contribute the most to international differences in RTI (Figure 5).
Among workers in low-skilled occupations which are mainly demanded in manufacturing and other tradable sectors (ISCO 7 – craft and related trades workers, ISCO8 – plant and machine operators), globalization plays an important role in predicting cross-country differences in tasks. As routine jobs are easier to offshore and so poorer countries may specialize in them (Grossman and Rossi-Hansberg, 2008), a higher FVA share in domestic production is associated with a higher RTI among the less-developed countries and a lower RTI among more-developed countries. For these occupations, about a half of the cross-country variance in predicted RTI can be attributed to differences in specialization in GVCs (Figure 5). The contribution of this factor is even higher among low- and lower middle-income countries.17 Accordingly, the predicted RTI for workers in these occupations is the highest in small open economies specialized in narrow segments of GVCs (e.g. Honduras, Vietnam, Cambodia). Among workers in elementary occupations (ISCO 9), which are largely demanded in the non-tradable sector, differences in development level and skills play a higher role, while differences in GVC specialization play a much smaller role than among craft and related trades workers, or plant and machine operators (both overall, Figure 5, and among the low- and lower middle-income countries).
Figure 5. Decomposition of cross-country variance of predicted routine task intensity (share of total variance).
Note: The contributions of particular factors to RTI variance, 𝜎𝑘 , calculated in line with equation (4) using the models presented in Table 2. Source: Own estimations based on PIAAC, STEP, CULS, World Bank, and RIGVC UIBE (2016) data.
17 The results of variance decomposition by country groups are available upon request.
14
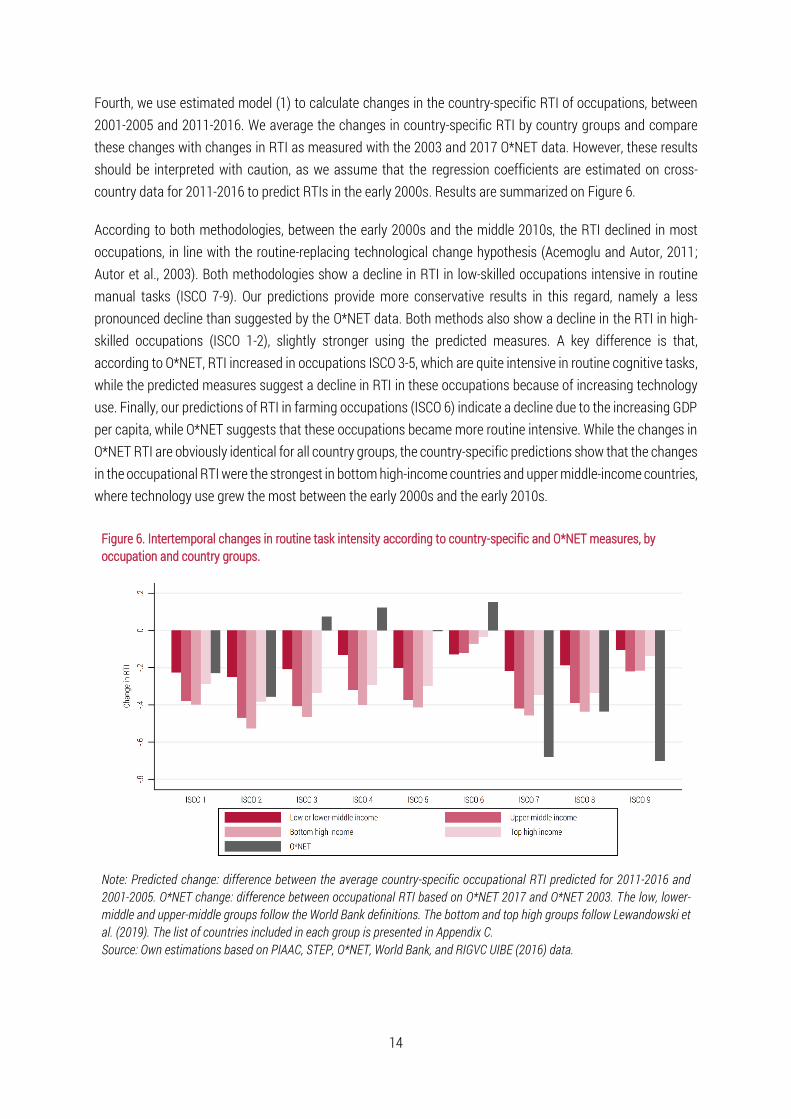
Fourth, we use estimated model (1) to calculate changes in the country-specific RTI of occupations, between 2001-2005 and 2011-2016. We average the changes in country-specific RTI by country groups and compare these changes with changes in RTI as measured with the 2003 and 2017 O*NET data. However, these results should be interpreted with caution, as we assume that the regression coefficients are estimated on cross-country data for 2011-2016 to predict RTIs in the early 2000s. Results are summarized on Figure 6.
According to both methodologies, between the early 2000s and the middle 2010s, the RTI declined in most occupations, in line with the routine-replacing technological change hypothesis (Acemoglu and Autor, 2011; Autor et al., 2003). Both methodologies show a decline in RTI in low-skilled occupations intensive in routine manual tasks (ISCO 7-9). Our predictions provide more conservative results in this regard, namely a less pronounced decline than suggested by the O*NET data. Both methods also show a decline in the RTI in high-skilled occupations (ISCO 1-2), slightly stronger using the predicted measures. A key difference is that, according to O*NET, RTI increased in occupations ISCO 3-5, which are quite intensive in routine cognitive tasks, while the predicted measures suggest a decline in RTI in these occupations because of increasing technology use. Finally, our predictions of RTI in farming occupations (ISCO 6) indicate a decline due to the increasing GDP per capita, while O*NET suggests that these occupations became more routine intensive. While the changes in O*NET RTI are obviously identical for all country groups, the country-specific predictions show that the changes in the occupational RTI were the strongest in bottom high-income countries and upper middle-income countries, where technology use grew the most between the early 2000s and the early 2010s.
Figure 6. Intertemporal changes in routine task intensity according to country-specific and O*NET measures, by occupation and country groups.
Note: Predicted change: difference between the average country-specific occupational RTI predicted for 2011-2016 and 2001-2005. O*NET change: difference between occupational RTI based on O*NET 2017 and O*NET 2003. The low, lower-middle and upper-middle groups follow the World Bank definitions. The bottom and top high groups follow Lewandowski et al. (2019). The list of countries included in each group is presented in Appendix C. Source: Own estimations based on PIAAC, STEP, O*NET, World Bank, and RIGVC UIBE (2016) data.

15
4. The distribution and evolution of task content around the world 4.1 The evolution of routine task intensity in countries at various development levels
In this section, we establish stylized facts on the evolution of task content of jobs around the world, by combining the occupational RTI values with ILOSTAT time series data on occupational structures.
Since 2000, occupational structures around the world have evolved away from routine-intensive occupations and towards non-routine-intensive occupations. However, accounting for the cross-country differences in task content of particular occupations highlights important differences between countries at various development levels. To focus on the changes in task content attributable to changes in occupational structure, in this subsection we hold the occupational RTI values constant at their end-period (2011-2016) values.
The country-specific measures indicate that the decline in the average routine intensity of tasks has been faster in high-income countries than in less-developed countries (Figure 7). This is particularly visible in the group of low- and lower middle-income countries, for which the average RTI has barely declined when using country-specific task measures. On the other hand, the O*NET-based measures suggest that trends in the gross reallocation of labor away from routine and towards non-routine tasks have been parallel in all country groups.
Figure 7. The evolution of average routine task intensity according to country-specific and O*NET measures, by country groups.
Note: The low, lower-middle and upper-middle groups follow the World Bank definitions. The bottom and top high groups follow Lewandowski et al. (2019). The list of countries included in each group is presented in Appendix C. The labels on the predicted RTI indicate the number of countries in each group with data available in a given year. Source: Own estimations based on PIAAC, STEP, O*NET, World Bank, RIGVC UIBE (2016) and ILOSTAT data.
16
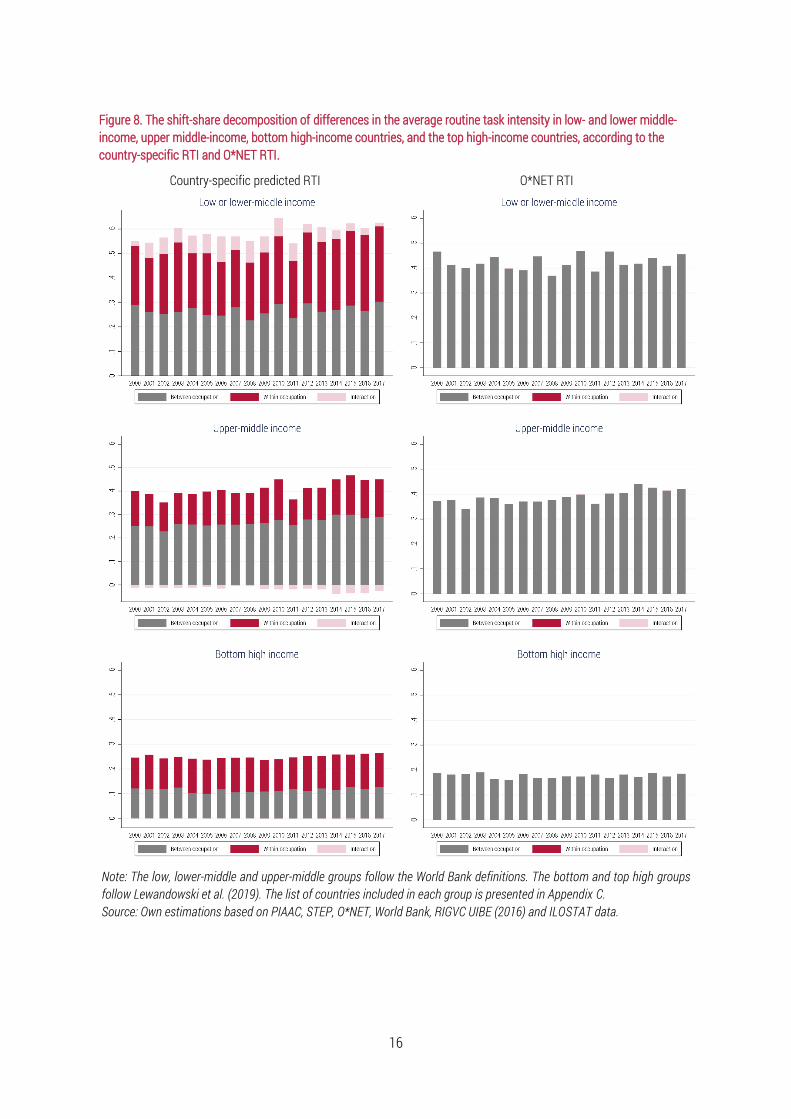
Figure 8. The shift-share decomposition of differences in the average routine task intensity in low- and lower middle-income, upper middle-income, bottom high-income countries, and the top high-income countries, according to the country-specific RTI and O*NET RTI.
Country-specific predicted RTI O*NET RTI
Note: The low, lower-middle and upper-middle groups follow the World Bank definitions. The bottom and top high groups follow Lewandowski et al. (2019). The list of countries included in each group is presented in Appendix C. Source: Own estimations based on PIAAC, STEP, O*NET, World Bank, RIGVC UIBE (2016) and ILOSTAT data.
17
Second, the differences in the average RTI between high-income countries and the rest of the world are substantially larger according to the country-specific measures than according to the O*NET measures (Figures 7 and 8). This finding is consistent with the RTI of comparable occupations being higher in less-developed countries, as discussed in the previous section. Our results show that assuming that occupations are identical around the world would substantially overestimate the role of non-routine tasks in these countries at low- or middle-income levels.
Third, according to the country-specific measures, the differences between high-income countries and the rest of the world have increased over time, especially in low- and middle-income countries (Figure 8). Moreover, a substantial share of these differences can be attributed to the differences in country-specific task content of comparable occupations (the within-occupation effect). In low- and lower middle-income countries, part of the RTI difference with respect to the top high-income countries can also be attributed to the interaction effect. This means that in these countries, the occupations which are more routine intensive than in the high-income countries also exhibit higher employment shares, in line with theories of trade and offshoring that imply that poorer countries with a less-productive labor force might specialize in more routine-intensive activities (Grossman and Rossi-Hansberg, 2008). On the other hand, under the assumption that occupations are identical around the world, the gaps in RTI between particular groups of countries have remained virtually unchanged.
Finally, we investigate the relevance of discrepancies in survey-based and O*NET methodologies18 by applying an alternative approach to measure RTI under the assumption that occupations are identical around the world. We use occupational RTI calculated using the US survey data rather than the US O*NET data. The results are presented in Appendix D. Overall, our conclusions remain the same. Specifically, the within-occupation differences between low- and middle-income countries and high-income countries are even more pronounced than in the case of the O*NET measures. For bottom high-income countries they are identical, and for top high-income countries the differences are smaller, indicating that the task contents of occupations in this group may most closely resemble those in the USA (Figure D1 in Appendix D).
4.2 Accounting for task content changes within occupations
Next, we investigate how the patterns discussed above change once we account for intertemporal changes in the task content of occupations. As this requires additional assumptions, we treat these results as complementary to our baseline results discussed in the previous subsection.
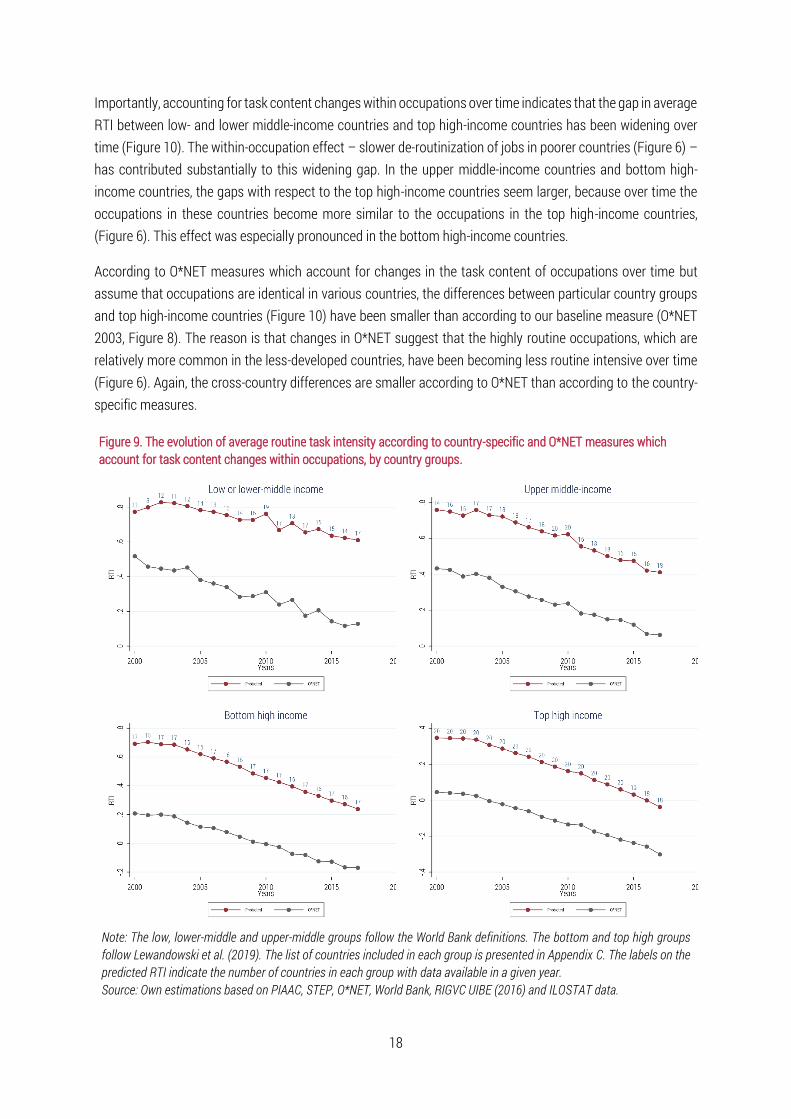
Our key findings remain valid. The decline in RTI between 2000 and 2017 is found to be stronger (Figure 9) because of the de-routinization of jobs within occupations (Figure 6). However, according to the country-specific measures of task content, the decline in RTI in low- and lower-middle countries has been much slower than in the other country groups. On the other hand, under the assumption that occupations are identical around the world, the trends in RTI have been virtually parallel in all country groups.
18 Most notably, the RTI differences between occupations are lower according to the country-specific measures drawing on survey data than according to the O*NET measures (see Lewandowski et al., 2019).
18
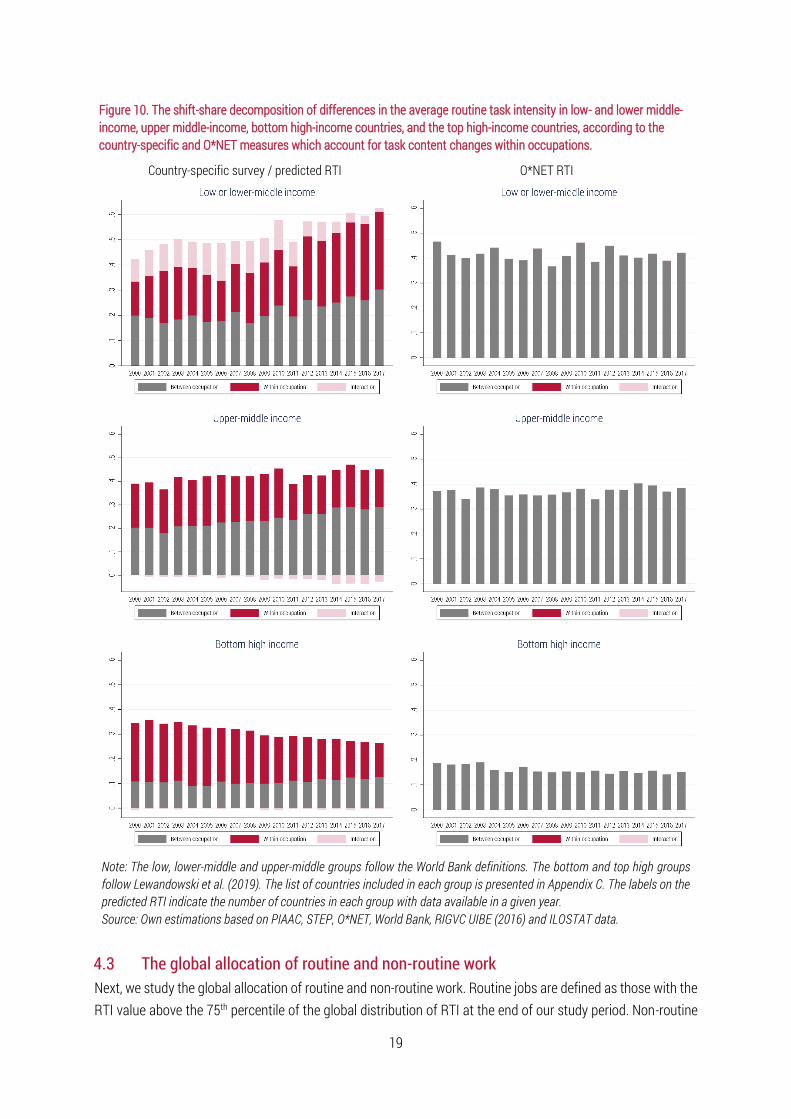
Importantly, accounting for task content changes within occupations over time indicates that the gap in average RTI between low- and lower middle-income countries and top high-income countries has been widening over time (Figure 10). The within-occupation effect – slower de-routinization of jobs in poorer countries (Figure 6) – has contributed substantially to this widening gap. In the upper middle-income countries and bottom high-income countries, the gaps with respect to the top high-income countries seem larger, because over time the occupations in these countries become more similar to the occupations in the top high-income countries, (Figure 6). This effect was especially pronounced in the bottom high-income countries.
According to O*NET measures which account for changes in the task content of occupations over time but assume that occupations are identical in various countries, the differences between particular country groups and top high-income countries (Figure 10) have been smaller than according to our baseline measure (O*NET 2003, Figure 8). The reason is that changes in O*NET suggest that the highly routine occupations, which are relatively more common in the less-developed countries, have been becoming less routine intensive over time (Figure 6). Again, the cross-country differences are smaller according to O*NET than according to the country-specific measures.
Figure 9. The evolution of average routine task intensity according to country-specific and O*NET measures which account for task content changes within occupations, by country groups.
Note: The low, lower-middle and upper-middle groups follow the World Bank definitions. The bottom and top high groups follow Lewandowski et al. (2019). The list of countries included in each group is presented in Appendix C. The labels on the predicted RTI indicate the number of countries in each group with data available in a given year. Source: Own estimations based on PIAAC, STEP, O*NET, World Bank, RIGVC UIBE (2016) and ILOSTAT data.
19
Figure 10. The shift-share decomposition of differences in the average routine task intensity in low- and lower middle-income, upper middle-income, bottom high-income countries, and the top high-income countries, according to the country-specific and O*NET measures which account for task content changes within occupations.
Country-specific survey / predicted RTI O*NET RTI
Note: The low, lower-middle and upper-middle groups follow the World Bank definitions. The bottom and top high groups follow Lewandowski et al. (2019). The list of countries included in each group is presented in Appendix C. The labels on the predicted RTI indicate the number of countries in each group with data available in a given year. Source: Own estimations based on PIAAC, STEP, O*NET, World Bank, RIGVC UIBE (2016) and ILOSTAT data.
4.3 The global allocation of routine and non-routine work Next, we study the global allocation of routine and non-routine work. Routine jobs are defined as those with the RTI value above the 75th percentile of the global distribution of RTI at the end of our study period. Non-routine
20
jobs are defined as those with the RTI value below the 25th percentile of the global distribution of RTI at the end of our study period. Results are presented in Figure 11.
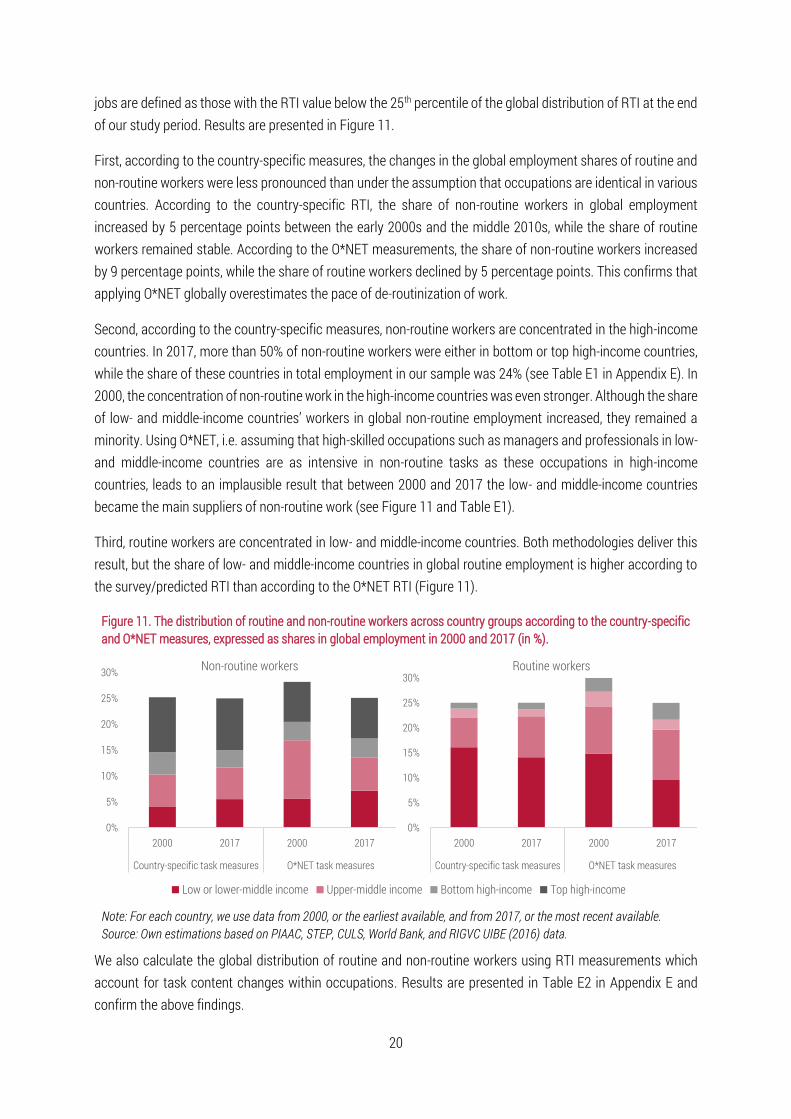
First, according to the country-specific measures, the changes in the global employment shares of routine and non-routine workers were less pronounced than under the assumption that occupations are identical in various countries. According to the country-specific RTI, the share of non-routine workers in global employment increased by 5 percentage points between the early 2000s and the middle 2010s, while the share of routine workers remained stable. According to the O*NET measurements, the share of non-routine workers increased by 9 percentage points, while the share of routine workers declined by 5 percentage points. This confirms that applying O*NET globally overestimates the pace of de-routinization of work.
Second, according to the country-specific measures, non-routine workers are concentrated in the high-income countries. In 2017, more than 50% of non-routine workers were either in bottom or top high-income countries, while the share of these countries in total employment in our sample was 24% (see Table E1 in Appendix E). In 2000, the concentration of non-routine work in the high-income countries was even stronger. Although the share of low- and middle-income countries’ workers in global non-routine employment increased, they remained a minority. Using O*NET, i.e. assuming that high-skilled occupations such as managers and professionals in low- and middle-income countries are as intensive in non-routine tasks as these occupations in high-income countries, leads to an implausible result that between 2000 and 2017 the low- and middle-income countries became the main suppliers of non-routine work (see Figure 11 and Table E1).
Third, routine workers are concentrated in low- and middle-income countries. Both methodologies deliver this result, but the share of low- and middle-income countries in global routine employment is higher according to the survey/predicted RTI than according to the O*NET RTI (Figure 11).
Figure 11. The distribution of routine and non-routine workers across country groups according to the country-specific and O*NET measures, expressed as shares in global employment in 2000 and 2017 (in %).
Note: For each country, we use data from 2000, or the earliest available, and from 2017, or the most recent available. Source: Own estimations based on PIAAC, STEP, CULS, World Bank, and RIGVC UIBE (2016) data.
We also calculate the global distribution of routine and non-routine workers using RTI measurements which account for task content changes within occupations. Results are presented in Table E2 in Appendix E and confirm the above findings.
0%
5%
10%
15%
20%
25%
30%
2000 2017 2000 2017
Country-specific task measures O*NET task measures
Non-routine workers
0%
5%
10%
15%
20%
25%
30%
2000 2017 2000 2017
Country-specific task measures O*NET task measures
Routine workers
Low or lower-middle income Upper-middle income Bottom high-income Top high-income

21
5. Summary and conclusions In this paper, we have developed a methodology to predict the country-specific task content of jobs in a wide range of countries. We have applied it to quantify the evolution of occupational task content in countries at different stages of development, and to determine the global allocation of routine and non-routine work. We have used survey data collected in 46 countries – including low-, middle-, and high-income economies – to estimate models which related the RTI of occupations to the level of economic development, technology use, participation in GVCs, and the supply of skills in a country. We have found that occupations in low- and middle-income countries are more routine intensive than in the high-income countries, especially in high-skilled occupations (ISCO 1-3). We have attributed these international differences in the RTI of occupations mainly to lower technology use in less-developed countries.
Having predicted the country-specific occupational task contents around the world, we have combined them with employment data in 87 countries that represent more than 2.5 billion of workers (75% of global employment), in order to study the global distribution of routine and non-routine work between 2000 and 2017. Accounting for the cross-country differences in occupational tasks, we have found that the gross reallocation of labor away from routine work and non-routine work has occurred much slower in the low- and middle-income countries than in high-income countries. In consequence, the gap between these groups of countries in terms of average RTI has widened. High-income countries have remained the dominant supplier of non-routine work, while low- and middle-income countries have remained the dominant supplier of routine work, although their share in the global pool of non-routine workers has increased. On the other hand, we have shown that the use of conventional O*NET task measures, which assume that occupations are identical around the world, would suggest that the average RTI has been declining in all country groups at a similar pace. It also leads to the implausible conclusion that, by 2017, low- and middle-income countries became the dominant supplier of non-routine work.
We strive to add to the understanding of how the nature of work evolves, and how it differs between countries which differ in technology use, supply of skills, and participation in globalization. Existing research (e.g. World Bank, 2019) has commonly assumed that occupations are identical across countries and can be quantified with the US O*NET task data. We show that such an assumption leads to an overestimation of the non-routine task content of jobs in developing and emerging economies, and to overly optimistic conclusions regarding the convergence of the nature of work in these countries towards the most advanced countries. This may, in turn, overestimate the importance of routine-replacing technological change, embodied in ICT and automation technologies, in explaining the evolution of wage inequality in low- or middle-income countries. From the policy perspective, our findings suggest that the reallocation of workers in low- and middle-income countries to higher-skilled occupations is unlikely to fully close the gaps in productivity and incomes with respect to high-income countries, as long as the gaps in occupational tasks are not closed. Policies aimed at increasing technology use and raising skill supply may be conducive to reducing these within-occupation gaps in the content of work.
22
References Acemoglu, D., Autor, D. H. (2011). Skills, Tasks and Technologies: Implications for Employment and Earnings.
In: Card, D. and Ashenfelter, O. (eds). Handbook of Labor Economics. Amsterdam: Elsevier, 1043–1171.
Arias, O.S., Sánchez-Páramo, C., Dávalos, M.E., Santos, I., Tiongson, E.R., Gruen, C., de Andrade Falcão, N., Saiovici, G., Cancho, C.A. (2014). Back to Work: Growing with Jobs in Eastern Europe and Central Asia, Europe and Central Asia reports. Washington, DC: The World Bank.
Apella, I., Zunino, G. (2018). Nonstandard Forms of Employment in Developing Countries: A Study for a Set of Selected Countries in Latin America and the Caribbean and Europe and Central Asia. Policy Research Working Paper, 8581. Washington, DC: The World Bank.
Autor, D. (2013). The "task approach" to labor markets: an overview, Journal for Labour Market Research, 46(3), 185-199.
Autor, D., Dorn, D. (2009). This Job is “Getting Old”: Measuring Changes in Job Opportunities using Occupational Age Structure. American Economic Review: Papers and Proceedings, 99(2), 45-51.
Autor, D., Dorn, D. (2013). The Growth of Low-Skill Service Jobs and the Polarization of the US Labor Market, American Economic Review, 103(5), 1553–97.
Autor, D., Handel, M. (2013). Putting Tasks to the Test: Human Capital, Job Tasks, and Wages. Journal of Labor Economics, 31(2), 59-96.
Autor, D. H., Levy, F., Murnane, R. (2003). The Skill Content of Recent Technological Change: An Empirical Exploration. Quarterly Journal of Economics, 118, 4.
Barron, M. (2014). LOOCV: Stata module to perform Leave-One-Out Cross-Validation, Statistical Software Components S457926, Boston College Department of Economics.
Du Y., Park A. (2018). Changing Demand for Tasks and Skills in China, Background Report for the World Bank Group (WBG)-Development Research Center under the State Council (DRC) report on New Drivers of Growth in China.
Eden, M., Gaggl, P. (2020). Do poor countries really need more IT? The World Bank Economic Review, 34(1), 48-62.
Eurofound (2020). European Working Conditions Survey Integrated Data File, 1991-2015. [data collection]. Available from http://doi.org/10.5255/UKDA-SN-7363-8.
Firpo, S., Fortin, N. M., Lemieux, T., (2011). Occupational Tasks and Changes in the Wage Structure, IZA Discussion Papers 5542, Institute for the Study of Labor (IZA).
Goos, M., Manning, A., Salomons, A. (2014). Explaining Job Polarization: Routine-Biased Technological Change and Offshoring. American Economic Review 104, 2509–2526.
Grossman, G., Rossi-Hansberg E. (2008). Trading Tasks: A Simple Theory of Offshoring, American Economic Review 98(5), 1978-1997.
Hardy, W., Keister, R., Lewandowski, P. (2018). Educational upgrading, structural change and the task composition of jobs in Europe. Economics of Transition, 26(2), 201-231.
Hsieh CT., Klenow P. J., (2010). Development Accounting, American Economic Journal: Macroeconomics 2(1), 207-223.
23
Institute of Population and Labor Economics of Chinese Academy of Social Science (2017). The China Urban Labor Survey (CULS) 2016. [data collection].
International Labour Organization. (2020). ILOSTAT database. Available from https://ilostat.ilo.org/data/
Lewandowski P., Keister R., Hardy W., Górka S. (2020). Ageing of routine occupations in Europe. Economic Systems, forthcoming.
Lewandowski, P., Park, A. Hardy, W., & Du Y. (2019). Technology, Skills, and Globalization: Explaining International Differences in Routine and Nonroutine Work Using Survey Data. IBS Working Paper 04/2019.
Lo Bello, S., Sanchez Puerta, M. L., Winkler, H. J. (2019). From Ghana to America: The Skill Content of Jobs and Economic Development. Policy Research working paper; no. WPS 8758. Washington, D.C.: World Bank Group.
Morduch, J., Sicular, T. (2002). Rethinking Inequality Decomposition, With Evidence from Rural China. The Economic Journal, 112: 93-106.
OECD (2014). Programme for the International Assessment of Adult Competencies (PIAAC) Survey, Round 1: 2011-12 (Austria, Belgium, Canada, Cyprus, Czechia, Denmark, Estonia, Finland, France, Germany, Ireland, Italy, Japan, South Korea, Netherlands, Norway, Poland, Russia, Slovakia, Spain, Sweden, UK, United States). Available from http://www.oecd.org/skills/piaac/data/
OECD (2017). Programme for the International Assessment of Adult Competencies (PIAAC) Survey, Round II: 2014-15 (Chile, Greece, Indonesia, Israel, Lithuania, New Zealand, Singapore, Slovenia, Turkey). Available from http://www.oecd.org/skills/piaac/data/
OECD (2019) Programme for the International Assessment of Adult Competencies (PIAAC) Survey, Round III: 2017 (Ecuador, Hungary, Kazakhstan, Mexico, Peru). Available from http://www.oecd.org/skills/ piaac/data/
RIGVC UIBE (2016). UIBE GVC Index. Research Institute for Global Value Chains, University of International Business and Economics
Spitz-Oener, A. (2006). Technical Change, Job Tasks, and Rising Educational Demands: Looking outside the Wage Structure. Journal of Labor Economics 24, 235–270.
Wang, Z., Wei, S., Yu, X., Zhu, K. (2017). Measures of Participation in Global Value Chains and Global Business Cycles. NBER Working Paper No. 23222, National Bureau of Economic Research, Inc.
World Bank (2016a). STEP Skills Measurement Household Survey, Wave 1: 2012 (Bolivia, Colombia, Lao PDR). Version v02. Available from https://microdata.worldbank.org
World Bank (2016b). STEP Skills Measurement Household Survey, Wave 2: 2013 (Armenia, Georgia, Ghana, Macedonia). Version v02. Available from https://microdata.worldbank.org
World Bank (2018). STEP Skills Measurement Employer Survey, Wave 3: 2016-2017 (Kenya). Version v01. Available from https://microdata.worldbank.org
World Bank (2019). World Development Report 2019: Digital Dividends. Washington, DC.
World Bank (2020). World Development Indicators. Washington, DC: The World Bank. Available from https://databank.worldbank.org/source/ world-development-indicators.
24
Appendices
Appendix A. List of countries in PIAAC, STEP and CULS
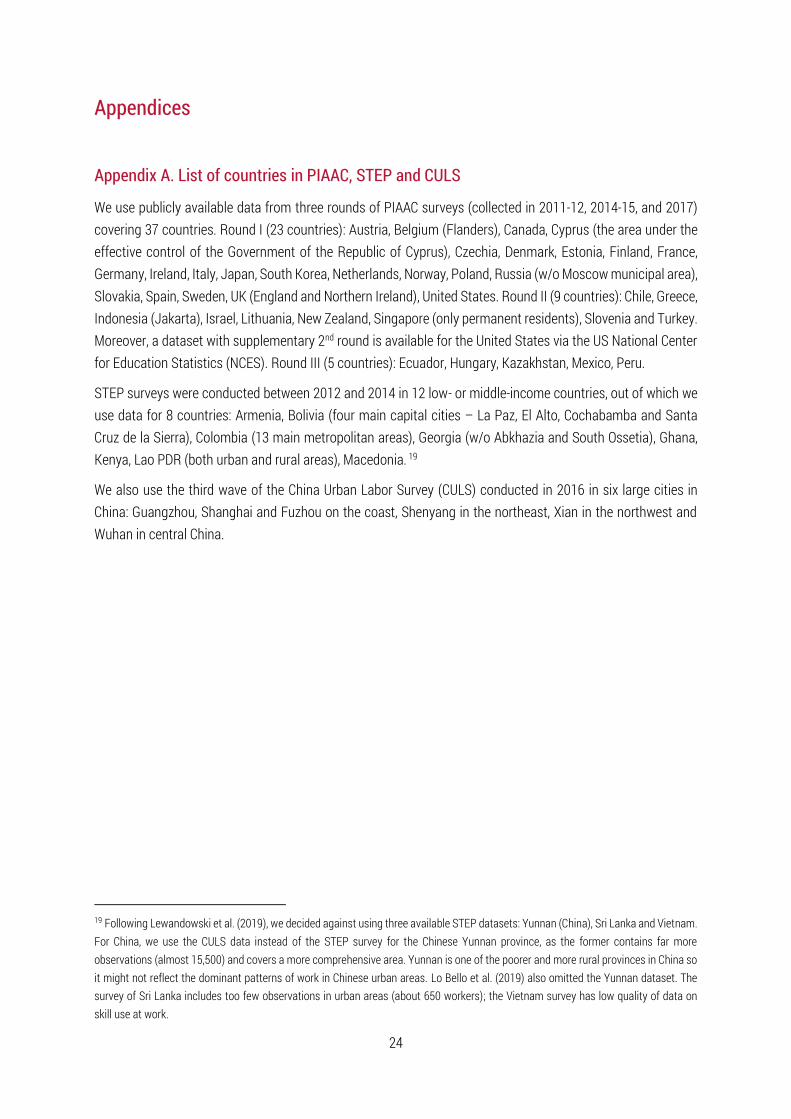
We use publicly available data from three rounds of PIAAC surveys (collected in 2011-12, 2014-15, and 2017) covering 37 countries. Round I (23 countries): Austria, Belgium (Flanders), Canada, Cyprus (the area under the effective control of the Government of the Republic of Cyprus), Czechia, Denmark, Estonia, Finland, France, Germany, Ireland, Italy, Japan, South Korea, Netherlands, Norway, Poland, Russia (w/o Moscow municipal area), Slovakia, Spain, Sweden, UK (England and Northern Ireland), United States. Round II (9 countries): Chile, Greece, Indonesia (Jakarta), Israel, Lithuania, New Zealand, Singapore (only permanent residents), Slovenia and Turkey. Moreover, a dataset with supplementary 2nd round is available for the United States via the US National Center for Education Statistics (NCES). Round III (5 countries): Ecuador, Hungary, Kazakhstan, Mexico, Peru.
STEP surveys were conducted between 2012 and 2014 in 12 low- or middle-income countries, out of which we use data for 8 countries: Armenia, Bolivia (four main capital cities – La Paz, El Alto, Cochabamba and Santa Cruz de la Sierra), Colombia (13 main metropolitan areas), Georgia (w/o Abkhazia and South Ossetia), Ghana, Kenya, Lao PDR (both urban and rural areas), Macedonia. 19
We also use the third wave of the China Urban Labor Survey (CULS) conducted in 2016 in six large cities in China: Guangzhou, Shanghai and Fuzhou on the coast, Shenyang in the northeast, Xian in the northwest and Wuhan in central China.
19 Following Lewandowski et al. (2019), we decided against using three available STEP datasets: Yunnan (China), Sri Lanka and Vietnam. For China, we use the CULS data instead of the STEP survey for the Chinese Yunnan province, as the former contains far more observations (almost 15,500) and covers a more comprehensive area. Yunnan is one of the poorer and more rural provinces in China so it might not reflect the dominant patterns of work in Chinese urban areas. Lo Bello et al. (2019) also omitted the Yunnan dataset. The survey of Sri Lanka includes too few observations in urban areas (about 650 workers); the Vietnam survey has low quality of data on skill use at work.
25
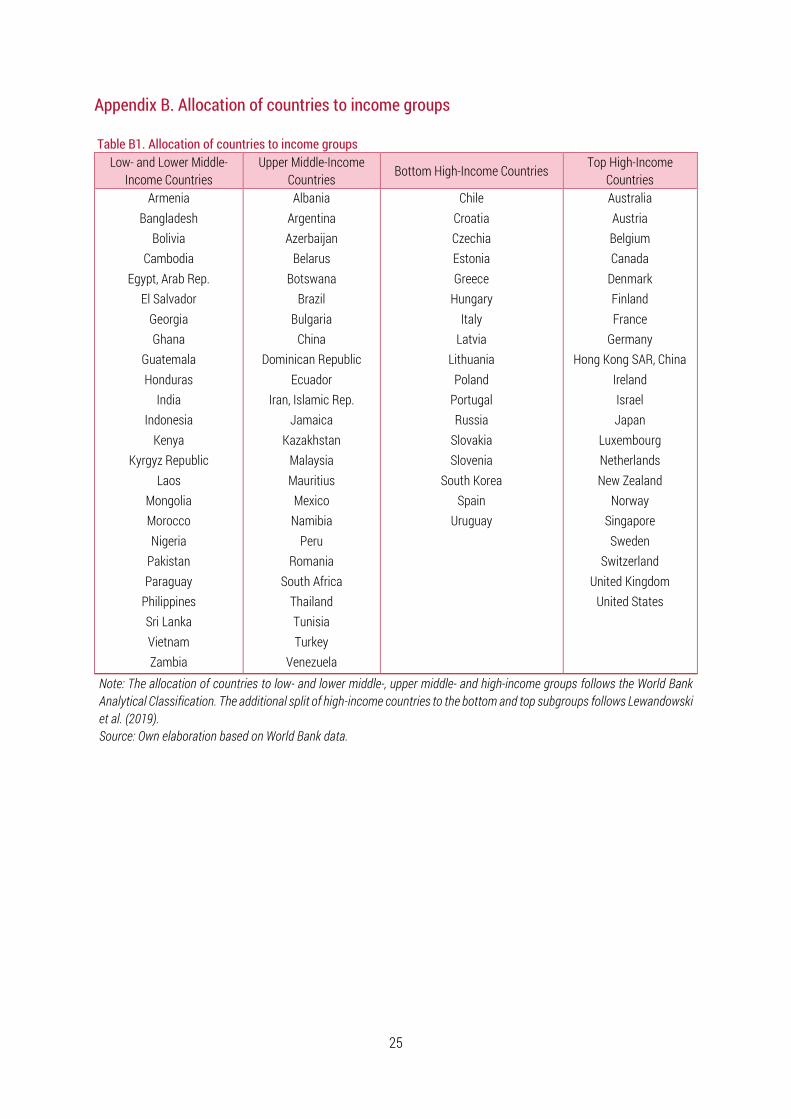
Appendix B. Allocation of countries to income groups
Table B1. Allocation of countries to income groups Low- and Lower Middle-
Income Countries Upper Middle-Income
Countries Bottom High-Income Countries
Top High-Income Countries
Armenia Bangladesh
Bolivia Cambodia
Egypt, Arab Rep. El Salvador
Georgia Ghana
Guatemala Honduras
India Indonesia
Kenya Kyrgyz Republic
Laos Mongolia Morocco Nigeria
Pakistan Paraguay
Philippines Sri Lanka Vietnam Zambia
Albania Argentina Azerbaijan
Belarus Botswana
Brazil Bulgaria
China Dominican Republic
Ecuador Iran, Islamic Rep.
Jamaica Kazakhstan
Malaysia Mauritius Mexico
Namibia Peru
Romania South Africa
Thailand Tunisia Turkey
Venezuela
Chile Croatia Czechia Estonia Greece
Hungary Italy
Latvia Lithuania
Poland Portugal Russia
Slovakia Slovenia
South Korea Spain
Uruguay
Australia Austria Belgium Canada
Denmark Finland France
Germany Hong Kong SAR, China
Ireland Israel Japan
Luxembourg Netherlands New Zealand
Norway Singapore Sweden
Switzerland United Kingdom
United States
Note: The allocation of countries to low- and lower middle-, upper middle- and high-income groups follows the World Bank Analytical Classification. The additional split of high-income countries to the bottom and top subgroups follows Lewandowski et al. (2019). Source: Own elaboration based on World Bank data.
26
Appendix C. Model selection
Table C1. The correlations between country-level explanatory variables used in the prediction models and occupation-specific averages of variables used by Lewandowski et al. (2019) in worker-level models
Managers (ISCO 1)
Profes-sionals (ISCO 2)
Techni-cians
(ISCO 3)
Clerical workers (ISCO 4)
Sales and services workers (ISCO 5)
Crafts-men (ISCO 7)
Machine operators (ISCO 8)
Elemen-tary occ. (ISCO 9)
All workers
Internet use w/ occupation-
specific computer use
(survey)
0.87 0.81 0.81 0.78 0.91 0.86 0.85 0.77 0.95
Average years of schooling
w/ occupation-specific literacy
proficiency (survey)
0.87 0.83 0.85 0.84 0.86 0.83 0.80 0.82 0.87
FVA share w/ occupation-specific FVA
share
na na na na na 0.97 0.95 0.98 1.00
Number of countries with available data: 44 in the case of technology and skill variables, 42 in the case of FVA share. Source: own calculations based on PIAAC, STEP, CULS, World Bank, and RIGVC UIBE (2016) data.
Table C2. Specification of regression models used in the leave-one-out cross-validation procedure (1) (2) (3) (4) (5) (6) (7)
Ln (GDP per capita) x x x x x x x FVA (%) x x x x FVA share * Ln (GDP per capita) x x x x Internet use (%) x x x x Average years of schooling x x x Source: Own elaboration.
27
Table C3. Model fit measures based on the leave-one-out cross-validation procedure at the 1-digit ISCO level (1) (2) (3) (4) (5) (6) (7)
ISCO 1 RMSE 0.235 0.236 0.239 0.230 0.242 0.233 0.238 MAE 0.190 0.189 0.193 0.186 0.194 0.186 0.191 Pseudo-R2 0.329 0.339 0.308 0.363 0.309 0.361 0.342
ISCO 2 RMSE 0.257 0.267 0.264 0.236 0.276 0.256 0.250 MAE 0.199 0.207 0.204 0.182 0.215 0.198 0.193 Pseudo-R2 0.104 0.082 0.069 0.245 0.048 0.155 0.195
ISCO 3 RMSE 0.234 0.243 0.238 0.214 0.247 0.233 0.224 MAE 0.176 0.184 0.182 0.171 0.190 0.174 0.180 Pseudo-R2 0.036 0.020 0.020 0.189 0.009 0.095 0.162
ISCO 4 RMSE 0.230 0.236 0.231 0.210 0.237 0.228 0.215 MAE 0.178 0.186 0.179 0.161 0.185 0.185 0.167 Pseudo-R2 0.000 0.000 0.003 0.160 0.000 0.042 0.149
ISCO 5 RMSE 0.236 0.239 0.241 0.224 0.244 0.234 0.234 MAE 0.183 0.186 0.187 0.175 0.191 0.188 0.191 Pseudo-R2 0.102 0.114 0.076 0.195 0.086 0.151 0.164
ISCO 6 RMSE 0.281 0.293 0.288 0.298 0.301 0.301 0.313 MAE 0.220 0.233 0.221 0.228 0.234 0.237 0.242 Pseudo-R2 0.364 0.318 0.337 0.299 0.294 0.292 0.254
ISCO 7 RMSE 0.247 0.252 0.254 0.235 0.259 0.239 0.240 MAE 0.198 0.194 0.203 0.181 0.199 0.187 0.185 Pseudo-R2 0.000 0.017 0.010 0.079 0.004 0.097 0.104
ISCO 8 RMSE 0.273 0.267 0.280 0.270 0.276 0.259 0.257 MAE 0.229 0.222 0.234 0.218 0.227 0.215 0.207 Pseudo-R2 0.337 0.025 0.105 0.006 0.008 0.080 0.111
ISCO 9 RMSE 0.220 0.209 0.213 0.208 0.199 0.214 0.194 MAE 0.175 0.170 0.169 0.164 0.158 0.175 0.154 Pseudo-R2 0.156 0.062 0.022 0.069 0.153 0.037 0.202 Note: RMSE, MAE and pseudo-R2 calculated with the leave-one-out cross-validation method. Bold numbers indicate the models we chose for the predictions. Source: Own estimations based on PIAAC, STEP, CULS, World Bank, and RIGVC UIBE (2016) data.
28
Table C4. The estimated occupation-specific models at the 1-digit ISCO level, using survey measures of technology (computer use at work) and skill supply (literacy proficiency)
Managers (ISCO 1)
Profes-sionals (ISCO 2)
Techni-cians
(ISCO 3)
Clerical workers (ISCO 4)
Sales and services workers (ISCO 5)
Agricul-tural
workers (ISCO 6)
Crafts-men (ISCO 7)
Machine operators (ISCO 8)
Elemen-tary occ. (ISCO 9)
Ln (GDP per capita)
0.003 0.082 0.156 0.172 0.070 -0.308*** 0.147 0.157 -0.054 (0.098) (0.104) (0.095) (0.110) (0.105) (0.056) (0.101) (0.116) (0.105)
FVA share 1.308*** 1.705*** 0.764
(0.480) (0.550) (0.501)
FVA share * Ln (GDP per
capita)
-0.462 -0.712 0.994
(0.816) (0.935) (0.852)
Computer use at work
-1.730*** -1.951*** -1.825*** -0.956** -1.361*** -1.919*** -1.659*** -0.493 (0.423) (0.446) (0.408) (0.471) (0.450) (0.422) (0.483) (0.441)
Literacy skills
0.004** 0.005*** 0.004** 0.003 0.003 0.005** 0.005** 0.003* (0.002) (0.002) (0.002) (0.002) (0.002) (0.002) (0.002) (0.002)
Constant -0.651*** -0.488*** -0.129*** 0.284*** 0.537*** 0.470*** 0.526*** 0.869*** 1.080*** (0.030) (0.031) (0.029) (0.033) (0.032) (0.041) (0.030) (0.035) (0.032)
Obser-vations
45 45 45 45 45 44 45 45 45
Adjusted R2 0.533 0.412 0.356 0.069 0.290 0.404 0.376 0.294 0.128 Note: *** p<0.01, ** p<0.05, * p<0.1. Standard errors in parentheses. We use standardized weights that give each country equal weight. Source: Own estimations based on PIAAC, STEP, CULS, World Bank, and RIGVC UIBE (2016) data.
29
Table C5. The coefficients pertaining to country-level variables estimated in models at the 2-digit ISCO level
Managers (ISCO 1)
Profes-sionals (ISCO 2)
Techni-cians
(ISCO 3)
Clerical workers (ISCO 4)
Sales and services workers (ISCO 5)
Craftsmen (ISCO 7)
Machine operators (ISCO 8)
Elemen-tary occ.
(ISCO 9)
Ln (GDP per capita)
0.039 0.091 0.068 0.236*** 0.105 -0.276*** 0.266*** 0.198** (0.074) (0.056) (0.063) (0.070) (0.067) (0.078) (0.072) (0.090)
FVA share (%)
1.276*** 1.590***
(0.359) (0.457)
FVA share * Ln (GDP per
capita)
-0.604 -0.949
(0.577) (0.737)
Internet use (%)
-1.152*** -1.389*** -1.242*** -1.318*** -1.331*** -1.678*** -1.476*** (0.309) (0.236) (0.264) (0.294) (0.282) (0.304) (0.370)
Average years of
schooling
0.025 0.076*** 0.073*** 0.091*** 0.064*** 0.064*** 0.088*** (0.021) (0.016) (0.018) (0.020) (0.019) (0.020) (0.025)
Constant -0.810*** -0.495*** -0.188*** 0.255*** 0.542*** 0.428*** 0.520*** 0.812*** (0.048) (0.045) (0.046) (0.046) (0.044) (0.087) (0.050) (0.046)
Obser-vations
164 246 205 164 164 90 200 112
Adjusted R2 0.368 0.390 0.330 0.158 0.201 0.116 0.233 0.197 Note: *** p<0.01, ** p<0.05, * p<0.1. Standard errors in parentheses. We do not estimate models at the 2-digit level for agricultural workers (ISCO 6). Source: Own estimations based on PIAAC, STEP, CULS, World Bank, and RIGVC UIBE (2016) data.
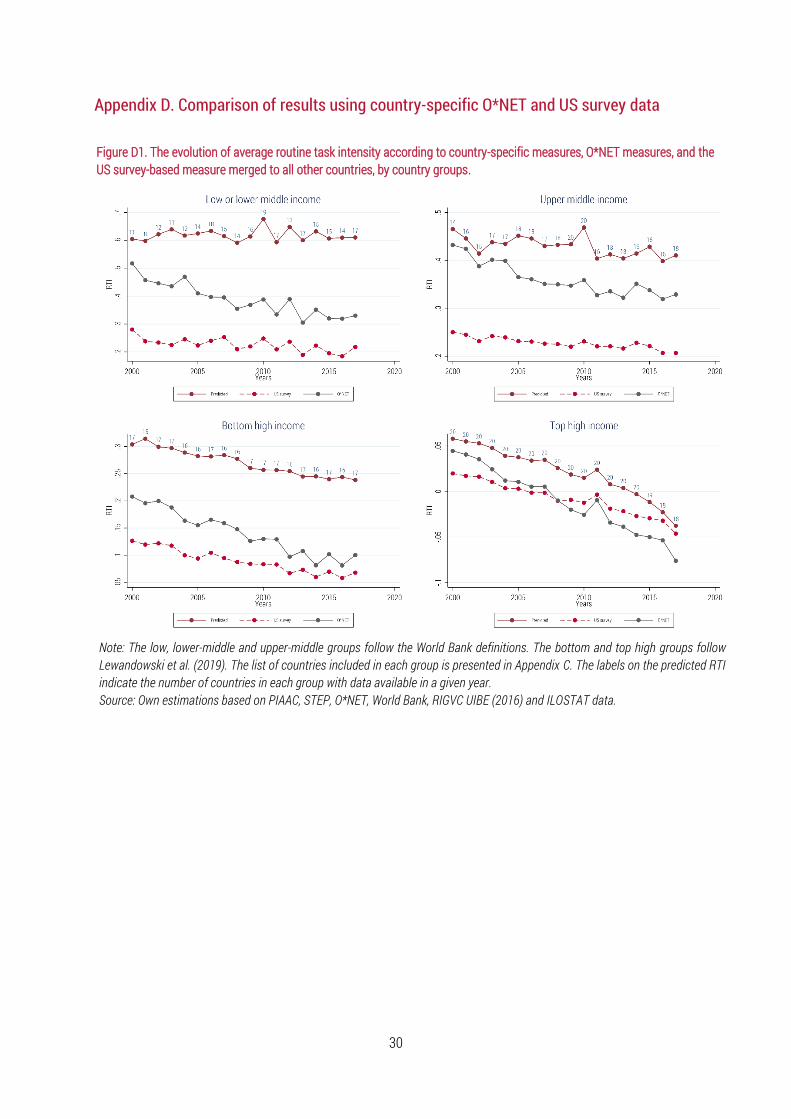
30
Appendix D. Comparison of results using country-specific O*NET and US survey data
Figure D1. The evolution of average routine task intensity according to country-specific measures, O*NET measures, and the US survey-based measure merged to all other countries, by country groups.
Note: The low, lower-middle and upper-middle groups follow the World Bank definitions. The bottom and top high groups follow Lewandowski et al. (2019). The list of countries included in each group is presented in Appendix C. The labels on the predicted RTI indicate the number of countries in each group with data available in a given year. Source: Own estimations based on PIAAC, STEP, O*NET, World Bank, RIGVC UIBE (2016) and ILOSTAT data.
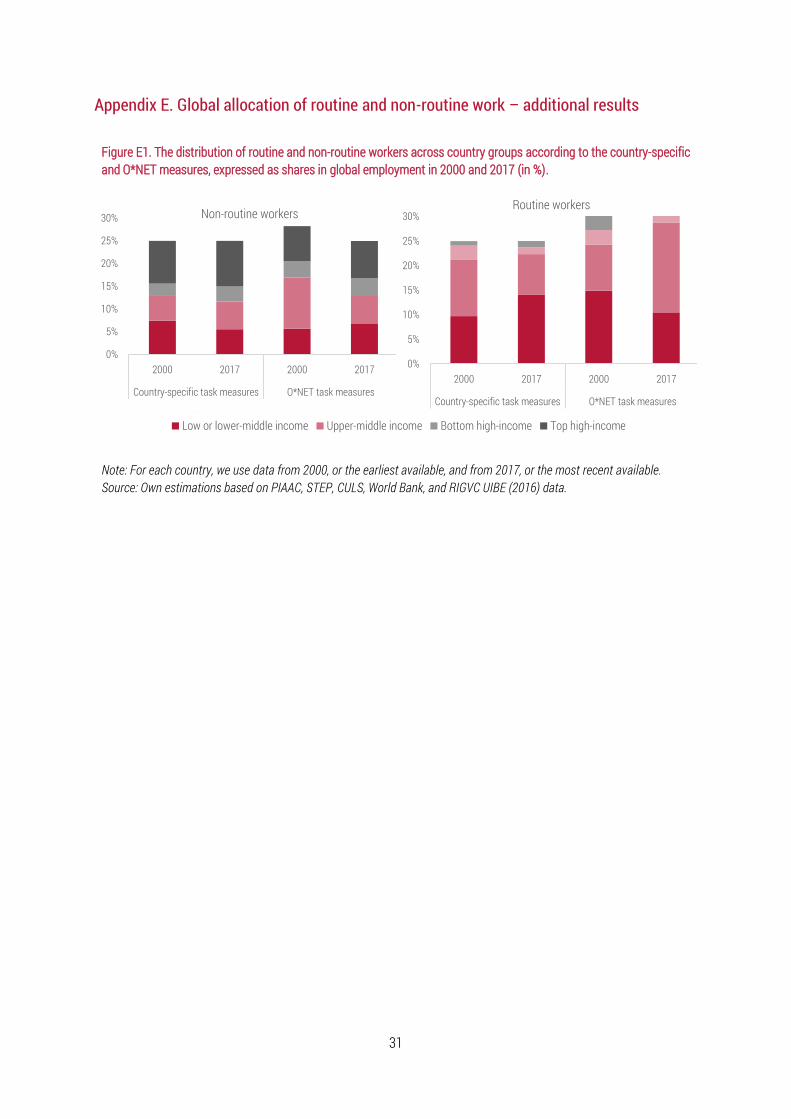
31
Appendix E. Global allocation of routine and non-routine work – additional results
Figure E1. The distribution of routine and non-routine workers across country groups according to the country-specific and O*NET measures, expressed as shares in global employment in 2000 and 2017 (in %).
Note: For each country, we use data from 2000, or the earliest available, and from 2017, or the most recent available. Source: Own estimations based on PIAAC, STEP, CULS, World Bank, and RIGVC UIBE (2016) data.
0%
5%
10%
15%
20%
25%
30%
2000 2017 2000 2017
Country-specific task measures O*NET task measures
Non-routine workers
0%
5%
10%
15%
20%
25%
30%
2000 2017 2000 2017
Country-specific task measures O*NET task measures
Routine workers
Low or lower-middle income Upper-middle income Bottom high-income Top high-income
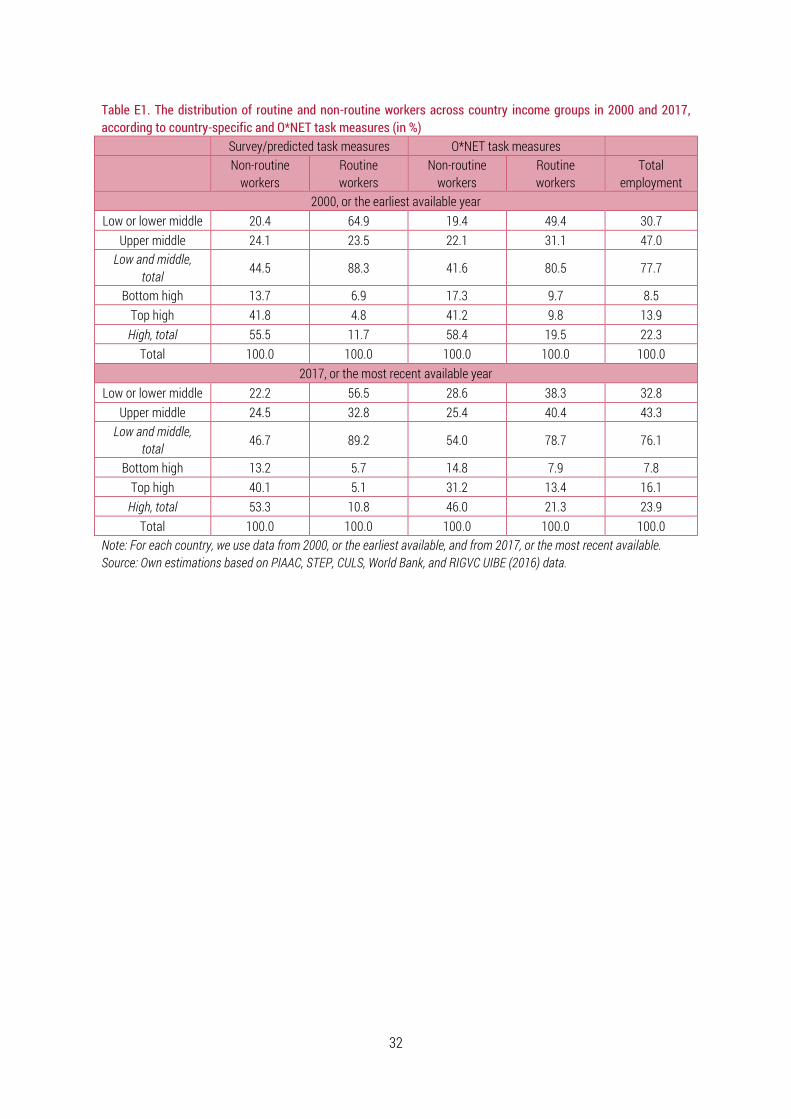
32
Table E1. The distribution of routine and non-routine workers across country income groups in 2000 and 2017, according to country-specific and O*NET task measures (in %)
Survey/predicted task measures O*NET task measures
Non-routine
workers Routine workers
Non-routine workers
Routine workers
Total employment
2000, or the earliest available year Low or lower middle 20.4 64.9 19.4 49.4 30.7
Upper middle 24.1 23.5 22.1 31.1 47.0 Low and middle,
total 44.5 88.3 41.6 80.5 77.7
Bottom high 13.7 6.9 17.3 9.7 8.5 Top high 41.8 4.8 41.2 9.8 13.9
High, total 55.5 11.7 58.4 19.5 22.3 Total 100.0 100.0 100.0 100.0 100.0
2017, or the most recent available year Low or lower middle 22.2 56.5 28.6 38.3 32.8
Upper middle 24.5 32.8 25.4 40.4 43.3 Low and middle,
total 46.7 89.2 54.0 78.7 76.1
Bottom high 13.2 5.7 14.8 7.9 7.8 Top high 40.1 5.1 31.2 13.4 16.1
High, total 53.3 10.8 46.0 21.3 23.9 Total 100.0 100.0 100.0 100.0 100.0
Note: For each country, we use data from 2000, or the earliest available, and from 2017, or the most recent available. Source: Own estimations based on PIAAC, STEP, CULS, World Bank, and RIGVC UIBE (2016) data.
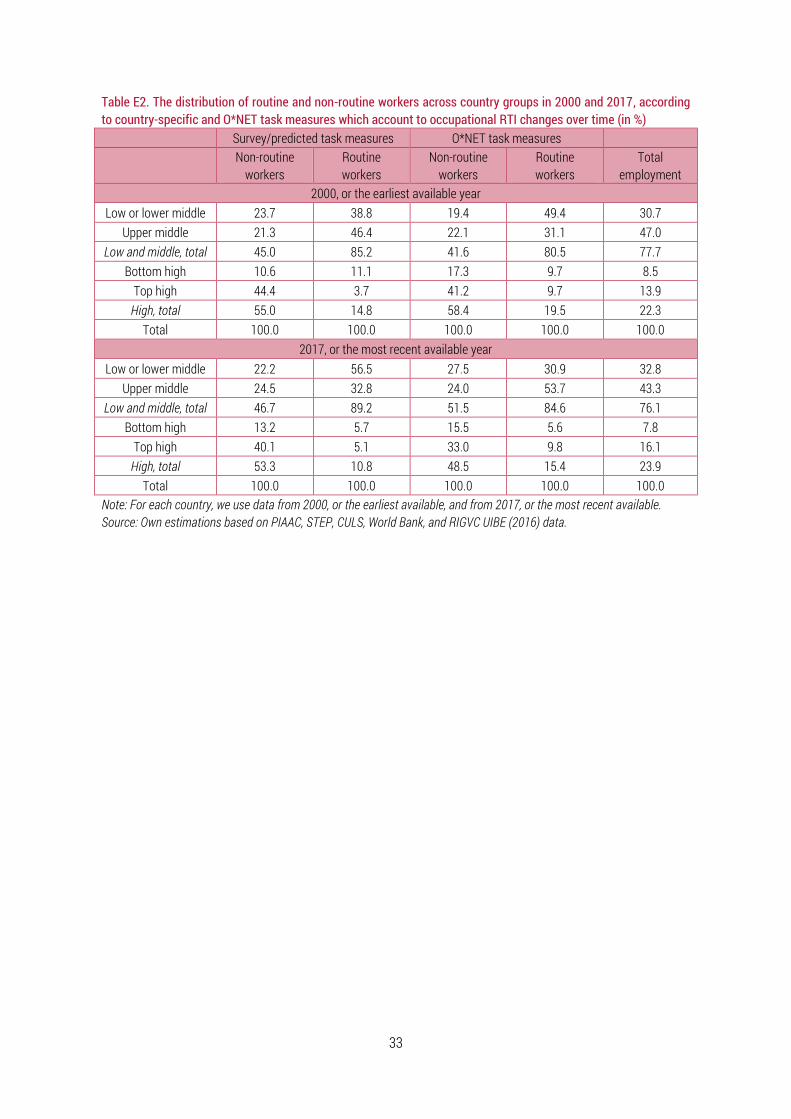
33
Table E2. The distribution of routine and non-routine workers across country groups in 2000 and 2017, according to country-specific and O*NET task measures which account to occupational RTI changes over time (in %)
Survey/predicted task measures O*NET task measures
Non-routine
workers Routine workers
Non-routine workers
Routine workers
Total employment
2000, or the earliest available year Low or lower middle 23.7 38.8 19.4 49.4 30.7
Upper middle 21.3 46.4 22.1 31.1 47.0 Low and middle, total 45.0 85.2 41.6 80.5 77.7
Bottom high 10.6 11.1 17.3 9.7 8.5 Top high 44.4 3.7 41.2 9.7 13.9
High, total 55.0 14.8 58.4 19.5 22.3 Total 100.0 100.0 100.0 100.0 100.0
2017, or the most recent available year Low or lower middle 22.2 56.5 27.5 30.9 32.8
Upper middle 24.5 32.8 24.0 53.7 43.3 Low and middle, total 46.7 89.2 51.5 84.6 76.1
Bottom high 13.2 5.7 15.5 5.6 7.8 Top high 40.1 5.1 33.0 9.8 16.1
High, total 53.3 10.8 48.5 15.4 23.9 Total 100.0 100.0 100.0 100.0 100.0
Note: For each country, we use data from 2000, or the earliest available, and from 2017, or the most recent available. Source: Own estimations based on PIAAC, STEP, CULS, World Bank, and RIGVC UIBE (2016) data.