Embed Size (px)
Citation preview
Working Paper/Document de travail2008-20
The Effect of the Sarbanes-Oxley Acton CEO Pay for Luck
by Teodora Paligorova
www.bank-banque-canada.ca
Bank of Canada Working Paper 2008-20
June 2008
The Effect of the Sarbanes-Oxley Acton CEO Pay for Luck
by
Teodora Paligorova
Financial Markets DepartmentBank of Canada
Ottawa, Ontario, Canada K1A [email protected]
Bank of Canada working papers are theoretical or empirical works-in-progress on subjects ineconomics and finance. The views expressed in this paper are those of the author.
No responsibility for them should be attributed to the Bank of Canada.
ISSN 1701-9397 © 2008 Bank of Canada
ii
Acknowledgements
An earlier version of this paper was circulated under the title “Corporate Governance and
Executive Pay: Evidence from a Recent Reform.” I am grateful to Stepán Jurajda for invaluable
encouragement, guidance and advice. I also thank Jan Bena, Greg Bauer, Martin Conyon,
Chris D’Souza, Randall Filer, Peter Katuscák, Scott Hendry, Antonio Diez de los Rios,
Wally Speckert, Siew Hong Teoh, Jonathan Witmer, and Zhaoxia Xu for helpful comments.
I thank the Center for Organization Dynamics at the University of Pennsylvania for helping me to
access the data during my stay as a visiting scholar.
˘ ˘
˘ ˘
iii
Abstract
According to the rent-extraction hypothesis, weak corporate governance allows entrenched CEOs
to capture the pay-setting process and benefit from events outside of their control—get paid for
luck. In this paper, I find that the independence requirement imposed on boards of directors by the
Sarbanes-Oxley Act of 2002 (SOX), together with the governance regulations subsequently
introduced by stock exchanges, affects CEO pay structure. In firms whose corporate boards were
originally less independent, and thus more affected by these provisions, CEO pay for performance
strengthened while pay for luck decreased after adopting SOX. In contrast, those firms that
exhibited strong board independence prior to SOX showed little evidence of pay for luck and little
change in pay for performance following the adoption of SOX. The results are consistent with the
rent-extraction hypothesis, and they are robust to alternative explanations such as asymmetric
benchmarks, oligopoly, and managerial talent.
JEL classification: G38, J33, M52Bank classification: Labour markets
Résumé
Pour les tenants de la théorie de l’appropriation de la rente, la faiblesse des mécanismes de
gouvernance d’entreprise permet aux chefs de direction de contrôler le processus d’établissement
de leur rémunération et de profiter des retombées d’événements indépendants de leur volonté
(rétribution liée à la chance). L’auteure constate que l’indépendance prescrite par la loi Sarbanes-
Oxley de 2002 a, tout comme les règlements en matière de gouvernance édictés plus tard par les
bourses, modifié la structure de rémunération des chefs de direction. Dans les entreprises où les
conseils d’administration ont été plus touchés par les dispositions du texte (parce qu’ils étaient au
départ moins indépendants qu’ailleurs), les primes de rendement des dirigeants ont augmenté et la
part de la rétribution attribuable à la chance a diminué à la suite de l’adoption de la loi Sarbanes-
Oxley. Dans le cas des entreprises où se trouvaient déjà en place des conseils d’administration
forts, par contre, peu de données ont confirmé l’existence de ce type de rétribution et la loi
Sarbanes-Oxley n’a guère eu d’effets sur les primes versées. Ces résultats sont conformes à la
théorie de l’appropriation de la rente et restent les mêmes lorsqu’on examine d’autres hypothèses
d’explication telles que l’asymétrie conjoncturelle des émoluments, la présence d’une structure
oligopolistique et la qualité des dirigeants.
Classification JEL : G38, J33, M52Classification de la Banque : Marchés du travail
1 Introduction
Executive pay has recently been at the center of a heated debate in the United States
due to the 200% increase in average CEO compensation over the last two decades (Hall
and Liebman, 1998; Bebchuk and Grinstein, 2005). Two potential explanations for this
increase include the greater use of managerial incentives, such as stock options, as well as
the large growth in stock market valuations over that period (Bebchuk and Grinestein,
2005; Conyon, 2006). While the typical compensation package includes stock options
in order to motivate the manager to increase shareholders’ wealth, it is not clear how
managers should be compensated when a firm’s value increases as a result of general
stock market movements and not from managerial effort (Jensen and Murphy, 1990).
The bull market during the 1990s thus brought about a potential conflict of interest be-
tween managers and owners. Shareholders were concerned that managers were rewarded
for riding the bull market, rather than being compensated for their own actions. The
central question in this paper is whether CEOs are actually paid for their contribution
to maximizing the value of the firm, or whether they are instead paid for “luck,” i.e., for
events outside of their control.
Prior research offers two competing views as to whether CEOs are primarily paid
based on luck. In the first view, Bebchuk et al. (2002) argue that powerful CEOs can
capture the pay-setting process in firms with weak boards which fail to oppose managerial
opportunistic behavior. In such firms, CEOs have been awarded excessive pay, ultimately,
undermining the interests of shareholders. Bertrand and Mullainathan (2001) find that
CEOs are paid for luck, defined as pay for observable shocks in firm performance beyond
the manager’s control, such as movements in industry returns, oil prices, or exchange
rates. Most importantly, their study shows that strongly governed firms, as defined by
the presence of a large shareholder, pay their CEOs less for luck than do the more weakly
governed firms.
In the second view, CEO pay is designed to respond to changes in industry return in
order to motivate managers to exert an optimal level of effort. Rajgopal et al. (2006)
document that the sensitivity of CEO compensation to industry-wide and market-wide
performances is systematically higher for talented CEOs who enjoy outside employment
2

opportunities. Gopalan et al. (2007) also find that “pay for luck” is prevalent for talented
CEOs operating in industries that offer greater strategic flexibility. According to these
studies, pay for luck arises from an optimal contract.
It is important, from a shareholder’s perspective, to know whether CEOs are skim-
ming at the expense of shareholders (by being paid for luck), or whether they are instead
being optimally paid as a result of movements in industry performance. If CEOs are
paid for luck, compensation reform that aims to decrease this type of pay should be
demanded. However, if a CEO’s pay contract serves as an incentive device consistent
with firm value maximization, then the owner intervention is not needed.
To understand whether CEOs are paid for luck, I explore how changes in corporate
governance mechanisms affect this type of pay. In particular, the percentage of indepen-
dent directors is used as a proxy for the efficacy of corporate governance. If a low fraction
of independent directors is associated with low pay for luck, then it can be inferred that
corporate governance mechanisms such as requiring a majority of independent directors,
might work to reduce pay for luck and could potentially increase pay for performance.
Consistent with the previous literature, I define pay for luck as the response of pay to
industry-wide movements, versus pay for performance, which is the response of pay to
changes in a firm’s own performance (Bertrand and Mullainathan, 2001; Garvey and
Milbourn, 2006). Finding evidence that CEO pay for luck is sensitive to changes in
board independence provides support for the skimming view. The association between
pay for luck and board structure, however, is determined endogenously by firm and CEO
characteristics, which makes it difficult to infer causality (Core et al., 1999; Grinstein
and Hribar, 2004). Powerful CEOs who manage to influence and control the board will
tend to appoint directors with whom they have an affiliation. In return, weak boards
comprised of inside directors are more likely to allow their CEOs to be paid for luck.
In order to analyze the underlying causality between board independence and pay
for luck, I use a recent regulatory change in the U.S. corporate governance as a “natural
experiment.” Specifically, I consider a change requiring that the listed firms be composed
of a majority of independent directors. This legal requirement was imposed by the
Sarbanes-Oxley Act (SOX) of 2002. Together with the corporate governance amendments
3

to the New York Stock Exchange (NYSE) and the National Association of Securities
Dealers Automated Quotation System (NASDAQ), the SOX act was aimed to restore
investor confidence and to enhance the auditing standards of U.S. public companies after
a wave of corporate scandals broke in 2000. This paper estimates the impact of these
exogenous shifts in board independence on CEO pay for luck and pay for performance.1
To test the effect of these 2002 legal reforms on CEO pay for luck and pay for per-
formance, I construct two groups of firms based on the degree to which they comply
with the new rules. The group of compliant firms, comprised of firms with a majority
of independent directors prior to 2002, is expected to be less affected by SOX and stock
exchanges stipulations than firms that were forced to change their boards’ structure.2
The corporate governance rules of 2002 provide two sources of variation that I employ in
my empirical methodology. First, I compare changes in CEO pay for performance (and
pay for luck) before and after 2002, second, I compare the difference in CEO pay for
performance (and pay for luck) before and after 2002 in independent board firms (more
compliant) to the difference in CEO pay for performance (and pay for luck) before and
after 2002 in independent board firms (less compliant). The first level of change measures
the effect of SOX by using temporal identification, which fails to eliminate the effect of
potential shocks occurring contemporaneously with the passage of the law and corre-
lated with CEO pay. The second level of change, however, eliminates the effects of these
shocks because it is sensitive to a firm’s degree of exposure to the reform. Difference-in-
differences methodology is applied to the ExecuComp data set over the period 1998-2005
as well as the Investor Responsibility Research Center (IRRC) data set over the period
1998-2002. The results show that CEO pay for luck is present only in less compliant
“dependent-board firms” before SOX, and consistent with improved governance, the ef-
1Throughout the paper a reference to SOX will also take into account NYSE and NASDAQ regulationsof 2002.
2SOX is a complex law consisting of new requirements for accounting firms, financial analysts, cor-porate officers, and corporate directors (See Section 2 for details.) In this paper, compliance level refersonly to the requirement that a board is comprised of a majority of independent directors. More specif-ically, SOX mandates an independent audit committee, and stock exchanges requires that all memberfirms appoint a majority of independent directors who will sit on the nomination, compensation, andaudit committees.
4
fect disappears after 2002.3 Next, I find that a CEO’s pay for performance, designed to
make managers act in the best interest of shareholders, increases in the dependent-board
firms after SOX and does not change for the rest of the firms.
These results are supportive of the skimming view, which suggests that regulatory
interventions might help to resolve agency conflicts between CEOs and shareholders.
However, these results could also be consistent with three alternative explanations. First,
Garvey and Milbourn (2006) posit that a positive response of pay to changes in industry
returns might not capture pay for luck but instead pay for taking systematic risk within
an industry. To address this concern, I test whether the sensitivity of pay to industry
returns remains when the “luck” turns out to be bad luck. The results suggest that the
sensitivity is greater when industry returns are positive than when they are negative, but
only in the dependent-board firms before SOX. The lack of such an asymmetry in the
sensitivity of pay for luck to positive industry return after SOX suggests that the reforms
have managed to diminish the impact of skimming by making mangers bear the effect of
negative industry returns.
Second, Gopalan et al. (2007) and Milbourn (2003) find that pay for luck is more
likely to be observed among talented CEOs who possess valuable human capital and who
operate in an industry that offers strategic flexibility defined as the “choice of magnitude
of the firm’s exposure to sector or market factors.” According to their model, this type
of pay is designed to motivate executives to adjust the firm’s risk exposure to sector
movements. In examining the impact of CEO talent on firms with independent and
dependent boards, I have demonstrated that CEO talent is not as consistently rewarded
as an optimal contract design would predict. That is talent is rewarded only in dependent-
board firms before SOX; however, it is not rewarded after SOX. Overall, the sensitivity
of the results to board structure and the time of passage of SOX lend support to the
argument that CEOs are paid for luck rather than for talent, and that the 2002 corporate
governance regulations manage to decrease this type of pay.
Third, Aggarwal and Samwick (1999b) postulate that strategic interaction among
3“Dependent-board” firm is defined as a firm not reaching certain threshold of a percentage of inde-pendent directors before the adoption of SOX. See Section 3 for details.
5
firms may explain the presence of pay for luck. In less competitive industries, managers
might not be paid for industry movements in order to discourage them from competing
excessively with other firms in the industry. According to this explanation, pay for
luck is expected to be lower in companies that operate in less competitive industries. I
find empirical evidence of nondecreasing pay for luck as product market concentration
increases. In addition, the dependent-board firms exhibited a larger decrease in pay for
luck than did the independent-board firms. Hence, the presence of pay for luck does
not seem to be related to strategic interaction within sectors, which further supports the
skimming view that managers are indeed extracting rents.
This paper contributes to several strands of research on corporate governance and
CEO pay. First, I add to the literature on CEO pay and board structure by suggest-
ing a better strategy for identifying the relationship between CEO pay and the board
structure (Hermalin and Weisbach, 2003; Becht et al. 2002). This paper circumvents the
simultaneity between CEO pay and board independence by examining the requirement
of maintaining a majority of independent directors imposed by SOX and stock exchange
amendments. In a related study, Wang (2005) finds that chief financial officer (CFO)
pay for performance decreases in compliant independent-board firms with high uncon-
trollable risk (i.e, risk that cannot be eliminated by maximum auditing) after SOX, while
it increases in less compliant dependent-board firms and high controllable risk. Unlike
the study by Wang (2005), this paper focuses on the impact of SOX on CEO pay for luck
as opposed to CFO pay for performance. In addition, I find that CEO pay for perfor-
mance increases in less compliant dependent-board firms after 2002, which compliments
the finding of Wang (2005) that CFO pay for performance increases for the same type
of firms. Further, my analysis builds on Bertrand and Mullainathan (2001) and Garvey
and Milbourn (2006) that investigate the pay for luck phenomenon outside of the context
of SOX.
I also contribute to the literature on CEO pay growth. Gabaix and Landier (2008)
show theoretically that the recent rise in CEO pay is an efficient equilibrium response
to the increase in the market value of firms rather than occurring as a result of agency
problems. The results obtained in this paper indirectly imply that CEO pay structures,
6
associated with rent extraction, are affected by the 2002 legal reform, which, contrary to
the model proposed by Gabaix and Landier (2008) implies that agency problems might
still play a role in determining CEO pay.
Finally, the findings are relevant to the current debate regarding the impact of SOX,
and whether or not its enactment was a costly political overreaction (Coates, 2007). In
particular, the results should be of interest to: (i) company boards which have been
strengthened and have presumably abandoned the practice of granting pay packages
which provide the possibility for rent-extraction; (ii) regulators who have been criticized
for implementing costly regulation; and (iii) shareholders who want to make sure that
their return on investment is not expropriated by the managers of their companies.
The remainder of this paper is organized as follows. Section 2 provides background
information on SOX and discusses related research. Section 3 describes the data and pay
patterns. Section 4 discusses the identification strategy employed in the paper and the
empirical specification. Section 5 proceeds with the results. Section 6 reports the results
for alternative explanations of pay for luck. Section 7 presents several robustness tests.
Concluding remarks are offered in Section 8.
2 Background, Prior Literature and Hypothesis
The Sarbanes-Oxley Act was enacted in 2002 as an anti-fraud measure in the wake of
large accounting scandals at Enron, WorldCom, Tyco International, and Adelphia. In-
vestors lost billions of dollars when the share prices of the affected companies collapsed.
Concerns were also raised about the stability of the U.S. securities markets in the after-
math of the scandals. Initiated by the federal government, the Sarbanes-Oxley Act is
considered to be among the most extensive reforms affecting U.S. corporate governance
since the initial federal securities laws were adopted in 1933 and 1934. The Act con-
sists of eleven provisions, which include new requirements for accounting firms, financial
analysts, corporate officers and corporate directors. SOX established the Public Com-
pany Accounting Oversight Board (PCAOB) to oversee and regulate auditing. SOX also
7
strengthened corporate governance.4 For example, the audit committee, which is the
committee that oversees the auditors of a firm must be composed of only independent
directors, defined as those who are: “not receiving, other than for service on the board,
any consulting, advisory, or other compensation fee from the issuer, and as not being an
affiliated person of the issuer of any of its subsidiaries.” Each member of the audit com-
mittee must be financially literate, and must be an “audit committee financial expert.”
If these conditions are not satisfied the company must disclose that it does not have such
a committee and explain why it does not.
Immediately following the passage of SOX in July 2002, the NYSE and NASDAQ
announced their own new governance requirements. According to these requirements,
the board of directors of each NYSE- and NASDAQ-listed firm must have a majority of
independent directors, who must comply with an elaborate definition of independence.
Furthermore, the compensation, nomination, and audit committees shall consist of only
independent directors.
Scholars and practitioners are debating whether the costs of implementing the 2002
reforms outweigh their benefits.5 This legislation has forced firms to spend significantly
more on internal controls. In return for these higher costs, investors will presumably
face a lower risk of losses from fraud and theft and benefit from greater transparency
and accountability. Apart from these direct costs and benefits, SOX might indirectly
affect certain stakeholders. Although the Act does not regulate CEO pay, agency theory
4Timely and accurate information for investors is ensured by drastically increasing the sanctions formanagement “misconduct.” SOX imposes a fourfold increase in the maximum prison term for criminalfraud. In addition, if there is an accounting restatement as a result of misconduct, the Act requires CEOsand CFOs to reimburse any incentive-based compensation, or profits from the sale of stock received 12months after the misreporting (Section 304). Furthermore, executives are prohibited from selling stockduring the pension blackout period and are required to report sales or purchases of company stock withintwo days, rather than the previous window of ten days, after the transaction (Section 306).
5Eldridge and Kealey (2005) document a significant increase in audit fees associated with internalcontrol systems between 2003 and 2004. In an event study, Zhang (2007) finds negative cumulativeabnormal returns around SOX. This Act is also blamed for the increased incidence of delisting after2002 and for the lost competitiveness of the NYSE compared to the London Stock Exchange. Hallinget al. (2006) suggest that the decline in cross-listing is due to the improved liquidity of foreign capitalmarkets rather than to SOX enactment. Comparing cross-listed foreign companies subject to SOX in theU.S. to non-cross-listed foreign companies, and to cross-listed companies that are not subject to SOX,Litvak (2007) shows that the market premium after the passage of SOX declined for more profitable,riskier and smaller companies with a higher level of pre-SOX disclosure that were cross-listed in the U.S.
8

suggests that improved monitoring through board independence will affect CEO pay for
performance (Demsetz and Lehn, 1985).
Even prior to the passage of SOX and the preceding scandals, the role of board
structure on CEO pay had been studied extensively. Hallock (1997) finds that boards
with interlocking directors—directors of two companies who sit simultaneously on each
other’s company boards—pay a higher wage to the CEO. Similarly, Core et al. (1999)
show that CEO wages are positively correlated with the presence of interlocking directors.
CEOs seem to be paid more when they are appointed as board chairmen and when the
percentage of affiliated directors is high. Grinstein and Hribar (2004) discover that a
powerful CEO, who is also chairman, manages to extract higher bonuses. All these
studies remain silent, however, on the potential endogeneity among firm value, CEO pay
and board structure. Core et al. (1999) use ex-post performance to infer causality. Their
study investigates the consequences of excessive CEO compensation in firms with weaker
governance and find a negative relationship with future performance.
An alternative approach to examining the impact of board structure on CEO pay is to
look at changes in board structure due to factors outside the firm. For example, changes
in legislation associated with board requirements might be viewed as an exogenous source
of variation potentially explaining pay variation. In the current analysis, I use the SOX
requirement for board independence to examine changes in CEO pay structure.
Research examining SOX and CEO pay is closely related to my study.6 Holmstrom
and Kaplan (2003) reason that SOX might increase the risk of CEOs and CFOs of being
accused of “misconduct” when selling a large number of stock options. Henceforth,
executives will be more reluctant to cash in their equity holdings after the passage of
SOX. Furthermore, their portfolios will be less liquid and will shift managerial attention
from short- to long-term stock prices.
6The impact of law regulations on executive pay has received attention in the literature before SOX.Hubbard and Palia (1995) find that CEOs in the banking industry earn more after U.S. banking deregu-lation occured in the 1980s and exhibit a stronger pay-for-performance link. Bertrand and Mullainathan(1998) consider state anti-takeover legislation. They suppose that weak takeover threat should raise paybecause the entrenched CEOs can “skim” more easily whatever pay they can. In other words, the lackof takeover threats allow entrenched CEOs to increase their rents at the expense of shareholders. Theauthors find that large shareholders, who are associated with strong governance, help in limiting the risein mean CEO pay after the passage of the law and also increase their pay-for-performance sensitivity.
9
Cohen et al. (2004) examine the change in the structure of executive compensation
after the passage of SOX. Focusing on pre- and post-SOX comparisons, firms are expected
to respond to the increased liability by lowering the incentive component of managerial
pay and by increasing the fixed component so that managers are insured against risks
beyond managerial control. The results based on the ExecuComp data confirm an in-
crease in fixed salary and a decrease in incentive-based compensation of CEOs after the
passage of the Act. The observed shift from more risky to less risky pay is interpreted
as a form of insurance against the imposed liability after SOX. Another finding of the
paper is that CEOs choose less risky projects after SOX, which might negatively affect
shareholder returns because of forgone profitable projects. Cohen et al. (2004) rely on
time series identification of SOX, which makes it difficult to isolate the effect of other
contemporaneous events related to the reform’s passage.
Wang (2005) explores the effect of the Act on CFO pay in firms with strong and weak
board oversight prior to the passage of SOX. According to Wang (2005), two factors
are expected to affect CFO pay. The first is increased risk of material misstatement
of unaudited financial reports in the absence of internal control procedures, and the
second factor is increased monitoring. According to standard agency theory, firms with
a strong board of directors will respond to the increased risk with reduced incentive
pay. Firms with weak boards, however, will be affected by both a rise in risk and
improved monitoring. The direction of the change in pay is unclear, since it depends
on the proportion of uncontrollable risk, managerial risk aversion and the cost of effort.
Wang (2005) finds that CFO incentive pay is reduced after SOX in firms with independent
boards and a high proportion of uncontrollable risk. Furthermore, firms with weak boards
before the Act and low uncontrollable risk increase CFO incentive compensation after
the reform.
My paper borrows from the methodology of Wang (2005) to identify groups of firms
with different level of pre-SOX exposure regarding board independence. Unlike Wang
(2005), I focus on CEO pay for luck. CEOs are a highly visible group, with their corporate
responsibility increasing after the 2002 legal reforms. CEOs have recently been accused
of being excessively paid, presumably because they have managed to largely determine
10
their own pay. Bebchuk and Fried (2004) argue that because option contracts lack explicit
relative performance valuation executives receive windfall gains as market value increases.
In general, an optimal CEO contract should not depend on luck because this practice
fails to realign the interests of CEOs and shareholders.
The passage of SOX act aims to strengthen corporate governance which potentially
may reduce pay for luck. Dependent-board firms might be weak and dominated by en-
trenched CEOs who appoint their friends to the board and subsequently capture the
pay-setting process. These firms are subject to stronger consequences of the reform than
better-governed firms in terms of meeting the board independence requirement. Further-
more, the improved board oversight is expected to decrease the incidence of pay-for-luck
practices. The above argument leads to Hypotheses 1a and 1b:
Hypothesis 1a. All else being equal, CEO pay for luck decreases in less compliant
dependent-board firms after the passage of the 2002 reforms.
Well-governed firms are not expected to change their pay structure after SOX because
pay for luck was not part of their compensation package before the reform was imple-
mented. I summarize this prediction in the following hypothesis:
Hypothesis 1b. All else being equal, CEO pay for luck remains unchanged in more
compliant independent-board firms after the passage of the 2002 reforms.
This paper derives predictions about the impact of SOX not only on CEO pay for
luck but also on CEO pay for performance. Agency theory suggests that board structure
and pay for performance are connected. The role of the board is to offer a pay package
that would give managers incentives to act in the best interest of shareholders.7 Apart
from offering a contract, boards also monitor whether managers act in the owner’s best
interests. Board monitoring, however, comes at a cost. The role of monitoring is to
7In this optimal contracting world, the board might use an alternative mechanism to realign theinterests of managers with these of owners. Bertrand and Mullainathan (1998) see the threat of atakeover as another incentive scheme to motivate CEOs to perform better.
11
transfer risk from the risk-averse managers to the risk-neutral owners and to reduce
information asymmetry, which will enable owners to tailor the managers’ rewards more
closely to their actions rather than to firm profits. Hence, the expected result of improved
monitoring should be a reduction in pay-for-performance costs relative to the situation
without monitoring (Demsetz and Lehn, 1985). Monitoring will happen only if the cost
of doing so is offset by the additional payoff of economizing pay for performance.
The passage of SOX demands stronger monitoring through the rule for a majority
of independent directors. According to the principal-agent theory, improved monitoring
leads to lower levels of pay for performance at the margin, because strong boards can
instruct managers to take actions that maximize shareholders’ value. If monitoring is
too costly, however, boards can motivate managers by using pay for performance mecha-
nisms. Stated differently, increased board oversight after SOX might increase or decrease
pay for performance depending on monitoring costs. The magnitude of pay for perfor-
mance changes due to the adoption of SOX is an empirical question, which is addressed
by testing the following hypotheses:
Hypothesis 2a. All else being equal, CEO pay for performance changes in less compli-
ant dependent-board firms after the passage of the 2002 reforms.
Hypothesis 2b. All else being equal, CEO pay for performance remains unchanged in
more compliant independent-board firms after the passage of the 2002 reforms.
3 Data Sample and Descriptive Statistics
Standard & Poor’s (S&P) ExecuComp database provides information about the five
highest-paid executives available in proxy statements. Disclosure rules for U.S. executives
require details on salary, annual bonuses, option holdings, equity and option grants, and
CEO age and CEO tenure. The database covers firms from the S&P 500, the S&P
MidCap 400, the S&P SmallCap 600 and other supplemental S&P indices.8 The IRRC
8Since the sample contains both LargeCap and SmallCap firms, ex-post survivorship bias is less likely.
12
data are of annual frequency and cover the directors of the S&P 500, S&P 400 MidCap
and S&P 600 SmallCap firms for the period 1998 to 2005. The data provide details on
the structure and practices of the boards of directors and historical information for each
director, such as the committees to which they belong to, board affiliations, shares held
and total voting power.
The ExecuComp sample contains 2,350 firms, or 14,592 firm-years, for the period 1998
to 2005 (See Table 1). Officers named as CEOs are defined by the CEOANN field for
each year.9 In 1998, around 10% of the firms in the ExecuComp data did not report on
their CEOs, while, in 2005, only 1% did not report. Before excluding these firms from the
analysis, a sample selectivity analysis is made on the relationship between the incidence of
not reporting CEOs records and firm characteristics. The results from a logit regression
analysis shows that none of the estimated set of parameters is statistically significant,
which insures against biases caused by systematic non-reporting.
The IRRC data cover 2,906 firms, or 12,959 firm-years, for the period 1998 to 2005.
The sample obtained after matching both data sets over the period 1998 to 2005 consists
of 1,722 executives named as CEOs and 10,812 firm-years. I rely on a successful match
between the IRRC and ExecuComp data only if a firm is present for at least two years
for the period 1998 to 2002 in the IRRC data. This restriction allows me to calculate the
yearly average of board independence. Under this condition, there are 217 firms present
in the ExecuComp data but missing from the IRRC data. A sample selectivity analysis
explores whether the non-matched firms, which are available in the ExecuComp sample
but missing from the IRRC data for the period 1998 to 2002, are randomly distributed
across firms with different characteristics. The results show that SmallCap firms are
more likely to be missing in comparison to the LargeCap and MidCap firms.
Two alternative measures of board independence are used. First, I construct ten
portfolios according to firms’ sales for the period 1998 to 2001 and define the median
percentage of independent directors in each portfolio as a threshold. Then, for each
9Chief operating officers (COOs) and Chief financial officers (CFOs) are retrieved from the fieldTITLEANN. The group of COOs is considerably smaller in comparison to CEOs and CFOs. It ispossible that COOs are not ranked among the top highest-paid executives and/or they are not reportedin the data.
13
portfolio I classify a firm as belonging to the independent-board subsample if its percent
of independent directors is higher than the median percent of independent directors in the
relevant portfolio. Similarly, the sample of dependent-board firms consists of firms with
a lower percent of independent directors than the portfolio median. Second, I employ an
alternative measure that relies on the majority of independent directors (more than 50%
of all board members) .
Firm-level data are taken from the Compustat industrial annual database. The in-
dustry affiliation is based on the Standard Industrial Classification. The three largest
industry groups in the sample comprise Commercial Banks (SIC 6020, 4.5% of the sam-
ple), Prepackaged Software (SIC 7372, 4.19% of the sample) and Crude Petroleum and
Natural Gas (SIC 1311, 2% of the sample). Furthermore, after eliminating firms with
missing data for either total pay or return and trimming the pay variable at the 1% level,
the analysis-ready sample consists of around 1,650 firms and 10,000 CEO-firm-years.
Table 2 reports summary statistics. The upper panel of the table presents the full
sample of all matched firms, the middle one details the unmatched sample, and the
bottom panel shows the mean differences between independent and dependent firms.
Total pay reaches a maximum of around $7 million in 2000 when the majority of corporate
scandals occurred. The value of granted options in the total pay package reaches its
maximum in the same year. Firms seem to divert the most from granting options to
their CEOs in 2003 and 2004.
The middle panel covers firms that are not present in the IRRC data but that are
available in the ExecuComp data. Except for 1998, the unmatched firms pay less than
the matched firms; these firms also report lower net sales and return on assets but larger
volatilities compared to the volatilities of the matched sample. Furthermore, I investigate
whether or not the non-matched group is similar to the independent or dependent-board
firms in terms of pay and firm performance. Over the whole period, the unmatched
firms seem to be significantly smaller than both the dependent- and independent-board
group of firms; however, they are closer in size to the latter group than to the former.
In addition, the non-matched firms are less profitable than both the independent and
dependent groups. Looking at CEO pay, the unmatched firms seem to be similar to the
14

independent-board firms. Hence, the non-matched group of firms may be characterized
as a separate set of firms that are smaller and less profitable but exhibit pay levels similar
to that of the independent-board firms.
The bottom panel of Table 2 shows that the dependent-board firms pay their managers
a greater amount than the independent-board firms do. The difference of approximately
$2 million in annual pay in 2001 is the highest over the sample period. The main reason
for this pay differential is the particularly large option grants that the dependent-board
firms bestow on their CEOs. The value of options grants is calculated as the number of
options times the Black-Scholes option value,10 and it captures the effect of the size of
the option grants and any equity overvaluation.
Inspecting the value of a single option grant shows that the grants of dependent-board
firms are overvalued compared to the grants of independent-board firms only before SOX;
after SOX this differential disappears. As for the size of the grant measured by the number
of shares as a fraction of a firm’s outstanding shares, the dependent-board firms do not
give larger grants than the independent-board firms, except in 2004 and 2005.
Another important tendency is that the dependent-board firms exhibit larger levels
of sales than do the independent-board firms, although for 1999-2001, the difference
is not statistically significant. The mean return on assets (ROA) indicates that the
dependent-board firms perform better than the independent-board firms only in 1998
and 2002. Comparing equity return volatilitiy across firms shows that, except for the
most turbulent periods for the financial markets in 2001 and 2002, the independent-board
firms are less volatile than the dependent-board firms.
10The most widely used method for valuing options is the Black-Scholes formula adjusted for con-tinually paid dividends. The value of European call option paying dividends is: OptionV alue =Pe−ln(1+d)T N(z) − Xe−ln(1+r)N(z − σ
√T ), where P is the grant-date stock price, X is the exer-
cise price, T is the time remaining until expiration, d is the annualized dividend yield, σ is thestock-price volatility, r is the risk-free discount rate, N(.) is the cumulative distribution function, andz = (ln(P/X) + [ln(1 + r)− ln(1 + d) + σ2/2]T )/(σ
√T ).
15
4 Identification and Empirical Specification
The fall of Enron in 2001 is used as a motivating event for the corporate governance
reforms in 2002. The pre-reform period of analysis is from 1998 to 2001 and the post-
reform from 2003 to 2005. Year 2002 is dropped, since it is the year when the reform
was enacted. Although SOX is a complex regulation, this paper looks only at the im-
pact of improved board oversight through the requirement that boards be comprised of
a majority of independent directors. The level of board independence before SOX per-
mits the analysis of a more compliant group of firms with strong board oversight and a
less compliant group of firms with weak board oversight. The former group is defined
as a “control” group and the latter as a “treatment” group. The differences in pay-
performance sensitivities between these two groups of firms are more accurate measure
of the impact of SOX on CEO pay compared to only relying on before-after changes in
pay-performance sensitivities.
Previous studies using cross-sectional data to examine board monitoring and executive
pay rely on a potentially endogenous source of variation (Lehn et al., 2003). For example,
talented CEOs may influence the composition of company boards, equally plausible,
company boards may affect CEO pay. Using the act as a “surprising” event that causes
a forceful change in board structure might be a better identification of the relationship,
though to some degree, the extent of board change depends on the composition of the
board before the reform. I examine the pre-SOX change of the percentage of independent
directors to determine whether or not firms expected the upcoming regulation and thus
adjusted their board policy before the passage of SOX. Considering independent- and
dependent-board firms separately, the results show that there is no systematic difference
in the way board structure changes across firms before 2002.
The share of independent directors has increased over the whole period from 1998 to
2005. To distinguish the trend effect from the potential effect of SOX, I estimate a pre-
liminary regression where a percent of independent directors is a left-hand-side variable,
and a linear trend and a dummy for the passage of the act are right-hand-side vari-
ables. The results show that the percentage of independent directors increases after 2002
even when accounting for the time trend (results are untabuilated). Although the trend
16
towards more independence has started before SOX, the regulation itself contributes a
more significant increase.
Table 3 summarizes the changes in board independence after the passage of SOX
and confirms the actual reform’s treatment. Each cell of the table reports the percent-
age change of the share of independent directors from before to after SOX across board
committees (rows) classified as independent or dependent (columns). Regardless of the
way an independent board committee is defined, we observe that the reform affects firms
with originally dependent boards to a greater extent than firms with initially indepen-
dent boards. The table shows that the share of independent audit committee members
increases by 13% when using the median-portfolio-based approach and by 6% for the
majority-rule-based method. Overall, the percentage increase in the share of different
types of independent directors is significantly higher (at the 1% level) in firms with pre-
SOX dependent boards than in firms with pre-SOX independent boards, which supports
the use of board independence as a proxy for changed monitoring environment.
A two-stage approach that allows for the simultaneous examination of the impact of
SOX on pay for luck and pay for performance is used. At the first stage, firm performance
is decomposed into two parts: a systematic-risk component and a firm-specific compo-
nent. The systematic-risk component reflects common industry shocks that affect all
firms in an industry. To be consistent with prior literature (Bertrand and Mullainathan,
2001; Garvey and Milbourn, 2006), pay for luck is measured by the response of pay to
changes in industry-wide returns, and pay for skill (i.e., pay for performance) is measured
by the response of pay to changes in firm-specific performance. At the first stage, the
time series of each firm’s performance is decomposed as:
Returnjit = β1IndustryReturnjit + ζ1t + η1i + ε1jit, (1)
where IndustryReturn is asset value weighted (or equal-weighted) industry return on
assets based on the two-digit SIC industry j in year t and firm i itself is excluded from
the mean calculation,11 t is year fixed effects, η1i is firm fixed effects and ε1jit is resid-
11A mechanical correlation arises if a firm’s return itself is included in the calculation of the averageindustry return and then included in equation (1) to predict firm performance.
17
ual, which is the firm-specific component of firm performance. The systematic compo-
nent, Returnjit, is a product of the estimated coefficient and the industry performance,
β1IndustryReturnjit. At the second stage, the following regression is estimated:
Log(Payit) = [β2Returnjit + δ2XXit + γθ1jit](1 + SOX) +
+ ρSOX + ζ2t + η2i + ε2it, (2)
where SOX takes a value of one for the period 2003 to 2005 and zero for the period
1998 to 2001; Log(Payit) includes salary, bonus, benefits, total value of restricted stock
granted, total value of stock options granted, long-term incentive payouts and all other
pay; Returnjit is the systematic component common for the industry group and not
attributable to CEO actions or CEO quality; β2 is the response of pay to industry
performance that is associated with luck and Xit is a set of firm-specific variables such
as firm size and stock return volatility; θ1jit = η1i + ε1jit; η2i is firm fixed effects and ε2jit
is residual.
The above specification is estimated separately for dependent- and independent-board
firms. Following previous literature on CEO pay, time-invariant firm heterogeneity is
accounted for by including firm fixed effects.12 The standard errors are clustered at
the firm level, allowing for correlation between different observations within firms across
different years. The effect of the reform is captured separately by the post-SOX change
in pay for industry-induced (i.e., pay for luck) and pay for firm-specific return (i.e., pay
for performance) in dependent-board (treatment group) and independent-board firms
(control group).
It is well known that the difference-in-differences estimator is based on strong identi-
fication assumptions.13 In particular, in the absence of treatment the average outcomes
for the treatment and control groups would have followed parallel paths over time. Com-
paring the annual total pay between the independent- and dependent-board firms, the
12Murphy (1999) shows that controlling for firm fixed effects is important in the managerial payliterature.
13See Heckman and Hotz (1989) for an explanation of difference-in-differences, and Bertrand and Mul-lainathan (1998) for an application of this methodology to analyze the effect of anti-takeover legislationon CEO pay in the US during the 1980s.
18
value of option grants is the component that induces significant variation between the
pay levels in both groups of firms. To reduce the existing disparity, I first consider pay
without options as a dependent variable in the main specification (Section 5) and pay
plus options’ value is presented in Section 7 as a robustness check.
Garvey and Milbourn (2006) argue that the link between pay and industry perfor-
mance might reflect compensation for taking systematic industry risk and not necessarily
reflecting pay for luck. This argument assumes that managerial pay is symmetrically
linked both to good and bad industry fortune. However, if executives have managed to
capture the pay-setting process, their pay would be expected to be sensitive to industry
performance when the industry return (benchmark) is up but not when it is down. To
incorporate their argument in the current analysis, I estimate a model that allows for
the sensitivity of pay for luck and skill to vary with positive and negative values of luck
and skill. Particularly, the following terms (both with and without the SOX dummy) are
added to equation (2):
[ξ Returnjit ×Down1 + χε1jit ×Down2](1 + SOX), (3)
where Down1 takes on value one if Returnjit < 0 and zero otherwise, and Down2 takes
on value one if ε1jit < 0. If CEOs are expropriating by being asymmetrically paid for
luck, ξ is expected to be negative significant. In the SOX framework, ξ is expected to be
negative in dependent board firms before SOX and decreasing afterwards.
5 Are CEOs Paid for Luck?
The empirical analysis begins by examining whether the average CEO is paid for changes
in firm-specific and/or industry-induced returns. To decompose firm performance into
systematic and idiosyncratic components as specified in equation (1), I follow the method-
ology of Bertrand and Mullainathan (2001) and Garvey and Milbourn (2006). Because
I explore the impact of SOX, I allow for pre- and post-SOX changes in pay sensitivities
separately for dependent- and independent-board firms. The estimates of total pay (op-
19

tions excluded) regressions are reported in Table 4.14 This pay measure ignores changes
in the value of the CEO’s existing shares and options. Whether the consequence of this
exclusion is an underestimation of the managerial incentives depends on the managers’
activities regarding their personal portfolios.15 Given the difficulty of controlling for
managers’ activities, using current compensation has the advantage of measuring only
compensation components over which the board of directors has direct control. More-
over, the focus of this analysis is on the potential influence of SOX on executive pay,
rather than on the optimal managerial pay dynamics.
Since board decisions are the major channel through which SOX may affect CEO
current pay, I use pay levels instead of annual changes in pay. Another reason for using
the current level of CEO pay is that I study the impact of SOX on pay for luck, which does
not vary with fluctuations in previously granted pay. It is expected that SOX has limited
control over the amount of pay that CEOs choose to retain in their portfolios. The use
of current compensation is further justified by Core and Guay (1999), who conclude that
firms use flow of equity incentives to reward past performance and re-optimize incentives
for future performance.
Table 4 presents the results from the second stage pay regressions which include the
estimated industry and firm-specific performances from equation (1). Columns 1 thought
3 of the table report the results for the full sample, independent- and dependent-board
firms. Column 1 shows that the coefficient on industry-induced return is not significant.
On the contrary, firm-specific performance is linked positively to pay, which confirms that
the more skilful a manager is, the higher her or his pay will be. Columns 2 and 3 provide
a better understanding of the impact of SOX on pay structure because this specification
not only accounts for the passage of SOX but also, for differences between treatment and
control groups. The estimates presented in Column 2 include only independent-board
14Financial Accounting Standards Board (FASB) issued a revised statement No.123 in December 2004according to which all U.S. public firms are now required to expense stock options for all financialreporting periods that begin after June 15, 2005. To avoid the impact of these changes on CEO paylevels, I examine pay without options in the main specification.
15Ofek and Yermack (2000) report evidence that managers alter their portfolios in response to thecomposition of their pay packages. Similarly, managers counteract the effects of existing holdings throughhedging transactions.
20
firms and confirm that these firms, associated with strong governance, do not pay their
CEOs for changes in industry performance, either before or after the passage of SOX.
On the contrary, the dependent-board firms reward managers for industry performance
before SOX, which is consistent with Hypothesis 1b. After the passage of SOX, however,
the dependent-board firms seem to abandon this practice by decreasing the sensitivity
of pay to industry performance by 70%, which supports Hypothesis 2b. One standard
deviation increase in industry-induced return (0.045 units) corresponds to a 0.30% less
pay for industry-induced ROA for a dependent-board CEO after SOX than before SOX
.16
Next, concerning the estimates of firm-specific return, the results show that there are
no differences between the dependent- and independent-board firms before SOX. The
post-SOX period, however, is associated with a notable 1.47 increase on a base of 0.93
in firm-specific performance estimate in the dependent-board firms, while the sensitivity
remains unchanged for the independent-board firms, which supports Hypothesis 2a and
2b.17 These results are consistent with those of Wang (2005), who studies the impact
of SOX on CFO pay. In particular, the author finds that CFO incentive pay is reduced
after SOX in firms with strong boards prior to the reform, while firms with weak boards
increase their incentive compensation for CFOs after the reform.18
The overall impact of SOX on CEO pay for industry-induced performance is the
difference between the estimates of SOX*Industry-Induced ROA for dependent- and
independent-board firms. The estimate of -6.59, with a p-value of 0.13, shows that
16A test for the equality of variance of industry returns before and after SOX is performed. The resultssuggest that industry returns are more volatile after SOX. Another set of tests of equality of variancesof industry return separately before and after SOX between dependent- and independent-board firmsindicates that industry returns for the independent-board firms are more volatile than the industryreturns for the dependent-board firms both before and after the passage of SOX.
17I also explore CEO pay in firms present in the ExecuComp data but unavailable in the IRRC data.These unmatched firms exhibit CEO pay similar to the pay in the independent-board firms, but bothgroups of firms differ substantially in terms of firm performance and size. Both samples, the unmatchedand the independent-board, are combined and the specification in equation 2 is re-estimated. The resultsdo not show any material change from the estimates reported in column 2. Thus, the lack of a completematch does not seem to affect the conclusion of the main results.
18Wang (2005) estimates the sensitivity of pay to firm-specific return in a one-stage pay regressionwhere only a firm’s performance is controlled for. I estimate similar and the results confirm a substantialincrease in pay for performance in the dependent-board firms after the passage of the act, while there isno change evident for the independent-board firms.
21

the reform reduce the impact of industry return on pay. The other notable effect of SOX,
measured by the differences in pay for firm-specific performance between dependent- and
independent board firms, is a relative increase in pay for skill by 1.37%. As a whole,
the reform seems to better link CEO pay to company performance and to reduce pay for
industry-induced return.
6 Evidence of Alternative Explanations
6.1 Asymmetric Benchmarking
Bertrand and Mullainathan (2001) interpret the response of pay to movements in industry
returns as pay for luck, i.e., pay for actions outside of CEO control. Garvey and Milbourn
(2006) argue that the positive sensitivity of pay to industry return might compensate for
bearing systematic risk instead of being pay-for-luck scenarios. Similar questions arise
in this paper’s specification: whether the strong link between pay and industry return
in dependent-board firms before SOX and its subsequent decrease after SOX is indeed
pay for luck. To further clarify the interpretation of this evidence, following Garvey
and Milbourn (2006), positive and negative industry changes are included in the pay
regressions. Under the pay-for-luck interpretation, CEO pay is expected to respond
less to industry performance during industry recessions than during times of industrial
boom. The results of this exercise are presented in columns 4 to 6 in Table 4, and Table
5 summarizes the total effects.
The specification in equation (3) allows for a complete interaction of industry-induced
return with its positive and negative values: Industry-Induced ROA*Down1, where Down1
is an indicator variable taking the value of one if Industry-Induced ROA is negative and
zero otherwise; Firm-Specific ROA*Down2, where Down2 is taking value of one if firm-
specific ROA is negative, and zero otherwise; SOX*Industry-Induced ROA*Down1 and
SOX*Firm-Specific ROA*Down2 account for the SOX-related changes in these sensi-
tivities. Table 5 summarizes the total sensitivities from this specification for depen-
dent and independent boards. For the full-sample specification, displayed in the upper
panel of the table, the sensitivity of total pay to industry-induced ROA before SOX is
22
higher in booms than it is during recessions (Industry-Induced ROA+Industry-Induced
ROA*Down1 ); however, the link between industry-induced return and pay disappears
after SOX.19 Analyzing the group of independent-board firms when industry return is
positive shows that pay is not linked to industry performance; however, the negative
sign in times of recession implies that systematic risk is filtered out. The results for the
dependent-board firms depict a different picture. When downward industry returns are
observed, CEO pay decreases by 9.7% before SOX and by 5.14% after it (not significant).
In times of fortune, one percent increase in industry fortune leads to a 12.8% increase of
pay before SOX and only a 4.8% (not significant) increases after SOX. This asymmetry
of the pay-for-luck estimates for positive and negative industry returns before the pas-
sage of the reforms provides evidence that managers are paid for luck rather than being
compensated for bearing industry risk.
In the independent-board firms the response of pay to firm-specific return remains
the same as for the pre-SOX period. The independent-board firm results shown in Table
5 imply that CEOs are rewarded for skill in a similar way both before and after SOX. In
the dependent-board firms, the estimates of pay for skill suggest a different story. Before
the passage of SOX, CEOs are rewarded for skill without being punished for a lack of it.
After SOX, pay for skill increases significantly in these firms, and CEOs are punished for
the lack of skill.
Overall, the results of the sensitivity of pay to industry-induced and firm-specific re-
turn suggest that companies with different board structures pursue different pay policies.
The results support the skimming view. CEOs of weakly governed firms are rewarded for
industry performance when the industry is up, but they are punished to a lesser degree
when the industry is down. In addition, after the passage of SOX, there is no evidence
for such types of asymmetric benchmarking. Analysis of the robustness of this result to
two alternative explanations follows in subsections 6.2 and 6.3.
19Descriptive statistics of the performance benchmark show that industry-induced return, based onthe firm’s two-digit SIC code, is positive in 78% of all cases. This evidence is similar to the statisticsreported in Garvey and Milbourn (2006).
23
6.2 The Impact of Managerial Talent
Gopalan et al. (2007) provide an explanation as to why it might be optimal to compensate
managers for luck. Their model assumes that CEOs can affect industry performance by
implementing the firm’s strategy for exposure to industry factors. Since this strategy
is partially under the control of the CEO, incentives are all-important for ensuring an
optimal choice of the exposure level. Furthermore, the authors conclude that the optimal
contract rewards a risk-averse manager more for good luck than punishing him/her for
bad luck. The testable prediction of the model is that talented CEOs must be paid more
for luck than their less talented peers to motivate them to choose efficiently the firm’s
exposure to industry fluctuations. Table 6 presents the results of pay for luck estimates
for talented and less talented CEOs, incorporating the SOX framework. Unlike in Table
4 where firm specific return is a regressor, in Table 6 each regression is is estimated
separately for positive and negative idiosyncratic return. Similarly to Gopalan et al.
(2007), a positive (negative) idiosyncratic return is used as an indicator for talent (no
talent). The lower part of the panel uses tenure as an alternative, yet somewhat cruder,
proxy for talent. As in Gopalan et al. (2007) and Milbourn (2003), the presumption
is that the longer CEOs manage to stay with a company, the more talented they are:
hence, they are in a position to make better strategic choices.20
Starting with the upper panel, the results suggest that pay for industry-induced return
is not sensitive to talent either before or after SOX. In the independent-board firms before
SOX, it is precisely the less talented CEOs who seem to be rewarded most for industry-
induced return interpreted as pay for luck. The interpretation of the large positive pay for
luck for talented CEOs in dependent-board firms is interesting in terms of the skimming
view. A talented CEO in a firm with weak board oversight is expected to dominate the
pay-setting process more than less talented CEOs in similar firms. There is approximately
a 60% decrease in pay for luck for talented CEOs only in dependent-board firms after the
passage of SOX, which could imply that the reform manages to reduce pay for luck. The
results in the lower panel of Table 6 reaffirm that the talent hypothesis cannot explain
20Rajgopal et al. (2006) use firm size to proxy for managerial talent. In Section 7 I check the sensitivityof the results to firm size.
24
pay-for-luck changes. The results tend to support the view that, for the period 1998 to
2005, higher pay for luck for talented CEOs in dependent-board firms is better explained
by the rent-extraction hypothesis than by the optimal incentives view.
Himmelberg and Hubbard (2000) consider that demand-supply dynamics in the man-
agerial labor market might explain higher pay in times of industry fortune when there is
a higher demand for skilled CEOs. The authors argue that the supply of highly skilled
CEOs is relatively inelastic; therefore, positive shocks to aggregate demand increase both
the value of the firm as well as the marginal value of the CEO pay. In other words, the
link of pay to positive industry-wide return might be used to motivate a manager to
stay with the company when facing the opportunity to accept a better outside offer. If
we believe that the link between CEO pay and industry-return fluctuations is driven by
demand-supply changes in the managerial labor market due to shocks, and particularly
during positive industry change, when talented CEOs are rewarded more for staying with
the company, then we would expect positive shocks to affect this link consistently over
time. On the contrary, we see that the average CEO is rewarded more for positive shocks
than for negative ones only before 2002; however, after the passage of SOX, positive
industry fortunes do not seem to be positively linked to CEO pay (See Table 5). This in-
consistency allows us to rule out the demand-supply argument, as quantified by industry
performance, when examining the before/after change of pay for industry performance
among firms with different governance structures.
6.3 Market Concentration
Aggarwal and Samwick (1999b) suggest that pay for industry-induced return is affected
by strategic interactions among firms in imperfectly competitive markets. In particular,
managers operating in less competitive industries are expected to be exposed to a lower
sensitivity of pay to industry return to discourage them from competing too aggressively.
This lower sensitivity of pay for industry-induced return implies that executives will
receive lower compensation if executives of other firms in the industry deliver lower return
to their shareholders. Thus according to this model, in highly concentrated industries
where oligopolistic structures are present, lower pay for industry performance is expected
25
to weaken competition. To empirically address this explanation, I investigate whether
pay for industry-induced return varies with the Herfindahl-Hirschman Index, which is
the sum of the industry’s (two-digit SIC) squared market shares in percentages. By
construction, an increase in the index indicates greater market concentration. Likewise,
a small Herfindahl-Hirschman Index is indicative of a competitive market.
I follow the specification of Aggarwal and Samwick (1999b), where industry-induced
return and firm-specific return are interacted with the cumulative distribution function of
the Herfindahl-Hirschman Index, which is calculated over the five years prior to the event
year. If it were optimal to soften product market competition, the interaction term of
industry-induced return and the index would assume a negative coefficient. The results
are presented in Table 7. The first three columns of the table present a specification where
industry-induced ROA is interacted with the industry concentration index without allow-
ing for before- or after-SOX changes. Focusing on the coefficients on Industry-Induced
ROA*Her.Percentile, we see a significant increase in pay for industry-induced return
with increase of industry concentration. When examining separately the independent-
and dependent-board firms a large part of this sensitivity originates from the dependent
board firms, although it is not statistically significant. The sign of the coefficient is oppo-
site to the one predicted by the model of Aggarwal and Samwick (1999b), and therefore
does not support the view that product market competition reduces the sensitivity of
pay to industry return.
In an alternative specification, I interact the SOX dummy with the industry-induced
and firm-specific returns. The estimates in columns 4 to 6 indicate that pay for industry
return decreases significantly for highly concentrated industries after SOX only for the
dependent board firms. Hence, the results are not consistent with the market competition
explanation of pay for industry-induced return.
7 Robustness Tests
The results thus far strongly support the conclusion that CEOs managing companies
with dependent-board firms were paid for luck, while CEOs in independent-board firms
26
did not manage to capture the pay-setting process and set their own pay before SOX.
This section tackles several possible concerns with the baseline results.
i) Table 8 shows estimates from a specification in which the dependent variable is
total pay instead of total pay without options presented in Table 4. Option grants
constitute a larger part of pay in dependent-board firms than in independent-board firms
only before SOX. When adding the value of granted options to the rest of CEO pay,
the results differ slightly from the estimates in Table 4. The coefficient on industry-
return, -4.393 (p<10%), suggests that industry risk is filtered out in independent-board
firms before SOX. This evidence is consistent with the agency theory prediction that
the industry component of a firm’s returns is removed from the compensation package
since a CEO cannot affect the market, and it is costly for executives to bear the related
risks. After SOX, however, there is a notable increase in the link between CEO pay and
industry return. As for the dependent-board firms, the results confirm a strong sensitivity
between CEO pay and industry return before SOX and a sharp decline after it. Table 9
reports the estimates of pay for luck when industry returns are positive and when they
are negative. The independent-board firms are filtering out the effect of negative industry
return before SOX. The dependent-board firms follow a different policy: during industry
fortunes, CEOs are rewarded, but during slowdowns they are punished, however, to a
smaller extent.
ii) Let’s now suppose that firm performance is measured by stock return instead of
return on assets. Return on assets is closely related to short-term accounting profit,
and it directly reflects managerial decisions and a firm’s interaction with the product
market. As a frequently used measure of performance, stock return incorporates a firm’s
expected profitability, which might be independent of the evaluation of current perfor-
mance and the effort of the current manager. As an accounting measure, ROA is more
easily manipulated than stock return measures. Due to the substantially higher number
of restatements as a result of improved internal control systems after 2002, it is possible
that ROA is subject to substantial accounting corrections (Coates, 2007). Stock return
is used as an alternative measure of performance because it has remained unaffected by
accounting procedures. Similar to previous evidence (Kaplan, 1994), the results from Ta-
27
ble 8 show that a percentage change in compensation is more strongly related to changes
in return on assets than to changes in stock returns. The conclusion from the main
specification in Table 4, however, is preserved—firms with dependent boards link their
CEO pay to market-wide movements in performance that are beyond the control of the
executives before SOX; however, they abandon this practice afterwards. The impact of
industry-induced stock return on total pay confirms a decrease in the sensitivity of pay to
industry-wide movements in performance in the dependent-board firms only after SOX.
The independent-board firms, viewed as better governed firms, do not pay their man-
agers for changes in industry-related stock performance. Looking at the pay for firm-
specific return, dependent-board firms reward managers for firm-specific return, i.e., skill,
only after SOX, while the independent-board firms do not change their pre-SOX policy of
rewarding skill. When accounting for asymmetric response of pay to market performance,
the results are very similar to those in Table 5.
iii) Whether pay for luck varies with firm size is also tested. Table 10 reports results
separately for small and large firms. Small firms are defined as those with lower sales
than the median sales level. The results remain unchanged for the large and small firms.
Earlier work shows that talented CEOs manage large firms because doing so maximizes
their impact and economic efficiency (Gabaix and Landier, 2008). In addition to the
measures of talent used in Section 6, I look at firm size as a proxy for talent—large
firms attract more talented CEOs. The results clearly indicate that there is no difference
in pay for luck for large and small firms across board type, thus excluding the role of
talent in explaining the before/after changes of pay for luck between dependent and
independent-board firms.
iv) Aggarwal and Samwick (1999a) show that ignoring the impact of stock volatility
on CEO pay might significantly understate the strength of the pay-performance relation-
ship. The cumulative distribution function of stock volatility, measured as the standard
deviation of stock returns using the five years of monthly data preceding the data year,
captures both size effects and risk effects. Similar to the result in Garvey and Milbourn
(2006), Table 11 shows that on average the sensitivity of pay to industry-wide return is
decreasing as the risk increases for the period 1998-2005. However, the main result of
28
pay for luck across various board structures before and after SOX remains unchanged.
These results are preserved also when accounting for positive and negative industry-return
changes in Table 12.
v) I assess the sensitivity of the results to the measure of board independence. In Table
13, board independence is based on a majority rule, according to which companies with
more than 50% independent directors are classified as independent. The total number of
this type of company is 358. The results do not show any material difference from the
estimates in Table 4. The estimates in Table 14 suggest that the same pattern of pay for
luck changes when industry returns are positive and negative, as shown in the results in
Table 5.
vi) The specification in equation (2) follows Bertrand and Mullainathan (2001) who
consider contemporaneous industry-induced and firm-specific returns to explain varia-
tions in CEO pay. This specification is appealing for the present before/after comparison
of the impact of SOX using firm fixed effects in which deviations from sample means
are estimated. However, pay might respond to lagged industry-induced and lagged firm-
specific return, because some components of pay, such as salary, are set at the beginning
of the year, while others, such as bonuses, are determined at the end of the year. Table 15
shows that when including lagged industry-induced and firm-specific returns, the sensi-
tivity of pay to industry return decreases significantly after SOX, compared to the levels
from the pre-SOX period in dependent-board firms. The effect of lagged industry-induced
and firm-specific return is insignificant. This evidence further supports the conclusion
from the base specification in Table 4.
8 Conclusion
This paper examines the change in executive pay before and after the passage of the
Sarbanes-Oxley Act, NYSE and NASDAQ regulations of 2002. Introduced soon after
a series of corporate scandals, the reforms mandated independent audit, nomination,
and compensation committee. Employing a difference-in-differences methodology, this
paper explores the effect of these reforms on CEO pay for performance and pay for luck.
29
The pre- and post-SOX differences are compared across two types of firms: those with
stronger board monitoring before the reform and those with weaker board monitoring
with respect to the percentage of independent directors. The pay-for-performance link
was found to increase in firms with weaker board oversight (firms more affected by SOX
stipulations) after 2002. In contrast, the pay-for-performance relationship changed little
in firms with independent boards.
The results further show that pay for luck disappears in dependent board firms after
SOX. Overall, the results are found to be robust to several alternative explanations:
asymmetric benchmarking, CEO talent and the degree of industry concentration.
Unlike Wang (2005), who focuses on SOX and pay for performance of specific execu-
tive groups (CFOs and COOs), this study examines CEO pay for performance and pay
for luck, thereby contributing to the contemporary literature on CEO pay. The results
also confirm earlier findings of Bertrand and Mullainathan (2001) that stronger corpo-
rate governance decreases pay for luck associated with the inefficient transfer of wealth
from executives to shareholders. Finally, this analysis contributes to the literature by
employing a superior approach for identifying the effect of the recent governance reforms
of 2002 on CEO pay for luck.
The policy implications of this paper suggest that stricter corporate governance rules,
ensured by SOX, can be beneficial for shareholders. Reduced pay for luck can help to
improve agency problems between CEOs and shareholders. To evaluate the total effect
of the corporate governance reforms of 2002, however, it is necessary to account for the
costs of SOX (e.g., increased audit fees), which is left for future research.
References
Aggarwal, R. K. and A. A. Samwick (1999a) “The Other Side of the Trade-off: TheImpact of Risk on Executive Compensation,” Journal of Political Economy 107,65-105.
Aggarwal, R. K. and A. A. Samwick (1999b) “Executive Compensation, Strategic Com-petition, and Relative Performance Evaluation: Theory and Evidence,” Journal ofFinance 54, 1999-2043.
30
Bebchuk, L. A. and J. Fried (2004) “Pay Without Performance: The Unfulfilled Promiseof Executive Compensation,” Cambridge, Mass. Harvard University Press.
Bebchuk, L. A. and Y. Grinstein (2005) “The Growth of Executive Pay,” Oxford Reviewof Economic Policy 21, 283-303.
Bebchuk, L. A., J. M. Fried and D. I. Walker (2002) “Executive Managerial Power andRent Extraction in the Design of Executive Compensation,” University of ChicagoLaw Review 69, 751-846.
Becht, M., P. Bolton and A. Roell (2002) “Corporate Governance and Control,” ECGIFinance Working Paper No 02/2002.
Bertrand, M. and S. Mullainathan (1998) “Executive Compensation and Incentives:The Impact of Takeover Legislation,” NBER Working Paper No. 6830.
Bertrand, M. and S. Mullainathan (2001) “Are CEOs Rewarded for Luck? The Oneswithout Principals Are,” Quarterly Journal of Economics, 116, 901-32.
Coates, J. C. (2007) “The Goals and Promise of the Sarbanes-Oxley Act,” Journal ofEconomic Perspectives 21 91-116.
Cohen, D. A., A. Dey and T. Z.Lys (2004) “The Sarbanes-Oxley Act of 2002: Implica-tions for Compensation Contracts and Managerial Risk-Taking,”http : //papers.ssrn.com/sol3/papers.cfm?abstractid = 1027448.
Conyon, M. J. (2006) “Executive Compensation and Incentives,” Academy of Manage-ment Perspectives 20, 25-44.
Core, J. E., R.W. Holthausen and D. F. Larcker (1999) “Corporate Governance, CEOCompensation, and Firm Performance,” Journal of Financial Economics, 51, 371-406.
Demsetz, H. and K. Lehn (1985) “The Structure of Corporate Ownership: Causes andConsequences,” Journal of Political Economy 93, 1155-1177.
Eldridge, S. W., and B. T. Kealey (2005) “SOX Costs: Auditor Attestation underSection 404,” http : //papers.ssrn.com/sol3/papers.cfm?abstractid = 743285.
Gabaix, X. and A. Landier (2008) “Why Has CEO Pay Increased So Much?,” QuarterlyJournal of Economics, 123, 49-100.
Garvey, G. and T. Milbourn (2006) “Asymmetric Benchmarking in Compensation: Ex-ecutives Are Rewarded for Good Luck but Not Penalized for Bad,” Journal ofFinancial Economics, 82, 197-225.
Gopalan, R., T. T. Milbourn and F. Song (2007) “Strategic Flexibility and the Opti-mality of Pay for Luck,” http : //papers.ssrn.com/sol3/papers.cfm?abstractid =1012975.
31
Grinstein, Y. and P. Hribar (2004) “CEO Compensation and Incentives: Evidence fromM&A Bonuses,” Journal of Financial Economics, 73, 119-143.
Hall, B. J. and J. B. Liebman (1998) “Are CEOs Really Paid Like Bureaucrats?,”Quarterly Journal of Economics, 113, 653-691.
Halling, M., M. Pagano, O. Randl and J. Zechner (2006) “Where is the Market? Evi-dence from Cross-Listings in the U.S.?,” CSEF Working Paper No. 129.
Hallock, K. F. (1997) “Reciprocally Interlocking Boards of Directors and ExecutiveCompensation,” Journal of Financial and Quantitative Analysis, 32, 331-344.
Heckman, J. J. and J. J. Hotz (1989) “Choosing among Alternative NonexperimentalMethods for Estimating the Impact of Social Programs: The Case of ManpowerTraining,” Journal of the American Statistical Association, 84, 862-874.
Hermalin, B. E. and Weisbach, M. S. (2003) “Boards of Directors as an EndogenouslyDetermined Institution: A Survey of the Economic Literature,” Economic PolicyReview, 9, 7-26.
Himmelberg, C. P. and R. G. Hubbard (2000) “Incentive Pay and the Market for CEOs:An Analysis of Pay-For-Performance Sensitivity,” Working Paper, Columbia Busi-ness School.
Holmstrom, B. and S. Kaplan (2003) “The State of U.S. Corporate Governance: What’sRight and What’s Wrong?,” Journal of Applied Corporate Finance, 15, 8-20.
Hubbard, R. and D. Palia (1995) “Executive Pay and Performance: Evidence from theUS Banking Industry,” Journal of Financial Economics, 39, 105-130.
Jensen, M.C. and K. J. Murphy (1990) “Performance Pay and Top-management Incen-tives,” Journal of Political Economy, 98, 225-264.
Lehn, K., S. Patro and M. Zhao (2003) “Determinants of the Size and Structure of Cor-porate Boards: 1935-2000,” http : //papers.ssrn.com/sol3/papers.cfm?abstractid =470675.
Litvak, K. (2007) “The Effect of the Sarbanes-Oxley Act on Non-US Companies Cross-Listed in the US,” Journal of Corporate Finance, 13, 195-228.
Milbourn, T. T. (2003) “CEO Reputation and Stock-based Compensation,” Journal ofFinancial Economics, 68, 233-262.
Murphy, K. J. (1999) “Executive Compensation,” In O.Ashenfelter and D. Card (eds),Handbook of Labor Economics, Volume 3B, North Holland, 2485-2525.
Rajgopal S., T. Shevlin, T. Zamora (2006) ”CEOs Outside Employment Opportunitiesand the Lack of Relative Performance Evaluation in Compensation Contracts,”Journal of Finance, 61, 4, 1813-1844.
32
Ofek, E. and D. Yermack (2000) “Taking Stock: Equity-Based Compensation and theEvolution of Managerial Ownership,” Journal of Finance, 55, 1367-1384.
Wang, X. (2005) “The Impact of the Corporate Governance Reform Initiatives on ChiefFinancial Officer Compensation,” University of Chicago, Working Paper.
Zhang, I. X. (2007) “Economic Consequences of the Sarbanes-Oxley Act of 2002,” Jour-nal of Accounting and Economics, 44, 74-115.
33
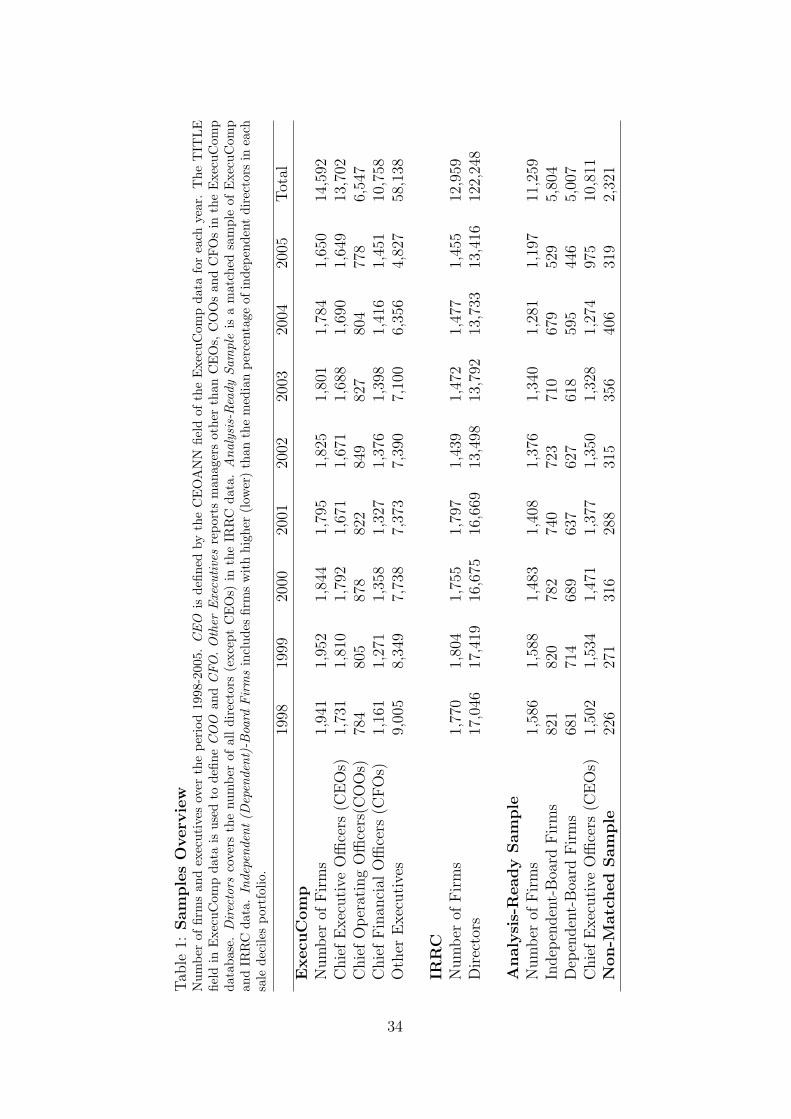
Tab
le1:
Sam
ple
sO
verv
iew
Num
ber
offir
ms
and
exec
utiv
esov
erth
epe
riod
1998
-200
5.C
EO
isde
fined
byth
eC
EO
AN
Nfie
ldof
the
Exe
cuC
omp
data
for
each
year
.T
heT
ITLE
field
inE
xecu
Com
pda
tais
used
tode
fine
CO
Oan
dC
FO
.O
ther
Exe
cutive
sre
port
sm
anag
ers
othe
rth
anC
EO
s,C
OO
san
dC
FO
sin
the
Exe
cuC
omp
data
base
.D
irec
tors
cove
rsth
enu
mbe
rof
alldi
rect
ors
(exc
ept
CE
Os)
inth
eIR
RC
data
.A
naly
sis-
Rea
dySa
mpl
eis
am
atch
edsa
mpl
eof
Exe
cuC
omp
and
IRR
Cda
ta.In
depe
nden
t(D
epen
dent
)-Boa
rdFir
ms
incl
udes
firm
sw
ith
high
er(l
ower
)th
anth
em
edia
npe
rcen
tage
ofin
depe
nden
tdi
rect
ors
inea
chsa
lede
cile
spo
rtfo
lio.
1998
1999
2000
2001
2002
2003
2004
2005
Tot
alExecu
Com
pN
um
ber
ofFir
ms
1,94
11,
952
1,84
41,
795
1,82
51,
801
1,78
41,
650
14,5
92C
hie
fE
xec
uti
veO
ffice
rs(C
EO
s)1,
731
1,81
01,
792
1,67
11,
671
1,68
81,
690
1,64
913
,702
Chie
fO
per
atin
gO
ffice
rs(C
OO
s)78
480
587
882
284
982
780
477
86,
547
Chie
fFin
anci
alO
ffice
rs(C
FO
s)1,
161
1,27
11,
358
1,32
71,
376
1,39
81,
416
1,45
110
,758
Oth
erE
xec
uti
ves
9,00
58,
349
7,73
87,
373
7,39
07,
100
6,35
64,
827
58,1
38
IRR
CN
um
ber
ofFir
ms
1,77
01,
804
1,75
51,
797
1,43
91,
472
1,47
71,
455
12,9
59D
irec
tors
17,0
4617
,419
16,6
7516
,669
13,4
9813
,792
13,7
3313
,416
122,
248
Analy
sis-
Ready
Sam
ple
Num
ber
ofFir
ms
1,58
61,
588
1,48
31,
408
1,37
61,
340
1,28
11,
197
11,2
59In
dep
enden
t-B
oard
Fir
ms
821
820
782
740
723
710
679
529
5,80
4D
epen
den
t-B
oard
Fir
ms
681
714
689
637
627
618
595
446
5,00
7C
hie
fE
xec
uti
veO
ffice
rs(C
EO
s)1,
502
1,53
41,
471
1,37
71,
350
1,32
81,
274
975
10,8
11N
on-M
atc
hed
Sam
ple
226
271
316
288
315
356
406
319
2,32
1
34

Tab
le2:
Desc
riptive
Sta
tist
ics
Des
crip
tive
stat
isti
csov
erth
epe
riod
1998
-200
5.Tot
alPay
isC
EO
’ssa
lary
,bo
nus,
othe
ran
nual
pay,
tota
lva
lue
ofre
stri
cted
stoc
kgr
ante
d,to
tal
valu
eof
stoc
kop
tion
s,lo
ng-t
erm
ince
ntiv
esan
dal
lot
her
pay
(tho
usan
dsU
SD).
Tot
alPay
1is
Tot
alPay
wit
hop
tion
gran
tsex
clud
ed.
Sale
sis
net
annu
alsa
les.
RO
Ais
the
annu
alne
tin
com
ebe
fore
extr
aord
inar
yit
ems
and
disc
ount
edop
erat
ion
divi
ded
byto
tal
asse
ts.
Opt
ion
Val
uere
pres
ents
opti
ongr
ants
Bla
ck-S
chol
esva
lue
ofth
eop
tion
sgr
ante
dto
the
CE
O.St
ock
Vol
atili
tyis
the
stan
dard
devi
atio
nof
stoc
kre
turn
sco
mpu
ted
usin
gth
efiv
e-ye
arm
onth
lyda
tapr
eced
ing
the
data
year
.A
naly
sis-
Rea
dySa
mpl
eis
the
mat
ched
sam
ple
ofth
eE
xecu
Com
pda
taan
dth
eIR
RC
data
.N
on-
Mat
ched
Sam
ple
incl
udes
firm
spr
esen
tin
the
Exe
cuC
omp
data
but
not
pres
ent
inIR
RC
data
.In
depe
nden
t-D
epen
dent
pane
lsho
ws
the
annu
alav
erag
edi
ffere
nces
betw
een
inde
pend
ent-
and
depe
nden
t-bo
ard
firm
s.In
this
pane
l,St
ock
Vol
atili
tysh
ows
the
vari
ance
-com
pari
son
rati
obe
twee
nin
depe
nden
tan
dde
pend
ent-
boar
dfir
ms.
***
Sign
ifica
ntat
the
1%le
vel;
**Si
gnifi
cant
at5%
;*
Sign
ifica
ntat
10%
.
1998
1999
2000
2001
2002
2003
2004
2005
Anal
ysi
s-R
eady
Sam
ple
Tot
alPay
4,04
55,
322
7,12
26,
430
5,16
34,
800
5,43
76,
134
Tot
alPay
11,
859
2,09
12,
352
2,30
02,
455
2,94
43,
322
4,12
7Sal
es3,
860
4,15
24,
831
5,03
84,
923
5,32
26,
003
7,67
2R
OA
0.03
90.
043
0.03
70.
016
0.01
70.
025
0.03
90.
047
Opti
onV
alue
2,18
63,
230
4,77
04,
129
2,70
21,
855
2,11
42,
006
Sto
ckV
olat
ility
0.17
0.21
0.27
80.
316
0.34
0.35
0.35
0.25
Non
-Mat
ched
Sam
ple
Tot
alPay
7,47
24,
677
4,70
95,
822
3,84
63,
758
4,52
35,
012
Tot
alPay
14,
738
1,75
71,
718
1,80
11,
815
2,14
02,
617
3,38
1Sal
es3,
001
2,87
52,
898
3,86
03,
395
3,38
33,
568
4,97
7R
OA
0.01
0.02
0.02
0.01
0.00
40.
020.
035
0.04
Opti
onV
alue
2,73
32,
919
2,99
04,
021
2,03
11,
617
1,90
61,
630
Sto
ckV
olat
ility
0.37
0.37
0.44
0.52
0.58
0.44
0.43
0.28
Indep
enden
t-D
epen
den
tTot
alPay
-907
**-1
,093
**-1
,090
***
-2,0
23**
*-6
25*
-733
**-4
51-1
,051
***
Tot
alPay
1-1
76*
-24
-268
-522
*-2
76*
-572
**-1
36-6
66**
Sal
es-1
87**
-392
-722
-823
-1,1
98*
-1,4
55*
-1,5
30*
-2,3
54*
RO
A-0
.013
**0.
000.
005
-0.0
2-0
.013
*0.
005
-0.0
01-0
.009
**O
pti
onV
alue
-750
**-1
,121
**-8
06-1
,500
*-3
48-1
62-3
15-6
03**
*Sto
ckV
olat
ility
0.84
***
0.85
**0.
91*
0.94
0.95
0.91
***
0.80
***
0.78
***
35
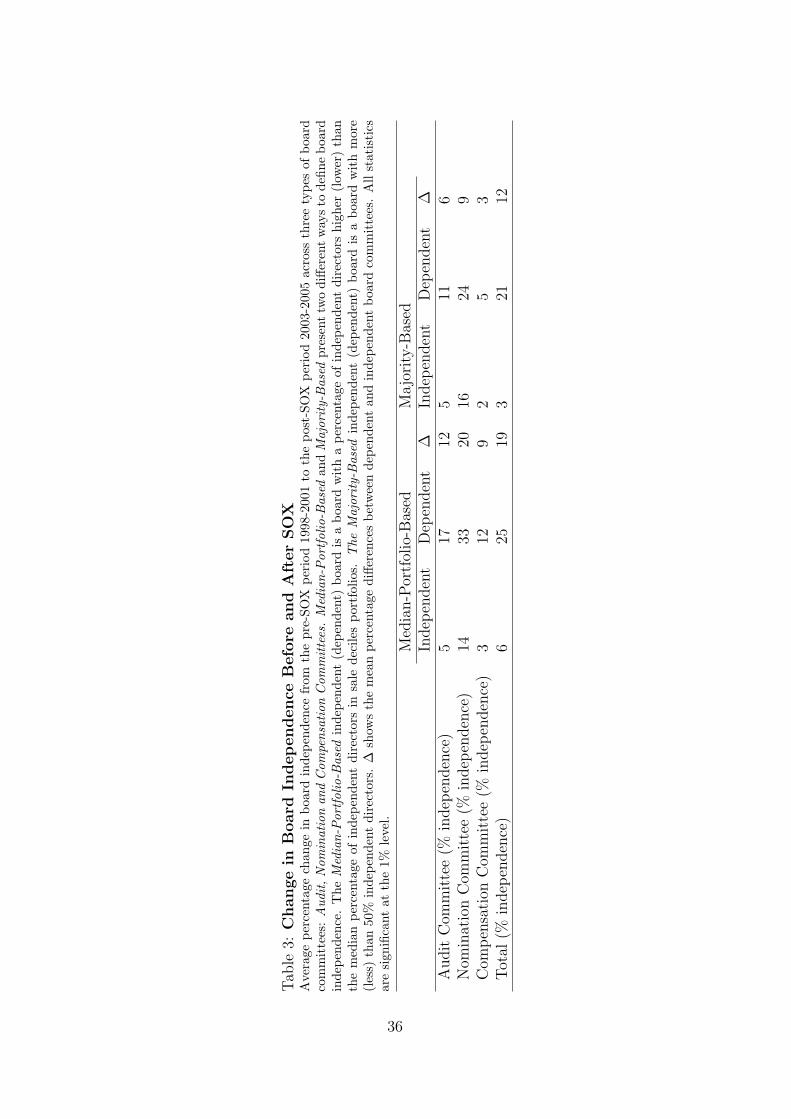
Tab
le3:
Change
inB
oard
Independence
Befo
reand
Aft
er
SO
XA
vera
gepe
rcen
tage
chan
gein
boar
din
depe
nden
cefr
omth
epr
e-SO
Xpe
riod
1998
-200
1to
the
post
-SO
Xpe
riod
2003
-200
5ac
ross
thre
ety
pes
ofbo
ard
com
mit
tees
:A
udit,N
omin
atio
nan
dC
ompe
nsat
ion
Com
mitte
es.
Med
ian-
Por
tfol
io-B
ased
and
Maj
ority-
Bas
edpr
esen
ttw
odi
ffere
ntw
aysto
defin
ebo
ard
inde
pend
ence
.T
heM
edia
n-Por
tfol
io-B
ased
inde
pend
ent
(dep
ende
nt)
boar
dis
abo
ard
wit
ha
perc
enta
geof
inde
pend
ent
dire
ctor
shi
gher
(low
er)
than
the
med
ian
perc
enta
geof
inde
pend
ent
dire
ctor
sin
sale
deci
les
port
folio
s.T
heM
ajor
ity-
Bas
edin
depe
nden
t(d
epen
dent
)bo
ard
isa
boar
dw
ith
mor
e(l
ess)
than
50%
inde
pend
ent
dire
ctor
s.∆
show
sth
em
ean
perc
enta
gedi
ffere
nces
betw
een
depe
nden
tan
din
depe
nden
tbo
ard
com
mit
tees
.A
llst
atis
tics
are
sign
ifica
ntat
the
1%le
vel.
Med
ian-P
ortf
olio
-Bas
edM
ajo
rity
-Bas
edIn
dep
enden
tD
epen
den
t∆
Indep
enden
tD
epen
den
t∆
Audit
Com
mit
tee
(%in
dep
enden
ce)
517
125
116
Nom
inat
ion
Com
mit
tee
(%in
dep
enden
ce)
1433
2016
249
Com
pen
sati
onC
omm
itte
e(%
indep
enden
ce)
312
92
53
Tot
al(%
indep
enden
ce)
625
193
2112
36
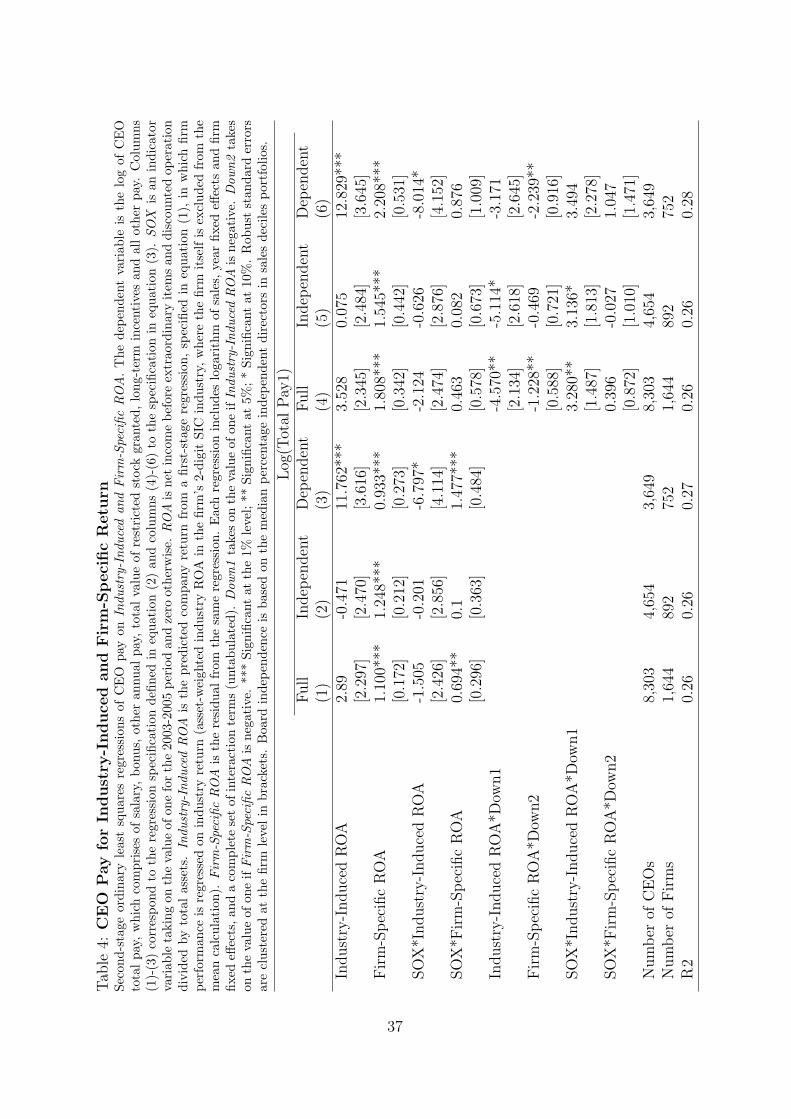
Tab
le4:
CEO
Pay
for
Indust
ry-I
nduce
dand
Fir
m-S
peci
fic
Retu
rnSe
cond
-sta
geor
dina
ryle
ast
squa
res
regr
essi
ons
ofC
EO
pay
onIn
dust
ry-I
nduc
edan
dFir
m-S
peci
ficRO
A.T
hede
pend
ent
vari
able
isth
elo
gof
CE
Oto
talpa
y,w
hich
com
pris
esof
sala
ry,bo
nus,
othe
ran
nual
pay,
tota
lva
lue
ofre
stri
cted
stoc
kgr
ante
d,lo
ng-t
erm
ince
ntiv
esan
dal
lot
her
pay.
Col
umns
(1)-
(3)
corr
espo
ndto
the
regr
essi
onsp
ecifi
cati
onde
fined
ineq
uati
on(2
)an
dco
lum
ns(4
)-(6
)to
the
spec
ifica
tion
ineq
uati
on(3
).SO
Xis
anin
dica
tor
vari
able
taki
ngon
the
valu
eof
one
forth
e20
03-2
005
peri
odan
dze
root
herw
ise.
RO
Ais
netin
com
ebe
fore
extr
aord
inar
yit
ems
and
disc
ount
edop
erat
ion
divi
ded
byto
talas
sets
.In
dust
ry-I
nduc
edRO
Ais
the
pred
icte
dco
mpa
nyre
turn
from
afir
st-s
tage
regr
essi
on,sp
ecifi
edin
equa
tion
(1),
inw
hich
firm
perf
orm
ance
isre
gres
sed
onin
dust
ryre
turn
(ass
et-w
eigh
ted
indu
stry
RO
Ain
the
firm
’s2-
digi
tSI
Cin
dust
ry,w
here
the
firm
itse
lfis
excl
uded
from
the
mea
nca
lcul
atio
n).
Fir
m-S
peci
ficRO
Ais
the
resi
dual
from
the
sam
ere
gres
sion
.E
ach
regr
essi
onin
clud
eslo
gari
thm
ofsa
les,
year
fixed
effec
tsan
dfir
mfix
edeff
ects
,and
aco
mpl
ete
set
ofin
tera
ctio
nte
rms
(unt
abul
ated
).D
own1
take
son
the
valu
eof
one
ifIn
dust
ry-I
nduc
edRO
Ais
nega
tive
.D
own2
take
son
the
valu
eof
one
ifFir
m-S
peci
ficRO
Ais
nega
tive
.**
*Si
gnifi
cant
atth
e1%
leve
l;**
Sign
ifica
ntat
5%;*
Sign
ifica
ntat
10%
.R
obus
tst
anda
rder
rors
are
clus
tere
dat
the
firm
leve
lin
brac
kets
.B
oard
inde
pend
ence
isba
sed
onth
em
edia
npe
rcen
tage
inde
pend
ent
dire
ctor
sin
sale
sde
cile
spo
rtfo
lios.
Log
(Tot
alPay
1)Full
Indep
enden
tD
epen
den
tFull
Indep
enden
tD
epen
den
t(1
)(2
)(3
)(4
)(5
)(6
)In
dust
ry-I
nduce
dR
OA
2.89
-0.4
7111
.762
***
3.52
80.
075
12.8
29**
*[2
.297
][2
.470
][3
.616
][2
.345
][2
.484
][3
.645
]Fir
m-S
pec
ific
RO
A1.
100*
**1.
248*
**0.
933*
**1.
808*
**1.
545*
**2.
208*
**[0
.172
][0
.212
][0
.273
][0
.342
][0
.442
][0
.531
]SO
X*I
ndust
ry-I
nduce
dR
OA
-1.5
05-0
.201
-6.7
97*
-2.1
24-0
.626
-8.0
14*
[2.4
26]
[2.8
56]
[4.1
14]
[2.4
74]
[2.8
76]
[4.1
52]
SO
X*F
irm
-Spec
ific
RO
A0.
694*
*0.
11.
477*
**0.
463
0.08
20.
876
[0.2
96]
[0.3
63]
[0.4
84]
[0.5
78]
[0.6
73]
[1.0
09]
Indust
ry-I
nduce
dR
OA
*Dow
n1
-4.5
70**
-5.1
14*
-3.1
71[2
.134
][2
.618
][2
.645
]Fir
m-S
pec
ific
RO
A*D
own2
-1.2
28**
-0.4
69-2
.239
**[0
.588
][0
.721
][0
.916
]SO
X*I
ndust
ry-I
nduce
dR
OA
*Dow
n1
3.28
0**
3.13
6*3.
494
[1.4
87]
[1.8
13]
[2.2
78]
SO
X*F
irm
-Spec
ific
RO
A*D
own2
0.39
6-0
.027
1.04
7[0
.872
][1
.010
][1
.471
]N
um
ber
ofC
EO
s8,
303
4,65
43,
649
8,30
34,
654
3,64
9N
um
ber
ofFir
ms
1,64
489
275
21,
644
892
752
R2
0.26
0.26
0.27
0.26
0.26
0.28
37
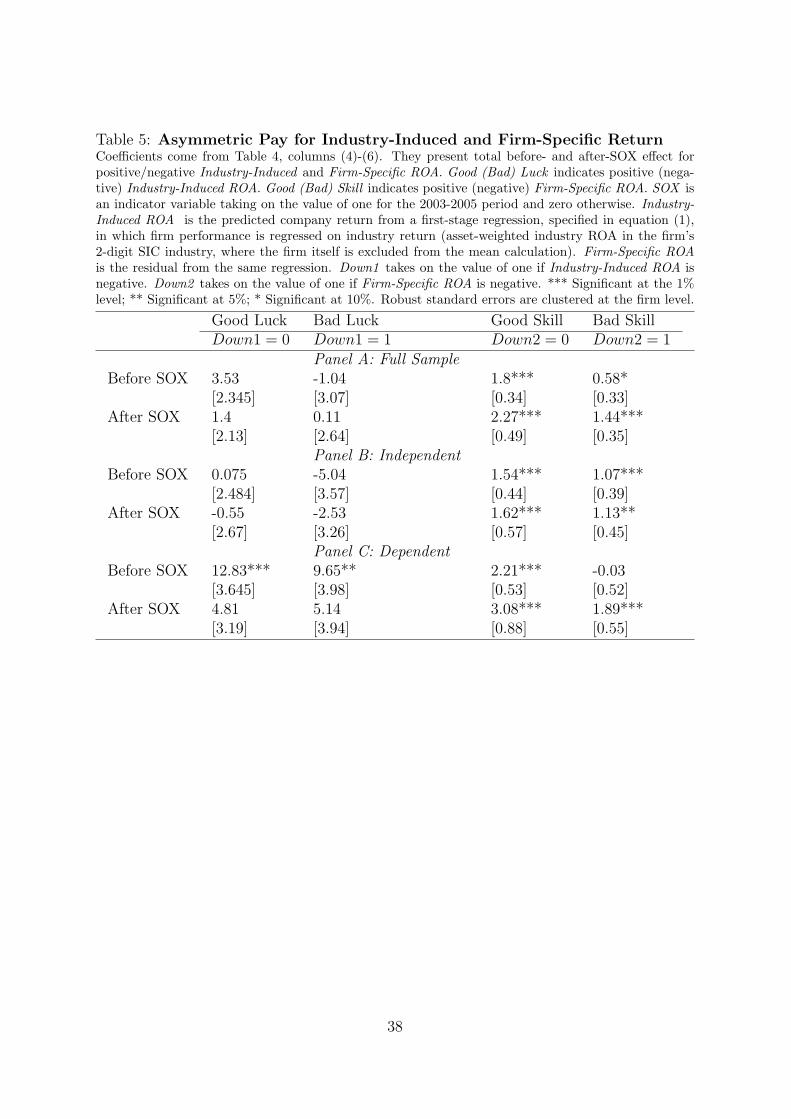
Table 5: Asymmetric Pay for Industry-Induced and Firm-Specific ReturnCoefficients come from Table 4, columns (4)-(6). They present total before- and after-SOX effect forpositive/negative Industry-Induced and Firm-Specific ROA. Good (Bad) Luck indicates positive (nega-tive) Industry-Induced ROA. Good (Bad) Skill indicates positive (negative) Firm-Specific ROA. SOX isan indicator variable taking on the value of one for the 2003-2005 period and zero otherwise. Industry-Induced ROA is the predicted company return from a first-stage regression, specified in equation (1),in which firm performance is regressed on industry return (asset-weighted industry ROA in the firm’s2-digit SIC industry, where the firm itself is excluded from the mean calculation). Firm-Specific ROAis the residual from the same regression. Down1 takes on the value of one if Industry-Induced ROA isnegative. Down2 takes on the value of one if Firm-Specific ROA is negative. *** Significant at the 1%level; ** Significant at 5%; * Significant at 10%. Robust standard errors are clustered at the firm level.
Good Luck Bad Luck Good Skill Bad SkillDown1 = 0 Down1 = 1 Down2 = 0 Down2 = 1
Panel A: Full SampleBefore SOX 3.53 -1.04 1.8*** 0.58*
[2.345] [3.07] [0.34] [0.33]After SOX 1.4 0.11 2.27*** 1.44***
[2.13] [2.64] [0.49] [0.35]Panel B: Independent
Before SOX 0.075 -5.04 1.54*** 1.07***[2.484] [3.57] [0.44] [0.39]
After SOX -0.55 -2.53 1.62*** 1.13**[2.67] [3.26] [0.57] [0.45]
Panel C: DependentBefore SOX 12.83*** 9.65** 2.21*** -0.03
[3.645] [3.98] [0.53] [0.52]After SOX 4.81 5.14 3.08*** 1.89***
[3.19] [3.94] [0.88] [0.55]
38
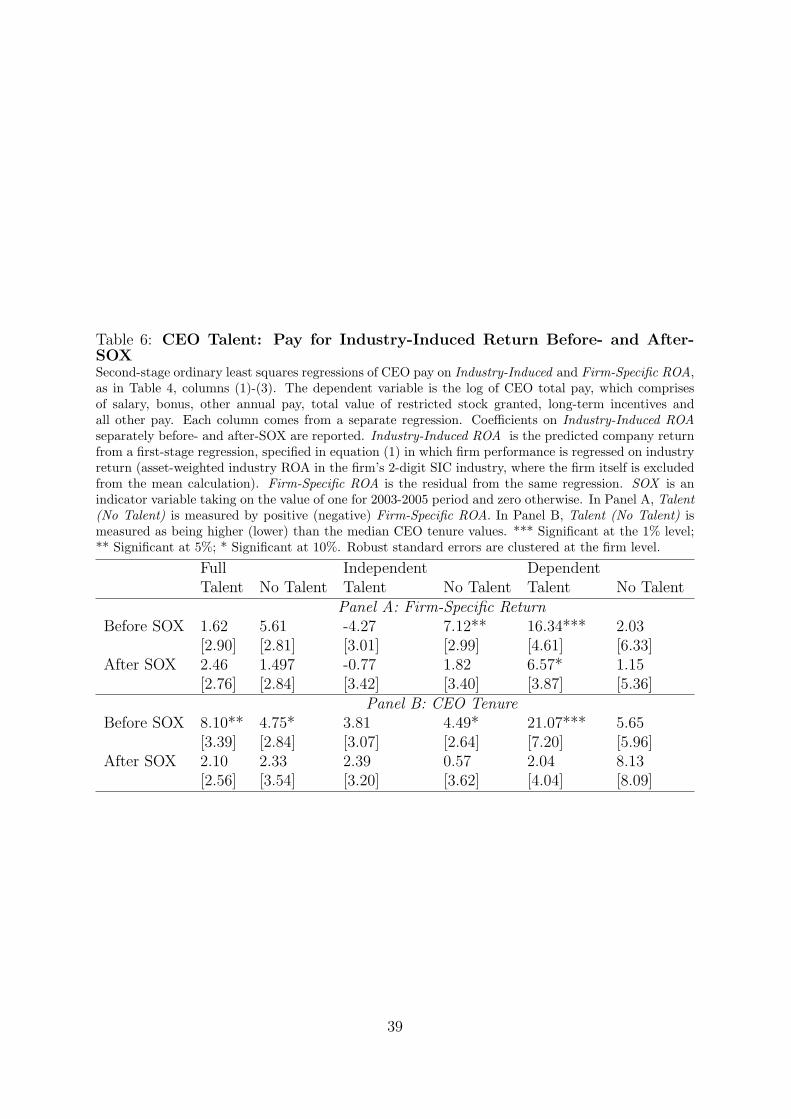
Table 6: CEO Talent: Pay for Industry-Induced Return Before- and After-SOXSecond-stage ordinary least squares regressions of CEO pay on Industry-Induced and Firm-Specific ROA,as in Table 4, columns (1)-(3). The dependent variable is the log of CEO total pay, which comprisesof salary, bonus, other annual pay, total value of restricted stock granted, long-term incentives andall other pay. Each column comes from a separate regression. Coefficients on Industry-Induced ROAseparately before- and after-SOX are reported. Industry-Induced ROA is the predicted company returnfrom a first-stage regression, specified in equation (1) in which firm performance is regressed on industryreturn (asset-weighted industry ROA in the firm’s 2-digit SIC industry, where the firm itself is excludedfrom the mean calculation). Firm-Specific ROA is the residual from the same regression. SOX is anindicator variable taking on the value of one for 2003-2005 period and zero otherwise. In Panel A, Talent(No Talent) is measured by positive (negative) Firm-Specific ROA. In Panel B, Talent (No Talent) ismeasured as being higher (lower) than the median CEO tenure values. *** Significant at the 1% level;** Significant at 5%; * Significant at 10%. Robust standard errors are clustered at the firm level.
Full Independent DependentTalent No Talent Talent No Talent Talent No Talent
Panel A: Firm-Specific ReturnBefore SOX 1.62 5.61 -4.27 7.12** 16.34*** 2.03
[2.90] [2.81] [3.01] [2.99] [4.61] [6.33]After SOX 2.46 1.497 -0.77 1.82 6.57* 1.15
[2.76] [2.84] [3.42] [3.40] [3.87] [5.36]Panel B: CEO Tenure
Before SOX 8.10** 4.75* 3.81 4.49* 21.07*** 5.65[3.39] [2.84] [3.07] [2.64] [7.20] [5.96]
After SOX 2.10 2.33 2.39 0.57 2.04 8.13[2.56] [3.54] [3.20] [3.62] [4.04] [8.09]
39

Tab
le7:
Mark
et
Com
peti
tion:
CEO
Pay
for
Indust
ry-I
nduce
dand
Fir
m-S
peci
fic
Retu
rnSe
cond
-sta
geor
dina
ryle
ast
squa
res
regr
essi
ons
ofC
EO
pay
onIn
dust
ry-I
nduc
edan
dFir
m-S
peci
ficRO
A.T
hede
pend
ent
vari
able
isth
elo
gof
CE
Oto
talp
ay,w
hich
com
pris
esof
sala
ry,b
onus
,oth
eran
nual
pay,
tota
lval
ueof
rest
rict
edst
ock
gran
ted,
long
-ter
min
cent
ives
and
allo
ther
pay.
SOX
isan
indi
cato
rva
riab
leta
king
onth
eva
lue
ofon
efo
rth
e20
03-2
005
peri
odan
dze
root
herw
ise.
RO
Ais
net
inco
me
befo
reex
trao
rdin
ary
item
san
ddi
scou
nted
oper
atio
nsdi
vide
dby
tota
las
sets
.In
dust
ry-I
nduc
edRO
Ais
the
pred
icte
dco
mpa
nyre
turn
from
afir
st-s
tage
regr
essi
on,sp
ecifi
edin
equa
tion
(1),
inw
hich
firm
perf
orm
ance
isre
gres
sed
onin
dust
ryre
turn
(ass
et-w
eigh
ted
indu
stry
RO
Ain
the
firm
’s2-
digi
tSI
Cin
dust
ry,w
here
the
firm
itse
lfis
excl
uded
from
the
mea
nca
lcul
atio
n).
Fir
m-S
peci
ficRO
Ais
the
resi
dual
from
the
sam
ere
gres
sion
.E
ach
regr
essi
onin
clud
eslo
gari
thm
ofsa
les,
year
fixed
effec
ts,
firm
fixed
effec
tsan
da
com
plet
ese
tof
inte
ract
ion
term
s(u
ntab
ulat
ed).
Her
finda
hlIn
dex
isth
esu
mof
afir
m’s
mar
ket
shar
ein
anin
dust
ryat
the
two-
digi
tSI
Cle
vel.
***
Sign
ifica
ntat
the
1%le
vel;
**Si
gnifi
cant
at5%
;*
Sign
ifica
ntat
10%
.R
obus
tst
anda
rder
rors
are
clus
tere
dat
the
firm
leve
l.B
oard
inde
pend
ence
isba
sed
onsa
lede
cile
spo
rtfo
lios.
Log
(Tot
alPay
1)Full
Indep
enden
tD
epen
den
tFull
Indep
enden
tD
epen
den
t(1
)(2
)(3
)(4
)(5
)(6
)In
dust
ry-I
nduce
dR
OA
2.63
70.
185
11.7
56**
1.88
7-0
.796
10.6
45**
[3.3
88]
[4.4
44]
[4.9
47]
[3.3
76]
[4.4
78]
[4.8
99]
Fir
m-S
pec
ific
RO
A0.
209
1.06
9**
-0.1
130.
386
0.59
10.
682
[0.3
01]
[0.4
23]
[0.5
81]
[0.3
81]
[0.5
46]
[0.7
54]
Her
findah
lPer
centi
le-0
.086
-0.0
80.
03-0
.10
-0.0
6-0
.02
[0.1
][0
.140
][0
.158
][0
.101
][0
.145
][0
.167
]In
dust
ry-I
nduce
dR
OA
*SO
X-0
.886
-0.1
41-9
.793
*2.
027
4.99
7-5
.699
[2.9
65]
[3.5
72]
[5.1
69]
[3.1
41]
[3.8
44]
[5.8
38]
Fir
m-S
pec
ific
RO
A*S
OX
0.66
5**
0.04
51.
497*
**0.
131
0.86
9-0
.66
[0.2
60]
[0.3
77]
[0.4
70]
[0.5
49]
[0.7
97]
[1.0
60]
Indust
ry-I
nduce
dR
OA
*Her
f.Per
centi
le3.
114*
*1.
243.
353
3.80
9**
1.30
14.
793*
*[1
.443
][2
.186
][2
.106
][1
.487
][2
.231
][2
.166
]Fir
m-S
pec
ific
RO
A*H
erf.
Per
centi
le1.
458*
**0.
352
1.91
9**
1.11
1*1.
238
0.44
6[0
.477
][0
.696
][0
.926
][0
.659
][0
.976
][1
.249
]H
erfindah
lPer
centi
le*S
OX
0.07
80.
006
0.14
3[0
.058
][0
.089
][0
.105
]In
dust
ry-I
nduce
dR
OA
*SO
X-2
.732
***
-3.0
73**
-3.9
04**
[0.9
20]
[1.2
90]
[1.6
96]
Fir
m-S
pec
ific*
RO
A1.
097
-1.6
574.
147*
*[1
.085
][1
.583
][1
.895
]N
um
ber
ofC
EO
s9,
734
4,41
43,
569
9,73
44,
414
3,56
9N
um
ber
ofFir
ms
2,16
589
275
22,
165
892
752
R2
0.24
0.24
0.28
0.25
0.24
0.28
40

Tab
le8:
Robust
ness
toC
EO
Pay
and
Sto
ckR
etu
rnSe
cond
-sta
geor
dina
ryle
ast
squa
res
regr
essi
ons
ofC
EO
pay
onIn
dust
ry-I
nduc
edan
dFir
m-S
peci
ficRO
A.T
hede
pend
ent
vari
able
isth
elo
gof
CE
Oto
talpa
y,w
hich
com
pris
esof
sala
ry,bo
nus,
othe
ran
nual
pay,
tota
lva
lue
ofre
stri
cted
stoc
kgr
ante
d,to
talva
lue
ofst
ock
opti
ons,
long
-ter
min
cent
ives
and
allot
her
pay.
SOX
isan
indi
cato
rva
riab
leta
king
onth
eva
lue
ofon
efo
rth
e20
03-2
005
peri
odan
dze
root
herw
ise.
Ret
urn
isth
eon
e-ye
arto
tal
retu
rn,in
clud
ing
mon
thly
rein
vest
men
tof
divi
dend
s.In
dust
ry-I
nduc
edRet
urn
isth
epr
edic
ted
com
pany
retu
rnfr
oma
first
-sta
gere
gres
sion
,sp
ecifi
edin
equa
tion
(1),
inw
hich
firm
perf
orm
ance
isre
gres
sed
onin
dust
ryre
turn
(ass
et-w
eigh
ted
indu
stry
buy-
and-
hold
annu
alst
ock
retu
rnin
the
firm
’s2-
digi
tSI
Cin
dust
ry,w
here
the
firm
itse
lfis
excl
uded
from
the
mea
nca
lcul
atio
n).
Fir
m-S
peci
ficRet
urn
isth
ere
sidu
alfr
omth
esa
me
regr
essi
on.
Eac
hre
gres
sion
incl
udes
sale
s,ti
me
and
firm
fixed
effec
tsan
da
com
plet
ese
tof
inte
ract
ion
term
s(u
ntab
ulat
ed).
Col
umns
(1)-
(3)
pres
ent
esti
mat
esfo
ra
spec
ifica
tion
whe
reth
ede
pend
ent
vari
able
isto
talpa
yw
ith
opti
ons
incl
uded
.C
olum
ns(4
)-(6
)pr
esen
tes
tim
ates
ofto
talpa
yre
gres
sion
sus
ing
Stoc
kRet
urn
inst
ead
ofRO
A.**
*Si
gnifi
cant
atth
e1%
leve
l;**
Sign
ifica
ntat
5%;*
Sign
ifica
ntat
10%
.R
obus
tst
anda
rder
rors
clus
tere
dat
the
firm
leve
lar
ein
brac
kets
.In
depe
nden
ceis
base
don
sale
deci
les
port
folio
s.
Tot
alPay
Sto
ckR
eturn
Full
Indep
enden
tD
epen
den
tFull
Indep
enden
tD
epen
den
t(1
)(2
)(3
)(4
)(5
)(6
)In
dust
ry-I
nduce
dR
eturn
-0.2
28-4
.393
*12
.9**
*0.
085
-0.2
320.
335*
**[2
.442
][2
.514
][4
.834
][0
.106
][0
.167
][0
.117
]Fir
m-S
pec
ific
Ret
urn
1.07
0***
1.11
7***
1.01
3***
0.05
6***
0.09
8***
0.01
2[0
.232
][0
.304
][0
.354
][0
.018
][0
.028
][0
.024
]SO
X*I
ndust
ry-I
nduce
dR
eturn
2.88
37.
388*
**-1
0.57
**-0
.35*
*0.
029
-0.3
19[2
.403
][2
.631
][4
.683
][0
.162
][0
.251
][0
.19]
SO
X*F
irm
-Spec
ific
Ret
urn
0.26
20.
152
0.36
80.
05-0
.009
0.12
2**
[0.3
63]
[0.4
69]
[0.5
66]
[0.0
37]
[0.0
53]
[0.0
50]
41
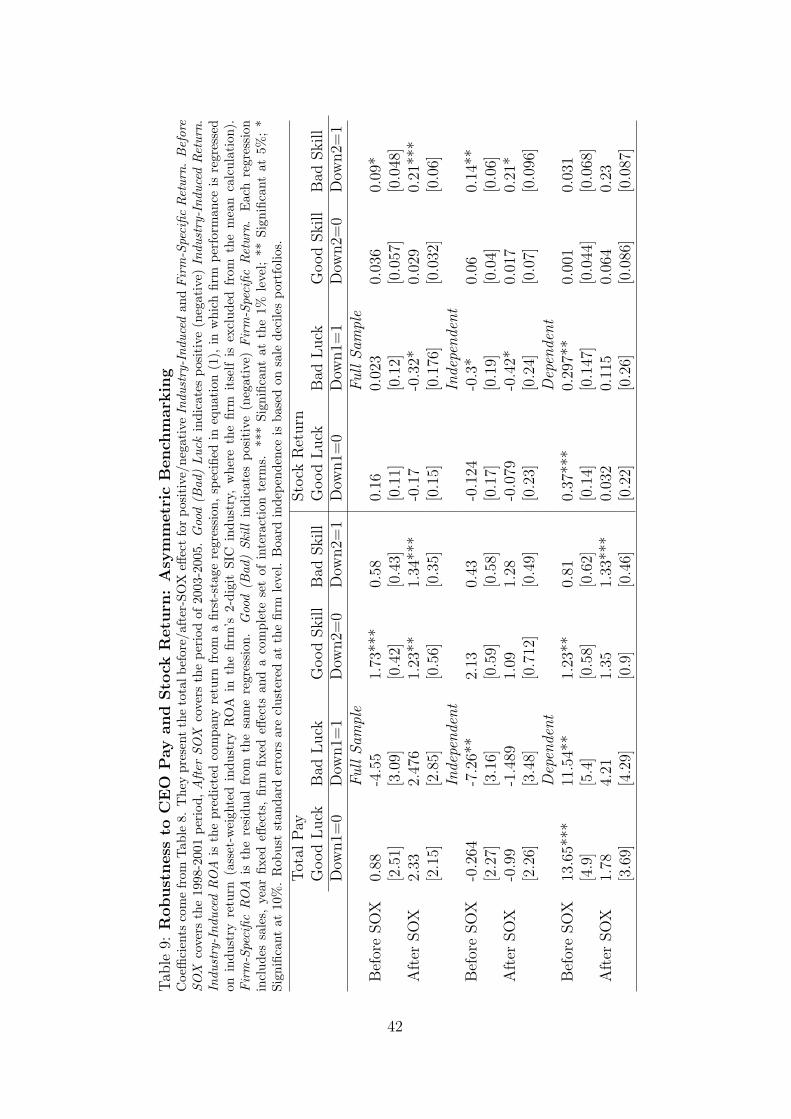
Tab
le9:
Robust
ness
toC
EO
Pay
and
Sto
ckR
etu
rn:
Asy
mm
etr
icB
ench
mark
ing
Coe
ffici
ents
com
efr
omTab
le8.
The
ypr
esen
tth
eto
talb
efor
e/af
ter-
SOX
effec
tfo
rpo
siti
ve/n
egat
ive
Indu
stry
-Ind
uced
and
Fir
m-S
peci
ficRet
urn.
Bef
ore
SOX
cove
rsth
e19
98-2
001
peri
od,A
fter
SOX
cove
rsth
epe
riod
of20
03-2
005.
Goo
d(B
ad)
Luc
kin
dica
tes
posi
tive
(neg
ativ
e)In
dust
ry-I
nduc
edRet
urn.
Indu
stry
-Ind
uced
RO
Ais
the
pred
icte
dco
mpa
nyre
turn
from
afir
st-s
tage
regr
essi
on,sp
ecifi
edin
equa
tion
(1),
inw
hich
firm
perf
orm
ance
isre
gres
sed
onin
dust
ryre
turn
(ass
et-w
eigh
ted
indu
stry
RO
Ain
the
firm
’s2-
digi
tSI
Cin
dust
ry,
whe
reth
efir
mit
self
isex
clud
edfr
omth
em
ean
calc
ulat
ion)
.Fir
m-S
peci
ficRO
Ais
the
resi
dual
from
the
sam
ere
gres
sion
.G
ood
(Bad
)Sk
ill
indi
cate
spo
siti
ve(n
egat
ive)
Fir
m-S
peci
ficRet
urn.
Eac
hre
gres
sion
incl
udes
sale
s,ye
arfix
edeff
ects
,fir
mfix
edeff
ects
and
aco
mpl
ete
set
ofin
tera
ctio
nte
rms.
***
Sign
ifica
ntat
the
1%le
vel;
**Si
gnifi
cant
at5%
;*
Sign
ifica
ntat
10%
.R
obus
tst
anda
rder
rors
are
clus
tere
dat
the
firm
leve
l.B
oard
inde
pend
ence
isba
sed
onsa
lede
cile
spo
rtfo
lios.
Tot
alPay
Sto
ckR
eturn
Good
Luck
Bad
Luck
Good
Skill
Bad
Skill
Good
Luck
Bad
Luck
Good
Skill
Bad
Skill
Dow
n1=
0D
own1=
1D
own2=
0D
own2=
1D
own1=
0D
own1=
1D
own2=
0D
own2=
1Full
Sam
ple
Full
Sam
ple
Bef
ore
SO
X0.
88-4
.55
1.73
***
0.58
0.16
0.02
30.
036
0.09
*[2
.51]
[3.0
9][0
.42]
[0.4
3][0
.11]
[0.1
2][0
.057
][0
.048
]A
fter
SO
X2.
332.
476
1.23
**1.
34**
*-0
.17
-0.3
2*0.
029
0.21
***
[2.1
5][2
.85]
[0.5
6][0
.35]
[0.1
5][0
.176
][0
.032
][0
.06]
Inde
pende
nt
Inde
pende
nt
Bef
ore
SO
X-0
.264
-7.2
6**
2.13
0.43
-0.1
24-0
.3*
0.06
0.14
**[2
.27]
[3.1
6][0
.59]
[0.5
8][0
.17]
[0.1
9][0
.04]
[0.0
6]A
fter
SO
X-0
.99
-1.4
891.
091.
28-0
.079
-0.4
2*0.
017
0.21
*[2
.26]
[3.4
8][0
.712
][0
.49]
[0.2
3][0
.24]
[0.0
7][0
.096
]D
epen
dent
Dep
ende
nt
Bef
ore
SO
X13
.65*
**11
.54*
*1.
23**
0.81
0.37
***
0.29
7**
0.00
10.
031
[4.9
][5
.4]
[0.5
8][0
.62]
[0.1
4][0
.147
][0
.044
][0
.068
]A
fter
SO
X1.
784.
211.
351.
33**
*0.
032
0.11
50.
064
0.23
[3.6
9][4
.29]
[0.9
][0
.46]
[0.2
2][0
.26]
[0.0
86]
[0.0
87]
42

Tab
le10
:R
obust
ness
toFir
mSiz
eSe
cond
-sta
geor
dina
ryle
ast
squa
res
regr
essi
ons
ofC
EO
pay
onIn
dust
ry-I
nduc
edan
dFir
m-S
peci
ficRO
A.T
hede
pend
ent
vari
able
isth
elo
gof
CE
Oto
tal
pay,
whi
chco
mpr
ises
ofsa
lary
,bo
nus,
othe
ran
nual
pay,
tota
lva
lue
ofre
stri
cted
stoc
kgr
ante
d,lo
ng-t
erm
ince
ntiv
esan
dal
lot
her
pay.
SOX
isan
indi
cato
rva
riab
leta
king
onth
eva
lue
ofon
efo
rth
e20
03-2
005
peri
odan
dze
root
herw
ise.
RO
Ais
net
inco
me
befo
reex
trao
rdin
ary
item
san
ddi
scou
nted
oper
atio
ndi
vide
dby
tota
lass
ets.
Indu
stry
-Ind
uced
RO
Ais
the
pred
icte
dco
mpa
nyre
turn
from
afir
st-s
tage
regr
essi
on,s
peci
fied
ineq
uati
on(1
),in
whi
chfir
mpe
rfor
man
ceis
regr
esse
don
indu
stry
retu
rn(a
sset
-wei
ghte
din
dust
ryR
OA
inth
efir
m’s
2-di
git
SIC
indu
stry
,w
here
the
firm
itse
lfis
excl
uded
from
the
mea
nca
lcul
atio
n).
Fir
m-S
peci
ficRO
Ais
the
resi
dual
from
the
sam
ere
gres
sion
.La
rge
(Sm
all)
indi
cate
sfir
msi
zehi
gher
(low
er)
than
the
year
lym
edia
nsi
ze.
Eac
hre
gres
sion
incl
udes
sale
s,ye
arfix
edeff
ects
,fir
mfix
edeff
ects
and
aco
mpl
ete
set
ofin
tera
ctio
nte
rms
(unt
abul
ated
).**
*Si
gnifi
cant
atth
e1%
leve
l;**
Sign
ifica
ntat
5%;*
Sign
ifica
ntat
10%
.R
obus
tst
anda
rder
rors
are
clus
tere
dat
the
firm
leve
l.B
oard
inde
pend
ence
isba
sed
onsa
les
deci
les
port
folio
s.
Full
Indep
enden
tD
epen
den
tLar
geSm
all
Lar
geSm
all
Lar
geSm
all
Indust
ry-I
nduce
dR
OA
3.67
*2.
690.
514
-0.8
6412
.03*
**11
.73*
**[2
.26]
[2.2
7][2
.41]
[2.3
8][3
.74]
[3.5
8]Fir
m-S
pec
ific
RO
A1.
6***
0.74
***
2.12
***
0.7
0.99
**0.
84**
*[0
.33]
[0.1
97]
[0.3
78]
[0.2
6][0
.49]
[0.3
]SO
X*I
ndust
ry-I
nduce
dR
OA
-2.6
-0.9
3-1
.27
0.1
-7.7
3*-5
.48
[2.4
9][2
.39]
[2.9
][2
.7]
[4.3
2][4
.11]
SO
X*F
irm
-Spec
ific
RO
A0.
966*
0.62
6**
-0.0
740.
292.
26**
*1.
05**
[0.5
5][0
.33]
[0.6
6][0
.43]
[0.8
4][0
.53]
43
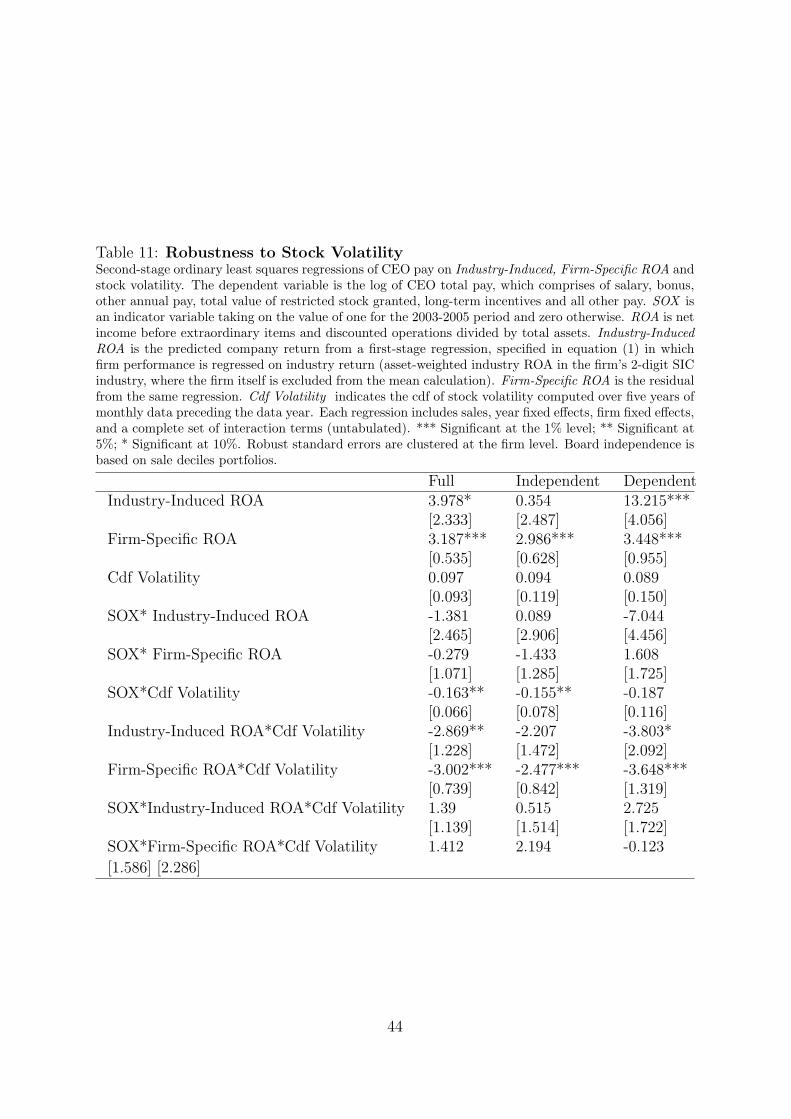
Table 11: Robustness to Stock VolatilitySecond-stage ordinary least squares regressions of CEO pay on Industry-Induced, Firm-Specific ROA andstock volatility. The dependent variable is the log of CEO total pay, which comprises of salary, bonus,other annual pay, total value of restricted stock granted, long-term incentives and all other pay. SOX isan indicator variable taking on the value of one for the 2003-2005 period and zero otherwise. ROA is netincome before extraordinary items and discounted operations divided by total assets. Industry-InducedROA is the predicted company return from a first-stage regression, specified in equation (1) in whichfirm performance is regressed on industry return (asset-weighted industry ROA in the firm’s 2-digit SICindustry, where the firm itself is excluded from the mean calculation). Firm-Specific ROA is the residualfrom the same regression. Cdf Volatility indicates the cdf of stock volatility computed over five years ofmonthly data preceding the data year. Each regression includes sales, year fixed effects, firm fixed effects,and a complete set of interaction terms (untabulated). *** Significant at the 1% level; ** Significant at5%; * Significant at 10%. Robust standard errors are clustered at the firm level. Board independence isbased on sale deciles portfolios.
Full Independent DependentIndustry-Induced ROA 3.978* 0.354 13.215***
[2.333] [2.487] [4.056]Firm-Specific ROA 3.187*** 2.986*** 3.448***
[0.535] [0.628] [0.955]Cdf Volatility 0.097 0.094 0.089
[0.093] [0.119] [0.150]SOX* Industry-Induced ROA -1.381 0.089 -7.044
[2.465] [2.906] [4.456]SOX* Firm-Specific ROA -0.279 -1.433 1.608
[1.071] [1.285] [1.725]SOX*Cdf Volatility -0.163** -0.155** -0.187
[0.066] [0.078] [0.116]Industry-Induced ROA*Cdf Volatility -2.869** -2.207 -3.803*
[1.228] [1.472] [2.092]Firm-Specific ROA*Cdf Volatility -3.002*** -2.477*** -3.648***
[0.739] [0.842] [1.319]SOX*Industry-Induced ROA*Cdf Volatility 1.39 0.515 2.725
[1.139] [1.514] [1.722]SOX*Firm-Specific ROA*Cdf Volatility 1.412 2.194 -0.123
[1.586] [2.286]
44
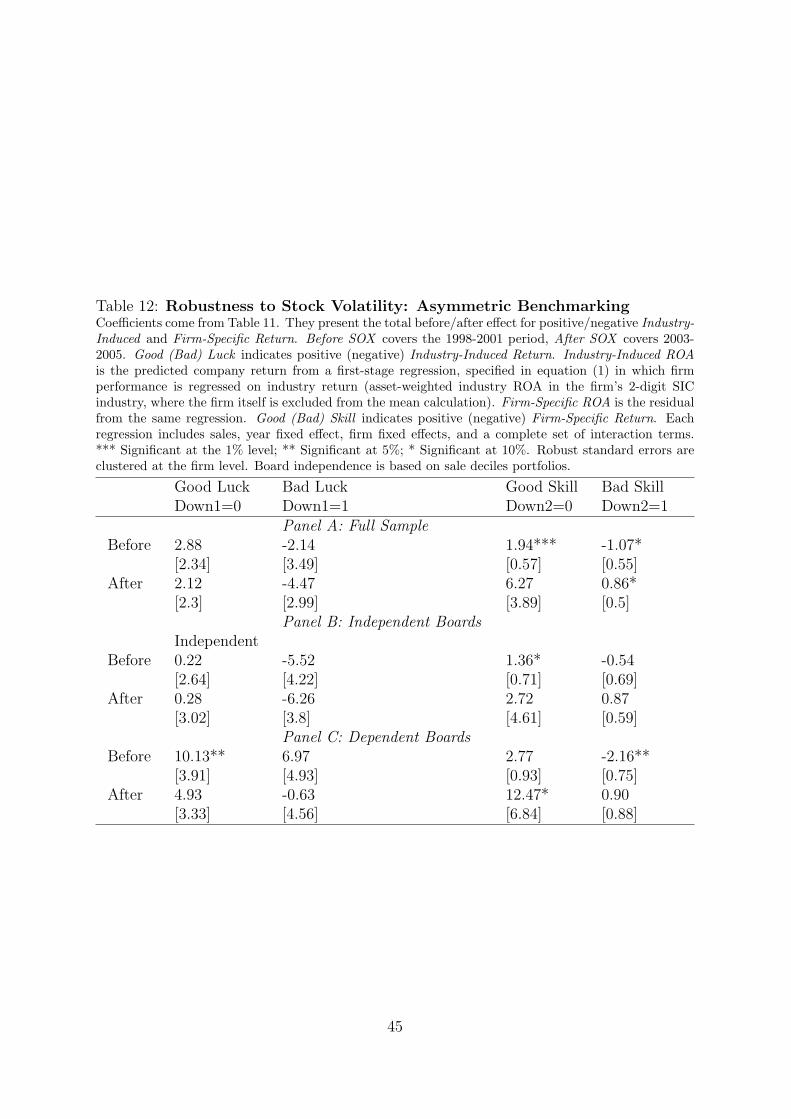
Table 12: Robustness to Stock Volatility: Asymmetric BenchmarkingCoefficients come from Table 11. They present the total before/after effect for positive/negative Industry-Induced and Firm-Specific Return. Before SOX covers the 1998-2001 period, After SOX covers 2003-2005. Good (Bad) Luck indicates positive (negative) Industry-Induced Return. Industry-Induced ROAis the predicted company return from a first-stage regression, specified in equation (1) in which firmperformance is regressed on industry return (asset-weighted industry ROA in the firm’s 2-digit SICindustry, where the firm itself is excluded from the mean calculation). Firm-Specific ROA is the residualfrom the same regression. Good (Bad) Skill indicates positive (negative) Firm-Specific Return. Eachregression includes sales, year fixed effect, firm fixed effects, and a complete set of interaction terms.*** Significant at the 1% level; ** Significant at 5%; * Significant at 10%. Robust standard errors areclustered at the firm level. Board independence is based on sale deciles portfolios.
Good Luck Bad Luck Good Skill Bad SkillDown1=0 Down1=1 Down2=0 Down2=1
Panel A: Full SampleBefore 2.88 -2.14 1.94*** -1.07*
[2.34] [3.49] [0.57] [0.55]After 2.12 -4.47 6.27 0.86*
[2.3] [2.99] [3.89] [0.5]Panel B: Independent Boards
IndependentBefore 0.22 -5.52 1.36* -0.54
[2.64] [4.22] [0.71] [0.69]After 0.28 -6.26 2.72 0.87
[3.02] [3.8] [4.61] [0.59]Panel C: Dependent Boards
Before 10.13** 6.97 2.77 -2.16**[3.91] [4.93] [0.93] [0.75]
After 4.93 -0.63 12.47* 0.90[3.33] [4.56] [6.84] [0.88]
45
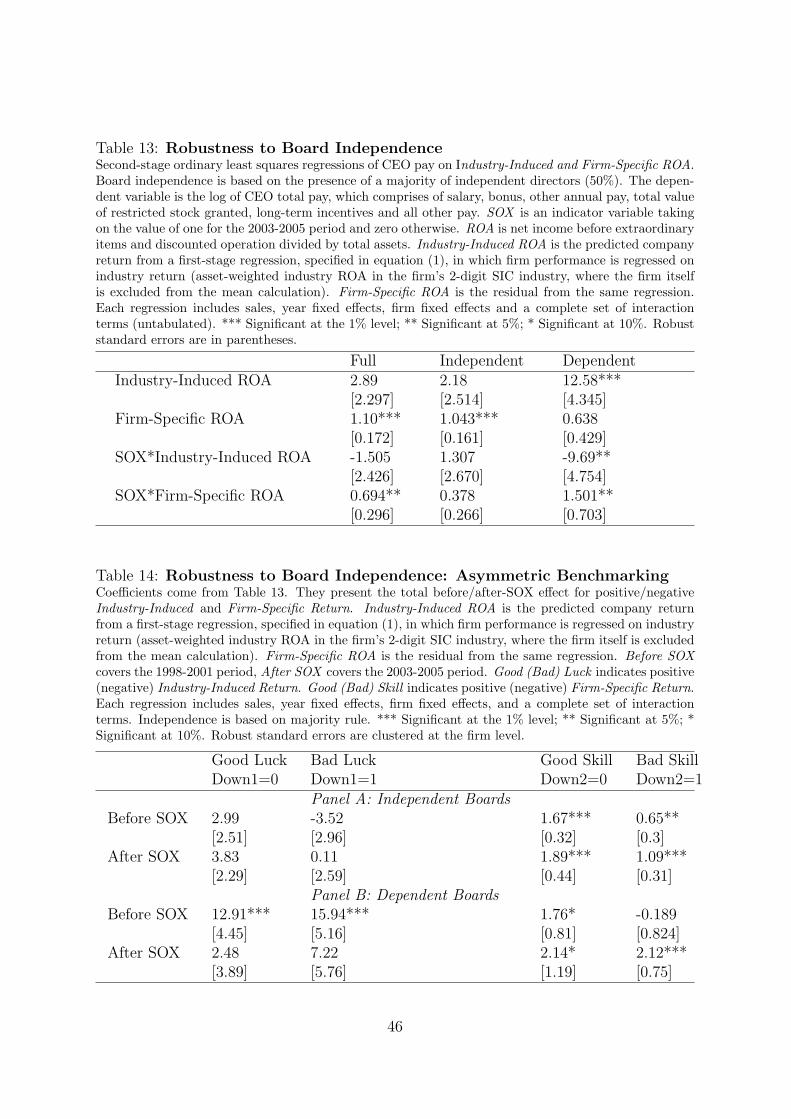
Table 13: Robustness to Board IndependenceSecond-stage ordinary least squares regressions of CEO pay on Industry-Induced and Firm-Specific ROA.Board independence is based on the presence of a majority of independent directors (50%). The depen-dent variable is the log of CEO total pay, which comprises of salary, bonus, other annual pay, total valueof restricted stock granted, long-term incentives and all other pay. SOX is an indicator variable takingon the value of one for the 2003-2005 period and zero otherwise. ROA is net income before extraordinaryitems and discounted operation divided by total assets. Industry-Induced ROA is the predicted companyreturn from a first-stage regression, specified in equation (1), in which firm performance is regressed onindustry return (asset-weighted industry ROA in the firm’s 2-digit SIC industry, where the firm itselfis excluded from the mean calculation). Firm-Specific ROA is the residual from the same regression.Each regression includes sales, year fixed effects, firm fixed effects and a complete set of interactionterms (untabulated). *** Significant at the 1% level; ** Significant at 5%; * Significant at 10%. Robuststandard errors are in parentheses.
Full Independent DependentIndustry-Induced ROA 2.89 2.18 12.58***
[2.297] [2.514] [4.345]Firm-Specific ROA 1.10*** 1.043*** 0.638
[0.172] [0.161] [0.429]SOX*Industry-Induced ROA -1.505 1.307 -9.69**
[2.426] [2.670] [4.754]SOX*Firm-Specific ROA 0.694** 0.378 1.501**
[0.296] [0.266] [0.703]
Table 14: Robustness to Board Independence: Asymmetric BenchmarkingCoefficients come from Table 13. They present the total before/after-SOX effect for positive/negativeIndustry-Induced and Firm-Specific Return. Industry-Induced ROA is the predicted company returnfrom a first-stage regression, specified in equation (1), in which firm performance is regressed on industryreturn (asset-weighted industry ROA in the firm’s 2-digit SIC industry, where the firm itself is excludedfrom the mean calculation). Firm-Specific ROA is the residual from the same regression. Before SOXcovers the 1998-2001 period, After SOX covers the 2003-2005 period. Good (Bad) Luck indicates positive(negative) Industry-Induced Return. Good (Bad) Skill indicates positive (negative) Firm-Specific Return.Each regression includes sales, year fixed effects, firm fixed effects, and a complete set of interactionterms. Independence is based on majority rule. *** Significant at the 1% level; ** Significant at 5%; *Significant at 10%. Robust standard errors are clustered at the firm level.
Good Luck Bad Luck Good Skill Bad SkillDown1=0 Down1=1 Down2=0 Down2=1
Panel A: Independent BoardsBefore SOX 2.99 -3.52 1.67*** 0.65**
[2.51] [2.96] [0.32] [0.3]After SOX 3.83 0.11 1.89*** 1.09***
[2.29] [2.59] [0.44] [0.31]Panel B: Dependent Boards
Before SOX 12.91*** 15.94*** 1.76* -0.189[4.45] [5.16] [0.81] [0.824]
After SOX 2.48 7.22 2.14* 2.12***[3.89] [5.76] [1.19] [0.75]
46
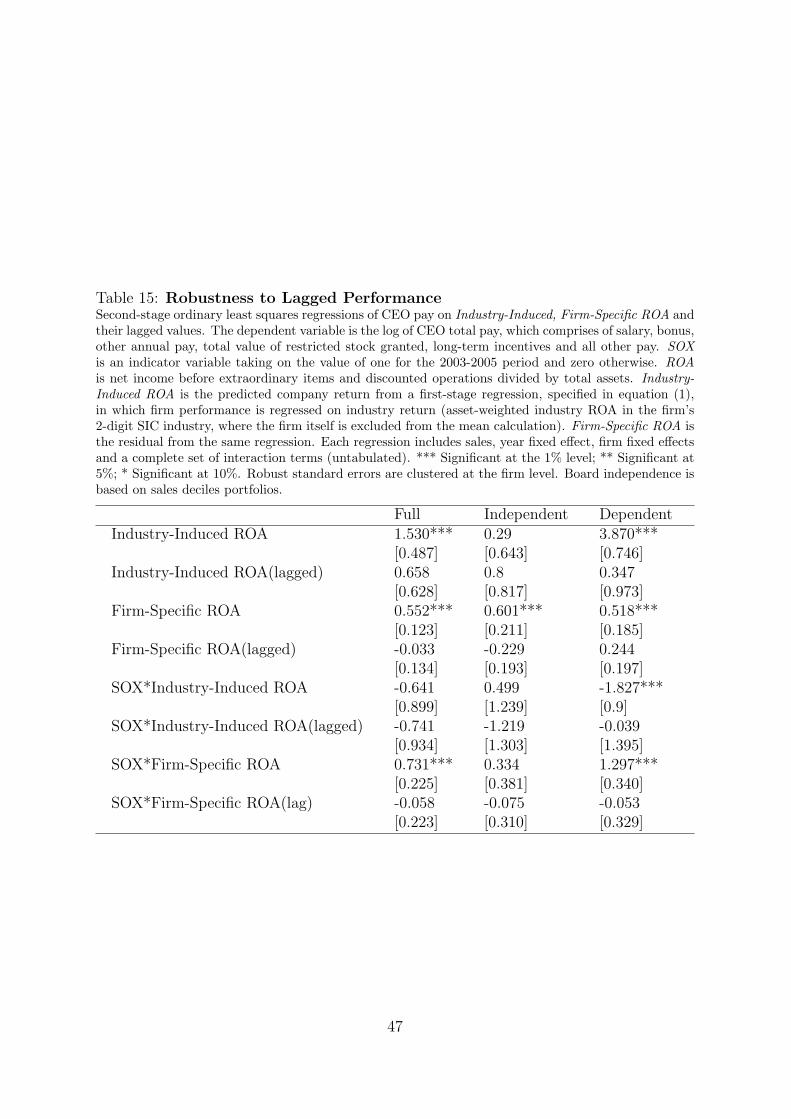
Table 15: Robustness to Lagged PerformanceSecond-stage ordinary least squares regressions of CEO pay on Industry-Induced, Firm-Specific ROA andtheir lagged values. The dependent variable is the log of CEO total pay, which comprises of salary, bonus,other annual pay, total value of restricted stock granted, long-term incentives and all other pay. SOXis an indicator variable taking on the value of one for the 2003-2005 period and zero otherwise. ROAis net income before extraordinary items and discounted operations divided by total assets. Industry-Induced ROA is the predicted company return from a first-stage regression, specified in equation (1),in which firm performance is regressed on industry return (asset-weighted industry ROA in the firm’s2-digit SIC industry, where the firm itself is excluded from the mean calculation). Firm-Specific ROA isthe residual from the same regression. Each regression includes sales, year fixed effect, firm fixed effectsand a complete set of interaction terms (untabulated). *** Significant at the 1% level; ** Significant at5%; * Significant at 10%. Robust standard errors are clustered at the firm level. Board independence isbased on sales deciles portfolios.
Full Independent DependentIndustry-Induced ROA 1.530*** 0.29 3.870***
[0.487] [0.643] [0.746]Industry-Induced ROA(lagged) 0.658 0.8 0.347
[0.628] [0.817] [0.973]Firm-Specific ROA 0.552*** 0.601*** 0.518***
[0.123] [0.211] [0.185]Firm-Specific ROA(lagged) -0.033 -0.229 0.244
[0.134] [0.193] [0.197]SOX*Industry-Induced ROA -0.641 0.499 -1.827***
[0.899] [1.239] [0.9]SOX*Industry-Induced ROA(lagged) -0.741 -1.219 -0.039
[0.934] [1.303] [1.395]SOX*Firm-Specific ROA 0.731*** 0.334 1.297***
[0.225] [0.381] [0.340]SOX*Firm-Specific ROA(lag) -0.058 -0.075 -0.053
[0.223] [0.310] [0.329]
47


