Embed Size (px)
Citation preview
The Journal of Applied Business Research – March/April 2014 Volume 30, Number 2
Copyright by author(s); CC-BY 341 The Clute Institute
The Effect Of Higher Wages On Production
Cost And Mechanization: A South
African Maize Sector Study Lehanri Saayman, North-West University, South Africa
Sanlie L. Middelberg, North-West University, South Africa
ABSTRACT
The South African labor market was recently characterized by violent and hostile labor strikes by
workers demanding exorbitant wage increases. These demands and violent protests overflowed to
the agricultural sector, followed by an announcement of a 51% increase in the agricultural
minimum wage. Labor costs form an integral part of a producer’s production costs and labor
increases will therefore directly affect the profitability of producers. The purpose of this study is to
investigate the effect higher wages have on the South African maize sector. Furthermore, to
determine whether there is a relationship between higher labor cost and increased mechanization
in the maize sector. Quantitative and qualitative research techniques were utilized to address the
research problem. The findings of the study include that the higher wages do not have a
significant effect on the maize sector as it is less dependent on manual labor and therefore more
tolerant to wage increases. Furthermore, it was determined that there is a relationship between
the maize sector’s level of mechanization and the impact of higher wages. It was found that the
maize sector is more developed and mechanized than other agricultural sectors. Notwithstanding,
it is recommended that the sector should maintain the investment in mechanization to increase
global competitiveness.
Keywords: Minimum Wages; Labor Cost; Mechanization; Production Cost; Agriculture
1. INTRODUCTION
inimum wages in South Africa were first implemented in 2002 (Roberts & Antrobus, 2013).
However, on the 5th of February 2013, the minimum wage for farm workers was increased with a
staggering 51%, effective from 1 April 2013 (Anon, 2013a). This latest increase in South African
agricultural minimum wages is a prominent topic of discussion. A number of questions have been raised
surrounding the effect this increase will have not only on the economy and unemployment, but also the impact
thereof on South African producers. Maize producers specifically play a vital role in ensuring food security in South
Africa provided that they can produce profitably over the long-term. The intention of this study is to provide
information to South African producers and policy makers by empirically determining whether, based on the cost of
labor, it is still financially viable to continue maize production in South Africa. Therefore, this paper will
furthermore investigate the trend of increased agricultural mechanization as a result of significant increases in
agricultural wages.
Increased labor cost is not the only type of production cost putting pressure on producers and forcing them
to consider alternatives. Instead, it can be viewed as a mixture of total increases in various input cost such as: i)
labor, ii) fertilizer, iii) fuel, iv) electricity, and v) seed (Vink & Hall, 2010). Kirsten (1999) concluded that it is
essential to evaluate not only production output but also production input, for both contribute to a producer’s
competiveness and adds value during the value chain cycle. As a result of significant increases in total production
input cost, producers must make structural changes to remain profitable. If, for some reason, structural changes
cannot be implemented, consideration must be given to other production practices such as: i) diversify into other
M
The Journal of Applied Business Research – March/April 2014 Volume 30, Number 2
Copyright by author(s); CC-BY 342 The Clute Institute
agricultural markets, ii) exit farming and seek other employment, or iii) diversifying or relocating to other countries
(Sherry, 2013; Hall, 2012).
In order to define the research objectives, this paper will use production cost data gathered from Grain
South Africa (Grain SA, 2013). This data will be used to analyze and interpret trends in the various elements of
maize’s production cost. This will enable the researcher to determine whether increases in labor cost do indeed
impact maize producers’ production decisions and therefore the profitability of the South African maize sector as a
whole. It should be noted that different markets in the agricultural sector will react differently to increases in labor
cost, depending on the specific market’s labor intensity (Meyer, 2013). For purposes of this study, the focus will be
on the maize market and the effect of higher labor cost thereon.
This research paper will be structured as follows: The first section will present the literature review and
research gap, the theoretical framework, and the research problem and research objectives. The second section will
discuss the relevant research methodology followed in order to empirically determine the set of research objectives.
Section 3 will focus on the agricultural sector in South Africa, paying special attention to the grain market in South
Africa and furthermore, it will focus on increased mechanization in the South African agricultural sector. Section 4
will empirically investigate labor cost as an element of total production cost. The paper will conclude with findings
and final conclusions about the effect of increased labor cost on the South African maize market.
1.1 Literature Review and Research Gap
A thorough review of the relevant literature was performed to identify the knowledge gap and establish the
appropriate research method to follow to fill this gap. Statistics South Africa (Stats SA) (2011) annually releases an
agricultural survey focusing on expenditure, Gross Domestic Product (GDP) contribution, production levels and
agricultural employment. Research conducted by Simbi and Aliber (2000) focused on labor trends in the South
African agricultural sector. The main findings of the report include that employment in the commercial farming
sector is declining as producers have chosen to shed permanent workers. Kirsten (1999) was concerned about the
input industry of South African agriculture and the effect thereof on competitiveness. The research recommended
that the agricultural industry should be well integrated to ensure competitiveness in the overall agricultural value
chain. A comprehensive report released by the Bureau of Food and Agricultural Policy (BFAP) (2012) focused on
the effect of labor increases and the result thereof on four agricultural sectors in the Western Cape area in South
Africa. This report forecasted the different net farming income according to different levels of minimum wages
using a model developed by BFAP called the FinSim Model.
Based on the afore-mentioned, it is clear that a knowledge gap of research investigating the effect of higher
labor cost focusing on maize producers, exist. This topic is however relevant especially in light of the significant
increase in the latest announced minimum wage for the period 2013-2014 and the important role maize production
plays in providing food security.
1.2 Theoretical Framework
This exploratory study will be based on the theoretical concept of value chain analysis developed by
Michael Porter. This theory states that activities in the production process adds value to the final product for the end
user, and that non value adding activities should be eliminated (CIMA, 2012a; CIMA, 2012b). For example,
research conducted by Ramaila et al. (2011) was based on this theoretical concept and found that technology and
increased mechanization can help increase competitiveness and add value.
1.3 Problem Statement and Research Objectives
The agricultural sector of South Africa is of great importance, not only can it be viewed as the primary
sector responsible for securing food production, it is also an earner of foreign exchange, and a significant provider of
employment (Roberts & Antrobus, 2013; Greyling, 2012; Lestrada-Jefferis, 2000). Its importance is further
highlighted by the sector’s inclusion in the South African Government’s Plan, Vision 2030, with the aim of creating
employment and uplifting poverty by 2030. This government plan aims to create 1 million jobs in the agricultural

The Journal of Applied Business Research – March/April 2014 Volume 30, Number 2
Copyright by author(s); CC-BY 343 The Clute Institute
sector alone (Anon, 2013b; Meyer, 2012). This goal may be difficult to reach considering factors such as
governmental policies, legislation, and intervention (Vink & Hall, 2010), which will be elaborated upon later on in
the study. However, to ensure this goal of creating employment is met, and for food security to be achieved, a maize
producer should operate profitably. The following research questions can therefore be asked: Is it still financially
viable for maize producers to produce in South Africa based solely on labor considerations? And furthermore, what
effect does the increase in labor cost have on the maize producers’ total production cost? Does the increased labor
cost lead to increased mechanization?
In order to successfully answer the before-mentioned research problems, the following objectives were set:
i) to determine the financial effect of increased labor cost on maize producers’ production cost, in relation to
increases in other input cost, and ii) to determine the possible link between higher labor cost and increased
mechanization.
2. RESEARCH DESIGN
A mixed method approach was followed to address the research problem, combining quantitative and
qualitative research techniques. Data was gathered from Grain SA (2013), a voluntary non-profit organization of
South African grain producers established to represent the interest of its members. The data regarding total
production cost of maize producers in different regions in South Africa was analyzed and interpreted. A weighted
average production cost for different regions was calculated, with the regions including: i) North-West, ii) Eastern
Free-State, iii) Mpumalanga, and iv) Kwazulu-Natal Provinces (Grain SA, 2013). These regions are considered the
key maize producing areas in South Africa (BFAP, 2013).
Furthermore, data on mechanization in the agricultural sector was gathered by means of a two-fold process
using qualitative techniques. Firstly, a critical review of relevant research published was performed, and secondly an
interview was conducted with Dr. Ferdi Meyer, Head of the Bureau for Food and Agricultural Policy (BFAP).
BFAP performs agricultural research for interested parties, including government and producers, in order to improve
decision making. Meyer is also a grain producer, and is heavily involved in developing governmental plans for
agriculture. He can therefore be regarded as an expert in the field of agriculture. Making use of this relatively small
number of participants was a conscious choice of trade-off between quality and quantity of data by the researcher.
The basis for this decision is that more reliable data was obtained by interviewing a small number of experts in this
field of research than interviewing a large number of inadequate informed producers.
3. BACKGROUND
3.1 Agricultural Minimum Wages and the Economic Effect
As mentioned previously, minimum wages was first implemented in South Africa in 2002 with an effective
date of 1 March 2003 (Roberts & Antrobus, 2013). Some of the main reasons for this implementation were to
protect farm workers and reduce poverty (Kassier et al., 2003, p. 7). Vink (2001, p. 60) found that most farm
workers were living in absolute poverty and therefore government intervention was needed to regulate the living and
working conditions of farm workers (Kassier et al., 2003, p. 7). Agriculture however, is still the lowest paid sector in
South Africa. Implementing higher wages in order to uplift poverty, especially in rural areas, is a normal
transformation for a developing country, and from a social prospective is can be viewed as a step in the right
direction. Especially since the government’s main aim is to protect workers and uplift their poverty (Meyer, 2013).
Higher wages for all may have a positive effect, indirectly contributing to lower crime rates. This theory can only be
true if no social problems exist in a country. The reality is that South Africa is a country with a number of social
issues that needs to be addressed before significant increases in minimum wages, for mostly unskilled workers will
bring about the possible positive effects. In South Africa significant increases in the agricultural minimum wage
such as the 51% increase announced by the Minister of Labor, Ms Mildred Oliphant, on the 5th of February 2013,
brought about nearly 2,000 retrenchments (Anon, 2013a). Simulations and calculations performed by BFAP suggest
that a further 120,000 jobs are expected to be lost in the agricultural sector of South Africa (Meyer, 2013). Thus, in
effect more people are now unemployed with no income, creating even more social problems and working against
the governments’ plan, Vision 2030, that aims to reduce poverty and create employment in the agricultural sector of
South Africa (Meyer, 2013; Van der Westhuizen, 2013).
The Journal of Applied Business Research – March/April 2014 Volume 30, Number 2
Copyright by author(s); CC-BY 344 The Clute Institute
3.2 South African Grain Sector
The South African grain sector utilizes 4.3 million hectares of available land in South Africa. Based on the
size of the grain sector, it remains a significant provider of employment in South Africa (BFAP, 2012). Grain is
classified as being a field crop. The grain producing sector of South Africa is divided into different types of grain,
with maize and wheat being the two largest contributors. In 2011 maize contributed 47.2% (R15,086 million) of
total field crop production in South Africa (DAFF, 2011). There are about 9,000 commercial maize producers in
South Africa and the maize market provides employment to 150,000 workers (DAFF, 2012a). Wheat on the other
hand, is the second largest contributor to total field crop production in South Africa with a contribution of 9%
(R3,850 million) of the total value (DAFF, 2011). In terms of global wheat production, South Africa is ranked 37th
.
It is estimated that there are about 3,800 to 4,000 wheat producers in South Africa. The wheat market provides
employment to about 28,000 people in South Africa (DAFF, 2012b). With global technology changing constantly,
the maize market has already undergone significant changes in their production process with the implementation of
for example, technologically-advanced tractors replacing manual laborers. The maize sector in South Africa has
therefore already started to implement structural changes, becoming less dependent on manual laborers (Meyer,
2013; BFAP, 2012). Furthermore, a sector’s labor intensity determines their exposure to volatility when wages are
changed.
4. MECHANIZATION VERSUS HIGHER WAGES WITH SPECIAL REFERENCE TO THE
MAIZE SECTOR
For the South African agricultural sector to remain competitive and compete against subsidized producers
globally, mechanization is a necessity. Producers should consider moving away from labor intensive farming by
implementing structural changes (Sherry, 2013). Recent research conducted by Ramaila et al. (2011) indicated that
technological improvement can lead to increased agricultural productivity. Furthermore, mechanization, such as
technologic advanced tractors, can substitute manual laborers needed, reduce harvesting time and cut production
cost (BFAP, 2012). However, not all sectors are able to implement structural changes to the same extent and
mechanization can be a costly process, but the value that can be added to the value chain, is endless. A producer has
to evaluate the increase in production cost as result of increased minimum wages, against the capital outlay and costs
of restructuring business processes.
Since drastic increases in labor cost are resulting in producers not being able to cover operating expenses,
producers are considering alternatives including: i) diversifying operations in order to spread risk, ii) diversifying
through producing alternate agricultural products less labor intensive, iii) substituting numerous unskilled workers
with more, skilled workers, and iv) mechanization (BFAP, 2012; Hall, 2012). BFAP (2012) stated that
mechanization should not be seen as a threat to employment but rather as an opportunity to increase the value added
per farm worker. The South African agricultural sector is still relatively labor intensive, with dependency on manual
laborers varying according to different sub-sectors. An increase in mechanization in South Africa is however evident
with sales figures of mechanical implements from 2003 to 2012 increasing from 3,200 to 7,800 units sold per annum
(Sherry, 2013; Anon, 2013a). Part of this increase in sales can be directly contributed to significant increases in
labor cost (Meyer, 2013; Sherry, 2013; Anon, 2013a; BFAP, 2012). However, increased wages are not the only
reason for this increase in sales, another contributor is the agricultural commodity price boom from 2007 to 2012.
Agricultural commodity prices nearly doubled during this period, resulting in the net farming income of producers
increasing significantly. With the available surplus funds, producers increased investments into capital equipment
(Meyer, 2013). Larger farms that invested in technology leading to increased mechanization and economies of scale,
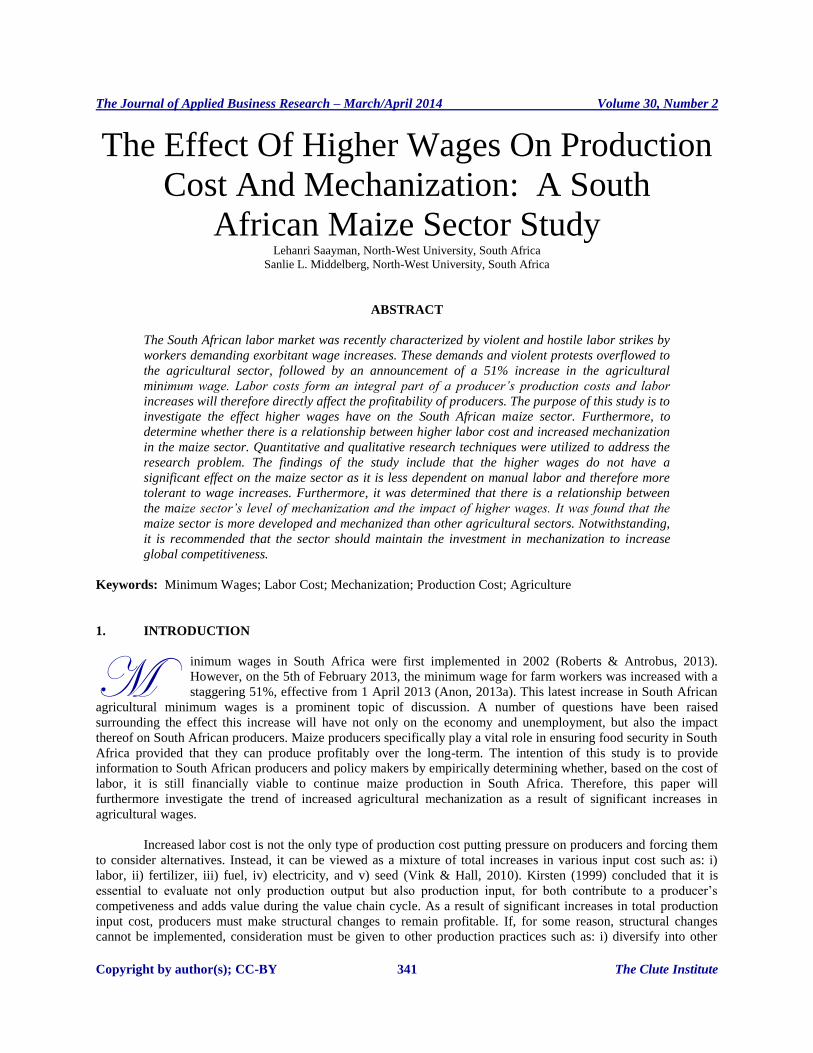
are currently able to produce at lower production cost. Graph 1 illustrates the declining rate of employment by the
agricultural sector in South Africa over the period 2003 to 2012. This trend can also be an indication of the South
African agricultural sector becoming more mechanized by substituting manual laborers with increased
mechanization.
The Journal of Applied Business Research – March/April 2014 Volume 30, Number 2
Copyright by author(s); CC-BY 345 The Clute Institute
Graph 1: Employment in the Agricultural Sector of South Africa: 2003 To 2012 Source: World Bank (2013) adapted
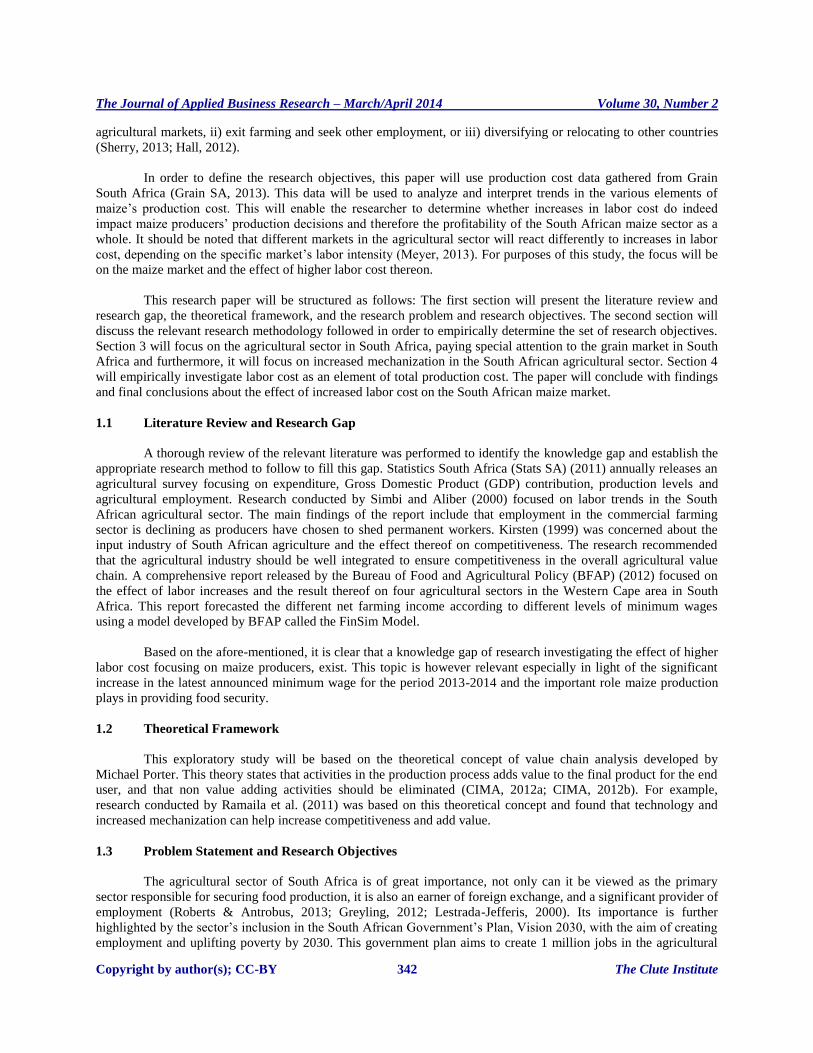
Graph 2 illustrates the capital expenditure of commercial producers for the period 2010 to 2011. Although
two years’ data is not sufficient to determine a trend, it is evident that expenditure on motor vehicles, tractors,
machinery and other transport represented the biggest portion.
Graph 2: Capital Expenditure by Commercial Farming Sector: 2010 to 2011 Source: Stats SA (2011) adapted
The extent of the effect of higher labor cost on production cost will depend largely on the percentage that
labor represents of total production cost. However, sectors that have already undergone structural changes and
therefore less dependent on manual laborers, will be more tolerant to increases in the labor cost.
Mechanization was first introduced in the maize production process, while the harvest process was more
reliant on manual laboring. However, with technological developments over the last number of years, the harvesting
process is also now moving towards increased mechanization (BFAP, 2012). Furthermore, when compared to other
sectors, the maize sector is more mechanized and able to implement structural changes than other sectors such as the
vegetable and fruit sector (Meyer, 2013). Currently, labor represents about 7.65% of total production cost on an
average grain producing farm, compared to a 34% average on an apple and pear farm (Meyer, 2013; BFAP, 2012).
Mechanized production methods are able to add more value to the value chain and can in effect eliminate cost
disadvantages created through increased labor cost (Ramaila et al., 2011). This is in contrast to labor-intensive
sectors which are more negatively influenced by higher wages and therefore prone to retrench workers (BFAP,
2012).
0
1000
2000
3000
4000
5000
6000
7000
8000
9000
Construction works,
roads and parking
areas
Computers and IT
equiptment
Other capital
expenditure
Plantations Land and buildings Motor vehicles,
tractors, machinery
and other transport
R m
illi
on
2010 2011
4
6
8
10
12
2003 2004 2005 2006 2007 2008 2009 2010 2011
South Africa
The Journal of Applied Business Research – March/April 2014 Volume 30, Number 2
Copyright by author(s); CC-BY 346 The Clute Institute
5. ANALYSIS OF LABOR COST AS PART OF PRODUCTION COST
Labor is only one element of a number of production cost items and in South Africa this labor cost is
heavily influenced by the agricultural minimum wage. However, an increase in statutory labor or minimum wage
rates is not directly correlated with the percentage increase of labor’s portion of total production cost. For example, a
10% increase in the agricultural minimum wage rate may only lead to a 4% increase in labor cost as a percentage of
total production cost (Meyer, 2013). This imperfect relationship may be attributed to: i) producers saving costs by
reducing their workforce through retrenchments resulting in labor representing a smaller percentage of total
production cost, and ii) a sector’s level of dependence on manual labor, as a highly dependent sector will be more
influenced by higher wages (Meyer, 2013; BFAP, 2012).
The open question of this study for the core audience of South African producers and policy makers is to
determine whether the effect of higher wages negatively influenced the financial viability of the maize sector of
South Africa focusing specifically on the production data of maize in the key producing areas. As total production
cost has increased due to increases in the various production cost items, one can ask; what percentage of the total
increase in production cost can be directly attributed to higher wages? This question will be addressed by analyzing
the different factors that led to higher production cost for South African maize producers. However, the literature
indicates that significant increases in labor are not the only element contributing to higher production cost which in
turn negatively affects the profitability of producers. It should also be noted that some variables influencing a
producer’s profitability cannot be controlled, including: i) weather conditions, and ii) commodity prices.
Variable maize production cost (excluding fixed production cost) consist of the following items: i) seed, ii)
fertilizer, iii) weed control cost, iv) pest control cost, v) fuel, vi) seasonal workers, vii) permanent workers, and viii)
a combination of smaller items (Grain SA, 2013; DAFF, 2012c). These main production cost elements will be used
to conduct the analysis.
Certain seasons in the maize production process require increased labor, which is when seasonal workers
are utilized. These seasonal workers are paid at the same rate as permanent workers, which are regarded as a
criticism against a fixed minimum wage rate for all farm workers (Meyer, 2013).
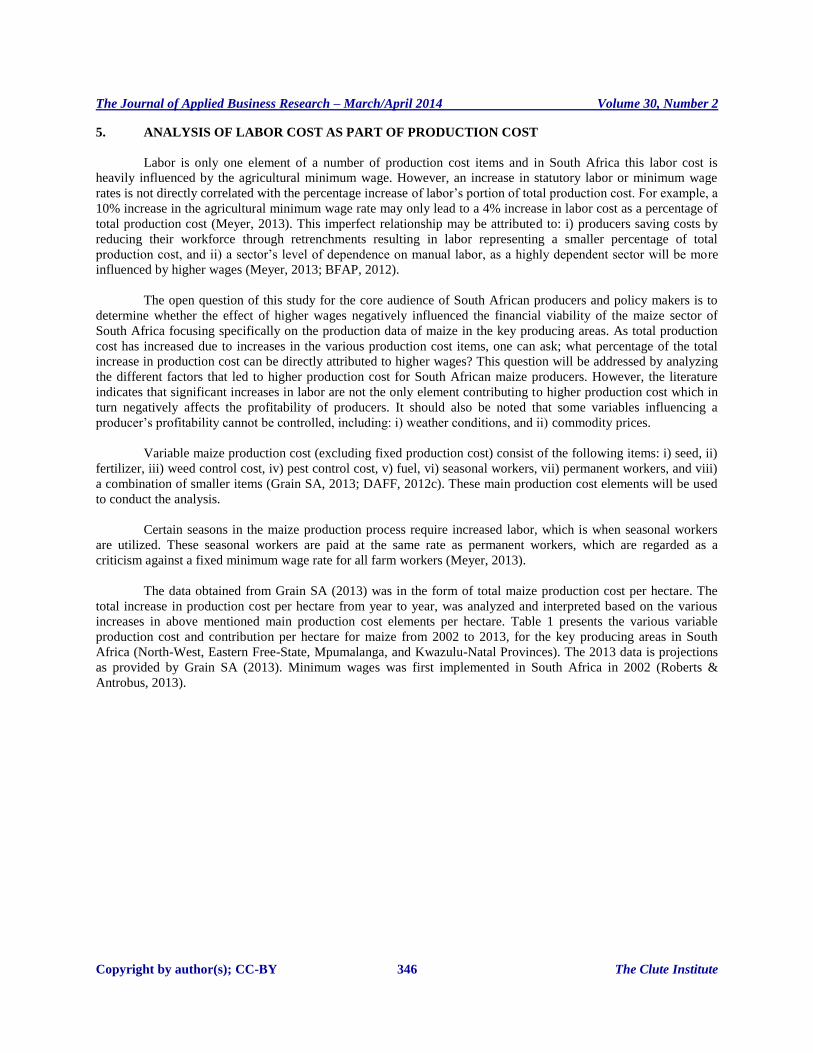
The data obtained from Grain SA (2013) was in the form of total maize production cost per hectare. The
total increase in production cost per hectare from year to year, was analyzed and interpreted based on the various
increases in above mentioned main production cost elements per hectare. Table 1 presents the various variable
production cost and contribution per hectare for maize from 2002 to 2013, for the key producing areas in South
Africa (North-West, Eastern Free-State, Mpumalanga, and Kwazulu-Natal Provinces). The 2013 data is projections
as provided by Grain SA (2013). Minimum wages was first implemented in South Africa in 2002 (Roberts &
Antrobus, 2013).
The Journal of Applied Business Research – March/April 2014 Volume 30, Number 2
Copyright by author(s); CC-BY 347 The Clute Institute
Table 1: Variable Production Cost of Maize per Hectare: 2002 to 2013
2002 2003 2004 2005 2006 2007 2008 2009 2010 2011 2012 2013
Income/ha 5376.88 3890.58 4347.90 3105.27 5400.72 8926.95 8926.95 8027.40 5062.89 7837.88 8599.23 12437.46
Production Cost: Rand 2572.59 2812.48 2925.42 2951.35 3251.58 3890.02 4419.11 5702.45 4278.78 4604.34 6576.67 9027.40
Seed 209.21 217.38 294.36 332.57 341.17. 456.63 431.96 599.63 572.67 726.65 1268.00 1170.54
Fertilizer 548.06 765.81 730.41 753.95 788.98 1020.17 1342.87 1903.21 1586.22 1754.72 2705.00 3098.83
Weed Control 132.02 165.64 162.79 155.18 184.48 259.38 236.41 485.79 371.50 415.30 582.00 634.31
Pest Control 60.76 96.57 86.71 95.13 64.98 45.00 64.40 0.00 115.00 111.75 335.00 297.81
Fuel 365.39 322.64 334.42 384.58 477.38 505.21 652.09 627.29 572.54 642.48 727.00 909.47
Permanent Workers 207.48 210.03 236.36 240.74 287.99 277.11 296.08 320.00 334.46 332.81 398.58 577.83
Seasonal Workers 27.87 29.50 17.03 23.41 30.05 35.47 35.47 45.50 51.31 57.25 70.00 -
Other Combined 1021.80 1004.91 1063.34 965.79 1076.54 1291.04 1359.83 1720.75 674.85 563.14 491.09 2338.61
Contribution/ha 2804.30 1078.10 1422.49 153.92 2149.14 5036.94 4507.84 2324.95 784.11 3233.53 2022.56 3410.06 Source: Grain SA, 2013
The Journal of Applied Business Research – March/April 2014 Volume 30, Number 2
Copyright by author(s); CC-BY 348 The Clute Institute
Table 2 indicates the overall real growth from 2002 to 2013 in the income, production cost elements and
contribution per hectare.
Table 2: Annual Average Growth Rate in Variable Maize Production Cost Elements from 2002 to 2013
Growth Rate
Income/ha 7.92%
Production Cost/Variable Cost 12.09%
Seed 16.95%
Fertilizer 17.06%
Weed Control 15.34%
Pest Control 15.55%
Fuel 8.64%
Permanent Workers 9.76%
Seasonal Workers (2003 To 2012) 9.65%
Other Combined 7.82%
Contribution/ha 7.82% Source: Own calculations based on data obtained from Grain SA (2013)
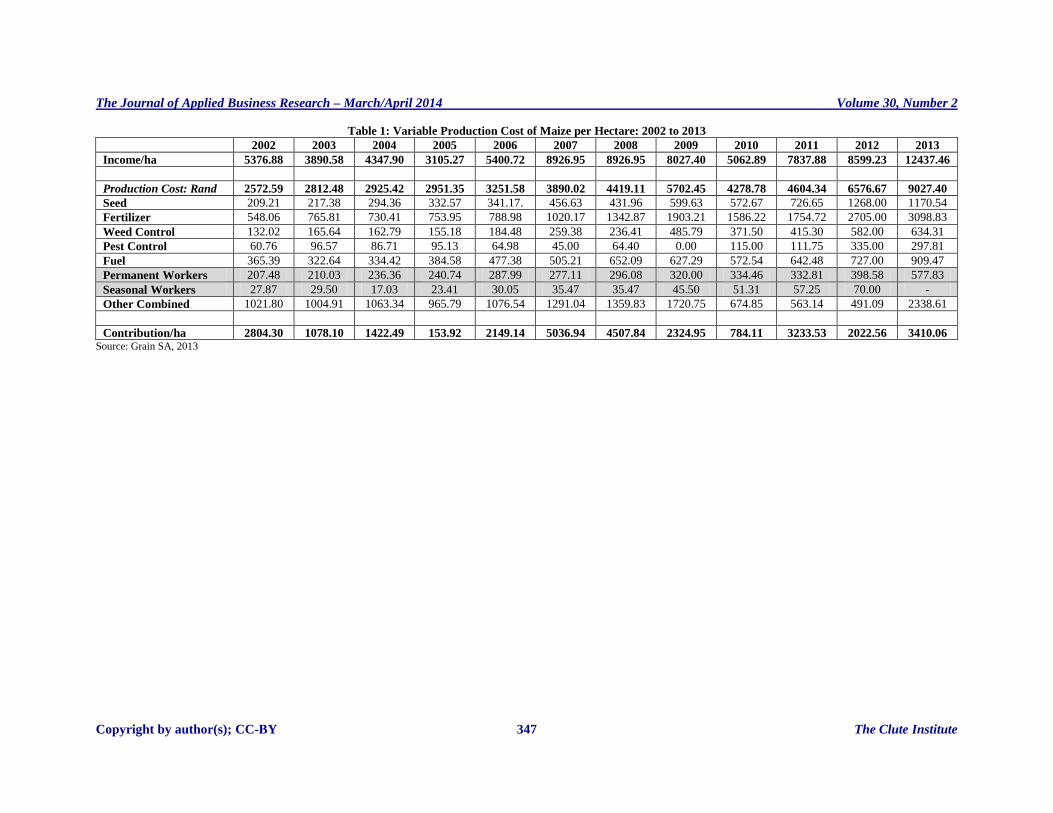
Table 3 illustrates the annual percentage change for the income, production cost elements and contribution
per hectare. There has been a 19.76% and 22.27% increase from 2011 to 2012 in the cost of permanent and seasonal
workers, respectively. The 2013 projection data anticipates a 44.97% increase in the labor cost of permanent
workers; this is due to the 51% increase in agricultural minimum wages for the period 2013 to 2014. This increase of
44.97% is therefore slightly lower than the percentage increase in the fixed minimum wage rate for the
corresponding period. However, significant increases in other production cost elements is also evident from 2003 to
2012 with pest control, seed and fertilizer all showing increases in excess of 50%.
Table 3: Annual Percentage (%) Change in Variable Maize Production Cost: 2002 to 2013
2003 2004 2005 2006 2007 2008 2009 2010 2011 2012 2013
Income/ha -27.64 11.75 -28.58 73.92 65.29 51.66 -10.08 -36.93 54.81 9.71 44.63
Production Cost 9.33 4.02 0.89 10.17 19.63 13.60 29.04 -24.97 7.61 42.84 37.26
Seed 3.91 35.41 12.98 2.59 33.84 -5.40 38.82 -4.50 26.89 74.50 -7.69
Fertilizer 39.73 -4.62 3.22 4.65 29.30 31.63 41.73 -16.66 10.62 54.16 14.53
Weed Control 25.47 -1.72 -4.68 18.88 40.60 -8.86 105.49 -23.53 11.79 40.14 8.99
Pest Control 58.92 -10.20 9.70 -31.69 -30.75 43.11 -100.00 0.00 -2.83 199.78 -11.10
Fuel -11.70 3.65 15.00 24.13 5.83 29.07 -3.80 -8.73 12.22 13.16 25.10
Permanent Workers 1.23 12.53 1.86 19.62 -3.78 6.85 8.08 4.52 -0.49 19.76 44.97
Seasonal Workers 5.86 -42.29 37.52 28.34 18.04 -0.01 28.29 12.77 11.58 22.27 -
Other Combined -1.65 5.81 -9.17 11.47 19.92 5.33 26.54 -60.78 -16.55 -12.79 376.21
Contribution/ ha -61.56 31.94 -89.18 1296.29 134.37 125.82 -39.12 -11.96 47.20 -33.12 68.60
Source: Own calculations based on data obtained from Grain SA (2013)
This data was further analyzed with Table 4 presenting the results of the weight the various increases in
production cost represented of the total increase in production cost. For example, the increase of 37.26% in 2013
was further analyzed to determine the percentage each production cost element contributed (as a % of 100%) to the
total increase in production cost per hectare. This was done to determine what portion of the total increase in
production cost was represented by labor cost.

The Journal of Applied Business Research – March/April 2014 Volume 30, Number 2
Copyright by author(s); CC-BY 349 The Clute Institute
Table 4: Percentage Contribution per Production Cost Element: 2002 to 2013 2003 2004 2005 2006 2007 2008 2009 2010 2011 2012 2013
Production Cost 100.00 100.00 100.00 100.00 100.00 100.00 100.00 100.00 100.00 100.00 100.00
Seed 8.13 7.73 10.06 10.49 11.74 9.77 10.52 13.38 15.78 19.28 12.97
Fertilizer 21.30 27.23 24.97 24.26 26.23 30.39 33.38 37.07 38.11 41.13 34.33
Weed Control 5.13 5.89 5.56 5.67 6.67 5.35 8.52 8.68 9.02 8.85 7.03
Pest Control 2.36 3.43 2.96 2.00 1.16 1.46 0.00 2.69 2.43 5.09 3.30
Fuel 14.20 11.47 11.43 14.68 12.99 14.76 11.00 13.38 13.95 11.05 10.07
Permanent
Workers 8.07 7.47 8.08 8.86 7.12 6.70 5.61 7.82 7.23 6.06 6.40
Seasonal
Workers 1.08 1.05 0.58 0.92 0.91 0.80 0.80 1.20 1.24 1.06 -
Other
Combined 39.72 35.73 36.35 33.11 33.19 30.77 30.18 15.77 12.23 7.47 25.91
Source: Own calculations based on data obtained from Grain SA (2013)
As is evident from the data in Table 4, the 42.84% and 37.26% increase in the production cost from 2011 to
2012 and 2012 to 2013 respectively (refer to Table 3), is mostly due to a 41.13% and 34.33% increase in fertilizer
for both 2012 and 2013. Labor cost (permanent workers and seasonal workers) contributed roughly 6% to the total
increase. The two elements mostly contributing to the annual production cost increase are the other combined
element and the increase in fertilizer. The increase in labor cost as a percentage of total production cost cannot
therefore be regarded as significant. A possible reason may be that the maize sector in South Africa is relatively not
heavily reliant on manual labor and therefore the higher minimum wages will not significantly influence the
profitability of the sector.
In order to investigate the influence of the minimum wage increases on labor as percentage of maize
production cost, a comparison was drawn between the latter and the increase in agricultural minimum wages.
Table 5 indicates the monthly agricultural minimum wage in South Africa from 2003 to 2013 compared to
the annual increase or decrease of the cost of permanent and seasonal workers included in the total variable
production cost of maize. Furthermore, Table 5 includes the annual average of the South African Producer Price
Index (PPI) for commodities in domestic output. The increase/decrease in minimum wage and labor as part of
variable production cost is compared to the PPI as it is used as an indicator of inflation or deflation for locally
produced commodities (Stats SA, 2013).
Table 5: Agricultural Minimum Wage Rate Compared to % Increase in Labor as Part of Variable Production Cost
2003 2004 2005 2006 2007 2008 2009 2010 2011 2012 2013
Minimum
wage rate
per month
800.00 871.00 949.00 994.00 1041.00 1073.00 1231.00 1316.00 1375.00 1503.00 2274.00
% Increase 8.88% 8.96% 4.74% 4.73% 3.07% 14.73% 6.90% 4.48% 9.31% 51.30%
% Increase
in
permanent
and
seasonal workers
cost
1.78% 5.78% 4.25% 20.40% -1.72% 6.07% 10.24% 5.55% 1.11% 20.13%
% Increase
in PPI 0.6% 3.1% 7.6% 10.9% 14.2% -0.1% 6.0% 8.4% 6.2%
6.6%
(July)
Source: Own calculations from data obtained from Stats SA (2013); South Africa (2013); South Africa (2012); South Africa (2009); South Africa (2006);
South Africa (2002); and DPRU (2010)
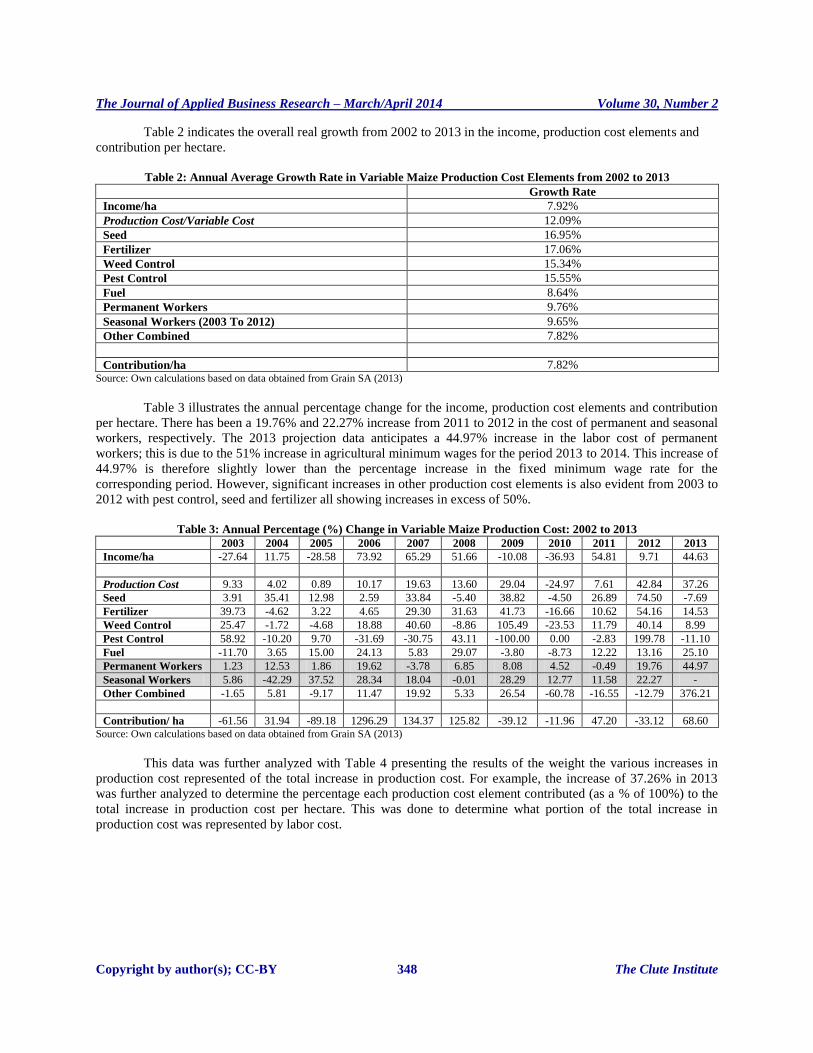
From the data analyzed in Table 5, it can be gathered that the agricultural minimum wage rate increased
from 2012 to 2013 with 51.30% while the % increase in permanent and seasonal workers cost, i.e. labor cost was
only 20.13%. These increases are significantly higher than the PPI increase of 6.6% (refer to Graph 3). A possible
reason is that the latest increase in minimum wage is only effective from 1 April 2013 and will take time to filter
through to a PPI increase. The average annual increase in minimum wages over the past 10 years (as per data in
Table 5) was calculated as 11.74%. If such a trend continues then evidence suggests that the increase in the
minimum wage rate is much higher than the resultant increase or decrease that labor contributed to the increase or
The Journal of Applied Business Research – March/April 2014 Volume 30, Number 2
Copyright by author(s); CC-BY 350 The Clute Institute
decrease in total variable production cost per hectare (refer to Graph 3). Considering labor percentage as part of total
production cost, the highest percentage labor formed of total production cost was 9.78% which is much lower than
the astonishing annual average increase of 11.74% (refer to Table 4).
Graph 3: Agricultural Minimum Wage Rate Compared to % Increase in Labor as Part of
Variable Maize Production Cost Source: Own calculations from data obtained from Stats SA (2013); South Africa (2013); South Africa (2012);
South Africa (2009); South Africa (2006); South Africa (2002); and DPRU (2010)
6. FINDINGS AND CONCLUSIONS
The research objectives of the study was firstly to determine the financial effect of increased labor cost on
maize producers’ production cost in relation to increases in other input cost, and secondly to determine the possible
link between higher labor cost and increased mechanization. The study started off by analyzing the various variable
maize production cost elements per hectare from 2002 to 2013 (refer to Table 1) followed by a calculation of the
annual average growth rate of each element (refer to Table 2). The data in Table 2 indicated that the annual average
growth rate from 2002 to 2013 was 9.76% and 9.65% for permanent workers and seasonal workers, respectively.
Next the annual percentage change in each cost element was determined in Table 3, followed by a further analysis
presenting the results of the weight the various increases in production cost represented of the total increase in
production cost. Finally, Table 5 compared the increase in agricultural minimum wages to i) the annual increase or
decrease of the cost of permanent and seasonal workers included in the total variable production cost of maize, and
ii) the annual average South African PPI increase. It was found that although the annual increase in agricultural
minimum wages over the last decade was 11.74%, labor as a percentage of maize production cost did not increase at
the same rate. It can therefore be concluded that the increase in minimum wages did not have a significant financial
effect on maize producers’ production cost. It was furthermore found that the main cause for the increased
production cost of South African maize producers relates to increases in other production inputs such as fertilizer
and other combined items.
With regards to the second research objective, the findings suggest that there is a definite relationship
between a sector’s level of mechanization and the impact of higher wages, i.e. a labor intensive sector will be more
negatively affected by rising labor costs compared to more mechanized sectors. When considering the South African
maize sector, it can be concluded based on calculations performed combined with interviews conducted and
literature reviewed that the maize sector of South Africa is more developed and mechanized compared to other
agricultural sectors. However it is recommended that the maize sector of South Africa should maintain the
investment in structural changes and move from labor intensive production towards increased mechanization to
increase global competitiveness. This supports the value chain analysis theory that activities in the production
process such as mechanization adds value to the final product for the end user, and that non value adding activities
should be eliminated. Mechanization however, can be a costly process and the cost thereof will have to be weighed
-10
0
10
20
30
40
50
60
2004 2005 2006 2007 2008 2009 2010 2011 2012 2013
% Increase in minimum wage rate
per month
% Increase in PPI
% Increase in permanent and
seasonal workers cost
The Journal of Applied Business Research – March/April 2014 Volume 30, Number 2
Copyright by author(s); CC-BY 351 The Clute Institute
up against the cost of higher labor. Through increased mechanization the negative effects of increased wages can be
countered to a certain degree, but sectors not able to implement structural changes to increase mechanization, will be
affected the most by drastic increases in the minimum wage rate.
Areas for further research include the expansion of this study by investigating the impact of higher labor
cost on other agricultural sectors, such as the wine and certain vegetable sectors.
AUTHOR INFORMATION
Lehanri Saayman is currently a full-time Masters’ student at the North-West University's Potchefstroom campus in
South Africa. This article is based on the research conducted for her Masters in Commerce (Management
Accountancy) degree. Telephone number: +27 82 395 7346. E-mail: [email protected]
Prof. Sanlie L. Middelberg is currently an associate professor in the School of Accounting Sciences at the North-
West University, South Africa and holds a PhD in Management Accountancy and is an Associate Chartered
Management Accountant (ACMA). She has worked as refining accountant and senior internal auditor at Total South
Africa (Pty) Ltd for 5 years. She teaches in the chartered management accountancy and financial accountancy
programs. Her academic research output includes a number of peer reviewed articles and conference presentations.
Her current research focuses on the area of sustainable agriculture. Telephone number: +27 18 299 4428. E-mail:
[email protected] (Corresponding author)
REFERENCES
1. Anon. (2013a). Farm workers lose jobs after wage hike. Retrieved 5 February 2013 from
http://www.bizcommunity.com/Article/196/475/88918.html
2. Anon. (2013b). Agri SA states position on minimum wage. Retrieved 5 February 2013 from
http://www.bizcommunity.com/Article/196/358/88738.html
3. Babbie, E., & Mouton, J. (2001). The practice of social research (South African edition, p. 674). Oxford:
Oxford University Press.
4. BFAP (Bureau for Food and Agricultural Policy). (2013). BFAP baseline agricultural outlook, 2012 –
2021. Retrieved 20 July 2013 from http://www.bfap.co.za/documents/baselines/BFAP_Baseline_2012.pdf
5. BFAP (Bureau for Food and Agricultural Policy). (2012). Farm sectoral determinations: An analysis of
agricultural wages in South Africa. Retrieved 15 April 2013 from
http://bfap.co.za/documents/research%20reports/BFAP%20farm%20sector%20determination%20report%2
0draft%2017%20Dec.PDF
6. CIMA (Chartered Institute of Management Accountants). (2012a). CIMA official study text: Paper E1,
Enterprise Operations (p. 484). Oxford: Elsevier.
7. CIMA (Chartered Institute of Management Accountants). (2012b). CIMA official study text: Paper E3,
Enterprise Strategy (p. 574). BPP Learning Media.
8. DAFF (Department of Agriculture, Fisheries and Forestry). (2012a). Maize market value chain profile.
Retrieved 22 May 2013 from http://www.nda.agric.za/docs/AMCP/MaizeMVCP2011.pdf
9. DAFF (Department of Agriculture, Fisheries and Forestry). (2012b). Wheat market value chain profile.
Retrieved 22 May 2013 from http://www.nda.agric.za/docs/AMCP/WheatMVCP2011.pdf
10. DAFF (Department of Agriculture, Forestry and Fisheries). (2012c). Economic review of the South African
Agriculture. Retrieved 9 April 2013 from http://www.daff.gov.za/docs/statsinfo/ EcoReview2012.pdf
11. DAFF (Department of Agriculture, Fisheries and Forestry). (2011). Trends in the agricultural sector.
Retrieved 9 April 2013 from http://www.nda.agric.za/docs/statsinfo/Trends2011.pdf
12. DPRU (Development Policy Research Unit). (2010). Addressing the plight of vulnerable workers: The role
of sectoral determinations. Retrieved 5 August 2013 from
http://www.labor.gov.za/downloads/documents/useful-documents/basic-conditions-of-
employment/The%20role%20of%20Sectoral%20Determinations.pdf
13. Grain SA. (8 June 2013). Versoek om inligting.
14. Greyling. J. C. (2012). The role of the agricultural sector in the South African economy. Retrieved 12
February 2013 from http://scholar.sun.ac.za/handle/10019.1/71713
The Journal of Applied Business Research – March/April 2014 Volume 30, Number 2
Copyright by author(s); CC-BY 352 The Clute Institute
15. Hall, R. (2012). The next great trek? South African commercial producers move north. Journal of Peasant
Studies, 39(3-4), 823-843.
16. Kassier, E., Cherry, M., Du Toit, I., Aihoon, K., & Le Clus, K. (2003). Advice and assistance in the process
of assessing applications for the ministerial determination to pay prescribed minimum wages in the farm
worker sector. Report of the Department of Labor. Pretoria.
17. Kirsten, J. (1999). The agricultural input industry and the competitiveness of South African agriculture.
Agrekon, 38(4), 487-512.
18. Kothari, C. R. (2009). Research methodology: Methods and techniques (2nd ed., pp. 1-8). India, New
Dehli: New Age International Publishers.
19. Lestrada-Jefferis, J. (2000). Employment trends in Agriculture in South Africa. Retrieved 12 February 2013
from https://www.statssa.gov.za/Publications/EmployTrendsAgri/EmployTrendsAgri.pdf
20. Meyer, F. (2012). The role of the national development plan – Vision 2030 in shaping SA agriculture and
agribusiness. Presentation at Agricultural Business Chamber Congress, 5-6 June, Drakensberg, South
Africa.
21. Meyer, F. (2013). Grain producers’ labor cost in South Africa [Telephonic interview]. 6 June,
Potchefstroom. (Digital recording).
22. Ramaila, M., Mahlangu, S., & du Toit, D. (2011). Agricultural productivity in South Africa: Literature
review. Directorate: Economic Services Production Economics Unit. Retrieved 3 May 2013 from
http://www.nda.agric.za/docs/GenReports/AgricProductivity.pdf
23. Roberts, T., & Antrobus, G. G. (2013). Farmers’ perceptions of the impact of legislation on farm workers’
wages and working conditions: an Eastern Cape case study. Agrekon, 52(1), 40-67
24. Sherry, S. (2013). Farming mechanization: Not an easy switch. Financial Mail: 50, 28 June – 3 July.
25. Simbi, T., & Aliber, M. (2000). Agricultural employment crisis in South Africa. Trade and Industry Policy
Strategies (TIPS) (Working Paper 13). Pretoria: Trade and Industry Policy Strategies.
26. South Africa. (2013). Basic conditions of Employment Act 1997 (Act no. 75 of 1997). Sectoral
determination 13, farm worker sector, South Africa. Government Gazette, 36115, 5 Feb.
27. South Africa. (2012). Basic conditions of employment act 1997 (Act no. 75 of 1997). Sectoral
determination 13, farm worker sector, South Africa. Government Gazette, 35067, 24 Feb.
28. South Africa. (2009). Basic conditions of Employment act 1997 (Act no. 75 of 1997). Sectroral
determination 13, farm worker sector, South Africa. Government Gazette, 31888, 13 Feb.
29. South Africa. (2006). Basic conditions of Employment act 1997 (Act no. 75 of 1997). Sectroral
determination 13, farm worker sector, South Africa. Government Gazette, 28518, 17 Feb.
30. South Africa. (2002). Basic conditions of Employment act 1997 (Act no. 75 of 1997). Sectroral
determination 13, farm worker sector, South Africa. Government Gazette, 24114, 2 Dec.
31. Stats SA (Statistics South Africa). (2011). Agricultural survey 2011 (Preliminary). Retrieved 15 May 2013
from http://harvestchoice.org/sites/default/files/downloads/publications/RSA_2011_Survey.pdf
32. Stats SA (Statistics South Africa). (2013). Producer Price Index (PPI). Retrieved 20 September 2013 from
http://www.statssa.gov.za/publications/statsdownload.asp?PPN=P0142.1&SCH=4316
33. Van der Westhuizen, E. (2013). Labor cost and considerations in South Africa [Personal interview]. 28
June, Pretoria. (Digital recording).
34. Vink, N. (2001). Livelihoods of farm workers in South African agriculture. (Unpublished research report).
Stellenbosch: Department of Agricultural Economics, University of Stellenbosch.
35. Vink, N., & Hall, R. (2010). Agriculture and land reform in South Africa's first decade of democracy. In S.
Jones & R. Vivian (eds.). South Africa: Economy and policy 1990-2000 (pp. 644-670). Manchester:
Manchester University Press.
36. World Bank. (2013). Employment in agriculture (% of total employment). Retrieved 28 May 2013 from
http://data.worldbank.org/indicator/SL.AGR.EMPL.ZS/countries/ZA?display=graph


