Embed Size (px)
Citation preview
The effect of distractor frequency on judgments of targetlaterality based on interaural delays
Raymond H. Dye, Jr.Department of Psychology and Parmly Hearing Institute, Loyola University, Chicago, Illinois 60626
Mark A. StellmackWaisman Center, University of Wisconsin—Madison, Madison, Wisconsin 53706
Anthony N. Grangea) and William A. YostParmly Hearing Institute, Loyola University, Chicago, Illinois 60626
~Received 20 January 1995; revised 14 June 1995; accepted 23 August 1995!
A two-dimensional stimulus-classification paradigm was used to examine the ability of listeners tojudge the laterality of an interaurally delayed low-frequency target component presentedconcurrently with a distractor component. Of primary interest was the effect on performance of thefrequency difference (D f ) between the target and distractor. In one set of conditions, the target wasfixed at 753 Hz and the distractor was 353, 553, 653, 703, 803, 853, 953, or 1153 Hz~fixed withina block of trials!. In a second set of conditions, the distractor was fixed at 753 Hz and the targetfrequency was 353, 553, 653, 703, 803, 853, 953, or 1153 Hz. The listeners were presented with atarget component with an interaural delay that varied from trial to trial, taking on one of ten values,five leading to the left ear and five leading to the right. A distractor component was simultaneouslypresented with an interaural delay that also took on one of the same ten values. Delays ranged from290 to190 ms in 20-ms steps. During a block of 100 trials, each of the possible combinations oftarget and distractor delay was presented once and only once in a random order. Listeners wereinstructed to make left–right judgments based on the target delay. Each condition was repeated tentimes, and the slopes of the best linear boundaries between left and right responses were used toderive the relative weights given to the target and distractor. The duration of the signals was 200 ms.Two of the eight listeners weighted the target heavily when the target and distractor were spectrallyremote but gave the two components equal weight when the difference in frequency was small.These two listeners yielded similar target weights regardless of which component was designated asthe target. One listener gave nearly equal weight to the target and the distractor regardless ofD f .Five of the listeners gave greater weight to the higher of the two frequencies regardless of whichwas assigned as the target. This high-frequency dominance is explained in terms of cross-correlationfunctions based on the composite two-tone waveforms. ©1996 Acoustical Society of America.
PACS numbers: 43.66.Pn, 43.66.Qp
INTRODUCTION
The manner in which binaural information arising fromdifferent frequency regions is processed to form single fusedor multiple segregated spatial percepts has been a topic ofgrowing interest to auditory scientists. For the most part, theproblem has been addressed by binaural discrimination para-digms in which threshold interaural delays are measured fora target signal presented against a background of diotic com-ponents. One finds that threshold interaural delays are el-evated relative to those obtained for targets presented in iso-lation, and the difference is taken as a measure of ‘‘binauralinterference’’~McFadden and Pasanen, 1976!. Binaural inter-ference has been demonstrated with low-frequency tones~Dye, 1990; Buell and Hafter, 1991; Woods and Colburn,1992; Stellmack and Dye, 1993!, broadband noise~Zurek,1985; Trahiotis and Bernstein, 1990; Buell and Trahiotis,1994!, and with high-frequency SAM tones~Buell andTrahiotis, 1993! serving as the targets and distractors.
Interference is thought to arise from an integration ofbinaural information across the frequency domain withoutregard for which interaural differences are associated withwhich regions of the frequency spectrum; Buell and Hafter~1991! and Woods and Colburn~1992! have modeled this asnonoptimal weighting of binaural information. The proposalof spectral fusion of binaural information is partially basedon listeners’ reports of fused intracranial images produced bytonal complexes even though only one component of thecomplex is interaurally delayed~Dye, 1990; Buell andHafter, 1991; Woods and Colburn, 1992!. The range of fre-quencies over which components interact to produce interfer-ence exceeds estimates of auditory filter bandwidths. For in-stance, Moore and Glasberg~1983! estimate the equivalentrectangular bandwidth at 750 Hz to be about 100 Hz, whileDye ~1990! and Stellmack and Dye~1993! measured sub-stantial amounts of interference at 750 Hz when the distrac-tors were more than 200 Hz away from a 753-Hz target.Others also report interference effects for sinusoidal targetsand distractors separated by more than a critical band~Buelland Hafter, 1991; Woods and Colburn, 1992!, although Buell
a!Present address: Center for Neurological Sciences, University of Connecti-cut Health Center, Farmington, CT 06030.
1096 1096J. Acoust. Soc. Am. 99 (2), February 1996 0001-4966/96/99(2)/1096/12/$6.00 © 1996 Acoustical Society of America
and Hafter~1991! only obtained interference when the targetand distractor were harmonically related. Even though inter-ference is evident when theD f ’s between target and distrac-tors are larger than auditory filter bandwidths, the amount ofinterference tends to decrease asD f increases~Dye, 1990;Stellmack and Dye, 1993!.1 The goal of this paper is to ex-amine the effect of the frequency difference between compo-nents on the ability of listeners to process binaural informa-tion at a particular frequency. Rather than measuringinterference by comparing threshold interaural delays for tar-get plus distractors versus target alone, the current paper willdescribe results obtained with a psychophysical paradigmthat assesses the extent to which judgments of target lateral-ity are dependent upon the interaural parameters of the indi-vidual components~Dye et al., 1994!.
A stimulus-classification paradigm is employed in whichthe target is presented with one of ten different interauraldelays, five leading to the left channel and five leading to theright. The distractor, too, is presented with one of the sameten interaural delays. During a block of 100 trials, each of tentarget delays is paired once with each of the ten distractordelays. Listeners are instructed to respond according towhich side of the head the intracranial image associated withthe target appears and to ignore the distractor. By examiningthe dependence of left–right judgments of the target on theinteraural delay of the distractor, one can assess the extent towhich target laterality depends on the distractor. This is ac-complished by examining laterality judgments as a jointfunction of target delay and distractor delay. The slope of thebest-fitting linear boundary between left and right responsesprovides an estimate of the relative weights of the target anddistractor (wT/wD). This procedure has been used thus far indescribing the effect of duration on the ability of listeners tolateralize one tone independent of another, demonstratingthat the ability improves with duration for most but not alllisteners~Dye et al., 1994!.
Of particular interest in the current study is the effect ofthe frequency difference between the target and distractor onclassification performance. To this end, data were obtainedfor conditions in which the frequency of the target was fixedat 753 Hz and the distractor was 50, 100, 200, or 400 Hzabove or below the target. Complimentary data were alsogathered for conditions in which the roles of spectral com-ponents were reversed—the distractor was fixed at 753 Hzand the target was 50, 100, 200, or 400 Hz above or belowthe distractor.
I. EXPERIMENTAL METHODS
A. The task
Each trial consisted of two intervals, with the first pro-viding a diotic presentation of a cue tone that served to in-dicate the intracranial midline and the target frequency. Thesecond interval presented the test signal, which was a two-tone complex consisting of the target and distractor compo-nents. In one set of conditions, the target was fixed at 753 Hzand the distractor frequency was 353, 553, 653, 703, 803,853, 953, or 1153 Hz. In a second set of conditions the dis-tractor was fixed at 753 Hz and the target was 353, 553, 653,
703, 803, 853, 953, or 1153 Hz. The two intervals that com-prised a trial were separated by 300 ms. Data were gatheredin blocks of 100 trials, with the target and distractor eachpresented at ten different interaural delays that ranged from290 to190ms in 20-ms steps, with negative delays indicat-ing left-leading signals and positive delays indicating right-leading signals. Each possible pairing of target and distractordelay was presented once, in a random order, during eachblock of trials. Subjects were instructed to indicate by press-ing one of two keys on a response terminal whether thetar-get componentappeared to the left or right of the intracranialmidline as marked by the cue tone presented during the firstinterval. Feedback was provided to listeners on a trial-by-trial basis.
The durations of the signals were 200 ms, with the targetand distractor gated simultaneously with 10-ms rise–decaytimes. All interaural delays reported were ongoing delays,since the waveforms at the two ears were also gated simul-taneously. The level of each component was 57 dB SPL.Within a block of 100 trials, the frequencies of the target anddistractor were fixed. Each condition was repeated ten times.Composite matrices based on 1000 judgments were gener-ated that depicted the probability of a left response as a jointfunction of the target and distractor delay.
Before each block of 100 trials, subjects were allowed tolisten to a series of practice trials which were like those to bepresented during the experimental session~with target anddistractor interaural delays varying from trial to trial!. Lis-teners were instructed to adjust the position of the head-phones during practice trials so that the diotic cue tone~firstinterval! sounded intracranially centered. When ready, thelisteners initiated test trials. Data were collected in sessionsthat lasted approximately 1.5 h, during which each listenermade 600–900 left–right judgments.
B. Analysis of left–right responses
Details of the analysis can be found in Dyeet al. ~1994!.A somewhat abbreviated description is provided here. Theslope and they intercept of the best-fitting linear boundariesbetween left and right responses is extracted from each com-posite matrix. The rationale is as follows: LetXi indicate thepercept associated with thei th interaural difference of timeof the target andYj indicate the percept associated with thej th interaural difference of time of the distractor. The deci-sion variable used by listeners can be expressed as aweighted combination of the percepts arising from the targetand the distractor dimensions, withwT andwD representingthe weights given to the target and the distractor perceptualdimensions, respectively. Left-leading signals produce nega-tive values of the percept and right-leading signals producepositive values. Listeners respond
‘‘Right’’ if ~wTXi1wDYj !.C and~1!
‘‘Left’’ if ~wTXi1wDYj !,C,
whereC is the decision criterion used for making left andright responses on the basis of the decision variable. Solvingfor Yj yields
Yj5~2wT /wD!Xi1C/wD , ~2!
1097 1097J. Acoust. Soc. Am., Vol. 99, No. 2, February 1996 Dye et al.: The effect of distractor frequency
and the slope of the linear boundary between left and rightresponses is the ratio of the weights given to the two percep-tual dimensions. The weights are normalized so thatwT1wD51.0 and are found from the slope by
wT5m/~m21! and wD51/~12m!. ~3!
Target weights near 1.0 indicate that target judgments areindependent of the interaural delay of the distractor. Targetweights near 0.5 reflect equal weighting of the target anddistractor. Target weights below 0.5 indicate more weightbeing given to the distractor than to the target.
Best linear boundaries were found with an algorithmthat minimizes the sum of the Euclidian distances betweenthe boundary and misclassified responses~‘‘left’’ responsesto the right of boundary, ‘‘right’’ responses to the left of theboundary!. The algorithm assessed the performance ofboundaries associated with target weights ranging from 0.0to 1.2 in steps of 0.01 at values ofC ranging from240 to140 ms in 2-ms steps.
C. Stimulus generation and presentation
Signals were generated and presented by a Masscompminicomputer interfaced with 16-bit digital-to-analog con-verters with output rates set to 20 kHz per channel. Thesignals were low-pass filtered by a pair of matched Rockland~Series 2000! filters set to 7.5 kHz~for signal reconstruc-tion!. The levels of the signals were adjusted with variableattenuators~Tech Lab, Inc.! before being passed on to Crownstereo amplifiers which were used to drive Sony MDR-V6headphones. Listeners were seated in a sound-attenuatingchamber and responses were recorded on Toshiba 1000 note-book computers interfaced with the Masscomp.
D. Subjects and training
All eight observers who participated in the study wereundergraduates at Loyola University who were paid anhourly wage for their participation. Three~BK, SG, and JL!had participated in other lateralization experiments. The re-maining five had participated in other psychoacoustical ex-periments. Two were females~MU and SW! and six weremales~BK, MW, JL, JR, RK, and SG!. With the exception ofBK, the listeners were in their early 20’s; BK was in hismid-30’s. Prior to data collection, all listeners received atleast 20–30 h of training during which they lateralized low-frequency tones in isolation as well as in the presence ofother components.
II. RESULTS
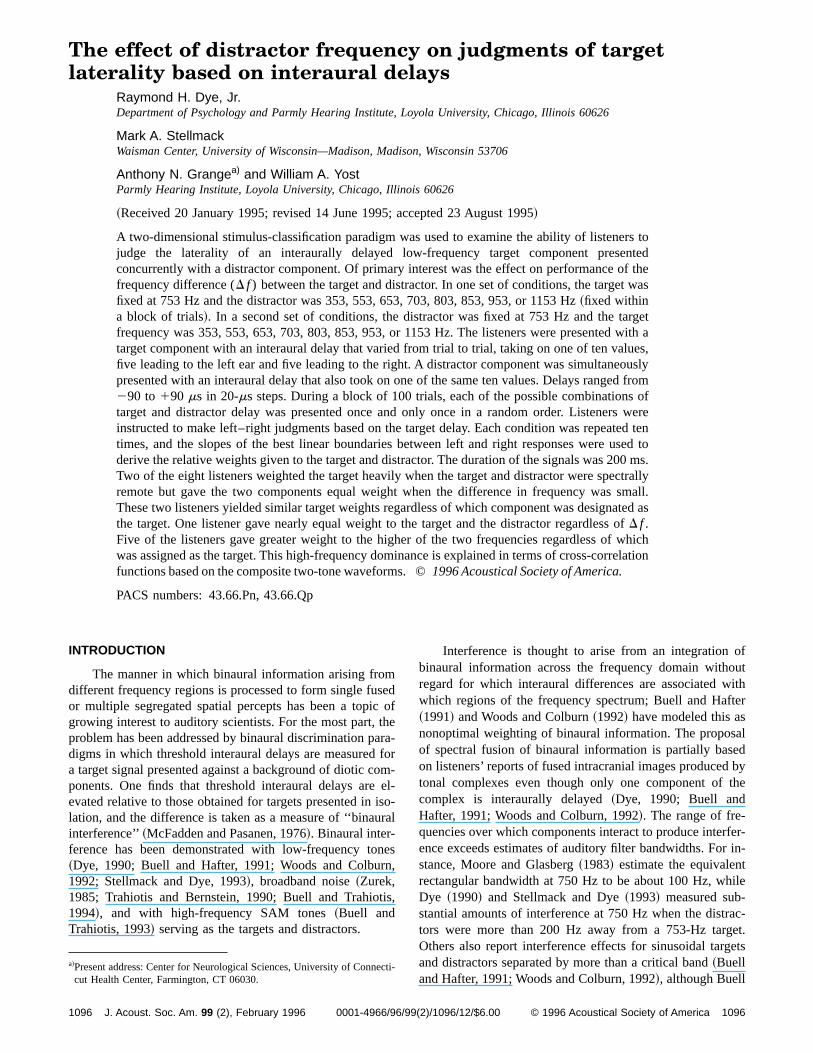
Composite histograms based on ten repetitions of eachcombination of target and distractor frequency are shown forone ~BK! of the eight subjects in Figs. 1 and 2. Figure 1shows the results for conditions in which the target was fixedat 753 Hz and the distractor frequency was varied from 353to 1153 Hz. Figure 2 shows the results for the complemen-tary conditions in which the distractor was fixed at 753 Hzand the target frequency was varied. In both figures, the his-tograms show the probability of a left response plotted as ajoint function of the target and distractor delay. The bottom
panel of each figure shows plots of the target weight derivedfrom the slope of the best-fitting liner boundaries as a func-tion of the distractor frequency~in Fig. 1! or the target fre-quency~Fig. 2!. The results from this particular listener arenot intended to be representative; only one other listenershowed a similar effect of the frequency difference betweenthe target and distractor. Instead they are shown first becausethey are the simplest to describe.
Figure 1 shows that left–right judgments of subject BKwere independent of the distractor delay when the distractorwas spectrally remote from the 753-Hz target~distractor5353 or 1153 Hz!. As the difference between the target anddistractor frequency was made smaller, the influence of thedistractor became more prominent until, forD f550 Hz, thedistractor and target were weighted equally. This can be ob-served in the composite histograms by the fact that left–rightjudgments tended to be segregated by a boundary runningalong target delay50 ms whenD f was large and by a bound-ary running along target delay52distractor delay whenD fwas small. It can also be observed in the bottom panel, whichshows that the target weight approached 0.5 when the dis-tractor was set to 703 or 803 Hz.
The left–right judgments shown in Fig. 2 show a similareffect ofD f for conditions in which the distractor was fixedat 753 Hz and the target frequency was varied. The samedependence of target weight onD f that was shown in Fig. 1is shown in the bottom panel of Fig. 2. Which of the twocomponents was assigned the role of the target had littleeffect on the performance of BK; i.e., the estimated targetweight of a 753-Hz component lateralized in the presence ofa 353-Hz distractor was the same as the estimated targetweight of a 353-Hz component lateralized in the presence ofa 753-Hz distractor. A slight asymmetry was found for con-ditions in which the components were 753 versus 953 Hz or753 versus 1153 Hz, such that the higher of the two frequen-cies was a more effective target.
Figures 3 and 4 show data for a second subject, JR. Fiveof the eight listeners showed similar effects of distractor/target frequency upon lateralization judgments. Figure 3shows that as the distractor frequency was raised from belowto above the 753-Hz target, this listener gave more weight towhichever of the two components was higher in frequency.As the distractor was increased from 353 to 703 Hz, thetarget weight fluctuated slightly from its starting value of0.75, then dropped to about 0.25 as the distractor frequencywas increased to 803 Hz. The target weight increased toabout 0.5 as the distractor frequency increased to 1153 Hz.The data in Fig. 4 are quite consistent with those shown inFig. 3—the higher of the two spectral components wasweighed more heavily by JR regardless of which of the twohad been designated as the target component. For this lis-tener, the weight given to a particular component did notchange as its role changed from that of target to distractor, sothat a 753-Hz component paired with a 353-Hz distractor isgiven a relative weight of about 0.75, as is the case when the753-Hz component is the distractor and the 353-Hz compo-nent is made the target.
Figure 5 shows plots of target weights as a function ofdistractor and target frequency for all eight subjects who par-
1098 1098J. Acoust. Soc. Am., Vol. 99, No. 2, February 1996 Dye et al.: The effect of distractor frequency
FIG. 1. The probability of a ‘‘left’’ response is plotted for subject BK as a joint function of the target and distractor delays. The separate panels represent datafor different distractor frequencies. The target frequency was fixed at 753 Hz. Each cell represents data for ten repetitions of 100-trial blocks. The bottom panelshows the derived target weight as function of distractor frequency for this listener.
1099 1099J. Acoust. Soc. Am., Vol. 99, No. 2, February 1996 Dye et al.: The effect of distractor frequency
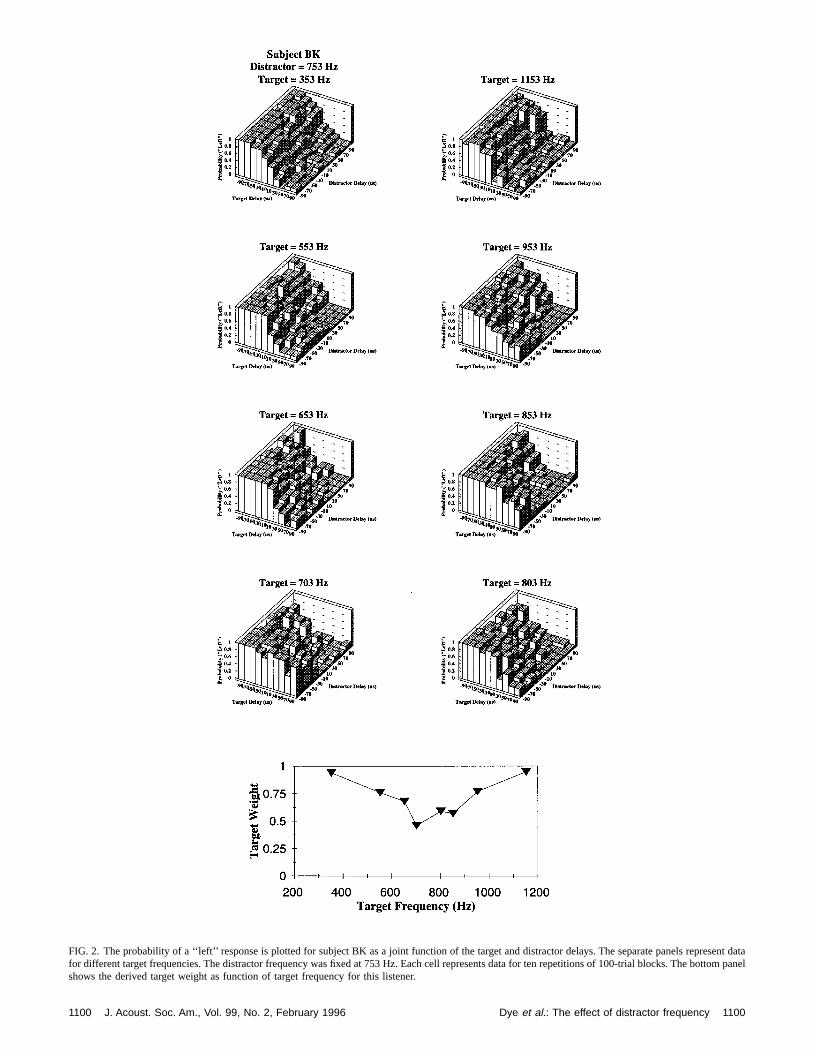
FIG. 2. The probability of a ‘‘left’’ response is plotted for subject BK as a joint function of the target and distractor delays. The separate panels represent datafor different target frequencies. The distractor frequency was fixed at 753 Hz. Each cell represents data for ten repetitions of 100-trial blocks. The bottom panelshows the derived target weight as function of target frequency for this listener.
1100 1100J. Acoust. Soc. Am., Vol. 99, No. 2, February 1996 Dye et al.: The effect of distractor frequency
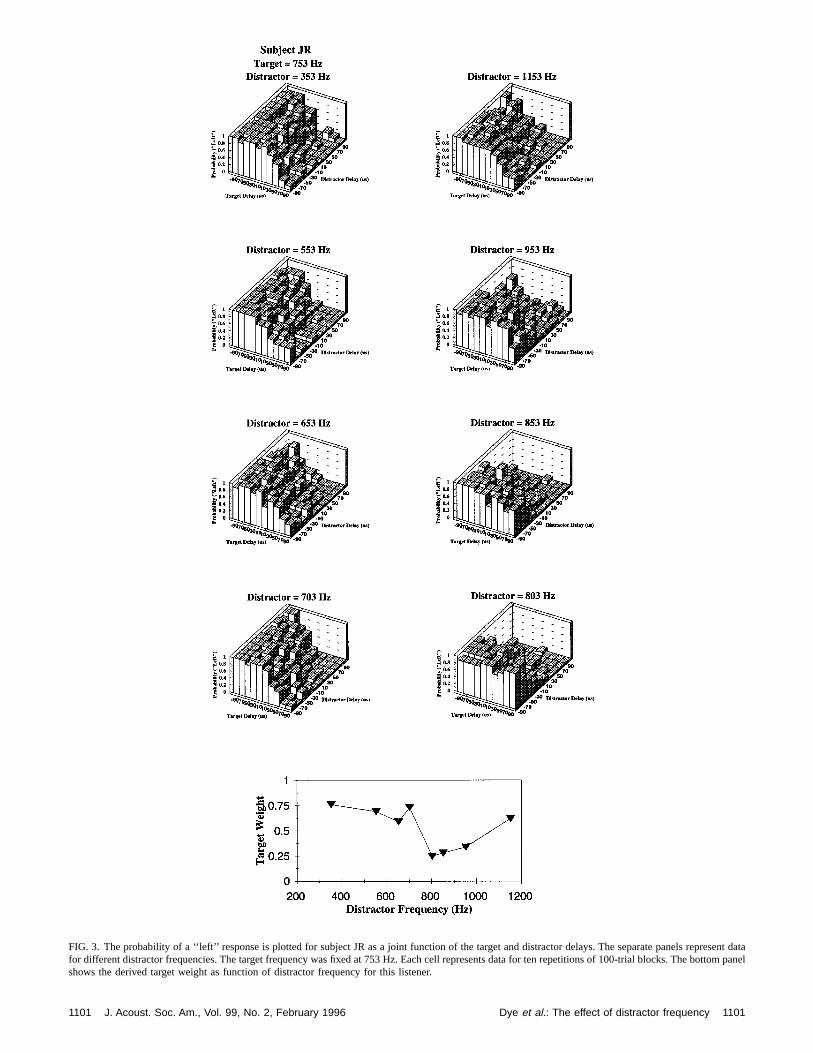
FIG. 3. The probability of a ‘‘left’’ response is plotted for subject JR as a joint function of the target and distractor delays. The separate panels represent datafor different distractor frequencies. The target frequency was fixed at 753 Hz. Each cell represents data for ten repetitions of 100-trial blocks. The bottom panelshows the derived target weight as function of distractor frequency for this listener.
1101 1101J. Acoust. Soc. Am., Vol. 99, No. 2, February 1996 Dye et al.: The effect of distractor frequency
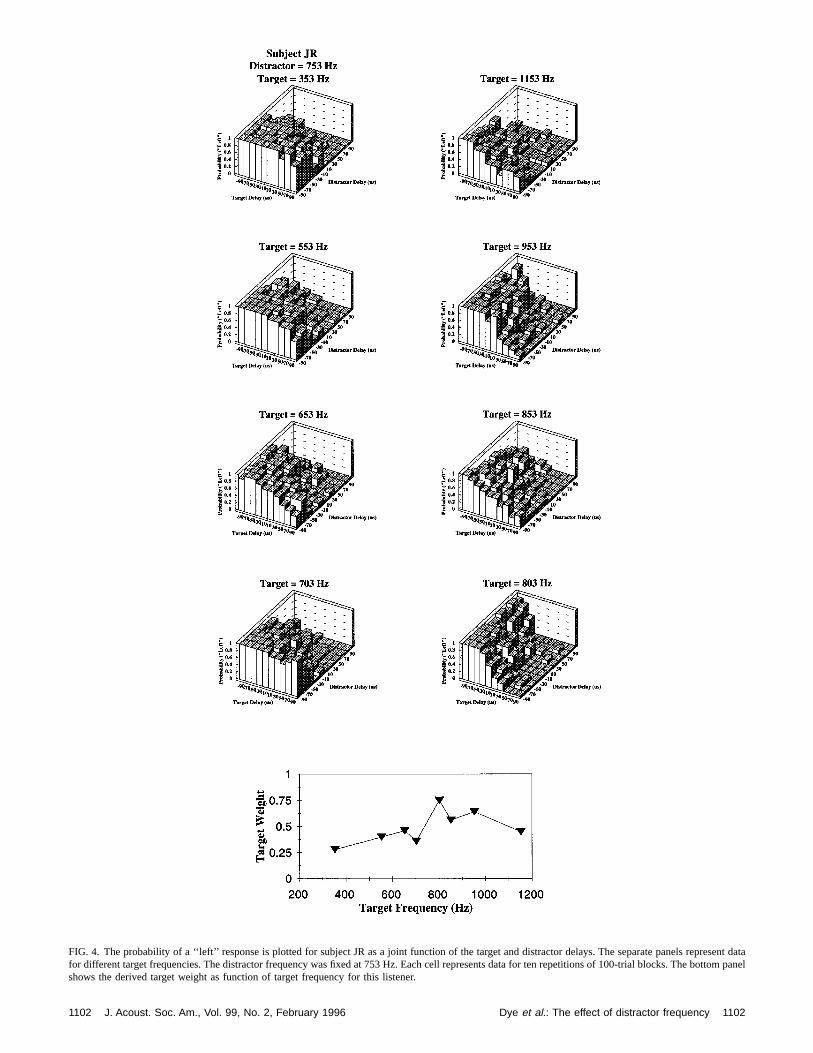
FIG. 4. The probability of a ‘‘left’’ response is plotted for subject JR as a joint function of the target and distractor delays. The separate panels represent datafor different target frequencies. The distractor frequency was fixed at 753 Hz. Each cell represents data for ten repetitions of 100-trial blocks. The bottom panelshows the derived target weight as function of target frequency for this listener.
1102 1102J. Acoust. Soc. Am., Vol. 99, No. 2, February 1996 Dye et al.: The effect of distractor frequency
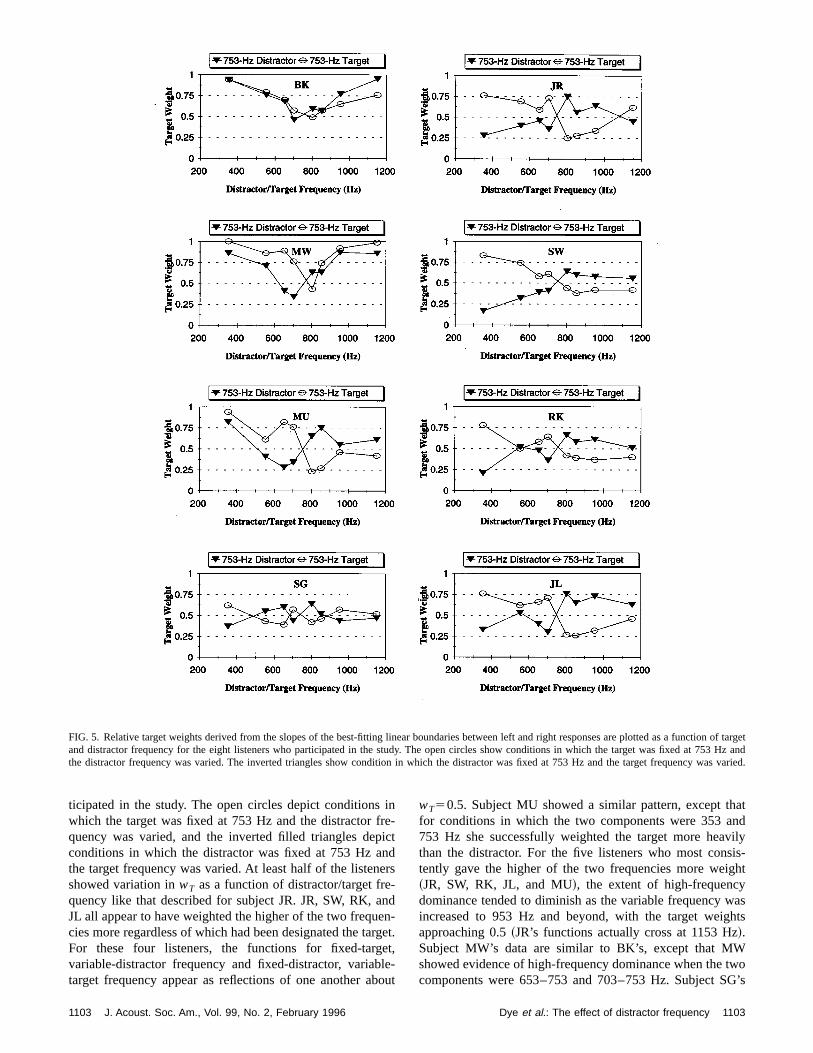
ticipated in the study. The open circles depict conditions inwhich the target was fixed at 753 Hz and the distractor fre-quency was varied, and the inverted filled triangles depictconditions in which the distractor was fixed at 753 Hz andthe target frequency was varied. At least half of the listenersshowed variation inwT as a function of distractor/target fre-quency like that described for subject JR. JR, SW, RK, andJL all appear to have weighted the higher of the two frequen-cies more regardless of which had been designated the target.For these four listeners, the functions for fixed-target,variable-distractor frequency and fixed-distractor, variable-target frequency appear as reflections of one another about
wT50.5. Subject MU showed a similar pattern, except thatfor conditions in which the two components were 353 and753 Hz she successfully weighted the target more heavilythan the distractor. For the five listeners who most consis-tently gave the higher of the two frequencies more weight~JR, SW, RK, JL, and MU!, the extent of high-frequencydominance tended to diminish as the variable frequency wasincreased to 953 Hz and beyond, with the target weightsapproaching 0.5~JR’s functions actually cross at 1153 Hz!.Subject MW’s data are similar to BK’s, except that MWshowed evidence of high-frequency dominance when the twocomponents were 653–753 and 703–753 Hz. Subject SG’s
FIG. 5. Relative target weights derived from the slopes of the best-fitting linear boundaries between left and right responses are plotted as a function of targetand distractor frequency for the eight listeners who participated in the study. The open circles show conditions in which the target was fixed at 753 Hz andthe distractor frequency was varied. The inverted triangles show condition in which the distractor was fixed at 753 Hz and the target frequency was varied.
1103 1103J. Acoust. Soc. Am., Vol. 99, No. 2, February 1996 Dye et al.: The effect of distractor frequency
target weights fluctuated about 0.5 regardless of the spectralrelationship between the target and distractor.
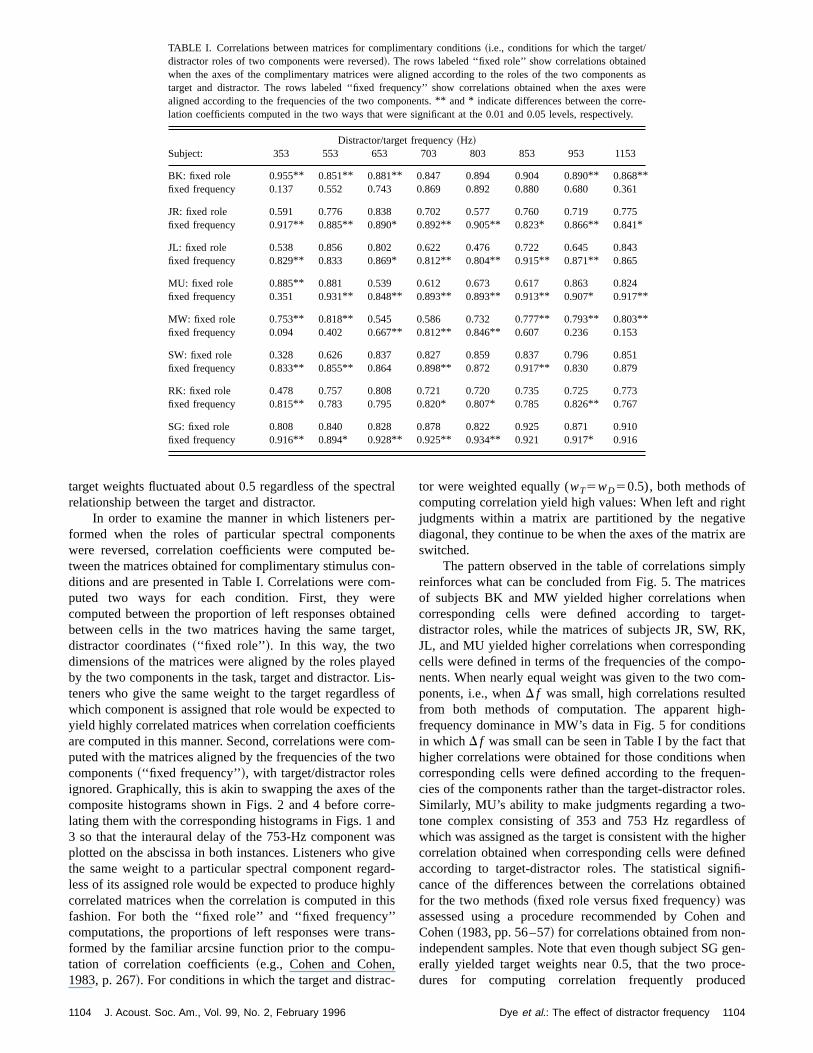
In order to examine the manner in which listeners per-formed when the roles of particular spectral componentswere reversed, correlation coefficients were computed be-tween the matrices obtained for complimentary stimulus con-ditions and are presented in Table I. Correlations were com-puted two ways for each condition. First, they werecomputed between the proportion of left responses obtainedbetween cells in the two matrices having the same target,distractor coordinates~‘‘fixed role’’ !. In this way, the twodimensions of the matrices were aligned by the roles playedby the two components in the task, target and distractor. Lis-teners who give the same weight to the target regardless ofwhich component is assigned that role would be expected toyield highly correlated matrices when correlation coefficientsare computed in this manner. Second, correlations were com-puted with the matrices aligned by the frequencies of the twocomponents~‘‘fixed frequency’’!, with target/distractor rolesignored. Graphically, this is akin to swapping the axes of thecomposite histograms shown in Figs. 2 and 4 before corre-lating them with the corresponding histograms in Figs. 1 and3 so that the interaural delay of the 753-Hz component wasplotted on the abscissa in both instances. Listeners who givethe same weight to a particular spectral component regard-less of its assigned role would be expected to produce highlycorrelated matrices when the correlation is computed in thisfashion. For both the ‘‘fixed role’’ and ‘‘fixed frequency’’computations, the proportions of left responses were trans-formed by the familiar arcsine function prior to the compu-tation of correlation coefficients~e.g., Cohen and Cohen,1983, p. 267!. For conditions in which the target and distrac-
tor were weighted equally (wT5wD50.5), both methods ofcomputing correlation yield high values: When left and rightjudgments within a matrix are partitioned by the negativediagonal, they continue to be when the axes of the matrix areswitched.
The pattern observed in the table of correlations simplyreinforces what can be concluded from Fig. 5. The matricesof subjects BK and MW yielded higher correlations whencorresponding cells were defined according to target-distractor roles, while the matrices of subjects JR, SW, RK,JL, and MU yielded higher correlations when correspondingcells were defined in terms of the frequencies of the compo-nents. When nearly equal weight was given to the two com-ponents, i.e., whenD f was small, high correlations resultedfrom both methods of computation. The apparent high-frequency dominance in MW’s data in Fig. 5 for conditionsin whichD f was small can be seen in Table I by the fact thathigher correlations were obtained for those conditions whencorresponding cells were defined according to the frequen-cies of the components rather than the target-distractor roles.Similarly, MU’s ability to make judgments regarding a two-tone complex consisting of 353 and 753 Hz regardless ofwhich was assigned as the target is consistent with the highercorrelation obtained when corresponding cells were definedaccording to target-distractor roles. The statistical signifi-cance of the differences between the correlations obtainedfor the two methods~fixed role versus fixed frequency! wasassessed using a procedure recommended by Cohen andCohen~1983, pp. 56–57! for correlations obtained from non-independent samples. Note that even though subject SG gen-erally yielded target weights near 0.5, that the two proce-dures for computing correlation frequently produced
TABLE I. Correlations between matrices for complimentary conditions~i.e., conditions for which the target/distractor roles of two components were reversed!. The rows labeled ‘‘fixed role’’ show correlations obtainedwhen the axes of the complimentary matrices were aligned according to the roles of the two components astarget and distractor. The rows labeled ‘‘fixed frequency’’ show correlations obtained when the axes werealigned according to the frequencies of the two components.** and* indicate differences between the corre-lation coefficients computed in the two ways that were significant at the 0.01 and 0.05 levels, respectively.
Distractor/target frequency~Hz!Subject: 353 553 653 703 803 853 953 1153
BK: fixed role 0.955** 0.851** 0.881** 0.847 0.894 0.904 0.890** 0.868**fixed frequency 0.137 0.552 0.743 0.869 0.892 0.880 0.680 0.361
JR: fixed role 0.591 0.776 0.838 0.702 0.577 0.760 0.719 0.775fixed frequency 0.917** 0.885** 0.890* 0.892** 0.905** 0.823* 0.866** 0.841*
JL: fixed role 0.538 0.856 0.802 0.622 0.476 0.722 0.645 0.843fixed frequency 0.829** 0.833 0.869* 0.812** 0.804** 0.915** 0.871** 0.865
MU: fixed role 0.885** 0.881 0.539 0.612 0.673 0.617 0.863 0.824fixed frequency 0.351 0.931** 0.848** 0.893** 0.893** 0.913** 0.907* 0.917**
MW: fixed role 0.753** 0.818** 0.545 0.586 0.732 0.777** 0.793** 0.803**fixed frequency 0.094 0.402 0.667** 0.812** 0.846** 0.607 0.236 0.153
SW: fixed role 0.328 0.626 0.837 0.827 0.859 0.837 0.796 0.851fixed frequency 0.833** 0.855** 0.864 0.898** 0.872 0.917** 0.830 0.879
RK: fixed role 0.478 0.757 0.808 0.721 0.720 0.735 0.725 0.773fixed frequency 0.815** 0.783 0.795 0.820* 0.807* 0.785 0.826** 0.767
SG: fixed role 0.808 0.840 0.828 0.878 0.822 0.925 0.871 0.910fixed frequency 0.916** 0.894* 0.928** 0.925** 0.934** 0.921 0.917* 0.916
1104 1104J. Acoust. Soc. Am., Vol. 99, No. 2, February 1996 Dye et al.: The effect of distractor frequency
statistically differentR’s. Figure 5 shows that although theweights obtained for this listener deviated only slightly from0.5, that the deviations tended to be in opposite directionswhen the target was fixed at 753 Hz than when the distractorwas fixed at 753 Hz. Since the variation in target weight withfrequency for this subject is unlike that observed for anyother listener, these minor deviations from 0.5 will not beemphasized in the remainder of the paper even though theyresulted in statistically different correlations.
III. DISCUSSION
The magnitude of the individual differences that werefound in this study precludes any simple discussion of the‘‘average’’ listener. Our goal instead will be to account forthe differences that were found and to explain their bases inthe binaural auditory system’s representation of the interau-rally delayed two-tone complexes. While it should be ac-knowledged that subtle differences exist between all eightsubjects, it is useful to partition them into two groups oflisteners. One group~BK and MW! was able to judge targetlaterality independent of the distractor when theD f ’s werelarge and it did not matter appreciably which of the twocomponents was designated as the target. AsD f was nar-rowed, this group gave increasing weight to the distractor sothat the target and distractor were weighted equally at thenarrowest frequency spacings. The second group~JR, SW,RK, JL, and MU! showed high-frequency dominance, withthe higher of the two components being weighted moreheavily than the lower regardless of which was designated asthe target. Listener SG, who weighted both componentsequally regardless ofD f , falls into neither category.
Consider what the task requires of listeners in order forthem to perform as subjects BK and MW did at wide fre-quency spacings. In order for lateralization judgments basedon target interaural delays to be independent of distractorinteraural delays, the listener must form separate intracranialimages associated with each component of the compositestimulusandmaintain information about the spectral compo-sition of each image.Spectrally analyticbinaural processingcan fail for at least two reasons; there can be a failure to formseparate intracranial images~i.e., binaural spectral fusion! ora failure to maintain information about the spectral compo-sition of each image, responding instead on the basis ofwhich side of intracranial space was associated with the mostlateralized image. The stimulus-classification paradigm usedin the current study cannot distinguish between these twotypes of failure of analysis, but listeners BK and MW clearlyhad more difficulty ignoring the distractor asD f decreased.
For the most part, binaural interference has been de-scribed in terms of binaural integration occurring across thefrequency domain~Dye, 1990; Buell and Hafter, 1991;Woods and Colburn, 1992! such that diotic distractors con-tribute to the decision variable even though better perfor-mance would be obtained had they not. It is not clear how asimple failure to maintain information regarding the spectralcomposition of the intracranial image of the target wouldresult in interference in a typical interference paradigm sincedetecting the presence of an interaural delay does not requireinformation about the spectral composition of the lateralized
image. One might postulate that the added component re-sulted in a loss in binaural acuity, even though separate im-ages associated with the target and distractor were discern-able. This might be explained in terms of a decrease in thelaterality of the image associated with the target, a broaden-ing of the intracranial image, or by greater variability in theintracranial position of a particular target interaural delay.
Cross correlation has long been considered a good quan-titative approximation to the operations carried out by thebinaural auditory system~see Colburn and Durlach, 1978!.The most straightforward accounting of the high-frequencydominance found in the laterality judgments of JR, SW, RK,JL, and, to a large extent, MU, is that these listeners basedtheir judgments on the cross-correlation functions associatedwith the summedtwo-tone complexes~Sayers and Cherry,1957; Dye, 1990; Shackletonet al., 1992!. The cross-correlation function of periodic waveforms is given by
(i51
N
CLiCRi cos~2p f it1dLi2dRi!,
whereN is the number of components,CLi andCRi are therms values of thei th component at the left and right ears,respectively, anddLi2dRi is the interaural phase differenceof the i th component~Lee, 1960!. The cross-correlationfunction is periodic at greatest common divisor21 of thecomponent frequencies, which is a full second for the inhar-monic two-tone complexes used in this study. Althoughmany positive peaks in the cross-correlation function occurover a 1-s range ofts, all but one peak is located outside ofbiologically relevant range of interaural delays.
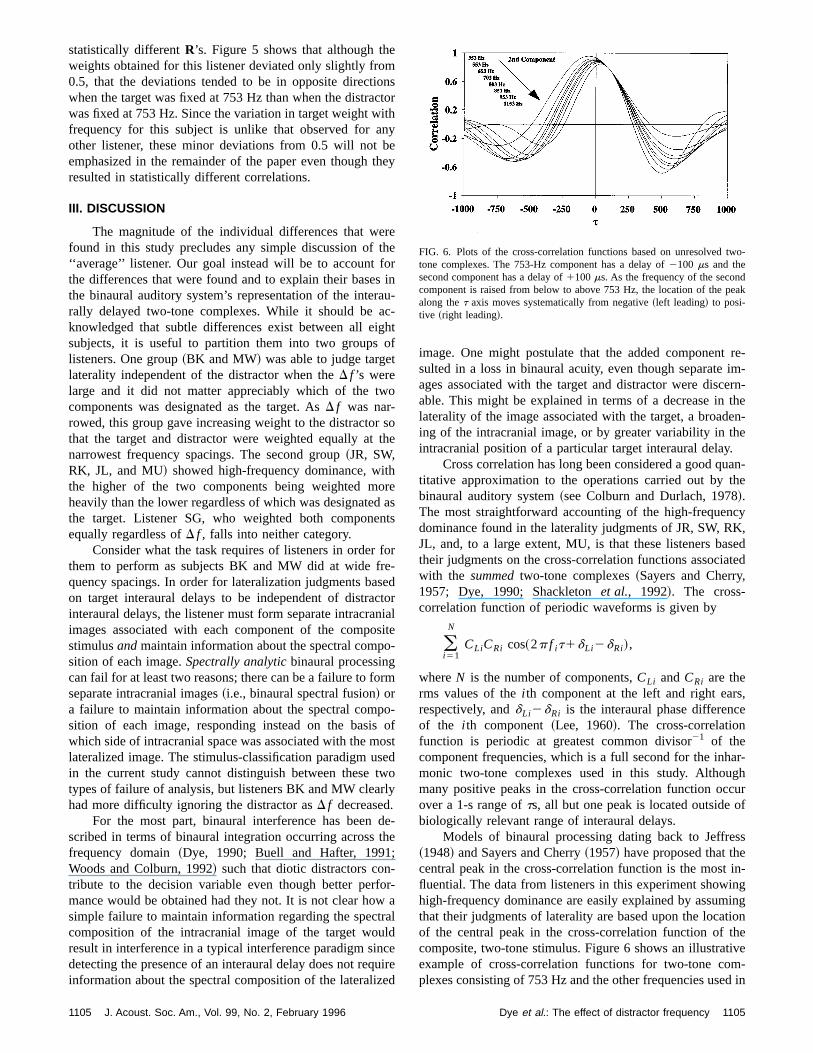
Models of binaural processing dating back to Jeffress~1948! and Sayers and Cherry~1957! have proposed that thecentral peak in the cross-correlation function is the most in-fluential. The data from listeners in this experiment showinghigh-frequency dominance are easily explained by assumingthat their judgments of laterality are based upon the locationof the central peak in the cross-correlation function of thecomposite, two-tone stimulus. Figure 6 shows an illustrativeexample of cross-correlation functions for two-tone com-plexes consisting of 753 Hz and the other frequencies used in
FIG. 6. Plots of the cross-correlation functions based on unresolved two-tone complexes. The 753-Hz component has a delay of2100 ms and thesecond component has a delay of1100ms. As the frequency of the secondcomponent is raised from below to above 753 Hz, the location of the peakalong thet axis moves systematically from negative~left leading! to posi-tive ~right leading!.
1105 1105J. Acoust. Soc. Am., Vol. 99, No. 2, February 1996 Dye et al.: The effect of distractor frequency
the current experiment. The 753-Hz component leads at theleft ear by 100ms ~negative delays! and the second compo-nent leads at the right ear by 100ms ~positive delays!. Acentral weighting function was applied to the cross-correlation functions to ensure that interaural delays near 0ms were emphasized. The weighting function was Gaussianwith a mean of 0ms and a standard deviation of 600ms ~alaShackletonet al., 1992!. For the range oft’s plotted in Fig.6, the effect of the central weighting function on peak posi-tion is minimal. The side/sign of the central peak is consis-tent with the higher of the two frequencies.
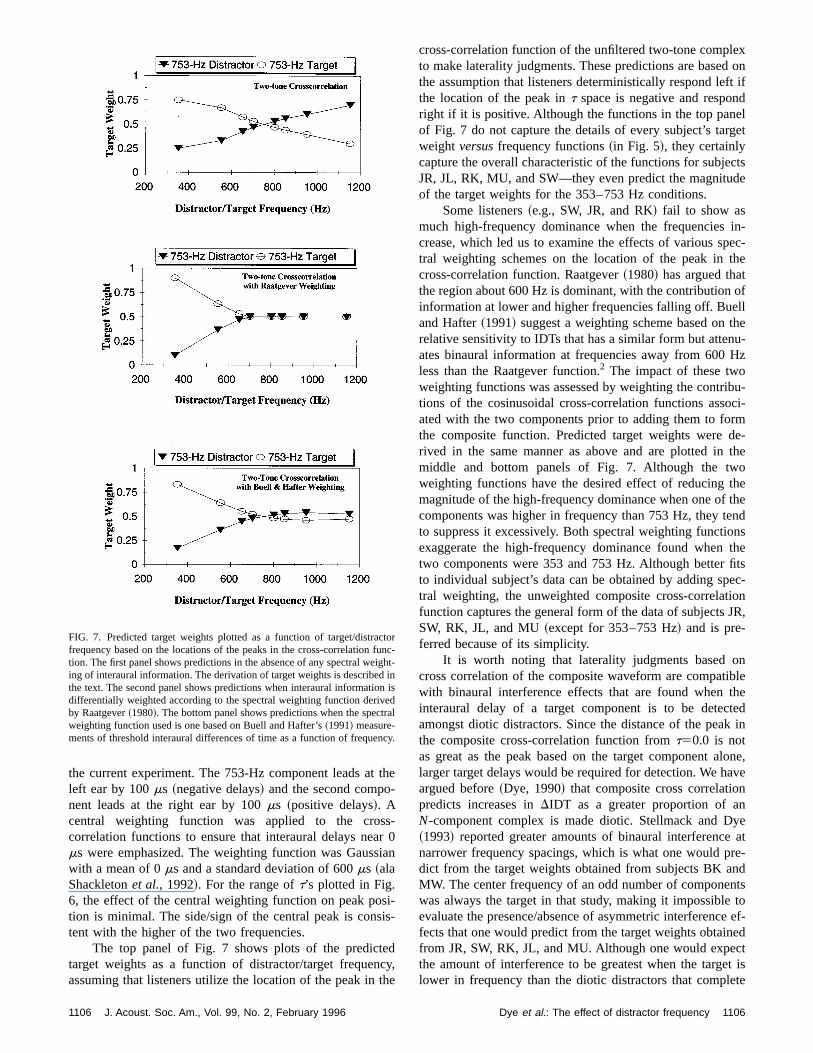
The top panel of Fig. 7 shows plots of the predictedtarget weights as a function of distractor/target frequency,assuming that listeners utilize the location of the peak in the
cross-correlation function of the unfiltered two-tone complexto make laterality judgments. These predictions are based onthe assumption that listeners deterministically respond left ifthe location of the peak int space is negative and respondright if it is positive. Although the functions in the top panelof Fig. 7 do not capture the details of every subject’s targetweight versusfrequency functions~in Fig. 5!, they certainlycapture the overall characteristic of the functions for subjectsJR, JL, RK, MU, and SW—they even predict the magnitudeof the target weights for the 353–753 Hz conditions.
Some listeners~e.g., SW, JR, and RK! fail to show asmuch high-frequency dominance when the frequencies in-crease, which led us to examine the effects of various spec-tral weighting schemes on the location of the peak in thecross-correlation function. Raatgever~1980! has argued thatthe region about 600 Hz is dominant, with the contribution ofinformation at lower and higher frequencies falling off. Buelland Hafter~1991! suggest a weighting scheme based on therelative sensitivity to IDTs that has a similar form but attenu-ates binaural information at frequencies away from 600 Hzless than the Raatgever function.2 The impact of these twoweighting functions was assessed by weighting the contribu-tions of the cosinusoidal cross-correlation functions associ-ated with the two components prior to adding them to formthe composite function. Predicted target weights were de-rived in the same manner as above and are plotted in themiddle and bottom panels of Fig. 7. Although the twoweighting functions have the desired effect of reducing themagnitude of the high-frequency dominance when one of thecomponents was higher in frequency than 753 Hz, they tendto suppress it excessively. Both spectral weighting functionsexaggerate the high-frequency dominance found when thetwo components were 353 and 753 Hz. Although better fitsto individual subject’s data can be obtained by adding spec-tral weighting, the unweighted composite cross-correlationfunction captures the general form of the data of subjects JR,SW, RK, JL, and MU~except for 353–753 Hz! and is pre-ferred because of its simplicity.
It is worth noting that laterality judgments based oncross correlation of the composite waveform are compatiblewith binaural interference effects that are found when theinteraural delay of a target component is to be detectedamongst diotic distractors. Since the distance of the peak inthe composite cross-correlation function fromt50.0 is notas great as the peak based on the target component alone,larger target delays would be required for detection. We haveargued before~Dye, 1990! that composite cross correlationpredicts increases inDIDT as a greater proportion of anN-component complex is made diotic. Stellmack and Dye~1993! reported greater amounts of binaural interference atnarrower frequency spacings, which is what one would pre-dict from the target weights obtained from subjects BK andMW. The center frequency of an odd number of componentswas always the target in that study, making it impossible toevaluate the presence/absence of asymmetric interference ef-fects that one would predict from the target weights obtainedfrom JR, SW, RK, JL, and MU. Although one would expectthe amount of interference to be greatest when the target islower in frequency than the diotic distractors that complete
FIG. 7. Predicted target weights plotted as a function of target/distractorfrequency based on the locations of the peaks in the cross-correlation func-tion. The first panel shows predictions in the absence of any spectral weight-ing of interaural information. The derivation of target weights is described inthe text. The second panel shows predictions when interaural information isdifferentially weighted according to the spectral weighting function derivedby Raatgever~1980!. The bottom panel shows predictions when the spectralweighting function used is one based on Buell and Hafter’s~1991! measure-ments of threshold interaural differences of time as a function of frequency.
1106 1106J. Acoust. Soc. Am., Vol. 99, No. 2, February 1996 Dye et al.: The effect of distractor frequency
the complex, there is little evidence of sizable frequencyasymmetries in the current literature~Dye, 1990; Buell andHafter, 1991; Woods and Colburn, 1992!. Given the largeindividual differences in the manner in which the targetweight depended on its frequency relationship to the distrac-tor, the ability to predict binaural interference from the targetweights could only be assessed in a study in which both weremeasured under similar stimulus conditions and with thesame set of listeners.
The contention that listeners sometimes lateralize sig-nals on the basis of the location of peaks in the compositecross-correlation functions has previously been put forth bySayers and Cherry~1957! and Sayers~1964! and plays aprominent role in the model proposed by Shackletonet al.~1992!. When laterality judgments were measured as a func-tion of interaural delay for two-tone complexes consisting of600 and 800 Hz, Sayers and Cherry found them to be con-sistent with the location in thet domain of the peak in thecross correlation based on the complex rather than either ofthe two components individually. In their formulation, crosscorrelation is carried out on the original signals at the twoears, with no provision made for filtering by the auditoryperiphery. Shackletonet al. ~1992! propose a model that in-cludes simulation peripheral mechanical and neural process-ing, with composite cross correlation resulting from the av-eraging of coincidence-counting units across the frequencydomain. The current data provide no basis for distinguishingbetween cross correlation of the summed components versussummation of cross-correlation functions based on individualcomponents.
Cherry and Sayers’ seminal paper on the ‘‘HumanCross-Correlator’’~1956! points out that listeners are mostlikely to lateralize the complexgestalten, but that they maybe able to judge one or the other component, ‘‘though itappears very often to be difficult’’~p. 891!. The current studyfound that six of eight listeners, indeed, found making judg-ments based on one of the two components to be difficult,although the other two listeners succeeded whenD f ’s werelarge. The fact thatany listener lateralized target componentspresented with distractors in a spectrally analytic manner im-plies that a neural representation exists of frequency-selective processing of interaural delays, at least when thefrequency difference between the target and distractor islarge. The fact that many listeners instead appear to fusebinaural information across the frequency domain indicatesthat the salience of or access to frequency-selective codes forinteraural differences of time is somewhat limited.
ACKNOWLEDGMENTS
We would like to thank our colleagues at the ParmlyHearing Institute~William Shofner, Stan Sheft, Richard Fay,Sheryl Coombs, and J. D. Trout! for many hours of discus-sion of the experiments presented in the manuscript. Specialthanks to Scott Tindale for pointing out the statistical tests ofthe difference between dependent correlation coefficients.We wish to thank Scott Larson for his help with data collec-tion. We are grateful to Holly Richards for her help in pre-paring the figures. This work was supported by a programproject grant from the National Institutes of Health.
1Stellmack and Dye~1993! reported larger interference effects at moderateD f ’s than at smallerD f ’s when the subjects’ task was to discriminate dioticcomplexes from complexes in which the central component was interau-rally delayed and the number of total components was five or greater. Thiswas believed to be due to the detection of a change in interaural correlationby listeners when theD f ’s were 50 Hz or less. When listeners were re-quired to discriminate target delays to the right from delays to the left,performance continued to decline asD f was narrowed.2A polynomial expression for the weighting function of Raatgever~1980!can be found in Sternet al. ~1988!. It is q( f )5102(b1f1b2f
21b3f3), where
b15~29.383!~1022!, b25(1.126)(1024), b35(23.992)(1028), andf isfrequency in Hz. The polynomial expression used by Buell and Hafter~1991! to describe the relationship between threshold IDT and frequency isDIDT( f )5b1f2b2f
21b3f3, whereb152.12452,b25(4.28)(1023), and
b35(3.45)(1026). The spectral weighting function,q( f ), derived fromBuell and Hafter is taken to beDIDT21.
Buell, T. N., and Hafter, E. R.~1991!. ‘‘Combination of interaural informa-tion across frequency bands,’’ J. Acoust. Soc. Am.90, 1894–1900.
Buell, T. N., and Trahiotis, C.~1993!. ‘‘Interaural temporal discriminationusing two sinusoidally amplitude-modulated, high-frequency tones: Con-ditions of summation and interference,’’ J. Acoust. Soc. Am.93, 480–487.
Buell, T. N., and Trahiotis, C.~1994!. ‘‘Detection of interaural delay inbands of noise: Effects of spectral interference combined with uncer-tainty,’’ J. Acoust. Soc. Am.95, 3568–3573.
Cherry, E. C., and Sayers, B. McA.~1956!. ‘‘Human ‘cross-correlator’—Atechnique for measuring certain parameters of speech perception,’’ J.Acoust. Soc. Am.28, 889–895.
Cohen, J., and Cohen, P.~1983!. Applied Multiple Regression/CorrelationAnalysis for the Behavioral Sciences~Erlbaum, Hillsdale, NJ!, 2nd ed.
Colburn, H. S., and Durlach, N. I.~1978!. ‘‘Models of binaural interaction,’’in Handbook of Perception, edited by E. C. Carterette and M. P. Friedman~Academic, New York!, Vol. IV.
Dye, R. H. ~1990!. ‘‘The combination of interaural information across fre-quencies: Lateralization on the basis of interaural delay,’’ J. Acoust. Soc.Am. 88, 2159–2170.
Dye, R. H., Yost, W. A., Stellmack, M. A., and Sheft, S.~1994!. ‘‘Stimulusclassification procedure for assessing the extent to which binaural process-ing is spectrally analytic or synthetic,’’ J. Acoust. Soc. Am.96, 2720–2730.
Jeffress, L. A.~1948!. ‘‘A place mechanism of sound localization,’’ J. Comp.Physiol. Psychol.41, 35–39.
Lee, Y. W.~1960!. Statistical Theory of Communication~Wiley, New York!.McFadden, D., and Pasanen, E. G.~1976!. ‘‘Lateralization at high frequen-cies based on interaural time differences,’’ J. Acoust. Soc. Am.59, 634–639.
Moore, B. C. J., and Glasberg, C. R.~1983!. ‘‘Suggested formulae for cal-culating auditory-filter bandwidths and excitation patterns,’’ J. Acoust.Soc. Am.74, 750–753.
Raatgever, J.~1980!. ‘‘On the binaural processing of stimuli with differentinteraural phase relations,’’ Doctoral dissertation, Technische HogeschoolDelft, The Netherlands.
Sayers, B. McA.~1964!. ‘‘Acoustic-image lateralization judgments with bin-aural tones,’’ J. Acoust. Soc. Am.36, 923–926.
Sayers, B. McA., and Cherry, E. C.~1957!. ‘‘Mechanism of binaural fusionin the hearing of speech,’’ J. Acoust. Soc. Am.29, 973–987.
Shackleton, T. M., Meddis, R., and Hewitt, M. J.~1992!. ‘‘Across frequencyintegration in a model of lateralization,’’ J. Acoust. Soc. Am.91, 2276–2279.
Stellmack, M. A., and Dye, R. H., Jr.~1993!. ‘‘The combination of interauralinformation across frequencies: The effects of number and spacing ofcomponents, onset asynchrony, and harmonicity,’’ J. Acoust. Soc. Am.93,2933–2947.
Stern, R. M. Zeiberg, A. S., and Trahiotis, C.~1988!. ‘‘Lateralization ofcomplex binaural stimuli: a weighted-image model,’’ J. Acoust. Soc. Am.84, 156–165.
Trahiotis, C., and Bernstein, L. R.~1990!. ‘‘Detectability of interaural delaysover select spectral regions: Effects of flanking noise,’’ J. Acoust. Soc.Am. 87, 810–813.
Woods, W. S., and Colburn, H. S.~1992!. ‘‘Test of a model of auditoryobject formation using intensity and interaural time difference discrimina-tion,’’ J. Acoust. Soc. Am.91, 2894–2902.
Zurek, P. M.~1985!. ‘‘Spectral dominance in sensitivity to interaural delayfor broadband stimuli,’’ J. Acoust. Soc. Am. Suppl. 178, S18.
1107 1107J. Acoust. Soc. Am., Vol. 99, No. 2, February 1996 Dye et al.: The effect of distractor frequency


