Embed Size (px)
Citation preview

TheEconomicImpactofPaternityLeave SaiMingLiew
1
SchoolofEconomics
L13500EconomicsDissertation2016
TheEconomicImpactofPaternityLeave
Student:SaiMingLiew

TheEconomicImpactofPaternityLeave SaiMingLiew
2
Abstract
Thispaperconsidershowpaternityleavelegislationafterthebirthofchildrenaffects
labour market outcomes for men and women, focusing on the gender gaps in these
outcomes, across countries. Such family policies are granted for various lengths of time,
have differing wage replacement rates and are typically in addition to maternity and
parental leave.Asoutlined inaUSDepartmentofLabourpolicybrief,paternity leavehas
been found to increase father engagement, result in better health and development
outcomesforchildren, improveequalityathome,andimproveemploymentandwagesof
mothers.Thisstudylooksattheconsequencesofpaternity leaveonthegenderwagegap
and on female,male and gender differences in prime-age (25-54 years old) employment
ratesandaverageweeklyworkinghours. Ittakesanunconventionalmacro-levelapproach
byusingdatafrom30OECDcountriesfrom2000to2013andusingamodelproposedby
Thévenon&Solaz (2013).Thestudyhasshownthatpaternity leave legislationhas largely
insignificant impacts on employment rates and average weekly working hours, with the
exception of the presence of paternity leave raising the male employment rate by
approximately4%onaverage.However,thestudydoesfindthatonaverage,eachweekof
legislated paternity leavewidens the genderwage gap. Longer durations of entitlements
comparedtoshorteronesarenotfoundtohaveanysignificantimpact.Theseresultsdonot
conform to what theory would suggest. The study provides a foundation for future
investigationtounderstandtheeffectsofpaternityleavepolicyonlabourmarketoutcomes
whichcanhelpgovernments shape theirown familypoliciesas they seekmoreequitable
societies.

TheEconomicImpactofPaternityLeave SaiMingLiew
3
Contents
Abstract........................................................................................................2
Introduction..................................................................................................4
LiteratureReview..........................................................................................6
DataCollectionandEmpiricalSetting..........................................................11
Results........................................................................................................32
Discussion...................................................................................................43
Conclusion...................................................................................................48
References..................................................................................................50
Appendix.....................................................................................................52

TheEconomicImpactofPaternityLeave SaiMingLiew
4
Introduction
Aprominentglobaleconomicthemeofthe21stcenturyisthepathtowardsgender
equality. Much of the focus has been on discrimination faced by females in the labour
market,whether it iswagesoropportunitiesforemployment.McKinseyrecentlyreported
annualglobalGDPcould riseby$28 trillion,or26%, if labourparticipation ratesbetween
genderswereequal(Woetzeletal.,2015).Aninterestingandkeyissuerelatedtothisisthe
significanceofpaternityleave.
In 1994, just 28% of 141 countries investigated had paternity leave provisions
(InternationalLabourOffice,2014).In2013,47%of167countrieshadlegislationproviding
paternity leave, signalling the ever-growing recognition for the need of fathers at home.
While the US has not legislated paternity leave, a policy brief by the US Department of
Labouroutlinesseveralkeybenefits.Benefits includeincreasedfatherengagement,better
health and development outcomes for children, equality at home, and improvements in
employmentandwagesofmothers.Personalperceptionsand traditional viewsofgender
roles,andalackofgovernmentandworkplacepolicieshinderthepathtowardsequality.In
a 2012 survey, almost half of workers who required leave did not take it for economic
reasons.Anothersurveyofhighlyeducatedprofessional fathers found that they took less
than was available due to workplace pressures. The policy brief suggests supportive
paternityleavepoliciesandeducationregardingitsbenefitscanincreaseaccessanduptake.

TheEconomicImpactofPaternityLeave SaiMingLiew
5
Perceptionsof parental relationships are shifting away fromneotraditional gender
roles toones thatareegalitarian.A reportby theFamilies andWork Institute found that
both genders were less likely in 2008 to conform to traditional gender roles of male
breadwinners and female caregivers compared to 1977 (Galinsky et al., 2011).Under the
title, “The Economic Impact of Paternity Leave”, the claims in the aforementioned policy
brief are tested by studying the effects of paternity leave on several household variables
across the globe, with a particular focus on the effect on earnings, working hours and
employmentofmenandwomen. Legislationcanonlygo so far inbringingaboutchange.
Employersandparentsmustbewillingtoembracechangetoo.Understandingtheeffectsof
varying structures of paternity leave policies can assist governments and corporations in
encouragingitsuptake.Progressiveculturalnormsandtheeradicationofthestigmaaround
ahealthywork-lifebalancecanhelpputprinciplesintopractice.

TheEconomicImpactofPaternityLeave SaiMingLiew
6
LiteratureReview
Of particular interest will be the effect of legislation of paternity leave on
subsequentearningsofmothers.Johansson(2010)investigatedtheeffectofbothownand
spousal parental leave on subsequent earnings in Sweden. An explanation for the
unexplainedearningsgapistheunequalshareofhousework,caregivingandparentalleave
usage (Lundberg & Pollak, 2007; Datta Gupta et al., 2008). The future division of intra-
household labourandchildcarehasbeen ignored inpreviousstudiesandcouldbecaused
by specialisation in caregivingoremployment. Theeffectsof spousalparental leavewere
alsopreviouslyignored.
Johansson(2010)usescrosssectionalandfixedeffectsmodels,aswellastwopolicy
reformsoftheparentalleavesysteminSweden.Thereformsreservedoneandtwomonths
ofpostnatalleaveforeachspouse.Theeffectofreformexposurewasestimatedusingboth
difference-in-differences and triple differences models. Panel data sourced from register
information encompassing the entire Swedish population highlights the strength of the
analysis. Under the fixed effects model, controlling for unobserved time-constant
heterogeneity,ownleavewasfoundtohaveanegativeeffectonownfutureearnings,likely
duetothelossinhumancapital(Mincer&Polachek,1974).Spousalleavetoohasaneffect,
but only for women. Each month of paternity leave taken has a net positive effect on
mothers’earnings.Johansson(2010)postulatesthatincreasedpaternityleaveuptakecould
improvemen’schildcare-relatedskills,resultinginamoreevendivisionofemploymentand
caregivingbetweenmenandwomen.Themodelcouldbeimprovedby includingthenon-
TheEconomicImpactofPaternityLeave SaiMingLiew
7
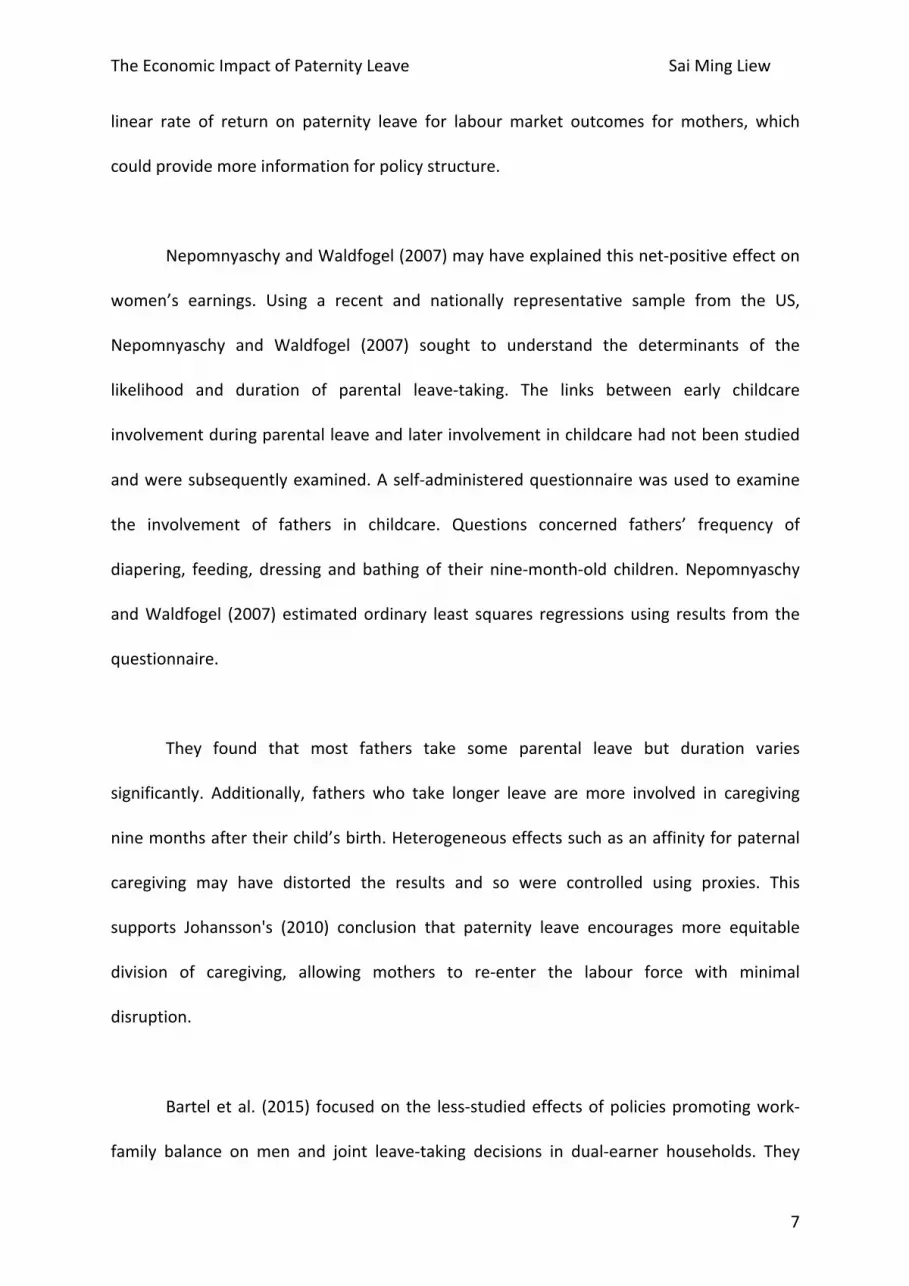
linear rate of return on paternity leave for labour market outcomes for mothers, which
couldprovidemoreinformationforpolicystructure.
NepomnyaschyandWaldfogel(2007)mayhaveexplainedthisnet-positiveeffecton
women’s earnings. Using a recent and nationally representative sample from the US,
Nepomnyaschy and Waldfogel (2007) sought to understand the determinants of the
likelihood and duration of parental leave-taking. The links between early childcare
involvementduringparentalleaveandlaterinvolvementinchildcarehadnotbeenstudied
andweresubsequentlyexamined.Aself-administeredquestionnairewasusedtoexamine
the involvement of fathers in childcare. Questions concerned fathers’ frequency of
diapering, feeding, dressing and bathing of their nine-month-old children.Nepomnyaschy
andWaldfogel (2007) estimatedordinary least squares regressionsusing results from the
questionnaire.
They found that most fathers take some parental leave but duration varies
significantly. Additionally, fathers who take longer leave are more involved in caregiving
ninemonthsaftertheirchild’sbirth.Heterogeneouseffectssuchasanaffinityforpaternal
caregiving may have distorted the results and so were controlled using proxies. This
supports Johansson's (2010) conclusion that paternity leave encourages more equitable
division of caregiving, allowing mothers to re-enter the labour force with minimal
disruption.
Barteletal. (2015) focusedon the less-studiedeffectsofpoliciespromotingwork-
family balance on men and joint leave-taking decisions in dual-earner households. They
TheEconomicImpactofPaternityLeave SaiMingLiew
8
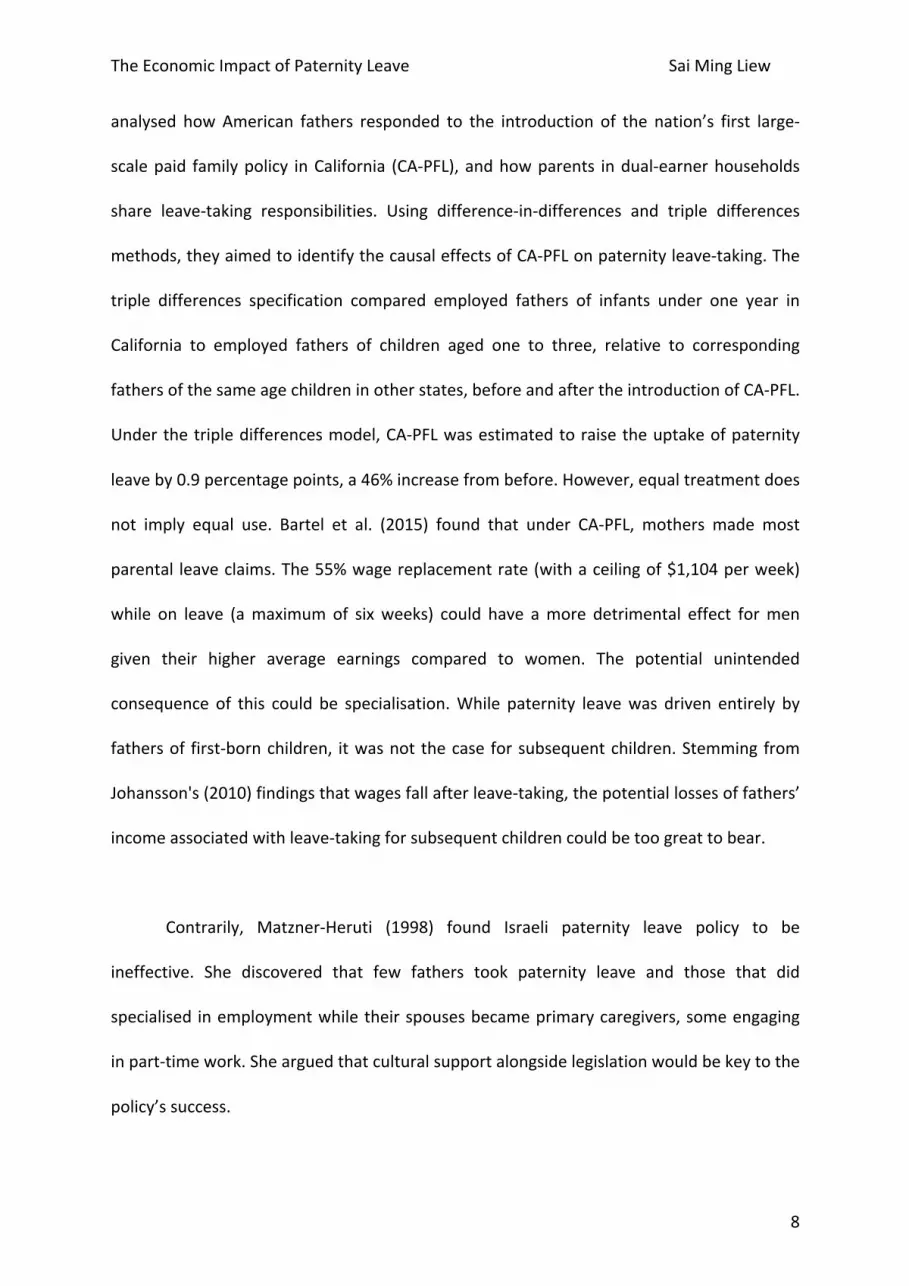
analysed howAmerican fathers responded to the introduction of the nation’s first large-
scalepaid familypolicy inCalifornia (CA-PFL),andhowparents indual-earnerhouseholds
share leave-taking responsibilities. Using difference-in-differences and triple differences
methods,theyaimedtoidentifythecausaleffectsofCA-PFLonpaternityleave-taking.The
triple differences specification compared employed fathers of infants under one year in
California to employed fathers of children aged one to three, relative to corresponding
fathersofthesameagechildreninotherstates,beforeandaftertheintroductionofCA-PFL.
Underthetripledifferencesmodel,CA-PFLwasestimatedtoraisetheuptakeofpaternity
leaveby0.9percentagepoints,a46%increasefrombefore.However,equaltreatmentdoes
not imply equal use. Bartel et al. (2015) found that under CA-PFL, mothers made most
parental leaveclaims.The55%wagereplacementrate(withaceilingof$1,104perweek)
while on leave (amaximum of sixweeks) could have amore detrimental effect formen
given their higher average earnings compared to women. The potential unintended
consequence of this could be specialisation.While paternity leavewas driven entirely by
fathersof first-bornchildren, itwasnot thecase forsubsequentchildren.Stemmingfrom
Johansson's(2010)findingsthatwagesfallafterleave-taking,thepotentiallossesoffathers’
incomeassociatedwithleave-takingforsubsequentchildrencouldbetoogreattobear.
Contrarily, Matzner-Heruti (1998) found Israeli paternity leave policy to be
ineffective. She discovered that few fathers took paternity leave and those that did
specialised inemploymentwhiletheirspousesbecameprimarycaregivers,someengaging
inpart-timework.Shearguedthatculturalsupportalongsidelegislationwouldbekeytothe
policy’ssuccess.

TheEconomicImpactofPaternityLeave SaiMingLiew
9
In Israel,onlypaternity leaveisdependentuponsomecriteriatobefulfilledbyhis
spouse. Having dissimilar systems for mothers and fathers may promote neotraditional
gender roles. Stigma may play a part too. Separate analysis from Coltrane et al. (2013)
revealed that, similar to thatofwomen,menwho choose flexibleworkpathsexperience
lowerlong-termearnings,suggestingthat“theflexibilitystigmaisrelativelygenderneutral”.
Equally,RudmanandMescher(2013)foundthatmaleworkerswhorequestedfamilyleave
wereperceivedtobepoorworkersandbelieve“theconceptofwork-lifebalanceisstrongly
gendered”. It appeared that there were higher expectations of men to uphold the
characteristicsofan“idealworker”.
Matzner-Heruti (1998) proposed a supplementary policy, the “Reduced Schedule
Provision”,totackle lowmaleengagement.Thepolicywouldrequireemployerstoreduce
men’s working hours, whose working hours exceeded 40 hours, for the first six months
following their child’s birth.While this policymay notwork in all sectors andwould still
promotegenderroles,shearguesthatimprovedintegrationbetweenworkandfamilycould
changeculturalnormsinthelong-term.
Dahletal.(2014)establishedthatco-workersandbrothersweremorelikelytotake
paternity leave if a peer father became eligible for paternity leave and discovered a
snowballeffectwitheachsubsequentbirth. Improvements in informationaboutemployer
reactions and costs and benefits were the likely cause. Acknowledging the presence of
workplacestigmaisanotherfindingfromBarteletal.(2015)thatbothmenandwomenin
occupations with a high share of female workers were more likely to take leave. While

TheEconomicImpactofPaternityLeave SaiMingLiew
10
paternity leavepolicies are important, educationanda shift in attitudes couldencourage
uptakeofpaternityleave.
Relatingmore closely to this study, Thévenon& Solaz (2013) analysed the labour
market effects of parental leave policies in OECD countries. The authors examined “the
long-runconsequencesofextendedpaid leaveon female,maleandgenderdifferences in
prime-age (25-54) employment rates, average working hours, and earnings in 30 OECD
countries from 1970 to 2010”. They used fixed effectsmodels to estimate the impact of
changes in leave duration on labour market outcomes for men and women separately,
before estimating the effect on the gender gaps.While the paper does not explore the
significanceofpaternityleaveonlabourmarketoutcomes,itdoesprovideaframeworkfor
which it is possible to build upon for the purpose of this examination. Results from this
paper present an opportunity for comparison and evaluation. While most studies have
employed amicroeconomic approach, this cross-countrymodel accounts for unobserved
heterogeneity across countries and could indicate how successful different governments
maybe inusingpaternity leavepolicies, likely inconjunctionwithmaternityandparental
leavepolicies,inachievingtheirfamilypolicyandlabourmarketobjectives.
TheEconomicImpactofPaternityLeave SaiMingLiew
11
DataCollectionandEmpiricalSetting
IntroductiontoparentalleavepoliciesintheOECD
TheOECD has identified four general types of parental leave policies. The following four
policy definitions are included for clarity and have been taken from the OECD family
database:
Maternity leave is defined as employment-protected leave of absence for employed
womenataroundthetimeofchildbirth.Thismayincludeadoptioninsomecountries.The
International LabourOrganisation convention onmaternity leave stipulates the period of
leavetobeatleast14weeks.However,thestructuresofmaternityleavemayvary.Inmost
countries,mothersmaycombinepre-withpost-birthleavewhileinsomecountries,ashort
periodofpre-birthleaveiscompulsoryalongwithasixtotenweekleaveperiodfollowing
thebirthoftheirchild.Furthermore,somecountriesseparateregulationformaternityleave
withstipulationsinsteadintegratedintotheparentalleavescheme.
Paternityleaveisdefinedasemployment-protectedleaveofabsenceforemployedfathers
atorwithinthefirstfewmonthsafterchildbirth.Unlikematernityleave,paternityleaveis
notstipulatedbyinternationalconvention.Ingeneral,periodsofpaternityleavearemuch
shorterthanformaternityleave.
Parentalleaveisdefinedasemployment-protectedleaveofabsenceforemployedparents.
Itisoftensupplementarytoparent-specificleaveperiods,andcommonlyfollowstheperiod

TheEconomicImpactofPaternityLeave SaiMingLiew
12
ofmaternity leave. Entitlement to the parental leave period is often individual (i.e. each
parent has their own entitlement) while entitlement to public income support is often
family-based, so that only one parent can claim such income support at any one time
(except for a short period after childbirth). Some countries structure their parental leave
policysuchthatthereisasharablefamilyentitlementbutwithcertainperiodsreservedfor
usebyindividualparents,whileinothers,‘bonus’paidweeksareofferedifbothparentsuse
a certain portion of the family entitlement. This implies that a certain proportion of the
parental leave is effectively ‘reserved’ for fathers, assuming that the family wishes to
maximisethetotallengthofleaveonoffer.
Homecare leave (orchildcareorchild raising leave) isdefinedasemployment-protected
leavesofabsencethattypicallyallowsatleastoneparenttoremainathometoprovidecare
untilthechildistwoorthreeyearsofage.Outofthefourdifferenttypesofparentalleave,
homecare leave isthe leastcommonand isonlyoffered inaminorityofOECDcountries.
Theyarealsooftenunpaidbutifpaid,onlyatalowflat-rate.
Datacollection
This analysis relies on The Organisation of Economic Co-operation and
Development’s(OECD)databaseforaggregatedatafor30outof34members1acrossatime
period of 14 years from 2000 to 2013 due to its credibility and depth. TheOECD Family
Databasecomplementsthisdatawithinformationonthenumberoflegislatedpaidweeks
ofpaternityleave,thekeyexplanatoryvariableinquestion.SectionAintheappendixshows1ExcludesChile,Estonia,IsraelandSloveniaduetoanabsenceinpaternityleavedata.

TheEconomicImpactofPaternityLeave SaiMingLiew
13
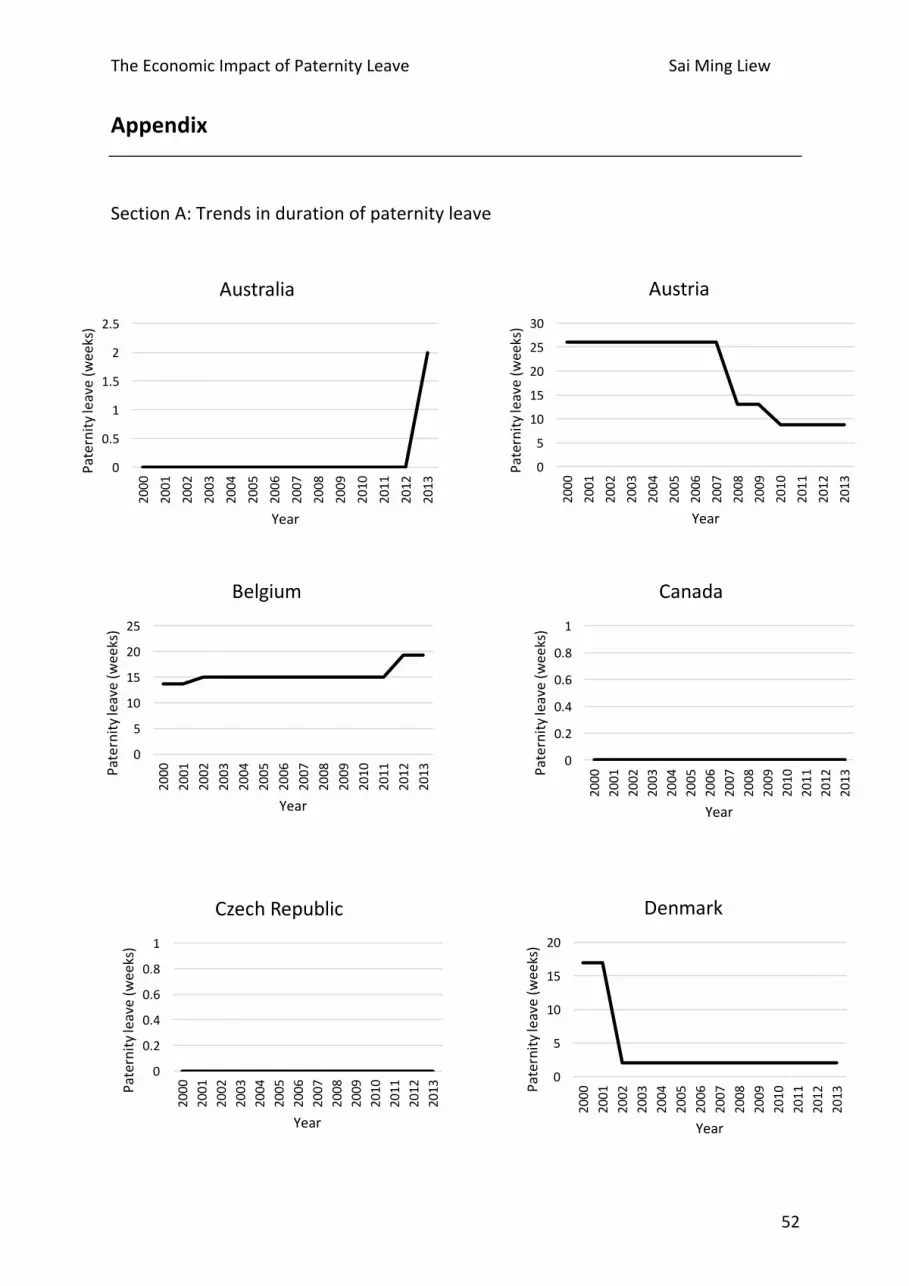
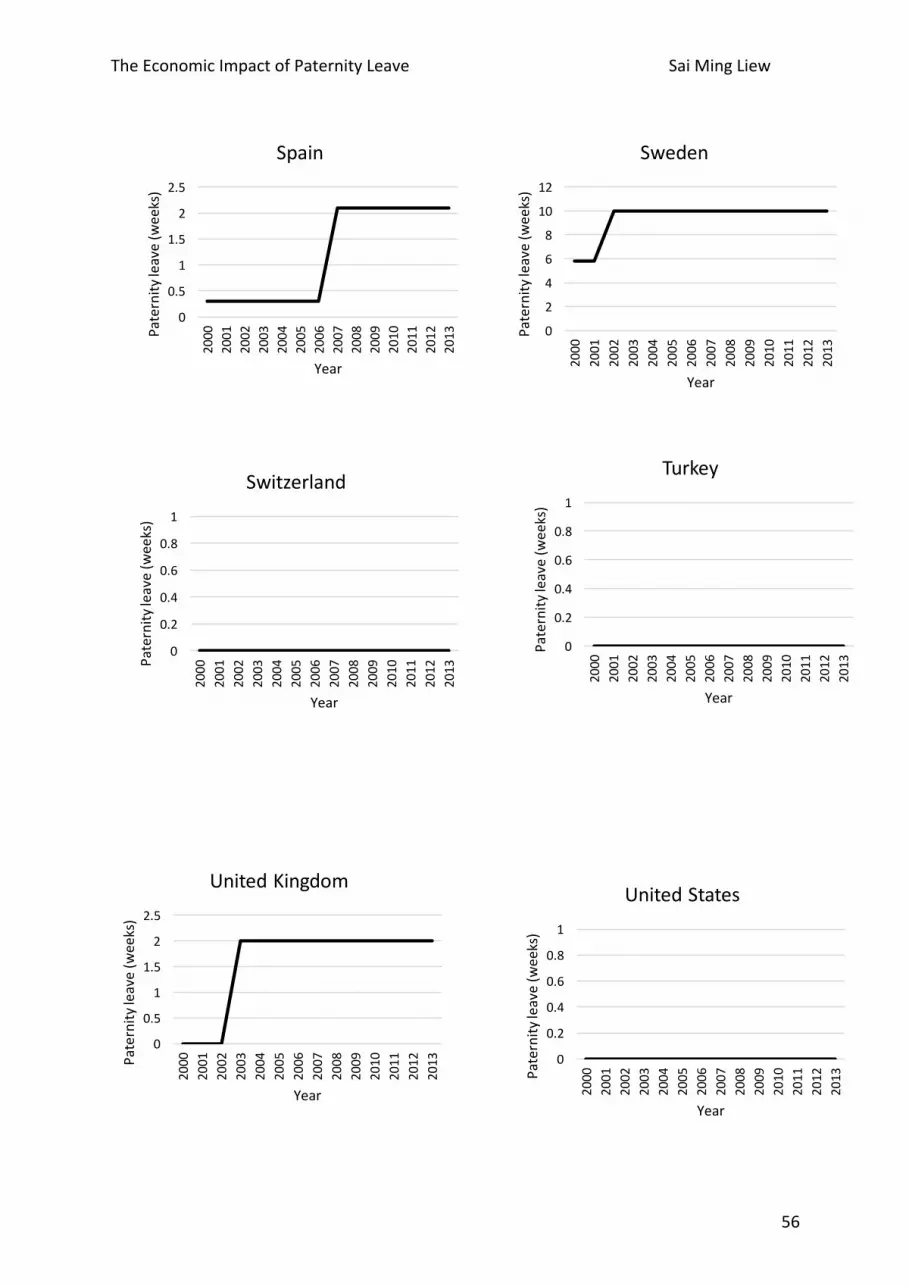
the trends in thedurationof legislatedpaidweeksofpaternity leave forall30countries.
Due to the commonly shorter duration of paternity leave compared to maternity leave,
fathers typicallycontinue to receive fullwagepayments.SectionB in theappendixshows
the averagepayment rate for fathers inOECD countries in 2015. TheOECDnotes that in
somecountries,“fatherspecific leaveentitlementsarepartof theparental leavescheme,
rather than a separate right”. For this study, the data on paternity leave refers to
“entitlements to paternity leave, 'father quotas' or periods of parental leave that can be
usedonlybythefatherandcannotbetransferredtothemother,andanyweeksofsharable
leavethatmustbetakenbythefatherinorderforthefamilytoqualifyfor'bonus'weeksof
parental leave”. Figure 1 shows how the average duration of paternity leave for the 30
countrieshasevolvedfrom2000to2013.
Figure1.Averagedurationofpaternityleave(weeks)in30OECDcountriesfrom2000to2013
0
1
2
3
4
5
6
7
8
9
10
2000 2001 2002 2003 2004 2005 2006 2007 2008 2009 2010 2011 2012 2013
Paternity
leave(w
eeks)
Year
Averagepaternityleavefor30OECDcountries

TheEconomicImpactofPaternityLeave SaiMingLiew
14
Over the14-yearperiod for the30countries, theaveragepaternity leaveduration
more thandoubled from justunder fourweeksofpaternity leave in2000 toalmostnine
weeks in 2013. There were a total of 30 changes (27 increases and 3 decreases) in the
duration of legislated paternity leave. Therewere 7 changes (6 increases, 1 decrease) in
2002,thehighestforasingleyear.Denmarkreducedthepaternityleaveentitlementfrom
17weeksin2001tojust2weeksin2002.Austriahalvedthepaternityleavedurationto13
weeks in 2008 and thenby a further 4.3weeks in 2010. Thebiggest changes came from
SouthKorea(+52weeks,2008)andJapan(+52weeks,2010).However,somecountrieshad
notenactedpaidpaternityleavepoliciesby2013,includingCanada,CzechRepublic,Ireland,
NewZealand,SlovakRepublic,Switzerland,Turkey,andmostnotably,theUnitedStates.
Dependentvariable
To study the impact of paternity leave on the three labourmarket outcomes, the
OECD database provides time-series data across 30 countries on paternity leave
entitlements.Whilepaternity leavemaybe legislated tocloseemploymentgapsbetween
menandwomenortoacknowledgeafather’srole inthecareofhischild, legislationonly
provides themeans for fathers tograsp theopportunity.Theenacted lawscannotcoerce
fatherstoutilisepaternityleave.Theextentofpaternityleaveuptake,eitherinrelativeor
absolute terms,wouldhave likelybeenanadditional significantmeasureof theeffectsof
paternityleaveonthethreelabourmarketoutcomes.Further,itwouldbeadvantageousto
include information on wage replacement rates providing further guidance on paternity
leave policy structure. However, there is no available cross-country time-series data and
therefore are not considered. As a result, the impact of changes in legislation may be

TheEconomicImpactofPaternityLeave SaiMingLiew
15
overestimated. Nevertheless, variations of paternity leave legislation as explanatory
variablesshouldpresentsome insight into the impact legislationcanhave in termsof the
acknowledgement of the importance of paternity leave. Figures 2, 3 and 4 compare the
differencesinthedurationofpaternityleaveentitlementsandthegendergapsinthethree
labourmarketvariablesacrossvariouscountrieswithintheOECDin20132.
2OnlyOECDcountrieswithdatafortheinterestedvariablesareincluded.

TheEconomicImpactofPaternityLeave SaiMingLiew
16
Figure2.Durationofpaternityleave(weeks)andthegenderwagegap(%)in2013
0
10
20
30
40
50
60
Paternity
leave(w
eeks)/Gen
derw
agegap(%
)
Paternityleavedurationandthegenderwagegap
Paternityleave(weeks) Genderwagegap(%)

TheEconomicImpactofPaternityLeave SaiMingLiew
17
Figure3.Durationofpaternityleave(weeks)andthemale-to-femaledifferencesinemployment-to-populationratios(%)in2013
0
10
20
30
40
50
60
Paternity
leave(w
eeks)/Employmen
t-to-po
pulatio
nratio
(%)
Paternityleavedurationandthemale-to-femaledifferencesinemployment-to-populationratios
Paternityleave(weeks) Employment-to-populationratio(%)

TheEconomicImpactofPaternityLeave SaiMingLiew
18
Figure4.Durationofpaternityleave(weeks)andthemale-to-femaledifferencesinaverageweeklyworkinghoursin2013
0
5
10
15
20
25
30
Paterin
tyleave(w
eeks)/Averageweeklyw
orkinghou
rs
Paternityleavedurationandthemale-to-femaledifferencesinaverageweeklyworkinghours
Paternityleave(weeks) Averageweeklyworkinghours
TheEconomicImpactofPaternityLeave SaiMingLiew
19
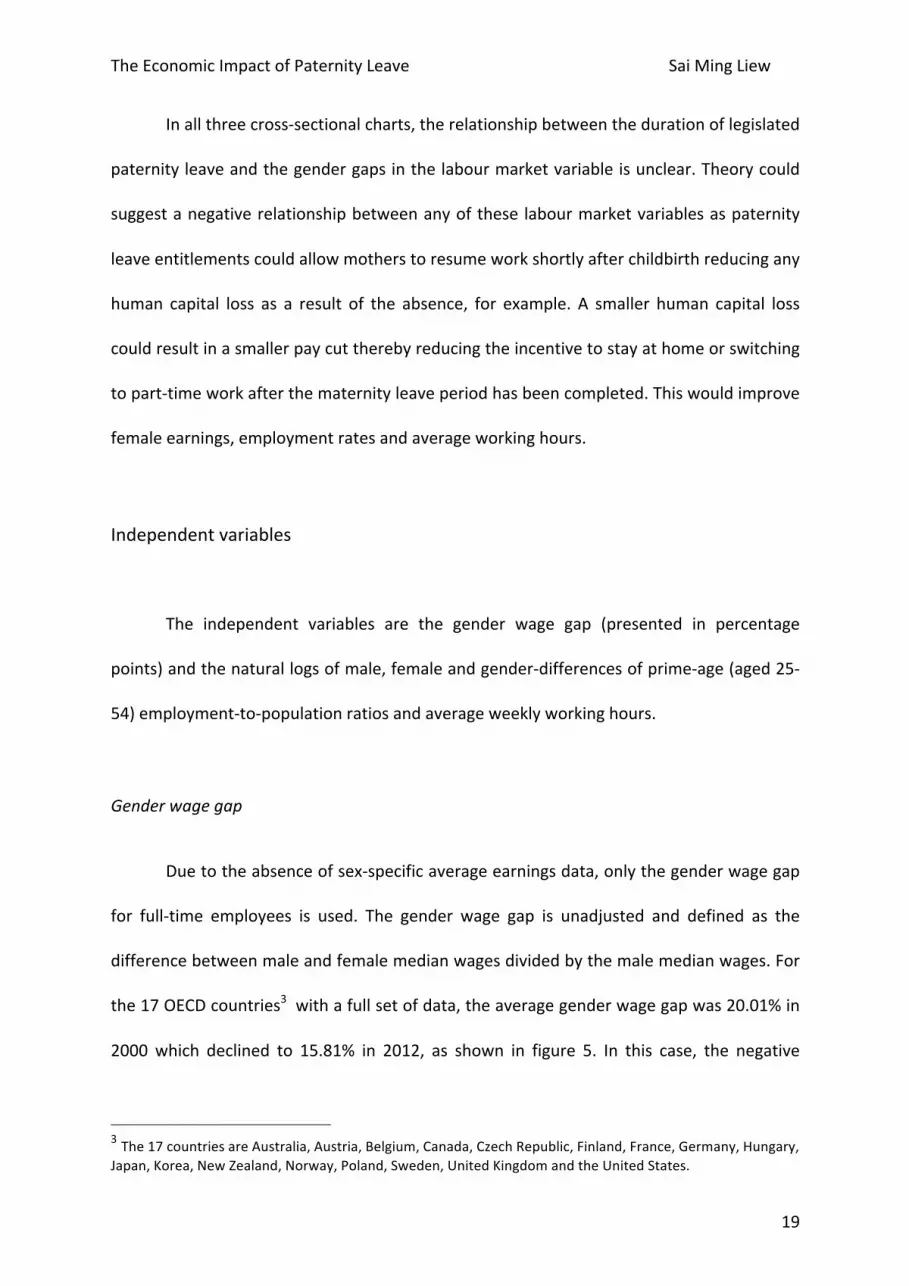
Inallthreecross-sectionalcharts,therelationshipbetweenthedurationoflegislated
paternityleaveandthegendergapsinthelabourmarketvariableisunclear.Theorycould
suggestanegativerelationshipbetweenanyofthese labourmarketvariablesaspaternity
leaveentitlementscouldallowmotherstoresumeworkshortlyafterchildbirthreducingany
human capital loss as a result of the absence, for example. A smaller human capital loss
couldresultinasmallerpaycuttherebyreducingtheincentivetostayathomeorswitching
topart-timeworkafterthematernityleaveperiodhasbeencompleted.Thiswouldimprove
femaleearnings,employmentratesandaverageworkinghours.
Independentvariables
The independent variables are the gender wage gap (presented in percentage
points)andthenaturallogsofmale,femaleandgender-differencesofprime-age(aged25-
54)employment-to-populationratiosandaverageweeklyworkinghours.
Genderwagegap
Duetotheabsenceofsex-specificaverageearningsdata,onlythegenderwagegap
for full-time employees is used. The gender wage gap is unadjusted and defined as the
differencebetweenmaleandfemalemedianwagesdividedbythemalemedianwages.For
the17OECDcountries3withafullsetofdata,theaveragegenderwagegapwas20.01%in
2000 which declined to 15.81% in 2012, as shown in figure 5. In this case, the negative
3The17countriesareAustralia,Austria,Belgium,Canada,CzechRepublic,Finland,France,Germany,Hungary,Japan,Korea,NewZealand,Norway,Poland,Sweden,UnitedKingdomandtheUnitedStates.

TheEconomicImpactofPaternityLeave SaiMingLiew
20
relationship between the trends in paternity leave duration and the gender wage gap is
clearerastheymoveinoppositedirectionsovertime.
Figure5.Thegenderwagegap(%)andaveragepaternityleaveduration(weeks)for17OECD
countriesovertheyears2000to2012
Employment-to-populationratio
The age band chosen for this variablewas between 25 and 54 years old as those
outside this range of prime-age workers are likely to be affected by other factors. The
averageageofwomenatbirth (shown in appendix sectionC) grew from27.4 in1970 to
30.3yearsold in2014fortheOECD-26,suggestingparental leavepolicieswouldhavethe
greatestimpactonindividualsinthisageband.Underthereasonableassumptionthatmen
0
2
4
6
8
10
12
0
5
10
15
20
25
2000 2001 2002 2003 2004 2005 2006 2007 2008 2009 2010 2011 2012
Paternity
leave(w
eeks)
Gend
erwagegap(%
)
Year
Genderwagegap(%)
Genderwagegap(%) Paternityleave(weeks)
TheEconomicImpactofPaternityLeave SaiMingLiew
21
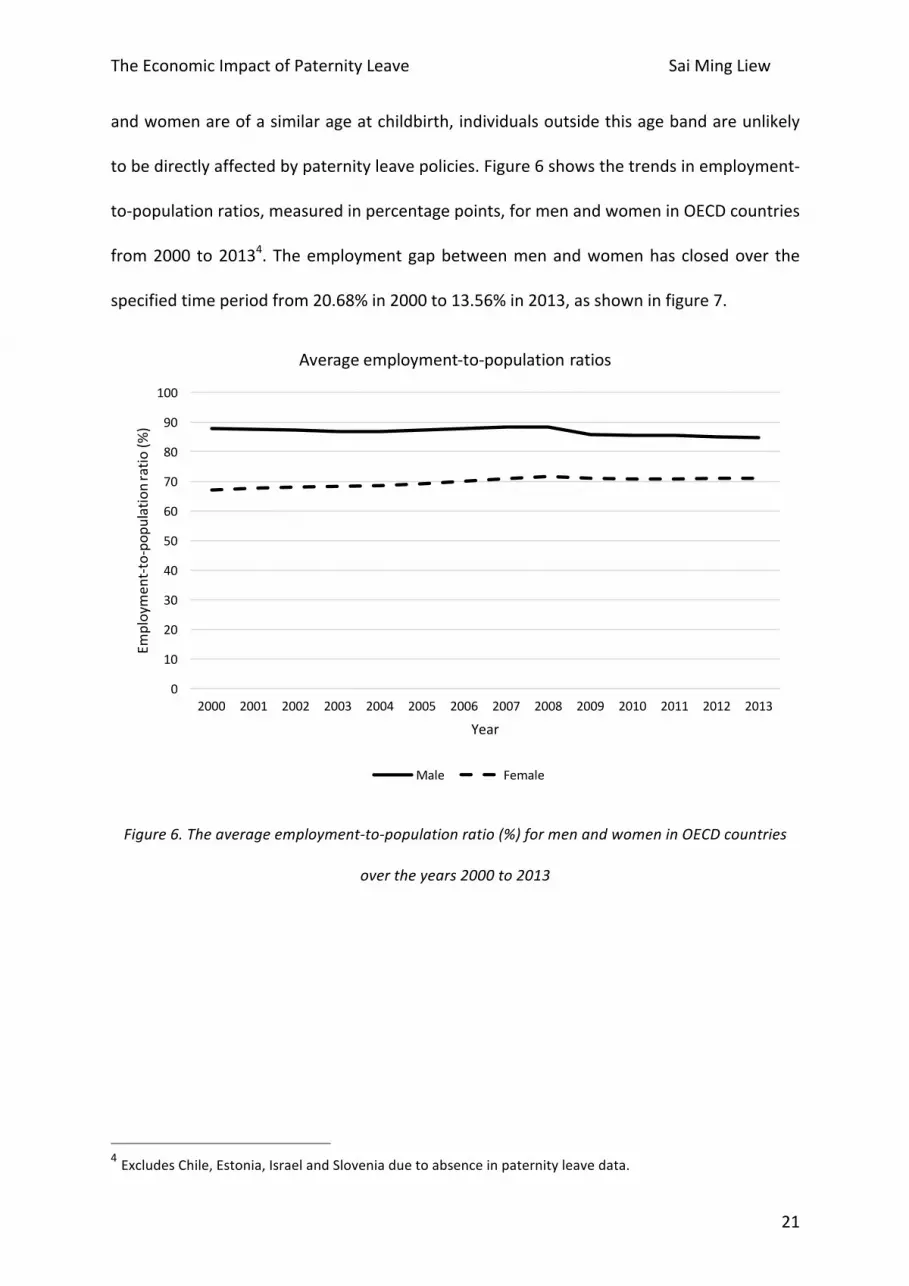
andwomenareofasimilarageatchildbirth,individualsoutsidethisagebandareunlikely
tobedirectlyaffectedbypaternityleavepolicies.Figure6showsthetrendsinemployment-
to-populationratios,measuredinpercentagepoints,formenandwomeninOECDcountries
from2000 to20134.Theemploymentgapbetweenmenandwomenhas closedover the
specifiedtimeperiodfrom20.68%in2000to13.56%in2013,asshowninfigure7.
Figure6.Theaverageemployment-to-populationratio(%)formenandwomeninOECDcountries
overtheyears2000to2013
4ExcludesChile,Estonia,IsraelandSloveniaduetoabsenceinpaternityleavedata.
0
10
20
30
40
50
60
70
80
90
100
2000 2001 2002 2003 2004 2005 2006 2007 2008 2009 2010 2011 2012 2013
Employmen
t-to-po
pulatio
nratio
(%)
Year
Averageemployment-to-populationratios
Male Female

TheEconomicImpactofPaternityLeave SaiMingLiew
22
Figure7.Themale-to-femaledifferenceintheaverageemployment-to-populationratio(%)inOECD
countriesovertheyears2000to2013
Fromfigure7,thedownwardtrendofthemale-to-femaledifferenceintheaverage
employment-to-population ratio over the 14-year time period compared to the rising
durationofpaternityleaveisashypothesised.
Averageweeklyworkinghours
Averageweeklyworkinghoursareshownasaverageusualweeklyhoursworkedon
the main job in the OECD’s labour force statistics. Those with an employment status of
‘dependent employment’ were chosen. This would exclude thosewho are self-employed
whohavemore freedomwith regards to decision-making. Similar to the employment-to-
0
1
2
3
4
5
6
7
8
9
10
0
5
10
15
20
25
2000 2001 2002 2003 2004 2005 2006 2007 2008 2009 2010 2011 2012 2013
Paternity
leave(w
eeks)
Employmen
t-to-po
pulatio
nratio
(%)
Year
Male-to-femaledifferenceinaverageemployment-to-populationratios
Male-to-femaledifference(%) Paternityleave(weeks)
TheEconomicImpactofPaternityLeave SaiMingLiew
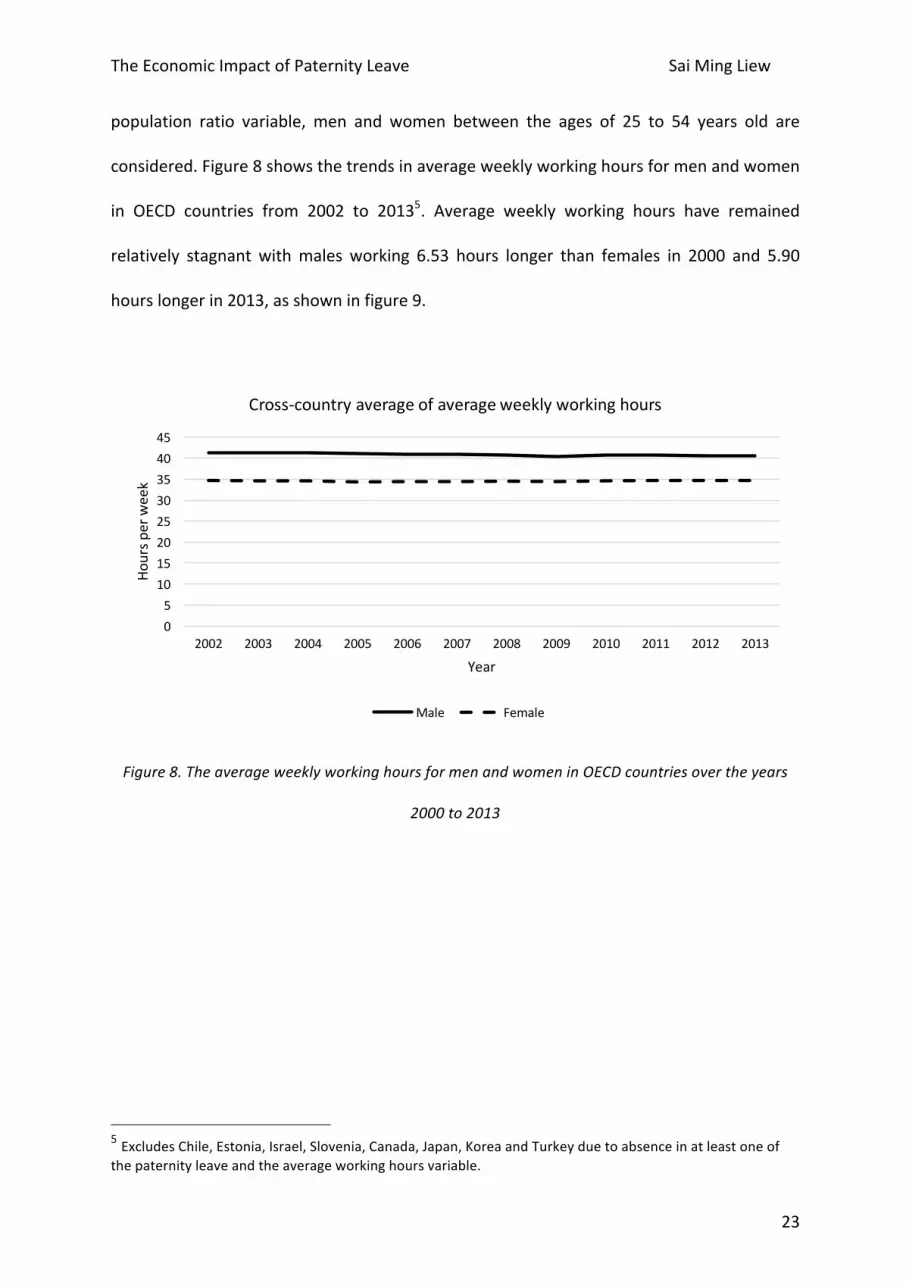
23
population ratio variable, men and women between the ages of 25 to 54 years old are
considered.Figure8showsthetrendsinaverageweeklyworkinghoursformenandwomen
in OECD countries from 2002 to 20135. Average weekly working hours have remained
relatively stagnant withmales working 6.53 hours longer than females in 2000 and 5.90
hourslongerin2013,asshowninfigure9.
Figure8.TheaverageweeklyworkinghoursformenandwomeninOECDcountriesovertheyears
2000to2013
5ExcludesChile,Estonia,Israel,Slovenia,Canada,Japan,KoreaandTurkeyduetoabsenceinatleastoneofthepaternityleaveandtheaverageworkinghoursvariable.
05
1015202530354045
2002 2003 2004 2005 2006 2007 2008 2009 2010 2011 2012 2013
Hoursp
erweek
Year
Cross-countryaverageofaverageweeklyworkinghours
Male Female

TheEconomicImpactofPaternityLeave SaiMingLiew
24
Figure9.Themale-to-femaledifferenceinthecross-countryaverageofaverageweeklyworking
hoursformenandwomeninOECDcountriesovertheyears2000to2013
Fromfigure9,thetrendsobservedbetweentheaveragemale-to-femaledifference
in average weekly working hours and the average duration of paternity leave is as
hypothesised. Figure 9 shows that the 2013 gap in average weekly working hours has
dropped from the levels in 2002, a positive outcome. However, the difference is just 38
minutesofworkperweek,aninsignificantdifferencecomparedtoroughly35to40hoursof
work per week. A potential explanation for the average female weekly working hours
remainingstagnantcouldbethatmorepart-timeandfull-timeworkersareparticipatingin
thelabourmarket,suggestedbytheincreasingemployment-to-populationratioinfigure6.
0
1
2
3
4
5
6
7
5.4
5.6
5.8
6
6.2
6.4
6.6
6.8
2002 2003 2004 2005 2006 2007 2008 2009 2010 2011 2012 2013
Paternity
leave(w
eeks)
Hoursp
erweek
Year
Male-to-femaledifferenceinthecross-countryaverageofaverageweeklyworkinghours
Averageworkinghours Paternityleave(weeks)

TheEconomicImpactofPaternityLeave SaiMingLiew
25
Summary
Figure10 shows thecomparisonbetweenpercentagechanges in thegenderwage
gap,theemployment-to-populationratiogapandthegapinaverageweeklyworkinghours
forcountrieswithandwithoutpaternity leavefrom2002to2012.Only4countries inthis
samplehadnotenactedpaternityleaveby2013.
Figure10.Comparisonbetweenpercentagechangesinthegenderwagegap,theemployment-to-
populationratiogapandthegapinaverageweeklyworkinghoursforcountrieswithandwithout
paternityleavefrom2002to2012for14OECDcountries6
6Only 14 countries with full set of data included. 4 countries with no paternity leave: Australia, CzechRepublic, New Zealand, and United States. 10 countries with at least 1 week of paternity leave: Austria,Belgium,Finland,France,Germany,Hungary,Norway,Poland,Sweden,andUnitedKingdom.
-30
-20
-10
0
10
20
30
2002 2003 2004 2005 2006 2007 2008 2009 2010 2011 2012
Percen
tagech
ange(%
)
Year
Percentagechangeindependentandindependentvariables
Genderwagegap(0weeks) Genderwagegap(>0weeks)
Gendergapinemploymentrates(0weeks) Gendergapinemploymentrates(>0weeks)
Gendergapinaverageweeklyworkinghours(0weeks) Gendergapinaverageweeklyworkinghours(>0weeks)
Paternityleave(weeks)

TheEconomicImpactofPaternityLeave SaiMingLiew
26
From figure10, given the rise in the averagedurationof paternity leave from the
year2002to2012,thedownwardtrendsinthegapsinthethreelabourmarketoutcomes
for those that have enacted paternity leave are as theory would suggest. Furthermore,
though these trendsareobserved incountries thathavenotenactedpaternity leave, the
trends in those that have legislation are considerably steeper. Econometric analysis is
requiredtodeterminethedegreeofcausalityandimpactofpaternityleave.
Table1presentssummarystatisticsforthevariablesofinterestintheeconometric
analysis. Themean for paternity leave entitlements is approximately eight times smaller
than that of maternity and parental leave, suggesting that most countries in the OECD
conform to traditional gender roles where mothers are the primary caregivers.
Furthermore,thedisparitybetweenchildbirthleavepoliciesispronouncedwhenobserving
therangeofdurationsinpaternity,maternityandparentalleave.
Table1.Summarystatistics
Variable N Mean S.D. Min Max
Paternityleave(weeks) 424 5.86 10.29 0.00 52.60
Maternityandparentalleave(weeks) 424 47.43 42.18 0.00 164.00
Genderwagegap(%) 351 16.72 7.57 0.38 41.65
Maleemployment-to-populationratio(%) 476 86.35 4.51 70.44 95.29
Femaleemployment-to-populationratio(%) 476 69.60 11.46 24.43 86.16
Maleaverageweeklyworkinghours 408 41.38 3.00 36.55 53.39
Femaleaverageweeklyworkinghours 408 35.17 3.75 25.33 45.93
TheEconomicImpactofPaternityLeave SaiMingLiew
27
Empiricalsetting
This paper uses an empirical model constructed similar to that in Thévenon and
Solaz’s (2013) study. For the dependent variables of average weekly working hours and
employment-to-populationratio,theeffectsofpaternityleavearemeasuredintwostages.
First,thedependentvariablesare logarithmicallytransformedwithnatural logarithmsand
regressedupon.Second,thedifferencesbetweenthelogarithmicallytransformedvariables
formenaresubtractedfromthatofwomenbeforebeingregressedupon.Thegenderwage
gapdoesnotrequirelogarithmictransformationpriortoregression.
Testforheteroskedasticity
Given the panel data set, a potential issue in the regression model is
heteroskedasticity.Under heteroskedasticity,while the estimates from the regression are
unbiasedandconsistent, thestandarderrorsarebiased.Thiswouldresult inabias inthe
test statistics and confidence intervals.While Thévenonand Solaz (2013)donotmention
the use of any tests for heteroskedasticity, they present robust standard errors in their
regressions.ThisstudyincludesaformoftheWhitetesttotestforheteroskedasticitydue
to the non-linearity of the proposed model. The White test tests whether the residual
variances in a regression rely on the values of the independent variables. Generally, the
Whitetesttakesthelistofregressorsandadjuststhemwithsquaresandcrossproductsof
eachofthesevariables.Thetestthenrunsanauxiliaryregressionofthesquarederrorterm
on the regressors, their squares and the cross products, while removing any duplicate
elements.As thereare several regressors, thealternativeWhite test isused. In this case,
TheEconomicImpactofPaternityLeave SaiMingLiew
28
only the fitted values of the original regression and their squares are used. An F-test is
conductedtodetermine joint-significanceofthecoefficientsofthefittedvalues. Thenull
hypothesis states that thevariancesof the residualsareconstantandare independentof
the values of the independent variables. The alternative hypothesis states that the
estimated variances are a multiplicative function of one or more variables, suggesting
heteroskedasticityispresent.A5%confidenceintervalofstatisticalsignificancewaschosen.
Robuststandarderrorswillbeincludedinthemodelstoaccountforanyheteroskedasticity.
Testforfixedorrandomeffectsestimator
Astheremaybesomeunobservedheterogeneityinthemodels,ThévenonandSolaz
(2013)usedfixedeffectsestimatorsintheirregressionsbutdonotstatetheuseofanytests
forthisdetermination.Thisanalysistakesthe initialstepofconductingteststodetermine
whetherarandomorfixedeffectsestimatorwouldbesuitablefortheregressionanalyses.
The estimator is used to control for any unobservable country-specific factors. Given the
possible heteroskedasticity, an appropriate test would be the Sargan-Hansen test, as
proposed by Wooldridge (2002). The test is similar to the Hausman test but is
heteroskedastic-robust. In the case of homoskedastic errors, the reported test statistic is
equivalenttotheusualHausmanfixedvs.randomeffectstest.TheSargan-Hansentestisa
suitable test as the test of fixed or random effects can also be seen as a test of
overidentifying restrictions. The null hypothesis states that the individual effects are not
correlatedwithanyoftheindependentvariables.Thealternativehypothesisstatesthatthe
individual effects are correlatedwith any of the independent variables. If the alternative
hypothesis isrejected,arandomeffectsestimator isappropriate.Therejectionofthenull
TheEconomicImpactofPaternityLeave SaiMingLiew
29
hypothesiswouldmean that the randomeffectsestimator isnotconsistentand the fixed
effects estimator should be used. A 5% confidence interval of statistical significancewas
chosen.
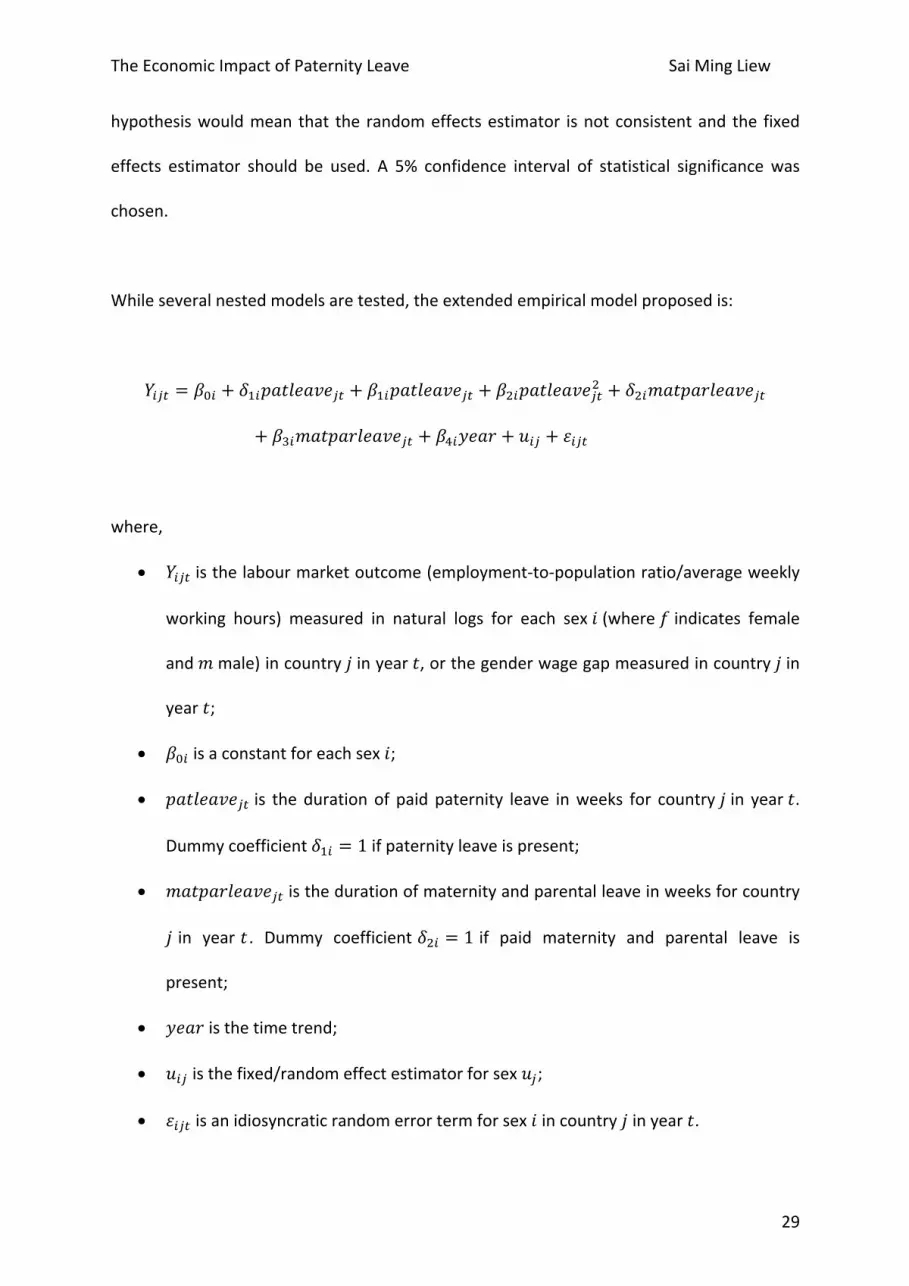
Whileseveralnestedmodelsaretested,theextendedempiricalmodelproposedis:
!"#$ = &'" + )*"+,-./,0/#$ + &*"+,-./,0/#$ + &1"+,-./,0/#$1 + )1"2,-+,3./,0/#$
+ &4"2,-+,3./,0/#$ + &5"6/,3 + 7"# + 8"#$
where,
• !"#$isthelabourmarketoutcome(employment-to-populationratio/averageweekly
working hours) measured in natural logs for each sex9(where:indicates female
and2male)incountry;inyear-,orthegenderwagegapmeasuredincountry;in
year-;
• &'" isaconstantforeachsex9;
• +,-./,0/#$is the durationof paid paternity leave inweeks for country;in year-.
Dummycoefficient)*" = 1ifpaternityleaveispresent;
• 2,-+,3./,0/#$isthedurationofmaternityandparentalleaveinweeksforcountry
; in year- . Dummy coefficient)1" = 1if paid maternity and parental leave is
present;
• 6/,3isthetimetrend;
• 7"# isthefixed/randomeffectestimatorforsex7#;
• 8"#$isanidiosyncraticrandomerrortermforsex9incountry;inyear-.
TheEconomicImpactofPaternityLeave SaiMingLiew
30
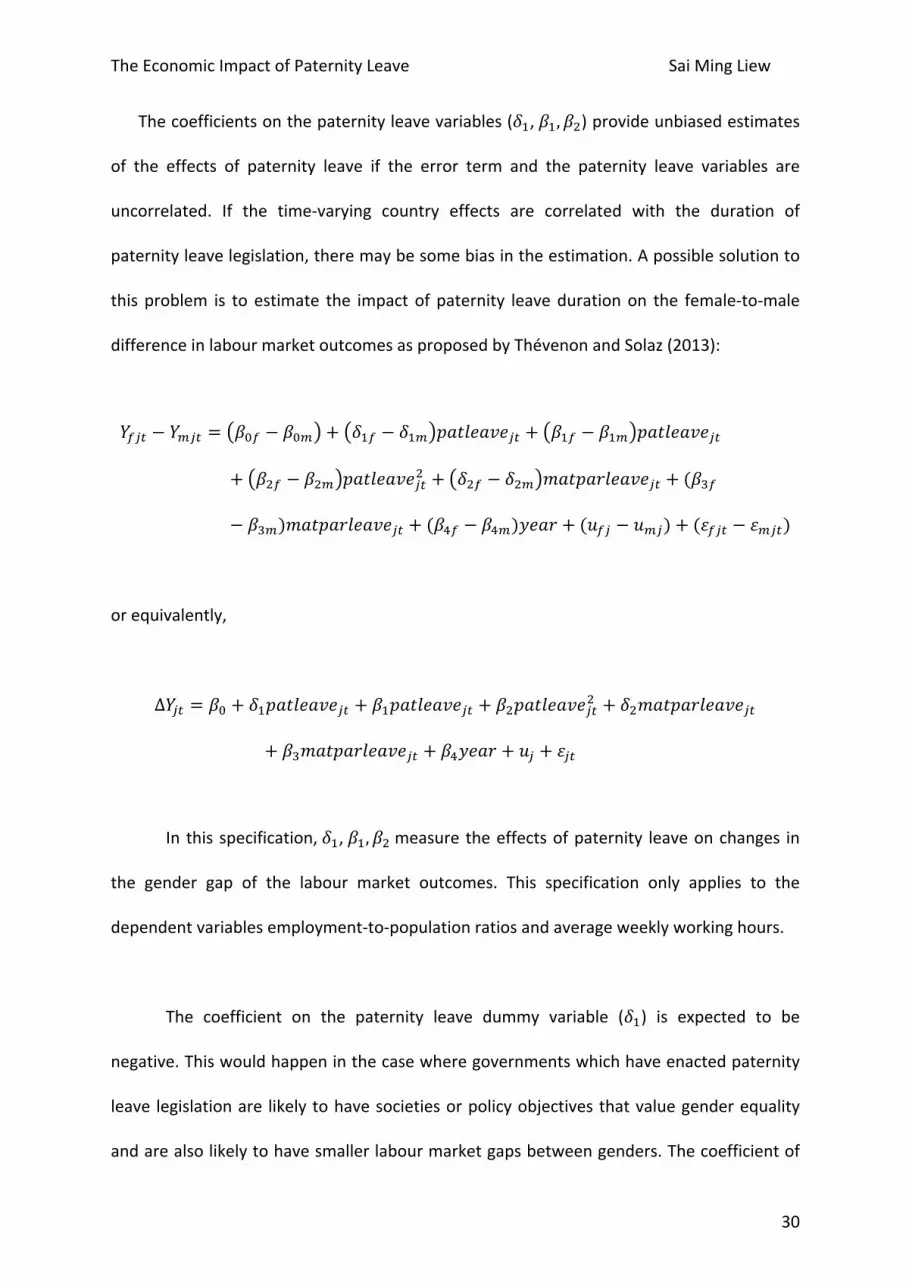
Thecoefficientsonthepaternityleavevariables()*,&*, &1)provideunbiasedestimates
of the effects of paternity leave if the error term and the paternity leave variables are
uncorrelated. If the time-varying country effects are correlated with the duration of
paternityleavelegislation,theremaybesomebiasintheestimation.Apossiblesolutionto
this problem is to estimate the impactof paternity leavedurationon the female-to-male
differenceinlabourmarketoutcomesasproposedbyThévenonandSolaz(2013):
!?#$ − !A#$ = &'? − &'A + )*? − )*A +,-./,0/#$ + &*? − &*A +,-./,0/#$
+ &1? − &1A +,-./,0/#$1 + )1? − )1A 2,-+,3./,0/#$ + (&4?
− &4A)2,-+,3./,0/#$ + (&5? − &5A)6/,3 + (7?# − 7A#) + (8?#$ − 8A#$)
orequivalently,
∆!#$ = &' + )*+,-./,0/#$ + &*+,-./,0/#$ + &1+,-./,0/#$1 + )12,-+,3./,0/#$
+ &42,-+,3./,0/#$ + &56/,3 + 7# + 8#$
In thisspecification,)*,&*, &1measuretheeffectsofpaternity leaveonchanges in
the gender gap of the labour market outcomes. This specification only applies to the
dependentvariablesemployment-to-populationratiosandaverageweeklyworkinghours.
The coefficient on the paternity leave dummy variable ()*) is expected to be
negative.Thiswouldhappeninthecasewheregovernmentswhichhaveenactedpaternity
leave legislationare likelytohavesocietiesorpolicyobjectivesthatvaluegenderequality
andarealsolikelytohavesmallerlabourmarketgapsbetweengenders.Thecoefficientof

TheEconomicImpactofPaternityLeave SaiMingLiew
31
the linear paternity leave variable (&*) is also hypothesised to be negative. Eachweekof
paternity leave would result in losses in human capital for men, similar to the effect of
maternityleaveonwomen.Atthesametime,thisallowsmotherstoreturntoworksooner,
reducingtheirhumancapital lossandtherebyclosingthelabourmarketgap.Theaddition
ofthesquaredpaternityleavevariableisincludedtoaccountforanynon-lineareffects.The
coefficientonthesquaredvariable(&1)ishypothesisedtobepositive.Increasingdurations
of paternity leavemayhave little effectwhen theduration is long in the casewhere the
significanceofhumancapitallossislow.
Maternityandparental leavevariablesareaddedtoactascontrolvariables in the
regressions.Whileparentalleavecanbesharedbetweenmothersandfathers,mostofthe
uptakeisfrommothers.Thismayresultinsomebiasbutthebiasislikelytobesmallgiven
the lowmaleuptake inmostcountries (Ruhm,1998).Furthermore,dueto the infrequent
nature of policy amendments regarding paternity leave, time trends are included in the
regressiontoaccountforexogenoustrendsinlabourmarketoutcomes.

TheEconomicImpactofPaternityLeave SaiMingLiew
32
Results
Tables 2-8 present the results from the regressions conducted to investigate the
impactofpaternity leave legislationonthethree labourmarketoutcomesof interest.For
each dependent variable, one complete and five nested models containing variations of
independent variables are presented for the purpose of comparison. In eachmodel, the
variable‘year’isanindexnumberfortheselectedtimeperiodstartingfromtheyear2000
(i.e. 2000=1, 2001=2, etc.). Thevariables ‘paternity leave’and ‘maternityandparental
leave’ are durations of entitlements measured in weeks. Each table presents the results
from the statistical tests for heteroskedasticity and fixed vs. random effects. As
heteroskedasticity ispresent(rejectionofthenullhypothesisoftheWhitetestwithfitted
values) in the majority of regressions, robust standard errors have been included in all
regressions for heteroskedastic-robustness. In cases where theWhite test does not find
heteroskedasticity, the robust standarderrorsactasaconservativemeasure.P-values for
theSargan-Hansentestsandtheresultingestimatorshavealsobeenincluded.
TheEconomicImpactofPaternityLeave SaiMingLiew
33
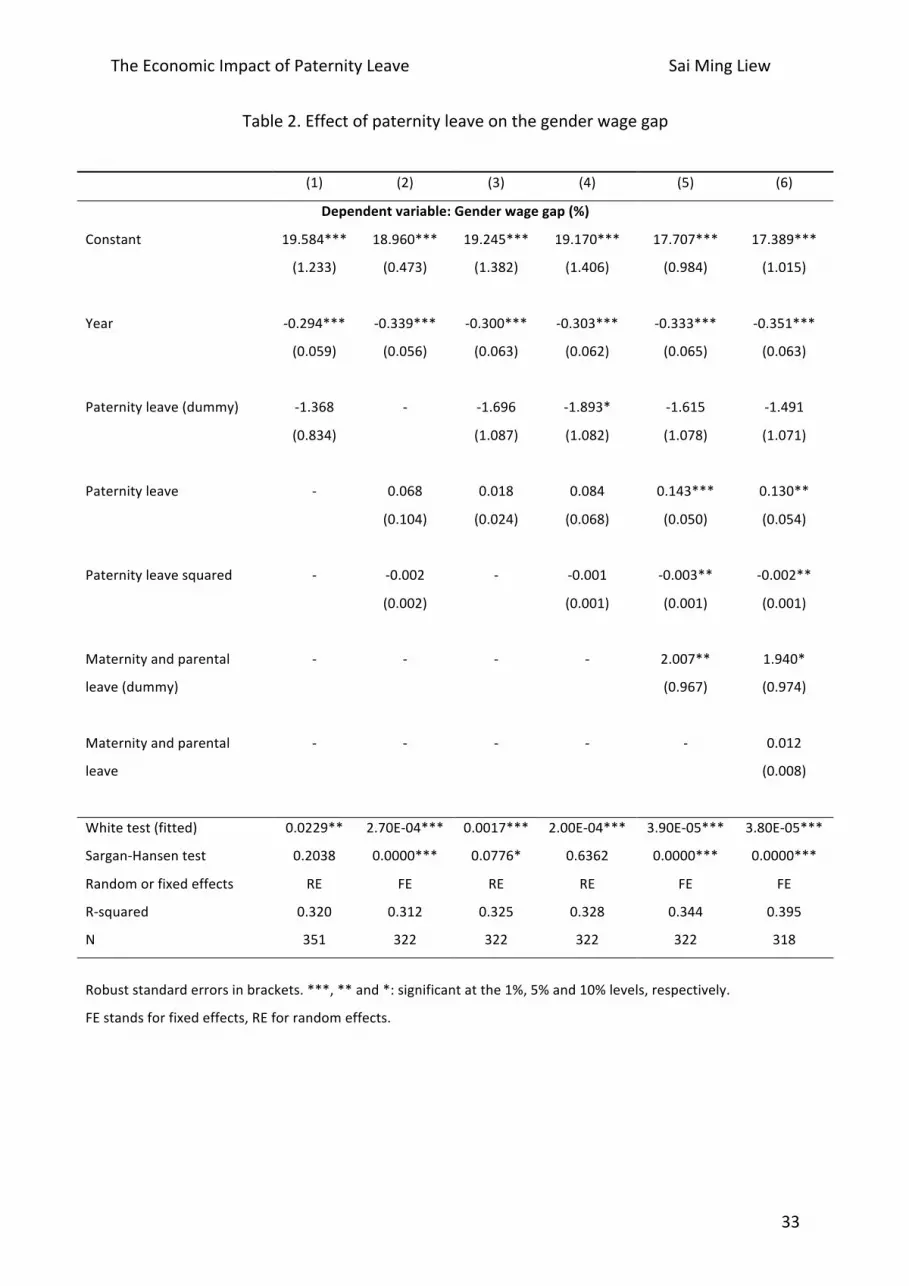
Table2.Effectofpaternityleaveonthegenderwagegap
(1) (2) (3) (4) (5) (6)
Dependentvariable:Genderwagegap(%)
Constant 19.584*** 18.960*** 19.245*** 19.170*** 17.707*** 17.389***
(1.233) (0.473) (1.382) (1.406) (0.984) (1.015)
Year -0.294*** -0.339*** -0.300*** -0.303*** -0.333*** -0.351***
(0.059) (0.056) (0.063) (0.062) (0.065) (0.063)
Paternityleave(dummy) -1.368 - -1.696 -1.893* -1.615 -1.491
(0.834)
(1.087) (1.082) (1.078) (1.071)
Paternityleave - 0.068 0.018 0.084 0.143*** 0.130**
(0.104) (0.024) (0.068) (0.050) (0.054)
Paternityleavesquared - -0.002 - -0.001 -0.003** -0.002**
(0.002)
(0.001) (0.001) (0.001)
Maternityandparental - - - - 2.007** 1.940*
leave(dummy)
(0.967) (0.974)
Maternityandparental - - - - - 0.012
leave
(0.008)
Whitetest(fitted) 0.0229** 2.70E-04*** 0.0017*** 2.00E-04*** 3.90E-05*** 3.80E-05***
Sargan-Hansentest 0.2038 0.0000*** 0.0776* 0.6362 0.0000*** 0.0000***
Randomorfixedeffects RE FE RE RE FE FE
R-squared 0.320 0.312 0.325 0.328 0.344 0.395
N 351 322 322 322 322 318
Robuststandarderrorsinbrackets.***,**and*:significantatthe1%,5%and10%levels,respectively.
FEstandsforfixedeffects,REforrandomeffects.
TheEconomicImpactofPaternityLeave SaiMingLiew
34
Table 2 presents the results obtained for the estimationof the effect of paternity
leaveonthegenderwagegap.Anegativecoefficientonanyoftheindependentvariables
wouldbeviewedasaprogressivesteptowardsequalityas itwouldrepresentaclosurein
thegenderwagegap.
The largest effect of paternity leaveon the genderwagegap is noticeable for the
coefficientofthedummyvariablewhichshowsthat,onaverage,thepresenceofpaternity
leave reduces the gender wage gap by 1.893 percentage points. This is shown to be
statisticallysignificantatthe10%levelinmodel4.Thehumancapitaleffectsareanunlikely
explanationgiven that in this regression, it is thepresenceofpaternity leave, rather than
theduration,thathasthebiggestimpact.Itislikelythatthepaternityleavepolicyhasbeen
enactedalongsideothergenderequality-promotingpolicies.Furthermore,models5and6
present better statistically significant results showing that, on average, each week of
paternity leaveresults ina0.143and0.13percentagepointwideningofthegenderwage
gaprespectively,contradictingthehypothesis.Interestingly,thepresenceofmaternityand
parentalleaveseemstonegatethepositiveimpactofpaternityleave,significantatthe5%
and10%levelsinmodels5and6.
TheEconomicImpactofPaternityLeave SaiMingLiew
35
Table3.Effectofpaternityleaveonnaturallogoffemaleemployment-to-populationratio
(1) (2) (3) (4) (5) (6)
Dependentvariable:naturallogoffemaleemployment-to-populationratio
Constant 4.170*** 4.173*** 4.163*** 4.165*** 4.176*** 4.181***
(0.039) (0.011) (0.042) (0.009) (0.008) (0.009)
Year 0.006*** 0.007*** 0.006*** 0.006*** 0.006*** 0.005***
(0.001) (0.001) (0.002) (0.002) (0.002) (0.001)
Paternityleave(dummy) 0.018 - 0.025 0.024 0.024 0.030**
(0.011)
(0.015) (0.015) (0.015) (0.013)
Paternityleave - -0.003 -0.001 -0.003 -0.003 -0.003
(0.002) (0.000) (0.002) (0.002) (0.002)
Paternityleavesquared - 0.000 - 0.000 0.000 0.000
(0.000)
(0.000) (0.000) (0.000)
Maternityandparental - - - - -0.013 -0.007
leave(dummy)
(0.011) (0.010)
Maternityandparental - - - - - 0.000
leave
(0.000)
Whitetest(fitted) 9.70E-08*** 0.0256** 5.20E-06*** 1.20E-05*** 8.80E-09*** 1.10E-16***
Sargan-Hansentest 0.0782* 0.0004*** 0.1858 0.0026*** 0.0034*** 0.0332***
Randomorfixedeffects RE FE RE FE FE FE
R-squared 0.301 0.308 0.309 0.316 0.318 0.316
N 476 424 424 424 424 410
Robuststandarderrorsinbrackets.***,**and*:significantatthe1%,5%and10%levels,respectively.
FEstandsforfixedeffects,REforrandomeffects.

TheEconomicImpactofPaternityLeave SaiMingLiew
36
Table4.Effectofpaternityleaveonnaturallogofmaleemployment-to-populationratio
(1) (2) (3) (4) (5) (6)
Dependentvariable:naturallogofmaleemployment-to-populationratio
Constant 4.462*** 4.482*** 4.466*** 4.468*** 4.451*** 4.450***
(0.012) (0.011) (0.007) (0.008) (0.009) (0.009)
Year -0.002** -0.002** -0.003*** -0.003*** -0.003*** -0.003***
(0.001) (0.001) (0.001) (0.001) (0.001) (0.001)
Paternityleave(dummy) 0.020* - 0.038*** 0.039*** 0.039*** 0.040***
(0.010)
(0.014) (0.014) (0.014) (0.014)
Paternityleave - -0.001 -0.001* -0.002 -0.002 -0.002
(0.002) (0.000) (0.002) (0.002) (0.002)
Paternityleavesquared - 0.000 - 0.000 0.000 0.000
(0.000)
(0.000) (0.000) (0.000)
Maternityandparental - - - - 0.020* 0.021*
leave(dummy)
(0.010) (0.011)
Maternityandparental - - - - - -0.000
leave
(0.000)
Whitetest(fitted) 0.1828 0.0029*** 0.006*** 0.0038*** 5.20E-04*** 0.002***
Sargan-Hansentest 0.2033 0.0001*** 0.0004*** 0.0000*** 0.0000*** 0.0000***
Randomorfixedeffects RE FE FE FE FE FE
R-squared 0.086 0.110 0.158 0.162 0.169 0.179
N 476 424 424 424 424 410
Robuststandarderrorsinbrackets.***,**and*:significantatthe1%,5%and10%levels,respectively.
FEstandsforfixedeffects,REforrandomeffects.
TheEconomicImpactofPaternityLeave SaiMingLiew
37
Table5.Effectofpaternityleaveonfemale-to-maledifferenceinnaturallogofemployment-to-
populationratio
(1) (2) (3) (4) (5) (6)
Dependentvariable:female-to-maledifferenceinnaturallogofemployment-to-populationratio
Constant -0.290*** -0.309*** -0.307*** -0.304*** -0.275*** -0.269***
(0.008) (0.012) (0.010) (0.010) (0.009) (0.009)
Year 0.008*** 0.009*** 0.009*** 0.009*** 0.010*** 0.009***
(0.002) (0.002) (0.002) (0.002) (0.002) (0.002)
Paternityleave(dummy) -0.007 - -0.016 -0.015 -0.015 -0.010
(0.013)
(0.017) (0.017) (0.017) (0.016)
Paternityleave - -0.002 0.000 -0.001 -0.002 -0.001
(0.002) (0.000) (0.002) (0.002) (0.002)
Paternityleavesquared - 0.000 - 0.000 0.000 0.000
(0.000)
(0.000) (0.000) (0.000)
Maternityandparental - - - - -0.033** -0.028**
leave(dummy)
(0.013) (0.012)
Maternityandparental - - - - - 0.000
leave
(0.000)
Whitetest(fitted) 2.30E-09*** 0.0083*** 5.70E-07*** 9.40E-07*** 1.10E-10*** 3.00E-18***
Sargan-Hansentest 0.0332** 0.0001*** 0.0423** 0.0001*** 0.0002*** 0.0005***
Randomorfixedeffects FE FE FE FE FE FE
R-squared 0.429 0.477 0.478 0.479 0.486 0.487
N 476 424 424 424 424 410
Robuststandarderrorsinbrackets.***,**and*:significantatthe1%,5%and10%levels,respectively.
FEstandsforfixedeffects,REforrandomeffects.

TheEconomicImpactofPaternityLeave SaiMingLiew
38
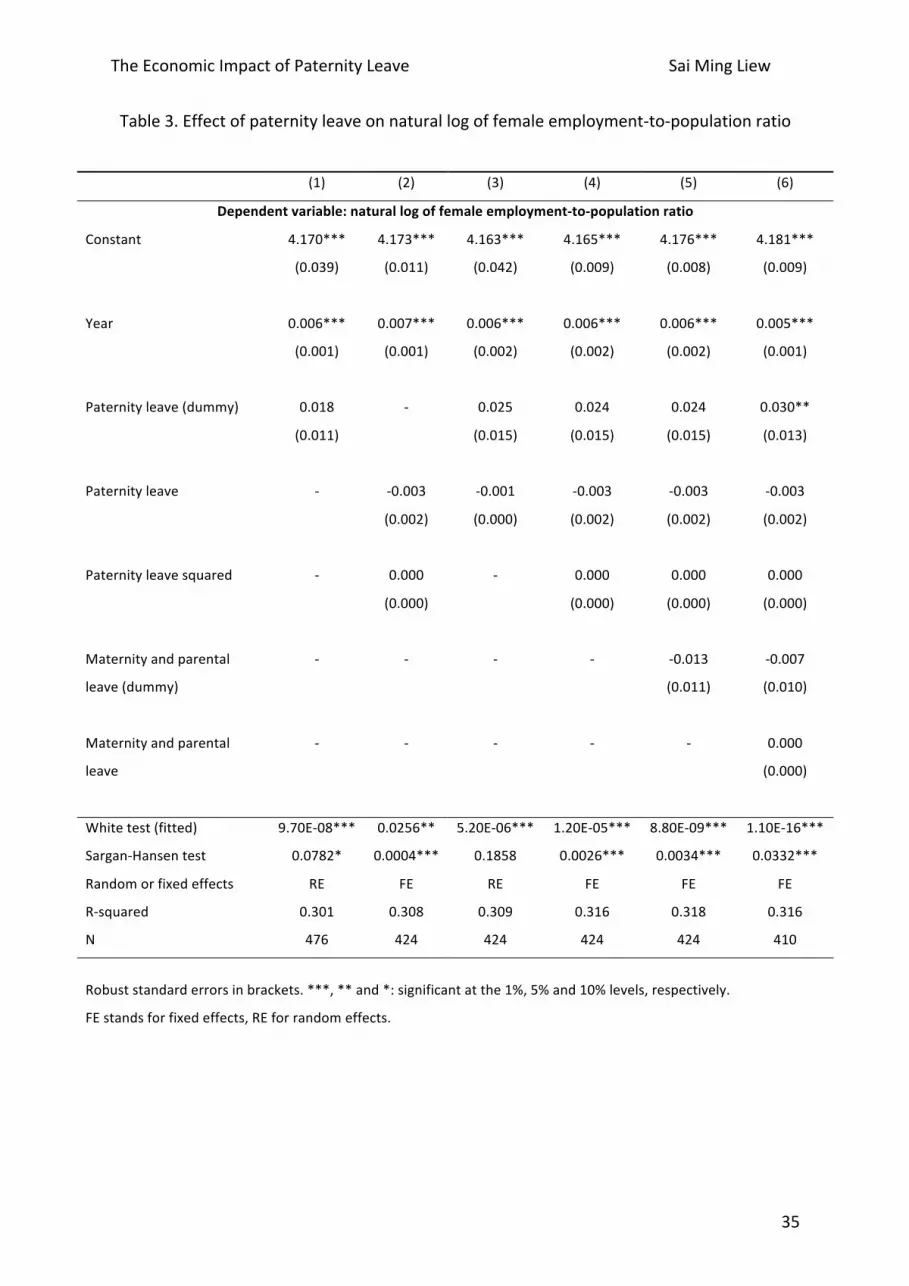
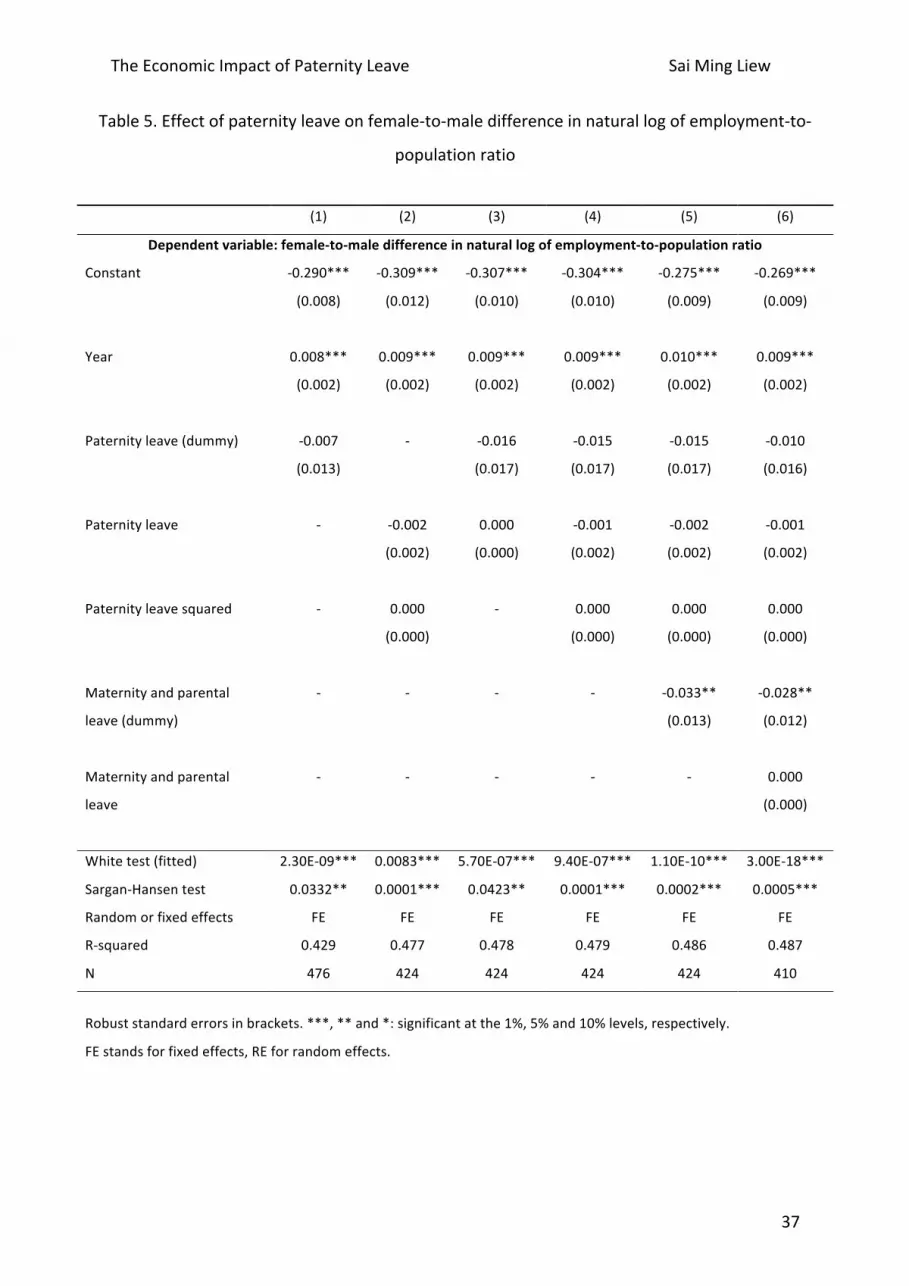
Tables3, 4 and5present the resultsobtained for theestimationsof theeffectof
paternity leaveon the female,maleandgenderdifferences inemployment-to-population
ratios respectively. Positive coefficients on the explanatory variables would indicate
progressionintheemploymentratesformenandwomen(tables3and4)andareduction
in the gap in employment rates (table 5). As the dependent variable uses natural logs,
coefficientsshouldbemultipliedby100togiveitsimpactintermsofpercentage.
Tables 3 and 5 present largely insignificant results with regards to the impact of
paternityleaveontheemployment-to-populationratio.Theexceptiontothisismodel6in
table 3 which shows that, on average, the presence of paternity leave raises female
employmentratesby3%,statisticallysignificantatthe5%level.Fromtable4,thepresence
ofpaternityleaveisfoundtohaveastatisticallysignificantimpactinfiveregressions(fourat
the1%level)onthemaleemployment-to-populationratio.Thegreatestimpactisobserved
inmodel 6 which shows that, on average, the presence of paternity leave improves the
employment-to-populationratioby4%,statistically significantat the1% level.Apotential
justificationfortheresult formaleandfemaleemploymentrateswouldbethatcountries
thathavehigheremploymentratesare likelytobericherandsocanaffordto implement
somelevelofpaternityleavepolicy.

TheEconomicImpactofPaternityLeave SaiMingLiew
39
Table6.Effectofpaternityleaveonnaturallogoffemaleaverageworkinghours
(1) (2) (3) (4) (5) (6)
Dependentvariable:naturallogoffemaleaverageworkinghours
Constant 3.547*** 3.534*** 3.529*** 3.530*** 3.520*** 3.515***
(0.006) (0.005) (0.007) (0.007) (0.007) (0.008)
Year -0.000 -0.000 -0.000 -0.000 -0.000 -0.001
(0.001) (0.000) (0.001) (0.001) (0.001) (0.001)
Paternityleave(dummy) 0.016 - 0.012 0.014 0.014 0.012
(0.011)
(0.012) (0.012) (0.012) (0.014)
Paternityleave - 0.001 0.001*** 0.000 0.000 0.001
(0.002) (0.000) (0.002) (0.002) (0.002)
Paternityleavesquared - -0.000 - 0.000 0.000 -0.000
(0.000)
(0.000) (0.000) (0.000)
Maternityandparental - - - - 0.011** 0.009
leave(dummy)
(0.004) (0.006)
Maternityandparental - - - - - 0.000
leave
(0.000)
Whitetest(fitted) 0.6996 9.60E-06*** 3.60E-06*** 6.10E-05*** 3.10E-06*** 0.0075***
Sargan-Hansentest 0.0000*** 0.0000*** 0.0000*** 0.0000*** 0.0000*** 0.0002***
Randomorfixedeffects FE FE FE FE FE FE
R-squared 0.025 0.034 0.049 0.050 0.057 0.060
N 408 358 358 358 358 358
Robuststandarderrorsinbrackets.***,**and*:significantatthe1%,5%and10%levels,respectively.
FEstandsforfixedeffects,REforrandomeffects.
TheEconomicImpactofPaternityLeave SaiMingLiew
40
Table7.Effectofpaternityleaveonnaturallogofmaleaverageworkinghours
(1) (2) (3) (4) (5) (6)
Dependentvariable:naturallogofmaleaverageworkinghours
Constant 3.727*** 3.730*** 3.722*** 3.722*** 3.719*** 3.713***
(0.007) (0.017) (0.007) (0.007) (0.007) (0.009)
Year -0.002*** -0.002*** -0.002*** -0.002*** -0.002*** -0.002***
(0.001) (0.000) (0.001) (0.001) (0.001) (0.001)
Paternityleave(dummy) 0.014 - 0.013 0.011 0.011 0.008
(0.012)
(0.013) (0.014) (0.014) (0.016)
Paternityleave - 0.002 0.000 0.002 0.002 0.003
(0.001) (0.001) (0.002) (0.002) (0.003)
Paternityleavesquared - -0.000 - -0.000 -0.000 -0.000
(0.000)
(0.000) (0.000) (0.000)
Maternityandparental - - - - 0.003 0.000
leave(dummy)
(0.004) (0.006)
Maternityandparental - - - - - 0.000
leave
(0.000)
Whitetest(fitted) 0.0352** 0.2104 0.0807* 0.1467 0.0253** 0.0029***
Sargan-Hansentest 0.0000*** 0.1238 0.001*** 0.0028*** 0.0001*** 0.0001***
Randomorfixedeffects FE RE FE FE FE FE
R-squared 0.138 0.113 0.117 0.121 0.121 0.126
N 408 358 358 358 358 358
Robuststandarderrorsinbrackets.***,**and*:significantatthe1%,5%and10%levels,respectively.
FEstandsforfixedeffects,REforrandomeffects.

TheEconomicImpactofPaternityLeave SaiMingLiew
41
Table8.Effectofpaternityleaveonfemale-to-maledifferenceinnaturallogofaverageworking
hours
(1) (2) (3) (4) (5) (6)
Dependentvariable:female-to-maledifferenceinnaturallogofaverageworkinghours
Constant -0.180*** -0.191*** -0.193*** -0.192*** -0.199*** -0.198***
(0.006) (0.009) (0.008) (0.008) (0.006) (0.013)
Year 0.002** 0.002*** 0.002** 0.002*** 0.002** 0.002**
(0.001) (0.001) (0.001) (0.001) (0.001) (0.001)
Paternityleave(dummy) 0.002 - -0.001 0.003 0.003 0.004
(0.009)
(0.010) (0.012) (0.012) (0.013)
Paternityleave - -0.001 0.001 -0.001 -0.001 -0.001
(0.002) (0.001) (0.003) (0.003) (0.004)
Paternityleavesquared - 0.000 - 0.000 0.000 0.000
(0.000)
(0.000) (0.000) (0.000)
Maternityandparental - - - - 0.008 0.009
leave(dummy)
(0.005) (0.009)
Maternityandparental - - - - - -0.000
leave
(0.000)
Whitetest(fitted) 0.2961 0.0014*** 0.0017*** 0.0367** 0.1235 7.70E-04***
Sargan-Hansentest 0.0231** 0.0000*** 0.0000*** 0.0000*** 0.0000*** 0.0000***
Randomorfixedeffects FE FE FE FE FE FE
R-squared 0.166 0.201 0.187 0.202 0.207 0.207
N 408 358 358 358 358 358
Robuststandarderrorsinbrackets.***,**and*:significantatthe1%,5%and10%levels,respectively.
FEstandsforfixedeffects,REforrandomeffects.
TheEconomicImpactofPaternityLeave SaiMingLiew
42
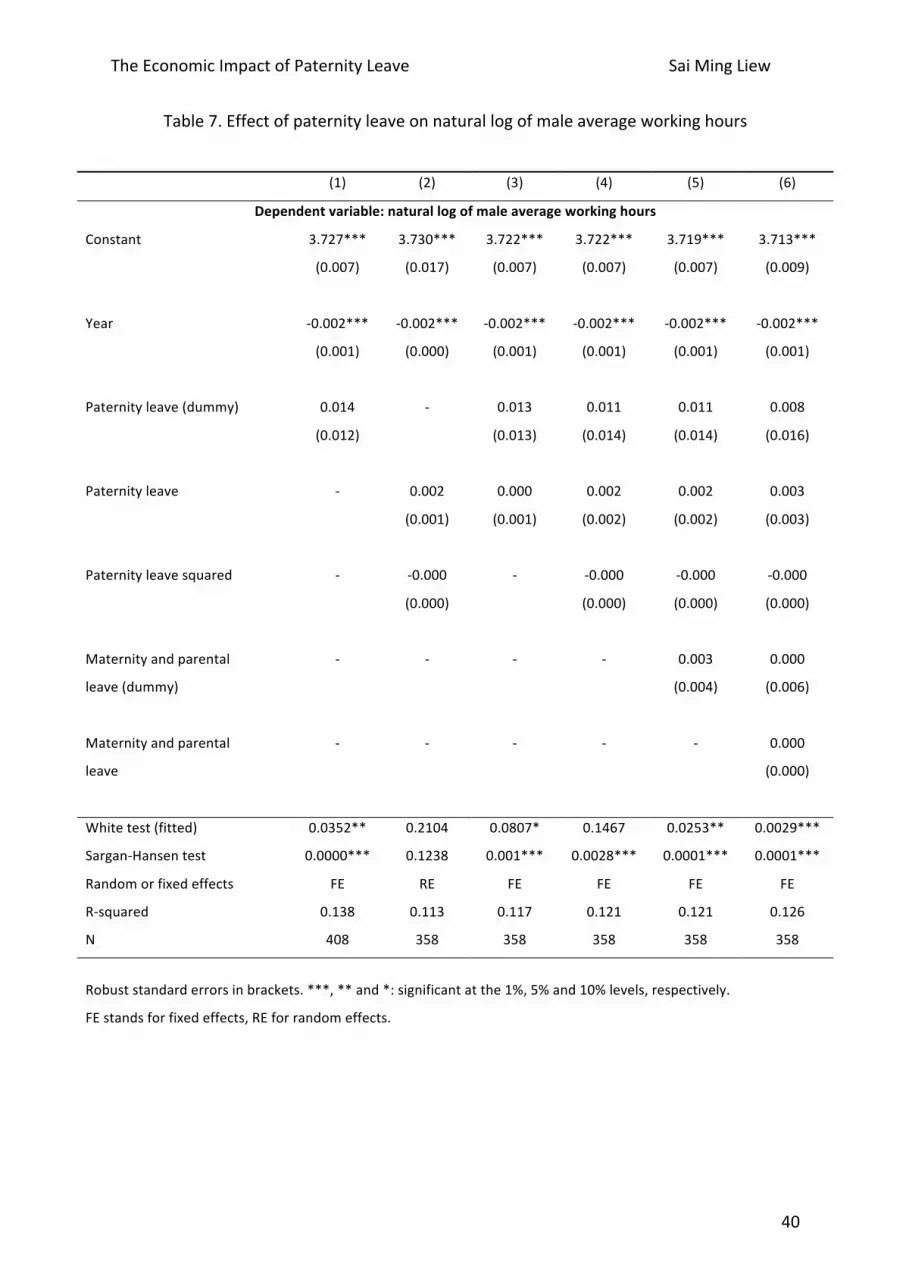
Tables6, 7 and8present the resultsobtained for theestimationsof theeffectof
paternity leave on the female, male and gender differences in average working hours
respectively. Positive coefficients on the explanatory variables would indicate
improvements in theaverageweeklyworkinghours formenandwomen (tables6and7)
and a reduction in the gap in averageweeklyworking hours (table 8). As the dependent
variable uses natural logs, coefficients should be multiplied by 100 to give its impact in
termsofpercentage.
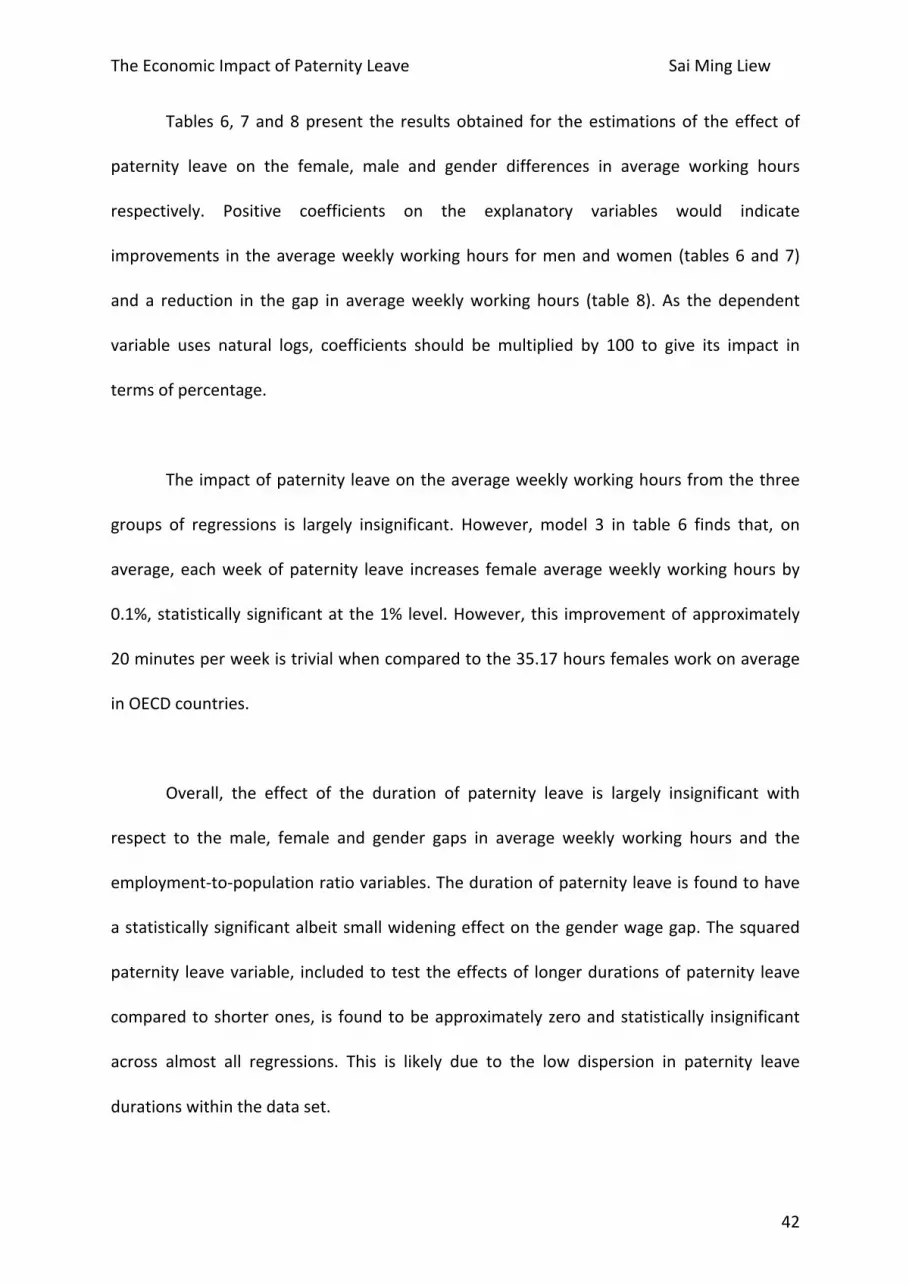
Theimpactofpaternityleaveontheaverageweeklyworkinghoursfromthethree
groups of regressions is largely insignificant. However, model 3 in table 6 finds that, on
average,eachweekofpaternity leave increases femaleaverageweeklyworkinghoursby
0.1%,statisticallysignificantatthe1%level.However, this improvementofapproximately
20minutesperweekistrivialwhencomparedtothe35.17hoursfemalesworkonaverage
inOECDcountries.
Overall, the effect of the duration of paternity leave is largely insignificant with
respect to the male, female and gender gaps in average weekly working hours and the
employment-to-populationratiovariables.Thedurationofpaternityleaveisfoundtohave
astatisticallysignificantalbeitsmallwideningeffectonthegenderwagegap.Thesquared
paternity leavevariable, includedtotesttheeffectsof longerdurationsofpaternity leave
comparedtoshorterones, is foundtobeapproximatelyzeroandstatistically insignificant
across almost all regressions. This is likely due to the low dispersion in paternity leave
durationswithinthedataset.
TheEconomicImpactofPaternityLeave SaiMingLiew
43
Discussion
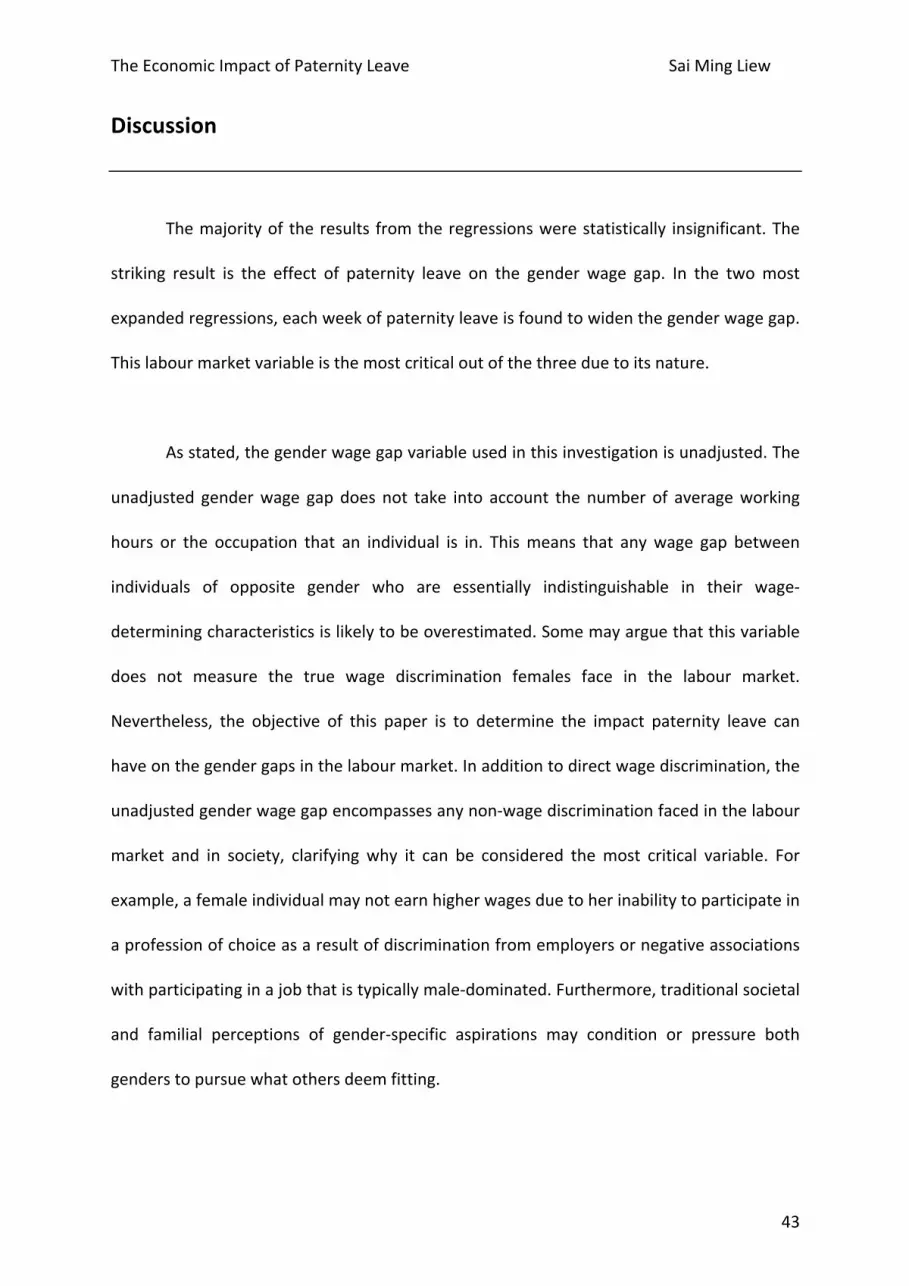
Themajorityof theresults fromtheregressionswerestatistically insignificant.The
striking result is the effect of paternity leave on the gender wage gap. In the twomost
expandedregressions,eachweekofpaternityleaveisfoundtowidenthegenderwagegap.
Thislabourmarketvariableisthemostcriticaloutofthethreeduetoitsnature.
Asstated,thegenderwagegapvariableusedinthisinvestigationisunadjusted.The
unadjusted genderwage gap does not take into account the number of averageworking
hours or the occupation that an individual is in. Thismeans that anywage gap between
individuals of opposite gender who are essentially indistinguishable in their wage-
determiningcharacteristicsislikelytobeoverestimated.Somemayarguethatthisvariable
does not measure the true wage discrimination females face in the labour market.
Nevertheless, the objective of this paper is to determine the impact paternity leave can
haveonthegendergapsinthelabourmarket.Inadditiontodirectwagediscrimination,the
unadjustedgenderwagegapencompassesanynon-wagediscriminationfacedinthelabour
market and in society, clarifying why it can be considered themost critical variable. For
example,afemaleindividualmaynotearnhigherwagesduetoherinabilitytoparticipatein
aprofessionofchoiceasaresultofdiscriminationfromemployersornegativeassociations
withparticipatinginajobthatistypicallymale-dominated.Furthermore,traditionalsocietal
and familial perceptions of gender-specific aspirations may condition or pressure both
genderstopursuewhatothersdeemfitting.

TheEconomicImpactofPaternityLeave SaiMingLiew
44
Duetotheabsenceofgender-specificdata,itisnotpossibletodeducewhetherthe
gendergapwidenswitheachweekofpaternity leaveasa resultof femalewages falling,
male wages rising, or a combination of both outcomes. Taking the more statistically
significant result, implementing the average duration of paternity leave of approximately
nineweekswidens the genderwage gap by 1.26 percentage points. This contradicts the
theory that a significant duration of paternity leave would represent an opportunity for
morebalancedsharingofchildcareandotherhouseholdresponsibilitiesbetweenparents.
More equality in the home could encourage mothers to return to work sooner after
childbirthwhilealsoencouragingthemtoengageinlongerworkinghoursandhigherpaying
occupations than in the case with significantly imbalanced household and child caring
responsibilities.Furthermore,motherswhoreturntoworkquickerloselesshumancapital,
adeterminantofwages,andthussufferasmallerwageloss.Conversely,morebalancingof
non-employment responsibilities and longer absences from work can have the opposite
effectonmen.Combined,theseconsequenceswouldresultinaclosureofthegenderwage
gap.Possibleexplanationsforthisobservedresultandsolutionsarediscussed.
The contradictory result may be due to a misguiding variable. Paternity leave
entitlements may reflect societal behaviours or the government’s objectives for family
policybutpaternity leaveuptake,measuredeitherabsolutelyor relative to the legislated
duration, is likely to be a better direct contributor to closing the gender gaps in labour
marketoutcomes,aspreviouslyhighlighted.Acomparisonof leaveentitlementsdoesnot
capture theeffectof cross-country variationsbetween takeup rates. Japan, for example,
offers the second-most generous father-specific leave entitlement in the OECD, yet only
approximately 2% of employed fathers take advantage of the leave (Nakazato and

TheEconomicImpactofPaternityLeave SaiMingLiew
45
Nishimura,2015). This is likelydue to the invisiblebarriersof societalnormsandculture.
The intergenerational conflict of work-life flexibility and gender roles will take time to
erode.
Giventhenatureofthestudy,i.e.oneongovernmentpolicy,changesinlegislation
maytaketimetorevealitsfulleffects.Becausetheconceptofpaternityleaveisrathernew
(18 out of 30 countries in the OECD had no paternity leave in 2000 but this fell to 8
countriesby2013), uptakeof paternity leavemaybe low in early yearsof adoption.The
labour market may not respond instantaneously to a change in paternity leave policy.
Labourmarketoutcomesformenandwomenmayonlybeaffectedafteranumberofyears.
Lagged values of paternity leave entitlements would be an appropriate addition to the
estimation.ThévenonandSolaz(2013)notedintheirpaperthat“adividepersistsbetween
countriesthatfirstpromotedrightstoparentalleaveinthelate1960sandearly1970s–and
whichstillgrantlongperiodsofpaidleave–andthosethatintroducedsuchrightsfromthe
1980sonwards”,suggestingthatthe14-yeartimeperiodmaynotbe longenoughforthis
investigation. Longer cross-country time-series data may find significant results for the
economicimpactofpaternityleave,potentiallycausedbythesnowballeffectsuggestedby
Dahletal.(2014).
UsingthedataforJapanandKoreaasexamples,theresultsforthegenderwagegap
variablemayalsobeskewed.Suchradicalpaternityleavepolicies(52weeksenactedfrom
zero in 2010 and 2008 respectively) have been enacted to combat the extremely high
genderwagegaps,andpotentiallyotherlargelabourmarketgendergaps.Usingdatafrom
theOECD and proprietary analysis, a report by PwC noted Japan and Korea’s GDP levels

TheEconomicImpactofPaternityLeave SaiMingLiew
46
couldpotentiallygrowby11%and13%respectivelyshouldtheirfemaleemploymentrates
match that of Sweden’s, highlighting the importance of closing these gaps. The slow
adoptionratesupportstheinclusionoflongertime-seriesdataandlaggedvaluesinfuture
investigations.
Future investigations could also focus on the relative values of gender-specific
parentalleave.Followingatwo-weekperiodofabsenceformothers7,anyadditionalleave
couldbecomparedtothatoffathersasaproxyforhowgovernmentsandbusinessesview
genderroles inparenting.Thisvariablecouldalsoprovidesome indicationabouthowthe
gendergapsinpolicyaffectthegendergapsinthelabourmarket.
Bytakingacross-countryapproachtotheinvestigation,thediversityandcomplexity
among parental leave systems are not considered. In some countries, state and local
governments provide alternative leave and financial entitlements, such as the
aforementioned CA-PFL. Moreover, by using the macro-level approach and a model
proposedbyThévenonandSolaz (2013), the independentvariables in theregressionsare
ratherdifferenttothosethattaketheconventionalmicro-levelapproach.Forexample,the
regressions do not include any other variables that would typically be a determinant of
wages, such as the level of education. This underspecification would result in omitted
variable bias, resulting in biased coefficients and variances. Ultimately, any hypothesis
testingwouldbeinvalidated.Futureinvestigationsshouldincludeanymacro-levelvariables
that influence the outcomes any of the three labour market variables alongside any
paternityleavevariables.
7MandatorymaternityleaveistwoweeksintheUK,assuminglyforpost-childbirthrecovery.

TheEconomicImpactofPaternityLeave SaiMingLiew
47
It iswidelyknownthat theNordiccountrieshavesomeof the lowestgendergaps
andsomeofthemostgenerousfamilypolicies.Aproblemfacedinthispaperisdetermining
thedirectionofcausality.Theself-reinforcingcircleofalackoffamily-friendlypoliciesand
largegendergapsinthelabourmarketcouldbehypothesised.Policiesthatdonotpromote
gender equality tend to lead to traditional outcomes for men and women. Conversely,
countrieswithtraditionalfamilyperceptionsmaynotunderstandthenegativeimplications
ofgender inequality inthelabourmarketorhavemyopicviewsofthecostsof legislation,
and so do not enact such policies. Political or ideological stances may explain why, for
example,theUS,despiteDepartmentofLaboursupport,hasnotenactedmaternityleave,
let alone paternity leave. Moreover, the case for a self-reinforcing circle between the
genderwagegapand theuptakeofpaternity leavecanalsobeargued.A smallergender
wage gap would mean a lower cost to families if fathers, typically higher earners, take
unpaidorfractionallypaidpaternityleave.Breakingthiscyclecouldresultinimprovements
in gender-balanced household responsibilities in the future, further contributing to the
closure inthegendergaps inthelabourmarketandpotentiallypaternity leaveuptakefor
future children. These cycles would suggest that a change in mindset is necessary. The
existence of these perceptions were highlighted in a recent survey conducted by the
International Social Survey Programme (shown in appendix section D). The survey asked
respondentstoconsiderafull-timeemployedcouple,both insimilarworksituations,who
haveanewbornchild.Withbothparentseligibleforleave,thesurveyaskedhowthepaid
leaveshouldbedivided.63%ofrespondentsfeltthatthemothershouldtakemost, ifnot
all, of the leave available. This figure may be higher in practice. Changing mindsets of
societies, governments and businesses is needed to break these cycles and progress
towardsequality.
TheEconomicImpactofPaternityLeave SaiMingLiew
48
Conclusion
Theobjectiveofthisdissertationwastodeterminetheeconomicimpactofpaternity
leave legislation. The examination of the impact of father-specific leave entitlements on
three labour market variables stems from the claims made about improvements in
employmentandwagesofwomenmadebytheUSDepartmentofLabourinapolicybrief
on paternity leave. This study builds upon the existing literature, forwhichmost authors
take a micro-level approach, by taking a macro-level approach, looking at the OECD
countriesinparticular.Themostrecentstudythatcloselymatchesthisdissertationisthat
by Thévenon and Solaz (2013). Thévenon and Solaz (2013) looked at the labour market
effectsofmaternityandparentalleavepoliciesinOECDcountries.Thisdissertationtakesan
unprecedentedanglebylookingattheeffectsoffather-specificleaveinstead.
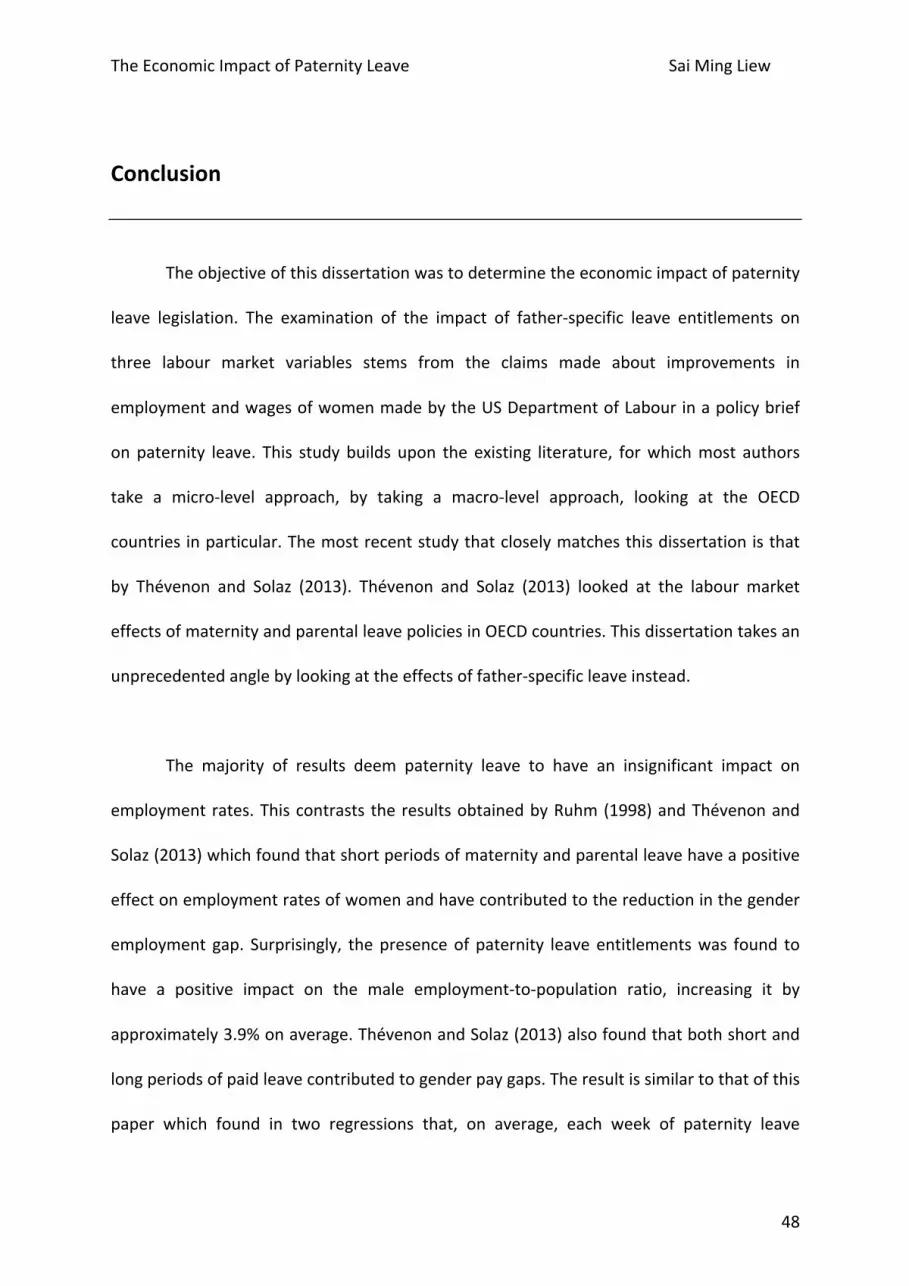
The majority of results deem paternity leave to have an insignificant impact on
employmentrates.Thiscontrasts theresultsobtainedbyRuhm(1998)andThévenonand
Solaz(2013)whichfoundthatshortperiodsofmaternityandparentalleavehaveapositive
effectonemploymentratesofwomenandhavecontributedtothereductioninthegender
employment gap. Surprisingly, thepresenceof paternity leaveentitlementswas found to
have a positive impact on the male employment-to-population ratio, increasing it by
approximately3.9%onaverage.ThévenonandSolaz(2013)alsofoundthatbothshortand
longperiodsofpaidleavecontributedtogenderpaygaps.Theresultissimilartothatofthis
paper which found in two regressions that, on average, each week of paternity leave
TheEconomicImpactofPaternityLeave SaiMingLiew
49
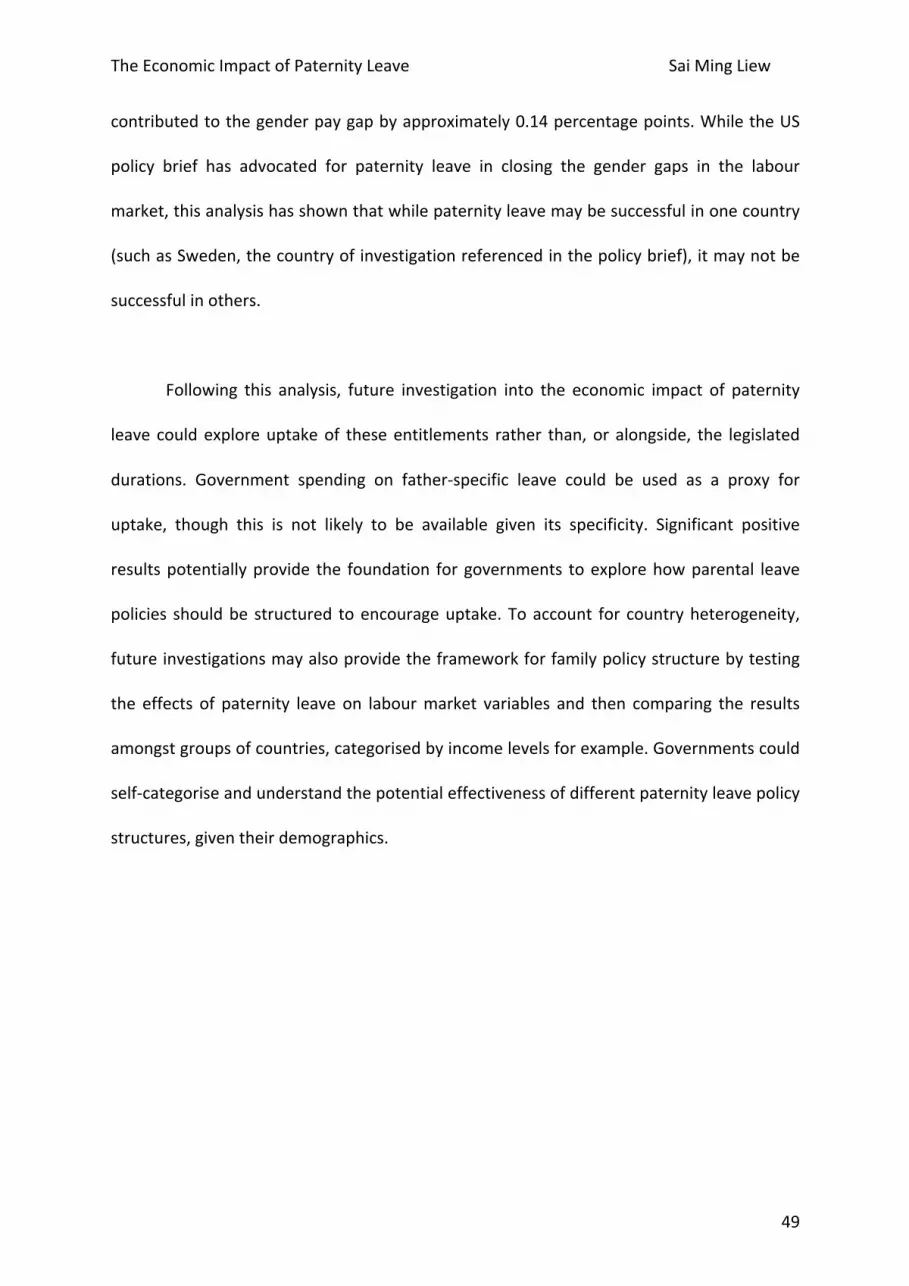
contributedtothegenderpaygapbyapproximately0.14percentagepoints.WhiletheUS
policy brief has advocated for paternity leave in closing the gender gaps in the labour
market,thisanalysishasshownthatwhilepaternityleavemaybesuccessfulinonecountry
(suchasSweden,thecountryofinvestigationreferencedinthepolicybrief),itmaynotbe
successfulinothers.
Following this analysis, future investigation into the economic impact of paternity
leave couldexploreuptakeof theseentitlements rather than,or alongside, the legislated
durations. Government spending on father-specific leave could be used as a proxy for
uptake, though this is not likely to be available given its specificity. Significant positive
resultspotentiallyprovide the foundation forgovernments toexplorehowparental leave
policies shouldbe structured toencourageuptake.Toaccount for countryheterogeneity,
futureinvestigationsmayalsoprovidetheframeworkforfamilypolicystructurebytesting
the effects of paternity leave on labourmarket variables and then comparing the results
amongstgroupsofcountries,categorisedbyincomelevelsforexample.Governmentscould
self-categoriseandunderstandthepotentialeffectivenessofdifferentpaternityleavepolicy
structures,giventheirdemographics.
TheEconomicImpactofPaternityLeave SaiMingLiew
50
References
Bartel,A.etal.,2015.PaidfamilyLeave,Fathers’Leave-Taking,andLeave-SharinginDual-
EarnerHouseholds.NBERWorkingPaper,1,pp.1–41.
Coltrane,S.etal.,2013.FathersandtheFlexibilityStigma.JournalofSocialIssues,69(2),
pp.279–302.
Dahl,G.B.,Løken,K.V.&Mogstad,M.,2014.Peereffectsinprogramparticipation.
AmericanEconomicReview,104(7),pp.2049–2074.
DattaGupta,N.,Smith,N.&Verner,M.,2008.PerspectiveArticle:TheimpactofNordic
countries’familyfriendlypoliciesonemployment,wages,andchildren.Reviewof
EconomicsoftheHousehold,6(1),pp.65–89.
Galinsky,E.,Aumann,K.&Bond,J.T.,2011.2008NationalStudyoftheChangingWorkforce,
InternationalLabourOffice,2014.Maternityandpaternityatwork:Lawandpracticeacross
theworld,Geneva.
Johansson,E.-A.,2010.Theeffectofownandspousalparentalleaveonearnings.IFAU-
InstituteforLabourMarketPolicyEvaluation.
Lundberg,S.&Pollak,R.A.,2007.TheAmericanFamilyandFamilyEconomics.National
BureauofEconomicResearch,53,p.160.
Matzner-Heruti,I.,1998.Allyouneedisleave?Rethinkingtheconceptofpaternityleave.
CardozoJournalofLaw&Gender,21(475),pp.475–498.
Mincer,J.&Polachek,S.,1974.FamilyInvestmentsinHumanCapital:EarningsofWomen.
JournalofPoliticalEconomy,82(2).
Nakazato,H.andNishimura,J.,2015.‘Japancountrynote’,in:P.Moss(ed.)

TheEconomicImpactofPaternityLeave SaiMingLiew
51
International Review of Leave Policies and Research 2014. Available at:
http://www.leavenetwork.org/lp_and_r_reports/
Nepomnyaschy,L.&Waldfogel,J.,2007.PaternityLeaveandFathers’InvolvementWith
TheirYoungChildren.Community,Work&Family,10(4),pp.427–453.
PwC,InternationalWomen’sDay.WomeninWorkIndex.March,2016.
Rudman,L.A.&Mescher,K.,2013.PenalizingMenWhoRequestaFamilyLeave:IsFlexibility
StigmaaFemininityStigma?,pp.1–33.
Thévenon,O.&Solaz,A.,2013.LabourMarketEffectsofParentalLeavePoliciesinOECD
Countries.(141).
Woetzel,J.etal.,2015.ThePowerofParity:HowAdvancingWomen'sEqualityCanAdd$12
trilliontoGlobalGrowth.McKinseyGlobalInstitute.September,2015.
Wooldridge,J.M.,2010.Econometricanalysisofcrosssectionandpaneldata.MITpress.
US Department of Labour,Why Parental Leave For Fathers Is So Important ForWorking
Families.DepartmentofLabourPolicyBrief.
TheEconomicImpactofPaternityLeave SaiMingLiew
52
AppendixSectionA:Trendsindurationofpaternityleave
0
0.5
1
1.5
2
2.5
2000
2001
2002
2003
2004
2005
2006
2007
2008
2009
2010
2011
2012
2013
Paternity
leave(w
eeks)
Year
Australia
0
5
10
15
20
25
30
2000
2001
2002
2003
2004
2005
2006
2007
2008
2009
2010
2011
2012
2013
Paternity
leave(w
eeks)
Year
Austria
0
5
10
15
20
25
2000
2001
2002
2003
2004
2005
2006
2007
2008
2009
2010
2011
2012
2013Pa
ternity
leave(w
eeks)
Year
Belgium
0
0.2
0.4
0.6
0.8
1
2000
2001
2002
2003
2004
2005
2006
2007
2008
2009
2010
2011
2012
2013Pa
ternity
leave(w
eeks)
Year
Canada
0
0.2
0.4
0.6
0.8
1
2000
2001
2002
2003
2004
2005
2006
2007
2008
2009
2010
2011
2012
2013Pa
ternity
leave(w
eeks)
Year
CzechRepublic
0
5
10
15
20
2000
2001
2002
2003
2004
2005
2006
2007
2008
2009
2010
2011
2012
2013Pa
ternity
leave(w
eeks)
Year
Denmark

TheEconomicImpactofPaternityLeave SaiMingLiew
53
0
2
4
6
8
10
2000
2001
2002
2003
2004
2005
2006
2007
2008
2009
2010
2011
2012
2013
Paternity
leave(w
eeks)
Year
Finland
00.51
1.52
2.5
2000
2001
2002
2003
2004
2005
2006
2007
2008
2009
2010
2011
2012
2013
Paternity
leave(w
eeks)
Year
France
0
0.1
0.2
0.3
0.4
0.5
2000
2001
2002
2003
2004
2005
2006
2007
2008
2009
2010
2011
2012
2013
Paternity
leave(w
eeks)
Year
Greece
00.20.40.60.81
1.2
2000
2001
2002
2003
2004
2005
2006
2007
2008
2009
2010
2011
2012
2013Pa
ternity
leave(w
eeks)
Year
Hungary
02468101214
2000
2001
2002
2003
2004
2005
2006
2007
2008
2009
2010
2011
2012
2013Pa
ternity
leave(w
eeks)
Year
Iceland
0
2
4
6
8
10
2000
2001
2002
2003
2004
2005
2006
2007
2008
2009
2010
2011
2012
2013Paternity
leave(w
eeks)
Year
Germany

TheEconomicImpactofPaternityLeave SaiMingLiew
54
00.20.40.60.81
1.2
2000
2001
2002
2003
2004
2005
2006
2007
2008
2009
2010
2011
2012
2013Pa
ternity
leave(w
eeks)
Year
Mexico
0102030405060
2000
2001
2002
2003
2004
2005
2006
2007
2008
2009
2010
2011
2012
2013Pa
ternity
leave(w
eeks)
Year
Korea
0102030405060
2000
2001
2002
2003
2004
2005
2006
2007
2008
2009
2010
2011
2012
2013Pa
ternity
leave(w
eeks)
Year
Japan
051015202530
2000
2001
2002
2003
2004
2005
2006
2007
2008
2009
2010
2011
2012
2013Pa
ternity
leave(w
eeks)
Year
Luxembourg
0
0.2
0.4
0.6
0.8
1
2000
2001
2002
2003
2004
2005
2006
2007
2008
2009
2010
2011
2012
2013
Paternity
leave(w
eeks)
Year
Ireland
17.217.2517.317.3517.417.4517.517.55
2000
2001
2002
2003
2004
2005
2006
2007
2008
2009
2010
2011
2012
2013Pa
ternity
leave(w
eeks)
Year
Italy

TheEconomicImpactofPaternityLeave SaiMingLiew
55
0
5
10
15
20
25
2000
2001
2002
2003
2004
2005
2006
2007
2008
2009
2010
2011
2012
2013Pa
ternity
leave(w
eeks)
Year
Portugal
00.050.10.150.20.250.30.35
2000
2001
2002
2003
2004
2005
2006
2007
2008
2009
2010
2011
2012
2013
Paternity
leave(w
eeks)
Year
Netherlands
0
0.5
1
1.5
2
2.52000
2001
2002
2003
2004
2005
2006
2007
2008
2009
2010
2011
2012
2013Pa
ternity
leave(w
eeks)
Year
Poland
0
0.2
0.4
0.6
0.8
1
2000
2001
2002
2003
2004
2005
2006
2007
2008
2009
2010
2011
2012
2013Pa
ternity
leave(w
eeks)
Year
NewZealand
02468101214
2000
2001
2002
2003
2004
2005
2006
2007
2008
2009
2010
2011
2012
2013Pa
ternity
leave(w
eeks)
Year
Norway
0
0.2
0.4
0.6
0.8
1
2000
2001
2002
2003
2004
2005
2006
2007
2008
2009
2010
2011
2012
2013Pa
ternity
leave(w
eeks)
Year
SlovakRepublic
TheEconomicImpactofPaternityLeave SaiMingLiew
56
0
0.5
1
1.5
2
2.52000
2001
2002
2003
2004
2005
2006
2007
2008
2009
2010
2011
2012
2013Pa
ternity
leave(w
eeks)
Year
Spain
0
0.2
0.4
0.6
0.8
1
2000
2001
2002
2003
2004
2005
2006
2007
2008
2009
2010
2011
2012
2013
Paternity
leave(w
eeks)
Year
Turkey
0
2
4
6
8
10
12
2000
2001
2002
2003
2004
2005
2006
2007
2008
2009
2010
2011
2012
2013
Paternity
leave(w
eeks)
Year
Sweden
0
0.5
1
1.5
2
2.5
2000
2001
2002
2003
2004
2005
2006
2007
2008
2009
2010
2011
2012
2013Pa
ternity
leave(w
eeks)
Year
UnitedKingdom
0
0.2
0.4
0.6
0.8
1
2000
2001
2002
2003
2004
2005
2006
2007
2008
2009
2010
2011
2012
2013Pa
ternity
leave(w
eeks)
Year
UnitedStates
0
0.2
0.4
0.6
0.8
1
2000
2001
2002
2003
2004
2005
2006
2007
2008
2009
2010
2011
2012
2013Pa
ternity
leave(w
eeks)
Year
Switzerland
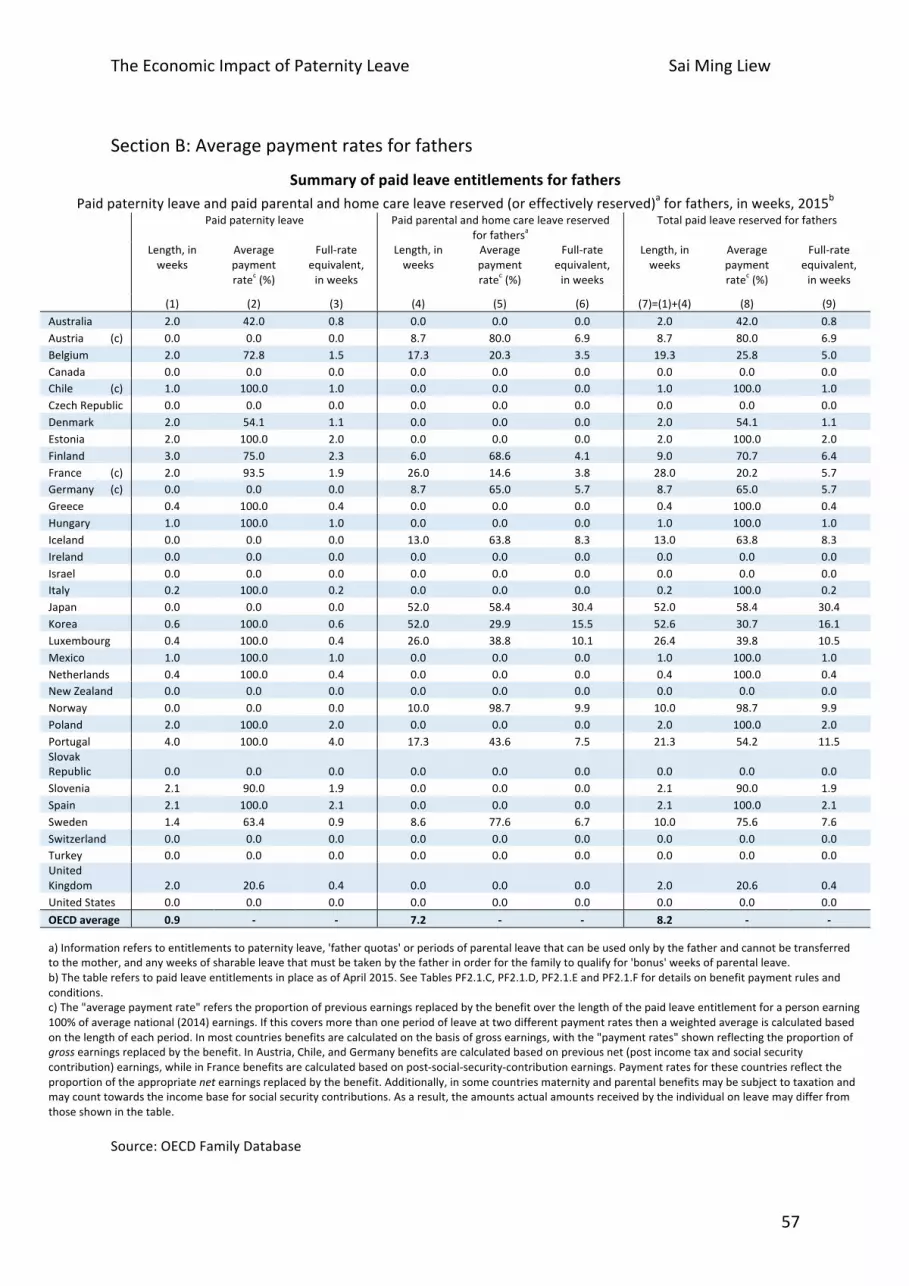
TheEconomicImpactofPaternityLeave SaiMingLiew
57
SectionB:Averagepaymentratesforfathers
SummaryofpaidleaveentitlementsforfathersPaidpaternityleaveandpaidparentalandhomecareleavereserved(oreffectivelyreserved)aforfathers,inweeks,2015b
Paidpaternityleave Paidparentalandhomecareleavereserved
forfathersaTotalpaidleavereservedforfathers
Length,inweeks
Averagepaymentratec(%)
Full-rateequivalent,inweeks
Length,inweeks
Averagepaymentratec(%)
Full-rateequivalent,inweeks
Length,inweeks
Averagepaymentratec(%)
Full-rateequivalent,inweeks
(1) (2) (3) (4) (5) (6) (7)=(1)+(4) (8) (9)Australia 2.0 42.0 0.8 0.0 0.0 0.0 2.0 42.0 0.8Austria (c) 0.0 0.0 0.0 8.7 80.0 6.9 8.7 80.0 6.9Belgium 2.0 72.8 1.5 17.3 20.3 3.5 19.3 25.8 5.0Canada 0.0 0.0 0.0 0.0 0.0 0.0 0.0 0.0 0.0Chile (c) 1.0 100.0 1.0 0.0 0.0 0.0 1.0 100.0 1.0CzechRepublic 0.0 0.0 0.0 0.0 0.0 0.0 0.0 0.0 0.0Denmark 2.0 54.1 1.1 0.0 0.0 0.0 2.0 54.1 1.1Estonia 2.0 100.0 2.0 0.0 0.0 0.0 2.0 100.0 2.0Finland 3.0 75.0 2.3 6.0 68.6 4.1 9.0 70.7 6.4France (c) 2.0 93.5 1.9 26.0 14.6 3.8 28.0 20.2 5.7Germany (c) 0.0 0.0 0.0 8.7 65.0 5.7 8.7 65.0 5.7Greece 0.4 100.0 0.4 0.0 0.0 0.0 0.4 100.0 0.4Hungary 1.0 100.0 1.0 0.0 0.0 0.0 1.0 100.0 1.0Iceland 0.0 0.0 0.0 13.0 63.8 8.3 13.0 63.8 8.3Ireland 0.0 0.0 0.0 0.0 0.0 0.0 0.0 0.0 0.0Israel
0.0 0.0 0.0 0.0 0.0 0.0 0.0 0.0 0.0
Italy 0.2 100.0 0.2 0.0 0.0 0.0 0.2 100.0 0.2Japan 0.0 0.0 0.0 52.0 58.4 30.4 52.0 58.4 30.4Korea 0.6 100.0 0.6 52.0 29.9 15.5 52.6 30.7 16.1Luxembourg 0.4 100.0 0.4 26.0 38.8 10.1 26.4 39.8 10.5Mexico 1.0 100.0 1.0 0.0 0.0 0.0 1.0 100.0 1.0Netherlands 0.4 100.0 0.4 0.0 0.0 0.0 0.4 100.0 0.4NewZealand 0.0 0.0 0.0 0.0 0.0 0.0 0.0 0.0 0.0Norway 0.0 0.0 0.0 10.0 98.7 9.9 10.0 98.7 9.9Poland 2.0 100.0 2.0 0.0 0.0 0.0 2.0 100.0 2.0Portugal 4.0 100.0 4.0 17.3 43.6 7.5 21.3 54.2 11.5SlovakRepublic 0.0 0.0 0.0 0.0 0.0 0.0 0.0 0.0 0.0Slovenia 2.1 90.0 1.9 0.0 0.0 0.0 2.1 90.0 1.9Spain 2.1 100.0 2.1 0.0 0.0 0.0 2.1 100.0 2.1Sweden 1.4 63.4 0.9 8.6 77.6 6.7 10.0 75.6 7.6Switzerland 0.0 0.0 0.0 0.0 0.0 0.0 0.0 0.0 0.0Turkey 0.0 0.0 0.0 0.0 0.0 0.0 0.0 0.0 0.0UnitedKingdom 2.0 20.6 0.4 0.0 0.0 0.0 2.0 20.6 0.4UnitedStates 0.0 0.0 0.0 0.0 0.0 0.0 0.0 0.0 0.0OECDaverage 0.9 - - 7.2 - - 8.2 - -
a)Informationreferstoentitlementstopaternityleave,'fatherquotas'orperiodsofparentalleavethatcanbeusedonlybythefatherandcannotbetransferredtothemother,andanyweeksofsharableleavethatmustbetakenbythefatherinorderforthefamilytoqualifyfor'bonus'weeksofparentalleave.b)ThetablereferstopaidleaveentitlementsinplaceasofApril2015.SeeTablesPF2.1.C,PF2.1.D,PF2.1.EandPF2.1.Ffordetailsonbenefitpaymentrulesandconditions.c)The"averagepaymentrate"referstheproportionofpreviousearningsreplacedbythebenefitoverthelengthofthepaidleaveentitlementforapersonearning100%ofaveragenational(2014)earnings.Ifthiscoversmorethanoneperiodofleaveattwodifferentpaymentratesthenaweightedaverageiscalculatedbasedonthelengthofeachperiod.Inmostcountriesbenefitsarecalculatedonthebasisofgrossearnings,withthe"paymentrates"shownreflectingtheproportionofgrossearningsreplacedbythebenefit.InAustria,Chile,andGermanybenefitsarecalculatedbasedonpreviousnet(postincometaxandsocialsecuritycontribution)earnings,whileinFrancebenefitsarecalculatedbasedonpost-social-security-contributionearnings.Paymentratesforthesecountriesreflecttheproportionoftheappropriatenetearningsreplacedbythebenefit.Additionally,insomecountriesmaternityandparentalbenefitsmaybesubjecttotaxationandmaycounttowardstheincomebaseforsocialsecuritycontributions.Asaresult,theamountsactualamountsreceivedbytheindividualonleavemaydifferfromthoseshowninthetable.
Source:OECDFamilyDatabase

TheEconomicImpactofPaternityLeave SaiMingLiew
58
SectionC:Meanageofwomenatbirth
Meanageofwomenatbirth,1970,1995and2014a
a)Data forCanadaandMexico refer to2011, forChile to2012, and forAustralia, Israel, Japan,Korea,NewZealand, the
UnitedStates,theRussianFederationandCostaRicareferto2013
b)Thestatisticaldata for Israelaresuppliedbyandunder the responsibilityof the relevant Israeliauthorities.Theuseof
suchdatabytheOECDiswithoutprejudicetothestatusoftheGolanHeights,EastJerusalemandIsraelisettlementsinthe
WestBankunderthetermsofinternationallaw.
c)FootnotebyTurkey:The information inthisdocumentwithreferenceto«Cyprus»relatestothesouthernpartof the
Island.ThereisnosingleauthorityrepresentingbothTurkishandGreekCypriotpeopleontheIsland.Turkeyrecognizesthe
Turkish Republic of Northern Cyprus (TRNC). Until a lasting and equitable solution is foundwithin the context of United
Nations,Turkeyshallpreserveitspositionconcerningthe“Cyprusissue”;
d)FootnotebyalltheEuropeanUnionMemberStatesoftheOECDandtheEuropeanCommission:TheRepublicofCyprusis
recognizedbyallmembersoftheUnitedNationswiththeexceptionofTurkey.Theinformationinthisdocumentrelatesto
theareaundertheeffectivecontroloftheGovernmentoftheRepublicofCyprus.
Source:OECDFamilyDatabase

TheEconomicImpactofPaternityLeave SaiMingLiew
59
SectionD:Parentalleaveuptake
Usersofpaidparentalleave
Recipients/usersofpublicly-administeredparentalleavebenefitsorpublicly-administeredpaidparentalleavea,bygender,2013b
a)Data refer to recipients/users of publicly-administeredparental leavebenefits or publicly-administeredpaid parental leave, anddonot includeusers ofmaternityorpaternityleaveunlessthecountryinquestiondoesnotmakeadistinctionbetweenthedifferentleaves(e.g.Iceland,Portugal).DataforBelgiumandKorea refer to users of statutory paid parental leave (or equivalent). For Korea, data cover private sector employees only.Data forAustralia, Austria,Canada, the Czech Republic, Denmark, Estonia, Finland,Germany, Iceland, Italy, Luxembourg,Norway, Poland and Sweden refer to recipients of statutoryparental leave benefits (or equivalent). For Australia, data refer to recipients of 'Parental Leave Pay' only. For Austria, data refer to recipients of'Kinderbetreuungsgeld'(childcareallowance).ForDenmark,datarefertorecipientsofbenefitsforthe32week'commonleave'periodonly.ForFinland,datarefertothemaleshareofrecipientsoftheparentalallowanceonly,anddonotincluderecipientsofthepaternityallowance(eitherthatavailableduringoraftertheparental leaveperiod).ForFrance,datarefertorecipientsofCLCA(Complémentdelibrechoixd’activité).ForGermany,datarefertorecipientsof'Elterngeld' (parental allowance) for those with children born in the given year. For Iceland, data refer to recipients of any benefits in relation tomaternity/paternity (i.e.benefitspaidduringeitherthemotheror father-quotaorduringthesharableperiodofparental leave).ForPortugal,datarefertorecipientsofbenefitsfor 'InitialParentalLeave'only. Inallcasesdatareferonlytothoseusingstatutoryschemesanddonot includeindividual'susingonlyemployer-providedparentalleaveorparentalleavepay.
b)DataforAustraliareferto2012-13,forBelgiumto2012,forFranceto2011,andforKoreaandPolandto2014
0
50
100
150
200
250
300
350
400
Users/recipientsper100livebirths
PanelA.Recipients/usersofpublicly-administeredparentalleavebenefitsorpublicly-administeredpaidparentalleaveaper100livebirths
Men Women
0102030405060708090
100
Share of users/recipients (%)
Panel B. Gender distribution of recipients/users of publicly-administered parental leave benefits or publicly-administered paid parental leavea
Men Women
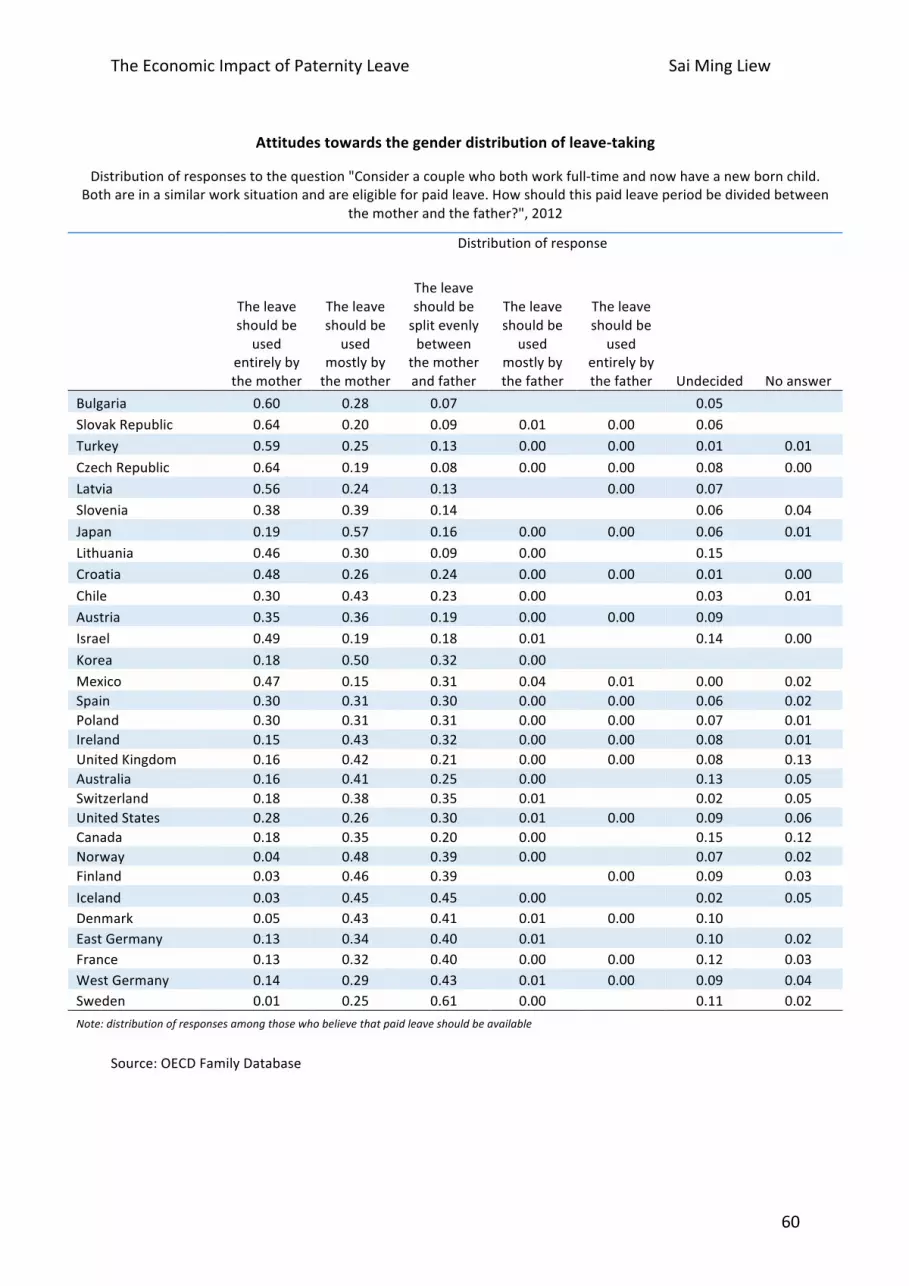
TheEconomicImpactofPaternityLeave SaiMingLiew
60
Attitudestowardsthegenderdistributionofleave-taking
Distributionofresponsestothequestion"Consideracouplewhobothworkfull-timeandnowhaveanewbornchild.Bothareinasimilarworksituationandareeligibleforpaidleave.Howshouldthispaidleaveperiodbedividedbetween
themotherandthefather?",2012
Distributionofresponse
Theleaveshouldbe
usedentirelybythemother
Theleaveshouldbe
usedmostlybythemother
Theleaveshouldbesplitevenlybetween
themotherandfather
Theleaveshouldbe
usedmostlybythefather
Theleaveshouldbe
usedentirelybythefather Undecided Noanswer
Bulgaria 0.60 0.28 0.07 0.05 SlovakRepublic 0.64 0.20 0.09 0.01 0.00 0.06 Turkey 0.59 0.25 0.13 0.00 0.00 0.01 0.01CzechRepublic 0.64 0.19 0.08 0.00 0.00 0.08 0.00Latvia 0.56 0.24 0.13 0.00 0.07 Slovenia 0.38 0.39 0.14 0.06 0.04Japan 0.19 0.57 0.16 0.00 0.00 0.06 0.01Lithuania 0.46 0.30 0.09 0.00 0.15 Croatia 0.48 0.26 0.24 0.00 0.00 0.01 0.00Chile 0.30 0.43 0.23 0.00 0.03 0.01Austria 0.35 0.36 0.19 0.00 0.00 0.09 Israel 0.49 0.19 0.18 0.01 0.14 0.00Korea 0.18 0.50 0.32 0.00 Mexico 0.47 0.15 0.31 0.04 0.01 0.00 0.02Spain 0.30 0.31 0.30 0.00 0.00 0.06 0.02Poland 0.30 0.31 0.31 0.00 0.00 0.07 0.01Ireland 0.15 0.43 0.32 0.00 0.00 0.08 0.01UnitedKingdom 0.16 0.42 0.21 0.00 0.00 0.08 0.13Australia 0.16 0.41 0.25 0.00 0.13 0.05Switzerland 0.18 0.38 0.35 0.01 0.02 0.05UnitedStates 0.28 0.26 0.30 0.01 0.00 0.09 0.06Canada 0.18 0.35 0.20 0.00 0.15 0.12Norway 0.04 0.48 0.39 0.00 0.07 0.02Finland 0.03 0.46 0.39 0.00 0.09 0.03Iceland 0.03 0.45 0.45 0.00 0.02 0.05Denmark 0.05 0.43 0.41 0.01 0.00 0.10 EastGermany 0.13 0.34 0.40 0.01 0.10 0.02France 0.13 0.32 0.40 0.00 0.00 0.12 0.03WestGermany 0.14 0.29 0.43 0.01 0.00 0.09 0.04Sweden 0.01 0.25 0.61 0.00 0.11 0.02Note:distributionofresponsesamongthosewhobelievethatpaidleaveshouldbeavailable
Source:OECDFamilyDatabase