Embed Size (px)
Citation preview
THE UNIVERSITY OF SHEFFIELD
THE DETERMINANTS OF TECHNOLOGICAL INNOVATION ADOPTION AMONG BUMIPUTERA
SMALL SCALE FOOD PROCESSING INDUSTRIES IN MALAYSIA
being a thesis submitted for the degree of Ph. D in Economics and Business Studies
in Sheffield University Management School
By
Faridah Bind Shahadan BS Louisiana State University, Baton Rouge MS Louisiana State University, Baton Rouge
August 1996
THE DETERMINANTS OF TECHNOLOGICAL INNOVATION ADOPTION AMONG BUMIPUTERA SMALL SCALE FOOD
PROCESSING INDUSTRIES IN MALAYSIA
by:
Faridah Binti Shahadan
SUMMARY
Bumiputera Small scale Food Processing Industry (FPI) need to modernise and adopt
technological innovation to stay competitive. This will increase their efficiency,
improve productivity and allow for the introduction of new products and services to
satisfy existing market demand or expanding market share. By adopting new
technology, Bumiputera small scale FPI will not only decrease cost and increase
productivity, but they will also be enabled to increase their share in the domestic
market and even export their products. The development of FPI is to ensure that
Malaysia can produce adequate food and help to provide much needed employment
and contribute to national income. Being small scale there are various factors that
inhibit or influence Bumiputera small scale FPI ability to adopt a technological
innovation. Hence, the main aim of this study is to identify the determinants of
technological innovativeness among small-scale Bumiputera entrepreneurs in the
food processing industry in Malaysia. The pertinent questions are: Why do some
Bumiputera small scale FPI adopt technological innovation while others do not do
the Bumiputera small scale FPI have the capabilities to introduce new technology;
how does institutional support shape SSIs' response to technology adoption?
The theoretical model developed in this study used five main theoretical
approaches - adoption decision process, organisational buying behaviour, decision
theory of firms, small firms decision process and the personality of entrepreneurs.
i
From this model the key factors influencing technology innovation decisions among
Bumiputera small scale food processing firms were identified. Based on this model,
we can show and quantify the inter-relationship between the various factors
influencing technology adoption decisions. The researcher used a survey method to
collect information from 197 Bumiputera entrepreneurs in small scale FPI. In the
statistical analysis, as a way of solving the problem of multicollinearity among
hypothesised factors, based on firms' size, the researcher stratified the respondents
into two groups - tiny and small firms.
Findings of this study showed that Bumiputera small scale FPI has a greater
tendency to adopt an incremental type of innovation. The entrepreneurs'
characteristics, communication, their perception of the buying situation, the
objective characteristic of the innovation, institutional involvement and their firms'
characteristics significantly influenced entrepreneurs in small and tiny firms to
innovate. The entrepreneurs' perception of the innovation only influenced the
decision to innovate of the entrepreneurs in tiny firms.
In tiny and small firms, among the entrepreneurs' characteristics that influence
the innovativeness are their personal demographics, personality traits and skill
upgrading. Firms' performance and their financing problem are the characteristics
of their firms that had significant influence on firms' innovativeness. Firms' age
only has significant influence on tiny firms, while firms' size and structure have
significant influence on small firms' decision to innovate.
ü

ACKNOWLEDGEMENTS
My sincere thanks are due to many people who have helped to made this study
possible. First, I wish to express my heartfelt gratitude to my academic supervisor,
Professor Dr. Andrew Tylecote for his interest and guidance. This research has
benefited greatly through his dedicated supervision, constant prodding, constructive
criticism and comments. I would also like to thank Professor Dr. Roy Payne and Dr.
Mike Dietrich for their suggestions and comments at the beginning of this study,
while Dr. Gerald Hodgkinson shared his experience in developing the measurement
of "locus of control".
My thanks also go to Public Service Department of Malaysia for granting me a
scholarship and the Universiti Kebangsaan Malaysia for funding my research and
granting study leave which enabled me to pursue my study.
I would also like to express my appreciation to the research officers of
Economics Division, and Food Technology Division of Malaysian Agricultural
Research Development Institute (MARDI) at Serdang, Selangor; the officers of
MARA in Kuala Lumpur, who have given full co-operation in providing me with
various information of their institutions and small scale Bumiputera entrepreneurs.
Special note of indebtedness is due to the Bumiputera entrepreneurs who participated
in this study. Without their full co-operation the research would not have been
possible.
Special thanks go to my Malaysian friends in Hull especially Mac, Zaimah
and her family for their assistance and moral support during my stay in U. K.
iii

This thesis is dedicated to my sisters, brothers and niece; Abang, Kak Siah,
Kak Wi, Kak Pit, Lah, Fuad, Tim and Zira, without whose constant encouragement
and sacrifice none of this would have been possible. The study is specially dedicated
to my mother Hajjah Jimah binti Janom, and my late father Allahyarham Cikgu
Shahadan bin Haji Hashim who believed that the priceless asset parents can provide
to their children is education.
IV
TABLE OF CONTENTS
SUMMARY ...................................................................
ACKNOWLEDGEMENT .............................................
TABLE OF CONTENTS ...............................................
LIST OF TABLES .........................................................
LIST OF FIGURES .......................................................
LIST OF ABBREVIATIONS ........................................
Chapter one: INTRODUCTION
....................................................... 1
...................................................... 111
....................................................... V
..................................................... X11
..................................................... XV
1. INTRODUCTION ...................................................................................................... 1
1.1 THE RESEARCH PROBLEM ....................................................................................... ..
2
1.2 PURPOSE OF THE STUDY ...................................................................................... 10
1.3 IMPORTANCE OF THE STUDY ...............................................................................
10
1.4 SCOPE OF THE STUDY ............................................................................................
11
1.5 STUDY LIMITATIONS ............................................................................................
13
1.6 ORGANISATION OF THESIS ..................................................................................
14
Chapter two: SMALL SCALE FOOD PROCESSING INDUSTRY IN MALAYSIA: CURRENT ISSUES AND CHALLENGES
2. INTRODUCTION ....................................................................................................
17
2.1 INDUSTRIALISATION AND TIE NEW ECONOMIC POLICY ........................................
18
2.2 FOOD PROCESSING INDUSTRY IN MALAYSIA: ITS ECONOMIC ROLE ......................
28
2.3 ROLE OF FPI IN ECONOMIC DEVELOPMENT ...........................................................
30
2.4 NATURE OF SMALL SCALE FOOD PROCESSING INDUSTRY ...................................
31
2.5 CRITICAL ISSUES IN THE DEVELOPMENT OF THE FOOD PROCESSING INDUSTRY... 40
2.6 THE PLACE OF SMALL-SCALE INDUSTRIES IN MALAYSIA .....................................
47
V
2.7 POTENTIAL OF SMALL SCALE INDUSTRIES .............................................................
50
2.8 PROBLEMS OF SMALL SCALE INDUSTRIES .............................................................
52
2.8.1 Marketing and Competition ............................................................................ 53
2.8.2 Financial Constraints ..................................................................................... 56
2.8.31'roduction ...................................................................................................... 58
2.8.4 1ersonnel ........................................................................................................ 61
2.8.5 Technicul ........................................................................................................ 65
2.8.6 Discriminatory Government Policies ............................................................. 66
2.8.7 Access to Business Service ............................................................................. 66
2.9 INSTITUTIONAL FRAMEWORK FOR SMALL SCALE INDUSTRIES ..............................
67
2.9.1 Marketing Assistance ......................................................................................
69
2.9.2 Finance ...........................................................................................................
70
2.9.3 Skill Upgrading and Technology ................................................................... 72
2.9.4 Institutional Support for Science and Technology .........................................
74
2.10 SUMMARY ............................................................................................................ 76
Chapter three: THEORETICAL BACKGROUND
3. INTRODUCTION ................................................................................................... 78 3.1 INNOVATION: A BRIEF INTRODUCTION
.................................................................. 78
3.2 THEORETICAL APPROACHES ..................................................................................
83
3.2.1 Adoption Decision Process .............................................................................. 84
3.2.2 Organisational Buying Behaviour .................................................................. 91
3.2.3 Decision Theory of Firms ............................................................................. 100
3.2.4 Small Firms Decision Process: Theoretical Convergence .........................
109
3.2.5 Personality Theory of Entrepreneurs ........................................................... 113
3.3 SummARY ............................................................................................................ 117
h
Chapter Four: CONCEPTUAL FRAMEWORK
4. INTRODUCTION .................................................................................................
119 4.1 CONCEPT OF INNOVATION ADOPTED IN THIS STUDY
........................................... 119
4.2 THE DETERMINANTS OF TECHNOLOGICAL INNOVATION ADOPTION: AN OVERVIEW
..................................................................................................... 125
4.3 FACTORS THAT DETERMINE THE DECISION To ADOPT TECHNOLOGICAL
INNOVATION: THE HYPOTHESES ........................................................................
131
4.3.1 Characteristics of Entrepreneurs ................................................................ 131
4.3.2 Organisational Characteristic ..................................................................... 13 7
4.3.3 Communication ............................................................................................ 144
4.3.4 The Objective Characteristics of the Technology ....................................... 147
4.3.5 The Perceived Characteristics of the Technology ....................................... 148
4.3.6 Entrepreneurs' Perception of the Buying Procedure .................................. 150
4.3.7 Environmental Factors ................................................................................ 151
4.4 SUIvnv1ARY .......................................................................................................... 154
Chapter Five: METHODOLOGY
5. INTRODUCTION ................................................................................................
156
5.1 SURVEY DESIGN ..................................................................................................
156
5.2 RESEARCH LOCATION ..........................................................................................
158
5.3 SAMPLING TECHNIQUE ........................................................................................
158
5.3.1 Population .................................................................................................... 158
5.3.2 Sampling Frame ........................................................................................... 159
5.3.3 Sample Selection ........................................................................................... 160
5.4 COLLECTION OF INFORMATION ............................................................................
161
5.5 DEFINITIONS ........................................................................................................
163
S. S. 1 Technological innovation .............................................................................
163
5. S. 2 Level of Innovativeness .................................................................................
164
5.5.3 Firms ' Size ....................................................................................................
165
S. 5.4 Entrepreneurs ..............................................................................................
166
vu
5.6 MEASUREMENT OF VARIABLES ............................................................................
166
5.6.1 Innovutiveness ..............................................................................................
167
5.6.2 The characteristics of Entrepreneurs ........................................................ 167
5.6.3 Organisational Characteristics .................................................................. 171
5.6.4 Communication ............................................................................................. 174
5.6.5 Entrepreneurs' Perception of the 13uving Situation ...................................... 174
5.6.6 The Objective Characteristics of the Innovation ......................................
174
5.6.7 The Perceived Characteristics of the Innovation ..................................... 175
5.6.8 Environmental factors ................................................................................ 175
5.7 VALIDITY AND RELIABILITY OF THE MEASUREMENT ...........................................
176
5.7.1 Validity ......................................................................................................... 176
5.7.2 Reliability ..................................................................................................... 177
5.8 STATISTICAL ANALYSIS .......................................................................................
179
5.8.1 Development of Mathematical Model ........................................................ 179
5.8.2 Collinearity .................................................................................................. 181
5.8.3 Evaluation of the Logistic Regression models ............................................. 187
5.9 SUMMARY ............................................................................................................ 189
Chapter Six: ENTREPRENEURS' CHARACTERISTICS AND ADOPTION OF TECHNOLOGICAL INNOVATION
6. INTRODUCTION ................................................................................................. 191
6.1 PERSONAL DEMOGRAPHICS .................................................................................
197
6.1.1 Age ................................................................................................................ 197
6.1.2 Sex ................................................................................................................. 199
6.1.3 Level of Formal Education .......................................................................... 205
6.1.4 Number of Years Managing Existing Business ............................................. 207
6.1.5 Previous Work Experience ........................................................................... 209
6.2 PERSONALITY TRAITS ..........................................................................................
217
6.2.1 Need for Achievement (n Ach) ...................................................................... 217
6.2.2 Locus of Control ........................................................................................... 225
6.2.3 Attitude Toward Risks .................................................................................. 229
viii
6.3 SKILL UPGRADING ...............................................................................................
230
6.4 KNOWLEDGE ABOUT INNOVATION ......................................................................
234
6.5 SummARY ............................................................................................................
236
Chapter Seven: THE INFLUENCE OF COMMUNICATION, PERCEPTION, INNOVATION AND ENVIRONMENT ON DECISION
7. INTRODUCTION ................................................................................................. 237
7.1 COMMUMCATION ................................................................................................
239
7.2 ENTREPRENEURS' PERCEPTION OF THE BUYING PROCEDURE .............................
242
7.3 ENTREPRENEURS' PERCEPTION OF THE CHARACTERISTICS OF INNOVATION....... 246
7.3.1 The Perception of Entrepreneurs in Tiny Firms ........................................... 247
7.3.2 The Perception of Entrepreneurs in Small Firms ......................................... 250
7.4 THE OBJECTIVE CHARACTERISTICS OF INNOVATION ...........................................
256
7.4.1 The Objective Characteristics of Innovation Adopted in Tiny Firms .......... 256
7.4.2 The Objective Characteristics of Innovation Adopted in Small Firms ........ 258
7.5 ENVIRONMENTAL FACTORS ................................................................................. 260
7.5.1 Competitive Intensity .................................................................................... 260
7.5.2 Institutional Involvement .............................................................................. 261
7.5.3 Government Assistance ................................................................................. 271
7.6 SUMMARY ............................................................................................................
273
Chapter Eight: THE INFLUENCE OF FIRMS' CHARACTERISTICS ON THE ADOPTION OF TECHNOLOGICAL INNOVATION
8. INTRODUCTION ................................................................................................. 275
8.1 ANALYsis ............................................................................................................
275
8.2 FmMs' SE .........................................................................................................
277
8.3 ORGANISATIONAL STRUCTURE ............................................................................
279
8.3.1 Centralisation ...............................................................................................
280
8.3.2 Complexity .................................................................................................... 281
8.3.3 Formalisation ...............................................................................................
281
ix
8.4 MISMATCHING OF EXISTING AND REQUIRED LABOUR FORCE .............................
286
8.5 FINANCING ...........................................................................................................
288
8.6 FIRMS' AGE .........................................................................................................
294
8.6.1 Tiny Firms' Age ............................................................................................ 295
8.6.2 . Small 1 E'irm s'Age. .......................................................................................... 299
8.7 FIRMS' PERFORMANCE .........................................................................................
302
8.8 SuMMARY .......................................................................
306 .....................................
Chapter Nine: TECHNOLOGICAL INNOVATION IN TINY AND SMALL SCALE FOOD PROCESSING INDUSTRY: DISCUSSION, DIRECTION FOR FURTHER RESEARCH AND POLICY IMPLICATIONS
9. INTRODUCTION ................................................................................................. 307
9.1 LEVEL OF INNOVATIVENESS AMONG TINY AND SMALL FIRMS:
A DiscUSSION .................................................................................................... 313
9.1.1 Personal Demographic Factors .................................................................. 315
9.1.2 Personality Traits ......................................................................................... 319
9.1.3 Knowledge And Skill Upgrading ................................................................. 321
9.1.4 Knowledge About The Innovation ................................................................ 322
9.1.5 Firms' Structure .......................................................................................... 323
9.1.6 Labour ......................................................................................................... 324
9.1.7 Firms' Age And Performance ....................................................................... 325
9.1.8 Financing ................................................. :................................................... 327
9.1.9 Perception of The Innovation ...................................................................... 329
9.1.10 Buying Situation ........................................................................................ 330
9.1.11 Communication And Access To Information ............................................. 331
9.1.12 Competition ............................................................................................... 340
9.1.13 Role of government agencies ..................................................................... 341
9.1.14 Conclusion .................................................................................................
342
9.2 SUGGESTIONS FOR FURTHER RESEARCH ............................................................
342
X
9.3 POLICY IMPLICATIONS FOR ENHANCING TECHNOLOGICAL INNOVATION ...........
344
9.3.11: ncouraging Non-Innovative Firms To Become Innovative .......................
344
9.3.2 Encouraging Smnall Firms to Adopt Radical Type of Innovation ................
349
REFERENCES ................................ .......................................................................... .. 56
APPENDIX I: Agencies involved in Small Business Development in Malaysia and Their function
............................................................. 374
APPENDIX II: Translation of questionnaire .......................................................... . 377
APPENDIX III: Logistic Regression Function of All Firms ....................................
408
APPENDIX IV: Correlation Coefficients of Independent Variables in Logistic Function for All Firms ................................................................... 411
APPENDIX V: Correlation Coefficients of Independent Variables in Logistic Function for Tiny Firms
................................................................ . 415
APPENDIX VI: Correlation Coefficients of Independent Variables in Logistic Function for Small Firms
.............................................................. . 419
APPENDIX VII: Logistic Regression Function of Tiny Firms ................................. 424
APPENDIX VIII: Logistic Regression Function of Small Firms ............................. . 429
APPENDIX IX: Loan Schemes ................................................................................ 435
xi
LIST OF TABLES
TABLE 2.1: OWNERSHIP AND CONTROL OF THE CORPORATE SECTOR IN 1971 IN MALAYSIA (RM MILLION)
............................................................................ 20
TABLE 2.2: CLASSIFICATION OF FOOD PROCESSING INDUSTRY IN MALAYSIA ................ .
28
TABLE 2.3: RAW MATERIALS AND MAJOR TYPES OF MACHINE/EQUIPMENT USED BY SELECTED FOOD PROCESSING FIRMS IN MALAYSIA
........................................ . 36
TABLE 2.4: SELECTED COURSES FOR SMALL SCALE FIRMS IN MALAYSIA ............................ .
63
TABLE 2.5: MALAYSIA'S DEVELOPMENT PLANS AND PERTINENT ISSUES ON THE DEVELOPMENT OF SMALL AND MEDIUM SCALE INDUSTRIES
........................... . 68
TABLE 4.1: A TAXONOMY OF SMALL FIRMS AND TECHNOLOGICAL INNOVATION ..............
121
TABLE 5.1: NUMBER OF FIRMS LISTED IN THE SAMPLE FRAME AND THE NUMBER OF FIRMS SELECTED IN THIS STUDY ACCORDING TO GEOGRAPHICAL REGIONS IN PENINSULAR MALAYSIA
.............................................................. 159
TABLE 5.2: PERCENTAGE DISTRIBUTION OF FIRMS' CHARACTERISTICS BASED ON RESEARCH FINDING OF VARIOUS INSTITUTIONS AND THIS STUDY
.................. 161
TABLE 5.3: RELIABILITY TEST ............................................................................................
179
TABLE 5.4: TESTING FOR COLLINEARITY ............................................................................
186
TABLE 5.5: STATISTICAL TESTS FOR MODEL EVALUATION ...............................................
188
TABLE 5.6: CLASSIFICATION TABLE OF LOGISTIC REGRESSION FUNCTIONS ......................
189
TABLE 6.1: LOGISTIC REGRESSION FUNCTION IN TINY FIRMS ............................................
193
TABLE 6.2: LOGISTIC REGRESSION FUNCTION IN SMALL FIRMS .........................................
195
TABLE 6.3: MEANS OF ENTREPRENEURS' PERSONALITY TRAITS BY SEX IN TINY FIRMS ..................................................................................................... 201
TABLE 6.4: THE MEANS OF FIRMS' PRODUCTION, SALES AND FIXED ASSETS (RM'000) BY SEX OF ENTREPRENEURS IN TINY FIRMS
..................................................... 202
TABLE 6.5: ENTREPRENEURS AND FIRMS CHARACTERISTICS, COMMUNICATION AND INSTITUTIONAL INVOLVEMENT BY SEX IN SMALL FIRMS
................................ 204
TABLE 6.6: ENTREPRENEURS' LEVELS OF EDUCATION BY LEVEL OF INNOVATIVENESS .....
206
TABLE 6.7: PREVIOUS WORK EXPERIENCE OF ENTREPRENEURS FROM TINY FIRMS............ 211
TABLE 6.8: THE DISTRIBUTION OF ENTREPRENEURS IN TINY FIRMS BASED ON PREVIOUS WORK EXPERIENCE, FIRMS' CATEGORIES AND GOVERNMENT ASSISTANCE
..................................................................................................... 212
TABLE 6.9: PREVIOUS WORK EXPERIENCE AND LEVEL OF INNOVATIVENESS OF ENTREPRENEURS IN SMALL FIRMS
................................................................... 213
TABLE 6.10: PREVIOUS WORK EXPERIENCE AND LEVEL OF INNOVATIVENESS OF ENTREPRENEURS IN SMALL FIRMS
.................................................................. 215
xi
TABLE 6.11: ENTREPRENEURS' (TINY FIRMS) NEED OF ACHIEVEMENT MEAN SCORE
BY COMMUNICATION CHANNELS ...................................................................
220
TABLE 6.12: PERSONALITY TRAITS AND LEVEL OF EDUCATION OF ENTREPRENEURS IN SMALL FIRMS
.............................................................................................. 222
TABLE 6.13: LOCUS OF CONTROL AND LEVEL OF EDUCATION AMONG ENTREPRENEURS IN SMALL FIRMS
.................................................................. 228
TABLE 6.14: THE DISTRIBUTION OF ENTREPRENEURS BY THE NUMBER OF TIMES ATTENDING COURSES BASED ON LEVEL OF INNOVATIVENESS
....................... 231
TABLE 6.15: TYPES OF COURSE ATTENDED BY ENTREPRENEURS BASED ON FIRM CATEGORIES
................................................................................................... 232
TABLE 7.1: THE COEFFICIENT OF SELECTED INDEPENDENT VARIABLES IN LOGISTIC REGRESSION EQUATION FOR TINY FIRMS
......................................................... 238
TABLE 7.2: THE COEFFICIENT OF SELECTED INDEPENDENT VARIABLES IN LOGISTIC REGRESSION EQUATION FOR SMALL FIRMS
..................................................... 238
TABLE 7.3: THE DETERMINANTS OF COMMUNICATIVE BEHAVIOUR OF ENTREPRENEURS IN SMALL FIRMS
................................................................... 241
TABLE 7.4: THE PERCENTAGE DISTRIBUTION OF ENTREPRENEURS' PERCEPTION
OF PROBLEM RELATED TO INNOVATION BUYING PROCEDURE ......................... 244
TABLE 7.5: MEAN SCORE OF ENTREPRENEURS PERCEPTION OF THE CHARACTERISTICS OF INNOVATION BASED ON LEVEL OF INNOVATIVENESS IN TINY FIRMS ...........
248
TABLE 7.6: CORRELATION COEFFICIENT OF ENTREPRENEURS PERCEPTION OF INNOVATION AND COST OF INNOVATION IN TINY FIRMS
.................................. 249
TABLE 7.7: THE DETERMINANTS OF ENTREPRENEURS' PERCEPTION OF THE CHARACTERISTICS OF THE INNOVATION (SMALL FIRMS)
................................. 253
TABLE 7.8: MEAN COST OF INNOVATION BASED ON ENTREPRENEURS REASONS FOR INNOVATING (TINY FIRMS)
.............................................................................. 257
TABLE 7.9: MEANS OF COST OF INNOVATION BASED ON ENTREPRENEURS' CHARACTERISTICS (TINY FIRMS)
...................................................................... 258
TABLE 7.10: THE DETERMINANTS OF COST OF INNOVATION IN SMALL FIRMS ....................
259
TABLE 7.11: DISTRIBUTION OF FIRMS BASED ON THEIR MAIN COMPETITORS .................... 261
TABLE 7.12: PERCENTAGE DISTRIBUTION OF FIRMS BASED ON THEIR NUMBER OF CONSULTATIONS WITH SELECTED INSTITUTIONS
........................................... 263
TABLE 7.13: PERCENTAGE DISTRIBUTION OF PREVIOUS PARTICIPANTS OF MARDI'S TRAINING PROGRAMME
.................................................................................. 264
TABLE 7.14: PERCENTAGE DISTRIBUTION OF PREVIOUS PARTICIPANTS OF MARA'S TRAINING PROGRAMME
.................................................................................. 265
TABLE 7.15: THE DETERMINANTS OF INSTITUTIONAL INVOLVEMENT OF ENTREPRENEURS IN SMALL FIRMS
............................................................... 268
TABLE 7.16: NUMBER OF ENTREPRENEURS WHO RECEIVED GOVERNMENT ASSISTANCE BASED ON THE COST OF MACHINES AND AGENCIES PROVIDING THE ASSISTANCE
........................................................................ 272
ME
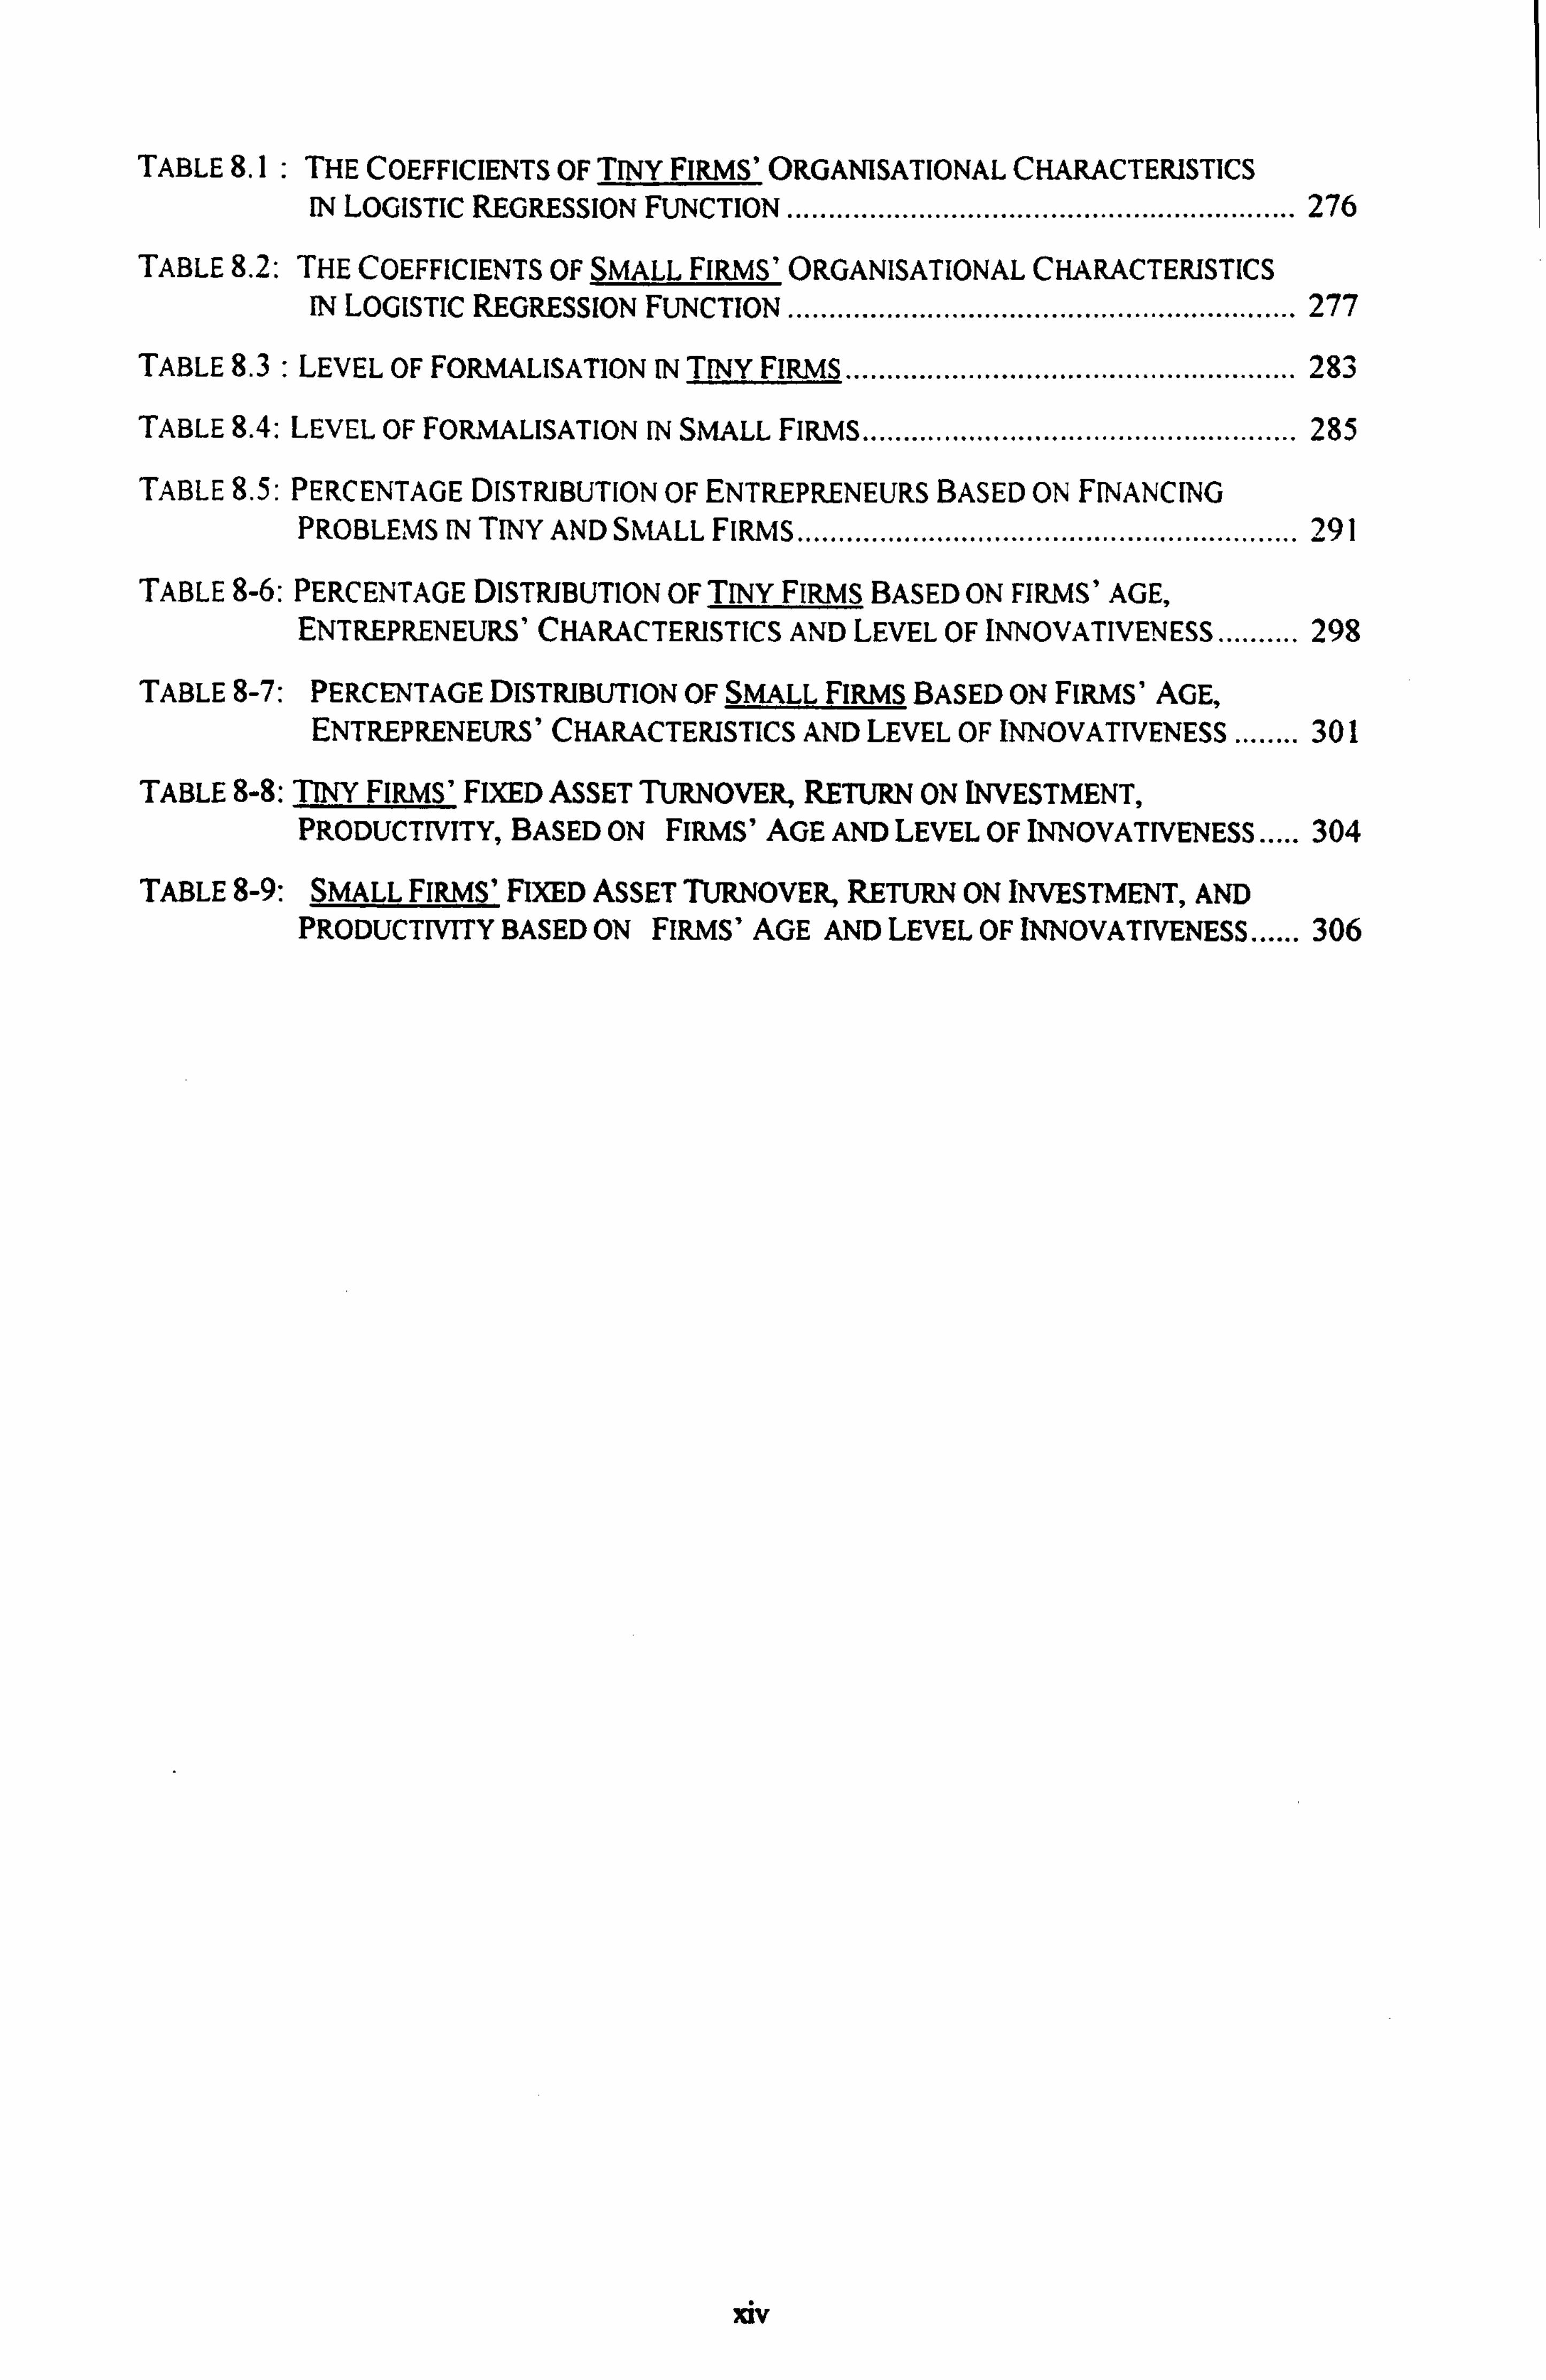
TABLE 8.1 : THE COEFFICIENTS OF TINY FIRMS' ORGANISATIONAL CHARACTERISTICS IN LOGISTIC REGRESSION FUNCTION
.............................................................. 276
TABLE 8.2: THE COEFFICIENTS OF SMALL FIRMS' ORGANISATIONAL CHARACTERISTICS IN LOGISTIC REGRESSION FUNCTION
.............................................................. 277
TABLE 8.3 : LEVEL OF FORMALISATION IN TINY FIRMS .......................................................
283
TABLE 8.4: LEVEL OF FORMALISATION IN SMALL FIRMS .....................................................
285
TABLE 8.5: PERCENTAGE DISTRIBUTION OF ENTREPRENEURS BASED ON FINANCING PROBLEMS IN TINY AND SMALL FIRMS
............................................................. 291
TABLE 8-6: PERCENTAGE DISTRIBUTION OF TINY FIRMS BASED ON FIRMS' AGE, ENTREPRENEURS' CHARACTERISTICS AND LEVEL OF INNOVATIVENESS.......... 298
TABLE 8-7: PERCENTAGE DISTRIBUTION OF SMALL FIRMS BASED ON FIRMS' AGE, ENTREPRENEURS' CHARACTERISTICS AND LEVEL OF INNOVATIVENESS
........ 301
TABLE 8-8: TINY FIRMS' FIXED ASSET TURNOVER, RETURN ON INVESTMENT, PRODUCTIVITY, BASED ON FIRMS' AGE AND LEVEL OF INNOVATIVENESS
..... 304
TABLE 8-9: SMALL FIRMS' FIXED ASSET TURNOVER, RETURN ON INVESTMENT, AND PRODUCTIVITY BASED ON FIRMS' AGE AND LEVEL OF INNOVATIVENESS...... 306
'dV
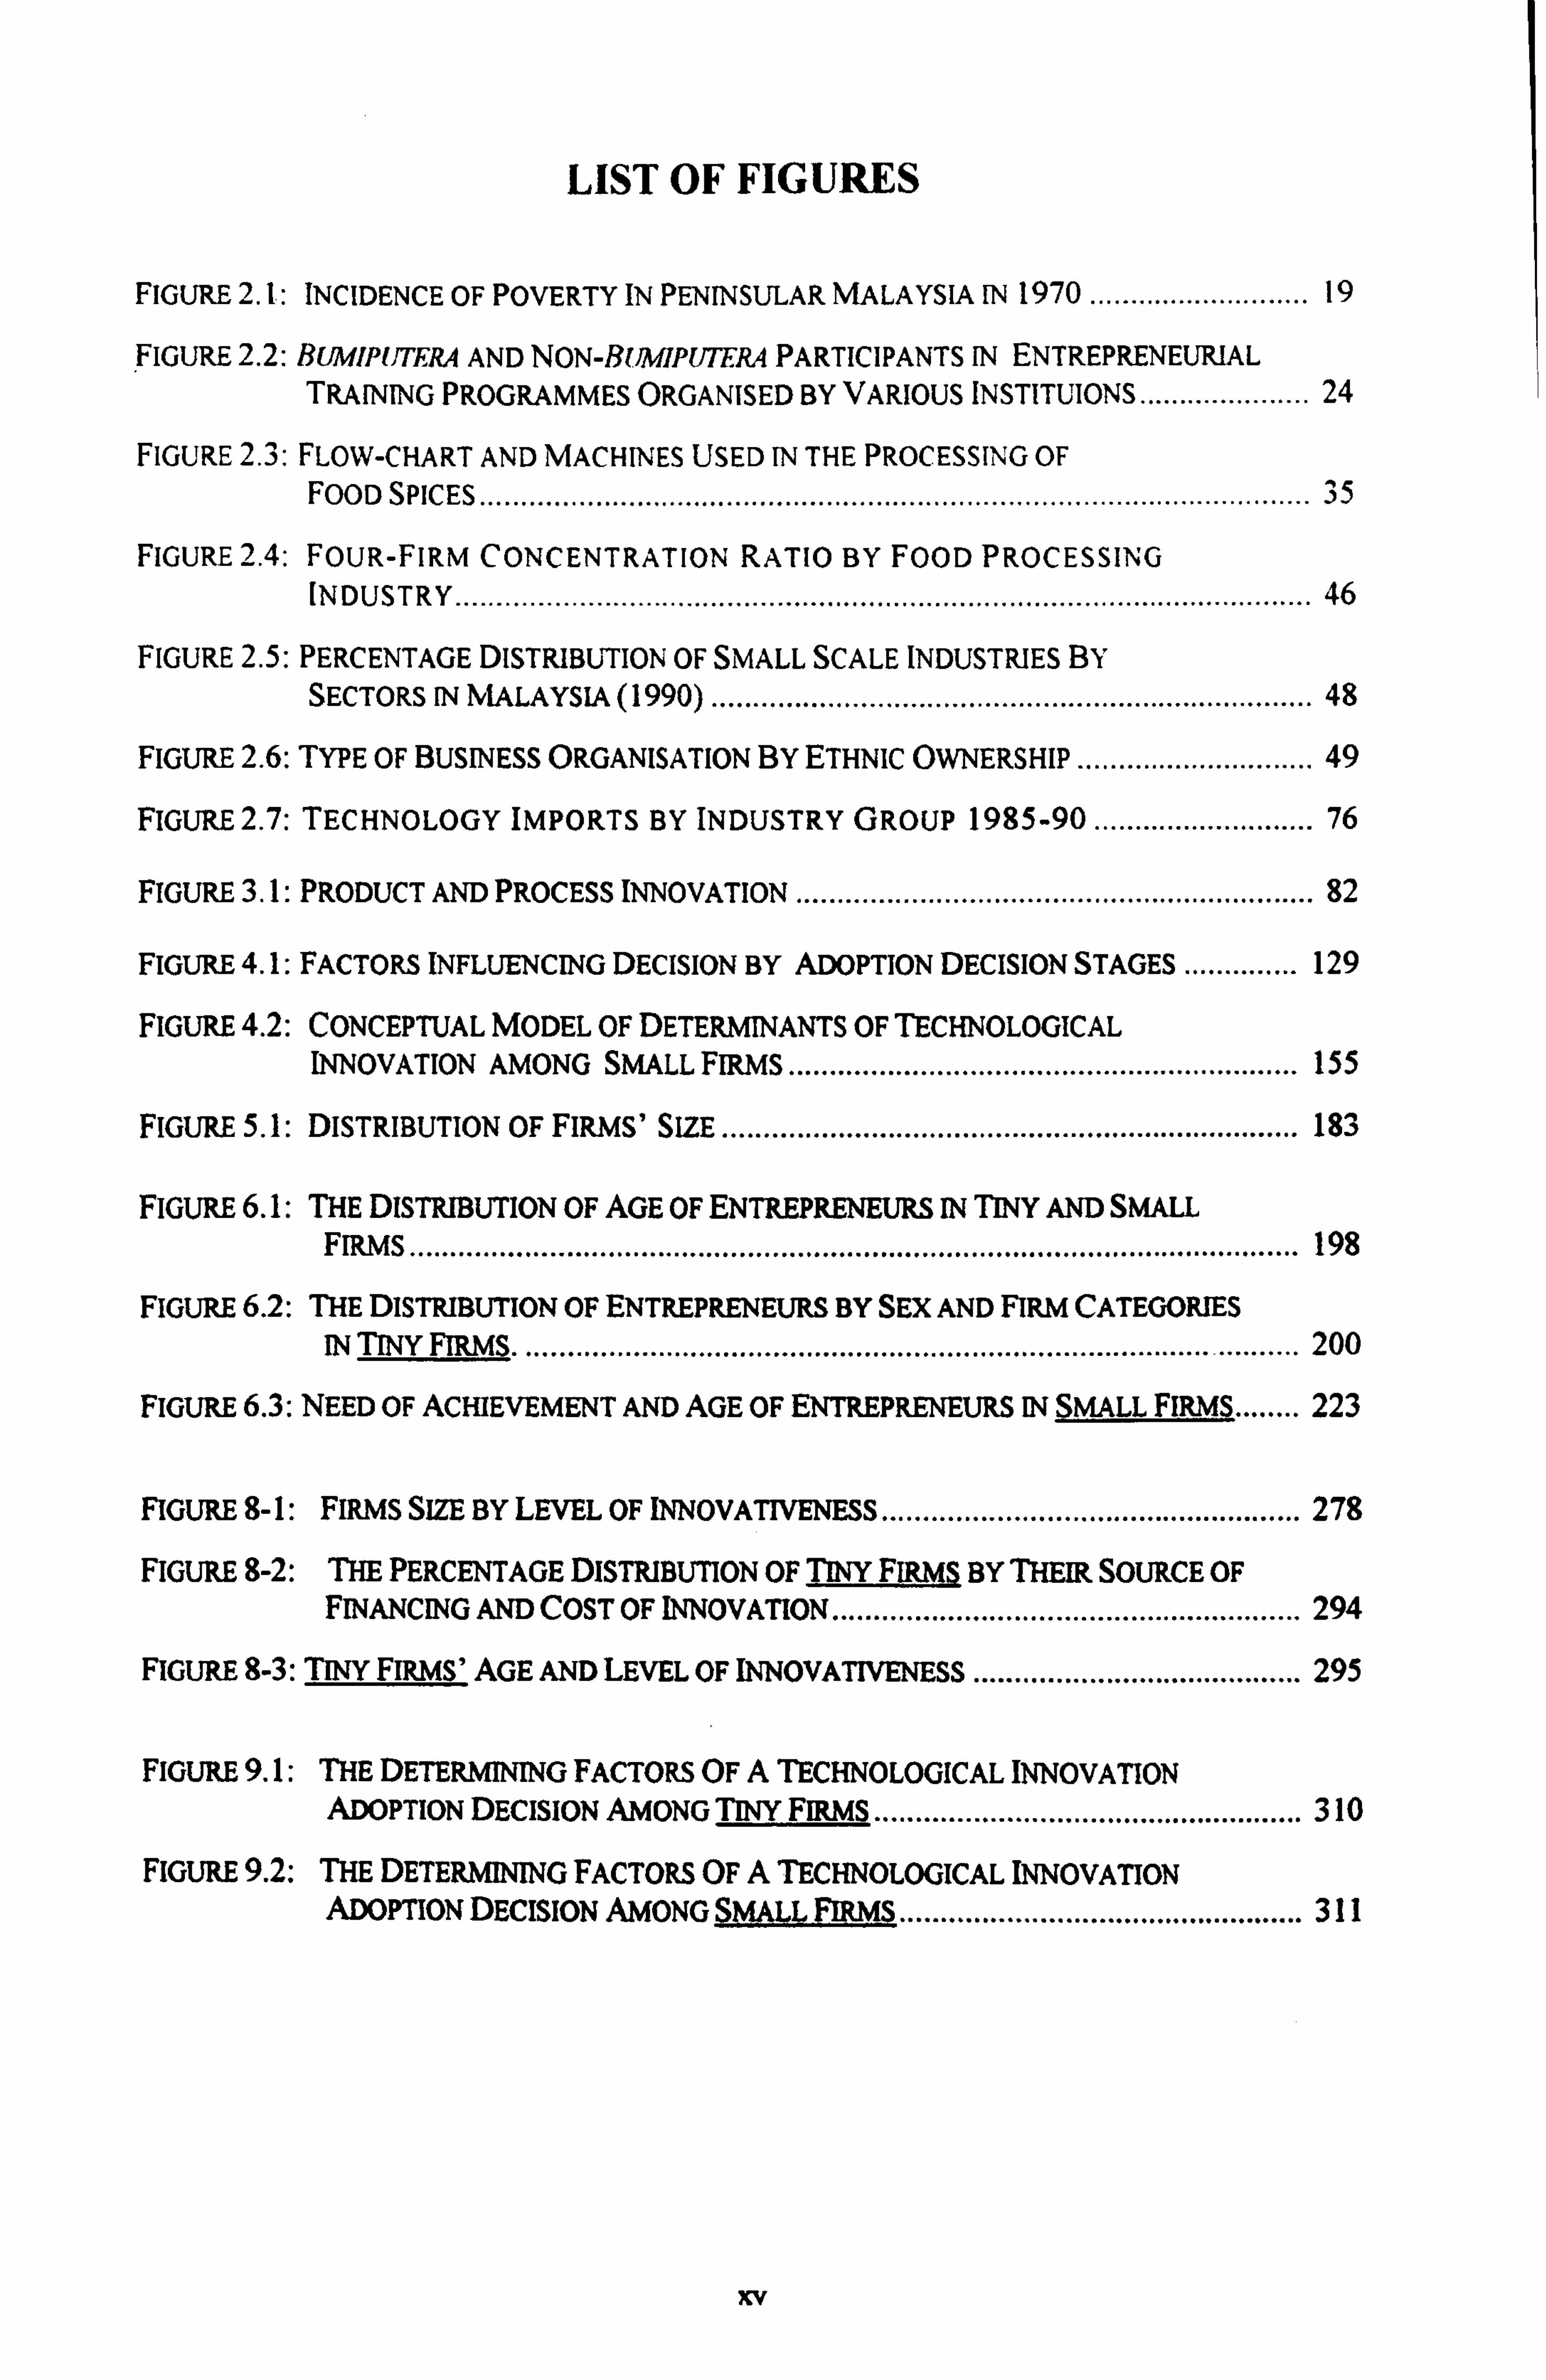
LIST OF FIGURES
FIGURE 2.1: INCIDENCE OF POVERTY IN PENINSULAR MALAYSIA IN 1970 ...........................
19
FIGURE 2.2: BUMIPUTERA AND NON-BUMIPUTERA PARTICIPANTS IN ENTREPRENEURIAL TRAINING PROGRAMMES ORGANISED BY VARIOUS INSTITUIONS
..................... 24
FIGURE 2.3: FLOW-CHART AND MACHINES USED IN THE PROCESSING OF FOOD SPICES
..................................................................................................... 35
FIGURE 2.4: FOUR-FIRM CONCENTRATION RATIO BY FOOD PROCESSING INDUSTRY
........................................................................................................ 46
FIGURE 2.5: PERCENTAGE DISTRIBUTION OF SMALL SCALE INDUSTRIES BY SECTORS IN MALAYSIA (1990)
......................................................................... 48
FIGURE 2.6: TYPE OF BUSINESS ORGANISATION BY ETHNIC OWNERSHIP .............................
49
FIGURE 2.7: TECHNOLOGY IMPORTS BY INDUSTRY GROUP 1985-90 ...........................
76
FIGURE 3.1: PRODUCT AND PROCESS INNOVATION ...............................................................
82
FIGURE 4.1: FACTORS INFLUENCING DECISION BY ADOPTION DECISION STAGES ..............
129
FIGURE 4.2: CONCEPTUAL MODEL OF DETERMINANTS OF TECHNOLOGICAL INNOVATION AMONG SMALL FIRMS
.............................................................. 155
FIGURE 5.1: DISTRIBUTION OF FIRMS' SIZE ......................................................................
183
FIGURE 6.1: THE DISTRIBUTION OF AGE OF ENTREPRENEURS IN TINY AND SMALL FIRMS ............................................................................................................ 198
FIGURE 6.2: THE DISTRIBUTION OF ENTREPRENEURS BY SEX AND FIRM CATEGORIES
IN TINY FIRMS .............................................................................................. 200
FIGURE 6.3: NEED OF ACHIEVEMENT AND AGE OF ENTREPRENEURS IN SMALL FIRMS........ 223
FIGURE 8-1: FIRMS SIZE BY LEVEL OF INNOVATIVENESS ...................................................
278
FIGURE 8-2: THE PERCENTAGE DISTRIBUTION OF TINY FIRMS BY THEIR SOURCE OF FINANCING AND COST OF INNOVATION
......................................................... 294
FIGURE 8-3: TINY FIRMS' AGE AND LEVEL OF INNOVATIVENESS ........................................
295
FIGURE 9.1: THE DETERMINING FACTORS OF A TECHNOLOGICAL INNOVATION ADOPTION DECISION AMONG TINY FIRMS
.................................................... 310
FIGURE 9.2: THE DETERMINING FACTORS OF A TECHNOLOGICAL INNOVATION ADOPTION DECISION AMONG SMALL FIRMS
................................................. 311
xv

LIST OF ABBREVIATIONS
ASEAN - Association of South East Asia Nations BPMB - Malaysian Development Bank CCDSI - the Coordinating Council for Development of Small and
Medium Industries CGC - Credit Guarantee Corporation, CIAST - Centre for Instruction and Advanced Skill Training FPI - Food Processing Industry GDP - Gross Domestic Products IMP - Industrial Master Plan IRPA - Research in Priority Area IS - Import Substitution ITAF - Industrial Technical Assistance Fund IFCT - The Industrial Co-operation in Thailand ITI - Industrial Training Institute JETRO - Japan External Trade Office KEMAS - Kemajuan Masyarakat (Community Development) LSIs - Large scale industries LPP - Lembaga Pertubuhan Peladang (Farmers' Association
Authority) MARA - Majlis Amanah Rakyat (Council of Trust for Indigenous People) MARDI - Malaysian Agricultural Research Development Institute MIDA - Malaysian Industrial Development Authority MIDF - Malaysian Industrial Development Finance MITI - Ministry of Trade and Industry MNCs - Multinational corporations MSIs - Medium scale industries NEP - New Economic Policies MEXPO - Malaysian Export Trade Centre NPC - National Productivity Centre PERNAS - Perbadanan National (National Corperation) PNB - Permodalan Nasional Berhad (National Investment Limited) R&D - Research and Development RIDA - Rural Industrial Development Authority RM - Ringgit Malaysia S&T - Science and Technology SEDCs - State Economic Development Corporations SIRIM - Standard Industrial Research Institute of Malaysia SMI - Small Medium Industry SSIs - Small Scale Industries TSIs - Tiny scale industries UKM - Universiti Kebangsaan Malaysia UNIDO - United Nation Industrial Development Organisation
xvi

Chapter One
CHAPTER ONE
INTRODUCTION
1. Introduction
Food processing activities must increase to maintain the food supply for Malaysia's
growing population. Improvement in crop yields alone will not solve the problem of
excess demand for food; it needs to be accompanied by a concerted effort to increase
the amount of food produced. The main reasons why Malaysia needs to increase the
amount of food produced are to reduce its dependence on imports and to increase its
exports.
Although Malaysia is a resource-rich and agriculture based economy, it
still relies on imported food. For example, Malaysia imports RM64 million'
(approximately £16 million) worth of fresh and processed fruits annually from
Thailand, Australia and United States of America (MARDI 1991a: 2). Malaysia
consumes an average of 7 million litres or RM30 million' worth of fruit juice
annually, which it imports from USA, France and Australia. Furthermore, there is
a considerable potential in the world food trade. MARDI (1991b) estimated that
the value of world trade in fruits and vegetables will increase from US$4,000
million in 1988 to US$8,000 million in the 1990s. The market share for tropical
fruits is expected to increase from US$250 million in 1988 to US$1,200 million in
1990s. One of the most popular tropical fruit juices is pineapple of which the
major exporters are the Philippines and Thailand. Malaysia, however, is one of
the major exporters of canned pineapple. Malaysia could gain considerably by
1 RM1.00 = £0.25 2 £7.5 million
Chapter One
exporting processed food. For example, the price of "single-strength" markisa
fruit juice is from US$1,000 to US$1,400 per metric ton, while a frozen
concentrated fruit juice can fetch between US$3,500 and US$4,000 per metric ton.
For mango, guava and pineapple, the price is USS700, US$600 and US$2,400 per
metric ton respectively.
Here lies the importance of the food processing industry (FPI): increasing
food production and ensuring that consumers can obtain products of the desired
quality, in sufficient quantity. The development of the FPI would not only ensure
that Malaysia can produce adequate food, but it would also help to provide much
needed employment, contribute to national income and most importantly, achieve
the twin objectives of the New Economic Policies (NEP), namely poverty
eradication and economic restructuring.
1.1 The Research Problem
The FPI is an important industry, contributing RM1,700 million' worth of exports and
employing 29,080 workers in 1990 (Malaysia 1991: 130-131). In 1986, the
government identified FPI as one of the twelve industries to be developed under the
Industrial Master Plan (IMP) to spearhead Malaysia's effort at "leap frogging into an
industrialised country" (UNIDO 1985). As one of the twelve prioritised industries,
FPI has an important role to play in Malaysia's scheme of planned industrial
development. The government's effort in promoting FPI to spearhead Malaysia's
industrialisation effort is commendable; however, we are concerned about the ability
of the industry to play its role. This doubt regarding capability of the FPI pertains
mainly to two key issues: the size of the firms in the industry and its ability to
adapt to a changing social and economic environment.
3 1425 million
2
Chapter One
The food processing industry is dominated by small scale firms, which are
mostly operated as sole proprietorship or family businesses. They use low
technology and their products are for the most part sold in the domestic market.
Small scale industries (SSIs) are confronted with a variety of problems, such as
limited market, unskilled labour, lows technology and limited finance (Chee 1985.
1991a, 1991b; Ismail 1990; UKM 1990). All these problems prevent SSIs from
realising their full potential and contributing to Malaysia's economic
development. Another related problem is that of ethnic composition. A close
examination of Malaysia's manufacturing sector reveals an imbalance in ethnic
composition; with the majority of Bumiputera° dominating the less productive
sectors such as the traditional food industries and handicraft industries. Even in
the food industries, they are mostly concentrated in the highly competitive sectors
such as spice production and sauce making. The share of Bumiputera in the more
productive sectors, such as chemicals and chemical products, iron and steel,
textiles, electrical machinery appliances and parts is still limited, due to high
capital and skill requirement in these sub-sectors
Apart from the problems associated with size and ethnic composition,
another problem which appears to be of serious concern is the inability of
Malaysia's manufacturing industries to adapt to the changing social and economic
environment resulting from two recent developments: (a) introduction of "new"
technology, and (b) changes in local and international demand.
(a) "New" Technology
During the 1990s, one of the most critical issues confronting the domestic SSIs is
the state of their technologies and their innovative capacity. Studies by UKM
(1990,1992) and MITI (1990) have shown that most SSIs lack skilled labour and
The term, Bumiputera refers to the Malays and other indigenous communities. The non- Bumiputera are the Chinese and Indians.
3
Chapter One
are constrained by their low technologies. Unless they make certain efforts to
improve their technological base, the SSIs may be seriously affected by the rapid
structural change that is currently shaping Malaysia's manufacturing sector, due in
large part to the introduction and application of "new" technologies. Generally,
one can classify these new technoloaies into five, namely, information, new
materials, biotechnology, space and nuclear. These new technologies principally
emanate from the industrialised countries, but have also affected the
industrialisation and development process in developing countries like Malaysia
(Anuwar 1992). UNIDO (1989: 1-20) argued that these new technologies can
create an economic imbalance and techno-structural gaps, in term of the varying
speed of innovation for increasing competitiveness and changes in output and
composition conforming to a changing demand structure. What is the implication
of these new technologies for small scale firms in Malaysia? The immediate
effect of new technologies is that a firm's competitiveness will be determined by
the technology it utilises. The new technologies can alter the price relationships
and the situation created by the comparative cost of factors such as labour and
capital. According to Anuwar (1992: 65), the wide application and dissemination
of the new technologies have some effect on the basic structure of industrial
production in terms of production cost, labour utilisation and productivity.
The technologies developed up to the early 1970s were designed for large
scale industries (LSIs) involved in mass production. Today's technology,
however, is more focused on software, multi-item and small-scale development,
such as computer controlled equipment and programmable automation. In short,
SSIs need to modernise and adopt technological innovation to stay competitive.
This will increase their efficiency, improve productivity and allow for the
introduction of new products and services to satisfy existing market demand or
expanding market share. By adopting a technology, the SSls will not only
decrease cost and increase productivity, but they will also be enabled to increase
4
Chapter One
their share in the domestic market and even export their products. All these
developments offer potential opportunities of fulfilling SSIs' needs. More
importantly, technology will become a critical factor in the reorganisation and
adjustment of the SSIs if they are to improve their competitiveness. For example,
firms with electronic-based technologies and automation are able to market their
products more quickly once they have been designed, and to respond rapidly and
flexibly to their customers' needs and specifications. However, the rapidity of
technological change and automation has created new problems of obsolescence
and competition. Firms with the technology may be able to meet the changing
demand, but technology tends to shorten the life-span of new products (Anuwar
1992: 65). Small firms may find themselves in a difficult situation; they are under
pressure to adopt technology and maximise returns from their new products as
soon as possible, before their products become obsolete. Only through
technology upgrading, can the SSIs exploit new business opportunities and adapt
to the changing social and economic environment. Thus, the key element in a
firm's competitiveness is technology upgrading.
(b) Changes in Demand
Malaysia is currently experiencing rapid economic growth. From 1985 to 1990 and
from 1990 to 1995, its Gross Domestic Product experienced an average annual growth
rate of 6.7 per cent and 8.7 per cent respectively (Bank Negara Malaysia 1992;
Malaysia 1991; Ministry of Finance 1995). Such rapid economic growth is usually
accompanied by an increase in the standard of living and changes in the pattern of
consumption and purchasing behaviour. With increased income, consumer needs will
be more diversified and "sophisticated" and the market for individual products and
services will become more closely defined. For example, we see a growing demand
for fast foods due to changes in work patterns with increases in income and in the
05
Chapter One
number of women leaving home to join the labour market. SSIs, compared with LSIs
are more flexible, and are potentially able to respond more quickly to this changing
consumer demand by expanding their activities into new areas or improving their
product quality and services. However, in order to meet the increasingly
sophisticated needs of the market, the SSIs need to improve their technology.
We have seen that in the face of change in technology and in demand.
Malaysian SSIs will depend on the acquisition and diffusion of new technology to
increase productivity, competitiveness and efficiency. The benefits derived from
technology adoption and upgrading are unquestionable. What is, however, at
issue, is the extent to which new technology can and will be adopted. Some
manufacturers may respond and adopt new technology, while others may not. A
common theme running through studies on SSIs in Malaysia is that while some
SSIs have responded by introducing new technology such as computer-aided-
design, many others continue to produce using "old" techniques. Previous studies
(Chee 1985; Ismail 1990; Mohd and Shaari 1988; UKM 1990,1992) have revealed
that SSIs face many problems due to their use of obsolete machines, low level of
technology and lack of access to technological information. A study by a
Universiti Kebangsaan Malaysia (UKM) research team (UKM 1990: 82) revealed
that 30 per cent of small scale firms under study were using machines aged
between 5 to 10 years, while 10 to 15 per cent were using machines aged 11 to 15
years. In fact more than 50 per cent of the entrepreneurs had not changed their
production methods since they first began operating. These results suggest that
small scale firms have responded differently, one manufacturer to another,
depending on a variety of factors.
The usage of old and inefficient machines does not necessarily indicate
that entrepreneurs are unaware of the availability of better alternatives or more up-
to-date production technologies in the market. Some entrepreneurs are aware of
better alternatives; however, there are numerous factors that they need to consider
6
Chapter One
in making their decision to shift or adopt new technology. The most commonly
cited reason for the lack of technological adoption by SSIs is that they lack
financial resources to finance new technology. These studies argue that the need
to undertake fixed investment and the high cost involved may prevent SSIs from
adopting new technology. Access to capital is necessary to finance the adoption
of new technology. Assuming that this is true, then an increase in financial support
to SSIs, would encourage them to adopt new technology.
A closer examination, however, reveals that financial constraints are more
of a "myth" than a reality to the majority of the SSIs in UKM's (1990) study.
Although the majority cited financial constraints as their major reasons for non-
adoption of new technology, only 38 per cent of the sampled firms had made
efforts to seek institutional funding for such purpose. This research finding was
parallel to the finding in Chee's (Chee 1977: 34) earlier study which stated that
many small establishments had never approached a bank when they were short of
funds, mainly because they did not think they could get a bank loan. In fact, there
are no less than 13 government ministries and thirty agencies (Chee 1991b; Ismail
1990) involved in promoting SSIs in Malaysia, suggesting that there is no lack of
support for SSIs. In terms of financial support, Bank Negara Malaysia (Central
Bank), the commercial and development banks have introduced various
programmes and funds to provide financial assistance to SSIs. Agencies such as
Majlis Amanah Rakyat (MARA) or Council of Trust for Indigenous People, Bank
Pembangunan Malaysia Berhad (Development Bank of Malaysia), and Malaysian
Industrial Development Finance (MIDF) have special schemes to assist the
financing of machines and equipment for SSIs. Considering that the majority of
SSIs' entrepreneurs have not made any attempt to obtain financing from these
agencies to enable them to buy new machines and equipment, it is difficult for us
to believe that lack of financial resources is the major constraint to their
technological adoption.
7
Chapter One
Another commonly cited reason for the lack of technological adoption
among SSIs is that they do not have information on the latest available technology
(Asit and Siti 1988: 52, UKM 1990). However, there is enough evidence to
suggest that there are several government agencies involved in disseminating
information on technology and providing technological support to SSIs. The
government has also established agencies such as the Malaysian Agricultural
Research Development Institute (MARDI) and Standard Industrial Research
Institute of Malaysia (SIRIM) to provide technological support to the SSIs.
Nevertheless, studies by Chee (1990), Ismail (1990), Mohd and Shaari (1988) and
UKM (1990,1992) revealed that only a small percentage of SSIs had used the
facilities provided by these agencies, suggesting that SSIs have limited access to
these agencies.
SSIs' abilities to adopt a new technology introduced by the above agencies
reflect their level of innovativeness. This new technology is a process innovation,
involving some new machinery, that is considered by these agencies as
appropriate to be introduced to small firms to improve their performance. The
abilities of some firms to introduce this technological innovation showed that they
were able to search for information about the existence of such an innovation and
their willingness to make changes in their firms which indicated their innovative
behaviours.
It seems to us, that the problem associated with technological innovation is
not one of lack of finance or institutional support as has often been perceived, but
a combination of factors which are internal and external to the producers. Yes,
technology will increase efficiency, improve product quality and strengthen SSIs'
level of competitiveness. Adoption of a technological innovation seems to be the
In this study we define innovation as the adoption of a new machine by small firms to improve their performance. This is a type of process innovation (refer to Chapter Three and Chapter Four for the details).
8
Chapter One
near perfect solution to the problems of inefficiency, lack of market
competitiveness and low quality of products faced by SSIs. However, despite
government efforts to facilitate technology transfer, the SSIs do not innovate.
Even if they do innovate, they undertake only incremental innovation and
marginal adaptations to meet local needs, rather than the design and development
of new products and processes. Assuming that technological innovation is good,
then why is it that there is differential response by SSIs to the scope which expect
for technology adoption? This brings us to the research question in this study:
Why do some small scale Bumiputera entrepreneurs in food processing
industries in Malaysia adopt technological innovation while others do not?
Other related questions are: do the Bumiputera SSIs have the capabilities to
introduce new technology? Is there a need for them to introduce new technology?
How does institutional support shape SSIs' response to technology adoption? The
answers to these questions will enable us to achieve the following:
(a) identify who adopted technology in the food processing industry, and what
are the personal characteristics, demographic background, attitudinal
factors, and experience of those who adopted and those who did not;
(b) explain how the above characteristics influence entrepreneurs' decision to
innovate;
(c) examine the characteristics of firms which promote or constrain
technological adoption in Bumiputera SSIs;
(d) discuss the role of institutions (government and private) in promoting
Bumiputera small scale entrepreneurs' capabilities to adopt technology;
and
9
Chapter One
(e) examine the effects of other factors such as competitive intensity and the
characteristics of the innovation on the entrepreneurs' decision to innovate.
1.2 Purpose of the study
This study seeks to explore influences of technological innovativeness
among small-scale Bumiputera entrepreneurs in the food processing
industry in Malaysia. The study includes inquiries into:
(a) The general background of the food manufacturing industry in
Malaysia, for example, its role in Malaysia's economic development,
potentials and constraints, and the effect of government policies on
FPI;
(b) The characteristics of the entrepreneurs, for example their
demographic background, educational achievement, personality traits,
level of knowledge on innovation and experience. What are the
characteristics of innovative or non-innovative entrepreneurs?
(c) The characteristics of firms, for example size, age, economic
performance including organisational structure. What is the process
of technological acquisition?
(d) The effect of institutional support, competitive intensity, the characteristics of
the innovation, the entrepreneurs' perception of innovation and buying
procedures on technology adoption decisions.
1.3 Importance of the Study
Previous studies on Malaysian SSIs have tended to focus on their problems (Chee
1986,1990; Ismail 1990; Mohd and Shaari 1988; UKM 1990,1992). It seems to us,
10
Chapter One
that these studies lack a sectoral approach. These studies appears to treat all SSIs as
alike, assuming that they have similar potential and face similar problems. This study
differs from previous ones because it focuses on one particular sector, that is, the food
processing industry. By doing so, we hope to identify the potentials and constraints
which are pertinent to this particular sector.
This study hopes to improve existing knowledge on technology innovation
studies in Malaysia. Previous studies on technology innovation tended to focus on
the macro-level (regardless of the size of firms) with limited discussion of small
scale industries. Both Anuwar (1992) and Fong (1986) have provided useful
insights . into Malaysia's industrialisation programme and the need for
technological advancement. Our study complements Fong's and Anuwar's studies
by discussing technological innovation at the micro-level.
The theoretical model developed in this study can identify the key factors
influencing technology innovation decisions in Bumiputera small scale food
processing firms. Based on this model, we can show and quantify the inter-
relationship between the various factors influencing technology adoption
decisions.
1.4 Scope of the Study
This study's scope is limited to small scale FPI. Before we provide our
justification for limiting this study to a set of ethnic groups, we have to
understand the background of the Malaysian population. The population of
Malaysia comprises three main ethnic groups, namely Malays, Chinese and
Indians. Malays, with other indigenous groups such as Iban, Melanau, Jakun and
Kadazan, are called Bumiputera. Malays, Chinese and Indians have their own
distinctive cultures, which influence their life styles. Before the 1970s, these main
ethnic groups could be identified by their economic activities. For example,
ii
Chapter One
Malays were involved in the agricultural sector in rural areas, Indians worked as
agricultural labourers in rubber estates while the Chinese were involved in the
industrial and commercial sectors in urban areas. However, there has been a rapid
increase in the number of Bumiputeru participating in FPI over the last twenty
years. The increase in number of Bumiputeru participating in FPI, the positive
discrimination by government which helped to bring this about, and the distinctive
culture of Malays with other major ethnic groups were the main reasons why we
limit the scope of this study to Bumiputeru in small scale FPI.
The main reason for the increase in Bumiputera small scale food
processing firms was the launching of the New Economic Policy (NEP) in 1971
with its twin objectives of poverty eradication and economic restructuring. The
second prong of this policy aims at accelerating the process of restructuring of
economic imbalances, so as to reduce and eventually eliminate the identification
of race with economic function. Hence, its strategy was to bring about greater
participation of Bumiputera in manufacturing sector activities. The essential part
of this strategy was the creation of the Bumiputera Entrepreneurs Commercial and
Industrial Community (Malaysia 1971). In order to achieve this objective, a high
proportion of public spending was used to set up conducive environments for such
creation, such as setting up various institutions and public enterprises for training,
providing physical facilities and financial assistance. By limiting the scope of this
study to Bumiputera entrepreneurs, indirectly we could observe the role of some
of these institutions in promoting technological innovation adoption among
Bumiputera entrepreneurs.
Another reason for the emergence of small scale Bumiputera entrepreneurs
in FPI was the increase in demand for halal' food. The increase in demand for
halal food was due to Islamic resurgence and an increase in the number of
6 Food prepared according to Muslim dietary laws.
12
Chapter One
Bumiputera women participating in the labour force in the 1970s. Islamic
resurgence led to more inclination among Bumiputera to buy from Bumiputera
firms which provided halal food. Hence, to some extent Bumiputera production
was supplying some distinct segment within the market - for rural Malays and
urban Malays who were inclined to buy from corner shops as opposed to
supermarkets.
Bumiputera, about 90 per cent of which consist of Malay Muslims (the
major ethnic group) have distinctive culture, quite different from Non-Bumiputera
(Chinese and Indian). We believe that the distinction in culture to some extent
influence their management style and performance of their firms. By limiting the
scope of this study to Bumiputera entrepreneurs we were able to control the
influence of culture in determining firms' innovativeness in the analysis.
We also have to recognised the constraints which would have been faced
to operationalise the study if we had wanted to include small scale FPI of Chinese
and Indian entrepreneurs. Since the study was conducted by the survey method,
and we used interviews and questionnaires as our instruments of obtaining
information, if we were to have included, Indian and Chinese entrepreneurs, we
would have had to develop two more sampling frames, develop questionnaires in
theses two languages and hire Indian and Chinese field workers to ease the process
of collecting information. Limited funds and time does not permit us to study
beyond the scope of Bumiputera small scale FPI.
1.5 Study Limitations
This study has several limitations. The first limitation arises due to use of the survey
method. Our study is based on information gathered from small scale Bwniputera
firms in the food processing industry. As a result of using a survey method, we are
13
Chapter One
unable to generalise our findings to firms beyond the survey area or those which differ
in ethnic composition and size from the surveyed firms. This study uses cross-
sectional data which do not take into account the process of change. By examining
their innovation decisions at one particular period, we exclude the various innovations
that may have been made previously (before 1989). Rather than discussing different
types of innovation, our study only focuses on process innovation, particularly of
automation and machine. Though we may improve our understanding of the factors
involved in the adoption of process innovation, we have overlooked other
innovations, such as those related to information technology.
1.6 Organisation of Thesis
Our thesis is organised into nine chapters. In Chapter One we introduce briefly the
importance of the FPI and its role in Malaysia's economic development. We proceed
to discuss the need for technology in Malaysian SSIs. Part of this need is due to the
emerging trend in technological development and changes in demand today. SSIs
need to respond to these changes in order to survive. Previous studies on SSIs show
that there is differential response to technological innovation. The purpose of our
study is to identify the factors which explain this differential response; why do some
SSIs innovate while other do not? Besides outlining the purpose of this study, we also
outline its importance and limitations.
In Chapter Two, we discuss the role of the New Economic Policy (NEP)
and the growth of industrialisation, the nature of the food processing industry and
the role of small scale industry in Malaysia. We also discuss the potential. and
constraints of SSIs and the role of government agencies in developing the industry.
14
Chapter One
In Chapter Three we begin by introducing what we mean by
"innovation". This will then be followed by a discussion of some of the
theoretical approaches used in this study, such as the adoption decision process,
organisational buying behaviour, decision theory and small firms' decision
process. From this theoretical discussion, we hope to identify the stages involved
in the small firms' buying process including the factors affecting their buying
behaviour. We use this theoretical discussion as a foundation for developing our
theoretical framework in the next chapter.
In Chapter Four, we attempt to develop a conceptual framework to study ... the determinants of technological innovation in SSIs, focusing on Bumiputera
entrepreneurs in the food processing industry. For the purpose of discussion, we
also propose the hypothesis regarding the factors that influence technological
innovation.
Chapter Five outlines the methodology of the study. It includes a
discussion on the instruments, sampling techniques and statistical tools used in
this study, which has adopted a survey method to collect information from 197
Bumiputera entrepreneurs in the food processing industry. We use a logistic
regression function to identify the significant factors that determine technological
innovation decisions.
Chapters Six, Seven and Eight contain analysis of research findings. In
Chapter Six we identify the characteristics of entrepreneurs that influence their
decision to innovate. We found that among the significant characteristics that
influenced the entrepreneurs to innovate are their age, level of education,
experience, skill upgrading, need for achievement and attitude towards risks. In
Chapter Seven, we analyse the influence of communication, entrepreneurs'
perception of the characteristics of the innovation and buying procedure. We also
analyse the influence of institutional involvement and government agencies in
15
Chapter One
determining their innovative behaviour. Chapter Eight identifies the significance
of firms' characteristics in relation to entrepreneurs' decision to innovate. We
found that factors such as financing and economic performance have a significant
influence on entrepreneurs' innovative behaviour.
Chapter Nine is the concluding chapter. In this chapter we discuss the
inter-relationship of all the factors influencing technological innovation. We
attempt to answer the research questions and summarise the research findings. In
this chapter we also propose some policies that could be adopted to enhance
technological innovation among small scale FPI in Malaysia. This chapter also
includes some suggestions for future research.
16
Chapter Two
CHAPTER TWO
SMALL SCALE FOOD PROCESSING INDUSTRY IN MALAYSIA: CURRENT ISSUES AND CHALLENGES
2. Introduction
This chapter contains a discussion on the role of the food processing industry
(FPI) in the Malaysian economy. By way of introduction, it is useful to discuss
Malaysia's New Economic Policy (NEP) and the growth of industrialisation in
Malaysia. Our discussion will trace briefly the different stages in Malaysia's
industrialisation. In this section, we shall also the discuss the role of
industrialisation in achieving the twin objectives of the New Economic Policy
(NEP). This will be followed by a discussion of critical issues in Malaysia's FPI,
focusing on small-scale firms. Such a discussion is necessary to provide the
context for explaining why the FPI industry is what it is today; the most
"important" industry as reflected by the size of its contribution to Malaysia's
Gross Domestic Product (Malaysia 1991) and number of establishments (UNIDO
1995).
We must emphasise that most of the information used in this chapter is
based on secondary data, informal or unstructured interviews (with entrepreneurs
and government officers), and the researcher's impression and understanding of
the issues discussed. This chapter not only serves as a background, but it also
17
Chapter Two
complements the information provided in the later chapters which are based on a
survey using structured interviews.
2.1 Industrialisation and the New Economic Policy
A study of Malaysia's industrialisation effort is incomplete without discussing the
role of the New Economic Policy (NEP). To understand the reasons behind
Malaysia's introduction of the NEP, we must first understand its economic history.
Malaysia' which was once a British colony achieved its independence in 1957.
After independence, Malaysia pursued a laissez-faire approach to development.
The government's role was mainly limited to its traditional role of maintaining
law and order, and provision of education and basic utilities.
The government's limited role, however, changed with the implementation
of the NEP in 1971. The NEP was implemented in reaction to the racial riots of
1969. The government realised that it could no longer play a passive role in
development, for there were obvious signs of economic imbalances between races,
regions and sectors in the economy. In terms of races, there is evidence that there
is a clear identification of race with economic occupations. The Bumiputera2 are
mostly concentrated in the rural traditional sector (such as agriculture, fishing)
while the non-Bumiputera are mostly concentrated in the modem industrial and
commercial sector. There is a wide income inequality between the races resulting
from the identification of race with economic activities. Figure 2.1 shows the
' The Federation of Malaya gained its independence in 1957. Sabah and Sarawak joined with the Federation of Malaya in 1963 to form Malaysia.
2 The terms Bumiputera is literally translated as "sons of the soil". In Malaysia the Bumiputera comprises the indigenous people of Sabah, Sarawak and Peninsular Malaysia. It does not include the Chinese and Indians.
18

('hapler Iwo
incidence of poverty by rural-urban strata in Peninsular Malaysia prior to the
implementation of the NEP. It is evident from Figure 2.1, that the agricultural
sector had the highest incidence of poverty; 64.7 per cent of rubber smallholders,
88.1 per cent for padi farmers and 91.8 for other agriculture. Of all the sectors,
the trade and services had the lowest incidence of poverty (10.1 per cent).
Figure 2.1: Incidence of Poverty In Peninsular Malaysia in 1970
Source: Malaysia (1981) Table 3-2.
In 1970, the incidence of poverty in Malaysia was 49.3 per cent, with 65
per cent of total Malay households living below the poverty line. The Malays
earned an average income of RM 172.003, compared to RM394.004 for the Chinese
3 £43.00
4 £99.00
19
Chapter Two
and RM304.005 for the Indians giving the non-Malays: Malay income ratio of 2: 1
(Malaysia 1971).
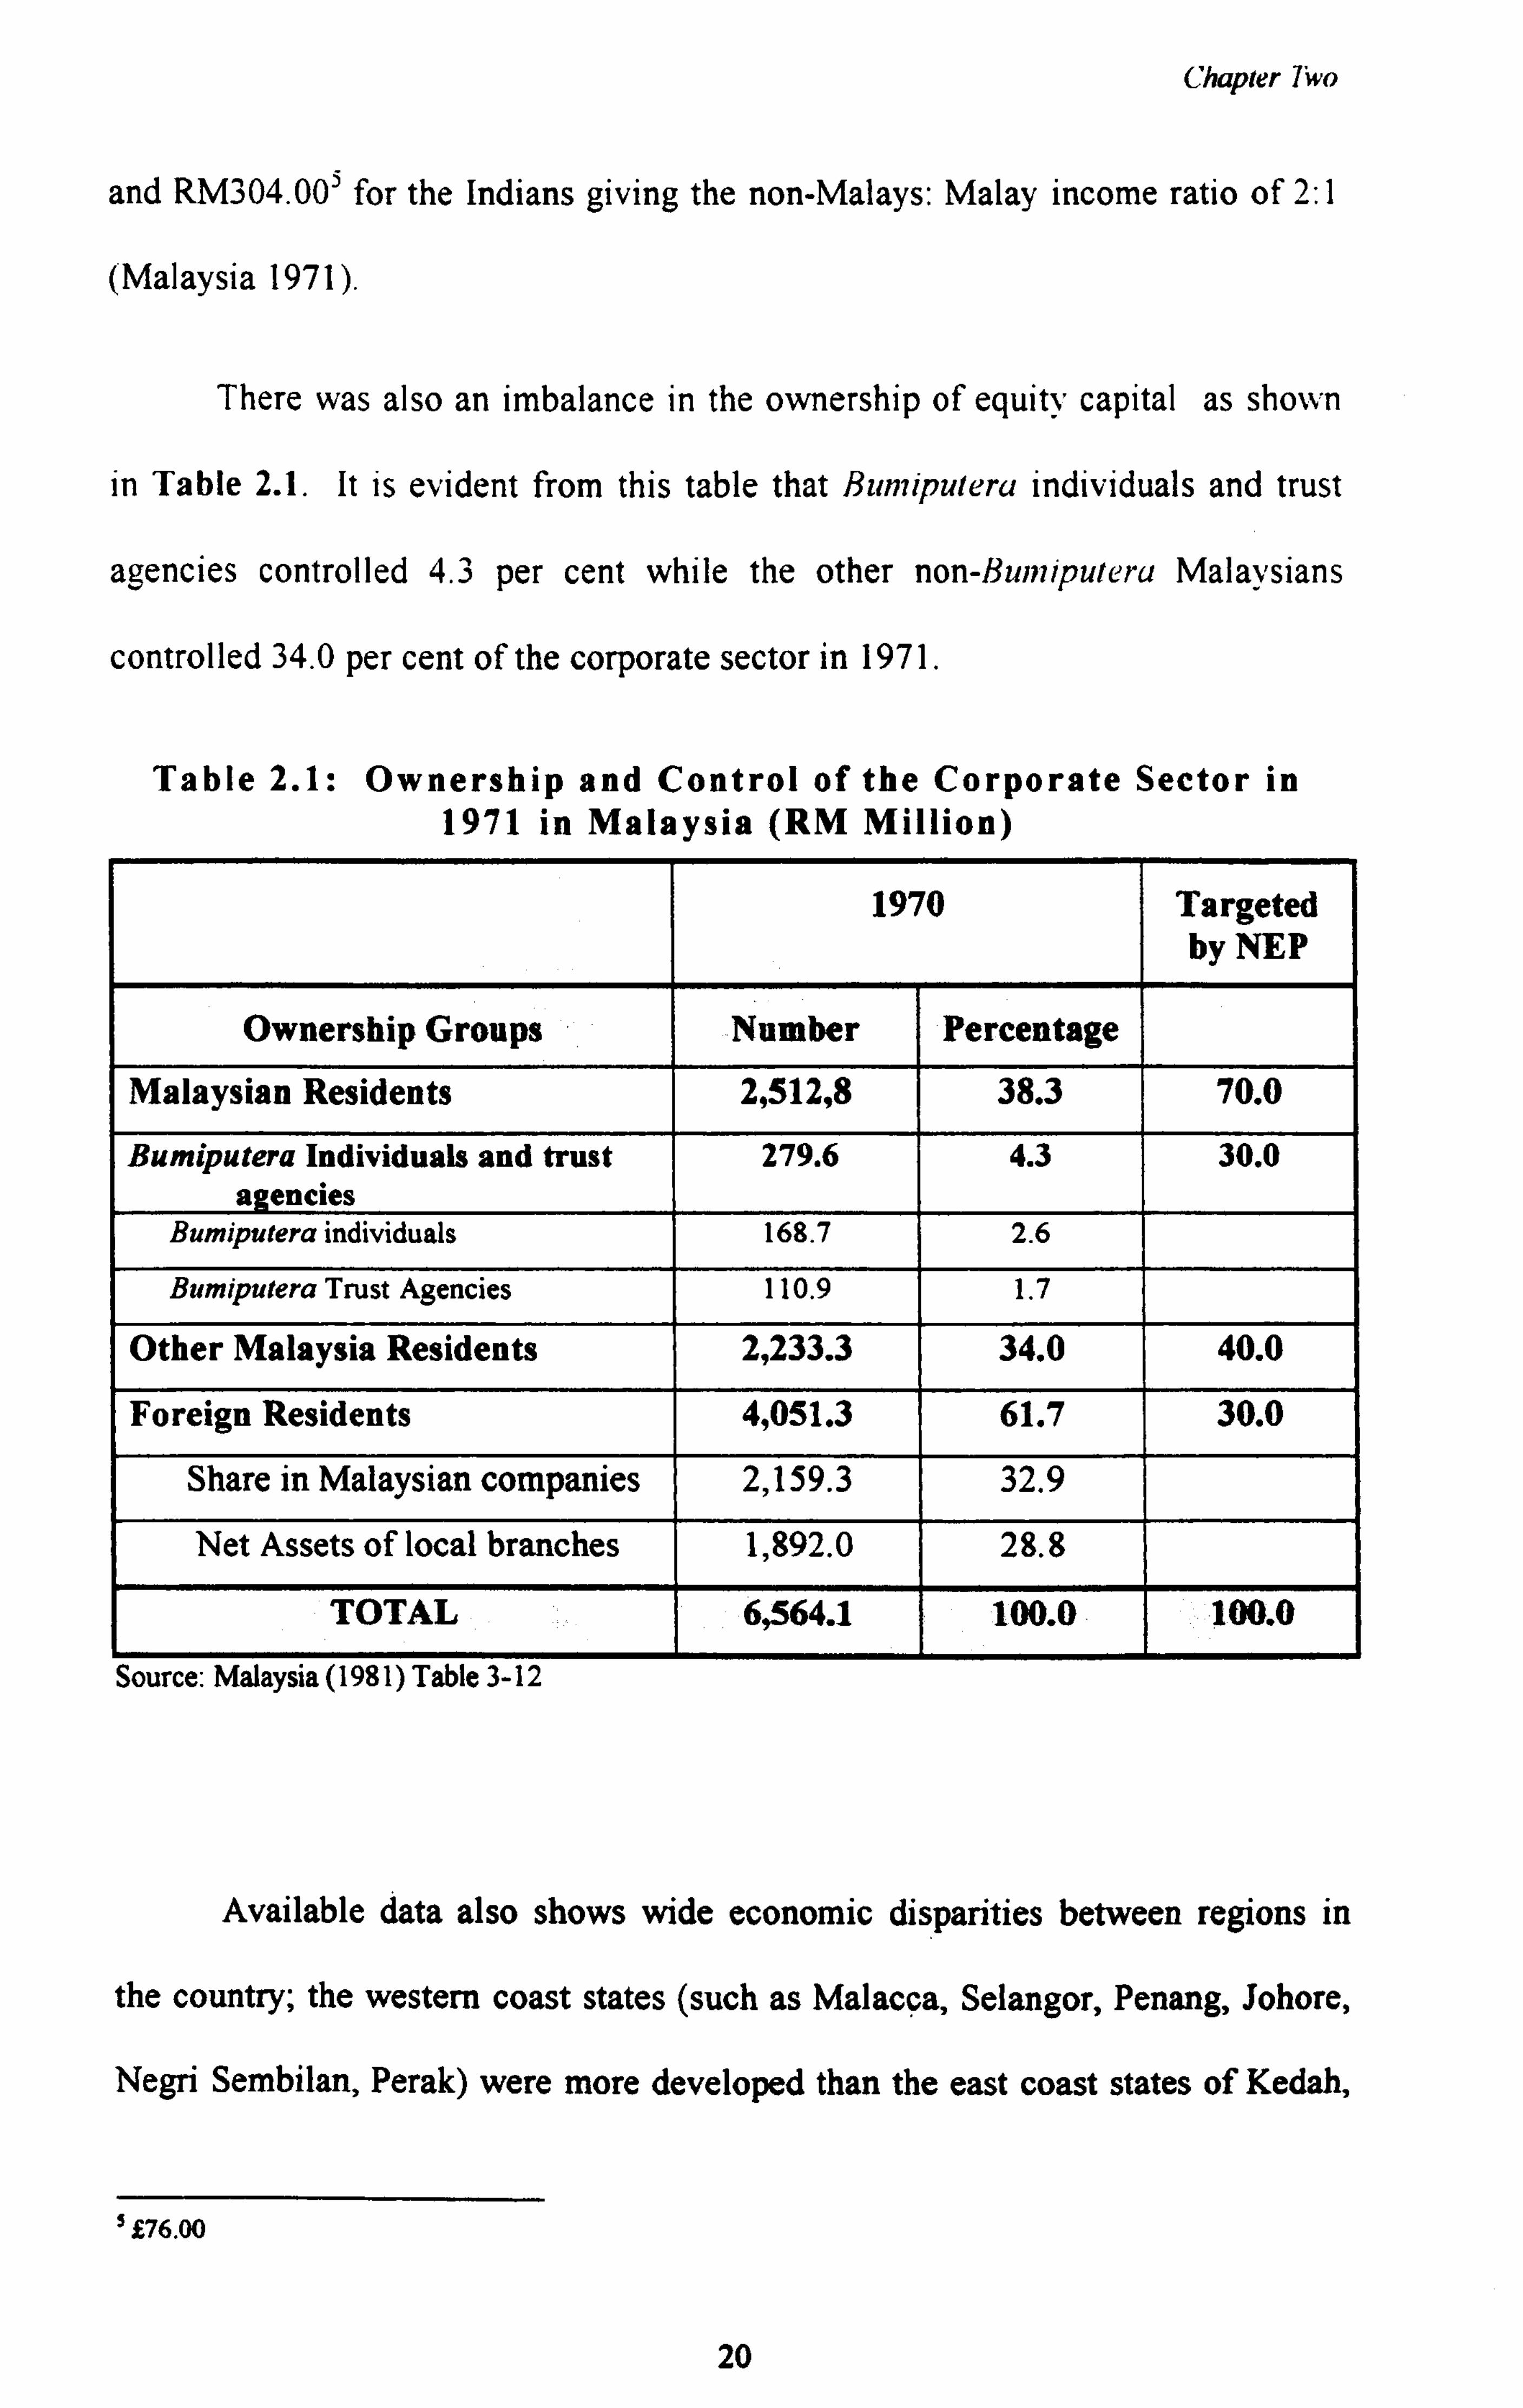
There was also an imbalance in the ownership of equity capital as shown
in Table 2.1. It is evident from this table that iumiputeru individuals and trust
agencies controlled 4.3 per cent while the other non-Bumiputeru Malaysians
controlled 34.0 per cent of the corporate sector in 1971.
Table 2.1: Ownership and Control of the Corporate Sector in 1971 in Malaysia (RM Million)
1970 Targeted by NEP
Ownership Groups Number Percentage
Malaysian Residents 2,512,8 38.3 70.0
Bumiputera Individuals and trust agencies
279.6 4.3 30.0
Bumiputera individuals 168.7 2.6
Bumiputera Trust Agencies 110.9 1.7
Other Malaysia Residents 2,233.3 34.0 40.0
Foreign Residents 4,051.3 61.7 30.0
Share in Malaysian companies 2,159.3 32.9
Net Assets of local branches 1,892.0 28.8
TOTAL 6,564.1 100.0 100.0
Source: Malaysia (1981) Table 3-12
Available data also shows wide economic disparities between regions in
the country; the western coast states (such as Malacca, Selangor, Penang, Johore,
Negri Sembilan, Perak) were more developed than the east coast states of Kedah,
V6.00
20
Chapter Two
Kelantan, Trengganu and Pahang in Peninsular Malaysia. There was also
economic disparity between Peninsular Malaysia, and the two states in Borneo,
namely Sabah and Sarawak.
In response to this situation, the government introduced the NEPG with its
twin objectives of poverty eradication and economic restructuring.
The Plan incorporates a two-prong New Economic Policy for development. The first prong is to reduce and eventually eradicate poverty, by raising income levels and increasing employment opportunities for all Malaysians, irrespective of race. The second prong aims at accelerating the process of restructuring of economic imbalance, so as to reduce and eventually eliminate the identification of race with economic function. This process involves the modernisation of rural life. a rapid and balanced growth of urban activities and the creation of a Malay commercial and industrial community in all categories and at all levels of operation. so that Malays and other indigenous people will become full partners in all aspects of economic life. (Malaysia 1971: 1) (Our emphasis)
To achieve its restructuring objectives, the government announced that by
1990, Malaysians would own 70 per cent of total share capital of limited
companies with Bumiputera owning at least 30 per cent, the non-Bumiputera 40
per cent and foreign interests 30 per cent. In fact, the 30 per cent Bumiputera
ownership target became a rule that was applied almost throughout the economy.
As we can see from Table 2.1, the NEP laid down that the Bumiputera
equity share had to increase from 4.3 per cent in 1970 to 30 per cent in 1990.
The non-Bumiputera share had to increase from 34 per cent to 40 per cent,
while the foreign interest had to reduce from 61.7 per cent to 30 percent. The
government realised that total reliance on market forces and the private sector
to uplift the economic status of the Malays in commerce and industry would be
6 The NEP period spans from 1970-1990.
21

Chapter Iwo
slow, uncertain and probably not feasible. The implementation of the NEP saw
a shift in government's role in development; from a passive to an active one. It
was argued that government assistance or "intervention" was required to assist
rapid Bumiputera entry into and increased involvement in the modern
industrial sector.
In the Malaysian case, economic restructuring was achieved through
corporate growth rather than asset redistribution. The government created
specialised or "trust" agencies, such as Council of Trust for Indigenous People
(MARA), State Economic Development Corporations (SEDCs), Bank Bumiputra,
and Permodalan Nasional Berhad (PNB) or National Investment Limited, to
ensure the rapid growth of Bumiputera commercial and industrial community.
One of the responsibilities of these agencies was to provide support (marketing,
financial, technical, consultancy services) to the Bumiputera. The government
also introduced guidelines for lending by commercial and financial institutions to
the Bumiputera.
Active Bumiputera involvement in the non-agricultural sectors, particularly
manufacturing, became a major element in the strategy of the NEP. By
encouraging the Bumiputera to participate in the non-agricultural sectors, the
government hopes to help move the Bumiputera from the low productivity and
income activities to higher productivity and income activities.
Though it is not within the scope of this study, however, it is also useful to
evaluate the criticisms of the NEP. Many non-Bumiputera have voiced their
serious concern over the implementation of the NEP. One of the strongest voices
22
Chapter Two
came from the Kuala Lumpur and Selangor Chinese Chamber of Commerce
(Dewan Perniangaan dan Perindusirian C'ina Kuala Lumpur dan Selangor). In
their memorandum to the Ministry of Trade, they wrote:
Over the last 15 years, since the promulgation of the NEP, the environment for industrial development has become increasingly regulated..... The result is a highly over-regulated industrial environment that suffers from significant market distortions, and inefficiencies... A large part of the blame for this state of affair must be put on the abuses and excesses in the implementation of the New Economic Policy (NEP) in the past. (KLSCCI, 1986: 7) (Our emphasis)
To the Chinese communities, the NEP has been subject to "biases" and
"abuses". Among their areas of discontent are the government's contract award
system and the bias in the government's support programmes.
The government contract award system for supplies and public work has shown consistent bias in favour of [B]umiput[e]ra contractors. Instead of an open tender system, many contracts are awarded based purely on NEP criteria with little regard for cost competitiveness (KLSCCCI, 1986: 9)
The government has shown consistent bias in its Small Scale Industry (SSII assistance/support programs and in its manpower/entrepreneurial training programs. For example, practically all the government operated entrepreneurial training programs catered exclusively to [B]umiput[e]ra businessmen. (KLSCCCI, 1986: 10)
Their criticism is not without basis. A close examination of the
participants in government (or trust agencies) sponsored entrepreneurial
programmes, shows that there is obvious bias against the non-Bumiputera. Table
2.2. It appears to us that the non-Bumiputeras have limited access to government
support.
23
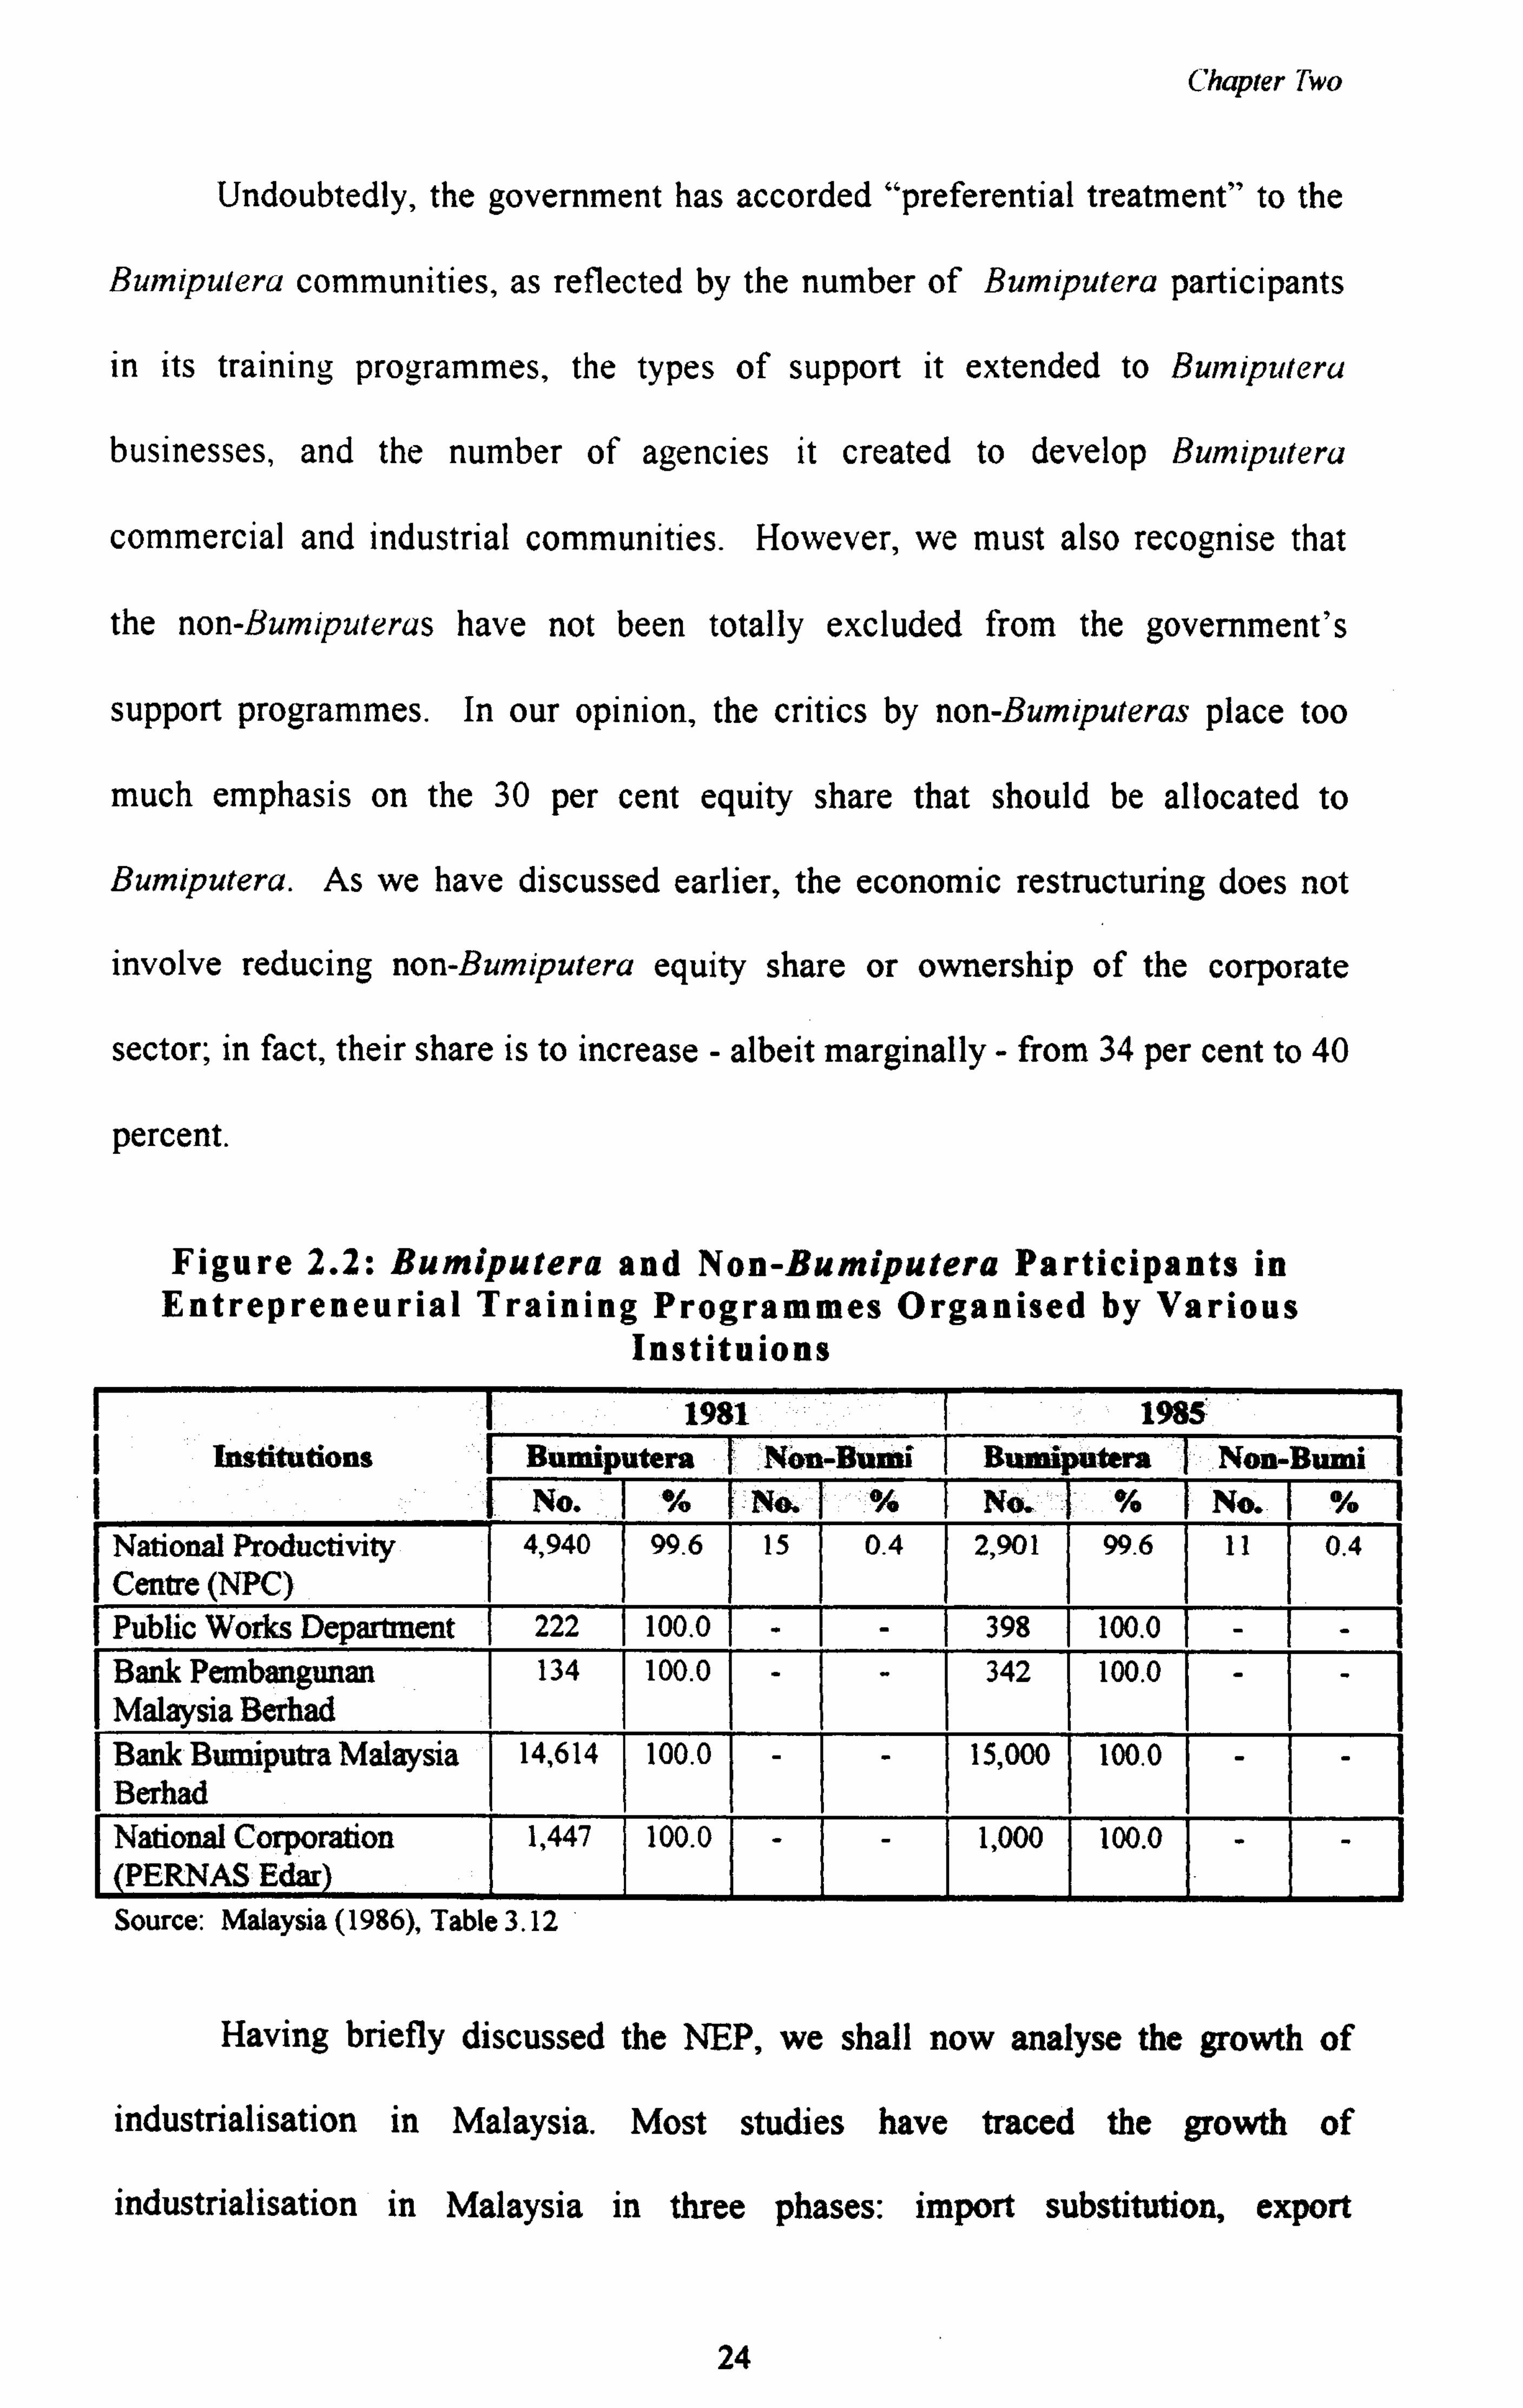
Chapter Two
Undoubtedly, the government has accorded "preferential treatment" to the
Bwnipulera communities, as reflected by the number of Bumiputera participants
in its training programmes, the types of support it extended to Bumiputeru
businesses, and the number of agencies it created to develop Bumiputeru
commercial and industrial communities. However, we must also recognise that
the non-Bumiputeras have not been totally excluded from the government's
support programmes. In our opinion, the critics by non-Bumiputeras place too
much emphasis on the 30 per cent equity share that should be allocated to
Bumiputera. As we have discussed earlier, the economic restructuring does not
involve reducing non-Bumiputera equity share or ownership of the corporate
sector; in fact, their share is to increase - albeit marginally - from 34 per cent to 40
percent.
Figure 2.2: Bumiputera and Non-Bumiputera Participants in Entrepreneurial Training Programmes Organised by Various
Instituions
1981 198 5 Institutions 11 Bumiputera Non-Bumf Bumi putera Non- Bumf
No. % No. % No. % Na % National Productivity Centre (NPC)
4,940 99.6 15 0.4 2,901 99.6 11 0.4
Public Works Department 222 100.0 - - 398 100.0 - - Bank Pembangunan Malaysia Berhad
134 100.0 - - 342 100.0 - -
Bank Bumiputra Malaysia Berhad
14,614 100.0 - - 15,000 100.0 - -
National Corporation (PERNAS Edar
1,447 100.0 - - 1,000 100.0 - -
Source: Malaysia (1986), Table 3.12
Having briefly discussed the NEP, we shall now analyse the growth of
industrialisation in Malaysia. Most studies have traced the growth of
industrialisation in Malaysia in three phases: import substitution, export
24
Chapter Two
orientation and export-led growth based on heavy industries (Anuwar 1992; Fong
1986). The import substitution stage covers the period immediately after
independence in 1957, up to 1968. The export orientation phase started in 1968,
with the launching of the Investment Incentive Act of that year. The third phase,
which began in 1980, continues to the present.
The first phase in Malaysia's industrialisation programme was
characterised by a strong emphasis on import substitution. Like many newly
independent countries at that time, Malaysia saw industrialisation as the key to
rapid economic growth. Industrialisation was also pursued as a form of economic
diversification and a way to absorb the increase in the labour force which could
not be absorbed by the agricultural sector. To promote industrialisation, the
government introduced the Pioneer Industries Ordinance of 1958. During this
phase, the emphasis was on industrial development, with the private sector and
foreign investment playing the key role. Foreign companies were producing
consumer durables using technology imported from their parent companies. Local
companies were indirectly encouraged to import foreign technology by the duty
exemption given to imported technology and capital equipment. Furthermore,
government incentives tended to favour large-scale and capital intensive
manufacturing industries over small ones. Not only did government policies
neglect small scale industries, they also failed to promote industrial linkages and
develop indigenous technological capability. Undeniably, import-substitution
succeeded in promoting industrial development and increasing manufacturing
contribution to GDP. However, it did not promote manufactured exports or
encourage industries to make full use of domestic raw materials. In fact, the value
25
Chapter Two
of Malaysia's import of manufactured products increased more rapidly than its
exports. By the 1970s, many of the Malaysian industries were unable to market
their products due to market saturation. The government realised that the solution
to this problem was to adopt an industrial policy which encouraged export
promotion.
The second phase in the growth of industrialisation which started in 1968
and continued up to 1980, marked the beginning of Malaysia's effort at
industrialisation based on export expansion. The government introduced the
Investment Incentive Act of 1968 to promote export-oriented industrialisation.
The major instruments in this regard were the granting of pioneer status, tax
holidays based on the nature of product, the location of the firm, and the content
of local raw materials, and export incentives to new industries (Anuwar 1992: 9;
Fong 1986: 33).
The export-oriented industrialisation continued to emphasise foreign
investment, particularly multinational corporations (MNCs). The MNCs were
expected to play important roles such as providing capital, industrial technology
and access to foreign markets. In this phase, the emphasis was on the development
of labour-intensive industries, particularly electronics and textiles. Towards the
end of this phase, we saw a shift away from labour-intensive industries to more
capital- and technology-intensive industries, and resource based industries.
The third phase continues to emphasise the production of export
manufactures and the manufacturing sector continues to be the leading growth
sector. Besides emphasising the export-orientation, the government began to
26
Chapter Two
promote the development of heavy industries. Under the Fourth Malaysia Plan
(1981-85), the development of heavy industries (such as chemical complexes,
fertiliser, automobiles, cement integrated steel mills) was also part of the
government's effort to develop the underdeveloped regions in Malaysia. The
government hopes that by setting these heavy industries in underdeveloped
regions, the linkage effects will be felt in these regions, leading to the
development of other ancillary industries (Fong 1986: 42). One of the drawbacks is
that the growth of these heavy industries has not been complemented by the
expansion of indigenous technological capacity (Anuwar 1989,1992).
Also; in the third phase, we have seen the implementation of the Industrial
Master Plan (IMP). The IMP was launched in 1986, with the principal objectives
of. (a) accelerating the growth of manufacturing to ensure a continued rapid
growth in the Malaysian economy consistent with the objectives of the New
Economic Policy, (b) promoting opportunities for the maximum and efficient
utilisation of the nation's natural resources, and (c) building up the foundation for
leap-frogging towards an advanced industrial country by increasing
competitiveness and upgrading skills and technologies (UNIDO 1985: 52).
The IMP identified twelve major industrial sectors which would spearhead
Malaysia's industrialisation programme during the IMP period (1986-1995). The
twelve sectors were rubber products, palm oil products, food processing industry,
wood-based industry, chemical industry, electronics and electrical industry,
transport equipment industry, machinery and engineering industry, iron and steel,
and textile and apparel industry.
27
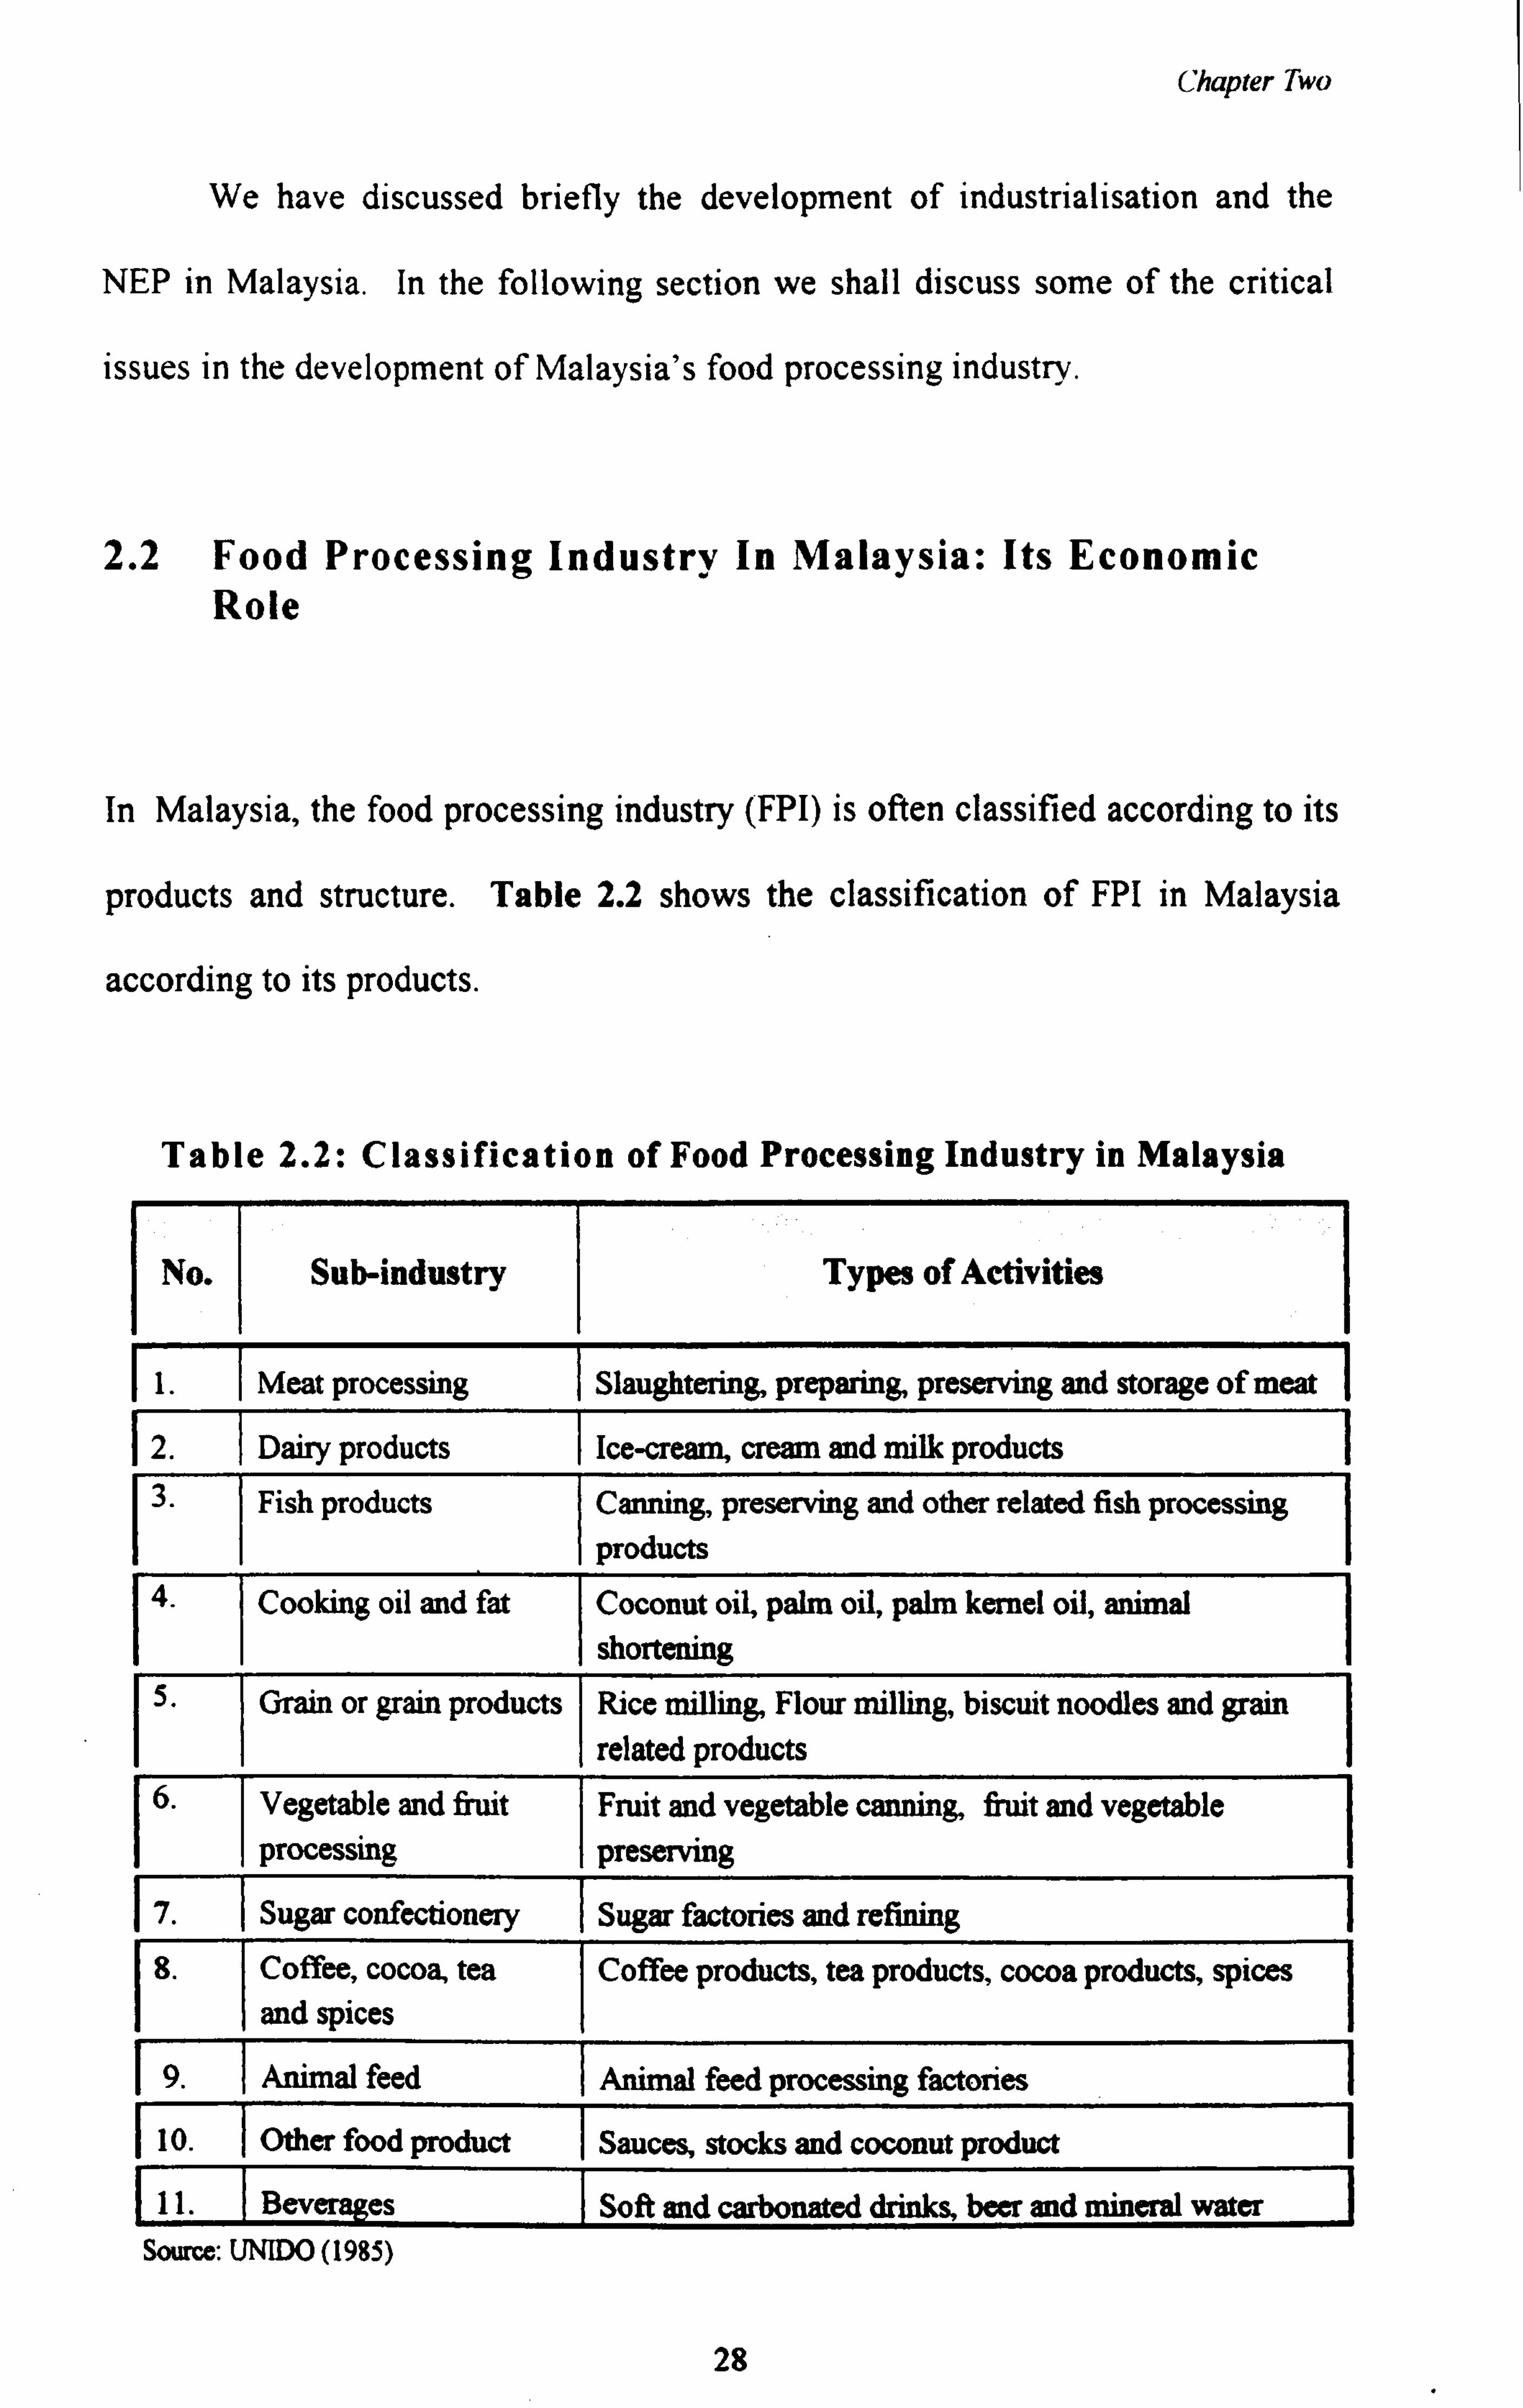
Chapter Two
We have discussed briefly the development of industrialisation and the
NEP in Malaysia. In the following section we shall discuss some of the critical
issues in the development of Malaysia's food processing industry.
2.2 Food Processing Industry In Malaysia: Its Economic Role
In Malaysia, the food processing industry (FPI) is often classified according to its
products and structure. Table 2.2 shows the classification of FPI in Malaysia
according to its products.
Table 2.2: Classification of Food Processing Industry in Malaysia
No. I Sub-industry I Types of Activities
1 1. Meat processing Slaughtering, preparing, preserving and storage of meat
12. Dairy products Ice-cream, cream and milk products 3. Fish products Canning, preserving and other related fish processing
products 4. Cooking oil and fat Coconut oil, palm oil, palm kernel oil, animal
shortening
6. Vegetable and fruit Fruit and vegetable canning, fruit and vegetable processing preserving
7. T Sugar confectionery Sugar factories and refining 8. Coffee, cocoa, tea Coffee products, tea products, cocoa products, spices
and spices
9. I Animal feed Animal feed processing factories
10. I Other food product Sauces, stocks and coconut product
11. Beverages Soft and carbonated drinks, beer and mineral water Source: UNIDO (1985)
28

Chapter Two
The food industry has two important roles to play in Malaysia's economic
development; it provides the country with export earnings and food. In 1985, the
food industry contributed RM755.5 million? worth of export earnings, and, with
its annual growth rate of 17.6 per cent, by 1990 the amount had increased to
RMI, 700 million" (Malaysia 1990: 130). Between 1985 and 1990, the sector
registered an average annual production growth rate of 9.1 per cent which enables
it to contribute to employment creation, but only to a small extent9. In 1990, this
sector employed 29,080 workers, or 6.3 per cent of the total labour force. Though
the sector does not contribute significantly to employment creation, compared to
other sectors like electrical machinery and appliances10, it is still an important
sector because of its role in providing food and reducing Malaysia's dependence
on imported food. For example in 1986, food alone constituted 6.1 per cent
(RM1,675 million") of Malaysia's total imports (Bank Negara Malaysia 1986). In
1992, food constituted 3.4 per cent (RM3,447 million12) of the total import (Bank
Negara Malaysia 1992). It may seem that the percentage of food imported
decreased between these two years, but the actual value of food imported
increased. For a country which is agricultural and resource-based the value of
imported food is considered high. This suggests that Malaysia continues to spend
much of its income on imported food.
i 189 million
£425 million 9Between 1986 and 1990, the average annual employment growth rate for food industry is 2.5 per cent (Malaysia
1990: 131)
'0 Between 1986 and 1990, the average annual employment growth rate for electrical machinery and appliances sub- sector is 20.6 per cent (Malaysia 1990: 131)
" £419 million 12 £862 million
29

Chapter Two
We can trace the history of the Malaysian FPI to the 1950s. During that
period, production techniques were simple, the sizes of firms were small and they
were geared towards the production of basic food such as biscuits, bread and
sauces. The majority of firms catered only for local markets, suggesting the
limited capabilities of the Malaysian FPI to penetrate the international market.
The 1960s and 1970s saw a new trend in the Malaysian FPI with the development
of large-scale firms. Many of these firms used modern techniques, and some even
managed to penetrate the international market. Two firms even managed to
market their chilli sauces using the "Linggam" and "Aminah Hassan" brand.
Foreign multinationals such as NESTLE and MAGGI built up production in
Malaysia. Both these firms used advanced technology and were highly capital
intensive.
Now, we can differentiate the food manufacturing firms into two
categories; those in the first use traditional or semi-traditional methods of
production, rely on local raw materials and cater for the local market. They are
mostly small-scale firms. On the other hand, there are the medium- and large-
scale firms, which are located in the urban areas, use modem technology, are
capital intensive, and cater for national and even international markets.
2.3 Role of FTI in Economic Development
In Malaysia's Industrial Master Plan (1986), the FPI was identified as a resource-
based industry with strong forward and backward linkages to the agricultural
sector, refrigeration and machine industry. FPI increased its contribution to GNP
30
Chapter Two
from RM2 million to 11 million between 1975 and 1985. During the same period,
the industry's contribution to total output in the manufacturing sector were up
from 22 per cent to 27 per cent. Of the whole food industry, the highest
contributor to GNP is edible oils and fats (63.4%).
FPI also plays an important role in terms of employment. According to
Malaysia's Industrial Survey 1985 and Annual Digest of Statistics 1985, the
industry employed 68,089 workers which formed 14.3 per cent of the total labour
force in manufacturing industry (Department of Statistics, 1986a, 1986b).
Having discussed the role of FPI in the Malaysian economy, it is also
useful for us to discuss the nature of the industry.
2.4 Nature of Small Scale Food Processing Industry
In this section, we shall introduce the nature of the food processing industry (FPI)
in Malaysia. For this discussion, we rely on information obtained from secondary
sources, particularly Annual Statistics Report and research results. According to a
study by UKM (1990), 83.9 per cent of their sample of food processing firms
employed less than 20 full time workers, 14.1 per cent employed 20 to 100
workers, and 3.5 per cent employed more than 100 workers. UKM's research
also shows that the majority of the sampled bakery (67.5%) and sauce (86.7%)
firms reported having capital valued less than RM50,000 (about £12,500). Unlike
the larger firms which are highly mechanised and capital intensive, the small-scale
firms tend to produce using manual or semi-mechanised techniques.
31
Chapter Two
The majority (79.8%) of the entrepreneurs were aged between 35 to 45
years. In terms of experience, 49.3 per cent had less than ten years of experience
in the FPI. That the majority were mostly middle-aged and with relatively short
experience in FPI suggests that they have been involved in other forms of
occupation or economic activities before setting up their food processing business.
Being small, the majority of the small-scale firms were owner-operated.
Our study in 1993 confirms the observation made by the UKM (1990)
study. We found that about 60.0 per cent of our respondents had previously
worked in other economic activities, such as petty trading, waged employment,
farming, and fishing before their involvement in the FPI. Some even had worked
as factory workers in food processing firms. Our research also confirms the
findings of earlier studies (UKM 1990; Chee 1990,1986) which shows that the
majority of the small scale entrepreneurs had limited education. In our study, we
found that 61.9 per cent of our respondents only had lower secondary education or
lower. The larger firms, however, have different backgrounds to that of the
smaller firms. Compared to their smaller counterparts, the majority of their
workers are relatively skilled and educated.
Regarding processing, we found that FPI either directly process perishable
commodities (such as fruits and vegetables, meat and fish) or use non-perishable
materials as intermediate materials in the processing of final products such as
bakery and cereal products, snack foods, vegetable-oil products. Firms which
directly process perishable commodities tend to rely on close proximity to sources
of raw materials, while those which rely on non-perishable materials depend on
the market. Not only do they differ in their terms of their success factors, but also
32

Chapter 7ivo
in terms of techniques and equipment used. These differences reflect the diversity
and complexity of the FPI in Malaysia.
Theoretically, the location of a food plant is often determined by the nature
of the raw material, the finished product or the market, and availability of basic
infrastructure. Firms producing highly perishable products, such as tomato
ketchup, must be close enough to the fields so that tomatoes can be transported
immediately to the plants after harvesting. The proximity to the market is another
important locational determinant, particularly for bread bakeries, milk
pasteurising and fresh meat.
In the case of Malaysia, the majority of firms locate their food plants near
their market to make delivery economic. Previous studies (Mohd and Shaari 1988;
UKM 1990) showed that the majority of firms producing perishable items, such as
tomato ketchup, fresh noodles, beancurd and chilli paste, do not locate their plants
near the source of supply of raw materials. One of the main reason for this is that
these firms used imported raw materials or processed products such as flour,
canned tomatoes, dried chillies and soya flour. For these firms, it is the market
rather than the source of raw materials that determines their location. For those
firms which are located near the source of supply of raw materials, the majority
are producing traditional snacks and keropok (fish crackers). Unlike other firms,
they use raw materials which are available locally. For example traditional snacks
used tapioca flour, sugar-cane, palm-sugar, coconut milk, Tice flour or bananas,
while keropok use fresh fish, prawns and cuttlefish. These firms are mostly
located in the rural areas and are usually tiny in size. Some of these rural food-
33
Chapter Two
processing firms have a close economic relationship with local producers of raw
materials, such as farmers and fisherman. Ishak and Chang (1993), study showed
that keropok manufacturers purchase raw materials from peraih sungei (beach
dealers). " Some of these firms even have contracts to buy raw materials from the
local producers. This type of arrangement has some advantages, for both the
suppliers and the food manufacturers; the firms will have a constant supply of raw
materials, while the suppliers have a ready market for their products. Firms which
use processed or imported raw materials usually purchase their raw materials in
bulk and stored them in warehouses.
In Malaysia, a typical food process consists of five stages. In the first
stage, raw materials are received, inspected, cleaned and graded. In the second
stage, the raw materials are cut up or mixed with other food ingredients and
chemical additives. In the next stage, they are then subjected to heat,
refrigeration, de-aeration, pasteurisation, sterilisation, sometimes are coated and
then are packed. Some firms may also employ fermentation, smoking and
extraction at this stage. In the final stage, the packaged products are ready for
marketing. Below we have outlined some of the steps involved in the processing
of food in some of our sampled firms.
Firm A produces serbuk perencah segera (food spices), such as meat and
chicken rendang, assam pedas, and lemak cilli api, Figure 2.3 shows Firm A's
production flow-chart.
13 In their study of the marketing structure of Kuala Besut fishing industry, Ishak and Chang (1993: 58) found that the taukeh or boat-owners market their fish in three ways, that is to distribute through the perwh sungai (beach dealers), local wholesalers and in-state retailers. The peraih sungai in tum sell fish to local distributors (peraih basikal or peraih morosikal) or to owners of keropok busines.
34
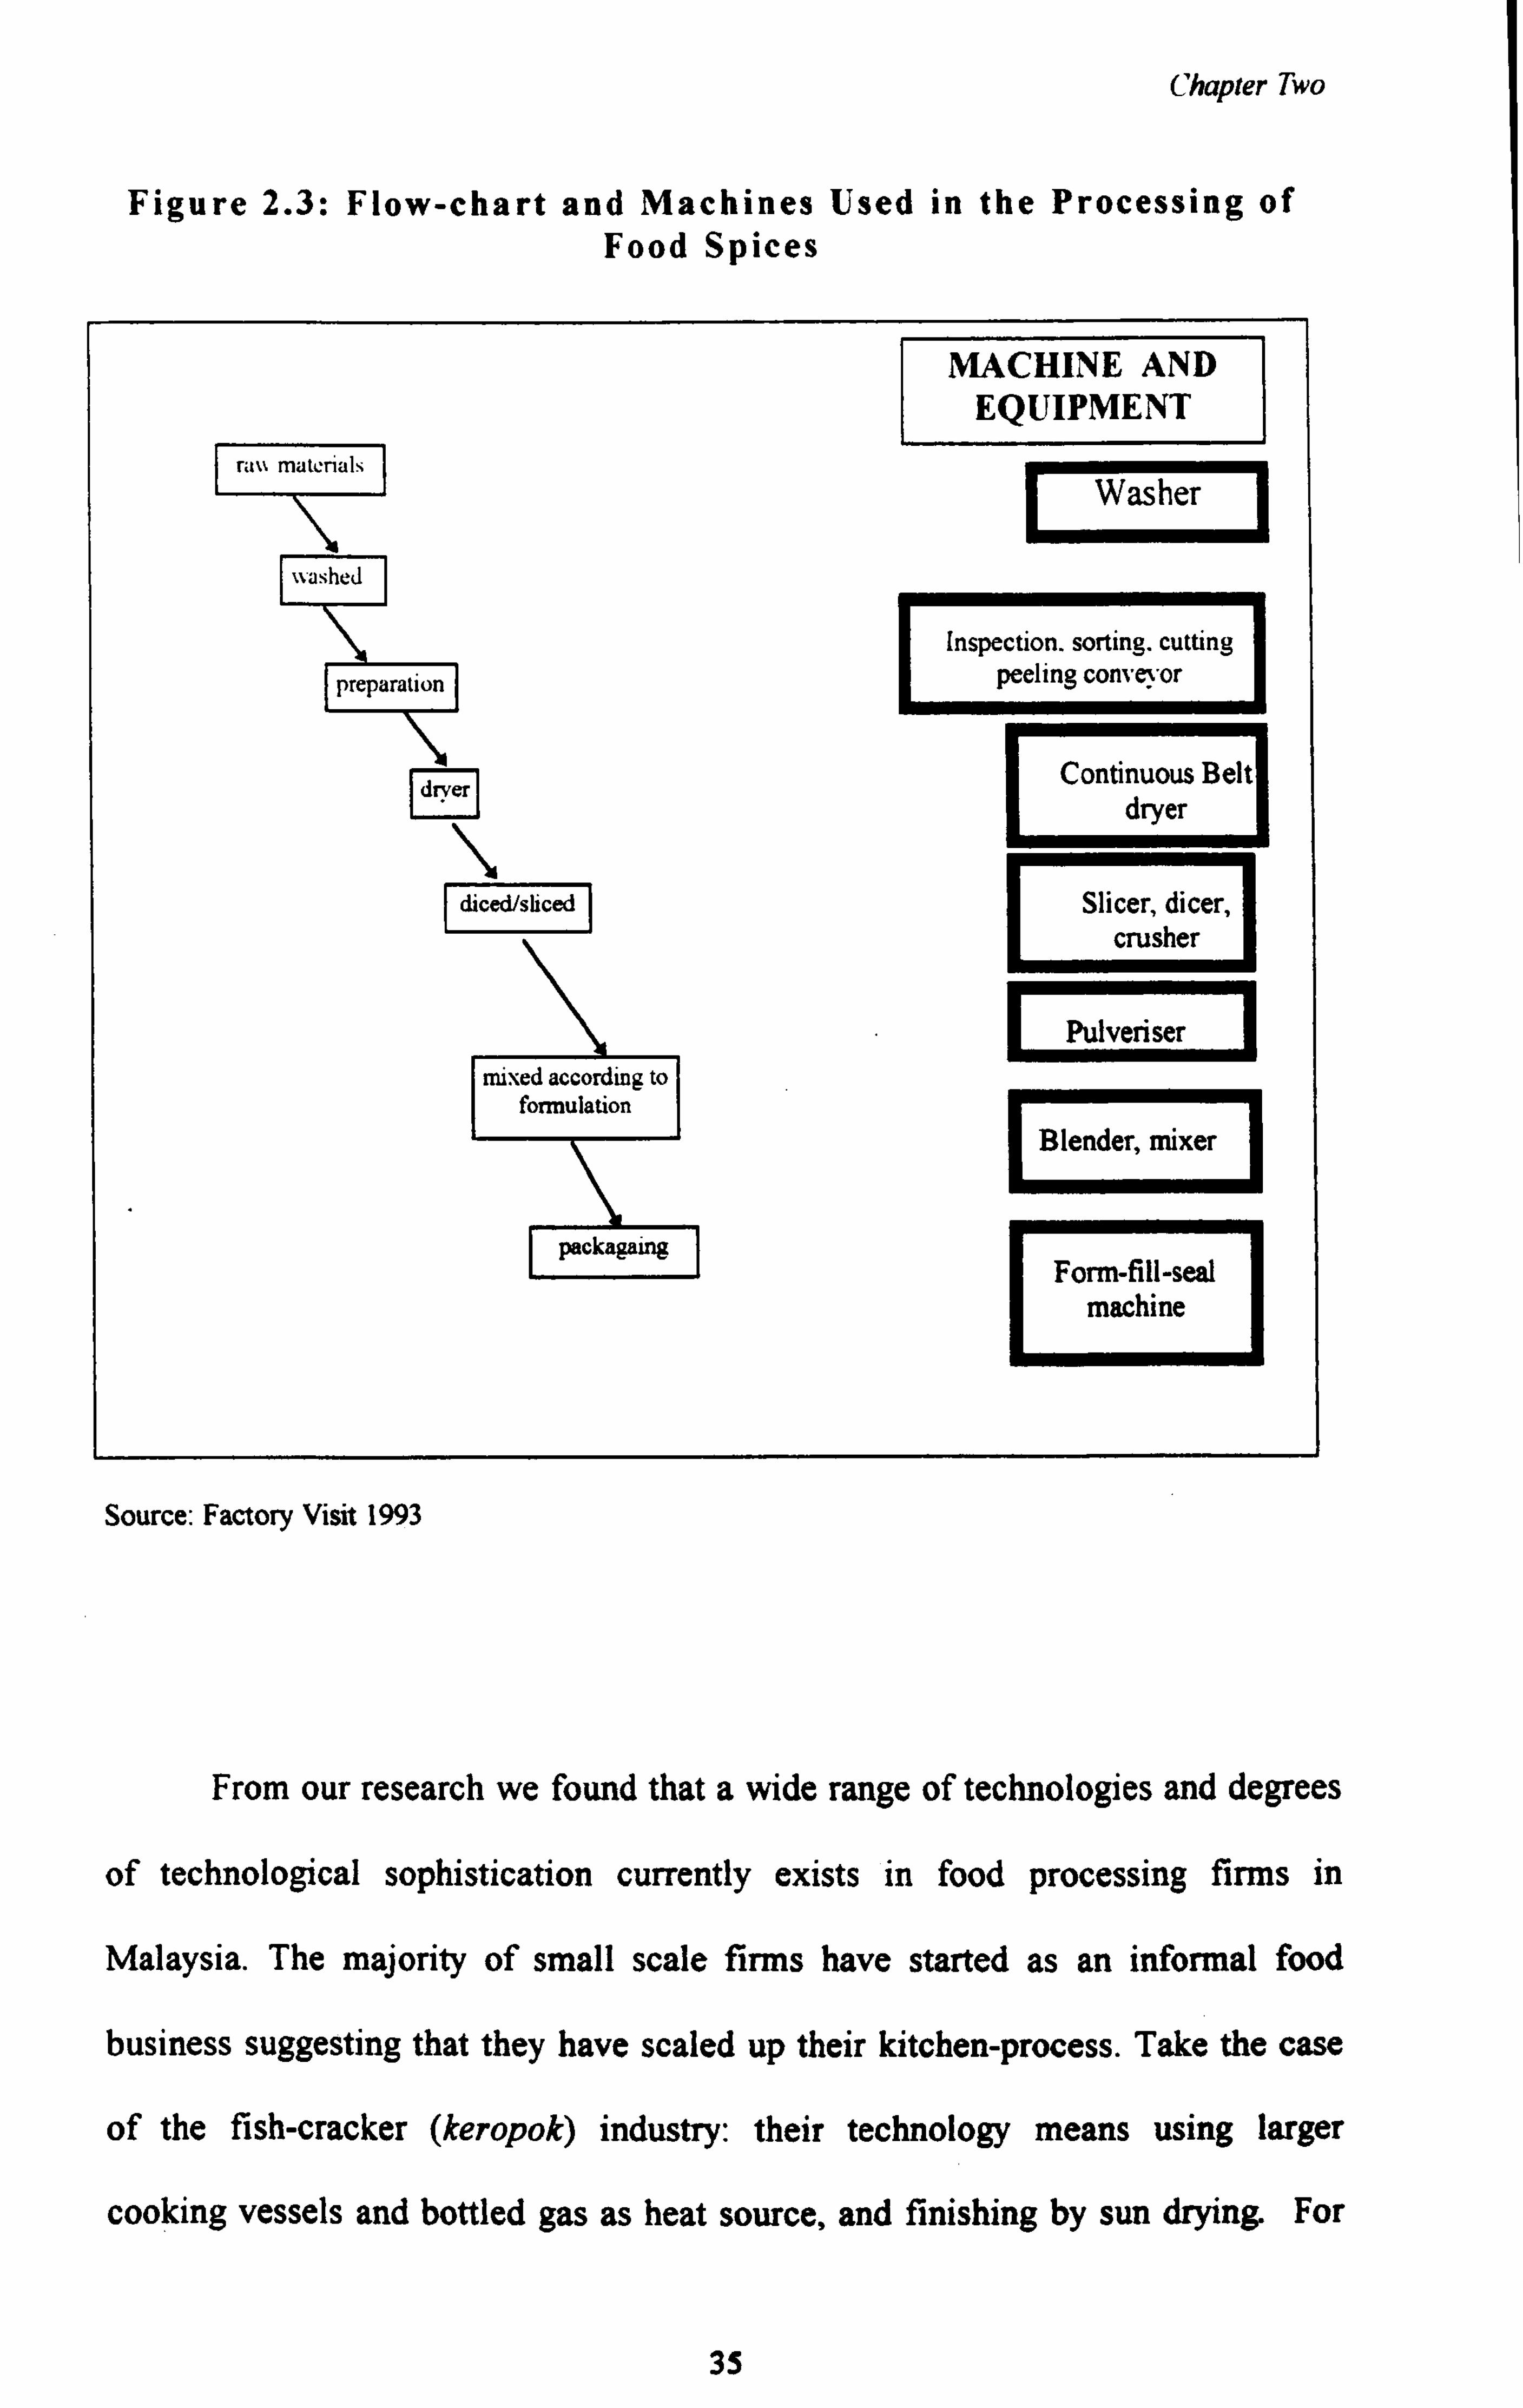
Chapter Two
Figure 2.3: Flow-chart and Machines Used in the Processing of Food Spices
MACHINE AND EQUIPMENT
rau materials -7 t Washer
ashed !
onsoingcut! ng
preparation peeling conveyor
dryer
EEBe1t
diced/sliced Slicer, dicer, crusher
I Pulveriser
I mixed according to formulation
Blender, mixer
packagaing Form-fill-seal
machine
Source: Factory Visit 1993
From our research we found that a wide range of technologies and degrees
of technological sophistication currently exists in food processing firms in
Malaysia. The majority of small scale firms have started as an informal food
business suggesting that they have scaled up their kitchen-process. Take the case
of the fish-cracker (keropok) industry: their technology means using larger
cooking vessels and bottled gas as heat source, and finishing by sun drying For
35
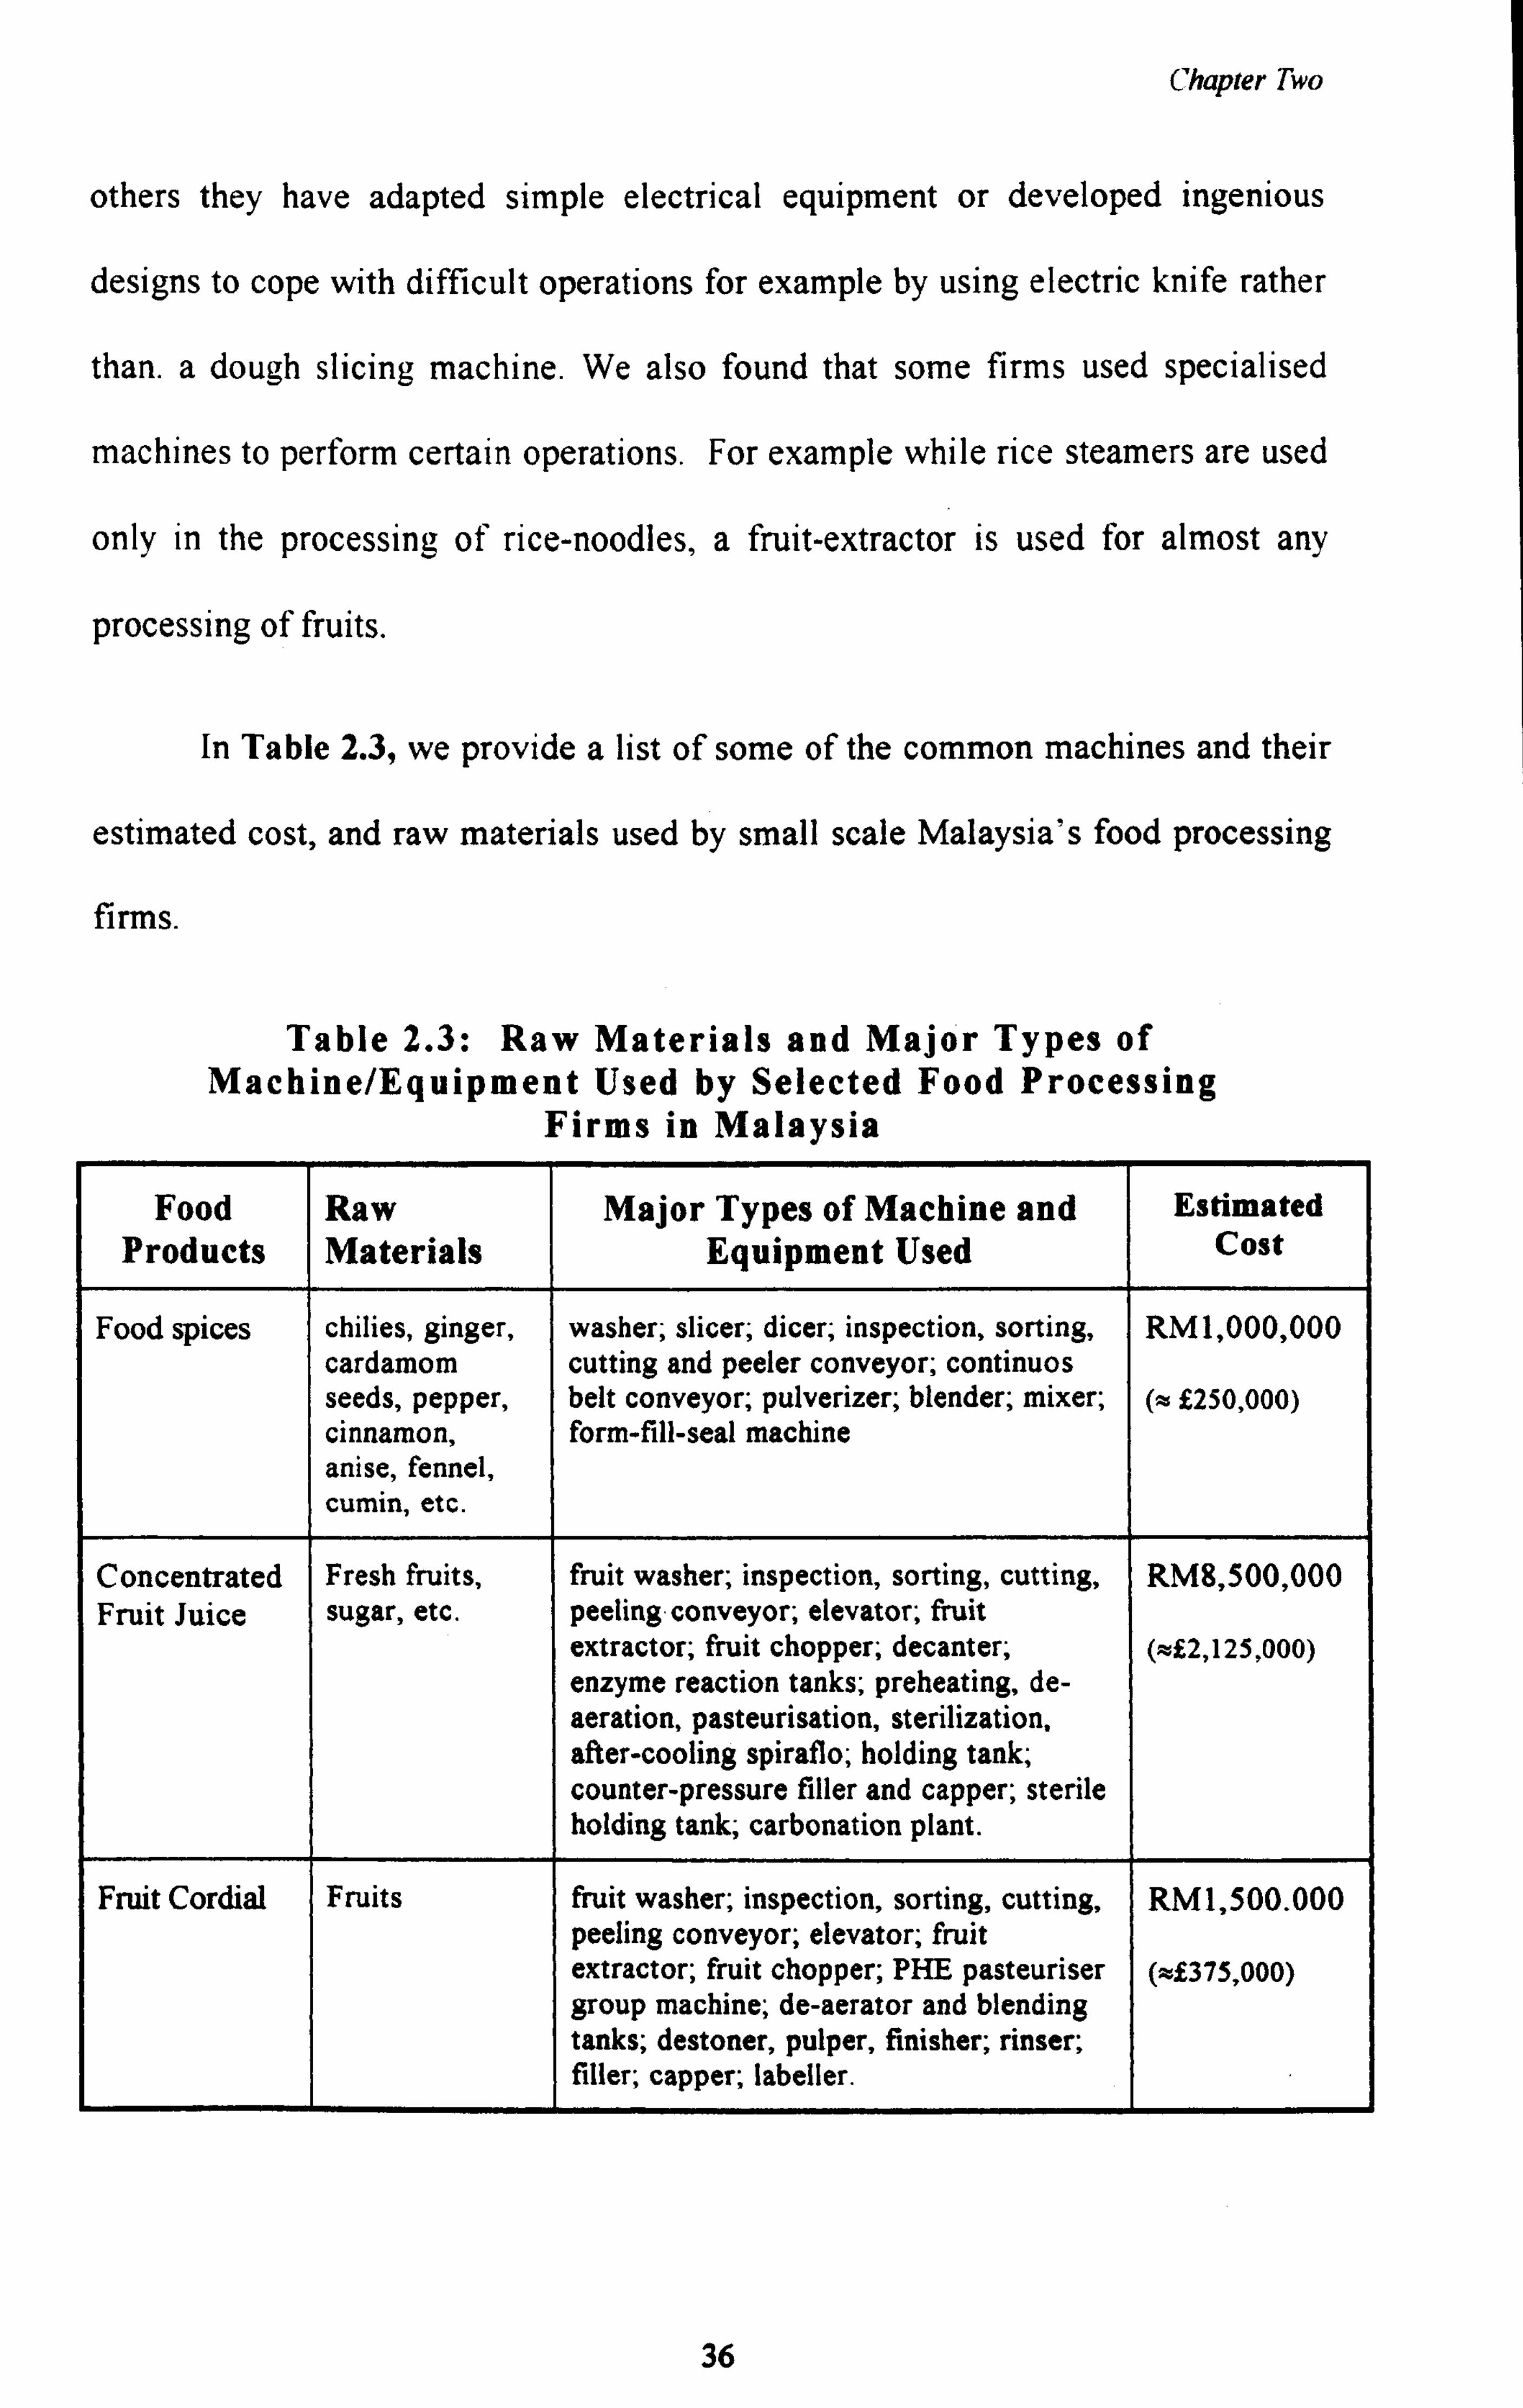
Chapter Two
others they have adapted simple electrical equipment or developed ingenious
designs to cope with difficult operations for example by using electric knife rather
than. a dough slicing machine. We also found that some firms used specialised
machines to perform certain operations. For example while rice steamers are used
only in the processing of rice-noodles, a fruit-extractor is used for almost any
processing of fruits.
In Table 2.3, we provide a list of some of the common machines and their
estimated cost, and raw materials used by small scale Malaysia's food processing
firms.
Table 2.3: Raw Materials and Major Types of Machine/Equipment Used by Selected Food Processing
Firms in Malaysia
Food Raw Major Types of Machine and Estimated Products Materials Equipment Used Cost
Food spices chilies, ginger, washer; slicer; dicer; inspection, sorting, RM1,000,000 cardamom cutting and peeler conveyor; continuos seeds, pepper, belt conveyor; pulverizer; blender; mixer; (z £250,000) cinnamon, form-fill-seal machine anise, fennel, cumin, etc.
Concentrated Fresh fruits, fruit washer; inspection, sorting, cutting, RM8,500,000 Fruit Juice sugar, etc. peeling conveyor; elevator; fruit
extractor; fruit chopper; decanter; (m£2,125,000) enzyme reaction tanks; preheating, de- aeration, pasteurisation, sterilization, after-cooling spiraflo; holding tank; counter-pressure filler and capper; sterile holding tank; carbonation plant.
Fruit Cordial Fruits fruit washer; inspection, sorting, cutting, RM1,500.000 peeling conveyor; elevator; fruit extractor; fruit chopper; PHE pasteuriser (x£375,000) group machine; de-aerator and blending tanks; destoner, pulper, finisher; rinser; filler; capper; labeller.
36
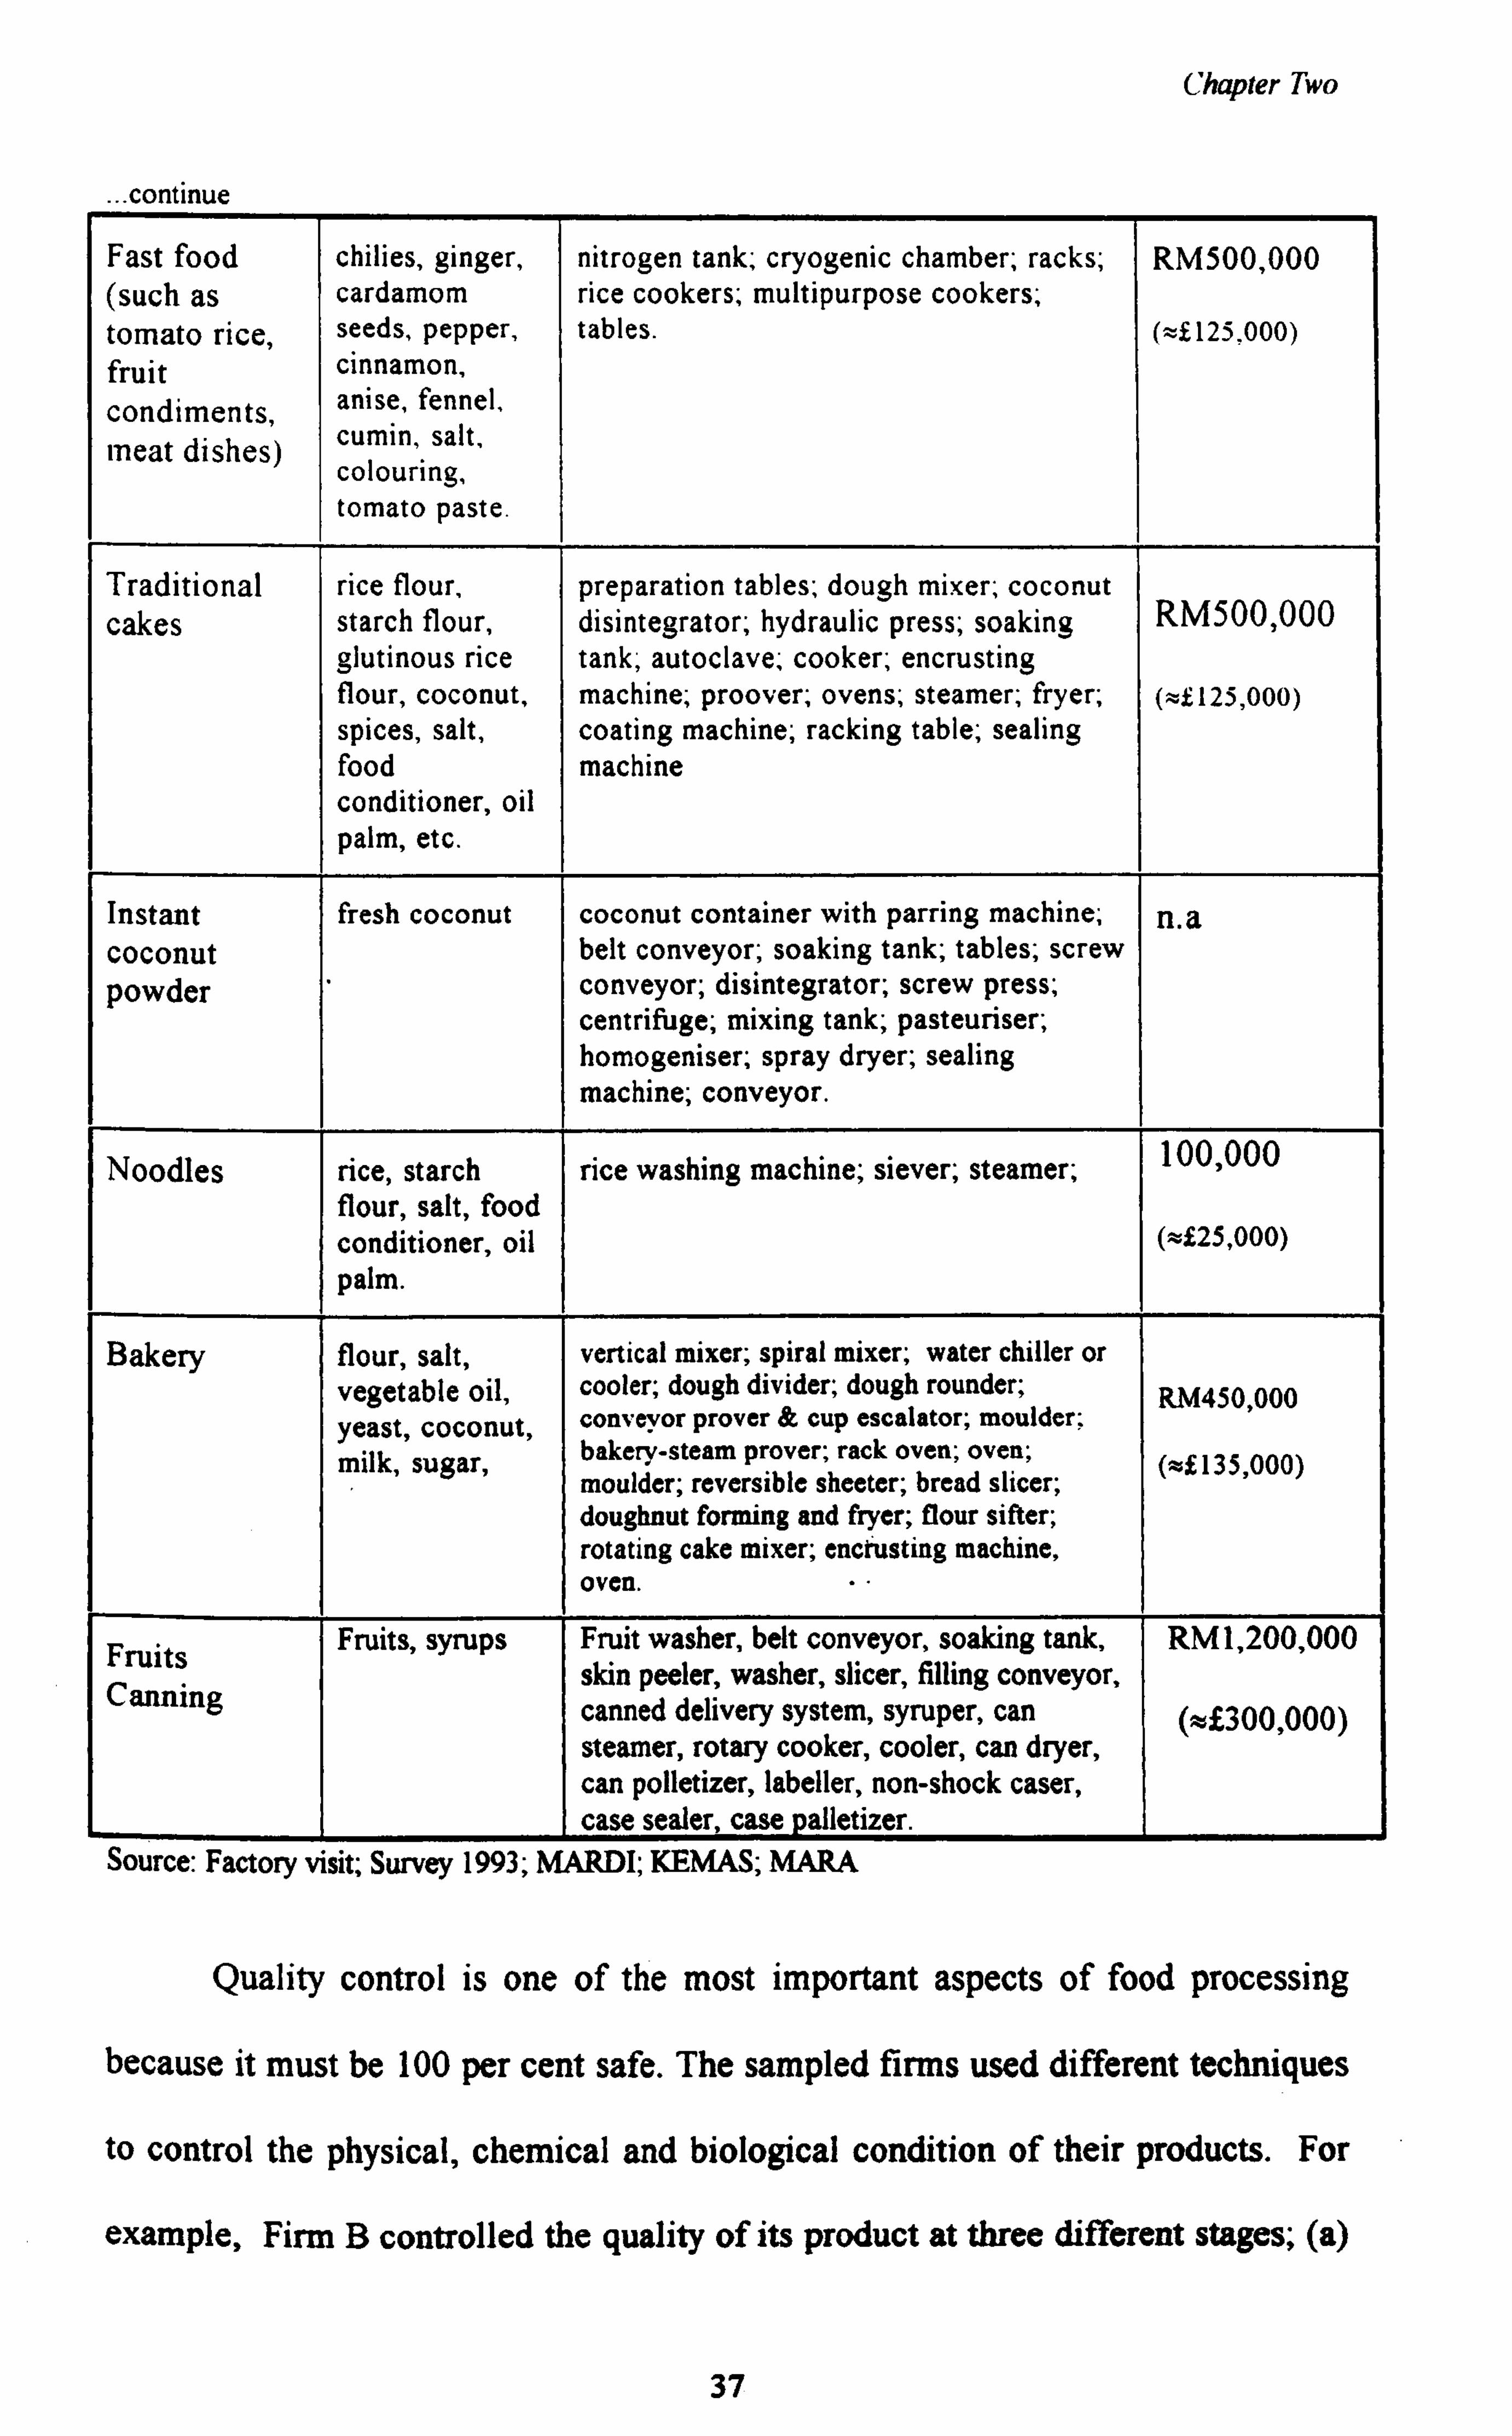
Chapter Two
. continue
Fast food chilies, ginger, nitrogen tank; cryogenic chamber; racks; RM500,000 (such as cardamom rice cookers; multipurpose cookers; tomato rice, seeds, pepper, tables. (x£125.000) fruit cinnamon, condiments, anise, fennel,
meat dishes) cumin, salt, colouring, tomato paste.
Traditional rice flour, preparation tables; dough mixer; coconut cakes starch flour, disintegrator; hydraulic press; soaking RM500,000
glutinous rice tank; autoclave; cooker; encrusting flour, coconut, machine; proover; ovens; steamer; fryer; (xf 125,000)
spices, salt, coating machine; racking table; sealing food machine conditioner, oil palm, etc.
Instant fresh coconut coconut container with parring machine; n, a coconut belt conveyor; soaking tank; tables; screw powder conveyor; disintegrator; screw press;
centrifuge; mixing tank; pasteuriser; homogeniser; spray dryer; sealing machine; conveyor.
Noodles rice, starch rice washing machine; siever; steamer; 100,000
flour, salt, food conditioner, oil (x£25,000)
palm.
Bakery flour, salt, vertical mixer; spiral mixer; water chiller or vegetable oil, cooler; dough divider; dough rounder; g"M450,000 yeast, coconut, conveyor prover & cup escalator; moulder;
milk, sugar, bakery-steam prover; rack oven; oven; (m£ 135,000) moulder; reversible sheeter; bread slicer; doughnut forming and fryer; flour sifter; rotating cake mixer; encrusting machine, oven.
Fruits Fruits, syrups Fruit washer, belt conveyor, soaking tank, RM1,200,000
Canning skin peeler, washer, slicer, filling conveyor, canned delivery system, syruper, can (ft£300,000) steamer, rotary cooker, cooler, can dryer, can polletizer, labeller, non-shock caser, case sealer, case palletizer.
Source: Factory visit; Survey 1993; MARDI; KEMAS; MARA
Quality control is one of the most important aspects of food processing
because it must be 100 per cent safe. The sampled firms used different techniques
to control the physical, chemical and biological condition of their products. For
example, Firm B controlled the quality of its product at three different stages; (a)
37
Chapter Two
raw materials, (b) food additives, and (c) packaging. Being a rice-noodle
producing firm, Firm B places great emphasis on the raw materials it uses,
particularly rice. Being the main ingredient, the grade of rice used determines the
quality of the rice-noodle. Though Firm B recognises that a high grade rice will
result in a high quality product, it uses a lower grade rice - "broken Grade Dl" - in
its kuetiau production to reduce production cost. Like the majority of rice-noodle
producer in the study, the entrepreneur of Firm B uses lower grade rice as long as
it is clean, standardised, white and new. Some firms used food conditioners such
as sodium metabisulphate to prevent "browning" of raw materials and to ensure
that rice has a white colour.
Besides using "safe" additives, Malaysian firms also use machine to
control product quality. For example, in fruit juices processing plants, they have
to use machine for pasteurisation, sterilisation and other automatic time-
temperature control machine for thermal killing of micro-organisms.
Besides controlling raw materials, firms also control the quality of their
products during processing and packaging. Firms used machine not only to
produce but also to ensure their products achieve the desired quality. Rice-
noodles may be cut and packed manually, but many firms have introduced
machines to ensure that the rice-noodles have the same thickness (approximately 1
centimetre) and are well-packed.
Packaging is an important aspect of food processing operations. Foods are
packed in order to measure out a suitable quantity, to protect against
contamination, to make them easy to handle, to identify the product and its
38
Chapter Two
ingredients, and to promote the sale of the product. A' casual examination of the
type of machine and materials used in packaging reveals that innovations are
continuously being introduced. Now we find that wet foods are not only stored in
jars, bottles and cans, but also packed in heat-sealed flexible containers which are
lighter in weight and more flexible to handle. We also find that flexible plastic
films (such as high density polyethylene) and aluminium foil are slowly replacing
paperboard cartoon to store dry food (MARDI 1993a: 8). Given the importance of
packaging in the marketing of food, firms have little choice but to give some
consideration to this aspect.
Packaging operation are performed differently according to firms' capacity.
High capacity firms use high speed machines, including casing. In our visit to a
fruit canning firm, we found that the firm even used palletizers to assemble cases
of products (Survey 1993). Low capacity firms, however, use manual labour or
semi-automated techniques for packaging. The majority of the tiny firms used
simple manual methods to pack their products. To illustrate the simplicity of the
technique used, let us cite an example of the packaging technique used by Firm C
in our sample. It is a vermicelli (bee hoon) producing firm. Packing was done by
four female workers using only three pieces of equipment; a table (with a large
hole in the middle), a portable weighing machine and a portable electric plastic-
sealer. Two of the workers were sitting on top of a table; one of them would
weigh the required amount of vermicelli which she passed to the second worker.
The second worker then tied the vermicelli and lowered it through the hole in the
table to the third worker who waited under the table with a plastic package. She
then sealed the package and passed it to the fourth worker who packed it in a
39

Chapter Two
cardboard case. There are, however, firms which do not pack their products.
Instead they contract out this process to a packaging company or individuals (such
as housewives).
It appears to us that the processes used by the majority of Malaysian food
processing firms are a mixture of traditional and modern methods. In our visit to
a traditional-cake manufacturer, we found that a encrusting machine operates
alongside a gas cooker.
2.5 Critical Issues in the Development of the Food Processing Industry
As we have discussed in an earlier section, the FPI has been identified as one of
the twelve industries to be developed under the IMP. Malaysia's attempt at "leap-
frogging" into an industrialised economy hinges on technological up2radinS.
The IMP envisaged that industrial development will be based on the development
and use of "new" technologies, such as process control, automation, automated
processing, computer-based communications and communications-linked
information processing systems. This suggests the critical role of technology in
Malaysia's industrial development. Malaysia's attempt at catching up with the
industrialised countries is also dependent on the ability of its industry to maximise
the efficient utilisation of Malaysia's natural resources and development of
intersectoral linkages. Explicitly, the IMP calls for the FPI to develop its
technological capability and utilise efficiently Malaysia's natural resources.
40
Chapter Two
There are several critical issues in the development of the FPI in Malaysia,
of which the pertinent ones are: (a) low levels of indigenous technology, (b)
delayed industrialisation, (c) weakness in interindustry structure, (d) raw
materials, (e) market structure and (f) small scale.
(a) Low Levels of Indigenous Technology
One of the major problems confronting the Malaysian FPI is the low level and
limited adaptive capability of its technology. Many of those industries which are
high-tech, are either foreign-owned or are owned jointly with foreign firms. Like
many other Malaysian manufacturing industries, FPI has tended to rely heavily on
foreign technology making it difficult for such firms to exercise leadership in
marketing and new product strategies.
Part of the explanation for the FPI is low level of technological capacity
lies in its relative lack of an industrial base, underdeveloped intersectoral and
inter-industry linkages, economies of scale due to small market size, as well as
foreign dominance. Furthermore, the government's policies in the 1960s and
1970s which gave tariff protection to import-substitution industries tended to
make the FPI complacent and less competitive. Typical of Malaysia's
manufacturing industries, the FPI has a relatively slow pace of technology
acquisition and adaptation due to the absence of strong R&D personnel and
facilities (UNIDO 1985). It was only with the launching of the Fifth Malaysia
Plan (1986-90) and the IMP that Malaysia started to focus on the development of
industrial technology. The government may have realised the importance of
technological development; however, the rapid pace of technological changes at
wfit0i
41 ý. 18ý

Chapter Two
the international level and the increasing complexities of science and technology
(S & T), make it difficult to manage technological change. For a resource-rich
country, Malaysia faces difficulties in fostering technological effort that leads to
the most efficient use of available domestic resources. Since most of the
technologies developed in industrialised countries are capital intensive, it is
reasonable that these technologies may be inappropriate to a labour-abundant
country like Malaysia. As we have mentioned, Malaysia is heavily dependent on
foreign investment in its manufacturing activities. This makes it difficult for
Malaysia to develop indigenous technology and manage technological change.
Malaysia's earlier emphasis on foreign investment and MNCs also hinders
indigenous technology development. The MNCs tended to rely on technologies
developed in their parent firms, suggesting a lack of technological creativity and
heavy reliance on foreign technologies. There is reason to believe that Malaysia's
private sectors do not have a tradition of industrial technology development; they
still lack the capability to develop industrial technology.
(b) Delayed Industrialisation
In Malaysia, the FPI as we know it today is a recent development. However, food
processing activity has always been part of Malaysian life. Before the industry was
fully developed in the early twentieth century, the people processed their food
using the techniques they knew best; simple, labour intensive and effective. In the
absence of effective demand for manufactured food, the food processing industry
did not extend beyond pineapple canning until the last twenty years. For an
agricultural producing country, Malaysia was a late starter in food manufacturing;
42
Chapter Two
the first food processing plant (pineapple) was only established in the early
twentieth century.
It appears to us, that there was a lack of attention to the food
manufacturing industries in the early period of Malaysia's economic development.
When Malaya became independent in 1957, it inherited an economy that was
heavily dependent on two products; rubber and tin. Malaysia's early development
efforts were geared towards the development of these sectors, suggesting a neglect
of other industries, including food processing. Not surprisingly, the food
processing industry was hardly mentioned in Malaysia's early development plans.
In the 1960s, we saw a shift in Malaysia's industrial strategy aimed at
promoting industrialisation through import substitution (IS). The government
introduced the Pioneer Industries Ordinance of 1958 to encourage foreign direct
investment. The food processing industry, however, benefited little from the
fiscal incentives provided under the ordinance, because the incentives were biased
towards the development of large scale industries which manufactured consumer
non-durables to replace imports. It was only with the enactment of the Investment
Incentives Act of 1968 that we saw a major emphasis on investment promotion of
export-industries. The pineapple processing industry, grew rapidly behind the
safety of the government's protectionist policy. The incentives also encouraged
the development of new industries such as dairy products, flour milling, animal
feeds and sugar refining. However, they were still based on imported raw
materials. It was only with the implementation of the IMP in 1986, that we see the
emergence of industries based on local raw material (UNIDO 1985). The FPI may
43
Chapter Two
have been prioritised as one of the industries to spearhead Malaysia's industrial
development in the 1990s, but the three leading industries are electronics,
machinery and textile industries.
(c) Weakness in Inter-Industry Structure
The FPI, like many manufacturing industries in Malaysia, tends to have weak
interindustry linkages. As a resource-based industry, the FPI has largely
concentrated on primary processing and has done little to exploit the potential in
downstream processing. Furthermore, the industry has a low industrial linkage, as
reflected by its relatively high leakage ratio; 20.2 per cent for backward linkage
and 22.4 per cent for its forward linkage (UNIDO 1985). Its inability to generate
linkage is strongly linked to the fact that the majority of the industries are relying
on imported raw materials. Moreover, the sector is also dependent on foreign
investments.
(d) Raw Materials
Malaysia's economy may be resource-based; but 70 per cent of FPI raw materials
are imported. This heavy reliance on foreign imports such as flour, sugar, dairy
products and beverages suggest that the industry has yet to establish comparative
advantages in its import-substituting sector.
(e) Market Structure
Market structure refers to the number and size distribution of firms, as well as the
height of barriers and entry in an industry. An industry which has a high entry
44
Chapter Two
barrier is one where it is difficult for new entrants to establish a presence in the
market. Market structure is an important factor because it influences an
industry's ability to charge high prices and earn supernormal profits. Markets can
be characterised by the level of concentration. The more concentrated an industry,
the more it approaches the monopolistic situation and the higher its profits are.
Our study shows that the overall market concentration'' in the food industry is
generally low. Many of them have a concentration ratio of between 30 per cent to
40 per cent. The results suggest that the industry is highly competitive which
means that profit is relatively low. However, concentration is relatively high in
certain sub-sectors such as pineapple canning (1.000), slaughtering and preserving
meat (0.718), other dairy products (0.868) and sugar refineries (0.995). The high
concentration ratio in this four sub-sectors suggests that they are highly
concentrated and controlled by a few large firms. Our study shows that the
majority of Bumiputera firms are concentrated in the production of spices,
canning and preserving and processing of fish, and preserving of fruits and
vegetables. As we can see, these sub-sectors are highly competitive, as reflected
by their low market concentration. It appears that the Bumiputera tend to be
involved in sub-sectors where competition is high and profit is low.
'4 Market concentration has three dimensions, namely the number of firms, their relative sham in the market and the viability of collusion by the leading firms. A four-firm concentration ratio (CR4) measures the contribution of the largest four firms to total industry output. By this criterion, an industry with a CR4 of at least 40'/. is considered an oligopolistic. An industry with a CR4 of at least 70% is considered to have a high degree of concentration.
45
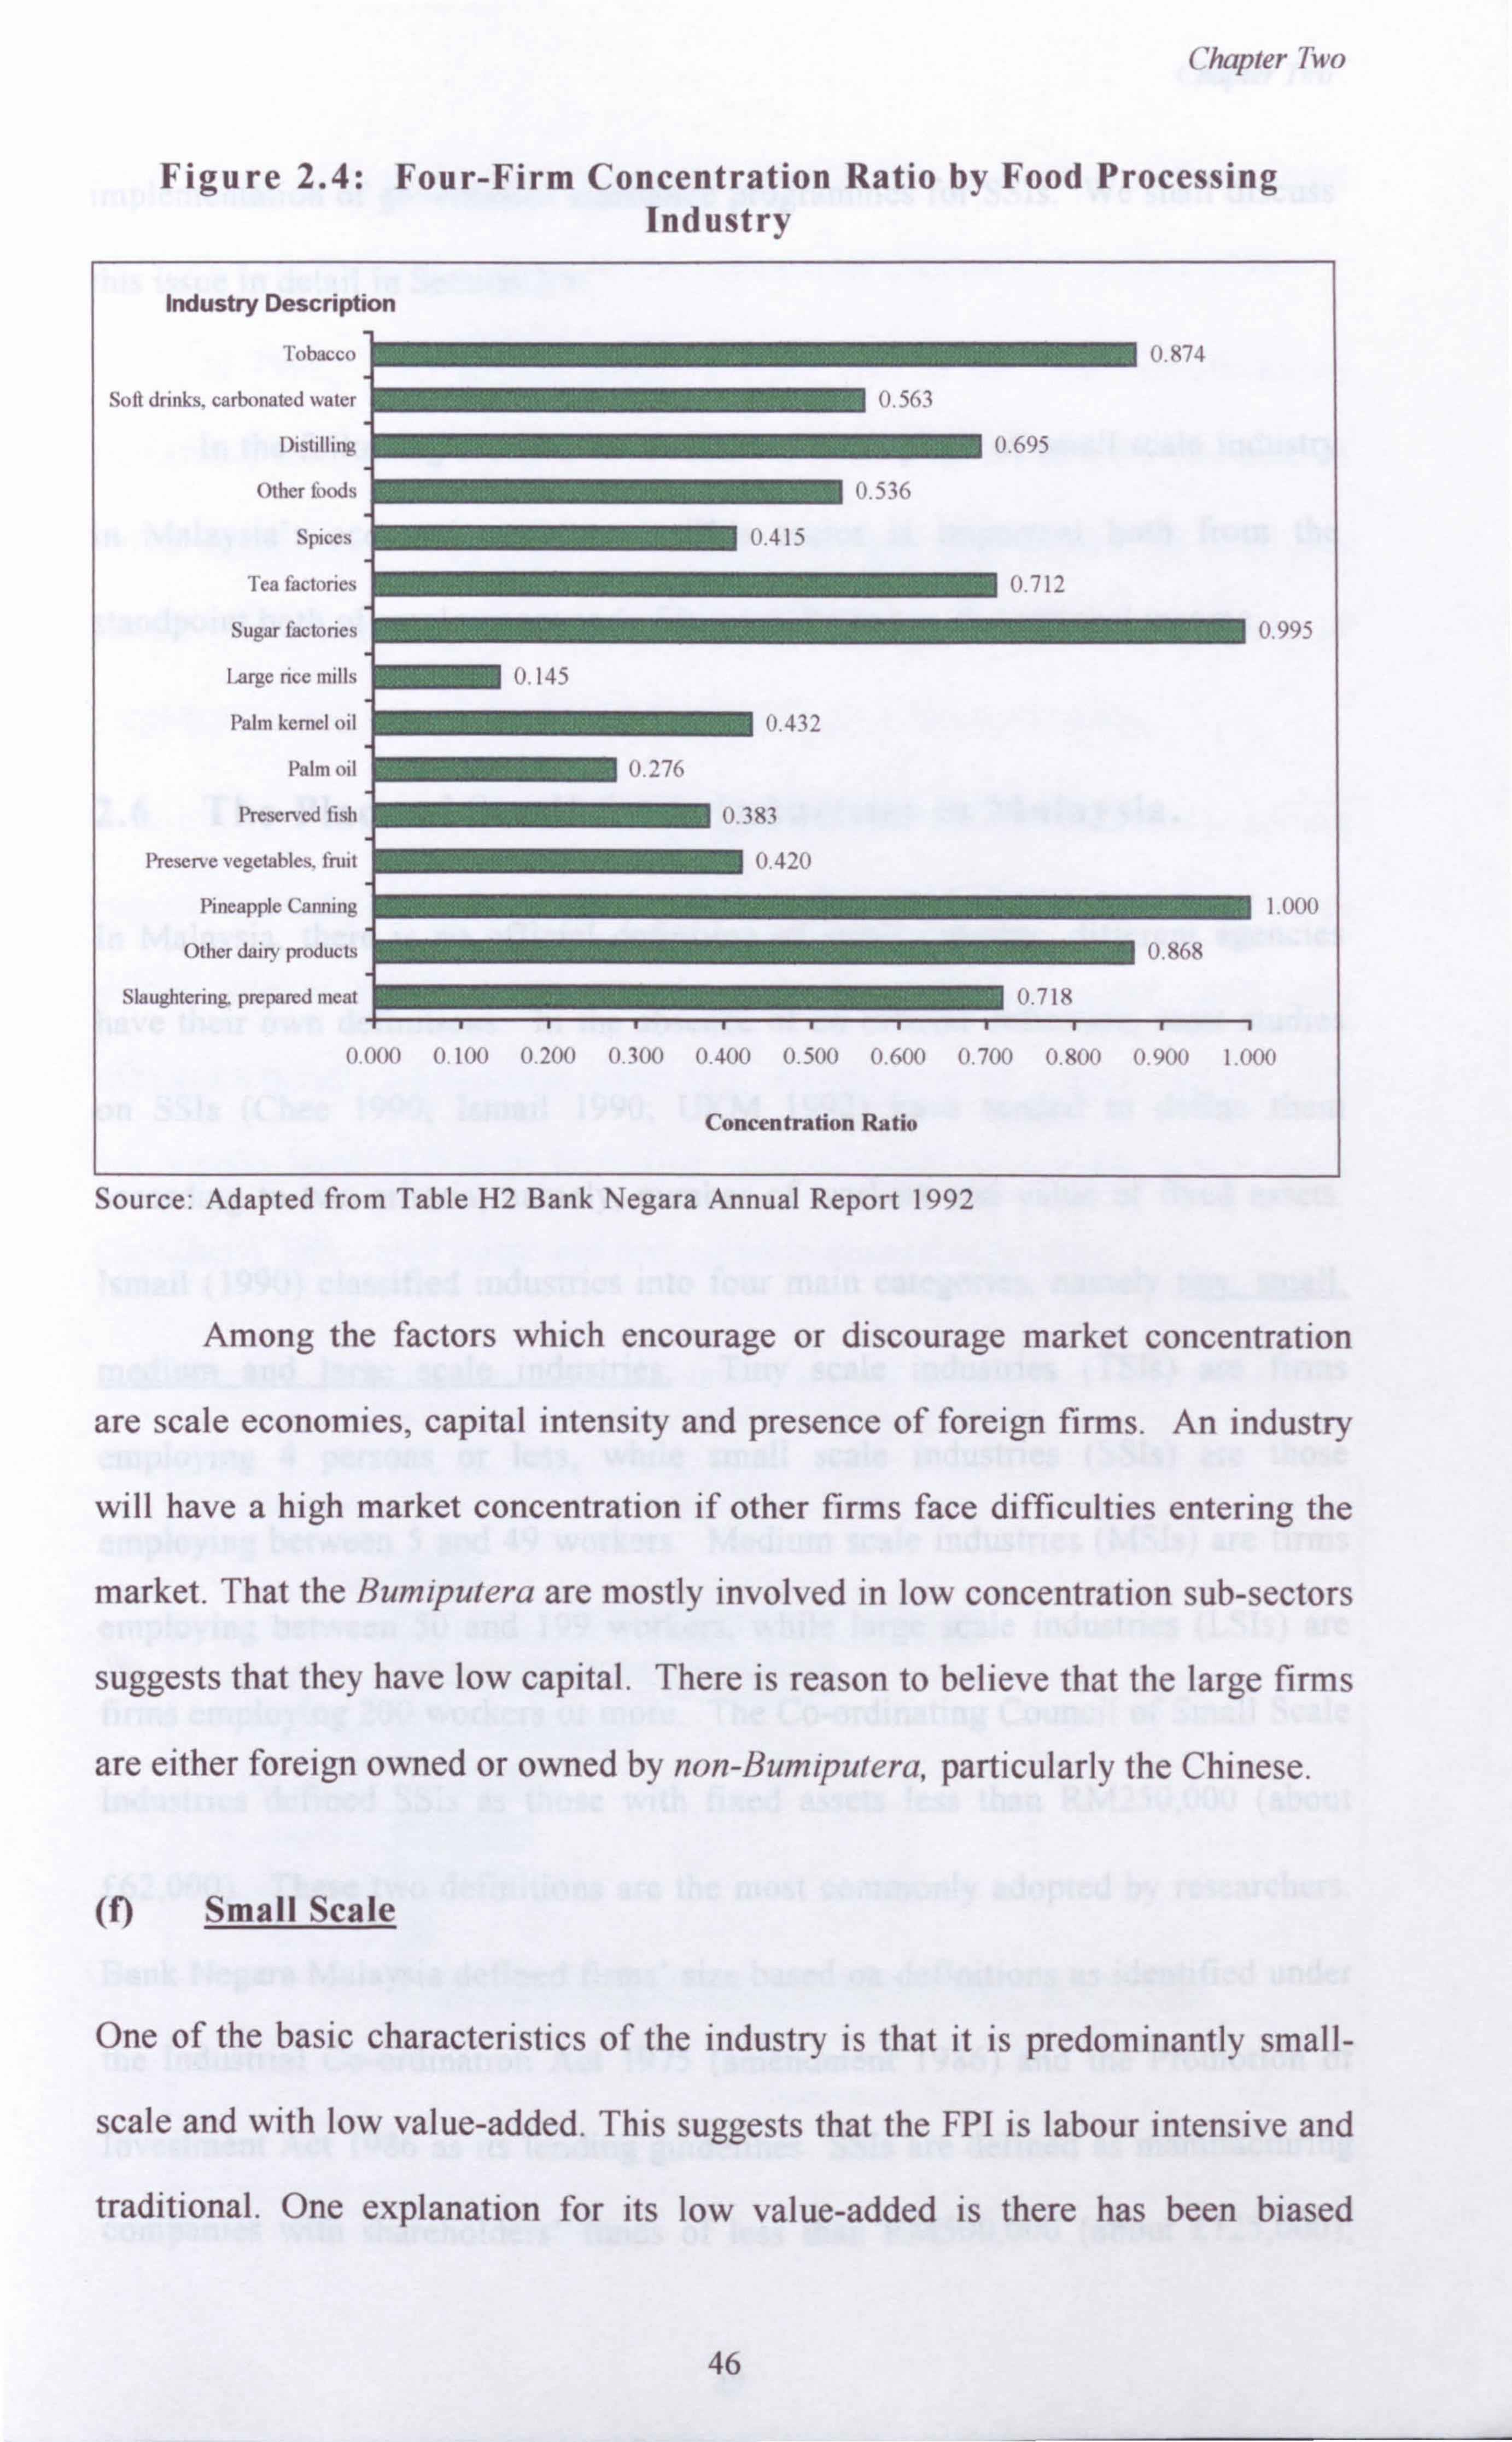
Chapter Two
Figure 2.4: Four-Firm Concentration Ratio by Food Processing Industry
Industry Description
Tobacco
Soft drinks, carbonated water
Distilling
Other foods
Spices
Tea factories
Sugar factories
Large rice mills
Palm kernel oil
Palm oil
Preserved fish
Preserve vegetables. fruit
Pineapple Canning
Other dairy products
Slaughtering. prepared meat
Concentration Ratio
0.995
1.000 1
Source: Adapted from Table H2 Bank Negara Annual Report 1992
Among the factors which encourage or discourage market concentration
are scale economies, capital intensity and presence of foreign firms. An industry
will have a high market concentration if other firms face difficulties entering the
market. That the Bumiputera are mostly involved in low concentration sub-sectors
suggests that they have low capital. There is reason to believe that the large firms
are either foreign owned or owned by non-Bumiputera, particularly the Chinese.
(t) Small Scale
One of the basic characteristics of the industry is that it is predominantly small-
scale and with low value-added. This suggests that the FPI is labour intensive and
traditional. One explanation for its low value-added is there has been biased
46
0_(IIIU 0.100 0200 .0
300 0.400 0.500 0.600 0.700 0.800 0.900 1.000
Chapter Two
implementation of government assistance programmes for SSIs. We shall discuss
this issue in detail in Section 2.9.
In the following section, we shall discuss the place of small scale industry
in Malaysia's economic structure. This sector is important both from the
standpoint both of employment and of its contribution to the national income.
2.6 The Place of Small-Scale Industries in Malaysia.
In Malaysia, there is no official definition of small industry; different agencies
have their own definitions. In the absence of an official definition, most studies
on SSIs (Chee 1990; Ismail 1990; UKM 1992) have tended to define them
according to two criteria, namely, number of workers and value of fixed assets.
Ismail (1990) classified industries into four main categories, namely tiny, small.
medium and large scale industries. Tiny scale industries (TSIs) are firms
employing 4 persons or less, while small scale industries (SSIs) are those
employing between 5 and 49 workers. Medium scale industries (MSIs) are firms
employing between 50 and 199 workers, while large scale industries (LSIs) are
firms employing 200 workers or more. The Co-ordinating Council of Small Scale
Industries defined SSIs as those with fixed assets less than RM250,000 (about
£62,000). These two definitions are the most commonly adopted by researchers.
Bank Negara Malaysia defined firms' size based on definitions as identified under
the Industrial Co-ordination Act 1975 (amendment 1986) and the Promotion of
Investment Act 1986 as its lending guidelines SSIs are defined as manufacturing
companies with shareholders' funds of less than RM500,000 (about £125,000);
47
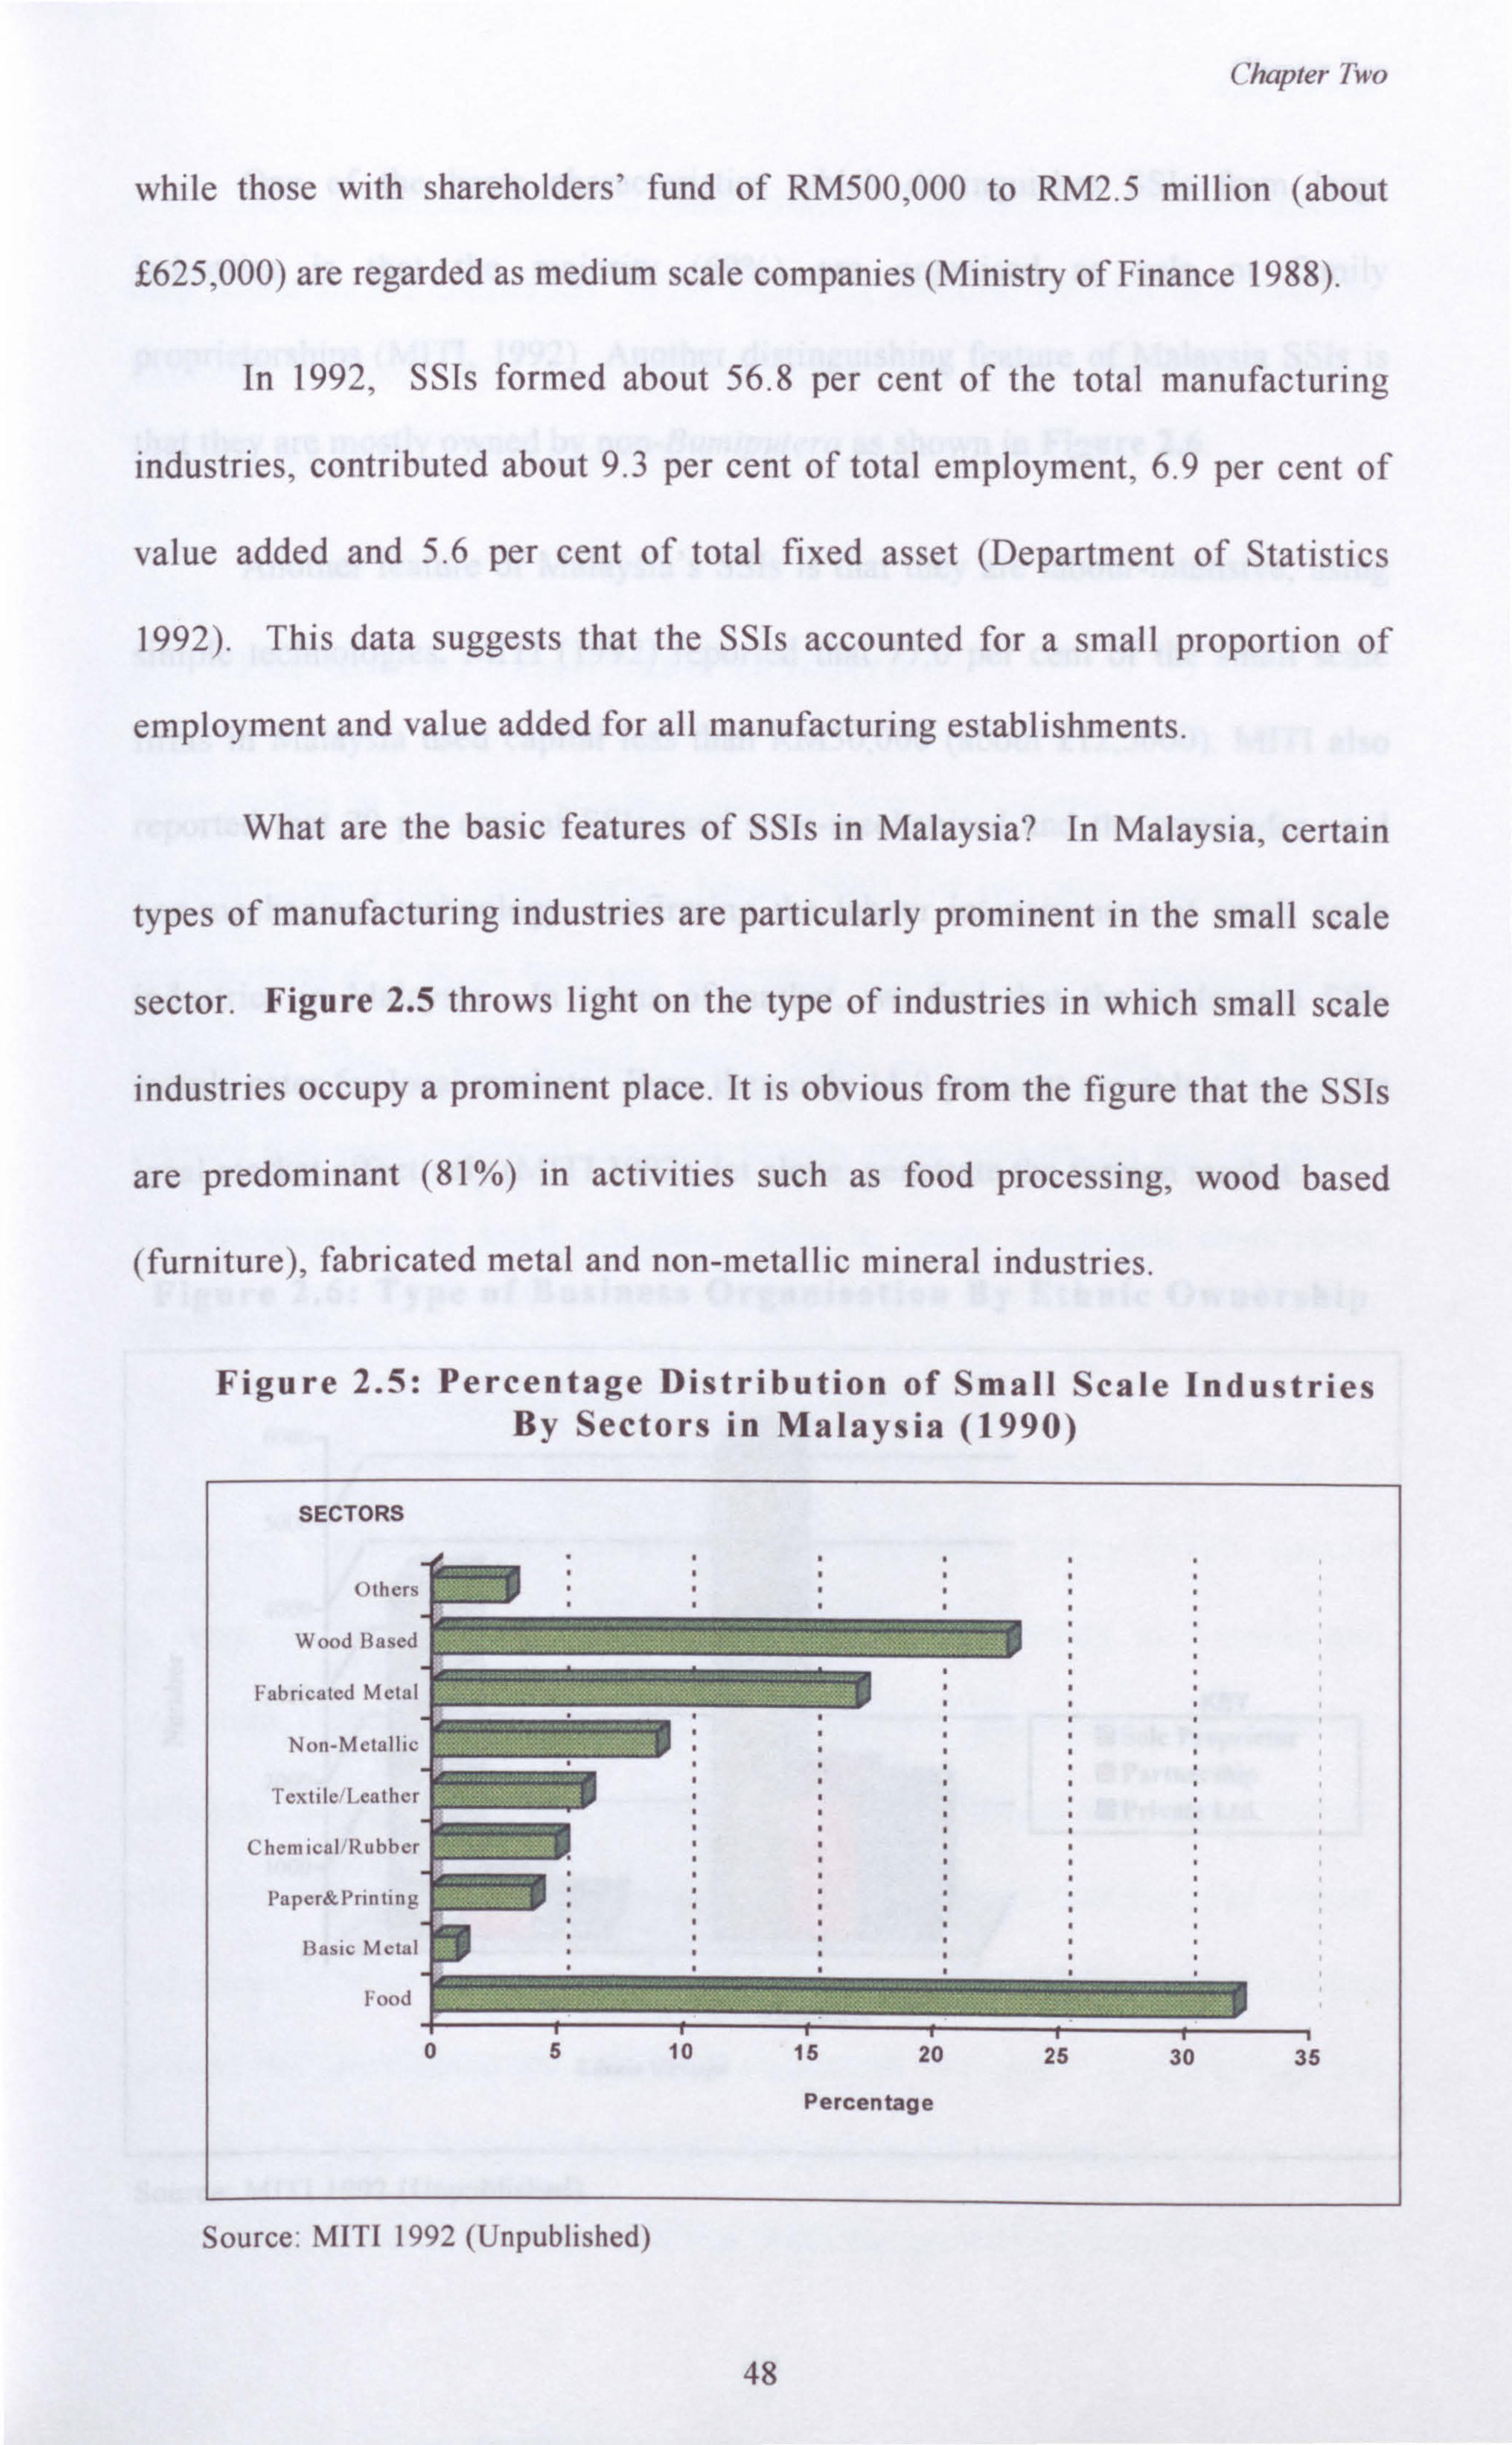
Chapter Two
while those with shareholders' fund of RM500,000 to RM2.5 million (about
£625,000) are regarded as medium scale companies (Ministry of Finance 1988).
In 1992, SSIs formed about 56.8 per cent of the total manufacturing
industries, contributed about 9.3 per cent of total employment, 6.9 per cent of
value added and 5.6 per cent of total fixed asset (Department of Statistics
1992). This data suggests that the SSIs accounted for a small proportion of
employment and value added for all manufacturing establishments.
What are the basic features of SSIs in Malaysia? In Malaysia, certain
types of manufacturing industries are particularly prominent in the small scale
sector. Figure 2.5 throws light on the type of industries in which small scale
industries occupy a prominent place. It is obvious from the figure that the SSIs
are predominant (81%) in activities such as food processing, wood based
(furniture), fabricated metal and non-metallic mineral industries.
Figure 2.5: Percentage Distribution of Small Scale Industries By Sectors in Malaysia (1990)
Source: MITI 1992 (Unpublished)
48
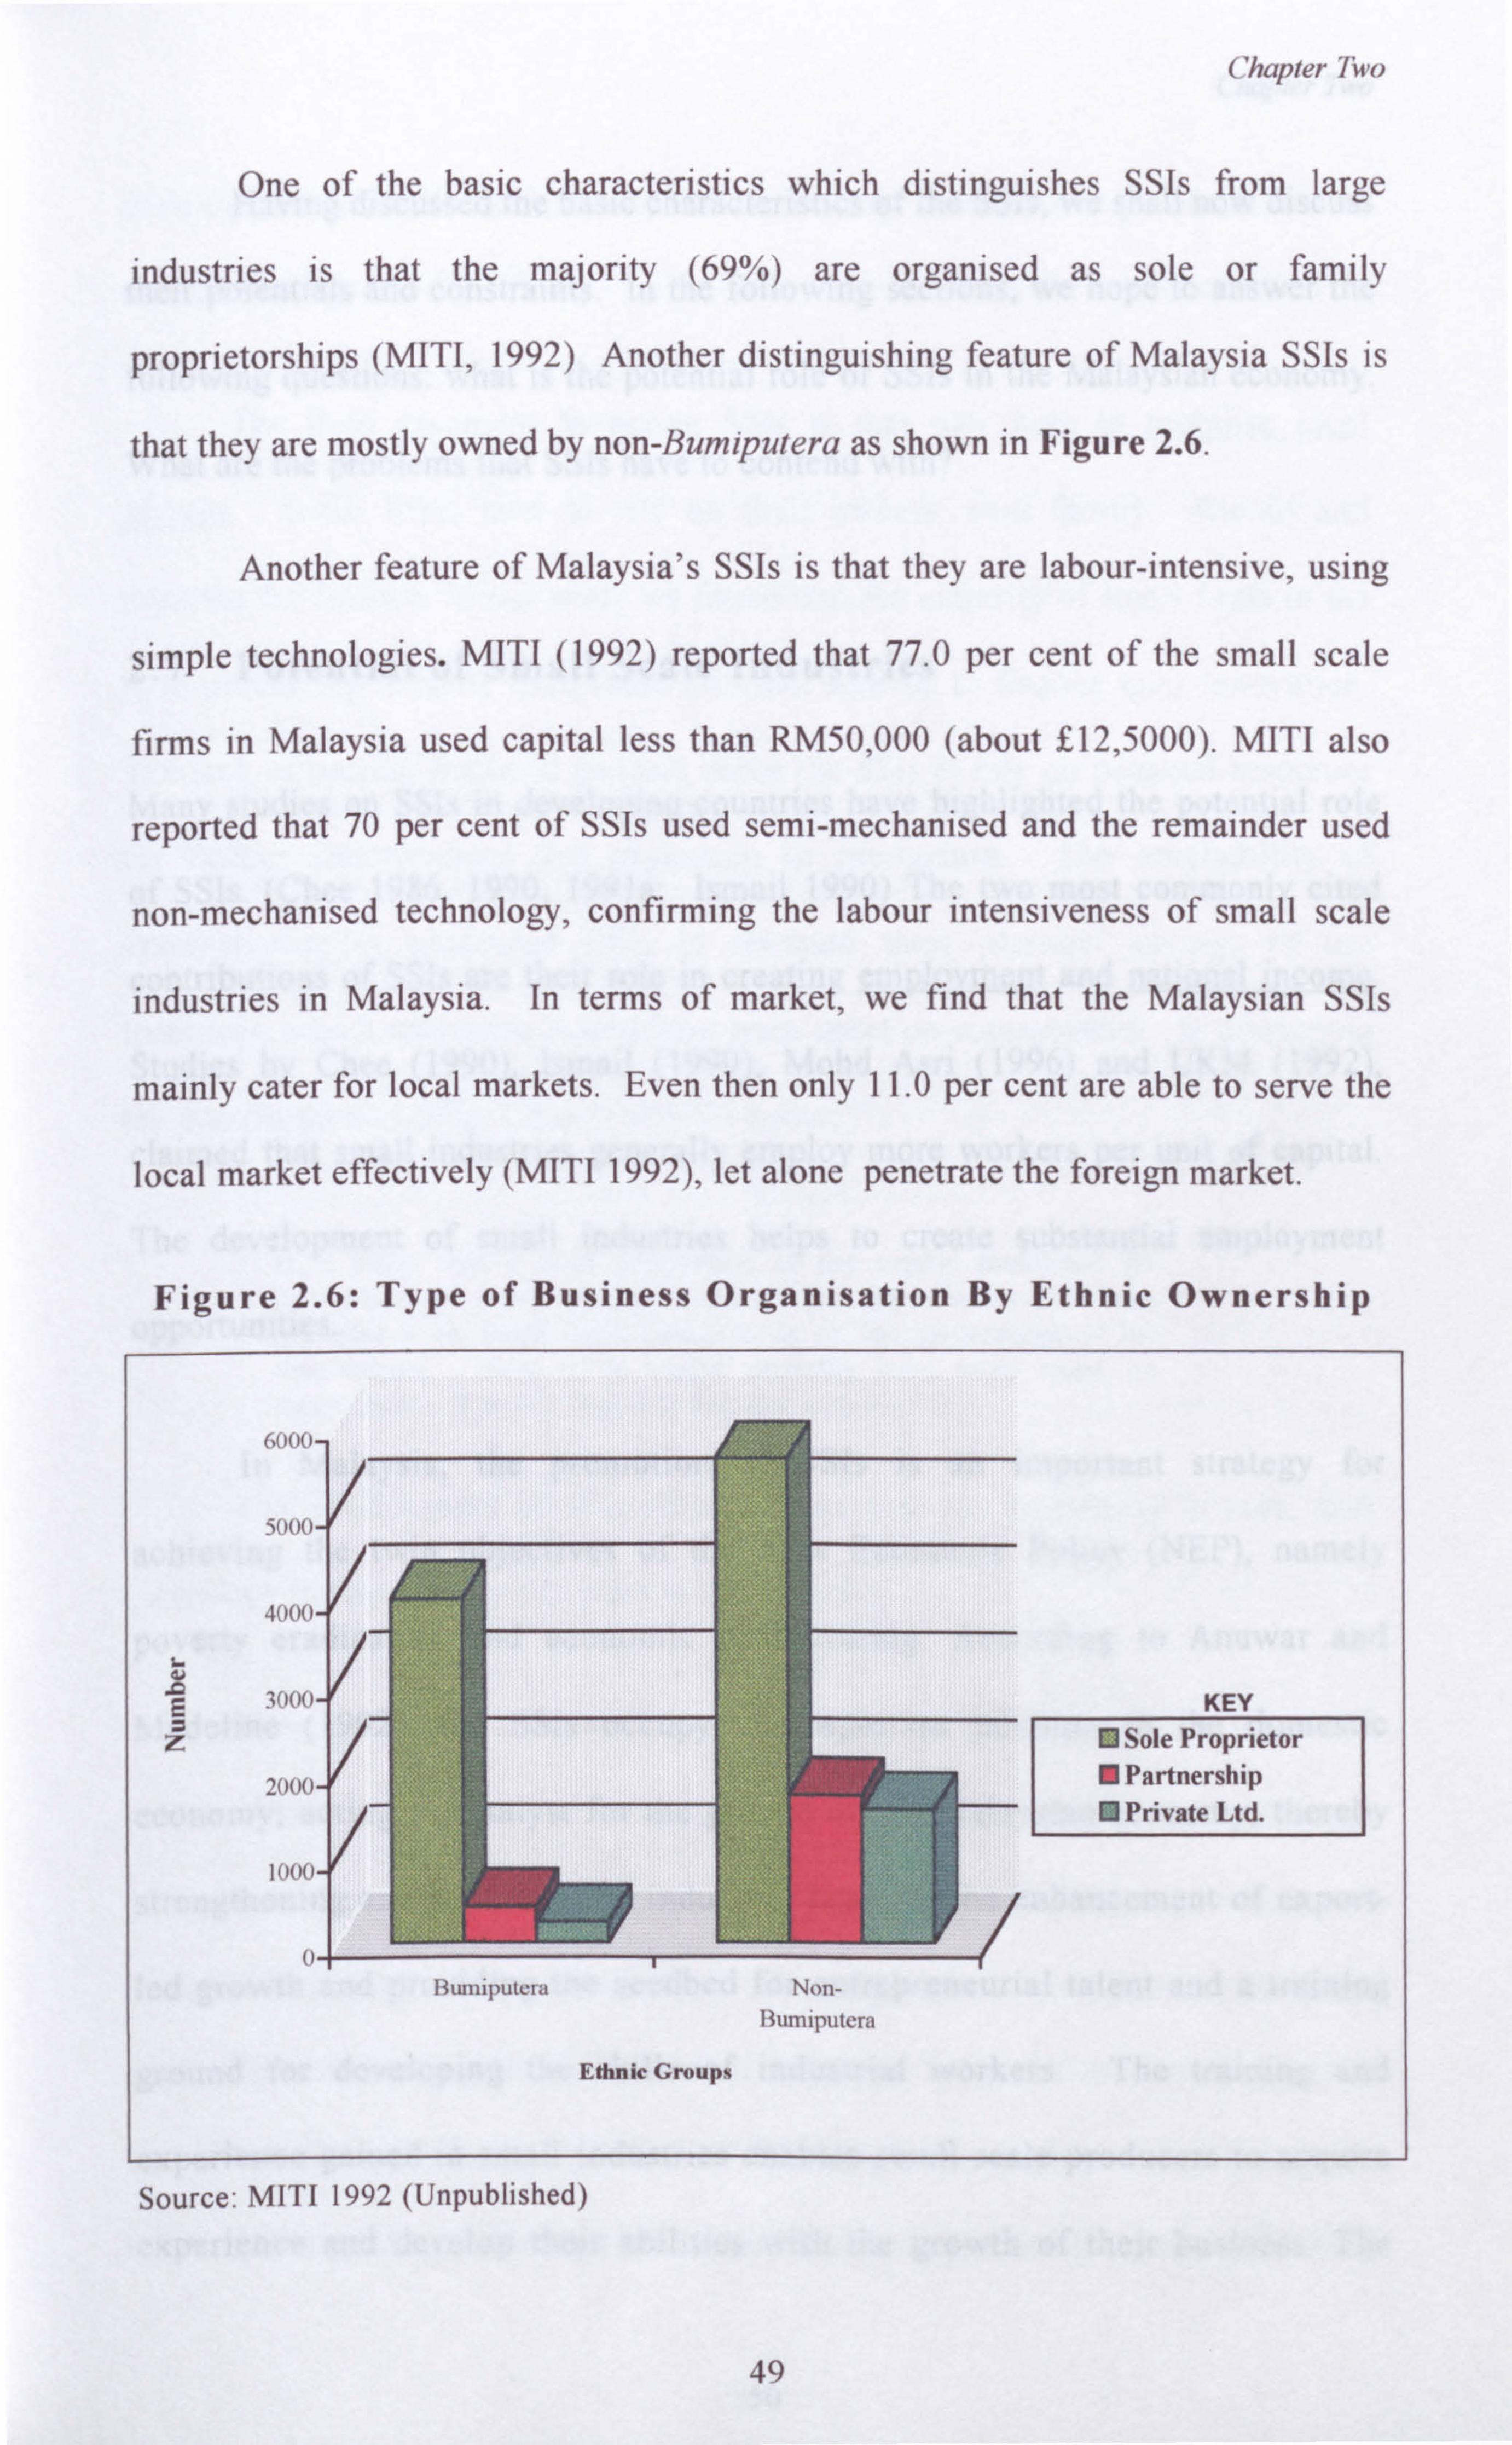
Chapter Two
One of the basic characteristics which distinguishes SSIs from large
industries is that the majority (69%) are organised as sole or family
proprietorships (MITI, 1992) Another distinguishing feature of Malaysia SSIs is
that they are mostly owned by non-Bumiputera as shown in Figure 2.6.
Another feature of Malaysia's SSIs is that they are labour-intensive, using
simple technologies. MITI (1992) reported that 77.0 per cent of the small scale
firms in Malaysia used capital less than RM50,000 (about £12,5000). MITI also
reported that 70 per cent of SSIs used semi-mechanised and the remainder used
non-mechanised technology, confirming the labour intensiveness of small scale
industries in Malaysia. In terms of market, we find that the Malaysian SSIs
mainly cater for local markets. Even then only 11.0 per cent are able to serve the
local market effectively (MITI 1992), let alone penetrate the foreign market.
Figure 2.6: Type of Business Organisation By Ethnic Ownership
600p
iUUO
40(1(1 t_; t,.....
4J
E 3(1(1(1 KEY ZF® Sole Proprietor
Partnership ® Private Ltd.
1000Y I
( Bumiputera Non-
i3umiputera
Ethnic Groups
Source: MITI 1992 (Unpublished)
49
Chapter Two
Having discussed the basic characteristics of the SSIs, we shall now discuss
their potentials and constraints. In the following sections, we hope to answer the
following questions: what is the potential role of SSIs in the Malaysian economy.
What are the problems that SSIs have to contend with?
2.7 Potential of Small Scale Industries
Many studies on SSIs in developing countries have highlighted the potential role
of SSIs. (Chee 1986,1990,1991a; Ismail 1990) The two most commonly cited
contributions of SSIs are their role in creating employment and national income.
Studies by Chee (1990), Ismail (1990), Mohd Asri (1996) and LTKM (1992),
claimed that small industries generally employ more workers per unit of capital.
The development of small industries helps to create substantial employment
opportunities.
In Malaysia, the promotion of SSIs is an important strategy for
achieving the twin objectives of the New Economic Policy (NEP), namely
poverty eradication and economic restructuring. According to Anuwar and
Madeline (1992), the SSIs occupy an important position in the domestic
economy; acting as catalyst for the growth of the Malaysian economy, thereby
strengthening and widening the industrial base for the enhancement of export-
led growth and providing the seedbed for entrepreneurial talent and a training
ground for developing the skills of industrial workers. The training and
experience gained in small industries enables small scale producers to acquire
experience and develop their abilities with the growth of their business. The
50
Chapter Two
development of SSIs is one way of increasing Bumiputera participation in
manufacturing.
The third argument favouring SSIs is that they help to mobilise local
savings. Small firms tend to rely on their owners' own family, friends and
relatives for finance. In our study we found that the majority of small firms in the
food processing industry used these informal sources to finance their innovation.
The lack of outside financial support, force the SSIs to rely on personal resources
for further improvement and expansion in production. The unreliability of
external support encourage SSIs to increase their personal savings or use
resources, which otherwise would have been spent on consumption. In discussing
the contribution of SSIs, Chee (1990: 30) wrote:
It is likely that a large proportion of the capital mobilised for investment in small industries would not have otherwise been available - to large establishments or to the government - for investments. Most of it would probably have been spent on consumption if small industries had not mobilised it.
The development of SSIs helped to increase the propensity to save, thus
increasing the overall savings ratio in the economy.
The experiences of Japan, South Korea and Taiwan illustrate the important
role of SSIs as a supplier of components to large firms (Hasnah and Rahmah
1989; Madeline and Faridah 1989; Rogayah and Ahmad 1989). Studies in
Malaysia (UKM 1992,1990) have also highlighted the pattern of inter-
dependence of the large-scale and small industrial unit, and the development of
the latter as ancillary to the former. The SSIs can supply components and
intermediate products to larger firms and create a process generally known as
51
Chapter Two
subcontracting. The sub-contracting relationship is a prelude to the enhancement
of greater inter-industry linkage. There are several advantages of subcontracting,
of which the most common ones are:
(a) the small industries obtain a ready market for their product by supplying
parts and components to the "parent" firms (large firms with which they
establish a sub-contracting relationship);
(b) the subcontracting system enables large industries to operate at a relatively
lower cost, since the cost of manufacture is relatively lower in small
industries; and
(c) the "parent" firms provide assistance (technology, finance, skilled labour)
to small firms thus ensuring their economic survival.
Another argument favouring SSIs in Malaysia is the issue of equity; their
impact on income distribution. SSIs tend to employ more workers and
manufacture products which are consumed by the lower income groups. The low
cost of setting up small firms enables entrepreneurs with limited finance to gain
entry into the industrial sector (Chee 1990; Ismail 1990).
2.8 Problems of Small Scale Industries
In this study it is also useful to examine some of the critical issues in the
development of small scale food processing industries, because the problems they
face are different from those of large industries. In this section, we shall discuss
some of the major problems confronting small scale food processing firms in
52
Chapter Two
Malaysia, focusing on such aspects as market, competition, finance and credit,
labour, raw materials and technology. The problems confronting small scale
industries differ in detail from one sub-sector to another and between units in the
same sub-sector. However, these problems can be broadly classified as applicable
to small scale industries in the FPI.
2.8.1 Marketing and Competition
There are two categories of market constraints confronting SSIs, namely demand
and supply. Generally, the demand constraints are related to the restrictions on
the size and pattern of the markets, including factors that account for the lack of
demand or a fall in the demand for a certain kind of food. The supply constraints
are related to restrictions on the market for inputs.
Among the problems of marketing the following appear to be pressing: (a)
sales (b) competition (c) credit sales, (d) indebtedness and credit. One of the
common problems perceived by small firms is their inability to sell their products
well to attain a reasonable profit (Mohd and Shaari 1988; UKM 1990). Unlike
large firms, tiny and small firms seldom conduct market research to enable them
to plan their marketing strategies and programmes adequately. Part of the reason
lies with their limited financial and human resources.
As we have mentioned earlier, tiny and small firms mainly cater for the
local market. Even in the local market, only a small percentage are able to market
their products effectively. Their inability to penetrate the overseas market or
compete in the local market is mainly due to the non-competitiveness of their
53
Chapter Two
products with regard to price, quality and after-sales service. Their products are
not only poor in quality and after-sales service, but they are not backed by
attractive packaging and labelling, elaborate sales promotion apparatus such as
publicity and advertisement campaigns, salespersons, posters and press. The
problems are due to a combination of factors including lack of funds and inability
to initiate R&D. SSIs also lack information on trade and banking practices,
knowledge of the demand patterns and the need to cope with administrative
procedures. Large and well-established firms usually have patented brand-names
(such as Maggi chilli sauce and noodles, Ramly beef-burgers, Peladang curry
powder, Yeos drinks, Kipas Udang soya sauce, Lingham chilli sauce). Without the
backing of sales promotion, small scale food producers have to rely on the local
market and the persuasive capacity of their local dealers. The dealers demand and
the producers are obliged to pay a higher rate of commission than those allowed
by large scale firms. This not only increases small scale food producers' unit cost
and affects their working capital but also impinges on their competitive ability.
Another serious constraint to growth of rural firms is the limitation of
demand for their products. Small firms face competition not only from large but
also from small and tiny industries in their effort to market their products. Small
firms located in a particular area face competition not only from outside the
region, but also from local producers (within the immediate locality). There is
also a lack of product development and improvement in the quality of product.
Lately, rural small scale food producers are finding that their potential markets are
slowly disappearing in the face of competition from large, urban enterprises
operating in the same product market. Large scale urban industries are often able
54
Chapter Two
to supply lower priced goods in rural markets compared to the rural enterprises.
Small and tiny firms are often denied the economic advantages of bulk purchasing
and efficient production. Large firms are able to sell their products at competitive
prices because of their low cost of production due to bulk purchase of raw
materials and efficient machinery. Our study shows that the majority of firms are
using manual operations, suggesting that production is less efficient. Small and
tiny firms have limited finance to enable them to purchase raw materials in bulk
and at seasons when such materials are readily available. In the case of food
processing where the raw materials involved are not obtainable throughout the
year, much economic benefit could be achieved by making bulk purchases. The
inability to purchase in bulk necessitates that small scale food producers purchase
their raw materials at frequent intervals and at higher cost.
A study by UKM (1990) showed that a high proportion of SSIs sold their
products on credit. The duration of their credit was also comparatively high. The
study reported that credit sales have a negative effect on the insufficient working
capital resources of small firms. This problem has been responsible for keeping
some firms idle and inhibiting their competitive ability.
Another marketing problem confronting small scale food producers in
Malaysia is that of indebtedness and credit. As we are aware, the financial
position of these producers condition their day-to-day performance and reflect
their success. Small scale producers are indebted to suppliers, intermediary
agencies, financial institutions, and friends and relatives. The most important
reason for this indebtedness was for fixed capital.
55
Chapter Two
Recall Table 2.3 which shows some the characteristics of popular
machines and equipment and the average cost of machines for selected food
processing industries available in the market. The majority of the machines are
imported. A casual glance at these machines and their cost, reveals that they are
far beyond the financial capabilities of the majority of tiny and small scale firms,
particularly Bumiputera firms.
2.8.2 Financial Constraints
The problem of indebtedness reflects the financial constraints facing small scale
food producers. It may be observed from our survey, that the majority of
respondents purchased new equipment using finance borrowed from personal
resources, friends, relatives and government agencies. Small scale producers'
dependence upon these sources of credit for operating needs is a point of interest,
because it has some bearing on the adequacy and cost of credit, their ability to
expand and their freedom of purchase. The fact that the resources were from
informal sources suggests that the amount of credit may be inadequate. Our study
shows that entrepreneurs from small firms spend an average of RM7,000 (about
£1,750) and RM23,000 (about £5,750) to replace old machines and introduce new
products respectively. By relying on friends and relatives, the small scale
producers may have difficulties financing the full amount of loan that the producer
would like to obtain. Without adequate funds the small firms may be prevented
from expanding production, thus reducing their competitive ability. The other
point to be noted is the influence of dependence upon credit, on the freedom of
56
Chapter Two
purchase by small scale food producers. They are denied the benefits of
bargaining in the market that are open to payers in cash.
The small scale food producers also face problems securing credit. These
problems take different forms, such as high interest rate and lack of collateral,
including unavailability of credit facilities (Chee 1986; Faridah and Madeline
1992; Ismail 1990; UKM 1990). Small scale producers who succeed in securing
loans from commercial banks have to pay excessive rates of interest on their
loans, which imposes upon them a heavy financial burden. Small and tiny firms
also face difficulties providing adequate collateral as security for procuring
financial assistance. Though there are no less than 30 agencies involved in
promoting small scale industries in Malaysia (Appendix I) the number of small
scale producers who can actually have access to these agencies is still limited
(Chee 1986; Faridah and Madeline 1992; Ismail 1990; UKM 1992). The access of
such entrepreneurs to credit is often limited by stringent collateral and
administrative requirements of the organised financial sector. It is claimed that
urban financial institutions have been 'reluctant' in giving out loans to small scale
industries because of the high risk involved. Commercial banks find it more
profitable and less risky to extend loans to large industries because of their high
credit ratings. Moreover, these agencies are often located in the urban areas
creating locational disadvantages for firms located in the rural areas. All this
demonstrates the insignificant role played by the commercial banks in the
provision of industrial finance to SSIs.
57

Chapter Two
2.8.3 Production
Small and tiny firms also face production problems which are related to excess
capacity and finance. A study by UKM (1990) showed that small scale firms in
Malaysia face excess capacity in machine and workers. The problem of excess
capacity arises because of problems related to lack of finance, raw materials,
labour and lack of demand.
As we have discussed earlier, the small firms have limited finance, which
create an obstacle in raising production to full capacity. This problem is prevalent
among those who lack operating funds for the purchase of raw materials, for the
payment of wage bills and rent. Without adequate funds, the small scale food
producers may not be able to keep their units in continuous operation for a certain
period.
The small scale food producers also face difficulties in obtaining raw
materials. As we have discussed, Malaysia's food processing is still dependent
upon imported raw materials. Seventy per cent of raw material required by the
food processing industry in Malaysia is imported (UNIDO 1985). Some examples
of sub-industries that use imported raw materials are flour milling, sugar refining,
dairy product processing and animal feed preparation. In the case of sugar
refining, although various attempts have been made to produce raw materials
locally, problems such as susceptibility to pests and disease and low sugar
contents made the production of quality raw materials less viable. Wheat flour
milling, of course has to depend entirely on imported raw materials as the
Malaysian climate does not permit the production of wheat. Except for wheat,
58
Chapter Two
considerable effort is being made to commercialise or further improve the current
local production of raw material such as cane sugar, maize, tomatoes and chillies
(Tasir 1991).
The problem of the supply of raw materials are due to various reasons.
One reason is lack of suitable land and know-how of commercial production.
With the exception of oil palm and pineapple, the raw material plantations are
small and uneconomic for commercialisation. For example the majority of farms
currently producing tomatoes and chillies for the sauce production subsector are
small in size, disorganised and consequently achieving poor returns. Small
holders prefer to plant cash crops such as rubber and oil palm because of stability
in economic return (Tasir 1991).
Sometimes, the quality of material required may not be available in the
market. The problem is most prevalent among those who rely on local raw
material. With the few exceptions of poultry, pigs, pineapple, palm oil and
cocoa, producers often face inconsistent quality of raw materials due among other
reasons to their perishable nature and the seasonality of production. For example,
the majority of ricemillers have difficulties of obtaining paddy (unprocessed rice)
during off seasons (Tasir 1991). Large firms have storage and transportation
facilities and adequate financial resources; their production capacity is not heavily
influenced by the availability and cost of raw materials. Without adequate
finance, storage and transportation facilities, small firms may have to wait for the
prices of raw materials to go down in cases where there are fluctuations as in the
case of the fish for keropok or chillis for chilli sauce.
59
Chapter Two
A problem of under-capacity in small and tiny firms also arises because of
lack of demand. This problem is related to the location, age and enthusiasm of the
entrepreneurs. In rural Malaysia, it is common to find small firms or a group of
producers producing almost similar products. For example, in the East Coast
States of Malaysia where keropok making is popular, the close clustering of too
many producers in certain areas might force some to produce below capacity.
Comparatively newer units may find it difficult to penetrate the existing market. In
the food processing industry, the problems faced by newer firms are much more
serious. Our informal discussion with some entrepreneurs revealed that they face
serious difficulties capturing demand at their initial inception. Because they are
new, their products are unknown or viewed with suspicion by consumers. They
claimed that established firms even "bad-mouth" their products through gossip
and rumours. Without adequate finance, they are unable to advertise their products
and establish goodwill. Until there is sufficient demand for their products, these
new firms may have to produce below capacity.
Some firms also face problems of under-capacity due to lack of demand in
the industry as a whole. In the Malaysian food processing industry, there has been
a gradual switching of demand for halal15 and health food which seems to be
permanent in character. Firms which are unable to keep abreast of these changes
may find themselves producing in excess, due to lack of demand. The ability of a
firm to exploit these changes in demand is dependent on their financial resources
which in turn affects their capacity to introduce new products or techniques of
production. Small scale food producers also face excess capacity due to seasonal
11 Food prepared according to Muslim dietary laws
60
Chapter Two
demand in their products. The demand for food tends to be relatively high during
festive seasons. Some firms may face excess capacity after these festive seasons
due to lack of demand. These situations suggest that small firms have poor
inventory control and lack production planning and control which is related to the
lack of skilled workers or professional manpower in manufacturing management.
2.8.4 Personnel
Small firms experience significantly greater difficulty than larger firms in
recruiting both skilled and technical workers, managers and professionals. Skilled
worker shortages represent a problem for small firms as indicated by a small
percentage of firms which employ skilled workers reveals the low level of skill
among small and tiny industries in the study area. One reason for difficulty in
attracting and retaining skilled workers is that SSIs, which lack working capital,
are generally unable to offer attractive salaries and benefits to their workers to
handle highly technical production operations, set up orderly accounting systems
or conduct research and development. Without skilled manpower, this could slow
down the pace of technology adoption in small firms.
In small and tiny firms, skill-upgrading is often made difficult by a high
rate of labour turnover. In some cases, the high rate of labour turnover,
particularly in rural firms, arises from seasonality in employment and rural urban
migration among rural youths.
The problems connected with the acquisition of skill relate essentially to
the lack of training facilities suited to the trade, particularly in rural areas. The
61

Chapter Two
majority of Malaysia's training institutes and facilities are located in Kuala
Lumpur or other major towns. Many rural producers, particularly women, are
unable to avail themselves of these facilities. The problem is exacerbated by the
high cost (time and money) involved in training. Though the majority of the short-
courses organised by government agencies are free or subsidised, course
participants may have to incur travelling and living expenses during the course.
For small and tiny firms, this will be an extra financial burden which, with their
meagre working capital they can ill afford. From Table 2.4 we can see that some
of the courses incur high fees. The cost of training in private institutions is
relatively more expensive; courses such as those offered by the Penang Skills
Development Centre are not within reach of small and tiny firms.
Apart from the high training cost, time is another factor constraining small
scale producers from undergoing technical training. Since the majority of the
research institutes are located in the major towns, the rural producers will have to
stay at the training centres for the duration of their training course. In tiny firms
with an average workforce of only five members, the entrepreneurs' absence is
bound to have an adverse effect on production.
62

L
CC v
E r L O
W
h
y L = O U
V
ti
V1
N
: tT
E"'
o 0
c y
Z
O 1! = . -
ce d _y "C
C r' y ti -
cyU in 'y O3 äý 3 5;
C ;ny
p aý °
x 3cß p Z. O z C _
F- C .,
C
Uý c ° cCC 3N
ý y °'
i .v Da s 4, Y
20 V. c
. rC. r
6. U . -
'y cu VT
U T
uU r-.. T
eC R d0 ¢
X' ý U p L
C 'O V O yO O CJ c
. jý r/i ä ril c >o : °' Are 3 °' °V cC
c
C :F a2 Oy m yN
cä
:-Q VI
NT a
-0
TO i0 w
V1 - cL ýe ö3 rý ö= , a
ö- °' x 'c a VýC L
yU : 'ý U .E :L .9n ee C Oy Oy TS
Ö
2ä2 ä' YO ä0 '3 ý
L ý1 :p 'ý O VI
EL Qn 0°°c ° t1. aeE
. .................. ........... .. ------- -- ----------------------- ....... ------------ .................. y
Q%
.. y
------------------ V1 V1
V
---- ---- L
f
L 1 :,
ý yN
33 C
3 VO3
33 cC ý
tu ý c
N ;N :N 0 M 00 V1 , rý , N ' A N N
ýn O
........... .............. ........ ..................... .............. ........................ ........... ....................... .......
5C
C _Cj, CU ;a
V Ol y + CýÜ dp 40 . /; `. ý d
rcpv c aýem ý
" C :Z oz
C GJ OL a> n ON7 r vt CC C
=O *E d0 C of C1 "C v 0' Cd C p +ý C S
F
-
. U 6J V
o e y -E oa
- yam,.
CC - L vri
= O_ nn
R ýý
S" U üC
VJ Ly
V 'L 'Vý Q
L vl Q
ý-;

0
- Ö
y r U
C ÖO v,: ý iC: CiC -.
T
O fý
L :L
w CO - O O 'n 0 ; N v C
:O
O rn %1 In In n v1 n Vl V) In ..:. "E vl {n !n -, In R
- t CO
rs RR RR
72 üzs ýs-a RRR CO R
a-o-ov a RR
-o a CO
c ° O
°E O: y' R; CO R
EE: °:. "J' M M- MMN MMNN "' NN
ýN NNN; NM
y ý V] 9U: CA: L
C
ä4 cý C ° '3 C
..: U y ýL N O O a) CO c CO
i' p `' CC V1 r: Z O 00 0 Xpi. CO N N C
2 ti R cRä EE Ei iEi -2: ''. w: "-,
m 0 E- 81 0v
öEEc m- ý ö °'
n ' ý
> ý ä -a ýn :c a"i
: : :w ä äuc 0. ° z c C u ýJ j 3
R. y vý G
+= a' ö CO
= r A - G H
R
ý y 7CCr Ci R C
ß, x
aý
N
R E V1 y '. I-
W ýc
ýG
1
GO cC G
ýÖ
Oy
C -y
.. y ýw
) w F" ýý Vý
ý"' Q
ýz
ýr
Chapter Two
There is also the problem of the lack of awareness on the part of some
small scale food producers about the need for undergoing technical training. A
casual discussion with some of the producers revealed that they recognised the
need for improvements in the quality of their products as well as a general rise in
their productivity. However, many of them believed that these could be brought
about by other means without actually undergoing technical training. Some of
them even claimed they had "more knowledge" or "more first hand experience"
about what was being taught in the institutes.
2.8.5 Technical
Many small scale firms have low capital and labour productivity suggesting that
they have lower technical capabilities. Many of these problems are related to lack
of information and knowledge of existing technical and advisory facilities for
small scale industries. The size and characteristics of a technology available to
the small scale producers depend on the nature of the particular industry, as well
as the channels of information available to them. Often they face problems in
relation to the availability of technological alternatives existing in the industry and
the capacity of the entrepreneur to collect and assimilate the information.
Differences also exist in technology and equipment used in the production
processes, thus creating differences in the quality of products. In this study, a
large percentage of the firms were found to be using simple tools and equipment
in their production. In addition, small firms lack inter-sectoral links with
machine workshops, repair or service facilities for some of their machines, often
making it difficult for them to use sophisticated or non-readily available machines.
65
Chapter Two
2.8.6 Discriminatory Government Policies
A close examination of government policies reveals a picture of bias against SSIs.
These policies do not deliberately discriminate against SSIs, however their impact
and the way they are implemented tends to do so. Chee (1990: 37) argued:
[T]he fiscal incentive system in Malaysia, as in many other countries, generally links the value of such incentives to the level of investment, implying that larger enterprises (in terms of investment) receive greater benefits.
There is an inherent capital bias in many government incentive schemes.
SSIs are sometimes unaware of the incentives available.
Another form of indirect discrimination faced by the SSIs relates to
government procurement policies. The SSIs are often left out of the lucrative
government procurement business. Part of the explanation lies with the fact that
government bulk purchase and tender tend to favour large scale industries because
of their competitive prices and higher quality products.
2.8.7 Access to Business Service
Small and tiny firms, particularly those in rural areas, are widely seen as having
relatively less access to business services such as banks, accountants,
management, marketing, advertising and market research agencies, given that
most of these services are located in towns. The frequency of use of external
advice by rural small firms is fairly low. Government agencies such as MARA and
MARDI lead the list of agencies providing advice to rural firms. These points
seem to support the notion of rural isolation and its effects; firms in rural
66
Chapter Two
Malaysia are relatively disadvantaged in terms of frequency of business service
advice used by them.
2.9 Institutional Framework for Small Scale Industries
The government's involvement in small industries mainly developed after the
launching of the New Economic Policy in 1971. The government may have
established the Rural Industrial Development Authority (RIDA) in 1960 to
promote industrial development, but at that time, there was no serious effort to
develop SSIs. Malaysia's early development programmes focused to a large extent
on the development of large scale industries. Such a strategy may have succeeded
in accelerating economic growth, but it failed to address the social and economic
imbalances prevailing in Malaysian society; a wide gap between the rich and the
poor, between regions (rural and urban, West coast and East coast of Peninsular
Malaysia), and most important, between ethnic groups (Bumiputera and non-
Bumiputera. The NEP was implemented in 1971 with a commitment to eradicate
122veM by raising income levels and employment opportunities and to restructure
society so as to reduce and eventually eliminate the identification of race with
economic function. (Malaysia 1971: 154). The overriding concern of the NEP is to
enhance Bumiputera participation in commercial, industrial and urban-based
activities in which their participation has always been minimal. Table 2.5
summarises some of the pertinent issues regarding the development of small and
medium scale industries (SMIs) as highlighted in Malaysia's respective
development plans.
67

Chapter Two
Table 2.5: Malaysia's Development Plans and Pertinent Issues on the Development of Small and Medium Scale Industries.
Development Plans Pertinent Issues On SMIs development First Malaysia Plan " No mention of SMIs (1965-70) Second Malaysia Plan " Implementation of the New Economic Policy. (1971-75) " Promotion of SMIs
" Government provide technical, financial and management assistance Government established institutions such as Credit Guarantee Corporation (CGC), Malaysian Industrial Development Finance (MIDF) to assist SMIs
Third Malaysia Plan " Development of SMIs as an integral part of Malaysia's
(1976-80) industrial development " Focus on training of small entrepreneurs " National Productivity Centre (NPC), Majlis Amanah Rakvat
Malaysia, Ministry of Culture, Youth and Sports conduct entrepreneurial development programmes
Fourth Malaysia Plan " Development of entrepreneurship,
(1981-85) " Creation of employment " Mobilisation of savings " broadening of industrial base of Bumiputeras " Providing inputs and support service " Government allocated RM318 million for development of SMIs " Established the Division of Small Enterprise in the Ministry of
Trade and Indust Fifth Malaysia Plan " Expansion, improvement and modernisation of SMIs. (1986-90) " Improving of incentive system
" Develop R&D activities by encouraging SMIs to establish links with research agencies.
" Introduce a Special Programme for the Development of Small Industries involving total financial assistance of RM234 million undertaken with cooperation with World Bank
Sixth Malaysia Plan " Foster inter-industry linkages
(1991-95) " Focus on the supportive role of SMIs producing parts and components
" Development of indigenous technology " Develop international marketing networks " Efforts to link SMIs with larger enterprise through
subcontracting arrangements " Establishment of Tabung BantuanTeknikal Perindustrian Kecil
Industrial Technical Assistance Fund Source: Malaysia (1991,1986,1981,1976,1971)
It is evident from the table that much attention and support has been given
to the development of small and medium industries in Malaysia. The
government's commitment to SMIs development is reflected by the number of
ministries and agencies providing assistance to SMIs. (See Appendix I). The
68

Chapter Two
government has extended different types of programmes to assist SMIs. The
government has adopted two approaches (a) promotional measures designed
directly to help SMIs financially, technically and organisationally, and (b)
protective measures to remove some of the problems in the day-to-day functioning
of these units, by regulating the market for their products and reserving markets
for SMIs. The major programmes that have been implemented to promote the
development of SMIs are outlined in the following sub-sections.
2.9.1 Marketing Assistance
The government has designed an integrated marketing programme to assist SMIs
to increase their market. Under the Sixth Malaysia Plan (1991-95: 144) the
government adopted the konsep payung (umbrella concept) which is a
government purchasing scheme. Under this scheme, SMIs' products will be
marketed through companies participating in the programme, such as Besta
Distributor Sendirian Berhad, PERNAS Edar Sendirian Berhad including Guthrie
Malaysia Trading Corporation. This umbrella concept was established to provide
linkages through product sourcing and marketing in the food processing industry.
The government has also established the Sub-Contract Exchange Unit to
assist SMIs to establish linkages. The unit serves as a meeting or a market place
where buyers and sellers meet. Small scale entrepreneurs can also receive
advisory services from this unit. Several private and public agencies, such as
Malaysian Industrial Development Authority (MIDA), National Productivity
Centre (NPC) Malaysian Development Bank (BPMB) participate in this scheme.
69

Chapter Two
In 1980, the government established the Malaysian Export Trade Centre (MEXPO)
to provide assistance such as information regarding trade opportunities and
international marketing, maintaining database of local exporters and foreign
buyers and provision of space for exporters to exhibit their products.
2.9.2 Finance
The financial problems faced by the SMIs point strongly towards the need to
supplement their existing sources of financial help. There are several private and
public institutions which have been established to provide financial assistance to
SMIs. Among these institutions are: Bank Industri Malaysia Berhad (Bank of
Industry), Bank Pembangunan Malaysia Berhad (Development Bank of Malaysia),
Credit Guarantee Corporation (CGC), Malaysian Industrial Development Finance
(MIDF) and MARA. These agencies provide financing for new fixed assets and
factory building undertaking modernisation and expansion. The government has
also initiated the Tabung Bantuan Teknikal Industri (Industrial Technical
Assistance Fund or ITAF), Skim Pembiayaan Usawan Kecil (Small Entrepreneurs
Finance Scheme), Bumiputera Entrepreneurs' Development Programme, New
Entrepreneurs Fund, ASEAN Japan Development Fund Loan Scheme and Tabung
Usahawan Industri Kecil Sederhana (Financing Fund for Entrepreneurs in Small
and Medium Scale Industries) to provide grants and finance to help SMIs conduct
R&D and upgrade their technological capacity.
Bank Industri Malaysia Berhad has initiated an engineering financing
facility to assist SMIs in their new engineering projects and enable them to lease
machinery and equipment. Bank Pembangunan Malaysia Berhad provides project
70
Chapter Two
loans to Bumiputera firms for the purchase of land, factories, warehousing, office
building, machinery and transport equipment. The ITAF was set up in 1990 with
the purpose of providing grants to qualified SMIs to help them (a) engage
consultants to conduct feasibility studies to modernise and upgrade their existing
plants, and improve quality and productivity, (b) improve local product
development and design, build up indigenous technological know-how to develop
new products and improve existing products, (c) improve the quality of their
product to meet the standard requirements as outlined by SIRIM, and (d) enter the
export market and develop export marketing expertise. New or existing
entrepreneurs who face financial difficulties can also apply to the New
Entrepreneurs Fund to obtain loans to purchase fixed assets and for working
capital. A nursery factory scheme has been provided to Bumiputera entrepreneurs
under the Bumiputera Entrepreneur Development Programme. Under the scheme,
Bumiputera entrepreneurs are provided with factory complexes for a specific
period at a special rental rate. Another source of finance for Bumiputera
entrepreneurs is the New Entrepreneurs Fund, which provides funds to new
entrepreneurs to acquire fixed assets. SMIs can also obtain loans from the
Malaysian Industrial Development Finance to finance new fixed assets, undertake
new industrial ventures or undertake modernisation and expansion. Another
source of finance for SMIs is the ASEAN Japan Development Fund Loan Scheme.
However, the majority of all these institutions require some forms of
security such as fixed assets, life insurance, marketable securities, Amanah Saham
Bumiputera shares, negotiable certificate of deposit, treasury bill, government
securities, corporate guarantee, joint- and several directors/shareholders guarantee
71

Chapter Two
or assignment of contract proceeds including debentures on fixed and floating
assets. In most cases, tiny and small scale firms are prevented from benefiting
from these sources of support, due to their inability to provide the required
security or collateral.
2.9.3 Skill Upgrading and Technology
There are also a number of agencies involved in providing training to SMIs.
Among the most common ones are the Centre for Instructor and Advanced Skill
Training (CIAST), Industrial Training Institute (ITI), MARDI, MARA, National
Productivity Centre (NPC), Forest Research Institute Malaysia and Penang Skills
Development Centre. These agencies provided different types of courses to SNIIs
such as courses on technical aspects, improving management standards, efficiency
and productivity in industrial operation, development of entrepreneurial skills,
industrial training and food processing technology.
MARDI has one of the most comprehensive programmes on food
technology, encompassing a variety of areas such as Food Information
Development, Food Project Development, Food Industrial Development, Food
Extension Services, Training for Food Industry and Food Quality Control Service.
MARDI's Food Information Development programme documents information on
Malaysia's food processing industry, food research information and food industry
information systems. The purpose is to update information such as technology,
manufacturing, trade, economy, policy and market relevant to the food processing
industry. Small scale food producers can also obtain information regarding the
72

Chapter Two
latest technology on food production under the MARDI Food Project Development
which is a programme concerned with producing packaged technologies which has
been tested.
Under its Food Project Development, MARDI designs and develops
commercially viable systems for production of food products from research
prototypes and other available machinery and equipment, design post-harvest
handling systems for food, conduct commercial feasibility studies on food
manufacturing projects and produce consumer acceptance reports on food
products. This programme not only conducts technical and financial studies on all
new products and technologies, but also is able to disseminate viable projects to
interested producers.
Under its Food Industrial Development programme, MARDI provides
technical and consultancy services to firms to develop new food manufacturing
industries, or to existing industries to improve their quality and productivity, and
to conduct research with selected industries in the development and testing of new
ingredients, products, machinery and systems. MARDI also has special
programmes for the development and improvement of SMIs in selected industries.
MARDI assists potential entrepreneurs set up new small scale industries and
transfer technologies and provides comprehensive guidance services on existing
SMIs with respect to proper production technology, quality control systems and
presentation of products. These programmes only focus on technical consultancy
services and their purpose is to assist existing SMIs to operate efficiently, produce
products of high quality and improve the marketing of products.
73

Chapter Two
These programmes are complemented by MARDI's Food Extension
Services which provide advisory and consultancy services to local food
manufacturers including food technology, quality control, machinery layout,
product diversification, labelling, packaging, food regulation and hygiene and
sanitation. MARDI conducts training programmes not only for potential and
existing entrepreneurs but also for extension officers from government agencies
on aspects of food processing and quality control. It also organises seminars,
forums, workshops and technical attachment training to assist food manufacturers.
Under its Food Quality Control Services, MARDI provides information on
analytical services (chemical, nutritional, physical, microbiological and
specialised services) and expertise on Muslim dietary laws to the food industry,
either directly or through its extension programmes.
2.9.4 Institutional Support for Science and Technology
Besides these support programmes, the government has also introduced a
comprehensive policy for the development of Science and Technology (S&T). Its
strategies and programmes were aimed at widening and improving the S&T base
through indigenous technological development with the acquisition of selective
technology from abroad. To ensure the quality of R&D activities in the public
sector, the government have implemented a programme entitled Intensification of
Research in Priority Areas (IRPA). This is a more centralised and coordinated
management system for R&D and technology development in the areas of
agriculture, industry, medical and selected strategic areas. There is a heavy
74
Chapter Two
emphasis on R&D activities in the agriculture sector. This emphasis is not only
limited to increasing productivity but also covers downstream applications-
oriented research in the processing of agricultural output and by-products,
including research on end use product development and marketing, particularly in
food processing industries. In the industrial sector, R&D activities are mostly
focused on areas such as micro-electronics, information technology, automated
manufacturing technology and material science. According to the Sixth Malaysia
Plan (1991: 190), local institutions have succeeded in designing and fabricating
low cost small machinery for food processing and production, particularly for
SMIs.
To supplement Malaysia's technological base, the government has
imported foreign technology, which has always played an important role in
accelerating industrial expansion in the country, and continues to do so. Figure
2.9 shows that the level of technology imports in the food processing industry is
relatively high.
Despite Malaysia's efforts at facilitating technology transfer, there is little
evidence suggesting that Malaysian firms, particularly SMIs have succeeded in
developing technological innovations. Their innovations have been mostly geared
towards incremental improvements or marginal adaptations to meet local needs
rather than the design and development of new products and processes. In the
following section, we provide some insights into the dynamics of Bumiputera
small-scale entrepreneurs in the FPI.
75
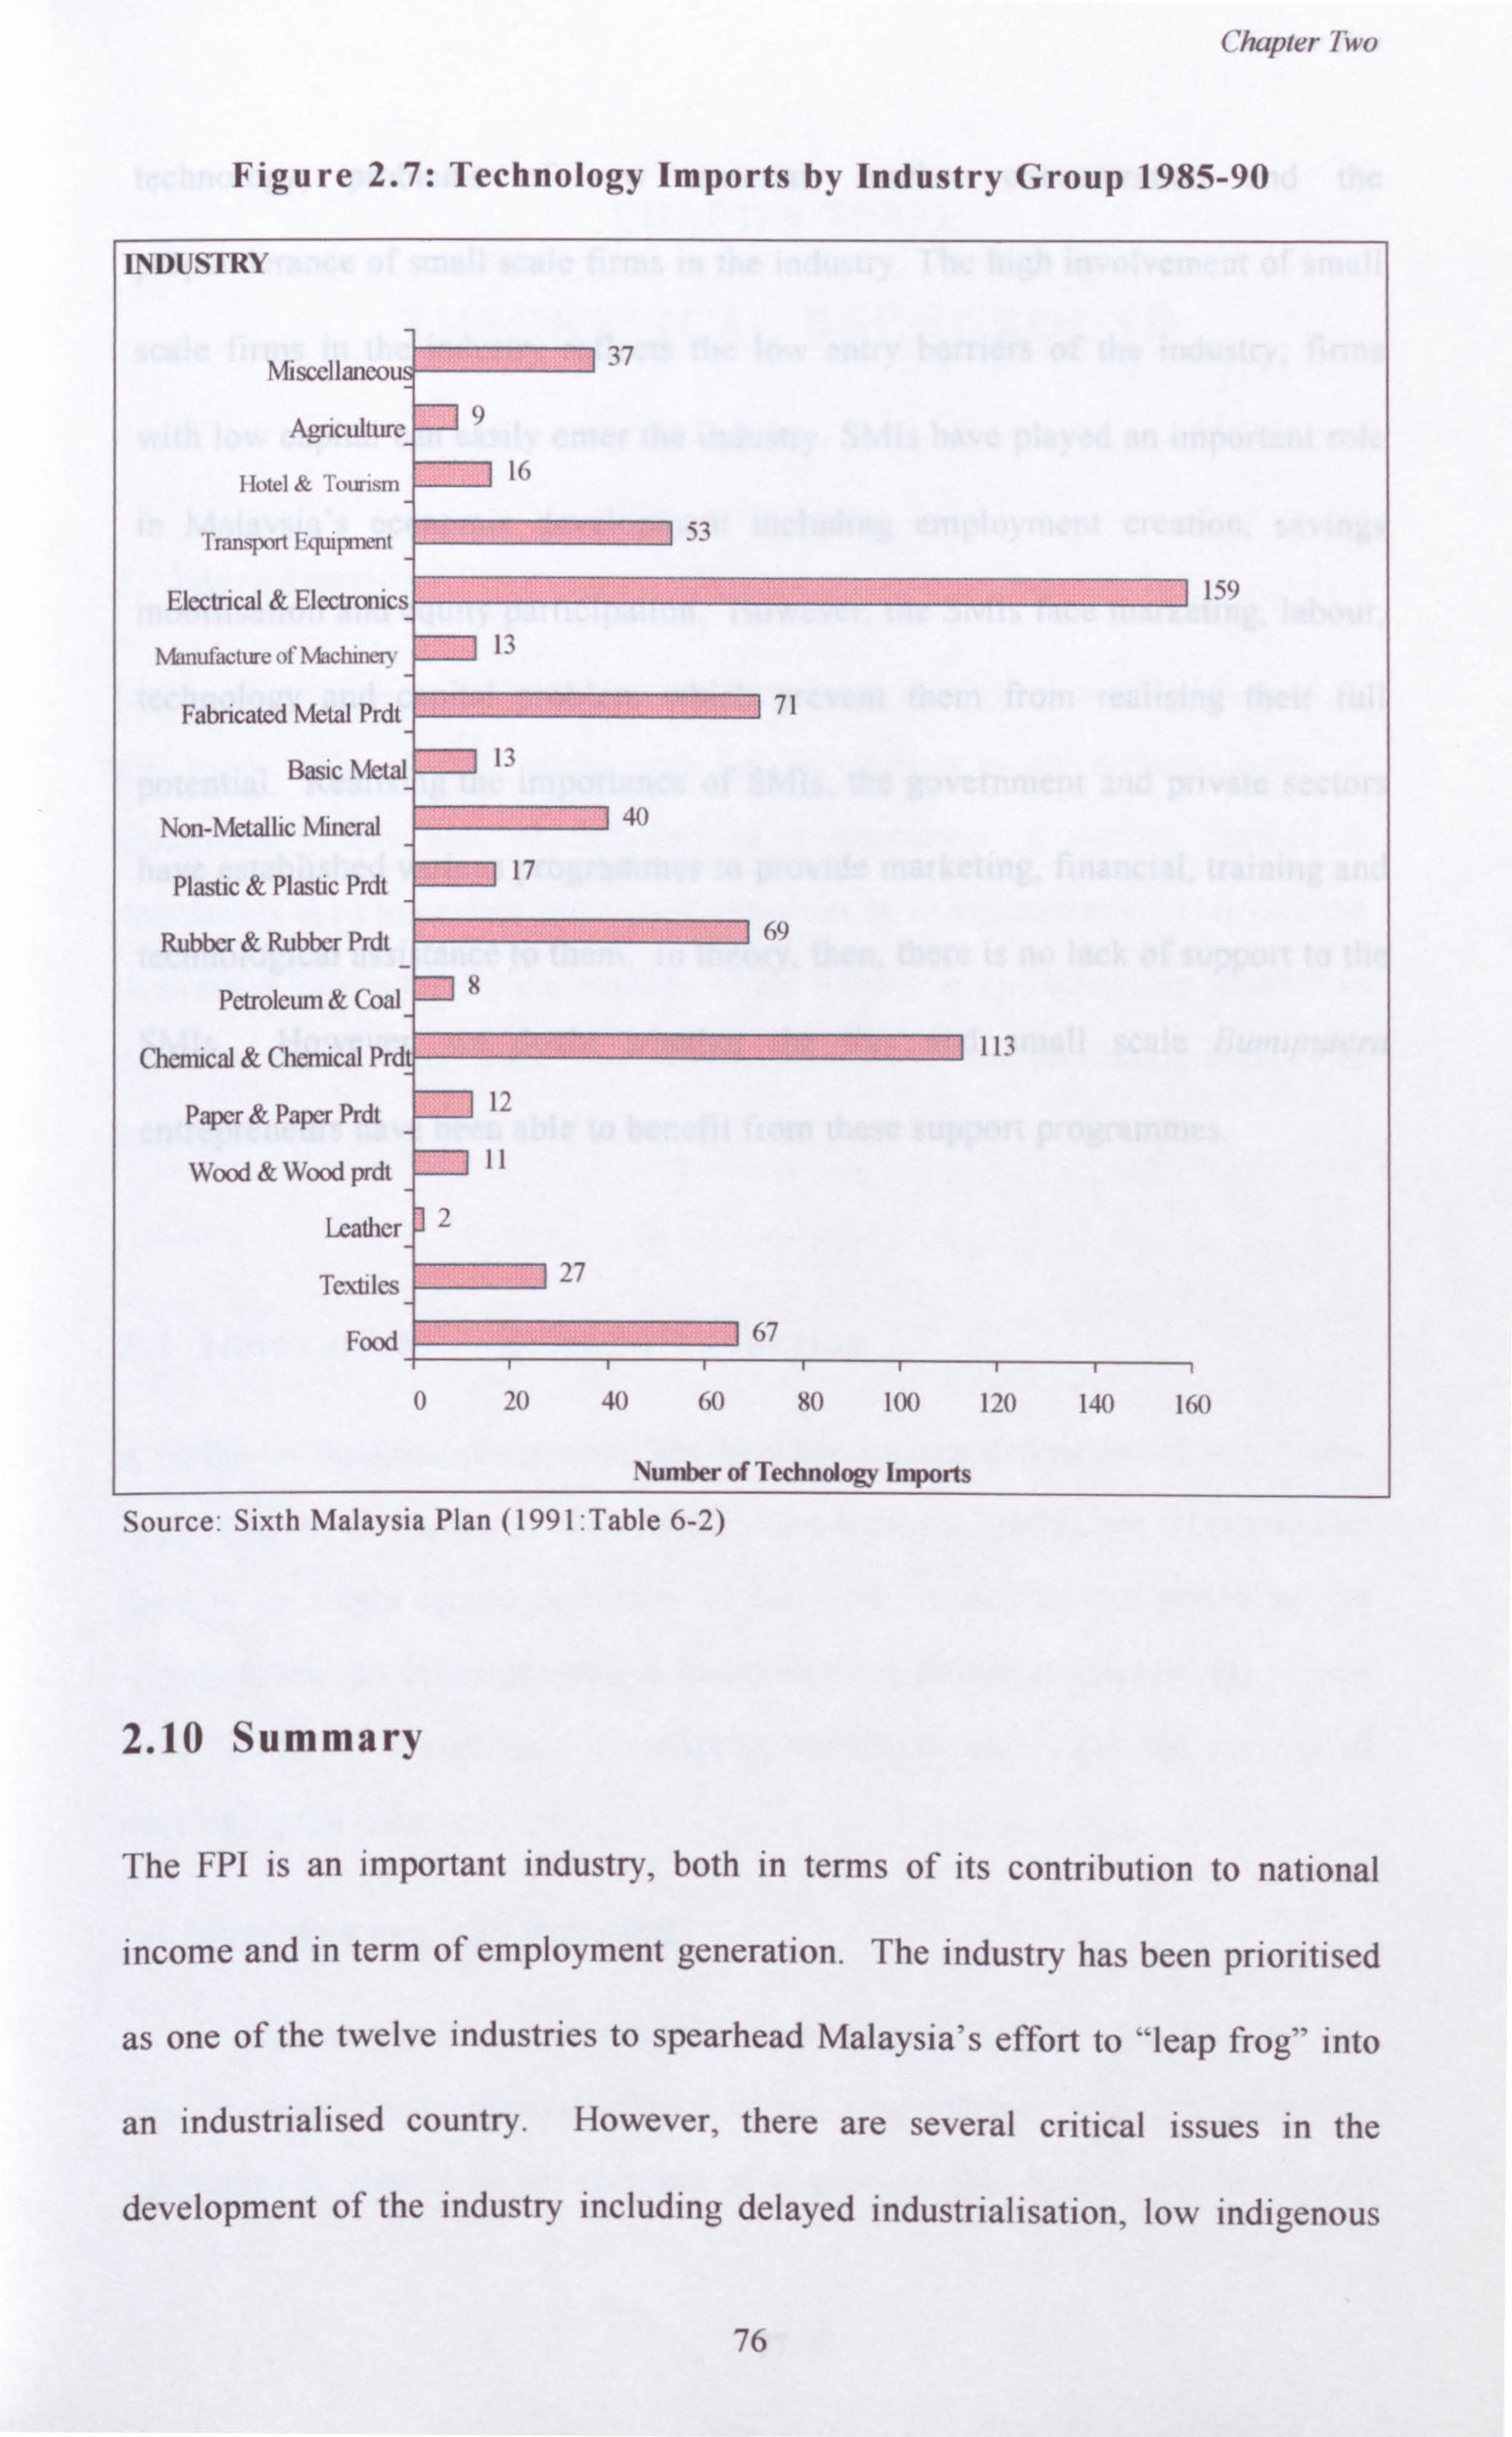
Chapter Two
Figure 2.7: Technology Imports by Industry Group 1985-90
37
Agriculture_ 9
Hotel & Tourism 16
Transport FquiF(nent 53
Electrical & Electronics 159
Manulacti re of Machines 13
Fabricated Metal Prdt 71
Basic Metal ` 13
Non-Metallic Mineral 40
Plastic & Plastic Prdt 17
Rubber & Rubber Prdt 69
Petroleum & Coal
Chemical & Chemical Prd 113
Paper & Paper Prdt 12
Wood & Wood prdt I1
Leather 2
Textiles 27
Food 67
0 20 40 60 80 100 120 140 160
Number of Technology Imports
Source: Sixth Malaysia Plan (1991. Table 6-2)
2.10 Summary
The FPI is an important industry, both in terms of its contribution to national
income and in term of employment generation. The industry has been prioritised
as one of the twelve industries to spearhead Malaysia's effort to "leap frog" into
an industrialised country. However, there are several critical issues in the
development of the industry including delayed industrialisation, low indigenous
76

Chapter Two
technology, problems of raw material, market concentration and the
preponderance of small scale firms in the industry. The high involvement of small
scale firms in the industry reflects the low entry barriers of the industry; firms
with low capital can easily enter the industry. SMIs have played an important role
in Malaysia's economic development including employment creation, savings
mobilisation and equity participation. However, the SMIs face marketing, labour,
technology and capital problem which prevent them from realising their full
potential. Realising the importance of SMIs, the government and private sectors
have established various programmes to provide marketing, financial, training and
technological assistance to them. In theory, then, there is no lack of support to the
SMIs. However, we doubt whether the tiny and small scale Bumiputera
entrepreneurs have been able to benefit from these support programmes.
77
CHAPTER THREE
THEORETICAL BACKGROUND
3. Introduction
In this chapter, we will discuss in detail the main theoretical approaches used in
this study. The chapter begins with an introduction to the different types of
innovation. This will be followed by a discussion of various theoretical
approaches used to explain innovation decisions in an organisation. This lays the
theoretical foundation for our analysis of the influences on technology innovation
decisions among small scale Bumiputera firms in the food processing industry in
Malaysia.
3.1 Innovation: A Brief Introduction
A review of the literature reveals that there are various definitions of innovation,
suggesting the ambiguity of the concept. Like Beimans (1992), we recognise that
there is no single agreed definition of the term. Based on our review of the
literature, we can define innovation based on three different concepts: (a) a "new
item" itself (b) the process of adopting the "new item", (c) the process of
developing the "new item",
(a) Innovation as a 'new item itself
According to Beimans (1992), innovation refers to "the item itself that has
been invented" and regarded as new to the adopting unit. In this definition,
innovation is viewed as an outcome of a process, that is the new item itself
78
Chapter Three
(Beimans 1992: 7; Rogers and Shoemaker 1971; Rogers 1983: 11; Zaltman et. al
1973: 10). Hannan and McDowell (1984), Mahajan et. a! (1990), Masterson and
Hayward (1979) and Damanpour (1991) have adopted this concept of innovation
in their studies). The newness of the innovation is from the point of view of the
potential adopter, and it may not be new to the world (Rogers and Shoemaker
1971). The new item is either new equipment for a production process, which is
process innovation, or a new product produced, which is production innovation
(see below).
(b) Innovation as a 'Process of adopting new item'
The second perspective views innovation as the process whereby the new
item is adopted, and thus implemented by the adopting unit- organisation.
Innovation is defined as the process of adopting of ideas, knowledge or
techniques that are 'new' to the adopting organisation (Aiken and Hage, 1971;
Damanpour 1991,1990; Herbig and Kramer 1993). If an entrepreneur discovers
some knowledge, information or techniques which he or she perceives as "new"
and "useful" to his or her firm and introduces those discoveries in his or her
business, then innovation has taken place in that firm.
(c) Innovation as the 'Process of developing the new Item'
Innovation in this category refers to the creative and development process
that result in something new. In other words, innovation is viewed as a process
which links together numerous activities of which the ultimate objectives are the
creation of new products (Bradbury 1989, Nystrom and Edvarsson 1982). In this
concept, innovation is defined from the perspective of the developing units, such
as organisation which produce a new product for the market.
79
Chapter Three
Some writers differentiated innovation into various types, such as technological,
administrative' and ancillarv2 (Damanpour 1987,1990; West and Farr 1990).
Technological innovation is concerned with the use of knowledge for the creation
and implementation of new technologies. It occurs in the technical system of an
organisation and is directly related to the primary work activity of the
organisation. It may take the form of either a product or process innovation. Holt
(1983) classified product innovation into three categories, namely: (a) products
new to the market, (b) products new to the company, and (c) improved company
products. Process innovation involves the introduction of new elements (such as
input materials, task specification, work and information flow mechanisms, new
equipment) into a firm's production or service operation (Damanpour 1991;
Utterback and Abernathy 1975). The development of process innovation toward
improved output productivity often leads to capital intensiveness, improvement in
labour productivity and larger product scale. Thus, it is always associated with
performance improvement.
A review of the literature reveals that small firms as well as large are
capable of innovative behaviour; it can be in the form of simple imitation,
invention or radical innovation. However, it is widely accepted ( e. g. Santarelli
and Sterlacchini 1990) that the manner of innovation tends to differ between firms
of different sizes. They showed that small firms tend to carry out their innovative
activities without specific financial resources and formalised procedure. Unlike
large firms, small firms are often organised along informal structures based on
family business. Studies in Malaysian small firms (UKM 1990) have shown that
' It occurs in the social system of an organisation. Examples of this type of innovation is the implementation
of a new way of recruiting workers or employee performances appraisal. It comprises innovations in
organisational structure and administrative processes.
2 (Damanpour 1990: 127) defined Ancillary innovation, as organisation-environment boundary innovation. Such innovations go beyond the traditional function of an organisation.
80
Chapter Three
the majority of small firms do not have specific plans or budget allocations for
technology adoption, suggesting their lack of attention to such matters.
There are also differences in the type of innovation chosen. According to
Dewar and Dutton (1986), Ettlie (1983), Ettlie et. al (1984), Harvey et ul. (1991)
and Meredith (1987). SSIs are more likely to adopt incremental rather than
radical3 innovation, because they have fewer financial and technological
resources compared to LSIs. This explains why they are very selective in their
investment decisions; scrutinising any investment, and evaluating its compatibility
with existing equipment, cost effectiveness, feasibility and risks. By adopting
incremental innovation, SSIs can maximise the benefits and minimise the cost
from their limited financial resources.
Overall, it is widely accepted that LSIs are more innovative than SSIs as
reflected by the number of innovations that have been made. The LSIs can reap
the benefits of economies of scale, and have comparative advantages in terms of
financial and technological resources. SSIs, however, have behavioural advantages
(such as entrepreneurial dynamism, internal flexibility and responsiveness to
changing circumstances) which make them responsive to innovative activities
(Fiegenbaum and Karnani 1991; Rothwell 1989,1984). SSIs have the ability to
respond quickly to changing market requirements because of their less formal
management style. Regarding the source of innovation, it appears that SSIs are
mostly engaged in informal innovative activities in contrast with the systematic
research and development (R & D) activities within structured laboratories which
are normally carried out by LSIs (Santarelli and Sterlacchini 1990; Variyam and
Kraybill 1993).
West and Farr (1990) define radical innovation as something very different from what a organisation has done before. It is more disruptive than incremental innovation and requires more change within the organisation
81
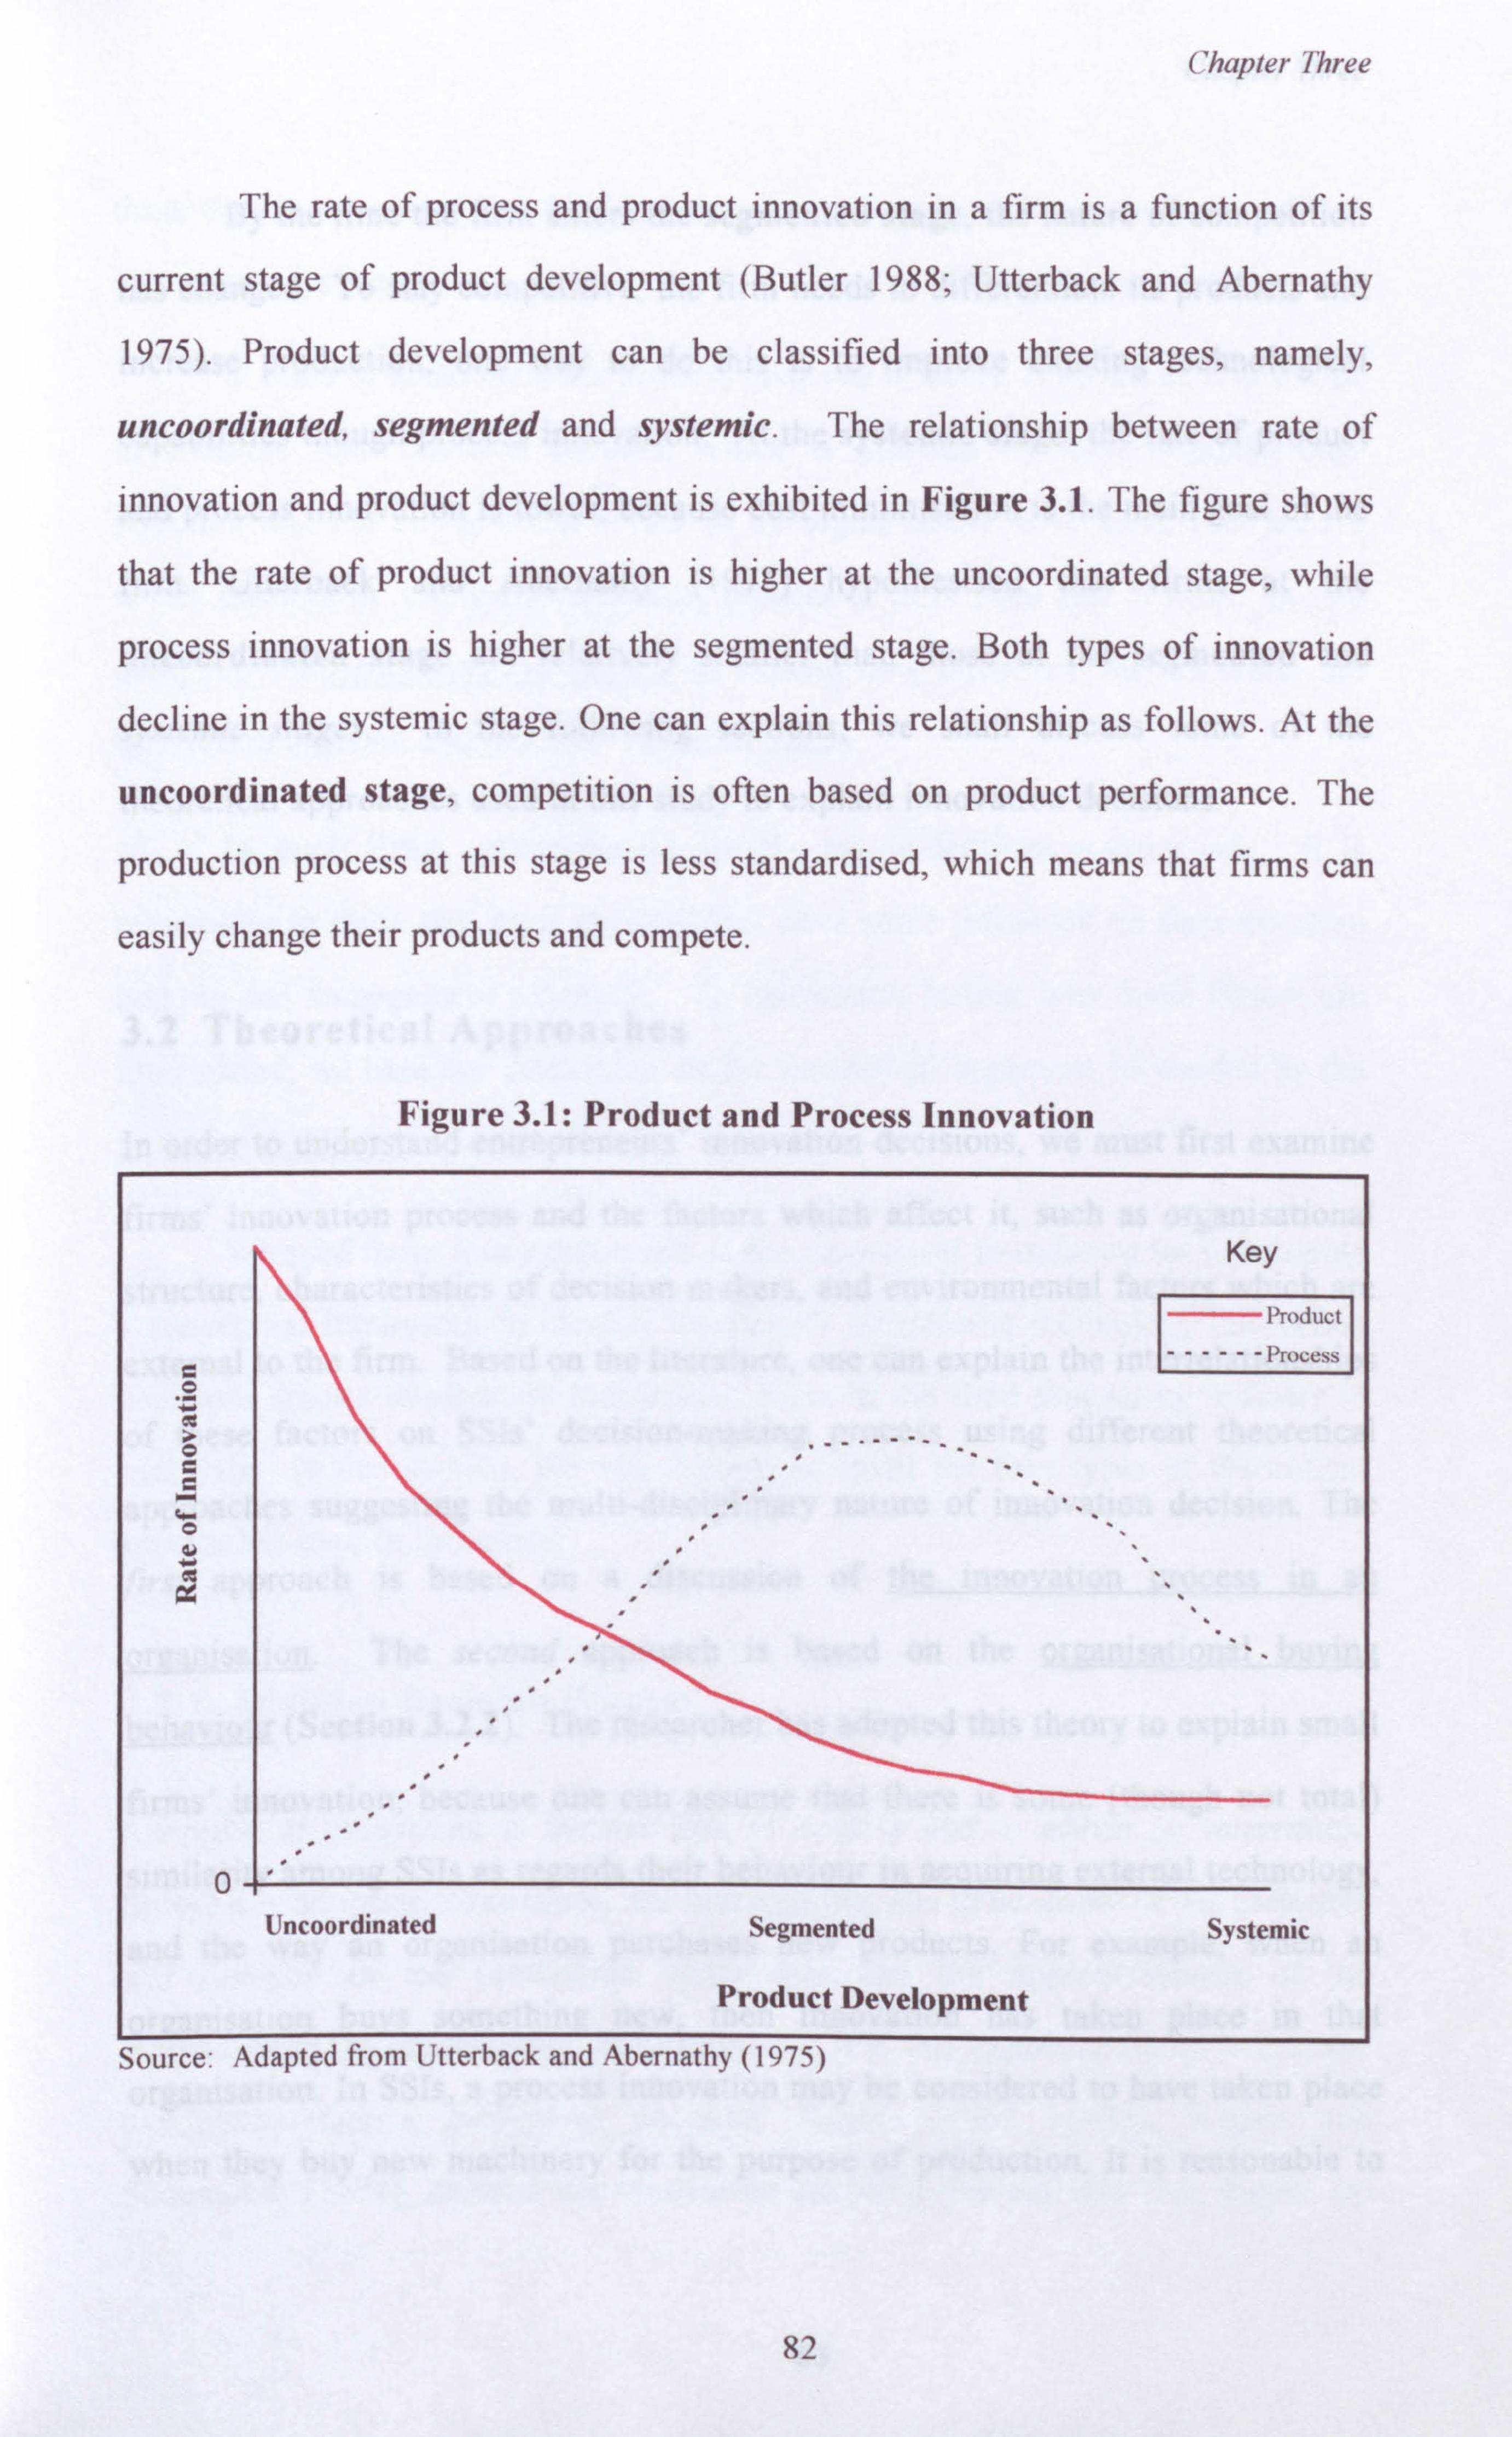
Chapter Three
The rate of process and product innovation in a firm is a function of its
current stage of product development (Butler 1988; Utterback and Abernathy
1975). Product development can be classified into three stages, namely,
uncoordinated, segmented and systemic. The relationship between rate of
innovation and product development is exhibited in Figure 3.1. The figure shows
that the rate of product innovation is higher at the uncoordinated stage, while
process innovation is higher at the segmented stage. Both types of innovation
decline in the systemic stage. One can explain this relationship as follows. At the
uncoordinated stage, competition is often based on product performance. The
production process at this stage is less standardised, which means that firms can
easily change their products and compete.
Figure 3.1: Product and Process Innovation
Key
Product
------ Process
4n
a+
0 Uncoordinated Segmented Systemic
Product Development
Source: Adapted trom Utterback and Abernathy (1975)
82
Chapter Three
By the time the firm enters the segmented stage, the nature of competition
has changed. To stay competitive, the firm needs to differentiate its products and
increase production; one way to do this is to improve existing technological
capabilities though process innovation. At the systemic stage, the rate of product
and process innovation is lower, because cost minimisation is the main goal of the
firm. Utterback and Abernathy (1975) hypothesised that firms at the
uncoordinated stage are relatively smaller than those at the segmented and
systemic stages. In the following sections, we shall discuss some of the
theoretical approaches used in this study to explain innovation decisions.
3.2 Theoretical Approaches
In order to understand entrepreneurs' innovation decisions, we must first examine
firms' innovation process and the factors which affect it, such as organisational
structure, characteristics of decision makers, and environmental factors which are
external to the firm. Based on the literature, one can explain the interrelationships
of these factors on SSIs' decision-making process using different theoretical
approaches suggesting the multi-disciplinary nature of innovation decision. The
first approach is based on a discussion of the innovation process in an
organisation. The second approach is based on the organisational buying
behaviour (Section 3.2.2). The researcher has adopted this theory to explain small
firms' innovation, because one can assume that there is some (though not total)
similarity among SSIs as regards their behaviour in acquiring external technology,
and the way an organisation purchases new products. For example, when an
organisation buys something new, then innovation has taken place in that
organisation. In SSIs, a process innovation may be considered to have taken place
when they buy new machinery for the purpose of production. It is reasonable to
83
Chapter Three
think that the organisational buying behaviour theory is useful in explaining SSIs'
innovation decisions.
In order to understand the process involved in firms' innovation, it is useful
to examine their decision process, which is affected by their organisational
structure and the entrepreneur's role in an organisation. It is these two factors
which distinguish the decision making process of SSIs from that of LSIs. In this
study we use firms decision theory to explain how these two factors affect the
innovation decision and process. (Section 3.2.3)
In small firms, entrepreneurs are the major decision making unit. It is
reasonable to think that their personalities have some influence on their decision
making and management strategies. To understand further how these factors are
interrelated, we base our discussion on the theoretical argument forwarded by the
personality theory. (Section 3.2.5)
We used these four approaches as the theoretical foundation for developing
a conceptual framework to identify the factors influencing technology innovation
decisions among small-scale Bumiputera firms in the food processing industry in
Malaysia. In this section, we will discuss in detail the four types of theoretical
approaches used in this study.
3.2.1 Adoption Decision Process
Adoption of innovation is the decision to acquire and to utilise an innovation.
Before any adoption takes place, the entrepreneur has to be aware of the existence
and function of the innovation. Only then can the appropriateness of the
innovation to the organisation be determined. It is this exposure which will shape
the entrepreneur's innovation decision. Rogers (1962,1983), Rogers and
Shoemaker (1971), divided the innovation adoption process into five stages; (a)
84
Chapter Three
knowledge or awareness, (b) interest or persuasion, (c) evaluation or decision, (d)
trial and implementation, and (e) confirmation or adoption. Time taken in the
decision making process and the outcome of the decision are dependent on the
various factors that influence the decision making process at each of these five
stages.
The knowledge or awareness stage; is the stage when decision makers start
to realise the existence of a particular innovation. At this stage, it is the
entrepreneur's characteristics which determine the timing and types of
information obtained. According to Rogers and Shoemaker (1971) and Rogers
(1983), entrepreneurs who know earlier about the innovation and those who obtain
most information on innovation have the following characteristics; they are better
educated, have higher social status, better exposure to the mass media and
interpersonal channels of communication, have more chances of agent contact,
have higher social participation and are more cosmopolitan.
At the persuasion stage, decision makers form a favourable or unfavourable
attitude toward the innovation. At this stage they start to develop interest in the
innovation and actively seek information about it. In order to develop a
favourable or unfavourable attitude toward the innovation, they visualise the
applicability of the new idea to their present situation and anticipate future
outcome if innovation takes place. Since innovation involves some degree of
uncertainty, decision makers are motivated to seek more information on the
innovation to reduce uncertainty about the innovation's expected consequences.
The information obtained influences the decision maker's perception of the
relative advantage, compatibility and complexity of the innovation.
The third stage in Roger and Shoemaker's framework, is the decision
stage. It is at this stage that decisions are made. To cope with the uncertainty of
85
Chapter Three
the innovation, decision makers may try out the new idea first before confirming
their decision, though not all have the chance to do so.
The stage when an individual puts the innovation into practice is called
the implementation stage. At this stage, a certain degree of uncertainty about the
expected consequences of the innovation still exists. Questions on unexpected
consequences such as incompatibility and operational problems may arise. These
problems of implementation may be likely to occur when the decision makers and
the implementors are different sets of people. Implementation problems can also
occur when the decision maker has incomplete information on the innovation.
At the confirmation stage, decision makers seek reinforcement for the
innovation decision already made. If they face conflicts about the innovation, they
may decide to reject it, even after having had previously adopted it.
While Rogers and Shoemaker's theory may seem relevant to discussing the
stages in the innovation decision, however, there is one drawback which
compromises its applicability to our study. In our opinion, this theory assumes that
innovation decisions always occur in phases or as a linear evolutionary process.
What this theory fails to recognise is that decisions are made continuously and
there is often overlap between one stage and another. Furthermore, this theory
assumes that everyone has similar access to information and technology; it does
not take into account the presence of market imperfections, such as subsidies and
biases in government's policies towards certain communities or sectors.
One of the important predictors of adoption decision is the characteristic of
the innovation itself (Down and Mohr 1976; Fichman and Kemerer 1993; Rogers
1983; Prescott 1995; Prescott and Conger 1995). Masterson and Hayward (1979)
classified the characteristic of the innovation as traditional or non-traditional,
while Dewar and Dutton (1986), Ettlie (1983) and Meredith (1987) classified
innovation into two types, incremental or radical. Traditional or incremental
86
Chapter Three
innovation involves a relatively lower technological advancement. Its cost is
normally lower and firms can easily adopt it without having to make much
adjustment to their existing production system. In contrast, the non-traditional or
radical innovation involves considerable technological advancement, with a higher
innovation cost, and has the ability to bring larger economic returns, although the
initial cost are normally higher. Unlike traditional or incremental innovations,
non-traditional or radical ones have a relatively slower adoption rate.
Prescott and Conger (1995) and Rogers (1983) identified five
characteristics of innovation which can affect the diffusion of innovation.
According to Fichman and Kemerer (1993), these characteristics is also tailored
somewhat to fit better the context of organisational adoption of complex
technologies. The characteristics are: (a) relative advantage, (b) compatibility, (c)
complexity, (d) trialability, and (e) observability. Chin and Ghopal (1995) added
two more characteristics. They are ease of use and enjoyment. Dewees and
Hawkers (1988) recategorised relative advantage into two categories; namely
economic advantage and other advantage. They also identify ease of use,
compatibility and trialability as characteristics of the innovation in their study. In
addition to these characteristics they added three more namely, prestige,
plasticity and perceived risks.
(a) Relative Advantage
Relative advantage is the degree to which an innovation is perceived as being
better than the technique or idea it supersedes. The degree of relative advantage
is often expressed in terms of economic profitability, status giving, and time
saving. Time taken for the decision making process and the decision to innovate or
reject innovation are determined by the importance of each type of relative
advantage (for examples, economic or social) to the adopter. The characteristics of
87
Chapter Three
the potential adopters also affect which dimensions of relative advantage are most
important.
One of the important motivations for almost any entrepreneur to adopt an
innovation is the desire to achieve better economic performance (Chin and Ghopal
1995; Dimnik and Johnston 1993; Premkumar and Potter 1995; Prescott and
Conger 1995; Rogers, 1983). Entrepreneurs will innovate if they feel that it will
improve their economic returns and efficiency or increase their ability to capture
bigger market shares. However, not all entrepreneurs are motivated by economic
factors. Some entrepreneurs innovate because of the social status associated with
such decisions. There is a relationship between relative advantage and rate of
adoption. When individuals pass through the innovation-decision process, they are
motivated to seek information in order to decrease uncertainty about the relative
advantage of an innovation. Potential adopters want to know the degree to which
the innovation is better than an existing one. So relative advantage is often the
most important factor considered for innovation, and information search is
normally related to this aspect. There are a number of sub-dimensions of relative
advantage, about which potential adopters normally inquire, such as the degree of
economic profitability, level of initial cost, degree of comfort and time saving,
which Dewees and Hawkes (1988) categorised as "other advantages".
(b) Compatibility
Compatibility is the degree to which an innovation is perceived as consistent with
the existing condition, past experiences, and needs of potential adopters. The
degree of compatibility is influenced by the social, cultural and economic factors
held by the potential adopter. From experience, we learn that old ideas are the
main tools with which new ideas are assessed. The decision to innovate is,
therefore, affected by the old system that it replaces or supplements. However, not
88
Chapter Three
all compatible innovations are adopted. For example, if a new idea is completely
congruent with existing practices, it may not be adopted because the potential
adopter is unable to distinguish the benefit derived from the introduction of the
new innovation. A positive experience with previous innovation can also have a
positive effect on the adoption decision. Those who have experienced success in
innovation are more likely to adopt innovations, compared to those who have
experienced failure.
(c) Complexity
Potential adopters' decisions are also influenced by their perception of the
complexity of a particular innovation. Complexity is associated with the degree of
difficulty in understanding the function and use of the innovation, as perceived by
the potential adopter. Firms which do not have skilled employees to operate an
innovation may reject it.
(d) Trialabilitv
Trialability is the degree to which an innovation may be used temporarily by the
potential adopters before their commitment to adopt. Trialability can speed up the
rate of innovation. Trialability is very important as the basis of decision-making
for early adopters compared to late adopters. This is because they have no
precedent to follow when they adopt, while late adopters have the opportunity to
witness those who have already adopted the innovation before them.
(e) Observabilitv
According to Rogers (1983: 232), observability is the degree to which the results
of an innovation are visible to others. The results of some innovations can be
easily observed by potential adopters, and communicated to others, while others
89
Chapter Three
can not. The observability of an innovation has some effect on potential
adopters' decision to adopt the innovation.
(f) Ease of Used
Chin and Ghopal (1995) and Davis (1989) defined ease of use as the degree to
which a person believes that using an innovation would be free of effort. In other
words the innovation is simple to use. In their study, they found that enjoyment is
positively correlated to the rate of adoption.
(g) Enjoyment
Chin and Ghopal (1995) defined enjoyment as the extent to which the activity of
using the innovation is perceived as enjoyable, irrespective of its performance.
(h) Prestige
Dewees and Hawkers (1988) defined prestige as the degree in which an innovation
is perceived to change adopters' level of prestige and admiration within their
community. They showed that prestige is positively correlated to the rate of
adoption.
(i) Plastici
An innovation has plasticity when it is perceived to be adaptable to the potential
situation (Dewees and Hawkers 1988). Besides fulfilling the current aim of the
potential adopter in innovating, the innovation with this characteristic can also be
used for other purposes. Plasticity is positively correlated to the rate of adoption.
90
Chapter Three
(j) Perceived Risk
Perceived risk is defined as the degree to which the innovation is perceived to be
economically or personally risky to the potential adopter (Dewees and Hawkers,
1988). The perceived risk is negatively correlated to the rate of adoption.
Other than the characteristics of the innovation, the adopter's competitive
environment is one of the important predictors of adoption decisions (Acs and
Audretsch 1988; Gatignon and Robertson 1989). Studies show that firms with
greater concentration ratio will be more likely to adopt an innovation, which they
use as a competitive tool.
3.2.2 Organisational Buying Behaviour
In this section, we shall discuss the second theoretical approach used in this study:
the organisational buying behaviour. We use this theoretical approach to
understand the different stages in the organisational buying process and factors
influencing organisational buying behaviour.
The theory of organisational behaviour is often used in the study of large
organisations, with a multilevel management hierarchy and various departments of
specialised function. We recognise that SSIs do not have similar structures to
LSIs. However, there is reason to believe that their innovation decision is similar;
that is to "buy" either a product (in the case of an organisation) or technology (in
the case of SSIs).
3.2.2.1 Stages in Organisational Buying Process
Previous researchers such as Bradley (1977), Ozanne and Churchill (1971), Rogers
(1983) and Wind (1978) have developed various models to illustrate the
91
Chapter Three
organisational buying process. These models vary in their complexity from only
four stages (Bradley 1977) to twelve stages (Wind 1978). This variation exists
because the models were developed to accommodate variations of organisation
type, structure, product and buying situation. Although different stages have been
proposed by researchers to describe organisational buying process, these stages
can be simplified and recategorised into five stages equivalent to the stages in the
adoption innovation process described by Rogers and Shoemaker (1971) and
Rogers (1962,1983). These five stages are (a) identification of problems and
needs of the organisation, (b) development of interest in the objects intended for
purchase and search for other alternatives to make comparisons, (c) evaluation of
alternatives, searching for suppliers, and negotiations, (d) making the decision to
buy or confirming on the selection of technology and trying it, if possible, and
lastly (e) the adoption or usage of the technology bought.
Unlike the adoption innovation process, the organisational buying process
has two additional elements, namely (a) the search for alternatives to the intended
technology, and (b) the search and selection of suppliers of the selected
technology. These two elements are included in the process because the theory
assumes that the innovation needs come from the organisation and there is more
than one way of innovating and sourcing information.
The first stage is the identification of organisational problems and needs to
solve the problems. This may lead to recognition of a need of innovation and
search for the environment of that particular innovation (buying situation).
Organisational problems and needs stimulate decision makers to purchase the kind
of technology that matches the innovation environment, solves their problems,
and fulfils the needs of the organisation. At this stage, decision makers are already
aware of the existence of the technology which they intend to purchase.
92
Chapter Three
The second stage is when entrepreneurs or decision makers develop an
interest in the technology, searching for information about it, while at the same
time searching for other alternatives. The decision to buy can be viewed as a
decision under uncertainty which involves risk. As such, decision makers' buying
behaviour may be looked at as risk handling behaviour (Newall 1977). The
search for alternatives is one way by which the decision makers reduce their
uncertainty and perceived risks.
The third stage is when the decision maker evaluates the technology
considered and its alternatives by comparing the alternatives available. At this
stage, the characteristics of the technology and suppliers are important
determinants in the process of comparing the alternatives. Technology attributes
are important factors examined by decision makers in their selection process.
Here lies the importance of the role of suppliers, on whom the object's trialability
and observability largely depends. Decision makers are more likely to select
suppliers that provide them with the best service. There is also reason to believe
that entrepreneurs have some feeling of loyalty toward certain suppliers. The
relationship between entrepreneurs and suppliers may even be the determining
factors in selecting the technology supplier.
At the fourth stage, entrepreneurs or decision makers make the choice of
which type of technology to buy and choose a supplier. Depending on the supplier
or the technology, some entrepreneurs have the opportunity to use the technology
on a trial basis before confirmation of purchase. Entrepreneurs who do not have
the opportunity to try the technology will rely on the experience of others who are
currently using it.
The last stage is when entrepreneurs make the final decision whether to
buy or reject the technology. Those who decide to buy the technology will start
93
Chapter Three
using it, while others may change their mind; at this point the whole buying
process may start all over again.
3.2.2.2 Factors Affecting Organisational Buying Behaviour
Time taken for the overall buying process of an organisation is affected by
various factors. Wind and Thomas (1980: 243-245) have recategorised the factors
that affect the organisational buying process, identified by previous researchers
into two sets of factors; (a) the buying situation, and (b) the idiosyncratic
personal, interpersonal, organisational, and environmental conditions.
Different decision processes and different sets of decision making unit are
followed according to their buying situations. The buying situation can be looked
at in term of the intensity of the need and purpose of the purchase (Kennedy 1982;
Wind and Thomas 1980) and familiarity of the participant in the buying process
with the technology under consideration (Robinson and Wind (1980) as quoted by
Parkinson and Baker 1986). The buying situation determines the amount of
information required by the decision maker (Anderson et al. 1987; Bunn 1993). If
the purchase of technology is to achieve a new major task, such as making a new
production line (radical innovation) then intensive problem solving is necessary
and more information and more sophisticated evaluation techniques are needed of
before the final decision. Hence, time taken for the decision to buy is longer. If
the purchase of the technology is just casual, routine (repeat of a previous
purchase) or an extension or modification of a previous purchase, then the
decision process become less complicated (Bunn 1993). For such purchase, less
information searching is required because the organisation already has most of the
information on the technology. Parkinson and Baker (1986) suggest the buying
situation will vary according to the type of technology, its requirement and its
perceived importance, cost, its standardisation and complexity. The buying
94
Chapter Three
process is also affected by the decision-maker's perception of the importance of
the technology, its installation cost and degree of complexity. We believe that the
buying situation affects the overall buying decision process, such as the different
information needs, level of risk and propensity to search for suppliers.
Above, we have seen the importance of communication in the buying
situation of an organisation. According to Moriarty and Spekman (1984), in an
organisational buying process there are four sources of information. They are (a)
personal commercial such as salespersons, (b) personal non-commercial such as
colleagues, (c) impersonal commercial such as publications and (d) impersonal
non-commercial, such as trade associations. Their work shows that the
characteristics of the buying situation, organisational characteristics, individual
characteristics and phases in the decision process are the determining factors that
influence the usage of these sources of information.
The second set of factors which influence an organisation's decision
process includes personal factors, decision-makers' personal characteristics,
interpersonal relationships, and organisational characteristics. The personal
factors include individual background, job responsibilities, perceived risk,
education and experience, all of which are often associated with the buyer's
decision process (Kennedy 1982; Newall 1977). These factors have some
influence on their leadership quality, confidence, attitude toward change,
personality and communication behaviour.
Interpersonal factors, are those which are related to the relationship
among decision makers, that between decision makers and implementors, and
individual communication behaviour within firm. The influence of interpersonal
factors on an organisation's buying process is more marked in larger firms. This
is because interpersonal factors are related to the organisational structure. The
relationship includes the extent to which the organisation is centralised in its
95
Chapter Three
operations, its level of hierarchy of powers, division of labour and department's
role, function and specialisation. Larger firms have a multi-level power
hierarchy and departments with specific roles, suggesting that their buying
decision process involves more than one department or more than one group of
individuals. The relationships among individuals in a group and between groups
will affect their buying decision process. These interpersonal relationships act as
communication paths which can speed up or retard the buying process. Small
firms generally have a simpler organisational structure, less level of
management hierarchy, and a more centralised decision process; the entrepreneurs
have more decision making power. For example, a sole proprietor's buying
process will be less affected by interpersonal factors. For small firms which have
more than one owner (partnership or private limited company) the decision
making process is more complicated because decisions are made jointly by a
group of individuals (share holders). Interpersonal relationships within this group
of decision makers can affect the organisational buying decision.
Past researches have shown that organisational characteristics are
important factors influencing an organisation's buying decisions. Among
organisational characteristics which affect organisational buying decision are
organisational size (Cainarca et al. 1990; Kimberly and Evanisko 1981; Link and
Bozeman 1991; Mohr 1982), centralisation (Damanpour 1991; Hage and Aiken
1967; Khan and Manopichetwattana 1989; Rogers 1983; Ruppel and Harrington
1995; Zaltman et al. 1973, Zmud 1982), complexity (Hage and Aiken 1967;
Kimberly and Evanisko 1981; Rogers 1983), formalisation (Damanpour 1991;
Rogers 1983; Ruppel and Harrington 1995; Zaltman et al. 1973; Zmud 1982),
organisational slack (Cyert and March 1992) and specialisation (Ruppel and
Harrington 1995).
Kimberly and Evanisko (1981), Link and Bozeman, (1991) and Mohr
(1982) found organisational size to be the best predictor of both technological
96
Chapter Three
and administrative innovation in an organisation Small firms are less innovative
compared to larger firms. Though larger firms have longer decision making
process, they have the financial and technological resources to innovate.
Centralisation is the degree to which power and control in a system are
concentrated in the hands of relatively few individuals at the top of the
organisation hierarchy. Centralisation has usually been found to be negatively
associated with decisions to buy in an organisation (innovativeness), because
centralisation restricts the channels of communication, thus reducing the
availability of information (Muchinksky 1993). Although the initiation of
innovations in a centralised organisation is less frequent than in a decentralised
organisation, the centralisation may actually encourage the implementation of
innovations, once the innovation decision is made (Khan and Manopichetwattana
1989; Rogers 1983).
Complexity is the degree of knowledge and expertise in members of an
organisation. It is usually measured by the number of professionals and trained
personnel in an organisation. Complexity encourages organisational members to
conceive and propose innovations, but it may make it difficult to achieve
consensus about implementing them (Rogers, 1983).
Formalisation is the degree to which an organisation emphasises following
rules and procedures in the role performance of its members. Such formalisation
acts to inhibit consideration of innovations by organisation members, but
encourages implementation of innovations.
Organisational slack is the degree to which uncommitted resources are
available to an organisation. It is the difference between total resources and total
necessary payment required to maintain the firm (Cyert and March 1992: 41).
Organisational slack is used as a cushion in the case of unfavourable conditions
97
Chapter Three
within or external to the organisation. Slack resources allow an organisation to
purchase innovation, absorb failure, and explore ideas that lead to an innovation.
The results of previous studies of organisational innovativeness, reveal
rather low correlation between organisational structure (independent variables)
and the level of innovativeness in the organisations. The basic reason for these
results is that each of the organisational structure variables is related to innovation
in one direction during initiation, and in the opposite direction during
implementation. Low centralisation, high complexity, and low formalisation
facilitates initiation in the innovation process, but these same structural
characteristics make it difficult for an organisation to implement an innovation
(Zaltman et al. 1973).
Degree of specialisation is the number of different job specialisation found
in the organisation. Ruppel and Harrington (1995) believed that high degree of
specialisation is related to a broader level of expertise, the cross-fertilisation of
ideas, and the ability of the potential adopter to adopt an innovation.
Other than the factors mentioned above, Wind and Thomas (1980)
suggested that other factors such as marketing, competition and environment
should be included in establishing comprehensive studies of organisational buying
behaviour. Parkinson and Baker (1986) responded to Wind and Thomas's
(1980) suggestion by including environmental factors, such as the structure of the
market, nature of competition, governmental intervention and changes in
technology, in modelling influences on the buying process.
One of the reasons for increasing production in any firm is to accommodate
the increase in product demand. To increase production, firms have to increase
production rate by adopting new production techniques. The intensity of
competition among firms also leads to a firm adopting new technology. Increased
competition acts as a serious threat to firms, especially small firms, because it
98
Chapter Three
affects their market share. Changes in competitive environment may make
process technology obsolete (Hughes 1984). Hence, competition among firms is
among the effective stimuli in the decision to buy new technology. The adoption
of new technology is also affected by market impact and the need to satisfy
existing or additional customers. The market impact may be to the extent of
gaining a non adopter's market share. Competitive pressure faced by non adopters
is affected by the strategies of adopters. In order to be competitive, non adopters
will follow adopters in improving their products by adopting new technology.
There are various ways in which government policies can influence the
buying behaviour of a firm. For example, a government trade policy which
increases the cost of capital equipment can affect the buying rate of new
technologies. Increases in interest rates may induce firms to undertake additional
technical efforts in order to simplify or standardise their product design, reduce
handling time, or improve management of inventories, with the purpose of
shortening the duration of the production cycle (Copley 1990). Government fiscal
and monetary policy has an immediate and obvious impact for the demand of
firms' product, and hence, their decision to invest (Parkinson and Baker 1986).
The theory of organisational buying behaviour explains the buying
decision process in organisations with complex structure and multi-level
management hierarchy. However, this theory can also be applied to small firms'
buying decision process, although small firms have a rather more simple
organisational structure. Unlike large organisations, where different units and
different management levels perform different functions, in small firms, decision
makers, implementors and sometimes users are the same set of people. There may
be a distinction between details of the decision making process of small firms and
large organisation, but the factors influencing the buying decision in either type of
firms should be the same. Individual characteristics, interpersonal characteristics,
organisational characteristics, inter-organisational characteristics, the buying
99

Chapter Three
situation and the environment are believed to have effects on small firms' buying
decisions. These factors should be analysed in order to identify the determining
factors that influence small firms to adopt an innovation.
3.2.3 Decision Theory of Firms
The third theoretical approach used in this study is the decision theory of firms.
One strand of such theory is based on the rational model, which views decision
making as a process involving the identification of goals, alternatives, and
evaluation techniques. One decision maker's decision will be different from
another's because he perceives the situation differently, or has different goals, or a
different set of alternatives, or weighs the alternatives differently. This model can
be represented in mathematical form by loading all values into a single function
called the utility function. The development of the rational model is based on
several assumptions. First, it assumes that a decision maker has a well-defined
utility function, and hence that he can attach a cardinal numerical value to his
liking of any particular scenario of events over the future. Second, it assumes that
the decision maker is confronted with a well-defined set of alternatives from
which to choose. These alternatives need not be one-time choices, but may
involve sequences of choices or strategies in which each subchoice will be made
only at a specified time using the information available at that time. Third, it
assumes that the decision maker can assign a consistent joint probability
distribution to all future sets of events. Finally, it assumes that the decision maker
will (or should) choose the alternative, or the strategy that will maximise the
expected value, in terms of his utility function, of the set of events consequent on
the strategy. With each strategy, then, is associated a probability distribution of
future scenarios that can used to weight the utilities of those scenarios (Harrison
1987; Simon 1988,1959,1955).
100

Chapter Three
The decision process generally follows some or all of the following
stages: (a) recognising opportunities based on complete information on
environment; (b) diagnosis of a problem which is defined in terms of the
objectives of the decision maker; (c) search for information on possible solutions;
(d) creating possible solutions to the problem; (e) evaluation of possible solution;
(f) choosing the optimal solution according to prior objectives; and (g)
implementation of the solution (Butler 1991: 43). This model pictures decision
makers as highly alert human beings who are very clear about their objectives.
The decision makers are assumed to have complete information on their
environment as a basis for making decisions. They understand and have
knowledge of all alternative choices open to them, both at the present and future.
They understand the consequences of each of the available choice strategies, at
least up to the point of being able to assign a joint probability distribution to the
future states of the world. They are able to select the alternative that will optimise
utility.
In traditional economics, rationality is related to maximisation. The
economic rational man is one who can maximise her or his utility. A related but
not quite equivalent postulate of traditional economics is that the goal of firms is
to maximise profit. The theory assumes that entrepreneurs are rational and they
will select alternatives to obtain optimal solutions for goal achievement. When
the rational model is applied in the theory of firms, it is assumed that
entrepreneurs and firms have similar objectives, that is, to maximise profit and
that firms operate with perfect knowledge. In our view, there are some
weaknesses in this model, which compromise its applicability.
One critique of the rational model is that it is normative in nature. It
explains how a decision maker should make decisions in order to achieve a
particular goal, but it does not explain the actual decision process; it is more
concerned with prescribing the stages a decision maker needs to follow to obtain
101

Chapter Three
an optimal solution to his or her problem. There is a lack of evidence to show
that the human decision process actually goes through these complex stages. The
accuracy of this model also depends on the accuracy of the approximating
assumptions and the data supporting them (Simon 1986a, 1986b). There is a
strong possibility that the actual decision process is quite different from that
described by rational model (Mohr 1982). Indeed, Nutt (1984) found that
managers do not use the normative methods prescribed by scholars of good
decision making.
According to Simon (1959), who developed the satisficing model, the aim
of decision makers, in fact, is not the selection of the alternative which will yield
an optimal solution, but rather, the search for a solution which is satisfactory at
the time. The element of satisfaction embedded in the firm decision theory is
influenced by psychological theories which see motivation to act as influenced
by drives, and suggest that action will terminate when these drives are satisfied.
The condition of satisfaction is not fixed but specified by an aspiration level that
itself adjusts upward or downward on the basis of experience.
The rational model assumes that decision makers have full information to
make decisions. In most circumstances, however, decision makers need to make
decision with incomplete information, under pressure of time and other
constraints. Obtaining full information on alternatives as a basis on which to
make a decision is rare, because there are
processing capacities of the decision maker4.
constraints on the information-
4 Simon (1959) proposed that although people makes decisions to pursue their own interests, they do not always know what these are; they are aware of only a few of all the possible alternatives, and are willing to settle for an adequate solution in contrast to an optimal one.
102
Chapter Three
Another basic assumption of the rational model is that the decision maker
has a well-defined utility function which can be measured. The development of
the utility function in the decision process seems too good to be true. Naylor el
al. (1984; 326) mentioned that 'Economists and management scientists do not
know how to come up with an objective measure of utility for individual decision
makers. In spite of the vast literature available on the use of utility theory for
decision making under risk, we do not know of a single case in which a major
corporate decision has been made where the decision maker's utility function was
specified and quantified. The techniques which have been proposed in the
literature for quantifying are impossible to implement in the real world. They are
based either on information that is not available or information that can be
obtained only at an inordinate cost in terms of the decision maker's time. In
summary, utility theory is an abstract concept of limited practice value'.
3.2.3.1 The goal of entrepreneurs
To explain the decision process of an entrepreneur, first, we have to identify the
goal of the entrepreneurs. As we have seen, according to the rational model, the
goal of entrepreneurs is to maximise profit. When entrepreneurs make a decision
to achieve their goal (to maximise profit), they have complete information on the
alternatives available to them or him and on the likely outcome of each
alternative, as a basis for decision making. The rational model appears to assume
that profit maximisation is the sole goal of entrepreneurs and all decision or
actions taken by them are directed toward achieving that particular goal.
However, entrepreneurs, like anyone else also have personal motives (such as
social responsibility). Profit maximisation may be only one of a number of
considerations. Monetary return may not be the only objective of an
entrepreneur. So when entrepreneurs want to maximise their utility, they
sometimes have to balance profit against non-monetary objectives. According to
103
Chapter Three
Simon (1959: 263), the actual motive of an entrepreneur is not to maximise profit
but to earn a return at a satisfactory level.
Scitovsky as cited by White (1960: 187) showed that entrepreneurs' choice
between more and less activity" or between "more income or more leisure" are
independent of their income. That is, their motivation to increase profit does not
depend on their current income. This point raises a question about the
effectiveness of profit as entrepreneurial motivation.
Rothschild (1947) as cited by Cyert and March (1992: 9), has suggested
that the primary motive of the entrepreneur is long term survival. According to
this view, the aim is to maximise the security level of the organisation (i. e, the
probability that the organisation will survive over the indefinite future). According
to Rothschild, the long term aim of entrepreneurs is to stay in business. Since
entrepreneurs are operating in an uncertain situation, they have a limited number
of options from which to choose at any one time. In their attempt to play safe, it
is not surprising that they adopt a set of yardsticks that promise reasonably
satisfactory profits in the long run and a maximum of stability in relations with
customers, suppliers and competitors (Curwen 1976: 136). This suggests that
entrepreneurs are likely to adopt the principle of satisfactory profit rather than
profit maximisation.
3.2.3.2 The objectives of firms
. The objectives of a firm supply the value premises that underlie decision making
within it. Value premises are assumptions about what ends are preferred. The
objective of a firm is the ultimate yardstick by which the managerial decision and
the outcome will be judged. According to the rational model, the objective of a
firm is the same as the goal of its entrepreneur; that is to maximise profit
104
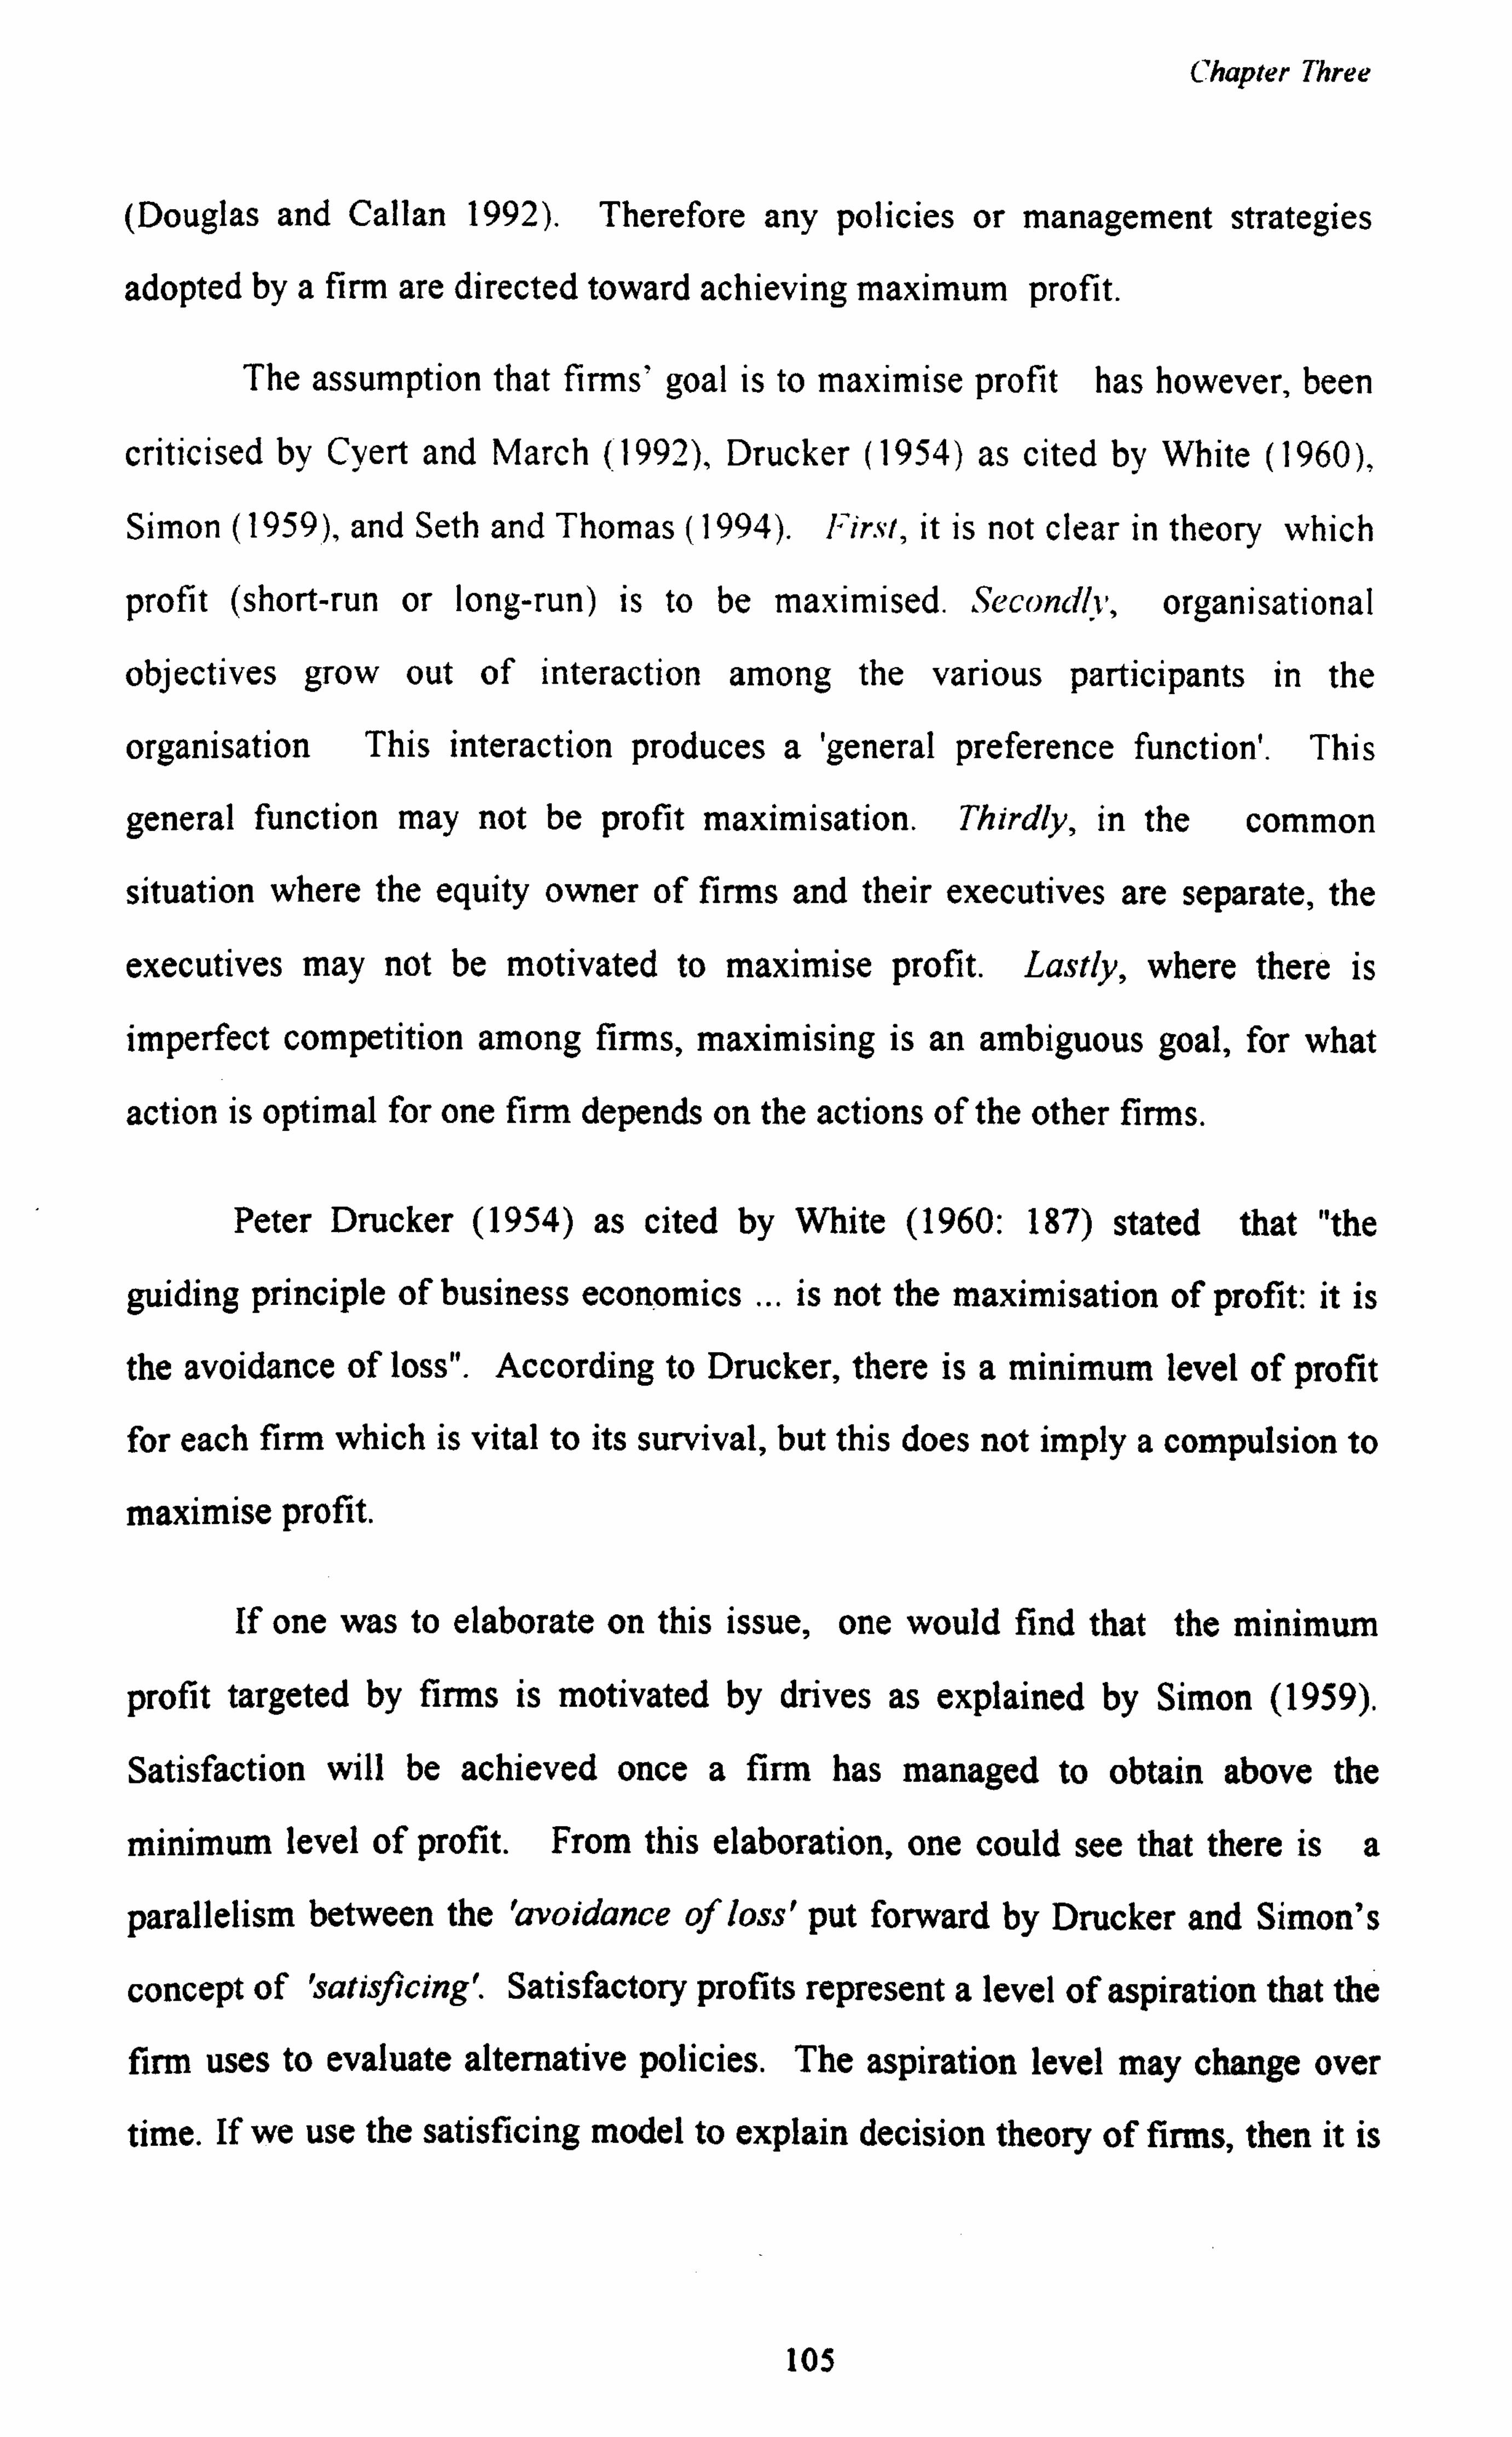
Chapter Three
(Douglas and Callan 1992). Therefore any policies or management strategies
adopted by a firm are directed toward achieving maximum profit.
The assumption that firms' goal is to maximise profit has however, been
criticised by Cyert and March (1992), Drucker (1954) as cited by White (1960),
Simon (1959), and Seth and Thomas (1994). First, it is not clear in theory which
profit (short-run or long-run) is to be maximised. Secondly, organisational
objectives grow out of interaction among the various participants in the
organisation This interaction produces a 'general preference function'. This
general function may not be profit maximisation. Thirdly, in the common
situation where the equity owner of firms and their executives are separate, the
executives may not be motivated to maximise profit. Lastly, where there is
imperfect competition among firms, maximising is an ambiguous goal, for what
action is optimal for one firm depends on the actions of the other firms.
Peter Drucker (1954) as cited by White (1960: 187) stated that "the
guiding principle of business economics ... is not the maximisation of profit: it is
the avoidance of loss". According to Drucker, there is a minimum level of profit
for each firm which is vital to its survival, but this does not imply a compulsion to
maximise profit.
If one was to elaborate on this issue, one would find that the minimum
profit targeted by firms is motivated by drives as explained by Simon (1959).
Satisfaction will be achieved once a firm has managed to obtain above the
minimum level of profit. From this elaboration, one could see that there is a
parallelism between the 'avoidance of loss' put forward by Drucker and Simon's
concept of 'satisficing'. Satisfactory profits represent a level of aspiration that the
firm uses to evaluate alternative policies. The aspiration level may change over
time. If we use the satisficing model to explain decision theory of firms, then it is
105
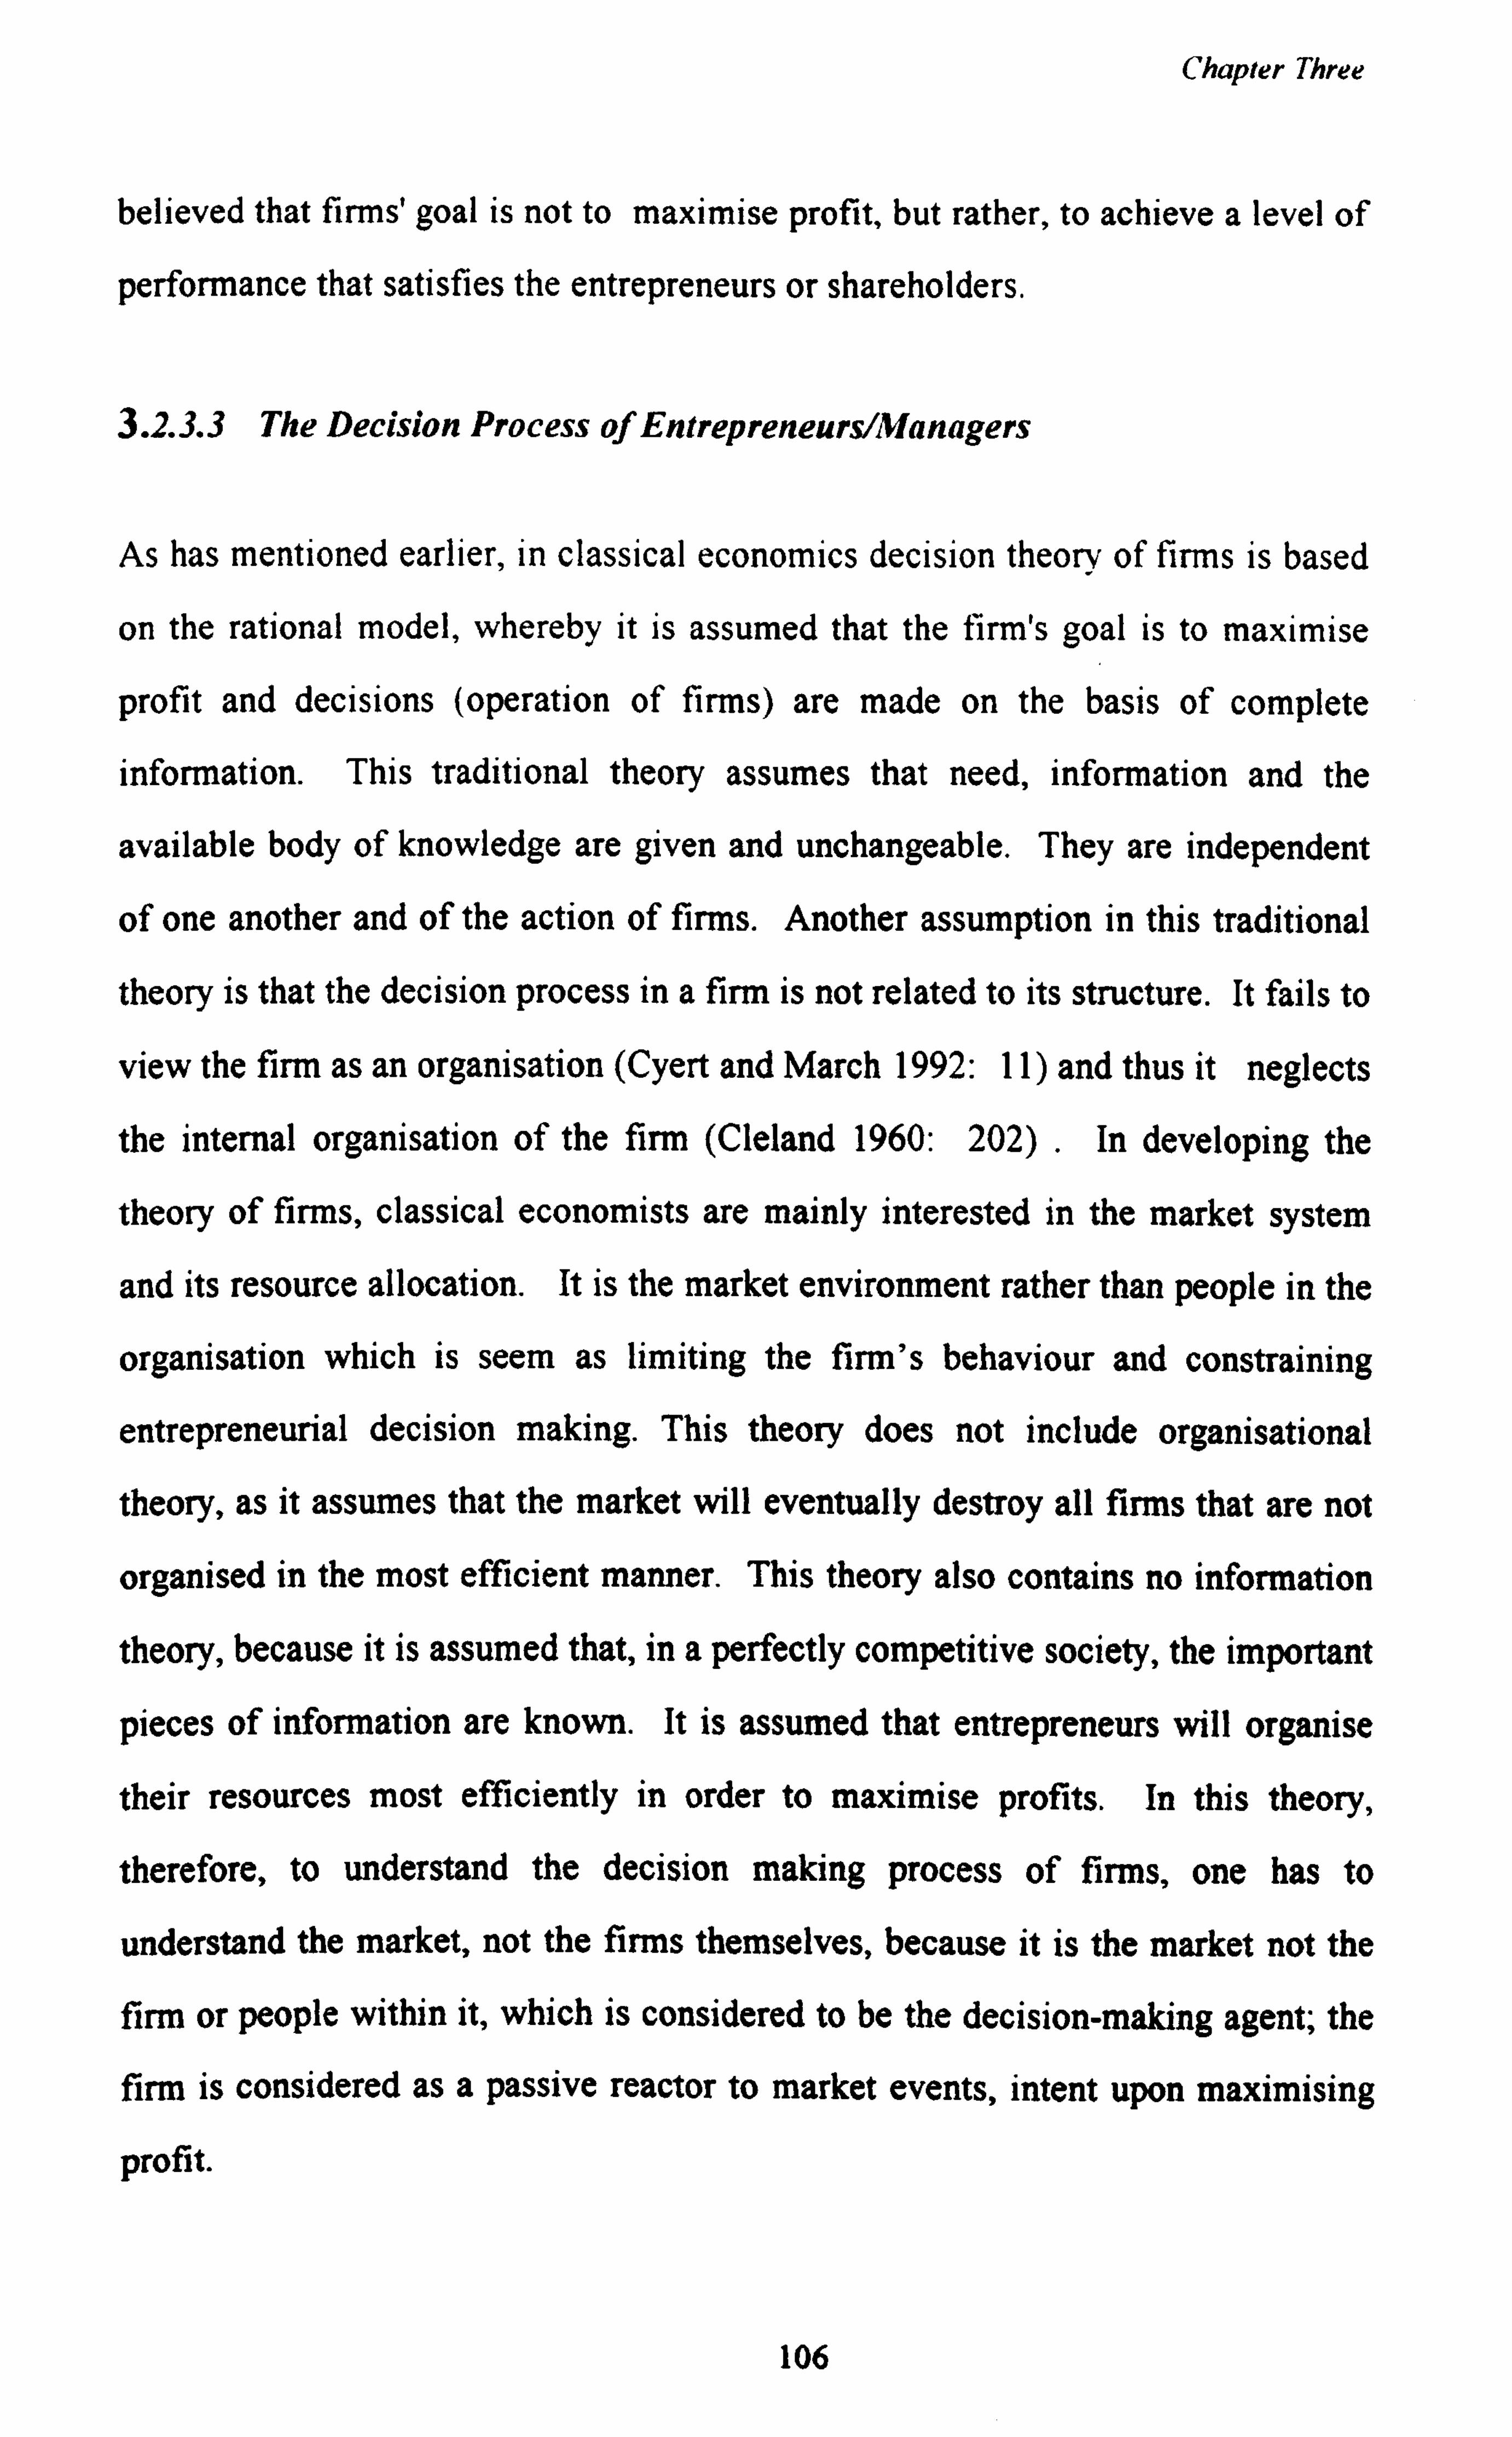
Chapter Three
believed that firms' goal is not to maximise profit, but rather, to achieve a level of
performance that satisfies the entrepreneurs or shareholders.
3.2.3.3 The Decision Process of Entrepreneurs/Managers
As has mentioned earlier, in classical economics decision theory of firms is based
on the rational model, whereby it is assumed that the firm's goal is to maximise
profit and decisions (operation of firms) are made on the basis of complete
information. This traditional theory assumes that need, information and the
available body of knowledge are given and unchangeable. They are independent
of one another and of the action of firms. Another assumption in this traditional
theory is that the decision process in a firm is not related to its structure. It fails to
view the firm as an organisation (Cyert and March 1992: 11) and thus it neglects
the internal organisation of the firm (Cleland 1960: 202) .
In developing the
theory of firms, classical economists are mainly interested in the market system
and its resource allocation. It is the market environment rather than people in the
organisation which is seem as limiting the firm's behaviour and constraining
entrepreneurial decision making. This theory does not include organisational
theory, as it assumes that the market will eventually destroy all firms that are not
organised in the most efficient manner. This theory also contains no information
theory, because it is assumed that, in a perfectly competitive society, the important
pieces of information are known. It is assumed that entrepreneurs will organise
their resources most efficiently in order to maximise profits. In this theory,
therefore, to understand the decision making process of firms, one has to
understand the market, not the firms themselves, because it is the market not the
firm or people within it, which is considered to be the decision-making agent; the
firm is considered as a passive reactor to market events, intent upon maximising
profit.
106
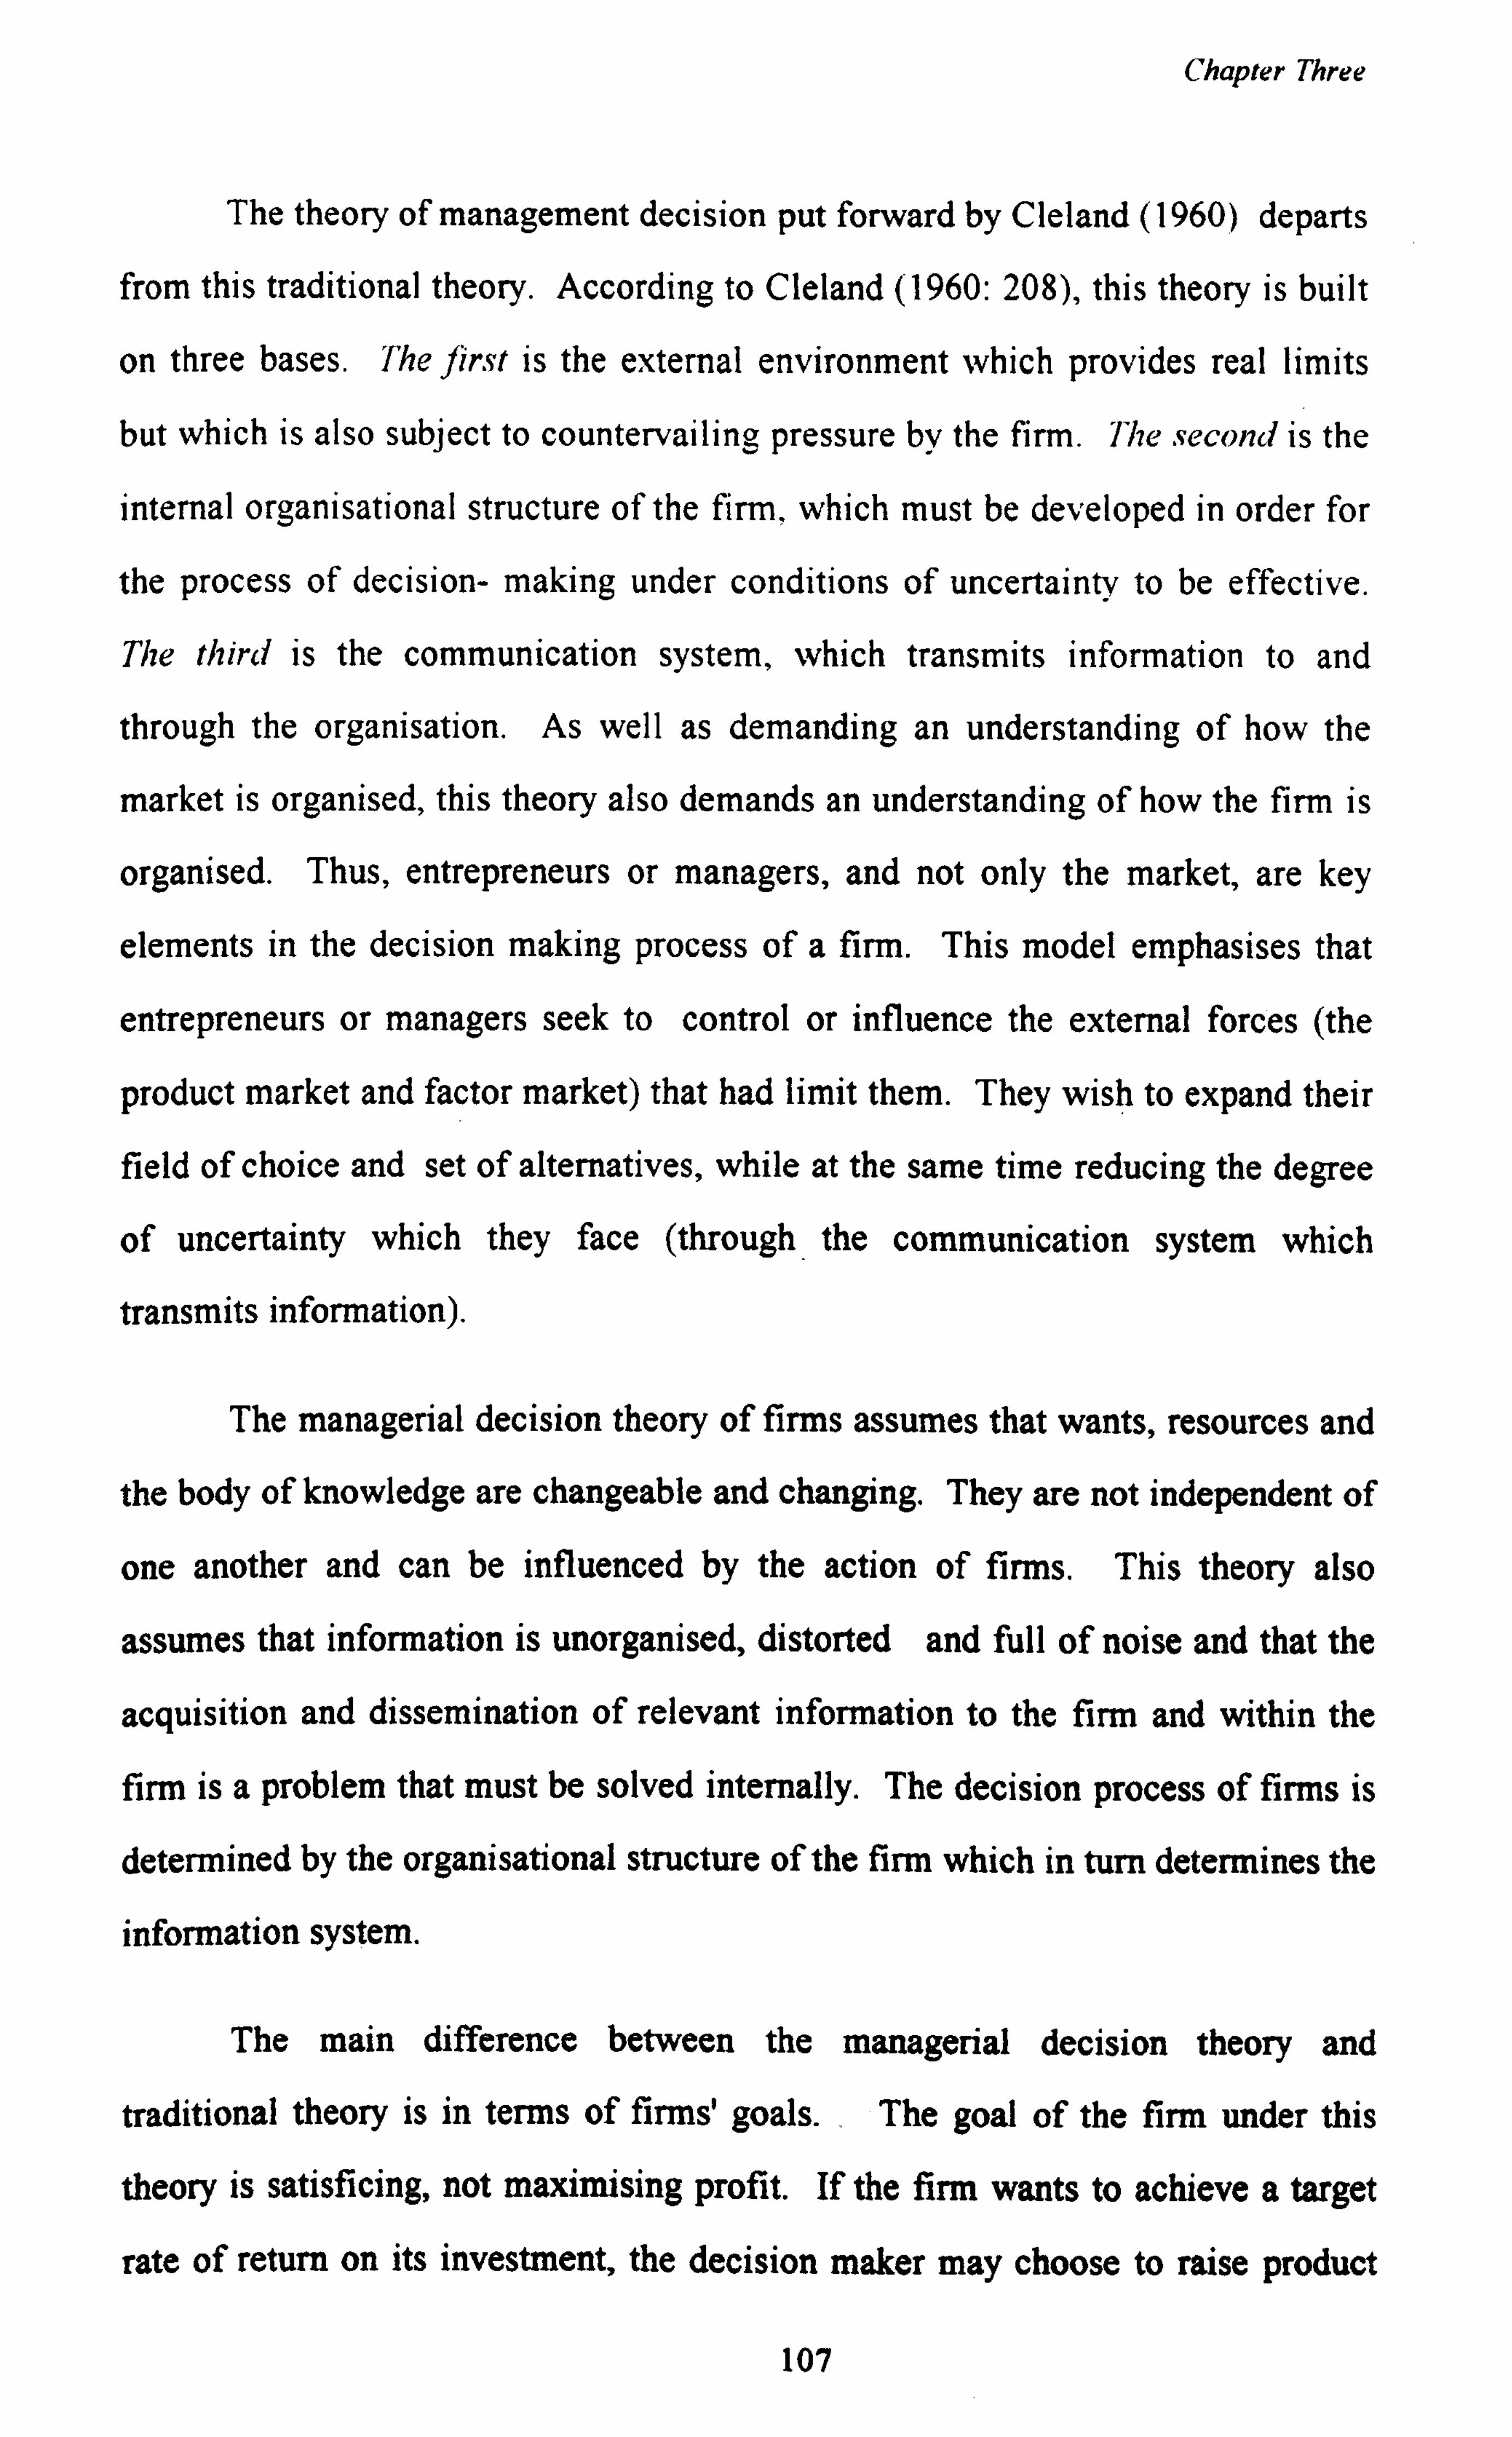
Chapter Three
The theory of management decision put forward by Cleland (1960) departs
from this traditional theory. According to Cleland (1960: 208), this theory is built
on three bases. The first is the external environment which provides real limits
but which is also subject to countervailing pressure by the firm. The second is the
internal organisational structure of the firm, which must be developed in order for
the process of decision- making under conditions of uncertainty to be effective.
The third is the communication system, which transmits information to and
through the organisation. As well as demanding an understanding of how the
market is organised, this theory also demands an understanding of how the firm is
organised. Thus, entrepreneurs or managers, and not only the market, are key
elements in the decision making process of a firm. This model emphasises that
entrepreneurs or managers seek to control or influence the external forces (the
product market and factor market) that had limit them. They wish to expand their
field of choice and set of alternatives, while at the same time reducing the degree
of uncertainty which they face (through the communication system which
transmits information).
The managerial decision theory of firms assumes that wants, resources and
the body of knowledge are changeable and changing. They are not independent of
one another and can be influenced by the action of firms. This theory also
assumes that information is unorganised, distorted and full of noise and that the
acquisition and dissemination of relevant information to the firm and within the
firm is a problem that must be solved internally. The decision process of firms is
determined by the organisational structure of the firm which in turn determines the
information system.
The main difference between the managerial decision theory and
traditional theory is in terms of firms' goals.. The goal of the firm under this
theory is satisficing, not maximising profit. If the firm wants to achieve a target
rate of return on its investment, the decision maker may choose to raise product
107
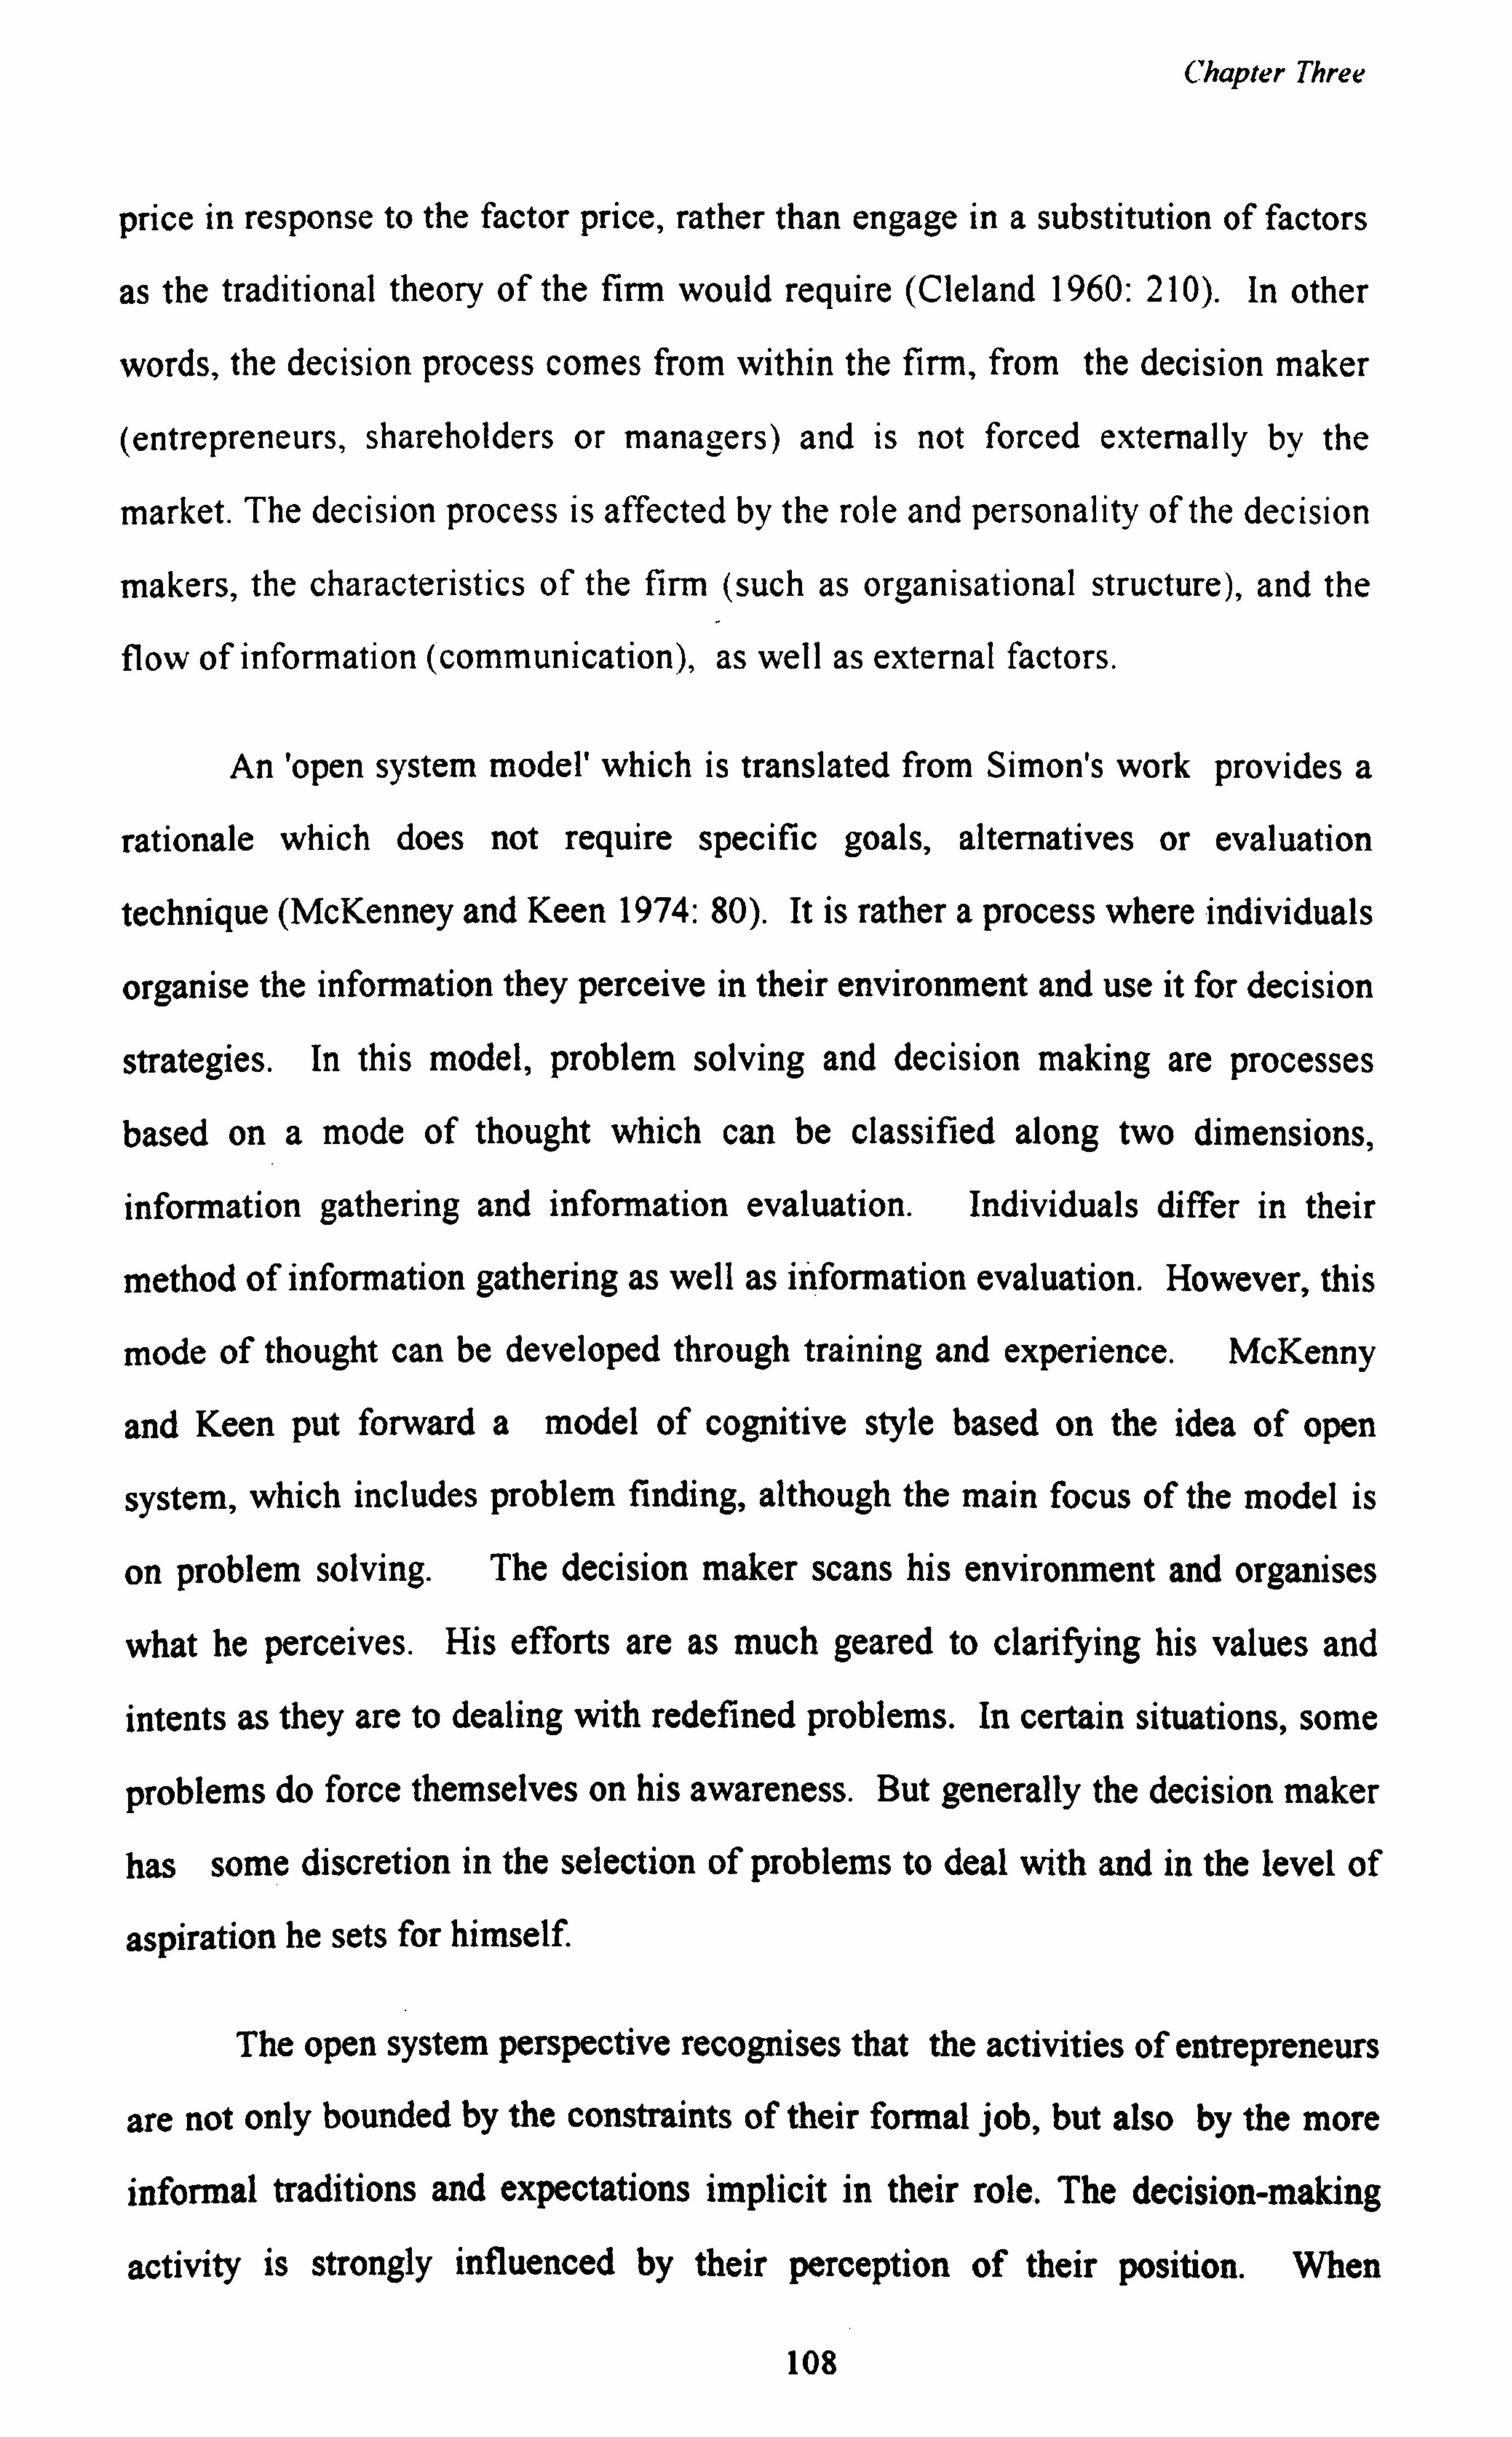
Chapter Three
price in response to the factor price, rather than engage in a substitution of factors
as the traditional theory of the firm would require (Cleland 1960: 210). In other
words, the decision process comes from within the firm, from the decision maker
(entrepreneurs, shareholders or managers) and is not forced externally by the
market. The decision process is affected by the role and personality of the decision
makers, the characteristics of the firm (such as organisational structure), and the
flow of information (communication), as well as external factors.
An 'open system model' which is translated from Simon's work provides a
rationale which does not require specific goals, alternatives or evaluation
technique (McKenney and Keen 1974: 80). It is rather a process where individuals
organise the information they perceive in their environment and use it for decision
strategies. In this model, problem solving and decision making are processes
based on a mode of thought which can be classified along two dimensions,
information gathering and information evaluation. Individuals differ in their
method of information gathering as well as information evaluation. However, this
mode of thought can be developed through training and experience. McKenny
and Keen put forward a model of cognitive style based on the idea of open
system, which includes problem finding, although the main focus of the model is
on problem solving. The decision maker scans his environment and organises
what he perceives. His efforts are as much geared to clarifying his values and
intents as they are to dealing with redefined problems. In certain situations, some
problems do force themselves on his awareness. But generally the decision maker
has some discretion in the selection of problems to deal with and in the level of
aspiration he sets for himself.
The open system perspective recognises that the activities of entrepreneurs
are not only bounded by the constraints of their formal job, but also by the more
informal traditions and expectations implicit in their role. The decision-making
activity is strongly influenced by their perception of their position. When
108
Chapter Three
entrepreneurs or decision makers face some event or cue in the environment that
activates them into a search-analyse-evaluate sequence and this results in a
solution, then a decision process has taken place. This search-analyse-evaluate
sequence in the decision process is initiated according to entrepreneurs'
environment assessment.
The cognitive style model provides some explanation of the process
affecting entrepreneurs or decision makers in assessing their environment. It
includes problem finding, problem recognition and problem definition, which is
an important aspect of decision behaviour. Cognitive style relates to the
characteristics of the decision makers (such as their personality traits), resulting
in different individuals assessing their environment differently (Ghosh and Ray
1992; Harrison 1987; Kirton 1994).
The 'social model' put forward by Cleland (1960) and the `open system
model' put forward by McKenny and Keen (1974) are based on satisficing
motivation of firms, not profit maximisation as assumed in the rational model.
The rationale of these models is based on 'sensitivities' to undefined elements in
the environment. The social model of decision making, then, calls for managerial
decision making to operate in an 'open system' seeking satisfactory rather than
optimal solutions (Rice and Hamilton 1979).
3.2.4 Small Firms Decision Process: Theoretical Convergence
In the previous section we discussed various theories of firms' decision process.
In this section, we shall attempt to integrate and adapt the discussed theories, to
suggest the decision process of small firms.
The satisficing model is normally used in analysing decision behaviour of
big firms or complex organisations where there is a separation between ownership
and management. There is strong evidence that the interests of managers do not
109
Chapter Three
always coincide with those of the stockholders. In some cases, managers'
functional and personal goals are more important than profit maximisation. The
rational decision model is unable to incorporate managers' or employees'
motivation. It primarily rests on weak assumptions: that firms, stockholders and
managers are one and the same, that managers behave in a manner consistent
with the interest of stockholders and that they share a common goal, that is, to
maximise profit.
In analysing the decision process of small firms one might argue that the
rational model is more appropriate because owner and manager can not be
regarded as two separate entities; thus, they have a common goal. Small business
owners who are normally sole proprietors or partners are highly involved in the
operations of their firms, and thus involved in different aspects and levels of the
decision making process. Their personal and functional goals can be identified
with the goals of the firms which are fully owned by them or of which they are the
major shareholders (Birley and Westhead 1990). They regard business profit as
their personal income; therefore, we can assume that they are motivated to
maximise profit in order to increase their personal wealth. If these assumptions
are true, there should be a relationship between the entrepreneur's motivation for
more income and his present income. However, according to diminishing
marginal utility theory, as wealth increases the marginal utility decreases.
Therefore, at a certain level of income the entrepreneur will prefer leisure and
motivation to increase income will become less important.
There are a number of points to be considered in developing a theory of
decision making of small firms. Birley (1989,1983) considered goals, market or
product choice, resources and organisational structure to distinguish the decision
making process of small firms from those of big firms. Sharma (1994) showed
that the decision process of firms is affected by their culture. Small firms'
culture, which is classified as entrepreneurial-oriented, involves uncoordinated
110
Chapter Three
strategies in the decision making process. There are only few decision makers and
the decision making process is very simple. d'Amboise and Muldowney (1988)
suggested that one perspective that can be used to analyse management decision
theory of small business is the theme of small business evolution. In other words,
the decision process which is usually reflected in management practice is related
to the firm's stage of growth, age and organisational structure (bearing in mind
that one can deduce a firm's age, structure, goal, resources, market and product
choice based on its stage of growth). If that is the case, then, the rational model is
not appropriate to explain decision making in small firms, especially those at the
existence, survival and growth stages'. At these stages, the main goal of the
business is to remain alive, able to generate enough cash flow and to ensure
business resources. Success in small business always means survival. Generally,
in small firms, survival means that entrepreneurs are able to keep their business
operating as long as they do not make a loss (refer to the work of Rothschild, as
explained in section 3.2.3.1). Based on the above arguments, the satisficing model
is more appropriate to describe small firms' goals. Therefore, if one is to explain
small firms' decision process based on this theory, one might expect that small
firms' goal is not profit maximisation, but rather, to achieve satisfactory economic
performance in terms of, for example, attaining a certain level of profit, sales, or
production. This view is supported by a variety of research on small business
(Birley 1983; Rice and Hamilton 1979).
On the other hand, some may argue that in order to survive, entrepreneurs
will try their best to maximise firms' profit. Therefore, there is not much
distinction between survival and profit maximisation in explaining small firms'
5 Churchill and Lewis (1983), Scott and Bruce (1987) put forward five stages of growth in small business. The stages are existence, success, growth, expansion and maturity. As firms go through these stages, size increases, there are changes in ownership and organisational structure and goal. Not all firms must go through these stages.
111
Chapter Three
goal. Even if this assumption is true, we still cannot deduce that the rational
model is more appropriate in explaining the decision process of small firms. As
has been mentioned earlier, the rational model assumes that decisions are made
under complete information or perfect knowledge. This is where the model fails
to explain the decision process of small firms. Although small firms'
entrepreneurs try to maximise their profit, they operate their business with limited
skill and knowledge and do not have complete understanding of their business
environment (Birley 1983; Rice and Hamilton 1979).
The works of Langley and Truax (1994), Fredrickson (1986), Shrivastava
and Grant (1985), Rice and Hamilton (1979), suggest that small scale
entrepreneurs utilised primarily a very informal approach to decision making.
These authors have suggested that Simon's 'satisficing' concept is useful in
analysing the factors shaping small scale entrepreneurs' decisions. The rational
model seems to be much too ambitious an undertaking for small scale
entrepreneurs (Rice 1980,1983). Small scale entrepreneurs have an incomplete
understanding of the environment affecting them. Their goals are often vague or
inadequately defined, and are generally pragmatic and short range. Often small
scale entrepreneurs are unable to determine the full range of alternatives open to
them. This is due to their inability to process all the necessary information,
because they lack the necessary skills, time or opportunity to analyse the relevant
data. This is supported by Birley (1983), Robinson and Pearce (1984) who stated
that small scale entrepreneurs lack expertise, trust and openness; and have limited
knowledge of the planning process. They often manage their firms without
proper training or help. Hamilton and Rice (1979) also concluded that small
scale entrepreneurs operate in a manner described by the social model; making
decisions based on their experience.
Mintzberg (1973) as cited by Davig and Brown (1992: 54), has said that the
decision process of small firms is characterised by "reactive" solutions to existing
112
Chapter Three
problems. The decision maker moves forward in incremental steps, focusing first
on what is familiar, then considers convenient alternatives, as well as alternatives
that differ only slightly from the status quo. It seems that this argument is
similar to that of Rice and Hamilton (1979), who claimed that the goal of small
firms are short term and rather fragmented, and that their decision process
approach is informal and incremental.
3.2.5 Personality Theory of Entrepreneurs
Entrepreneurs' personality is widely discussed in studies of entrepreneurship
(Chell 1991,1986,1985; Hebert and Link 1989; Keats and Bracker 1988;
Naffziger et al. 1994). These studies suggest that entrepreneurs have certain
personality traits that set them apart from other groups of individuals. From these
writings, we gather that entrepreneurs are individuals who are high achievers,
confident, pro-active, risk takers and have internal locus of control. In most
studies of small scale entrepreneurs, the personality of entrepreneurs is analysed
in association with firms' performances (Keats and Bracker 1988) and
management constraints or barriers (Cainarca et al. 1990). There are hardly any
studies; however which associate entrepreneurs' personality with innovation
decision. Hence, in this study we intend to examine whether there is a
relationship between entrepreneurs' personality traits and their decision to
innovate.
It has been indicated above that small firms' culture is entrepreneurial-
oriented and their ownership and management are inseparable; thus decisions
(including innovation) are greatly influenced by entrepreneurs' personality. The
relationship between entrepreneurs' personality and their decision making is
shown by Miller and Toulouse (1986). Their personality influences their
management style, business strategies, communication behaviour, perception and
113
Chapter Three
search for business opportunities, which are considered important in adoption of
an innovation decision process. Entrepreneurs' personality will not only affect
their innovation adoption decision but also the whole process of innovation
diffusion. Previous studies (Rothwell 1989,1984; Rizzoni 1991; Santarelli and
Sterlachhini 1990) have tended to ignore the importance of the entrepreneurs'
personality in their discussion of innovation decision. They do not include
entrepreneurial factors to explain the relationship between innovation and small
firms. Only recently have there been attempts to include entrepreneurs'
personality in study of small firms innovativeness (Khan and Manopichetwattana
1989; Lefebvre and Lefebvre 1992; Young and Francis 1991).
In the following section, we will discuss the personality traits of
entrepreneurs that can affect the small scale entrepreneurs' innovation decision.
The personality traits are locus of control, need of achievement and attitude
toward risk.
(a) Locus of Control
Gilad (1982) theorised that locus of control influences the ability of entrepreneurs
to see opportunities in their environment. Locus of control was used in this study
to differentiate entrepreneurs from the general public, middle, senior or managers
as well as to distinguish between successful and unsuccessful entrepreneurs.
People with internal locus of control are those who believe they can control their
destiny. In contrast, people with external locus of control are those who believe in
fate; they are unable to control the situation or events around them. According to
Durand and Shae (1974) and Hodgkinson (1992), individuals with internal locus
of control are active seekers of information that is useful to them; they are likely
to display entrepreneurial qualities.
114
Chapter Three
Ward (1993) suggested that locus of control may be viewed from a
theoretical viewpoint as a potential determinant of whether or not a person
involved with a small business is aware of and seeking opportunities overlooked
by others within a given economic environment. In view of this, we use the locus
of control as a determinant of small firms' innovativeness.
(b) Need for Achievement (n-ach)
McClelland's in his classic work suggested that entrepreneurs are high achievers.
High achievers are individuals who favour situations where they can take personal
responsibility for finding solutions to problems. They evaluate their performance
and search the environment, for opportunities to improve themselves.
Entrepreneurs with a high need for achievement are more ambitious and have the
desire to have as much control over their environment as possible. They do not
want anything left to chance. One way to improve business performance is by
adopting new technology or processing techniques so that the firm will be able to
stay competitive. We believe that there is a correlation between adopting
technological innovation and entrepreneurs' need of achievement. Entrepreneurs
with high need of achievement are likely to be more innovative than those with
lower need of achievement.
Entrepreneurs' personality is greatly affected by their background, such as
family, education and social status. Achievement motivation, according Chell
(1986,1985), can be inculcated through socialisation and training. Training
courses designed to develop achievement motivation have improved small
business performance significantly in term of increased sales, profits and numbers
employed. Thus,. this study assumes that the need for achievement can be trained
and improved through entrepreneurs' experience. -
115
Chapter Three
(c) Attitude Toward Risk
A technological innovation is a sort of game involving risk. The amount of risk
will depend on how radical and unfamiliar the changes are for the firms
concerned. It also requires great resources for creation and implementation.
Although most technological innovation brings at least some advantages for its
potential adopters, these advantages are not always very clear-cut to all intended
adopters. They can seldom be very certain that an innovation represents a superior
alternative to whatever it might replace. Technological innovation creates a kind
of uncertainty in the minds of potential adopters (about its expected
consequences). To reduce the uncertainty, potential adopters will take various
steps such as re-examining the need for the innovation and the reaction of their
main competitors to it. The amount of information processed depends also on the
decision makers' attitude toward risks. Even if two entrepreneurs have similar
goals, needs to innovate and financial capabilities, the same amount of
information and a similar environment, yet they might make different innovation
decisions. Under similar circumstances, it is the entrepreneurs' attitude toward
risk which explains differential response or decision.
Generally, it is assumed that individual decision makers are risk averse.
They prefer small risks to larger ones provided the outcome and other factors are
constant. Rather than gamble, an individual prefers the alternative, the outcome
of which is certain. Decision makers' definition of risk may differ significantly
from the definition of risk in the theoretical literature and different individuals
will see the same risk situation in quite different ways. There are differences
between human behaviour theory and decision theory with regard to risk in the
following respects. First, human behaviour tends to ignore events which, although
possible, are very unlikely or very remote, regardless of their consequences.
Second, human behaviour is only able to look at a few possible outcomes, not all.
116
Chapter Three
Third, generally human behaviour deals with verbal risk rather than numerical
risk. This attitude toward risk is usually pictured in term of properties of an
individual which are likely to be related to their personality development (March
and Shaper 1987: 1404).
In a decision making process, the choice of alternative involves a trade-off
between risk and expected return. Risk averse individuals prefer an alternative
with low risk while risk seekers would prefer a relatively high risk. The decision
theory assumes that decision makers deal with risk by first calculating and then
choosing among the alternative risk-return combinations that are available (March
and Shapira 1987). Entrepreneurs may, however, see risk in ways that are
different from decision theory. First, entrepreneurs do not treat uncertainty of
positive outcome as an important aspect of risk, suggesting that risk is often
associated with negative outcome. Second, entrepreneurs do not perceive risk as a
probability concept; to them, possible bad outcomes are more salient. Lastly, it is
not easy for entrepreneurs to quantify risk. From here, we can conclude that
entrepreneurs calculate the risks of available alternatives, based on their
perception, which in turn is influenced by their attitude toward risk. The decision
to adopt technological innovation is one that involves risk. Entrepreneurs'
attitude toward risk influences their decision making (Ghosh and Ray 1992).
Hence, it is expected that entrepreneurs' attitude toward risks will have a
relationship with their decision to adopt or reject technological innovation.
3.3 Summary
In this chapter, we have discussed the four theoretical approaches, namely (a)
adoption decision process, (b) organisational buying behaviour, (c) decision theory
of small firms, and (d) personality theory of entrepreneurs, which we shall use to
117
Chapter Three
develop a conceptual framework on technological adoption among small scale
food processing industries in Malaysia. We argued that the adoption decision
process of small firms is similar to that of any organisation. However, the time
involved and factors affecting small firms' adoption decisions differ from those
affecting large firms, due to the simplicity of their organisational structure,
management style, environmental factors and the people who make up the
organisation.
The second theoretical approach used in this study is the theory of
organisational buying behaviour. This approach is relevant to this study because
small firms innovate through buying not inventing. Factors affecting the decision
process of small firms in buying an innovation are similar to those mentioned in
the theory of adoption process forwarded earlier.
The adoption decision process is an aspect of a decision theory. In this
study, we argued that small firms' decision process follows the satisficing model
rather than the rational model. The non-separation of ownership and management
in small firms suggests that the personality of entrepreneurs has a strong influence
on their adoption decision. Personality theory has been widely used to distinguish
entrepreneurs from other groups of people, and to differentiate successful
entrepreneurs from the unsuccessful ones. We can use the personality theory to
differentiate innovative from non-innovative entrepreneurs in small scale firms.
We believe that entrepreneurs' level of innovativeness is influenced by three
personality traits; locus of control, need of achievement and attitude toward risk.
118
Chapter Four
CHAPTER FOUR
CONCEPTUAL FRAMEWORK
4. Introduction
In this Chapter we begin by discussing the concept of innovation adopted in this
study. This then will be followed by the discussion of our conceptual framework
with the aim to hypothesise factors that determine the decision of entrepreneurs
of small firms whether to adopt a technological innovation. This conceptual
framework provides the basis for the empirical analysis in Chapter Six to Chapter
Eight
4.1 Concept of Innovation Adopted in This Study
From our review of the literature, as has been mentioned in Chapter Three, we
can define innovation according to three different concepts: (a) a "new item"
itself, (b) the process of adopting the "new item" and (c) the process of developing
the "new item". For the purpose of this study, we follow the concepts (a) and
(b). Innovation is an item which is perceived as new to the organisation and the
process of adopting the item. In this study the item is a machine or machines
which is perceived as new by Bumiputera entrepreneurs of small scale FPI,
considered for adoption or adopted by them during 1990-93.
As has been mentioned in Chapter Three, technological innovation is
comprised of (a) product innovation and (b) process innovation. Process
119
Chapter Four
innovation had been defined as the introduction of new elements such as new
equipment (machines) into a firm's production or service operation (Damanpour
1991; Utterback and Abernathy 1975). The introduction of new equipment is part
of the process of improving labour productivity, output productivity and
performance. Hence, the adoption of a new machine which is perceived as new by
small scale entrepreneurs is part of process innovation.
How fair is it to use the adoption of a machine which is perceived as new
as a measure of process innovation in small scale FPI firms in Malaysia? First, we
have to examine the nature of small scale FPI and technological innovation as
undertaken by firms of such nature. According to previous research findings' the
characteristics of small scale FPI in Malaysia are as follows. The organisational
structure is rather simple in that the majority of small firms of FPI in Malaysia are
sole proprietors (more than 55.0 per cent) and partnerships. In this type of firm,
the management style is direct supervision or supervised supervision, that is, the
owners of the firms manage almost every aspect of their organisation and directly
manage their subordinates. There are at most three levels of management
hierarchy. The owners of the firms are also their managers and they are the sole
or major decision makers of their firms. The level of technology is rather low
(semi-mechanised) and workers generally have low skill. The majority of firms do
not use up-to-date technology. For example, sun-drying is the most popular
method for drying (Asit and Siti 1988). Their aim in introducing a new machine
is to improve output productivity and firms' performance through replacing
' The description of small scale FPI is based on the findings of Faridah and Madeline (1992), Fong (1989), Mohd and Shaari (1988), Ismail (1990) and MITT, Malaysia (1992) and UKM research group (1990).
120
Chapter Four
manual methods or replacing an outdated machine. Capital and markets are the
main growth constraints for these firms. The majority of the firms market their
product locally, that is, within the community near their factory. Based on these
characteristics we placed the small scale FPI in Malaysia in a taxonomy of small
firms developed by Rizzoni (1991) to recognise the nature of their innovation.
According to Rizzoni (1991) one can develop a taxonomy of small firms
in six categories. This taxonomy can be a substantial benchmark for recognising
types of innovation in small firms and the development of analyses on the
determinants and effects of technological innovation in small firms. The
categories of small firms are (a) static (b) traditional (c) dominated (d) imitative
(e) technology-based and (f) new technology-based. (These categorisations were
developed based on a number of variables, namely, (1) the main factors of firm's
success, (2) sectoral patterns, (3) types of process technology (4) types and source
of innovation, (5) innovative strategy, (6) corporate strategy, (7) organisational
structure and 8) factors of weakness). This taxonomy is exhibited in Table 4.1.
Based on the characteristic of small scale FPI in Malaysia, it is reasonable
for us to conclude that the majority of them fall into the static and traditional
categories. Some of the firms can be classified as `Dominated' small firms.
According to the taxonomy, the static and traditional types of firm have low
manufacturing cost and technological innovation focuses only on machinery.
Firms either bu y new machinery or modify the existing machinery . This suggests
that it is an incremental type of innovation. Rizzoni described innovative
strategy for static firms as minimal or almost absent, and in traditional firms he
121
Chapter Four
states that the innovative strategy comes from outside, for example (we may add)
under the initiative of institutions (such as MARDI, MARA and KEMAS in the
case of small scale FPI in Malaysia) responsible for the development of small
firms, suppliers or firms which have already adopted the innovation. The above
explanation justifies the usage of adoption of new machines as a proxy for
technological innovation in Bumiputera small scale FPI in Malaysia. Previous
studies of small scale firms in Malaysia and our pilot test for this study showed
that the adoption of a new machine is a key part of process innovation for these
firms. Even when the entrepreneurs' immediate aim was to replace the existing VVV
machine, their main purpose of adopting was to improve performance - thus
process innovation.
Some may dispute the appropriateness of using the adoption of a new
machine as a reflection of firms' level of innovativeness. However, previous
studies did recognise its appropriateness. For example, Masterson and Hayward
(1979) recognised the purchase of a capital equipment as innovative behaviour
Studies of the adoptions of technological innovations also recognised the adopters
were more innovative than non-adopters (Rogers 1983; Damanpour 1991; Chin
and Ghopal 1995, Lefebvre and Lefebvre 1992). In the case of small scale firms,
we should recognise the financial and physical constraints faced by them which
act as barriers to adoption of new machine. We should also recognise the
activities the entrepreneurs had to go through in searching and introducing new
machine in the firms such as undergo training, attending seminars and trade fair.
Hence, their ability to search for, introduce, and overcome barriers of adopting,
new machine does reflect their innovative behaviour.
122

ä 7E -u Co r_ en IÄ GM
yY o s O >G' ü "r N ° #i
ö r_: = == cz =öe 2 )
3Z L 4!
U CD.. 2 °? r rin = Uör
Z C sic ýý 3s °rs,
aý -nn ý 3 aý
i ýv s aý > ýs ýýý "= L E ZE o Z
y Q: 6
i Uß
ÖCy
aý = C- W
v y
iv tu y y Uv G e4 L ,
M 0
Gt I L CD- M
t0 CE -m =
ei _ -8 ß. _ Ua CC 3 M
s ` ß N
° r n.
°> Ö
tu e ß -
Gn 0) n
WCU 5 CD
<C f"Gn Z >
N C U1
3 cG 4) ° - ID '° ävy 0
e t: RU Go C
äi vi aOOWO
UA yY A >.. L,
ýö ZC0y E°
«ß° ö .;
4^r y /1
ö
C y> 3Xy
O 29 C
e
=U C
>pý SE « 'j H VCU 3
Y t
. S. SQ mýUýö
d^l
r C "
5 fýY v
ý ° y
ý "ý ý ,y
a% Qi ý 3
'ý y°y ý?
ci VV ý
O "ý O ý
~O4. CC ýý äo m 3ö. vo 'ý
aq ä cý c13 Z
1 % i
* ý Em 1 *e; wEv % g-8 Zl g.
ti
1 tiq 4 E C
ýy! d1 U
ö
, 0. FN a *0 2I , E. 0 r m
O it
c
C
C
F
M N

I, c
c 8
g kp ß0 eCOa E
ed C =" 4O0
y d TEÜ 'O
0
j 3 CC
M"U 'ß Ü .. S
c e. c ýý. s _ý ýsý cw "v L
Cý COp Z . U. E 'UO
Ö cCO
0 C
C N r_ >
r _=
e) 0 L "+
0. m s VLy
O C3 r. y. Q
U
B
U v7
. '" - U ý'
0,2 0
fS. C+D C ies c
VäO ý O Ü~ n '«+ cQ
O'ß . i
V aý+
E ýR CC
Ü'ý 'y C
M Q Ü C p
y
»Z O
0 v7y
L
A C C'`
LLO tG N
CI) ? ä y cad +7 ++ O2 . UO ö
OW U O ýn. C v
O Ö Cl) i.
cm Je 3r
U 0
0 , . a ö
Ö k'! ý k Lz ý" v
Vi OU V
cl L CI) c
vi O v G v c
v
- o e = e o= 9
- 8 ße:: ä M S se c J V J9 vl F. L
r O O i
"ý (S O ý. ' ýý
t d zU. C ^ýj
F i 6'i
( ', dW Z 2
Vj JE- (31 e
ä E- vö 3
gj 4e ,ZQ 44-, cd
CC6ýýý P L ea O O
IC`n Ü(A 092 23 º 1 vi oö
0)
0' a
0 N 94
U 2 O
e N
Chapter Four
4.2 The Determinants of Technological Innovation Adoption: An Overview
The conceptual framework developed in this chapter was to hypothesise the
determinants of technological innovation adoption among small scale FPI. It was
developed by combining the concepts of firms' buying behaviour, the theory of the
adoption process, entrepreneurs' personality theory and decision theory of small
firms, which had been discussed in the previous Chapter. We believe that the
analysis of small firms' adoption decisions is a form of dynamic decision analysis
which involves the interaction of factors which are interrelated in a complex
manner. One discipline alone, such as economics, cannot explain the interaction
of factors which determine the decision of small firms' entrepreneurs to adopt a
technological innovation. It makes sense to be eclectic in the choice of
approaches on which to draw. Thus, we have drawn on the theory of
organisational buying behaviour. In analysing the decision of small firms to adopt
a technological innovation, the same concept can be used, in that the buying
process takes place once the entrepreneurs adopt the technology. The equivalence
of the concepts is revealed when analysing the behaviour of firms and the
determining factors that cause such behaviour, prior to their final decision to
adopt, postpone adoption or not to adopt.
Based on the theory of organisational buying behaviour, we can assume
that small firms' buying motivation has two dimensions; task and non task. Task
motives relate to the specific buying problem. Non-task motives, on the other
hand, explain organisational behaviour in relation to a set of variables which do
125
Chapter Four
not have a direct bearing on the specific buying problem, although they may be
important determinants of the final adoption decision (Webster and Wind 1972a).
Based on theory of organisational buying behaviour we learn that firms' decisions
to buy are determined by their characteristics, the characteristics of decision
maker, internal and external communication and environmental factors.
From the decision theory of small firms we learn that the entrepreneurs
utilise primarily a very informal approach to decision making. The entrepreneurs
operate their business with limited skill and knowledge and decision making is
very much influenced by their experience. Decision making process in small
firms was very much influenced by the characteristics of their entrepreneurs.
Hence we believe the characteristics of entrepreneurs such as their personal
background (or, as we shall put it , "personal demographics"), experience and
personality traits influence their decision to innovate. The personality theory of
entrepreneurs on the other hand indicates `that entrepreneurs' need for
achievement, locus of control and attitude toward risk influence their innovative
behaviour.
From the theory of the adoption process, we believe that in the process by
which small firms search or become aware of the existance of the new technology
to their final decision to adopt or reject it, they go through the five stages as had
been described in the theory. As we recall, there are five stages in the adoption
process; (a) awareness, (b) interest, (c) evaluation, (d) trial and (e) adoption.
Small firms become aware of the existence of the technological innovation from
various sources. First, they might have witnessed the innovation in other firms
126
Chapter Four
which have already adopted it. Secondly, the innovation might have been
introduced by suppliers. Thirdly, the innovation may be introduced by
institutions responsible for the development of small scale FPI. Alternatively, the
entrepreneurs might seek out technological innovation themselves.
Being aware of the existence of a technological innovation, the
entrepreneurs develop interest in it and this motivates them to enquire for more
information about it. Then, the entrepreneur would evaluate the innovation to
examine whether the innovation has the characteristics that will fulfil their need
to innovate. Entrepreneurs will consider adopting an innovation if they perceive
that it has the required characteristics, and the innovation will be adopted for a
trial period. In this trial period, the entrepreneurs assess the performance of the
innovation before their final decision to adopt it. The behaviour of firms or
entrepreneurs demonstrated within the first four stages of the adoption process
determines the final innovation decision process. At any particular stage, the
process and the decision to move forward to the next stage or go backward to the
previous stage is influenced by various factors. These factors can be internal or
external to the firm. As has been discussed earlier, the entrepreneurs of small
firms play a very important role in their firms' decision to innovate. Considering
this fact, we believe that their personal demographic characteristics, education and
skill level and their personality traits to some extent influence their decision
process.
The characteristics of firms such as their size and structure, are also
important factors that determine the process of the decision to adopt a
127
Chapter Four
technological innovation. These characteristics can act as barriers or catalysts to
firms' innovation decision. In addition to the characteristics of the entrepreneurs
and their firms, we believe there are other factors which also influence small
firms' decision. These factors are the characteristics of the technological
innovation itself, entrepreneurs' communication behaviour, their perception of the
innovation, their perception toward the procedure of buying the innovation and the
environment, such as their intensity of institutional involvement and competitive
intensity. The influence of these factors in each stage of the adoption decision
process is exhibited in Figure 4.1.
We believe that the characteristics of the entrepreneurs are influential at
the following stages: awareness, interest and evaluation. At the awareness stage,
for example, entrepreneurs with higher levels of education, or those who have
upgraded their skill by attending courses or those with a higher need for
achievement, tend to have early awareness of the innovation. Entrepreneurs with
these characteristics usually demonstrate innovative behaviour and search for
opportunities to improve their firms' performance. Hence, at the interest stage,
they tend to develop interest in the innovation because they believe that by
adopting it they will improve their firms' performance. At the evaluation stage,
the entrepreneurs' level of education, skill and attitude toward risk influence their
perception of the innovation. Those with higher levels of education, skill or
greater knowledge of the innovation, or with greater propensity to take risks, will
evaluate favourably an innovation of a higher technical level.
128
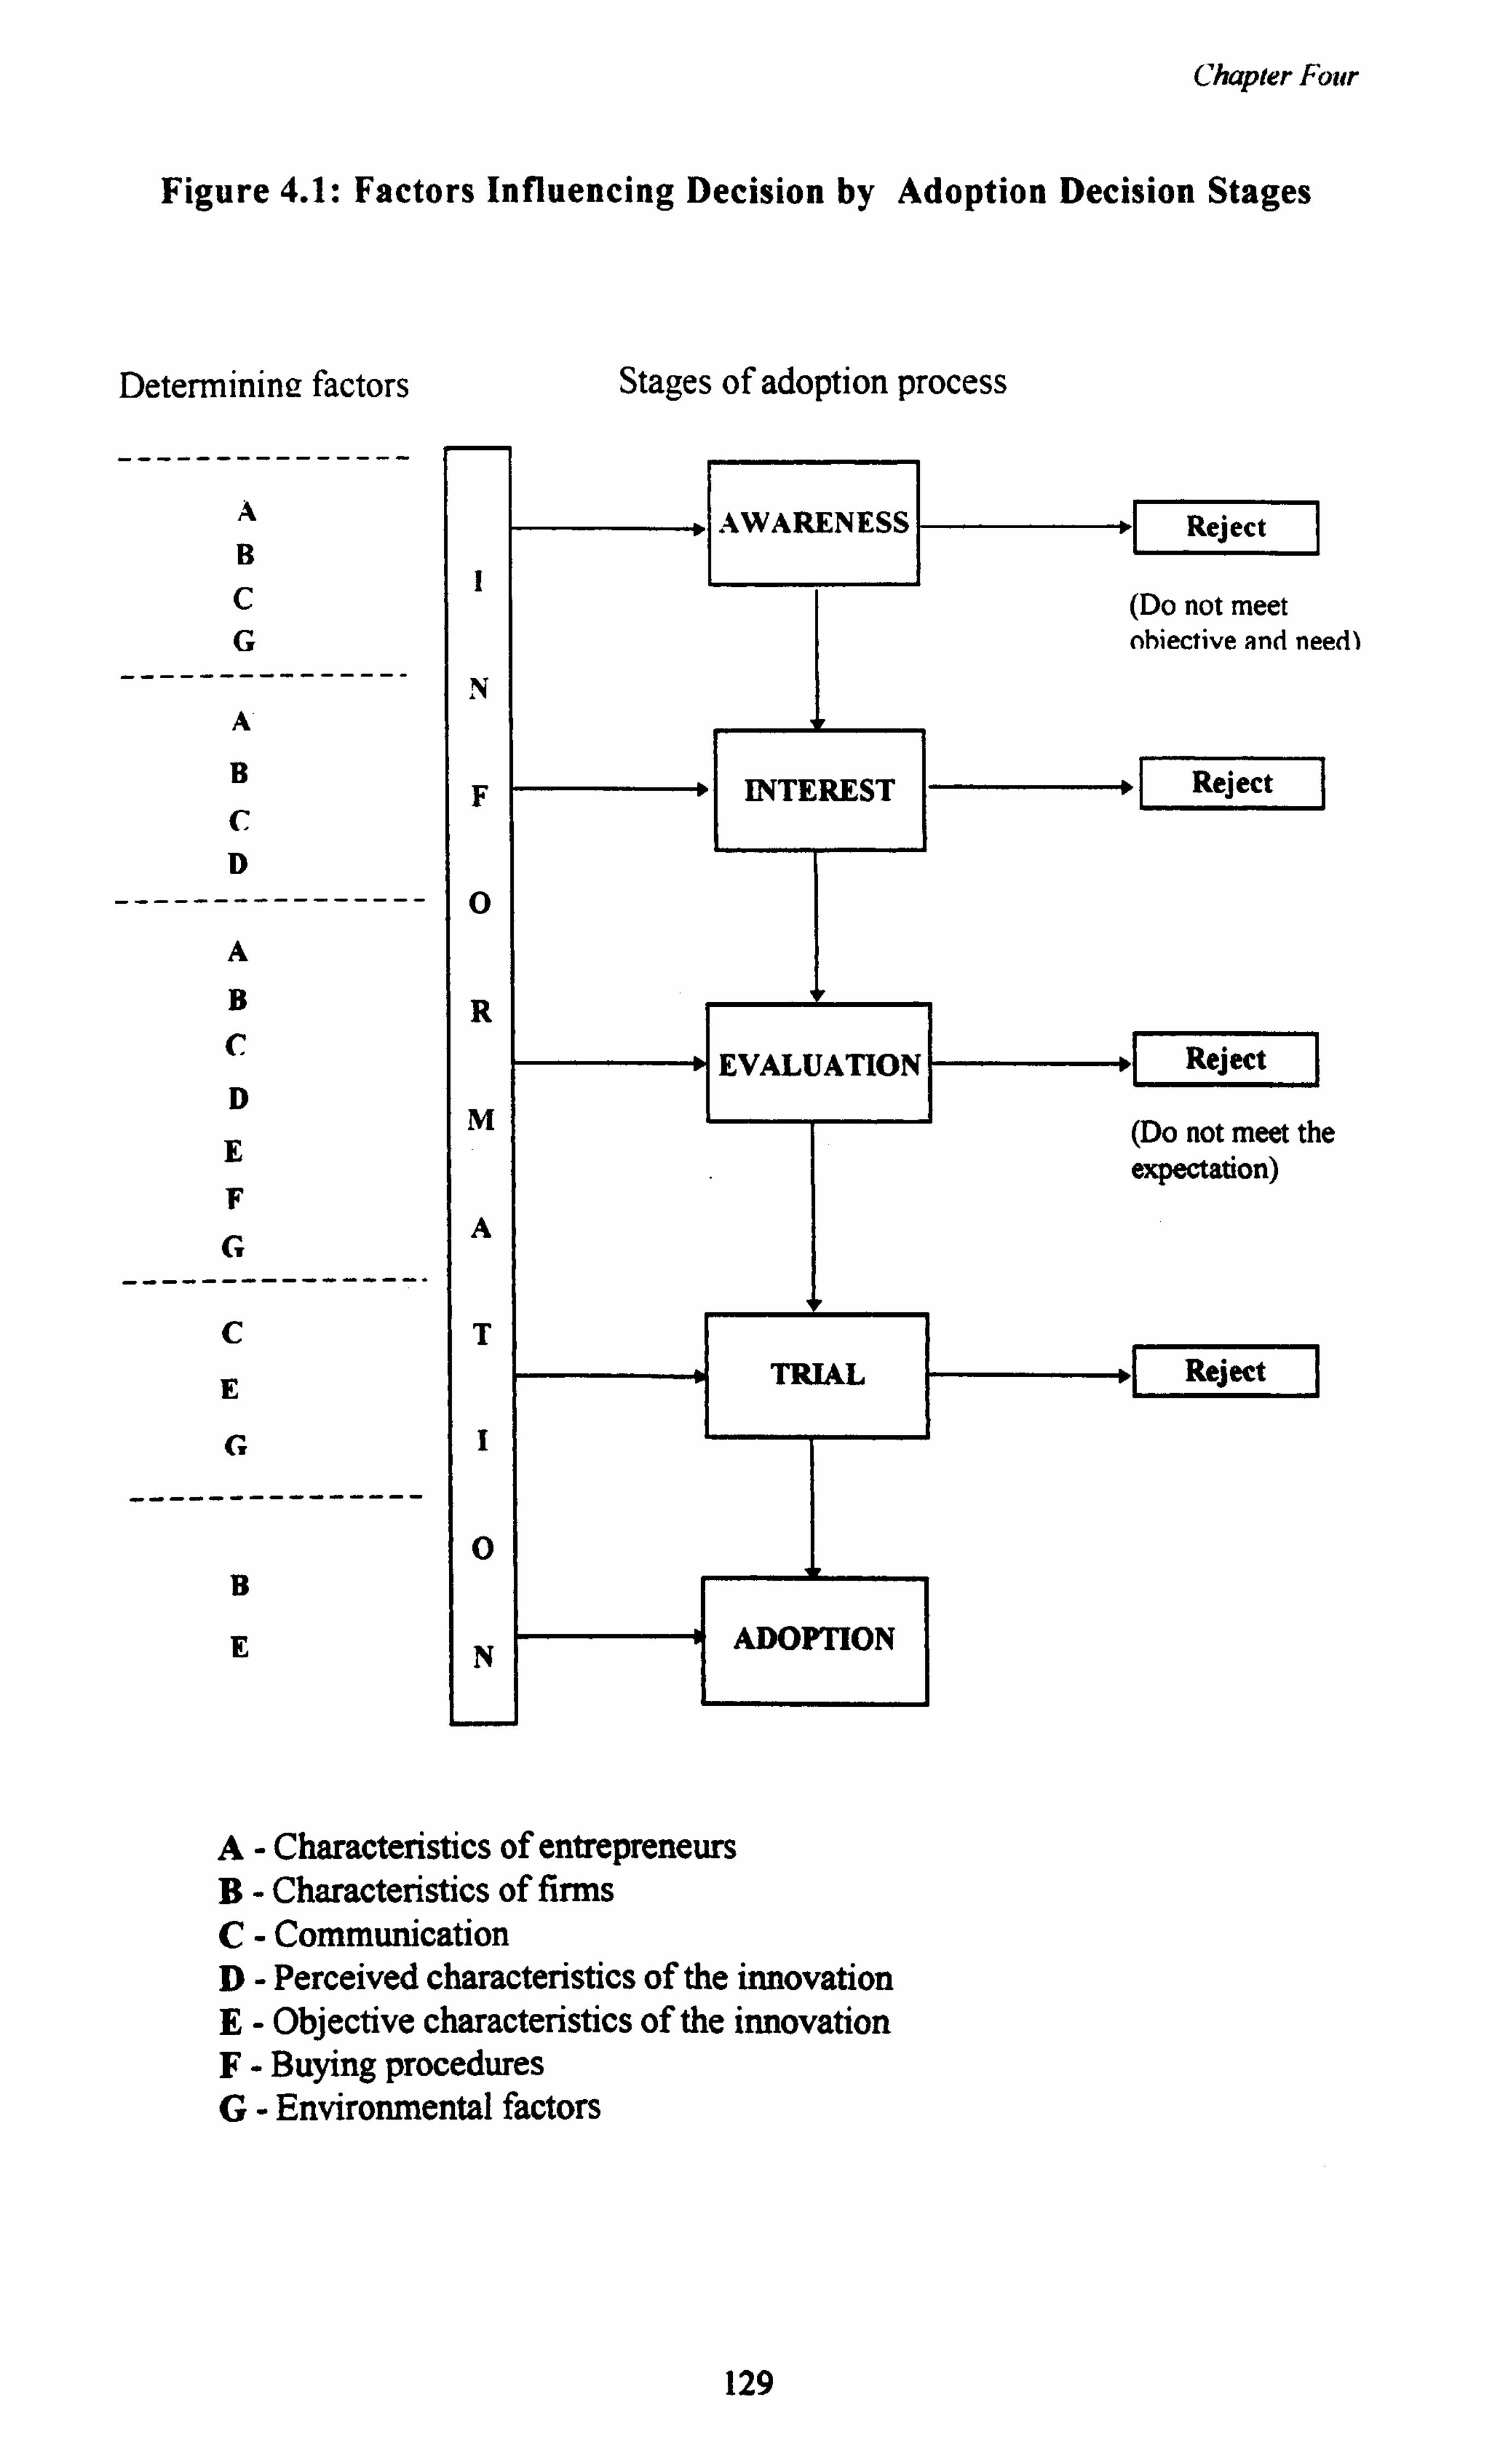
Chapter Four
Figure 4.1: Factors Influencing Decision by Adoption Decision Stages
Determining factors
A
B
C G
--------------- A
B
c D
---------------- A
B
c D
E F
G ----------------
C
E
G
---------------
B E
A- Characteristics of entrepreneurs B- Characteristics of firms C- Communication D- Perceived characteristics of the innovation E- Objective characteristics of the innovation F- Buying procedures G- Environmental factors
Stages of adoption process
(Do not meet nhiective and need)
Reject
(Do not meet the expectation)
129
Chapter Four
The characteristics of firms influence the entrepreneurs' decision at the
stages of awareness, interest, evaluation and adoption. Among small firms,
relatively bigger firms have a greater tendency to become aware of the existence
of the innovation earlier and show more interest in it. At the evaluation stage, for
example, we believe that for the same level of technical complexity of an
innovation, firms which have a lower level of complexity will evaluate differently
from more complex firms.
Except for the adoption stage, communication plays an important role in all
stages of adoption process. Through communication, information on innovation
is accumulated from the stage of awareness to the trial stage. Communicative
entrepreneurs tend to know about the existence of the innovation earlier. Having
considerable information about the innovation, they tend to develop interest, have
the ability to evaluate it and have the opportunity to try the innovation before
confirming its introduction.
The entrepreneurs' perception of the innovation determines their decision
at the interest stage and evaluation stage. Entrepreneurs develop interest in an
innovation if they perceive that it has the required capability, function, and low
risk. Their perceptions of the innovation are then confirmed in the evaluation
stage. If the performance, function, capability and level of risk match those
expected of the innovation, then the adoption decision process moves to the trial
stage.
130
Chapter Four
The objective characteristics of the innovation determine the
entrepreneurs' decision to adopt a technological innovation at the stages of
evaluation, trial and adoption. At the evaluation stage, as mentioned above, the
objective characteristics of the innovation are examined in relation to the
entrepreneurs' perceptions. At the trial stage, the performance of the innovation
will determine whether the entrepreneur moves to the stage of adoption.
4.3 Factors That Determine The Decision To Adopt Technological Innovation: The Hypotheses
4.3.1 Characteristics of Entrepreneurs
In small and medium scale firms, entrepreneurs play an important role in decision
making development. Their characteristics influence firms' behaviour, including
firms' strategies, policies and innovative activities. Therefore we believe that the
influence of entrepreneurs' characteristics is the major determinant of adoption
decision. The characteristics of entrepreneurs could be divided into the following
categories, namely (a) personal demographic characteristics, (b) personality traits,
(c) knowledge and skill upgrading and (d) knowledge of innovation.
4.3.1.1 Personal Demographics
These include entrepreneurs' age, sex, education, length of managing in the
company and previous work experience. According to Khan and
Manipichetwattana (1989), young entrepreneurs are more innovative than older
131
Chapter Four
entrepreneurs due to their higher level of education. Korteling (1994), Ray
(1993), and Warr (1994) showed that young individuals are capable of handling
complicated tasks and receptive to change. For this reason, we believe that
young entrepreneurs are more innovative than older entrepreneurs. However, it
is also argued that older people are equally capable of attitude change as younger
people, provided that they have personal experience that leads to attitude change
(Tyler and Schuller 1991). Considering this fact, we believe that there is a
possibility that older entrepreneurs also can be as innovative as young
entrepreneurs, based on their experience.
Entrepreneurs' level of education determines their innovativeness
(Variyam and Kraybill 1993). Entrepreneurs with higher levels of education are
likely to adopt a technological innovation. We believe that the entrepreneurs'
level of education will be a determining factor in other factors' influence on their
innovativeness. Khan and Manipichetwattana (1989) showed that young
entrepreneurs innovate due to higher levels of education. Education is likely to
be positively associated with adoption of highly technically complex technology.
An entrepreneur who is highly educated or who has technical knowledge will be
more likely to adopt new, technically complex technology, compared to less
educated entrepreneurs.
In addition to the entrepreneurs' age and level of education, we believe
their gender will also influence their innovative behaviour. Variyam and Kraybill
(1993) showed that in small firms, there is a relationship between the
entrepreneurs' gender and the adoption of a technological innovation. Female
132
Chapter Four
entrepreneurs are less mobile, less communicative and have less opportunity to
attend business courses due to their domestic commitments (Faridah 1990; Wan
Sarah et al. 1992). Their main aim in venturing into a business usually is to
contribute to the family income (Nor Aini and Faridah 1991,1988; Madeline and
Faridah 1991). Hence, in this study we predict that female entrepreneurs will be
less innovative than male entrepreneurs.
Entrepreneurs' experience in managing their firm may have an effect on
their decision to adopt new technology. Entrepreneurs who have been working for
many years have more experience, are very familiar with their business
environment, have wider business contacts, have better access to information and
are able to seek business opportunities. Experience makes them confident in
decision making. These entrepreneurs will be likely to adopt new technology
earlier than their counterparts because they know about the existence of the
technology earlier. However, there is a possibility that new entrepreneurs with
less experience in managing their business will be innovative. These new
entrepreneurs are under pressure to be competitive with existing and established
firms. In order to be competitive, they have to be innovative.
Besides the entrepreneurs' experience in their current business, we predict
that their previous work experience also influence their innovative behaviour.
Entrepreneurs with longer previous work experience, usually are more confident
and they saw setting up their own firms as a form of upward mobility (Birley
1989; Cooper 1979). Hence, they had a higher tendency to be innovative.
Entrepreneurs who had previously worked in the same sector as they were
133

Chapter Four
currently in, also had a greater tendency to be innovative compared to those who
had worked in other sectors. This gave them an advantage over those who were
less experienced or who had previously worked in sectors different from those in
which they were engaged.
4.3.1.2 Personality Traits
As mentioned earlier in Chapter Three, the personality of entrepreneurs of small
scale firms has an effect on their business decision process in general. Hence, it is
believed that the technological innovation decision process and the decision to
adopt technological innovation are affected by the personality of entrepreneurs.
According to Gray and Starke (1988), personal factors such as level of education
affect the personality of an individual. In view of this, we believe that the
entrepreneurs' level of education has some influence in developing their
personality, such as their need for achievement, locus of control and attitude
toward risk.
(a) Locus of Control
Entrepreneurs' locus of control is believed to have some effect on their
formulation of business strategy, such as an adoption of new technology. It
reflects the beliefs individuals have about who controls the events of their life.
Internal- oriented entrepreneurs perceive their lives to be controlled by their own
action, skills and ability. On the other hand, external-oriented entrepreneurs
perceive their life to be controlled by external factors. Locus of control plays a
134
Chapter Four
mediating role in determining whether persons become involved in pursuit of
achievement (Lefcourt 1976). Internally-oriented entrepreneurs are more likely to
plan ahead, actively seeking information about business achievement, and have a
tendency to lead rather than follow competitors (Hodgkinson 1992). They are
more likely to adopt new technology than entrepreneurs with external locus of
control
(b) Need for Achievement
Need for achievement of entrepreneurs can be considered as a factor that
contributes in explaining entrepreneurs decision behaviour. High achiever
entrepreneurs are motivated by their desire to perform to the best of their ability.
They take a long-term view in their planning for the success of their firms. These
entrepreneurs are not easily satisfied with the performance of their firms, despite
firms' progress, and are always willing to make changes if they believe that such
changes can bring progress to their firms. High achiever entrepreneurs are likely
to adopt new technology. On the other hand, low achiever entrepreneurs do not
have the motivation to improve their firms. They are easily satisfied with their
firms' performances, as long as they do not make a loss. This type of entrepreneur
is normally less innovative and unlikely to adopt new technology.
(c) Attitude Toward Risk
Attitude toward risk is believed to be one of the main factors that significantly
influence entrepreneurs' decision to adopt technology, since the adoption decision
135
Chapter Four
is one that involves risk. Risk-taking entrepreneurs make decisions to adopt in
the condition of uncertainty, by balancing success against potential loss. Some
entrepreneurs would not think of taking a risk, regardless of the probabilities of
success. They prefer to stay in a secure position. Kim et al. (1993) and Lefebvre
and Lefebvre (1992) showed that entrepreneurs who are risk takers are likely to
adopt technological innovation, while risk averse entrepreneurs are unlikely to
adopt it.
Some studies which have looked at the impact of personality on
organisational buying decisions have found only limited direct relationships. See
Hakansson and Wootz (1975), Peters and Venkatesan (1973), Sheth (1973) and
Wilson (1971). However, in the case of small organisations such as small and
medium scale FPI in Malaysia, it is believed that entrepreneurs' personality does
play an important role in determining firms' decision to adopt new technology.
This is because the majority of the entrepreneurs are the founders of their firms.
Furthermore they are the sole-proprietors or the active partners of the firms.
Therefore, the personality and attitude of the entrepreneurs are believed to have a
great influence in the adoption of technological innovation.
4.3.1.3 Knowledge and Skill Upgrading
As has been mentioned in Chapter Two, small scale entrepreneurs lack knowledge
and skill in management. Their knowledge and skill can be upgraded by attending
business courses or training offered by various institutions such as MARA and
NPC. Lack of skill and knowledge is a constraint to adoption of technological
innovation (Foley and Watt 1994). Hence, we believe that the entrepreneurs who
136
Chapter Four
upgrade their knowledge and skill have a stronger tendency to adopt
technological innovation.
4.3.1.4 Entrepreneurs' Knowledge of The Innovation
Entrepreneurs' knowledge of the technology itself, in terms of its applicability,
influences their adoption decision. Entrepreneurs may adopt technology after
having gained extensive understanding of it. This knowledge may depend on the
extent of exposure to information obtained from external or internal sources.
Facts about advantages and limitations of the technology may come from various
sources such as competitors, research institutes, or the company's own research
and development unit. Incomplete understanding of the technology makes the
adoption unlikely.
4.3.2 Organisational Characteristic
As has been mentioned in Chapter Two certain characteristics of small firms, such
as their simple structure, are conducive to innovation. On the other hand, other
characteristics of small firms, such as their lack of capital, and lack of skilled
workers, act as barriers for them to innovate. Therefore, the influence of
organisational characteristics on the innovation adoption process is worth
examining. Organisational characteristics such as firm size, firm's age, firm's
structure and availability of skilled labour are among the factors which can
influence the adoption of technological innovation among small scale FPI in
Malaysia
137
Chapter Four
4.3.2.1 Firm Size
Firm size has played an important role in examinations of the adoption process.
Kimberly and Evanisko (1981) found organisational size to be the best predictor of
technological innovation. Their research revealed that larger organisations are
more likely to adopt an innovation. Lefebvre and Lefebvre (1992), and Variyam
and Kraybill (1993) showed that firms' size is a predictor of the degree of
innovativeness among small firms. Larger firms normally give greater attention to
the use of formal techniques in their investment evaluation decision, they are
likely to have more specialists involved in different management functions such as
purchasing and thus they are more innovative. These firms are believed to be
more efficient in their performance and financially more stable, compared to
smaller firms. Although larger firms take a longer time in their decision making
process, they are likely to adopt new technology earlier. In view of this, we
predict that within small scale FPI, larger firms are more likely, other things equal,
to adopt new technology.
We must also bear in mind the existence of some "reverse causation" here.
The more innovation the firm, the faster it is likely to grow, and the larger it is
likely to become. Thus, in the empirical work we shall have to take care to
identify the direction of causation as clearly as possible.
138
Chapter Four
4.3.2.2 Organisational Structure
Aspects of organisational structure of small firms which are believed to have some
degree of influence on the decision to innovate are (a) centralisation, (b)
formalisation and (c) complexity.
(a) Centralisation
Within small scale FPI we expect there is a variation in their degree of
centralisation. Khan and Manopichetwattana (1989), Kim et al. (1993) found that
centralisation of small firms in U. S. A and Korea respectively is negatively
associated with the decision to adopt a technological innovation. As has been
mentioned in Chapter Three, the negative correlation between level of
centralisation and firms' innovativeness is due to restricted channels of
communication, which reduce the availability of information. Hence, in this
study we hypothesise that firms with a lower level of centralisation are more
innovative than more centralised firms.
(b) Formalisation
Formalisation is the degree of emphasis placed on following rules and procedures
in role performance (Damanpour 1991; King 1990). Firms that emphasise
formality in the decision making process have fewer autonomous, more
committee decisions, and this lengthens the decision making process. Firms with
a lesser degree of formalisation normally emphasise performance and minimise
status differences between individuals within firms. The relationship between
139
Chapter Four
employees and employers is usually rather informal. Innovation is likely to occur
more quickly in firms with a lower degree of formalisation in decision making and
administrative structure (Baker 1975; Kim et al. 1993).
(c) Complexity
Complexity of firms is measured by the number of professional workers the firms
have. The degree of complexity is believed to be positively correlated to
innovativeness. Therefore, firms with a greater number of professional workers
such as engineers, are likely to adopt technological innovation.
4.3.2.3 Mismatch of the Existing and Required Labour Force
The adoption of technological innovation involves the reallocation of resources in
the firm. For example, if a firm buys a new machine to replace an old one,
labour, capital and materials must be available to accommodate the existence and
the usage of the new machine. Hence, in the case of adopting technological
innovations, as a result of adopting new technology, some workers may be thrown
out of work, at least temporarily; others must be retrained to operate the new
equipment or new skilled employees must be hired.
One of the problems of small firms is shortage of skilled labour (Chee
1991a; El-Namaki 1988). Shortage of skilled employees to operate new
technology has an important influence in firms' reaction to new technology (Foley
and Watt 1994; Harvey et al. 1992). The availability of skilled employees to
operate new technology fastens the process of adoption. Attitude toward
140
Chapter Four
recruitment and training of employees is an important determinant of whether
firms without the availability of skilled labour to operate it, will adopt new
technology. Firms which do not, are likely to postpone or not to adopt the new
technology.
For some firms, restructuring of labour force and redundancy may occur if
they adopt new technology. As a result, certain employees may be promoted,
transferred or lose their jobs. Firms that perceive redundancy may occur if they
adopt new technology, are unlikely to adopt it.
4.3.2.4 Financing
Evaluation of capital requirement is part of the technological innovation adoption
process. Without an injection of capital investment, adoption may not take place.
Hence, the decision to innovate is the decision to earmark internal or borrowed
capital to finance the adoption (Josty 1990; Oakey 1984). One of the problems
faced by small firms is lack of financing. For capital investment, most small
firms use their own funds (Bruch 1983; Chee 1991a; Himmelberg and Petersen
1994; Ishak and Wook 1988; UKM 1990). Small firms face difficulties in
obtaining financing from formal private financial institutions such as
commercial and development banks. The unwillingness of these institutions to
finance small firms is due to small firms' lack of collateral and lack of proper
formal feasibility studies which make the institutions uncertain of the viability of
the proposed investment. Some small firms do not even attempt to obtain
financing from commercial banks, due to inaccessibility, lack of confidence that
141
Chapter Four
they will obtains a loan, inability to provide collateral or high interest rate (Chee
1990, Oakey 1984).
Other than commercial and development banks, there are government
agencies such as 'Majlis Amanah Rakyat (MARA)', or the Department of Co-
operative Development which play a role in providing financial credit to small
firms. Previous studies on small firms in Malaysia have, however, indicated that
not many small firms are able to get financing from these sources (Chamhuri et
a!. 1990; UKM 1990).
Adopting new technology normally involves a usage of large amount of
funds. In view of this, entrepreneurs may have difficulty in using informal
institutions (such as relatives and friends) as their source of financing. Lack of
financial resources might cause entrepreneurs to abandon the idea of adopting the
innovation or delay the adoption process until they are able to obtain financing
(Kleinknecht 1989). In view of this, we believe that firms which have difficulties
obtaining financing from external sources of financing are less able to adopt a
technological innovation.
4.3.2.5 Firms' Age
There is a relationship between firms' age, their stage of growth and strategic choice
(Churchill and Lewis 1983; Dodge et al. 1994; Scott and Bruce 1987; Quinn and
Cameron 1983). As firms mature, there is a tendency that size and management style
also change. Young firms which are in the early stage of their life cycle usually; are
smaller in size, invest highly in working capital, and have a management style which
142
Chapter Four
is more entrepreneurial and individualistic. As firms mature, their size might
increase, and their major investment is on marketing effort and management style is
more towards professional or administrative (Scott and Bruce 1987). Hence, we
believe that firms' age can be used as one of the determining factors that could
predict firms' innovativeness. Young firms whose main effort revolves around
developing a commercially acceptable product and establishing a place for it in the
market are more willing to accept changes as they have not yet established the same
sort of set routines as older firms. Hence, we hypothesised that younger firms have a
greater tendency to be innovative compared to older firms.
As has been mentioned above, management style of young firms is more
entrepreneurial or individualistic. This is due to direct supervision by top
management - entrepreneurs. It is believed that strategic choice of small firms at this
stage is strongly influenced by the entrepreneurs. Therefore, entrepreneurs'
characteristics are expected to play an important role in determining new technology
adoption decisions in young firms. On the other hand, mature firms have a more
professional and administrative style of management. We therefore predict that firms'
performance will be an important factor in determining strategic choice for small
firms at this stage. Hence, firms' performance is believed to be a factor which at this
stage influences small firms to adopt new technology.
4.3.2.6 Firms' Performance
Firms' performance ( in terms of return on investment, fixed asset turnover and
labour productivity) may well be an important factor in determining their decision to
143
Chapter Four
adopt new technology, since it is either the means or the end of entrepreneurs'
management strategies. However it is far from clear what the causal relationships
are. According to Singh (1986), firms' performance is negatively correlated with their
subsequent innovativeness, because firms which perform poorly are pressured to
innovate in order to improve performance. He showed that poor performance is
related to risk taking in organisational decisions (Singh, 1986: 580). Singh here is
clearly assuming that entrepreneurs are satisficers. In Chapter Three we found in
favour of the satisficer assumption as regards small firms (see Section 3.2.4). It could
alternatively be argued, however, that successful firms also have a tendency to
innovate because they have the physical and financial ability to do so. This by
implication assumes that they are maximisers not satisficers.
4.3.3 Communication
March (1994) stated that the amount and source of information influence decision
making. Looking at the stages of the innovation adoption process, as exhibited in
Figure 4.1, information plays a very important part at every stage. Hence, the
amount of information and the source of information on the innovation affect
entrepreneurs' decision to adopt it.
The amount of information about the innovation is determined by the
entrepreneurs' communicative behaviour, that is, the frequency of communication
between the entrepreneurs and sources of information. Ebadi and Utterback (1984)
and Schroeder et al. (1989), showed that there is a relationship between
entrepreneurs' communicative behaviour and technological innovation.
144
Chapter Four
Communicative entrepreneurs have the ability to gather a large amount of
information from various sources. Hence, in this study we suggest that
entrepreneurs' communicative behaviour is one of the determining factors that
influence their decision to innovate. The entrepreneurs' communication behaviour
is exhibited in terms of the use of information sources, both external and internal.
Past research on sources of information has shown that the entrepreneurs of small
firms regularly use external rather than internal; informal rather than formal;
customers or suppliers rather than competitors as their sources of information
(Hartman et al. 1994). This suggests that contact among entrepreneurs, between
entrepreneur and suppliers; customers; and other external sources of information
could become influential factors in entrepreneurs' decision to adopt a
technological innovation. A basic issue in communication is the influence these
individuals have, in convincing each other of the importance of adopting the
innovation.
Technological innovation adoption, like creating and assimilating new
processes and products, is essentially a learning process. This takes place by
means of communication between information providers and information
receivers (entrepreneurs). In the case of small scale FPI, internal information
providers are less important because the entrepreneur is the main decision maker
and initiator of the firm's activities. External sources of information such as
suppliers, experts from research institutions and entrepreneurs who have already
adopted the innovation (earlier adopters) are very important information
providers. Information from these sources reduces uncertainty about the
innovation. Once the technology is introduced, it spreads like an epidemic, with
145
Chapter Faur
non adopters being influenced by adopters in the course of their contacts with
them, leading to eventual adoption (Kalish 1985).
Entrepreneurs' contacts with external sources of information occur
through various communication channels. Among them are business associations,
subscribing to business magazines, and attending seminars or expositions. In
Malaysia there are several business associations relevant to small scale producers
such as Persatuan Peniaga Kecil, which are to some extent beneficial to small
scale food manufacturers. We believe that business associations can create
interpersonal communication among entrepreneurs, enabling them to learn from
each others' experience. Information on a technological innovation can also be
obtained from business magazines. It is usual for suppliers to advertise the latest
technological developments in business magazines, therefore subscribing to such
magazines, can create awareness among the entrepreneurs of the existence of the
innovation and this can lead to communication between entrepreneurs and
suppliers. Business seminars are well attended by some small scale entrepreneurs
of FPI and suppliers (UKM 1990). Usually these seminars are organised by
business association or institutions responsible for developing small scale
industries in Malaysia. Experts, bankers and academicians are usually invited to
present their experience or research in such seminars. Hence, these events create
communication linkage between entrepreneurs and experts, suppliers and other
entrepreneurs (information providers). Similarly, business expositions or trade
fairs also create communication linkage between entrepreneurs and information
providers. Entrepreneurs use expositions to promote their products while
suppliers promote the latest technological innovations that they can supply to
146
Chapter Four
potential customers. Experts, meanwhile, promote the services provided by their
institutions. The extent to which entrepreneurs use these communication channels
is termed their communicative behaviour. Communicative entrepreneurs use these
communication channels more frequently than less communicative entrepreneurs.
This study hypothesises that communicative entrepreneurs have a greater tendency
to adopt a technological innovation.
Entrepreneurs communicative behaviour is determined by various factors.
Rowland et al. (1984) showed that entrepreneurs', and firms' characteristics,
together with the buying situation, influence entrepreneurs' communicative
behaviour.
4.3.4 The Objective Characteristics of the Technology
The characteristics of the technology are expected to influence the decision of
entrepreneurs in making a decision to adopt or reject it. The characteristics of the
new technology can be viewed in terms of (a) their technical level and (b) their
price and installation cost.
4.3.4.1 Technical Level
This refers to technical complexity of the new technology. In this respect, the
technology can be categorised as manual, semi automatic and fully automatic.
There is normally a relationship between the technical level of a machine and the
number of workers needed to operate it. Compared to manual machinery, fewer
workers are required to operate semi-automatic machinery. In the case of fully
147
Chapter ! 'our
automatic technology, although in terms of numbers, far fewer workers are
required to operate it, normally, these workers need a higher level of skill. As it
has been mentioned in Chapter Two that small firms had a shortage of skilled
workers; thus, we hypothesised that entrepreneurs have a greater tendency to adopt
an innovation with a low technical level.
4.3.4.2 Price and Installation Cost
This refers to the price of the new technology and cost incurred in installing it.
Although firms might receive the same price quotation for the new technology,
installation cost might vary between firms. The price and installation cost is
expected to influence the decision of entrepreneurs to adopt the technology. Low
cost innovation are likely to be adopted by entrepreneurs.
4.3.5 The Perceived Characteristics of the Technology
The characteristics of technology as perceived by entrepreneurs influence their
decision to adopt. Entrepreneurs will form an opinion on the cost of the machine
relative to the financial position of the firm, and the extent of available knowledge
to use the innovation. Some technology is adopted readily because it is not too
great a technological advance. When new concepts need to be integrated, it may
slow down the adoption rate or act as a barrier to the adoption process. The
characteristics of technology perceived by entrepreneurs can be classified into a)
economic advantage, b) simplicity, c) prestige, d) perceived risk, and e)
compatibility.
148
Chapter Four
4.3.5.1 Economic Advantage
This is the degree to which an innovation is perceived to be economically more
profitable than the existing technology. Entrepreneurs are likely to change to new
technology if they believe that it will improve product quality and increase firms'
productivity, which may in turn lead to increase in sales and profit. Thus,
perceived economic advantage should be positively related to increased likelihood
of adoption.
4.3.5.2 Simplicity
This is how entrepreneurs perceive the new technology as relatively easy to
understand and use. Simplicity of the new technology as perceived by the
entrepreneurs is believed to influence their decision to adopt it. Entrepreneurs
who feel that the technology can be operated and managed by the existing
employees, are more likely to adopt it.
43.5.3 Prestige
Having new technology is sometimes perceived to enhance one's prestige within
the community of entrepreneurs of the same industry. Entrepreneurs who feel
that the technology will increase their prestige may be more likely to adopt it.
4.3.5.4 Perceived Risk
Newall (1977) has shown how the organisational buyer's behaviour is also
influenced by the risk which the buyer perceives to be associated with the
149
C hapler Four
decision. If entrepreneurs feel that it is risky to adopt the new technology, it is
unlikely that they will do so.
4.3.5.5 Compatibility
This is the perception of entrepreneurs regarding the compatibility of the machine
with their existing production techniques. This can be viewed in term of
entrepreneurs' perception of the suitability of the new technology to the physical
and financial capabilities of the firms; and the ability of the technology to meet
whatever need prompts the innovation. Entrepreneurs who perceive that the
technology is compatible with their existing production techniques will be likely
to adopt it.
4.3.6 Entrepreneurs' Perception of the Buying Procedure
This is a function of entrepreneurs' experience of the related situation and their
attitudes in dealing with it. Entrepreneurs' perception of the buying situation is
influenced by the difficulties faced by them in dealing with buying procedures and
other related circumstances; searching for suppliers, negotiating with them and
obtaining a loan to finance the purchase is not a simple process for some
entrepreneurs.
The buying process may take time and can cause entrepreneurs to be
absent from their firms for a considerable period. As owner-operators in their own
firms, their absence is a problem for some small scale entrepreneurs, whose
150
Chapter Four
firms' operations are heavily dependent on them (UKM 1990). Entrepreneurs who
are relying on assistance from a financial institution to adopt a technological
innovation, may face difficulties in obtaining loans. Loan procedures normally
involve contracts and legal matters which are too complicated for some
entrepreneurs to handle. Entrepreneurs' perception of buying procedures can be a
barrier to innovation. In view of this, we hypothesise that entrepreneurs who
have difficulties in finding suppliers, negotiating with them, dealing with legal
matters, being absent from the firm for a long period and obtaining financing will
be less likely to adopt a technological innovation.
4.3.7 Environmental Factors
A firm is more likely to be an early adopter of new technology when it appears to
have a positive attitude to the collection and use of information on changes in its
environment. The influence of external factors on the decision making of firms is
called environmental influence. Some of the principal environmental influences
are (a) competitive intensity, and (b) institutional involvement.
4.3.7.1 Competitive Intensity
As Hannan and Mc Dowell (1987) and Reinganum (1981) stated that the
decisions of firms to adopt take account of not only the costs and benefits of the
innovation itself, but also the effects of competitors' adoption upon pre- and post
adoption profit rates. By witnessing the development of competitors' performance
as the result of adopting new technology small firms are motivated to adopt,
151
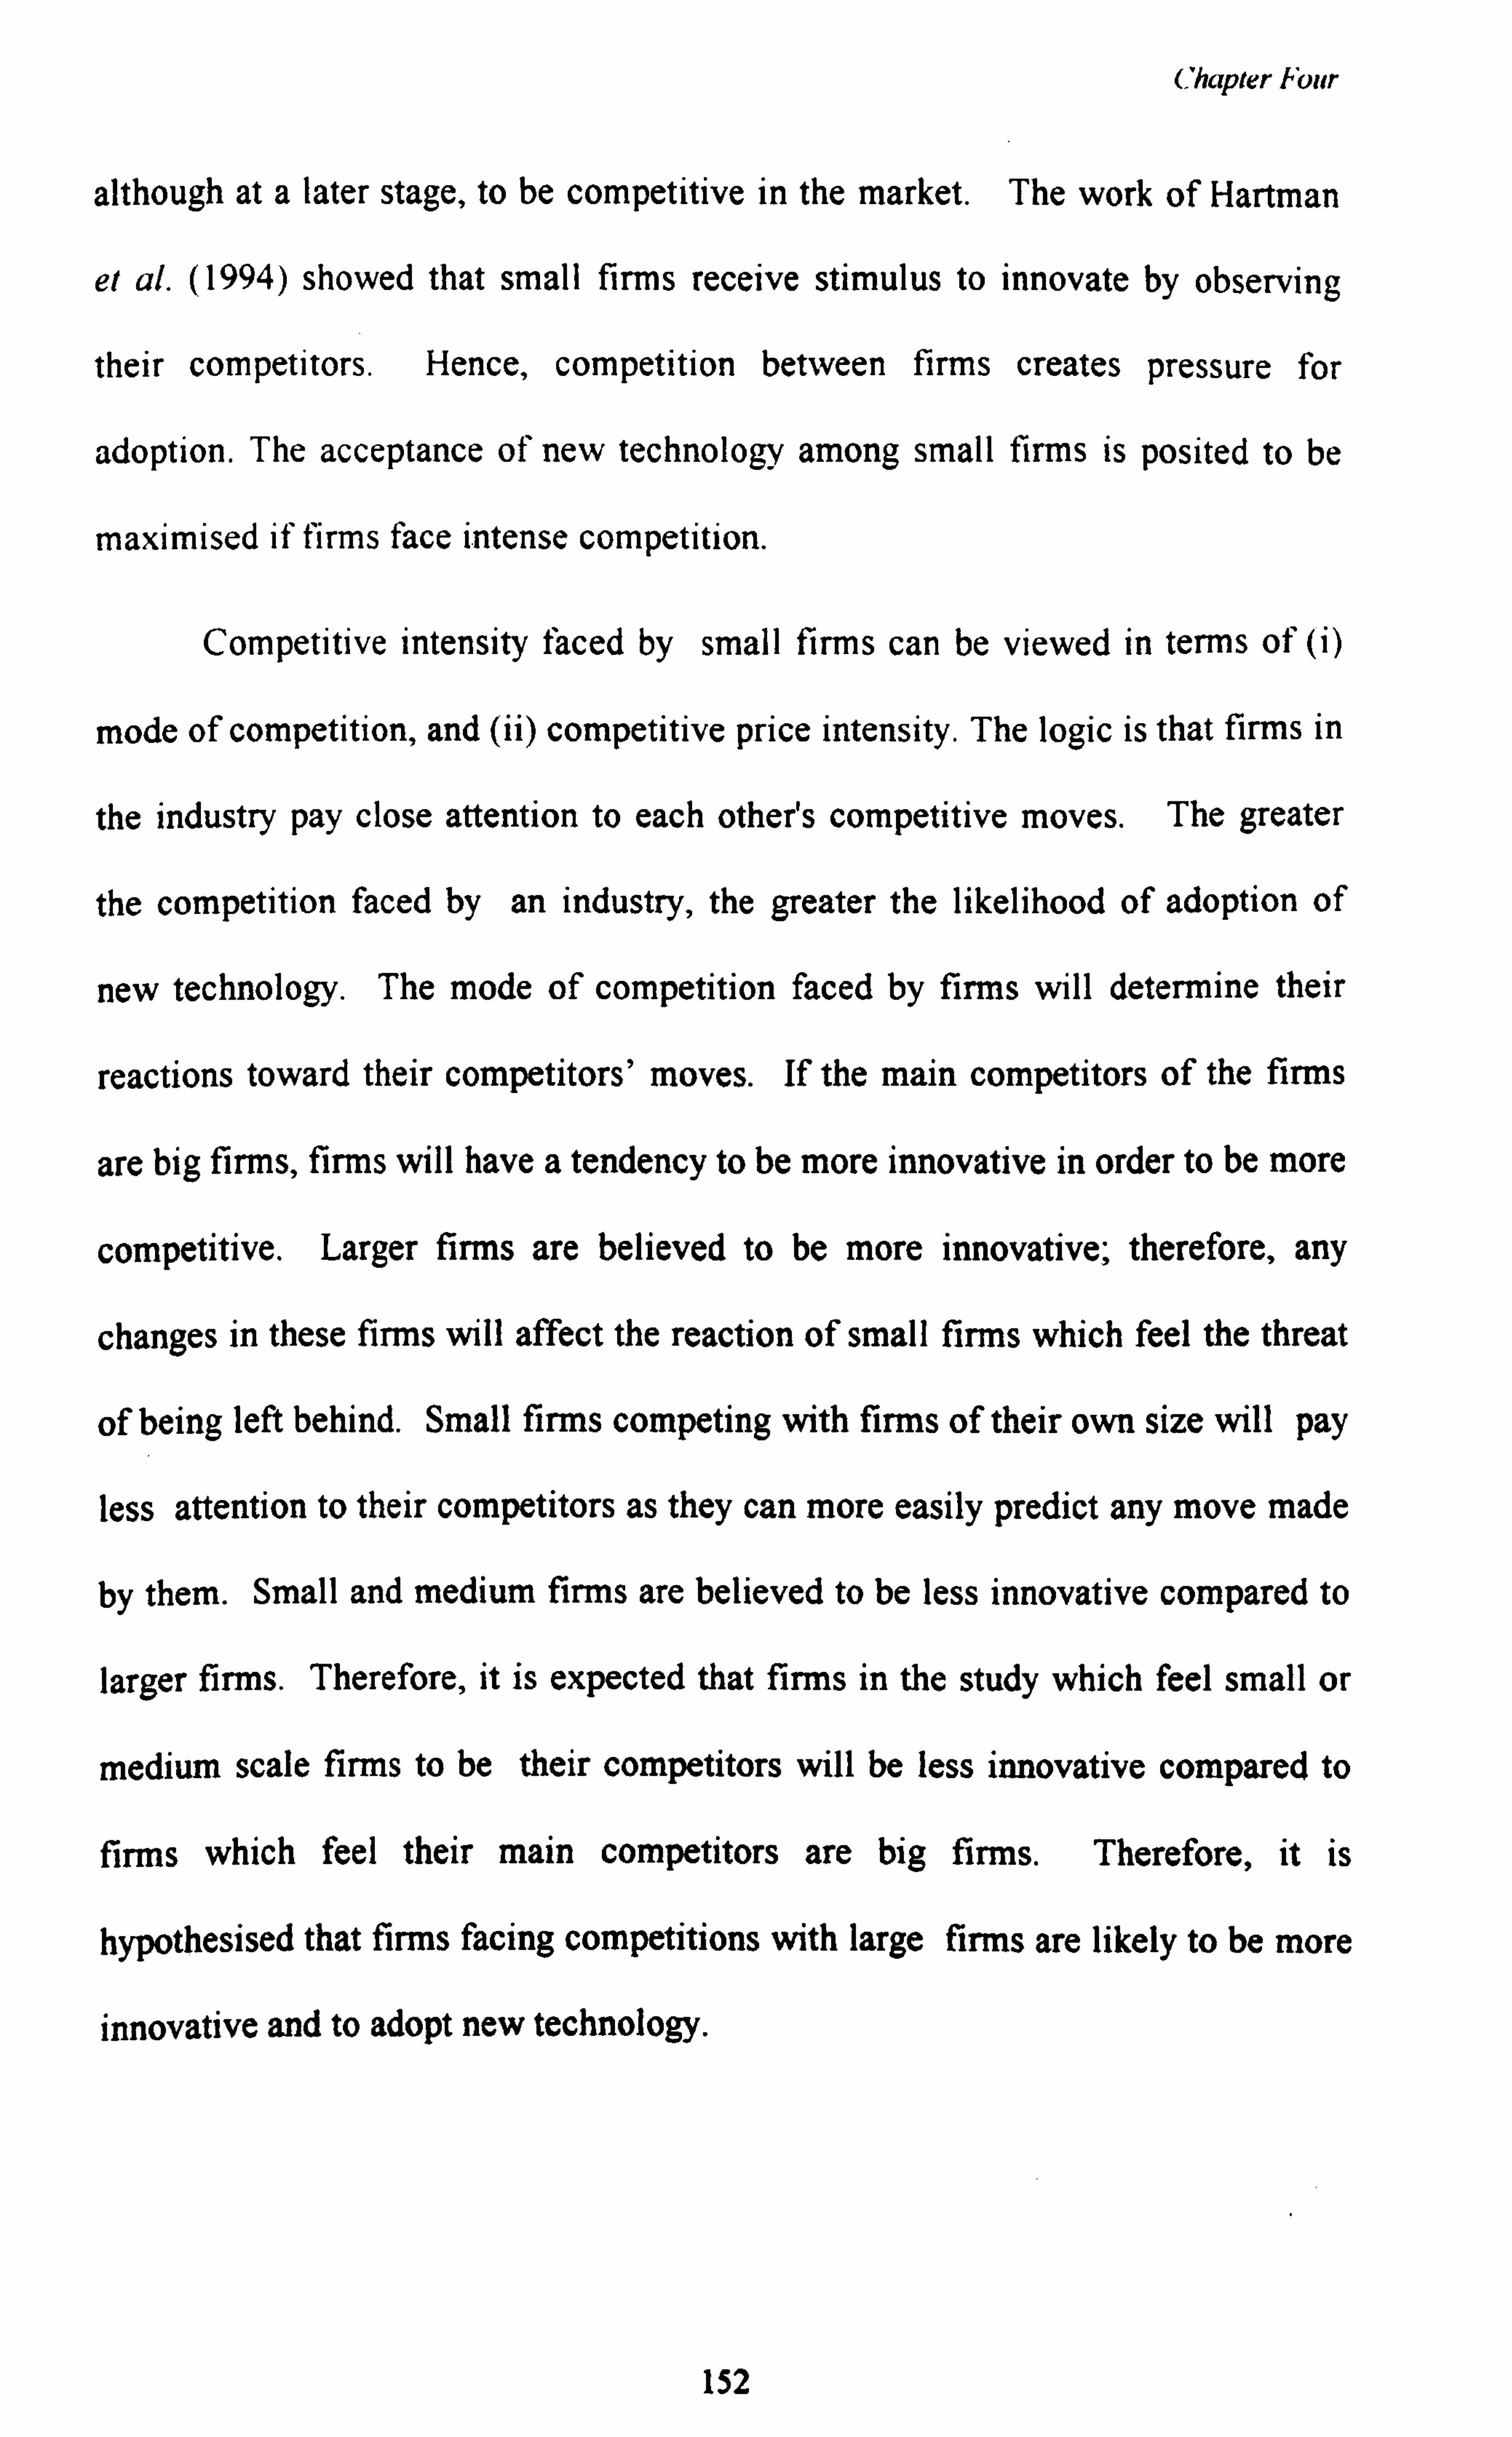
Chapter Four
although at a later stage, to be competitive in the market. The work of Hartman
et al. (1994) showed that small firms receive stimulus to innovate by observing
their competitors. Hence, competition between firms creates pressure for
adoption. The acceptance of new technology among small firms is posited to be
maximised if firms face intense competition.
Competitive intensity faced by small firms can be viewed in terms of (i)
mode of competition, and (ii) competitive price intensity. The logic is that firms in
the industry pay close attention to each other's competitive moves. The greater
the competition faced by an industry, the greater the likelihood of adoption of
new technology. The mode of competition faced by firms will determine their
reactions toward their competitors' moves. If the main competitors of the firms
are big firms, firms will have a tendency to be more innovative in order to be more
competitive. Larger firms are believed to be more innovative; therefore, any
changes in these firms will affect the reaction of small firms which feel the threat
of being left behind. Small firms competing with firms of their own size will pay
less attention to their competitors as they can more easily predict any move made
by them. Small and medium firms are believed to be less innovative compared to
larger firms. Therefore, it is expected that firms in the study which feel small or
medium scale firms to be their competitors will be less innovative compared to
firms which feel their main competitors are big firms. Therefore, it is
hypothesised that firms facing competitions with large firms are likely to be more
innovative and to adopt new technology.
152
Chapter Four
Some firms are more likely to compete on price than on other aspects of
marketing mix. It is expected that high competitive price intensity reduces
receptivity to innovation because the firms' financial resources are depleted
(Gatignon and Robertson 1989,1986). Therefore, the greater price intensity
within industry, the less likely the adoption of new technology.
4.3.7.2 Institutional Involvement
The distribution aspect of the technology defines who is to have access to the
innovation, in what way, and when. Institutions which are responsible for
diffusion of innovation are the major actors in the diffusion process. Their
diffusion strategies determine not only what segments of the population under
study are to have access to the innovation, but also the subjective aspects of the
innovation associated with the potential adopters' perception about their diffusion
agencies (Brown 1981). Small firms have greater tendency to rely on external
sources, especially institutions for the acquisition of technical knowledge
(Variyam and Kraybill 1993). Malaysian Agricultural Research Development
Institute (MARDI) is responsible for developing production processes in small
scale FPI in Malaysia. MARA conducts management courses and motivation
courses which are believed will indirectly influence the innovative behaviour of
entrepreneurs. It is believed that entrepreneurs' involvement with these
institutions and other government agencies influence their ability to adopt
technological innovation.
153
Chapter Four
4.4 Summary
The conceptual framework which has been developed to explain firms'
behaviour in the buying decision, can be appropriately adapted to develop a
conceptual framework of small firms' decision to adopt new technology. We
have considered a number of factors which are likely to influence entrepreneurs'
adoption decision. These factors can be internal or external to firms and their
relationship to the adoption decision is presented in Figure 4.2. Internal factors
which are likely to influence small firms' adoption decisions are entrepreneurs'
characteristics, organisational characteristics, communication and the perceived
characteristics of new technology. External factors which are considered in this
conceptual framework are competitive intensity and institutional involvement.
154
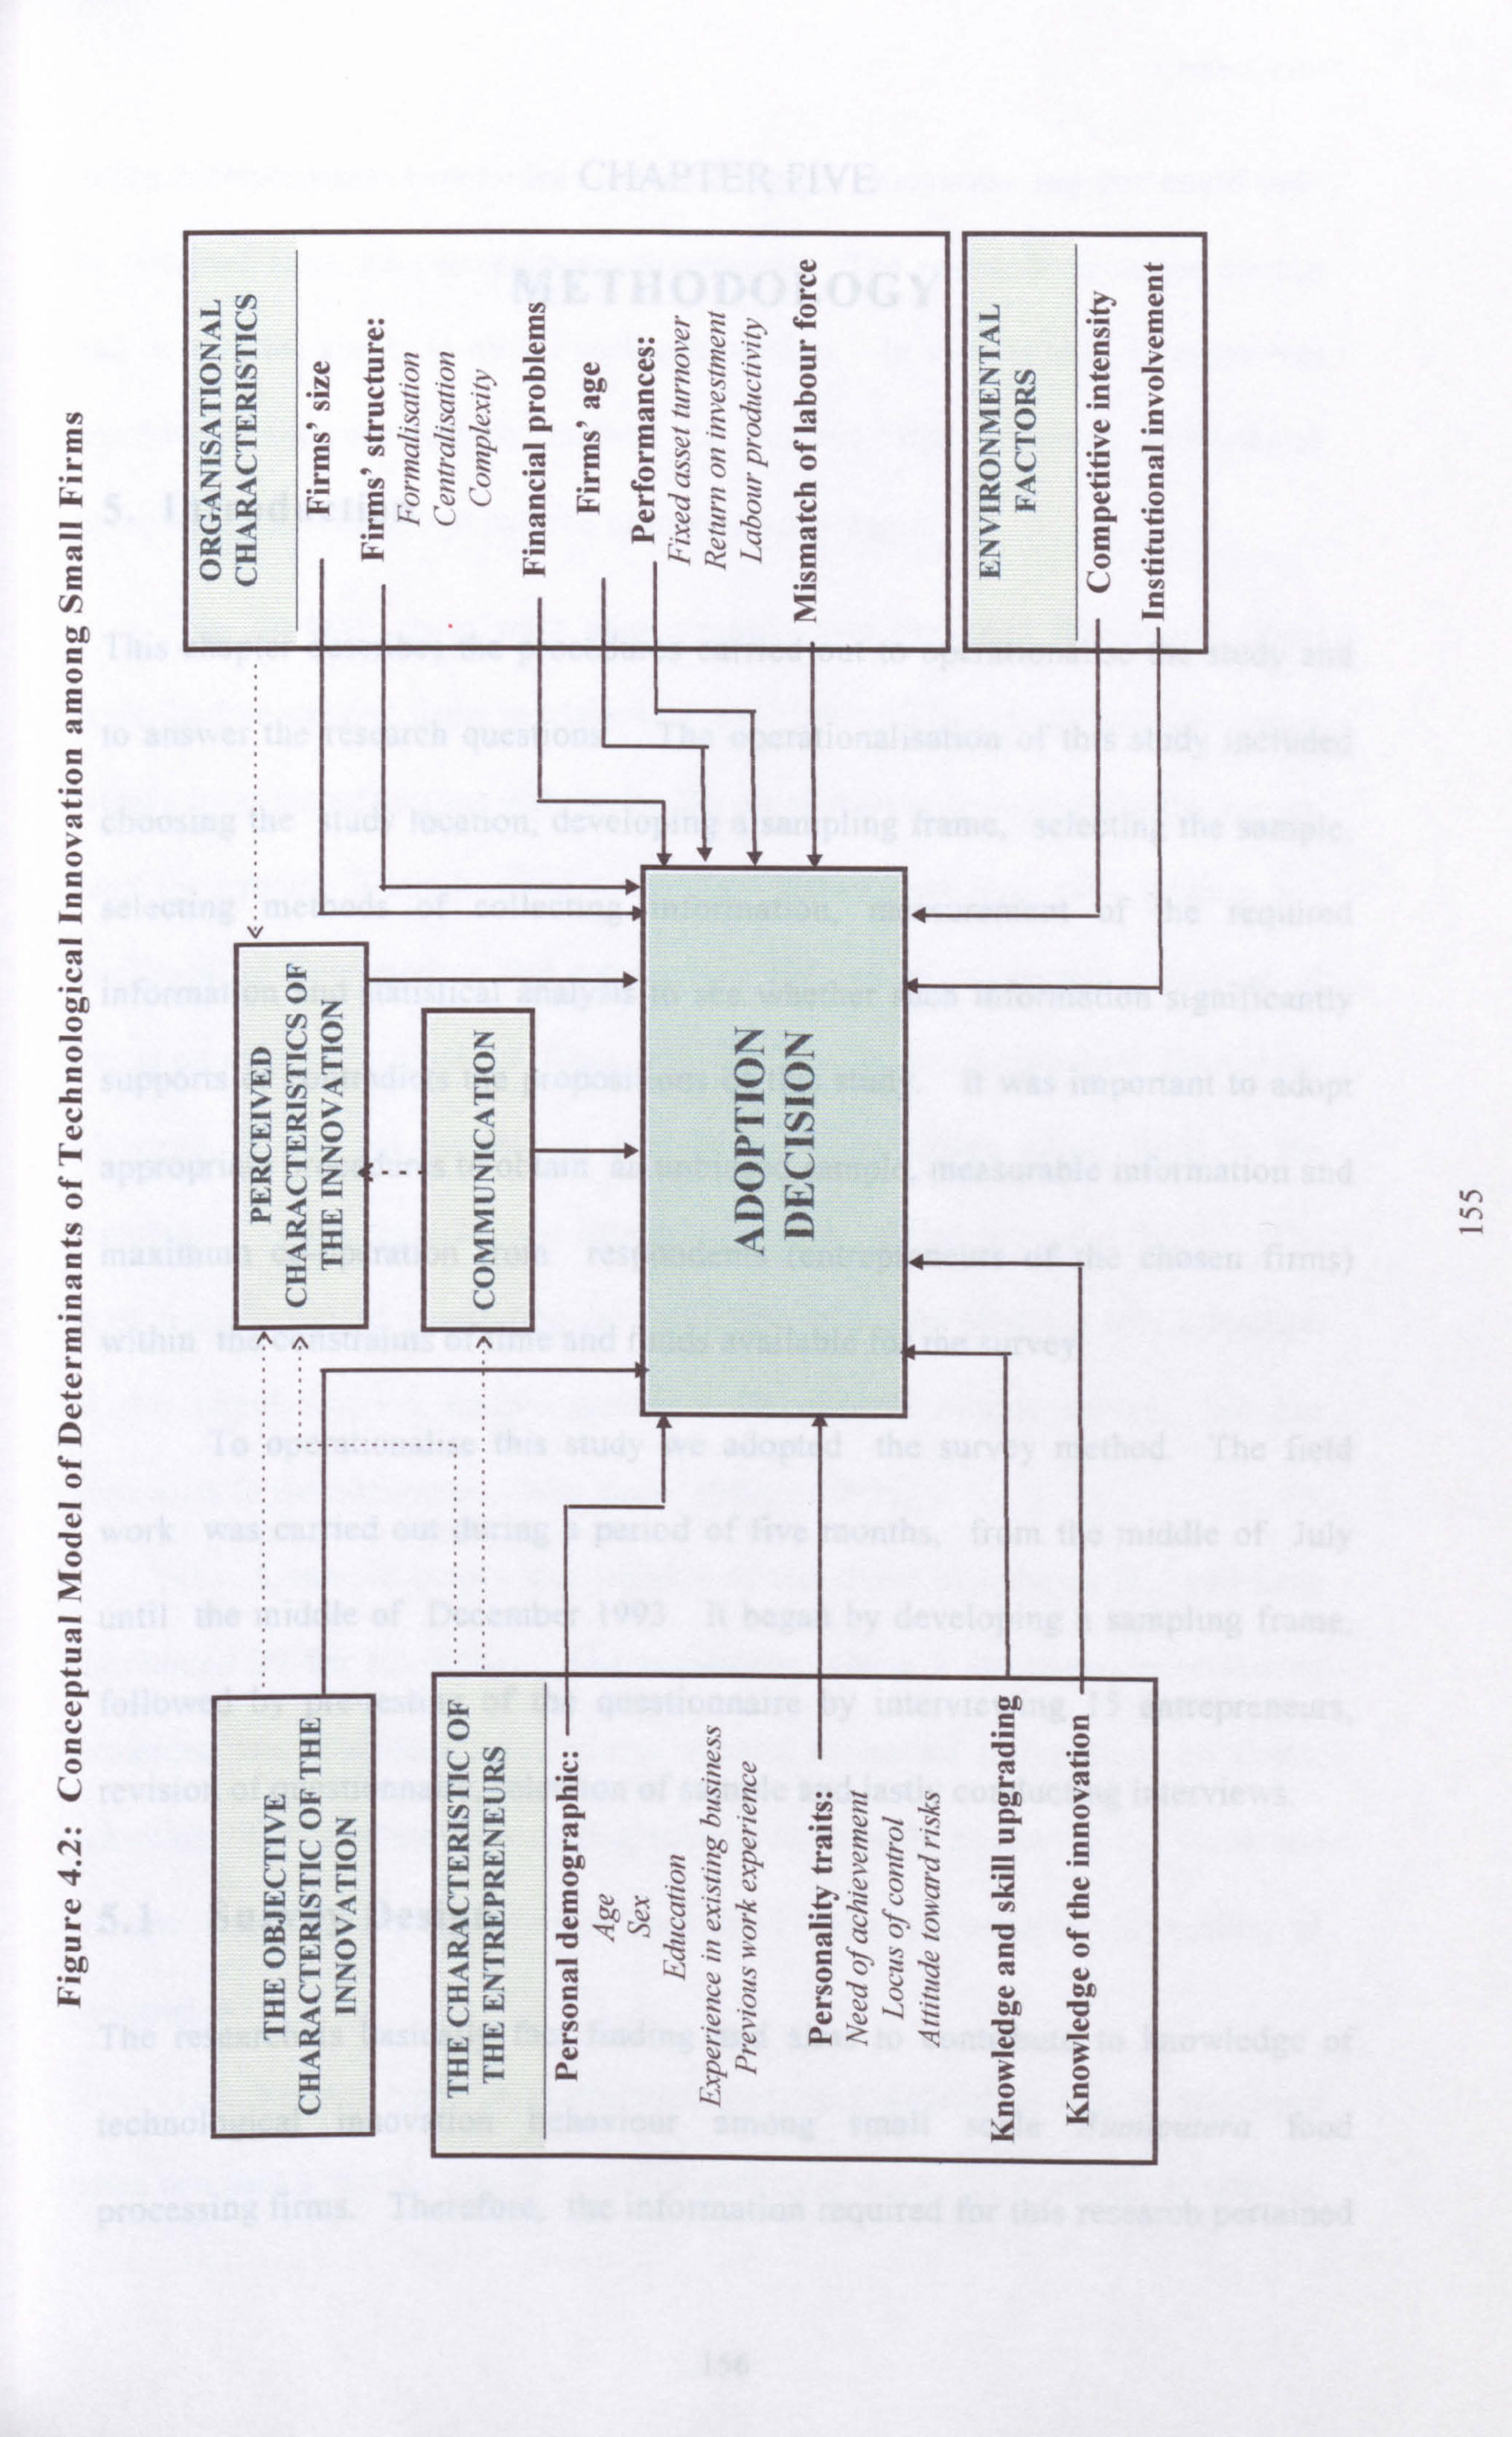
N 14 V L
bfi
C/ý
V Z'
y
6r
O V' C . ̂ý. .G
6ý e6rj
O J
ö z V1 +'
"" .ý u O Cý of Gal CG C O >
r y i ß Z Ö Z U i E
'- ý . O U
a Gs . tx G L ' v Z
V
L L
GL Oz vý z Z ý
UwZ ccvz -
U -z
`ý U
aw. ýw ý Q ä
ZF Q U U
!ýn
- --- ---
n
-------
w Gz. O o
F U yy _O ý'
>Oz 22 UJ :: 2 '
" ý' V Fý f
�ý2 Q
F cý
UC o qj
p"'
c
,-
ry
ke
y öý Z
ý u i
0 ý ,
` Qw ý. w s ,� :Zy r c o wUzQ
cj
W
6C ^
ö, ý
LyJ4- d o,
Zi v
ýx Q W
Wz ä Q. Q 3 Z ýF ß. ý ö C V x
kr)
CHAPTER FIVE
METHODOLOGY
. 5. Introduction
This chapter describes the procedures carried out to operationalise the study and
to answer the research questions. The operationalisation of this study included
choosing the study location, developing a sampling frame, selecting the sample,
selecting methods of collecting information, measurement of the required
information and statistical analysis to see whether such information significantly
supports or contradicts the propositions of this study. It was important to adopt
appropriate procedures to obtain an unbiased sample, measurable information and
maximum co-operation from respondents (entrepreneurs of the chosen firms)
within the constraints of time and funds available for the survey.
To operationalise this study we adopted the survey method. The field
work was carried out during a period of five months, from the middle of July
until the middle of December 1993. It began by developing a sampling frame,
followed by pre-testing of the questionnaire by interviewing 15 entrepreneurs,
revision of questionnaire, selection of sample and lastly conducting interviews.
5.1 Survey Design
The research is basically fact finding and aims to contribute to knowledge of
technological innovation behaviour among small scale Bumiputera food
processing firms. Therefore, the information required for this research pertained
156
Chapter Five
to the entrepreneurs' experience in technological innovation and this could only
be obtained from the entrepreneurs themselves. The research technique chosen
had to have the ability to obtain such information. In view of this, a survey was
considered the appropriate method to achieve that purpose. Information
gathering by survey design had the following advantages:
(a) In 1989, there were approximately two thousand Bumiputera small
scale food processing firms in Malaysia (MITI 1992). The type of business varied
widely from manufacturing snacks for the local market to manufacturing instant
food for export. Their level of technology also varied from fully manual and
traditional to fully modern and mechanised methods of production. Because of
the geographical location of firms, and their scattered distribution throughout
Malaysia, it was not feasible to conduct an investigation of all firms in the
population. This research was conducted within limited time and funds. The
most feasible way of conducting the investigation was by studying only a fraction
of this population -a sample survey. By using a sample survey, we can
generalise to the population under study (Miller 1991).
(b) A sample survey was suitable to test those hypotheses that had been
formulated by the researcher. The researcher chose a structured interviewing
technique with standard form (questionnaire) to gather information on firms.
Adoption of a standard questioning technique as well as employing valid and
reliable measurement of variables facilitated statistical analysis for testing of
hypotheses.
(c) Various types of information gathering techniques can be employed
when one uses a sample survey. For this particular study, for example, in addition
157
Chapter Five
to conducting structured interviews, we also used observation and informal
interview and discussion with entrepreneurs.
5.2 Research Location
Malaysia comprises 14 states of which 12 are situated in the Peninsula and the
other two states are situated in the northern part of the island of Borneo. Due to
this geographical location and the history of formation of Malaysia in 1963, the
division of Malaysia usually referred to are not the states, but its three main
regions, namely Peninsular Malaysia, Sabah and Sarawak.
The population of Malaysia is approximately 18 million, and
approximately 80 per cent of them reside in Peninsular Malaysia. In terms of
distribution of small firms, 89 per cent of small firms are located in Peninsular
Malaysia (MITI 1992). In view of this background, we chose Peninsular Malaysia
as the study area.
5.3 Sampling Technique
5.3.1 Population
The population of the study is small-scale Bumiputera food processing firms that
had been operating for at least last five years and had adopted or considered
adopting a technological innovation during the last three years (after 1989)'.
' We assumed that firms which are five years old or more had innovate had a greater tendency to improve their production by adopting new machine.
158
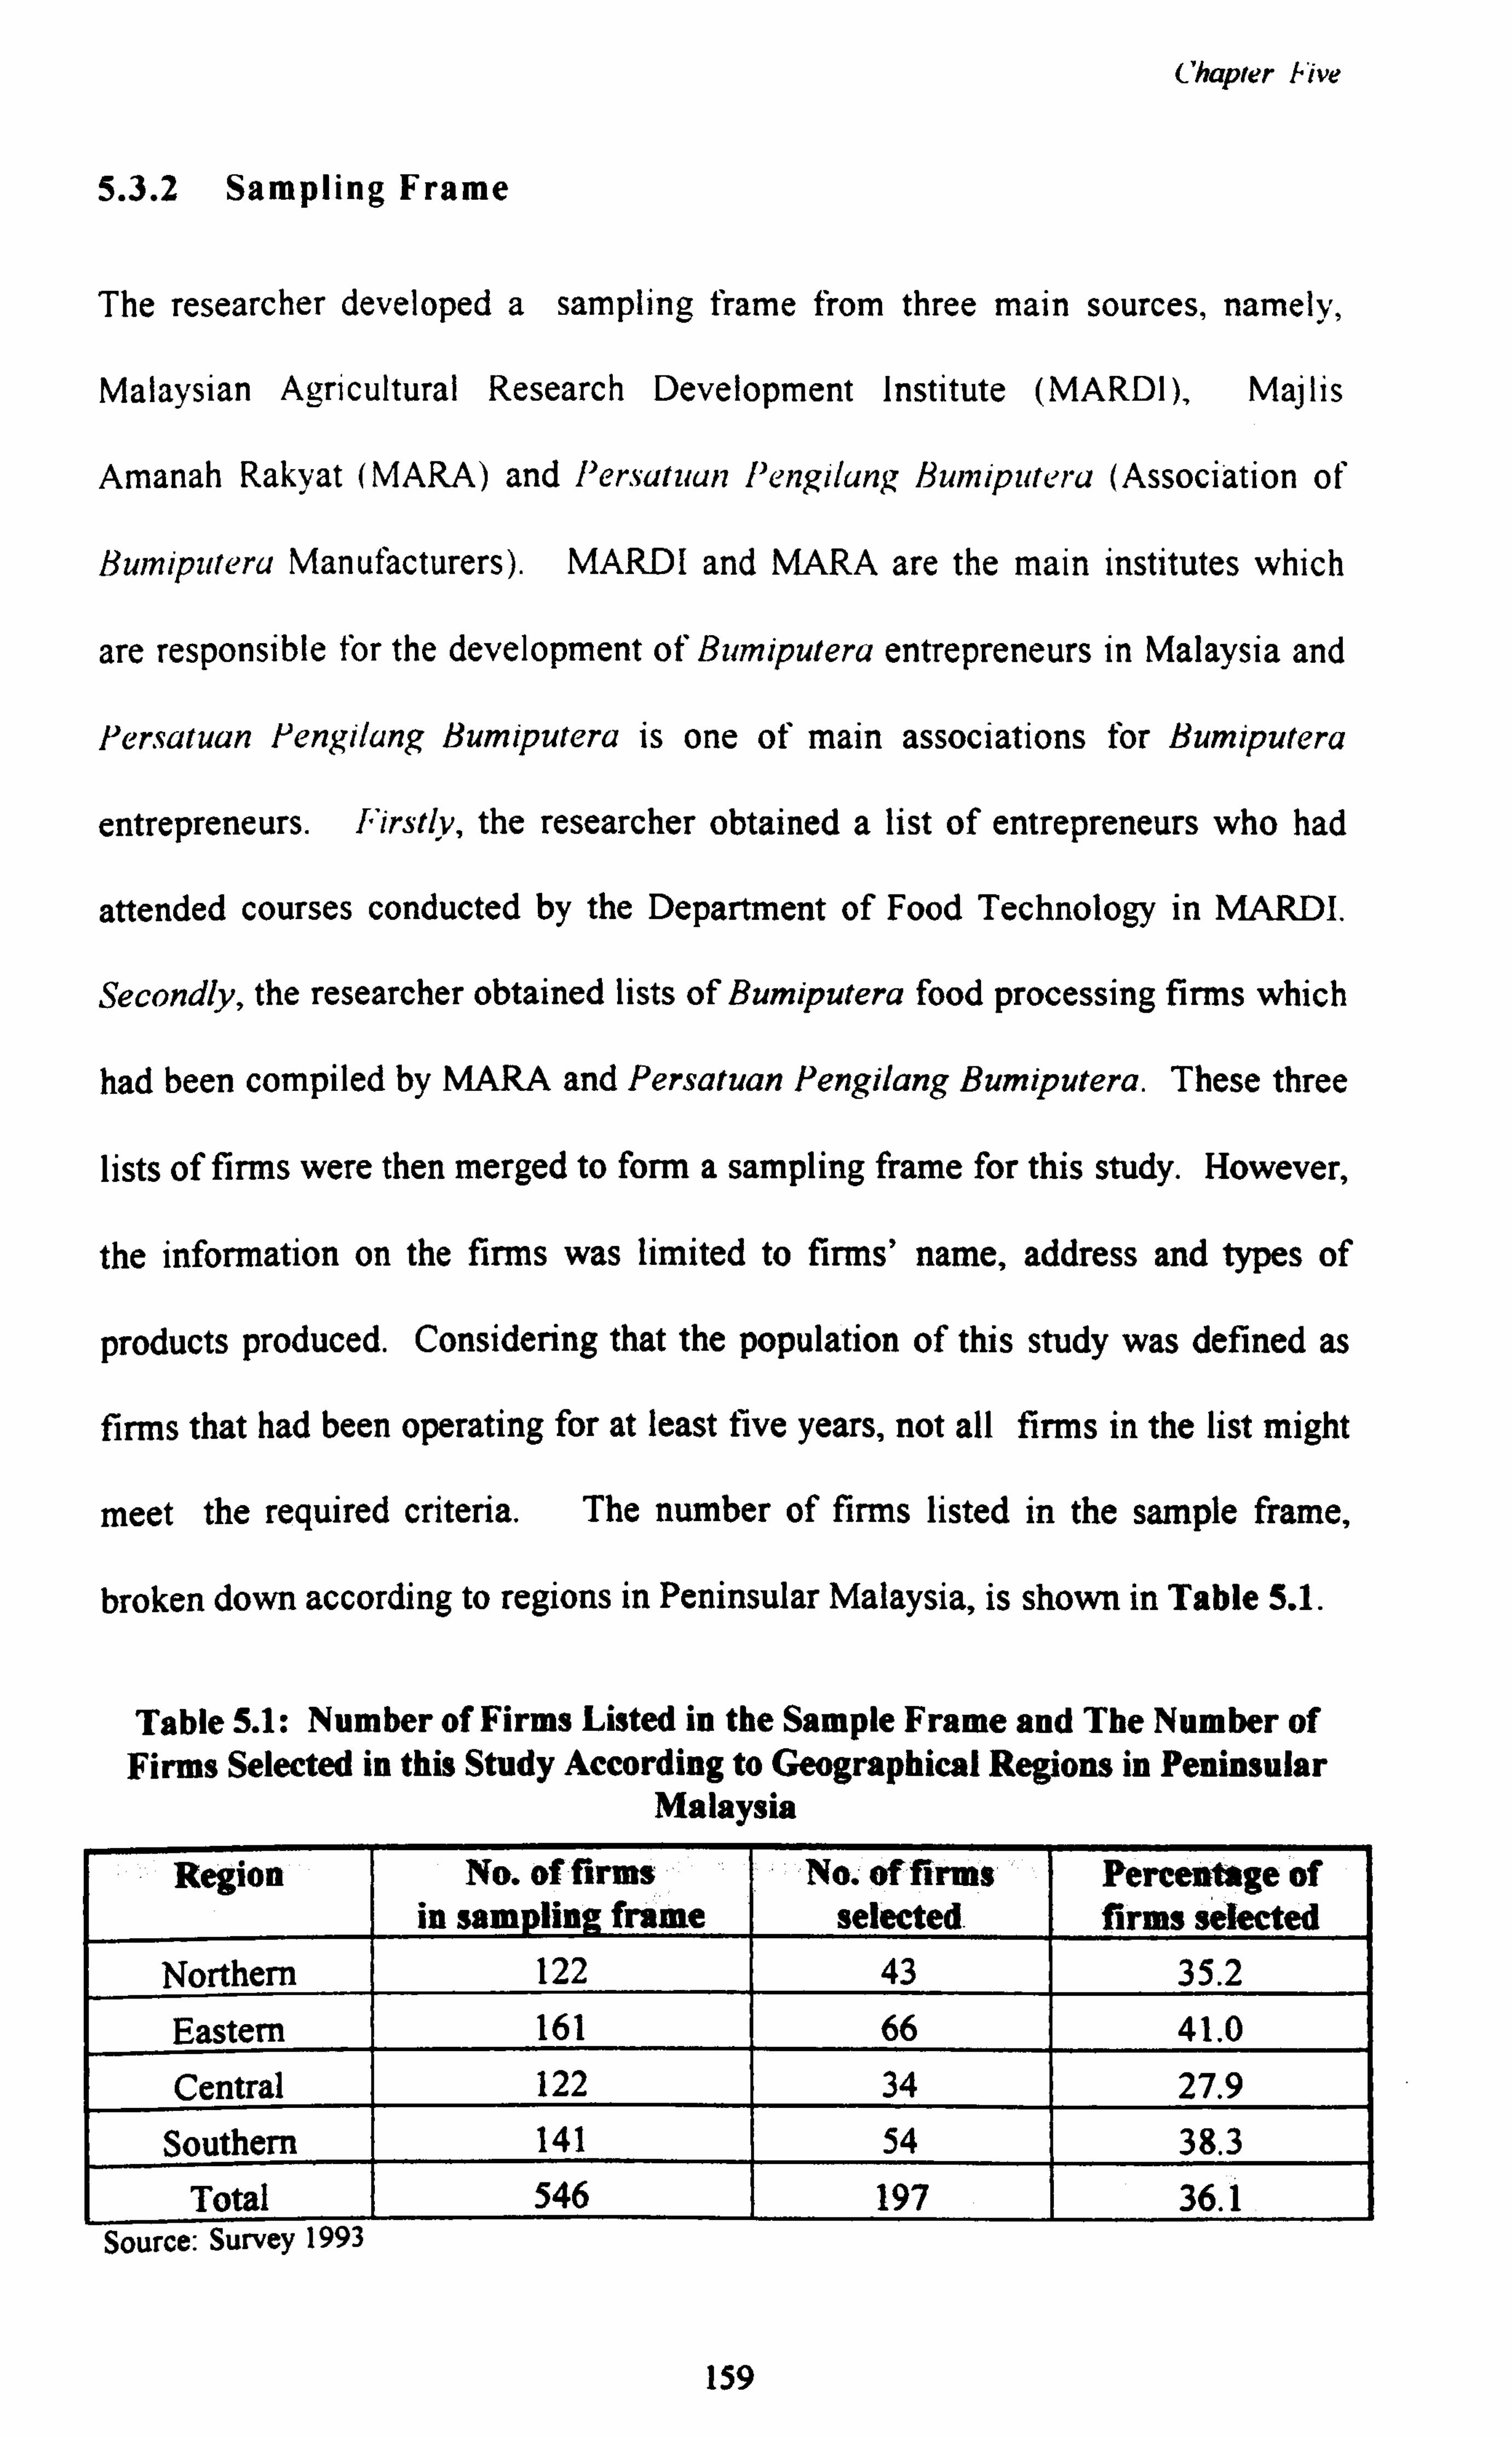
Chapter hive
5.3.2 Sampling Frame
The researcher developed a sampling frame from three main sources, namely,
Malaysian Agricultural Research Development Institute (MARDI), Majlis
Amanah Rakyat (MARA) and Persutuun Pengilung Bunziputeru (Association of
Bumiputeru Manufacturers). MARDI and MARA are the main institutes which
are responsible for the development of Bumiputera entrepreneurs in Malaysia and
fersatuan Pengilang Bumiputera is one of main associations for Bumiputera
entrepreneurs. Firstly, the researcher obtained a list of entrepreneurs who had
attended courses conducted by the Department of Food Technology in MARDI.
Secondly, the researcher obtained lists of Bumiputera food processing firms which
had been compiled by MARA and Persatuan Pengilang Bumiputera. These three
lists of firms were then merged to form a sampling frame for this study. However,
the information on the firms was limited to firms' name, address and types of
products produced. Considering that the population of this study was defined as
firms that had been operating for at least five years, not all firms in the list might
meet the required criteria. The number of firms listed in the sample frame,
broken down according to regions in Peninsular Malaysia, is shown in Table 5.1.
Table 5.1: Number of Firms Listed in the Sample Frame and The Number of Firms Selected in this Study According to Geographical Regions in Peninsular
Malaysia
Region No. of firms in sampling frame
No. of firms selected.
Percentage of firms selected
Northern 122 43 35.2
Eastern 161 66 41.0 Central 122 34 27.9
Southern 141 54 38.3 Total 546 197 36.1
Source: Survey 1993
159
Chapter Hive
5.3.3 Sample Selection
Based on this sampling frame, the researcher used a purposive sampling
technique, by identifying towns in the regions that had the greatest number of
firms. These firms were selected for interview. However, not all the considered
firms could be interviewed by the enumerators (the researcher and field workers).
This was due to two main reasons. Firstly, it was not possible to locate some
firms, as they had already moved to other places or the firms had closed down.
Secondly, some firms did not fulfil the criteria of a respondent. The researcher
and field workers successfully interviewed 197 firms, that is, 36.1 per cent of all
firms listed in the sampling frame (refer to Table 5.1). This percentage might
seem small and one may question its representativeness of the population
specified. To examine the representativeness, the characteristics of the firms
selected in this study were compared with those characteristics of small firms
which had been widely quoted by past researches and MITI of Malaysia. The
researcher used types of organisation, number of workers and level of
mechanisation as the basis of comparison between this study and studies
conducted by MITI (1992), UKM (1990) and Mohd and Shaari (1988). The
outcome can be observed in Table 5.2.
As exhibited in Table 5.2 small firms surveyed by these three researches
and surveyed by this study revealed similar characteristics. The majority of
Bumiputera food processing firms were sole proprietors and had less than 5
full-time workers. In terms of their level of mechanisation of processing
technique, the majority were semi-mechanised.
160
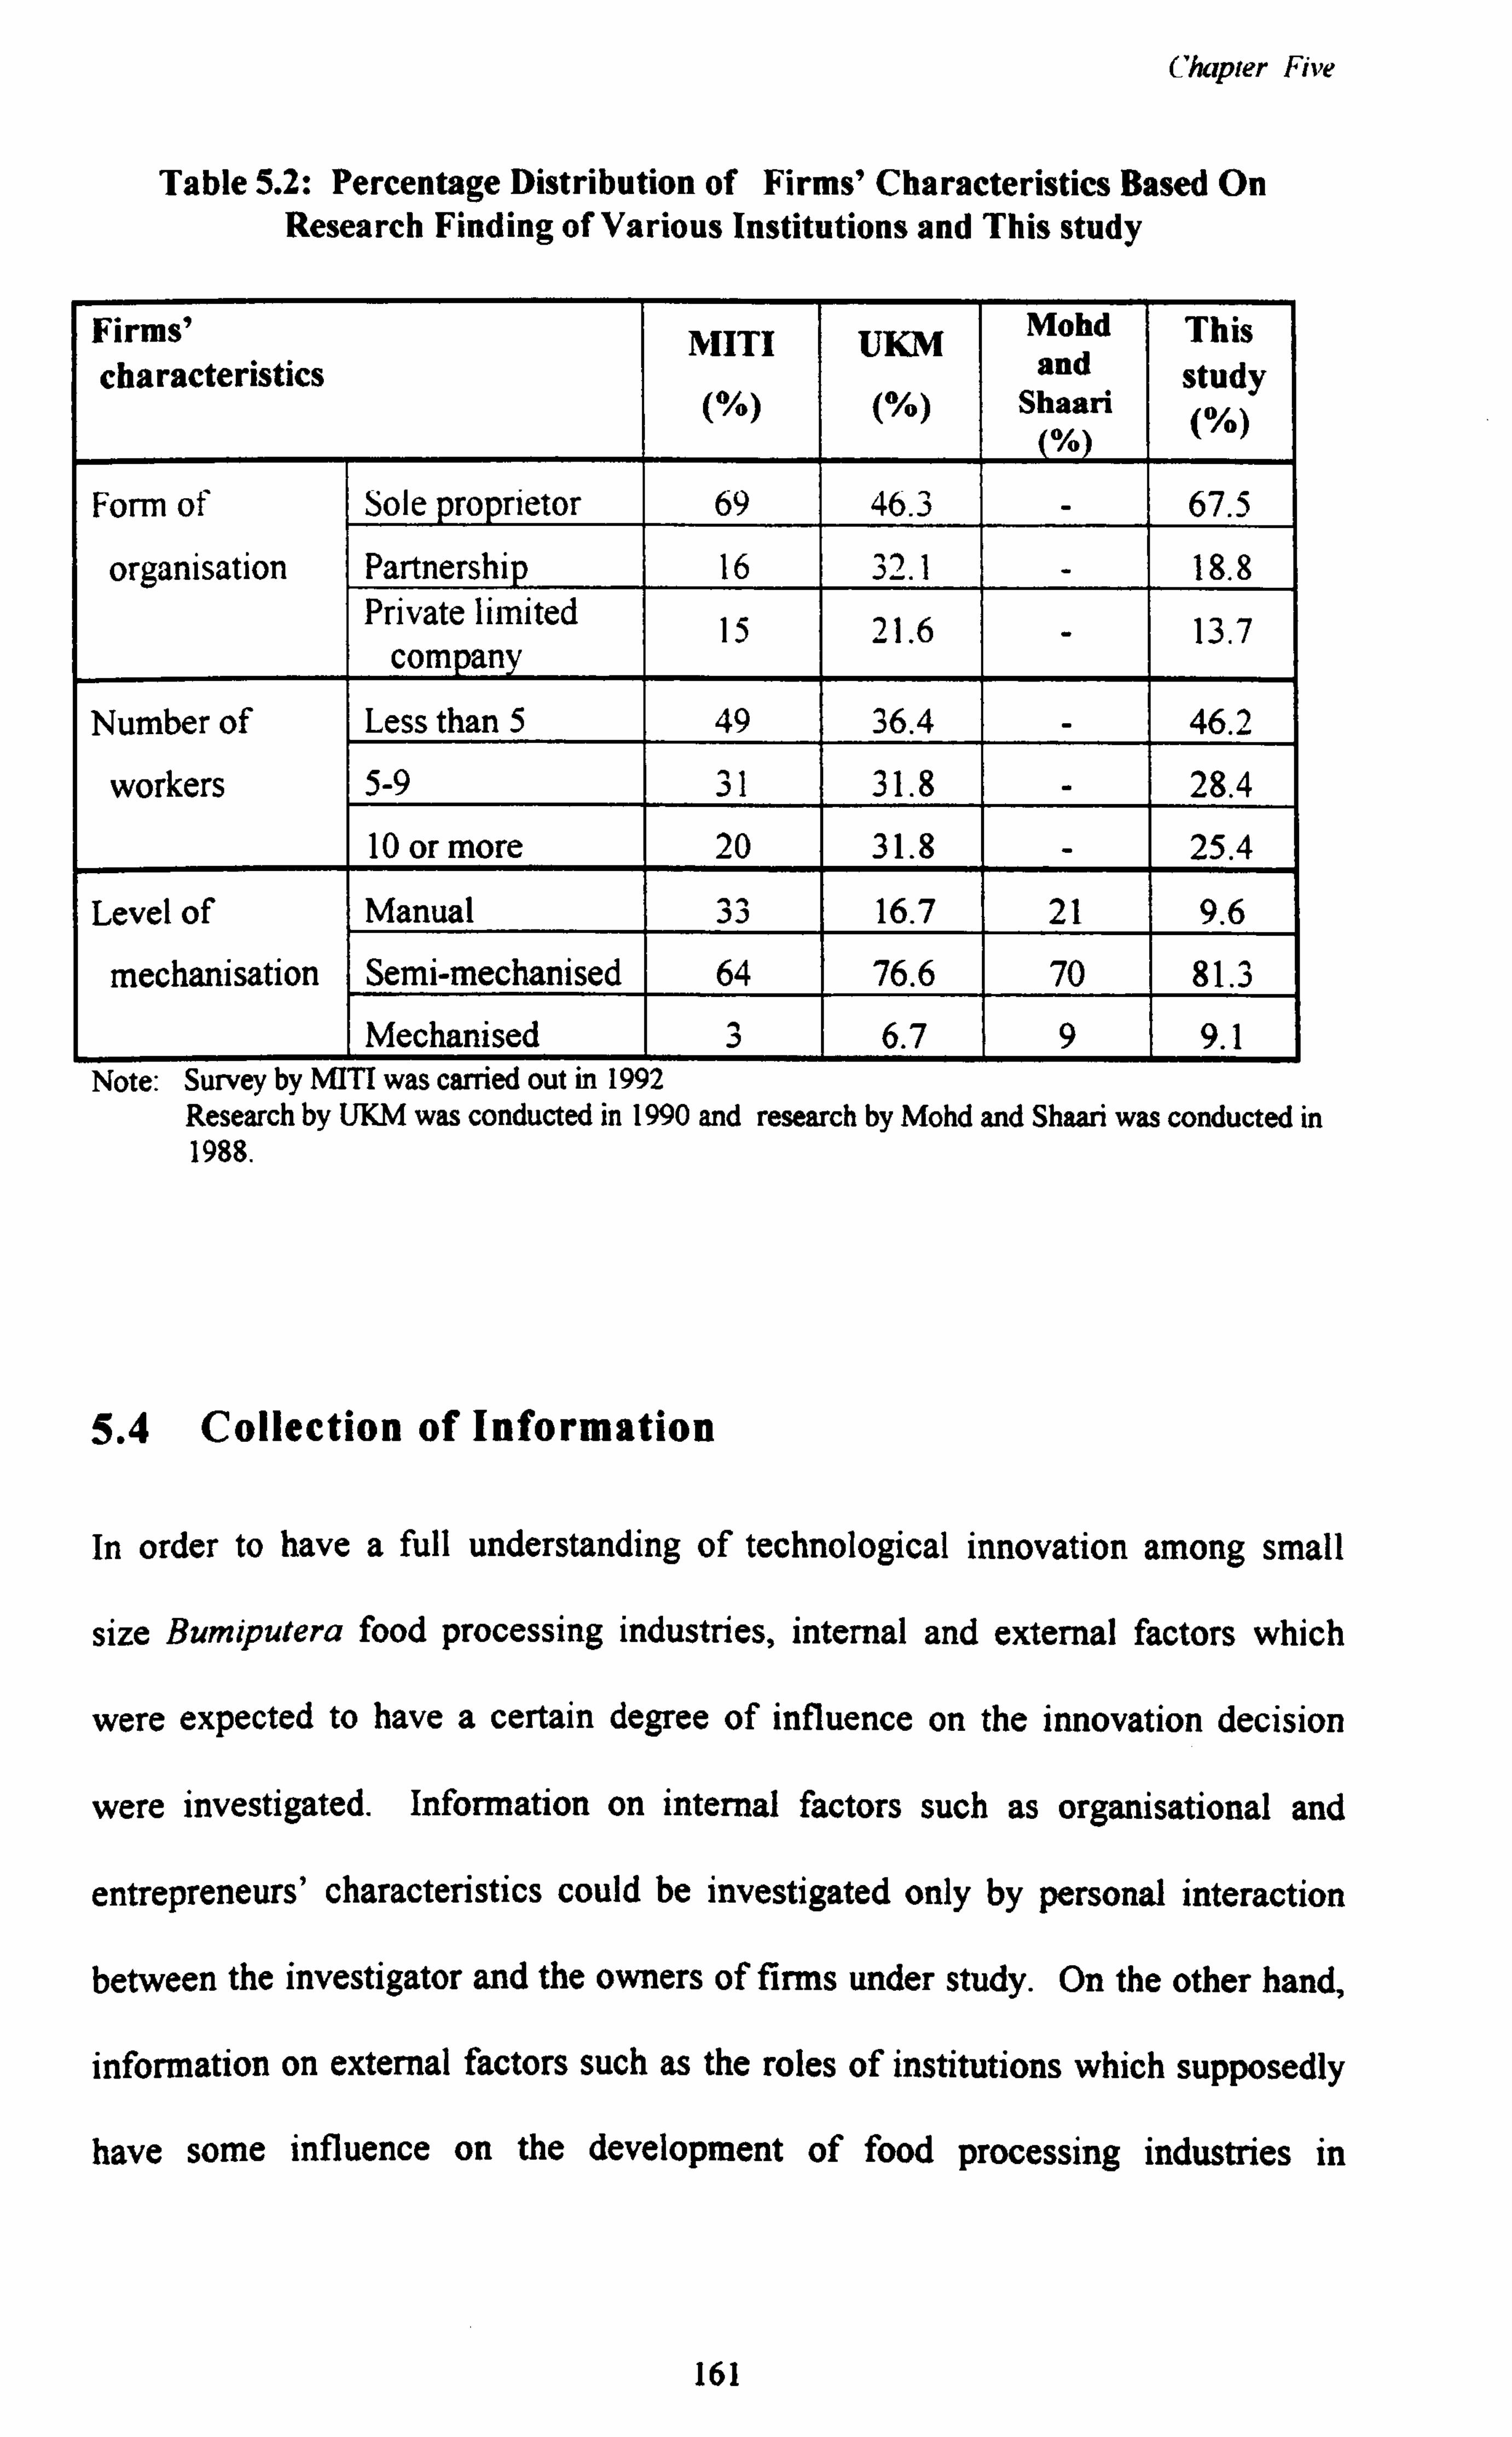
Chapter Five
Table 5.2: Percentage Distribution of Firms' Characteristics Based On Research Finding of Various Institutions and This study
Firms' characteristics
MITI UKM Mohd and
Shaari
This
study 0
Form of Sole proprietor 69 46.3 - 67.5
organisation Partnership 16 32.1 - 18.8 Private limited
company 15 21.6 - 13.7
Number of Less than 5 49 36.4 - 46.2
workers 5-9 31 31.8 - 28.4
10 or more 20 31.8 - 25.4
Level of Manual 33 16.7 21 9.6
mechanisation Semi-mechanised 64 76.6 70 81.3
Mechanised 3 6.7 9 9.1 Note: Survey by MITI was carried out in 1992
Research by UKM was conducted in 1990 and research by Mohd and Shaari was conducted in 1988.
5.4 Collection of Information
In order to have a full understanding of technological innovation among small
size Bumiputera food processing industries, internal and external factors which
were expected to have a certain degree of influence on the innovation decision
were investigated. Information on internal factors such as organisational and
entrepreneurs' characteristics could be investigated only by personal interaction
between the investigator and the owners of firms under study. On the other hand,
information on external factors such as the roles of institutions which supposedly
have some influence on the development of food processing industries in
161
Chapter Five
Malaysia, could only be obtained through interactions of researcher and the
officers concerned and through investigation of documents published by those
institutions. Thus, the types of information needed to conduct this research
influenced the choice of information collection techniques.
Three basic techniques of information collection were used in this study.
These techniques were (a) structured interviews with the entrepreneurs of the
selected firms, (b) unstructured interviews with officers of government agencies
that provide assistance to food processing firms, and (c) a detailed study of
documents published by various institutions that provide information on food
processing industries in Malaysia.
For the structured interview, we used a questionnaire to administer the
questions put during the course of the interview. The questionnaire was written in
the Malay language (an English translation is given in Appendix II). The
interviews did not depart from the questions shown in the questionnaire, except on
occasion to the extent that some rephrasing was necessary in order to clarify them.
The questionnaire had been previously tested by the researcher by interviewing 15
entrepreneurs to examine the appropriateness of the questions asked and the
method of measurement of the information provided by them. Because of the large
number of firms and their widely scattered location, the researcher hired five field
workers to assist her in conducting the interviews. During the period of this field
work, she conducted 30 interviews (inclusive of interviews for questionnaire pre-
testing) and the rest of the respondents were interviewed by the five field workers.
These field workers were final year UKM undergraduate students from the
Faculty of Management Studies. They were selected on the basis of their previous
162
Chapter Five
experience of conducting interviews in survey research. These field workers
were then given training for two days and provided with a research manual to
familiarise them with the questions in the questionnaire. This training emphasised
how to identify and approach respondents, interviewing technique and
questionnaire administration. Each interview section took 2 to 3 hours. The
collection of information by interviewing and administering structured
questionnaires to all the 197 respondents took place from early September to the
end of November 1993.
5.5 Definitions
5.5.1 Technological innovation
This study defines technological innovation as the adoption of new technology in
firms' processing technique (please refer to Chapter Four, section 4.1 for concept
of innovation adopted in this study). Although technology is a much wider
concept than this, for our purposes we have defined technology as machinery
new to the firms in this study, adopted to improve their production process during
the past three years from the time the survey was conducted. Because the firms
in this study did not produce the same type of food products, the machinery
adopted or considered for adoption by the entrepreneurs may vary in nature,
function and value. However, the machine adopted or considered for adoption by
the entrepreneurs were perceived as new by them, and the aim of adopting was to
improve performance.
163
Chapter Five
5.5.2 Level of Innovativeness
Firms' level of innovativeness was measured in two categories: innovative and
non-innovative. Innovative firms are firms which had already adopted at least
one new process technology, embodied in a new machine, after 1989. Since this
study was conducted at the end of 1993, innovative firms were firms which
adopted at least one new process technology within the period 1990 - 1993 (4
years). We refer to the entrepreneurs of these firms as innovative entrepreneurs.
Non-innovative firms are firms which did not adopt any new process technology
during that period although they had considered doing so. The entrepreneurs of
non-innovative firms are referred to as non-innovative entrepreneurs.
We recognised the limitation of using a period of time to measure firms'
level of innovativeness such as its inability to capture firms which had innovated
prior to the time period (1989 or before). Recalling that firms in this study were
firms which had considered adopting a technological innovation, however, only a
proportion of them had actually adopted the considered innovation. Hence,
compared with firms which were unable or unwilling to adopt, the fact of firms
successfully adopting a technological innovation to some extent reflects their
innovative behaviour (bear in mind that small firms faced financial and physical
constraints which act as barriers to technological innovation). Furthermore, if
innovativeness is a persistent characteristic of firms, it may be that innovativeness
as measured between year 1989 to 1993 (4 years) is a good proxy.
164
Chapter Five
5.5.3 Firms' Size
There is no standard procedure for measuring firms' size in Malaysia. Different
government agencies have adopted different methods of measurement. For
example, the Coordinating Council for Development of Small and Medium
Industries (CCDSI) used firms' fixed asset and paid up capital to indicate their
size. This agency defined SMIs as those which have fixed assets of less than
RM250,000 (about £62,500). Small industry was defined differently for
Bumiputera-owned firms and non-Bumiputera owned firms. Bumiputera-owned
firms, were considered small if the paid up capital did not exceed RM200,000
(about £50,000). For non-Bumiputera firms, the criterion level was only
RM100,000 (about £25,000). Finally the original provision of the Industrial
Coordinating Act exempted SMIs from applying for a licence if they had less than
RM250,000 in shareholders' funds and employed fewer than 25 full time workers
(Chee 1986)
In this study we define the size of a firm by its number of full time
workers. Small firms are defined as firms employing less than 50 full time
workers in 1989; medium firms are firms which employed 50 to 199 workers and
large firms as those which employed 200 or more full-time workers, in 1989. We
pointed out in Chapter Four that there might be some dispute over causal direction
if a correlation was found between size and innovativeness. It will be noted that
the lag between the date of measurement of size and the period of measurement of
innovativeness makes it more likely that the direction of causation is from size to
innovation.
165
Chapter Five
5.5.4 Entrepreneurs
The term entrepreneur in this study refers to a person or small group of persons
who have owned and managed the existing business for more than five years and
stand to gain or lose significant financial reward based upon the success or failure
of that business. This includes the main shareholder of the business who actively
manages it and takes part in major decision making. Managing the business is
their main economic activity. Entrepreneurs as so defined, are the respondents of
this study.
5.6 Measurement of Variables
The questionnaire consisted of six sections. The first section was on the firms'
background. The second and the third sections concerned firms' machines and the
procedures of acquiring the latest machine or the considered machine (for
entrepreneurs who had not adopted any machine after 1989 until the filed work of
this study was conducted). The fourth section covered firms' economic
performance. Section five investigated the entrepreneurs' background, while the
sixth section was about the entrepreneurs' personality traits. The sample of the
questionnaire (which had been translated) used in this study is exhibited in
Appendix II.
Several types of scales were used to measure variables, depending on their
appropriateness. The following is a description of scales used in measuring
variables considered in the conceptual framework. One of the main issues in the
study of choice behaviour is the assurance of the existence of a relatively unique
166
Chapter Five
numerical scale which in some sense represents the choice behaviour of
respondents. The questionnaire developed was believed to have the ability to
measure the behaviour and the perception of entrepreneurs in the study.
5.6.1 Innovativeness
Firms innovativeness was measured by whether or not the firms had adopted a
technological innovation in the three years before this study was conducted. If
the firms had adopted an innovation, these firms were categorised as innovative
firms while firms which had not adopted any innovation were categorised as non-
innovative firms.
5.6.2 The characteristics of Entrepreneurs
5.6.2.1 "Personal Demographic"
Variables categorised under "personal demographic" are the entrepreneurs' sex,
age, level of education, years of managing the existing business and years of
experience in their previous work. The possible answers to the questions on sex,
age and level of education were pre-coded in the questionnaires using nominal
and interval scales. The variables, years of experience in the existing business and
previous work were measured by a ratio scale2. The entrepreneurs stated the
number of years they had already managed their existing business and their
2A ratio scale possess an absolute zero point, so that multiplication and division become
meaningful operations. Ratio scales enable a researcher to state the relationship among variables as a product or ratio.
167

Chapter Five
previous work. The entrepreneurs also had to reveal the types and sectors of their
previous work. Information on the entrepreneurs' personal demographics could be
obtained in question number 4,5,6,7 and 8 in section E of the questionnaire.
5.6.2.2 Personality Traits
Three variables were used to measure the personality of entrepreneurs, namely,
need for achievement, locus of control and attitude toward risks. Information on
personality traits was obtained in section F of the questionnaire (refer to questions
1,2 and 3 of section F in the questionnaire).
(a) Need for Achievement
The work of McClelland in 1960s suggested that the key to entrepreneurial
behaviour lies in achievement motivation. A person endowed with such a need to
achieve will spend time considering how to do a job better or how to accomplish
something important to them. High achievers are said to like situations where they
can take personal responsibility (Chell 1991) To measure entrepreneurs' need
for achievement, the researcher developed several items describing behaviour that
reflected the need for achievement of respondents. The statements were based on
several aspects of individual motivation such as (i) they seek recognition by
performing well, (ii) they have high aspiration level, (ii) they have strong striving
for upward mobility and (iv) their time perspective is very much future-oriented.
For each statement, respondents were required to indicate the degree of the
similarity of their behaviour to that described, based on a five point Likert scale,
168
Chapter Five
whereby I meant the statement was almost never true for the respondent, 3 meant
occasionally true for respondent and scale 5 meant that the statement was true for
the respondent most of the time. Scores were reversed for statements that
indicated low need for achievement.
(b) Locus of Control
To measure locus of control of an entrepreneur, the researcher adapted the
measurement developed by Hodgkinson (1992). We develop eleven items that
could measure respondents' belief about his or her strategic management and
experiences in their firms. The items were balanced with respect to the number of
internally and externally worded items. Respondents were required to indicate the
extent to which they agreed with statements on a five point Likert scale ranging in
the case of externally worded items from 1 (strongly disagree), through 3 (unsure)
to 5 (strongly agree). Internally worded items were reverse scored. Total scores
received by respondents represented their locus of control.
(c) Attitude Toward Risks
To measure the attitude toward risk, choice dilemmas procedure was used as an
instrument. This measurement was first introduced by Wallach and Kogan in
1959. The instrument contains descriptions of situations that a person might
encounter in everyday life. In each situation, a person is faced with a choice
between two alternative courses of action. The first alternative is more desirable
and attractive than the second alternative, but the probability of achieving the first
169
Chapter Five
alternative is less than the second alternative. For each situation, the respondents
were asked to indicate the minimum probability of success they would require
before recommending the first alternative to be chosen. The respondent's
selection of the probability level for the risky alternative's success that would
make it sufficiently attractive to be chosen, would thus reflect the deterrence of
failure for him in a particular decision area (Kogan and Wallach 1964). The
instrument is semi-projective in nature, the respondent being asked how he or she
would advise others in the situation described. It is assumed that his advice would
reflect his own regard for the desirability of success, relative to the disutility of
failure. Probability levels provided for the success of the risky alternative were 1
in 10,3 in 10,5 in 10,7 in 10 and 9 in 10. A subject might also refuse to gamble
on the risky alternative, no matter what the probabilities. In that case, a score of
10 out of 10 was assigned to the item. It can be seen that higher scores are
associated with greater conservatism3.
5.6.2.3 Skill upgrading
Skill upgrading was measured by number of business courses attended by the
entrepreneurs in the five years prior to the conduct of this study. Other than the
number of business courses, the entrepreneurs also had to reveal the types of
courses and the organiser of the courses attended by them (refer to question
number 9 in section E of the questionnaire).
3 In the logistic regression model, the score is reversed. A higher score indicated that the entrepreneurs were risk takers.
170
Chapter Five
5.6.2.4 Entrepreneurs' Knowledge of the Technology
It is assumed that entrepreneurs would have a deeper knowledge of the innovation
if they had used various methods of searching for information and learning about
the innovation. This study measured this variable by asking the entrepreneurs
whether they had carried out any detailed study on the considered machine before
deciding whether or not to adopt it. If the entrepreneurs said they had conducted a
study, they were asked to state the types of studies they had carried out. This
information was obtained in questions 19 and 19.1 in section B of the
questionnaire.
5.6.3 Organisational Characteristics
5.6.3.1 Firms' Size
This study hypothesised that firms' size determine innovativeness. Hence, the size
of firms was measured before firms' adopt a technological innovation. We used
number of full time workers at the end of 1989 to measure firms' size.
5.6.3.2 Firms' Structure
Firms' structure was viewed in terms of their level of formalisation,
centralisation and complexity.
(a) Formalisation
To measure the level of formalisation, 10 statements were formulated that
describe levels of formalisation in various situations in any firm. The situations
described concerned the relationship between employer and employee, the
171
Chapter Five
decision making process and direction of communication in the organisation.
Using a Likert scale, for each statement, the respondents had to indicate the
degree of correspondence between the statement and their firm's situation.
(b) Centralisation
Firms' level of centralisation was measured by the number of individuals who
took part in the decision making process. This study measured firms' level of
centralisation by form of the firm, such as sole proprietorship, partnership and
limited private company.
(c) Complexity
Firms' level of complexity was measured by the number of skilled workers.
Skilled employees were those who worked in the management and technical
levels.
5.6 3.3 Mismatch of the Existing and Required Labour Force
This was measured by the following information on the occurrence of the
following situations when or if firms adopt new technology: (i) the existence of
enough labour able to operate the technology, (ii) restructuring of labour force as a
result of adoption, (iii) existence of redundancy, (iv) retraining of employees and
(v) recruiting of new employees.
For firms which had already adopted the new technology, the above
information revealed by firms reflected the actual situation that obtained when
172
Chapter Five
they adopted the technology. For firms which had not adopted the technology, the
measurement is done on the perception of entrepreneurs of the existence of the
above situations if they were to adopt the considered new technology.
5.6.3.4 Financing
As well as enquiring about their source of financing for technology adoption, we
measured the degree of difficulty firms had to obtain financing to adopt new
technologies. Five statements were formulated describing the situation of
obtaining financing and the respondent had to indicate the degree of difficulty that
they might face or had already encountered in each of the situations. A four point
Likert scale was used to measure the degree of difficulty.
5.6.3.5 Firms' Age
Firms' current life cycle is measured by number of years firms had been operating
(refer to question 5 in section A of the questionnaire).
5.6.3.6 Firms' Performances
Firms' performance was measured by the following ratios: (i) Fixed asset turnover
ratio, which represents efficiency ratio, (ii) return on investment, which
represents profitability ratio and (iii) labour productivity. These ratios were
calculated as follows:
(i) Fixed asset turnover = Sales /Fixed assets,
(ii) Return on investment (ROI) = Net operating income/ total asset,
(iii) Productivity of labour = value added/ number of full-time workers.
173
Chapter Five
5.6.4 Communication
To measure entrepreneurs' communication behaviour, 4 items were measured.
These items were (1) membership of associations, (2) frequency of attending
seminars (3) frequency of attending trade fairs during the past five years and (4)
subscribing to business magazines.
5.6.5 Entrepreneurs' Perception of the Buying Situation
Five statements describing the situation of buying procedure were given to
respondents. Using a Likert scale, for each statement, respondents had to indicate
the degree of problems that they had already faced or they might encounter during
the buying process. Scale 0 indicated no problem, I indicated minor problem that
could be solved by them, 2 indicated serious problems that required external
assistance, and 3 indicated serious problems that could not be solved (refer to
question 24 in section B and question 8 in section C of the questionnaire).
5.6.6 The Objective Characteristics of the Innovation
As had been mentioned in Chapter Four, the objective characteristics of the
innovation can be viewed in term of their technical level and the cost incurred.
However, due to the heterogeneity of the innovation that had been adopted or
considered to be adopted by respondents, this study measured the objective
characteristics of the innovation only by total cost incurred to install the
innovation. We assumed that cost of innovation is positively correlated with their
levels of technicality.
174
Chapter Five
5.6.7 The Perceived Characteristics of the Innovation
The characteristics of technology perceived by entrepreneurs were classified into
five categories, namely (a) economic advantage, (b) simplicity, (c) prestige, (d)
perceived risk and (e) compatibility. To measure respondents' perception of each
of the characteristics of technology, three statements were used to describe each
category. Using a five point Likert scale, entrepreneurs were asked to indicate the
extent to which they agreed with each statement (refer to question 25 in section C
of the questionnaire).
5.6.8 Environmental factors
5.6 8.1 Competitive Intensity
Competitive intensity was viewed in terms of (i) form of competition, and (ii)
competitive price intensity. Form of competition was measured by identifying
who were the major competitors of the firms in the study. The measure of
competitive price intensity was the frequency with which price-cutting had taken
place in the firm during the last 3 years4.
5.6. &2 Institutional Involvement
This was measured by (i) kind of assistance such as financial or subsidy received
from government agencies (ii) participation in any government agencies'
activities, such as attending courses and (iii) number of visits to government
4 In the logistic regression model, we only used form of competition as a proxy for competitive intensity. We could not use price intensity as a proxy for competitive intensity because only two firms (of 197 firms) had price cut within the time period asked.
175
Chapter Five
agencies for consultations (refer to question 14 in section B and questions 10,11
and 12 in section E of the questionnaire).
5.7 Validity and Reliability of the Measurement
Adams and Schvaneveldt (1985: 79) defined validity and reliability of research as
follows:
'... validity refers to the general correctness of the fact or evidence used in understanding behaviour, while reliability refers to the consistency or dependability of the fact itself '
Realising the importance of validity and reliability of measurement to
obtain correct and precise information, we will discuss some tests we conducted to
ensure the validity of the measurement used. However, for this study, only
relevance of methods of measurement required some test of reliability.
Information measured by a ratio scale, for example, did not require such test.
5.7.1 Validity
The validity of research measures deals with what is actually being measured by
the assessment device. In other word, the validity of research instruments refers
to whether those instruments measure what they are designed to measure. This
study used a questionnaire as a research instrument. Generally, there are four types
of validity that are addressed in building good research instruments (Adams and
176
Chapter Five
Schvaneveldt 1985: 80). These are face validity, criterion-related validity, content
validity and construct validity5.
One way to ensure the validity of this instrument was through a pilot test.
Fifteen entrepreneurs participated in the pilot test of the questionnaire. The
researcher took care to choose the correct variables to represent the information
sought and which entrepreneurs would be able to provide. Since all respondents
were Malays with different levels of education, the variables were then translated
into simple, direct questions in Malay language, to avoid ambiguity. Collecting
the information by using questionnaire and interviewing meant that the questions
could also be rephrased by the field workers if required, according to situations
and respondents. Information from the pilot test was analysed to ensure that the
instrument was capable of measuring the proposed theoretical constructs, by
examining the related variables that made up these constructs.
5.7.2 Reliability
Reliability of the measurement used refers to the amount of agreement between
independent attempts to measure the same theoretical construct. There are two
types of reliability. The first type is internal consistency, where two or more
methods are used to measure the same theoretical concept at the same point in
time. The second type is known as test-retest reliability or stability where
measurement of the same theoretical concept is repeated over time. Therefore, a
s Face validity is to ensure the instrument appears to measure the subject matter under consideration. Criterion-related validity shows that the individual's test score predicts the probable behaviour on a second variable. Content validity is a subjective judgement of the relevance of an item to a scale and construct validity deals with assessing the degree of accuracy in
measuring the underlying elements (construct) of a scale.
177
Chapter Five
highly reliable measure is one that gives the user consistent results over time,
places, and occasions. Reliability is typically reported by means of a correlation
coefficient which is technically called a reliability coefficient. One of the most
frequently used reliability coefficients is Cronbach alpha'. Cronbach alpha has
the value between 0 and 1 inclusive, with higher values indicating greater
reliability. Cronbach alpha greater than 0.60 is generally accepted for exploratory
research to indicate reliability for the measurement, though a value greater than
0.70 is more preferable (Bagozzi 1994: 18). This alpha value can easily be
calculated by SPSS statistical package.
The second type of reliability was not relevant for this study. However, the
first type of reliability test had its relevance to some of the theoretical constructs
used in this study. The theoretical constructs of entrepreneurs' need for
achievement, locus of control and attitude toward risks (section F, questions 1,2
and 3 in the questionnaire) and firms' formalisation (section A, question 15 in the
questionnaire) required this type of reliability test. The calculated Cronbach
alpha obtained for each construct after eliminating a few items, is exhibited in
Table 5.3. After eliminating certain items in certain constructs, except the
6 The measurement of Cronbach alpha was calculated by the following formula:
n x= (1. E s; 2 / &2 )
n-I
where: n= number of measurement sie = variance of measure i Sý = variance of total scale formed by the sum of square.
This can be computed by adding the variances and covariance among the multiple measures from the covariance matrix.
178
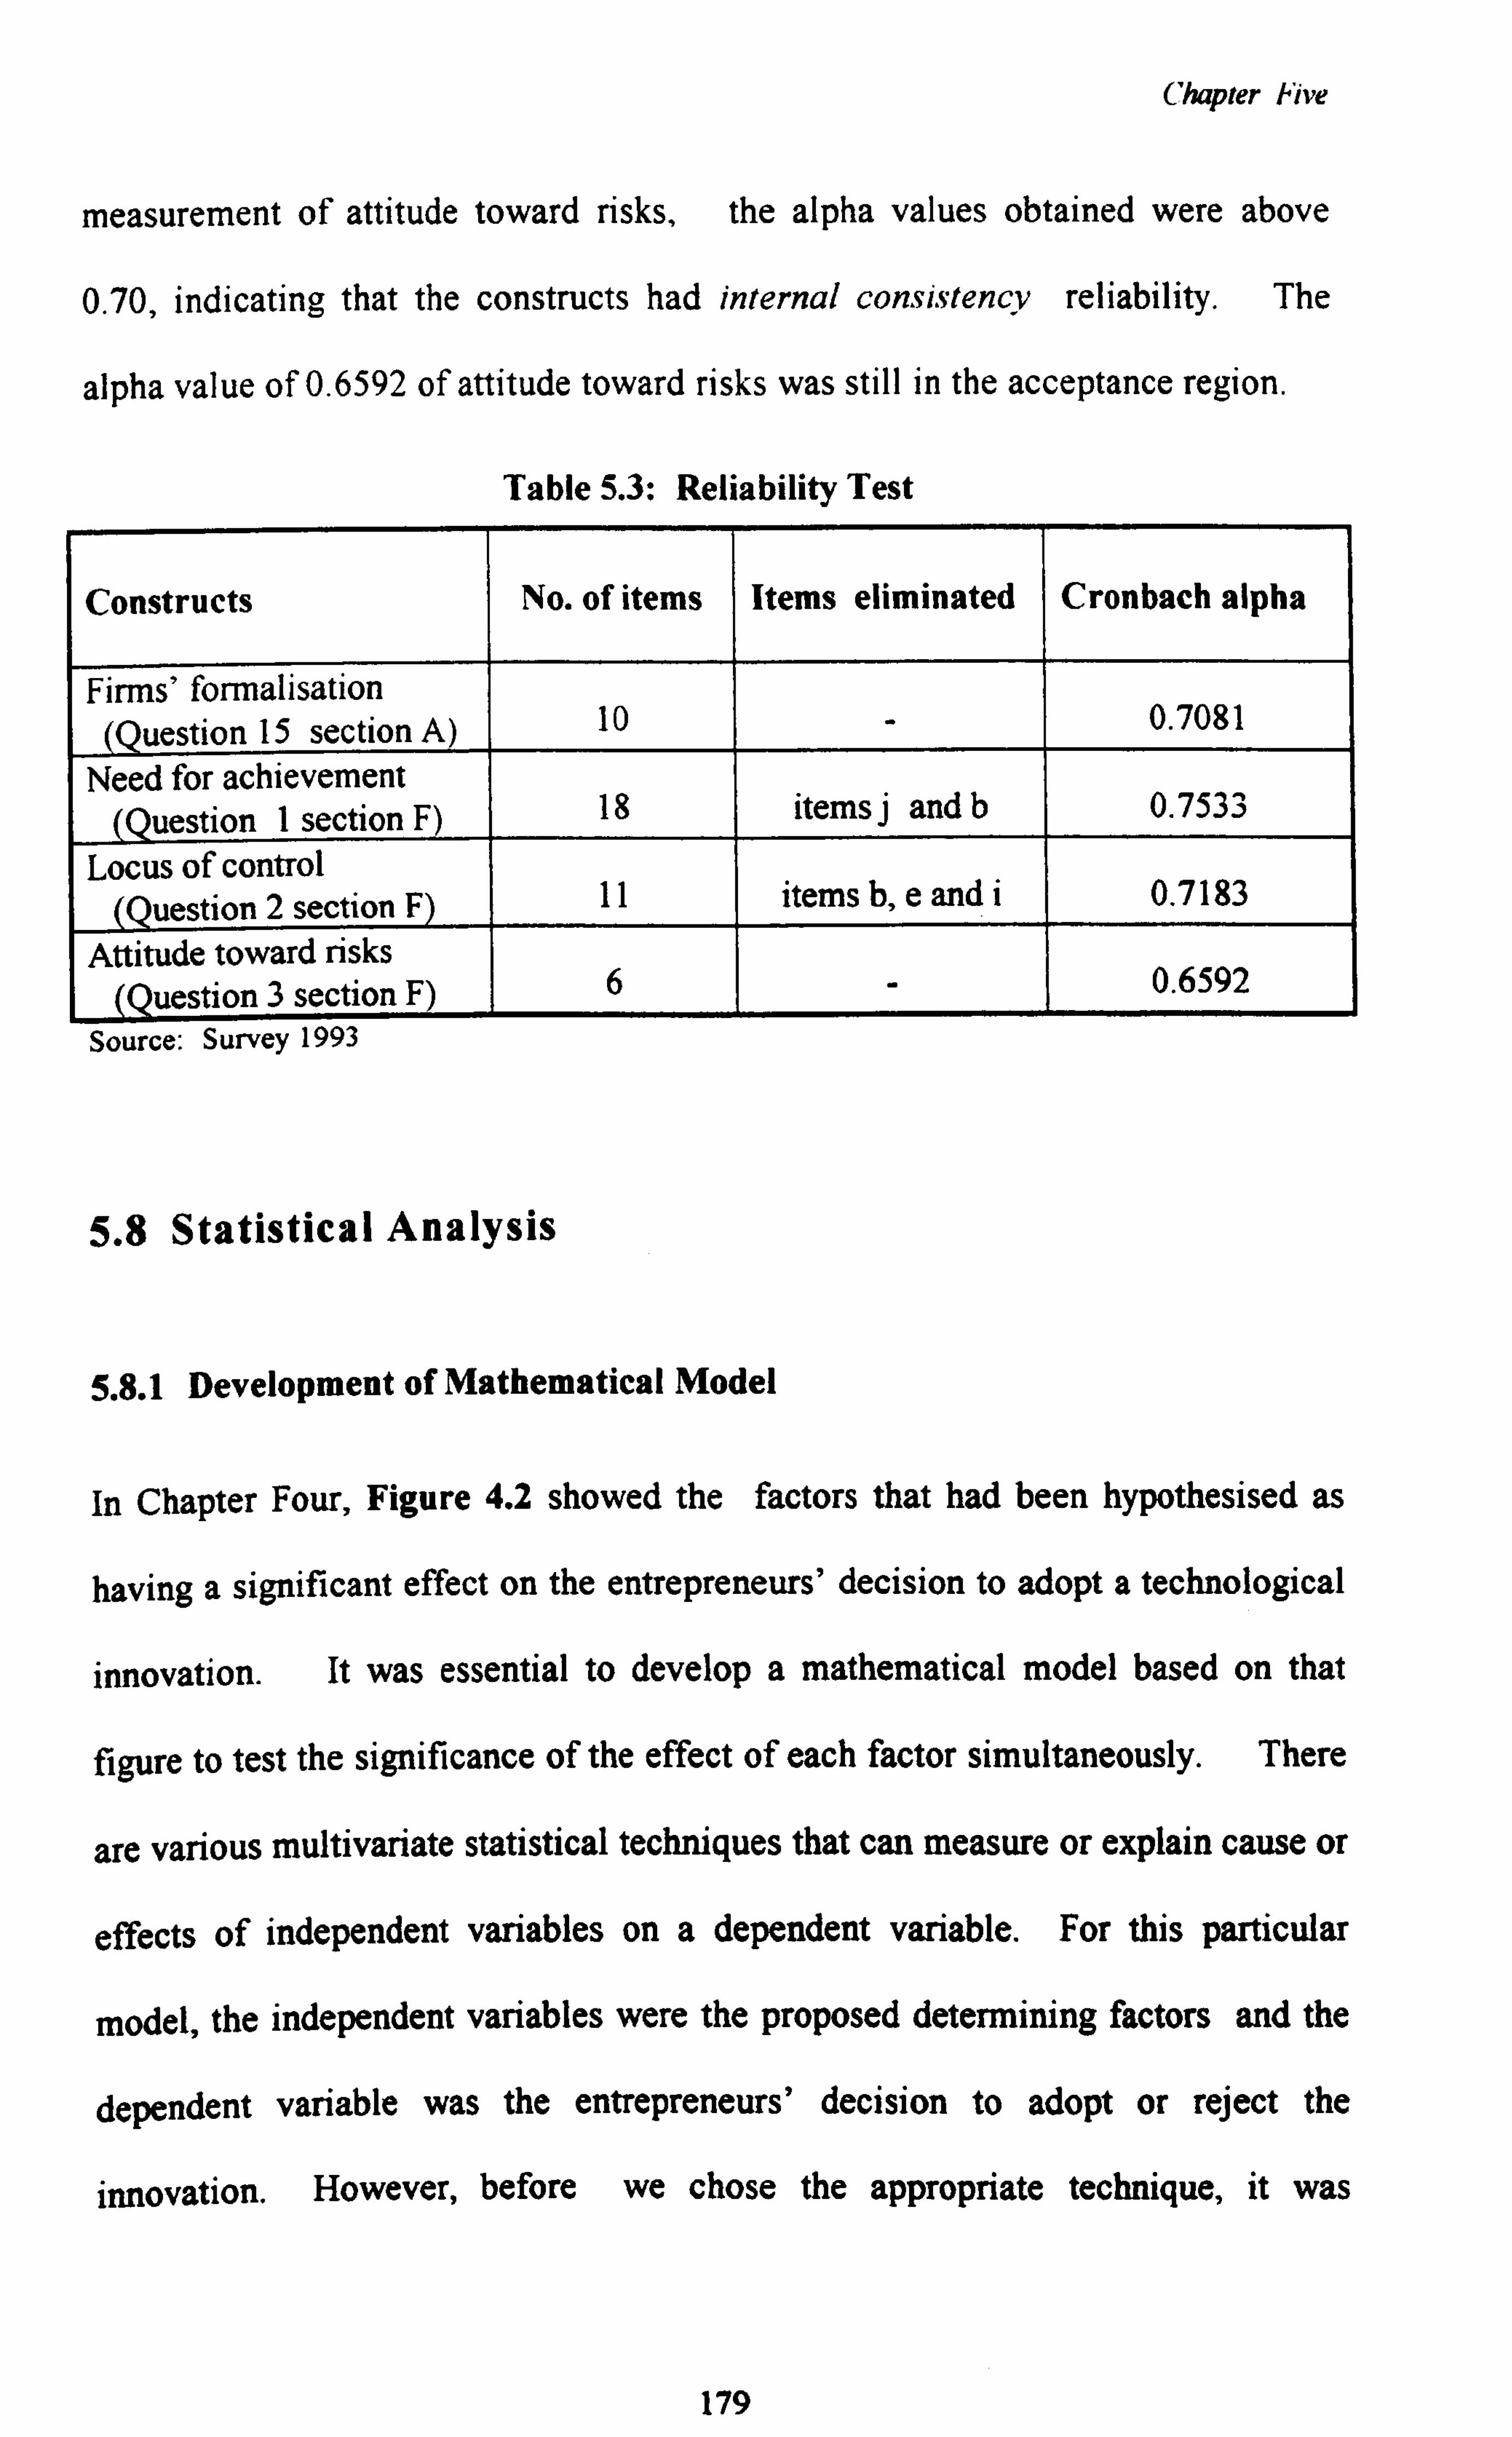
Chapter Five
measurement of attitude toward risks, the alpha values obtained were above
0.70, indicating that the constructs had internal consistency reliability. The
alpha value of 0.6592 of attitude toward risks was still in the acceptance region.
Table 5.3: Reliability Test
Constructs No. of items Items eliminated Cronbach alpha
Firms' formalisation (Question 15 section A) 10 - 0.7081
Need for achievement (Question I section F) 18 items j and b 0.7533
Locus of control (Question 2 section F) 11 items b, e and i 0.7183
Attitude toward risks
_ (Question 3 section F) 6 I - 0.6592 I
Source: Survey 1993
5.8 Statistical Analysis
5.8.1 Development of Mathematical Model
In Chapter Four, Figure 4.2 showed the factors that had been hypothesised as
having a significant effect on the entrepreneurs' decision to adopt a technological
innovation. It was essential to develop a mathematical model based on that
figure to test the significance of the effect of each factor simultaneously. There
are various multivariate statistical techniques that can measure or explain cause or
effects of independent variables on a dependent variable. For this particular
model, the independent variables were the proposed determining factors and the
dependent variable was the entrepreneurs' decision to adopt or reject the
innovation. However, before we chose the appropriate technique, it was
179
Chapter Five
necessary to consider the nature of the data. The set of independent variables
comprised of continuous data and discrete data. Data on the entrepreneurs' sex,
government assistance, and competitive intensity were discrete in nature while
others were continuous. The dependent variable, on the other hand, had
dichotomous or binary value (the value of 0 or 1). There are various techniques
that can be used to predict a binary dependent variable from a set of independent
variables. Multiple regression analysis and discriminant analysis have been used
by some researchers. However, when the dependent variable has only two values,
the assumptions necessary for hypothesis testing in regression analysis are
violated. For example, it is unreasonable to assume that the distribution error is
normal. The interpretation of the regression equation is not straightforward. It
might also be difficult to interpret the predicted values in terms of probability
because they are not constrained to fall in the interval between 0 and 1 (SPSS
1990: 1).
Linear discriminant analysis on the other hand, is capable of predicting a
binary dependent variable. However in order to be optimal, the assumption of
multivariate normality of the independent variables, as well as equal variance-
covariance matrices in the two categories of dependent variable, is required.
Considering the constraints of the two statistical techniques mentioned
above, we developed a mathematical model based on the logistic regression
model. This model requires far fewer assumptions than discriminant analysis; and
even when the assumptions required for discriminant analysis are satisfied,
logistic regression still performs well (SPSS 1990: 1).
180
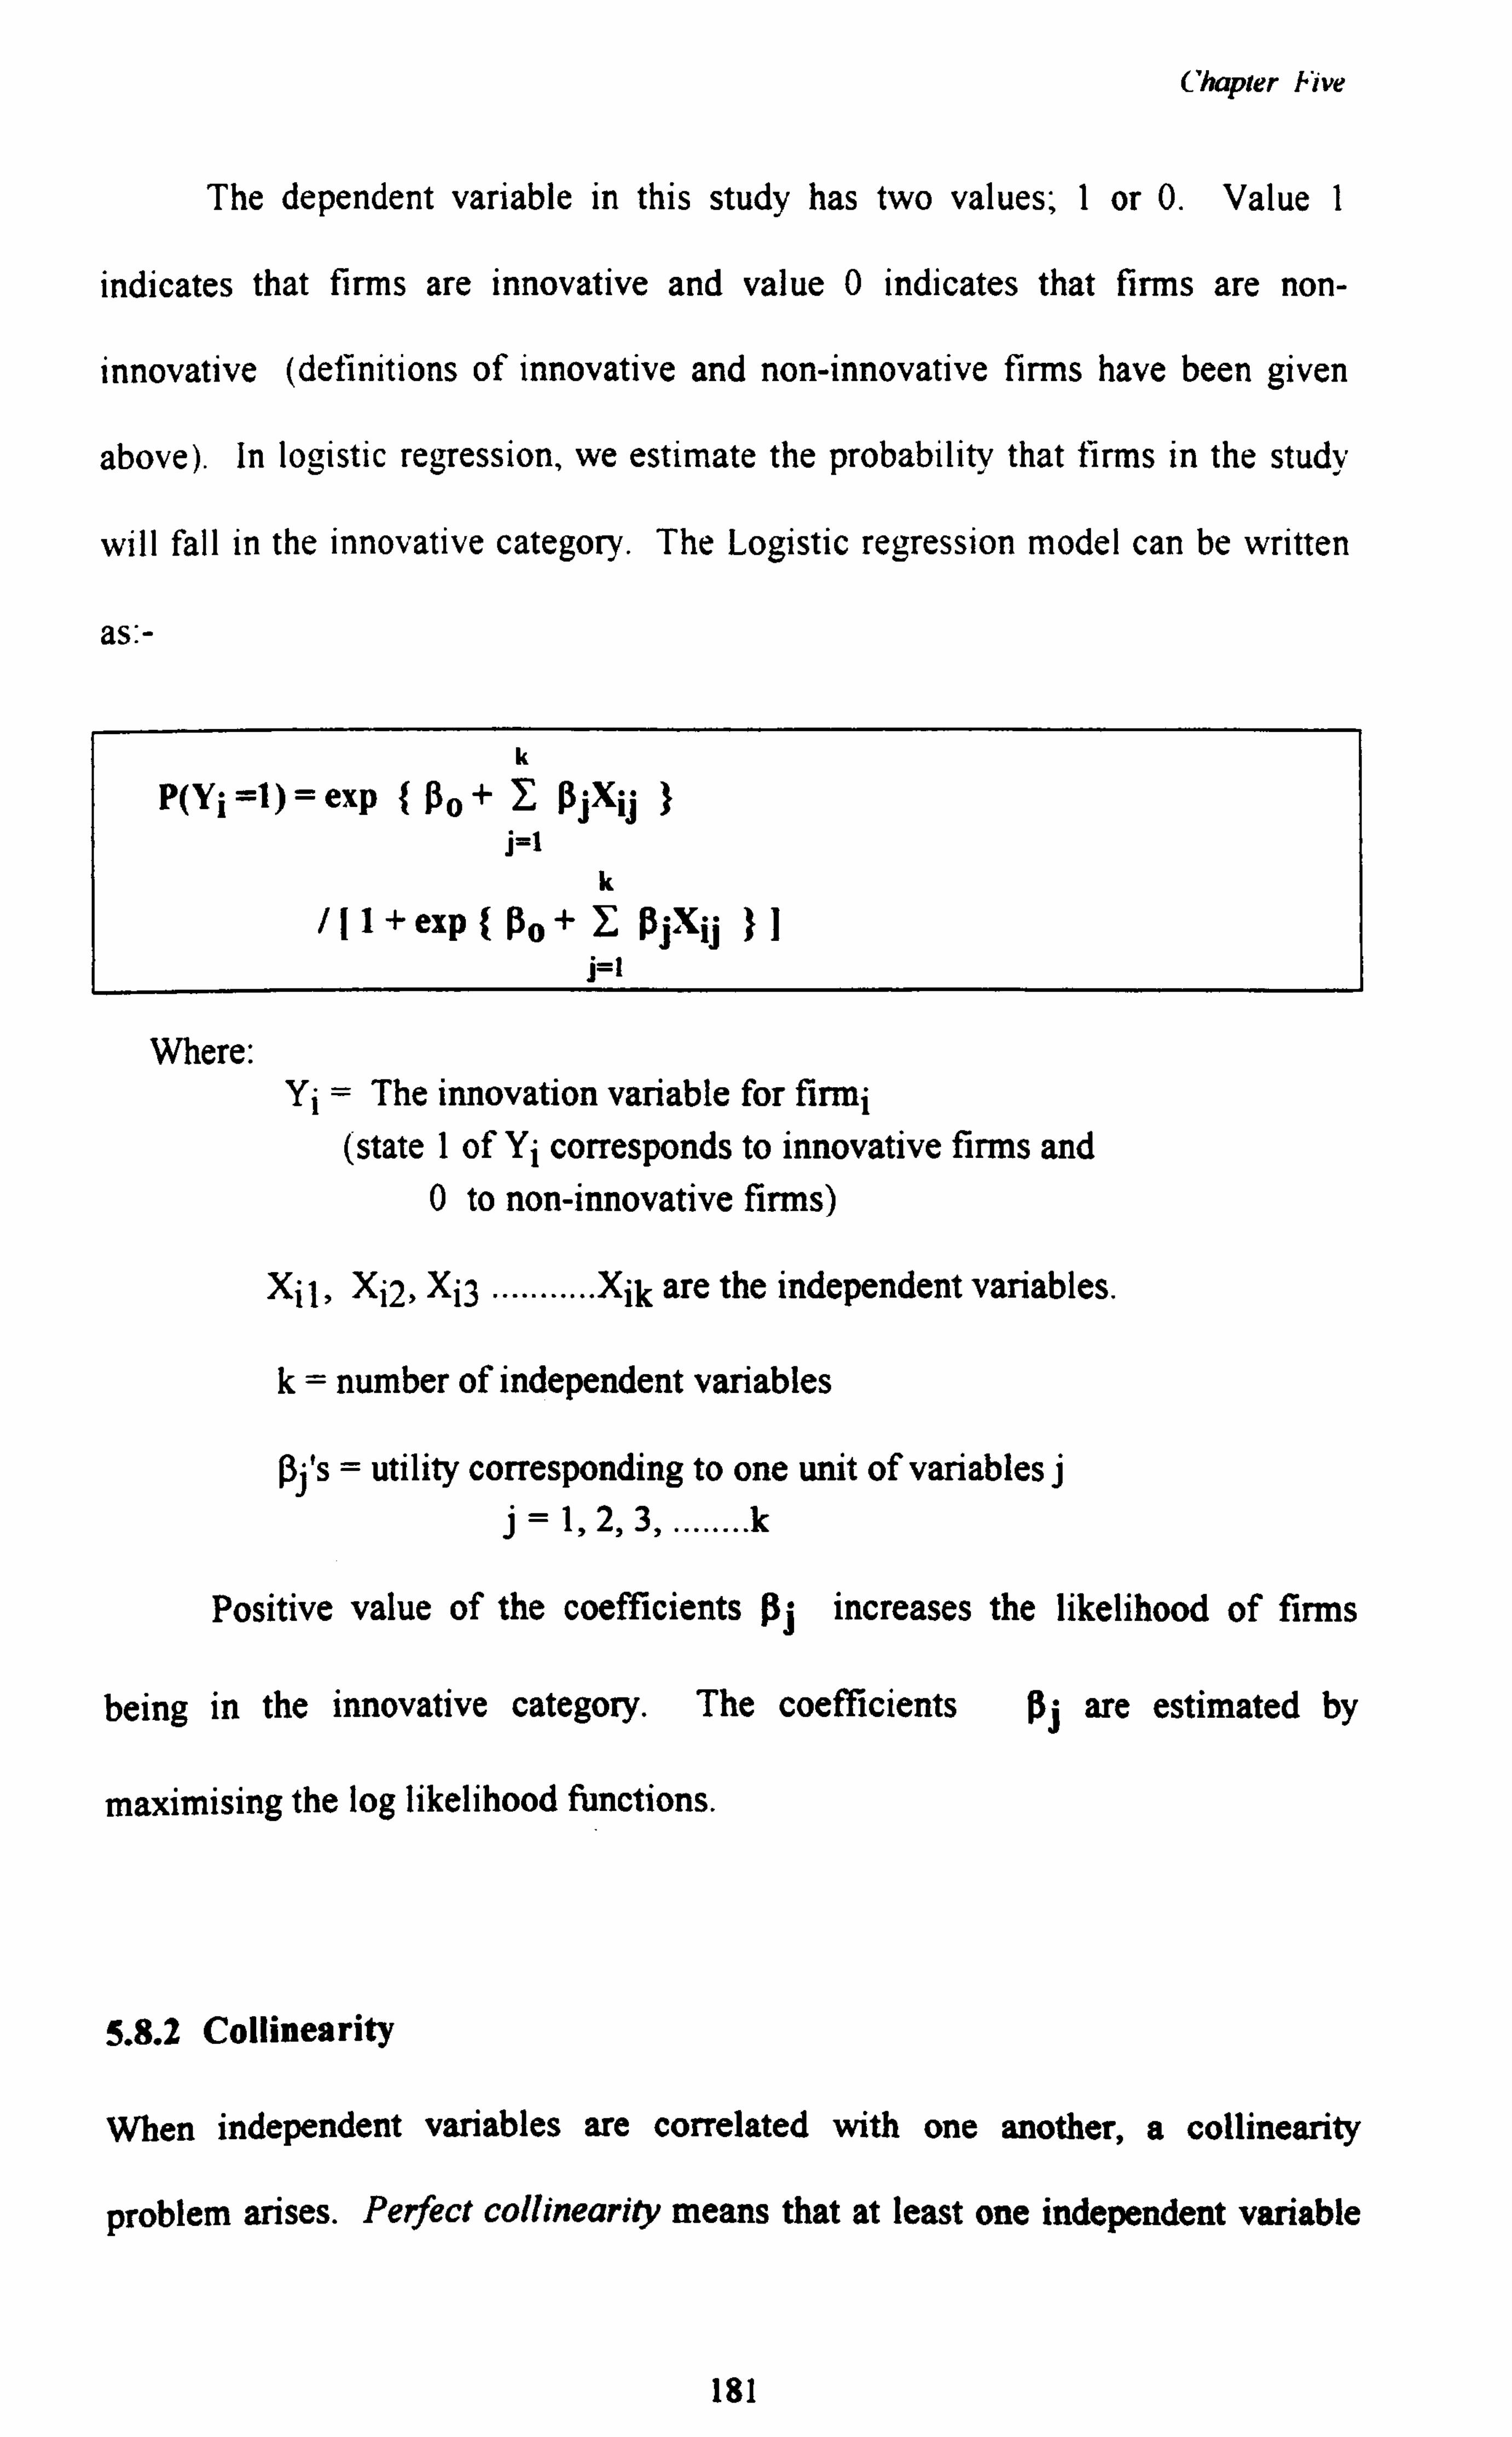
Chapter /Five
The dependent variable in this study has two values; I or 0. Value I
indicates that firms are innovative and value 0 indicates that firms are non-
innovative (definitions of innovative and non-innovative firms have been given
above). In logistic regression, we estimate the probability that firms in the study
will fall in the innovative category. The Logistic regression model can be written
as: -
k
P(Yi=1)=exp { D0+ I ßjXij }
j=l k
/[1+exp{ßo+E ßjYij }I j=t
Where: Yi = The innovation variable for firmi
(state 1 of Yi corresponds to innovative firms and 0 to non-innovative firms)
Xi 1, Xi2, Xi3 ...........
Xik are the independent variables.
k= number of independent variables
ßj's = utility corresponding to one unit of variables j j= 1,2,3......... k
Positive value of the coefficients Oj increases the likelihood of firms
being in the innovative category. The coefficients ßj are estimated by
maximising the log likelihood functions.
5.8.2 Collinearity
When independent variables are correlated with one another, a collinearity
problem arises. Perfect collinearity means that at least one independent variable
181
Chapter Five
is a perfect linear combination of the others (Menard 1995: 65). If each
independent variable is treated as a dependent variable in turn and the rest of the
independent variables as predictor variables, and its coefficient of determination
(R2) is calculated, perfect collinearity- exists if R2 of I for at least one of the
variable exists. Perfect collinearity seldom occurs.
In most regression equations, less than perfect collinearity is rather
common. Collinearity may be present when the standard errors for logistic
regression coefficients are large. Unbiased estimates may be obtained and their
level of efficiency may be poor. However, generally, low levels of collinearity
are not problematic and are acceptable in a regression model. Menard (1995)
defined high collinearity as where the value of at least one R2 is 0.80 or more but
1. less than 0.90. Very high collinearity is when the value of at least one R2 is 0.90
or more. High levels of collinearity tend to produce problems and very high
collinearity leads to coefficients that are not statistically significant, even though
the value is quite large.
The independent variables used in this study were expected to have some
correlation, one with another. In theory, firms' size, for example should have
some correlation to other characteristics of firms. Bigger firms usually have
higher levels, of complexity and formalisation and a lower levels of centralisation.
Indication of some extent of collinearity was shown when only six independent
variables (PREXP, COURSE, SIZE, FINANCE, MACOST and ASSIST) were
significant at 85 per cent confident level to predict the dependent variable in
logistic regression function. The coefficient of variable EDU in that function,
although was not significant but had wrong sign (Appendix III). To further
182
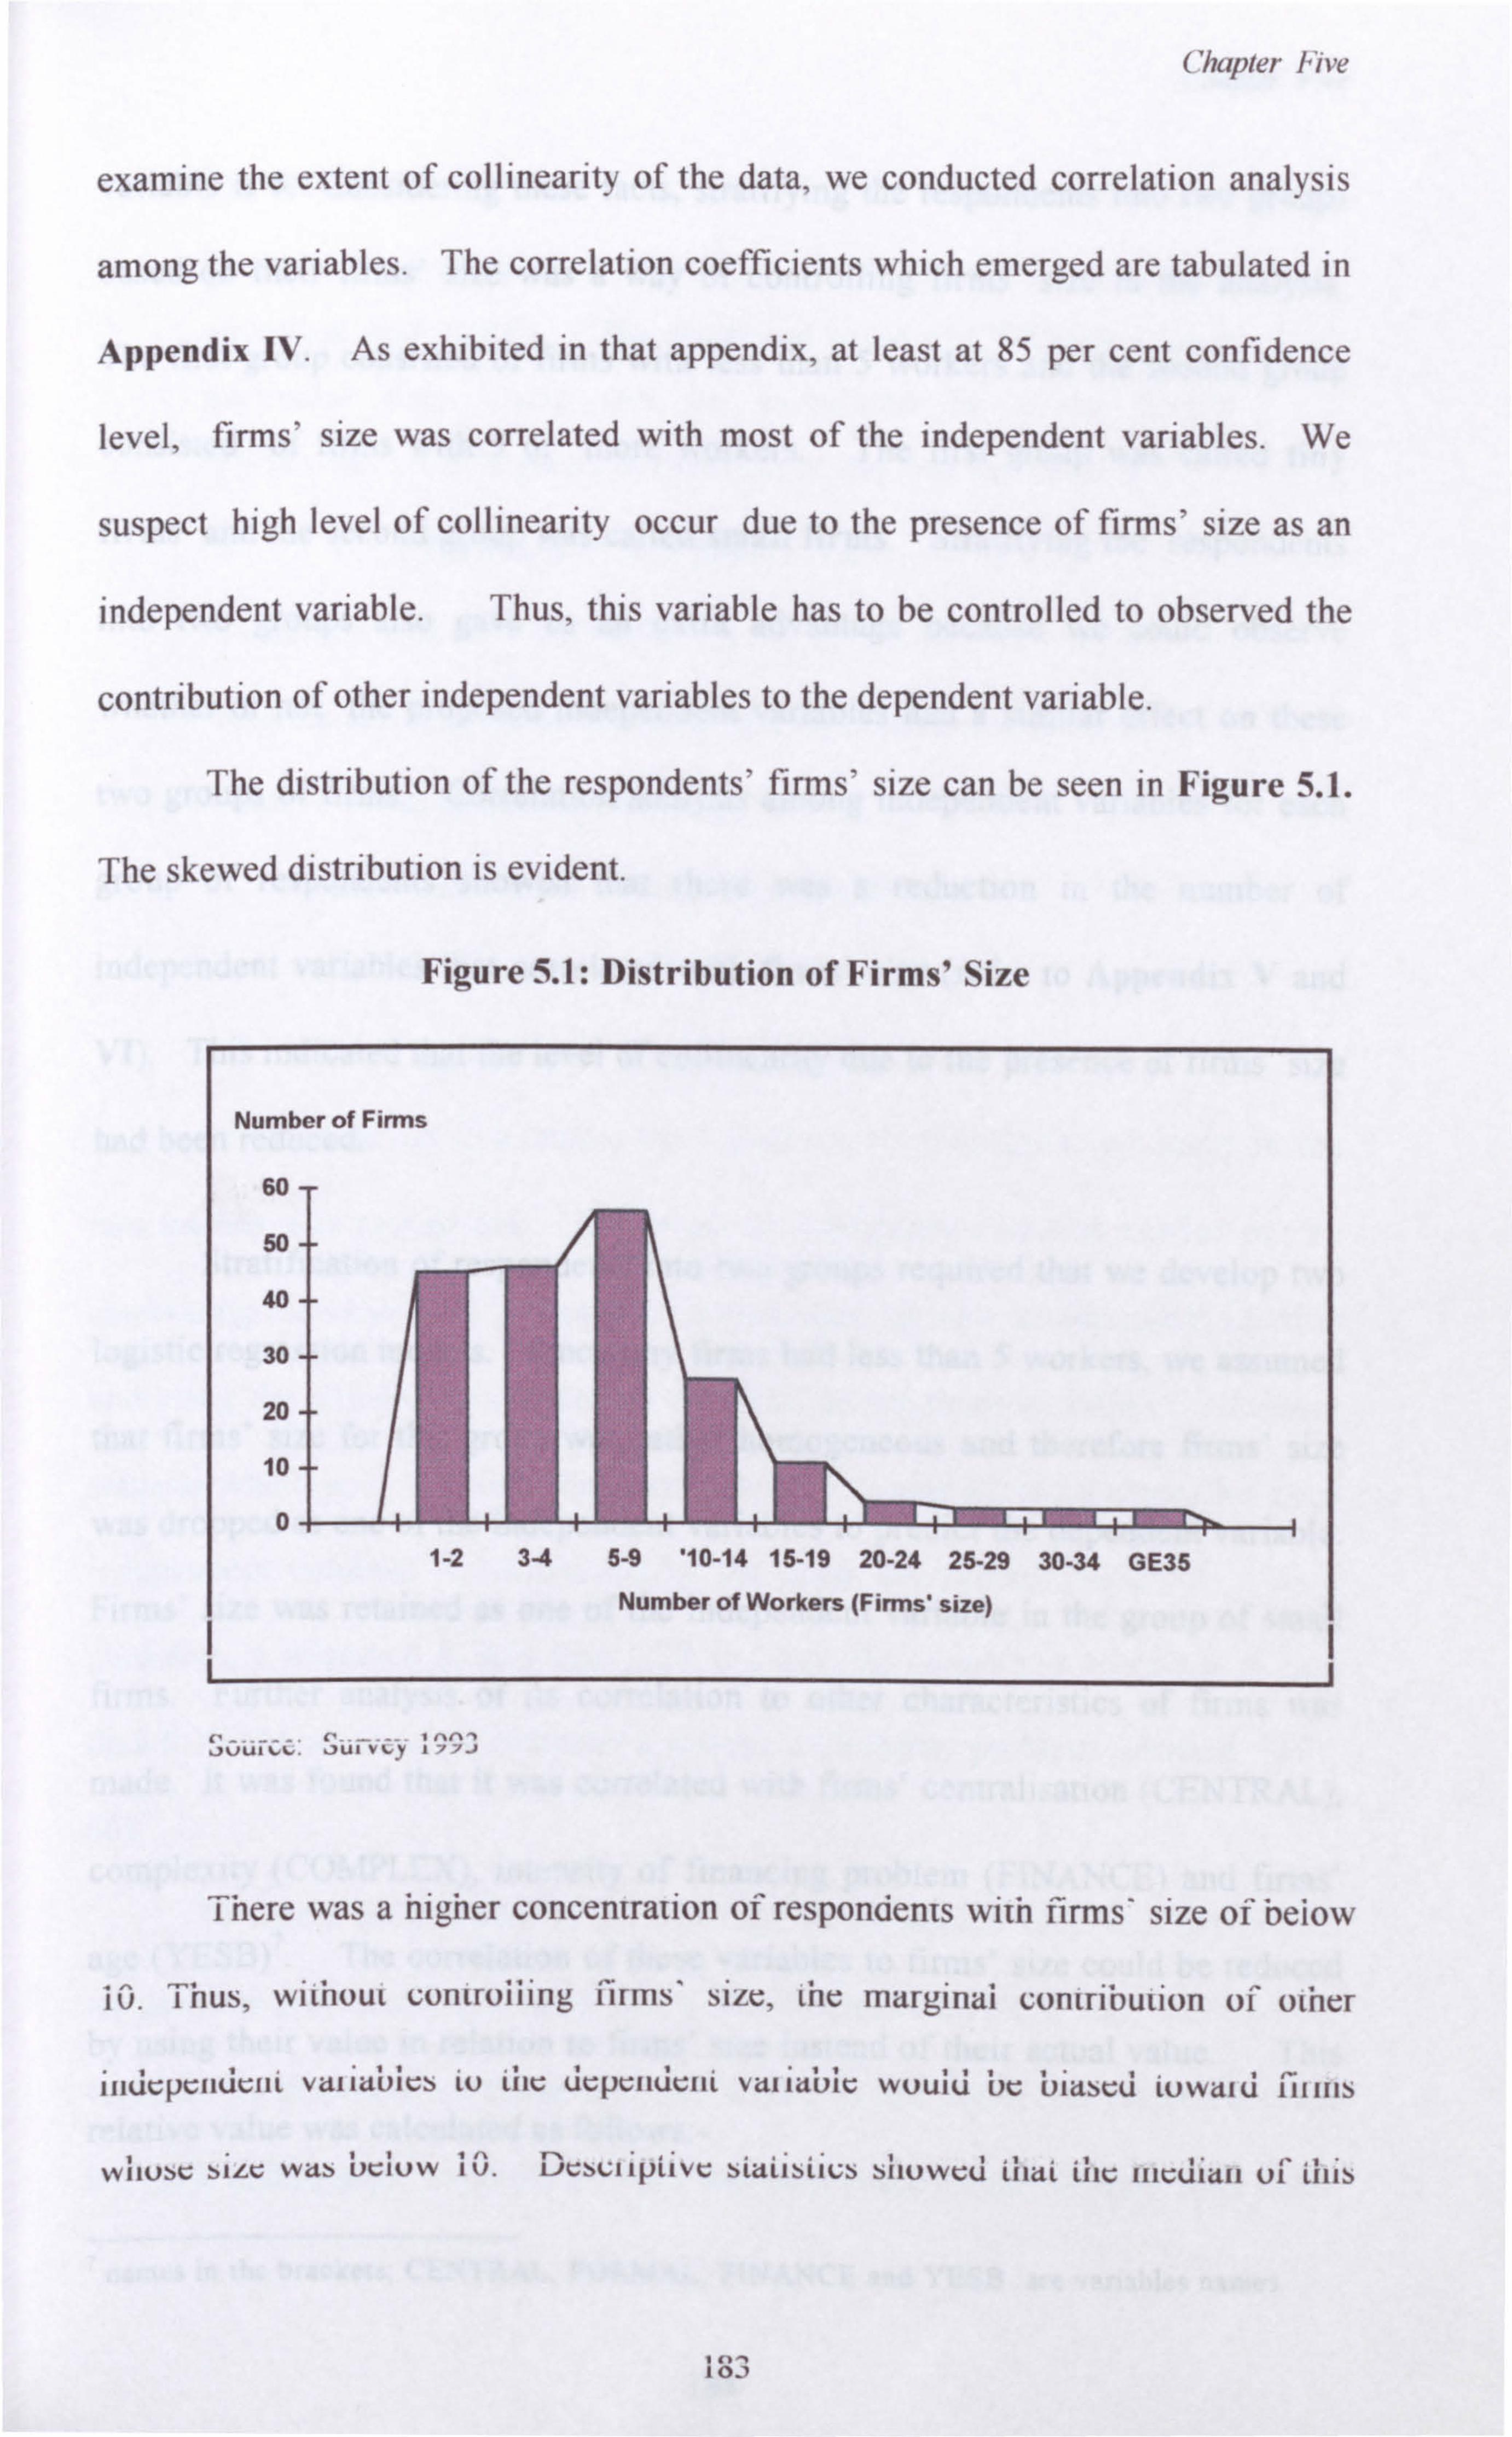
Chapter Five
examine the extent of collinearity of the data, we conducted correlation analysis
among the variables. The correlation coefficients which emerged are tabulated in
Appendix IV. As exhibited in that appendix, at least at 85 per cent confidence
level, firms' size was correlated with most of the independent variables. We
suspect high level of collinearity occur due to the presence of firms' size as an
independent variable. Thus, this variable has to be controlled to observed the
contribution of other independent variables to the dependent variable.
The distribution of the respondents' firms' size can be seen in Figure 5.1.
The skewed distribution is evident.
Figure 5.1: Distribution of Firms' Size
Number of Firms
60
50
40
30
20
10
0 1-2 3-4 5-9 '10-14 15-19 20-24 25-29 30-34 GE35
Number of Workers (Firms' size) 1
'Sui-ýCy
There was a higher concentration of respondents with firms size of beiow
i0. Thus, without cenrrwiiing firms' size, the marginai contribution of other
IIIUCpCIIUCIIL VaI1ubiCJ LO LIIC UCpeIIUCIII VUIIQUIC WUUIU UC UlasCU LUWQlU 1111IIJ
WIIUJC RIGG was ! )Clow IU. LICJUlipLIVC sLaL1JUl: J JIIUWCU Milt UIC 111CÜIQII 01 IIIIS
I"I 1 OJ
Chapter Five
variable is 5. Considering these facts, stratifying the respondents into two groups
based on their firms' size was a way of controlling firms' size in the analysis.
The first group consisted of firms with less than 5 workers and the second group
consisted of firms with 5 or more workers. The first group was called tiny
firms and the second group was called small firms. Stratifying the respondents
into two groups also gave us an extra advantage because we could observe
whether or not the proposed independent variables had a similar effect on these
two groups of firms. Correlation analysis among independent variables for each
group of respondents showed that there was a reduction in the number of
independent variables that correlated with firms' size (refer to Appendix V and
VI). This indicated that the level of collinearity due to the presence of firms' size
had been reduced.
Stratification of respondents into two groups required that we develop two
logistic regression models. Since tiny firms had less than 5 workers, we assumed
that firms' size for this group was rather homogeneous and therefore firms' size
was dropped as one of the independent variables to predict the dependent variable.
Firms' size was retained as one of the independent variable in the group of small
firms. Further analysis of its correlation to other characteristics of firms was
made. It was found that it was correlated with firms' centralisation (CENTRAL),
complexity (COMPLEX), intensity of financing problem (FINANCE) and firms'
age (YESB)7. The correlation of these variables to firms' size could be reduced
by using their value in relation to firms' size instead of their actual value. This
relative value was calculated as follows: -
names in the brackets; CENTRAL, FORMAL, FINANCE and YESB are variables names.
184
Chapter hive
For example:
Centralisation of firms (CENTRAL) is found to be correlated
with firm size (SIZE). The predicted value of CENTRAL for a
particular firms' size can be calculated by using simple
regression. The regression function of the two variables is
CENTRAL =x+ 3SIZE +c
Predicted value of CENTRAL is E(CENTRAL) =a+ bSIZE
where a and b is the estimates of the regression coefficients.
Relative value of centralisation is,
CENT-R = CENTRAL / E(CENTRAL).
CENT-R is a new independent variable.
Further analysis to examine the existence of collinearity problems in the
two models was carried out. Detection of collinearity could be carried out by
calculating the value of R2 for each of independent variable as dependent variable
and using the remaining independent variables as predictor variables. Tolerance
statistic which is 1- Rex was then calculated. R2x was R2 or variance for each
independent variable, X, explained by the other independent variables. As a
guideline, a tolerance of less than 0.20 is cause for concern; a tolerance of less
than 0.10 almost certainly indicates a serious collinearity problem (Menard, 1995:
66)
To detect collinearity in the two logistic regression functions developed,
we used the procedures described above. The tolerance levels of each independent
variable are displayed in Table 5.4. As shown in that table, the tolerance value
for each independent variable for both tiny and small firms' models were more
185
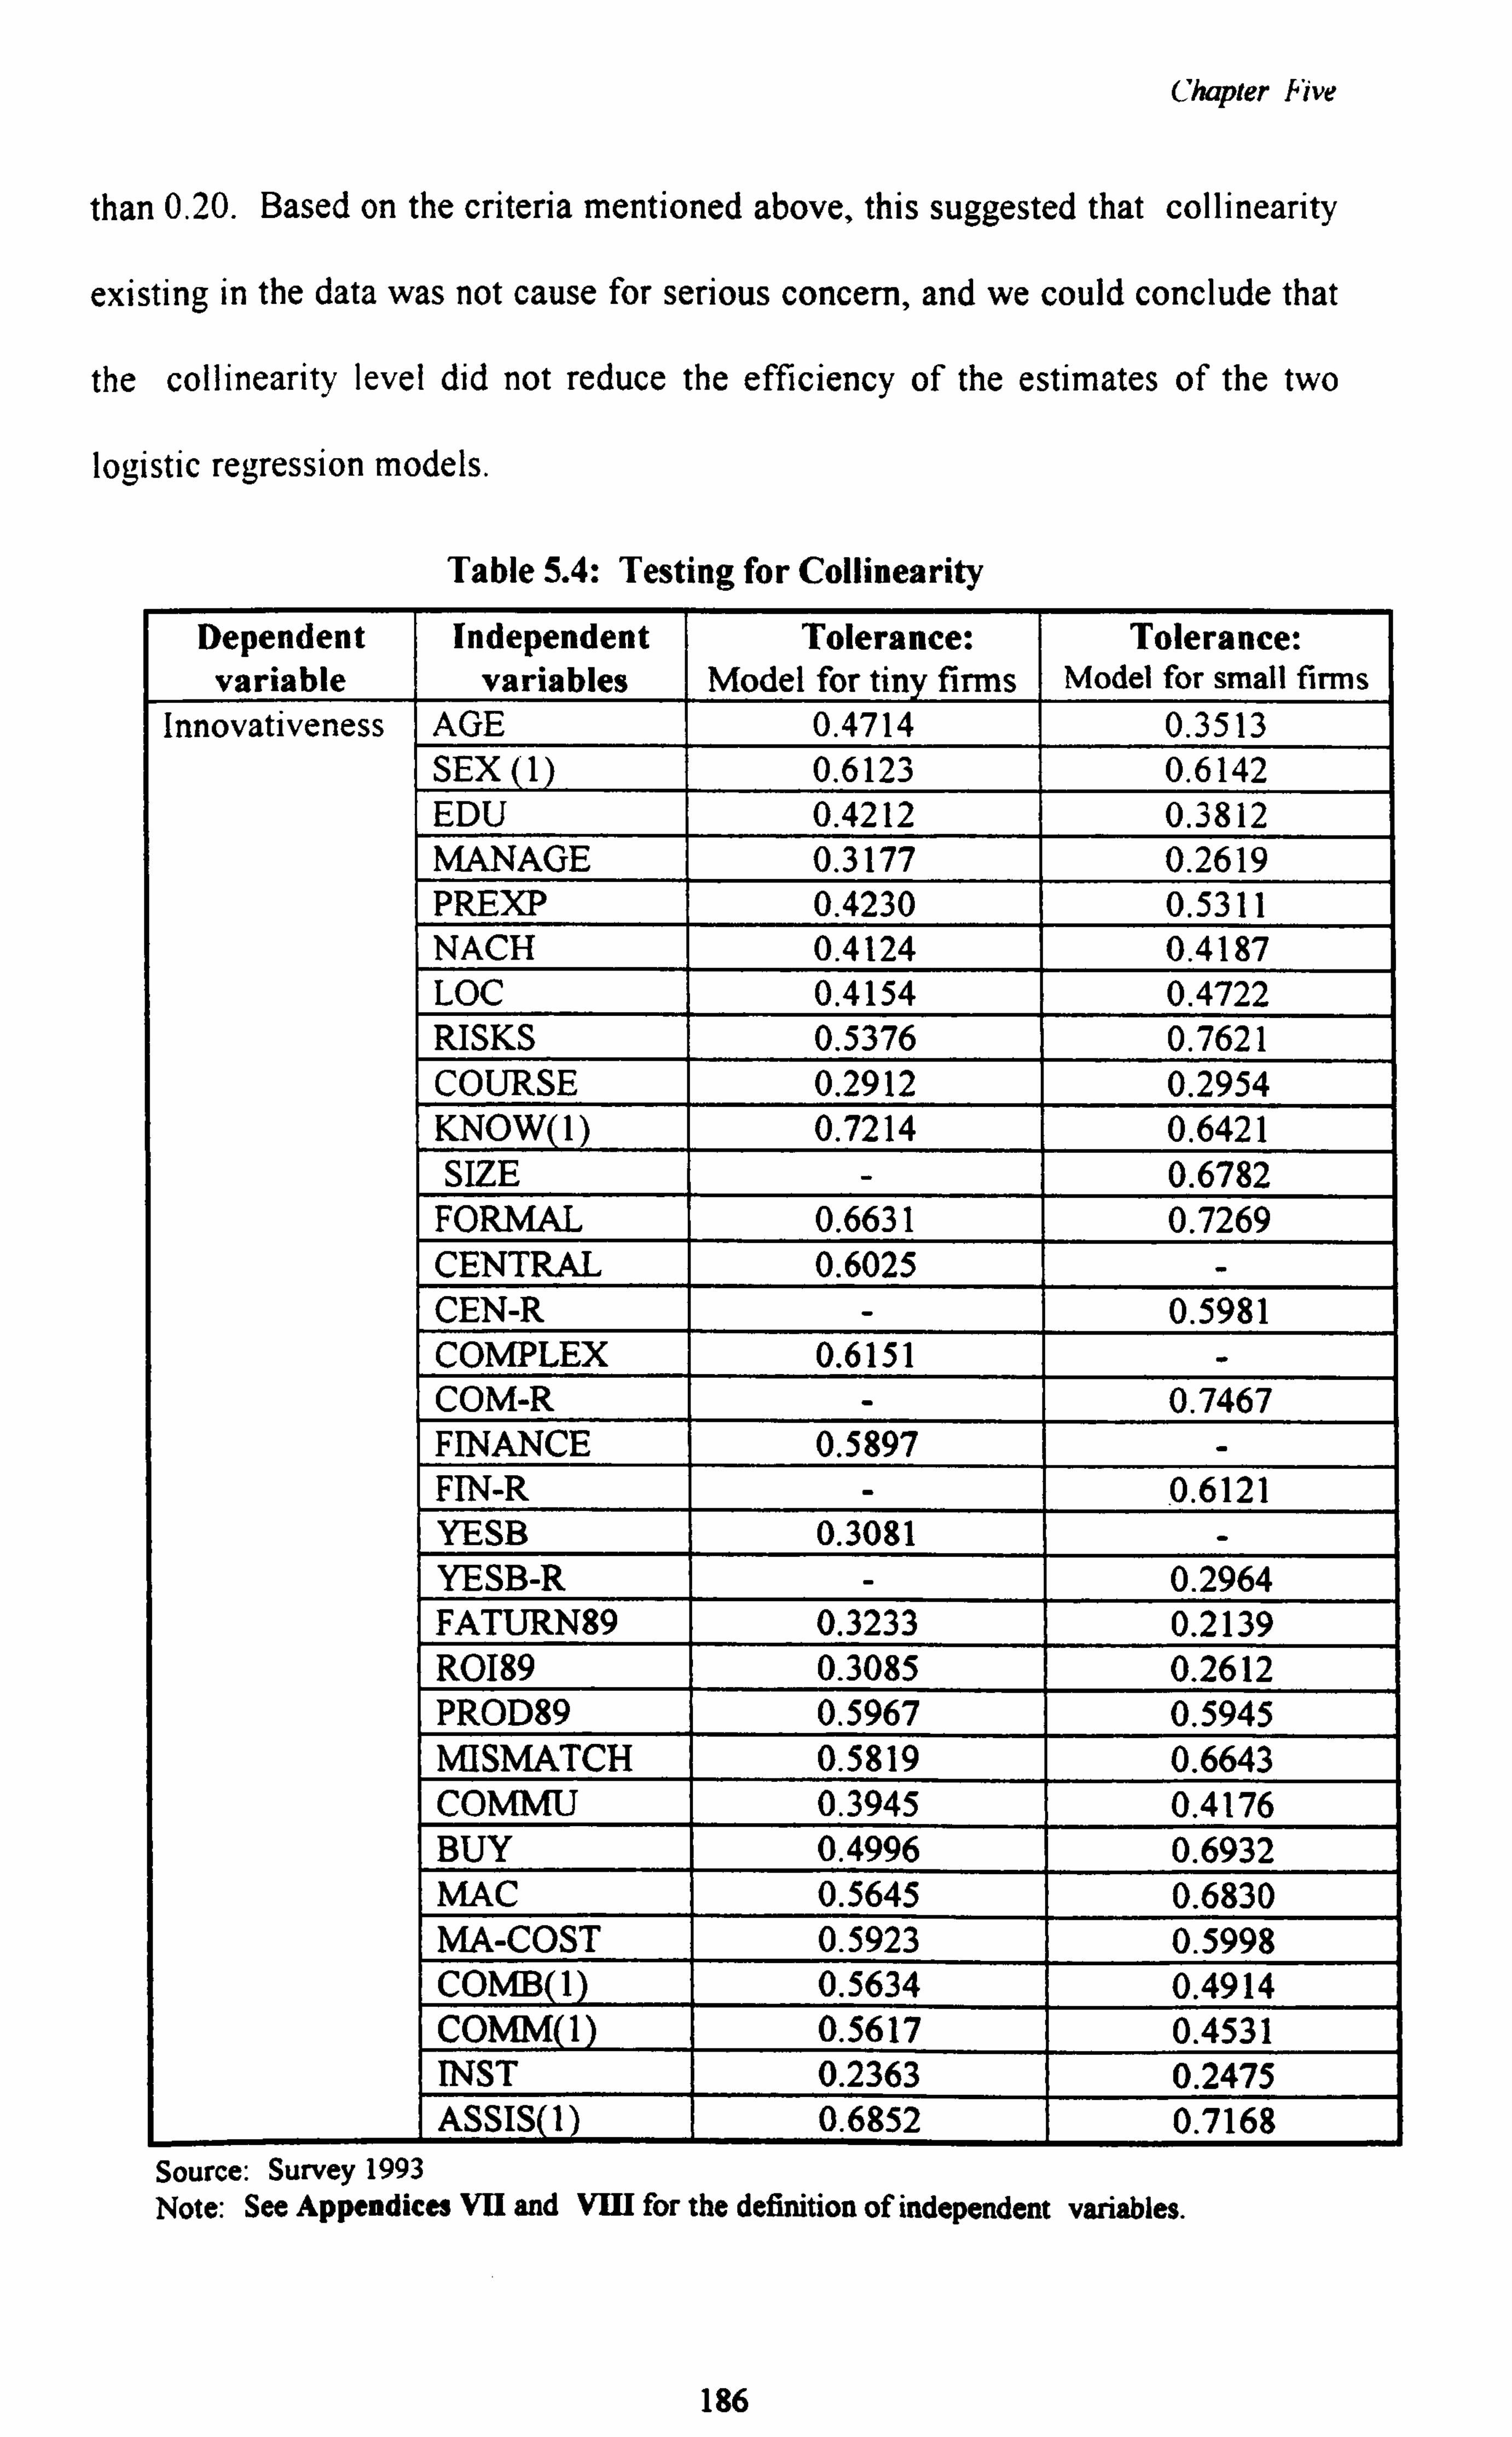
Chapter Five
than 0.20. Based on the criteria mentioned above, this suggested that collinearity
existing in the data was not cause for serious concern, and we could conclude that
the collinearity level did not reduce the efficiency of the estimates of the two
logistic regression models.
Table 5.4: Testing for Collinearity
Dependent variable
Innovativeness
Independent variables
AGE SEX (1) EDU MANAGE PREXP NACH LOC RISKS COURSE KNOW(1) SIZE
FORMAL CENTRAL CEN-R COMPLEX COM-R FINANCE FIN-R YESB YESB-R FATURN89 R0189 PROD89 MISMATCH COMMU BUY MAC MA-COST COMB(1) COMM(1) INST
Tolerance: Model for tiny firms
0.4714 0.6123 0.4212 0.3177 0.4230 0.4124 0.4154 0.5376 0.2912 0.7214
0.6631 0.6025
0.6151
0.5897
0.3081
0.3233 0.3085 0.5967 0.5819 0.3945 0.4996 0.5645 0.5923 0.5634 0.5617 0.2363 0.6852
Tolerance: Model for small firms
0.3513 0.6142 0.3812 0.2619 0.5311 0.4187 0.4722 0.7621 0.2954 0.6421 0.6782 0.7269
0.5981
0.7467
0.6121
0.2964 0.2139 0.2612 0.5945 0.6643 0.4176 0.6932 0.6830 0.5998 0.4914 0.4531 0.2475 0.7168 I
Source: Survey 1993 Note: See Appendices VII and VIII for the definition of independent variables.
186
Chapter Hive
5.8.3 Evaluation of the Logistic Regression models
We used -2log-likelihoods and `model chi-square' statistics to evaluate the logistic
regression function of tiny and small firms. 'Model chi-square' is the difference
between the value of -2log-likelihood with none of the independent variables in
the model (Initial -2/og-likelihood) and the value of -? log-likelihood with all of
the independent variables in the model (model -2loglikelihoocl). `Model chi-
square' provides a test of the null hypothesis9 that ß, = ßZ = .......... ßk_, = ß,, = 0;
that none of the independent variable can predict the dependent variable. The
value of -2log-likelihood and `model chi-square' of logistic regression function
of tiny and small firms can be observed in Table 5.5 .
For tiny and small
firms, the values of `model chi-square' statistics were equal to 81.405 and 109.713
respectively, and these values were significant at 99.9 per cent confidence level.
This indicated that we could reject the null hypothesis that none of the
independent variables can predict the dependent variable. As we observed in
Appendices VII and VIII, 17 and 20 independent variables were found to be
able to predict the dependent variable at least at 85 per cent confidence level in
the logistic regression function for tiny and small firms respectively.
8 In logistic regression function, the log-likelihood is a criterion for selecting parameters (Menard, S. 1995, p 19). This is just like the sum of squared errors (SSE) in the linear
regression function. SPSS statistical package calculates the value of the log-likelihood and multiplies it by -2 so that the value has approximately a X2 distribution. The value of -2log- likelihood is an indicator of how poorly the model fits.
9 ̀ Model chi-square' is analogous to the multiple variate F test for linear regression, as well as the regression sum of squares.
187
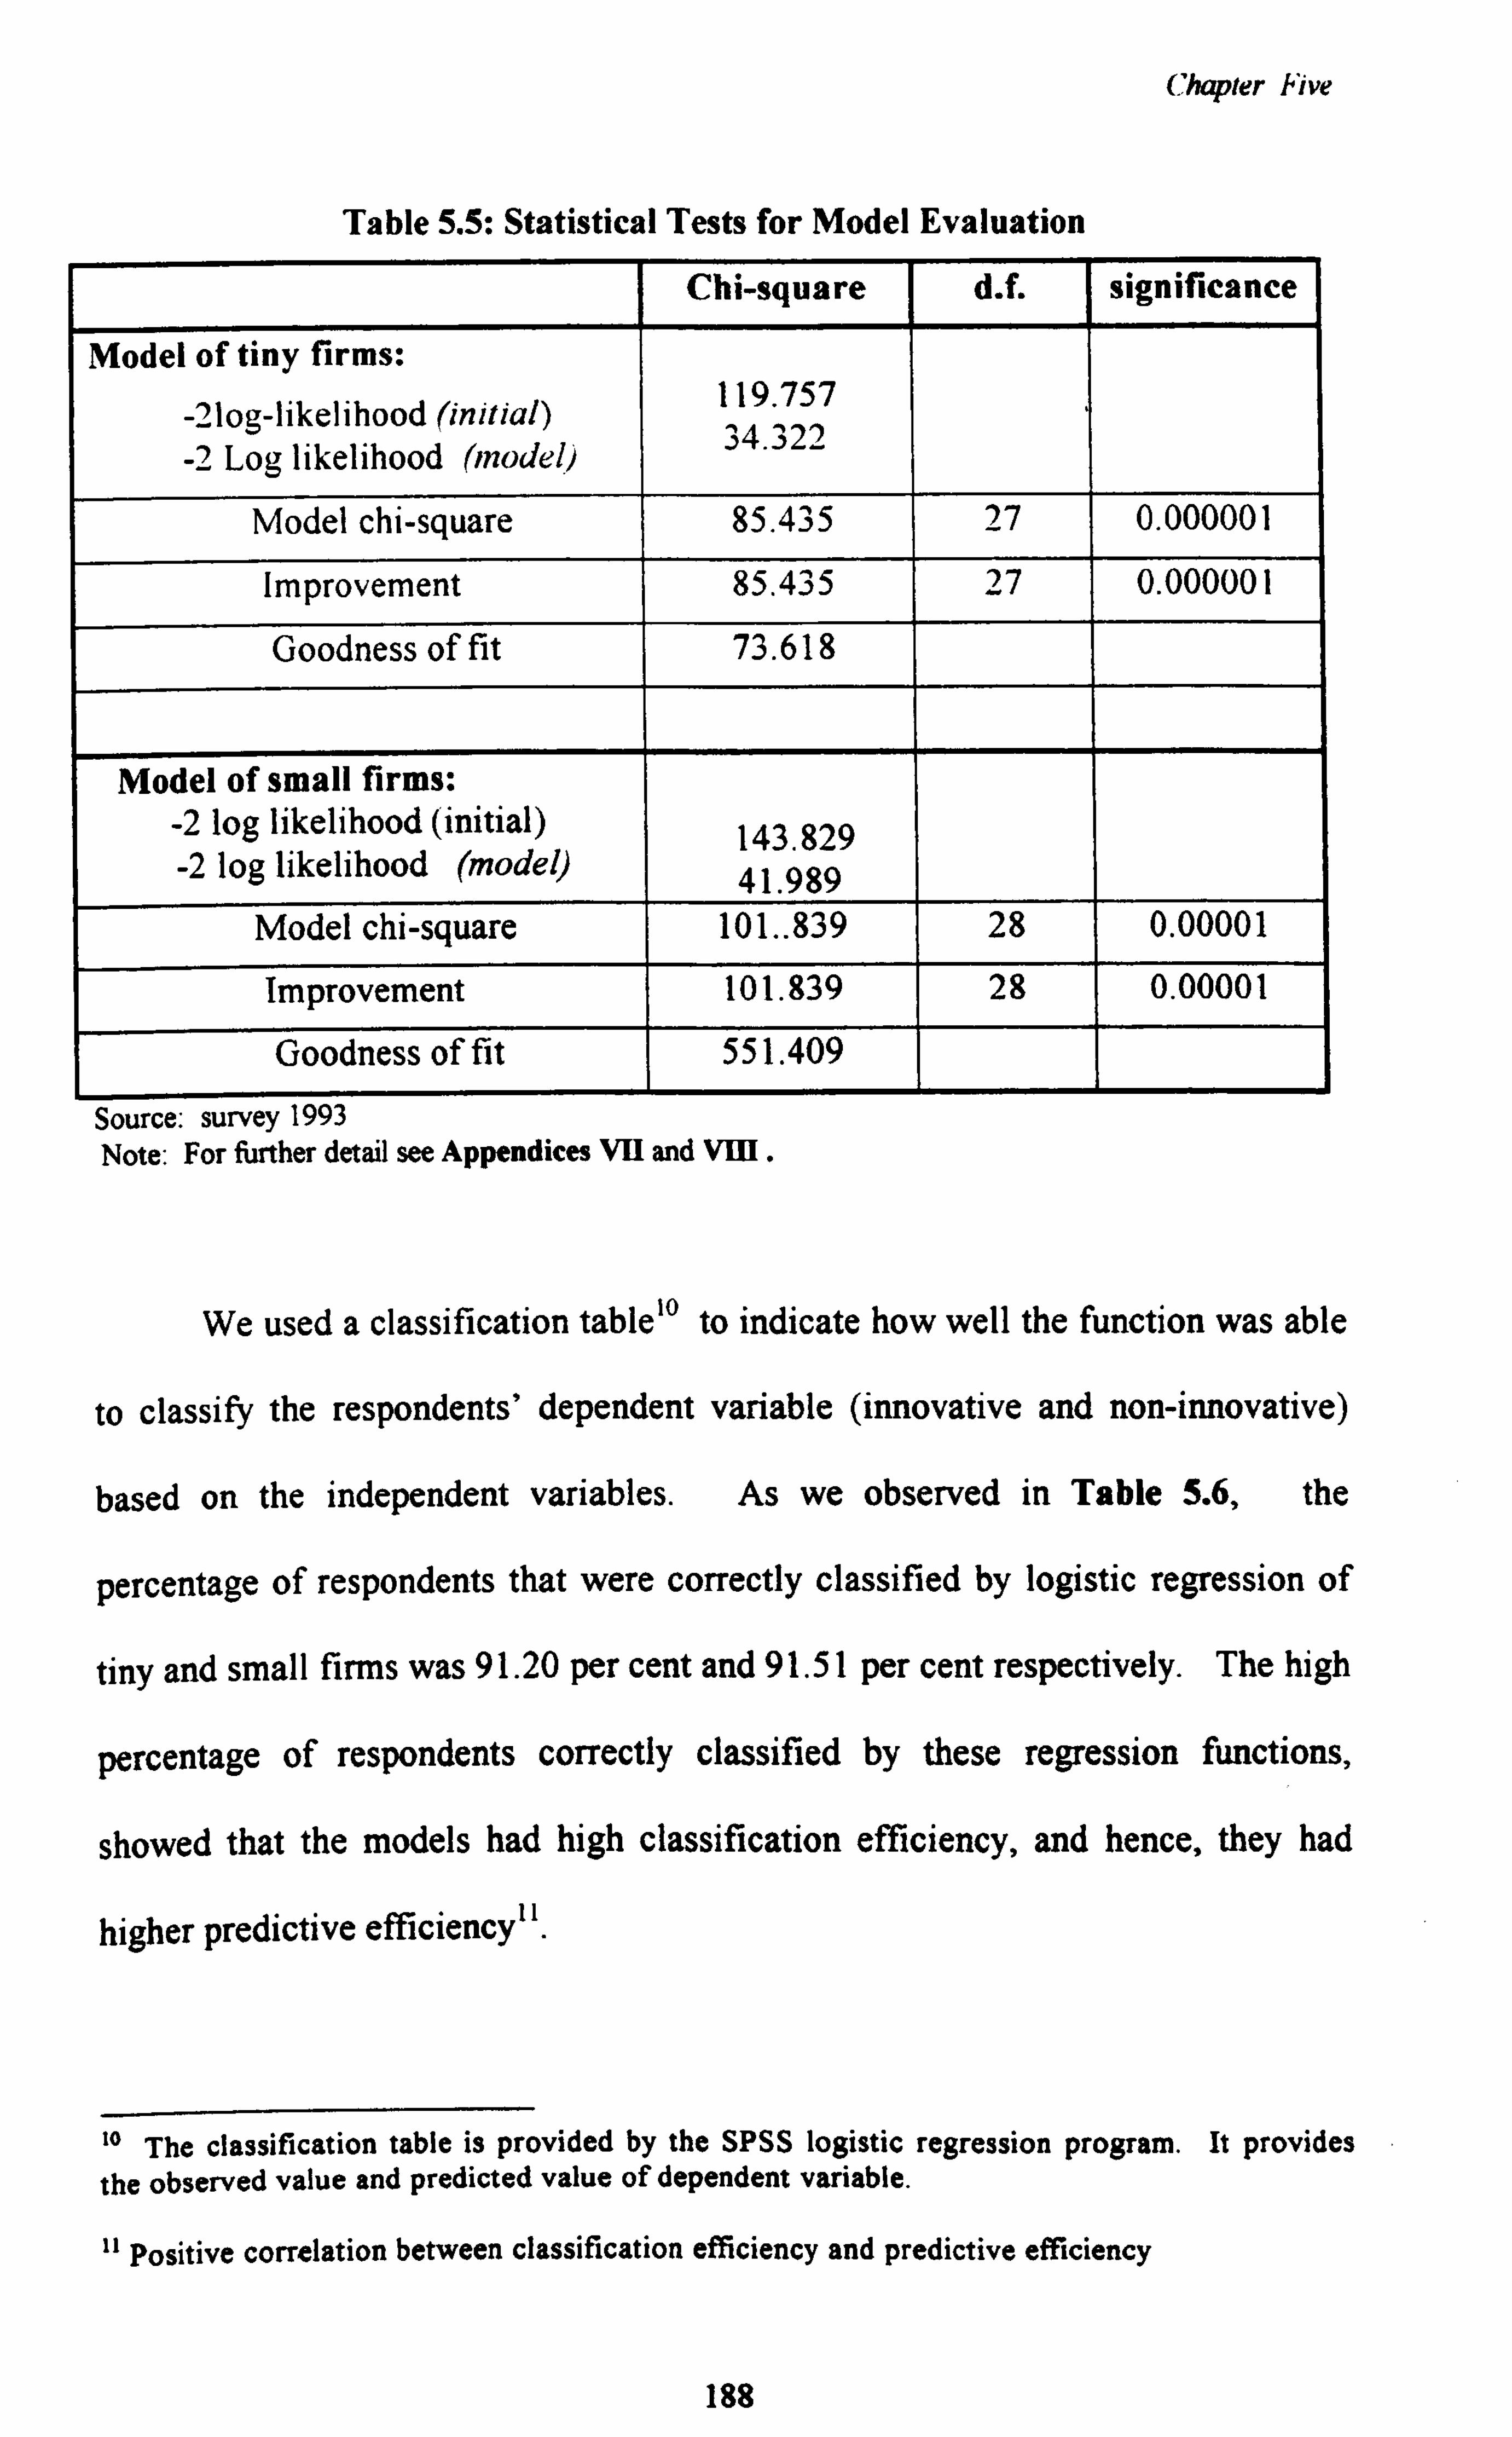
Chapter Five
Table 5.5: Statistical Tests for Model Evaluation
Chi-square d. f. significance
Model of tiny firms:
-2log-likelihood (initial)
-2 Log likelihood (model)
119.757
'4.322
Model chi-square 85.435 27 0.000001
Improvement 85.435 27 0.000001
Goodness of fit 73.618
Model of small firms:
-2 log likelihood (initial)
-2 log likelihood (model) 143.829 41.989
Model chi-square 101.. 839 28 0.00001
Improvement 101.839 28 0.00001
Goodness of fit 551.409
Source: survey 1993 Note: For further detail see Appendices VII and VIII .
We used a classification table1° to indicate how well the function was able
to classify the respondents' dependent variable (innovative and non-innovative)
based on the independent variables. As we observed in Table 5.6, the
percentage of respondents that were correctly classified by logistic regression of
tiny and small firms was 91.20 per cent and 91.51 per cent respectively. The high
percentage of respondents correctly classified by these regression functions,
showed that the models had high classification efficiency, and hence, they had
higher predictive efficiency"
10 The classification table is provided by the SPSS logistic regression program. It provides the observed value and predicted value of dependent variable.
11 Positive correlation between classification efficiency and predictive efficiency
188
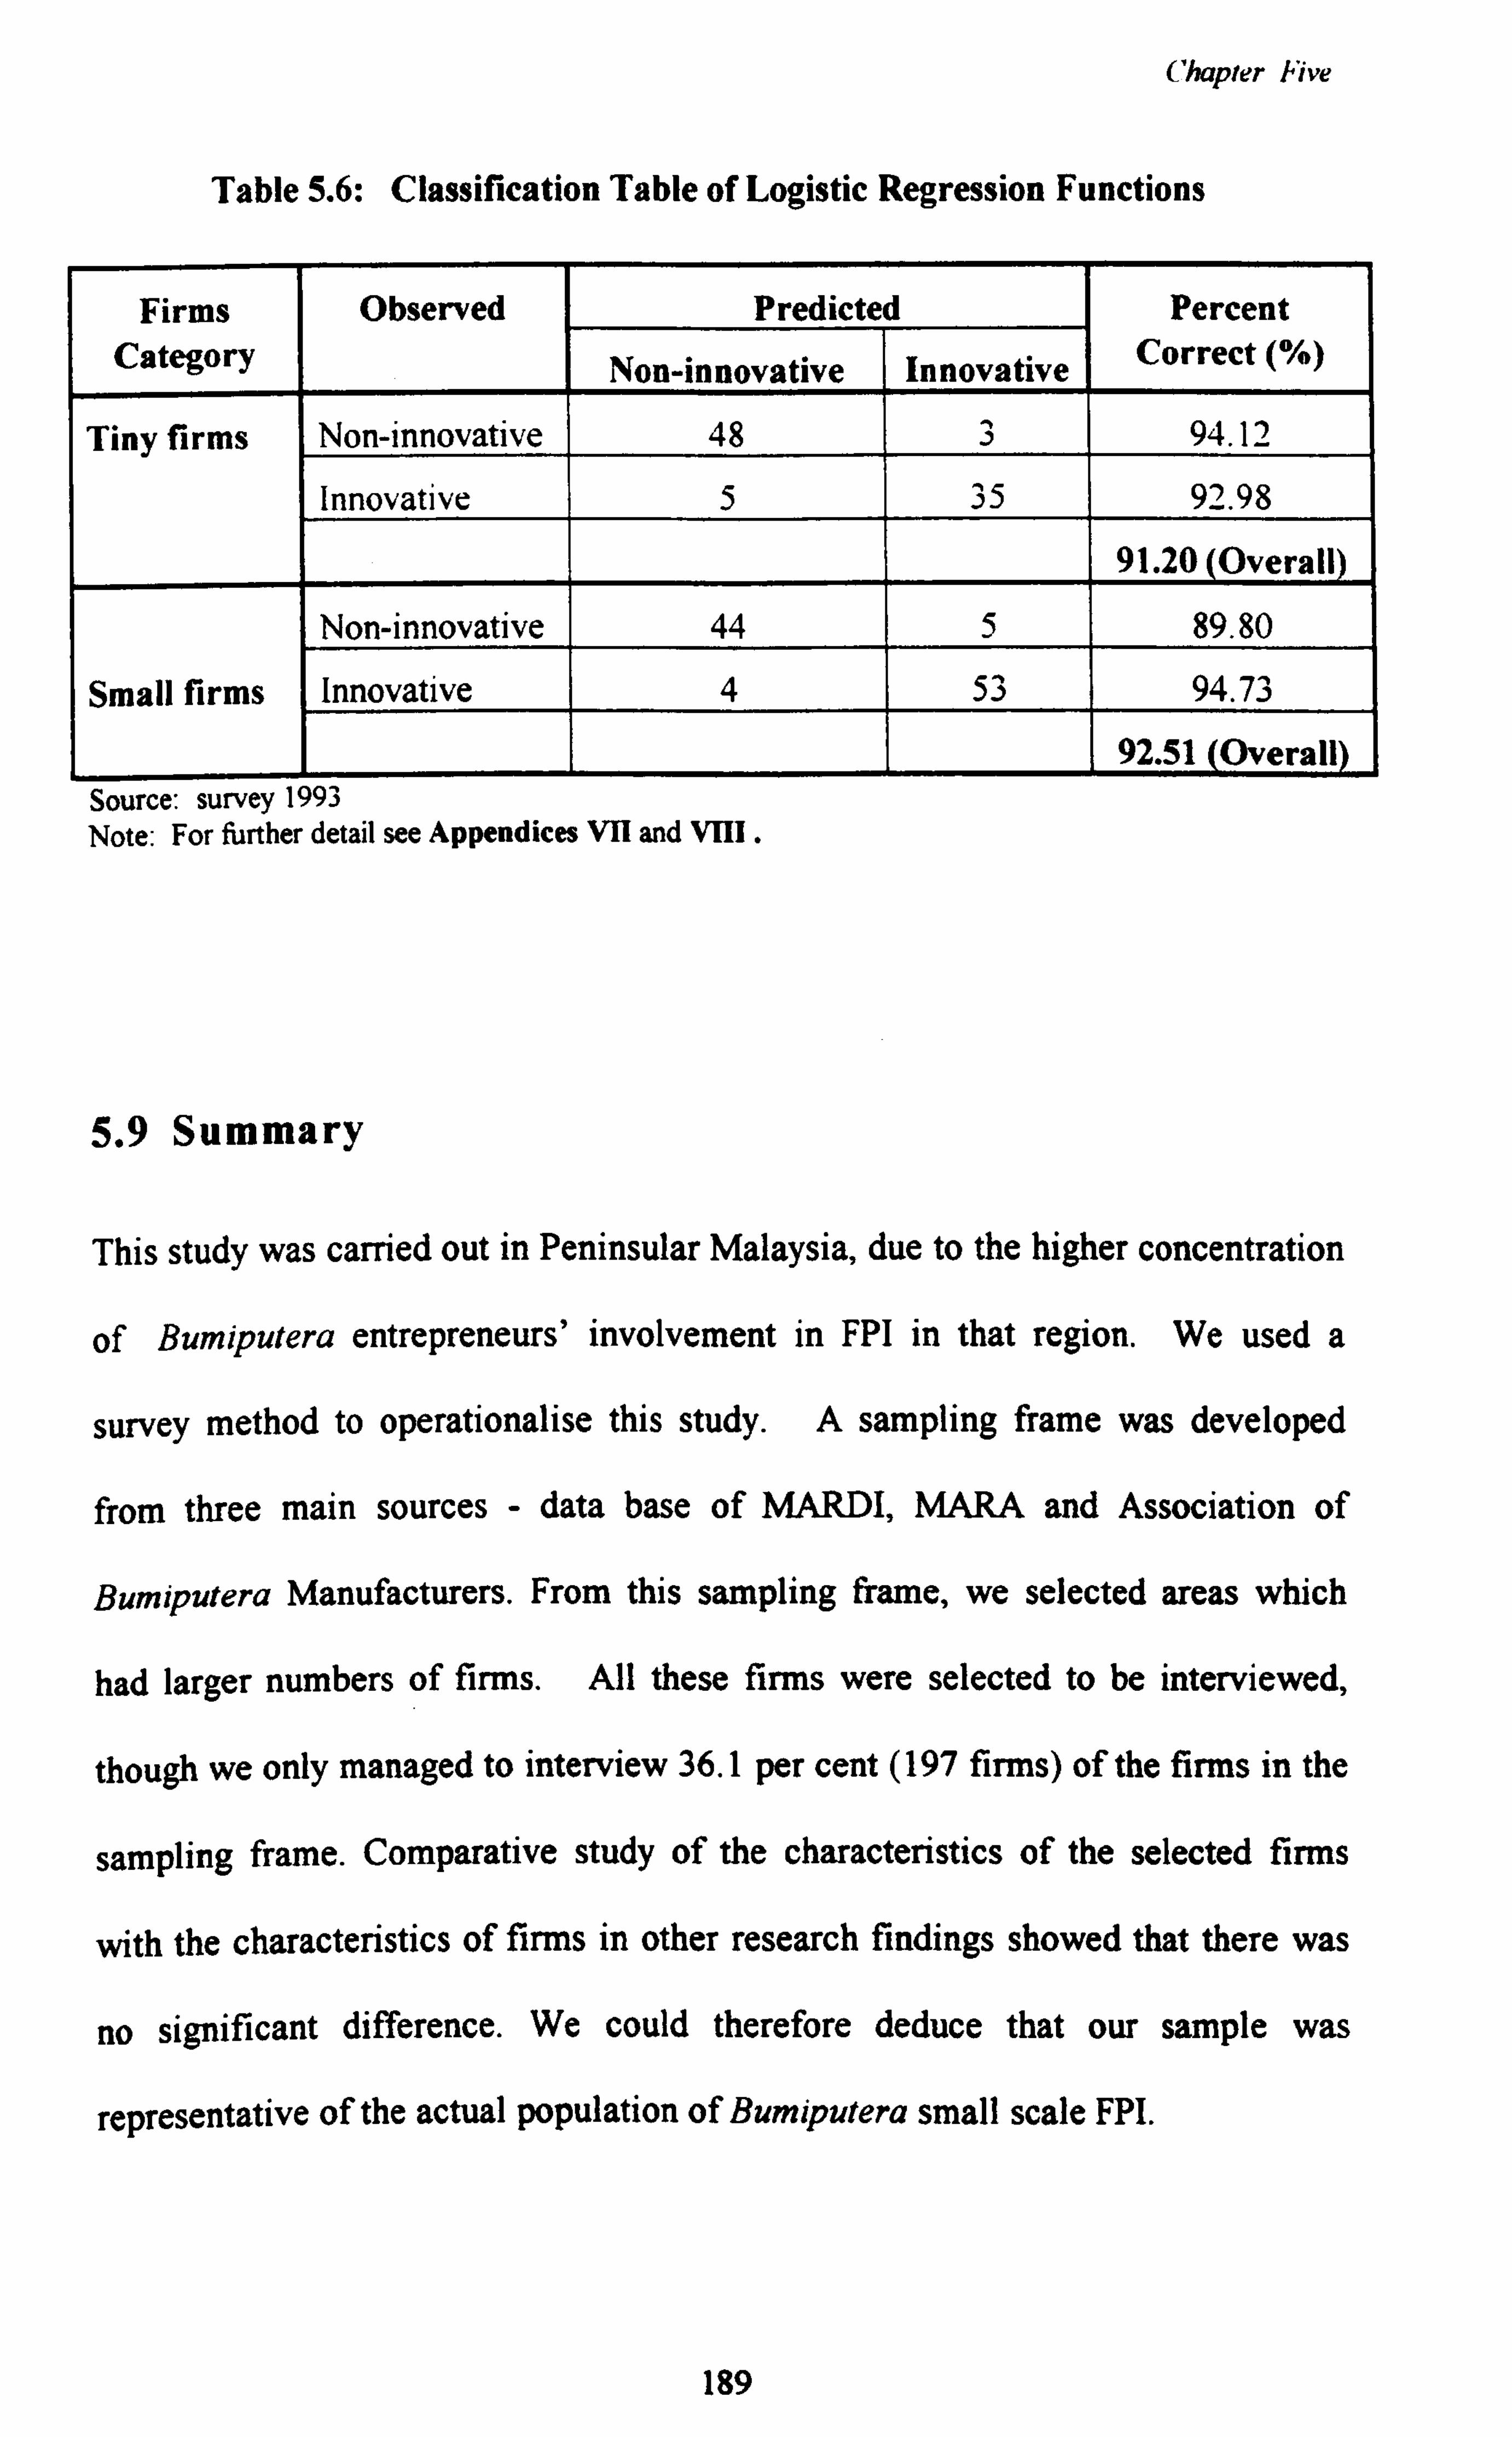
Chapter Five
Table 5.6: Classification Table of Logistic Regression Functions
Firms Observed Predicted Percent Category Non-innovative Innovative Correct (%)
Tiny firms Non-innovative 48 3 94.12
Innovative 5 35 92.98
91.20 (Overall)
Non-innovative 44 5 89.80
Small firms Innovative 4 53 94.73
92.51 Overall Source: survey 1993 Note: For further detail see Appendices VII and VIII .
5.9 Summary
This study was carried out in Peninsular Malaysia, due to the higher concentration
of Bumiputera entrepreneurs' involvement in FPI in that region. We used a
survey method to operationalise this study. A sampling frame was developed
from three main sources - data base of MARDI, MARA and Association of
Bumiputera Manufacturers. From this sampling frame, we selected areas which
had larger numbers of firms. All these firms were selected to be interviewed,
though we only managed to interview 36.1 per cent (197 firms) of the firms in the
sampling frame. Comparative study of the characteristics of the selected firms
with the characteristics of firms in other research findings showed that there was
no significant difference. We could therefore deduce that our sample was
representative of the actual population of Bumiputera small scale FPI.
189
Chapter Five
To obtain information on the characteristic of the entrepreneurs, firms and
the process of adopting a technological innovation we used a structured
interviewing technique together with a questionnaire. Information on institutions
such as MARDI, MARA was obtained by informal interview with the officers
concerned. Other than these two techniques, we also obtained information from
documents and observation during factory visits. Since we used a questionnaire,
we tested the validity and the reliability of the measurement of the variables.
The value of reliability coefficient was within the acceptance level. We also
developed two logistic regression functions to test the relationship of factors
(variables) that had been hypothesised to have significant influence on the
adoption decision of entrepreneurs in tiny and small firms. These models did not
have a serious problem of multicollinearity and had the ability to classify
entrepreneurs into two categories - innovative and non-innovative.
190
Chapter Six
CHAPTER SIX
ENTREPRENEURS' CHARACTERISTICS AND ADOPTION OF TECHNOLOGICAL INNOVATION
6. Introduction
In the conceptual framework we developed in Chapter Four, we hypothesised a
relationship between the dependent variable (innovativeness), and independent
variables. This chapter presents the outcome of an empirical test of this
relationship which we conducted by using two logistic regression functions. The
first function was estimated using information from 91 entrepreneurs from tiny
firms and 106 entrepreneurs from small firms were used to estimate the second
function. In this study we conducted separate analyses on tiny and small, first,
because we recognise that tiny and small firms have different characteristics,
potentials and constraints, and second, in order to compare and contrast the
factors that influence innovativeness in small and tiny firms.
The estimators of the logistic regression function are presented in Table
6.1 (for tiny firms) and Table 6.2 (for small firm). Throughout this study, we used
a confidence level of 85 per cent as the minimum cut-off point of interval
estimation of coefficient of each factor to determine its significance. '
The significance of each factor can be examined by the value at its respective Significant Level column in Table 6.1 and Table 6.2. If the value in this column is less than 0.15, the respective factor is considered as a determining factor in this study.
191

Chapter Six
From Table 6.1, we can identify 17 independent variables which are
statistically significant to explain the innovativeness (as the dependent variable) of
tiny firms. In the case of small firms (Table 6.2), twenty independent variables
were found to be statistically significant in explaining innovativeness.
192
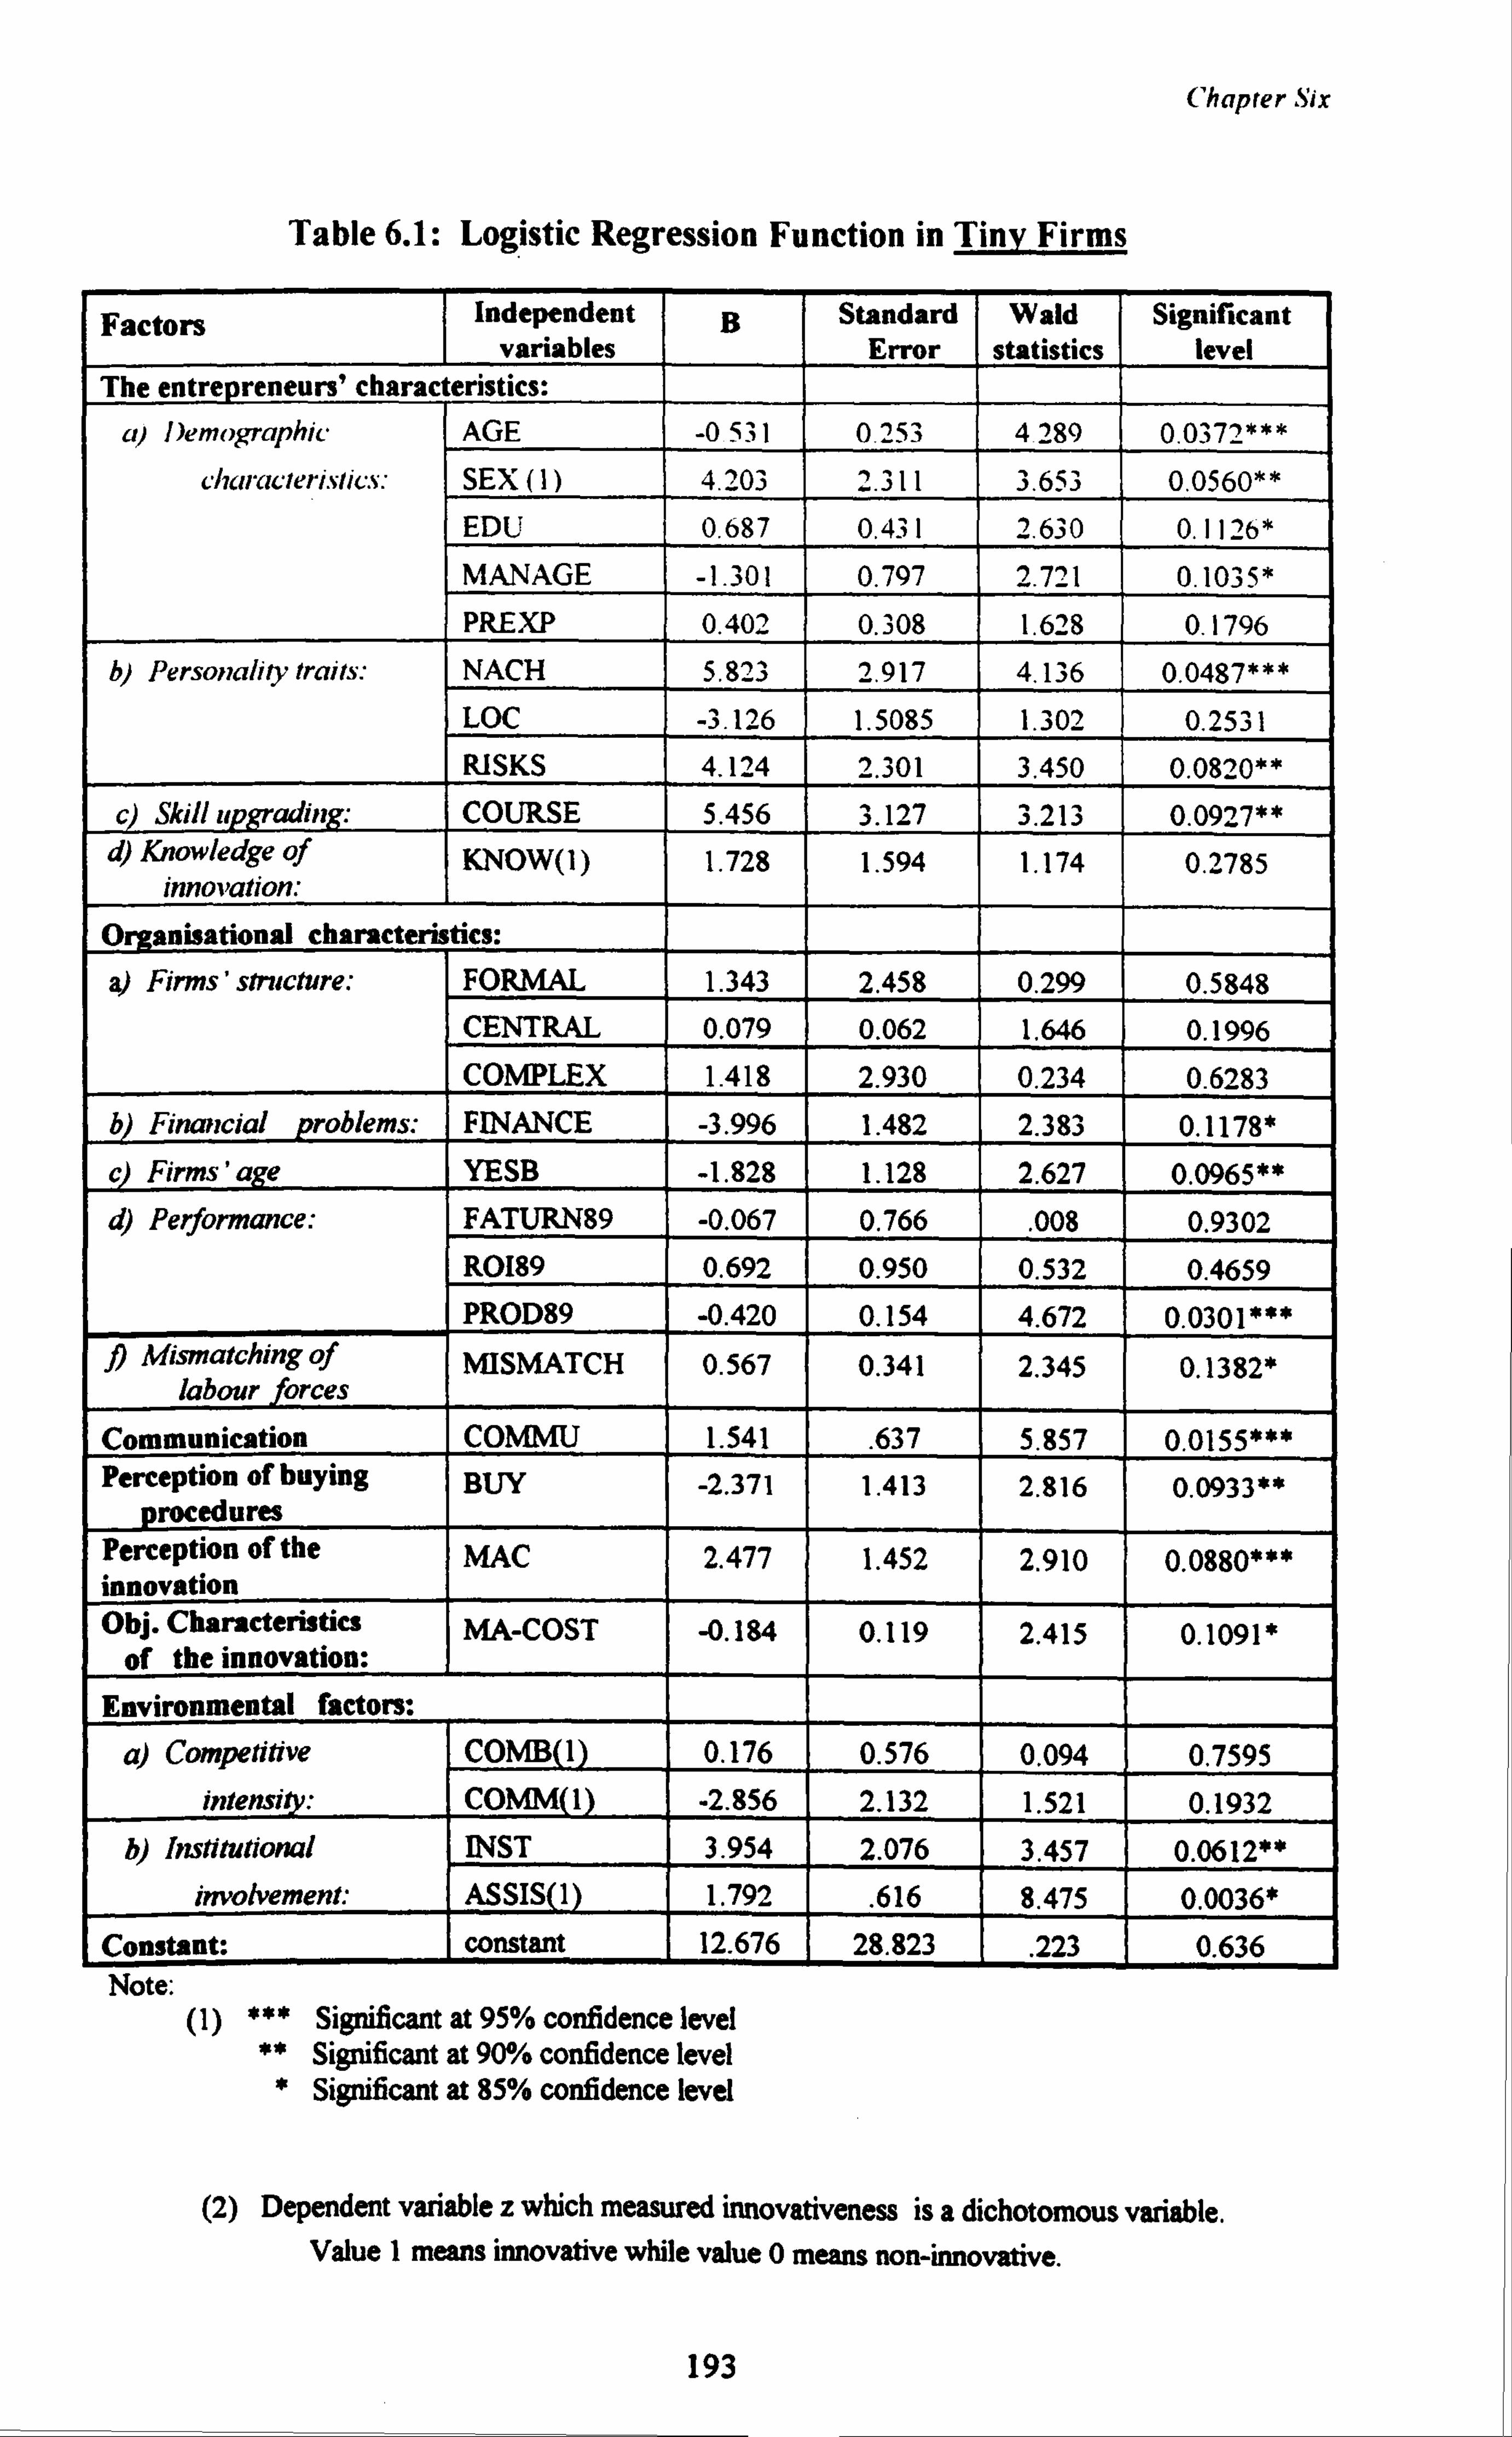
Chapter Six
Table 6.1: Logistic Regression Function in Tiny Firms
Factors Independent variables
B Standard Error
Wald statistics
Significant level
The entrepreneurs' charact eristics:
a) Demographic AGE -0 531 0.253 4 289 0.0372***
characteristics: SEX (1) 4.203 2.311 3.653 0.0560**
EDU 0.687 0.431 2.630 0.1 126*
MANAGE -1.301 0.797 2.721 0.103.5 *
PREXP 0.402 0.308 1.628 0.1796
b) Personality traits: NACH 5.823 2.917 4.136 0.0487***
LOC -3.126 1.5085 1.302 0.2531
RISKS 4.124 2.301 3.450 0.0820**
c) Ski//upgrading: COURSE 5.456 3.127 3.213 0.0927** d) Knowledge of
innovation: KNOW(]) 1.728 1.594 1.174 0.2785
Organisational characteristics:
a) Firms' structure: FORMAL 1.343 2.458 0.299 0.5848 CENTRAL 0.079 0.062 1.646 0.1996
COMPLEX 1.418 2.930 0.234 0.6283 b) Financial problems: FINANCE -3.996 1.482 2.383 0.1178*
c) Firms'age YESB -1.828 1.128 2.627 0.0965** d) Performance: FATURN89 -0.067 0.766
. 008 0.9302
R0189 0.692 0.950 0.532 0.4659
PROD89 -0.420 0.154 4.672 0.0301*** Mismatching of
labour forces MISMATCH 0.567 0.341 2.345 0.1382*
Communication COMMU 1.541 . 637 5.857 0.0155***
Perception of buying
procedures BUY -2.371 1.413 2.816 0.0933**
Perception of the innovation
MAC 2.477 1.452 2.910 0.0880***
Obj. Characteristics of the innovation:
MA-COST -0.184 0.119 2.415 0.1091 *
Environmental factors:
a) Competitive COMB(1) 0.176 0.576 0.094 0.7595 intensi : COMM 1 -2.856 2.132 1.521 0.1932
b) Institutional INST 3.954 2.076 3.457 0.0612** involvement: ASSIS 1 1.792
. 616 8.475 0.0036* Constant: constant 12.676 28.823
. 223 0.636 Note:
(1) *** Significant at 95% confidence level ** Significant at 90% confidence level
* Significant at 85% confidence level
(2) Dependent variable z which measured innovativeness is a dichotomous variable. Value I means innovative while value 0 means non-innovative.
193
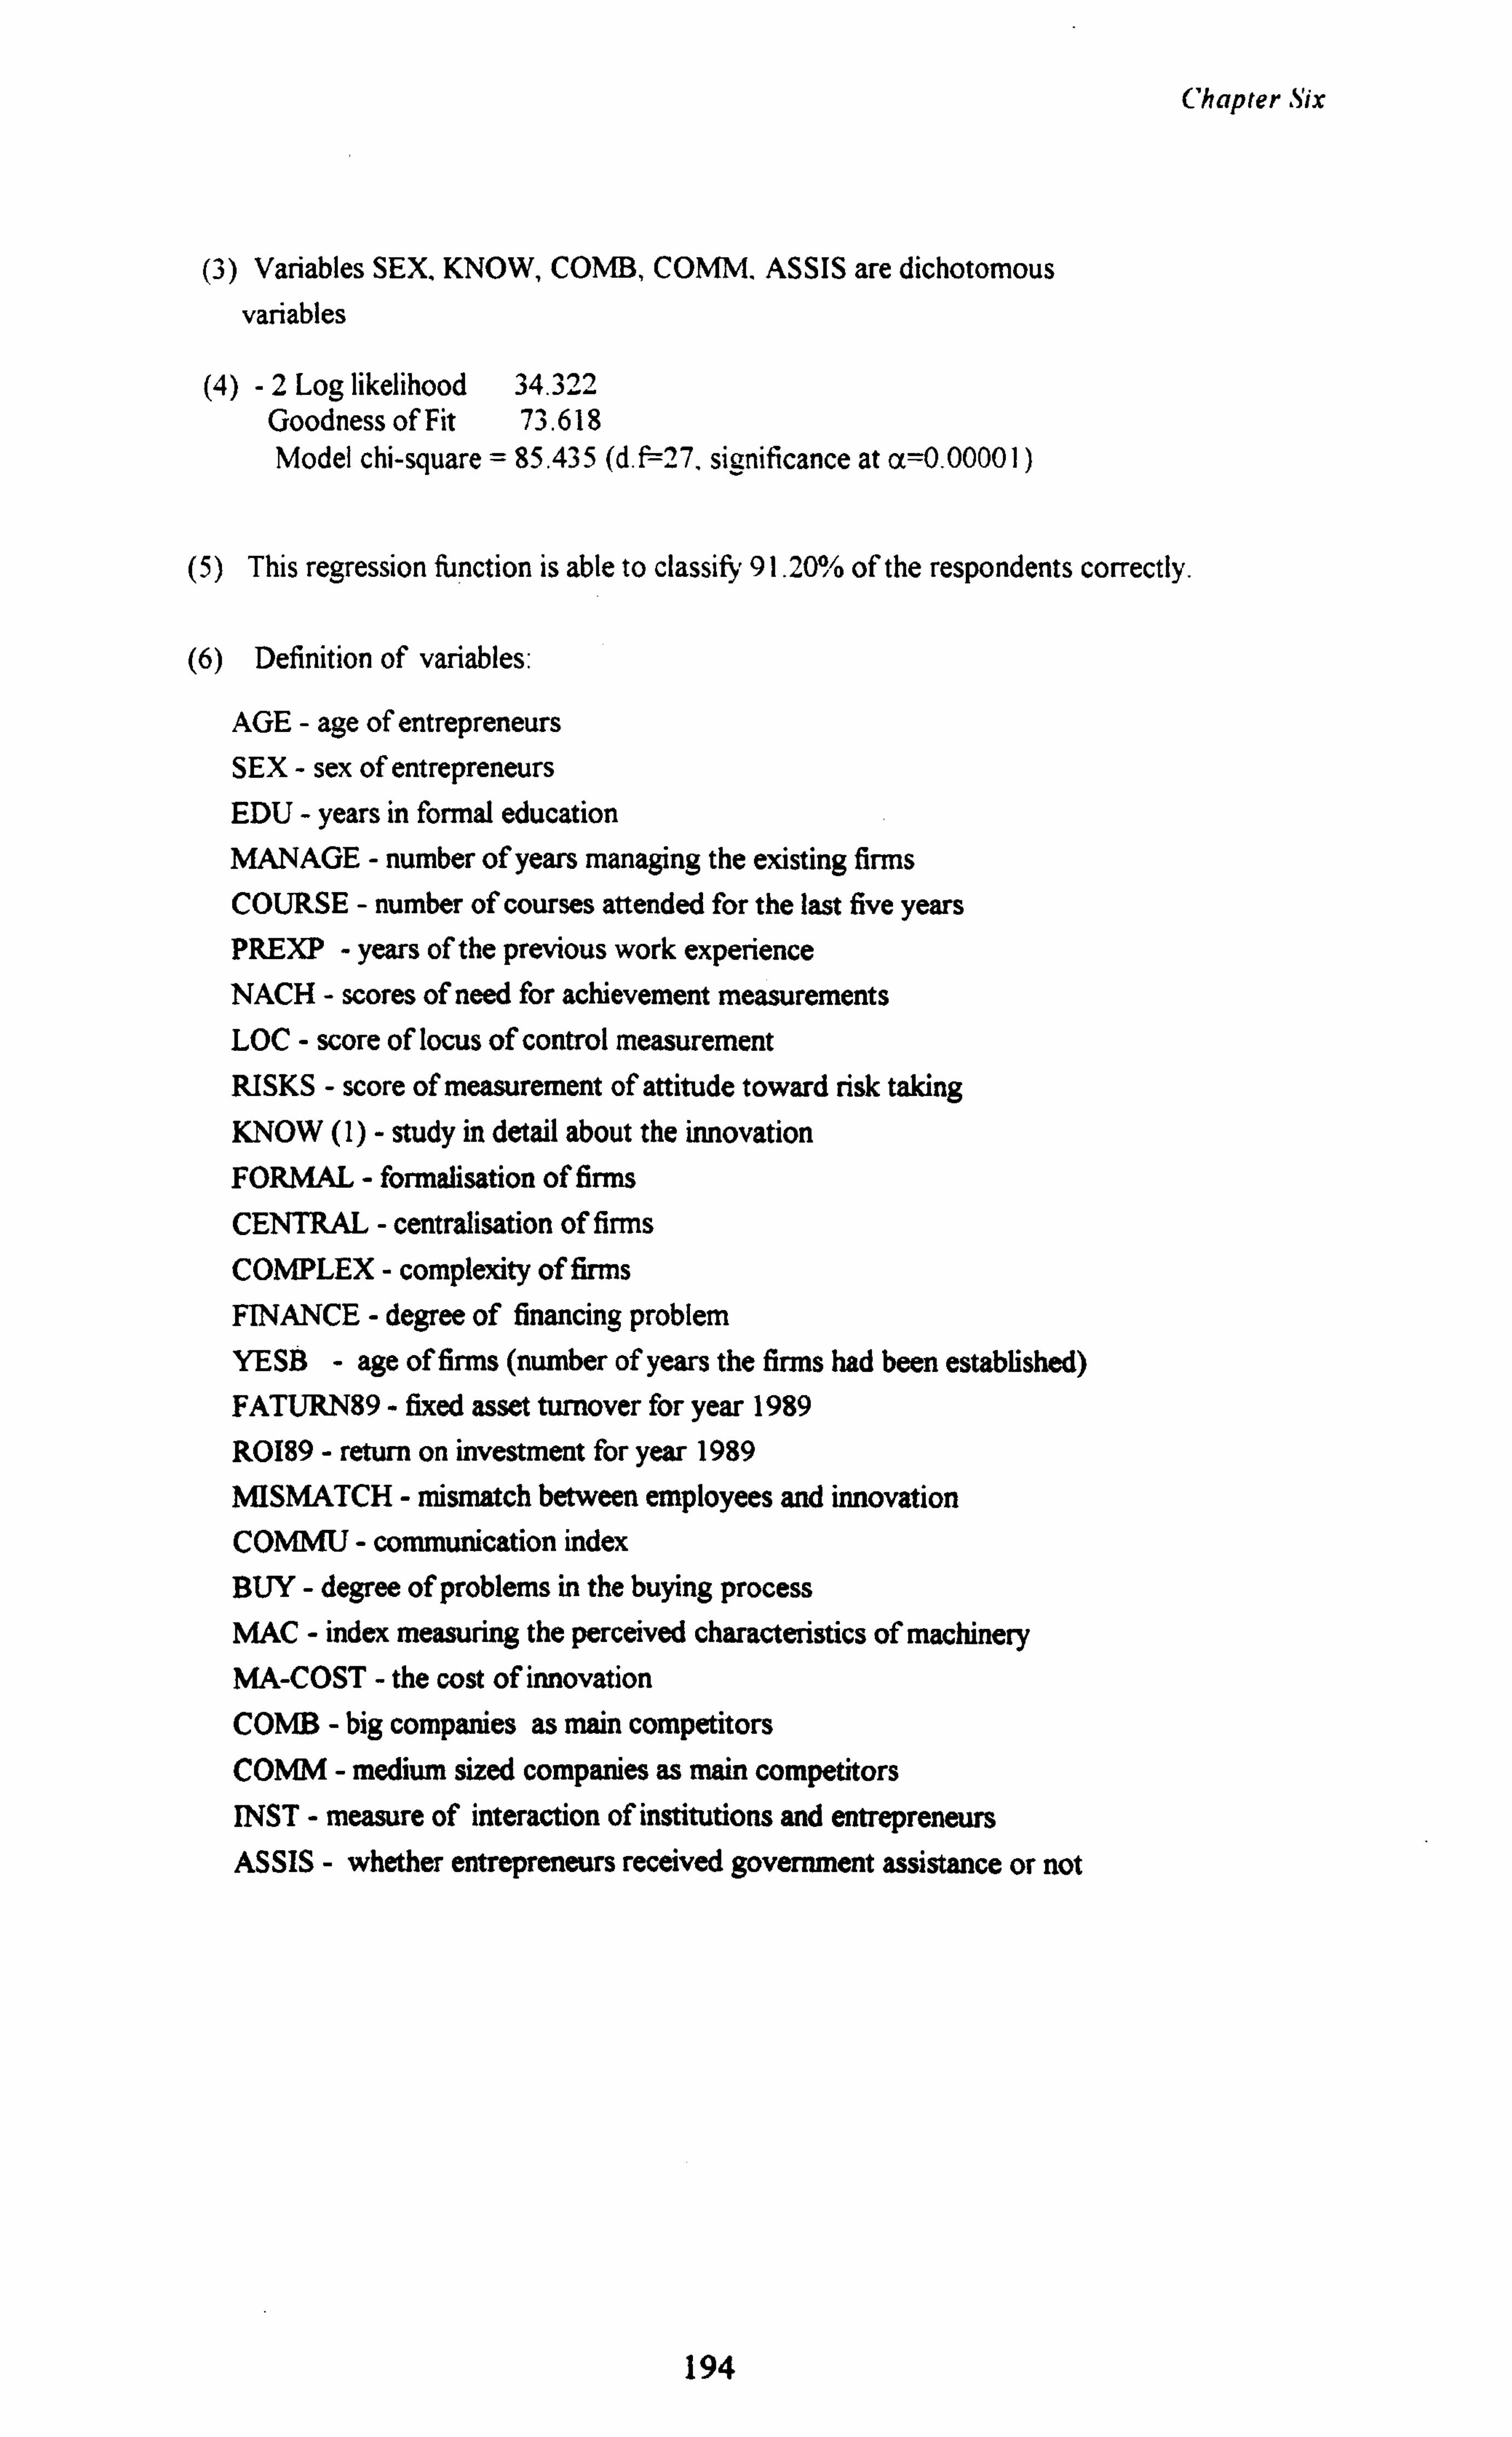
Chapter Six
(3) Variables SEX. KNOW, COMB, COMM. ASSIS are dichotomous
variables
(4) -2 Log likelihood 34.322 Goodness of Fit 73.618 Model chi-square = 85.435 (d. 27, significance at a=0.00001)
(5) This regression function is able to classify 91.20% of the respondents correctly.
(6) Definition of variables:
AGE - age of entrepreneurs SEX - sex of entrepreneurs EDU - years in formal education MANAGE - number of years managing the existing firms
COURSE - number of courses attended for the last five years PREXP - years of the previous work experience NACH - scores of need for achievement measurements LOC - score of locus of control measurement RISKS - score of measurement of attitude toward risk taking KNOW (1) - study in detail about the innovation
FORMAL - formalisation of firms CENTRAL - centralisation of firms COMPLEX - complexity of firms FINANCE - degree of financing problem YESB - age of firms (number of years the firms had been established) FATURN89 - fixed asset turnover for year 1989
R0189 - return on investment for year 1989
MISMATCH - mismatch between employees and innovation COMMU - communication index BUY - degree of problems in the buying process MAC - index measuring the perceived characteristics of machinery MA-COST - the cost of innovation COMB - big companies as main competitors COMM - medium sized companies as main competitors INST - measure of interaction of institutions and entrepreneurs ASSIS - whether entrepreneurs received government assistance or not
194
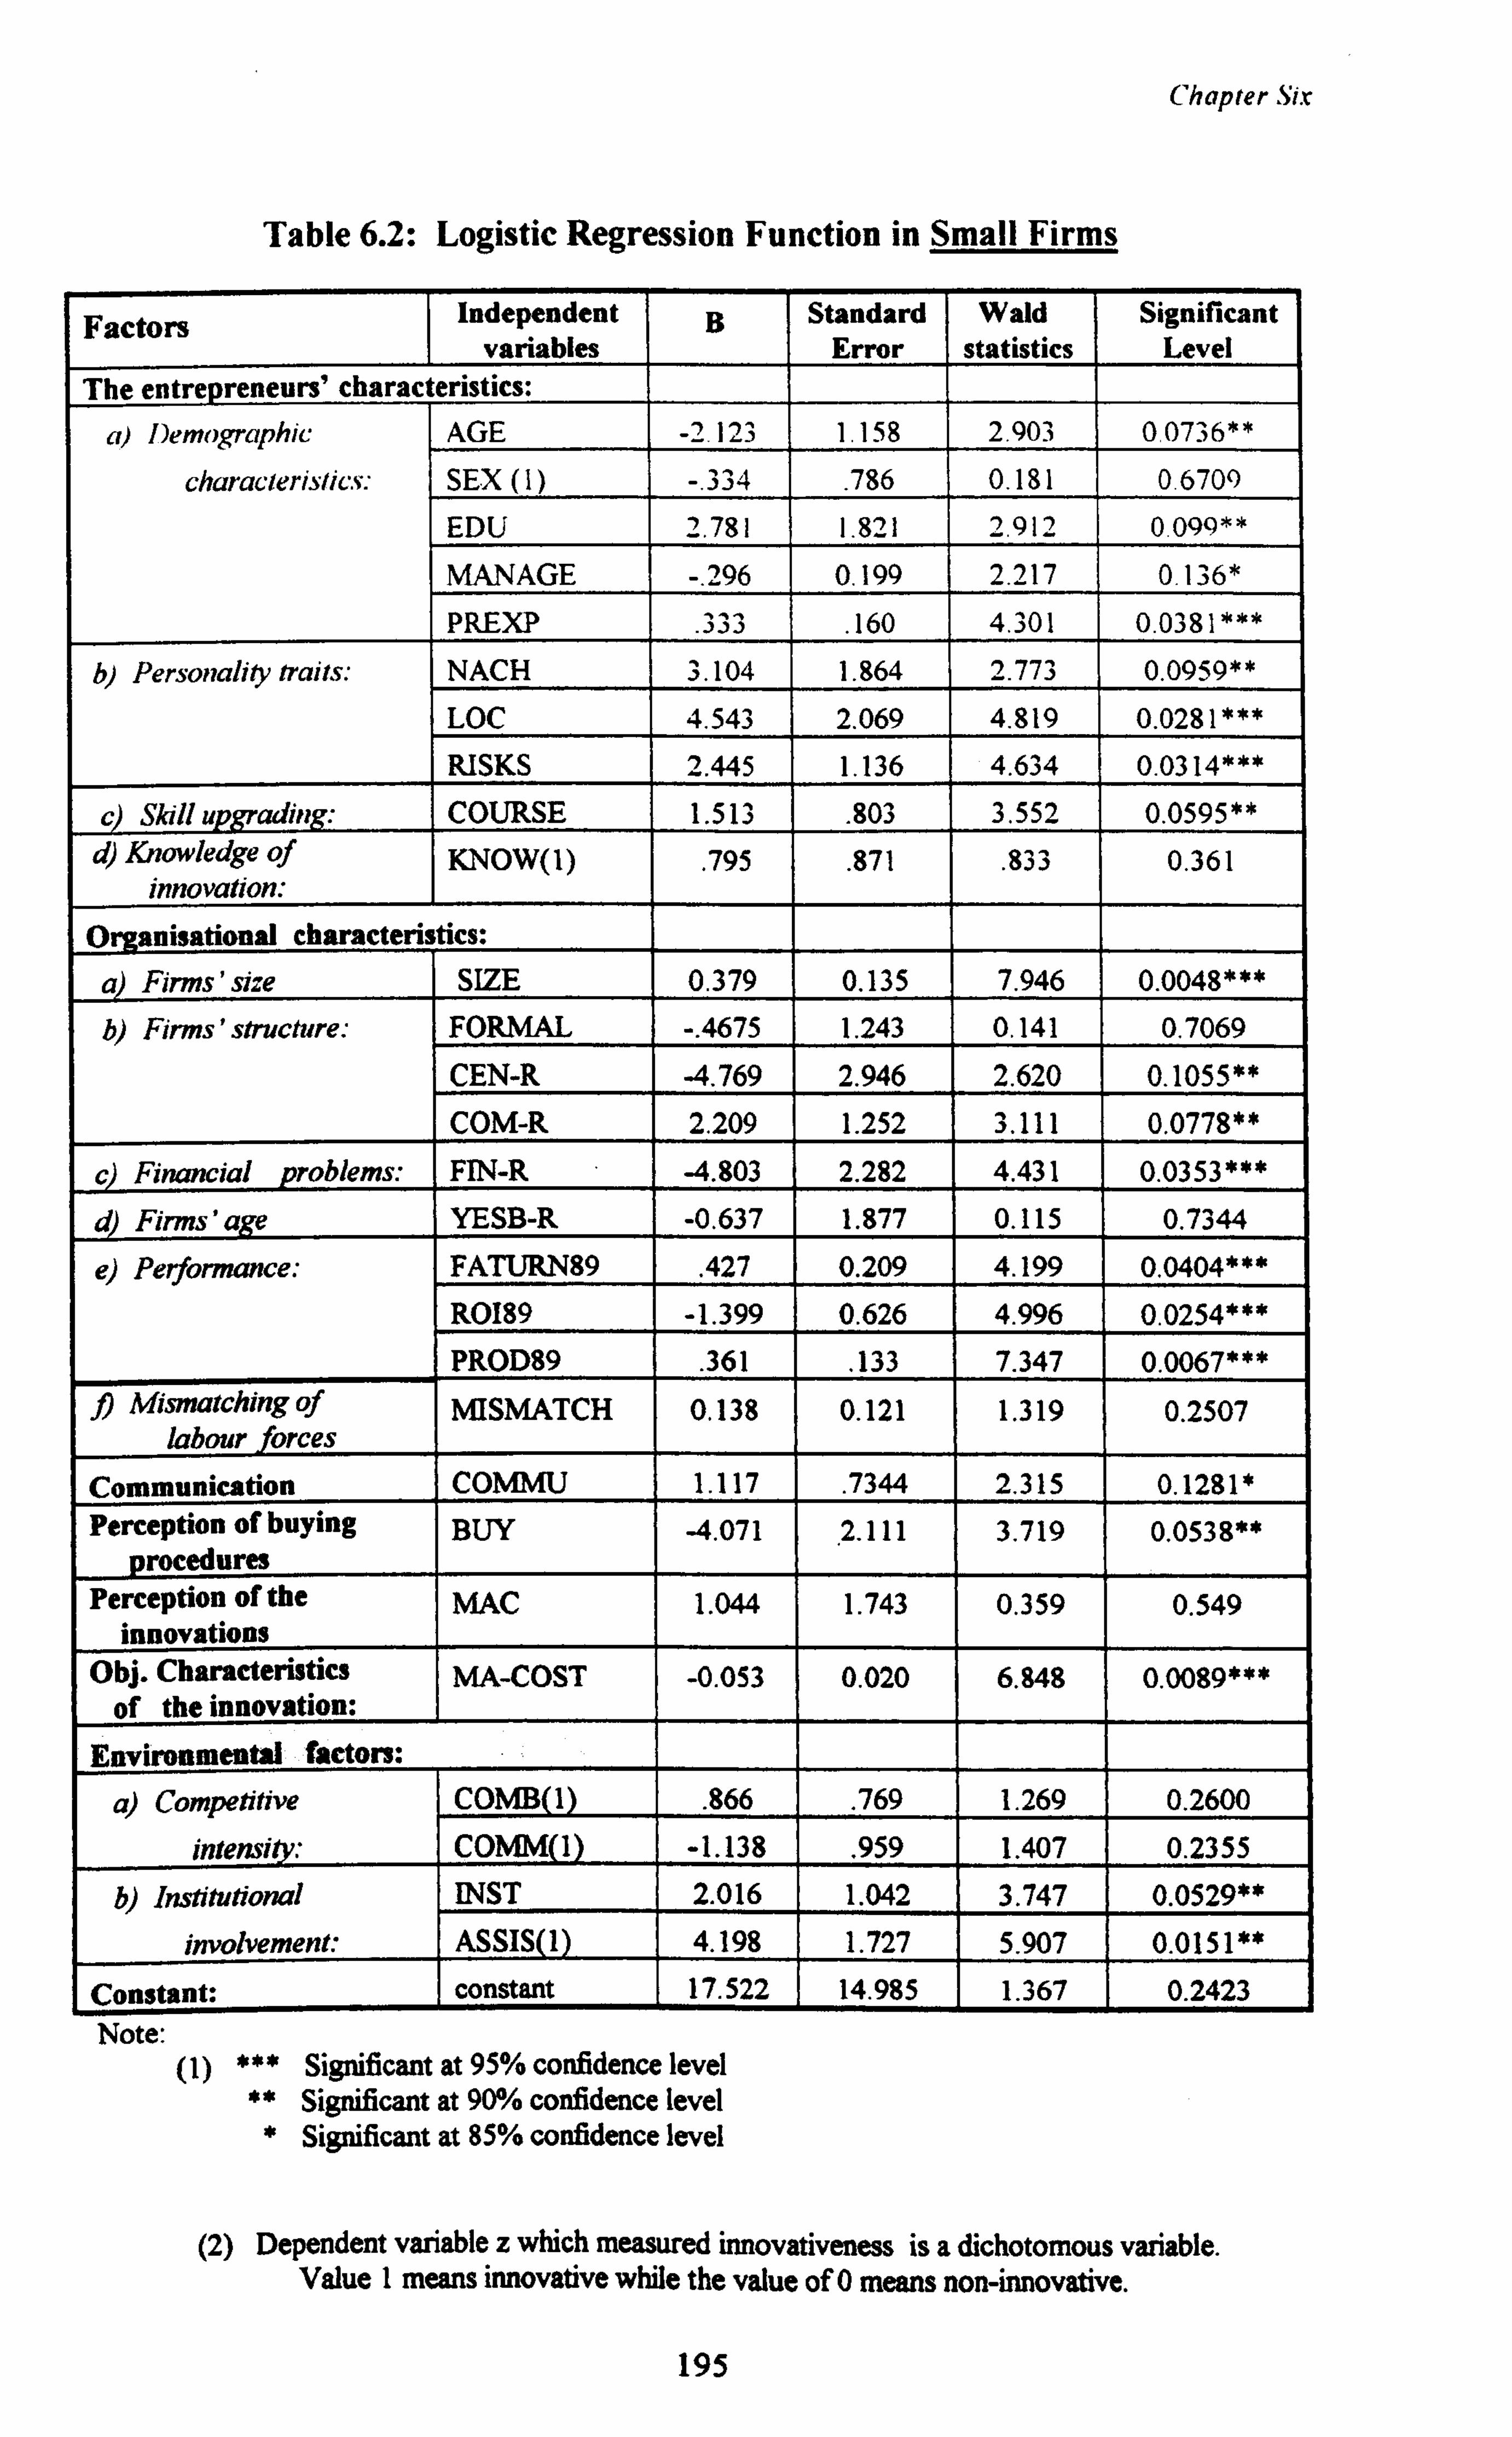
Chapter Six
Table 6.2: Logistic Regression Function in Small Firms
Factors Independent variables
B Standard Error
Wald statistics
Significant Level
The entrepreneurs' charact eristics:
a) Demographic AGE -1123 1.158 2.903 0 0736**
characteristics: SEX (1) -. 334 . 786 0.181 0.6709
EDU 2.781 1.821 2.912 0.099**
MANAGE -. 296 0.199 2.217 0.136*
PREXP . 333
. 160 4.301 0.0381 ***
b) Personality traits: NACH 3.104 1.864 2.773 0.0959**
LOC 4.543 2.069 4.819 0.0281***
RISKS 2.445 1.136 4.634 0.0314***
c) Skill upgrading: COURSE 1.513 . 803 3.552 0.0595**
d) Knowledge of innovation:
KNOW(1) . 795
. 871
. 833 0.361
Organisational characteristics:
a) Firms'size SIZE 0.379 0.135 7.946 0.0048*** b) Firms' structure: FORMAL -. 4675 1.243 0.141 0.7069
CEN-R -4.769 2.946 2.620 0.1055** COM-R 2.209 1.252 3.111 0.0778**
c) Financial problems: FIN-R -4.803 2.282 4.431 0.0353*** d) Firms' ae YESB-R -0.637 1.877 0.115 0.7344
e) Performance: FATURN89 . 427 0.209 4.199 0.0404***
R0189 -1.399 0.626 4.996 0.0254***
PROD89 . 361
. 133 7.347 0.0067***
f) Mismatching of labour forces
MISMATCH 0.138 0.121 1.319 0.2507
Communication COMMU 1.117 . 7344 2.315 0.1281 *
Perception of buying
procedures BUY -4.071 2.111 3.719 0.0538**
Perception of the innovations
MAC 1.044 1.743 0.359 0.549
Obj. Characteristics
of the innovation: MA-COST -0.053 0.020 6.848 0.0089***
Environmental factors:
a) Competitive COMB(I) . 866
. 769 1.269 0.2600
intensi : COMM 1 -1.138 . 959 1.407 0.2355
b) Institutional INST 2.016 1.042 3.747 0.0529**
involvement: ASSIS 1 4.198 1.727 5.907 0.0151**
Constant: constant 17.522 14.985 1.367 0.2423 Note:
(1) *** Significant at 95% confidence level ** Significant at 90% confidence level * Significant at 85% confidence level
(2) Dependent variable z which measured innovativeness is a dichotomous variable. Value 1 means innovative while the value of 0 means non-innovative.
195
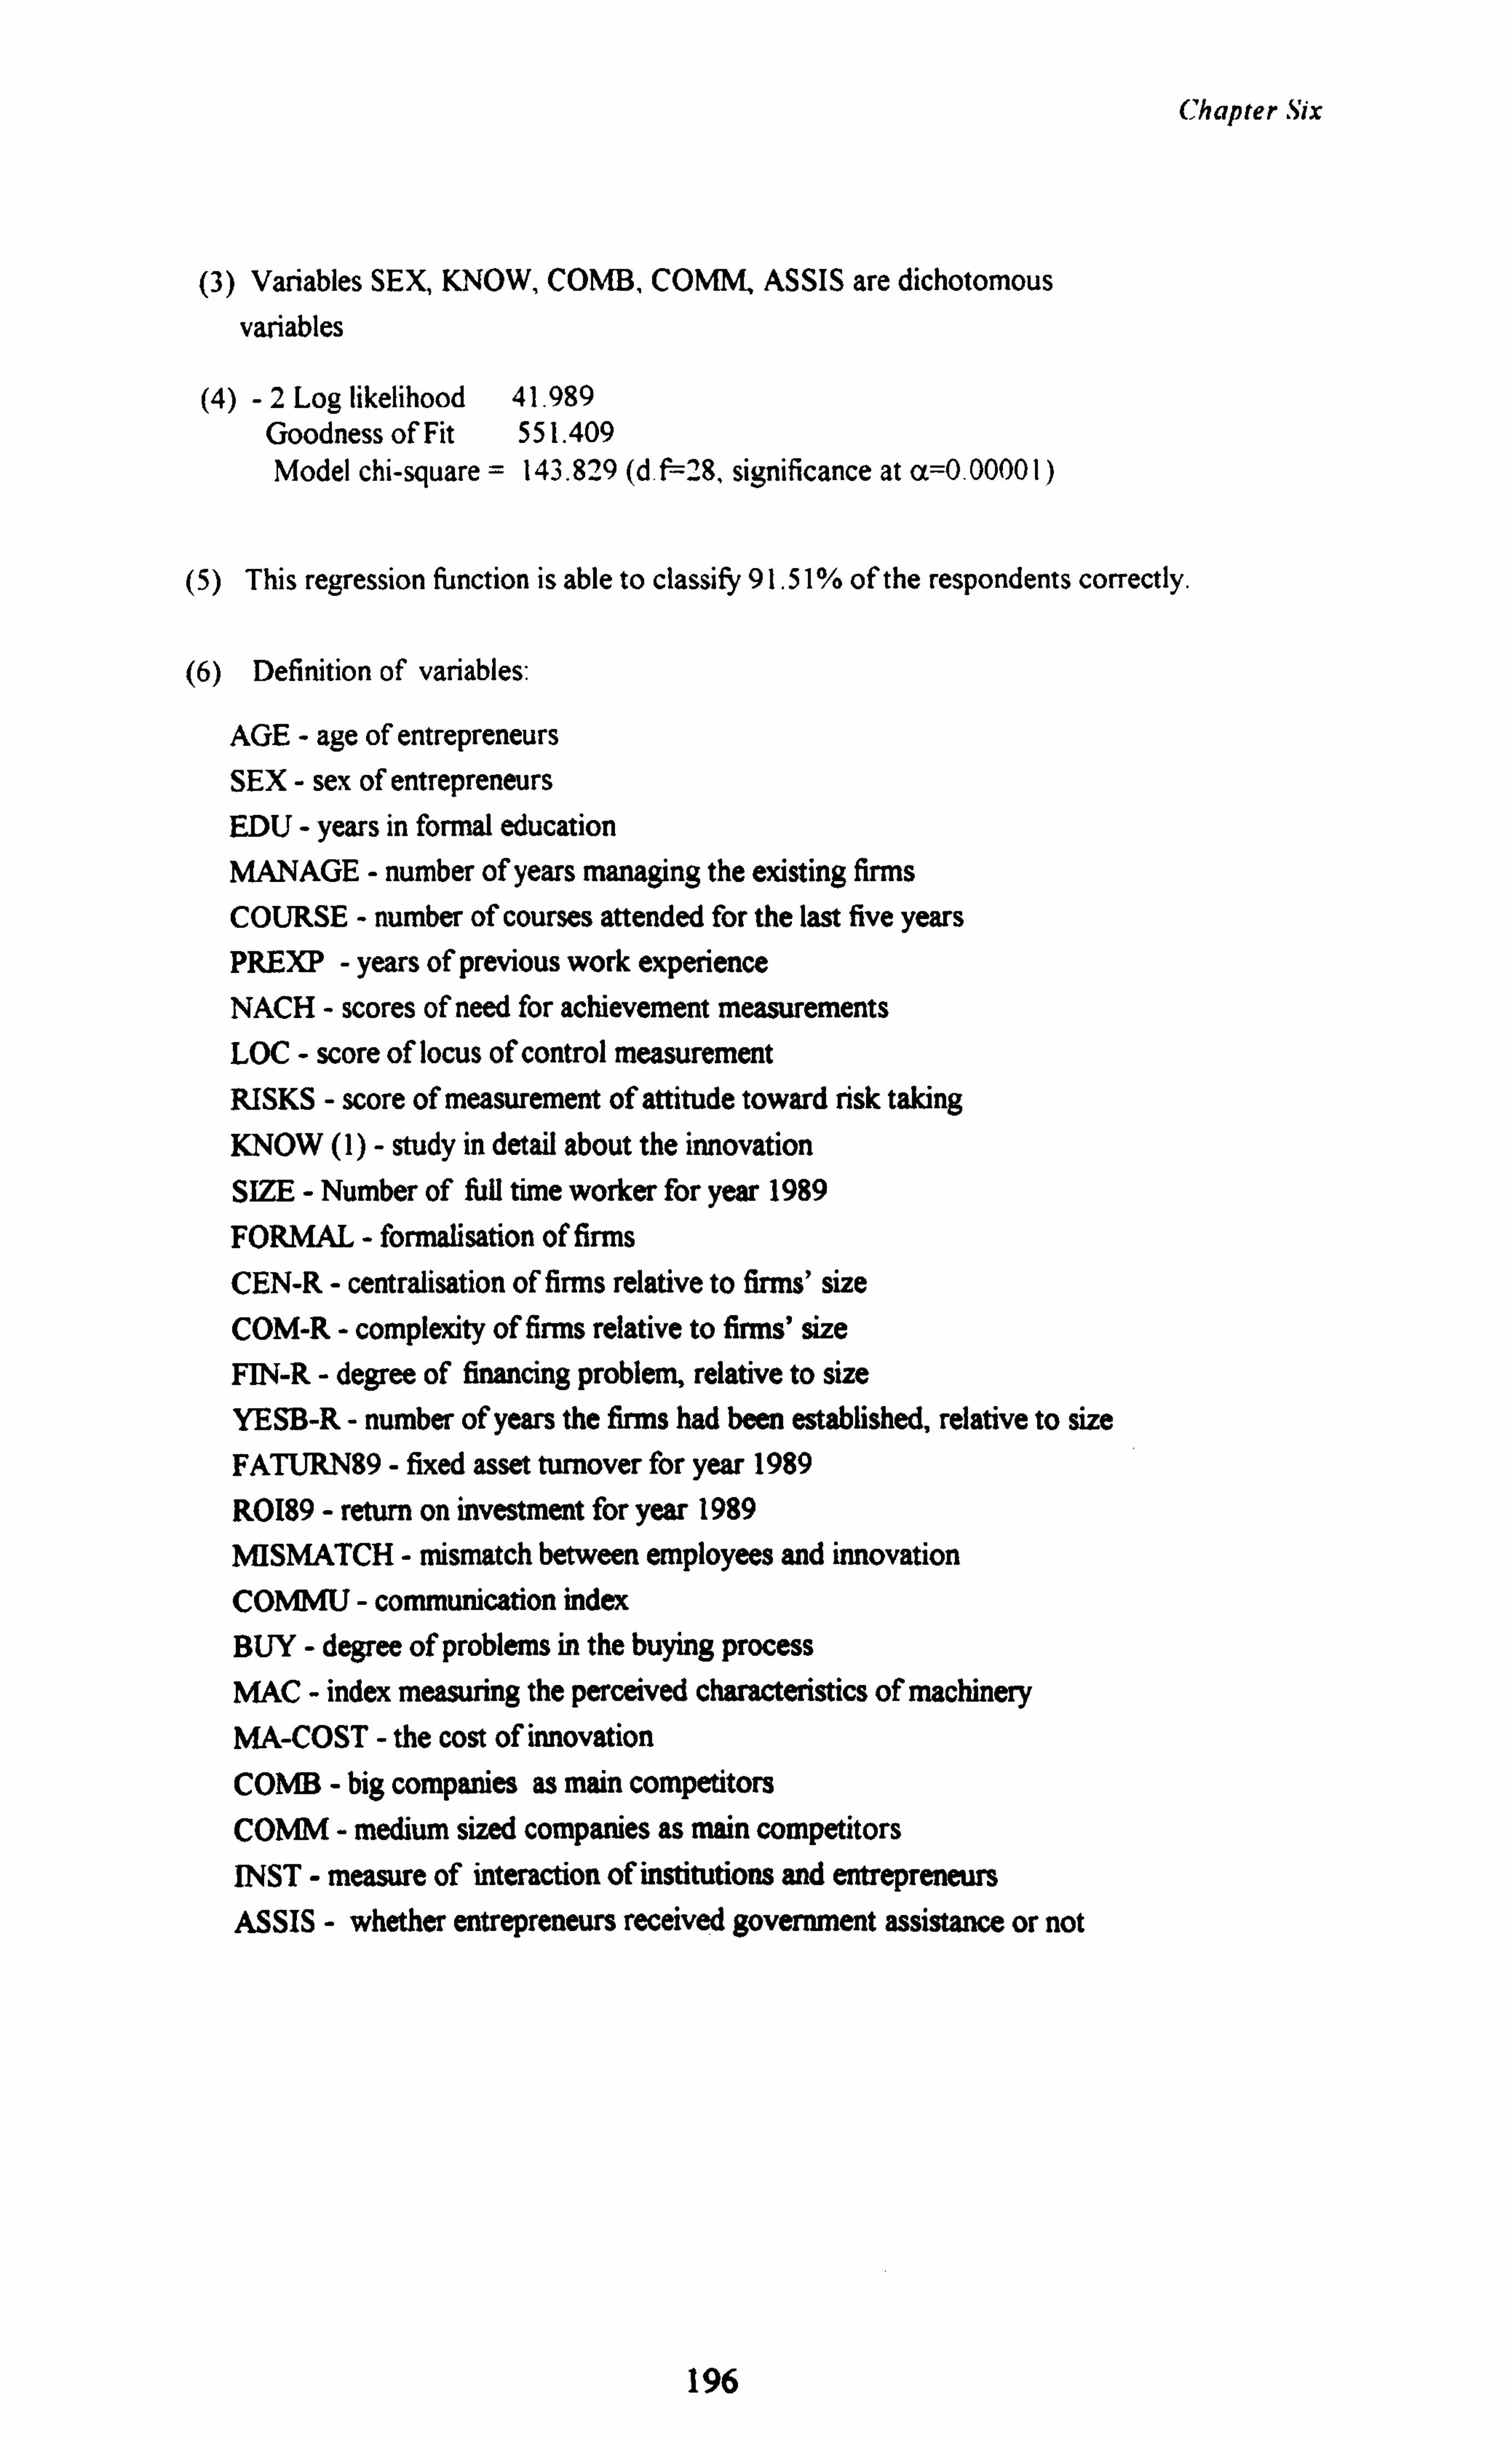
Chapter Six
(3) Variables SEX, KNOW, COMB, COMM. ASSIS are dichotomous
variables
(4) -2 Log likelihood 41.989 Goodness of Fit 551.409 Model chi-square = 143.829 (d. f=28, significance at a=0.00001)
(5) This regression function is able to classify 91.51% of the respondents correctly.
(6) Definition of variables:
AGE - age of entrepreneurs SEX - sex of entrepreneurs EDU - years in formal education
MANAGE - number of years managing the existing firms COURSE - number of courses attended for the last five years PREXP - years of previous work experience NACH - scores of need for achievement measurements LOC - score of locus of control measurement RISKS - score of measurement of attitude toward risk taking KNOW (1) - study in detail about the innovation SIZE - Number of full time worker for year 1989 FORMAL - formalisation of firms
CEN-R - centralisation of firms relative to firms' size COM-R - complexity of firms relative to firms' size FIN-R - degree of financing problem, relative to size YESB-R - number of years the fines had been established, relative to size FATURN89 - fixed asset turnover for year 1989 R0189 - return on investment for year 1989 MISMATCH - mismatch between employees and innovation COMMU - communication index BUY - degree of problems in the buying process MAC - index measuring the perceived characteristics of machinery MA COST - the cost of innovation
COMB - big companies as main competitors COMM - medium sized companies as main competitors INST - measure of interaction of institutions and entrepreneurs ASSIS - whether entrepreneurs received government assistance or not
196
Chapter Six
In this section we begin our discussion by analysing the personal
demographic factors, followed by a discussion of entrepreneurs' personality traits,
skill upgrading. and knowledge about the innovation that they were considering
adopting. We believe that these four factors have a significant influence on the
entrepreneurs' decision to adopt a technological innovation.
6.1 Personal Demographics
In this section, our analysis will focus on five personal demographic factors:
entrepreneurs' age, sex, educational background and work experience (current and
previous).
6.1.1 Age
The results of this study as shown in the logistic regression functions in Table 6.1
and Table 6.2, revealed that there was a statistically significant tendency among
entrepreneurs in both tiny and small firms, for age to influence innovative
behaviour - youth made for more innovativeness. The majority of the entire
sample were less than 50 years old. If we relate human age and productivity, the
fact that majority of the entrepreneurs were in this age group implies that they
were in the stage of high productivity. From Figure 6.1, we can see that 60.0 per
cent of innovative entrepreneurs from tiny firms and 57.9 per cent of them from
small firms were aged 40 years or below. There is reason to believe that younger
entrepreneurs are likely to be more receptive to change, more willing to take the
calculated risk involved in technological innovation and more capable of handling
197
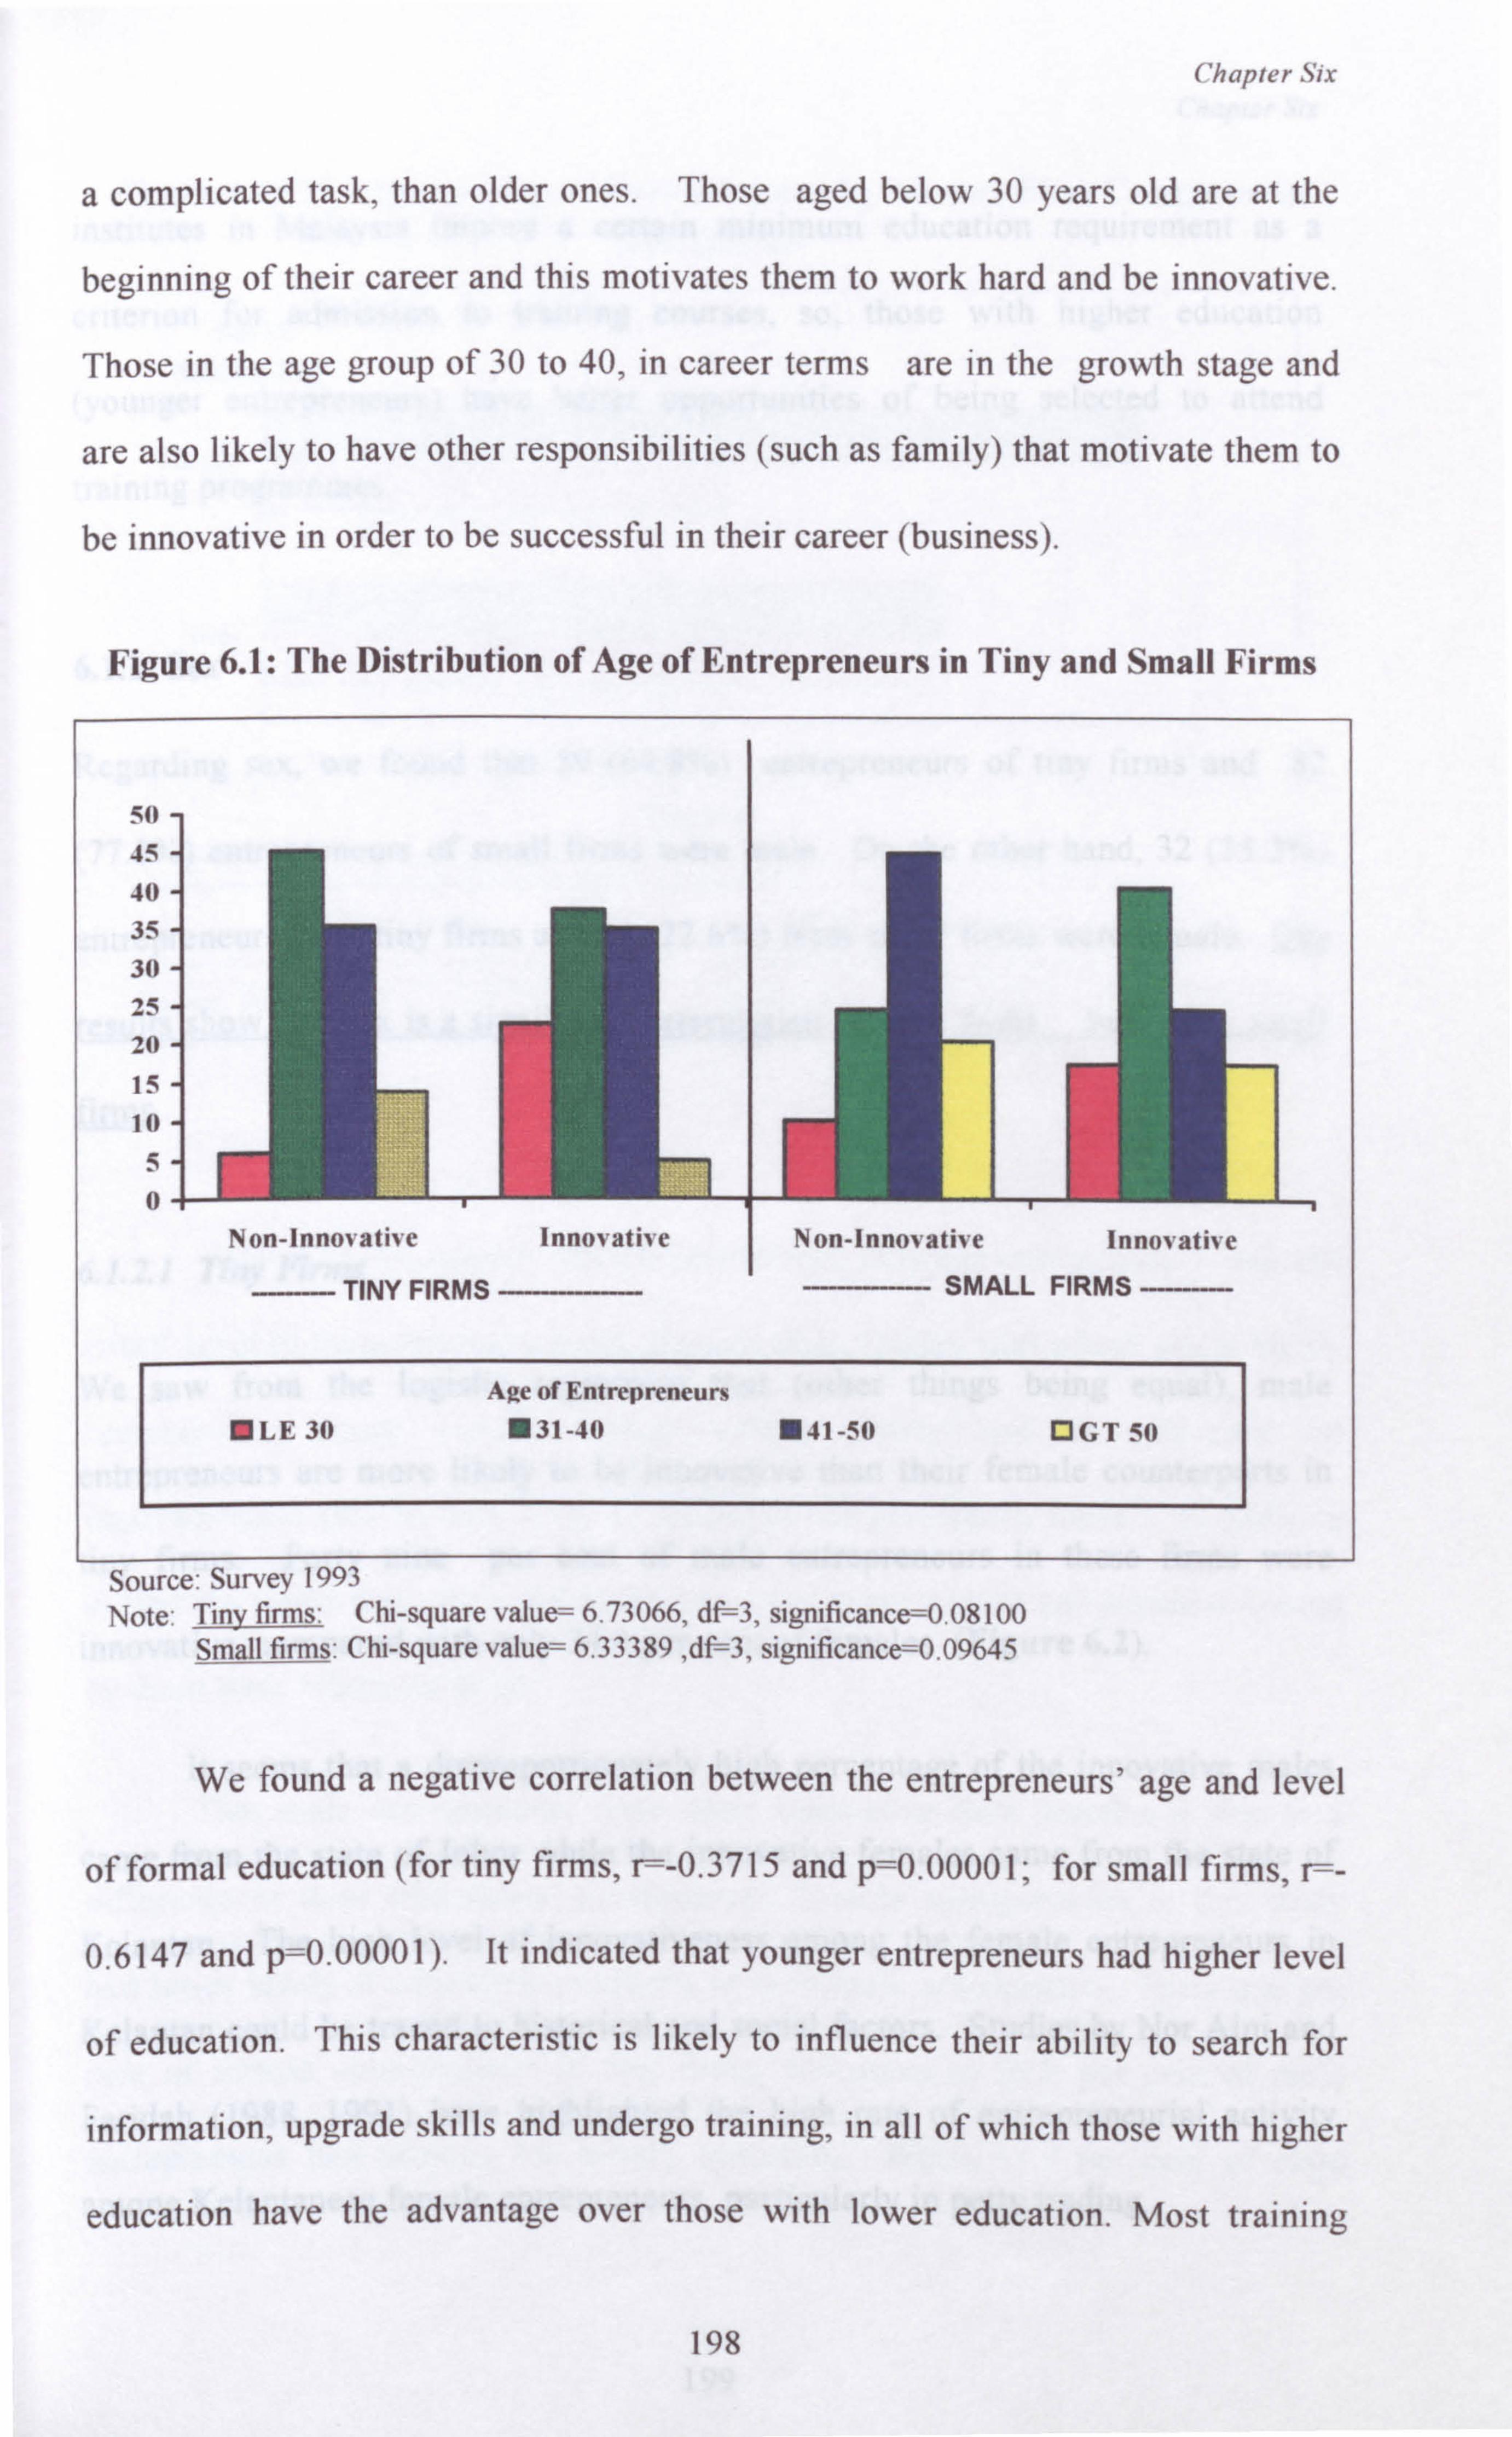
Chapter Six
a complicated task, than older ones. Those aged below 30 years old are at the
beginning of their career and this motivates them to work hard and be innovative.
Those in the age group of 30 to 40, in career terms are in the growth stage and
are also likely to have other responsibilities (such as family) that motivate them to
be innovative in order to be successful in their career (business).
Figure 6.1: The Distribution of Age of Entrepreneurs in Tiny and Small Firms
50 45
40 35 30 25 20
15 10
5 0
Age of Entrepreneurs LE 30 31-40 41-50 OGT 50
Source: Survey 1993 Note: Tiny firms: Chi-square value= 6.73066, df 3, significance=0.08100
Small firms: Chi-square value= 6.33389 , d3, significance=0.09645
We found a negative correlation between the entrepreneurs' age and level
of formal education (for tiny firms, r=-0.3715 and p=0.00001; for small firms, r=-
0.6147 and p=0.00001). It indicated that younger entrepreneurs had higher level
of education. This characteristic is likely to influence their ability to search for
information, upgrade skills and undergo training, in all of which those with higher
education have the advantage over those with lower education. Most training
198
TINY FIRMS SMALL FIRMS
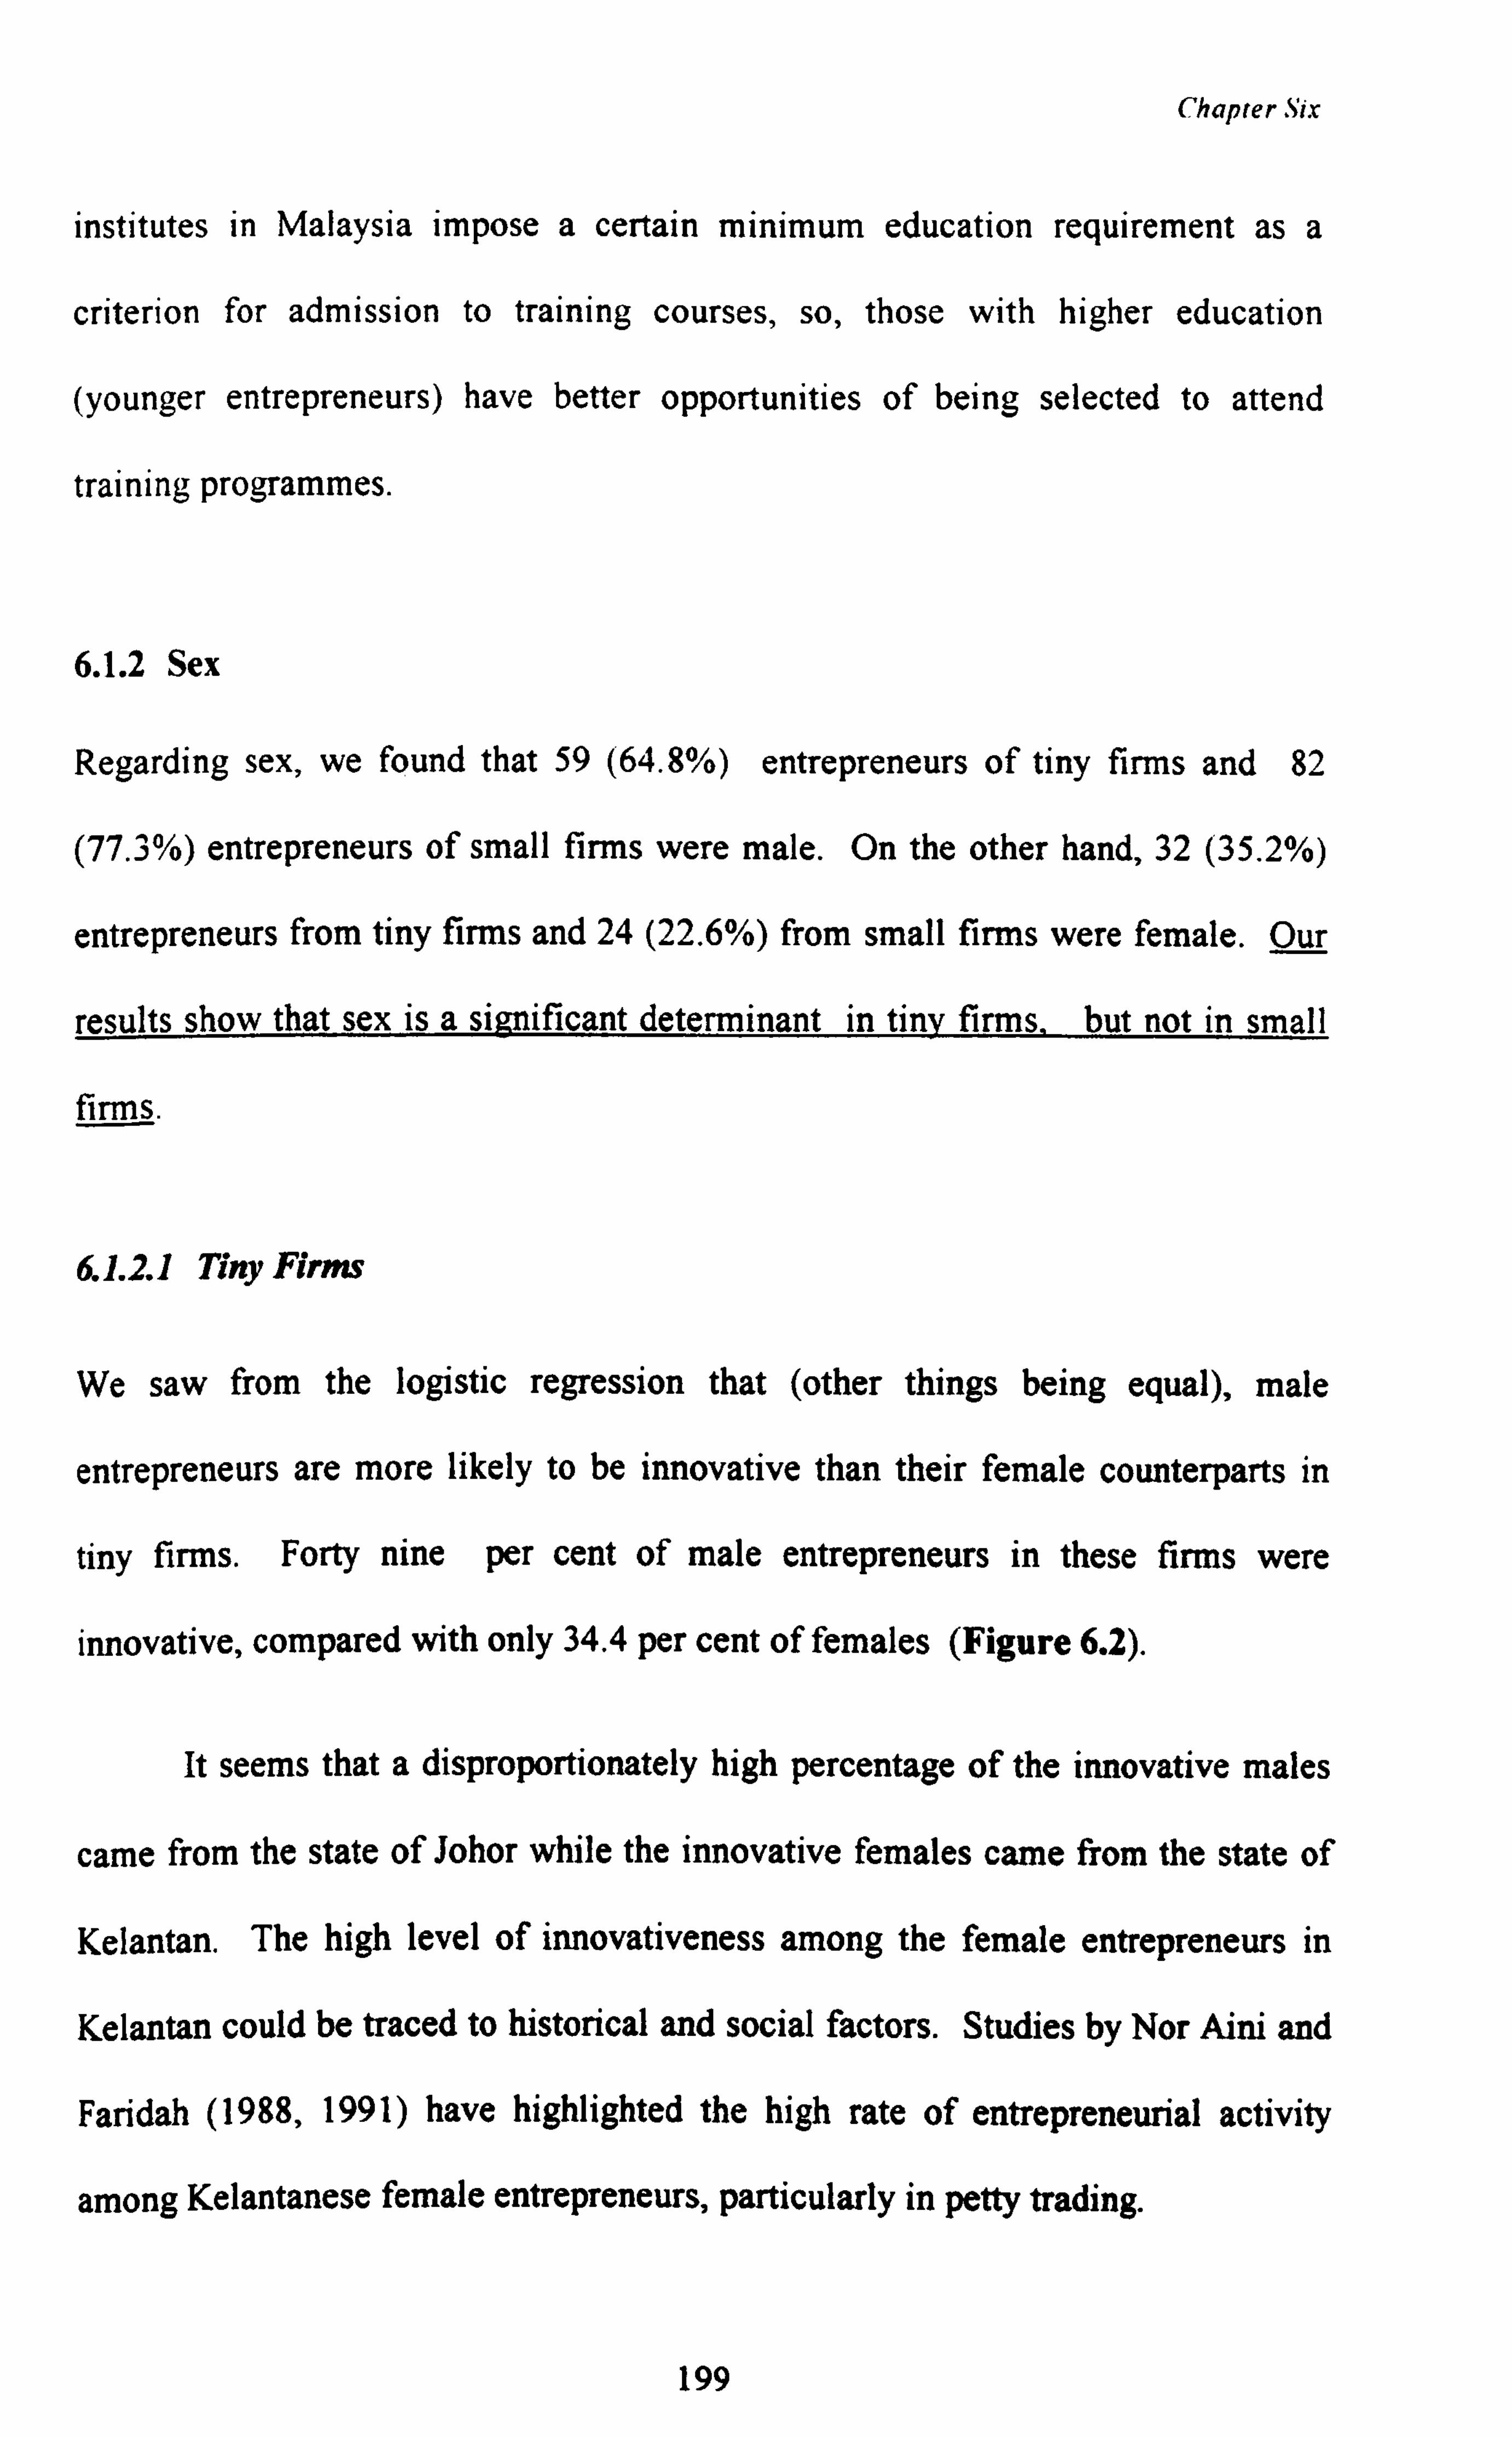
Chapter Six
institutes in Malaysia impose a certain minimum education requirement as a
criterion for admission to training courses, so, those with higher education
(younger entrepreneurs) have better opportunities of being selected to attend
training programmes.
6.1.2 Sex
Regarding sex, we found that 59 (64.8%) entrepreneurs of tiny firms and 82
(77.3%) entrepreneurs of small firms were male. On the other hand, 32 (35.2%)
entrepreneurs from tiny firms and 24 (22.6%) from small firms were female. Our
results show that sex is a significant determinant in tiny firms, but not in small
firms.
661.2.1 Tiny Firms
We saw from the logistic regression that (other things being equal), male
entrepreneurs are more likely to be innovative than their female counterparts in
tiny firms. Forty nine per cent of male entrepreneurs in these firms were
innovative, compared with only 34.4 per cent of females (Figure 6.2).
It seems that a disproportionately high percentage of the innovative males
came from the state of Johor while the innovative females came from the state of
Kelantan. The high level of innovativeness among the female entrepreneurs in
Kelantan could be traced to historical and social factors. Studies by Nor Aini and
Faridah (1988,1991) have highlighted the high rate of entrepreneurial activity
among Kelantanese female entrepreneurs, particularly in petty trading.
199
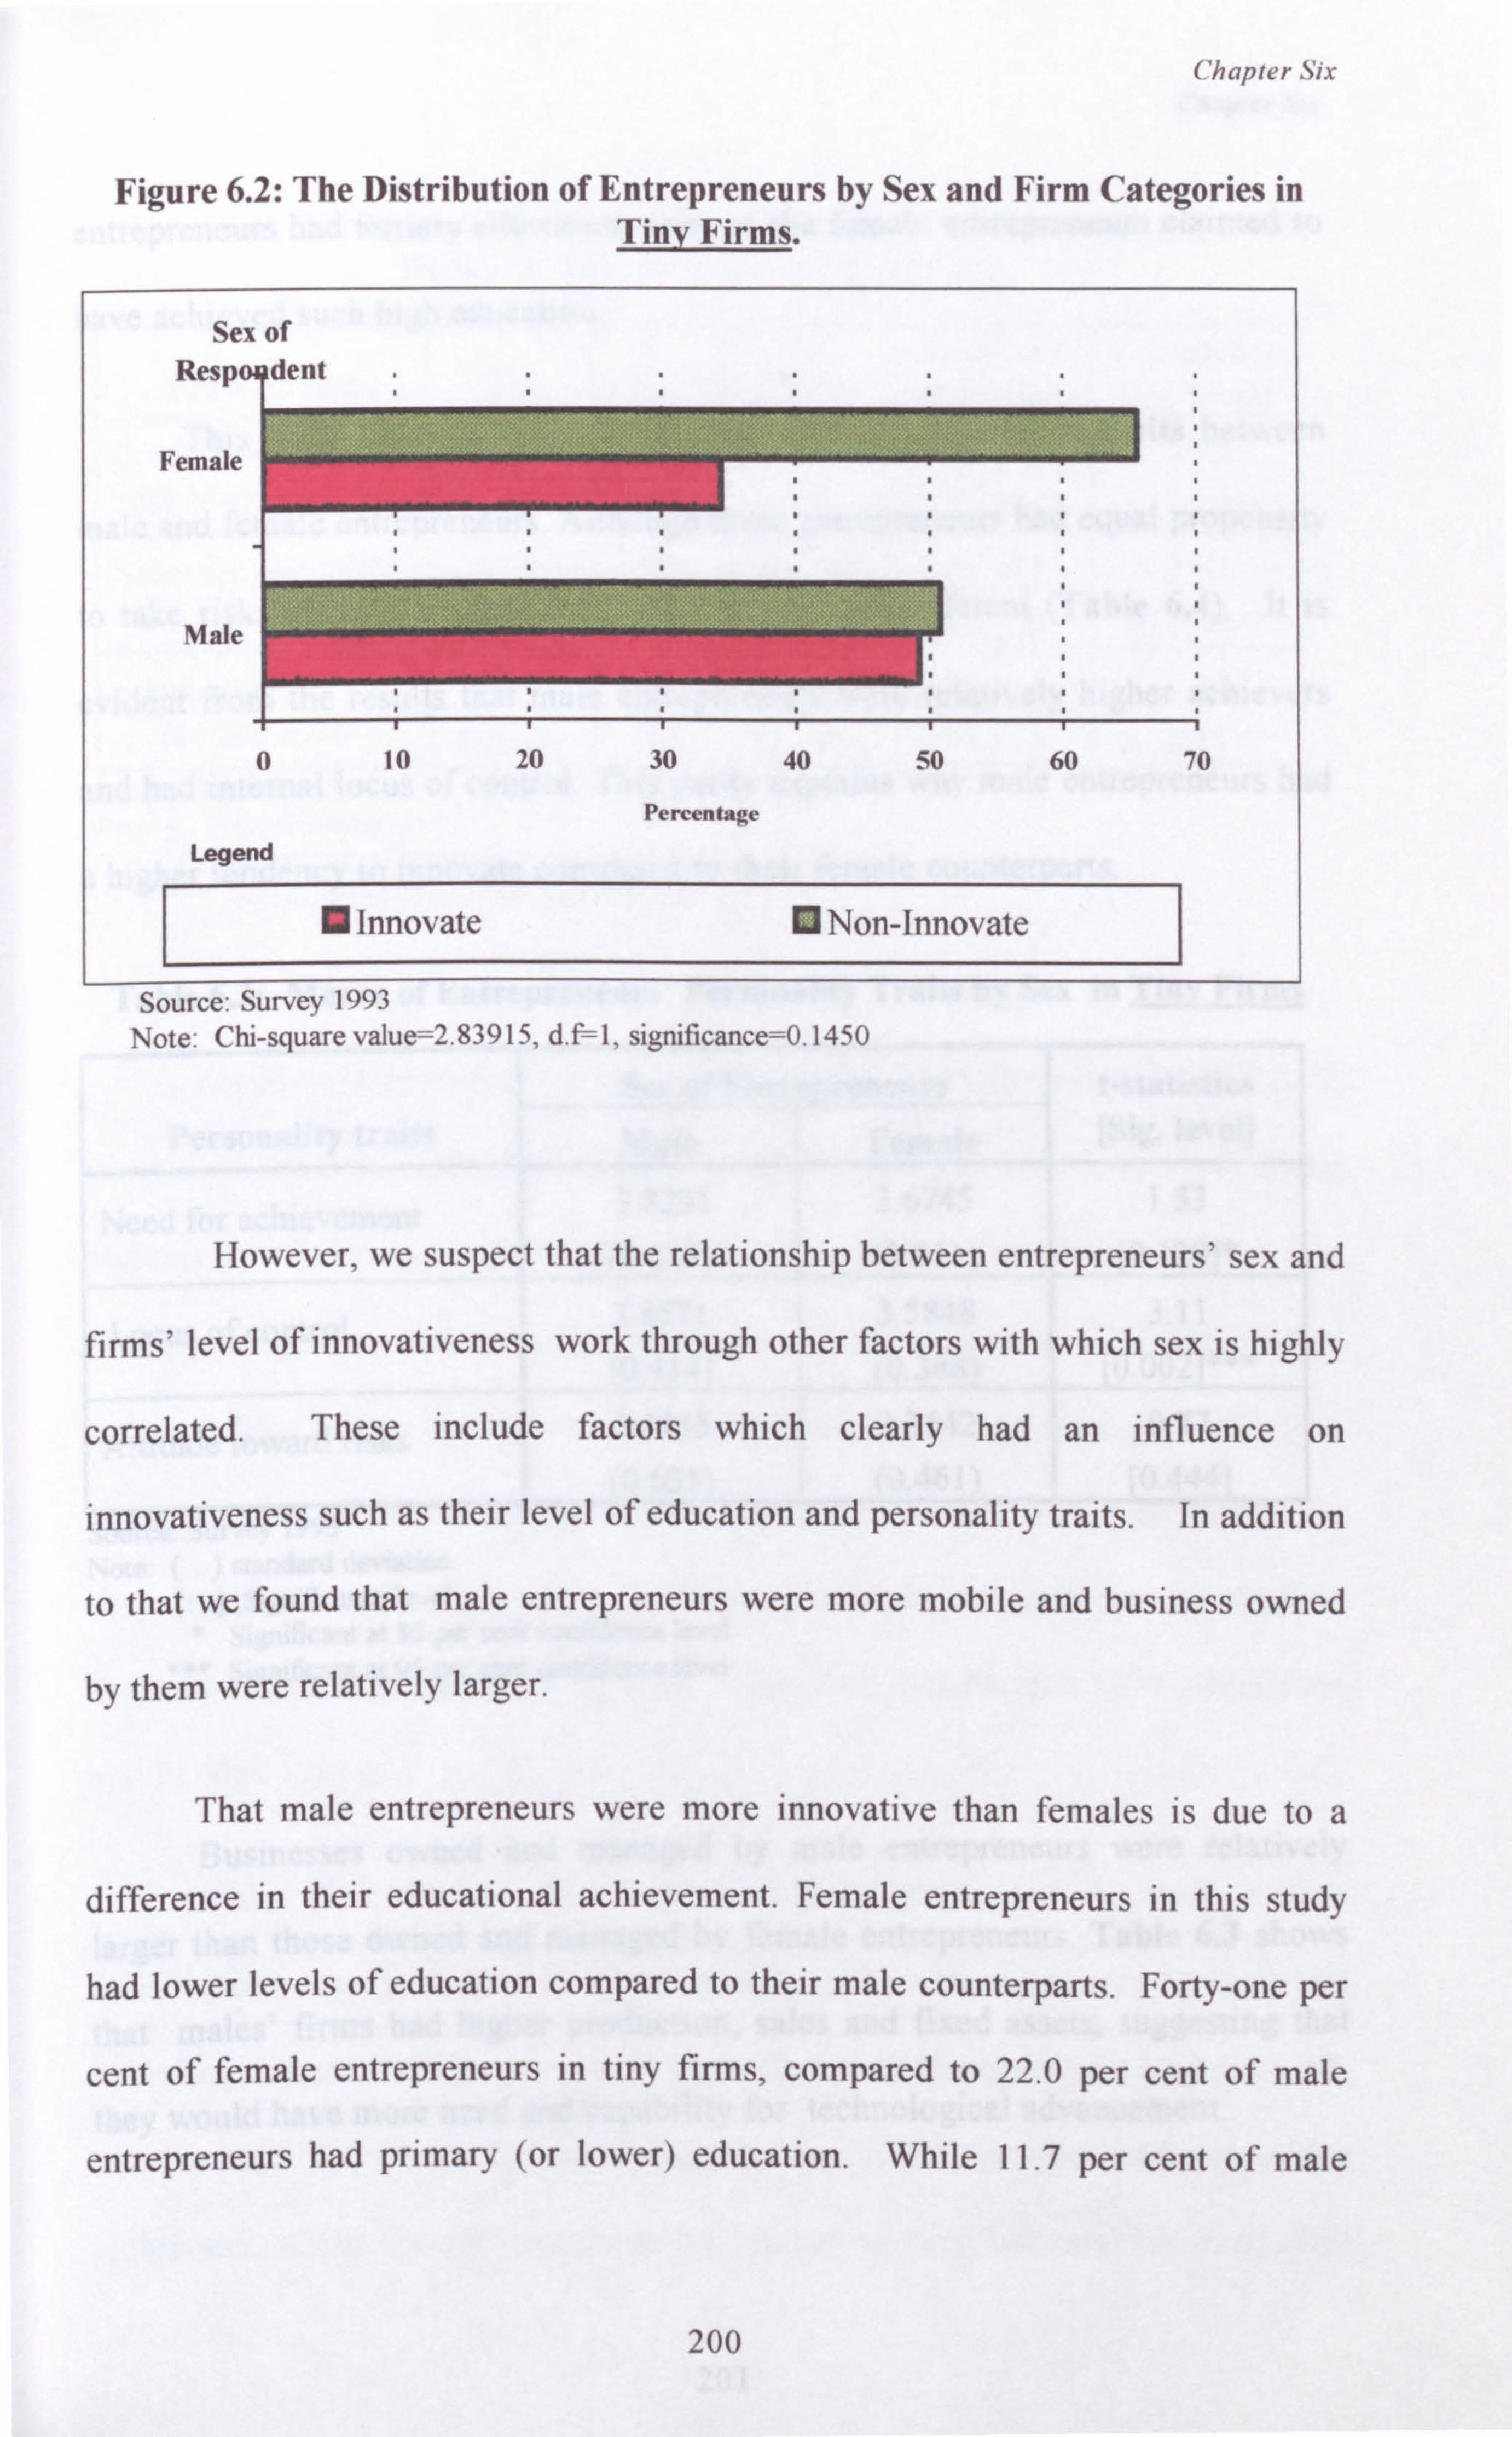
Chapter Six
Figure 6.2: The Distribution of Entrepreneurs by Sex and Firm Categories in Tiny Firms.
Sex of
F
Legend
Innovate ® Non-Innovate
Source: Survey 1993 Note: Chi-square value=2.83915, d. f1, significance=0.1450
However, we suspect that the relationship between entrepreneurs' sex and
firms' level of innovativeness work through other factors with which sex is highly
correlated. These include factors which clearly had an influence on
innovativeness such as their level of education and personality traits. In addition
to that we found that male entrepreneurs were more mobile and business owned
by them were relatively larger.
That male entrepreneurs were more innovative than females is due to a
difference in their educational achievement. Female entrepreneurs in this study
had lower levels of education compared to their male counterparts. Forty-one per
cent of female entrepreneurs in tiny firms, compared to 22.0 per cent of male
entrepreneurs had primary (or lower) education. While 11.7 per cent of male
200
0 10 20 30 40 50 60 70
Percentage
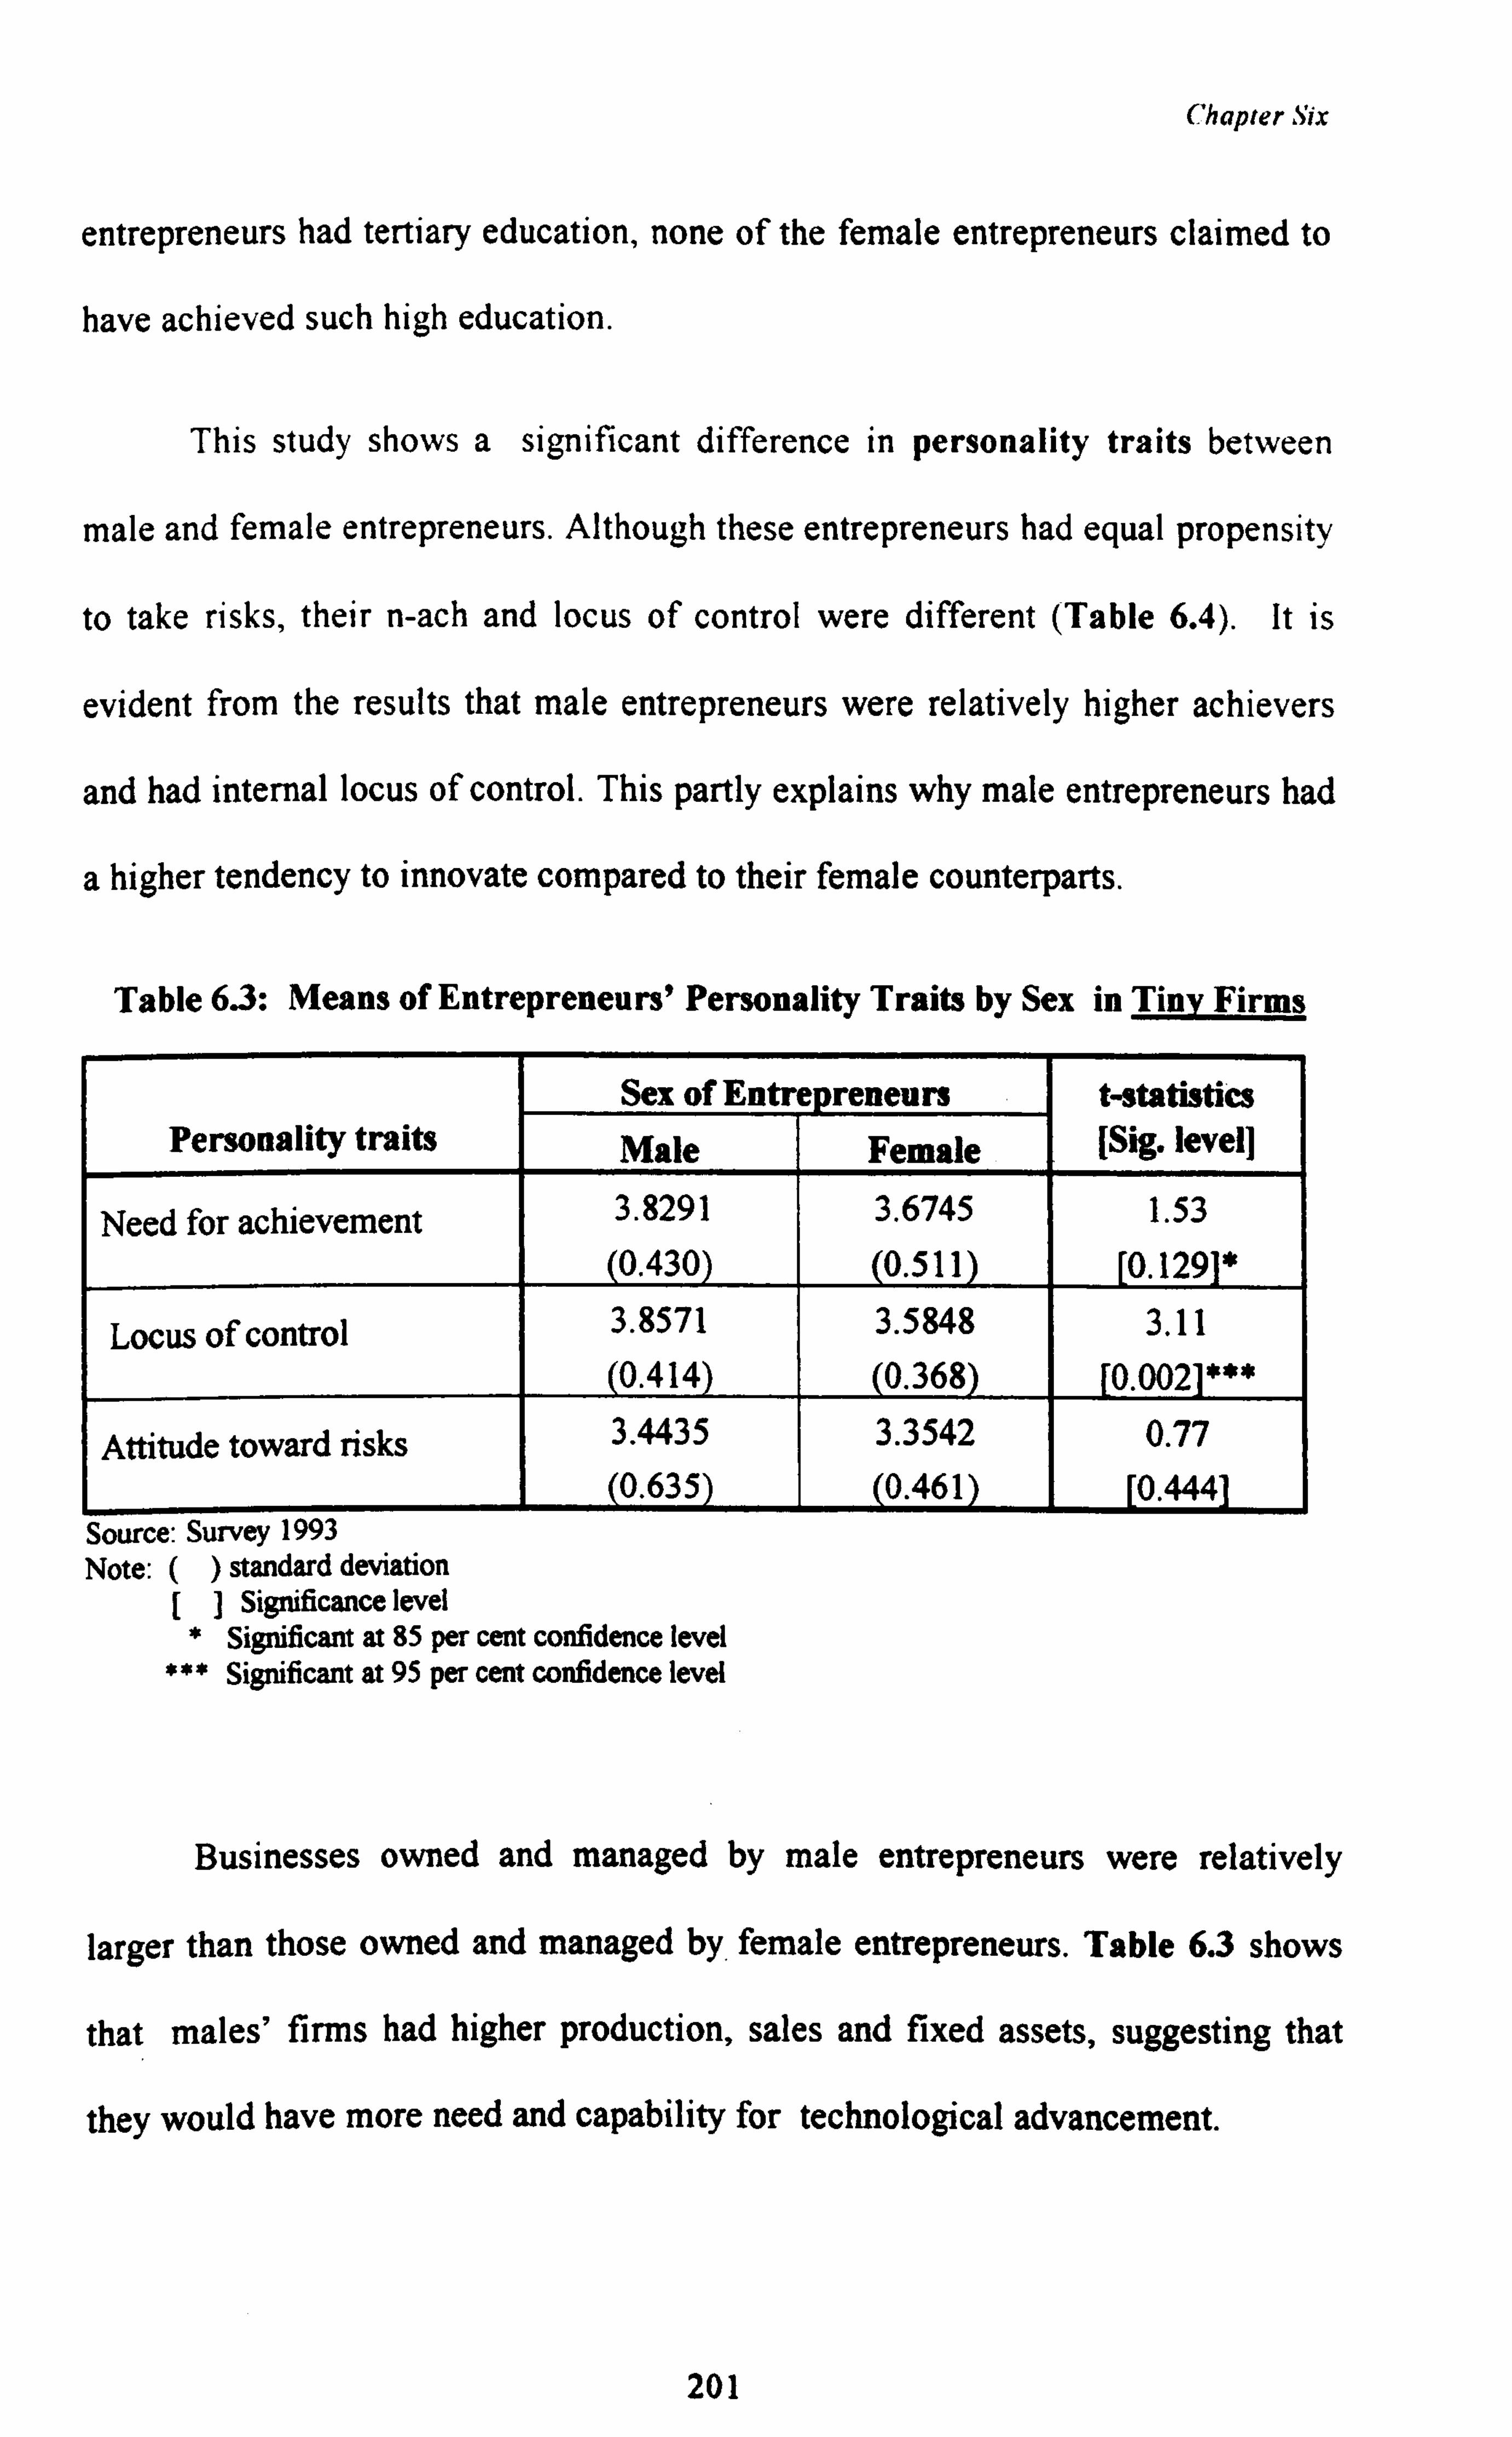
Chapter Six
entrepreneurs had tertiary education, none of the female entrepreneurs claimed to
have achieved such high education.
This study shows a significant difference in personality traits between
male and female entrepreneurs. Although these entrepreneurs had equal propensity
to take risks, their n-ach and locus of control were different (Table 6.4). It is
evident from the results that male entrepreneurs were relatively higher achievers
and had internal locus of control. This partly explains why male entrepreneurs had
a higher tendency to innovate compared to their female counterparts.
Table 6.3: Means of Entrepreneurs' Personality Traits by Sex in Tiny Firms
Sea of Entrepreneurs t-statistics Personality traits Male Female [Sig" level]
Need for achievement 3.8291 (0.430)
3.6745 (0.511)
1.53 0.129 *
Locus of control 3.8571 0.414
3.5848 (0.368)
3.11 [0.0021***
Attitude toward risks 3.4435 (0.635)
3.3542 (0.461)
0.77 0.444
Source: Survey 1993 Note: () standard deviation
[] Significance level * Significant at 85 per cent confidence level
*** Significant at 95 per cent confidence level
Businesses owned and managed by male entrepreneurs were relatively
larger than those owned and managed by female entrepreneurs. Table 6.3 shows
that males' firms had higher production, sales and fixed assets, suggesting that
they would have more need and capability for technological advancement.
201
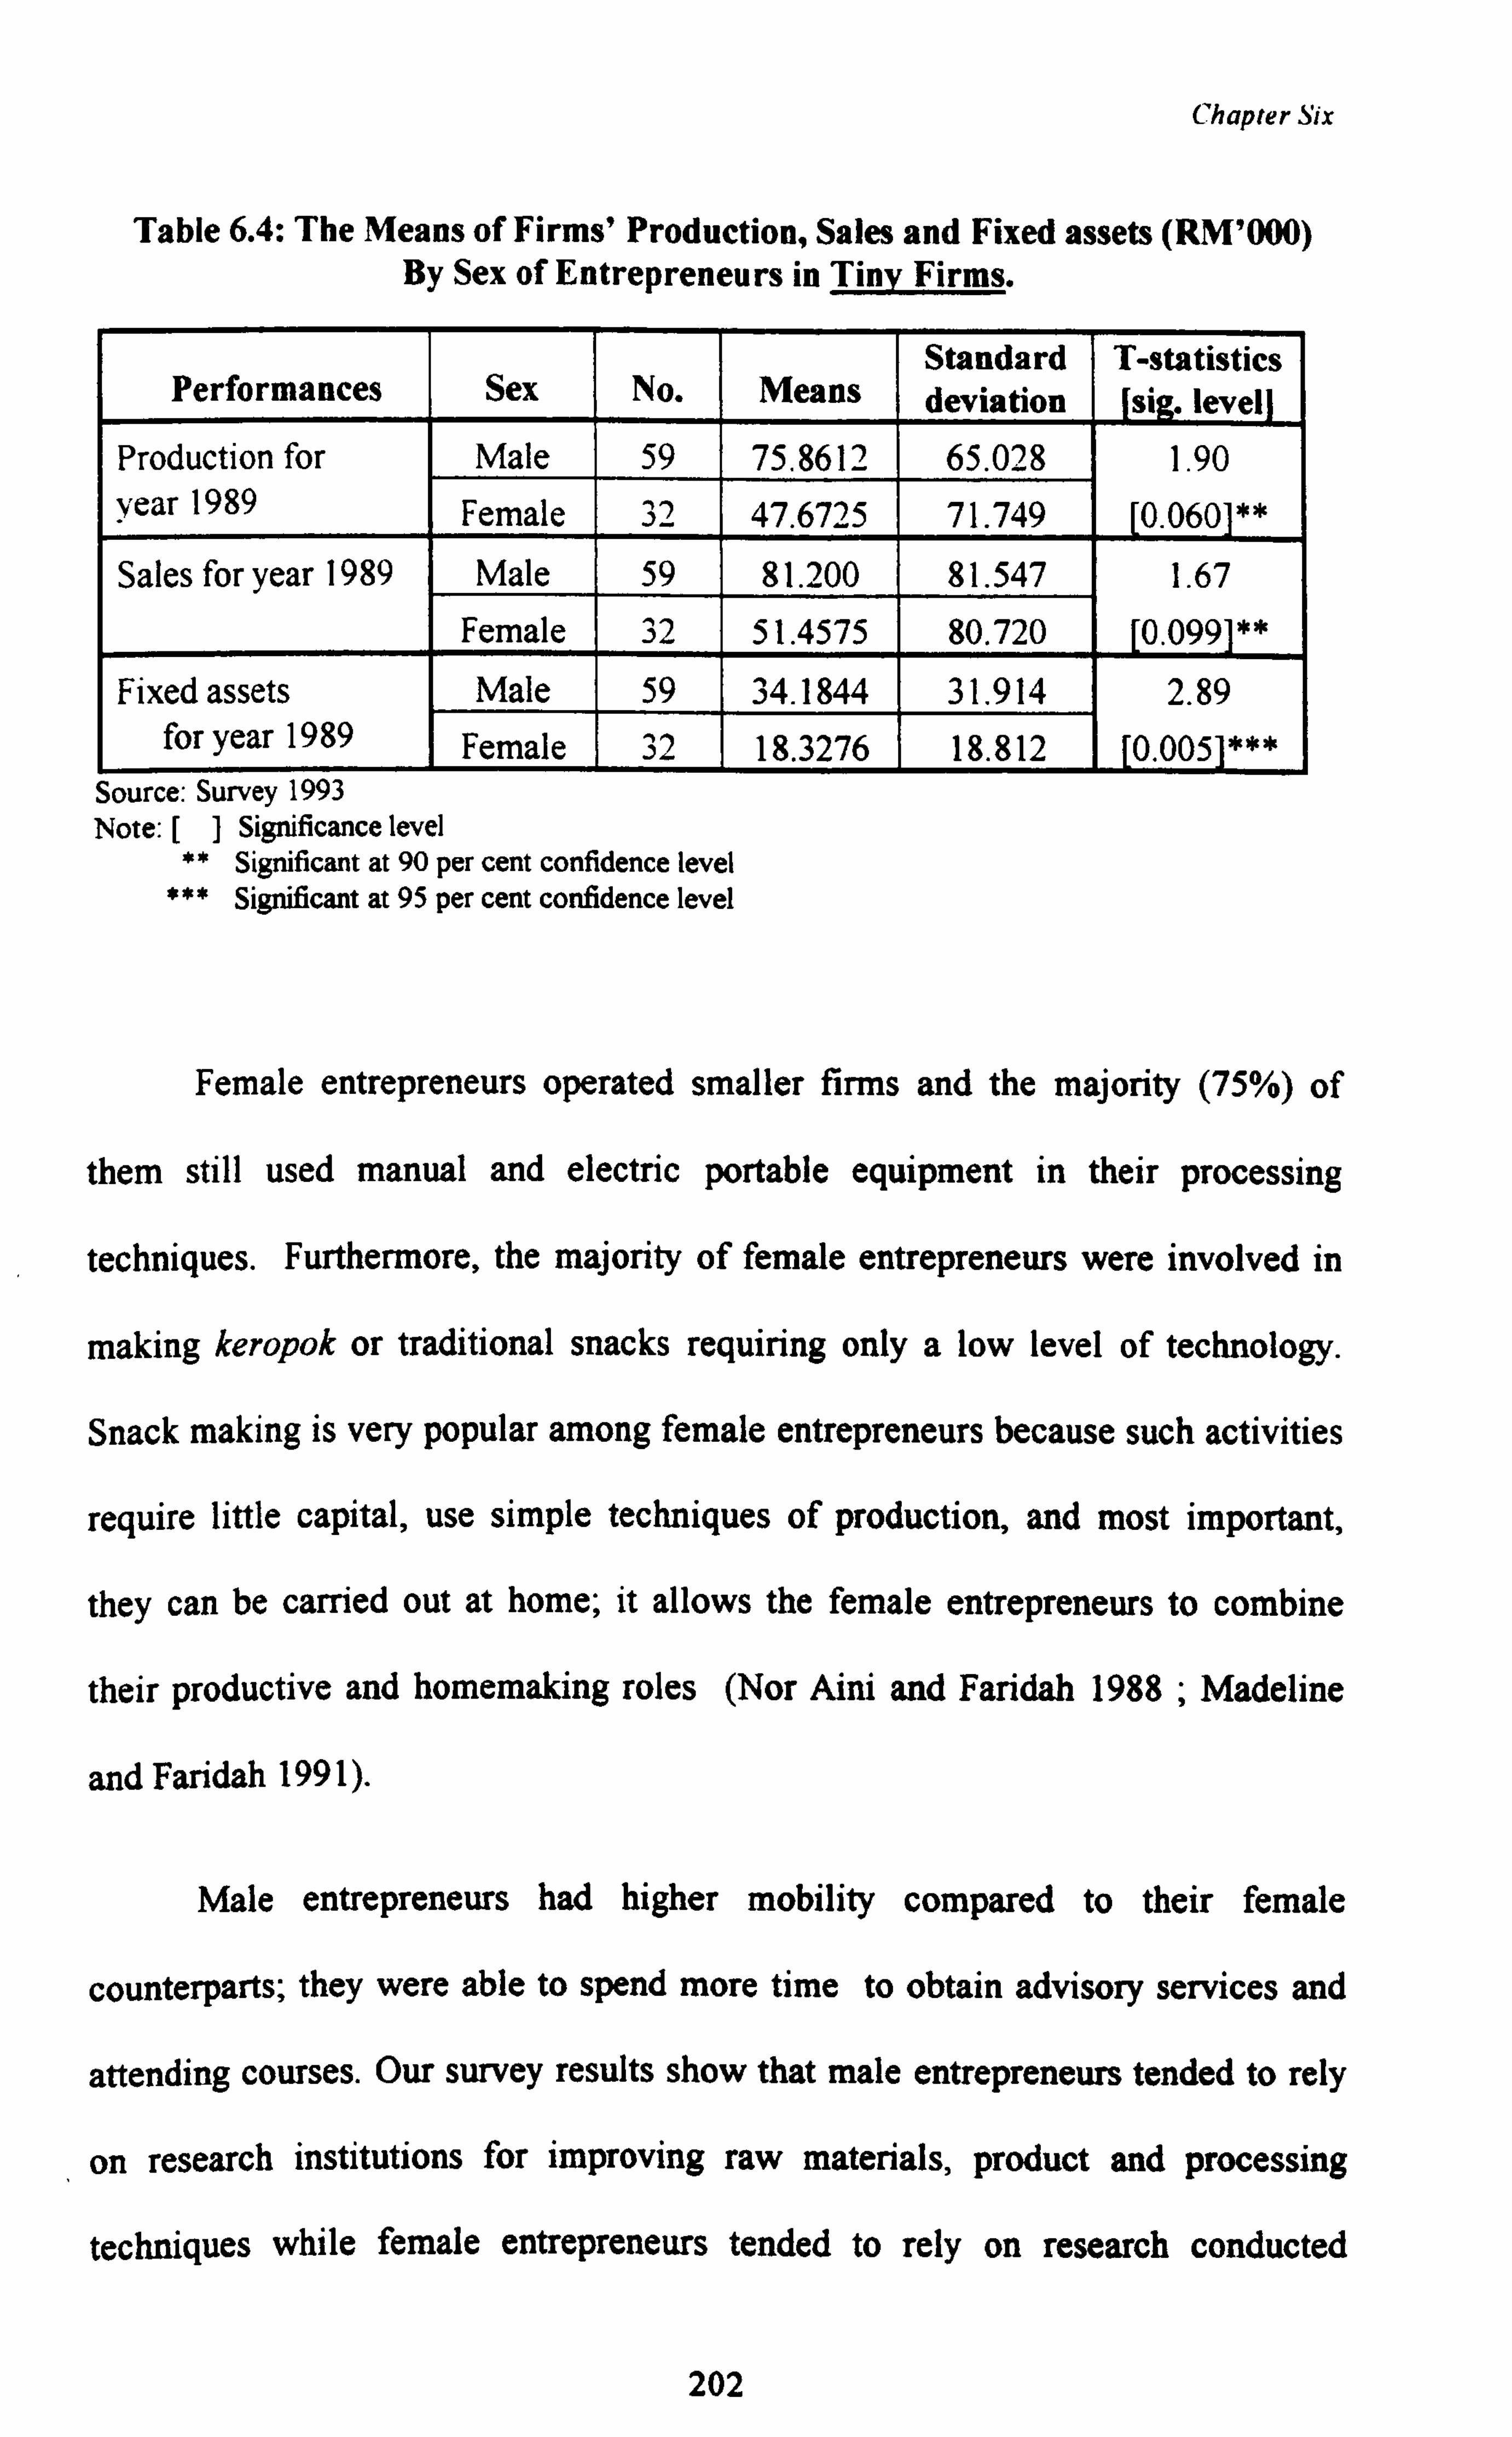
Chapter Six
Table 6.4: The Means of Firms' Production, Sales and Fixed assets (RM'OOO) By Sex of Entrepreneurs in Tinv Firms.
Performances Sex No. Means Standard deviation
T-statistics si . level
Production for Male 59 75.8612 65.028 1.90 year 1989 Female 32 47.6725 71.749 [0.0601**
Sales for year 1989 Male 59 81.200 81.547 1.67 Female 32 51.4575 80.720 [0.0991**
Fixed assets Male 59 34.1844 31.914 2.89 for year 1989 Female 32 18.3276 18.812 [0.005]***
Source: Survey 1993 Note: [] Significance level
** Significant at 90 per cent confidence level *** Significant at 95 per cent confidence level
Female entrepreneurs operated smaller firms and the majority (75%) of
them still used manual and electric portable equipment in their processing
techniques. Furthermore, the majority of female entrepreneurs were involved in
making keropok or traditional snacks requiring only a low level of technology.
Snack making is very popular among female entrepreneurs because such activities
require little capital, use simple techniques of production, and most important,
they can be carried out at home; it allows the female entrepreneurs to combine
their productive and homemaking roles (Nor Aini and Faridah 1988 ; Madeline
and Faridah 1991).
Male entrepreneurs had higher mobility compared to their female
counterparts; they were able to spend more time to obtain advisory services and
attending courses. Our survey results show that male entrepreneurs tended to rely
on research institutions for improving raw materials, product and processing
techniques while female entrepreneurs tended to rely on research conducted
202
Chapter Six
personally or by fellow entrepreneurs. In fact, 52.5 per cent of male
entrepreneurs had attended business courses compared to 43.8 per cent of female
entrepreneurs. Besides, male entrepreneurs were better able to obtain government
assistance to finance their innovation because of their mobility and better access
to information. Our survey shows that of 15 entrepreneurs who had received
assistance from KEMAS, 12 (80%) were male.
6.1.2.2 Small Firms
We hypothesised that female entrepreneurs are less innovative than male
entrepreneurs because they are less mobile, less communicative and have less
opportunity to attend business courses due to their domestic commitments.
However, from the logistic regression function as exhibited in Table 6.2, the sex
factor is unable to predict entrepreneurs' innovativeness in small firms. Although
in bivariate analysis as exhibited in Table 6.5, we found that female entrepreneurs
were less communicative than male entrepreneurs, this did not make them less
innovative than male entrepreneurs. In fact, compared to male entrepreneurs, we
found that female entrepreneurs were equally mobile. They had greater
opportunity for access to information from institutions as their institutional
involvement was higher than that of males. Also, from Table 6.5 we found that
the number of courses attended by female entrepreneurs were equal to male
entrepreneurs which indicated that they have equal opportunity to attend business
courses.
Unlike tiny firms, in small firms, entrepreneurs' sex do not correlate with
factors that have causal influence on firms' level of innovativeness such as
203
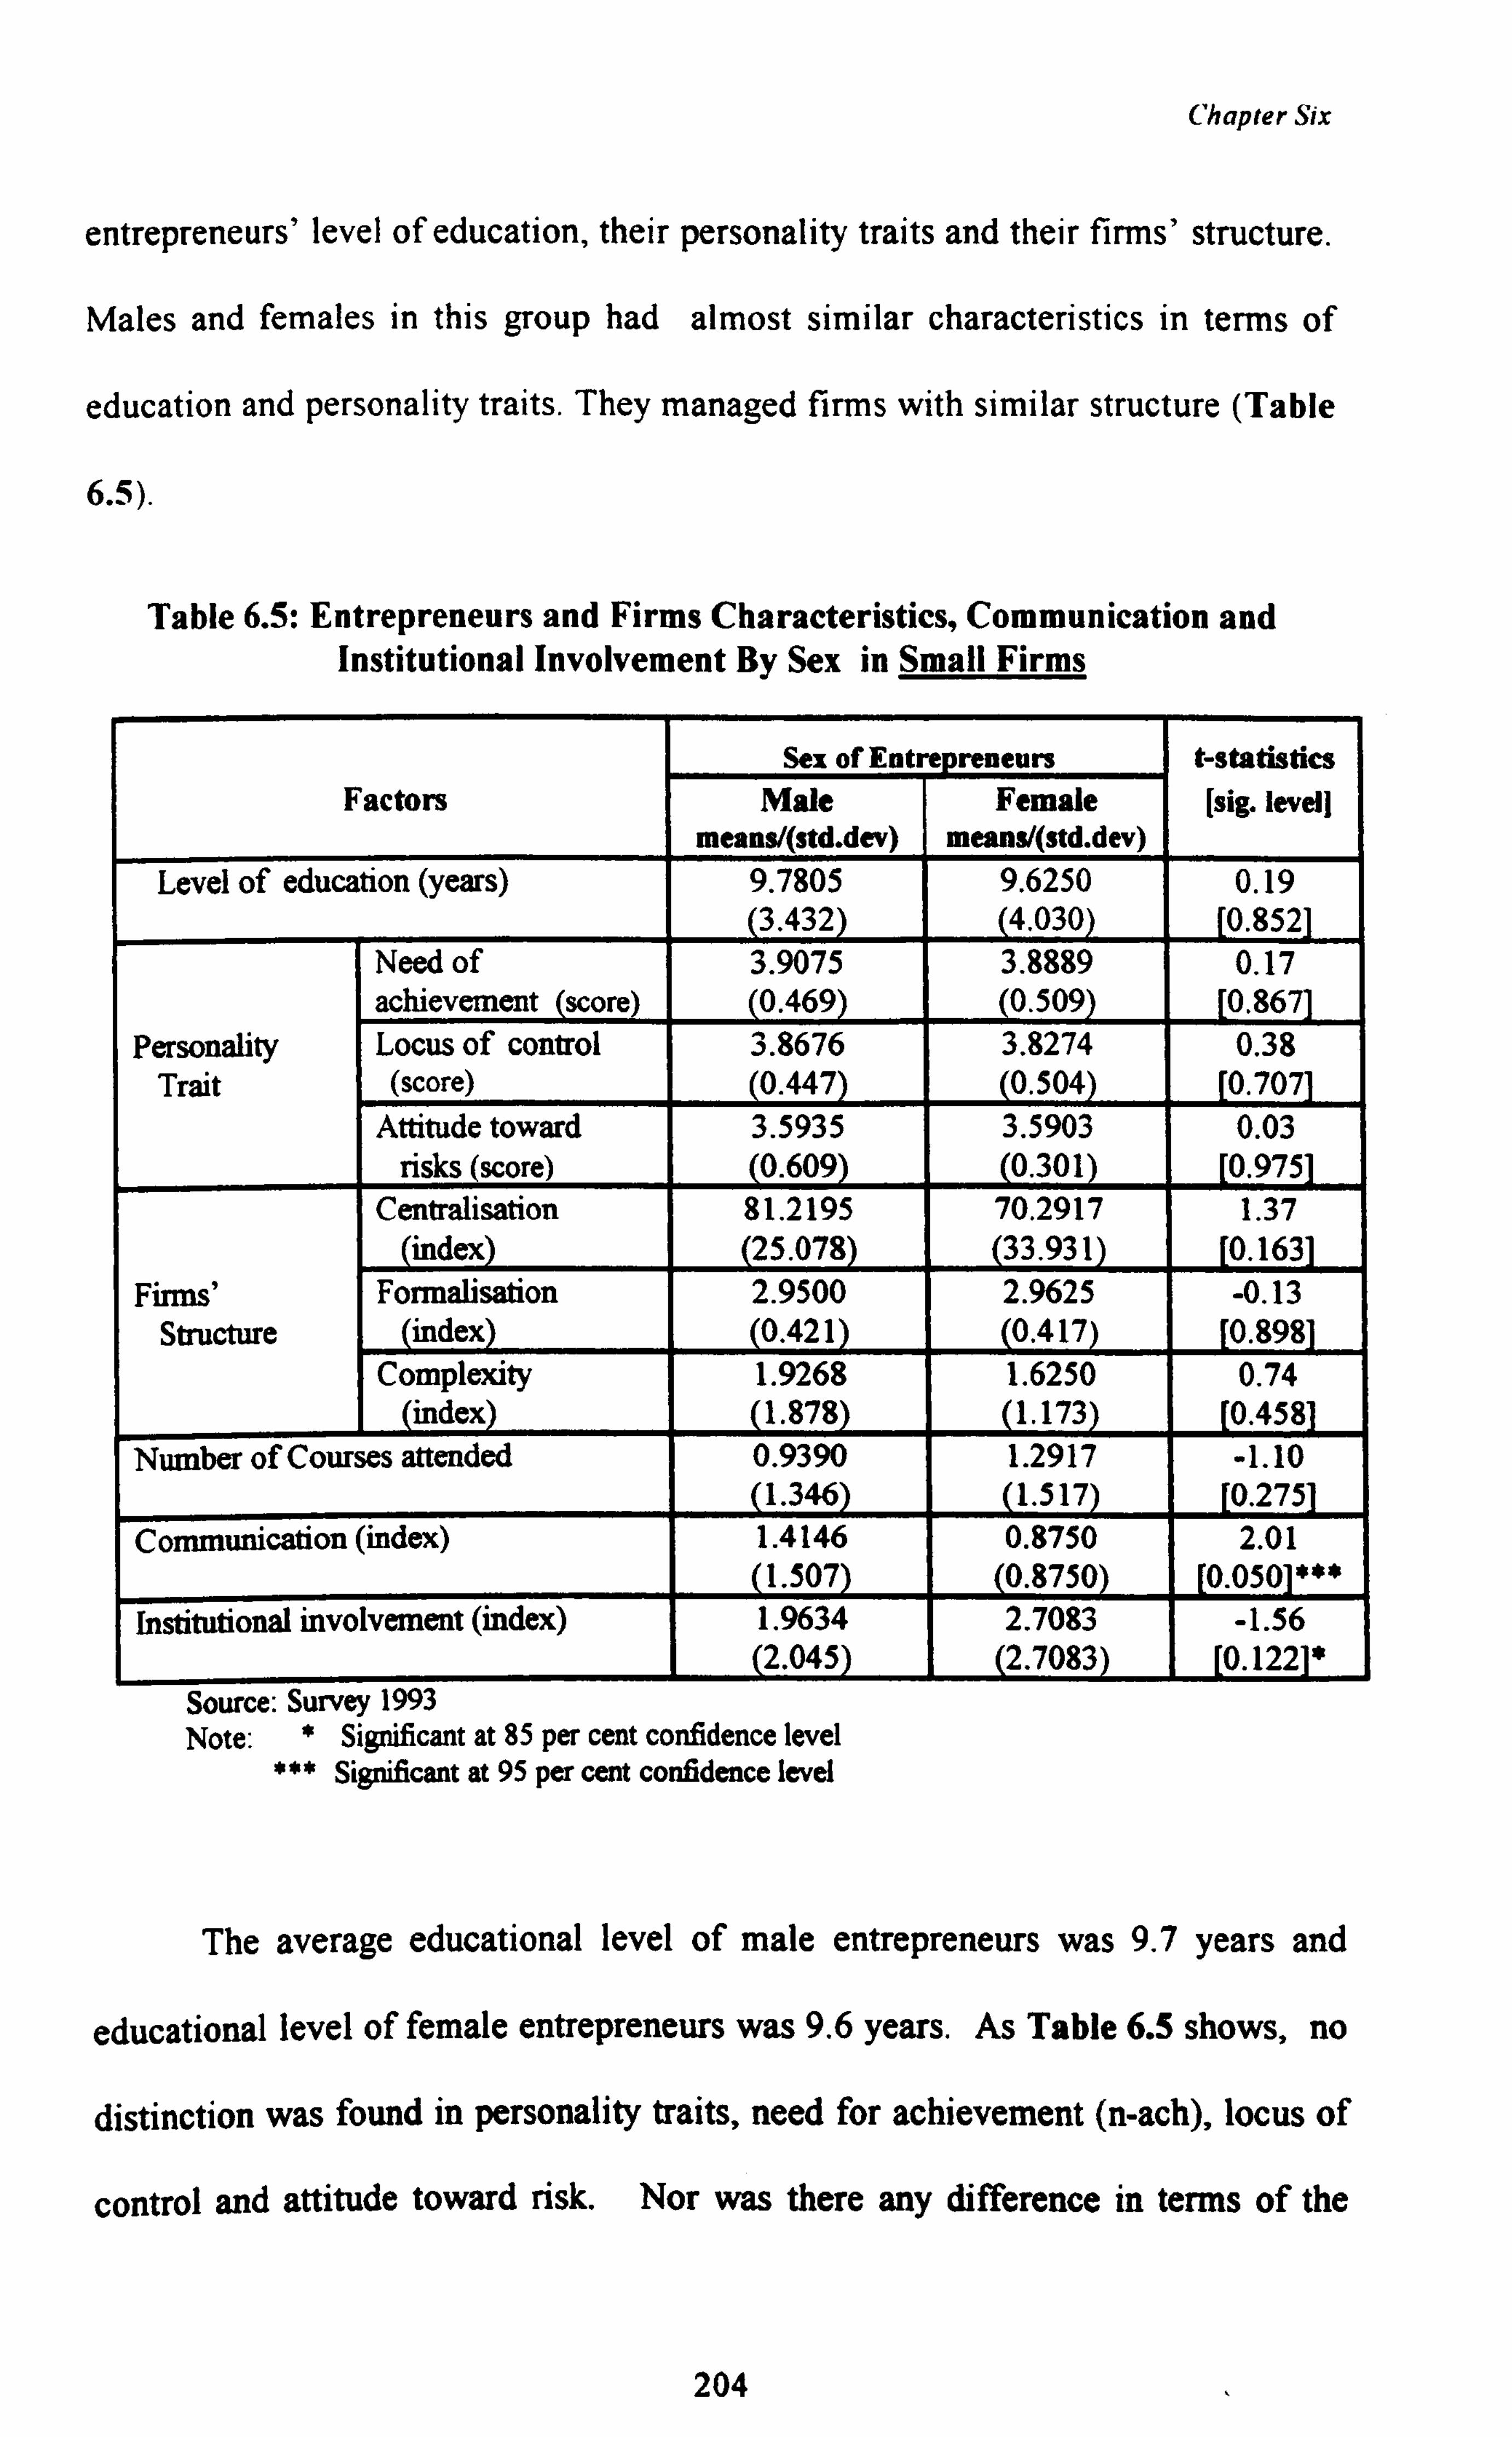
Chapter Six
entrepreneurs' level of education, their personality traits and their firms' structure.
Males and females in this group had almost similar characteristics in terms of
education and personality traits. They managed firms with similar structure (Table
6.5)
Table 6.5: Entrepreneurs and Firms Characteristics, Communication and Institutional Involvement By Sex in Small Firms
Sex of Entre reneurs t -statistics Factors Male Female [sig. level]
means/(std. dev) means/(std. dev) Level of education (years) 9.7805 9.6250 0.19
(3.432) 4.030 0.852 Need of 3.9075 3.8889 0.17 achievement (score) (0.469) (0.509) 0.867
Personality Locus of control 3.8676 3.8274 0.38 Trait (score) (0.447) (0.504) 0.707
Attitude toward 3.5935 3.5903 0.03 risks (score) (0.609) (0.301) 0.975
Centralisation 81.2195 70.2917 1.37 index (25.078) 33.931 0.163
Firms' Formalisation 2.9500 2.9625 -0.13 Structure index (0.421) (0.417) 0.898
Complexity 1.9268 1.6250 0.74 index (1.878) 1.173 0.458
Number of Courses attended 0.9390 1.2917 -1.10 (1.346) (1.517) 0.275
Communication (index) 1.4146 0.8750 2.01 (1.507) (0.8750) [0.0501***
Institutional involvement (index) 1.9634 2.7083 -1.56 (2.045) 2.7083 [0.12*
Source: Survey 1993 Note: * Significant at 85 per cent confidence level
*** Significant at 95 per cent confidence level
The average educational level of male entrepreneurs was 9.7 years and
educational level of female entrepreneurs was 9.6 years. As Table 6.5 shows, no
distinction was found in personality traits, need for achievement (n-ach), locus of
control and attitude toward risk. Nor was there any difference in terms of the
204
Chapter Six
structure of firms managed by these two groups of entrepreneurs. The firms
managed by male entrepreneurs and female entrepreneurs had similar degrees of
centralisation, formalisation and complexity.
6.1.3 Level of Formal Education
As we indicated in Chapter Three, previous studies have shown that one of the
characteristics that differentiates early and late knowers of innovation is their
level of education. Those who are aware of the existence of innovation at an early
stage, have a tendency to adopt innovation earlier than those who do not learn
about it till later. Thus, we hypothesised that entrepreneurs level of education
had causal relationship with their innovative behaviour. Entrepreneurs are more
likely to innovate if they have a higher level of education.
The importance of education in determining the innovativeness of
entrepreneurs is reflected in the logistic regression equations displayed in Table
6.1 and 6.2. The positive results indicated that in both small and tiny firms.
entrepreneurs with higher levels of education had a greater tendency to be
innovative. This can be seen in Table 6.6; on average, innovative tiny and small
entrepreneurs had received 9.7 and 10.34 years of formal education respectively,
compared to 8.8 and 9.00 years for non-innovative entrepreneurs in tiny and small
firms respectively2.
zI of significant difference in mean;
(a) between innovative and non-innovative in tiny firm: N; =40, mean; -9.7000 years and SD1=3.204; NQ 51, mean. = 8.8235 years, SDI 2.575: t-value=-1.45, df=89, sig. =0.150
(b) between innovative and non-innovative in small firms: Ni=57, mean, "=10.38 years ansig. 0.041
205
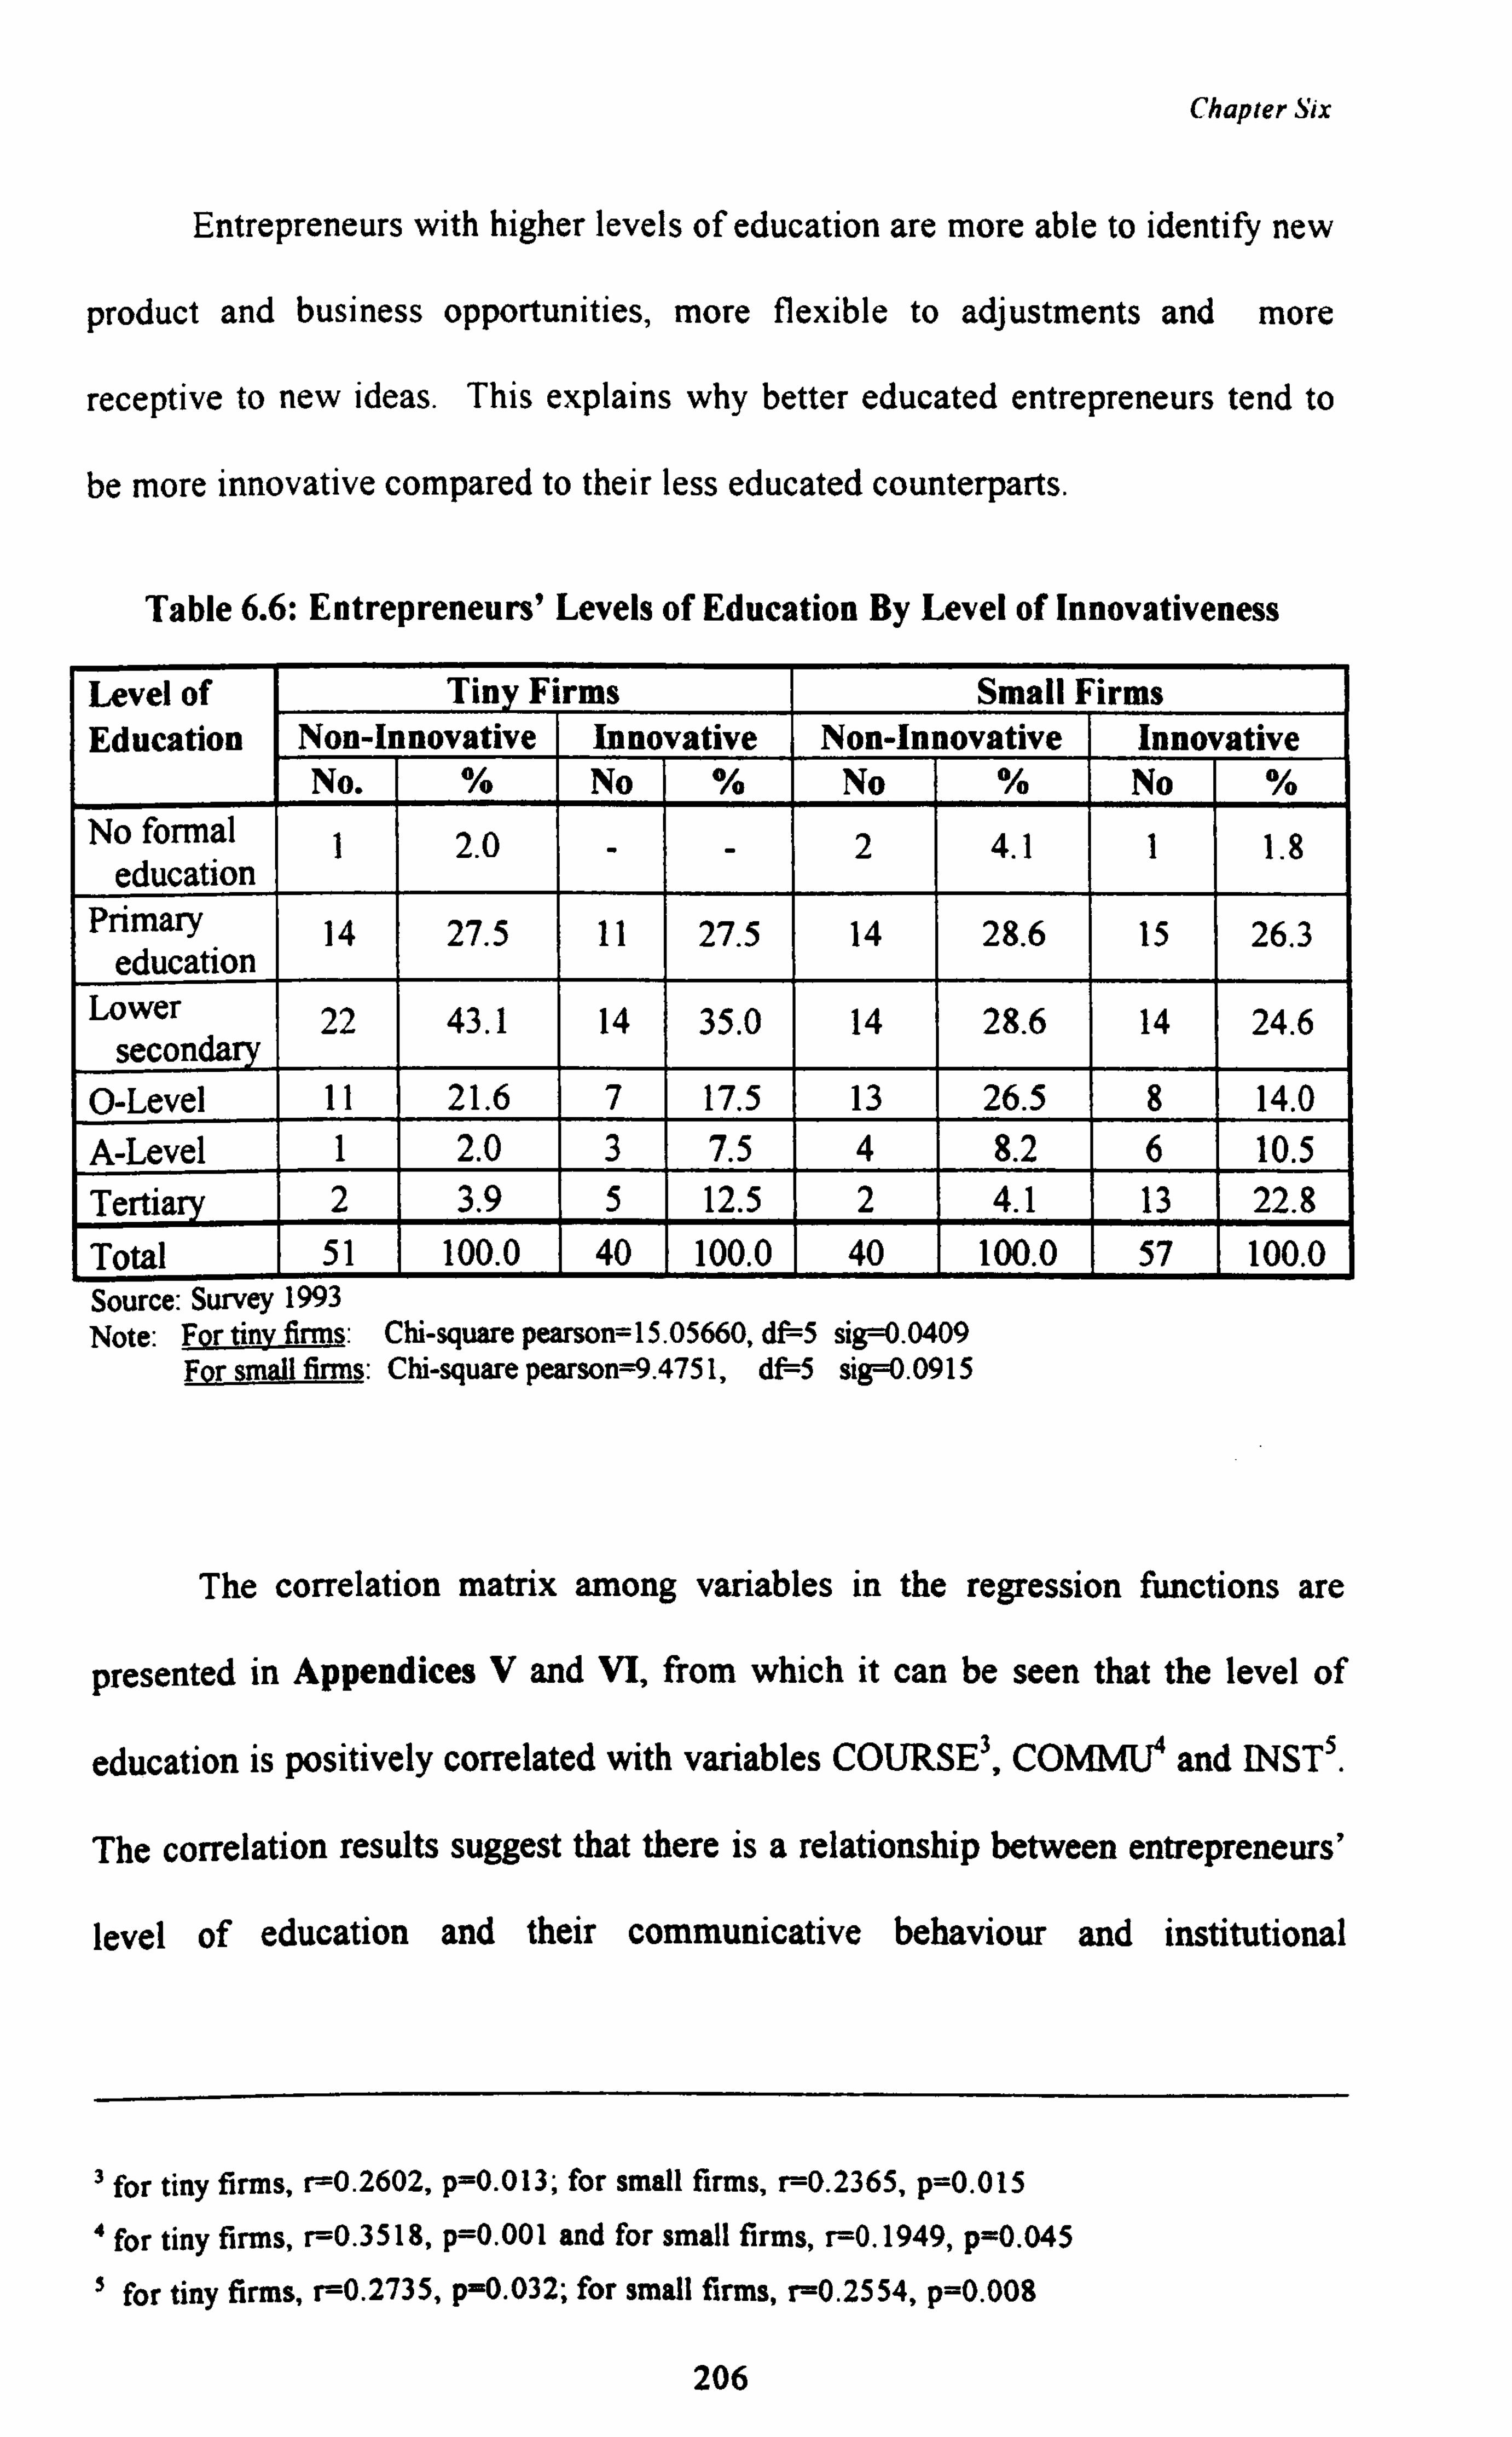
Chapter Six
Entrepreneurs with higher levels of education are more able to identify new
product and business opportunities, more flexible to adjustments and more
receptive to new ideas. This explains why better educated entrepreneurs tend to
be more innovative compared to their less educated counterparts.
Table 6.6: Entrepreneurs' Levels of Education By Level of Innovativeness
Level of Tiny Fi rms Small Firms Education Non-In novative Innovative Non-In novative Innov ative
No. % No % No % No %
No formal education
1 2.0 - - 2 4.1 1 1.8
Primary education
14 27.5 11 27.5 14 28.6 15 26.3
Lower secondary
22 43.1 14 35.0 14 28.6 14 24.6
O-Level 11 21.6 7 17.5 13 26.5 8 14.0 A-Level 1 2.0 3 7.5 4 8.2 6 10.5 Tertia 2 3.9 5 12.5 2 4.1 13 22.8 Total 51 100.0 40 100.0 40 100.0 57 100.0 Source: Survey 1993 Note: f tim firms: Chi-square pearson=15.05660, df--5 sig=0.0409
For small firms: Chi-square pearson=9.4751, df--5 sig=0.0915
The correlation matrix among variables in the regression functions are
presented in Appendices V and VI, from which it can be seen that the level of
education is positively correlated with variables COURSE3, COMMU4 and INST5.
The correlation results suggest that there is a relationship between entrepreneurs'
level of education and their communicative behaviour and institutional
3 for tiny firms, r-0.2602, p=0.013; for small firms, r=0.2365, p=0.015 ° for tiny firms, r=0.3518, p=0.001 and for small firms, r=0.1949, p=0.045 5 for tiny firms, r=0.2735, p=0.032; for small firms, r=0.2554, p=0.008
206
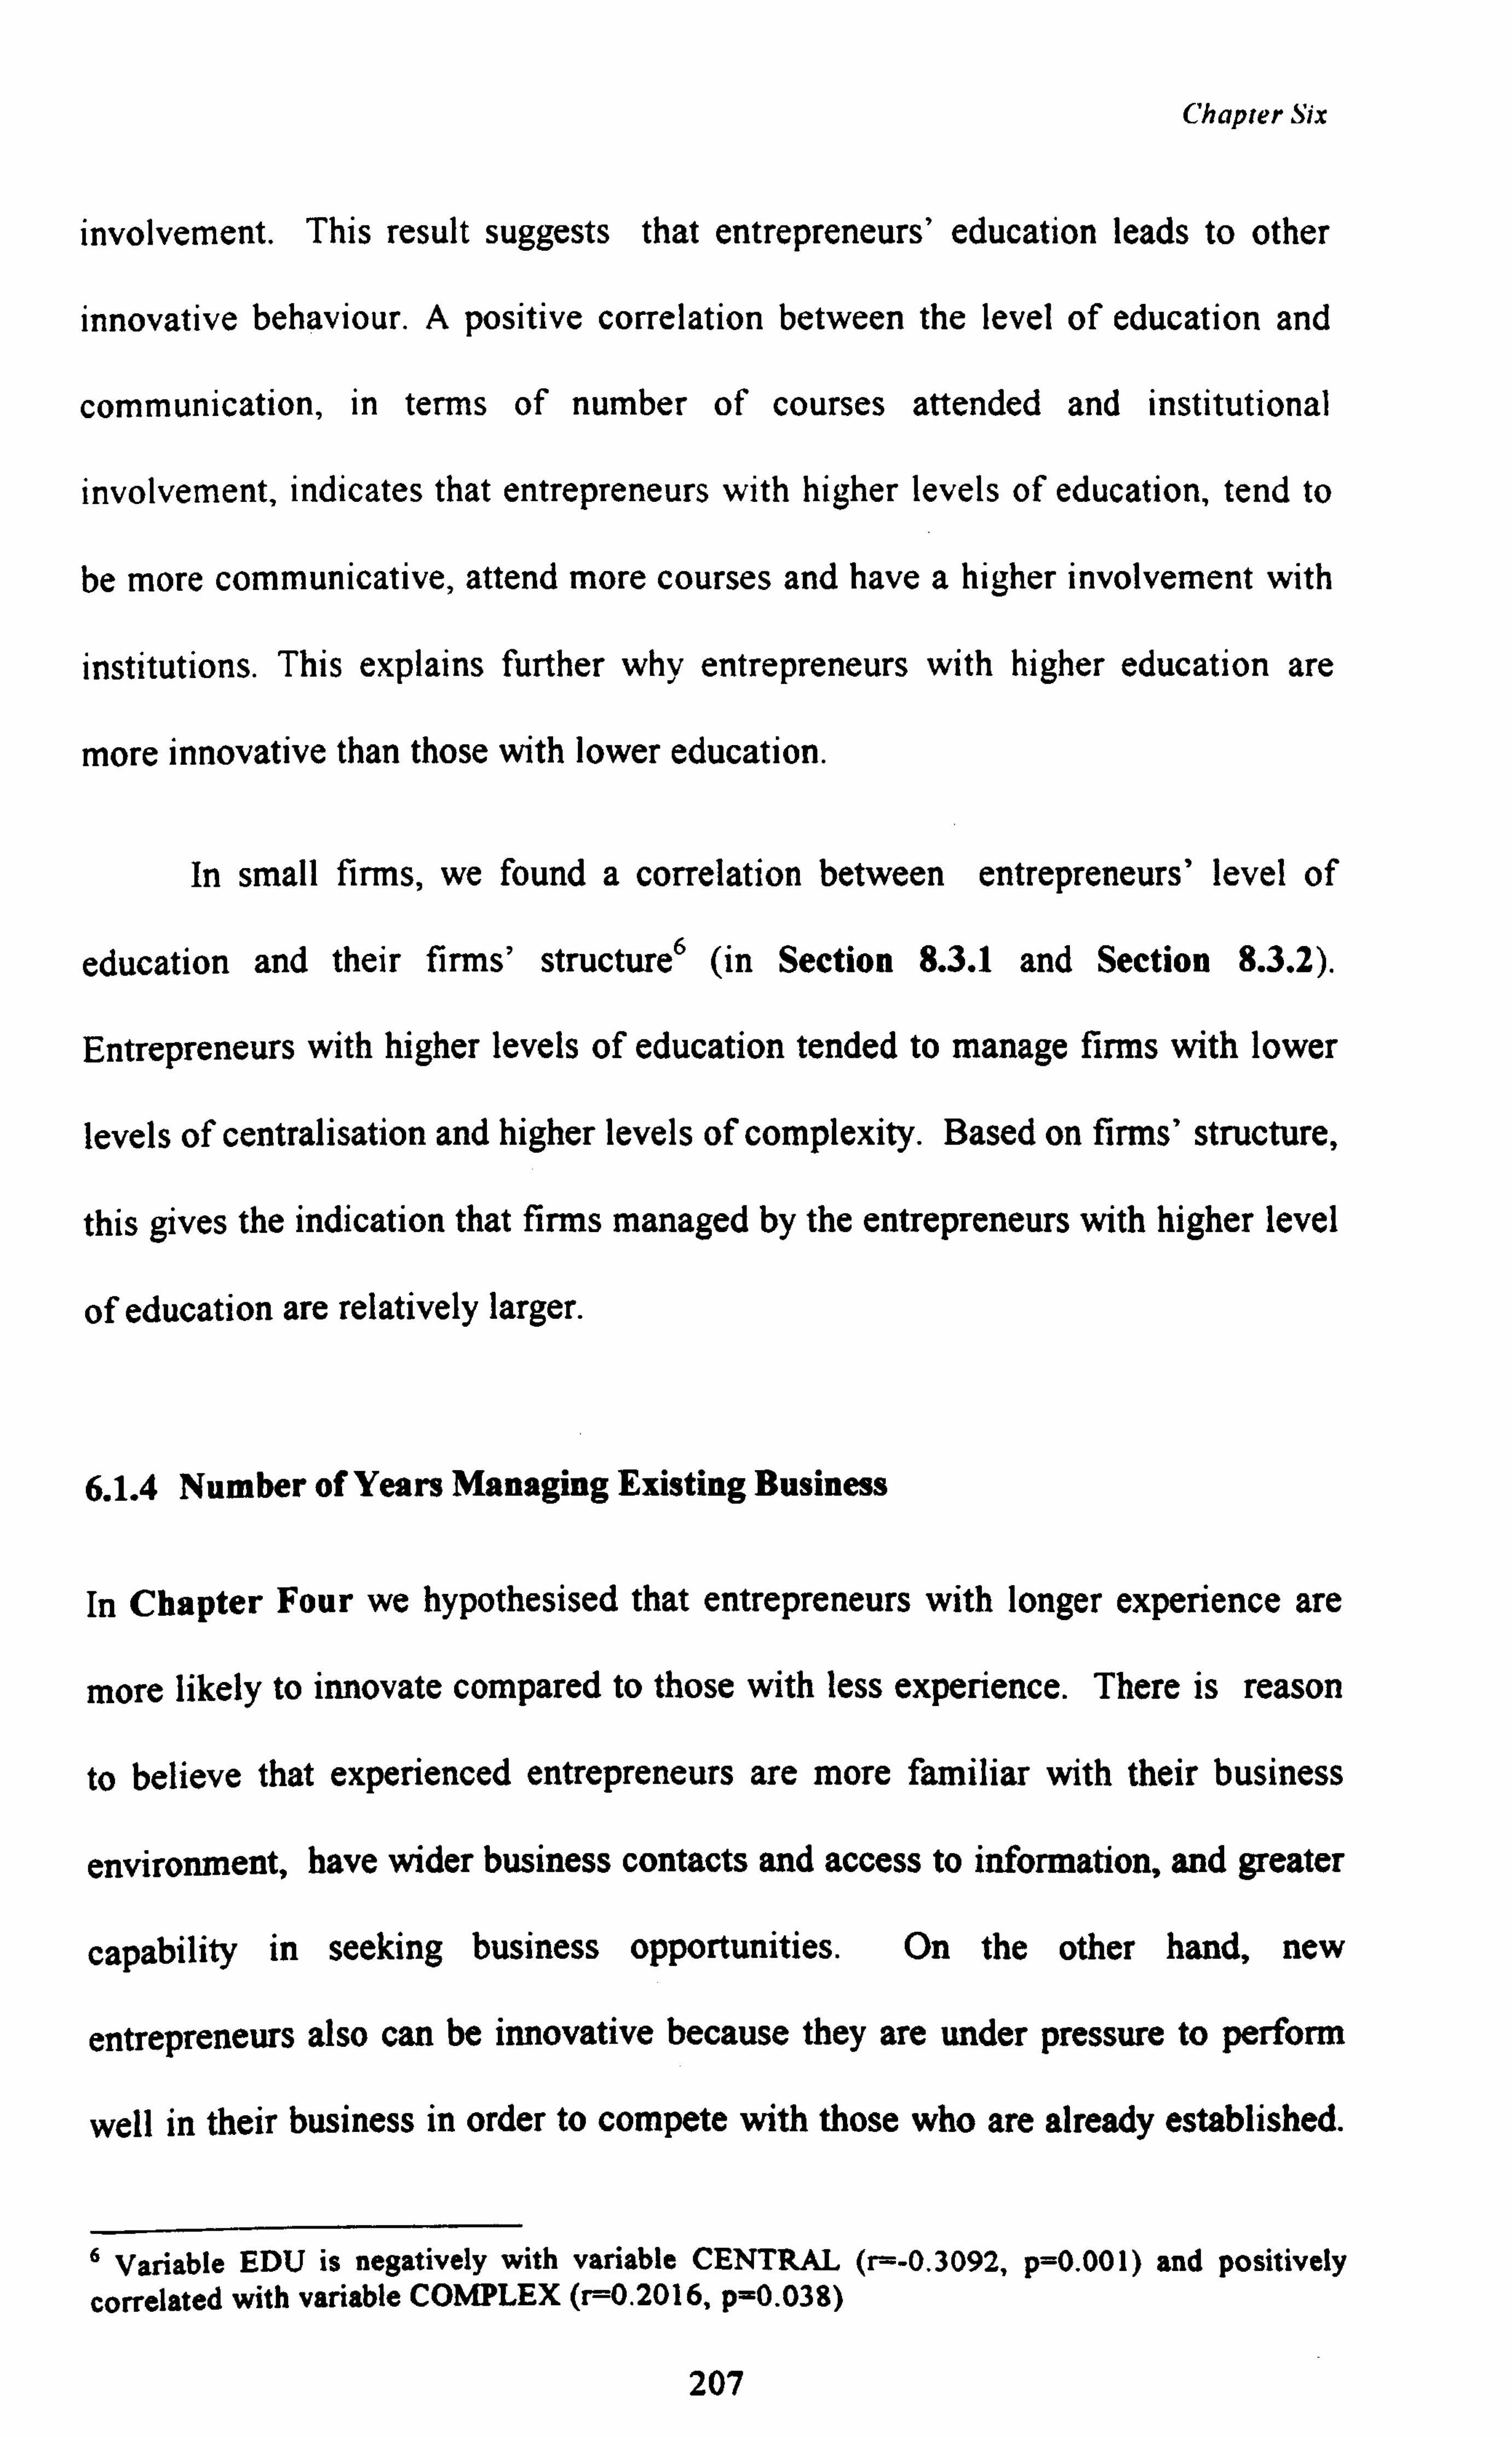
Chapter Six
involvement. This result suggests that entrepreneurs' education leads to other
innovative behaviour. A positive correlation between the level of education and
communication, in terms of number of courses attended and institutional
involvement, indicates that entrepreneurs with higher levels of education, tend to
be more communicative, attend more courses and have a higher involvement with
institutions. This explains further why entrepreneurs with higher education are
more innovative than those with lower education.
In small firms, we found a correlation between entrepreneurs' level of
education and their firms' structure6 (in Section 8.3.1 and Section 8.3.2).
Entrepreneurs with higher levels of education tended to manage firms with lower
levels of centralisation and higher levels of complexity. Based on firms' structure,
this gives the indication that firms managed by the entrepreneurs with higher level
of education are relatively larger.
6.1.4 Number of Years Managing Existing Business
In Chapter Four we hypothesised that entrepreneurs with longer experience are
more likely to innovate compared to those with less experience. There is reason
to believe that experienced entrepreneurs are more familiar with their business
environment, have wider business contacts and access to information, and greater
capability in seeking business opportunities. On the other hand, new
entrepreneurs also can be innovative because they are under pressure to perform
well in their business in order to compete with those who are already established.
6 Variable EDU is negatively with variable CENTRAL (r=-0.3092, p=0.001) and positively correlated with variable COMPLEX (r=0.2016, p=0.038)
207
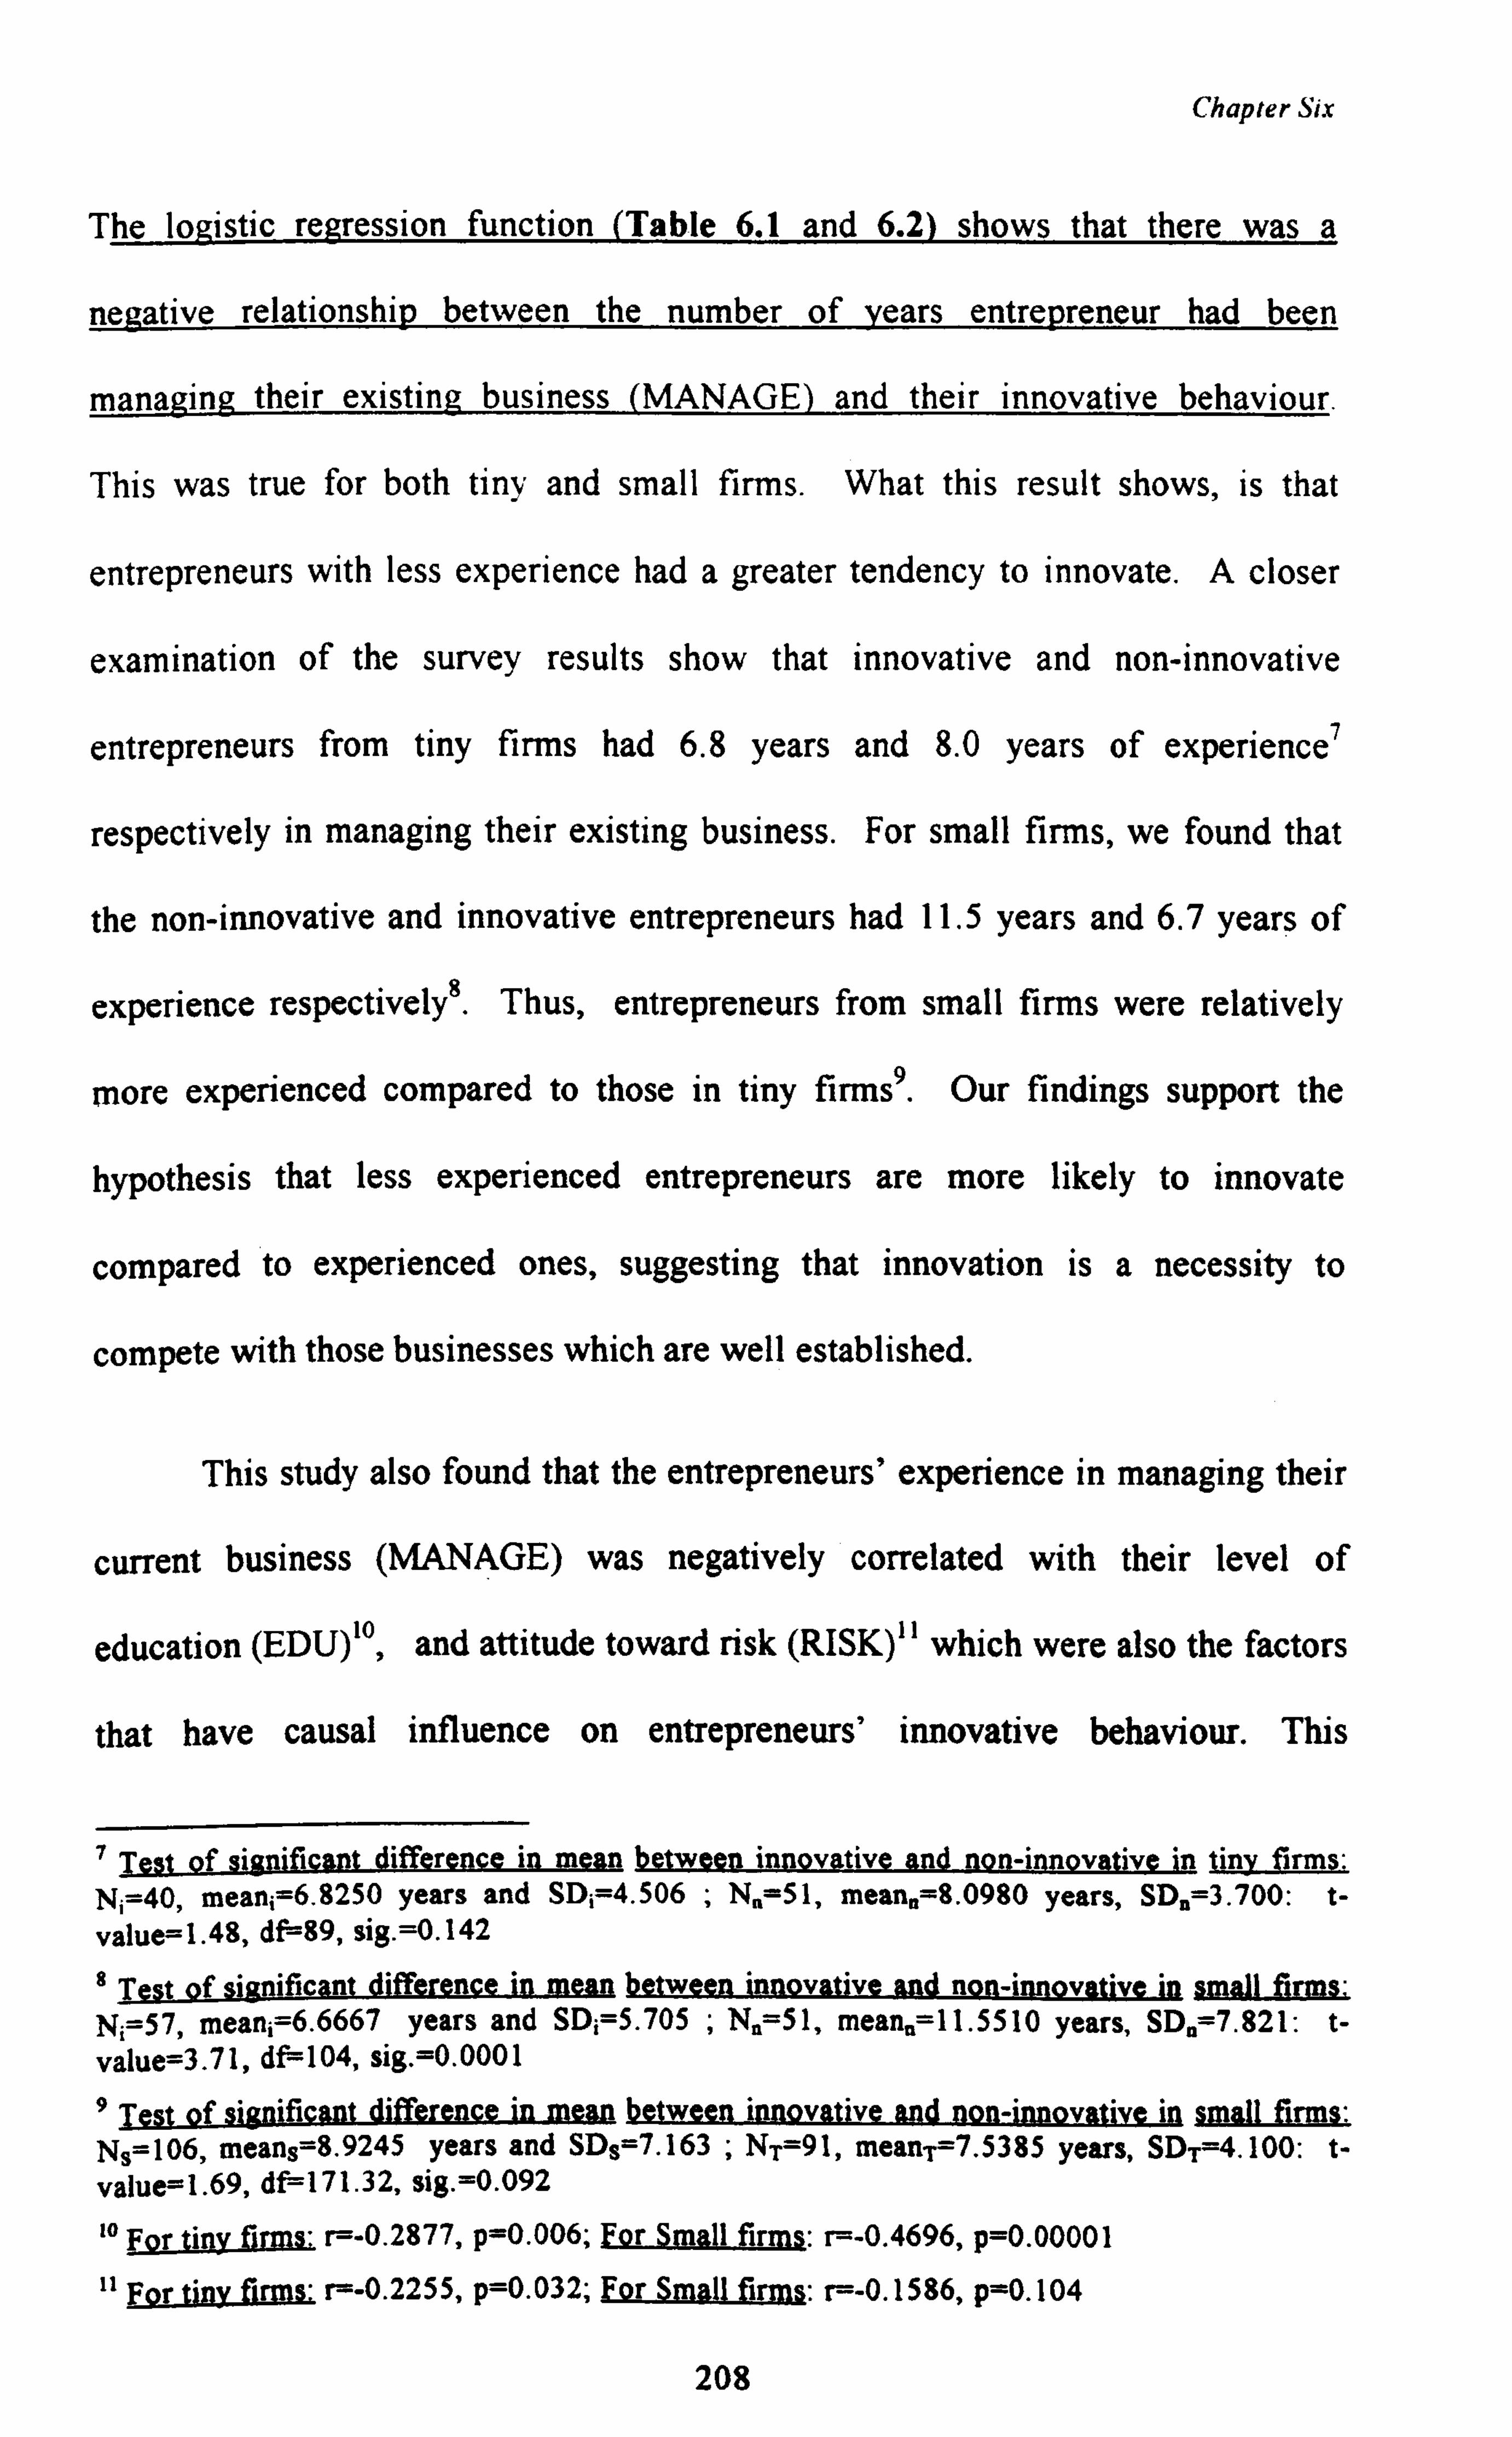
Chapter Six
The logistic regression function (Table 6.1 and 6.2) shows that there was a
negative relationship between the number of years entrepreneur had been
managing their existing business (MANAGE) and their innovative behaviour.
This was true for both tiny and small firms. What this result shows, is that
entrepreneurs with less experience had a greater tendency to innovate. A closer
examination of the survey results show that innovative and non-innovative
entrepreneurs from tiny firms had 6.8 years and 8.0 years of experience'
respectively in managing their existing business. For small firms, we found that
the non-innovative and innovative entrepreneurs had 11.5 years and 6.7 years of
experience respectively8. Thus, entrepreneurs from small firms were relatively
more experienced compared to those in tiny firms9. Our findings support the
hypothesis that less experienced entrepreneurs are more likely to innovate
compared to experienced ones, suggesting that innovation is a necessity to
compete with those businesses which are well established.
This study also found that the entrepreneurs' experience in managing their
current business (MANAGE) was negatively correlated with their level of
education (EDU)10, and attitude toward risk (RISK)" which were also the factors
that have causal influence on entrepreneurs' innovative behaviour. This
Test of significant difference in mean between innovative and non-innovative in tiny firm: N; =40, mean=6.8250 years and SD; 4.506 ; N. =51, mean. =8.0980 years, SDI 3.700: t-
value=1.48, df=89, sig. =0.142
8 Test of significant difference in mean between innovative and non-innovative in small firms: Ni=57, mean; =6.6667 years and SD; =5.705 ; N,, =51, means 11.5510 years, SDI 7.821: t- value=3.71, df104, sig. =0.0001 9 Test of significant difference in mean between innovative and non-innovative in small firms: Ns=106, means=8.9245 years and SD8=7.163 ; NT=91, mean=7.5385 years, SDT=4.100: t- value=1.69, df 171.32, sig. =0.092 10 For tiny firms: r=-0.2877, p=0.006; For Small firms: r=-0.4696, p=0.00001 11 For tiny firms: r--0.2255, p=0.032; For Small firms: r=-0.1586, p=0.104
208
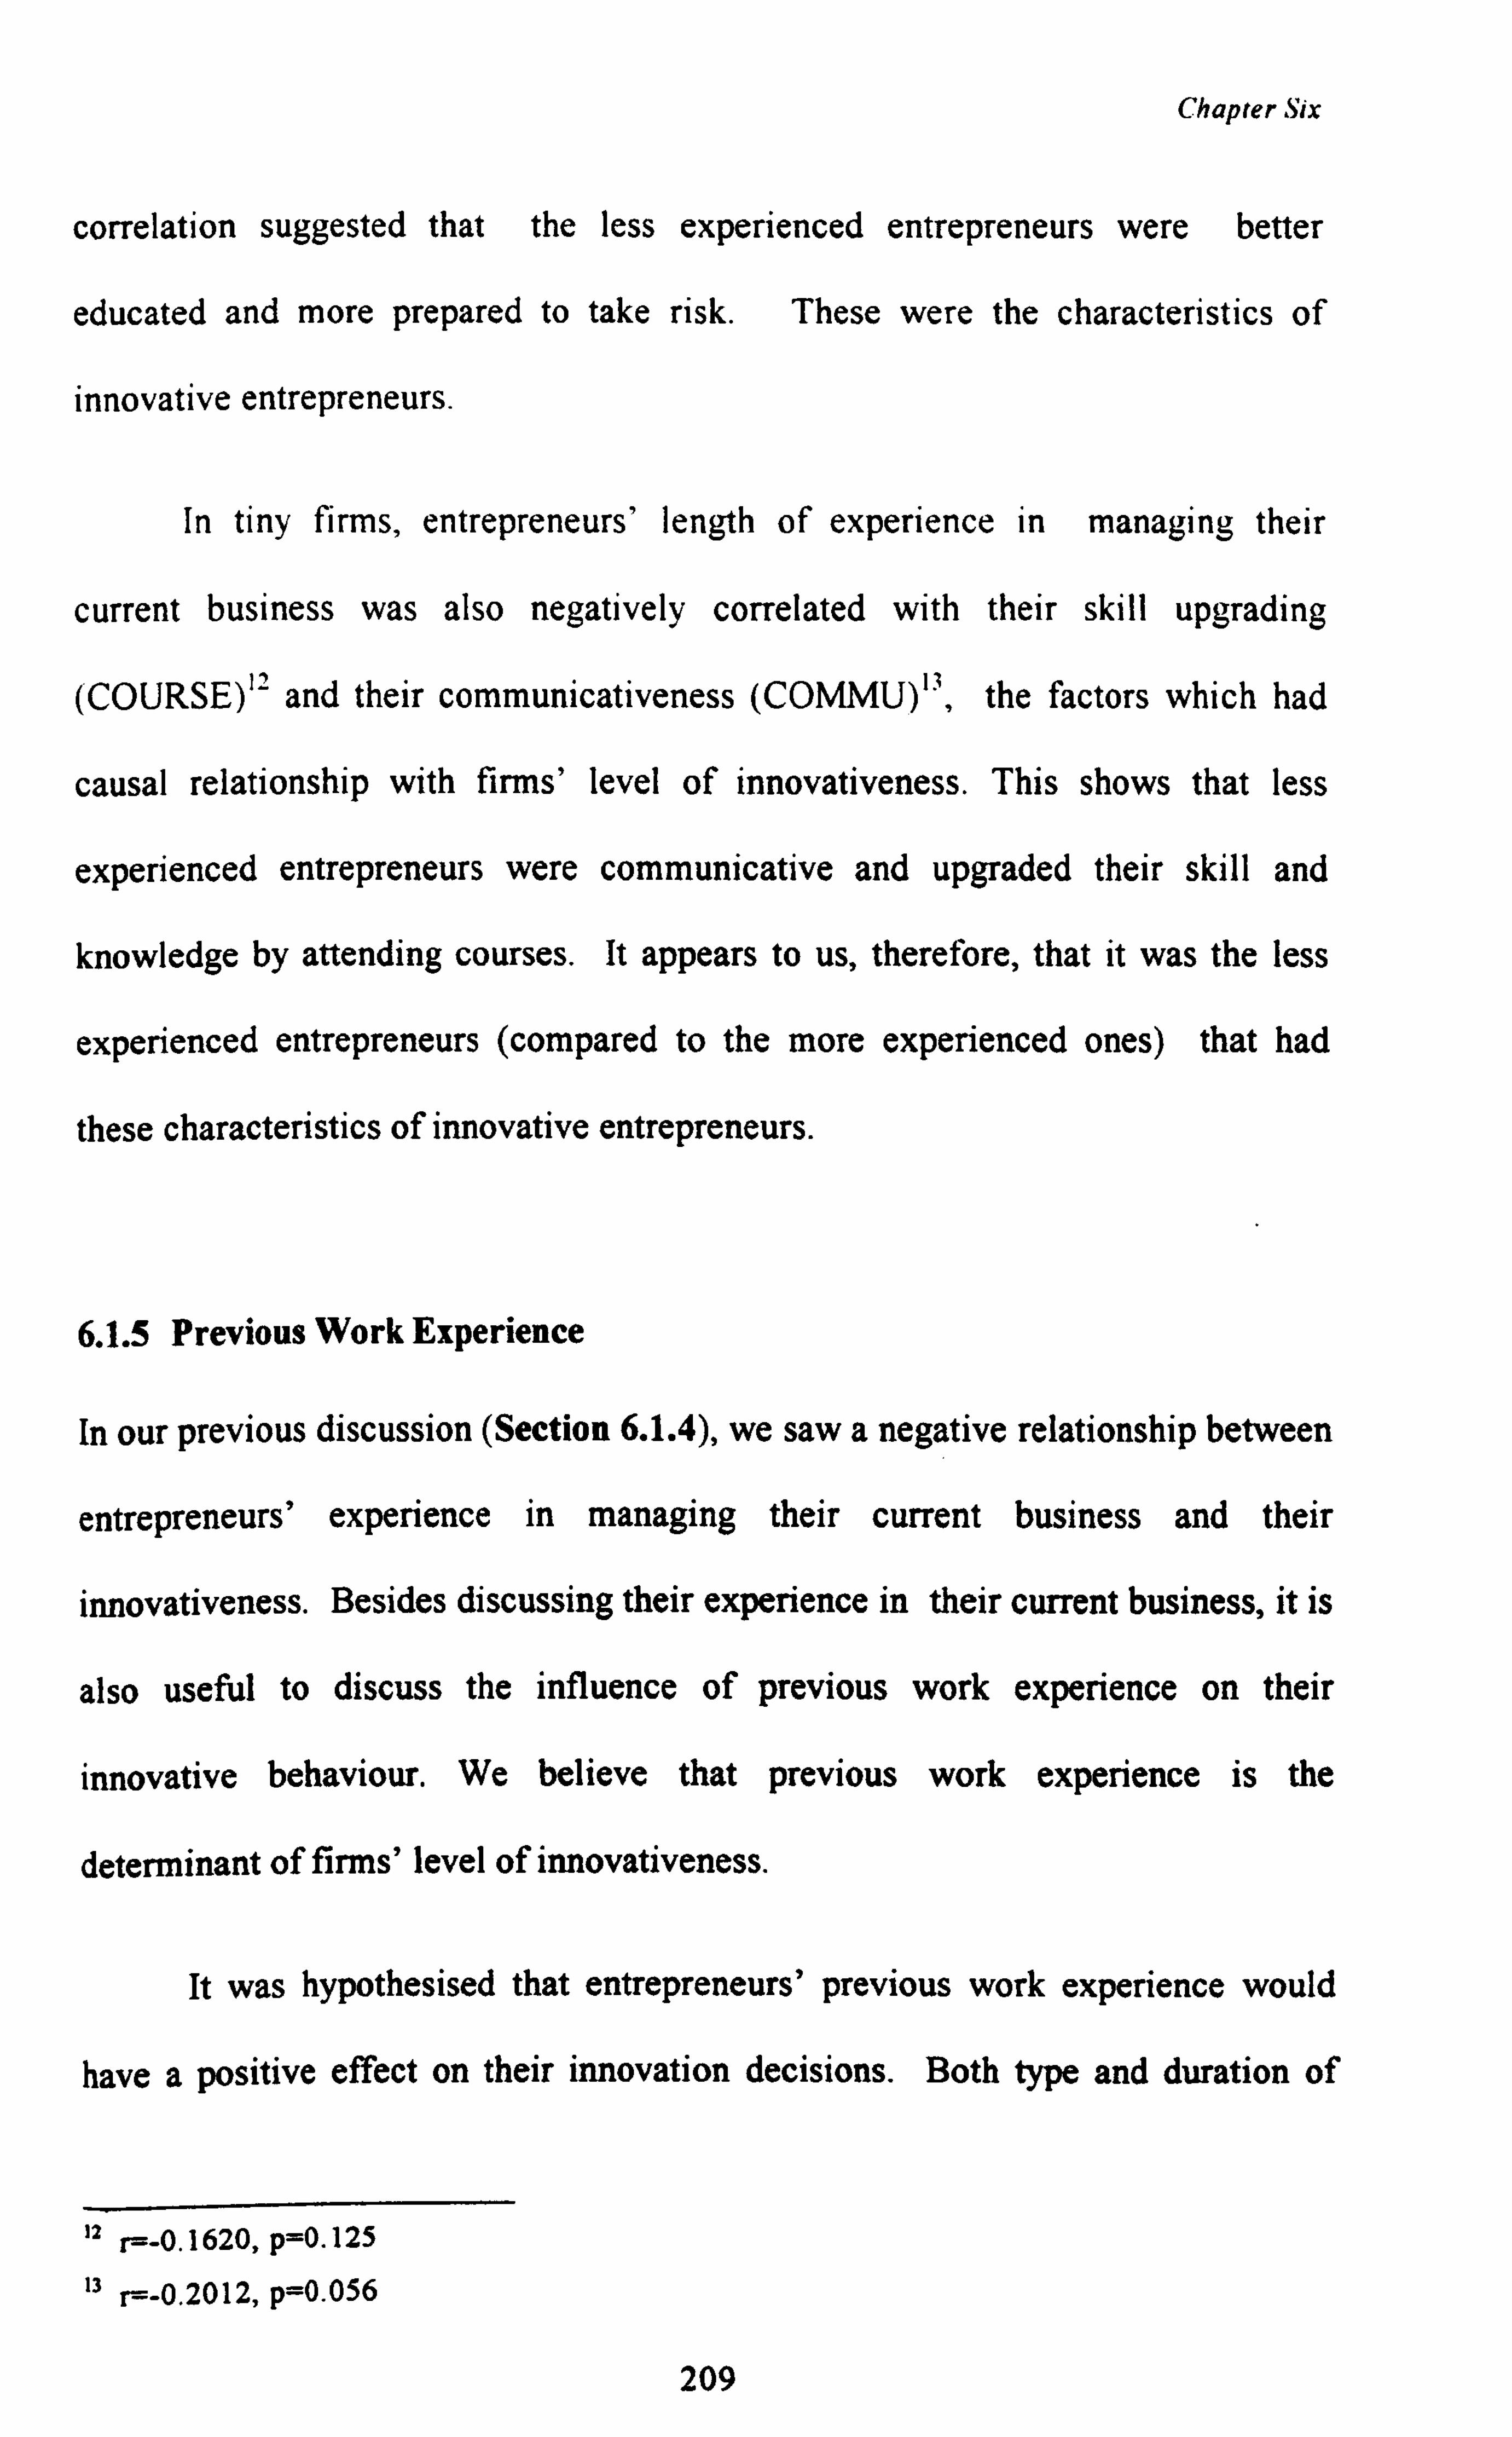
Chapter Six
correlation suggested that the less experienced entrepreneurs were better
educated and more prepared to take risk. These were the characteristics of
innovative entrepreneurs.
In tiny firms, entrepreneurs' length of experience in managing their
current business was also negatively correlated with their skill upgrading
(COURSE)'`' and their communicativeness (COMMU)'3, the factors which had
causal relationship with firms' level of innovativeness. This shows that less
experienced entrepreneurs were communicative and upgraded their skill and
knowledge by attending courses. It appears to us, therefore, that it was the less
experienced entrepreneurs (compared to the more experienced ones) that had
these characteristics of innovative entrepreneurs.
6.1.5 Previous Work Experience
In our previous discussion (Section 6.1.4), we saw a negative relationship between
entrepreneurs' experience in managing their current business and their
innovativeness. Besides discussing their experience in their current business, it is
also useful to discuss the influence of previous work experience on their
innovative behaviour. We believe that previous work experience is the
determinant of firms' level of innovativeness.
It was hypothesised that entrepreneurs' previous work experience would
have a positive effect on their innovation decisions. Both type and duration of
12 r=-0.1620, p=0.125
13 r=-0.2012, p=0.056
209
Chapter Six
experience might be relevant. Entrepreneurs with previous work experience in
the same sector as their current business, have an advantage over those whose
previous work experience was in a different sector. For example, an entrepreneur
who had previously worked as an employee in a food processing firm and then
came to own a firm producing a very similar range of products might be more
aware of the relevant technology, have more contacts in the sector, etc., than one
who had switched sectors or never had any previous work experience.
6.1.5.1 Previous Work Experience of Entrepreneurs in Tiny Firms
Of the total 91 entrepreneurs in tiny firms, 51 had previous work experience
before venturing into their existing business. Of these, 29 were non-innovative
while the other 26 were innovative. Referring to Table 6.1, the number of years of
the previous work experience is not a significant predictor of innovativeness in
tiny firms.
One reason why past experience did not have a significant effect on
entrepreneurs' innovativeness in tiny firms is that their work experiences had not
been directly related to their current type of business. Table 6.7 shows that the
majority of entrepreneurs were previously employed in economic activities
different from their current business.
As shown in Table 6.7, only 17 entrepreneurs had previously owned small
businesses, and all of these were in the retail business. The majority of
entrepreneurs were once employees in government or private sectors. Only 5
entrepreneurs had previously been employed in the manufacturing sector; 4 of
210
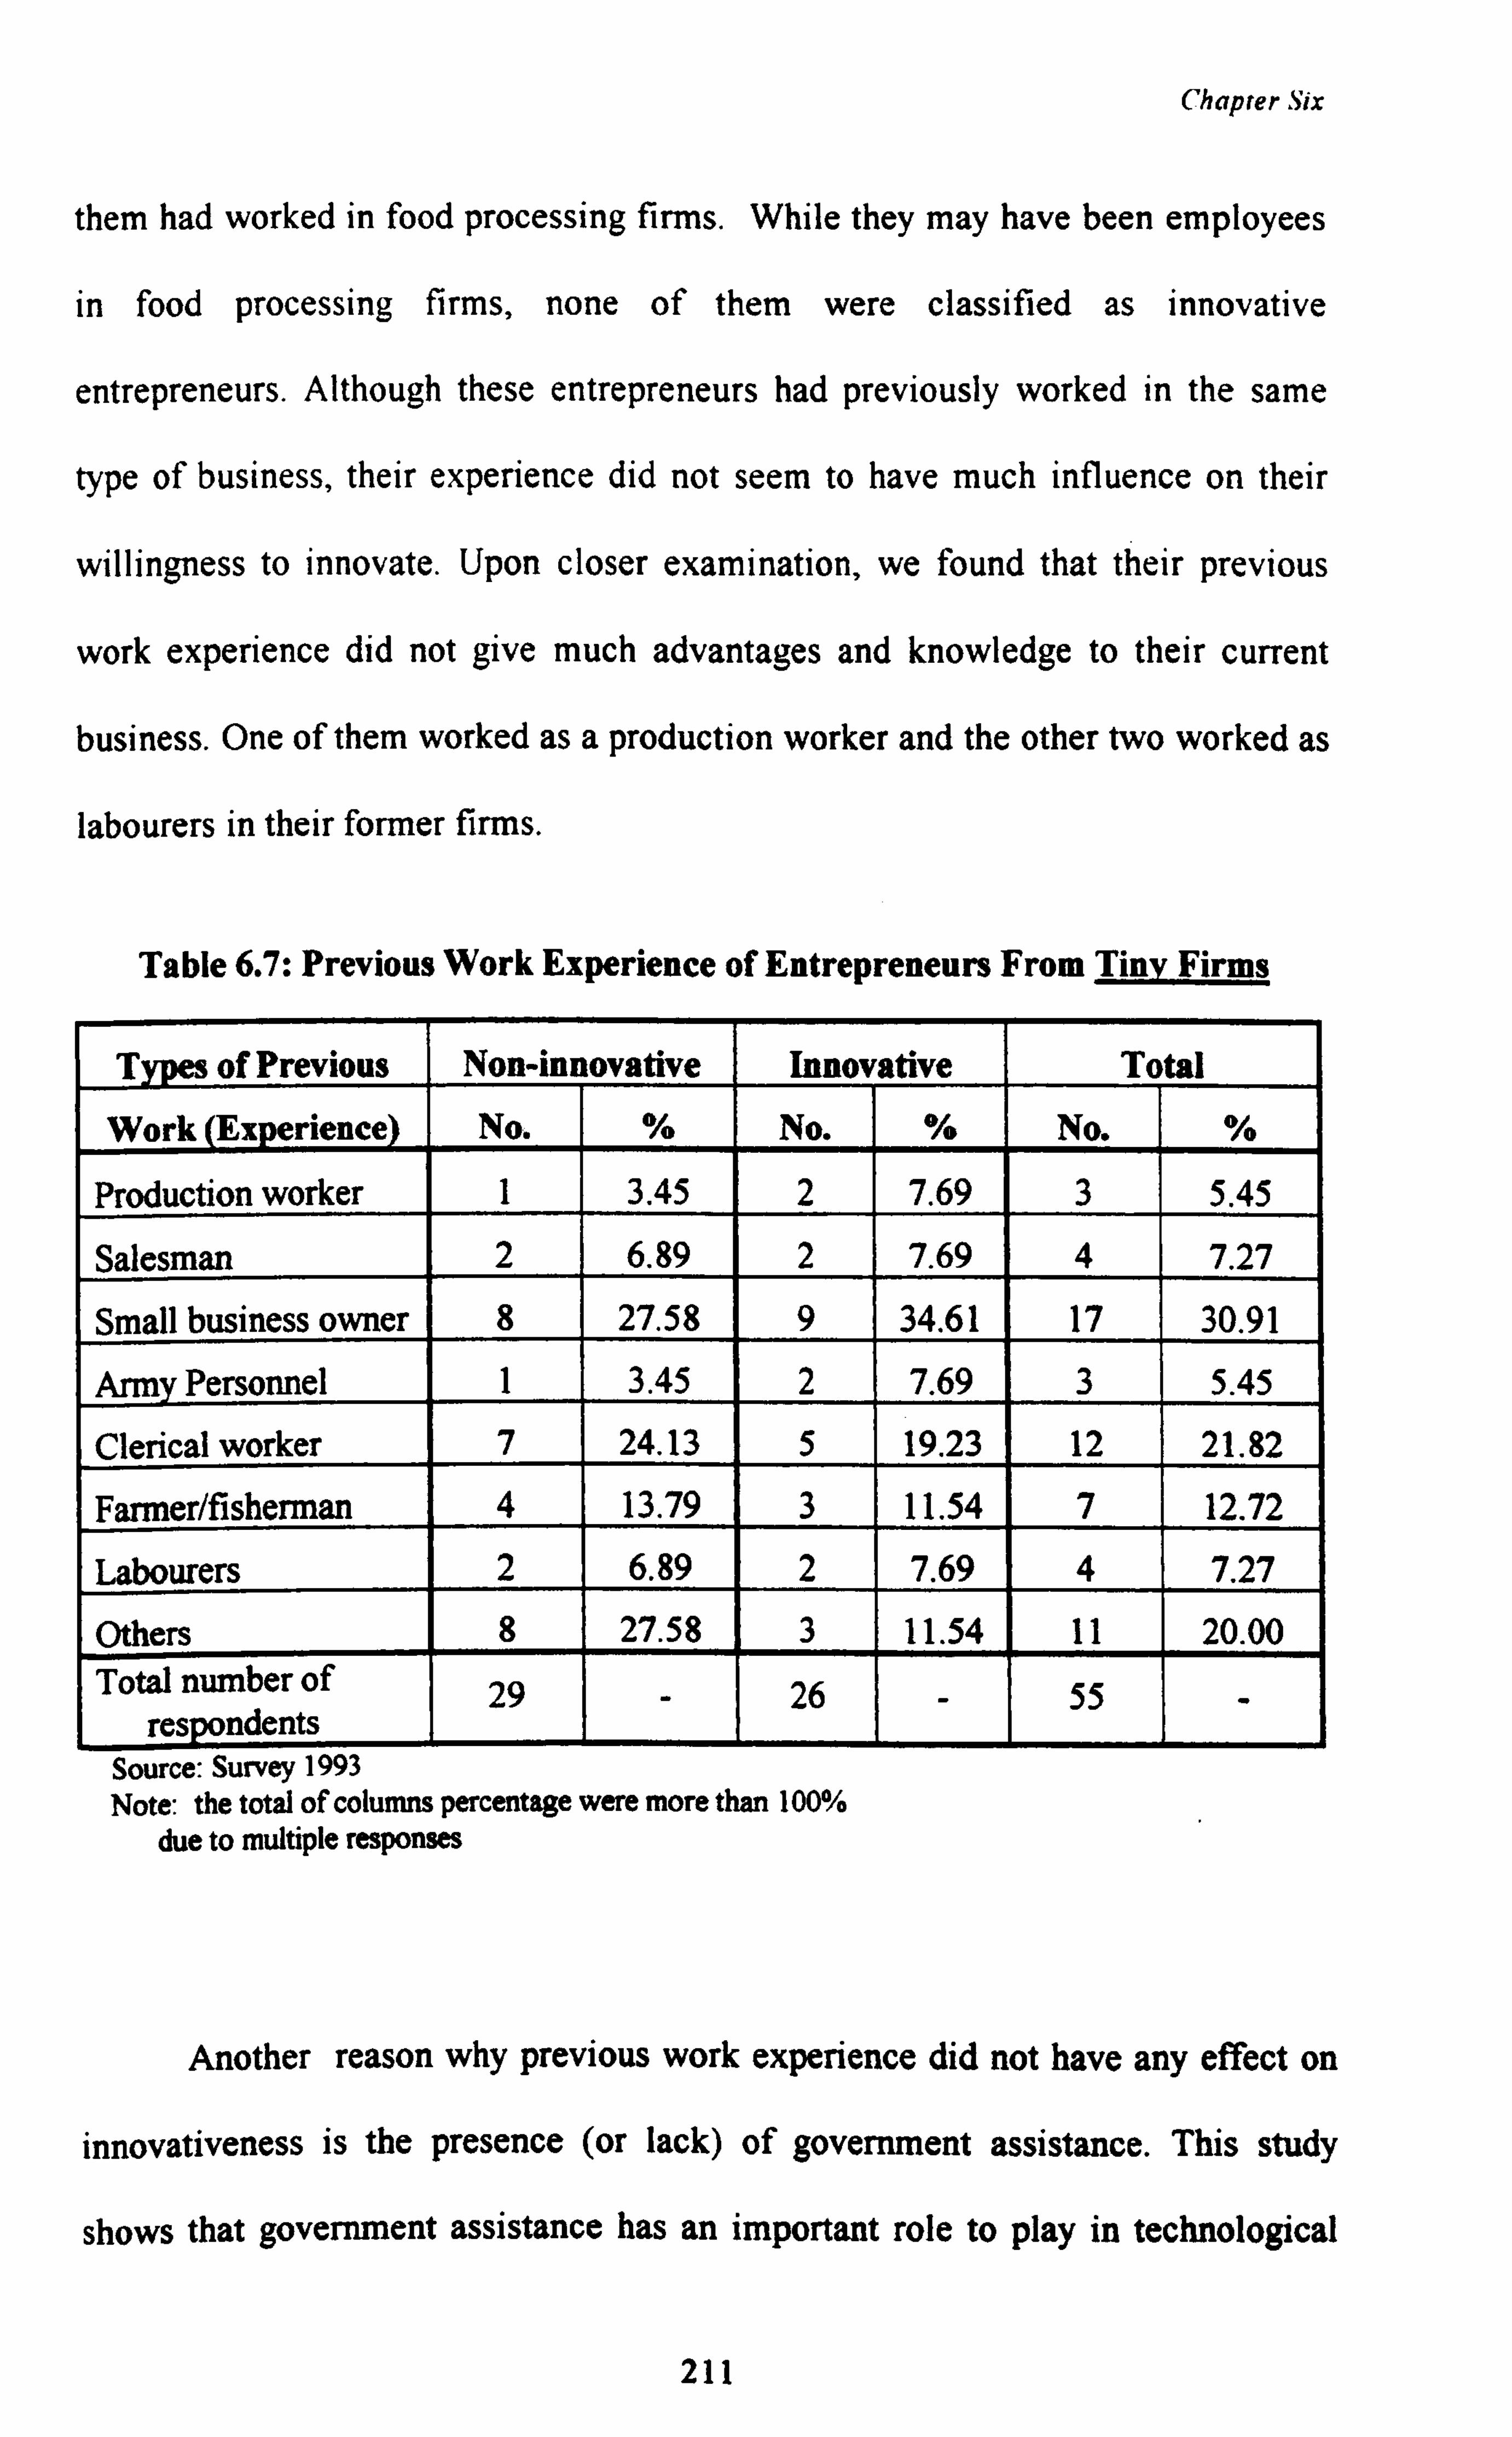
Chapter Six
them had worked in food processing firms. While they may have been employees
in food processing firms, none of them were classified as innovative
entrepreneurs. Although these entrepreneurs had previously worked in the same
type of business, their experience did not seem to have much influence on their
willingness to innovate. Upon closer examination, we found that their previous
work experience did not give much advantages and knowledge to their current
business. One of them worked as a production worker and the other two worked as
labourers in their former firms.
Table 6.7: Previous Work Experience of Entrepreneurs From Tiny Firms
Types of Previous Non-innovative Innovative Total
Work (Experience) No. % No. % No. %
Production worker 1 3.45 2 7.69 3 5.45
Salesman 2 6.89 2 7.69 4 7.27
Small business owner 8 27.58 9 34.61 17 30.91
Army Personnel 1 3.45 2 7.69 3 5.45
Clerical worker 7 24.13 5 19.23 12 21.82
Farmer/fisherman 4 13.79 3 11.54 7 12.72
Labourers 2 6.89 2 7.69 4 7.27
Others 8 27.58 3 11.54 11 20.00 Total number of
respondents 29 - 26 - 55 -
Source: Survey 1993 Note: the total of columns percentage were more than 100%
due to multiple responses
Another reason why previous work experience did not have any effect on
innovativeness is the presence (or lack) of government assistance. This study
shows that government assistance has an important role to play in technological
211
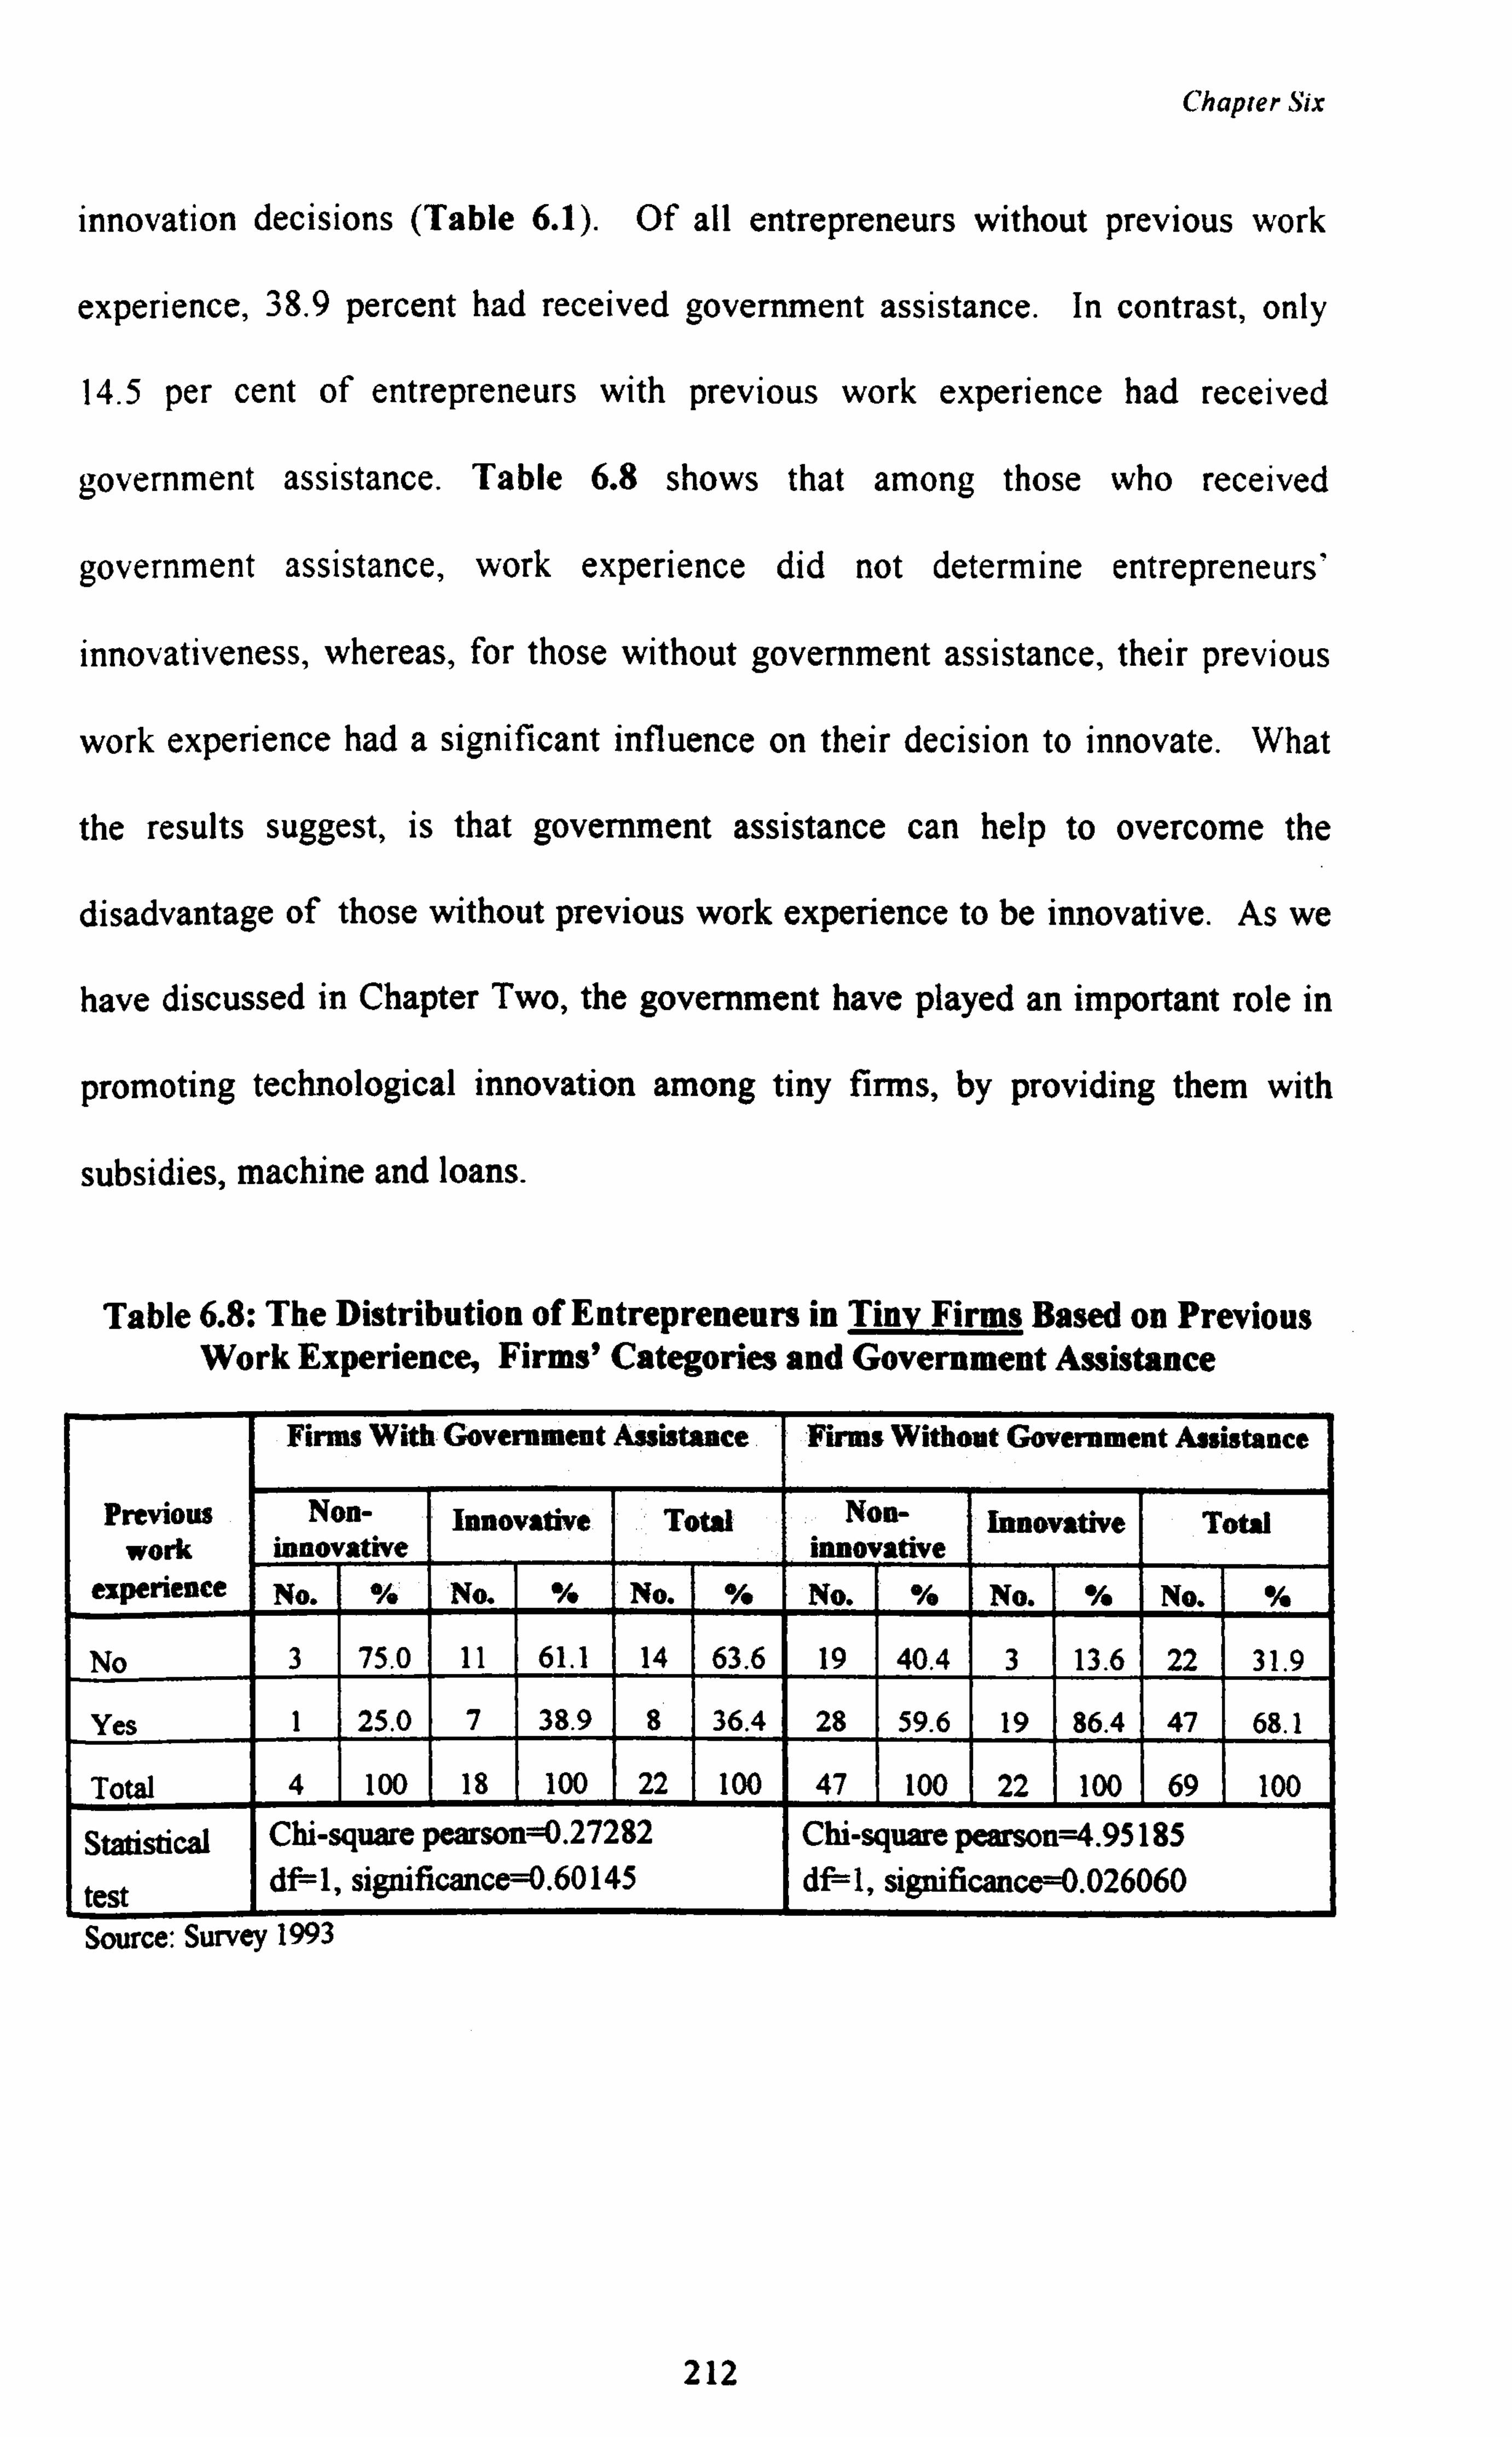
Chapter Six
innovation decisions (Table 6.1). Of all entrepreneurs without previous work
experience, 38.9 percent had received government assistance. In contrast, only
14.5 per cent of entrepreneurs with previous work experience had received
government assistance. Table 6.8 shows that among those who received
government assistance, work experience did not determine entrepreneurs'
innovativeness, whereas, for those without government assistance, their previous
work experience had a significant influence on their decision to innovate. What
the results suggest, is that government assistance can help to overcome the
disadvantage of those without previous work experience to be innovative. As we
have discussed in Chapter Two, the government have played an important role in
promoting technological innovation among tiny firms, by providing them with
subsidies, machine and loans.
Table 6.8: The Distribution of Entrepreneurs in Tiny Firms Based on Previous Work Experience, Firms' Categories and Government Assistance
Finns With Government Assistance Firms Without Government Assistance
Previous work
Non- innovative
Innovative Total NOn- innovative
Innovative Total
experience No. % No. % No. % No. % No. % No. %
No 3 75.0 11 61.1 14 63.6 19 40.4 3 13.6 22 31.9
Yes 1 25.0 7 38.9 8 36.4 28 59.6 19 86.4 47 68.1
Total 4 100 18 100 22 100 47 100 22 100 69 100
Statistical
test
Chi-square pearson 0.27282 dgl, significance 0.60145
Chi-square pearson=4.95185 06-1, significance=0.026060
Source: Survey 1993
212
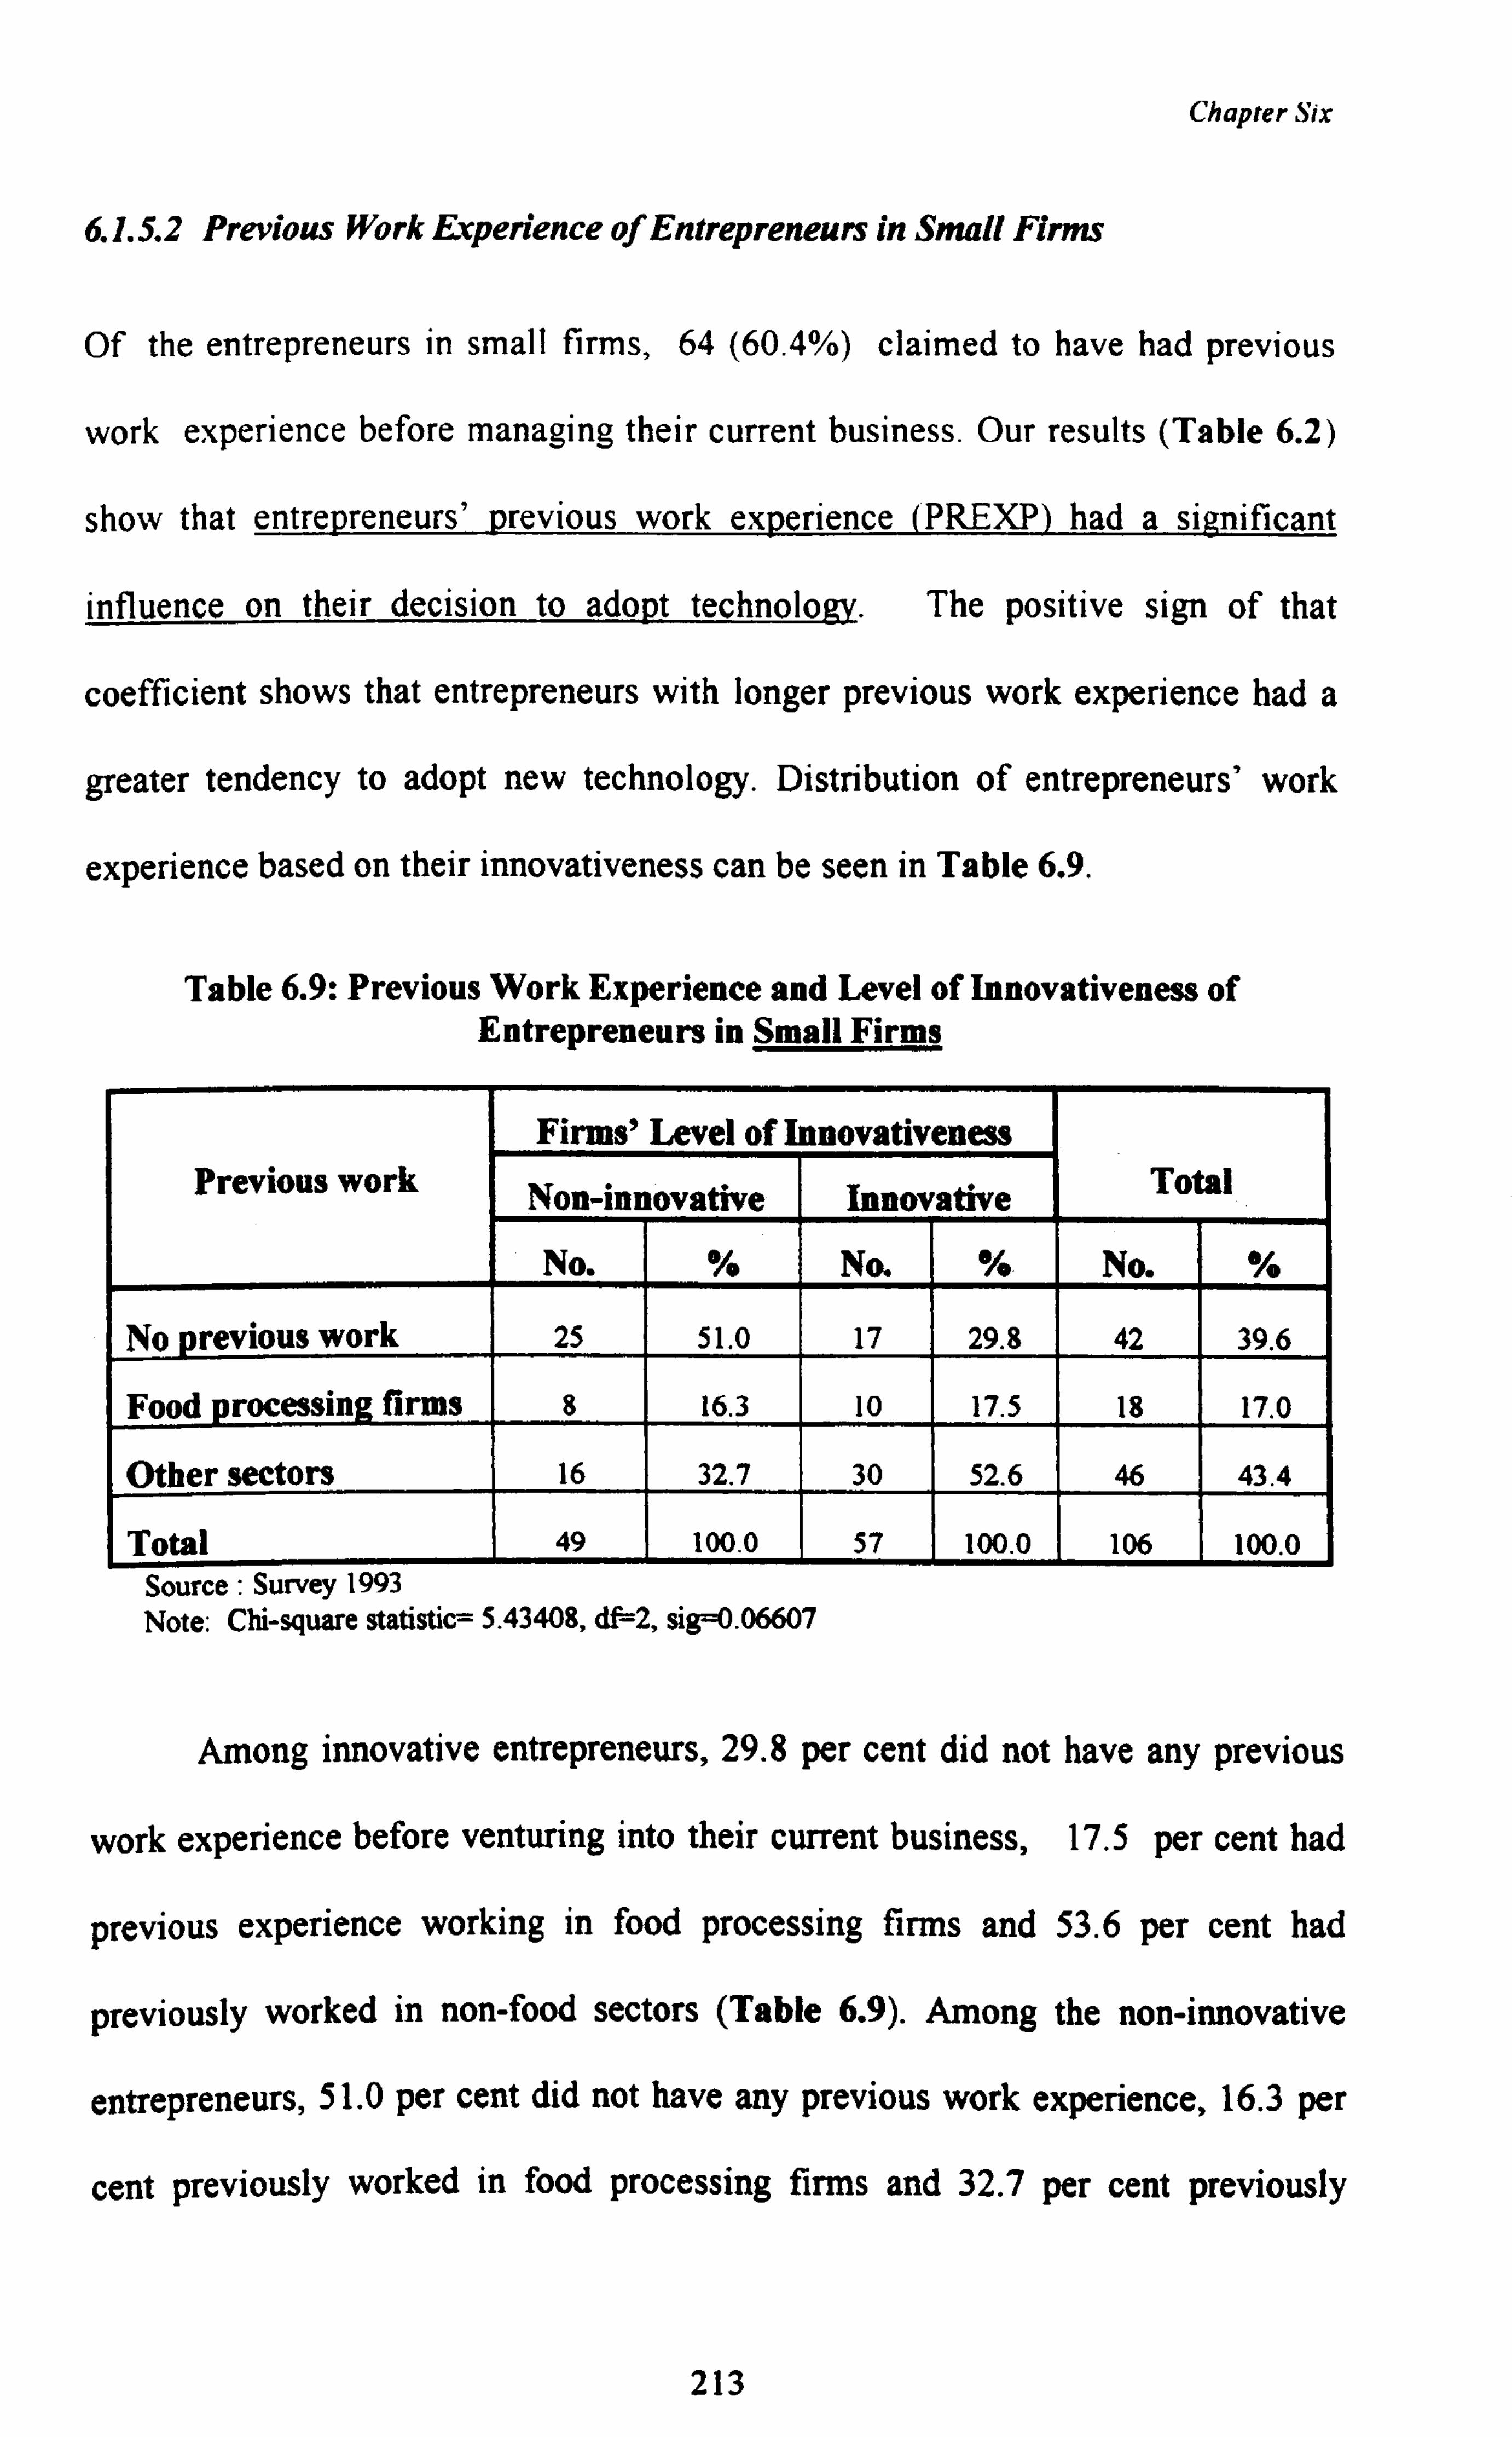
Chapter Six
6.1.5.2 Previous Work Experience of Entrepreneurs in Small Firms
Of the entrepreneurs in small firms, 64 (60.4%) claimed to have had previous
work experience before managing their current business. Our results (Table 6.2)
show that entrepreneurs' previous work experience (PREXP) had a significant
influence on their decision to adopt technology. The positive sign of that
coefficient shows that entrepreneurs with longer previous work experience had a
greater tendency to adopt new technology. Distribution of entrepreneurs' work
experience based on their innovativeness can be seen in Table 6.9.
Table 6.9: Previous Work Experience and Level of Innovativeness of Entrepreneurs in Small Firms
Firms' Level of I nnovativeness Previous work Non-innovative Innovative Total
No. % No. %a No. %
No previous work 25 51.0 17 29.8 42 39.6
Food processing firms 8 16.3 10 17.5 18 17.0
her sectors 16 32.7 30 52.6 46 43.4
Total 49 100.0 57 100.0 106 100.0 Source : Survey 1993 Note: Chi-square statistic= 5.43408, df=2, sig 0.06607
Among innovative entrepreneurs, 29.8 per cent did not have any previous
work experience before venturing into their current business, 17.5 per cent had
previous experience working in food processing firms and 53.6 per cent had
previously worked in non-food sectors (Table 6.9). Among the non-innovative
entrepreneurs, 51.0 per cent did not have any previous work experience, 16.3 per
cent previously worked in food processing firms and 32.7 per cent previously
213
Chapter Six
worked in non-food sectors. Of the 18 entrepreneurs who had previously worked
in food processing firms, 8 of them had worked in firms that produced similar
products to those they were currently producing. Of these eight entrepreneurs, 6
were innovative while the other 2 were non-innovative.
Types of previous work also had some influence on entrepreneurs'
innovativeness. Table 6.10 shows variations in the level of innovativeness among
different types of work experience, suggesting that some work experience is more
conducive than others to innovativeness. We can see from Table 6.10, that the
majority of those who innovated had previously worked as managers, executives,
administrators, clerks, in the army or as salespersons. On the other hand, the non-
innovative entrepreneurs were those who had previously worked as labourers,
drivers, fishermen and farmers.
Entrepreneurs who had previously worked in the same sector as they were
currently in, had a greater tendency to be innovative compared to those who had
worked in other sectors. The result suggests that entrepreneurs' previous work
experience which was relevant to their current business, gave them an advantage
over those who were less experienced or who had previously worked in sectors
different from those in which they were engaged at the time of the study.
Table 6.10 shows that 54 per cent of those who had previously worked as
production workers were innovative. One explanation for this is that the majority
of them had previously worked in the food industries. They also had longer
working experience (more than 8 years). Although they were previously
production workers, their years of experience in the food industry enabled them to
214
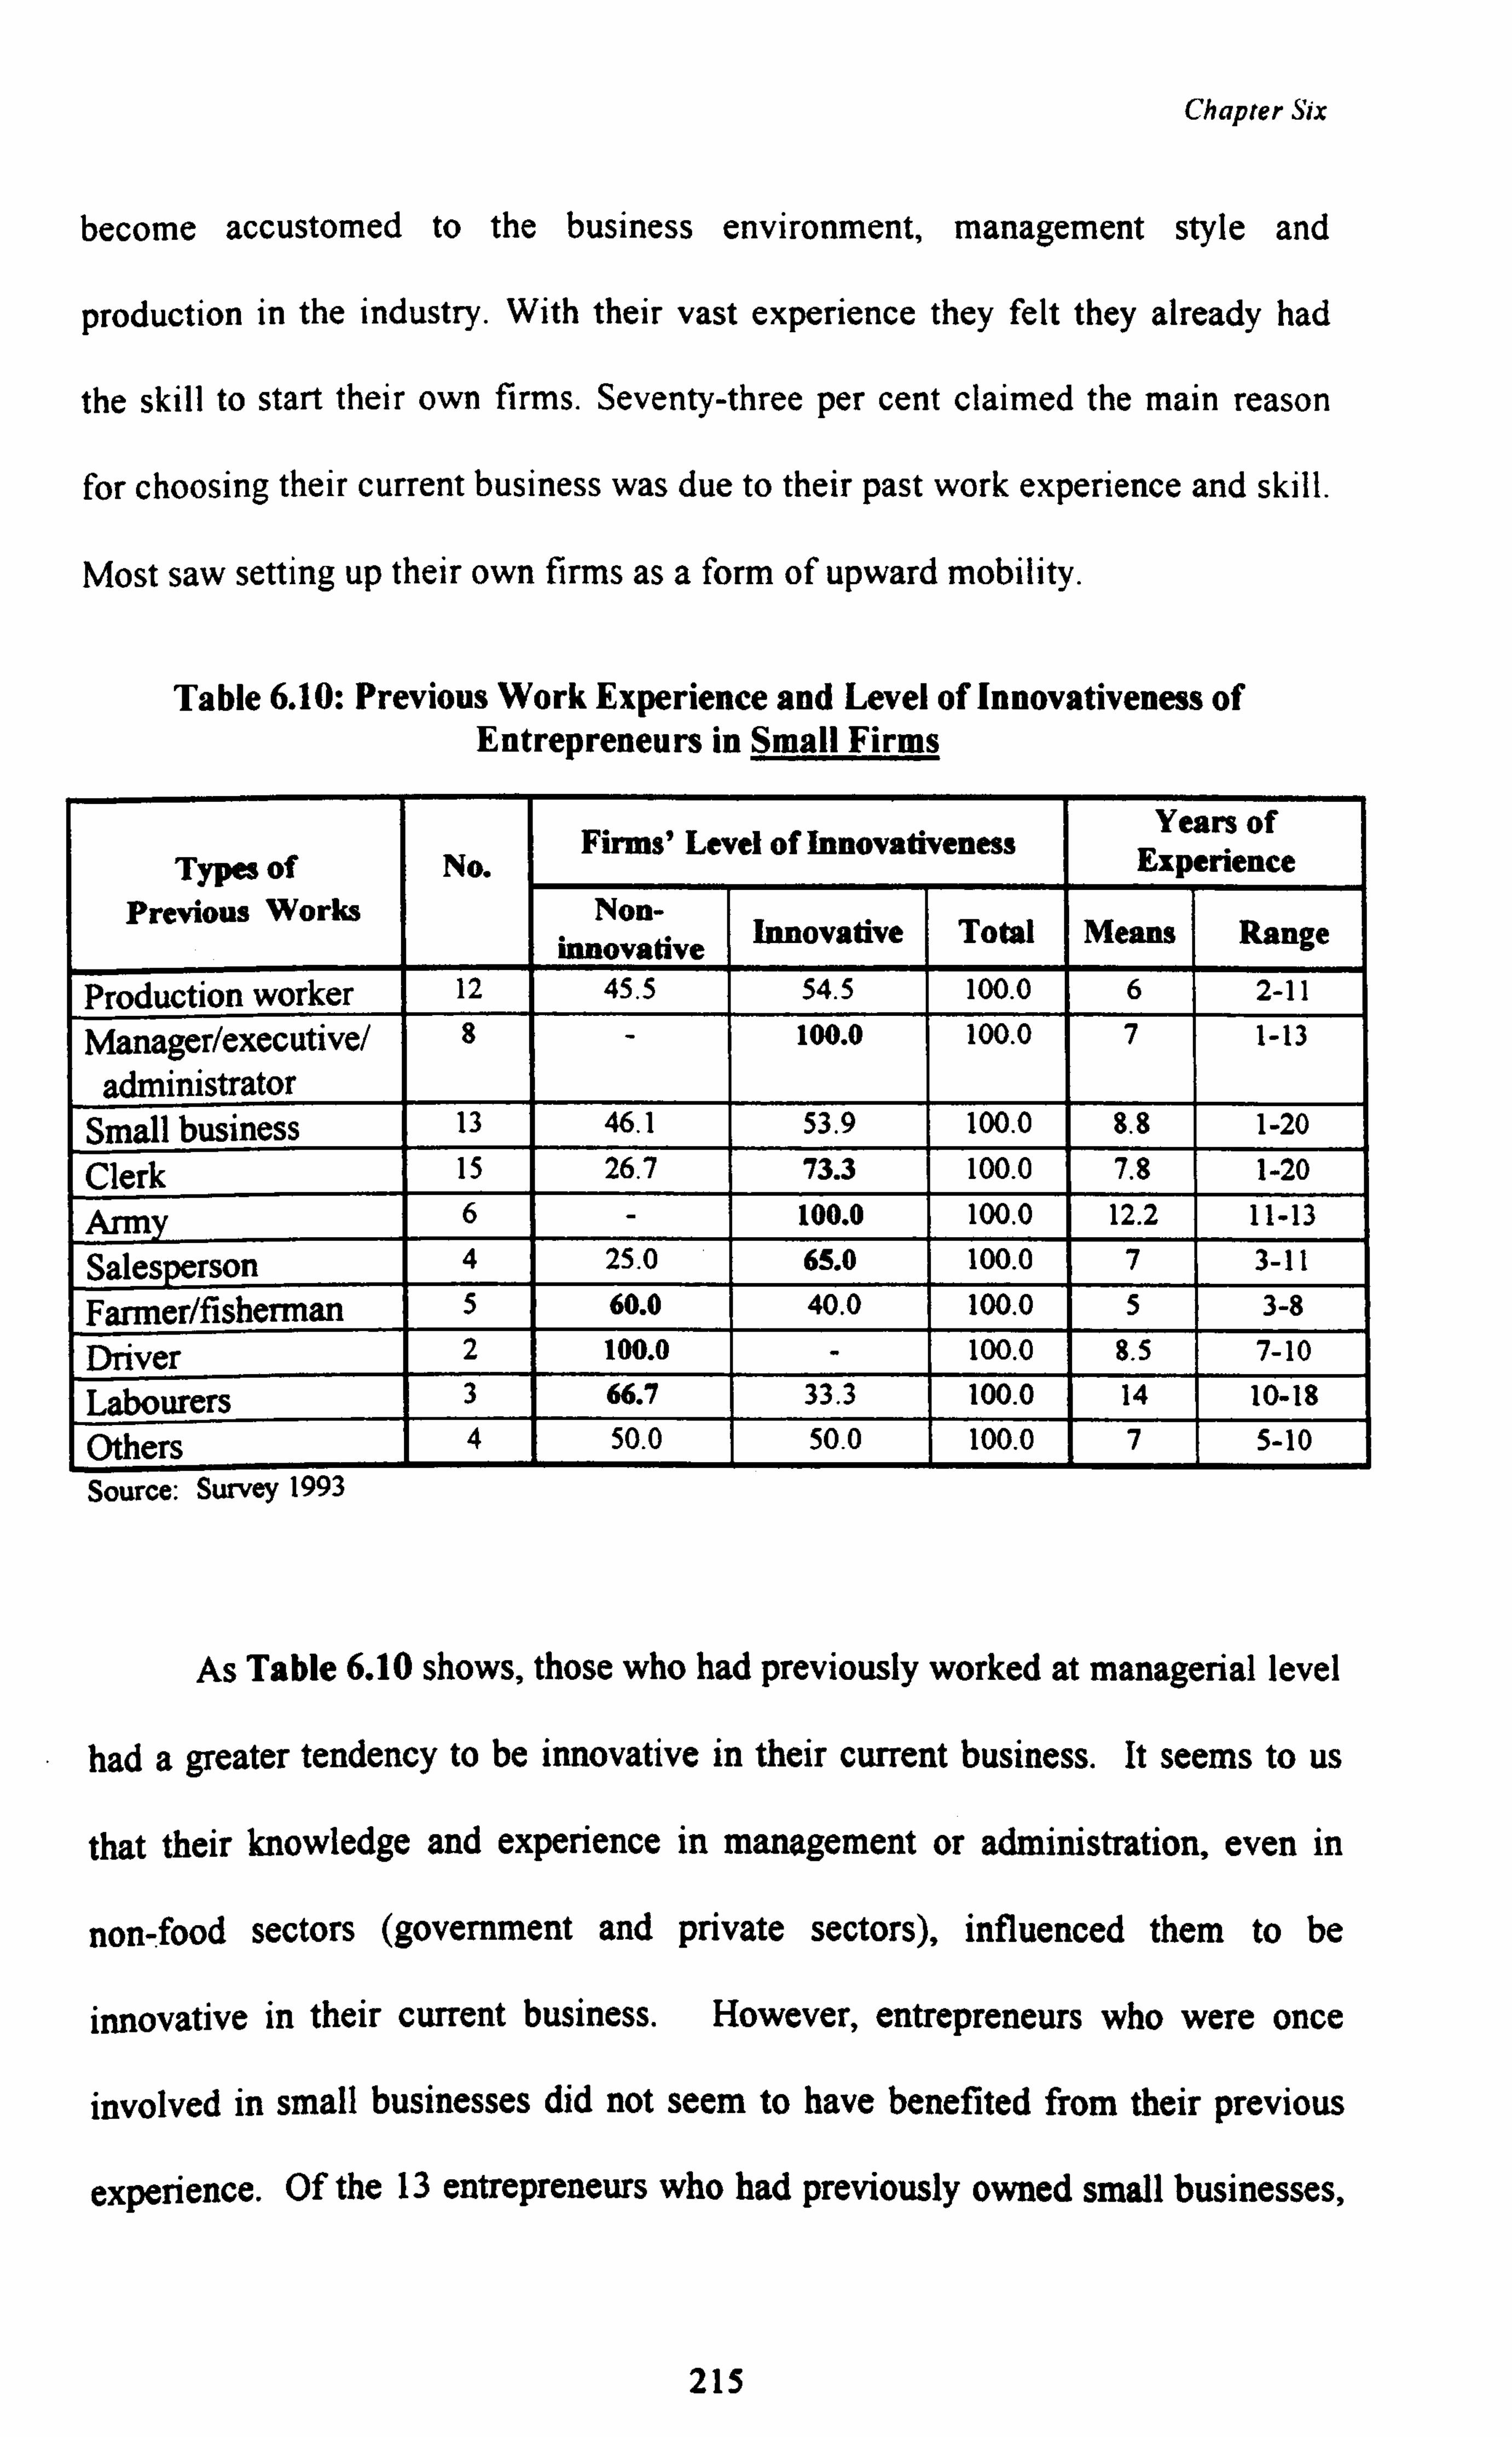
Chapter Six
become accustomed to the business environment, management style and
production in the industry. With their vast experience they felt they already had
the skill to start their own firms. Seventy-three per cent claimed the main reason
for choosing their current business was due to their past work experience and skill.
Most saw setting up their own firms as a form of upward mobility.
Table 6.10: Previous Work Experience and Level of Innovativeness of Entrepreneurs in Small Firms
Types of No. Firms' Level of Innovativeness Yearsof
Experience Previous Works Non-
innovative innovative ovative Innovative Total Means Range
Production worker 12 45.5 54.5 100.0 6 2-11
Manager/executive/
administrator
8 - 100.0 100.0 7 1-13
Small business 13 46.1 53.9 100.0 8.8 1-20
Clerk 15 26.7 73.3 100.0 7.8 1-20 Anny - 100.0 100.0 12.2 11-13
Salesperson 4 25.0 65.0 100.0 7 3-11
Farmer/fisherman 5 60.0 40.0 100.0 5 3-8
Driver 2 100.0 - 100.0 8.5 7-10
Labourers 3 66.7 33.3 100.0 14 10-18
Others 4 50.0 50.0 100.0 7 5-10 Source: Survey 1993
As Table 6.10 shows, those who had previously worked at managerial level
had a greater tendency to be innovative in their current business. It seems to us
that their knowledge and experience in management or administration, even in
non-food sectors (government and private sectors), influenced them to be
innovative in their current business. However, entrepreneurs who were once
involved in small businesses did not seem to have benefited from their previous
experience. Of the 13 entrepreneurs who had previously owned small businesses,
215
Chapter Six
11 were retailers. Although they may have had limited experience in
manufacturing, 53.9 per cent of them had taken the step of introducing new
technology.
The majority of entrepreneurs who had previously worked as clerks
(73.3%), in the army (100%) or as salespersons (75%) were innovative. Those who
had previously worked in the army had an advantage because they could use their
retirement pensions to finance their business and innovation. Furthermore, they
had acquired basic entrepreneurial skills through a government-sponsored pre-
retirement programme. Thus, their experience, skill and capital gave them a
greater capacity to be innovative. Those who had previously worked as clerks had
a relatively higher level of education, which enabled them to be more receptive to
new ideas and business environment. The majority of them had also attended
courses prior to their involvement in their current business. Their education and
skill background, made them more responsive to innovation. Regarding
salespersons, their communicative experience would gave them wider business
contacts and better access to information on innovation and institutions, which
would explain why they were innovative in their current business.
Those who had previously worked as farmers, fisherman, drivers and
labourers were less innovative compared to the categories discussed above. This
may be ascribed in part to the lack of relevance of their previous work experience
to their current business. Furthermore, the majority of them had low levels of
education, less communicative experience and lack of entrepreneurial skill. In
fact, none of them had ever attended any courses related to their business.
216
Chapter Six
6.2 Personality Traits
In this section we shall discuss some of the personality traits of the entrepreneurs,
focusing on such aspects as their need for achievement (n-ach), locus of control
and attitude toward risk. These personality traits are determining factors of
entrepreneurs' innovative behaviour. Hence, we believe that they had causal
relation to firms' ability to adopt a technological innovation.
6.2.1 Need for Achievement (n-Ach)
This study hypothesised that entrepreneurs with a high need of achievement are
more likely to be innovative compared to those with lower n-ach. Those with
high n-ach will always find ways and means to succeed; one way is to introduce
new ideas and techniques of production. Thus, such people tend to be more
innovative compared to those with lower n-ach.
The research findings show that n-ach was indeed a significant determinant
of entrepreneurs' innovativeness in both tiny and small firms (Tables 6.1 and 6.2).
A positive coefficient of the variable that measured entrepreneurs' need of
achievement (NACH) in the logistic regression functions displayed in Tables 6.1
and 6.2 indicate that entrepreneurs with higher n-ach were more likely to adopt
technological innovation compared to those with lower n-ach.
As we have discussed in our conceptual framework, entrepreneurs' n-ach is
determined by their personal background. In the case of tiny firms, there was a
correlation between entrepreneurs' n-ach and their education, age and sex.
217
Chapter Six
However, in small firms there was no relationship between n-ach and level of
education. age and sex.
In this study, we measured entrepreneurs' n-ach using a5 point Likert scale
(Chapter Five). For analytical purposes we classified the entrepreneurs into two
groups; (a) "high achievers", whose n-ach score was above the median score of
3.75 for tiny firms and 3.9 for small firms and (b) "low achievers", whose n-ach
score was below or equal to the median score. Our survey results show that 40.7
per cent of entrepreneurs in tiny firms were high achievers, while and 59.3 per
cent were low achievers. In the case of small firms, 50.9 per cent and 49.1 per
cent were high and low achievers respectively.
6 . 21.1 Need for Achievement of Entrepreneurs in Tiny Firms
As indicated in Chapter Four there is a significant positive relationship between
n-ach and entrepreneurs' personal background such as their level of education.
Hence, in this section, we would to observe whether such relationship exist in tiny
firms. The entrepreneurs' level of education also correlated significantly with n-
ach (r=0.2242, p=0.033), implying that those with higher education are more
likely to have higher n-ach compared to those with lower level of education.
Perhaps, it is more the case that those with high n-ach extend their education as a
way of meeting their need for achievement.
Entrepreneurs' n-ach correlates not only with their personal characteristics
but also with other personality traits. We found positive correlation between n-
218
Chapter Six
ach and the variables, locus of control (r=0.4937, p=00001) and entrepreneurs'
attitude towards risk (r=0.2765, p=0.008). The results suggest that entrepreneurs
with higher degree of n-ach also have internal locus of control and they are risk
takers. The results in this survey indicate that personality traits are important
determinants of innovativeness for entrepreneurs in tiny firms.
High achieving personality lead to other innovative behaviour such as
communicative and highly involved with institutions. We can infer from the
positive correlation between variable NACH and variable COMMU (r=0.2740,
p=0.009) that entrepreneurs' with high n-ach have strongly communicative
behaviour, i. e. are better exposed to various communication channels. Table 6.11
shows the relationship between n-ach and communication behaviour.
From Table 6.11, we can see that entrepreneurs who were members of at
least one association, or attended seminars and expos, had a higher mean n-ach
score compared to those who were not members of any association and never
attending such events. Thus, being communicative seem to have a positive
influence on entrepreneurs' level of n-ach. Or perhaps it is the other way round,
i. e, high n-ach impels people to communicate, seek information etc., to increase
their chance of success and so meet that need.
219
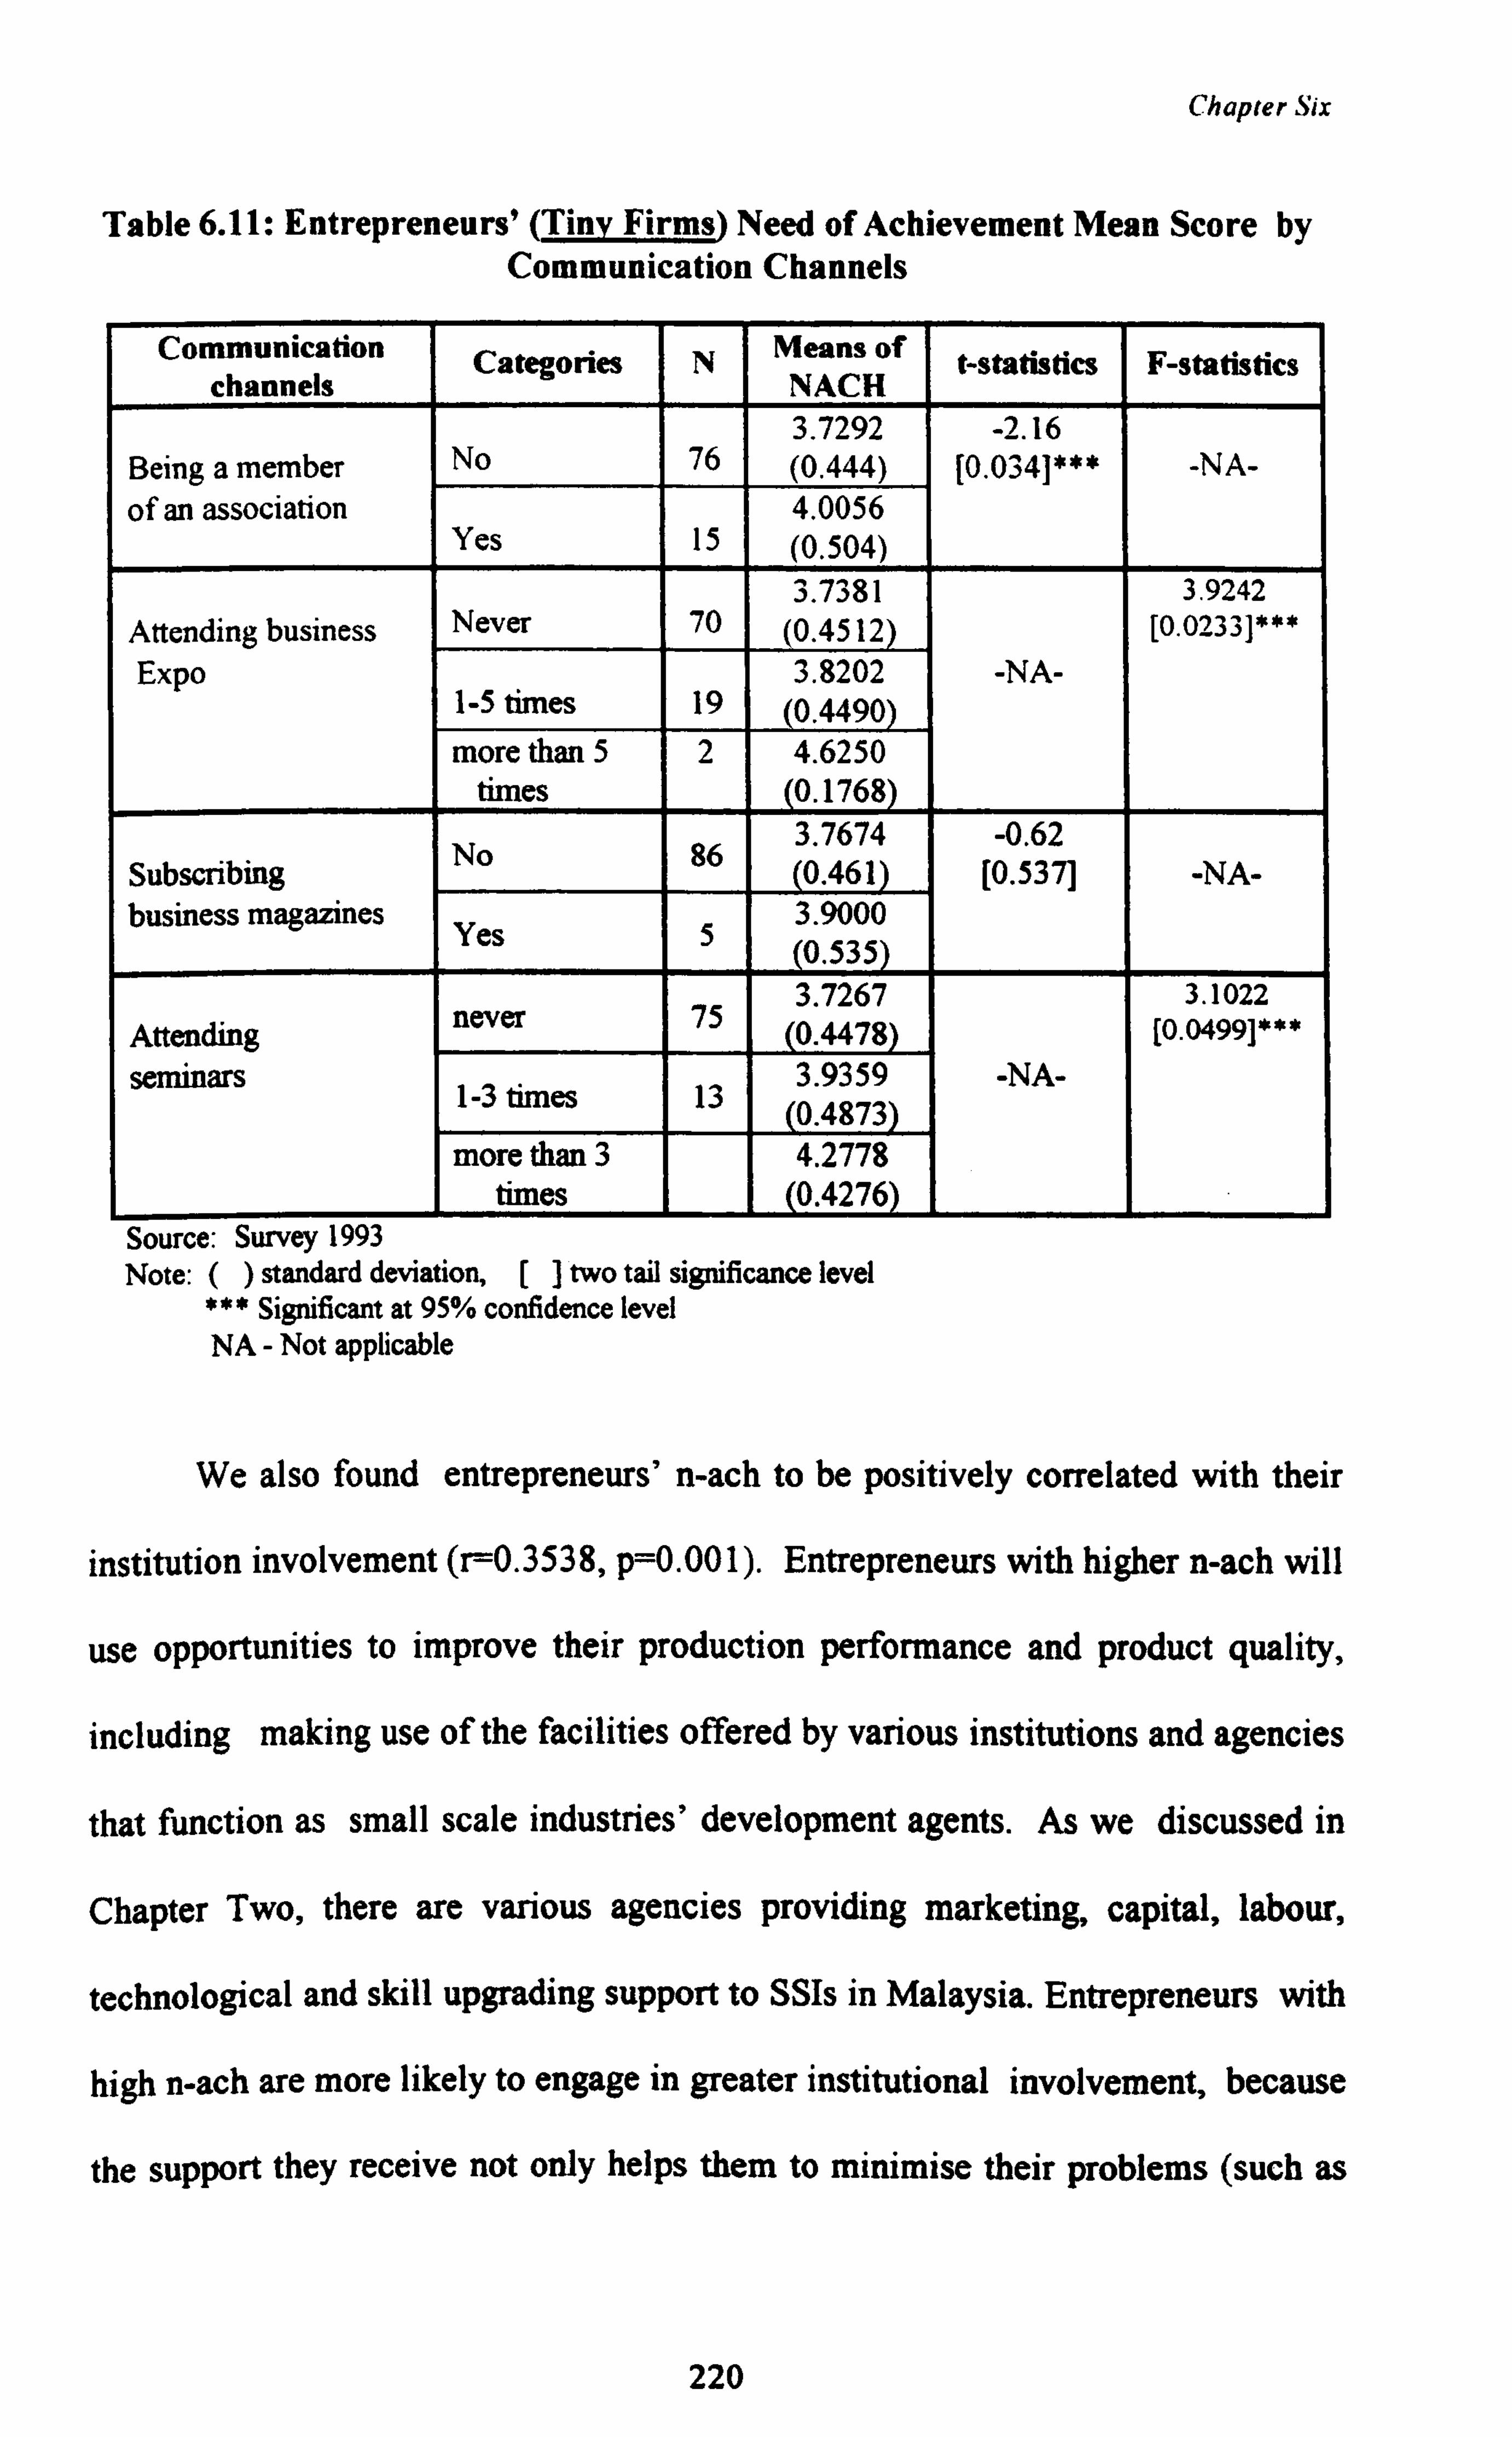
Chapter Six
Table 6.11: Entrepreneurs' (Tiny Firms) Need of Achievement Mean Score by Communication Channels
Communication Categories N Means of t-statistics F-statistics channels NACH
3.7292 -2.16 Being a member No 76 (0.444) [0.034]*** -NA- of an association 4.0056
Yes 15 (0.504) 3.7381 3.9242
Attending business Never 70 0.4512 [0.0233]***
Expo 3.8202 -NA- 1-5 times 19 (0.4490) more than 5 2 4.6250
times (0.1768) 3.7674 -0.62
Subscribing No 86 0.461 [0.537] -NA- business magazines 3.9000
Yes 5 (0.535) 3.7267 3.1022
Attending never 75 (0.4478) [0.0499]***
seminars 1-3 times 13 3.9359 -NA- 0.4873
more than 3 4.2778 times 0.4276
Source: Survey 1993 Note: () standard deviation, [] two tail significance level
*** Significant at 95% confidence level NA - Not applicable
We also found entrepreneurs' n-ach to be positively correlated with their
institution involvement (r=0.3538, p=0.001). Entrepreneurs with higher n-ach will
use opportunities to improve their production performance and product quality,
including making use of the facilities offered by various institutions and agencies
that function as small scale industries' development agents. As we discussed in
Chapter Two, there are various agencies providing marketing, capital, labour,
technological and skill upgrading support to SSIs in Malaysia. Entrepreneurs with
high n-ach are more likely to engage in greater institutional involvement, because
the support they receive not only helps them to minimise their problems (such as
220
Chapter Six
marketing, capital, technology), but also improves their entrepreneurial skills to
meet business challenges and identify opportunities.
The type and structure of firms managed by these two groups of
entrepreneurs was also found to differ. A disproportionately high percentages of
high achieving entrepreneurs were involved in business with high economic return
and high durability such as tomato or chilli sauce making. On the other hand, a
disproportionately high percentage of low achieving entrepreneurs were involved
in snack and noodle making. A casual look at the kind of business activities
reveals that the production of tomato and chilli sauce is relatively more complex
compared to noodle and snack making. The results show that the high achievers
also registered high productivity (PROD89), high fixed turnover (FATURN89) and
managed firms with a greater level of complexity (COMPLEX)14.
6.2.1.2 Need for Achievement of Entrepreneurs in Small Minn
While the literature (see Chapter Four) may have suggested that there is a
significant positive relationship between n-ach and entrepreneurs' personal
background, our study does not seem to show a distinctive trend. Our study
shows that entrepreneurs' n-ach is not correlated with their age, sex or education.
As exhibited in Table 6.12, in our survey entrepreneurs with primary education
had a higher n-ach compared to those with higher education. For example, the
14 Positive correlation between variables NACH and PROD89 (r=0.2973, p=0.004), FATUR89 (r=0.2113, p=0.044) and COMPLEX (r=0.1886, p=0.073).
221
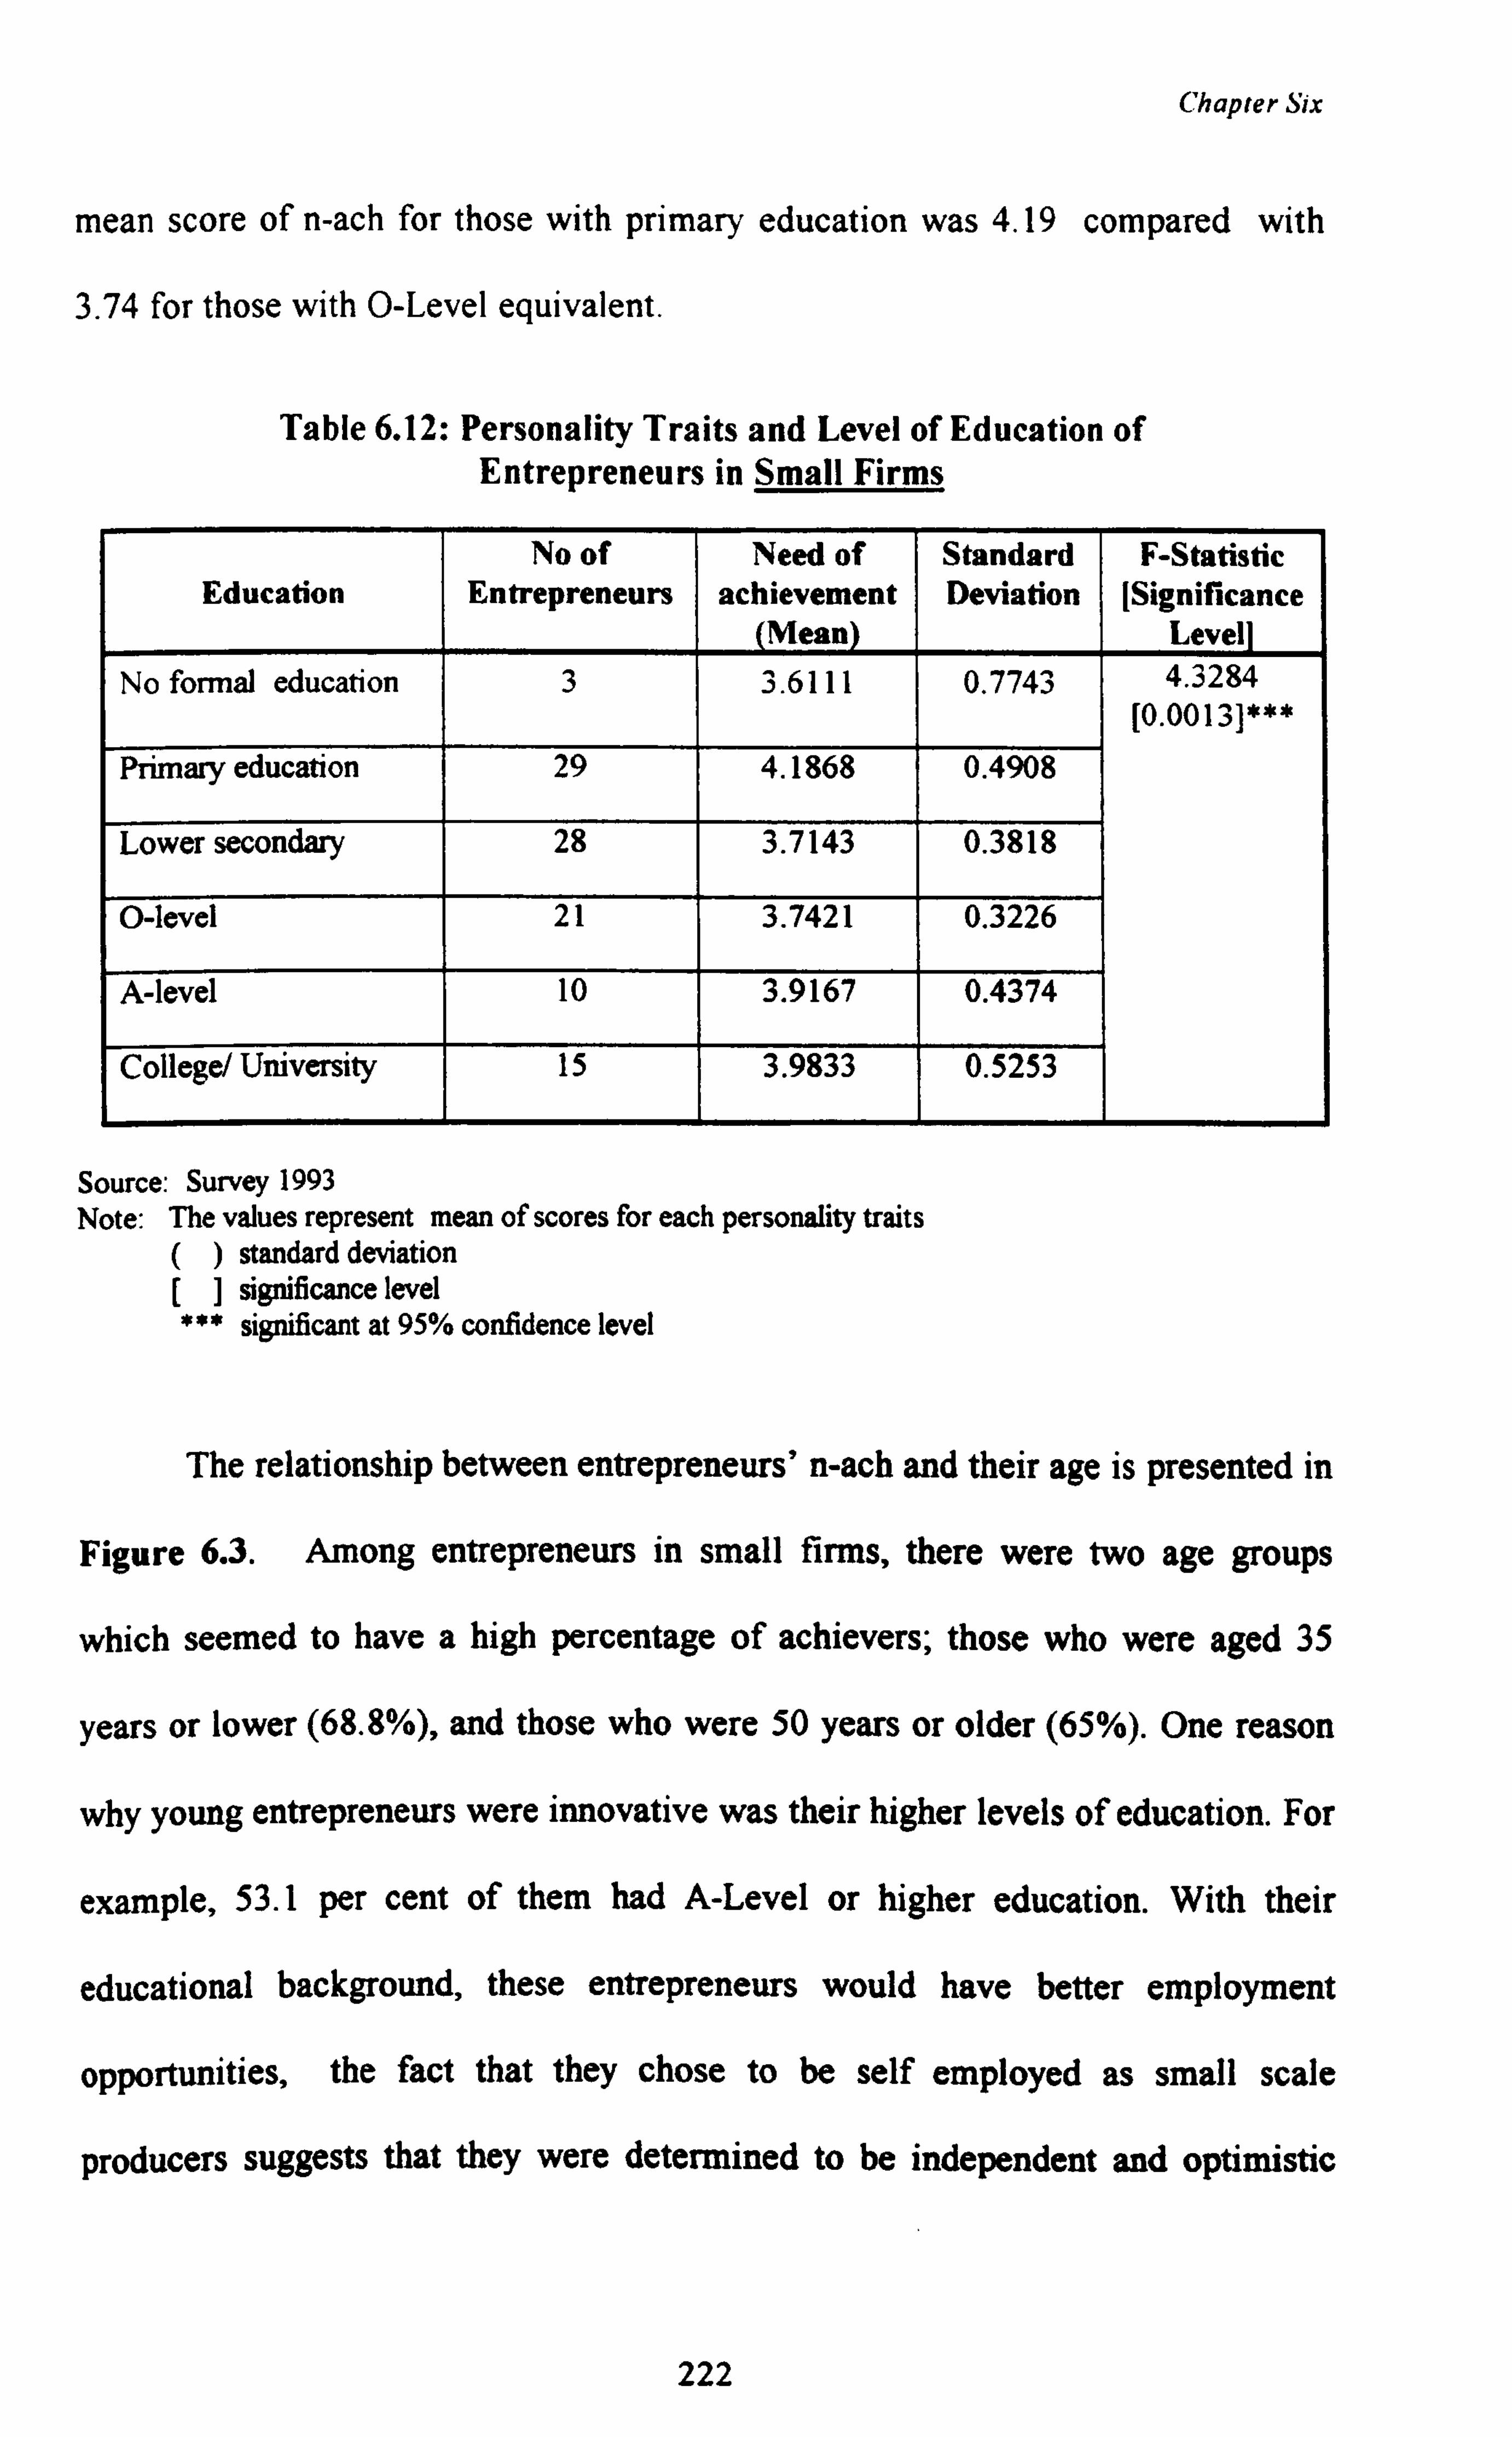
Chapter Six
mean score of n-ach for those with primary education was 4.19 compared with
3.74 for those with O-Level equivalent.
Table 6.12: Personality Traits and Level of Education of Entrepreneurs in Small Firms
Education No of
Entrepreneurs Need of
achievement (Mean)
Standard Deviation
F-Statistic [Significance
Level
No formal education 3 3.6111 0.7743 4.3284 [0.0013]***
Primary education 29 4.1868 0.4908
Lower secondary 28 3.7143 0.3818
O-level 21 3.7421 0.3226
A-level 10 3.9167 0.4374
College/ University 15 3.9833 0.5253
Source: Survey 1993 Note: The values represent mean of scores for each personality traits
() standard deviation [] significance level *** significant at 95% confidence level
The relationship between entrepreneurs' n-ach and their age is presented in
Figure 6.3. Among entrepreneurs in small firms, there were two age groups
which seemed to have a high percentage of achievers; those who were aged 35
years or lower (68.8%), and those who were 50 years or older (65%). One reason
why young entrepreneurs were innovative was their higher levels of education. For
example, 53.1 per cent of them had A-Level or higher education. With their
educational background, these entrepreneurs would have better employment
opportunities, the fact that they chose to be self employed as small scale
producers suggests that they were determined to be independent and optimistic
222
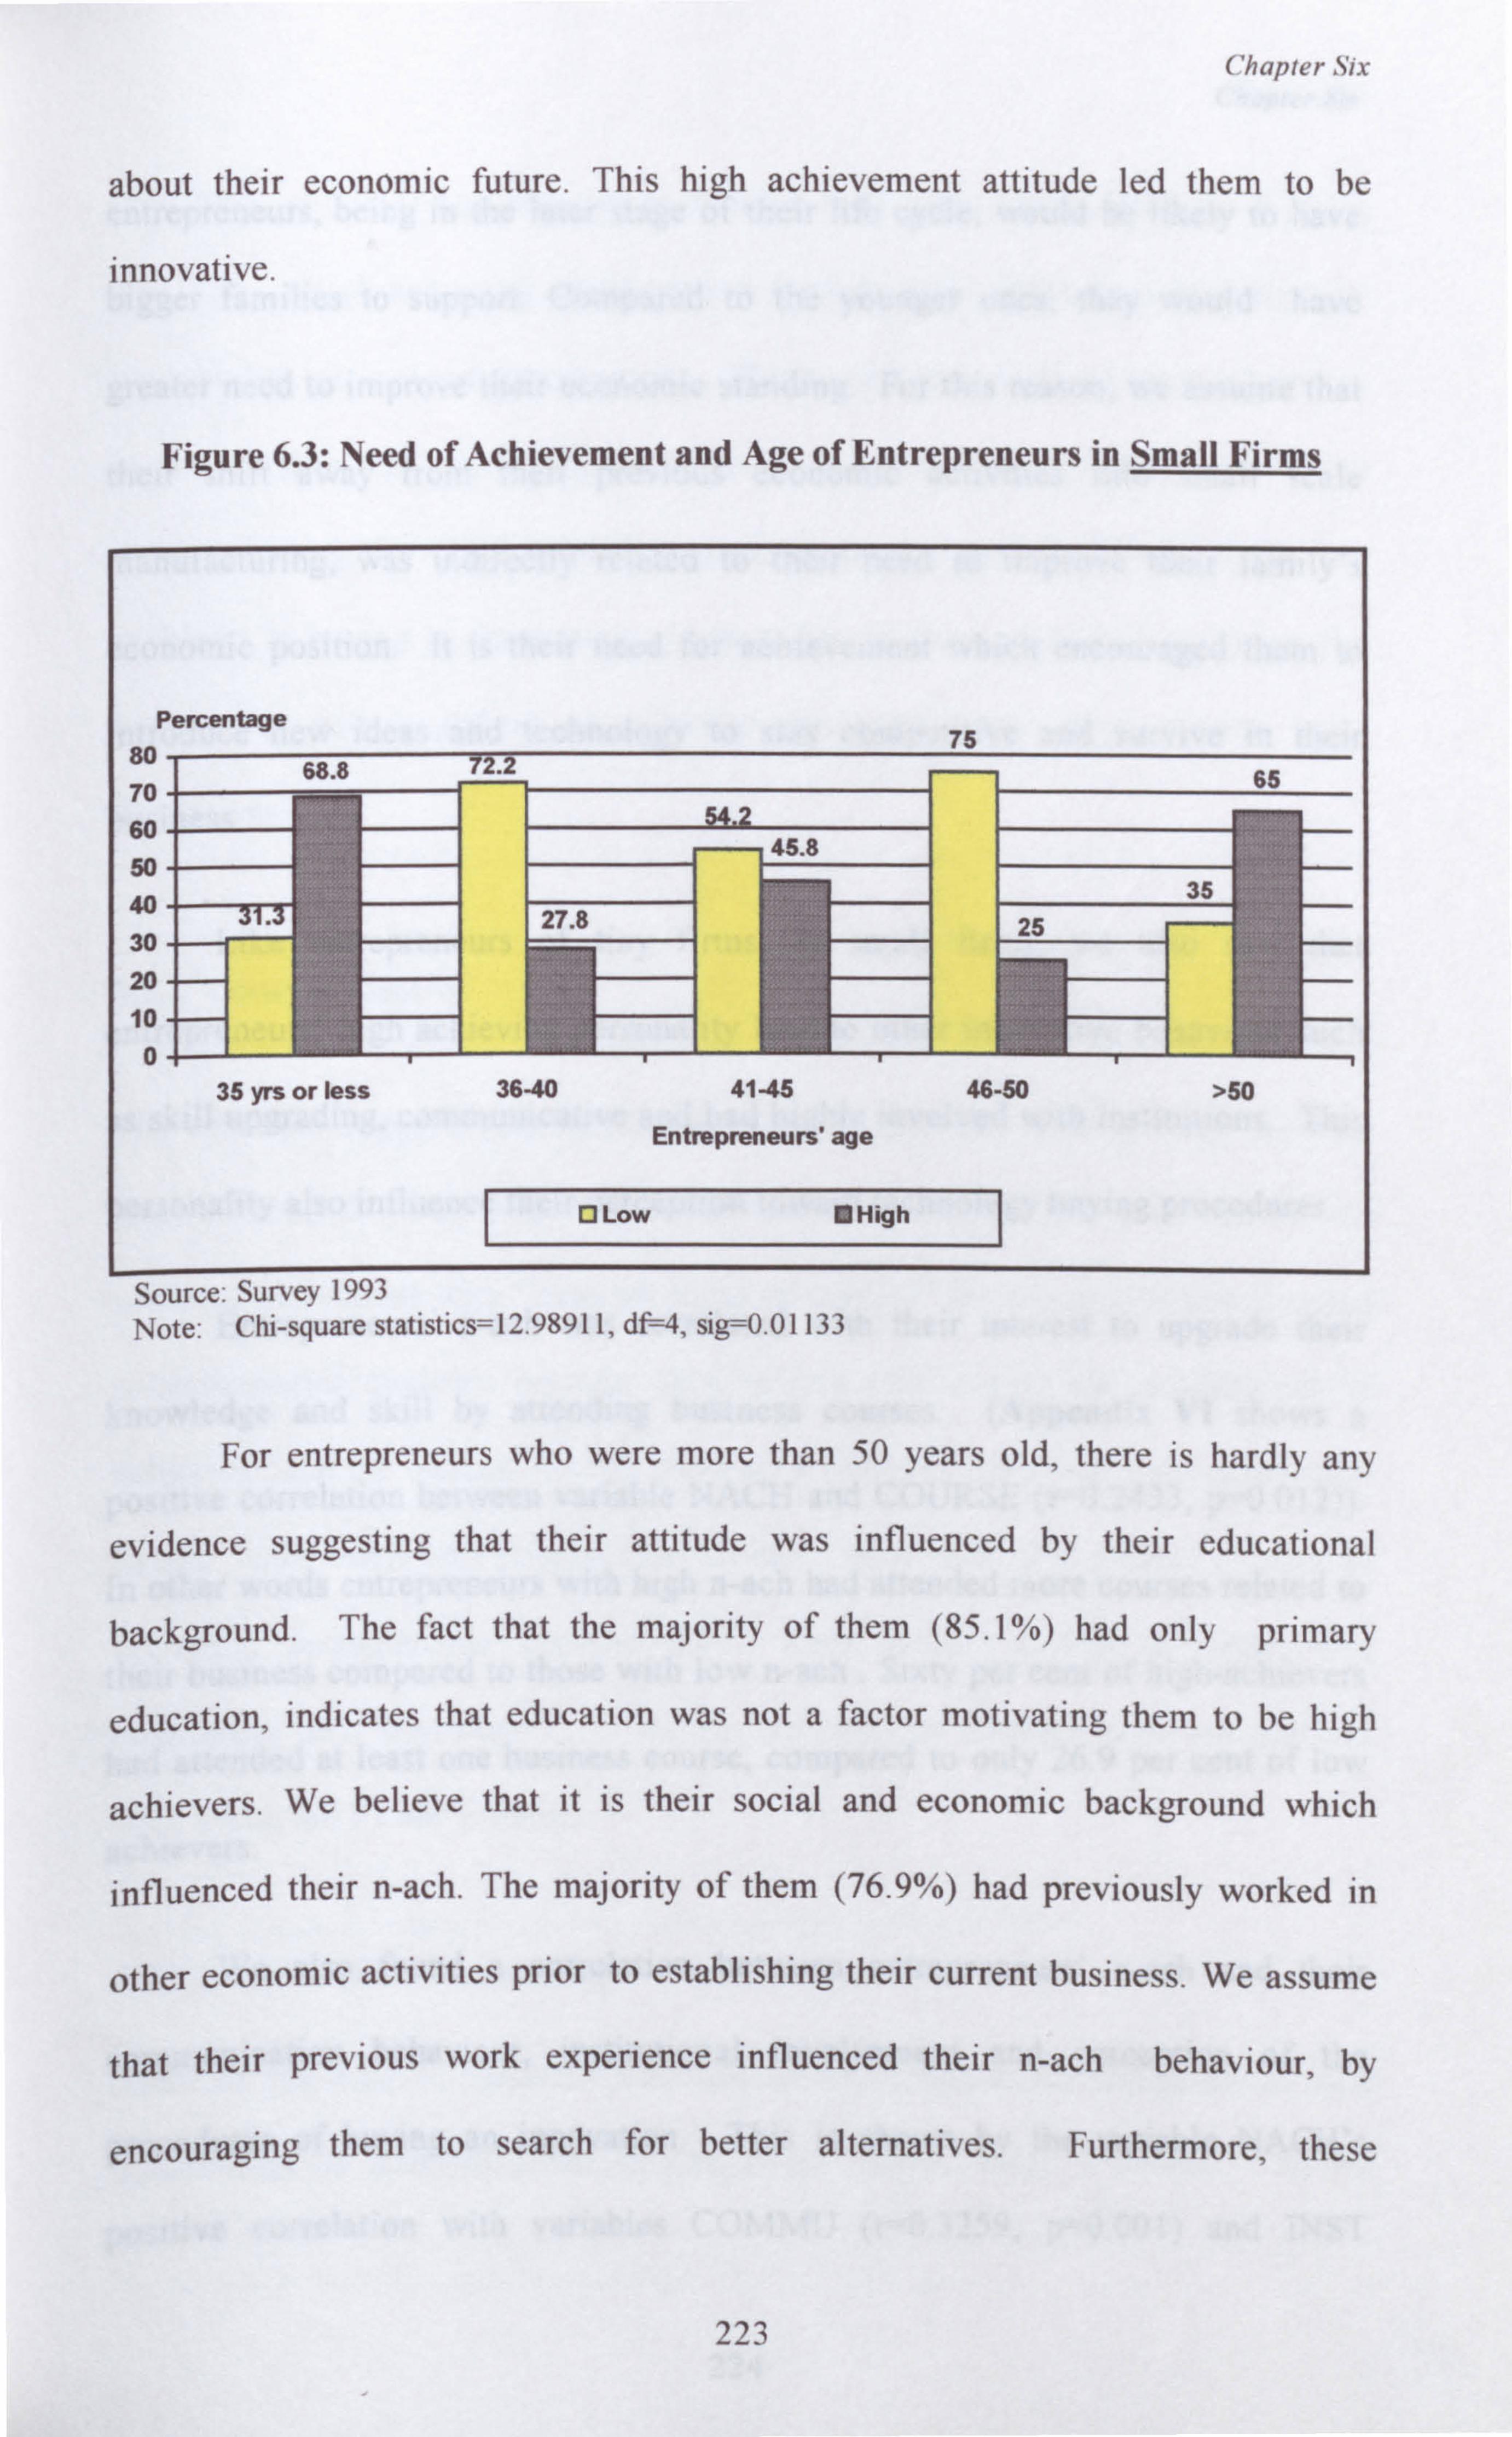
Chapter Six
about their economic future. This high achievement attitude led them to be
innovative.
Figure 6.3: Need of Achievement and Age of Entrepreneurs in Small Firms
Percentage 75
80 68.8 72.2 65 70 60- 54.2
45.8 50
35 40- 27.8 25 30 20 10
0 35 yrs or less 36-40 41-45 46-50 >50
Entrepreneurs' age
0 Low High
Source: Survey 1993
Note: Chi-square statistics= 12.98911, df=4, sig=0.01133
For entrepreneurs who were more than 50 years old, there is hardly any
evidence suggesting that their attitude was influenced by their educational
background. The fact that the majority of them (85.1%) had only primary
education, indicates that education was not a factor motivating them to be high
achievers. We believe that it is their social and economic background which
influenced their n-ach. The majority of them (76.9%) had previously worked in
other economic activities prior to establishing their current business. We assume
that their previous work experience influenced their n-ach behaviour, by
encouraging them to search for better alternatives. Furthermore, these
223
Chapter Six
entrepreneurs, being in the later stage of their life cycle, would be likely to have
bigger families to support. Compared to the younger ones, they would have
greater need to improve their economic standing. For this reason, we assume that
their shift away from their previous economic activities into small scale
manufacturing, was indirectly related to their need to improve their family's
economic position. It is their need for achievement which encouraged them to
introduce new ideas and technology to stay competitive and survive in their
business.
Like entrepreneurs of tiny firms, in small firms, we also saw that
entrepreneurs' high achieving personality lead to other innovative behaviour such
as skill upgrading, communicative and had highly involved with institutions. This
personality also influence their perception toward technology buying procedures.
Entrepreneurs' n-ach was correlated with their interest to upgrade their
knowledge and skill by attending business courses. (Appendix VI shows a
positive correlation between variable NACH and COURSE (r--0.2433, p=0.012)).
In other words entrepreneurs with high n-ach had attended more courses related to
their business compared to those with low n-ach . Sixty per cent of high-achievers
had attended at least one business course, compared to only 26.9 per cent of low
achievers.
We also found a correlation between entrepreneurs' n-ach and their
communication behaviour, institutional involvement and perception of the
procedures of buying an innovation. This is shown by the variable NACH's
positive correlation with variables COMMU (rß. 3259, p=0.001) and INST
224
Chapter Six
(0.2066, p=0.034) and negative correlation with the variable BUY (r=-0.1843,
p=0.059). High achieving entrepreneurs tended to be more communicative or
have higher institutional involvement. This would give them an early advantage
in information on innovation compared to the low achievers. Being
communicative also, the high achieving entrepreneurs would be less likely to face
problems in buying an innovation. In fact, few of them perceived searching and
negotiating with suppliers as "major problems which they cannot solve
themselves".
6.2.2 Locus of Control
The literature suggests that entrepreneurs are individuals who possess "internal
locus of control". They believe that they are in control of their own destiny. In
contrast, individuals with "external locus of control" are thought to have limited
entrepreneurial qualities because they believe that events are independent of
behaviour, and are instead, the results of such forces as fate, luck and supernatural
forces. Individuals who possess internal locus of control have greater chances of
becoming entrepreneurs because they have greater ability to master and
manipulate their environment. Below, we consider whether these assumptions
were borne out by our findings.
6.12.1 Locus of Control Among Entrepreneurs in Tiny Ftrmc
Based on the logistic regression equation. locus of control did not appear to be a
determinant of innovativeness in tiny firms (Table 6.2). Indeed, a closer
225
Chapter Six
examination of the results shows that the proportion of innovative entrepreneurs
with external locus of control was higher than that of those who were non-
innovative. One explanation for this could be the strong influence of non-
quantifiable factors such as culture and religion. All the entrepreneurs in this
study were Malays and Muslims. Muslims are brought up to believe in the
concept of tawakal; believing that God influences all aspects of their daily life,
including their business activities.
An analysis of locus of control of entrepreneurs in relations to other factors
showed the following facts. Entrepreneurs with previous work experience had a
tendency to have internal locus of control, compared to entrepreneurs without any
previous work experience. The mean of locus of control of entrepreneurs with
previous work experience was 3.8416 while the mean of entrepreneurs without
work experience was 3.638915. As mentioned in the previous section, there was a
positive correlation between n-ach and locus of control. Entrepreneurs who were
higher achievers also had internal locus of control. Entrepreneurs' locus of
control also had a positive correlation with their attitude toward risk (rß. 2001,
p=0.057) suggesting that entrepreneurs with internal locus of control are more
prepared to take risk.
6.2.2.2 Locus of Control Among Entrepreneurs in Small Finns
While the locus of control was not a determining factor in tiny firms, it was a
significant determinant of innovativeness in small firms. The logistic regression
13 t_va1ue'_2.32, df=89, significance--0.023
226
Chapter Six
function in Table 6.3 shows that the coefficient of variable locus of control (LOC)
has a positive sign, su ag estina that those with internal locus of control have a
higher tendency to innovate compared to those with external locus of control.
Entrepreneurs' locus of control was measured by a5 point Likert scale
with point 1 indicating the extreme of external locus of control and point 5
indicating the extreme of internal locus of control (see Chapter Five). Since
the majority of the entrepreneurs in this study obtained an average score of more
than 3, this shows the majority of them tended to have internal locus of control.
Distribution of the entrepreneurs' locus of control showed that their
median16 score was 3.857. For analytical purposes, further analysis was
undertaken of the relationship of entrepreneurs' locus of control with other factors
and entrepreneurs' innovativeness. The researcher classified the entrepreneurs
into two categories, based on the value of the median as a cut off point.
Entrepreneurs who had a score above the median were classified as having
internal locus of control, while those who scored equal to or lower than the
median were regarding as having external locus of control. Based on this
classification, 68.4 per cent of innovative entrepreneurs and only 42.9 per cent of
non-innovative entrepreneurs had internal locus of control.
r
Like need for achievement, we found that there was no trend between
entrepreneurs' locus of control with their background. We found that
entrepreneurs' locus of control did not correlate with their age and education. We
16 in this study, we used median as the cut-off point because we considered the status of entrepreneurs locus of control in relation to other entrepreneurs.
227
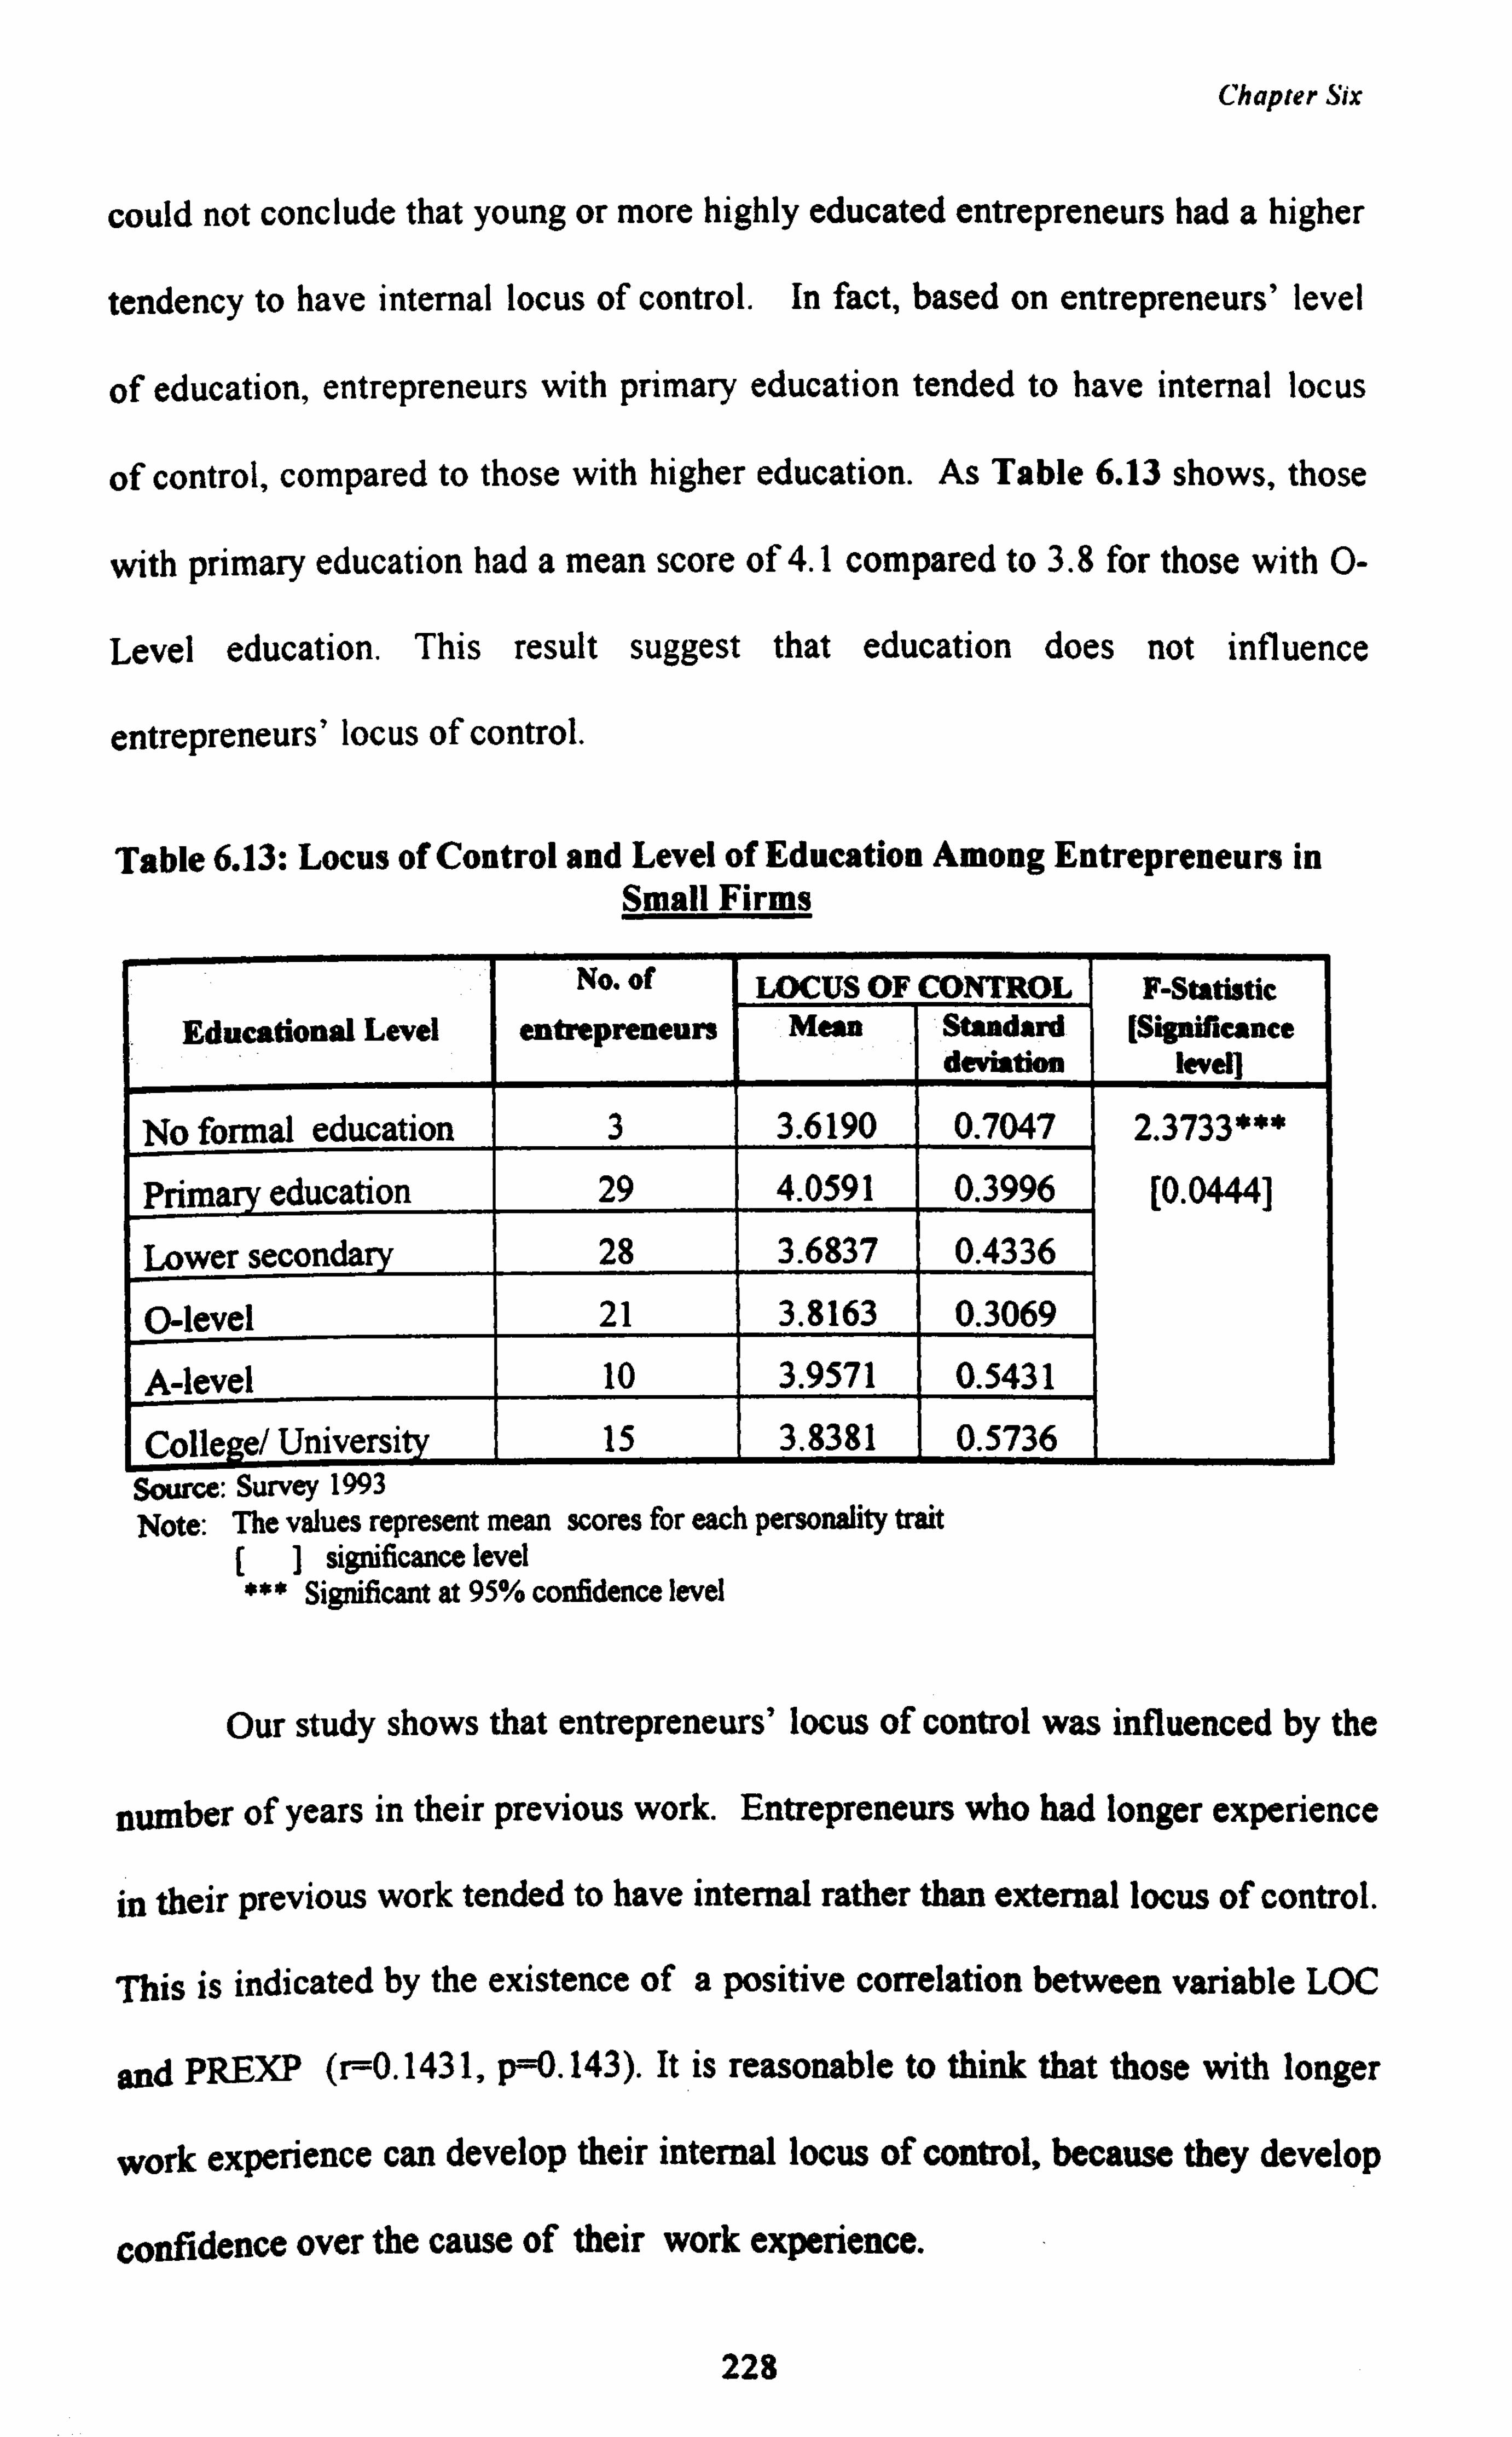
Chapter Six
could not conclude that young or more highly educated entrepreneurs had a higher
tendency to have internal locus of control. In fact, based on entrepreneurs' level
of education, entrepreneurs with primary education tended to have internal locus
of control, compared to those with higher education. As Table 6.13 shows, those
with primary education had a mean score of 4.1 compared to 3.8 for those with 0-
Level education. This result suggest that education does not influence
entrepreneurs' locus of control.
Table 6.13: Locus of Control and Level of Education Among Entrepreneurs in Small Firms
No. of LOCUS OF CONTROL F-Statistic Educational Level entrepreneurs Mean Standard
deviation [Significance
level]
No formal education 3 3.6190 0.7047 2.3733***
Primarv education 29 4.0591 0.3996 [0.0444]
Lower secondary 28 3.6837 0.4336
0-level 21 3.8163 0.3069
A-level 10 3.9571 0.5431
College/ University 15 3.8381 0.5736 Source: Survey 1993
Note: The values represent mean scores for each personality trait [] significance level *** Significant at 95% confidence level
Our study shows that entrepreneurs' locus of control was influenced by the
number of years in their previous work. Entrepreneurs who had longer experience
in their previous work tended to have internal rather than external locus of control.
This is indicated by the existence of a positive correlation between variable LOC
and pREXp (r=0.1431, p--0.143). It is reasonable to think that those with longer
work experience can develop their internal locus of control, because they develop
confidence over the cause of their work experience.
228
Chapter Six
This study found relationships between entrepreneurs' locus of control and
other factors that determine their innovativeness, such as degree of financing
problems and perception of buying procedure'7. Those with internal locus of
control had a greater tendency had fewer financing problems, and perceived the
procedure of buying an innovation as less problematic, than those with external
locus of control.
6.2.3 Attitude Toward Risks
In Chapter Four, we hypothesised that entrepreneurs' attitude toward risk would
be a significant determinant of their innovativeness; risk-taking entrepreneurs
would have a higher tendency to be innovative, compared to risk-averse ones. This
study supports the hyyothesis that entrepreneurs' attitude toward risk can
influence their innovativeness. The logistic regression functions in Tables 6.1.
and 6.2 show that the coefficient of the variable attitude towards risk (RISKS) has
a positive value, indicating that risk takers tend to be more innovative than the risk
averse. Risk taking entrepreneurs are always looking for ways of improving their
firms' performance; adopting technological innovation is one way of doing this.
In the case of tiny firms, there was a relationship between entrepreneurs'
attitude towards risk and their back ground such as age, education, years of
managing current business and other personality traits such as n-ach and locus of
11 In small firms LOC was negatively correlated with variable FINANCE (r=-0.2382, pa0.014) and variable BUY (r=-0.2142, p=0.027)
229
Chapter Six
control's. Our results indicated that risk takers were younger, had higher levels of
education, were less experienced in managing their current business, high
achievers and had internal locus of control.
Our survey results indicated that attitude toward risk of entrepreneurs of
tiny firms influence their communicative behaviour, skill upgrading behaviour,
their involvement with institutions and their perception toward machine that they
considered to buy. Risk takers are individuals who have high communicative
behaviour (r=0.3575, p=0.001, had higher frequency of attending courses to
upgrade their skill (r=0.2887, p=0.006), had greater institutional involvement
(r=2632, p=0.012) and had a positive perception toward the machine that they
intended to adopt (r=0.2670, p=0.011). This further explain why risk takers
entrepreneurs were more innovative than risk adverse entrepreneurs.
6.3 Skill Upgrading
To stay competitive and survive in the business, entrepreneurs need to upgrade
their entrepreneurial skill and keep abreast of recent developments. There are
various ways that entrepreneurs can do this; one way is by attending courses which
are related to their business. By attending business courses, entrepreneurs can
develop their business contacts and improve their access to knowledge and
information regarding technological innovations. We believe that skill upgrading
behaviour of entrepreneurs had causal relationship with their innovative
behaviour. Therefore, this study hypothesised that entrepreneurs who upgrade
it In tiny firms, RISKS was negatively correlated with AGE (x. 0.2365, p=0.024) and EDU (r-0.1619, p=0.125) and MANAGE (r=-0.2255, ps0.032). RISKS is positively correlated with NACH (r=0.2765, p=0.008) and LOC (r=0.2001, p-0.057)
230
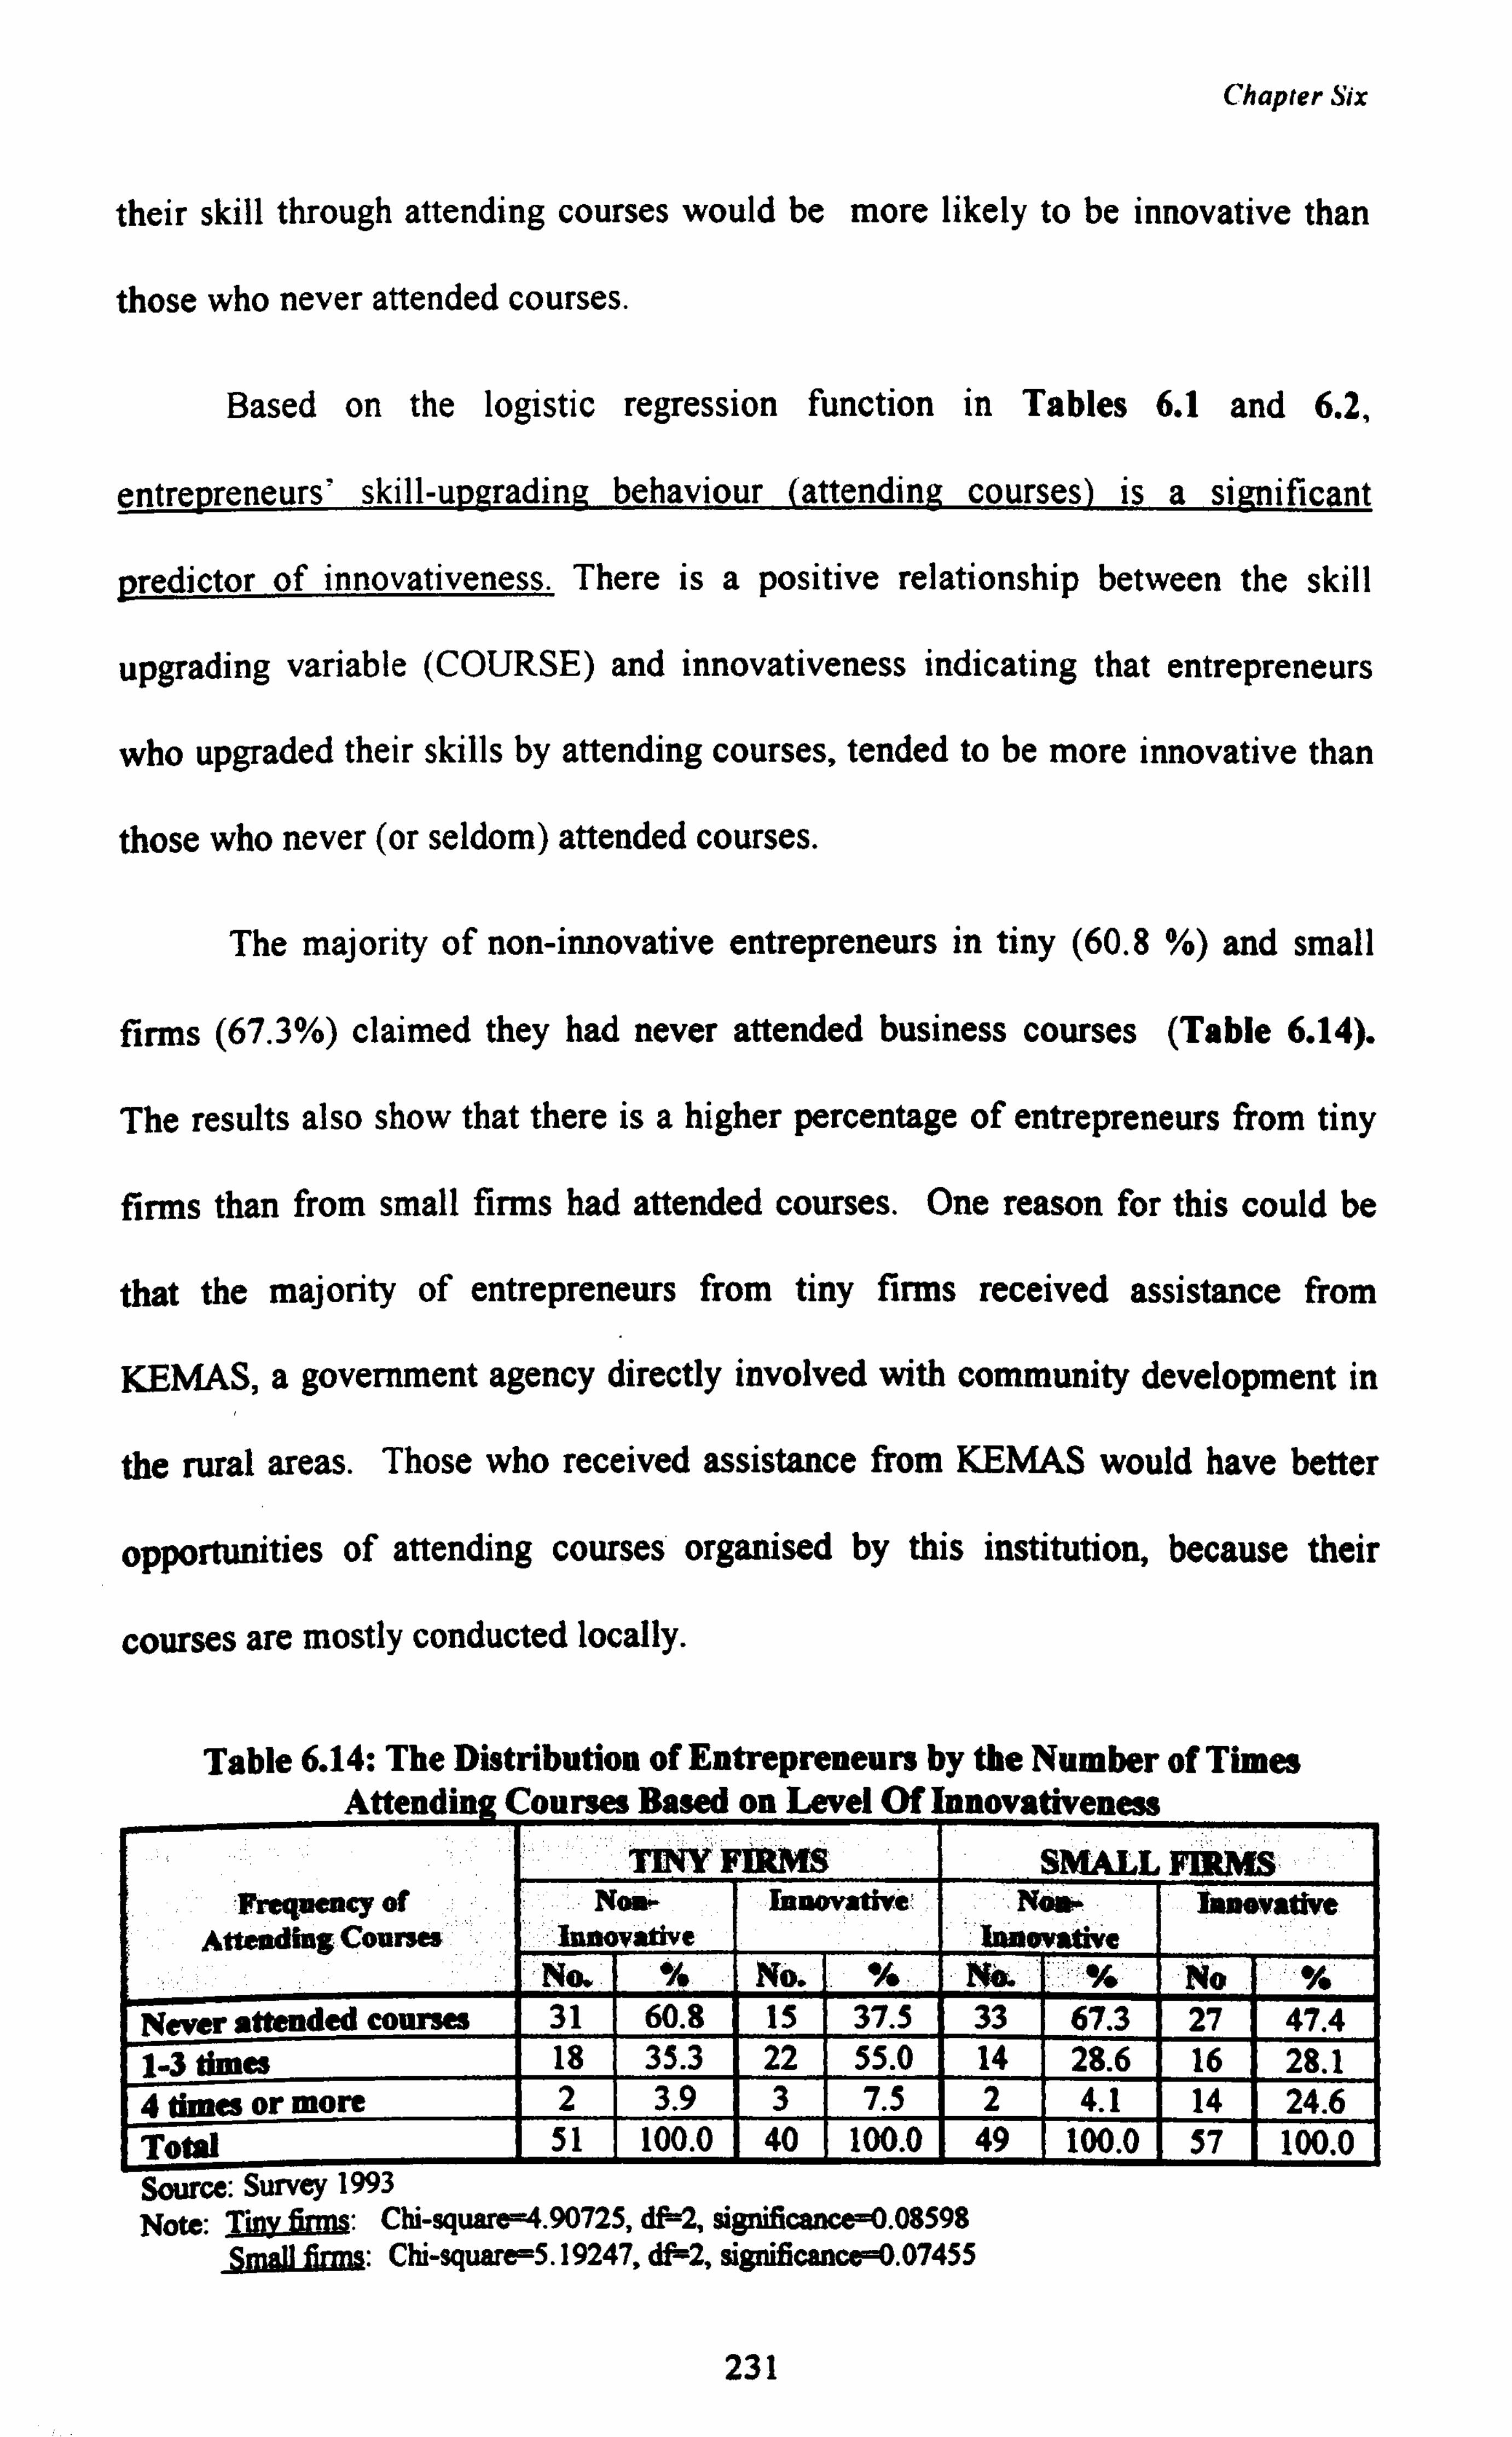
Chapter Six
their skill through attending courses would be more likely to be innovative than
those who never attended courses.
Based on the logistic regression function in Tables 6.1 and 6.2,
entrepreneurs' skill-upgrading behaviour (attending courses) is a significant
predictor of innovativeness. There is a positive relationship between the skill
upgrading variable (COURSE) and innovativeness indicating that entrepreneurs
who upgraded their skills by attending courses, tended to be more innovative than
those who never (or seldom) attended courses.
The majority of non-innovative entrepreneurs in tiny (60.8 %) and small
firms (67.3%) claimed they had never attended business courses (Table 6.14).
The results also show that there is a higher percentage of entrepreneurs from tiny
firms than from small firms had attended courses. One reason for this could be
that the majority of entrepreneurs from tiny firms received assistance from
KEMAS, a government agency directly involved with community development in
the rural areas. Those who received assistance from KEMAS would have better
opportunities of attending courses organised by this institution, because their
courses are mostly conducted locally.
Table 6.14: The Distribution of Entrepreneurs by the Number of Times Attending Course_a Based on Level Of Innovativenme
TINY FIRM SMALL FIRMS Frequency Of
Attending Courses Nom-
Innovative Innovative. Non
inaovive Innovative
No. % No. % 1 % No % Never attended courses 31 60.8 15 37.5 33 67.3 27 47.4 1-3 dmes 18 35.3 22 55.0 14 28.6 16 28.1 4 times or more 2 3.9 3 7.5 2 4.1 14 24.6 Total 51 100.0 40 100.0 49 100.0 57 100.0 Source: Survey 1993 Note: Tinte: Chi-square=4.90725, df=2, significance-0.08598
fig: Chi-square=5.19247, df2, significance-0.07455
231
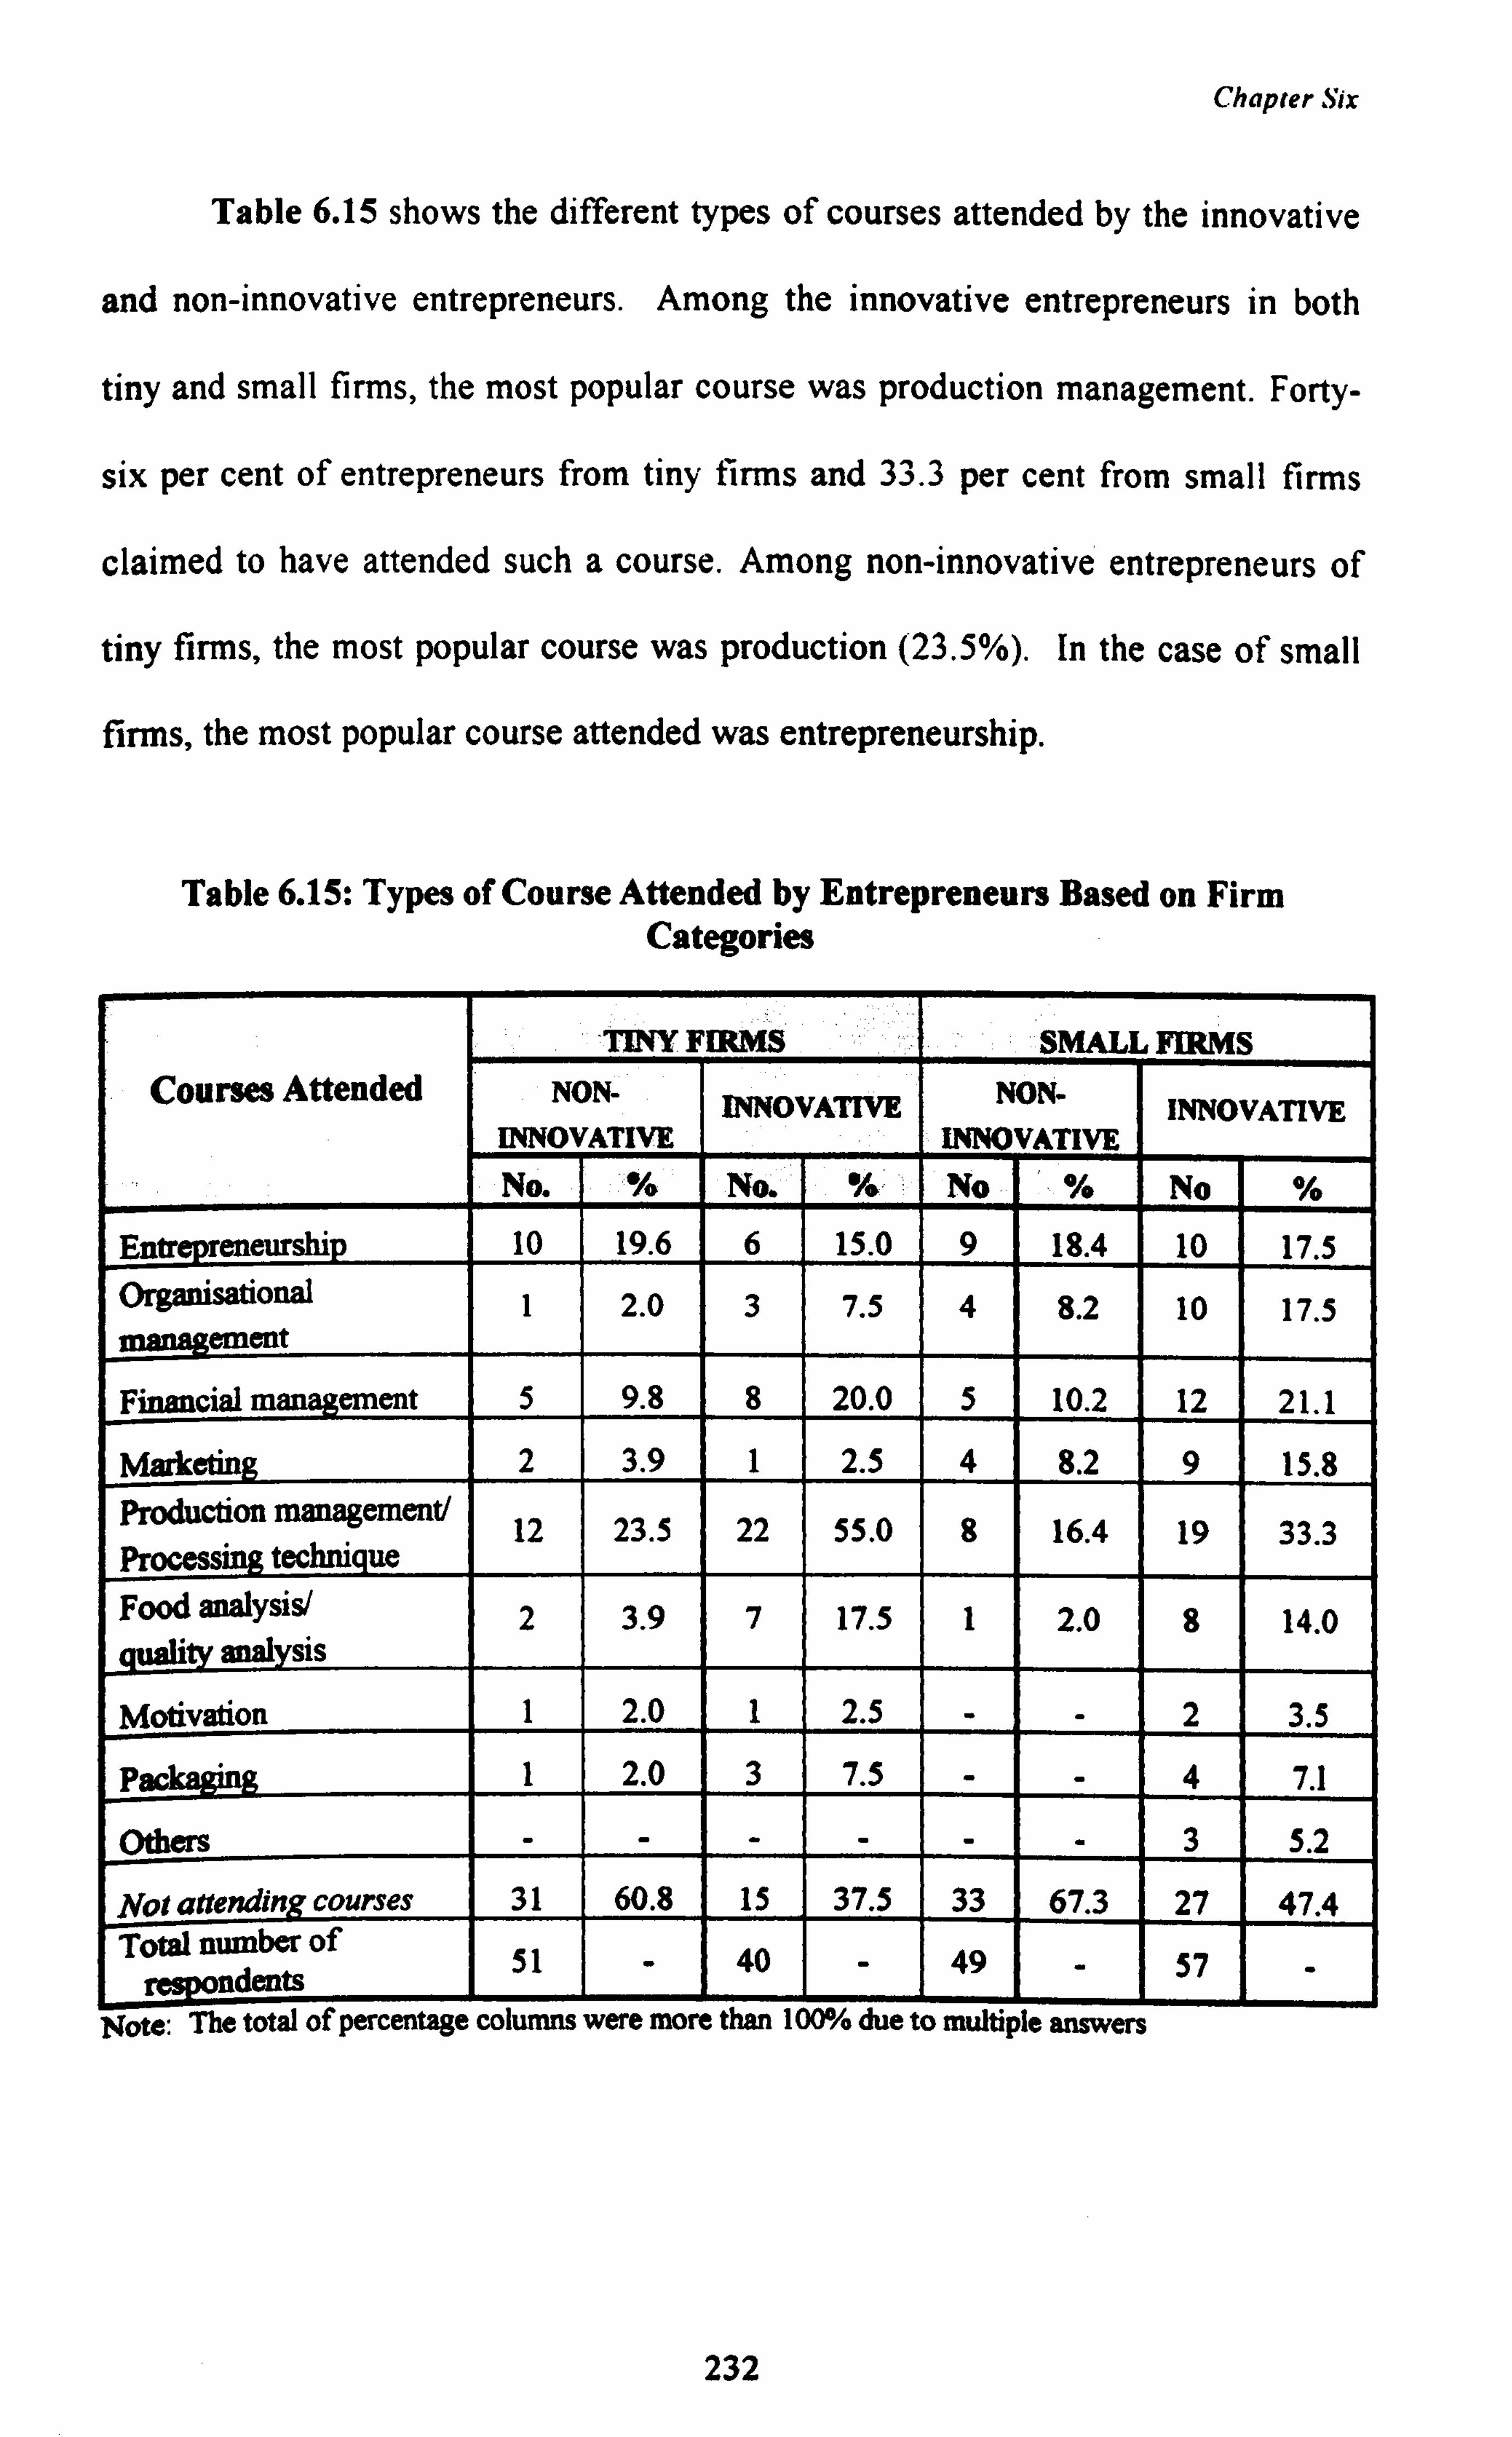
Chapter Six
Table 6.15 shows the different types of courses attended by the innovative
and non-innovative entrepreneurs. Among the innovative entrepreneurs in both
tiny and small firms, the most popular course was production management. Forty-
six per cent of entrepreneurs from tiny firms and 33.3 per cent from small firms
claimed to have attended such a course. Among non-innovative entrepreneurs of
tiny firms, the most popular course was production (23.5%). In the case of small
firms, the most popular course attended was entrepreneurship.
Table 6.15: Types of Course Attended by Entrepreneurs Based on Firm Categories
TINY FIRMS SMALL FIRMS Courses Attended NON-
INNOVATIVE IWOVATM NON-
INNOVATIVE INNOVATIVE
No. % No. % No % No %
Entrepreneurship 10 19.6 6 15.0 9 18.4 10 17.5 Organisational
ement 1 2.0 3 7.5 4 8.2 10 17.5
Financial management 5 9.8 8 20.0 5 10.2 12 21.1
Marketing 2 3.9 1 2.5 4 8.2 9 15.8 Production management/ Processing technique
12 23.5 22 55.0 8 16.4 19 33.3
Food analysis/ analysis qualit
2 3.9 7 17.5 1 2.0 8 14.0
Motivation 1 2.0 1 2.5 - - 2 3.5
Packaging 1 2.0 3 7.5 - - 4 7.1
Others - - - - - - 3 5.2
Not attendin courses 31 60.8 15 37.5 33 67.3 27 47.4 Total number of
respop. dents 51 - 40 - 49 - 57 - Note: The total of percentage columns were more man 100% due to multiple answers
232
Chapter Six
There is a distinction between the types of courses attended by the
innovative and non-innovative entrepreneurs. A higher percentage of non-
innovative entrepreneurs attended courses on entrepreneurship, reflecting their
need for basic skills necessary for initiating and developing their business. On the
other hand, the higher percentage of innovative entrepreneurs attending courses on
production indicates that they recognised the importance of having skill in
production management and appropriate techniques of production in operating
their business. It is likely that entrepreneurs who attended production related
courses would have more opportunity of being exposed to new techniques of
production which may be appropriate to their firms. By attending courses, the
entrepreneurs can acquire more knowledge and learn new techniques which help
them to minimise risk associated with innovation. The results show that course
attendance has played an important role in entrepreneurship development by
increasing entrepreneurs' willingness to take risk and developing an inner locus
of control.
Table 6.14 shows that 60.8 per cent of non-innovative entrepreneurs and
37.5 per cent of innovative entrepreneurs in tiny firms claimed they had never
attended any business courses. In small firms, the proportion of entrepreneurs
who had never attended any courses was relatively higher (67.3% of non-
innovative and 47.4% of innovative). Among the most commonly cited reasons
for their unwillingness to attend courses were that they saw such courses as
"irrelevant" to their business needs, did not need courses, and had no time.
233
Chapter Six
As mentioned in the earlier sections, the entrepreneurs' tendency to
upgrade their knowledge and skill was influenced by their level of education and
personality traits (such as n-ach). We also found that their tendency to upgrade
knowledge and skill was influenced by their communicative behaviour and
institutional involvement19. This suggested that the channels of communication
used by the entrepreneurs, such as business associations or expos and institutions,
play an important role in providing information about courses relevant to the
entrepreneurs.
6.4 Knowledge About Innovation
It is believed that entrepreneurs may adopt a technological innovation after they
have extensive understanding of it, as such understanding is one of ways to reduce
the risks involved in technological innovation. In Chapter Four, we hypothesised
that entrepreneurs who seek extensive knowledge about innovation are more
likely to adopt technological innovation. However, in both tiny and small firms,
the variable KNOW in the logistic regression equations (Tables 6.1 and 6.2). does
not explain the dependent variable which measures innovativeness. suggesting
that we should reject the hypothesis.
Entrepreneurs' knowledge of innovation was not a determinant factor for
their innovativeness. The majority of surveyed entrepreneurs (86.3% of non-
innovative and 85.0% of innovative entrepreneurs in tiny firms; 93.9% of non-
19 Variable COURSE is positively correlated with variable COMMU(for tiny firms: r-0.5105, p=0.0001; for small firms: r=0.3724, p=0.0001) and variable INST (for tiny firms: r=0.9002, pa0.0001; for small firms: r=0.8581, p=0.0001)
234
Chapter Six
innovative and 85.2% of innovative entrepreneurs in small firms ) claimed that
they had conducted a detailed study of the machine which they were considering
buying, before making the decision whether or not to adopt the new technology.
We found that entrepreneurs used various methods of studying innovation;
some referred to their suppliers while others referred to government agencies such
as MARDI and MARA. The majority of innovative entrepreneurs claimed they
relied on information provided by suppliers, from whom they learned to operate
the machine. Suppliers also provide after sales services, guarantees and a trial
period. These were the factors that tended to encourage entrepreneurs to adopt
innovations. Some entrepreneurs also learned about an innovation from other
firms, and perceived the feasibility of adopting it by observing the advantages
brought by it to other firms. Following Rogers' (1983) classification, non-
innovative entrepreneurs are laggard in the innovation diffusion process. They
will adopt an innovation only after witnessing the success of other firms which
have already adopted it.
Although innovative entrepreneurs regarded suppliers and non-innovative
entrepreneurs regarded other firms as their main references when they conducted
detailed study about the innovation, the majority indicated that they first became
aware of the innovation from government institutions. These institutions did not
provide machine; they only recommended the appropriate machines that can be
adopted by the entrepreneurs. The entrepreneurs will then contacted the suppliers
who will provide detailed information on the innovation. It appears that the
235
Chapter Six
suppliers have an important role to play; they provide the necessary information to
enable the entrepreneurs to make their decision.
6.5 Summary
In this chapter, we have discussed the relationship between entrepreneurs'
characteristics and their innovative behaviour. We can summarise the results as
follows. In tiny firms, we found four characteristics which had causal influence
on entrepreneurs' decision to innovate, namely entrepreneurs' level of education,
need for achievement, attitude towards risk and skill-upgrading behaviour. In the
case of small firms, there were six characteristics which had causal influence
entrepreneurs' technological innovation decisions. These characteristics were;
entrepreneurs' level of education, previous work experience, need for
achievement, locus of control, attitude towards risk, and skill-upgrading
behaviour. We presume the relationship of entrepreneurs' age, their experience
of managing the existing business (in both small and tiny firms), and sex (in tiny
firms) with their innovative behaviour were just correlation.
236
Chapter Seven
CHAPTER SEVEN
THE INFLUENCE OF COMMUNICATION, PERCEPTION, INNOVATION AND
ENVIRONMENT ON DECISIONS-MAKING
7. Introduction
In the previous chapter we discussed entrepreneurs' characteristics and their
influence on innovativeness. In this chapter, we focus our discussion on
entrepreneurs' communication, perception of the procedures of buying an
innovation, perception of the characteristics of the innovation, institutional
involvement, competition and the objective characteristics of the innovation. In
our hvyotheses. we assumed that all these factors would have an influence on the
nro nsity to innovate. To confirm the hypotheses we used the logistic regression
functions presented in Tables 6.1 and 6.2. However, for clarity, we shall present
the parts of these two tables which are relevant to our discussion in this chapter, in
Tables 7.1 and 7.2 respectively.
237
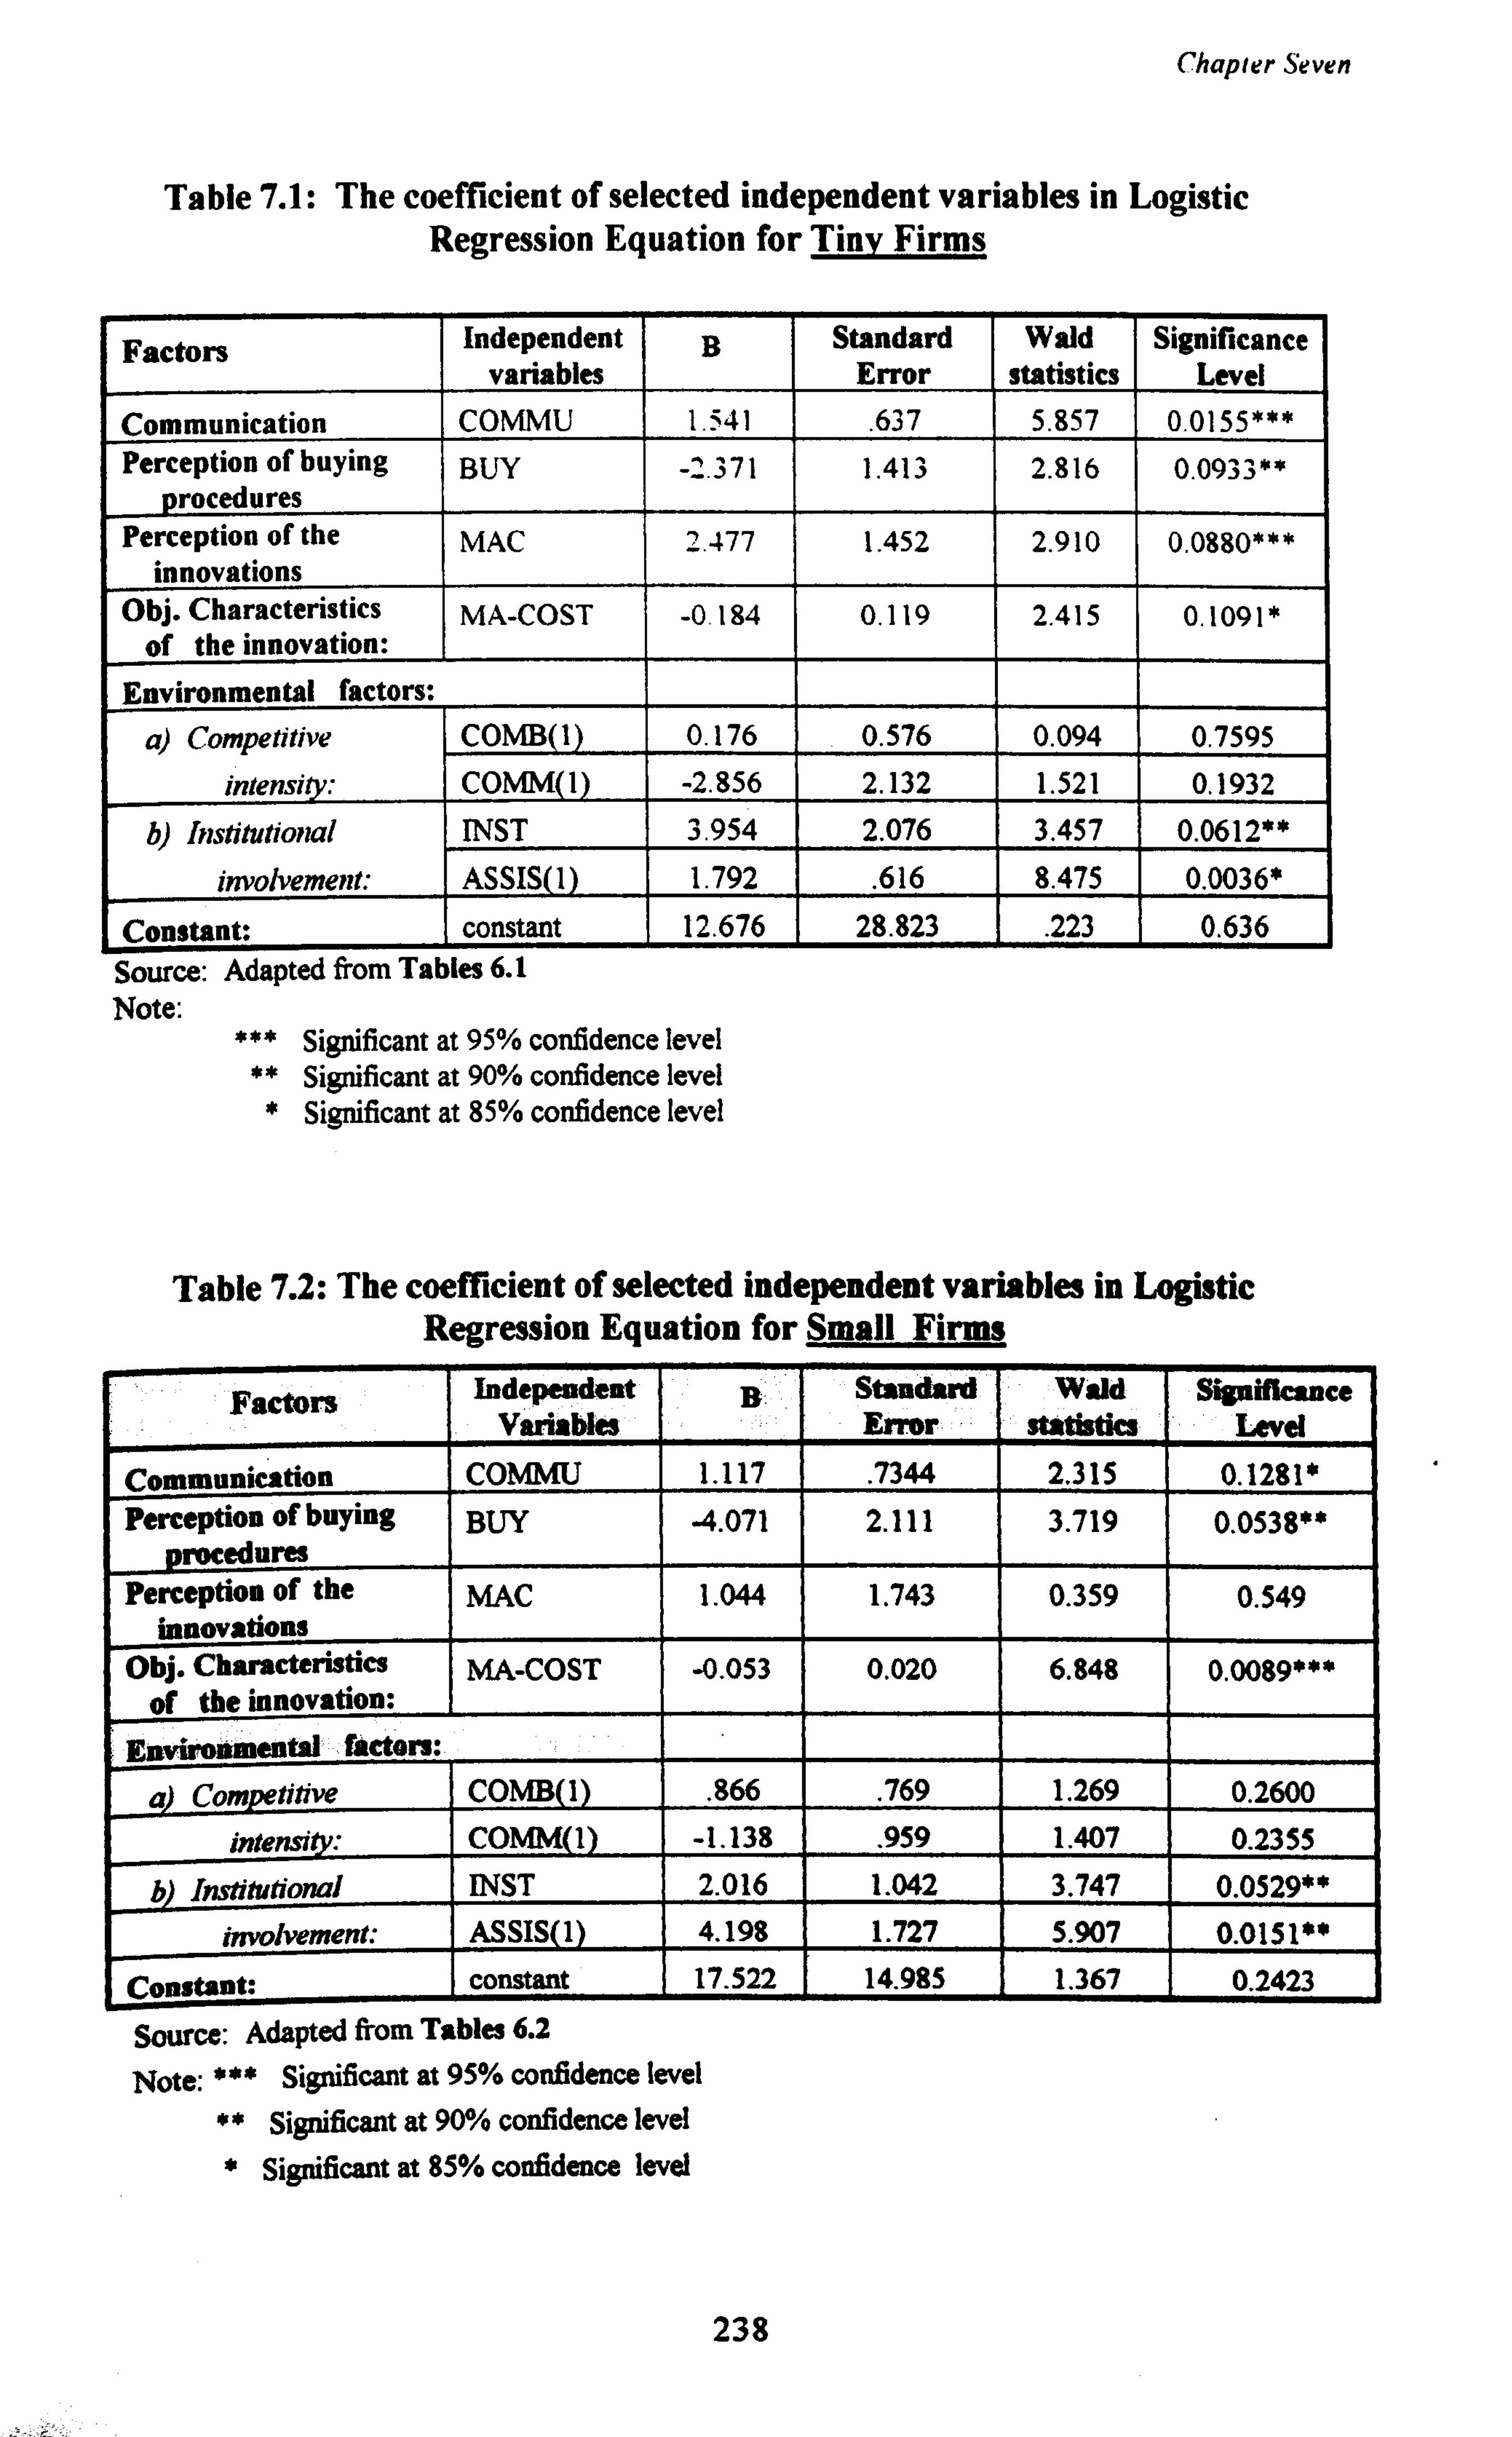
Chapter Seven
Table 7.1: The coefficient of selected independent variables in Logistic Regression Equation for Tiny Firms
Factors Independent variables
B Standard Error
Wald statistics
Significance Level
Communication COMMU 1.541 . 637 5.857 0.0155*** Perception of buying
procedures BUY -2.371 1.413 2.816 0.0933**
Perception of the innovations
MAC 2.477 1.452 2.910 0.0880***
Obj. Characteristics of the innovation:
MA-COST -0.184 0.119 2.415 0.1091 *
Environmental factors:
a) Competitive COMB(l) 0.176 0.576 0.094 0.7595
intensi : COMM 1 -2.856 2.132 1.521 0.1932
b) Institutional INST 3.954 2.076 3.457 0.0612**
involvement: ASSIS 1 1.792 . 616 8.475 0.0036*
Constant: constant 12.676 28.823 . 223 0.636
Source: Adapted from Tables 6.1 Note:
*** Significant at 95% confidence level ** Significant at 90% confidence level * Significant at 85% confidence level
Table 7.2: The coefficient of selected independent variables in Logistic Regression Equation for Small Firms
Factors Independent Variables
B Standard Error
Wald statistics
Significance Level
Communication COMMU 1.117 . 7344 2.315 0.1281 * Perception of buying
procedures BUY -4.071 2.111 3.719 0.0538**
Perception of the innovations
MAC 1.044 1.743 0.359 0.549
Obj. Characteristics of the innovation:
MA-COST -0.053 0.020 6.848 0.0089***
Environmental factors:
a) Competitive COMB(1) . 866 . 769 1.269 0.2600
intensi : COMM 1 -1.138 . 959 1.407 0.2355
b Institutional INST 2.016 1.042 3.747 0.0529**
involvement: ASSIS 1 4.198 1.727 5.907 0.0151**
Constant: constant 17.522 14.985 1.367 0.2423
Source: Adapted from Tables 6.2
Note: *** Significant at 95% confidence level
** Significant at 90% confidence level
* Significant at 85% confidence level
238
Chapter Seven
7.1 Communication
Entrepreneurs' decisions to adopt technological innovation were very much
influenced by their communicative behaviour. We analysed entrepreneurs'
communicative behaviour by their usage of communication channels, such as
membership of business associations, subscribing to business magazines, attending
business seminars and expos. Our hypothesis was that the more communicative
the entrepreneurs, the more likely that they would innovate. The rationale for this
was the belief that entrepreneurs who have more communicative behaviour, have
better access to information on innovation, which would give them an advantage,
by reducing the perceived risk and uncertainty involved in adoption of innovation.
Hence, we predict that communicative behaviour of entrepreneurs has a cause-and
-effect relationship with their innovative behaviour.
Tables 7.1 and 7.2 show that entrepreneurs' communicative behaviour
was a significant predictor of their innovativeness, for both tiny and small firms.
Entrepreneurs with higher levels of communicative behaviour had a greater
tendency to innovate, suggesting that innovation decisions are favourably
influenced by communication.
As indicated above, we had assumed that involvement in business
associations, attending seminars or expos and subscribing to business magazines
can improve entrepreneurs' access to information, and that communicative
entrepreneurs can use these communication channels to learn about innovation,
improve their production efficiency and exchange ideas and problems. These
assumptions would appear to be borne out by our findings.
239
Chapter Seven
However, the majority of entrepreneurs surveyed did not use any
communication channels. Only 36.3 per cent of tiny firms and 40.6 per cent of
small firms used at least one of the communication channels. This implies that
entrepreneurs from small firms are more communicative compared to those in tiny
firms. This study also found that a higher percentage of innovative entrepreneurs
(49.1% of those in small firms and 45.0% of those in tiny firms) used at least one
of the above channels of communication compared to non-innovative
entrepreneurs (28.6% of small firms and 29.4% of tiny firms). The most popular
channel of communication for both small (45.3%) and tiny firms (23.1%) was
attending business expo or trade fairs. Other communication channels were less
popular. The preference of most entrepreneurs for expos or trade fairs may be
explained in terms of the opportunities they offer to gather more first-hand
information from suppliers, producers and institutions present at the expo.
Although, communicative behaviour of entrepreneurs in tiny firms, had
causal influence on their innovative behaviour, it also been influenced by other
determining factors. Our results show that entrepreneurs' level of education, skill
upgrading, n-ach and attitude towards risk influenced their communicative
behaviour'. Entrepreneurs who showed more communicative behaviour, had
higher levels of education, had upgraded their skill (through attending courses),
and were higher achievers and risk takers.
1 Variable COMMU is positively correlated with variable EDU (ra0.3518, p-0.001), COURSE (x0.5105, p=0.00001), NACH (r=0.2740, p=0.009) and RISKS (r=0.3575, p-0.001).
240
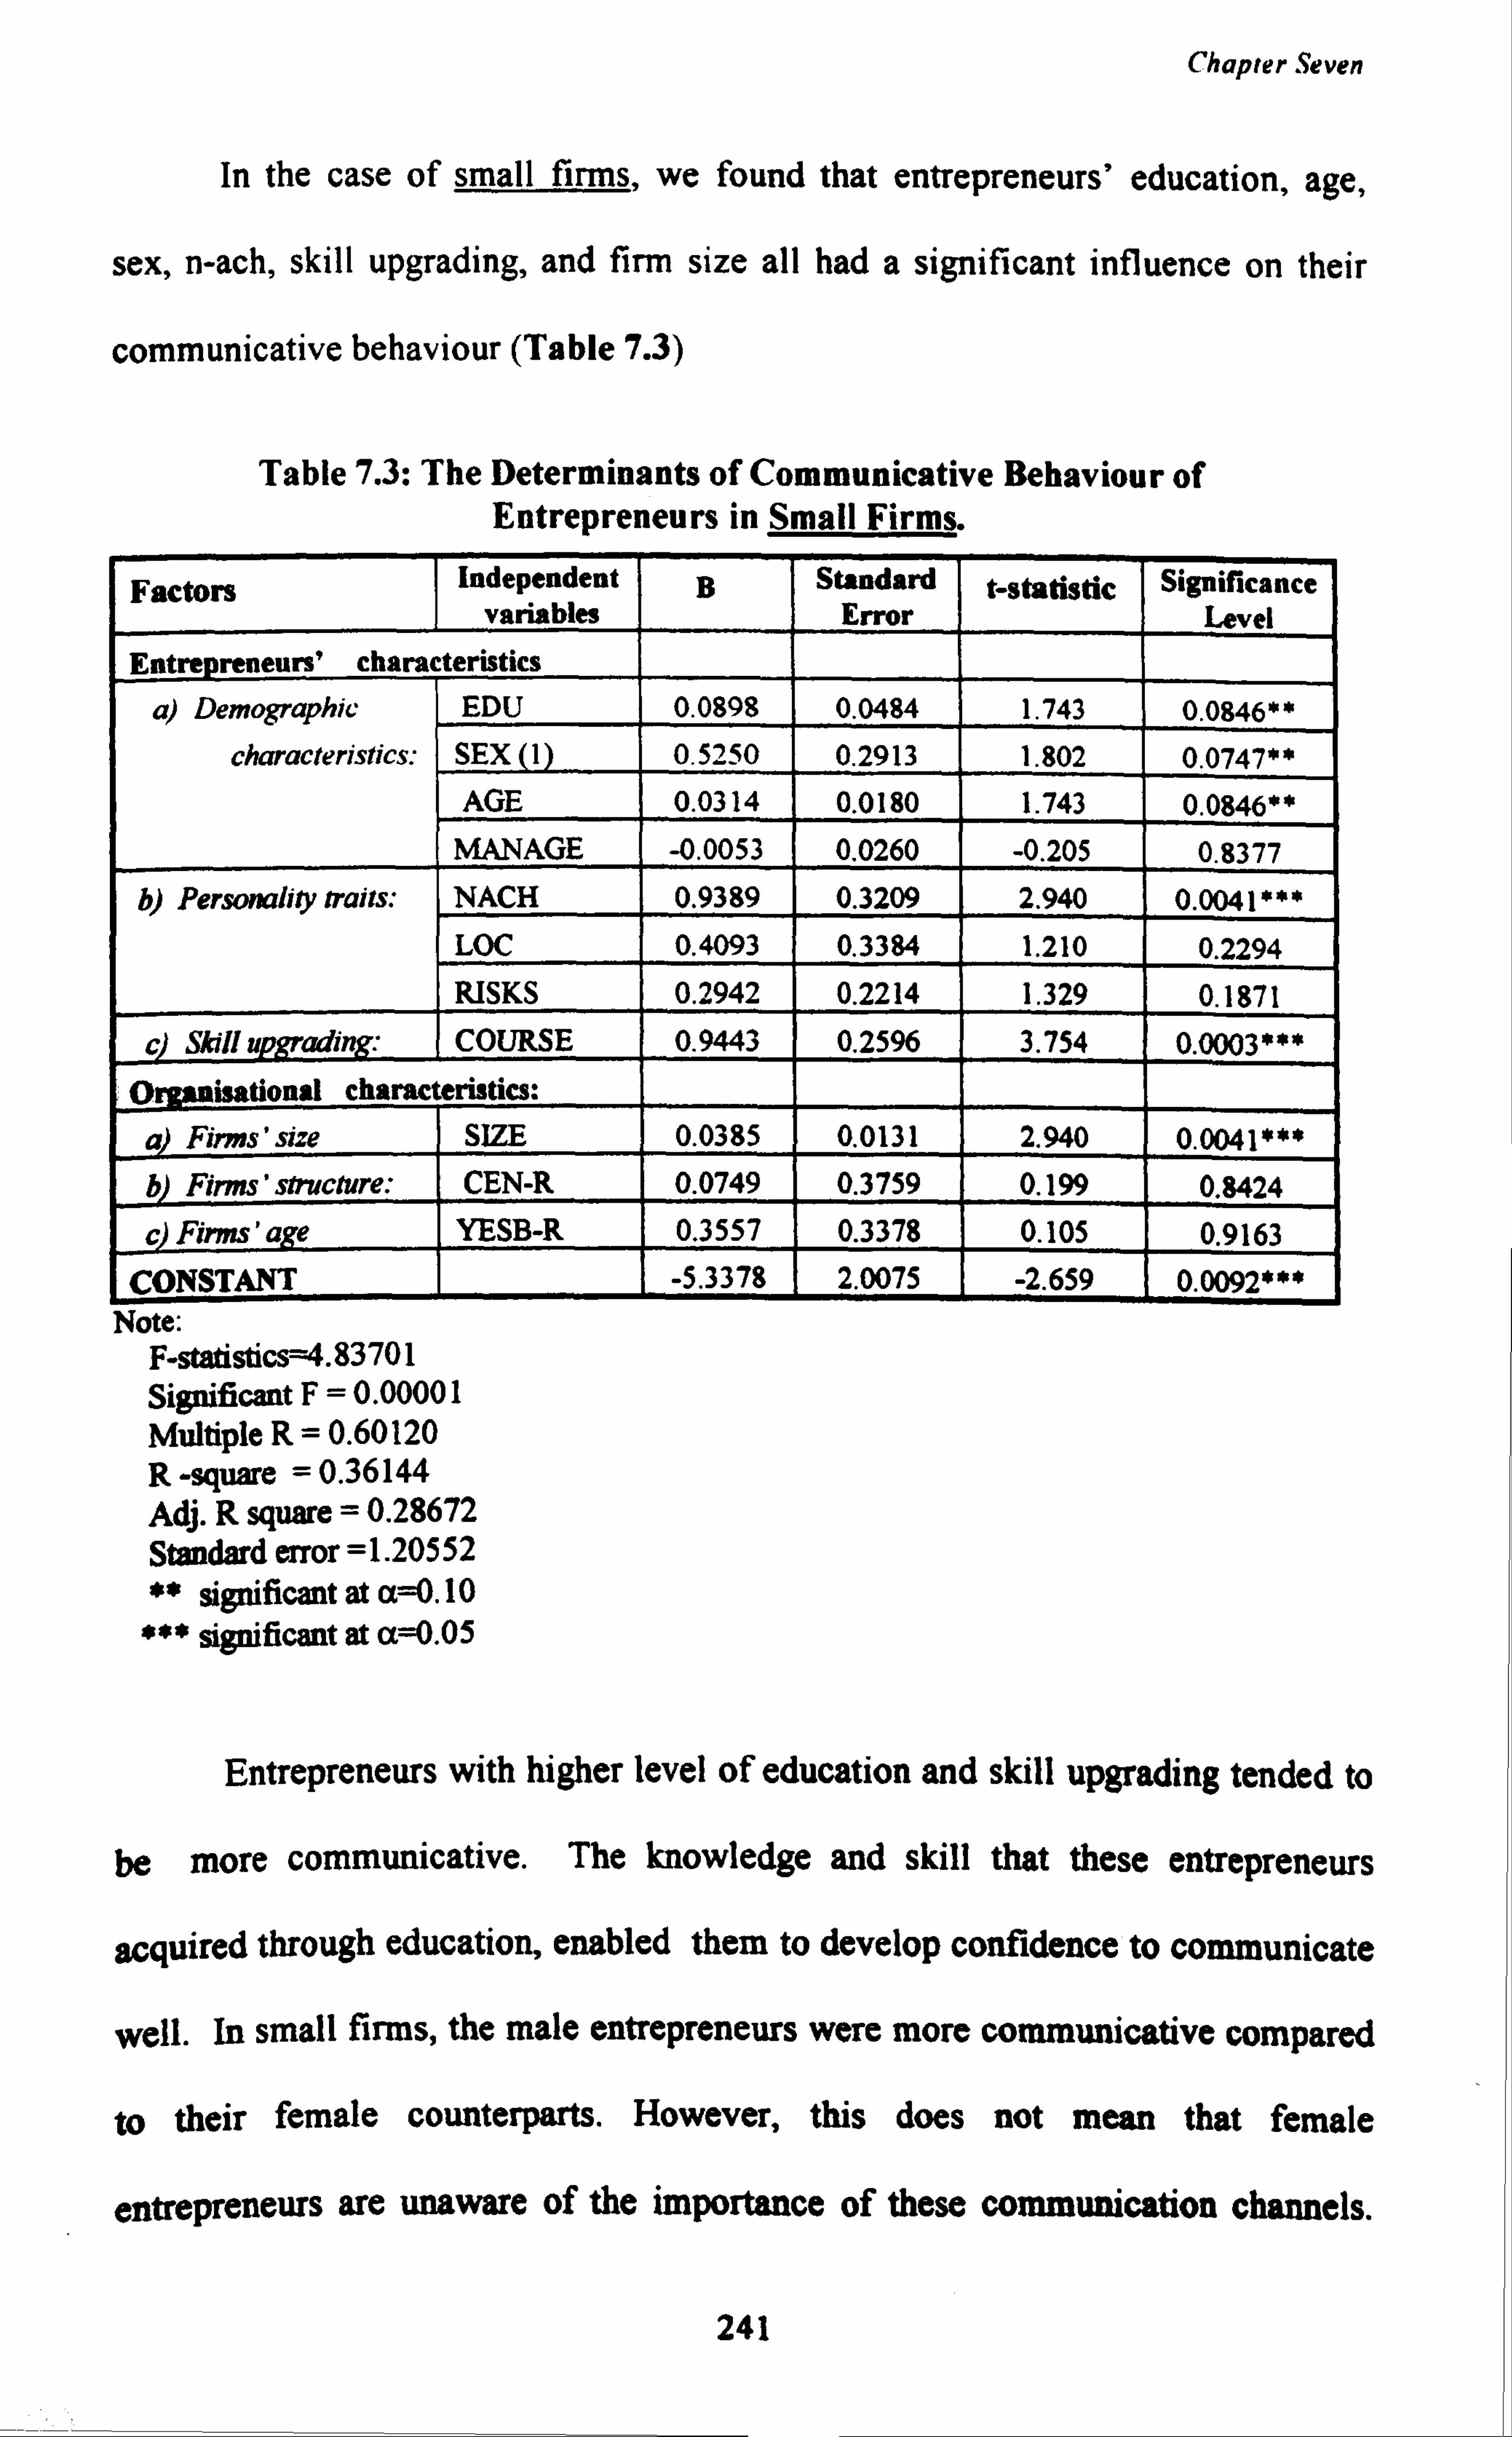
Chapter Seven
In the case of small firms, we found that entrepreneurs' education, age,
sex, n-ach, skill upgrading, and firm size all had a significant influence on their
communicative behaviour (Table 7.3)
Table 7.3: The Determinants of Communicative Behaviour of Entrepreneurs in Small Firms.
Factors Independent variables
B Standard Error
t -statistic Significance
Level
Entrepreneurs' characteristics
a) Demographic EDU 0.0898 0.0484 1.743 0.0846**
characteristics: SEX (1) 0.5250 0.2913 1.802 0.0747**
AGE 0.0314 0.0180 1.743 0.0846**
MANAGE -0.0053 0.0260 -0.205 0.8377 b) Personality traits: NACH 0.9389 0.3209 2.940 0.0041***
LOC 0.4093 0.3384 1.210 0.2294
RISKS 0.2942 0.2214 1.329 0.1871
c) Skill upgrading. - COURSE 0.9443 0.2596 3.754 0.0003*** O isational characteristics:
a Firms' size SIZE 0.0385 0.0131 2.940 0.0041*** b) Firms' structure: CEN-R 0.0749 0.3759 0.199 0.8424
c Firms' ae YESB-R 0.3557 0.3378 0.105 0.9163 CONSTANT -5.3378 2.0075 -2.659 0.0092***
Note: F-statistics=4.83701 Significant F=0.0000 1 Multiple R=0.60120 R -square = 0.36144 Adj. R square = 0.28672 Standard error =1.20552 ** significant at aß. 10
*** significant at aß. 05
Entrepreneurs with higher level of education and skill upgrading tended to
be more communicative. The knowledge and skill that these entrepreneurs
acquired through education, enabled them to develop confidence to communicate
well. In small firms, the male entrepreneurs were more communicative compared
to their female counterparts. However, this does not mean that female
entrepreneurs are unaware of the importance of these communication channels.
241
Chapter Seven
As most of the female entrepreneurs were married, it is reasonable to think that
they were constrained by domestic responsibilities, which explains why their
communication level was lower compared to that of male entrepreneurs. Female
entrepreneurs tend to rely on government institutions as a source of information.
Our results show that older entrepreneurs were more communicative than
younger ones. As our earlier results have shown, older entrepreneurs had longer
experience managing their current business compared to younger entrepreneurs.
There is reason to believe that they had already established a communication
network through the usage of these communication channels.
Among the entrepreneurs' personality traits, only their n-ach was
significant related to their communicative behaviour. Higher achieving
entrepreneurs appeared to value the importance of information to improve their
firms performances.
Firm size also influenced entrepreneurs' communicative behaviour;
entrepreneurs of bigger firms were more communicative compared to those from
smaller firms. Bigger firms usually have more financial and human resources,
which enables them to be more communicative compared to smaller firms.
7.2 Entrepreneurs' Perception of the Buying Procedure
The entrepreneurs in this study bought their technological innovation from
suppliers. Purchase of a technological innovation involved various stages, and
the procedures involved may have influenced entrepreneurs' decision to innovate.
Those procedures include finding the right suppliers and negotiating with them.
242
Chapter Seven
Technology buying procedure often involves legal matters, such as signing
contracts. As part of their buying process, the entrepreneurs have to leave their
firms for a certain period, which means they have to delegate their responsibilities
to their subordinates.
We hypothesised that entrepreneurs' perception of the technology-buying
procedure would influence their decision to innovate. If entrepreneurs perceive
that they may face difficulties in the process of buying innovation, they are less
likely to innovate. Based on the logistic regression functions in Tables 7.1 and
7.2, we support the hypothesis that entrepreneurs who perceive that they face
problems in the process of buying technological innovation are unlikely
innovate (The coefficient of variable BUY is negative). Hence, we believe that
this factor had a causal influence on entrepreneurs' innovative behaviour. A
detailed analysis of the types of problems in the buying procedure which have a
significant influence on entrepreneurs' innovativeness is presented in Table 7.4.
From Table 7.4 we can see that there was no significant difference
between non-innovative and innovative entrepreneurs in terms of their perception
of finding suppliers, long absence from their firms and delegating work
responsibilities while they were away. Both innovative and non-innovative
entrepreneurs regarded these buying procedures as only minor problems.
243
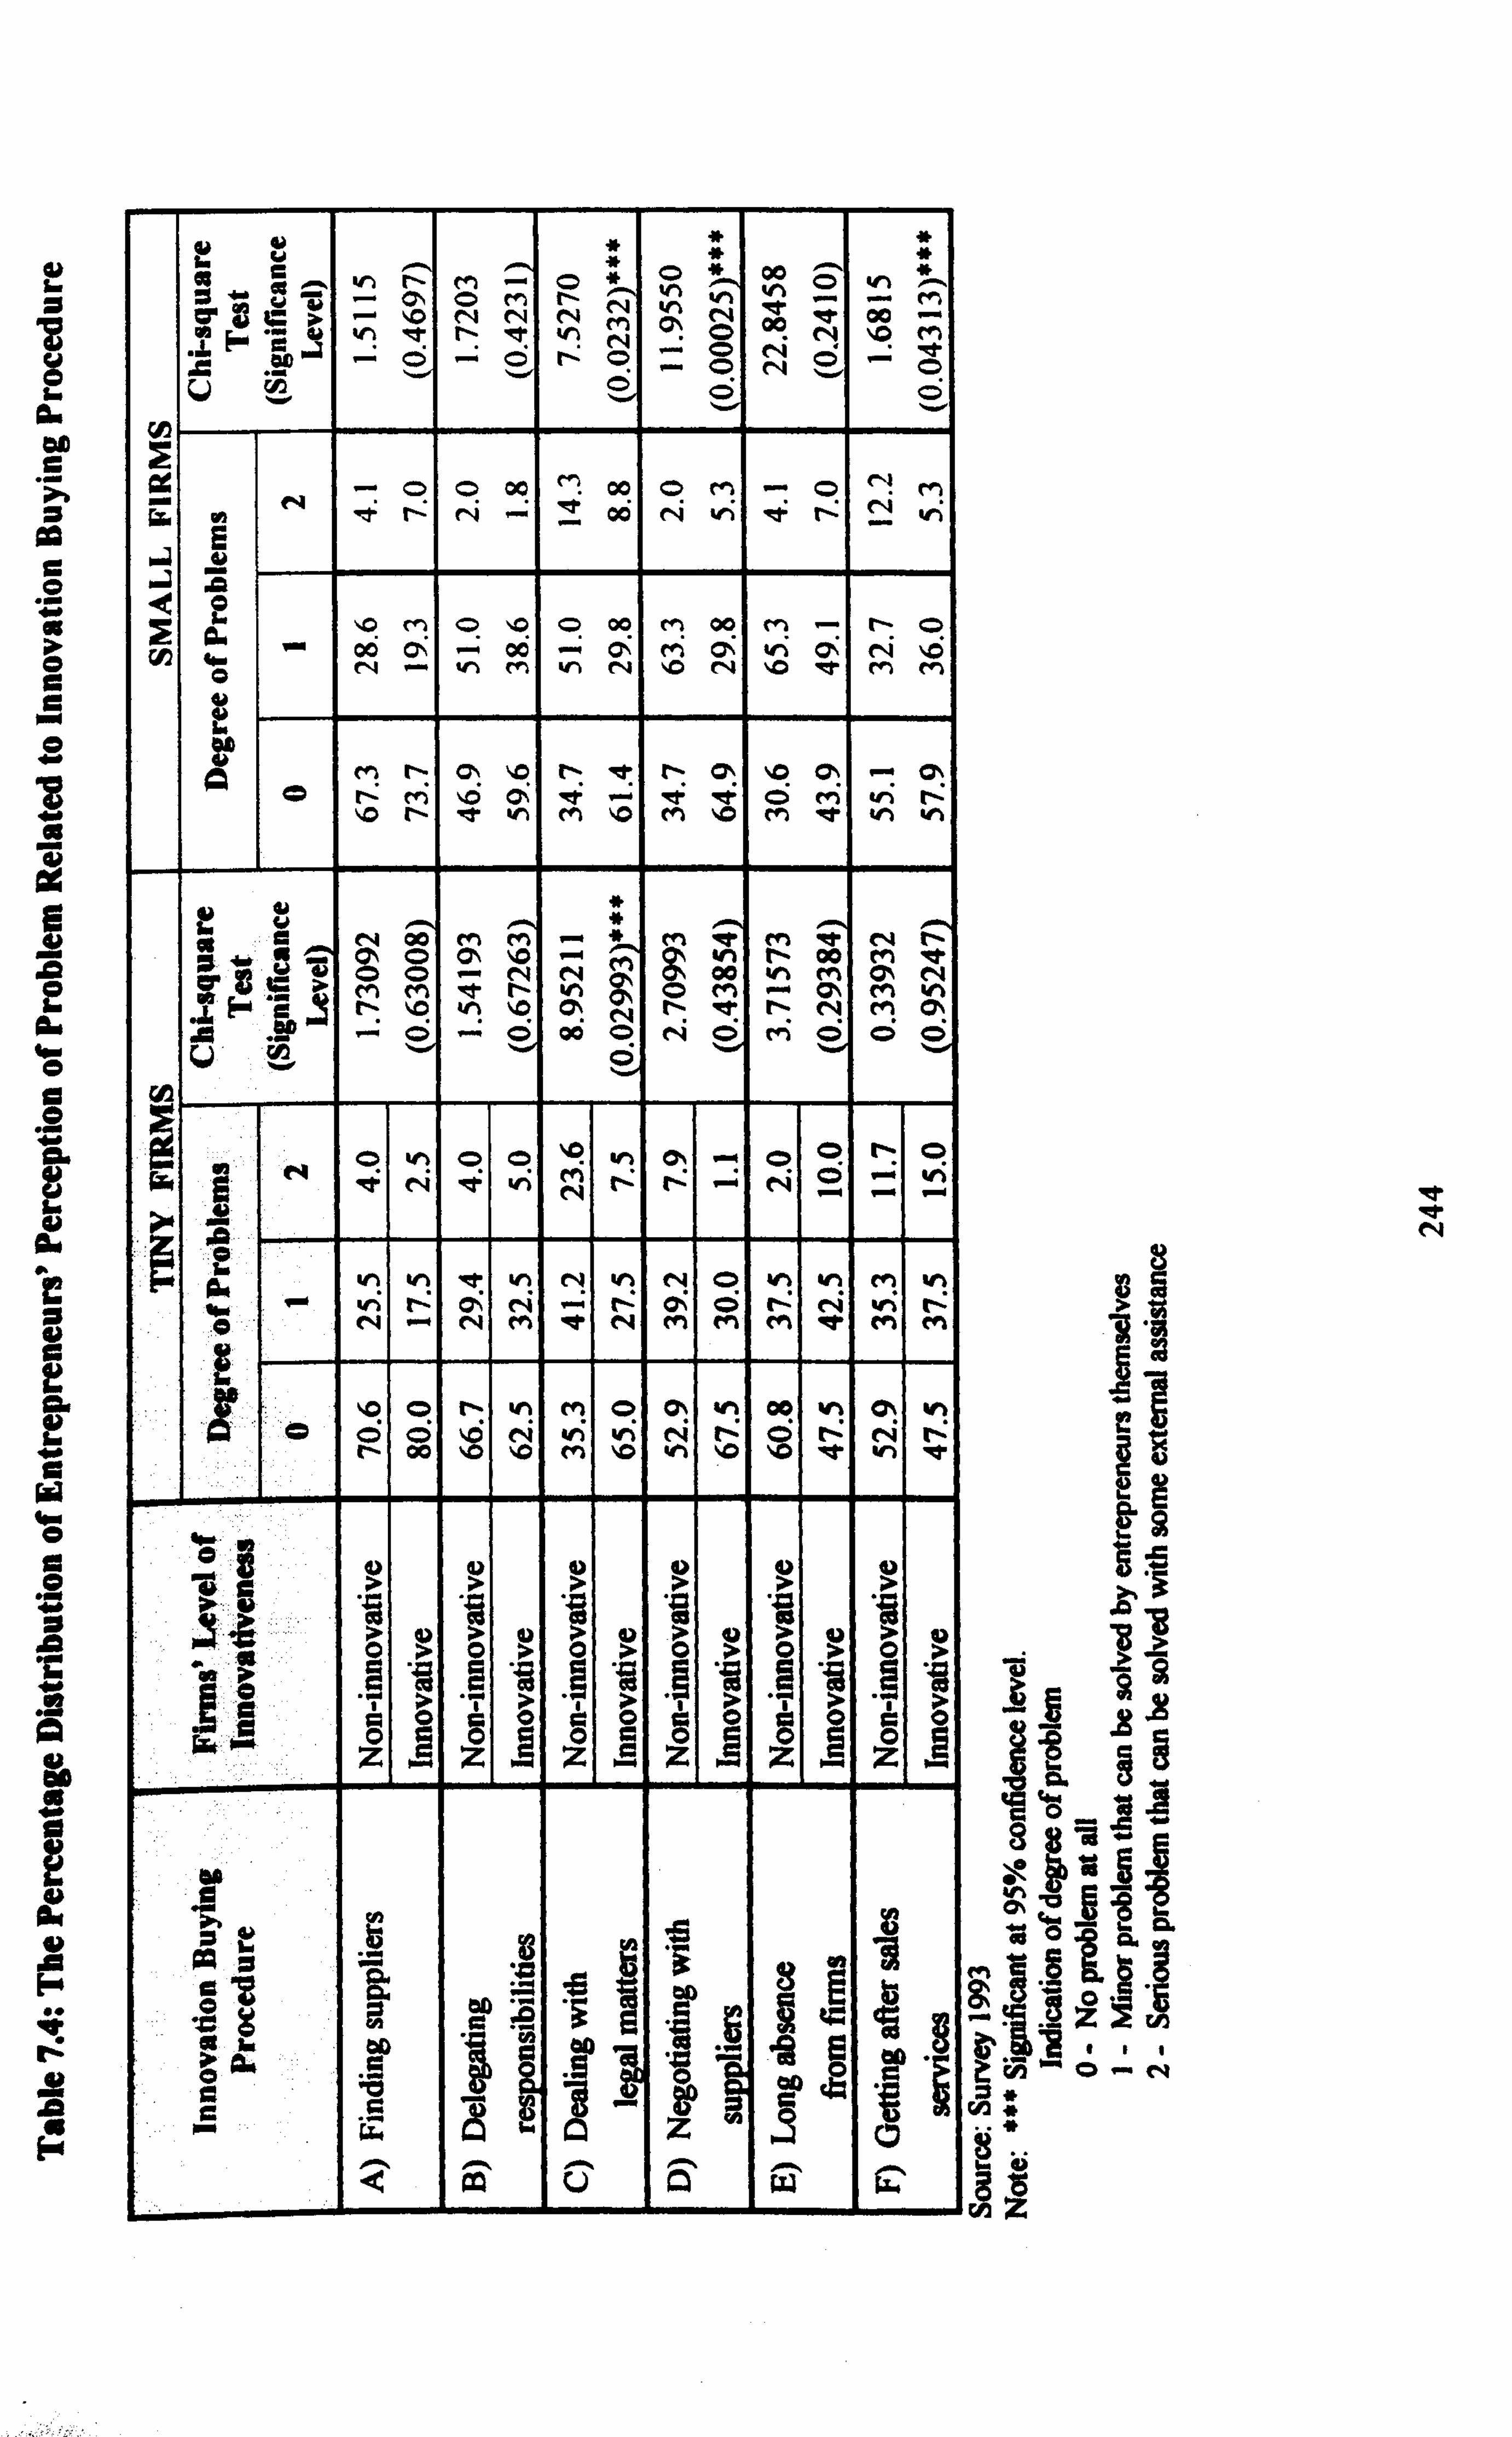
* a 00 - - p ý"' CT °3 s>
^ Qý .O
O N
M N N e, y
v1 00 er 00
M "-+
vj F t ' N d N 0 N \O M 00 ^ O O r O O
N " O U " ° ö 0
N ^ 0 0 00 00 0 M -» O N M ý7r 1'- 06 N v; 4 I_ W1
e o 'O Cl) O SO O 00 M 00 M ^ N O
9) ö 04. - 06 N 0` ^ ^ h 00 M ^ ý1
Cý N
m ýO
CS N
in ýO
47N !h
" M
\0 M
d
en N O\ \O N D I-
I'D M l1- et
Cý v1
4 M
^' ýD
4 M ýO
O M
M et
of v'1
[ý v1
V y M 0. r y
C14 Qý 0
en ON ýD M Oý vii
en 0ý0
M
j F G M '. O cn It
*t r-
'. O kA
O' C) ON
M
et N CS
N en
M wl
Q'. , ü ^ O 0 00 0 N Ö M 0 co O
U v ö 0 I
- O N '.
N O d
v , N
O 0 v1
M an tý
p'. tý
- -r
O N N -. .. r
i' a V1 Y1 'ý h N V) N O h h M h
y m - Wt N
N CN N
N M
^ N N
O's M
O ! +1
C-- M
N e}
in M
lý M
i Q
ýO O Ö
tý v1 M 1
O 1
Oý v1 00 v1 C' v1 O N 00
'. O '. C
N '. O
V m
v \0
N w1
N '. O
O "0
S et
N v1
N
1 . 1. 1 > a > a > aý
> > a > w
0 o c o 0 0 ý o 0 0 0 0 Z z g z z g z z A
Q äý Ü Ä w
a oýa,
Vw
-z
N
Chapter , Seven
We found that both innovative and non-innovative entrepreneurs in tiny
firms faced similar problems regarding negotiations with suppliers and getting
after sales service. In the case of small firms, in contrast, we found that there was
a significant difference between innovative and non-innovative entrepreneurs: the
non-innovative entrepreneurs faced more serious problems than the innovative
ones. One reason why the non-innovative entrepreneurs perceived that they had
some problems with negotiating with suppliers and getting after sales service is
because their lack of experience in buying innovation. Due to this lack of
experience, they have fewer business contacts, which prevents them from
establishing a close relationship with suppliers..
The non-innovative and innovative entrepreneurs in both tiny and small
firms had different perceptions of dealing with legal matters in the procedure of
buying innovations. Legal matters were seen as more of a problem by those who
had not innovated. This is probably due to their low level of education; they may
find it difficult to interpret or fully understand matters that they perceive to have
legal implications.
There is a positive correlation between entrepreneurs' perception of the
procedures of buying an innovation and their financing problems2. The
entrepreneurs who perceived that they had a financial problem also perceived that
they would have problems in purchasing new machinery. In the case of tiny
firms, we found a negative correlation between the entrepreneurs' perception of
buying procedures and their institutional involvement (r=-0.1886, p-0.073). This
2For y firms: r=0.2366 and p=0.024; for small firms: r=0.3078 and p=0.001
245
<< ,
Chapter Seven
reflected that those with higher intensity of institutional involvement experienced
or anticipated fewer problems in dealing with the procedures of buying the
innovation. The discussion of the correlation of these two variables is further
elaborated in section 7.5.2.1.
7.3 Entrepreneurs' Perception of the Characteristics of Innovation.
As we can recall, there are five stages in an innovation decision process (see
Chapter Four). At the evaluation stage, entrepreneurs' perception of a particular
innovation would influence their adoption decision. It is reasonable to think that
those who have a positive perception of the innovation are more likely to adopt it
compared to those who perceive otherwise. This study hypothesised that the
characteristics of the innovation as perceived by the entrepreneurs had causal
influence on their innovation decision. Entrepreneurs who perceive that an
innovation will improve their economic position, is simple to operate, is less risky
and is compatible with their existing processing techniques will be more willing to
adopt such innovation, while some entrepreneurs may adopt a particular
innovation due to the prestige associated with it.
In the case of tiny firms, entrepreneurs' perception of the characteristics of
the innovation had a significant influence on their decision to innovate (Table
7.1). However, in small firms, there was no relationship between entrepreneurs'
perception of the innovation and their decision to innovate (Table 7.2).
246
Chapter Seven
7.3.1 The Perception of Entrepreneurs in Tiny Firms
The result in Table 7.5 shows that there was no significant difference between the
perceptions of innovative and non-innovative entrepreneurs, with regard to the
innovation's economic advantage, compatibility, prestige and simplicity. The
majority of both innovative and non-innovative entrepreneurs had a positive
perception of these aspects of the innovation. It appears that the entrepreneurs in
tiny firms were favourably disposed to innovation, in that they perceived it as
beneficial in terms of increase in sales, cost reduction and improvement of
product quality. They did not perceive that the new technology would affect their
existing methods of production or employee work schedule, or that it was
technically sophisticated or difficult to operate. Nor did the majority of
entrepreneurs believe that introducing an innovation would improve the prestige
of their firms.
The non-innovative entrepreneurs may have had positive perceptions of the
economic advantage, compatibility and simplicity of an innovation; however, their
perception of the possible risk involved with the introduction of an innovation
might influence their decision3. To the non-innovative entrepreneurs, the
machines they were considering were relatively expensive. New technology may
not in itself seem costly (less than RM5,000), but to many who had to rely on
external sources of financing, such a purchase would be risky to their current
financial position.
3 Table 7.5 shows that at 95 per cent confidence level, the mean score of non innovative
entrepreneurs (3.25) are higher than the innovative ones (2.76)
247
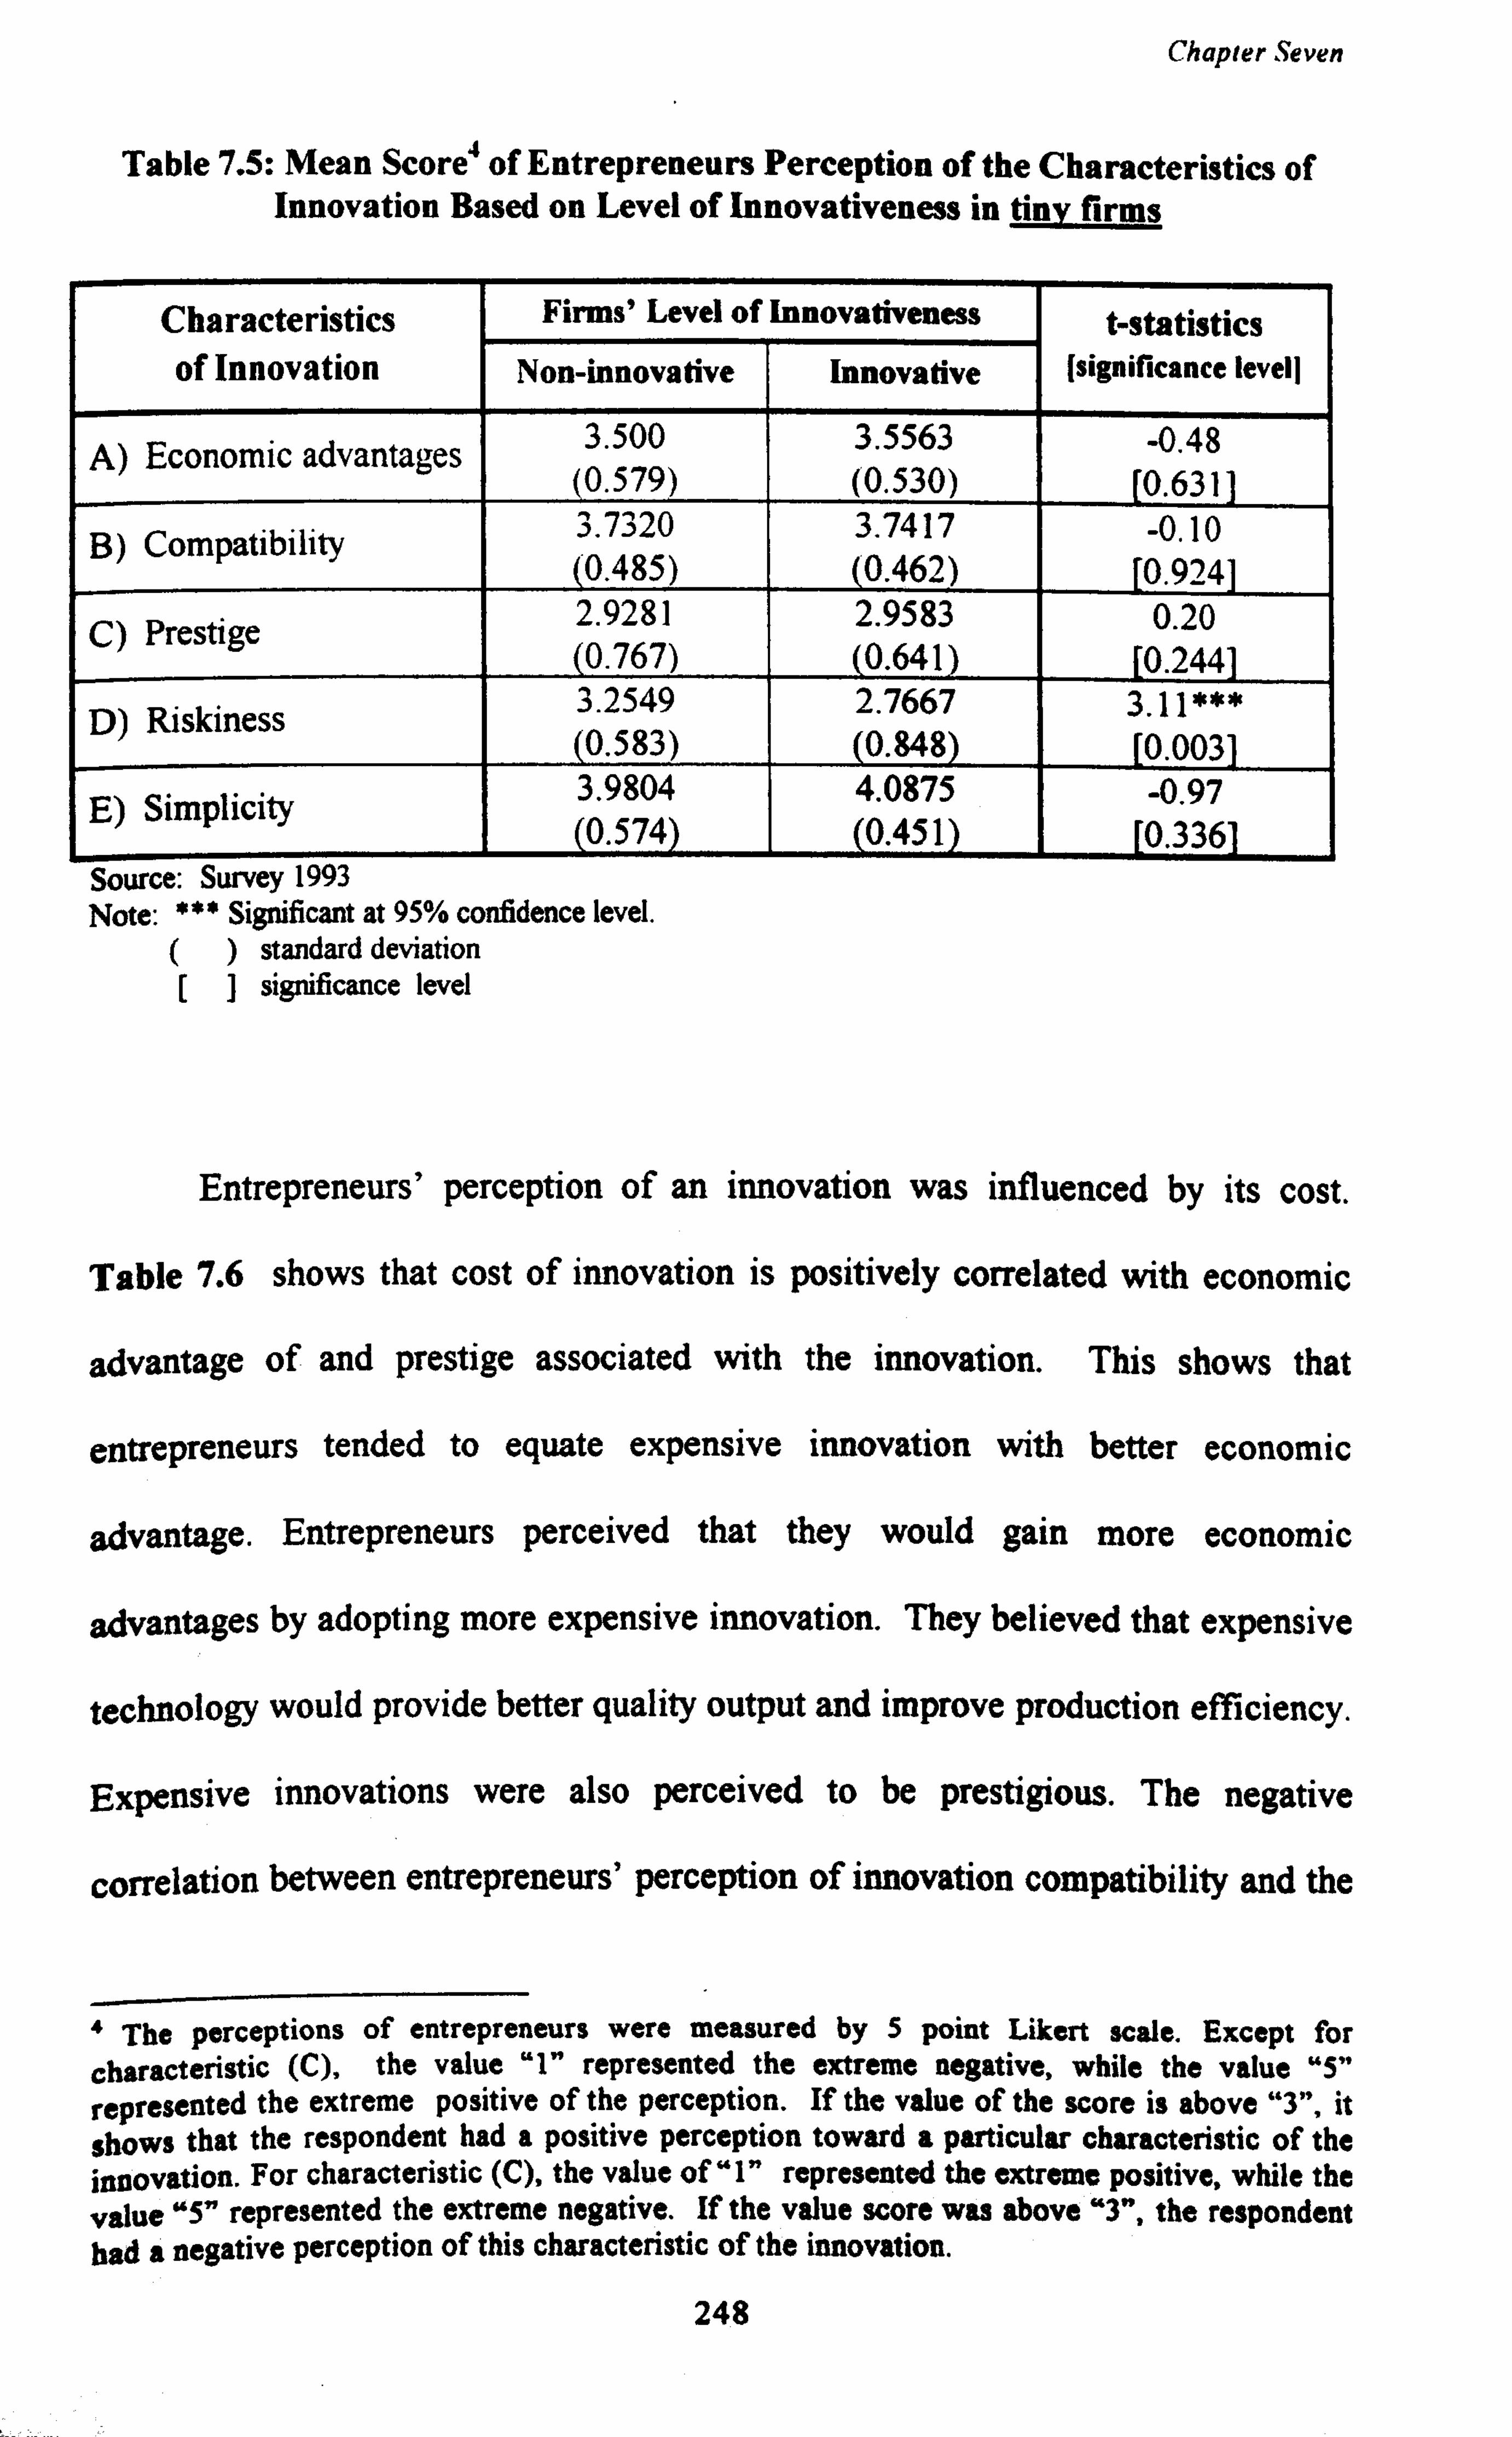
Chapter Seven
Table 7.5: Mean Score4 of Entrepreneurs Perception of the Characteristics of Innovation Based on Level of Innovativeness in tiny firms
Characteristics Firms' Level of Innovativeness t-statistics
of Innovation Non-innovative Innovative (significance level]
A) Economic advantages 3.500 3.5563 -0.48
(0.579) (0.530) 0.631
B) Compatibility 3.7'20 3.7417 (
-0.10 (0.485) 0.462) 0.924
C) Prestige 2.9281 2.9583 0.20 (0.767) (0.641) [0.244]
D) Riskiness 3.2549 2.7667 3.11 *** (0.583) 0.848 0.003
E) Simplicity 3.9804 4.0875 -0.97 (0.574) (0.451) 0.336
Source: Survey 1993 Note: *** Significant at 95% confidence level.
() standard deviation [] significance level
Entrepreneurs' perception of an innovation was influenced by its cost.
Table 7.6 shows that cost of innovation is positively correlated with economic
advantage of and prestige associated with the innovation. This shows that
entrepreneurs tended to equate expensive innovation with better economic
advantage. Entrepreneurs perceived that they would gain more economic
advantages by adopting more expensive innovation. They believed that expensive
technology would provide better quality output and improve production efficiency.
Expensive innovations were also perceived to be prestigious. The negative
correlation between entrepreneurs' perception of innovation compatibility and the
` The perceptions of entrepreneurs were measured by 5 point Likert scale. Except for characteristic (C), the value "1" represented the extreme negative, while the value "5" represented the extreme positive of the perception. If the value of the score is above "3", it
shows that the respondent had a positive perception toward a particular characteristic of the innovation. For characteristic (C), the value of "1" represented the extreme positive, while the value "5" represented the extreme negative. If the value score was above "3", the respondent had a negative perception of this characteristic of the innovation.
248
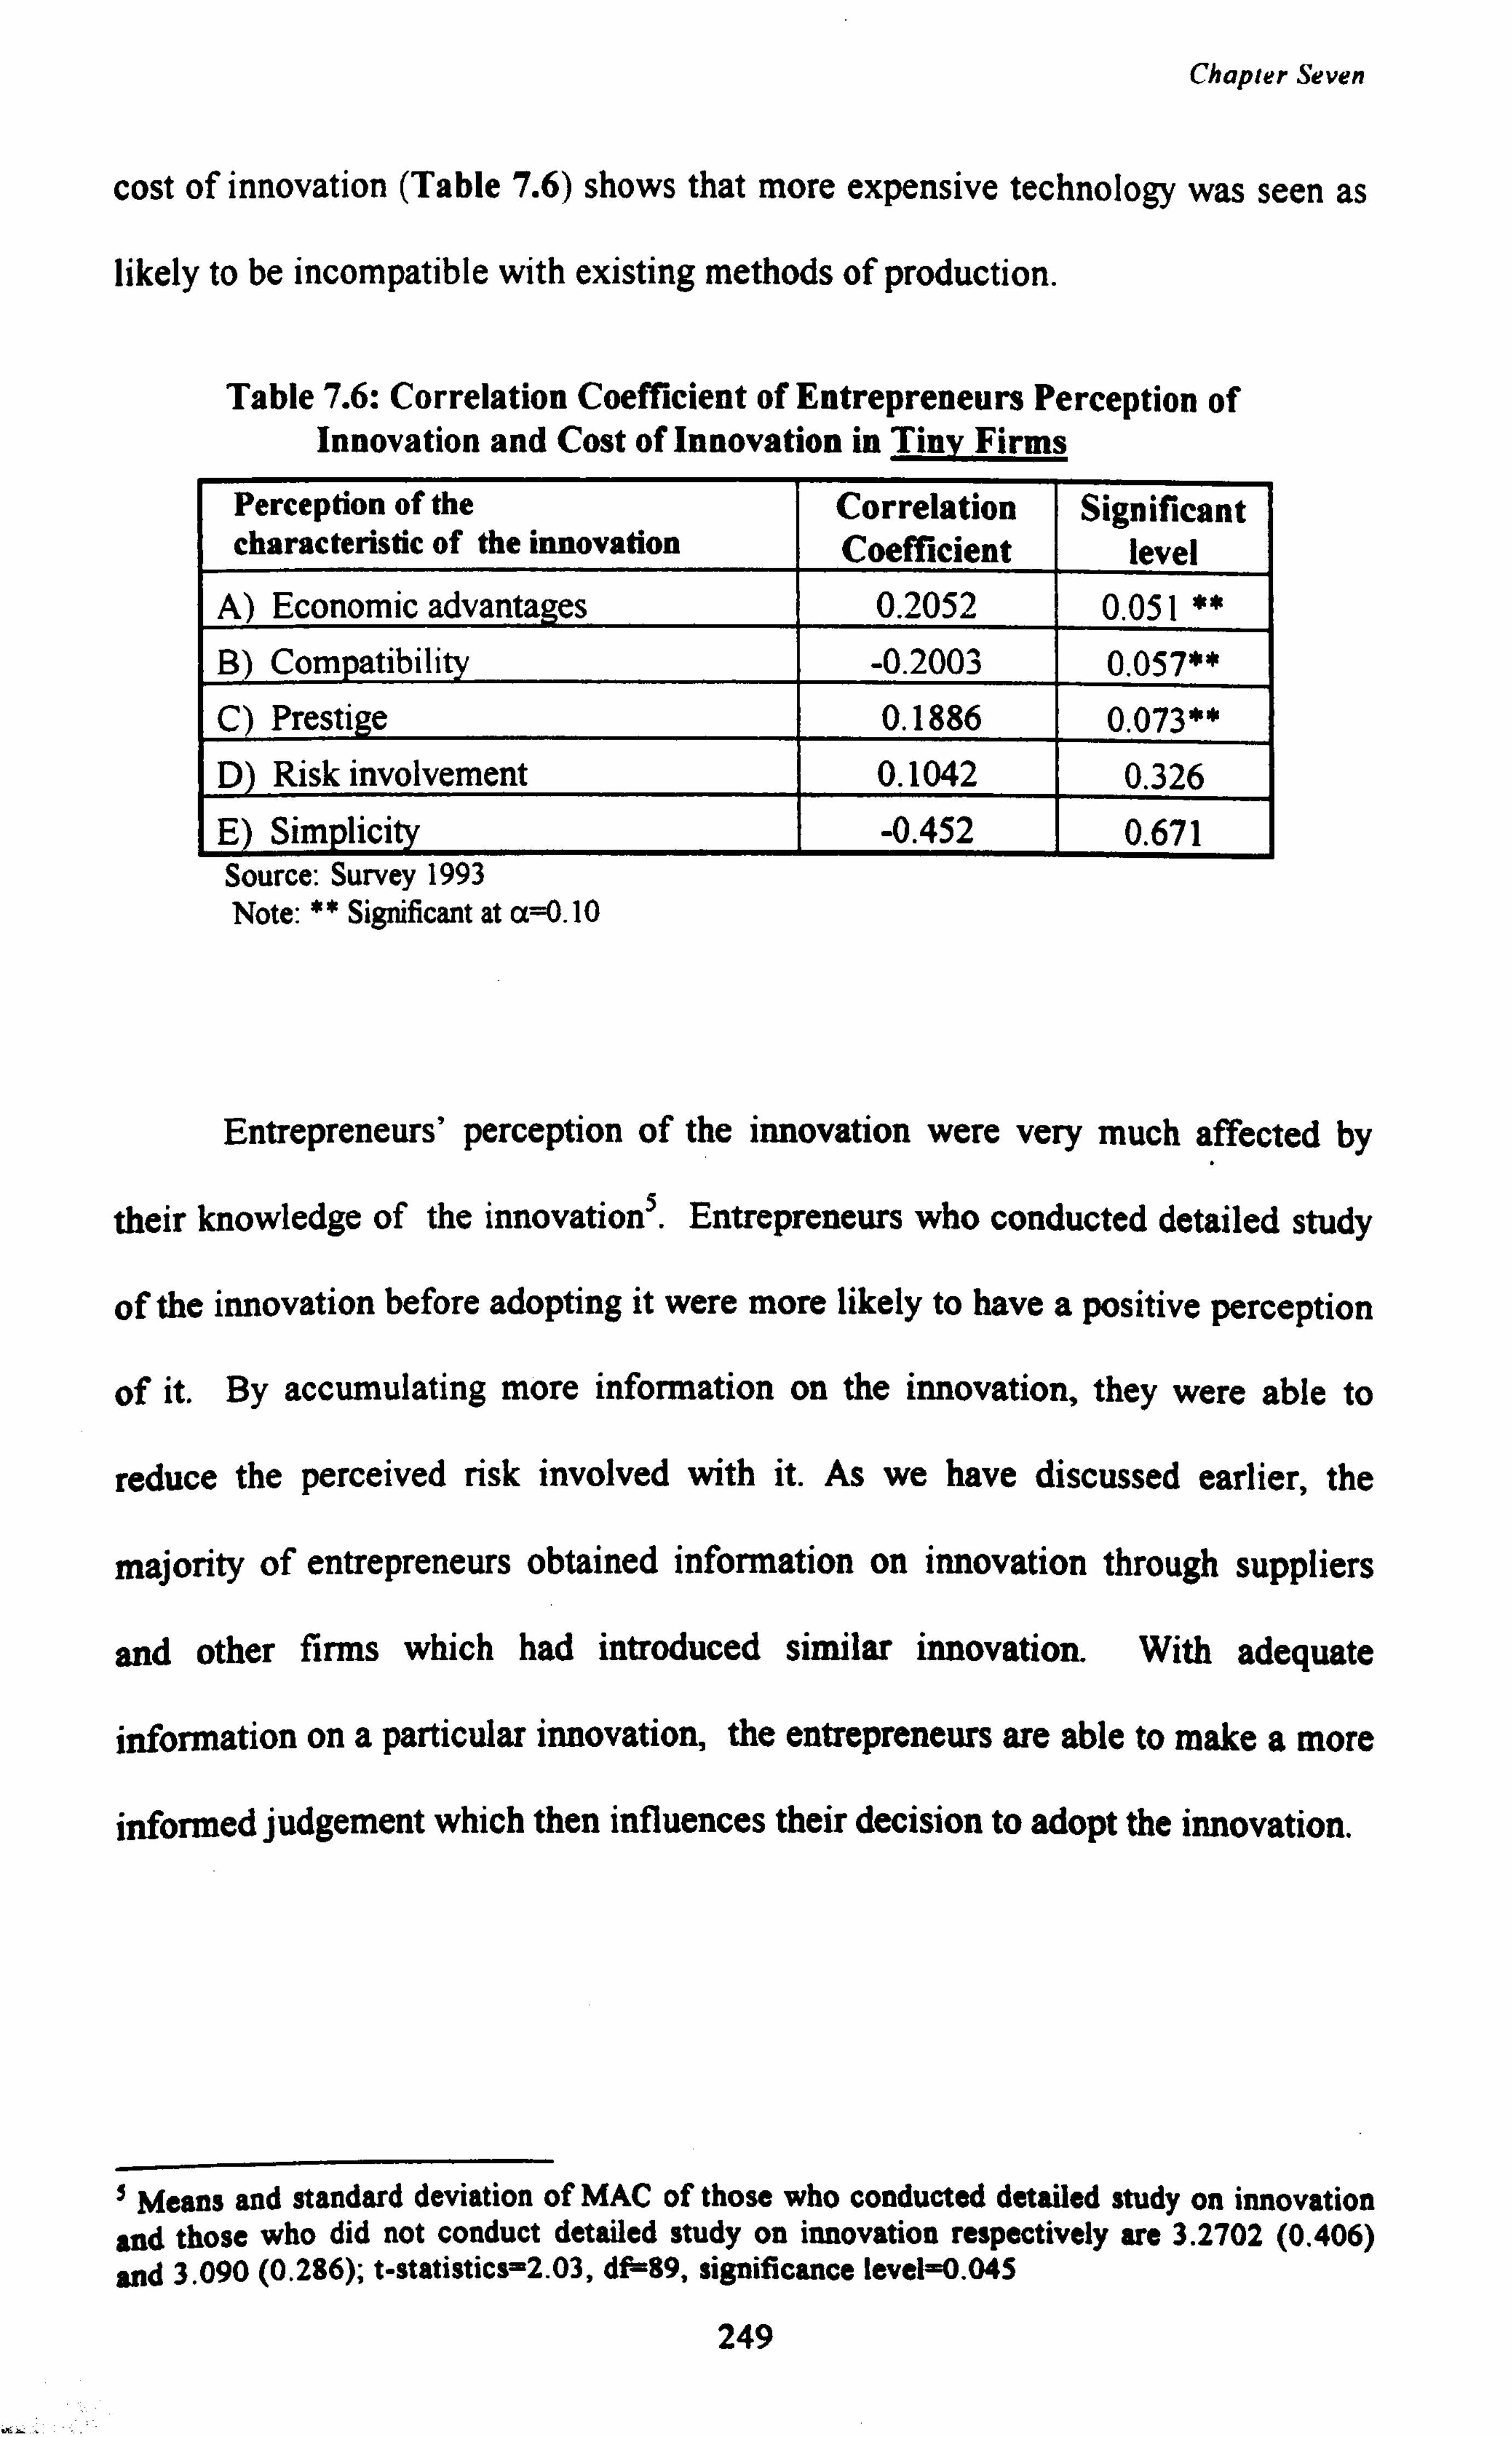
Chapter Seven
cost of innovation (Table 7.6) shows that more expensive technology was seen as
likely to be incompatible with existing methods of production.
Table 7.6: Correlation Coefficient of Entrepreneurs Perception of Innovation and Cost of Innovation in Tiny Firms
Perception of the characteristic of the innovation
Correlation Coefficient
Significant level
A) Economic advantages 0.2052 0.051 ** B) Compatibility -0.2003 0.057**
C) Prestige 0.1886 0.073** D) Risk involvement 0.1042 0.326 E) Simplicity -0.452 0.671 Source: Survey 1993 Note: ** Significant at aß. 10
Entrepreneurs' perception of the innovation were very much affected by
their knowledge of the innovation5. Entrepreneurs who conducted detailed study
of the innovation before adopting it were more likely to have a positive perception
of it. By accumulating more information on the innovation, they were able to
reduce the perceived risk involved with it. As we have discussed earlier, the
majority of entrepreneurs obtained information on innovation through suppliers
and other firms which had introduced similar innovation. With adequate
information on a particular innovation, the entrepreneurs are able to make a more
informed judgement which then influences their decision to adopt the innovation.
S Means and standard deviation of MAC of those who conducted detailed study on innovation
and those who did not conduct detailed study on innovation respectively are 3.2702 (0.406) and 3.090 (0.286); t-statistics=2.03,06 89, significance level-0.045
249
Chapter Seven
7.3.2 The Perception of Entrepreneurs in Small Firms
In the case of small firms, entrepreneurs' perception of innovation was not
statistically significant as a predictor of entrepreneurs' decision to adopt or reject
a technological innovation. (Table 7.2) This suggested that innovative and non-
innovative entrepreneurs had similar perceptions of innovation. The majority of
the entrepreneurs in this study perceived that the innovation that they considered
adopting had some economic advantages. The majority of innovative
entrepreneurs admitted that the machine they had bought was capable of
producing better quality products. By innovating, they were able to increase
their profit and penetrate the market more easily. The majority of non-innovative
entrepreneurs also had similar perceptions of the economic advantages they might
receive if they adopted the considered innovation.
The majority of innovative entrepreneurs claimed that the innovation that
they had introduced did not pose any serious incompatibilities with their existing
technique. Those who had not innovated, also perceived their considered
innovation as being easily adaptable to their existing techniques of production.
Although a small percentage of the entrepreneurs perceived that they would have
to make some changes in their work routine, these changes were not seen as
major problems. To the majority of entrepreneurs, the innovations that they had
introduced or intended to introduce, were not only compatible but also simple to
use. These innovations could be easily operated by their existing employees. Non-
innovative entrepreneurs and innovative entrepreneurs had a similar perception of
the risks involved with innovation adoption. They did not perceive that innovation
250
Chapter Seven
had incurred or would incur high risk. The prestige of having the innovation was
not the important criterion in adoption decisions. The technology under
consideration might not necessarily be the latest in the market. To entrepreneurs
in small firms, the two most important criteria were compatibility and economic
advantages.
Statistically, this study could not show that innovative and non-innovative
entrepreneurs had different perceptions toward their considered innovation.
However, close examination of the entrepreneurs' perceptions of each criterion of
the innovation characteristics showed that the absolute percentage of innovative
entrepreneurs who had a positive perception toward the innovation was relatively
higher compared to that of non-innovative entrepreneurs. We can deduce that the
innovative entrepreneurs tend to have a more positive perception towards
innovation compared to non-innovative entrepreneurs. However, some
entrepreneurs had negative or neutral perceptions toward their innovation. This
indicated there were variations in the perception of the considered innovation
among the entrepreneurs in this study. What were the factors that affected these
variations in their perception? This study hypothesised that the entrepreneurs'
education, their communicative behaviour, the objective characteristics of the
innovation, the entrepreneurs' perception of the buying procedures and their
institutional involvement determined their perception of a considered innovation.
The entrepreneurs' educational level was related to their perception of the
simplicity of the innovation (Table 7.7). The entrepreneurs with higher
educational level had greater ability to learn new and complex tasks. Given an
251
Chapter Seven
equal level of exposure to a technological innovation, entrepreneurs with higher
levels of education would understand the function and the capabilities of the
innovation faster compared to those with lower education. This would explain
their greater tendency to perceive the innovation they considered adopting as
simple to operate.
Entrepreneurs' personality, particularly their n-ach, also influenced their
perception of the economic advantages, compatibility, simplicity and the prestige
of the innovation. High achieving entrepreneurs had a more favourable attitude
toward changes and believed the innovation could bring success to their firms.
These entrepreneurs felt the importance of having the innovation. Their
personality led them to believe that they could handle any tasks that would lead to
the development of their firms, which explains why they perceived innovations as
simple to operate and compatible with their firms' existing technique of
production.
The entrepreneurs' locus of control and attitude toward risks determined
their perceptions of the risks of the innovation. Entrepreneurs with internal locus
of control believed they could manage changes in their firms or risks in the
adoption of a technological innovation. They tended to perceive innovation as
being relatively low-risk. Entrepreneurs with higher propensity to take risks
were more willing to take chances, and perceived adoption of an innovation in
this light. This attitude led them to perceive the considered innovation to be of
low risk. Entrepreneurs who had carried out detailed study into the innovation
they were considering, tended to be knowledgeable about it, and their increased
252
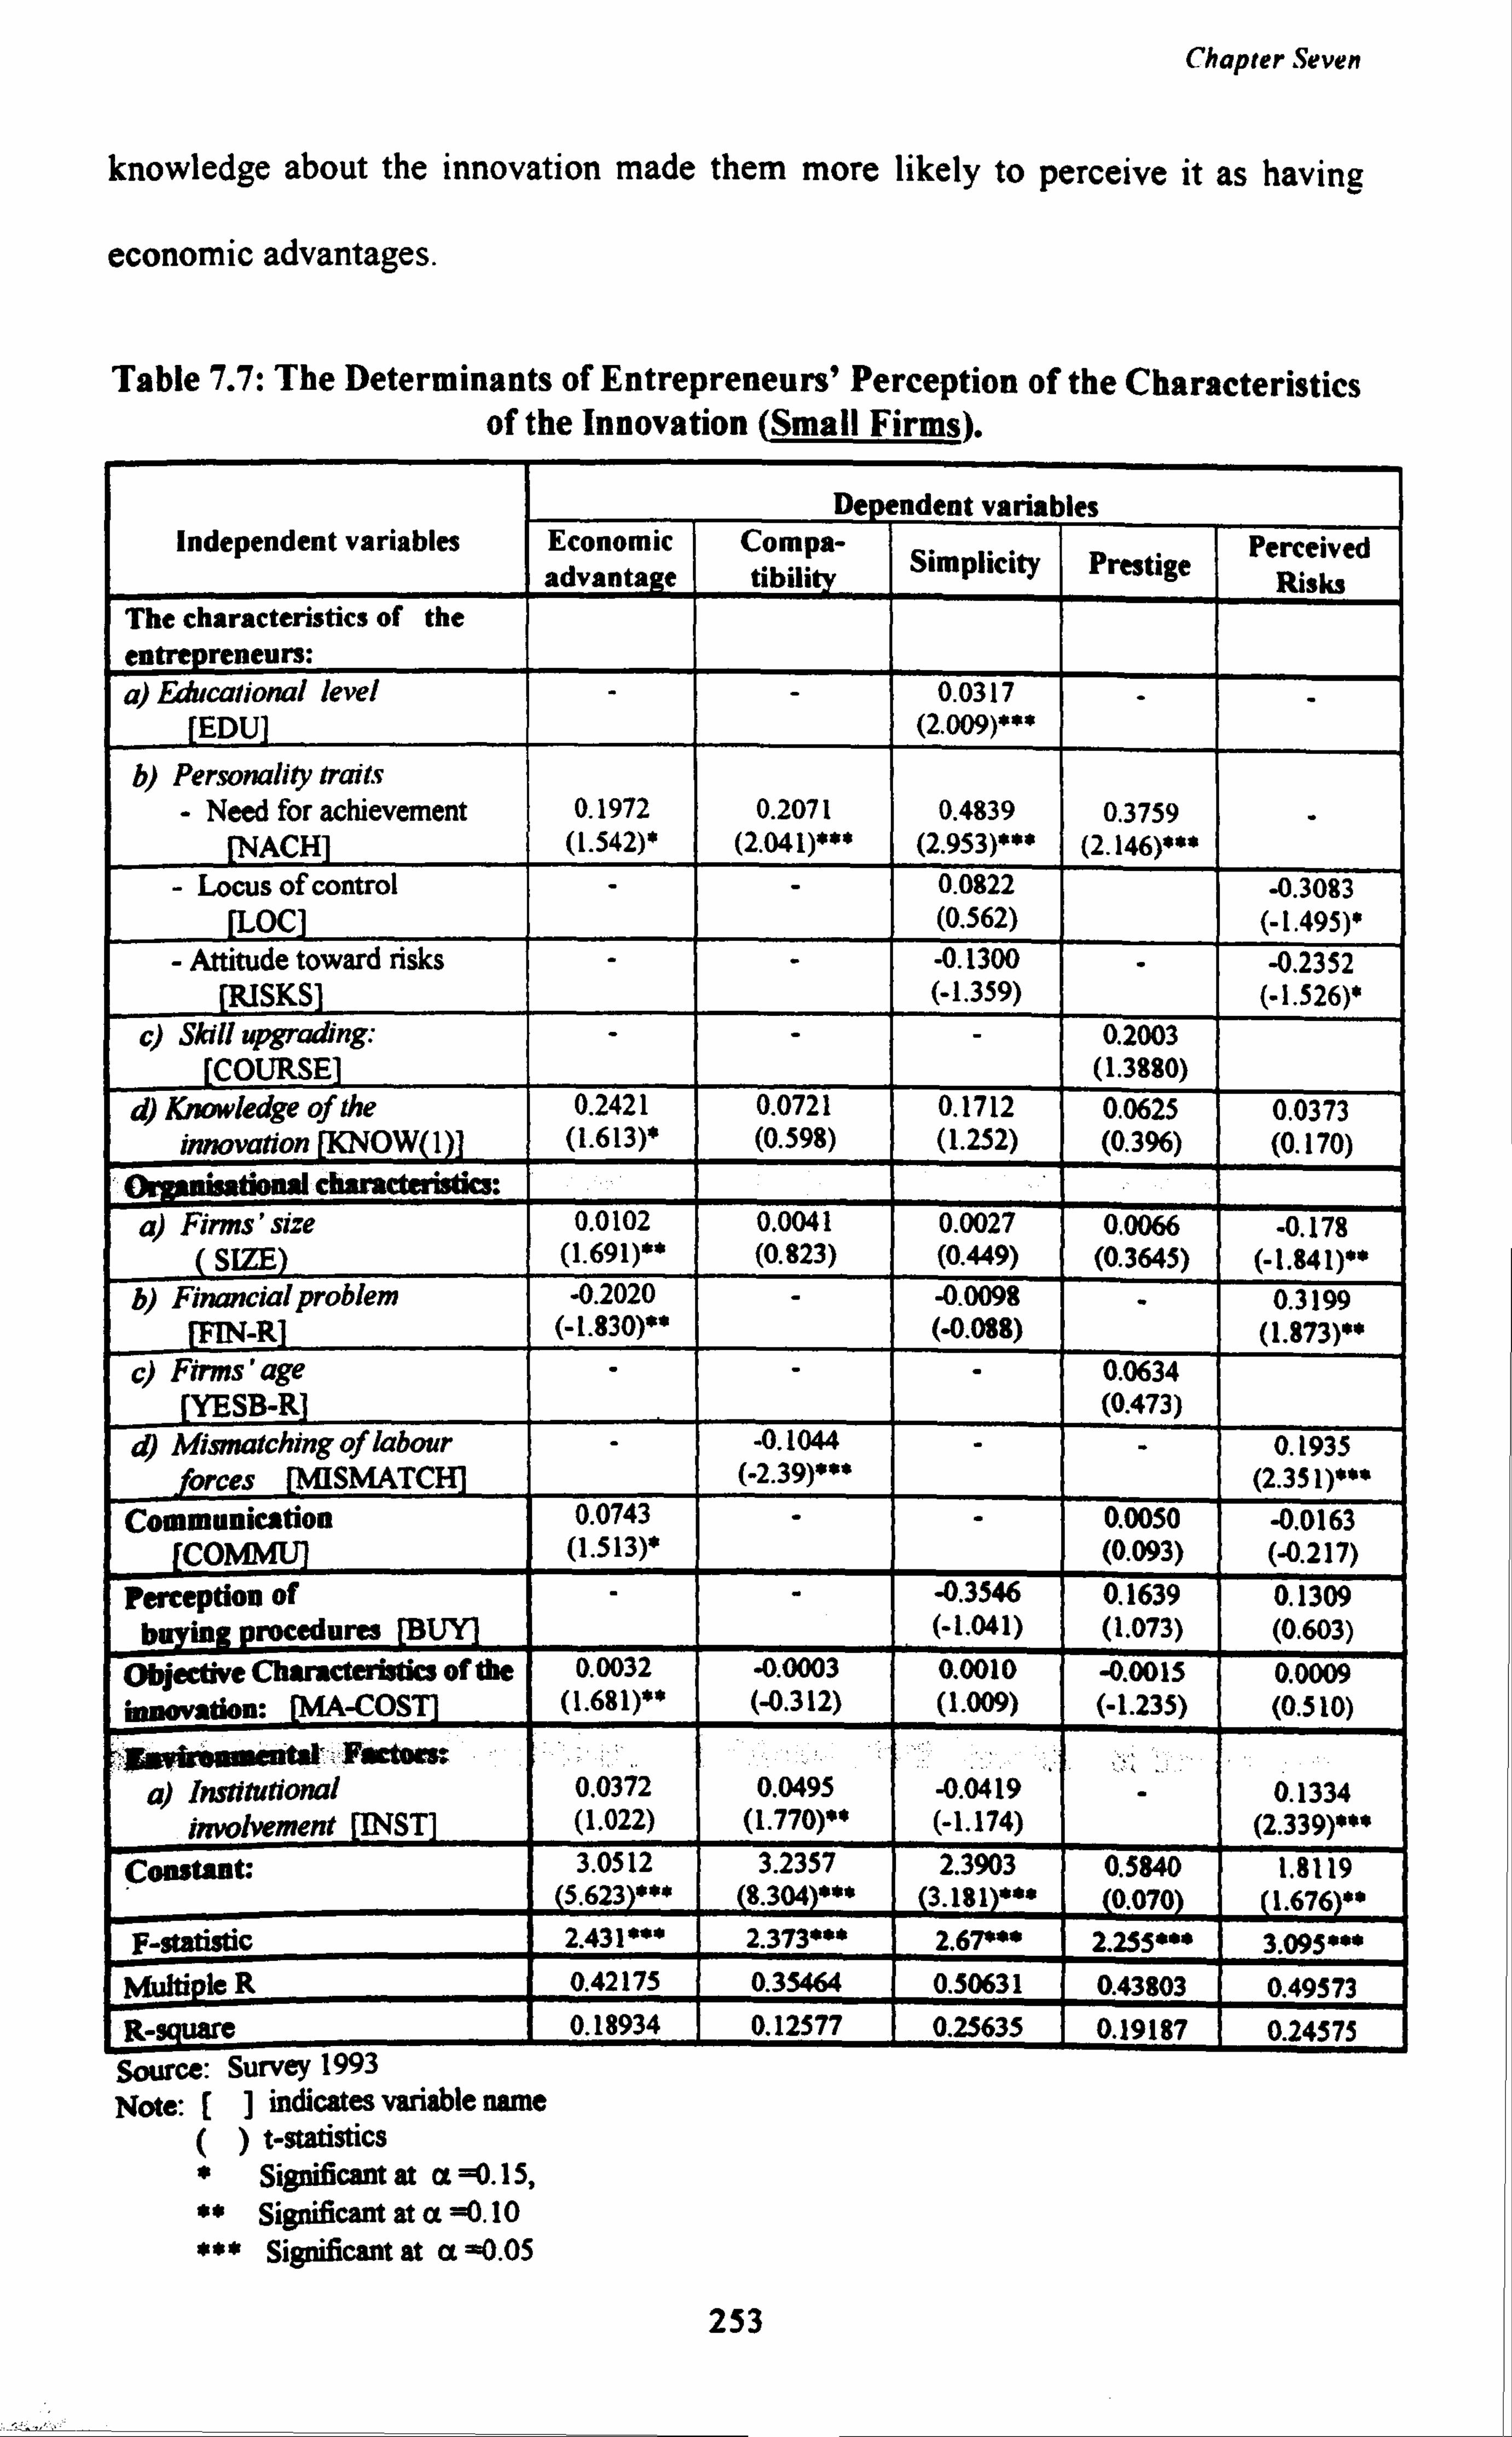
Chapter Seven
knowledge about the innovation made them more likely to perceive it as having
economic advantages.
Table 7.7: The Determinants of Entrepreneurs' Perception of the Characteristics of the Innovation (Small Firms).
De ndent variables Independent variables Economic Compa- Perceived
advantage tibility Simplicity Prestige Risky The characteristics of the
entrepreneurs: a) Educational level - - 0.0317 - - EDU (2.0(9)x:
b) Personality traits - Need for achievement 0.1972 0.2071 0.4839 0.3759
ACH (1.542)' (2.041)'=' (2.953)'"" (2.146)***
- Locus of control - - 0.0822 -0.3083 [LOCI (0.562) (-1.495)'
- Attitude toward risks - - -0.1300 -0.2352 (RISKS] (-1.359) (-1.526)'
c) Skill upgrading: - - - 0.2003 COURSE (1.3880)
d) Knowledge of the 0.2421 0.0721 0.1712 0.0625 0.0373 innovation [KNOW(l)] (1.613)' (0.598) (1.252) (0.396) (0.170)
tiooal character cs: a) Firms' size 0.0 0.0041 0.0027 -0.178
SIZE )"' ( (0.449) (0. ý
) (-1.841)0" b) Financial problem -0.2020 - -0.0098 0.3199
-R (-1.830)** (-0.088) (1.873)""
C) Firms' age - - - 0.0634 (YESB-R] (0.473)
a) Mismatching of labour - -0.1044 - - 0.1935 forces SMATC (-2.39)'. ' (2.351)*$*
Communication 0.0743 - - 0.0050 -0.0163 CO (1.513)' (0.093) (-0.217)
perception of - - -0.3546 0.1639 0.1309 buying Procedures (-1.041) (1.073) (0.603)
objective Characteristics of the 0.0032 -0.0003 0.0010 -0.0015 0.0009 innovation: -COS (1.681). ' (-0.312) (1.009) (-1.235) (0.510)
etat .F rcbors
a) Institutional 0.0372 0.0495 -0.0419 - 0.1334 involvement [INSTJ (1.022) (1.770)0" (-1.174) (2.339)'. "
Cowtant: 3.0512 3.2357 2.3903 0.5840 1.8119 5.623)*** (8.304)*** (3.181)*** 0.070 (1.676)**
F- statistic 2.431". ' 2.373*** 2.67. ** 2.255*0* 3.095*** Multi pie R 0.42175 0.35464 0.50631 0.43803 0.49573
P. -sciuare 0.18934 0.12577 0.25635 0.19187 0.24575 Source: Survey 1993 Note: (] indicates variable name
() t-statistics * Significant at a x. 15, ** Significant at a x. 10 *** Significant at a -0.05
253
Chapter Seven
Besides personal characteristics, organisational characteristics (such as
firm size, financial problems, mismatching of labour force) can also influence
innovation decisions. Firms' size had a bearing on entrepreneurs' perception of
the economic advantages of the innovation and the risks of adopting it.
Entrepreneurs from bigger firms tended to have a positive perception of the
innovations' characteristics, and did not perceive technological innovation as
risky. The explanation presumably lies in the ability of bigger firms to conduct
feasibility and comparative studies on the considered innovation. Entrepreneurs
from bigger firms have better access to information which enables them to
evaluate the economic advantage or possible risks involved in adopting
innovation. But may be it is more profitable for them anyway because of scale
economics.
Firms' financing problems also determined their entrepreneurs' perception
of the economic advantages and risks of adopting the innovation. The results in
Table 7.7 show a negative coefficient suggesting that firms with fewer financing
problems perceived the considered innovation as being more economically
beneficial or less risky. Firms which do not face financing problems are not only
financially secure but they also have the resources to conduct research on the
considered innovation. Firms which are financially secure do not have to spend
additional time searching for loans to finance their considered innovation. This
leads them to develop a more positive perception of the economic advantages of
adopting the innovation.
254
Chapter Seven
Entrepreneurs who perceive that an innovation will result in mismatching
are more likely to reject adoption. This brings to the fore the issue of
compatibility and risk associated with the introduction of technology. Those who
perceive that innovation would not result in mismatching are more likely to think
that the considered innovation is compatible with their existing production
techniques, and therefore less risky.
Through communication, entrepreneurs would learn more about an
innovation. This study showed that entrepreneurs' communicative behaviour had
a bearing on their perception of the economic advantage of the innovation. As we
have mentioned, communicative entrepreneurs have wider business contacts;
thus, they tend to have better access to information regarding the economic
advantages of the innovation.
The characteristics of the innovation also influenced entrepreneurs'
perceptions of its economic advantages. Many entrepreneurs tended to equate cost
with quality. They believe that expensive innovations would produce high quality
products, thus enabling them to increase production, improve their economic
performance and market share. This partly explains why entrepreneurs considering
introducing more expensive innovation tended to perceive that the innovation
would generate greater economic advantages.
The entrepreneurs' institutional involvement appeared to influence their
perception of the compatibility and risks of the innovation. Our results show that
entrepreneurs with higher institutional involvement tended to perceive the
innovation under consideration as compatible to their firms' existing technique of
255
Chapter Seven
production. They also perceived that the innovation had low risks. The results
suggest that institutions have an important role to play in shaping entrepreneurs'
perceptions about innovation. The institutions provide the entrepreneurs with
relevant information and advisory services on various aspects, including
technological innovation. Some agencies even assist small firms to conduct pre-
feasibility studies. Through their institutional involvement, the entrepreneurs can
improve their knowledge of technology, thus explaining their positive attitude
towards the economic advantages resulting from the adoption of technological
innovation.
7.4 The Objective Characteristics of Innovation
This study hypothesised that the cost of adopting innovation had a direct effect on
entrepreneurs' decision to innovate. If the cost of purchase and installation of the
innovation was perceived as high, entrepreneurs might regard the innovation as
not feasible, and abandon the idea. Based on Tables 7.1 and 7.2, we support the
hypothesis that there is a negative relationship between the cost of innovation and
entrepreneurs' decision to adopt technology.
7.4.1 The Objective Characteristics of Innovation Adopted in Tiny Firms
The majority (70.0%) of the innovative entrepreneurs in tiny firms adopted an
innovation costing less than RM10,000. The cost of innovation was very much
affected by the aim of the entrepreneurs to innovate. As Table 7.8 shows, the
majority of these entrepreneurs innovated due to government assistance.
256
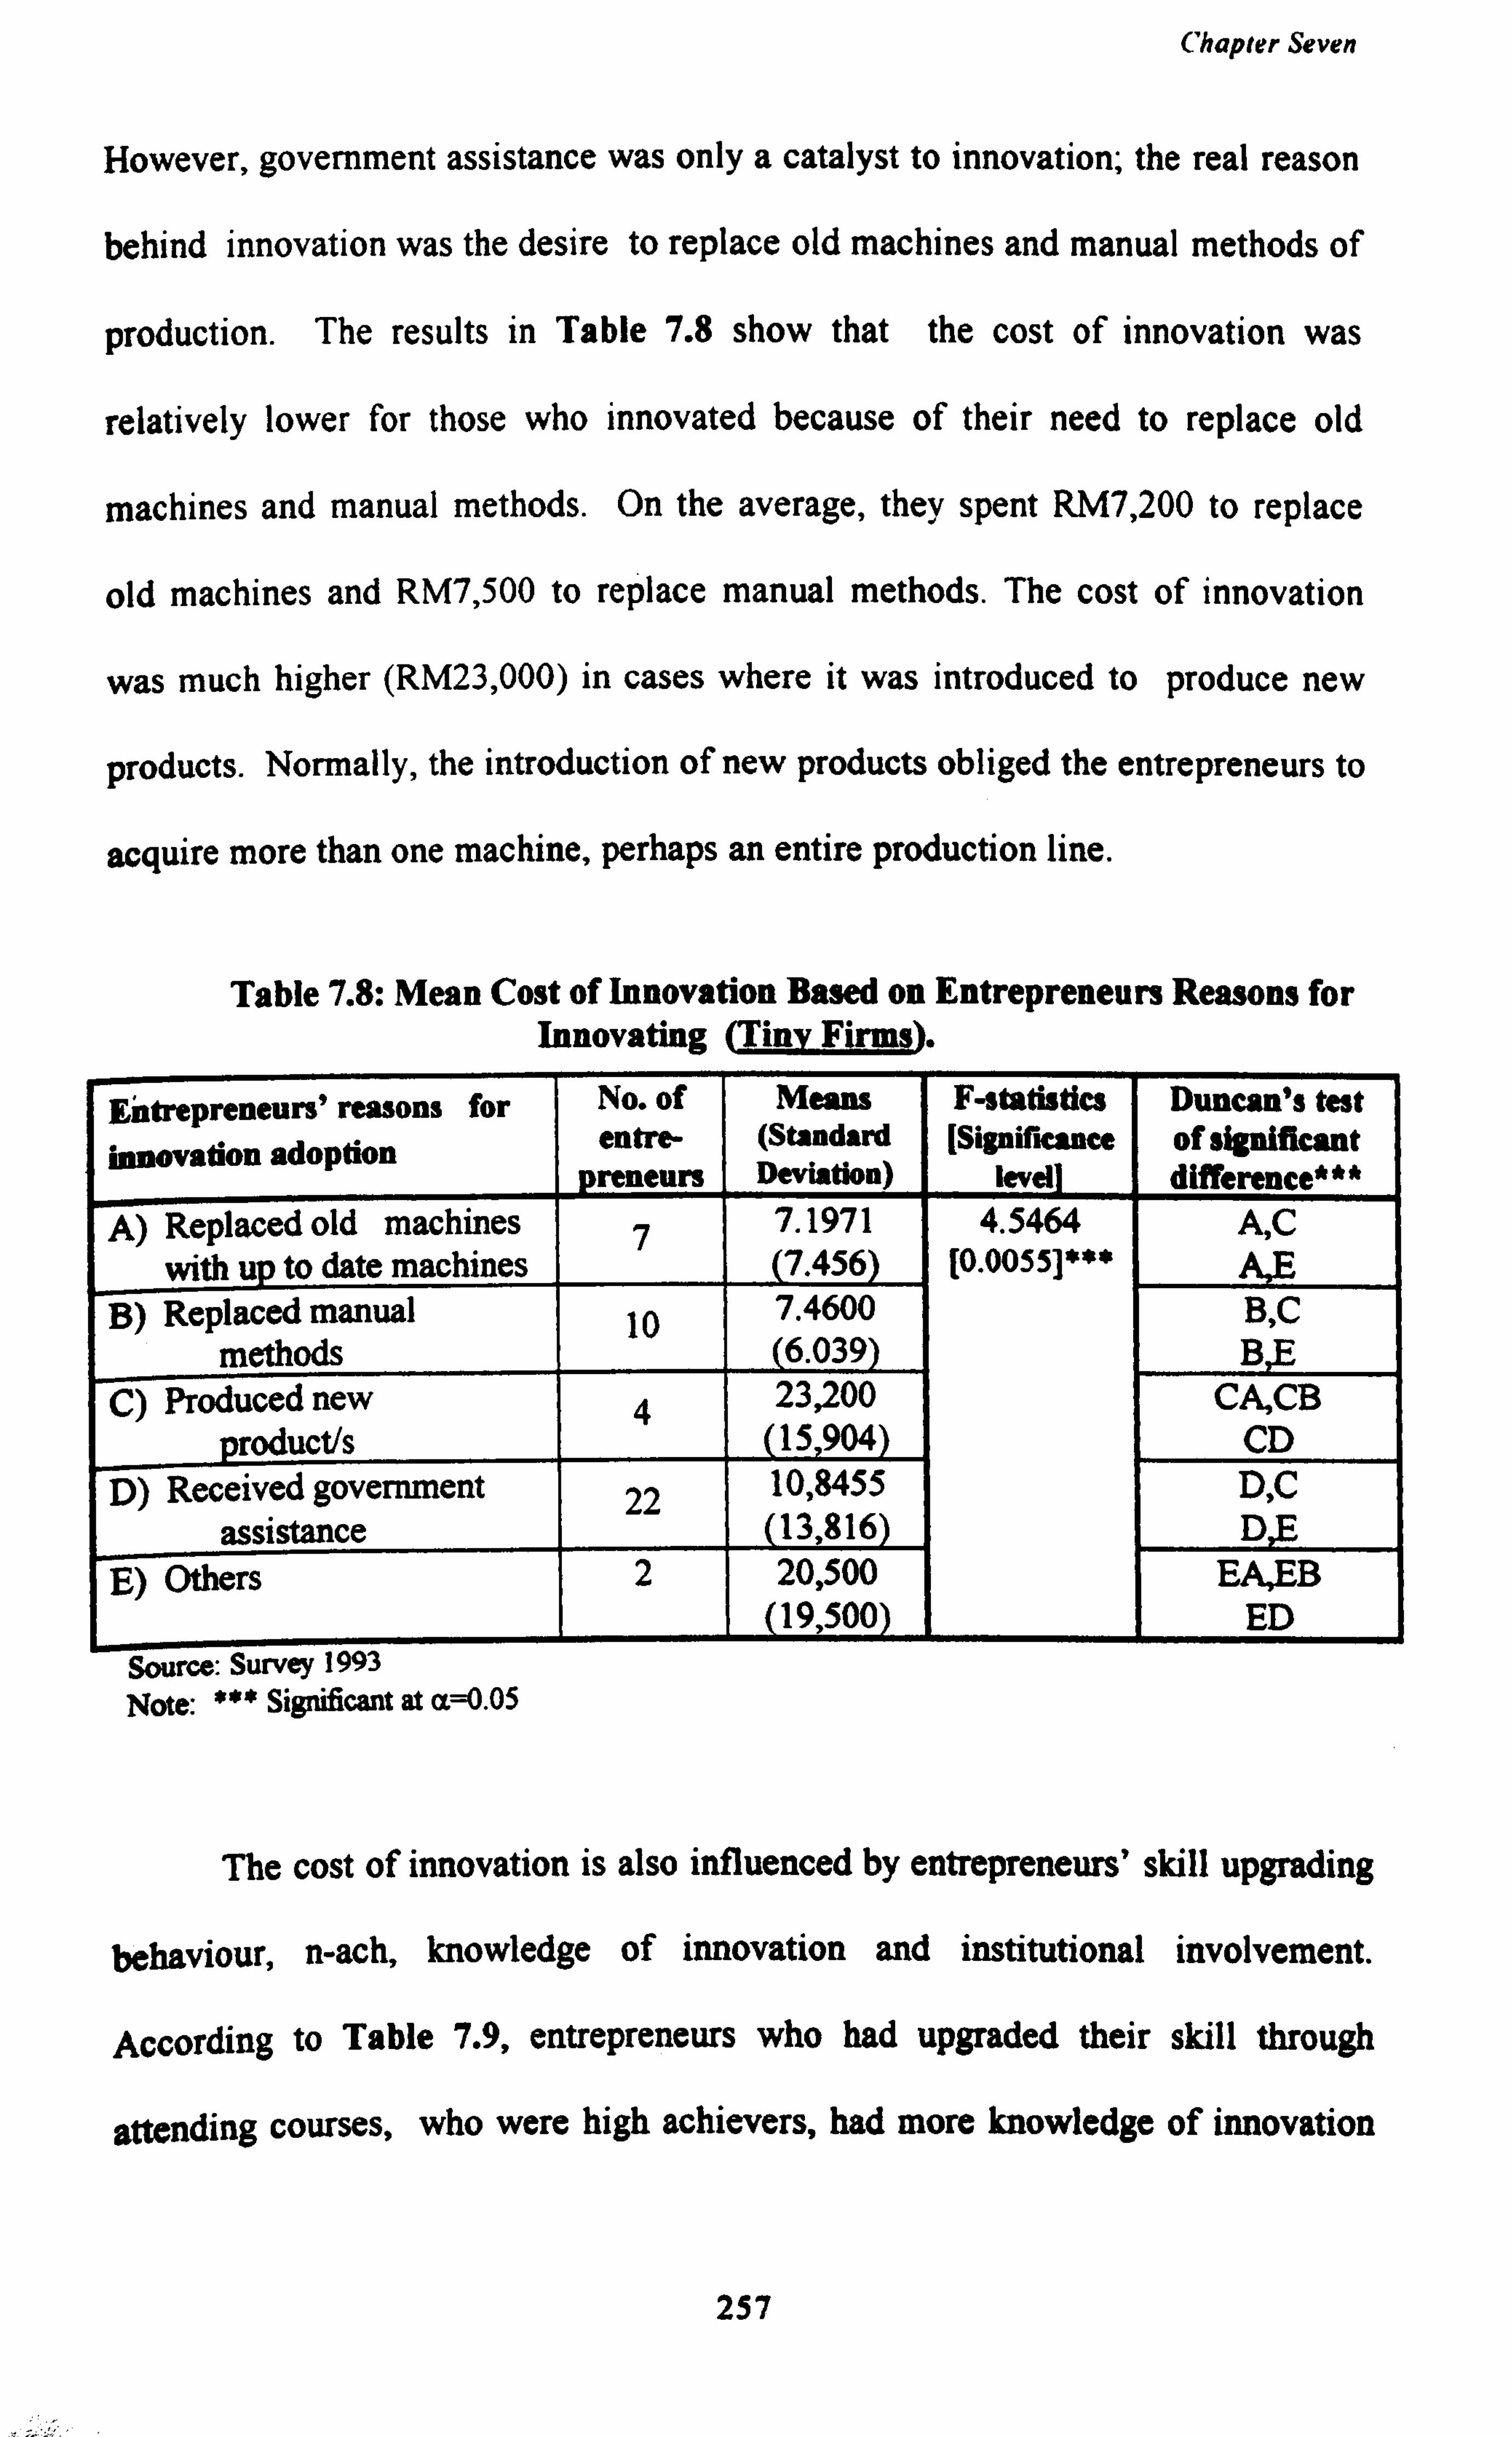
Chapter Seven
However, government assistance was only a catalyst to innovation; the real reason
behind innovation was the desire to replace old machines and manual methods of
production. The results in Table 7.8 show that the cost of innovation was
relatively lower for those who innovated because of their need to replace old
machines and manual methods. On the average, they spent RM7,200 to replace
old machines and RM7,500 to replace manual methods. The cost of innovation
was much higher (RM23,000) in cases where it was introduced to produce new
products. Normally, the introduction of new products obliged the entrepreneurs to
acquire more than one machine, perhaps an entire production line.
Table 7.8: Mean Cost of Innovation Based on Entrepreneurs Reasons for Innovating (Tiny Firms).
Eätrepreneurs' reasons for No. of Means F-statistics Duncan's test innovation adoption entre- (Standard [Significance of significant
preneurs Deviation) level] difference***
A) Replaced old machines 7 7.1971 4.5464 A, C with up to date machines (7.456) [0.0055]***
B) Replaced manual 10 7.4600 B, C
methods (6.039) BE C) Produced new 4 23,200 CA, CB
product's (15,904) CD D) Received government 22 10,8455 D, C
assistance (13,816) DE E) Others 2 20,500 EA, EB
(19,500) ED Source: Survey 1993 Note: *** Significant at aß. 05
The cost of innovation is also influenced by entrepreneurs' skill upgrading
behaviour, n-ach, knowledge of innovation and institutional involvement.
According to Table 7.9, entrepreneurs who had upgraded their skill through
attending courses, who were high achievers, had more knowledge of innovation
257
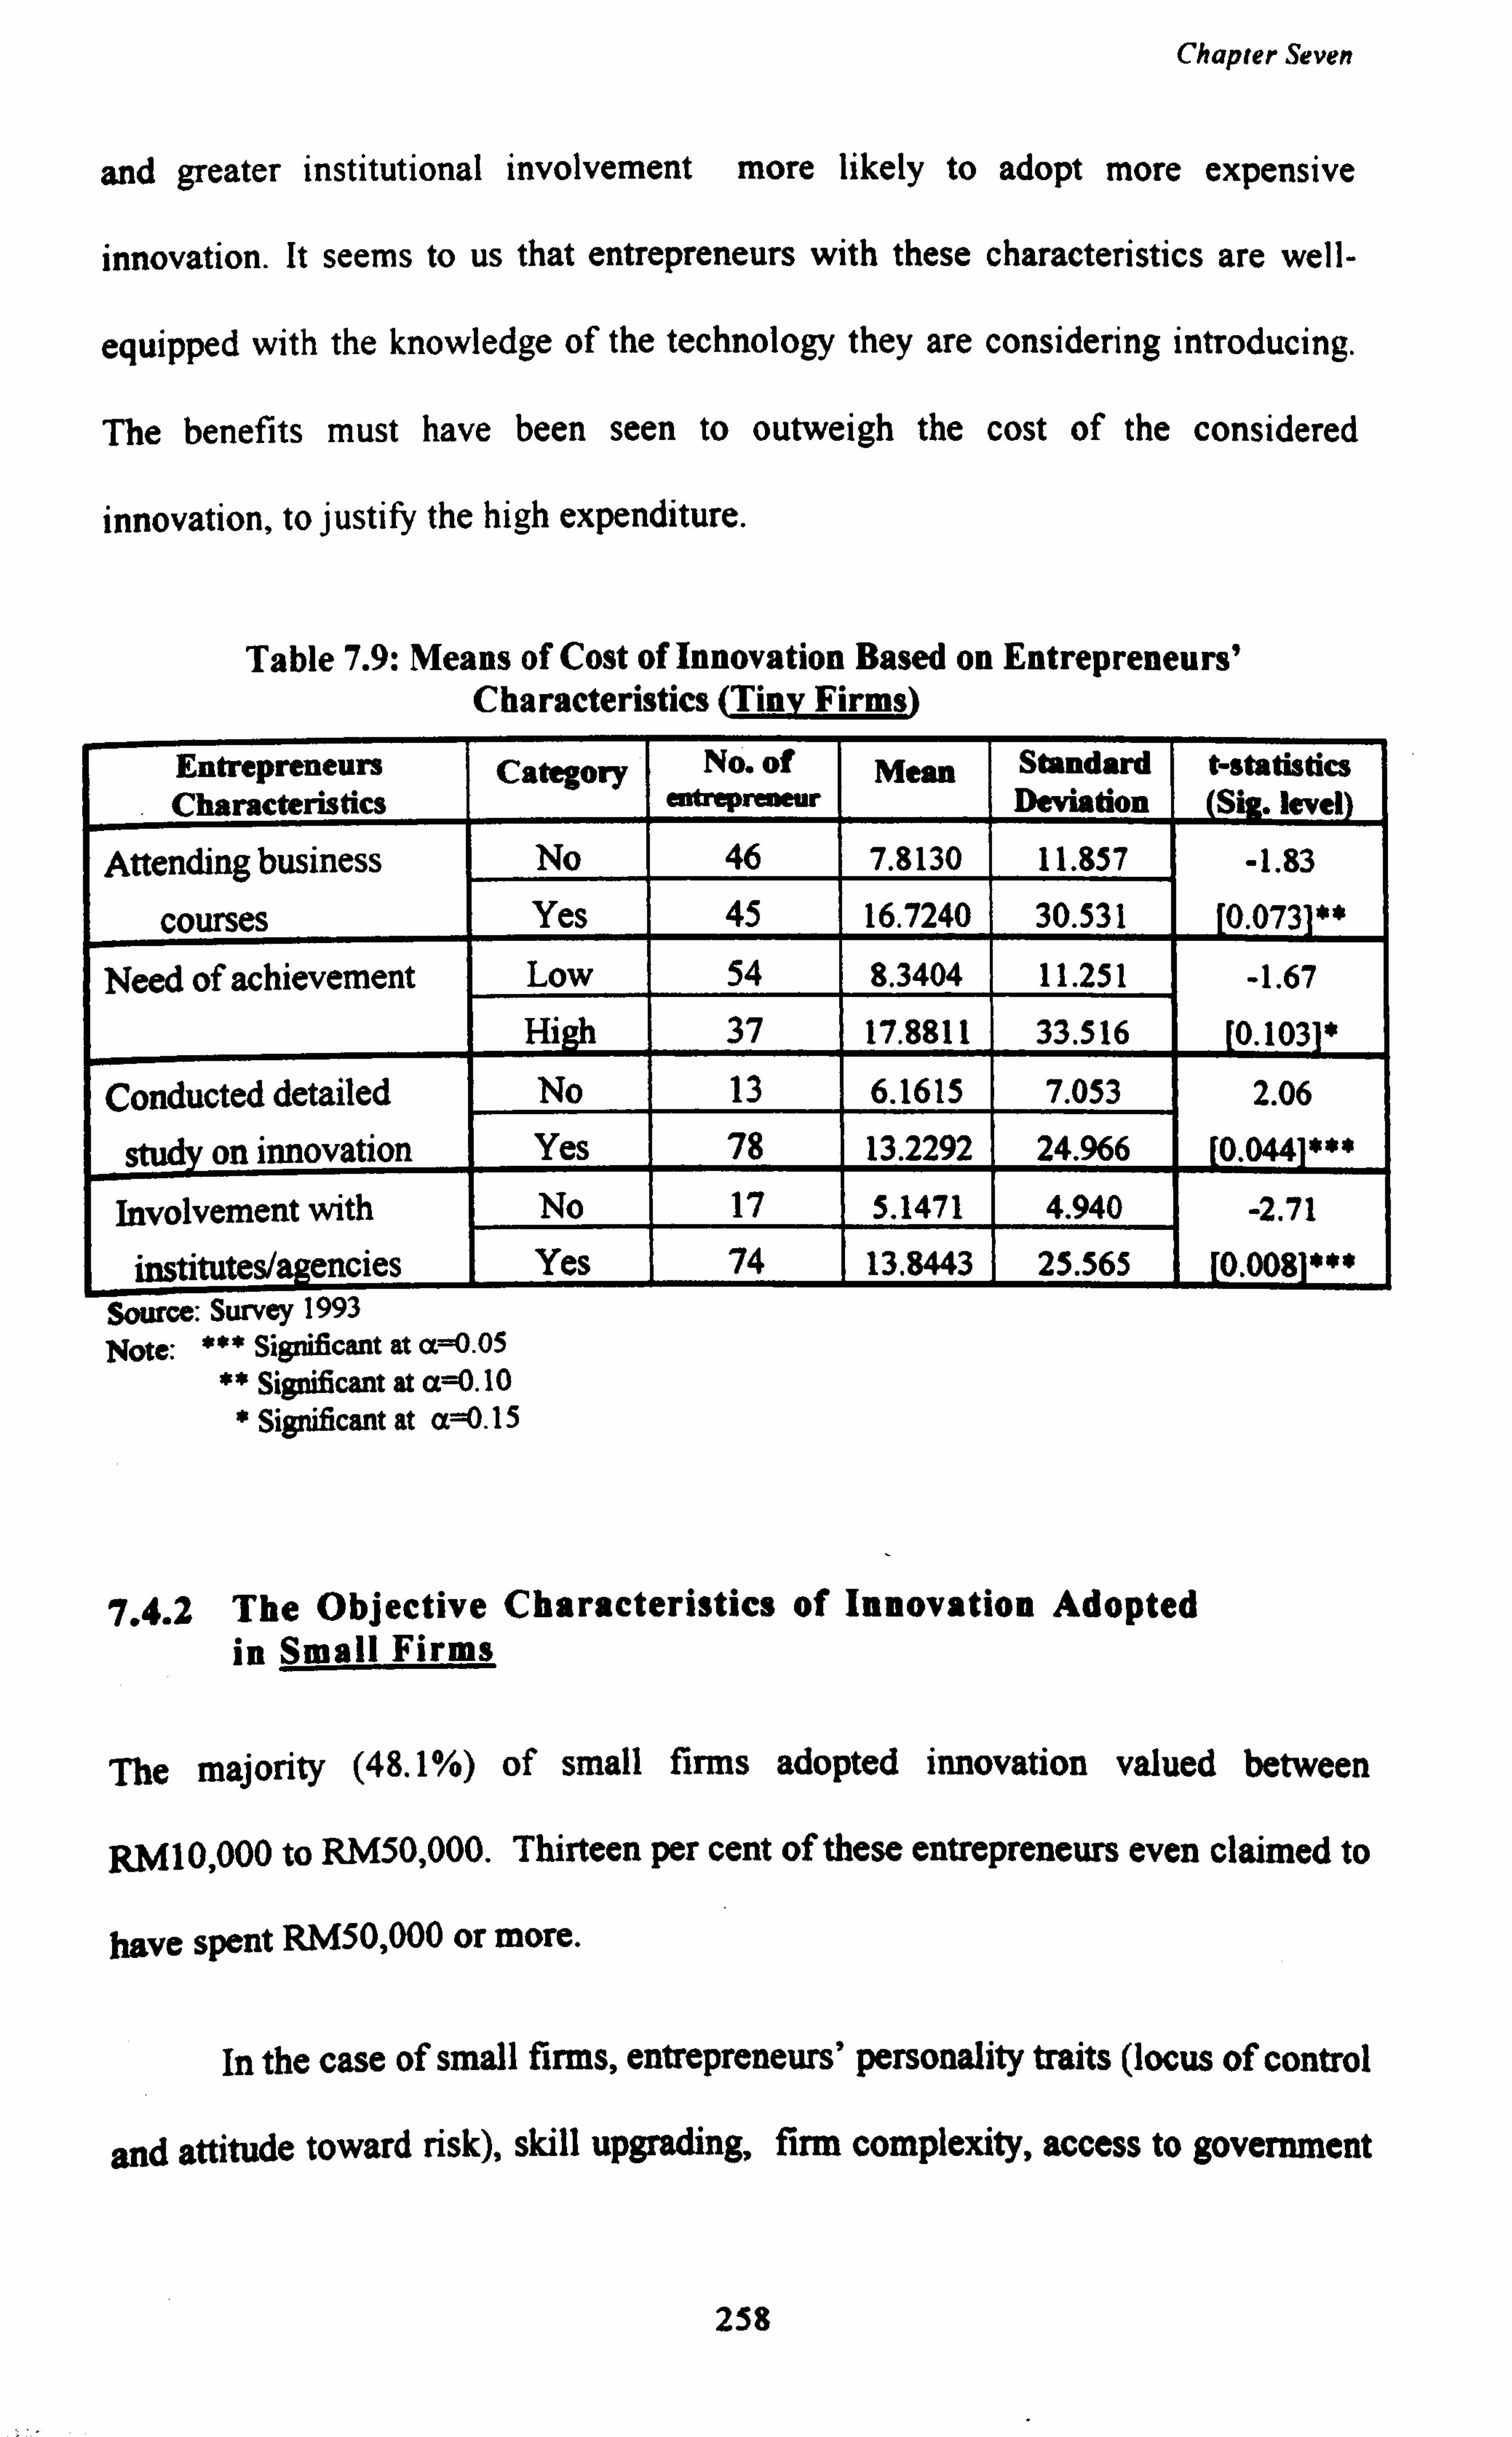
Chapter Seven
and greater institutional involvement more likely to adopt more expensive
innovation. It seems to us that entrepreneurs with these characteristics are well-
equipped with the knowledge of the technology they are considering introducing.
The benefits must have been seen to outweigh the cost of the considered
innovation, to justify the high expenditure.
Table 7.9: Means of Cost of Innovation Based on Entrepreneurs' Characteristics (Tiny Firms)
Entrepreneurs Characteristics
Category No. of mtrepreneur
Mean Standard Deviation
t -statistics (Sig. level
Attending business No 46 7.8130 11.857 -1.83 courses Yes 45 16.7240 30.531 [0.0731**
Need of achievement Low 54 8.3404 11.251 -1.67 High 37 17.8811 33.516 0.103 *
Conducted detailed No 13 6.1615 7.053 2.06
study on innovation Yes 78 13.2292 24.966 [0.0441***
Involvement with No 17 5.1471 4.940 -2.71 institutes/ agencies Yes 74 13.8443 25.565 0.008 ***
Source: Survey 1993 Note: *** Significant at aß. 05
** Significant at a 0.10 * Significant at cc=O. 15
7.4.2 The Objective Characteristics of Innovation Adopted in Small Firms
The majority (48.1%) of small firms adopted innovation valued between
RM10,000 to RM50,000. Thirteen per cent of these entrepreneurs even claimed to
have spent RMS0,000 or more.
In the case of small firms, entrepreneurs' personality traits (locus of control
and attitude toward risk), skill upgrading, firm complexity, access to government
258
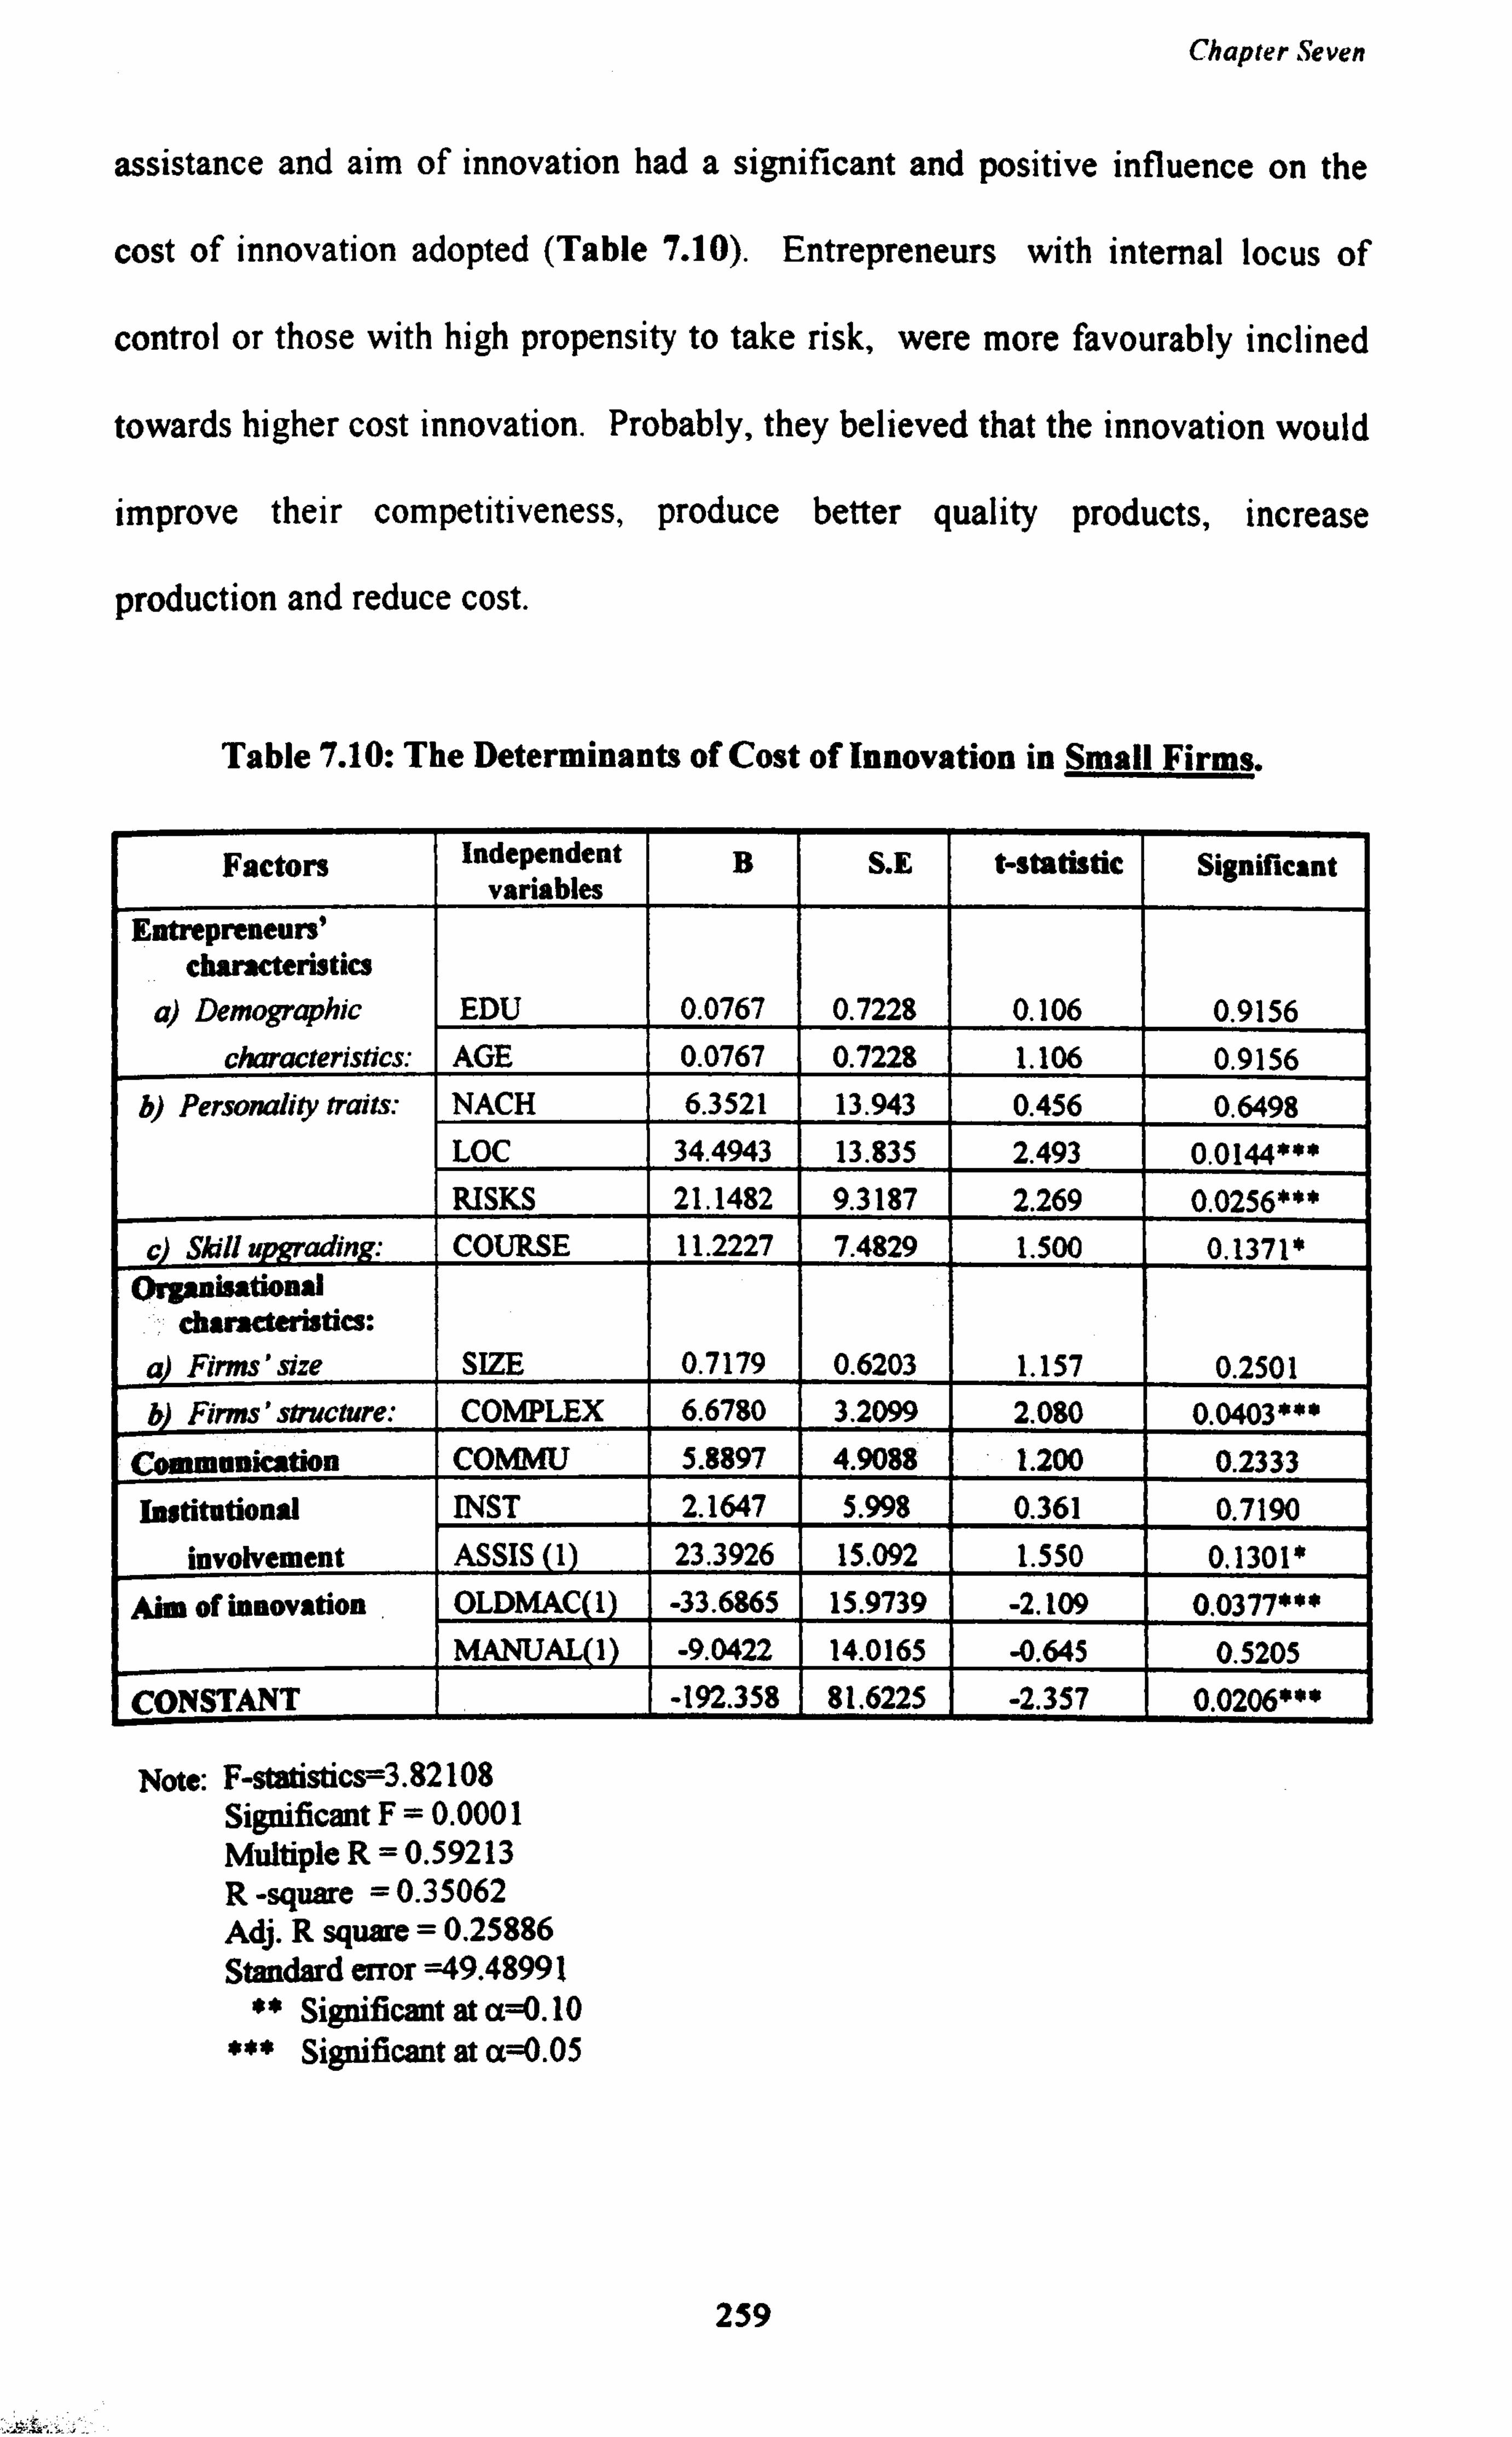
Chapter Seven
assistance and aim of innovation had a significant and positive influence on the
cost of innovation adopted (Table 7.10). Entrepreneurs with internal locus of
control or those with high propensity to take risk, were more favourably inclined
towards higher cost innovation. Probably, they believed that the innovation would
improve their competitiveness, produce better quality products, increase
production and reduce cost.
Table 7.10: The Determinants of Cost of Innovation in Small Firms.
Factors Independent variables
B S. E t -statistic Significant
Entrepreneurs' characteristics
a) Demographic EDU 0.0767 0.7228 0.106 0.9156
characteristics: AGE 0.0767 0.7228 1.106 0.9156 b) Personality traits: NACH 6.3521 13.943 0.456 0.6498
LOC 34.4943 13.835 2.493 0.0144*** RISKS 21.1482 9.3187 2.269 0.0256***
adin : c Skill upgr COURSE 11.2227 7.4829 1.500 0.1371 * Organisational
characteristics: a Firms' size SIZE 0.7179 0.6203 1.157 0.2501 b) Firms' structure: COMPLEX 6.6780 3.2099 2.080 0.0403***
Communication COMMU 5.8897 4.9088 1.200 0.2333
Institutional INST 2.1647 5.998 0.361 0.7190
involvement ASSIS (1) 23.3926 15.092 1.550 0.1301*
Aim of innovation OLDMAC 1 -33.6865 15.9739 -2.109 0.0377*** MANUAL(1) -9.0422 14.0165 -0.645 0.5205
CONSTANT -192.358 81.6225 -2.357 0.0206***
Note: F-statistics=3.82108 Significant F=0.0001 Multiple R=0.59213 R -square =0.35062 Adj. R square = 0.25886 Standard error =49.48991
** Significant at a 0.10 *** Significant at a=0.05
259
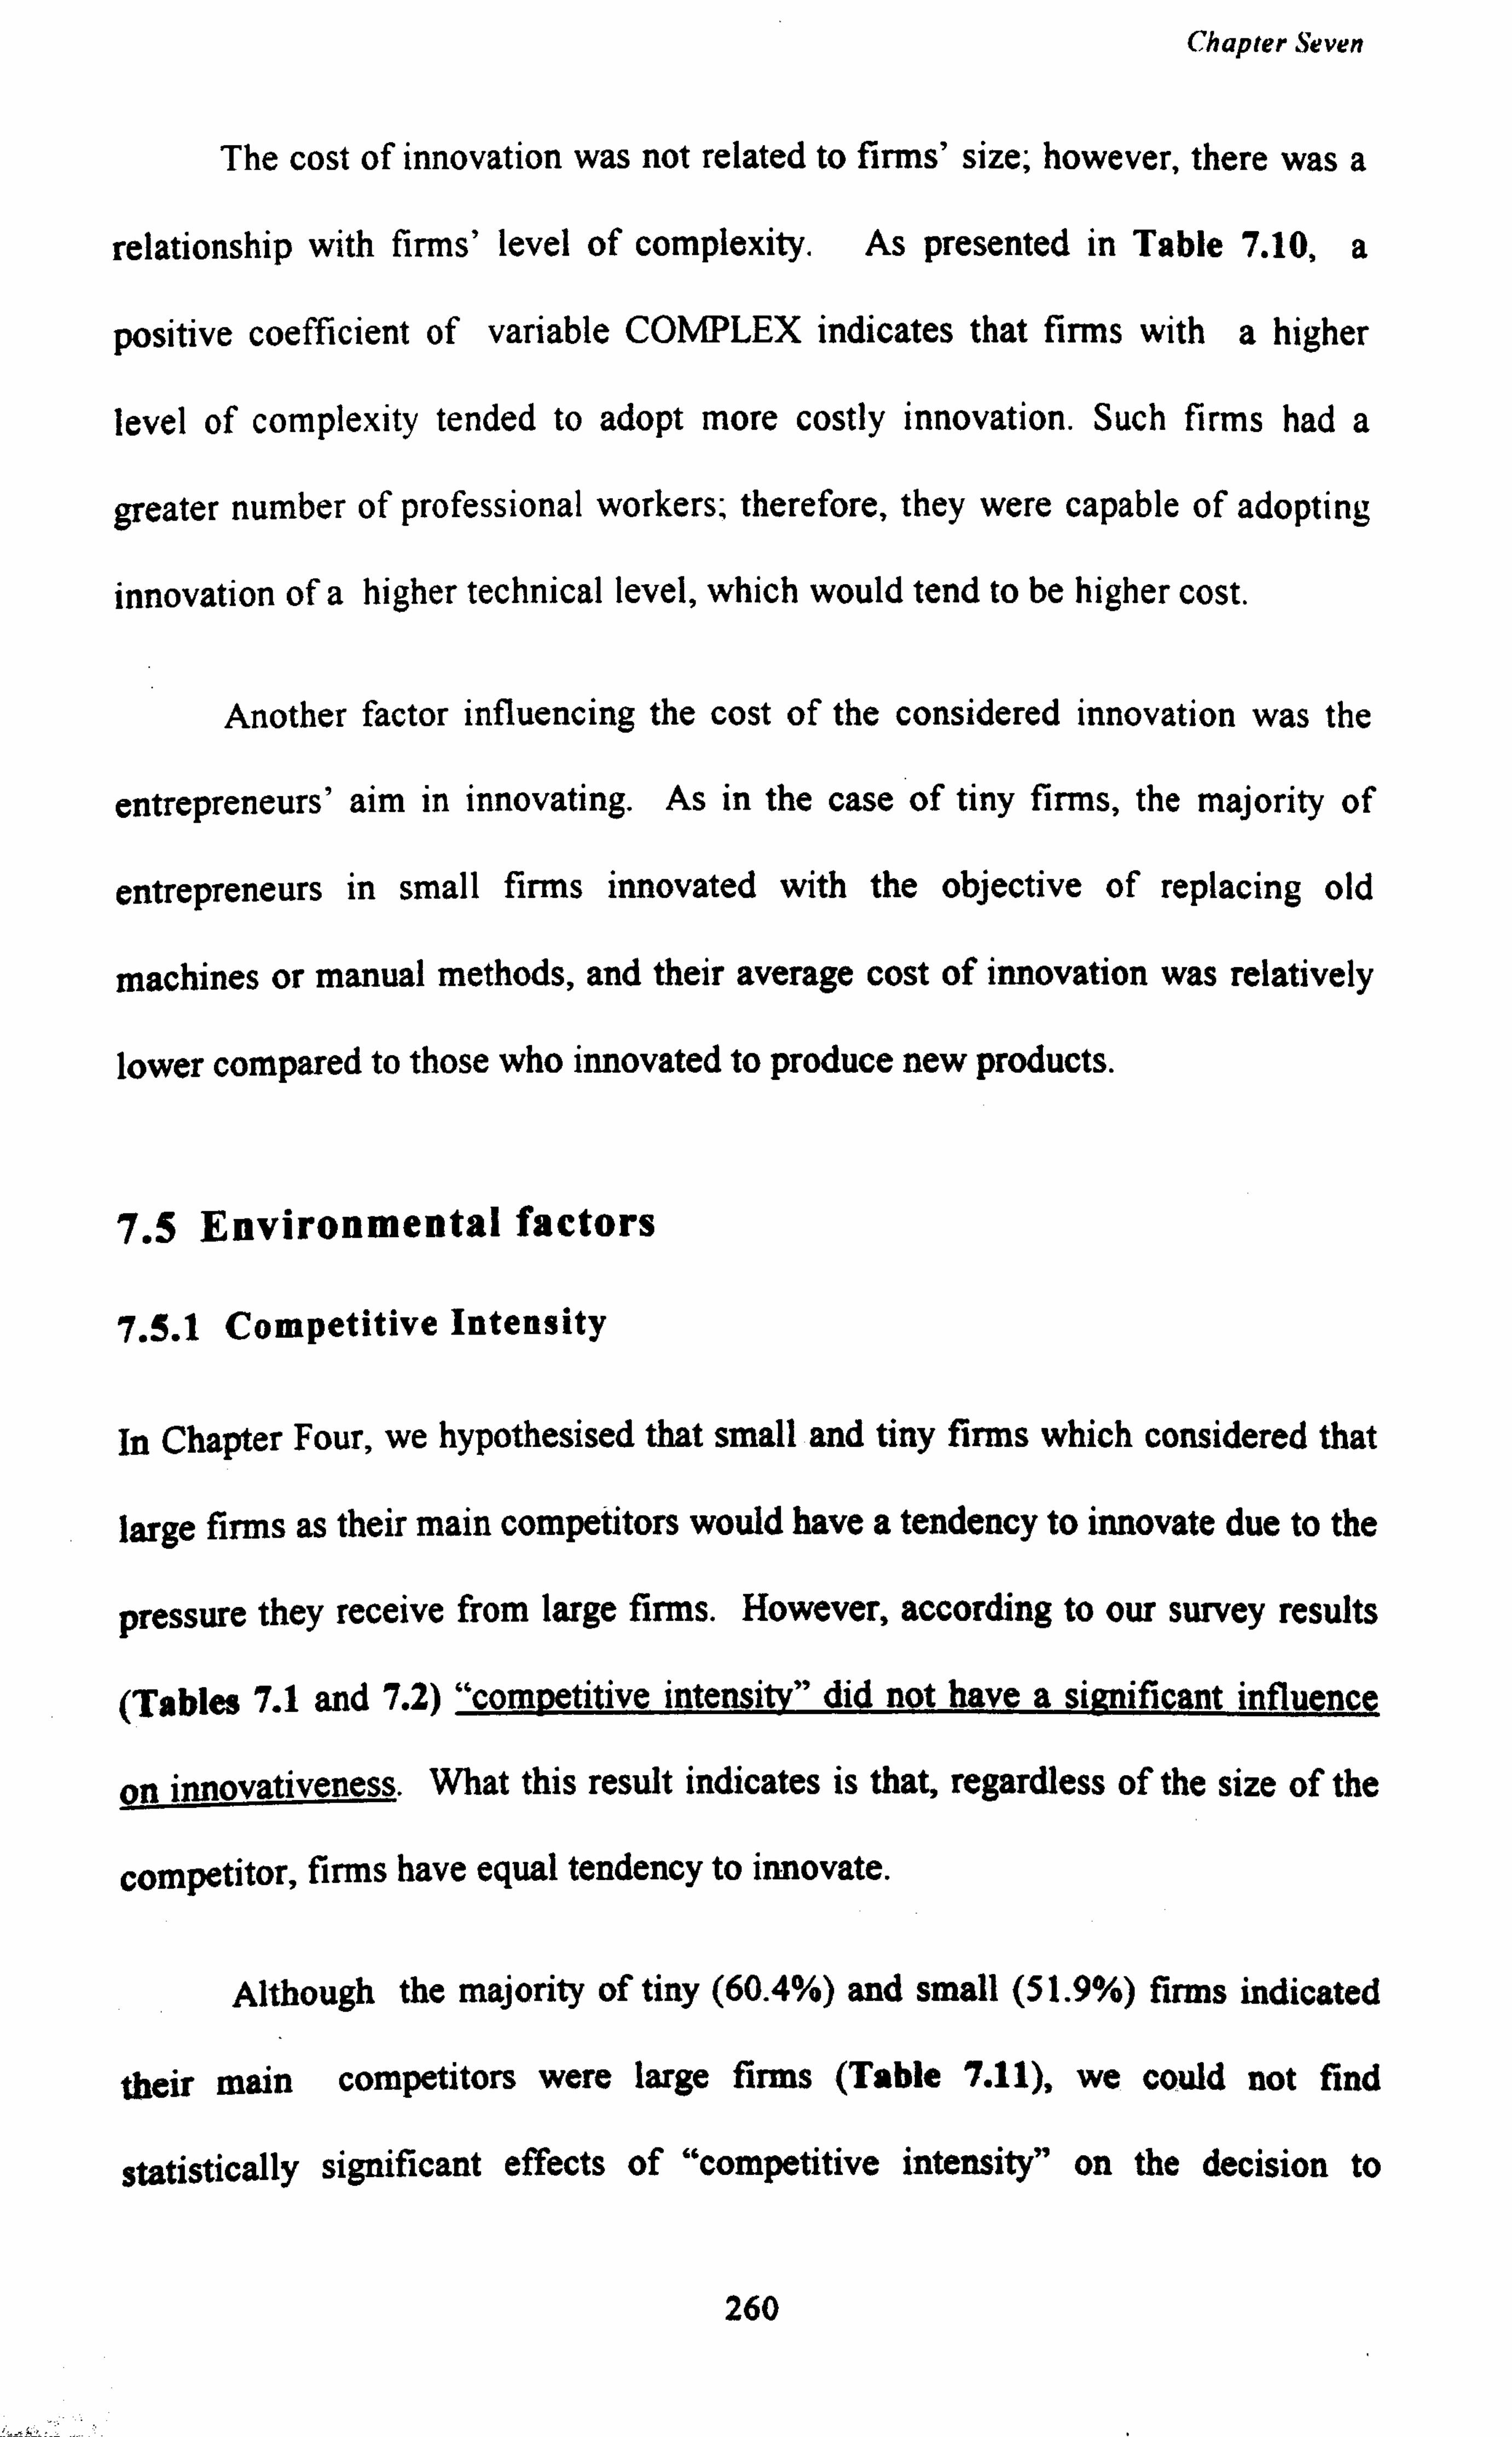
Chapter Seven
The cost of innovation was not related to firms' size; however, there was a
relationship with firms' level of complexity. As presented in Table 7.10, a
positive coefficient of variable COMPLEX indicates that firms with a higher
level of complexity tended to adopt more costly innovation. Such firms had a
greater number of professional workers, therefore, they were capable of adopting
innovation of a higher technical level, which would tend to be higher cost.
Another factor influencing the cost of the considered innovation was the
entrepreneurs' aim in innovating. As in the case of tiny firms, the majority of
entrepreneurs in small firms innovated with the objective of replacing old
machines or manual methods, and their average cost of innovation was relatively
lower compared to those who innovated to produce new products.
7.5 Environmental factors
7.5.1 Competitive Intensity
In Chapter Four, we hypothesised that small and tiny firms which considered that
large firms as their main competitors would have a tendency to innovate due to the
pressure they receive from large firms. However, according to our survey results
(Tables 7.1 and 7.2) "competitive intensity" did not have a significant influence
on innovativeness. What this result indicates is that, regardless of the size of the
competitor, firms have equal tendency to innovate.
Although the majority of tiny (60.4%) and small (51.9%) firms indicated
their main competitors were large firms (Table 7.11), we could not find
statistically significant effects of "competitive intensity" on the decision to
260
Chapter Seven
innovate. Where firms faced competition, mainly from bigger firms, innovative
ability was not significantly different from that of firms which faced competition
mainly from small firms. It may be that we could not find a good proxy for
competitive intensity. Although big firms may in principle be competitors, in
practice, small firms may be producing more similar products. Later, in section
8.7, we will see that firms with lower profitability (in the case of small firms)
show a higher tendency to innovate; it may be that this variable has captured the
effect of competitive intensity.
Table 7.11: Distribution of Firms Based on Their Main Competitors.
TINY FIRMS SMALL FIRMS
Size of main Competitors
Non- Innovative
Innovative Non- Innovative
Innovative
No. % No. % No % No %
Large firms 33 64.7 22 55.0 31 63.3 24 42.1
Medium firms 5 9.8 9 22.5 11 22.4 17 29.8
Small firms 13 25.5 9 22.5 7 14.3 16 28.1
Total 51 100.0 40 100.0 49 100.0 57 100.0 Source: Survey 1993 Note: TiM fums: Pearson chi-square=2.78110, df2, significance level 0.24894
Small firms: Pearson chi-square=3.12378, df2, significance level=0.17716
7.5.2 Institutional Involvement
Discussion in Chapter Two have highlighted the importance of institutional
involvement in developing entrepreneurial skill, providing R&D facilities, and
providing advisory services to small producers. We hypothesised that institutional
involvement had causal influence on entrepreneurs' decision to innovate. our
261
Chapter Seven
study reveals that institutional involvement is a significant determinant of
innovation decision. (Tables 7.1 and 7.2)
Table 7.12 shows the percentage distribution of entrepreneurs who had
consulted at least one institution during the five years previous to the date of this
study. Our results show that 68.1 per cent of tiny firms and 69 per cent of small
firms had consulted at least one institution, on one occasion. MARDI, MARA and
KEMAS were the most popular institutions visited frequently by entrepreneurs
from small and tiny firms.
(a) Malaysian Agricultural Research & Development Institute (MARDI)
MARDI was consulted by 26.4 per cent of entrepreneurs from tiny firms and 41.5
per cent from small firms. Their main purposes in these visits were to obtain
advice on appropriate processing methods and quality control. Entrepreneurs in
the bakery business, tomato and chilli sauce making used MARDI as their main
source of information on production techniques. In fact, MARDI has a bakery
factory which operates daily and uses this factory as a laboratory for its course
participants. The factory is considered to represent a model which can be
appropriately adapted by small and medium scale producers. Entrepreneurs who
produced noodles, spices and drinks used MARDI to obtain advice on quality
control and product analysis. For new entrepreneurs or entrepreneurs who wanted
to innovate, the majority consulted MARDI to obtain information on appropriate
machinery for their production.
262
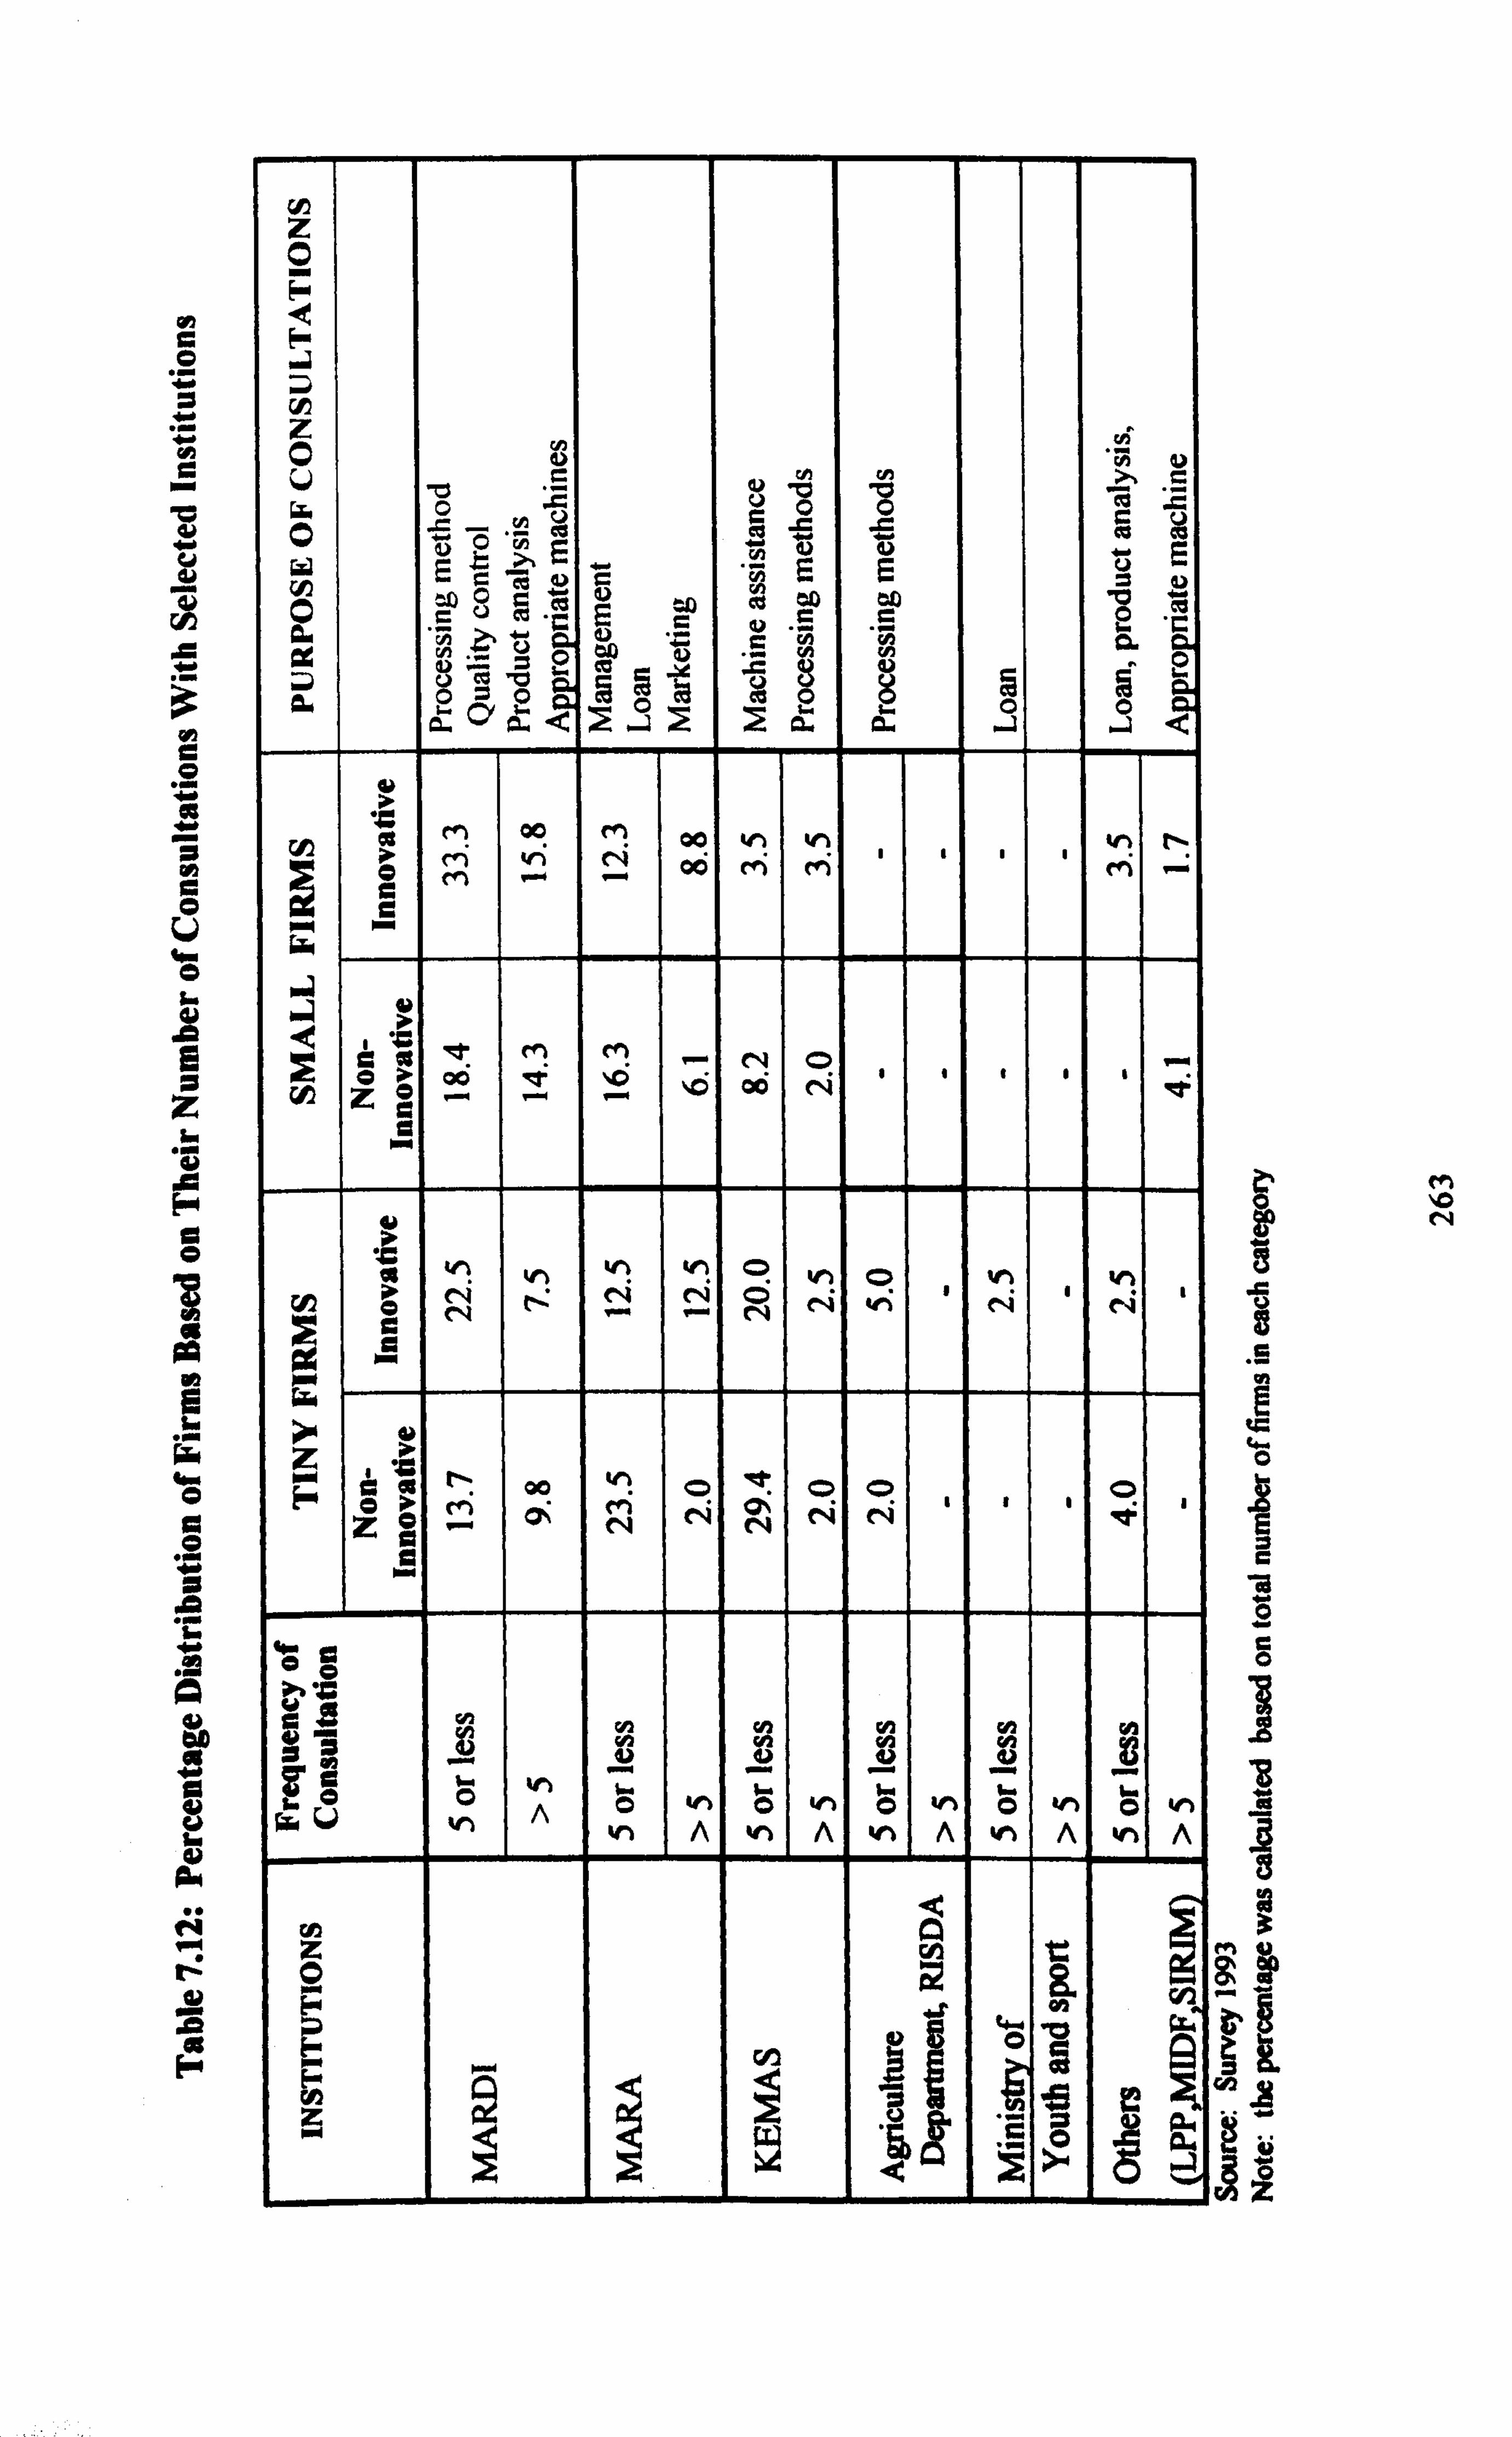
I, 0
3
0
0 U 0 L
I ß
0 0
ii
N
F-
O F
z O N y of 6) C N N C
ý sý "ý
ý ýs s ýß
'N c ee aý e Ec `ý c c
ýu ö cd 'V G
rn vg 'O R
O
bA j R
-X 5 et{ ßä m
v m cý a7
rßä O
o " O O äO'ä
c °a eC O
ci O ä
M 00 i
M 00 V1 w1 *f i_ M v pp M M m -
C
iÖ -. . - - O OC (V et
C
ä v1 ý v1 v1 O yý O Y1 h
C Ö N N N N h ý N ' N
Gtr
~ C N oo O O O O Z0 - N N N N N
O
y d% N H
CI, h yý
V ö ö ö ö ö V-1 A A
ö g
8 ö 5 w m
1- M
r
s v
e
w O
0 C
r O
C O
I
8
3
ü
M ýO N
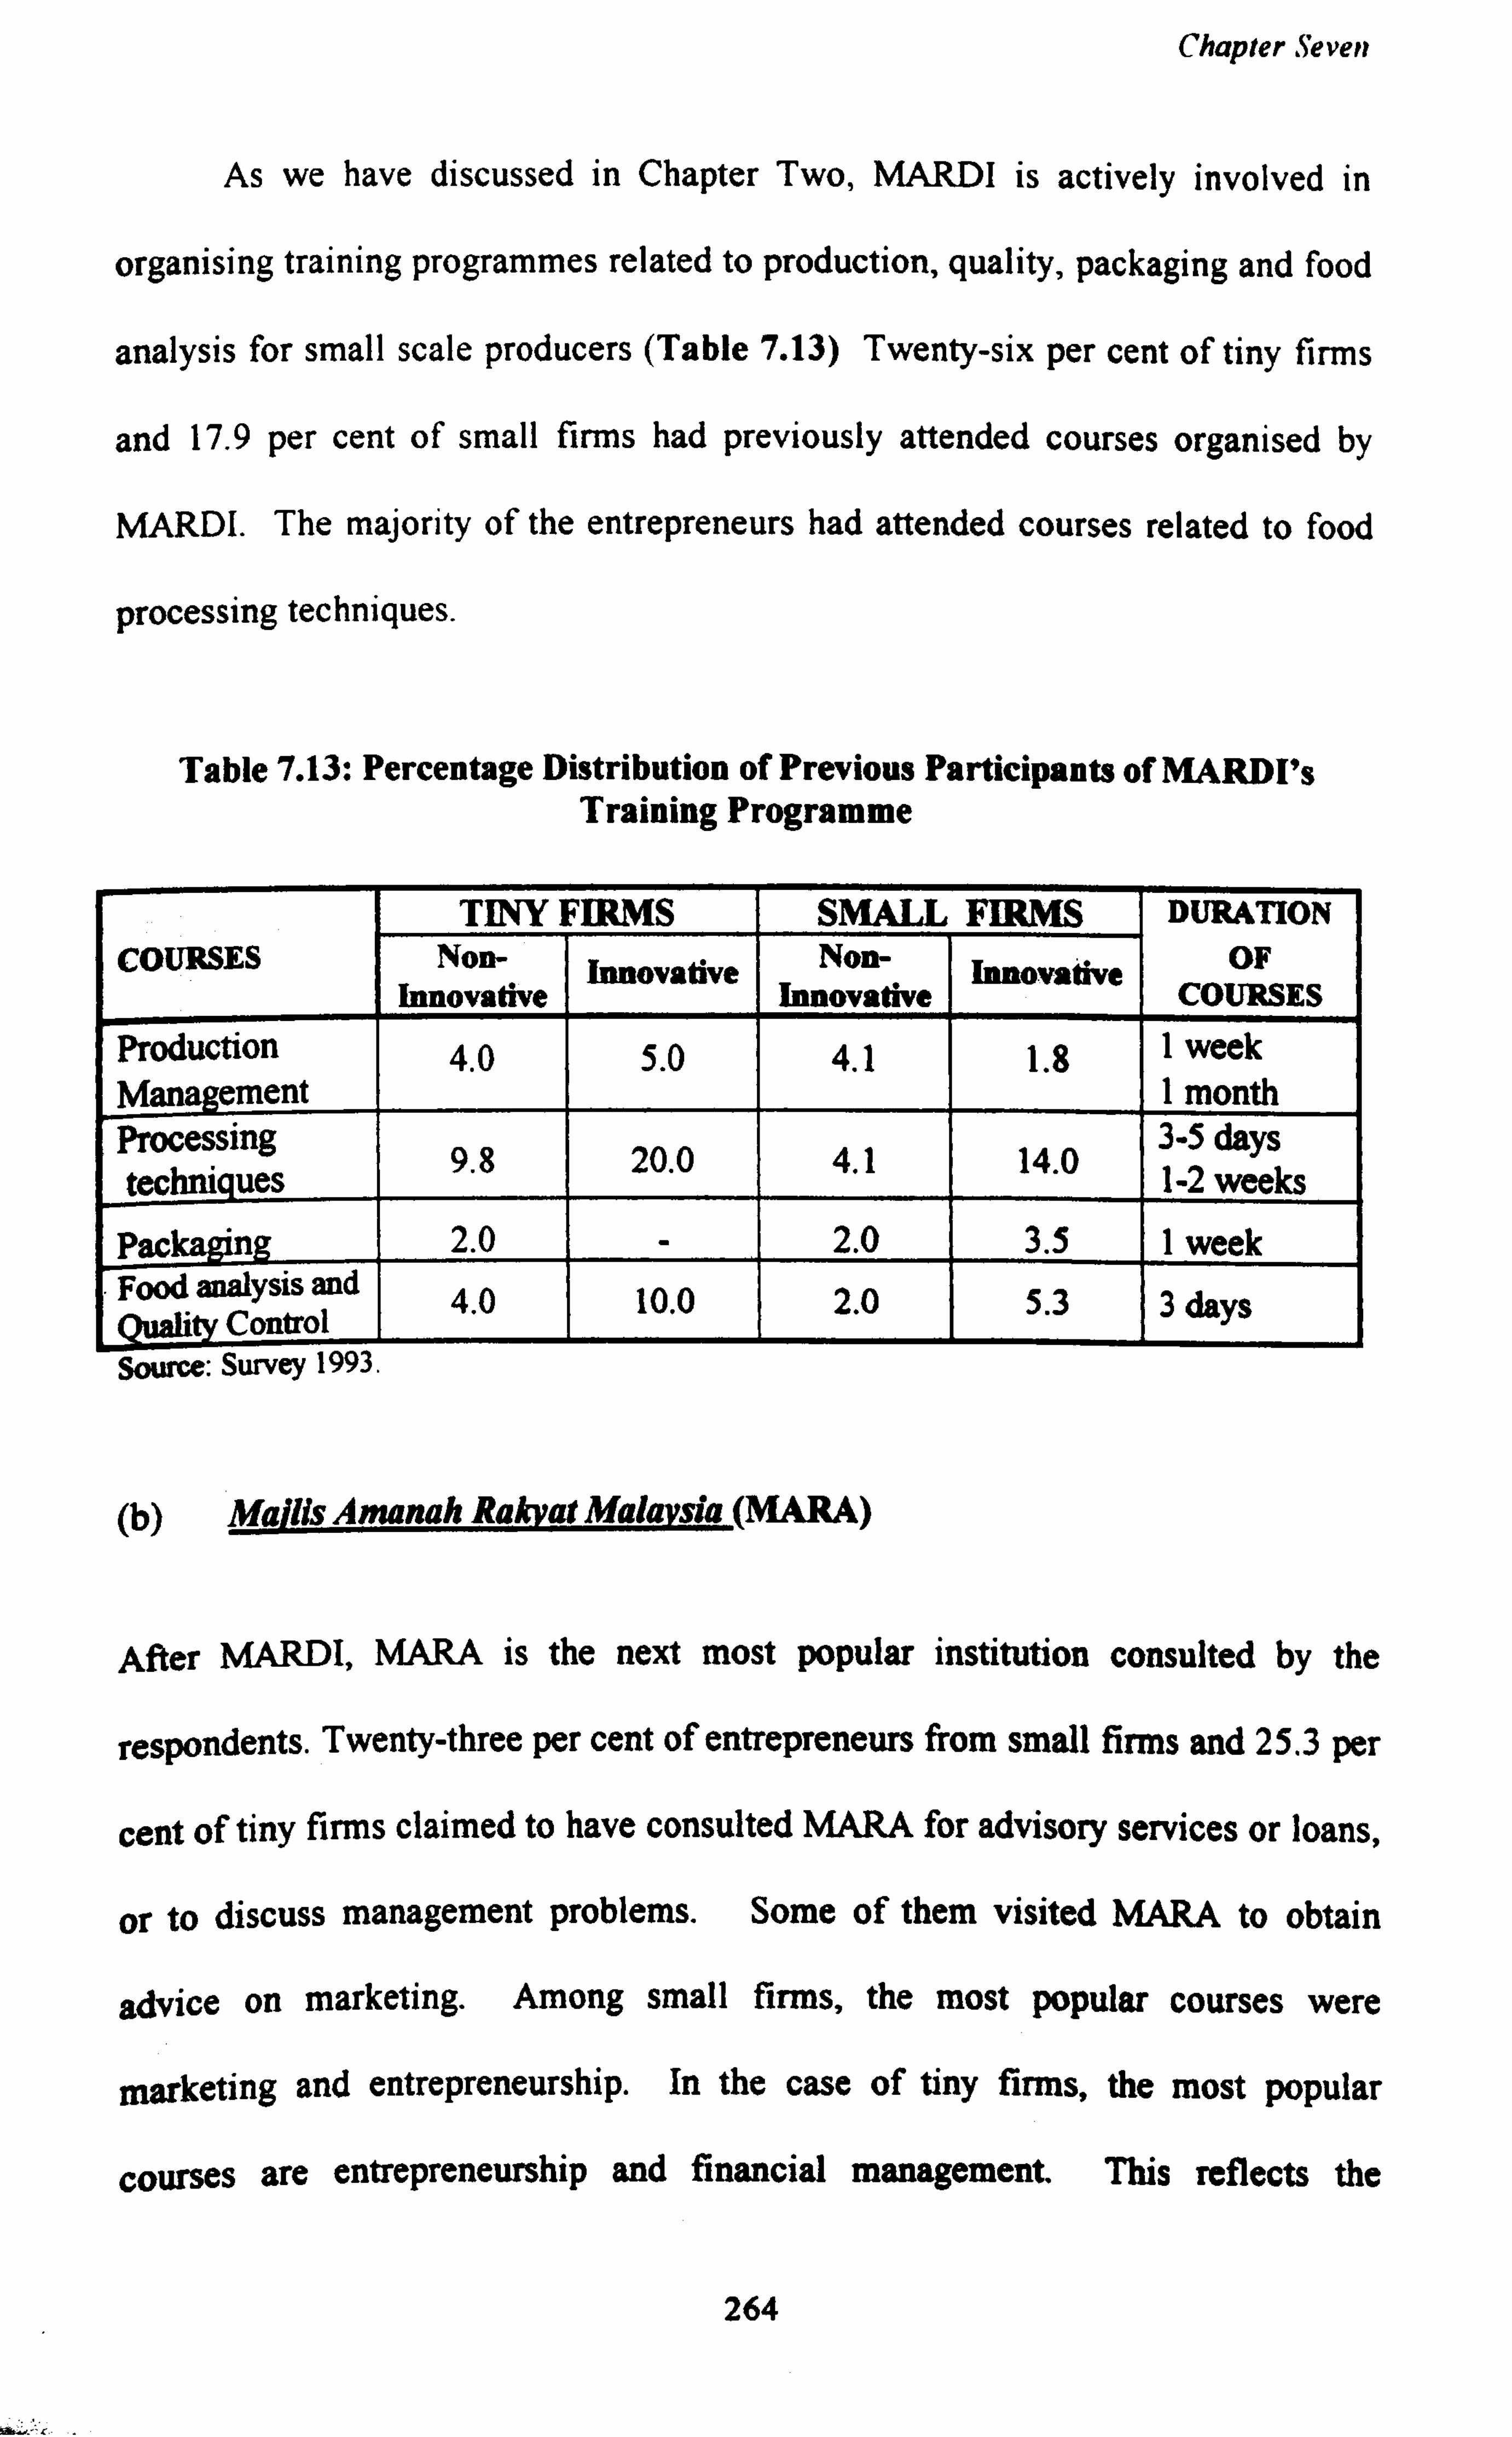
Chapter Seven
As we have discussed in Chapter Two, MARDI is actively involved in
organising training programmes related to production, quality, packaging and food
analysis for small scale producers (Table 7.13) Twenty-six per cent of tiny firms
and 17.9 per cent of small firms had previously attended courses organised by
MARDI. The majority of the entrepreneurs had attended courses related to food
processing techniques.
Table 7.13: Percentage Distribution of Previous Participants of MARDI's Training Programme
TINY FIRMS SMALL FIRMS DURATION
COURSES Non- Innovative Non- Innovative OF Innovative Innovative COURSES
Production 4.0 5.0 4.1 1.8 1 week Management I month Processing 3-5
hn techniques 9.8 20.0 4.1 14.0 1 -2
weeks
Packaging 2.0 - 2.0 3.5 1 week Food analysis and 4.0 10.0 2.0 5.3 3 days Qqafitý Control Source: Survey 1993.
(b) Mallis Amanah Rabat Malaysia (MARA)
After MARDI, MARA is the next most popular institution consulted by the
respondents. Twenty-three per cent of entrepreneurs from small firms and 25.3 per
cent of tiny firms claimed to have consulted MARA for advisory services or loans,
or to discuss management problems. Some of them visited MARA to obtain
advice on marketing. Among small firms, the most popular courses were
marketing and entrepreneurship. In the case of tiny firms, the most popular
courses are entrepreneurship and financial management. This reflects the
264
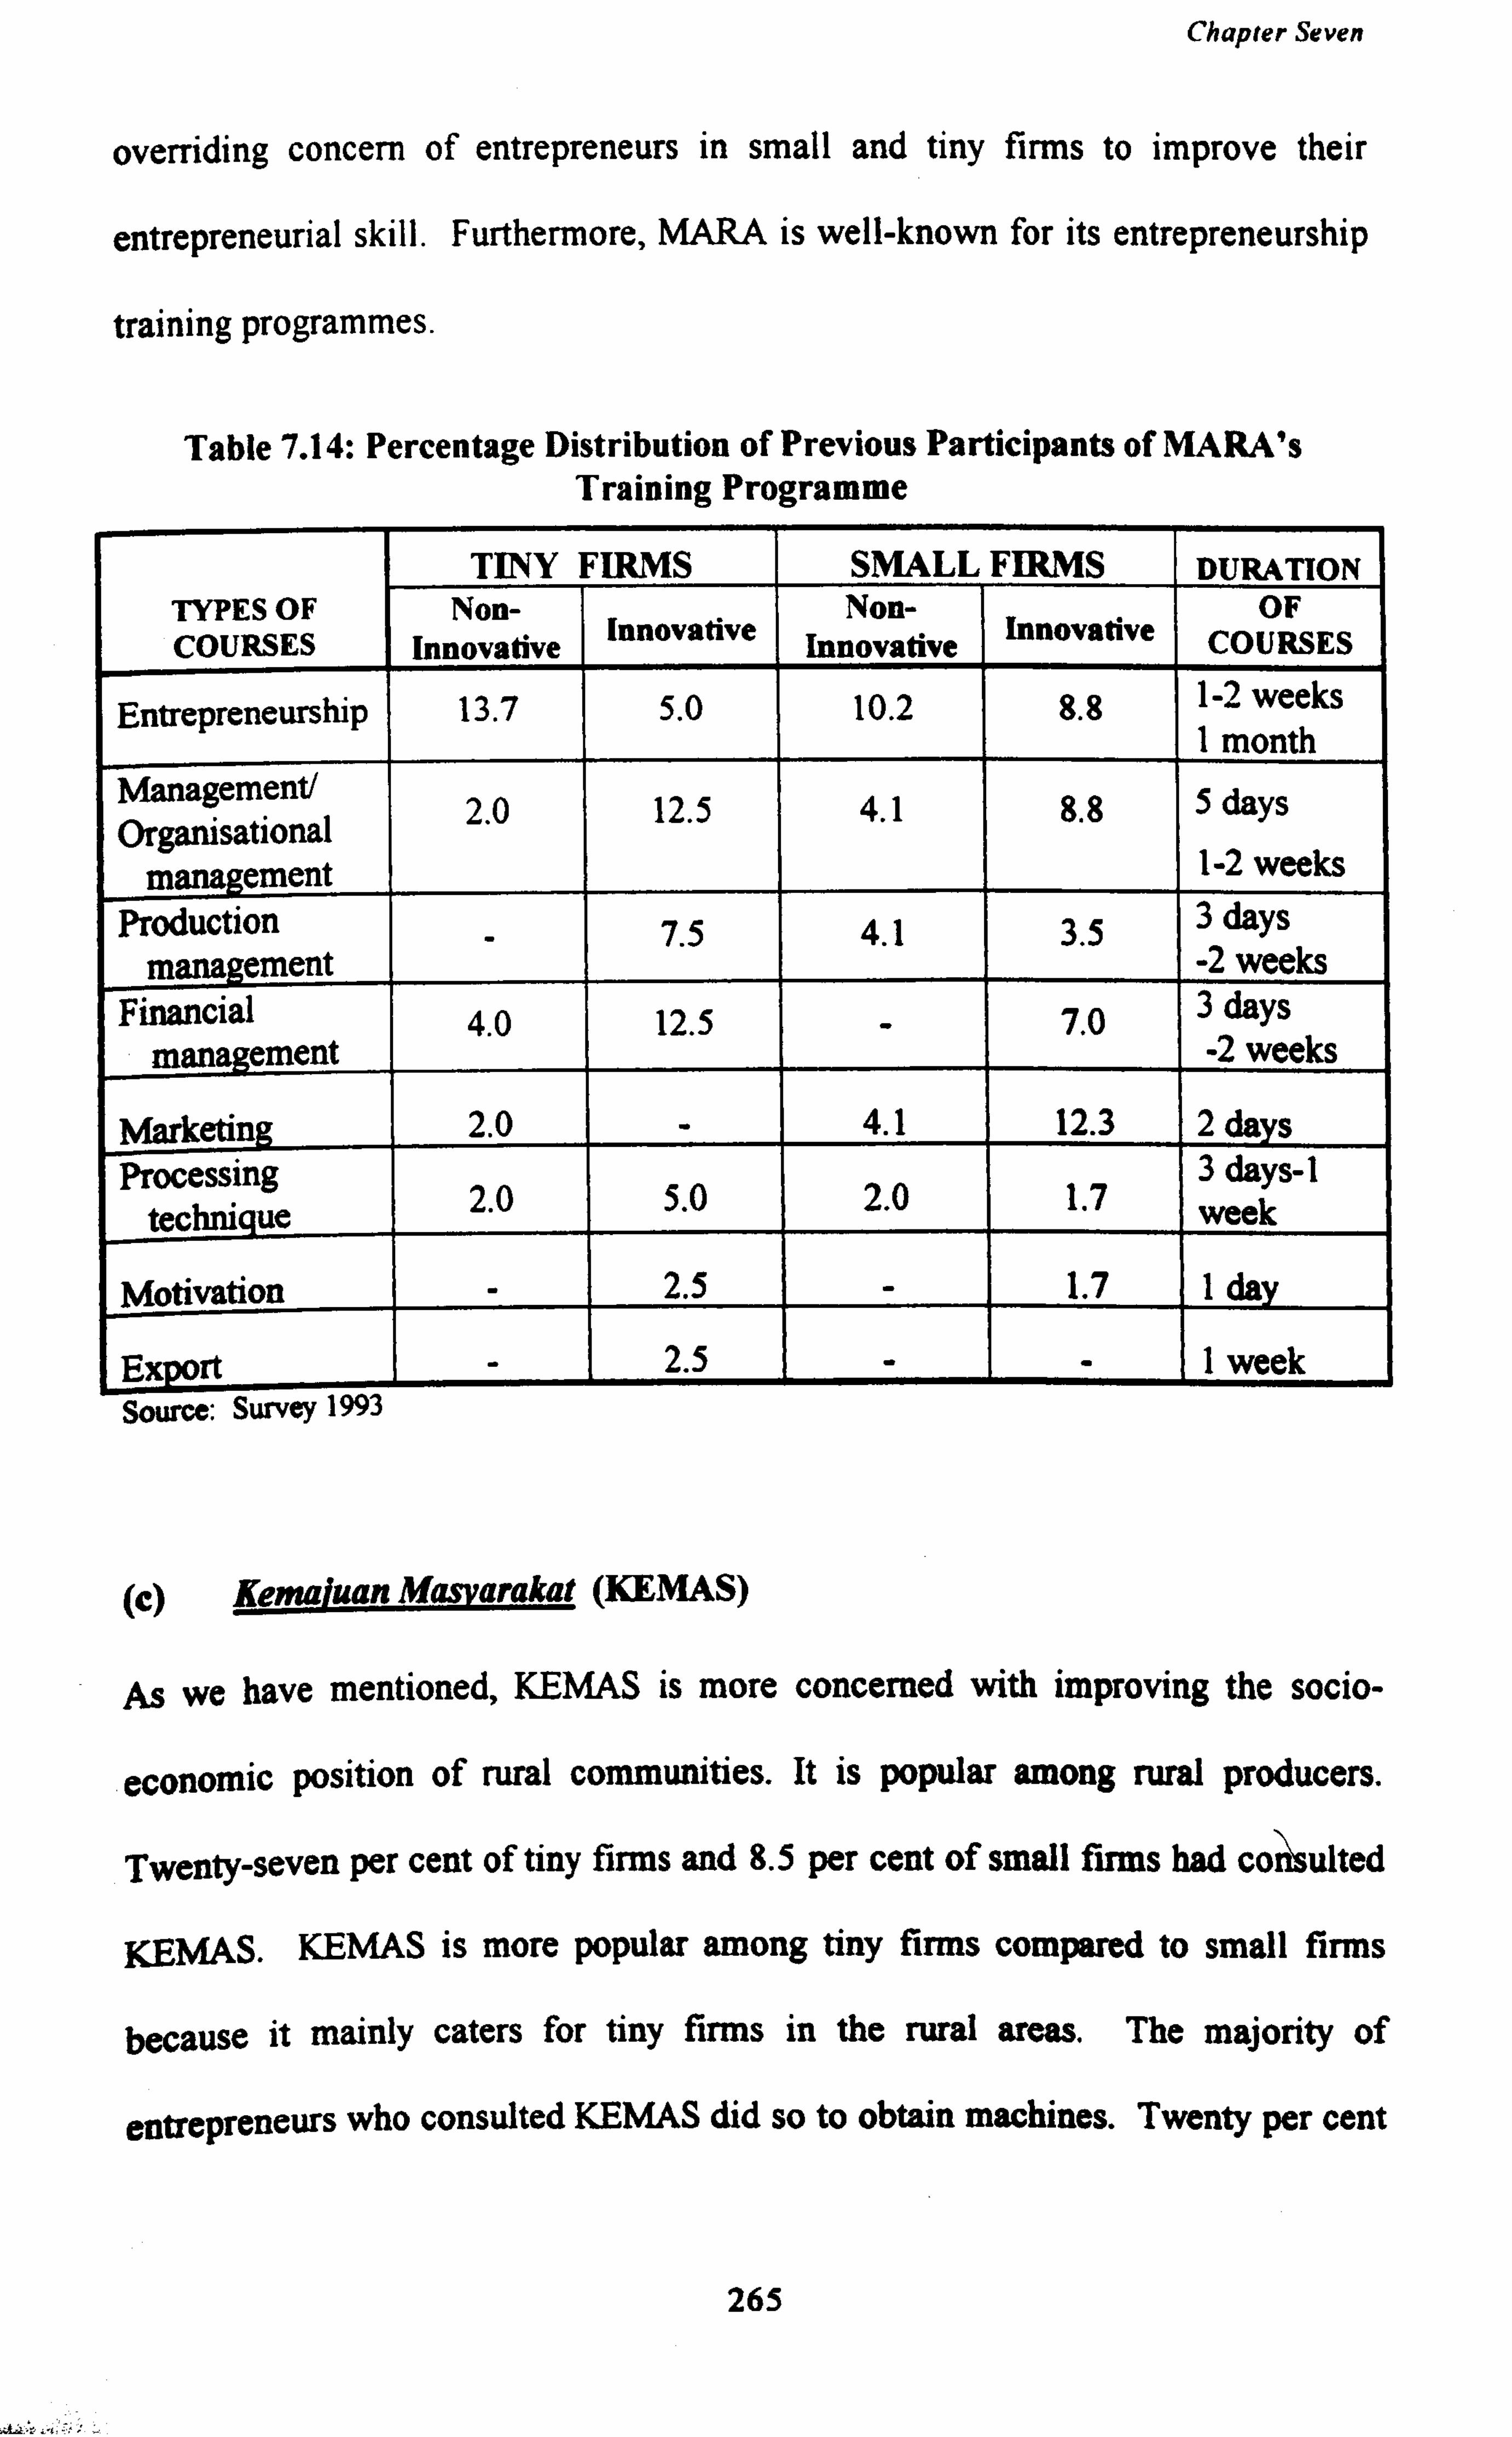
Chapter Seven
overriding concern of entrepreneurs in small and tiny firms to improve their
entrepreneurial skill. Furthermore, MARA is well-known for its entrepreneurship
training programmes.
Table 7.14: Percentage Distribution of Previous Participants of MARA's Training Programme
TINY FIRMS SMALL FIRMS DURATION TYPES OF COURSES
Non- Innovative Innovative
Non- Innovative Innovative
OF COURSES
Entrepreneurship 13.7 5.0 10.2 8.8 1-2 weeks I month
Management/ 2 0 12 5 1 4 8 8 5 days Organisational . . . .
management 1-2 weeks Production
- 7.5 4.1 3.5 3 days
management -2 weeks Financial 4.0 12.5 - 7.0 3 days
management -2 weeks
Marketing 2.0 - 4.1 12.3 2 days Processing 3 days-1
technique 2.0 5.0 2.0 1.7
week
Motivation - 2.5 - 1.7 1 day
Export - 2.5 - - 1 week Source: Survey 1993
(c) Kemaiuan Masvarakat (KEMAS)
As we have mentioned, KEMAS is more concerned with improving the socio-
economic position of rural communities. It is popular among rural producers.
Twenty-seven per cent of tiny firms and 8.5 per cent of small firms had co suited
KESS. KEMAS is more popular among tiny firms compared to small firms
because it mainly caters for tiny firms in the rural areas. The majority of
entrepreneurs who consulted KEMAS did so to obtain machines. Twenty per cent
265
Chapter Seven
of innovative entrepreneurs in small firms in this study admitted they adopted
technological innovation because of the assistance they received from this
institution. Besides providing machines, KEMAS also provide advisory services
to rural producers.
(d) Private institutions
Besides government institutions, small scale entrepreneurs also receive assistance
from private institutions. However, their involvement is very limited. Part of the
reason for the limited involvement of private institutions is their high consultancy
and training costs. None of the entrepreneurs in this study had consulted private
institutions for any advisory services. Nevertheless, a small percentage of the
entrepreneurs had attended courses organised by private institutions. Only 11.0
per cent of entrepreneurs from tiny firms and 12.3 per cent of entrepreneurs from
small firms had attended production management, processing techniques, financial
management and motivation courses organised by private institutions.
7.5.2.1 The Determinants of Institutional Involvement in Tiny Firms
Entrepreneurs' degree of involvement with institutions was related to their age.
level of education. their n-ach. attitude toward risks. communicative behaviour
andý_____uercention of buying procedure6. Our results show that young, better
6 The entrepreneurs' institutional involvement negatively correlated with entrepreneur's age (ra -0.1919, p=0.068) and perception of buying procedure (r=-0.1886, p=0.073). However, it is positively correlated with entrepreneur's education (r=0.2735, p-0.009), need of achievement (r=0.3538, p=0.001), attitude towards risk (r-0.2632, p=0.012), and communicative behaviour (r=0.5058, p=0.0001).
266
Chapter Seven
educated, high achievers and risk takers have a stronger tendency to be involved
with institutions.
The negative correlation between the variables INST and BUY
(r--0.1886, p=0.073) shows that entrepreneurs with greater degree of involvement
with institutions saw purchasing as less problematic than others. Entrepreneurs
who are involved with institutions will have fewer problems finding and
negotiating with suppliers because the institutions usually have a list of suppliers
to which small firms can refer. Such services reduce the cost of searching for
suppliers. Moreover, since these suppliers have an interest in maintaining a good
reputation with government institutions, the entrepreneurs would be likely to
receive good service from suppliers referred through these sources.
Thirty five per cent of the entrepreneurs had not consulted any institution
during the five years before this study was conducted. Sixty-three cent of non-
innovative entrepreneurs and 60.0 per cent of innovative entrepreneurs stated that
they did not have any reasons to refer to any institutions, because they did not
have any problems that required their assistance. For innovative entrepreneurs
who did not refer to any institutions, their main sources of information on
innovation were suppliers and firms that had already adopted the innovation. In
the case of non-innovative entrepreneurs, most of them were the entrepreneurs of
relatively newly-established firms, less than seven years old (67.4%).
267
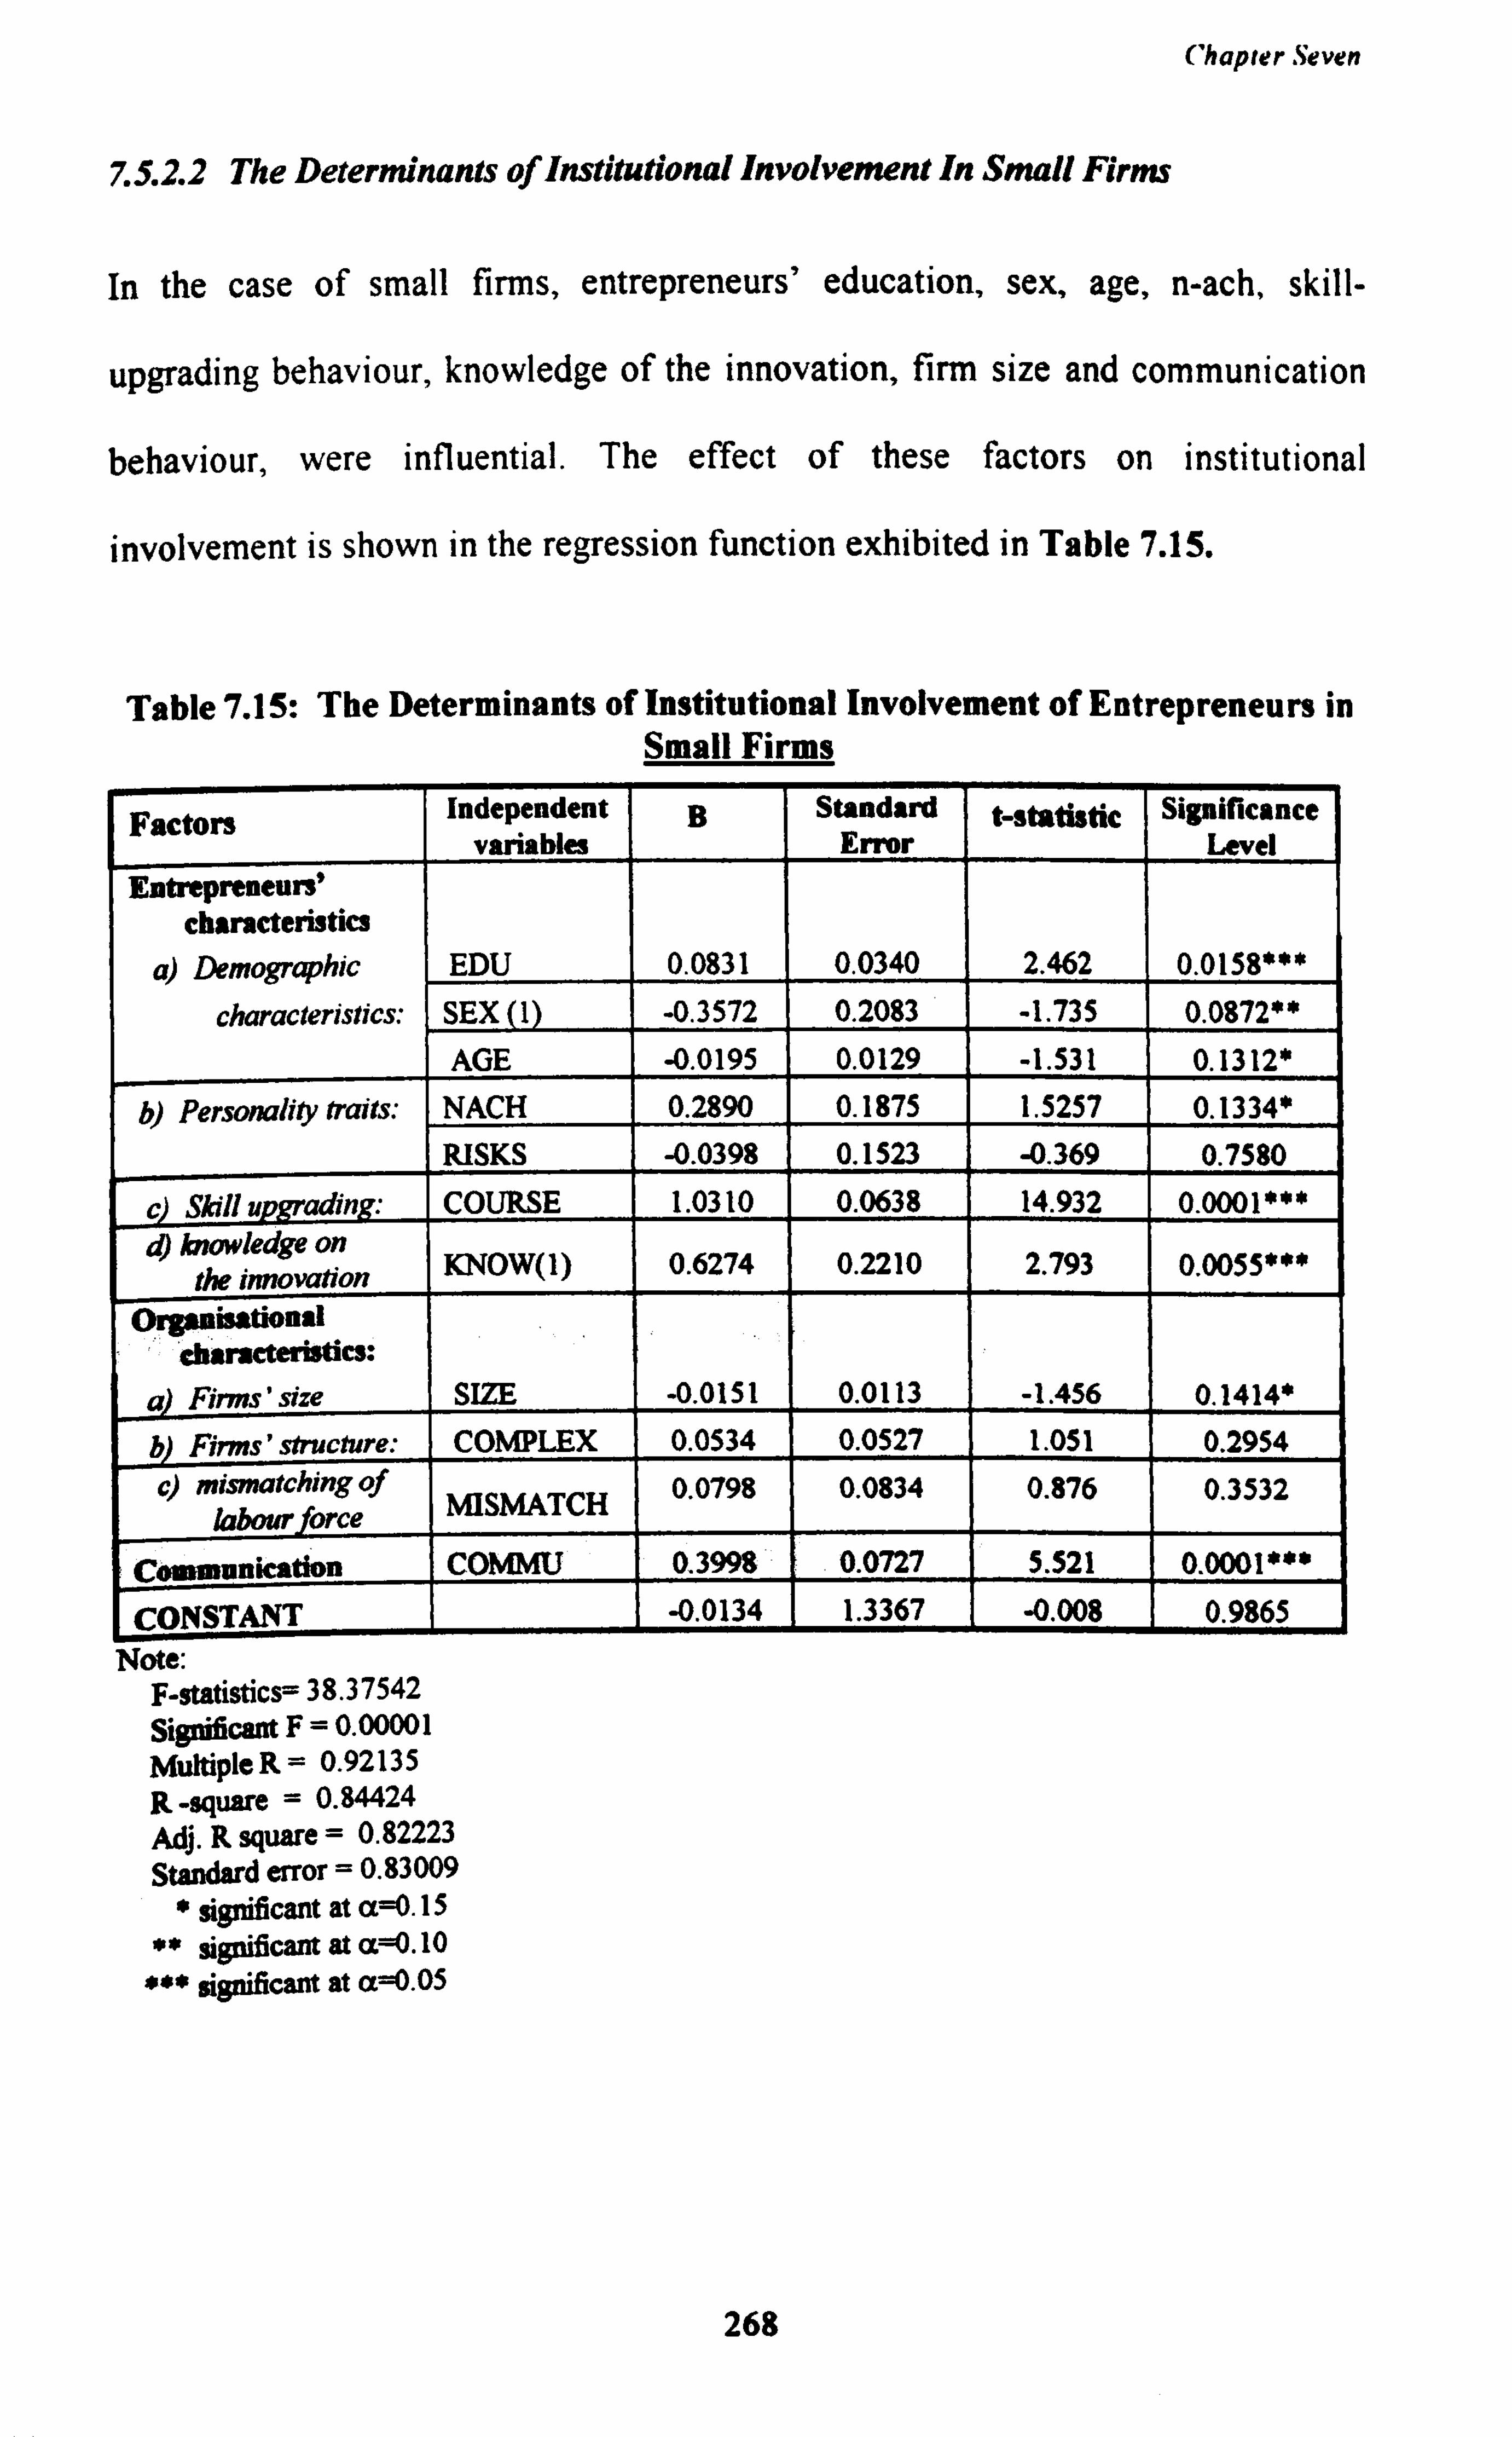
Chapter Seven
7.5.2.2 The Determinants of Institutional Involvement In Small Firms
In the case of small firms, entrepreneurs' education, sex, age, n-ach, skill-
upgrading behaviour, knowledge of the innovation, firm size and communication
behaviour, were influential. The effect of these factors on institutional
involvement is shown in the regression function exhibited in Table 7.15.
Table 7.15: The Determinants of Institutional Involvement of Entrepreneurs in Small Firms
Factors Independent variables
B Standard Error
t -statistic Significance Level
Entrepreneurs' characteristics
a) Demographic EDU 0.0831 0.0340 2.462 0.0158***
characteristics: SEX (1) -0.3572 0.2083 -1.735 0.0872** AGE -0.0195 0.0129 -1.531 0.1312*
b) Personality traits: NACH 0.2890 0.1875 1.5257 0.1334* RISKS -0.0398 0.1523 -0.369 0.7580
c) Skill u adin : COURSE 1.0310 0.0638 14.932 0.0001***
a) knowledge on the innovation KNOW(1) 0.6274 0.2210 2.793 0.0055***
Organisational Characteristics:
a Firms' size SIZE -0.0151 0.0113 -1.456 0.1414*
b Firms' structure: COMPLEX 0.0534 0.0527 1.051 0.2954
c) mismatching of labour force MISMATCH 0.0798 0.0834 0.876 0.3532
Communication COMMU 0.3998 0.0727 5.521 0.0001***
CONSTANT -0.0134 1.3367 -0.008 0.9865 Note:
F-statistics= 3 8.3 7542 Significant F=0.00001 Multiple R=0.92135 R -square = 0.84424 Adj. R square= 0.82223 Standard error = 0.83009
* significant at a 0.15 ** significant at aß. 10 *** significant at c t=0.05
268
Chapter Seven
Among the entrepreneurs' personal demographic characteristic, their
level of education, sex, and age influenced their institutional involvement
intensity. Entrepreneurs with higher levels of education, younger people and
females had a higher intensity of institutional involvement. Young entrepreneurs
and those with higher levels of education perceived the importance of knowledge
acquisition to accommodate process changes in their firms. Knowledge acquisition
could be obtained through institutional involvement. Being less communicative,
female entrepreneurs required assistance from institutions for knowledge, skill and
information acquisition, in order to be competitive with their male counterparts.
Success was the main objective of high achieving entrepreneurs. Such
entrepreneurs would always search for opportunities and assistance, as long as it
could improve their business performance. Bumiputera firms tend to rely heavily
on government assistance, which explains their high involvement with institutions
providing support to small scale industries. This partly explains why the
entrepreneurs with higher need for achievement had higher institutional
involvement.
The entrepreneurs' frequency of attending courses was related to their
institutional involvement. The higher the frequency of attending courses, the
move involved they were with institutions, especially the institutions that
organised the courses. Through attending courses, they had the opportunity of
meeting experts from these institutions and receiving various assistance and
services provided by such institutions.
269
Chapter Seven
The intensity of entrepreneurs' institutional involvement was influenced by
their need to search for information on the innovation they considered adopting.
These entrepreneurs recognised the importance of these institutions as sources of
technological information. It is reasonable to think that entrepreneurs will
increase their institutional involvement to obtain further information about the
considered innovation.
Firms' size was also a significantly related with entrepreneurs' institutional
involvement. The negative coefficient of size of firm (SIZE) suggested that that
smaller firms had a higher institutional involvement. Compared to large firms,
smaller firms tend to face more development constraints, in terms of inability to
obtain institutional finance and upgrade their level of technology, management
and production efficiency. Consequently, many of them tend to rely heavily on
external assistance.
The entrepreneurs' communicative behaviour influenced their intensity of
institutional involvement. Communicative entrepreneurs have a higher
institutional involvement because they have better information and exposure to the
kinds of assistance provided by government agencies. These entrepreneurs have
better opportunities of establishing links with government agencies through their
involvement in seminars and expos. This partly explains why communicative
entrepreneurs had higher institutional involvement.
270
Chapter Seven
7.5.3 Government Assistance
Some entrepreneurs received government assistance to introduce new techniques
and manage change associated with their introduction. The types of assistance
received by the entrepreneurs depended on the institutions providing the
assistance. Some institutions provided financial assistance and others provided
machines. Twenty four per cent of entrepreneurs in tiny firms and 10.4 per cent of
entrepreneurs of small firms reported having received government assistance.
Based on firms' level of innovativeness, 45.0 per cent of innovative entrepreneurs
in tiny and 26.3 per cent of innovative entrepreneurs in small firms received
government assistance.
This study showed that government assistance is a significant determinant
of entrepreneurs' innovativeness. Assistance received from the government helps
to speed up the rate of technological innovation in small and tiny firms. The
majority of the entrepreneurs who received government assistance admitted that
the innovation process would have been delayed without government assistance.
Government agencies that had provided assistance to the entrepreneurs in this
study were KEMAS, MARA, LPP, Ministry of Rural Development, Ministry of
Youth and Sports and Ministry of Agriculture. Of these institutions, the most
popular one was KEMAS because it caters for tiny firms and small firms in rural
areas. As shown in Table 7.16, fifteen entrepreneurs in tiny firms and 3
entrepreneurs in small firms had received assistance in the form of machines from
KEMAS. The majority of them had received assistance worth from RM5,000 to
RI410,000. Four firms producing bean curd had received machines worth from
271
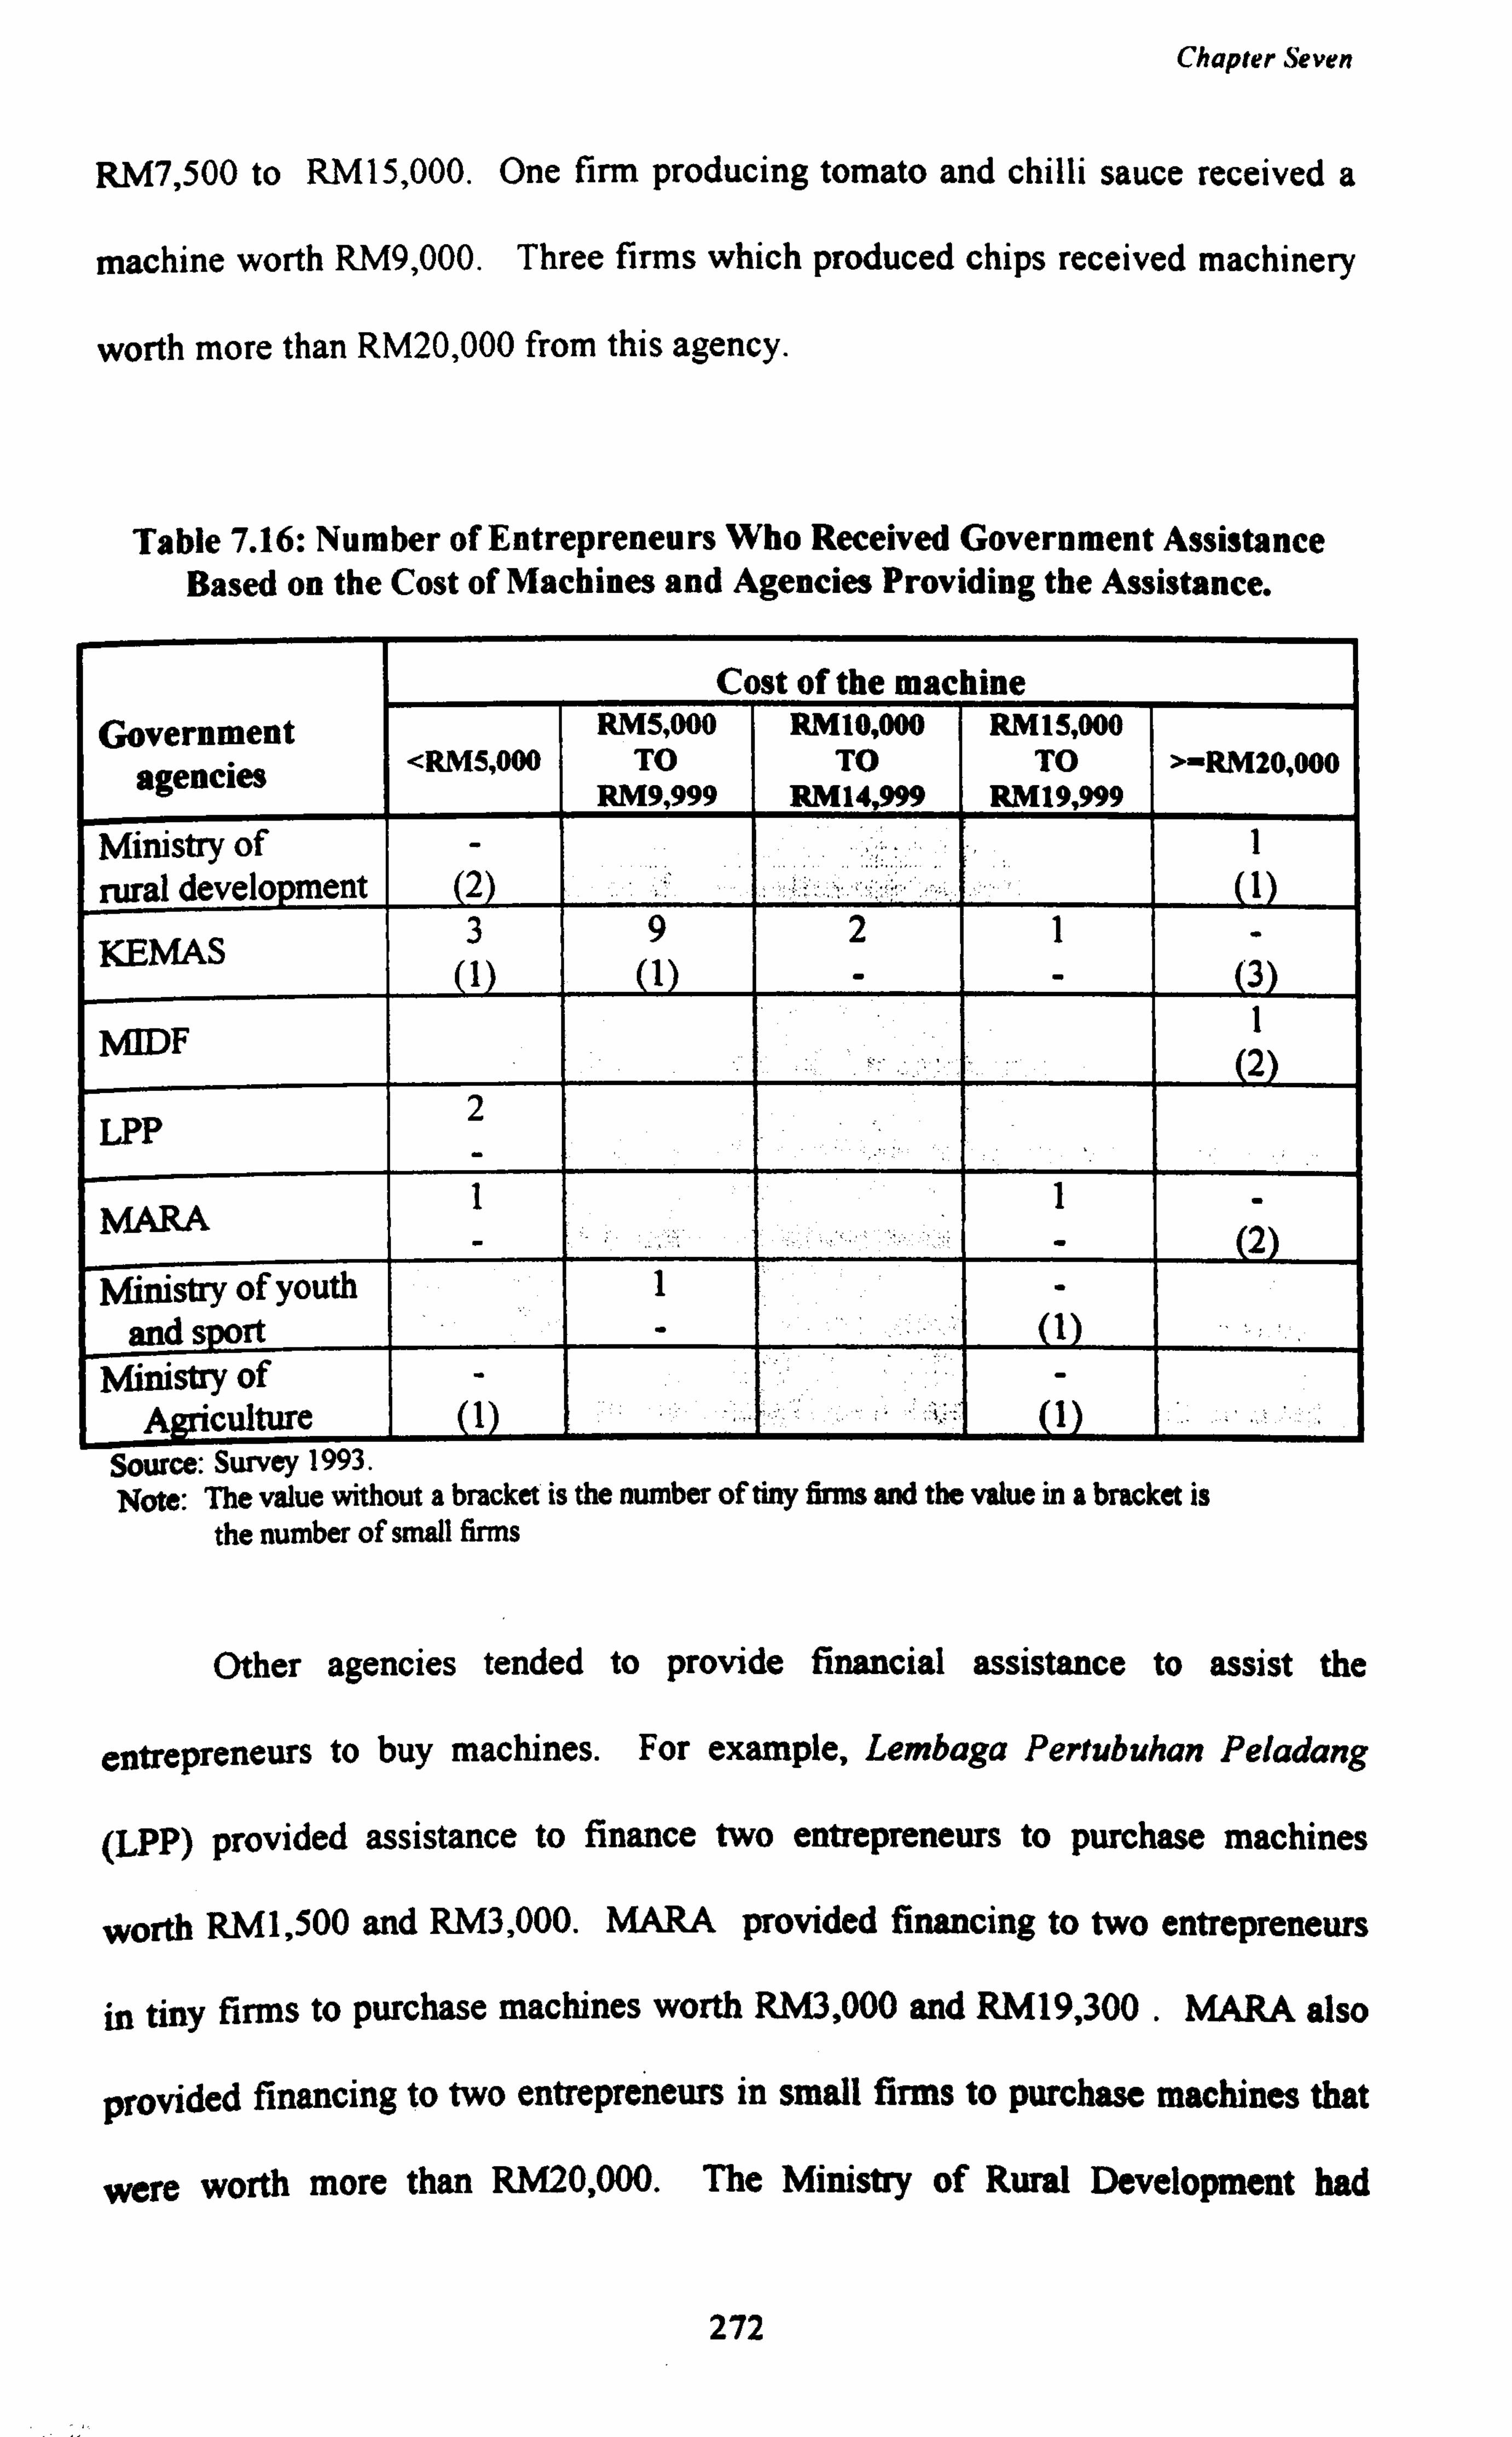
Chapter Seven
RM7,500 to RM15,000. One firm producing tomato and chilli sauce received a
machine worth RM9,000. Three firms which produced chips received machinery
worth more than RM20,000 from this agency.
Table 7.16: Number of Entrepreneurs Who Received Government Assistance Based on the Cost of Machines and Agencies Providing the Assistance.
Cost of the machine Government RM5,000 RM10,000 RM15,000
agencies <RMS, 000 TO TO TO >-RM20,000 RM9,999 RM14,999 RM19,999
Ministry of - 1 viral development (2)
3 9 2 1 - KEMAS 1 1 - - 3
MIDF 1
(2) 2
LPP
1 1 MARA 2 Ministry of youth 1 -
and s pod Ministry of - -
Agriculture 1 ': 1 Source: Survey 1993. Note: The value without a bracket is the number of tiny firms and the value in a bracket is
the number of small firms
Other agencies tended to provide financial assistance to assist the
entrepreneurs to buy machines. For example, Lembaga Pertubuhan Peladang
(LPP) provided assistance to finance two entrepreneurs to purchase machines
worth RM1,500 and RM3,000. MARA provided financing to two entrepreneurs
in tiny firms to purchase machines worth RM3,000 and RM19,300. MARA also
provided financing to two entrepreneurs in small firms to purchase machines that
were worth more than RM20,000. The Ministry of Rural Development had
272
Chapter Seven
provided financing to two entrepreneurs in small firms to purchase machines that
cost less than RM5,000. This Ministry also provided financing to one
entrepreneur in a tiny firm who produced cooking oil and one entrepreneur in a
small firm who produced cordial drinks, to purchase machinery worth more than
RM20,000. Malaysian Industrial Development Finance (MIDF) provided
financing to one entrepreneur in a tiny firm and two entrepreneurs in small firms.
7.6 Summary
In this chapter, we have discussed the influence on entrepreneurs innovation
decisions, of communicative behaviour, their perception of buying procedures, the
perceived and the objective characteristic of the innovation and environmental
factors. We found that those with more communicative behaviour had a higher
tendency to be innovative. Their communicative behaviour was demonstrated by
their involvement with business associations, attending business expos or
seminars. These communication channels linked entrepreneurs with sources of
information.
The entrepreneurs' perception of buying procedures was one of the factors
that influenced their decision to innovate. Among the procedures that non-
innovative entrepreneurs perceived as problematic, were negotiating with
suppliers and dealing with legal matters. They did not consider finding suppliers
and being absent from their firms as major problems.
The majority of the entrepreneurs from tiny and small firms had positive
perceptions of the innovations under consideration, seeing them as economically
273
Chapter Seven
beneficial, simple to use and compatible with their existing methods of
production. However, there were differences in entrepreneurs' perception of the
innovation related to their educational level, personality traits, knowledge of the
innovation, firms' size, financing problems, the cost of the innovation and
institutional involvement.
The cost of innovation not only influenced the entrepreneurs' perception of
the innovation, but also their decision to innovate. This study showed that
entrepreneurs were more likely to innovate when the cost of innovation was lower.
The cost of innovation adopted or under consideration by the entrepreneurs in the
study was related to their personality traits, their skill upgrading behaviour, firm's
structure, receipt of government assistance, and the aim in innovating.
The majority of tiny and small firms considered larger firms as their main
competitors. However, this study showed that the intensity of the competition
from larger firms did not influence tiny and small firms to adopt technological
innovations.
A relationship between entrepreneurs' innovativeness and their
institutional involvement can be seen from this study, with innovative
entrepreneurs making more use of institutional assistance. The main institutions
with which respondents were involved were MARDI, MARA and KEMAS. A
small percentage of entrepreneurs had received financial assistance or machines
from government institutions. Such assistance enabled the entrepreneurs to
innovate at an early stage, and to introduce more costly equipment than might
otherwise have been the case.
274
(hapler Eight
CHAPTER EIGHT
THE INFLUENCE OF FIRMS' CHARACTERISTICS ON THE ADOPTION OF TECHNOLOGICAL
INNOVATION
8. Introduction
In the previous chapter, we discussed the influence of entrepreneurs'
communication behaviour and perception on technological innovation adoption
decisions, as well as the impact of objective characteristics of the innovation in
question, and environmental factors such as the availability of government
assistance. Another important factor which we believe may influence
entrepreneurs' innovation adoption decision is the characteristics of the firm, such
as its size, structure, performance, stage in the life-cycle, financing and labour
requirement. In this chapter, therefore, we will be guided by this question: what
are the characteristics of innovative and non-innovative firms?
8.1 Analysis
Characteristics of firms can act as catalysts or barriers in their innovation
decision process. We hypothesised the following characteristics of firms as
determining factors for firms to be technologically innovative. In both tiny and
275
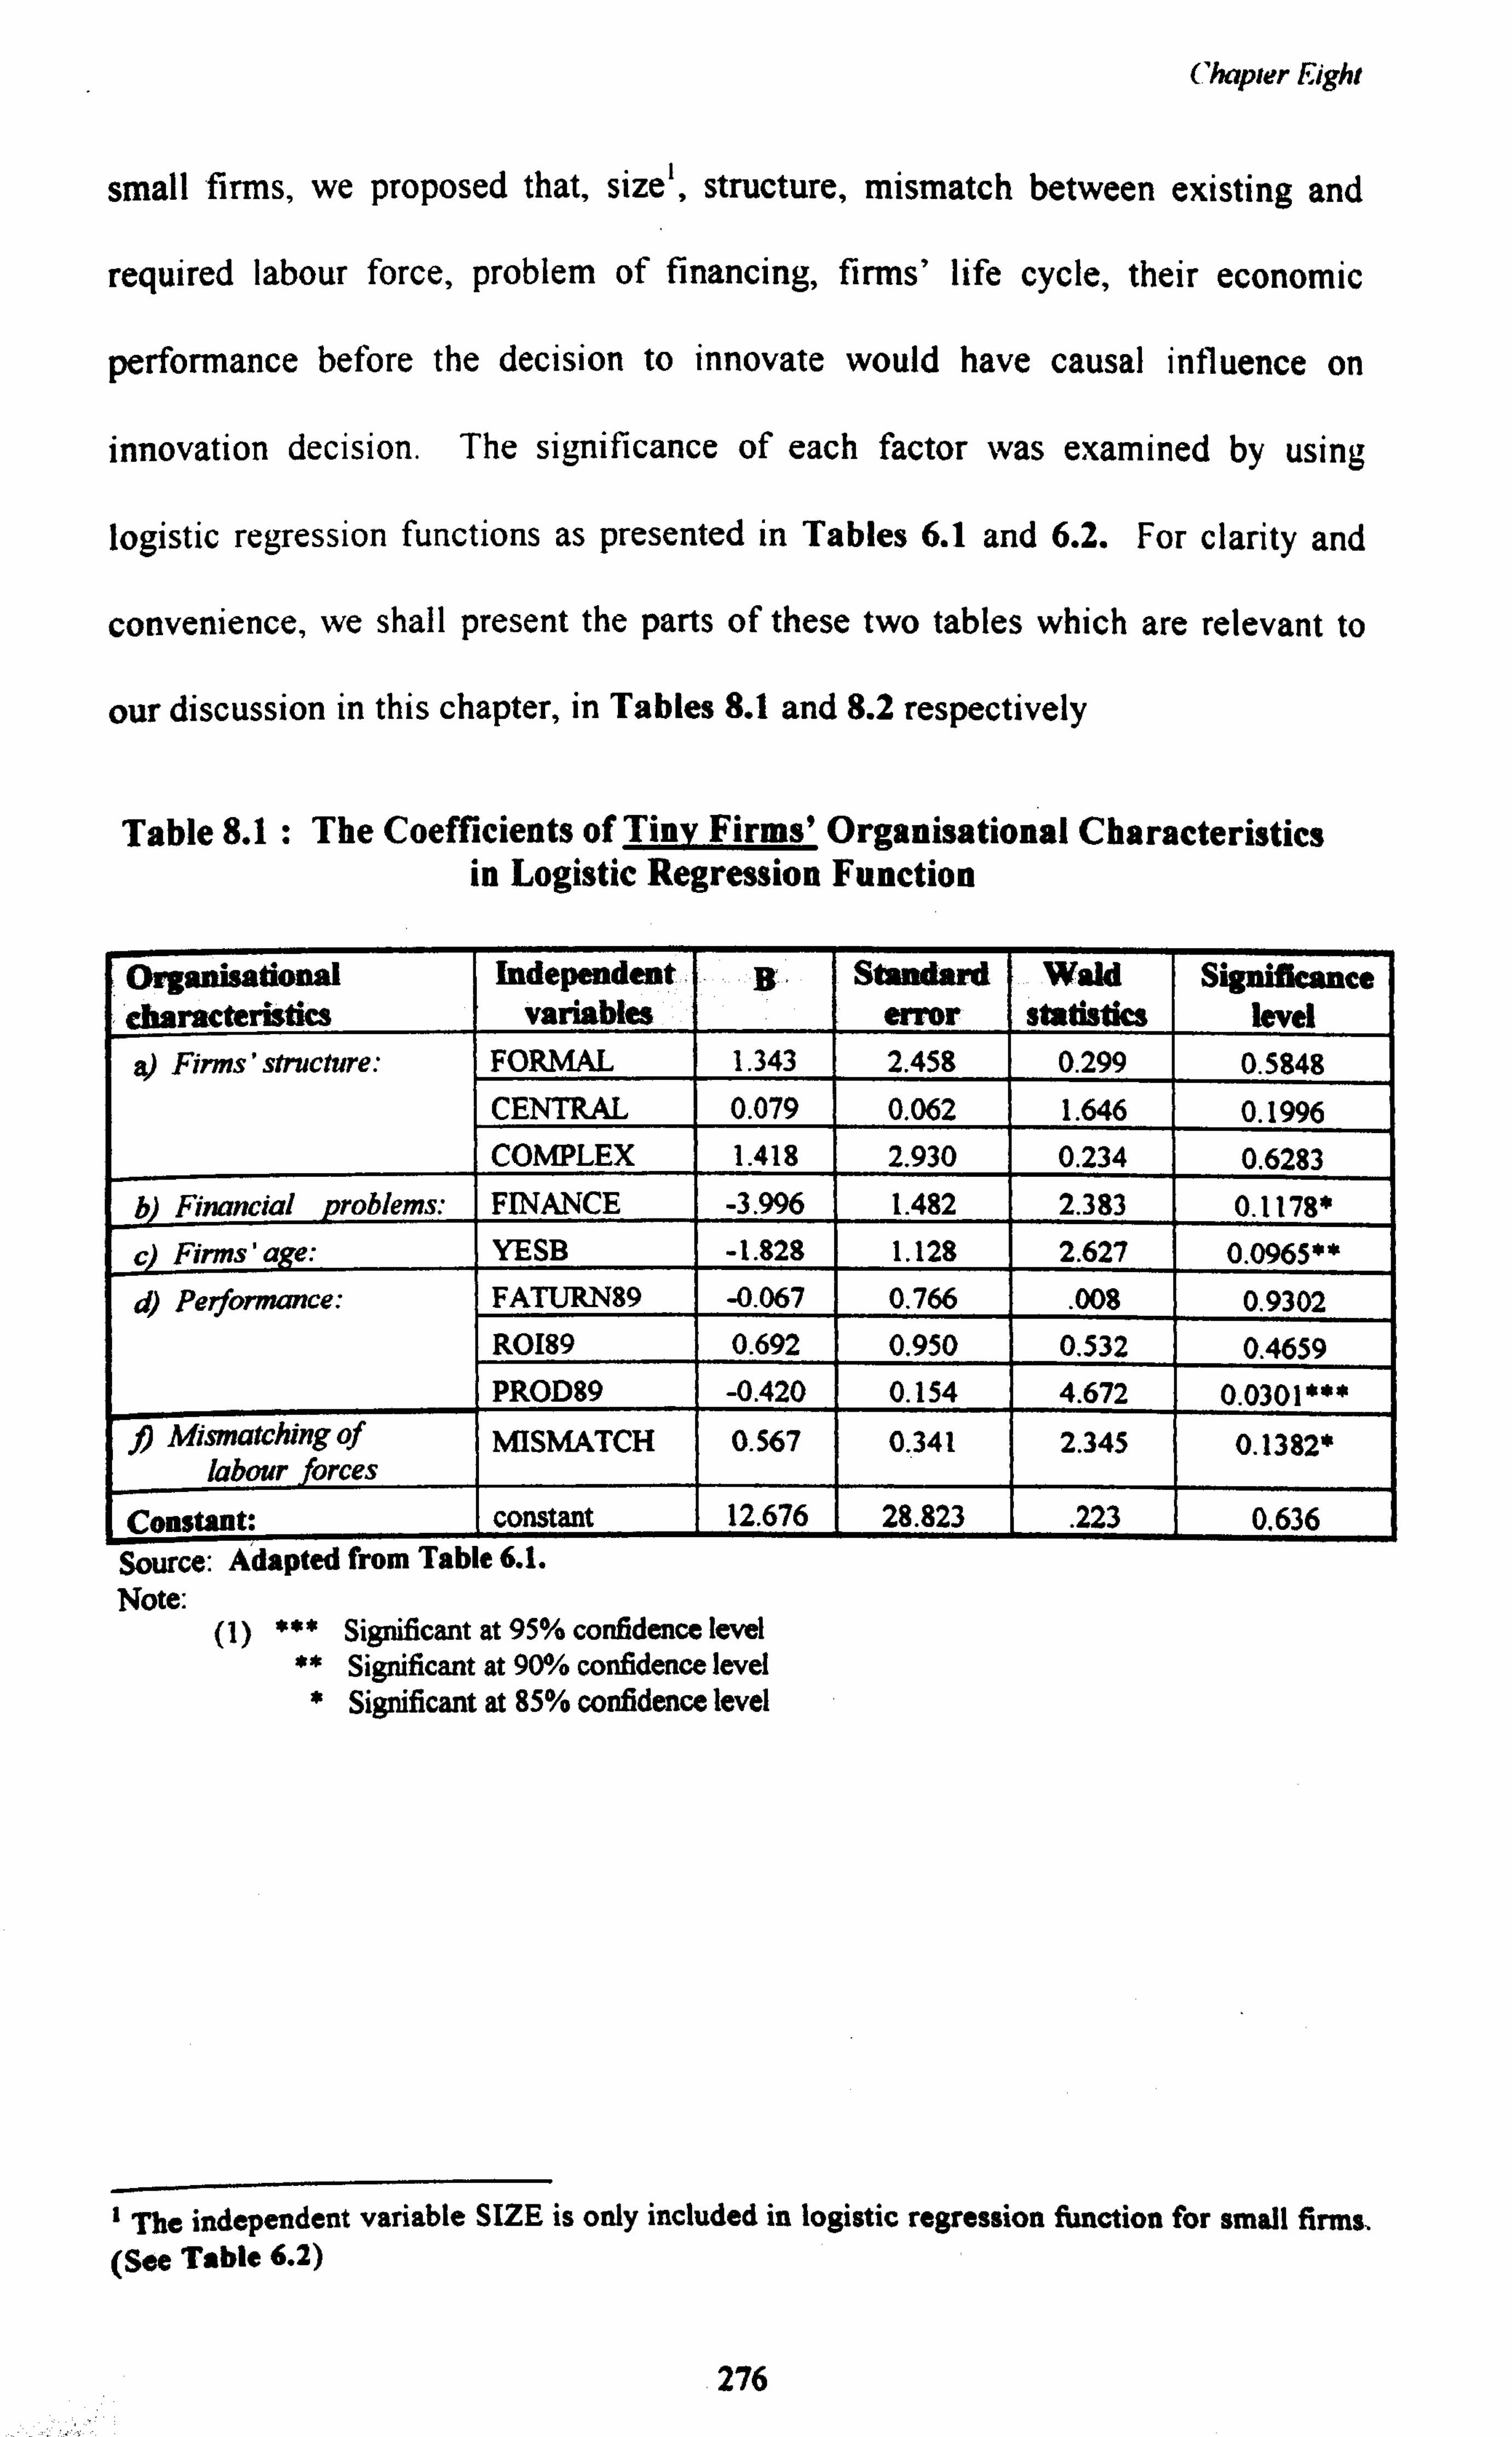
Chapter Fight
small firms, we proposed that, size`, structure, mismatch between existing and
required labour force, problem of financing, firms' life cycle, their economic
performance before the decision to innovate would have causal influence on
innovation decision. The significance of each factor was examined by using
logistic regression functions as presented in Tables 6.1 and 6.2. For clarity and
convenience, we shall present the parts of these two tables which are relevant to
our discussion in this chapter, in Tables 8.1 and 8.2 respectively
Table 8.1 : The Coefficients of Tiny Firms' Organisational Characteristics in Logistic Regression Function
Organisational characteristics
Independent variables
B- Standard error
Wald statistics
Significance level
a) Firms' structure: FORMAL 1.343 2.458 0.299 0.5848 CENTRAL 0.079 0.062 1.646 0.1996 COMPLEX 1.418 2.930 0.234 0.6283
A Financial problems: FINANCE -3.996 1.482 2.383 0.1178*
c Firms' a e: YESB -1.828 1.128 2.627 0.0965**
d) Performance: FATURN89 -0.067 0.766 . 008 0.9302
R0189 0.692 0.950 0.532 0.4659 PROD89 -0.420 0.154 4.672 0.0301***
J Mismatching of labour forces
MISMATCH 0.567 0.341 2.345 0.1382*
Constant: constant 12.676 28.823 . 223 0.636
Source: Adapted from Table 6.1. Note:
(1) *** Significant at 95% confidence level ** Significant at 90% confidence level * Significant at 85% confidence level
i The independent variable SIZE is only included in logistic regression function for small firms. (See Table 6.2)
276

C hapler Eight
Table 8.2: The Coefficients of Small Firms' Organisational Characteristics in Logistic Regression Function
Organisational Characteristics
Independent Variables B
Standard Error
Wald statistics
Significance Level
a) Firms'si e SIZE 0.379 0.135 7.946 0.0048***
b) Firms' structure: FORMAL -. 4675 1.243 0.141 0.7069 CEN-R -4.769 2.946 2.620 0.1055** COM-R 2.209 1.252 3.111 0.0778**
c Financial pro FIN-R -4.803 2.282 4.431 0.0353*** d) Firms' ae YESB-R -0.637 1.877 0.115 0.7344
e Performance: FATURN89 . 427 0.209 4.199 0.0404*** R0189 -1.399 0.626 4.996 0,0254*** PROD89 . 361
. 133 7.347 0.0067*** n Mismatching of
labour force MISMATCH 0.138 0.121 1.319 0.2507
Constant: constant 17.522 14.985 1.367 0.2423 Source: Adapted from Table 6.2.
Note: *** Significant at 95% confidence level ** Significant at 90% confidence level
* Significant at 85% confidence level
8.2 Firms' Size
This analysis only applies to small firms, where variation in sizes2 was more
prevalent. We did not conduct a separate study on tiny firms because such firms
were homogenous (all having less than 5 workers). This study shows that firms
size is a significant determinant of technological innovation among small firms. A
positive coefficient of the variable SIZE, suggests that larger firms are more likely
to be more innovative than smaller ones (Table 8.2).
The distribution of firms based on their number of full time workers and
firms' innovativeness can be observed in Figure 8.1. As we can see from the
2 In this study, we define small firms, as those firms with 5 workers or more.
277
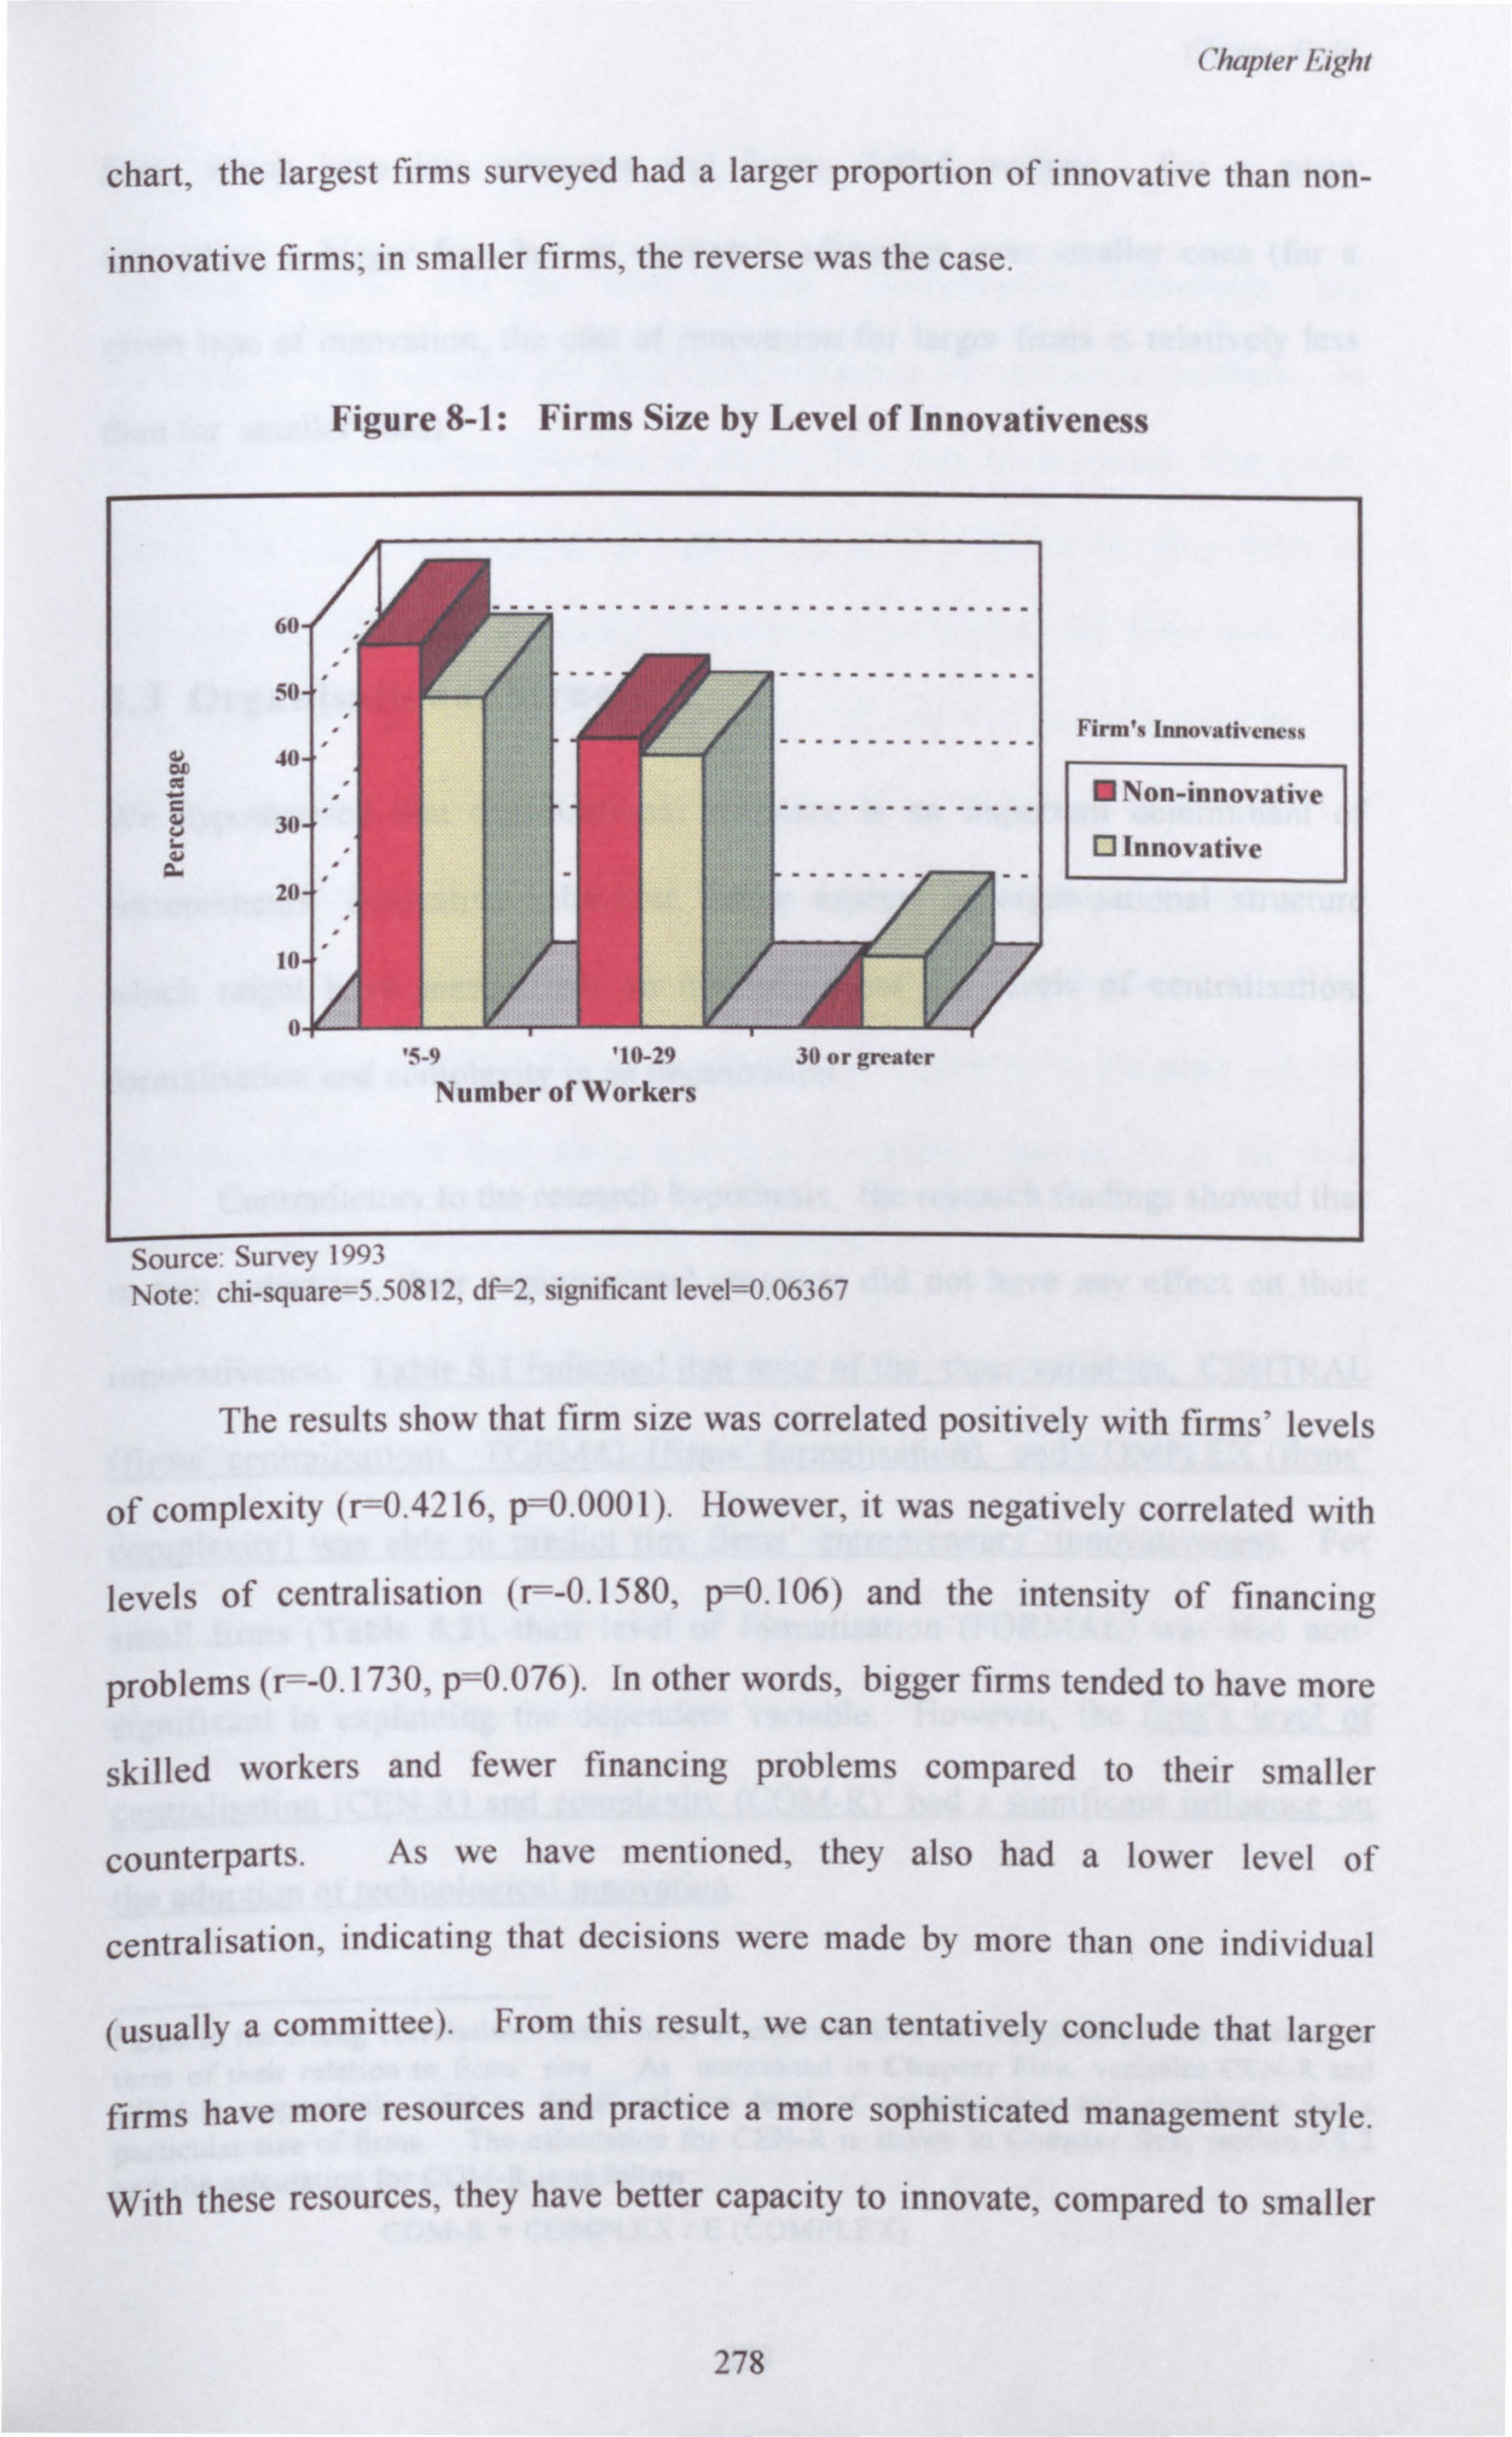
Chapter I: 'ighi
chart, the largest firms surveyed had a larger proportion of innovative than non-
innovative firms; in smaller firms, the reverse was the case.
Figure 8-1: Firms Size by Level of Innovativeness
------------------------------- 60
------------- 50 Firm's Innovativeness
40
Non-innovative C ------------- 30- Q Innovative
20-
10
S_y '10-29 3(1 or greater
Number of Workers
Source: Survey 1993
Note: chi-square=5.50812, df 2, significant level=0.06367
The results show that firm size was correlated positively with firms' levels
of complexity (r=0.4216, p=0.0001). However, it was negatively correlated with
levels of centralisation (r=-0.1580, p=0.106) and the intensity of financing
problems (r=-0.1730, p=0.076). In other words, bigger firms tended to have more
skilled workers and fewer financing problems compared to their smaller
counterparts. As we have mentioned, they also had a lower level of
centralisation, indicating that decisions were made by more than one individual
(usually a committee). From this result, we can tentatively conclude that larger
firms have more resources and practice a more sophisticated management style.
With these resources, they have better capacity to innovate, compared to smaller
278
Chapter Eight
firms which have less resources and fewer skilled workers. For a given
innovation, a bigger firm has an economic advantage over smaller ones (for a
given type of innovation, the cost of innovation for larger firms is relatively less
than for smaller ones).
8.3 Organisational Structure
We hypothesised that organisational structure is an important determinant of
entrepreneurs' innovative behaviour. Some aspects of organisational structure
which might have some effect on innovativeness are levels of centralisation,
formalisation and complexity in an organisation.
Contradictory to the research hypothesis, the research findings showed that
in tiny industries, their organisational structure did not have any effect on their
innovativeness. Table 8.1 indicated that none of the three variables. CENTRAL
(firms' centralisation), FORMAL (firms' formalisation), and COMPLEX (firms'
complexity) was able to predict tiny firms' entrepreneurs' innovativeness. For
small firms (Table 8.2), their level of formalisation (FORMAL) was also non-
significant in explaining the dependent variable. However, the firm's level of
centralisation (CEN-R) and comvlexity (COM-R)3 had a significant influence on
the adoption of technological innovation.
3 Due to the strong correlation, firms' level of centralisation and complexity were measured in
term of their relation to firms' size. As mentioned in Chapter Five, variables CEN-R and COM-R respectively refer to firms' relative level of centralisation and complexity for a particular size of firms. The calculation for CEN-R is shown in Chapter five, section 5.8.2
and the calculation for COM-R is as follow:
COM-R = COMPLEX /E (COMPLEX)
279
Chapter Eight
8.3.1 Centralisation
The main reason why the three factors (centralisation, complexity and
formalisation) did not have any significant influence on innovation decisions in
tiny firms is because the structure of these firms was homogenous. Being tiny
firms, they had a high degree of centralisation as reflected by their form of
organisation and equity ownership. Seventy-nine per cent of the firms were sole
proprietors, 16.5 per cent were partnerships and only 4.4 per cent were private
limited companies. Regarding equity ownership, 74.7 per cent of entrepreneurs in
the study owned 100 per cent of their firms' equity, 15.4 per cent owned between
50 to 75 per cent of the firms' equity and only 9.9 per cent owned less than 25 per
cent of their firms' equity. The majority of the entrepreneurs in the study (74.7%)
were the founders of their firms and they considered themselves as the final
decision makers on any innovation for their firms.
In small firms, firms' level of centralisation was a significant determinant
of firms' innovativeness. A negative coefficient of the variable CEN-R (Table
8.2) indicates that firms with a low level of centralisation in relation to their size
had a greater tendency to be innovative. For a particular firm's size, a low degree
of centralisation means more people were given autonomy in the decision
where: E(COMPLEX) =a+ bSIZE
a and b are the estimates of the coefficients of regression function of COMPLEX =a+ ßSIZE +a
If the value of these particular variables were more than one, it indicated that the firm had
higher level of complexity or centralisation than expected for its size.
280
Chapter Eight
making process; thus, decision makers had wider access to information on the
innovation they were considering adopting.
8.3.2 Complexity
As we can recall, complexity is defined by the number of professional, technical
and managerial (inclusive of the entrepreneurs) workers in an organisation. Tiny
firms were mostly managed single-handedly by the entrepreneur; the majority
(93.4%) did not have any technical workers.
In the case of small firms, we found that there was some variation in the
relative level of complexity, which influenced firms' innovativeness. The results
show that the variable COM-R had a significant influence on firms' decision to
innovate (Table 8.2), i. e. firms with a high degree of complexity relative to other
firms of the same size had a greater tendency to be innovative. This is
understandable, as firms with more professional, technical and managerial
workers in relation to their size will be more able to assimilate innovation. We
can tentatively conclude that firms with a high relative level of complexity have a
greater tendency to be innovative, compared to less complex firms.
8.3.3 Formalisation
Formalisation measures the degree of formality within an organisation. Tiny firms
tend to have low level of formalisation compared to larger ones, because of the
size and the number of employees. Our results show that the level of formalisation
among the firms surveyed, was low in both tiny and small firms.
281
Chapter Eight
8.3.3.1 Formalisation in Tiny Firms
Regardless of whether the firms were categorised as innovative or not, they had
an almost equal degree of formalisation. In Table 8.3, we can see that only in
descriptions E and G, is there a significant difference in mean score; however,
their mode of formalisation is the same. We can make several observations about
the result. First, entrepreneurs perceived their relationship with their employees
as informal. Second, entrepreneurs often shared firms' problems with their
employees, although they did not encourage their employees to reveal their
personal problems. Third, entrepreneurs were willing to accept reasonable
suggestions given by their employees, although the final decisions were made by
certain individuals, normally the entrepreneurs themselves and their assistants,
through an informal meeting. Fourth, employees only participated in the decision
process on issues related to them; however, they were not given a formal report on
their performance. Fifth, there is a significant difference in the level of
formalisation between innovative and non-innovative firms in terms of conducting
feasibility studies on the considered innovation being considered for adoption
(description E). Innovative firms were more formalised; they formed special
committees to conduct detailed pre-feasibility studies of innovation. Sixth, there
was a significant difference in the level of formalisation between innovative and
non-innovative firms regarding employee performance appraisal, the level of
formalisation in this respect being' relatively higher in innovative firms
(description G in Table 8.3)
282
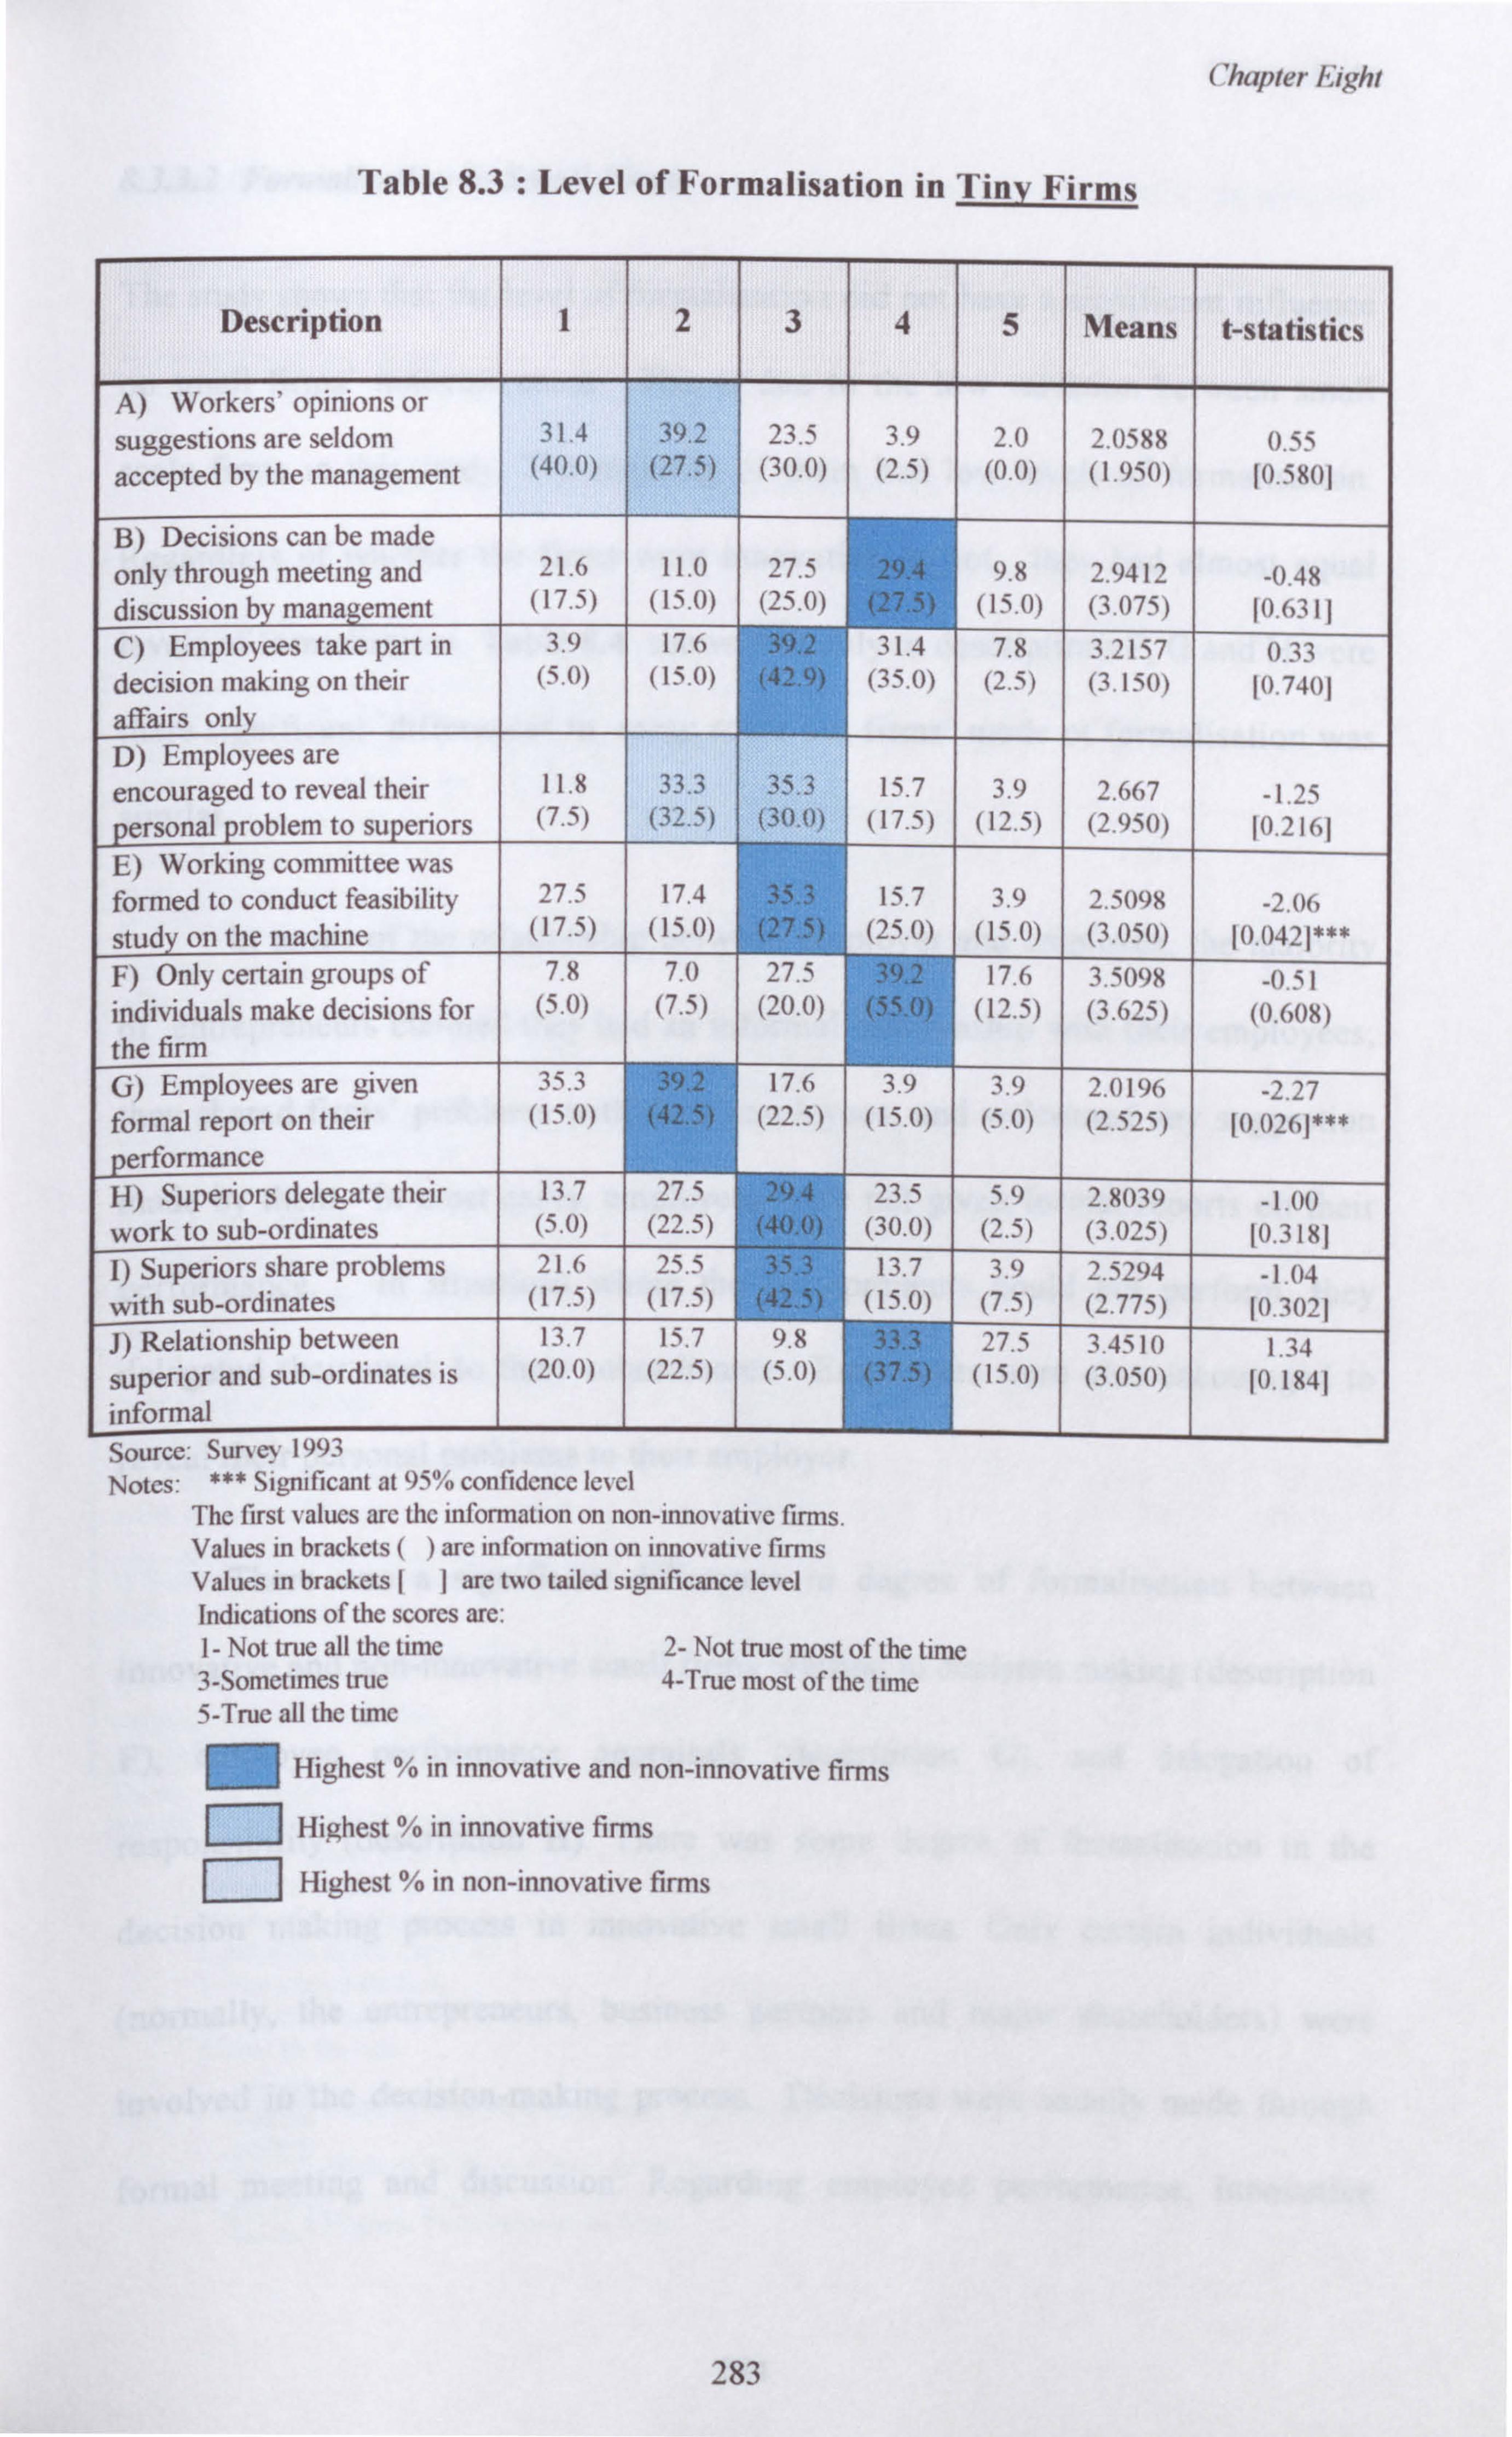
Chapter Eight
Table 8.3 : Level of Formalisation in Tiny Firms
Description 1 2 3 4 5 Means t-statistics
A) Workers' opinions or suggestions are seldom 31.4 39.2 23.5 3.9 2.0 2.0588 0.55 accepted by the management (40.0) (27.5) (30.0) (2.5) (0.0) (1.950) 10.5801
B) Decisions can be made only through meeting and 21.6 11.0 27.5 29.4 9.8 2.9412 -0.48 discussion bmanagement (17.5) (15.0) (25.0) (27.5} (15.0) (3.075) 106111
C) Employees take part in 3.9 17.6 39.2 l. 4 7.8 3.2157 0.33 decision making on their (5.0) (15.0> (42.9) 135.0) (2.5) (3 150) 10.7401
affairs only D) Employees are encouraged to reveal their 11.8 33.3 35.3 15.7 3.9 2.667 -1.25 personal problem to superiors (7.5) (32.5) (30.0) (17.5) (12.5) (2.950) 10.2161
E) Working committee was formed to conduct feasibility 27.5 17.4 1 35.3 15.7 3.9 2.5098 -2.06 stud on the machine (17.5) (15.0) (27.5) (25 0) (15.0) (3.050) 10.0421*** F) Only certain groups of 7.8 7.0 27 39.2 17.6 3.5098 -0.; 1 individuals make decisions for (5.0) (7.5) (20.0) (55.0) (12.5) (3.625) (0.608) the firm G) Employees are given 35.3 X9.2 I7 3.9 2.0196 -2.27 formal report on their (15.0) (42.5) (2j. 5) (15.0) (5.0) (2.525) 10.0261*** performance H) Superiors delegate their 13.7 17 29.4 23.5 5.9 2.8039 -1 00 work to sub-ordinates (5.0) (22.5) (40.0) (30.0) (2.5) (3.025) 10.3181 I) Superiors share problems 21.6 25.5 35.3 13.7 3.9 2.5294 -1.04 with sub-ordinates (17.5) (17.5) (42.5) I5.0) (7.5) (2.775) 10.3021 J) Relationship between 13.7 15.7 ')N 33.3 27.5 3.4510 1.34 superior and sub-ordinates is (20.0) (22.5) (5.0) (37.5) (15.0) (3.050) 10.1841 informal Source: Jur. ev- 1 y9J
Notes: ***Significant at 95% confidence level The first values arc the information on non-innovative firms. Values in brackets () are information on inno%ative firms Values in brackets II are two tailed significance level Indications of the scores are: 1- Not true all the time 2- Not true most of the time 3-Sometimes true 4-True most of the time 5-True all the time
Highest % in innovative and non-innovative firms
Highest % in innovative firms
Highest % in non-innovative firms
283
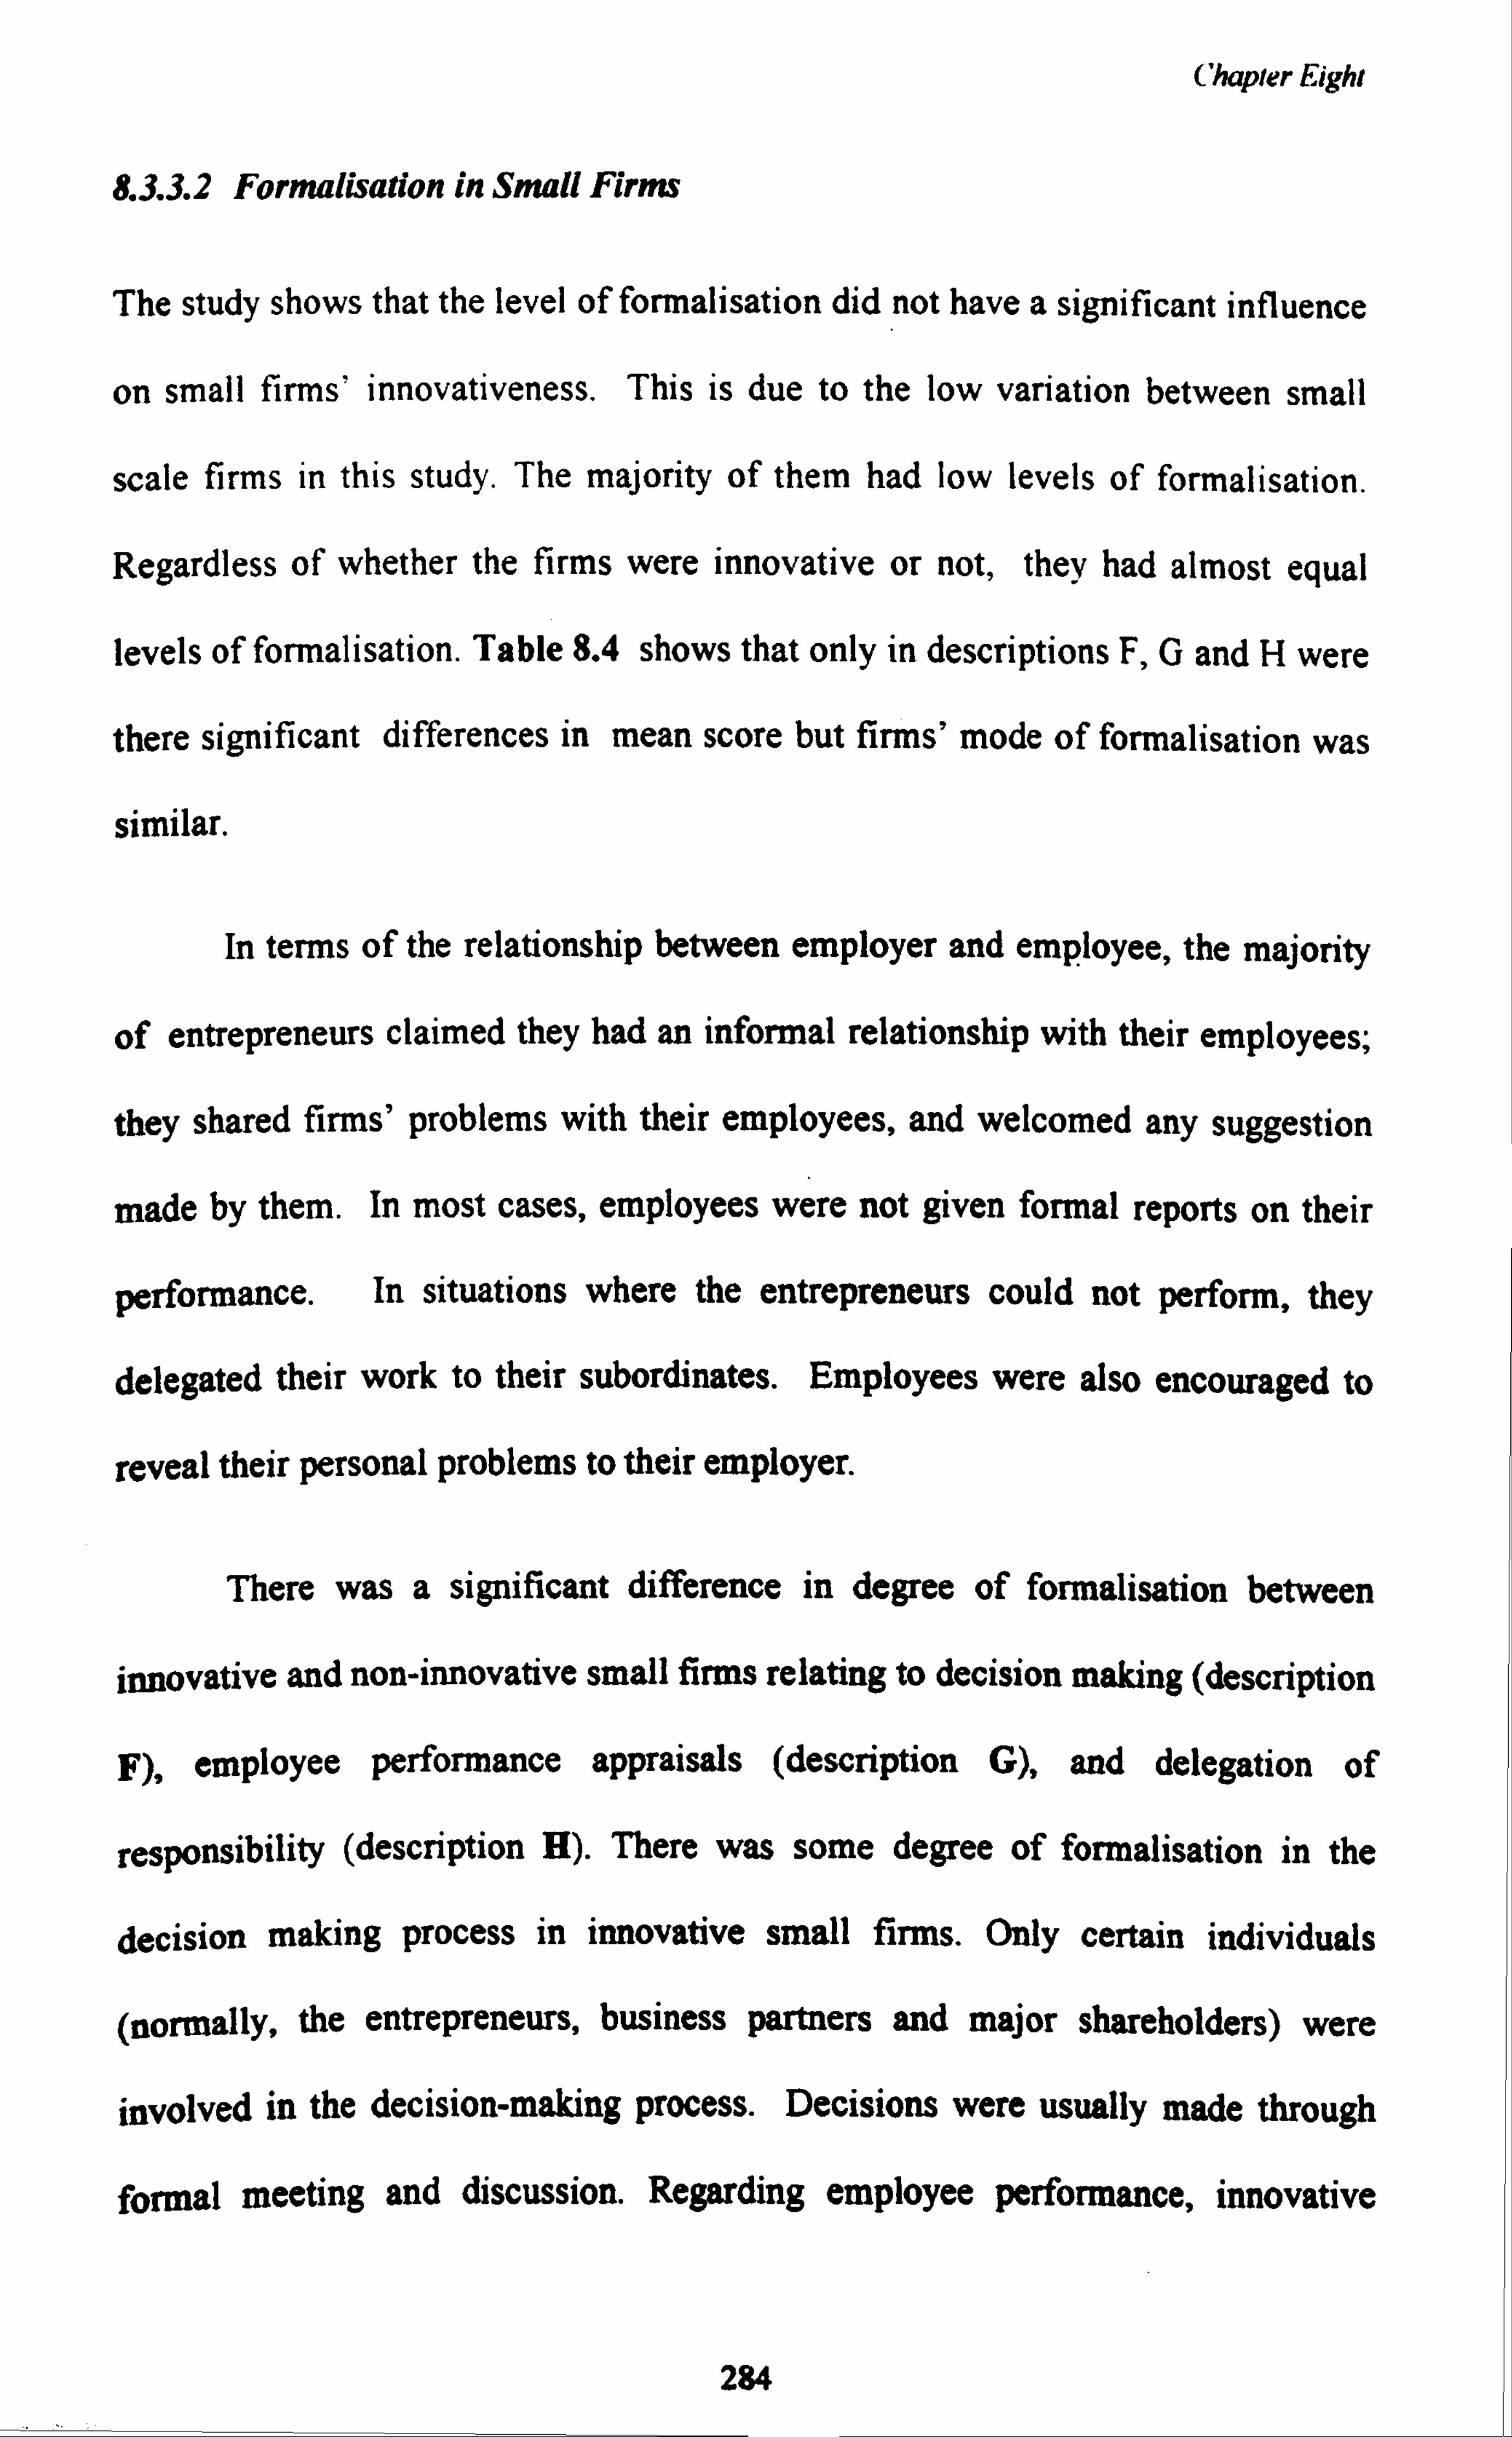
Chapter Eighi
8.3.3.2 Formalisation in Small Firms
The study shows that the level of formalisation did not have a significant influence
on small firms' innovativeness. This is due to the low variation between small
scale firms in this study. The majority of them had low levels of formalisation.
Regardless of whether the firms were innovative or not, they had almost equal
levels of formalisation. Table 8.4 shows that only in descriptions F, G and H were
there significant differences in mean score but firms' mode of formalisation was
similar.
In terms of the relationship between employer and employee, the majority
of entrepreneurs claimed they had an informal relationship with their employees;
they shared firms' problems with their employees, and welcomed any suggestion
made by them. In most cases, employees were not given formal reports on their
performance. In situations where the entrepreneurs could not perform, they
delegated their work to their subordinates. Employees were also encouraged to
reveal their personal problems to their employer.
There was a significant difference in degree of formalisation between
innovative and non-innovative small firms relating to decision making (description
F), employee performance appraisals (description G), and delegation of
responsibility (description H). There was some degree of formalisation in the
decision making process in innovative small firms. Only certain individuals
(normally, the entrepreneurs, business partners and major shareholders) were
involved in the decision-making process. Decisions were usually made through
formal meeting and discussion. Regarding employee performance, innovative
284
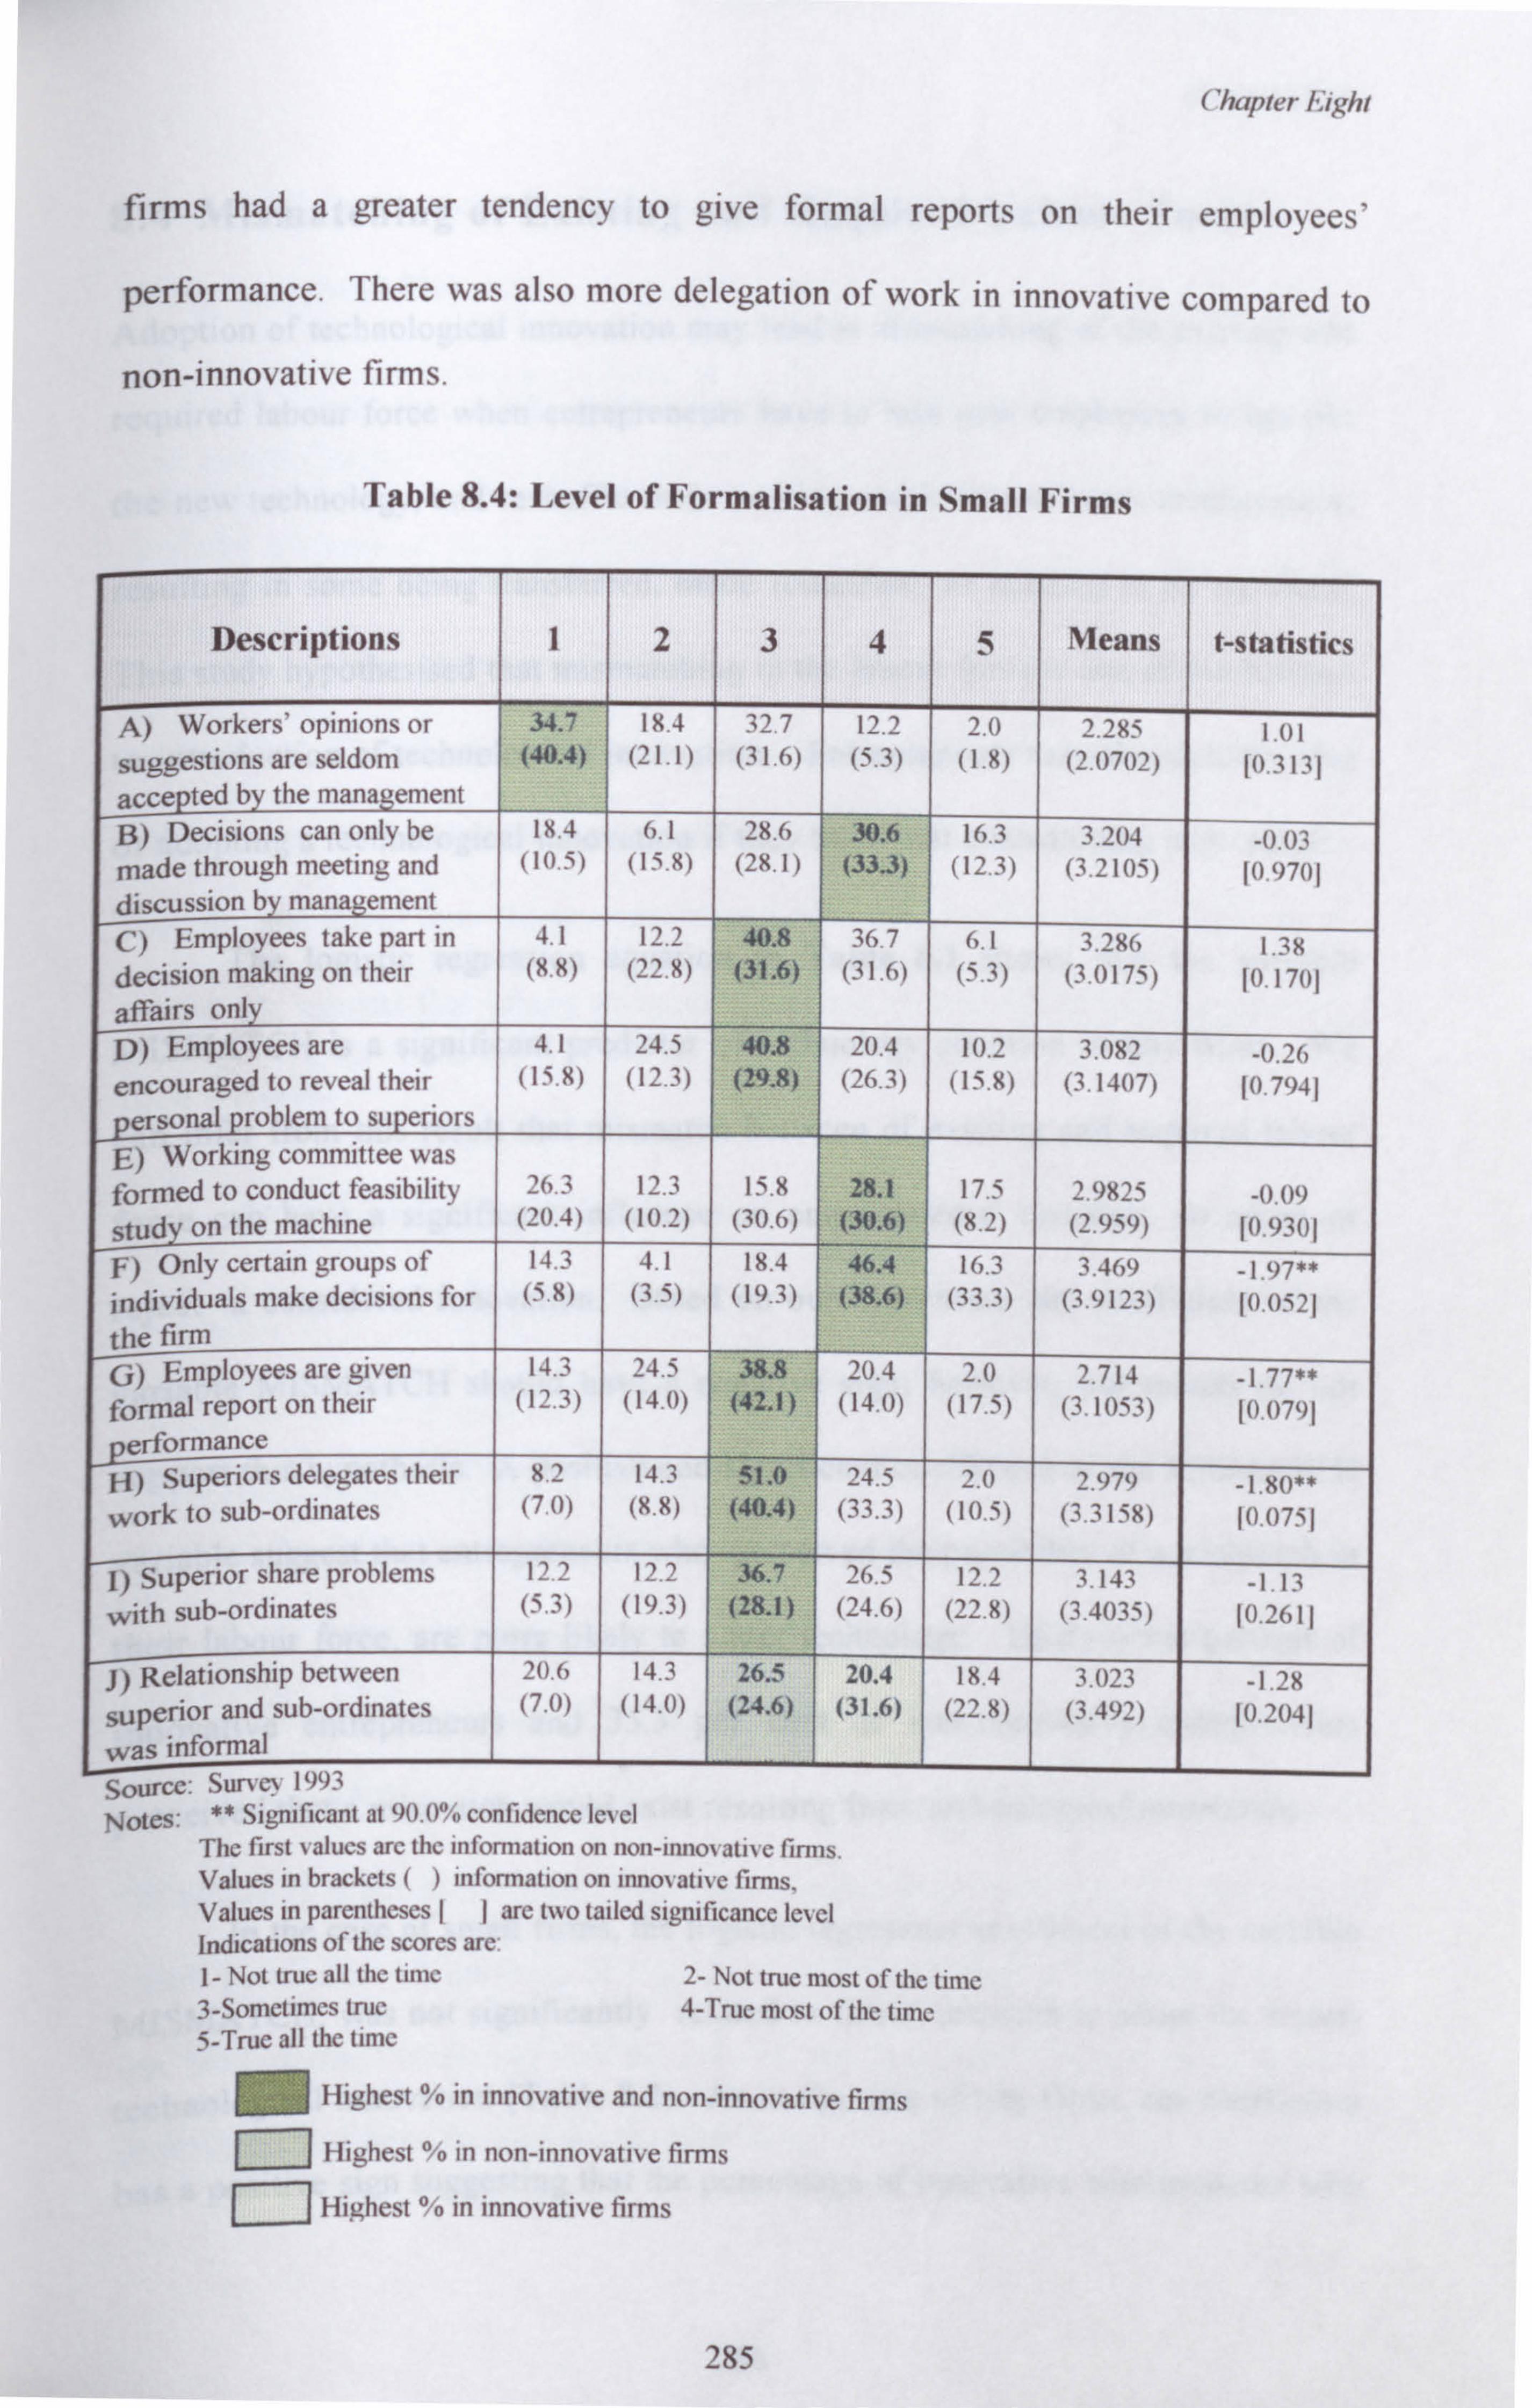
Chapter Eight
firms had a greater tendency to give formal reports on their employees'
performance. There was also more delegation of work in innovative compared to
non-innovative firms.
Table 8.4: Level of Formalisation in Small Firms
Descriptions 1 2 3 4 5 Means t-statistics
p) Workers' opinions or 34.7 18.4 32.7 12.2 2.0 2.285 I. 01 suggestions are seldom (40.4) (21.1) (31.6) (5.3) (1.8) (2.0702) 10.3131
accepted b the management B) Decisions can only be 18.4 6.1 28.6 30.6 16.3 3.204 _0.03 made through meeting and (10.5) (15.8) (28.1) (33.3) (12.3) (3.2105) 10.9701 discussion by management C) Employees take part in 4.1 12.2 40.8 36 7 6.1 3.286 1.38 decision making on their (8.8) (22.8) (31.6) (31.6) (5.3) (3.0175) 10.1701
affairs only D) Employees are 4.1 24.5 40.8 20.4 10.2 3.082 -0.26 encouraged to reveal their (15.8) (12.3) (29.8) (26.3) (15.8) (3.1407) 10.7941
ersonal roblern to superiors E) Working committee was formed to conduct feasibility 26.3 12.3 15.8 28.1 17.5 2.9825 _0.09 stud on the machine (20.4) (10.2) (30.6) (30.6) (8.2) (2.959) 10.9301
F) Only certain groups of 14.3 4.1 18.4 46.4 16.3 3.469 _1.77** individuals make decisions for (5.8) (3.5) (19-3) (38.6) (33.3) (3.9123) 10.0521
the firm G) Employees are given 14.3 24.5 38.8 ? 0.4 2.0 2.714 -177** formal report on their (12.3) (14.0) (42.1) (14.0) (17.5) (3.1053) 10.0791
erformance H) Superiors delegates their 8.2 14.3 51.0 24.5 2.0 2.979 -180** work to sub-ordinates (7.0) (8.8) (40.4) (, 3.3) (10.5) (3.3158) 10.0751
I) Superior share problems 12.2 12.2 36.7 26.5 12.2 3.143 -1.13 with sub-ordinates (5.3) (19.3) (28.1) (24.6) (22.8) (3.4035) 10.2611
J) Relationship between 20.6 14.3 26.5 20.4 18.4 3.023 -1.28 superior and sub-ordinates (7.0) (14.0) (24.6) (31.6) (22.8) (3.492) 10.2041
was informal
Source: )urN c. 1 ", ", Notes: ** Significant at 90.0% confidence level
The first -, alues are the information on non-innovative firms. Values in brackets () information on innovative firms, Values in parentheses II are two tailed significance level Indications of the scores are: 1- Not true all the time 2- Not true most of the time 3-Sometimes true 4-True most of the time 5-True all the time
Highest % in innovative and non-innovative firms
Highest % in non-innovative firms
Highest % in innovative firms
285
Chapter Eight
8.4 Mismatching of Existing and Required Labour Force
Adoption of technological innovation may lead to mismatching of the existing and
required labour force when entrepreneurs have to hire new employees to operate
the new technology, and reshuffle their existing employees or work arrangement,
resulting in some being transferred, made redundant, or needing to be retrained.
This study hypothesised that mismatching in the labour force is one of the barriers
to introduction of technological innovation. Entrepreneurs may abandon the idea
of adopting a technological innovation if they think that mismatching may result.
The logistic regression equation in Table 8.1 shows that the variable
MISMATCH is a significant predictor of technology adoption in tiny firms. We
can infer from this result that mismatch between of existing and required labour
force can have a significant influence on entrepreneurs' decision to adopt or
reject a considered innovation. Based on our hypothesis, the coefficient of the
variable MISMATCH should have a negative sign; however, our results do not
support this hypothesis. A positive and significant coefficient of the WSMATCH
variable suggest that entrepreneurs who perceived the possibility of a mismatch in
their labour force, are more likely to adopt technology. Thirty-seven percent of
innovative entrepreneurs and 35.3 per cent of non-innovative entrepreneurs
perceived that a mismatch would exist resulting from technological innovation.
In the case of small firms, the logistic regression coefficient of the variable
MISMATCH, was not significantly related to firms' decision to adopt (or reject)
technological innovation (Table 8.2). As in the case of tiny firms, the coefficient
has a positive sign suggesting that the percentage of innovative entrepreneurs who
286
Chapter Eight
experienced mismatch is higher (59.6%) compared to non-innovative
entrepreneurs (40.8%).
The main reason why there is a relatively higher percentage of innovative
entrepreneurs who perceived a mismatch of labour force was due the difference in
their experience, the innovative entrepreneurs had actually experienced such a
mismatch, while the non-innovative entrepreneurs were relying on their
perception. They had not seriously considered innovation and so, perhaps, did
not know or failed to realise the extent of the possible mismatch. The fact that
they did not adopt innovation, even though they did not foresee the problem of a
mismatch, suggest that labour mismatch was not an important factor influencing
their decision.
Among innovative entrepreneurs, 37.5 per cent of tiny firms and 59.6 per
cent of small firms had experienced mismatch when they first adopted the
innovation. Some of them continued to innovate despite a mismatch, due to the
presence of government assistance. An analysis of the types of mismatching
revealed the following results: Twenty-three per cent of small firms and 14.0 per
cent of tiny firms admitted that none of their employees had the required skill to
operate the new technology; 76.5 per cent of small firms and 46.0 per cent of tiny
firms indicated that they had to retrain their employees; 44.1 per cent of small
fines and 30.0 per cent of tiny firms had to recruit new employees; 5.9 per cent of
small firms and 4.0 per cent of tiny firms faced redundancy problems; and 17.6
per cent of small firms and 10.0 per cent of tiny firms admitted that some of their
employees had to be transferred to other work.
287
Chapter Eight
Although some innovative entrepreneurs experienced mismatch and some
non-innovative entrepreneurs perceived that mismatch might occur, almost all
felt that mismatch between required and existing labour force was not a problem
that would inhibit them from adopting an innovation. Mismatch was not a
problem because of the simplicity of their organisational structure and the types
of technological innovation under consideration. In such small firms, transferring
of employees, recruiting new employees and provide training would not involve
physical expansion or creation of additional departments. The nature of the
technological innovation that firms adopted or intended to adopt was not so
technically sophisticated that only highly qualified skilled workers could handle
it. By undergoing some training and slight adjustment to their usual work
routines, the innovation could be easily assimilated.
Statistically the data on tiny firms may show the coefficient of
MISMATCH to be related to innovativeness in tiny firms; however, due to
various evidence discussed above, we concluded that the mismatch factor is not a
determining factor in technological innovation.
8.5 Financing
This study hypothesised that financing problems would be a determinant of
technological innovation. Entrepreneurs who face financing problem are more
likely to reject technological innovation compared to those without the problem.
Although entrepreneurs may have felt the need to innovate, they might even
abandon the idea due to lack of finance. This study shows that the variable
288
Chapter Eight
FINANCE had a significant influence on small and tiny firms' decision to adopt or
reject innovation. (Table 8.1 and 8.2) The negative coefficient of the FINANCE
variable in the logistic regression of tiny firms, and FIN-R4 variable in the logistic
regression of small firms, suggests that entrepreneurs with more severe financial
problems are less likely to innovate.
This study measured financing problem based on the difficulties
entrepreneurs faced when trying to obtain finance form commercial financial
institutions. The entrepreneurs faced many difficulties when obtaining finance, of
which the major ones were related to access, providing collateral, preparation of a
feasibility study or the investment plan, and high interest rate. These problems
usually caused entrepreneurs to abandon their idea of seeking financial assistance
from formal institutions. The percentage distribution of entrepreneurs based on
the degree of problems mentioned above is exhibited in Table 8.5.
4 Firms' problems in obtaining financing from financial institution were strongly correlated with firms' size (see Chapter Five). Smaller firms had more serious financing problems than larger firms. We can conclude that firms' financing problems may not be the major factor determining their innovative behaviour; instead it is firms' size. The financial problem may just be a spurious factor, the effect of which on firms' innovative behaviour may reflect firms'
size. Bearing this in mind, we examine firms' financing problems in relation to their size to predict firms' innovativeness in our multivariate analysis. The variable FIN-R in the logistic
regression function (Table 8.2) indicated the firms' financing problem intensity with respect to size. The calculation for FIN-R is as follow:
FIN-R = FINANCE /E (FINANCE)
where: E(FINANCE) =a+ bSIZE
a and b are the estimates of the coefficients of regression function of
FINANCE =a+ ßSIZE +s
A value of FIN-R above "1" indicated that for a particular size of firm, the severity of financing problem was greater than expected. Conversely, a firm with a FIN-R of "1 and below" is considered as having low financing problem intensity in relation to size.
289
Chapter Eight
Based on the results presented in Table 8.5, the problem of financing was
more prevalent among tiny firms compared to small firms. The majority of
entrepreneurs in this study faced difficulties obtaining financing; however, the
severity of the problem was greater for non-innovative entrepreneurs.
In the case of tiny firms, the majority of entrepreneurs (21.6 per cent of
non-innovative and 10.0 per cent of innovative) felt that they had or would have
serious problems getting their loans approved. Due to this lack of confidence,
many of them were discouraged from seeking loans from formal institutions.
Providing the feasibility studies or investment plans required by financial
institutions was not a major problem for the majority of entrepreneurs in the
study. Providing collateral was considered a major problem by 47.1 per cent of
non-innovative entrepreneurs and 40.0 per cent of innovative entrepreneurs.
Access to financial institutions and high interest rates were considered as major
problems for non-innovative entrepreneurs; however, such was not the case for
innovative entrepreneurs. Access to financial institutions was a major problem
for a larger percentage of the non-innovative entrepreneurs, because they lacked
exposure to the facilities offered by various commercial banks to small scale
entrepreneurs. The high interest rate charged by financial institutions also
imposed a heavy financial burden on entrepreneurs. In fact 45.1 per cent of non-
innovative and 30.0 per cent of innovative entrepreneurs regarded interest rates as
their main problem. Some also believed that the charging of interest conflicted
with their religious principles (interest is considered an example of riba, or usury,
which is forbidden in Islam).
290
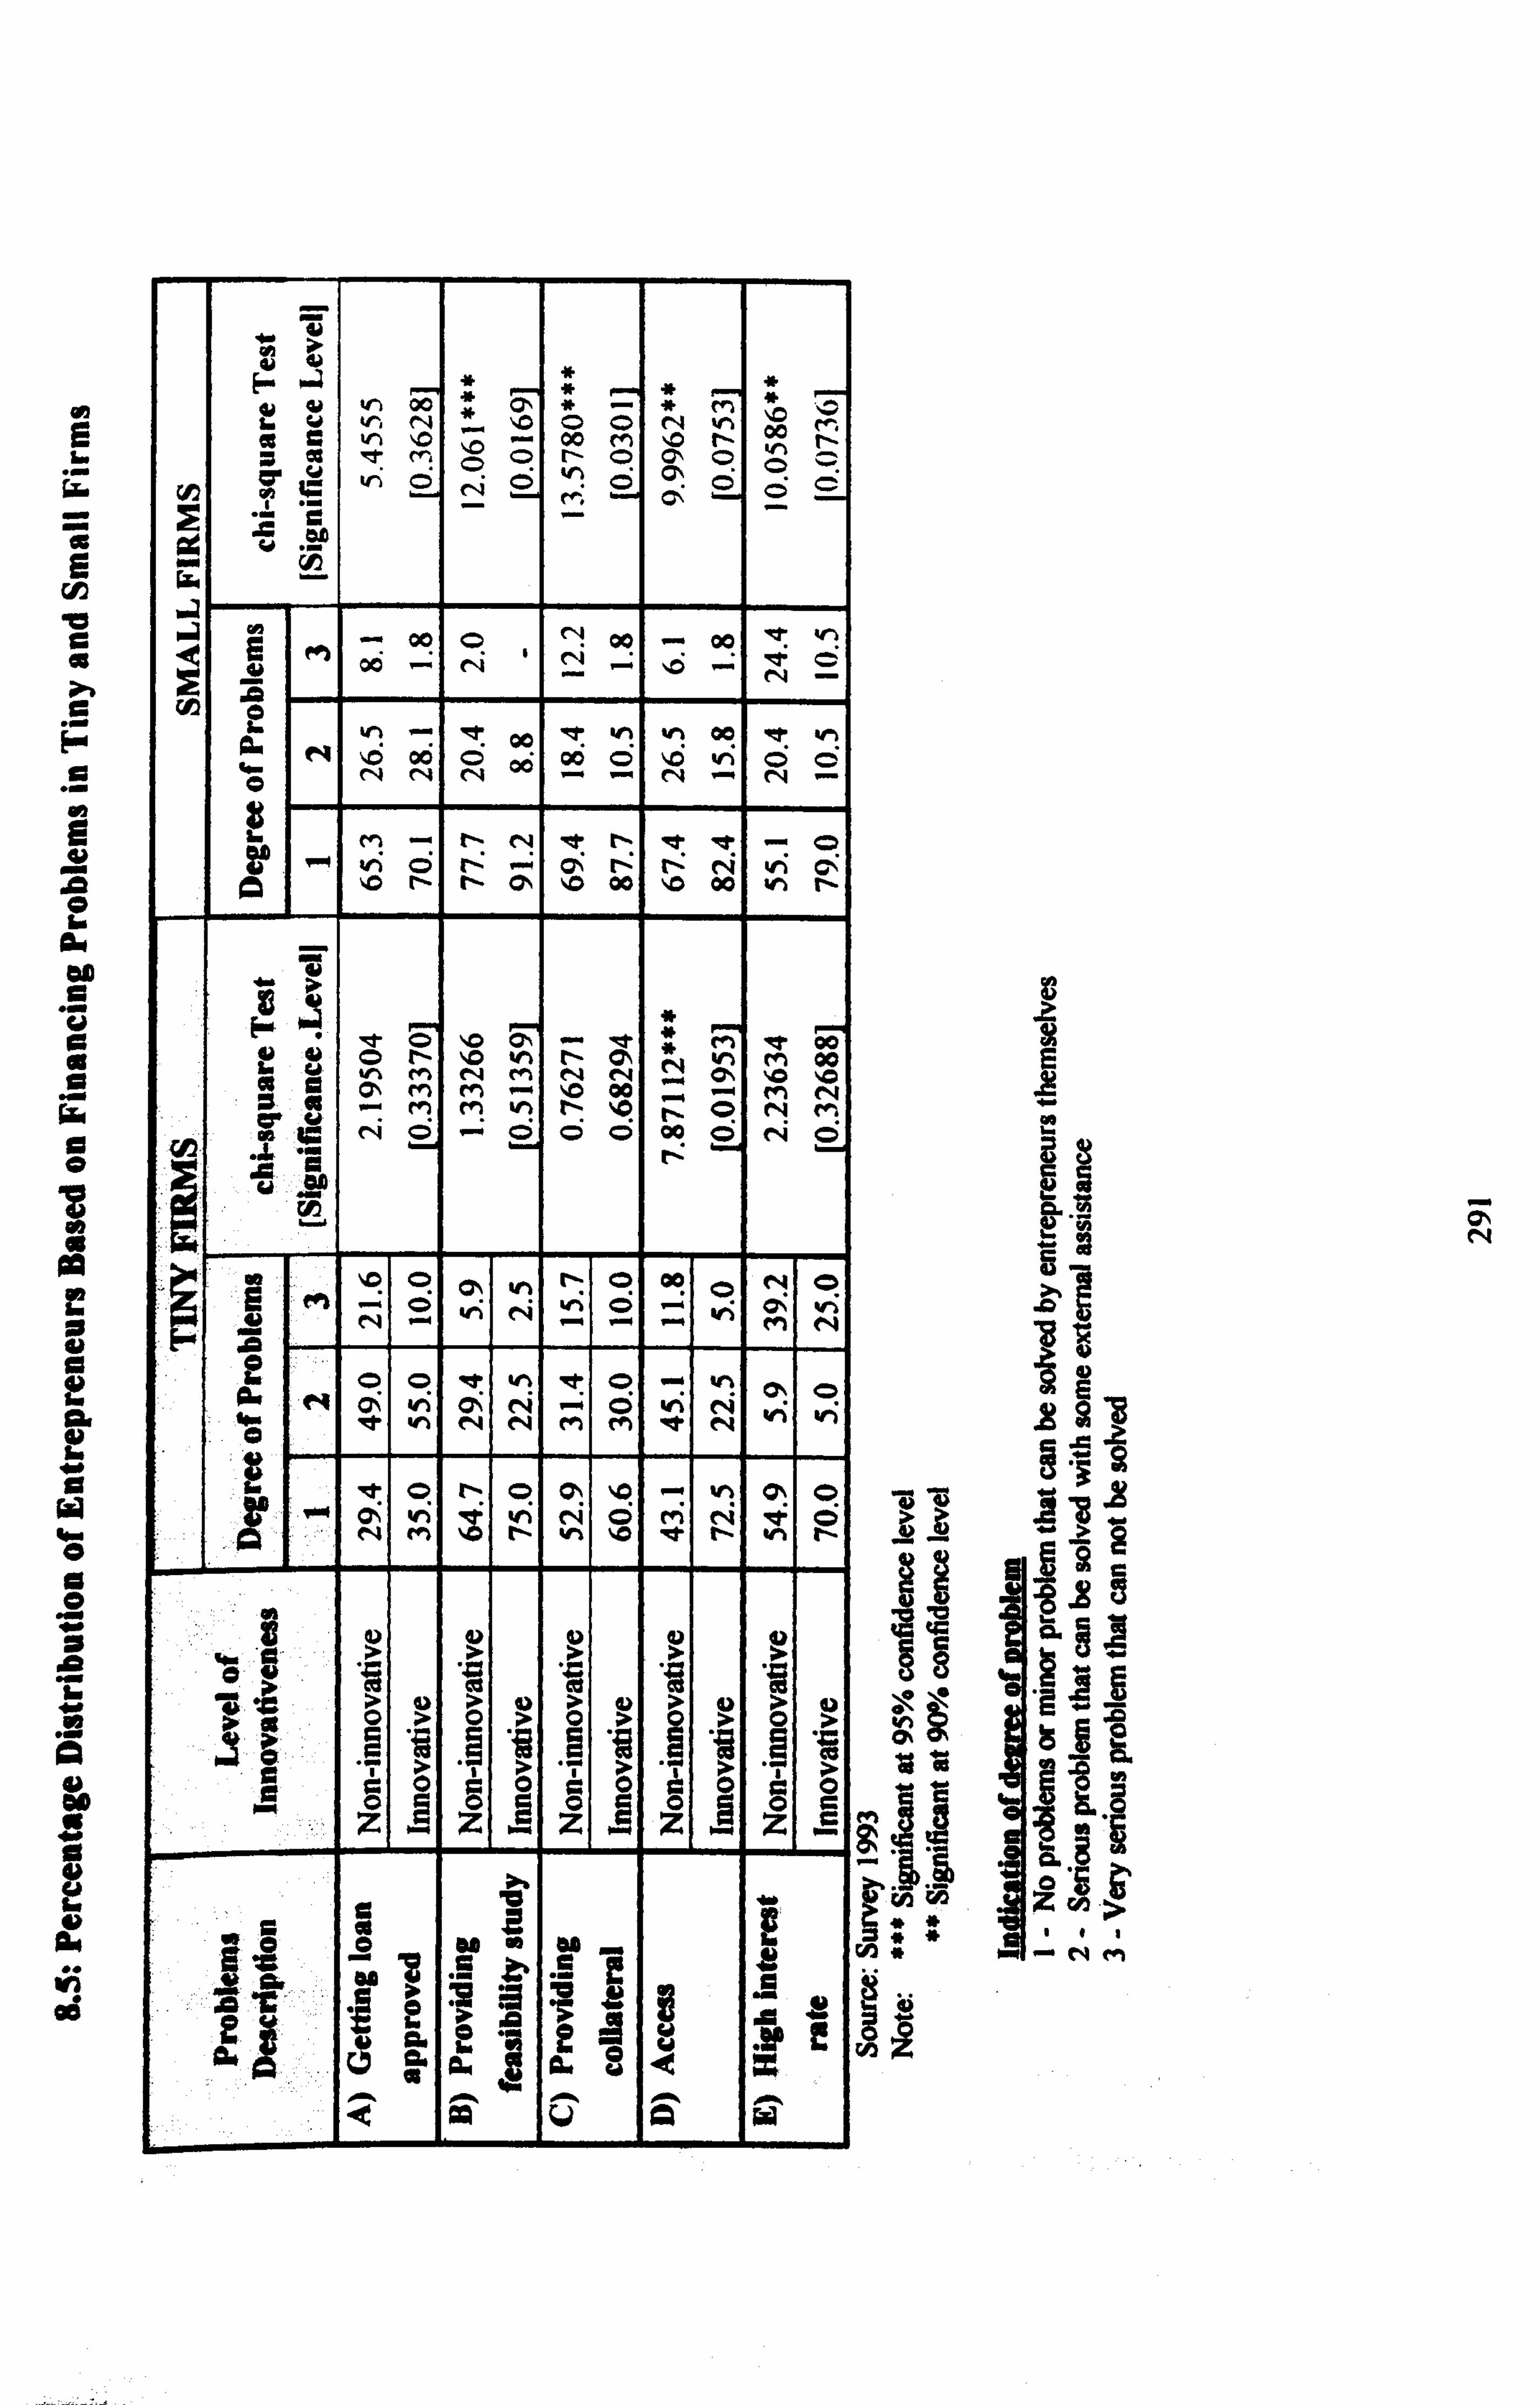
v (f
00 * * ö
O N
in x 00 c`ýý C
Ix v1 ýo
rý O O 00 [-
M O
'0 ON
fN O ,ý y
o N
V1 ` O O Wý
C
M -- 00 O N 00 .. 0 et c! '
v'ý C y 00 N N
- ýp N Ö ý
f' ß'
V'1 -- O tf h in 00 et in N c oö 0 0n ö 'D vn o c Ö N N N N - N
{i ~ Q ýO N Oý I'D 00 110 00 in N
GO
d L O ýD in
l4t C * N In
M 00 00 V if M N M_ N N ,/ � Oý ýO ýp
M M ýn N ýO O N M a
c N 0 - O 0 0 00 Ö N 0 "
a ýD O O ý O 00 O N O
M N
E o o it ýn 't o,
A. N C' Vi
in a; N
N N
-» M
O M
on V1 e?
N N y, h
II N O N
I O ON
h NO ý
- v" ý
O1 h
O ý
M tý ý
Ov 1
" Q
ý O ý Ö q Ö C Ö ý Ö 1 z z A z A z z 1
ýC ae
7 qh*
, Eý o ý
ý 96
ý W Ü Ä W
III
ö%
y Vý
V# w
I
E
w
w
p8 tii V it
811
ýýNM
N
Chapter Eight
For small firms, the majority both innovative and non-innovative firms
regarded getting their loan approved, providing feasibility study on firms' future
investment plan, providing collateral, approaching financial institutions and
interest rates as minor problems which they could solve. However, there were
some differences between the two. A higher percentage of innovative compared
to non-innovative firms considered financing as minor problems (see column I in
degree of problem, Table 8.5, for small firms). On the other hand, a considerably
higher percentage of non-innovative than innovative firms regarded financing as
their major problem (columns 2 and 3 in Table 8.5).
As mentioned above, the majority of entrepreneurs in this study felt that it
was difficult to get approval for a loan from a financial institution. Therefore,
commercial financial institutions were not the source of financing in either tiny or
small firms. The majority relied on informal sources (such as their own funds,
relatives, friends). This study showed that only two entrepreneurs in tiny firms and
five entrepreneurs from small firms had obtained financing from a commercial
bank to finance their innovation.
Among tiny firms that had innovated, 37.1 per cent had used their own
funds, 51.5 per cent had used finance from government institutions, 8.6 had
borrowed from their family and only 2.8 per cent had obtained financing from a
commercial bank. Of the small firms that had innovated, 68.4 per cent (39
entrepreneurs) had used their own funds, 3.5 per cent had used family resources,
8.8 per cent had borrowed from a financial institution and 19.3 per cent had
applied to government agencies to finance their innovation. These results suggest
292
Chapter Eight
that tiny firms tend to rely on government agencies to finance their innovation,
whereas, small firms tend to be financially self-reliant.
Among tiny and small firms which had not innovated but intended to do so
in the near future, the majority (50.0% of tiny firms and 62.901% of small firms) of
them claimed they would use their own funds, rather than seeking external
assistance. Considering the high cost of technological innovation, personal funds
may not be sufficient; these entrepreneurs may have to resort to external sources.
In any event, their choice will be constrained by the funds available. In fact, other
than the appropriateness of the machine, its cost in relation to the finance
available was given as a reason why a particular machine was chosen. If the cost
of innovation is too high, entrepreneurs may have to abandon the idea of
innovating. The results suggest that high cost of innovation would affect
entrepreneurs' ability to finance the innovation themselves5.43.2 per cent of non-
innovative entrepreneurs admitted they did not innovate because of financing
problems and the innovation they had considered introducing was too expensive
for them to finance it themselves. A brief glance at Figure 8.2 shows that
entrepreneurs who relied on informal sources tended to be constrained in their
innovation. For example, entrepreneurs who relied on personal funds, for the most
part spent no more than RM5,000. Those who obtained finance from government
institutions, on the whole innovated at a cost of RM5,000 to RM10,000.
s There is a positive correlation between the cost of innovation and financing problem faced by
the entrepreneurs (For tiny firms: r=0.1697, p=0.0108; for small firms: r=0.1785, p=O. 067).
293
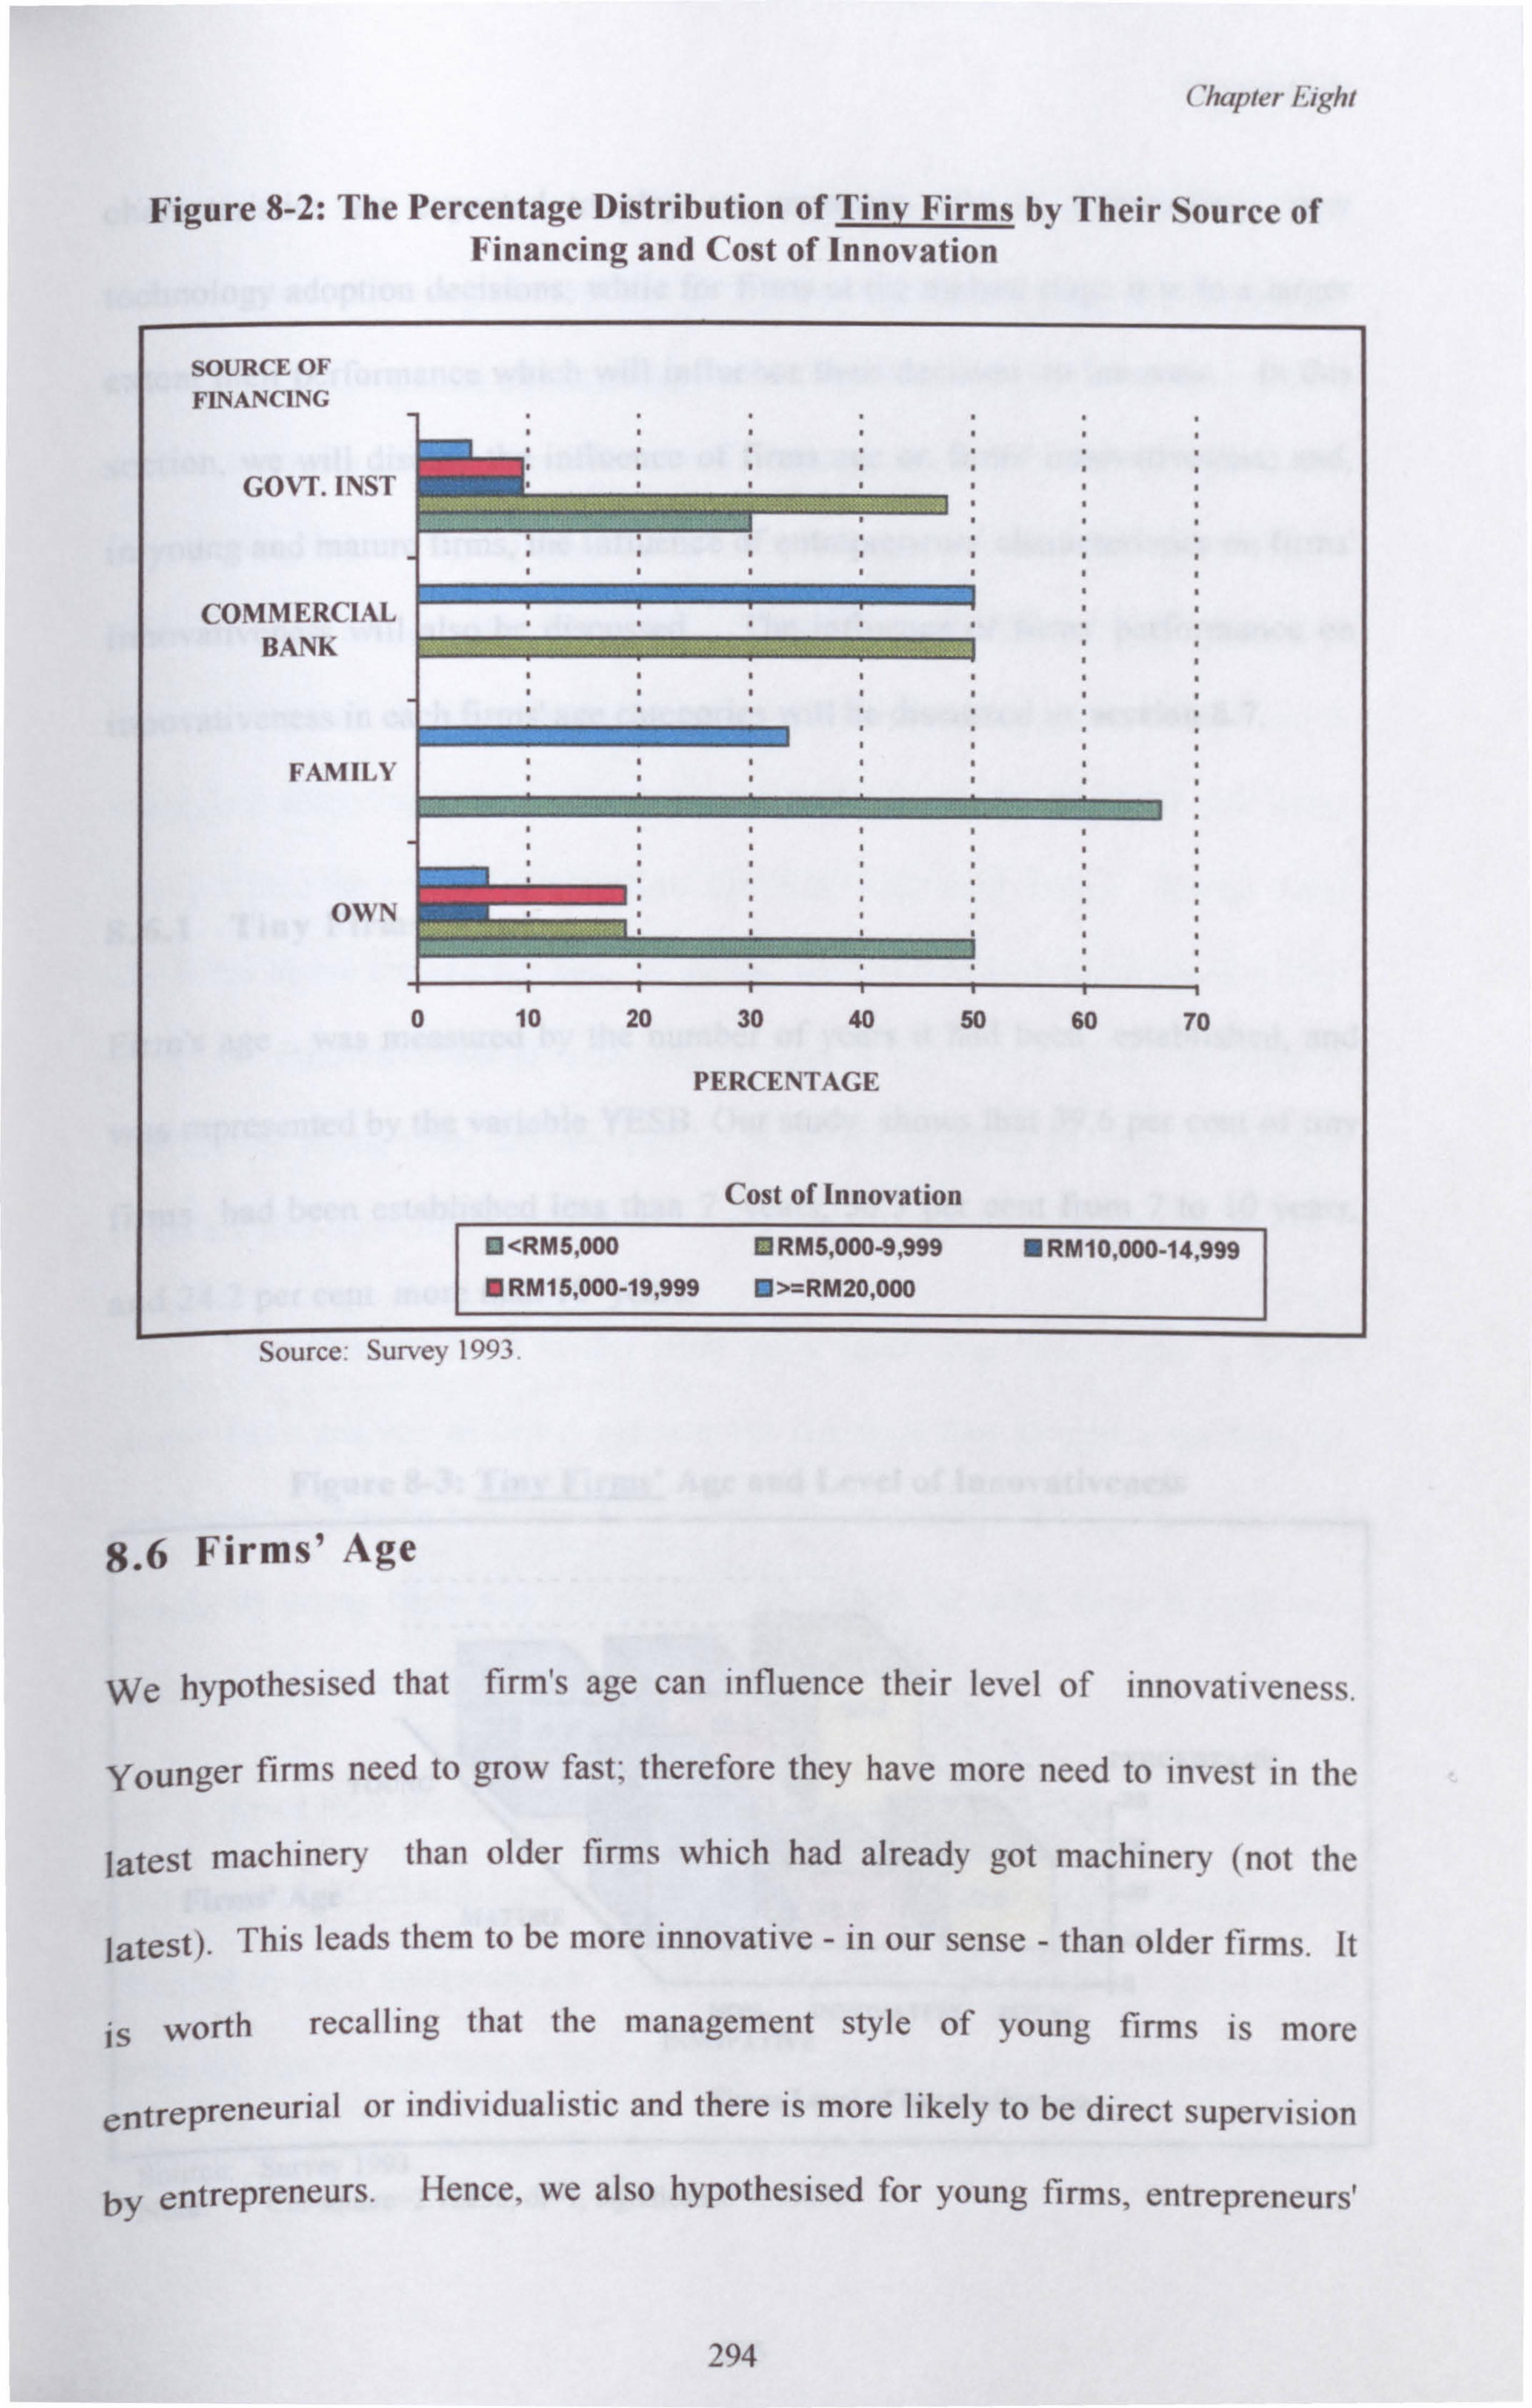
m
Chapter Fight
Figure 8-2: The Percentage Distribution of Tiny Firms by Their Source of Financing and Cost of Innovation
SOURCE OF
FINANCING
GOVT. INST
COMMERCIAL BANK
FAMILY
OW"
0 10 20 30 40 50 60 70
PERCENTAGE
Cost of Innovation
<RM5,000 IRM5,000-9,999 RM10,000-14,999
RM15,000-19,999 >=RM20,000
Source Survey 1Y93.
8.6 Firms' Age
We hypothesised that firm's age can influence their level of innovativeness.
Younger firms need to grow fast; therefore they have more need to invest in the
latest machinery than older firms which had already got machinery (not the
latest). This leads them to be more innovative - in our sense - than older firms. it
is worth recalling that the management style of young firms is more
entrepreneurial or individualistic and there is more likely to be direct supervision
by entrepreneurs. Hence, we also hypothesised for young firms, entrepreneurs'
294
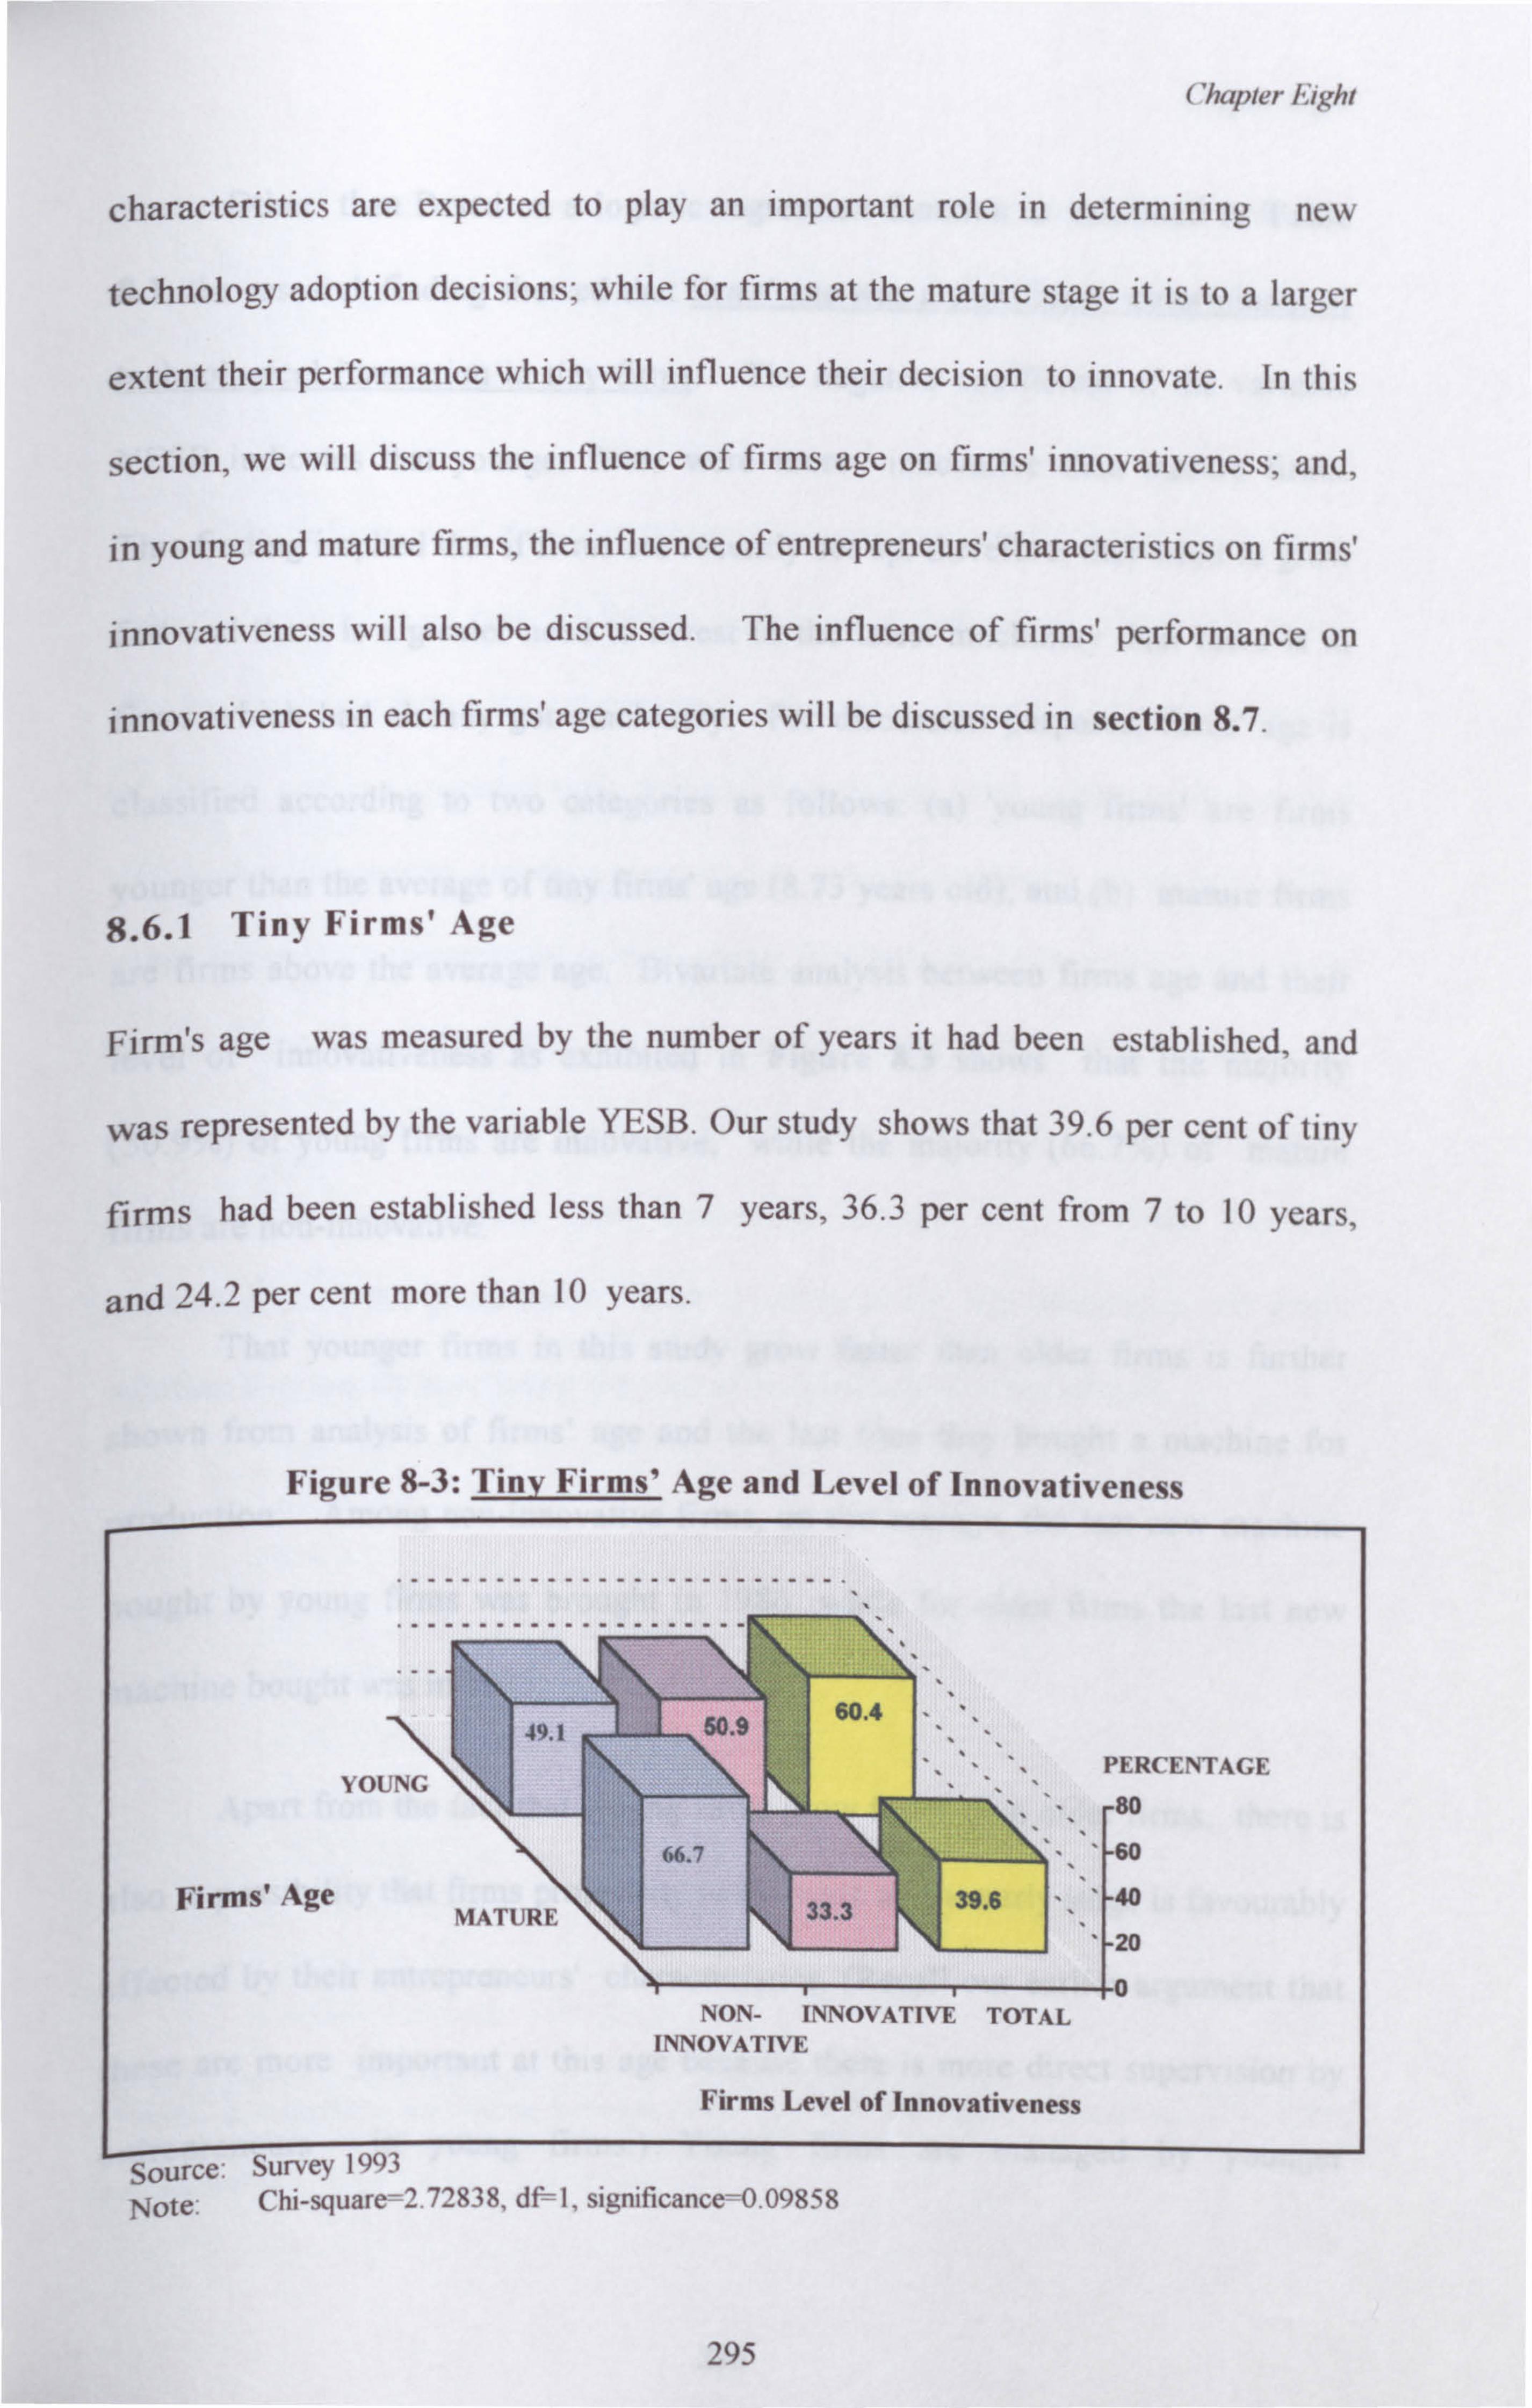
Chapter Eight
characteristics are expected to play an important role in determining new
technology adoption decisions; while for firms at the mature stage it is to a larger
extent their performance which will influence their decision to innovate. In this
section, we will discuss the influence of firms age on firms' innovativeness; and,
in young and mature firms, the influence of entrepreneurs' characteristics on firms'
innovativeness will also be discussed. The influence of firms' performance on
innovativeness in each firms' age categories will be discussed in section 8.7.
8.6.1 Tiny Firms' Age
Firm's age was measured by the number of years it had been established, and
was represented by the variable YESB. Our study shows that 39.6 per cent of tiny
firms had been established less than 7 years, 36.3 per cent from 7 to 10 years,
and 24.2 per cent more than 10 years.
Figure 8-3: Tiny Firms' Age and Level of Innovativeness
PERCENTAGE
Firms' Age
Source: Juº VGy , 'y->>
Note: Chi-square=2.72838, d=1, significance=0.09858
295
NON- INNOVATIVE TOTAL INNOVATIVE
Firms Level of Innovativeness
Chapter Eight
Other than Based on a logistic regression function as exhibited in Table
8.1, the research finding showed that firms' age was a significant determinant of
technological innovation in tiny firms. The negative coefficient of the variable
YESB indicates that younger firms were more innovative than mature firms.
This finding implied that if firms are recently set up, therefore, they need to grow
fast and there is a greater need to invest in the latest machinery than there is in
firms which had already got machinery. For discussion purposes, firms' age is
classified according to two categories as follows: (a) 'young firms' are firms
younger than the average of tiny firms' age (8.73 years old), and (b) mature firms
are firms above the average age. Bivariate analysis between firms age and their
level of innovativeness as exhibited in Figure 8.3 shows that the majority
(50.9%) of young firms are innovative, while the majority (66.7%) of mature
fines are non-innovative.
That younger firms in this study grow faster than older firms is further
shown from analysis of firms' age and the last time they bought a machine for
production. Among non-innovative firms, on the average, the last new machine
bought by young firms was brought in 1986 while for older firms the last new
machine bought was in 1983.
Apart from the fact that young firms grow faster than older firms, there is
also a possibility that firms propensity to innovate at the early stage is favourably
affected by their entrepreneurs' characteristics. (Recall our earlier argument that
these are more important at this age because there is more direct supervision by
trepreneurs in young firms. ) Young firms are managed by younger
296
Chapter Eight
entrepreneurs6 ; and, these young entrepreneurs, compared to older entrepreneurs
usually have higher level of education and are higher achievers (as has been
mentioned in Chapter Six).
The influence of the entrepreneurs' characteristics on firms' decision to
innovate among young firms is further explained in Table 8.6. This table shows
that among young firms, the entrepreneurs who: were younger, had higher level of
education, and had upgraded their skill and knowledge, were higher achievers and
had higher propensity to take risk, had a greater tendency to innovate. The
characteristics of the entrepreneurs have less influence on firms' innovativeness in
mature firms. (see Table 8.6). Firms innovate at the mature stage of their life
cycle due to other factors, such as government assistance. In fact, 50.0 of
entrepreneurs from mature firms innovated because they received financial
assistance from the government. Had it not been for this assistance, we doubt
whether they would have taken the step of introducing new techniques.
6 There is a positive correlation between firms' age and their entrepreneurs' age (r=0.1787, pa0.090). This indicated that compared to mature firms, young firms are managed by younger entrepreneurs.
297
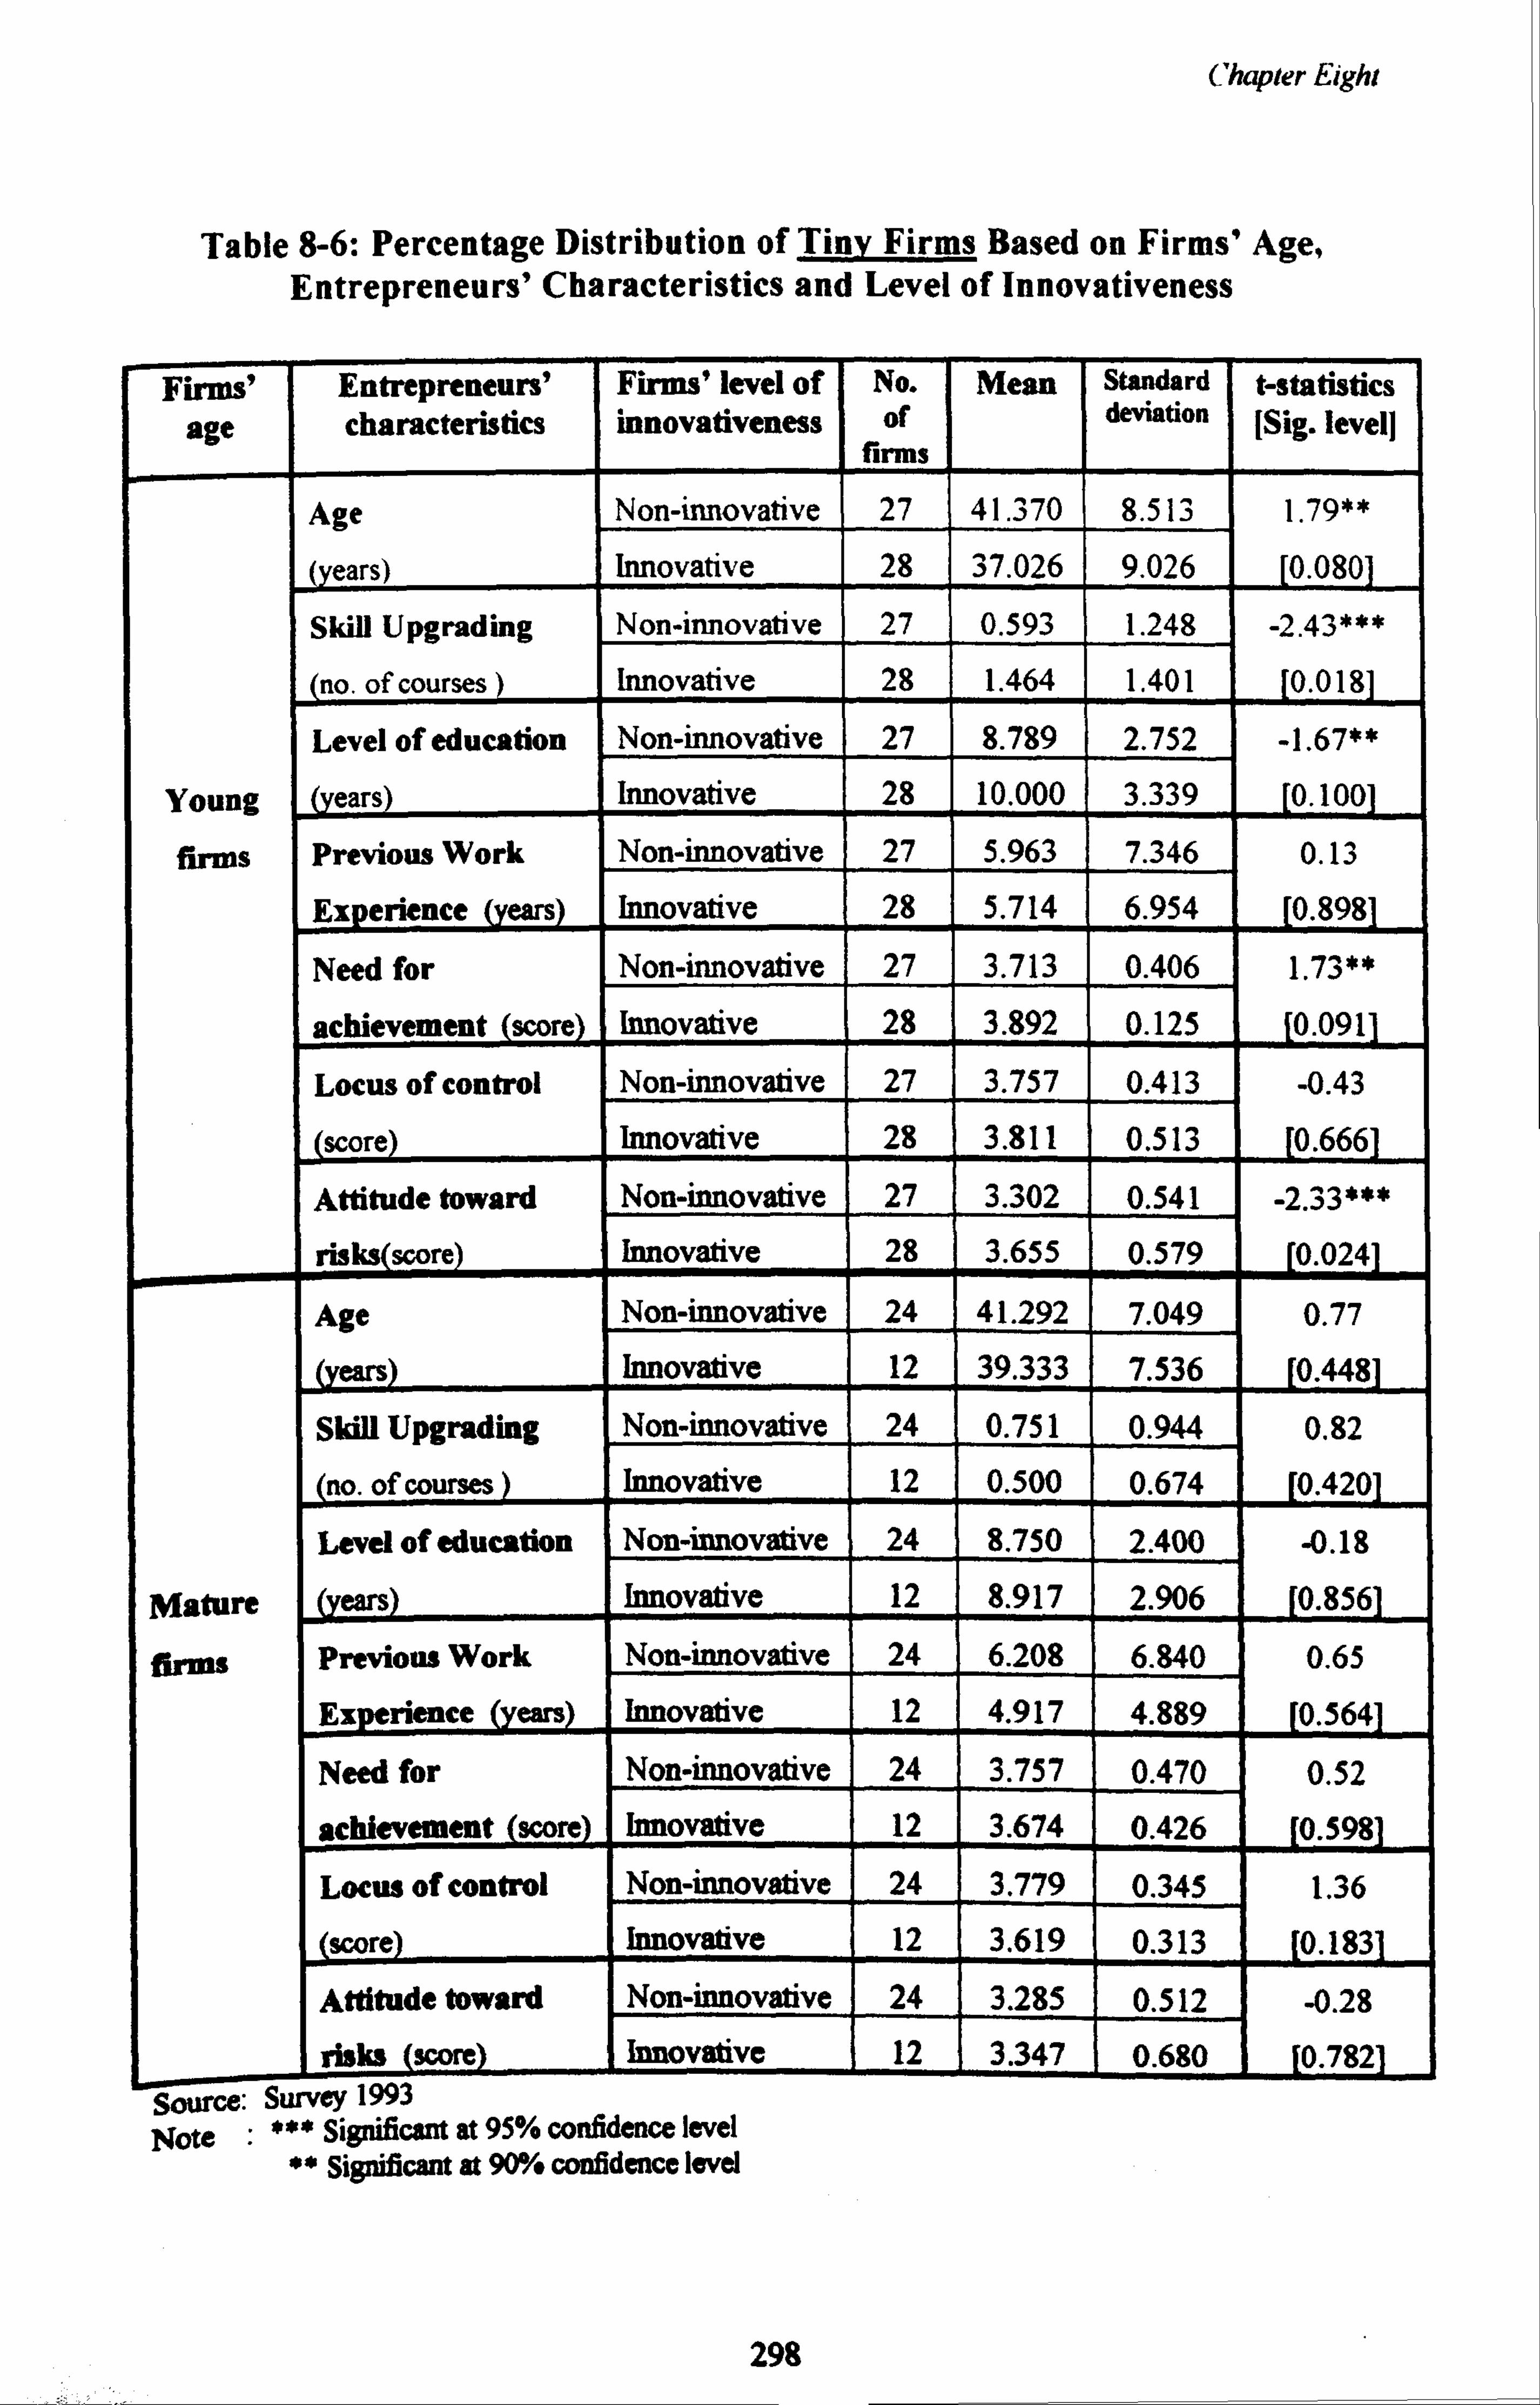
Chapter Eight
Table 8-6: Percentage Distribution of Tiny Firms Based on Firms' Age, Entrepreneurs' Characteristics and Level of Innovativeness
Firms' age
Entrepreneurs' characteristics
Firms' level of innovativeness
No. of
firms
Mean Standard ßt1on
t -statistics [Sig. level]
Age Non-innovative 27 41.370 8.513 1.79**
(years) Innovative 28 37.026 9.026 0.080
Skill Upgrading Non-innovative 27 0.593 1.248 -2.43*** (no. of courses) Innovative 28 1.464 1.401 0.018
Level of education Non-innovative 27 8.789 2.752 -1.67**
Young (years) Innovative 28 10.000 3.339 0.100
firms Previous Work Non-innovative 27 5.963 7.346 0.13
Experience (years) Innovative 28 5.714 6.954 0.898
Need for Non-innovative 27 3.713 0.406 1.73**
achievement (score) Innovative 28 3.892 0.125 [0.0911
Locus of control Non-innovative 27 3.757 0.413 -0.43
score Innovative 28 3.811 0.513 0.666
Attitude toward Non-innovative 27 3.302 0.541 -2.33*** risks(score) Innovative 28 3.655 0.579 0.024
Age Non-innovative 24 41.292 7.049 0.77
(years) Innovative 12 39.333 7.536 0.448
Skill Upgrading Non-innovative 24 0.751 0.944 0.82
no. of courses Innovative 12 0.500 0.674 0.420
Level of education Non-innovative 24 8.750 2.400 -0.18 Mature ears Innovative 12 8.917 2.906 0.856
firma Previous Work Non-innovative 24 6.208 6.840 0.65
Experience (years) Innovative 12 4.917 4.889 0.564
Need for Non-innovative 24 3.757 0.470 0.52
achievement (score) Innovative 12 3.674 0.426 0.598
Locus of control Non-innovative 24 3.779 0.345 1.36
score Innovative 12 3.619 0.313 [0.1831
Attitude toward Non-innovative 24 3.285 0.512 -0.28 risks score Innovative 12 3.347 0.680 0.782
Source: Survey 1993 Note : *** Significant at 95% confidence level
** Significant at 90°% confidence level
298
Chapter Eight
8.6.2 Small Firms' Age
Our study shows that 54.7 per cent of small firms had been established less than
10 years, 34.9 per cent had been established between 10 to 19 years, and 3.4 per
cent had been established more than 20 years. In our analysis of small firms,
compared to tiny firms, we adopted a slightly different approach; we measured
small firms' age by their years of establishment in relation to their size7, as
represented by the variable YESB-R. We assume that firms with their YESB-R
value less than or equal to 1 are young firms while firms with their YESB-R value
greater than I are mature firms.
The logistic regression function (Table 8.2) indicated that firms' age was
not a significant determinant of innovativeness in small firms. What this result
suggests is that firms had equal tendency to innovate, regardless of their age.
Small firms innovated at the young age to stay competitive and they did so by
improving production efficiency. The majority claimed they innovated to replace
old machines and manual methods, rather than introducing new products. Firms
which innovated at the mature stage, did so to increase their market share,
business expansion or diversification. It is reasonable to think that firms at this
'Due to the strong correlation between years of establishment and firm size, as a way to avoid collinearity, firms' age can be measured according to firm size. It is named as variable YESB- R. The value of YESB-R was calculated as follow:
YESB-R = YESB /E (YESB)
where: E(YESB) =a+ bSIZE
a and b are the estimates of the coefficients of regression function of YESB=a+ßSIZE+E
For a particular size of firm, a score of "less than 1" for the variable YESB-R indicates that the firm is at its younger age. Alternatively if the firm has a score of "1 or higher" for the variable YESB-R, indicates that the firm is the mature stage of its life-cycle.
299
Chapter Eight
stage will introduce new machinery to produce new products. Referring back to
our hypothesis, it may be that the innovations which we are looking at, which
involve modest improvements in process technology, would not much tend to
upset organisational routines and would therefore not fall foul of conservatism in
older firms.
Unlike tiny firms, in small firms, we found that the influence of
entrepreneurs' characteristics on firms' innovativeness exist in both stages of firms'
life cycle. However, the influence become less significant as firms mature. This
indicated that in small firms, their entrepreneurs' involvement in managing the
firms is more intense in their early age. As exhibited in Table 8.7, entrepreneurs'
skill upgrading behaviour, their previous work experience and their locus of
control influence firms to innovate in the young age. At this stage, entrepreneurs
with previous work experience, or who had upgraded their skill, or who had
internal locus of control had a greater tendency to be innovative. For mature
firms, only the entrepreneurs' skill upgrading behaviour influence their level of
innovativeness.
300
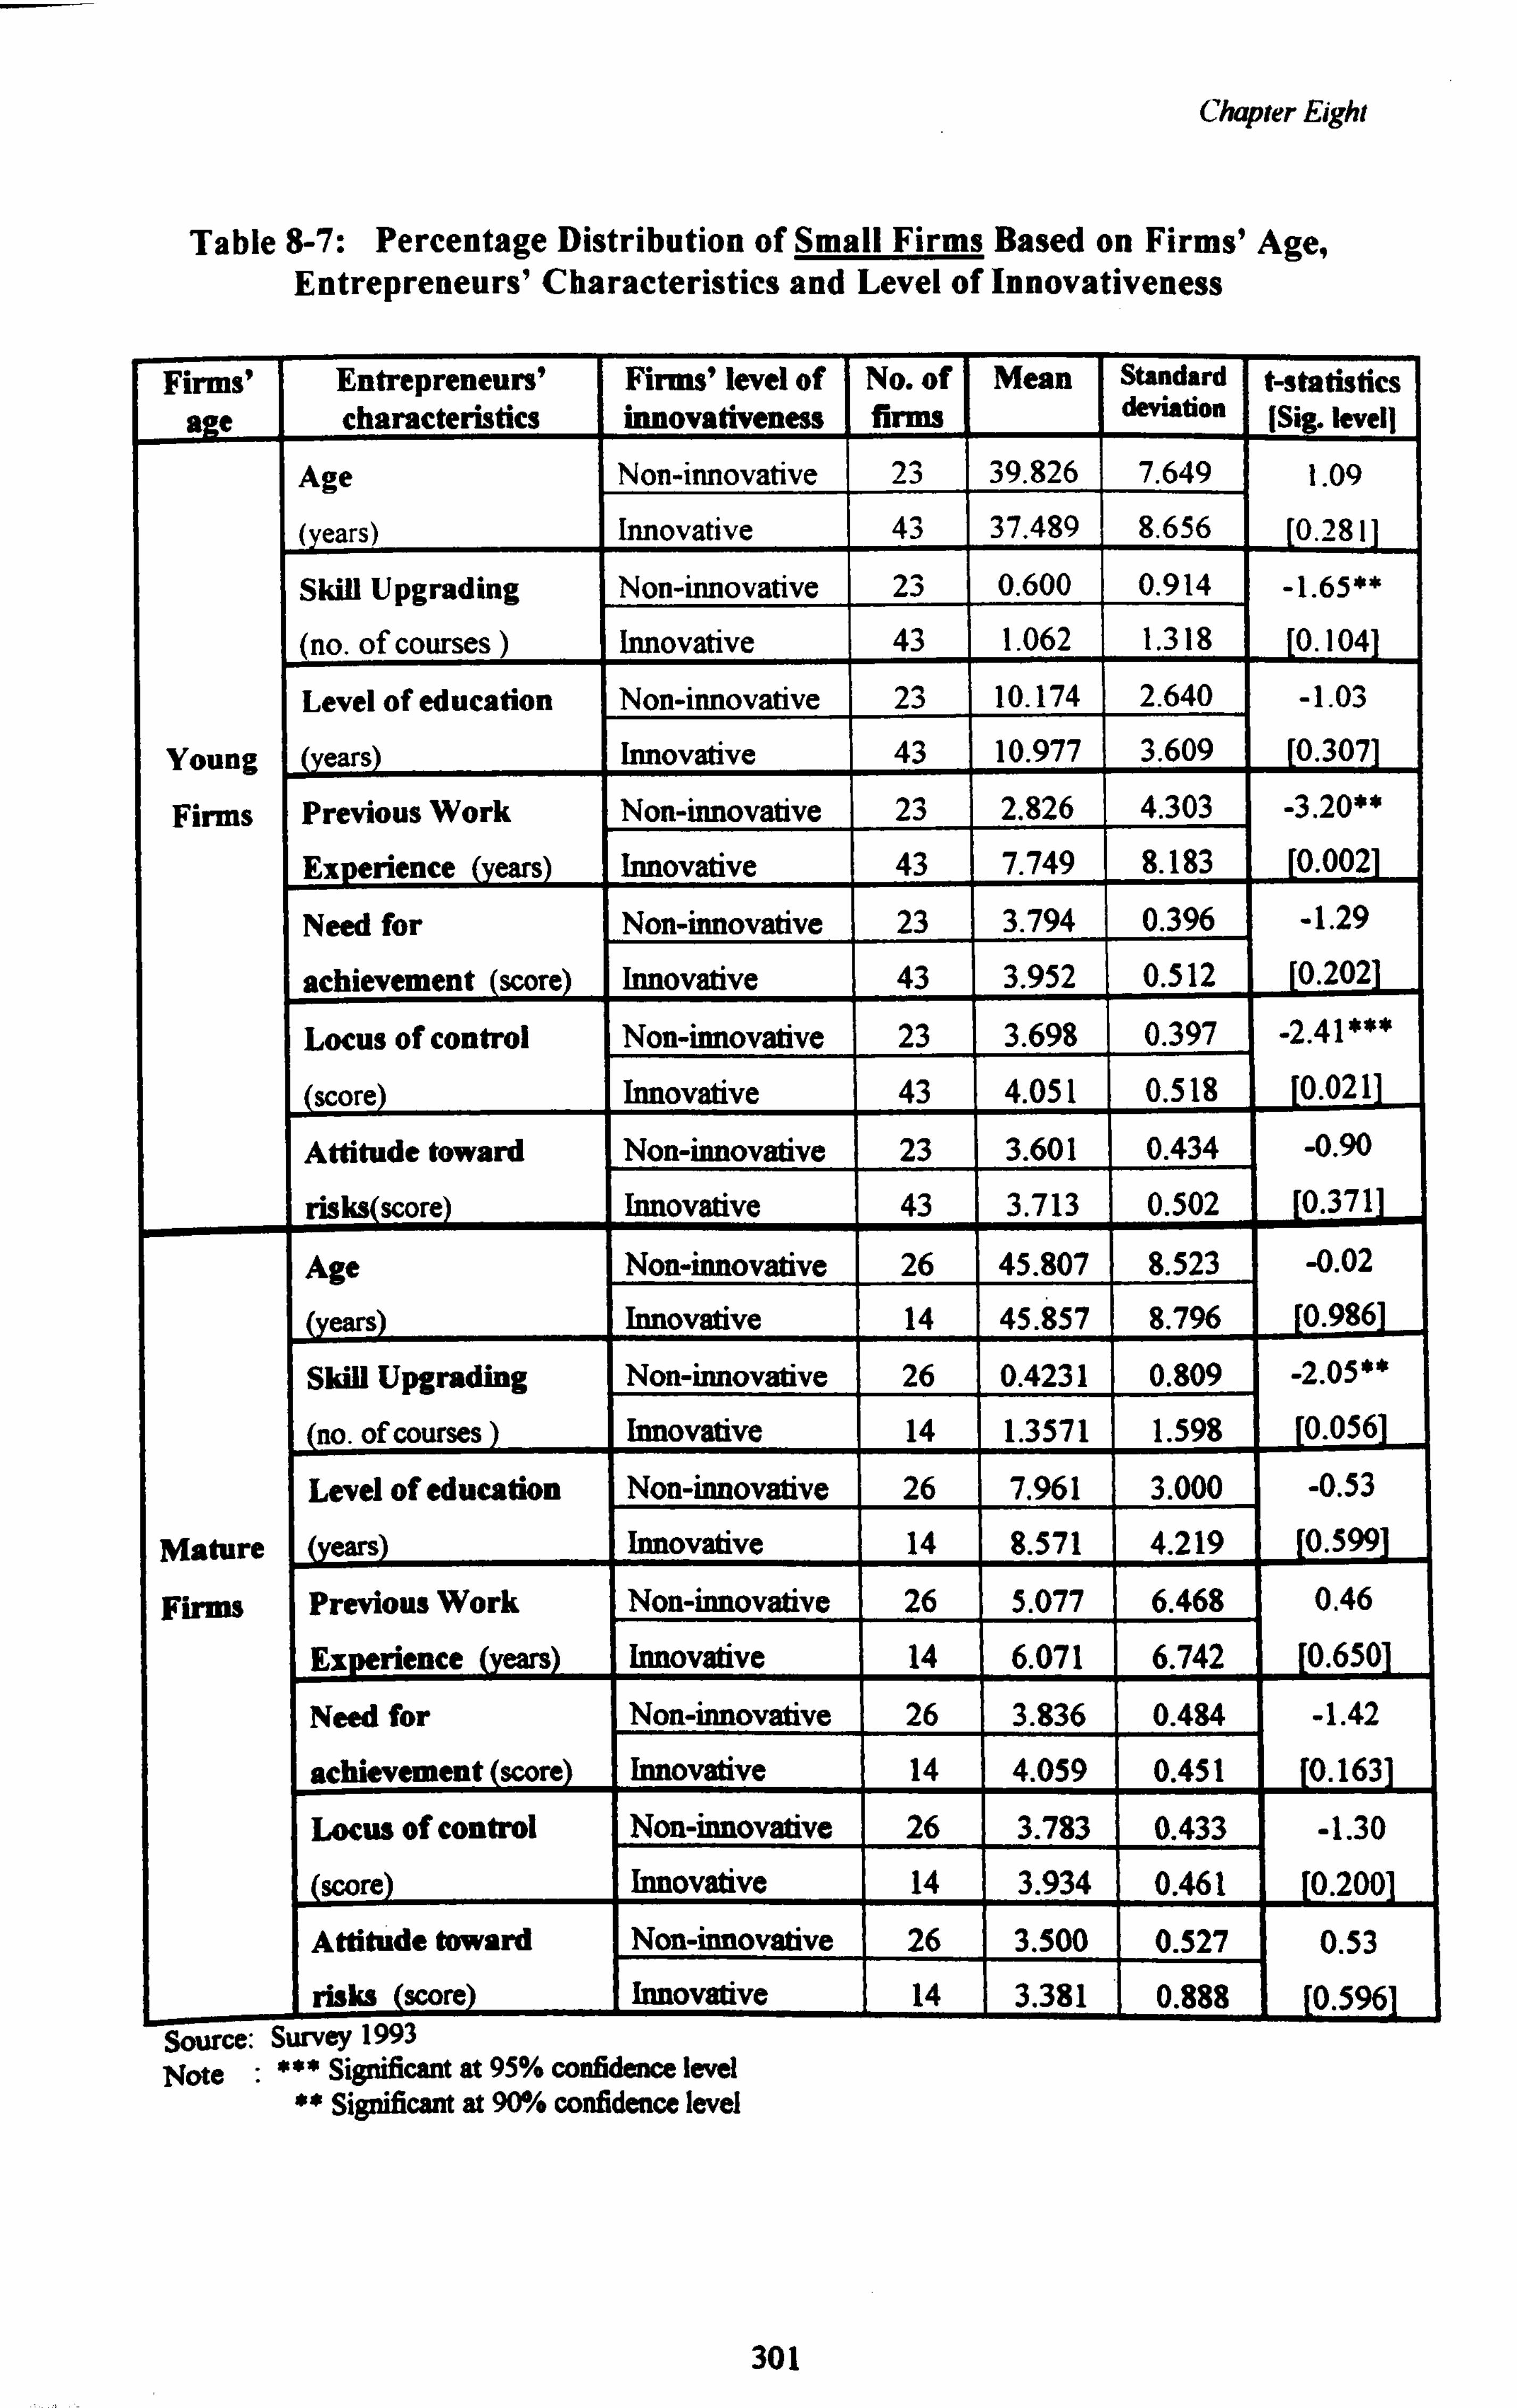
Chapter Eight
Table 8-7: Percentage Distribution of Small Firms Based on Firms' Age, Entrepreneurs' Characteristics and Level of Innovativeness
Firms' age
Entrepreneurs' characteristics
Firms' level of innovativeness
No. of firms
Mean Standard &-lia6on
t statistics (Sig. levell
Age Non-innovative 23 39.826 7.649 1.09
(years) Innovative 43 37.489 8.656 0.281
Skill Upgrading Non-innovative 23 0.600 0.914 -1.65** (no. of courses) Innovative 43 1.062 1.318 0.104
Level of education Non-innovative 23 10.174 2.640 -1.03
Young (years) Innovative 43 10.977 3.609 0.307
Firms Previous Work Non-innovative 23 2.826 4.303 -3.20**
Experience (years) Innovative 43 7.749 8.183 0.002
Need for Non-innovative 23 3.794 0.396 -1.29
achievement (score) Innovative 43 3.952 0.512 0.202
Locus of control Non-innovative 23 3.698 0.397 -2.41 ***
(score) Innovative 43 4.051 0.518 0.021
Attitude toward Non-innovative 23 3.601 0.434 -0.90
risks(score) Innovative 43 3.713 0.502 0.371
Age Non-innovative 26 45.807 8.523 -0.02
ears Innovative 14 45.857 8.796 0.986
Skill Upgrading Non-innovative 26 0.4231 0.809 -2.05**
no. of courses Innovative 14 1.3571 1.598 0.056
Level of education Non-innovative 26 7.961 3.000 -0.53 Mature (years) Innovative 14 8.571 4.219 0.599
Firms Previous Work Non-innovative 26 5.077 6.468 0.46
Experience (years) Innovative 14 6.071 6.742 [0.6501
Need for Non-innovative 26 3.836 0.484 -1.42 achievement (score) Innovative 14 4.059 0.451 0.163
Locus of control Non-innovative 26 3.783 0.433 -1.30 (score) Innovative 14 3.934 0.461 0.200
Attitude toward Non-innovative 26 3.500 0.527 0.53
risks score Innovative 14 3.381 0.888 0.596 Source: Survey 1993 Note Significant at 95% confidence level
"* Significant at 90% confidence level
301
Chapter Eight
8.7 Firms' Performance
In our conceptual framework, we proposed that firm's performance is a significant
determinant of innovativeness for small and tiny firms. This study measured
performance by fixed asset turnover, return on investment and productivity of
labour for 1989. As indicated by the logistic regression function, in the case of
tiny firms, the productivity of labour (PROD89) had a significant influence on
firms' decision to innovate. (Table 8.1) The negative coefficient suggested that
firms with low labour productivity had a greater tendency to innovate. However,
firms' fixed asset turnover (FATURN89) and return on investment (R0189) were
not statistically significant in influencing firms' innovativeness.
One of the reasons why tiny firms with low labour productivity innovate is
to increase value added and production. In fact, 45.7 per cent of innovative
entrepreneurs admitted that their aim in introducing the innovation was to replace
their usual manual methods.
In the case of small firms, as shown by the logistic regression function, all
the three indicators of firm performance (FATURN89, R0189, PROD89) had a
significant influence on firms' innovativeness. (Table 8.2) The positive coefficient
of the variable FATURN89 and PROD89, suggested that firms with higher level of
fixed asset turnover and labour productivity had a greater tendency to adopt
technological innovation. However, firms with low return on investment had a
greater tendency to innovate, as suggested by the negative coefficient of the
variable ROI89.
302
Chapter Eight
Fixed asset turnover measures the turnover of plant and equipment. If a
firm has a high fixed asset turnover, it means that this firm has higher sales value
in relation to its investment on plant and equipment. Productivity of labour, on
the other hand, measures the value added contributed by each labour in the firm.
Thus, firms with higher productivity of labour are those with higher value added
with respect to their number of workers. If a firm has high values of fixed asset
turnover and labour productivity, this suggests that they have high quality of
management and effective use of resources (such as plant, equipment and labour).
It also indicates that the firm is efficient and able to accumulate funds and wealth.
These firms have adequate financial and human resources to innovate. This
explains why such firms have a greater tendency to innovate, compared to those
with lower fixed asset turnover and labour productivity.
Generally, firms with high returns on investment are efficient. However,
this study showed an inconclusive result. It shows that it was the less efficient
firms (those with low returns on investments) rather than the efficient ones which
innovated. There is reason to believe that the less efficient firms innovated to stay
competitive and improve.
In the following paragraphs we shall also analyse the influence of
performance on innovativeness at various stages of firms' age. The purpose of this
analysis is to test the hypothesis that their performance has a significant influence
on their innovativeness in mature firms and not in young firms. We believe that
mature firms have a more professional and administrative style of management;
303
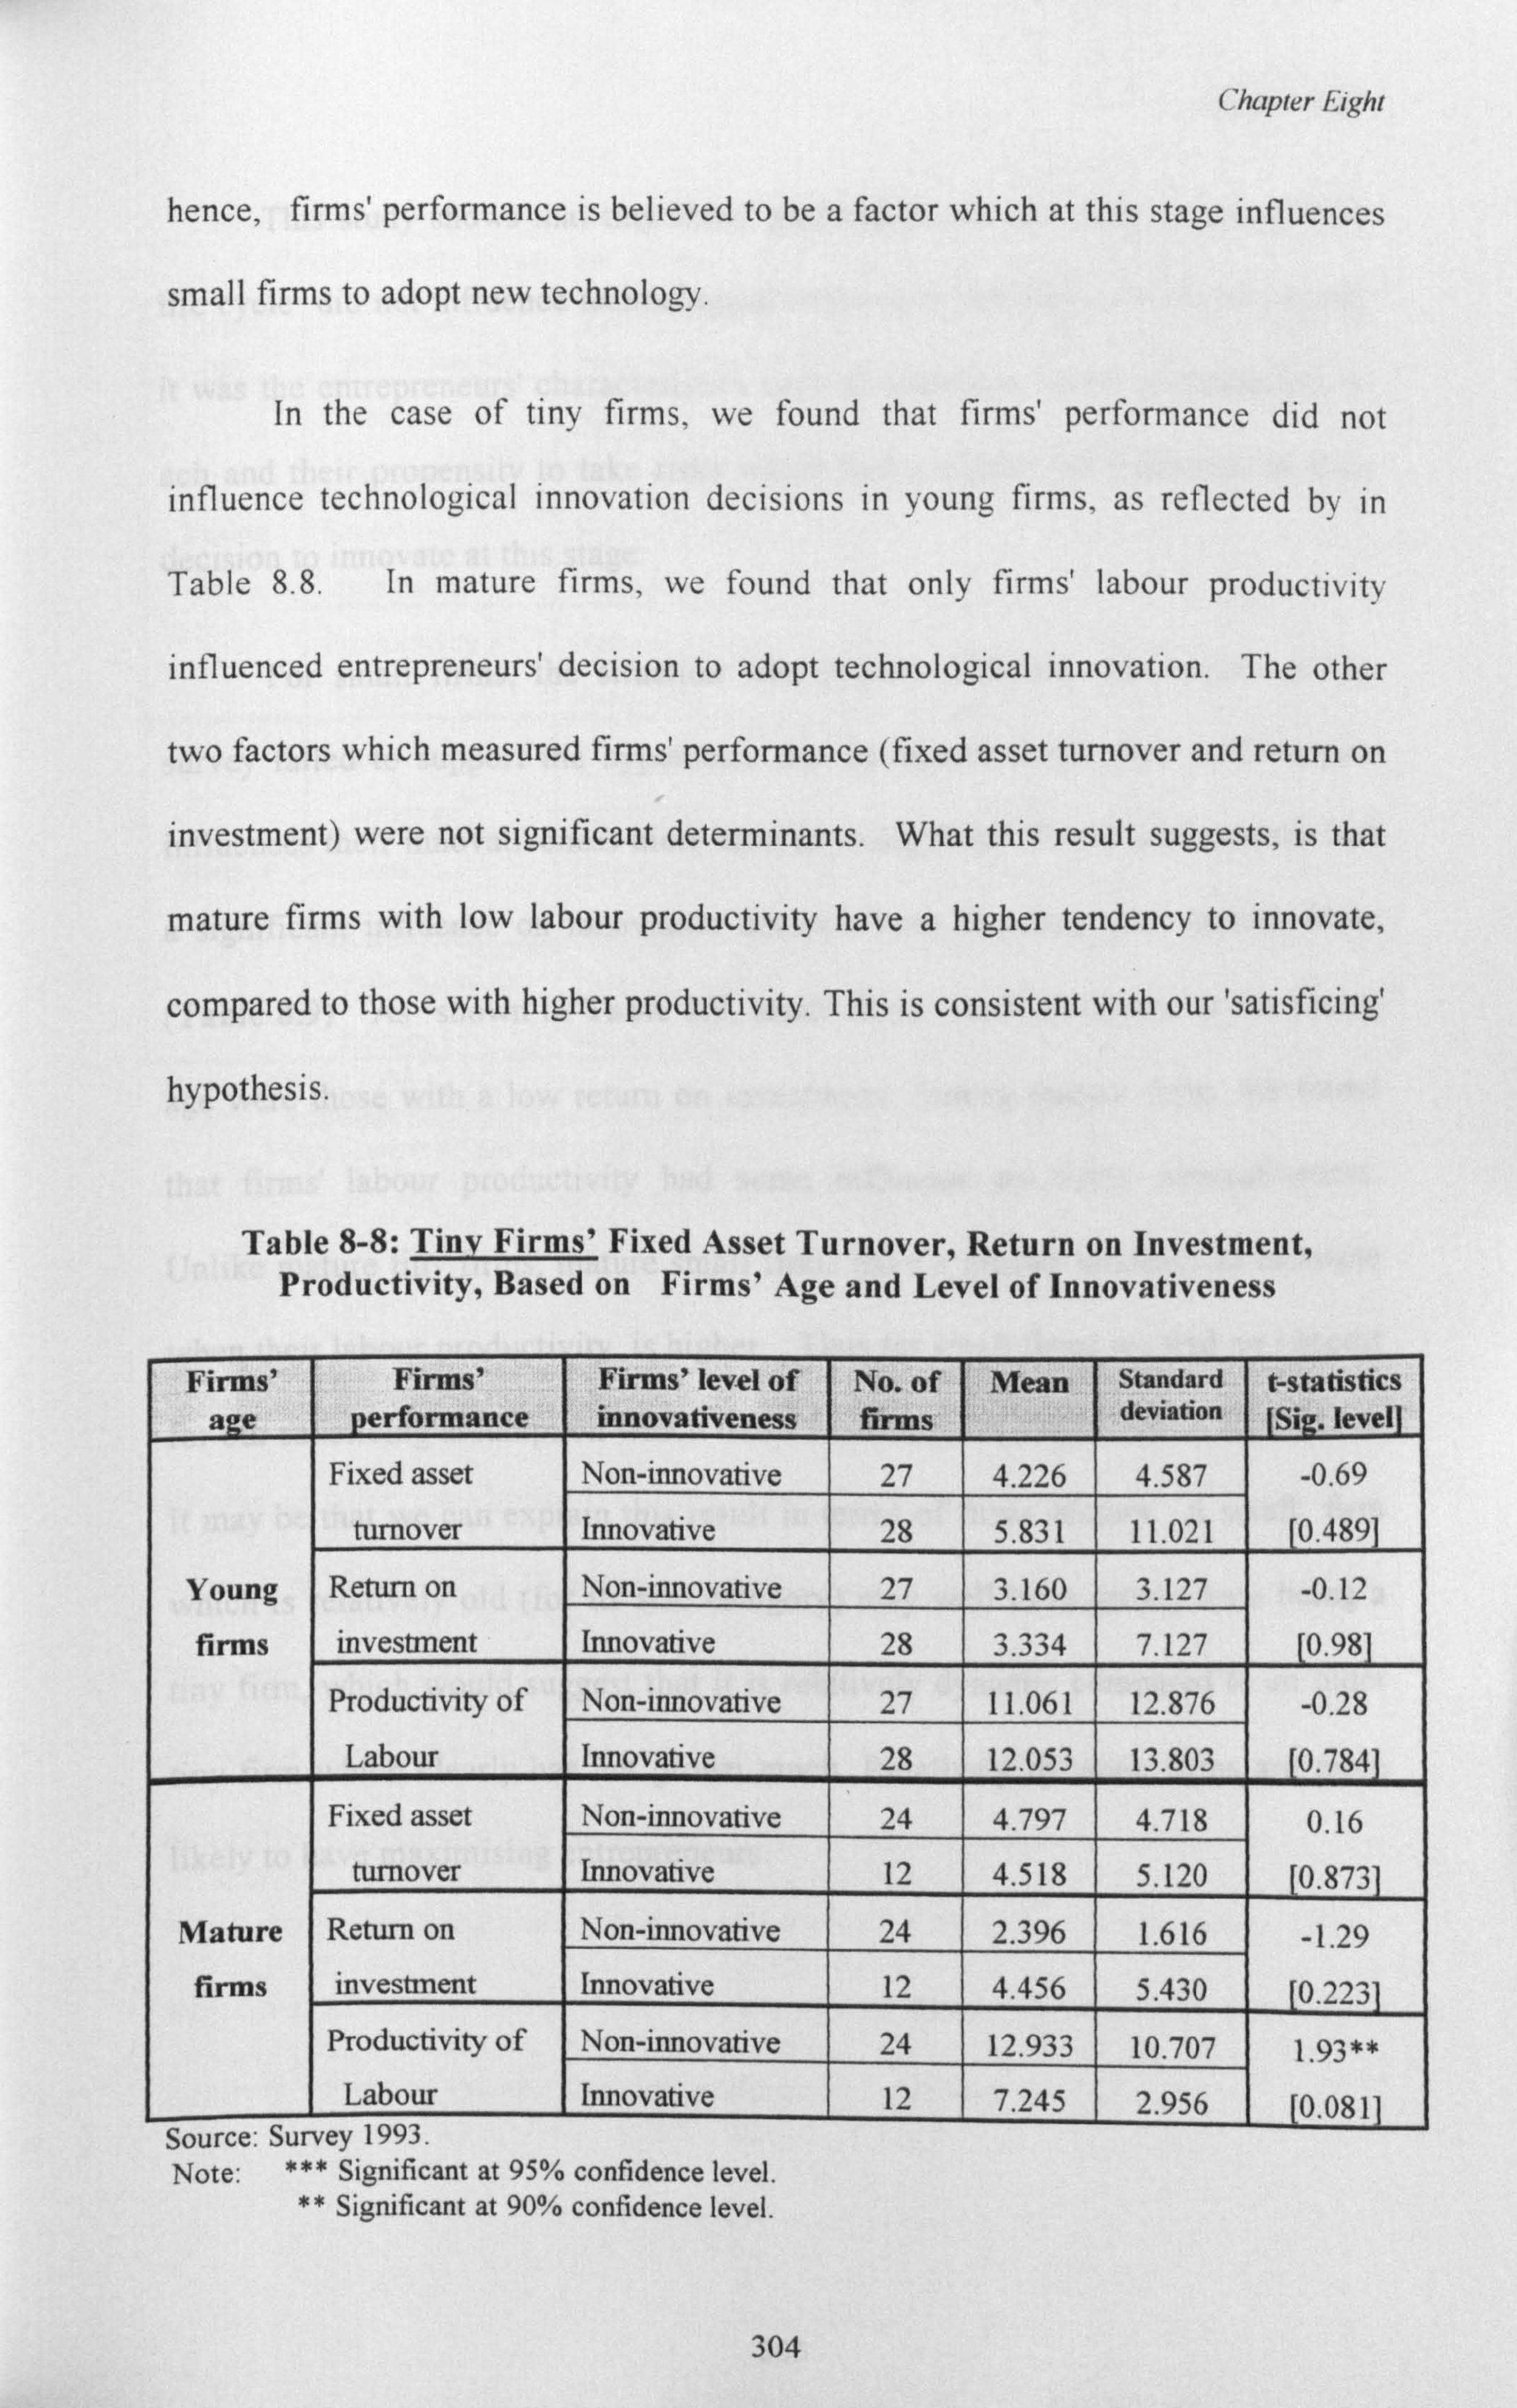
Chapter Eight
hence, firms' performance is believed to be a factor which at this stage influences
small firms to adopt new technology.
In the case of tiny firms, we found that firms' performance did not
influence technological innovation decisions in young firms, as reflected by in
Table 8.8. In mature firms, we found that only firms' labour productivity
influenced entrepreneurs' decision to adopt technological innovation. The other
two factors which measured firms' performance (fixed asset turnover and return on
investment) were not significant determinants. What this result suggests, is that
mature firms with low labour productivity have a higher tendency to innovate,
compared to those with higher productivity. This is consistent with our 'satisficing'
hypothesis.
Table 8-8: Tiny Firms' Fixed Asset Turnover, Return on Investment, Productivity, Based on Firms' Age and Level of Innovativeness
Firms' age
Firms' performance
Firms' level of innovativeness
No. of firms
Mean Standard deviation
t -statistics [Sig. level
Fixed asset Non-innovative 27 4.226 4.587 -0.69
turnover Innovative 28 5.831 11.021 0.489
Young Return on Non-innovative 27 3.160 3.127 -0.12 firms investment Innovative 28 3.334 7.127 0.98
Productivity of Non-innovative 27 11.061 12.876 -0.28 Labour Innovative 28 12.053 13.803 0.784
Fixed asset Non-innovative 24 4.797 4.718 0.16
turnover Innovative 12 4.518 5.120 0.873
Mature Return on Non-innovative 24 2.396 1.616 -1.29 firms investment Innovative 12 4.456 5.430 0.223
Productivity of Non-innovative 24 12.933 10.707 1.93** Labour Innovative 12 7.245 2.956 0.0811
source: purvey i yy. i. Note: *** Significant at 95% confidence level.
** Significant at 90% confidence level.
04 3
Chapter Eight
This study shows that tiny firms' performance at the early stage of their
life cycle did not influence technological innovation decisions. As we can recall,
it was the entrepreneurs' characteristics such as their age, levels of education, n-
ach and their propensity to take risks which had a significant influence on their
decision to innovate at this stage.
For small firms, the situation was slightly different. The results of the
survey failed to support the hypothesis that in mature firms, their performance
influences their innovativeness more than in young firms. Firms' performance had
a significant influence on innovation decision both in young and mature firms
(Table 8.9) As shown in Table 8.9, small firms which innovated at the young
age were those with a low return on investment. Among mature firms, we found
that firms' labour productivity had some influence on firms' innovativeness.
Unlike mature tiny firms, mature small firms have a greater tendency to innovate
when their labour productivity is higher. Thus for small firms we find no support
for our satisficing assumption which treats innovation as 'defensive' in motivation.
It may be that we can explain this result in terms of firms' history. A small firm
which is relatively old (for its size category) may well have grown from being a
tiny firm, which would suggest that it is relatively dynamic compared to an older
tiny firm which clearly has not grown much. Relatively dynamic firms are more
likely to have maximising entrepreneurs.
305
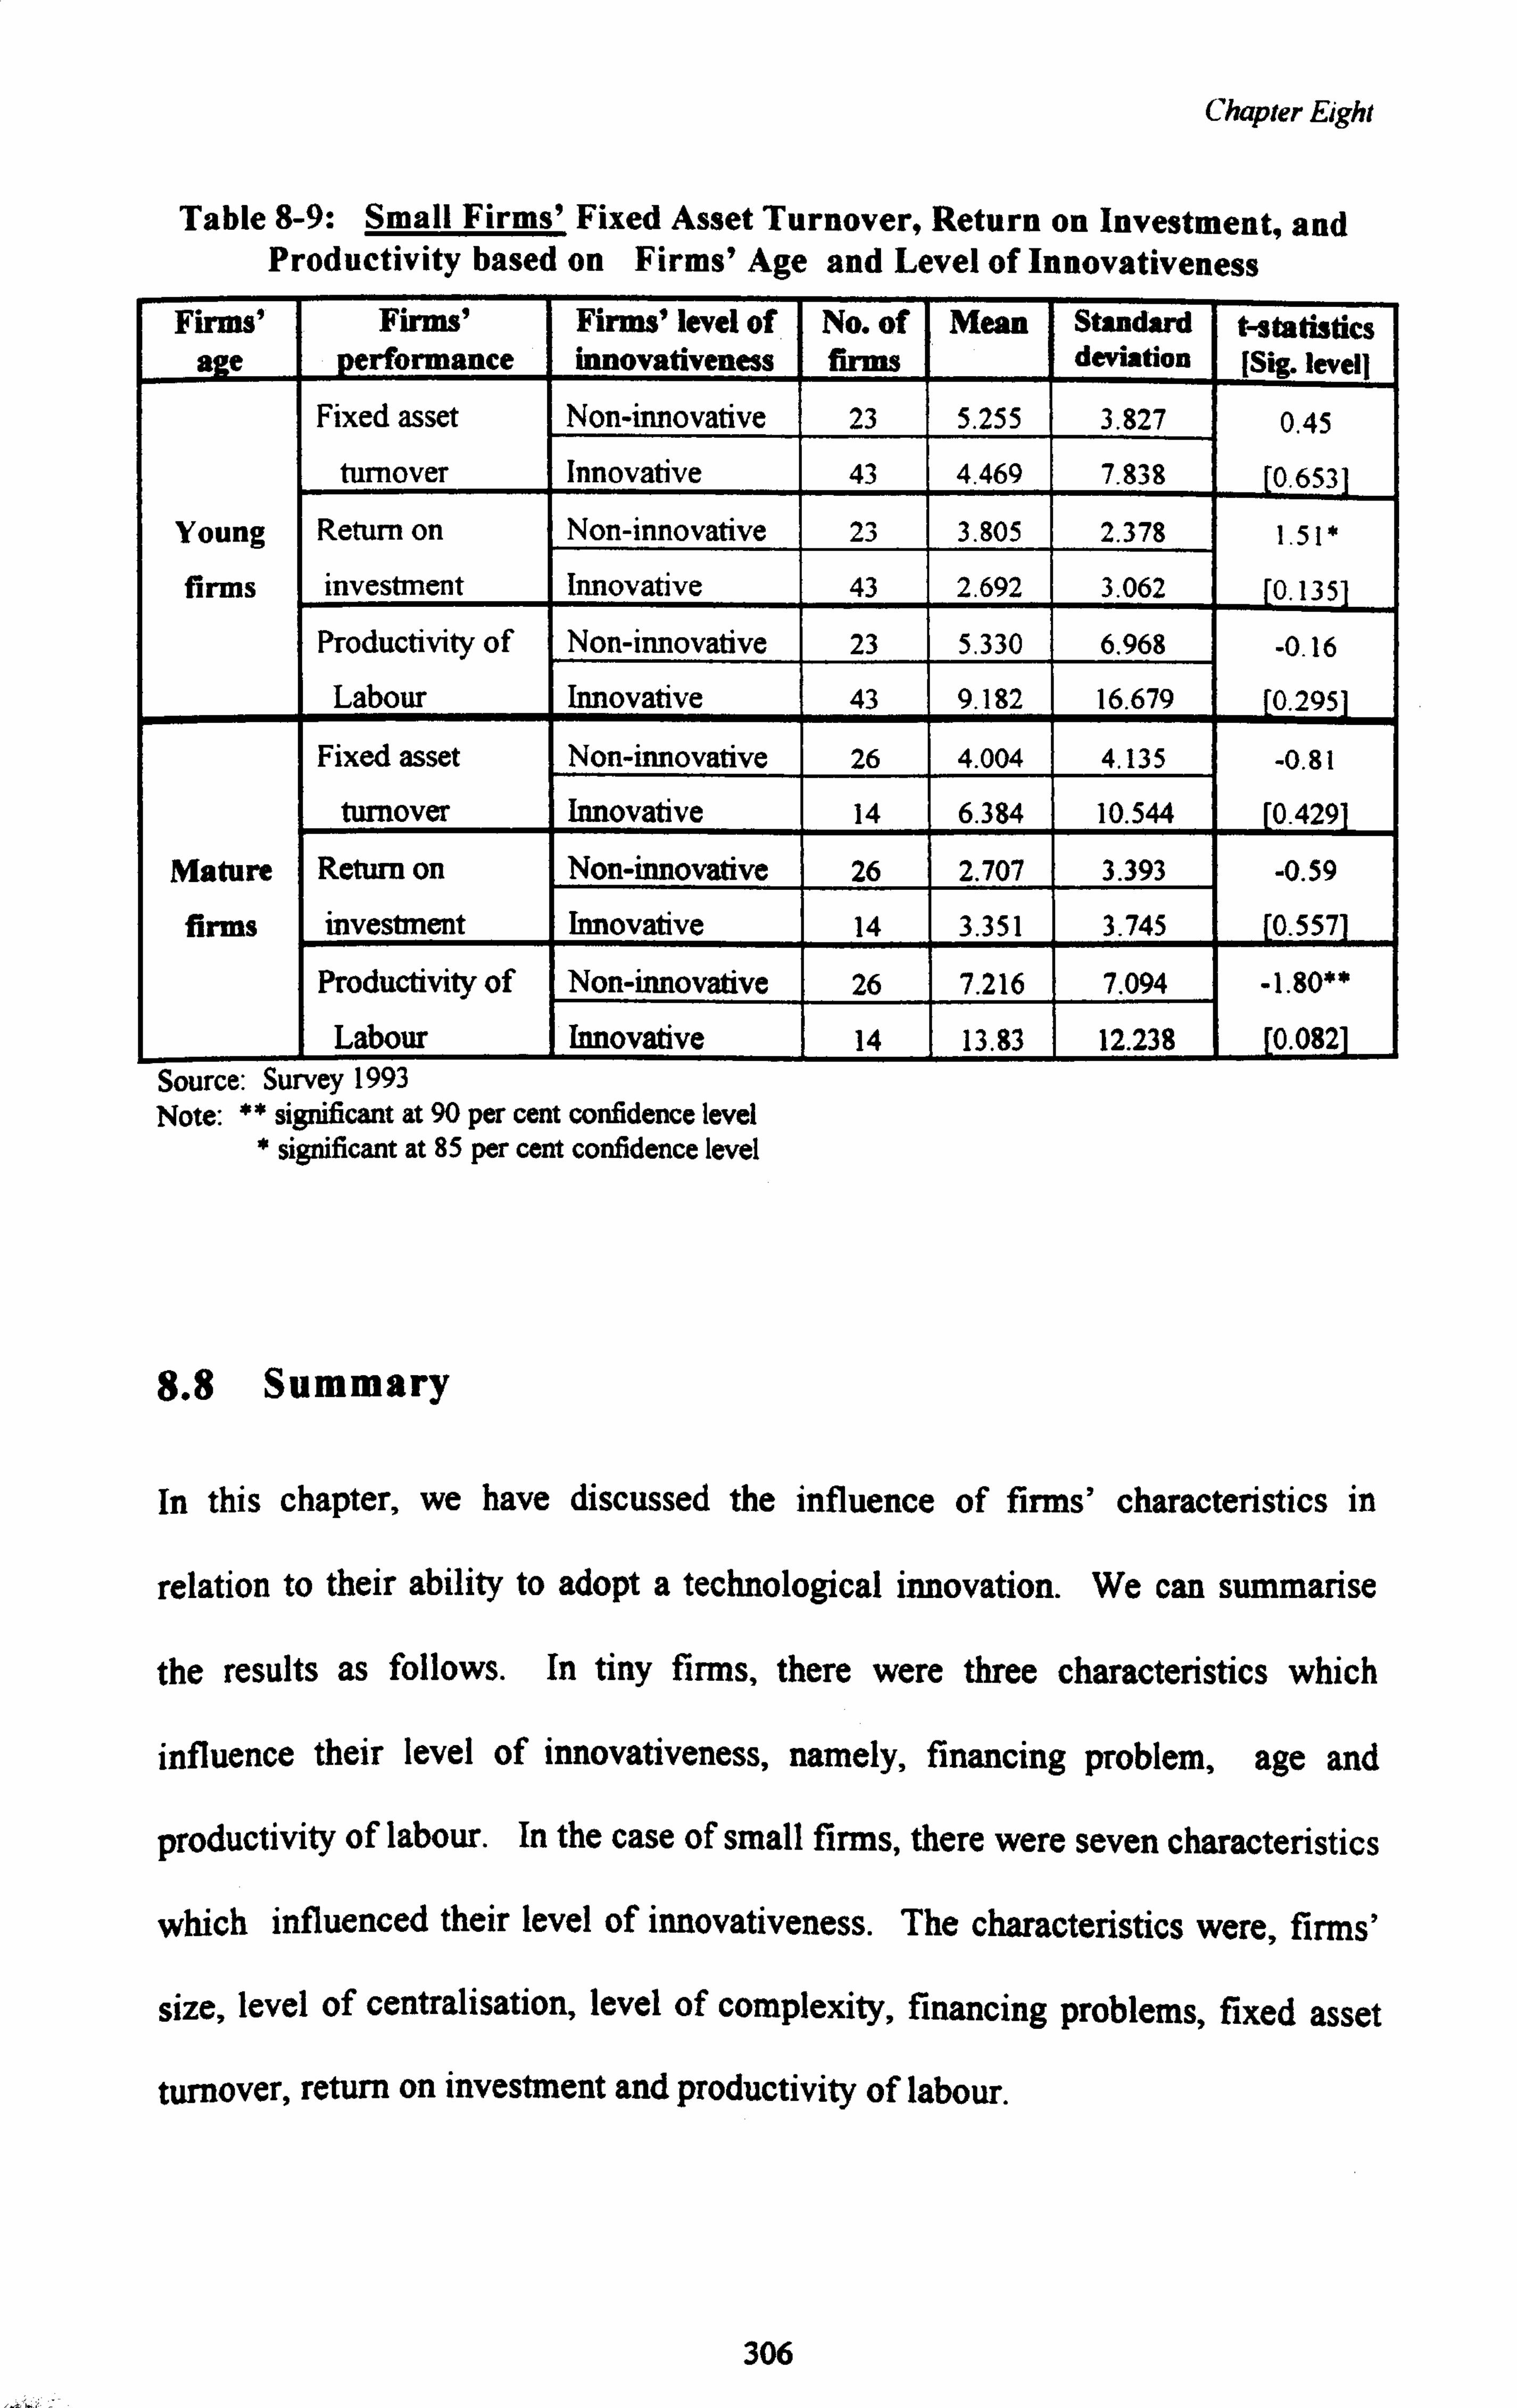
Chapter Eight
Table 8-9: Small Firms' Fixed Asset Turnover, Return on Investment, and Productivity based on Firms' Age and Level of Innovativeness
Firms' age
Firms' performance
Firms' level of innovativeness
No. of firms
Mean Standard deviation
t-statistics [Sig. level]
Fixed asset Non-innovative 23 5.255 3.827 0.45
turnover Innovative 43 4.469 7.838 0.653
Young Return on Non-innovative 23 3.805 2.378 1.51*
firms investment Innovative 43 2.692 3.062 0.135
Productivity of Non-innovative 23 5.330 6.968 -0.16
Labour Innovative 43 9.182 16.679 0.295
Fixed asset Non-innovative 26 4.004 4.135 -0.81
turnover Innovative 14 6.384 10.544 0.429
Mature Return on Non-innovative 26 2.707 3.393 -0.59 firms investment Innovative 14 3.351 3.745 0.557
Productivity of Non-innovative 26 7.216 7.094 -1.80** Labour Innovative 14 13.83 12.238 0.082
Source: Survey 1993 Note: ** significant at 90 per cent confidence level
* significant at 85 per cent confidence level
8.8 Summary
In this chapter, we have discussed the influence of firms' characteristics in
relation to their ability to adopt a technological innovation. We can summarise
the results as follows. In tiny firms, there were three characteristics which
influence their level of innovativeness, namely, financing problem, age and
productivity of labour. In the case of small firms, there were seven characteristics
which influenced their level of innovativeness. The characteristics were, firms'
size, level of centralisation, level of complexity, financing problems, fixed asset
turnover, return on investment and productivity of labour.
306
Chapter Nine
CHAPTER NINE
TECHNOLOGICAL INNOVATION IN TINY AND SMALL SCALE FOOD PROCESSING INDUSTRY:
DISCUSSION, DIRECTIONS FOR FURTHER RESEARCH AND POLICY IMPLICATIONS
9. Introduction
In Chapter Six, Seven and Eight, we identified factors that encouraged or
constrained innovation by influencing the entrepreneurs in tiny and small firms.
As we have already discussed in those chapters, some factors such as the
entrepreneurs' age and level of education influenced entrepreneurs in both tiny
and small firms to innovate, while some factors influenced only entrepreneurs in
tiny firms and some factors influenced only those in small firms. Even if the
same factors affected the entrepreneurs in both tiny and small firms, the intensity
and the direction of the effect may be different. The aims of this chapter are a) to
summarise briefly the factors that influence the entrepreneurs in tiny and small
firms to innovate and b) to highlight the important issues regarding these
determining factors. The discussion of this chapter will answer the research
questions of this study: What factors influence both tiny and small firms? How,
and Why? Is there any distinction in factors affecting tiny and small firms? Why
do such factors influence only one group and not the other? At the end of the
chapter we will propose some recommendations for future researche. Also, we
will discuss the policy implications of our findings.
307
(. %apxer Nine
This study hypothesised that among the characteristics of the entrepreneurs
from tiny and small firms, their personal demographic details, personality traits,
knowledge and skill upgrading and knowledge about the innovation would have
significant influence on their decision to adopt a technological innovation.
Firms' characteristics such as their structure, financial problems, age,
performances and mismatch of existing and required labour force were also
assumed likely to have significant effects on the decision to innovate. In
addition, it was suggested that the entrepreneurs' perception of the buying
situation and of the characteristics of the innovation, the objective characteristics
of the innovation, communication and environmental factors such as competitive
intensity and institutional involvement, would influence firms' innovativeness.
Figures 9.1 and 9.2 showed the significant factors that influence tiny and
small firms respectively to innovate, based on the analysis discussed in Chapters
Six to Eight. As exhibited in these figures, we have been able to support most of
the hypotheses that were put forward in this study. We support the hypothesis
that the entrepreneurs' personal demo¢raohics. personality traits and skill
u yýgrading have sismificant influence on their decision to adopt a technological
innovation. However. we fail to support the hvoothesis that the entrepreneurs'
knowledge about the innovation is a determining factor that influences their
decision to adopt the innovation. We found no evidence that the entrepreneurs
with more knowledge about an innovätion are more inclined to adopt it.
As exhibited in Figures 9.1 and 9.2, this study supported the hypothesis
that firms' performances and financing problems have significant influence on
308
(hupier Nitre
firms' ability to adopt a technological innovation. Firms' structure and size
appeared to influence small but not tiny firms. Firms' age was found to influence
tiny firms but not small firms. However, we were unable to show mismatching of
existing and required labour force as significant factors that affect firms'
decision to adopt a technological innovation.
We also found support for the hypothesis that communication, the
entrepreneurs' perception of buying procedures and the objective characteristics of
the innovation are significant determinants of adoption decision of tiny and small
firms. However analysis of the influence of the entrepreneurs' perception of the
innovation suggested that it has significant influence only in tiny firms. We
failed to find such influence in small firms.
Analysis of the influence of external factors on firms' decision to adopt a
technological innovation, supported the hypothesis that the entrepreneurs'
institutional involvement plays a significant role in such decisions. However,
using size of main competitors as an indicator of competitive intensity, we did not
find evidence that competitive intensity has a significant influence on firms'
innovativeness.
309
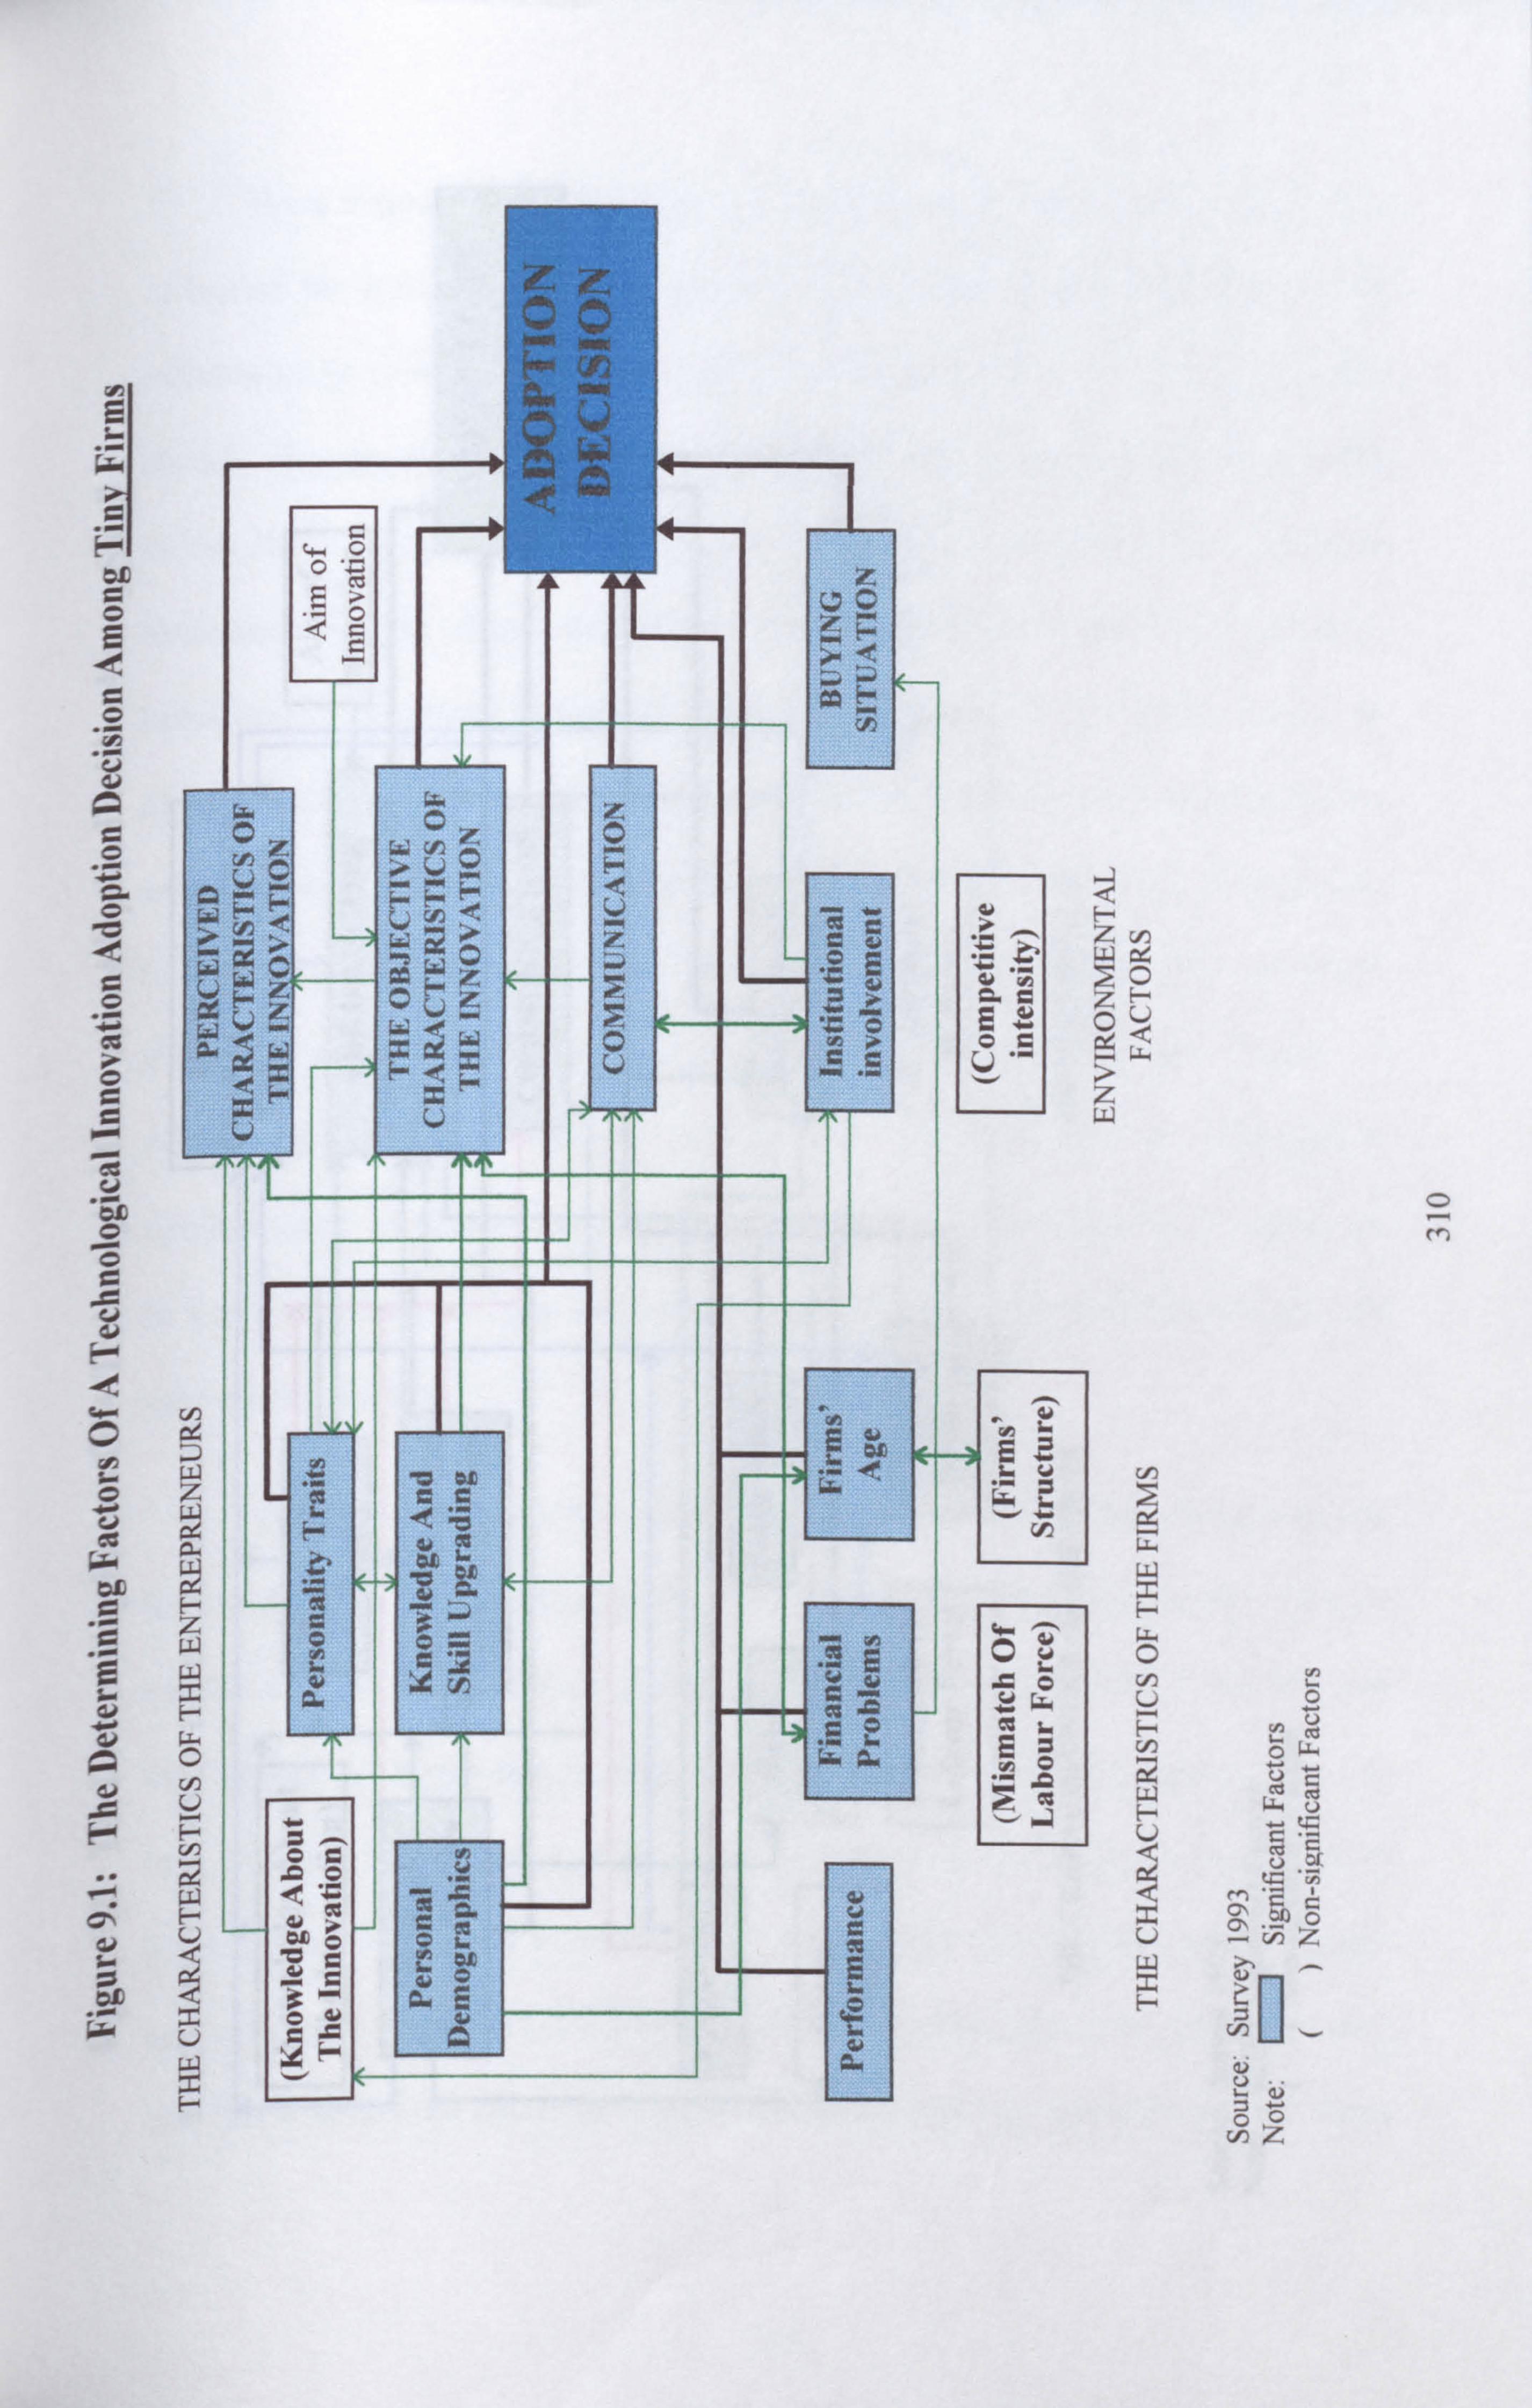
E
U
O
r-+
u on
u
O
Cd
W
CD
it
4J
CIO
4J
ýý
F F.
F zcD wx CD zu o¢ J z w
ä w
O c C. ) H
U
U W
Ct O Ü Cd
O GL+ ÜC
c0 U
C; l z
U U
0 z
o_ M
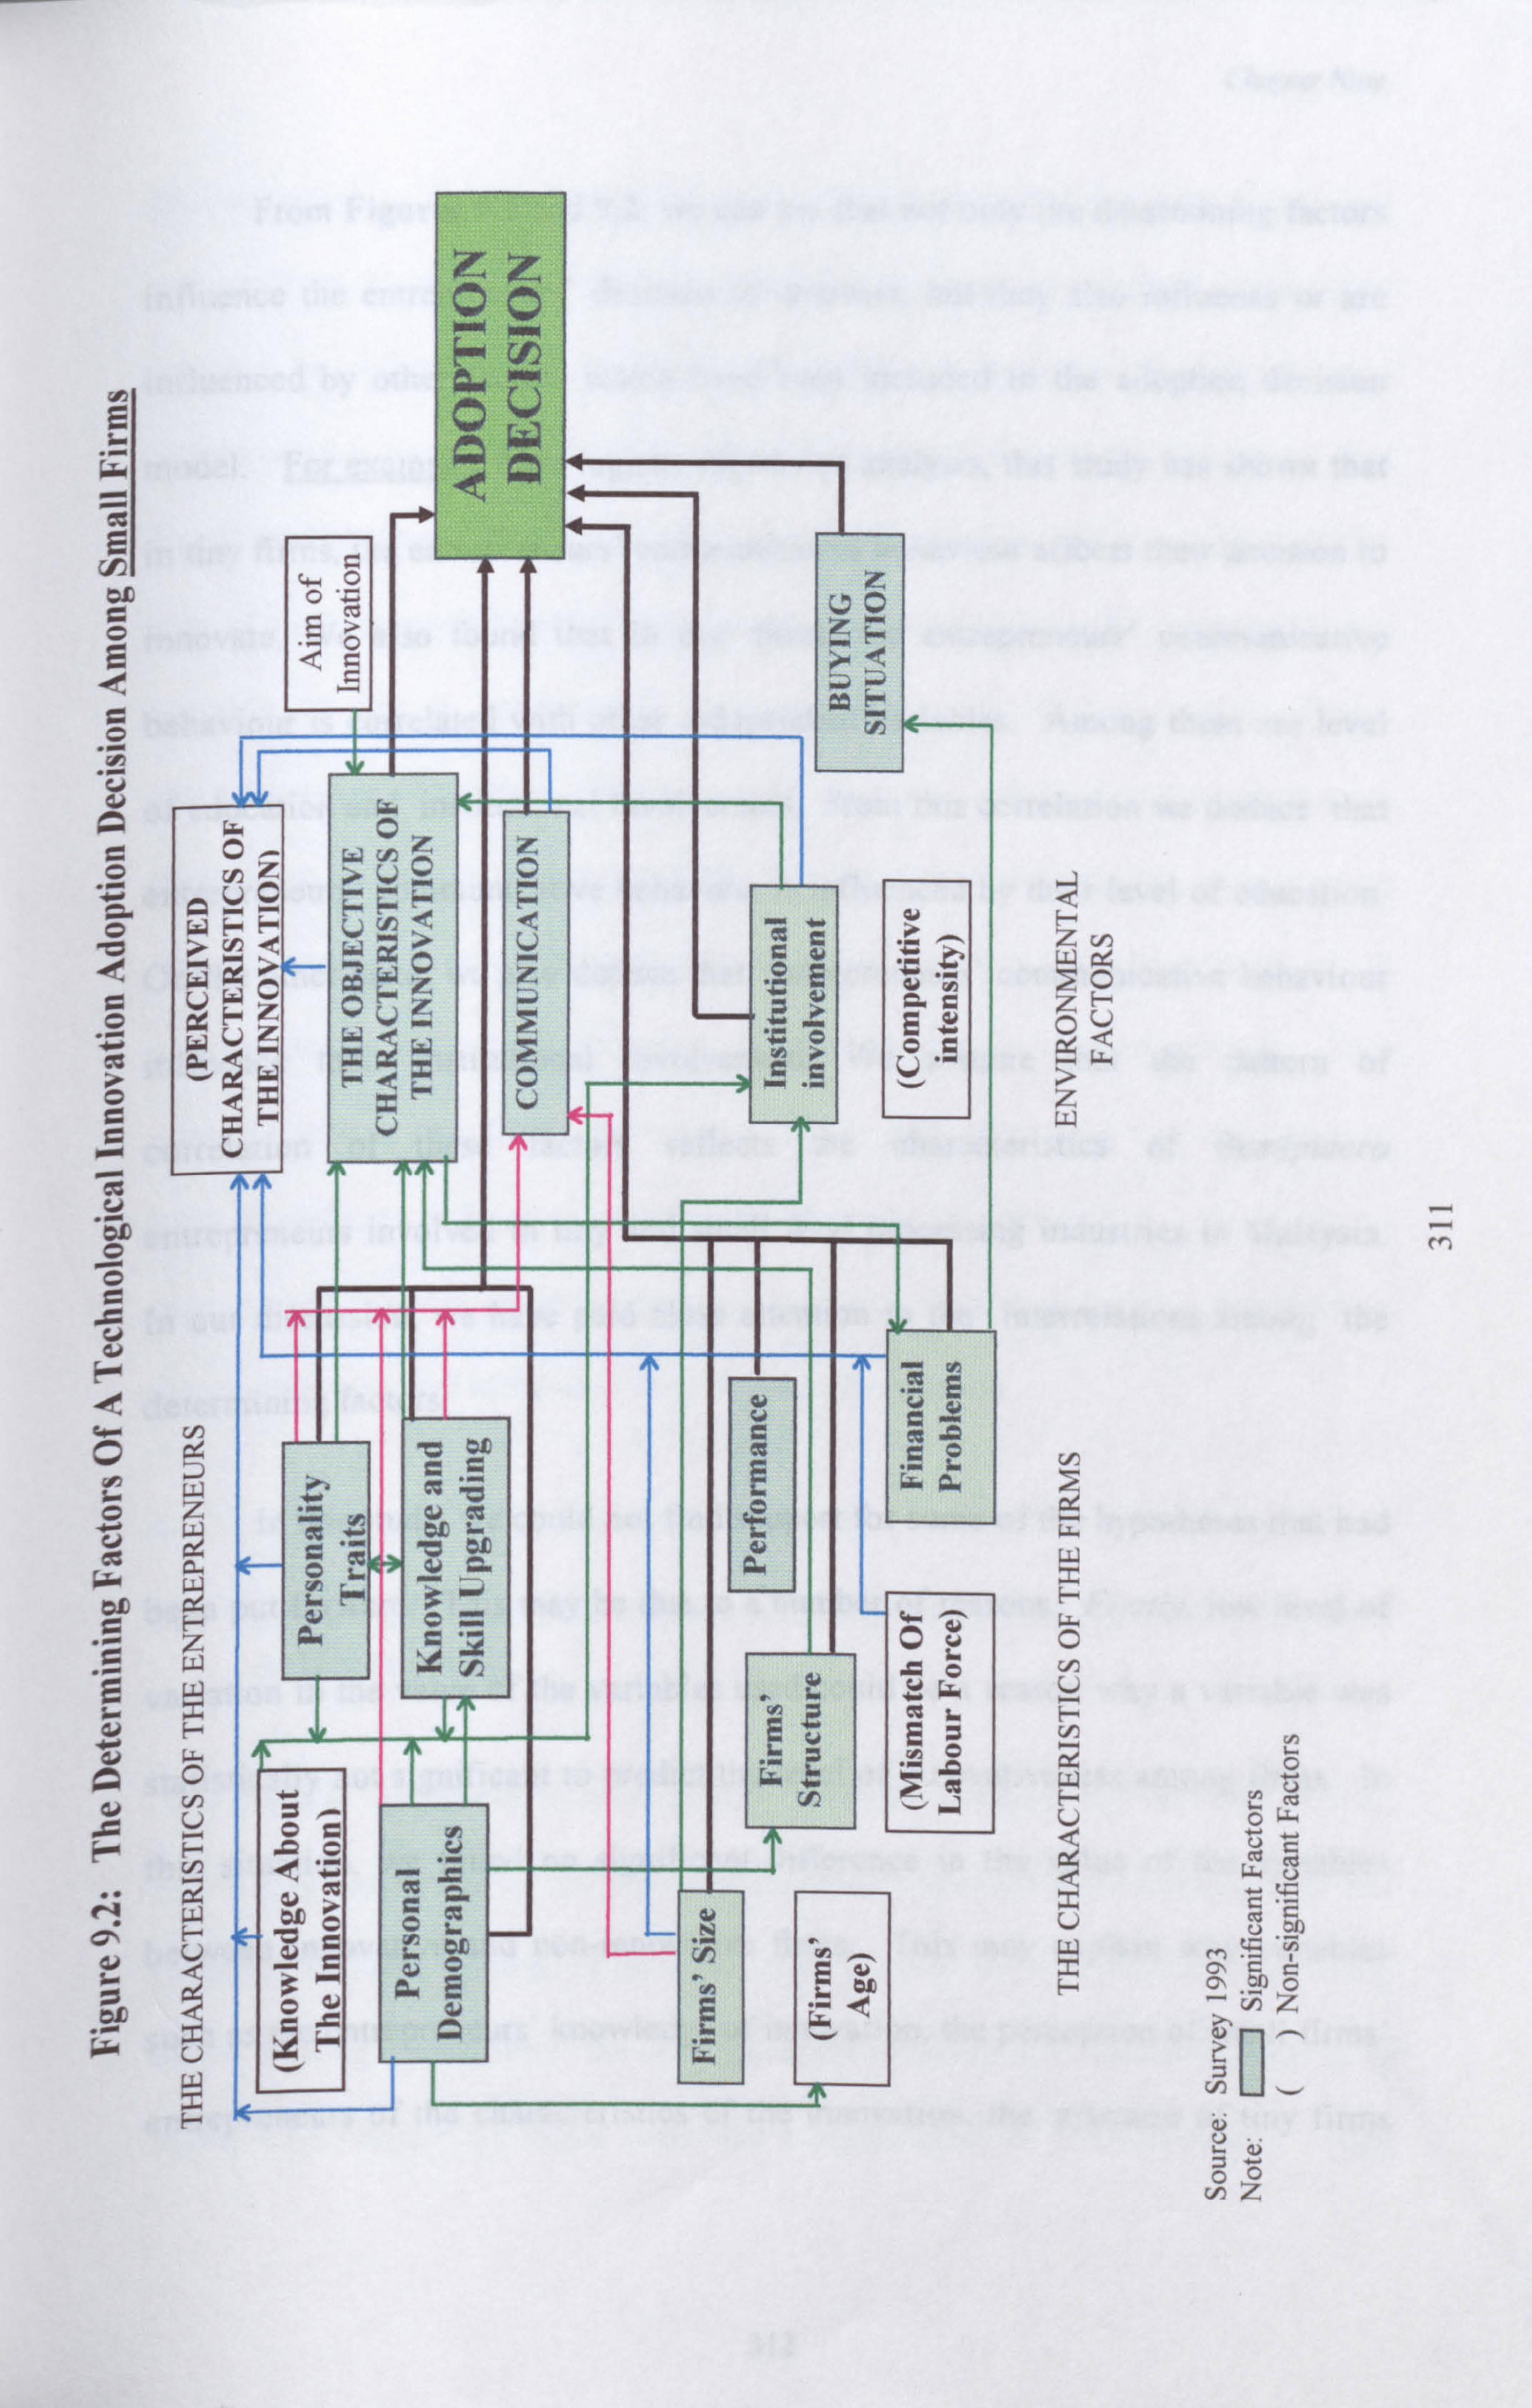
E
E
8
C
L'C
c
O
E
N O\
i. D OL
.r W
ý¢ F-- z&
0 zý OV ýw > z w
u, w z H w O
U (ID
W EU
Qpý
Q x U W
x H
NV Ct3 o
CC G7r (ýj
CQ
v. y
o ýz
M
Chapter Niger
From Figures 9.1 and 9.2, we can see that not only the determining factors
influence the entrepreneurs' decision to innovate, but they also influence or are
influenced by other factors which have been included in the adoption decision
model. For example, from logistic regression analysis, this study has shown that
in tiny firms, the entrepreneurs' communicative behaviour affects their decision to
innovate. We also found that in tiny firms, the entrepreneurs' communicative
behaviour is correlated with other independent variables. Among them are level
of education and institutional involvement. From this correlation we deduce that
entrepreneurs' communicative behaviour is influenced by their level of education.
On the other hand, we also deduce that entrepreneurs' communicative behaviour
influence their institutional involvement. We assume that the pattern of
correlation of these factors reflects the characteristics of Bumiputera
entrepreneurs involved in tiny and small food processing industries in Malaysia.
In our discussion, we have paid close attention to the interrelations among the
determining factors.
In this study, we could not find support for some of the hypotheses that had
been put forward. This may be due to a number of reasons. Firstly, low level of
variation in the value of the variables used could be a reason why a variable was
statistically not significant to predict the level of innovativeness among firms. In
this situation, we found no significant difference in the value of the variables
between innovative and non-innovative firms. This may explain why variables
such as the entrepreneurs' knowledge of innovation, the perception of small firms'
entrepreneurs of the characteristics of the innovation, the structure of tiny firms
312
Chapter Nine
and mismatch of the existing and required labour force did not have significant
influence on firms' innovativeness. Secondlv, in some cases, the variable used
appears on reflection not to be a good proxy to represent the hypothesised
determining factors. This explains why we could not support the hypothesis that
firms' competitive intensity influences their level of innovativeness. We used the
size of main competitors as a proxy for competitive intensity. We suspect that this
variable is not a good proxy because of its inability to predict firms'
innovativeness. However, based on other variables such as firms' performance,
there is an indication of a relationship between firms' competitive intensity and
innovativeness. Lastly, we suspect that we had put forward a hypothesis which
appears not to have much relevance for a particular set of respondents. This
explains why in tiny firms, the entrepreneurs' locus of control was not found to
have significant influence on their tendency to be innovative. In a set of
respondents strongly governed by religion, locus of control is not a determining
personality trait that influences their decision to innovate.
9.1 Level Of Innovativeness Among Tiny And Small Firms: A Discussion
We found a difference in level of innovativeness between tiny and small firms.
The higher percentage of innovative entrepreneurs in small firms compared to tiny
firms implied that the level of innovativeness of small firms is greater than in tiny
firms. Among small firms, the level of innovativeness also varied according to
firms' size. Relatively larger firms had a higher level of innovativeness. The
313
C kq er Nine
positive correlation between firms' size and level of innovativeness found in this
study confirms previous studies that showed firms' size can be used as a predictor
in studies of technological innovation adoption. Bigger firms tend to have a
more sophisticated management style, a larger number of skilled workers and
higher accumulated funds and resources. For a given cost of an innovation,
bigger firms have higher capacity to adopt, compared to smaller firms.
The correlation between fines' level of innovativeness and their size can
not, however, be interpreted to mean that tiny and small firms innovate for
different reasons. This study found no distinction between tiny and small firms in
terms of their aim or purpose in introducing innovation. Their main aim of
innovation was merely to replace their previous manual methods of production or
to replace old machines with new ones which might be expected to be more
efficient, shorten the production cycle and at the same time increase product
quality. Only a few entrepreneurs in this study reported introducing technological
innovation due to producing new products. The aim of the entrero 'eneurs in
innovating largely determines the cost of innovation (refer to figures 9.1 and
9.2). We found (see Chapter 7, Section 7.4) the cost of innovation is relatively
lower if the entrepreneurs want to replace the manual method or old machines
than if they want to produce a new product. For this reason, the findings of this
study support the hvoothesis that entrepreneurs in tiny and small firms are more
likely to adopt a technological innovation if the cost is low. Since the
entrepreneurs have a greater tendency to adopt low cost innovation and their main
aims in adopting the innovation are to replace manual method or old machines,
314
C aper Nine
this give us an indication that they are only capable of adopting an incremental
type of innovation.
Other than the aim of innovation, we found that the cost of innovation
adopted or under consideration by the entrepreneurs in the study was determined
by their personality traits (locus of control and attitude toward risks), their skill
upgrading behaviour, firms' structure, and receipt of government assistance. The
influence of these factors on the cost of innovation which entrepreneurs were able
to introduce, suggests that these factors also influence the ability of firms to
introduce incremental or radical type of innovation. We find that entrepreneurs
with the potential to adopt radical innovation tend to be those who attach
importance to upgrading their skill and knowledge, have internal locus of control
and high propensity to take risk. In terms of firms' characteristics, those firms
with more skilled workers and those receiving government assistance can more
readily introduce a radical innovation. The influence of government assistance
in determining the cost of innovation adopted by the entrepreneurs indicated that
government assistance plays a very important role in the ability of tiny and small
firms to adopt radical innovation.
9.1.1 Personal Demographic Factors
Personal demographic factors which we hypothesised to have significant influence
on the entrepreneurs' decision to adopt a technological innovation were their age,
sex, level of education and previous experience. The findings of this study
support the hypothesis with respect to age and level of education. The
3,5
Chapter Nine
entrepreneurs' previous experience only had significant influence on the
entrepreneurs in small firms. We made no definite prediction about the effect of
experience in the current business, since the relevance arguments worked in both
directions.
This study appears to show that younger entrepreneurs are more innovative
than older entrepreneurs. This finding supports the view that younger
entrepreneurs are more receptive to change and able to handle new or complicated
tasks compared to older entrepreneurs, although the latter usually have longer
experience in managing their current business. This evidence that younger
entrepreneurs are capable of handling changes is further supported by our finding
that younger entrepreneurs have a higher level of education and are more inclined
to uc¢rade their skill through attending business courses. These characteristics
further help them to be innovative.
In tiny firms. we found support for our prediction about the effect of
entrepreneurs' sex. We believe that the effect was largely through the relationship
of variable sex with entrepreneurs' level of education, their personality traits and
the communicative behaviour. Male -entrepreneurs were found to be more
innovative than female entrepreneurs. It seems that male and female
reneurs in tiny firms had distinouishable characteristics which affect their
level of innovativeness. Male entrepreneurs had a higher level of education and
were higher achievers. They also were more mobile compared to their female
counterparts. This enabled them to have wider business contacts and be more
communicative. The size of firms managed by male entrepreneurs was relatively
316
Chapter Nine
larger; thus, they had the resources to carry out innovative activities (This variable
was not included in the regression for tiny firms - all the more reason why sex
should have pick up some of its effects). On the other hand, the nature of business
conducted by female entrepreneurs was rather informal. Their initial idea in
venturing into business was to contribute to the family income.
In the case of small firms, however, sex did not appear to affect their
capability to be innovative. This may be connected with the fact that there were
no significant differences between sexes in their personal characteristics. They
were in the same age range, and had a similar level of education, experience, n-
ach and attitude toward risk. There was also no significant difference in terms of
type, size and structure of firms managed by female and male entrepreneurs.
Nevertheless, like females in tiny firms, female entrepreneurs of small firms were
also less communicative due to their limited mobility and domestic commitments.
Lack of communication did not, however, hinder them from obtaining information
and being innovative. Female entrepreneurs of small firms tended to compensate
by relying on institutions as their source of information.
The entrepreneurs' level of education was among the determining factors
that influenced their decision to adopt a technological innovation in both tiny and
small firms. Higher levels of education made for a greater tendenc tyo be
innovative. As mentioned above, the level of education may help to explain
why young entrepreneurs of tiny and small firms and male entrepreneurs in tiny
firms had a greater tendency to be innovative.
3,7
Chapter Nine
The entrepreneurs' experience in managing the current business appear to
influence innovativeness in both tiny and small firms. This study showed that
less experienced or new entrepreneurs were more innovative than those who had
longer experience in managing their current business. One possibility is that
although new entrepreneurs had fewer years of experience in managing their
business, they innovated in the early years of managing the business, presumably
due to pressure from already established firms. Moreover, since the majority of
the entrepreneurs were the founders of their firms, newness in the current business
would be correlated with youth, thus, with the level of education. The
entrepreneurs with less work experience tended to attend more courses compared
to those with longer experience in their business. This implies that they
perceived the importance of knowledge and skill upgrading in order to stay
competitive with the established businesses. Having higher levels of education,
skill and knowledge helped them to be innovative.
The entrepreneurs' previous work experience (in other jobs) aooeared to
influence innovativeness in small firms but did not acoear to have a significant
influence on tiny firms. The finding for tiny firms implies that previous work
experience did not provide them with skill and knowledge that helped them to be
innovative in their current business. In the case of the entrepreneurs in small
firms, this study showed that those with more previous work experience were
more inclined to be innovative. Unlike the case of tiny firms, we can deduce that
their previous work experience provided them with knowledge and skill that
could be used in their current business.
318
(: hapter Nine
The difference in the effect of previous work experience on entrepreneurs
in tiny and small firms can be explained in terms of two factors - the type and
length of the previous work experience. Entrepreneurs who previously worked in
firms producing the same type of product as those currently produced, had a
greater tendency to be innovative. Those who previously owned small businesses,
or worked at managerial level for their previous employers, also were more likely
to be innovative. Length of previous work experience also affected the amount
of skill and knowledge acquired, which was helpful in the current business. For
example, some entrepreneurs who had previously worked as production workers
for more than 8 years were capable of being innovative in their own current
businesses. This suggested that their long years of experience enabled them to
accumulate knowledge, skill and familiarity with the business environment, which
could be applied to their current business.
9.1.2 Personality Traits
This study hypothesised three personality traits of the entrepreneurs as having
significant influence on their decision to adopt a technological innovation. These
were, n-ach, locus of control and attitude toward risk. Our findings support the
hypothesis that entrepreneurs' n-ach and attitude toward risks has significant
ice, illence on their innovativeness. However, locus of control was found to have
significant influence on the entrepreneurs in small firms. not in tiny firms. Higher
achieving entrepreneurs are very determined to be successful in their business.
Those with a high propensity to take risk are ever willing to accept challenges or
319

Chapter Nine
make changes in managing their business. This explains why entrepreneurs with
these personality traits had a greater tendency to be innovative. Entrepreneurs
with internal locus of control believe that the success of their firms is very much
dependent on their own effort and hard work. This explains why this personality
trait influenced small firms' innovativeness. However, a similar explanation
could not be put forward for the entrepreneurs in tiny firms. We believed their
religious value influenced their perception on their ability to control situation
around them. We suspect that these values somewhat affected the way they
answered the questions on locus of control.
In tiny firms, we found a relationship between entrepreneurs' personality
and their level of education. This study showed that entrepreneurs with high
levels of education were high achievers and risk takers. Based on previous
studies which show that individuals' level of education affects their personality,
we can also deduce from this study that the entrepreneurs' n-ach and attitude
toward risk are affected by their level of education. From this correlation, we can
see the importance of education in entrepreneurial development. It seems that
formal education developed the personality of the entrepreneurs in tiny firms.
However, in the case of small firms, there was no linear relationship between the
entrepreneurs' level of education and their personality. Contrary to the case in
tiny firms, we could not deduce that entrepreneurs with higher levels of
education were also those who were higher achievers, had internal locus of control
and were more prepared to take risk. In fact, this study showed that
entrepreneurs with primary education were relatively higher achievers and tended
to have internal locus of control. The most likely explanation seems to be that
320
Chapter Nine
only if they had such helpful personality traits would people with little education
manage to reach the position of owning a small (tiny) firms. Considering the fact
that the majority of the entrepreneurs with primary education had longer years of
managing their current business or had previous work experience before venturing
into their current business, we may infer that experience can also influence
entrepreneurs' personality development. Hence, entrepreneurs with a low level of
education also can be innovative provided that they have the right personality
traits.
9.1.3 Knowledge And Skill Upgrading
As has been mentioned above, this study spjooorts the hvDothesis that
entrevreneurs who upttrade their skills by attending business courses va
greater tendency to be innovative. This implies that courses attended by the
entrepreneurs have some influence in developing their innovative behaviour.
These courses are usually organised by various government or private agencies.
Government agencies that organised courses attended by the entrepreneurs in this
study were MARA and MARDI. Courses that were well attended by innovative
entrepreneurs were production management, financial management and
entrepreneurship. Lack of awareness was the main reason why the entrepreneurs
did not attend courses. Courses can also act as meeting places for entrepreneurs
to exchange experiences. Through attending business courses, information on the
existence of technological innovation may be obtained and more information can
be gained if the entrepreneurs interact with other entrepreneurs who have already
introduced the innovation.
321
Chapter Nine
This study showed that the entrepreneurs with a higher level of education
and those who were communicative. attended more courses. From the number
of courses attended by the entrepreneurs with higher levels of education, we can
make two deductions. First, compared to the entrepreneurs with lower levels of
education, the more educated entrepreneurs attached more importance to skill and
knowledge, and second, courses offered to entrepreneurs of tiny and small firms
are more conducive for those who have a certain minimum of academic
qualification. The relationship between the entrepreneurs' communicative
behaviour and number of courses indicates that communication channels used by
them can create awareness among them about the courses.
9.1.4 Knowledge About The Innovation
The entrepreneurs' knowledge about the innovation did not have a significant
influence on their decision to adopt a technological innovation. We failed to
suooort the hypothesis that the greater knowledge about the innovation the
entrepreneurs have. the more likely they are to adoot it. The entrepreneurs in this
study claimed to have quite extensive knowledge about the innovation. We may
recall that the respondents of this study were those who had already adopted or
considered adopting a technological innovation in the last three years prior to the
conduct of this study; hence, it is reasonable to believe that the two groups of
entrepreneurs had similar levels of knowledge about the innovation. Other factors
were more important in determining the entrepreneurs' decision to innovate.
322
Chapter Nine
9.1.5 Firms' Structure
We hypothesised that firms' level of formalisation, centralisation and complexity
have significant influence on their ability to adopt a technological innovation. In
tiny firms, we failed to support the above hypothesis. However, analysis of small
firms, suggested that the level of centralisation and complexity had a significant
influence on their innovativeness. As with tiny firms, we failed to support the
hypothesis that firms' level of formalisation has a significant influence on their
level of innovativeness.
Tiny firms were homogeneous in structure: highly centralised with low
levels of complexity and formalisation. Since there was little variation in firms'
structure, it is not surprising that we found no significant influence on firms'
innovativeness. Since the firms were tiny, employers' relationships with
employees were rather informal. They shared firms' problems and employees
were encouraged to reveal their personal problems. Nevertheless, decision
making was in the hands of the entrepreneurs who might act alone or with their
business partners or with their assistants. This explained why firms' structure did
not affect their innovativeness, but the decision to innovate was very much
affected by decision makers' (entrepreneurs') personal characteristics.
In the case of small firms. firms with lower levels of centralisation and
higher levels of complexity were more liable. other things equal to be innovative.
[n firms with a low level of centralisation, these firms had wider access to
information on the innovation. Firms with a high level of complexity have more
skilled workers; thus, they have the ability to absorb a technological innovation.
323
chapter Nine
This implies that availability of skilled workers is very important in determining
whether firms innovate. As in tiny firms, small firms' level of formalisation did
not influence significantly firms' ability to adopt a technological innovation. The
entrepreneurs in general had relatively informal relationships with their workers,
shared their problems and welcomed any suggestions made by them.
9.1.6 Labour
As mentioned above, more complex firms tend to be more innovative. This
indicates the importance of skilled workers in order for a firm to introduce a
technological innovation. In the situation where there is a lack of skilled workers
to operate the considered innovation, mismatching between the existing and
required labour force occurs. Consequently, it may be necessary to hire new
workers, transfer existing workers, make some workers redundant, or introduce
retraining. Entrepreneurs might abandon the idea of innovating if such mismatch
causes them major problems. Considering this fact, we hypothesised that
firms which do not foresee the likelihood of mismatching if they ado an
innovation will be more likely to iit. However. we were not able to supper
this h thesis. We found that entrepreneurs willingness to innovate did not
appear to be reduced still introduced by mismatch. It would appear that they
considered mismatching as a minor problem which could be solved by training of
the present employees and adoption of a new *routine. Since mismatching was
not seen as a major problem by entrepreneurs, at a glance we may think that tiny
and small firms do not have a problem of lack of skilled workers, such as has been
widely found to be the case in the previous studies of small scale industries in
324
Chapter Nine
Malaysia. Alternatively, it may be that tiny firms do not need skilled workers in
order to innovate (the majority of tiny firms did not have skilled workers and yet
some of them innovated). However, observation of the types of technological
innovation (machinery) adopted by small and tiny firms revealed that the majority
of them introduced relatively simple machinery costing less than RM10,000,
which did not require highly skilled labour to operate. For this reason they faced
little or no problem in terms of mismatching between their existing and required
labour force. Tiny and small firms may face more serious problems of lack of
skilled labour if they introduce a radical type of innovation. Hence, in the
decision to adopt a radical type of innovation, we believe that mismatching of the
existing and required tabour force would be one of the determining factors.
9.1.7 Firms' Age And Performance
We support the hypothesis that firms' performance significantly affects their
level of innovativeness. We used fixed asset turnover, productivity of labour and
return on investment as indicators of firms' performance in this study.
Nevertheless, in tiny firms we found that only productivity of labour had a
significant influence on firms' level of innovativeness. Firms had a greater
tendency to innovate if they had low labour productivity.
In small firms. fixed asset turnover. return on investment and productivity
of labour all significantly influence firms' level of innovativeness. Firms with
higher fixed asset turnover and productivity of labour showed a stronger tendency
to adopt a technological innovation. On the other hand, firms which had low
325
Chapter Nilre
return on investment also were more likely to innovate. High fixed asset turnover
or high productivity of labour suggests that the firms in question used their
resources efficiently and effectively. The availability of resources would make
them better able to innovate. Firms which innovated when they had lower return
on investment might be under more pressure to be innovative due to low net
operating income.
It appear that productivity of labour had a different influence on small and
tiny firms. Small firms tended to be more innovative, other things equal, when
their productivity of labour was high, while tiny firms tended to be innovative
when productivity of labour was low. If firms innovate more when their
productivity of labour is low, this implies they innovate to survive; which implied
that tend to be satisficers. Small firms' tendency to innovate more when the
productivity of labour is high implies that they have some drive to improve their
performance and efficiency when they are doing well, and are better placed to do
so. This implies that they are maximisers.
A significant effect of firms' age in influencing firms' decision to adopt a
technological innovation could only be seen in tiny firms. Younger firms had a
greater tendency to be innovative than those at the mature stage which indicated
that they need to grow fast by investing in the latest machinery. In contrast to tiny
firms, firms' age had no significant influence on small firms' decision to innovate.
When firms innovate at a younger age, this would indicate that they want to
increase their efficiency of production and market penetration, hence, they tend
to be profit maximisers. Firms at this stage are usually managed by young
326
Chapter Nair
entrepreneurs who are more educated, have a higher need for achievement and
have higher propensity to take risks. Firms which innovated at the later stage of
their life cycle usually did so because of market saturation and static sales. In the
case of tiny firms, where mature firms were less innovative compared to young
firms, again, we can infer that their entrepreneurs were satisficing types, whose
main objective was to survive and make some profit at a `satisfactory' level. In
situation where their firms' performance was not up to the level they considered
`satisfactory', these entrepreneurs were pressured to find means to improve their
performance and the solution was to innovate. The situation is indicated in the
finding of this study which showed that mature tiny firms tend to be innovative
when they had low labour productivity. Government assistance also helps them
to innovate at this stage.
9.1.8 Financing
Financing is one of the problems faced by tiny and small firms. Considering this
fact we hypothesised that financing difficulty is one of the significant factors that
determines firms' innovativeness. The findings of this study suooort this
hyRothe is. The majority of the entrepreneurs admitted that they had problems
obtaining financing from formal financial institutions but the intensity of the
problem was greater among non-innovative entrepreneurs. Problems in obtaining
financing from formal institutions affected entrepreneurs' ability to innovate.
Among problems faced by entrepreneurs in the process of applying for financial
assistance from financial institutions were providing collateral, providing a
327
Chapter Niste
feasibility study on firms' investment plans and also debt service and repayment
due to high interest rates. Both in tiny and small firms, company funds or
entrepreneurs' personal savings were the main sources of financing for innovation.
The next alternative source of financing was informal institutions, such as families
and friends. If unable to find financing from informal institutions, entrepreneurs
applied for financing assistance from government institutions. However, since
the majority of the entrepreneurs perceived that they would have problems
obtaining financing from commercial financial institutions, quite a large number
of them did not even attempt to seek loans from these institutions, but preferred
government institutions as their external source of financing.
The cost of the innovation influenced the intensity of the financing
problem. High cost of innovation affected their chances of obtaining external
financing. Therefore, entrepreneurs who considered introducing a more costly
innovation perceived financing as a more serious problem. Since entrepreneurs
tended to rely on their own funds to finance the innovation, this limited the kind
of innovation they could introduce, and is one reason why tiny and small firms
were generally able to adopt only incremental, rather than radical innovations.
We found a positive correlation between the entrepreneurs' financing problems
and their perception of the buying situation. In the case of small firms, the
entrepreneurs' financing problems also influenced their perception of the
characteristics of the innovation.
328
Chapter Nine
9.1.9 Perception of The Innovation
Entrepreneurs observe various characteristics of an innovation before making
their decision to adopt or reject it. Among the characteristics that they observe
are the innovation's economic advantages, its simplicity, its compatibility with the
existing machinery, the prestige it might carry and the risks of adopting it. We
hypothesised that the entrepreneurs' perceptions of the innovation affect their
decision whether to adopt it.
The majority of the entrepreneurs had positive perceptions of the
innovations they had already adopted or considered adopting. They believed
that the innovation would bring economic advantages, was simple to operate and
compatible with their existing production technique. They foresaw little risk in
adopting the innovation. The entrepreneurs did not consider prestige as an
important criterion in deciding on the appropriate innovation. Statistically, we
found that there was a significant difference in perception between innovative and
non-innovative entrepreneurs in tiny firms but not in small firms. Hence, for tiny
firms, we sunoort the hypothesis that entrepreneurs' exception of the innovation
has significant influence on their decision to innovate. but. for small firms. failed
to sunoortthe hypothesis. The significant difference of opinion between the two
groups of entrepreneurs in tiny firms, is their perception of risk involved when
adopting the innovation. Non-innovative entrepreneurs perceived the
innovations they wanted to adopt as rather expensive, and since they would have
to rely on external sources to finance the cost of innovation, they perceived the
ventures as rather risky. This perception influenced their decision to reject or
329
C lhpter Nine
postpone innovation. In the case of small firms, although statistically we could
not show a difference in perception between innovative and non-innovative
entrepreneurs, close examination shows that although the majority of both groups
of entrepreneurs had positive perceptions, there were some variations, due to
various factors. These factors are the entrepreneurs' level of education, their
personality traits, their knowledge of the innovation, their firms' size, their
financing ability, the perceived likelihood of mismatching of labour force,
intensity of institutional involvement and the characteristics of the innovation.
9.1.10 Buying Situation
As has been mentioned above, our findings suynort the hypothesis that the
entrepreneurs' oerceotion of the procedures that they are required to go through
in the process of buying new machine affects their decision to adopl the
innovation. Entrepreneurs who perceive that they do not or will not have major
problems in dealing with buying procedures are more likely to adopt the
innovation. Most entrepreneurs did not see the search for suppliers as
problematic, nor was obtaining after-sales service considered as a problem.
However, quite a high percentage of non-innovative entrepreneurs anticipated
they would have problems in dealing with suppliers and dealing with legal
matters. Long absence from firms during the buying process was also perceived
as a problem to some entrepreneurs. For small scale producers, long absence
from firms would disrupt their firms' daily operation.
330
Chapter Nine
9.1.11 Communication And Access To Information
In the evaluation and trial stages of the innovation decision process, the
entrepreneurs will accumulate knowledge before they decide to adopt or reject the
innovation. We assumed that the amount of knowledge acquired would be
dependent on the extent of search for information the entrepreneurs conducted,
and their interaction with information sources. For example, information from
research institutions, suppliers or other firms could be very important at these
stages of innovation decision process. Hence we hvoothesised that
communication is among the determining factors that influence firms' level of
innovativeness. Our findinssupports the hypothesis.
9.1.11.1 Internal Communication
As has been mentioned earlier, the level of formalisation of tiny and small firms is
low. The relationship between entrepreneurs and workers is informal; they share
problems, and ideas or suggestions by workers are welcomed by the entrepreneurs.
Considering the low level of formalisation between employer and employee, we
could deduce the existence of a two-way flow of information or communication
style. Although there is two-way communication, however, there is not much
input from employees regarding technological innovation. In most situations,
ideas and initiatives come from the entrepreneurs themselves.
9.1.11.2 External Communication
Various studies have shown that small firms rely heavily on external sources of
information, rather than internal. This is presumably due to their lack of skilled
331
Chapter Nine
personnel. A similar situation was found in the tiny and small firms of this
study.
(a) Communication Channels
This study supports the hypothesis that communicative entrepreneurs were more
innovative. Communicative entrepreneurs have better access to external sources
of information on technological innovation. Acquisition of more information
would reduce the risk and uncertainty of adopting an innovation. Of the various
communication channels used by the entrepreneurs in this study, the most popular
were attending seminars and expos or trade fairs. Seminars and expos are the
meeting ground for entrepreneurs and a good source of information.
Entrepreneurs can widen their business contacts, and exchange ideas and
experiences. Other forms of communication used by a small percentage of the
entrepreneurs were business associations and subscribing to business magazines.
(i) Business Associations
In Malaysia, there are various business organisations which cater for small
business or Bumiputera entrepreneurs, such as Persatuan Pengilang Bumiputera
(Association for Bumiputera Manufacturers). Members of this association are
provided regularly with the latest information on government policies, up-to-date
technology in the local and foreign market, seminars, expos, and support
programmes. During their meetings, members have the opportunity of exchanging
ideas and sharing experiences with fellow members.
332
Chapter Nine
Based on the above functions of a business association, it seems to us that
such associations are among the communication channels from which
entrepreneurs would have information on the existence of technological
innovation. Through business association membership, we believe interpersonal
communication among entrepreneurs can be created. There is a strong possibility
that through this form of interpersonal communication, entrepreneurs can obtain
information on the existence of technological innovation or suppliers of the
innovation, from entrepreneurs who have knowledge of, or experience of
adopting it.
Occasionally, associations organise seminars or courses or provide
information on seminars pertinent to their members' needs. Usually,
representatives of relevant research or financial institutions are called to give
talks during the seminars or courses. By holding such seminars or courses,
business associations play a role in linking the entrepreneurs with external sources
of information.
Based on the above explanation, we see the benefit of being a member of a
business association as a way of obtaining information. Due to the importance of
information in a technological adoption process we predicted that entrepreneurs
who are members of a business association have a greater tendency to be
innovative. However, this study shows that less than 30 per cent of all
entrepreneurs surveyed were involved in a business association and we could not
find a relationship between being a member of a business association and
innovativeness.
333
Chapter Nine
The type of business association joined by these entrepreneurs is among the
reasons why we could not see its relationship with innovativeness. The majority
of them were members of an association formed on the basis of ethnicity or size
of firms, regardless of products produced. Associations such as Dewan
Perniagaan Melayu, or Persatuan Pengilang Bumiputera are formed on the basis
of the ethnicity of the entrepreneurs, regardless of firms' size or product produced.
Associations such as Persatuan Pejaja Melayu, Kelantan or Persatuan peniaga
kecil, on the other hand, are formed based on size of firms (small or medium sized
firms) and regions. Business associations formed on the basis of ethnicity, rather
than size or products, normally carry out activities commonly needed by or
relevant to that particular ethnic group. Committee members normally consist of
the entrepreneurs of larger firms, and naturally, activities carried out are more
relevant to bigger firms, such as on the issue of export or import. Business
associations formed on the basis of size, not business sector, although their
activities are relevant to small firms, have less relevance to firms' sector. Issues
discussed in such associations are those commonly experienced by small scale
producers, such as financing, management technique and marketing problems.
Entrepreneurs who are members of a business association which has not much
relevance to their business sector, will have less chance of obtaining information
on technological innovation through interpersonal communication among
members of the association.
A high percentage of the entrepreneurs in this study are not members of
any business association, mainly because they were not aware of the existence of
any business association relevant to their needs. The business associations
334
Chapter Nine
normally joined by the entrepreneurs in this study, such as Dewan Perniaguan
Melayu, are centred in big cities. Their activities such as meetings, conducting
seminars or courses are normally carried out in big cities. As non-members,
entrepreneurs of small firms in small towns are not aware of such activities,
although some of them would be relevant to their business. Thus, these
entrepreneurs could not see the benefits of joining any business association.
(ii) Subscribing To Business Mafa: ines
Communication between entrepreneurs and source of information could also be
facilitated through publications such as business magazines. By subscribing to
business magazines which are pertinent to their business, entrepreneurs can
obtain beneficial information related to firms' improvement. Those who
subscribe to business magazines usually have better access to external
information so have greater tendency toward early awareness of any technological
innovation. Thus, we believe that they would be likely to be more innovative.
However, this communication channel was hardly used by the entrepreneurs in
this study. Only a small percentage of them claimed that they subscribed to
business magazines. Due to this small percentage, we could not find a relationship
between subscription to business magazines and innovativeness. The main reason
why only a small percentage of the entrepreneurs subscribed to business
magazines was the limited number of business magazines available, relevant to
their existing business. Most business magazines in the market are meant for
335
Chapter Now
larger groups of readers involved in business, regardless of business sectors or
firms' size.
(iii) Attending Business Expos
Occasionally, there are business expos organised by various business associations
or government agencies to promote small and medium scale firms. Suppliers or
distributors use these as opportunities to promote the latest innovations and
processing techniques that are appropriate for small scale producers in the market.
Some entrepreneurs also promote their products in these expos. Government
agencies also participate in the expo as a way of informing visitors of various
services available to assist small scale entrepreneurs. Hence, expos could be
considered as a point of interpersonal contact between entrepreneurs and various
sources of information. This explains why attending expos was the most popular
of the four communication channels used by entrepreneurs in this study.
Despite the importance of attending expos, however, there were some
entrepreneurs who had not attended any business expos in the last five years
before this study was conducted. Agencies responsible for organising business
expos usually hold them at Kuala Lumpur, only once a year, for a period of 5 days
to one week. Since business expos pertinent to entrepreneurs of small firms are
held only infrequently and the venue was usually far from their business premises,
entrepreneurs of small firms were hardly aware of their existence. This was the
main reason why these entrepreneurs did not attend the expos.
336
Chapter Nine
(iv) Attending Seminars
Seminars were a communication channel through which entrepreneurs might
acquire knowledge from the experts and at the same time have the opportunity to
meet other entrepreneurs to exchange ideas and experiences. Moreover, through
seminars entrepreneurs would be able to widen their business contacts. The
importance of attending seminars can be seen in this study, as our survey revealed
a link between seminar attendance and innovativeness. However, a relatively
large percentage of entrepreneurs had never attended a seminar, mainly due to
lack of information. Usually, seminars are organised by business associations or
agencies that are responsible for the development of small firms. The organisers
seldom use media such as newspapers, which have wide circulation, to announce
their seminars. As a result, only certain groups of entrepreneurs, such as those
who are members of business associations and those who have greater institutional
involvement, are aware of such seminars.
(b) Sources Of Information
This study showed that various external sources of information were used by the
entrepreneurs to obtain knowledge about innovation and to obtain various forms of
assistance. Among such external sources are (a) institutions, (b) suppliers and (c)
other firms.
(i) Institutions
The institutions channel their information through various sources, among them,
publications such as monthly magazines, manuals or pamphlets, and conducting
337
Chapter Nine
courses that would interest small scale producers. Some of these institutions
also have advisory services and are available for entrepreneurs to visit for
consultations. This study sunuorts the hypothesis that the entrepreneurs'
institutional involvement is one of the significant factors that determines their
innovativeness. The majority of the entrepreneurs in this study admitted that
they first learned about the innovation under consideration through institutions.
MARDI was the main institution providing information to the entrepreneurs in this
study. The degree of entrepreneurs' involvement with institutions depended on
their personal characteristics, personality traits and communicative behaviour.
Younger entrepreneurs, the more educated, the communicative, high achievers,
and those with a higher propensity to take risks, were more involved with
institutions.
(ii) Suppliers
Suppliers are the main information providers to the entrepreneurs about a
technological innovation. Although the majority of the entrepreneurs admitted
that they first learned about the innovation from institutions, thej+ obtained
detailed information about it from suppliers. The role of suppliers as
information providers is very important in the evaluation and trial stages of the
adoption decision process. The relationship between suppliers and entrepreneurs
is very important in these two stages. As mentioned above, in the process of
buying an innovation, one of the significant differences between innovative and
non-innovative entrepreneurs was in the relationship with suppliers. If
338
Chapter Nine
entrepreneurs have already established a close relationship with suppliers, such
problems can be resolved.
(iii) Other firms
This study has shown that other firms are also important sources from which
entrepreneurs can obtain information about technological innovation. Firms
which used other firms as their source of information indicated that they were late
adopters or laggards in the innovation diffusion process. The compatibility of
the innovation with existing procedures in other firms and the performance of
these firms, motivated the entrepreneurs in this study to adopt the innovation.
9.1.11.3 The determinants of communicative behaviour
The entrepreneurs' communicative behaviour was very much affected by their
personal demographic characteristics, need for achievement, skill upgrading
behaviour and their firms' size. Highly educated, male, or older entrepreneurs
tended be more communicative. Skill and knowledge obtained through education
and experience led them to be more communicative. Male entrepreneurs were
usually more mobile and this enabled them to be more communicative compared
to their female counterparts. High achievers were more communicative than low
achievers. They realised the importance of being communicative in order to be
innovative and successful in their business.
The entrepreneurs who upgraded their skill and knowledge through
attending business courses were more communicative than those who did not
attend business courses. Through business courses, these entrepreneurs had the
339
Chapter Nine
opportunity to learn about the importance of business associations and other
communication channels from which they could obtain information. This in turn,
helped them to be innovative.
One characteristic of firms that had some effect on their entrepreneurs'
communicative behaviour was firm's size. The entrepreneurs of larger firms were
more communicative than those with smaller firms. Bigger firms usually are
more efficient in managing their funds and resources. Thus they have greater
capacity to use communication channels to obtain information from external
sources.
9.1.12 Competition
Previous studies on technological innovation adoption have tended to show that
one of the determining factors is the intensity of the competition. Considering
this fact, we hypothesised that competitive intensity is one of the factors that
influence tiny and small firms to innovate. In this study we measured firms'
competitive intensity by the size of their main competitor. Based on this
measurement. we were unable to support the above hvnothesis. The implication
is that firms which face competition from large firms have a similar level of
innovativeness to firms which face competition from small firms. It seems that
firms which perceive that their main competitors are large firms do not feel
pressure from their competitors to innovate. Perhaps the greater competitive
strength of large firms is balanced by greater distance in the market in terms of
cross-elasticity of demand. It seems that size as a proxy for competition is
340
C hapier Nine
unsatisfactory. Considering the fact that tiny firms tended to innovate when they
had low labour productivity and small firms tended to innovate when they had low
return on investment, one interpretation is that these firms innovated in order to be
competitive in the market. This would imply that competitive intensity does have
significant influence on tiny and small firms' innovation behaviour.
9.1.13 Role of government agencies
Tiny and small firms had to rely on external sources to improve or examine their
product qualities. Research institutions, especially MARDI, play a very
important role in providing R&D facilities as well as providing advisory services
to tiny and small producers in FPI. Other than MARDI, there are various
government agencies such as MARA, KEMAS and NIIDF which support the
development of small scale industries. However, only three government agencies
played an important role in providing assistance to the entrepreneurs in this study.
These were MARDI, KEMAS and MARA. MARDI provided facilities for R&D,
training and advisory services on techniques of production, packaging, quality
control and food analysis. KEMAS provided machines to small producers in rural
areas. Sometimes it also conducted training on production techniques. This
institution is popular among tiny firms. MARA, on the other hand, provided
training and advisory services on management, entrepreneurship and marketing.
This institution also provided loans to small scale producers. This study showed
that financial assistance provided by MARA and machines provided by KEMAS
increase the ability of tiny and small firms to adopt a technological innovation.
Dependence on MARA and KEMAS as their external sources of financing for a
341
Chapter Nine
technological adoption implied that the size of loan supplied was relatively small
and the process of applying for the loan was simpler compared to applying for
funding from other government agencies such as MIDF, or from commercial
financial institutions. For radical (i. e. more expensive) types of innovation, the
entrepreneurs could not rely on MARA or KEMAS for financial assistance.
9.1.14 Conclusion
There is a need for small scale food processing industries to adopt technological
innovation to respond to changes in demand and to stay competitive. However,
there are wide variations among them in innovative behaviour. The difference in
behaviour appears to be due to the characteristics of the entrepreneurs, the
characteristics of their firms, communication, the objective characteristics of the
innovation, the entrepreneurs' perception of the characteristics of the innovation
and of the buying procedures and their involvement with institutions.
9.2 Suggestions For Further Research
This study may be regarded as an exploratory one with the aim of identifying the
significant factors that determine adoption of a technological innovation in tiny
and small scale FPI in Malaysia. The factors included in this study affect
different stages of the adoption decision process (refer to Figure 4.1) and we
assumed in the hypothesis that these factors had equal importance in determining
firms' final decision to adopt or reject the considered technological innovation.
The technological innovations covered in this study were limited to process
342
Chapter Nine
innovation, which is defined as the adoption of new machinery for the production
process. The firms' level of innovativeness was classified into only two
categories, that is, innovative and non-innovative. For future research, we suggest
that researchers take into account product innovation to measure firms' level of
innovativeness. Possibly, researchers could develop a firms' 'level of
innovativeness index', which covers both product and process innovation. We
believe such an index, which would be continuous in nature (not dichotomous),
would be a better measurement of firms' level of innouativeness.
The focus of the study was to address the determinants of innovativeness of
firms. Hence, this study did not address the process of innovation within firms or
diffusion of an innovation over time. We suggest that future research on
innovation among small firms should focus on these two aspects.
Research on the process of innovation within firms investigates the nature
of the innovation process; how and why innovations emerge, develop, grow and
terminate are examined. Such work focuses on the sequence of activities in the
development and implementation of innovations. It is longitudinal in nature and
uses qualitative approaches to data gathering. The diffusion of an innovation
refers to its spread through a population of potential adopters. The aim of this
research is usually to explain or predict rates and patterns of innovation adoption
over time. However, such research is limited to one innovation. The research
we propose in this area would enable us to identify the characteristics of
innovators, early adopters, early majority, late majority and laggards.
343
Chapter Nine
9.3 Policy Implications for Enhancing Technological Innovation
There is a need for tiny and small firms to improve their production efficiency,
produce higher and more consistent output quality and be competitive.
Improvement of production efficiency can be achieved when firms have the ability
to adopt technological innovation within a conducive environment. To create
such an environment, requires policy initiatives that will stimulate the growth of
innovative firms. From this study, we could see the existence of non-innovative
firms which do not have the ability or inclination to adopt the considered
innovation; firms which only had the ability to adopt an incremental type of
innovation; and, some firms which were able to adopt more radical types of
innovation'. Hence, the aim of policy initiatives should be to increase the
capability to adopt technological innovation among tiny and small firms, including
providing a conducive environment for (a) non-innovative firms to become
innovative, and (b) promoting firms which have the potential to adopt radical
rather than merely incremental innovation.
9.3.1 Encouraging Non-Innovative Firms To Become Innovative
To carry out technological innovation, SSIs require financing and skilled workers
who have the basic education and training. They also must collect and analyse
various kinds of information, such as changes in market environment and the trend
of new technology. However, in this study we found that there are various factors
which hinder technological innovation among non-innovative SSIs. The factors
' The fact that 13 per cast of smt>all firms adopted a machine that cost more than RM50,000 (about £12,500) showed that some firms had the potential to adopt a more radical type of innovation.
344
Chapter Nine
are limited financial resources. low level of education and lack of training of the
entrepreneurs and limited access to information. It is difficult for SSIs to take
measures to upgrade the knowledge of their personnel, obtain financing for
technological innovation and obtain maximum access to information. Hence, in
order to encourage non-innovative firms to become innovative, policy
recommendations should emphasise the following areas: (a) education, training
and skill upgrading, (b) technology and management guidance and information
services, and (c) strengthening financial support.
(a) Training And Skill Upgrading
As shown in this study, the majority of non-innovative entrepreneurs were less
communicative and do not attend courses or send their employees for training to
upgrade their skills. The main reasons for not attending courses are lack of
information about the courses and the entrepreneurs' perception that the courses
do not have much relevance to their needs. There are more than seven
institutions which provide training for small firms. However, only MARA and
MARDI provided training programmes that are relevant to the entrepreneurs of
small scale FPI. In view of this, MARA, MARDI and other institutions
responsible for providing training for SSIs should continually update their course
modules according to current needs and improve ways of providing information
on courses to potential entrepreneurs. Most of the courses offered by MARA and
other institutions are basic courses for new entrepreneurs, such as
entrepreneurship and book keeping courses which are conducted by university
345

Chapter Nine
professors. As a result, the courses are centred around theory, rather than practice.
Hence, there is a deficiency of implementation by the entrepreneurs. It is
recommended that innovative and successful entrepreneurs should also be
included in designing course modules and conducting courses.
Female entrepreneurs in tiny firms should not be ignored, as the income
from their business can be a major contribution to their family income. They
should be provided with necessary support so that they can be as innovative as
their male counterparts or as females in small firms. Their low level of
innovativeness was due to a low level of education and lack of training. Their
lack of knowledge and skill due to their low educational level can be made up
through training and attending courses. Therefore courses or training provided by
institutions should take into account constraints faced by female entrepreneurs.
There should be an improvement in institutions' methods of circulating the
information to create awareness among entrepreneurs about courses offered by the
training institutions. Most of the training institutions circulate their information
by pamphlets which are only available to the entrepreneurs who make the effort to
contact the institutions or obtain them through business associations. MARDI has
made an effort to advertise its courses through the internet. However, only a
small number of SSIs have this facility. Announcements about courses offered by
institutions should be made in media of wider circulation, such as newspapers,
radio and television.
346

Chapter Nine
(b) Technical And Management Guidance And Information Services
This study showed that MARA and MARDI play a very important role in
technical and management guidance and information services to small scale
entrepreneurs in SSIs. There is a need for other institutions, such as financial
institutions, to provide services in these areas. These institutions should undertake
on-the-spot communication and counselling guidance by experts to cultivate
adoption of technological innovation by SSIs whose technological level is low
and managerial ability is weak. This would result in reducing constraints faced
by SSIs in the process of adopting the innovation. The technical guidance should
be provided by MARDI and SIRIM, the management guidance should be provided
by MARA and National Productivity Centre (NPC), while Malaysian Industrial
Development Finance (MIDF), Credit . Guarantee Corporation (CGC) and
Development Bank should provide financial support. The strategy is to combine
technical guidance and managerial guidance, and then examine how their advice
can be put into practice with financial support.
The Division of Small and Medium-scale Industries in the Ministry of
Trade and Industry (MITI) should act as a source of information for SSIs. This
division could collect and supply related information at any time, according to the
needs of SSIs. This division should play a role in identifying SSIs which have
growth potential but have difficulty in collecting various kinds of information and
then supplying the information they need. This division could act as a channel
that links entrepreneurs with information providers, such as research institutions.
347
Chapter Niere
There are many institutions which have a role of providing assistance to
SSIs (refer to Appendix I). However. based on this study. less than 45.0 r cent
of small firms and less than 30.0 per cent of tiny firms used facilities or obtained
assistance from these institutions. One of the main reasons for lack of
institutional involvement is lack of information about the existence and the
function of such institutions and inaccessibility of the institutions. Research by
UKM (1990) showed that 77.7 per cent of the entrepreneurs knew about the
existegce, of MARDI, 71 per cent knew about its functions while only 30 per cent
received assistance from it. Hence, other than the Division of Small and
Medium- scale Industries in MITI suggested above as information provider, there
is a need to establish a mobile Extension Service Unit which can provide all types
of information needed by small scale FPI. Currently, MARDI has a programme
called Extension and Advisory Service to Small Scale Food Industries (MARDI
1993). However, this programme only provides advisory services to local food
entrepreneurs, regarding improving processing technologies and product quality,
through personal communication. The Extension Service Unit suggested, would
be an extension of this programme by including information provision to
entrepreneurs on other aspects needed by them, such as training and financial
assistance, to enhance their ability to be innovative. The extension officer of this
unit would approach entrepreneurs and provide them with the necessary
information.
348
Chapter Nine
(c) Strengthening Financial Suonort
This study showed that the financing problem was one of the determining factors
of firms' innovativeness. However, only a few of the entrepreneurs in this study
were (and chose) able to obtain a loan from a financial institution although various
loan schemes have been set up for SSIs. Among the schemes related to
technological innovation of SSIs are (i) feasibility study schemes (ii) product
development and design schemes and (iii) quality and productivity improvement
schemes. The institutions participating in such schemes are the Development
Bank, MIDF and Bank of Industry. The majority of Bumiputera small scale FPI do
not apply for loans under these schemes, mainly due to lack of information about
such schemes, strict conditions for eligibility (refer to Appendix IX) and the
requirement that the firms support at least 50% of the cost of the project. Hence,
in this study for technological innovation, small scale FPI are very much
dependent on loans from MARA, or KEMAS, or on an overdraft from a
commercial bank In view of the importance of MARA and KEMAS in providing
loans for technological innovation, these institutions should increase the
maximum loan provided to entrepreneurs and introduce a longer repayment
period. This would encourage small scale FPI to modernise their production
technique by adopting new technology.
9.3.2 Encouraging Small Firms to Adopt Radical Type of Innovation.
The majority of small scale FPI surveyed adopted an incremental type of
innovation. However, there are small scale FPI which have the potential of
adopting a radical type of innovation. As we have seen in this study, bigger firms
349
Chapter Nine
(firms with more than 30 workers) and firms with a higher level of complexity
(those that do not have a problem of lack of skilled workers) are more innovative
than small firms. We may infer that they have the potential to adopt a radical type
of innovation. Hence, there is a need for policy initiatives which can encourage
such firms to realise this potential. The nature of the research performed for this
study means that our policy conclusion here, frankly, be more speculative and less
clearly derived from our findings than those put forward so far.
We propose that financial and technical assistance should also be provided
to these firms. The policy initiatives provided to these firms should encourage
expansion through (a) increasing demand for their products and (b) providing
financial and technical assistance.
(a) Increasing The Demand for Tiny and Small Firms' Products
We believe that the incentive for SSIs to innovate will increase where there is an
increase in the demand for their product (We showed above that larger size of
firms made for innovation; and presumably so does the need to expand capacity. ).
In the current situation, the majority of them market their product locally through
distributors. They are very much dependent on distributors to promote their
product. As a results, there is no significant increase in demand for their
products. Demand for small firms' products could be increased through (a)
government procurement, (b) umbrella concept (c) strengthening the inter-industry
linkages and (d) export.
350
Chapter Nine
(i) Government Procurement
Utilising the public sector's purchasing power in promoting domestic industries is
not entirely new, and the policy should be vigorously pursued with more specific
guidelines to take full advantage of the potential in terms of technology
acquisition and innovation. Government can influence demand through regulation
and procurement. However, as was mentioned in Chapter Two, there is an
indirect discrimination faced by SSIs related to government procurement policies
which tend to favour large firms because of their competitive prices and higher
quality products. Hence, there should be an improvement of the government
procurement system towards the products of SSIs. In Japan, for example, a
special act was established in 1966 to ensure that SSIs are given equal chance or
priority in government procurement (Madeline and Faridah 1989). This act
required (i) government or public agencies to give priority to SSIs in providing
purchase contracts, (ii) government policies regarding purchase contracts to be
notified annually to SSIs to ensure that they have a chance of bidding for
government contracts and (iii) MITI to have a complete record of government
contracts and make sure that all government agencies follow regulations in
providing government contracts. We suggest that Malaysia should also implement
a similar act.
(ü) 'Konsey Yayung' (Umbrella Concept)
Currently only BESTA Distributor Limited Company participates in the umbrella
concept to market the products of small scale FPI under the brand name BESTA.
Under this marketing concept, small scale firms concentrate on production, while
351
Chapter Nine
leaving the marketing aspect of their business to this organisation. At the same
time, the organisation provides the necessary assistance such as financing, raw
materials, quality control and packaging which are needed by SSIs. It is timely
for more private companies to participate in this umbrella concept to increase the
market for SSIs. The umbrella concept would enable small scale FPI to be
competitive with larger firms and MNCs and penetrate export markets.
(iii) Strengthening inter-indust linkages
Linkages between small firms and large firms or between firms of different sectors
should be strengthened through sub-contracting. The Sub-Contracting Exchange
Unit in the MITI is responsible for creating these linkages. However, less than 10
per cent of the entrepreneurs of SSIs are aware of the existence of such a unit and
not many food processing firms have the benefit of that unit (UKM 1990).
Under Abatement for Purchases from Small Scale Companies, an incentive of 5
per cent of adjusted income will be given to large industries which purchase
components from small scale light engineering industries. We suggest that a
similar abatement be given for purchases of semi-processed products from small
scale FPI to encourage interlinkages between small scale FPI with larger firms.
Linkages between small firms and larger firms are weak due to various
factors. Among them are poor quality products, delay in delivery, shortage of
suitably qualified small firms and instability of the management of SMIs (Ismail
1990: 21). Hence, in the light of these problems, assistance such as financial
support to adopt technological innovation, upgrade management skill and quality
352
Chapter Nine
control should be given to small firms whose products have been identified for
sub-contracting arrangement.
(iv) Exert
Export incentives given to SMIs are double deduction of expenses on promotion
of export overseas, double deduction of Premium Credit Insurance for Exports
and Industrial Building Allowance. However, these incentives are only given to
firms which have already exported their products. The majority of small firms do
not export their products because they do not have the capacity to do so.
Incentives should be given to establish linkage between specific small scale food
processing industries and established exporters. The arrangement should allow
for the facilitation of direct contact between exporters and producers, with MITI
playing the role of initiator and facilitator, as well as provider of necessary
information to both parties. Provision of appropriate incentives should be given to
exporters which obtain supplies from small firms.
Assistance should also be made available to SSIs in order to help them to
penetrate foreign markets. Thailand and Japan can be used as examples. Two
institutions; the "Export Service Centre" and a programme under the Industrial
Finance Co-operation in Thailand (IFCT) are responsible for promoting exports of
SSIs. The Export Service Centre provides assistance in terms of packaging,
providing information on overseas market by conducting market research and
promoting export of SSIs products through publicity and trade fairs. IFCT, on the
other hand, provides specific programmes for SSIs' which export their products,
by providing assistance in technological innovation to modernise production
353
Chapter Nine
techniques and upgrade product quality IFCT also provide technical support as
well as financial support. Malaysia can also learn from Japan which promotes
exports of SSIs by establishing an institutions like "Japan External Trade Office"
(JETRO). JETRO has its branch offices in various countries, which carry out
market research and provide information of export opportunities in the particular
countries to SSIs. Also, through JETRO, linkages between SSIs in Japan and
foreign firms through the process of sub-contracting can be created. JETRO is
also responsible for promoting products of SSIs abroad at trade fairs and
expositions (Madeline and Faridah 1989). The creation of such an establishment
in Malaysia appears highly desirable.
(b) Providing Financial And Technical Assistance Package
Adoption of radical types of innovation also requires technical assistance from
research institutions and financing. To finance such innovation the entrepreneurs
cannot rely on MARA and KEMAS. They need to be able to obtain financing
from government assisted institutions such as MIDF and Development Bank or
from private commercial banks. However, financing from such institutions
requires them to provide collateral, guarantors and an assurance of the success of
the project. Hence, a package of financial and technical assistance should be
provided to firms which have the potential to adopt a radical innovation. This
package would use similar concepts to the Technical and Management Guidance
and Information Service proposed for non-innovative firms. The only difference
is that it would concentrate on technical and financial assistance. Hence, this
package would be monitored by committee members consisting of officers
354

Chapter Nine
representing research and financing institutions. Other than a board of directors,
members of the committee could act as the guarantors for project loans.
Currently, MIDF and Development Bank finance up to the maximum of 70 per
cent of the cost of fixed assets acquired by firms at an interest rate of 10-12 per
cent per annum and maximum repayment period of 10 years. Since these financial
institutions would become the main financiers, we suggest that these institutions
should finance at least 90 per cent of the cost of innovation at an interest rate of
not more than 10 per cent.
355
REFERENCES
Acs, Z. J. and David B. Audretsch (1988). 'Innovation in Large and Small Firms: An Empirical Analysis', The American Economic Review, Vol. 78, No. 4, pp. 678-690.
Adams, G. R. and Jay D. Schvaneveldt (1985). Understanding Research methods New York: Longman.
Aiken, M. and J. Hage (1971), `The Organic Organization and Innovataion', Sociology. 5, pp. 63-82.
d'Amboise, G. and Marie Muldowney (1988). `Management Theory for Small Business: Attempts and Requirements', Academy of Management Review, Bol 13, No. 2, pp. 226-240.
Anderson, E., Wujin Chu and Barton Weitz (1987). ̀ Industrial Purchasing: An Empirical Exploration of the Buyclass Framework', Journal of Marketing, Vol. 51, July, pp. 71-86.
Anuwar Ali (1992). Malaysia's Industrialization: The Quest for Technology. Singapore: Oxford University Press.
_ (1989). 'Development Policies for Heavy Industries' in Suh Jang-Won, (ed. ),
Strategies for Industrial Development: Concept and Policy Issues, Kuala Lumpur: Asian and Pacific Development Centre and Korea Development Institute, pp. 20-45.
(1984). ̀ The Need for Technical Skills and Innovative Capacity: The Case of the Manufacturing Industries in Malaysia' Akademika, No. 25. pp. 40-62.
Anuwar Ali and Madeline Berma (1992). Action Plan Study on Small and Medium- Scale Industries in Malaysia (Unpublished Report).
Armson, R. and Rob Paton (ed. ) (1994). Organizations: Cases. Issues. concepts, London: Paul Chapman.
Asit K. Sarkar and Siti Khairon Sharif (1988). 'Technology Suport Base for Malaysia's Small and Medium Scale Enterprise' in Mohd Ghazali Mohayidin and Shaari Abd. Hamid (eds. ), Small and Medium Scale Enterprises in Malavsia: Technological and Managerial Capacity Kuala Lumpur: Universiti Pertanian Malaysia, pp. 49-62.
Bagozzi, R. P. (ed. ), (1994). Principles of Marketing Research, Cambridge, Massachusetts: Blackwell Publishers.
356
Baker, M. J., (1975). Marketing New Industrial Product, London: Macmillan.
Bank Negara Malaysia (1992). Annual Report , Kuala Lumpur.
(1990). Annual Report ,
Kuala Lumpur.
(1986). Annual Report .
Kuala Lumpur.
(1970). Annual Report , Kuala Lumpur.
Bell, D. E. Howard Raiffa and Amos Tversky (ed. ) (1988). Decision Makine: Descriptive, Normative, and Prescriptive Interactions, Cambridge University Press, Cambridge.
Biemans, W. G. (1992), Managing Innovation Within Networks, London: Routledge.
Birley, S. (1989). `The start up', in Burns, P. and Jim Dewhurst (eds. ), Small business and entrepreneurship, London: Macmillan Education Ltd., pp. 8-31.
_(1983). 'Corporate Strategy and The Small Firm', Journal of General
Management, Vol. 8, No. 2, Winter. 1982/83, pp. 82-86.
Birley, S. and P. Westhead (1990). ̀ Growth and Performances Contrasts Between `Types' of Small Firms', Strategic Management Journal, Vol. 11, No. 7, pp. 535-557.
Bradley, M. F. (1977). `Buying Behaviour in Ireland's Public Sector', Industrial Marketing Management, 6, August, pp. 251-258.
Bradbury, J. A. A. (1989), Product Innovation Idea to Exploitation, Chichester: John Wiley & Sons.
Brown, L. A. (1981). Innovation Diffusion: A New Perspective, New York: Metheven.
Bruch, M., (1983). ̀ Source of Financing of Small-Scale Manufacturers: A Micro- Analysis for Malaysia', The Singapore Economic Review, April, pp. 21-33.
Bunn, M. D. (1993). ̀ Taxonomy of Buying Decision Approach', Journal of Marketing, January, Vol. 57, pp. 38-56
Bums, P. and Jim Dewhurst (eds. ) (1989). Small business and entrepreneurship, London: Macmillan Education Ltd.
Butler, J. E. (1988). 'Theories of Technological Innovation as a Useful Tools for Corporate Strategy', Strategic Management Journal, Vol. 9, pp. 15-29.
357
Butler, R. (1991). Designing Organizations: A Decision- Making Perspective, London: Routledge.
Cainarca, G. C., Colombo M. G. and Sergio Mariotti (1990). `Firm Size and the Adoption of Flexible Automation', Small Business Economics, 2, pp. 129- 140.
Cartland, J. W., Hoy, F. Boulton and W. R. Cardland, J. A. C. (1984). ̀ Differentiating Entrepreneurs from Small Business Owners: A Conceptualization', Academy of Management Review. 9.2: pp. 354-359.
Chamhuri Siwar, Ahmad Mad Zin and Abdul Hamid Jaafar (1990). Masalah dan Prospek Industri Kampung di Malaysia (Problems and Prospects of Rural Industries in Malaysia), Research Report submitted to Faculty of Economics, Universiti Kebangsaan Malaysia (unpublished).
Chee Peng Lim (1991 a). ̀ Potential and Problem of SMI', in Kim Seung Jin & Suh Jang Won (ed. ), Cooperation in Small and Medium-Scale Industries in ASEAN, Kuala Lumpur: Asian and Pacific Development Centre, pp. 29-51.
(1991b). 'Government Policies and Institutional Framework for SMI Developmant', in Kim Seung Jin & Suh Jang Won (ed. ), Cooperation in Small and Medium-Scale Industries in ASEAN, Kuala Lumpur: Asian and Pacific Development Centre, pp. 29-51.
(1990). ̀ Promotion of Small Industries: The Malaysian Experience', in Esderts, Hans J and Ismail Md Salleh (eds. ), Promotion of Small-Scale Industries and Strategies for Rural Industrialisation-The Malaysian Experience Kuala Lumpur: Fridrich Ebert Stiftung, pp. 25-63.
(1986). Small Industry in Malaysia, Kuala Lumpur: Berita Publishing.
Chell, E. (1991). The Entrepreneurs Personality: Conceyt. Case and Categories, London: Routledge.
_(1986). `The Entrepreneurial Personality: A Review and Some Theoretical
Developments' in Curran, J., Stanworth, J. and David Watkin (ed. ) The Survival of the Small Firms, Vol. 1, The Economics of Survival and Entrepreneurship, Alsershot: Gower, pp. 102-119.
(1985). The Entrepreneurial Personality: A Few Ghosts Laid to Rest? ', International Small Business, Vol. 3, No. 3, pp. 43-54
Chin, W. W. and Abhijit Ghopal (1995). 'Adoption Intention in GSS: Relative Importance of Belief The Data Base for Advances in Information Systems, Vol. 26, No. 2&3, May/ August, pp. 42-63.
358
Churchill, N. C. and Virginia L. Lewis (1983). The Five Stages of Small Business Growth', Harvard Business Review, May/June, pp. 30-50.
Cleland, S. (1960). ̀ A short Essay on a Managerial Theory of The Firm', in Kenneth E. Boulding and W. Allen Spirely (ed. ), Linear Programming and The Theory of The Firms, New York. MacMillan, pp. 202-225.
Cooper, A. C. (1979). `Strategic Management: New Ventures and Small Business' in Schendel, D. E. and Charles W. Hofer (ed. ), Strategic Management: A view of Business Policy and Planning, Little, Brown and Company, Boston, pp. 316-326.
Copley, B. H. (1990). 'Technical Change in Latin America Manufacturing Firms: Review and Synthesis', World Development, Vol 18, No. 11, pp. 1457-1469.
Curran, J., Stanworth, J. and David Watkin (1986) (ed. ) The Survival of the Small Firms, Vol. 1, The Economics of Survival and Entrepreneurship, Alsershot: Gower.
Curwen, P. J. (1976). The Theory of the Firm, The Mac Millan Press Ltd, London.
Cyert, R. M. and James G. March (1992). A Behavior Theory of Firm, Second Edition, Cambridge, Massachusetts: Blackwell Publishers.
Damanpour, F. (1991). ̀ Organizational Innovation: A Meta-Analysis of Effects of Determinants and Moderators', Academy of Management Journal, Vol. 34, No. 3, pp. 555-590.
(1990). ̀ Innovation Effectiveness, Adoption, And Organizational Performances', in West and Farr (ed. ), Innovation And Crativity At Work, Chichester: John Wiley & Son.
(1987). ̀ The Adoption of Technological, Administrative, and Ancillary Innovation: Impact of Organisational Factors', Journal of Management, Vol. 34, No. 3, pp. 555-590.
David E. Bell, Howard Raffa and tAmos Tuerskey (1988). Decision Making: Descriptive, normative, and prescriptive interactions, Cambridge University Press, Cambridge.
Davig, W. and Steve Brown (1992). ̀ Incremental Decision Making in Small Manufacturing Firms', Journal of Small Business Management, April, pp. 53- 60.
Davis, F. D (1989). `Perceived Usefullness, Perceived Ease of Use, and User Acceptance of Information Techonology', MIS Quarterly. Vol. 13, No. 3, pp. 319-340
359
Davis, F. D., Bagozzi, R. P. and P. R. Warshaw (1989). ̀ User Acceptance of Cumputer Technology: A Comparison of Two Theoretical Models', Management Science, Vol. 35, No. 8, pp. 982-1003.
Department of Statistics (1992), Manufacturing Sector Survey, Kuala Lumpur: National Printing Department
(1986a), Annual Statistic 1985, Kuala Lumpur. National Printing Department
(1986b), Industrial Survey, Kuala Lumpur: National Printing Department
Dewar, R. D. and Jane E. Dutton (1986). ̀ The Adoption of Radical and Incremental Innovation: An Empirical Analysis', Management Science, Vol. 32, No. 11. November, pp. 1422-1433.
Dewees, C. M. and G. R. Hawkes (1988). ̀ Technical Innovation in the Pacific Coast Trawl Fishery: The Effect of Fishermen's Characteristics and Perceptions on Adoption Behaviour', Human Organization, Vol. 47, No. 3, pp. 224-234.
Dimnik, T. P. and D. A. Johnston (1993). ̀ Manufacturing Managers and The Adoption of Advanced Manufacturing Technology', OMEGA- International Journal of Management Science, Vol. 21, No. 2, pp. 155-162.
Dodge, H. R., Fullerton, S. and J. E. Robbins (1994), ̀ Stage of the Organizational Life Cycle and Competition as Mediators of Problem Perception for Small Business', Strategic Management Journal, Vol. 15, pp. 121-134.
Douglas, E. J. and Scott Callan (1992). Managerial Economics: Analysis and Strategy, 4th edition, Prentice- Hall International, Inc, New Jersey.
Downs, G. W. Jr and Lawrence B. Mohr (1976). ̀ Conceptual Issues in the Study of Innovation', Administrative Science Quarterly, Dec, Vol. 21, pp. 700-714
Drucker, P. F. (1985). Innovation and Entrepreneurship, Practice and Principles , London: Heinmann.
(1954), The Practice of Management, New York: Harper & Brother.
Durand and Shae (1974). 'Entrepreneurial Activity as a Function of Achievement Motivation and Reinforcement Control', Journal of Psychology, Vol. 88, pp. 57-88.
Ebadi, Y. M and James M. Utterback (1984). The Effects of Communication on Technological Innovation', Management Science, Vol. 30, No. 5, May, pp. 572-585.
360
Edwardson, W. (1989). `Improvement of The Small-Scale Food Processing Industry in Developing Countries', Industry and Development, No. 27, pp. 67-79.
El-Namaki (1988). ̀ Encouraging Entrepreneurs in Developing Countries', Long Range Planning, Vol. 21, No. 4, pp. 98-106.
Ettlie, J. E. (1983). `Organisational Policy and Innovation Among Suppliers to the Food Processing Sector', Academy of Management Journal. Vol. 26, No. 1, pp. 27-44.
Ettlie, J. E., Bridges, W. P., and R. D. O'Keefe (1984). `Organisational Strategy and Structural Differences for Radical vs. Incremental Innovation', Management Science. Vol. 30, No. 6, pp. 682-695.
Esderts, Hans J and Ismail Md. Salleh (eds. ) (1990). Promotion of Small-Scale Industries and Strategies for Rural Industrialisation-The Malaysian Experience Kuala Lumpur: Fridrich Ebert Stiftung.
Faridah Shahadan (1990). Wanita dalam Pembangunan Ekonomi Analisis ke atas Penglibatan Wanita dalam Industri Skel Kecil (Women in Economic Development, Analysis of Women Participataion in Small Scale Industries), paper presented at Conference on Population and Development Orientation for 21st Century, organised by Faculty of Delopment Science, Universiti Kebangsaan Malaysia, Kota Kinabalu, 10-11 December.
Faridah Shahadan and Madeline Berma (1992). Prospects of Rural Industries in Malaysia, ISIS Malaysia (Unpublished Research Report)
Fichman, R. C. and Chris F. Kemerer (1993). ̀ Adoption of Software Engineering Process Innovation: The Case of Object Orientation', Sloan Management Review, Winter, pp. 7-22.
Fiegenbaum, A. and Aneel Karnani (1991). ̀ Output Flexibility-A Competitive Advantage For Small Firms', Strategic Management Journal, Vol. 12, pp. 101- 114.
FMM (1990). Handbook for Small and Medium Sized Industries in Malaysia (Unpublished), Compiled by The Federation of Malaysian Manufacturers (FMM).
Foley, P. and Doug Watts (1994). 'Skills Shortages and Training: A Forgotten Dimension in New Technology', R&D Management, Vol. 24, No. 3, pp. 279- 289.
361
Fong Chan Onn (1989). Pelan Tindakan Pembangunan Industri Kecil dan Sederhana LAction Plans for The Development of Small and Medium Scale Industries), Report Submitted to Division of Small Industries, Ministry of Trade and Industry, Malaysia (Unpublished Report)
(1986). Technological Leap: Malaysian Industry in Transition. Singapore: Oxford University Press.
Fredrickson, J. W. (1986). ̀ The Strategic Decision Process And Organizational Structure', Academy of Management Review, Vol. 11, No. 2, pp. 280-297.
Gatignon, H. and Thomas S. Robertson (1989). `Technology Diffusion: An Empirical Test of Competitive Effects', Journal of Marketing, Vol. 53, January, pp. 35- 49.
Gilad , B. (1982). ̀ On Encouraging Entrepreneurship: An Interdisciplinary Analysis'. Journal of Behavioral Economics, 11, pp. 132-163.
Ghosh, D. & Manash R. Ray (1992). ̀ Risk attitude, embiguity intolerance and decision making: exploratory investigation', Decision Science Journal, Vol. 23, No. 2 March/April pp. 431-444.
Gray, J. L. and Frederick A. Starke (1988), Organizational Behaviour Concepts and Applications, Columbus: Merrill.
Hage, J. and M. Aiken (1967). ̀ Program Change and Organizational Properties, a Comparison Analysis', American Journal of Sociology. 72, pp. 503-519.
Hakansson and Wootz (1975). ̀ Suplier Selection in an International Environment: An Empirical Study', Journal of Marketing Research, 11, February, pp. 46-51.
Hannan, T. H. and John M. Mc Dowell (1987). ̀ Rival Precedence and the Dynamics of Technology Adoption: an Empirical Analysis', Economics, 54, pp. 155- 71.
(1984), The Determinants of Technology Adoption: the case of the banking firms', Rank Journal of Economics, 15, No. 3, Autumm, pp. 328-335.
vol.
Harrison, F. E. (1987). The Managerial Decision-Making Process, Third Edition, Boston: Bhoghton Mifflin Company.
Hartman, A. E., C. Buck Tower, and Terrence C. Sebora (1994). `Information sources and their relationship to organisational innovation in small business' Journal of Business Management. January, pp. 36-47.
Harvey, J., Lefebvre, L. A. and E. Lefebvre (1992), ̀ Exploring Relationship Between Productivity Problem and Technology Adoption in Small Firms', IEEE Transaction on Engineering Management, Vol. 39, No. 4, November, pp. 352-358.
362
Hasnah All and Rahmah Ismail (1989). `Industri Skel Kecil di Korea (Smal Scale Industries in Korea)', in Ismail Mohd Salleh (ed. ), Industri-Industri Kecil (Small Industries), Kuala Lumpur: AMK Interaksi Sdn. Bhd., pp. 198-232.
Herbig, P. A. and Hugh Kramer (1993). ̀ Low Tec Innovation: Resurveying the Basic Meaning of Innovation', Management Decision, Vol. 31, No. 3, pp. 4-7.
Hebert, R. F. and Albert N. Link (1989). ` In Search of the Meaning of Entrepreneurship', Small Business Economics, 1, pp. 39-49.
Himmelberg and Petersen (1994). ̀ R&D and Internel Finance: A Panel Study of Small Firms in High-Tech Industries', The Review of Economics and Statistics, pp. 39-51.
Hodgkinson, G. P. (1992). 'Research Notes and Communications Development and Validation of the Strategic Locus of Control Scale', Strategic Management Journal, Vol 13, pp. 311-17.
Holt, K. (1983). Product Innovation Management, third edition, Butterworths, London
Hughes, R. E. (1984). 'Responding to changes in process technology: Strategies for the small business', Journal of Small Business Mann e$ ment, January.
Ishak Shari and Chang Yii Tan (1993). Technology and Social Change: The Impact of Technological Development on Fishing Communities in East Coast of Peninsular Malaysia, Bangi: Penerbit Universiti Kebangsaan Malaysia
Ishak Shari and Wook (1989). ̀ Industri Kecil di Malaysia: Perkembangan Struktur dan Masalahnya (Smal Industries in Malaysia: Structural Development and Problems)', in Ismail Mohd Salleh (ed. ), Industri-Industri Kecil (Small Industries), Kuala Lumpur: AMK Interaksi Sdn. Bhd., pp. 1-49.
Ismail Md Salleh (1990). 'Small and Medium Scale Industrialisation: Problems and Prospects' in Esderts, Hans J and Ismail Md Salleh (eds. ), Promotion of Small-Scale Industries and Strategies for Rural Industrialisation-The Malaysian Experience Kuala Lumpur Fridrich Ebert Stiftung. pp. 1-7.
(1989) (ed. ), Industri-Industri Kecil (Small Industries), Kuala Lumpur: AMK Interaksi Sdn. Bhd.
Johnson, G. and Kevan Scholes (1988). Exploring Corporate Strategy, 2nd edition, London: Prentice Hall.
363
Josty, P. L. (1990). ̀ A Tentative Model of The Innovation Process', R&D Management, Vol. 20, No. 1, pp. 35-45.
Kalish, S. (1985). New Product Adoption Model with Price, Advertising and Uncertainty', Management Science, Vol. 31, No. 12, December, pp. 1569-85
Keats B. W. and Jeffrey S. Bracker (1988). ̀ Toward a Theory of Small Firm Performance: A Conceptual Model', American Journal of Small Business. Spring, pp. 41-57.
Kennedy, A. M. (1982). `Industrial Buying Behaviour: A review of Literature and Research Needs', Management Decision, Vol. 20, No. 1, pp. 38-53.
Kenneth E. Boulding and W. Allen Spirely (ed. ) (1960). Linear Programming and The Theory of The Firms, New York. MacMillan.
Khan, A. M. and V. Manopichetwattana (1989). ̀ Innovative and Noninnovative Small Firms: Types and Characteristics', Management Science, Vol. 35, No. 5, May,
pp. 597-606.
Kim Seung Jin and Suh Jang Won (ed. ) (1991) Cooperation in Small and Medium Scale Industries in ASEAN, Kuala Lumpur: Asian and Pacific Development Centre.
Kim, Y., Song, K. and Jinjoo Lee (1993). ̀ Determinants of Technological Innovation in The Small Firms in Korea', R&D Management, Vol. 23, No. 3, pp. 215- 226.
Kim Song-Chin (1992). ̀ SMI Technology Development Policies in Korea' in Kim Seung Jin & Suh Jang Won (ed. ), Cooperation in Small and Medium-Scale Industries in ASEAN, Kuala Lumpur: Asian and Pacific Development Centre, pp. 271-308.
Kimberly, J. R. and M. J. Evanisko (1981). 'Organizational Innovation: The Influence of Individual, Organizational, and contextual factors on hospital adoption of technological and administrative innovation', Academy of Management Journal, 24, pp. 689-713.
King, N. (1990). `Innovation at Work: the research literature', in West, M. A. and James L. Farr (ed. ) Innovation and Creativi at Work, Chichester: John Wiley & Sons. pp.
King, V. and Nazaruddin Mohd. Jail (ed. ) (1992). Isu Pembangunan Luar Bandar di Malaysia (Rural Development Issues in Malaysia), Kuala Lumpur: Dewan Bahasa dan Pustaka.
3 64
Kirton, M. J. (1994). `Theory of Cognitive Style' in Kirton, M. J. (ed. ), Adaptors and Innovators: Styles of Creativity and Problem Solving, revised edition, London: Routledge, pp. 1-33.
Kleinknecht, A. (1989). ̀ Firm Size and Innovation', Small Business Economics pp. 215-222.
KLSCCI (1986). Views and Positions on the Industrial Masterplan (IMP)- A Memorandum Submitted to the Ministry of Trade and Industry, (Unpublished)
Kogan, N and Michael A Wallach (1964). Risk Taking, a study in cognition and personality, New York: Holt, Rinehart and Winston.
Korteling, J. E (Hans) (1994). `Effects of Aging, Skill Modification and Demand Alterations on Multiple Task Performance', Human Factors. Vol. 36, No. 1, pp. 27-43.
Langley, A. and J. Truax (1994). ̀ A Process Study of New Technology Adoption in Smaller Manufacturing Firms', Journal Of Management Studies, Vol. 31, No. 5, pp. 619-652.
Lefcourt, H. M. (1976). Locus of Control: Current Trends in Theory and Research, New Jersey: Lawrence Erlbaum Associates, Publishers.
Lefebvre, E. and L. A. Lefebvre (1992). `Firms Innovativeness and CEO Characteristics in Small Manufacturing Firms', Journal of Engineering and Technology Management, Vol. 9, pp. 243-277.
Link, A. N. and Barry Bozeman (1991). `Innovative Behaviour in Small-Sized Firms', Small Business Economics, 3, pp. 179-184.
Madeline Berma and Faridah Shahadan (1991). A Study on Women's Need for Family and Economic Development -A Study on Women in Informal Sector, IKWAM and UNFPA (Unpublished Research Report)
(1989). ̀ Industri Bersaiz Kecil dan Sederhana di Jepun (Small and Medium Scale Industries in Japan)', in Ismail Mohd Salleh (ed. ), Industri-Industri Kecil (Small Industries), Kuala Lumpur: AMK Interaksi Sdn. Bhd., pp. 233-272.
Mahajan, V., Muller, E. and R. K.. Srivastava (1990), `Determinants of Adopter Categories by Using Innovation Diffusion Models', Journal of Marketing Research, Vol. XXVII
, February, pp. 37-50.
Malaysia (1991). Sixth Malaysia plan 1991-1995. Kuala Lumpur: National Printing Department.
365
(1986). Fifth Malaysia Plan 1986-1990, Kuala Lumpur: National Printing Department.
198 1). Fourth Malaysia Plan 1981-1985, Kuala Lumpur: National Printing Department.
_(1976). Third Malaysia Plan 1976-1980, Kuala Lumpur: National Printing
Department.
(1971). Second Malaysia Plan 1971-1975, Kuala Lumpur. National Printing Department.
(1966). First Malaysia Plan 1966-1970. Kuala Lumpur: National Printing Department
March, J. G. (1994). ̀ Theories of Choice and Making Decisions' in Armson, R. and Rob Paton (ed. ), Organizations: Cases. Issues, concepts, London: Paul Chapman, pp. 160-174.
March, J. G. and Zur Shapira (1987). Managerial Perspective on Risk Taking', Management Science, Vol. 33, No. 11, November, pp. 1404-1418.
MARDI (1993a), Model Perusahaan Kuetiau, (Manufacture of Kuetiau), Serdang: Pusat Penyelidikan Perusahaan Makanan.
(1993b). Development Programmes. Vol. II, Compiled by Food Technology Research Centre, MARDI, Serdang, Selangor (Unpublished).
(1991 a), Profile Perusahaan Makanan . No. 8. (Profile of Food Industry, No. 8), Serdang: Pusat Penyelidikan Perusahaan Makanan.
(1991 b), Profile Perusahaan Makanan , No. 7. (Profile of Food Industry, No. 7), Serdang: Pusat Penyelidikan Perusahaan Makanan.
Martinsons, M. G. (1993). ̀ Strategic Innovation: A Lifeboat for Planning in Turbulent Waters', Management Decision Vol. 31, No. 8, pp. 4-11.
Masterson, J. J. and G Hayword (1979). `Adoption of Innovation: A Concept Attainment View', Management Decision, Vol. 17, No. 4, pp. 284-294.
McKenney, James. L. and Peter G. W. Keen (1974). `How managers' Minds Work', Harvard Business Review, 52: pp. 79- 90.
Menard, S. (1995). Anlied LoL's tic Regression Analysis, Thousand Oaks California: Sage Publication.
366
Meredith, J., (1987). `Strategies Advantages of New Manufacturing Technologies for Small Firms', Strategic Management Journal, Vol. 8, pp. 249-258.
Miller, D. and Jean-Marie Toulouse (1986). ̀ Chief Executive Personality and Corporate Strategy', Management Science, Vol. 32, No. 11, November, pp. 1389-1409.
Miller, D. C (1991). Handbook of Research Design and Social Measurement, Fifth Edition, Newbury Park, California: Sage Publications.
Ministry of Finance of Malaysia (1995). Economic Report 1995/1996, Kuala Lumpur: National Printing Department
(1988). Economic Rebort 1988/1989, Kuala Lumpur: National Printing Department.
Ministry of International Trade and Industry (MITI) (1992). Malaysia: Profile of Small Scale Industry. Kuala Lumpur. (Unpublished Report).
Mintzberg (1973). ̀ Strategy Making in Three Modes', California Management Review, 16,2, (Winter), pp. 44-53.
Mohamed Ariff (ed. ) (1991) Islam and Economic Development of Southeast Asia: The Muslim Private Sector in Southeast Asia, Singapore. Institute of Southeast Asian Studies.
Mohd Asri Abdullah (1996). ̀ Pertumbuhan Sektor Perkilangan dan Peranan Industri Kecil dan Sederhana (IKS) di Malaysia (Growth of Manufacturing Sector in Malaysia and the Role of Small and Medium Industries)', Perantara, April, pp. 7-10.
Mohd Ghazali Mohayidin and Shaari Abd. Hamid (ed. ) (1988). Small and Medium Scale Entemrise in Malaysia: Technological and Mann eRerial Capacity, Serdang: Universiti Pertanian Malaysia.
Mohr, L. B. (1982). Explaining Organizational Behavior: The Limits and Possibilities of Theory and Research, San Francisco: Jossey-Bass Publishers.
Moore, B. C. and 1. Benbasat (1991). `Development of Instrument to Measure the Perception of Adopting an Information Technology Innovation', Information System Research, Vol. 2, No. 3, pp. 192-222.
Moriarty, R. T. and Robert E. Spekman (1984). An Empirical Investigation of the Information Source Used During Industrial Buying Process', Journal of Marketing Research, Vol. 21, pp. 137-147.
367
Muchinksky, P. M. (1993). Psychology Aplied to Work, fourth edition, Brooks/Cole Publishing Company, California.
Naffziger, D. W., Hornsby, J. S and D. F. Kuratko (1994). `A Proposed Research Model of Entrepreneurial Motivation', Entrepreneurship Theory and Practice, Spring, pp. 29-42.
Naylor, T., John M. Vernon and Kenneth L. Wertz (1984). Managerial Economics. Corporate Economics and Strategy New York: Mc Graw Hill International Book Company.
Newall, J. (1977). 'Industrial Buying Behaviour: A model of the Implication of Risk Handling Behaviour for Communication Policies in Industrial Marketing', European Journal of Marketing, Vol. 11, No. 3, pp. 166-211.
Nor Aini Haji Idris and Faridah Shahadan (1991). `The Role of Muslim Women Traders in Kelantan', in Mohamed Ariff (ed. ), Islam and Economic Development of Southeast Asia: The Muslim Private Sector in Southeast Asia, Singapore. Institute of Southeast Asian Studies, pp. 201-256.
(1988). Sumbangaan Wanita Terhadan Pendapatan Keluarga (Women's Role In The Contribution of Household Income), Occational Paper No. 37, Faculty of Economics, Universiti Kebangsaan Malaysia
Nutt, P. C. (1984). ̀ Types of Organisational Decision Process', Adminstrative Science Quarterly, Vol. 29, No. 3, pp. 414-450.
Oakey, RP. (1984). `Finance and Innovation in British Small Independent Firms', OMEGA International Journal of Management Science, Vol. 12, No. 2,
pp. 113-124.
Ozanne, U. B. and Gilbert A. Churchill, Jr (1971). 'Five Dimensions of the Industrial Adoption Process', Journal of Marketing Research, August.
Parkinson, T. S. and Michael J. Baker (1986). Organizational Buying Behaviour: Purchasing and Marketing Management Implications, MacMillan Press, London.
Peters, M. P. and M. Venkatesan (1973). 'Exploration of variables Inherent in Adopting an Industrial Product', Journal of Marketing Research, 10, August, pp. 312-315.
Premkumar, G. and M. Potter (1995). 'Adoption of Computer Aided Software Engineering (CASE) Technology: An Innovation Adoption Perspective', The Data Base for Advances in Information Systems, Vol. 26, No. 2&3, May/ August, pp. 105-123.
368
Prescott, M. B. (1995). `Diffusion of Innovation Theory: Borrowing, Extensions, and Modifications from IT Researches', The Data Base for Advances in Information Systems, Vol. 26, No. 2&3, May/ August, pp. 16-19.
and Sue A. Conger (1995). `Information Technology Innovation: A Classification by IT Locus of Impact and Research Approach' The Data Base for Advances in Information Systems. Vol. 26, No. 2&3, May/ August, pp. 20-41.
Quinn, R. E. and K. Cameron (1983), ̀ Organizational Life Cycles and Shifting Criteria of Effectiveness: Some Preliminary Evidence', Management Science. Vol. 29, No. 1, January, pp. 3 3-51.
Ray, Dennis M (1993). `Understanding the Entrepreneur: Entrpreneurial Attributes, Experience and Skill' Entreprenueship and Regional Development, Vol. 5, pp. 345-357.
Reinganum, J. F. (1981). 'Market Structure and the Diffusion of New Technology', Bell Journal of Economics, 12, pp. 618- 624.
Rice, G. H. (1983). ̀ Strategic Decision Making in Small Business', Journal of General Management, Vol. 9, No. 1, Autumn, pp. 58-65.
(1980). ̀ But How Do Managers Make Decisions', Management Decisions, Vol. 18, No. 4, pp. 194-202.
Rice, G. H. and Richard. E. Hamilton (1979). ̀ Decision Theory And The Small Businessman', American Journal of Small Business Vol. IV, No. 1, July, pp. 1-9.
Rizzoni, A. (1991). ̀ Technological Innovation and Small Firms: A Taxonomy', International Small Business Journal vol. 9, No 3, April-June
, pp. 31-42.
Robertson, T. S and H. Gatingnon (1986). ̀ Competitive Effect on Technology Diffusion', Journal of Marketing, Vol. 50, July, 1-12.
Robinson, R. B. and Pearce, J. A. (1984). ̀ Research Trusts in Small Firms Strategic Planning', Academy of Management Review, 9, pp. 128-137.
Rogayah Haji Mat Zin and Ahmad Mohd Zin (1989). ̀ Industri Kecil di Taiwan (Smal Scale Industries in Taiwan)', in Ismail Mohd Salleh (ed. ), Industri- Industri Kecil (Small Industries), Kuala Lumpur: AMK Interaksi Sdn. Bhd., pp. 159-197.
Rogers, E. M. (1962). Diffusion of Innovations, London, Collier-Macmillan.
369
(1983). Diffusion of Innovations, Third Edition, The Free Press, New York.
Rogers, E. M. and F. F. Shoemaker (1971). Communication of Innovations - ACross- Cultural Agroach, London, Collier-Macmillan.
Rothchild (1947) ............... Tengok dalam Cyert and March
Rothwell, R (1989). ̀ Small Firms, Innovation and Industrial Change', Small Business Economics, 1, pp. 51-64.
Rothwell, R (1984). ̀ The Role of Small Firms in The Emergence of New Technologies', OMEGA International Journal of Management Science, Vol 12, No. 1, pp. 19-29.
(1989). `Small Firms, Innovation and Industrial Change', Small Business Economics. 1, pp. 51-64.
Rowland, T., Moriarty, JR. and Robert E. Spekman (1984). 'An Empiral Investigation of the Information Sources Used During the Industrial Buying Process, Journal of Marketing Research, Vol. 21, pp. 137-147.
Ruppel, C. P. and Susan J. Harrington (1995). ̀ Telework: An Innovation Where Nobody is Getting On the Bandwagon' The Data Base for Advances in Information Systems Vol. 26, No. 2&3, May/ August, pp. 87-104.
Santarelli, E. and Alessandro Sterlacchini (1990). `Innovation, Formal vs Informal R
and D, and Firm Size: Some Evidence from Italian Manufacturing Firms', Small Business Economics 2: pp. 223-228
Schroeder, D. M, Gopinath, C. and Steven W. Congden (1989). ̀ New Technology And The Small Manufacturer: Panacea or Plague? ', Journal of Small Business Management, July pp. 1-10
Scitovsky, T., (1952), ̀ A Note on Profit Maximization and Its Implication', Reading in Price Theory, Homewood, California: Richard D. Irwin.
Scott, M. and Richard Bruce (1987). ̀ Five Stages of Growth in Small Business', Long Range Planning, Vol. 20. No. 3, pp 45-52.
Seth, A. and Howard Thomas (1994). `Theories of Firms: Implication for Strategy Research', Journal of Management Studies, Vol. 31, No. 2, March, pp. 165- 191.
Sharma, A. (1994). ̀ Organisational Culture and Adoption of High-technological Products', Journal of Marketing Management, Vol. 10, pp. 513-526.
Sheth, J. N. (1973). `A Model of Industrial Buyer Behaviour', Journal of Marketing:, 37, October, pp. 50-55.
3 70
Shrivastava, P. and J. H. Grant (1985). `Empirically Derived Models of Strategic Decision Making Processes', Strategic Management Journal, Vol. E, pp. 97- 113.
Simon, Herbert. A. (1988). `Rationality as Process and as Product of Thought' in Bell, D. E., Howard Raiffa and Amos Tversky (ed. ), Decision Making: Descriptive. Normative. and Prescriptive Interactions, Cambridge University Press, Cambridge.
(1986a). ̀Rationality in Psychology and Economics', Journal of Business, Vol. 59, No. 4 pt. 2, pp. s209-s224.
(1986b). ̀ Alternative Visions of Rationality', in Arkes, H. R Kenneth R. Hammond (ed. ), Judgement and Decision Making: An interdiscplinarv Reader, Cambridge University Press, Cambridge.
and
(1959). ̀ Theories of Decision Making in Economics and Behavioral Science', The American Economic Review, Volume XLIX, No. 3, June, pp. 253-283.
(1955). ̀ A Behaviour Model of Rational Choice', Quarterly Journal of Economics, 69, pp. 99-118.
Singh, J. V. (1986). ̀ Performance, Slack, and Risk Taking in Organizational Decision Making', Academy of Management Journal, Vo. 29, No. 3, pp. 562-585.
SPSS/PC+ (1990). Advance Statistics. Michigan: SPSS Inc.
Tasir, A. (1991). Technological Improvement Efforts in Firms Operating in The Food Processing, Ph. D Desertatition, University of Manchester
Tyler, T. R. and R. A. Schuller (1991). ̀ Aging and Attitude Change', Journal of Personality and Social Psychology, 61, November, pp. 689-691.
UNIDO (United Nations Industrial Development Organisation ) (1990). Global Outlook: Economic. Social and Environmental United Nations Publications, Sales No. E. 90, II. C. 3.
(1989). Industry and Development Global Report, 1989/90 Vienna.
(1985). Medium and Long Term Industrial Master Plan Malaysia 1986-1990: Overview of the Industrial Master Plan', Vol. 1-1-1 (Unpublished report)
371
Universiti Kebangsaan Malaysia (UKM) (1992). Peranan Industri Kecil and Sederhana sebagai Industri Sokongan (The Role of Small and Medium Industries as Supporting Industries), (Unpublished Research Report)
(1990). Lapuran Penyelididkan Industri Skel Kecil di Malaysia (Research Report on Small Scale Industries in Malaysia ), Research Report (Unpublished Research Report).
Utterback, J. M and William J. Abernathy (1975). `A Dynamic Model of Process and Product Innovation', OMEGA International Journal of Management Science. 3, December, 1975.
Variyam, J. N. and David S. Kraybill (1993). ̀ Small Firms' Choice of Business Strategies', Southern Economic Journal, Vol 60, July, pp. 136-145.
Wan Sarah Abdullah, Abdul Halim Hamid and Habsah Nawawi (1992). ̀ Penglibatan Wanita Dalam Pembangunan Luar Bandar: Kajian Kes Industri Desa di Kelantan (Women Participation in Rural Development: Case Study of Rural Industry in Kelantan)', in King, V. and Nazaruddin Mohd. Jali (ed. ), Isu Pembangunan Luar Bandar di Malaysia (Rural Development Issues in Malaysia), Kuala Lumpur: Dewan Bahasa dan Pustaka, pp. 212-243.
Ward, E. A (1993). 'Motivation of expansion plans of entrepreneurs and small business managers' Journal of Small Business Management, Vol. 31, No. January.
Warr, P (1994). 'Age and Job Performance' in Snel J and Roel Cremmer (eds., ) Work and Aging: A European Perspective, Taylor and Francis, London.
Webster, F. E. and Yoram Wind (1972a). Organizational Buying Behaviour, New Jersey: Prentice Hall
(1972b). ̀ A General Model for Understanding Organisational Buying Behaviour', Journal of Marketing, 36, April, pp. 12-19.
West, M. A. and James L. Farr (1990). ̀ Innovation at Work' in West, M. A and James L. Farr (ed. ), Innovation and Creativity at Work, Chichester: John Wiley & Son. pp.
(1990) (ed. ) Innovation and Creativity at Work, Chichester: John Wiley & Sons.
White, M. C. (1960). `Multiple Goals in The Theory of The Firms', in Kenneth E. Boulding and W. Allen Spirely (eds. ), Linear Programming and The Theory of The Firms, New York. MacMillan, pp. 181-198.
Wilson, D. T. (1971). 'Industrial Buyer's Decision Making Sytles', Journal of Marketing Research, 8, November, pp. 433-4336.
372
Wind, Y., (1978). `Organizational Buying Behaviour', in Zaltman, G. and Bonoma, T. V. (eds. ), Review of Marketing, (Chicago, American Marketing Association)
Wind, Y., and Robert J. Thomas (1980). ̀ Conceptual Model and Methodological Issues in Organisational Buying Behaviour', European Journal of Marketing, Vol. 14, No. 5&6, pp. 239-263.
Young, R. C. and Joe D. Francis (1991). ̀ Entrepreneurship and Innovation in Small Manufacturing Finns', Social Science Quarterly, Vol. 72, No. 1, March, pp. 149-162.
Zaltman, G., Duncan, R. and J. Holbek (1973). Innovations and Organisation, London: John Wiley and Sons.
Zmud, R. W. (1982). ̀ Diffusion of Modem Software Practices: Influence of Centralization and Formalization', Management Science. Vol. 28, No. 12, pp. 1421-1431.
3 ý3*
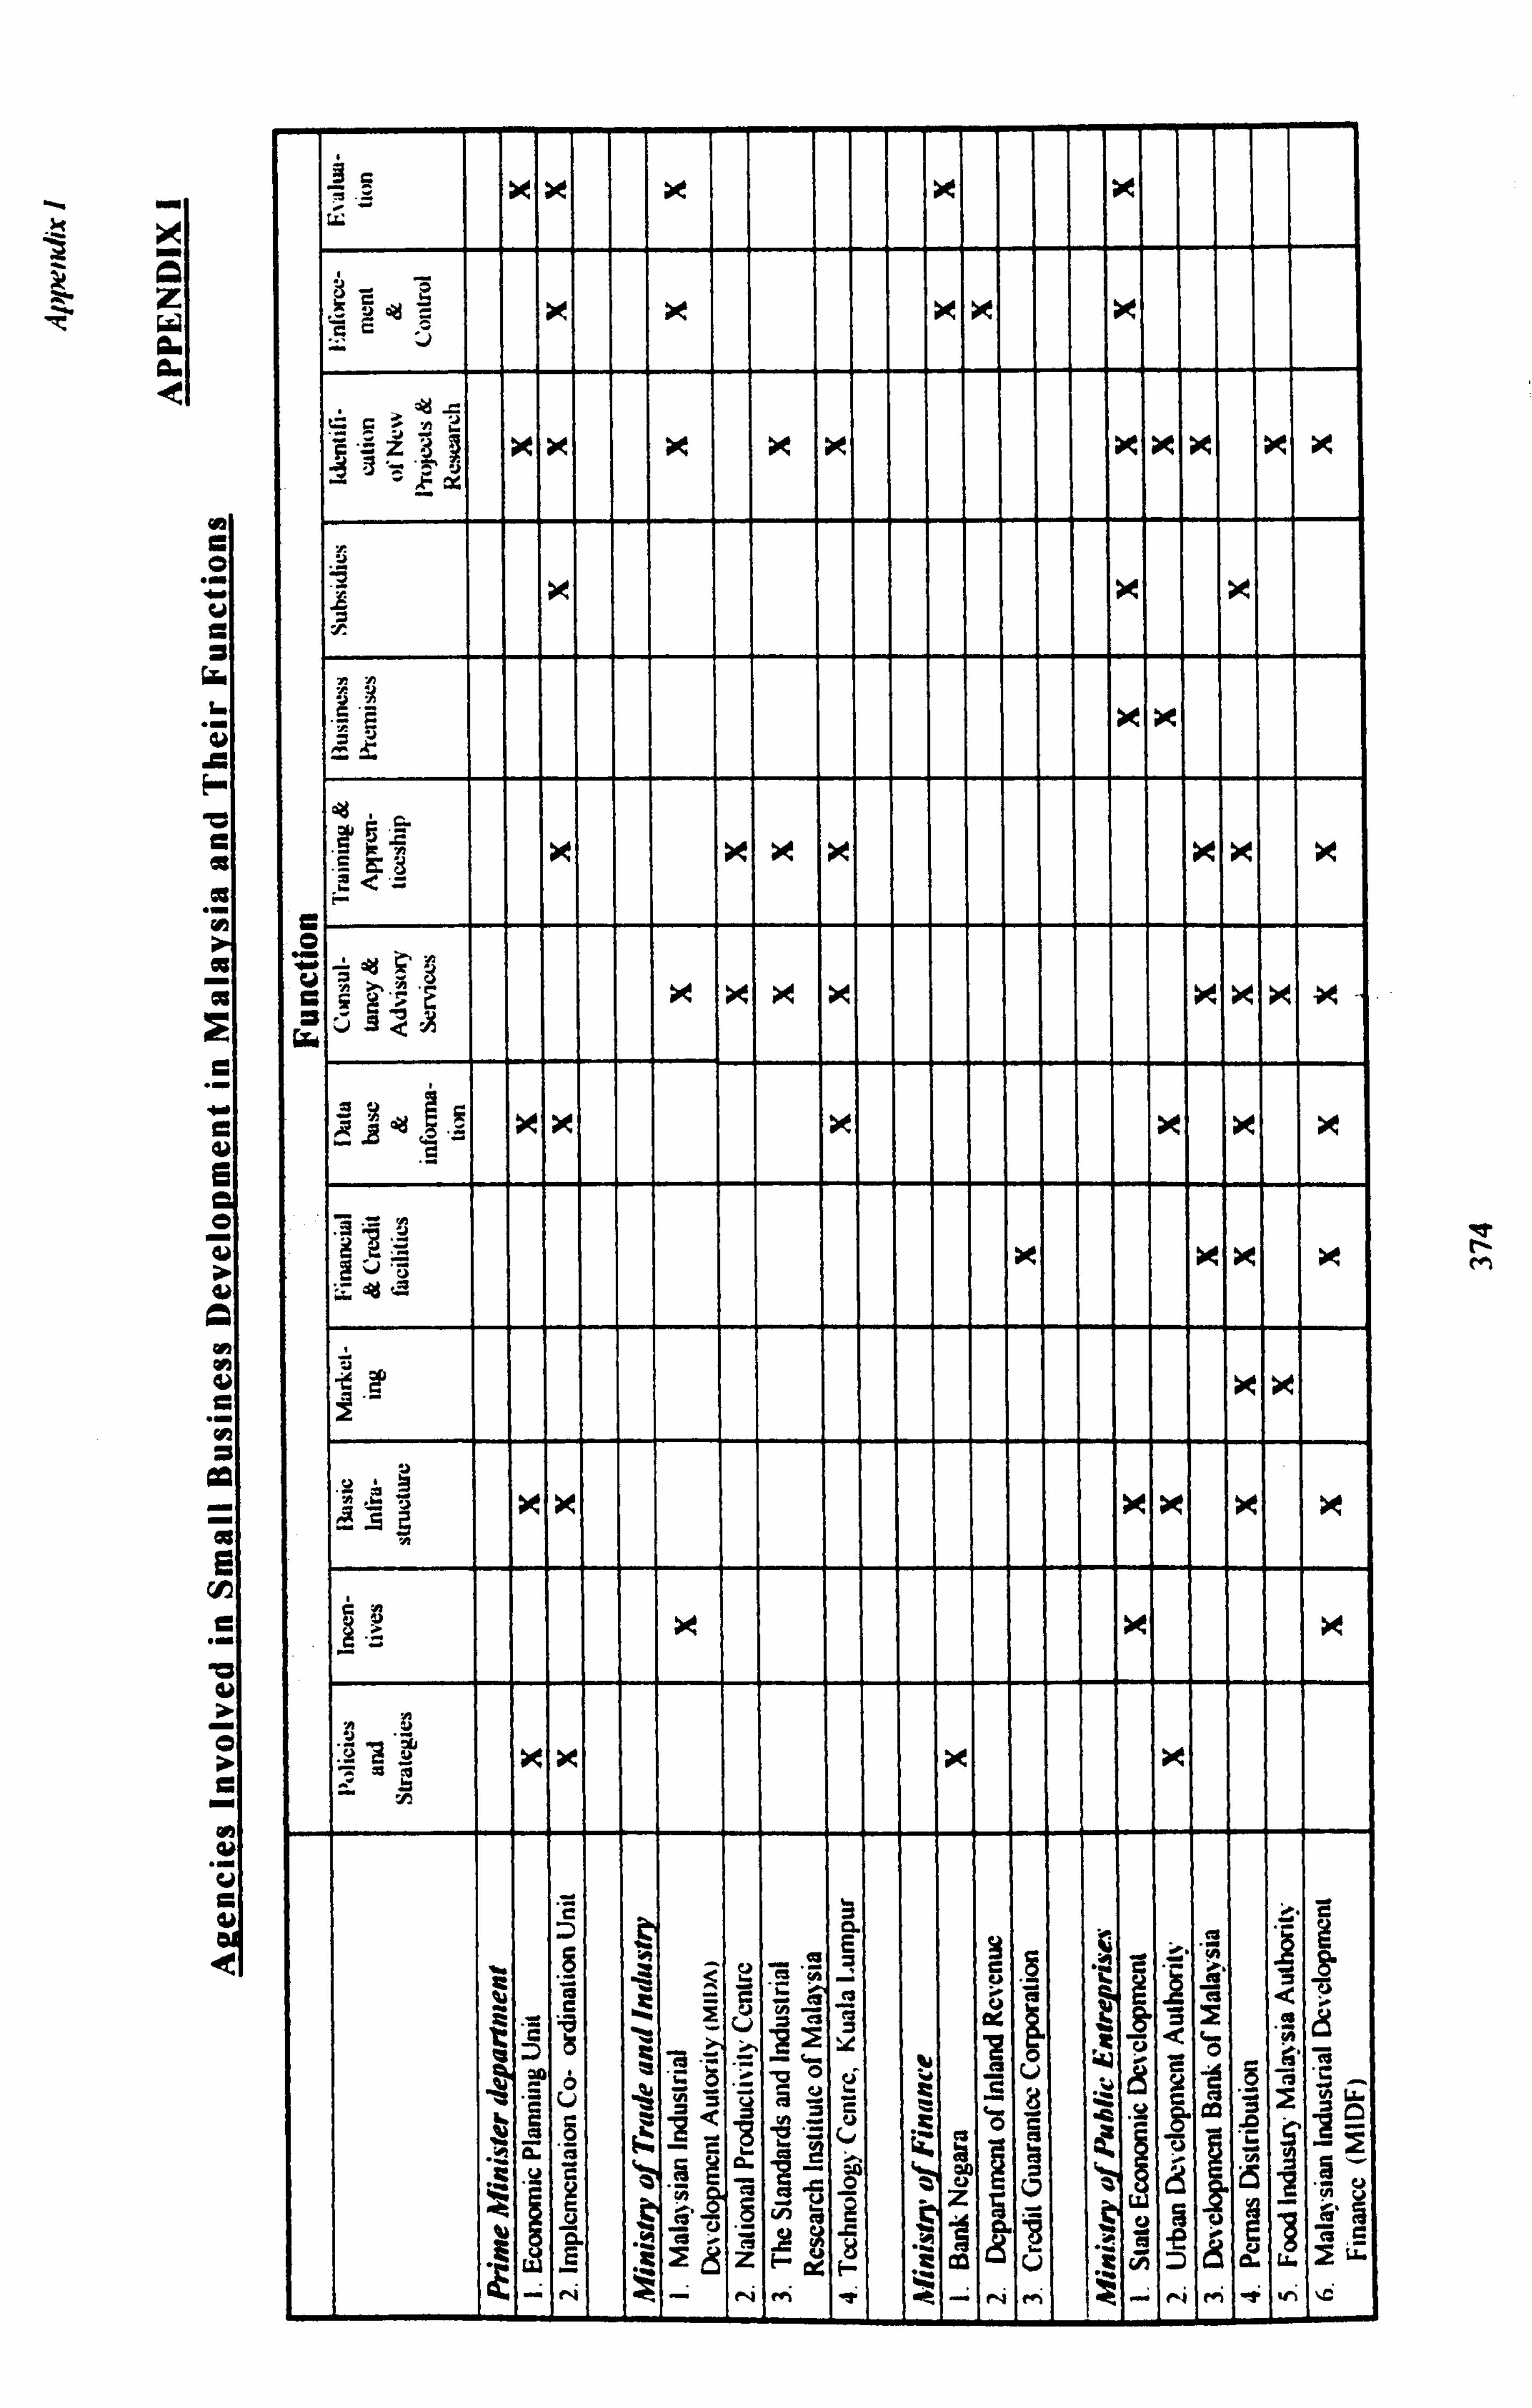
1r
z a Q
.ý
..
7G 7_ ý %C %C %C iC Cl..
VcÖC x x. xi x
z8 x x ýe ýe x x x x x x
"r.
in n
ýi 1r x y
r
I
x
LT. . 1
73 ýJv
ýrýj ? ý5ý2 x x x x ie ýe
II y x x Iv
. cO ä
C y o =
C ' a 5 O ä.
6 i _ a
t
! I
I I J j
jl ;
Z di t
Z N e
N M T C ,- N M N M Y w1 %C
e N M
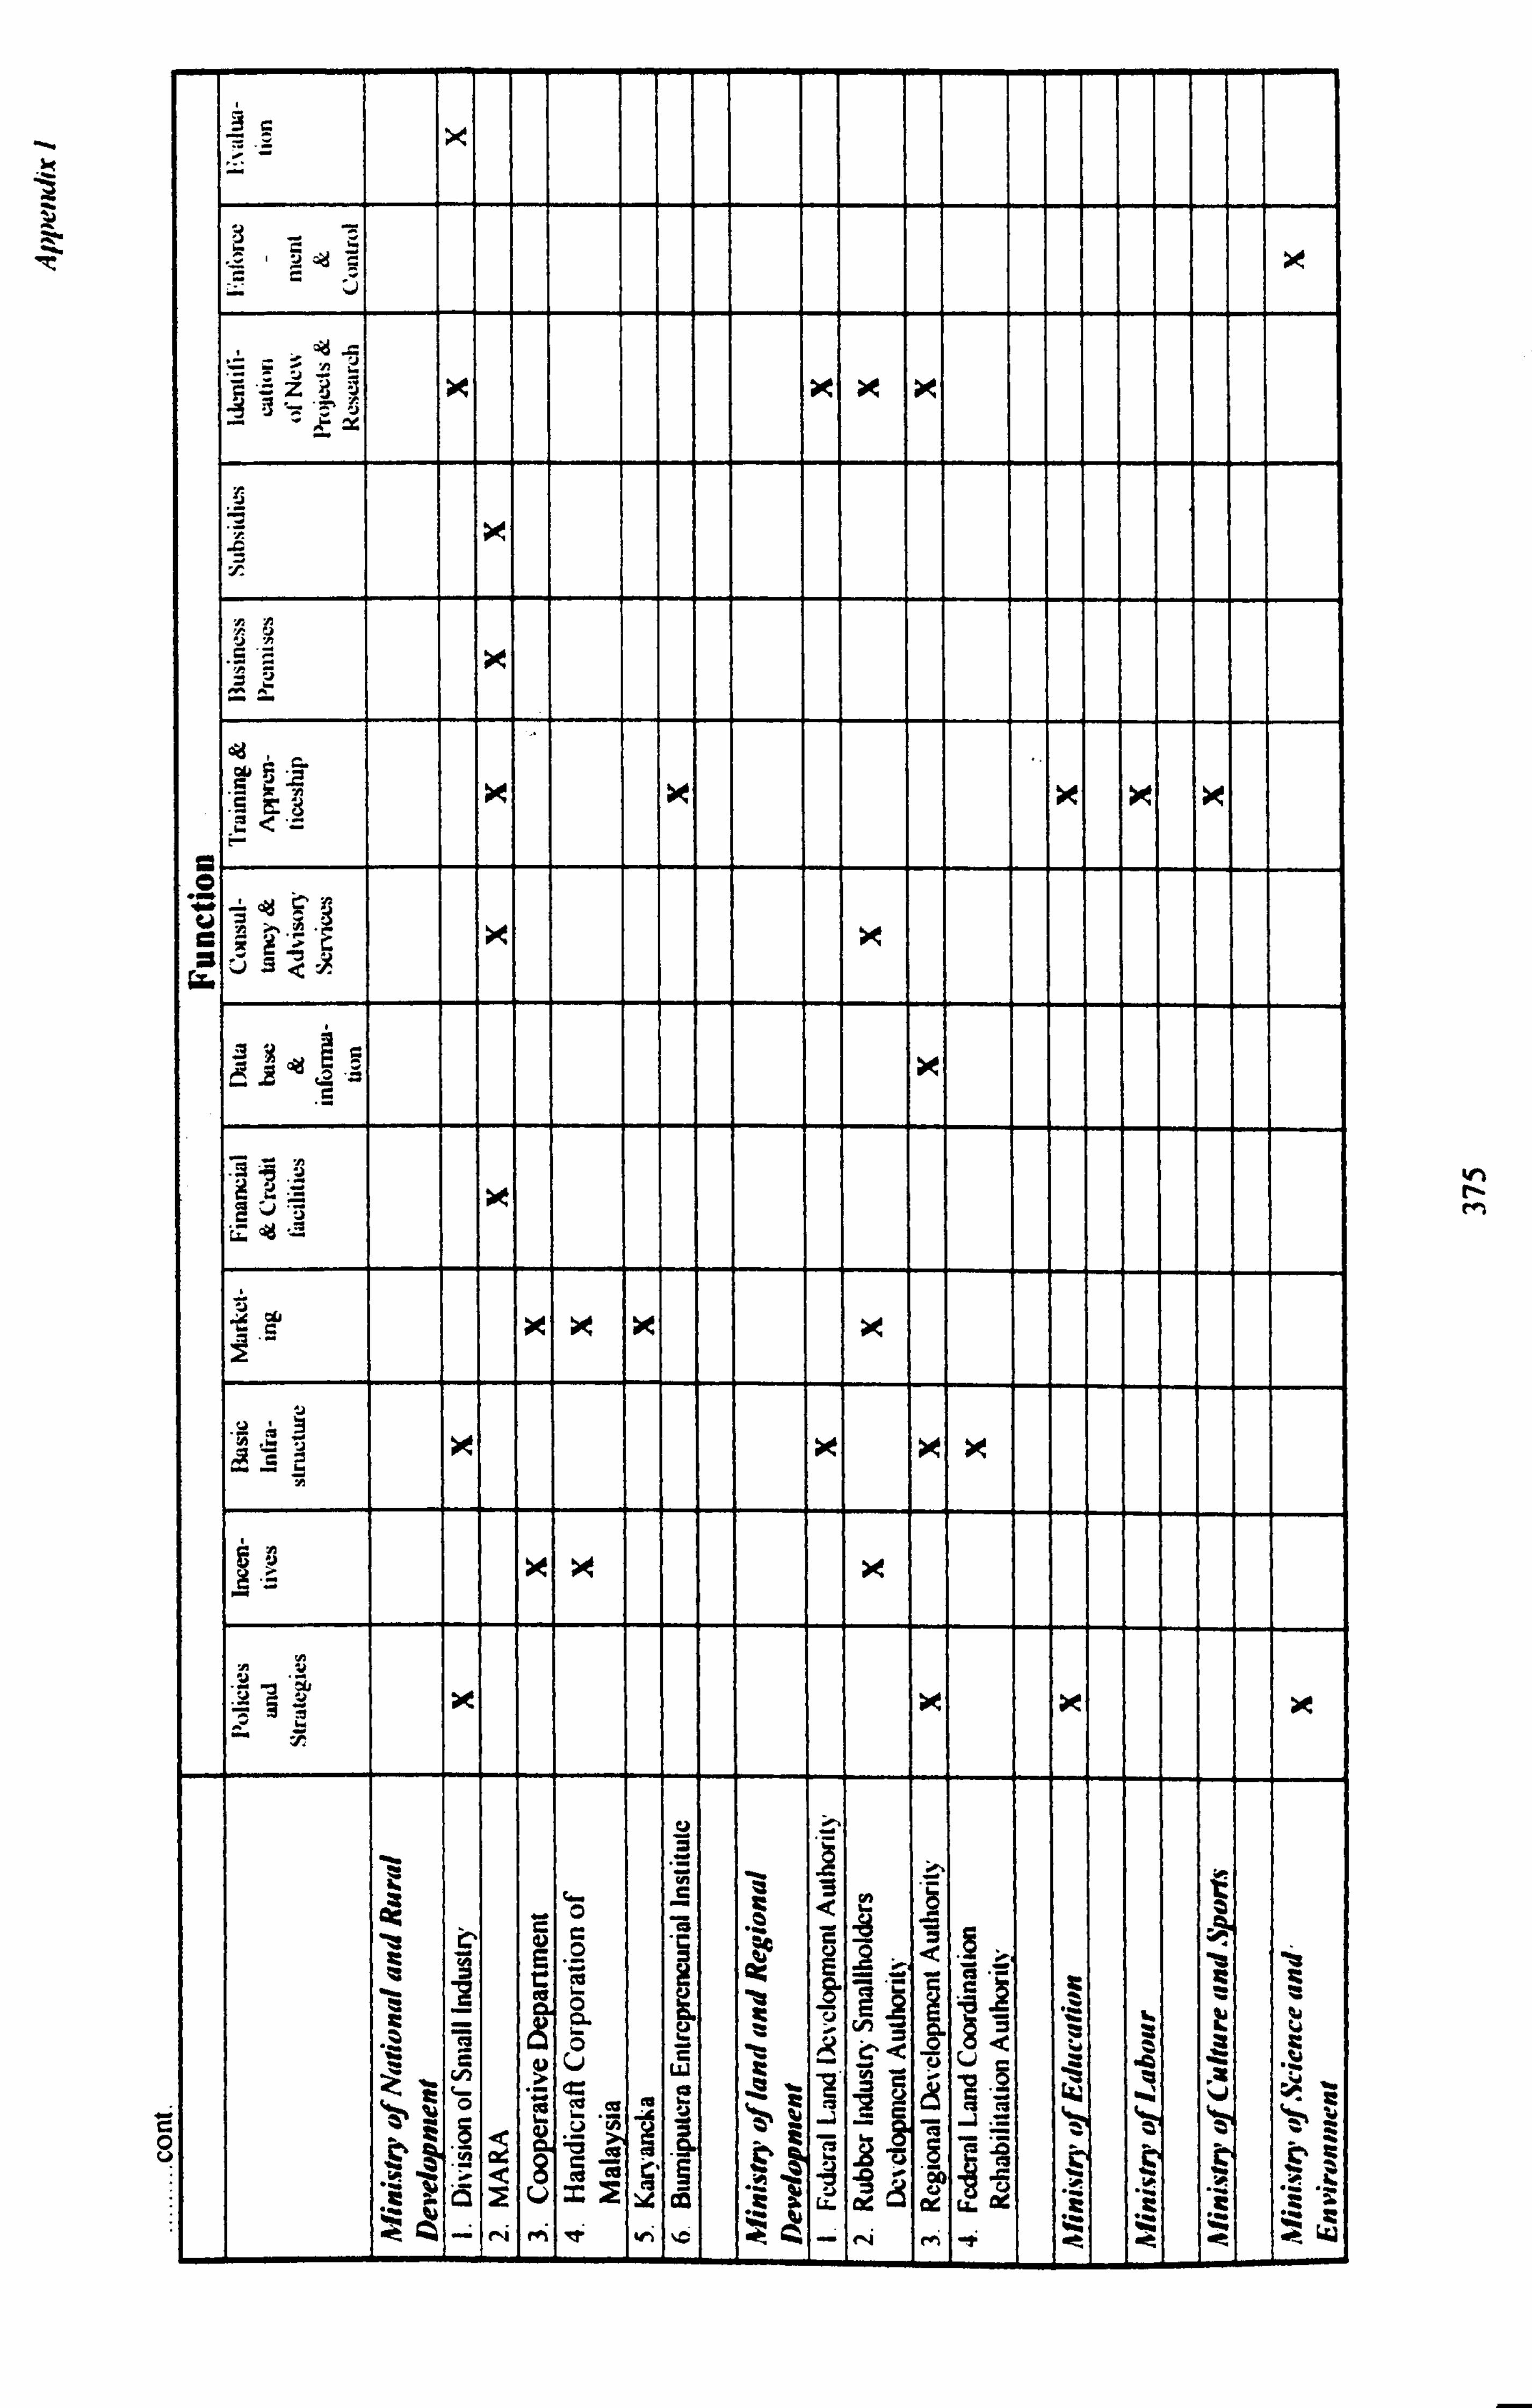
k
7C ,x
111 1 1
x -13
nn
r2 : x x x x x __ýý
0
C
.3 'ö 3 2v x
ýC x x x x
JCa, x x ýe x
Iý1
v
:29 x x x x
v
= I - C 0
y
ß
ý
.Z - a 1_
r
v `3
V. ý" it
2: N r C 9
C! i ¢ .! > 14 Z.
'Ö fi
n G.
ö v =
t v
X N 7L
' -
% ý+ z
V t
C Ö o Q `,
,
I I i
i
31 el: < -2 00
Y m i C fi Z O
r oC o ca. ..
t ..
E ýt
'Z N M t1' h ýL^ C N M t C j
N M

r
Z nC
CGým
JE x
cFz
Q ý ýý' it k k k
k x
ä k
.
24
f
VJ
4ýf
A ºý ,. ý... r Q of J
` C v
e Q
ý r*
ve ä
ci äý c r ö: ý
r `
`
00
to
E
L.
0
e r- M

Appendix /t
APPENDIX II
TRANSLATION OF QUESTIONNAIRE
A study of
SMALL SCALE INDUSTRIES
Determinants of Technological Innovation among Bumiputera Food Processing Firms
in Malaysia
Firm's name: ..............................................................
Firm's address: ..............................................................
Tel. no: .............................
Enumerator's name: ............................ Date of interview .................................
Respondent's Code Number
377
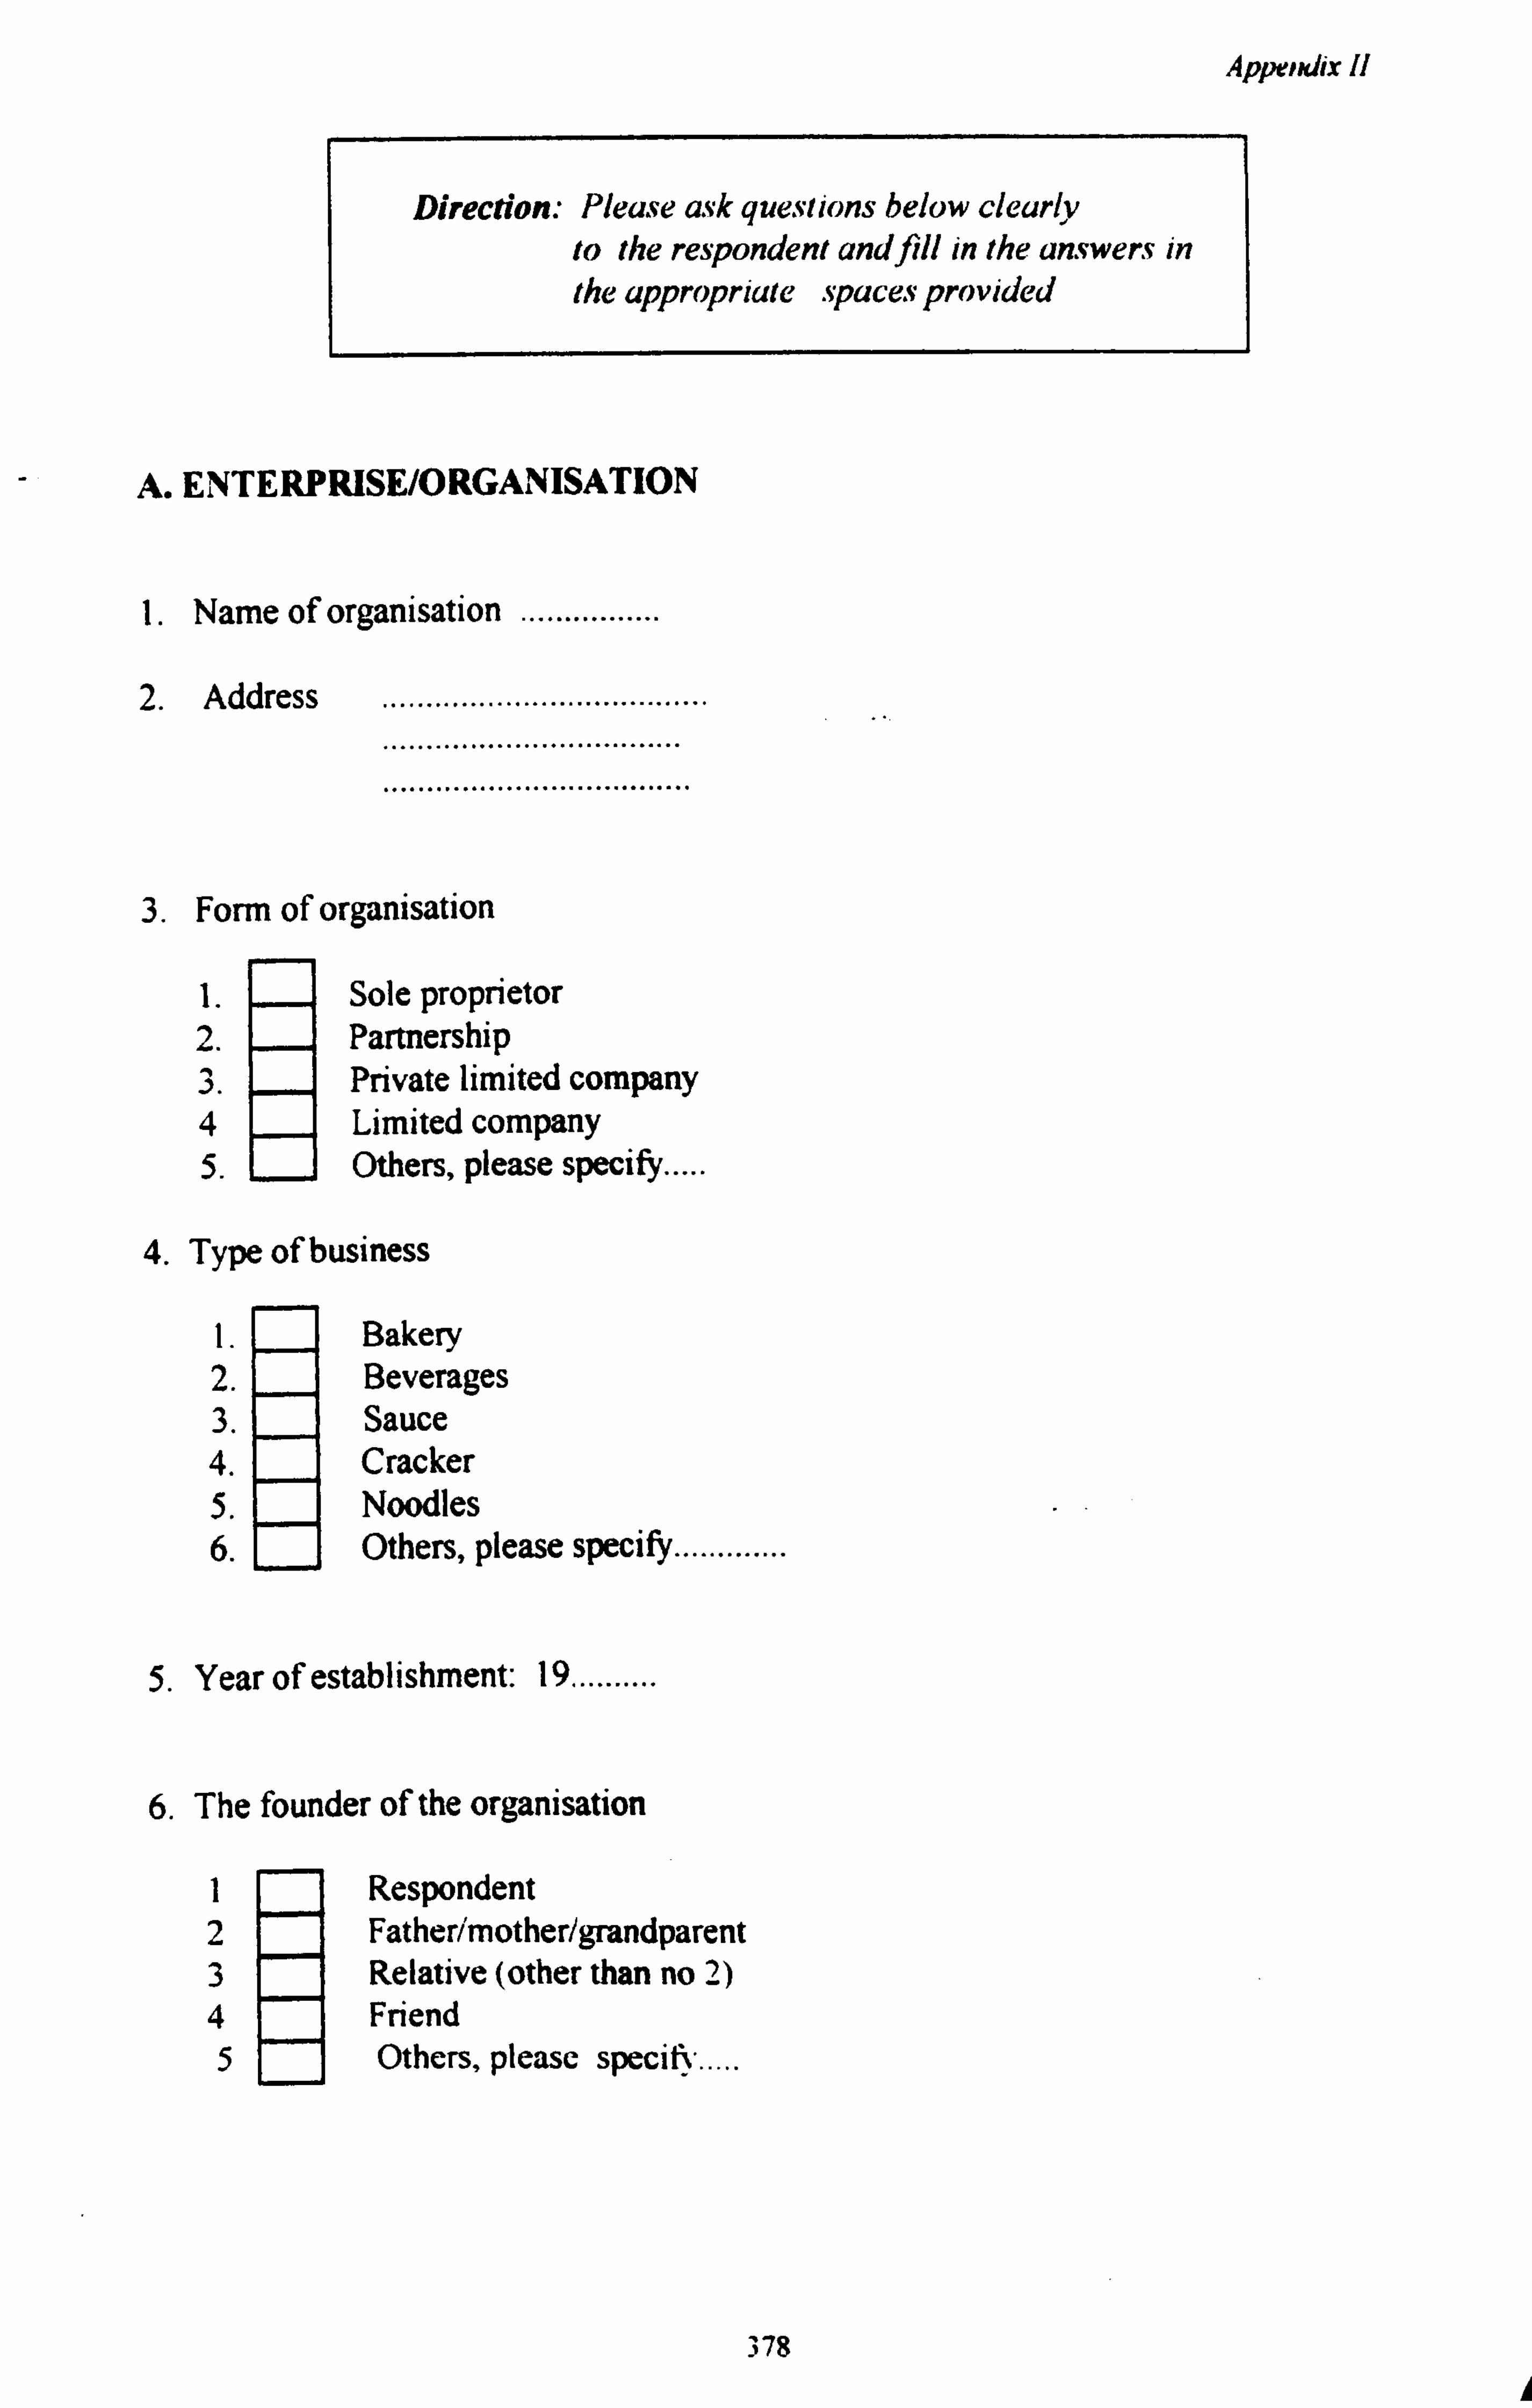
Appendix 11
Direction: Please ask questions below clearly to the respondent and fill in the answers in the appropriate . spaces provided
A. ENTERPRISE/ORGANISATION
1. Name of organisation ................
2. Address ..................................... .................................. ...................................
3. Form of organisation
I. Sole proprietor 2. Partnership 3. Private limited company 4 Limited company 5. Others, please specify....
4. Type of business
1. Bakery 2. Beverages 3. Sauce 4. Cracker 5. Noodles 6. H Others, please specify .............
5. Year of establishment: 19..........
6. The founder of the organisation
1 Respondent 2 Father/mother/grandparent 3 Relative (other than no 2) 4 Friend 5 Others, please specify.....
378

Appendix 11
7. Percentage distribution of ownership by race
Race % of ownership
1. Bumiputera
2. Non-Bumiputera
3. Non-Malaysian
4. Others, please ci ............. Total 100.0
8. Number of workers.
Number of workers Workers' status end of 1992 end of 1989
Full time
Part time
8.1 Please indicate the number of full-time workers by their job categories at the end of year 1992 and 1989
Number of worker Job category end of 1992 end of 1989
a. Professional
b. Administrative
c. Clerical
d. Sales
e. Technical
f. Production
g. Others
Total
379
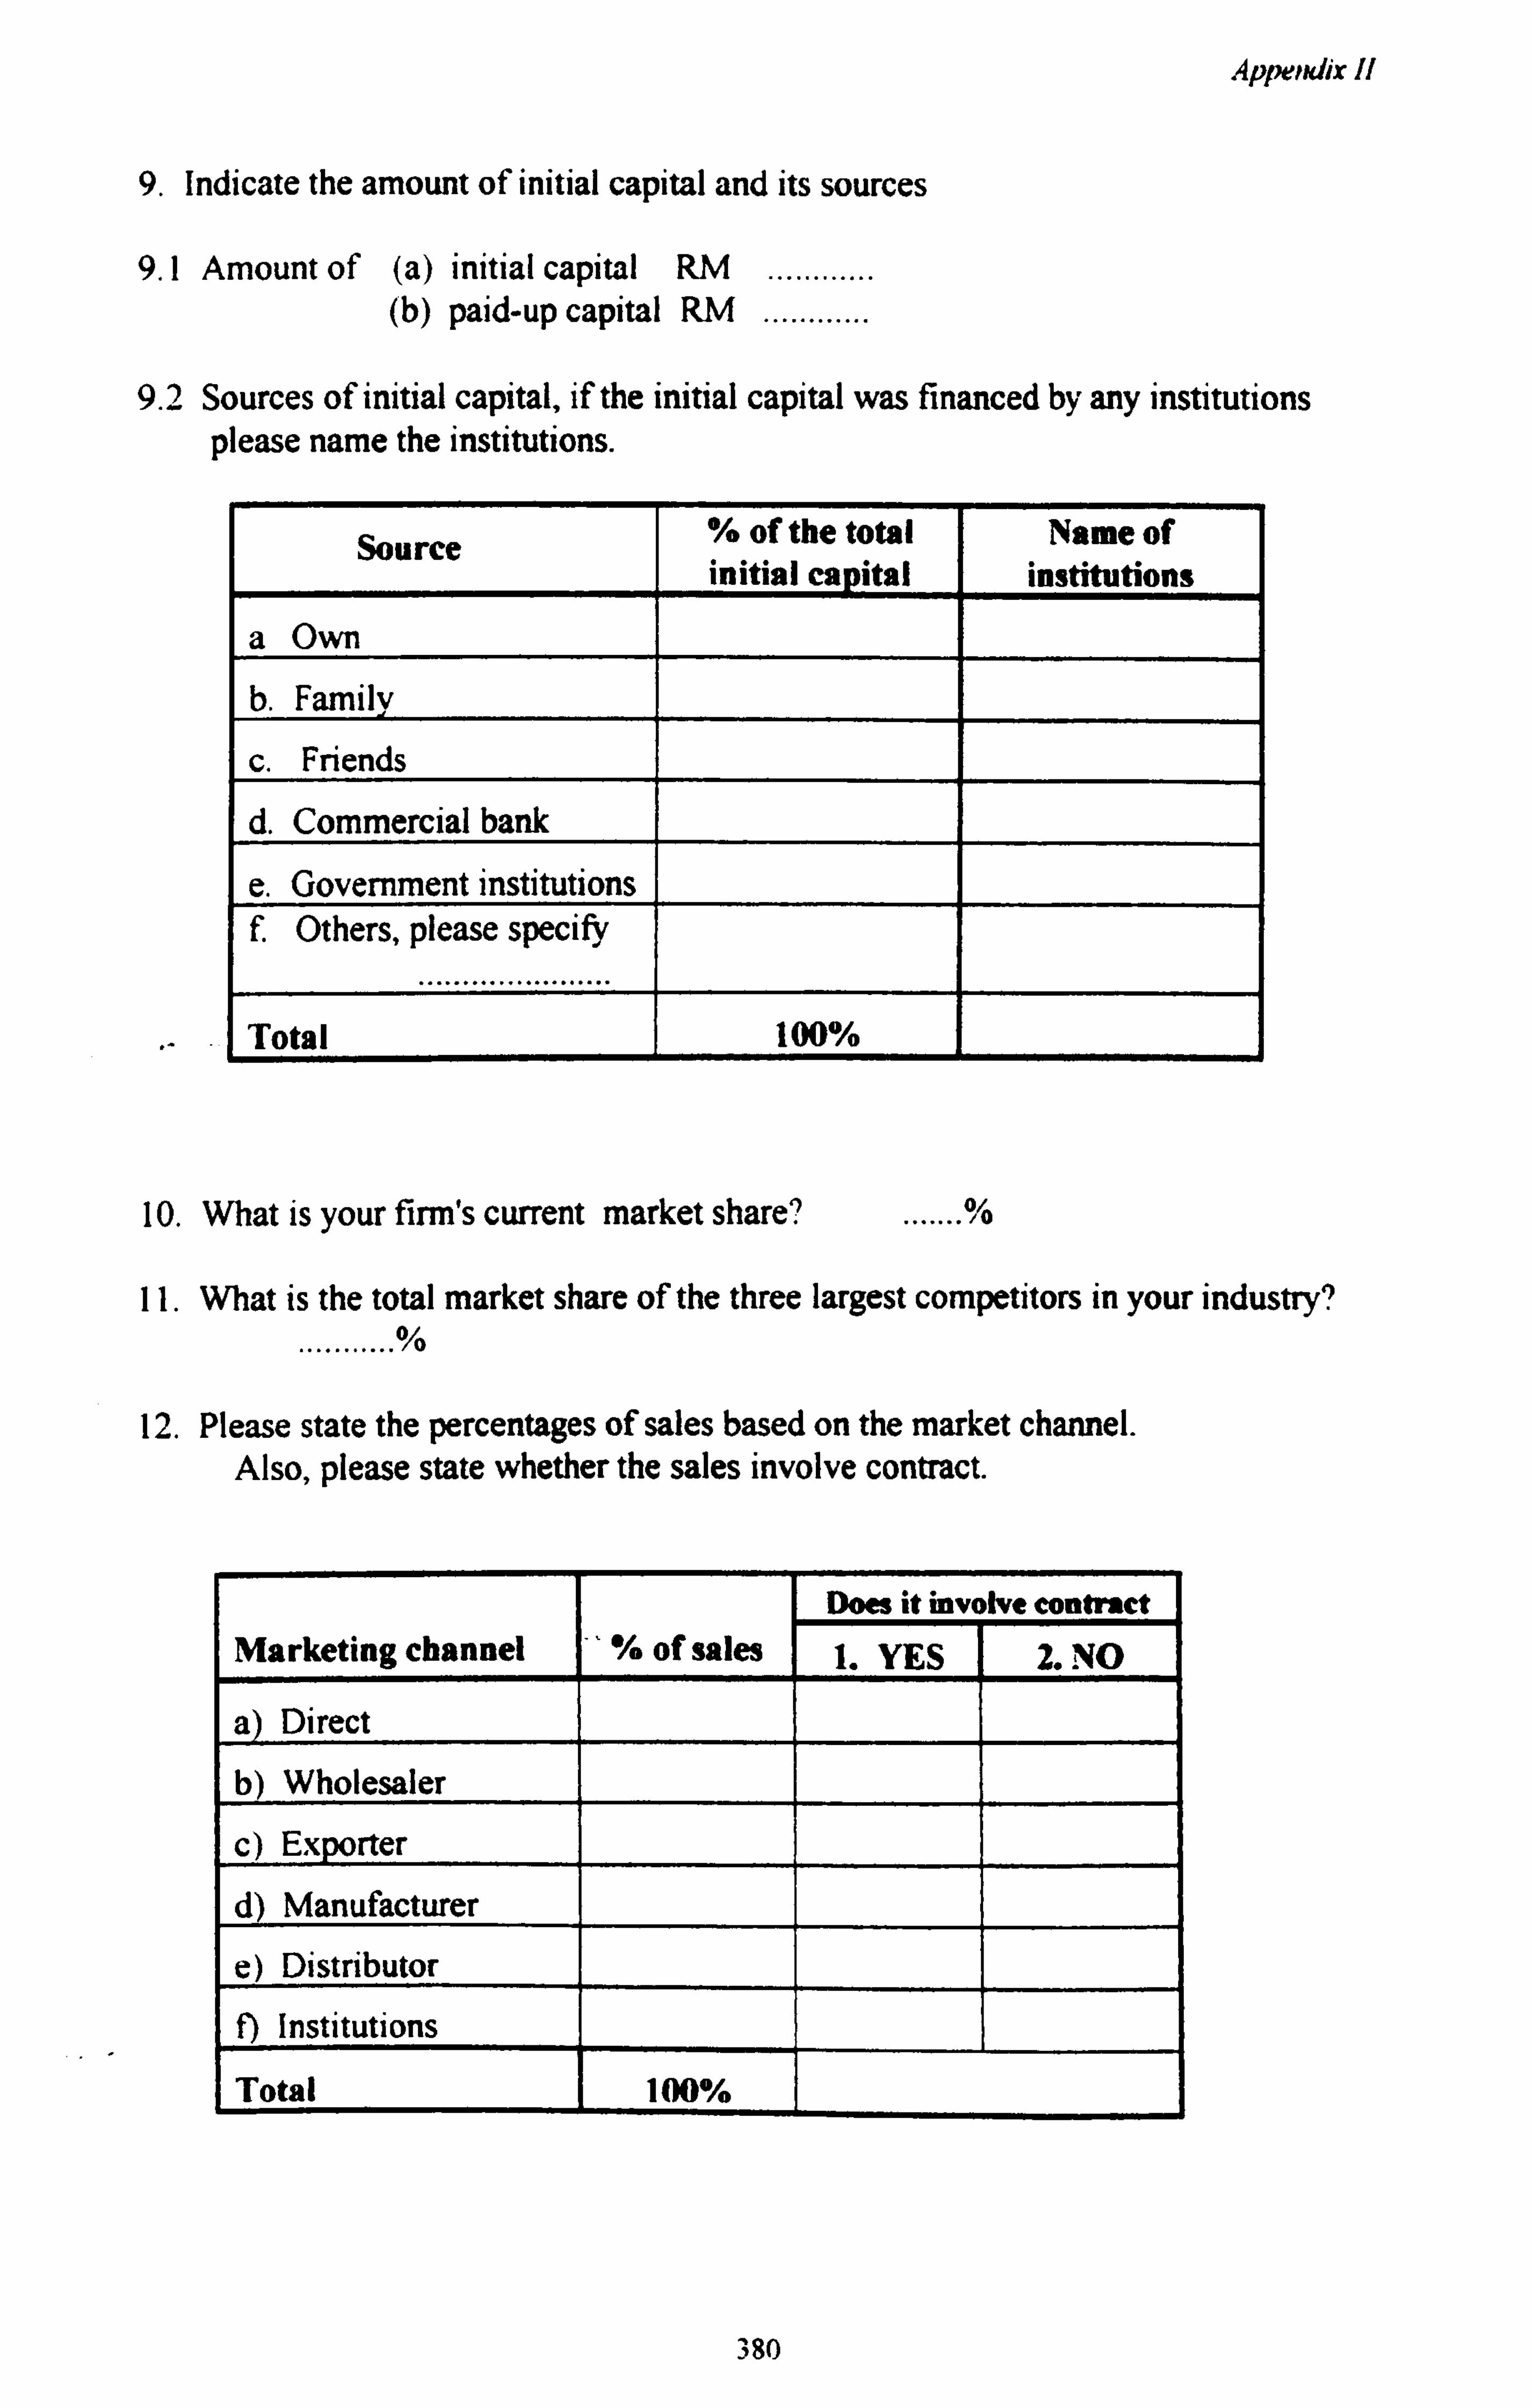
Appendix !!
9. Indicate the amount of initial capital and its sources
9.1 Amount of (a) initial capital RM ............ (b) paid-up capital RM ............
9.2 Sources of initial capital, if the initial capital was financed by any institutions please name the institutions.
Source % of the total initial capital
Name of institutions
a Own
b. Family
c. Friends
d. Commercial bank
e. Government institutions f. Others, please specify
Total 100%
10. What is your firm's current market share? %
11. What is the total market share of the three largest competitors in your industry?
........... %
12. Please state the percentages of sales based on the market channel. Also, please state whether the sales involve contract.
Does it involve contract Marketing channel % of sales 1. YES 2. NO
a) Direct
b) Wholesaler
C) Exporter
d) Manufacturer
e) Distributor
f) Institutions
Total 100%
380

Appendix 11
13. Please state your firm's main competitors and number them according to their importance (I =most important)
a) Large size firm b) Medium size firm c) Small size firm e) Others, please specify
14. In the last three years, how often has price cutting taken place in your firm?
.......... times.
15. Please read the statements below carefully and for each statement, indicate the appropriate number that best describes your organisation, according to the code below.
1- Rarely or almost never true 2- Sometimes but frequently never true 3- Occasionally true 4- Very often true 5- True for most of the time
Description 1 2 3 4 5 a. Ideas from workers are not easily
accepted by management. 1 2 3 4 5 b. Decision making can only be done through
proper meeting and consultation by top 1 2 3 4 5 management only
c. Usually employees are involved in making decisions that affect them. 1 2 3 4 5
d. Management encourages its employees to reveal their personal problems to their superiors. 1 2 3 4 5
e. When the firm decides to buy new machine, a committee is set up to conduct a feasibility 1 2 3 4 5 study on the machine
f. Only certain people make decisions for the firm 1 2 3 4 5 g. Workers are given a formal report of their
poor performance. 1 2 3 4 5 h. Occasionally superiors delegate their work to
subordinates. 1 2 3 4 5 I. Superiors share business problems with
subordinates 1 2 3 4 5 j. The relationship between superiors and
subordinates is rather informal 1 2 3 4 5
381
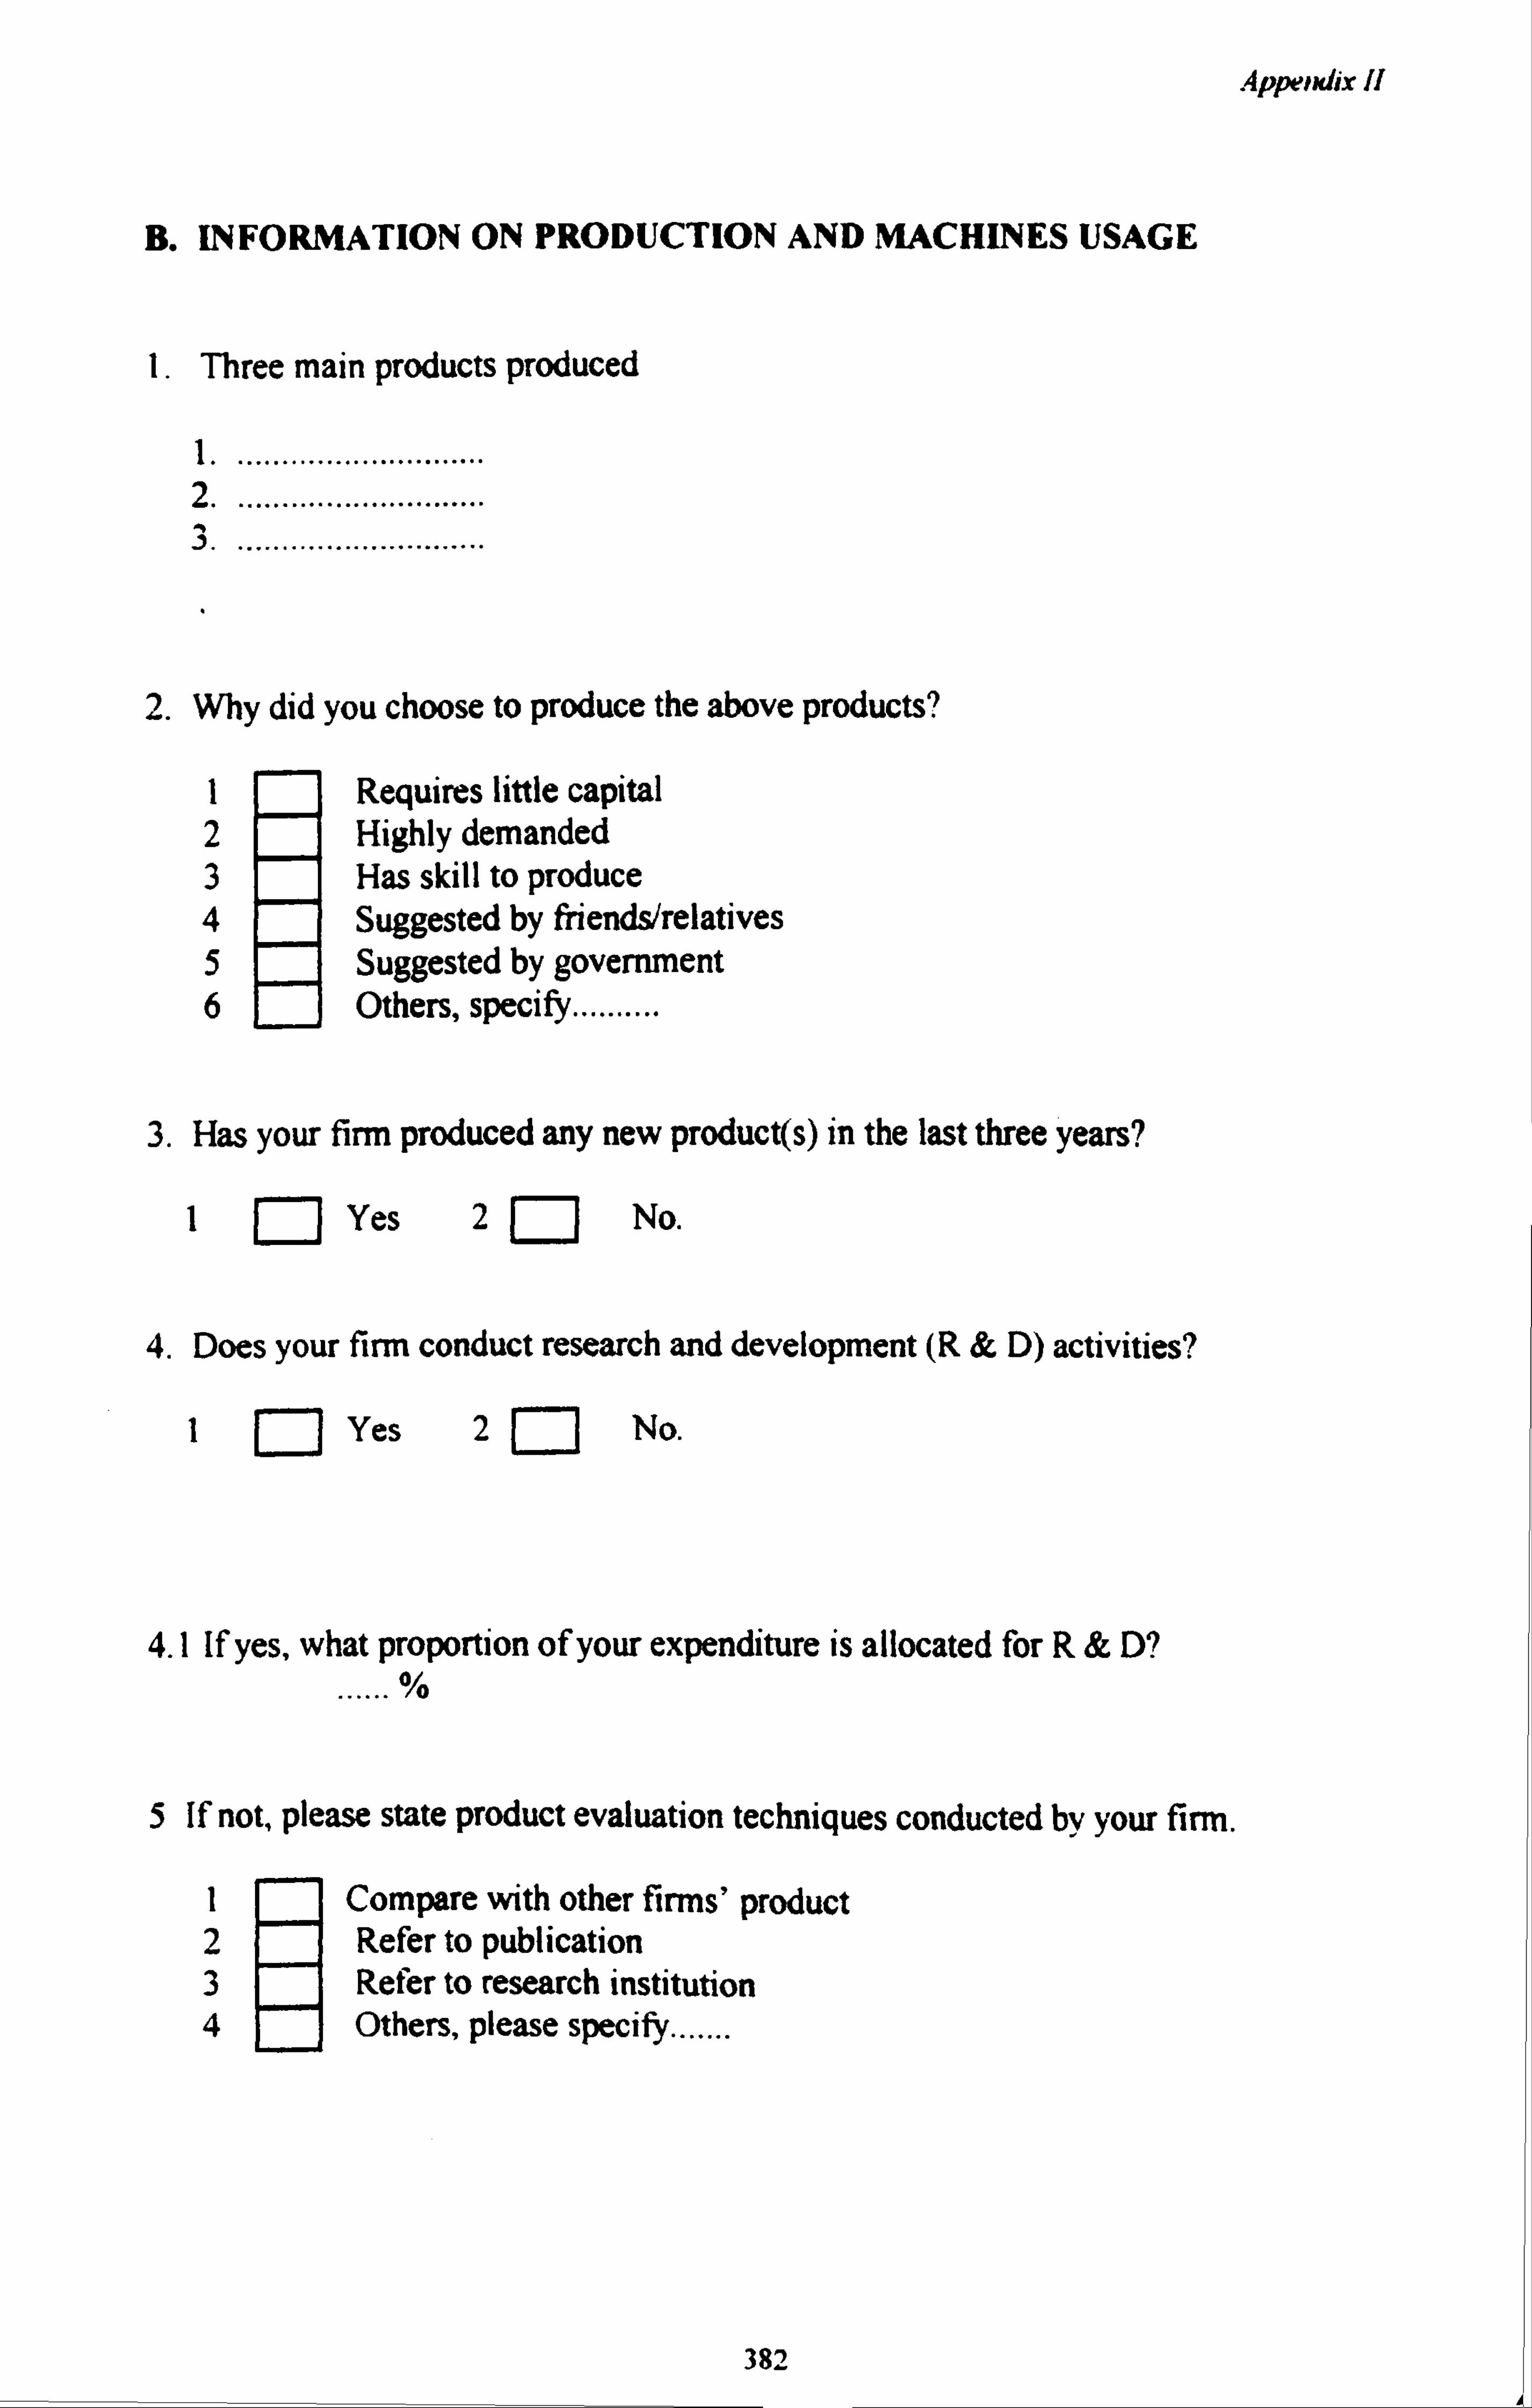
Appendix 11
B. INFORMATION ON PRODUCTION AND MACHINES USAGE
1. Three main products produced
I............................. 2.............................
. ............................
2. Why did you choose to produce the above products?
I Requires little capital 2 Highly demanded 3 Has skill to produce 4 Suggested by friends/relatives 5 Suggested by government 6 Others, specify..........
3. Has your firm produced any new product(s) in the last three years?
I Yes 2a No.
4. Does your firm conduct research and development (R & D) activities?
1 Yes 2 F7 No.
4.1 If yes, what proportion of your expenditure is allocated for R&D? ......
%
5 If not, please state product evaluation techniques conducted by your firm.
I Compare with other firms' product 2 Refer to publication 3 Refer to research institution 4 Others, please specify.......
382

Appendix II
6. Have you made any changes in raw materials used for production in the last three years? If you did, please state how you went about doing it.
I Did not make any changes 2 Conduced own research 3 Contacted research institution 4 Read publication 5 R Learned from other firm 6 Others, please specify........
7. Has your firm introduce any product innovation in the last three years? If so, please state in what way.
1 2
Did not make any innovation Storage
3 Packaging 4 Appearance 5 Taste 6 Others, please specify..........
8. Who initiated the innovation?
Owner 2 Staff 3 Other entrepreneur 4 Supplier 5 Expert from research institution 6 H Others, please specify...........
9. Generally, what is your firm's level of mechanisation?
1. Manual 2. Partially mechanised 3. Fully mechanised 4. Others, please specify ...................
383

Appendix It
10. Please briefly give the information on your main machines of production.
Type/name of
machine
Countr y of
origin
Source of information
Code 31
Suppliers
Code 31
Model I- Latest 2- Old
Year of
acquisition
a)
b)
c)
d) I I - --- F
Code 3
I. SIRIM 2. MARDI 3. MARA 4. Other govt. inst. 5. Parent Company 6. Suppliers
7. Other firms 8. Media 9. Distributor 10. Association 11. Exhibition/trade fair 12. Others, specify
11. Who makes decisions on the appropriateness of the machines used in this firm?
I Owner 2 Skilled workers 3 Advice from research institution 4 Other firm 5 Supplier 6 H Others, please specify
12. Has your firm bought new machine(s) in the last 3 years?
1 F7 Yes 2a No.
12.1 If no, when was the last time your firm bought new machine?
I Year ............. 2 Never bought new machine since
firm first established
(go to section C)
384

Appendix II
The rest of'the questions in this section ask for the information about the last
machine bought.
13. Reasons for buying the machine
I Replacing old machine 2 Replacing manual method 3 Producing new product 4 Received assistance 5 Others, please specify .............
14. If your firm received assistance, please state the source and kind of assistance
15. Why did you choose that particular machine?
I The best in market 2 Appropriate for firm 3 No choice 4 Limited budget 5 Others, please specify.
16. Was the machine brand new when you bought it?
I yes Ia No.
16.1 If the machine was second hand, how old was the machine when you bought it?
............. years
7. Total cost incurred when you bought the machine
a) Price of the machine RM...., b) Installation cost RM.....
385
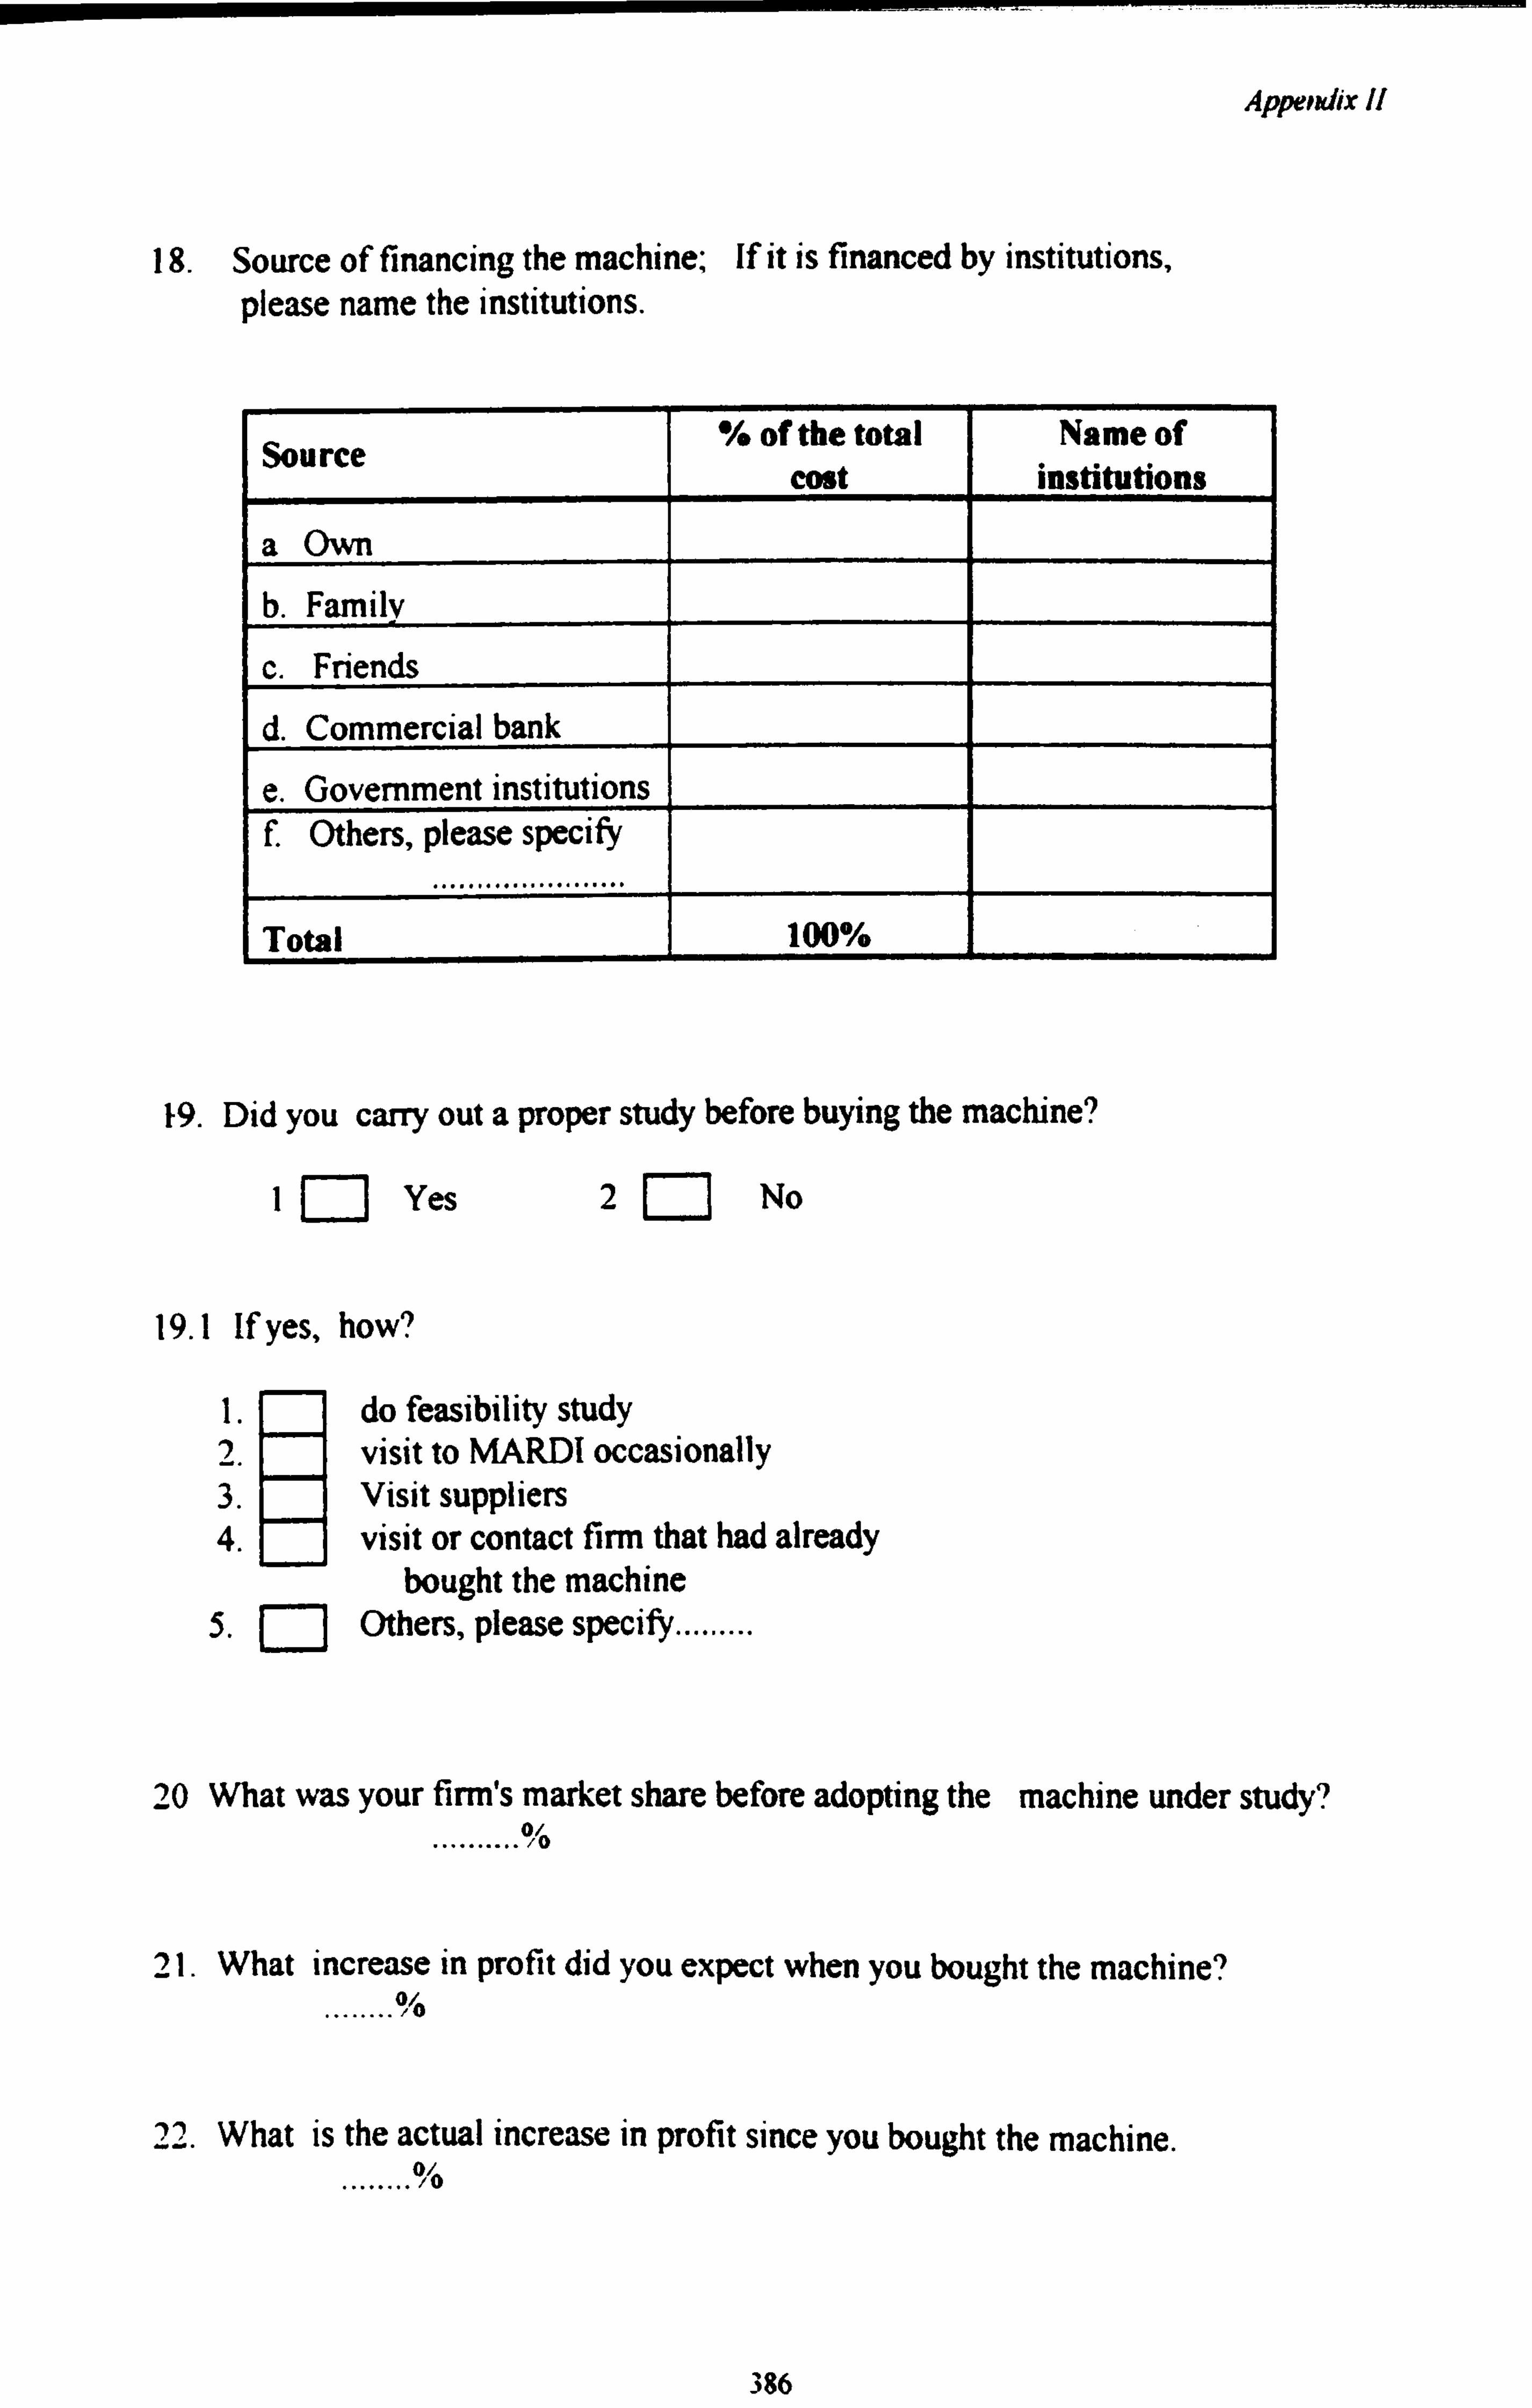
Appendix II
18. Source of financing the machine; If it is financed by institutions, please name the institutions.
Source % of the total cost
Name of institutions
a Own
b. Family
c. Friends
d. Commercial bank
e. Government institutions f. Others, please specify
Total 100%
19. Did you carry out a proper study before buying the machine?
I f-I Yes 2 No
19.1 If yes, how?
1. do feasibility study 2. visit to MARDI occasionally 3. Visit suppliers 4. visit or contact firm that had already
bought the machine 5. Others, please specify.........
20 What was your firm's market share before adopting the machine under study? .......... °, 'o
21. What increase in profit did you expect when you bought the machine? ........ 10 °
? 2. What is the actual increase in profit since you bought the machine. ........
°1o
386

Appendix 1I
23. Please indicate whether the situations described below existed when you first acquired the machine under study. If the situation existed, please indicate whether it was a problem to your firm and why it was a problem.
(a) No existing employee was able to operate the machine
Why was it a problem?
Situation exist
IR Yes 2 No
Was it a problem?
IP Yes 2 No
(b) Some employees had to be IR Yes transferred to another 2 No division.
Why was it a problem?
IP Yes 2 No
(c) Some employees became 1 Yes. IP Yes redundant. 2 No 2 No
Why was it a problem?
(d) Some employees had to be 1 Yes l Yes retrained 2 No 2 No
Why was it a problem?
(e) Firm had to recruit 1 Yes 1 Yes new employees 2 No 2 No
Why was it a problem?
387

Appendix 11
24. For each of the statements on the buying situation, given below, Please indicate the number in code 4, that represents the degree
of problems that you faced in the process of buying the machine under study.
Code 4 0- No problem at all 1- Minor problem that could be solved by the entrepreneurs 2- Serious problem that could be solved with external assistance 3- Very serious problem that could not be solved
Buying situation Degree of problem
a) Finding supplier of new technology 0 1 2 3 (b) Delegating responsibility while
away to negotiate to buy new technology 0 1 2 3
(c) Dealing with legal matters such as contract 0 1 2 3
(d) Negotiating with supplier 0 1 2 3
(e) Getting finance 0 1 2 3
(f) Long absence from firm 0 1 2 3 (g) Getting after sales services from
supplier - 0 1 2 3
388
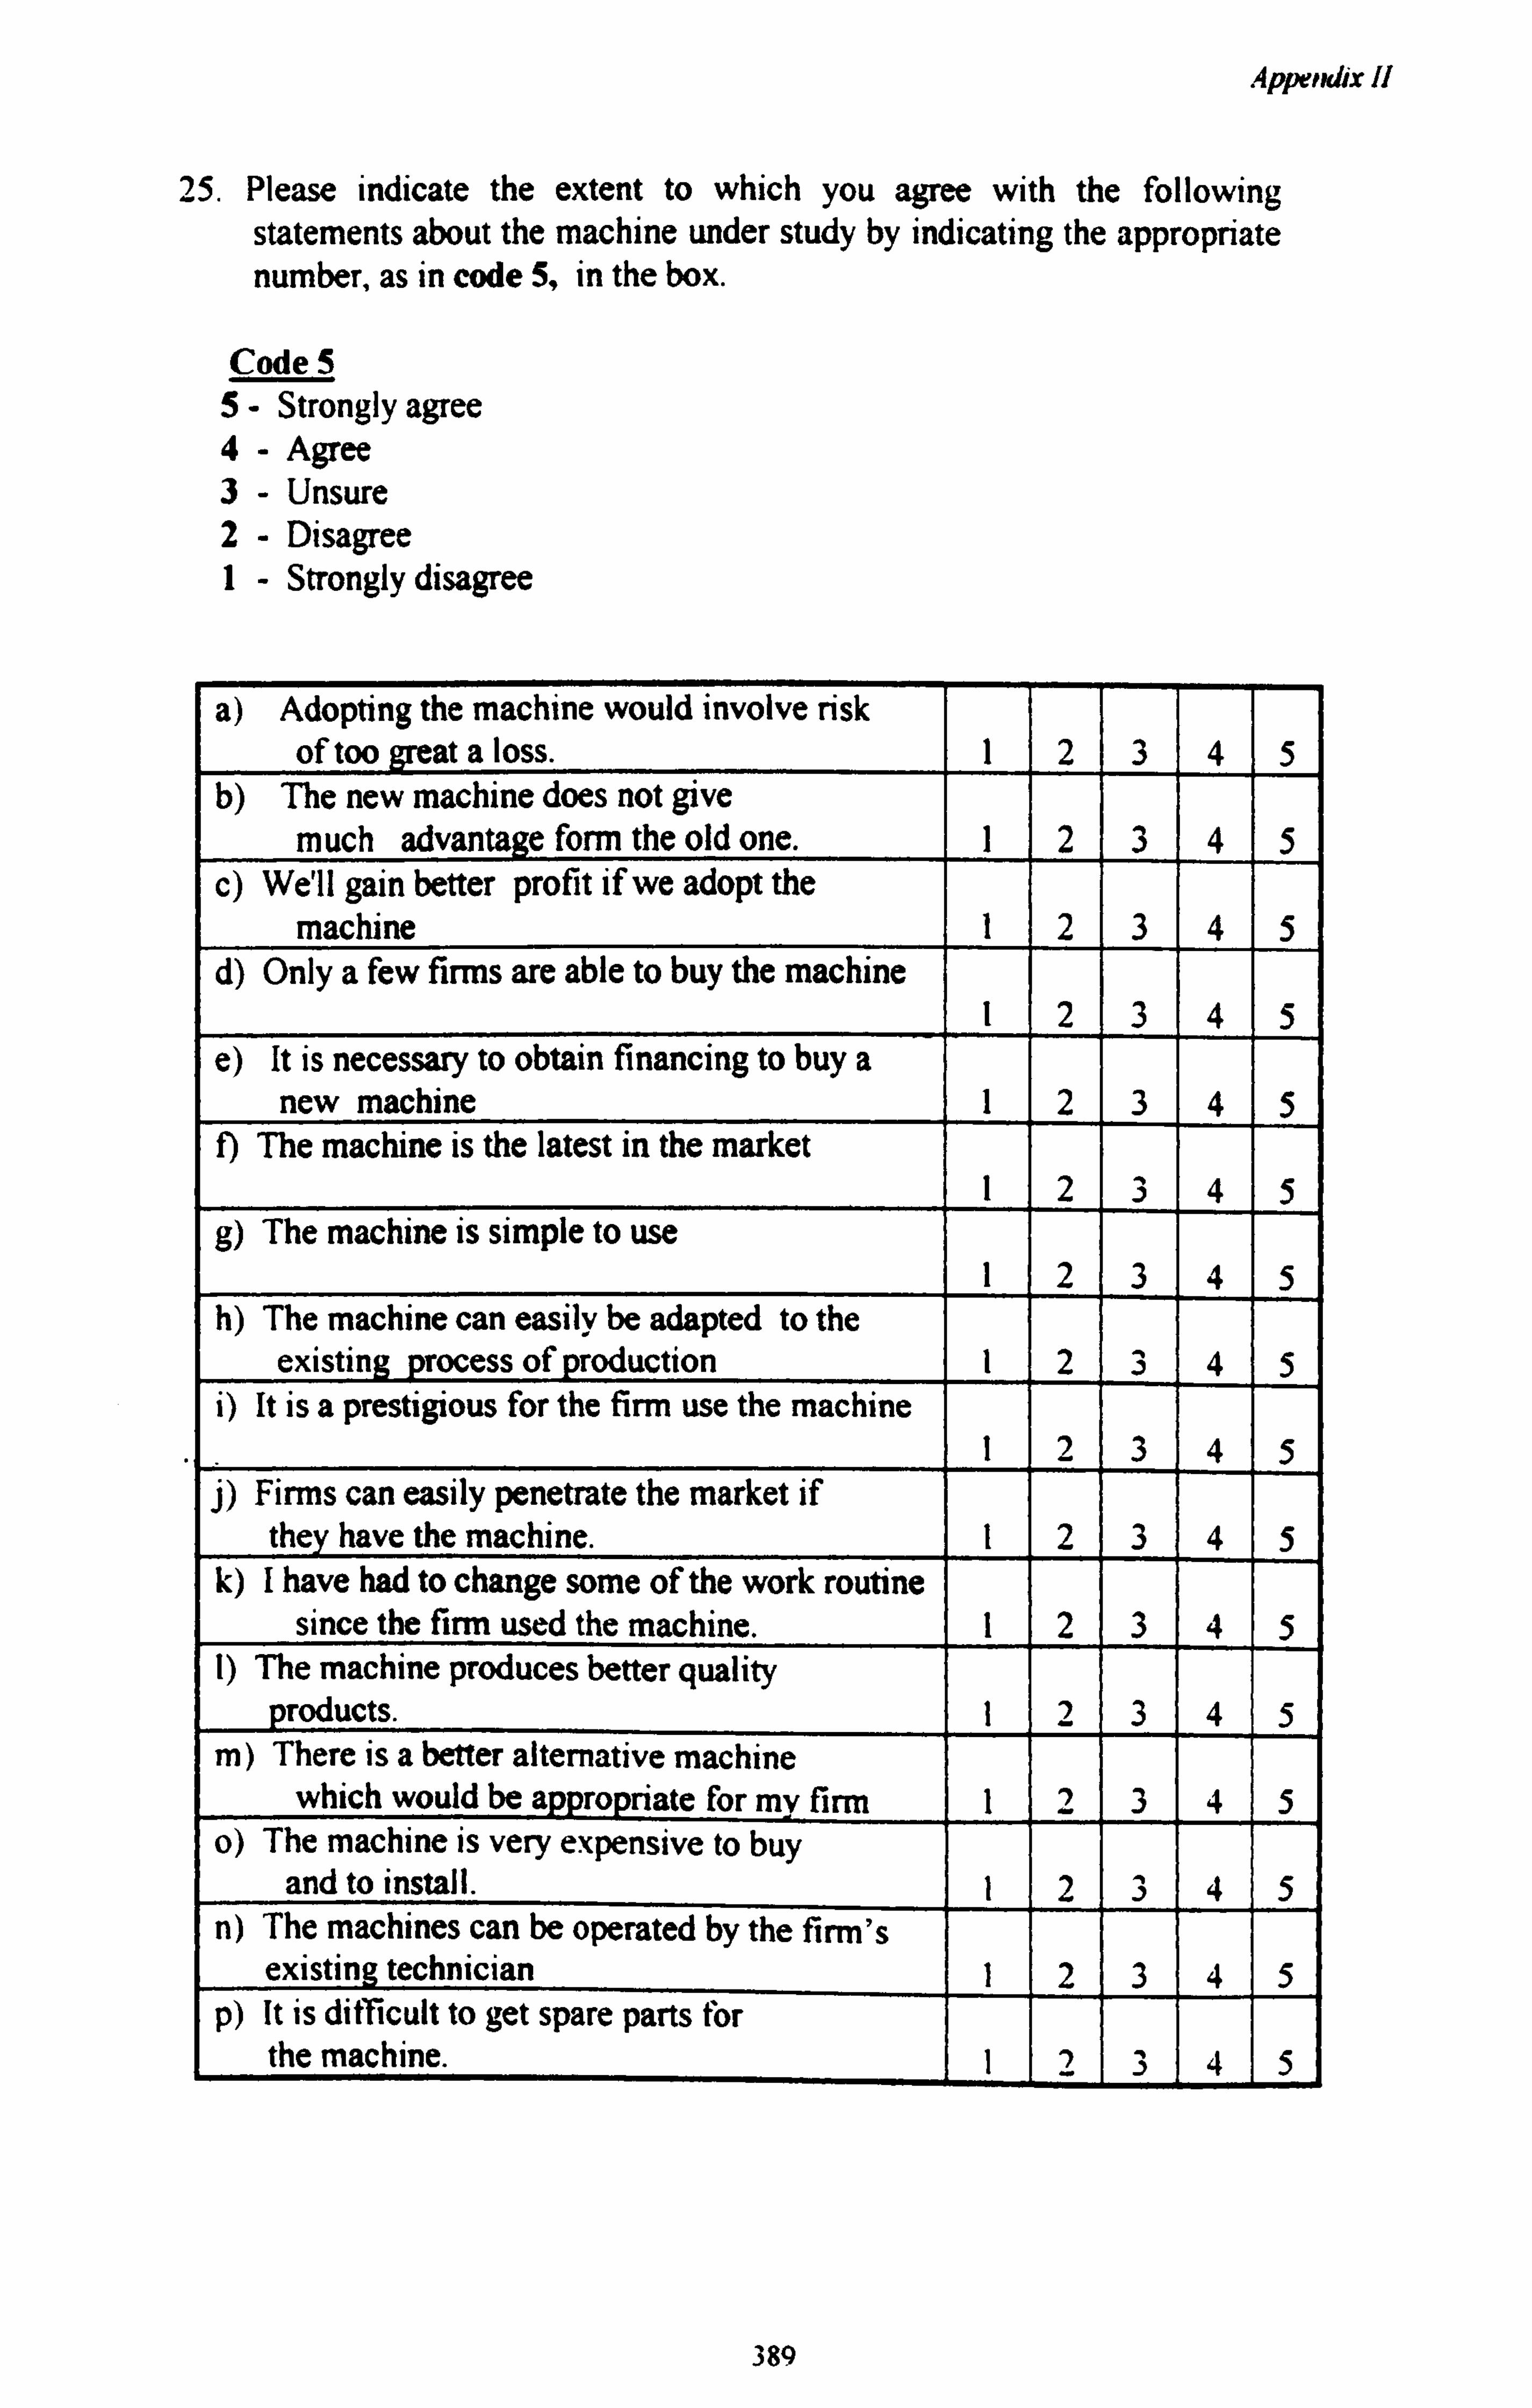
Appendix 11
25. Please indicate the extent to which you agree with the following statements about the machine under study by indicating the appropriate number, as in code 5, in the box.
Code 5 5- Strongly agree 4- Agree 3- Unsure 2- Disagree 1- Strongly disagree
a) Adopting the machine would involve risk of too great a loss. 1 2 3 4 5
b) The new machine does not give much advantage form the old one. 1 2 3 4 5
c) We'll gain better profit if we adopt the machine 1 2 3 4 5
d) Only a few firms are able to buy the machine 1 2 3 4 5
e) It is necessary to obtain financing to buy a new machine 1 2 3 4 5
f) The machine is the latest in the market 1 2 3 4 5
g) The machine is simple to use 1 2 3 4 5
h) The machine can easily be adapted to the existing process of production 1 2 3 4 5
i) It is a prestigious for the firm use the machine 1 2 3 4 5
j) Firms can easily penetrate the market if they have the machine. 1 2 3 4 5
k) I have had to change some of the work routine since the firm used the machine. 1 2 3 4 5
1) The machine produces better quality products. 1 2 3 4 5
m) There is a better alternative machine which would be appropriate for my firm 1 2 3 4 5
o) The machine is very expensive to buy and to install. 1 2 3 4 5
n) The machines can be operated by the firm's existing technician 1 2 3 4 5
p) It is difficult to get spare parts for the machine. 1 2 3 4 5
389
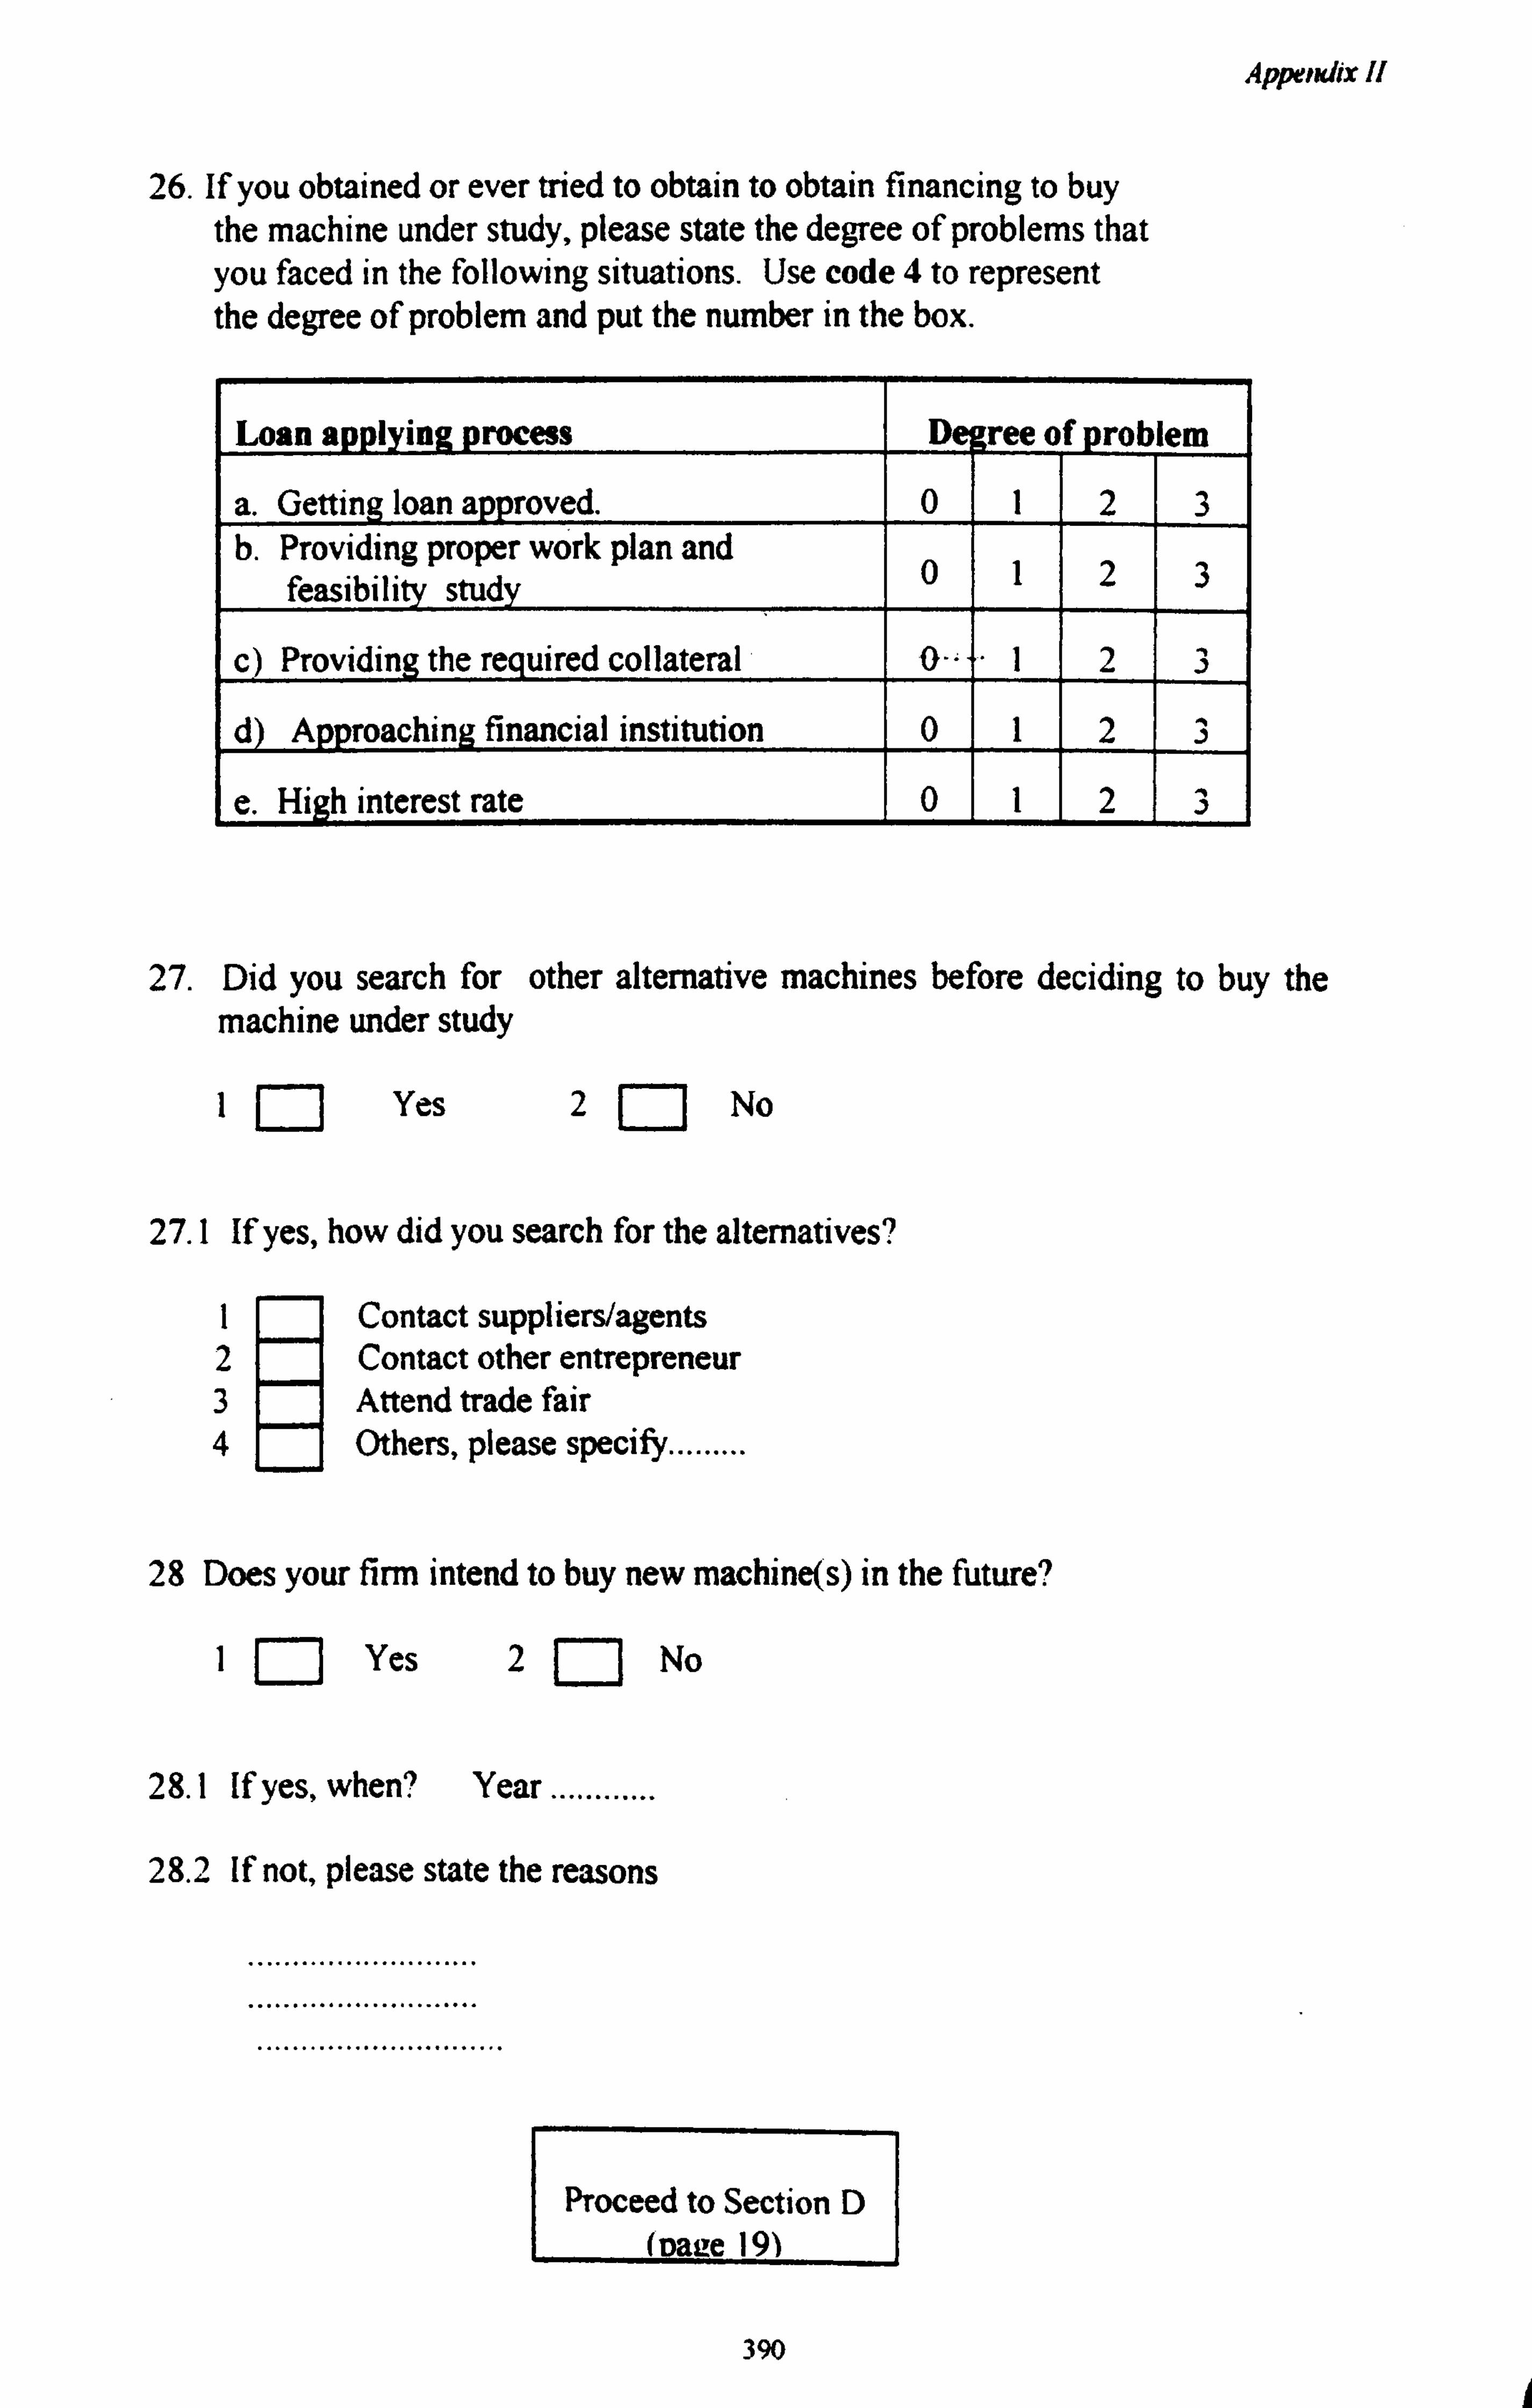
Appendix I!
26. If you obtained or ever tried to obtain to obtain financing to buy the machine under study, please state the degree of problems that you faced in the following situations. Use code 4 to represent the degree of problem and put the number in the box.
Loan applying process Degree of pro lem
a. Getting loan approved. 0 1 2 3 b. Providing proper work plan and
feasibility study 0 1 2 3
c) Providing the required collateral 4-= -1 2 3
d) Approaching financial institution 0 1 2 3
e. High interest rate 0 1 2 3
27. Did you search for other alternative machines before deciding to buy the machine under study
I Yes 2 No
27.1 If yes, how did you search for the alternatives?
I Contact suppliers/agents 2 Contact other entrepreneur 3 Attend trade fair 4 Others, please specify.........
28 Does your firm intend to buy new machine(s) in the future?
Ia Yes 2Q No
28.1 If yes, when? Year ........
28.2 If not, please state the reasons
Proceed to Section D (nage 19)
390

Appendix 11
C) INFORMATION ON THE PROCESS OF INNOVATION SEARCH for firms which had considered buying a new machine
Directions: Questions in this section are only to be asked to firms which have not acqired any machinery in the last three years but had considered doing so
1. Please state the reasons why your firm has not bought any new machinery in the last three years
1. Not sure of the machine's appropriateness to firm 2. The considered machine is expensive 3. Could not get financing 4. Do not have skilled workers 5. Some workers may become redundant 6. The existing machine is still good and reliable 7. Others, please specify............
2. What are the main factors that you think very important when you buy a new machinery? (Please number the answers below according to their importance,
I= the most important)
a. The best in the market b. Appropriate for firm c. Suggested by an expert d. Budget e. Others, please
specify
3. What is the appropriate cost of new machinery for your firm
a) Price of the machine RM ......... b) Installation cost RM .........
4. If you want to buy new machinery, please state your source of financing
I Own 2 Family
Friend 4 commercial bank 5 Govt. institution 6U Others, please specify ............
391

Appendix II
5. Do you make a proper study before buying the machine?
I Yes
5.1 If yes, how
2 No
1. do feasibility study 2. visit to MARDI occasionally 3. visit suppliers 4. visit or contact firm that have already
bought the machine 5. a Others, please specify.........
6. Do you expect an increase in profit when you buy the new machine? If yes, what percentage of an increase do you expect?
oha
7. Please indicate whether the situation described below will be likely to exist if your firm acquires new machinery. If the situation will exist, please indicate whether it might be a problem to your firm and why.
Situation exist
(a) No existing employee is able to operate the machine
Why will it be a problem?
(b) Some employees will have to be transferred to another division.
Why will it be a problem?
2 IR
Will it be a problem?
Yes IR Yes No 2 No
1 Yes 2 No
392
IR Yes 2 No
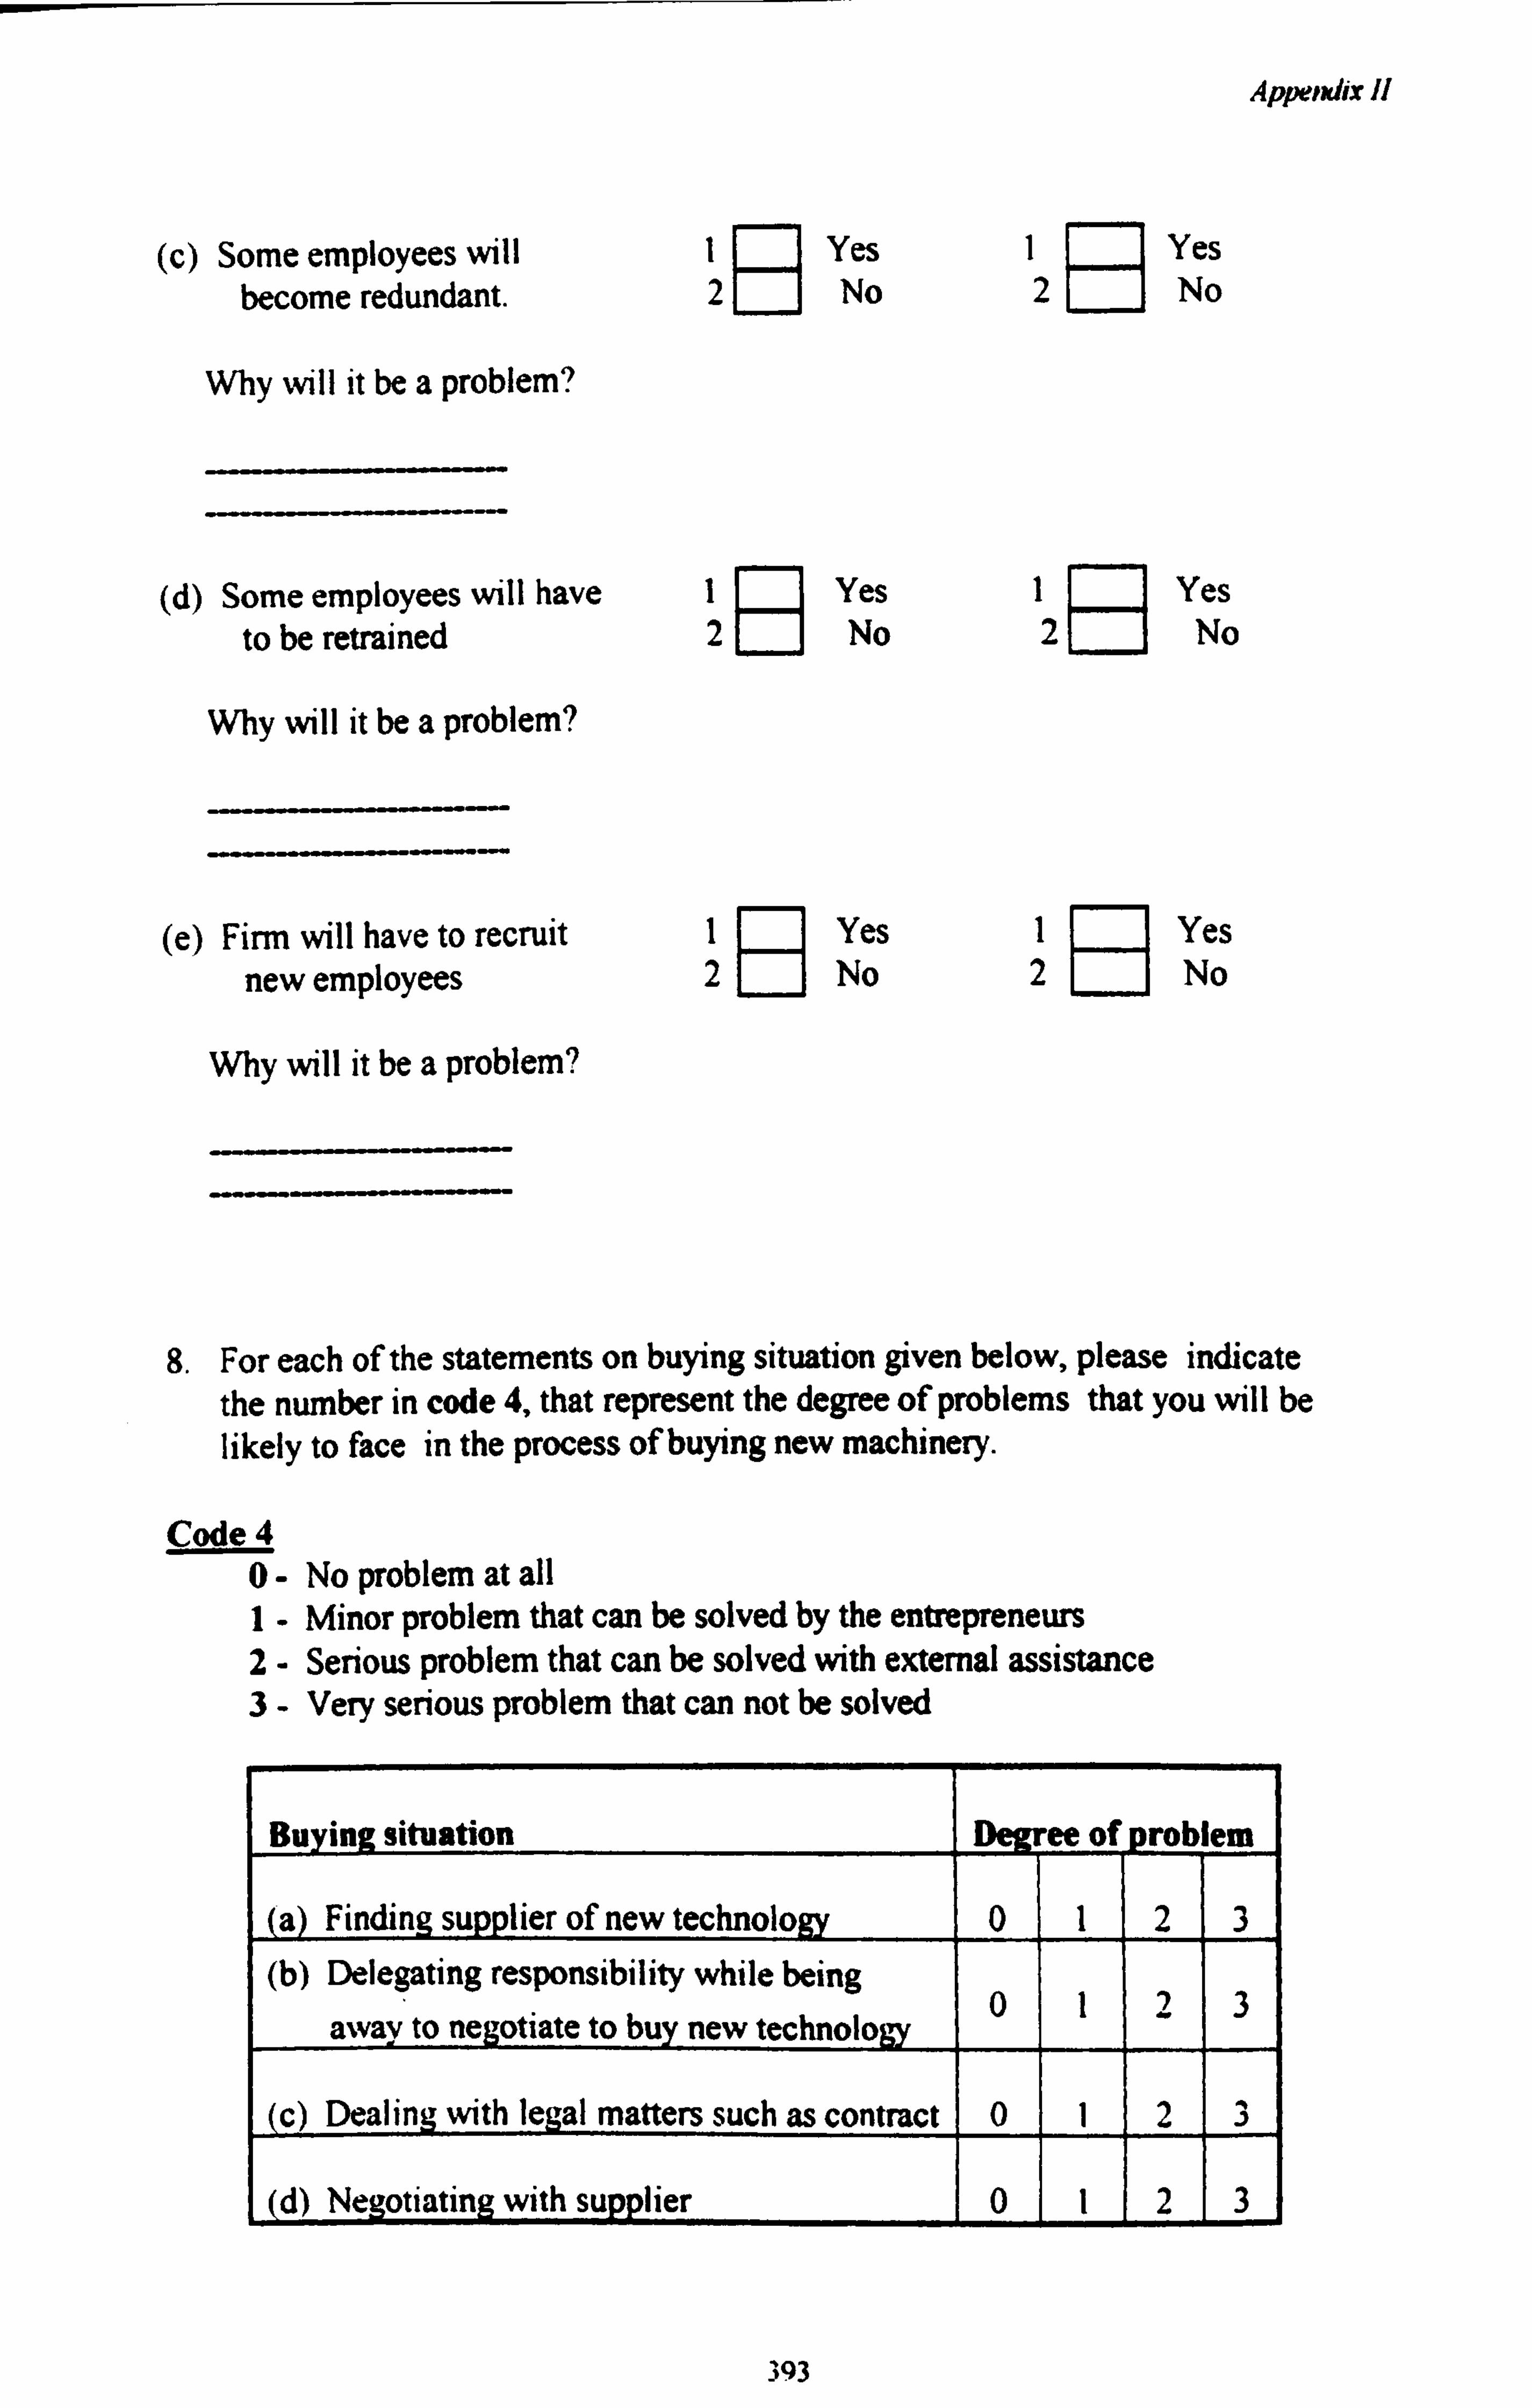
Appendix II
(c) Some employees will become redundant.
Why will it be a problem?
iR Yes IP Yes 2 No 2 No
(d) Some employees will have IR Yes IP Yes
to be retrained 2 No 2 No
Why will it be a problem?
(e) Firm will have to recruit I Yes 1R Yes
new employees 2 No 2 No
Why will it be a problem?
8. For each of the statements on buying situation given below, please indicate the number in code 4, that represent the degree of problems that you will be likely to face in the process of buying new machinery.
Code 4 0- No problem at all 1- Minor problem that can be solved by the entrepreneurs 2- Serious problem that can be solved with external assistance 3- Very serious problem that can not be solved
Buying situation Decree of problem
(a) Finding supplier of new technology 0 1 2 3 (b) Delegating responsibility while being
away to negotiate to buy new technology 0 1 2 3
(c) Dealing with legal matters such as contract 0 1 2 3
(d) Negotiating with supplier 0 1 2 3
393

Appendix II
(e) Getting finance 0 1 2 3
Long absence from firm 0 1 2 3
(g) Getting after sales service from 0 1 2 3
supplier
9. By using code 5, please indicate the extent to which you agree with the following statements on the machine you considered to acquire by putting the appropriate number in the box.
Code 5
5- Strongly agree 4- Agree 3- Unsure 2- Disagree 1- Strongly disagree
a) Acquiring the machine would involve risk of too great a loss. 1 2 3 4 5
b) The considered machine will not give much advantage from the old one. 1 2 3 4 5
c) We'll gain better profit if we adopt the machine 1 2 3 4 5
d) Only a few firms are able to buy the machine 1 2 3 4 5
e) It is necessary to obtain financing to buy new machine 1 2 3 4 5
i) The considered machine is the latest in the market 1 2 3 4 5
g) The machine is simple to use 1 2 3 4 5
h) The machine can easily be adapted to the existing process of production 1 2 3 4 5
i) It is a prestigious for the firm use the machine 1 2 3 4
j) Firms can easily penetrate the market if the have the machine. 1 2 3 4 5
k) I will have to change some of the work routine of the firm uses the machine. 1 2 3 4 5
1) The machine produces better quality products. 1 2 3 4 5
394

Appendix 1I
m) There is a better alternative machine which is appropriate for mfirm 1 2 3 4 5
o) The machine is very expensive to buy
and to install. 1 2 3 4 5
n) The machines can be operated by the firm's existing technician 1 2 3 4 5
p) It is difficult to get spare parts for the machine. 1 2 3 4 5
10. If you intend to obtain financing when you buy new machinery, please state the degree of problems that you think you will face in the following situations. Use code 4 that represent the degree of problem and mark the answer in the appropriate box.
Loans applying process Degree of pro em
a. Getting loan approved. 0 1 2 3 b. Providing proper work plan and
feasibility study 0 1 2 3
c Providing the required collateral 0 1 2 3
d) Approaching financial institution 0 1 2 3
e. High interest rate 0 1 2 3
11. Did you look for other alternative machines before deciding to buy the considered machine? If yes, how
1 Contact suppliers/agents 2 Contact other entrepreneur 3 Attend trade fair 4 Others, please specify.........
12. Please state your reason for buying the considered machine?
395
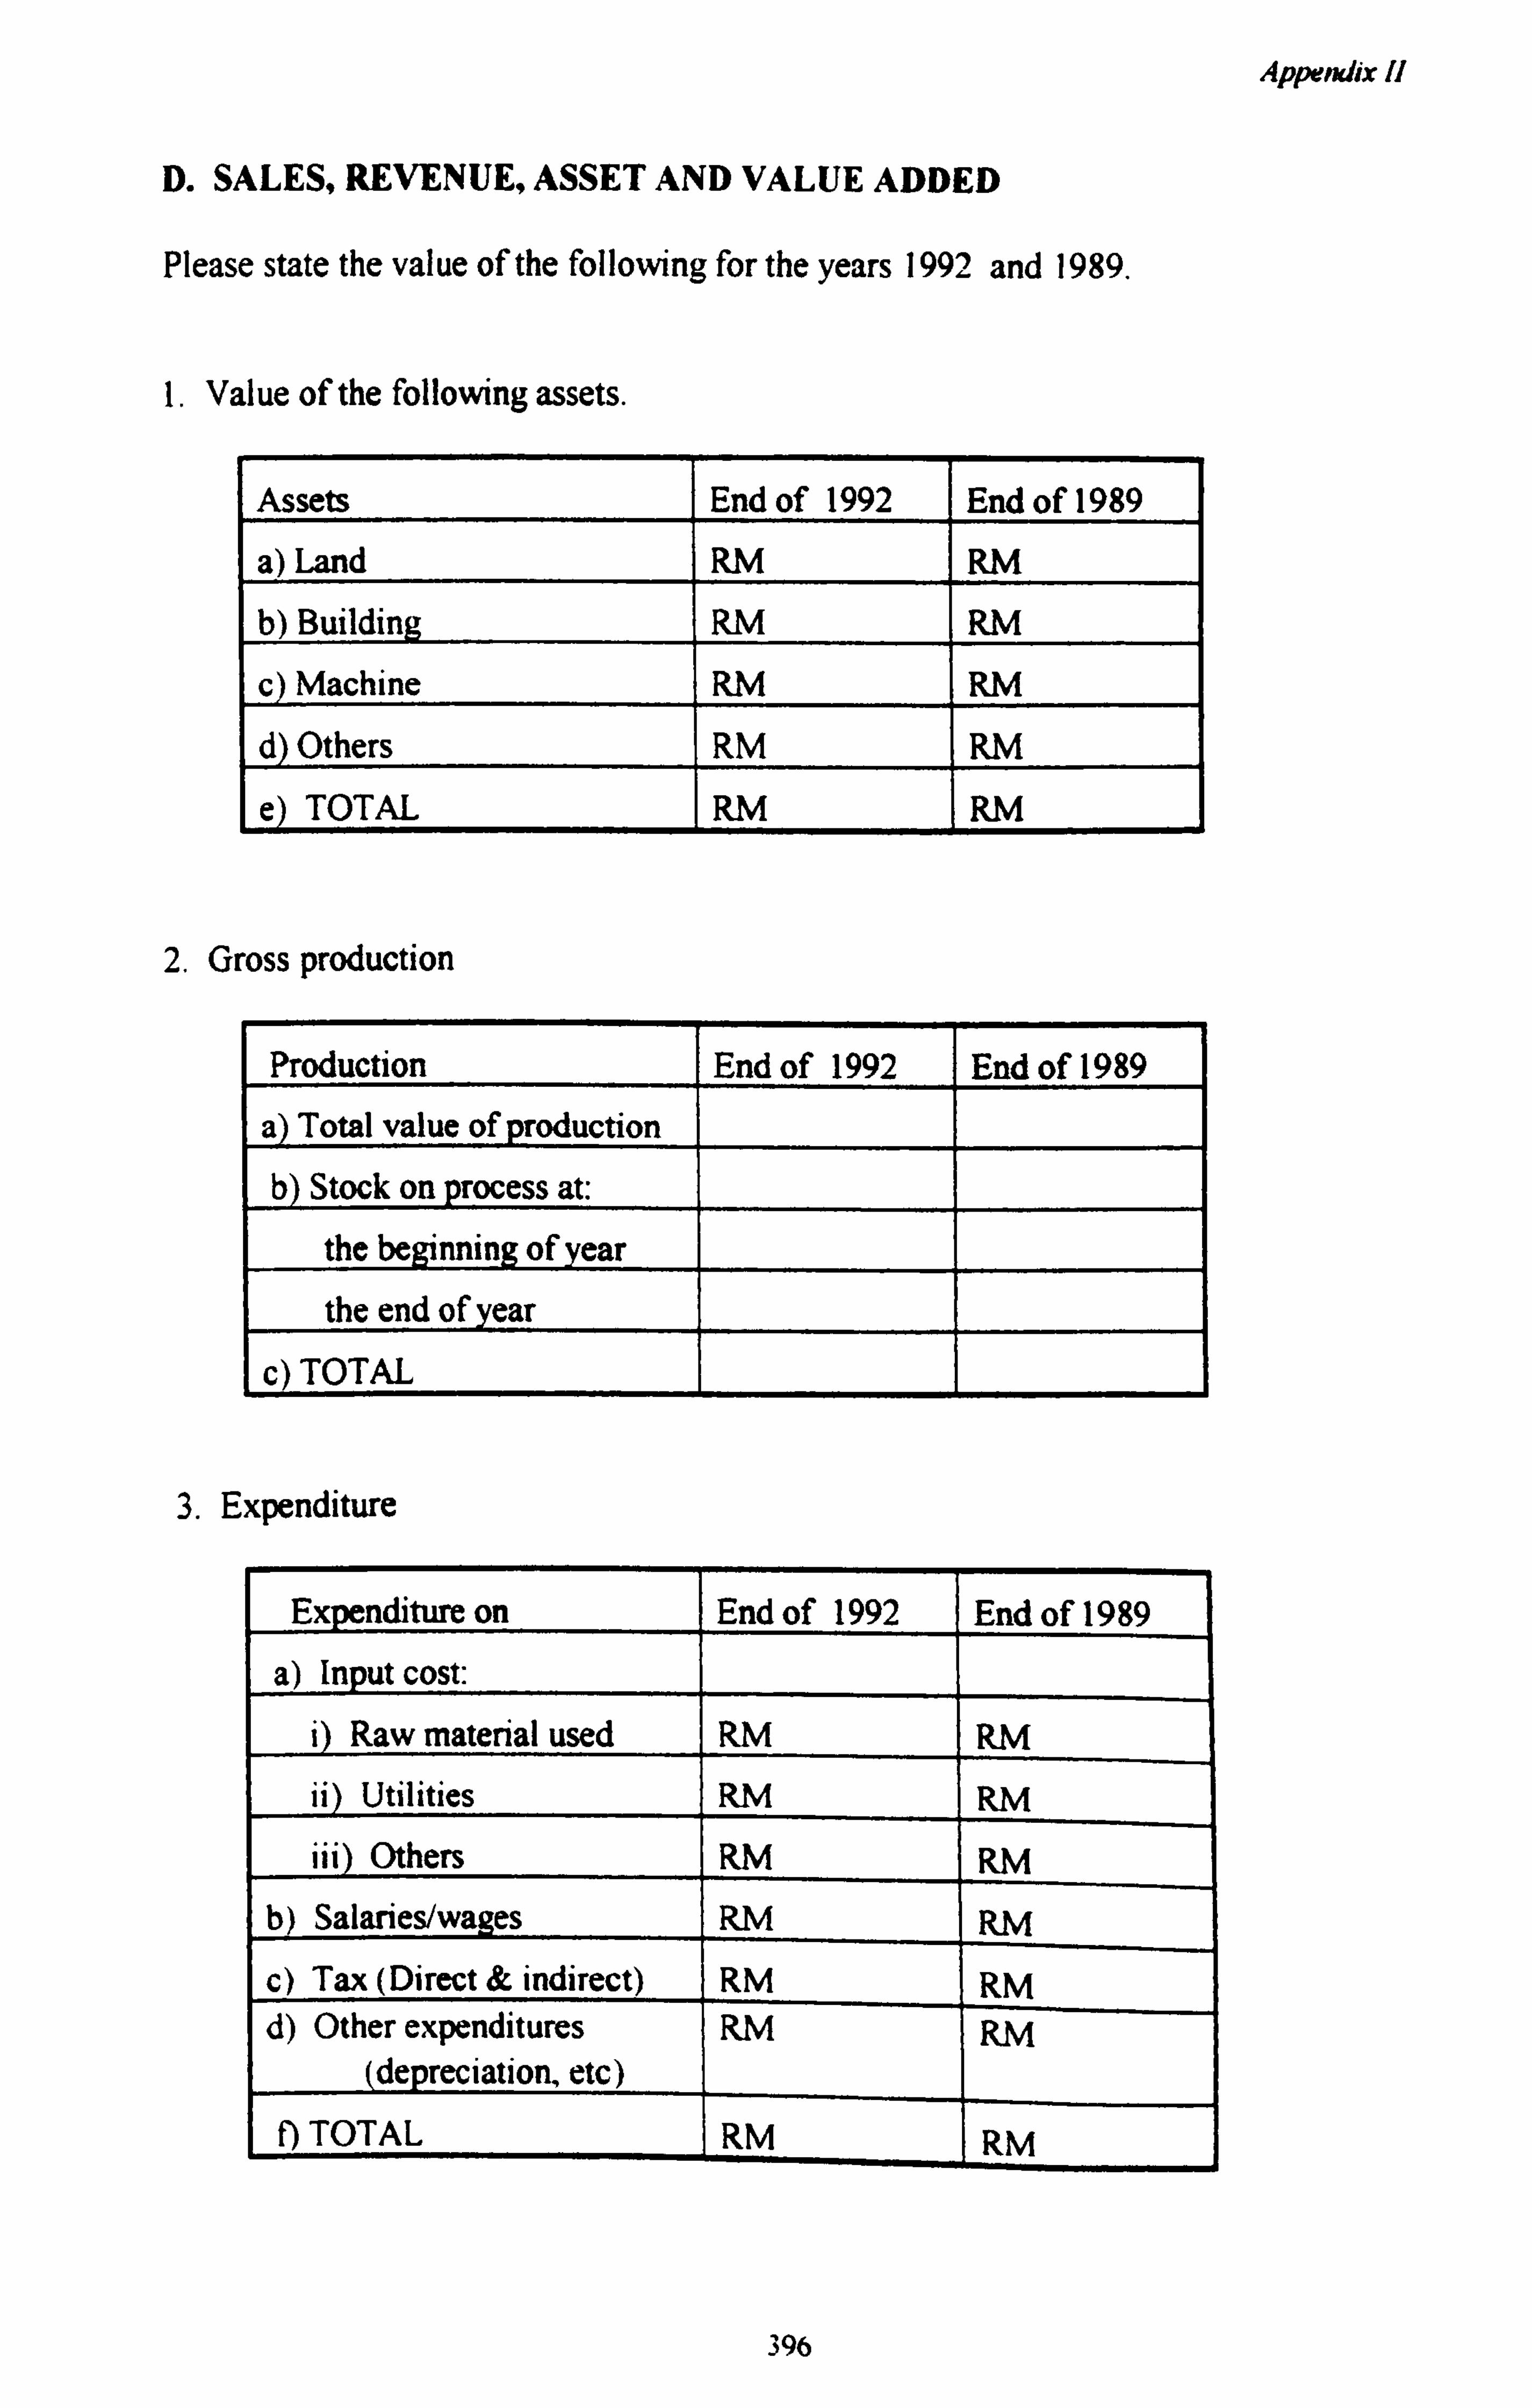
Appendix 11
D. SALES, REVENUE, ASSET AND VALUE ADDED
Please state the value of the following for the years 1992 and 1989.
1. Value of the following assets.
Assets End of 1992 End of 1989
a) Land RM RM
b) Building RM RM
c) Machine RM RM
d) Others RM RM
e) TOTAL RM RM
2. Gross production
Production End of 1992 End of 1989
a) Total value of production
b) Stock on process at:
the beginning of year
the end of year
c) TOTAL
3. Expenditure
Expenditure on End of 1992 End of 1989
a) Input cost:
i) Raw material used RM RM ii) Utilities RM RM
iii Others RM RM b) Salaries/wages RM PIM
c) Tax (Direct & indirect) RM RM d) Other expenditures
(depreciation, etc) RM RM
f) TOTAL RM RM
396
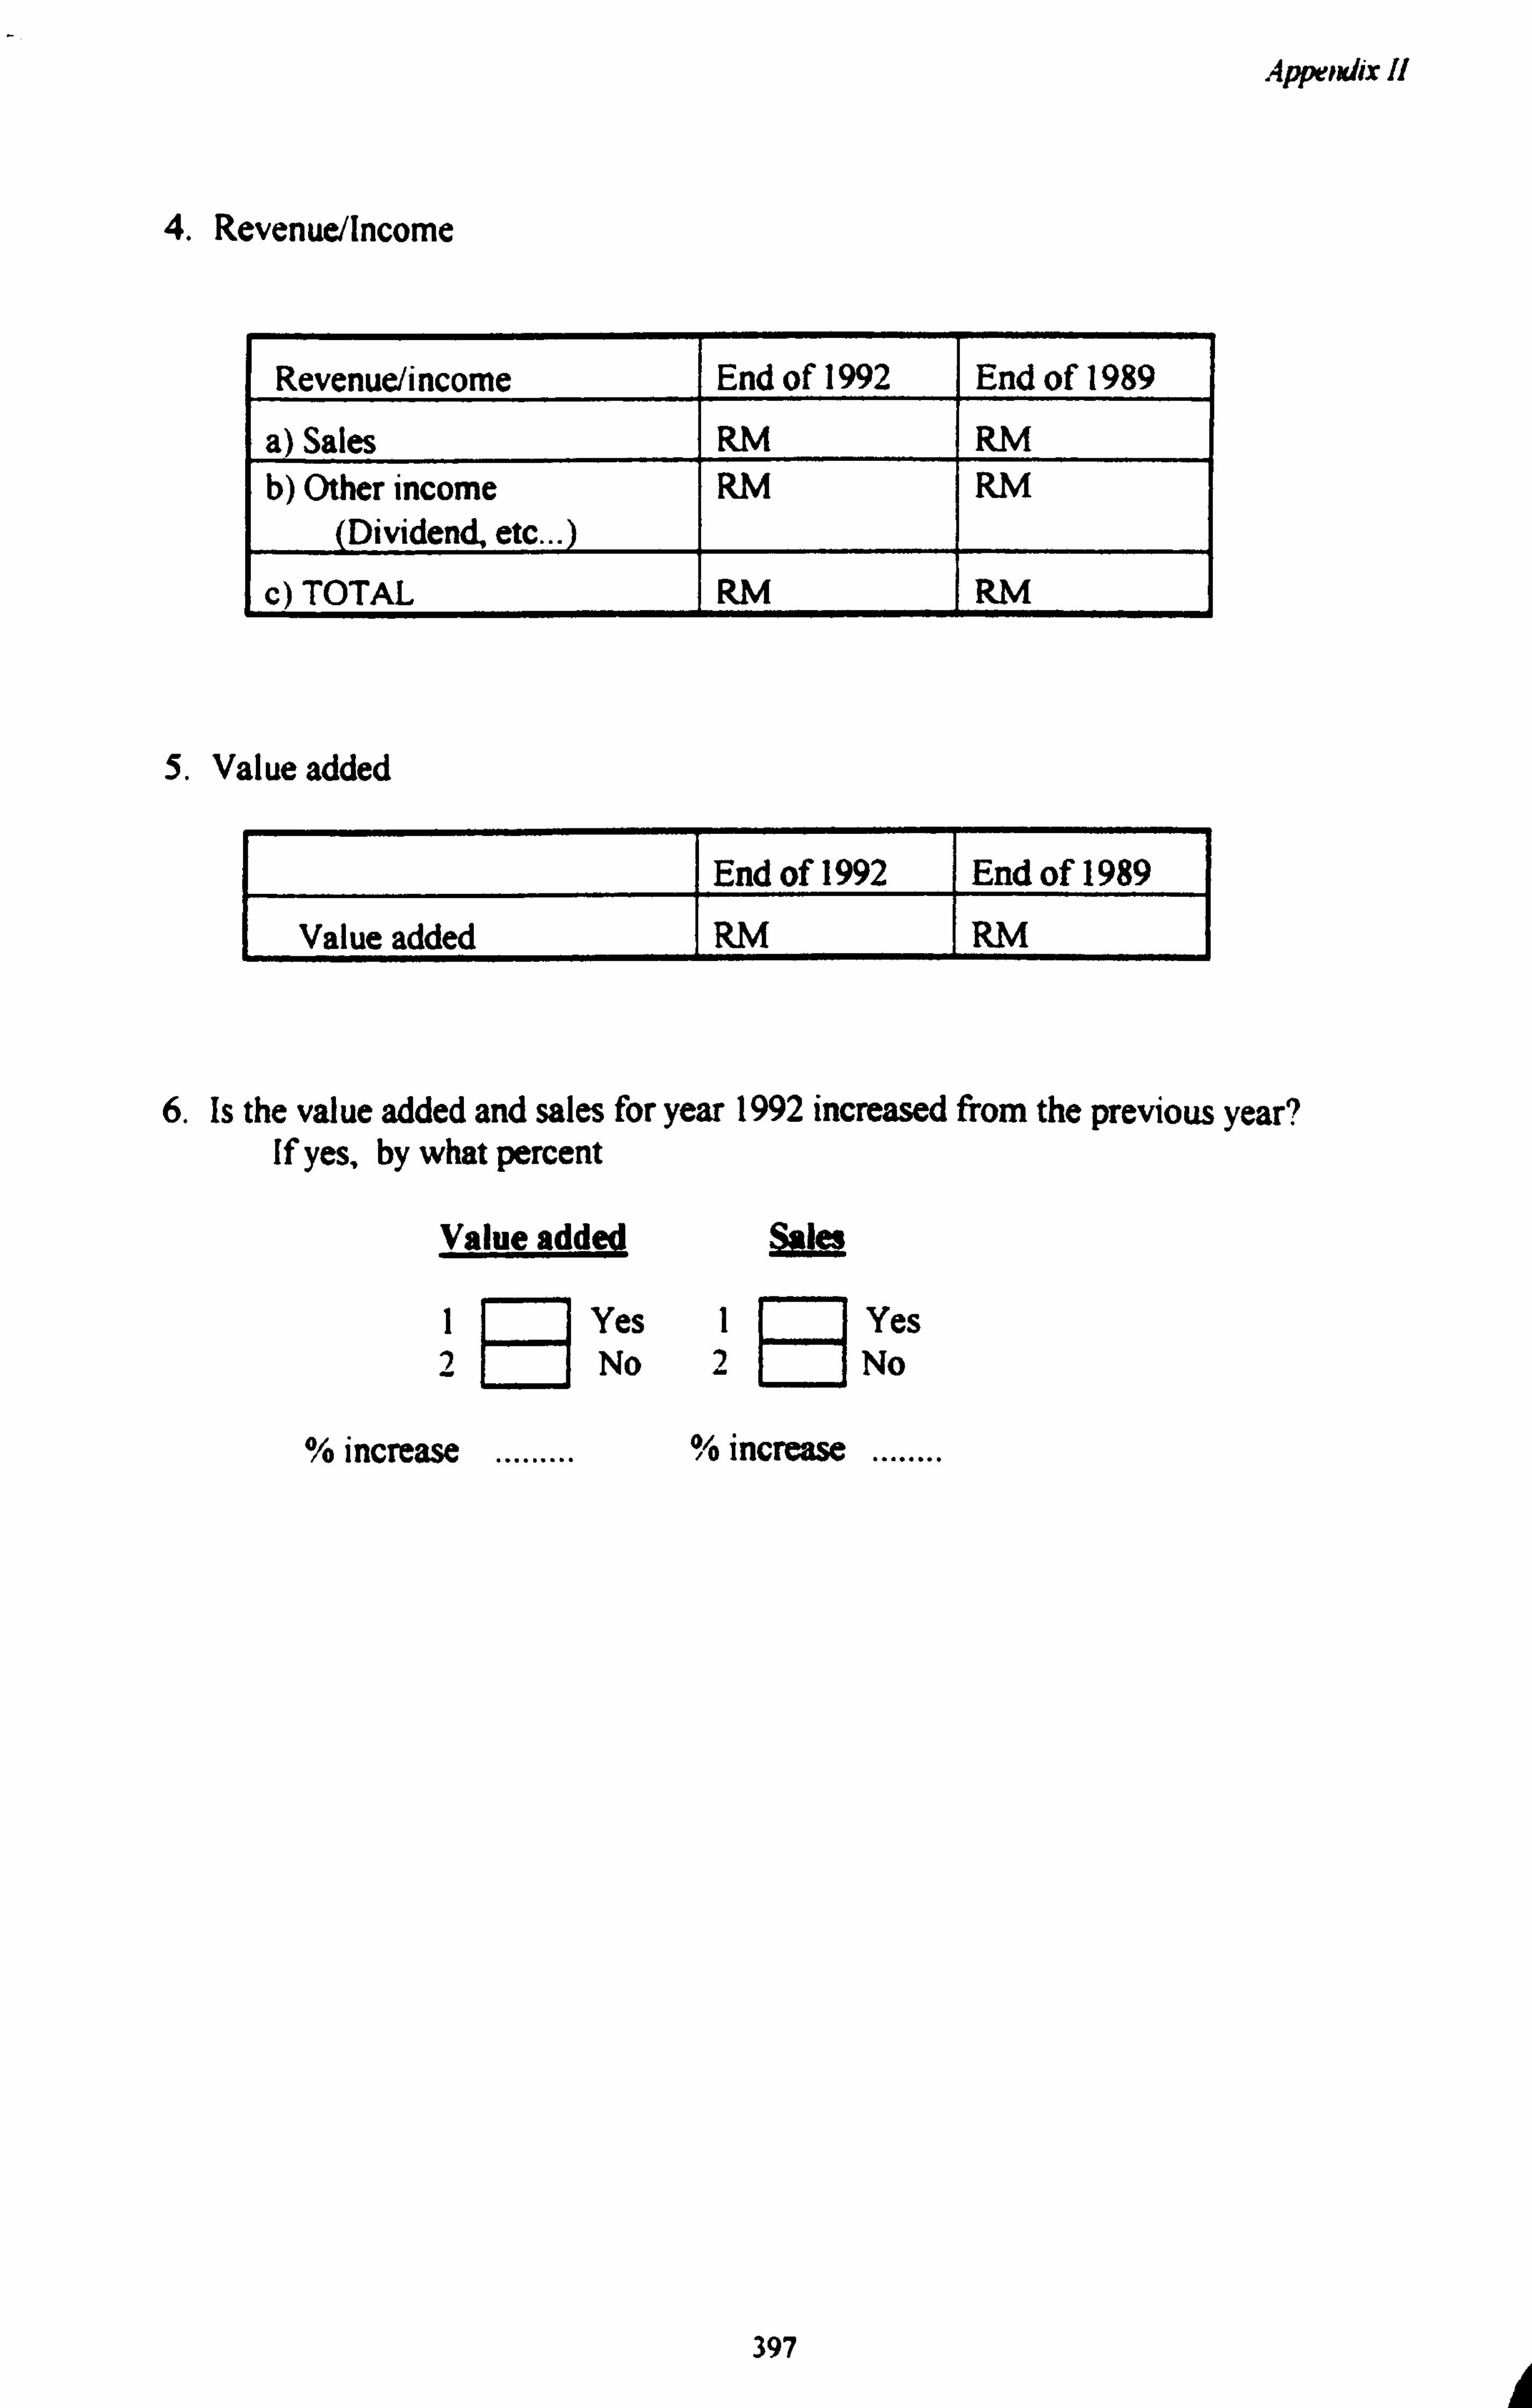
Appendix II
4. Revenue/Income
Revenue/income End of 1992 End of 1989
a) Sales RM RM b) Other income
(Dividend, etc... RM RM
c) TOTAL RM RM
5. Value added
End of 1992 End of 1989
Value added RM RM
6. Is the value added and sales for year 1992 increased from the previous year? If yes, by what percent
Value added
1P Yes 2 No
% increase .........
SaLe-S
IR Yes 2 No
% increase ........
397

Appendix !1
E. ENTREPRENEURS' BACKGROUND
1. Respondent's status of ownership.
1. Sole owner 2. Partner 3. Major shareholder
2. If respondent is partner or major shareholder of the firm, please state, the percentage of share belong to respondent.
Percentage of share %
3. Respondent's current position in the firm
1. Chairman 2. Director 3. Manager 4. Others, please specify
4. Highest educational level:
1. No formal education 2. Primary school 3. Lower secondary 4. Upper secondary (O-level) 5. A- level or equivalent 6. College/University/Professional 7. Others; please specify
5. Age of respondent
1. 25 years old or less 2. 26 - 30 3. 31-35 4. 36 - 40 5. 41 - 45 6. 46 - 50 7 More than 50 years old
6. Sex of respondent
I Male 2 Female
398

Appendix II
7. Number of years working in the current company
Number of years
8. Respondent's previous working experience
Tv es of job Sector Number of years
a)
b)
c)
d)
10. If you have attended any formal courses that related to your business, please state the types of courses and the organiser.
Courses Organiser Year Duration (days)
a)
b)
C)
d)
e)
10.1 If you have never attended any courses, please state the reasons
399

Appendix //
11. For the last five years, if you have ever visited (referred) to any government institution such as MARDI, MARA for your business, please name the institution, the number of visits and purpose of visits.
Institution Number of visit Pur e of visit
12. If your firm has never referred to any institution, please state the reasons
I No reason to visit 2 The institution is very far 3 Do not know which institution to visit 4 Others, please specify.........
13. Are you a member of any association related to your business?
1 Yes 21 No
13.1 If yes, please name the association
a) ............... b) ............... c) ..............
14. In the last 3 years how many times have you attended trade fairs and seminars related to your business?
Trade fairs ....... times
Seminars ....... times
15. Do you subscribe to any magazines related to your business? If yes, name the magazines
a) ............................
b) ...........................
400

Appendix 11
F. PERCEPTION
Please read the statements below carefully and for each statement, indicate the number that best describes yourself, in the box beside the statement (refer to Code 6)
Code 6 1- Rarely or almost never true for me 2- Sometimes but not frequently true for me 3- Occasionally true for me 4- Very often true for me 5- True for me all or most of the time
(a) I never delay to grab any opportunity that comes along. 1 2 3 4 5
(b) The success of my business depends on my relationship with politicians 1 2 3 4 5
(c) I expect my workers to work hard with minimal guidance from me.
1 2 3 4 5
(d) I hate to see people have nothing to do 1 2 3 4 5 (e) I feel a great sense of satisfaction
when I do my job well l 2 3 4 5
(f) When I am working, the demands I make upon myself are very high. 1 2 3 4 5
In general I am strongly future-oriented 1 2 3 4 5 (h) All I want out of life in the way of a
career is a secure, not too difficult job, 1 2 3 4 5 with enough pay to afford a nice car and eventually a home of my own.
(i) Planning only makes me unhappy since 1 2 3 4 5 plans hardly ever work out anyway.
(j) I believe in 'takdir' (God determined our fate 1 2 3 4 5
(k) I believe that I am capable of handling any business activities 1 2 3 4 5
(1) I worked hard at school to make sure that I would have a better life than my 1 2 3 4 5
parents. (m) I don't care what other entrepreneurs
do, I go my own way. 1 2 3 4 5
(n) I tind it easy to relax completely when I am on holida 1 2 3 4 5
401

Appendix /I
(o) I work hard for the future of my children, so that they will have better 1 2 3 4 5
life (p) I find it easy to forget about my work
outside normal working hours 1 2 3 4 5
Other people think I work very hard 1 2 3 4 5 (r) If I have not attained my goal and
have not done a task well then 1 1 2 3 4 5 continue to do my best to attain
the goal.
2. Using code 7, please indicate the extent to which you agree with the following
statements by putting the appropriate number in the box.
Code 7
5- Strongly agree 4- Agree 3- Unsure 2- Disagree 1- Strongly disagree
(a) Sales of my company are very much 1 2 3 4 5 affected by its marketing strategy
(b) Government regulations play an important part in predetermining 1 2 3 4 5
market opportunity in my industry.
(c) The success of my company are very much dependent on hard work of its 1 2 3 4 5 staff.
(d) Many problems faced by firms can be solved internally 1 2 3 4 5
(e) There is little point in engaging in detailed strategic analyses and planning 1 2 3 4 5 because often events occur that my company cannot control.
(f) Failure of SMI is due to mismanagement
1 2 4 5
b their entrepreneurs. (g) SMI fail because they have not taken
1 2 3 4 5
402

Appendix II
advantage of their opportunities (h) Good entrepreneurs should use the
latest technology in the market. '- 3 4 5
(1) Success in food producing business, for the most part depends on luck - 1 2 3 4 5 there's no way an entrepreneur can change his or her luck.
(j) In many case, getting what I want has little nor nothing to do with luck. 1 2 3 4 5
(k) Many times, I feel that I have little influence over the things that happen 1 2 3 4 5 to me.
3. Below you will find a series of situations that are likely to occur in every day life. The central person in each situation is faced with a choice between two alternativees courses of action, which we might call X and Y. Alternative X is more desirable and attractive than alternative Y, but the probability of attaining or achieving X is less than that of attaining or achieving Y.
For each situation, you will be asked to indicate the minimum odds of success you would demand before recommending that the more attractive or desirable alternative, X, be chosen.
Read each situation carefully before giving your judgement. Tryto place yourself in the position of the central person in each of the situations. There are six situations in all. Please do not omit any of them.
a) Mr. A, a doctor who is married, aged 35 years old has a child. Since graduating from university, ten years ago, he has been working at a government hospital with a salary of RM3,000 a month with annual increment of RM200.00 up to the maximum salary of RM5,000 a month. Upon retirement at the age of 55, he will receive pension benefit. Recently a friend proposed that Mr. A establish his own private clinic in town Z. Z is a small town with only a small government clinic. Being the only private clinic, and if his clinic manages to get contracts with nearby firms as their panel doctor, the friend estimated that Mr A could earn an income of more than RM4,000 a month without working during weekends and at night . Mr. A also has no problem in providing RM100,000 as an initial capital to open the clinic.
Imagine that you are advising Mr. A. Listed below are several probabilities that the proposed clinic will get contracts.
403
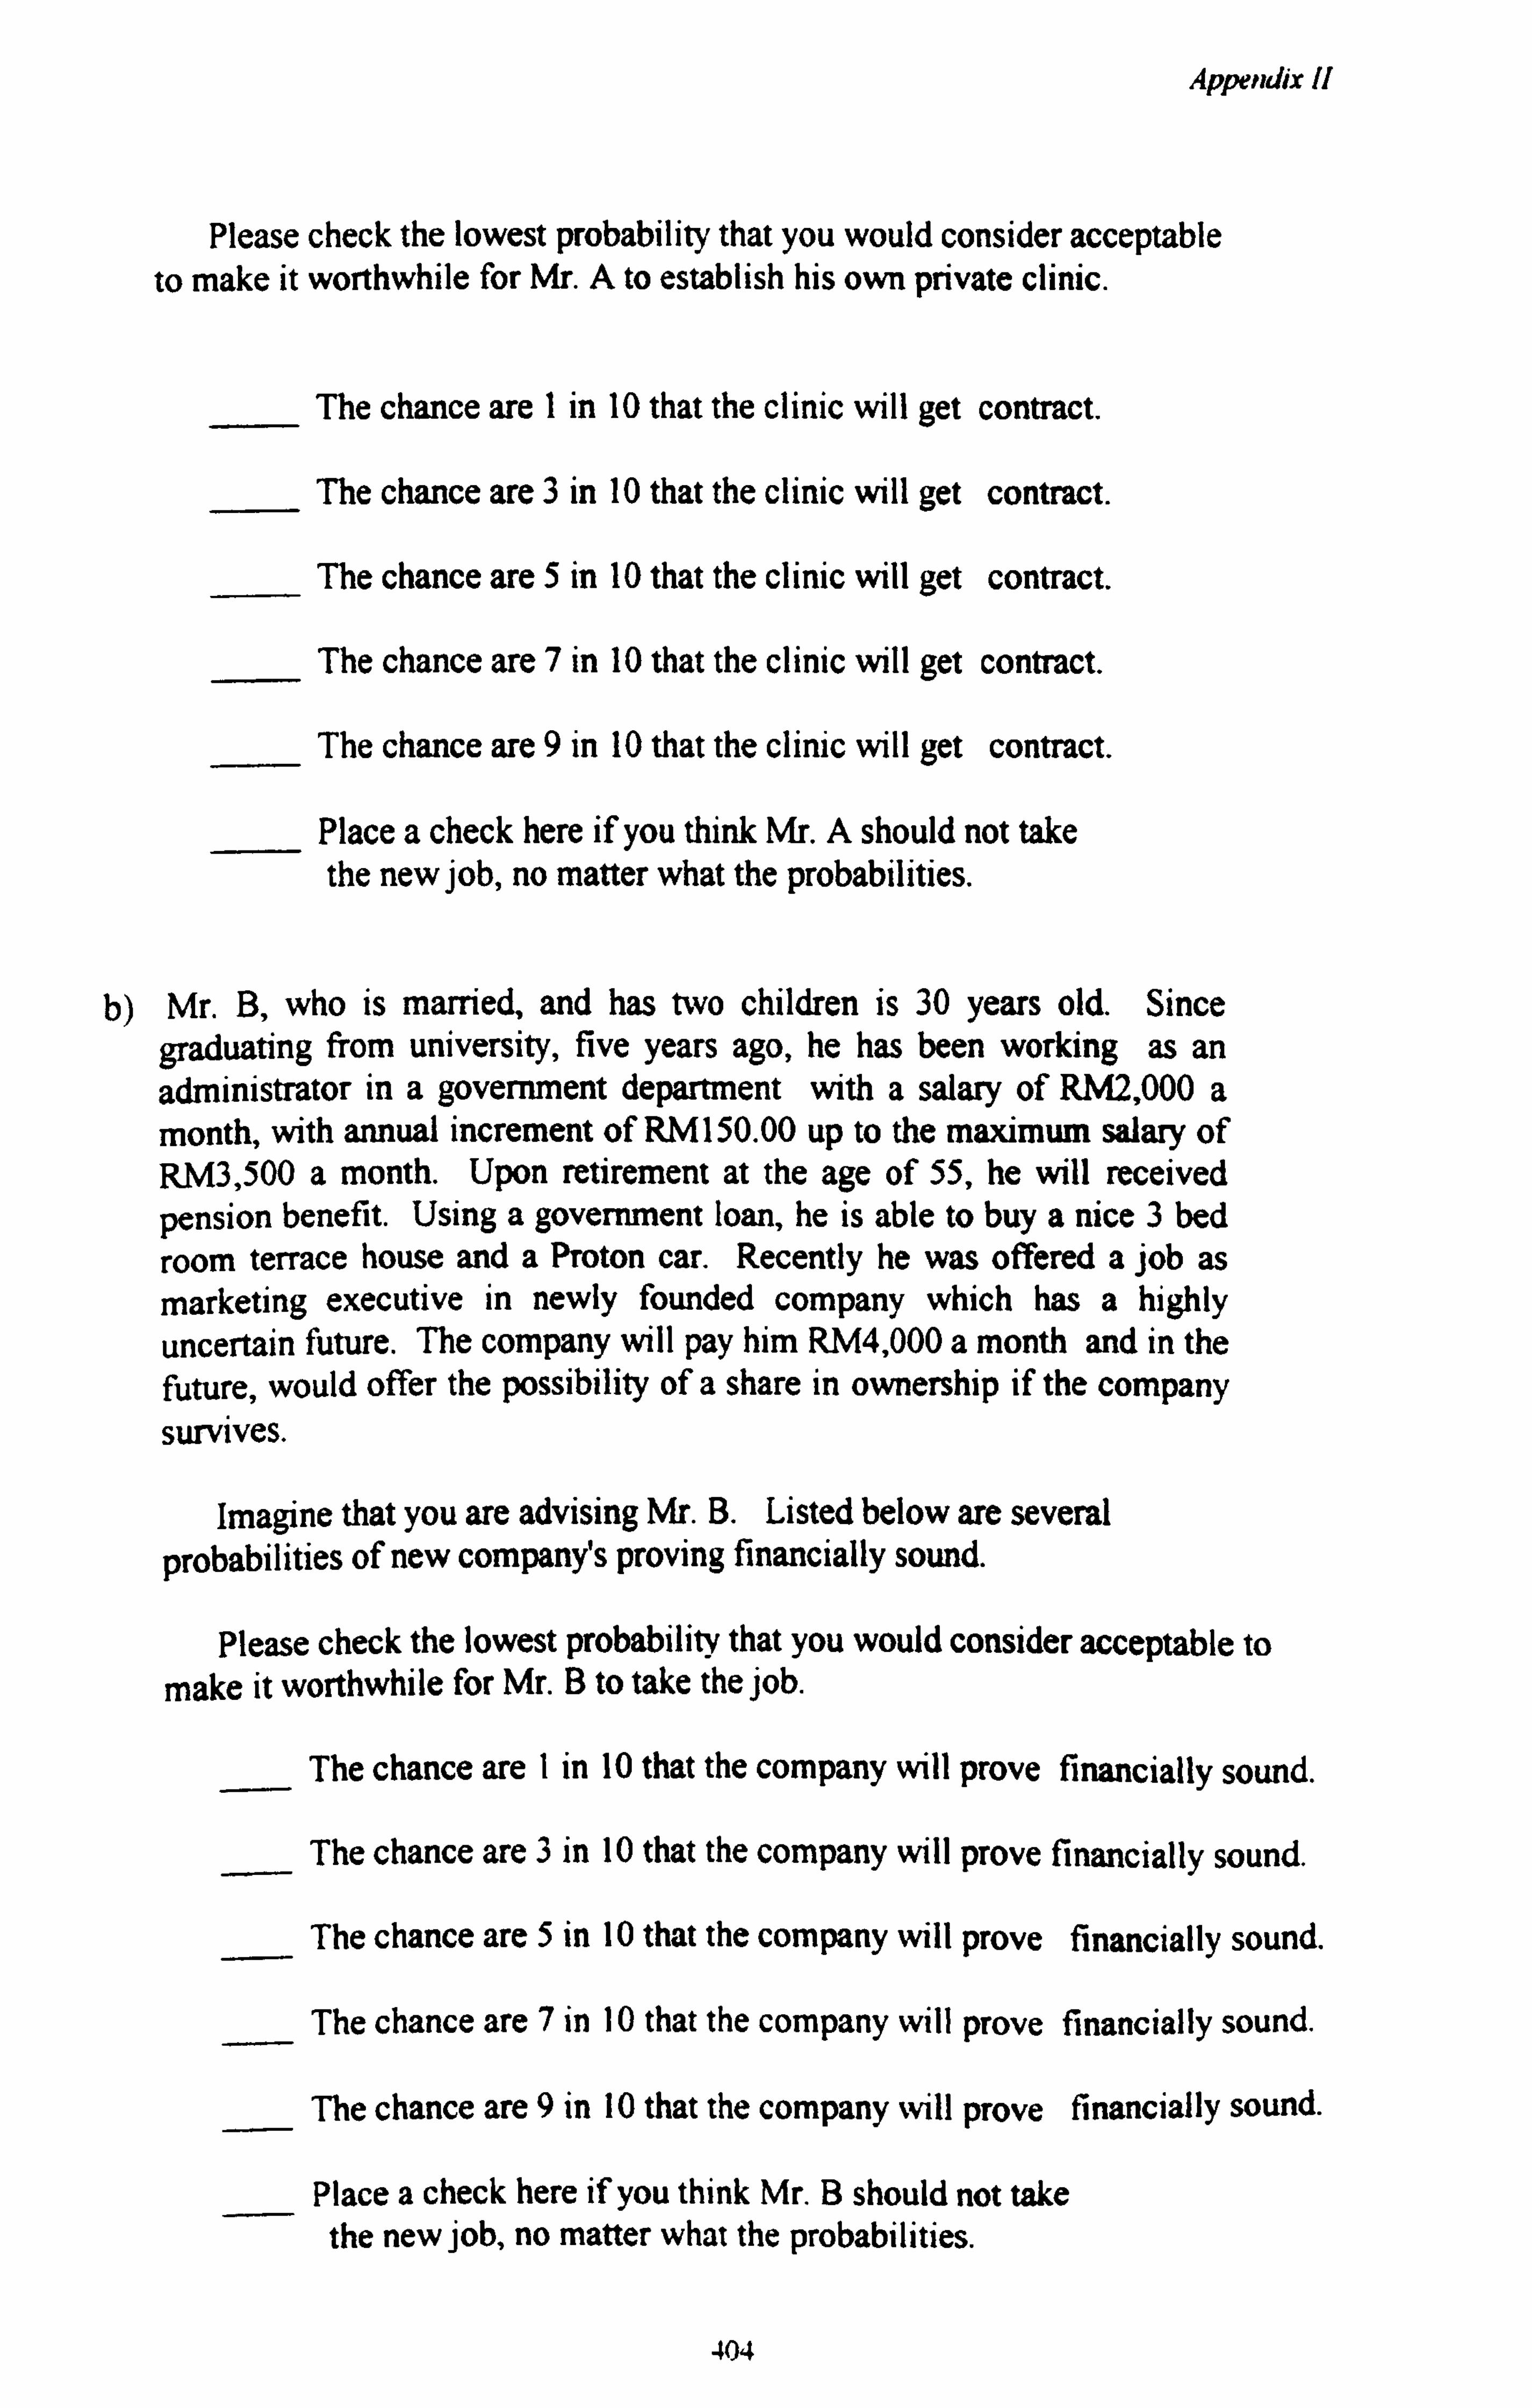
Appendix 11
Please check the lowest probability that you would consider acceptable to make it worthwhile for Mr. A to establish his own private clinic.
The chance are I in 10 that the clinic will get contract.
The chance are 3 in 10 that the clinic will get contract.
The chance are 5 in 10 that the clinic will get contract.
The chance are 7 in 10 that the clinic will get contract.
The chance are 9 in 10 that the clinic will get contract.
Place a check here if you think Mr. A should not take the new job, no matter what the probabilities.
b) Mr. B, who is married, and has two children is 30 years old. Since graduating from university, five years ago, he has been working as an administrator in a government department with a salary of RM2,000 a month, with annual increment of RM 150.00 up to the maximum salary of RM3,500 a month. Upon retirement at the age of 55, he will received pension benefit. Using a government loan, he is able to buy a nice 3 bed room terrace house and a Proton car. Recently he was offered a job as marketing executive in newly founded company which has a highly uncertain future. The company will pay him RM4,000 a month and in the future, would offer the possibility of a share in ownership if the company survives.
Imagine that you are advising Mr. B. Listed below are several probabilities of new company's proving financially sound.
Please check the lowest probability that you would consider acceptable to make it worthwhile for Mr. B to take the job.
The chance are l in 10 that the company will prove financially sound.
The chance are 3 in 10 that the company will prove financially sound.
The chance are 5 in 10 that the company will prove financially sound.
The chance are 7 in 10 that the company will prove financially sound.
The chance are 9 in 10 that the company will prove financially sound.
Place a check here if you think Mr. B should not take the new job, no matter what the probabilities.
404

Appendix 11
c) Mr. C, a 35 year old man, is blind due to a certain illness when he was 4 years old. Although he is blind he can see distinguish light and shade, and make out blurred shapes and colours that enable him to move freely without assistance. Recently he was informed by a well known surgeon that he might see normally if he undergoes an operation. But if the operation fails, he might be completely blind.
Imagine that you are advising Mr. C. Listed below are several probabilities that the operation will prove successful.
Please check the lowest probability that you would consider acceptable for the operation to be performed.
The chance are 1 in 10 that the operation will be a success.
The chance are 3 in 10 that the operation will be a success.
The chance are 5 in 10 that the operation will be a success.
The chance are 7 in 10 that the operation will be a success.
The chance are 9 in 10 that the operation will be a success.
Please check here if you think Mr. C should not have the operation, no matter what the probabilities.
d) Mr. D is president of ABC corporation in Malaysia. The corporation is quite prosperous, and has strongly considered the possibilities of business expansion by building an additional plant in a new location. The choice is between building another plant in Malaysia, where there would be a moderate return on the initial investment, or building a plant in a foreign country. Lower labour costs and easy access to raw materials in that country would mean a much higher return on the initial investment. On the other hand, there is a history of political instability and revolution in the foreign country under consideration. In fact, the leader of a small minority party is committed to nationalising, that is taking over, all foreign investment.
Imagine that you are advising Mr. D. Listed below are several probabilities of continued political stability in the foreign country under consideration.
Please check the lowest probability that you would consider acceptable for Mr. D's corporation to build plant in that country.
The chances are I in 10 that the foreign country will remain politically stable.
405
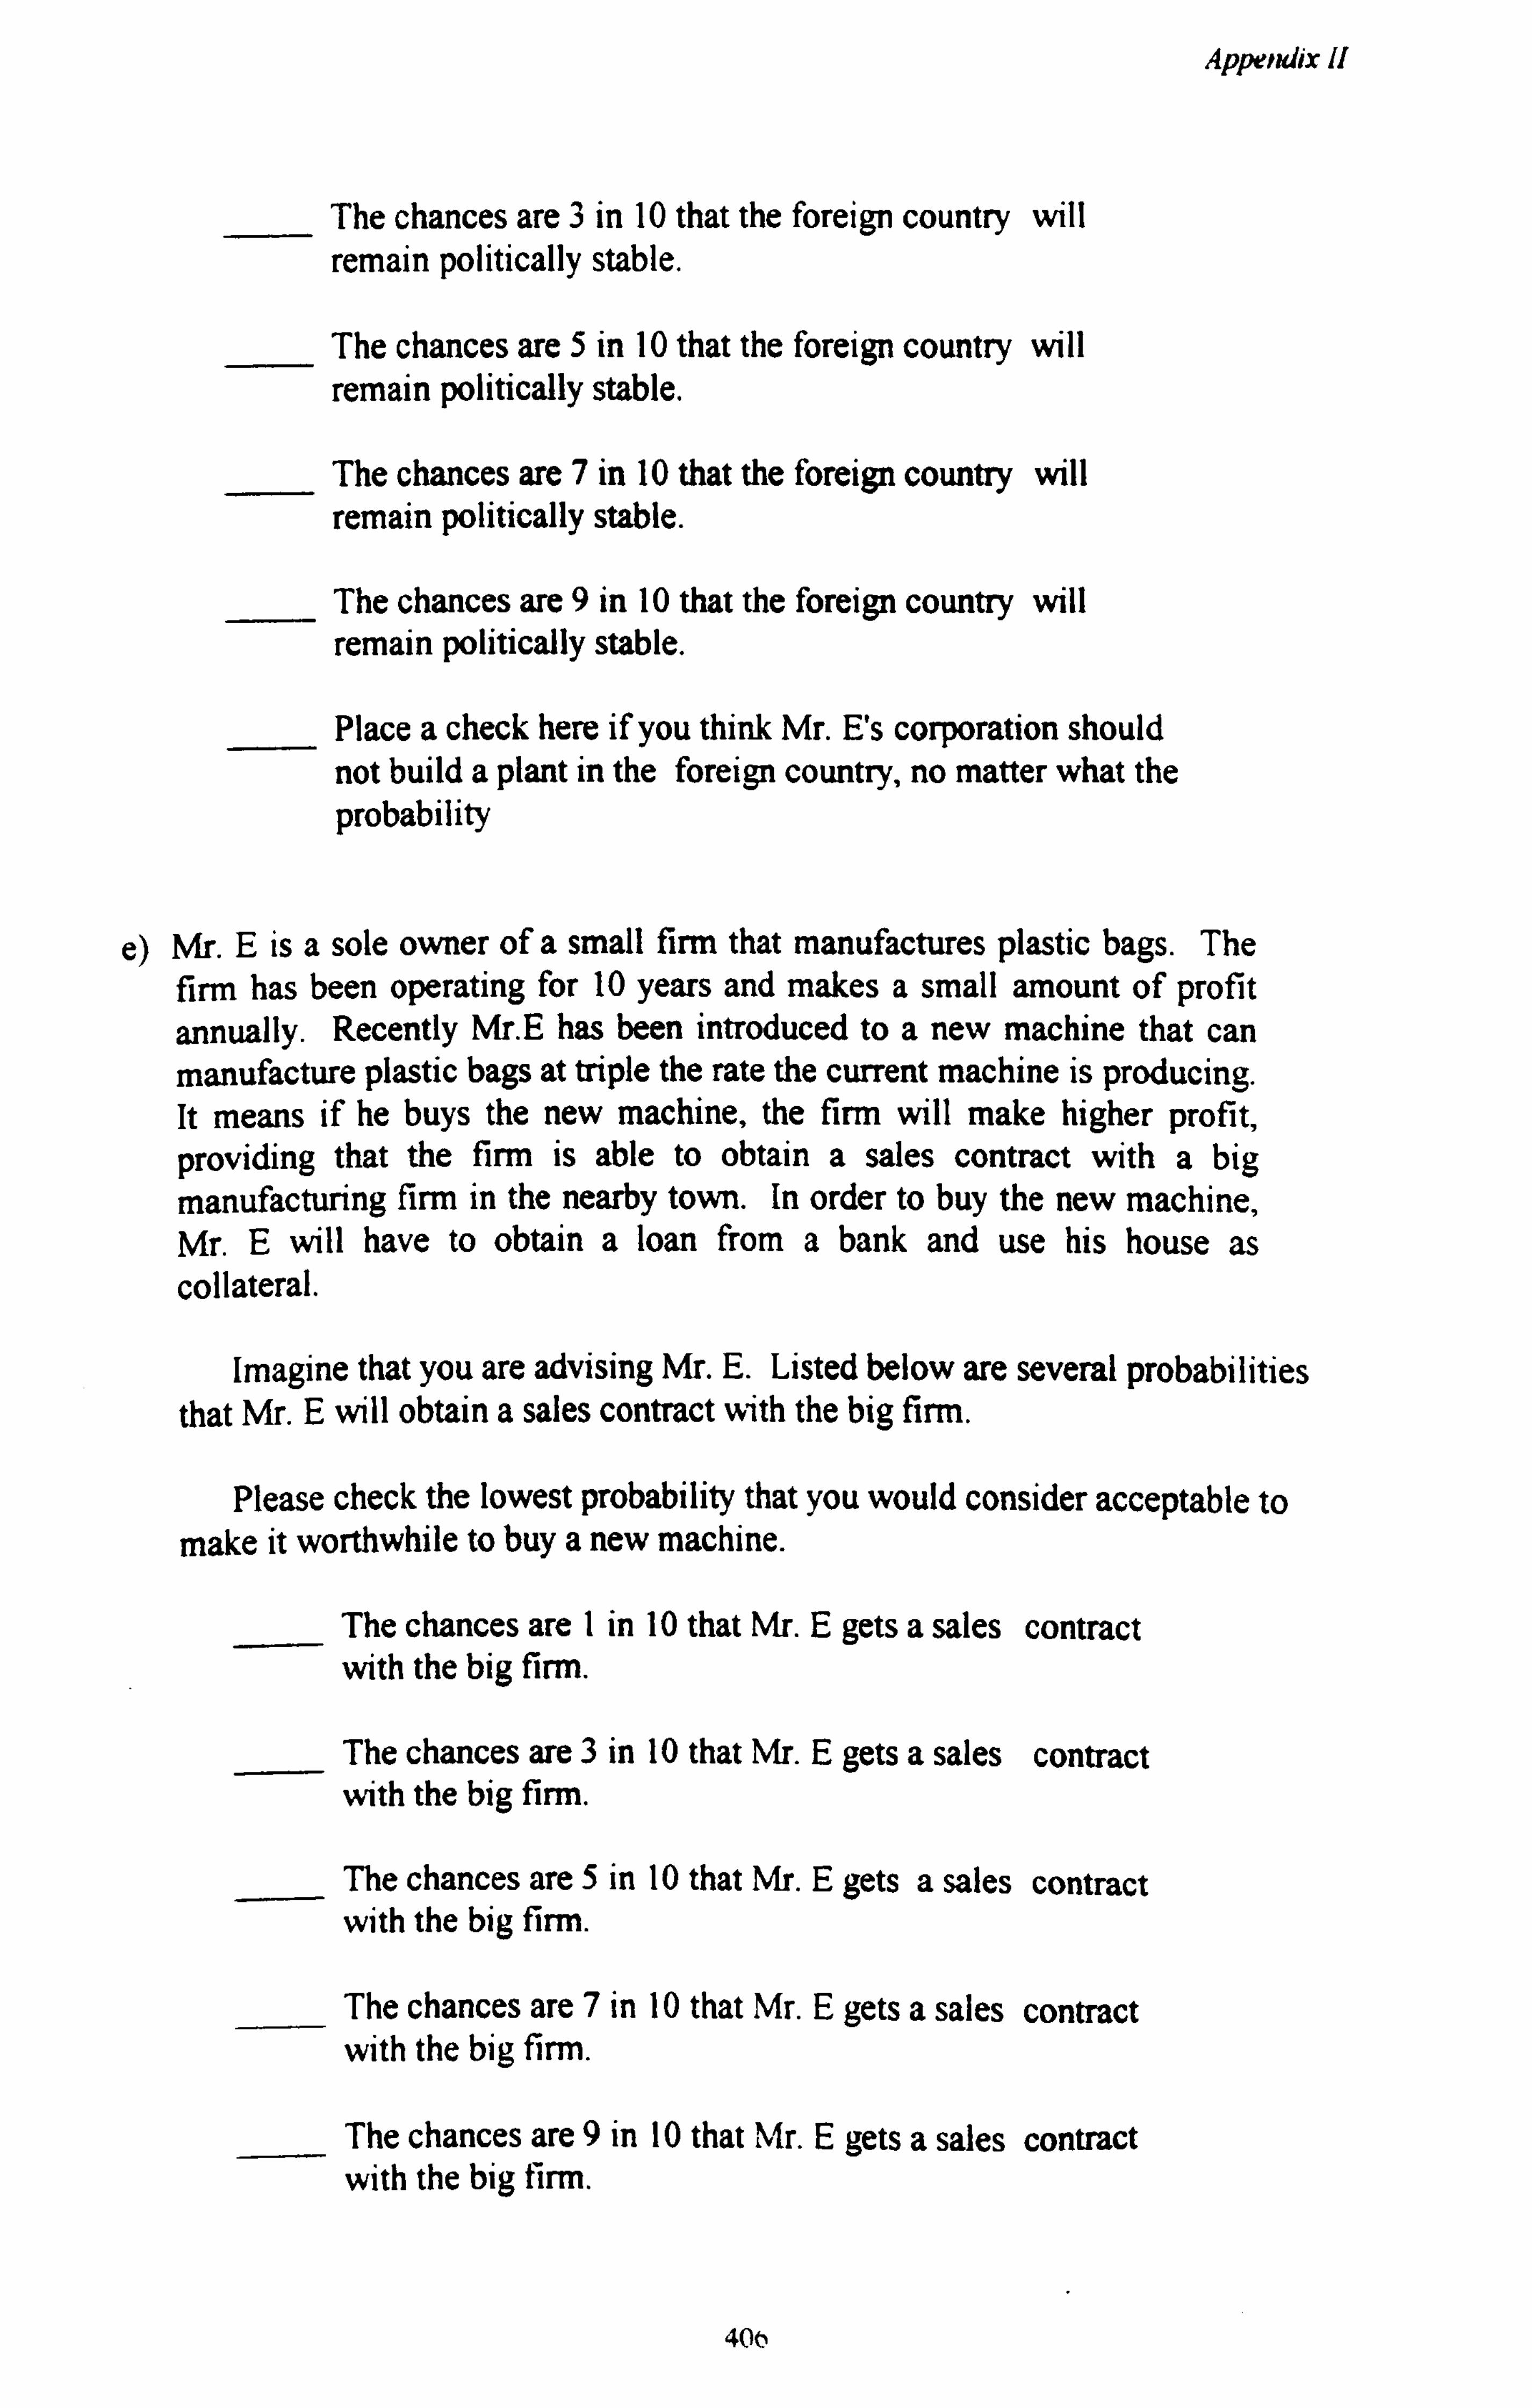
Appendix II
The chances are 3 in 10 that the foreign country will remain politically stable.
The chances are 5 in 10 that the foreign country will remain politically stable.
The chances are 7 in 10 that the foreign country will remain politically stable.
The chances are 9 in 10 that the foreign country will remain politically stable.
Place a check here if you think Mr. E's corporation should not build a plant in the foreign country, no matter what the probability
e) Mr. E is a sole owner of a small firm that manufactures plastic bags. The firm has been operating for 10 years and makes a small amount of profit annually. Recently WE has been introduced to a new machine that can manufacture plastic bags at triple the rate the current machine is producing. It means if he buys the new machine, the firm will make higher profit, providing that the firm is able to obtain a sales contract with a big manufacturing firm in the nearby town. In order to buy the new machine, Mr. E will have to obtain a loan from a bank and use his house as collateral.
Imagine that you are advising Mr. E. Listed below are several probabilities that Mr. E will obtain a sales contract with the big firm.
Please check the lowest probability that you would consider acceptable to make it worthwhile to buy a new machine.
The chances are 1 in 10 that Mr. E gets a sales contract with the big firm.
The chances are 3 in 10 that Mr. E gets a sales contract with the big firm.
The chances are 5 in 10 that Mr. E gets a sales contract with the big firm.
The chances are 7 in 10 that Mr. E gets a sales contract with the big firm.
The chances are 9 in 10 that Mr. E gets a sales contract with the big firm.
40b

Appendix 11
Place a check here, if you think Mr. E should not buy the new machine, no matter what the probabilities
f) Mr. F, a teacher, aged 35 years old, married withs two children aged 6 and 10 years old. The family live comfortably in a small town where Mr. F is teaching. Mr. F also participates in a number of civic activities of considerable value to the community. Mr. F has been approached by the leaders of his political party as a possible candidate in the next election. Although Mr. F's party is the majority party in the district, the candidate of the opponent party is a prominent person and also popular in the community. If Mr. F agrees to become the candidate of his party, he will have to quit his job before the election day and lose all the benefit of working with the government. If he wins the election, his family will have a better future.
Imagine you are advising Mr. F. Listed below are several probabilities of Mr. F's winning the election in his district.
Please check the lowest probabilities that you would consider acceptable to make it worthwhile for Mr. F to run for political office.
The chance are 1 in 10 that Mr. F would win the election.
The chance are 3 in 10 that Mr. F would win the election.
The chance are 5 in 10 that Mr. F would win the election.
The chance are 7 in 10 that Mr. F would win the election.
The chance are 9 in 10 that Mr. F would win the election.
Place a check here if you think Mr. F should not run for political office, no matter what the probabilities.
407
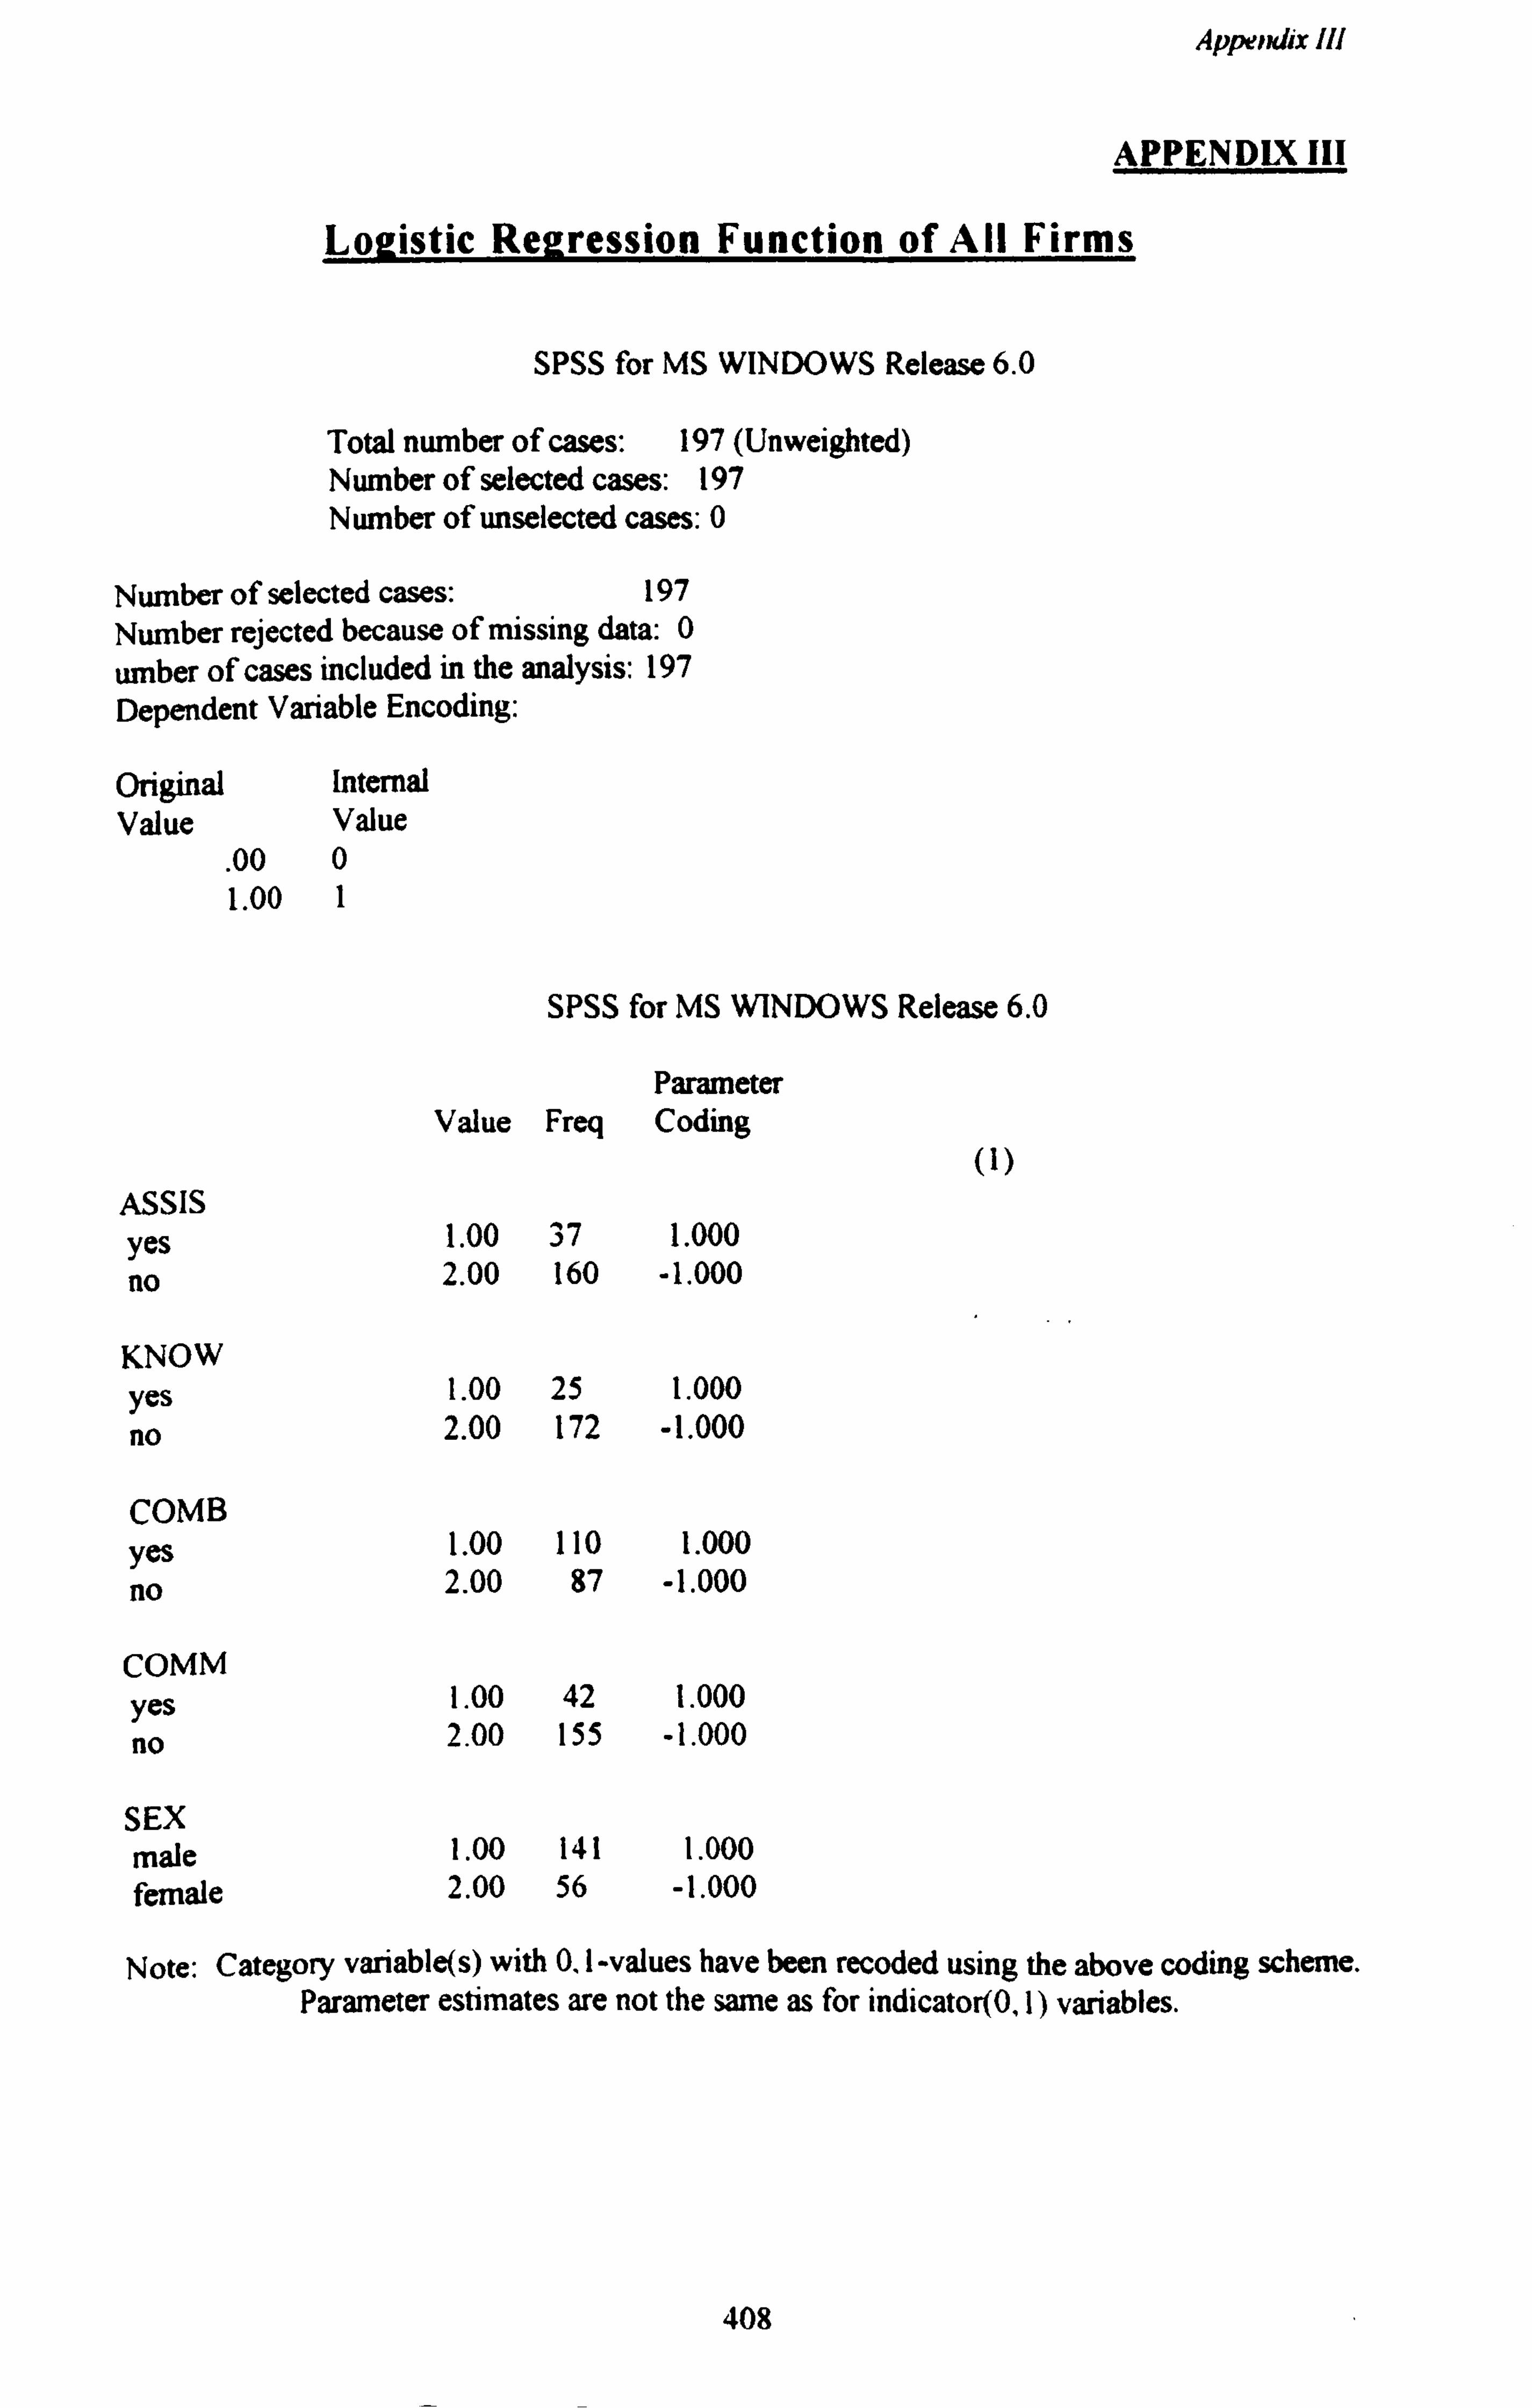
Appendix III
APPENDIX III
Logistic Regression Function of All Firms
SPSS for MS WINDOWS Release 6.0
Total number of cases: 197 (Unweighted) Number of selected cases: 197 Number of unselected cases: 0
Number of selected cases: 197 Number rejected because of missing data: 0
umber of cases included in the analysis: 197 Dependent Variable Encoding:
Original Internal Value Value
. 00 0 1.00 1
SPSS for MS WINDOWS Release 6.0
Parameter Value Freq Coding
ASSIS yes 1.00 37 1.000 no 2.00 160 -1.000
KNOW yes 1.00 25 1.000
no 2.00 172 -1.000
COMB yes 1.00 110 1.000
no 2.00 87 -1.000
COMM yes 1.00 42 1.000
no 2.00 155 -1.000
SEX male 1.00 141 1.000 female 2.00 56 -1.000
Note: Category variable(s) with 0,1-values have been recoded using the above coding scheme. Parameter estimates are n ot the same as for indicator(0,1) variables.
408
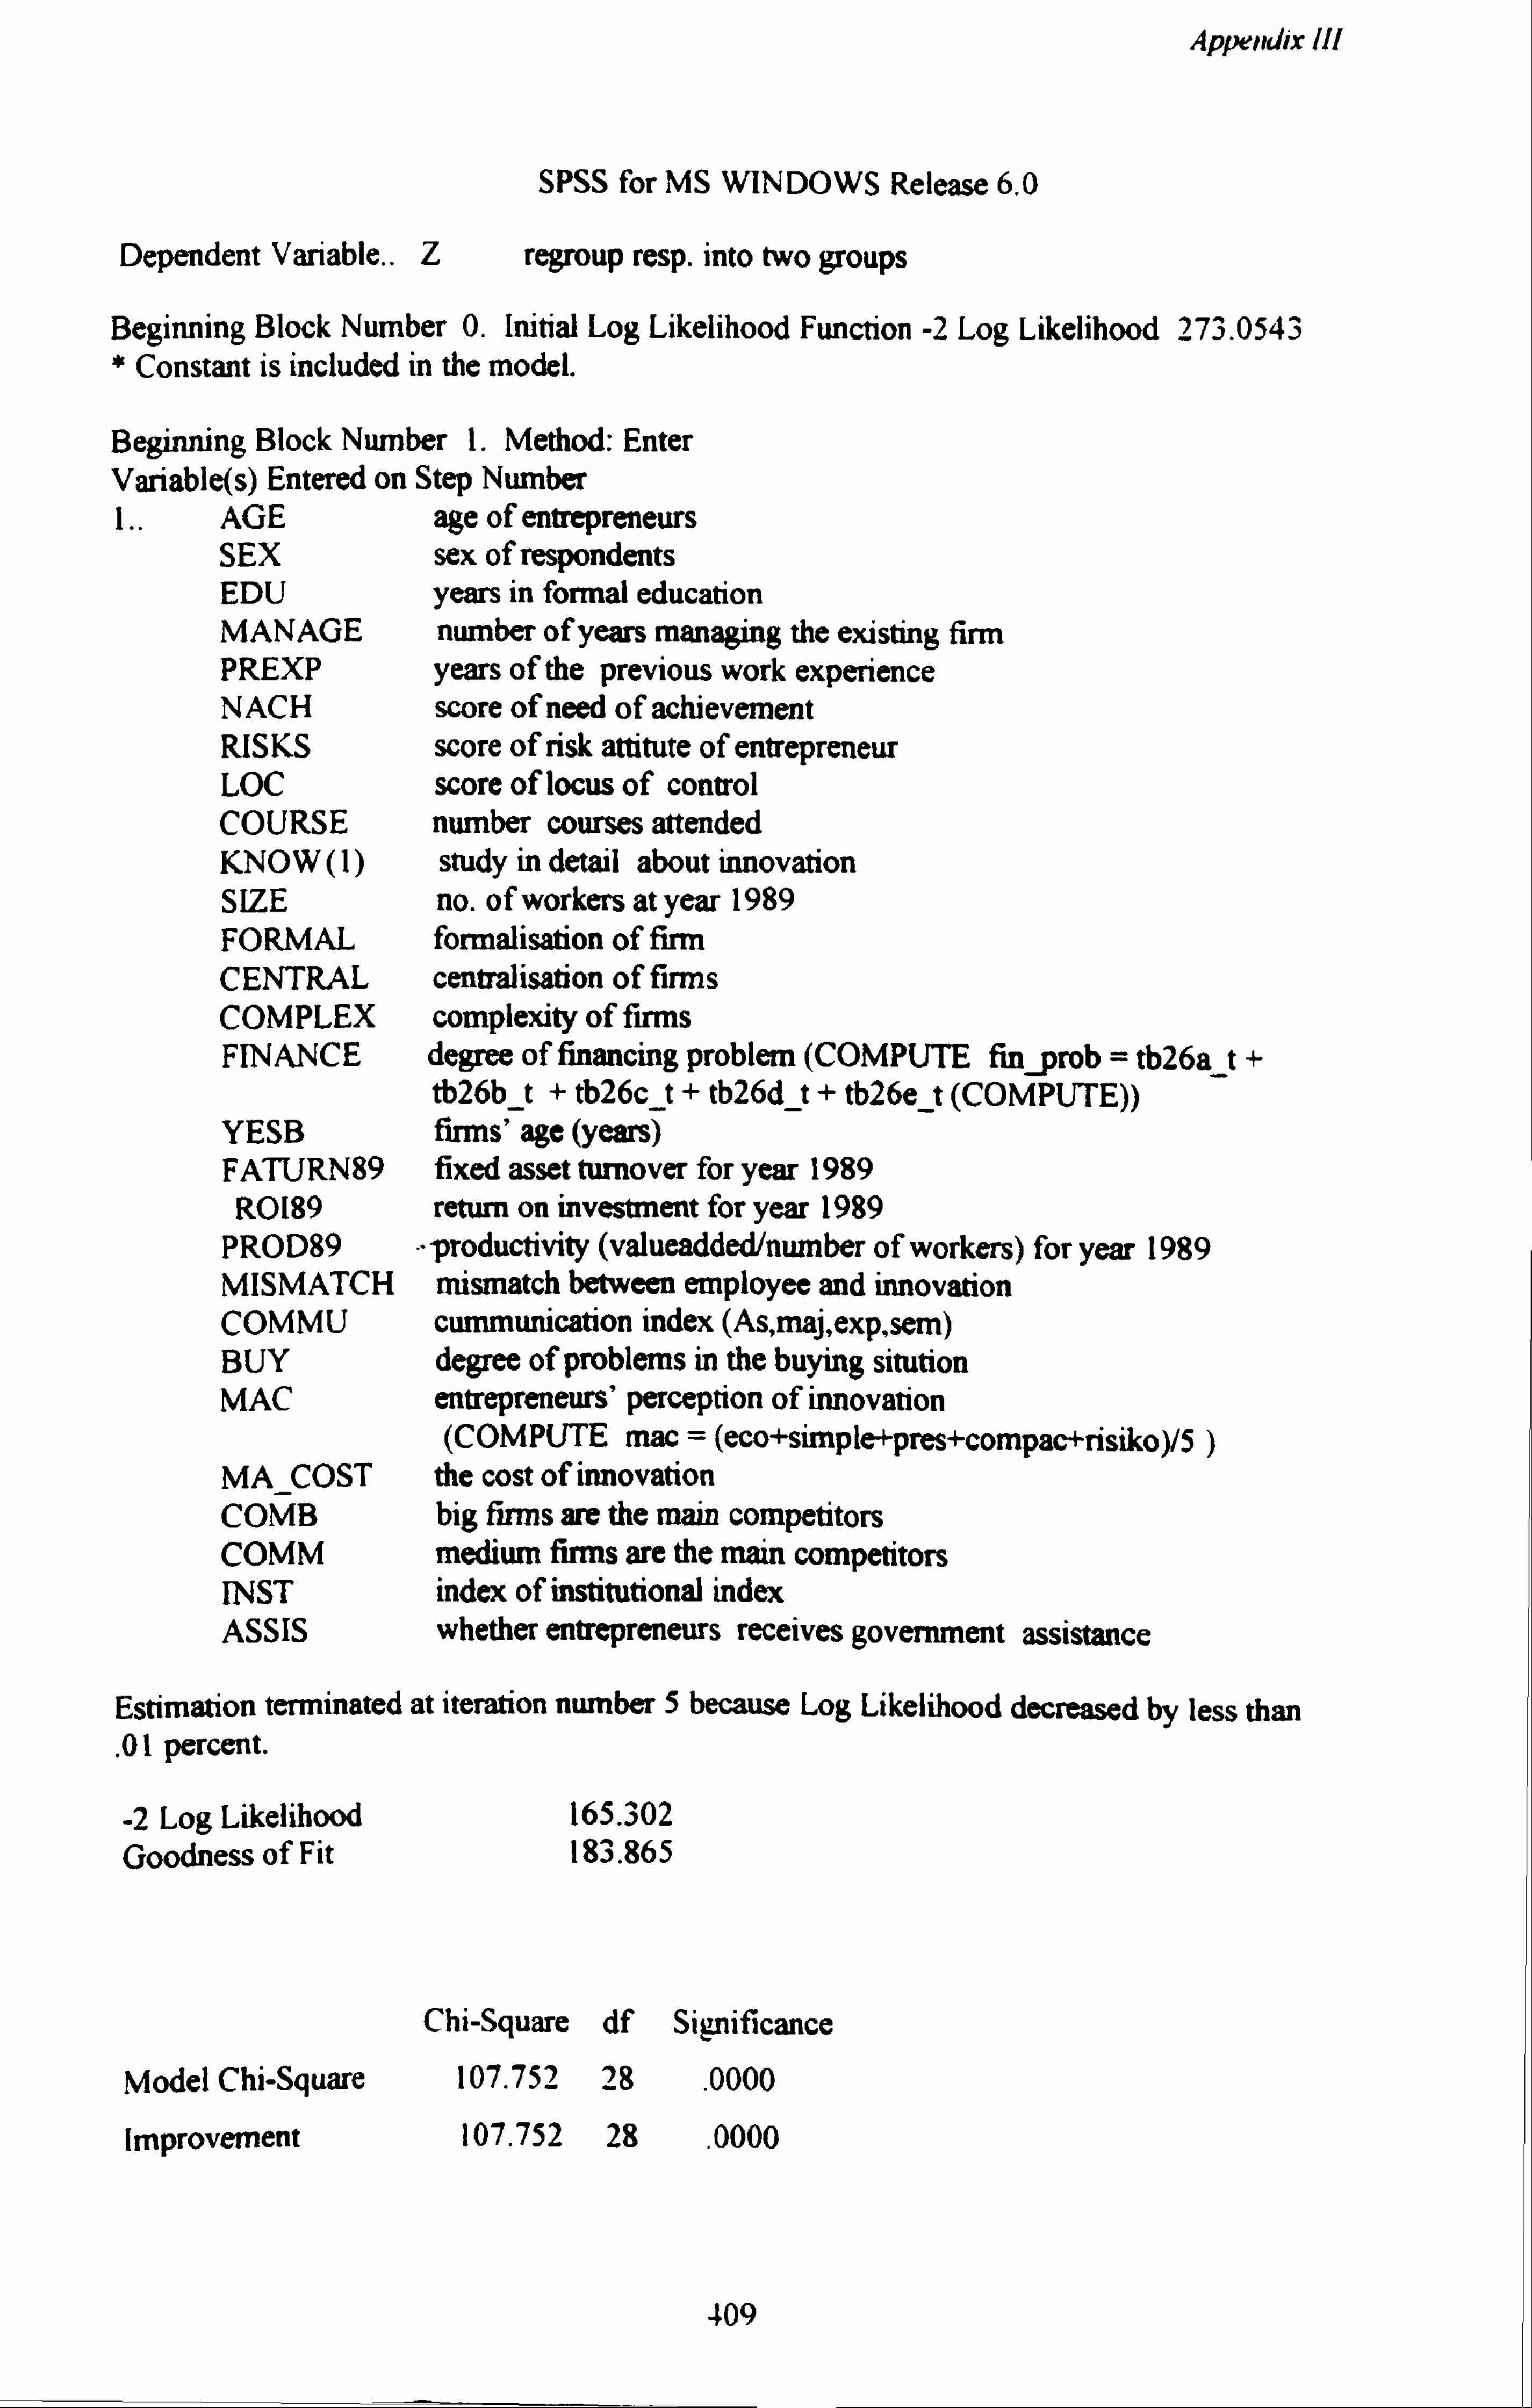
Appendix Ill
SPSS for MS WINDOWS Release 6.0
Dependent Variable.. Z regroup resp. into two groups
Beginning Block Number 0. Initial Log Likelihood Function -2 Log Likelihood 273.0543 * Constant is included in the model.
Beginning Block Number 1. Method: Enter Variable(s) Entered on Step Number L. AGE age of entrepreneurs
SEX sex of respondents EDU years in formal education MANAGE number of years managing the existing firm PREXP years of the previous work experience NACH score of need of achievement RISKS score of risk attitute of entrepreneur LOC score of locus of control COURSE number courses attended KNOW (1) study in detail about innovation SIZE no. of workers at year 1989 FORMAL formalisation of firm CENTRAL centralisation of firms COMPLEX complexity of firms FINANCE degree of financing problem (COMPUTE fin_prob = tb26a_t +
tb26b_t + tb26c_t + tb26d_t + tb26e t (COMPUTE)) YESB firms' age (years) FATURN89 fixed asset turnover for year 1989 RO189 return on investment for year 1989
PROD89 -productivity (valueadded/number of workers) for year 1989 MISMATCH mismatch between employee and innovation COMMU cummunication index (As, maj, exp, sem) BUY degree of problems in the buying sitution MAC entrepreneurs' perception of innovation
(COMPUTE mac = (eco+simple+pres+compac+risiko)/5 ) MA COST the cost of innovation COMB big firms are the main competitors COMM medium firms are the main competitors INST index of institutional index ASSIS whether entrepreneurs receives government assistance
Estimation terminated at iteration number 5 because Log Likelihood decreased by less than
. 01 percent.
-2 Log Likelihood Goodness of Fit
Model Chi-Square
165.302 183.865
Chi-Square df
107.752 28
Improvement 107.752 28
Significance
. 0000
. 0000
409
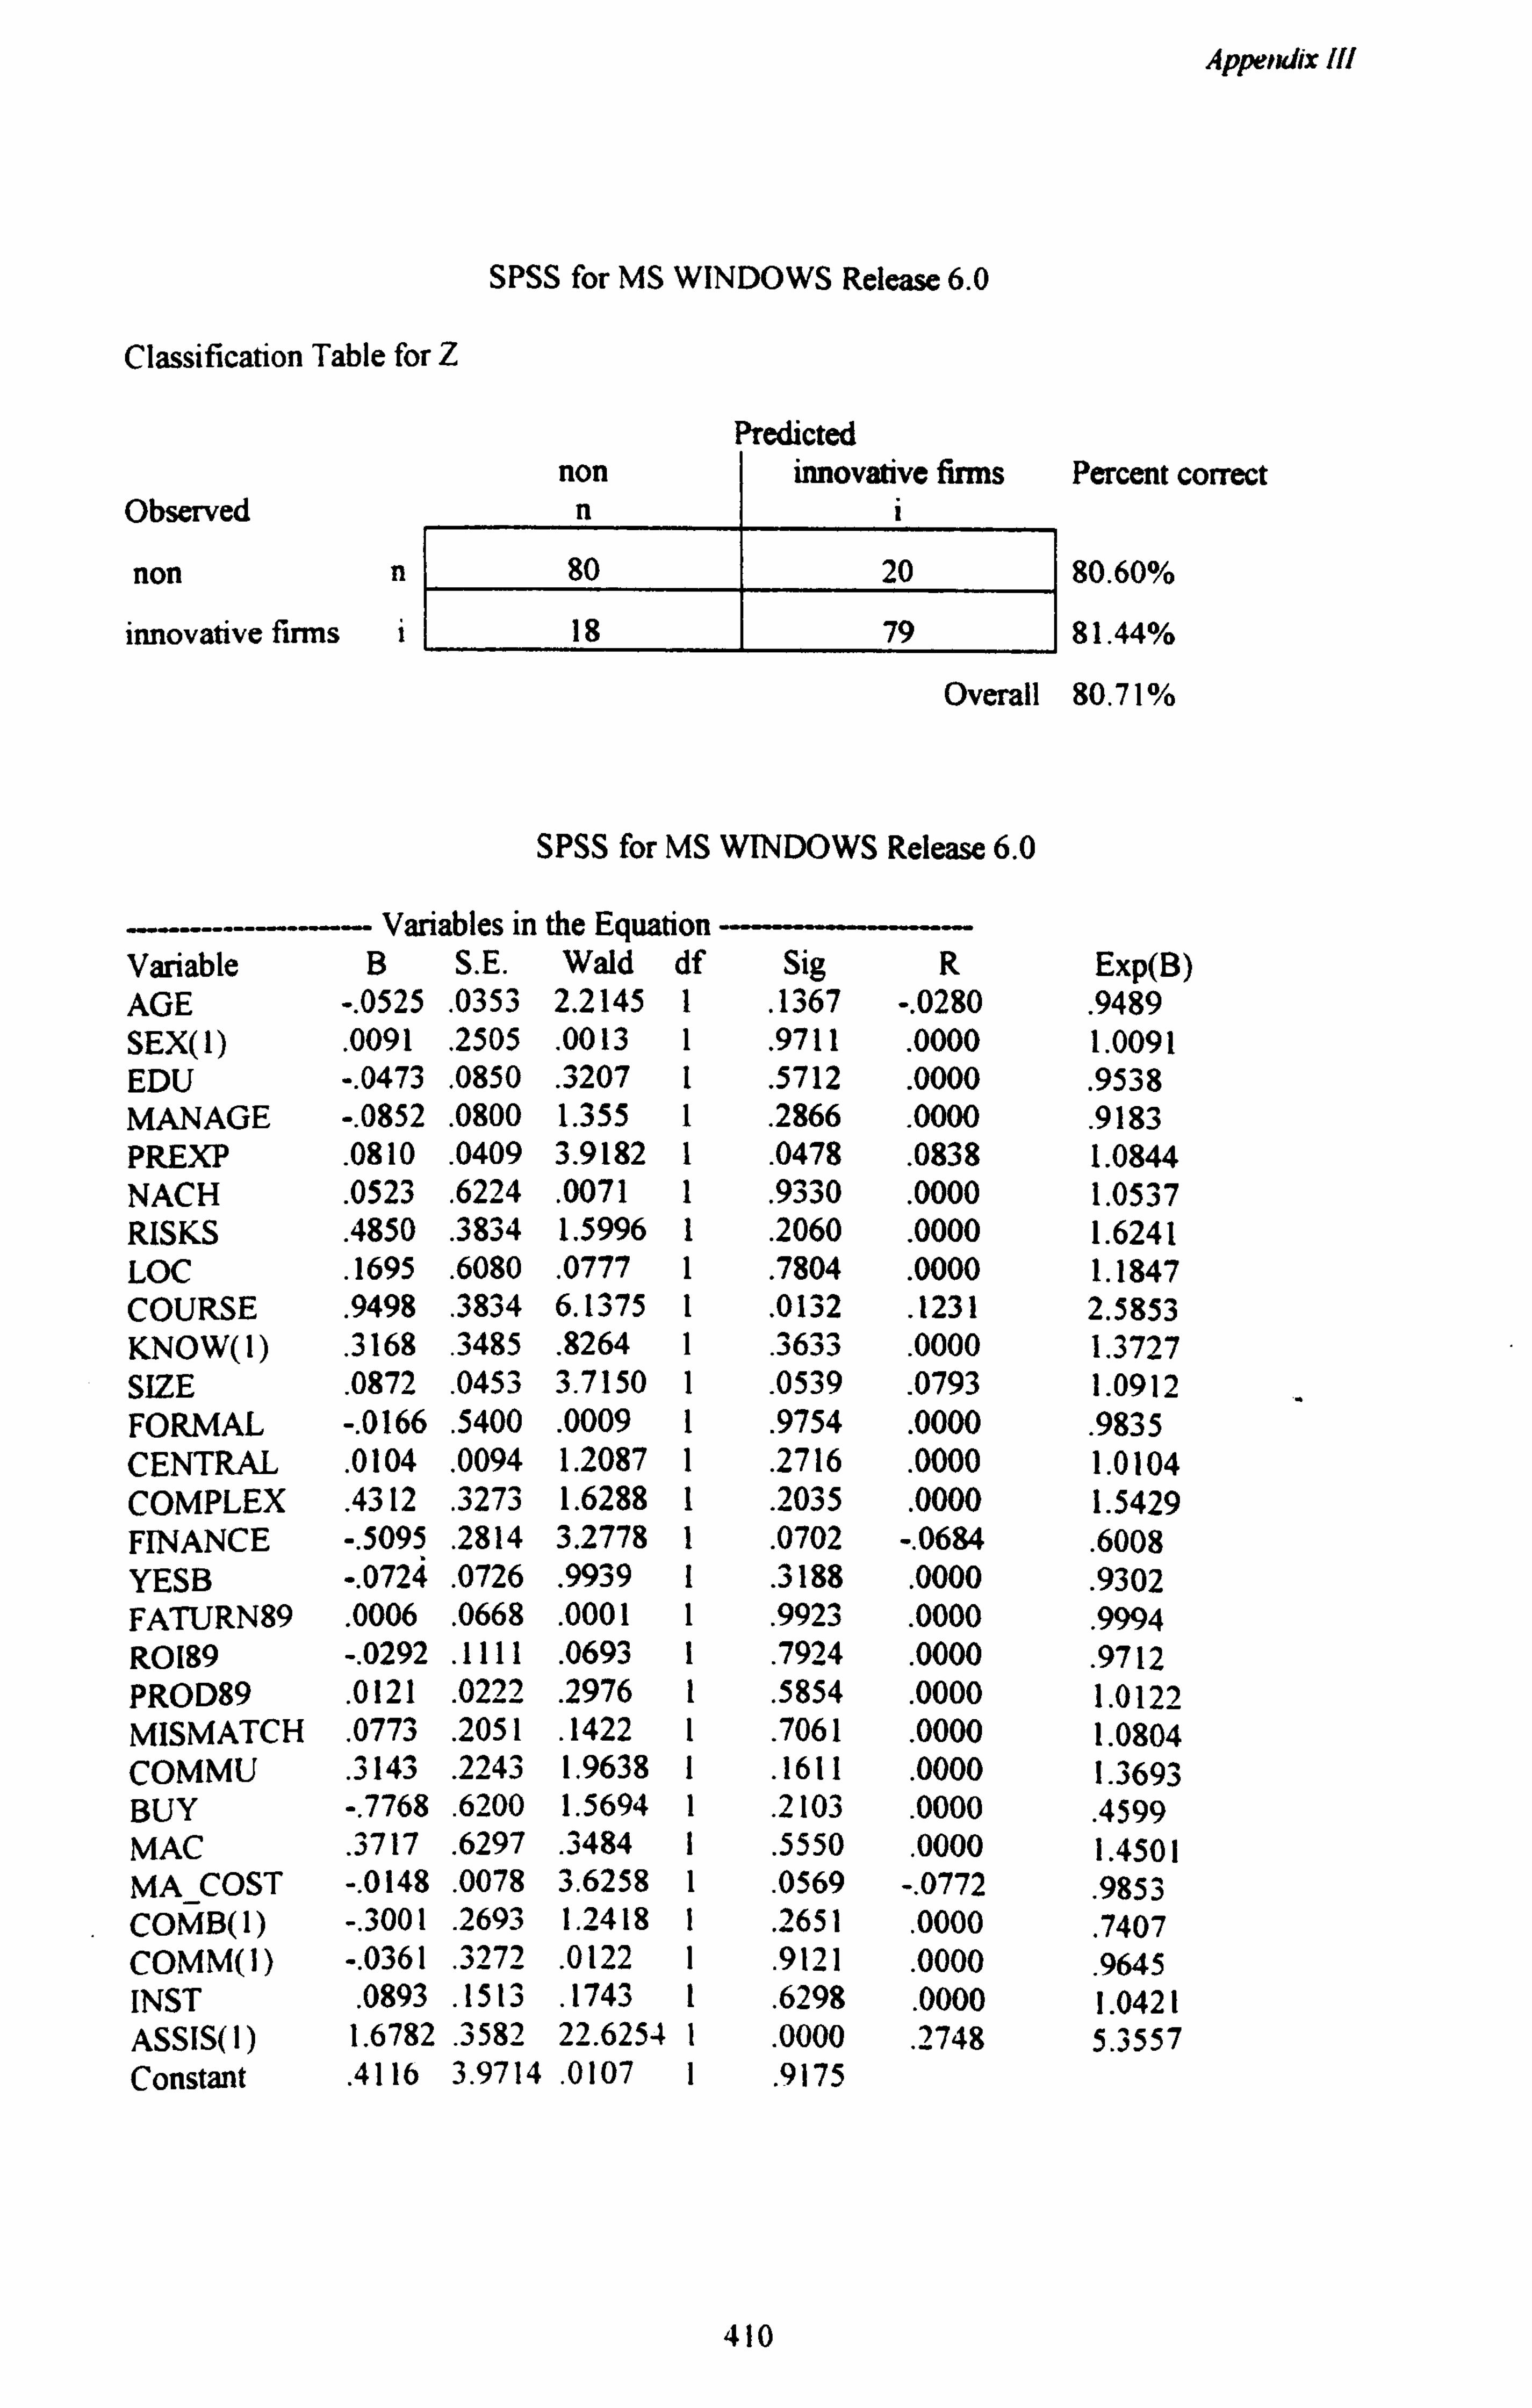
Appendix IU
SPSS for MS WINDOWS Release 6.0
Classification Table for Z
Observed
non n
innovative firms i
Predicted non
n innovative firms
i
80 20
18 79
Percent correct
80.60%
81.44%
Overall 80.71 %
SPSS for MS WINDOWS Release 6.0
Variables in the Equation Variable B S. E. Wald df AGE -. 0525 . 0353 2.2145 1 SEX(l) . 0091 . 2505 . 0013 1 EDU -. 0473 . 0850 . 3207 1 MANAGE -. 0852
. 0800 1.355 1
PREXP . 0810
. 0409 3.9182 1
NACH . 0523 . 6224 . 0071 1 RISKS . 4850 . 3834 1.5996 1 LOC .
1695 . 6080 .
0777 1 COURSE . 9498 . 3834 6.1375 1 KNOW(1) . 3168 . 3485 . 8264 1 SIZE . 0872 . 0453 3.7150 1 FORMAL -. 0166 . 5400 . 0009 1 CENTRAL . 0104 . 0094 1.2087 1 COMPLEX .
4312 . 3273 1.6288 1 FINANCE -. 5095 . 2814 3.2778 1 YESB -. 0724 . 0726 . 9939 1 FATURN89 . 0006 . 0668 . 0001 1 R0189 -. 0292 . 1111 .
0693 1 PROD89 . 0121 . 0222 . 2976 1 MISMATCH . 0773 . 2051 . 1422 1 COMMU . 3143 . 2243 1.9638 1 BUY -. 7768
. 6200 1.5694 1
MAC . 3717 . 6297 . 3484 1 MA_COST -. 0148
. 0078 3.6258 1
COMB(1) -. 3001 . 2693 1.2418
COMM(1) -. 0361 . 3272 . 0122 1 INST .
0893 . 1513 . 1743 1 ASSIS(I) 1.6782 . 3582 22.6254 1 Constant .
4116 3.9714 . 0107 1
Sig R Exp(B) 13 )67 -. 0280
. 9489
. 9711 . 0000 1.0091
. 5712 . 0000
. 9538
. 2866 . 0000
. 9183
. 0478
. 0838 1.0844
. 9330 . 0000 1.0537
. 2060 . 0000 1.6241
. 7804 . 0000 1.1847
. 0132
. 1231 2.5853
. 3633 . 0000 1.3727
. 0539 . 0793 1.0912
. 9754 . 0000 . 9835
. 2716 . 0000 1.0104
. 2035 . 0000 1.5429
. 0702 -. 0684 . 6008
.3 188 . 0000 . 9302
. 9923 . 0000 . 9994
. 7924 . 0000 . 9712
. 5854 . 0000 1.0122
. 7061 . 0000 1.0804
. 1611 . 0000 1.3693
. 2103
. 0000
. 4599
. 5550
. 0000 1.4501
. 0569 -. 0772 . 9853
. 2651
. 0000
. 7407
. 9121 . 0000
. 9645 . 6298
. 0000 1.0421 . 0000
. 2748 5.3557
. 9175
410
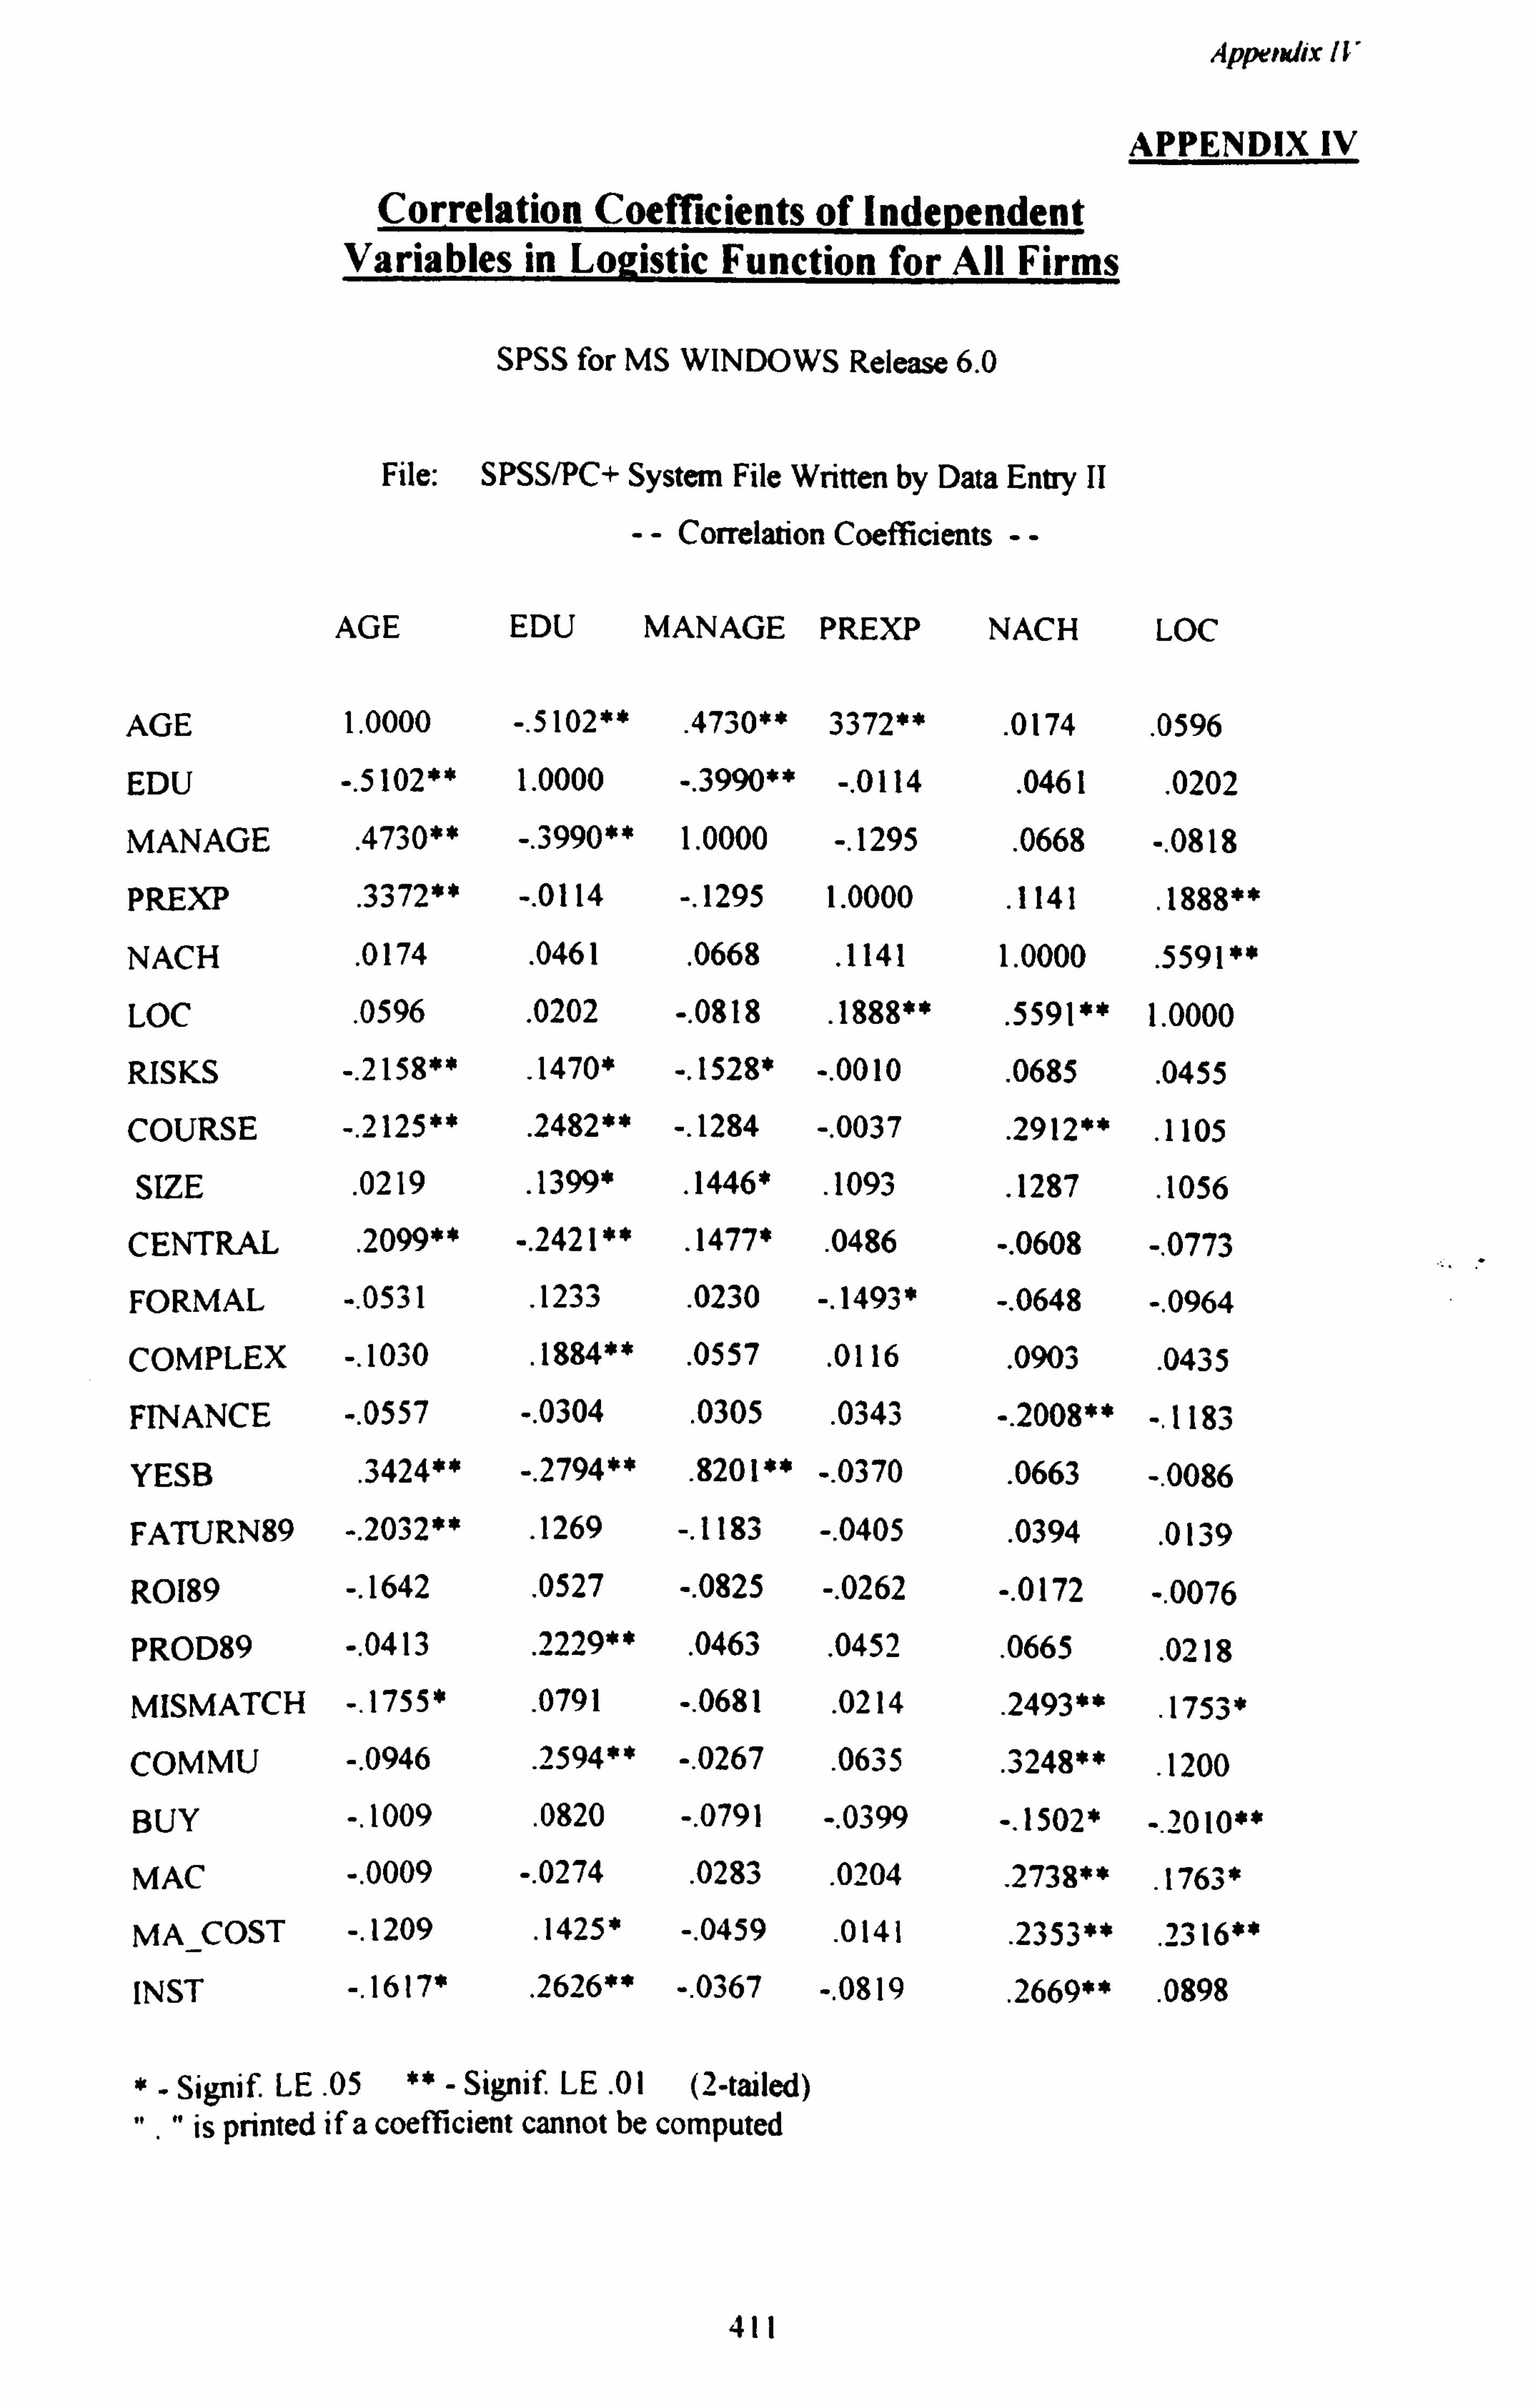
Appendix It'
APPENDIX IV
Correlation Coefficients of Independent Variables in Logistic Function for All Firms
SPSS for MS WINDOWS Release 6.0
File: SPSS/PC+ System File Written by Data Entry II
-- Correlation Coefficients --
AGE EDU MANAGE PREXP NACH LOC
AGE 1.0000 -. 5102** . 4730** 3372**
. 0174
. 0596
EDU -. 5102** 1.0000 -. 3990** -. 0114 . 0461 . 0202
MANAGE . 4730** -. 3990** 1.0000 -. 1295 . 0668 -. 0818
PREXP . 3372** -. 0114 -. 1295 1.0000 . 1141 . 1888**
NACH . 0174 . 0461 . 0668 . 1141 1.0000 . 5591**
LOC . 0596 . 0202 -. 0818 . 1888**
. 5591** 1.0000
RISKS -. 2158** . 1470* -. 1528* -. 0010 . 0685
. 0455
COURSE -. 2125** . 2482** -. 1284 -. 0037 . 2912** . 1105
SIZE . 0219 . 1399* . 1446* . 1093
. 1287 . 1056
CENTRAL . 2099** -. 2421** . 1477* . 0486 -. 0608 -. 0773
FORMAL -. 0531 . 1233
. 0230 -. 1493 -. 0648 -. 0964
COMPLEX -. 1030 . 1884** . 0557 . 0116 . 0903
. 0435
FINANCE -. 0557 -. 0304 . 0305 . 0343 -. 2008** -. 1183
YESB . 3424** -. 2794**
. 8201** -. 0370 . 0663 -. 0086
FATURN89 -. 2032** . 1269 -. 1183 -. 0405 . 0394
. 0139
R0189 -. 1642 . 0527 -. 0825 -. 0262 -. 0172 -. 0076
PROD89 -. 0413 . 2229** . 0463 . 0452
. 0665 . 0218
MISMATCH -. 1755* . 0791 -. 0681
. 0214
. 2493**
. 1753*
COMMU -. 0946 . 2594** -. 0267 . 0635
. 3248** . 1200
BUY -. 1009 . 0820 -. 0791 -. 0399 -. 1502* -. 2010**
MAC -. 0009 -. 0274 . 0283 . 0204
. 2738** . 1763*
MA COST -. 1209 . 1425* -. 0459 . 0141
. 2353** . 2316**
INST -. 1617* . 2626** -. 0367 -. 0819 . 2669** . 0898
*- Signif. LE. 05 ** - Signif. LE . 01 (2-tailed) ". " is printed if a coefficient cannot be computed
411
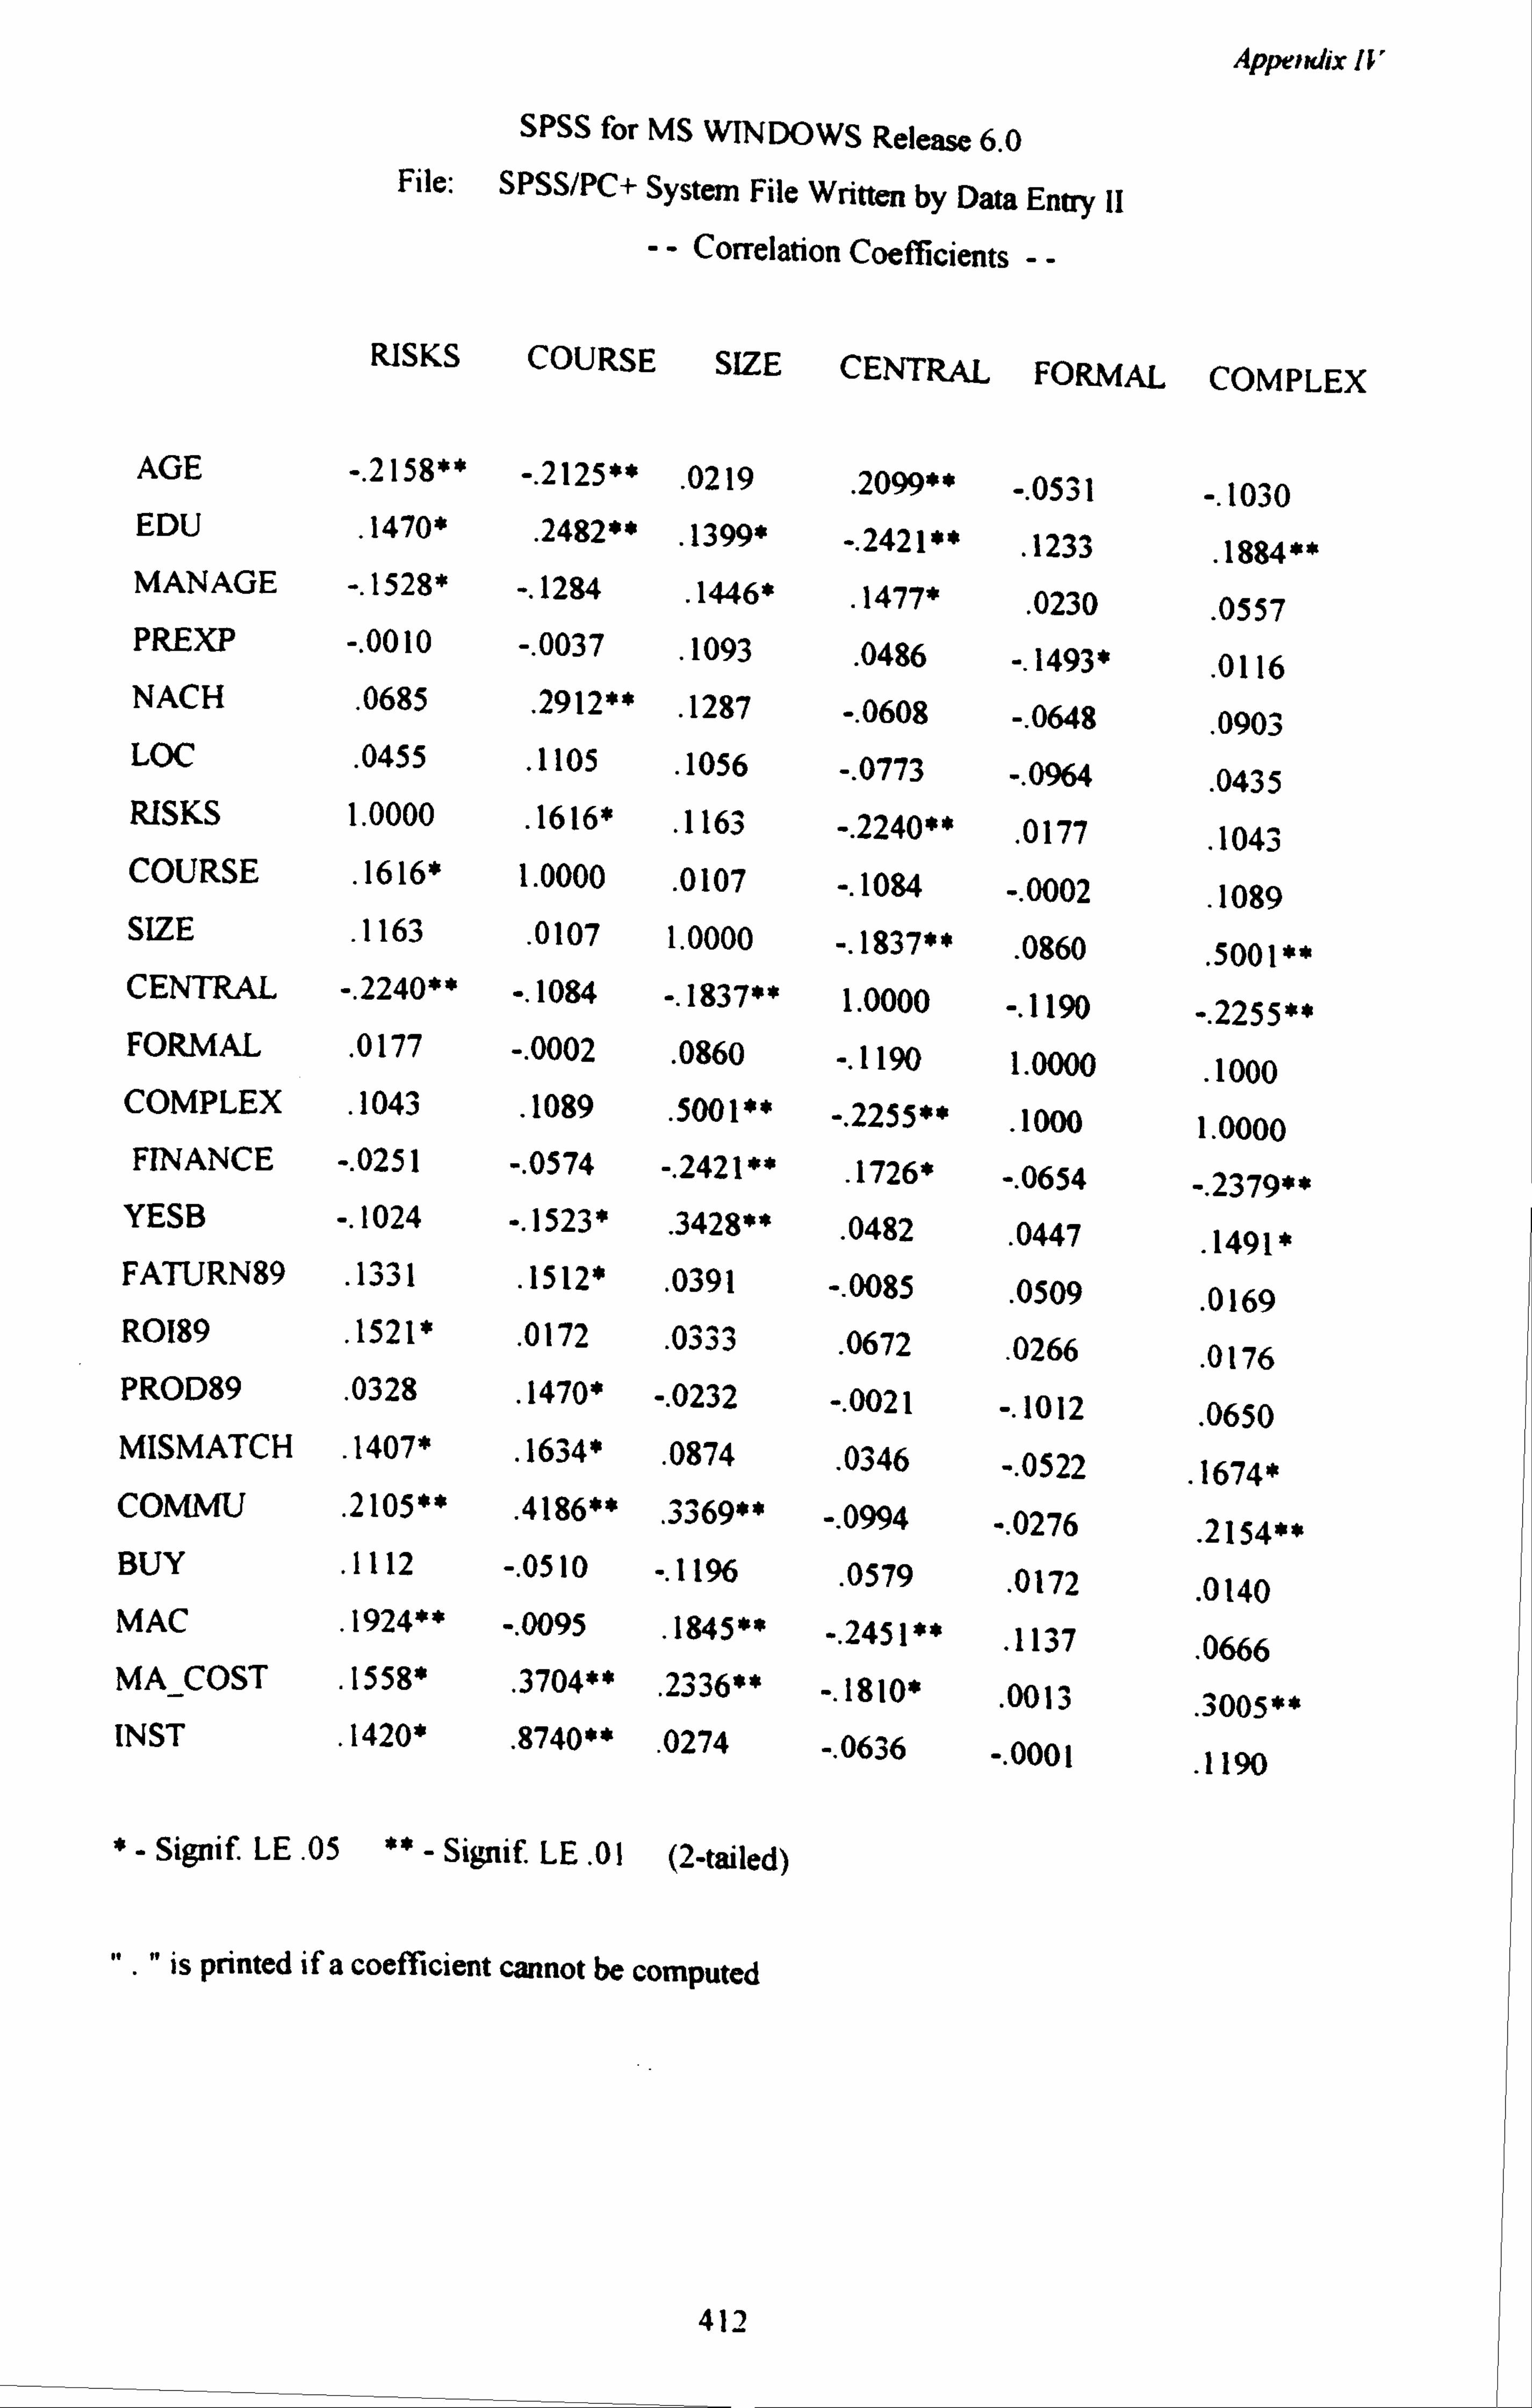
Appendix /V
SPSS for MS WINDOWS Release 6.0 File: SPSS/PC+ System File Written by Data Entry 11
-- Correlation Coefficients --
RISKS COURSE SIZE CENTRAL FORMAL COMPLEX
AGE -. 2158** -. 2125** . 0219
. 2099** -. 0531 -. 1030 EDU
. 1470*
. 2482**
. 1399* -. 2421** . 1233
. 1884**
MANAGE -. 1528* -. 1284 . 1446*
. 1477* . 0230
. 0557
PREXP -. 0010 -. 0037 . 1093
. 0486 -. 1493* . 0116
NACH . 0685
. 2912** . 1287 -. 0608 -. 0648
. 0903 LOC
. 0455 . 1105
. 1056 -. 0773 -. 0964 . 0435
RISKS 1.0000 . 1616*
. 1163 -. 2240** . 0177
. 1043 COURSE
. 1616* 1.0000 . 0107 -. 1084 -. 0002
. 1089 SIZE
. 1163 . 0107 1.0000 -. 1837**
. 0860 . 5001**
CENTRAL -. 2240** -. 1084 -. 1837** 1.0000 -. 1190 -. 2255** FORMAL
. 0177 -. 0002 . 0860 -. 1190 1.0000
. 1000 COMPLEX
. 1043 . 1089
. 5001** -. 2255** . 1000 1.0000
FINANCE -. 0251 -. 0574 -. 2421** . 1726* -. 0654 -. 2379**
YESB -. 1024 -. 1523* . 3428**
. 0482 . 0447
. 1491* FATURN89 . 1331
. 1512* . 0391 -. 0085
. 0509 . 0169
R0189 . 1521*
. 0172 . 0333
. 0672 . 0266
. 0176 PROD89 . 0328
. 1470* -. 0232 -. 0021 -. 1012 . 0650
MISMATCH . 1407* . 1634*
. 0874 . 0346 -. 0522
. 1674* COMMU .
2105** . 4186**
. 3369** -. 0994 -. 0276 . 2154**
BUY . 1112 -. 0510 -. 11% . 0579
. 0172 . 0140
MAC . 1924** -. 0095 . 1845** -. 2451**
. 1137 . 0666
MA_COST . 1558* . 3704**
. 2336** -. 1810* 0013 . 3005**
INST . 1420*
. 8740**
. 0274 -. 0636 -. 0001
. 1190
*- Signif. LE. 05 ** - Signif. LE. 01 (2-tailed)
". " is printed if a coefficient cannot be computed
412
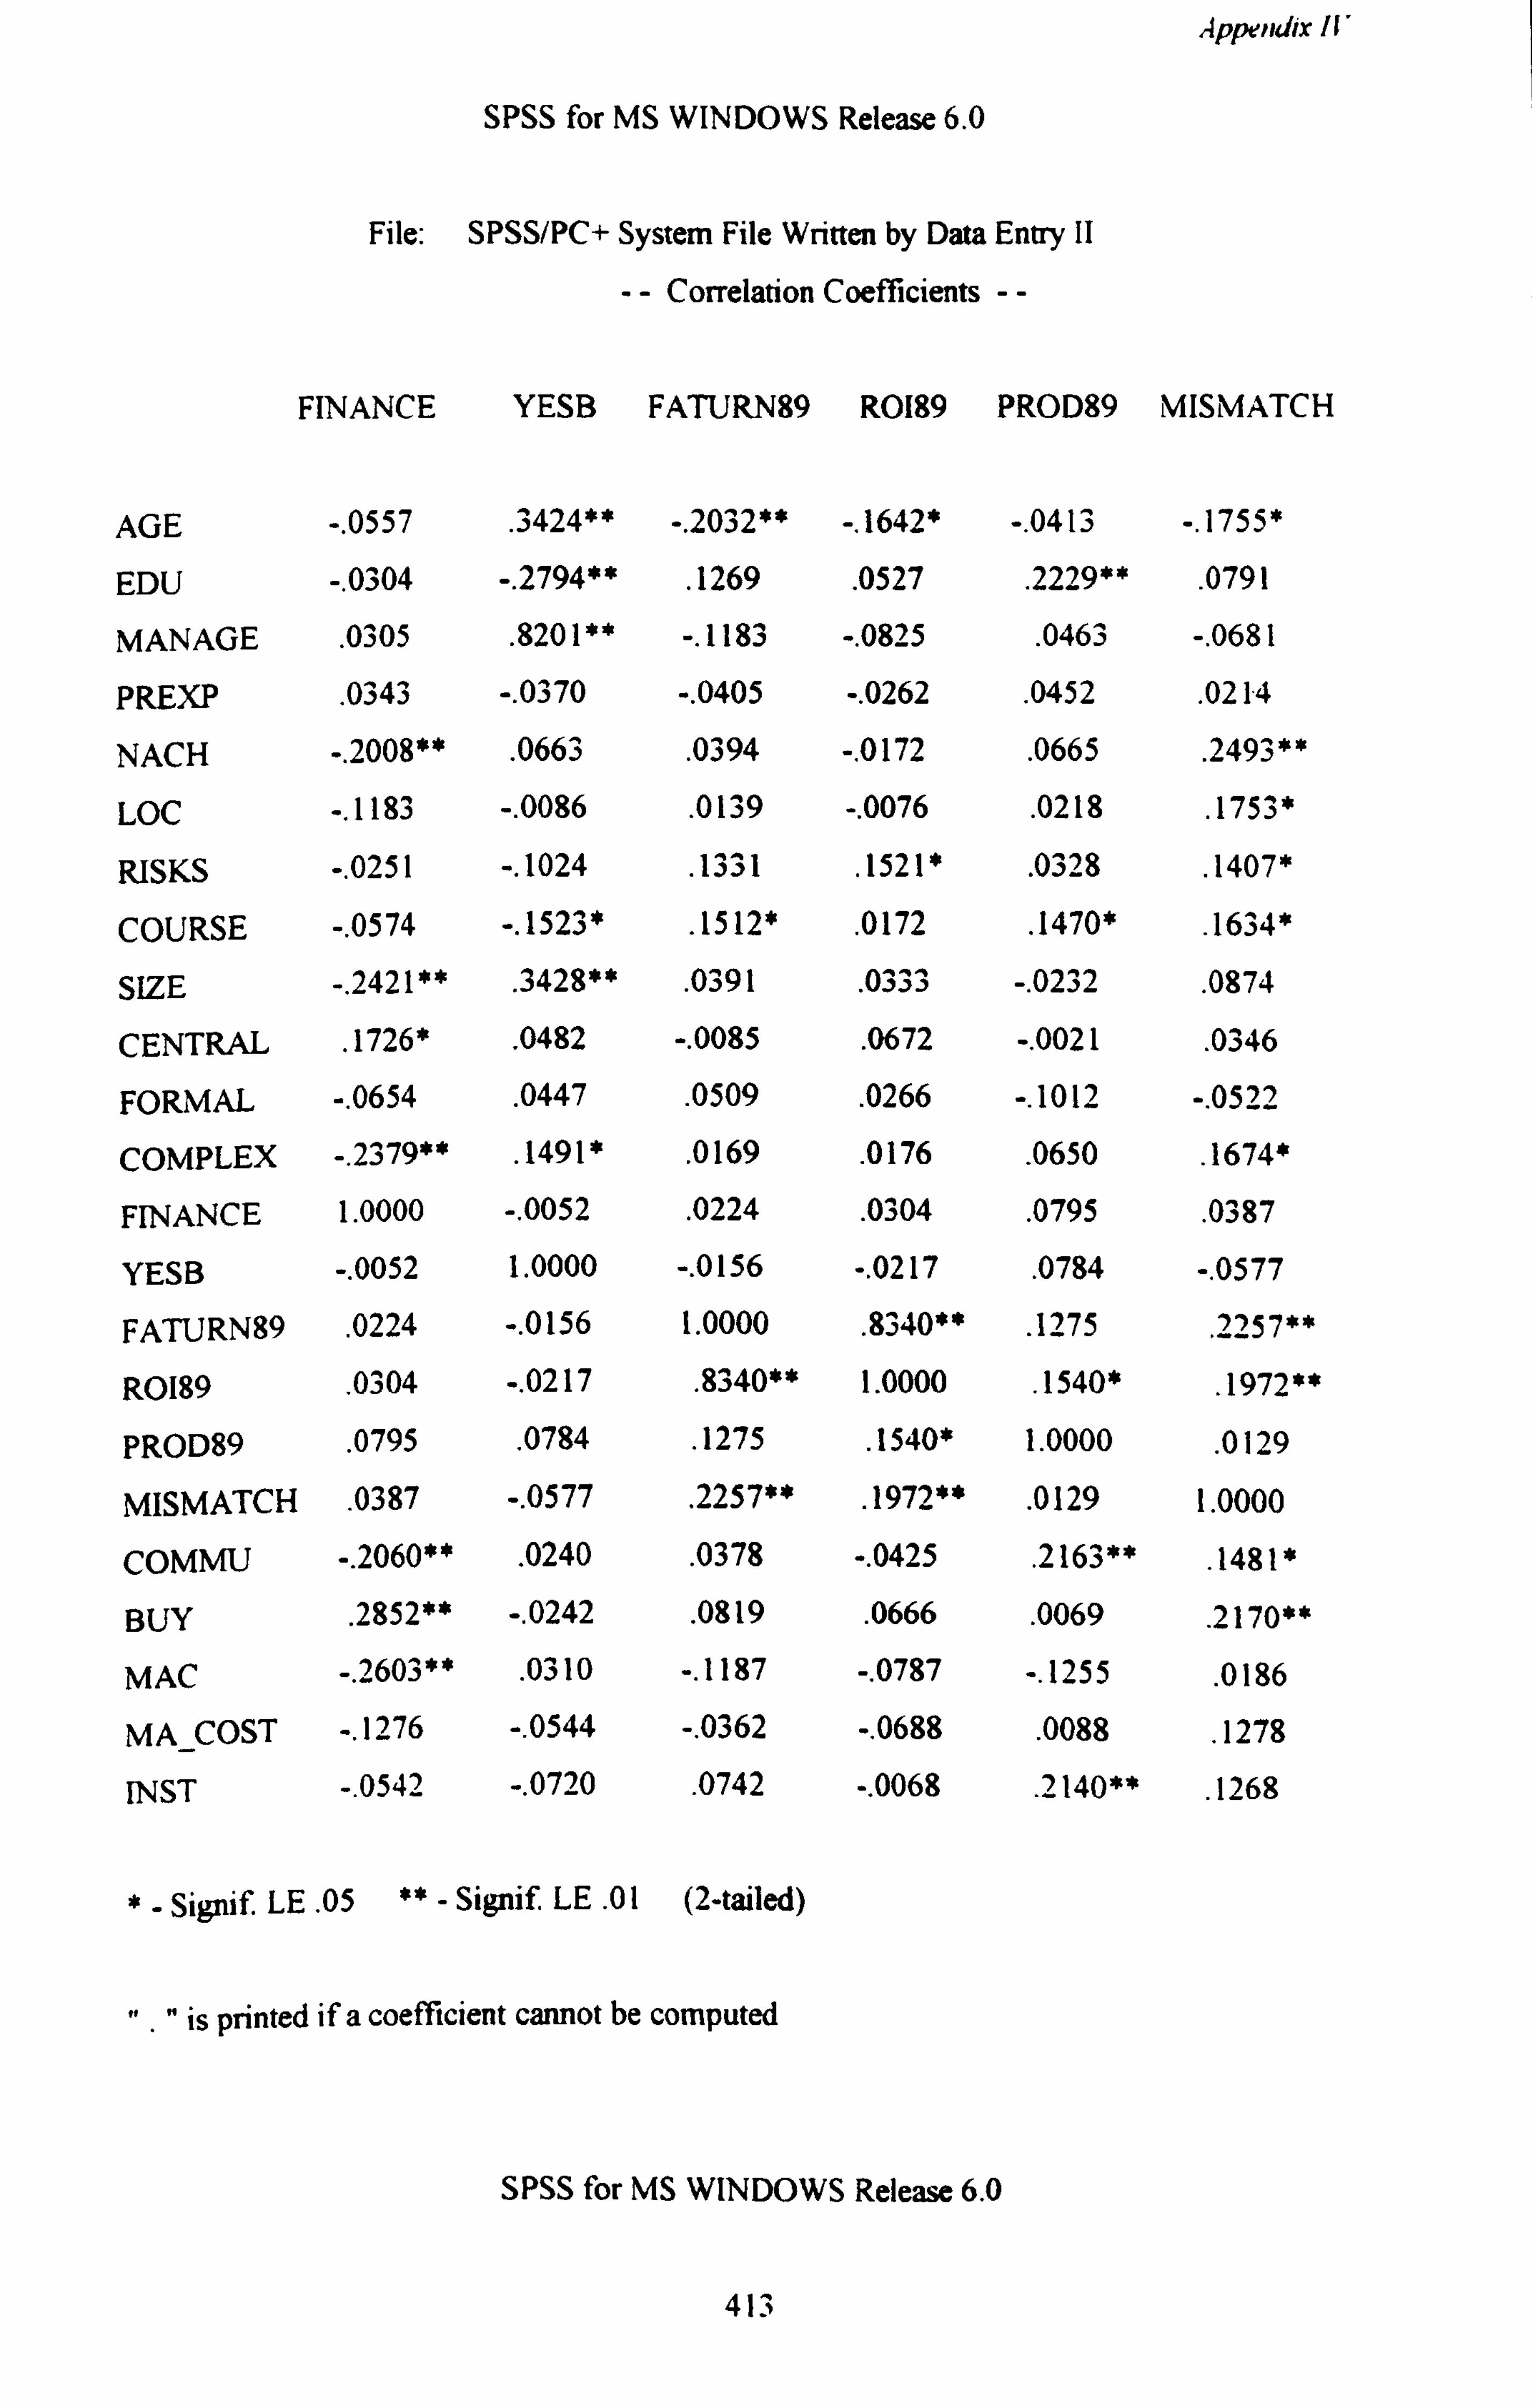
Appendix Ii
SPSS for MS WINDOWS Release 6.0
File: SPSS/PC+ System File Written by Data Entry II
-- Correlation Coefficients --
FINANCE YESB FATURN89 R0189 PROD89 MISMATCH
AGE -. 0557 . 3424** -. 2032** 1642* -. 0413 -. 1755*
EDU -. 0304 -. 2794** . 1269 . 0527 . 2229** . 0791
MANAGE . 0305 .
8201 ** -. 1183 -. 0825 . 0463 -. 0681
PREXP . 0343 -. 0370 -. 0405 -. 0262
. 0452
. 0214
NACH -. 2008** . 0663 . 0394 -. 0172 . 0665 . 2493**
LOC -. 1183 -. 0086 . 0139 -. 0076 . 0218 . 1753*
RISKS -. 0251 -. 1024 . 1331 . 1521* . 0328 . 1407*
COURSE -. 0574 -. 1523* . 1512* . 0172 . 1470*
. 1634*
SIZE -. 2421** . 3428** . 0391 . 0333 -. 0232 . 0874
CENTRAL . 1726* .
0482 -. 0085 . 0672 -. 0021
. 0346
FORMAL -. 0654 . 0447 . 0509 . 0266 -. 1012 -. 0522
COMPLEX -. 2379** . 1491 *
. 0169
. 0176
. 0650
. 1674*
FINANCE 1.0000 -. 0052 . 0224 . 0304 . 0795 . 0387
YESB -. 0052 1.0000 -. 0156 -. 0217 . 0784 -. 0577
FATURN89 . 0224 -. 0156 1.0000 . 8340**
. 1275 . 2257**
R0189 . 0304 -. 0217 . 8340** 1.0000 . 1540* . 1972**
PROD89 . 0795 . 0784 . 1275 . 1540* 1.0000
. 0129
MISMATCH . 0387 -. 0577 . 2257**
. 1972** . 0129 1.0000
COMMU -. 2060** . 0240 . 0378 -. 0425 . 2163**
. 1481*
BUY . 2852** -. 0242
. 0819
. 0666
. 0069
. 2170**
MAC -. 2603** . 0310 -. 1187 -. 0787 -. 1255 . 0186
MA COST -. 1276 -. 0544 -. 0362 -. 0688 . 0088
. 1278
INST -. 0542 -. 0720 . 0742 -. 0068
. 2140**
. 1268
*- Signif. LE . 05 ** - Signif. LE . 01 (2-tailed)
". " is printed if a coefficient cannot be computed
SPSS for MS WINDOWS Release 6.0
413
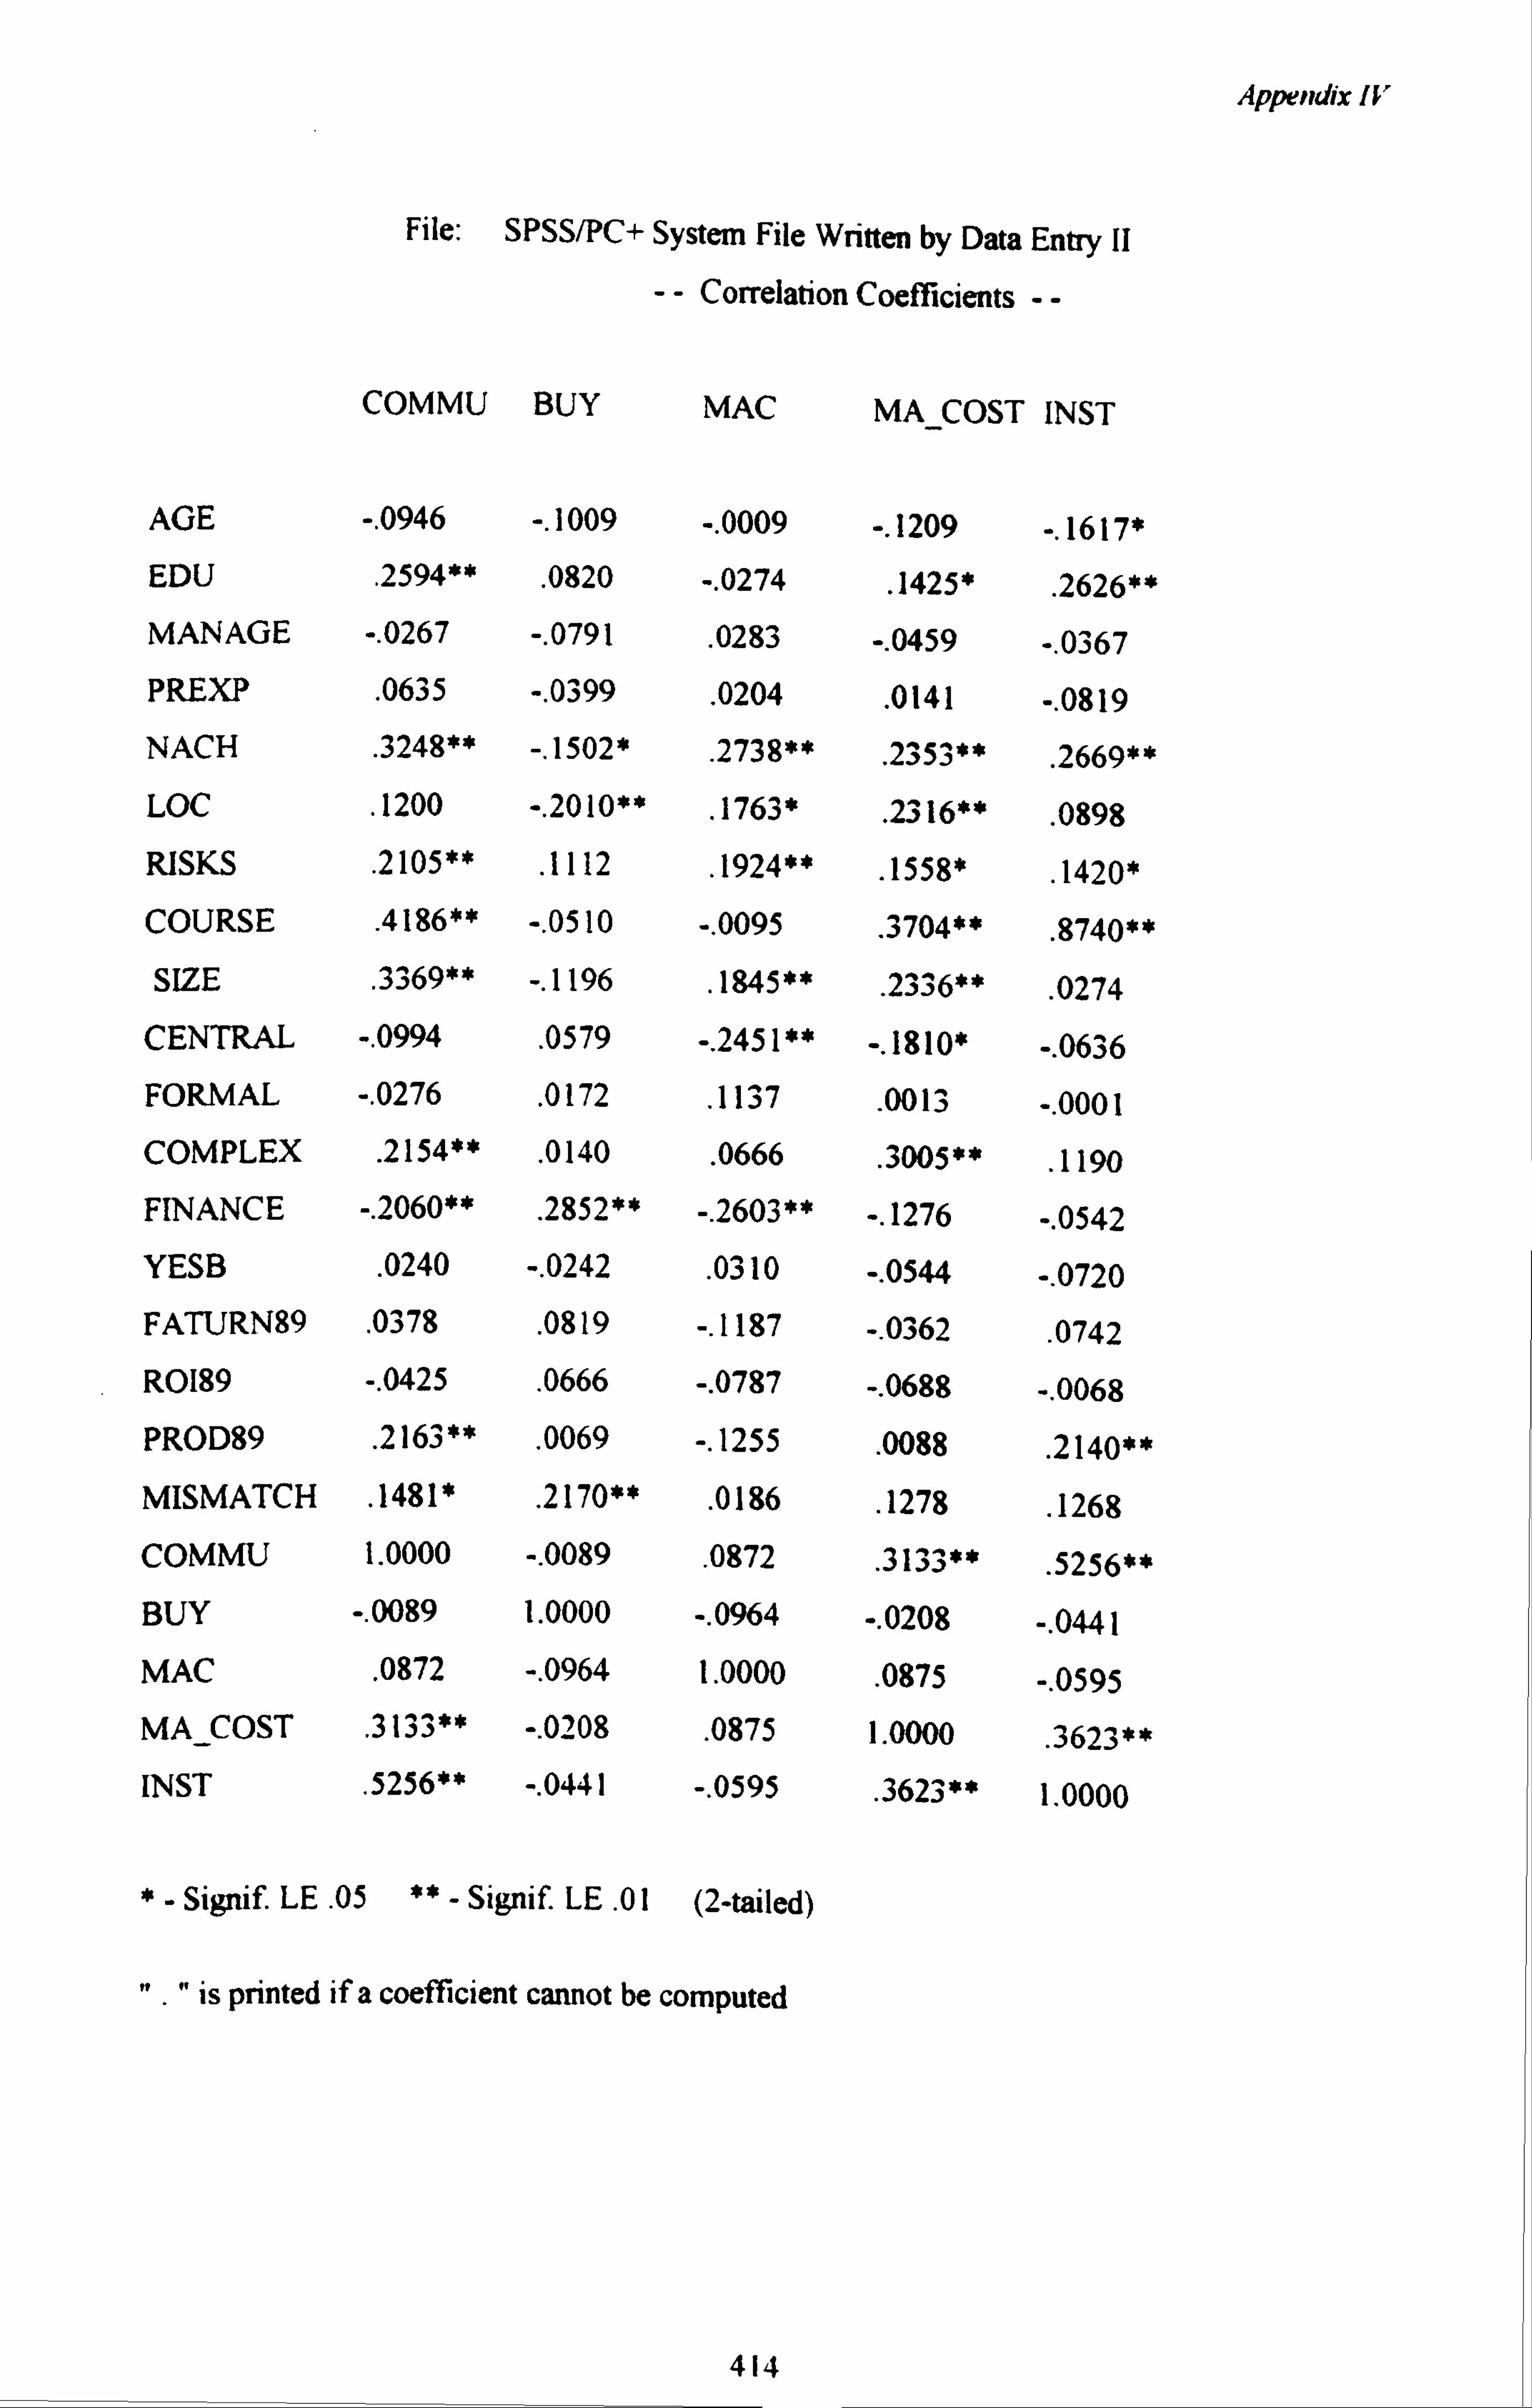
Appendix IV
File: SPSS/PC+ System File Written by Data Entry II
-- Correlation Coefficients --
COMMU BUY MAC MA COST INST
AGE -. 0946 -. 1009 -. 0009 -. 1209 -. 1617* EDU . 2594**
. 0820 -. 0274
. 1425* . 2626**
MANAGE -. 0267 -. 0791 . 0283 -. 0459 -. 0367
PREXP . 0635 -. 0399 . 0204
. 0141 -. 0819 NACH .
3248** -. 1502* . 2738**
. 2353**
. 2669**
LOC . 1200 -. 2010** . 1763*
. 2316** . 0898
RISKS . 2105** . 1112
. 1924** . 1558*
. 1420* COURSE . 4186** -. 0510 -. 0095
. 3704** . 8740**
SIZE . 3369** -. 1196 . 1845**
. 2336** . 0274
CENTRAL -. 0994 . 0579 -. 2451** -. 1810* -. 0636
FORMAL -. 0276 . 0172
. 113 7
. 0013 -. 0001
COMPLEX . 2154** . 0140 . 0666
. 3005** . 1190
FINANCE -. 2060** . 2852** -. 2603** -. 1276 -. 0542
YESB . 0240 -. 0242 . 0310 -. 0544 -. 0720
FATURN89 . 0378 . 0819 -. 1187 -. 0362
. 0742 R0189 -. 0425
. 0666 -. 0787 -. 0688 -. 0068
PROD89 . 2163** . 0069 -. 1255
. 0088 . 2140*
MISMATCH . 1481* . 2170**
. 0186 . 1278
. 1268 COMMU 1.0000 -. 0089
. 0872
. 3133**
. 5256**
BUY -. 0089 1.0000 -. 0964 -. 0208 -. 0441
MAC . 0872 -. 0964 1.0000 . 0875 -. 0595
MA_COST . 31331* -. 0208 . 0875 1.0000
. 3623** INST .
5256** -. 0441 -. 0595 . 3623** 1.0000
*- Signif. LE . 05 ** - Signif. LE. 01 (2-tailed)
". " is printed if a coefficient cannot be computed
414
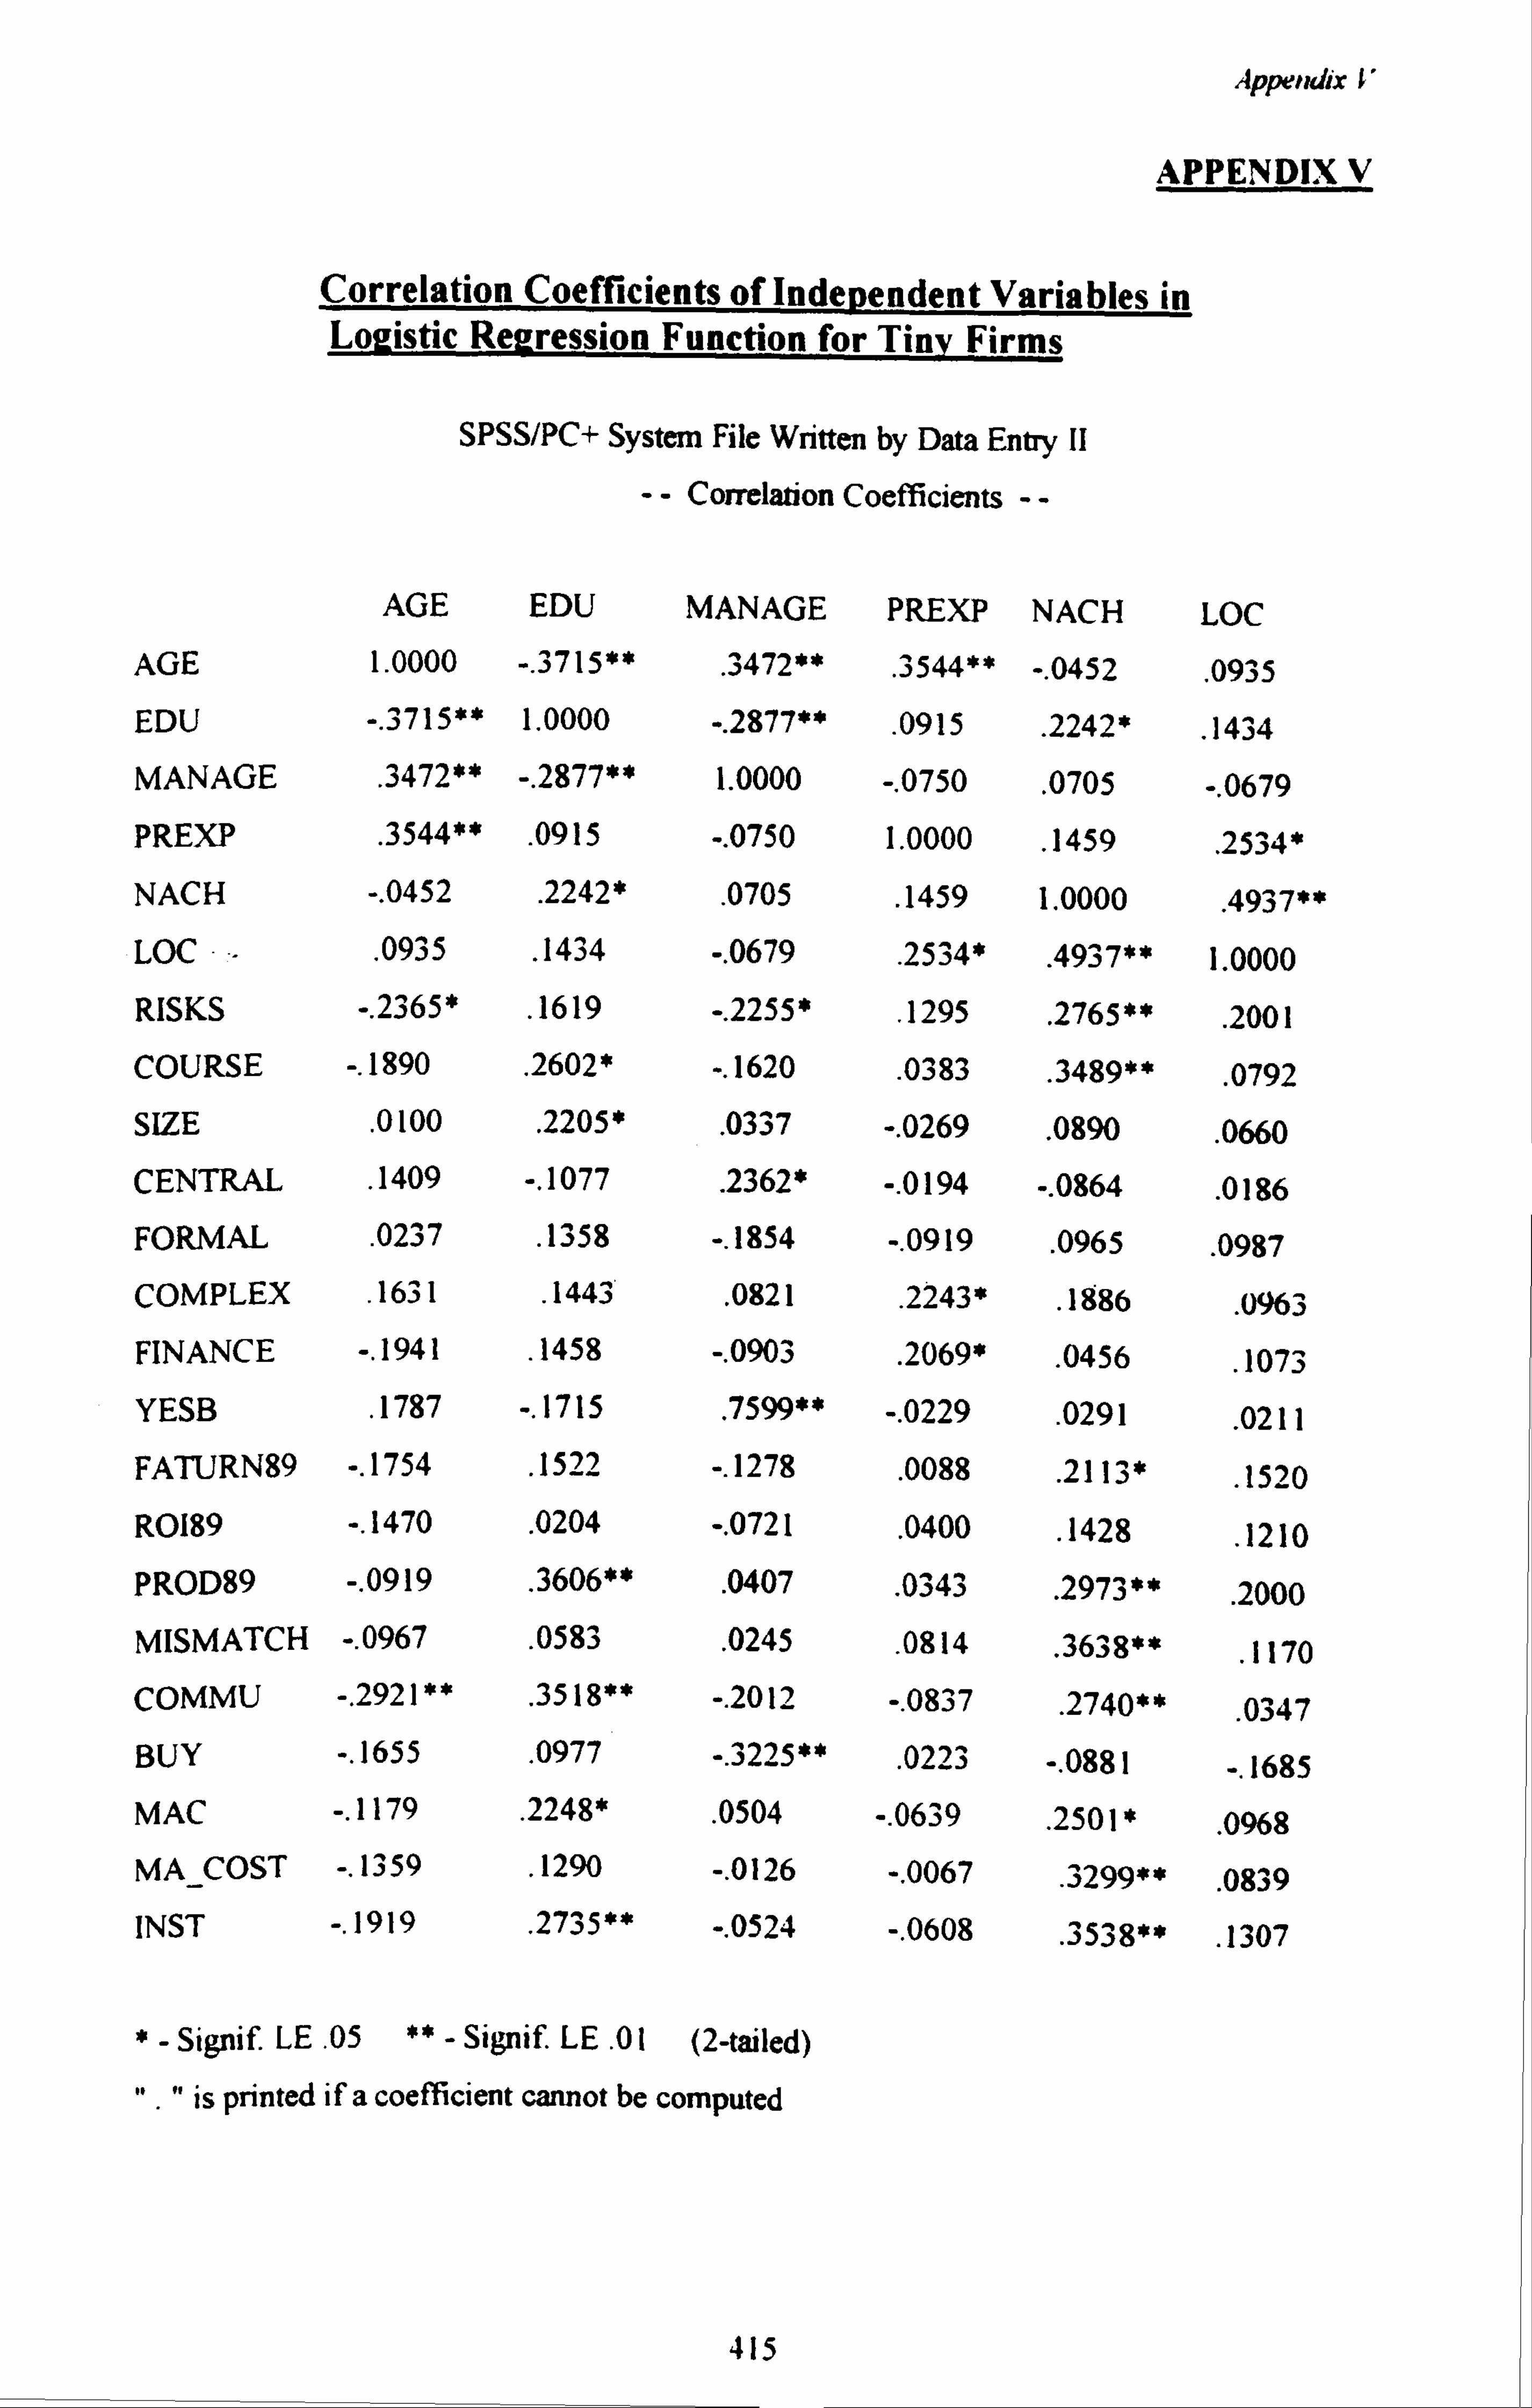
Appendix V
APPENDIX V
Correlation Coefficients of Independent Variables in Logistic Regression Function for Tiny Firms
SPSS/PC+ System File Written by Data Entry II
-- Correlation Coefficients --
AGE EDU MANAGE PREXP NACH LOC AGE 1.0000 -. 3715**
. 3472**
. 3544** -. 0452
. 0935
EDU -. 3715** 1.0000 -. 2877** . 0915
. 2242*
. 1434
MANAGE . 3472** -. 2877** 1.0000 -. 0750 . 0705 -. 0679
PREXP . 3544**
. 0915 -. 0750 1.0000
. 1459
. 2534*
NACH -. 0452 . 2242*
. 0705
. 1459 1.0000 . 4937**
LOC - . 0935
. 1434 -. 0679 . 2534*
. 4937** 1.0000 RISKS -. 2365*
. 1619 .. 2255* . 1295 . 2765**
. 2001 COURSE -. 1890
. 2602* -. 1620
. 0383
. 3489**
. 0792
SIZE . 0100 . 2205* . 0337 -. 0269
. 0890 . 0660
CENTRAL . 1409 -. 1077 . 2362* -. 0194 -. 0864
. 0186 FORMAL .
0237 . 1358 -. 1854 -. 0919
. 0965
. 0987
COMPLEX . 1631
. 1443
. 0821 . 2243*
. 1886 . 0963
FINANCE -. 1941 . 1458 -. 0903 . 2069*
. 0456 . 1073
YESB . 1787 -. 1715 1599** -. 0229 . 0291
. 0211 FATURN89 -. 1754 . 1522 -. 1278
. 0088 . 2113*
. 1520 R0189 -. 1470 . 0204 -. 0721
. 0400 . 1428
. 1210 PROD89 -. 0919 .
3606** . 0407
. 0343 . 2973**
. 2000 MISMATCH -. 0967 . 0583
. 0245 . 0814
. 3638** . 1170
COMMU -. 2921 ** . 3518** -. 2012 -. 0837
. 2740**
. 0347
BUY -. 1655 . 0977 0225**
. 0223 -. 0881
-. 1685
MAC -. 1179 . 2248* . 0504 -. 0639
. 2501 * . 0968
MA_COST -. 1359 . 1290 -. 0126 -. 0067
. 3299**
. 0839
INST -. 1919 . 2735** -. 0524 -. 0608
. 3538**
. 1307
*- Signif. LE . 05 ** - Signif. LE
. 01 (2-tailed)
". " is printed if a coefficient cannot be computed
415
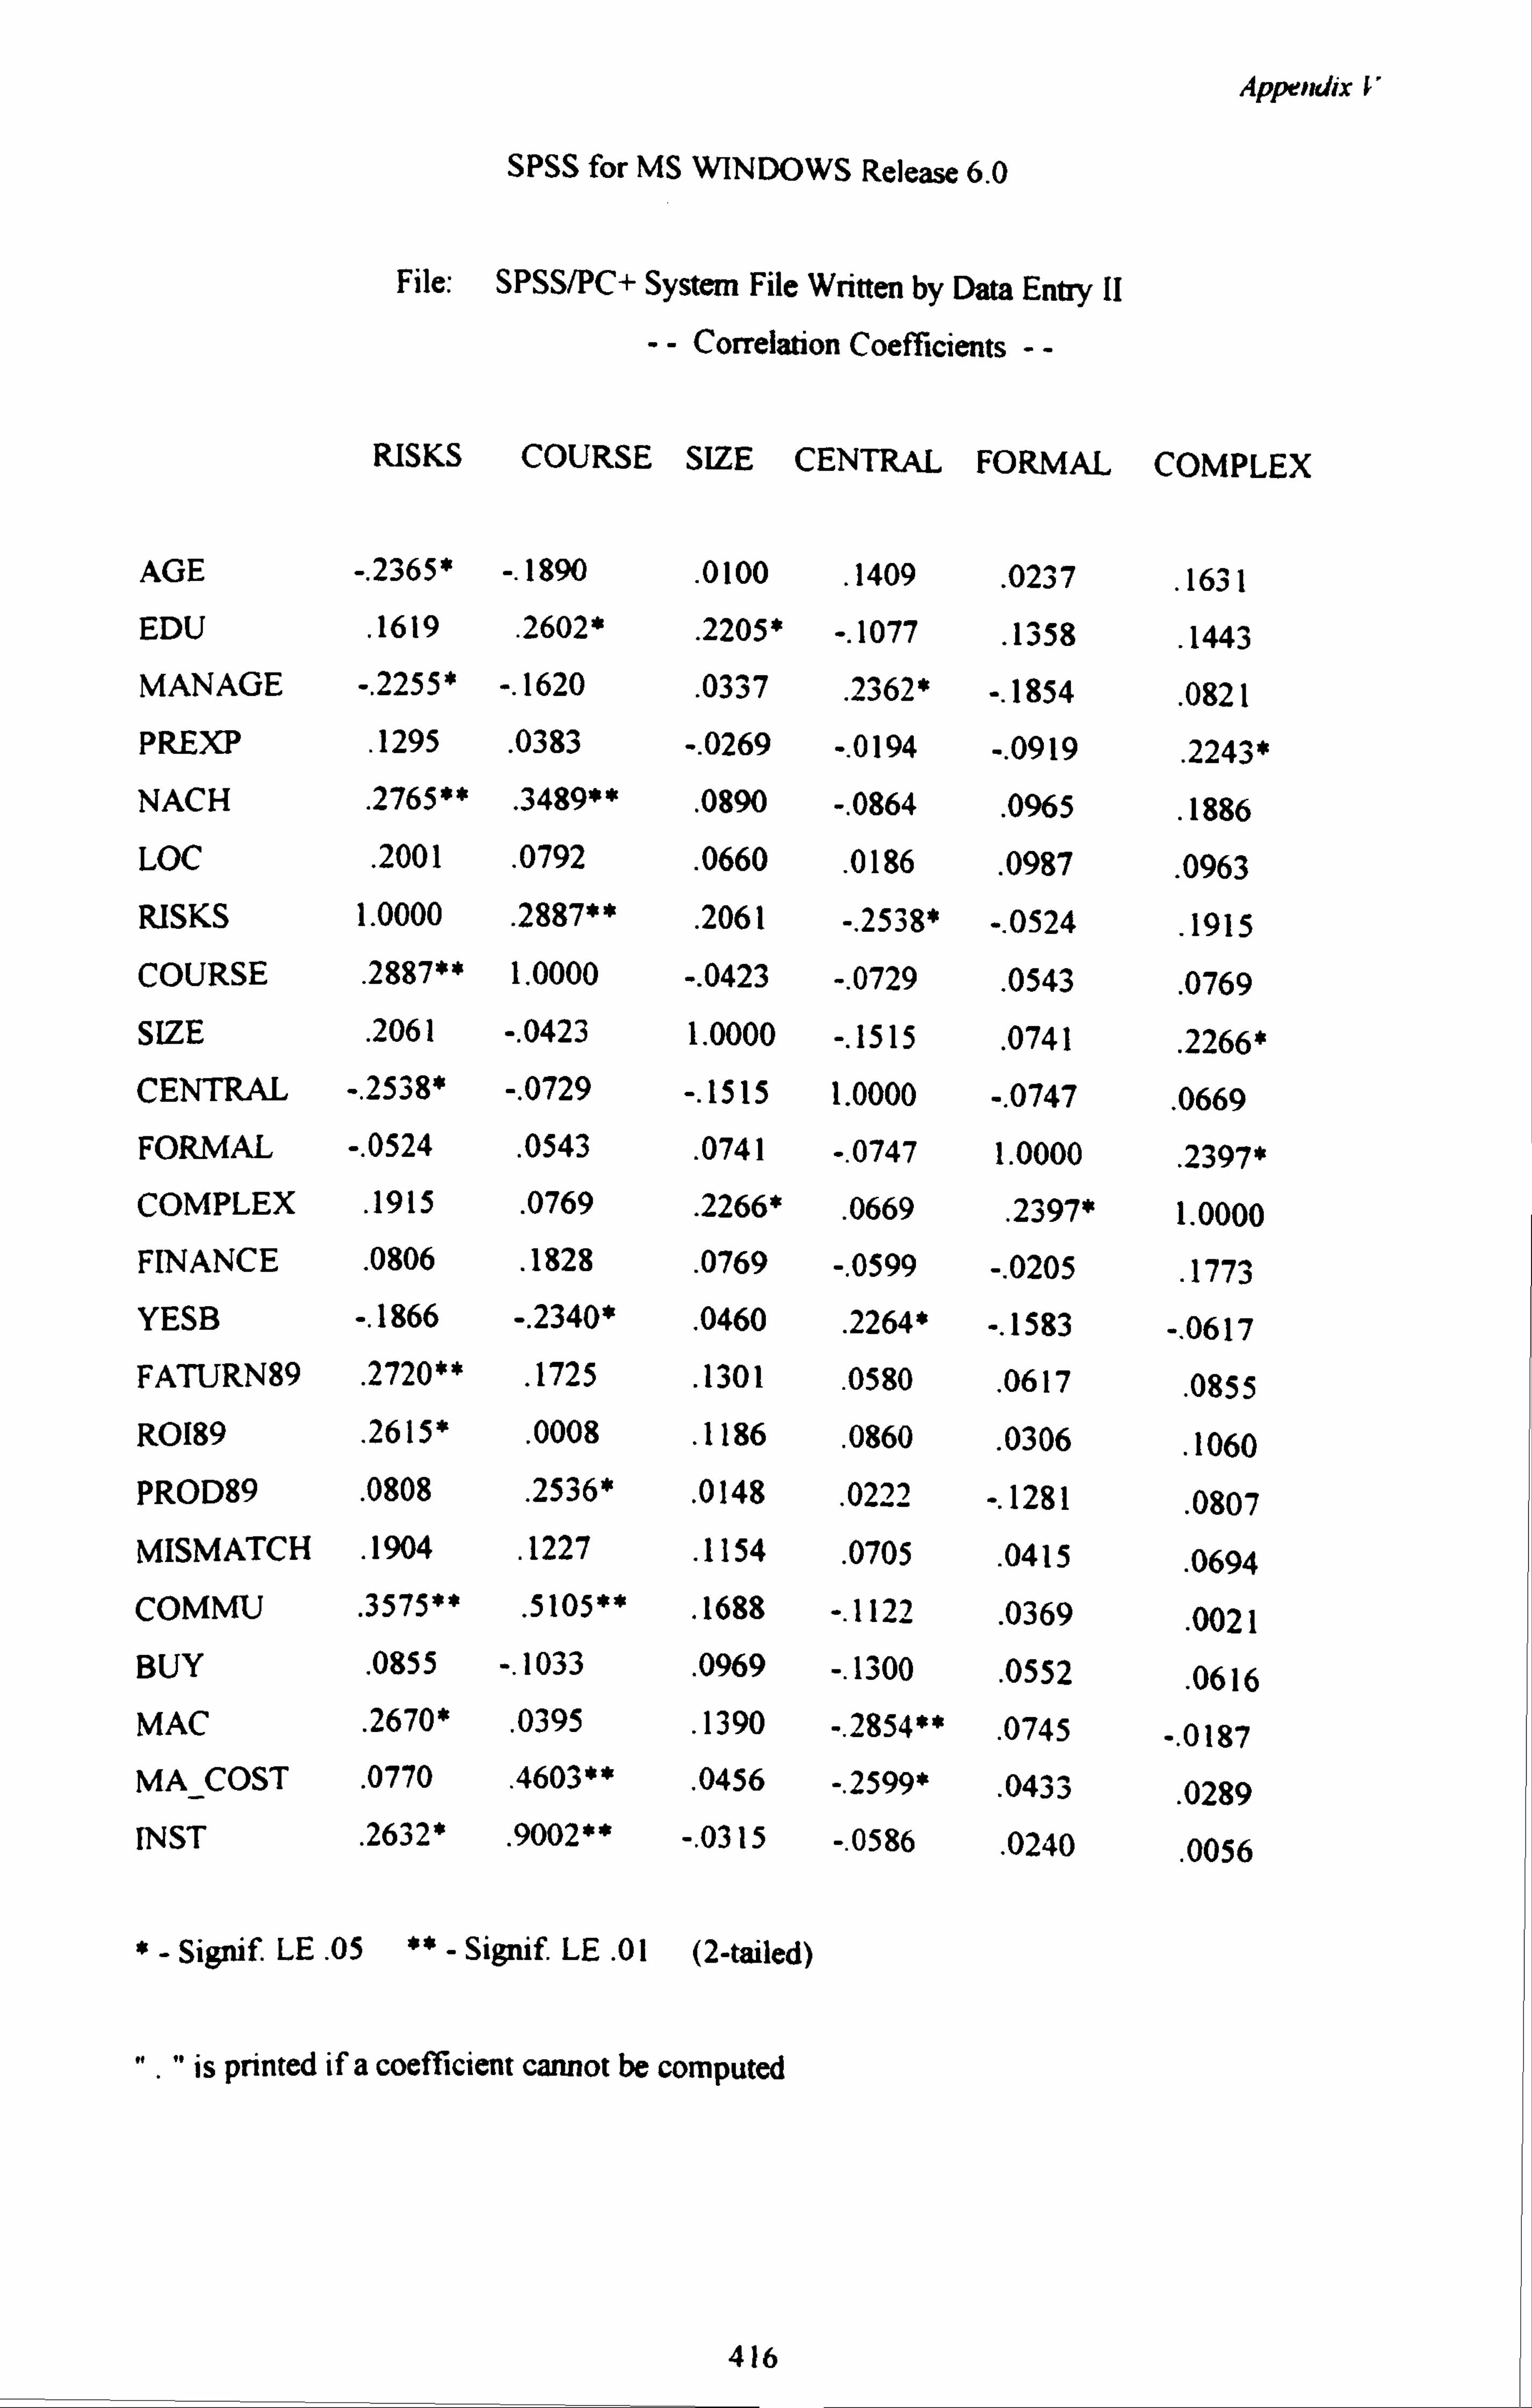
Appendix V
SPSS for MS WINDOWS Release 6.0
File: SPSS/PC+ System File Written by Data Entry II
-- Correlation Coefficients --
RISKS COURSE SIZE CENTRAL FORMAL COMPLEX
AGE -. 2365 * -. 1890 . 0100
. 1409
. 023 7
. 163 1
EDU . 1619
. 2602*
. 2205* -. 1077
. 1358
. 1443
MANAGE -. 2255* -. 1620 . 0337
. 2362* -. 1854 . 0821
PREXP . 1295
. 0383 -. 0269 -. 0194 -. 0919
. 2243*
NACH . 2765** . 3489** . 0890 -. 0864 . 0965
. 1886 LOC . 2001 . 0792
. 0660 . 0186
. 0987 . 0963
RISKS 1.0000 . 2887** . 2061 -. 2538* -. 0524
. 1915 COURSE . 2887** 1.0000 -. 0423 -. 0729
. 0543 . 0769
SIZE . 2061 -. 0423 1.0000 -. 1515 . 0741
. 2266* CENTRAL -. 2538* -. 0729 -. 1515 1.0000 -. 0747
. 0669 FORMAL -. 0524
. 0543 . 0741 -. 0747 1.0000
. 2397* COMPLEX .
1915 . 0769
. 2266*
. 0669
. 2397* 1.0000
FINANCE . 0806 . 1828 . 0769 -. 0599 -. 0205
. 1773 YESB -. 1866 -. 2340*
. 0460 . 2264* -. 1583 -. 0617
FATURN89 . 2720**
. 1725 . 1301
. 0580 . 0617
. 0855 R0189 . 2615*
. 0008 . 1186
. 0860 . 0306
. 1060 PROD89 . 0808
. 2536* . 0148
. 0222 -. 1281 . 0807
MISMATCH . 1904 . 1227 . 1154
. 0705 . 0415
. 0694 COMMU . 3575** . 5105** . 1688 -. 1122
. 0369 . 0021
BUY . 0855 -. 1033 . 0969 -. 1300 . 0552
. 0616 MAC . 2670*
. 0395 . 1390 -. 2854**
. 0745 -. 0187 MA_COST .
0770 . 4603**
. 0456 -. 2599*
. 0433
. 0289
INST . 2632*
. 9002** -. 0315 -. 0586
. 0240
. 0056
*- Signif. LE. 05 ** - Signi£ LE. 01 (2-tailed)
". " is printed if a coefficient cannot be computed
416
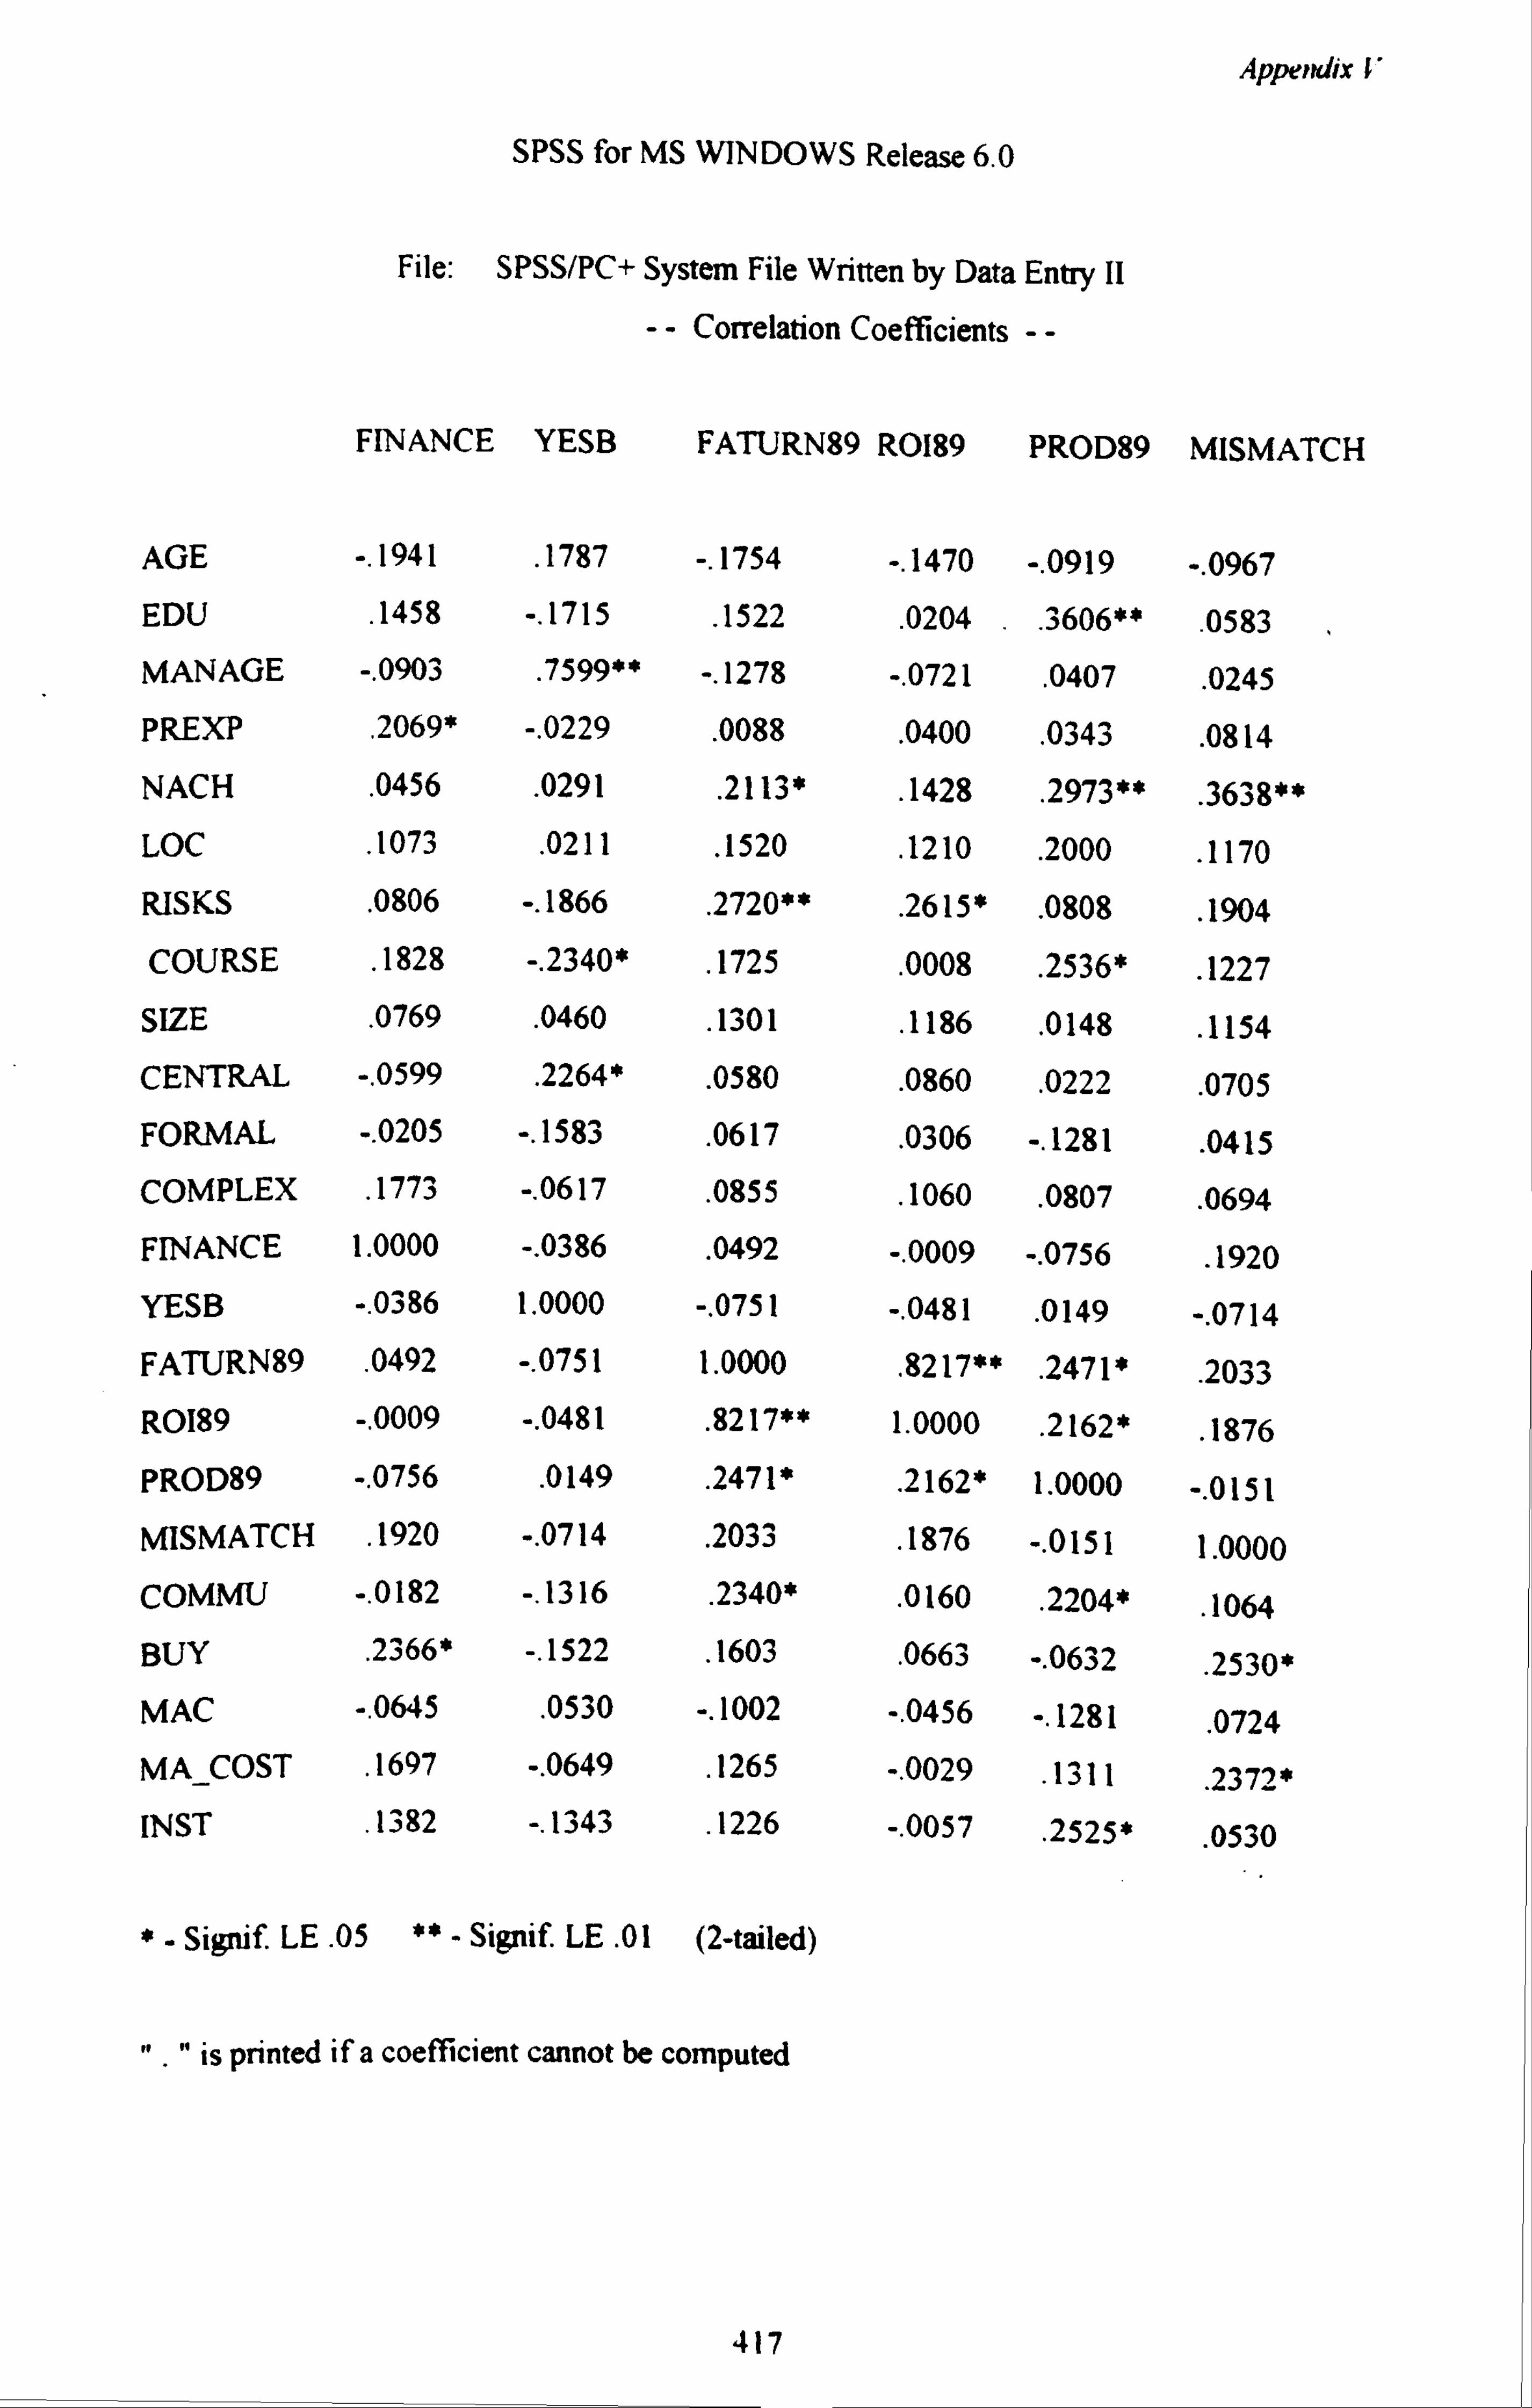
Appendix V "
SPSS for MS WINDOWS Release 6.0
File: SPSS/PC+ System File Written by Data Entry II
-- Correlation Coefficients --
FINANCE YESB FATURN89 R0189 PROD89 MISMATCH
AGE -. 1941 . 1787 -. 1754 -. 1470 -. 0919 -. 0967 EDU . 1458 -. 1715
. 1522 . 0204
. . 3606** . 0583
MANAGE -. 0903 . 7599** -. 1278 -. 0721
. 0407
. 0245
PREXP . 2069* -. 0229 . 0088
. 0400 . 0343
. 0814 NACH . 0456 . 0291
. 2113* . 1428
. 2973** . 3638**
LOC . 1073 . 0211 . 1520 . 1210
. 2000 . 1170
RISKS . 0806 -. 1866 . 2720**
. 2615* . 0808
. 1904 COURSE . 1828 -. 2340*
. 1725 . 0008
. 2536*
. 1227 SIZE . 0769 . 0460
. 1301 . 1186 . 0148
. 1154 CENTRAL -. 0599 . 2264*
. 0580 . 0860
. 0222 . 0705
FORMAL -. 0205 -. 1583 . 0617
. 0306 -. 1281 . 0415
COMPLEX . 1773 -. 0617
. 0855
. 1060
. 0807
. 0694
FINANCE 1.0000 -. 0386 . 0492 -. 0009 -. 0756
. 1920 YESB -. 0386 1.0000 -. 0751 -. 0481
. 0149 -. 0714
FATURN89 . 0492 -. 0751 1.0000
. 8217** . 2471*
. 2033 R0189 -. 0009 -. 0481
. 8217** 1.0000 . 2162*
. 1876 PROD89 -. 0756 . 0149
. 2471* . 2162* 1.0000 -. 0151
MISMATCH . 1920 -. 0714 . 2033
. 1876 -. 0151 1.0000 COMMU -. 0182 -. 1316
. 2340* . 0160
. 2204* . 1064
BUY . 2366* -. 1522 . 1603 . 0663 -. 0632
. 2530* MAC -. 0645 . 0530 -. 1002 -. 0456 -. 1281
. 0724 MA_COST . 1697 -. 0649
. 1265 -. 0029 . 1311 2372*
INST . 1382 -. 1343
. 1226 -. 0057
. 2525*
. 0530
*- Signif. LE. 05 ** - Signif. LE. 01 (2-tailed)
It ." is printed if a coefficient cannot be computed
417
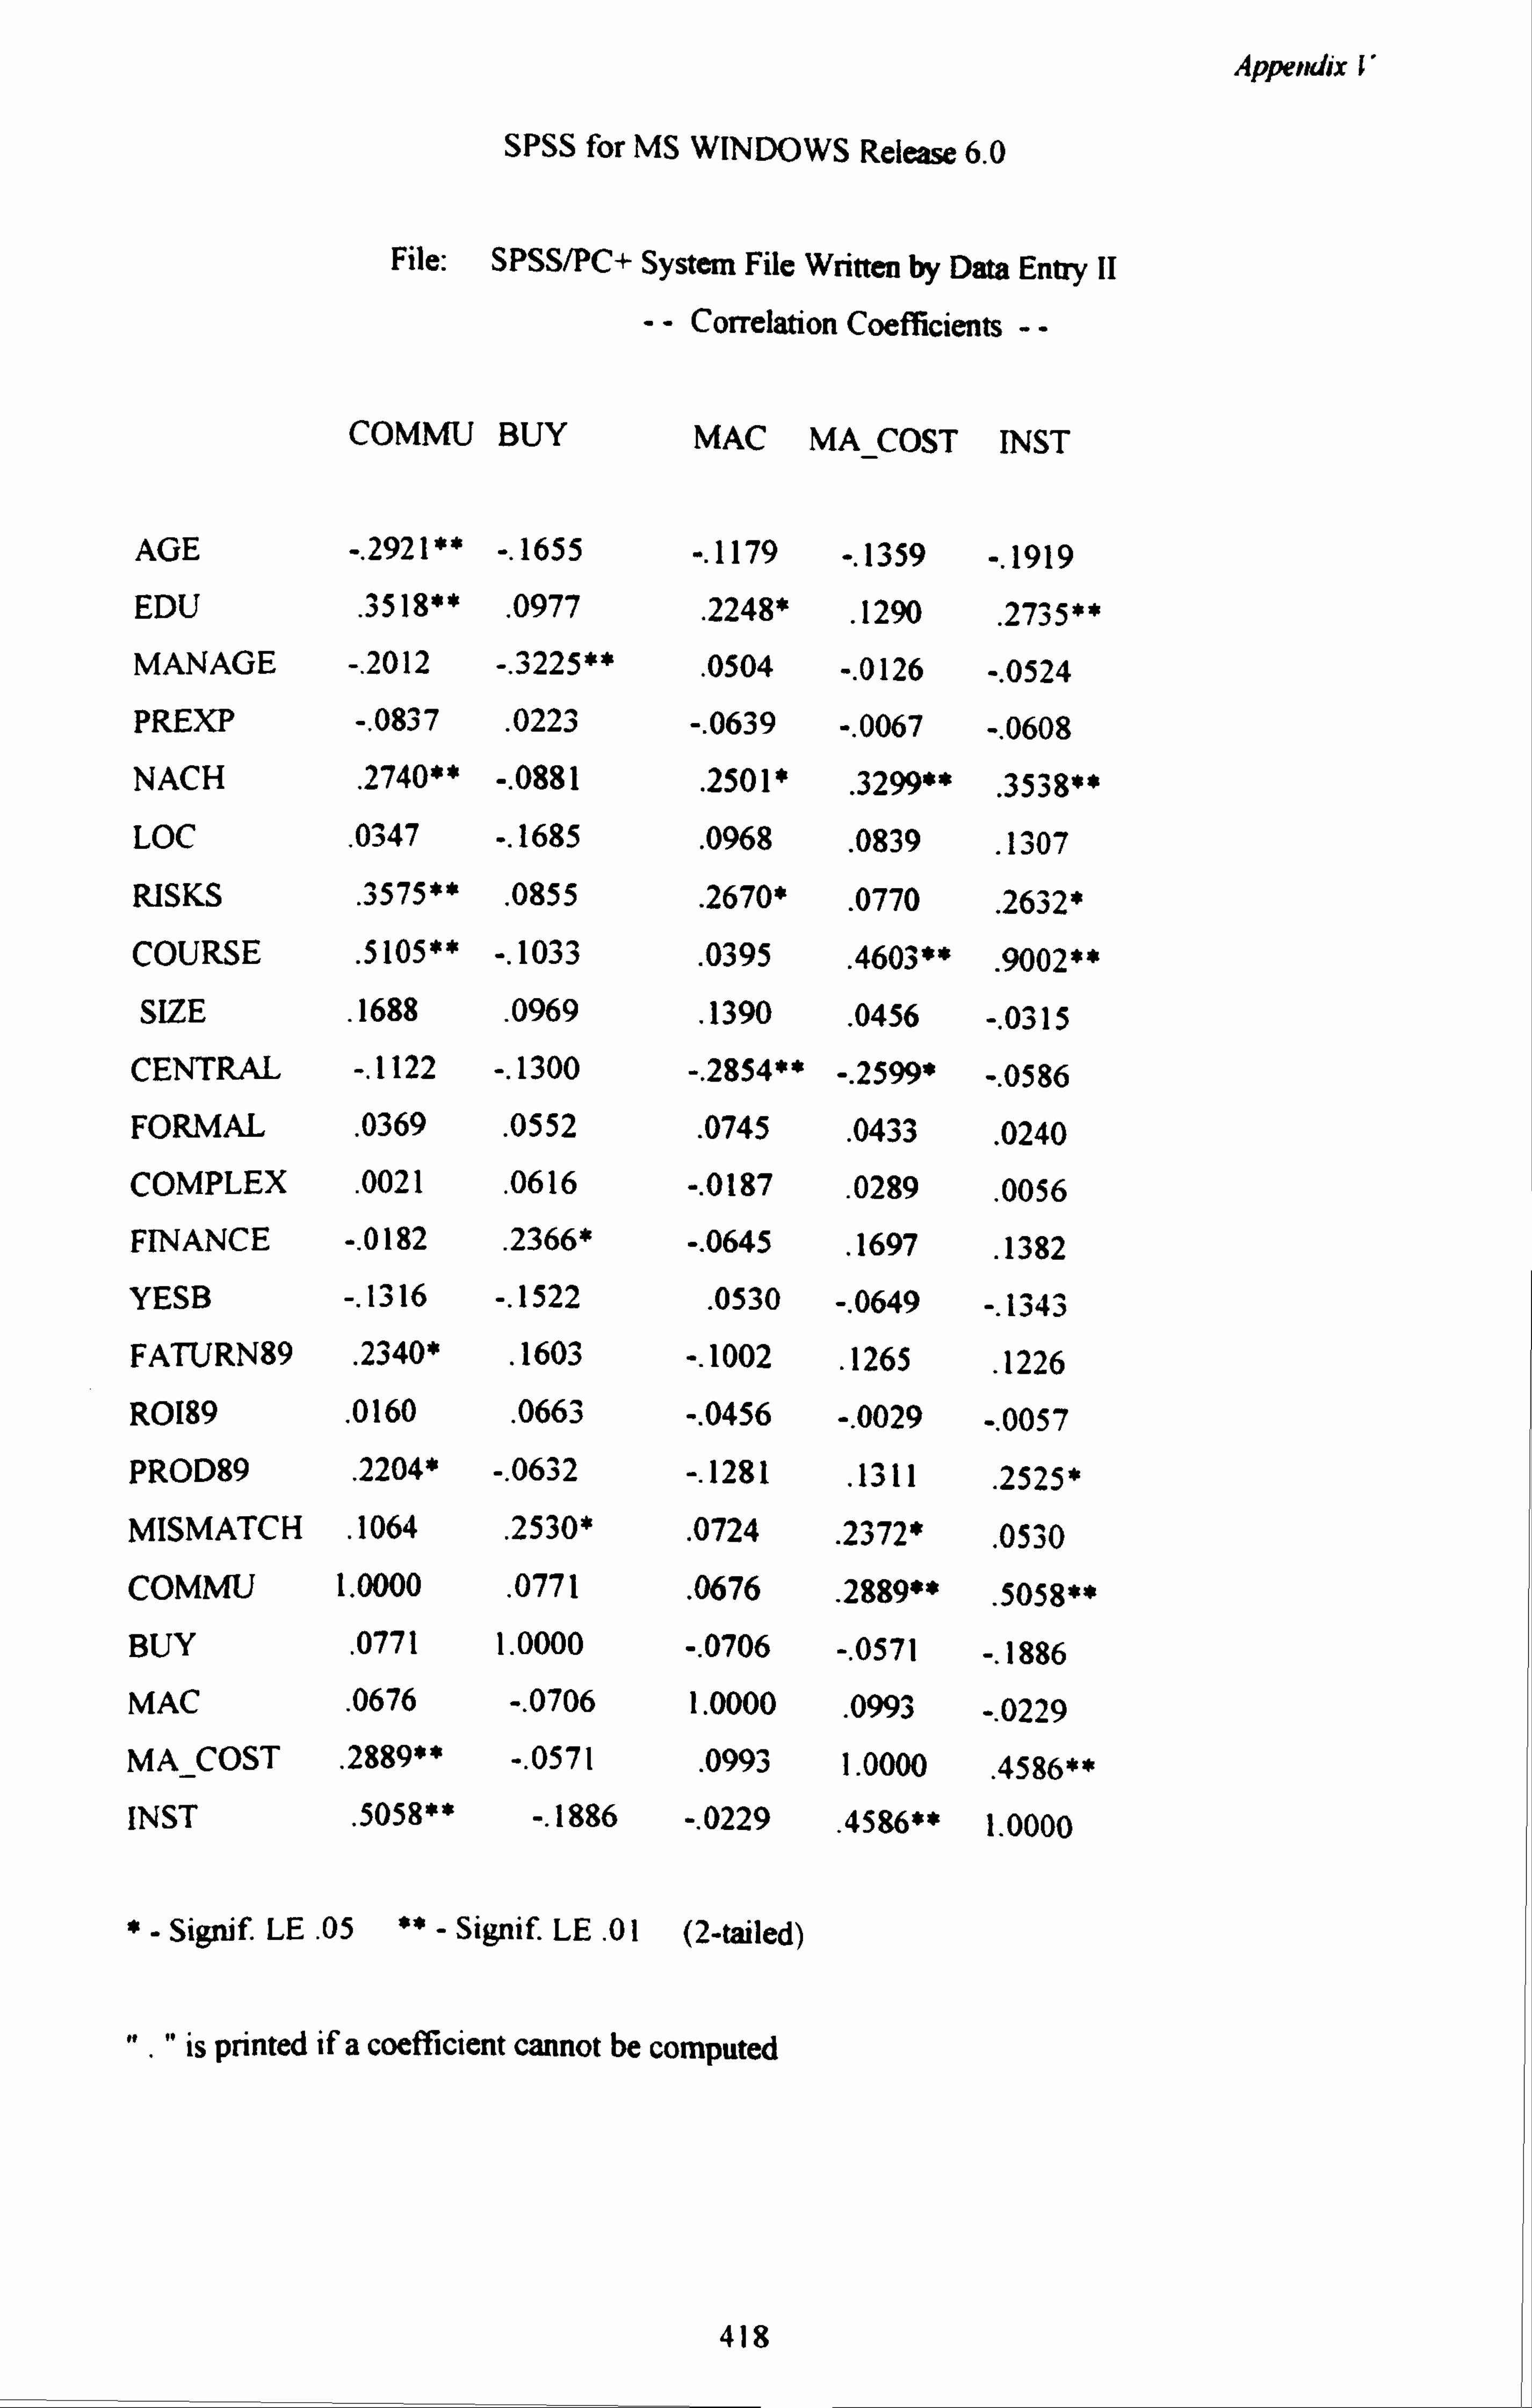
Appendix V
SPSS for MS WINDOWS Release 6.0
AGE
EDU
MANAGE
PREXP
NACH
LOC
RISKS
COURSE
SIZE
CENTRAL
FORMAL
COMPLEX
FINANCE
YESB
FATURN89
R0189
PROD89
MISMATCH
COMMU
BUY
MAC
MA COST
INST
File: SPSS/PC+ System File Written by Data Entry II
-- Correlation Coefficients --
COMMU BUY
-. 2921** -. 1655
. 3518**
. 0977
-. 2012 -. 3225**
-. 0837 . 0223
. 2740** -. 0881
. 0347 -. 1685
. 3575**
. 0855
. 5105** -. 1033
. 1688 . 0969
-. 1122 -. 1300
. 0369 . 0552
. 0021 . 0616
-. 0182 . 2366*
-. 1316 -. 1522
. 2340* . 1603
. 0160 . 0663
. 2204* -. 0632
. 1064 . 2530*
1.0000 . 0771
. 0771 1.0000
. 0676 -. 0706
. 2889** -. 0571
. 5058** -. 1886
MAC MA COST INST
-. 1919
. 2735**
-. 0524
-. 0608
. 3538**
. 1307
. 2632*
. 9002**
-. 0315
-. 0586
. 0240
. 0056
. 1382
-. 1343
. 1226
-. 0057
. 2525*
. 0530
. 5058**
-. 1886
-. 0229
. 4586**
1.0000
-. 1179 -. 1359
. 2248* . 1290
. 0504 -. 0126
-. 0639 -. 0067
. 2501* . 3299**
. 0968 . 0839
. 2670* . 0770
. 0395 . 4603**
. 1390 . 0456
-. 2854** -. 2599*
. 0745 . 0433
-. 0187 . 0289
-. 0645 . 1697
. 0530 -. 0649
-. 1002 . 1265
-. 0456 -. 0029
-. 1281 . 1311
. 0724 . 2372*
. 0676 . 2889**
-. 0706 -. 0571
1.0000 . 0993
. 0993 1.0000
-. 0229 . 4586**
*- Signif. LE . 05 ** - Signif. LE
. 01 (2-tailed)
". " is printed if a coefficient cannot be computed
418
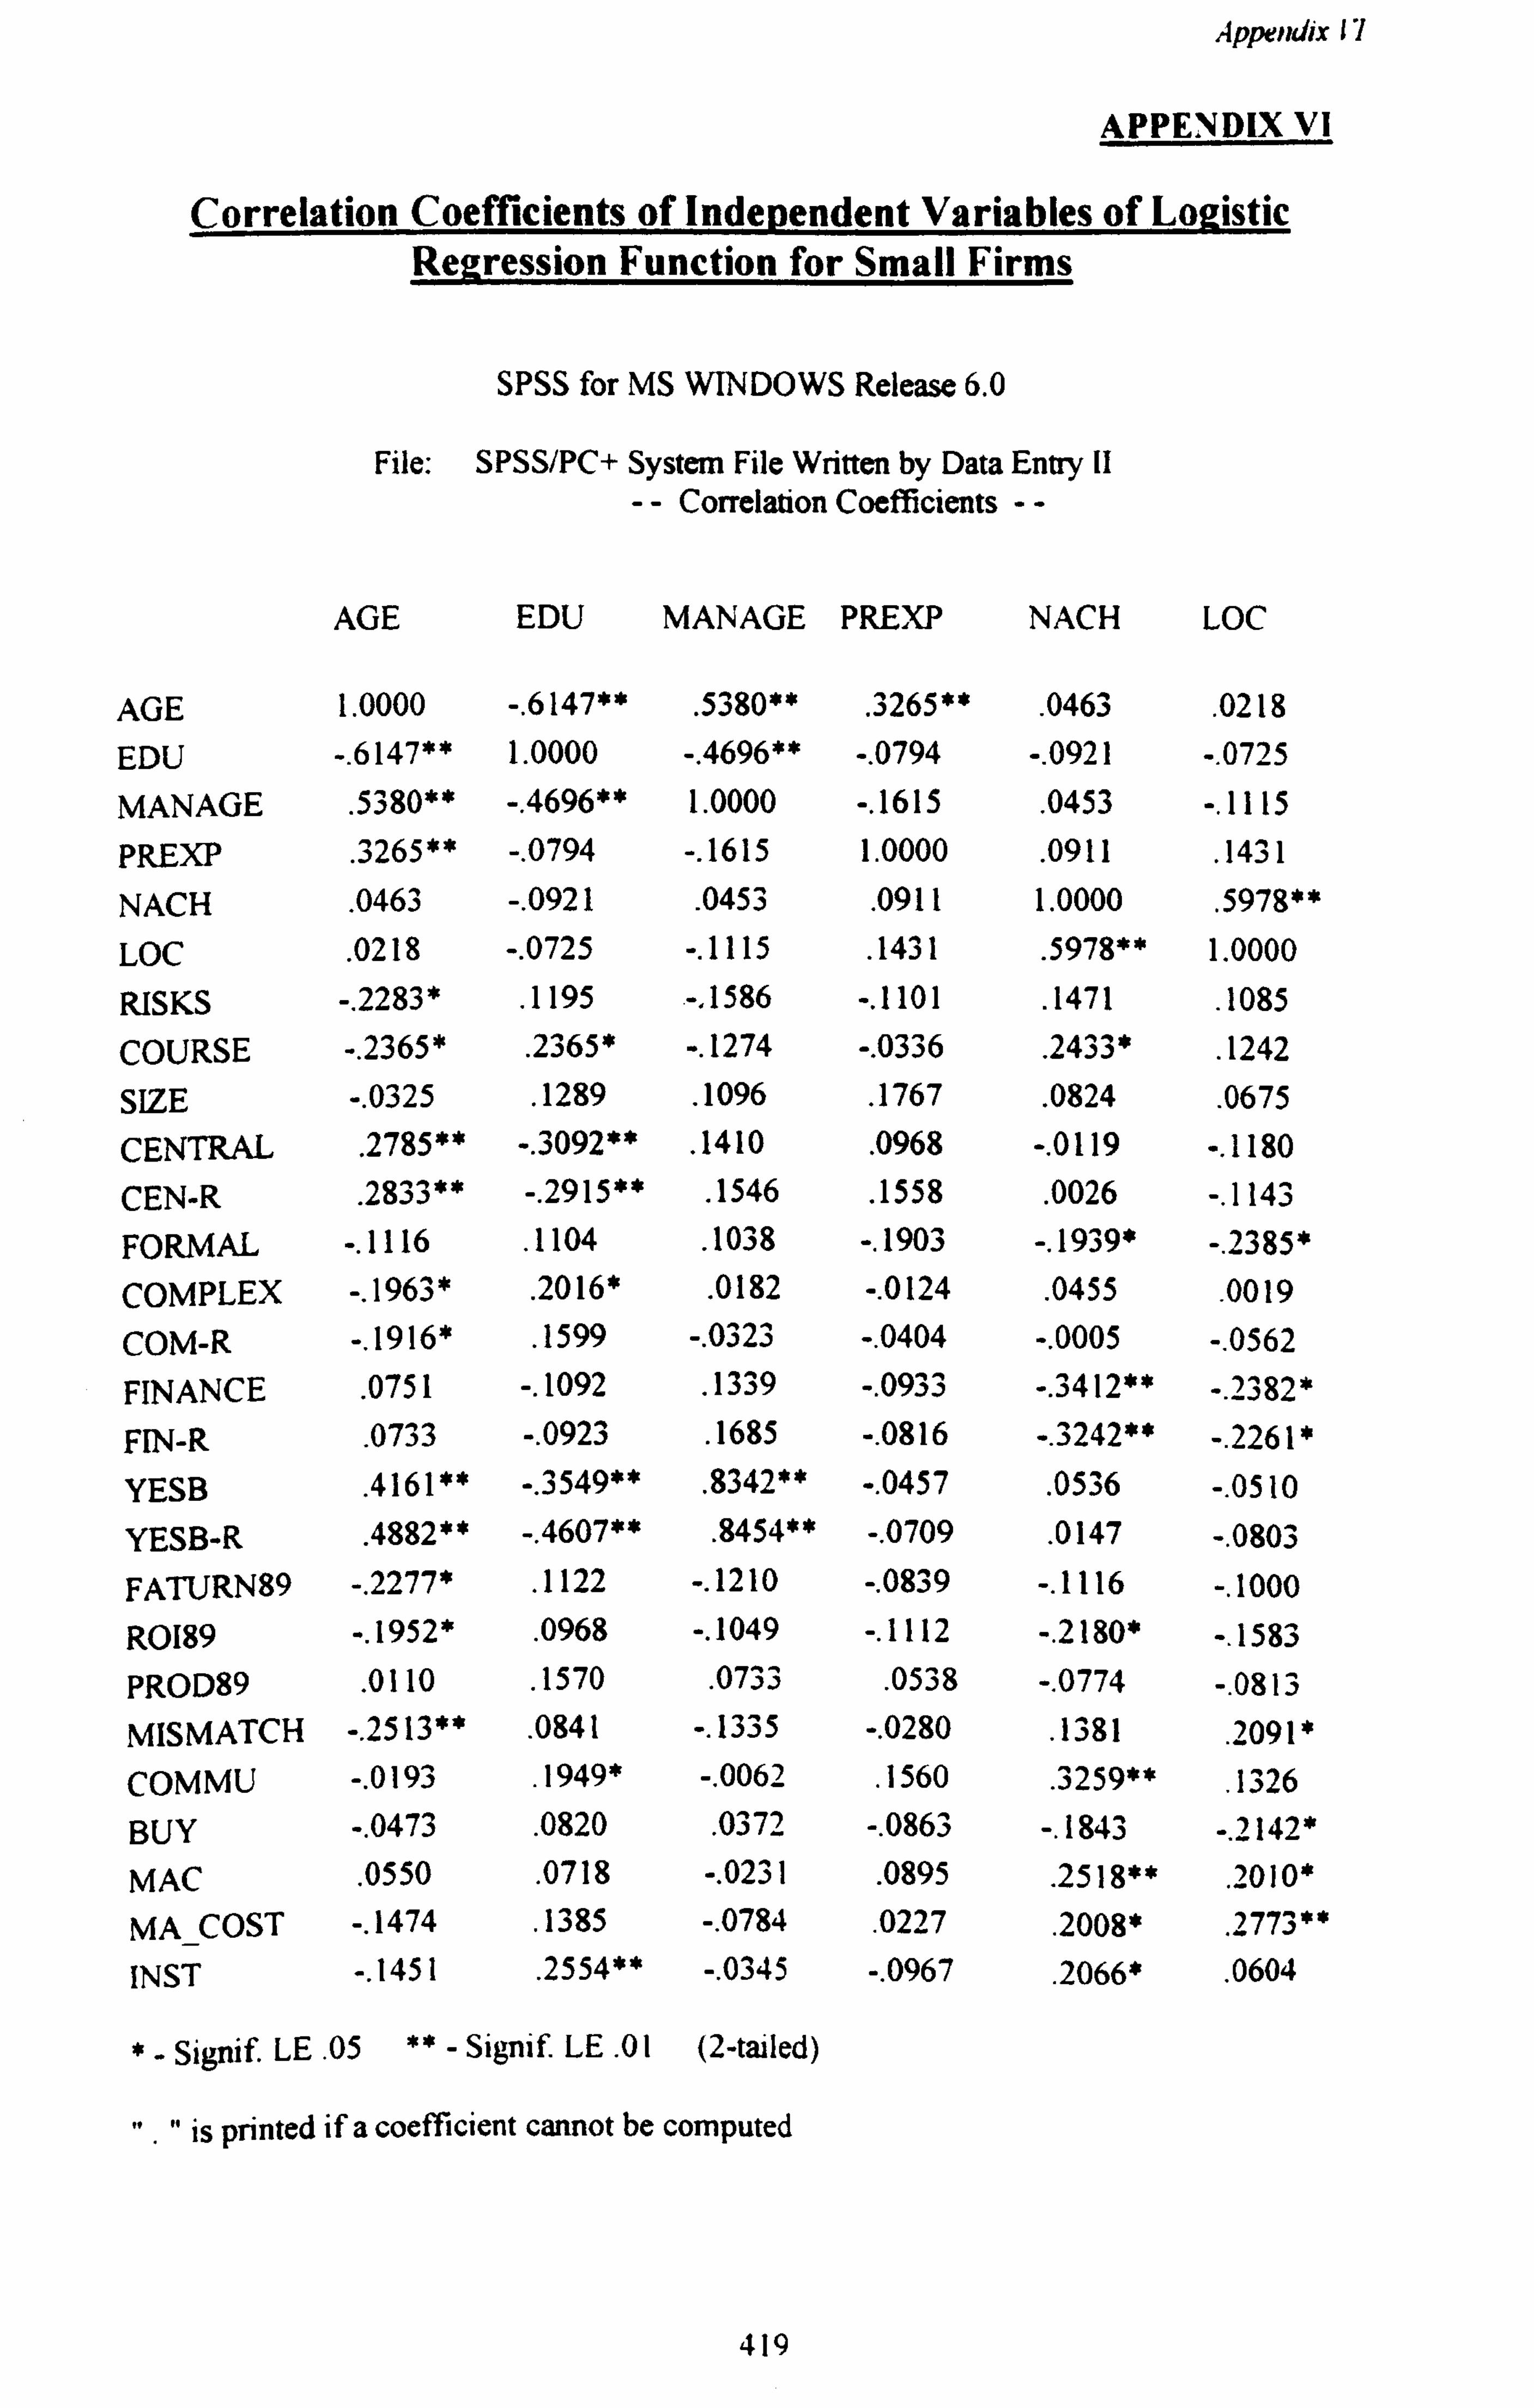
Appendix 17
APPENDIX VI
Correlation Coefficients of Independent Variables of Logistic Regression Function for Small Firms
SPSS for MS WINDOWS Release 6.0
File: SPSS/PC+ System File Written by Data Entry lI -- Correlation Coefficients --
AGE EDU MANAGE PREXP NACH LOC
AGE 1.0000 -. 6147** . 5380** . 3265** . 0463 . 0218 EDU -. 6147** 1.0000 -. 4696** -. 0794 -. 0921 -. 0725
MANAGE . 5380** -. 4696** 1.0000 -. 1615 . 0453 -. 1115
pREXP . 3265** -. 0794 -. 1615 1.0000 . 0911 . 1431
NACH . 0463 -. 0921 . 0453 . 0911 1.0000 . 5978**
LOC . 0218 -. 0725 -. 1115 . 1431 . 5978** 1.0000
RISKS -. 2283* . 1195 -, 1586 -. 1101 . 1471 . 1085 COURSE -. 2365* . 2365* -. 1274 -. 0336 . 2433*
. 1242
SIZE -. 0325 . 1289 . 1096 . 1767 . 0824 . 0675
CENTRAL . 2785** -. 3092** . 1410 . 0968 -. 0119 -. 1180 CEN-R . 2833** -. 2915** . 1546 . 1558 . 0026 -. 1143 FORMAL -. 1116 . 1104 . 1038 -. 1903 -. 1939* -. 2385* COMPLEX -. 1963* . 2016* . 0182 -. 0124
. 0455 . 0019
COM-R -. 1916* . 1599 -. 0323 -. 0404 -. 0005 -. 0562
FINANCE . 0751 -. 1092 . 1339 -. 0933 -. 3412** -. 2382*
FIN-R . 0733 -. 0923 . 1685 -. 0816 -. 3242** -. 2261*
YESB . 4161** -. 3549** . 8342** -. 0457
. 0536 -. 0510
YESB-R . 4882** -. 4607** . 8454** -. 0709 . 0147 -. 0803
FATURN89 -. 2277* . 1122 -. 1210 -. 0839 -. 1116 -. 1000 R0189 -. 1952* . 0968 -. 1049 -. 1112 -. 2180* -. 1583 PROD89 .
0110 . 1570 .
0733 . 0538 -. 0774 -. 0813
MISMATCH -. 2513** . 0841 -. 1335 -. 0280 . 1381
. 2091 COMMU -. 0193 .
1949* -. 0062 . 1560
. 3259**
. 1326
BUY -. 0473 . 0820 . 0372 -. 0863 -. 1843 -. 2142* MAC . 0550 . 0718 -. 0231
. 0895 . 2518**
. 2010* MA_COST -. 1474 . 1385 -. 0784
. 0227 . 2008* . 2773**
INST -. 1451 . 2554** -. 0345 -. 0967
. 2066* .
0604
*- Signif. LE . 05 ** - Signif. LE . 0l (2-tailed)
11 ." is printed if a coefficient cannot be computed
419
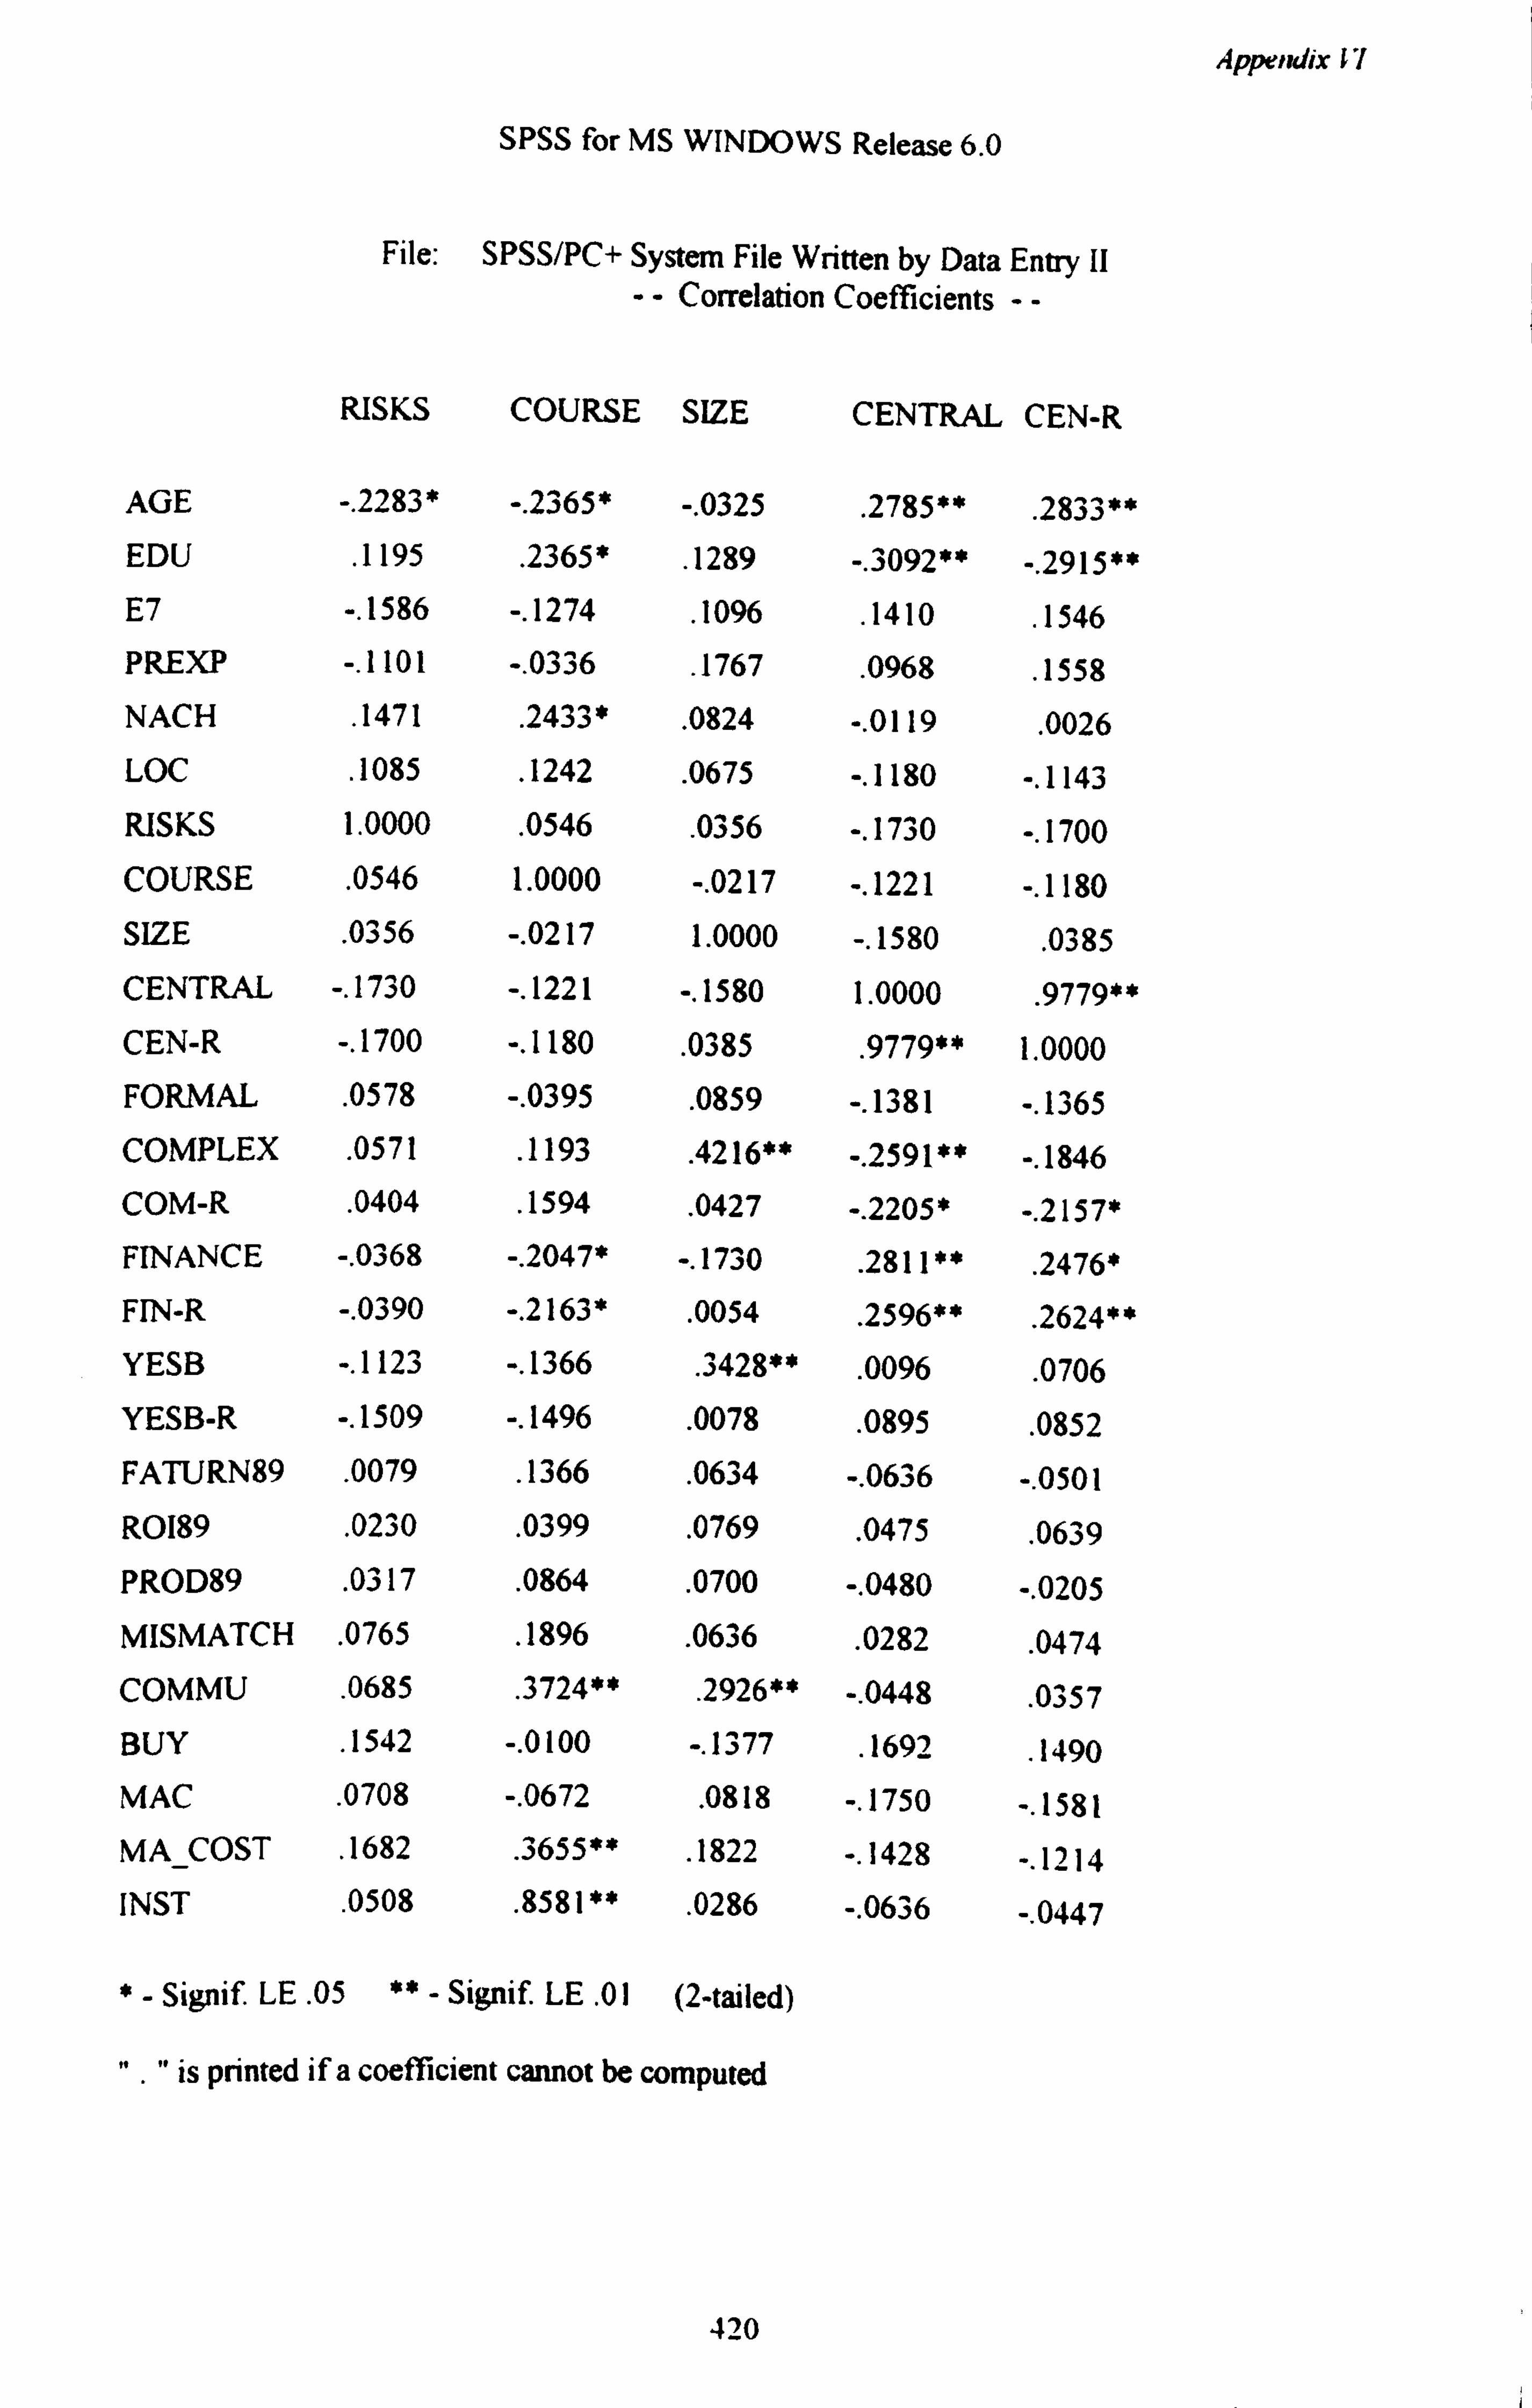
Appendix t7
SPSS for MS WINDOWS Release 6.0
File: SPSS/PC+ System File Written by Data Entry II -- Correlation Coefficients --
RISKS COURSE SIZE CENTRAL CEN-R
AGE -. 2283* -. 2365* -. 0325 . 2785**
. 2833** EDU . 1195 . 2365*
. 1289 -. 3092** -. 2915** E7 -. 1586 -. 1274
. 1096 . 1410
. 1546 PREXP -. 1101 -. 0336
. 1767
. 0968
. 1558 NACH .
1471 . 2433*
. 0824 -. 0119
. 0026
LOC . 1085
. 1242
. 0675 -. 1180 -. 1143
RISKS 1.0000 . 0546 . 0356 -. 1730 -. 1700
COURSE . 0546 1.0000 -. 0217 -. 1221 -. 1180 SIZE . 0356 -. 0217 1.0000 -. 1580 . 0385 CENTRAL -. 1730 -. 1221 -. 1580 1.0000
. 9779** CEN-R -. 1700 -. 1180
. 0385 . 9779** 1.0000
FORMAL . 0578 -. 0395 . 0859 -. 1381 -. 1365
COMPLEX . 0571 . 1193
. 4216** -. 2591** -. 1846 COM-R .
0404 . 1594
. 0427 -. 2205* -. 2157*
FINANCE -. 0368 -. 2047* -. 1730 . 2811 **
. 2476*
FIN-R -. 0390 -. 2163* . 0054
. 2596**
. 2624**
YESB -. 1123 -. 1366 . 3428**
. 0096 . 0706
YESB-R -. 1509 -. 1496 . 0078
. 0895 . 0852
FATURN89 . 0079 . 1366 . 0634 -. 0636 -. 0501
R0189 . 0230 . 0399 . 0769 . 0475
. 0639 PROD89 . 0317 . 0864
. 0700 -. 0480 -. 0205 MISMATCH . 0765 . 1896
. 0636 . 0282
. 0474 COMMU .
0685 . 3724**
. 2926** -. 0448
. 0357
BUY . 1542 -. 0100 -. 1377
. 1692
. 1490
MAC . 0708 -. 0672 . 0818 -. 1750 -. 1581 MA_COST .
1682 . 3655**
. 1822 -. 1428 -. 1214
INST . 0508
. 8581 **
. 0286 -. 0636 -. 0447
*- Signif. LE . 05 ** - Signif. LE . 01 (2-tailed)
". " is printed if a coefficient cannot be computed
420
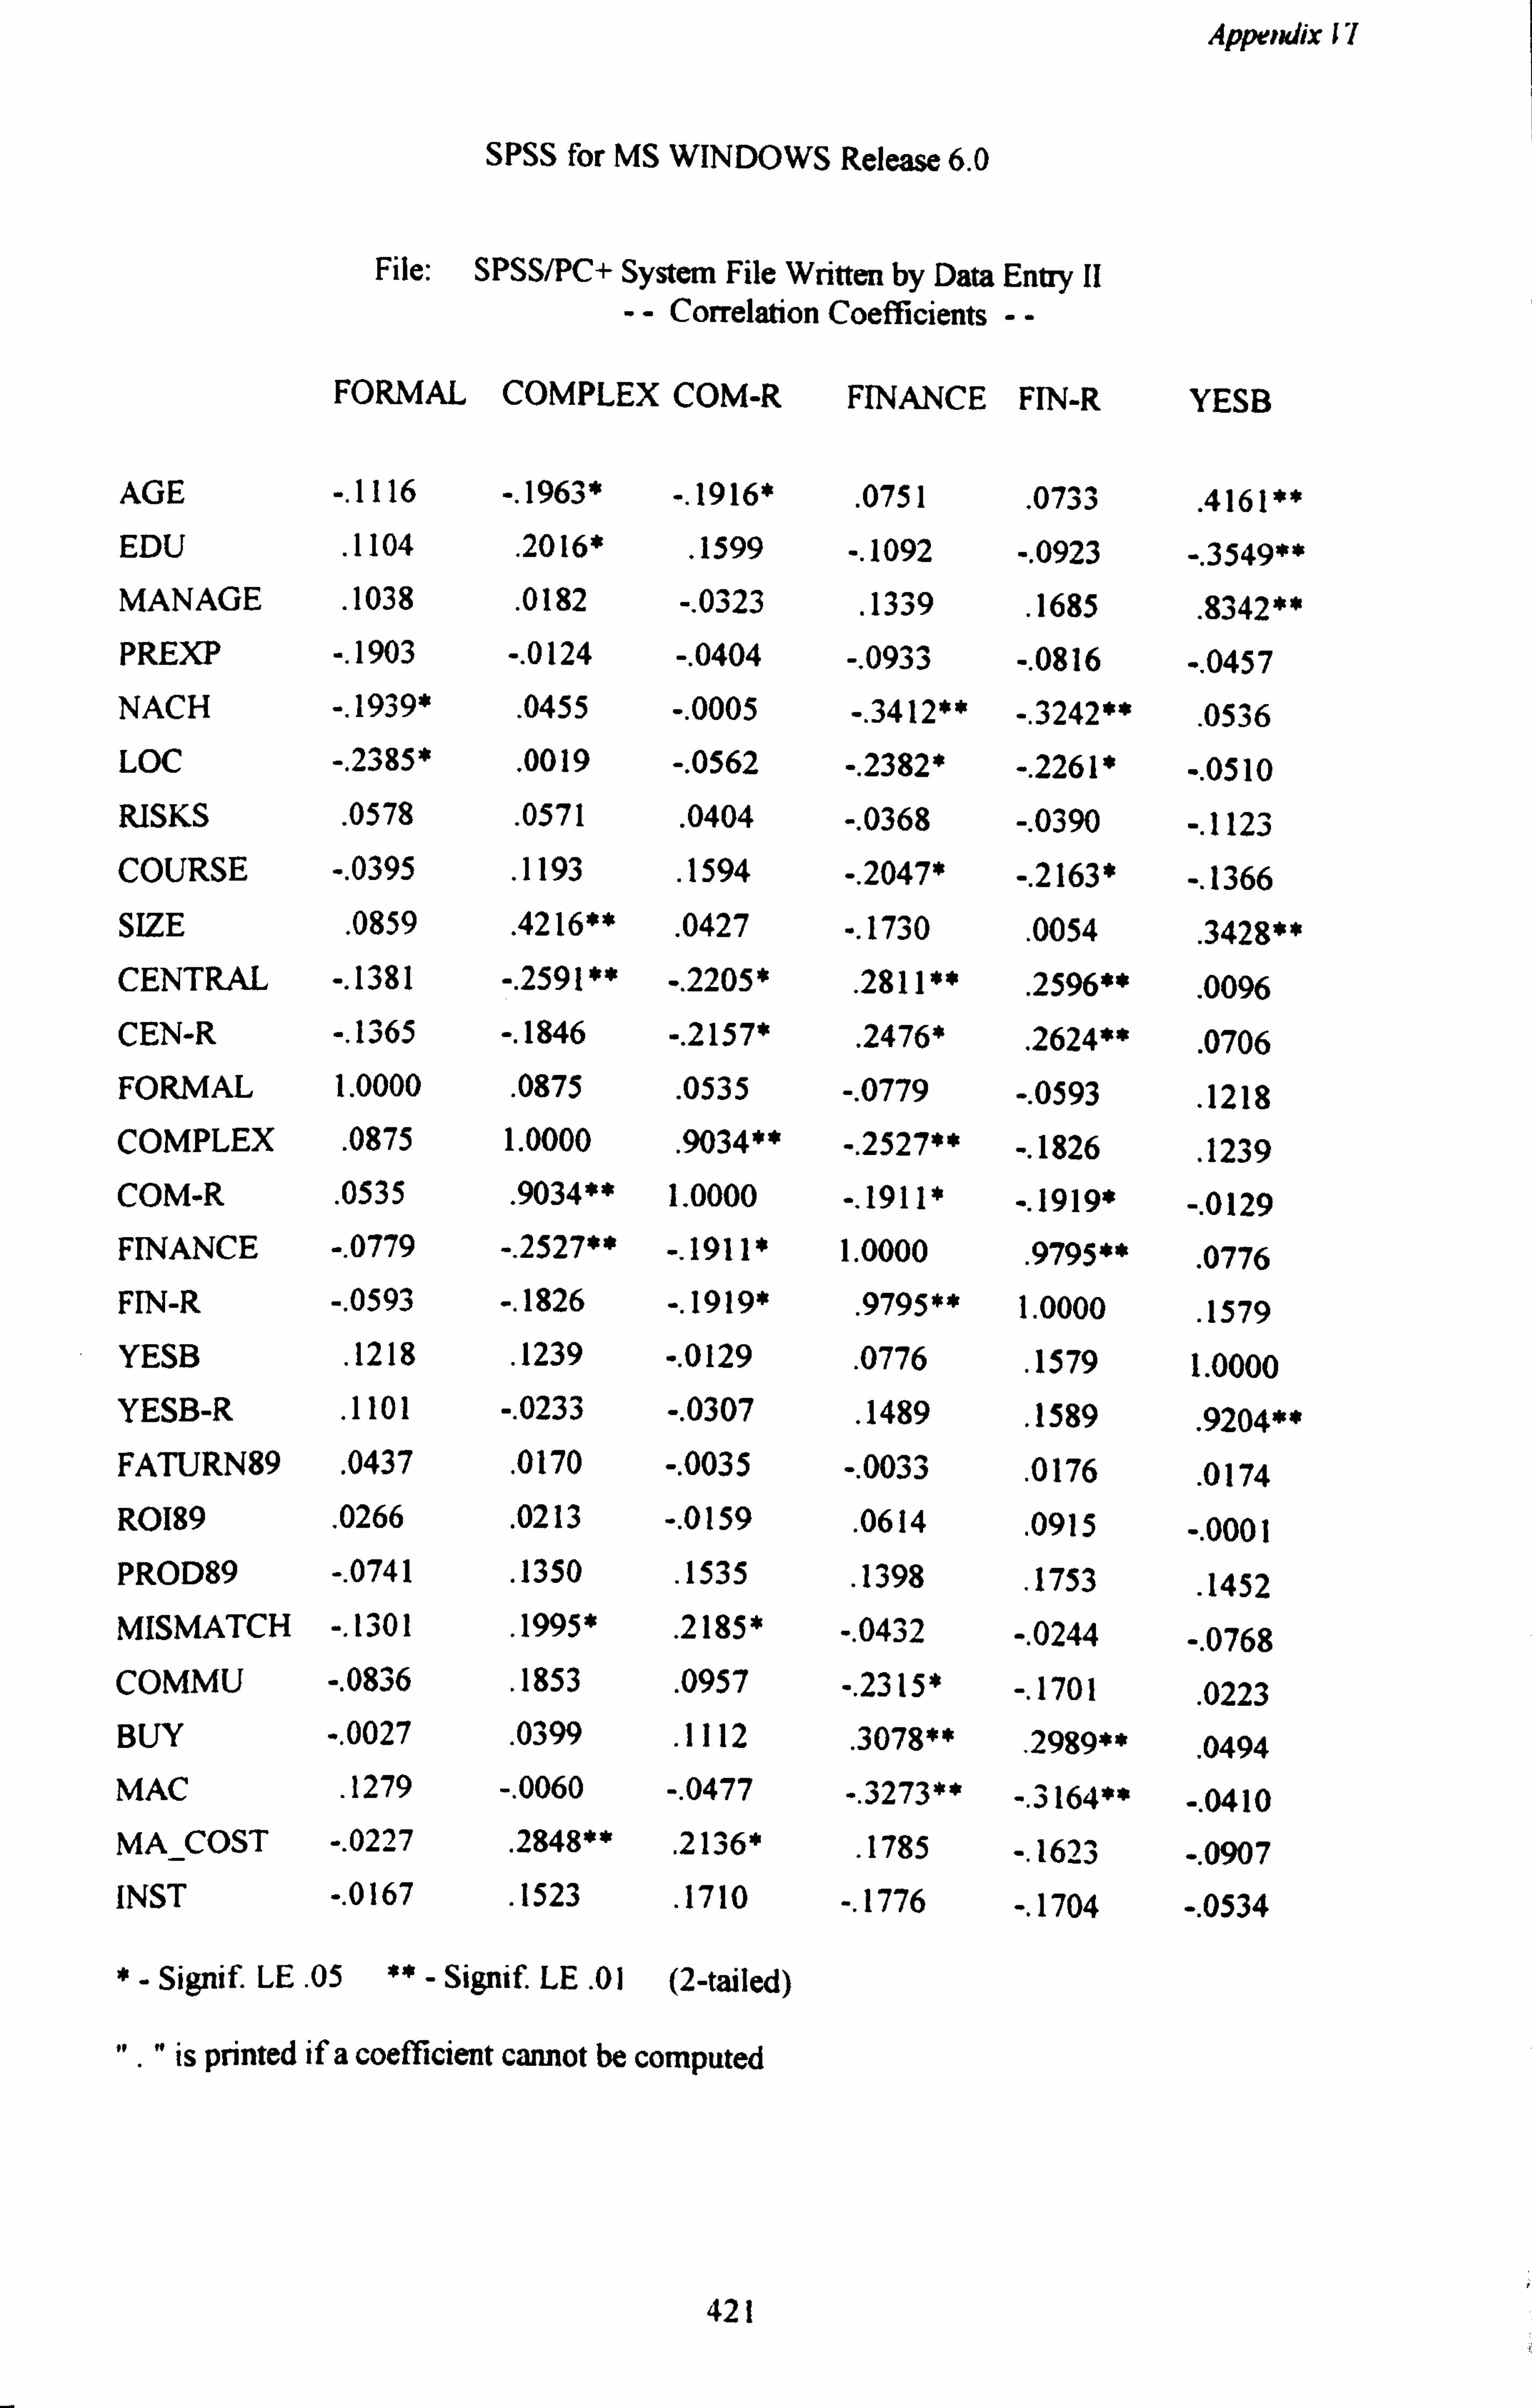
Appendix 17
SPSS for MS WINDOWS Release 6.0
File: SPSS/PC+ System File Written by Data Entry II -- Correlation Coefficients --
FORMAL COMPLEX COM-R FINANCE FIN-R YESB
AGE -. 1116 -. 1963* -. 1916* . 0751
. 0733 . 4161**
EDU . 1104
. 2016*
. 1599 -. 1092 -. 0923 -. 3549**
MANAGE . 1038 . 0182 -. 0323 . 1339
. 1685 . 83342**
PREXP -. 1903 -. 0124 -. 0404 -. 0933 -. 0816 -. 0457 NACH -. 1939* . 0455 -. 0005 -. 3412** -. 3242**
. 0536 LOC -. 2385* . 0019 -. 0562 -. 2382* -. 2261* -. 0510 RISKS . 0578 . 0571 . 0404 -. 0368 -. 0390 -. 1123 COURSE -. 0395
. 1193 . 1594 -. 2047* -. 2163* -. 1366
SIZE . 0859 . 4216** . 0427 -. 1730
. 0054 . 3428**
CENTRAL -. 1381 -. 2591 ** -. 2205* . 2811 **
. 2596** . 0096
CEN-R -. 1365 -. 1846 -. 2157* . 2476*
. 2624** . 0706
FORMAL 1.0000 . 0875 . 0535 -. 0779 -. 0593
. 1218 COMPLEX . 0875 1.0000
. 9034** -. 2527** -. 1826 . 1239
COM-R . 0535
. 9034** 1.0000 -. 1911 * -. 1919* -. 0129
FINANCE -. 0779 -. 2527** 1911 * 1.0000 . 9795**
. 0776 FIN-R -. 0593 -. 1826 1919*
. 9795** 1.0000
. 1579 YESB . 1218 . 1239 -. 0129
. 0776 . 1579 1.0000
YESB-R . 1101 -. 0233 -. 0307 . 1489
. 1589 . 9204**
FATURN89 . 0437 . 0170 -. 0035 -. 0033 . 0176
. 0174 R0189 . 0266 . 0213 -. 0159
. 0614 . 0915 -. 0001
PROD89 -. 0741 . 1350 . 1535 . 1398
. 1753 . 1452
MISMATCH -. 1301 . 1995* . 2185* -. 0432 -. 0244 -. 0768
COMMU -. 0836 . 1853 . 0957 -. 2315* -. 1701 . 0223
BUY -. 0027 . 0399 . 1112
. 3078** . 2989**
. 0494 MAC .
1279 -. 0060 -. 0477 -. 3273** -. 3164** -. 0410 MA_COST -. 0227
. 2848**
. 2136* . 1785 -. 1623 -. 0907
INST -. 0167 . 1523 . 1710 -. 1776 -. 1704 -. 0534
*- Signif. LE . 05 ** - Signif. LE. 01 (2-tailed)
". " is printed if a coefficient cannot be computed
421
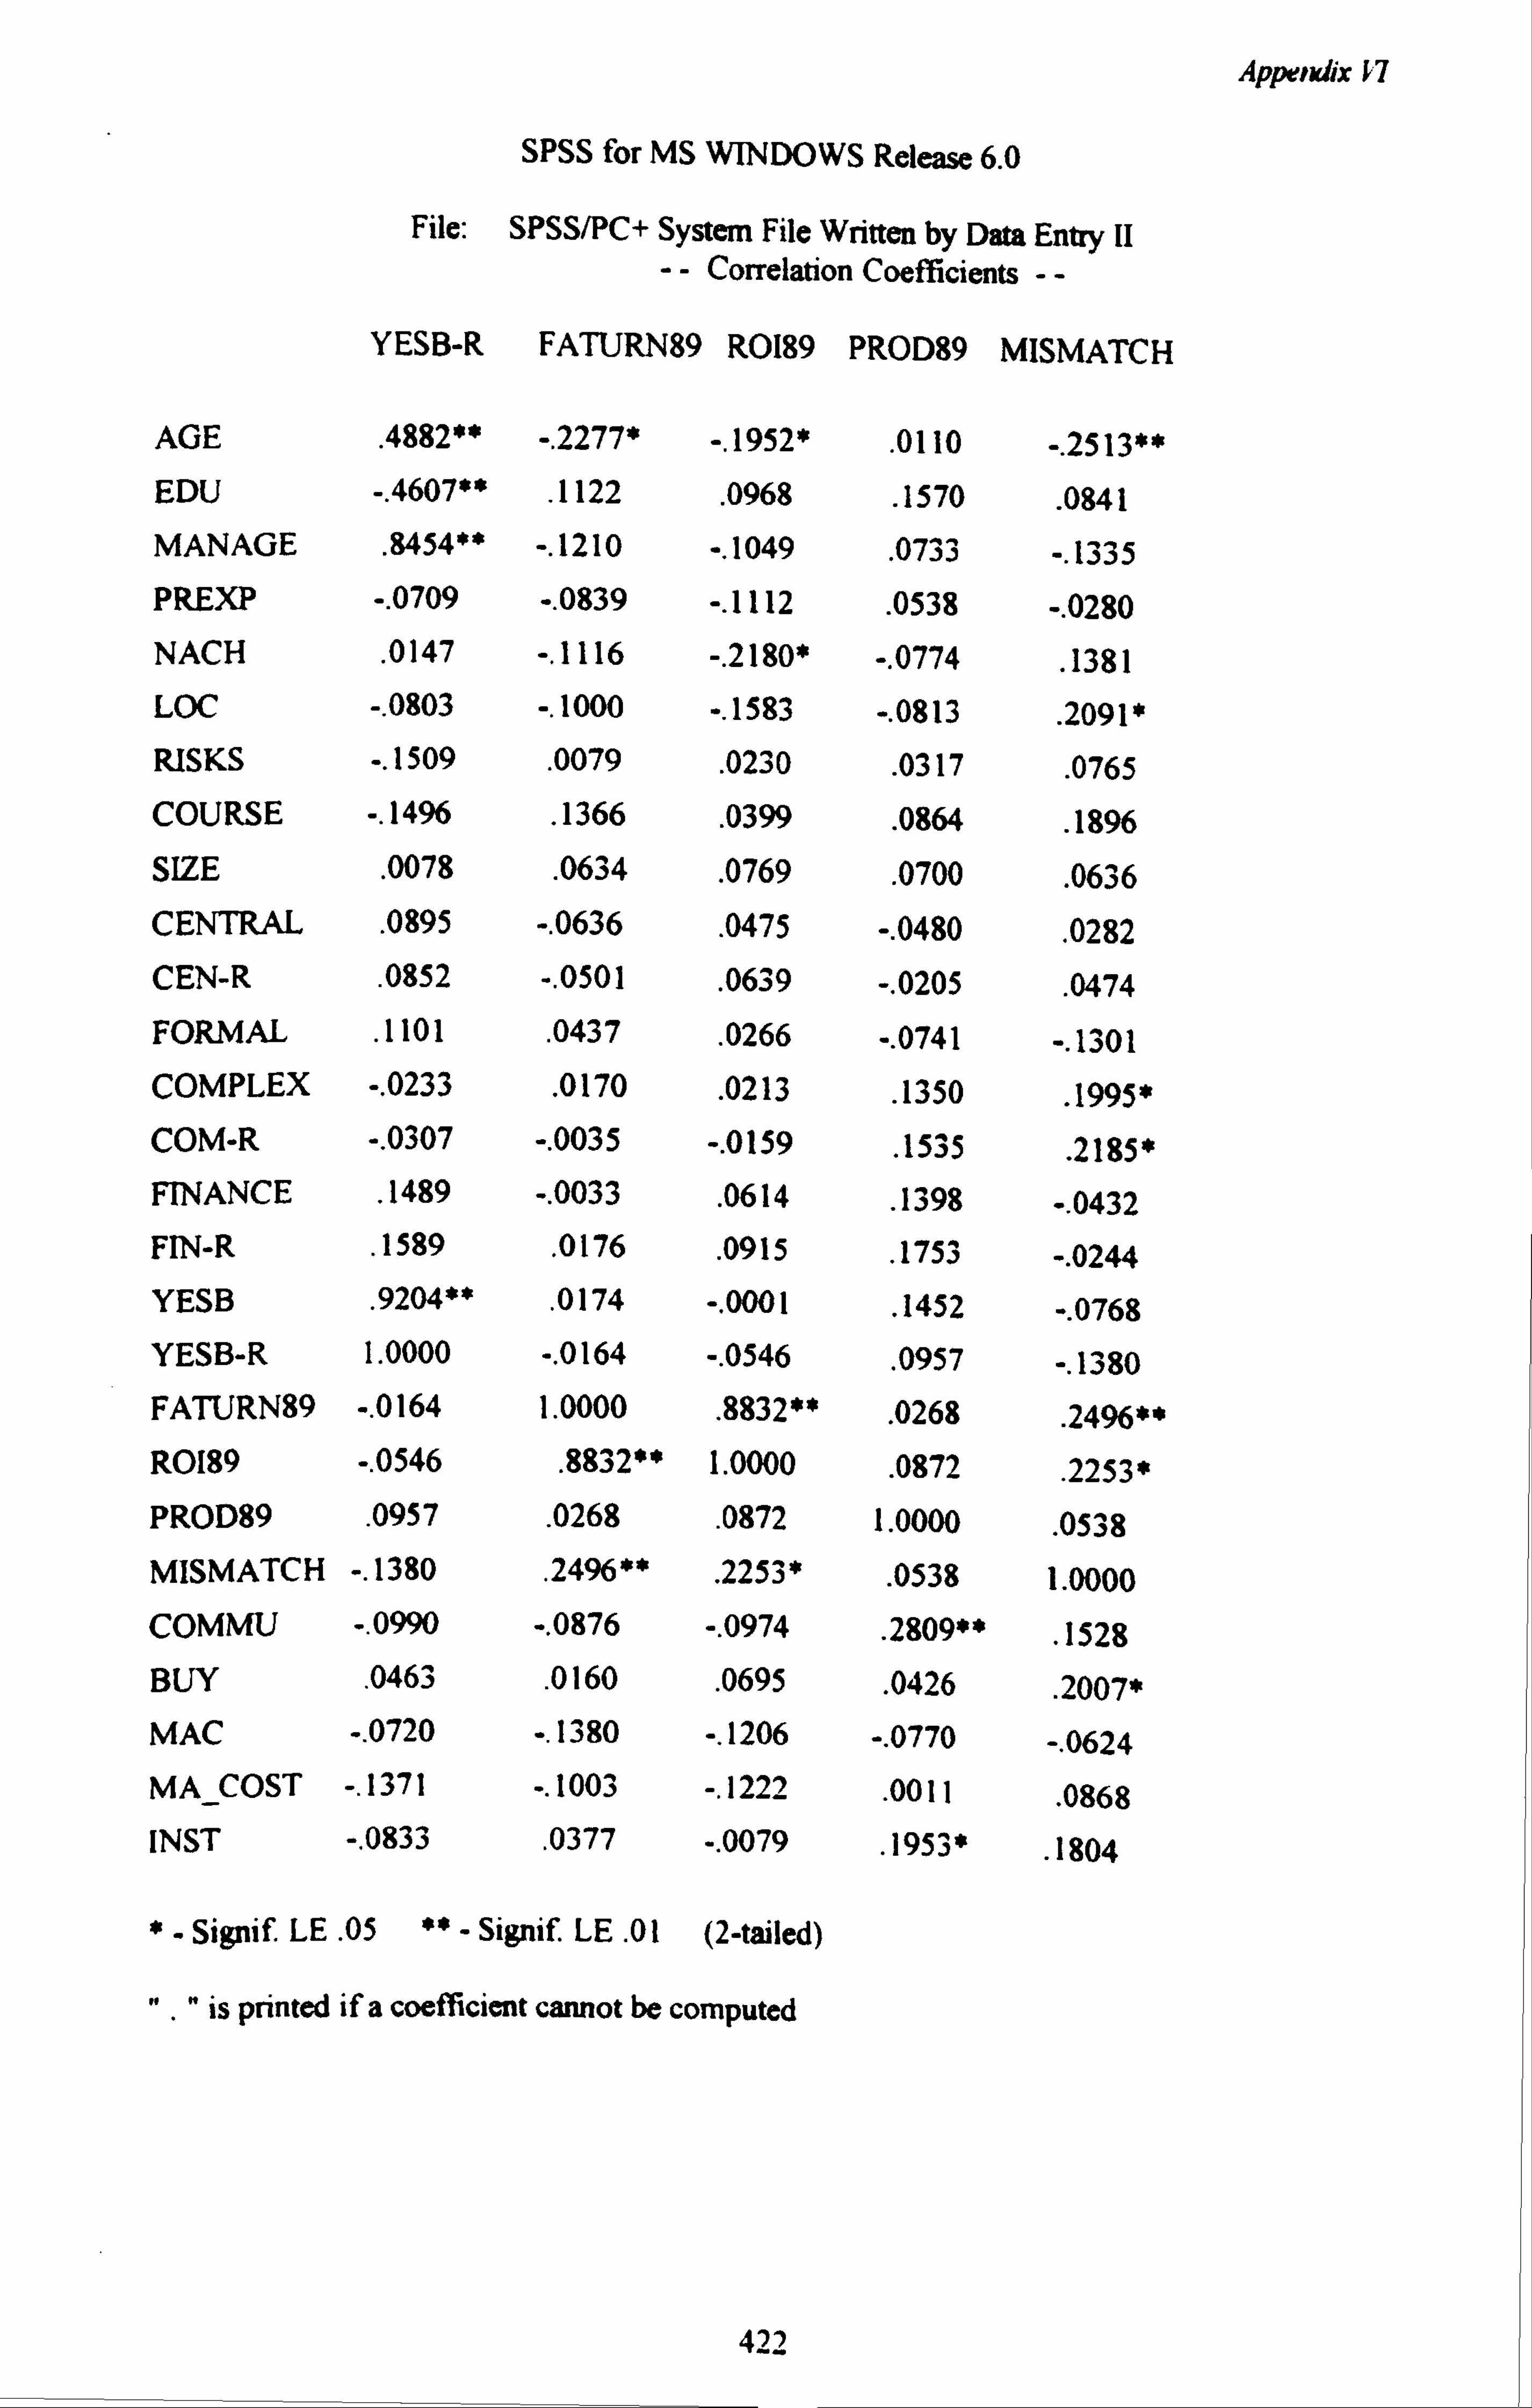
Appendix G7
SPSS for MS WINDOWS Release 6.0
File: SPSS/PC+ System File Written by Data Entry II -- Correlation Coefficients --
YESB-R FATURN89 R0189 PROD89 MISMATCH
AGE . 4882** -. 2277* -. 1952* . 0110 -. 2513**
EDU -. 4607** . 1122
. 0968 . 1570
. 0841 MANAGE .
8454** -. 1210 -. 1049 . 0733 -. 1335
PREXP -. 0709 -. 0839 -. 1112 . 0538 -. 0280
NACH . 0147 -. 1116 -. 2180* -. 0774 . 1381
LOC -. 0803 -. 1000 -. 1583 -. 0813 . 2091 *
RISKS -. 1509 . 0079
. 0230
. 0317
. 0765
COURSE -. 1496 . 1366 . 0399
. 0864 . 1896
SIZE . 0078 . 0634
. 0769 . 0700
. 0636 CENTRAL . 0895 -. 0636
. 0475 -. 0480 . 0282
CEN-R . 0852 -. 0501 . 0639 -. 0205
. 0474 FORMAL . 1101 . 0437
. 0266 -. 0741 -. 1301 COMPLEX -. 0233
. 0170 . 0213
. 1350 . 1995*
COM-R -. 0307 -. 0035 -. 0159 . 1535
. 2185* FINANCE . 1489 -. 0033
. 0614 . 1398 -. 0432
FIN-R . 1589
. 0176
. 0915
. 1753 -. 0244
YESB . 9204**
. 0174 -. 0001
. 1452 -. 0768
YESB-R 1.0000 -. 0164 -. 0546 . 0957 -. 1380
FATURN89 -. 0164 1.0000 . 8832**
. 0268 . 2496**
R0189 -. 0546 . 8832** 1.0000
. 0872 . 2253*
PRO D89 . 0957 . 0268
. 0872 1.0000 . 05 38
MISMATCH -. 1380 . 2496** . 2253*
. 0538 1.0000 COMMU -. 0990 -. 0876 -. 0974
. 2809**
. 1528
BUY . 0463 . 0160
. 0695 . 0426
. 2007* MAC -. 0720 -. 1380 -. 1206 -. 0770 -. 0624
MA_COST -. 1371 -. 1003 -. 1222 . 0011
. 0868 INST -. 0833
. 0377 -. 0079
. 1953*
. 1804
*- Signif. LE. 05 ** - Signif. LE. 01 (2-tailed)
". " is printed if a coefficient cannot be computed
422
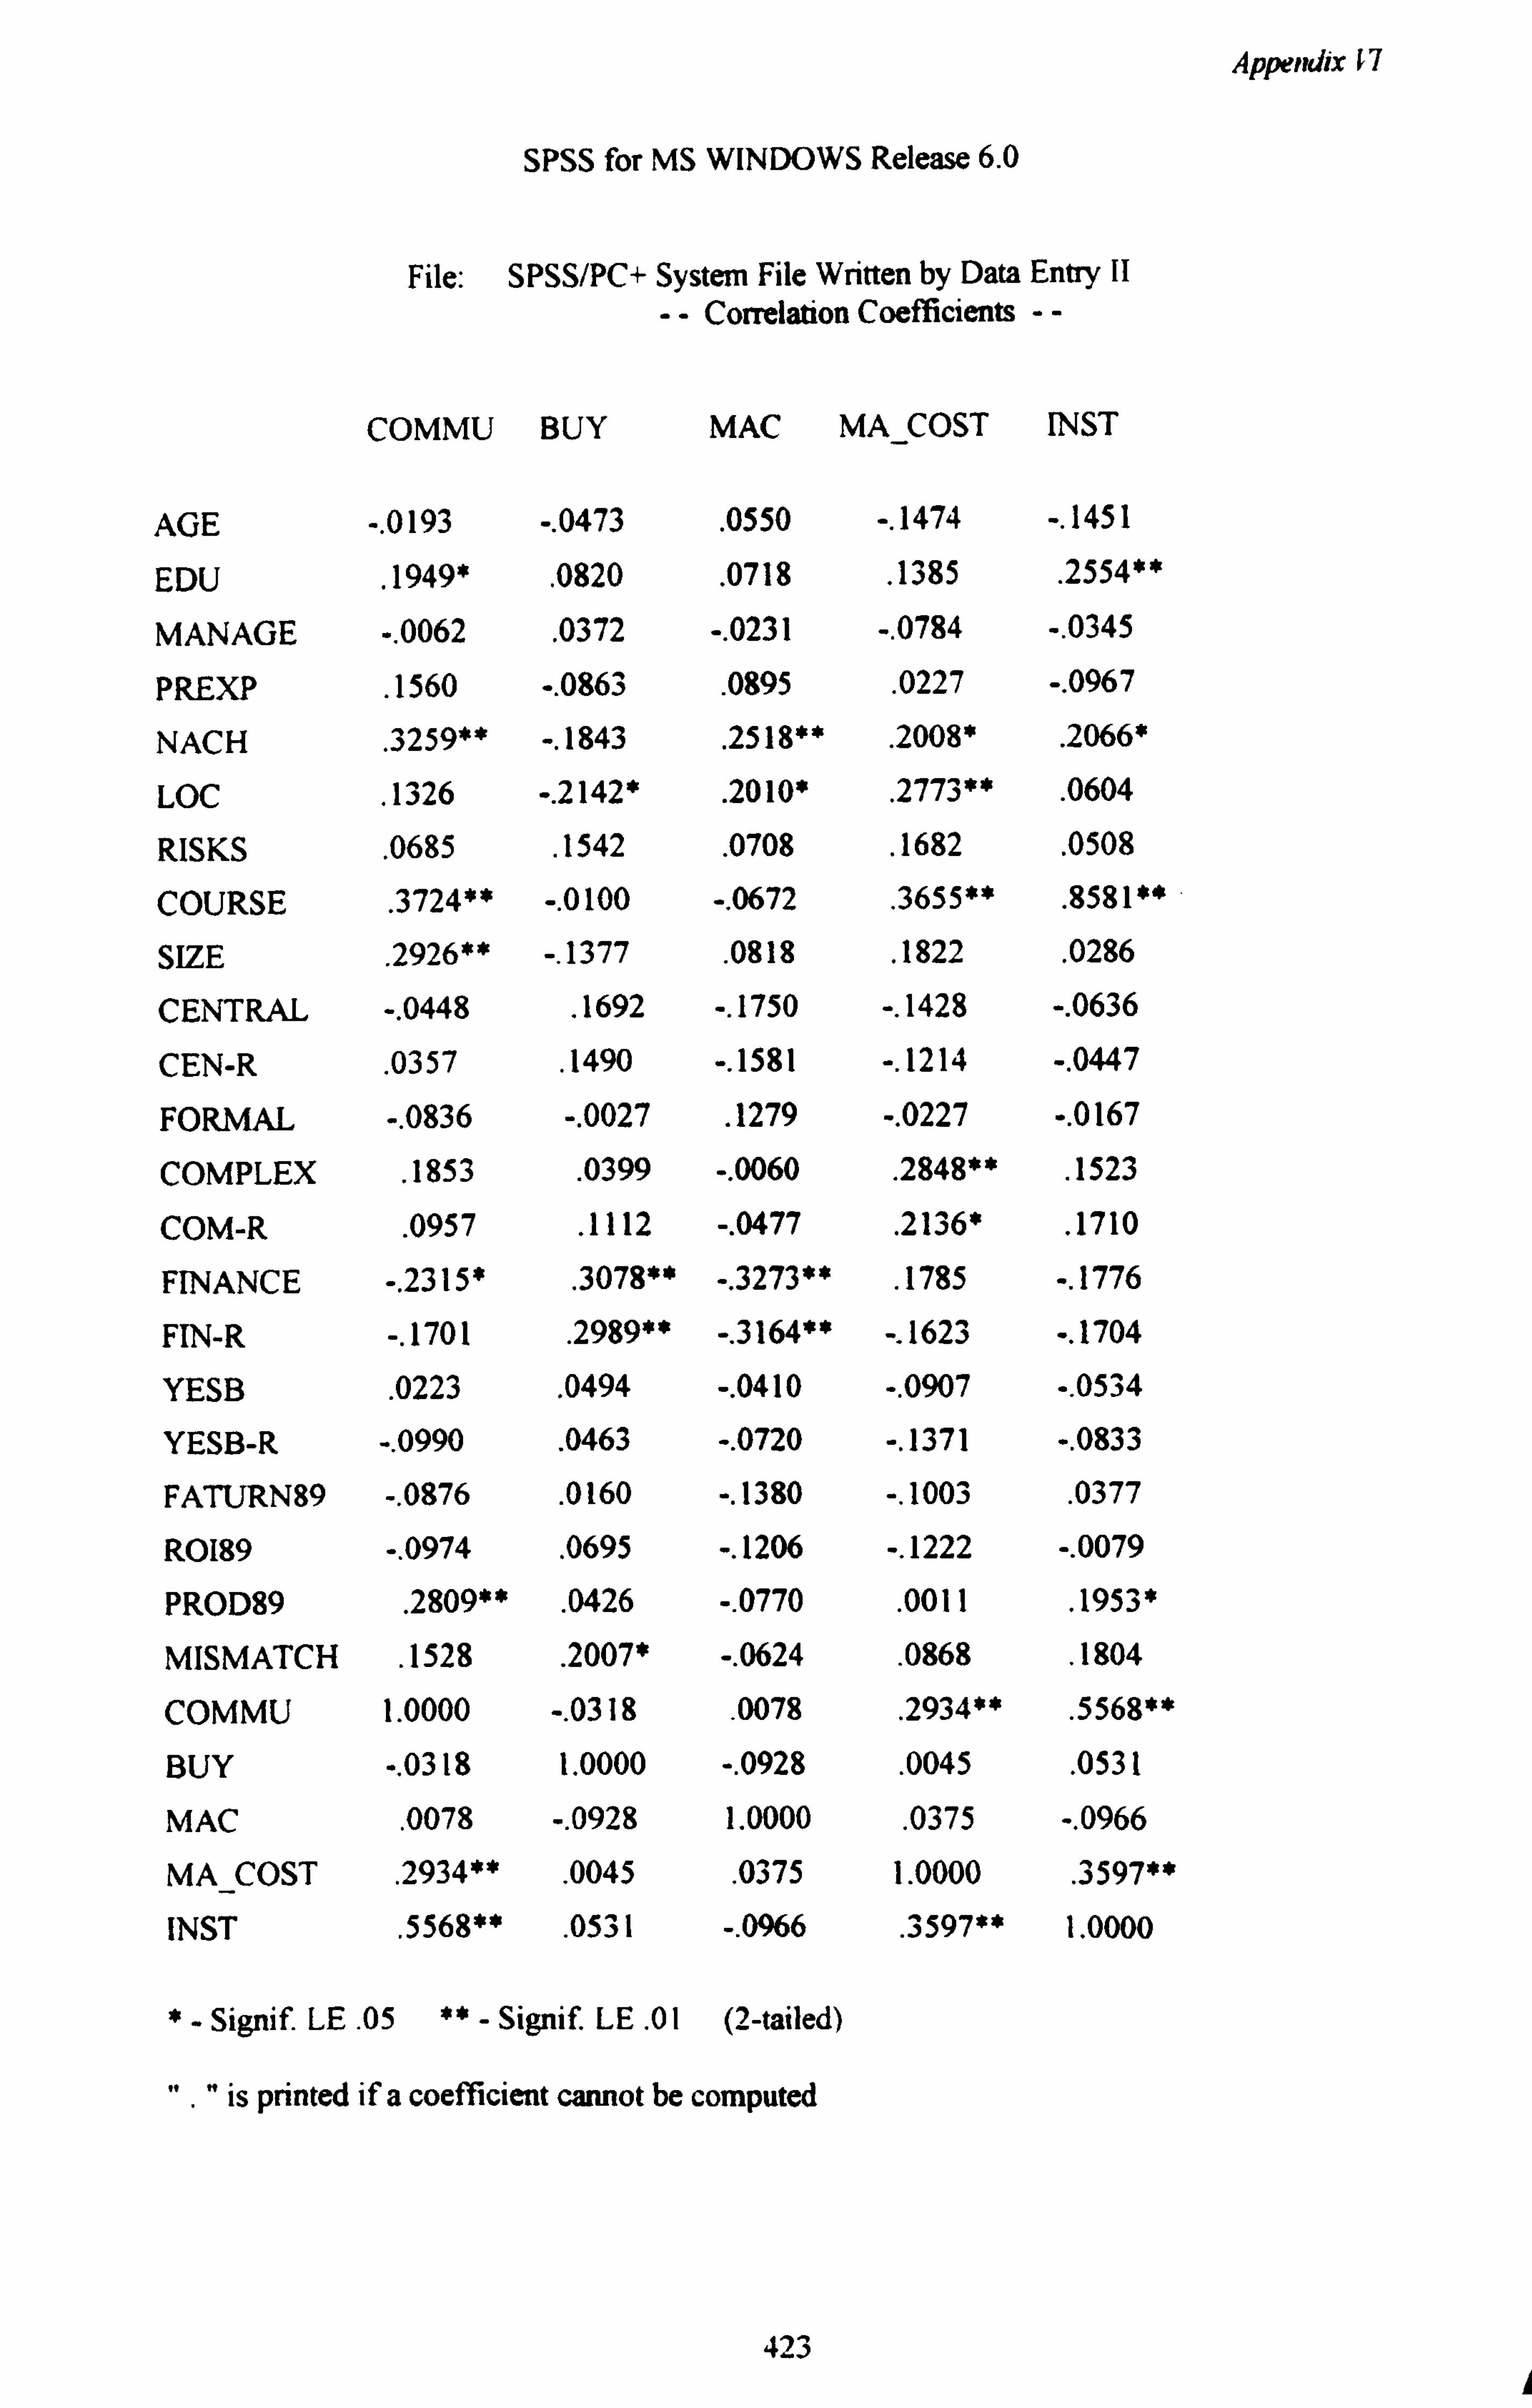
Appendix 67
SPSS for MS WINDOWS Release 6.0
File: SPSS/PC+ System File Written by Data Entry 11
-- Correlation Coefficients --
COMMU BUY MAC MA_COST INST
AGE -. 0193 -. 0473 . 0550 -. 1474 -. 1451
EDU . 1949* . 0820 . 0718 . 1385 . 2554**
MANAGE -. 0062 . 0372 -. 0231 -. 0784 -. 0345
PREXP . 1560 -. 0863 . 0895 . 0227 -. 0967
NACH . 3259** -. 1843 .
2518** . 2008* .
2066*
LOC . 1326 -. 2142* . 2010* . 2773** . 0604
RISKS . 0685 . 1542 . 0708 . 1682 . 0508
COURSE . 3724** -. 0100 -. 0672 . 3655** . 8581
SIZE . 2926** -. 1377 . 0818 . 1822 . 0286
CENTRAL -. 0448 . 1692 -. 1750 -. 1428 -. 0636
CEN-R . 0357 . 1490 -. 1581 -. 1214 -. 0447
FORMAL -. 0836 -. 0027 . 1279 -. 0227 -. 0167
COMPLEX . 1853 . 0399 -. 0060 . 2848** . 1523
COM-R . 0957 . 1112 -. 0477 . 2136* . 1710
FINANCE -. 2315* . 3078** -. 3273** . 1785 -. 1776
FIN-R -. 1701 . 2989** -. 3164** -. 1623 -. 1704
YESB . 0223 . 0494 -. 0410 -. 0907 -. 0534
YESB-R -. 0990 . 0463 -. 0720 -. 1371 -. 0833
FATURN89 -. 0876 . 0160 -. 1380 -. 1003 .
0377
R0189 -. 0974 . 0695 -. 1206 -. 1222 -. 0079
PROD89 . 2809** . 0426 -. 0770 . 0011 . 1953 *
MISMATCH . 1528 . 2007* -. 0624 . 0868 . 1804
COMMU 1.0000 -. 0318 . 0078 . 2934** . 5568**
BUY -. 0318 1.0000 -. 0928 . 0045 . 0531
MAC . 0078 -. 0928 1.0000 . 0375 -. 0966
MA COST . 2934** . 0045 . 0375 1.0000 . 3597**
INST . 5568**
. 0531 -. 0966
. 3597** 1.0000
*- Signif. LE. 05 ** - Signif. LE . 01 (2-tailed)
". " is printed if a coefficient cannot be computed
423
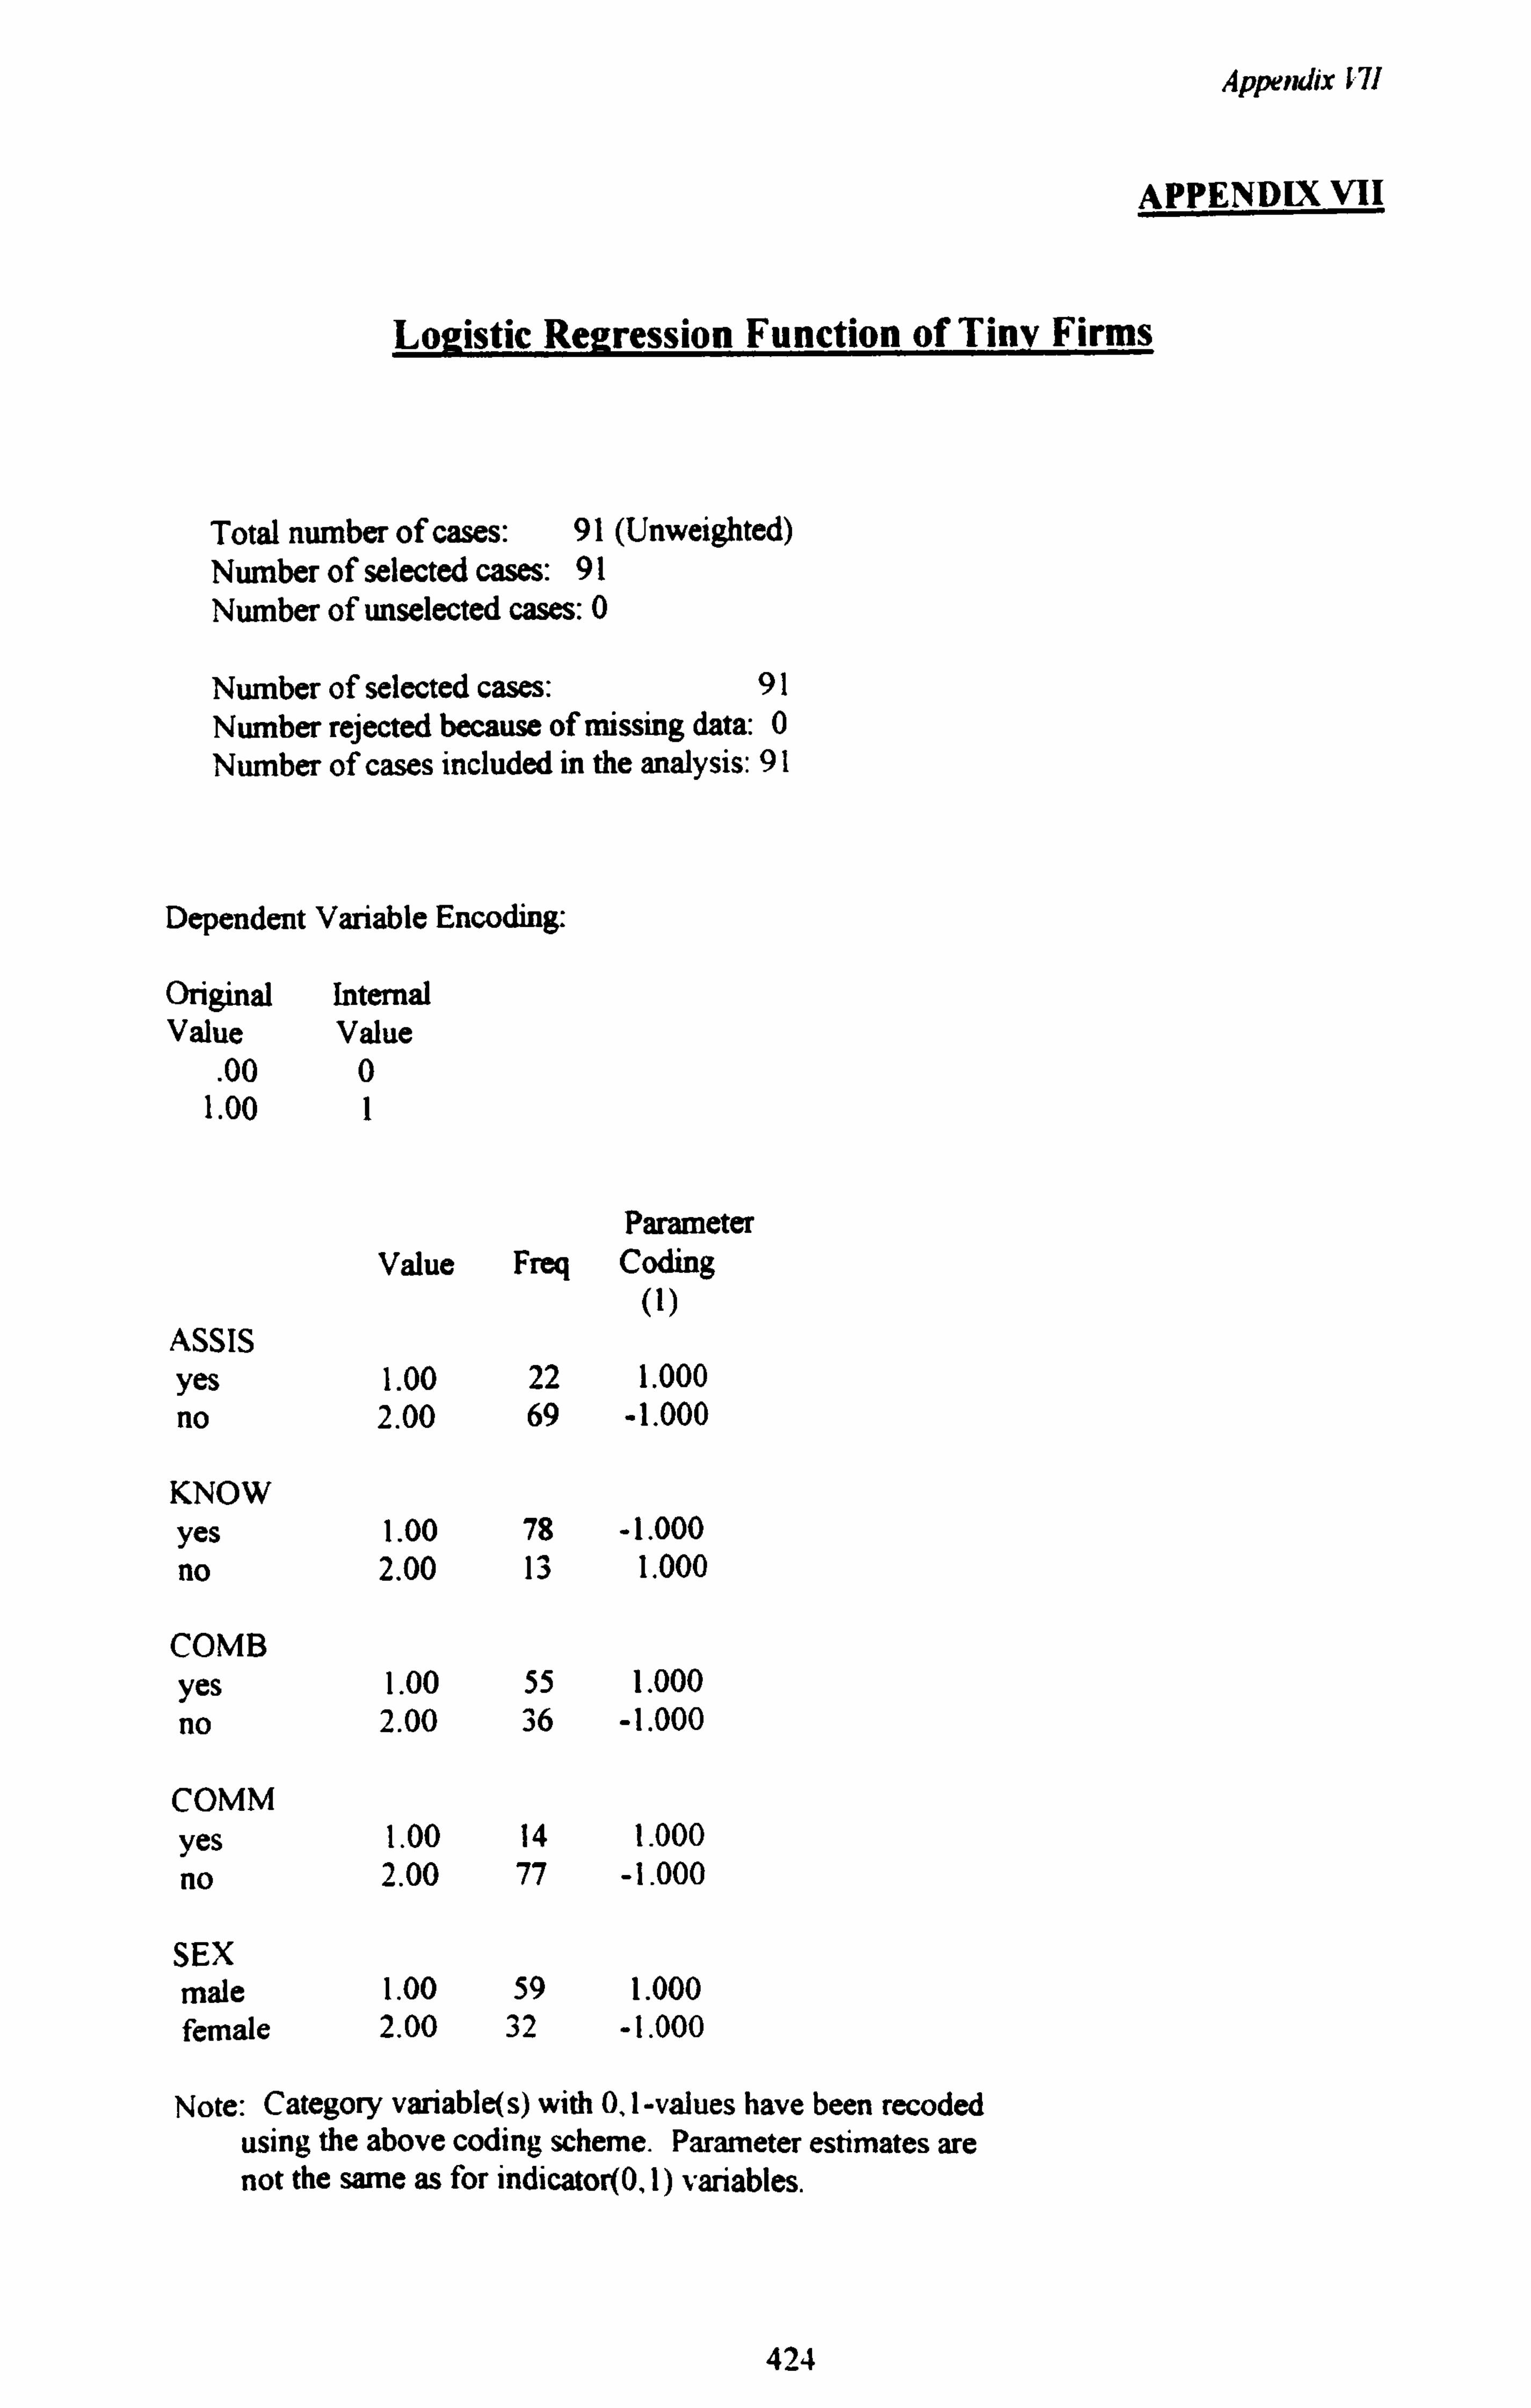
Appernlix 171
APPENDIX VII
Logistic Regression Function of Tiny Firms
Total number of cases: 91 (Unweighted) Number of selected cases: 91 Number of unselected cases: 0
Number of selected cases: 91 Number rejected because of missing data: 0 Number of cases included in the analysis: 91
Dependent Variable Encoding:
Original Internal Value Value
. 00 0 1.00 1
Parameter Value Freq Coding
(1) ASSIS yes 1.00 22 1.000 no 2.00 69 -1.000
KNOW yes 1.00 78 -1.000 no 2.00 13 1.000
COMB yes 1.00 55 1.000 no 2.00 36 -1.000
COMM yes 1.00 14 1.000 no 2.00 77 -1.000
SEX male 1.00 59 1.000 female 2.00 32 -1.000
Note: Category variabl e(s) with 0,1-values have been recoded using th e above coding scheme. Parameter estimates are not the same as for indicator(0,1) variables.
424
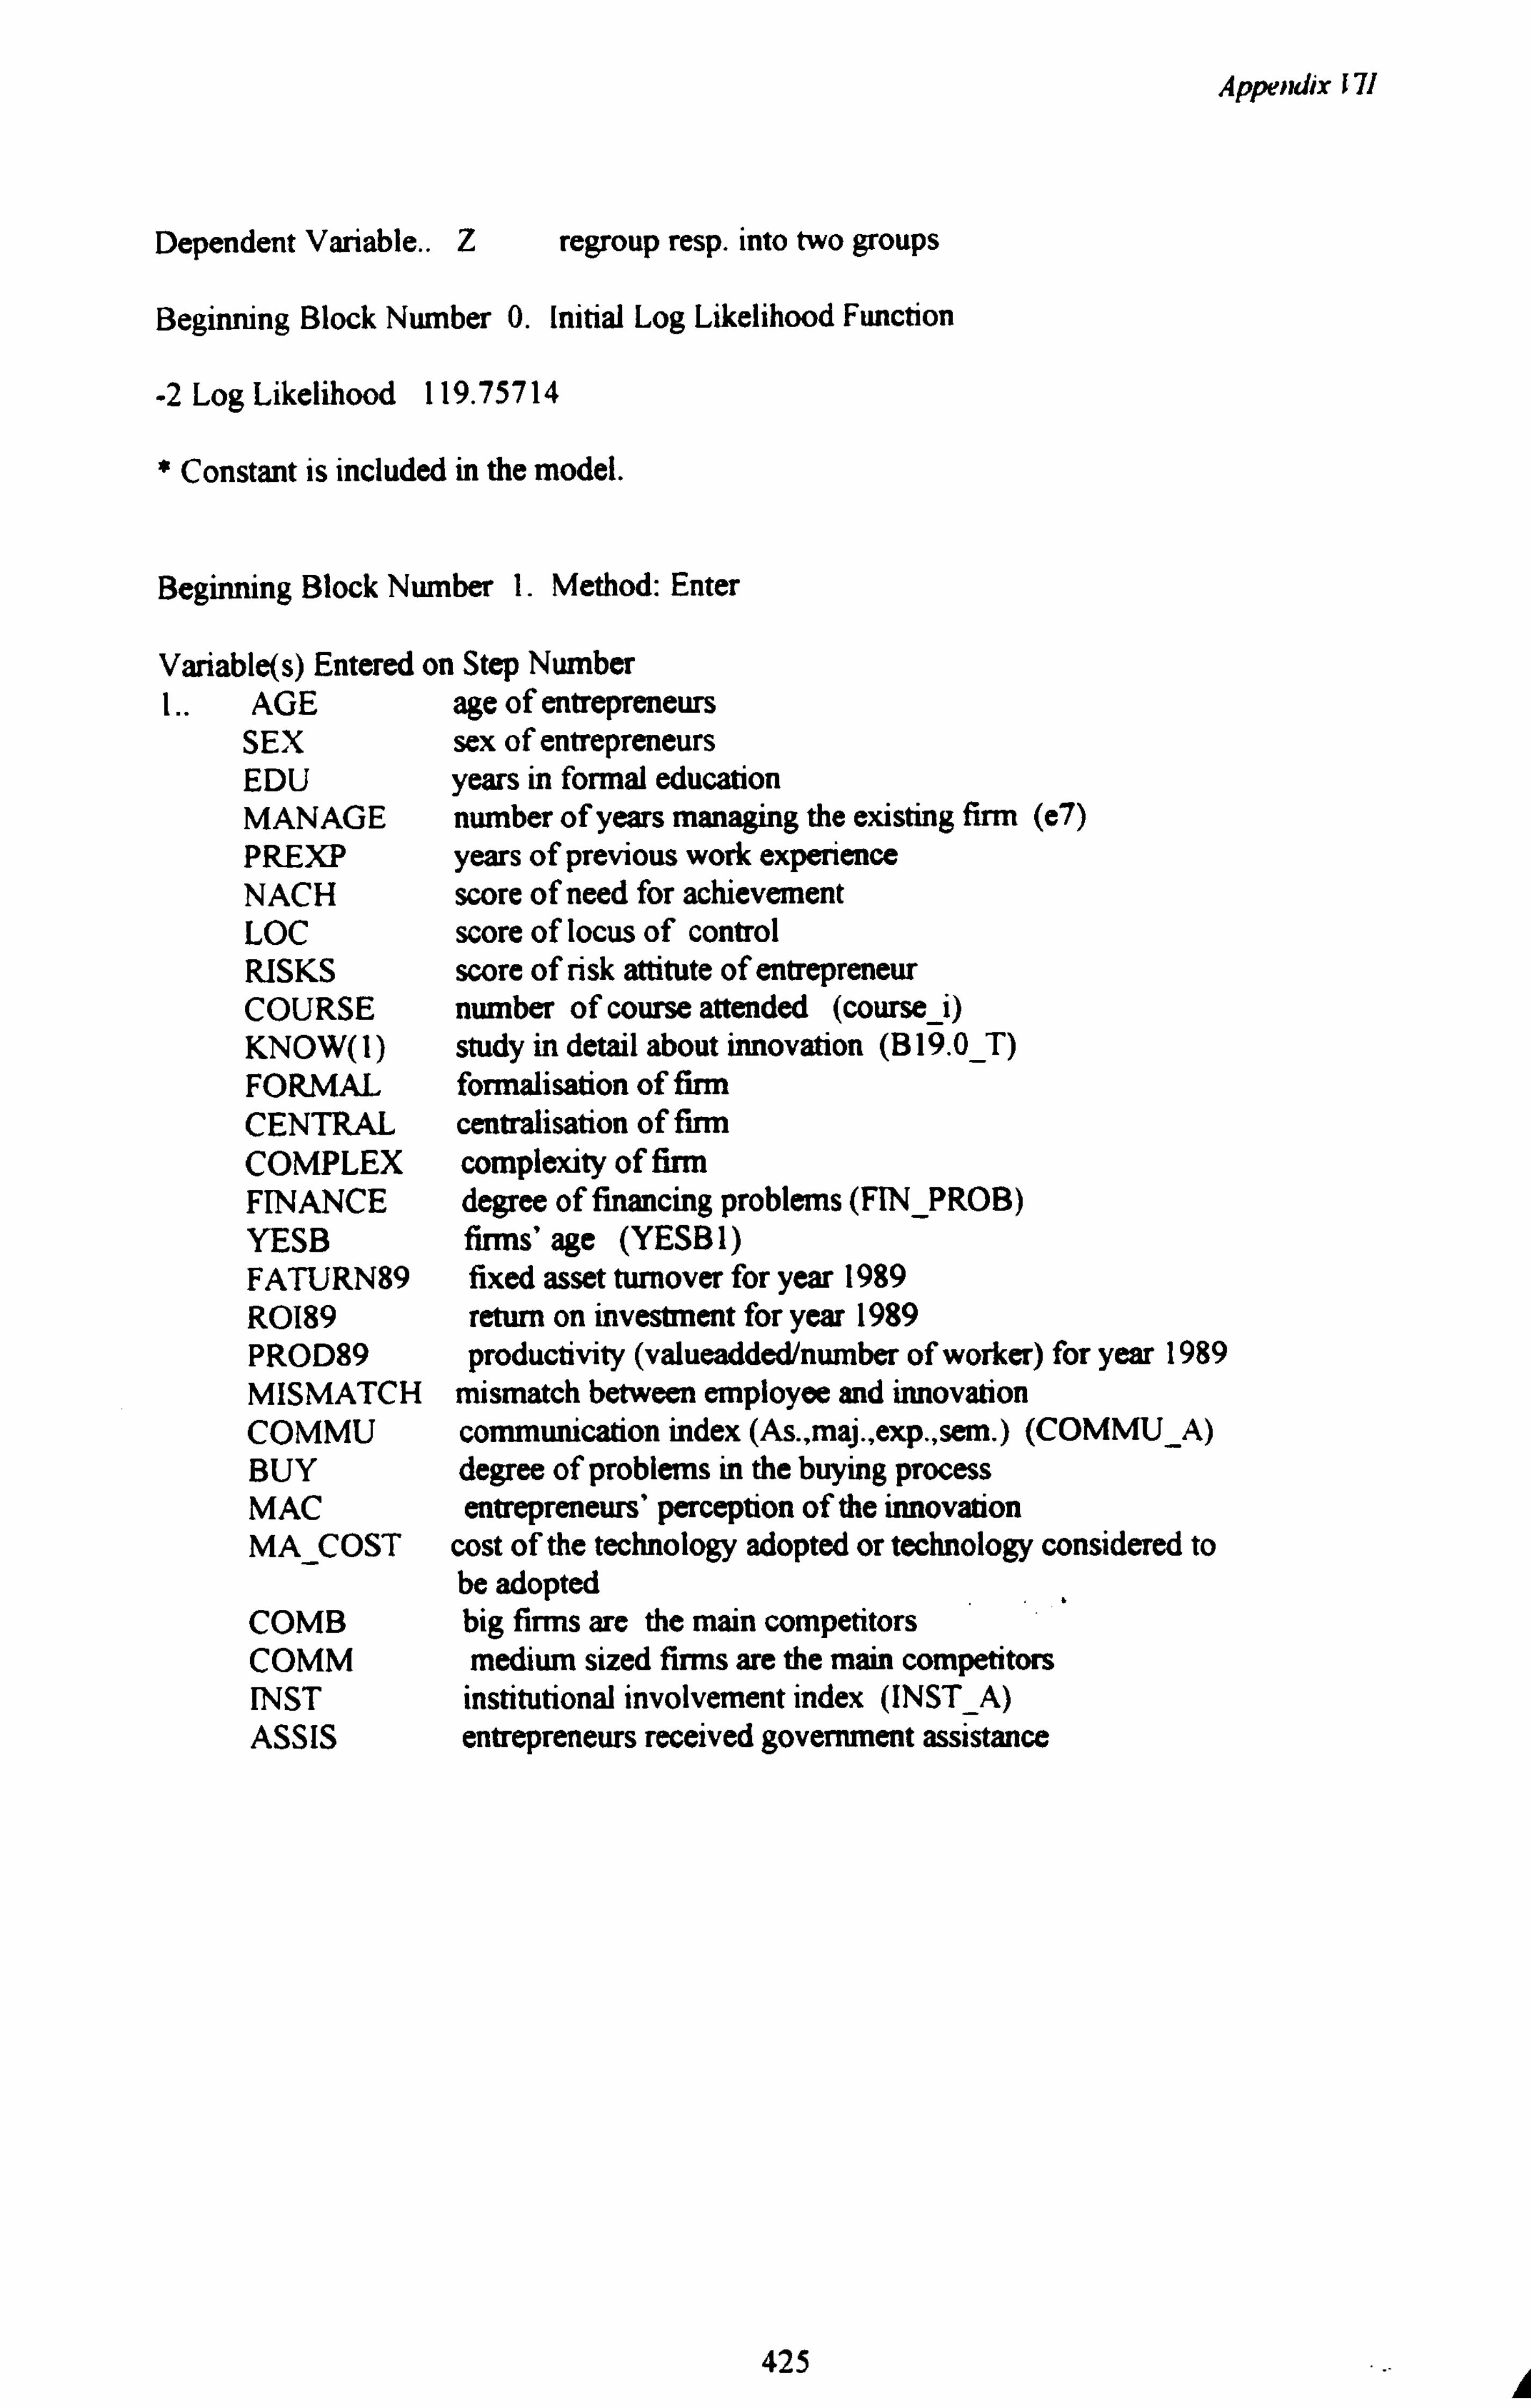
Appendix 171
Dependent Variable.. Z regroup resp. into two groups
Beginning Block Number 0. Initial Log Likelihood Function
-2 Log Likelihood 119.75714
* Constant is included in the model.
Beginning Block Number 1. Method: Enter
Variable(s) Entered on Step Number L. AGE age of entrepreneurs
SEX sex of entrepreneurs EDU years in formal education MANAGE number of years managing the existing firm (e7) PREXP years of previous work experience NACH score of need for achievement LOC score of locus of control RISKS score of risk attitute of entrepreneur COURSE number of course attended (course
_i) KNOW(l) study in detail about innovation (B 19.0_T) FORMAL formalisation of firm CENTRAL centralisation of firm COMPLEX complexity of fum FINANCE degree of financing problems (FIN_PROB) YESB firms' age (YESB 1) FATURN89 fixed asset turnover for year 1989 ROI89 return on investment for year 1989 PROD89 productivity (valueadded/number of worker) for year 1989 MISMATCH mismatch between employee and innovation COMMU communication index (As., maj., exp., sem. ) (COMMU_A) BUY degree of problems in the buying process MAC entrepreneurs' perception of the innovation MA_COST cost of the technology adopted or technology considered to
be adopted COMB big firms are the main competitors COMM medium sized firms are the main competitors INST institutional involvement index (INST_A) ASSIS entrepreneurs received government assistance
425
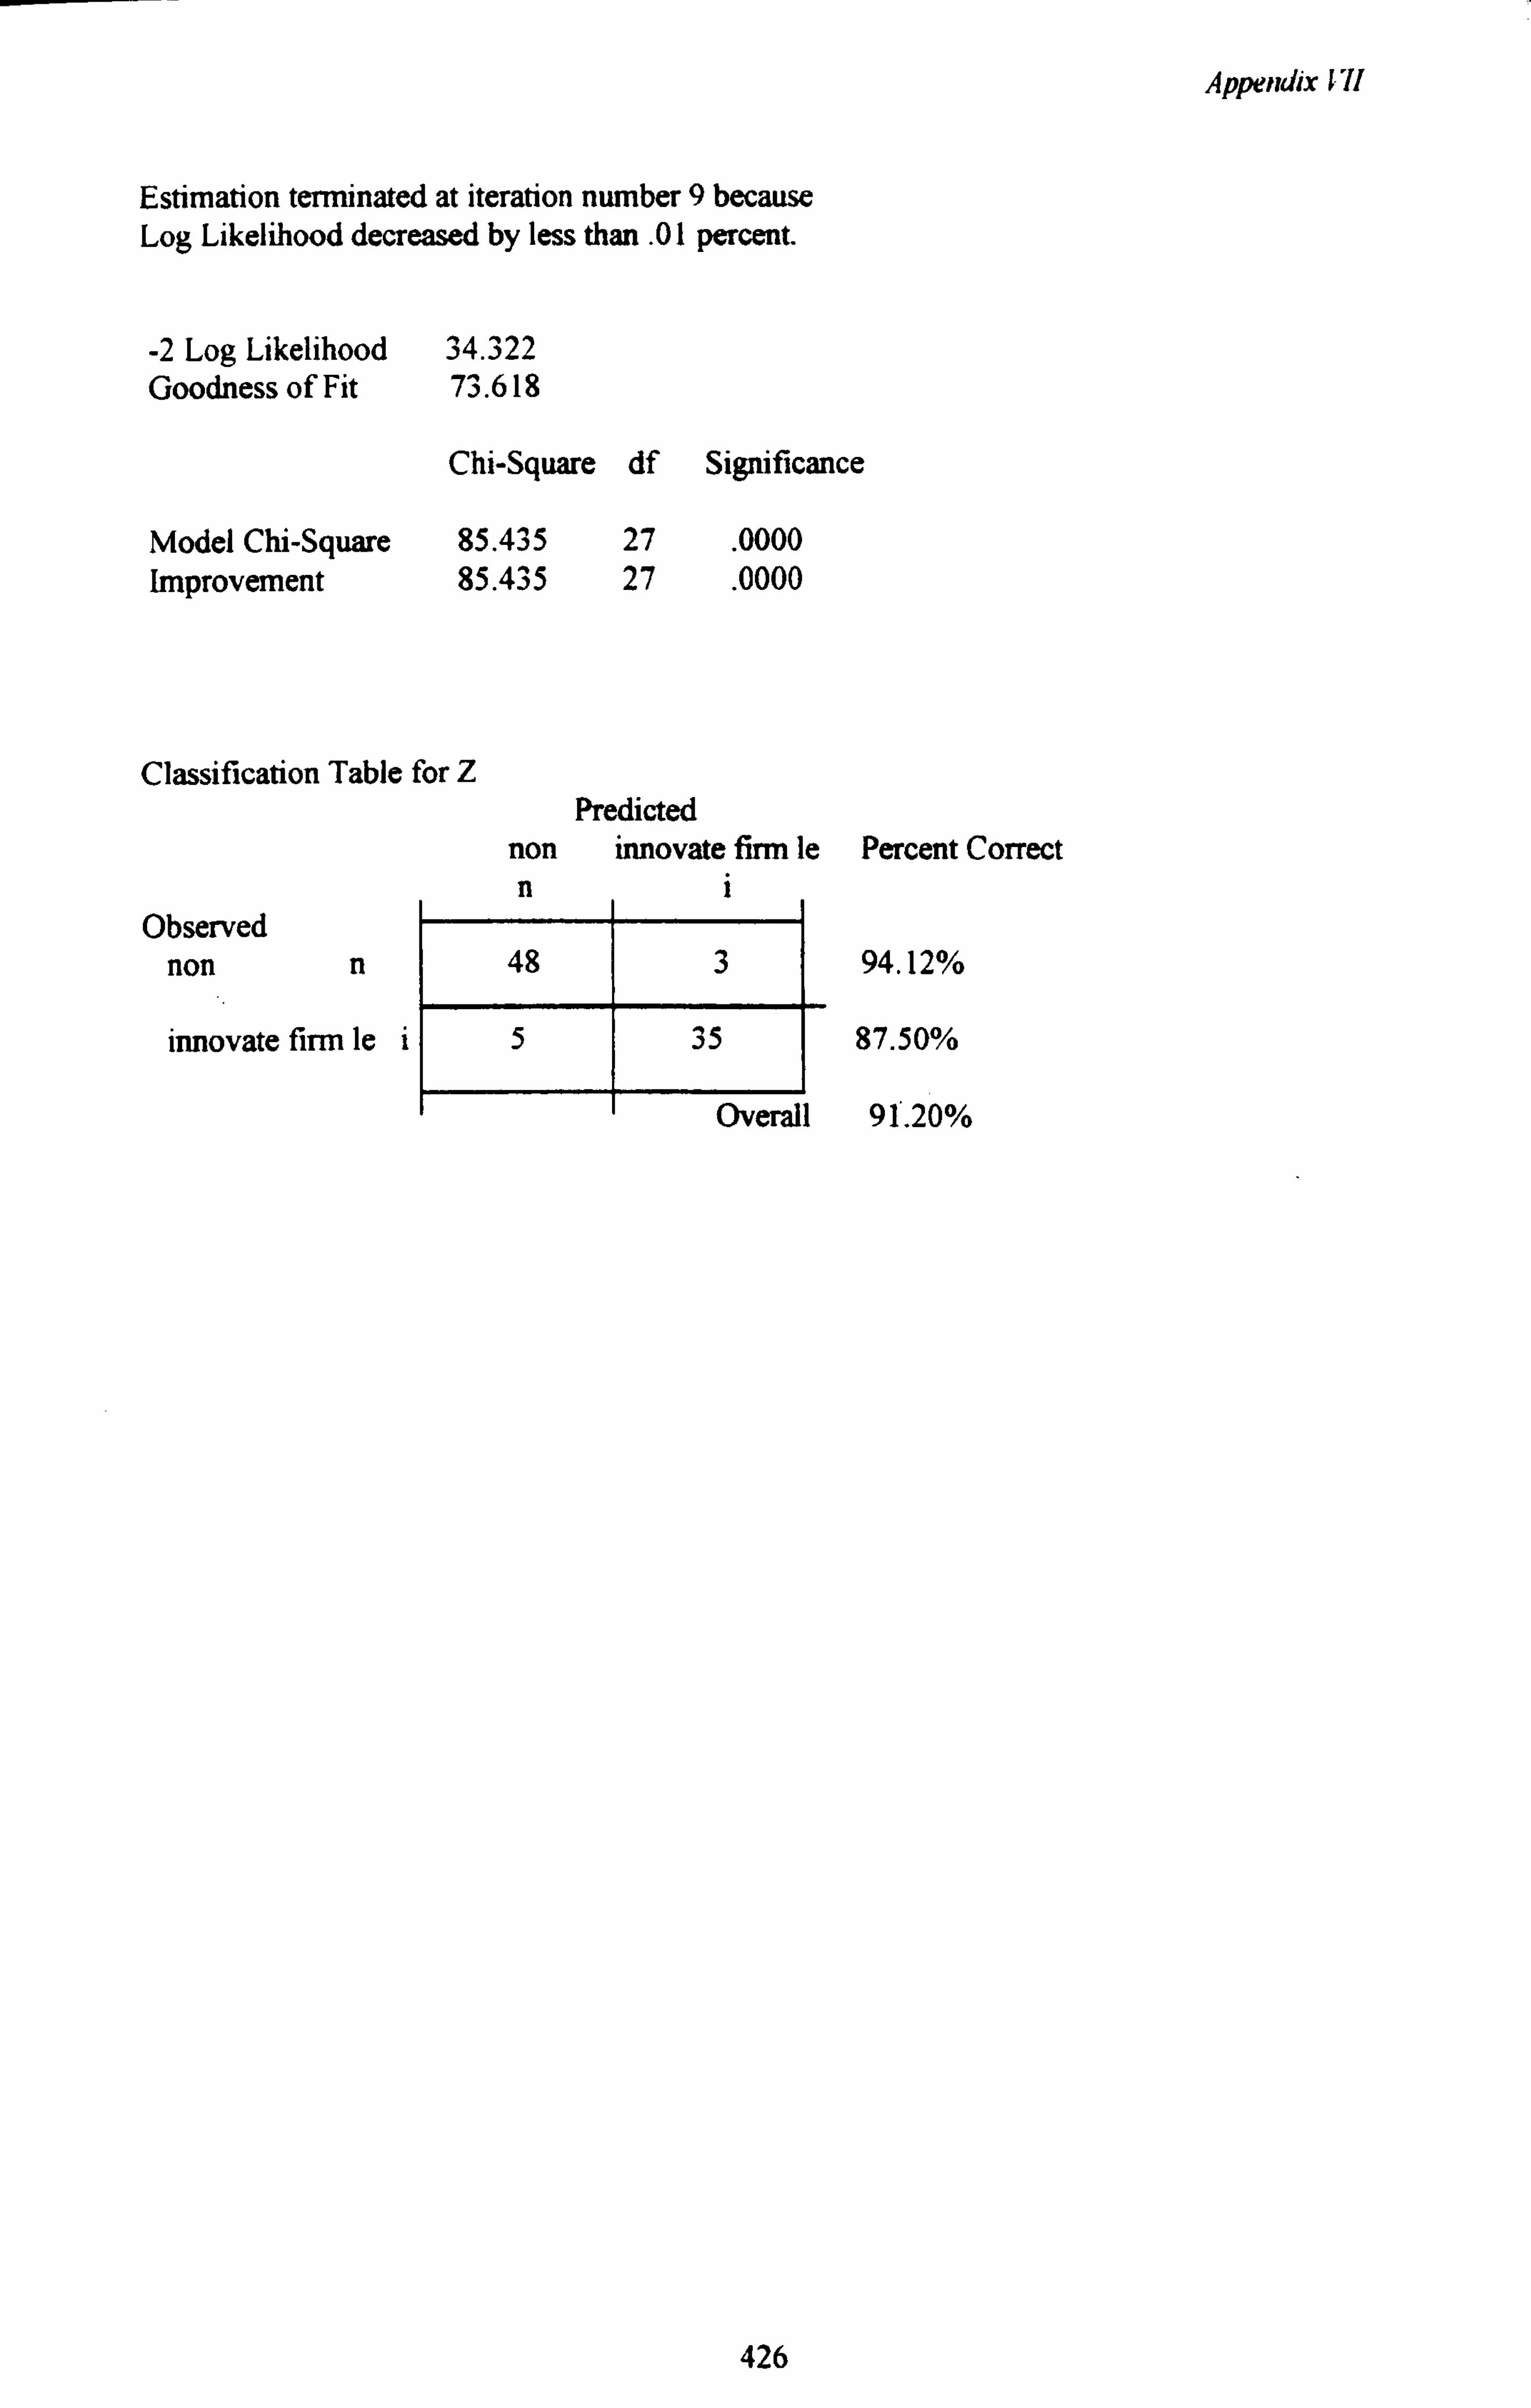
Appendix 671
Estimation terminated at iteration number 9 because Log Likelihood decreased by less than .
01 percent.
-2 Log Likelihood Goodness of Fit
Model Chi-Square Improvement
34.322 73.618
Chi-Square df Significance
85.435 27 . 0000
85.435 27 . 0000
Classification Table for Z
Observed non n
innovate firm le i
Predicted non innovate firm le Percent Correct ni
94.12%
87.50%
Overall 91.20%
426
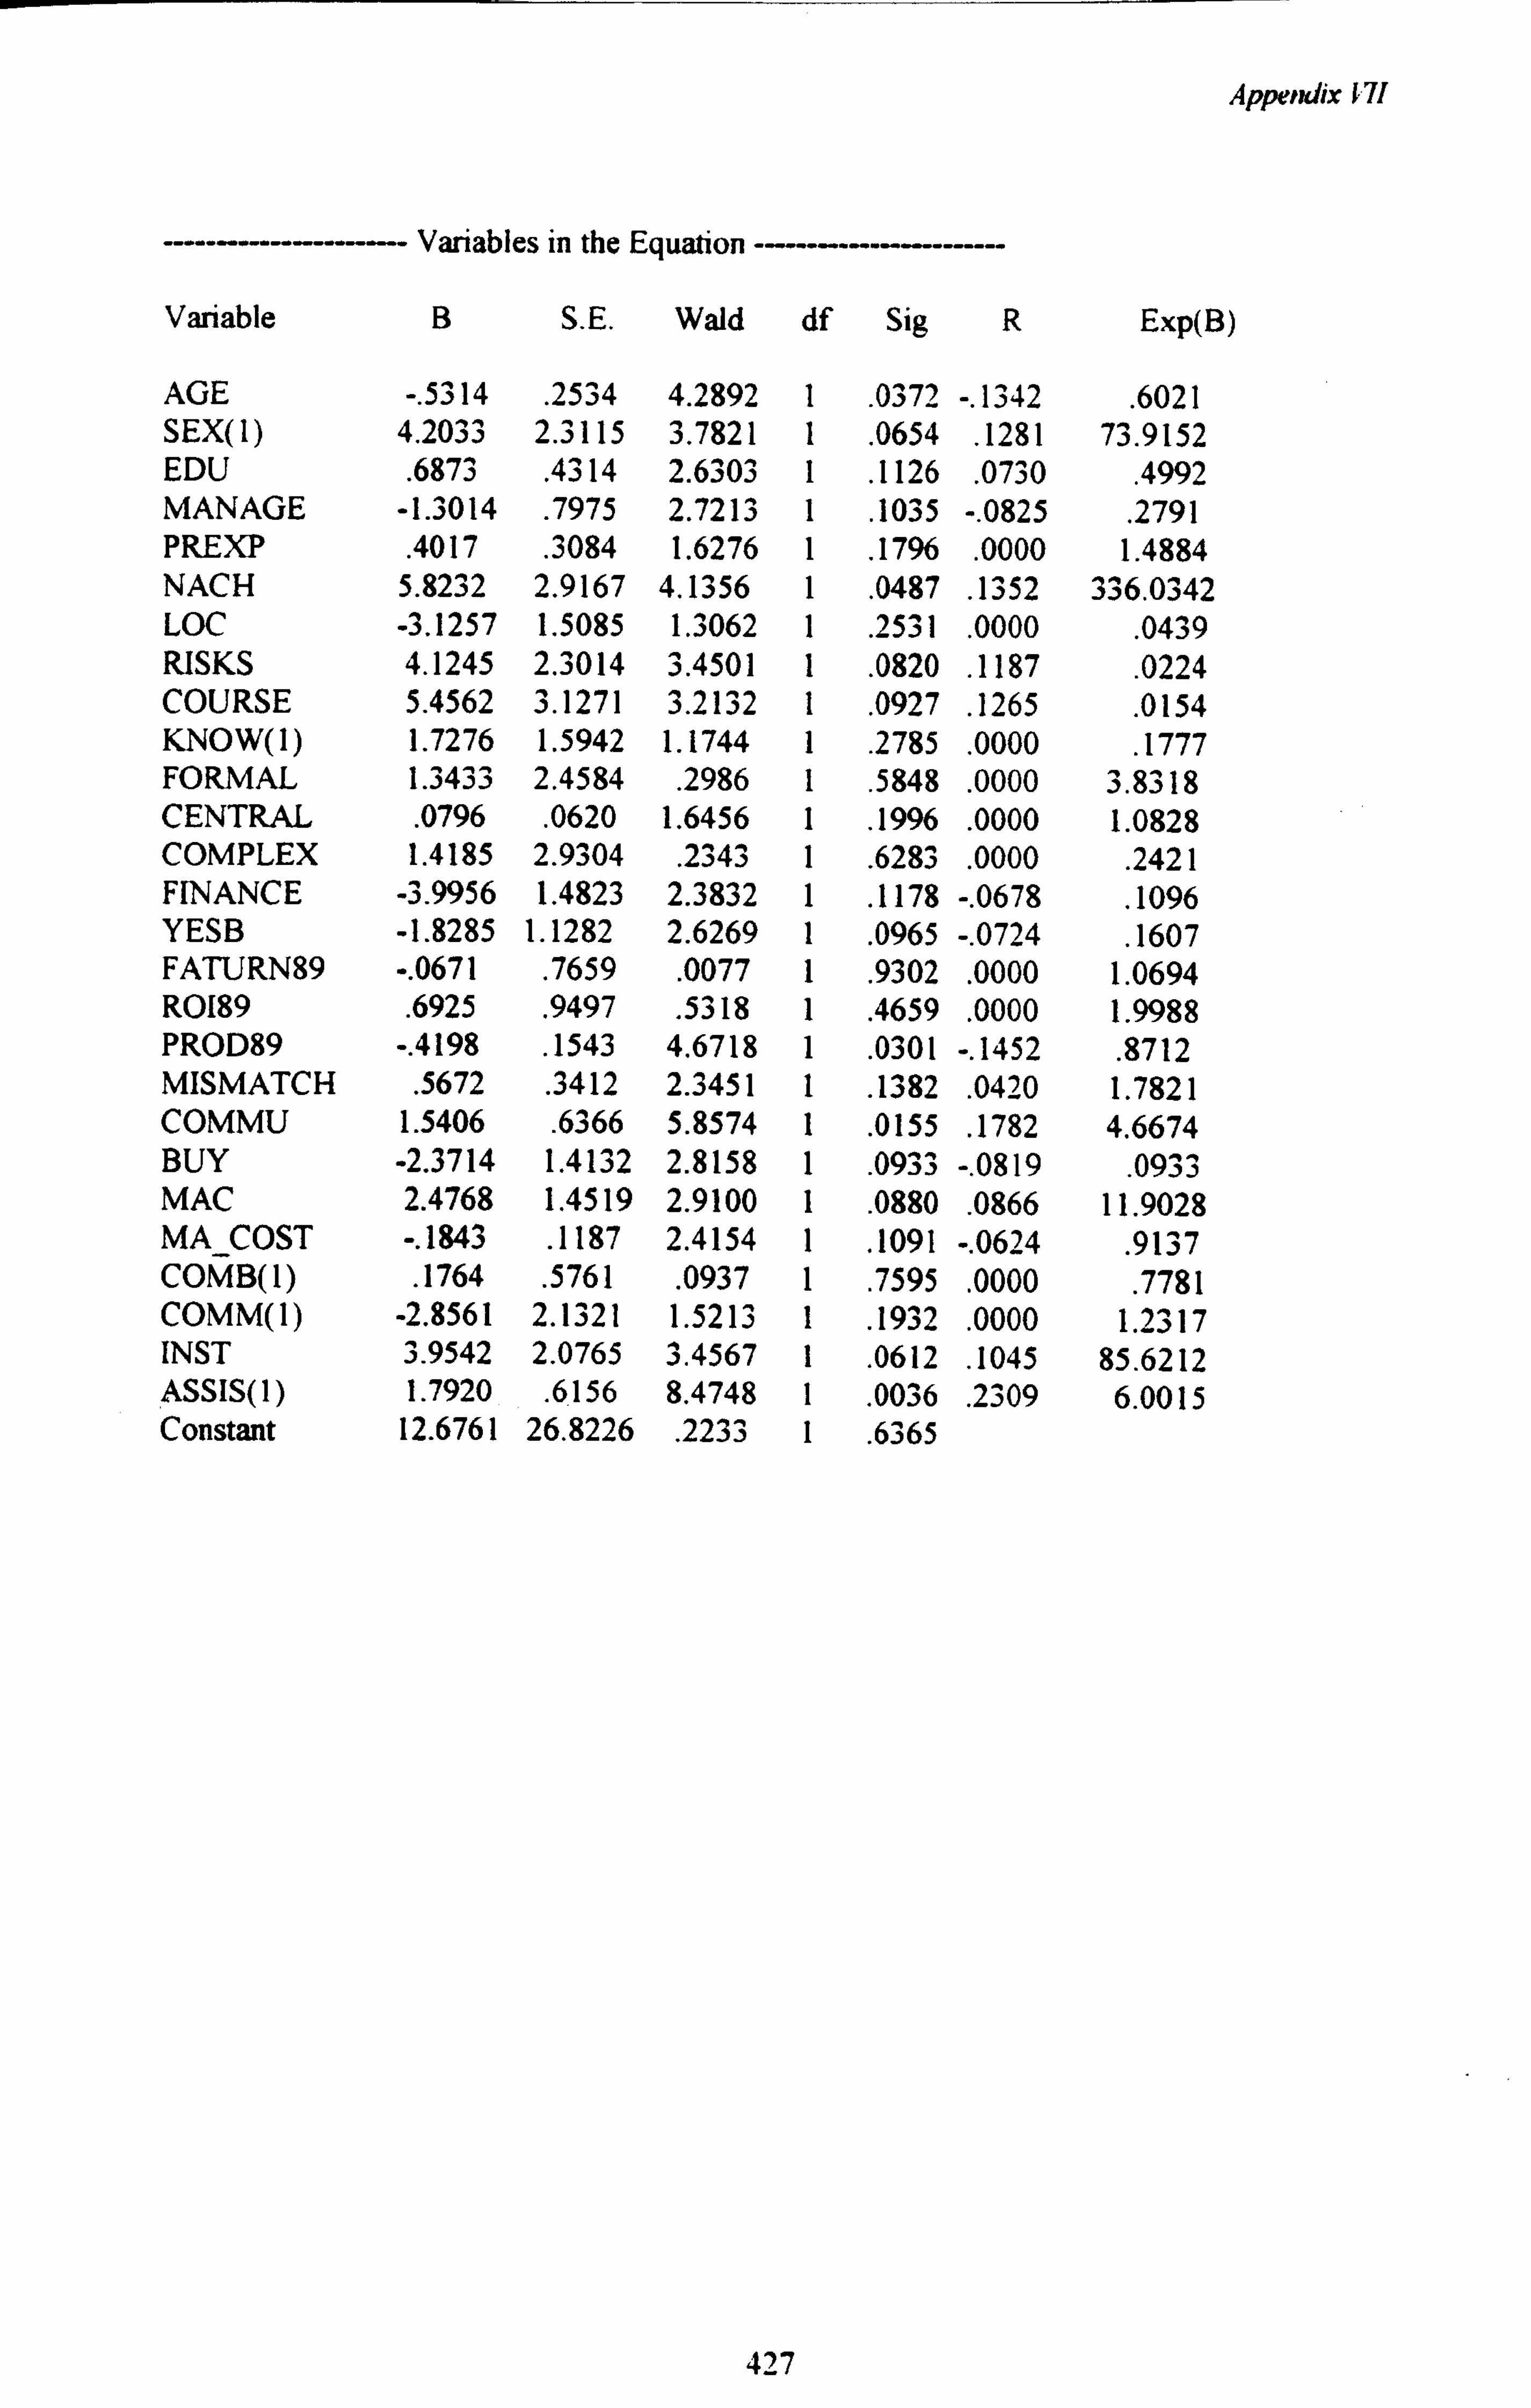
Appendix 1.71
----------------------- Variables in the Equation -------
Variable B S. E. Wald df Sig R Exp(B)
AGE -. 5314 . 2534 4.2892 1 . 0372 -. 1342 . 6021 SEX(1) 4.2033 2.3115 3.7821 1 . 0654
. 1281 73.9152 EDU . 6873 . 4314 2.6303 1 . 1126 . 0730
. 4992 MANAGE -1.3014 .
7975 2.7213 1 . 1035 -. 0825
. 2791
PREXP . 4017
. 3084 1.6276 1
. 1796
. 0000 1.4884
NACH 5.8232 2.9167 4.1356 1 . 0487 . 1352 336.0342 LOC -3.1257 1.5085 1.3062 1 . 2531 . 0000
. 0439 RISKS 4.1245 2.3014 3.4501 1 . 0820
. 1187 . 0224
COURSE 5.4562 3.1271 3.2132 1 . 0927 . 1265 . 0154
KNOW(1) 1.7276 1.5942 1.1744 1 . 2785
. 0000
. 1777
FORMAL 1.3433 2.4584 . 2986 1
. 5848
. 0000 3.8318
CENTRAL . 0796
. 0620 1.6456 1
. 1996
. 0000 1.0828
COMPLEX 1.4185 2.9304 . 2343 1
. 6283
. 0000
. 2421
FINANCE -3.9956 1.4823 2.3832 1 . 1178 -. 0678 . 1096 YESB -1.8285 1.1282 2.6269 1 . 0965 -. 0724
. 1607 FATURN89 -. 0671 . 7659
. 0077 1 . 9302 . 0000 1.0694 R0189 . 6925 . 9497 . 5318 1 . 4659 . 0000 1.9988 PROD89 -. 4198
. 1543 4.6718 1
. 0301 -. 1452
. 8712
MISMATCH . 5672
. 3412 2.3451 1
. 1382
. 0420 1.7821
COMMU 1.5406 . 6366 5.8574 1 . 0155 . 1782 4.6674 BUY -2.3714 1.4132 2.8158 1
. 0933 -. 0819 . 0933
MAC 2.4768 1.4519 2.9100 1 . 0880
. 0866 11.9028 MA_COST -. 1843 . 1187 2.4154 1 . 1091 -. 0624 . 9137 COMB(1) . 1764 . 5761
. 0937 1 . 7595 . 0000
. 7781 COMM(1) -2.8561 2.1321 1.5213 1 . 1932 . 0000 1.2317 INST 3.9542 2.0765 3.4567 1
. 0612
. 1045 85.6212
ASSIS(1) 1.7920 . 6156 8.4748 1 . 0036 . 2309 6.0015 Constant 12.6761 26.8226
. 2233 1 . 6365
427
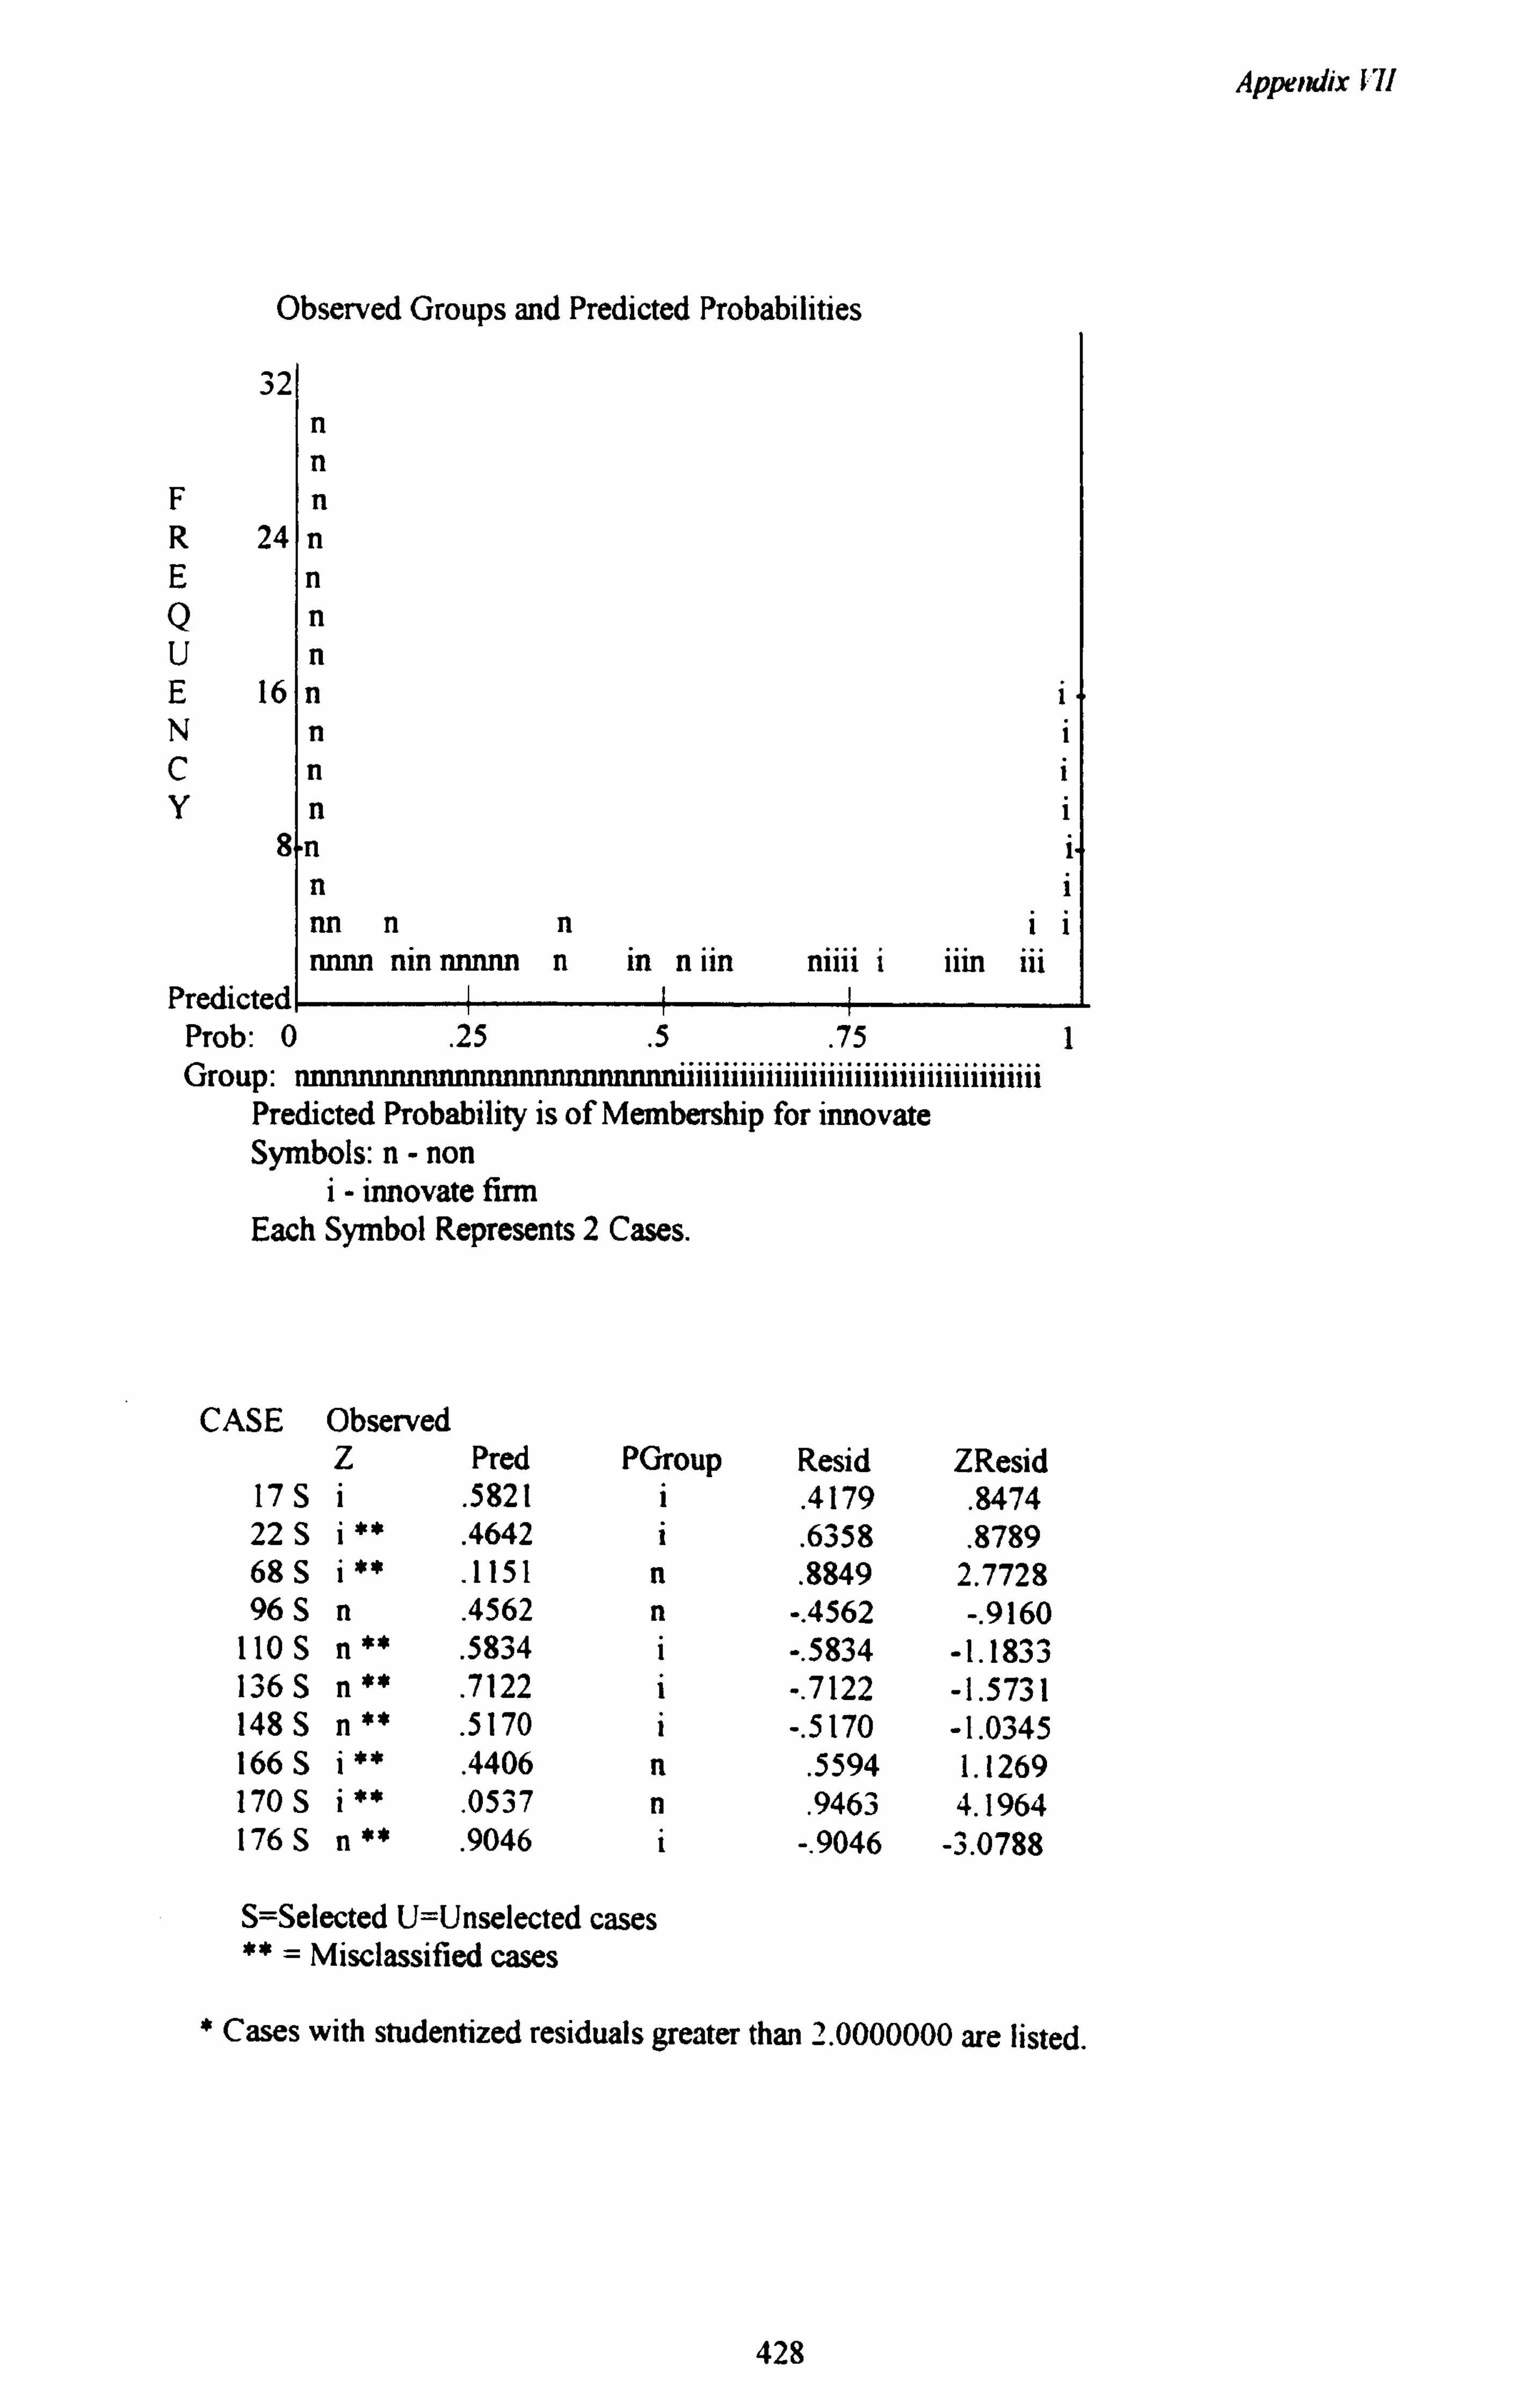
Appendix I'll
1 J
F R E Q U E N C Y
2
Predicted! Iii Prob: 0
. 25
.5 . 75
......................................... Group: tnnnutnnuuuuuutttuuuuu Predicted Probability is of Membership for innovate Symbols: n- non
i- innovate firm Each Symbol Represents 2 Cases.
CASE Observed Z Pred PGroup Resid ZResid
17S i . 5821 i . 4179 . 8474
22 S i ** . 4642 i
. 6358
. 8789
68S i ** . 1151 n .
8849 2.7728 96S n .
4562 n -. 4562 -. 9160 110 S n . 5834 i -. 5834 -1.1833 136 S n . 7122 i -. 7122 -1.5731 148S n . 5170 i -. 5170 -1.0345 166S i
. 4406 n .
5594 1.1269 170S i
. 0537 n .
9463 4.1964 176S n .
9046 i -. 9046 -3.0788
S=Selected U=Unselected cases ** = Misclassified cases
1
* Cases with studentized residuals greater than 2.0000000 are listed.
428
Observed Groups and Predicted Probabilities
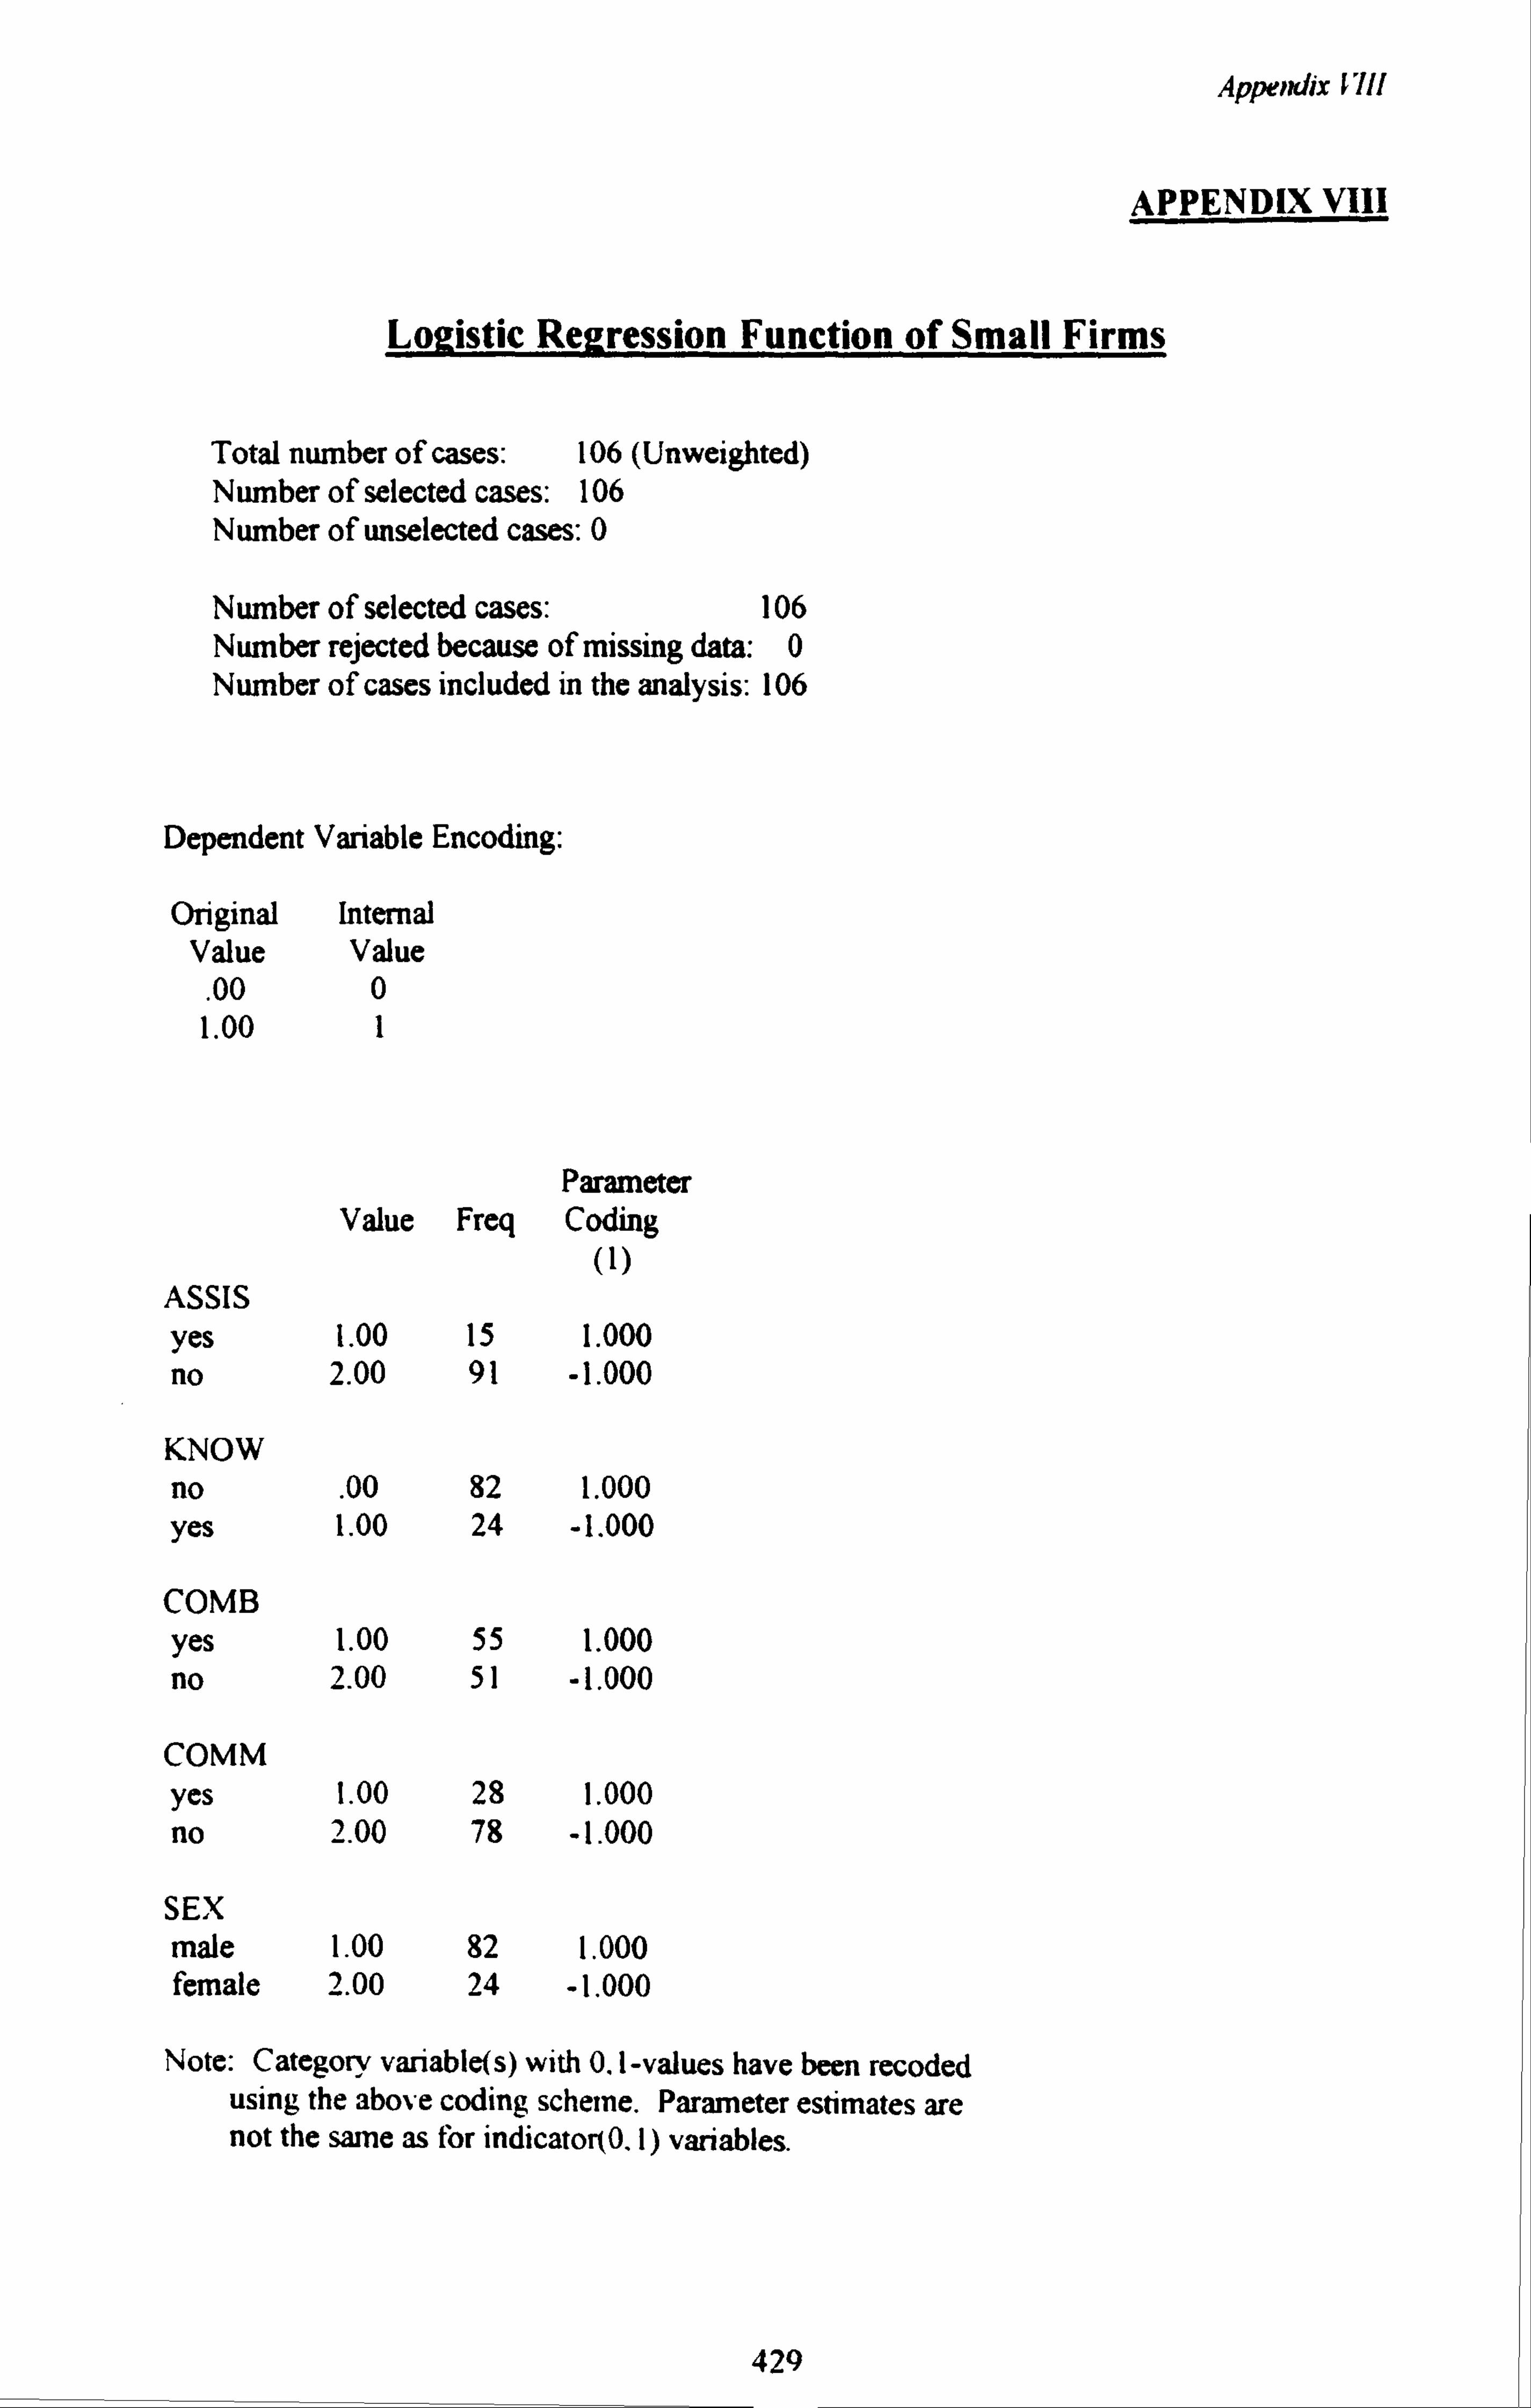
Appendix VII!
APPENDIX VIII
Logistic Repression Function of Small Firms
Total number of cases: 106 (Unweighted) Number of selected cases: 106 Number of unselected cases: 0
Number of selected cases: 106 Number rejected because of missing data: 0 Number of cases included in the analysis: 106
Dependent Variable Encoding:
Original Internal Value Value
. 00 0
1.00 1
Parameter Value Freq Coding
(1) ASSIS yes 1.00 15 1.000 no 2.00 91 -1.000
KNOW no .
00 82 1.000 yes 1.00 24 -1.000
COMB yes 1.00 55 1.000 no 2.00 51 -1.000
COMM yes 1.00 28 1.000 no 2.00 78 -1.000
SEX male 1.00 82 1.000 female 2.00 24 -1.000
Note: Category variable(s) with 0.1-values have been recoded using the above coding scheme. Parameter estimates are not the same as for indicator(0.1) variables.
429

Appendix 6I11
SPSS for MS WINDOWS Release 6.0
Dependent Variable.. Z regroup resp. into two groups
Beginning Block Number 0. Initial Log Likelihood Function
-2 Log Likelihood 143.828827
* Constant is included in the model.
Beginning Block Number 1. Method: Enter
Variable(s) Entered on Step Number 1.. AGE age of entrepreneur
SEX sex of entrepreneur EDU number of years in formal education MANAGE number of years managing the existing firm (E7) PREXP years of the previous work experience NACH score of need for achievement LOC score of locus of control RISKS score of risk attitute of entrepreneur COURSE number of courses attended (course-i) KNOW study in detail about innovation (B 19.1 T)
SIZE number of full time workers for year 1989 (WORKER89) FORMAL formalisation of firm CEN-R cenralisation of firms relative of firms' size (CE_REL_S) COM-R complexity of firms relative to firms' size (CO_REL_S) FIN-R degree of financing problem relative to firms' size (FI_REL_S) YESB-R firms' age (years) relative to size (YS_REL_S) FATURN89 fixed asset turnover for year 1989 R0189 return on investment for year 1989 PROD89 productivity (valueadded/number of workers) for year 1989 MISMATCH mismatch between employees and innovation COMMU cumrnunication index (As, maj, exp, sem) (COMMU_A) BUY degree of problem in buying sitution MAC index measuring the perceived characteristics of machinery MA COST the cost of innovation COMB big firms as is main competitors COMM medium sized firms as competitors INST index of institutional involvement (INST_A) ASSIS whether entrepreneurs receive government assistance
430
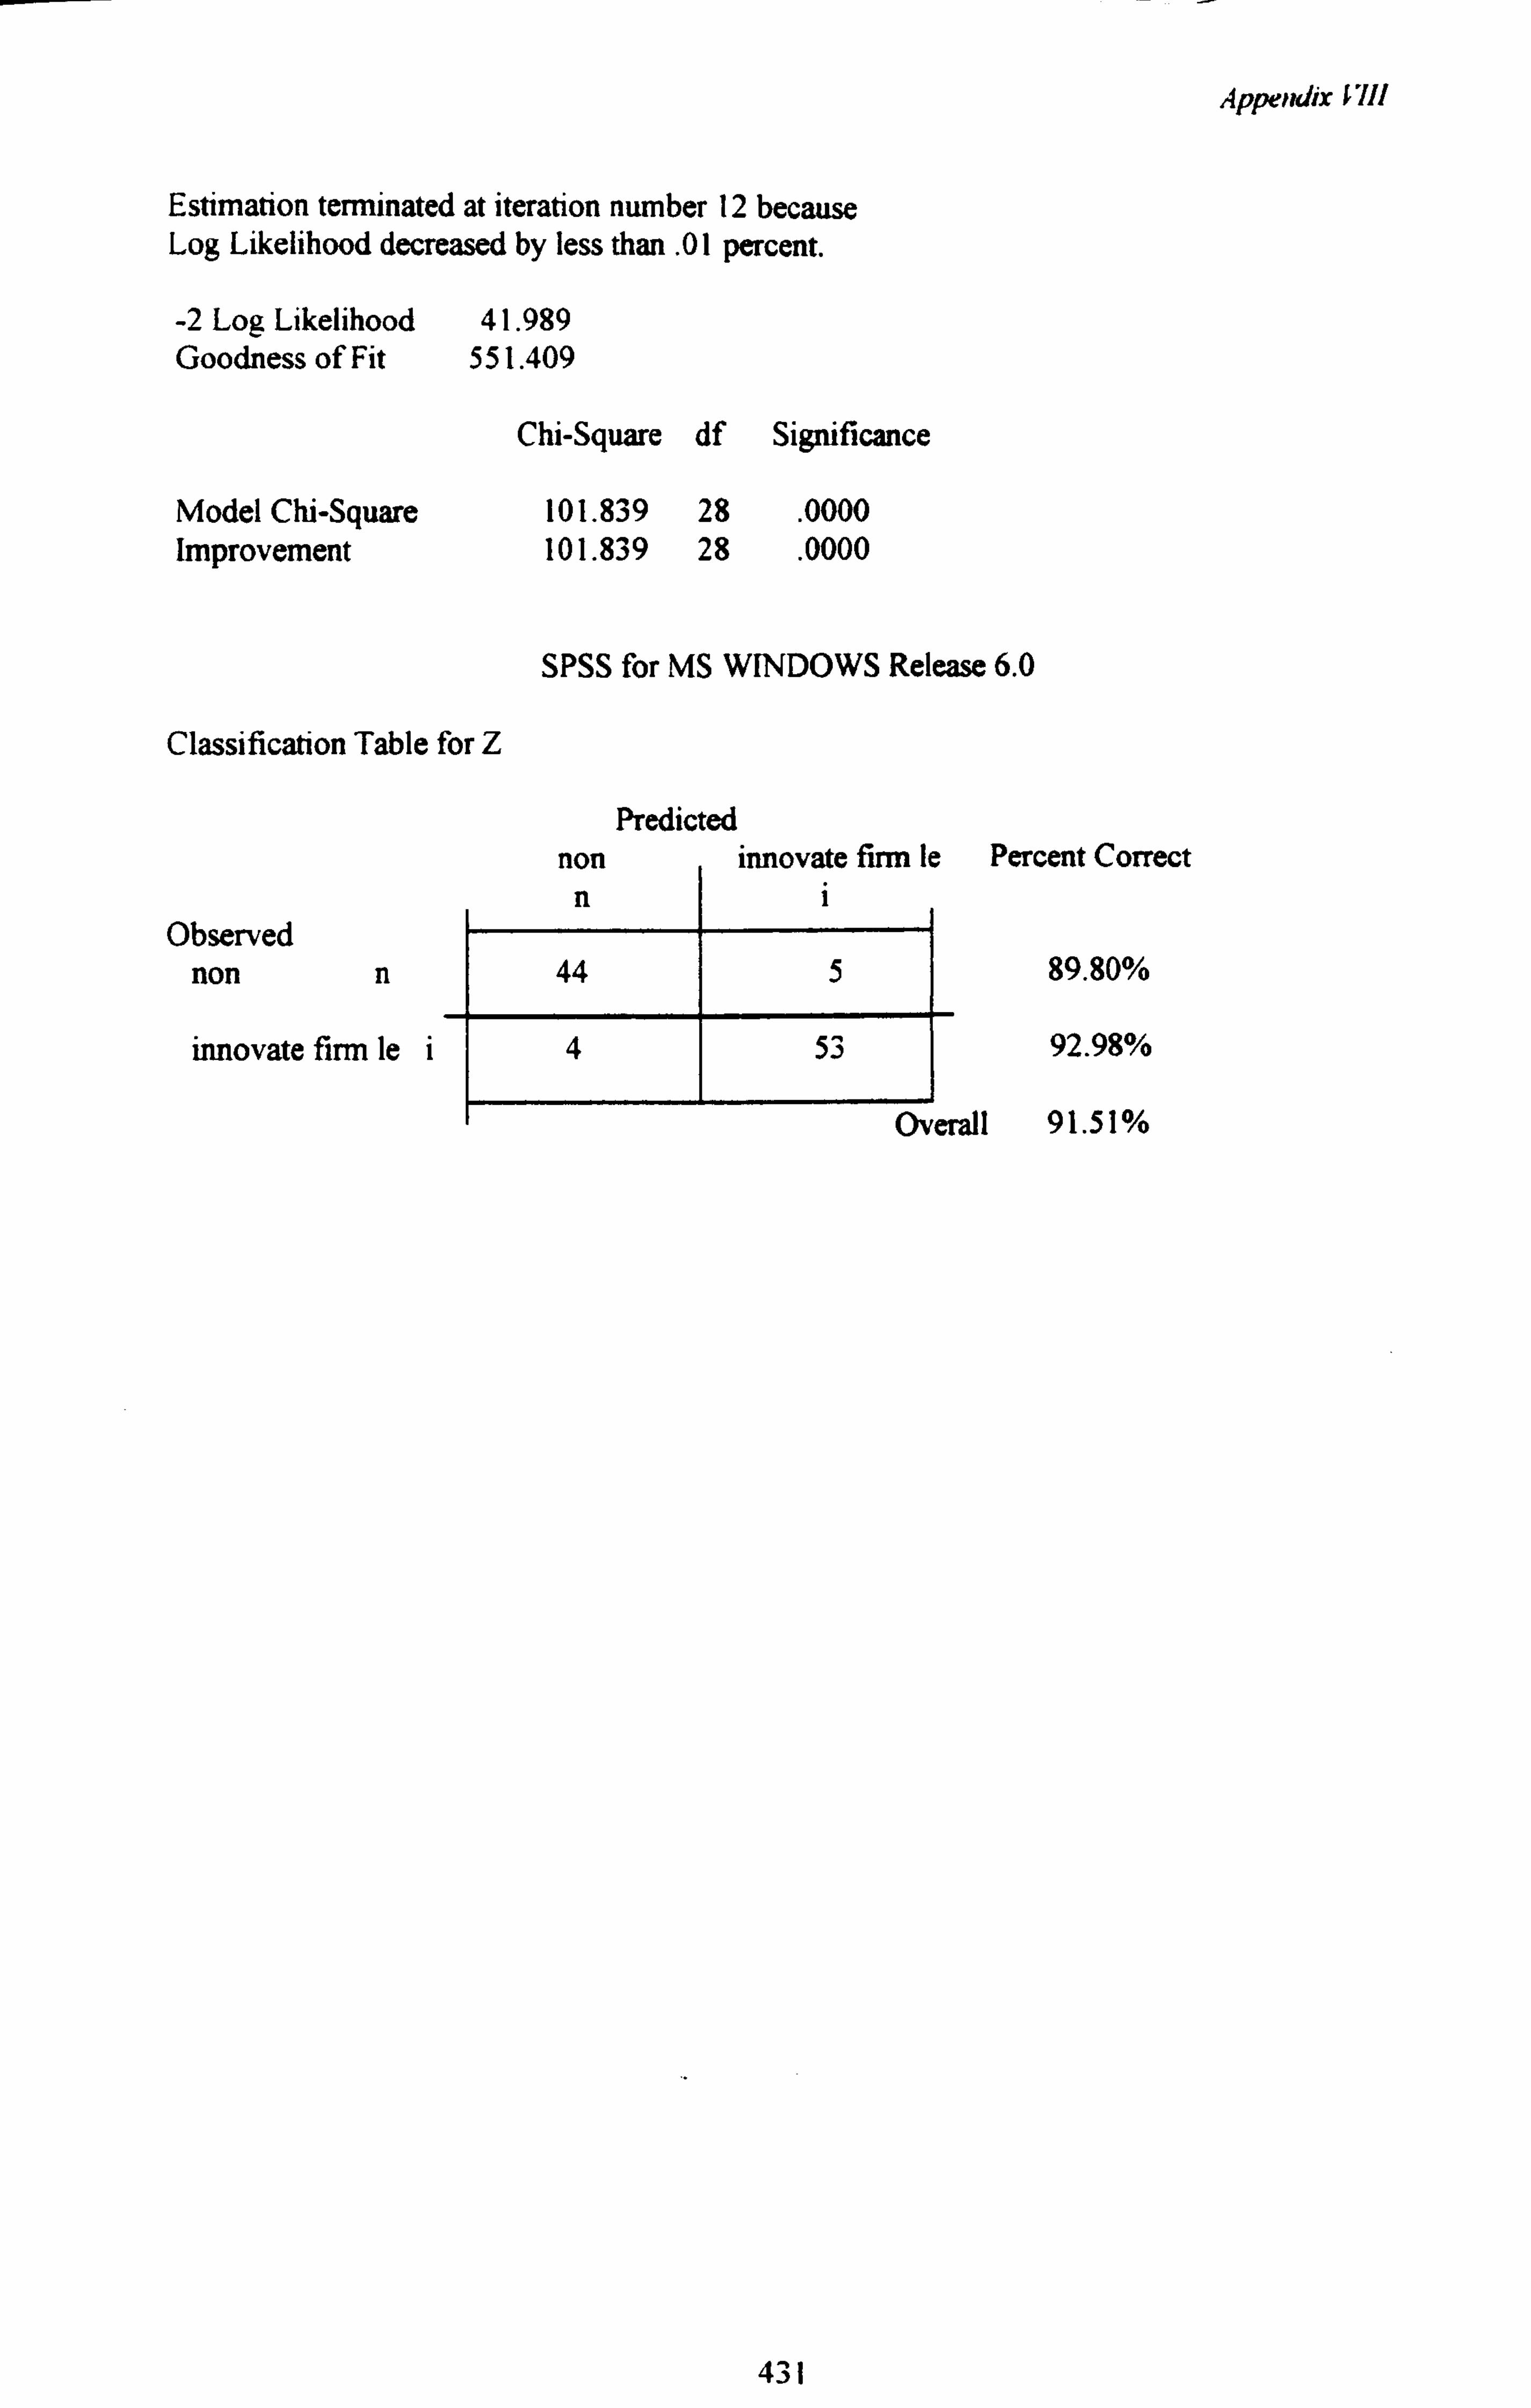
Appendix VIII
Estimation terminated at iteration number 12 because Log Likelihood decreased by less than. 01 percent.
-2 Log Likelihood 41.989 Goodness of Fit 551.409
Chi-Square df Significance
Model Chi-Square 101.839 28 . 0000 Improvement 101.839 28 . 0000
SPSS for MS WINDOWS Release 6.0
Classification Table for Z
Predicted non innovate firm le Percent Correct
Observed non n
innovate firm le i
89.80%
92.98%
Overall 91.51%
431
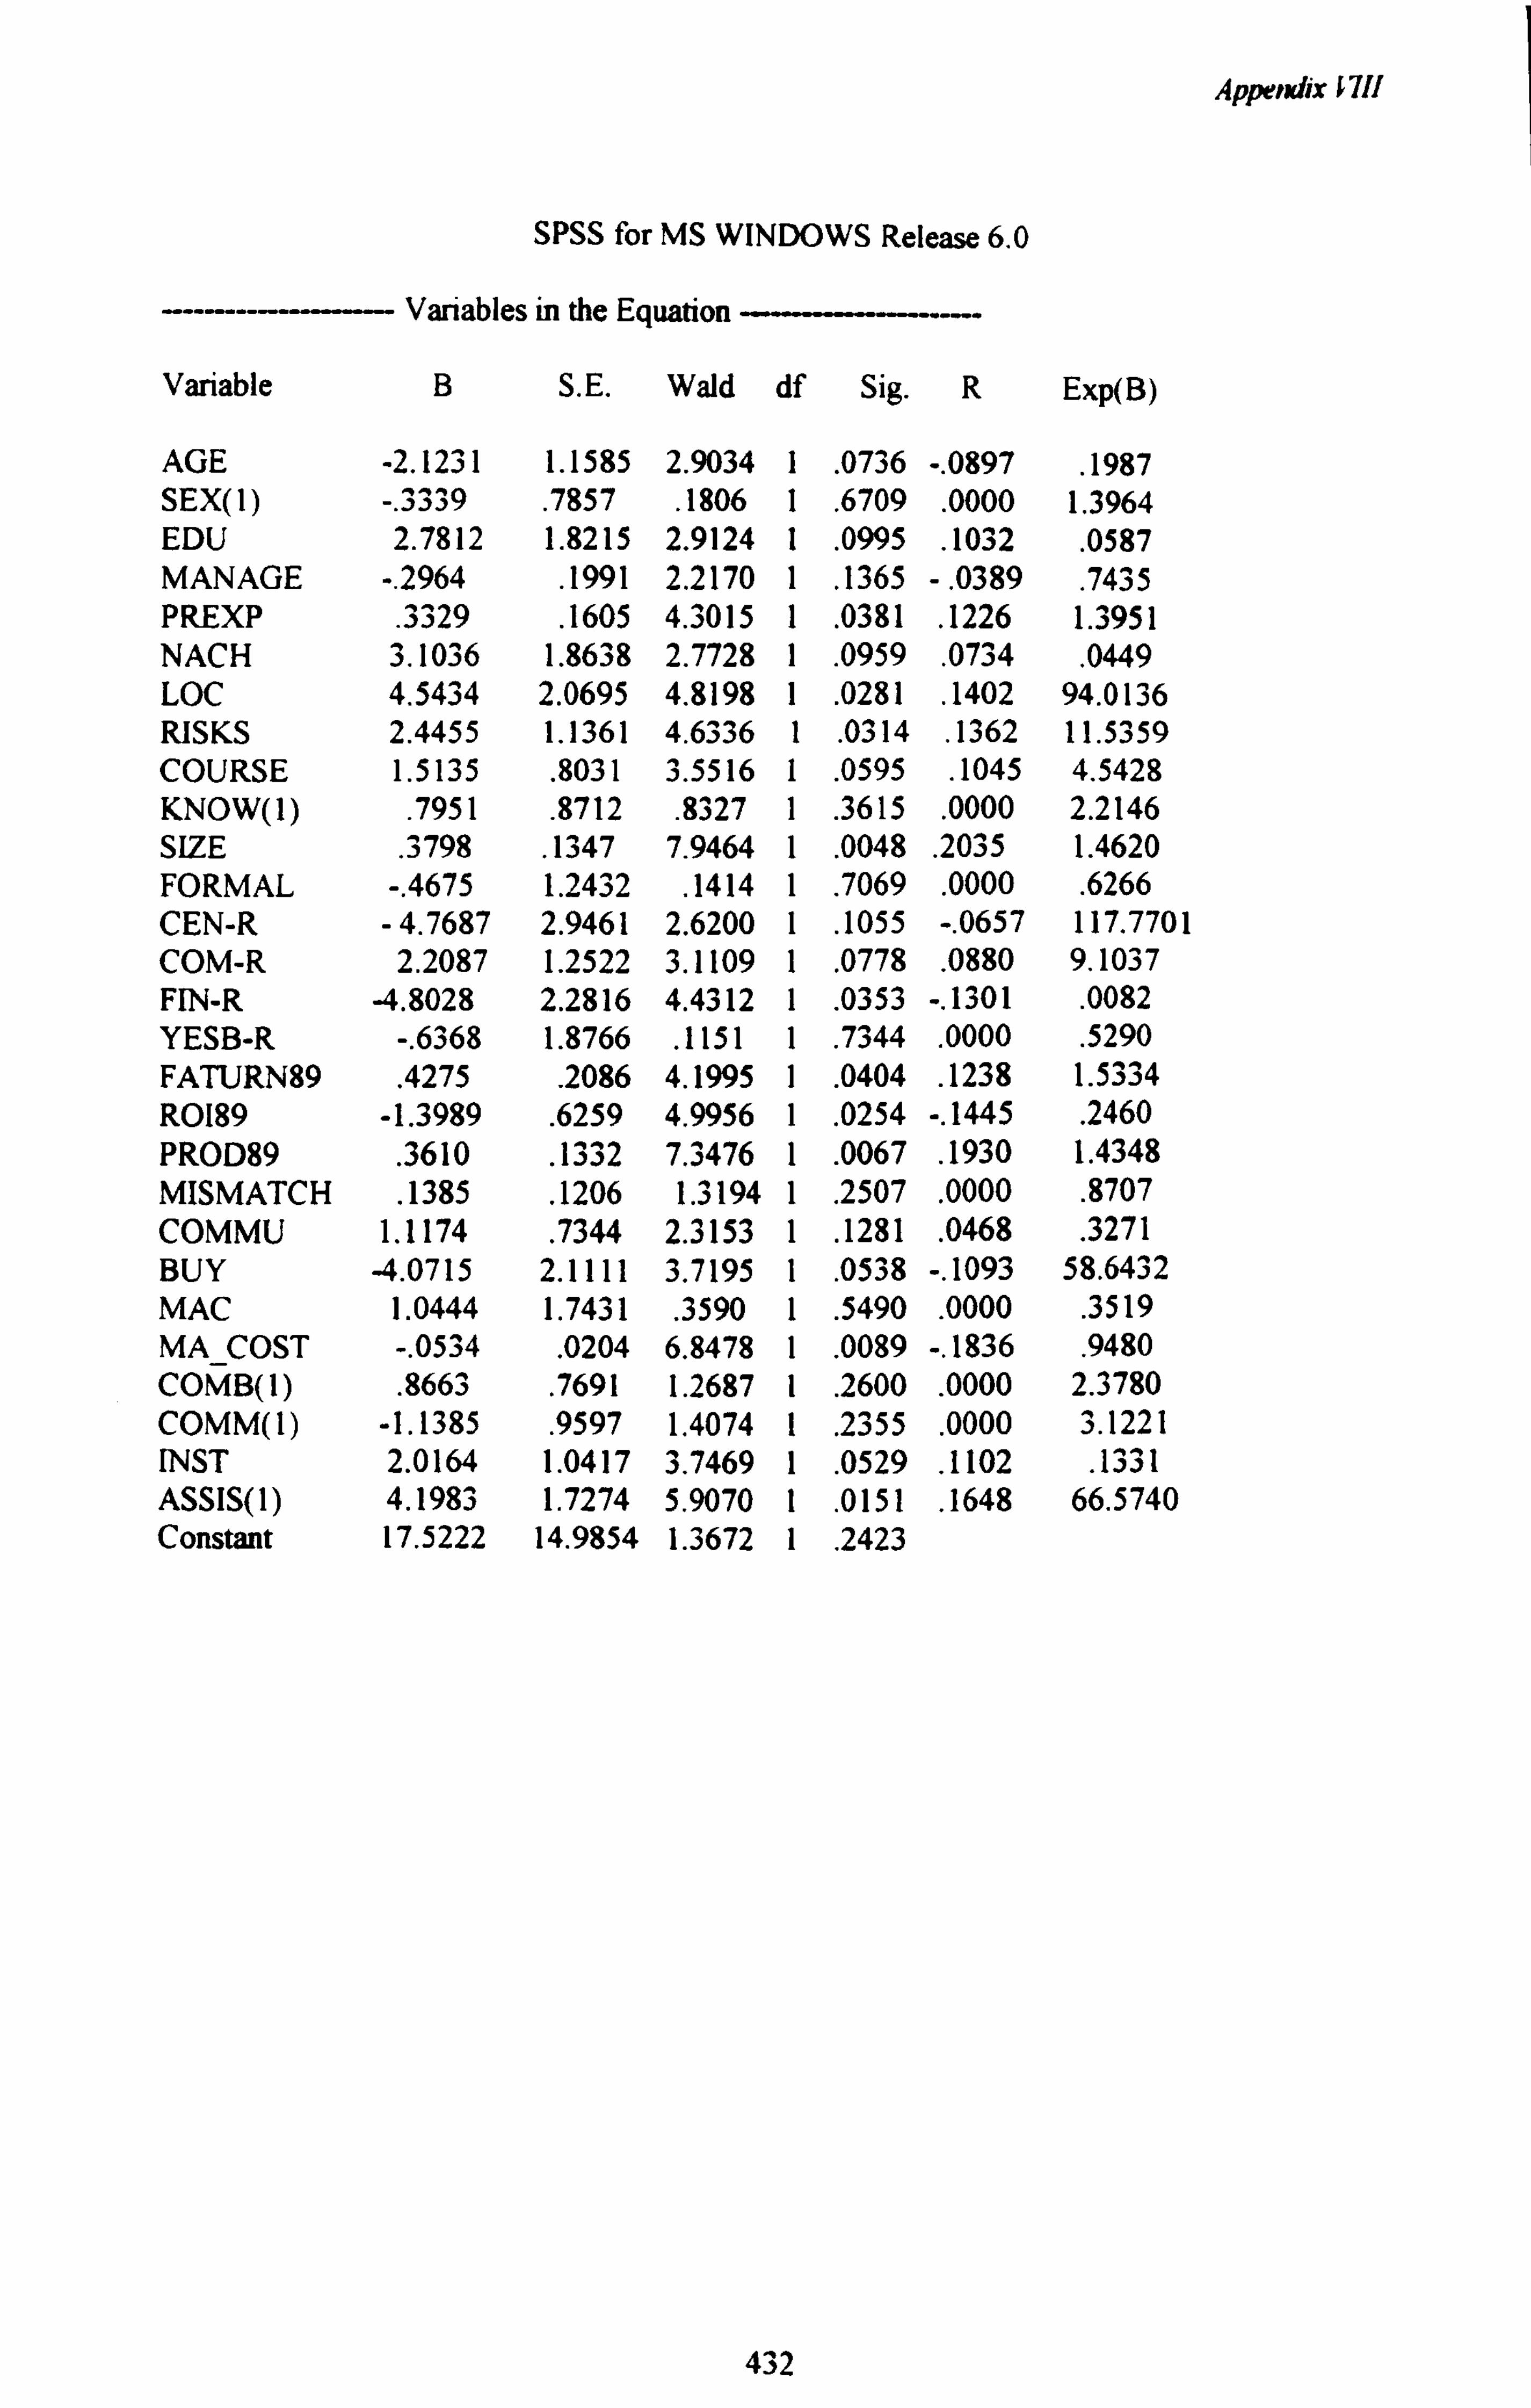
Appendix 67! /
SPSS for MS WINDOWS Release 6.0
------------ Variables in the Equation
Variable B S. E. Wald df Sig. R Exp(B)
AGE -2.1231 1.1585 2.9034 1 . 0736 -. 0897
. 1987
SEX(1) -. 3339 . 7857
. 1806 1
. 6709
. 0000 1.3964
EDU 2.7812 1.8215 2.9124 1 . 0995 . 1032 . 0587 MANAGE -. 2964 . 1991 2.2170 1 . 1365 -. 0389
. 7435 PREXP . 3329 . 1605 4.3015 1 . 0381 . 1226 1.3951 NACH 3.1036 1.8638 2.7728 1 . 0959 . 0734
. 0449 LOC 4.5434 2.0695 4.8198 1 . 0281 . 1402 94.0136 RISKS 2.4455 1.1361 4.6336 1 .
0314 . 1362 11.5359
COURSE 1.5135 . 8031 3.5516 1
. 0595
. 1045 4.5428
KNOW(1) . 7951 . 8712 . 8327 1 . 3615 . 0000 2.2146 SIZE . 3798 . 1347 7.9464 1 . 0048 . 2035 1.4620 FORMAL -. 4675 1.2432 . 1414 1 . 7069 . 0000 . 6266 CEN-R -4.7687 2.9461 2.6200 1
. 1055 -. 0657 117.7701
COM-R 2.2087 1.2522 3.1109 1 . 0778 . 0880 9.1037 FIN-R -4.8028 2.2816 4.4312 1 . 0353 -. 1301 . 0082 YESB-R -. 6368 1.8766
. 1151 1 .
7344 . 0000
. 5290
FATURN89 . 4275 . 2086 4.1995 1 . 0404 . 1238 1.5334 R0189 -1.3989 . 6259 4.9956 1 . 0254 -. 1445 . 2460 PROD89 . 3610 . 1332 7.3476 1 . 0067 . 1930 1.4348 MISMATCH . 1385 . 1206 1.3194 1 . 2507 . 0000 . 8707 COMMU 1.1174 . 7344 2.3153 1 . 1281 . 0468 . 3271 BUY -4.0715 2.1111 3.7195 1 . 0538 -. 1093 58.6432 MAC 1.0444 1.7431 . 3590 1 . 5490 . 0000 . 3519 MA_COST -. 0534
. 0204 6.8478 1
. 0089 -. 1836
. 9480
COMB(1) . 8663
. 7691 1.2687 1
. 2600
. 0000 2.3780
COMM(1) -1.1385 . 9597 1.4074 1 . 2355 . 0000 3.1221 INST 2.0164 1.0417 3.7469 1 . 0529 . 1102 . 1331 ASSIS(1) 4.1983 1.7274 5.9070 1 . 0151 . 1648 66.5740 Constant 17.5222 14.9854 1.3672 1
. 2423
432
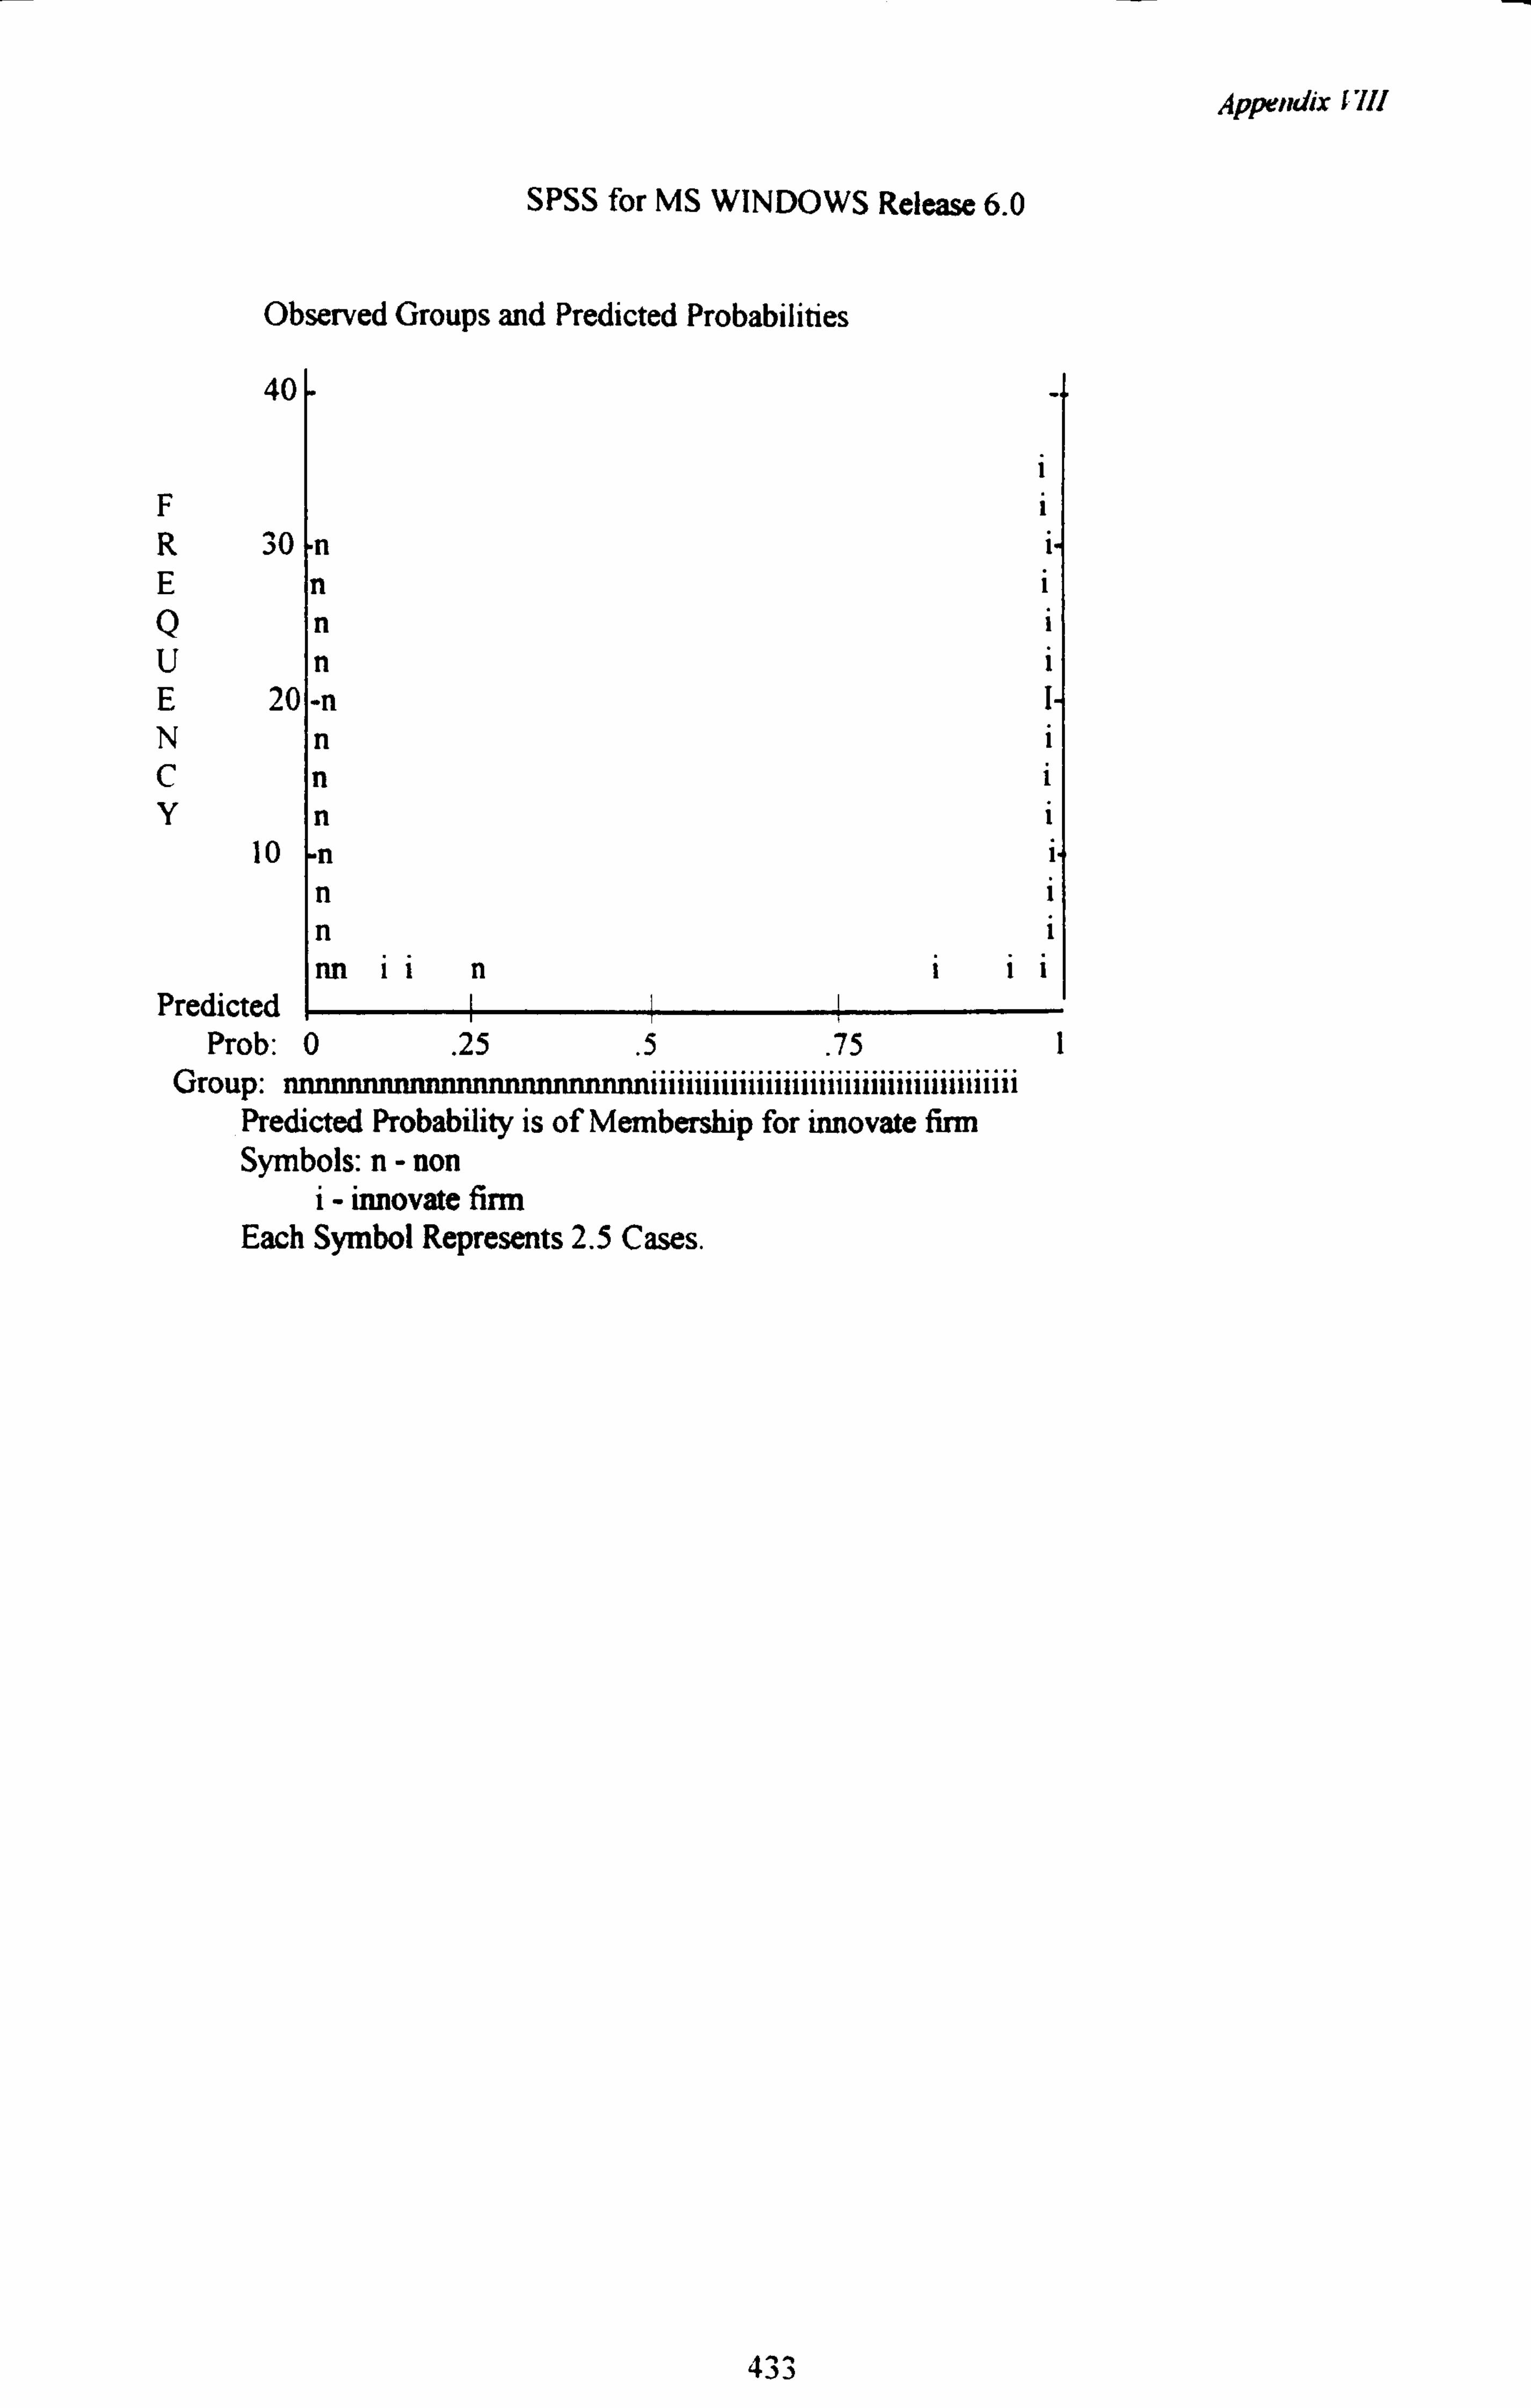
Appendix VIII
SPSS for MS WINDOWS Release 6.0
Observed Groups and Predicted Probabilities
40
F R 30 E Q U E 20 N C Y
10
Predicted Prob: 0
. 25
.5 . 75
.......................................... Group: uummmumitmuntuunumm Predicted Probability is of Membership for innovate firm Symbols: n- non
i- innovate firm Each Symbol Represents 2.5 Cases.
43 J
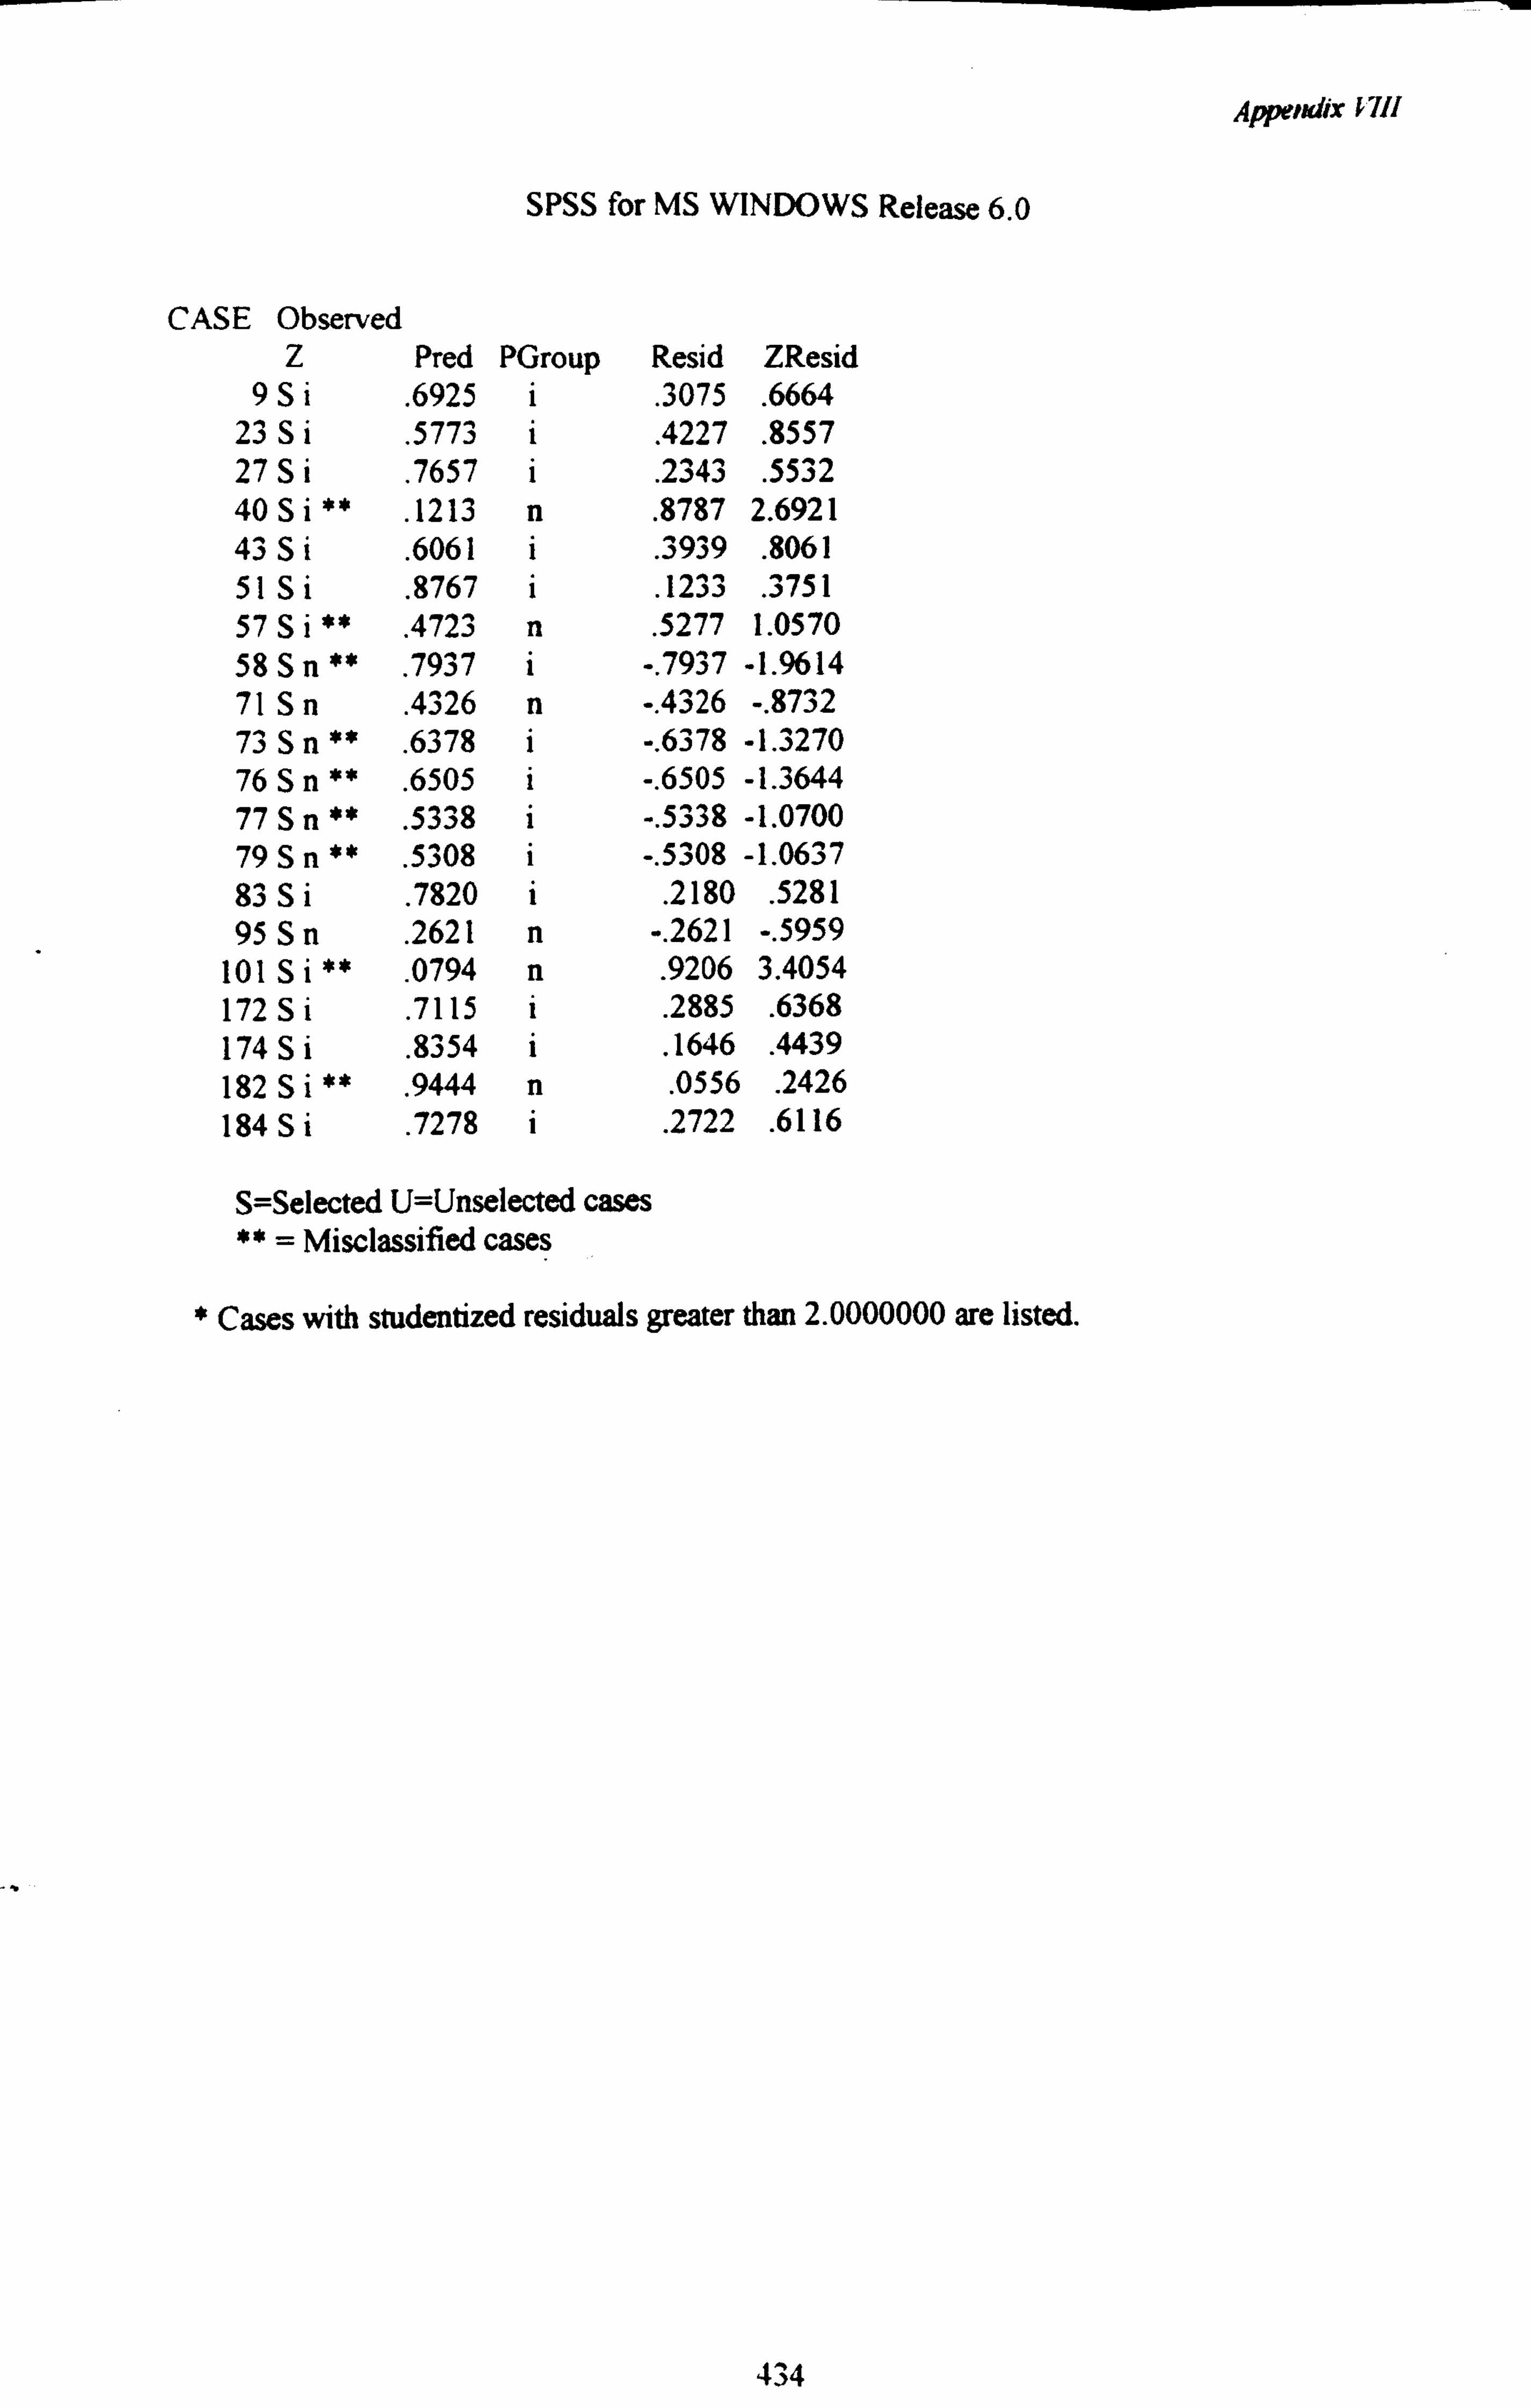
Appeixifx 1711
SPSS for MS WINDOWS Release 6.0
CASE Observed Z Pred PGroup Resid ZResid
9Si . 6925 i . 3075 . 6664 23 Si
. 5773 i . 4227 . 8557 27 Si
. 7657 i . 2343 . 5532 40 Si** . 1213 n . 8787 2.6921 43 Si
. 6061 i
. 3939
. 8061
51 Si . 8767 i . 1233 . 3751 57 Si **
. 4723 n .
5277 1.0570 58 Sn ** . 7937 i -. 7937 -1.9614 71 Sn . 4326 n -. 4326 -. 8732 73 Sn **
. 6378 i -. 6378 -1.3270
76 Sn ** . 6505 i -. 6505 -1.3644
77 Sn . 5338 i -. 5338 -1.0700 79 Sn **
. 5308 i -. 5308 -1.0637
83 Si . 7820 i . 2180 . 5281 95 Sn . 2621 n -. 2621 -. 5959
101 Si** . 0794 n . 9206 3.4054
172 Si . 7115 i . 2885 . 6368 174 Si . 8354 i . 1646 . 4439 182 Si **
. 9444 n .
0556 . 2426
184 Si . 7278 i . 2722 . 6116
S=Selected U=Unselected cases ** = Misclassified cases
* Cases with studentized residuals greater than 2.0000000 are listed.
434
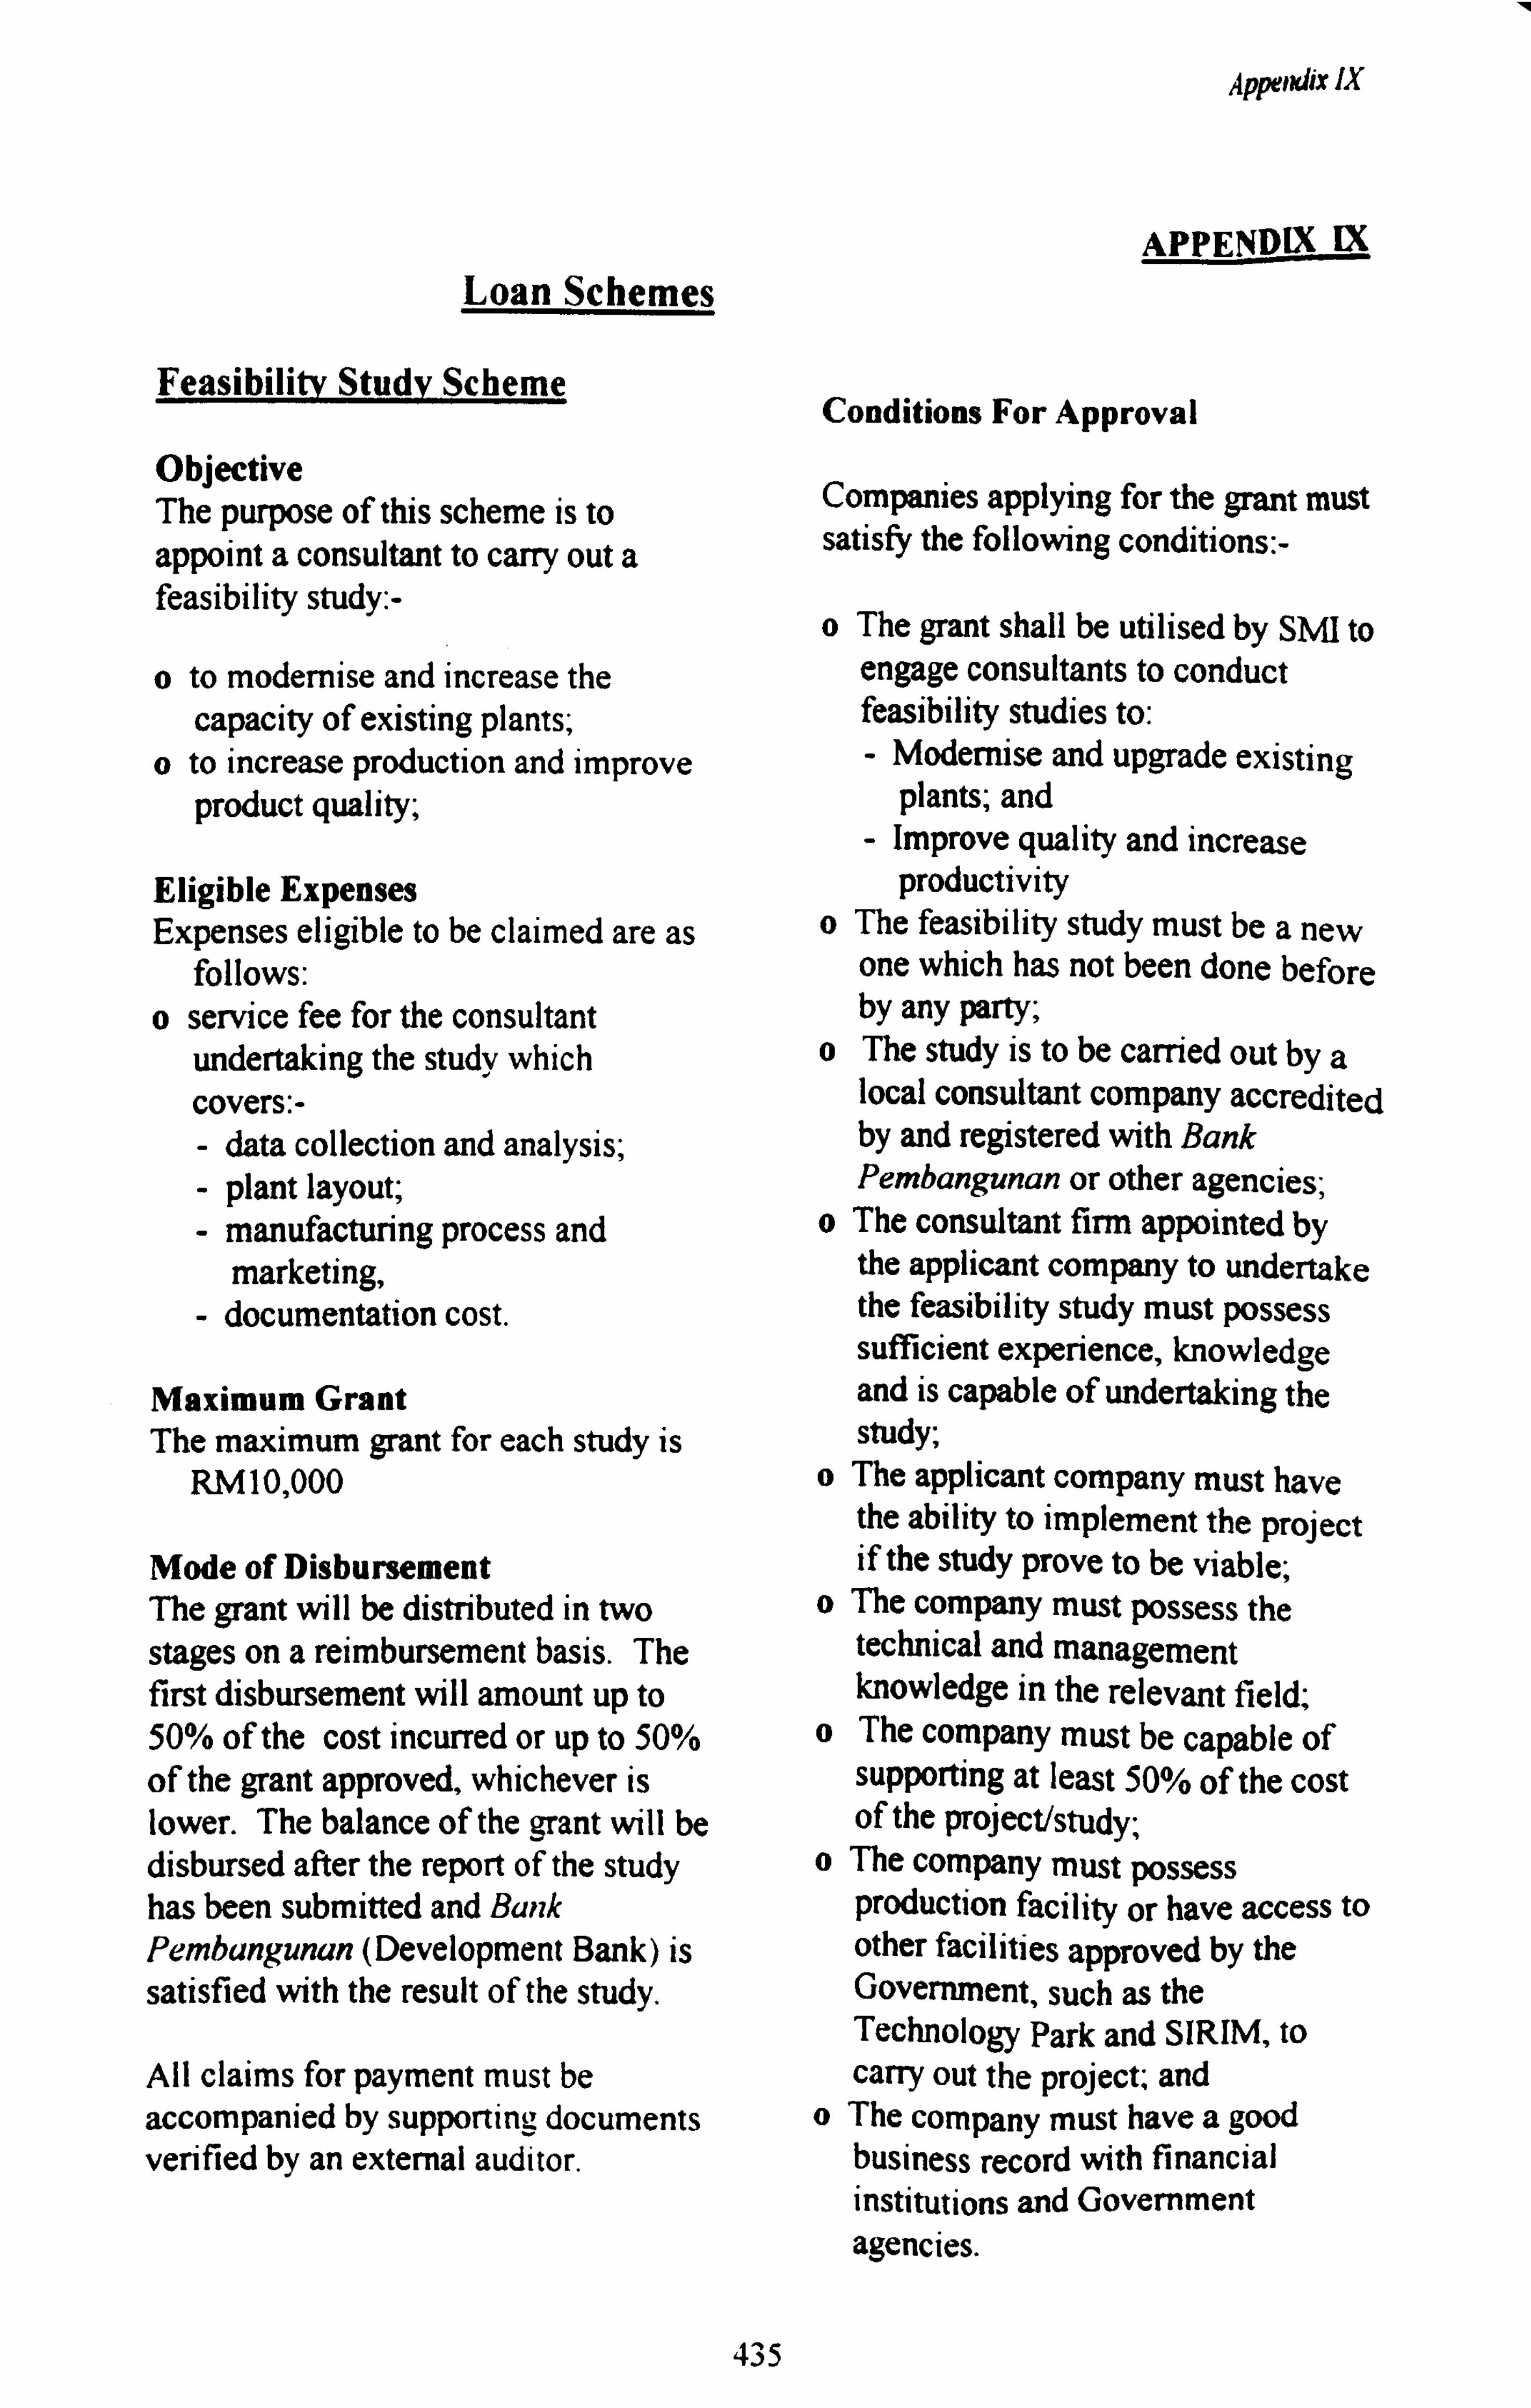
Appendix IX
APPENDIX IX Loan Schemes
Feasibility Study Scheme
Objective The purpose of this scheme is to appoint a consultant to carry out a feasibility study: -
o to modernise and increase the capacity of existing plants;
o to increase production and improve product quality;
Eligible Expenses Expenses eligible to be claimed are as
follows: o service fee for the consultant
undertaking the study which covers: - - data collection and analysis; - plant layout;
- manufacturing process and marketing,
- documentation cost.
Maximum Grant The maximum grant for each study is
RM 10,000
Mode of Disbursement The grant will be distributed in two stages on a reimbursement basis. The first disbursement will amount up to 50% of the cost incurred or up to 50% of the grant approved, whichever is lower. The balance of the grant will be disbursed after the report of the study has been submitted and Bank Pembangunan (Development Bank) is satisfied with the result of the study.
All claims for payment must be accompanied by supporting documents verified by an external auditor.
Conditions For Approval
Companies applying for the grant must satisfy the following conditions: -
o The grant shall be utilised by SMI to engage consultants to conduct feasibility studies to: - Modernise and upgrade existing
plants; and - Improve quality and increase
productivity o The feasibility study must be a new
one which has not been done before by any party;
o The study is to be carried out by a local consultant company accredited by and registered with Bank Pembangunan or other agencies;
o The consultant firm appointed by the applicant company to undertake the feasibility study must possess sufficient experience, knowledge and is capable of undertaking the study;
o The applicant company must have the ability to implement the project if the study prove to be viable;
o The company must possess the technical and management knowledge in the relevant field;
o The company must be capable of supporting at least 50% of the cost of the project/study,
o The company must possess production facility or have access to other facilities approved by the Government, such as the Technology Park and SIRIM, to carry out the project; and
o The company must have a good business record with financial institutions and Government agencies.
435

Appendix IX
Product Development and Design Scheme Conditions For Approval
Objectives
o to improve local product development and design;
o to build up indigenous technological know-how to develop new product/process;
o to improve existing product/process
Eligible expenses
o salary of technical manpower directly involved in product development;
o cost of purchasing additional equipment for existing machinery;
0 cost of materials used for designing prototypes;
o cost of acquiring technology/licence/patent/copyright/ prototype;
o cost of packaging and documentation.
o consultancy fees
Maximum Grant
The maximum grant for each study/project is RM100,000
Mode of Disbursement
The grant will be disbursed in two stages on a reimbursement basis. The first disbursement will amount up to 50% of the cost incurred or up to 50% of the grant approved, whichever is lower. The balance of the grant will be disbursed after completion of the project and submission of all claims and a project report.
All claims for payment must be accompanied by supporting documents verified by an external auditor.
Companies applying for the grant must satisfy the following conditions: - o The proposed product must be of a
high technical standard in the Malaysian context and conform to sound design practice;
o The development team undertaking the project must possess in-depth knowledge of the technical and commercial aspects of the product and/or process;
o The development work must be carried out in Malaysia by local engineers or designers. However, where appropriate foreign experts or consultants may be engaged to lead or supervise the project;
o The project and/or process must be a marketable item and not a one-off project tailored to a particular customer;
o Should a company decide to conduct a technical and/or marketing feasibility study to establish the viability of a proposed product/process, 50% of the related expenses can also be supported subject to a maximum grant of RM5,000;
oA separate application is required for a feasibility study, Upon completion of the study, the applicant company can then apply for the grant to carry out the development phase of a project provided that the outcome of the feasibility study is positive;
oA company must apply for the two phases simultaneously but the approval for the second (development) phase is conditional upon the positive outcome of the first (feasibility study) phase;
o In cases where a feasibility study is not necessary, a company can
436

Appendix IX
proceed to apply for support of the development phase;
o The company must possess the technical and management knowledge in the relevant field;
o The company must be capable of supporting at least 50% of the cost of the project/study;
o The company must possess production facility or have access to other facilities approved by the Government, such as the Technology Park and SLUM, to carry out the project; and
o The company must have good business record with financial institutions and Government agencies
Ouality and Productivity Improvement Scheme
Maximum Grant
The maximum grant for each study/project is RM 100,000
Mode of Disbursement
The grant will be disbursed in three stages on a reimbursement basis. The first disbursement of 20% will be made after the appointment of the project consultant. The second payment of 30% will be made upon submission of the consultant's report. the balance of the grant will be paid upon obtaining certification with SIRIM and submission of final project report.
All claims for payment must be accompanied by supporting documents verified by an external auditor.
Objectives
o to improve the quality assurance system in order to meet the requirements of the National Certification Scheme, the ISO 9000 as a recognition for `Good Manufacturing Practice (GMP)' and other standard schemes of SIRIM:
o to encourage SMIs to achieve high Quality Management Practice.
Eligible Expenses
o service fee for the consultant accredited by SIRIM to carry out the study;
o cost of training managers, technical staff and other approved personnel
o testing fees charged by SIRIM or other approved laboratories
o registration fees charged by SIRIM o cost of purchasing additional quality
development tools
Conditions For Approval
Companies applying for the grant must satisfy the following conditions: -
o Have applied to SIRIM to participate in the relevant certification scheme;
o Have been in production and its product is sold in the market;
o Possess the necessary technical and management knowledge in the relevant field;
o Capable of financing at least 50% of the cost of the project/study;
o Possess production facility or have access to other facilities approved by the Government, such as the Technology Park and SIRIM, to carry out the project; and
o Have good business record with financial institutions and government agencies.
437