Embed Size (px)
Citation preview

i

ii
The Data Warehouse Lifecycle Toolkit
Table of Contents
Chapter 1 - The Chess Pieces Section 1 - Project Management and Requirements Chapter 2 - The Business Dimensional Lifecycle Chapter 3 - Project Planning and Management Chapter 4 - Collecting the Requirements
Section 2 - Data Design
Chapter 5 - A First Course on Dimensional Modeling Chapter 6 - A Graduate Course on Dimensional Modeling Chapter 7 - Building Dimensional Models
Section 3 - Architecture
Chapter 8 - Introducing Data Warehouse Architecture Chapter 9 - Back Room Technical Architecture Chapter 10 - Architecture for the Front Room Chapter 11 - Infrastructure and Metadata Chapter 12 - A Graduate Course on the Internet and Security Chapter 13 - Creating the Architecture Plan and Selecting Products
Section 4 – Implementation
Chapter 14 - A Graduate Course on Aggregates Chapter 15 - Completing the Physical Design Chapter 16 - Data Staging Chapter 17 - Building End User Applications
Section 5 - Deployment and Growth
Chapter 18 - Planning the Deployment Chapter 19 - Maintaining and Growing the Data Warehouse

iii
The Purpose of Each Chapter
1.
The Chess Pieces. As of the writing of this book, a lot of vague terminology wasbeing tossed around in the data warehouse marketplace. Even the term data warehouse has lost its precision. Some people are even trying to define the datawarehouse as a nonqueryable data resource! We are not foolish enough to think we can settle all the terminology disputes in these pages, but within this book we willstick to a very specific set of meanings. This chapter briefly defines all the importantterms used in data warehousing in a consistent way. Perhaps this is something like studying all the chess pieces and what they can do before attempting to play a chessgame. We think we are pretty close to the mainstream with these definitions.
Section 1: Project Management and Requirements
2.
The Business Dimensional Lifecycle. We define the complete Business Dimensional Lifecycle from 50,000 feet. We briefly discuss each step and give perspective on the lifecycle as a whole.
3.
Project Planning and Management. In this chapter, we define the project and talk about setting its scope within your environment. We talk extensively about thevarious project roles and responsibilities. You won’t necessarily need a full headcountequivalent for each of these roles, but you will need to fill them in almost any imaginable project. This is a chapter for managers.
4.
Collecting the Requirements. Collecting the business and data requirements is the foundation of the entire data warehouse effort—or at least it should be. Collecting the requirements is an art form, and it is one of the least natural activities for an ISorganization. We give you techniques to make this job easier and hope to impress upon you the necessity of spending quality time on this step.
Section 2: Data Design
5.
A First Course on Dimensional Modeling. We start with an energetic argument for the value of dimensional modeling. We want you to understand the depth of ourcommitment to this approach. After performing hundreds of data warehouse designsand installations over the last 15 years, we think this is the only approach you can use to achieve the twin goals of understandability and performance. We then revealthe central secret for combining multiple dimensional models together into a coherentwhole. This secret is called conformed dimensions and conformed facts. We call this approach the Data Warehouse Bus Architecture. Your computer has a backbone,called the computer bus, that everything connects to, and your data warehouse has abackbone, called the data warehouse bus, that everything connects to. The remainder of this chapter is a self-contained introduction to the science of dimensional modeling for data warehouses. This introduction can be viewed as anappendix to the full treatment of this subject in Ralph Kimball’s earlier book, The Data Warehouse Toolkit.
6.
A Graduate Course on Dimensional Modeling. Here we collect all the hardest dimensional modeling situations we can think of. Most of these examples come fromspecific business situations, such as dealing with a monster customer list.
7.
Building Dimensional Models. In this chapter we tackle the issue of how to create the right model within your organization. You start with a matrix of data marts anddimensions, and then you design each fact table in each data mart according to the techniques described in Chapter 5. The last half of this chapter describes the real-life management issues in applying this methodology and building all the dimensional models needed in each data mart.
Section 3: Architecture
8.
Introducing Data Warehouse Architecture. In this chapter we introduce all the components of the technical architecture at a medium level of detail. This paints theoverall picture. The remaining five chapters in this section go into the specific areasof detail. We divide the discussion into data architecture, application architecture, and infrastructure. If you follow the Data Warehouse Bus Architecture we developed inChapter 5, you will be able to develop your data marts one at a time, and you will end

iv
up with a flexible, coherent overall data warehouse. But we didn’t say it would beeasy.
9.
Technical Back Room Architecture. We introduce you to the system components in the back room: the source systems, the reporting instance, the data staging area,the base level data warehouse, and the business process data marts. We tell you what happened to the operational data store (ODS). We also talk about all theservices you must provide in the back room to get the data ready to load into yourdata mart presentation server.
10.
Architecture for the Front Room. The front room is your publishing operation. You make the data available and provide an array of tools for different user needs. We give you a comprehensive view of the many requirements you must support in thefront room.
11.
Infrastructure and Metadata. Infrastructure is the glue that holds the data warehouse together. This chapter covers the nuts and bolts. We deal with the detailwe think every data warehouse designer and manager need to know abouthardware, software, communications, and especially metadata.
12.
A Graduate Course on the Internet and Security. The Internet has a potentially huge impact on the life of the data warehouse manager, but many data warehouse managers are either not aware of the true impact of the Internet or they are avoidingthe issues. This chapter will expose you to the current state of the art on Internet-based data warehouses and security issues and give you a list of immediate actions to take to protect your installation. The examples throughout this chapter are slantedtoward the exposures and challenges faced by the data warehouse owner.
13.
Creating the Architecture Plan and Selecting Products. Now that you are a software, hardware, and infrastructure expert, you are ready to commit to a specificarchitecture plan for your organization and to choose specific products. We talk about the selection process and which combination of product categories you need. Bear inmind this book is not a platform for talking about specific vendors, however.
Section 4: Implementation
14.
A Graduate Course on Aggregations. Aggregations are prestored summaries that you create to boost performance of your database systems. This chapter dives deeply into the structure of aggregations, where you put them, how you use them,and how you administer them. Aggregations are the single most cost-effective way to boost performance in a large data warehouse system assuming that the rest of your system is constructed according to the Data Warehouse Bus Architecture.
15.
Completing the Physical Design. Although we don’t know which DBMS and which hardware architecture you will choose, there are a number of powerful ideas at thislevel that you should understand. We talk about physical data structures, indexingstrategies, specialty databases for data warehousing, and RAID storage strategies.
16.
Data Staging. Once you have the major systems in place, the biggest and riskieststep in the process is getting the data out of the legacy systems and loading into thedata mart DBMSs. The data staging area is the intermediate place where you bringthe legacy data in for cleaning and transforming. We have a lot of strong opinionsabout what should and should not happen in the data staging area.
17.
Building End User Applications. After the data is finally loaded into the DBMS, we still have to arrange for a soft landing on the users’ desktops. The end userapplications are all the query tools and report writers and data mining systems forgetting the data out of the DBMS and doing something useful. This chapter describesthe starter set of end user applications you need to provide as part of the initial datamart implementation.
Section 5: Deployment and Growth
18.
Planning the Deployment. When everything is ready to go, you still have to roll thesystem out and behave in many ways like a commercial software vendor. You needto install the software, train the users, collect bug reports, solicit feedback, and respond to new requirements. You need to plan carefully so that you can deliveraccording to the expectations you have set.

v
19.
Maintaining and Growing the Data Warehouse. Finally, when your entire data mart edifice is up and running, you have to turn around to do it again! As we saidearlier, the data warehouse is more of a process than a project. This chapter is anappropriate end for the book, if only because it leaves you with a valuable lastimpression: You are never done.
Supporting Tools
• Appendix A. This appendix summarizes the entire project plan for the BusinessDimensional Lifecycle in one place and in one format. All of the project tasks and rolesare listed.
• Appendix B. This appendix is a guided tour of the contents of the CD-ROM. All of the useful checklists, templates, and forms are listed. We also walk you through how to useour sample design of a Data Warehouse Bus Architecture.
• CD-ROM. The CD-ROM that accompanies the book contains a large number of actualchecklists, templates, and forms for you to use with your data warehouse development. Italso includes a sample design illustrating the Data Warehouse Bus Architecture
The Goals of a Data Warehouse
One of the most important assets of an organization is its information. This asset isalmost always kept by an organization in two forms: the operational systems of recordand the data warehouse. Crudely speaking, the operational systems of record are wherethe data is put in, and the data warehouse is where we get the data out. In The Data Warehouse Toolkit, we described this dichotomy at length. At the time of this writing, it is no longer so necessary to convince the world that there are really two systems or thatthere will always be two systems. It is now widely recognized that the data warehousehas profoundly different needs, clients, structures, and rhythms than the operational systems of record.
Ultimately, we need to put aside the details of implementation and modeling, andremember what the fundamental goals of the data warehouse are. In our opinion, thedata warehouse:
•
Makes an organization’s information accessible. The contents of the data warehouse are understandable and navigable, and the access is characterized by fastperformance. These requirements have no boundaries and no fixed limits.Understandable means correctly labeled and obvious. Navigable means recognizing your destination on the screen and getting there in one click. Fast performance means zero wait time. Anything else is a compromise and therefore something that we mustimprove.
•
Makes the organization’s information consistent. Information from one part of the organization can be matched with information from another part of the organization. Iftwo measures of an organization have the same name, then they must mean the samething. Conversely, if two measures don’t mean the same thing, then they are labeled differently. Consistent information means high-quality information. It means that all of the information is accounted for and is complete. Anything else is a compromise andtherefore something that we must improve.
•
Is an adaptive and resilient source of information. The data warehouse is designed for continuous change. When new questions are asked of the data warehouse, theexisting data and the technologies are not changed or disrupted. When new data is added to the data warehouse, the existing data and the technologies are not changedor disrupted. The design of the separate data marts that make up the data warehousemust be distributed and incremental. Anything else is a compromise and thereforesomething that we must improve.
•
Is a secure bastion that protects our information asset. The data warehouse not only controls access to the data effectively, but gives its owners great visibility into theuses and abuses of that data, even after it has left the data warehouse. Anything else is a compromise and therefore something that we must improve.

vi
•
Is the foundation for decision making. The data warehouse has the right data in it to support decision making. There is only one true output from a data warehouse: the decisions that are made after the data warehouse has presented its evidence. Theoriginal label that predates the data warehouse is still the best description of what we aretrying to build: a decision support system.
The Goals of This Book
If we succeed with this book, you—the designers and managers of large data warehouses—will achieve your goals more quickly. You will build effective datawarehouses that match well against the goals outlined in the preceding section, and you will make fewer mistakes along the way. Hopefully, you will not reinvent the wheel anddiscover “previously owned” truths.
We have tried to be as technical as this large subject allows, without getting waylaid byvendor-specific details. Certainly, one of the interesting aspects of working in the datawarehouse marketplace is the breadth of knowledge needed to understand all of the datawarehouse responsibilities. We feel quite strongly that this wide perspective must bemaintained because of the continuously evolving nature of data warehousing. Even ifdata warehousing leaves behind such bedrock notions as text and number data, or thereliance on relational database technology, most of the principles of this book wouldremain applicable, because the mission of a data warehouse team is to build a decisionsupport system in the most fundamental sense of the words.
We think that a moderate amount of structure and discipline helps a lot in building a largeand complex data warehouse. We want to transfer this structure and discipline to youthrough this book. We want you to understand and anticipate the whole BusinessDimensional Lifecycle, and we want you to infuse your own organizations with thisperspective. In many ways, the data warehouse is an expression of information systems’fundamental charter: to collect the organization’s information and make it useful.
The idea of a lifecycle suggests an endless process where data warehouses sprout andflourish and eventually die, only to be replaced with new data warehouses that build on thelegacies of the previous generations. This book tries to capture that perspective and helpyou get it started in your organization.
Visit the Companion Web Site
This book is necessarily a static snapshot of the data warehouse industry and themethodologies we think are important. For a dynamic, up-to-date perspective on these issues, please visit this book’s Web site at www.wiley.com/compbooks/kimball, or log on to the mirror site at www.lifecycle-toolkit.com. We, the authors of this book, intend to maintain this Web site personally and make it a useful resource for data warehouse professionals.

1. 1

1. 2
Overview
All of the authors of this book worked together at Metaphor Computer Systems over aperiod that spanned more than ten years, from 1982 to 1994. Although the real value ofthe Metaphor experience was the building of hundreds of data warehouses, there was anancillary benefit that we sometimes find useful. We are really conscious of metaphors. How could we avoid metaphors, with a name like that?
A useful metaphor to get this book started is to think about studying the chess piecesvery carefully before trying to play the game of chess. You really need to learn theshapes of the pieces and what they can do on the board. More subtly, you need to learnthe strategic significance of the pieces and how to wield them in order to win the game.Certainly, with a data warehouse, as well as with chess, you need to think way ahead.Your opponent is the ever-changing nature of the environment you are forced to work in.You can’t avoid the changing user needs, the changing business conditions, thechanging nature of the data you are given to work with, and the changing technicalenvironment. So maybe the game of data warehousing is something like the game ofchess. At least it’s a pretty good metaphor.
If you intend to read this book, you need to read this chapter. We are fairly precise in thisbook with our vocabulary, and you will get more out of this book if you know where westand. We begin by briefly defining the basic elements of the data warehouse. As we remarked in the introduction, there is not universal agreement in the marketplace overthese definitions. But our use of these words is as close to mainstream practice as wecan make them. Here in this book, we will use these words precisely and consistently, according to the definitions we provide in the next section.
We will then list the data warehouse processes you need to be concerned about. This list isa declaration of the boundaries for your job. Perhaps the biggest insight into your responsibilities as a data warehouse manager is that this list of data warehouse processesis long and somewhat daunting
Basic Elements of the Data Warehouse
As you read through the definitions in this section, please refer to Figure 1.1. We will move through Figure 1.1 roughly in left to right order.
Figure 1.1 The basic elements of the data warehouse.
Source System
An operational system of record whose function it is to capture the transactions of the business. A source system is often called a “legacy system” in a mainframe environment.The main priorities of the source system are uptime and availability. Queries againstsource systems are narrow, “account-based” queries that are part of the normal transaction flow and severely restricted in their demands on the legacy system. Weassume that the source systems maintain little historical data and that managementreporting from source systems is a burden on these systems. We make the strong assumption that source systems are not queried in the broad and unexpected ways thatdata warehouses are typically queried. We also assume that each source system is a

1. 3
natural stovepipe, where little or no investment has been made to conform basic dimensions such as product, customer, geography, or calendar with other legacysystems in the organization. Source systems have keys that make certain things unique,like product keys or customer keys. We call these source system keys production keys, and we treat them as attributes, just like any other textual description of something. Wenever use the production keys as the keys within our data warehouse. (Hopefully that gotyour attention. Read the chapters on data modeling.)
Data Staging Area
A storage area and set of processes that clean, transform, combine, de-duplicate, household, archive, and prepare source data for use in the data warehouse. The data staging area is everything in between the source system and the presentation server.Although it would be nice if the data staging area were a single centralized facility on onepiece of hardware, it is far more likely that the data staging area is spread over a numberof machines. The data staging area is dominated by the simple activities of sorting andsequential processing and, in some cases, the data staging area does not need to bebased on relational technology. After you check your data for conformance with all theone-to-one and many-to-one business rules you have defined, it may be pointless to takethe final step of building a full blown entity-relation-based physical database design.
However, there are many cases where the data arrives at the doorstep of the datastaging area in a third normal form relational database. In other cases, the managers ofthe data staging area are more comfortable organizing their cleaning, transforming, andcombining steps around a set of normalized structures. In these cases, a normalizedstructure for the data staging storage is certainly acceptable. The key defining restrictionon the data staging area is that it does not provide query and presentation services. As soon as a system provides query and presentation services, it must be categorized as apresentation server, which is described next.
Presentation Server
The target physical machine on which the data warehouse data is organized and stored for direct querying by end users, report writers, and other applications. In our opinion,three very different systems are required for a data warehouse to function: the sourcesystem, the data staging area, and the presentation server. The source system should be thought of as outside the data warehouse, since we assume we have no control over thecontent and format of the data in the legacy system. We have described the data stagingarea as the initial storage and cleaning system for data that is moving toward the presentation server, and we made the point that the data staging area may well consistof a system of flat files. It is the presentation server where we insist that the data bepresented and stored in a dimensional framework. If the presentation server is based on a relational database, then the tables will be organized as star schemas. If thepresentation server is based on nonrelational on-line analytic processing (OLAP) technology, then the data will still have recognizable dimensions, and most of the recommendations in this book will pertain. At the time this book was written, most of thelarge data marts (greater than a few gigabytes) were implemented on relationaldatabases. Thus, most of the specific discussions surrounding the presentation server are couched in terms of relational databases.
Dimensional Model
A specific discipline for modeling data that is an alternative to entity-relationship (E/R) modeling. A dimensional model contains the same information as an E/R model but packages the data in a symmetric format whose design goals are user understandability,query performance, and resilience to change. The rationale for dimensional modeling ispresented in Chapter 5.
This book and its predecessor, The Data Warehouse Toolkit, are based on the discipline of dimensional modeling. We, the authors, are committed to this approach because wehave seen too many data warehouses fail because of overly complex E/R designs. Wehave successfully employed the techniques of dimensional modeling in hundreds ofdesign situations over the last 15 years.
The main components of a dimensional model are fact tables and dimension tables, which are defined carefully in Chapter 5. But let’s look at them briefly.
A fact table is the primary table in each dimensional model that is meant to contain
1. 4
measurements of the business. Throughout this book, we will consistently use the wordfact to represent a business measure. We will reduce terminology confusion by not usingthe words measure or measurement. The most useful facts are numeric and additive. Every fact table represents a many-to-many relationship and every fact table contains a set of two or more foreign keys that join to their respective dimension tables.
A dimension table is one of a set of companion tables to a fact table. Each dimension isdefined by its primary key that serves as the basis for referential integrity with any givenfact table to which it is joined. Most dimension tables contain many textual attributes(fields) that are the basis for constraining and grouping within data warehouse queries.
Business Process
A coherent set of business activities that make sense to the business users of our datawarehouses. This definition is purposefully a little vague. A business process is usually a set of activities like “order processing” or “customer pipeline management,” but businessprocesses can overlap, and certainly the definition of an individual business process willevolve over time. In this book, we assume that a business process is a useful grouping of information resources with a coherent theme. In many cases, we will implement one ormore data marts for each business process.
Data Mart
A logical subset of the complete data warehouse. A data mart is a complete “pie-wedge” of the overall data warehouse pie. A data mart represents a project that can be broughtto completion rather than being an impossible galactic undertaking. A data warehouse ismade up of the union of all its data marts. Beyond this rather simple logical definition, we often view the data mart as the restriction of the data warehouse to a single businessprocess or to a group of related business processes targeted toward a particularbusiness group. The data mart is probably sponsored by and built by a single part of the business, and a data mart is usually organized around a single business process.
We impose some very specific design requirements on every data mart. Every data martmust be represented by a dimensional model and, within a single data warehouse, allsuch data marts must be built from conformed dimensions and conformed facts. This isthe basis of the Data Warehouse Bus Architecture. Without conformed dimensions andconformed facts, a data mart is a stovepipe. Stovepipes are the bane of the data warehouse movement. If you have any hope of building a data warehouse that is robustand resilient in the face of continuously evolving requirements, you must adhere to thedata mart definition we recommend. We will show in this book that, when data marts have been designed with conformed dimensions and conformed facts, they can becombined and used together. (Read more on this topic in Chapter 5.)
We do not believe that there are two “contrasting” points of view about top-down vs. bottom-up data warehouses. The extreme top-down perspective is that a completely centralized, tightly designed master database must be completed before parts of it aresummarized and published as individual data marts. The extreme bottom-up perspective is that an enterprise data warehouse can be assembled from disparate and unrelateddata marts. Neither approach taken to these limits is feasible. In both cases, the onlyworkable solution is a blend of the two approaches, where we put in place a properarchitecture that guides the design of all the separate pieces.
When all the pieces of all the data marts are broken down to individual physical tables on various database servers, as they must ultimately be, then the only physical way tocombine the data from these separate tables and achieve an integrated enterprise datawarehouse is if the dimensions of the data mean the same thing across these tables. We call these conformed dimensions. This Data Warehouse Bus Architecture is afundamental driver for this book.
Finally, we do not adhere to the old data mart definition that a data mart is comprised of summary data. Data marts are based on granular data and may or may not containperformance enhancing summaries, which we call “aggregates” in this book.
Data Warehouse
The queryable source of data in the enterprise. The data warehouse is nothing more than the union of all the constituent data marts. A data warehouse is fed from the data stagingarea. The data warehouse manager is responsible both for the data warehouse and thedata staging area.

1. 5
Please understand that we (and the marketplace) have departed in a number of ways from the original definition of the data warehouse dating from the early 1990s.Specifically, the data warehouse is the queryable presentation resource for an enterprise’s data and this presentation resource must not be organized around an entity-relation model because, if you use entity-relation modeling, you will lose understandability and performance. Also, the data warehouse is frequently updated on a controlled load basis as data is corrected, snapshots are accumulated, and statuses and labels are changed. Finally, the data warehouse is precisely the union of its constituent data marts.
Operational Data Store (ODS)
The term “operational data store” has taken on too many definitions to be useful to the data warehouse. We have seen this term used to describe everything from the databasethat underlies the operational system to the data warehouse itself. There are two primarydefinitions that are worth exploring in the context of the data warehouse. Originally, the ODS was meant to serve as the point of integration for operational systems. This wasespecially important for legacy systems that grew up independent of each other. Banks,for example, typically had several independent systems set up to support different products—loans, checking accounts, savings accounts, and so on. The advent of tellersupport computers and the ATM helped push many banks to create an operational datastore to integrate current balances and recent history from these separate accounts under one customer number. This kind of operational lookup is a perfect example of theuseful role an ODS can play. In fact, this need for integration has been the driving forcebehind the success of the client/server ERP business.
Since this kind of ODS needs to support constant operational access and updates, itshould be housed outside the warehouse. That is, any system structured to meetoperational needs and performance requirements will be hard pressed to meet decisionsupport needs and performance requirements. For example, you don’t want someone tolaunch a complex scoring model that requires full table scans and aggregation of thecustomer history at the same time 1,000 catalog phone reps are trying to view customerhistory to support a one-to-one marketing relationship. This would not be good.
In the second definition, the purpose of the ODS has changed to include what soundslike decision support access by “clerks and executives.” In this case, the logic seems to be that since the ODS is meant to contain integrated data at a detailed level, we shouldbuild one to support the lowest layer of the data warehouse.
In our view, these two definitions are very different. The original ODS is truly anoperational system, separate from the data warehouse, with different service levels andperformance requirements it must meet. The second ODS is actually the front edge ofthe kinds of data warehouse we design, really a part of the data warehouse and not aseparate system at all.
If you have an operational data store in your systems environment, or in your plans,examine it carefully. If it is meant to play an operational, real-time role, then it truly is an operational data store and should have its own place in the systems world. If, on the other hand, it is meant to provide reporting or decision support, we encourage you to skipthe ODS and meet these needs directly from the detailed level of the data warehouse.We provide additional discussion on including this detailed level in the warehouse in Chapter 9.
OLAP (On-Line Analytic Processing)
The general activity of querying and presenting text and number data from data warehouses, as well as a specifically dimensional style of querying and presenting that isexemplified by a number of “OLAP vendors.” The OLAP vendors’ technology isnonrelational and is almost always based on an explicit multidimensional cube of data. OLAP databases are also known as multidimensional databases, or MDDBs. OLAPvendors’ data designs are often very similar to the data designs described in this book,but OLAP installations would be classified as small, individual data marts when viewed against the full range of data warehouse applications. We believe that OLAP-style data marts can be full participants on the data warehouse bus if they are designed aroundconformed dimensions and conformed facts.
ROLAP (Relational OLAP)
1. 6
A set of user interfaces and applications that give a relational database a dimensionalflavor. This book is highly consistent with both ROLAP and MOLAP approaches,although most of the specific examples come from a ROLAP perspective.
MOLAP (Multidimensional OLAP)
A set of user interfaces, applications, and proprietary database technologies that have astrongly dimensional flavor.
End User Application
A collection of tools that query, analyze, and present information targeted to support abusiness need. A minimal set of such tools would consist of an end user data accesstool, a spreadsheet, a graphics package, and a user interface facility for eliciting promptsand simplifying the screen presentations to end users.
End User Data Access Tool
A client of the data warehouse. In a relational data warehouse, such a client maintains asession with the presentation server, sending a stream of separate SQL requests to theserver. Eventually the end user data access tool is done with the SQL session and turnsaround to present a screen of data or a report, a graph, or some other higher form ofanalysis to the user. An end user data access tool can be as simple as an ad hoc querytool, or can be as complex as a sophisticated data mining or modeling application. A fewof the more sophisticated data access tools like modeling or forecasting tools mayactually upload their results into special areas of the data warehouse.
Ad Hoc Query Tool
A specific kind of end user data access tool that invites the user to form their own queriesby directly manipulating relational tables and their joins. Ad hoc query tools, as powerfulas they are, can only be effectively used and understood by about 10 percent of all the potential end users of a data warehouse. The remaining 90 percent of the potential usersmust be served by pre-built applications that are much more finished “templates” that donot require the end user to construct a relational query directly. The very best ROLAP-oriented ad hoc tools improve the 10 percent number to perhaps 20 percent.
Modeling Applications
A sophisticated kind of data warehouse client with analytic capabilities that transform ordigest the output from the data warehouse. Modeling applications include:
• Forecasting models that try to predict the future
• Behavior scoring models that cluster and classify customer purchase behavior orcustomer credit behavior
• Allocation models that take cost data from the data warehouse and spread the costsacross product groupings or customer groupings
• Most data mining tools Metadata
All of the information in the data warehouse environment that is not the actual data itself. We take an aggressive and expansive view of metadata in this book. Chapter 11enumerates all the forms of metadata we can think of and tries to give you someguidance about how to recognize, use, and control metadata. You should catalog yourmetadata, version stamp your metadata, document your metadata, and backup yourmetadata. But don’t expect your metadata to be stored in one central database. There is too much that is metadata, and its formats and uses are too diverse.
Basic Processes of the Data Warehouse
Data staging is a major process that includes, among others, the following subprocesses:extracting, transforming, loading and indexing, and quality assurance checking.

1. 7
•
Extracting. The extract step is the first step of getting data into the data warehouse environment. We use this term more narrowly than some consultants. Extractingmeans reading and understanding the source data, and copying the parts that areneeded to the data staging area for further work.
• Transforming. Once the data is extracted into the data staging area, there are manypossible transformation steps, including
–
Cleaning the data by correcting misspellings, resolving domain conflicts (such as acity name that is incompatible with a postal code), dealing with missing data elements, and parsing into standard formats
–
Purging selected fields from the legacy data that are not useful for the datawarehouse
–
Combining data sources, by matching exactly on key values or by performing fuzzy matches on non-key attributes, including looking up textual equivalents of legacysystem codes
–
Creating surrogate keys for each dimension record in order to avoid a dependenceon legacy defined keys, where the surrogate key generation process enforces referential integrity between the dimension tables and the fact tables
– Building aggregates for boosting the performance of common queries
•
Loading and Indexing. At the end of the transformation process, the data is in the form of load record images. Loading in the data warehouse environment usually takesthe form of replicating the dimension tables and fact tables and presenting these tablesto the bulk loading facilities of each recipient data mart. Bulk loading is a very important capability that is to be contrasted with record-at-a-time loading, which is far slower. The target data mart must then index the newly arrived data for query performance, if it hasnot already done so.
•
Quality Assurance Checking. When each data mart has been loaded and indexed and supplied with appropriate aggregates, the last step before publishing is the qualityassurance step. Quality assurance can be checked by running a comprehensiveexception report over the entire set of newly loaded data. All the reporting categoriesmust be present, and all the counts and totals must be satisfactory. All reported valuesmust be consistent with the time series of similar values that preceded them. Theexception report is probably built with the data mart’s end user report writing facility.
•
Release/Publishing. When each data mart has been freshly loaded and qualityassured, the user community must be notified that the new data is ready. Publishingalso communicates the nature of any changes that have occurred in the underlyingdimensions and new assumptions that have been introduced into the measured orcalculated facts.
•
Updating. Contrary to the original religion of the data warehouse, modern data marts may well be updated, sometimes frequently. Incorrect data should obviously becorrected. Changes in labels, changes in hierarchies, changes in status, and changesin corporate ownership often trigger necessary changes in the original data stored inthe data marts that comprise the data warehouse, but in general these are “managedload updates,” not transactional updates.
•
Querying. Querying is a broad term that encompasses all the activities of requestingdata from a data mart, including ad hoc querying by end users, report writing, complexdecision support applications, requests from models, and full-fledged data mining. Querying never takes place in the data staging area. By definition, querying takes placeon a data warehouse presentation server. Querying, obviously, is the whole point of using the data warehouse.
•
Data Feedback/Feeding in Reverse. There are two important places where data flows “uphill” in the opposite direction from the traditional flow we have discussed in this section. First, we may upload a cleaned dimension description from the data stagingarea to a legacy system. This is desirable when the legacy system recognizes thevalue of the improved data. Second, we may upload the results of a complex query or a model run or a data mining analysis back into a data mart. This would be a natural wayto capture the value of a complex query that takes the form of many rows and columnsthat the user wants to save.

1. 8
•
Auditing. At times it is critically important to know where the data came from and what were the calculations performed. In Chapter 6, we discuss a technique for creating special audit records during the extract and transformation steps in the data stagingarea. These audit records are linked directly to the real data in such a way that a usercan ask for the audit record (the lineage) of the data at any time.
•
Securing. Every data warehouse has an exquisite dilemma: the need to publish thedata widely to as many users as possible with the easiest-to-use interfaces, but at the same time protect the valuable sensitive data from hackers, snoopers, and industrialspies. The development of the Internet has drastically amplified this dilemma. The datawarehouse team must now include a new senior member: the data warehouse securityarchitect. Data warehouse security must be managed centrally, from a single console.Users must be able to access all the constituent data marts of the data warehouse witha single sign-on. In Chapter 12, we present an in-depth discussion of security issues in the data warehouse and what you should do about them.
•
Backing Up and Recovering. Since data warehouse data is a flow of data from thelegacy systems on through to the data marts and eventually onto the users’ desktops, areal question arises about where to take the necessary snapshots of the data for archivalpurposes and disaster recovery. Additionally, it may be even more complicated to back upand recover all of the metadata that greases the wheels of the data warehouse operation. In Chapter 9, we discuss the various kinds of backup activities, and what a realisticrecovery operation would entail.
The Big Data Warehouse Debates
At the time of writing this book, the data warehouse market is in the middle of a numberof evolutionary changes. As an industry, we have thousands of working data marts anddata warehouses under our belts. We must now revisit some of the original assumptions and restrictions we placed on ourselves in the late 1980s and early 1990s. And ofcourse, we have very different technology to work with. In early 1998, $10,000 could buya machine with twin 300 MHz processors, 512 MB of random access memory, and 50 GB of fast disk drive. This machine can sit on a fast Ethernet system and run any of themajor relational databases, even DB2. Although many data marts need a bigger machinethan this, one wonders if terabyte data marts on PC class machines are just around the corner.
At the same time, the data warehouse market has reacted strongly to the difficulty ofplanning and implementing a single, undifferentiated, master data warehouse for thewhole enterprise. This job is just too overwhelming for most organizations and mostmortal designers to even think about.
The future of data warehousing is modular, cost effective, incrementally designed,distributed data marts. The data warehouse technology will be a rich mixture of large monolithic machines that grind through massive data sets with parallel processing,together with many separate small machines (i.e., maybe only terabyte data marts!)nibbling away on individual data sets that may be granular, mildly aggregated, or highly aggregated. The separate machines will be tied together with navigator software that willserve as switchboards for dispatching queries to the servers best able to respond.
The future of data warehousing is in software advances and design discipline. Although the largest machines will continue to be even more effective at parallel processing, thesmallest machines will become proportionally more powerful due to hardware advances.The biggest gains in performance, analysis power, and user interface effectiveness, however, will come from better algorithms and tighter, more predictable data designs. Byadhering to the discipline of dimensional modeling, a data warehouse will be in a muchbetter position to ride the advances being made in database software technology.
At the time of this writing, the most visible discussions in data warehousing included thetopics listed in the next section. We will not develop the full arguments in this chapter, butwe make our summary positions clear.
Data Warehouse Modeling
As we have already remarked several times, we believe strongly in dimensional modelingfor the presentation phase of the data warehouse. Chapter 5 leads off with a detailed justification for this approach. To summarize, dimensional modeling should be used in allthe presentation servers of a data warehouse because, compared to entity-relation (E/R)

1. 9
modeling, this approach yields predictable, understandable designs that users can useand assimilate and that can be queried with high performance. Understandability andperformance are the twin, nonnegotiable requirements of the data warehouse. Thedimensional approach, unlike the E/R approach, does not require the database to berestructured or the queries to be rewritten when new data is introduced into thewarehouse or when the relationships among data elements must be revised. Adimensional data mart, unlike the E/R data mart, does not need to anticipate the user’squeries and is very resilient to changes in user analysis patterns.
Data Marts and Data Warehouses
Again, as we have already described, the data warehouse is nothing more than the union of its constituent data marts. These data marts avoid being stovepipes by beingorganized in a Bus Architecture around conformed dimensions and conformed facts. Themain data design task for the data warehouse team is identifying and establishing these conformed dimensions and facts. The opposite perspective, which we disagree with, isthat the data warehouse is a nonqueryable, E/R structured, centralized store of data andthat data marts are disjoint and incomplete summarization of the central data warehouse that are spun off when the users demand a particular kind of analysis.
As a historical footnote, the idea that a data warehouse can be built incrementally from aseries of data marts with conformed dimensions was fully described by Ralph Kimball in a DBMS magazine article in August 1996. Other descriptions of this technique, notablythe “Enterprise Data Mart Architecture” with “common dimensions” and “common facts,”appeared in the literature a year later. These descriptions are virtually identical to Kimball’s work. The original terms “conformed dimensions” and “conformed facts” weredescribed by Nielsen Marketing Research to Ralph Kimball in 1984, and referred toNielsen’s practice at that time of tying together syndicated scanner data with customers’ internal shipments data. The terms “dimension” and “fact” originated from developmentsconducted jointly by General Mills and Dartmouth University in the late 1960s. It is clearthat these ideas for combining data marts had been invented and introduced into the commercial marketplace long before the current generation of industry experts andconsultants, even if we didn’t call them data marts.
Distributed versus Centralized Data Warehouses
We feel that the tide has been coming in for some time in this industry. The idea that an organization’s data warehouse is supported by a single, centralized mainframe-class machine is about as realistic as the 1950s idea that you only need one computer in anorganization. At the personal computing level, we already have tens of thousand ofcomputers in large organizations. The data warehouse is already following suit. Futuredata warehouses will consist of dozens or hundreds of separate machines with widelydifferent operating systems and widely different database systems, including all flavors ofOLAP. If designed correctly, these machines will share a uniform architecture ofconformed dimensions and conformed facts that will allow them to be fused into acoherent whole.
We think that these last two topics, namely data warehouses consisting of many datamarts and the enterprise data warehouse being a distributed system, will fuse togetherinto a single architectural view. This view allows both the “hub and spoke” view of anoverall data warehouse as well as a fully distributed view of the warehouse. We don’t inany way oppose the idea of a large monolithic machine at the middle of a datawarehouse operation. Some organizations will find that this makes most sense forthem. Inside that monolithic machine will be hundreds of tables, organized by subjectareas. We will call these groups of tables “data marts,” and they will only function as aseamless whole if they possess conformed dimensions.
Summary
We have defined all the parts of the data warehouse environment shown in Figure 1.1, and we have described how they work together. We have briefly touched on the big discussionstaking place in the data warehouse industry today. In the next chapter it is time to turn our attention to the Business Dimensional Lifecycle, which is the framework for the rest of thebook.

2.1

2.2
Overview
Before we delve into the specifics of data warehouse design, development, anddeployment, we will provide an overall methodology by introducing the BusinessDimensional Lifecycle. The Business Dimensional Lifecycle provides the framework thatties together the content of this book. It sets the stage and provides placeholders for thedetailed information that unfolds in the following chapters.
This chapter begins with historical background on the evolution of the BusinessDimensional Lifecycle. We formally introduce the steps of the lifecycle and theassociated diagram. Each high-level task or component of the Business DimensionalLifecycle is then described. Finally, we provide general guidelines for effectively using thelifecycle throughout your project.
We recommend that all readers take the time to peruse this brief introductory chapter, evenif you are involved in only a single facet of the data warehouse project. We believe it is beneficial for the entire team to understand the overall methodology. This chapter is writtento help you see the big picture. For now, we will focus on the forest; subsequent chapterswill get down to the tree, leaf, bark, and root level.
Lifecycle Evolution
The Business Dimensional Lifecycle presented in this book first took root at MetaphorComputer Systems in the mid-1980s. Many of you have probably heard of Metaphor as ithas found a place in data warehousing folklore, but you may not be aware of the specifics. Briefly, Metaphor was a pioneering decision support vendor that was foundedin 1982. At that time, Metaphor’s product was based on LAN technology with a relationaldatabase server platform and user-friendly GUI client. Sounds strangely familiar, doesn’t it? At any rate, Metaphor focused on this industry when it was called “decision support,”long before the term data warehousing came into use.
The authors of this book worked together during the early days at Metaphor implementing decision support solutions. At the time, there were no industry bestpractices or formal written methodologies. The authors and other Metaphor colleaguesbegan developing techniques and approaches to deal with the idiosyncrasies of decision support. We had been groomed in traditional development methodologies, but wemodified and enhanced those practices to address the unique challenges of providingdirect data access to business end users while considering growth and extensibility for the long haul.
Over the years, the authors have been involved with literally hundreds of data warehouseprojects. Many have been wildly successful, some have met minimum expectations, anda few have failed in spectacular ways. Each project taught us a lesson. In addition, we have each had the opportunity to learn from many talented individuals and organizationsover the years. Our approaches and techniques have been refined and honed overtime—and distilled into The Data Warehouse Lifecycle Toolkit.
Successful implementation of a data warehouse depends on the appropriate integrationof numerous tasks and components. It is not enough to have the perfect data model orbest-of-breed technology alone—you need to coordinate the many facets of a data warehouse project, much like a conductor must unify the many instruments in anorchestra. A soloist cannot carry a full orchestra. Likewise, the data warehouseimplementation effort needs to demonstrate strength across all aspects of the project for success. The Business Dimensional Lifecycle is similar to the conductor’s score. Itensures that the project pieces are brought together in the right order and at the righttime.
In spite of dramatic advancements in technology since the early days of Metaphor in the 1980s, the basic constructs of the Business Dimensional Lifecycle have remained strikinglyconstant. Our approach to designing, developing, and deploying data warehouses is triedand true. It has been tested with projects across virtually every industry, business function, and technology platform. The Business Dimensional Lifecycle approach has been proven towork.

2.3
Lifecycle Approach
The overall Lifecycle approach to data warehouse implementation is illustrated in Figure 2.1. This diagram depicts the sequence of high-level tasks required for effective data warehouse design, development, and deployment. The diagram shows the overallproject roadmap, in which each box serves as a guidepost or mile (or kilometer) marker.
Figure 2.1 The Business Dimensional Lifecycle diagram.
Project Planning
The Lifecycle begins with project planning, as one would expect. Project planningaddresses the definition and scoping of the data warehouse project, including readiness assessment and business justification. These are critical early tasks due to the highvisibility and costs associated with most warehouse projects. From there, projectplanning focuses on resource and skill-level staffing requirements, coupled with project task assignments, duration, and sequencing. The resulting integrated project planidentifies all tasks associated with the Business Dimensional Lifecycle and notes theparties involved. It serves as the cornerstone for the ongoing management of your data warehouse project. Project planning is dependent on the business requirements, asdenoted by the two-way arrow between these activities.
A data warehouse’s likelihood for success is greatly increased by a sound understanding of the business end users and their requirements. Without this understanding, datawarehousing will likely become an exercise in futility for the project team. The approachused to gather knowledge workers’ analytic requirements differs significantly from more traditional, data-driven requirements analysis. Data warehouse designers mustunderstand the key factors driving the business to effectively determine businessrequirements and translate them into design considerations. The business requirements establish the foundation for the three parallel tracks focused on technology, data, andend user applications. Chapter 4 provides a comprehensive discussion of gathering business requirements.
Data Track: Dimensional Modeling
The definition of the business requirements determines the data needed to addressbusiness users’ analytical requirements. Designing data models to support these analyses requires a different approach than that used for operational systems design.We begin by constructing a matrix that represents key business processes and theirdimensionality. The matrix serves as a blueprint to ensure that your data warehouse is extensible across the organization over time.
From there, we conduct a more detailed data analysis of relevant operational sourcesystems. Coupling this data analysis with our earlier understanding of businessrequirements, we then develop a dimensional model. This model identifies the fact tablegrain, associated dimensions, attributes, and hierarchical drill paths and facts. The logicaldatabase design is completed with appropriate table structures and primary/foreign key relationships. The preliminary aggregation plan is also developed. This set of activitiesconcludes with the development of the source-to-target data mapping.
Dimensional modeling concepts are discussed in Chapters 5-7. Chapter 5 provides an introduction and justification for dimensional modeling, while Chapter 6 covers advanced dimensional modeling topics. Chapter 7 describes the recommended approach and process for developing a dimensional model.
Data Track: Physical Design

2.4
Physical database design focuses on defining the physical structures necessary tosupport the logical database design. Primary elements of this process include definingnaming standards and setting up the database environment. Preliminary indexing andpartitioning strategies are also determined. Physical database design is addressed inChapter 15.
Data Track: Data Staging Design and Development
The data staging design and development process is typically the most underestimateddata warehouse project task. The data staging process has three major steps: extraction, transformation, and load. The extract process always exposes data quality issues thathave been buried within the operational source systems. Since data quality significantlyimpacts data warehouse credibility, you need to address these quality problems during data staging. To further complicate matters, you need to design and build two warehousestaging processes—one for the initial population of the data warehouse and another forthe regular, incremental loads. Details about developing the data staging process are provided in Chapter 16.
Technology Track: Technical Architecture Design
Data warehouse environments require the integration of numerous technologies. Thetechnical architecture design establishes the overall architecture framework and vision.You will need to consider three factors—your business requirements, current technical environment, and planned strategic technical directions—simultaneously to establish the data warehouse technical architecture design. Chapter 8 provides an introduction to data warehouse technical architecture. Specific architecture discussions for the back roomand front room are presented in Chapters 9 and 10, respectively. Chapter 11 highlights the architecture’s infrastructure and metadata. Finally, a “graduate course” on datawarehouse security and the impact of the Internet is provided in Chapter 12.
Technology Track: Product Selection and Installation
Using your technical architecture design as a framework, specific architecturalcomponents such as the hardware platform, database management system, data staging tool, or data access tool will need to be evaluated and selected. A standard technicalevaluation process is defined along with specific evaluation factors for each architecturalcomponent. Once the products have been evaluated and selected, they are then installed and thoroughly tested to ensure appropriate end-to-end integration within your data warehouse environment. Chapter 13 highlights the architecture design, technology evaluation, and subsequent selection and installation processes.
Application Track: End User Application Specification
We recommend defining a set of standard end user applications since not all business users need ad hoc access to the data warehouse. Application specifications describe thereport template, user driven parameters, and required calculations. These specificationsensure that the development team and business users have a common understanding of the applications to be delivered. Details regarding these specifications for end userapplications are provided in Chapter 17.
Application Track: End User Application Development
Following application specification, the development of end user applications involvesconfiguring the tool metadata and constructing the specified reports. Optimally, theseapplications are built using an advanced data access tool that provides significantproductivity gains for the application development team. In addition, it offers a powerfulmechanism for business users to easily modify existing report templates. Chapter 17describes the end user application development process.
Deployment
Deployment represents the convergence of technology, data, and end user applications accessible from the business users’ desktop. Extensive planning is required to ensurethat these puzzle pieces fit together properly. Business user education integrating allaspects of the convergence must be developed and delivered. In addition, user support and communication or feedback strategies should be established before any businessusers have access to the data warehouse. As emphasized in Chapter 18, it is critical that the deployment be well orchestrated—deployment should be deferred if all the pieces are

2.5
not ready for release. Maintenance and Growth
Plenty of work remains following the initial deployment of the data warehouse. You need to continue focusing on your business users by providing them with ongoing support andeducation. You also need to focus attention on the back room, ensuring that theprocesses and procedures are in place for effective ongoing operation of the warehouse. Data warehouse acceptance and performance metrics should be measured over timeand logged to support marketing of the data warehouse. Finally, your maintenance gameplan should include a broad-reaching communication strategy.
If you have used the Business Dimensional Lifecycle thus far, your data warehouse isbound to evolve and grow. Unlike traditional systems development initiatives, changeshould be viewed as a sign of success, not failure. Prioritization processes must be established to deal with this business user demand for evolution and growth. After theproject priorities are identified, we go back to the beginning of the lifecycle, leveragingand building upon what has already been established in the data warehouse environment, with a focus on the new requirements. Chapter 19 details our recommendations to address the long-term health and growth of your data warehouse.
Project Management
Project management ensures that the Business Dimensional Lifecycle activities remain ontrack and in sync. As illustrated in Figure 2.1, project management activities occur throughout the lifecycle. These activities focus on monitoring project status, issue tracking,and change control to preserve scope boundaries. Finally, project management includes the development of a comprehensive project communication plan that addresses both thebusiness and information systems organizations. Ongoing communication is absolutelycritical to managing expectations, and managing expectations is absolutely critical to achieving your data warehousing goals. Chapter 3 also details these project management activities.
Guidelines for Using the Business Dimensional Lifecycle
The Business Dimensional Lifecycle diagram lays out the general flow that occurs duringa data warehouse implementation. It identifies high-level task sequencing and highlights the activities that should be happening concurrently throughout the technology, data, andapplication tracks. For example, you should not attempt to complete your physical datadesign and begin building your data staging area without a clear understanding of thebusiness requirements, overall technical architecture design, and specific technicalarchitecture selections, including the end user data access tool.
The Business Dimensional Lifecycle, however, does not attempt to reflect an absoluteproject timeline. As you likely noticed, each box or mile marker in Figure 2.1 is the same width, with the exception of project management. If you have any experience with datawarehousing, you know that the magnitude of resources and time required for eachlifecycle box is not equal. Clearly, the reader should not lay a ruler along the bottom ofthe diagram and divide the tasks into timeline months. Focus on sequencing andconcurrency, not absolute timelines.
As with most project methodology and management tools, you may need to customizethe Business Dimensional Lifecycle to address the unique needs of your organization. Ifthis is the case, we applaud your adoption of the framework, as well as your creativity. Truth be told, we usually tailor the specific lifecycle tasks for each new project.Throughout this book, we attempt to describe nearly everything you need to think aboutduring the design, development, and deployment of a data warehouse. Don’t let the volume of material overwhelm you. Not every detail of every lifecycle task will beperformed on every project. We understand that all systems development is based uponcompromises. However, in our experience, successful projects will perform all the tasks at some point—it’s just a matter of when and how.
Finally, as we’ll further describe in Chapter 3, the Business Dimensional Lifecycle is most effective when used to implement projects of manageable yet meaningful scope. It is nearlyimpossible to tackle everything at once, so don’t let your business users, fellow teammembers, or management force that approach. On the other hand, it is extremely doable to design, develop and deploy your data warehouse environment through multiple iterationsusing the Business Dimensional Lifecycle.

2.6
Business Dimensional Lifecycle Mile Markers and NavigationAids
You’ll find references to the Business Dimensional Lifecycle throughout the book. Forstarters, each chapter title page will include a miniature graphic version of the BusinessDimensional Lifecycle diagram (Figure 2.1), which highlights where you are within the overall Lifecycle framework. You should view this as your Lifecycle mile marker. Beforewarned that there is not always a one-to-one relationship between mile markers and book chapters. In some cases, a single chapter will address multiple markers, as inChapter 3, which covers both project planning and project management. In other cases,multiple chapters will cover a single mile marker, such as Chapters 5, 6 and 7, which discuss dimensional modeling.
In addition to the you-are-here mile marker, the process-oriented chapters will include the following common elements as appropriate:
• List of detailed project plan tasks and associated responsibilities with the milemarker. These listings are then pulled together into a complete integrated project planin Appendix A.
• Key project team roles.
•
Estimating considerations. Every project is so unique it’s nearly impossible toprovide specific time estimates for each mile marker. Instead, we provide a list ofvariables or dependencies you should consider as you allocate time to each milemarker on your project plan.
• Listing of the supporting templates associated with the mile marker. We have provided sample templates to support your use of the Business DimensionalLifecycle. The templates are included on the companion CD-ROM.
Summary
The Business Dimensional Lifecycle provides the framework to organize the numeroustasks required to implement a successful data warehouse. The Business Dimensional Lifecycle has evolved through years of hands-on experience and is firmly grounded in the realities you face today. Now, with the Lifecycle framework in mind, let’s get started!

3.1

3.2
Overview
Now that you have a high-level understanding of the Business Dimensional Lifecycle, it istime to dig in and get started. This chapter explores the considerations and activities associated with the project planning and project management boxes of the Lifecyclediagram.
The chapter is organized into three major sections. The first section focuses on defining your data warehouse project. It provides advice and guidelines for getting started withyour data warehouse initiative, from assessing readiness through scoping andjustification for funding. The middle section concentrates on detailed project planning activities, including staffing and project plan development. Last, we discuss considerations for running your data warehouse project, focusing on the unique aspectsof a warehouse initiative.
This chapter is geared toward people who are responsible for the overall data warehouseproject, regardless of whether they are part of the information systems (IS) or the functionalbusiness organization. Both IS and business management should read the chapter to better understand the overall data warehouse project landscape and their essential role. Otherproject team members would also benefit from a common understanding of these projectplanning and management challenges and recommendations, but it is not required that they read this chapter in depth.
Define the Project
So you have been asked to spearhead the data warehouse project at your company.What does that mean and where do you start? Unfortunately, there is no easy recipe forthe early, up-front activities associated with defining the warehouse project and securingfunding—there is a very low degree of repeatability in this phase of the lifecycle becauseit varies so greatly from one organization to another. To further complicate matters, theactivities associated with project definition are seldom linear. You will find yourselflooping between activities in the real world.
Nevertheless, chances are your organization fits one of the following scenarios:
•
Demand from a lone business zealot. In this scenario, one business executive has a vision about getting better access to better information to make better decisions. Weprobably encounter this situation in more than half of our engagements. In many ways,this is the most desirable and manageable situation—unless the zealot doesn’t have what it takes to be an effective sponsor or leaves to take a new job with a differentorganization in the middle of the project.
•
Too much demand. In this scenario, multiple business executives are voicing a need for better information. This scenario is slightly more complicated than the first, becauseyou need to prioritize the requirements before proceeding, but that can typically beaccomplished without too much difficulty.
•
In search of demand. This scenario might also be viewed as demand from a loneCIO. Your CIO doesn’t want to be the only kid on the block without a data warehouse.This is by far the most challenging scenario to deal with. Based on our experience,most if not all organizations can benefit from a decision support solution, even if thedemand doesn’t currently exist. However, it will require effort to ferret out the demandbefore you can get rolling with your data warehouse.
Regardless of your situation scenario, we suggest that you take a moment to assessyour organization’s readiness for a data warehouse before proceeding full steam ahead
3.3
with the project. The following material on readiness factors is intended to help you, yourmanagement, and your sponsors understand what it takes for an organization to achievesuccess with data warehousing. You don’t necessarily need glowing marks in each areato “pass” and move forward. However, all involved parties should be keenly aware of anyshortfalls or vulnerabilities and work together to devise strategies to shore them up.
Tip
Before beginning a data warehouse or data mart project, make sure youunderstand whether there is demand and where that demand is coming from. Ifyou have no strong business sponsor and no eager users, postpone theproject.
Assess Your Readiness for a Data Warehouse
Based on our experience, five key factors must be in place before you begin detailedwork on the design and development of your data warehouse. These factors establish the foundation to ensure you can successfully build your data warehouse. If you areunable to confidently give your organization a relative passing grade on the combinedfactors, we strongly suggest slowing down and reconsidering whether your organization is ready for a data warehouse. Our experiences indicate that readiness factor shortfallswill not correct themselves over time. It is far better to pull the plug on the project beforesignificant investment has been made than it is to continue marching down a path filled with hazards and obstacles.
Strong Business Management Sponsor(s)
Strong support and sponsorship from business management is the most critical factorwhen assessing data warehouse readiness. Strong business sponsors share a number of key characteristics. First of all, they have a vision for the potential impact of a datawarehouse. Strong sponsors possess a firm personal conviction about their vision, whichis generally demonstrated by their willingness to be accountable for it.
Strong business sponsors are influential leaders within the organization. Typically, theyhave demonstrated a solid track record of success and are well respected by others. Inother words, they have organizational clout. Strong business sponsors are typically politically astute and well connected. Interestingly, the lone zealot sponsor described inthe situation scenarios is often new to an organization—they come on board and have gung-ho visions of changing the organization. We have seen the new kid achievesuccess with a data warehouse, but it is a riskier proposition given their lack ofknowledge about the culture, players, politics and process.
The ideal business sponsor is not only strong, but realistic. It helps if they have a basic understanding of data warehousing concepts, including the iterative development cycle,to avoid unrealistic expectations. Effective sponsors are able to accept short-term problems and setbacks because they are focused on a long-term success of the project. Realistic sponsors are willing to compromise. They are also able to make the toughdecisions and live with the consequences.
Finally, successful data warehouse teams typically cultivate several strong business sponsors within their organization—in other words, don’t put all your eggs in one basket. It is not uncommon for a data warehouse to stall in the wake of the departure of a solebusiness sponsor. The sponsor’s replacement typically doesn’t have much time for their predecessor’s pet project.
Tip
Your project will live and die with your business sponsor. Be sure you have abusiness sponsor, and stay in communication with that individual.
Compelling Business Motivation
A data warehouse is an enabler to address specific critical business requirements.Period. Organizations that have successfully implemented data warehouses often sharea common characteristic: an organizational sense of urgency caused by a compellingbusiness motivation. Sometimes competition and changes in the competitive landscapeare the motivators. Internal crisis has motivated other organizations. Elsewhere, thestrategic vision of a potential marketplace opportunity is the overpowering motivator. Ifyour executives have determined that survival over the next decade is dependent onbeing a customer-centric organization, who is going to question a data warehouseinitiative that brings the vision of an entirely new way of conducting business to reality.Some organizations have historically grown through acquisition, and the integrationnecessary to understand performance across the organization is nearly impossible

3.4
without developing an integrated data warehouse.
Data warehouses that align with these strategic business motivations stand a good chance of succeeding. Likewise, business justification becomes nearly a nonissue if thedata warehouse is poised to support a compelling business motivation. In thesesituations, the organization also likely possesses the economic willpower to continue investing in the data warehouse for the long haul. Organizations in the midst of completeupheaval, such as significant downsizing or unfriendly merger discussions, are probablytoo distracted to launch a successful data warehouse initiative.
IS/Business Partnership
Successful data warehouses result from a joint business and IS effort in which bothgroups share responsibility for the initiative. Neither group is likely to achieve success ifthey try to build a warehouse on their own. The good news is that a data warehouseproject is the perfect opportunity to fix a broken relationship between IS and the businesscommunity, assuming both parties are willing to come to the table and talk.
Current Analytic Culture
Data warehousing is all about providing improved access to better information to supportdecision making. If your business community does not currently place value oninformation and analyses, its readiness for a data warehouse is questionable. The adage “you can bring a horse to water, but you can’t make it drink” certainly applies to datawarehousing. The most successful data warehouses are deployed in organizations inwhich fact-based decision making is encouraged and rewarded. If your business users prefer to rely on gut feelings, think twice before investing resources to construct anelegant data warehouse environment. At a minimum, be prepared for the additionalburden of shifting the cultural mindset.
Feasibility
The term feasibility commonly refers exclusively to technical feasibility. Today’stechnology offerings seem to make almost anything possible, although you are in farbetter shape if the overall infrastructure to support your data warehouse is already in place and robust.
The primary feasibility concern with data warehousing relates to the data itself. If the datarequired to support the compelling business motivation is too filthy, overly complex forthe initial effort (e.g., located in twenty unique manufacturing systems at sites around the world), or not even collected, you have a significant feasibility issue on your hands.Likewise, your data warehouse timeline will expand if common business rules anddefinitions have not already been agreed to across the organization.
Take the Readiness “Litmus Test”
Let’s now see how your organization stacks up against the five strategic readinessfactors. It is all too easy to say that you have a strong sponsor, but do you really? Takethe following self-check test to bring these strategic readiness factors into focus so youcan determine if you are ready to move forward with a data warehouse initiative—you can pull out your pink and blue highlighters if you want to better visualize the litmus paper readings (Figure 3.1).
Figure 3.1 Data warehouse readiness litmus test. Readiness Factor
Low Readiness
High Readiness
Strong Business Management Sponsor
Not well respected
Considerable organizational clout
Can take weeks forteam to gain access
Readily available to team
“I’ll get back to you onthat”
Quick, decisive resolution to issues

3.5
Hope “you” get it done
Active, vocal and visible supporter—willing to put own neck on the line
You can deliver this to250 users next month,right?
Realistic expectations
“A data whatta?”
Data warehouse savvy
Compelling Business Motivation
“And your point is?”
Survival dependent on data warehouse
Funding is a bigproblem
Cost is not an issue—we can’t afford not to do this!
“Shifting sands” vision
Clearly articulated vision
Ten different views ofthe solution
Consistent view of the solution
Tactical issue
Strategic issue
Cost savingsopportunity
Revenue enhancement opportunity
Unable to quantify thepayback
Huge payback
IS/Business Partnership
Business engagesoutside consultantwithout IS knowledge
Business and IS work hand-in-hand
Business unit createsown pseudo-IS team to build a data warehouse
IS actively engaged with business unit
“We can’t trust anynumbers from oursystems”
Strong confidence in existing reporting environment
It takes “years” to get a new ad hoc requestturned around
Quick IS response to ad hoc requests
Users don’t even submitrequests anymore
Short existing user request backlog
Current Analytic Culture
“Gut feel” decisionmaking
Decision making relies on facts and figures
Users don’t ask for data
Business users clamor for access to data—“Just get me the data and I’ll figure it out”
Users don’t look atcurrent reports
Current reports are consistently rekeyed into spreadsheets for analysis and historical trending
Current reports used as
Current reports are dog

3.6
doorstop until therecycling bin comes by s
eared, highlighted and filled with yellow self adhesive notes
Users have secretarieslog on and print off e-mail to read it
Users are very computer literate
Finance is extremelypossessive of bottomline performance figures
Information shared openly throughout the organization
Feasibility
Data warehouse wouldrequire purchase of allnew technology
Robust technical infrastructure in place
Everyone and theiruncle is committed tothe year 2000 project
Experienced resources available
Reliable data won’t beavailable until after the enterprise resourceplanning (ERP)implementation
Quality data available
Evaluate your Combined Readiness Factors
As we indicated earlier, the five readiness factors are not equally weighted in importance. Strong business management sponsorship bears a disproportionate share of the overallimportance—around 60 percent of the total in our experience. Compelling businessmotivation and feasibility each receive about 15 percent of the weighting, and theremaining two factors split the remaining 10 percent.
Business sponsorship is critically important for a number of reasons. Strong sponsorscan formulate and articulate the necessary vision for data warehousing and its impact onthe organization. Data warehouses tend to be expensive, with support and growth coststhat never end. Strong sponsorship, coupled with a solid financial return, is needed tosustain the economic willpower for the long haul. A strong sponsor is also able tocommand the appropriate resources even when competing with other mission-critical projects. Finally, warehouses are often the catalyst for cultural change—a strong sponsor will embrace and facilitate this change.
Strong business sponsorship can cover a multitude of shortcomings elsewhere on the project. Conversely, if your project has everything going for it but lacks a strong businesssponsor, you have a very steep hill to climb. Even the most elegantly designed datawarehouse cannot overcome a lack of business sponsorship.
Research conducted by Barbara Haley of the University of Virginia confirms ourexperienced-based assertions. In her 1997 doctoral dissertation titled “Implementing theDecision Support Infrastructure: Key Success Factors in Data Warehousing,” she states that “management support is a critical factor impacting the success of a data warehouseimplementation.”
At this point, you need to evaluate your combined readiness factor score givingconsideration to the weightings described earlier. As we mentioned, with the exception of business sponsorship, you don’t need high marks in each area to pass, but anyshortcomings represent risks to the project. Risk-reduction strategies and contingency plans should be developed in conjunction with your management and sponsors to address any shortfalls.
Your next step depends on your level of data warehouse readiness, coupled with yourspecific situation scenario. If you originally described your situation as “in search ofdemand,” you clearly have significant work to do before you can start building the datawarehouse. On the other hand, you may have a lone business zealot requesting a datawarehouse, yet still have significant work to do if the zealot lacks the sponsor

3.7
characteristics described earlier.
We outline several alternatives for addressing readiness shortcomings in the followingsection. If you are confident of your readiness, with a strong business sponsor targeting aspecific, compelling, high-payback business requirement, you can bypass this section and proceed directly to developing your preliminary scope. However, if you have anydoubts, the following techniques will help relieve your concerns, in addition to supportingthe subsequent scoping and justification efforts.
Techniques to Address Readiness Shortfall
We describe the following techniques to address your data warehouse readiness shortfallas isolated activities; however, they are frequently used in conjunction with one another.
High-Level Business Requirements Analysis
This first approach is effective in numerous situations—whether you are in search of demand, trying to better understand requirements to prioritize overwhelming demand orlooking for new demand due to a poorly positioned or focused lone zealot.
Chapter 4 spells out detailed tactics and techniques for effectively gathering businessrequirements. Rather than repeat that material here, we suggest you jump forward toChapter 4, since these techniques apply here with a few minor adjustments. For now, wewant to focus on high-level business issues and the business value impact—we don’t need to drop down to 500 feet to gather gory details for designing the dimensional datamodel. In general, you will want to uncover the following during a high-level requirements analysis with business management:
• Understand their key strategic business initiatives.
• Identify their key performance indicators or success metrics for each of the strategicbusiness initiatives.
• Determine the core business processes they monitor and want to impact.
• Determine the potential impact on their performance metrics with improved access to improved business process information.
You will also need to conduct preliminary data discovery sessions, as described inChapter 4, to identify any gaping data feasibility issues.
Business Requirements Prioritization
The next technique, prioritization of the business requirement opportunities, is often afollow-on activity to the high-level business requirements analysis just described. Thisbusiness-centric technique is appropriate when you are evaluating several alternatives,struggling with justification, attempting to build organizational consensus on a warehousegame plan, or trying to mend a broken relationship between the business community andIS.
We first observed the highly effective facilitation-based technique described next while working with Sequent Computer Systems. In this scenario, key business and IS influencers participate in a facilitated session sponsored by either the CIO or businesssponsor. The facilitation team and attendees must be well prepared to ensure aneffective session similar to the pre-interview prep work described in Chapter 4.
The facilitated session begins with a review of meeting objectives, participantintroductions, and session ground rules. The results of the high-level business requirement analysis are then presented as business “themes,” that is reasonably well-defined, manageably sized opportunities to impact the business. Everyone at themeeting should have a consistent understanding of the requirements themes. The themes often focus on a single core business process, although not always.
The facilitator helps the group prioritize the business requirement themes based on twoconsiderations—potential impact on the business and feasibility/readiness. The business influencers assign a priority to each theme depending on it is importance to the businessbased on potential dollar payback to the organization, strategic significance, availabilityof alternatives, political willpower, and so on. Optimally, the priority is expressed in a quantified dollar impact; alternatively, a “high/medium/low” or “1 to 10” ranking isassigned.

3.8
The business influencers at this meeting need to both represent their own departmentalor divisional interests as well as those of the overall organization. We worked with oneclient who brought two baseball caps to the prioritization session. One was labeled withthe corporation’s name, and the other was labeled “divisional.” The hat props were usedby everyone in the meeting to encourage a focus on the needs of the overall entity,rather than the needs of a single user group.
After the business priorities have been set, the requirement themes are prioritized interms of feasibility. Typically, the IS representatives apply similar “high/medium/low” or “1 to 10” feasibility rankings. Feasibility is largely a function of data availability, perceivedease of development and deployment, and resource availability and experience.
Finally, the business impact and feasibility priorities are brought together. As illustrated inFigure 3.2, quadrant analysis is used to diagram the combined priorities. Sometimes thethemes are written on yellow self-adhesive pads for easy manipulation on the quadrant grid while interactively reaching group consensus on the combined priorities.
Figure 3.2 Quadrant analysis for requirement prioritization.
Chart from Sequent Computer Systems’ Business Benefit Analysis offering.
Optimally, the group has identified a requirement theme that has high business impactand a high feasibility score. If multiple themes receive a high business impact score, thenthe feasibility score is the tie-breaker.
Requirements themes in the upper-right quadrant, such as Theme B, are the ones you should initially focus on—they are highly feasible with high potential business impact.The remaining themes are less desirable for various reasons. Theme A has highbusiness impact but is extremely difficult to implement. It still warrants attention given its impact, but should not be the first one tackled by the data warehouse initiative. Theme Dis more feasible, but it has little impact on the business. Requirement themes like C inthe lower-left quadrant should be avoided like the plague—they have very little impact on the business and are difficult to implement.
This technique is effective for numerous reasons. First, it identifies a specific requirementthat represents the highest impact that can be delivered in a reasonable time frame—what more could you ask for at this point? We have associated a measure of businessbenefit, in conjunction with feasibility, for each requirement so we avoid tackling pipedreams. From the start, a business-based focus for data warehousing initiatives that boosts the long-term probability for success has been established. The sessiongenerates a prioritized roadmap for future development as the themes frequentlytranslate into phased warehouse deliverables. The technique relies on consensus, so the attendees leave the session with buy-in and a sense of ownership for the direction, rather than the sponsor dictating a course of action. It also demonstrates and strengthens thepartnership between the business and IS. Last, but not least, the scoping and business justification activities just got much easier if you have conducted an early facilitatedsession with key business and IS influencers in your organization.
Proof of Concept The proof of concept is a small, low-cost effort to demonstrate the potential impact of a

3.9
data warehouse project to the business community. Again, this technique may be used inconjunction with the others, perhaps to illustrate a high-priority business requirement that was uncovered using the earlier techniques.
Vendors have adopted the proof-of-concept technique to accelerate their sales cycle as it is difficult to sell something people don’t understand or realize they need. Vendors oftenoffer proof-of-concept packages that bundle software and services at a reduced price.They are usually presented under an attractive marketing name that starts with adescriptive word like quick or fast and ends with an action verb like start or strike. These bundled packages can be a valuable way to educate your organization and generateenthusiasm, but don’t be fooled by the marketing hype. It is not possible to build a robust,business-based data warehouse with a flexible infrastructure and repeatable data stagingprocess in four weeks.
Tip
The proof of concept should be positioned as a “disposable” effort. While quickresults are very positive, don’t let the proof-of-concept development cause expectations to rise to unattainable heights.
Develop the Preliminary Scope
By now, you should be comfortable with your organization’s overall readiness to proceedwith a data warehouse. We need to begin putting a fence around the project scope andgetting it justified so you have the funding to proceed. In reality, scope and justification go hand-in-hand—it is nearly impossible to complete one without the other, so teams oftenloop between the two activities. For clarity, we will present the concepts separately in thenext two sections, but these activities will probably be intermixed on your project.
Before we get started with specifics, it is important to first discuss what we are scoping. Once again, this varies widely by organization. Are we scoping and requesting funding tocover the short-term requirements definition and design phases? Or the first delivery ofdata warehouse information to the business community? Or the whole three-year enchilada? It is almost certain that the farther you try to see, the worse your visionbecomes. Consequently, defining the scope and building the justification becomes muchmore perilous the further you need to predict into the future.
Project managers are most frequently asked at this stage to put together a scope andjustification for the initial delivery of warehouse information to business users. Throughout the remainder of this section, we will proceed with this assumption. Scopingis still a best-guess exercise at this point, but you need funding to further explorebusiness requirements and feasibility in order to more crisply define scope. In general, we are attempting to make as few promises as possible with this preliminary scope, yetfill in enough of the picture to identify benefits and costs associated with going forward.
Here are general guidelines for developing the preliminary data warehouse projectscope:
Tip
Define your scope based on your business requirements, not calendardeadlines.
•
Defining scope is a joint effort performed by IS and businessrepresentatives. Scope is usually established to address a specific businessrequirement. Obviously, a reasonable understanding of these requirements is aprerequisite to defining scope. Scope is occasionally established by a given targetdelivery date, and then the deliverables are managed to meet the delivery date. Whilewe have seen this approach work, it is a riskier path.
•
The initial data warehouse project scope should be meaningful yetmanageable. Meaningful typically translates into business value or impact derived from addressing a well-defined business requirement. Many teams’ first instinct is tostart where no one will notice, but the data warehouse project will go nowhere if no onenotices.
Manageable means doable. In other words, start small. The Lifecycle is intended to support iterative development of your data warehouse. We encourage launchingsmaller, quicker-to-market, four-to-eight month development projects rather than tackling the monolithic multiyear effort in one big gulp. There are two key variables to consider in terms of satisfying the “small” recommendations: the number of sourcesystems and the number of users. The source data variable is the one most likely tocause uncontrollable scope creep.

3.10
•
Focus initially on a single business requirement supported by data from a singlesource process. It is much too broad to say that you are going to serve the needs ofthe marketing or actuarial departments. Their analyses look at information from multiplebusiness processes. Instead, try to define your scope in terms of a single businessprocess, like customer orders or claims payments, rather than extracting andintegrating information from multiple business processes generated by multiple sourcesystems. The data staging effort grows exponentially with each additional major sourcesystem. Don’t get greedy and attempt multiple concurrent initial projects to satisfypolitical pressures. No one will be satisfied with this approach.
• Limit the number of users who will initially access the data warehouse. On average, a user count somewhere around 25 supports this manageability requirement,with a plan to roll out quickly after this core user base has been established.
•
Begin establishing success criteria for the project while scope is being defined. It is extremely important to understand what business management expectsfrom the data warehouse project. More details will be described in Chapter 4 about establishing specific, measurable project success criteria.
Tip Your biggest risk is not understanding the difficulty of sourcing your data.
Once IS and business management have agreed on scope, it should be documented. Given the unknowns at this stage of the project, scope is destined to change.Regardless, write it down so everyone has a consistent understanding of the project’spreliminary focus and mo- tivating business requirements, anticipated data, target users, and estimated completion date at this time. It may also be appropriate to explicitly listdata and analyses that will not be addressed with the initial project. By identifying what isoutside of the scope, you are demonstrating that you have heard the users’ requests andare not just ignoring them. Figure 3.3 shows a sample preliminary project scope.
Figure 3.3 Sample initial project scope. Background
ACME wants to maximize its return on promotion investments. It currently spendsapproximately $40 million annually in promotional efforts. ACME’s goal is to reducepromotion spending by 25% in three years.
The Promotion Data Mart project will create a decision support environment containing promotion information, complementing the earlier warehouse project focused on salesinformation. Brand teams, sales operations, and marketing research will have access toboth the sales and promotion information to enable more effective promotion spending to improve ACME’s return on promotion investments.
Phase 1 Scope The initial phase (Phase 1) of the Promotion Data Mart is defined as follows: • Three years of historical internal promotion detail information.
• Maximum of 25 initial users, with roll-out plans for 150 ultimate users in brands, sales operations, and marketing research.
• Technical architecture for Phase 1 of the Promotion Data Mart will be based on . . .
• Current project timeline calls for initial production deployment by the end of secondquarter.
• . . . Exclusions From Phase 1 Scope The following items are specifically excluded from the Phase 1 scope: • External data such as competitive sales and promotions information. • Support for nondomestic promotion programs. • . . .

3.11
Success Criteria Several key success criteria have been designated for the Promotion Data Mart Project: • Provide a single source to support promotions-related analysis. • Reduce the time required to perform an promotions-related analysis.
• Increase the effectiveness of promotion programs due to improved allocation decisionsbased on insights from the Promotion Data Mart.
• . . . Risks and Risk Reduction Action Plan Phase 1 poses the following risks: • . . .
The scope of your data warehouse project will likely change several times before your first business end users access the data warehouse. This is to be expected, since thescope becomes more clearly defined and more clearly negotiated with each step youtake toward delivery. The project scope statement should not sit on a shelf—it should be reviewed frequently, revised as needed, and republished. Finally, it is important torecognize that scope refinement is different from scope creep. The goal of scope refinement is to retain the same sized box, although the contents may change; the dimensions of the box expand in the case of scope creep.
Adjust Scope Based on Project Magnitude
Data warehouse projects take on many different forms. Although we haveparticipated in hundreds of them, no two have been identical. As we mentioned in Chapter 2, you need to adjust scope and adapt the Lifecycle accordingly dependingon the magnitude of your project.
Throughout this chapter and book, we have attempted to describe nearlyeverything you need to think about throughout the lifecycle of a data warehouseimplementation. Don’t let the weight and depth of the material overwhelm you. Youcan still deliver valuable information to business end users in less than six months,but you may not be able to dot all your i’s in the process.
Build the Business Justification
Now that the project scope has been established with the business and IS sponsors and management, the project’s business justification needs to be built. Justification is anotherjoint activity that depends on a strong IS/business partnership; IS cannot develop thedata warehouse justification in a vacuum.
Building the justification simply means that you are identifying the anticipated costs andbenefits associated with the data warehouse project over time. You shouldn’t let termslike return on investment (ROI) intimidate you—basically you are comparing the predicted financial return (i.e., business benefits) against the predicted investment (i.e.,costs). Other traditional financial performance measurements such as net present value(NPV) or internal rate of return (IRR) are essentially variations on the theme. If you are unfamiliar or uncomfortable with these concepts, enlist the help of others in yourorganization who are seasoned veterans of this process.
In this next few sections, we will begin by reviewing the investment or cost side of theequation, followed by the more challenging return or benefits. Finally, we will pull the twocomponents together to create the justification. Your organization probably has astandardized financial model for consistently analyzing project justifications; we will focus on deriving or estimating the numbers to input into your model.
Determine the Financial Investments and Costs We will start first with the easier side of the equation. You should consider the following

3.12
cost components when developing your financial justification. These costs begin now andcontinue for the foreseeable future. When in doubt, it is preferable to err on the side ofoverestimating costs rather than underbudgeting.
•
Hardware and software license purchase or lease expenses. You should include all hardware components and/or upgrades, including database servers, applicationservers and client desktop hardware. On the software side, consider the databasemanagement system software, data staging tools, connectivity software, and desktop licenses. If you are unfamiliar with the technology components required for a datawarehouse, refer to Chapters 8-13.
• Ongoing maintenance expenses. Most hardware and software purchases will be accompanied by ongoing maintenance expenses. Be certain whether thesemaintenance charges are based on list price or your negotiated discount price.
• Internal development resources. You need to do preliminary project planning to estimate resource headcount requirements at a high level.
• External resources as required. • Education for both the project team and business community.
• Ongoing support. You can’t presume that the existing user help desk will suffice fordata warehouse support. Also, unlike many systems, user support will not decline overtime with the data warehouse.
•
Expenses to support scaleable growth. Depending on your planning horizon, you may need to consider ongoing expenses to support changing business requirements,loading of additional data, expanded user populations, new release upgrades,technology to support higher performance demands, and so on.
Determine the Financial Returns and Benefits
Now that the costs have been estimated, we will turn our attention to the businessreturns or benefits. Unfortunately, the financial benefits are much more difficult toquantify up front than the associated costs.
Business end users typically struggle to provide specific business impact numbers beforebuilding a data warehouse. They will request better access to better information.Unfortunately, this frequently heard request does not translate immediately into bottom-line business impact. Any personnel productivity gains provided by better access arelikely to be negligible when compared to the potential impact of improved decisionmaking. The layers of the onion need to be peeled back to understand the why, what if, and how much behind this seemingly innocent user request.
“A priori” data warehouse justification typically focuses on revenue or profitenhancement, rather than reducing costs. It is very difficult to justify a data warehouse by eliminating the costs associated with a mainframe-based reporting system. Unfortunately, the benefits that can be easily quantified typically aren’t the significantones. Instead, we focus on opportunities such as the following:
• Increasing revenue due to new sales to new customers, increased sales to existingcustomers (either cross-selling additional products or up-selling more expensive products), and so on.
•
Increasing profit due to increased response rate to mailings, increased average sale per mailing, elimination of low-margin products, decreased raw material costs, decreased promotional spending, reduced fraudulent claim expense, reduced customerchurn or turnover, and so on.
• Increasing customer service or quality levels due to improved service levels, reduceddefect rates, increased closure rate on first call, and so on.
• Enabling a new information-based capability or market opportunity never beforepossible.
The key to ferreting out quantified business benefits from statements like the preceding isto keep asking probing questions. What would it mean to the business if you had . . . ?Would you be able to . . . ? How much is . . . worth? You need to continue questioning and searching for the component numbers that can be extrapolated into businessbenefits.

3.13
For example, assume the direct marketing manager said that better-targeted mailings would allow them to increase response rates by 20 percent. There is not enough information in that statement alone to derive the financial impact. You need to ask thefollow -up questions to bring that high-level impact prediction down into dollars and cents. If you simply asked “On average, what is the revenue generated by a direct mail campaign?” and “How many campaigns to you run each year?” you would have the dataneeded to derive the financial impact from this 20 percent increase in response rate.Take the $700,000 average revenue per campaign times 12 campaigns per year times 20 percent increased response rate to come up with $1,680,000 in incremental revenueattributed to the 20 percent improvement in response. You will find additionalquantification examples in the “Crunch the Numbers” sidebar.
Crunch the Numbers
We have provided several additional benefit quantification examples to help conveyhow these elusive numbers are derived.
Reduce time to market. Development estimates the average revenue derivedfrom new products following launch is $50,000 per month. They believe they canreduce the development cycle and bring products to market six weeks sooner onaverage with better access to information. Fifteen new products are typicallyintroduced each year.
The financial benefit is calculated as follows:
Each new product generates $50,000 revenue each month times 1.5 months dueto the six-week cycle time reduction times 15 new products per year, which resultsin $1,125,000 incremental revenue per year.
Facilitate movement to new store format. The Store Operations group believed that implementing a more effective fact-based selling approach would allow them to transition between 300 and 400 franchise stores to a new format each year. StoreOps agreed that the new format stores would show an average sales increase of$50,000 the first year. The company determined a 10 percent margin rate on theincreased revenues.
The financial benefit is calculated as follows:
300 impacted stores per year times $50,000 increased revenue per store results in $15 million in increased sales revenue. Given a 10 percent profit margin rate, thisresults in increased profit of $1.5 million.
Improve customer acquisition capabilities. Marketing believes improved customer segmentation analysis will enable the company to better target itsmarketing efforts on more appropriate candidates. They think they can reduce thecost of acquiring new customers by $75 each. In addition, they believe they canadd 125,000 new customers per year.
The financial benefit is calculated as follows:
$75 reduction per customer in acquisition costs times 125,000 new customers peryear results in $9,375,000 improved profitability per year.
Improve seasonal merchandise stocking. Merchandising has determined that it can improve its seasonal merchandise sales through better stocking strategies ifgiven better access to information. Merchandising estimated the company couldpositively impact seasonal sales by 10 to 20 percent. Seasonal products represent approximately one-third of the company’s $750 million in sales or about $250million of sales revenues. The company determined a 12 percent margin rate onthe increased revenues.
The financial benefit is calculated as follows:
A 10 percent improvement in seasonal sales represents an increase of $25 millionin revenues. Multiplied by a 12 percent margin rate results in a $3 million profitimprovement.
Focus catalog mailings more accurately. Large catalog retailers spend

3.14
enormous sums of money on catalogs sent to prospective purchasers. If theretailers can more accurately understand the recipients of the catalogs, they canusually trim the mailing list significantly, while retaining the same marketing effectiveness. Sending fewer catalogs causes savings in production to go all theway to the bottom line.
Combine the Investments and Returns to Calculate ROI
At this point, your investments and returns figures are entered into a financial model to calculate the return on investment. The resulting ROI percentages tend to be verylarge—so large, that even taking a fraction of the predicted return will probably besatisfactory to provide adequate justification and obtain funding approval.
You can also look at the financial justification in terms of “opportunity cost.” If theprojected benefit of the data warehouse is $100,000 in incremental revenue per month,then it costs the organization $100,000 each month the project is delayed.
Once again, a strong partnership between IS and business is required to complete thejustification task. IS can determine the investment or cost side of the equation, but thebusiness users must drive the returns or benefits side. Going back to our early readiness factors, justification is much easier if you are working with a strong sponsor on a strategicbusiness issue. If you are really struggling with financial justification, then you areprobably still in search of the right sponsor and business problem.
Some organizations are much more rigorous in their justification process than others. Asa division president at a $14 billion company recently explained, justification was merelya test to ensure that the people in his organization were committed to making the initiative work. The raw numbers weren’t particularly important—he viewed the justification as a measure of organizational buy-in. Other organizations examine costs and benefits rounded to the nearest whole dollar.
We have tried to help you estimate a justification or return on investment before the datawarehouse is built. It is worthwhile to remember that it is much easier and much morebelievable to provide the justification and return on investment after the data warehouse is implemented.
For instance, if the Credit department decides to grant more liberal credit to a group ofcustomers after using the data warehouse, this decision should be claimed by the datawarehouse. Or, if the Store Operations group decides to merchandise the storesdifferently as a result of using the data warehouse, this decision should also be claimedas belonging to the data warehouse. Once these kinds of decisions are claimed by thedata warehouse, calculating the ROI is relatively straightforward. As the data warehousemanager, be sure that you are on the alert for these kinds of decisions, which you canlegitimately claim.
Tip
The key step is providing the after-the-fact analysis is to claim the decisions made as a result of using the data warehouse.
Plan the Project
Congratulations, you have defined the initial project and gained approval and funding tomove forward! What next? You are now ready to do detailed project planning.
In this section, we will describe key considerations for getting the project staffed andbuilding your overall project plan. But first, we will deal with the project’s identity crisis.
Establish the Project Identity
Your data warehouse project needs to have a name. Like most systems projects, thename you select is often reduced to an acronym, such as PAM for the Pricing Analysisfor Marketing project—perhaps it should have been called Strategic Pricing Analysis forMarketing instead. In any case, this task requires creativity—it is a good time to collaborate with your business cohorts. Some organizations even create project logos,which then appear on presentations, deliverables, T-shirts, coffee mugs, and so on. As anyone who has been to the vendor booths at a data warehouse conference knows, youcan never have too many T-shirts or coffee mugs.

3.15
Staff the Project
A data warehouse project requires a number of different roles and skills, from both thebusiness and IS communities, during its lifecycle. The various roles on a data warehouseproject are actually somewhat analogous to those in a professional sports team. Theteam starts with a front office of owners and general managers—in the data warehouse world, these are the sponsors and drivers, who set the direction and foot the bill. Thefront office relies on the coaching staff to establish a regular starting lineup—in our parlance, the business project lead and project manager are the coaches who lead thecore project team charged with developing the data warehouse. Along the way, specialtyplayers are added to the team roster—as does the warehouse team. Finally, the professional sports team wouldn’t last long if it weren’t for the fans—if we do our job right, the business end users are analogous to these fans. Unfortunately, this analogy fallsapart completely when we get to player salary negotiations.
In this section, we will review the major categories of people involved in the datawarehouse—front office, coaches, regular lineup, and special teams. We will brieflydescribe the tasks each role is responsible for; however, this will be illustrated in muchgreater detail in the project plans located at the end of appropriate chapters, as well as inAppendix A and on the CD-ROM.
Before we get started, remember that there is seldom a one-to-one relationship between data warehouse roles and individual people. Like the regular lineup running back whoalso returns kickoffs, the same player may fill multiple roles on the data warehouseproject. The relationship between project roles and actual headcount varies byorganization. We have worked with data warehouse teams as small as two people—a project manager (who also handled the dimensional modeling, end user applicationdevelopment, and user support) working with a part-time data staging programmer. At the other end of the spectrum, we have occasionally worked on project teams with more than 25 members. One project had almost a dozen data modelers alone. The vastmajority of the data mart projects fall somewhere in between, say, between two and fivefull-time members, with access to others as required.
Tip
Although there are many roles in a data warehouse project, individual staffmembers will wear several hats at once. Don’t be daunted by the number ofroles!
Front Office: Sponsors and Drivers
As we described extensively earlier in this chapter, business sponsors play an extremely critical role on the data warehouse team in a number of areas. They are the business owners of the project and often have financial responsibility for the project. Businesssponsors help make and then support key project scope decisions. In addition, businesssponsors fill both high-level cheerleader and enforcer roles for the warehouse. As cheerleaders, their enthusiasm encourages others to share the vision for the impact ofimproved access to information. At the other end of the spectrum, their reinforcement isimportant as it encourages apprehensive users to jump on the bandwagon.
There is usually a complementary sponsorship role from the IS organization. The ISsponsor carries the project budget in cases where the business sponsor does not. The ISsponsor works closely with the business sponsor to ensure a joint success. The IS sponsor also works closely with the data warehouse project manager to assist withdispute resolution, especially when the disputes pertain to resources.
The data warehouse team often does not have continuous access to the businesssponsor due to the sponsor’s typical stature within an organization. The businesssponsor often designates a “business driver” to tactically serve in their place. Thebusiness driver is accessible, engaged, and empowered to make the difficult decisionsregarding priorities and dispute resolution that are bound to come up on a datawarehouse project. Business drivers must have a solid understanding of theirsurrounding business organization.
Some organizations use a business user steering committee instead of a business driver. This group makes the tough decisions on behalf of the business community at large. Thisgroup needs to meet frequently to avoid becoming a project bottleneck.
Coaches: Project Managers and Leads In professional sports, there are several coaches who direct day-to-day activities with a
3.16
slightly different focus. The same is true for a data warehouse project.
•
Project manager. The project manager is responsible for day-to-day management of project tasks and activities, including resource coordination, status tracking, andcommunication of project progress and issues, working closely with the businessproject lead. This role is typically staffed from among the best and brightest of the ISorganization—project managers should possess a broad knowledge of technology andsystem development in order to comprehend the full lifecycle. The project managershould have strong communication skills, as well as a strong affiliation with and therespect of the business community. The project manager should also have a good sense of balancing the mechanics of project management with the needs of the peopleworking on the project.
Ideally, a project manager is also skilled in navigating the political environment of theorganization. While project management skills are important, overall drive can be evenmore critical to the project’s success.
This is a full time position—it just doesn’t work to have a part-time data warehouse project manager. However, as described earlier, sometimes the project manager is a player/coach who both leads the charge and plays specific roles on the datawarehouse project.
•
Business project lead. This business community representative works with theproject manager on a day-to-day basis, jointly monitoring project progress and communicating to the rest of the organization. The business project lead should have asolid understanding of the business requirements. Optimally, the person who fills thisrole is well respected by the business community. Sometimes the same person fills thebusiness driver role. This is typically a part-time role, but the business project lead is expected to attend status meetings and be extremely accessible to the team, just asevery coach would attend team meetings.
Regular Lineup: Core Project Team
This team bears the bulk of the responsibility for the design and development of the datawarehouse. We will introduce the players in approximately the order that they come ontothe scene.
Some team members are assigned to the project full time. Others, like the businessproject lead, are needed on a part-time or sporadic basis. Part-time team members are expected to attend regular status meetings and actively assist the team as needed.
Before you start hyperventilating, remember that each core project team member often plays more than one role on the project team. For example, the business system analystmay also be responsible for end user application development and education. The data modeler and database administrator roles may be handled by the same individual. Theroles listed correspond to a set of project tasks—they do not correspond to actual headcount. We described the roles individually because each organization combines the roles differently depending on prior experiences, skill sets, and workloads.
•
Business systems analyst. The business systems analyst is responsible for leadingthe business requirements definition activities and then representing those requirements as the dimensional model is developed. The business systems analystrole is often filled by an IS resource who is extremely user-centric and knowledgeable about the business. Alternatively, it may be staffed with a resource who currentlyresides in the business organization but has a solid technical foundation. On smallerprojects, the project manager or business project lead may fill this position. Regardless,the person in this role must have strong communication skills; it is certainly beneficial if they are respected by the business community as the business systems analyst, alongwith the business project lead, will be representing their requirements to the rest of theteam.
•
Data modeler. The data modeler is responsible for performing detailed data analysis and developing the dimensional data model. Knowledge about existing corporate datamodels is extremely valuable. Strong data modeling skills are beneficial, but theindividual must be able to break away from traditional OLTP and E/R design practices and embrace data warehouse design techniques. It is also helpful if this person has asolid understanding of the business rules; he or she often participates in the businessrequirements definition activities in a secondary role. Finally, this role is often responsible for also developing an overall data architecture strategy; in larger

3.17
organizations, a data architect role may be established to handle these responsibilities.
Tip
The data modeler in a data warehouse project should be equally interested in the data relationships in the data and in the users’ ability to understand the datamodels.
•
Data warehouse database administrator (DBA). The DBAs translate the dimensional model into physical table structures. In many cases, they are involved in the dimensional modeling process; at a minimum, they should be knowledgeable ofthese data warehouse design techniques and be open to new approaches. The DBAalso determines initial aggregation, partitioning, and indexing strategies. The DBA is often responsible for the day-to-day operational support of the database, ensuring data integrity, database availability, and performance. In larger organizations, this role issometimes divided into separate design and production DBA roles.
•
Data staging system designer. The data staging system designer is responsible for the end-to-end design of the production process to extract, transform, and load thedata in preparation for the data warehouse. While many aspects of data warehousing differ from traditional development, the development of the data staging processrequires strong modular system design skills. Too often this role is not identified, andprogrammers just begin coding.
•
End user application developers. This role creates and maintains the end user applications, typically using off-the-shelf data access software. The end user application developer is also responsible for loading the data access tool metadata.The end user application developer needs moderate PC knowledge and a deep interest and understanding of the business. If complex applications are required,technical proficiency equivalent to writing Excel macros is typically adequate. Like thebusiness system analysts, this role may be filled from either the IS or business organizations; resources that currently reside in the business organization, but behaveas systems professionals by developing databases and creating ad hoc reports, areprime candidates for this role. The business systems analyst may handle this responsibility on smaller projects.
Tip
Data staging system design and end user application design are both softwaredevelopment activities, and these activities need to be planned and managedwith a traditional software development perspective.
•
Data warehouse educator. The business end users must be educated on the datacontent, the prebuilt end user applications, and the data access tool itself. Clearly, theeducator must have in-depth knowledge of each of these areas. This role typically develops the initial education course materials, as well as delivers the education on anongoing basis. Responsibility for user education is sometimes split between players inthe IS and business communities—an IS resource teaches tool mechanics and the business representative covers the data and end user application topics. Alternatively,the data access tool vendor assumes responsibility for the tool education component.Again, this role is often filled by another team member, such as the business system analyst or end user application developer.
Special Teams
These data warehouse team players contribute to the project on a very specialized,limited basis. These special team players may become part of the core team during specific parts of the project lifecycle. For example, data staging programmers may betreated as core team members during the development of the data staging process, butthey are not required to attend all status meetings during the requirements analysis phase. As we mentioned earlier, these special roles may be assumed by resources whoare already members of the core team.
•
Technical/security architect. This architect is responsible for the design of the technical infrastructure and security strategy to support the data warehouse. This roledoes not need to be an expert in all the infrastructure and security technologies, but heor she must provide the overall cohesiveness to ensure that the components will fittogether within your organization. The security architect is a new member of the datawarehouse team and must represent the special needs and risks of the datawarehouse to the rest of IS. This role is described in detail in Chapter 12.
• Technical support specialists. Depending on your environment, there may be specialists focused on mainframe systems software, client/server systems, and

3.18
networking. These specialists are involved in early stages of the warehouse to performresource and capacity planning. During product selection, they ensure compatibilitywith the existing technical environment. Once technology has been selected, they areinvolved in the installation and configuration of the new components. The specialistsalso provide ongoing production support.
•
Data staging programmer. Programmers are needed to construct and automate thedata staging extract, transformation, and load processes under the direction of the data staging system designer. Optimally, this resource has an intimate knowledge of thesource systems as well as a basic understanding of the target dimensional models.Obviously, the requirement for this resource drops significantly if you are using an automated data staging tool.
•
Data steward. The data steward, sometimes called the data administrator, isresponsible for gaining organizational agreement on common definitions for conformedwarehouse dimensions and facts, and then publishing and reinforcing these definitions.This role is often also responsible for developing the warehouse’s metadatamanagement system.
•
Data warehouse quality assurance analyst. The QA (quality assurance) analyst ensures that the data loaded into the warehouse is accurate. This person identifiespotential data errors and drives them to resolution. The QA analyst is sometimes alsoresponsible for verifying the integrity of prebuilt end user applications. Since the business side must take responsibility to identify fundamental data errors, this role istypically staffed from within the business community, often with resources who straddlethe business and IS organizations. Once a data error has been identified, the IS organization takes responsibility for correction. This role has a significant workloadduring the initial data load to ensure that the data staging process is working properly.However, the QA analyst role does not end once the warehouse is put into production as the data must be reviewed with each load for accuracy.
Now that you understand the required roles, you must determine how to fill those roles.Once again, the readiness assessment reviewed earlier comes into play. If thewarehouse ties to overall organizational priorities, we often find a “whatever it takes”mentality supported by senior management. On the other hand, some projects need tobeg, borrow, and steal to get things done.
Once your team is staffed, the coaches need to turn their attention to team cohesiveness and development. Team building activities are important to ensure that the team gels—personality issues can quickly undermine a talented roster. In terms of playerdevelopment, chances are that the team lacks the first-hand experience necessary to build a successful data warehouse. You need to acknowledge that data warehousingdemands new techniques and skills, and then allocate the time and money to get yourteam up to speed on general data warehousing concepts and methodologies, dimensional modeling, and technology-specific topics, either through specialized courses or industry conferences.
Tip
It is far cheaper to invest in education than it is to fund rework due to lack ofknowledge.
Role of External Consultants on your Project Team
Admittedly, the author team provides data warehouse consulting services.However, putting our biases aside, you should be aware of several considerationsbefore enlisting consultants to participate in one of the most visible systems projects under development in your organization.
Like most systems development projects, you obviously want to work withexperienced people. However, the unending nature of a data warehouse projectand its business orientation warrants additional requirements of externalconsultants:
1.
Don’t let consultants fill all the key roles on your core project team. You shouldretain ownership of the data warehouse project and not let an externalorganization build it for you.
2. Demand extensive skills and knowledge transfer from your consultants.

3.19
3.
Clearly understand if you are buying a consultant with specialized knowledge orwhether you are augmenting your regular staff. When possible, it may be valuable to bring in an external resource to offload the existing staff’s routineresponsibilities. This would free up internal resources with critical knowledgeabout your business and underlying systems for the data warehouse project.
4.
Don’t let a consultant talk you into a data- or technology-centric warehouse development approach, even if it feels more comfortable to both you and yourconsultants. Your development should always be based on businessrequirements
Managing the expectations of the data warehouse project team is often overlooked. Dueto the iterative nature of data warehouse development, frustrations can mount on theteam. Think about traditional incentives offered to systems personnel. When given a design specification, they developed programs, tested them, and released them forproduction. If major rework was required, either the design was wrong or theprogrammers did a poor job. These same resources are now invited to join the datawarehouse project where change is good—rework is a fact of life and necessary to address changing business requirements and growth. The data warehouse team needsto be reminded of this mindset shift, or morale is certain to plummet.
We have worked with teams that have been extremely creative with incentives andbonuses to compensate the data warehouse team for its heroic efforts. In addition, manyteams members often find motivation from working with the business users and/orhearing of their enthusiasm for the data warehouse.
Develop the Project Plan
Obviously, the data warehouse project needs a project plan given its complexity, both interms of task and player counts. There are two key words that need to describe thisplan—integrated and detailed. Unfortunately, data warehouse teams often have multipleproject plans that don’t tie together. There may be a plan for the modeling tasks, anotherfor the data transformation process, and perhaps yet another for defining the technicalarchitecture. Without a single integrated plan, the likelihood of completing the manydiscrete tasks on time is greatly reduced.
The level of detail tracked is another common problem with data warehouse projectplans. A single task called “Develop the Data Transformation Process” is not sufficient given the many underlying subtasks required. The goal is to provide enough detail to beable to track progress on key tasks and to identify issues or delays as soon as possible.If a single task will require more than two weeks, subtasks should be identified.
Many organizations have already established methodologies and supporting software forsystems development projects. We encourage you to use the resources available to you.However, we want to remind you that the best project management software package willbe worthless unless the time is invested to input and maintain the project plan, including detailed dependencies.
Too often, significant time is spent developing the initial plan, but then it is not updated and used throughout the lifecycle. The key to effective project management is to employtools that you and the team will actually use—even if that means resorting to a spreadsheet for project task tracking.

3.20
Figure 3.4 Sample project plan excerpt.
Figure 3.4 illustrates an excerpt from a project plan. We recommend you track thefollowing information for each project task:
• Resources. Individuals responsible for completing this task. There should be one and only one person with primary responsibility for each task, and that person should belisted first.
• Original estimated effort. Original estimated number of days to complete this task.This number should never be revised.
• Start date. Date task is estimated to begin.
• Original estimated completion date. Original date when this task is to be completed. Again, this date should never be revised.
• Current estimated completion date. Current estimated completion date for this task.
• Status. Indicates current status as a percentage of the total effort required based onthe current estimated effort.
• Effort to complete. Currently estimated number of work days required to complete this task.
• Dependencies. Identification of other tasks that must be completed prior to beginningthis task.
• Late flag. Simple math between the estimated completion date and current date toidentify tasks that are behind schedule.
A template that outlines high-level project plan tasks and each roles’ responsibilities islocated in Appendix A, and it is included on the CD-ROM. Specific project plan tasks are described in the subsequent chapters, if applicable.
We suggest you identify and list all the tasks associated with the entire lifecycle. The taskshould be included even if you do not yet know when, who, or how effort will be required.You can estimate approximate dates, but make sure that others are aware that this is anestimate. Otherwise, you can list the tasks but only complete the other pertinentinformation as you develop greater visibility with project progress.
The project plan should include formal user acceptance tasks following each majordeliverable.
Overall task estimating guidelines and considerations are provided at the end of theappropriate chapters. In general, there is no single variable that drives the amount oftime required to build a data warehouse. The number of business users is an estimatingvariable that drives the time spent collecting requirements and deploying the datawarehouse. However, the business user count has virtually no impact on the effortrequired to design and develop the data staging process; that effort is the same for oneor one hundred users.
As you are building your project plan, remember to inflate estimates for unknowns. Due to all the unknown data realities hidden in your source system data, data stagingprocesses have a well-earned reputation of being nearly impossible to estimate anddeliver on time—at a minimum, double your best-guess estimate to construct the data staging processes (and then double it again). You may also need to inflate estimates dueto cultural issues. We worked with one client where it typically took three weeks lead timeto get three managers in same room at the same time—they needed to incorporate this cultural reality into their project plan. Don’t forget that data staging development is a

3.21
classic software development task with five distinct phases: development unit testing,system testing, trial deployment, and final rollout with documentation. Inexperienced project managers may focus most of their attention on what turns out to be the first ofthese five steps.
The project manager typically develops a skeleton project plan prior to the project teamkickoff meeting, perhaps starting with the template provided in this book. The projectmanager then meets with key representatives for each major lifecycle activity for theirinput on tasks. These representatives should be responsible for developing the estimatedeffort and preliminary schedule for their tasks, working in conjunction with the projectmanager. Their participation in this up-front planning encourages buy-in from the people who will actually be doing the work.
More often than not, we witness a lack of project planning and management on data warehouse projects, but we have also seen the opposite extreme. Don’t delay the start ofthe project for six weeks while the project manager develops an overly detailed projectplan. Projects need to be defined and tracked but not just for the sake of project management.
Manage the Project
In this final section, we discuss techniques for keeping your data warehouse project ontrack as it begins to unfold, starting with the team kickoff, through monitoring status and managing scope, and finally, focusing on your ongoing communication strategy. Many ofthese concepts are rooted in basic project management techniques. However, datawarehouse projects have a few unique characteristics that cause some of these concepts to warrant additional discussion:
• Cross-functional implementation team. The sheer number of players with varying responsibilities throughout a data warehouse project drives the need to monitor statusclosely and communicate effectively.
•
Iterative development cycle. The development of the data warehouse never ends.This causes a greater need for communication to keep everyone in sync, issue trackingfor future enhancements, and detailed project documentation to support an evolving data warehouse team. All projects should go through cycles in which the requirementsare “open” and the requirements are “closed.” Both the project team and the businessusers should be aware of these characteristic phases.
• Inevitable data issues. Project scope is vulnerable to unknown data issues, drivingmore focus on scope containment. Data issues will wreak havoc on anyone’s best laid project plans.
• Elevated visibility. Organizational expectations of a data warehouse typically run high. Effective communication is required to keep them in check.
In general, we assume you are familiar with basic project management concepts.However, based on our experience with numerous clients, these basics are oftenforgotten or ignored. We feel compelled to review the basics at a high level, focusing onthe unique aspects of managing a data warehouse project whenever possible.
Conduct the Project Team Kickoff Meeting
The data warehouse project officially begins with a project team kickoff meeting. The purpose of this meeting is to get the entire project team on the same page in terms ofwhere the project currently stands and where it hopes to go. Attendees should includethe coaches, members of the core project team, and all specialty players if possible. A separate launch meeting, described in Chapter 4, will be held for the business community.
As illustrated in the sample agenda in Figure 3.5, the meeting begins with a briefintroduction by the business sponsor, who describes the overall goals for the project andits business relevance. From there, the project manager assumes responsibility for the remainder of the meeting. If appropriate, based on team members’ exposure to datawarehousing, a brief primer is often presented next. The project team roles andresponsibilities are then discussed. The project plan is presented at a high level, probably without estimated effort and due dates, and general project managementexpectations are reviewed. Finally, the next steps are identified.

3.22
Figure 3.5 Sample project team kickoff meeting agenda. Project Team Kickoff Meeting Agenda Project Introduction
Business Executive Sponsor
• Goals and Objectives
• Project Scope
Data Warehousing Overview
Project Manager
Team Roles and Responsibilities
Project Manager
Project Management
Project Manager
• Project Administration Tools
• Project Milestones
• Draft Project Plan Review
Questions and Answers
Next Steps
The project manager typically compiles a project kickoff packet for distribution at themeeting. The packet should include copies of the project scope document, a project teamcontact list with responsibilities, an initial project plan and sample status meeting agenda,status report, issue log, and change control documents.
Monitor Project Status
Like all systems development projects, the project status should be formally monitoredon a regular basis. As we described in Chapter 2, the data warehouse project lifecycle requires the integration of numerous resources and tasks that must be brought together at the right time to achieve success. Monitoring project status is key to achieving thiscoordination.
We have observed many teams that initially have fine intentions concerning statusmonitoring, but these status-related activities take a back seat once the project is incrunch mode. Unfortunately, that is when status should be monitored most closely duringthe project.
Project Status Meetings
We recommend regular status meetings for the core project team—typically these meetings should be scheduled for a one-hour time slot at the same time and place each week. Attendance will eventually suffer if you allow the meeting to overrun or stray offcourse. As illustrated on the sample status meeting agenda in Figure 3.6, the status meeting should focus on accomplishments and current task progress, particularly tasksthat are past due. In addition to reviewing the project plan, the status meeting is a forumto raise concerns that have become visible since the last meeting. In general, these issues are identified, but their resolution is frequently handled off-line.
Figure 3.6 Sample status meeting agenda. Status Meeting Agenda Review Project Plan • Review completed tasks • Review milestones completed and pending • Review major deliverables status

3.23
• Task assignments for the next period Review Issues and Follow-up • Review issues resolved since last meeting (resolution, who, when, move to closed)
• Review new issues (determine steps to resolve, responsible party, priority, date to beresolved by)
• Review open issues and determine if a change in status is needed Review Change Requests • Review change requests closed since last meeting
• Review new change requests (determine responsible party for analysis, impact analysis,priority)
• Review open change requests to determine if a change in status is needed Announcements and General Comments
The project manager plays an important role in setting the tone of the status meeting andrunning an efficient meeting without numerous discussion tangents. In addition, theproject manager should create an atmosphere of openness within the team. While noone wants tasks to overrun the estimate, it far preferable to know about it sooner ratherthan later. Often the missed deadline is caused by other demands on the resources’time—a problem the project manager should be well suited to tackle.
Project Status Reports
Status reports provide a high-level snapshot of project progress. They go hand-in-hand with regularly scheduled status meetings. The status reports capture keyaccomplishments, significant decisions, planned activities for the next period, and majorissues. The status report should not be overly detailed. Keep it relatively brief so thatpeople will actually read it. Figure 3.7 provides a sample format.
Figure 3.7 Sample data warehouse status report. Data Warehouse Status Report To:
Tim Barnes
Business Proj Lead
Leah Andrews
Business System Analyst
Julie Hustead
Data Modeler
Michael Kells
DBA
Paul Leaf
End User Appl Devel
From:
Mark Emerson
Project Manager
CC:
Susan Reed
Business Driver
Period:
Week of 1/13
Work Accomplished during week of 1/13 • Completed project team kick-off meeting. • Revised project plan based on team input—see attached.
• Conducted four interviews as scheduled with Sales, Sales Support, Financial Analysis, and Market Research.
Work Planned through 1/27 • Document and deliver individual interview write-ups.

3.24
• Begin drafting the requirement findings document. Open Issues/Change Control • Schedule additional interview requested by Sales. Tim responsible, due by 1/30.
Status reports should be distributed to the entire project team and key IS and businessmanagement. Be aware that even if the status reports are brief and summarized, they may not be the most effective tool for communicating with your executive business sponsor but more on that later in this chapter.
Maintain the Project Plan and Project Documentation
The integrated project plan should be updated weekly to accurately reflect progress andthen shared with the core project team. As we mentioned earlier, the project plan shouldreflect reality, whether it is good, bad, or ugly. Early flagging of project plan problemsallows the team to develop strategies to adjust as well as minimize downstream rippleeffects.
Like most system projects, you need to understand and evaluate your options if your project falls behind schedule. Working with your business sponsor, you may be able toreduce the project scope. Alternatively, you may need to obtain an extension on theproject deliverable date. Finally, you could obtain more funding to supplement the project team with additional resources. This final alternative is probably the least effective optionfor dealing with data warehousing project delays. Regardless of the alternative selected,the important thing is to have the courage to acknowledge to your management and sponsors that you are behind.
It is only worse if expectations continue gaining speed with hopes that the team will makeup the schedule shortfall during the two weeks before the target deliverable date. It won’thappen. Pretending that it will and continuing to go through the motions with usereducation and deployment is typically a fatal mistake.
The unending nature of a data warehouse generates demand for detailed projectdocumentation. In addition, the data warehouse project team is bound to evolve—additional players will come on board and others will head for greener pastures now thatthey have warehousing on their resumes. Robust documentation will help ease theburden of getting the new team members up to speed. Documentation is also invaluable in the event that the warehouse does not meet expectations. It may be necessary to referto key project assumptions and decision points. Document every step.
Unfortunately, documentation is not usually anyone’s favorite task. When time pressures mount, the first item that gets eliminated is typically formal documentation. Werecommend that you avoid falling into this trap. While it may seem like you are getting thewarehouse delivered faster, you are probably costing the organization more in the long run.
Data warehouse project documentation is often stored in a set of official project bindersas well as in electronic format with a section corresponding to each major activity in theLifecycle. The official binders should contain copies of all project communication and allmajor deliverables. Obviously, all project documentation should be dated and/orversioned appropriately.
Manage the Scope
There is only one guarantee for any data warehouse project and that is that there will be change! There are two major sources of these changes—previously unidentified issues and additional user requests. Each issue or request may be manageable and doable onits own, but when they are added all together, they become mission impossible.
The data warehouse project manager has the unenviable job of managing scopechanges. Out of one side of our mouths, we encourage you to focus on the businessusers and their requirements, while the other side is reminding you to stay on track. In general, the project manager has several options when facing a previously unidentifiedissue or additional user request:
• Just say no.

3.25
• Adjust scope assuming a zero-sum. In other words, the overall effort remains the same, but what is in and out of scope is modified.
• Expand the scope. In this case, the fence around the project grows. It is thenmandatory to expand timeline and/or budget appropriately.
The right choice depends on the specific situation. Regardless of the situation, it iscertain that the data warehouse project manager should not make scope decisions in avacuum. We have observed numerous data warehouse project managers ignore thiswarning—and their solo decisions regarding scope changes were inevitably second guessed. Don’t bear the burden of adjusting scope alone. A strong IS and businesspartnership is invaluable when evaluating these scope alternatives.
In the next section, we will provide you with tools and techniques to track issues and change requests. Once again, many organizations have already adopted issue trackingor change management methodologies and software. You should use the resourcesavailable to you (and that you are expected to use).
Track Issues
Tracking issues on a data warehouse project is probably similar to issue tracking youhave done on other systems projects. However, the data warehouse poses greaterchallenges given its elevated visibility. In addition, the required integration of numerous resources, data, and technologies in a data warehouse project tends to generatenumerous issues.
Issue tracking is critical to ensure that nothing slips between the cracks, that everyone’sconcerns have been heard, and finally, that the rationale used to resolve issues has beencaptured for future reference. Identifying issues or roadblocks is the first step towardresolving them. The data warehouse project manager should establish a team mindsetthat having numerous issues is allowed and preferable to simply pretending they don’texist.
There are two classes of issues—project issues that impact the overall project and task-related issues that must be resolved to complete a major task but may have no impact onthe project budget and/or schedule. In addition to an overall project issue log, severalindividual task issue logs are typically developed, each corresponding to the majorlifecycle activities such as dimensional modeling, data staging, end user application development, and deployment.
A simple issue log format can be used for both project- and task-level issue logs, as illustrated in Figure 3.8. The issues are typically captured in a table within a wordprocessing software package or spreadsheet; alternatively, some teams log the issues in a database. Your issue-tracking technology choice is irrelevant, as long as you do itsomewhere.
Figure 3.8 Sample issue tracking log.
The project issue log should be reviewed at each status meeting. The task issue logshould be reviewed at major design sessions. It is helpful to shade all closed issues tomaintain group focus on open issues in these forums.

3.26
Control Changes
Formal acknowledgment of project changes is critical to overall project success. Anyissue resolution that impacts the project schedule, budget, or scope should beconsidered a change. If a change does not affect the schedule or budget, it is often notdocumented. However, these changes may still impact the overall scope. By formallydocumenting and communicating the change, users’ expectations will be readjusted aswell.
Many organizations and project managers have mechanisms in place to handle majorchanges. These major changes are typically scrutinized and then a collective businessdecision is made.
Tip
The changes that often cause the biggest impact on a project are the littleones, cumulatively applied.
Individually, the minor requests might be quite simple to implement. However, problems develop if there are too many small requests. If a small change is estimated to take half aday, but ten different team members independently agree to make only two changeseach, those few small changes could impact the schedule by several weeks.
Figure 3.9 shows a sample of a change control log. Each change should be documentedin detail and entered in the log. Priorities, often described in terms of business impact,should be assigned to every change request.
Figure 3.9 Sample change control log.
Document Enhancement Requests
As the data warehouse implementation effort progresses, additional user requests andenhancements will inevitably arise. Like issues and changes, these enhancements should be documented in a database or log. The enhancement log provides amechanism to capture requests for future action, rather than expanding the currentproject’s scope. Documentation regarding each request should identify the “value” of the enhancement; asking what the enhancement is worth will facilitate future enhancementprioritization.
Develop Communications Plan to Manage Expectations
Last, but certainly not least, successful data warehouse project managers establish a robust communications game plan to address the needs of their various audiences orconstituencies. Communication allows the project manager to consistently establish andmanage expectations of the data warehouse project; expectation management is an absolute key to success for a data warehouse project. Regular, ongoing communicationessentially makes the “black box syndrome” disappear.
The overall communication plan should outline general message content, format, andfrequency for communicating with each group of constituents. Developing acommunication plan forces the project manager to fully consider the organization’srequirements—otherwise, it is far too easy to just let communication slip through thecracks. This section will review communications recommendations for the commonconstituency groups.
Project Team
Naturally, most project managers tend to focus on communication within the projectteam, much as a sports team’s coach reviews the play book and game plan with the team regularly. Many of the tools described in this chapter, such as the project scopedocument, status meetings, status reports, and project plans, facilitate communicationwithin the team. These communication vehicles should be shared with both the core team and specialty players as appropriate, especially on large data warehouse teams.

3.27
Sponsor and Driver Briefings
Obviously, you need to keep your business and IS sponsors and drivers in the loop.Generally, we find that face-to-face communication with these players is more effectivethan merely copying them on project communication documents. Everyone in the frontoffice certainly has access to the coach’s playbook, but most aren’t interested in thatlevel of detail. Clearly, these communication briefings need to be well planned—don’t wing it with the business sponsor. The briefings should focus on progress to date andany issues requiring higher-level assistance. In general, project managers typicallyschedule monthly sponsor briefings and weekly sessions with the business driver,although this varies by organization.
Tip
Communicate face to face with your sponsors. Don’t rely exclusively on projectmemos.
We believe it is absolutely imperative that you develop a “no surprises” communication strategy with the sponsors and drivers. Based on our experience, this approach is notoften employed in most organizations. Regardless, we have personally found it moreeffective to communicate honestly. The problem you are trying to ignore will surface eventually, so you should tell all early—your sponsors and drivers might even have the wherewithal to make the problem go away permanently.
Business User Community
Perception is reality, as they say. It is important that the business users’ perception of thedata warehouse matches reality. Communication is key to accomplishing this goal. Inaddition, communication with your business user community helps maintain theirinvolvement with the data warehouse project. Greater involvement typically translatesinto a greater likelihood of acceptance and usage.
The first formal communication with the business users involved in the project, the userkickoff meeting, will be described in Chapter 4. It is important that you follow up this launch meeting with regular communication on an ongoing basis. As with communicationto the sponsor and driver constituency, it is helpful to tailor your message to theaudience, so once again we discourage you from merely distributing the status reports tothe user community. Chances are slim that they will take the time to read a status report;the chances are even greater that they will be confused if they do.
Tip
Business users should be reading the front page of the sports section, not thedetailed game plan.
We recommend that user communication focus on what’s in it for them in terms of capabilities, exclusions, and timeframes—expectations, in other words. You should let them know what is expected of them in terms of involvement, feedback checkpoints, andso on. Finally, business users should be reminded every so often about the iterative nature of data warehouse development. Let them know that the warehouse is going toevolve, just as their business does.
Business user communication is broadcast in a variety of formats—one-page monthly memos or e-mails, newsletters, or a regularly updated Web page on the organization’s intranet. Regardless of the communication medium, the message should be brief,pointed, and free of any technical vocabulary. Involved business users should alsoreceive the project scope document as it is updated and republished. Finally, in addition to written communication, the business driver and project lead should routinelycommunicate informally with the business community regarding the data warehouse.
Communication with Other Interested Parties
In addition to the key communication constituencies just described, several otheraudiences should be kept in the loop:
•
Executive management. Like all high visibility projects, data warehouse projects areof great interest to your company’s executive team. A briefing, often part of a regularstaff meeting, is the best way to keep them informed. The joint business and ISsponsors typically spearhead this briefing. Depending on organizational factors, theseexecutive briefings sometimes occur one on one. As we mentioned earlier, you willneed acceptance of the data warehouse across the organization if it is to grow andthrive—these briefings are a start.

3.28
•
IS organization. Naturally, other IS professionals in the organization will be interested in data warehousing as it is one of the more popular buzzwords in the IS industrytoday. To start, interested resources in the IS organization should receive a generalbriefing on data warehousing in addition to a few specifics about the project, including scope, timelines, and resource requirements. In addition, the project manager oftenprovides a monthly status briefing to other IS managers. This communication isimportant to ensure that the warehouse is integrated with other development activities, and it helps establish expectations for the warehouse across IS. It seems that the datawarehouse often becomes the answer to everyone’s problem in an IS organization—year 2000 issues with the antiquated batch reporting systems, ERP reporting, integration of newly acquired businesses, implementation of activity-based costing systems, and so on.
Tip
The sooner proper project boundaries are established, the less you will need todeal with misperceptions. You will gain as much respect for saying what you will not do as for saying what you will do.
•
Organization at large. Finally, there are probably others within your businesscommunity who are interested in the data warehouse. Data warehousing has becomeso popular today that many people hear about it through nontechnical publications andother business contacts. Again, a short newsletter or Web page can publicize data warehouse news to the rest of the organization. With this approach, the datawarehouse team conveys a consistent message across the organization rather than letthe corporate rumor mill serve as the primary source of information.
Key roles The key roles for project planning and management include:
• The project manager and business project lead drive the project definitionactivities, with heavy involvement from both business and IS management.
• Project planning is also guided by the project manager and business project lead,with active participation and input from all other team members.
• Ongoing project management responsibilities rest primarily on the shoulders of the project manager again with assistance from the business project lead.
Estimating Considerations
The effort required to define your data warehouse is highly dependent on yourreadiness and situation scenario. At one end of the spectrum, it may require only a few weeks to establish scope and build the justification. However, if you identify asignificant readiness shortfall, it may require several months of effort to conduct ahigh-level business requirements analysis and construct a proof of concept before you can proceed.
The initial project plan should be developed in less than two weeks. This plan willcontinue to be revised every step of the way.
The ongoing project management effort is directly related to the project’s size and scope. As we mentioned earlier, the data warehouse project manager should beassigned full time to the initiative although he or she may also perform non-project-management tasks depending on his or her availability and skill set.

3.29
Summary
The up-front definition of your data warehouse initiative plants numerous stakes in theground that have downstream implications on your ultimate success. We encourage youto assess your overall readiness, paying extra attention to the requisite business sponsorship. This sponsorship is essential as you define project scope and build thefinancial justification.
Once the initiative is funded, the project manager needs to focus on resource staffingand detailed project task and timeline planning. Ongoing management of a datawarehouse project is similar to more traditional system development efforts, but therealities of a cross-functional project team working on a highly visible initiative imposesadditional demands on status monitoring, documentation, scope control, and, mostimportantly, communication. Be sure to consult the project plan tasks spreadsheet at theend of this chapter for a summary of the tasks and responsibilities for project planningand management (Figure 3.10).
Figure 3.10 Project plan tasks for project planning and management.

4.1

4.2
Overview
Business users and their requirements impact almost every decision made throughoutthe implementation of a data warehouse. From our perspective, business requirements sit at the center of the “data warehouse universe” as illustrated in Figure 4.1. As you readin Chapter 3, the scope of your data warehouse initiative must be driven by businessrequirements. Requirements determine what data must be available in the datawarehouse, how it is organized, and how often it is updated. Although architecture designsounds like a technology-centric activity, business-driven requirements, such as the number of warehouse users and their locations, have a large impact on the architecture.Clearly, the end-user application templates are defined by requirements. Finally, yourdeployment, maintenance, and growth plans must be user-driven. You begin to formulate answers to all these lifecycle questions based on your understanding of users’ businessrequirements.
Figure 4.1 Business requirements impact virtually every aspect of the data warehouse project.
This chapter provides tips and techniques for effectively uncovering businessrequirements. It begins with a recommended overall approach, focusing on interviewingtechniques for requirements gathering and the preliminary data auditing. Specific tactics to prepare for the interview, including research, questionnaire development, intervieweeselection, and scheduling, are detailed. The interview flow is then outlined, along withinterviewing ground rules and common obstacles. Analysis of the interview findings and deliverable development are discussed. Finally, we review the use of facilitation,particularly for prioritizing and consensus-building at the conclusion of requirements analysis.
This chapter is a must-read for project managers and business system analysts who areleading requirements definition activities. Likewise, any other team members who areparticipating in the requirements process should become familiar with the techniques andguidelines outlined in this chapter. Business and IS project sponsors should also peruse thismaterial to help manage organizational expectations appropriately.
Overall Approach to Requirements Definition
To better understand business requirements, we recommend you begin by talking to your business users. Although this may sound obvious, we have seen many organizations tryalternative approaches. Unfortunately, we all prefer to operate within our comfort zone;we are at ease looking at copy books and talking with DBAs and source system experts.

4.3
On the other hand, business users can be intimidating and demanding. They also speaka language that the typical IS person may be unfamiliar with—for example, the word index means something completely different to a marketing person than it does to a DBA. Regardless of the intimidation factor, you need to begin with the business users.Remember, they sit at the center of your data warehouse universe.
You can’t just ask users what data they would like to see in the data warehouse. Instead, you need to talk to them about their jobs, their objectives, and their challenges and try tofigure out how they make decisions, both today and in the future.
As you gather requirements from the business users, you should also intersperse some data reality into the process by interviewing key IS personnel. You must consider whatthe business needs in tandem with the availability of data to support these requirements.It’s a balancing act, but failure is inevitable if you consider one without the other. As we conduct business user meetings, we begin interweaving sessions with the data side ofthe house, typically DBAs or operational source system experts. These meetings tend tostart out as informal discussions with knowledgeable project team members. Once you begin to hear consistent themes from users, it is time to formally sit down with the datagurus and get into the gory details of their source systems. In these data audit interviews,you are trying to understand whether the data is there to support what users are asking for and whether the data is complete and reliable. You are also trying to understandwhere the land mines are hidden in the data. For example, there might be indicator fieldsthat were never populated or were labeled one thing but then used for somethingcompletely different. These kinds of land mines will invariably expode when loading yearsof history into your data warehouse.
Interviews versus Facilitated Sessions
There are two basic techniques for gathering requirements and investigating theunderlying operational data: interviews and facilitated sessions. Interviews are conductedeither with individuals or very small groups. One advantage of this approach is that youneed to schedule a relatively limited amount of time on the interviewees’ calendars. Youdon’t need to try to coordinate ten people for a full off-site meeting. Interviews also encourage a high degree of participation from the interviewees, which generatestremendous detail data. There is no way an interviewee can just listen withoutparticipating in one of these meetings. Interviews ensure that every voice is heard.
The alternative approach is to schedule larger group sessions led by a facilitator.Facilitated sessions can be used to encourage creative brainstorming with a limitednumber of participants. Although they require a greater time commitment from eachparticipant, facilitated sessions can actually reduce the elapsed time required to gatherinformation, assuming you can schedule a convenient time to meet with ten to twelvepeople within a reasonable time period. Based on our experience, facilitation is moreappropriate after you have gathered enough baseline information to understand thegeneral business and its vocabulary. Teams will often tell us that they fully understandthe business, only to be amazed after sitting through an interview by all that wasuncovered and learned.
We don’t believe that one technique is necessarily always better than the other. We recommend that you use the technique that is most effective given your organization’sexpertise, challenges, and what you have already subjected your users to. No twoorganizations are identical, so there is no right approach.
Having acknowledged that different approaches should be used in different situations, weare going to describe the approach that seems to “fit” most often. It is actually a hybrid ofthe two techniques. Interviews are used to gather the gory details, and then facilitated sessions are used to agree on priorities and next steps. We believe the “interview first”approach ensures effective, productive facilitated group sessions.
The reader should note that most of the recommendations throughout this chapter will be applicable regardless of the technique chosen.
Prepare for the Interview
We believe the prerequisite setup activities prior to gathering business requirements areoften overlooked. We want to review the techniques to position you for success by eliminating as many unknowns during the requirements gathering process as possible.

4.4
These are all common-sense activities, but are frequently forgotten. Identify the Interview Team
First of all, you need to determine roles and responsibilities within the interview team. We strive to have the same team conduct both the business user requirements and IS dataaudit meetings for continuity. We typically structure a team with the following teammembers.
Lead Interviewer
The primary responsibility of the lead interviewer is to direct the questioning. The leadinterviewer also takes notes, primarily as the basis for the next questions to be asked. Akey candidate for this role is the business systems analyst described in Chapter 3. Desirable characteristics include basic business knowledge and good verbalcommunication skills. It helps if the lead interviewer has a genuine interest and curiosity about the business. The best lead interviewers are “quick studies” who can think on theirfeet and are nimble enough to go with the flow.
This is a relatively risky role. Not everyone is cut out to be a lead interviewer. We caution against coercing potential candidates into working beyond their personally deemedcompetence levels. The lead interviewer’s relationship with interviewees and the usercommunity should be taken into consideration. The requirements analysis process depends on open, honest communication between the lead interviewer and interviewees.
Scribe
The scribe’s primary responsibility is to take copious notes during the interview. Thescribe should capture as much detail as possible regarding the interview content, regardless of whether it is news to them. These notes serve as the documentation basefor the entire data warehouse team, many of whom may not be as familiar with thesubject matter. The scribe also asks for clarification if a disconnect or misunderstanding between the lead interviewer and interviewee occurs. The scribe is the safety net thatcatches any points missed by the lead interviewer and can intervene if the interviewee isbecoming frustrated with the process. Finally, the scribe asks questions during interview lulls.
Although it sounds like a relatively easy role to fill, again, not everyone is destined to bean effective scribe. Good scribes must be willing and able to capture excruciating details. Also, the scribe typically develops the initial draft of deliverables from the requirementsdefinition activities, so solid written communication skills are necessary. Finally, somepeople may find the scribe’s naturally passive role frustrating and be tempted to barge onto the lead interviewer’s turf and establish themselves as the expert. Potential conflictslike these between the lead interviewer and scribe should be avoided as they aredistracting to everyone in the interview.
Tip
We are generally opposed to using tape recorders instead of human scribesduring the interviewing process.
We are sometimes asked about using a tape recorder instead of a human scribe.Generally, we discourage this practice for several reasons. First of all, tape recorders change the dynamics of the meeting. Users are often uncomfortable with the notion ofbeing taped. Also, they might want segments of the meeting to be off the record, whichmakes for awkward transitions during the meeting. Second, the lead interviewer’s written notes will inevitably not capture the full content of the interview. Someone will need tolisten to the tape recordings and take supplemental notes from them. This process issomewhat like watching a television rerun. It is not very interesting but consumes large chunks of time. We believe it is better to have two people with two brains and two sets ofeyes and ears actively engaged in the session rather than using a tape recorder as yourpartner.
However, tape recorders may be used to supplement the scribe, depending on theirexperience and comfort level with physical note taking. You will not want to listen to thewhole tape, but it can be useful as a backup. If an interviewee is really on a roll, therecorder may be helpful to ensure that the complete content is captured without slowingdown the interviewee. If you choose to use a tape recorder, you should inform theinterviewee during the interview introduction that the tape will only be used by theinterview team; the tape is not part of the permanent project files and will be erased oncethe interview has been documented.

4.5
Observers
Observers are an optional part of the interview team. Other data warehouse teammembers, such as data modelers, DBAs, or technical support specialists involved in tool evaluations, are often interested in sitting in on interviews. We frequently have observersduring our interviews since we are transferring interviewing skills to our clients’ datawarehouse teams. Optimally, there should be no more than two observers during aninterview. It is important to remember that the role of observers is to observe—they are spectators.
Conduct the Pre-interview Research
It is important to do your homework before starting the requirements gathering process. We recommend you start by reading your company’s annual report. The letter fromsenior management provides clues about strategic corporate initiatives. If initiatives arementioned by the president, you can usually bet it’s important to know about them. You should also focus on the narrative review of business operations. You can usually skipthe detailed financial statements as the important financial highlights have probablyalready been presented elsewhere in the report. Finally, the last couple of pages of the annual report may provide insight regarding organizational structure and reportinghierarchies.
If it is available, get a copy of your sponsor’s internal business plan. You are inevitablygoing to discuss the business plan during the interviews, so you might as well read itahead of time.
The interview team should also read the organization’s external marketing literature, ifappropriate. The Internet is another resource that should be leveraged. Take a look at your organization’s Web site to understand the messages your company is trying toproject to the marketplace, as well as your internal intranet for insight on organizationalpersonnel changes and other company initiatives. Finally, you should use the Internet to research some of your key competitors. Understanding where your competitors arefocused will probably provide insights into your own organization.
Tip
Try to thoroughly understand any earlier attempts at data warehousing within your organizations.
The saying “those who forget the past are condemned to repeat it” certainly applies todata warehousing initiatives. Chances are that earlier efforts were not called “datawarehousing” since that is the latest buzzword—maybe it was the “management reporting system” or “marketing information system” or some cleverly constructedacronym for a business-oriented reporting and analysis system. It is in your best interestto find out what worked, what didn’t, and why. Most importantly, you need to determine who was involved in these prior initiatives. You will want to use a different approachwhen dealing with any interviewees who were involved in a recent data warehouseattempt.
Select the Interviewees
Working with your business and IS management sponsors, you need to determine whoshould be interviewed. It is inefficient, not to mention impossible, to speak with everyone,so you need to select a cross section of representatives. You need to have adocumented organization chart to review with your sponsors or a trusted coach. It isimportant that you understand both the formal organization structure, as well as the moreinformal, undocumented organization. You need to know who is highly influential, who isconsidered a visionary, who is the departmental mover and shaker, who is a supporter,and finally, who is a naysayer when it comes to information-based decision making. You also need to consider the political ramifications of not interviewing someone. It may beeasier to conduct an extraneous interview for political reasons than to risk alienatingsomeone within the organization. Depending on the number, you may need to work withyour sponsors to prioritize potential interviewees.
Select the Business Interviewees
Even though you may be focused on a single primary business area for your initial datawarehouse project, you should interview horizontally across the organization beyond theinitial group. This horizontal, cross-functional perspective helps build a blueprint to ensure that your warehouse will be extensible across the enterprise, especially when it

4.6
comes to common data such as product or customer information. For example,Marketing may be designated as the initial user group. We suggest you speak with representatives from other functional areas, such as Sales, Customer Service, Logistics,Manufacturing, and Finance to better understand the big picture—in other words, the organization’s value chain. This horizontal perspective is absolutely critical to developing the Data Warehouse Bus Architecture matrix, as we’ll learn in Chapter 7. You want to make sure you have an enterprise-wide understanding of common vocabulary during the early development phases so you can integrate data in the warehouse over time andensure that you are not building those dreaded “data islands” or “stovepipes.” Thatdoesn’t mean you should take six months to speak with representatives from every function within your organization—focus on the core business processes.
You should strive for vertical representation from your target business user area. Youneed to meet with executive business management to understand high-level strategy and overall vision. However, you shouldn’t just stay in the treetops. You need to venture intothe middle management trenches of the target user area to add reality to your interviewfindings. Middle management understands how those high-level strategies are translated into business tactics. They also have a realistic perspective of where they’d like to begoing with information and analysis versus where they are today. Finally, you shouldmeet with business analysts from the target area. These individuals will have greatinsight into existing information usage. Naturally, we are all attracted to the “best andbrightest” analysts, but you should meet with a cross-section of business analyst representatives to understand the needs of the masses, not just the empowered,privileged few.
Select the IS Data Audit Interviewees
Every organization has key IS people who know the data inside and out. You definitelywant to interview these data gurus, kings, queens, and czars. You will also want to speak with the people who are responsible for the core operational systems. You need toconduct preliminary interviews with the programmers who support the likely candidatesource systems, as well as key database administrators and data modelers. Finally, you should meet with IS liaisons to the user community.
The data audit interview has a different flavor than the business user interviews.
Tip
The data audit is a systematic exploration of the underlying legacy source systems, not a free-wheeling discussion of where the business would like to go.
In addition, we also often meet with senior IS management during the interviewingprocess. IS management sometimes offers a vision for the potential use of information within the organization for competitive advantage. In other cases, these interviews offerguidance regarding overall plans for information dissemination throughout theorganization. Although senior IS management may have already approved funding for the data warehouse initiative, depending on the size of the organization andcommunication channels, the data warehouse team may not fully understand ISmanagement’s vision or perspective on the project. It is important that the team allocatetime to meet with these players to ensure they are in sync with general direction andstrategies related to the data warehouse.
Develop the Interview Questionnaires
The lead interviewer must develop an interview questionnaire before interviewing begins. Actually, the lead interviewer should develop multiple questionnaires because theinterview questioning will vary by job function and level. You are not going to ask amarketing executive the same questions you would a financial analyst. Also, the questionnaires for the data audit sessions will differ from business user requirementsquestionnaires. Though data audit meetings are more within our comfort zone, it is stillimportant that the lead interviewer generate a more IS- and data-oriented questionnaire prior to sitting down with the data gurus.
The interview questionnaires should be structured to align with your intended interviewflow. The questionnaire should fit on one page so you are not flipping through pages ifthe interview comes to a lull. It is important that the lead interviewer view thequestionnaire as a fall-back device, not a rigid script. The questionnaire can help youorganize your thoughts before the interview, but it shouldn’t be followed like a cookbookduring the interview. The lead interviewer needs to be mentally prepared for on-the-fly questioning to be successful. Figure 4.2 provides a sample questionnaire for a businessmanager or analyst. Questionnaire content for interviews with business executives and

4.7
IS representatives are detailed later in this chapter. Figure 4.2 Sample interview questionnaire for a business manager or analyst. A. INTRODUCTION • Discuss data warehouse project objectives and overall status.
• Discuss interview goals (e.g., focus on business requirements, talk about what youdo, what you want to be doing, and why) and interview flow.
• Introduce interview team and roles. • Confirm time available. • Describe next steps following interview. B. RESPONSIBILITIES • Describe your organization and its relationship to the rest of the company. • What are your primary responsibilities? C. BUSINESS OBJECTIVES AND ISSUES
• What are the objectives of your organization? What are you trying to accomplish?What are your top priority business goals?
• What are you success metrics? How do you know you’re doing well? How often doyou measure key success factors?
• What are the key business issues you face today? What prevents you frommeeting your business objectives? What’s the impact on the organization?
• How do you identify problems/exceptions or know you’re headed for trouble?
• Describe your products (or other key business dimension such as customer,vendor, etc.). How do you distinguish between products? Natural way you categorize products? How would you narrow a list of thousands of products?
• How often do these categorizations change? What should happen with yourbusiness analysis following a change?
D. ANALYSES REQUIREMENTS
• What type of routine analysis do you currently perform? What data is used? Howdo you currently get the data? What do you do with the information once you get it?
• What analysis would you like to perform? Are there potential improvements to yourcurrent method/process?
• What type of on-the-fly analysis do you typically perform? Who requests ad hocanalysis? What do they do with the analysis? Do you have time to ask the follow-up questions?
• Which reports do you currently use? What data on the report is important? How do you use the information? If the report were dynamic, what would the report dodifferently?
• What analytic capabilities would you like to have? • Are there specific bottlenecks to getting at information? • How much historical information is required?
• What opportunities exist to dramatically improve your business based on improvedaccess to information? What’s the financial impact?
E. WRAP-UP • Summarize findings heard.

4.8
• What must this project accomplish to be deemed successful? Criteria must bemeasurable.
• Thank participants.
• Describe next steps (e.g., draft interview write-ups available within week) and upcoming opportunities for user involvement.
Schedule the Interviews
Once it is time to actually schedule the interviews, we strongly suggest you get anadministrator to help you. Even with electronic calendars, scheduling can become a nightmare. Also, don’t be surprised by the lead time that is sometimes required.Especially with rigorous travel schedules, it might be two to three weeks before you canconduct an interview. You should plan for this inevitable down time. For example, it may be useful to use this time for data warehouse team education.
Sequence the Interviews
We recommend you begin the requirements definition process by first meeting with yourbusiness sponsorship. Optimally, you would interview the business driver, followed by a meeting with the business sponsor. You should understand the playing field from theirperspective. From there, our preference is to initially interview in the middle of theorganizational hierarchy, rather than leading off at the top or bottom. The bottom is a disastrous place to begin because you have no idea where you are headed. The top isan appropriate place to grasp the overall vision, assuming you have the businessbackground, confidence, and credibility to converse at those levels. If you are not adequately prepared with in-depth business familiarity, the safest route is to begin in themiddle of the organization.
If you are interviewing several marketing teams, several finance teams, several teamsfrom the field, and conducting several source system data audits, you should scramblethe interviews so that you don’t complete one type of interview before you start anothertype. It is very typical to hear certain messages from marketing and then get quite adifferent perspective from finance or from a data audit interview. If you have completedall your marketing interviews, it is difficult to return to these people and try to resolve thediscrepancies you have uncovered.
Tip
Scramble the sequence of interviews so that you have a mix of departments and perspectives throughout the interview process.
Establish the Interview Time and Place
As for logistics, we suggest you schedule executives for private interviews. They canhandle being a lone interviewee with a two- or three-person interview team. If an executive insists on bringing anyone else to the interview, their lieutenant will eitherparticipate sparingly or monopolize the interview. If they do contribute, it probably won’tbe at the level of detail that you need, so it is better to interview these people separately.Executives should be interviewed in their own offices or an adjacent conference room. Itis always best to meet with users on their turf.
The remaining interviews should either be scheduled in candidates’ offices, assumingthere is adequate space for the interview team, or in a conference room in theirdepartment. We have been asked to do user interviewing in an IS conference room thatwas a 20-minute hike across campus from the user community. It may have been aneasy room for the administrator to reserve, but users struggled to locate it. We wastedvaluable interview time waiting for, or searching for, lost interviewees. When they finallyfound the room, they didn’t have ready access to their key resources, like a binder ofmonthly reports. You should make sure the interview space is large enough toaccommodate the interviewees and interview team, including the observers. No onewants to be shoved together like sardines. If you do meet in an office, you should shut the door to minimize disruptions.
Tip
All interviews should be conducted on the users’ turf. This minimizes delays,and allows the users to fetch supporting documents at the end of the interview. Make sure disruptions such as phone calls are minimized.
Interviews with nonexecutive business users may be set up as individual interviews or

4.9
small group sessions. Middle management can handle an interview team, but the teammay overwhelm a lone individual contributor. If you are scheduling small groups, thegroups must be homogenous. The fact that all the interviewees “come from Marketing” isnot homogeneous enough. You want the interview group to come from the same functionand/or job focus. In small group interviews, no more than four people should beinterviewed at once, representing no more than two organizational levels.
Tip
Having their boss’s boss in the same meeting is enough to squelch most users’candor and enthusiasm for the process.
Sometimes even two levels of organizational hierarchy in the same interview is too much,depending on the working relationship between the interviewees. Data audit interviewswith IS representatives typically focus on a single source system.
Business requirements and data audit interviewing is exhausting. It requires intenseconcentration to listen, take notes, and formulate the next brilliant question. Youshouldn’t schedule more than three or four interviews in a day. Executive interviews typically require about thirty minutes, unless you have hit upon their hot button. Youshould allow a minimum of an hour for analytic users and one and a half to two hours forsmall groups. Last but not least, you need to reserve at least thirty minutes between interviews. You need this break between interviews to debrief, allow for “overruns” beginto fill in your meeting notes, and deal with biological requirements. Interviewing can be anextremely painful process otherwise.
Although you can’t schedule eight interviews a day, we do suggest that you attempt toschedule the interviews in a relatively short period of time, remembering to allowadequate time for interview absorption, analysis, and documentation. As you saw inFigure 4.1, the requirements you gather impact almost every aspect of theimplementation. Since you can’t immerse yourself in dimensional data modeling until the completion of the interviews, you don’t want to drag out the entire process. Interviewingis a critical path. We recommend you get it scheduled and finished in a reasonableperiod of time so that you can move on to the next step of the data warehouse implementation.
Prepare the Interviewees
Even before you start scheduling interviews, it is important that the project beappropriately launched. We recommend conducting a user kickoff meeting todisseminate a consistent message. All business users potentially impacted by this project, as well as their management, should be invited to reinforce their role andimportance to the data warehouse. This meeting is similar to the project team kickoffmeeting described in Chapter 3, but the focus and emphasis is shifted.
Tip
Schedule all interviewees for a single large kickoff meeting at the start of theproject.
A sample agenda for the user kickoff meeting is shown in Figure 4.3. We suggest thebusiness sponsor start the meeting by communicating the why behind the data warehouse project. Everyone at the meeting needs to understand the importance of thisinitiative and the high-level level of commitment behind it. The joint IS and businessproject leads should then discuss the hows and whens of the project to help everyone understand the general approach without getting mired in the detail.
Figure 4.3 Sample user kickoff meeting agenda.
PROJECT NAMEUser Kickoff Meeting Agenda
• Introductions
•
Project OverviewGoals & Objectives
Business Sponsor
•
Project DetailScope High-Level PlanProject Team Roles and ResponsibilitiesUsers’ Roles and Responsibilities
Project Manager &Business Project Lead

4.10
Project MilestonesNext Steps
This meeting is a critical tool for managing your users’ expectations. Everyone should geta consistent message regarding the preliminary scope and general timeframes. It is alsoan opportunity to set expectations regarding the amount of time users will need to investin this project for interviews, requirements validation, checkpoint reviews on the data model or application specifications, and education. One of the indirect benefits of thismeeting is to communicate that this is a joint user/IS project, not a technology-driven IS initiative. Rather, the data warehouse is a user system that is driven by user requirements. All users should walk away from the kickoff with a sense of ownership andcommitment to make the project successful.
Sometimes the geographic dispersion of people makes a physical kickoff meetingimpossible. If that is the case, you still shouldn’t skip this step. The project still must belaunched and all the information just described must be conveyed, even if it can’t beaccomplished face-to-face. You will waste valuable minutes at the beginning of everyinterview explaining this general launch information if it is not communicated up-front.
As soon as requirements and data audit interviews are scheduled, you should send apre-interview letter or e-mail message to the interviewees to set their generalexpectations regarding their meeting. You probably already met most of the intervieweesduring the user kickoff. The letter is another opportunity to reiterate the overall projectand its objectives. This correspondence should be sent by someone they know andrespect such as the business sponsor. Otherwise, it should be sent out jointly by theproject manager and business project lead.
The pre-interview letter, illustrated in Figure 4.4, should let the interviewee know what toexpect during the interview. You should explain that the goal is to understand their jobresponsibilities and business objectives, which then translate into the information andanalyses required to get their job done. The interviewees may be asked to bring copiesof frequently used reports or spreadsheet analyses.
Figure 4.4 Sample pre-interview letter. Dear ATTENDEE,
Thank you for participating in user meetings for the PROJECT NAME data warehouseproject. As a reminder, the PROJECT NAME project is focused on . . .
The objective of the user meetings is to better understand your area’s business goalsand priorities which translate into data and analyses needs. Your insight during thesemeetings is crucial to defining the requirements for PROJECT NAME.
Specifically, project team members intend to discuss the following topics during theirmeeting with you:
• Responsibilities Individual and departmental responsibilities
• Business Objectives and Issues Business metrics, industry and competitive trends, opportunities and obstacles
• Analyses and Data Requirements Key reports and analyses, frequencies and current limitations
• Project Success Criteria Please bring copies of the analyses you are currently performing and/or requesting.
ATTENDEE, thanks in advance for your participation. The project team looks forward tomeeting you on DATE at TIME in MEETING ROOM. Please call me if you have anyquestions in the meantime.
Sincerely, Executive Sponsor or Joint Project Managers

4.11
CC:
Tip
If there is any resistance from the users to sharing reports, don’t push. Theusers will almost always give you stacks of reports after the interviews.
Finally, you should remind them of the interview time, duration, and location. A variationof the pre-interview letter should also be sent to the IS interviewees.
We typically advise against attaching a list of the fifty questions you might ask in hopes that the interviewees will come prepared with answers. It is nearly inevitable that theywon’t take the time to prepare responses to your list of questions. It is also likely thatsome interviewees will cancel because they’ve been overly intimidated by the volume of your questions. However, the interviewees’ reaction to the “laundry list” approach variesby corporate culture.
Conduct the Interview
Before we delve into the actual interview, we want to review some general interviewing ground rules.
Remember your Interview Role
The first ground rule for effective interviewing is to abide by your designated roles andresponsibilities on the interview team. The lead interviewer is supposed to ask unbiasedquestions; the user is to answer; the scribe should take notes and everyone else shouldlisten. The entire interview team should be absorbing like a sponge. Unfortunately,people seem to often forget their job assignments.
We have witnessed lead interviewers ask very leading questions of the user rather than the classic, open-ended why, how, what-if, and what-then questions. We have seen scribes get so caught up in the conversation that they forget to take notes. Finally, wehave seen observers answering the questions rather than letting the user respond or defending the current systems using highly technical terms in response to criticism.
In each of these scenarios, someone on the interview team has missed the point, andthey are not going to uncover what they need to be successful.
Verify Communications
During the interview, it is important to make sure you comprehend what the intervieweeis saying. Paraphrasing what you have heard in your own words is one technique toensure comprehension. It is also critical that you address any confusion during theinterview.
You shouldn’t wait until the interview is over to confide to your team members that youdidn’t understand what the interviewee was referring to during a fifteen-minute segment. The lead interviewer and scribe should have the courage to acknowledge that they arelost and resolve these miscommunication points during the meeting.
Define Terminology
As you are conducting interviews, it is important that vocabulary not be taken for granted. The exact definition of terminology will have a huge impact on the grain anddimensionality of your data model. We often find that the same word has multiplemeanings and that different words are frequently used to mean the same thing. For example, we worked with a client on a data warehouse focused on customer revenue.Even though the board had approved a multimillion dollar budget for this project, no oneseemed to have a consistent view or definition of customer revenue. Was it what the customer paid, what they paid less taxes, what they paid less commissions to thirdparties, or some combination of the above? Vocabulary standardization issues becomeespecially apparent as you conduct interviews horizontally across the organization. You should be identifying and making note of inconsistencies in vocabulary during theinterviews, but don’t attempt to resolve them in the interview forum. You have just sentup a red flag that more work awaits you down the road as you attempt to define common vocabulary in the data warehouse. This type of issue is best resolved by a facilitatedsession with cross-department empowered decision makers.

4.12
Establish Peer Basis
It can be intimidating to conduct an interview with executive management. After all, we are mere mortals, and they are division presidents. If possible, the interview team shouldtry to ignore those hierarchical differences and assume they are equals. It helps the flowof the interview if you are able to establish a peer relationship with the interviewee. A keyto establishing this type of relationship is to use the interviewees’ vocabulary. It is alsohelpful to demonstrate general business acumen, especially when you are trying to getthe interviewees to think outside of the box. You may integrate general learning fromearlier interviews to illustrate your understanding without forgetting that the interview is allabout them talking and you listening. Finally, the attitude of the lead interviewer is alsoimportant. Within the same day, the lead interviewer may need to demonstrate theconfidence to converse with an executive without being condescending to analysts.
Maintain Interview Schedule Flexibility
During the interview process, the number of interviews typically grows from 10 to 25 percent. It is very common for an interviewee to suggest that you meet with someoneelse in the organization. The interview team should anticipate these additionalinterviewees and view them as a bonus rather than a burden. Based on our experience, these additional interviewees frequently have keen insights to add. Since it is inevitable,the interview team should mentally prepare for the additions.
Avoid Interview Burnout
Having just suggested that the interview team stay flexible about adding interviews to theschedule, it is also important to remember that user interviewing is very draining. You willprobably be exhausted and uncertain what you asked whom by the third or fourthinterview in a day. It is a waste of everyone’s time to attempt to conduct thirty interviewsin a week due to the diminishing returns. Depending on the players involved, you maywant to rotate the lead interviewer and scribe responsibilities.
You will know the interview process is nearly complete when you begin to hear significantrepetition during the interviews, although you may still need to conduct some interviewsfor political or organizational reasons. Hearing the same answers repetitively is goodnews. It means that you have encircled the organization’s business requirements.
Manage Expectations Continuously
The final interview ground rule is to manage user expectations during the course of theinterview. Data warehouses are typically very high-visibility projects. The user kickoff meeting and interview process reinforce that visibility. Throughout the interview asappropriate, the data warehouse initiative should be presented positively, withoutoverselling and making promises that can’t be delivered on. Users should be informed that the data warehouse will evolve. The users are probably used to a more traditional, one-time requirements gathering process following by frozen specifications and a lengthyenhancement queue. Now is the time to set the expectation that data warehousing is aniterative process. There will be an ongoing process for gathering requirements andreleasing functionality in the data warehouse. This leaves the door open for a return visit togather more requirements for the next phase.
Start the Interview
We are now ready to begin interviewing. Every interview starts with introductions toremind the user who we are and why we are here. Depending on the interview teamcomposition, the project manager or business project lead may communicate this high-level project information; otherwise, the lead interviewer takes responsibility for this partof the interview. Both the project and interview objectives should be reviewed. It is alsoappropriate to introduce the team players in attendance and explain their roles during theinterview. Otherwise, the interviewees may wonder why the scribe isn’t asking anyquestions. The overall requirements analysis process should also be communicated tothe interviewees during the introduction. You should let the interviewee know that you willbe documenting the interview, providing documentation to the interviewee for their reviewand feedback, and then publishing the consolidated findings. Finally, it is always wise toreconfirm the time available for the interview.
The first couple of minutes of the interview are critical as they set the tone for the rest of

4.13
the meeting. We strongly suggest that you use organized notes or a pseudo-script for this segment of the meeting and rehearse what you are going to say in advance. It isimportant that you convey a crisp and clean message. You want the users to feel at easeand comfortable talking with you openly. At the same time, you want them to understandthe importance of the requirements-gathering activity. In part, you convey this importance by being organized and prepared for the meeting. This is not the time orplace to “wing it.” It is also essential that you use the interviewee’s vocabulary during theintroduction. You should tell them that this will not be a technical meeting. Unfortunately,we have been on teams where the user interview introductions were littered with techno-babble, including hardware model numbers, network protocols, and so on. Thesecomments were totally inappropriate and did not set a productive tone for the userinterview.
Tip
The one question you never ask in an interview is “what do you want in yourcomputer system?” That answer is your job, not theirs.
Following the introduction, the lead interviewer jumps into the substance of the meetingby getting users to talk about what they do and why. The initial questions should focus ontheir jobs and where they fit. It is similar to the name and address block on a consumersurvey. The questions are very simple, nonthreatening, and don’t force the interviewee tothink very hard from the start. You should ask them what their responsibilities are.Although you already know their official title from the organization charts, it is typically enlightening to hear them describe their key responsibilities.
From this point, there are forks in the road depending on the general responsibilities ofthe person you are interviewing. We describe each of these forks in the followingsections. However, you should be aware that there are gray lines distinguishing thesevarious routes. Some executives will have specific analytic requirements; some businessanalysts will have intimate knowledge of the underlying source systems. The interviewcontent questions should be used as general guidelines.
You should strive to peel back the layers of the onion by asking high-level questions and then follow the interviewee’s lead to get into the details. The ability to follow theinterviewee’s lead and ask follow-up questions distinguishes a mediocre interviewer from an outstanding one.
First of all, you are building credibility by demonstrating that you are listening andabsorbing what they saying. It also gets you to the ultimate level of detail you need to build a dimensional model. If you stay at the treetops level of questioning, you will neverget users to tell you what they need on a dimension table and which aggregates will beused most frequently. Finally, it is a very comfortable flow for the interviewee because it is conversational. People typically don’t mind taking the time to tell you what they do.However, it is not much fun to be pelted with questions from a five-page questionnaire whether they make sense to ask at this time or not. We provide sample questions, but every interview flows differently. Don’t expect to ask all of these questions or to ask themin this order; you need to go with the flow.
Business Executive Interview Content
The objective of the executive interview is to get an overall understanding of theorganization and where it is headed. This perspective helps tie together the datacollected elsewhere throughout the organization. High-level questions you might ask of an executive include the following:
•
What are the objectives of your organization? What are you trying toaccomplish? These questions provide insight into the key business processes thatthey monitor and attempt to impact, such as increasing sales, decreasing direct mail expenses, and so on.
•
How do you measure success? How do you know you are doing well? How oftendo you measure yourselves? It is absolutely critical that you understand the organization’s success metrics. These are the core data elements that must be tracked in the data warehouse. Depending on the situation, this data might be sales volume,market share, response rate, profit, quality, length of stay, and so on. The response to“How often do you measure yourself” has implications on the update strategy for the data warehouse.
• What are the key business issues you face today? What could prevent you frommeeting these objectives? What is the impact on the organization? This is the

4.14
classic “What keeps you awake at night?” question, which may be a challenge for some interviewers to pose to their senior executives.
Tip
You need to be brave enough to ask executives what keeps them awake atnight.
•
How do you identify problems or know when you might be headed for trouble? How do you spot exceptions in your business? What opportunities exist todramatically impact your business based on improved access to information?What is the financial impact? If you could . . . , what would it mean to yourbusiness? These are key questions, especially if you still need to financially justify thedata warehouse initiative. Even if quantified business impact isn’t a current projectconcern, ask the questions anyway. The answers will probably be extremely useful atsome point down the road.
•
What is your vision to better leverage information within your organization? Doyou anticipate that your staff will interact directly with information? With this question, you are getting an understanding of their vision, and assessing whether they have the political willpower to encourage and reinforce fact-based decision making instead of the more prevalent gut-based process that is currently used. You will also gain an understanding of their expectations regarding their staff’s interaction with data. Some executives don’t want their staff to “play” with the data. If that is a concern forthem, it is better to know it sooner rather than later.
Business Manager or Analyst Interview Content
The business manager or analyst interview is similar to the business executive interview,but the lead interviewer asks more detailed questions. As with the business executiveinterview, we begin with departmental objectives and goals following introductions.
• What are the objectives of your department? What are you trying to accomplish?How do you go about achieving this objective?
• What are your success metrics? How do you know you are doing well? Howoften do you measure yourselves?
• What are the key business issues you face today? What limits your successtoday?
•
Describe your products (or other key business dimensions such as customers,vendors, manufacturing sites, etc.). How do you distinguish between products?Is there a natural way to categorize your products? How often do these majorcategorizations change? Assuming you can’t physically look at a list of all yourthousands of products, how would you narrow the list to find the one productyou are looking for? Users’ responses to these questions provide insight into how they describe key aspects of their business. The data warehouse must support “slicing-and-dicing” on these descriptive characteristics. The example question assumes youare interviewing someone focused on a product set. It could just as easily be a customer-oriented database marketing question, such as “How do you distinguishbetween your customers?”
The team should also try to understand the relationship between these key businessattributes. For example, “Is there only one broker associated with an account?” or “Cana rep cover more than one territory?” The team needs to pay close attention to theexceptional relationships. A red flag should go off if the answer is “Not usually” toquestions like these.
Following these higher-level business objectives and overview questions, we typicallymove onto analysis requirements with questions such as the following:
• What types of routine analysis do you currently perform? What data is used?How do you currently get that data? What do you do with the information onceyou get it?
• What analysis would you like to perform? Are there potential improvements toyour current methods/process?
• Currently, what on-the-fly analysis do you typically perform? Who requests these ad hoc analyses? What do they do with the analyses? How long does it typicallytake? Do you have the time to ask the follow-on question?

4.15
• What analytic capabilities would you like to have? Is there much re-creation of the wheel across the organization?
• Are there specific bottlenecks to getting at information? • How much historical information is required?
•
What opportunities exist to dramatically improve your business based on improved access to information? What is the financial impact? If you had thecapability just described, what would it mean to your business? These are key questions that should be asked regardless of whether quantified business impact is acurrent project concern. Sometimes it is easier for users, especially analysts, todescribe their existing key reports and analyses, than respond to more free-form questioning. Rather than simply collecting copies of their current standard reports andspreadsheets, you should ask for details about how they currently use thesedocuments. Inevitably, they rekey data into a spreadsheet program, where they arethen building their personal “data warehouse.”
•
Which reports do you currently use? Which data on the report is important? How do you use the information? If the report were dynamic, what would it dodifferently? Unfortunately, there is an abundance of data on current standard reportsthat is never looked at. The lead interviewer should try to identify opportunities for improving current reports. Maybe there should be additional data on the report, such ascalculated ratios, additional summarization, and so on.
Tip
The interview team needs to resist the temptation to focus only on the top five reports or top ten questions.
As you analyze the results of input based on current reports and analysis, it is importantto remember than you are designing an analytic environment with the data warehouse,not a reporting system.
You need to understand the larger picture so you can construct an analytic platform thatwill allow users to build today’s top five reports without running into a brick wall threemonths from now when they want a different set of top reports.
Interviews with business managers and analysts typically provide most of the detailedcontent derived from the requirements definition process. Unfortunately, deciphering theinterview and translating it into a dimensional data model is more art than science. It takes practice to become comfortable with the free-form questioning while listening for key user information, including:
• Business objectives and key processes. • Performance metrics such as revenue, share, variance, and so on.
•
Vocabulary and business dimensionality. For example, a business manager may tellyou that they want to look at monthly revenue by customer by product by salesterritory. In this case, customer, product, and sales territory reflect the business dimensionality. We often refer to the “by words” as the business dimensions because the business users describe their analytic needs using these words. You should alsolisten for dimension hierarchies as the user describes their business. In this example, the manager may want to look at sales territories rolled up into their respective salesdistricts and regions, too.
• General information and analytic needs representing the business questions that mustbe answered, the data required to answer the questions (including information integration), the process used to answer the questions, and the frequency.
Inevitably, you will hear about constraints and problems with the current environment.“The data’s not accessible, we are rekeying everything into Excel, the data doesn’t match, . . .” This is all valuable insight, but it doesn’t replace the need to fully understandthe fundamental business requirements.
IS Data Audit Interview Content
The goal of the data audit interviews is to assess whether the data exists to support thethemes you are hearing from the user interviews. The IS interviews are intended toprovide a reality check. You should view these data audit meetings as surface

4.16
scratchers. There will be subsequent meetings to really pour into the data and better understand the field definitions, granularity, data volumes, data demographics, and so onas described in Chapter 7. At this stage, you are merely trying to assess the feasibility ofaddressing users’ requirements with existing operational data.
Following a discussion of their job responsibilities, we generally focus on several keydata access and analysis requirements:
• Request an overview of their key operational source systems. Discuss the update frequency and availability of historical data.
•
What is the current process used to disseminate information to users? What tools are currently used to access and analyze information? Review documentation (file layouts, copy books, or a data model) on existing reporting oranalysis systems focused on this business process, including a demonstration ifavailable.
• What types of analyses are routinely generated?
• How are ad hoc requests for information handled? How are business users’ dataaccess and analytic requirements currently supported? Do multiple IS orbusiness analyst resources support the same business users?
• Are there any known data caveats or quality issues? • What is the biggest bottleneck or issue with the current data access process?
• What are your concerns, if any, about data warehousing? What roadblocks do you see to its success in the organization?
• What do you want the data warehouse to accomplish within the organization?
At this stage of the lifecycle, the interview team should conduct data audit interviews untilthey are confident that source data exists to support the business requirements themes.You need not understand every nuance of the data, but you must be comfortable with theavailability of data to address users’ requirements.
We strongly caution that this may require more data digging than you might initially imagine. For example, profitability analysis, whether by product, customer, vendor,shipper, or agent, is a very common business request. Through a relatively superficialreview, you’ll inevitably learn that both revenue and cost information exists in yoursource operational systems. Based on this cursory understanding of revenue and costinformation, you might jump to the conclusion that you can deliver profitability data toyour business users. In most cases, you would have leapt to an erroneous conclusionand gravely mismanaged user expectations. In fact, upon further data interrogation,you probably would have discovered that your operational source systems don’tcapture cost information at the appropriate granularity or that it can’t be appropriately allocated to support profitability analysis by a key business dimension. This is theclassic data audit horror story. We encourage you to resist being overly hasty with yourdata audit interviews—it’s imperative that you keep digging until you’re reasonablyconfident about the availability of the core data needed to support the frequentlyrequested business requirements.
Wrap Up the Interview
The final step of the interview is its closure. The lead interviewer should watch the timeand allocate at least five minutes at the end of the session to bring the interview to anorderly conclusion. The wrap-up should begin with a summarization of what has beendiscussed during the session.
Determine the Success Criteria
This is the time to ask about project success criteria. You have established rapportduring the meeting. Now is the perfect opportunity to get a better understanding of their attitudes and expectations. The lead interviewer should ask what is the number-one thing this project must accomplish to be deemed successful. You should try to get them toarticulate measurable, quantifiable success criteria. “Easy to use” and “fast” are not adequate success criteria because they mean something different to everyone. Based onour experience, this bare-your-soul success criteria question sometimes makes members

4.17
of the interview team uncomfortable. They may worry that users will want subsecondresponse time to deem the project successful. If users’ success criteria are unrealistic, itis better to know it now when you still have time to react and reset their expectationsrather than learn of their expectations as you are about to deploy the warehouse.Acceptable success metrics include the following:
• Implementation metrics. These metrics include the number of gigabytes of dataavailable to users, number of users trained or number of users with installed end user software. Each of these could be tracked as of the end of a given time period.
• Activity and usage metrics. For a given time period, such as a day, week, month, orquarter, you might track the number of queries, number of logons, total number of logon minutes, or average number of logon minutes.
• Service level metrics. Some organizations establish service level agreements withtheir users that are based on the following types of measures:
– Availability based on database and application server down time.
–
Data quality based on the number of errors (e.g., completeness or adherence totransformation business rules) per gigabyte of data.
–
Data timeliness based on the amount of time following the close of business before the data is available in the data warehouse.
–
Data warehouse responsiveness based on the average response time to a standardset of queries and applications.
–
Support responsiveness based on the average response time to service requests oraverage time to resolve service requests. Both these measures are extremelycumbersome to track.
•
Business impact metrics. Business impact metrics include the financial impactassociated with cost savings or incremental revenue generation. This financial impactcan then be used to calculate a return on investment. These are typically the mostimportant success metrics for a data warehouse, although they are difficult to capture.Even if your numbers aren’t absolutely precise, you should strive to capture andcalculate these business impact metrics.
•
Performance against “pre–data warehouse” baseline. For example, you may hear that it took a week to perform a given analysis prior to the data warehouse; following the implementation of the data warehouse, the same analysis could be completed inless than an hour. These “before and after” examples are typically useful andimpressive, although they presume that you had a pre-data warehouse baseline measurement for comparative purposes.
As you’re wrapping up the interviews, you should thank interviewees for theirparticipation and valuable insights. It’s a good idea to request their permission for futurecontact to clarify any key points.
Avoid Requirements Interview Obstacles
There are several common interviewing obstacles that you might run into as yougather business requirements:
•
Abused user. This is an uncooperative business user who claims “we already told IS what we want.” These users have been interviewed in the past but haveyet to see anything result from their efforts. They are frustrated by these pastfalse starts and will probably refuse to meet with an interview team again.
As we mentioned earlier, you should proactively determine who was involved andinterviewed in earlier attempts at data warehousing. Any documentation relatingto business requirements from the prior project should be reviewed.Unfortunately, documentation is seldom sufficient to take the place of a face-to-face meeting with the user again. When scheduling meetings with these abusedusers, it is helpful to first of all acknowledge their participation in previous effortsand let them know that you have already reviewed the resulting documentation.The new session should be presented to the interviewees as a “validation” ratherthan as another interview. Naturally, users will resist going back to the very

4.18
beginning, but may be more willing to meet if you are focused on understanding current priorities. Finally, this is probably a good time to select an alternativeforum for gathering requirements. If interviews were conducted previously, usethe earlier requirements documentation as a baseline and grounding for a facilitated session to gather details on changes within their business.
•
Overbooked user. These uncooperative business users are simply too busy tomeet anytime soon. If this is a contagious malady within your primary userorganization and executive management is unwilling to acknowledge andaddress the condition, we suggest you stop now before expending more effort onthis initiative. It is a safe bet that users who don’t have time to meet and sharetheir requirements won’t have time to attend education and incorporate new information and analyses into their daily jobs. This results in a never-ending uphill struggle for data warehouse teams. We strongly recommend that you get off thisslippery slope now before any damage is done. You will probably be able to find a more cooperative business partner elsewhere within your organization.
•
Comatose user. These business users respond to your classic, open-ended questions with monosyllabic, one-word responses. Fortunately, this is a relatively rare syndrome. It is sometimes effective to ask these people questions from amore negative perspective. For example, rather than trying to get them toenvision life outside the box, they sometimes find it easier to tell you what iswrong inside the box. We try to pry information out of interviewees like this, but itis senseless to prolong everyone’s pain as these interviews are no fun for anyoneinvolved. We suggest you make a valiant attempt, but if it is still not effective,abort the interview. You should schedule a replacement representative if this useris in a critical function or position.
•
Overzealous user. This is the opposite end of the spectrum. This conditionmanifests itself when you think you are interviewing two business users, but seven people arrive in the conference room. The users are excited and want tobe heard by the data warehouse team. It is great news that the users areengaged and enthused. However, that won’t last long if you try to interview sevenpeople in a single one-hour meeting. We suggest you quickly assess thehomogeneity of the crowd. Are they all doing the same job and can build off ofone another’s ideas, or do they represent various jobs and functions? It is almostalways the latter, so you should break them into smaller groups and give themslots on the interview schedule. This results in a more efficient use of everyone’stime and ensures that adequate time is allocated for each meeting to gather thedetails you need.
•
Nonexistent user. The final obstacle is typically fatal to a data warehouseinitiative. This condition results when members of IS organizations say they knowwhat the business users need, “in fact, we know it better than they do.” These arethe IS organizations that attempt to model their data warehouse based onexisting data copy books exclusively and then don’t understand why businessusers aren’t clamoring to use the data warehouse. The good news is that thisobstacle is totally within the ability of the IS organization to overcome.
You should also let them know what to expect next in terms of deliverables andopportunities for user feedback. As we stated in Chapter 3, communication with your users is extremely important but too often forgotten. Rather than leaving them in thedark, you should take advantage of every opportunity to let them know what to expectnext. For example, tell them that you will have the documented interview write-up to them by a certain date and that you will need their review and comments returned by anotherspecific date. It is then important that you meet the deadline you have established. Youare building your credibility with the users at every point of contact.
Finally, we suggest you include a general disclaimer at the end of each interview,reminding the interviewee there is no firm commitment that what was discussed will bedelivered in the initial release. Again, let the interviewee know about the high-level process you will be using to prioritize requirements. Also, they should be informed ofgeneral timeframes when these priorities will be communicated back to them.
Review the Interview Results

4.19
Just because the interview is over doesn’t mean that your requirements definition work isdone. The team should informally debrief with each other right after the interview. It is very helpful to confirm that everyone on the team is on the same page regardingcommon, repetitive user requirements “themes.” You should also identify areas wherethere is any misunderstanding so these points can be clarified in subsequent interviews. The lead interviewer should keep a running list of unresolved questions or open issues. Ifany team member has experience with the source operational systems, they shouldshare their thoughts regarding the feasibility of the requirements being heard. There is no sense in letting these requirements gain momentum if they can’t possibly be supportedby data captured in the current operational systems. Finally, as you are definingrequirements to drive the data model, you are also gathering insights about the users’ comfort level with data, analysis, and technology. Users’ expectations regarding theirlevel of direct interaction with the data will have an impact on tool selection and the needfor standard analysis templates and customized data-specific user education. These insights should be shared with other data warehouse team members.
As soon as possible following each interview, we recommend reviewing your interviewnotes and completing any partial remarks. Inevitably, your notes will be littered with dangling thoughts or stubs followed by white space as you jumped to capture theinterviewee’s next point. We also suggest that you comb through your notes and highlightkey findings. We often supplement our notes with margin tags to identify business issues, information requirements, success criteria, and so on. These activities should occurimmediately following the debriefing, if possible. Your interview notes will become anindistinguishable blob after even one full day of interviews.
Tip Summarize and flush out your notes within a few hours of your interviews.
You should also review the key reports and analyses gathered following the interviews.These reports and analyses typically provide a rough translation into your dimensional data model. As illustrated in Figure 4.5 and further described in Chapter 7, dimension tables will supply the values for the report headings and row or supercolumn headings.The reported numeric measures are represented as facts. In this example, the fact issales dollars, while the month and region, district and sales rep hierarchy are supportedby dimension tables. It is often helpful to review the gathered reports off-line for further insight on the business’ dimensionality and users’ analytic requirements. Sometimes youwill see dimensions or attributes in these reports that never came up in interviews.Deeper granularity or more dimensionality should then be discussed in follow-up conversations with business users. Finally, you should label these key reports with thename of the end user who provided it and the date. These should then be filed with otherproject documentation.
Tip
Don’t forget to ask for key reports at the end of each interview. You will beamazed at what you will receive after a positive interview. Mark each receivedreport with the donor’s name, department, and the date received.
Figure 4.5 Analysis of business dimensions and facts from users’ key reports.
Sales Rep Performance ReportCentral Region
February 1998
January1998
Chicago District
Adams
$ 990
$ 999
Brown
990
999
Frederickson
990
999
Minneapolis District
Andersen
950
999
Smith
950
999
----------
----------

4.20
Central Region Total
$4,780
$4,995
“Dimensions” Report, row, andsuper-column headings
“Facts” Numeric report values
Prepare and Publish the Requirements Deliverables
Formal documentation seems to be everyone’s least favorite activity, so it isconsequently the most frequently skipped task. We strongly recommend that youdevelop formal documentation from the requirements analysis process.
It is absolutely essential to write down the information gathered for several reasons. Firstof all, documentation becomes the encyclopedia of reference material as resources areadded to the data warehouse team. Likewise, critical information will be lost if people rolloff the team without documenting their findings. You won’t have the opportunity to sendthe replacement resources back for a tour of the users world just because of teamattrition. Secondly, documentation helps the team crystallize and better understand theinterview content. It is one thing to listen passively to an interviewee, but another toactively document what was said. Finally, documentation allows you to validate thefindings with users. It closes the loop with the users by confirming that we accuratelyheard and documented what they said. This checkpoint further reinforces the users’ role as the driver for the entire data warehouse project.
Interview Write-Ups
As the first level of documentation, we recommend writing up each interview as soon aspossible following the interview session. The write-up, shown in Figure 4.6, should organize the interview content by topic.
Figure 4.6 Sample business manager interview write-up. INTERVIEW WRITE-UP BACKGROUND AND BUSINESS OBJECTIVES
John is Vice President of Outcomes Management at Healco. His organization focuses on analyzing patient outcomes in order to improve the quality of patient care, as well asoperational efficiencies at Healco. . . .
ANALYTIC REQUIREMENTS
—
Outcomes analysis John wants the ability to analyze performance by diagnosis codes at a specific facilityversus the company baseline broken down by patient age, cost, and diagnosis. Heneeds to evaluate functional improvement/decline based on a variety of keyindicators including . . .
—
Operative performance analysis John’s group analyzes operative performance by procedure, procedure type, andsurgeon. Key monthly metrics include surgical procedure counts, patient counts,length of stay, and operative mortality. John’s group wants the ability to probe deeper into the information. Are the exceptional outcomes isolated to a given surgeon? Is itdue to unusual risk factors in their case load?
INFORMATION REQUIREMENTS
—
Patient information Patient demographics include age, gender, date of birth, risk factors, history of prior procedures. . .
—
Diagnosis codes Outcomes analysis requires all diagnosis codes including primary diagnosis,

4.21
admitting diagnosis, discharge diagnosis, and secondary diagnosis. . .
—
Acuity measures Acuity measures are captured several times during a patient stay. . .
SUCCESS CRITERIA John identified the following success criteria for this project: 1. Access to three years of history to support trending.
2.
Productive usage of the warehouse with no more than two days of initial usereducation.
It is important to provide a well-organized interview summary—this is not meant to be an interview transcript. Depending on the situation, it might include sections on business background and objectives, analytic and information requirements (including potentialbusiness impact), and success criteria. You should review this document with theinterviewee and get their sign-off before publishing it for others’ consumption.
Requirements Findings Document
In addition to the individual interview write-ups, the data from all the interviews should be consolidated and synthesized into a requirements findings document. This document is organized similarly to the interview write-ups to facilitate its creation:
• Executive overview • Project overview (including requirements definition approach and participants) • Business requirements: – High-level review of business objectives
–
Analytic and information requirements (typically organized by business process, asillustrated in Figure 4.7)
• Preliminary source system analysis (tied as often as possible to a businessrequirement)
• Preliminary success criteria Figure 4.7 Sample requirement findings excerpt. Requirements Findings Excerpt Sales Performance Analysis
Business users in the Sales Division want to leverage existing sales order information to better understand customer, product, and sales channel performance. They need to seethe impact of pricing changes or promotional trade offerings on sales volumes and salesmix by product or customer grouping. Users currently receive summary monthly sales performance reports, but are unable to drill into the detail information. They also need tosee sales trends over time, rather than just viewing a single month’s activity compared tolast year. Due to the lack of timely, actionable information, sales business users may be unaware of customer opportunities and problem situations. They need access to salesinformation on a daily basis in order to react to performance problems or opportunitiesbefore the close of the current month.
Typical analytic questions that could be answered with access to more timely sales orderinformation include:
• How much volume have we done with a specific customer or group of customers overthe last 6 months?
• Has my customer participated yet in a promotion which ends in two weeks?
• What is the sales mix by market and customer? Is there an opportunity to up-sell or cross-sell? Has that mix changed over the last 12 months?

4.22
• How does the sales mix for a given store compare with similar stores in the chain?
• What other products are frequently ordered with lower-productivity SKUs—are they dragging along sales and creating a larger “market basket”?
Depending on the breadth of interviews, we sometimes use a spreadsheet to consolidateinformation across interviews and assist in the development of the requirements findingsdocument. The spreadsheet allows you to track the frequency of a response orrequirements and to categorize and group the interview findings.
Tip
The business requirements findings document is immensely important becauseit establishes the relevance and credibility of the data warehouse project. It alsois probably the first time anyone has tied the business requirements to the realistic availability of data.
It is important that you communicate both the requirements and realities back to theusers in this consolidated document. The data warehouse will not be a panacea for atwenty-five-year-old operational system that is wrapped in layers of bandages. A draft ofthe requirements findings should be reviewed with the joint IS and business project leadsand sponsors and then distributed to the interviewees, their management, the datawarehouse team, and IS management.
Agree on Next Steps after Collecting Requirements
At this point, you have listened to users’ requirements and conducted a high-level investigation of likely source systems. You have a sense of what users want and what it is going to take to deliver against those requirements. Depending on your organization,one or more of the following activities should take place now. First, users need to confirmthat the synthesized requirement findings are accurate. Second, unless your users differ significantly from most we have worked with, they inevitably want more than can bedelivered in a single phase of your data warehouse implementation. The data warehouseteam needs input from the business community regarding priorities, and then the joint IS and business team needs to reach consensus and agree on scope before going forward.
Facilitation for Confirmation, Prioritization, and Consensus
Approaches for confirmation, prioritization, and consensus-building seem to vary from one organization to the next. We typically rely on a facilitated session with business andIS management representatives. Although it requires more coordination and effort,facilitation makes everyone part of the decision. The attendees walk away with a sense of ownership of the solution.
We suggest you use the business requirements prioritization technique described inChapter 3. In this approach, the facilitation attendees should have already received andread a copy of the requirements findings prior to the session.
Following the prioritization as described in Chapter 3, the session concludes with next-step action planning as appropriate focused on realistic, measurable tasks in a specifiedtime frame. Of course, any scope changes should be reflected in the project scopedocument as described in Chapter 3 and then redistributed.
Even if the initial project has already been firmly scoped, we still suggest a joint checkpoint session to confirm that the project team and business community are still insync. It also brings the requirements definition tasks for this phase of warehousedevelopment to closure.
Facilitation as an Alternative to Interviewing
As we said at the beginning of this chapter, facilitation is another viable approach for gathering user requirements. Although people often consider facilitation and interviewingto be dramatically different approaches, you will see that they are fairly similar byreviewing the following tasks associated with the facilitation process:
• Identify the facilitation team and roles (facilitator, cofacilitator/scribe). • Prepare the facilitation team with background information and preworkshop briefings.

4.23
• Determine workshop participants. • Determine workshop schedule and coordinate logistics. • Develop workshop materials.
• Prepare the participants with a pre-workshop packet sent by the workshop sponsor, outlining the project and workshop objectives and their roles to manage participantexpectations.
• Conduct the workshop, beginning with a structured introduction, followed by interactiondriven largely by the facilitator’s style, skills, and prior experience, and concluding witha session wrap-up.
• Document the workshop results. • Distribute to the participants for validation.
As you can see, the task flow for a successful facilitated session is similar to ourrecommended interview flow. Most of the techniques described in this chapter areapplicable to the facilitation process with a few minor adjustments.
Key Roles The key roles for collecting the requirements include:
•
The business system analyst drives the process to gather and documentrequirements. The project manager, business project lead, data modeler, and end user application developer often assist with these requirements definitionactivities.
• Representative business users and management are actively involved in theinterviews and prioritization activities. IS resources knowledgeable about the source systems also participate as data audit interviewees.
Estimating Considerations
The effort needed to collect the requirements is obviously impacted by the projectmagnitude and scope. In general, we try to complete the requirements definitiontasks within a four to six week window. Dependencies include:
• Number of interviewees. Assume a maximum of three interviews can be conducted in a single day. Add 60 to 90 minutes for each interview, plus 30 minutes for debrief and recovery.
•
Ability to get on interviewees schedules. If possible, try to avoid conducting requirements definition interviews or facilitated sessions during the “busyseason,” while the annual planning process is taking place, or in the midst ofsome other time-consuming corporate initiative. These competing activities willhave a large impact on your ability to schedule the requirements sessions and onthe quality of the sessions given the distractions.
• Number of source systems involved. The number of IS data audit sessions that must be scheduled is impacted by the number of source systems.
•
Level of documentation produced. Allocate a minimum of four hours per interview to produce a draft interview write-up. Additional time should be allocated for the review process and incorporation of changes. Also, be sure toallocate time in the project plan for the analysis of the interview findings anddevelopment of the overall findings document.
•
Ability to schedule a facilitated session for prioritization andconsensus. You should begin lining up calendars for this wrap-up facilitated session prior to the completion of your overall findings document. Travelschedules can severely impact the timeliness of this meeting. Also, don’t forget toallow time to prepare materials for this meeting.
• Commonality of needs. This variable impacts the effort required to reach

4.24
consensus.
Summary
The Business Dimensional Lifecycle approach is anchored in a fundamental belief thatdata warehouses must focus on the business and its requirements. This chapterprovided specific tips and techniques to establish that focus with your businesscommunity. The information gathered using the tools described in this chapter will beinvaluable as your data warehouse development effort unfolds, especially as you embarkon the design of your dimensional model. Be sure to consult the project plan tasksspreadsheet at the end of this chapter for a summary of the tasks and responsibilities forcollecting the requirements (Figure 4.8).
Figure 4.8 Project plan tasks for collecting the requirements.

5.1
5.2
Overview
Now that we have gathered the business requirements and performed the data audit, weare ready to start on the logical and physical design of our data warehouse. This design will transform the legacy data resources into final data warehouse structures. The logicaland physical designs are the cornerstone of the data warehouse. From these designs wewill be able to plan the data extraction and transformation steps. We will able to estimate the overall size and administrative needs of the central DBMS, and we will be able toplan and begin prototyping the final applications.
The authors of this book have spent most of their professional careers designing and using databases for decision support. From this experience, we have concluded that thedimensional modeling approach is the best way to model decision support data.Dimensional modeling provides the best results for both ease of use and high performance. We start this chapter with an impassioned argument for the benefits ofdimensional modeling. Then we show how a set of dimensional models can be fittedtogether into a Data Warehouse Bus Architecture.
This chapter provides a good introduction to dimensional modeling. Chapter 6 is a “graduate course” that explores a series of challenging design situations. In Chapter 7, we return to a project management perspective and discuss the practical steps forbuilding a set of dimensional models in a real environment.
All project team members should carefully read the sections on the case for dimensional modeling and the Data Warehouse Bus Architecture. The rest of the chapter’s content, the basic dimensional modeling techniques, should be well understood by the datamodelers. If there are remaining questions about these basic concepts, it would beworthwhile to refer to The Data Warehouse Toolkit. Although the rest of the team does not need to have the same detailed level of understanding as the modelers, it may beuseful for them to peruse the second half of this chapter.
The Case for Dimensional Modeling
Dimensional modeling is the name of a logical design technique often used for datawarehouses. It is different from entity-relationship modeling. This section points out the many differences between the two techniques and makes the clearest possible case fordimensional modeling:
Tip
Dimensional modeling is the only viable technique for delivering data to endusers in a data warehouse.
Entity-relationship modeling is very useful for transaction capture and can be used in thedata administration phases of constructing a data warehouse, but it should be avoidedfor end user delivery.
What is Entity-Relationship Modeling?
Entity-relationship modeling is a logical design technique that seeks to eliminate dataredundancy. Imagine that we have a business that takes orders and sells products tocustomers. In the early days of computing, long before relational databases, when wefirst transferred this data to a computer, we probably captured the original paper order asa single fat record with many fields. Such a record could easily have been 1000 bytesdistributed across 50 fields. The line items of the order were probably represented as a

5.3
repeating group of fields embedded in the master record. Having this data on thecomputer was very useful, but we quickly learned some basic lessons about storing andmanipulating data. One of the lessons we learned was that data in this form was difficultto keep consistent, because each record stood on its own. The customer’s name andaddress appeared many times, since this data was repeated whenever a new order wastaken. Inconsistencies in the data were rampant, since all the instances of the customeraddress were independent, and updating the customer’s address was a messytransaction.
Even in the early days, we learned to separate the redundant data into distinct tables,such as a customer master and a product master, but we paid a price. The softwaresystems used for retrieving and manipulating the data became complex and inefficientbecause they required careful attention to the processing algorithms for linking these setsof tables together. We needed a database system that was very good at linking tables. This paved the way for the relational database revolution where the database wasdevoted to just this task.
The relational database revolution took place in the mid-1980s. Most of us learned what a relational database was by reading Chris Date’s seminal book, An Introduction to Relational Databases (Addison Wesley), first published in the early 1980s. As we pagedthrough Chris’ book, we worked through all his Parts, Suppliers, and Cities databaseexamples. It didn’t occur to most of us to ask whether the data was completely “normalized” or whether any of the tables could be “snowflaked,” and Chris didn’t developthese topics. In our opinion, he was trying to explain the more fundamental concepts ofhow to think about tables that were relationally joined. All the issues of entity-relationship modeling and normalization were to be developed in the coming years as the industryshifted its attention to transaction processing.
Entity-relationship modeling is a discipline used to illuminate the microscopic relationships among data elements. The highest art form of entity-relationship modeling is to remove all redundancy in the data. This is immensely beneficial to transactionprocessing because it makes transactions very simple and deterministic. The transaction of updating a customer’s address may devolve to a single record lookup in a customeraddress master table. This lookup is controlled by a customer address key that definesthe uniqueness of the customer address record and allows an indexed lookup that is extremely fast. It is safe to say that the success of transaction processing in relationaldatabases is mostly due to the discipline of entity-relationship modeling.
However, in our zeal to make transaction processing efficient, we lost sight of the original, more important goal of relational databases.
Tip We have created transaction-oriented databases that cannot be queried.
Even our simple order-taking example creates a database of dozens of tables that arelinked together by a bewildering spider web of joins (see Figure 5.1). We are all familiarwith the big chart on the wall in the IS database designer’s cubicle. The entity-relationship model for the enterprise has hundreds of logical entities. High-end enterprise resource planning (ERP) systems like SAP have thousands of entities. Each of these entities usually turns into a physical table when the database is implemented. Thissituation is not just an annoyance, it is a show stopper:

5.4
Figure 5.1 An entity-relationship model of an enterprise that manufacturesproducts, sells products to chain retailers, and measures the retailers’ sales.
• End users cannot understand or remember an entity-relationship model. End users cannot navigate an entity-relationship model. There is no GUI (graphical user interface)that takes a general entity-relationship model and makes it usable by end users.
• Software cannot usefully query a general entity-relationship model. Cost based optimizers that attempt to do this are notorious for making the wrong choices, withdisastrous consequences for performance.
• Use of the entity-relationship modeling technique defeats the purpose of datawarehousing, namely intuitive and high performance retrieval of data.
From the beginning of the relational database revolution, IS shops have noticed thisproblem. Many who have tried to deliver data to end users have recognized theimpossibility of presenting these immensely complex schemas to end users, and many of these IS shops have stepped back to attempt “simpler designs.” We find it striking thatthese “simpler” designs all look very similar. Almost every one can be thought of as“dimensional.” In a natural, almost unconscious way, hundreds of IS designers have returned to the roots of the original relational model because they know a databasecannot be used by end users unless it is packaged simply.
Tip
It is probably accurate to say that this natural dimensional approach was not invented by any single person. It is an irresistible force in the design ofdatabases that will always appear when the designer places understandabilityand performance as the highest goals.
We are now ready to define the dimensional modeling approach. What Is Dimensional Modeling?
Dimensional modeling is a logical design technique that seeks to present the data in astandard framework that is intuitive and allows for high-performance access. It is inherently dimensional and adheres to a discipline that uses the relational model withsome important restrictions. Every dimensional model is composed of one table with amultipart key, called the fact table, and a set of smaller tables called dimension tables.Each dimension table has a single part primary key that corresponds exactly to one ofthe components of the multipart key in the fact table (see Figure 5.2). This characteristicstar-like structure is often called a star join. This term dates back to the earliest days of relational databases.
Figure 5.2 A dimensional model isolating the retail sales process from the firstfigure. The facts and dimensions can be found in the entity-relationship model.
Interestingly, the dimensional modeling approach may predate the entity-relationship modeling approach. As best we can determine, in the late 1960s General Mills andDartmouth University developed vocabulary consisting of “facts” and “dimensions.” Webelieve that this allowed Nielsen Marketing Research to carry these techniques forward

5.5
with grocery and drug store audit data in the 1970s and later with grocery and drug storescanner data in the late 1970s and early 1980s. The authors first became aware of theseideas from Nielsen in 1984.
A fact table, because it has a multipart primary key made up of two or more foreign keysalways expresses a many-to-many relationship. The most useful fact tables also containone or more numerical facts that occur for the combination of keys that define each record. In Figure 5.2, the facts are Dollars Sold, Units Sold, and Dollars Cost.
The most useful facts in a fact table are numeric and additive.
Additivity is crucial because data warehouse applications almost never retrieve a single fact table record. Rather, they fetch back hundreds, thousands, or even millions of theserecords at a time, and the only useful thing to do with so many records is to add them up.
Dimension tables, by contrast, most often contain descriptive textual information. The dimension attributes are the source of most of the interesting constraints in datawarehouse queries and are virtually always the source of the row headers in theStructured Query Language (SQL) answer set. In Figure 5.2, we constrain on the lemon-flavored products via the Flavor attribute in the Product table, and radio promotions viathe AdType attribute in the Promotion table. It should be obvious that the overall power ofthe database in Figure 5.2 is proportional to the quality and depth of the dimensiontables.
Tip Dimension tables are the entry points into the data warehouse.
The charm of the database design in Figure 5.2 is that it is highly recognizable to the end users in the particular business. We have observed literally hundreds of instances where end users agree immediately that this is “their business.”
The Relationship between Dimensional Modeling and Entity-Relationship Modeling
Obviously, Figures 5.1 and 5.2 look very different. Many designers react to this by saying that there must be less information in the star join or that the star join is only used forhigh-level summaries. Both of these statements are false.
The key to understanding the relationship between dimensional modeling and entity-relationship is that a single entity-relationship diagram breaks down into multiple fact table diagrams. Think of a large entity-relationship diagram as representing every possible business process in the enterprise. The master entity-relationship diagram may have Sales Calls, Order Entry, Shipment Invoices, Customer Payments, and ProductReturns, all on the same diagram. In a way, the entity-relationship diagram does itself a disservice by representing on one diagram multiple processes that never coexist in asingle data set at a single consistent point in time. No wonder the entity-relationship diagram is overly complex. Thus the first step in converting an entity-relationship diagram to a set of dimensional modeling diagrams is to separate the entity-relationship diagram into its discrete business processes and to model each one separately.
The second step is to select those many-to-many relationships in the entity-relationship model containing numeric and additive non-key facts, and designate them as fact tables.
The third step is to denormalize all the remaining tables into flat tables with single-part keys that connect directly to the fact tables. These tables become the dimension tables.In cases where a dimension table connects to more than one fact table, we represent this same dimension table in both schemas, and we refer to the dimension tables as“conformed” between the two dimensional models.
The resulting master dimensional model of a data warehouse for a large enterprise willconsist of somewhere between 10 and 25 very similar-looking star-join schemas. Each star join will have 5 to 15 dimension tables typically. If the design has been donecorrectly, many of these dimension tables will be shared from fact table to fact table.Applications that drill down will simply be adding more dimension attributes to the SQLanswer set from within a single star join. Applications that drill across will simply belinking separate fact tables together through the conformed (shared) dimensions.
Tip
Even though the overall suite of star-join schemas in the enterprise dimensional model is complex, the query processing is very predictable because at thelowest level, we recommend that each fact table should be queried

5.6
independently. The Strengths of Dimensional Modeling
The dimensional model has a number of important data warehouse advantages that theentity-relationship model lacks. First, the dimensional model is a predictable, standardframework. Report writers, query tools, and user interfaces can all make strong assumptions about the dimensional model to make the user interfaces moreunderstandable, and to make processing more efficient. For instance, since nearly all ofthe constraints set up by the end user come from the dimension tables, an end user tool can provide high-performance “browsing” across the attributes within a dimension via theuse of bit vector indexes. Metadata can use the known cardinality of values in adimension to guide the user interface behavior. The predictable framework offers immense advantages in processing. Rather than using a cost based optimizer, adatabase engine can make very strong assumptions about first constraining thedimension tables, and then “attacking” the fact table all at once with the Cartesian product of those dimension table keys satisfying the user’s constraints. Amazingly, usingthis approach it is possible to evaluate arbitrary n-way joins to a fact table in a single pass through the fact table’s index. We are so used to thinking of n-way joins as “hard” that a whole generation of DBAs doesn’t realize that the n-way join problem is formally equivalent to a single sort-merge. Really.
Tip
The predictable framework of a dimensional model allows both databasesystems and end user query tools to make strong assumptions about the datathat aid in presentation and performance.
A second strength of the dimensional model is that the predictable framework of the starjoin schema withstands unexpected changes in user behavior. Every dimension is equivalent. All dimensions can be thought of as symmetrically equal entry points into thefact table. The logical design can be done nearly independent of expected querypatterns. The user interfaces are symmetrical, the query strategies are symmetrical, and the SQL generated against the dimensional model is symmetrical.
A third strength of the dimensional model is that it is gracefully extensible toaccommodate unexpected new data elements and new design decisions. By that, we mean several things. First, all existing tables can be changed in place either by simplyadding new data rows in the table or by executing an SQL ALTER TABLE command.Data should not have to be reloaded. Graceful extensibility also means that that no query tool or reporting tool needs to be reprogrammed to accommodate the change. Andfinally, graceful extensibility means that all old applications continue to run withoutyielding different results. In Figure 5.2, we have labeled the schema with the numbers 1 through 4 indicating where we can make the following graceful changes to the designafter the data warehouse is up and running by:
1.
Adding new unanticipated facts, as long as they are consistent with the fundamentalgrain of the existing fact table.
2.
Adding completely new dimensions, as long as a single value of that dimension isdefined for each existing fact record.
3. Adding new unanticipated dimensional attributes.
4.
Breaking existing dimension records down to a lower level of granularity from acertain point in time forward.
Tip Dimensional models can be changed gracefully.
A fourth strength of the dimensional model is that there are a number of standardapproaches for handling common modeling situations in the business world. Each ofthese situations has a well-understood set of alternatives that can be specifically programmed in report writers, query tools, and other user interfaces. These modelingsituations include:
•
Slowly changing dimensions, where a “constant” dimension like Product or Customeractually evolves slowly and asynchronously. Dimensional modeling provides specific techniques for handling slowly changing dimensions, depending on the businessenvironment.
• Heterogeneous products, where a business like a bank needs to track a number of

5.7
different lines of business together within a single common set of attributes and facts, but at the same time needs to describe and measure the individual lines of business inhighly idiosyncratic ways using incompatible facts.
• Pay-in-advance databases, where the transactions of a business are not little pieces of revenue, but the business needs to look at both the individual transactions as well asreport on revenue on a regular basis.
• Event-handling databases, where the fact table usually turns out to be “factless.”
A final strength of the dimensional model is the growing body of administrative utilitiesand software processes that manage and use aggregates. Recall that aggregates are summary records that are logically redundant with base data that is already in the data warehouse, but are used to greatly enhance query performance. A comprehensiveaggregate strategy is required in every medium- and large-sized data warehouse implementation. To put it another way, if you don’t have aggregates, then you arepotentially wasting millions of dollars on hardware upgrades to solve performanceproblems that could be otherwise addressed by aggregates.
Tip
All of the available aggregate navigation software packages and utilitiesdepend on a very specific single structure of fact and dimension tables that are absolutely dependent on the dimensional model. If you don’t adhere to thedimensional approach, you cannot benefit from using these tools.
Myths about Dimensional Modeling
There are a few myths floating around about dimensional modeling that deserve tobe addressed.
Myth #1 is that implementing a dimensional data model will lead to stovepipedecision support systems. This myth sometimes goes on to blame denormalizationfor supporting only specific applications that therefore cannot be changed. This is ashort-sighted interpretation of dimensional modeling that has managed to get themessage exactly backwards. First, we have argued that every entity-relation model has an equivalent set of dimensional models that contain the same information.Second, we have shown that even in the presence of organizational change andend-user adaptation, the dimensional model extends gracefully without altering itsform. It is in fact the entity-relation model that whipsaws the application designersand the end users by requiring SQL to be rewritten.
A source of this myth, in our opinion, is the designer struggling with fact tables thathave been prematurely aggregated. For instance, the design in Figure 5.2 is expressed at the individual sales ticket line item level. This is the correct startingpoint for the retail database because it is the lowest possible grain of data. Therejust isn’t any further breakdown of the sales transaction. If the designer had startedwith a fact table that had been aggregated up to weekly sales totals by store, thenthere would be all sorts of problems in adding new dimensions, new attributes, andnew facts. However, this isn’t a problem with the design technique, this is aproblem with the database being prematurely aggregated.
Myth #2 is that no one understands dimensional modeling. We have seen hundreds of really good dimensional designs done by people we have never met orhad in our classes. There is a whole generation of designers from the packagedgoods retail and manufacturing industries who have been using and designingdimensional databases for the last 15 years. We personally learned aboutdimensional models from existing A.C. Nielsen and IRI applications that wereinstalled and working in places like Procter & Gamble and Clorox as early as 1982.
Incidentally, although this section has been couched in terms of relationaldatabases, nearly all the arguments in favor of the power of dimensional modelinghold perfectly well for proprietary multidimensional databases, such as OracleExpress, Arbor Essbase, Microsoft’s SQL Server OLAP component, and others.
Myth #3 is that dimensional models only work with retail databases. This myth is rooted in the historical origins of dimensional modeling but not in its current-day reality. Dimensional modeling has been applied to many different business areas, including retail banking, commercial banking, property and casualty insurance,

5.8
health insurance, life insurance, brokerage customer analysis, telephone companyoperations, newspaper advertising, oil company fuel sales, government agency spending, manufacturing shipments, health care, and many more.
Myth #4 is that snowflaking is an alternative to dimensional modeling. Snowflaking is removing low-cardinality textual attributes from dimension tables and placingthem in “secondary” dimension tables. For instance, a product category can betreated this way and physically removed from the low-level product dimension table. While we believe this compromises cross-attribute browsing performance and may interfere with the legibility of the database, we know that some designersare convinced that this is a good approach. Snowflaking is certainly not at oddswith dimensional modeling. We regard snowflaking as an embellishment to thesimplicity of the basic dimensional model. We think that a designer can snowflake with a clear conscience if this technique improves user understandability andimproves overall performance. The argument that snowflaking assists themaintainability of the dimension table is specious. Maintenance issues are indeed leveraged by entity-relation-like disciplines, but all of this happens in the datastaging area, before the data is loaded into the dimensional schema.
Tip
A data model that cannot gracefully accommodate new sources of data has probably been prematurely aggregated.
In summary, we firmly believe that dimensional modeling is the only viable technique fordesigning end user delivery databases. Entity-relationship modeling defeats end user delivery and should not be used for this purpose.
Entity-relationship modeling does not really model a business, rather it models the micro-relationships among data elements. Entity-relationship modeling does not have business rules, it has data rules. Few if any global design requirements in the entity-relationship modeling methodology speak to the completeness of the overall design. For instance,does your entity-relationship computer-aided software engineering (CASE) tool try to tell you if all the possible join paths are represented and how many there are? Are you even concerned with such issues in an entity-relationship design? What does entity-relationship have to say about standard business modeling situations like slowlychanging dimensions? In a sense, entity-relationship techniques model the structure of data, whereas dimensional techniques model the semantics of the data.
Entity-relationship models are wildly variable in structure. Predict in advance how tooptimize the querying of hundreds of interrelated tables in a big entity-relationship model. By contrast, even a big suite of dimensional models has an overall deterministic strategyfor evaluating every possible query, even those crossing many fact tables. (Hint: youcontrol performance by querying each fact table separately.) The wild variability of the structure of entity-relationship models means that each data warehouse needs custom-written and fine-tuned SQL. It also means that each schema, once it is tuned, is veryvulnerable to changes in the user’s querying habits, because such schemas are asymmetrical. By contrast, in a dimensional model, all dimensions serve as equal entrypoints to the fact table. The visual symmetry that is obvious in Figure 5.2 is mirrored in the query strategies that should be used with such a physical model. Changes in user’squerying habits don’t change the structure of the SQL or the standard ways of measuringand controlling performance.
Entity-relationship models do have their place in the data warehouse. First, the entity-relationship model should be used in all legacy OLTP applications based on relationaltechnology. This is the best way to achieve the highest transaction performance and the highest ongoing data integrity. Second, the entity-relationship model may possibly be used in the back room data cleaning and combining steps of the data warehouse. This isthe data staging area.
However, before data is packaged into its final queryable format, it must be loaded into adimensional model on the presentation server. The dimensional model is the only viabletechnique for achieving both user comprehension and high query performance in theface of ever-changing user questions.
Putting Dimensional Models Together: The Data WarehouseBus Architecture

5.9
One of the most widely debated issues in data warehousing is how to plan thewarehouse construction. Do we build the whole data warehouse all at once from a central, planned perspective (the monolithic approach) or do we opportunistically buildseparate subject areas whenever we feel like it (the stovepipe approach)? We need todemolish two powerful myths. First, nobody believes in a totally monolithic approach, and nobody defends a totally stovepipe approach. All the leading data warehousepractitioners use some kind of architected step-by-step approach to build an enterprise data warehouse. We describe a specific variation of that step-by-step approach called the Data Warehouse Bus Architecture.
Second, we have moved beyond the phase in data warehouse development where adata mart must be restricted to being a highly aggregated subset of a nonqueryable datawarehouse. This view of data marts is the source of many problems andmisunderstandings. In Chapter 1 we defined a data mart to be a natural complete subsetof the overall data warehouse.
Tip
Every useful data mart should be based on the most granular (atomic) data thatcan possibly be collected and stored.
The Planning Crisis
The task of planning an enterprise data warehouse is daunting. The newly appointed manager of the data warehousing effort in a large enterprise is faced with two huge andseemingly unrelated challenges. On the one hand the manager is supposed tounderstand the content and location of the most complicated asset owned by the enterprise: the legacy data. Somehow (usually overnight) the new data warehousemanager is supposed to become an authority on exactly what is contained in all thoseVSAM, ISAM, IMS, DB2, and Oracle tables. Every field in every table must beunderstood. The data warehouse manager must be able to retrieve any such element ofdata and, if necessary, must be able to clean it up and correct it. On the other hand, thedata warehouse manager is supposed to understand exactly what keeps managementawake at night. The data warehouse is expected to contain exactly the data needed toanswer the “burning questions.” Of course, the data warehouse manager is “free” to dropin on senior management at any time to discuss current corporate priorities. Just makesure you get this data warehouse done pretty soon.
The pressure of this daunting task has built up to the point where its relief has a name.The name is data mart.
Tip
The term data mart means avoiding the impossibility of tackling the enterprise data warehouse planning job all at once.
Data warehouse planners take refuge in carving off a little piece of the whole datawarehouse and bringing it to completion, calling it a data mart.
Unfortunately, in many cases building separate data marts rather than a single data warehouse has become an excuse for ignoring any kind of design framework that mighttie the data marts together. Vendors’ marketing claims for a “data mart in a box” and a“15-minute data mart” pander to the marketplace’s demand for a simple solution, but these claims are a real disservice to the manager of data warehousing who must makethese data marts fit together into a coherent whole.
Isolated stovepipe data marts that cannot usefully be tied together are the bane of the data warehouse movement. They are much worse than a simple lost opportunity foranalysis. Stovepipe data marts perpetuate incompatible views of the enterprise.Stovepipe data marts enshrine the reports that cannot be compared with one another. And stovepipe data marts become legacy implementations in their own right, where, bytheir very existence, they block the development of an integrated enterprise datawarehouse.
So if building the data warehouse all at once is too daunting and building it as isolated pieces defeats the overall goal, what is to be done?
Data Marts with a Bus Architecture
The answer to this dilemma is to start planning the data warehouse with a short overalldata architecture phase that has very finite and specific goals and then to follow this architecture phase with a step-by-step implementation of separate data marts, where

5.10
each implementation step closely adheres to the architecture. In this way the datawarehouse manager gets the best of both worlds. The data architecture phase produces specific guidelines that the separate data mart development teams can follow, and thedata mart development teams can work fairly independently and asynchronously. As theseparate data marts come on line, they will fit together like the pieces of a puzzle. At some point, enough data marts exist to make good on the promise of an integratedenterprise data warehouse.
Any successful data warehouse implementer who succeeds in implementing anenterprise data warehouse will inevitably perform the following two steps:
1.
Create a surrounding architecture that defines the scope and implementation of thecomplete data warehouse.
2. Oversee the construction of each piece of the complete data warehouse.
Now stop and consider step 2. The biggest task in constructing the data warehouse isdesigning the extract system that gets the data from a specific legacy system into thedata staging area where it can be transformed into the various load record images needed by the final database that presents the data for querying. Since theimplementation of the extract logic is largely specific to each original data source, it reallydoesn’t matter whether you think of the task as one task or whether you break it into pieces. Either way, you have to put your pants on one leg at a time. You will, in effect, beimplementing your data marts one at a time no matter how you plan your project.
Conformed Dimensions and Standard Fact Definitions
In the architecture phase that precedes the implementation of any of the data marts, thegoals are to produce a master suite of conformed dimensions and to standardize thedefinitions of facts. The resulting set of standards are called the Data Warehouse Bus Architecture. We are assuming here that you have a proper dimensional design for all ofthe data marts. Any given data mart is assumed to consist of a set of fact tables, eachwith a multipart key made up of dimension key components (foreign keys joining to the dimension tables). Recall that the fact tables all contain zero or more facts that representmeasurements taken at each combination of the dimension key components. Every facttable is surrounded by a halo of dimension tables, where the dimension keys are primary keys in each respective dimension table. This design is also called a star join. These dimensional modeling constructs are defined carefully later in this chapter.
Tip
A conformed dimension is a dimension that means the same thing with every possible fact table to which it can be joined.
Generally this means that a conformed dimension is identically the same dimension ineach data mart. Examples of obvious conformed dimensions include customer, product,location, deal (promotion), and calendar (time).
Tip
A major responsibility of the central data warehouse design team is toestablish, publish, maintain, and enforce the conformed dimensions.
The establishment of a conformed dimension is a very significant step. A conformed customer dimension is a master table of customers with a clean customer key and manywell-maintained attributes describing each customer. It is likely that the conformedcustomer dimension is an amalgamation and a distillation of data from several legacy systems and possibly outside sources. The address fields in the customer dimension, forinstance, should constitute the best mailable address that is known for each customeranywhere within the enterprise. It is often the responsibility of the central data warehouse team to create the conformed customer dimension and provide it as a resource to therest of the enterprise, both for legacy use and for data warehouse use.
The conformed product dimension is the enterprise’s agreed-upon master list of products, including all product rollups and all product attributes. A good productdimension, like a good customer dimension, should have at least 50 separate textualattributes.
The conformed location dimension should ideally be based on specific points on the map, like specific street addresses or even precise latitudes and longitudes. Specificpoints in space roll up to every conceivable geographic hierarchy, including city, county,state, country, and zip code, as well as idiosyncratic sales territories and sales regions.

5.11
The conformed calendar dimension will almost always be a table of individual days,spanning a decade or more. Each day will have many useful attributes drawn from thelegal calendars of the various states and countries the enterprise deals with, as well asspecial fiscal calendar periods and marketing seasons relevant only to internalmanagers.
Conformed dimensions are enormously important to the data warehouse.
Tip
Without a strict adherence to conformed dimensions, the data warehousecannot function as an integrated whole.
If a dimension like customer or product is used in an nonconformed way, then either theseparate data marts simply cannot be used together, or worse, attempts to use them together will produce wrong results. To state this more positively, conformed dimensionsmake the following possible:
1.
A single dimension table can be used against multiple fact tables in the samedatabase space.
2. User interfaces and data content are consistent whenever the dimension is used.
3.
There is a consistent interpretation of attributes and, therefore, rollups across datamarts.
Designing the Conformed Dimensions
The task of identifying and designing the conformed dimensions should take a fewweeks. Most conformed dimensions will naturally be defined at the most granular(atomic) level possible. The grain of the customer dimension will naturally be theindividual customer. The grain of the product dimension will naturally be the lowest levelat which products are tracked in the source systems. The grain of the time dimension willusually be individual days.
We recommend that conformed dimensions always have an anonymous (surrogate) data warehouse key that is not a production system key from one of the legacy systems.There are many reasons for the data warehouse keys to be independent fromproduction. The administrative goals of the production systems are different from those of the data warehouse. Sooner or later, the production system will step on the datawarehouse, either by reusing the same key or by changing the administrativeassumptions in some way. Also, the data warehouse has to produce generalized keys for various situations, including the problem of slowly changing dimensions. We discussslowly changing dimensions later in this chapter.
Taking the Pledge
If the central data warehouse team succeeds in defining and providing a set of master conformed dimensions for the enterprise, it is extremely important that the data martteams actually use these dimensions. The commitment to use the conformed dimensionsis more than a technical decision. It is a business policy decision that is key to making the enterprise data warehouse function.
Tip
Since the creation of conformed dimensions is as much a political decision as itis a technical decision, the use of the conformed dimensions should besupported at the highest executive levels. This issue should be a sound bite for the enterprise CIO.
Using data effectively in a large enterprise is intimately connected to how the enterpriseis organized and how it communicates internally. The data warehouse is the vehicle fordelivering the data to all the affected parties. Changing the way an enterprise isorganized, how it communicates, and how it uses its data assets is mainline businessreengineering. The CIO of the enterprise should make all the separate data mart teamstake the pledge to always use the conformed dimensions.
Establishing the Conformed Fact Definitions
Thus far, we have talked about the central task of setting up conformed dimensions to tieour data marts together. This is 80 percent of the up-front data architecture effort. The remaining effort goes into establishing conformed fact definitions.

5.12
Fortunately, the task of identifying the conformed fact definitions is done at the same timeas the identification of the conformed dimensions. We need conformed fact definitions when we use the same terminology across data marts and when we build single reportsthat drill across the data marts as described in the last section.
Examples of facts that must be conformed include revenue, profit, standard prices, andstandard costs. The underlying equations that derive these facts must be the same ifthey are to be called the same thing. These conformed fact definitions need to be definedin the same dimensional context and with the same units of measurement from data martto data mart. Revenues and profits need to be reported in the same time periods and inthe same geographies.
Sometimes a fact has a natural unit of measure in one fact table and another natural unitof measure in another fact table. For example, the flow of product down a typicalmanufacturing value chain may best be measured in shipping cases at the manufacturer, but it should be measured in scanned units at the retailer. Even if all the dimensionalconsiderations have been correctly taken into account, it would be difficult to use thesetwo incompatible units of measure in one drill-across report. The usual solution to this kind of problem is to refer the user to a conversion factor buried in the product dimensiontable and hope the user can find the conversion factor and use it correctly. This isunacceptable overhead in our opinion. The correct solution is to carry the fact in both shipping cases and in scanned units in the manufacturer’s table or in a view of themanufacturer’ table. That way a report can easily glide down the value chain, picking offcomparable facts.
Tip
If it is difficult or impossible to exactly conform a fact, be sure to give thedifferent interpretations different names.
A similar unit-of-measure conflict can occur when reporting financial figures. Revenue isa very important measure but it can have slightly different interpretations. For instance, we must distinguish Month End Revenue from Billing Cycle Revenue. The most seriousmistake is to seriously call both of these facts Revenue.
The Importance of Data Mart Granularity
The conformed dimensions will usually be granular (atomic) because each record inthese tables most naturally corresponds to a single description of a customer, a product,a promotion, or a day. This makes it quite easy to bring in the associated fact tables atthe intersection of all these granular dimensions. In other words, the base level facttables in each data mart should be at the natural lowest levels of all the constituentdimensions.
There is tremendous power and resiliency in granular fact table data.
Tip
By expressing the bedrock data of the data mart at the lowest grain, the datamart becomes almost impervious to surprises or changes.
Such a granular fact table can be gracefully extended by adding newly sourced facts, byadding newly sourced dimension attributes, and by adding whole dimensions. When wesay “gracefully extended” we mean specifically that all old queries and applicationscontinue to run after a graceful change has been made, no fact tables have to bedropped and reloaded, and no keys have to be changed. This notion of gracefulextension is one of the strong characteristics of the dimensional modeling approach.
An unfortunate practice of some designers is to state that the atomic data in the datawarehouse should not be in a dimensional format but should be highly normalized. Thisis confusing the data staging area with the data marts that make up the main, queryabledata warehouse.
Tip
The main, queryable data warehouse must remain dimensional all the way down to the most granular data. It is impractical to drill down throughdimensional data “almost” to the most granular data and then lose the benefitsof a dimensional presentation at the last step.
When the fact tables are granular, they serve as the natural destination for current operational data that may be extracted very frequently from the operational systems. Thecurrent rolling snapshot of an operational system finds a happy home in the granular facttable defined at the Account by Day by Transaction level. In Chapter 6 we describe a common business situation calling for two companion tables, a transaction fact table, and

5.13
snapshot fact table, that can be the bedrock foundation of many of our data marts.
A new and growing justification for extreme granular data is the desire to do data miningand to understand customer behavior. Data mining is generally much less effective on aggregated data.
Multiple-Source Data Marts
This discussion has mostly focused around single-source data marts that are recognizable images of legacy applications. In other words, if we have an orders system,then we have an orders data mart. If we have a payments and collections system, thenwe have a payments and collections data mart.
We recommend starting with these kind of single-source data marts because we believe it minimizes the risk of committing to an impossible implementation that is too ambitious. Most of the risk comes from biting off too big an extract programming job.
Tip
An efficiently implemented single-source data mart will provide users with enough interesting data to keep them happy and quiet while the data mart teams keep working on harder issues.
After several single-source data marts have been implemented, it is reasonable tocombine them into a multiple source data mart. The classic example of a multiple-source data mart is the profitability data mart, where separate components of revenue and costare combined to allow a complete view of profitability. Profitability data marts at agranular level are tremendously exciting because they can be rolled up through thecustomer dimension to generate customer profitability. They can be rolled up through theproduct dimension to generate product profitability. And they can be rolled up through thepromotion dimension to generate promotion profitability. The lesson here is to bedisciplined. Don’t try to bring up a complete profitability data mart on the first try or youwill drown in extract programming as you struggle to source all the separate componentsof revenue and cost.
Later, when you have time to source the cost detail correctly, you can bring up an Activity-Based Profitability multiple source data mart to supersede your single-source data mart.
Tip
If you are absolutely forced to bring up profitability in your first data mart, thenyou may need to assign costs with simple rule-of-thumb allocations rather than by doing the complete job of sourcing all the underlying cost detail.
Rescuing Stovepipes
Can you rescue your stovepipes and convert them into architected data marts? You cando this only if the dimensions used in the stovepipes can be mapped one-to-one or one-to-many with the proper conformed dimensions. If you can, the stovepipe dimension canbe replaced with the conformed dimension. In some cases the conformed dimension cangracefully inherit some of the special attributes of the stovepipe dimension. But stovepipedata marts usually have one or more dimensions that cannot easily be mapped into theconformed dimensions. The stovepipe sales geographies may simply be incompatiblewith the conformed sales geographies. Be careful about assuming that you candecompose something simple like stovepipe weeks back into conformed dimension days.While this sounds simple logically, you are probably making an unfounded assumptionthat you can spread a stovepipe week over weekdays and then turn around and add upagain into months.
As difficult as it is to admit, stovepipe data marts usually have to be shut down and rebuiltin the proper conformed dimensional framework.
When You Don‘t Need Conformed Dimensions
If you have several lines of business where your customers and products are disjoint,and you don’t manage these separate business lines together, there is little point inbuilding a data warehouse that tightly integrates these businesses. For example, if you are a conglomerate business whose subsidiaries span food businesses, hardwarebusinesses, and services, it probably doesn’t make sense to think of your customers asleveraging your brand name from product to product or service to service. Even if you tried to build a set of conformed product and customer dimensions in a single data

5.14
warehouse spanning all the lines of business, most of the reports would end up weirdly“diagonalized” with the data from each business line in rows and columns not shared by the other lines. In this case your data warehouse would mimic your managementstructure, and you would be better off building separate, self-contained data warehouses for each subsidiary.
In this section we have described a rational approach to decomposing the daunting taskof planning an enterprise data warehouse. We have achieved the best of two worlds. Wehave created an architectural framework that guides the overall design, but we havedivided the problem into bite-sized data mart chunks that can be implemented by realhuman beings. Along the way, we have adjusted the conventional definitions of the datamart. We see now that a data mart is a complete subset of the overall data warehouseand almost always based on the most granular possible data we can extract from ourlegacy systems. Every data mart is a family of similar tables sharing conformeddimensions. These conformed dimensions have a uniform interpretation across theenterprise. Finally, we see the overall data warehouse for what it is: a collection of separately implemented data marts bound together with a powerful architecture based onconformed dimensions and conformed facts.
The Data Warehouse Bus
Conformed dimensions and conformed facts are the “bus” of the data warehouse. The word bus is an old term from electrical power plants that is now used commonly in thecomputer industry. A bus is a common structure that everything connects to and derivespower from. The bus in your computer is a standard interface that allows many different kinds of devices to be connected to your computer. If all the devices conform to thestandard interface definition imposed by the bus, then these devices can usefully coexistwith the rest of the computer.
It should be obvious from this section that conformed dimensions and conformed factsplay the role of a bus in the data warehouse.
Tip
By defining a standard bus interface for a given data warehouse environment, anew data mart may be brought into the data warehouse where it can usefullycoexist with what is already there.
Almost certainly the new data mart will derive power from the bus, because the busoffers an array of standard dimensions and parallel facts that increase theexpressiveness of the new data mart.
Basic Dimensional Modeling Techniques
Having made the case for dimensional modeling, let us review the standard techniques that define this data modeling discipline. This chapter discusses most of the importantdimensional modeling situations without motivating the discussions with specific businessexamples. The grounding of these situations with examples is extremely important, but this grounding was done originally in The Data Warehouse Toolkit, and it is assumed that the reader is familiar with that material.
Fact Tables and Dimension Tables
The fundamental idea of dimensional modeling is that nearly every type of business data can be represented as a kind of cube of data, where the cells of the cube containmeasured values and the edges of the cube define the natural dimensions of the data. Ofcourse, we allow more than three dimensions in our designs, so we technically should call the cube a hypercube, although the terms cube and data cube are used by almost everyone.
Real dimensional models in the business world seem to contain between 4 and 15dimensions. Models with only 2 or 3 dimensions are rare, and often lend the suspicion that more dimensions should be added to the design, if only the designer would stop andthink. Models with 20 or more dimensions, for different reasons, seem unjustified. A 20-dimension design usually has superfluous dimensions that should be combined. Although the final choice of dimensions is the prerogative of the designer, there is afundamental sense that the identity of the dimensions is rooted in the reality of thebusiness environment, and not in the designer’s taste. Few of us really believe that we live in a world in which 20 or more independent variables affect every observation.

5.15
Facts
A dimensional model distinguishes between facts and attributes. A fact is usuallysomething that is not known in advance. A fact is “an observation in the marketplace.”Many facts in the business world are numeric, although a few can be text valued. Thedesigner should suspect that any numeric data field, especially if the value is a floatingpoint number, is probably a fact, not an attribute. Sometimes a numeric value like a“standard price” seems to be an attribute of the product dimension, and it seems to be aconstant that is known in advance. But on closer examination, the standard priceattribute turns out to be adjusted once or twice per year. In these cases, late in thedesign phase, we change our minds and make the standard price a “measured” fact. Wecan ensure that there is ultimately no difference in the information content of thedatabase, but we have made a typical (and correct) decision to make nearly all floatingpoint number fields into facts.
Attributes
Attributes, by contrast, are usually text fields, and they usually describe a characteristicof a tangible thing. The most obvious attributes are the descriptions of products. Theflavor of a product is a well-known attribute of the product, and it is probably displayed ina prominent way on the product packaging. We don’t measure the flavor attribute of aproduct, we know it in advance. If we create another product with a new flavor, we createa new product record. Creating a new product record for a new flavor is a fundamentaldata warehouse activity, and does not require the production OLTP system to assign anew product ID to the new flavor, although they usually do.
Dimensions
The textual attributes that describe things are organized within the dimensions. In a retaildatabase, at a minimum, we have a product dimension, a store dimension, a customerdimension, a promotion dimension, and a time dimension. A dimension is a collection oftext-like attributes that are highly correlated with each other. There is a degree ofdesigner judgment in the choice of dimensions. In a retail database, we could attempt to combine the product dimension with the store dimension and make a single monolithicproduct-store dimension. If we had 1000 products and 100 stores, we must ask howmany product-stores we ended up with when we tried to combine these dimensions. Ifthere was no meaningful correlation between product and store, and every product wassold in every store, then our combined product-store dimension would be the Cartesian product of the two original dimensions, and we would have 100,000 product-stores. Although this new combined dimension would contain exactly the same information asthe original dimensions, we would reject this design immediately because the new largerdimension would be unwieldy and would present performance problems and no userinterface advantages. Conversely, if the combined dimension contained only 2000product-stores, it would indicate that products were branded to sell in very specificstores. In this case the combined dimension would be very useful. Not only would it bevery compact, but the dimension itself would reveal much interesting information aboutthe relationship between products and stores and it would be a desirable “browsing”target. In most cases the designer can use his or her intuition about separate dimensionsto determine whether they should be combined, but in some cases the dimensions areabstract, and the designer may have to perform a series of COUNT DISTINCToperations on combinations of attributes to see whether they are really independent ornot.
Inside Dimension Tables, Drilling Up and Down Drilling down is the oldest and most venerable kind of drilling in a data warehouse.
Tip
Drilling down means nothing more than give me more detail by, for instance,adding a row header to an existing SQL request.
In a dimensional model, the attributes in the dimension tables play a crucial role. Theseattributes are textual, or they behave like text, they take on discrete values, and they arethe source of application constraints and row headers in the final report. In fact, one can always imagine creating a row header in a report by opportunistically dragging adimension attribute from any of the dimension tables down into the report, therebymaking it a row header. See Figure 5.3. The beauty of the dimensional model is that all dimension attributes are revealed to be equal candidates to become row headers. The

5.16
process of adding row headers can be compounded, with as many row headers from asmany dimension tables as the user wishes. The great strength of SQL is that these row headers simply get added to the SELECT list and the GROUP BY clause and the rightthing happens. Usually we add these row headers to the ORDER BY clause also so thatwe get the grouping in a prescribed order.
Figure 5.3 The relationship of a star schema model to a report.
From the preceding discussion we see that the precise definition of drilling down is to adda row header. A few query tool vendors have tried to be overly helpful, and they have implemented Drill Down commands in their user interfaces that adds specific rowheaders, usually from the product hierarchy. For instance, the first time you press theDrill Down button, you add a Category attribute. The next time, you add the Subcategory attribute, and then the Brand attribute. Finally, the detailed product description attribute isat the bottom of the product hierarchy. This is very limiting and often not what the userwants! Real drill down mix hierarchical and nonhierarchical attributes from all the available dimensions.
In fact, there is almost always more than one well-defined hierarchy in a given dimension. In some companies, Marketing and Finance have incompatible and differentviews of the product hierarchy. Although one might wish that there was only a singleproduct hierarchy, all of the Marketing-defined attributes and all of the Finance-defined attributes are well defined in the detailed master product table. See Figure 5.4. Usersmust be allowed to traverse any hierarchy and to choose unrelated attributes that are notpart of the hierarchy, like flavor.
Figure 5.4 A product dimension table showing two incompatible hierarchies andattributes unrelated to any hierarchy.
Large customer dimension tables often have three simultaneous hierarchies. If the grainof the customer table is the Ship To location, we automatically have a geographichierarchy defined by the customer’s address (city, county, state, and country). We probably also have a hierarchy that is defined by the customer’s organization, such asShip to, Bill To, Division, and Corporation. Finally, we may have our own sales hierarchythat is based on assigning sales teams to the customer’s Ship To location. This sales hierarchy could be organized by Sales Territory, Sales Zone, and Sales Region. In arichly defined customer table, all three hierarchies could coexist happily, awaiting allpossible flavors of end user drill down.

5.17
If drilling down is adding row headers from the dimension tables, then drilling up issubtracting row headers. Of course, it is not necessary to subtract the row headers in thesame order that they were added. In general, each time a user adds or subtracts a rowheader, a new multitable join query must be launched. If we have an aggregatenavigator, each such multitable join query smoothly seeks its proper level in the space ofexplicitly stored aggregates.
Tip
In a properly tuned data warehouse, there will be little difference in performance between bringing back 1000 answer set rows at a high level ofaggregation and bringing back 1000 answer set rows at a low level ofaggregation.
The Importance of a Good Browser
The data warehouse marketplace has been using the word browsing for at least fifteen years. In this context, it means interactively examining the relationships among attributesin a dimension table. Data warehouse browsing has nothing to do with browsing on theInternet. At least for this section of the book, we will use the term browsing in the older data warehouse sense, although we realize our claim to this word is a lost cause.
A good browser should allow the user to explore an unfamiliar dimension table andreveal the relationships in it. The user should be able to enumerate all the distinct valuesof an attribute as a user interface action that takes place within one or two seconds.There should be a threshold number of distinct values above which the browser simplyreturns the COUNT DISTINCT rather than each distinct value. The results of a browserequest must be affected by other constraints that may have been set in the dimensiontable during the browse session. Finally, a set of constraints that have been carefullyspecified during a browse session must be able to be saved with a user defined name sothat this set of constraints can be used at various times in the future in queries andreports. Please ask your favorite query tool vendor for this set of features. If you get a blank stare, ask why the vendor’s developers don’t spend time building queries againstreal dimension tables with their customers.
Permissible Snowflaking
A dimension is said to be snowflaked when the low cardinality fields in the dimension have been removed to separate tables and linked back into the original table withartificial keys. An example snowflaked product dimension table is shown in Figure 5.5.Generally, snowflaking is not recommended in a data warehouse environment.Snowflaking almost always makes the user presentation more complex and moreintricate. Database designers often like this intricacy, but users are often intimidated bythe detail. Snowflaking also makes most forms of browsing among the dimensionalattributes slower. Remember that most browses involve selecting the distinct values of adimension attribute subject to one or more other attributes in the dimension beingconstrained. Obviously a snowflaked category table will perform extremely well if the useris asking only for the distinct values of category with no ancillary constraints, but if theuser is constraining on package type at the same time, then the query needs to join thesnowflaked category table back through to the product dimension table and possibly out through another snowflake link to the package-type table where the constraint has been placed. In a realistic product dimension with 250,000 records, this query could run forseveral minutes on well-known relational databases. And yet this simple query is supposed to be a user interface action that responds in one or two seconds.
Figure 5.5 The same product dimension table as in Figure 5.4, this time snowflaked to remove low cardinality attributes and place them in separatetables. Note the presence of many new keys to implement the new joins.

5.18
Some database designers snowflake because they are trying to save space on the disk. Surely by eliminating all those nasty text fields, we will save space. Granted, if theartificial key required for each snowflaked entry is shorter than the text string it replaces(a reasonable assumption), some space will be saved. Suppose in our 250,000-row product table, we replaced 250,000 fifteen-byte category names with a two-byte artificial category key. We have thereby saved approximately 250,000 times 13 bytes or 3.25 MB.Our overall product table may well be larger than 100 MB, and the associated sales fact table is likely to be at least 10 GB. We have just saved 3 MB on a base of 10 GB, or 0.03percent. This questionable savings has been paid for with an extra step of administrationin creating and populating the artificial keys, as well as an almost certain severeperformance penalty for cross-attribute browsing.
A final reason for not using snowflaking as a standard technique is that it probablydefeats the purpose of a new and useful class of indexes called bitmap indexes. Bitmap indexes are meant for low cardinality fields, like our category field, or even Yes/Noindicator fields with only two values. Bitmap indexes encourage the DBA to directly indexall low cardinality fields. The best bitmap indexes may even perform a kind of “internal snowflake” that makes the enumeration of the distinct, unconstrained list of attributevalues extremely fast. It is virtually certain that if the snowflaked value resides off in aremote table connected to the primary dimension table through one or more joins, then the ability to cross browse the original unsnowflaked dimensional attributes while usingthe bitmap indexes will be lost.
Tip
Snowflaking (the removal of low cardinality attributes from a dimension table) almost always interferes with user understandability and cross-attribute browsing performance. Snowflaking probably interferes with the use of the newbitmap indexes in a dimension.
In spite of this prohibition against snowflaking, there are still some situations where we urge you to build a “subdimension” that has the appearance of a snowflaked table. SeeFigure 5.6. Subdimensions have some special requirements that make it different from asimple snowflaked attribute. In our example, the subdimension is a set of demographic attributes that have been measured for the county that the customer is in. All thecustomers in the county will share this identical set of attributes, and thus the dimensionattributes are all at a different level of granularity. Furthermore, since the demographic data consists of the names and population counts and population percentages of 50different demographic groupings, we have 150 fields in the subdimension. Now, for manyreasons, it makes sense to isolate this demographic data in a snowflaked subdimension. First, the demographic data is available at a significantly different grain than the primarydimensional data and is administered and loaded at different times than the rest of thedata in the customer dimension. Second, we really do save significant space in this caseif the underlying customer dimension is large. And third, we may often browse among theattributes in the demographics table, which strengthens the argument that theseattributes live in their own separate table.
Figure 5.6 An example of permissible snowflaking where a large cluster ofrelatively low cardinality attributes can be removed all at once.
Another similar example of permissible snowflaking occurs when we use a dimension like location or business entity or time in a “role.” The creation of role dimensions, which areactually views on a single underlying dimension is described in Chapter 6.
The Importance of High-Quality Verbose Attributes

5.19
Dimension attributes are the entry points into the data warehouse. Dimension attributesare where most of the interesting constraints are placed. Dimension attributes provide the content of most of the user interface responses when the user asks to see what isavailable by browsing.
Tip
In many ways the quality of the data warehouse is measured by the quality ofthe dimension attributes.
An ideal dimension table contains many readable text fields describing the members ofthe particular dimension. These text fields contain individual fully expanded words orshort phrases, not codes or abbreviations. Data designers are often convinced that users want production codes or that they will accept these codes in lieu of full-text equivalents. A major responsibility of the data warehouse team is to source the full text for each codeand to quality assure this text. It is helpful to remember that user interface responses andfinal reports themselves usually are restricted to the precise contents of the dimensiontable attributes. Incomplete or poorly administered text attributes lead directly toincomplete or poorly produced final reports.
The data warehouse team should eliminate attributes that look like C001AX247 or GRN PAPR TOWLS 3OZ MULTIPCK RVS
The first attribute is obviously a code, and only rarely would something like this be a desirable constraint or report row header. Perhaps it can serve as a semiautomated linkfor jumping through a 3270 screen back to the production system. The second attribute isa typical multifield abbreviation. While it may be useful for report headings, it cannot be used as a target for constraining and it is incomprehensible. What does RVS mean? Thislong field must also be presented as a series of separate fields with complete words inthem, preferably mostly in lowercase letters.
The goal of the data warehouse team should be to make dimension table attributes: • Descriptive • Complete (no missing values)
• Quality assured (no misspellings, impossible values, obsolete or orphaned values, orcosmetically different versions of the same attribute)
• Indexed (perhaps B-tree for high cardinality and bitmap for low cardinality) • Equally available (in a single, flat-denormalized dimension) • Documented (in metadata that explains the origin and interpretation of each attribute) Recommended Time Dimension
The Time dimension occupies a special place in every data warehouse because virtuallyevery data warehouse fact table is a time series of observations of some sort. We always seem to have one or more time dimensions in our fact table designs. In The Data Warehouse Toolkit, we discussed a recommended standard time dimension table at adaily grain that contained a number of useful attributes for describing calendars and for navigating. We present that table in Figure 5.7 for reference. This table lets us comparecomparable days and weeks across separate years, lets us find month ends, and lets uslabel our private seasons and fiscal periods. Remember that the big reason for this detailed time table is to remove every last vestige of calendar knowledge from our actualapplications. We drive calendar navigation through the time dimension table, not throughhard coded logic.

5.20
Figure 5.7 A subdimension for calendar details specific to a number of differentcountries.
As data warehouses serve increasingly multinational needs, we can generalize thedomestic view of this standard time table to handle multinational calendars as shown in Figure 5.7. In this case we include day names, month names, and holidays for all of thecountries we must deal with.
Recommended Name and Address Coding for People
Any data warehouse that stores names and addresses of individual human beings faces a number of similar issues. Most of the current designs for name and address storageare too simple and lack structure that would be very helpful. Since so many datawarehouses are trying to support detailed views of customer behavior and customer profitability, it is time for data warehouse designers to upgrade their designs.
The main application issues for names and addresses are to support the following:
• High-quality mailable addresses (i.e., creation of valid domestic and international address labels).
• Sufficient detail to support international mailing idiosyncrasies. • Address parsing to support written or telephone greetings. • Name part recognition to accommodate cultural idiosyncrasies. • Address parsing to support easy to use geographic area queries. • Address parsing to support address consistency analysis for data cleaning. • Address parsing to support automated demographic and latitude/longitude matching. • Alternate or multiple mailing and legal addresses. • Alternate communication addresses, including telephones, fax, telex, and Internet.
Lacking a discipline or a design framework, most data designers allocate a few general-purpose fields for names and addresses, such as Address-1 through Address-6. The designer feels that “any eventuality can be handled with a liberal design with six fields. Ifanything, this is too elaborate.”
Tip
A good name and address record should be broken down into as many partsas possible.
It is too easy to design the name and address fields in a generic way that actuallycontributes to data quality problems. Consider a typical design with the following fields:
Field
Example
Name
Ms. R. Jane Smith, Atty
Address1
123 Main Rd, North West, Suite 100A
Address2
PO Box 2348
City
Kensington
State
Ark.

5.21
Zip Code
88887-2348
Phone Number
509-555-3333 x776 main, 555-4444 fax
The name field is far too limited. There is no consistent mechanism for handlingsalutations, titles, or suffixes, or for identifying what the person’s first name is. Ad hoc abbreviations are used in various places. The address fields may contain enough roomfor any address, but there is no discipline imposed by the fields that will guaranteeconformance with postal authority regulations, such as the Coding Accuracy Support System (CASS) guidelines from the United States Postal Service. This design may all tooeasily contain unmailable addresses and will not support downstream systems that usethe data warehouse to automate customer greetings or create address labels.
The key to a proper design is a full breakdown of names and addresses with as muchdetail as possible. Very few individual records will have every attribute filled in. Theextract process must perform significant parsing on the original dirty names and addresses. Ideally, the extract system will flag records with questionable parsing orunrecognizable elements. Abbreviations in the original data must be replaced with fulltext words. In other words, Chas. becomes Charles and Str. becomes Street. Numbers rendered as words should become numbers in street addresses. A recommended setname and address fields for individuals in a business context are shown next. Some ofthe business organization fields could be omitted in a database of residential customers. Examples of the fields are shown, but one should not treat the entire set of examples ascomprising a realistic single example of an address!
Field
Example
Salutation
Ms.
Greeting Style
Professional
Informal Greeting Name
Jane
First and Middle Names
R. Jane
Surname
Smith
Suffix
Jr.
Name Ethnicity
English
Gender
Female
Title
Attorney
Relationship
Trustee for John Doe
Organization
ABC Generic International
Sub Organization
Estate Planning Division
Second Sub Organization
Analysis Department
Street Number
123
Street Name
Main
Street Type
Road
Direction
North West
Post Box
2348
Suite
100A
City
Kensington
District
Cornwall
Second District
Berkeleyshire

5.22
State Arkansas Country
United States
Continent
North America
Primary Postal Code
88887
Secondary Postal Code
2348
Postal Code Type
United States
Contact Telephone Country Code
1
Contact Telephone Area Code
509
Contact Telephone Number
5553333
Contact Extension
776
FAX Telephone Country Code
1
FAX Telephone Area Code
509
FAX Telephone Number
5554444
(perhaps others, like home phone andpager numbers)
Web Site
www.ABCGenInt.com
Public Key Authentication
Type X.509
Certificate Authority
Verisign
Recommended Commercial Customer Address Coding
Commercial customers are represented in the data warehouse quite differently thanindividual people are. Commercial customers have complex names and multipleaddresses. Commercial customers usually have a hierarchy of identities ranging fromindividual locations or organizations up through regional offices, internationalheadquarters, and parent companies. These hierarchical relationships change frequentlyas customers reorganize themselves internally or are involved in acquisitions anddivestitures. In our experience, the best representation of this complex picture is to makea separate customer record for each level of this kind of hierarchy. Doing this allows usto focus on the issues of describing a single customer entity without also trying torepresent the hierarchy itself. In Chapter 6, we will return to the larger issue of representing and navigating the hierarchy.
A single commercial customer may have multiple addresses, such as physical addressand shipping address. Each address follows much the same logic as the address structure for people we developed in the previous section:
• Organization name • Post name • Post name abbreviation • Role • Street name • Street type • Street number • Street modifier • Location 1

5.23
• . . . Location 5 • City • Pre-city modifier • Post-city modifier • District (area, county) • Primary postal code • Secondary postal code • State • Country • Continent Slowly Changing Dimensions
In The Data Warehouse Toolkit, we discussed the classic techniques for handling a slowly changing dimension like a product or a customer. The key assumption is that theproduction product key or the production customer key does not change, but the description of the product or customer does. In response to these changes, the datawarehouse has three main options:
Overwrite the dimension record with the new values, thereby losing history. Create a new additional dimension record using a new value of the surrogate key.
Create an “old” field in the dimension record to store the immediate previous attributevalue.
These three options are referred to as the Type 1, 2, and 3 responses to a slowlychanging dimension. The Type 1 response is used whenever the old value of theattribute has no significance or should be discarded. Certainly, the correction of an errorfalls into this category. The Type 2 response is the primary technique for accuratelytracking a change in an attribute within a dimension.
Tip
The Type 2 response requires the use of a surrogate key because we are assuming that the production product key or customer key has not beenallowed to change.
It is permissible in this case to place an effective date and an end date in the record, butthis should be done with caution. These dates do not have the same meaning as a datekey in a fact table. For instance, the begin effective date and the end effective date in aproduct record might refer to the span of time during which the particular formulation ofthe product was being manufactured. But the date in a corresponding fact table mightindicate when the product was sold, and this selling date does not have to lie within thespan of times defined in the dimension record. These various dates simply have differentmeanings. Also, one needs to be careful about the interpretation of the effective dates inthe dimension if there are several possible dimension attributes that might get updated. In such a case, what do the effective dates refer to? A general solution to this dilemma ofeffective dates is presented in the human resources tracking example in Chapter 6.
The Type 2 response to a slowly changing dimension is used when a true physicalchange to the dimension entity (like a product or customer) has taken place and it isappropriate to perfectly partition history by the different descriptions. Each of the separate surrogate keys governs a unique description of the product or customer thatwas true for a span of time. Thus each particular surrogate key is naturally used duringthe time when the particular instance of the product or customer was valid. Simply by constraining on any combination of attributes in the dimension, the query does the rightthing. If the query constrains directly on the attribute that was changed, then it can veryprecisely pick out the version of the product or customer that is needed. But if the querynaturally constrains on other attributes in the dimension unaffected by the slow changes,then several versions of the product or customer will be swept into the query. This iswhat we want to happen.

5.24
The Type 3 response to a slowly changing dimension is used in a different businesssituation than the Type 2 response. Usually in the Type 3 response we do not have achange that perfectly partitions history. We may have a change, like the redrawing of sales district boundaries or the redefinition of product category boundaries that is a “soft”change. In other words, although the change has occurred, it is still logically possible toact as if the change had not occurred. We may want to track the sales offices for a while with either the old or the new sales district definitions. We may want to track the sales ofproducts for a while with either the old or the new category definitions. In this case, wecannot partition history disjointly as in Type 2 response, but we simultaneously provideboth the old description and the new description in the same record. This lets us choosebetween the two versions of the sales district or the product categories at will.
Tip
The Type 3 response is used when a change is “soft,” or tentative, or when wewish to keep tracking history with the old value of the attribute as well as thenew.
If we are using the Type 3 response to a slowly changing dimension, we push down theold attribute value into the “old” attribute and we write the new attribute value into theregular current field. This has the effect of causing all existing standard queries andreports to switch seamlessly to the new attribute assignment, but allows a query or reportto return to the old attribute assignments (the old sales district boundaries or the oldcategory boundaries) by changing the query or report to use the old dimension attribute.In using this technique, no new dimension record needs to be created and no new surrogate key needs to be created. It should be obvious that this technique works bestfor one such soft change at a time. If your environment really has a succession of manysoft changes, and you really believe that the requirement is for the user to switch back and forth amongst more than two alternative sales district maps or more than twocategory definitions, then you need a more complex design. Make sure you really needsuch complexity because your application may be confusing to end users.
Rapidly Changing Small Dimensions
Although we have used the term slowly changing to refer to the occasional and sporadic changes that occur to dimensional entities like product and customer, this description ismore a pedagogical aid than a real guide for the designer. After all, what is slow? What if changes are fast? Must I use a different design technique?
Even if your changes are rapid and happen every day or at least many times per year,you should probably use the Type 2 slowly changing dimension technique to track all the versions of your product or your customer. In Chapter 6, we describe a human resources tracking example where the profiles of 100,000 employees are each tracked throughmany changes per year. Even though the employee dimension is relatively large andeach employee record is quite verbose (2000 bytes), we find it very attractive to use theType 2 response, together with beginning and ending effective dates for eachtransaction. Please see the next chapter for the details of this example.
There is a certain self-consistency in the need to track rapid transactional changes to aproduct or a customer dimension. If you are a business like a telecommunicationscompany that has thousands of rate structure-oriented products and services, and you are constantly tinkering with their definitions, then you almost certainly need to track eachversion of each product or service accurately. Especially if the definition of the product orservice is independent from its provision, you must record these products or services in a dimension table. In other words, we don’t want to lose track of a product or service justbecause we never actually provided it to any customer.
Similarly, if you are a human resources department or agency or are an insurancecompany, then you are very motivated to capture the descriptions of your employees orcustomers accurately. Again, this requires a large human being dimension tableadministered using the Type 2 response, as described in the human resources examplein Chapter 6.
Finally, at some point we have to cry “uncle” and stop creating new dimension records forevery measured change. This occurs in the extreme realm of monster dimensions and rapid changes. To handle this case, we must make some compromises. But first let usdiscuss these very large dimensions more broadly.
Large Dimensions

5.25
Data warehouses that store extremely granular data may require some extremely large dimensions. Any enterprise or agency that deals with the general public needs anindividual human being dimension. The biggest retailers and the biggest governmentagencies have monster people dimensions whose size approaches the population of the United States (100 million records or more). Other, “more reasonable” dimensions innormal-sized enterprises may contain five or ten million human being records.
The biggest commercial customer dimensions, such as those in telecommunications, may contain up to ten million records. The biggest product dimensions, such as those indepartment store retail environments, may contain several million records. Big insurancecompanies may, in addition to their monster human being dimensions, have automobile or house dimensions with millions of records.
We are now in a position where in most cases we can support these very largedimensions with the current generation of relational databases. We must, however, adopta conservative design to keep these dimensions under control. In particular, we mustchoose indexing technologies and data design approaches that:
• Support rapid browsing of the unconstrained dimension, especially for low cardinalityattributes.
• Support efficient (if not rapid) browsing of cross-constrained values in the dimension table.
• Do not penalize the fact table query for using a large and “expensive” dimension.
• Find and suppress duplicate entries in the dimension (e.g., with name and address matching).
• Do not create additional records to handle the slowly changing dimension problem. The first three bullets are requirements you should take to your RDBMS vendors. The Worst Case: Rapidly Changing Monster Dimensions
Unfortunately, huge customer dimensions are even more likely to change than themedium-sized product dimensions. Retailers are anxious to periodically updateinformation about their customers. Insurance companies must update information about their customers, their insured automobiles, and their insured homes, because it is criticalto have an accurate description of these items when a policy is approved and when aclaim is made. Figure 5.8 shows a typical customer dimension, with hot demographic fields that are especially interesting to track on a changing basis. It would seem like weare between a rock and a hard spot. We must track the slowly changing nature of thecustomer dimension, but we don’t dare use either of the techniques appropriate for medium-sized dimensions because of the size of the table.
Figure 5.8 A modeling solution for a rapidly changing monster dimension, such ahuge customer dimension with continuously revised demographics.
The solution to this dilemma is to break off the hot customer attributes into their ownseparate dimension table as in Figure 5.8. We will call this new dimensionDemographics. We leave behind constant information in the original customer table. We gain the advantage of being able to track the changing nature of the customerdescriptions, but we make some compromises as well.

5.26
First, we need to make a subtle change in order to successfully create this newdemographics dimension. All of the continuously variable demographic facts, such asincome and total purchases, must be converted to banded values. In other words, weforce the attributes in this new dimension to have a relatively small number of discretevalues. We then build the demographics dimension with all possible discrete attributecombinations. For example, in Figure 5.8, if each of the five attributes has ten possiblevalues, then the demographics dimension will have exactly 105 = 100,000 records. We also need to construct a surrogate demographics key for this dimension. It may as wellconsist of the consecutive numbers from 1 to 100,000.
Now every time something interesting happens with one of our customers, such as asales event, or an insurance claim event, we put a record into the appropriate fact tabledescribing this event. Two of the keys will always be customer and demographics, asshown in Figure 5.8. Because the decision to associate the demographics key with thecustomer key occurs whenever we place a record into the fact table, we can change thedemographics description of the customer as frequently as we wish. Amazingly, there is no added overhead in the dimension tables with this approach because we built everypossible demographics combination at table creation time. All we do is plug in the currentcorrect demographics profile for that customer whenever an event occurs, and a fact table record is created.
The big advantage of this approach for handling these changing monster dimensions isthat we can support very frequent “snapshotting” of customer profiles with no increase indata storage or data complexity as we increase the number of snapshots. But there are some trade-offs. First, we have been forced to clump the demographic attributes intobanded ranges of discrete values. This places a limit on the specificity of the data (suchas income), and makes it impractical to change to a different set of value bands at a later time. Once you decide on your bands, you are stuck with them. Second, thedemographic dimension itself cannot be allowed to grow too large. The 100,000predetermined values in our example is a reasonable number of possible values. In some cases it may make sense to support up to a million predetermined values in thedemographics dimension. There are certainly some cases where we need more than fivedemographic attributes with ten values each. Surprisingly, a workable solution to this problem is to build a second demographics dimension, as shown in Figure 5.9. At a largeretailer recently, we faced the problem of two sets of demographics facts. One set relatedto traditional income, family, and education measures of the customer, and the other related to volatile purchase and credit behavior measured while buying the retailer’sproducts. All of these attributes combined together resulted in several million possiblecombinations. We were worried that the demographic dimension approach was not going to work. Somewhat reluctantly, we proposed a two-demographics dimensions approach. To our surprise, the resulting data warehouse was very successful. The retailer was verypleased with the flexibility of the data model and the ability to very responsively track the changes both in family demographics and customer behavior.
Figure 5.9 A rapidly changing customer dimension with two separateddemographics dimensions, one for traditional customer attributes and one for purchase/credit behavior.
A third potential drawback of this approach is that we have separated the hotdemographics data from the more constant descriptors of the customer, such asgeographic location and birth date. Now it is harder to browse the data as if it were asingle dimension implemented as a flat file. The demographics data now can be browsedonly along with the more constant customer data by linking through the fact table. Thiswill usually be a slower and more expensive browse than if all the data were in a single

5.27
dimension table. We do not think this is a major criticism, however. A relational systemwill give the correct answer to the browse, but it may be a little slow. This seems like areasonable price to pay for the freedom to track the customers so responsively.
Finally, a sharp eyed reader may point out that by using this approach we can associatedemographics with the customer only when we actually generate a fact table record,such as a sales event or an insurance claim event. Theoretically, if there are no sales,the fact table is empty. If the fact table is empty, we will never be able to link thedemographics to the customer. While this is technically true, there are easy ways around this problem. If sales are so sparse that we are in danger of missing a demographicsmeasurement, all we need to do is define a demographics transaction event. This eventhas no sales dollars associated with it, but it is a good place to register a new demographics profile of the customer. Fact table records are cheap—we have billions of them in our fact tables, anyway.
Another way to associate current demographics with the customer is to add a currentdemographics key to the customer dimension table. This supports stand-alone demograhic analysis of your full customer base without traversing the fact table.
Degenerate Dimensions
Many of our dimensional designs revolve around some kind of control document like anorder, an invoice, a bill of lading, or a ticket. Usually these control documents are a kindof container with one or more line items inside. A very natural grain for a fact table inthese cases is the individual line item. In other words, a fact table record is a line item, and a line item is a fact table record. Given this perspective, we can quickly visualize thenecessary dimensions for describing each line item.
But what do we do with the order number itself? Or by extension, the invoice number, thebill of lading number, or the ticket number? These numbers are the old parent keys thatwe used when we designed parent-child transaction systems. The answer is not to discard these parent numbers. The order number, for instance, should go directly into thefact table, right after the dimensional keys and right before the normal numeric facts. Thisorder number looks like a dimension key (even though we don’t make a surrogate key forit) but when we are done with the design of the other dimensions, we usually discover that we have stripped out all the old parent or header information like the order date andthe customer identification from the order number and placed this information in the otherdimensions. At the end of the design, the order number is sitting by itself, without any attributes. We call this a degenerate dimension.
Tip Degenerate dimensions usually occur in line item-oriented fact table designs.
Degenerate dimensions are normal, expected, and useful. The degenerate dimensionkey should be the actual production order number (or invoice number, etc.) and shouldsit in the fact table without a join to anything. There is no point in making a dimensiontable because it would contain nothing. The degenerate key can be used to group line items on a single order, and it is required to answer even broad questions, like what theaverage number of line items on an order is. The degenerate key can be used as a linkthrough a 3270 screen to access an operational system to place real-time transactions against an order.
If for some reason, one or more attributes are legitimately left over after all the otherdimensions have been created, and they seem to belong to this header entity, youshould simply create a normal dimension record with a normal join. You don’t have a degenerate dimension any more. Make sure in this case that you create a surrogate key,just as you do with all your other dimensions.
Junk Dimensions
Sometimes when you are extracting from a complex production data source, after identifying source attributes for a number of obvious dimensions, you are left with anumber of miscellaneous flags and text attributes. These flags and text attributes do notseem to be organized in any coherent way. Often the meaning of the flags and text attributes is obscure. Many of the fields are filled in sporadically, or their content seemsto vary depending on the context of the record. This situation leaves the designer with anumber of bad alternatives, all of which should be avoided, including:
• Leaving the flags and attributes unchanged in the fact table record.

5.28
• Making each flag and attribute into its own separate dimension. • Stripping out all of these flags and attributes from the design.
Leaving the flags and attributes in the fact record is bad because it might cause the facttable record definition to swell alarmingly. It would be a shame to create a nice tightdimensional design with five dimensions and five facts, and then leave several uncompressed 20 byte text fields in the fact record. It could be prohibitively expensive tobuild indexes for constraining and browsing on these fields as well.
Making each separate flag and attribute into its own dimension doesn’t work either. A 5-dimensional design could balloon into a 25-dimensional design.
Finally, stripping out this information could be a mistake if there is demonstratedbusiness relevance to any of these fields. It is worthwhile, of course, to examine this question carefully. If the flags and text attributes are incomprehensible, noisy,inconsistently filled in, or only of operational significance, they should be left out.
The key to fixing this type of problem is to study these flags and text attributes carefully and to pack them into one or more junk dimensions.
A simple example of a useful junk dimension would be taking ten Yes/No indicators outof the fact table and putting them into a single dimension. It is assumed that theseindicators are left over after the other more obvious dimensions like Time, Product,Customer, and Location have been designed. Perhaps there seems to be no correlationamong these ten indicators or between these indicators and any of the other dimensions. This is okay! You simply pack all ten indicators into one dimension. At the worst, youhave 210 = 1024 records in this junk dimension. It probably isn’t very interesting to browseamong these flags within the dimension, because every flag occurs with every other flag if the database is large enough. But the junk dimension is a useful holding place for theflags, and it provides a home for the user interface that the user will use whenconstraining or reporting on these flags. Obviously, the ten fields in the fact table have been replaced with one little short surrogate key. A subtle issue in the design is whetheryou create all the combinations of these flags in your dimension beforehand or whetheryou create junk dimension records for the combinations of flags you encounter in the data. The answer depends on how many possible combinations you expect and what themaximum number could be. Generally, when the number of theoretical combinations isvery high and you don’t think you will encounter them all, you should build a junk dimension record at extract time whenever you encounter a new combination of fields.
Tip
A junk dimension is a convenient grouping of random flags and attributes to getthem out of a fact table and into a useful dimensional framework.
Sometimes the choice of a junk dimension is much less obvious. In our experience,however, some analytic digging into the real data pays off. Many times what look likeindependent junk attributes in the fact table turn out to be correlated. A whole group of junk attributes may turn out to have values only in certain transactional situations. Whenthis happens, all of these attributes may be able to be grouped into a single dimensionand removed from the fact table. The data designer needs to pose a number of test queries against the source data to tease out these relationships. Most of the messysource data sets we have encountered have yielded to this kind of analysis.
A final kind of messy attribute that fits well into the junk dimension approach is the open ended comments field that is often attached to a fact record, especially at the line itemlevel. If you decide that the contents of the comments field are good enough to justifyinclusion in the data warehouse, then you should proceed with the design. Hopefully, only a few of the comments fields have anything in them. In this ideal case, the junkdimension simply contains all the distinct comments. But the junk dimension is noticeablysmaller than the fact table because the comments are relatively rare. Of course you will need a special surrogate key that points to the “no comment” record in the dimension.Most of your fact table records use this key.
Foreign Keys, Primary Keys, and Surrogate Keys
All dimension tables have single part keys, which, by definition, are primary keys. In otherwords, the key itself defines uniqueness in the dimension table.
Tip
All data warehouse keys must be meaningless surrogate keys. You must notuse the original production keys.

5.29
In this book, we presume a surrogate key is a simple integer. As the data warehouseadministrator, you assign the first key the value 1, the next key the value 2, and so on.You simply assign the keys as you encounter the need for them. The keys themselves have no meaning. If all you have is a key for a dimension, you can tell absolutely nothingabout the underlying record. You must use the key to retrieve the record to see what itcontains. In most cases, a 4-byte integer makes a great surrogate key. A 4-byte integer can contain 232 values, or more than two billion positive integers, starting with 1. Twobillion is enough for just about any dimension, including customer, product, or time.
Surrogate Date Keys
The mandate to use surrogate keys applies to date keys as well as other types of keys. Itis a significant mistake to use an SQL-based date stamp as the join key between the time dimension table and a fact table. First, a SQL-based date key is typically 8 bytes, so you are wasting 4 bytes in the fact table for every date key in every record. Second, theonly excuse for actually using a date-meaningful key is that you intend to bypass the join to the time table and constrain directly on the date key in the fact table. This is an example of relying on smart keys in your application. You are now bypassing theinformation in the time dimension table, and you are almost certainly embeddingknowledge of your corporate calendar in your application, rather than querying this knowledge from your time dimension table. Finally, by using an SQL-based date stamp as the key, you are giving up the possibility of encoding a date stamp as “I don’t know,”or “it hasn’t happened yet,” or “a date stamp is not possible in this case.” All of these special cases can be handled gracefully with a surrogate date key, which can point tospecial records in the time table that cover these cases.
If, in addition to the calendar date, you are recording the precise time of day, you shouldsplit off the time and make it an SQL time stamp fact or simple integer fact that is not partof the date key.
Avoid Smart Keys
The data warehouse designer should always avoid smart keys with embedded meaning.In other words, resist the temptation to make a primary dimension key out of variousattributes in the dimension table. You will never actually program an application to usethe components of such a smart key for constraints, and you should not consider makingthe join to the fact table be a double-barreled or triple-barreled join that employs several fields at both ends of the join. You should always have these components broken out asseparate fields in the dimension tables anyway.
Avoid Production Keys
If you use production defined attributes as the literal components of your keyconstruction, sooner or later you will get stepped on. Several bad things can happen.First, production may decide to reuse keys. If they purge their version of the dimensionevery year, then they may have no compunction about reusing a key after two years. Youas the owner of the data warehouse may be left in an impossible position by this decisionbecause you may be storing three or more years of data. Another possibility is that yourcompany might acquire a competitor, and the rules for building the production key maybe thrown out the window. You may suddenly get handed ugly 14-byte alpha codes instead of the nice 6-byte integers you have been relying on. If you have been too literalin your use of production codes to build your dimension key, you will be sorry. Finally, theworst possibility is that you may be handed a revised dimension record from production,where the production key was deliberately not changed. If you decide that you must track this revised description as a legitimate new version of the dimension record, you arebetween a rock and a hard spot unless you have surrogate keys.
Additive, Semiadditive, and Nonadditive Facts
Whenever possible, the facts in the fact table should be chosen to be perfectly additive.That means it makes sense to add the facts along all of the dimensions. Discretenumerical measures of activity, such as retail cash register sales in either dollars or units,are often perfectly additive. Numerical measures of intensity, however, are not perfectlyadditive. The most important measures of intensity are account balances and inventorylevels. These facts are snapshots of something taken at a point in time. Unlike themeasures of activity, they do not represent a flow past a point. Measures of intensity areusually additive along all the dimensions except time. To combine account balances and

5.30
inventory levels across time, the query tool or reporting tool must add these facts acrosstime and then divide by the number of time periods to create a time-average. This is not the same as using the SQL AVG (average) function. Most of us are familiar with thistechnique because most of our banks report the average-daily-balance in our accounts.
Some numeric measures of intensity cannot be added across any dimension.Measurements of room temperature might make a good fact for a fact table, but thesetemperatures would have to be averaged across every dimension over which they werecombined. For measures of intensity that are averaged across all dimensions, it would beappropriate to use the SQL AVG function.
It is possible for a measured fact to be textual. This condition arises rarely because inmost cases a textual measurement is a description of something and is drawn from a discrete list of alternatives. The designer should make every effort to put textualmeasures into dimensions because they can be correlated more effectively with the othertextual attributes in a dimension, and they will require much less space, especially if the proposed fact table text field is a wide fixed-width field that is often empty. An example of a textual fact is the condition of the weather as written down by the police officer at thescene of an accident. If this weather description were free text with widely varyingdescriptions, it would be hard to store in a dimension without making every singleaccident into a dimension record. Assuming that the accident itself is the grain of the facttable (presumably with various dimensions like time, driver1, driver2, car1, car2, officer,location, type, severity, and status), then the weather phrase might well end up as atextual fact. Textual facts can be counted and constrained upon, but if, as in thisexample, they are unpredictable free text, the usual dimensional activities of constrainingand grouping on these text values will be of little value. A true “text fact” is not a verygood thing to have in a data warehouse.
The Four-Step Design Method for Designing an Individual Fact Table
The detailed logical design of a dimensional schema is driven by four steps. Thismethodology is discussed in more detail in The Data Warehouse Toolkit, and it is also discussed in Chapter 7 of this book in the larger context of managing an overall datawarehouse project. The four logical design steps for a single dimensional schema consistof four choices, made in order. We choose
1. The data mart 2. The fact table grain 3. The dimensions 4. The facts
Step 1. Choosing the Data Mart: Single-Source and Multiple-Source Data Marts
Choosing the data mart in the simplest case is the same as choosing the legacy sourceof data. Typical data marts include purchase orders, shipments, retail sales, payments,or customer communications. These would be examples of single-source data marts. In more complex cases, we can define a data mart that must include multiple-legacy sources. The best example of a multiple-source data mart is customer profitability, where legacy sources that describe revenue must be combined with legacy sources thatdescribe costs. We recommend strongly that the data warehouse designer limit risk byimplementing only single-source data marts at first, so as to reduce the number oflengthy extract system development tasks. We also recommend implementing theseseparate data marts only in the context of a set of conformed dimensions, so that thedata marts can plug into the Data Warehouse Bus. Using conformed dimensions guardsagainst building stovepipe data marts.
Tip Start your portfolio of data marts with a single-source data mart. Step 2. Declaring the Fact Table Grain: Styles of Fact Tables
Although it seems like a detailed technical step, it is crucial to define very clearly exactlywhat a fact table record is in the proposed dimensional design. Without this definition, the design cannot proceed, and without a clear definition, the data architects will waste

5.31
valuable time arguing about what a dimension is and what a fact is. We call this step“declaring the grain.”
Tip
Be very precise when defining the fact table grain. Do not leave this step out.The grain is the answer to the question “What is a fact record, exactly?”
Generally, the fact table grain is chosen to be as low, or as granular, as possible. Thereare many advantages to choosing a low-level grain, such as individual transaction, or individual day snapshot, or individual document line item. The lower the level ofgranularity, the more robust the design. We have seen that a very low level of granularityis far better at responding to unexpected new queries and far better at responding to theintroduction of additional new data elements than higher levels of granularity.
Typical choices for the grain of the fact table could be expressed as follows: • Each sales transaction is a fact record. • Each insurance claims transaction is a fact record. • Each ATM transaction is a fact record. • Each daily product sales total in each store is a fact record. • Each monthly account snapshot is a fact record. • Each line item on each order is a fact record. • Each line item on each shipment’s invoice is a fact record. • Each coverage in each individual insurance policy is a fact record.
Although all of these choices sound similar, the preceding list represents three commonstyles of fact tables. The first three choices of grain are individual transactions. In a given day or month, we can measure any number of transactions for a given product or against a given account. The number can be zero or a million. We are not guaranteed to find atransaction against a product or against an account in the database. The individualtransactions typically have a very simple structure, with a single amount field as the value of the transaction.
The next two grain examples in the list are snapshots. We wait until the end of the day or the end of the month, and we take a snapshot of the activity that occurred during thatperiod. This snapshot is more complex than the individual transaction perspective. Wemay have many measures of the activity during the period, including total sales, totalnumber of transactions, and semiadditive facts, such as the ending account balance. Insome cases, like retail sales, it may be easy to move from the individual transactionperspective to a daily snapshot because we can summarize the transactions to the dailylevel. In this case we would probably build the daily snapshot only if we needed toconstruct a summary table for performance reasons. In other cases, like the monthlyaccount snapshot, the pattern of transactions is potentially very complex, and thecreation of the snapshot is not a simple aggregation. The calculation of revenue, forexample, may depend on how a transaction like a deposit or an advance payment isbooked. In this case, the monthly snapshot is absolutely required to give management aflexible and quick view of revenue. Later in this chapter we will contrast the snapshottable more specifically with the transaction table, because in many cases we will needboth at once.
The final three examples are all line items on various control documents like orders, shipments, or policies. There is exactly one record in each of these fact tables for each line item on a control document. In this design, each fact table record represents theentire existence of a line item. These fact table records can be thought of as a rolling,evolving snapshots of the line items. We saw in The Data Warehouse Toolkit that line-item fact tables typically have multiple time keys representing various phases that theline item goes through. Line-item fact tables usually need a status dimension to recordthe current status of the line item. Finally, line-item fact table records are revisited for updating far more frequently than records in the other types of fact tables because theyhave a possibly long history that may need to be updated many times.
Tip
The three most useful fact table grains are individual transactions, higher-level snapshots, and line items from control documents like invoices.

5.32
Step 3. Choosing the Dimensions
Once the grain of the fact table is firmly established, the choice of dimensions is fairlystraightforward. The grain itself will often determine a primary or minimal set ofdimensions. For instance, the minimal set of dimensions for a line item on an order wouldhave to include the order date, the customer, the product, and a special degeneratedimension consisting of only the order number. Within this framework the designer canadd a potentially large number of additional dimensions. In almost every case, theseadditional dimensions take on a unique value in the context of the primary dimensions.Thus additional dimensions, like delivery date, contract terms, order status, and deliverymode, can be added at the designer’s discretion if the source data is available. In manyof these cases, a dimension can be added gracefully to the design because the additiondoes not change the grain of the fact table. An example of a gracefully added dimensionmight be a causal dimension that is added to the design to explain exogenous marketfacts like promotions, competitor actions, or the weather.
The fact table in a dimensional model is a set of simultaneous measurements at aparticular granularity. The most useful measurements are numeric, but they don’t have tobe numeric. Many times the dimensional designer is handed a set of measurements as afait accompli, and the designer must decide which dimensions are valid in the context ofthese measurements. At this point the dimensional designer “decorates” the set ofmeasurements with all of the dimensions he or she can find, driven by businessrequirements, of course. The best dimensions are those that take on a single value in the context of the proffered set of measurements. The powerful idea here is that there is nosense of anticipating queries or planning the schema based on user needs at all. This isjust physics.
Tip
The designer examines all the data resources at his or her disposal andpreferentially attaches the single-valued descriptors as dimensions.
The single-valuedness of the chosen dimensions has a couple of implications. The bestsingle-valued dimension to be attached to a set of measurements is the lowest level of granularity of that dimension that is still single valued. Thus if our measurements are trulyat a daily grain, the associated time dimension should also be at a daily grain. We couldalternatively attach the year to the measurements as a dimension, but that is rather dull.
We can actually attach many-valued dimensions to a set of measurements, but it is hardto build useful reports and queries across a many-to-many relationship. One needs a many-to-many bridge table in between the dimension table and the fact table, and to getthings to add up properly, some kind of allocation or weighting fact is required, and that iscontroversial and a lot of work. One example of this is the many values of diagnosis that a patient can simultaneously have when undergoing a single treatment. There is no easyway out of that one. It’s the physics, not the model.
The measurement-centric view of dimensional modeling makes it easier to see what to do if new descriptive data becomes available. If that new data is single valued in thepresence of some of the measurement sets, then you can gracefully attach the newsource of data to these measurements. For instance, if you have daily datameasurements according to some geography, you may be able to add daily weather datato the set of measurements in a graceful way. Just attach the weather key to the list ofkeys in the fact table. No tables need to be dropped or redefined, and no existingapplications change in any way.
Each dimension has its own granularity. The granularity of an individual dimensioncannot be lower than the overall fact table granularity. In other words, if the fact tablegranularity specifies a monthly time, the time dimension cannot be days or weeks. Interestingly, the granularity of an individual dimension can be coarser than thegranularity of the fact table without causing a logical contradiction. For instance, thedelivery mode dimension could be limited to “air” and “land” even though the underlying data contained much more detail. The product dimension could even be stated at ahigher level than individual stock keeping unit (SKU), such as brand. In both these casesit would seem that there was a loss of useful information to the end users, but the design by itself has not introduced any logical contradictions.
Step 4. Choosing the Facts
The grain of the fact table also allows the individual facts to be chosen, and it makes itclear what the scope of these facts must be. In the case of individual transaction fact

5.33
tables, we have already pointed out that there is usually only one fact, namely theamount of the transaction. Snapshot fact tables have the most open-ended number of facts because any summary of activity during the snapshot period is fair game for the facttable. Snapshot fact tables can be gracefully extended with additional facts whenadditional useful summaries are identified. Line-item fact tables also can contain several facts since, for example, an individual line item may be broken down into quantities,gross amounts, adjustments, discounts, net amounts, and taxes.
Tip Facts should always be specific to the grain of the fact table.
In other words, do not mix in facts from other time periods or other aggregations to makecalculations convenient. Any facts that do not match the exact grain of the fact tablerecord will wreak havoc when a query tool or reporting tool attempts to combine thesefacts along various dimensions. It is fine to create aggregate or summary records forperformance and other reasons, but these facts are always stored in different records in different fact tables. We discuss systems for building and loading aggregates later inChapter 14.
Families of Fact Tables
Although the preceding sections have focused on building a single fact table surroundedby a set of dimension tables, in reality even a single data mart is a coordinated set of facttables, all with similar structures. Throughout this book we stress that the secret of asuccessful incremental data warehouse design is the use of conformed dimensions.Conformed dimensions are common dimensions that are the same from fact table to facttable.
In this section we discuss four different fundamental reasons for building families of facttables within a single data mart or across a complete data warehouse. In complex environments, like insurance, we can have combinations of all of these separate kinds offact tables.
Chains and Circles
Many businesses have a logical flow that has a beginning and an end. An order, or aproduct, or a customer characteristically evolves through a series of steps. Often, wecapture transactions or snapshots for each step. Usually, it makes the most sense tobuild a separate fact table for each step. In the manufacturing world, a product movesfrom the acquisition of raw materials through to the finished good. This is often called thesupply chain. We may have a series of legacy systems that are data sources for eachstep of the supply chain:
• Raw material production, such as mining or growing • Ingredient purchasing • Ingredient delivery • Ingredient inventory • Bill of materials • Manufacturing process control • Manufacturing costs • Packaging • Trans-shipping to warehouse • Finished goods inventory
After a product enters finished goods inventory in a warehouse, it is thought of as beingpart of the demand chain, or value chain. The legacy systems in the demand chain mayinclude:
• Finished goods inventory • Manufacturing shipments

5.34
• Distributor inventory • Distributor shipments • Retail inventory • Retail sales
A budgeting process for a large organization also presents a kind of value chain (see Mike Venerable and Chris Adamson’s wonderful book Data Warehouse Design Solutions(Wiley, 1998) for a complete explanation of this particular value chain):
• Budgets • Commitments • Payments Insurance companies have a very important value chain: • Marketing • Agent/broker sales • Rating • Underwriting • Reinsuring • Policy creation • Claims processing • Claims investigation • Claims payments • Salvage • Subrogation
All of these examples can be approached in a similar way. A fact table and a set ofassociated dimensions is defined for each step in the chain. When this is done, the requirements for a set of conformed dimensions becomes obvious. The conformeddimensions are carefully designed, and these dimensions are used as the framework(the bus) for separately implementing each step in the chain. In the insurance example, perhaps the two most interesting steps in the value chain would be agent/broker salesand claims processing. These two dimensional models could be implemented prior to theothers, with the full confidence that the framework of conformed dimensions would always give guidance to the subsequent implementation efforts and would guarantee thatall the fact tables would work together in the future.
Tip
Multiple fact tables are needed to support a business with many processes.Each process spawns one or more fact tables, When the processes arenaturally arranged in order, we often call this a value chain.
Other kinds of businesses may be thought of as being organized in a value circle, rather than a linear chain. In these kinds of businesses, all the entities may be performing or measuring the same kind of transaction. A good example of a value circle is a largehealth care organization, which might consist of the following:
• Hospitals • Clinics • Long-term care facilities • Physician offices • Pharmacies

5.35
• Pharmaceutical manufacturers • Laboratories • Employers • Insurance companies • Government agencies like Medicare
In this value circle, all the organizations around the circle are either generating patienttreatments or measuring patient treatments. These organizations will be able to sharedata successfully if and only if the various sources of patient treatment data can be conformed. Specifically, this means that all these organizations must use the followingtypical set of conformed dimensions:
• Time (calendar) • Patient • Provider (physician) • Location • Treatment • Diagnosis • Employer • Payer
When this set of dimensions has been conformed, the patient treatment records acrossthis group of organizations will snap together on the Data Warehouse Bus in a simpleway that will make it possible for all of them to effectively share data.
Heterogeneous Product Schemas
In many financial service businesses, a dilemma arises because of the heterogeneousnature of the products or services offered. For instance, a retail bank may offer checking accounts, savings accounts, mortgage loans, personal loans, credit cards, retirementinvestment accounts, and safe deposit boxes. In this environment there are usually twoperspectives on the account activity that are difficult to present in a single fact table. The first perspective is the global view that needs to slice and dice all the accounts of alltypes at the same time. The global view wants to plan cross-selling and up-selling against the aggregate customer base spanning all the possible account types. Since in a big retail bank, there may be 25 lines of business, it is impractical to query 25 separatefact tables each time the customer base needs to be profiled. Thus the global view needsto be a single core fact table crossing all the lines of business. See Figure 5.10. Note thatthe core fact table can present only a limited number of facts that make sense for virtuallyevery line of business. The core fact table also turns out to be useful to inquire about aspecific customer’s complete account portfolio, since all the accounts are linked to thesame customer dimension.
Figure 5.10 A core fact table for a retail bank.
The second, and conflicting, perspective is the line-of-business view that focuses on one line of business like checking. In this case there is a long list of special facts that onlymake sense for the checking line of business. These special facts cannot be included inthe core fact table because if we did this for each line of business in a real retail bank, we

5.36
would have 200 special facts, most of which would have null values in any specificrecord. The solution to this dilemma is to create a custom fact table for checking that islimited to just checking accounts (see Figure 5.11). Now both the fact table and theaccount table may be extended to describe all the specific facts and attributes that makesense only for checking. We go ahead and build a custom fact table and custom accounttable for each line of business.
Figure 5.11 A custom fact table for the checking line of business in a retail bank.
If the lines of business in our retail bank are physically separated so that each one has itsown data mart computer, the custom fact and dimension tables will not reside in thesame space as the core fact and dimension tables. In this case, the total base of accountactivity in the core fact table must be duplicated exactly once to implement all the customtables. Remember that the custom tables provide a disjoint partitioning of the accountspace, so that there is no overlap between the custom tables.
Tip
Multiple fact tables are needed when a business has heterogeneous productsthat have naturally different facts but a single customer base.
If the lines of business are able to share the same database partition on the samephysical machine, then the copying of the primary fact table can be avoided. In this case,a special join key is added to each core fact table record. The requesting query tool orapplication must know to use this special join key to link to the correct extended fact tablefor each line of business. This is quite natural, since by the definition of theheterogeneous facts, it would almost never make sense to attempt in a single SQLexpression to join to more than one extended fact table representing more than one lineof business. The names of the facts in the separate extended fact tables are by definitiondifferent and no single SQL expression can “talk” to multiple extended fact tables. Thus arequesting application analyzing a specific line of business like checking would always behard-coded to link to the correct extended fact table.
Transaction and Snapshot Schemas
When we take an operational view of our data warehouse, we find that there are somecharacteristic structures that are probably independent of the specific kind of businesswe are in. Virtually every data mart needs two separately modeled versions of the data: a transaction version and a periodic snapshot version. Furthermore, the snapshot versionhas an additional special feature called the current rolling snapshot. The current rolling snapshot is properly integrated into the overall enterprise data warehouse. Let’s tease apart the transaction schema and the snapshot schema.
The Transaction Schema
We hope that the most basic view of our operational system is at the individualtransaction level. In a financial services environment the transactions may be individual deposits and withdrawals against accounts. In a communications environment thetransactions may be individual calls placed or individual charges against accounts. In aretail environment the transactions may be individual line items on sales tickets. And in some cases where we cannot get a proper transaction feed, we may have to constructpseudotransactions by examining the daily status of accounts and seeing what changedsince yesterday.
In any case, the flow of low-level transactions is often quite easy to place into a good

5.37
dimensional framework for querying in our data warehouse. Remember that the lowest-level data is the most naturally dimensional data. For instance, the raw feed of ATMtransactions in a retail bank environment contains the information needed to identify time,location, account, and transaction type. The extract process must convert the originallegacy system identifiers into proper data warehouse keys that link to the respective datawarehouse dimensions. This is basically a lookup process. The structure of the extractedATM transaction would look like Figure 5.12.
Figure 5.12 The fact and dimension tables that represent a set of ATMtransactions.
In addition to the obvious physical keys of Time, Location, Account, and TransactionType, we almost always add additional key-like information to the transaction fact record. See Figure 5.12. It is useful to add an audit key that points to a special dimension record created by the extract process itself. This audit dimension record can describe datalineage of the fact record itself, including the time of the extract, the source table, and theversion of the software that ran the extract.
We may also include the original transaction record production identifiers, like accountnumber and transaction reference, so that we could open a terminal connection back tothe transaction system and perform a direct on-line administrative operation.
The fact record for an individual transaction frequently contains only a single “fact,” whichis the value of the transaction. In most cases we must simply label this fact Amount, as inFigure 5.12. Since there may be many kinds of transactions in the same table, we usually cannot label this fact with anything more specific.
The design of the transaction fact schema is not nearly as open-ended as the snapshot schema will turn out to be. We almost never need to add more numeric facts to atransaction schema because the transaction capture system usually returns only oneamount in a transaction. More often we will add more transaction types to the transactiondimension, but that is not a schema change, it is a data content change.
Once we have built the transaction component of our data warehouse, we can performmany powerful analyses that cannot be done on any form of summarized data.Transaction-level data lets us analyze behavior in extreme detail. Using our ATM example, we can perform behavior counts such as the number of times users of ATMs make mortgage payments at ATM locations not near their homes. We can performexquisite time-of-day analyses such as the number of ATM transactions that occur duringthe lunch hour or before work. Time-of-day analyses may allow us to do a fairly accurate queue analysis.
The gap between certain kinds of transactions is usually very interesting. In insurancecompanies one of the most important measures is the time gap between the original claim and first payment against that claim. This is a basic measure of the efficiency of theclaims process.
Transaction detail also lets us look at sequential behavior. In the insurance example, we want to look at how many times we opened and closed the reserve against a claim, and whether there were any intervening changes in the claim made by the claimant.Interesting applications of sequential behavior analysis include fraud detection and cancellation warning. Banks are interested in predicting cancellation warnings because they would like to intercept the customer who is about to empty the account and askthem what is wrong or how the bank can better serve them.
Finally, transaction detail allows an analyst to do basket analysis. The obvious example is the retail environment, where we might ask what products naturally sell with 12-ounce

5.38
bottles of 7-Up. A less obvious example of basket analysis is to ask what additionalsatellite television channels we are likely to sign up for in the month following a purchase of season football watching. A very tough version of basket analysis is to ask what didn’tsell in the market basket when we bought 7-Up. We might call this missing basket analysis.
Many of the preceding examples are good, classic data mining. Most analysts agree emphatically that to do data mining, you need extreme, granular, unaggregated data. Inother words, you need individual transactions.
Having made a solid case for the charm of transaction-level detail, you may be thinking that all you need is a fast, big DBMS, and your job is over. Unfortunately, even with agreat transaction-level operational data warehouse, there is still a whole class of urgentbusiness questions that is impractical to answer using only transaction detail. These urgent business questions revolve around quick, accurate views of current status.
When the transactions are themselves little pieces of revenue, the boss can ask howmuch revenue we took in by adding up the transactions. The best example of such a data source is cash-register sales in a retail environment, but in most businesses, thereare many transactions that are not little pieces of revenue. Deposits and withdrawals in abank are transactions, but they are not revenue. Payments in advance for subscriptions and for insurance coverage are even worse. Not only are they not revenue, but theireffect must be spread out over many reporting periods as their organizations earn the revenue by providing the subscription or providing the insurance coverage. This complex relationship between individual transactions and the basic measures of revenue andprofit often makes it impossible to quickly please the boss by crawling through individualtransactions. Not only is such crawling time-consuming, but the logic required to interpret the effect of different kinds of transactions on revenue or profit can be horrendouslycomplicated.
Tip
Businesses that have a rich transactional history but whose transactions arenot little pieces of revenue usually need two fact tables to represent all theactivity. One fact table captures the transactions, and the other captures theperiodic snapshots. Hopefully, the snapshot data is provided from a legacysystem, because if it is not, the data warehouse must contain very complex logic to correctly interpret the financial impact of each transaction type.
The Snapshot Schema
The solution to this problem is to create a second, separate fact table, called thesnapshot table, that is a companion to the transaction table. The companion to our firstexample is shown in Figure 5.13. We add records to the snapshot table at the end ofspecific reporting time periods, often monthly. The application that creates the snapshotrecords must crawl through the previous period’s transactions to calculate the correctcurrent status, which is the snapshot, but at least this crawling occurs only once.
Figure 5.13 The ATM transactions rolled up to a companion ATM snapshot schema.
Often we find it convenient to build the monthly snapshot incrementally by adding theeffect of each day’s transactions to a current rolling snapshot. If we normally think of our data warehouse as storing 36 months of historical data in the snapshot table, then the current rolling month should be month 37. Ideally, when the last day of the month hasbeen reached, the current rolling snapshot simply becomes the new regular month in thetime series and a new current rolling snapshot is created the next day. The current rolling month becomes the leading breaking wave of the data warehouse.
The design of the snapshot table is closely related to the design of its companion

5.39
transaction table. Usually the snapshot table is explicitly account-specific. In the snapshot we keep the Account and Time dimensions, but we suppress several of theother dimensions found in the transaction table. Location, Employee, and TransactionType are all suppressed in Figure 5.13. We can keep the production identifier that refers to the account itself. We can keep an audit dimension, but we now refer to an aggregatestatus of the extract covering the entire reporting period. Finally, we introduce a statusdimension that flags this account in this time period according to various useful indicators like New Account, Regular Account, Account Under Scrutiny, and Account About ToClose.
The fact structure in the snapshot table is much more interesting and open-ended than that of the transaction table. Basically we can introduce as many facts, counts, andsummaries as we wish. It is important that all the facts refer to the current period. Someof the facts will be completely additive across all the dimensions, such as EarnedRevenue and Total Transaction Count. Other facts will be semiadditive, such as EndingAccount Balance and Average Daily Balance. These particular semiadditive facts addacross all the dimensions except time. Semiadditive facts must be averaged across timewhen used across time periods.
Because of the open-endedness of the snapshot table design, we may progressively addmore facts to this table as we understand our user’s needs in more detail. Obviously,there is a trade-off at some point. Obscure or rarely used summaries are not worth putting in the snapshot table and must be computed from underlying transaction detailevery time they are needed. Other basic facts like earned revenue and account balanceabsolutely must go in the snapshot table and are the reason for the table’s existence.
There may be times when we want a snapshot-like summary of a business at some intermediate point in time, not at the end of a reporting period. In such a case, it maymake sense to start with the immediately preceding snapshot and add the effect of the incremental transactions between the beginning of that period and the desired date. Thiswill be fairly straightforward if the fact you are interested in (say, account balance) existswithin the snapshot table. If the fact is more obscure (say, the cumulative number of times a request for credit was denied), and it is not part of the snapshot, then you mayhave no choice but to crawl through that account’s transaction history from the beginningof time because otherwise you have no starting point.
Transactions and snapshots are the yin and yang of a data warehouse. Transactionsgive us the fullest possible view of detailed behavior, and snapshots allow us to quicklymeasure the status of the enterprise. We need them both because there is no simple way to combine these two contrasting perspectives. Used together, transactions andsnapshots provide a full, immediate view of the business, and when they are part of theoverall data warehouse, they blend gracefully into the larger views across time and across the other main dimensions.
Aggregates
The fourth and final reason for creating families of fact tables is the creation ofaggregates. Aggregates are stored summaries built primarily to improve queryperformance. We won’t say a lot about them in this section because the issues ofdesigning, loading, and updating aggregates are more related to the physical designissues of the data warehouse, and we will treat aggregates in detail in other chapters.However, to complete our current topic, the creation of aggregates introduces a family offact tables that are usually derived from the most granular fact table in each data mart.Each member of the family represents a particular degree of summarization along one ormore of the fact table’s dimensions. A mature and full set of aggregates could involve adozen separate aggregate fact tables, all echoing the original structure of the base facttable. Each aggregate fact table will have one or more shrunken dimension tablestogether as well as other regular dimension tables.
Tip
Aggregates are meant to improve performance. Aggregates are stored inseparate tables, not in the original fact tables containing the unaggregateddata.
Occasionally an aggregate fact table is built for reasons other than performance. Certainfacts in the environment may not be expressible at the lowest granularity. In this case, anaggregate table is required to present these new aggregate facts. The regular aggregatefacts can also be placed in the aggregate table if the granularity is correct. The bestexample of the need for an aggregate table beyond simple performance considerations is

5.40
when costs are available to match with revenue data (hence providing a view ofprofitability), but the cost data cannot be expressed at the lowest grain of the fact data.For instance, shipping cost may be available at the customer level of the shipping invoicebut not at the line item or product level. If your organization cannot reach agreement onallocating the shipping cost to the individual line items of the invoice (and it is stronglyrecommended that you try to do so), then the data mart designer may have no choice butto express the shipping costs at a higher level. Another example might be advertising costs that can be expressed for a brand or a category but cannot be expressed at theindividual SKU.
Factless Fact Tables
There are two modeling situations in which the designer engages in normal designprocess but fails to find any facts to go into the fact table. These factless fact tables arevery useful to describe events and coverage, so we can ask what did not happen.
The first kind of factless fact table is a table that records an event. A good example of anevent-tracking table is shown in Figure 5.14. Here we are tracking student attendance ata college. Imagine that we have a modern student tracking system that detects eachstudent’s attendance event each day. Plausible dimensions include:
Figure 5.14 A factless fact table that represents student attendance events at aninstitution of higher learning. Every record contains the dummy attendance fieldwhose value is always 1.
• Date. One record in this dimension for each day on the calendar. • Student. One record in this dimension for each student. • Course. One record in this dimension for each course taught each semester. • Teacher. One record in this dimension for each teacher. • Facility. One record in this dimension for each room, laboratory, or athletic field.
The grain of the fact table in Figure 5.14 is the individual student attendance event.When the student walks through the door into the lecture, a record is generated. It is clear that these dimensions are all well defined and that the fact table record, consistingof just the five keys, is a good representation of the student attendance event. Each ofthe dimension tables is quite deep and rich, with many useful textual attributes on which we can constrain, and from which we can form row headers in reports.
The only problem is that there is no obvious fact to record each time the student attendsa lecture or suits up for physical education. Such things as the grade for the course don’t belong in this fact table. Our fact table represents the student attendance process, notthe semester grading process or even the midterm exam process. We are left with theodd feeling that something is missing.
Actually, this fact table consisting only of keys is a perfectly good fact table and probablyought to be left as is. A lot of interesting questions can be asked of this dimensionalschema, including:

5.41
• Which classes were the most heavily attended? • Which classes were the most consistently attended? • Which teachers taught the most students? • Which teachers taught classes in facilities belonging to other departments? • Which facilities were the most lightly used? • What was the average total walking distance of a student in a given day?
To make the SQL for these queries more readable, we may add a dummy fact-like field to each record called Attendance. Since we make a record every time the student attends, all of these attendance fields are set equal to 1. If we ever build aggregates onthis data, we will find this attendance field quite useful, because unlike the base table, theattendance field in the aggregate tables will contain interesting values that are not obvious.
A second kind of factless fact table is called a coverage table. A typical coverage table is shown in Figure 5.15. Coverage tables are frequently needed when a primary fact tablein a dimensional data warehouse is sparse. In Figure 5.15 we also show a simple salespromotion fact table that records the sales of products in stores on particular days undereach promotion condition. The sales fact table answers many interesting questions, but itcannot answer questions about things that didn’t happen, such as which products wereon promotion but didn’t sell.
Figure 5.15 A factless fact table representing the products sold on promotion bystore by time period.
The sales fact table cannot answer this question because it contains only the records ofproducts that did sell. The coverage table comes to the rescue. A record is placed in thecoverage table for each product in each store that is on promotion in each time period. Notice that we need the full generality of a fact table to record which products are onpromotion. In general, which products are on promotion varies by all of the dimensions ofproduct, store, promotion, and time.
Perhaps some of you are wondering why we don’t just fill out the original fact table withrecords representing zero sales for all possible products. This is logically valid, but itexpands the fact table enormously. In a typical grocery store, only about 10 percent ofthe products sell on a given day. Including all the zero sales could increase the size ofthe database by a factor of ten. Remember also that we would have to carry all theadditive facts as zeros.
The coverage factless fact table can be made much smaller than the equivalent set of zeros. The coverage table needs only to contain the items on promotion. The items noton promotion that did not sell can be left out. Also, it is likely for administrative reasonsthat the assignment of products to promotions takes place periodically, rather than every day. Often a store manager will set up promotions in a store once each week. Thus wedon’t need a record for every product every day. One record per product per promotionper store each week will do. Finally, the factless format keeps us from storing explicit zeros for the facts as well.

5.42
Answering the question of which products were on promotion but did not sell requires atwo-step application. First, we consult the coverage table for the list of products on promotion on that day in that store. Second, we consult the sales table for the list ofproducts that did sell. The desired answer is the set difference between these two lists ofproducts.
Tip
Factless fact tables are the preferred method for recording events in a data warehouse where there is no natural numeric measurement associated with theevent. Factless fact tables also are used to guarantee coverage.
Summary
In this chapter we defined what dimensional modeling is and why it works. We covered the need for developing data marts where your dimensions and your facts are conformed. Wecalled this the Data Warehouse Bus Architecture. Finally, the fundamental design techniques for dimensional modeling were reviewed. In Chapter 6, we delve into more advanced design techniques. If you are not responsible for modeling the data and do notneed to understand these advanced topics, you may move directly to Chapter 7, which covers how to build dimensional models in a real data warehouse project.

6.1
6.2
Overview
Dimensional modeling techniques have been applied to nearly every kind of business. Asthe body of accumulated modeling experience has grown, designers have recognized many recurring themes driven by common business situations. Businesses in health careand financial services have fundamental dimensions that show a many-to-many relationship rather than the usual one-to-many relationship to the major fact tables. Many businesses find that one or more of their dimensions seem to be repeated multiple timesin their designs as if these dimensions played different roles. As businesses extend theirreach internationally, characteristic calendar and currency issues always seem to arise.
This chapter identifies a number of advanced dimensional modeling issues and providesspecific guides for handling each situation. The first section discusses a set of extended dimension table designs, and the second section discusses specific fact table issues. The last section discusses some of the most challenging possible queries in a datawarehouse environment.
The reader should have a solid grasp of the material covered in Chapter 5 prior to reviewing the advanced topics in this chapter. This chapter is required reading for anyone who is responsible for developing the data model for a data warehouse. It alsomay be of interest to those who have a natural curiosity and are not faint of heart—after all, it is a graduate course. It may be useful for the other team members to simply skim the headings to know which topics are covered. If any of these situations apply to yourbusiness, you know where to turn for help. This chapter is targeted to those who havedigested the contents of The Data Warehouse Toolkit and are ready for more!
Extended Dimension Table Designs
In this section we describe a number of common modeling situations where a specificdimension structure is very effective or conversely where the designer may risk choosingan inefficient design.
Many-to-Many Dimensions
In a number of classic design situations the existence and grain of the fact table is easilyunderstood and very fundamental, and the existence of each of the dimensions attachedto the fact table records is obvious and not controversial. But one of the dimensions canlegitimately have many values. Often, the offending dimension can legitimately havezero, one, or many values for a given record. The number of dimension values for such afact record is not knowable before the fact table record is created. In some sense, thenumber of values for this dimension is a measured fact. We call this kind of dimension amany-to-many dimension.
Health care offers a clear example of a many-to-many dimension. If we build a fact table record for each line item of a hospital bill or each line item of a treatment performed in aphysician’s office, the dimensions would look something like Figure 6.1.

6.3
Figure 6.1 A billable patient encounter schema with a diagnosis dimension that can take only one value at a time.
The problem for the designer is what to do with the diagnosis dimension. Real patientssometimes have more than one diagnosis. Really sick patients in a hospital may have as many as ten diagnoses. To handle this open-endedness, we cannot add multiple diagnosis dimensions to the schema. Not only do we not know what the extreme upperbound is for the number of diagnoses, but such a schema would be awkward to query.OR joins across dimensions are anathema to relational systems, and SQL’s Group Bylogic fails.
We resolve the design problem and provide for an arbitrary number of diagnoses byinserting a bridge table in between the fact table and the diagnosis dimension, as in Figure 6.2. We must generalize the original diagnosis key in the fact table to be a specialdiagnosis group key. The diagnosis group table, which is our bridge table, contains aspecific set of records (a diagnosis group) for each patient. Each record in the diagnosis group table contains the diagnosis group key, an individual diagnosis key, and aweighting factor. A patient with three diagnoses will have three records in their respectivediagnosis group. Within a given diagnosis group, the sum of all the weighting factors must be 1.00.
Figure 6.2 Solving the multiple diagnosis problem with a diagnosis group bridgetable.
The individual diagnosis key joins to the diagnosis table, which contains a full description of the diagnosis. With this structure, the user can perform two important kinds of queries.First, the user can ask for a correctly weighted summary of all charges (the main fact inthe fact table) grouped by diagnosis. The join through the bridge table picks up the weighting factor for each diagnosis and multiplies it by the amount fact. The use of theweighting factor guarantees that the bottom line total of amounts adds up correctly.
Alternatively, the user can request an impact report that performs the same join across the tables but does not use the weighting factor. Such an impact report deliberatelydouble counts the amounts, but correctly totals the impact each diagnosis has in terms oftotal amounts associated with that diagnosis. The user decides which kind of report, correctly weighted or impact, to run.
Notice that over a period of time, a patient will have different diagnosis groups. Thus anembellishment to this design adds the patient key, a begin effective date, and an end effective date to the diagnosis group record, although these extra fields are not requiredfor the basic navigation we are describing here.
A fact table representing account balances in a bank has an exactly analogous problem.

6.4
Each account may have one or more individual customers as account holders. To join anindividual customer dimension table to an account balances fact table, we build anaccount to customer bridge table that has the same structure as the diagnosis grouptable in the last example (see Figure 6.3). With the account-to-customer bridge table, we can build a correctly weighted account balance report by any attribute within thecustomer table, or alternatively, we can build a customer impact report by ignoring theweighting factors. These contrasting styles of reports are both of interest in bankingenvironments.
Figure 6.3 Solving the multiple customers per account problem with an account-to-customer bridge table.
A fact table that represents revenue received from commercial clients also faces themany-to-many problem. Each commercial customer may be represented by one or morestandard industry classification codes (SICs). A large diversified commercial customercould have as many as ten SICs. Again, by building an SIC group bridge table with thesame structure as the last two bridge tables, we can report total revenue by any attributefound within the SIC table, either correctly weighted or as an impact report.
All of the examples discussed in this section would usually have one or more entries inthe outlying dimension for each fact table record. None of these examples would have alot of cases where no dimensional entry was valid. Nevertheless, to handle the case ofno valid value, we simply create special diagnoses, special bank customers, or specialSICs that represent “we don’t know,” “no value in this case.” and “hasn’t happened yet.”The bridge table then has just one record entry for that fact record, and this bridge record points to the special diagnosis, customer, or SIC.
Tip
An open-ended many-valued attribute can be associated with a fact tablerecord by means of a bridge table between the dimension table and the facttable, but summarizing facts from this dimension requires the assignment of weighting factors to get the numbers to add up correctly.
Many-to-One-to-Many Traps
It is worth pointing out that there are some simple situations where what appear to be theobvious joins between tables do not return the correct results in any relational system.Consider the case where customers create orders for products, and the same customersreturn the products. There is a one-to-many relationship between customer and order and another one-to-many relationship between customer and return. The orders andreturns tables are assumed to have different cardinalities. In other words, not everyreturn corresponds exactly to a single order. It would seem obvious to create a reportshowing orders and returns by customer by joining the tables together as shown inFigure 6.4. This simultaneous join does not return the correct answer in a relationaldatabase management system (DBMS). Fortunately, this problem is easily avoided. Wesimply issue multipass SQL and query the orders table and the returns table in separatequeries, outer-joining the two answer sets on the customer row header. Of course, thesetwo queries probably come back faster when issued separately than if the DBMSprocesses the combined SQL, anyway.
Figure 6.4 A many-to-one-to-many schema that should not be queried with one

6.5
SELECT statement.
Tip
Be very careful when simultaneously joining a single dimension table to twofact tables of different cardinality. In many cases, relational systems will returnthe “wrong” answer.
Role-Playing Dimensions
A role in a data warehouse is a situation where a single dimension appears several timesin the same fact table. This can happen in a number of ways. For instance, in certain kinds of fact tables, time can appear repeatedly. For instance, we may build a fact tableto record the status and final disposition of a customer order. This kind of fact table iscalled an accumulating snapshot fact table. The dimensions of this table could be the following:
• Order date • Packaging date • Shipping date • Delivery date • Payment date • Return date • Refer to collection date • Order status • Customer • Product • Warehouse • Promotion
Each of these dimensions is a foreign key in the fact table record that points to a specificdimension table. Dimension tables contain the descriptive textual attributes of the data warehouse and are the source of most of our interesting constraints.
The first seven dimensions in the design are all dates! However, we cannot join theseseven foreign keys to the same table. SQL would interpret such a seven-way simultaneous join as requiring all the dates to be the same. That doesn’t seem verylikely.
Instead of a seven-way join, we need to fool SQL into believing that there are sevenindependent time dimension tables. We even need to label all the columns in each of thetables uniquely. If we don’t, we get into the embarrassing position of not being able to tellthe columns apart if several of them are dragged into a report.
Even though we cannot literally use a single time table, we still want to build and administer a single time table behind the scenes. For the user, we can create the illusionof seven independent time tables by using views. We create seven SQL views of thetime table, being careful to make each of the view field names unique.
Now that we have seven differently described time dimensions, they can be used as ifthey were independent. They can have completely unrelated constraints, and they canplay different roles in a report.
The scenario described in the last few paragraphs is the classic role model exercise in adata warehouse. Although the other examples we are about to describe have nothing todo with time, they are handled in exactly the same way.
The second example occurs in data marts that represent voyages or networks. In such afact table, we need to have at least four “port” dimensions to properly describe thecontext of a journey segment. The dimensions of a frequent-flyer flight segment fact table need to include the following:

6.6
• Flight date • Segment origin airport • Segment destination airport • Trip origin airport • Trip destination airport • Flight • Fare class • Customer
The four airport dimensions are four different roles played by a single underlying airporttable. We build and administer these exactly the way we did the seven time tables in theprevious example.
The telecommunications industry has lots of situations that require role models. With theadvent of deregulation, a number of competing entities may all extract revenue from asingle phone call. On a single call these entities might include the following:
• Source system provider • Local switch provider • Long-distance provider • Added value service provider
These four entities may need to be dimensions on every call. In the complex andevolving telecommunications industry, it may be very difficult and confusing to maintain four different partially overlapping tables of business entities. Some business entities willplay several of these roles. It will be much easier to keep a single business entity tableand use it repeatedly within a data warehouse role model framework.
Actually, in building a full-blown call revenue analysis fact table, we would also recognizethat there are at least two more business entity roles that should be added to the design.The fifth and sixth business entity dimensions could be:
• Calling party • Called party
The telecommunications industry also has a very well-developed notion of location. Many telecommunications dimensions have a precise geographic location as part of their description. This location may be resolved to a physical address or even to a highlyprecise latitude and longitude. Using our role-modeling skills, we can imagine building a master location table and then using it repeatedly. The location table could be part of a working telephone number, billing telephone number, equipment inventory, networkinventory (including poles and switch boxes), real estate inventory, service location,dispatch location, right of way, and even business entity. Each record in the location table is a point in space. Points in space are great because they roll up to everyconceivable geography. Points in space roll up just as easily to area codes as they do tocounties, census tracts, and sales territories. A single location record should probably include all these rollups simultaneously.
However, you will have noticed a little different emphasis in this discussion of location.Location is more naturally thought of as a component of a dimension, not as astandalone dimension. The working telephone number dimension is the most basicdescription of where all the phone numbers are actually located, but this dimension alsoneeds to describe the customer who owns this working telephone number and perhapssomething about the type of service this number represents. For instance, is it part of aCentrex system? This larger description seems to confuse the issue of creating a role forthe location table.
Tip
A single dimension may play several simultaneous roles when used with a fact table. The underlying dimension may exist as a single physical table, but eachof the roles must be presented in a separately labeled view.

6.7
The use of an embedded role, like location, in a variety of unrelated larger dimensions, isone of the few places where we encourage and support snowflaking. In other words, werecommend creating a join from each of the tables that need to describe location to aclone of the location table. The issues in creating location clones are exactly the same as creating the time, airport, and business entity clones described earlier in this section. Weneed separate views for each use of the location table, being careful to createdistinguishable column names. These views are then used to join into their respective larger dimensions, like working telephone number.
Organization and Parts Hierarchies
Representing an arbitrary organization structure or an arbitrary parts hierarchy is adifficult task in a relational environment. For example, we may wish to report the revenues of a set of commercial customers who have relationships with each other. SeeFigure 6.5. We may sell our products or services to any of these commercial customers,and at different times we want to look at them individually or as families arranged in a hierarchical structure.
Figure 6.5 A schematic diagram of a set of parent companies and subsidiaries,all of whom may be customers.
The computer scientist in us would try to model such a hierarchical structure with a recursive pointer in each customer dimension record containing a customer key of theparent organization as shown in Figure 6.6. Although this is a compact and effective wayto represent an arbitrary hierarchy, this kind of recursive structure cannot be used effectively with standard SQL. The GROUP BY function in SQL cannot be used to followthe recursive tree structure downward to summarize an additive fact like revenue in anorganization. Oracle’s CONNECT BY function also cannot be used because although it is able to navigate a recursive pointer in a dimension table, the CONNECT BY phrasecannot be used in the presence of a join to another table. This prohibits connecting arecursive dimension table to any fact table.
Figure 6.6 A commercial customer dimension with a recursiveparent_customer_key link.
As a guide to a more effective SQL-oriented design, let’s pose a number of desirable requirements for an organization structure (or parts hierarchy) design. We would like to:
• Keep the original grain of the customer dimension, so that the customer key from this

6.8
dimension when desired can be joined directly to the fact table, bypassing any bridgetable we might build to navigate the hierarchy.
• Be able to additively summarize an additive fact across the entire subtree of anorganization, using standard SQL GROUP BY logic.
•
Be able to additively summarize an additive fact across either the set of immediate subsidiaries of a customer or, alternatively, the lowest-level subsidiaries of an organization, regardless of the depth or complexity of the organization tree, usingstandard SQL GROUP BY logic.
• Be able to find the immediate parent as well as the top-most parent of any customer in the organization hierarchy in one step by using standard SQL logic.
We can meet all these objectives simultaneously by building a special kind of bridgetable between the customer dimension and the fact table as depicted in Figure 6.7. Neither the customer dimension nor the fact table has to be modified in any way. The useof the bridge table is optional. If it is left out, the customer dimension joins to the facttable in the usual way, and there is no information available to navigate the organizationhierarchy. If the bridge table is used, it is inserted between the customer dimension andthe fact table and can be used in two different modes.
Figure 6.7 A commercial customer dimension with a navigation bridge table thatallows natural SQL reporting at all levels of the tree. This join configurationsupports descending the tree.
The organization bridge table contains one record for each pathway in Figure 6.5 from a customer entity to each subsidiary beneath it. There is also a record for the zero-length pathway from a customer to itself. Each pathway record contains the customer key of the customer entity (called the parent entity), the customer key of the specified subsidiary entity, the number of levels between the parent and the subsidiary, and finally a flag thatidentifies a subsidiary as being at the bottom-most possible level.
When we want to descend the organization hierarchy, we join the tables together asshown in Figure 6.7. We can now GROUP BY or constrain on any attribute within thecustomer table, and we can request in one step any aggregate measure of all the subsidiaries at or below all the customers implied by the GROUP BY or the constraint.We can use the number of levels field in the organization bridge table to control the depthof the analysis. A value of 1 would give all the direct subsidiaries of a customer. A value of “greater than zero” would give all subsidiary customers but not the original parent. Wecan use the bottom-most flag field to jump directly to all of the bottom-most customer entities but omit all higher-level customer entities.
When we want to ascend the organization hierarchy, we join the tables as shown inFigure 6.8. By constraining the number of levels field in the organization bridge table tothe value of 1, we find the unique single parent of the customer in the customer dimension. By searching for the maximum value of the number of levels field, we find thetop-most parent customer. Alternatively, we could add a top-most flag to the organization bridge table to accomplish the same purpose.

6.9
Figure 6.8 This different configuration of joins between the navigation bridgetable and the other tables is used to climb up the tree.
There are a number of administrative issues in building and maintaining an organization bridge table. Perhaps the biggest question is where does the original organizationinformation come from? How is the information captured and what happens when anorganization change occurs? If a complete history of old organizational relationships needs to be maintained, then the organization bridge table can be generalized to includebegin and end effective dates on each record. If these dates are properly administered,then every requesting application would have to constrain on a specific date between the begin and end effective dates. In this way, old organizational relationships can betracked.
Updating the organization structure would require a simple program, perhaps written inVisual Basic, that would perform the functions of Add, Delete, and Move subtrees within the organization bridge table. These manipulations are not difficult, but these operationsare not single SQL statements. To move a subtree from one place to another, all thecustomer entities within the subtree would first have to be enumerated as a set. Then allthe records in the bridge table that referred to any member of this set as a subsidiaryentity would have to be adjusted so that the parent entity key was the new destinationparent entity.
The number of records in the organization bridge table is several times the number ofrecords in the customer dimension table. For the organization shown in Figure 6.5, 13 customer entities are shown, and we need 43 records in the organization bridge table.
Small- and medium-sized parts explosions in a manufacturing application can bemodeled using the same kind of bridge table in between a part/assembly dimension table and a fact table. Some caution should be taken to estimate the size of the bridge tablebefore trying to build it automatically. A really large manufacturing parts explosion, suchas for a Boeing 747, taken all the way down to tiny individual components would almost certainly be impractical because the bridge table would probably have hundreds ofmillions of rows.
Tip
Organization hierarchies and parts explosion hierarchies may be representedwith the help of a bridge table. This approach allows the regular SQL groupingand summarizing functions to work through ordinary query tools.
Unpredictably Deep Hierarchies
In some situations a hierarchy exists within a dimension, but its use is inconsistent. A dimension describing financial services may have an elaborate hierarchy that only makessense for some of the products. If the differing hierarchical descriptions are obviouslydependent on the type of the product, it is probably because of heterogeneous products. As described in Chapter 5, in this case one normally makes a core schema describing allproducts and their associated measured facts on a lowest common denominator basis (the core tables), but then a set of custom tables are built for each grouping of productsthat have similar sets of extended attributes and measured facts.
However, sometimes the variable depth of the hierarchical description is due to the unique history of the individual product and not due to the surrounding family of similarproducts. For instance, among a large group of retail electronic products, we may haveproducts that have manufacturing profiles like the following:
• Locally manufactured, locally tested • Remotely partially assembled, locally finally assembled, locally tested • Remotely partially assembled, locally finally assembled, locally tested, sent to retail,
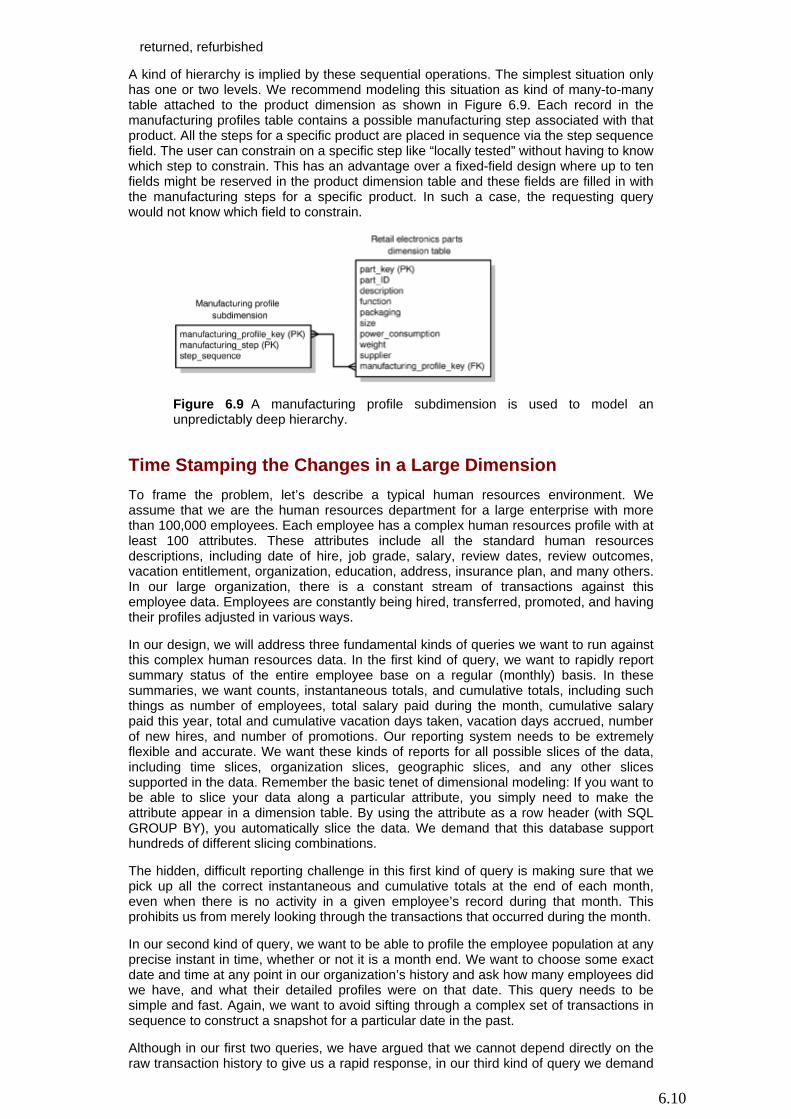
6.10
returned, refurbished
A kind of hierarchy is implied by these sequential operations. The simplest situation onlyhas one or two levels. We recommend modeling this situation as kind of many-to-many table attached to the product dimension as shown in Figure 6.9. Each record in the manufacturing profiles table contains a possible manufacturing step associated with thatproduct. All the steps for a specific product are placed in sequence via the step sequencefield. The user can constrain on a specific step like “locally tested” without having to know which step to constrain. This has an advantage over a fixed-field design where up to ten fields might be reserved in the product dimension table and these fields are filled in withthe manufacturing steps for a specific product. In such a case, the requesting querywould not know which field to constrain.
Figure 6.9 A manufacturing profile subdimension is used to model anunpredictably deep hierarchy.
Time Stamping the Changes in a Large Dimension
To frame the problem, let’s describe a typical human resources environment. Weassume that we are the human resources department for a large enterprise with morethan 100,000 employees. Each employee has a complex human resources profile with at least 100 attributes. These attributes include all the standard human resourcesdescriptions, including date of hire, job grade, salary, review dates, review outcomes,vacation entitlement, organization, education, address, insurance plan, and many others. In our large organization, there is a constant stream of transactions against thisemployee data. Employees are constantly being hired, transferred, promoted, and havingtheir profiles adjusted in various ways.
In our design, we will address three fundamental kinds of queries we want to run againstthis complex human resources data. In the first kind of query, we want to rapidly reportsummary status of the entire employee base on a regular (monthly) basis. In these summaries, we want counts, instantaneous totals, and cumulative totals, including suchthings as number of employees, total salary paid during the month, cumulative salarypaid this year, total and cumulative vacation days taken, vacation days accrued, number of new hires, and number of promotions. Our reporting system needs to be extremelyflexible and accurate. We want these kinds of reports for all possible slices of the data,including time slices, organization slices, geographic slices, and any other slices supported in the data. Remember the basic tenet of dimensional modeling: If you want tobe able to slice your data along a particular attribute, you simply need to make theattribute appear in a dimension table. By using the attribute as a row header (with SQL GROUP BY), you automatically slice the data. We demand that this database supporthundreds of different slicing combinations.
The hidden, difficult reporting challenge in this first kind of query is making sure that wepick up all the correct instantaneous and cumulative totals at the end of each month,even when there is no activity in a given employee’s record during that month. Thisprohibits us from merely looking through the transactions that occurred during the month.
In our second kind of query, we want to be able to profile the employee population at anyprecise instant in time, whether or not it is a month end. We want to choose some exactdate and time at any point in our organization’s history and ask how many employees did we have, and what their detailed profiles were on that date. This query needs to besimple and fast. Again, we want to avoid sifting through a complex set of transactions insequence to construct a snapshot for a particular date in the past.
Although in our first two queries, we have argued that we cannot depend directly on theraw transaction history to give us a rapid response, in our third kind of query we demand

6.11
that every employee transaction be represented distinctly. In this query, we want to see every action taken on a given employee, with the correct transaction sequence and thecorrect timing of each transaction. This detailed transaction history is the “fundamentaltruth” of the human resources data, and it should be able to answer every possible detailed question, including questions not anticipated by the original team of data martdesigners. The SQL for these unanticipated questions may be complex, but we areconfident the data is there waiting to be analyzed.
In all three cases, we demand that the employee dimension is always a perfectlyaccurate depiction of the employee base for the instant in time specified by the query. Itis a huge mistake to run a report on a prior month with the current month’s employeeprofiles.
Now that we have this daunting set of requirements, how on earth can we satisfy all ofthem and keep the design simple? Amazingly, we can do it all with a single dimensionalschema with just one fact table and a powerful dimension table called the Employee Transaction dimension. Take a moment to study Figure 6.10.
Figure 6.10 A model for a human resources environment with an employeetransaction dimension time stamped with current and next transaction dates andtimes.
The human resources data mart consists of a fairly ordinary looking fact table with threedimensions: employee transaction, month, and organization. We show all threedimensions in Figure 6.10 although we only explode the employee transaction table in detail because that is the interesting part of the design. The month table contains theusual descriptors for the corporate calendar, at the grain of the individual month. Theorganization dimension contains a description of the organization that the employee belongs to at the close of the relevant month.
The employee transaction dimension table contains a complete snapshot of theemployee record for each individual employee transaction. The employee transaction keyis an artificial key made during the extraction process, and it should be a sequentiallyassigned integer, starting with 1. Resist the urge to make this a smart key consisting ofemployee ID, transaction code, and effective date/time. All of those attributes arevaluable, but they are simply attributes in the employee transaction record, where theyparticipate in queries and in constraints like all the other attributes.
The employee ID is the normal human resources EMP ID that is used in the productionsystem. The transaction description refers to the transaction that created this particularrecord, such as Promotion or Address Change. The transaction date/time is the exactdate and time of the transaction. We assume that these date/times are sufficiently fine-grained that they guarantee uniqueness of the transaction record for a given employee.Therefore, the true underlying key for this dimension table is employee ID plustransaction date/time.
A crucial piece of the design is the second date/time entry: transaction end date/time. This date/time is exactly equal to the date/time of the next transaction to occur on this employee record, whenever that may be. In this way, these two date/times in each recorddefine a span of time during which the employee description is exactly correct. The two date/times can be one second apart (if a rapid sequence of transactions is beingprocessed against an employee profile) or many months apart.
The current last transaction made against an employee profile is identified by the Last Transaction Flag being set to True. This approach allows the most current or final statusof any employee to be quickly retrieved. If a new transaction for that employee needs to
6.12
be entered, the flag in this particular record needs to be set to False—we never said that we don’t update records in the data warehouse. The transaction end date/time in themost current transaction record can be set to an arbitrary time in the future.
Some of you may object to the storage overhead of this design. Even in a pretty large organization, this approach doesn’t lead to ridiculous storage demands. Assume we have100,000 employees and that we perform 10 human resources transactions on them eachyear. Assume further that we have a relatively verbose 2000-byte employee profile in the employee transaction record. Five years’ worth of data adds up to 5 ¥ 100,000 ¥ 10 ¥2000 bytes or just 10 GB of raw data. If your definition of employee transaction is muchmore fine-grained so that a job promotion requires dozens of low-level tiny transactions, you might consider creating a small set of super transactions like Job Promotion to makethe data sizing realistic. Admittedly, this makes the extraction task more complex.
This compact design satisfies our three categories of queries beautifully. The first kind ofquery, which wants fast high-level counts and totals, uses the fact table. All of the facts inthe fact table are additive across all of the dimensions except for the ones labeled asbalances. These balances, like all balances, are semiadditive and must be averagedacross the time dimension after adding across the other dimensions. The fact table isalso needed to present additive totals, like salary earned and vacation days taken.
The particular employee transaction key used in a fact table record is the preciseemployee transaction key associated with the stroke of midnight on the last day of thereporting month. This guarantees that the month end report is a correct depiction of allthe employee profiles.
The second query is addressed by the employee transaction dimension table. A time-based cut through the employee database can be made by choosing a specific date andtime and constraining this date and time to be greater than or equal to the transaction date/time and less than the transaction end date/time. This is guaranteed to returnexactly one employee profile for each employee whose profile was in effect at therequested moment. The query can perform counts and constraints against all the records returned from these time constraints.
The third kind of query can use the same employee transaction dimension table to look indetail at the sequence of transactions against any given employee.
Tip
The design for the slowly changing Type 2 dimension may be embellished byadding begin and end time stamps and a transaction description in eachinstance of a dimension record. This design allows very precise time slicing ofthe dimension by itself.
Some of you may be wondering if the employee transaction dimension table isn’t really akind of fact table since it seems to have a time dimension. While technically this may betrue, this employee transaction table mainly contains textual values, and it is certainly the primary source of constraints and row headers for query and report-writing tools. So it is proper to think of this table as a dimension table that serves as the entry point into thehuman resources data mart. The employee transaction table can be used with any fact table in any data mart that requires an employee dimension as long as the notion ofemployee key is extended to be the employee transaction key. This design is really anembellishment of the standard slowly changing dimension we routinely use when dimensions like Product change at unexpected intervals. The key idea that makes thishuman resources database fit into our familiar dimensional framework is making eachdimension record an individual employee transaction and then tying these records to precise moments in time.
Building an Audit Dimension
An interesting dimension to add to a fact table is an audit dimension that records thelineage of each fact record. The audit dimension is constructed during the extractprocess in the data staging area. An ideal audit dimension design is shown in Figure6.11. There is one record in the audit dimension for each separate run of software duringthe extract operations. The records of the runs are assembled into a single audit record describing the major phases run, the status of each phase upon completion, and theexact time of completion of each phase. If individual software modules need to betracked in more detail, then an optional Run Log fact table can be added that records therun results of as many individual software modules as desired.

6.13
Figure 6.11 An audit dimension can be used to accurately track the lineage ofindividual records in the fact table.
If a fact record is subject to updating, then the design needs to be generalized anadditional step. A many-to-many bridge table must be added between the audit dimension and the fact table in much the same way we described bridge tables forpatient diagnoses and customers within accounts earlier in this chapter.
Too Few Dimensions and Too Many Dimensions
Most dimensional models end up with between five and fifteen dimensions. At the low end, there is a strong suspicion that dimensions have been left out. The designer shouldcarefully think whether any of the following kinds of dimensions should be addedpresuming there is business demand:
• Causal dimensions, like promotion, contract, deal, store condition, or even the weather.
•
Additional time-stamp dimensions, especially when the grain of the fact table is a lineitem in a control document such as an order, a shipment, an invoice, a bill of lading, or a ticket. See The Data Warehouse Toolkit for examples of fact tables with a large number of time stamps.
•
Dimensions that implement multiple roles. Often even a single transaction may haveseveral business entities associated with it. As described earlier in this chapter, a telephone call may have a local service provider, a backbone carrier, a long-distance provider, and an added value service provider. All four of these can be dimensions onthe single call record. Similarly, sometimes a single transaction may have multiple employee role dimensions, or multiple responsible organization dimensions such assales organizations associated with the transaction. Each of these can be a separatedimension.
• Status dimensions that flag the current status of a single transaction or monthlysnapshot within some larger context, like New Customer or In Collections.
• An audit dimension, as described in earlier in this chapter.
• One or more degenerate dimensions that identify header control numbers usually ofsignificance to an operational system.
• A junk dimension, as described in Chapter 5.
Most of these dimensions can be added gracefully to the design even after the datawarehouse has gone into production. The addition of these dimensions usually does not alter the existing dimension keys or the measured facts in the fact table, and it does notcause the grain of the fact table to change. In this case, all existing applications shouldcontinue to run without any changes being required. Remember that any descriptive attribute that is single valued in the presence of the measurements in the fact table is agood candidate to be added to an existing dimension or to be its own dimension.
At the high end of the spectrum, especially if the design seems to have 20 or 30dimensions, one should look for ways to prune the dimension list.
Tip
Usually a very large number of dimensions is a sign that several dimensionsare not at all independent and should be combined into a single dimension.
Either the dimensions are obviously related to each other, such as brand, category, anddepartment in a typical product table, or the dimensions have a mathematical correlationthat may have to be uncovered by analysis, as described in the section on junk

6.14
dimensions in Chapter 5. Extended Fact Table Designs
In this section we describe a number of common modeling situations where a specific fact table structure is very effective or conversely where the designer may choose aninefficient design.
Facts of Differing Granularity and Allocating
The dimensional model gains power as the individual fact records become more and more atomic. At the lowest level of individual transaction or individual snapshot in time,the design is most powerful because:
• More of the descriptive attributes have single values.
• The design gracefully withstands surprises in the form of new facts, new dimensions, ornew attributes within existing dimensions.
These new data elements can usually be added to the existing design withoutunraveling existing administrative procedures or existing queries and reports.
•
There is usually more expressiveness at the lowest levels of granularity, and, thus,more dimensions make sense at this level. For example, one can often attach anemployee dimension to a customer transaction that represents the clerk, the customer agent, or the loan officer, but this employee dimension may not make logical sense ona monthly summary record or across multiple customers.
When the designer is faced with facts of differing granularity, the first response should be to try to force all of the facts down to the lowest level. We can broadly refer to thisprocedure as “allocating” the high-level facts to the low level. There are many, many examples of the need to allocate in a data warehouse. The most pervasive example is the need to allocate costs. For example, on a shipment invoice, there may be a shippingcost for the whole invoice that is initially not allocated down to the individual line item.
The data architect working with the business should make a significant effort to allocate invoice shipping costs down to the line-item level, even if the process of allocating involves some degree of compromise or controversy. If the design does not successfullyallocate this shipping cost, two bad things happen:
•
The shipping cost must be presented in a higher-level table, such as at the invoice level. Perhaps the situation is even worse, and the measured shipping costs are simplystandards or rates that are not even specific to the invoice, but rather exist at a regional or product category level. In any case, the design of a profitability reporting schemathat combines revenues and costs will be more complicated due to the presence ofmultiple fact tables at differing levels of granularity.
•
A worse problem may arise because of the refusal to allocate shipping cost to the lineitem level. If the line item distinguishes one product from another on a shipping invoice,this refusal may mean that product profit and loss (P&L) statements may not be possible because the shipping cost can only be represented independently from theproduct dimension. Such a refusal is usually unacceptable, and it forces the end usergroups to agree on an allocation scheme.
If we are successful in allocating all cost facts down to the lowest level, our problem goesaway. In Figure 6.12, we show a successfully allocated set of revenues and costs that isthe basis of the classic “most powerful” schema discussed in The Data Warehouse Toolkit. The items that had to be allocated are indicated in the figure. Incidentally, it iswonderful if the whole issue of allocations has been handled by the finance departmentand not by the data warehouse team. If the allocation process is too controversial or too complicated, the data warehouse team may be distracted and delayed. Also, in manycompanies, the need to rationally allocate costs has been recognized already, and thisfunction is completely independent of the data warehouse team—there may be a task force creating “activity-based costing” measures, for example. This is just another namefor allocating.

6.15
Figure 6.12 A shipment invoices fact table showing how a full view of profitabilitycan be expressed at the invoice line item level by allocating costs to the lowest level.
In the event that allocating facts down to the lowest level is impossible, the designer hasno choice but to present the higher level facts in separate fact tables. It is correct to think of these higher-level facts as existing within an aggregation or at the same level as anaggregation. A reasonable example of this situation would be high-level plans or forecasts. The management team may meet periodically to create high-level revenue and cost plans. These usually exist only at relatively rarefied aggregation levels, and it makesno sense to try allocate such plans down to an individual invoice line item. In this case, arequesting query or report that tries to match actuals to plans needs to roll up the actuals to the right levels implied by the plans. Hopefully, for performance reasons, the actualsare already being expressed as prestored aggregates. It may be helpful to make surethat the actual aggregates exist at exactly the same level as the plans. If the list of dimensions are identical, as in Figure 6.13, then the two tables could even be mergedinto a single table, simplifying the querying process even further.
Figure 6.13 When an aggregate table and a plan table share exactly the same dimensions, it may be reasonable to combine them into a single physical table.
However, one or both of the tables may have additional dimensions, making this mergerimpossible. For example, the plans fact table could have a plan version dimension that would need to be constrained to a particular value (e.g., Preliminary, Final, Approved)before running the report. In this case, the plan table would remain separate as shown inFigure 6.14.

6.16
Figure 6.14 A plan table with an extra dimension (plan version) that makes itimpossible to combine with an aggregate table.
A design mistake is sometimes made in the design of individual fact table records in aneffort to improve performance or to reduce query complexity. Aggregated factssometimes sneak into the fact record. In Figure 6.15 we show year-to-date totals and national totals in a record that is expressed at a daily grain. These totals are dangerousbecause they are not perfectly additive. While a year-to-date total reduces the complexity and runtime of a few specific queries, having it in the daily grain fact table invites a queryor report to double count this field if more than one day is ever included in a query. Similarly, the national market total will double count if the query ever includes more thanone location. It is very important that once the grain of a fact table is chosen, all of theadditive facts are presented at this uniform grain.
Figure 6.15 A fact table with facts at the wrong grain.
Time of Day
Fine-scale tracking of individual transactions may introduce a meaningful date and timestamp into the data that is accurate to the minute or even the second. In this case, we do not create a time dimension with one record for every minute or second in the entireepoch! Usually, the notions of day are quite distinct from the notions of time within theday, and we separate these into two entries in the fact table as in Figure 6.16. The day measure is virtually always expressed as a surrogate key to a full-fledged day dimension table that contains calendar information. But the time-of-day measure may be best expressed as a simple numerical fact rather than as a dimension, unless there are textual descriptions of certain periods within the day that are meaningful, like Lunch Houror Graveyard Shift. The time of day should be expressed as a number of minutes ornumber of seconds since midnight.
Figure 6.16 A sales fact table with transaction time recorded to the minute andsplit off from the transaction date.
Tip Break the time of day off from the calendar date, and make it a simple numeric

6.17
fact.
In applications that span multiple time zones, both the date and time of day may need tobe expressed both in local time and Greenwich Mean Time (GMT). This must be donewith separate date dimensions for local and GMT and separate time-of-day facts as well, as in Figure 6.17. Merely providing for offsets in either the time dimension table or thefact table doesn’t work because of the number of possible time zones and thecomplexities of switching to and from daylight savings time. Having two explicit timeinterpretations can be quite useful. In analyzing call center behavior where there aremultiple call centers in different time zones, calling behavior can be aligned in real timeby using the GMT interpretation and aligned on similar local times (but not real time) by using the local time interpretation. Finally, if it is easier for the users to understand, theGMT interpretation can be something more familiar, like Eastern Standard Time in theUnited States.
Figure 6.17 A sales fact table spanning multiple time zones where comparingcomparable telesales across time zones is required.
Multiple Units of Measure
Sometimes, in a value chain involving several business processes monitoring the flow ofproducts through a system or multiple measures of inventory at different points, a conflictarises in presenting the amounts. Everyone may agree that the numbers are correct, butdifferent parties along the chain may wish to see the numbers expressed in different units of measure. For instance, manufacturing managers may wish to see the entire productflow in terms of car loads or pallets. Store managers, on the other hand, may wish to seethe amounts in shipping cases, retail cases, scan units (sales packs), or consumer units (individual sticks of gum). Similarly, the same quantity of a product may have severalpossible economic valuations. We may wish to express the valuation in terms ofinventory valuation, in list price, in original selling price, or in final selling price. Finally, this situation may be exacerbated by having many fundamental quantity facts in eachfact record.
Consider an example (generalized from The Data Warehouse Toolkit) where we have 13 fundamental quantity facts, 5 unit-of-measure interpretations, and 4 valuation schemes. It would be a mistake to present only the 13 quantity facts in the fact table and then leave itup to the user or application developer to seek the correct conversion factors in remotedimension tables, as in Figure 6.18, especially if the user queries the product table at aseparate time from the fact table without forcing the join to occur. It would be equally badto try to present all the combinations of facts expressed in the different units of measurein the main fact table. This would require 13 x 5 quantity facts plus 13 x4 valuation factsor 117 facts in each fact table record! The correct compromise is to build an underlyingphysical record with 13 quantity facts, 4 unit-of-measure conversion factors, and 4 valuation factors. We need only 4 unit-of-conversion factors rather than 5 since the base facts are already expressed in one of the units of measure. Our physical design now has13 + 4 + 4, or 21, facts as shown in Figure 6.19.

6.18
Figure 6.18 The wrong design when fact table quantities need to be expressedin several units of measure.
Figure 6.19 The recommended design for multiple units of measure places theconversion factors directly in the fact table record to eliminate the possibility of choosing the wrong factors.
Tip
Packaging all the facts and all the conversion factors together in the same facttable record provides the safest guarantee that these factors will be used correctly.
Finally, packaging these factors in the fact table reduces the pressure on the productdimension table to issue new product records to reflect minor changes in these factors,especially the cost and price factors. These items, especially if they routinely evolve over time, are much more like facts than dimension attributes.
We now actually deliver this fact table to the users through one or more views. The mostcomprehensive view could actually show all 117 combinations of units of measure and valuations, but obviously we could simplify the user interface for any specific user groupby only making available the units of measure and valuation factors that the groupwanted to see.
Multinational Currency Tracking
In a multinational enterprise we may have transactions expressed in a dozen or morecurrencies. Although the idea of translating a number of local currencies into a singlestandard currency is obvious, we wish to make the database more flexible, so that any manager in any country can see summaries of the enterprise in any currency. Thisflexibility can be accomplished by expressing all currency amounts in primary factrecords both in terms of the applicable local currency as well as the internationalstandard currency and by adding a special currency conversion fact table to the design.This design is shown in Figure 6.20.

6.19
Figure 6.20 Tracking transactions in multiple currencies requires a dailycurrency exchange conversion fact table.
Suppose we are tracking the sales of a large retailer with locations in cities all around thePacific Rim. Suppose further that the New Zealand stores are part of the South Pacificregion, whose regional offices are in Australia. The main operational headquarters are in California, and the executive headquarters are in Switzerland. We assume that thestandard currency that is common to all fact table records is US dollars. Now a specificfact record for a sale that takes place in New Zealand has amounts expressed in New Zealand dollars and US dollars. The region manager can roll up all the sales in the SouthPacific region in Australian dollars by using the special currency conversion table. Finally,the senior executives in Zurich can roll up the worldwide business in Swiss francs in asimilar way.
Within each fact table record, the amount expressed in local currency is always exactlyaccurate since the sale was conducted in that currency on that day. The equivalent USdollar value would be based on a conversion rate to US dollars for that day. Theconversion rate table has all combinations of effective currency exchange rates going inboth directions since it is assumed that the symmetric rates between any two countriesare not exactly equal. Notice that since the exchange rate table reflects daily ratefluctuations, some moderately sophisticated analyses can be done that take into accountdelays in actually moving cash in and out of various currencies.
Value Band Reporting
Our final design example involving fact tables occurs when we want to perform value-band reporting on a fact. For instance, suppose that we have a large table of accountbalances, as shown in Figure 6.21, and we want to run a report of the form:
Balance Range
Number of Accounts
Total of Balances
0–1000
45,678
$10,222,543
1001–2000
36,788
$45,777,216
2001–5000
11,775
$31,553,884
5001–10000
2,566
$22,438,287
10001 and up
477
$ 8,336,728
It is not easy to create this report directly from the fact table. SQL has no generalizationof the GROUP BY clause that clumps additive values into ranges. Also note that the ranges are of unequal size and they have textual names like 10001 and up. The SQL CASE statement provides a rudimentary IF-THEN capability to create these ranges, but it is not easily accessible to end users. Also, one would like to have the flexibility to redefine the bands to have different boundaries or different levels of precision.
The schema design shown in Figure 6.21 allows us to do flexible value-band reporting. The band definition table contains as many sets of different reporting bands as desired. The name of a particular group of bands is stored in the band group field. When the banddefinition table is joined to the fact table, it is joined by a less-than, greater-than pair of joins to the balance fact. The report uses the band name as the row header and sorts thereport on the band sort field.

6.20
Figure 6.21 Arbitrary value band reporting can be done with a band definitiontable and a pair of nonequijoins.
Tip
Value-band reporting benefits from an index created directly on the affectedfact in the fact table.
The performance of a query that constrains or groups on the value of a fact like balancewill be improved enormously if the DBMS can efficiently sort and compress an individual fact. Such an approach was pioneered by the Sybase IQ product in the early 1990s, andit is now becoming a standard indexing option on several of the competing DBMSs thatwant to provide a high performance solution for this kind of report. Notice that the style of a value-band report encourages a scan of a very large number of accounts because thepoint of the report is to take a broad perspective across many accounts.
Advanced ROLAP Querying and Reporting
In this section we discuss a number of advanced techniques for querying and reportingthat have become important. For a more basic discussion of querying and reporting in adimensional environment, see Chapters 14, 15, and 16 in The Data Warehouse Toolkit.
Drill-Across Queries with Multiple Technologies
Having made the claim that by conforming dimension and conforming facts, we can tietogether disparate data marts, we need to take a look at exactly how that is done.Clearly, if we step far enough back and consider data marts implemented on differentDBMSs and even remote data marts implemented on various proprietary OLAPplatforms, there is no way to launch a single massive SQL-based query to any single machine and get a conformed drill-across-style answer.
Tip
To drill across multiple query technologies, we must launch a series of queriesagainst each data mart and bring the separate results sets back to anintermediate platform, where we tie the answers together by performing a sort-merge on the row headers of the answer sets.
A series of drill-across queries that solves this problem can be imagined by visualizingthe icon flow in Figure 6.22. At the level of the join operation in the icon flow, it doesn’tmake any difference what the underlying technologies of the query sources happen tobe, as long as the dimensions are carefully conformed so that the sorted row header listsin the answer sets can be matched perfectly on a character-by-character basis. Of course, there is always the deeper issue with conformed dimensions that requires theseparate copies of the conformed dimensions to be perfectly administered in unison sothat the internal relationships among the attributes are synchronized. Keeping suchdisparate dimensions perfectly synchronized is a matter for the dimension replicationfunction in the data staging area, which is discussed in detail in Chapter 16.

6.21
Figure 6.22 The query architecture for disparate conformed data sources.
Self Referencing Queries, Behavior Tracking, and SequentialSubsetting
SQL is very seductive. Simple SQL statements seem to read like English-language requests for information from a database. After all, almost everyone can figure out theintent of a simple SQL request like
Select Product_Description,Sum(dollars)
– all the columns in the final output
From Product, Time, Sales
– the tables needed in the query
Where Sales.Product_key =Product.Product_key
–
joining the Sales table to the Product table
And Sales.Time_key = Time.Time_key
–
joining the Sales table to the Time table
And Time.Month = ‘September, 1997’
– the “application” constraint
Group by Product_Description
– the row header in the final output
Here we are asking for the September sales of each of our products.
Unfortunately, almost any more ambitious business request begins to make the SQLcomplex to write and complex to read. For too long, query tool vendors did not venturevery far beyond the safe havens of simple SQL requests like the preceding example. In the early days, most query tools automated the construction of simple SQL requests,sometimes even showing the SQL clauses as they were being built. It has only been inthe last two or three years that query tool vendors have seriously tackled how to issue the really complex SQL needed for serious business questions. Some vendors havedeepened their tools by allowing the user to construct embedded subqueries. Othershave also implemented multipass SQL, in which complex requests are broken into many separate queries whose results are combined after the database has completedprocessing.
But, are these approaches sufficient? Are we able to pose all the interesting businessquestions we want? Aren’t there some business results that beg to be recognized but are trapped in the database because we just can’t “speak” clearly enough? Should the SQLlanguage committee give us more power to ask hard business questions, and could thedatabase vendors implement these language extensions, all before the next millennium?
To get some perspective on these issues, let us propose seven categories of businessquestions, ordered from the most simple to the most complex, in terms of the logicalcomplexity of isolating exactly the records in the database needed to answer thequestion. This isn’t the only possible taxonomy of business questions or SQL queries, butit is useful as a scale to judge SQL and SQL-producing tools. As you read the following seven categories of queries, try to imagine whether SQL could pose such a query, andtry to imagine whether your query tool could produce such SQL. The seven categories ofqueries are:

6.22
1.
Simple constraints. Constraints against literal constants, such as “Show the salesof candy products in September 1997.”
2.
Simple subqueries. Constraints against a global value found in the data, such as“Show the sales of candy products in September 1997 in those stores that hadabove-average sales of candy products.”
3.
Correlated subqueries. Constraints against a value defined by each output row,such as “Show the sales of candy products for each month of 1997 in those storesthat had above-average sales of candy in that month.”
4.
Simple behavioral queries. Constraints against values that are the result of an exception report or a complex series of queries that isolates desired behavior, suchas “Show the sales of those candy products in September 1997 whose householdpenetration for our grocery chain in the 12 months prior to September were more than two standard deviations less than the household penetration of the sameproducts across our ten biggest retail competitors.” This is a variation of the classicopportunity gap analysis.
5.
Derived behavioral queries. Constraints against values found in set operations (union, intersection, and set difference) on more than one complex exception reportor series of queries, such as “Show the sales of those candy products identified in example 4 and which also experienced a merchandise return rate more than twostandard deviations greater than our ten biggest retail competitors.” This is a setintersection of two behavioral queries.
6.
Progressive subsetting queries. Constraints against values as in example 4, but also temporally ordered so that membership in an exception report is dependent onmembership in a previous exception report, such as “Show the sales of those candy products in example number four that were similarly selected in August 1997 but were not similarly selected in either June or July 1997.” An important health careexample of a progressive subsetting query would be “Show the oldest 100 patientswho initially complained of chest pain, then had either treatment A or treatment B, then subsequently did not have surgery, and are still alive today.”
7.
Classification queries. Constraints on values that are the results of classifyingrecords against a set of defined clusters using nearest neighbor and fuzzy matchinglogic, such as “Show the percentage of low-calorie candy sales contained in the 1000 market baskets whose content most closely matches a Young Health-Conscious Family profile.”
The business questions in these seven categories grow progressively more interesting as we move down the list. The questions in categories 4-7 lead almost directly to decisions made and actions taken. Decisions made and actions taken are the trueoutputs of a data warehouse, and in that sense we should be devoting a large part of our creative energy to making these kinds of complex queries possible.
How did you do in comparing these business questions to SQL and to industry-standard tools? Not too well, we assume. Most query tools can really only handle category 1(simple constraints) easily. Some of the high-end tools can also handle category 2 (simple subqueries), although the user interface commands for doing these subqueriesmay be cumbersome. A few are aggressively selling their ability to handle category 3(correlated subqueries).
As far as we know, none of the standard query or reporting products have direct userinterfaces for categories 4-7. If you are trying to support queries in these categories, youare faced with an architectural problem: These business questions are too complex to express in a single request. Not only should the user partition these queries intosequential processing steps in order to think clearly about the problem, but theunderlying algorithms may be more stable and easier to control if they are doing less in each step. So how do you attack these hard problems in categories 4-7, and can you use your current tools to get you part way or all the way to useful answers?
The key is to use a technique that has been developed for doing behavior tracking applications in relational environments. This approach could be an important stepforward for query tools that would extend their reach across categories 4, 5, and 6(simple and derived behavioral queries and progressive subsetting queries). In some sense, this is a way to turbocharge existing query and reporting tools to perform deeperanalyses than they could before. The technique partitions the problem into two steps.

6.23
First, run an exception report or series of queries that defines the complex behavior you wish to label. For instance, define the candy products in September 1997 whosehousehold penetration for our grocery chain in the 12 months prior to September weremore than 2 standard deviations less than the household penetration of the same products across our 10 biggest retail competitors. Although this is a complex request,most of the good report and analysis systems on the market should be able to handle it,perhaps with several steps. After running the exception report (in this case yielding a list of products), capture the product keys of the products identified in the exception report as an actual physical table that consists of a single product key column.
Tip
The secret to building complex behavioral queries and progressive subsetting queries is to capture the keys of the customers or products whose behavior youare tracking. You then use the captured keys to subsequently constrain otherfact tables.
Now use the special behavior dimension table of product keys whenever you wish to constrain any analysis on any table to that set of specially defined products. The onlyrequirement is that the target fact table contain a product key as part of its overallcomposite key.
The use of the special behavior dimension is shown in Figure 6.23.
Figure 6.23 A special behavior dimension consisting only of keys of someselected dimension can be attached directly to any fact table containing thatdimension’s keys.
The special behavior dimension is just attached with an equijoin to the product keycomponent of the fact table’s composite key. This can even be done in a view that hidesthe explicit join to the special behavior dimension. In this way, the star schema looks and behaves like a regular, uncomplicated star. If the special dimension table is hidden undera view, and we call this view Special Product Sales instead of Sales, then virtually everyquery tool, report writer, and ROLAP tool should be able to smoothly analyze this specially restricted star schema without paying a syntax or user-interface penalty for the complex processing that defined the original exception report.
Like any design decision, this one has certain compromises. First, this approach requires a user interface for capturing, creating, and administering real physical tables in the datawarehouse. We can imagine building a simple applet in Visual Basic that sits outside ofyour favorite query tool or report writer. Whenever a complex exception report has been defined on the screen, you make sure that the appropriate set of keys are displayed andthen capture them into the applet with the Cut and Paste commands. This applet thencreates the special behavior dimension table.
A second reality is that these tables must live in the same space as the primary fact tablebecause they are going to be joined to the fact table directly. This affects the DBA’sresponsibilities.
Third, the use of a random set of product keys as in the preceding example will affect aggregate navigation on the product dimension. A sophisticated approach could buildcustom aggregations on the special behavior set for all the queries that summed over thewhole set rather than enumerating the individual members. Aggregate navigation on all

6.24
the other dimensions should be unaffected.
By storing the keys in the special behavior dimensions in sorted order, set operations ofunion, intersection, and set difference can be handled in a single pass. This allows us to construct derived behavior dimensions that are the combinations of two or more complexexception reports or series of queries.
Finally, by generalizing the behavior dimension to also include a time key in each recordalong with the product key (in the preceding example), the time key can be used toconstrain out records in the master fact table that occurred after the behaviorally defined event. In this way, we can search for behavior that happens in a sequential order.
One complexity arises in this approach if you are also tracking the product using slowlychanging dimension technique number 2, where a new record and a new surrogate keyfor the product table is created whenever a change in the product’s profile occurs. In this case, new surrogate keys would occasionally be created representing the same product.Depending on the business rules underlying the desired analysis, a periodic maintenancestep is needed for the behavior dimension. If the analysis wants to track the individual product forward in time, allowing changes in the product’s description, then subsequentsurrogate keys generated for that product would have to be added to the behaviordimension. This could be done in several different ways. If the frequency of updating product profiles is low, then each day, the few updated product profiles could trigger anupdate of the behavior dimension tables. The behavior dimension tables would besearched for the existence of the old value of a surrogate product key that had changed today. If the old value were found, then the new value would be also added at the end ofthe behavior dimension. The behavior dimensions should be sorted in order of the keysin any case to facilitate rapid set operations between these tables, like union, intersection, and set difference. This administrative step of updating the behaviordimensions is a little utility that is run as part of the daily extract operations. If any newsurrogate product keys are created because of changing product profiles, then the utility must be run.
Market Basket Analysis
Market basket analysis consists of noticing the combinations of products that selltogether. Although many market basket analyses are literally the analysis of grocery store market baskets, the concept can easily be extended to other situations. A differentbut perfectly good example is cable television purchases made within the monthfollowing the purchase of a sports viewing package.
Conceptually, the idea of recording market basket correlations is simple, but the sheercombinatorics of the large number of products makes the problem very challenging. Forexample, in Figure 6.24 we show how a standard retail sales fact table could drive thepopulation of a market basket table that records all possible pairs of products soldtogether. A useful market basket table represents an aggregation over one or more of themajor dimensions such as time or store. If there are N products in the store, and we attempt to build such a table with every possible pair of product keys encountered in realmarket baskets, we will approach N2 product combinations (actually N*(N - 1) for the mathematicians among you). In modern retail environments, this is ridiculous. Even asmall retail store with 10,000 SKUs could generate 10,0002 = 100,000,000 pairwise combinations. If we asked for the three-way combinations, we would worry about 10,0003
combinations, although in fairness we should point out that many market baskets wouldnever be encountered. At some point in these kinds of arguments, the laws of physicsintervene. Nevertheless, we are left with the absurdity of perhaps recording all thepossible combinations of products.
Figure 6.24 A market basket fact table populated from a sales fact table, showing the product keys that must be generalized to handle either base-level products or aggregate-level products, in any mixture.

6.25
Tip
The secret of performing market basket analysis efficiently is to start at the top of the merchandise hierarchy and begin subdividing it, with the goal of alwaysbalancing the number of baskets in each group.
By setting a threshold number of records in the market basket fact table, we can controlthe explosion and stop when we have generated as much detail as we can tolerate. InFigure 6.24 we indicate how the fact table schema for performing this analysis should begeneralized.
To populate this schema, we start at the top of the merchandise hierarchy, which we will assume is department. We first calculate the market basket counts for all pairs ofdepartments. If there are 20 departments, we will calculate the counts for up to 400 pairs.We then rank order the results by total market basket counts. The most desirable results of this first iteration are the records near the top of the list, where the dollars or the unitsfrom the two departments are reasonably balanced. These records are high-level (department) answers to the original question of what sold together. By the way, one could also ask the reverse question, namely what did not sell together. Answering this reverse question would require the additional step of recording baskets from which adepartment was missing from the basket if this was not already done. Although most baskets are missing many departments, the number of department pairs underconsideration is still 400. Again, the department pairs results start to answer thequestion. We look near the top of the basket count list for pairs of departments that are out of balance. These records would be evidence of many shopping experiences inwhich the two departments in question either did not occur in the same basket or onedepartment was much more heavily represented. An extreme form of this measurement would find a place in the fact table to record separately the baskets where one of thedepartments was completely missing. This would require a Type dimension in the marketbasket fact table to distinguish these baskets from the merely unbalanced baskets.
The key step in market basket analysis, however, is not to be content with thedepartment pairs we have generated already. We must now push down to the next levelof detail, which we will assume is category. We start with the high-frequency department pairs generated in the first step. To avoid the combinatorial explosion, we make adecision about descending to the next level depending on whether the departmentdollars or units are reasonably balanced. If the dollars (or the units) for both departments are reasonably balanced, then we calculate the category pairs for all the categories inboth departments. Again, if both departments have 20 categories, we are looking for upto 400 combinations, and we repeat the logic of the preceding paragraph, only at the category level within the selected pair of departments.
If both departments are not evenly balanced, we explode only the categories of the morepopulous department. This is the crucial step in avoiding the pairwise products explosion. Now we are just looking at 20 categories selling with one department. We process thisshorter list just as we processed the more balanced lists, by looking for the highest-ranking category-to-department market basket counts and hoping to find some of these that have reasonable balance.
This process continues until enough records have been collected to satisfy the analyst’scuriosity. One can imagine automating this process, searching the merchandisehierarchy downward, ignoring the low basket count results, and always striving for balanced dollars and units with the high basket counts. The process could halt when thenumber of product pairs reached some desired threshold or when the total activityexpressed in basket count, dollars, or units reached some lower limit.
A variation on this schema could, of course, start with a specific department, category,brand, or even a specific product. Again, the idea is to combine this specific item first withall the departments, and then work down the tree.

6.26
Summary
This collection of design techniques extends the basic dimensional design principles toaddress complex situations that occur rather frequently in the real world. We discussedadvanced modeling situations for dimension tables such as many-valued dimensions, role-playing dimensions, and hierarchical dimensions. We looked at a human resourcesexample where the large employee dimension can be time stamped and associated withevery underlying transaction in such a way that precise snapshots can be made of the entire set of employees at any arbitrary point in time. We finished the dimensiondiscussion with a design for a special audit dimension that provides a way to trace theextract lineage of any fact record.
The second part of this chapter described advanced modeling techniques for fact tables, including handling facts of differing granularity, different units of measure, and different international currencies. The last part of the chapter described how to use dimensional models to perform very complex queries such as progressive subsetting and market basketanalysis.

7.1

7.2
Overview
In Chapter 4 we described how to elicit the business requirements of an organization, and in Chapters 5 and 6 we justified the dimensional modeling approach and learned theskills of dimensional modeling. Now it is time to turn our attention to building dimensionalmodels in real environments. In this chapter, we describe a methodology for scoping the whole modeling job quickly, and then selectively drilling down on the groups of fact tablesthat comprise each data mart. We will conclude the chapter with a practical discussion ofhow to organize the modeling team, how to communicate business needs to the team, how to communicate the modeling results to the end users, and how to grow the designiteratively.
This chapter should be read by all of the team members, particularly the data modeler anddatabase administrator, who must understand this phase well enough to be able to lead theeffort. The project manager also needs to be able to understand the process to ensure thatthis critical piece of the project is on track. The business systems analyst must understanddimensional modeling to help the data modeler translate the business requirements into thedatabase design. The other team members must have a basic understanding of this topic tosupport the development of the dimensional model and to be prepared to carry the model forward into development of both data staging and end user applications.
Matrix Method for Getting Started
Taken together, our dimensional models constitute the logical design of the datawarehouse. To decide which dimensional models to build, we begin with a top-down planning approach we call the Data Warehouse Bus Architecture matrix. The matrixforces us to name all the data marts we could possibly build and to name all thedimensions implied by those data marts.
Once we have identified all the possible data marts and dimensions, we can get veryspecific about the design of individual fact tables within these data marts. For each facttable we apply the four-step method described in Chapter 5 to carry out the design. We will review the highlights of the four-step method again in this chapter.
Build the Matrix
It is very useful to think of a data mart as a collection of related facts that need to be used together. For instance, in a retail bank, a data mart might be built from a set of factsrelated to account activity such as:
• Deposit amount • Withdrawal amount • Fee amount • Number of transactions • Number of people standing in line
Tip
The best way to get started on the data warehouse design is to build a matrix ofdata marts and dimensions.
At this stage we don’t place severe restrictions on what goes into a data mart or whetherall these facts are consistent with each other. Generally the most useful items in a datamart are numerical facts that we “encounter” in the marketplace. Obviously, we are

7.3
looking for candidate facts to go into fact tables. At this stage we are just collecting aclump of facts that look like they could be used together. We call this clump of facts adata mart.
A data mart is a pragmatic collection of related facts, but it does not have to be exhaustive or exclusive. Certainly, a data mart is both a kind of subject area and an application, but these terms have been used in so many different contexts that we don’tfind them very useful. A data mart is, more than anything, a collection of numeric facts. That should be the guiding idea in identifying a data mart.
It will be easiest if a data mart is chosen from a single business process, like AccountTransactions or Customer Billing. One of the strengths of the matrix approach is that we can always combine simpler, single-source data marts into complex, multiple-source data marts.
A data mart can overlap another data mart. For instance, the single-source data mart defined earlier might be called Account Activity. We might define a multiple source data mart called Account Profitability, which includes facts such as:
• Deposit amount • Withdrawal amount • Fee amount • Processing cost • Labor cost • Other infrastructure cost
This data mart overlaps the first data mart, since the first three facts are common to bothgroups, but the last three facts may need to be derived from three more sources. This isa typical situation when you are listing all the data marts you are interested in.
We advise you to list 10 to 30 data marts for a large organization. In other words, choosethe data marts to be fairly high-level business subjects, like Account Activity and AccountProfitability. As you may suspect, each of these data marts will later devolve into a cluster of related fact tables that will be used together. If you choose fewer than 10 datamarts, you run the risk of making the data mart definitions unreasonably broad. Youhaven’t accomplished anything useful if a data mart has every known business fact and every possible dimension in it. The idea is to divide and conquer.
If you choose more than 30 or 40 data marts, you have probably divided the problemdown to too fine a grain. Several of your data marts could probably be usefully combined because they are drawn from the same sources and they will be used together over andover by the requesting reports and applications.
Do the Necessary Homework
Before you can do a good job of defining your data marts, you need to do some homework. You must thoroughly canvass your organization’s business needs andthoroughly canvass the data resources. These two homework assignments areabsolutely necessary preconditions for proposing the data marts. You must know what kinds of business questions will come from the various user groups, and you must knowwhat facts you can bring to the party. In the long run, achieving the best balance betweensatisfying the urgent questions of the organization and sourcing the most accessible data in your organization is the art of data warehousing.
List the Data Marts
To start building the matrix, we list a series of single-source data marts. A single-source data mart is deliberately chosen to revolve around a single kind of data source. In a second step, we propose multiple-source data marts that combine the single-source designs into broader views of the business such as profitability. But we want you toreduce your development risk by focusing initially on single sources of data so that you can bring your first deliverables to completion. Don’t worry: We are going to avoidstovepipes, even though we are focusing this first step of the design rather narrowly.
Let us imagine that we are a large telephone company and our task is to build the data

7.4
mart matrix for the overall data warehouse effort in this company. A large telephonecompany has many interesting sources of data. Here is a possible candidate set ofsingle-source data marts for such a company:
• Customer billing statements (residential and commercial) • Scheduled service and installation orders • Trouble reports • Yellow page advertising orders • Customer service and billing inquiries • Marketing promotions and customer communications • Call detail from the billing perspective • Call detail from the network switch perspective • Customer inventory (instruments, Centrex systems, features) • Network inventory (switches, lines, computers)
• Real estate inventory (poles, rights of way, buildings, street corner box locations,underground locations)
• Labor and payroll • Computer system job processing and chargeback • Purchase orders to suppliers • Deliveries from suppliers
Every one of these single-source data marts could be an interesting data mart all byitself. That is a very important insight. You reduce your development risk and your personal career risk by choosing a doable project. By judiciously choosing one of theaforementioned single-source data marts for your first real deliverable, you may be ableto get it into the hands of the end users much more quickly than if you take on something too ambitious. If you also have to deliver a second data mart from the list or if you haveto deliver a multiple-source data mart, then at least some of your users will be busy andhappy with your first deliverable while you are working on the more difficult projects. Multiple-source data marts drawn from the list might include:
• Combined field operations tracking (service orders, trouble reports, customer/networkinventory)
• Customer relationship management (customer billing, customer inquiries, promotiontracking)
• Customer profitability (just about everything on the list if you are analyzing costs ingreat detail!)
While we love customer profitability as a data mart, we hope you see the danger of starting with this one if you intend to source all the cost drivers in detail. You mayinadvertently sign up to extract and clean every data source in your company before youeven get started.
Tip
If you really are forced by your users to bring up customer profitability quickly, you should just bring up the revenue pieces like customer billing, and start byproviding the costs only as simple rule-of-thumb ratios from the customer activity (i.e., computer processing costs are always one cent per phone call).
In this way, your users will have some results quickly while you slog away building thelong list of single-source data marts.
List the Dimensions
The rows of the Data Warehouse Bus Architecture matrix are the data marts and the columns are the dimensions. The lists of data marts and dimensions can be createdindependently, but it is probably easiest to create the data mart list first and then have a

7.5
creative session where all the conceivable dimensions for each data mart are listed.
At this stage of the design we don’t need to be highly analytic or restrictive in namingdimensions. We simply decide if it is reasonable to list a dimension with a data mart,regardless of whether we have a clear example of a production data source that ties the dimension into the data. For example, in the first data mart, customer billing statements,we might list the following dimensions:
• Time (date of billing) • Customer (residential or commercial) • Service • Rate category (including promotion) • Local service provider
In this design we are suppressing the call item detail that often appears on a telephonebill. That could appear in a data mart oriented around call detail billing. This call detail billing data mart might include these dimensions plus:
• Calling party • Called party • Long-distance provider Proceeding down the list, we generate an imposing list of dimensions. Mark the Intersections
With the rows and columns of our matrix defined, we systematically mark all theintersections where a dimension exists for a data mart. For our telephone companyexample, we might end up with a matrix that looks like Figure 7.1.
Figure 7.1 The Data Warehouse Bus Architecture matrix for a telephonecompany.
Building a matrix such as the one in Figure 7.1 is usually an eye opener. Quite frequently the first reaction is that the matrix is surprisingly dense. A lot of the dimensions appear ina lot of the data marts. Looking across the rows of the matrix reveals the“connectedness” of a given data mart. The average data mart in Figure 7.1 encompasses roughly ten dimensions. Filling in the matrix is often a creative exercise because it forcesyou to ask whether each candidate dimension might in some way be linked to a givendata mart. Often some obscure associations can be found by thinking this way.
Looking down the columns is even more valuable. If a given column representing adimension has a lot of check marks, that dimension is important and it must be carefullyconformed across all the data marts.

7.6
Tip
The matrix is a kind of map of the political process that has to be undertaken toget all the groups to agree on the common definition of the dimension.Remember that there is no such thing as a half-way effort when it comes to conforming dimensions.
Not only must all the dimensions be conformed, but each dimension must be conformedcorrectly across all the data marts it touches.
A real matrix for a real data warehouse design will be larger and more complex thanFigure 7.1. Additional smaller data marts and dimensions will be added to the bottom andthe right. These additions are likely to give rise to a sparser part of the matrix. Forinstance, if we add customer payments as a new data mart, we might decide that suchpayments only intersect the time, customer, and account status dimensions. Similarly, ifwe add a general ledger budget center dimension, we might decide that this dimensiondoes not intersect very many of the data marts.
Use the Four-Step Method to Design Each Fact Table
When the data marts and their associated dimensions have been identified and theircontent has been communicated to all concerned parties, the team is ready to start the detailed logical and physical design of individual tables. It is worthwhile to do this evenbefore the first data mart is chosen for implementation, although in many cases the firstdata mart that must be implemented is obvious from the user demand. We discussed the four-step method in detail in Chapter 5, but we will review the highlights here.
Step 1. Choose the Data Mart
We look down the row headings of our matrix and choose one of the data marts. The firstfact table in the design should come from a single source data mart. The choice of thedata mart, and hence the source of data, anchors our thinking. As designers, we try to avoid idealized designs that model the way data should be, rather than the way it is. This is why we keep returning to actual data sources (single-source data marts) as the starting point.
Step 2. Declare the Grain
We emphasized in Chapter 5 that the dimensional design of a fact table could nothappen unless the grain of that fact table was declared by the design team at the beginning. Declaring the grain is equivalent to saying what is an individual fact tablerecord. If an individual fact table record represents the daily item sales total in a retailstore, then that is the grain. If an individual fact table record is a line item on an order, then that is the grain. If the individual fact table record is a customer transaction at anATM, then that is the grain. Every decision made in Steps 3 and 4 depend on correctlyvisualizing the grain.
Tip
Most arguments and misunderstandings in the design of dimensionaldatabases result from not paying close enough attention to the graindeclaration.
Having made such a high-contrast requirement for carefully declaring the grain, it isreasonable for the design team to change their minds about the grain of a particular facttable at some point in the design. For instance, if the grain has been declared to be thedaily inventory level of individual stock items in a distribution center, then the design team might decide that it would be possible to instead track lot numbers that roll up tostock items because it was discovered that the legacy systems were correctly tracking lotnumbers. Adding the extra detail of lot numbers might have a significant effect on the choice of dimensions and facts in Steps 3 and 4. The only point of this story is that at anypoint in time, the design team must visualize very clearly what the declared grain of thetarget fact table is.
Step 3. Choose the Dimensions
A good clear declaration of the grain often makes it easy to choose the dimensions forthe particular fact table. Frequently, the grain is stated in terms of primary dimensions.“Daily inventory levels of individual stock items in a distribution center” clearly specifies the time dimension, the stock item dimension, and perhaps the location dimension. Otherdimensions can quickly be tested against the grain to see if they make sense.

7.7
Tip
If a dimension doesn’t match the grain, the design team has two main choices: drop the dimension from consideration or change the grain declaration.Multivalued dimensions as discussed in the advanced modeling sections ofChapter 6 only rarely make sense.
In the customer billing example from the telephone company, we might choose the grainto be the individual line item on each monthly customer bill. This grain clearly specifies atime dimension, a customer dimension, a service (line item) dimension, and perhaps arate or promotion dimension.
The design team should be quite creative in this step. All of the dimensions in the master“portfolio” of possible dimensions should be tested against the grain to see if they fit. Any dimension that takes on a single value in the presence of the grain is a viable candidate.For instance, a retail database might have the obvious dimensions of time, product, andstore, but the design team could decide that a weather dimension be added to the data. Ithelps, of course, for the design team to have a weather data source in mind. It is up tothe business users to decide if such a coarse dimension is useful.
Note that billing month is not the same as calendar month and separate fact tables usingthese two interpretations of time must label them as distinct dimensions. This is one ofthe lessons of conformed dimensions. When things are the same, they should be exactlythe same and have the same names. When things are different, they must have differentnames.
Once a dimension is chosen, there may be a large number of descriptive attributes,which can be used to populate the dimension. These descriptive attributes may comefrom several sources. At this point in the four-step process it is helpful to make a long linear list of all the known descriptive attributes available to describe an item in thedimension (a product, a service, a customer, a location, or a day). The goal at this stage of the design is to be comprehensive and verbose. The details of data sourcing and dataquality will be resolved during the detailed design of the implementation phase.
Step 4. Choose the Facts
The last step is to add as many facts as possible within the context of the declared grain. As we said in Chapter 5, it is very important to resist the urge to add facts from the wrong grain.
Using our telephone customer billing example, if the grain is the individual line item on anindividual customer bill, we might have a dozen or more line items that representservices, such as toll charges, recurring charges, installation fees, and various taxes. With this line item grain definition, assuming we have a service dimension to distinguisheach type of charge, we generate a simple list of facts:
• Line item amount • Line item quantity
Note other possible facts having to do with the entire bill summary are excluded from thistable because they do not fit the fact table grain. These might include:
• Total recurring charges • Total late charges • Number of days since last statement
At this stage of the design, it is important not to get hung up on details of keyadministration. The leader of the design process should simply defer the key discussion.The answer, of course, is that we recommend using surrogate keys for all the dimensions, but trying to discuss the details of this approach with all the DBAs in theroom at this stage of the design is a mistake. The objective of this exercise is to correctlyidentify the dimensions and the facts and to complete that process.
Detailed Design Tips
In this section we list a number of miscellaneous design tips that have been usefulwhen working with a team of designers to progress through the four steps:

7.8
• The labels that are used to identify the data marts, dimensions, attributes, and facts will probably be the standard business names that will be displayed to theend users. Choose these labels carefully.
• An attribute can live in one and only one dimension, whereas a fact can be repeated in multiple fact tables.
•
If a single dimension, such as business entity, appears to reside in more than oneplace, several roles are probably being played. Name the roles uniquely and treatthem as separate dimensions. This is called a role model, and it is discussed in Chapter 6.
• A single field in the underlying source data can have one or more logical columns associated with it. For example, the product attribute field may translate toproduct code, product short description, and product long description.
•
Every fact should have a default aggregation rule (sum, min, max, latest, semiadditive,special algorithm, and not aggregatable). Not every query tool or report writer will beable to invoke the complete list of aggregation techniques, but this will serve as arequirements list when evaluating query tools and report writers.
Managing the Dimensional Modeling Project
In the first part of this chapter we described the sequence of steps of building a real setof dimensional models for a large organization. Like any procedural description, this oneis somewhat idealized. The rest of this chapter takes a more descriptive approach todealing with the realities of an actual design.
Much of the process of managing a dimensional modeling project is communicating the design back and forth between people. Visualization is absolutely essential to making thecommunication work. We recommend four graphical tools to facilitate the project:
1. Data Warehouse Bus Architecture matrix 2. Fact table diagram 3. Fact table detail 4. Dimension table detail
The diagrams should be combined with descriptive information to provide acomprehensive design document. This design document should include a brief introduction of dimensional modeling concepts and terminology.
Data Warehouse Bus Architecture Matrix
The matrix developed by the design team in their internal meetings can be cleaned upand used as a presentation aid for meetings with other designers, administrators, andend users. The matrix is very useful as a high-level introduction to the design. It gives each audience a view of what the eventual scope of the data warehouse will become.The matrix shown in Figure 7.1 is a reasonable example.
Fact Table Diagram
After preparing Bus Architecture the matrix, it is very worthwhile to prepare a logical diagram of each completed fact table. The fact table diagram for the telephone billing lineitem example is shown in Figure 7.2.

7.9
Figure 7.2 The telephone billing fact table diagram. Disconnected dimensionsare shown on both sides of the diagram.
The fact table diagram not only shows the specifics of a given fact table but the contextof the fact table in the overall data mart. The fact table diagram names the fact table,clearly states its grain, and shows all the dimensions to which it is connected. The facttable diagram includes an overview of all of the dimensions that have been identified forthe business. This serves as an introduction to the overall model. The supportinginformation for the diagram includes the name of each dimension and a description ofthat dimension.
For each of the dimensions, a brief description should also be provided. If possible, thedescriptions should appear directly with the diagram to enhance the usefulness of the model. Too often, all the pieces of a dimension model are developed, documentedseparately, and cross-referenced in detail. All the parts are there, but when attempting toactually use this information, you need to flip back and forth between documents or sections of documents. This is not easy to do and the process of searching for the piecescan be extremely frustrating, even for experienced data modelers. Keep yourdescriptions and diagrams together.
The fact table diagram also shows all the other dimensions proposed for the data mart without connections. These disconnected dimensions can serve as creative additionaldimensions that could be goals for connecting to the specific fact table or as warnings ofdimensions that cannot be provided for the specific fact table.
The fact table diagram also serves multiple communications purposes including:
•
Link between IS and users. The development of the fact table diagram allows closepartnering between IS and the users. The fact table diagram builds ownership of the business users in the project. The document can also be used for formal acceptance ofthe design by the business.
•
Help with data access tool selection. A scaled-back version of the fact table diagram can be submitted to data access tool vendors with a few key businessquestions. The vendors are asked to evaluate if and how they could address thebusiness questions. If you have narrowed down the list of possible vendors, you couldprovide sample data and have the vendors develop their solution for your evaluation.More details about how to do this can be found in Chapter 13.
• End user training. The fact table diagram has been proven to be a successful trainingtool because it provides an introduction to the data that is understandable by the users.
To aid in the understanding of the model, it is important to retain consistency in the fact table diagrams. Think about the order that you place the dimensions around the hub. Werecommend that you put the time dimension at the top and work your way around the facttable in order of importance of the dimension. Once you have selected an order of the dimensions, make sure all diagrams are arranged in the same order. As you work withthe model, the users will remember the location of the dimension visually. If you changethe location of a dimension from one fact table diagram to the next, they will get confused (and you probably will, too).
Also, some organizations prefer to eliminate a dimension completely when it does notapply to a specific fact table. If this is the case, leave that space blank while retaining thevisual location of the other dimensions.
Tip
The emphasis on a business perspective in the design stage of a datawarehouse is often missing. The fact table diagram should be the start of sucha perspective.
Fact Table Detail
The fact table detail provides a complete list of all the facts available through the facttable. See Figure 7.3. This list includes actual facts in the physical table, derived factspresented though DBMS views, and other facts that are possible to calculate from the first two groups. Aggregation rules should be provided with each fact to warn thereviewer that some facts may be semiadditive or nonadditive across certain dimensions.For instance, account balances are always semiadditive because they must be averaged across time, but they may be additive across other dimensions, such as customer. Other

7.10
facts, such as temperatures, are completely nonadditive across all dimensions, but theycan be averaged.
Figure 7.3 Fact table detail diagram showing dimension keys, basic facts, andderived facts (with asterisks).
The list of facts in a given fact table can reflect data that is not currently available but isdesired by the business as long as these hypothetical facts are clearly labeled as such. The users can see that their requirements have been heard and understood, even if theycannot be addressed with the initial release of the data warehouse. The future elementsmay not be captured anywhere today, or they may come from a data source that is not within the scope of this project. These elements provide the roadmap for the future.
Dimension Table Detail
The second type of detail diagram is the dimension table detail diagram, as shown inFigure 7.4. This shows the individual attributes within a single dimension. Eachdimension will have a separate diagram. The diagram shows the explicit grain of eachdimension. The dimension table detail shows the approximate cardinality of eachdimension attribute and allows the users to quickly see the multiple hierarchies andrelationships between the attributes. The relationships between the attributes define thedefault drill paths. The detailed dimension diagram also provides the ability to includeattributes that are desired by the users but are not available or are not within the scope ofthe initial project. This allows you to clearly communicate with the business. Users seethat you have not forgotten some of their requirements, but they can also see some willnot be available initially. This provides a tool to help you manage expectations. Thesupporting information required for this diagram includes: attribute name, attributedescription, and sample values. Use of existing data element names and descriptions is fine as long as they are indeed the same thing and are written in business terms.
Figure 7.4 Dimension table detail diagram (relative cardinalities shown inparentheses).

7.11
Consider the visual location of the attributes as you create the diagrams. It may be helpful to place “anchor” attributes (those with the highest cardinality) at the bottom, withno other attributes below them. Place the primary hierarchies in the middle of thediagram. The purpose is to be able to quickly distinguish between the primary hierarchiesand the other attributes.
Again, full descriptive information must be provided to support the diagram. Figure 7.5shows a sample of what should be documented for each dimension attribute. Each dimension attribute should have the following:
Figure 7.5 Dimension attribute detail descriptions.
• Attribute name. The official business attribute name. • Attribute definition. A brief but meaningful description of the business attribute.
• Cardinality. The best intuitive estimate of how many distinct values this attribute hasrelative to the number of rows in the whole dimension table.
• Sample data. Sample values that this attribute will contain. This is particularly usefulto really understand the attributes.
•
Slowly changing policy. Type 1 (overwritten), Type 2 (new record created when achange is detected), and Type 3 (an old and a new version of this attribute is continuously maintained in the dimension record). Perhaps there is a Type 0 as well,where the value in the record is never updated under any circumstances.
Advanced dimensional modeling concepts can also be reflected in the dimension table detail diagram. The specific situations that should be reflected in the model includemany-to-many relationships, slowly changing dimensions, and artificial attributes.
•
Many-to-many relationships. The many-to-many relationships should be identified. Recall the examples in Figures 6.2 and 6.3. The level of detail should be reviewed to determine if there truly is a many-to-many relationship. Note this when interviewing the users, then resolve the relationship within the design team. Quite often, many-to-many relationships are identified in the initial sessions, but further research into the true datayields only one or two that remain. These can be resolved in the logical databasedesign. In most cases, they can be represented as a separate bridge table that gracefully represents the many-to-many relationship. See Figure 7.6 and the in-depth discussion of this technique in Chapter 6.

7.12
Figure 7.6 Many-to-many and slowly changing dimension attributes.
• Slowly changing dimensions. Each attribute that is known to be slowly changing should be designated on the diagram. See Figure 7.6.
•
Artificial attributes. Often, when struggling with a dimension, there may be a need tocreate an attribute that does not exist within the business today. In these cases theremay not be a need for users to constrain or view this attribute, but it is needed at the lowest level of detail to support the other rollups within that dimension. In other cases,when combining similar dimensions into a single dimension, there may be a need tocreate an attribute to represent the existence of the Cartesian product of the branches of the new combined dimension. For example, a set of invoices may have bothdiscount codes and allowance codes. We may decide to create a single dimension thatcovers both discounts and allowances. Perhaps discounts and allowances are notespecially well correlated. The design would then benefit from an artificial attribute thatdescribed the combination of discount and allowance. Figure 7.7 shows an example ofan artificial attribute.
Figure 7.7 A dimension with a correlated attribute.
Steps for the Dimensional Modeling Team
As with any data modeling, the development of the dimensional model is an iterativeprocess. You will work back and forth between business user requirements and selected source file details. Always be willing to change the model as you learn more. You mayidentify another dimension or discover that two dimensions are really just one. Changesto the grain are also common.
Highly experienced data warehouse designers can develop the initial dimensional model and then present it to the team for review. While this can be done, it does not allow thewhole project team to truly observe the process and to learn how to develop a modelthemselves. It is important to keep in mind the dual objective of most data warehouseproject tasks: to get the work done and to teach the team to become self-sufficient. The approach that we have found to be the most successful over the years to meet both ofthese goals is to work as a team to develop the model.

7.13
Create the Initial Draft
The initial modeling should be done with a core data modeling team consisting of thedata modelers and database administrators and source system experts, along with thebusiness system analysts. A dimensional modeling team of between three and six peopletends to be a good size to get the work done in a timely manner. The larger the group,the longer it takes to complete the first draft.
The most effective method to develop the initial model is using flip charts. As you work through the model, you will wallpaper the conference room. Keep in mind that much ofthe initial modeling includes a great deal of brainstorming. Try to capture the ideas, butdon’t get bogged down with a specific question. Until the entire model is sketched out, it is very difficult to address what may seem like simple request. We have found thefollowing flow to be successful:
1. Identify possible data marts.
2.
Identify possible dimensions, often in response to the proposed data marts (thedimension list will probably change several times).
3. Fill in the matrix with these proposals. 4. For each data mart, identify the dimensions that apply and the grain for each one. 5. Identify specific base business facts for each data mart.
6.
Refine and flesh out the dimensions as needed through the process. Sometimes newdimensions are identified, others may be combined or split apart. This is naturalduring the modeling process.
As you work through each of the steps, it is likely that you will think of additional thingsthat should be added to parts of the model you have already started on. Take the time togo back and add the new information to the model (so it is helpful to have the charts hanging on the walls around you). You may find yourselves moving back and forthbetween all of these steps. This is common. A completed model can later be presentedin a clean step-by-step manner.
Tip
To minimize detailed design debate, capture questions and move on. Thesequestions should be included in an issue log.
When you review the log after several weeks, you will probably see some questions thatseem absurd in light of what you now know, but when you are just getting started it is hard to tell which questions are trivial and which ones are important.
One person should document the first draft while others begin researching questions.The core team should meet again, after the first draft has been cleaned up and made into a presentable form, to review and revise the model based upon clear thought and resultsof research. You must walk away for a day or two. Some of the best ideas will pop intoyour mind while you are in the shower or while brushing your teeth.
Track Base Facts and Derived Facts
The fields in your fact tables are not just source data columns. There may be many more columns that the business wants to analyze such as year-to-date sales, percentage difference in claims paid vs. prior year, and gross profit. You need to keep track of thederived facts as well as the base facts.
There are two kinds of derived facts. Derived facts that are additive and that can becalculated entirely from the other facts in the same fact table record can be shown in auser view as if they existed in the real data. The user will never know the difference. Themultiple units of measure discussion in Chapter 6 was an example of providing such avirtual extension of the fact table.
The second kind of derived fact is a nonadditive calculation, such as a ratio, or acumulative fact that is expressed at a different grain than the base facts themselves. Acumulative fact might be a year-to-date fact. In any case, these kinds of derived facts cannot be presented in a simple view at the DBMS level. They need to be calculated atquery time by the query tool or report writer.
Defining the full range of facts is a delicate political process. You may be defining the

7.14
numbers and calculations that determine a large part of the senior management financialincentive plan. These executives usually have strong opinions about this. Also, the broader the audience, the more opinions need to be considered, and the greaterdivergence among them. The data warehouse project will strain under this burden.
Many data access tools today offer a library capability that you can use to develop and maintain derived facts. This is where the official formulas and calculations are definedand then used by everyone.
Tip
Too often, the basic database design is completed and then no thought is putinto the derived facts until the team is ready to begin developing the end userapplications. This is too late in the process because often hundreds of businesscalculations are needed, and you must gain user consensus for the exactformulas. This takes time!
While the derived facts do not need to be complete prior to moving forward with thedevelopment of the data staging process, it is important to ensure that all the base factsare accounted for. If there is a specific derived fact that is required for the initial phase, but one part of the calculation is not reflected in the model, then action must be taken.The source for the missing data must be identified.
When the business users have specific ideas about what they want and need, thederived facts can be identified with a small session. In some cases, the users may nothave concrete ideas, but you still need to develop a starting set of derived facts. Keep inmind that the initial list of facts is not definitive—once the users get their hands on the system, they will want more. You will need to decide who has the authority to add newderived facts to the library.
On one project the authors worked on, the data was coming from a proprietary systemvia standard reports. It was unclear which columns of information were the actual facts and which columns were derived facts. The following process was used not only toidentify the derived facts but to define the base facts as well. The steps included:
•
Candidate facts. Identify all possible base and derived facts. Collect all reportssubmitted via the interview process. Compile a spreadsheet to contain all of the factsthat were listed on reports or requested in the interviews. Capture the fact name, whereit was identified (report name or interview), and who provided it (name of personinterviewed or who gave the report). In one case more than 500 facts were identifiedinitially.
•
Remove duplicate facts. Sort through all of the facts to eliminate duplicates. You mayneed to group the possible duplicates together and work with the key business users tomake sure. Identify base facts vs. derived facts. This is just the first pass. Identify theobvious ones, and research the others.
•
Discover and document the underlying calculations. Identify the ones that are the same derived fact with different criteria. For example, Total US Sales Dollars andWestern Region Sales Dollars may be the same calculation, but they are constrainedto different values in the organization dimension. In our project, we reduced the original 500 facts reduced to 150 distinct facts.
• Cross reference base facts. Ensure that all base facts that are needed for calculations are included, even if they are not displayed on any reports. We found that only six base facts were needed to derive the 150 derived facts.
• Final derived fact approval. Now that the basics are captured, you can move forwardto have the derived facts approved by the business users and management. You need to gain consensus on the names of the facts and the exact calculations.
The derived fact worksheet, shown in Figure 7.8, is helpful when working through thisprocess and documenting the final results.

7.15
Figure 7.8 Derived fact worksheet.
The derived fact worksheet contains the following columns:
•
Change flag. Indicates a row that has changed since the last release of the document.This is particularly helpful when dealing with dozens of calculations. The reviewer can quickly focus on the items that have changed rather than wade through the entiredocument again.
• Data mart. The name of the data mart where the base facts reside. If the fact is acalculation, this would be a list of all the data marts that are needed.
• Fact name. The name of the derived fact as to be seen through data access tools andon reports.
• Fact description. A brief description of the fact. • Type. Indicates what kind of fact from the following:
–
Column. An actual base fact. Pulling basic information directly from a column in afact table.
–
Constraints. A base fact with a predefined constraint. These are often created asbuilding blocks for other calculations. For example, Total US Sales Units (sales unitsconstrained on geography to be the total US) is needed to create the final derivedfact of the percentage of Total US Sales Units. Other query constraints would beapplied at the time of the query.
–
Transformation. A pre-defined process to translate a specific value within adimension to another value within that same dimension. When this is supported viaa data access tool, this eliminates the need for a user to specify (at the time of query) both the specific value and the transformed value. For example, allow theend user to specify only the current time period for the report and automaticallytransform that date to be able to identify the appropriate year ago date.
–
Calculation. A straightforward calculation based upon one or more previouslydefined facts.
–
Column with limits. Semiadditive fact, one that is not aggregatable across alldimensions. This requires you to specify what the specific limits are for this fact.
• Aggregation rule. Determines the default aggregation rule for this fact. Sometimesthe result of a calculation can be summed, but in other cases, the components must beaggregated separately and the final derived fact recalculated.
• Formula. Specific mathematical formula to create this fact.
• Constraints. Indicates constraints that must be applied to the data in order to createthis fact.
• Transformations. Indicates specific translations that must be calculated when creating this fact. For example, the query specifies a reporting time period. Acalculation may reflect prior period comparisons. This prior period must be based off
7.16
the specified reporting period. In some cases, the user may be required to also enter the prior period specifically to apply to this fact. In other cases the data access tool mayautomatically determine the prior period based upon the business metadata.
The derived facts can also be used as part of the end user tool selection process. You should not ask any vendor to develop all of these. Rather, select a representative sample(one of each mathematical type) to see how the software supports the calculation.
Once the list of derived facts is completed, it can be used to build the metadata for thedata access tool when you get to that point in the project.
Get IS Team Input
After several iterations of the overall data mart design with the core design team, it istime to get more input. Resist the urge to try to perfect the design. To facilitatecommunication in the meeting, the best approach is to use overhead foils and providehandouts for participants. This allows everyone to see changes to the model as youwork.
Presenting the model to the rest of the IS team serves several purposes. First, it forcesyou to practice presenting the model in preparation for the end users. Second, it bringsthe rest of the IS project team up to speed with the modeling process. Third, the other team members may have knowledge that can resolve open issues or point you in theright direction to get answers.
Once the initial design is drafted, the sessions to review the model with others arefacilitated design sessions. The information is presented, and discussion is encouragedto explore the model’s support for the business.
Work with Core Business Users
Now you are ready to present to select business users. Do not present initially to a largegroup of users. Instead, choose one or two key users. These should be people who areactively working on the project and who have the responsibility to assist in answeringquestions and resolving business questions, such as the business project lead.
From the core design team, two primary roles need to be filled for these meetings. Thefirst is the presenter/facilitator. This person is responsible for keeping the meeting going,focusing on one thing at a time, and for actually presenting the model. The second role is that of scribe. This person needs to make sure that any open issues are captured to beadded to the issue log. Also, the scribe needs to assist the presenter to ask specificquestions that are on the issue log.
Begin the session with a high-level introduction to dimensional modeling concepts sothey will better grasp the materials being presented. As you introduce the group to themodel, ask them to be patient. You may not answer their questions immediately sincemany of their questions will be answered as you walk through the entire model. Introduceall of the dimensions that have been identified for your business. Next, walk through anexample business question to assist the users in grasping how the dimensional modelworks.
Now you are ready to dive into the details. Review each dimension in detail. Makecorrections to relationships and add dimension attributes as suggested by the users.When adding a new dimension attribute, note where it could be sourced if you know, butdon’t worry about it if you don’t know at this time.
Ask the users to think of all the ways that they would want to report on the data. Also askthem to consider what would help them to navigate through a large dimension—you can’t (and don’t want to) scroll through 10,000 products searching for the one you areinterested in. What would help you get to the one you are interested in?
As new issues are identified and existing issues remain open, these core end usersshould take responsibility for resolving any business-related issues. These users are also expected to assist in naming dimensions, attributes, and facts and ensuring that thedescriptions are accurate and meaningful.
Present to Business Users
When most of the issues have been resolved, it is time to move beyond the core usersand confirm the design with a broader set of users. This group can include all of the

7.17
people who were interviewed, except senior management. The same process used topresent to the core users should be followed. Most of the discussion should be about thesupport of business questions. If many questions about the structure of the model areraised, you may need to back up and include additional users from different functions torefine the model.
You will find that the model makes sense to the users, once they understand how tointerpret the diagrams. There are usually only minor adjustments to the model once youget to this point. After working so hard to develop the model, the users may not show what you consider to be appropriate enthusiasm. They may not ooh and aah. The modelseems obvious to the users and makes sense (after all it is a reflection of their business).Do not be disappointed—that means you have done your job well! The oohs and aahs will come when the users see the real data for the first time.
Managing Issues in the Modeling Process
The core design team will meet between the facilitated sessions. The flow of thesemeetings will change from overall design discussions to very focused discussion of the remaining open issues. The team should review each open issue and determine whatneeds to be done to get closure. Do not be afraid to solicit additional assistance from theproject manager. In many cases, the primary obstacle to getting closure is freeing up enough time to work on the issues. The project manager may need to work with both ISand business management to get the required time allocated. Make sure thatmanagement understands what is at stake—if the modeling process is delayed, the entire project will be delayed!
As you work through the modeling process, maintain an issue log as discussed in Chapter 3. Most of these issues simply require additional research. It is very common tolog 75 or 100 issues that need to be addressed. Typical issues that are logged during themodeling process include:
• Do Regions report to Zones or the other way around? The actual hierarchical order of an organization structure often generates discussion. This is usually easilyresolved by a quick conversation with the business users.
• What is the Claims City attribute? You may get many attributes suggested during interactive modeling sessions that you may not know details about. Rather thanstopping the flow of the session, just note it as a question and follow up later.
•
Confirm that the Transaction Edit Flag is not used for analysis. First review the content with the operational system owner, who may be able to identify the field asprocessing information. If not, review the field and its contents with the key users.Never ask directly, “Do you need this field?” Rather, ask, “How would you use this for analysis?”
•
Evaluate the options of representing customer and field organization as one ortwo dimensions. Walk through business scenarios. Sketch out what the model would look like both ways. Review the types of uses for this information. Try to determine what you could not do for each scenario. Explore additional capability witheach scenario. At this point, if one alternative is not clearly better, consider severaloverall factors. How many dimensions do you have? What are the size ramifications of an additional dimension (as this will increase the size of the primary key of the facttable)?
• What does the Primary Units column contain? How does it differ from ShippedUnits? Understand each possible data element. Do not duplicate an element, and do not let different elements share the same name.
•
Users want to see average prices and the actual price as on the invoice. Ensurethat the model supports this. After the model is completely fleshed out, review examples of what users expect to be able to do. Make sure that the requiredinformation can indeed be supported by the model.
•
Customer invoice data reflects the expected sales amount but does not includerefunds or actual amounts paid. Use the issue log to document specific details that you do not want to lose throughout the process. This is not really an issue, but it isimportant that the users understand the data content. This may be included in the enduser training. This type of issue is often opened and closed on the same day.

7.18
•
Document each candidate data source and the reasoning behind the final sourceselection. Too often the actual data sources, the rationale for selection, and othersources that were considered is not written down. This is critical to assist in managingexpectations and managing project scope.
•
Review each data source to ensure all columns/fields are accountedfor. Although this is talked about, it is important for everyone to understand that once the modeling process is done, each incoming data source needs to be reviewed oncemore, field by field, to ensure completeness. This issue should be listed specifically forevery source. Often, a different person is responsible for each source.
Identifying the Sources for Each Fact Table and DimensionTable
Data analysis is the homework that you must complete in order to develop yourdimensional model. Two levels of analysis must occur. First, you must understand whatdata has been requested by the business. This helps you select your data sources.Second, you must gain an in-depth understanding of each of the data sources that are tobe included in this iteration of the data warehouse. While developing the dimensionalmodel, you bring together what the users have requested with a large dose of therealities of the data that exists today.
The user requirements process we discussed in Chapter 4 identifies both formal and informal data sources. The formal sources are supported by IS, and some rigor isassociated with the maintenance and integrity of the data. Informal data comes directlyfrom the business and is used in the decision making process. Although the informal datais not stored in the corporate data vaults, the information is collected and used by thebusiness today. Someone is responsible for collecting and distributing the information ona regular basis.
Tip
Users want and need to use informal data in conjunction with the formal datasources.
Informal data sources are often included in the data warehouse through the developmentof a new process for IS to capture this data. In some cases this is simply importing data from a personal database or through the development of screens for the users to enterthis data. In both cases, the input data needs to be treated as another data source. Thismeans the data must be cleaned and manipulated as you would any other data source. Do not simply allow users to input data directly into the data warehouse. While includinginformal data sources may not be in the initial project scope, seriously assess the impactof leaving it out. If the data is central to the users’ business, it must be treated seriously.
Understanding Candidate Data Sources
By understanding the data requested by the end users, we do not mean that as the veryfirst step you must perform a detailed analysis of each data source requested. There are often more than 20 sources mentioned throughout the interviewing process. You do needto understand at a high level what each of these sources are, what their availability is,and who is responsible for them. You eventually need to research in great detail the sources that are to be the basis of this project. It is worthwhile to have the greatest in-depth understanding of the sources that are closely related to the primary sources andthose that have been identified as the next sources to implement.
In many cases, your data warehouse project is defined and based upon making datafrom a specific data source available to the business such as customer billings or troublereport transactions. When this is the basis for your project, selecting the data source is much more straightforward. However, some decisions need to be made. Often, thesupporting dimensional information such as the detailed customer descriptions will comefrom a different source. This is almost always true in a conformed dimension environment.
You will also need to decide at which point in the processing the data should beextracted for the warehouse. If your project is not bounded by a specific data source,then there is more work to be done to determine where to start.
Candidate data sources are those listed in the user requirements document and othersthat may be needed to support them. Typically the users will state that they need sales,inventory, and financial data. Rarely do users also specify that they need the customer master reference data as well as the corporate product database. These supporting data

7.19
sources are implied when users request basic performance data by customer, region,and line of business.
Additional candidate sources can be identified by the veterans in the IS shop. They arefamiliar with the data that exists in the nooks and crannies of the organization. They alsoknow much of the history of these sources and other decision support or analysisinitiatives. Today, many organizations already have some sort of decision supportcapability in place or have design information about failed attempts. It is useful to knowabout these prior successes and failures. Understanding them can provide insight intowhat works and what does not in your organization.
While it may seem very basic to pull together a list of candidate sources with descriptiveinformation about each, such a list does not exist in a single place for most organizationstoday. Each individual source may or may not have a general description, and there israrely a consolidated list of them all. Figure 7.9 shows a sample data source definition.
Figure 7.9 Data source definitions.
Source
BusinessOwner
IS Owner
Platform
Location
Description
Gemini
Tom Owens
Alison Jones
Unix
HQ -Chicago
Distribution center inventory
Billings
Craig Bennet
Steve Dill
MVS
MF -Dallas
Customer Billings
Plant
Sylvia York
Bob Mitchell
Unix
6 Plants across country
Plant shipments
Sales Forecast
Sandra Phillips
None
Win95
HQ -Sales Dept.
Spreadsheet-based consolidated sales forecast.
Competitor Sales
Sandra Phillips
None
Win95
HQ -Sales Dept.
FoxPro database containing data from external supplier.
In your data source definitions, make sure that you include the following information: • Source. The name of the source system.
• Business owner. The name of the primary contact within the business who is responsible for this data.
• IS owner. The name of the person who is responsible for this source system. • Platform. The operating environment where this system runs.
• Location. The actual location of the system. The name of the city and the specific machine where this system runs. For distributed applications, include the number oflocations, too.
• Description. A brief description of what this system does. Source Data Ownership
Establishing responsibility for data quality and integrity can be extremely difficult in thedata warehousing environment. Most operational systems effectively capture key
7.20
operational data. A line in the order entry system will typically identify a valid customer,product, and quantity. Other optional fields that may be captured at that point, such asend user name or customer SIC code, are not usually validated, if they get filled in at all.Operational system owners are not measured on how accurate or complete these fields are. They are measured on whether or not the orders get taken, filled, and billed.
Source data owners need to be identified from two different groups for each data source:the business and IS. If you are purchasing external data, one person is responsible for that data and for monitoring its quality and tracking down issues related to the data. Treatyour internal data the same way from a business standpoint.
Data Providers
Operational system owners need to feel a responsibility to provide data to the warehouse as a regular part of their operational processes. The closer they are to the warehouse,the more likely the warehouse will know ahead of time before a major change in thesource system is implemented.
Data providers include external-source data vendors, external sources from other divisions of the organization, as well as people who are responsible for a system andneed to provide an extract file to the data warehouse team.
Detailed Criteria for Selecting the Data Sources
After the conformed dimensions have been identified, the individual data sources can beidentified. A small number of actual data sources must be identified as the primary focusfor the first phase project. It is not recommended to tackle too many at once. Successful projects generally begin with one or two primary data sources. Additional sources may beused for dimension construction, especially when the definition of the conformeddimension suggests multiple sources, but the facts are usually retrieved only from a single source system. The selection of the primary data source is often driven by thebusiness.
The biggest business pain that can be solved with a concrete set of data is usually therecommended place to start. In some cases the data could be extracted from multipleplaces. The decision must be made about where the data will be extracted from. Thecriteria to consider include:
•
Data accessibility. If two possible feeds exist for the data, one is stored in binary files maintained by a set of programs written before the youngest project team member wasborn and the other is from a system that already reads the binary files and providesadditional processing, then the decision is obvious. Use the second option for your source data.
•
Longevity of the feed. Often, data for the warehouse could be intercepted at manyplaces throughout a processing stream. If the data coming out of Step 5 is the cleanest,but that step is scheduled to be phased out in the next six months, then consider extracting from Step 4. Understand the additional processing that is done in Step 5 thatmay clean the data. Include this type of processing in the data staging process.
•
Data accuracy. As data is passed from system to system, many modifications aremade. Sometimes data elements from other systems are added, and sometimesexisting elements are processed to create new elements and other elements aredropped. Each system performs its own function well. However, it may become difficult or impossible to recognize the original data. In some cases, the data no longerrepresents what the business wants for analysis. If you provide the data from thesedownstream systems, the users may question the accuracy. In this case, it may be better to go back to the original source to ensure accuracy. Keep in mind that pullingdata from downstream systems is not always bad. Consider the use of electronic datainterchange (EDI) data. If you take in raw EDI feeds, you will be responsible for providing cleansing and editing of these transactions. It is much better to capture thedata after the editing has happened. This will also ensure that the data is synchronizedwith the other sources that use this same data.
•
Project scheduling. In many organizations the data warehouse project begins as partof a rewrite of an existing OLTP system. As the new system development projectbegins to unfold, it is often the case that the business users who are now firmlyconvinced of the value of a data warehouse begin to insist that the data warehouse beimplemented sooner rather than later. In order to provide historical data, you need to

7.21
include the data from the existing system in your data warehouse. If the rewrite of the old system is delayed, the data warehouse can continue using the existing system.Once the new system is released for production, the data feeds can be switched to it.In many cases it is possible to deliver the data warehouse before the new operationalsystem can be completed.
You will want to document any sources that were considered and not selected. Thisdocumentation will be extremely helpful months later when questions may arise aboutthe source of the data.
Some dimensional information usually comes with the transaction or fact data, but it isusually minimal and often only in the form of codes. The additional attributes that theusers may want and need are often fed from other systems or corporate master files. Inmany instances there can be multiple master files, especially for the customer dimension.There are often separate files that are used across an organization. Sales, Marketing andFinance may have their own customer master files. There are two difficult issues whenthis happens. First, the customers who are included in these files may differ, and theattributes about each customer may differ. To an extent, this is good, because it providesricher information. Second, the common information may not match. If you haveunlimited time and money you can pull rich information from all sources and then mergeit into a single comprehensive view of customers. In most cases, there is not enough timeor money to do that all at once. In these cases, it is recommended that the usersprioritize the information, and you start with what you can and expand in the future.
Detailed data analysis should be done for every data source that is to be included in thisiteration of the data warehouse. The goal is to gain a realistic understanding of the content of the data sources. Information can be gleaned from existing data models, filelayouts, and corporate metadata. The information that you will need about each datasource includes:
• Business owner • IS owner • System platform (UNIX, MVS) • File structure (flat files, Oracle, DB2, FoxPro) • Physical system location (HQ production mainframe, manufacturing plant A) • Data volumes (number of transactions per day, average transactions per week) • Primary and foreign key identification • Physical field characteristics (data type, length, precision) • Data integrity (real and perceived)
• Integration experiences (Has the data been successfully integrated in the past? Why or why not?)
• Future direction of the source (Is it being replaced by a new system? If so when?)
The detailed review sessions should be conducted with the data modeler and/or theprogrammer analyst responsible for that system. One of the most effective sessions wehave seen was when one of the programmer/analysts responsible for the system camewith copies of the programs in hand. When we had a question, she simply looked it upright then. This eliminated the need to compile an extensive list of questions to beresearched later. Another technique that helps in collecting this information is to havesample data from the source. If it is extremely time consuming to pull sample data, tryworking where you can easily access the system on-line to see what is contained in the fields.
Customer Matching and Householding
Combining data about customers from disparate data sources is a classic datawarehousing problem. It may go under the names of de-duplicating or customer matching, where the same customer is represented in two customer records because ithasn’t been recognized that they are the same customer. This problem may also gounder the name of householding, where multiple individuals who are members of the same economic unit need to be recognized and matched. The science of customer

7.22
matching is more sophisticated than it might appear. It is generally not worthwhile to buildan in-house customer matching or householding system. The fuzzy matching logic is simply too complicated.
Although these commercial systems are expensive and complex, we recommend that itis worthwhile to make such an investment if customer matching is a significant activity inyour organization.
Tip
A competent IS programmer, starting from scratch, with a few months ofprogramming, might be able to match 75 percent of the customers who inreality are the same customer or belong to the same household. However,commercially available systems from software vendors who specialize in customer matching and householding can probably achieve better than a 90percent customer matching score.
Browsing the Data Content
To better understand actual data content, a study can be performed against current source system data. This can be done with a data exploration prototype, which is arelatively new concept in data warehousing. In recent years, many companies have putmore standard infrastructure in place as they move to client/server-based operational systems. As part of this shift, operations data stores have migrated to relationalplatforms. This more open systems environment makes it much easier to set up a smallsystem that extracts data from the desired sources and dumps it into a temporaryexploration environment. The data exploration prototype gives you the opportunity tobrowse through the source data and learn its idiosyncrasies first hand.
This browsing process helps you understand the contents of the source files and get asense for the cleanliness of the data. Essentially, the process involves building a set ofdata audit and data cleanliness queries much like the ones that will eventually be part ofthe data staging process as described in Chapter 16. This includes queries that count the number of rows with each value of a given attribute, like gender, or size, or status. Or,bringing back all the distinct values of an attribute, such as the customer name, and sorting them to see what they contain such as how many duplicates or similar spellingsexist for the same customer.
The target database for the data exploration prototype should be the most readilyavailable platform. If it is the same platform as the ultimate warehouse, so much thebetter, but it is not critical. Speed and ease of implementation are more important. Ofcourse, if you can, use the same database as the one you expect to use for theproduction warehouse database, even if you use a desktop version for the exploration. Itis always good to get some practice.
Don’t spend a lot of time on design work for the target. In fact, it is probably easiest tosimply duplicate the source system directly.
Tip
The goal of setting up a browser for source data is to explore the source andget an understanding of the size and magnitude of the extraction effort, not totest a warehouse design.
If the source systems are already in relational tables, it may be possible to point the ad hoc query tool directly at the source and query away. Of course, be careful of this. Youdon’t want to be the one who submitted the query that brought the order entry system toits knees for three hours. Work with the source system owners to do your queries andextracts according to their schedule.
The primary deliverable for the data exploration prototype is a report on the data issuesthat were uncovered. Often, this report will have several audiences. Many of the problems are of interest to the source system owners. Others will need to be addressedin the data staging process. Still others are education issues for the user community.
Mapping Data from Source to Target
The source-to-target data map is the foundation for the development of the data stagingprocess. The primary purpose is to document specifically where the data can be located.It can also ensure that all of the source data has been analyzed. The complete mapincludes data elements that are in the source but are not to be included in the datawarehouse. Figure 7.10 shows a sample source-to-target data map.

7.23
Figure 7.10 Sample source-to-target data map.
This is just one sample of what could be used to collect this information. Additionalinformation may be useful to fully leverage data transformation tools. Each individualvendor should be able to help you determine what will be needed. Keep in mind that thefull data transformation business rules will be developed in future project tasks. This issimply capturing information that is known at this time. The columns that are includedare:
• Table name. The name of the logical table in the data warehouse. • Column name. The name of the logical column in the data warehouse.
• Data type. The data type of the logical column in the data warehouse (char, number,date).
• Length. The length of the field of the logical column. • Target column description. A description of the logical column.
• Source system. The name of the source system where data feeds the target logicalcolumn. There may be more than one source system for a single logical column.
• Source table/file. The name of the specific table or file where data feeds the targetlogical column. There may be more than one source system for a single logical column.
• Source column/field. The name of the specific column or field where data feeds the target logical column. There may be more than one source system for a single logicalcolumn.
•
Data transform. Notes about any transformations that are required to translate thesource information into the format required by the target column. This is not intended to be a complete list of the specific business rules but a place to note any anomalies orissues that are known at this time.
• Dimension/data mart. The name of the dimension or data mart that this columnrepresents.
• Attribute/fact. The name of the specific attribute within a dimension table or fact table.
The map also serves to identify differences between the source and target. Often thesedifferences are easy to resolve. For example, incoming data may contain only codes but no descriptions. Using the codes to look up the proper descriptive data is straightforward.Other common differences are in the length of the field. Using several sources, thephysical format of the data may vary.
Complex transformations may need to be performed. Initially, the need for additionaltransformations can be noted. Later the actual transformation based upon business rulesmust be developed. Development of detailed specifications is typically done during the design of the data staging process, discussed in Chapter 16.
Data elements that do not exist in the selected source are also identified. In some cases, the data may not be captured anywhere. In other cases, the data does exist, but thecurrent scope of the project does not include that source.

7.24
When the source-to-target data map has been completed, it is important to revise the fact table designs to reflect what will actually be included. You will often find that someattributes must be flagged as future and some you thought were future can be included,and you may have also uncovered new attributes that must be added to the fact table design.
When Are You Done?
You can consider yourself finished when you have exhausted the issues list or theproject team, whichever comes first. Realistically, the project team will be exhausted longbefore the dimensional model is complete. As with other data modeling, you could spendyears trying to track down every single issue. It is simply not feasible to take that muchtime. Over the years it has been proven that the last several issues can take as muchtime to resolve as the first 50 or 60, and the final result has minimal actual businessimpact. Once most of the issues have been addressed, the remaining should beprioritized. The major categories are:
• Critical data issues. Identifies issues that must be resolved in order to move forward at all or are required to meet the intended business goal. These issues relate to thedata itself and may require business assistance to resolve.
•
Critical business policy issues. Identifies issues that must be resolved in order to move forward at all or are required to meet the intended business goal. These issuesare not simply data issues. There is a need for a business decision on how to handle asituation or changes may be needed to existing business policies in order to support the data warehouse.
• Future/Out of Scope. Identifies items that would be nice to have, but are not worthdelaying initial implementation to address. Often these are attributes that would comefrom data sources that are not to be included with the first iteration.
As time goes on, you will find that more and more of the issues are either resolved ordetermined to be future enhancements. If you are waiting on input from other people tocontinue, then you must escalate this to the project manager. The entire project schedulecan be delayed by waiting for people to answer questions.
The final fact table diagram, plus an issues log providing the history, justification anddecisions made during the modeling process, are the final deliverables. The user sponsor can be asked to formally sign off on the design. This is a commitment that if theteam delivers what has been designed that it will meet their business needs within thescope of the project.
Preparing for the Future
In most cases, the funding and justification for the data warehouse hinges on setting thefoundation for growth. Often, the next critical data sources have been identified and areslated to be included in the warehouse once the first set of data is loaded. There are two approaches to take to ensure that the initial design can indeed be expanded.
First, the additional data sources can be analyzed in detail and included in thedimensional model. While this does indeed ensure that these sources will fit into the design, it can expand the data modeling efforts by weeks or months. This type of delay isusually not acceptable.
Second, the additional sources can be analyzed at a high level to assess how they will fit into the newly developed model. The overall review should take half a day. There will besome areas where the sharing of dimensions will be obvious, and they will fit exactly.Other areas, the conformed dimension may apply, but the exact level of detail and integratability may not be clear. Document any issues and concerns for the future. Sharethe document with both IS and business management. Depending upon the severity ofthe concerns, management may decide to move forward as originally planned or to step back and perform additional analysis, which will impact the project schedule.
Using a Data Modeling Tool
You should use a data modeling tool to develop the physical data model, preferably onethat stores your model’s structure in a relational database. As the data staging tools mature, information will flow more naturally from the popular data modeling tools, through

7.25
the transformation engine, and into the metadata that users will access to learn about thedata in the warehouse.
The advantages of a data modeling tool include: • Integrates the data warehouse model with other corporate data models. • Helps assure consistency in naming. • Creates good documentation in a variety of useful formats. • Generates physical object DDL (data definition language) for most popular RDBMSs.
• Provides a reasonably intuitive user interface for entering comments about objects(tables and columns). Many data modeling tools support two types of object comments. In a data warehouse, it works best to reserve one comment field for:
–
Technical documentation. Notes about the data transformation requirements orother pertinent tidbits. For example “From T58.CUSTNAME, converting to title case and changing NULL to ‘N/A’.”
–
Link to the dimension table designs. Tie the logical columns to a dimension and attribute.
–
Business users documentation. Information about the content of the column such as “Customer name as Last, First, e.g. ‘Smith, Joe’.”
Retaining the relationship between the logical table design and the business dimensionalmodel is important to ensure that the final data does indeed tie back to the originalbusiness requirements. This capability is just beginning to appear within data modeling tools.
Estimating the Number of Rows
The first inclination to determine the database size is to take the number of rows for eachdimension, multiply them all together to determine how many rows will exist in the fact table. Then, determine the overall size requirement based upon the length of the factrow. Anyone who has tried this approach knows that these numbers are enormous!When you work this out, your first instinct is that you typed the numbers in wrong or that you have an error in your spreadsheet. So, you check everything and then look onceagain at the bottom line. Your thoughts run out of control—this is just an estimate of raw data storage, not even including indexes or work space. You begin to review in your mind how many zeros are in mega-, giga-, and tera-. By now, you are hoping that no one else is looking your way because they might feel the need to call for medical help. The goodnews is that you have just determined the largest theoretical size for your raw data, not how big your data warehouse is likely to be.
You need to step back and consider specific characteristics of your business. Youprobably do not sell every product to every customer every day from every sales region. Taking these basic business assumptions into consideration you will find that you havemuch more reasonable estimates. Keep in mind, the sizing is based upon businessassumptions—your estimate will only be as accurate as the input.
Another, more accurate method to estimate the number of rows is through actualanalysis of the source data. This can be gathered from the data exploration prototypedescribed earlier. If a full data exploration prototype was not developed and your datamart table is at the transaction grain, volumes may be very easy to estimate. Forexample, you should be able to get a rough estimate of the number of invoice linesshipped or customer service calls answered last year without having to estimate howsparse it is.
The sparsity of the data is the key factor for correctly estimating the final size of thedatabase. In most cases it is far more effective to measure the sparsity with a sample ofreal data than it is to estimate the sparsity. You will need to estimate the number of rows in each table as input to the database size estimation process as described in Chapter 15.
Designing for Aggregation All data warehouses will contain pre-stored aggregates. Once you have determined your

7.26
overall design approach, you need to consider the strategy you will use to design youraggregate fact and dimension tables. For an in-depth discussion of aggregation, please study the material in Chapter 14. The design points that require consideration now arelisted next. The other design points come into play during implementation of the design.
• Aggregates must be stored in their own fact tables, separate from the base-level data. In addition, each distinct aggregation level must occupy its own unique fact table.
• The dimension tables attached to the aggregate fact tables must, whenever possible,be shrunken versions of the dimension tables associated with the base fact table.
Again, use these as guidelines, but ensure that your approach will work well with yourdata access tool.
Deciding What to Aggregate
Before you get too concerned about deciding which aggregates to build, keep in mindthat these will change. You will add and take away aggregates periodically. Remember,aggregates are a performance-tuning vehicle. You need to build some aggregates,conduct some performance tests, and then revise the aggregates you will use inproduction. From there, you need to monitor aggregate use over time and makeadjustments accordingly. Relax, changing your stored aggregates is not complicated as long as your users are isolated from changes with an aggregate navigator.
You need to consider two different areas when selecting which aggregates to build. First,you need to consider common business requests, and then you need to consider the statistical distribution of your data. We recommend that you develop document candidateaggregates when you have just finished data modeling. At this time, the user’srequirements are still fresh in your mind. By the time you have loaded detail data into the warehouse, you may have forgotten what the user’s common requests are.
First, determine what might be useful. Review the requirements document looking formention of higher-level reporting needs. When working with your business users, you will get a sense of the primary reporting levels that are in place today. Often these are bymajor geographic groupings, major product lines, and regular reporting time periods(weeks or months). Review each dimension to determine attributes that are commonly reported on. Next, review the combinations of these attributes to determine which onesare used together. The more dimensions you have, the more careful you need to be. Ifeach dimension has 3 attributes that are candidates for aggregation and you have 4 dimensions, then you could build 256 different aggregates. However, if you have 8dimensions (and each one has 3 candidate attributes), the number of possibleaggregates jumps to 65,536! Not all combinations of these candidate attributes will be commonly used together.
Second, you need to assess the statistical distribution of the data itself. Refer to the dataexploration prototype, the database design information, and possibly to the data itself,looking for counts at each level of the hierarchy in each dimension.
As you move past these design guidelines to the detailed planning of your aggregates,please consult Chapter 14.

7.27
Summary
In this chapter we reviewed the process used to apply dimensional modeling techniquesto your project. First we introduced the Bus Architecture matrix to lay out your data martsand dimensions. Next, we reviewed the four-step method to design a single data mart. We also introduced diagramming techniques to use during the modeling process. Aproven process was presented to assist you in developing and refining the dimensionalmodel. Also, data sourcing and mapping processes were reviewed. Before you move on,don’t forget to consult the project plan tasks spreadsheet at the end of this chapter for asummary of the tasks and responsibilities for building the dimensional model (Figure7.11).
In this section of the book we have focused on the data. In the next chapters, we want tostep back and follow a different path of the lifecycle—the technical architecture.
Figure 7.11 Project plan tasks for building the dimensional model.
Keys roles Key roles for building the dimensional model include:
• The data modeler and database administrator step forward to lead thedimensional modeling efforts.
• The dimensional model must be reviewed by the business users and the coreproject team. This can lead to modifications of project scope.
• The data staging team gets involved to identify the data sources needed topopulate the dimensional model.
• The database and data access tool vendors should also be involved to provideprinciples for database design to optimize their products.
Estimating Considerations
It can take from 2 weeks to 12 months to build a model, depending upon the complexity of the data, the industry, and the willingness and access to keybusiness personnel to make decisions. The scope of the project is also a factor. Ifyou’re designing a single-source data mart, expect the following elapsed times:
• Four-step logical database design: 3-8 weeks • Source-to-target data map: 2-4 weeks • Define business facts: 2-4 weeks

8.1

8.2
Overview
Most of us wouldn’t think of building a $150,000 house without a set of blueprints. Yet,it’s quite common for people to dive right into a data warehouse project costing 10 times as much without any clear idea of what they’re actually building. The most commonexample we see is the data warehouse project that starts out with an RDBMS running ona leftover server from some other project’s recent upgrade. It’s like saying, “Hey, I’ve got some wood and some concrete, let’s build a house!” The point is, you have to have aplan before you get started.
The analogy of architectural blueprints for a house is helpful to show the purpose andvalue of an IS architecture. First, the blueprints help the architect and the customercommunicate about the desired results and the nature of the construction effort. Next,before the first shovel digs into the dirt, a good contractor can examine the blueprints anddetermine the resources required, dependencies, timing, and costs of the project. Next,the subcontractors can also work from the blueprints to understand their roles in theproject—one worries about the plumbing, another about the electrical systems, andanother about the finished carpentry. Finally, a good set of blueprints, like any gooddocumentation, helps us later when it is time to remodel or add on.
The next six chapters are dedicated to the technical track of the Business DimensionalLifecycle. This chapter describes the value of creating an explicit architecture, presents aframework for approaching architecture, and gives a high-level overview of the data warehouse technical architecture. Most of the following chapters are descriptive innature. They describe what happens in each part of the architecture and list specificexamples of the capabilities that might be needed in each section. Specifically, Chapter 9zooms in on the data acquisition side of the architecture, called the back room. Chapter 10 concentrates on the data access half of the technical architecture, called the frontroom. Chapter 11 describes the underpinnings of the architecture: infrastructure and metadata. Chapter 12 presents a special graduate course on the Internet and securityrelative to the data warehouse. Finally, Chapter 13 presents the practical steps for creating an architecture and selecting products.
Chapters 8, 9, and 10 are targeted primarily for the technical architects and specialists. These people need to have an in-depth understanding of this material in order to create adata warehouse architecture. The team members who are responsible for back-room tasks, the data staging team and database administrator, should read these chapters to understand the major components they will be working with and how they fit together. Theproject manager must become familiar enough with this material to be able to identifylandmines and steer the team around them. These chapters are optional reading for nontechnical team members.
The Value of Architecture
In the information systems world, an architecture adds value in much the same wayblueprints for a construction project do: better communication and planning. Beyond that, an effective architecture will increase the flexibility of the system, facilitate learning, andimprove productivity.
•
Communication. The architecture plan is an excellent communications tool at severallevels. It helps communicate up, providing a way to help management understand the magnitude and complexity of the project. Imagine trying to sell senior management ona $2 million server investment without a clear understanding of what the loadprocessing demands will be, what the query load will be, how it fits with other pieces of the solution, and so on.

8.3
An architecture functions as a communications tool within the team and with other ISgroups, providing participants with a sense for where they fit in the process and whatthey need to accomplish. This kind of communication and coordination is particularlyimportant when other IS groups are also working on a data warehouse or data martproject.
•
Planning. The architecture provides a cross-check for the project plan. Many architectural details end up scattered throughout and buried in the depths of the projectplan. The architecture brings them all out in one place and prescribes how they will fittogether. The architecture plan also typically uncovers technical requirements and dependencies that do not come out as part of the planning process for a specificproject. For example, suddenly realizing the data access tool you picked requires aseparate NT server while you are attempting to load the software can be distressing. Unexpectedly having to ask for more money (or time) is never fun.
•
Flexibility and maintenance. Creating an architecture is really about anticipating as many of the issues as possible and building a system that can handle those issues asa matter of course, rather than after they become problems. The architecture describedin this chapter relies heavily on models, tools, and metadata. This adds what we call asemantic layer to the warehouse. This layer both describes the warehouse contents and processes and is used in those processes to create, navigate, and maintain thewarehouse. Practically speaking, this means the data warehouse is more flexible andeasier to maintain. For example, we can use these tools and metadata to quickly addnew data sources.
The data models and metadata allow us to analyze the impact of a major change, likethe conversion to a new transaction system, and, potentially, a single point of changeto support that conversion.
Tip
The architecture’s interface standards, especially the Bus Architecturedeveloped in this book, allow the plug and play of new tools as they improve.
•
Learning. The architecture plays an important role as documentation for the system. Itcan help new members of the team get up to speed more quickly on the components,contents, and connections. The alternative is to turn new people loose to build theirown mental maps through trial, error, and folklore. The accuracy of these kinds of self-built maps is suspect at best. A certain close family member of one of the authors stillbelieves, after 12 years of using a personal computer, that the only way to copy a file isto start up the application, open the file, and do a “Save As” to save the copy of the fileto the new location. The point is, people working from their own mental maps are notgoing to be as productive as they would be if they had accurate, professionaldocumentation. You don’t want people building your data warehouse based on mythsand folklore.
•
Productivity and reuse. The architecture we describe takes advantage of tools andmetadata as the primary enablers of productivity and reuse. Productivity is improvedbecause the architecture helps us choose tools to automate parts of the warehouseprocess, rather than build layers and layers of custom code by hand. Because we canunderstand the warehouse processes and database contents more quickly, it becomeseasier for a developer to reuse existing processes than to build from scratch. If it isnecessary to build, the ability to search the metadata makes it possible to find and borrowcode from similar processes and models. Building a new data mart or adding a new datasource is easier if you can use generic load utilities and work from existing examples.
An Architectural Framework and Approach
There are many different approaches to defining and developing a systems architecture.We’ve taken the same basic framework John A. Zachman of Zachman International usesfor IS architecture and adapted it to data warehousing. We’ve simplified it significantlybecause the data warehouse doesn’t (or shouldn’t) own the responsibility for the entiresystems architecture. For example, the warehouse shouldn’t have to worry abouttransaction processing infrastructure. In Figure 8.1 we show the complete architectureframework. Please study the major column headings and row headings. The columnheadings show the major architecture areas: data, technical, and infrastructure. Thesecolumn headings are intersected by the rows which represent increasing levels of detail:business requirements, architecture models, detailed models, and implementation.

8.4
Figure 8.1 The data warehouse architecture framework.
The art of developing your data warehouse architecture is traversing this framework inthe right sequence. We generally believe in a top-down approach. For each of the architecture areas (the columns of the framework) you should expect to gradually work downward as you approach the actual implementation.
Tip
Start with the big picture and break the architecture down into smaller andsmaller pieces until you reach a point where the pieces can actually beimplemented.
The columns, of course, are not independent. But it is helpful to compartmentalize tasksto make progress. In Chapter 13, we show how these columns interact and when you need to consider more than one “Zachman step.” As you are developing the big picture,you need to have a clear understanding of what is available and possible in the realworld today. Reconciling the vision of what it should be with the reality of what it can be is what makes architecture so difficult.
Now that you have had a chance to study the framework, let us be a little more preciseabout the architectural areas, the columns, and the levels of detail, the rows.
Defining the Columns
Each column defines an area of the architecture. Each area starts with a subset of thebusiness requirements gathering process described in Chapter 4.
The Data Architecture Area
The contents of the data warehouse are data—the objects we work with, the physical pieces we shuffle around, add together, graph, and examine. Data is the “what” that thedata warehouse is all about. The data area of the architecture includes the contents ofthe warehouse—the list of data that is important to the business, the data stores thatmake up the overall warehouse environment and the sources that feed it. It also includesthe design of the logical and physical data models, aggregations, hierarchies, and so on,again, all based on business needs. The data architecture also defines the granularity,volume, and timing of the data at various points in the warehouse. This becomes animportant parameter for the technical architecture and infrastructure. This column shouldseem familiar because Chapters 5, 6, and 7 were dedicated to data architecture.
Technical Architecture Area Technical architecture covers the processes and tools we apply to the data. This area

8.5
answers the question “how”—how do we get at this data at its source, put it in a form thatmeets the business requirements, and move it to a place that’s accessible? The technical architecture is made up of the tools, utilities, code, and so on that bring the warehouse tolife. They are the pumps and valves that keep the data flowing to the right places at theright times. The places where data is moved from and to are also part of the technicalarchitecture.
Two main subsets of the technical architecture area have different enough requirementsto warrant independent consideration. We’ve labeled these two areas the back room and the front room. The back room is the part of the warehouse responsible for gathering andpreparing the data. Another common term for the back room is data acquisition. The front room is the part responsible for delivering data to the user community. Another common term for the front room is data access. The front room and back room have their own services and data store components.
The technical architecture for most warehouses is a combination of custom code, homegrown utilities, and off-the-shelf tools.
Tip
The balance of the technical architecture is definitely shifting toward off-the-shelf tools as they become more capable of handling a broader range ofcomplex warehouse requirements.
The second half of Chapter 8 and all of Chapters 9 and 10 concentrate on the technical architecture.
Infrastructure Architecture Area
Infrastructure is about the platforms that host the data and processes. The infrastructure is the physical plant of the data warehouse—the pipes and platforms that hold and transport the data and support the applications. This is the hardware and operating-level software. Much of the infrastructure for the data warehouse already exists as part of the overall IS infrastructure. For most of us, IS infrastructure is so much a part of daily lifethat we don’t think about it. On the other hand, there are some parts of the infrastructureupon which the warehouse may place an unexpected burden. We need to carefullyexamine the IS infrastructure to make sure any special warehouse needs are addressedand to make sure we don’t assume something is there when it really isn’t. The linesbetween the infrastructure and technical architecture areas can be a bit blurry. For example, in many cases, the DBMS is a given for the data warehouse and is essentiallypart of the infrastructure. Chapter 11 dives into the depths of infrastructure and metadata. Chapter 12 deals with the security components of infrastructure.
Defining the Levels of Detail (the Rows)
Now we turn to the rows of the framework, starting at the highest level of detail. Part ofthis architectural thinking process involves creating lots of drawings and documents atvarious levels of detail with greater or lesser ties to reality. We call these models. Models are the communications medium of architecture. They are the blueprints for thewarehouse. We use higher-level architecture models to give us a structure for understanding and managing the lower levels of detail. Without a map of the forest, we’dconstantly get lost among the trees. We use detailed models to capture the details of thearchitecture as we define it and shape it to meet the business needs we’ve identified.
Business Requirements Level
The business requirements level is explicitly non-technical. The systems planner must be disciplined to not seek technical solutions at this level, but rather to understand the majorbusiness forces and boundary conditions that affect the data warehouse project. In thisbook, Chapter 4 is aimed directly at establishing the business requirements. In scanning across the first row of the framework in Figure 8.1, it should be apparent that the business requirements are a comprehensive mixture of end-user business needs, source data realities, state-of-the-art technology, and budget realities. We strongly recommend arealistic and down to earth perspective for stating the business realities. We are not veryimpressed with idealistic plans for source data or for analysis capabilities, if the means to achieve these goals are not already on the table.
A very useful technique for uncovering the technical underpinnings of the businessrequirements is the data discovery or audit process described in Chapter 4. This audit, along with the requirements findings, provides a comprehensive, high-level enumeration within each of the columns of Figure 8.1. In this context, an audit is a long list of

8.6
requirements, or realities, that does not descend to the levels of detail described in the next three sections.
Architecture Models Level
Architecture models are the first level of serious response to the requirements. Anarchitecture model proposes the major components of the architecture that must beavailable to address the requirements. All of the types of technology must be namedspecifically, and an argument must be made that these technologies will fit together intoa system. At this level, the system perspective addresses whether the various technicalcomponents can communicate with each other, whether the administrative assumptionssurrounding the use of the technologies are reasonable, and whether the organizationhas the resources to support the technologies. The data matrix described in Chapter 7 is the high-level data architecture model. The technical architecture model is described ingeneral terms in this chapter and detailed in Chapters 9 and 10.
Detailed Models Level
Detailed models are the functional specifications of each of the architectural components,at a significant level of detail. The detailed models must include enough information toserve as a reliable implementation guide for the team member or contractor. The detailed models also must be complete enough to create a legal contract so that when the work isdone, it can be held up to the functional specification to see whether the implementationis complete and conforms to the specification. It really doesn’t matter if the work is being done by an employee or by an outside contractor; this level of detail is extremely helpfulfor setting expectations and for communicating the intent. As we remarked at thebeginning of the chapter, the detailed models are especially valuable for communicating with and educating everyone on the team. The dimensional models and physical modelsfor each fact table are the detailed models for the data area. The technical architectureplan document serves as the detailed model for the technical architecture area.
Implementation Level
The implementation is the response to the detailed models. For a software deliverable, itis the code itself. For the data area, it’s the data definition language used to build the database, and in some ways, the data itself. For many of the technical components, theimplementation is expressed in metadata, whether it is a job schedule, an extractspecification, or a set of query tool parameters. An implementation must, above all, be documented.
Logical Models and Physical Models
We use models across all three columns of the framework. We have data models,technical architecture models, network models, and so on. Frequently, models arereferred to as either logical or physical. As you develop a model, the first thing you mighthave to determine is whether it will be a logical or physical model.
The distinction between logical models and physical models is sometimes confusing.When most people talk about logical models vs. physical models, they are really talkingabout the ideological vs. the actual. The logical model is often the vision of what thewarehouse should be—the ideal we’d like to attain—it’s simple, understandable, and it solves the problem. Logical models are found in the top rows of the framework.
Next, we have to face the real world. For example, some of our business requirementsmight rely on data that does not even exist or might not be usable. Or we can’t getmachines big enough to load all the detail or provide answers quickly enough. Or thetools we need to implement our vision don’t exist, are too expensive, or don’t run on ourplatforms. So, we make changes to the logical model to get it to work in the real world.This doesn’t mean the logical model was wrong or that it didn’t do its job. It’s just that itsjob is to guide us in the right direction. The physical models are created in the bottomrows of the framework.
If the models are clearly labeled as logical or physical, they both serve a useful purpose. You should be aware that the authors are very real-world oriented. As a result, the models discussed in this book stick very close to the physical (i.e., real) interpretation.Thus, our logical data models are usually meant to be implemented literally as the table diagrams imply.
Framework Summary

8.7
The data warehouse architecture framework helps break the architecture task intomanageable pieces. The three columns—data, technical, and infrastructure—address separate but related areas. Within each column, we can proceed in a rational fashion,from the business requirements down through the models and specifications to theimplementation details.
In a way, this framework is a functional twist on the Lifecycle’s process flow. Most of the steps in the Lifecycle deliver an element that fits into the architecture framework. In fact,we’ve already worked through the top three rows of the first column of Figure 8.1, the data architecture, in Chapters 5-7. The dimensional models that define the Data Warehouse Bus are the overall data blueprint for the warehouse. They are the cornerstone for data integration among data marts. Without the dimensional models andthe bus architecture, we risk building a set of stovepipe data marts that may solve a narrow range of problems but are not usable from an enterprise point of view.
In Chapter 5 we described how the Data Warehouse Bus acts as the skeleton, which is fleshed out through the dimensional models and physical database designs. Finally, wedescribed the various data stores where all this data might exist at various stages in theprocess. We also touched on the implications and risks of some of these data stores. At this point, you should be an expert at gathering the requirements from the businesscommunity and interpreting those requirements as a series of dimensional models. Therest of this chapter provides an overview of the middle column of the framework—the technical architecture.
Technical Architecture Overview
Now that we’ve identified the data, how do we get it into a useful form? We must nowturn our attention to the middle columns of Figure 8.1, the technical architecture. We have to get the data out of its source systems, transform and transport it to thepresentation servers, and then make it available to use in an effective manner by the ultimate end user clients of the data warehouse.
The framework described earlier starts with business requirements. While every businessfaces a different set of challenges, the high-level data warehouse functions and processes tend to be similar from a systems point of view. The real deliverable from thetechnical architecture effort is the set of technical models and detailed models specificallydesigned to meet your business requirements.
What we describe here is meant to be a starting point for your own customized technicalarchitecture based on your organization’s requirements and resources. Your mileagemay vary.
Tip
Remember that the business requirements are your primary guide to what should be in your architecture and what the priorities are.
The technical architecture breaks into two big pieces that are reflected in Figure 8.1, the back room and the front room. In spite of this compartmentalization, both applicationsinteract in very significant ways, as shown in Figure 8.2.
Figure 8.2 High-level technical architecture model.
Whereas the requirements answer the question “What do we need to do?” the technicalarchitecture answers the question “How will we do it?” The technical architecture is theoverall plan for what we want the warehouse to be when it matures. It describes the flow of data from the source systems to the decision makers and the transformations that data

8.8
goes through along the way. It also specifies the tools and techniques we will need tomake it happen. This is where the technology proves itself. These are the tools and utilities that make our jobs easier.
This area is changing rapidly, both in the overall context of client/server computing andeven more so within the confines of the data warehousing market. Major productupgrades and entirely new tools are constantly surfacing. Even entire tool categories arebeing created on a regular basis.
Figure 8.2 provides the high-level elements of the technical architecture. In this section,we discuss a natural separation between the internal workings of the warehouse—the back room—and its public face—the front room. This separation provides a useful organizing device for many of the concepts because different roles, and often differentpeople, focus on these two areas. We’ll also examine the concept of metadata and the metadata catalog and its role in the warehouse.
It is important to note that Figure 8.2 is a logical model. The actual physicalrepresentation will probably be very different depending on many factors, including the maturity of the warehouse, its size, and nature.
Services and Data Stores
The technical architecture depicted in Figure 8.2 has two major types of components:services and data stores. Services are the functions needed to accomplish the required tasks of the warehouse. For example, copying a table from one place to another is abasic data movement service. If services are the verbs of the warehouse, data stores arethe nouns. Data stores are the temporary or permanent landing places for data.
Flow from Source System to User Desktop
From a high-level view, data moves from the source systems to the staging area usingthe applications provided as part of the data staging services layer. This flow is driven bymetadata kept in the metadata catalog: data that describes the locations and definitionsof the sources and targets, data transformations, timings, and dependencies. Once thedata is combined and aligned in the staging area, the same set of data staging services are used to select, aggregate, and restructure the data into data sets as defined inChapter 7. These data sets are loaded onto the presentation server platforms and tied together via the conformed dimension and conformed facts that are the specifications ofthe Data Warehouse Bus. Remember that all data that is accessed in any way by an enduser, a query tool, a report writer, or a software model is defined by us to belong to a data mart. Some data marts will therefore have very granular data, and other data martswill have only aggregated data. In any case, it is essential to separate the issues of datastaging from data presentation.
Tip
The data staging area does not provide query services. Only the presentationservers provide query services, and they rely on storing and presenting thedata in a dimensional format.
The flow from source system to user desktop is supported by metadata from the metadata catalog.
Finally, users gain access to the data through desktop data access tools, which areusually a combination of off-the-shelf tools and custom front-ends created with programming products. These tools should take advantage of query support services to help manage the logon, locate the appropriate data, and collect information about theusage and performance of the system. Some front-end tools come with their own query support services. What we are calling query support services can take on many forms ranging from custom code to vendor-supplied data warehouse application products.
We have been describing logical data flows and haven’t yet dealt with which piece isactually running on which machine. Certainly, the presentation server is the first place where logical and physical tend to get mixed up. From the user’s point of view, thereshould only be one place to go for information. The dotted line around the presentationserver represents this single logical view of the world; it is a simplifying layer that makesall data marts accessible to the user community. This simplifying layer can be created inmany ways, the most common being physically locating the data together. If that isn’tpossible, other approaches like middleware, application servers, gateways, metadata,physical tables, or some combination can provide this simplifying layer to the users.

8.9
Key Technical Architecture Features
Several features of the technical architecture apply across the board. These are the basic design principles that underlie all of the tools, processes, and components of theservice layers.
Metadata Driven
The fact that metadata drives the warehouse is the literal truth. If you think you won’t use metadata, you are mistaken.
Metadata provides flexibility by buffering the various components of the system fromeach other. For example, when a source migrates to a new operational system,substituting in the new data source is relatively easy. Because the metadata catalog holds the mapping information from source to target, the warehouse manager can mapthe new source to the existing target in the warehouse. People will continue to accessthe old target without necessarily realizing the source has changed. To the extent that the new source collects additional data, the warehouse manager can add that data asneeded.
Tip
The metadata catalog plays such a critical role in the architecture that it makessense to describe the architecture as being metadata driven. The metadata catalog provides parameters and information that allow the applications toperform their tasks—a set of control information about the warehouse, itscontents, the source systems, and its load processes.
The metadata catalog itself is really only a logical concept at this point. The holy grail ofdata warehousing is to have a single source for metadata. In that case, a single changemade in the metadata catalog would be reflected throughout the architecture—it would be available to all services at once. In most cases, it’s not practical to bring all theinformation into a single place. Metadata lives in the various tools, programs, and utilitiesthat make the data warehouse work. You will be well served if you are aware of what metadata you keep, centralize it where possible, track it carefully, and keep it up to date.
Flexible Services Layers
The data staging services and data query services are application layers that alsoprovide a level of indirection that add to the flexibility of the architecture. For example,when a user issues a query, it is submitted to a query service which in turn uses a part ofthe metadata catalog to resolve the location and nature of the request. This might be particularly important when a database is moved from one system to another. In ametadata-driven environment, the desktop tools are not hard coded to point to aparticular IP address. Instead, a change is made in the domain name server (DNS)metadata to indicate its new location. The next user that requests information from thatdatabase will automatically be routed to the new location. On the back end, such adatabase move might involve switching from one database vendor to another. In thiscase, some of the warehouse management utilities will help migrate the database basedon a combination of the descriptive metadata, and the tool’s ability to generate vendor-specific data definition language (DDL). Both of the service layers work with themetadata catalog to insulate the user from the constant changes of the systems world, toautomate processes, and to provide information and documentation about thewarehouse.
Caveats
Not all tools and services on the market currently support the concept of an open metadata catalog or query services indirection. As a result, we recommend a phasedapproach to implementing the architecture. Set up the basic structure first, and addcomponents as the warehouse grows and resources permit. This allows you to transition to tools that support your architecture as they become available. The rapid developmentof software products in this area means you should set expectations that major parts ofyour architecture will be transitioning to new approaches in one-and-a-half to three years.
Evolution of Your Data Warehouse Architecture
The architectural plan evolves continuously. Business requirements change, new databecomes available, and new technologies sprout up in the marketplace. In fact, thewarehouse itself causes many of these changes. You will know you are successful if thebusiness users are pressuring you to make significant changes. Your initial

8.10
implementation of the warehouse will cover only a small section of your possiblearchitecture. As products, platforms, and designs improve over time, the physicalimplementation you choose will evolve to more closely resemble the logical model. Thearchitecture will also evolve over time as you learn more about the business andtechnology from your own experience and the experiences of others (typically a muchcheaper and less painful way to learn).
Many of the techniques we teach in this book are intended to be robust in the face of achanging architecture. For instance, we always are more comfortable with granular data expressed at the lowest possible level. Premature aggregation of data is one of thebiggest enemies of a flexible architecture. Granular data is highly resilient in the face ofchanging business requirements and the availability of more powerful technology. Perhaps the other important perspective we teach in this book that insulates againstarchitectural changes is the dimensional modeling approach. As we argued at thebeginning of Chapter 5, the dimensional modeling approach is so symmetric that everyuser request, even ones we have never seen before, follows the same pattern and is notsurprising. That is what we mean when we say we are resilient when faced with changesin the architecture of the data warehouse. Once you have defined your bus architecture,you can be assured that your dimensional data marts will connect together.
Summary
In an effort to convince you to invest in an architecture effort, this chapter started out bylisting the major benefits of architecture. Then we described a framework for approachingarchitecture, with data, technical and infrastructure areas. Finally, we gave a high-level summary of the middle columns of the framework, the technical architecture area, which isthe focus of the next two chapters.

9.1

9.2
Overview
The back room is where the data staging process takes place. It is the engine room ofthe data warehouse. The primary concern of DBAs and system administrators in the back room is with solving the specific problem of getting the right data from point A topoint B with the appropriate transformations, at the appropriate time. Another commonterm for the back room and the data staging process is data acquisition.
The data staging process began as a manually coded development effort, like shovelingcoal into the boiler of a steam engine. Fortunately, the industry has developed sometools and techniques to support the back room, so it is becoming more like running a diesel generator. It can be automated to some degree, but it is still a complex,temperamental piece of technology.
This chapter examines the components and services of the technical architecture for theback room. We start out by cataloging the primary data stores in the back room. Then weget a sense for the services that tie the data stores together, and help move data fromone store to another. Finally, we describe a set of asset management services that helpmaintain and protect the back room. The goal of this chapter is to communicate therange of elements you will find in the back room architecture, and help you determinewhat your back room architecture needs to include.
This chapter is required reading for the technical architects. The data staging and database administrator must also understand the specifics of back room architecture. Again, theproject manager must have a high-level understanding of each component in the Lifecycleto properly orchestrate the entire project.
Back Room Data Stores
Data stores are the temporary or permanent landing places for data along the way. Whatdata gets physically stored has obvious implications for the warehouse infrastructure—you need a place to put it. Most of the primary data stores are found in the back room ofthe warehouse, especially in small- and medium-sized projects. The data stores described here are based on the technical architecture shown in Figure 9.1. The actualdata stores you will need depend on your business requirements and the complexity ofyour extract and transformation process.

9.3
Figure 9.1 Back room technical architecture.
Source Systems
The transaction systems are the obvious sources of interesting business information. Usually, the initial, crying business need is for access to the core operational systems ofthe business, including order entry, production, shipping, customer service, and theaccounting systems. Other high-value sources may be external to the business, like demographic customer information, target customer lists, customer business segments(standard industry classifications or SIC codes), and competitive sales data. The datastaging process is iterative in nature, so the source for a particular load process may also be another data warehouse or the target data warehouse itself.
Source system data storage types are dictated by the source system. Many older legacy systems are standard mainframe data storage facilities. IMS, IDMS, VSAM, flat files, and DB2 are all common in this environment. In some cases, the desired data source isactually a standard batch report that everyone gets, and it has been the agreed-on source for years. If you can’t reverse-engineer the data transformations that take place in creating this report, then the report image itself becomes the source. The flat file is one ofthe standard sources for the warehouse.
It is usually easier to convince the source systems group to generate flat files for the warehouse as part of their regular processing than to convince them to give you directaccess to the source system. Often, these files are already generated as part of the dailyprocessing and are used for operational reporting. Note that just because they are flat doesn’t mean they are simple.
Source system data models cover the gamut of alternatives—hierarchical, fully denormalized flat file, and third normal form as dictated by the source system.
Understanding the nature of the source systems is critical to creating the back roomarchitecture. The tools, connections, and services all depend in part on where the data iscoming from and what form it will be in. A few specific source systems bear additionaldiscussion. These include client/server ERP systems, the reporting instance, and theODS.
Client/Server ERP Systems
A few major companies have won the battle to provide the client/server generation ofoperational systems. These systems, called Enterprise Resource Planning (ERP) systems, are typically made of up several modules that cover major functional areas ofthe business, such as Human Resources, Manufacturing, and so on. These systemshave been created to address the stovepipe problem.
We pay two major penalties for this wonderful integration from the data warehouse pointof view. First, there are often literally thousands of tables in these ERP source systems,and in some cases, they may be named in a different language from yours (such as German). Figuring out which tables hold the interesting data for the warehouse and howthey interconnect can be a nightmare. Second, these systems typically cannot supportdecision support. This should come as no surprise since it has long been known that systems designed for transaction processing have trouble with decision support—that is the whole reasoning behind the data warehouse and OLAP. Also, these systems have tomanage a much more complex distributed process. They rarely have the cycles left for decision support.
The ERP vendors and many other third parties have recognized this gap and are workingto include data warehouse capabilities in their products. These range from extractsystems to help pull the appropriate data out of the ERP to complete canned data warehouse schema designs. If you need to extract from a client/server ERP system,contact your vendor to see what tools and services they provide that might help.
Note that using a vendor-supplied, canned data warehouse does not mean you can forget about business requirements, design, and architecture. You must make sure theERP warehouse product can address the business requirements and will most likely stillneed the standard warehouse tools and processes to load data kept in systems other than the ERP.
Tip A canned data warehouse from an ERP vendor will probably not give you

9.4
enough flexibility to store all of your data sources or use your preferred clienttools.
Reporting Instance
Many of our customers with client/server based transaction systems or resource-constrained legacy systems end up creating a separate copy of the operational databaseto serve as the reporting environment for the operational systems. This comes aboutbecause the operational systems do not have enough horsepower to support bothtransaction processing and standard reporting, let alone ad hoc decision support queries.For some reason, one of the fundamental tenets of data warehousing ends up surprisinga lot of transaction system implementers—that a database design and implementation optimized for transactions will not effectively handle decision support.
Don’t get distracted by the idea that the reporting instance is really just another part ofthe data warehouse.
Tip
A reporting instance should be managed as a core component of theoperational system with appropriate service levels, monitoring, tuning, andplanning. It is another data source from the warehouse point of view.
Operational Data Store
The operational data store (ODS) is a part of the data warehouse environment manymanagers have ambivalent or confused feelings about. We are often asked “Should Ibuild an ODS?” We have decided that the real underlying question is “What is an ODS, anyway?”
In Building the Operational Data Store (Wiley 1996), Bill Inmon, Claudia Imhoff, and Greg Battas describe an ODS as a “subject oriented, integrated, volatile, current valued datastore containing only corporate detailed data.” As we stated in Chapter 1, there are two primary interpretations of the ODS that serve fundamentally different purposes.
In the first case, the ODS serves as a point of integration for operational systems. It is atruly operational, real-time source for balances, histories, and other detailed lookups. Inmany cases, these ODSs are implemented to better support one-to-one customer relationships in the order entry or customer service function. Since this type of ODSsupports constant operational access and updates, it should be housed outside thewarehouse. It’s impossible to structure a single system to meet both operational anddecision support needs and performance requirements.
The second interpretation of the ODS is to supply current, detailed data for decisionsupport. As our data warehouses have matured, there is a growing thirst for analyzingever more detailed customer behavior and ever more specific operational texture. In most cases, the analysis must be done on the most granular and detailed data possible.The emergence of data mining has also demanded that we crawl through reams of thelowest-level data, looking for correlations and patterns.
In our view, the first interpretation of the ODS is a valuable component of the operationalenvironment and the second is simply a part of the data warehouse.
Bringing the ODS into the Data Warehouse
Until now, the decision support oriented ODS was often thought to be a different systemfrom the main data warehouse because it was based on “operational” data, meaningdetailed, transaction-level data. Conventional wisdom used to say that the datawarehouse was almost always somewhat summarized. Since the warehouse was acomplete historical record, we didn’t dare store this operational, transaction data as acomplete history—we couldn’t afford to.
However, the hardware and software technology that supports warehousing has matured, and we are now able to store and query more data. We have also figured outhow to extract and clean data rapidly, and how to model it for user comprehension andextreme query performance. We are no longer willing to accept the original ODS assumption that you cannot store the individual transactions of a large business in ahistorical time series.
If our regular data warehouses can now embrace the lowest-level transaction data as a multiyear historical time series, and we are using high-performance data extracting and cleaning tools to pull this data out of the legacy systems at almost any desired frequency

9.5
each day, then why is the ODS a separate system?
Let us take this opportunity to tighten and restrict the definition of the ODS. We view the decision support–oriented ODS simply as the “front edge” of the data warehouse, nolonger warranting a separate designation or environment. Thus, the only free-standing ODS we should expect to encounter is supporting operational systems with integrated transaction data.
Tip
The ODS should be a subject-oriented, integrated, frequently updated store of detailed data to support transaction systems with integrated data. Any detaileddata used for decision support should simply be viewed as the lowest atomic level of the data warehouse.
Thus, the atomic level of detailed, operational data in the warehouse is characterized bythe following:
• Subject oriented. The atomic level, like the rest of the data warehouse, is organized around specific business processes such as customer orders, claims, or shipments.
• Integrated. The atomic level gracefully bridges between subjects and presents anoverarching view of the business rather than an incompatible stovepipe view of the business.
•
Frequently augmented. The atomic level data is constantly being added to. Thisrequirement is a significant departure from the original ODS statement, which said theODS was volatile; that is, the ODS was constantly being overwritten, and its data structures were constantly changing. This new requirement of frequently augmentingthe data also invalidates the original statement that the ODS contains only current valued data. We aren’t afraid to store the transaction history at the atomic level. In fact, that has now become our mission.
•
Sits within the full data warehouse framework of historical and summarized data. In a data warehouse containing a monthly summarized view of data, in additionto the transaction detail, the input flow of atomic data also contributes to a special“current rolling month.” In many cases, when the last day of the month is reached, thecurrent rolling month becomes the most recent member of the standard months in thetime series and a new current rolling month is created.
•
Naturally supports a collective view of data. We now see how the atomic levelpresents a collective view to the business user. The user can immediately andgracefully link to last month’s collective view of the customer (via the time series) andto the surrounding class of customers (via the data warehouse aggregations).
•
Organized for rapid updating directly from the legacy system. The data extraction and cleaning industry has come a long way in the last few years. We can pipeline thedata from the legacy systems through data cleaning and integrating steps and drop itinto the atomic level of the data warehouse. The original distinctions of Class I (nearreal-time upload), Class II (upload every few hours), and Class III (upload perhapsonce per day) described in Building the Operational Data Store are still valid, but the architectural differences in the extract pipeline are far less interesting than they used tobe. The ability to upload data very frequently will probably be based more on waiting forremote operational systems to deliver necessary data than for computing or bandwidthrestrictions in the data pipeline.
•
Should be organized around a star join schema design. Inmon, Imhoff and Battas recommend the star join data model as “the most fundamental description of the designof the data found in the operational data store.” We wholeheartedly agree. The starjoin, or dimensional model, is the basic preferred data model for achieving user understandability and predictable high performance, for both atomic and aggregateddata.
•
Contains all of the text and numbers required to describe low-level transactions. However, it may additionally contain back references to the legacy system that would allow real-time links to be opened to the legacy systems throughterminal or transaction based interfaces. This is an interesting aspect of the originaldefinition of the ODS, and it is somewhat straightforward if the low-level transactions are streamed out of the legacy system and into the atomic level portion of the datawarehouse. Technically what this means is that operational keys, like the invoicenumber and line number, are kept in the data flow all the way into the atomic level, so that an application can pick up these keys and link successfully back to the legacy

9.6
system interface. Note that if this link is meant to support real-time transaction loads, you are back to the original definition of the ODS in an operational, transaction-oriented environment.
• Supported by extensive metadata. Metadata is needed to explain and present the meaning of the data to end users through query and reporting tools, as well as describean extract “audit” of the data warehouse contents.
If you already have something that you believe is an ODS, examine it carefully todetermine its purpose. If it is meant to play an operational, real-time role, then it is truly an operational data store and should have its own place in your systems environment. On the other hand, if it is meant to provide reporting or decision support capabilities, itshould be integrated into the warehouse at the atomic level, conforming with the DataWarehouse Bus Architecture.
Bringing the decision support–oriented ODS into the existing data warehouse frameworksolves a number of problems. We can now focus on building a single data extractpipeline. We don’t need to have a split personality where we are willing to have a volatile,changing structure of data with no history or support for performance enhancingaggregations. And, we can go back to a single definition for the ODS.
Tip
We now understand how to take a flow of atomic level transactions, put theminto a dimensional framework, and simultaneously build a detailed transactionhistory with no compromised details.
Finally, if you have been saying to yourself that your organization doesn’t need to storeall that transaction detail because your management only looks at high-level summaries, then you need to broaden your perspective and listen to what is going on in the world.We are in a major move to one-on-one marketing where organizations are seeking to understand and respond to detailed and individual customer behavior. Banks need to know exactly who is at that ATM between 5 and 6 p.m., what transactions they areperforming, and how that pattern has evolved this year in response to various bankincentive programs. Catalina Marketing, a leading provider of in-store electronic scanner-activated consumer promotions, is ready to print coupons at your grocery store registerthat respond to what is in your market basket and what you have bought on recent tripsto the store. To do this, these organizations need all the gory transaction details, both current and historical.
Data Staging Area
The data staging area is the construction site for the warehouse. We will decompose theactivities of the data staging area in detail in Chapter 16, but suffice it to say that this is where much of the data transformation takes place and where much of the added valueof the data warehouse is created. Since many of these transformations, like the conversion to surrogate keys, are useful across the enterprise, it makes sense to dothem only once. Actually, in the case of key mapping, you need to have a single, officialplace where the mapping takes place. This central role for the staging area means that in many cases it evolves to become the “source system of record” for all downstream DSSand reporting environments and less-than-real-time interfaces between systems.
Tip
Investment in a solid data staging area that services a broad range oftransformation requirements will avoid requiring each business process toinvest in deciphering the source systems and performing the same calculations.
Data Staging Storage Types
The major storage types we’ve seen include flat files, relational tables, and proprietarystructures used by data staging tools. The choice depends on the data quantities and thetimeframes involved. Fast processing of large volumes may require compiled COBOL orC code running against flat files. Utilities like Syncsort work better with some file typesthan others. Staging the data in a relational database is common, and although it hasmany advantages, it is not all that efficient. The relational system imposes a lot of overhead to load, index, sort, and otherwise manipulate the data. The programminglanguages built into RDBMSs are relatively slow as well. On the other hand, one bigadvantage of a relational platform is its broad accessibility. Many of the data staging tools are designed to work with relational databases. Also, you can choose from a wide rangeof query tools to examine the contents of the data staging area at any point in time.
The data staging area will archive and store data for a number of purposes. Conformed

9.7
dimensions are created in the data staging area and are replicated out to all therequesting data marts. These conformed dimensions must be permanently housed in thedata staging area as flat files ready for export. The data staging area may be the best place to hold data for emergency recovery operations, especially if the data martmachines are remote affairs under the control of user departments. The data stagingarea must also be the source of the most atomic transactional data, especially if the client data marts do not use all of that data at any given point in time. This atomic datathen becomes available for further extraction. Again, this archival data may well bestored as flat files available for export or processing by a variety of tools.
Tip
The data staging area is really an assembly plant and is not intended to beseen by users.
Data Staging Data Models
The data models can be designed for performance and ease of development. Thismeans they are likely to match a combination of source structures on the incoming sideand dimensional warehouse structures on the “finished goods” side, with thetransformation process managing the conversion. Third normal form or E/R models oftenappear in the data staging area because the source systems are duplicated (like thereporting instance or ODS), and become the starting point for the process, or they arebuilt in the staging area to help tease apart the real nature of the sources.
The Presentation Servers
As we described in Chapter 1, presentation servers are the target platforms where thedata is stored for direct querying by end users, reporting systems and other applications. Early data warehouses were built in a monolithic structure with detail and aggregates in asingle location. This single instance proved frustrating for business process areas thathad to wait their turn and led to the development of independent data marts. The idea ofthe Data Warehouse Bus allows parallel development of business process data martswith the ability to integrate these data marts ensured by their use of conformeddimensions. Moving forward, we believe the approach that makes the most sense involves loading detail and aggregate data into data marts segmented by businessprocess. The conformed dimensions used in these data marts will allow querymanagement software to combine data across data marts for fully integrated enterprise analysis and reporting.
We show two kinds of data marts in Figures 8.2 and 9.1: data marts with atomic data and those containing only aggregated data. There is no significant difference in our mindsbetween these two types, since in all cases the data must be presented to the query services in a dimensional format. We show the two examples to reinforce the point thatatomic data belongs in a data mart framework. It is also helpful to show the two typesbecause they are often kept in different DBMSs on different platforms. Depending on your business requirements, the size of your warehouse, and the tools you select, youmay or may not need both types.
The Data Warehouse Bus matrix from Chapter 7 provides the elements of a descriptive metaphor that helps us organize data in the presentation layer. In a way, the matrix is likethe system bus in your computer. Each dimension is like a connector, or wire, on the bus. It carries a standard (i.e., conformed) “signal,” like product or customer. Each businessprocess is an expansion card that plugs into the data connectors as appropriate. Figure9.2 gives a conceptual example of how the bus might work for two business processes: manufacturing production and order entry. They both plug into the same bus, but theyonly overlap in two areas, time and product. As new business process data sets areadded, they are able to plug into the existing data bus.

9.8
Figure 9.2 Two processes plugging into the Data Warehouse Bus Architecture.
Atomic Data Marts
Atomic data marts hold data at the lowest-common-denominator level, that is, at the lowest level of detail necessary to meet most of the high-value business requirements.
Aggregate tables might be considered part of the business process data mart or part ofthe atomic data mart. Part of this decision is logical in nature. In other words, where you draw the line doesn’t have a big impact on what you actually do. So, the atomic data martmay contain a range of aggregates designed to improve performance. The choice ofaggregates will change over time based on analysis of actual warehouse usage.
• Atomic data mart storage types. The atomic data mart should be relational rather than OLAP. This is because of the extreme level of detail, the number of dimensions,the size of the dimensions, and the broad accessibility relational databases provide.
•
Atomic data mart data model. We recommend that atomic data marts be built around the dimensional model, not an E/R model. Whenever someone insists that theatomic data mart should be kept in third normal form, it is usually a problem of how something is defined, not a true difference of opinion. Ask two questions to clarify theissue: (1) What is the preferred model to support user access and (2) will users need orwant to access the detail? Almost everyone we’ve talked to agrees that the dimensional model is the best user access model. Everyone also agrees that users willwant to access the detail at some point, either via a drill-through process or directly. Since the atomic data mart contains the lowest level of detail and users will want to access it, it should be kept in the same dimensional model. It makes no sense to carrythe overhead of some kind of complex mapping layer to give users the simplified,dimensional view of the business they need but from an E/R source.
Aggregated Business Process Data Marts
Each core business process, like taking customer orders, generates data that is ofinterest to multiple business functions. The business function called Marketing might liketo analyze that data to get a sense for promotional effectiveness. Sales might like toexamine that data to understand regional, district, and individual sales performance.Customer service might like to analyze that data to understand the relationship betweenorders and service calls by product. The list goes on. We call the data related to eachcore business process a business process data mart. Business process data marts simplify the view of the world by bringing together relevant sets of data from the atomicdata mart and presenting it in a dimensional form that is meaningful to the businessusers.
Often, the first data warehouse project in a company is a single business process datamart. That is, the atomic data mart and the business process data mart are essentiallyindistinguishable. In fact, there is often only one presentation server involved rather thantwo. As the company adds data marts, the atomic data mart and the staging area mustexpand to accommodate the additional data and transformation processes. Note that this expansion has organizational implications for the warehouse team. During the firstdevelopment effort, the atomic data mart and the business process data mart aretypically created by a single team. As more data marts are created, the atomic data martmust become an enterprise resource, while the business process data mart is more

9.9
effective if it can focus on the needs surrounding the business process it is derived from.A central warehouse team evolves that is responsible for the master conformeddimension tables, warehouse tools, and data mart integration.
As the data warehouse expands, individual data mart projects will likely be built andmanaged independently by other IS teams that are dedicated to each major businessprocess or even by power users with desktop database tools. One problem we see withmany data mart projects is that organizations have no idea how much effort is required tosuccessfully extract and transform data. There is often a temptation to avoid the centralwarehouse team because “they’ll only slow us down.” The central warehouse teaminadvertently fosters this impression because they sound like the harbingers of doomwhen they describe how difficult the project will be. From an enterprise point of view, thegoal is to encourage all data mart projects to leverage the work that has already beendone and to source their internal data through the atomic data mart, and occasionallydirectly from the staging area (in the case of external data, for example). The warehouseteam can accomplish this by making the value added in the data staging process sogreat that alternative sources aren’t even considered. This will cause future data marts tobe based on the same standard sources and to use the same dimensions. As a result,they will be consistent with each other. They will also be able to take advantage of thedata management and access services tools to speed development and improvemaintenance.
•
Business process data mart storage. In our experience, business process data marts are usually either relational or proprietary multidimensional OLAP databases.Some projects house their data marts in a proprietary 4GL tool, many of which haveadded on data warehouse-style functions.
•
Business process data mart model. The data loaded into these data marts should follow the same dimensional structure of the data in the atomic data mart. The basicdimensionality of the data is the same, but its presentation may use different businessrules and contain different derived facts (e.g., gross sales versus net sales). Some of the dimensions may be trimmed or omitted altogether as you ascend to higher levels ofsummarization. Additionally, information of interest only to a particular businessprocess may be appended to the dimension tables during the load process. These differences are based on the different views of the world Marketing, Finance, Sales,Manufacturing, and so on all have. For example, Finance may be concerned withrevenue and have a very strict definition of what gets counted as revenue. The sales organization may be more interested in analyzing sales, which has a different (andsomewhat less strict) definition in terms of timing, allocations to sales reps, and so on.
Metadata Catalog
One of the data stores, called the metadata catalog, is really an integral part of the overall architecture. We discuss the metadata catalog separately because itrepresents the set of information that describes the warehouse and plays an activerole in its creation, use, and maintenance. A major part of Chapter 11 is dedicated to exploring the topic of metadata in detail.
Back Room Services
Back room services, or data staging services, are the tools and techniques employed inthe data staging process. (Of course, you recall the back room is where the data stagingprocess takes place; it is the engine room of the data warehouse.) Our focus in this section is to describe the major services we’ve seen to be valuable in various warehouseenvironments. Your warehouse will probably not need all of these services, at least notall at once.
We define a service as an elemental function or task. It might be as simple as to creatinga table in a database. An application is a software product that provides one or moreservices. An application may be code created by the warehouse team, an in-house utility, a vendor utility, or a full-scale vendor product designed for data warehousing. It dependson the business requirements, resources, and priorities. Again, our goal here is todescribe the nature and range of service functionality your warehouse might require.Additional detail about many of the services we describe here, along with examples, can

9.10
be found in Chapter 16, which covers data staging, and Chapter 13, which covers tool selection.
The data-staging process involves three major operations: extracting the data from thesources, running it through a set of transformation processes, and loading it into thetarget systems. These operations tend to overlap. For example, in many cases, it makessense to include some of the data transformations in the extract process. It is easy toapply certain calculations and aggregations as the data is pulled out. Also, there may becycles available on the source system platform to help speed the extract process. Finally,it may just be easier for the programmer.
General Data Staging Requirements
Before we start listing detailed data staging capabilities, it is helpful to consider a set ofoverall requirements for the data staging system. These cluster around the areas ofproductivity and usability.
•
Productivity support. Any system you decide to implement needs to provide basicdevelopment environment capabilities like code library management check in/checkout, version control, and production and development system builds. Initially, and forsmaller projects, these can be implemented through a standards document, a processdescription, and a set of standard directories. In the long run, and for larger projects,your data staging services will need to include these capabilities.
•
Usability. The data staging system also must be as usable as possible, given the underlying complexity of the task. In the last few years, this has translated into agraphical user interface. A good interface can reduce learning time, speeddevelopment, and be self-documenting (to a degree). Of course, a bad GUI can reduce productivity instead of improve it.
System documentation is another part of usability. The data staging system needs toprovide a way for developers to easily capture information about the processes thatthey are creating. This metadata should go into the information catalog and be easilyaccessible to the team and the users as necessary.
•
Metadata driven. One of the most important characteristics of the services thatsupport the data staging process is that they should be metadata driven. By this, we mean they should draw from a database of information about the tables, columns, jobs,and so on needed to create and maintain the warehouse rather than embed thisinformation in COBOL or SQL code, where it is almost impossible to find and change. It is becoming less common for the back room processes to use hard-coded data management services. Today most warehouses take advantage of tools that automatethe warehouse development process in some way, even if it means using daemons, scripts, and CRONTAB to schedule the nightly loads. This move toward metadata-based processes is driven, at least in part, by the overall push toward nightly (or morefrequent) loads. When the load cycle happened only once a month, someone could marshal it through by hand. Not so when the load has to happen every night—at least not reliably. Note that this push for more frequent loads is really a business-driven requirement.
Example Metadata-Driven Data Staging Utilities
Metadata can play an active or passive role in the data warehouse; it can serve asdocumentation for the contents and processes of the warehouse, and it can directlyserve as the instruction set for those processes. The documentation role is valuable because it is the most effective way to educate someone on the contentsof the warehouse and how it works. This is important both for new members of theteam and for new users of the warehouse.
Documentation is always the neglected step-child of the information systems project. However, if metadata is an active part of the process itself, it must becreated and captured; otherwise, the process won’t work. This example shows howmetadata can drive the data staging process. We are not encouraging you to build a set of utilities, although many early data warehouse teams have done so. At thispoint, smaller projects can take advantage of data staging utilities that are nowbeing built into the current generation of DBMS products. Larger systems should rely on full-featured, market-tested commercial products. View this example as a

9.11
good vehicle for understanding the value a data staging tool provides.
Basically, these data staging utilities are wrapper programs that tie some of thecore data manipulation statements to a metadata structure. Let us use theCREATE TABLE command as an example.
Dropping and creating tables is common in the load process as dimension tablesare refreshed, tables are copied from test to production, and so on. A simple version of the syntax for the SQL CREATE TABLE command looks something likethis:
CREATE TABLE employee ( emp_id integer, fname CHAR(20) NOT NULL, minitial CHAR(1) NULL, lname VARCHAR(30) NOT NULL, hire_date DATE NOT NULL, job_id SMALLINT NOT NULL )
The metadata-driven version would rely on two metadata tables and a procedure. One table has information about tables in it—one row per table. The second table has information about columns in it—one row per column. It ties back to the Tables table through a common Table_Name column. Rough pseudocode for theprocedure would go something like this:
Proc Create_Tab(TabName, DatabaseName, HostName, UserName,Password, DropFlag)
Declare Command_String, Length_String as string Command_String = "CREATE TABLE " & TabName & " (" ' Create a results set with an SQL call Connect MetadataHost, UserName/Password
Select column_name, data_type, length, Null_value fromColumns_Table where Columns_Table.TableName = TabName
' Loop through the results set to build the SQL command byappending to Command_String
For Each Record 'Loop until end of results set IF length = NULL THEN Length_String = "" ELSE Length_String = "(" & length & ")" END IF
Command_String = Command_String & column_name & " " &data_type & Length_String & " " and Null_value & ","
Next Record 'End Loop
' Finish the command (get rid of the last comma, add a closeparenthesis)
Command_String = Substring(Command_String, 1, Length(Command_String) -1)
Command_String = Command_String & ")" ' Submit the final command string to the database Connect HostName UserName/Password Use DatabaseName IF table_exists THEN IF DropFlag = TRUE THEN Drop Table TabName Command_String ELSE LogWrite( "Table already exists") ELSE Command_String End IF LogWrite(TabName & " created on " & HostName & " / " & DatabaseName & " at " & NOW) End Proc Now, instead of needing 8 lines of code (or 60!) to create a table, we can do it in

9.12
one statement: Create_Tab(Employee, DataWH, DWTest, system, manager, TRUE).
Once this kind of procedure becomes part of the data staging process, theprograms become more independent of the data. For example, in the old way, if thenumber of columns or data types changed in the Employee table, we would have tochange every reference to it. In the metadata model, all we need to do is changethe metadata, and the procedure buffers the data staging programs from thischange.
In fact, you can store metadata from one of the open modeling tools on the serverand use it as the source for your metadata tables. Note that deciphering thedatabase structure of many of these tools can require days of effort. Once youfigure out the mapping, you have an off-the-shelf metadata management tool as well. This is exactly the kind of metadata exchange many of the vendors are tryingto accomplish automatically.
Basic Procedures and Tables: Procedures: Create table Create index Drop table Drop index Copy table Add user Drop user Run SQL Script Run DBMS Table Loader Metadata tables Table Defs Column Defs Index Defs User Security Activity Log
These tables will be very similar to existing data definition tables found in theDBMS. The major difference is that the contents of these tables are persistent. If you delete a table from the database, its definition is removed from the DBMS datadictionary. These metadata tables give the definition a permanent home so you canrecreate it as needed. Look at your DBMS and front-end tool data dictionaries for examples of what kinds of information these tables should contain. Note that it isalso possible to draw this information from the underlying relational tables of one ofthe open data modeling tools. In this case, you don’t have to create the tables, just the SQL to extract the information you need. You may need multiple tables forseveral of the following tables to track repeating items like physical storage,constraints, keys, and so on.
Build versus Buy
Most of the services we describe in this section are available in the form of off-the-shelf tools specifically designed for data warehousing. They are constantly improving and arebecoming less expensive as the data warehouse market matures. These tools can improve productivity immensely but don’t expect to see the payback on day one. In our

9.13
experience, these tools do not improve productivity in the first round of a data warehouse. In most cases, it takes as much time to set them up and learn how to use them as they save in the first round. After that, as new data areas are added and theinitial database is improved, the productivity gains become clear (and significant). In aproduction data warehouse with a typical legacy environment, programmers can be as much as three times more productive with these tools. Or, if programming folks are alltied up on Year 2000 projects, a tool can help the warehouse team succeed with fewerprogramming resources.
Tip
Data extraction tools are complex and expensive and often do not improve productivity in the first round of a data warehouse. But they become quite costeffective for the second and subsequent iterations of the extractionprogramming.
It may make sense to implement the first-round effort by hand, especially if you have time and resources for a separate prototype phase. This will give you the opportunity tounderstand the challenges and complexities of implementing a warehouse first hand. Itwill also help you define the services you need in your environment and better understand the strengths and weaknesses of the tool alternatives.
However, you should plan to invest time and money on data staging tools. If you do buildthe first round by hand, make sure you include time and resources to convert it. We wouldn’t want to build a serious warehouse without a tool. Separate data staging toolsmay not be cost effective for a small warehouse effort. These projects should start withwhatever tools come bundled with the DBMS and add on any missing functionality needed to meet their requirements. At the other end of the spectrum, very large volumedata warehouse projects with lots of custom-coding requirements may have to go outside the tool too often to get the data loaded in a reasonable timeframe, but for most projects, it makes sense to get a tool.
Tip
Graphical flat-file transformation systems running on destination datawarehouse platforms such as NT and UNIX are cheaper and provide betterproductivity gains in the first round of a data warehouse. Such systems usually require that the data is extracted first from the mainframe and presented to thetarget system as a flat file.
That said, let us take a look at the data staging process. Extract Services
Pulling the data from the source systems is probably the largest single effort in the datawarehouse project, especially if the source systems are decades-old, mainframe-based, mystery-house-style systems.
Tip
As a rule of thumb, about 60 percent of the warehouse development hours are spent on the extract process. If you are building a new extract system, count onat least two months elapsed time. Six work-months of total development time on each separate legacy source is a reasonable first estimate.
Most often, the challenge is determining what data to extract and what kinds of filters toapply. We all have stories about fields that have multiple uses, values that can’t possiblyexist, payments being made from accounts that haven’t been created, and so on. From an architecture point of view, we need to understand the requirements of the extractprocess so we can determine what kinds of services will be needed.
Most extract processes generate temporary load files that become the input data for the next activity downstream. This is true even for the standalone extract tools, although theirintermediate files may be buried inside their extract and transformation system. Mostextracts we see are based on the host platform and are designed to get the data out of the source and into a simplified and easily accessible form. The following represent themajor classes of requirements we’ve come across and, therefore, a potential list of whatyour code and tools will need to deal with.
These are the kinds of capabilities your extract system will need to provide, whether youcode it all yourself or buy a $300,000 package.
Multiple Sources It is a rare data warehouse, especially at the enterprise level, that does not pull data from

9.14
multiple sources. In most cases, data must be pulled from multiple systems built withmultiple data stores hosted on multiple platforms. Even the lucky folks who are extractingdata from one of the integrated client/server packages may still need to deal with multiple platforms and versions (not to mention the thousands of source tables to choose from,possibly named in a foreign language).
Code Generation
In some cases, code generation means generating actual code that runs in the source system to create the extract files (like COBOL on the mainframe). Or, for many tools, thismeans internal code that is executed by the extract engine, which in turn will issuecommands against the source system. In either case, some kind of executable code needs to be created to get the data out. These code-generation tools are somewhat limited in the source data formats they can work with and the platforms they can pullfrom. Make sure the tools you are interested in work with your key source systems, or that you are willing and able to generate the extract code needed to get the data into aneutral format (like a flat file).
Multiple Extract Types Several common types of extracts serve different purposes in building the warehouse:
•
Incremental loads. Most data warehouses use incremental loads. Even tables thatinvolve snapshots, like a monthly account balance table, usually extract the balanceonly at the end of the current month. In many cases, the warehouse has grown too large to completely replace the central facts tables in a single load window.
This is typically based on a transaction date or some kind of indicator flag in the sourcesystem. The date of the last load is a nice little piece of metadata to keep handy for the load process.
Tip
It is much more efficient to incrementally load only the records that havechanged or been added since the previous load.
•
Transaction events. The extract must be able to identify several different kinds of transactions because the transformation and load processes will have to treat themdifferently. Since the previous load occurred, we may want to see all new transactions,updated records, and potentially deleted records (since this may indicate a cancelled state). In some cases, the source system does not have a reliable date stamp, so wedon’t know if something occurred after the previous load. Then it becomes necessaryto use some other technique to identify changed records. In some cases, the transaction log file can be pressed into service. It is possible, but it isn’t pretty.
•
Full refresh. Sometimes it is necessary to pull certain tables in their entirety ratherthan worry about figuring out what has changed. We’ve seen data sources where history could be changed by the transaction system without leaving any identifyingmarks. When the facts begin to drift like this, you may have to pull the whole table overon a regular basis. Obviously, there are size limits to this strategy, but even in the case of a large data source, it may make sense to resynchronize it once a quarter. Smallerdimension tables will probably be pulled in their entirety. In many cases, you need toidentify changed records yourself as part of managing the dimensions, but that usually takes place in the staging area.
Replication
Replication has several meanings depending on the database vendor or productinvolved. In a warehouse context, it may be used to continuously update a table in the staging database during the day, so it is up-to-date and available to support the data staging process overnight. Replication is especially valuable in enterprise warehousesituations where multiple load processes depend on access to updated versions of the conformed dimension tables. Bulk replication can mirror or copy the dimensions tomultiple data staging areas.
Compression/Decompression
Data compression can be an important capability in the extract stream if you plan totransfer large amounts of data over a significant distance. In this case, thecommunications link is often the bottleneck. If most of the elapsed time is spenttransmitting the data, compression can reduce the transmission time by a third to a half

9.15
or more, depending on the nature of the original data file. Data Transformation Services
Once the data is extracted from the source system, a range of unnatural acts areperformed on it to convert it into something presentable to the users and valuable to the business. In one recent example, we had to run a customer service data set throughmore than 20 transformation steps to get it into a usable state. This involved steps likeremapping the old activity codes into the new codes, cleaning up some of the free-form entry fields, and filling in a dummy customer ID for pre-sales inquiries. The following list is representative of the kinds of transformations you will probably need to include in yourwarehouse. Many of these are illustrated with more detailed examples elsewhere in the book.
• Integration. Integration involves generating surrogate keys, mapping keys from onesystem to another, and mapping codes into full descriptions. There is also an impliedresponsibility to maintain a master key lookup table behind this transformation.
•
Slowly changing dimension maintenance. Identifying changed values and creating surrogate keys is a tricky process, but it is not space-warp mathematics. If you buy a data staging tool, it should have the algorithms for managing slowly changing dimensions built in. If not, ask your vendor when they are going to provide this and holdthem to it.
•
Referential integrity checking. Referential integrity (RI) means the data in one table matches the corresponding data in another table. If you have a sale in the fact table forproduct number 323442, you need to have a product in the Product dimension tablewith the same number or you won’t know what you’ve sold. Indeed, if thereis no record in the dimension table with that product number, auser can easily construct a query that will omit this sale without even realizing it. RI canbe managed at the database level rather than as part of the transformation process,but it will reduce your flexibility and it doesn’t fix the problem. It just won’t let you load the data.
•
Denormalization and renormalization. Denormalizing a hierarchy of separate tables into a dimension is a standard warehouse transformation process. Some of the datastaging tools offer a star schema feature that automatically performs this function. Inaddition, some denormalization takes place in the fact table process. For example, afinancial schema may have a dimension that is the amount type, with the values Actual,Budget, or Forecast. Depending on the level of detail these records contain, it maymake a lot of sense to pivot this column out into a single row with three columns ofdollar amounts, one for each amount type.
In other cases, a source comes in as a fully denormalized flat file, and you need to normalize parts of the record. Keeping data in monthly “buckets” is a common examplefrom legacy systems. The source may keep a rolling 12 months of data in 12 columns,or buckets. In that case, we need to create a month column and convert the original record into 12 records, one for each of the 12 monthly buckets.
•
Cleansing, deduping, merge/purge. This is a big problem for many data warehouses, especially those concerned with external entities like customers, businesses, doctors, and patients. It is a complex process, but several vendors offertools and services specifically for this problem. We discuss this process in more detailin Chapters 6 and 16.
•
Data type conversion. This involves lower-level transformations converting one data type or format to another. This ranges from converting IBM’s mainframe character setEBCDIC to ASCII, to converting date, numeric, and character representations from onedatabase to another.
•
Calculation, derivation, allocation. These are transformations to apply the business rules you identified during the requirements process. Make sure the tool you choosehas a full set of functions available, including string manipulation, date and timearithmetic, conditional statements, and basic math. User extensibility for these functions is very valuable. One tool we worked with let us add a simple Nice_Namefunction that took a user-entered name field (first and last) and cleaned it up so itlooked nice. Nice in this case means we capitalized the first and last name, changing the all-caps entries to title case. It was no big deal, but it made the reports much morereadable and appealing to the user community.

9.16
•
Aggregation. Aggregation can be handled in any part of the load process, depending on which resources are available at which stage. If we calculate aggregations as part ofthe extract or transformation process, it is possible to apply tools like Syncsort directlyto the flat files. These utilities are optimized for sorting and summarizing and are extremely good at it. On the other hand, some database products provide the ability tocreate aggregates as part of the load process. In some cases, it is worth pulling dataout of the database, running it through a utility, and loading the results back in. We’ve dedicated Chapter 14 to a detailed discussion of the creation and maintenance ofaggregations.
•
Data content audit. The transformation process should spin off check sums, rowcounts, and tests of reasonableness as a matter of course. These are then comparedto figures generated by the source system and alerts generated when they don’t match.We saw a problem that took days to resolve and required a significant reload effortwhen a new employee in Japan converted sales figures from yen to dollars before thedata was entered into the transaction system. Unfortunately, the system also did theconversion, so the sales were about 130 times greater than normal. You can’t checkeverything, but a few solid tests can save a lot of painful recovery time.
•
Data lineage audit. The extract and transformation process can create logs of thespecific runs that created specific dimension records and fact records. In Chapter 6 we described a technique for associating these data lineage audit results with each record in a fact table or a dimension table.
•
Tool- or analysis-specific transformation. Some tools require specific data elements to be marked or updated as part of every load process. For example, a toolmay rely on a “current date” flag in the calendar table. Data mining is particularlysensitive to the nature and content of the data. It is common to have to flag abnormalfacts or changed status, or to normalize facts so they range between 0 and 1. Thisprepares the data for the statistical analysis tools that are the heart of data miningsystems. Chapter 16 on data staging describes several of these transformations in more detail.
•
Null values. Nulls can be a problem because many legacy systems didn’t have ameans to represent nulls. To handle nulls, programmers chose a particularly unlikelyvalue (like 9/9/99 for the date, or –1 for the product number). Since all the interaction with the data was moderated through a program, it was easy to apply the appropriateinterpretation for the null. No one ever saw the unlikely value. Now, if you pull the datadirectly from the source, those null-substitute values look like legitimate values. Analyses will go wrong, and people will get hurt. You need to identify these null-substitute values and develop rules for handling them in the database. Again, Chapter 16 has more discussion on handling nulls.
•
Pre- and post-step exits. This actually applies across the data staging processes.Every step you define in the process should have a way to make an external function call as a part of the step, both before and after the step is run. This can be critical whenyou need to do something outside the capabilities of the tool or utility. For example, itmay make sense to run the data set through a sort routine before the load process. Or, it may be necessary to call a proprietary function that scores a record based on apredetermined formula.
Data Loading Services
The capabilities you need during the data loading process are, in large part, a function of the target platform. Some of the capabilities you will likely need during the loadingprocess are:
•
Support for multiple targets. The atomic data mart may be on one DBMS, and the business process data marts may be on another. Each target will probably have its own syntax and idiosyncrasies, and your load process should know about these differencesand use or avoid them as appropriate.
•
Load optimization. Most DBMSs have a bulk loading capability that includes a range of features and can be scripted or invoked by your data staging tool through an API.Every database product has a set of techniques and tricks that optimize its loadperformance. These include steps like avoiding logging during loads and takingadvantage of bulk loader capabilities like creating indexes and aggregates during theload.

9.17
• Entire load process support. The loading services also need to support requirements before and after the actual load, like dropping and re-creating indexes and physical partitioning of table and indexes.
Data Staging Job Control Services
The entire data staging job stream should be managed, to the extent possible, through asingle, metadata-driven job control environment. The job control process also captures metadata regarding the progress and statistics of the daily job itself. The infrastructure tomanage this can be as basic (and labor-intensive) as a set of SQL stored procedures, or the process could implement a tool designed to help manage and orchestrate multi-platform data extract and loading processes. In any case, you need to set up anenvironment for creating, managing, and monitoring the data staging job stream. It isessential to facilitate maintenance and to develop a cohesive set of extract statistics metadata.
The job control services needed include:
•
Job definition. The first step in creating an operations process is to have some way todefine a series of steps as a job and to specify some relationship among jobs. This is where the flow of the data warehouse is written. In many cases, if the load of a giventable fails, it will impact your ability to load tables that depend on it. For example, if thecustomer table is not properly updated, loading sales facts for new customers that did not make it into the customer table is risky. In some databases, it is impossible.
•
Job scheduling. At a minimum, the operations environment needs to providestandard capabilities, like time- and event-based scheduling. Warehouse loads are almost always based on some upstream system event, like the successful completionof the general ledger close or the successful application of sales adjustments toyesterday’s sales figures. This includes the ability to monitor database flags, check for the existence of files, compare creation dates, and so on.
•
Monitoring. No self-respecting systems person would tolerate a black box schedulingsystem. The folks responsible for running the loads want to know as much as possible about what is going on. The system needs to provide information about what step theload is on, what time it started, how long it took, and so on. In the handcraftedwarehouse, this can be accomplished by having each step write to a log file or table as described next. A store-bought system should provide a more visual means of keepingyou informed about what is happening. If you are sharing computing resources, themore sophisticated systems will also tell you what else was running on the system during the data staging process, give you comparison reports with average times foreach process, and so on.
•
Logging. This means collecting information about the entire load process, not justwhat is happening at the moment. Log information supports the recovery and restarting of a process in case of errors during the job execution. Logging to text files is theminimum acceptable level. We prefer a system that logs to a database. The structuremakes it much easier to create graphs and reports. It also makes it possible to create time series studies to help analyze and optimize the load process.
•
Exception handling. Some systems have better data than others. At some point, theload process will hit a record with an incorrect data type, or it will fail a referential integrity check. The system needs a place to put rejected rows, a limit on how manyerrors are acceptable, and a way to exit gracefully. You also need a process to handlerows that are rejected during the load process. This can be as simple as manually inspecting and correcting the file, and rerunning the process. Where possible, data thatwas rejected due to basic data content errors, like a character in a numeric field, shouldbe routed directly to the source system owner for correction. Try to get the data owners involved—they are usually eager to correct problems but have no way of knowingthese problems exist. They’d rather hear about the problem from you than from theCEO.
Historically, the primary focus in IS has been on getting transactions done as fast as possible. The after-the-fact analysis of this data has been a much lower priority (hencethe frustration of many senior business executives with IS). It is as if your automechanic decided he was only going to work on the engine and accelerator. The brakes, headlights, and so on are your problem. Clearly, this front-end focus is a bit short-sighted. As data warehouses have proven their value, IS organizations are

9.18
shifting toward a broader understanding of the importance of information and of their responsibility for providing more than just transaction processing. In the short term, thiswill mean a greater degree of cooperation on issues like data quality. In the long run, itmeans a more active role in providing data to the warehouse.
Tip
This issue of handling rejected records is really just a symptom of a largerproblem: determining who is responsible for providing business information,and holding him or her accountable for data quality.
•
Error handling. You must plan for unrecoverable errors during the load because theywill happen. Your system should anticipate this and provide crash recovery, stop, andrestart capability. First, look for tools and design your extracts to minimize the impact of a crash. For example, a load process should commit relatively small sets of records ata time and keep track of what has been committed. The size of the set should beadjustable, since the transaction size has performance implications on different DBMSs. One of our customers based a central extract on technology that loaded alarge table from one database to another over the net
•
work. Unfortunately, it wrapped the entire load into a single commit statement. Thiswould work most days, but every so often, the network would take a hit in the middle ofa load and the whole process would have to back out and be restarted. The reloadwould take most of the next working day.
•
Notification. The importance of this capability correlates closely with the number of users and their reliance on the warehouse. If you don’t have a lot of users and if theyhaven’t grown to count on the warehouse being available when they need it, you mightbe able to wait until morning to find out the load failed and restart it.
This is a luxury you will likely have to give up at some point. Types of notification rangefrom sending a message to the system console, an e-mail, or a page (preferably taken from the on-duty list according to the current date and time).
Tip
Somebody needs to know if anything happened during the load, especially if aresponse is critical to continuing the process.
Back Room Asset Management
The data warehouse is subject to the same risks as any other computer system. Disk drives will fail, power supplies will go out, and sprinkler systems will turn on accidentally.In addition to these risks, the warehouse also has a need to keep more data for longerperiods of time than operational systems. The backup and recovery process is designed to allow the warehouse to get back to work after taking a hit. The archive and retrievalprocess is designed to allow business users access to older data that has been movedout of the main warehouse onto a less costly, usually lower-performing media, like tape or optical storage.
Backup and Recovery
Even if you have a fully redundant system with a universal power supply, fully RAIDeddisks, parallel processors with failover, and the whole works, some system crisis will eventually visit. Even with perfect hardware, someone can always drop the wrong table(or database). At the risk of stating the obvious, it is better to prepare for this than tohandle it on the fly. A full scale backup and recovery system needs to provide the following capabilities:
• High performance. The backup needs to fit into the allotted timeframe. This mayinclude on-line backups that don’t impact performance significantly.
• Simple administration. The administration interface should provide tools that easilyallow you to identify objects to back up (including tables, table spaces, redo logs, etc.),create schedules, and maintain backup verification and logs for subsequent restore.
Tip
The physical backup restores much faster than a logical backup because thepages can be read directly to the file system, indexes and all. It is usuallyeasier to restore as well, as long as the target database has not changed insize or segmentation. This speed and ease of recovery can be critical during a crisis situation.
• Automated, lights-out operations. The backup and recovery facility must provide

9.19
storage management services, automated scheduling, media and device handling,reporting, and notification.
The backup done for the warehouse is usually a physical backup. This is an image of thedatabase at a certain point in time, including indexes and physical layout information.
Archive and Retrieval
Deciding what to move out of the warehouse is a cost-benefit analysis. It costs money to keep the data around—it takes up disk space and slows the load and query times. Onthe other hand, the business users just might need this data to do some critical historicalanalyses. The solution is not to throw the data away, but to put it some place that costsless, but is still accessible. Archiving is the data security blanket for the warehouse.
How long it takes the data to get stale depends on the industry, the business, and the particular data in question. In some cases, it is fairly obvious when older data has littlevalue. For example, in an industry with rapid evolution of new products and competitors,history doesn’t necessarily help you understand today or predict tomorrow. This is particularly true in high-tech where large successful companies can become has-beens almost overnight.
As Chapter 16 describes, the transformation and load steps are a natural place to save asnapshot of the data. We can identify a coherent point-in-time set of data that includes facts and their corresponding dimensions along with additional metadata about thedatabase itself. With this information, we can recreate the environment so the data canbe loaded. When it is time to archive from the warehouse, we don’t have to redeterminewhat needs to be archived. We simply delete what we no longer need on-line.
Tip
The assumption about archiving is that it takes place when it is time to movethe data off the system. However, it actually makes more sense to archiveduring the load process.
Some archival systems can be configured to look like part of the database. If you query an archived table, it will automatically be loaded from tape or CD-ROM and included like a regular query object.
Archiving is typically a logical backup of a table or tables in the database. It includes theSQL that created the tables and the data itself. This gives the archive greater portabilityand flexibility. On the other hand, it is slower because the indexes will need to be rebuilt.
Backup and Archive Planning
The first level of preparation is creating and implementing a backup plan. Start by listing all the tables by category in the warehouse and the staging area. Then, go through andestimate the effort and time it would take to re-create these tables. This exercise often provides enough motivation to start a backup program immediately. Frequently, this process uncovers tables that contain history that essentially could not be re-created. If you crash, you would need to start collecting those sources over again from scratch.
• Determine an appropriate backup process. Make a list of what gets backed up, how often, and how long it will take. Work with professionals on this. Backup and recovery isa detail-driven process.
• Implement the process. The operations folks who manage the rest of the servers will likely do this.
•
Practice. Go through the drill of recovering the database at least once. Take extensivenotes about what information you need to have and where to find it. Database recoveryis like public speaking—most people hate it, but if you have to do it, you will be able to handle the real thing much better if you practice it first.
Extract and Load Security Issues
Security is not as big an issue in the back room as it is in the front room. This is mainly because the back room is an application development activity, and standard systemsecurity rules usually suffice. One issue to be careful of is the bulk data movementprocess. If you are moving data across the network, even if it is within the company firewall, it pays to be careful. Make sure you use a file transfer utility that uses a securetransfer protocol.

9.20
Another back room security issue we see has to do with who has administrator access tothe production warehouse server and software. We've seen situations where no one on the team had security privileges; in other cases, eveyone had access to everything.Obviously, many members of the team should have privileged access to thedevelopment environment, but the production warehouse should be fairly strictly controlled. On the other hand, someone from the warehouse team needs to be able toreset the warehouse machine if something goes wrong. We were recently involved with aproject that had no root privileges on the warehouse machine. One day, when the DBAs were not available, the network took a hit and the warehouse connectivity software gotconfused. The warehouse team was paralyzed, and the users were not happy. Finally,the warehouse team ended up running around to individual users and installing a different connectivity package. In general, it is worth figuring out how to give systemadministrator privileges to someone on the warehouse team. If the warehouse server isdedicated to the warehouse, it should be pretty straightforward.
Finally, in Chapter 12 we urge you to guard your backup media. The backup mediashould have as much security surrounding them as the on-line systems.
Future Staging Services
Several major forces are driving the rapid evolution of data warehouse services. Theunderlying megatrend is that the client/server world is developing real, robust applicationinfrastructures that will become relatively interchangeable. Much of this development isobject-based and is driven by a few major efforts like the Object Management Group’sCommon Object Request Broker Architecture (CORBA) and Microsoft’s DistributedCommon Object Model (DCOM). In the next few years, these efforts will add value to thewarehouse in the following ways.
Transaction Processing Support
Transactional data center operations are supported by a robust, full-featured monitoring system (for scheduling and monitoring jobs). Although most of these capabilities exist inthe data warehouse’s computing environment, they are not integrated or accessible. Alltoo often, we end up cobbling together a set of standalone utilities to get the job done.Although many data staging tools provide some form of job control, it is usuallyproprietary. When we have to step outside the tool to get something accomplished, wemust use some other means to manage the process.
Active Source System Participation
Although not really a service, one trend that will have a major impact on the warehouse isthe shift in ownership of data provision back to the source systems. Several factors,including the growth of data warehouses and the proliferation of ERP systems, arecausing IS to realize that the source system must be responsible for providing data toother systems and for coordinating the impact of changes to the source systems.Companies that are reaching this conclusion come to it through a succession of events.First, the data warehouse requests access to the source system. This access isreluctantly granted, with strict rules about the nature of the access (only between 1:30a.m. and 3:00 a.m.). The source system owner grants this access with the understandingthat they would benefit by not having to create as many reports as before. Now the userswill create reports for themselves!
Then a few more groups require access, and then a few more, until it begins tooverwhelm the nightly maintenance cycle. At this point, the source system owner’s inclination will be to cut off all access—clearly not a viable option. IS management (and perhaps business management) will then be called in to solve the problem.
Tip
We have come to recognize that the source systems have traded the burden of writing thousands of individual reports for the responsibility of providing arobust feeding mechanism for the systems that have taken over the reportingtask.
Data Push
Push technology is a likely direction source system owners will take as they begin to fullyunderstand their role in providing business information to the company. One approach tomanaging data push is to use the publish and subscribe paradigm. In this case, when thecustomer table is ready, it is automatically made available (published) to all systems thathave registered an interest in it (subscribed). The publish and subscribe analogy was

9.21
popularized by Digital Equipment Corporation and Apple Computer in the 1980s andearly 1990s with their VITAL architecture effort. Another approach to distributing sourcesystem data uses a data bus concept (not to be confused with the Data Warehouse Buswe discuss throughout this book). In this case, systems all share a communicationschannel, like the system bus on a computer. All the peripherals plug into the bus and useits command set and standards to exchange information with each other as needed. Inthis scenario, the warehouse could request a data set directly from the source systemalong with specifications for business rules, formats, delivery times, and dependencies.
Object-Oriented Systems
Objects are gradually working their way into the systems development mainstream. Objectscan be made available to the warehouse in several ways. First, the warehouse can ask for an object like the customer table through an object request broker. It is the object broker’sjob to figure out where the data object is, submit the request, and return the results. Thesedata objects are designed to insulate the destination from changes in the source. Forexample, intelligence about how the data should be structured and filtered can be built intoa special method in the object called warehouse_extract. In fact, the parameters for themethod could be pulled from the metadata, and that big investment in metadata will finallypay off.
Summary
Data staging is a conceptually straightforward process, even if the details and complexitiesof building a data staging system can be overwhelming. We return to this topic in Chapter 16 for a step-by-step description of the data staging process. The list of data stagingservices in this chapter should be enough to get you started on your own list. In the next chapter, let us move out to the front room and take a look at the major data stores and services employed there.

10.1

10.2
Overview
The front room is the public face of the warehouse. It’s what the business users see andwork with day-to-day. In fact, for most folks, the user interface is the data warehouse. They don’t know (or care) about all the time, energy, and resources behind it—they just want answers. Unfortunately, the data they want to access is complex. The dimensionalmodel helps reduce the complexity, but businesses are rife with rules and exceptions that must be included in the warehouse so we can analyze and understand them. Thiscomplexity only gets worse when we reach the implementation phase and add moreelements to the design to achieve better performance (like aggregate tables).
The primary goal of the warehouse should be to make information as accessible aspossible—to help people get the information they need. To accomplish this, we need tobuild a layer between the users and the information that will hide some of the complexities and help them find what they are looking for. That is the primary purpose ofthe data access services layer. Figure 10.1 shows the major stores and services to befound in the front room.
Figure 10.1 Front room technical architecture.
This chapter is laid out much like Chapter 9 was. First, we review the data stores that support the front room. Next, we discuss the types of services that are needed in thefront room to deliver information to the end users and manage the environment. Wedescribe the general characteristics of data access tools, followed by a discussion about data mining. Finally, we take a moment to discuss the impact of the Internet on the frontroom architecture.
This chapter is required reading for the technical architects and end- user application developers. The other project team members may find this material interesting at a high level when evaluating products in the data access marketplace. As usual, the projectmanager needs to spend some time reviewing this chapter to be able to interact effectivelywith tool vendors and manage expectations of the business community.
Front Room Data Stores Once the answer set to a specific data request leaves the presentation server, it usually

10.3
ends up on the user’s desktop. Alternatively, the result set can be fed into a local datamart or a special-purpose downstream system. This section looks at the architectureissues around front-end tools and other data stores downstream from the warehouse.
Access Tool Data Stores
As data moves into the front room and closer to the user, it becomes more diffused. Users can generate hundreds of ad hoc queries and reports in a day. These are typicallycentered on a specific question, investigation of an anomaly, or tracking the impact of aprogram or event. Most individual queries yield result sets with less than 10,000 rows—a large percentage have less than 1,000 rows. These result sets are stored in the dataaccess tool, at least temporarily. Much of the time, the results are actually transferredinto a spreadsheet and analyzed further.
Some data access tools work with their own intermediate application server. In somecases, this server provides an additional data store to cache the results of user queriesand standard reports. This cache provides much faster response time when it receives a request for a previously retrieved result set.
Standard Reporting Data Stores
As more transaction systems migrate to client/server packages, the tasks performed bythe old mainframe reporting systems are being left undone or are being done poorly. As a result, client/server-based standard reporting environments are beginning to pop up inthe marketplace. These applications usually take advantage of the data warehouse as aprimary data source. They may use multiple data stores, including a separate reporting database that draws from the warehouse and the operational systems. They may alsohave a report library or cache of some sort that holds a preexecuted set of reports toprovide lightning-fast response time.
Personal Data Marts
The idea of a personal data mart seems like a whole new market if you listen to vendorswho have recently released tools positioned specifically for this purpose. Actually, theidea is as old as the personal computer and dBase. People have been downloading data into dBase, Access, FoxPro, and even Excel for years. What is new is that industrial-strength database tools have made it to the desktop. The merchant database vendors allhave desktop versions that are essentially full-strength, no-compromise relational databases. There are also new products on the market that take advantage of datacompression and indexing techniques to give amazing capacity and performance on adesktop computer.
Tip
Be careful with personal data marts. The temptation to solve a problem by throwing data at it is strong, and it is made more seductive by the ease withwhich we can use new local database tools. But we are essentially talkingabout the difference between a prototype and a production system. It’s easy to populate the database the first time, but you need to be able to keep it updated,in synch, and secure. Otherwise, you’ll end up with another stovepipe data martand a maintenance headache you didn’t plan for.
Personal data marts are going to spread. You should plan for this component and makeit easy to take advantage of standard warehouse tools and processes (like metadata, jobscheduling, event notification, etc.). Personal data marts may require a replicationframework to ensure they are always in synch with the data warehouse.
The personal data mart is also the home turf of many of the MOLAP products. Theseproducts were born in the PC/NT environment and were created to target individualpower users or departments with specific reporting needs, like the financial reportinggroup. They will continue to play an important role in this personal segment of themarketplace.
Disposable Data Marts
The disposable data mart is a set of data created to support a specific short-lived business situation. It is similar to the personal data mart, but it is intended to have alimited life span. For example, a company may be launching a significant promotion ornew product or service (e.g., acquisition analysis or product recall) and want to set up a special launch control room.

10.4
Theoretically, the business needs of the disposable data mart can be met from the rest ofthe data warehouse. In practice, it may make sense to create a separate data mart.There may be temporary external data sources to feed in or internal sources that are notyet in the warehouse. There may be security reasons for creating a separateenvironment, as when a company is evaluating a merger or acquisition candidate. Thedisposable data mart also allows the data to be designed specifically for the event,applying business rules and filters to create a simple sandbox for the analysts to play in.
Application Models
Data mining is the primary example of an application model. Data mining is a confusing area mainly because it isn’t one entity. It’s a collection of powerful analysis techniques formaking sense out of very large data sets. From a data store point of view, each of theseanalytical processes usually sit on a separate machine (or at least a separate process) and works with its own data drawn from the data warehouse. Often, it makes sense tofeed the results of a data mining process back into the warehouse to use as an attributein one of the dimensions. Credit rating and churn scores are good examples of data mining output that would be valuable in the context of the rest of the data in thewarehouse. We’ll return to data mining later in this chapter.
Downstream Systems
As the data warehouse becomes the authoritative data source for analysis and reporting,other systems are drawn to it as the data source of choice. The basic purpose of these systems is still reporting, but they tend to fall closer to the operational edge of thespectrum.
While these systems are typically transaction oriented, they gain significant value byincluding some of the history in the warehouse. Good examples are budgeting systems that pull some of their input from the warehouse (e.g., monthly average phone charges by officelast year) and forecasting systems that draw on as many years of history as possible andwhatever causal data might be available. Another interesting application that has been growing in popularity is the use of warehouse data to support customer interactions. Manysales force automation systems are pulling in as much information as they can about acompany’s relationship with its customers. The same is true on the customer support side. When the phone rings in the call center, it can be extremely helpful to have access to thecustomer’s order history, aligned with payments, credits, and open orders—all on the same screen. These applications draw from data in the data warehouse, but are enabled inseparate environments.
Front Room Services for Data Access
There isn’t much in the way of standalone data access services in most data warehousestoday. Most of what exists is hard-wired into the front-end tools—the primary data stores and service providers of the front room. Two major forces are dragging the data accessservices out of the front-end tools and moving it into the applications layer. First, thebuying power of the data warehouse market is putting pressure on database vendors toimprove their products specifically for data warehousing. Second, the demand for Web-based tools is causing tool vendors to slim down their desktop clients and move some ofthe shared functionality to an application server. In the best of all possible datawarehouses, the data access services would be independent of specific tools, availableto all, and add as much value to the data access process as the data managementservices do in the back room.
Data access services cover five major types of activities in the data warehouse:warehouse or metadata browsing; access and security; activity monitoring; querymanagement; and standard reporting. As you gather architectural requirements, keep an eye out for the following kinds of functionality that would reside in the data accessservices layer.
Warehouse Browsing
Warehouse browsing takes advantage of the metadata catalog to support the users intheir efforts to find and access the information they need. Ideally, a user who needsbusiness information should be able to start with some type of browsing tool and perusethe data warehouse to look for the appropriate subject area.
Tip The warehouse browser should be dynamically linked to the metadata catalog

10.5
to display currently available subject areas and the data elements within thosesubjects. It should be able to pull in the definitions and derivations of thevarious data elements and show a set of standard reports that include those elements. Once the user finds the item of interest, the browser should provide alink to the appropriate resource: a canned report, a tool, or a report scheduler.
This sounds like a lot of work, but the payback is a self-sufficient user community. We’ve seen home-grown systems that provide much of this functionality. Historically, thesebrowsers were built on the Web or use tools like Visual Basic, Microsoft Access, andeven desktop help systems. Moving forward, companies that are rolling their own are mostly using Web-based tools to provide some portion of this service.
Providing warehouse browsing services has not been the main focus of most datawarehouses. In general, the front-end tool has been the beginning and end of the navigation process. A user opens the tool, and whatever they see is what they can get to.Fortunately, front ends have grown more sophisticated and now use metadata to definesubsets of the database to simplify the user’s view. They also provide ways to hook into the descriptive metadata to provide column names and comments.
Recently, several tools specifically designed to provide this kind of browsing capabilityhave come on the market. One interesting twist is that a data modeling tool company has released a warehouse metadata browsing tool. This makes perfect sense in that the datamodeling tool is one of the most likely places to capture the descriptive metadata aboutthe model.
Access and Security Services
Access and security services facilitate a user’s connection to the database. This can be amajor design and management challenge. We’ve dedicated Chapter 12 to a graduate-level discussion of access and security. Our goal in this section is merely to present anoverview of how access and security fit into the architecture.
Access and security rely on authorization and authentication services where the user is identified and access rights are determined or access is refused. For our purposes,authentication means some method of verifying that you are who you say you are. Thereare several levels of authentication, and how far you go depends on how sensitive the data is. A simple, constant password is the first level, followed by a system-enforced password pattern and periodically required changes. Beyond the password, it is alsopossible to require some physical evidence of identity, like a magnetic card. There are hardware- and network-based schemes that work from a preassigned IP address,particularly on dial-in connections. Authentication is really one of those infrastructureservices that the warehouse should be able to count on.
On the database side, we strongly encourage assignment of a unique ID to each user.Although it means more work maintaining IDs, it helps in tracking warehouse usage andin identifying individuals who need help.
Once we’ve identified someone to our satisfaction, we need to determine what they are authorized to see. Some of this depends on the corporate culture. In some companies,management wants people to see only a limited range of information. For example,regional managers can only see sales and expense information for their regions. We believe the value of a data warehouse is correlated with the richness and breadth of thedata sources provided. Therefore, we encourage our clients to make the warehouse asbroadly available as possible.
Authorization is a much more complex problem in the warehouse than authentication,because limiting access can have significant maintenance and computational overhead,especially in a relational environment.
Activity Monitoring Services
Activity monitoring involves capturing information about the use of the data warehouse.There are several excellent reasons to include resources in your project plan to create anactivity monitoring capability centered around four areas: performance, user support,marketing, and planning.
• Performance. Gather information about usage, and apply that information to tune thewarehouse more effectively. The DBA can use the data to see which tables andcolumns are most often joined, selected, aggregated, and filtered. In many cases, this

10.6
can lead to changes in the aggregate tables, the indexes, and fundamental changes inthe schema design.
•
User support. The data warehouse team should monitor newly trained users toensure they have successful experiences with the data warehouse in the weeks following training. Also, the team should be in the habit of monitoring query textoccasionally throughout the day. This will help the team understand what users aredoing, and it can also help them intervene to assist users in constructing more efficient queries.
• Marketing. Publish simple usage statistics to inform management of how theirinvestment is being used. A nice growth curve is a wonderful marketing tool, and a flator decreasing curve might be motivating for the warehouse team.
•
Planning. Monitor usage growth, average query time, concurrent user counts,database sizes, and load times to quantify the need and timing for capacity increases.This information also could support a mainframe-style charge-back system, if necessary.
Like many of the services we’ve discussed, you can build a rudimentary version of anactivity monitor yourself or buy a more full-featured package. Chapter 15, which focuses on physical design, has additional information on activity monitoring. There are packageson the market specifically designed to monitor data warehouse user activity. Many of the query management tools also offer some level of query monitoring as a natural byproductof managing the query process. Some of the front-end tools offer rudimentary activity monitoring support as well.
Query Management Services
Query management services are the set of capabilities that manage the exchangebetween the query formulation, the execution of the query on the database, and thereturn of the result set to the desktop. These services arguably have the broadest impacton user interactions with the database. The following paragraphs describe the majorquery management services you will likely want to include in your architecture. Each ofthe items in the list has a corresponding business requirement. For example, many of thequery formulation services are driven by a need to create certain kinds of reports that aredifficult for simple SQL generators to do. We’ll explore some of these capabilities furtherin the tool selection section in Chapter 13. Note that many of these services are metadata driven.
•
Content simplification. These techniques attempt to shield the user from thecomplexities of the data and the query language before any specific queries areformulated. This includes limiting the user’s view to subsets of the tables and columns,predefined join rules (including columns, types, and path preferences), and standardfilters.
Content simplification metadata is usually specific to the front-end tool rather than a generally available service. The simplification rules are usually hidden in the front-end tool’s metadata repository.
Tip
Content simplification metadata is usually created by the tool administrator during the tool implementation. Today, there are no standards at all for this typeof information.
•
Query reformulation. As we saw in Chapter 6, query formulation can be extremely complex if you want to solve real-world business problems. Tool developers have been struggling with this problem for decades, and have come up with a range of solutions,with varying degrees of success. The basic problem is that most interesting businessquestions require a lot of data manipulation. Even simple-sounding questions like “How much did we grow last year” or “Which accounts grew by more than 100 percent?” canbe a challenge to the tool. The query reformulation service needs to parse an incomingquery and figure out how it can best be resolved. Query retargeting, as described in thenext section, is the simplest form of reformulation. Beyond that, a query reformulation service should be able to generate complex SQL, including subqueries and unions.Many of these queries require multipass SQL, where the results of the first query arepart of the formulation of the second query. Since data access tools provide most of the original query formulation capabilities, we discuss this further in the data access tools section later in this chapter.

10.7
•
Query retargeting and multipass SQL. The query retargeting service parses the incoming query, looks up the elements in the metadata to see where they actuallyexist, and then redirects the query or its components as appropriate. This includessimple redirects, heterogeneous joins, and set functions such as union and minus. Thissimple-sounding function is actually what makes it possible to host separate fact tableson separate hardware platforms. It allows us to query data from two fact tables, likemanufacturing costs and customer sales, on two different servers, and seamlesslyintegrate the results into a customer contribution report.
•
Aggregate awareness. Aggregate awareness is a special case of query retargetingwhere the service recognizes that a query can be satisfied by an available aggregate table rather than summing up detail records on the fly. For example, if someone asksfor sales by month from the daily table, the service would reformulate the query to runagainst the monthly fact table. The user gets better performance and doesn’t need toknow there are additional fact tables out there.
The aggregate navigator is the component that provides this aggregate awareness. Inthe same way that indexes are automatically chosen by the database software, the aggregate navigator facility automatically chooses aggregates. The aggregatenavigator sits above the DBMS and intercepts the SQL sent by the requesting client, asillustrated in Figure 10.2. The best aggregate navigators are independent of the end user tools and provide the aggregate navigation benefit for all clients sending SQL tothe DBMS. An aggregate navigator that is embedded in the end user tool is isolated tothat specific tool and creates a problem for the DBA who must support multiple tools in a complex environment.
Figure 10.2 The aggregate navigator.
A good aggregate navigator maintains statistics on all incoming SQL and not onlyreports on the usage levels of existing aggregates but suggests additional aggregates that should be built by the DBA.
•
Date awareness. The date awareness service allows the user to ask for items likecurrent year-to-date and prior year-to-date sales without having to figure out the specific date ranges. This usually involves maintaining attributes in the Periodsdimension table to identify the appropriate dates.
•
Query governing. Unfortunately, it’s relatively easy to create a query that can bringthe data warehouse to its knees, especially a large database. Almost every warehousehas a list of queries from hell. These are usually poorly formed and often incorrectqueries that lead to a nested loop of full table scans on the largest table in thedatabase. Obviously, you’d like to stop these before they happen. After good design and good training, the next line of defense against these runaway queries is a querygoverning service.
Query governing is still in its nascent stages. With many tools, you can place a simplelimit on the number of minutes a query can run or the number of rows it can return. Theproblem with these limits is that they are imposed after the fact. If you let a query runfor an hour before you kill it, an hour of processing time is lost. Besides, the user who submitted it probably suspects it would have finished in the next minute or two if youhadn’t killed it. To govern queries effectively, the service needs to be able to estimatethe effort of executing a query before it is actually run. This can be accomplished in some cases by getting the query plan from the database optimizer and using its

10.8
estimate. A sophisticated query manager could also keep records of similar queriesand use previous performance as an indicator of cost. It can then check to see if the user has permission to run such a long query, ask if the user wants to schedule it forlater execution, or just tell the user to reformulate it.
Query Service Locations
There are three major options for where query services can be located in the architecture: on the desktop, on an application server, or in the database. Today, most ofthese services are delivered as part of the front-end toolset and reside on the desktop. In fact, all of the major front-end tool providers have had to develop many of these services over the years. The problem is that everything they’ve developed is locked inside theirtools. The tools have become large and costly, and other tools are unable to takeadvantage of the query management infrastructure already in place for the first tool. This is a good strategy from the vendor’s point of view because it locks their customers into amajor dollar and time investment. However, it’s not so good for the business whenmultiple tools are needed or demanded to meet multiple business requirements.
Some front-end tool vendors have created their own three-tier architecture and located many of these services on an application server between the desktop front-end and the database. Architecturally, this works well because it allows any client to take advantage of a shared resource. The client can concentrate on presenting the query formulation andreport creation environment and need not carry the additional burden of querymanagement. It also allows the query to be directed to multiple databases, potentially in multiple database platforms on multiple systems. The application server can own the taskof combining the results sets as appropriate. Unfortunately, few standards for theseapplication servers exist yet, so they are relatively proprietary.
There are also stand-alone middleware products that provide many of the data accessservices described above. Unfortunately, the major alternatives in this group are alsoproprietary, limited to a specific hardware or database platform.
Database vendors are moving to include some of these services in the core databaseengine. This is significantly better than having them trapped in the front end tool becauseall front end tools can then take advantage of the service. On the other hand, it is a little more limiting than the application-server approach because it makes it difficult to support cross-machine or cross-database awareness.
As you gain experience with these services, you’ll see how many of them would be much more valuable if they were based either in a common application layer or in the databaseplatform itself rather than in the desktop tool. We encourage you to explore themarketplace and communicate your requirements for these kinds of services to your tool and database vendors.
Standard Reporting Services
Standard reporting provides the ability to create production style fixed-format reports that have limited user interaction, a broad audience, and regular execution schedules. The application templates described in Chapter 17 are essentially a casual kind of standardreport. At the formal end of the spectrum, large standard reporting systems tend to surface when the ERP system cannot handle the workload of operational transactionsand reporting. Be careful not to take this on as a side effort of the data warehouse. Full-scale standard reporting is a big job that involves its own set of requirements and services. In this case, there should be a standard reporting project solely responsible formanaging this effort.
Of course, the data warehouse needs to support standard reports regardless of whetherthere is a large-scale standard reporting environment. In fact, most of the query activityon many warehouses today comes from what could be considered standard reporting. Insome ways, this idea of running production reports in an end user environment seems inappropriate, but it is actually a natural evolution. Often, analyses that are developed inan ad hoc fashion become standard reports. The ability to put these into a managedreporting environment is an obvious requirement. They will need to be run on a regular basis and made available to a broad base of consumers either on a push or pull basis(e.g., e-mail or Web posting). Most of the front-end tool developers include some form of this reporting capability in their products. Requirements for standard reporting tools include:
• Report development environment. This should include most of the ad hoc tool
10.9
functionality and usability.
• Report execution server. The report execution server offloads running the reportsand stages them for delivery, either as finished reports in a file system or in a customreport cache.
• Parameter- or variable-driven capabilities. For example, you can change the Region name in one parameter and have an entire set of reports run based on that new parameter value.
• Time- and event-based scheduling of report execution. A report can be scheduled to run at a particular time of day or after a value in some database table has beenupdated.
•
Iterative execution. For example, provide a list of regions and create the same report for each region. Each report could then be a separate file e-mailed to each regional manager. This is similar to the concept of a report section or page break, where everytime a new value of a given column is encountered, the report starts over on a newpage with new subtotals, except it generates separate files.
• Flexible report definitions. These should include compound document layout(graphs and tables on the same page) and full pivot capabilities for tables.
• Flexible report delivery:
–
Via multiple delivery methods (e-mail, Web, network directory, desktop directory and automatic fax).
–
In the form of multiple result types (data access tool file, database table, spreadsheet).
•
User accessible publish and subscribe. Users should be able to make reports they’ve created available to their departments or to the whole company. Likewise, theyshould be able to subscribe to reports others have made and receive copies or notification whenever the report is refreshed or improved.
•
Report linking. This is a simple method for providing drill-down. If you have pre-run reports for all the departments in a division, you should be able to click on a department name in the division summary report and have the department detail reportshow up.
• Report library with browsing capability. This is a kind of metadata reference that describes each report in the library, when it was run, and what its content is. A user interface is provided that allows the user to search the library using different criteria.
• Mass distribution. Simple, cheap access tools for mass distribution (Web-based).
• Report environment administration tools. The administrator should be able to schedule, monitor, and troubleshoot report problems from the administrator’s module.This also includes the ability to monitor usage and weed out unused reports.
Future Access Services
It’s worth taking a few moments to speculate on the direction of access services so wecan anticipate where future services might fit into our architecture.
•
Authentication and authorization. Logging on to the network once will be enough to identify you to any system you want to work with. If you need to go into the financialsystem to check on an order status or go to the data warehouse to see a customer’sentire history, one logon should give you access to both. Beyond that, a commonsecurity mechanism will tell the warehouse which security groups you belong to andwhich permissions you have. In Chapter 12 we describe the state of the market for“directory servers” that will fulfill this single logon function.
•
Push toward centralized services. Data access services soon will migrate either to the application server or back to the database. Three forces are driving this change. The first is the leverage the warehouse team gets by implementing one set of accessservices (and associated metadata) and making it available to a range of front-end tools. The second is the push that tools are getting from the Web. To function on the Web, vendors have to slim down the desktop footprint. One obvious way to do this is tomove the access services to an application server. The third is the competition among

10.10
database vendors to grab a piece of the data warehouse market. Once one vendorimplements a service like aggregate awareness, the rest have to follow.
• Vendor consolidation. There are too many front-end tool vendors for the market to support in the long run. The Web push will cause some of them to slip. Once a fewclear leaders emerge, the rest will begin falling quickly.
Tip
The implication for architecture is that unless you get lucky and pick a winner,you should expect a tool migration within three years.
•
Web-based customer access. Another implication of Web access to the warehouse is that businesses might view the Web as a means of providing customers with directaccess to their information, similar to the lookup services provided by express packagedelivery companies today. For example, a credit card company might provide significant value to its corporate customers by allowing them to analyze theiremployees’ spending patterns directly, without having to stage the data in-house. Or, any manufacturer or service provider might be able to provide customers with monthly summaries of their purchases, sliced in various interesting ways. The security,maintenance, and infrastructure issues are significant, but the business value might besignificant as well.
Desktop Services
Only a few services actually live on the desktop, but they are arguably the most importantservices in the warehouse. These services are found in the front-end tools that provide users with access to the data in the warehouse. Much of the quality of the user’s overall experience with the warehouse will be determined by how well these tools meet theirneeds. To them, the rest of the warehouse is plumbing—they just want it to work (and things get messy if it doesn’t). This section first looks at the different types of users and kinds of information needs that typically exist in a business. Next, it reviews thecategories of tools available to meet those needs. Then, it examines each category forthe specific capabilities a tool in that category should provide. Your architecture will draw from this list of capabilities and augment it with needs that are specific to your business.This list of capabilities will then be the primary guide for the front-end tool technology evaluation described in Chapter 13.
Multiple Consumer Types
Folks in the IS organization often forget this, but people vary significantly in terms of thedepth and quality of their technological capabilities. We often have been surprised byhow difficult it is for many people in the business community to understand what wethought was simple technology. The warehouse needs to support a range of technicalskill levels and degrees of analytical sophistication. Figure 10.3 shows where these usersfall across a technical skill level spectrum and what kinds of tools are appropriate tosupport their needs.
Figure 10.3 Technology styles.
User Type
Usage Area
Paper User
Push-Button
Simple Ad Hoc
Power User
General computer use
None
E-mail, some word processing
Word processing, spreadsheets, presentations
Macros, utilities, Web publishing
Data warehouse
Rely on othersto navigate
Standard reports, default parameters, EIS
Create simple queries, modify existing queries, browse/change parameters, navigate
Build full queries from scratch, direct database access

10.11
hierarchies
This profile is changing as computers become more prevalent in the education processand the computer literate generation grows up. But it’s a slow change coming.
Multiple Information Needs
Figure 10.4 lists four major categories of information needs and several correspondingattributes for each need. Although we’ve listed user roles in each category, it’s commonfor the same person to have needs across several categories. Although individuals playone role most of the time, roles do change from moment to moment, especially in today’sbusiness environment. Downsizing, increased competition, and empowerment mean thatmanagers may have to know the details of a specific order or that someone on theproduction line may need to know total revenues (and profits) by customer in order toallocate a scarce product. Note that the size of the audience isn’t necessarily directlycorrelated with its potential impact on the business or its importance to the warehouse.
Data Access Tool Capabilities
It’s possible to avoid much of the frustration of the front end tool selection process if you do your architecture homework now. The basic steps are:
• Understand who your primary consumers are and the information needs you are tryingto meet. Study the requirements documents, the user interview notes, the dimensional model, and the application specs. We are sorry to be so repetitive, but this is important.
• Identify the capabilities required to meet those needs. List these in detail as you spotthem during the requirements gathering phase. Collect a set of representative examples you can use for testing later.
Four main data access categories are identified in Figure 10.4: push-button, standard reports, ad hoc, and data mining. Push button applications generally provide a push-button interface to a limited set of key reports, targeted at a specific user community.Standard reports are the approved, official view of information. They are typically fixed-format, regularly scheduled reports that are delivered to a broad set of users. Ad hoc tools provide users with the ability to create their own reports from scratch. Data miningtools provide complex statistical analysis routines that can be applied to data from thewarehouse. Each of these categories provides certain capabilities that meet specific business requirements. Some of the more common capabilities are described next.
Figure 10.4 Information needs and attributes.
Information Needs Category
User Roles
Data AccessCategory
Common Tools
AudienceSize
High level monitoring—key metrics, flags
Senior management
Push-button—“dash board”
EIS-style interface; some query tool environments can support this, as well as MS Access or Visual Basic
Small
Business tracking—markets, products, customers, etc.; drill down to detail
Midmanagement,field sales,marketing managers, business managers, customer servicereps, etc.
Standard Reports—parameter driven
Reporting tools; OLAP-style front end tools with built-in report scheduling; managed query
Large

10.12
environments
Investigating—exceptions; new problems or opportunities; business case development
Same asabove plusbusiness analysts
Ad hoc analysis
OLAP-style tools; managed query environments; high-end analysis tools
Medium
Complex analysis—composite querying, statistical analysis, model development
Business analysts andanalytical experts
Data mining—advanced analysis
High-end analysis tools; statistical tools; data mining tools
Small
Push-Button Access
The term executive information system (EIS) has fallen out of favor in recent years, most likely because the data warehouse has effectively replaced the concept of an EIS. EarlyEIS systems had to do all the cleaning and integration the warehouse does but withoutthe tool support. Also, the systems could not contain much data, so true analysis was difficult. It was often possible to identify a potential problem, but not the explanation.Nevertheless, the need for an executive front-end still exists. In many companies, push-button access can be supplied through the standard reporting system. In others, some requirements call for a separate delivery system that is extremely graphical in nature andsimple to navigate. It includes the following kinds of functionality:
• Easy generation of sophisticated, interactive, engaging front-end screens. • Simple navigation controls. • Automatic replacement or on-the-fly creation of underlying report contents.
• User interface controls for conceptual representations like stoplights (high, medium,low), gauges, and sophisticated charts.
• Geographical charts with links to underlying reports.
• “Alerters,” or controls that monitor specified values, ranges, or differences and notifythe user when they exceed target levels. See Norton Utilities for a good example of this capability.
• Ability to define and interact with multiple simultaneous connections to multiple datasources.
Over time, we expect these capabilities to be provided as a matter of course on the Web.However, the category may continue to exist because the audience (senior executives)often has a distinct set of requirements.
The EIS concept has been continually reborn. Robert Kaplan and David Nortondescribed an EIS-like concept in their book, The Balanced Scorecard: Translating Strategy into Action (Harvard Business School Press 1996). In the February 17, 1997 issue of Fortune, Joel Kurtzman wrote, “In essence, the corporate scorecard is asophisticated business model that helps a company understand what’s really driving its success. It acts a bit like the control panel on a spaceship—the business equivalent of a flight speedometer, odometer, and temperature gauge all rolled into one.” Whatever formthe EIS takes, it is likely to be a major consumer of data from the warehouse.
Standard Reports
Since the bulk of the standard reporting environment is server based, we covered themajor capabilities these systems need in the standard reporting services section. On thefront end, standard reports need to provide the same formatting capabilities and userinterface controls as the push-button access systems we just described. In many cases,the ad hoc tool providers have incorporated a subset of these capabilities into their tools.Check the functionality these vendors provide against your list of requirements. You may

10.13
find that you don’t need a full-blown reporting environment. Ad Hoc
Ad hoc query tools are the mainstays of data access in the warehouse. These toolssupport direct, interactive exploration of the data. It’s fairly easy to build a tool that cangenerate straightforward select statements and return a set of rows and columns.Unfortunately, a tool that provides only this limited functionality will not survive more than 30 minutes in the real world. Part of the problem is that SQL was not meant to be areport writer language. In Chapter 6, we list several examples of SQL’s deficiency in formulating analytical queries. These tools must overcome the underlying deficiency ofthe language.
As a result, these tools can be challenging to use for anything beyond the simplest query.They demo well, but the real world is usually not as pretty. Their use is typically limited tobusiness analysts and power users because they require a fairly significant investment inlearning, not just for the tool but for the data as well.
In general, ad hoc query tools should include the following kinds of functionality. This listis not meant to be exhaustive; we left out many basic ad hoc capabilities.
Query Formulation
As its name suggests, the query tool’s chief task is to formulate queries. This is a challenging task made more difficult by the evolution of SQL standards that allow thecreation of increasingly complex queries. The kinds of query formulation capabilities youmay need include:
•
Multipass SQL. To calculate comparisons or to correctly calculate nonadditive measures in report break rows, the query tool must break the report down into anumber of simple queries that are processed separately by the DBMS. The query toolthen automatically combines the results of the separate queries in an intelligent way. Multipass SQL also allows drilling across to different fact tables in several conformeddata marts, potentially in different databases. For example, sales and costs might be indifferent databases, but as long as they share the same dimensions, like Organization and Period, we can create a simple contribution report by querying the two sources andcombining the results in the query tool. The processing of a single galactic SQLstatement would otherwise be impossible. Finally, multipass SQL gives the aggregate navigator a chance to speed up the report, because each atomic SQL request is simpleand easily analyzed by the aggregate navigator.
•
Highlighting. Highlighting is the interactive form of alerts. As data volumes blow through the roof, the query tool needs to help the user identify records that stand outfrom the others, like “show me districts that had a sales drop or increase of more than10 percent over last month.” An automatic All Other value is extremely helpful on this type of report. It lets the user put in a line that automatically aggregates all theremaining records. This means the report can show the exceptions along with the totalsfor the whole company. In a sense, highlighting is a rudimentary form of data mining.
•
Successive constraints. The results of one query are used as a limit or filter onsubsequent queries. This is a particularly important capability for behavioral studieswhen you identify a cohort and examine its behavior as a unit. This happens almost any time information on individual people is involved. For example, doctors andresearchers might be interested in identifying a group of patients with specificcharacteristics and then tracking their progress over time. They might want to identify the heavy smokers in a clinical trial group and see if the drug being tested reduces therisk of getting lung cancer. Any database with customer information will needsuccessive constraints at some point. The value of this capability is not limited to people, however. A semiconductor company may want to identify a set of silicon chipwafers and follow them through the production process to examine failure rates. Theseconstraint lists may be too large to store in the tool and thus may need to be passed back to the database so the join can be performed remotely. (It’s also possible togenerate these lists by creating temporary tables or view definitions in the database,although talk of writing lists or views to the database will make the DBAs nervous.)
•
Semiadditive summations. There is an important class of numeric measures incommon business fact tables that are not completely additive. Anything that is ameasure of intensity is usually not additive, especially across the Time dimension. For example, inventory levels and account balances are not additive across time. These

10.14
are called semiadditive facts. Everyone is familiar with the idea of taking one of thesesemiadditive facts, such as a bank balance, and creating a useful summary at the end of the month by averaging across time. Unfortunately, you cannot use the basic SQLAVG function to calculate this kind of average across time. AVG averages across all ofthe dimensions, not just time. If you fetch five accounts and four time periods from the DBMS, avg will divide the total account balance by 20 (five times four) rather thandoing what you want, which is to divide by four. It isn’t difficult to divide by four, but it isa distraction for the end user or the application developer, who must stop and store the number four in the application explicitly. What is needed is a generalization of the SUMoperator to become AVGTIMESUM. This function automatically performs a sum, but italso automatically divides by the cardinality of the time constraint in the surrounding query. This feature makes all applications involving inventory levels, account balances,and other measures of intensity significantly simpler.
•
ANSI SQL 92 support. Lots of interesting SQL92 capabilities, such as UNIONs, MINUS, and nested SELECTS in various locations of a SELECT statement (includingthe FROM clause!), are not supported by many tool vendors. Nested selects offeranother alternative to the successive constraint problem without having to write to the database.
•
Direct SQL entry. As a last resort, you will need to be able to view and alter the SQLgenerated by the tool. This includes creating complex queries and adding optimizerhints. If you find yourself doing this very often, something is wrong with your tool or your design.
Analysis and Presentation Capabilities
It is no longer enough to get the data and bring it back to the desktop in a tabular form.The tool must support the business requirements for manipulating data and putting it into a presentation quality format.
•
Basic calculations on the results set. This should include a range of math, statistical, string, sequential processing, conditional, and reporting functions. Thesecalculations are often used to overcome other deficiencies in the tool. For example, it ispossible to create a computed column using an IF or CASE statement that copies theDescription column if the rank = 25 or the value All Other if it’s greater. This newcolumn can then be used as the description in the pivot step to show a top 25 reportthat includes the total for the company, and it can even calculate the percentage oftotal for each of the top 25. How much of your business do your top 25 customersrepresent, anyway?
•
Pivot the results. Pivoting is the basis of multidimensional analysis. The row-based results set that SQL generates almost always end up being presented in a format withone or more dimensions displayed across the top of the report and one or more down the side. The report title usually gives it away (e.g., monthly sales report by region, ormonthly sales by sales rep by product).
•
Column calculations on pivot results. These calculations create a computed column that is a function of two or more of the pivoted columns. For example, if a queryreturned two months of data, say, July 1998 and August 1998, you should be able tocalculate a change or percentage change between the two columns. Single-column calculations, like percentage of column, cumulative, and n-tiles, fall into this category as well.
• Column and row calculations. Some calculations, like showing one row value as a percentage of another row value are useful. Share calculations and ratios rely on thiscapability.
•
Sorting. Sorting, especially by a nondisplaying element, is important. For example, afinancial report might show line items in a particular order that has nothing to do withthe information displayed. It is not alphabetical, it may not even be in order by line item number. In such a case, a sort order column in the dimension specifies the appropriatedisplay order. You don’t necessarily want to see that element on the report, but you dowant to use it in the sort.
•
Complex formatting. The tool should be able to create multisection reports, each witha different format such as compound documents with mixed tabular reports, pivots, andcharts. Formatting is often more important than it probably should be. Whateverproductivity gains we may have reaped from the personal computer have been diluted

10.15
by the print-tweak-repeat cycle. Of course, formatting can be critical, especially if seniormanagement is the audience. You need to have a full range of graphic design tools likelines, boxes, shading, fonts, sizes, and so on.
•
Charting and graphs. These elements are the sizzle of the analytical steak. Almost every report ends up as a graph, if only to do some eyeball correlation analysis orforecasting. If the data has to leave the tool to go elsewhere for this capability, thetransfer had better be truly seamless. It should be push-button simple, and the data source query should be linked to the charting tool to make it possible to automaticallyupdate the chart the next time the query is run.
•
User-changeable variables. User-changeable variables can be included anywhere in the query document, from the query filter to the report headings. For example, if youlimit a sales rep report to a single region, you’d like that region name to be accessible to the report header in the final report: Sales by rep for the last 12 months for theSoutheast Region. Variables should also be used to prompt users for input. When thishappens, they should have access to the appropriate pick lists. Finally, the tool should be able to iteratively set variables based on a list or query result set. The region salesreport above could be run for a list of regions dynamically created by a query stored inthe region name variable.
User Experience
The road to success in high technology is littered with the remains of superiortechnology. This applies to front-end tools as well. It doesn’t matter that the tool meets allof your technical requirements if the users can’t use it. The following capabilities help improve the user’s experience of the analytical process:
•
Ease of use. The tool should feel natural and have an intuitive interface. This is amatter of opinion. Often it means the tool works like a Microsoft tool. You must involve your users in assessing this area. Let them participate in the evaluation of any tool andget a sense of how they rate the usability of the tool.
• Metadata access. The tool should provide the user with context-sensitive help, not only about the tool, but about the data as well. This means the tool must provide aflexible way to draw from the descriptive data in the metadata catalog.
•
Pick lists. The tool should provide a way to look up the list of values that can be used as constraints or filters in a query. Ideally, this list should be done in a way thatsupports the cross-browsing of dimension attributes. For larger dimensions, a simpleSELECT DISTINCT isn’t helpful if thousands of rows (or more) are returned. In one case we worked on recently, the largest dimension table had more than 75 millionrows, each with a unique description. A direct pick list request against the column cannever return to the desktop, but there is a hierarchy in the dimension that allows the user to constrain the query at a higher level, thus limiting the results of subsequent picklists. It’s possible to get down to a short list pretty quickly. A smart tool will allow you toprotect the user from asking for a SELECT DISTINCT on 75 million rows.
• Seamless integration with other applications. At minimum, this includes cut and paste with full maintenance of display attributes (font, style, size). Better integrationincludes Object Linking and Embedding (OLE) of the report or chart pages.
• Export to multiple file types, including HTML. Ideally, this includes a full publishing capability of the final report and/or chart to a file directory, e-mail, or directly to the Web.
• Embedded queries. Users should be able to initiate queries from other applications. Itshould be possible, for example, to call a query from a spreadsheet and have it returnrows into a specific region, which then feeds a complex financial model.
Technical Features
The following technical issues are not sexy demo features, and the need for them maynot be immediately obvious. Some, like the ability to multitask and cancel queries are sofundamental to the tool’s usability that your users will get angry if they are missing.
• Multitasking. Users must be able to run other programs and create and run otherqueries while a query is running.
• Cancel query. Users should be able to kill a single query in process without killing all

10.16
of them. This cancel should manage a clean break from the database server, and itshould not require rebooting the desktop machine.
• Scripting. A scripting language is critical for automating report execution.
•
Connectivity. Make sure you can get to all the database platforms desired. We began a recent project thinking that we would only be querying one database platform, butfound ourselves querying data in four different database platforms within a few weeks.Connectivity includes connecting to other data sources—text and spreadsheet files and other database products (OLAP engines).
•
Scheduling. The tool needs to provide or take advantage of some kind of schedulingsystem. Users will want to defer queries for overnight processing or set them up for processing on a regular basis. This does not have to be the robust, enterprise structuredescribed in the Standard Reporting section, but it does have to work.
• Metadata driven. The administrator should be able to define simple subsets of the warehouse, including predefined join paths, business descriptions, calculated columns,pick list sources, and so on. This setup process should be simple and fast.
•
Software administration. This may be a disappearing problem with the adoption of the Web as an application platform. Until the transition is complete, make sure thevendor includes administration utilities that allow you to update any software, datamodels, local pick lists, connectivity software, and so on from a central location.
• Security. Ideally, the tool will participate in whatever user authentication system isavailable. Tool-based security is not that valuable in the warehouse environmentunless it participates with the network system and the database.
•
Querying. Direct querying of the database should be supported without anadministrative layer or with minimal work (i.e., initial setup of less than 10 minutes).This is especially valuable for the warehouse team because they are constantly examining new data sources, often on different platforms.
Modeling Applications and Data Mining
In our architecture, modeling applications includes several types of model-based analysis. This could include financial models, customer scoring systems, process optimization, and forecasting along with the hard-core data mining activities described next. Although it’s not necessarily a desktop tool, data mining can be one of the majordata access methods to the warehouse. Since data mining is the most common example of a modeling application, we will devote most of this section to it.
Origins of Data Mining
Although the marketplace for data mining currently features a host of new products andcompanies, the underlying subject matter has a rich tradition of research and practicethat goes back at least 30 years. The first name for data mining, beginning in the 1960s,was statistical analysis. The pioneers of statistical analysis, in our opinion, were SAS,SPSS, and IBM. All three of these companies are very active in the data mining fieldtoday and have very credible product offerings based on their years of experience.Originally, statistical analysis consisted of classical statistical routines such ascorrelation, regression, chi-square, and cross-tabulation. SAS and SPSS, in particular, still offer these classical approaches, but they and most other data mining vendors havemoved beyond these statistical measures to more insightful approaches that try toexplain or predict what is going on in the data.
In the late 1980s, classical statistical analysis was augmented with a more eclectic set oftechniques, including fuzzy logic, heuristic reasoning, and neural networks. This was theheyday of AI, or artificial intelligence. Although perhaps a harsh indictment, we shouldadmit that AI was a failure as packaged and sold in the 1980s. Far too much waspromised. The successes of AI turned out to be limited to special problem domains, andoften required a very complicated investment to encode a human expert’s knowledge into the system. Perhaps most seriously, AI forever remained a black box that most of usnormal IS people couldn’t relate to. Try selling the CEO on an expensive package thatperforms fuzzy logic.
Now in the late 1990s, we have learned how to package the best approaches fromclassical statistical analysis, neural networks, decision trees, market basket analysis, and

10.17
other powerful techniques and present them in a much more compelling and effectiveway. Additionally, we believe that the arrival of serious data warehouse systems was thenecessary ingredient that has made data mining real and actionable.
Data mining is a complete topic by itself, and not one we can do justice to in this book. Ifyou plan to do data mining at some point down the road, the following list will help youthink about the kinds of functionality your organization might need, and you mighttherefore need to provide. Data mining breaks out into four major categories: clustering, classifying, estimating and predicting, and affinity grouping.
Clustering
Clustering is a pure example of undirected data mining, where the user has no specificagenda and hopes that the data mining tool will reveal some meaningful structure. An example of clustering is looking through a large number of initially undifferentiatedcustomers and trying to see if they fall into natural groupings. The input records to thisclustering exercise ideally should be high-quality verbose descriptions of each customer with both demographic and behavioral indicators attached to each record. Clusteringalgorithms work well with all kinds of data, including categorical, numerical, and textualdata. It is not even necessary to identify inputs and outputs at the start of the job run. Usually the only decision the user must make is to ask for a specific number of candidateclusters. The clustering algorithm will find the best partitioning of all the customer records(in our example) and will provide descriptions of the centroid of each cluster in terms of the user’s original data. In many cases, these clusters have an obvious interpretation thatprovides insight into the customer base. Specific techniques that can be used forclustering include statistics, memory-based reasoning, neural networks, and decision trees.
Classifying
An example of classifying is to examine a candidate customer and assign that customerto a predetermined cluster or classification. Another example of classifying is medical diagnosis. In both cases, a verbose description of the customer or patient is fed into theclassification algorithm. The classifier determines to which cluster centroid the candidatecustomer or patient is nearest or most similar. Viewed in this way, we see that clustering may well be a natural first step that is followed by classifying. Classifying in the mostgeneral sense is immensely useful in many data warehouse environments. Aclassification is a decision. We may be classifying customers as credit worthy or credit unworthy, or we may be classifying patients as either needing or not needing treatment.
Techniques that can be used for classifying include standard statistics, memory-based reasoning, genetic algorithms, link analysis, decision trees, and neural networks.
Estimating and Predicting
Estimating and predicting are two similar activities that normally yield a numericalmeasure as the result. For example, we may find a set of existing customers who havethe same profile as a candidate customer. From the set of existing customers we mayestimate the overall indebtedness of the candidate customer. Prediction is the same asestimation except that we are trying to determine a result that will occur in the future.Estimation and prediction can also drive classification. For instance, we may decide thatall customers with more than $100,000 of indebtedness are to be classified as poor creditrisks. Numerical estimates have the additional advantage that the candidates can be rank-ordered. We may have enough money in an advertising budget to send promotionoffers to the top 10,000 customers ranked by an estimate of their future value to thecompany. In this case, an estimate is more useful than a simple binary classification.
Specific techniques that can be used for estimating and predicting include standardstatistics and neural networks for numerical variables, as well as all the techniquesdescribed for classifying when predicting only a discrete outcome.
Affinity Grouping
Affinity grouping is a special kind of clustering that identifies events or transactions thatoccur simultaneously. A well-known example of affinity grouping is market basketanalysis. Market basket analysis attempts to understand what items are sold together at the same time. This is a hard problem from a data processing point of view because in atypical retail environment there are thousands of different products. It is pointless toenumerate all the combinations of items sold together because the list quickly reaches astronomical proportions. The art of market basket analysis is to find the meaningful

10.18
combinations of different levels in the item hierarchy that are sold together. For instance,it may be meaningful to discover that the individual item Super Cola 12 oz. is very frequently sold with the category of Frozen Pasta Dinners.
Specific techniques that can be used for affinity grouping include standard statistics,memory-based reasoning, link analysis, and special-purpose market basket analysis tools.
Data mining, like standard reporting, is typically a separate system (or systems) withseparate tools designed to apply various forms of statistical analysis. It is also likeanother client to the warehouse, but without the daily demands a reporting system mighthave. The services a data mining application might need from the warehouse are morelike the data staging services a data mart would need, including:
• Support for periodic pulls of large files. • Transformation services as described in the data staging section. • Update access to the staging area to return the result of scoring or forecasting runs.
In an interesting twist, the data mining tools might also be called on to act as service providers themselves. That is, they could be considered an application layer between thefront-end tools and the database. In this scenario, a front-end tool would use the APIs of the data mining tool to pass it a set of parameters and instructions. The front-end tool might then incorporate the results directly into a report or model. This scenario becomesmore likely given that the database vendors are working to incorporate data miningcapabilities directly into the database engine (while at the same time, front-end tool vendors are trying to add their own data mining capabilities).
Tip
Successful data mining is not easy. It involves a complex set of tools andrequires a solid understanding of statistical analysis. It also requires an additional set of data transformations, which are described in Chapter 16.
If data mining is critical to your organization and will be a part of your next data warehouse project, we encourage you to get a copy of Michael Berry and Gordon Linoff’sbook, Data Mining Techniques for Marketing, Sales, and Customer Support (Wiley 1997). The categorization described in this chapter comes from this book; it will give you a wealth of information about specific tools and techniques.
Web Implications for Data Access
Web access is a requirement for the vast majority of data warehouses today, and it is arequirement with architectural implications. First, on the practical side, your architecturewill need to include access services for a Web server that supports access to yourdatabase. At the low end of the spectrum, many tools can create HTML documents.These static documents could be put in a directory and made available to the businesscommunity through a series of standard links on a Web page. On the other hand, most ofthe dynamic, Web-based data access alternatives work in connection with an existingWeb server. See Chapter 11, which covers infrastructure, for more details.
Second, and longer term, the Web is having a significant impact on the data access tools market. Web-based tools are extremely attractive from an IS point of view. In theory, theyare platform independent, zero maintenance, and low cost. As a result, IS organizationsare voicing an overwhelming demand for Web-based tools. Unfortunately, their legacy code base hinders many of the front-end tool vendors. They have created a monolithic desktop product by incorporating data access services into their tools, which has slowedtheir transition to Web-based tools. At the same time, new companies are rushing to fill the need with recently developed Web products. Unfortunately, these companies don’thave the experience or resources to develop a full set of query and reporting capabilities.What this means is that there will be a period of radical change on the data access tool side until the winners surface. Plan on significant front-end tool upgrades every 6 to 12 months, with at least one tool switch over the next 3 years.
Take Advantage of the Web
The Web will be extremely important as we move forward. It has a great potentialfor generating major benefits. The Web is an ideal distribution channel for standardreports and simple ad hoc access. It has low maintenance costs in terms of

10.19
distributing the software itself and broad availability in terms of the number ofpeople in an organization who have access to a browser. If your metadata catalogis stored in an open DBMS, the Web will be a good mechanism for providingaccess to the business metadata. The users should be able to access dynamic Web pages that query the metadata catalog and allow them to browse its contents.
Desktop Tool Architecture Approaches
Different vendors have chosen to implement different subsets of the data access functions described earlier, and they have implemented them in different ways. Figures10.5 through 10.7 will help prepare you for this. These three alternatives represent themajor approaches the market has taken to providing data access functionality.
Figure 10.5 Direct access.
Figure 10.6 ROLAP application layer.

10.20
Figure 10.7 MOLAP application layer.
Direct Connect (Two Tier)
As illustrated in Figure 10.5, the desktop tool is designed to connect directly to thedatabase. You may insert a query management layer, but it is not required for the tool towork. This is a common place to start because it is easy to install and relatively simple to manage. However, it does not scale well, so expect to migrate to a new tool if you havesignificant growth plans. Also watch out for quick-fix software designed to provide functionality at the checklist level but maybe not at the real-world level. A common example of this is the report server that is essentially a workstation with an automatedquery scheduler. It provides no added value in terms of managing reports, managing thequeries, caching results, and so on.
The simplicity of a two-tier desktop tool is both its greatest advantage and its greatestdrawback. These tools typically are very easy to install and administer, but that verysimplicity implies a sparser metadata store and less functionality than the other frontroom architectures described next.
ROLAP Application Layer (Three Tier)
The second approach, shown in Figure 10.6, is to separate most of the query management functions from the desktop front-end and centralize them on an application server. This method is becoming more common as front-end tools migrate to the Web. The shared query management function lightens the footprint of the desktop front end. This architecture is also called relational OLAP (ROLAP) since the server presents thedatabase to the client as a multidimensional environment.
The ROLAP tools make extensive use of metadata. The metadata resides in relationaltables and describes the facts, dimensions, dimensional attributes, hierarchicalrelationships, business metrics, aggregate navigation, and user profiles. Any change todata structures, aggregates, metrics, relationships, and user profiles can be centrally managed.
MOLAP Application Layer (Three+ Tier)
The third example is similar to the ROLAP strategy in that it incorporates a middle tierbetween the relational data warehouse and the user. However, in this case, the middletier includes its own database structure, called a multidimensional database cube. This cube is essentially a preaggregated rollup of the database. User queries are managed bythe OLAP server, which either sends it to the OLAP cube or passes it through to the baselevel warehouse if the answer cannot be generated from the data in the cube. Recently,database vendors have been moving to incorporate OLAP cubes into the relationaldatabase engine. In fact, this hybrid architecture is similar to the MOLAP architecture inFigure 10.7, except that the data warehouse and the cube occupy the same addressspace. The database vendors should be able to create tighter links and easier drill through to detail since they are responsible for both sides of the solution. We shall see.
Each vendor in this class has developed its own multidimensional cube technology. Theend user metadata layer in this class of tool is typically embedded within the cube, although it may exist additionally in the database. The metadata tends to be as rich as,and very similar to, metadata for ROLAP (application layer) tools.
Since the MOLAP tools were built for decision support, they tend to have much stronger analytical functions built into the engine. Some of the MOLAP tools allow both reads andwrites to the data, which makes them very important for applications like forecasting andbudgeting.

10.21
Summary
The front room is, in some ways, the easiest part of the architecture to develop. It iscertainly the richest part of the warehouse as far as the variety of available tools isconcerned. In fact, this very wealth of choices makes tool selection difficult, as discussed in Chapter 13.
The front room is vital, because it’s the part of the warehouse that your business userssee and use. Most users don’t care about the database or the difficulties of architectureand implementation and equate the warehouse with the tool on their desktops.
As we discussed in this chapter, your warehouse will serve a broad user community withdiverse needs, and you must architect the front room to support that variety. The firststep is to understand the types of front room data stores your implementation will use. Alldata warehouses will use access tool data stores and may additionally use standard reporting data stores and personal or disposable data marts. They may also feed data todata mining or other downstream systems.
The front room services consist of browsing, security, monitoring, reporting, administration,and—by far most important—querying and other desktop services. It is in the desktopservices that the wide variety of business user requirements will most affect yourarchitecture. This chapter describes many features that are commonly required of query,reporting, and analysis tools. As of yet, no one tool provides all these features. You need tounderstand and document the types of users your system will serve, the kinds of problemsthey need to solve, and which of the features described in this chapter are going to be mostvaluable.

11.1

11.2
Overview
Infrastructure and metadata provide the foundation for all of the architectural elementswe described in Chapters 8, 9, and 10. Infrastructure for the data warehouse includes the hardware, network, and lower-level functions, such as security, that the higher-level components take for granted. Metadata is a bit more ethereal than infrastructure, but it provides the same kind of supporting base layer for the back room and front room toolsets. This chapter identifies and defines the major infrastructure and metadatacomponents of a data warehouse.
In the first part of this chapter, we will look at the general factors that must be consideredwhen looking at back room infrastructure. Then we will review specific considerations forhardware, operating systems, and DBMS platforms, including some basic definitions.Next, we will take a similar look at the front room. Then, to tie these all together, we’lltake a quick look at connectivity and networking.
The second part of this chapter focuses on all the different flavors of metadata. We willclose this chapter with an example of active metadata usage and considerations formetadata maintenance. Although this chapter has a strong technical focus, it is intended toassist all team members in understanding these essential foundation pieces.
Infrastructure
Many factors combine to determine the appropriate infrastructure for a givenimplementation, and many of them are not necessarily technical. Let’s be clear right upfront about the fact that we are not infrastructure experts. Our strategy has always been to work closely with our client’s infrastructure experts (i.e., your coworkers) to help themclearly understand the warehouse’s infrastructure requirements. Our goal in this sectionis to identify and define the major infrastructure components involved in a typical data warehouse.
Drivers of Infrastructure
Even in the deepest technical layers of the warehouse, business requirements are stillthe primary determinant of what we need to provide. At the infrastructure level, businessrequirements are represented through measures that are more technical. For example,the business should determine the appropriate level of detail the warehouse needs tocarry and across what time spans. This tells us how much data the infrastructure needsto manage. Other business requirements determine things like how often we need toload data and how complex the business rules are that we need to apply during thetransformation process. These in turn help us estimate how much computing horsepowerwe will need to make it all happen.
Technical and systems issues often drive infrastructure choices. In some cases, theperformance drain of the extract process on the operational systems is too great. It canactually necessitate an investment in a separate mirrored hardware environment. Another common determining factor has to do with the specific skills and experience ofthe data warehouse implementers. Back room teams with mostly mainframe experiencetend to develop mainframe-based warehouses and vice versa. The same holds true for the database platform. If the DBAs have invested significant time and energy learning aspecific DBMS, getting them to switch will be nontrivial.
Policy and other organizational issues also play a role in determining infrastructure. Often, there are “temporary” limits on capital spending, which means you will need to

11.3
secure infrastructure through more creative means. Also, information systems policiesoften dictate certain platform decisions. Standardizing on a single platform allows a company to negotiate significant discounts, develop a core expertise, and ultimately,develop applications that are relatively easy to move from one system to another as theapplication grows.
The Evolution of Infrastructure
Hardware infrastructure for the data warehouse includes the hardware platforms for eachof the data stores, for any application servers, and for the desktop.
Tip
The basic tenet when considering hardware platforms is to remember that thewarehouse will grow quickly in the first 18 months, in terms of both data andusage.
The first step in determining platforms is to decide which platforms will actually berequired. That is, what data stores are you going to implement, and how many of them need to have separate hardware platforms? Figure 11.1 shows some typical hardwareplatform configurations for various sized warehouse initiatives.
Figure 11.1 Hardware platforms by data warehouse size and maturity.
Each box in the figure represents a machine, or a physical box, in the warehouse. At oneend of the spectrum, a small or initial warehouse can be successfully implemented in atwo-tier environment. However, even the smallest systems should expect to have an application server to support Web-based data access. Larger, more mature warehouses tend to split out the staging area from the warehouse or mart. Many companies start outat this level because they plan to grow and want to avoid the effort of migrating to a three-tier architecture. Moving down the figure, a large, enterprise-level warehouse is often implemented across several separate servers. Obviously, there is plenty of roomfor variation, but the message is that the number of servers can grow significantly.
Back Room Infrastructure Factors
The first step in any platform selection process is to understand the requirements. Simplyunderstanding what a platform should do and how it should perform from a technicalperspective is not sufficient. It is critical to consider the business requirements, too. Therequirements then help narrow down the alternatives to those that meet the needs, andthen we can compare costs and other factors to find the best alternative. The databaseserver is the biggest hardware platform decision most data warehouse projects take on.The major factors in determining requirements for the server platform include thefollowing:
•
Data size. How much data you need is determined by the business problems you are trying to solve. If the business goal is to develop one-to-one customer relationships, you will need customer-level transaction detail. Most data warehouse/data martprojects tend to start out with no more than 200 GB. In fact, they tend to start much smaller and grow as history accumulates, aggregates are created, and new datasources are added. Anything less than 200 GB is well within the bounds ofmanageability. We’ll designate data warehouses of less than 100 GB as small, thosefrom 100 to 500 GB as typical, and those with more than 500 GB to be large. Thesebreak points will continue to climb with the advance of hardware and database platformcapabilities.
• Volatility. Volatility measures the dynamic nature of the database. It includes areas

11.4
like how often the database will be updated, how much data changes or is replacedeach time, and how long the load window is. Again, look to the business requirementsfor clues to the volatility of the warehouse. Daily data is obviously more volatile than weekly or monthly data. Customer churn rates can tell you how much your customerdimension will change over time. The answers to these questions have a direct impacton the size and speed of the hardware platform. Data warehouses bear the full brunt of both the business and technology curves. That is, business and technology arechanging rapidly, and the data warehouse has to adjust to both.
•
Number of users. Obviously, the number of users, how active they are, how many areactive concurrently, and any periodic peaks in their activity (e.g., month end) are allimportant factors in selecting a platform. For a Fortune 1000-sized organization, the initial data warehouse/data mart efforts we work with usually start out with 25 to 50 active users. Within 18 months or so, this number grows to between 100 and 200, andin 3 years, there can be thousands of users, especially if the warehouse is used forboth ad hoc purposes and to create standard or push-button reports in a large organization. The geographical distribution of users is also important. If you have usersaround the world, 24-hour availability might be a requirement. This has implications forhardware. In this case, if the operational systems are centralized, the warehouse would probably be centralized, too, but the hardware would need to support parallel or trickleload processes that allow it to be constantly available. If the operational systems aredecentralized, it may make sense to have decentralized data marts as well.
•
Number of business processes. The number of distinct business processes supported in the warehouse increases the complexity significantly. If the userpopulation is large enough or the business justification strong enough, it makes senseto have separate hardware platforms for each business process. Note that you may stillneed a large, centralized server if consolidated data is critical to senior management,and middleware methods of providing virtual consolidation are not effective in your case.
•
Nature of use. The nature of usage and the front-end tool choices also have implications on platform selection. A few active ad hoc users can put a significant strainon a data warehouse. It is difficult to optimize for this kind of use because good analysts are all over the map, looking for opportunities. On the other hand, a systemthat mostly generates push-button-style standard reports can be optimized around those reports. (Note that if you are providing only structured access to the data through standard reports with limited flexibility, you will probably not get full value out of yourdata warehouse investment.) Many of the reporting tools on the market provide for thescheduling of canned reports so they run in the early morning hours, after the load is complete but before people arrive for work. This helps balance the load by shiftingmany of the standard reports into the off-peak hours. Larger-scale data mining also puts a massive demand on the hardware platform, both in terms of data size and I/O scalability. These beasts need to suck in huge amounts of data, comb through it withthe teeth of a good mining tool, and stream the results back out to support furtheranalysis and downstream business uses. It is important to understand the types of queries coming in because ad hoc use, reporting, and data mining all have differentquery profiles and may do better on different platforms.
•
Technical readiness. From an administrative perspective, the server environment issimilar to the mainframe environment at a conceptual level, but it is very different at theimplementation level. Do not think you can simply install a UNIX server or even a largeNT system without benefit of an experienced, professional system support resource as part of the warehouse team. Servers have a range of support requirements, from basichardware and system software administration, to connectivity (both out to the desktopand back to the source systems), DBA experience, backup and recovery, and so on. We’re not quite at the point where we can just plug them in and forget them—at least not yet. The quantity, quality, and experience of the IS support resources you are ableto muster may have a significant impact on your platform decision.
•
Software availability. Often, the requirements analysis will indicate a need for acertain capability, like a geographic information system that allows you to displaywarehouse data on a map. The software selection process may reveal that the bestgeographic mapping software for your particular requirements only runs on a certainhigh-end, graphics-based platform. Obviously, your decision is easy in a case like this.The business requirement simplifies the platform decision significantly.
• Financial resources. The amount of money spent on a project is usually a function of

11.5
the project’s expected value. With data warehouses, this is usually a chicken-and-egg problem. As we discussed in the section on cost justification in Chapter 3, it’s tough to identify and communicate the value of a data warehouse before you have one in place.In terms of hardware, the bottom line is get the biggest server you can.
Considerations for Hardware and Operating System Platforms
Since the machine won’t work without an operating system (OS), hardware and operatingsystems come as a package. In the mainframe environment, there is really only one operating system option. In the open systems world, every hardware manufacturer hasits own flavor of UNIX. Even NT has different flavors that do not all offer native supportfor much of the Intel/NT software base. The major hardware platform and OS platform options fall into the following categories:
•
Mainframes. Lately, there has been a spate of articles about applications returning tothe mainframe after failing in the client/server environment. The data warehouse isprobably the one application to which this does not apply. In general, the mainframe isnot the first-choice platform for data warehousing. Although there are many successfulmainframe-based data warehouses, most of them have either been on the mainframefor several years and would be costly to migrate, or they are taking advantage ofexcess capacity, so the marginal cost is relatively low. The mainframe is notnecessarily cost effective for data warehousing. Administrative, hardware, andprogramming costs are typically higher than on open system platforms, in part because the mainframe environment includes a robust transaction-processing infrastructure that is not critical to data warehousing.
Also, because the mainframe is designed primarily to support transaction requirements, it is relatively inflexible from a programming point of view. Although the tools andtechniques are robust, they are also difficult to use. Adding new data sources to thewarehouse, or simply maintaining existing extracts can be an onerous task.
Also, mainframe capacity is limited in many companies, and investment in additionalcapacity for new applications is unlikely. Clearly, if you have room, use it. However, if anew investment has to be made, the best choice is often a server environment.
•
Open system servers. Open system, or UNIX, servers are the primary platform formost medium-sized or larger data warehouses today. UNIX is generally robust enoughto support production applications, and it was adapted for parallel processing more than a decade ago. The UNIX server market is fairly commoditized. From a processpoint of view, UNIX can be a fairly cryptic and foreign environment for mainframeexperts or PC programmers to adapt to. Many of the standard mainframe tools and utilities are not standard in UNIX. If you choose a UNIX server as your platform, thewarehouse team will need to include the resources and experience to set up andmanage a UNIX environment. This is usually accomplished through a close,participatory relationship with the server management group. If the data warehouse isbased on a UNIX environment, the warehouse team will also need to know basic UNIXcommands and utilities to be able to develop and manage the warehouse. Make surepeople get training if they need it. Keep in mind that UNIX is not a standard. Eachmanufacturer has its own flavor of UNIX, and each one has its own idiosyncrasies.
•
NT servers. Although NT is by far the fastest growing operating system in the servermarket, it has only recently attained the ability to support a medium-sized warehouse. Viable large-scale hardware platforms for NT are just becoming available. Parallelprocessing capabilities have been limited to single-digit processor counts, and NT server clustering is only now becoming an operational reality. Given Microsoft’s history,NT will certainly evolve into a powerful operating system platform, but it is not the bestchoice for medium-to-large warehouses at this point. However, NT is certainly a cost-effective platform for smaller warehouses or data marts that might be populated fromthe atomic data mart.
Parallel Processing Architectures
The hardware industry pioneered the creative use of acronyms, and they continue to turnout new ones at a rapid pace. There are three basic parallel processing hardwarearchitectures in the server market: symmetric multiprocessing (SMP), massively parallelprocessing (MPP), and non-uniform memory architecture (NUMA), as shown in Figure11.2. These architectures differ in the way the processors work with disk, memory, andeach other. Over time, the defining edges of these architectures are getting fuzzy as

11.6
manufacturers improve their offerings. The following sections summarize how they applyto data warehousing.
Figure 11.2 Basic hardware architectures.
Symmetric Multiprocessing (SMP)
The SMP architecture is a single machine with multiple processors, all managed by oneoperating system and all accessing the same disk and memory area. An SMP machine with 8 to 32 processors, a parallel database, large memory (two or more gigabytes),good disk, and a good design should perform well with a medium-sized warehouse. To take advantage of multiple processors, the database needs to be able to run its processes in parallel, and the data warehouse processes need to be designed to takeadvantage of parallel capabilities.
Tip
The “shared everything” architecture means SMP machines are well suited forad hoc queries. In an ad hoc query environment, the access paths are notknown ahead of time. The shared, centralized nature of the SMP architecturegives the system the ability to allocate processing power across the entiredatabase.
SMP’s “shared everything” strength is also its weakness. The processors can accessshared resources (memory and disk) very quickly, but the access path they use to get atthose resources, the backplane, can become a bottleneck as the system scales. Sincethe SMP machine is a single entity, it also has the weakness of being a single point offailure in the warehouse. In an effort to overcome these problems, hardware companieshave come up with techniques that allow several SMP machines to be linked to eachother, or clustered. In a cluster, each node is an SMP machine that runs its ownoperating system, but the cluster includes connections and control software to allow themachines to share disks and provide fail-over backup. In this case, if one machine fails, others in the cluster can temporarily take over its processing load. Of course, this benefitcomes at a cost—clustering is extremely complex and can be difficult to manage. Thedatabase technology needed to span clusters is improving.
Massively Parallel Processing (MPP)
MPP systems are basically a string of relatively independent computers, each with itsown operating system, memory and disk, all coordinated by passing messages back andforth. The strength of MPP is the ability to connect hundreds of machine nodes together and apply them to a problem using a brute-force approach. For example, if you need to do a full-table scan of a large table, spreading that table across a 100-node MPP system and letting each node scan its 1/100th of the table should be relatively fast. It’s the computer equivalent of “many hands make light work.” The challenge comes when theproblem is difficult to split into clean, well-segmented pieces. For example, joining two large tables together, if both are spread across the 100 nodes, can be a problem. Any given record in one table may have matching records in the other table that are locatedon any (or all!) of the other 99 nodes. In this case, the coordination task among nodescan get overloaded. Of course, developers of MPP-based systems have designed workarounds for this and other parallelization issues.
MPP systems are typically found in larger scale (i.e., over one terabyte) data warehouses

11.7
and data-intensive applications (e.g., data mining). They can be configured for high availability by mirroring data on multiple nodes. MPP machines work best when the dataaccess paths are predefined and the data can be spread across nodes and disksaccordingly.
Tip
MPP systems tend to support canned query or standard reporting environments, or else they play the role of the atomic data mart feeder system.MPP is considered to be more expensive and more difficult to tune andmanage. Again, the database needs to be designed to take advantage of thishardware structure—the physical design for MPP can be significantly different than for SMP.
Non-Uniform Memory Architecture (NUMA)
NUMA is essentially a combination of SMP and MPP in an attempt to combine theshared disk flexibility of SMP with the parallel speed of MPP. This architecture is a relatively recent innovation, and it may prove viable for data warehousing in the long run.NUMA is conceptually similar to the idea of clustering SMP machines, but with tighterconnections, more bandwidth, and greater coordination among nodes. If you can segment your warehouse into relatively independent usage groups and place each groupon its own node, the NUMA architecture may be effective for you.
Considerations Common to All Parallel Architectures
As with all platforms, it pays to ask specific questions about software availability andsystem administration complexities. In particular, consider the following:
• What type and version of the operating system does it run? Remember that UNIX is not a standard.
•
What other applications are available on this version of the operating system? If the vendor of the software you want has not ported its package to your operatingsystem, it just won’t work. In particular, you want to know if it runs the most current version of your RDBMS, data warehouse utilities, application servers, and so on.
Hardware Performance Boosters
Disk speed and memory are especially important for data warehouses because thequeries can be data intensive. A transaction system request typically retrieves a singlerecord from a table optimized to already have that record in cache. A data warehousequery may require aggregation of thousands of records from across several tables.
Disk Issues
Disk drives can have a major impact on the performance, flexibility, and scalability of thewarehouse platform. The price range for server disks goes from about $0.10 to $2.00 permegabyte. At the high end, the drives are essentially built into a standalone computer or disk subsystem that manages disk access. These drive systems are fast, easilyexpandable (especially important for growth) and portable (they can be moved acrossservers and operating systems). They can also be set up with redundant storage for data protection (RAID 1 or 5) to give the warehouse greater availability. Note that databasestend to need large temporary storage spaces where sorts, joins, and aggregations areperformed. This space needs to be on high-performance drives and controllers, but it does not need to be mirrored—a cost savings. These drive systems can be configured tobe hot swappable to minimize downtime when there is a problem. Redundancy and hotswapping are important because disk drives are the most likely components to fail. Disk drive subsystems are more expensive but represent a good value over time. Start withenough disk for the next year or two, and expand as needed and as prices drop.
Memory
When it comes to memory, more is better for data warehousing. Again, this is another difference between decision support and transaction processing. Transaction requestsare small and typically don’t need much memory. Decision support queries are muchlarger and often involve several passes through large tables. If the table can fit in memory, performance can theoretically improve by one to two orders of magnitude, or 10to 100 times. This is one of the big advantages of 64-bit platforms. For example, 32-bit systems are limited to 2 GB (4 in some cases), but 64-bit chips can address a much

11.8
larger memory space. (Note that, for a 64-bit chip to be effective, the machine, operating system, and database all must be based on 64-bit code.)
Tip
The idea of preferring memory to disk has been around for decades—the speed difference is irresistable. In round numbers, the access time for a diskdrive is about 10 milliseconds compared to about 0.1 millisecond for memory,making memory about 100 times faster than disk. Of course, the effectiveimprovement of doing database processing with data already in memoryinstead of on disk is less than 100 times due to lots of intervening factors (likedisk read-aheads and memory cache on the controller or in the operatingsystem). Nonetheless, we’ve seen improvements in data warehouse performance of 10 to 30 times simply by adding a lot more memory to thedatabase configuration.
Service Level Agreements
The type and amount of hardware you need should take into consideration the level ofavailability you will need to provide. If the requirement is to provide worldwide access,parallel machines and significant component redundancy may be necessary (when dowe have downtime to load and maintain the database?). Availability of the atomic datamart is critical since it is the repository for the lowest level of detail and will probably belinked to all of the data marts in a drill-through fashion. Processing power is also key since the atomic data mart is a central part of the load process, and it must be able tomove new data out to the data marts in a small time window.
Secondary Storage
Make sure your configuration includes resources to support backup and archiving. If at allpossible, try to get a backup system that is fast enough to do the job during the load window. Although it is possible to back up a warehouse while it is on-line, doing so can add significant overhead, which will compete with the business users’ queries for CPUcycles.
Additional Factors for the Hardware Platform
The UNIX and NT server environments are the platforms of choice for most datawarehouses at this point, with UNIX being the primary option for medium-to-large warehouses. Some of the advantages of servers over mainframes are:
• More tool options. Most of the new tools and utilities for data warehouses are beingdeveloped for server platforms first (and exclusively, in many cases).
•
Database vendor development focus. Most database vendors develop on an operating system of choice. It’s usually the first platform the company supported, andit’s usually the one on which the product runs best. Once the core product isdeveloped, it is ported to other operating systems and other versions of UNIX. Ofcourse, waiting for a release can be a benefit; the early adopters will be your test team.
Tip
The further your platform choice is from the core product platform, the longeryou will wait for the next release and the less support you will get for platformspecific capabilities.
•
Application servers require UNIX- or NT-based platforms. Some data access products come with an application server component that needs to run on a serverplatform. If the warehouse is already server based, any application server can sharethe platform initially rather than forcing an additional hardware purchase. This probablyisn’t a good idea in the long run, but it can make the start-up process easier. Additional considerations for application servers follow in the front room section of this chaper.
•
Flexibility. The server environment is less tightly controlled than the mainframe,especially if the server is dedicated to the data warehouse. This will provide the localteam with direct access to the warehouse and the ability to test new scenarios, buildnew tables, and so on, without relying on remote resources.
Considerations for the Database Platform
In the data warehouse world, the choice of database platform is as incendiary as religionor politics. There are over a dozen alternative database platforms, each with examples of

11.9
successful data warehouse implementations and each with its own pack of supporting (and opposing) zealots. Aside from the major relational database products, most of themajor fourth-generation language (4GL) companies have data warehouse offerings.Some data warehouses are implemented in mainframe-based database products. Others are implemented using specialized multidimensional database products calledmultidimensional on-line analytical processing (MOLAP) engines. Many of the factors that drive the hardware platform decision also apply to the database decision. In ourexperience, what’s right for you depends on considerations specific to your situation. Oneof the biggest considerations is the choice between relational and multidimensionaldatabases.
Relational versus Multidimensional Databases
In terms of sheer numbers, the biggest debate is between relational databases andmultidimensional databases, with relational leading the pack. A heated debate hasechoed through the decision support industry over the last few years about the benefitsof selecting one of these approaches for analytical processing. Unfortunately, the debateis mostly heat and very little light.
The basic issue is more clearly understood when you examine it from a businessrequirements perspective. Multidimensional databases, also known as MOLAP engines, came about in response to three main user requirements: simple data access, cross-tab-style reports, and fast response time. Specialized databases were developed whenstandard relational databases and their predecessors were unable to meet these requirements. Many of these MOLAP products have been around for more than adecade. The following sections highlight some of the pros and cons of the twoalternatives.
Characteristics of Relational Engines
Most major relational database vendors have invested in data warehouse-specific improvements over the last few years and now provide reasonably good performance.The major RDBMS vendors have added capabilities like dimensional model support, starjoins, bit-mapped indexes, and improved cost-based optimizers. These advances and the advent of technologies like aggregate awareness have narrowed the performance gapsignificantly. Relational databases have the advantage of being able to hold much moredata at a detailed level. Of course, systems that are designed to solve specific problemsmust have advantages over general-purpose systems in order to survive in the marketplace.
Tip
If you’re building your warehouse on a relational platform, it makes little senseto consider anything other than the mainstream RDBMS alternatives for mostsmall-to-medium efforts.
In any case, it is extremely valuable to get references from similar warehouseimplementations, and do some testing first. Identify a set of challenging reports, especially multitable joins among large tables and see how they perform. This isespecially true for some of the more recent releases that include warehouse specificfeatures. Generally, the vendors will provide resources to help with the testing process. You also may be able to take advantage of internal experience with a product from otherIS projects.
Tip
Some relational databases are specifically designed to handle data warehouse-type database designs and queries. They are typically faster than the mainstream RDBMS products and work well—in fact, are almost mandatory—for high-end data warehouses.
Characteristics of MOLAP Engines
MOLAP engines, also known as multidimensional database management systems, areproprietary database management systems that are designed to provide highlyspecialized support for analysis. MOLAP engines can make an excellent data martplatform for business requirements that can be met by a fairly simple star schema—that is, relatively few dimensions, each with relatively few rows. The MOLAP engine adds alayer of complexity to the load and management processes.
Tip
Assuming there is a atomic data mart on an RDBMS platform, implementing aMOLAP engine means you will have a separate environment to administer and

11.10
tune, and it will probably need its own server.
The most significant benefits of using a MOLAP engine is the end user queryperformance. Facts are prestored at all valid combinations of the dimensions. Thisdelivers incredible end user response time. On the other hand, storing all of theseaggregates tends to expand the quantity of data. Historically, there were limitations onthe amount of data that could be stored in the multidimensional database. The typicalmultidimensional database size limitation has been less than 10 GB. The industry isinvesting resources to address these physical storage limitations. However, a practicallimit based upon the amount of time required to load new data or refresh the databasestill exists. Many business end users today require both detailed data and summarizedinformation. To meet this need, the capability to drill through the MOLAP engine directlyinto a relational database has been added to most of the MOLAP engines. Anothersignificant strength of many MOLAP engines is their ability to handle edits, complexcalculations, and roll-ups. This makes them perfect candidates for budgeting andforecasting systems.
The evaluation of multidimensional engines cannot be uncoupled from the end user data access tool evaluation, described in detail in Chapter 13. Some MOLAP products offer afull-scale end user data access tool and the database environment. Other MOLAP products provide the engine and a development environment. In this case, you musteither develop your own end user application or acquire the end user application from athird-party supplier.
Tip
As of the time of writing this book, the drill-through capabilities from MOLAP- to SQL-based RDBMSs are rudimentary at best. Note that the need for links fromthe MOLAP engine into the relational environment is exactly why we believethe detail-level data also needs to be stored in a dimensional model. If the twolevels have radically different designs, the ability to provide seamless access tothe supporting detail is limited.
You must test candidate MOLAP products carefully with clear user requirements, understanding of architecture, and remote usage tests before making any majorcommitment. Lightweight desktop-based solutions could be attractive in the short term, but they will likely end up creating more work than value. The warehouse team needs toassess the product’s size limitations and functionality carefully. Scalability will always bea challenge.
Tip
As of the writing of this book, the most serious scalability issues for MOLAPsystems are the total size of the input data for the main fact table and the number or rows in the largest possible dimension. In early 1998, the typicalworking limits for MOLAP systems are 5 GB of input data and 300,000 rows inthe largest dimension.
The whole multivendor/multiproduct issue may just disappear as the RDBMS vendors incorporate MOLAP capabilities into their products. All of the major vendors are movingtoward hybrid implementations that include both relational and MOLAP functionality. Notethat just because the products come from the same vendor doesn’t mean it will be cheaper—the MOLAP vs. RDBMS decision may still exist depending on your budget.
Front Room Infrastructure Factors
Infrastructure requirements for the front room are more diverse because they are muchmore business and tool dependent and there are many more alternatives to chose from.Let’s look at some of the high-level considerations that affect the front room.
Application Server Considerations
Servers are proliferating in the front room like mad. There are servers to handle data access from the Web, query management, standard reporting, authentication, metadatadatabases, and more. It’s difficult to give any meaningful information or advice on thesedevices since there are so many and they are so different. The best tactic you can take is to ask the vendor for detailed configuration information well in advance. In particular, askabout the following:
• Memory. How much memory does the system require? How much does it take toperform well?

11.11
• Disk. What determines disk usage? How much do you typically need? How fast doesit usually grow?
• Platform sharing. Is it okay to run multiple services on the same hardware platform?What are the performance impacts? What are the trade-offs? Are there any products that have poor compatibility?
•
Bottlenecks. What creates hot spots in the system? What slows it down? Is it trulymultithreaded? Can it spawn independent processes and let them run to completion?What difference will multiple processors make? How many simultaneous users can ithandle?
Desktop Considerations
The size of the desktop machine depends on the nature of the user and the associatedtool requirements. A casual user whose information needs are met by HTML reports through a Web browser needs only as much power as it takes to run the Web browser.On the other hand, a power user who builds complex queries and analyses from scratchwill probably need a much more powerful machine. Here are some of the main desktop-related challenges to watch out for.
Cross-Platform Support
Some organizations still have Macintosh hold-outs in the marketing organization, and many companies use UNIX workstations in engineering and manufacturing. Supporting multiple desktop platforms means much more work for the front-end team. Installation and support issues vary from platform to platform, requiring the team to have expertise inall platforms. And the problems don’t end once the software is successfully installed. Often reports will need to be created on each platform, potentially doubling thedevelopment and maintenance effort. Few front-end vendors still support platforms other than Windows/Intel. The good news is that a requirement to support multiple desktop platforms will simplify the data access tool selection process.
Desktop OS
Even if everyone is on the same desktop hardware platform, they still may not be able tosupport the client software because they are not on the right version of the desktop operating system. Find out which OS version your tools require and take a survey tomake sure it matches reality.
Tip
In the Windows world, if your users are not on Windows 95 or higher or NT 4.0or higher, expect trouble.
Software Distribution
This is an insidious problem for the data warehouse because it can sneak up slowly andquietly, and then hit you smack in the face. It’s easy to install the first few sets of users.You typically know who they are, because they’ve been involved in some of the designsessions. They’re eager to get the software and to get going. Then a few more folks needit, and then some people out in the regions, and then, the next thing you know, you’vegot a couple hundred copies out on random desktops around the company. Of course,this is when your tool vendor releases the big new version that gives you everythingeveryone wants—oh, but it’s not really backward compatible. You have to somehowupgrade everyone at once—by yourself. The point here, from an architecture view, is tomake sure you understand what your company is going to do about this problem(because it’s not one the data warehouse invented) and make sure you are prepared totake advantage of your resources.
Web-Based Tools
A main attraction of the Web and related technologies is that they provide the possibilityof platform independence and seamless distribution. This is only true in principle andonly at the simple report access level. True ad hoc analysis tends to require a significant desktop presence. Not that this isn’t possible based on a large applet—in fact, we were building complex applications based on a true diskless network computer at Metaphorback in 1984. The problem is that the tool providers have spent years developing a largecode base and do not have the resources to port it (nor is the development infrastructureas robust yet). The new Web-based tool companies don’t have the legacy to drag with

11.12
them, but they also haven’t had the time or experience to develop a powerful tool yet.They will need to go through several iterations, just like the generation before them.
Memory
It should come as no surprise that memory can make a big difference in performance on the desktop machine. One company we worked with spent a lot of time and energyresearching network issues only to find out that the performance bottleneck was causedby the fact that the machines in question did not have enough memory. They werespending most of their time paging data and programs in and out of virtual memory.
Desktop Summary
Our recommendation is to chose a standard platform and determine the minimumconfiguration that will support your tool set in a responsive way. Make it big enough to be effective. Consider a separate, more powerful, recommended configuration especially forpower users, since these folks are few in number but large in impact. It’s best not toartificially limit their impact on the company (and thereby the value of the data warehouse) by saving a few thousand dollars on computers.
Also, although it’s not as common a problem as computer prices drop, we stronglyrecommend one desktop computer per user. The idea of shared workstations doesn’t work very well because it raises the perceived cost of using the warehouse for theanalyst. If the analyst has to get up and go to the shared DSS workstation, perform somequeries there, then somehow get the results back to the primary desktop computer, it tends to not happen. It’s easier to just stay put and do it the old way.
Connectivity and Networking Factors
Connectivity and networking provide the links between the back room and front room. Ingeneral, connectivity is a straightforward portion of the infrastructure. Since this is a prerequisite to implementing any kind of client/server application, the groundwork isusually already in place. Most organizations have established a LAN or set of LANsconnected together, along with a group dedicated to keeping it working. If this isn’t the case for your organization, push to have an infrastructure task force set up immediatelyand figure out what needs to be done. Other connectivity issues that are likely to comeup include:
Bandwidth
Often, it helps to isolate the database and application servers on a dedicated high-speed LAN (100 MBPS Ethernet or FDDI). This provides the needed bandwidth to transfer largeblocks of data as quickly as possible.
Remote Access
If you have users in remote locations, they will obviously need to have access to thewarehouse in much the same fashion as local users. This means you need a reliable,high-bandwidth connection between their LAN and the LAN where the database andapplication servers are located.
Bandwidth is becoming more important because the front-end tools are changing their approach. Many tools are now providing the ability to specify an interesting analytical setof the data, retrieve it and slice and dice it locally. This means a fairly large chunk of data is coming down the pipe. Once you have a sense of what the reporting requirements are,work with the networking folks who can help you determine if the connection has enoughbandwidth (and when it’s available).
If your remote users are not connected to a LAN, you will need to provide dial-up access. Test this carefully for performance and be sure to read Chapter 12 on security.
Gateways
Most database vendors have gateway products that provide connectivity to databasesfrom other vendors and legacy data sources. Bringing up these gateways can be handyfor accessing data located in other databases from the warehouse. Third-party middleware products provide this connectivity as well and include the ability to combinedata from multiple sources—this is called a heterogeneous join. These gateways can

11.13
have some limitations in terms of speed, and they tend to be best used for batch importsand small table lookups. Test them at full volume to make sure they don’t break.
File Transfer
There are many file transfer protocols out there, along with programs that implement them. Certainly chief among them is File Transfer Protocol (FTP), which is a universaldata transfer utility. FTP has been around as long as the Internet, and it provides filetransfer services among the various and sundry computers on the Internet. It provides a base-level capability for establishing connectivity between two machines and moving flatfiles across that connection. One of the newer protocols, Secured Sockets Layer (SSL),comes from Netscape. It has the advantage of providing encryption built into the process so someone tapping into your network won’t get the senior executive sales summarybefore the senior executives do. SSL is widely implemented in the UNIX server worldbecause it is used to conduct secure transactions between Web browsers and servers. SSL has been submitted to the Internet Engineering Task Force for approval as astandard protocol.
Database Connectivity
Database connectivity is typically provided by the front-end tool providers. Most vendors provide a range of connection alternatives, including the proprietary protocol embeddedin most database products. There are also some standards for database connectivity,including Open Database Connectivity (ODBC), originally developed by Microsoft, andJava Database Connectivity (JDBC), originally developed by JavaSoft. ODBC’s goal is toprovide a standard database access method to access any data from any application.ODBC accomplishes this by inserting a layer that translates the queries from theapplication into commands the database can handle. ODBC has historically been thesecond-choice connectivity driver because many specific implementations have notperformed as well as the native database drivers. More robust drivers are now available,and ODBC is becoming a more popular alternative for database connectivity. JDBC hasbenefited from the ODBC evolution, and it is getting more use.
Meanwhile, the market moves forward. Microsoft has created a whole new superset ofconnectivity standards called OLE DB that promise to make database connectivity evenbetter.
Directory Services
Your networking infrastructure needs to provide some form of host naming and addressindependence. At the simplest level, the Internet/intranet provides a Domain Name Service (DNS) that will look up a name in a list and return its corresponding Internetprotocol (IP) address. This allows you to assign a name to the IP address of yourdatabase server and configure the front-end tools to ask for that name. The name is then translated dynamically to the IP address of the machine where the database lives. If youmove the database to a new machine, all you need to do is change the entry in the DNSlist. You see this name translation every time you use a Web browser to go to a particular site. When you type in www.site_name.com, that name is converted to an IP address by a DNS server before the request for a page is sent to the actual site itself.
Other, more complex directory services exist in the form of X.500 or Lightweight Directory Access Protocol (LDAP) directories. These directories contain much richerinformation than simple IP addresses. They can incorporate many types of directories,including: name and address, e-mail addresses, telephone lists, and hardware directories (like printers, computers, etc.)—just about anything you might want to look up. Thesedirectories can be used to list the locations of servers, user directories for data delivery,e-mail lists for distribution standard reports, and so on. In Chapter 12, we argue strongly that you should plan for an LDAP directory server as a single point of logon and as asingle point of administration.
Infrastructure Summary
As we’ve seen, there are a lot of components in the warehouse infrastructure coveringhardware platforms, connectivity and networking, and the desktop. For each of thesemajor areas, we need to understand the business requirements we have to meet andthe pivotal decision points. Fortunately, the responsibility for infrastructure extends wellbeyond the data warehouse. New client/server operational systems have very similar

11.14
infrastructure requirements, so in most cases, the data warehouse can simply rely onexisting infrastructure. However, infrastructure is like a snake in the grass—it will rise up and bite you if you are not careful, and you won’t realize you’ve been bitten until it’stoo late.
Metadata and the Metadata Catalog
Metadata is a big terminology battleground. In this section we offer up a descriptivedefinition of metadata (to help you know it when you see it). Then we take a look at an example of the supporting role metadata plays in the warehouse. Finally, we describe theconcept of the metadata catalog and offer some suggestions on tracking your metadata.
Metadata: What Is It?
Metadata is an amazing topic in the data warehouse world. Considering that we don’tknow exactly what it is or where it is, we spend more time talking about it, more timeworrying about it, and more time feeling guilty we aren’t doing anything about it than any other topic. Several years ago we decided that metadata is any data about data. Thiswasn’t very helpful because it didn’t paint a clear picture in our minds as to what exactlythis darn stuff was. This fuzzy view gradually clarified and recently we have been talking more confidently about the “back room metadata” and “front room metadata.” The backroom metadata is process related, and it guides the extraction, cleaning, and loadingprocesses. The front room metadata is more descriptive, and it helps query tools and report writers function smoothly. Of course, process and descriptive metadata overlap,but it is useful to think about them separately.
The back room metadata presumably helps the DBA bring the data into the warehouse,and it is probably also of interest to business users when they ask where the data comesfrom. The front room metadata is mostly for the benefit of the end user, and its definitionhas been expanded to not only be the oil that makes our tools function smoothly but to be a kind of dictionary of business content represented by all the data elements.
Even these definitions, as helpful as they may be, fail to give data warehouse managersmuch of a feeling for what they are supposed to do. But one can apply a traditional information technology perspective to metadata. At the very least we should do thefollowing:
• Make a nice annotated list of all of the metadata. • Decide just how important each part is. • Take responsibility for it or assign that responsibility to someone else. • Decide what constitutes a consistent and working set of it. • Decide whether to make or buy the tools to manage the metadata. • Store it somewhere for backup and recovery. • Make it available to the people who need it. • Quality assure it and make it complete and up-to-date. • Control it from one place. • Document all of these responsibilities well enough to hand this job off (soon).
The only trouble is, we haven’t really said what it is yet. We do notice that the last item in the preceding list really isn’t metadata—it’s data about metadata. With a sinking feeling, we realize we probably need meta meta data data. To understand this better, let’s try to make a complete list of all possible types of metadata. We surely won’t succeed in ourfirst try, but we will learn a lot.
Source System Metadata
First, let’s go to the source systems, which could be mainframes, separate nonmainframe servers, users’ desktops, third-party data providers, or even on-line sources. We will assume that all we do here is read the source data and extract it to a data staging area

11.15
that could be on the mainframe or could be a downstream machine. Source Specifications • Repositories • Source schemas • Copy books • Proprietary or third-party source schemas • Print spool file sources • Old formats for archived mainframe data • Relational source system tables and DDL • Spreadsheet sources • Lotus Notes databases • Presentation graphics (e.g., PowerPoint) • Universal resource locator (URL) source specifications Source Descriptive Information • Ownership descriptions of each source • Business descriptions of each source • Update frequencies of original sources • Legal limitations on the use of each source • Access methods, access rights, privileges, and passwords for source access Process Information • Mainframe or source system job schedules • COBOL/JCL, C, Basic, or other code to implement extraction • The automated extract tool settings, if we use such a tool • Results of specific extract jobs, including exact times, content, and completeness Data Staging Metadata
Now let’s list all the metadata needed to get the data into a data staging area and prepare it for loading into one or more data marts. We may do this on the mainframe withhand-coded COBOL or use an automated extract tool. We may also bring the flat fileextracts more or less untouched into a separate data staging area on a different machine. In any case, we have to be concerned about metadata, especially as it pertainsto the following sections.
Data Acquisition Information • Data transmission scheduling and results of specific transmissions • File usage in the data staging area including duration, volatility, and ownership Dimension Table Management • Definitions of conformed dimensions and conformed facts • Job specifications for joining sources, stripping out fields, and looking up attributes

11.16
• Slowly changing dimension policies for each incoming descriptive attribute (e.g.,overwrite, create new record, or create new field)
• Current surrogate key assignments for each production key, including a fast lookup table to perform this mapping in memory
• Yesterday’s copy of production dimensions to use as the basis for DIFF COMPARE Transformation and Aggregation • Data cleaning specifications
• Data enhancement and mapping transformations (e.g., expand abbreviations andprovide more detail)
• Transformations required for data mining (e.g., interpret nulls and scale numerics) • Target schema designs, source-to-target data flows, and target data ownership • DBMS load scripts • Aggregate definitions • Aggregate usage statistics, base table usage statistics, and potential aggregates • Aggregate modification logs Audit, Job Logs, and Documentation • Data lineage and audit records (where exactly did this record come from and when?) • Data transform run time logs, success summaries, and time stamps • Data transform software version numbers • Business descriptions of extract processing • Security settings for extract files, extract software, and extract metadata • Security settings for data transmission (e.g., passwords, certificates) • Data staging area archive logs and recovery procedures • Data staging archive security settings DBMS Metadata
Once we have finally transferred the data to the data warehouse or data mart DBMS,another set of metadata comes into play, including:
• DBMS system table contents • Partition settings • Indexes • Disk striping specifications • Processing hints • DBMS-level security privileges and grants • View definitions • Stored procedures and SQL administrative scripts • DBMS backup status, backup procedures, and backup security Front Room Metadata

11.17
In the front room we have metadata extending to the horizon, including: • Business names and descriptions for columns, tables, and groupings • Canned query and report definitions • Join specification tool settings • Pretty print tool specifications (for relabeling fields in readable ways) • End-user documentation and training aids (both vendor supplied and IT supplied) • Network security user privilege profiles • Network security authentication certificates
• Network security usage statistics, including logon attempts, access attempts, and user ID by location reports
• Individual user profiles, with link to Human Resources to track promotions, transfers,and resignations that affect access rights
• Link to contractor and partner tracking, where access rights are affected • Usage and access maps for data elements, tables, views, and reports • Resource charge-back statistics • Favorite Web sites (as a paradigm for all data warehouse access)
Now we can see why we didn’t know exactly what this metadata was all about. It iseverything! Except for the data itself. All of a sudden, the data seems like the simplestpart. In a sense, metadata is the DNA of the data warehouse. It defines what all theelements are and how they work together.
While this list helps give us a descriptive feel for metadata, another approach tounderstanding it is to see it in action.
An Active Metadata Example
Gathering and maintaining metadata because we are supposed to isn’t enough motivation in the long run. Metadata is like traditional systems documentation (in fact, it isdocumentation), and at some point, the resources needed to create and maintain it willbe diverted to other “more urgent” projects. Active metadata helps solve this problem. Active metadata is metadata that drives a process rather than documents it. The fact thatit documents the process as well is a fortuitous side effect.
Let’s see how this works by stepping through a simple metadata flow chart. First, you need a data model of the data warehouse. This process is technically straightforwardusing one of the popular modeling tools. Most of these tools will reverse- and forward-engineer, so you can use them to extract metadata from existing databases. You need to create both logical and physical models, including the logical, or business, columnnames, the physical column names, associated business terms and descriptions,example values, and query tips. Once each model is built, you save it out to the tool’s own open storage model in a relational database. Step 1 in Figure 11.3 shows thisprocess.

11.18
Figure 11.3 Step 1: Capturing the warehouse data models.
Next, we’ll add a little data staging metadata to the flow. The data warehouse modelscreated in Step 1 provide the information we need to know about the targets for thestaging process. The data staging tool also needs to know about the sources. So, Step 2is to capture the source definitions. As we described earlier, these can be anything fromflat files to mainframe databases. The data staging tool usually provides a way to capturethis information since it relies on it so heavily. Next, in Step 3, we use the staging tool topull down the table definitions and define the mapping relationships among the sourcesand targets. Step 3 also involves capturing information about any transformations thatmight take place during the staging process. If we have a good staging tool, it leveragesthe metadata we’ve already created about the target tables in Step 1. Finally, in Step 4,we save all this out into the data staging tool’s relational-based open storage model. This might look like Figure 11.4.
Figure 11.4 Steps 2–4: Capturing source defintions and target mapping.
Note that the process of creating these mappings in Step 3 is mostly just defining arelationship between two already existing metadata entries. We did most of the workwhen we built the data model. Now we can create as many mappings as we like andstore them in the metadata catalog.
Once we have completed all these definitions, we finally get some data loaded, as shownin Figure 11.5. To do this, the data staging tool queries the metadata in Step 5 to find out everything it needs to know about the source data types and locations, the target datatypes and locations, and the mappings between the two. It may also query the targetdatabase in Step 5a for current information on the physical state of the system, like how much disk space is available. In Step 6, we actually extract the raw source data, and inStep 7, we load the transformed data into the warehouse. Step 8 captures somestatistics and audit information about the load and saves it back to the metadata catalog.

11.19
Figure 11.5 Steps 5–8: Extract, transform, and load.
Now that we’ve finally loaded some data, the users are probably itching to get at it, butthey need something to tell them what information can be found where. Fortunately, wehave most of that in the data model already. The table and column names, descriptionsand examples of the contents, and so on are all there. Before we open the front doors,we need to provide a little more business structure to the warehouse. An alphabeticallisting of tables and columns isn’t going to be helpful because people tend to think interms of business groupings, not alphabetical listings. These groups would probably bethe fact tables we described in the modeling chapters. The front-end tool or application server usually provides a way to create this metadata.
Once this business metadata is available, Step 9 shows how it might be helpful toprovide a simple Web-based front end to the metadata. Users could browse the business groupings, drill down to see which tables are in the groupings, and drill further to seewhich columns are in the tables. Alternatively, they could use a simple search tool to lookfor columns or table descriptions that have, for example, the words sales or revenue in them.
Once they’ve found the right data, the users can formulate a query and submit it to thedatabase in Step 10. Note that the query also relies on physical table and columndefinitions retrieved in Step 9 to formulate the correct query syntax. The results arereturned to the user in Step 11, and a good query tool writes out some usage informationin Step 12.
Figure 11.6 The role of metadata in driving front-end tools.
This progression shows the central role the metadata catalog plays in a simplewarehouse example. Notice that only 3 of the 12 interactions actually involve data—the rest is metadata. Note also that portions of the same metadata are used in many different places. For example, the model we created in Step 1 contains the original physical table

11.20
definitions. The data staging tool needs those before it can do the source-to-target mapping and again when it’s time to actually transform and load the data. Finally, the query tool (or application server) needs to know the physical table definitions to formulatethe correct queries.
Hopefully, the metadata list and the flow example have given you some perspective onmetadata. But with this perspective, do we really need to keep track of all this? Yes, inour opinion. This list of metadata is the essential framework of your data warehouse. Justlisting it as we have done seems quite helpful. It’s a long list, but we can go downthrough it finding each of these kinds of metadata, identifying what it is used for, andwhere it is stored.
There are some sobering realizations, however. Much of this metadata needs to resideon the machines close to where the work occurs. Programs, settings, and specifications that drive processes have to be in certain destination locations and in certain veryspecific formats. That isn’t likely to change very soon.
Metadata Catalog Maintenance
Terms like information library, repository, and metadatabase, among others, have all been used to describe this data store. We’ve chosen the term metadata catalog as a generic descriptor for the overall set of metadata used in the warehouse. In the best of allpossible worlds, the metadata catalog would be the single, common storage point forinformation that drives the entire warehouse process. Every step in the warehouse, fromthe initial model through the recurring extract and load process to the navigation andaccess from the user’s desktop would use the metadata catalog. We don’t expect thissingle common storage point to actually exist anytime soon, so in the meantime we’lltreat the metadata catalog as a logical construct that actually exists in many differentphysical locations.
Tip
You need a tool for cataloging all of this metadata and keeping track of it. Thetool probably can’t read and write all the metadata directly, but it should at leasthelp you manage the metadata that is stored in so many locations.
Fortunately, there is a category of tools, loosely called metadata catalog tools, dedicated to this very purpose. A good listing of these tools can be found on Larry Greenfield’s Website at http://pwp.starnetinc.com/larryg/catalog.html.
The warehouse team also needs to provide basic maintenance tools to manage anymetadata in the metadata catalog that is not created and managed by one of the tools orservices. For example, user-entered comments, custom hierarchies, or specifications fora custom-ordered personal data mart might not be supported by existing products andwould need a separate service.
Other functionality around the metadata catalog may involve creating remote procedure calls (RPCs) to provide direct access to metadata for source systems and navigationtools.
Finally, data staging and data access services need to be able to work with security-related metadata in the metadata catalog. That metadata will need to be developed and maintained by a tool or function. This includes adding and deleting new users andgroups, assigning access rights to users and groups, and so on. This metadata alsoneeds to be integrated with database platform security tables (more metadata!).
The list of functions and services required in the metadata catalog maintenance areaincludes the following:
• Information catalog integration/merge (e.g., from the data model to the database to thefront-end tool)
• Metadata management (e.g., remove old, unused entries) • Capture existing metadata (e.g., DDL from mainframe or other sources)
• Manage and display graphical and tabular representations of the metadata catalogcontents (the metadata browser)
• Maintain user profiles for application and security use

11.21
• Security for the metadata catalog • Local or centralized metadata catalog support
Once we have taken the first step of getting our metadata corralled and under control, can we hope for even more powerful tools that will pull all the metadata together in oneplace and be able to read it and write it as well? With such a tool, not only would we havea uniform user interface for all this disparate metadata, but we would be able to consistently snapshot all the metadata at once, back it up, secure it, and restore it if weever lost it.
In our opinion, this will not happen soon. This is a very hard problem, and to encompassall forms of metadata will require a kind of systems integration we don’t have today. Webelieve the Metadata Coalition (a group of vendors trying seriously to solve the metadataproblem) will make some reasonable progress in defining common syntax and semanticsfor metadata, but this effort started in mid-1995. Unfortunately, Oracle and Microsoft, two of the biggest DBMS players, chose not to participate in this effort and have promised torelease their own proprietary metadata standards. One would need to see significant and compelling business advantages offered by these vendors as a magnet for other vendorsto write to their specifications if the metadata problem is going to be solved in a deepsense.
Metadata Summary
Metadata is the data warehouse’s Gordian knot, and Alexander and his sword are nowhere in sight. So, what can we do to cope with it in the meantime? Here are a fewsteps you can take to loosen the knot a little.
• Insist, in a loud voice, that the vendors you select support some form of open metadata exchange capability.
• Fill in the gaps with simple utilities to help you copy metadata from its primary source toother places where it is needed and manage the most repetitive metadata tasks.
• Manage the rest by hand. Catalog the metadata you have so you can maintain it properlyand migrate it to the integrated metadata catalog when it shows up. Remind your vendorsof their commitment to open metadata exchange.
Summary
Infrastructure and metadata provide the foundation upon which we build the warehouse.Either under-powered or insufficient infrastructure or limited, poorly maintained metadatacan weaken the entire warehouse. It makes no difference how clean or complete the data isif you can’t get it to the user’s desktop in a reliable, understandable, and predictable form.

12.1
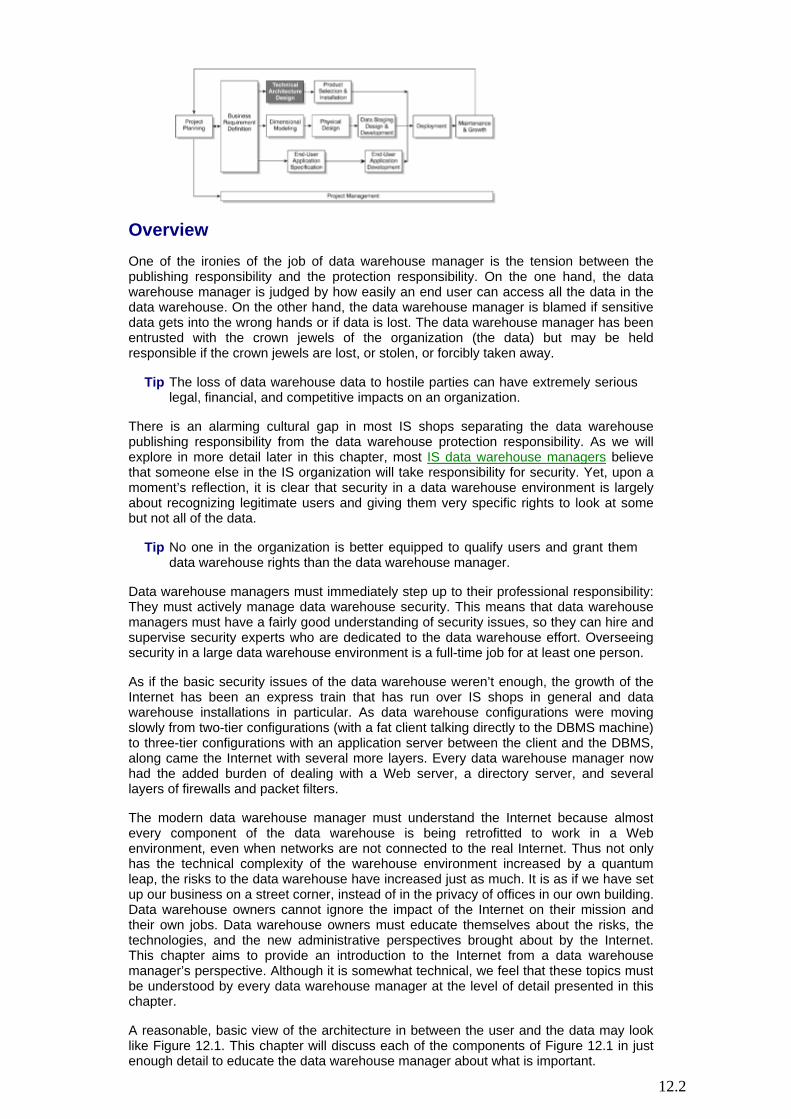
12.2
Overview
One of the ironies of the job of data warehouse manager is the tension between thepublishing responsibility and the protection responsibility. On the one hand, the data warehouse manager is judged by how easily an end user can access all the data in thedata warehouse. On the other hand, the data warehouse manager is blamed if sensitivedata gets into the wrong hands or if data is lost. The data warehouse manager has been entrusted with the crown jewels of the organization (the data) but may be heldresponsible if the crown jewels are lost, or stolen, or forcibly taken away.
Tip
The loss of data warehouse data to hostile parties can have extremely serious legal, financial, and competitive impacts on an organization.
There is an alarming cultural gap in most IS shops separating the data warehousepublishing responsibility from the data warehouse protection responsibility. As we willexplore in more detail later in this chapter, most IS data warehouse managers believe that someone else in the IS organization will take responsibility for security. Yet, upon a moment’s reflection, it is clear that security in a data warehouse environment is largelyabout recognizing legitimate users and giving them very specific rights to look at somebut not all of the data.
Tip
No one in the organization is better equipped to qualify users and grant themdata warehouse rights than the data warehouse manager.
Data warehouse managers must immediately step up to their professional responsibility:They must actively manage data warehouse security. This means that data warehousemanagers must have a fairly good understanding of security issues, so they can hire andsupervise security experts who are dedicated to the data warehouse effort. Overseeingsecurity in a large data warehouse environment is a full-time job for at least one person.
As if the basic security issues of the data warehouse weren’t enough, the growth of theInternet has been an express train that has run over IS shops in general and datawarehouse installations in particular. As data warehouse configurations were movingslowly from two-tier configurations (with a fat client talking directly to the DBMS machine)to three-tier configurations with an application server between the client and the DBMS,along came the Internet with several more layers. Every data warehouse manager nowhad the added burden of dealing with a Web server, a directory server, and severallayers of firewalls and packet filters.
The modern data warehouse manager must understand the Internet because almost every component of the data warehouse is being retrofitted to work in a Webenvironment, even when networks are not connected to the real Internet. Thus not onlyhas the technical complexity of the warehouse environment increased by a quantum leap, the risks to the data warehouse have increased just as much. It is as if we have setup our business on a street corner, instead of in the privacy of offices in our own building.Data warehouse owners cannot ignore the impact of the Internet on their mission and their own jobs. Data warehouse owners must educate themselves about the risks, thetechnologies, and the new administrative perspectives brought about by the Internet.This chapter aims to provide an introduction to the Internet from a data warehouse manager’s perspective. Although it is somewhat technical, we feel that these topics mustbe understood by every data warehouse manager at the level of detail presented in thischapter.
A reasonable, basic view of the architecture in between the user and the data may look like Figure 12.1. This chapter will discuss each of the components of Figure 12.1 in justenough detail to educate the data warehouse manager about what is important.

12.3
Figure 12.1 A typical modern data warehouse server architecture.
We start our discussion of security with a short overview of component softwarearchitecture. Just what are all these machines doing, anyway? We then try to list all thekinds of risks and exposures that the data warehouse manager needs to be aware of.We then take a fairly quick tour of the technologies that are ready to help deal with oursecurity and communications issues, and finally we present a checklist for immediateaction.
Component Software Architecture
The period from 1995 to 1997 saw a number of significant advances in the way we thinkabout building distributed systems. A profound architectural advance has been quietlybrewing both inside and outside of the Microsoft camp. This profound advance is calledcomponent software. Some time ago, the software industry realized that the task ofproducing large software systems has grown too complex to continue using a monolithicapproach. In the monolithic approach, each new large software system is coded from theground up, and all the interfaces between the software routines are defined as the projectproceeds. Not only does this approach fail to capitalize on previously built software, butthe sheer size of modern software makes a monolithic development effort impossible tomanage. A recent release of Microsoft Windows 95 reportedly was based on 14 millionlines of source code. Such a large body of software requires the efforts of literallythousands of developers over a number of years. The only hope of building systems thiscomplicated, and of meeting ever more aggressive release schedules, is to baseeverything on component software.
By the end of 1997, two significant competing systems for component software hademerged. Microsoft’s system is based on an architecture known as the DistributedComponent Object Model (DCOM). Although the DCOM specification is now no longer controlled directly by Microsoft, the company remains the dominant supplier. Its suite ofservices and applications that use component software is known as Active Platform. Thecomponents themselves are ActiveX controls, and the application shells that are invoked on clients and servers to launch these components are a generalization of HTML pagesknown as Active Server Pages. ActiveX controls and Active Server Page scripts can bewritten in a number of languages, including Visual Basic and C.
The competing component software approach is sponsored by the non-Microsoft camp, including Sun Microsystems, Netscape, and Oracle. This system is based on theCommon Object Request Broker Architecture (CORBA). This suite of services usescomponent software known as Enterprise Java. The components themselves areJavaBeans. JavaBeans can be called from HTML pages, and are meant to be written inthe Java language.
From 1998 onward, the data warehouse marketplace will see most systems building onone or both of these architectural approaches. However, the impact of componentizedsoftware on data warehousing is much more significant than simply understanding howprofessional software developers put their products together. The very nature of software has changed in fundamental ways:

12.4
• Software can be sold and released in a much more modular fashion. An upgrade or aservice pack need only consist of selected software components.
• Many more vendors and software development teams can add functionality to a system by producing standalone software components that obey disciplined componentinterfaces. We are already quite familiar with software plug-ins for graphics packages.
•
IS shops will undoubtedly buy major systems from large software vendors, but they will have many opportunities to develop their own custom components to fit into thisscheme. To add custom components, the IS shop will obviously have to invest inmodern, robust, component software-based architectures like DCOM and CORBA. Very soon it will not make sense to buy new software that does not conform to one ofthese architectures.
•
Software components have very specific protocols for communicating amongthemselves. These communications protocols allow software modules to find each other in different parts of memory, in different locations on the local hard drive, and onremote machines, all transparently from the user’s point of view. Software componentsalso are usually written to be multithreaded so that a single component can be used by many applications simultaneously.
•
Software components encourage distributed applications, in which the variousinteracting components reside on different machines. We are well past the point wherea networked computer can be viewed as a standalone bastion of hardware andsoftware with well-defined boundaries. As Scott McNealy, the chairman of SunMicrosystems said, “The network is the computer.”
•
Our reliance on distributed systems has made the issues of security enormously more difficult to understand and control. Our little software components are busy talking toeach other all around the net and very few of us understand the implications. In orderto not be distracted by this huge issue, we will complete our discussion of component software architecture in this section and we will forestall the discussion of security untilthe next section.
The Impact of the Internet on Architecture
The Internet has encouraged and accelerated the use of software components and put tremendous pressure on vendors to solve a number of compatibility, performance, andsecurity problems. Suddenly the client paradigm has changed. All clients are becomingHTML browsers. Some of the browsers reside on the local network and some are connecting through the Internet or a dial-up phone line. In many cases, the same users switch on a daily basis between all three modes of access with their browsers. Theseusers expect the same software to work no matter how they access the data warehouse.
At the same time, the original monolithic database engine is fragmenting into multipleprocesses running on multiple machines. There may be an aggregate navigatorintercepting SQL intended for the relational DBMS and directing the SQL to a number of separate machines. There may be an application server whose task it is to assemble acomplex report or analysis by separately querying multiple data sources. How do we sortall of this out?
In Figure 12.2, we show how a Web client (an HTTP-based browser) interacts with a Web server to establish a session with a database application. We show the connectionbetween the client and server as either being over the Internet or a protected intranet toemphasize that the two architectures are identical. We will postpone adding the securitylayers until the next section so that we can discuss the flow of control mandated by the component software approach without being distracted.

12.5
Figure 12.2 The browser-server HTTP session.
Referring to Figure 12.2 we follow the Steps 1 through 8 to understand how a usersession is handled. In Step 1, the user at the client browser specifies an HTTP-based URL located on a remote Web server. We assume the client browser and the Web serverare connected through the Internet or an intranet. Step 2 causes an HTML page to besent from the Web server to the client browser. The HTML page contains references todownloadable software components or more comprehensive applications that consist ofsoftware components. In the Microsoft world, these downloadable components areActiveX controls, and in the non-Microsoft world they are JavaBeans, or more generally,Java applets that may be composed of JavaBeans.
In Steps 3 and 4, the client browser downloads the requested software components andloads them into memory. The key new capability these components have is that they can communicate directly with other components, either elsewhere in the client browser or onthe Web server. They do not need to launch a new HTTP request or open a new Webpage. All of the various software components communicate directly via CORBA or DCOM. Thus in Step 5, a client software component calls a server software component.The server software component can be an arbitrary program, with the ability to makefurther calls to other machines, including database engines, as in Step 6. In Step 7, the database engine returns data to the server software component, and in Step 8, the datais transferred to the client browser.
These steps can be repeated at the request of the end user as many times as desired in the context of the original HTML page. The user doesn’t think of the screen as an HTMLpage, but rather as a single graphical user interface that is controlling a coherentsession. This ability to have a single page act as a comprehensive user interface with many possible responses to the user and to have the single page mediate the completeuser session is a huge leap forward in interactivity using the Web browser model. Theoriginal static page-oriented model for Web browsing prior to CORBA and DCOM could not support the notion of an interactive session.
The basic HTTP protocol remains as a stateless protocol. In other words, HTTP by itselfdoes not provide support for a user session. To provide for a continuous coherentsession, the Web server must rely on session information provided by the client browsereach time a request is made between machines. Each Web server application requiresits own information to maintain a coherent session, and thus the Web server requires thatthe client browser assemble and keep this information so that it can be revealed everytime the client and the server communicate. This piece of information is called a cookie. Cookies are small text files containing information of interest to the Web server that arestored in special cookie folders on the client machine. Cookies are controversial becausethey can potentially reveal information to a requesting Web server that the user may feeluncomfortable divulging. These security issues are discussed in the next section.
As the marketplace develops more useful solutions based on component softwarearchitectures, the data warehouse team must navigate through a confusing array of newproducts and conflicting terminology. To be safe, we recommend, for any new software acquisitions, that you avoid products based on static HTML generation or those that usethe Common Gateway Interface (CGI) or its derivatives, ISAPI and NSAPI. CGI, inparticular, is the first-generation approach to providing interactive Web pages, and it has

12.6
severe problems. CGI, like HTTP itself, is stateless. Each request sent from a clientbrowser screen to a CGI application, causes CGI to load and execute a fresh instance ofthe application. This is a performance showstopper for the Web server in a large data warehouse environment.
Security: Vulnerabilities
The transformation of our enterprise computer environments to fully distributed,networked client/server systems together with the intrusion of the Internet has, within thespace of one or two years, changed the game dramatically for the owners of datawarehouses. As an industry we are sitting on a time bomb. Our data is grossly exposedand at risk. We face significant legal and professional challenges in understanding ourvulnerabilities and responding to them effectively. Certainly, as of the time of this writing,data warehouse managers were generally not paying close attention to security issues.In this section we try to frame the security problem, and in the next section we suggest how to understand and manage security in a data warehouse environment.
This section may be somewhat painful reading. Although we are not trying to be alarmist, we feel that the data warehouse community has sidestepped the main issues of securityup until now. Most data warehouse managers have something of a positive marketingattitude, which can make them blind to security issues. The data warehouse represents an opportunity to learn new things about the enterprise and its customers. Most datawarehouse managers spend a significant amount of energy talking about theseopportunities and selling the benefits of the data warehouse. It is difficult for most of us to turn our thinking away from the benefits and look at risks and at the downside.
The total size of the security problem is surprising and underappreciated. As early asOctober 1996, Ernst and Young stated in Information Week that “78% of Information Security Chiefs, Information Security Officers and other higher-level executives [reported that their companies had] lost money from security breaches [related to informationtechnology]. More than 25% reported losses greater than twenty-five thousand dollars, and inside hackers were at fault for nearly 32% [of the losses].” In 1997, the AberdeenGroup, using slightly different measures, reported that the typical causes of“compromised information” included:
• 35 percent: human error • 25 percent: human omission • 15 percent: disgruntled employees • 10 percent: external people • 7 percent: fire • 5 percent: flood • 3 percent: other natural disasters
These findings suggest that the sources of vulnerability are very diverse, and that there isa very significant level of threat from internal sources, not just “hackers on the Internet.”Charles Pfleeger, in his seminal book, Security in Computing (Prentice-Hall 1989) divides the disgruntled employees and external people listed earlier into three categories:
• Amateurs. Normal people who exploit a flaw in a security system that allows themaccess to information, cash, or other valuables. This also includes disgruntled employees who are motivated to attack a system to settle a grudge.
•
Crackers. Often juveniles or isolated individuals for whom breaking through asystem’s security is a challenge and a thrill. Some crackers simply try to penetrate a system as if to keep score, while others attack for personal gain or to deliberatelycause chaos, loss, or harm.
•
Career criminals. Computer professionals who engage in computer crime, includingorganized crime and international groups with political or terrorist agendas.Additionally, a growing group of electronic spies and information brokers have begun totrade in companies’ or individuals’ secrets.

12.7
For the rest of this section, please try to think like a good security analyst instead of a data warehouse manager. Without offering any good news, we will systematicallyanalyze all the vulnerabilities we can think of in a modern networked data warehouse.We will be suspicious of everything and everyone. We will assume that we are under attack. Obviously, a draconian solution is to not let anyone have access to the datawarehouse, but we must keep in mind that we have a job to publish and disseminateenterprise information. Later in this chapter, we will try to resolve this conflict, but for now we will just examine our vulnerabilities. For each type of vulnerability we invite the readerto imagine how the activities of a data warehouse could be specifically impacted if thevulnerability were exploited and how a responsible data warehouse manager could act to reduce or eliminate the vulnerability.
Physical Assets
Our physical assets are the obvious ones, including mainframes and servers, desktopPCs, and laptops. Physical assets also include communications equipment, wires and fiber optics, buildings, file drawers, and off-line media. The main vulnerabilities of physical assets are shown in Figure 12.3.
Figure 12.3 Vulnerabilities of physical assets.
Vulnerability
Basic Description
How the Data WarehouseCould Be Involved
Theft
The loss of a physical assetbecause someone simply takesit off premises.
A PC may contain data warehouse information results; a PC may contain logon privileges or built-in passwords to data warehouse; a PC may contain data warehouse encryption passwords not stored elsewhere; a PC may contain private key used for authentication of user to data warehouse or certification of data warehouse results as being trustworthy; an asset may contain metadata needed for data warehouse operations. Loss by theft raises the possibility that the content of the information has fallen into hostile hands, requiring changing of access methods, procedures, and personnel.
Intentional Destruction
A deliberate attack on aphysical asset. There areendless ways in which aphysical asset can bedestroyed by a determinedindividual, including smashingwith a heavy instrument, settingon fire, dousing with liquid, prying open with a screw driver,dropping out a window, andmany others.
Loss of data warehouse data; loss of passwords; loss of metadata supporting data warehouse operations; loss of backups; resultant inability to recover information; loss may target specific information resource to cause maximum disruption or to disguise other fraud.
Fire
Accidental fire or deliberatearson, affecting the informationsystem specifically or as part ofa larger fire. This categoryincludes smoke damage and
Same as intentional destruction; may be more widespread, simultaneously affecting primary and backup systems.

12.8
water damage from fire fighting. Moisture
Degradation of a physical assetbecause it is stored improperly.
Inability to recover old versions of data; loss likely to go unnoticed until it is far too late to provide protection.
Water
Destruction of an assetbecause of flooding, beingdoused with water, or beingdropped in water.
Many high-tech portable devices, such as portable PCs, become instantly worthless when they are dropped in water. Less damaging than outright theft because the information is merely lost rather than compromised.
Dirt
Destruction of an asset because of improper storage orhandling. Dirt infiltrates fragilecomputer systems. Circuitsshort out and disk heads crash.
Same issues as moisture, plus likelihood of wasted time and money trying to use and repair damaged systems.
Aging
Destruction of an assetbecause it wears out, becomesfragile, or gradually is alteredchemically. Maybe it has beenleft in the sun. Maybe it hasbeen roughly handled.
Same issues as moisture.
Electrical Discharge and Electrical Interference
Destruction of an assetbecause the asset is notprotected against power circuitsurges, spikes, or brownouts.Also includes the effects oflightning as well as equipmentsuch as airport securitysystems.
Loss of a current on-line data warehouse asset such as a client machine or a server, and perhaps an asset that is on-line or possesses volatile data that has not been backed up.
Magnetic Disturbance
Destruction of an asset byexposing it to a magnetic field,such as a powerful soundspeaker or a security system.
Disk drives and other magnetic media that are compromised by a destructive magnetic field are usually complete losses and cannot be recovered.
Loss Through Oversight
An asset is rendered uselessbecause “the keys to it arelost.”
No one can remember what the significance of the tapes are, or no one can remember what the password or the encryption key to the tapes is. No one can remember what happened to the special cable that connects the two boxes together. It is likely that anyone who does remember the intended use of the tapes or the special devices will not be able to find them because they have not been tracked or described in inventory.
Loss Through Technological Obsolescence
An asset is rendered uselessbecause there is no card punchreader, paper tape reader, or 8-inch floppy device leftanywhere that still works.Technological obsolescencecan take place anywhere in thesystem: hardware, software, or
Even storage media that have been properly cared for and properly inventoried can be lost if the hardware systems, software systems, and procedures surrounding their use have not been kept current. This kind of loss is a gigantic

12.9
procedures. Technologicalobsolescence can take placebecause there are no morereplacement parts to fix anasset.
risk to the data warehouse owner. Old data assumed to be available is not available, and today’s data has a much shorter shelf life than the plan calls for.
Hijacked Assets
An intruder takes control overall or part of a physicalmachine. This can be viewedas a loss of control orcompromised trust. Perhapsthe intruder exploits thephysical access to replace atrusted software componentwith a rogue component. Forexample, a trusted Webbrowser could be replaced witha Web browser that wouldsilently reveal information theuser did not want disclosed. Orperhaps the intruder places atap on the local intranet. If noone in your organization has ever lifted the ceiling tiles tolook for unauthorized taps onthe network cable, then you arenot paranoid enough.
A data warehouse can be attacked or compromised through a hijacked asset in many ways. A hijacked control may reveal security codes to give the intruder unintended access. A physical tap on the network can accomplish the same purpose. Both of these attack modes can of course send real data results to the intruder, not just security codes. A hijacked asset destroys trust in the data warehouse system.
Information Assets: Data, Financial Assets, and Reputation
Data and information assets include nearly everything of value that isn’t a physical assetand isn’t software that we obtain from outsiders. These assets include all of the metadata categories listed earlier in the previous chapter, as well as all of our “real” data in documents, spreadsheets, e-mail, graphics systems, and databases of all kinds. Ourdata and information assets also include all derivative forms of electronic information, including printouts, photocopies, and the information carried in people’s heads.
Although in most respects our financial assets seem to take the form of information, suchassets have an obvious and special significance because they are often liquid and manytimes they are anonymous. Financial assets can be thought of as information assets thatcan be physically removed from us, not just copied.
Finally, there is a special kind of information asset that has a qualitative aspect to it: ourreputation. Our reputation is what people think of us, what people believe they knowabout us, and how much goodwill we have. In the deepest sense our reputation is ouridentity. Our reputation can be destroyed, damaged, and even stolen from us just likeother forms of assets.
There are many vulnerabilities to these kinds of assets, which for brevity we will call information assets in all of the following. First, let us discuss the general vulnerability toinformation theft, summarized in Figure 12.4.
Figure 12.4 Vulnerabilities of information assets.
Vulnerability
Basic Description
How the Data WarehouseCould Be Involved
Confidential Disclosure of Plans
Disclosure of your confidentialplans or tentative decisions.
The data warehouse is a known location for confidential plans such as budgets, projections, and other what-if analyses, and therefore, it will

12.10
be the target of anyone trying to find these plans. The data warehouse may signal the presence of confidential information in many ways. Detail data is obvious because it may be explicitly labeled, but summary data such as a yearly projection or a statistic attributed to a group of people can be just as revealing.
Disclosure of Codes
Disclosure of your own codesor account numbers orpasswords that can lead to further theft or disruptiveactions.
There are many places in the data warehouse where security and access codes are either entered or stored. Many forms of metadata are stored in the data warehouse and may contain explicit codes. Many data warehouse primary data tables contain sensitive information about individuals such as bank card numbers or mothers’ maiden names, which are kinds of codes.
Disclosure of Information Held in Trust
Disclosure of confidentialinformation you hold in trust for a third party, such as creditcard numbers, social securitynumbers, health information, orbusiness private data belongingto a third party.
This class of information exposure is especially bad not only because the owner of the information may be directly damaged, but you as the trusted holder of the information are probably liable for the loss and perhaps for additional damages. You also are likely to lose the relationship you have with the third party. If this isn’t enough, if you are the responsible employee who is held at fault for allowing this information to be stolen, you will probably lose your job.
Disclosure of Sensitive Information
Disclosure of politicallysensitive, ethically sensitive, orlegally sensitive information,that you may hold, whether ornot it is factually true. Also theuse of this information forblackmail.
The data warehouse may be in an awkward position of storing data that really should not be stored or should not be kept any longer. If the data warehouse contains politically, ethically, or legally sensitive data, it may be the target of legal actions such as subpoenas. Such data would also be a primary target of intruders. Data warehouses tracking the behavior of individuals have a set of very serious exposures ranging from simple privacy objections, to legally protected privacy requirements, to blackmail.
Removal of Protection or Time Advantage
Removal, in a financial sense,of a time advantage you mayhave with product plans,investment plans, or knowledgeof other future events. Also, in
Many what-if analyses take the form of trial forecasts or trial budgets, or other future time series. These time series may naturally be stored in the data

12.11
the same vein, disclosure of atrade secret that is nototherwise protected by patent.
warehouse environment, and therefore will be the target of intruders seeking this information.
Theft of Financial Assets
Direct theft of financial assetsby transferring funds to otheraccounts and by being able toinvoke meaningful financialtransactions using yourauthority.
The direct theft of financial assets would probably be the result of compromising account numbers, access codes, or other tokens such as maiden names through the data warehouse.
Theft of Service Assets
Direct theft of service assets byrevealing authorization codesfor telephone service, forinstance.
Telephone numbers and their access codes are a very obvious exposure, if the data warehouse contains such information. Other unlisted telephone numbers can cause problems, if they lead an intruder to a system that can be easily cracked.
Theft of Information to Leverage Violence or Terrorism
The theft of information, suchas travel plans, that placesindividuals in danger ofkidnapping or terrorism.
The more transaction-level information we record in our data warehouses about the behavior of individuals, the more risk we have that this information can be used to leverage violence or terrorism. Credit card transactions, for instance, would be very revealing.
Theft of Identity
Theft of identity in such a waythat your authority or yourcredit or your goodwill is usedby someone else against your wishes. This kind of theft forindividuals often turns out to bea real loss like the loss of aphysical or financial assetbecause it is surprisinglydifficult to persuade the worldthat the previous use of youridentity was fraudulent and that your really are who you say youare.
Identity theft may only require a few pieces of information from the data warehouse. Chief among these are account numbers, and security tokens such as, once again, your mother’s maiden name.
Theft of Privacy
Theft of privacy so that yourpersonal life details, beliefs,and activities are revealedagainst your wishes.
As an industry, we have a huge challenge to balance the desires of our marketing and sales departments to store customer behavioral data in the data warehouse, with the opposite desire to preserve our customers’ anonymity, dignity, and safety.
There are many ways to accomplish theft in our open, distributed information systems.Several modes of theft are illustrated in Figure 12.5.
Figure 12.5 Modes of theft.
How the Data Warehouse

12.12
Mode of Theft Basic Description Could Let Down Its Guard
Opportunistic Snatching
The information is unprotected by any real security system.Perhaps the information is in anobscure location. The thief maychance upon the informationwithout a focused priorintention to steal it, or the thiefmay be looking just for suchunprotected information.
Many aspects of our data warehouses have no real security protection at all. Temporary tables or derived aggregate tables may have no security protection. Perhaps the membership of the primary user access groups is not maintained effectively. Perhaps contractors, outsiders, and ex-employees are also members of such groups. Perhaps the backup media have no security and are stored in less-than-secure environments.
Inadvertent Broadcasting
The information is accidentallyleft in the open. Perhaps someone forgets to encrypt thefile or to set its accesspermissions. Perhaps theinformation is inadvertently sentin an e-mail.
This case is similar to opportunistic snatching, but the proximate cause is likely to be a breakdown in procedure.Perhaps an employee is careless or does not understand how to use a system. Probably no one has checked to see if the shared files contain sensitive information, or who exactly has accessed the sensitive files. These lapses are typically simple procedural gaffes caused by users and managers not thinking about security.
Eavesdropping
The thief mounts a deliberateattack on the informationsystem and is able to interceptcommunications intended forothers. Eavesdropping includeselectronic eavesdropping onthe Internet or the localintranet, as well aselectromagnetic eavesdroppingwith sophisticated equipmentcapable of picking upemanations from wires,screens, and keyboards.Eavesdropping also includeslistening to verbalconversations, and watching over someone’s shoulder asthey use a computer.Eavesdropping on a localintranet can be accomplishedeasily by equipping a normalPC with a “promiscuous packetsniffer” that can analyze allpackets flowing by on theEthernet. Commonly availableadministrative tools thatotherwise have many legitimateuses can be used by anyone toeavesdrop on e-mail messages, login sessions, andWeb surfing sessions from all
Eavesdropping attacks can involve the data warehouse in many obvious ways, including the direct compromising of passwords and information results. Since eavesdropping can take many forms, there is no one solution. Sensitization of employees and managers is an important first step. Encryption techniques can reduce many of the eavesdropping risks.

12.13
remote users connected to thatparticular intranet.
Physical Theft as a Means to Theft of Information
The thief physically takes thecomputer, the laptop, or thebackup tapes off-site in order to use them to gain information.The information may reside onthe physical asset taken, or thephysical asset may include theauthentication means to gainaccess elsewhere.
The data warehouse manager should be concerned about the physical security of laptops owned by employees with significant access to the data warehouse. Increasingly, laptops are being targeted for theft because of what they contain, not because of the underlying hardware.
Hijacked Session
The thief eavesdrops on a usersession until after the security is established, and then forciblybreaks the connection betweenthe user and the server andtakes over the remainder of thesession, with the thief thusbeing fully authenticated andauthorized.
The data warehouse manager can protect against some forms of hijacked sessions by controlling eavesdropping but should consider systems such Kerberos-protected systems to provide more effective protection against hijacked sessions.
Impersonation
The thief pretends to besomeone else, and is thereby authenticated by the system.The thief can accomplish thisby acquiring the securitytokens. If these tokens aresimply the text name and textpassword of the user, thenimpersonation may beridiculously easy. Passwordsare notorious for not providing effective security in the realworld. Passwords are oftendivulged. Passwords can beguessed in many cases,especially if they consist ofEnglish words or simplenumbers or they are short.Impersonation is also calledspoofing, and in a networked environment may not require auser name and password butmay only require impersonatinga machine address such as anIP address in the TCP/IPprotocol used betweenmachines on the Internet.
The data warehouse manager must not ignore the serious issues of authentication and access control. Even standard password-based systems can be pretty secure if management and employees use their password system correctly. But since most organizations lack the will to enforce strong password administration and use, the data warehouse manager should look to replacing conventional passwords with access tokens such as smart cards or biometric feedback systems.
Trapdoor
The thief prepares or plantssoftware that leaves a trapdooravailable. The trapdoor is a undocumented means ofaccess into a system.
The data warehouse manager must take responsibility for the security of the complete access chain from the user’s desktop to the disk of the relational database engine. Typically, no one besides the data warehouse manager has this perspective. To guard against trapdoors, all software in this pipeline must be certified as reliable by a trusted and knowledgeable authority.
Bribery, Robbery, and
All of these techniques aredirect manipulation of a trusted
The data warehouse may be able to diagnose or intercept

12.14
Extortion person or employee who thengrants the thief access orpasses information or stealssomething.
unusual access modes into the data warehouse system. Mostly what is needed is a monitoring system that reports unusual patterns, and accounts for all accesses to certain data.
In many cases, the goal of a security breach is not to steal information but to modify it.Deliberate modification of information assets include the kinds of information modificationshown in Figure 12.6.
Figure 12.6 Kinds of information modification.
Kinds ofModification
Basic Description
How the Data WarehouseCould Be Involved
Misdelivery
The information being deliveredto an intended party is copiedor diverted to other parties. Thegoal may be to reveal sensitiveinformation or to keep theoriginal recipient from receivingthe information.
Data warehouse results are often e-mailed. Users with this kind of data access need to use a reliable and secure e-mail protocol.
Misrepresentation
The information is deliveredunder false pretenses or with afalse origin address. This kindof security breach is verydamaging because it is hard toreach everyone who may havereceived the original fraudulentmessage, and it is hard toerase the original impressionscreated. A serious form ofmisrepresentation includes thedestruction of someone’s reputation.
Misrepresentation is easy in an open e-mail environment, whether it is inside an intranet or across the Web. The data warehouse manager should work with IS to implement public key encryption on all business e-mail so that the recipients can be sure the sender is who they claim to be.
False Repudiation
A person or a businessattempts to claim that theynever engaged in acommunication or invoked atransaction, when in fact theydid.
False repudiation is a huge issue in transaction processing systems, and a relatively minor one in data warehouse systems. The main concern is making sure that someone who invokes a change in the data warehouse can be held responsible for that change. If users can update budgets or forecasts or plans, then the issue of repudiation is somewhat important. Individuals with database administrator privileges or responsibilities may need to pass the false repudiation test if they are dealing with very sensitive data.
Software Assets Your software assets are vulnerable. We distinguish these vulnerabilities from physical

12.15
asset and information asset vulnerabilities, although clearly they overlap and combinewith each other. Software vulnerabilities include the ones listed in Figure 12.7.
Figure 12.7 Vulnerabilities to software theft.
Vulnerabilities
Basic Description
How the Data WarehouseCould Be Affected
Theft of Object Code
The thief copies your software in order to use it or sell itelsewhere. The thief’s use, ifdiscovered, may create aliability for you to the originalsoftware developer.
The data warehouse environment often has a serious set of software license responsibilities. Query tools, reporting tools, modeling tools, and other licensed software must be controlled.
Theft of Source Code
The thief uses the source codeto build derivative software orto disclose your trade secretsagainst your wishes.
The data warehouse may have a lot of custom software, from serious system code to spreadsheet cell formulas. Source code can reveal proprietary analysis techniques, and mistakes in source code, if revealed, can lead to lawsuits or damaging publicity.
Hijacked Control
The thief inserts unwantedcode into a softwarecomponent that is otherwisetrusted.
If this happens, then many other forms of data warehouse security breaches become possible, depending on how much control the software has of the target machine. A Trojan horse is a variant of a hijacked control in which a seemingly innocuous or normal piece of software has a hidden function that appears later or can be turned on by the thief remotely. The hidden function can wake up and disclose data warehouse information against your wishes or can cause damage to your information.
Compromised Certification
The thief gains access to aprivate encryption key that isused to certify software orcertify the identity of a user or a server. Until this isdiscovered, the thief can thenplant hijacked controls in allthose machines that otherwisewould trust the software.
Compromised certification is a nightmare not only because of the damage that is directly caused by the intruder but because of the cost to restore the trust and issue new certificates.
Virus
An unwanted piece of softwarethat enters your system andeither replicates itself, drawsattention to itself, or causesdamage to your information.Viruses can be attached toprograms or data.
Virus threats are fairly well understood by data warehouse managers compared to many of the other security threats. Most viruses that invade data warehouse environments cause an interruption of service rather than direct compromising of data warehouse information.

12.16
The Ability to Conduct Your Business
In other cases, the attack is meant to affect your ability to provide a service or conductyour business mission, including the vulnerabilities shown in Figure 12.8.
Figure 12.8 Vulnerabilities to conducting your business.
Vulnerabilities
Basic Description
How the Data WarehouseIs Involved
Denial of Service Attack
Your information system iscompromised specifically forthe purpose of halting orbottlenecking one or morecritical components. Forexample, your servers may bedeluged with thousands ormillions of false requests. Awell-known denial of serviceattack (the SYN flood) involvessending TCP/IP connectionrequests to a server withoutcompleting all of thenecessary machineacknowledgments. Anothersimilar denial of service attackis the FRAG attack, in whichTCP/IP packets are sent withconfusing or missing sequence numbers.
Denial of service is very possible almost anywhere in the data warehouse delivery pipeline. Outside attacks from the Web are more likely to affect the firewall and the Web server. If the firewall is brought down, legitimate outside users will not be able to access the data warehouse. If the Web server is brought down, all data warehouse users, both inside and outside the firewall, may be denied service due to our increasing reliance on browser-enabled user interfaces. A DBMS can be a direct target of a denial of service attack in the form of many huge queries, or certain queries that are known to cause the DBMS to hang. Users with direct SQL access to the DBMS can hang the DBMS fairly easily if that is their express purpose.
Inability to Reconstruct Consistent Software Snapshot
Through deliberate sabotage,accidental loss, or simpleoversight, you may not be ableto reconstruct a consistentsnapshot of your systems.
The loss of a consistent snapshot of your data warehouse business data has many serious financial and legal consequences. The loss of a consistent snapshot of your metadata may mean that you cannot restore a data pipeline or that you lose business rules you have been applying to data transformations.
Terrorism
A very serious kind of denial ofservice attack is one intendedto cause major publicinfrastructure to fail. Forexample an area’s 911emergency call service mightbe bottlenecked or hung. Onemight imagine a public utility such as a telephone companyor a power utility subject to adenial of service attackthrough an informationsystems security breach. Thisis not far-fetched. Is it possible
Normally a true data warehouse is not put in the position of being a critical link in an operational system. However, some kinds of data warehouses are very close to the operational line. For instance, if a data warehouse provides background information on the identity of a caller, and this information is linked into a 911 or emergency response system, then this system has ceased to be a

12.17
that such utilities have remotediagnostic and controlinterfaces that have realpower? This form of terrorismcould only be a passwordaway.
data warehouse and needs to be a nonstop fault tolerant operational system. A data warehouse manager needs to judge whether their system is gravitating in this direction.
Network Threats
The popularity of the Internet has driven nearly all of us to support the Internet’scommunication scheme as the way we implement wide area networks. The good news isthat the Internet has become a common highway that connects all of us together, but thebad news is that the Internet was never designed to protect privacy or commerce. TheInternet is a largely UNIX-oriented system that was designed in the 1960s as a way foruniversities and researchers to communicate informally. The Internet uses theTransmission Control Protocol/Internet Protocol (TCP/IP). This communications protocolis actually two schemes that work together, as the abbreviations suggest. TCP governshow two machines establish and maintain a connection. TCP forces the communicatingmachines to engage in a three-way handshake. For instance, the first machine will tellthe second machine how to synchronize the segments of an upcoming message. This iscalled sending the SYN bit. The second machine is then supposed to acknowledge(ACK) the SYN bit. Finally, the original machine sends a FIN bit to finish thecommunication. It is this three-way handshake that is at the root of a notorious denial ofservice attack. If the first machine floods the second machine with SYN bit requests butnever sends the final FIN bits, the receiving machine can become clogged withincomplete sessions that must slowly time out before being dropped. This is called aSYN Flood denial of service attack. Due to the open nature of all machines connected tothe Internet, there is no way to stop a SYN Flood from arriving at the front door. Thereceiving machine must somehow recognize and ignore a SYN Flood without beingdisabled by it. This is not simple. Remember that very busy machines connected to theInternet may receive millions of connection requests per day.
The IP portion of the protocol governs how machines on the Internet find each other. It can be thought of as the envelope, the intended address, and the return address, but notthe enclosed greeting or the enclosed message. Like the envelope/address metaphor, IPis in some sense unreliable. In other words, IP by itself does not guarantee that a message is delivered or that the message is in any way legitimate. IP simply provides theaddresses and the envelope. As a result of the logical separation of the IP addressingscheme from all other issues, and from the open nature of the IP addresses themselves,messages on the Internet are subject to abuse. Like a real envelope, they have to beviewed with a certain level of suspicion. An IP source address can be “spoofed” byanyone with a physical connection to the Internet backbone. In other words, you have noreal guarantee that a communication is from a known host just by looking at the IPsource address. Similarly, a communication packet from a legitimate source can bediverted to any destination by copying the packet and replacing the destination IP address. Although this all sounds horrifying, it is important not to get side tracked by theweaknesses of IP. (We can achieve all the reliability and security we need using TCP/IP,but we do it by protecting the contents of the envelope, not by tinkering with the addresses on the outside. Read on.)
Inside our organizations, on our intranets, we use the TCP/IP protocol extensively. Ourintranets are usually configured in one of two different modes. Our internal machines can be configured with IP addresses that make sense to the outside world and are activelyconnected to the outside world, or they can be configured with IP addresses that are notcompatible with the rest of the world. If the internal machines have private IP addresses, they cannot communicate with the Internet unless the internal machines are connectedthrough a gateway or firewall that provides the internal machines with an “outside”identity. Such a gateway or firewall is an excellent place to impose some security and control over Internet communications.
Before discussing gateways and firewalls, we must reveal some dirty laundry. Almost allof our internal networks, such as Ethernet-based systems, are so-called CS/MA/CD networks. This imposing abbreviation stands for Carrier Sense/Multiple Access/CollisionDetection. This means that the little cable strung around in the ceiling is carryingeveryone’s communications at once. All the computers connected to the network arecapable of seeing all the communications. It is just politeness that keeps any one of them

12.18
from listening to everything. And there is no real incentive to be polite.
In a CS/MA/CD network like Ethernet, every computer on the network looks at everypacket to see if packets are being addressed to it. If so, the packets are stored by theintended computer and eventually assembled (thanks to TCP) into complete messagesor files. There is no reason why an impolite computer cannot listen to everyone’smessages. Later in this chapter we describe how such a promiscuous packet sniffercould compromise security.
Tip
If we really need to protect our communications, then we must protect the contents,not the addressing scheme. If we continue to insist on sending everything via postcards, with the messages in effect being written for everyone to see, then we getwhat we deserve.
Security: Solutions
The last section was probably overwhelming for most readers. There are so manyvulnerabilities that one person cannot think of them all simultaneously. The problemsseem so pervasive and complex that it is difficult to know where to start. Security is a fundamentally negative topic, and it doesn’t have an “up side” like most other topics indata warehousing. But it is just this kind of reaction that causes paralysis. Before wefinally put all the pieces together and dig ourselves out of this mess, please read the “Blindness to Security” sidebar to examine the sources of our avoidance and why wedon’t want to dwell seriously on security issues.
Blindness to Security
Perhaps the biggest reason the data warehouse team does not address security is the feeling that “it’s not our problem.” Variations on this theme include “security ishandled by central IS,” or “security is handled by the firewall,” or “I don’t handlefacilities,” or “I am not responsible for contractors,” or “I am not responsible for personnel,” or “I don’t understand it,” or “it’s not in my job description,” or “anythingup to $50 is their problem” (with regard to credit cards). We go to great lengths toavoid confronting security issues. If we think someone else is responsible for a security issue, we stop worrying. “We do have a modem policy, but it will be okayjust this once.” Yet, we the data warehouse managers are exactly the people ourorganizations expect to own, understand, publish, and protect the corporate data asset. The data warehouse team uniquely understands who needs to access thedata and what they do with the data. Only we can make judgments aboutappropriate access or appropriate use. Whether we like it or not, we are in thedriver’s seat.
Another reason for not paying enough attention to security is that in spite of ourmany years of experience, networked computers are still an unfamiliar medium. Inmany important situations we just have the wrong instincts. Many times we have an inappropriate illusion of security. We seem to be alone in our offices. We are typingquietly. We cannot directly see other users. We easily imagine that we are notbeing noticed. We imagine that we are anonymous. But all of this may be false. It ispossible that our keystrokes and actions are being monitored by multipleindividuals in multiple locations. We are often not aware when our software isexchanging information with other entities. We discount the active nature of a threatbecause we don’t experience it in normal ways.
Our lack of experience and our lack of tangible feedback with the networkedcomputer medium can lead to naïve recklessness. We log in to remote servicesand decide to reveal sensitive information in the clear because we think that no one is watching. We are probably right—most of the time. We use FTP from our laptops over a conventional modem. We use the same password for the remote servicethat we use to secure our local machines. We don’t stop to think that FTP on theInternet sends such passwords in the clear. When we forget that the networkedcomputer medium is truly a different medium, we allow our emotions to affect ourcommunications, especially with e-mail. Humor rarely succeeds in e-mail and often comes across as dumb or insulting. Attempts at sarcasm are a disaster. Only thebiting “under message” comes across. Anger is even worse. Anger comes acrossas anger very effectively. But after we cool off, we die a thousand deaths as werealize what we have written cannot be retracted. Most of us have had the

12.19
experience, after sending a message, of sending a second message an hour or twolater asking everyone on the distribution list to ignore the first message.
In this section we describe the security technologies you need to know about. We deliberately take a manager’s perspective here, rather than a technologist’s perspective.There are many good books on security, like Charles Pfleeger’s Security in Computing,that go into great detail about the technology, but the preoccupation with the technology is part of the problem with the emerging security solutions industry. It is time for us tostep back from this technology and instead focus on understanding how to deploy it. Thetechnology is almost ready, but we the marketplace are not nearly as ready.
Routers and Firewalls
Every place one network connects to another we must have a device called a router that transmits packets between the two networks. The router listens to every TCP/IP packet on each net and looks at the destination addresses. If a packet on one network isaddressed to a computer on the other network, then the job of the router is to pass thatpacket through. If nothing else, routers do a useful job of isolating the “local” traffic on each network. If this didn’t happen, there would be far too much unnecessary noise onremote networks. Routers also know what to do if they see a packet addressed to a“faraway” network. Even if they don’t know where the faraway network is, they know where a higher visibility router is located, and they pass the packet on through, on theassumption that eventually some router a few hops away will know exactly how to deliverthe packet. Routers are very smart. They communicate with each other frequently, and they adapt when a new router is attached to the network. The “community” of routers isvery good at seeking the shortest path to a destination. This adaptive routing is a sourceof significant security problems. If an employee in a company connects his or her internally networked PC to the Internet through a dial-up telephone connection, it is quite possible that the community of routers will discover this connection and start transmittingcommunications from the employee’s PC across the Internet to another location, even within the same company, if the number of hops over the Internet connection is less thanthe number of hops through the company’s secured intranet connections. This is one ofthe reasons why dial-up modem connections from within a secure intranet environment should be prohibited.
Obviously, since a router looks at every destination address in every packet, it can alsolook at the source address. In this way, a router can serve as a packet filter. See Figure 12.9. Although we have already seen that source addresses cannot be entirely trusted,packet filtering is very important and should be used in multiple places in every networksystem. A packet-filtering router, also called a packet-filtering firewall, can provide the following useful functions:
Figure 12.9 A packet filtering firewall.
•
Rejecting connection attempts from unknown hosts. The packet-filtering firewall only lets known IP source addresses through. Although this doesn’t stop professional spoofing, it stops every other unauthorized host. The data warehouse manager mayset up a packet filter to accept special dynamically created IP addresses that representlegitimate remote users. The use of dynamic addresses may defeat most attempts for outsiders to spoof as legitimate users.
• Rejecting attempts from the outside that are spoofing as insiders. The packet-

12.20
filtering firewall in Figure 12.9 is the unique position of being able to recognize anoutside intruder who is trying to spoof as an insider, because the outside intrudercannot legitimately be arriving with an inside IP address. If the firewall were to let thisoutsider through, then the outsider might have special status on the protected network.This is another form of protection against outsiders trying to break in to the datawarehouse.
•
Isolating all traffic to come from a single machine. A packet-filtering firewall can serve as a kind of guardian to a small number of protected machines such as database servers, which are allowed to be accessed only through a specific applications serveron a surrounding less secure network. This is a key recommended configuration for thedata warehouse. It is shown specifically in Figure 12.10.
Figure 12.10 Screened subnet firewall.
•
Halting pollution and sniffing. The packet-filtering firewall can keep an insecure or unstable network from interfering with the more secure intranets by restricting outbound traffic originating from the insecure or unstable network. Additionally, the presence ofthe packet-filtering firewall defeats an attempt to sniff the packets on the more securenetworks from the public network. The data warehouse manager may wish to set up certain terminals and certain database systems on isolated networks so thatcontractors, consultants, and industrial partners can get their work done, but theycannot access, sniff, or otherwise detect network activity elsewhere in the organization.
Tip
Packet-filtering firewalls are one of the basic elements of security. The datawarehouse architect should develop a specific plan for isolating and protectingkey pieces of the technical architecture.
A good overall security configuration for a data warehouse environment is the so-called screened subnet firewall configuration shown in Figure 12.10. The screened subnetfirewall actually has two packet filters. The first filter acts as a primary firewall and sendsnearly all incoming network traffic to a special internal host called the bastion server. The bastion server is as a powerful, controlling bottleneck for all communications coming tothe organization from the outside. Except for certain specially qualified outsiders, allcommunications must go through “proxy” applications running on the bastion server. Aproxy application is what it sounds like. It is not the real application, but rather a kind offake application that shakes hands correctly with the remote requester, takes the requester’s commands one at a time, and then, if the commands are safe and legitimate,passes the commands on through to the real application inside the organization. Acommon example of a proxy application is FTP. A remote user wants to download a file,but does not get to talk directly to the FTP application of an internal host. Only by beingaccepted by the proxy FTP server on the bastion host can an outsider gain the desiredFTP services.
Tip
The idea of proxy servers is wonderful, but the limitation is that only rather simple applications like FTP and Gopher have fully implemented proxies.Modern query tools and report writers usually cannot engage a proxy becausenone is available.
However, the packet-filtering firewall can carefully allow selected external hosts to bypass the bastion server and directly access other internal servers. These “trustedpackets” do not need a proxy server. They are allowed to talk to the real server. If thisconfiguration is coupled with a powerful authentication and encryption system (which is discussed later in this chapter), then an organization can get the best of both worlds.

12.21
Powerful high-tech remote applications from trusted and authenticated clients can get fullaccess to internal resources, whereas ordinary, low-tech access attempts have to run the gantlet of the bastion server.
A proxy application running on the bastion server can also mediate outbound traffic.Users wishing to make a Web browser or FTP connection to the outside world have to go through the proxy server in order to make a connection. A proxy server for Web pagebrowsing can serve several useful functions in this configuration, depending upon yourpoint of view.
• Monitoring and auditing Web page access patterns. The Web access bottleneck created by the firewall allows all Web access usage to be monitored and recorded.
•
Restricting Web access. Certain prohibited sites, such as pornographic sites, couldbe impossible to reach from the inside network. As of this writing, it is unclear whether the censors or the pornographers are winning the race. The number of sites that mustbe filtered out now number in the thousands, and many of these lists of sites are onlypartially implemented. At the very least the site list would have to updated every few days, much as virus signatures are.
•
Caching Web pages for more efficient access. A Web server proxy can cache Web pages to make access more efficient. This proxy server function may become obsolete, however, as Web sites become larger, more continuously dynamic, and morepersonalized. The news service Internet sites are being changed every few minutes asnews breaks. Also, some of the sites have become too big to cache. The mainMicrosoft site (www.microsoft.com) in mid-1998 consisted of more than 150,000 Web pages.
Notice that in the screened subnet firewall configuration shown in Figure 12.10, we have isolated the internal network with a second packet filter. This extra level of screeningallows protection against a breached bastion server and gives this configuration thename screened subnet. If the bastion server is compromised by an intruder and takenover, the bastion server is sitting on an “uninteresting” network. The perimeter network islike a public waiting room. The intruder may be inside the door, but is not in a position to listen to sensitive traffic or probe other internal machines. No internal traffic passes overthe perimeter network.
Tip
On any corporate network environment, the main data warehouse applicationservers should be protected at a minimum by a screened subnet firewall.
The Directory Server
In Figure 12.10, the incoming access requests are shown as arriving at the Lightweight Directory Access Protocol (LDAP) network directory server. Although the world may stillnot be organized as ideally as this by the time you read these pages, we believe that alllarge organizations will have to gravitate to this kind of model to control their distributed networks and distributed applications.
The directory server is a kind of data warehouse of resources available on the associatednetwork. Resources include database machines, individual databases, documentrepositories, transaction systems, file storage areas, printers, and people. The peopledescriptions include names and addresses, organization roles, e-mail addresses, and more. The directory server reveals selected items of information to legitimate,authenticated requesters. It is meant to be the useful, centralized, controlling resource forfinding out how to communicate on the associated network.
Many vendors have agreed on the LDAP standard for communicating with a directoryserver, and, thus, implicitly for implementing a directory server. The term lightweight (the “L” in the acronym) is a reaction to a more comprehensive directory standard previouslyproposed, known as X.500, that was regarded as too complicated and cumbersome toimplement fully. LDAP is a derivative of X.500.
Tip
The directory server is very important to the data warehouse manager. It mustbe the single, central point for authenticating and authorizing all users of thedata warehouse, regardless of whether they are connected to the internal network or are coming in from the Internet.
The directory server has the following characteristics:

12.22
•
Single point of access. All access comes through a single point of control. Consistentand complete administration and auditing are possible with this approach. The singlepoint of access allows a single metadata description of security privileges and securityuse.
• Single point of authorization. Everyone must run the same authorization gantlet regardless of how they connect to a data warehouse resource.
•
Single console. Perhaps most important, the directory server is a singleadministrative console where access policies are defined and enforced just once.Lacking such an approach, the DBA may try to race from machine to machine, setting up low-level SQL GRANTS and REVOKES to implement security. This approachinvites disaster and defeats flexibility.
Encryption
In the preceding sections we have tried to whittle down the security nightmare somewhat by erecting multiple layer firewalls and concentrating all data warehouse access attemptsonto a single directory server. So far, so good. But all along we have been warning thatthe real protection has to apply to the contents of the communications, not just the mechanisms for delivering the communications.
Fortunately, we have a powerful technology that, if used correctly, can largely deliver theprotection we want for the contents of our communications. This technology isencryption.
Encryption in the broadest sense is altering a message with a secret code so that it canbe read only by people who know the code. In a sense, that is all the data warehousemanager has to know about encryption. There is an unfortunate tendency for encryption enthusiasts to describe the mathematical underpinning of the coding schemes. Themathematics of encryption, as appealing as it is to us techies, is basically irrelevant to theissue of using encryption, so we will refer the interested reader to more detailed books, such as Pfleeger’s, if that is what you want. Data warehouse managers need tounderstand the uses of a half dozen forms of encryption. No one encryption scheme willsolve every security problem. Encryption schemes range from being automatic and anonymous and of almost no concern to the data warehouse manager to being highlyvisible to all users of the data warehouse and potentially an onerous burden ifimplemented incorrectly.
Symmetric Key Encryption
The simplest form of encryption is symmetric key encryption. This kind of encryption is also called private key encryption. With symmetric key encryption, a single secret keycan both lock the data and unlock the data. Symmetric key encryption is mainlyinteresting in two situations:
•
Private encryption of data. The user encrypts data with a private key that the userdoes not reveal to anyone else. If the key is a good one, it is essentially impossible foranyone else to decrypt the data. Obviously, in this situation if the user forgets the key or dies, the data is lost forever. Private encryption of data would have many uses in thedata warehouse. Any data that is especially sensitive could be so encrypted. Privatekey encryption would work best for numeric fact table data that was not being constrained upon. Encrypted fact table data would need to be decrypted by thedatabase engine as the numbers arrived in the answer set to be summed.
•
Shared secret encryption of data. If two parties already know the secret key and no one else knows the key, then the two parties have a virtually bullet proof means ofcommunicating securely. This kind of shared secret is the basis of many forms ofsecure communication. The big issue, of course, is how the two parties decide on the key and communicate it with each other without giving anyone else a chance tointercept the key. Symmetric key encryption is the basis for many securecommunication schemes between data warehouse clients and servers and between users.
The main symmetric encryption technique that is relevant to data warehouse managersis the Data Encryption Standard (DES) algorithm. The DES algorithm has been officiallysanctioned by the U.S. government and by the International Standards Organization

12.23
(ISO). The main thing data warehouse managers need to know is that the strength of theDES approach is based on the length of the key that a user chooses for encryption.
The National Security Agency (NSA) in the United States has a conflict of interest in recommending and allowing encryption standards. The NSA believes that it has the rightto decrypt any message it deems to be a threat to national security, and the NSA hastried to limit the power of the keys used with the DES approach. In 1976, when the DES algorithm was first adopted, a 40-bit key was thought to be sufficient to balance the difficulty of decrypting with the NSA’s desire to override encrypted communications. Fromthe perspective of 1998, a 40-bit key is ridiculous. A message or file encrypted with a 40-bit DES key can be decrypted with a modern personal computer in a few hours today.The NSA is now trying to mandate a 56-bit key. However, in a widely publicized test, a team of researchers using a brute-force approach recently was able to decrypt a message encrypted with a 56-bit key. Although this brute force decryption was a tour deforce of parallel computing that would not be practical or fast to duplicate, nevertheless, itshowed that 56 bits will soon be a meaningless limit. Keys of 80 bits or more in length are quite feasible to implement, but they are currently illegal to export outside the UnitedStates. They are classified by the government as munitions. It is conceivable thatCongress will pass laws at some point that will make 80-bit DES encryption illegal anywhere. High-tech industries have a fairly poor record of influencing Congress. Othercountries have already passed such laws. Encryption of any sort is illegal in France as ofthis writing.
This situation leaves the data warehouse manager in the position of needing to protectdata from standard eavesdropping and amateur attacks while realizing that completelybullet proof symmetric key protection of data will probably not be allowed.
Nevertheless, symmetric key encryption remains a primary encryption technique we mustall use. We will use symmetric key encryption to encrypt personal files, and we will usesymmetric key encryption as a fleeting, temporary way to encrypt many forms of digital communications. If two parties can agree on an encryption key, even if it is the equivalentof a 56-bit DES key, then if they use the key for only 60 seconds (literally), their sessioncan be thought of as highly secure during those 60 seconds. If the parties can agree on a different key for the subsequent 60 seconds and keep repeating this process, then along, highly secure communication session can be established. If this approach iscoupled with careful time stamp monitoring by both parties, then even a delayed decryption of the communication may be of no use to the intruder.
Symmetric key encryption has the advantage that coding and decoding a message withthe intended key is extremely fast. Even if a communication has been set up with themore powerful public key encryption technique we are about to describe, most of acommunication episode will usually be handled by a symmetric key approach because ofits speed.
Public Key Encryption
Symmetric key encryption has the major problem of how to securely distribute the keys. A different set of encryption schemes has been developed to handle the problem of tworemote parties setting up a secure communications link, even over the Internet. Theseencryption schemes are called public key encryption.
With public key encryption, there are two keys. One key encrypts the data and the otherkey decrypts the data. The keys can be used in either order. In this scheme, one of thekeys is designated as the private key and the other is the public key. As the names imply, the private key is held in secret by the owner of the data and the public key is broadcastfreely and widely to everyone in the world. Lists of public keys can be publishedanywhere. It would be reasonable to know the public key of the President of the United States.
Now, if an individual possesses a private key and has published the corresponding publickey, two important scenarios are possible:
•
Secure delivery to the individual. Any other person in the world can encrypt a message with the individual’s public key and deliver it to the individual. Since only theindividual has the private key, the message cannot be read by anyone except thatperson. The message in our example could be a download of sensitive data from a data warehouse server to a client, perhaps on a batch basis. See Figure 12.11.

12.24
Figure 12.11 Secure delivery to the individual named John.
•
Guaranteed authenticity from the individual. If the individual encrypts a message with a private key, then everyone in the world can verify that the message is genuine,because the only way to decrypt the message is with the person’s unique public key. Ifa user needs to upload planning numbers or budget numbers to the data warehouse, this scheme could be used to guarantee that the numbers indeed came from thedesignated individual. See Figure 12.12.
Figure 12.12 Guaranteed authenticity from the individual named John.
If two different individuals (A and B) have public and private keys, then they can engagein secure communications:
•
Secure communications between parties. Person A encrypts the outgoing message with B’s public key. However, inside the message, person A appends his or her signature encrypted with A’s private key. B receives the message and successfullydecrypts the body of the message with B’s private key. B then verifies the authenticityof A’s signature by decrypting the signature with A’s public key. See Figure 12.13. This scheme is the basis of most secure communications over insecure media like theInternet or a public telephone line. Since it is computationally expensive, this scheme isoften used to securely exchange a higher-performance symmetric key that both parties can use temporarily to rapidly exchange large amounts of data. This is how the SecureSockets Layer (SSL) works. SSL is discussed later in this section.
Figure 12.13 Secure communications between parties.
The alert reader who has been following all of this may have a nagging concern. All ofthis sounds good, but how does anyone know that the public key for anyone really is thepublic key for that person? If the public key we are depending on for a remote party isfalsified, then the whole house of cards comes crashing down.
Trusted Certificate Authorities
The answer to the public key problem is a trusted certificate authority (CA). Imagine that there is an impeccable public authority that we “know in our hearts” is ethical and secure.We also understand and trust the authority’s mechanisms for collecting public keys. If they claim to have Bill Clinton’s public key, then we trust that it really is the public key for

12.25
Bill Clinton and not someone else. Finally, we have been given a CD-ROM or some other physical medium that contains the CA’s public key. We decide to trust the public key given to us on the CD-ROM completely. Now we are ready to do business.
•
Secure retrieval of a person’s or company’s public key. We connect to the CA’s Web server and request the public key for the desired individual or company. We receive the CA’s response, encrypted by their private key. We decrypt the messagewith the CA’s public key, verifying that indeed the message came from the CA. Insidethe message is the public key for the desired individual or company. See Figure 12.14. This is how people get public keys that they can trust. This is how a remote user getsyour public key. This is how a remote user may get the public key of his or her owncompany. This is how the remote user gets the public key of a software vendor so that the user can verify a software download legitimately originates with that vendor.
Figure 12.14 Secure retrieval of a person’s or company’s public key.
Although this system for dealing with private and public keys is pretty air tight, there arereal-life situations that have to be dealt with. The most serious is:
•
Revocation of a public key. A public key may have to be revoked because either thecorresponding private key has been compromised or the basis for trust in the individualor company is no longer valid. Perhaps the person lied about his or her identity.Perhaps the person is no longer entitled to the authority granted by the ownership ofthe private key. Revocation of a public key is a tricky issue because in effect the CAhas to communicate with every possible user of the invalidated public key. If acertificate has been revoked, in many cases there will be a window of vulnerabilitybefore all affected parties can be alerted to the revocation.
Signed Software Certificates
The public key encryption scheme can be used to validate and trust software. Basically,any given software component comes with a signed certificate.
•
Receiving a trusted software component. The software component is accompanied by a message identifying the creator of the software that is encrypted using thesoftware creator’s private key. As the consumer, you accept the software component if,and only if, you possess the software creator’s public key. If you don’t have this publickey, you can request it from (guess who) the trusted certificate authority. After youverify that the software component is indeed from a particular software vendor, you candecide if you want to let it run on your system.
Signed software certificates are, like other forms of public keys, pretty airtight, but thereare still a couple of tricky situations. You may successfully verify that a softwarecomponent has arrived at your computer doorstep from Ralph Kimball Software in someunknown city. If you have never heard of Ralph Kimball Software, you may not knowwhether to trust this vendor. The CA cannot provide this level of trust. All the CA tells youis that Ralph Kimball registered successfully with them as a commercial softwaredeveloper and that his certificate has not been revoked. Maybe the CA tries to qualifysoftware developers to a degree, but realistically we cannot expect the CA to do toomuch in this regard. So you are left with a personal decision whether to accept thesoftware component.
Another tricky situation arises when a disgruntled employee plants a Trojan horse or avirus inside an otherwise legitimate software component. It will not be feasible to revoke the software certificate of a major software vendor if this happens. The software vendorwill have to deal with this problem the way it deals with the same problem in physically

12.26
distributed media, namely by recalling the infected media and perhaps offering on-line software patches.
Sandbox Software
The bulk of this section describes security through various forms of encryption. Animportant aspect of security is the trust we need to have in downloaded softwarecomponents that we receive from various sources. The signed certificate model ofsoftware deployment says nothing about the software itself, but it places the burdenentirely on the trust we confer on the authenticated vendor. The Java developmentmodel, in its pure form, is based on a very different model. The Java language is definedto operate with the Java Virtual Machine, which is technically known as a sandbox. Within the Java sandbox, a Java program gains its security by being drastically limited inits function. A pure Java program cannot read or write files on the surrounding machine,access other hardware devices, or access memory directly. Although this approach isintellectually appealing, it is proving difficult for Java developers to stay so disciplinedand so confined. As of this writing, there is significant pressure on the Java community torelax the strong sandbox discipline and adopt some parts of the encryption-based signed certificate model.
Secure Sockets Layer (SSL)
In 1995, Netscape proposed Secure Sockets Layer (SSL) as an industry standardprotocol for secure communication between a client and a server. This standard is nowwidely used on the Internet and all the major commercial browsers support it. SSL uses acombination of public key encryption and symmetric key encryption. Public keyencryption is used, most typically, for the user at the client machine to verify that indeeda connection has been established with the intended server machine. Optionally, theserver can also demand verification of the client’s identity. This initial secure handshakeis used as the basis for the two machines to agree in secret upon a shared symmetricencryption key. The symmetric encryption key is used as a “bulk” encryption key for theactual high-speed communications dialogue that follows. The symmetric encryption keycan be changed by the two machines every few seconds, as desired, in order to maintainthe highest degree of confidence in the security.
Virtual Private Networks
Once a client and a host establish a secure symmetric encryption key, sometimes calleda session key, the client can be trusted by the host as if the client were physically local tothe host. This is the basis for a virtual private network (VPN) connection, also called an encrypted tunnel. The original Microsoft Point-to-Point Tunneling Protocol (PPTP) and the competing Cisco Layer 2 Forwarding (L2F) scheme have been merged to create anew standard called Layer 2 Tunneling Protocol (L2TP). It is likely that L2TP will be the basis for most virtual private network implementations in the future.
Tip
Virtual private networks will dominate the market for remote data warehouseaccess. The data warehouse manager needs to follow the development of thistechnology and work with his or her security manager to implement a flexible,scalable solution that does not impose an unreasonable administrativeoverhead or performance overhead.
It is technically important to choose a tunneling technology that performs data compression before performing data encryption, rather than the other way around. Dataencryption largely defeats the ability to compress, and thus if these steps are done in thewrong order, you will pay a huge and unnecessary performance penalty. In particular, modern high-speed modems rely on the ability to compress most data. If this is your onlydata compression step, it will not work if the data is encrypted before it arrives at themodem.
Kerberos Authentication
Kerberos authentication is a relatively strong and secure authentication and access-granting system that was originally developed at MIT. It is specifically designed toprovide secure authentication and access privilege granting in an insecure networkedenvironment. It is intended to withstand eavesdropping attacks, hijacked session attacks,and replay attacks. As of this writing, Kerberos authentication is planned as an intrinsicfacility in Microsoft NT Server 5.0.

12.27
Kerberos authentication depends on three different sever entities, as shown in Figure 12.15. To use an application, the user first opens a connection (Step A) to the Kerberosauthentication server and requests credentials. The authentication server issuescredentials encrypted with the user’s password and passes them back to the client (Step B). The client cannot proceed unless the client is legitimate, because only the clientknows his or her own password. Although this scheme avoids passing any form of theuser’s password over the network, it is still dependent on a password, and it is only as secure as the user’s password may be.
Figure 12.15 A Kerberos authenticated application.
When the user has received and decrypted the credentials, the user possesses a “ticket” and a temporary session encryption key to access the second server, the ticket-granting server. Meanwhile, the authentication server has passed the session encryption key tothe ticket-granting server over a securely encrypted communications session.
The user now opens a connection to the ticket-granting server (Step C) and requests another ticket to the final application. The ticket-granting server passes this ticket back to the user through the secure session (Step D).
Finally, the user opens the intended application connection with the Kerberos applicationserver using the session key originally provided (Step E). The application serverauthenticates the user and allows the actual usage that started the whole process (StepF).
In most Kerberos implementations, the session ticket given to the user has a specifictime stamp and a short time out fuse that limits the ticket’s validity. This is intended tothwart replay attacks and to defeat attempts to override the encryption schemes.
Obviously, this scheme is intricate and powerful. Kerberos systems have been criticizedon three grounds:
• Password vulnerability. A user’s security is only as strong as the password or othersecurity token the user employs at the client workstation. If the password or security token is compromised, then the security vanishes.
•
Need to “Kerberize” each application. The final target applications must be specifically modified to support the Kerberos scheme. It is not possible to take an arbitrary client/server application and embed it in a Kerberos environment. However,because of the increasing adoption of the Kerberos system, it is expected that softwarevendors will widely provide support for Kerberos.
•
Alleged difficulty in scaling. Security experts have criticized Kerberos for not scalingeasily past a single security domain. In other words, the administrative concerns growsignificantly when an organization has two or more separate Kerberos environments that must work with each other. It is beyond the scope of this chapter to analyze theprospects for Kerberos scalability, but this is an issue in 1998 that data warehousedesigners should be aware of.
Authentication Tokens

12.28
Plain text passwords typed by the user into computer keyboards are one of the glaringweaknesses in network security. Passwords can be guessed, either by knowingsomething about the end user or by mounting a “dictionary attack” that systematicallytries millions of combinations. Passwords are notorious for being compromised, given toother users voluntarily, being displayed in plain text on pieces of paper, and beingreused. Let’s face it, no one likes hard to remember passwords.
Tip
Every data warehouse manager should consider upgrading their securityauthentication to use tokens or perhaps to use biometric approaches if thattechnology improves enough.
There a number of promising alternatives to typed-in passwords that are worth considering:
•
Smart cards. Similar to an ATM card, these cards are possessed by the end user andare presented at login time to a card slot or a card swipe device. Also, like an ATMcard, the user may be required to enter a personal identification number (PIN) to thwart simple theft of the smart card. Many smart cards contain sophisticated electronics thatmay be able to generate session encryption keys every minute or two. This approachprovides automatic protection against replay attacks and after-the-fact decryption of a session key. It seems likely that an inexpensive peripheral for swiping the smart cardcould be developed that accompanies each personal computer in a large organization.
•
Thumbprint biometric scanning. In this case, the user presses his or her thumb against a sensor at login time. Although this alternative does not provide the fancygeneration-of-session encryption keys that smart cards can provide, biometric scanninghas the singular advantage of requiring the actual human being to be physically present in order to be authenticated. Hopefully, you can’t steal a thumb. Thumbprintsare highly individualistic and there are almost no false positive identifications. However,something like 3 percent of the population have very rough or very smooth prints that cannot be recognized reliably by the biometric scanners. One can expect thispercentage to be improved somewhat as biometric scanning technology improves, butthere will always need to be an alternative means of authentication for some individuals.
•
Retinal pattern biometric scanning. The human retinal pattern has many of the strong uniqueness characteristics of fingerprints. Retinal scanners can be made towork fairly well at a terminal like an ATM, even when the users are wearing eyeglasses or contacts. However, it seems less likely that retinal scanning technology could bemade cost effective for individual personal computers.
Cookies
In the previous section on component software, we described cookies as special text fileswritten by the client into the client’s file system, which are divulged to the remote serverwhenever a client/sever session is established. Cookies in some form are required in thestateless HTTP world to provide session identifiers between clients and servers. Althoughcookies have gotten a bad name for alleged security and privacy abuses, as anarchitectural component they are going to have to be tolerated if we want to have interactiveHTTP-based sessions on the Internet. The answer to the cookies issue is not to bancookies, but to filter them so that they don’t reveal information we don’t want disclosed andto discriminate against vendors that allow their cookies to contain too much informationabout the client environment. Going back to the initial discussion in this chapter on softwarecomponents, a fully enabled software component like an ActiveX component can in theory write anything into a cookie.
Managing Security in a Data Warehouse Environment
Now that we have analyzed the many vulnerabilities of our networked computer systemsand taken a tour of the new technologies we have to enforce our security, what do we actually do? What is the role of the data warehouse manager?
This book takes the strong view that the data warehouse manager has the centralresponsibility for data warehouse security and that no one else is going to do the job. As we remarked earlier, that data warehouse manager uniquely understands the data,uniquely understand what uses can be made of it, and uniquely understands who should

12.29
access the data and who should not.
An effective security program is a continuous cultural emphasis, not a one-time technological solution. The challenges of security are too multifaceted and too dynamicto snapshot any one fixed solution and expect it to work. The data warehouse managershould protect his or her information assets with a security program comprised of the following elements:
• Awareness. The need for security must be continuously reinforced through a constanteducation process. Just like safety, the main ideas of security need to be visible onposters, in briefings, and on the screen.
• Executive support. Executive management must be educated about the importanceof security and the main elements of security. Executives should work hard to create ahealthy respect for the security measures in place and to set good examples.
•
Policies. Security must be implemented through a comprehensive set of well-thought-out policies that are visible, actionable, and fair. Computer and network securitypolicies should be provided along with the employee reference manual, and the human resources staff should be aware and appreciative of the need for security.
• Vigilance. Effective security involves continuous vigilance. Security must be checkedand renewed constantly.
•
Suspicion. Someone on the data warehouse team must adopt a continuouslysuspicious attitude. Such a person should be reviewing login attempt records, liftingceiling tiles, and asking why people need to see the data. Although this suspiciousattitude cannot dominate the security management, it is absolutely necessary to havethis attitude available to act as a counterweight to all the people who want to overlooksecurity or not examine it closely.
•
Continuous renewal. Security must be a dynamic, continuously evolving quest. If it becomes static, it will be compromised. Every few months, the state of the local networksand the state of the industry as a whole must be reviewed, with the potential of upgradingsecurity measures. It should be expected that the technology available both to the data warehouse manager as well as to the intruder will change, adapt, and become morepowerful.
What to Do Now about Security
We conclude our long discussion of security with a set of very specific recommendations. You will perhaps be stunned by this list. It pulls no punches. We believe in strongsecurity. Our job as data warehouse managers is to professionally publish and protectour information assets.
The first measures are tactical things that should be done immediately. The second group is more strategic, although perhaps there is no hard boundary between the two.
Immediate Tactical Measures
•
Install virus checking software everywhere. Install virus checkers especially on end user PCs, but also on all servers. Renew the virus signature files on a frequent basis.Make sure that new sources of viruses such as macro viruses are handled by yourvirus checkers. Keep up-to-date on virus alerts and changes in virus technology.
•
Remove floppy disks drives from your environment. If a user needs to read a floppydisk, the user must take the disk to the local system administrator, who will check itmanually for viruses and for trusted software and then will mount it on a server with a floppy drive for remote access.
•
Remove local modems from your environment. Prohibit the use of dial-out modems inside your corporate facilities from any end user PC, portable or fixed. It is possible toallow packet-filtered, proxy-supported modems on the perimeter network (refer toFigure 12.10) that are relatively safe, and they can be used by internal users for dialing out.
• Control all software installed on internal machines. Inspect and qualify all executables.Install a runtime program that reports all executables on all machines to a centralized

12.30
database for analysis.
•
Assign your users passwords that they must memorize and use. These passwordsshould be robust and well-constructed meaningless combinations of upper- and lower-case letters and numbers. (In the strategic section following, plan on replacing all text passwords with more sophisticated and effective security tokens. Hopefully, the era ofonerous passwords will be short and sweet.)
• Funnel all Internet access through an Internet proxy server. Monitor and control accessto remote sites. Provide clear written guidelines for appropriate Internet use.
•
Install a packet-filtering firewall to restrict access from the outside world to known IPaddresses. Install a bastion server to intercept all service requests from the outsideworld except known service requests from known IP addresses, which you regard astrusted. Isolate the bastion server from the true internal network with a second packet-filtering firewall.
• Remove all unnecessary services from the bastion server so that if it is breached, thereis very little the intruder can do. Follow modern security practices for trimming andisolating the functions available on the bastion server.
• Implement a program for security education and security appreciation. Systematicallyeducate executives.
• Implement a program for auditing threats to security, such as break-in attempts, failed login attempts, and inappropriate use.
•
Implement a security tracking program that regularly reviews the security privileges ofall employees (what information they can see) as well as the security exposures of allinformation resources (who has access to the data). Make sure that both on-line and backup media are covered by this analysis.
• Physically secure all servers and all backup media. Inspect and secure allcommunications facilities and cable vaults. Apply an electrical sweep of all networksand account for all taps and connections.
Strategic Measures
The following measures are strategic steps that in many cases require both technologyand a change in behavior within the organization:
• Commit to an access token approach to replace all use of typed passwords (e.g., smart cards or biometric scanning) both internally and in the field. Include all contractors andall industrial partners.
• Assign a public/private key combination to every end user to use as the basis forsecure authentication. This pair of keys is probably coupled to the access tokenspecified in the preceding paragraph.
• Commit to a secure tunneling approach for remote access by trusted individuals.
•
Centralize all authentication and access control through a directory server based on the LDAP protocol. Require all users to funnel through the directory server whether theyare internal or external users. Administer all security from this one central point. Do notallow direct access to a database or application server by anyone.
• Require all software downloads to be based on signed certificates. Actively administerthe list of trusted software vendors whose software you will accept.
Key Roles Key roles for implementing security are:
•
The project manager must take a lead role in the battle for a secure environment.The project manager or a dedicated security specialist must start by educatingthe organization to be sensitive about security issues, and then must ensure that proper measures such as those described in this chapter are implemented and

12.31
maintained. Although the project manager will not, in most cases, be the one toactually implement these measures, the project manager must feel theresponsibility; otherwise security will slip through the cracks.
• Specific technical specialists will need to actually implement any changes to theenvironment, based upon the tactical and strategic plans.
Estimating Considerations
There are too many cultural factors to estimate how long it will take to establish asecure environment. Building awareness may take many months. The actualimplementation of these security measures may also take an extended period oftime. More optimistically, little additional effort may be required of the datawarehouse team if your organization is already tackling these issues.
Summary
In this chapter we have raised the understanding of why security is so important to thedata warehouse. Then we provided a technical primer on the basics of modern systemssecurity. Finally, we provided a set of action items that you can immediately act upon aswell as guidance for developing your strategic security plan. The project tasks are listed in Figure 12.16 and at the end of Chapter 13, so anyone who skimmed this graduate-level chapter will still see the recommended tasks.
Figure 12.16 Project plan tasks and responsibilities for implementing security.

13.1

13.2
Overview
In this chapter, we switch from the theoretical details of architectural components andservices to the practical matters of how to actually design your architecture and then select products to support it. The first part of this chapter concentrates on the process ofdesigning the architecture. The architecture plan is the technical translation of thebusiness requirements. It says “these are the capabilities we need to meet the information needs of the business.” The second half discusses product selection—the process of comparing the architecture to the real world to see who shines and who fades.
Your job in the architecture phase is to identify the capabilities that are most important to your organization. Once you have this list, you can work on identifying the vendors whoprovide these capabilities, and determine which is the best fit for your situation. You maynot find a single tool that meets the needs of the entire range of users. Start with thehighest priority requirements and make a decision. You will learn a lot from the first set ofexperiences that you can apply to the second round. Also, remember that having multipletools is not necessarily a bad thing. After all, you are addressing multiple problems.However, using multiple tools does have implications for software investment, training,and ongoing support.
While the primary audience for this chapter is the technical architects, other project team members should review it as well, since they often participate in the productselection process. The entire team must be familiar with your architecture design andthe role they play in bringing it to life.
Creating the Architecture
As we described in Chapter 8, there are many approaches to developing a systemsarchitecture, especially a data warehouse architecture. One standalone methodologycomes from John A. Zachman of the Zachman International. The Zachman Frameworkwas developed based on Zachman’s experience developing systems in the aerospace and construction industries. He reasoned that if it was possible to build something ascomplex as an airplane or a large building on time and on budget, you ought to be able todo the same for an information system. He and others took the tools and techniques that enabled an aerospace company to produce an airplane and transferred them to systemsdevelopment. Zachman first formalized these concepts in a 1987 article in IBM Systems Journal titled “A Framework for Information Systems Architecture.” He and others have extended the concepts in several articles and books since then.
As you might guess, the Zachman Framework is a rigorous, comprehensive approach toarchitecture development. From a warehouse point of view, many sections of the Zachman Framework deal with overall IS issues, and thus fall outside of the warehousespan of control. Although a straight application of the Zachman Framework is probablymore than you need for all but the largest data warehouse projects, it’s worth examining to make sure you haven’t missed any major issues.
The approach we use to develop an architecture is definitely based on the 80–20 rule; that is, we spend 20 percent of the effort to get 80 percent of the benefit. This is not to say that more wouldn’t be better, but in our experience, most organizations can barelymuster the resources for this 20 percent. Of course, this approach is an iterative process,much like the warehouse overall. Get the big picture in place, determine the priorities, and split the implementation into phases. As you move forward, you will uncover newinformation that will cause you to revise significant parts of the architecture. Celebratethese changes—they mean your map of the world is getting more accurate (and your chances of falling off the edge are decreasing).

13.3
Architecture Development Process
Figure 13.1 depicts the process flow for creating a data warehouse architecture. The flowdiagram actually covers the entire lifecycle of the warehouse, because the architecture both defines and draws from the other parts of the Lifecycle. In the beginning, therequirements set the boundaries and baselines for the architecture. At the other end, theimplementation is the realization of the architecture.
Figure 13.1 Architecture development process flow chart.
Although it is tempting to compartmentalize the three architectural threads we saw backin Figure 8.1, we know that they interact significantly. Figure 13.1 shows the way wethink these architecture projects interact as we work our way down from the businessrequirements to the ultimate implementation.
The layer enclosed in the dashed-line box near the top of Figure 13.1 is what we tend to think of as architecture; essentially, this is the technical architecture. This section outlinesa process for creating the technical architecture. While we will discuss the data andinfrastructure efforts, we will focus primarily on the data staging and end user applicationarchitectures.
You will create two major deliverables from the technical architecture developmentprocess: the technical architecture plan and the infrastructure plan. The technicalarchitecture plan seems daunting—it is usually 50 to 70 pages long, and it describes your vision for the future structure of the warehouse. As always, begin the document with a review of the driving business requirements. Just as we have structured the architecture section of this book (Chapter 8-12), discuss source systems and back room requirements, front room architecture, your plans for using metadata, and security.
Tip
Remember that the warehouse architecture document will get fairly widedistribution within your company, among people who may know relatively little about data warehousing. A significant portion of the document should bedevoted to explanations detailed enough to ensure that most readersunderstand the context.
Sometimes we include the infrastructure plan within the technical architecture plan, but we prefer to create it as a standalone document, which the architecture plan refers to.The infrastructure plan describes the nuts and bolts of the warehouse: the servers,network, and desktop. We use it primarily to communicate with the IS Operations folks who will help support the warehouse, to provide a clear and early warning of what thedata warehouse will require of their groups. We have found that it’s easy to forget aboutOps, and simply assume they will support the warehouse as they would any system. Generally they are quite willing to do so, but they do need to be told what therequirements are and don’t like to be surprised.
Create the Technical Architecture Plan
If your warehouse architect has not been through a data warehouse project before, it’s a good idea to hold off on the architecture development until after the requirements have

13.4
been identified and the initial dimensional models created. This deferment is valuablebecause it is difficult to create an architecture for a warehouse without having already seen one up close. Of course, postponing the architecture development will extend theduration of the project, so if you cannot afford to extend the project an extra month ortwo, plan to bring in an experienced data warehouse architecture person early on.Whenever you are ready to get started, the following outline will be useful for creating theapplication architecture:
•
Form an architecture task force. The task force is an ad hoc group brought together specifically to create the warehouse architecture. The task force is led by the technicalarchitect, and most of the members should come from the warehouse team, withrepresentatives from both the back room and the front room. It is also valuable to include a representative from the broader IS community. In particular, look for someonewho is creative and flexible and who has significant experience in the company. Thesize of the task force depends on the magnitude of the project. In general, a small group of two to four people is better than a larger group. Even for a small warehouseproject, where one person might create the architecture (in her spare time), it helps toinclude another participant to provide an additional viewpoint. Identify the team early on so they know they will be responsible for the architecture and can keep it in mindduring the early stages.
•
Gather architecture-related requirements. During the requirements gathering process, it’s a good idea to discuss the question sets with the lead interviewer ahead of time to make sure some of the questions address architectural topics. Attend the userinterviews and listen carefully for architecture-related issues. Make sure you don’t sidetrack the process. If you need to, conduct additional interviews. In particular, there are probably some IS development and infrastructure folks who didn’t make thebusiness interview list. Figure 13.2 shows a set of sample questions targeted at ISpeople. While you’re talking to the technical folks, keep an eye out for existing architectural “stakes” and directions.
Figure 13.2 Example architecture-related interview questions. Example Questions for Additional Architecture and Infrastructure Interviews IS Business Role
1.
How important is business or data analysis in support of management decisionmaking at the company?
2. What role does IS play in the management decision making process?
3.
Is this changing (due to the competitive environment, organizational restructuring,etc.)?
Technology Direction
4.
What is the company’s general approach to information technology over the next fewyears (e.g., aggressive client/server development, Web-based apps, ERP)?
5.
Is there a general direction or plan to address the related software infrastructurerequirements (DCOM, CORBA, object orientation, etc.)?
6. What are your plans and priorities for the foreseeable future?
7.
What infrastructure initiatives or plans will have an impact on information access(data movement, task scheduling, name servers, security, software distribution, etc.)?
8. Is there a specific role for metadata? How will it be managed?
9.
What are the company’s standard products today? What platforms, system software,DBMS, client software, and utilities do you think are going to be strategic over thenext few years?
10. What are the biggest bottlenecks or issues in the infrastructure area?

13.5
11.
Is there a group responsible for architecture, or are any documents or guidelinesavailable?
Infrastructure Process
12.
What groups are involved in acquiring, installing, and supporting new infrastructure (e.g., servers, utility software, connectivity)? What is the process for securingrequired infrastructure?
13.
Is there a centralized data and systems security function in the organization? How dothey work with other groups?
14. What kinds of timeframes are typically involved in these activities?
•
Create a draft architectural requirements document. Review and summarize interview documentation and other materials from an architectural view. Look forrequirements that set boundaries and baselines or that indicate a need for somecapability or service. One useful focusing technique, as soft as it sounds, is to developthe overall vision of the warehouse, sort of a technical mission statement. Think aboutthe major business issues you can address from an architecture point of view. Forexample, if lack of integrated data is a major stumbling block for the company,providing an integrated data source should be a key goal. If multiple conflicting datasources is a problem, providing the authoritative source should be a key goal (thisimplies good understanding of the source systems, strong data checking, and excellentdocumentation of what the differences are and why they occur). The vision thing canhelp. It’s like John Chattergee said, “If you don’t know where you’re going, any road willtake you there.”
• Review the draft with key players from both the IS and business user areas. • Incorporate feedback into a “final” architecture requirements document.
•
Create the technical architecture model and supporting descriptions based onrequirements. The easiest way to do this is to get the architecture task force in aconference room with a couple of big white boards for two days and hash it out. Work from the architecture requirements document to make sure you include all thenecessary components and capabilities.
•
Determine the architecture implementation phases. First, determine the priorities for the major components of the architecture and the estimated resources (people andmoney) needed to implement them. Look for logical boundaries in the architecture thatdeliver business value, are cost effective, and can be accomplished in a reasonabletimeframe.
• Identify clear deliverables for each phase of the architecture.
• Review the final architecture with key players (management and key technicalresources).
• Create a Technical Architecture Plan document. Take the results from the aforementioned activities and roll it all into a master plan document.
Technical Architecture Plan Sample
The sample model in Figure 13.3 is for a fairly large retail grocery chain that has decidedto implement a Club Card program for its frequent shoppers. The Club Card program is the high-value business issue that will serve as the primary focus for the initial datawarehouse effort. The warehouse will draw from two primary source systems: the legacysales tracking system and a new client/server system built to track and manage the Club Card member information. Fortunately, the Club Card system has to integrate thedemographic information to provide the point-of-sale (POS) system with coupons and discounts.

13.6
Figure 13.3 Technical architecture model sample.
Figure 13.3 includes some data sources and data access systems that are not part of theinitial effort. Listing them helps you keep them in mind so you don’t make implementationdecisions that will limit your ability to include these new elements down the road. It alsoshows that you are aware of the business need for these elements. To manageexpectations, make sure you identify them as future phases—you might even consider graying them out on the model.
This sample model is based on a combination of our experiences, and it does notrepresent any specific projects we have worked with. Remember that this model is onlyan example—one possible approach to a single situation—not the answer. Your model will be very different. Also, what you see here is only the tip of the iceberg with respect tothe data warehouse architecture for a mid-sized warehouse. This graphical representation would typically be accompanied by an architecture plan with 50 or more pages of detailed description of the required components and functions, business rules,and definitions where appropriate, and priorities, resources, and implementationtimeframes. A sample table of contents for the plan is included in Figure 13.4.
Figure 13.4 Technical architecture plan document sample table of contents.
Big Shopper Data Warehouse (BSDW)Technical Architecture Document
EXECUTIVE SUMMARY
1
Business Understanding
Project Focus
METHODOLOGY
2
Business Requirements
High-Level BSDW Architecture Development
BSDW Standards & Products
Ongoing Refinement
BUSINESS REQUIREMENTS SUMMARY
3
Business Issues
3
Information Access
3
Ad Hoc
Operational or “Canned” Reporting

13.7
Navigation 4 Data Quality
5
Common Data Elements and Business Definitions
6
Data Management
10
Infrastructure and Utilities
14
Organizational
19
Software Distribution
Education and Training
Communications
Miscellaneous
BSDW ARCHITECTURE OVERVIEW
20
Typical Data Flow
21
Metadata Driven
22
Flexible Services Layers
22
MAJOR ARCHITECTURAL ELEMENTS
23
Services and Functions
23
Data Staging Services
Data Access Services
Metadata Catalog Maintenance
Modeling
Data Stores
30
Sources and Reference Data
The Data Staging Area
The Enterprise Warehouse—Conformed Data Marts
The Metadata Catalog
BSDW ARCHITECTURE DEVELOPMENT PROCESS
47
Architecture Development Phases
47
Architecture Proof of Concept
50
BSDW Standards and Product Selection
52
First Pass Data Model
54
APPENDIX A—ARCHITECTURE MODELS
A1
APPENDIX B—REQUIREMENTS INTERVIEWS SUMMARY
B1
Even though it has been simplified to fit on one page, don’t let the model intimidate you.It is appropriate for a mid-sized data warehouse project. Most smaller projects will havesimpler architectures. If you start from the business requirements and take it step bystep, the model and the plan will fall neatly into place.

13.8
The technical architecture plan describes a high-level map for what you plan to do and where you plan to go with your data warehouse. Write the document with the expectationthat a wide variety of people in your IS organization will read it, and do not assume thereaders have any significant knowledge of data warehousing.
Begin with a summary of the warehouse’s business requirements, focusing on how thoserequirements affect the architecture. Describe the types of users and different accessrequirements. Discuss significant data issues. For example, if you must develop aservice to identify unique individuals from across multiple systems, you should introducethat concept here. Describe the business requirements for shared data and the need foraligned corporate reporting. Outline organizational issues for supporting a successfulwarehouse, including education and training.
In describing the architectural elements, remember throughout that you are describingyour vision for the future. Describe required services, such as data staging and data access, in enough detail that this document can help guide the product selectionprocess.
Tip
The architecture plan itself should be detached from products. In fact, you willfind that products do not yet exist to fill all your requirements. It’s particularly important to have an architecture plan so you can build the componentsmodularly and plan for new products and services to “snap into” the existinginfrastructure.
Create the Infrastructure Plan
As we described at the beginning of this chapter, the purpose of the infrastructure plan isto communicate infrastructure requirements to your operations group. Without spendingsome time to think about infrastructure—and to communicate those thoughts to the people chartered with delivering that infrastructure—you run a high risk of delaying the project for a Really Stupid Reason. For example, the machine room does not haveenough floor space (electricity, air conditioning, etc.) to host the warehouse server; there’s not enough network bandwidth between the machine room and users’ desktops;user desktop computers are underpowered; or a security shell does not permit datatransfer between operational systems and the warehouse server. All of these problemsare easy enough to solve, but they all require time, money, and management attention.
Since the goal of the infrastructure plan is to communicate requirements to theoperational groups in IS, it’s best to structure the plan so that each group’s requirements are in a separate section. Work with the operational groups to finalize the plan. There arethree main areas to cover in the infrastructure plan: server hardware, network, anddesktop.
•
Server hardware. At this point in the project, you should be putting your first stakes in the ground for your hardware requirements. Decide what your main warehouseplatform (hardware and OS) will be, based on business requirements and initial sizingestimates. Decide whether your staging area will live on the source system, on its own server, or be co-hosted with the warehouse, and what its size requirements are. It’sharder to specify the number of smaller application servers you will need until the enduser tools have been chosen, but you can give the server group a heads-up on the kinds of requirements you will have and when you expect them.
•
Network. There are two parts of the network to consider. You need a big pipebetween the source systems, staging area, and warehouse and good throughput between the warehouse and user desktops. Broadly specify the volumes andfrequencies that data will be moving between different systems. Document how thesecurity systems will affect data flow, and outline the solution for moving data throughdifferent security protocols.
•
Desktop. Decide what kind of user access applications the warehouse will support.Does your organization have an intranet that can support Web access to warehousedata? Most active warehouse users have a client application on their desktops. Even if you haven’t yet chosen that software, you can specify the general parameters for thedesktop PC. Generally, these tools require a fairly powerful PC to run well. Specify thedesktop operating systems the project will support. Specify the connectivity software that will be required. Is ODBC alone sufficient, or will you also need to install nativedatabase drivers?

13.9
You should plan to continue to keep the infrastructure document reasonably up-to-date as the warehouse evolves over time. What starts as a description of hardware, operatingsystems, and software expected from the operations group will turn into documentationfor an increasingly complex system. Figure 13.5 illustrates an infrastructure model for amature warehouse. Your model may not start out as complex as this one, but it probablywon’t take long.
Figure 13.5 Sample mature warehouse infrastructure model.
Additional Information Resources
If you want more detailed guidance after reading this, there are plenty of places to look.Most of the major consulting organizations have data warehouse practice groups, andseveral of the major vendors in the data warehouse market have architecturesubsections as part of their warehouse development methodologies. If you already havea relationship with any of these folks, ask them what they have and what they are willingto make available to you. A number of books have also been written about datawarehouse architecture. Get information and examples from a few different sources, andread them carefully. Then just get started.
Trying to build a warehouse without an architecture is like using a 14th century map ofthe world to plan a trip. Once you step outside the narrowly defined known world, the terrain is gray and uncharted. Without an accurate map, we are doomed to wanderaimlessly around the systems landscape. If we’re lucky, we’ll discover the new world.More likely, we’ll sail off the edge of the earth or get eaten by dragons. In our experience, there are plenty of dragons in the data warehouse implementation process.
This concludes our discussion on the process of designing the architecture. More detailedproject plan tasks and estimating considerations associated with creating the architecture are located at the end of this chapter.
Selecting the Products
Now you can turn your efforts to selecting specific products that can bring yourarchitecture to life. Once the data warehouse architecture is in place, you have in hand the two key components that drive the selection of products: business and technicalrequirements.
In this section we discuss the major areas where product evaluations are typicallyfocused. Next, we walk through a process that can be used for each area. This processincludes an optional prototype project. Finally, we review details that are specific to asingle area.
Keeping a Business Focus
This is our standard liturgy: How can you make a rational, effective tool selection if you don’t know what you need to do with that tool? At this point in the Lifecycle it may seemabsurd to you to even consider attempting to select a tool without having the slightestidea of your users’ requirements. Unfortunately, we have seen this happen. The project plan, the architecture, and the requirements documents are your guides. One of the earlycomments we hear all too often is “we’re just getting started, but we have the database

13.10
and hardware up and running.” The timing of the technical evaluation is key. If you do ittoo early, you won’t have a real understanding of the requirements, and you will end uptesting product features in a vacuum. If you do it too late, you won’t have enoughinformation about the platform and product-driven requirements in the physical database design process. You will end up redesigning and rebuilding to support theserequirements.
Major Warehouse Evaluation Areas
There are four major purchase areas for the typical warehouse, and each can include multiple tools to consider in a technical evaluation process:
•
Hardware platform(s). There may be multiple hardware platforms in the datawarehouse, including different servers/platforms for the staging area, data marts, and application server/engine. Most hardware testing is about scale, throughput, andcapacity.
•
DBMS platform. In most medium-sized warehouses, the base-level warehouse DBMS is a relational engine—not that that makes the evaluation any easier. In most cases, we find that the DBMS choice is a corporate standard, and any deviation requires aserious justification effort. The DBMS evaluation is tightly linked to the hardwareplatform.
• Data staging tool. This can be a major cost for the warehouse. It is also such a rapidly changing area that an evaluation is almost mandatory.
•
Data access tools. Most warehouses end up with more than one tool to supportdifferent kinds of requirements. The sheer quantity of tool options and lack of a clear market leader in many categories makes this evaluation process a particularly difficultone.
This list of evaluation areas is a little daunting. The good news is that, at least at thehardware and database platform level, the choices are relatively equal. That is, for most of the small-to-medium-sized warehouses, the mainstream open systems vendors anddatabase vendors all have reasonable platforms. On the other hand, if you expect yourwarehouse to be large, you must evaluate all the areas very carefully.
Evaluation Process
There are several basic steps that are common to the evaluation process for each of theareas described earlier. This section outlines those steps, and the following sectionsdescribe the twists, additions, and deletions specific to each of the areas.
A critical step to ensure a meaningful and thorough product evaluation process is tomake sure that resources are assigned to this effort. Even if much of the hands-on “prove it” work is done by the vendors, someone from your team has to deal with the vendorsdirectly and absorb the feedback.
The timeline for evaluating and selecting products must be reasonable. You need toallow enough time for the vendors to properly respond to your request. The rate that technology is changing today is almost alarming. If you take too long to complete yourtechnical evaluation, your information may be obsolete. Players eliminated fromconsideration early in the process may have actually caught up or, more likely, have leapfrogged other competitors.
Be warned that no matter how good a job you do on product evaluation, even if you do athorough prototype, it’s never good enough. You just cannot know about all the quirks ofa product until you are deep in to the details, at which point it’s often too late. Our advice,which the vendor community will hate, is to follow a thorough evaluation process, makeyour best choice, and tell your vendor that you want a 90-day trial period. Implement the product as best you can, and at the end of the 90 days you will have a list of significantissues to discuss with the vendor (we promise, you will!). You will be in a very goodposition—before the contract has been signed—to negotiate resolution of these issues. Or you may have found problems that are deep enough that you need to back down fromyour first choice and try an alternative product.
Develop the Product Evaluation Matrix

13.11
At this point in the project the business requirements have been collected following the guidelines given in Chapter 4. The technical requirements have been defined by thetechnical architecture, as detailed in Chapters 8-12. It is also critical for you to gather information about the product vendors themselves. Vendor evaluation criteria are described in a moment. The combined business, technical, and vendor criteria becomethe yard (or meter) stick by which you can evaluate different products.
All of the requirements, both business and technical, should be prioritized. At a minimum, the requirements should be flagged as “must have” or “nice to have.” Prioritization allowsyou to apply different weighting factors to different requirements. Assign a numeric value,typically between 1 and 5, to how each requirement is handled for each product. These values can then be analyzed. We have seen multiple products end up with relativelyequal scores. In these cases, simply reassessing priorities can often break a tie.
Any evaluation matrix we include here will be misleading for two reasons. First, the market is different today than it was when we wrote this book. Second, your situation andrequirements are different from any generic situation we could imagine. On the otherhand, there is value in seeing how someone else approached a problem. Figure 13.6 shows a simplified version of an evaluation matrix for data staging tools. Remember thatyours will not be like this one.
Figure 13.6 Sample data staging tool product evaluation matrix.
Feature
FeatureWeight
Product1
Product2
Product3
. . .
Basic Staging Capabilities
Supports source extractfrom multiple legacy andwarehouse platforms,including RDBMS, IDMS,WKS, DB2, VSAM
85
Can determine net changefrom source log/journal
50
Provides fast copy,replication
85
Provides datacompression/decompression
50
Supports transformationfunctions validate, translate,integrate, check integrity,calculate, derive, aggregateallocate
85
Provides loading of targetvia replace, append, updatefunctions on target RDBMS
85
Job Control and Scheduling
Supports job scheduling(time/event-based)
75
Supports monitoring,reporting, recovery fromunsuccessful completion
75
Supports archive/restore
25

13.12
Supports security viaaccess and encryptionchecks
25
Provides onlinesynchronization of updates
25
Metadata and Standards
Driven by open repository
100
Supports metadataexchange with other keyproducts
85
Supports messagingstandards, including COM, DCE, CORBA
25
Supports transport levels,including TCP/IP, FTP
25
Vendor Items
Cost
85
Tech support
85
Documentation
50
Training availability/quality
25
Consulting availability/quality
50
TOTAL SCORE (based on1–5 rating scale)
5975
0
0
0
Ranking
Vendor Evaluation Criteria
The tool you buy is not a standalone product. It is an extension of the vendor whocreated it. You will have a relationship with this vendor for as long as you own the tool, sopart of determining capabilities for the tool involves determining required capabilities forthe vendor as well. Most of these have to do with the nature and extent of support you can expect from the vendor and the technical community. This is where market sharecounts. The larger the installed base of the tool, the more likely it is that you will be ableto find someone who can help when problems surface.
• Vendor Support. What kind of resources do they have to help you be successful? Inparticular, look for the following:
–
Documentation. You should expect a range of well-written materials targeted at specific readers: business users, power users, developers, and the administrator. The materials should be available on-line in a form that’s easy to search and browse.
–
Training. Local training facilities are useful if you will not be setting up your owntraining facility. Training materials need to be extremely hands-on. Classes should be set up with one student per computer. The company should offer customizedtraining and on-line materials you can customize yourself.

13.13
–
Technical support. This one is hard to gauge in advance. Ask the references about their experience with the vendor’s technical support services. In addition to puretechnical expertise, you want the technical support organization to have the rightattitude: a real willingness to help figure out solutions to the inevitable problems.
–
Consulting. The company should have an organization of consultants who areexperts in the tool. They should also have a list of consulting organizations in thearea that have been trained and are experienced with the tool.
• External support. Beyond what the company can give you, look for external supportstructures as well. These include an active technical support forum on-line and a local user group for the product
•
Vendor relationship. How will this company be to work with? The representatives should be reasonable, rational people. The company should offer flexible pricing and afair upgrade policy. It should be financially stable with a good growth record. Inparticular, check into these areas:
–
Company background. How long has the company been in business? How manydevelopers are on staff? Ask about the firm’s revenue, profitability, growth, andproduct release history.
–
References. Check references. It’s not that difficult, and you usually find a wealth of information.
Conduct Market Research
The goal of this market research is for you to become an informed consumer. We findthat the variety and selection of data warehouse related products can be overwhelming, especially since many products profess to solve all of your problems. Basic informationabout products can be collected using the following techniques:
• Search the Web. • Read trade publications.
• Seek opinions from industry analysts. Most IS organizations have contracts with one ormore major information technology consulting firms. Ask your corporate library or ITresearch folks.
• Attend data warehouse conferences and seminars. • Collect marketing literature from the vendors.
This kind of basic research can help you identify candidate products. As you begin tocollect and distill this information, use your product evaluation matrix.
Narrow Your Options to the Short List
While the task of narrowing the list of products to evaluate seems overwhelming at first,we find that the results of your market research can quickly narrow down the list ofproducts that meet your combined business and technical criteria. You should select no more than five products that you believe may be able to meet your requirements. Inmany cases, only two or three products need to be scrutinized in more detail.
The most important thing to consider when selecting candidates for the short list is to seek comparable products. Too often, we see organizations attempting to compareapples and snow shovels. If you do not feel that you are equipped to make thesedecisions, get more help. There are sessions on selecting technologies at most of thetrade shows. Seek the advice of other professionals, with one caveat: Make sure that youunderstand clearly the formal and informal relationships between your advisor and anyvendors.
Why Requests for Information Don’t Work
An age-old practice to assist product selection is to create a formal Request forInformation (RFI) or Request for Proposal (RFP). It requires a lot of time to put

13.14
together a comprehensive request. This is a compilation of the questions you thinkare important. Each of the vendors that respond will do what they can to respondpositively to each of your questions. They are vying for the opportunity to compete.In our experience, the responses don’t really tell you much more than who has abetter marketing or proposal generating organization. You don’t really learn moreabout the product’s functionality or what is required to deliver that functionality.
A few high-quality vendors do not routinely respond to RFIs because theyrecognize the beauty-contest nature of the process.
If your organization’s standard mode of operations requires an RFI, provide eachvendor on the short list with the same business case study to solve. This casestudy should be small, but it should contain well-defined examples of your key requirements. Ask each vendor to respond with a working demonstration thatsolves the business problem. You will often find several vendors graciously bowingout of the competition. Of those who remain, you have a first-hand view of what the solution looks like.
Evaluate the Options
Now is the time to begin working directly with the vendors. Set up meetings with eachcandidate. Provide each vendor with the same information about what you are trying toaccomplish:
• Listen to each vendor’s pitch. Allow them to highlight their strengths. • Ask pointed questions that address your requirements. • Ask each competitor to discuss how they would deliver key functionality.
• Present a business case study that emphasizes your key requirements (this can beprovided in advance or introduced during the meeting).
• Use the evaluation matrix as a guide during these sessions. Fill it in as you getanswers to each issue.
You may want to have more than one meeting with the different vendors. This allows youthe opportunity to pursue issues you have learned from meeting with their competitors. Itis also helpful to include the representatives from the target user group to participate in these sessions.
Check References
This is incredibly important, as it’s only from other customers that you will getreliable information about how the product works in the real world. Ideally, you’llwant to talk to a customer that is “just like you,” which practically speaking meansthat you’ll need to talk to a handful of references and synthesize the results. Justbecause the product works with a “3-terabyte warehouse” doesn’t mean their implementation is anything like yours. Make sure that one or more references haveimplemented a dimensional warehouse. Talk to them without the vendor present.You are more likely to get the full story.
As a result of these sessions, decide which product you believe is most likely to meet your requirements. Before making a final commitment, you may want to develop aprototype to make sure that everything works as advertised. If you have narrowed theselection to two vendors, but are unable to see a clear decision, it can be helpful to develop a prototype for each.
Optional: Develop a Prototype
In some cases, the product choice is clear from research, including reference checks. If itisn’t, multiple products need to be evaluated more closely. In this case, the goal is to be able to compare and contrast a set of similar products to see which one best meets your

13.15
needs. We call this a “bake off.” All candidates are given the same problem to solve andthe same amount of time to develop the solution. It is important that you provide each vendor with the flexibility to solve the problem the best way they can. Do not imposeartificial limitations upon the competing vendors. By allowing them to take the same inputand produce the required result, you are able to see what it takes to make each solution work. In these situations, you should not ask many vendors to participate. This onlywastes their resources and yours. Once you understand your requirements, you shouldresearch the marketplace to select the primary candidates. We suggest that you limit the development of a technical evaluation prototype to two or three vendors.
Tip
The primary purpose of developing a prototype is to confirm that the design andthe technologies will meet the business requirements before you invest significant time and money developing the full data transformation system.
The most common prototyping process is to install the product at your location for hands-on testing. This allows the team to learn the technology and discover issues first hand. A second type of prototype involves testing in a controlled environment, like your corporatesoftware laboratory. This is often a strict requirement within large organizations beforeallowing the technology to be approved for use within the company. The purpose is not to determine if it will meet any business need but to prove that it would not disrupt existingapplications if it were implemented within the company. The testing group will alsodetermine if the product works with the supported versions of other software. A corporatearchitecture group is often responsible for this technology evaluation. Evaluation of theoverall functional capabilities of the product is left to the individual project teams.
Prototype Scale
Often, prototypes are built using data that is convenient for IS and not usually selected toprove any specific business value. Consequently, you may not gain any insight into howthis technology can solve business issues.
We suggest that you carefully select a small yet representative subset of data to use forprototyping. If you are evaluating hardware and/or database platforms, this small subsetcan be exploded out to high volumes yet retain realistic distribution of your data. A small subset can be effectively used to evaluate data staging and access tools. The key here isto select data that is a meaningful business set of data, not just whatever is easiest to getyour hands on.
On the other hand, if your project is dealing with significant amounts of data, and the data staging window is likely to be a problem from day 1 of operations, you really need to testwith a lot of data. A lot of performance-related issues will not arise until you’re dealing with large volumes of data. Although building a prototype on a huge dataset is not easy,you may need to step up to it. We advocate building a smaller prototype, as discussednext, and then scaling it up to test large volumes only on the points that are mostproblematic. The scaled-up data doesn’t need to be real. We usually duplicate a smallset over and over, adjusting the keys if necessary to assure uniqueness.
One common mistake when developing a prototype is to ignore performance tuning. Tounderstand how a design will work, some time must be spent in tuning. If you cannot getsmall sample data to work quickly, how will the system perform at full volume?
On one project, we assisted in the data modeling process, and the team went on to usethe model to develop a proof of design prototype. We were called back later with arequest for additional data modeling assistance. The team was very concerned becauseas far as they could tell, the initial data model did not work—performance was completely unacceptable. Basic queries took between 10 and 20 minutes, and some of the morecomplex queries ran for hours. The project team, which had a solid data designbackground, concluded that the design must be wrong. A little probing revealed that notuning had been done at all! In our experience one or two well-placed indexes can take queries that run for hours down to less than a minute, even on small volumes of data.Rather than jumping into a complete revision of the data model, the team spent severaldays tuning the prototype. It turned out that the data model was just fine. The prototypemust include a tuning step. This is especially important because there have beeninstances where people who don’t understand dimensional star schema design willpounce on a poorly performing prototype as proof that star schemas don’t work.
Develop a Meaningful Test Suite A typical test suite for a technology evaluation strives to test the components across a

13.16
range of requirements. Typically, these include the following areas:
•
Simple/complex functionality. Technical evaluations need to explore the full range of functions that will be needed. Too often the focus is on only one extreme. Someexplore only simple requirements. In other instances the most difficult case that anyone could dream up is provided as the base criteria. You need to take a balancedapproach. If the most complex report has never been developed using any tool, it isprobably not the only thing to use in an evaluation. This does not mean you should ignore it, but you also need to gain an understanding of the basic and middlecomplexity requirements.
• Low/high data volume. For many technologies, testing with low volume alone issufficient if paired with solid reference checking. In some cases, high-volume testing may be wise, such as selection of RDBMS software, especially for a large warehouse.
•
Single/multiuser. Single user testing can provide insight into how the functions work.Multiuser testing provides insight into performance implications of multiple users. The multiuser tests should reflect a combination of short browsing queries and multitablejoin queries. Again, reference checking can be used to learn about broad-scale usage characteristics.
Define Completion Criteria
A prototype is really a microproject. All the steps in the Lifecycle must be done, but in ascaled-back fashion. The biggest problem with prototyping is that a prototype is oftenstarted without clear completion criteria.
Depending upon the product under evaluation, you may need to define and develop adata model, extract and transform the data, and develop queries and reports. Like the fulldata warehouse project, the prototype must have a well-defined scope. Things to consider include:
• What are you trying to accomplish? • How will you know when you are done? • What are your decision criteria? • What must be accomplished for the prototype to be considered a success? Never Move a Prototype into Production
One large organization we’ve worked with was doing a technical evaluation of multipledata access tools. The data model developed for this evaluation was used for theproduction data warehouse as well without further analysis. Rather than simply being an evaluation, the prototype was viewed as a quick way to get the data warehouse up andrunning. The biggest problem with this approach was that the user requirements were notadequately gathered, and a few days of modeling was not sufficient to fully develop the data model. The evaluation of the technologies became tied up with massive revisions ofthe data model based upon actual data content and user input. Consequently, theevaluation dragged on, and the data model was still not production ready. The entire process ended up taking several months.
It may take longer to work through a runaway prototype than it would if completerequirements were gathered and full data modeling had occurred. To put it another way, prototype development in no way diminishes the need for true requirements analysis androbust data modeling.
Other Lessons to Learn
For many companies, the development of a prototype provides the team with its first fulldose of hands-on data warehouse experience. We find it useful to keep a list of what youlearned during the process. In addition to product evaluation input, you should also learnabout:
•
Design issues. The prototype will highlight your current design’s strengths and weaknesses. Expect several major issues to fall out of the prototype. The good news isthis gives you a chance to figure out solutions to issues before they become big, publicproblems.
13.17
•
Data challenges. The prototype gives you another opportunity to understand what is really in the data (as opposed to what everyone thought was in the data). Trackingeverything that was corrected, unusual, or wrong in the data is important. Theseirregularities are typically manually corrected or simply thrown out during prototype development. Every quick fix applied during the prototype must have a correspondingfunction in the production data transformation process. In some cases the actual datacontent may drive modifications to the data model itself.
•
Usability. By working with the front-end tool in the context of the proof of design, the application developers can gain a realistic understanding of what will be required tobuild applications. The end users can look at the prototype to validate the data model and tool capabilities. This is more of a guided process than hands-on training for the users. It doesn’t make sense to train them at this point because they won’t be able todo real queries for a while. By the time they actually get the tool, they will have forgotten the training. Instead, it is much more effective to sit with the users in acontrolled setting to review what they need to be able to do. The users can posequestions, while a member of the core project team constructs the required analyses. In some cases, the users may want to build the analyses themselves. In these cases,the core project team member should guide them through one step at a time. Thisprovides the feedback you need with minimal time required from the business.
•
Analytical power. Once the data is loaded, you can build samples of the types ofanalyses needed by the business. If you did a technical evaluation of the front-end tool, there should be few surprises here. If you chose a tool through some other means (e.g., management fiat), the proof of design is especially important to verify that the toolprovides the needed functionality. Although you reviewed your requirements during thesales cycle with the vendors, this gives you a hands-on opportunity to not only prove that it can be done but to see what is required to do so. Usually, when you ask avendor if they provide a certain capability, the answer will be yes. Remember that weare dealing with computers and software here—you can probably figure out a way to do anything with any given tool. What you really need to know, is how. Then you need to ensure that this is acceptable to your organization.
Speed of Prototype Development
The development of a prototype is often completed in about 4 to 6 weeks. Since this is very resource intensive, some vendors charge for this service. While it is great to be ableto see results so quickly, do not let the speed of development cause expectations to riseto unattainable heights.
Tip
Many people, within both IS and the business community, think that if aprototype can be developed in 2 weeks, the production system should be readyin a month. This is not possible!
Several reasons why prototypes can be developed so quickly include:
• Scope modifications. To meet the short deadline, the scope of the data is oftenmodified (i.e., simplified) during development. For example, if an attribute is unclear, itmay be eliminated from the model.
•
Manual data correction. In most cases, the data is not auditable. No businessdecisions should be made from these prototypes. If errors are discovered in the data,such as two products with the same product code, one may simply be dropped. If adescription is unclear about what additional attributes apply, an educated guess ismade. While these modifications can be made manually to get the prototype workingquickly, they will change the meaning of the data. The real warehouse developmentprocess includes additional research to determine the correct handling of data errors.
•
No update mechanism. The method used to create the prototype database is usuallyeither manual or quickly coded programs. These are not designed to be efficient orrepeatable, and they typically don’t perform error checking. They are created simply tomove the data quickly.
•
Vendor consultant time. Once the sample data is delivered to a vendor, you do notknow the real effort that went into the development. Consultants working on these prototypes often work extremely long hours and over the weekends to get themcompleted—we can vouch for this from first-hand experience.

13.18
• Data warehouse experience. The vendor consultants already have a good understanding of data warehouse concepts and design. They know the technologyextremely well and have direct access to their own gurus.
Recommend a Product
This product recommendation should be presented in the form of a report summarizingwhat was learned and rationale for the team’s recommendations. The recommendationtypically must be approved by a variety of people or committees. Once therecommendation has been accepted, the contract negotiation can begin. Differentvendors price based on different measures, such as concurrent users, named users, number of connections, site, enterprise, and so on. Watch out for maintenance, services,support, and other add-on costs.
Whatever product choices you make, keep in mind that the data warehouse market is changing rapidly, especially in the front-end and data staging tool areas. You should expect to reevaluate your choices in two or three years and migrate to new tools if thebenefits support it.
Evaluation Shortcuts
It is rare for a warehouse project to go through detailed evaluations for all four of themajor areas listed earlier. Usually, one of several factors intervenes to make theevaluation process irrelevant. Some of these factors include:
• Existing IS product standards. In other words, “we only buy our servers from (fill in the blank for your organization).”
•
Existing resources. This usually means spare boxes or software licenses. Typically,these are cast-offs as a result of upgrades done to save troubled client/server transaction systems. Site licenses are a part of this factor. If your company has a sitelicense for a certain database product, it will take some strong evidence to justifyadditional spending.
•
Team experience or relationships. Often, if someone on the team has had a successful experience with a data warehouse product, that product becomes theleading candidate. This internal experience with a known quantity is extremely valuableto the team.
Prototyping Guidelines
There are several basic guidelines to follow when building a data warehouseprototype, whether it is being done as a proof of concept (described in Chapter 3), to select a product, or to simply prove the design. Regardless of the type ofprototype you are building, the following guidelines apply:
• Ensure you define your prototype scope, including completion criteria. • Avoid tackling too much at once. • Use a meaningful but small subset of data.
• Provide only a quick and dirty data load process. A manual manipulation processhelps you avoid the urge to run those programs to load data that would turn your prototype into a weak, unstable production system.
• Learn as much as possible about source system data problems during prototypedevelopment.
• Learn as much as possible about hardware and software capabilities during prototype development.
• Learn as much as possible about support requirements during prototypedevelopment.
• Get end user feedback. Don’t just put the tool on their desk and ask them whatthey think after a week or two. Work side by side with them for several short

13.19
sessions.
• Get references and call them. You’ll be amazed at what you learn, and you mayend up with another resource to call on when you need some experiencedguidance.
• Do not allow a prototype to be put into production! • Keep a close handle on expectations. Do not allow them to spiral out of control.
Most of all, be honest about what you see and learn while developing a prototype.Celebrate the positives and explore the negatives to determine what can be done to resolve or minimize the impact on the project. An objective analysis here cansave a lot of time and money down the road.
Note that product selection by decree doesn’t necessarily mean failure, but it does mean you need to review your requirements against the imposed system and immediatelyreport any reduction in scope or capability caused by this decision. For example, youmay not be able to update all the data every night, or the system might not be physically able to store the level of detail or amount of history desired. This trade-off should be a business decision. Present the alternatives to business management and work with themto reach a decision.
Evaluations for the Back Room
While following the general process described earlier, there are characteristics that areunique to each specific area of evaluation. The next several sections provide a high-level summary of back room evaluation areas.
Hardware Platform Evaluation
A full hardware selection is relatively rare for a small first data warehouse project due tothe effort involved. If your needs fall within a certain range, a full test probably isn’tnecessary. Work with a vendor to identify references with similar warehouse projects. If you do an actual test, take advantage of vendor facilities and resources as much aspossible. The test suites should include both front room and back room activities, alongwith multiuser stress tests. A hardware test is useful if you will be using a cast-off server. In this case, you want to verify that it has the capacity to handle your needs.
1.
Determine configuration based on architecture, requirements, and database testing.Key factors include:
–
Memory. Data warehouses are memory hogs, and performance is often greatlyimproved by having a lot of memory. The 64-bit architecture allows very large memory configurations (i.e., more than 2 GB RAM).
– CPUs. Start with at least two, even for small implementations. – Disk. See the discussion in Chapter 15 about RAID configurations.
–
Database optimizer. Verify the specific features of your database across differenthardware platforms (e.g., versions, platform-specific improvements).
2. Design and implement routines to collect test results. 3. Design the physical database (disk, indexes, etc.). 4. Load test data. 5. Code and implement the test suite and results collection process. 6. Run baseline tests. 7. Tune. 8. Run final tests.

13.20
DBMS Platform Evaluation
The database evaluation is similar to the hardware evaluation because in a sense, theyare two sides of the same coin. You need database operations to test the hardwareperformance, and the hardware platform will have a major impact on the databaseperformance. The same test suite should apply to both evaluation processes. Databaseevaluations are especially important with large warehouses—make sure you can load the data within the load window and that queries return in a reasonable amount of time.
1. Design and implement routines to collect test results. 2. Design the physical database, including disk layout, indexes, and striping. 3. Load test data.
4.
Code and implement test suite, including staging and query scenarios, and results collection process.
5. Run baseline tests. 6. Tune. 7. Run final tests. Data Staging Tool Evaluation
If you don’t have data warehouse experience, you’ll find that data staging tools are unlikeany other software products. You will typically have to learn how to use the product fromscratch before you can test it. Count on one to three weeks of training before you canstart testing.
1.
Test across a range of load and transformation scenarios—more than the initial warehouse set.
2. Test key load processes, like dimension management and fact table updates. – Can they generate surrogate keys and do key look-ups? – How do they handle slowly changing dimensions? – Can they create aggregations?
Other tools that your data warehousing project may use include scheduling, codemaintenance, bug tracking, FTP, telnet, and Web server software. Typically, these toolchoices have already been made for you. This is fine, since the warehouse project’s requirements for these tools are very similar to other projects’ requirements.
Evaluations for the Front Room
The most critical area requiring evaluation in the front room is for a data access tool. Hardware must be selected here, too, but it is often an easy choice based upon the enduser tool and the data warehouse hardware platform. Hardware platform evaluationconsiderations are discussed in the preceding section and are not repeated here.
Data Access Tool Evaluation
The data access tool market space has become one of most complex and confusingsegments in the industry. Ten years ago there were approximately five vendors sellingdata access tools. Today there are more than 75 vendors selling data access tools or components of tools. The problem is that most of these vendors will claim they can solveall of your business and technical problems. Common sense tells us it isn’t possible forevery tool vendor to solve all of our problems. If each of them could, why are there so many of them? All of the vendors give beautiful demonstrations of their solutions. It thenbecomes your job to sort out fact from fiction and begin to understand how the differenttools work from both a functional and an architectural perspective. In fairness, most ofthe vendors can actually perform the functions that are in their demos.
Selecting a front-end tool is an exasperating process. There are so many alternatives,they all have different strengths and weaknesses, and none of them ever seems to solve

13.21
the problem completely. As we described in Chapter 10, this is because there is more than one problem to solve. Tool selection is tough when we don’t understand that there isa range of needs, and that one tool might not meet all of them. We actually want all of thecapabilities from all the categories in a single, excellent tool. For example, once we build a query and validate it in the ad hoc environment, it may make sense to schedule thatquery and have it run as a standard report from then on. Next, we’ll want to use the samequery in a push-button EIS system. This all-in-one desire has only made the tool choice problem more difficult. Most of the tool vendors have their roots in one category, butthey’ve been pushed to include some or all of the remaining categories. They all cansafely say they provide many of the functions described next. Your challenge will be to see which ones can actually meet your requirements.
Choosing a Data Modeling Tool
Although affordable tools to support the modeling process are fairly well developedat this point, they still tend to lack an enterprise focus and need to improve theiropenness in terms of exchanging metadata. In general, the following list describesthe desired functionality needed to support the model creation and maintenanceprocess:
• The tool must be based on an open metadata model. That is, it must be able toread and write to standard RDBMSs so it can store its own metadata on the datawarehouse platform.
• Reverse-engineering capability (source access, standard format). • Generate formal data definitions (DDL) for a range of database targets. • Allow specification of both sources and targets. • Support both logical and physical models. • Capture business descriptions, textual info, example values, and help. • Capture business rules and transformation definitions. • Specific data warehouse capabilities (e.g., star schema modeling support). • Enterprise-oriented with multiuser, multisite availability of models. This includes: – Model coordination and synchronization – Development capabilities (project support) – Version control – Library (check in, check out) • Provide a range of standard reports and flexible report customization.
• Ease of use. Present the model in a readable, controllable graphicalrepresentation, with the ability to identify subsections of the model.
• Import/export the model to and from other modeling tools.
• Generate DDL for only those elements that have changed (instead of an entirenew version).
• Support for database capabilities (e.g., triggers, stored procedures). • Support for existing development tools.
We feel obliged to note that we’ve been able to build many successful warehouseswith data modeling tools no more sophisticated than Microsoft Excel andPowerPoint.

13.22
Tip
The real question for data access tool evaluation is not only how they perform the functions, but how well do the tools scale, how much administration do thetools require, and what is the payoff for that level of administration.
The data access tool evaluation is probably the one evaluation area almost everywarehouse project goes through at some point. It is different because it includessignificant user participation. The first and critical step is to revisit the requirements andarchitecture. Although these steps follow the general evaluation process describedearlier in this chapter, the nuances of the data access tool warrant additional clarification.The following recommendations should help clearly define what a tool needs to provide:
•
Be very specific about the requirements. Compile a comprehensive list of the types of calculations that the tool will need to support (this year/last year, regression, timeperiod comparisons, share, etc.). Include other critical functionality, like Webpublishing, complex formatting, report scheduling, and so on.
•
Educate yourself and the evaluation team on the basics so that the vendors cannot pullthe wool over your eyes. Conduct literature searches for product information. Obtainindustry analyst reports on tool comparison. Contact anyone you know who may havesome direct experience.
• Review the data access tool features that we discussed in Chapter 10, to make sure you haven’t forgotten to list important features.
• Identify product candidates and rank based on priorities.
•
Develop a business case that represents a reasonable scenario. Don’t ask for themonster report that no one has been able to produce to date, but rather a realistic instance. Include business measures that mathematically represent the range that willbe required overall. This, tied with a scaled-down dimensional model, will be very helpful. You’ll get the information you need, and the vendors get a request that is in terms they can understand. (We still feel compassion for those presales consultants.)
• Install and test top candidates.
• Conduct user review sessions. User involvement is invaluable for two reasons: to gettheir perspective and to get their support for the final choice.
•
Heavy use of references is also important. You are looking for sites with similarbusiness problems, similar technical environments, and similar data/user volumes. Ofcourse, all these characteristics will probably never be shared by the same reference,so you need to talk to or visit several sites.
• Collect and organize test results and user feedback.
• Expect to be surprised when you actually select and install the tool and get it working for real in your own environment. No matter how good your tool selection process, there willalways be surprises.
Installation
Installation issues are very different among software products, and obviously differentbetween software and hardware. Your best bet to ensure successful installation is to payclose attention and take careful notes during the prototype process. In most cases, youshould have an expert in the product involved in the installation. Certain configuration parameters set during installation can have a major impact on the performance of thewarehouse. The following major steps should help you ask the right questions:
•
Site preparation. Make sure you have a place to put the component, whether it is hardware or software. There’s more to installing a large server than just plugging it in.You need a controlled environment with clean power and space. Servers haveproliferated over the last few years, and in many cases, space is at a premium. Make sure you work with the operations folks to find out where the box is going before itshows up on the loading dock.
• Training. Hopefully, the operations group has experience with the components youare bringing in. The team will need to know how it works as well, so include appropriate training in your install plan. This includes hardware and operating system

13.23
administration training. There is nothing more frustrating than for an uninitiated teammember to be stumbling around in UNIX, trying to figure out what is going on by trial and error.
• Installation, checkout and test. Bring it in and get it going.
• Acceptance criteria. Especially for a large warehouse, it’s a good idea to negotiateacceptance criteria based on minimum performance levels determined during the evaluation process.
Key Roles
Keys roles for creating the architecture plan and selecting products are highlightedbelow. Tasks to address short- and long-term security issues are included here too, although the concepts and tasks are detailed in Chapter 12. Since Chapter 12 is a graduate course, we want to ensure that all readers note the need for tasks devoted to security:
•
The special teams play a driving role in creating the technical architecture. Thedata warehouse architecture must be an extension of the existing corporatearchitecture, thus requiring participation from mainframe, client/server, networking, and security specialists.
•
The project manager must take a lead role in the battle for a secure environment,starting with educating the organization through ensuring that proper measuresare implemented and maintained. While the project manager will not be the oneto implement these measures in most cases, he or she does need to be heldresponsible, otherwise it will slip through the cracks.
• Specific technical specialists need to implement any changes to the environment, based upon the tactical and strategic plans.
•
The product selection process requires involvement from the technical specialistsas well as from the key team members who are the primary users of thatcomponent. For example, the data staging team plays a critical role in selectionof extract, cleansing, and transformation products.
• Installation again requires joint effort between the core data warehouse team andthe technical specialists who have the necessary skills to install each componentproperly.
Estimating Considerations for creating the architecture plan
You must have an initial architecture plan in place early in the process. This initialplan can be at a high level and incomplete, but it should allow the team to identifytheir parts and begin working on them in parallel. Additional architectural details willfall into place over time, as you gather real world experience working with the data,the platforms, the tools, and the users.
There is a spectrum of approaches to creating an architecture, ranging from a fewscribbles on the back of an envelope, to a full-blown, multiperson, multiyear struggle. In general, where your project falls on the spectrum depends on the overall size and scope of thewarehouse and on the level of detail desired. Theapproach we advocate is somewhere in the middle, requiring a month or two ofelapsed time, concurrent with other activities as illustrated on the lifecycle
diagram, and resulting in a practical, usable blueprint for the warehouse. Figure13.7 shows a matrix of the major drivers of an architecture effort.

13.24
Figure 13.7: Architecture development effort.
The closer you can get to the lower-left quadrant, the better. The upper-right quadrant ends up being an enterprise architecture project and usually gets tangledup in a complex web of organizational and technical issues.
Estimating Considerations for selecting products
Often hardware and/or software vendors provide (sometimes at minimal or no cost)resources to develop a prototype. You will want to actively participate, too. Sincedevelopment is occurring at your own facility, you should absolutely use this opportunity to begin to learn the technology. This also allows you to discover anyinstallation challenges first hand. If you go through a full-blown product selection process, count on two person-months of effort for each major area.
Summary
In this chapter we have reviewed the processes used to create and implement thearchitecture required to support the data warehouse. First we reviewed creation of yourarchitecture, focusing on the two main deliverables from the architecture process: the architecture plan and the infrastructure plan. Then we described how to select productsto make your architecture real. Finally, we briefly reviewed general considerations forinstalling those products. Be sure to consult the project plan spreadsheet at the end of this chapter for a summary of the tasks and responsibilities for creating the architectureplan and selecting products (Figure 13.8).
Figure 13.8 Project plan tasks and responsibilities for creating the architecture plan and selecting products.

14.1

14.2
Overview
The single most dramatic way to affect performance in a large data warehouse is toprovide a proper set of aggregate (summary) records that coexist with the primary base records.
Tip
Aggregates can have a very significant effect on performance, in some casesspeeding queries by a factor of 100 or even 1000. No other means exist toharvest such spectacular gains. Certainly, the IS owners of a data warehouse should exhaust the potential for using aggregates before investing in newhardware.
The benefits of a comprehensive aggregate building program can be realized with almostevery data warehouse hardware and software configuration, including all of the popular relational DBMSs such as Oracle, Red Brick, Informix, Sybase, and DB2, as well asuniprocessor, SMP, and MPP architectures. We describe how to structure a datawarehouse to maximize the benefits of aggregates, and how to build and use those aggregates without requiring complex accompanying metadata.
The basics of aggregate navigation have been summarized earlier in the book. The mainpoints are:
• In a properly designed data warehouse environment, multiple sets of aggregates are built, representing common grouping levels within the key dimensions of the datawarehouse.
•
An aggregate navigator is a piece of middleware that sits between the requesting clientand the DBMS as shown in Figure 10.2. An aggregate navigator intercepts the client’s SQL and, wherever possible, transforms base-level SQL into aggregate-aware SQL. An aggregate navigator understands how to transform base-level SQL into aggregate-aware SQL, because it uses special metadata that describes the data warehouseaggregate portfolio.
While this chapter does contain advanced content, it is also useful for anyone who wants to understand what aggregates are and the basic principles of their design. Data modelers andDBAs should study this chapter to understand how aggregate structures should bedesigned. The data staging team also needs to study this chapter to understand how to create and maintain aggregates.
Aggregation Goals and Risks The goal of an aggregate strategy in a large data warehouse must be more than just
improving performance. A good aggregate strategy should also do the following: • Provide dramatic performance gains for as many categories of user queries as
possible.
• Add only a reasonable amount of extra data storage to the warehouse. What isreasonable is up to the DBA, but many data warehouse DBAs strive to increase the overall disk storage for the data warehouse by a factor of two or less.
• Be completely transparent to end users and to application designers except for theobvious performance benefits; in other words, no end-user application SQL should reference the aggregates.

14.3
• Directly benefit all users of the data warehouse, regardless of which query tool theyuse.
• Impact the cost of the data extract system as little as possible. Inevitably, a lot ofaggregates must be built every time data is loaded, but their specification should be asautomated as possible.
• Impact the DBA’s administrative responsibilities as little as possible. The metadata that
supports aggregates should be very limited and easy to maintain.
A well-designed aggregate environment can achieve all of these objectives. A poorlydesigned aggregate environment can fail all of the objectives. We begin by helping youdecide what to aggregate, and then we will provide four design goals that, if followed, will achieve all of your desired objectives.
Deciding What to Aggregate
First, all data warehouses will contain prestored aggregates. If you are developing a datawarehouse that will not have any history loaded initially, you may think that you do not need to build any aggregates. However, depending upon the size of your data, you maystill need to consider building some aggregates. Two different areas need attention whenyou are designing aggregates: the structure of storing them and which ones to build. Details about aggregate structures can be found later in this chapter. Here, we will reviewthe process you can use to determine which aggregates you need to build.
Before you get too concerned about deciding which aggregates to build, keep in mind that these will change. You will add and take away aggregates periodically. They shouldbe considered a performance-tuning vehicle. You need to build some aggregates,conduct some performance tests, and then revise which aggregates you will use in production. From there, you need to monitor aggregate use over time and makeadjustments accordingly. Relax, changing your prestored aggregates is not acomplicated thing as long as your users are isolated from changes with an aggregatenavigator. Decide on a set of aggregates to start with, and then make adjustments asneeded.
Two different areas need to be considered when selecting which aggregates to build.First, you need to consider common business requests. Second, you need to consider statistical distribution of your data. When working with your business users, you will get asense of the primary reporting levels that are in place already. Often these arecategorized by major geographic groupings, major product lines, and regular reporting time periods (weeks or months). Review each dimension to determine which attributesare commonly used for grouping. Next, review the combinations of these attributes todetermine which ones are used together. Pay careful attention to this if you have a lot of dimensions. If each dimension has 3 attributes that are candidates for aggregation, andyou have 4 dimensions, you could build 256 different aggregates. This is perhapspossible, although likely unnecessary. However, if you have 8 dimensions (each having 3 candidate attributes), then the possible aggregates jumps to 65,536! Not all combinationsof these candidate attributes will be commonly used together.
Another thing to consider is the number of values for attributes that are candidates for aggregation. For example, suppose that you have 1,000,000 values for the lowest levelproduct package. There is a need to report at the product level, which is the next level ofdetail, and it has 500,000 values. Prestoring a product level would not provide a significant improvement since you are dealing with almost the same number of rows.However, if the product level has only 75,000 values, it would be a very strong candidatefor a prestored aggregate.
This statistical view can also be used to identify possible aggregates that would provide asignificant reduction in the number of rows processed, even if it is not a commonbusiness request. For example, you are tracking inventory for 300,000 parts. The mostcommon reporting attribute in the part hierarchy is part class that only has 100 values.You may want to consider aggregating to part type, which is not commonly used by thebusiness today but has 500 values. Another thing that would support this decision is ifthere are additional attributes that relate to part type that are of interest to the business,even though they are not commonly used today.
Another possibility is to create a composite aggregate, one that contains more than one

14.4
attribute from a dimension. For example, suppose that you have 10,000,000 consumers in your data warehouse. You know that many requests are needed for state/provincereporting, which has less than 100 values. The users are unable to clearly identify otherspecific attributes that will be used frequently. In order to support these other common requests, consider building an age/gender/income range aggregate. Business users maynot ask questions that pull data directly from this aggregate table, but this aggregate maybe used to create additional aggregates on the fly. Before implementing a compositeaggregate, consult with your data access or aggregate navigation software vendor to findout if they can use this type of aggregate.
We recommend that you develop a list of initial aggregates that you would like to build right after you finish data modeling, when the users’ requirements are still fresh in your mind. Bythe time you have loaded data into the database, you may have forgotten what the commonrequests are.
Develop the Aggregate Table Plan
In many ways, the creation and use of aggregates parallels the creation and use ofindexes. Like an index, an aggregate is a data structure that facilitates performance andrequires the attention of the database administrator. Chapter 16 on data staging describes the creation and administration of aggregates in detail.
Note that what you do with aggregates depends in a large part on what tools you have available. Specifically, you need to have an aggregate navigator to help your users takeadvantage of aggregate tables without having to learn to navigate them manually. If youraggregate navigator is built into the front-end tool, you may also need to collect usage information for aggregates, both the aggregate tables and all queries with aggregatefunctions, out of your usage monitoring tables. This is important because the initialaggregates you choose are not likely to be the ones people use most.
Still, your initial plan can come close if you do a little research. First, determine whatmight be useful. Review the requirements document and application plan, looking formention of higher-level grouping needs. Next, determine what might make an impact. Go back through the data audit and database design information (and potentially the dataitself), looking for counts at each level of the hierarchy in each dimension. An easyexample of this is the Period dimension table. If we had a Period table that covered five years, the information would look like this:
Level
Count
Day
1,826
Month
60
Quarter
20
Year
5
Total
1
A simple Product dimension table might look like this: Level
Count
SKU
2,023
Product
723
Brand
44
Category
15
Total
1
Next, you need to get a sense for the sparsity of the data. In our case, we need to knowwhat percentage of products are sold on a given day. Once you have all this information, a little spreadsheet work will help you calculate the number of aggregate rows you wouldhave at each level of aggregation. In the extreme case, where there is no sparsity, everySKU is sold every day, which results in almost 3.7 million rows at the detail level. Figure

14.5
14.1 shows the row counts for the zero sparsity case, in thousands, for every intersectionof the two dimensions. Figure 14.2 shows the row counts for the 50-percent sparsity case (half the SKUs are sold on a given day).
Figure 14.1 Aggregate counts with zero sparsity.
Figure 14.2 Aggregate counts with 50 percent sparsity.
Finally, look for places where there are both value and impact. In our example, an aggregate by Month and one by Brand are two places to start. At the risk of stating theobvious, the Month aggregate alone cuts the data to 1/30 of the detail size. The Brandaggregate cuts it again to about 1/50 of the detail size. That means if someone asks for brand totals by month in the zero sparsity case, we need only select 2,640 rows from theaggregate table rather than summing 3,693,998 rows from the detail table. This has to befaster, regardless of the platform.
A Product aggregate may be useful if a lot of reporting is done at the product level. Notethat a product aggregate has less impact if the detail data is somewhat sparse. Our two-dimensional example is much simpler than the real world. Determining the interactionsamong multiple dimensions can be mind bending. This is another argument for getting atool to help.
Processing Aggregates
How do we actually create aggregates? The only absolute requirement is thataggregates are fed from the underlying atomic base data. There are several variations on the theme of building aggregates:
1.
Aggregates are built outside the target DBMS by sorting the granular input data andcalculating break rows. The break rows are the aggregates, by definition. In thisapproach, the aggregates exist outside the DBMS before the load step, and they canbe separately archived along with the base data.

14.6
2.
Aggregates are built over a period of time by adding the current load records toexisting accumulating buckets in the DBMS.
3.
Aggregates are built automatically as part of the load process. This can be thought ofas a variation of the first two techniques, but where the aggregates do not physicallyexist outside the DBMS.
4.
Aggregates are built inside the DBMS using SQL after the granular data has beenloaded.
Generally, we do not recommend the last option. Aggregate building involves two stepsthat may be inefficient inside the DBMS. First, aggregate building is necessarily a sorting operation. Sorting may be much faster outside the DBMS with a dedicated sort packagethan inside the DBMS using the ORDER BY clause in SQL. Second, a crucial step inaggregate creation is looking up the appropriate surrogate key value for the aggregate or possibly even assigning a new surrogate key if the aggregate has never beenencountered in the data before. The logic for doing these operations is simple enough,but this is sequential processing, not relational processing.
Tip
The surest sign that aggregate creation is based on the wrong technology isthe existence of a long programming script with embedded SQL SELECT,INSERT, UPDATE, and DELETE statements. Most aggregate creation shouldbe done outside the DBMS with dedicated sorting packages and flat file programming logic. This process is not relational.
The creation of aggregates is equivalent to the creation of break rows in a report. Ifaggregates representing product category totals are needed, then the incoming datamust be sorted by product. Actually, several passes may be required to produce all thecategory aggregates. For example, if the base fact table data has a granularity of productby store by day, we might want to produce the following aggregates:
• Category by store by day • Category by region by day • Category by store by month and • Category by region by month
If we are loading data every day, then for each day the first two aggregates can becreated entirely from the daily load. Two sorts of the data are required: The first isstore/product with products rolling up to categories within each store. The second isregion/product with products rolling up to categories within each region. If stores roll intoregions, we could create the aggregates with a single sort.
The first sort can also be used to augment the category by store by month aggregate byreplacing the day surrogate key with the proper month surrogate key and presenting thisrecord to the category by store by month fact table. When we say augment, we mean that the records generated each day either cause an insert or an update. We can’t tellwhether an insert or an update is required until we present the new aggregate record tothe fact table. If a record with the same key is already present, we do an update, addingthe appropriate facts to those already in the target record. If the record with the same keyis not in the fact table, we perform an insert. It is a good idea to have a DBMS loader thatcan perform these augmenting loads in a bulk mode. If a sequential program has tocheck the database record by record to decide whether to perform an update or aninsert, the load process will run far more slowly.
Every time we encounter a new aggregate that we have never seen before, we need to generate a new surrogate key for it. For instance, if we encounter a new productcategory, we must create a new key.
Keys for aggregates are by definition surrogate keys. To put it another way, there is no bar code for the Candy category. To maintain the needed flexibility for the datawarehouse, the DBA should assign aggregate keys during the aggregate creationprocess. For the same reason we do not use production keys at the granular productlevel in our data warehouse, we do not want to use production keys for aggregate entitieslike category or sales district. Sooner or later, the requirements for the production keyswill diverge from the requirements for the data warehouse keys. It is much better for the

14.7
data warehouse to assign its own keys for everything at the outset.
Each load of new fact records requires that aggregates be calculated or augmented. It isvery important to keep the aggregates synchronized with the base data at every instant in time.
Tip
If the base data is updated and placed on-line, but a delay ensues before the aggregates are updated, then the old aggregates must be taken off-line until the new ones are ready. Otherwise, the aggregates will not correctly mirror the base data. In this situation, the DBA has to choose between delaying the publishing of the datauntil both the base data and the aggregates are ready or releasing the revised basedata in a performance-degraded mode while the aggregates are being updated off-line.
Administering the Aggregates
Over the course of time, the DBA will create and drop aggregates. The beauty of theaggregate navigator architecture is that the aggregates behave very much like indexes.They are used if they are present, but the system runs if they are not present. End usersand application developers do not have to explicitly code their applications for thepresence of aggregates.
Aggregates are a dynamic resource in the data warehouse environment. The DBA needs to study the aggregate statistics fairly frequently. Aggregates that are not being used canbe dropped. This will free up disk space and will simplify the extract and load process.Hopefully, the statistics will also give a clear picture of which new aggregates should be built and what the trade-offs will be. The DBA needs to estimate how big the newaggregates will be and how long it will take to build or augment them during each extractand load cycle. Ideally, the DBA should estimate how much query time will be saved, but this may have to wait to be measured directly.
Tip
As a general rule of thumb, it is reasonable to plan on a 100 percent storageoverhead for aggregates as a target for the overall data warehouse.
In other words, the sum of all the aggregate tables should be approximately equal instorage to the sum of the lowest-level base tables. If the sum of the aggregate tables is25 percent or less of the base tables, then almost certainly the users are payingperformance penalties that should be addressed. Similarly if the sum of the aggregatetables is several times that of the base tables, too many aggregates have been built.Some are not being used, and the biggest aggregate tables probably have been built tooclose to the base level. There is a detailed discussion of a phenomenon known assparsity failure in The Data Warehouse Toolkit, where we explained how the size of the aggregate tables can overwhelm a data warehouse.
It is also possible to build aggregates that are too close to each other. If only five subcategories roll up to a category, it probably isn’t worthwhile to build aggregates atboth levels. Try taking the category aggregate off-line. The subcategory aggregate will then be chosen for all category queries, and this may yield satisfactory performance.Conversely, perhaps no one is asking for subcategories. In that case, keep the categoryaggregates instead.
The underlying physical sort order of the database often provides a kind of wild card that reduces the need for aggregates in at least one dimension. For instance, if we have retailsales data physically sorted by time by product by store, then all the records for todaymay be in a set of sequentially assigned disk blocks. Within each of these blocks will be a large number of records, all for a given single product. The individual adjacent recordswill represent each store. See Figure 14.3. A query that looks at a single product on asingle day will automatically access many store records with each disk block fetch. Thus a one-way Region aggregate on the store dimension would probably not result inimproved performance. The store aggregate should be left out of the aggregate plan ifthe physical sort order is time by product by store.

14.8
Figure 14.3 Sort order wild card.
The DBA should take advantage of the flexibility afforded by the aggregate navigator andshould feel free to take aggregates off-line and put them on-line at any time. Doing so allows aggregate processing to take place after the primary loading.
The DBMS loader should support the natural activities of building and maintainingaggregates. If the DBMS loader does not support the creation of aggregates as part ofthe primary data load, the aggregates will have to be loaded by passing the data throughthe loader multiple times. Individual sales transaction records, for instance, may beloaded initially into a transaction grain fact table one by one. These same records maythen be loaded into one or more monthly accumulating buckets. There are two mainscenarios for loading this monthly data:
1.
The incoming data is saved until the end of the month when it is totaled correctlyoutside the DBMS and loaded in that form. The monthly records simply are stored in a fresh monthly bucket when this load event takes place.
2.
The incoming data is loaded incrementally each day into an accumulating monthlybucket. In this case, the timestamp on each incoming record must be replaced with the correct monthly surrogate key. The individual records are then presented to theDBMS loader. As each record arrives in the monthly file, the loader must decidewhether to create a new record or whether to augment an existing record. A new record will be created whenever a product is sold in a store for the first time in amonth. Otherwise, the incoming record must augment one with the same set of keys.It is very desirable for the DBMS loader to support high-speed bulk loading with this option of augmenting existing records. If the DBA builds a SQL script that tests forthe existence of a record and branches to either an UPDATE or an INSERT, theresulting load operation will run 100 times more slowly than if the DBMS loader hasnative support for augmenting.
It is fairly common to change the boundaries of aggregates. The Sales department maydecide that aspirin should no longer be in Cough and Cold but should be in Over theCounter. Once such a decision is made, Sales usually wants past history to reflect the change, not just the history from this point in time forward. In The Data Warehouse Toolkit, we discussed a so-called Type 3 change that allows the sales department tocarry both categorizations for a period of time. The DBA has a couple of interesting choices in this situation. If the Type 3 change has been implemented with Over theCounter as the value of the Category attribute, and Cough and Cold as the value of the Old Category attribute, then aggregates can be built on both Category and Old Category. The aggregate navigator will transparently provide the performance benefit for bothchoices. If, however, the change is made permanent and the Cough and Colddesignation is discarded, the DBA should just build the new aggregate.
When aspirin is transferred out of Cough and Cold, the DBA probably should not rebuildthe entire set of Cough and Cold aggregates from scratch. The aspirin time series canmerely be decremented from Cough and Cold, by using the augmentation feature of the loader described earlier. Then the aspirin time series must be added to the Over theCounter aggregates by reversing the procedure.
In organizations with category managers, such as packaged goods manufacturing,distribution, or retail, this kind of category boundary adjustment happens continually. Itwould be worthwhile for the IS department to build an application specifically forautomating this aggregation maintenance process.
Finally, aggregates play an important role during system recovery. If a data mart must be rebuilt either because of system failure or an administrative blunder, and no current

14.9
disk-level backups are available, then the daily load scenario may have to be replayedforward from some point in time. Generally, this is easier if this scenario is mostly loading and very little administering. By storing the aggregates for safekeeping duringthe extract process, the DBA may be able to add them to the bulk loading processrather than running slower in-DBMS processes.
Design Goals for an Aggregate Navigation System
The remainder of this chapter describes a specific architecture for building aggregates in your data marts and surrounding those aggregates with a minimal amount of easilymaintained metadata. This architecture is simple enough that you could consider buildingit yourself, if you can provide some system programming between your query andreporting tools and your database server. If you are not inclined to develop your ownaggregate navigation tools, this section can be used as a guideline for judging thecomplexity of various vendors’ aggregate navigation approaches.
Keep in mind as you read this next section that your choice of front-end tools will also have an impact on aggregate design.
Design Goal 1
Tip
Aggregates must be stored in their own fact tables, separate from the baseatomic data. In addition, each distinct aggregation level must occupy its own unique fact table.
The separation of aggregates into their own fact tables is very important. First, theaggregate navigation scheme we describe is simpler when the aggregates occupy theirown tables, because the aggregate navigator can learn almost everything it needs fromthe DBMS’s ordinary system catalog, rather than requiring additional metadata.
Second, an end user is less likely to double-count additive fact totals accidentally when the aggregates are in separate tables because every query against a given fact table willby definition go against data of a uniform granularity. Double-counting is a significant risk when the aggregates are placed in the same fact table as the base data.
Third, the small number of giant numerical entries representing, for instance, nationalsales totals for the entire year do not have to be shoehorned into the base table. Often,the presence of these few giant numbers forces the database designer to increase the field widths of all entries in the database, thereby wasting disk storage. Because thebase table is a huge table that can occupy as much as half of the entire database, it isvery helpful to keep its field widths as tight as possible.
Fourth, the dimension record that represents the aggregated item (say, a category recordin a low-level product table) will be much simpler if it is represented in a shrunken versionof the dimension table that is separate from the expanded, original version of the dimension table. If the aggregate dimension entry is stored in the low-level table, it is represented at the wrong grain and must contain many null or “not applicable” fieldentries. For instance, a category record in a typical 50-attribute product dimension table might contain 45 nulls, because attributes like flavor and package size do not makesense at the category level. All of these null entries cause hiccups in user interfaces andqueries.
Fifth, the administration of aggregates is more modular and segmented when the aggregates occupy separate tables. Aggregates can be built at separate times, and usingan aggregate navigator, individual aggregates can be taken off-line and placed back on-line throughout the day without impacting other data.
Design Goal 2
Tip
The dimension tables attached to the aggregate fact tables must, whereverpossible, be shrunken versions of the dimension tables associated with thebase fact table.
We assume a typical star join schema structure exists in which a large central fact table is surrounded by a single level of independent dimension tables. This schema isillustrated in Figure 14.4.

14.10
Figure 14.4 A typical unaggregated set of fact and dimension tables.
In other words, using the base-level fact table in Figure 14.4, you might wish to buildcategory-level aggregates that represent the product dimension rolled up from theindividual product to the category. See Figure 14.5.
Figure 14.5 The one-way category aggregate schema.
Notice that in this example you have not requested aggregates in either the Timedimension or the Store dimension. The central Sales fact table in Figure 14.5 represents how much of a category of product was sold in each store each day. Your designrequirement tells you that the original Product table must now be augmented with ashrunken Product table, called Category. A simple way to look at this shrunken Producttable is to think of it as containing only those fields that survive the aggregation fromindividual product up to the category level. Only a few fields will still be uniquely defined.For example, both the category description and the department description would be well defined at the category level, and they must have the same field names they have in thebase product dimension table. However, the individual SKU number, the package type,and the size would not exist at this level and must not appear in the category table. This addresses the fourth point in the preceding section.
Shrunken dimension tables are extremely important for aggregate navigation because the scope of any particular aggregation level can be determined by looking in the systemcatalog description of the shrunken table. In other words, when you look in the Categorytable, all you find is category description and department description. If a query asks for product flavor, you know immediately that this aggregation level cannot satisfy the query,and thus the aggregate navigator must look elsewhere.
Shrunken dimension tables are also attractive because they let you avoid filling the original dimension tables with null or “not applicable” values for all of the dimensionattributes that are not applicable at the higher levels of aggregation. Because you don’thave package type and size in the category table, you don’t have to dream up null values for these fields, and you don’t have to encode user applications with tests for these nullvalues.
Although we have focused on shrunken dimension tables, it is possible that the fact tablewill also shrink as you build ever-higher levels of aggregation. Most of the basic additive

14.11
facts, such as dollar sales, unit sales, and dollar cost, will survive at all levels ofaggregation, but some dimensions, such as promotion, and some facts, such aspromotion cost, may make sense only at the base level and may need to be dropped inthe aggregate fact tables.
Design Goal 3
Tip
The base atomic fact table and all of its related aggregate fact tables must beassociated together as a “family of schemas” so that the aggregate navigator knows which tables are related to one another.
Any single schema in the family consists of a fact table and its associated dimensiontables. There is always exactly one base atomic schema that is the unaggregated data,and there will be one or more aggregate schemas, which represent computed summarydata. Figure 14.4 is a base schema and Figure 14.5 is one of perhaps many aggregate schemas in your family.
The registration of this family of fact tables, together with the associated full-size and shrunken dimension tables, is the sole metadata needed in this design. Obviously, thisdesign is a guide for you. You may have a specific query or reporting tool that departsfrom this level of detail. However, one of the points of this section argues that aggregate navigation can be fairly simple. If a candidate query or reporting tool imposes a muchmore complex aggregate administration on your data warehouse than is described here,you may want to continue looking for something simpler.
Design Goal 4
Tip
Force all SQL created by any end user data access tool or application to referexclusively to the base fact table and its associated full-size dimension tables.
This design requirement pervades all user interfaces and end-user applications. When users examine a graphical depiction of the database, they should only see the equivalentof Figure 14.4. They should not be aware that aggregate tables even exist. Similarly, allhand-coded SQL embedded in report writers or other complex applications shouldreference only the base fact table and its associated full-size dimension tables. In environments in which ad hoc query tools let the end users see every table in the system, it is a good idea to place the aggregate tables in a separate database to hidethem from end users. Because the aggregate navigator maintains its own connections tothe DBMS, this should not present a technical problem.
Aggregate Navigation Algorithm
Assuming that you built your dimensional data warehouse according to these four designrequirements, you are now in a position to understand how aggregate navigation works.
The aggregate navigation algorithm is very simple. It consists of only three steps:
1.
Sort the schemas from smallest to largest based on row count. For any given SQLstatement presented to the DBMS, find the smallest fact table. Choose the smallestschema and proceed to Step 2.
2.
Compare the table fields in the SQL statement to the table fields in the particular factand dimension tables being examined. This is a series of lookups in the DBMSsystem catalog. If all of the fields in the SQL statement can be found in the fact and dimension tables being examined, alter the original SQL by simply substitutingdestination table names for original table names. No field names need to bechanged. If any field in the SQL statement cannot be found in the current fact and dimension tables, go back to Step 1 and find the next larger fact table. This processis guaranteed to terminate successfully because eventually you arrive at the baseschema, which is always guaranteed to satisfy the query.
3.
Run the altered SQL. It is guaranteed to return the correct answer because all of thefields in the SQL statement are present in the chosen schema.
The beauty of this algorithm is that almost no metadata is required to support generalnavigation. The metadata amounts to only one row for each fact table and dimensiontable in the aggregate schemas. The maintenance of the metadata does not requirecomplex logical modeling. Only the existence of the shrunken fact and dimension tables

14.12
must be recorded.
In actually implementing this algorithm, several points are worth noting. In Step 2, onlythe shrunken dimension tables and the fact table must be examined. If a given schemauses a base-level dimension table, then its fields do not need to be searched because a match is guaranteed. For example, in the aggregate schema shown in Figure 14.5, the time and store dimension tables are not shrunken. Any SQL reference to a field in one of these tables does not need to be checked. Only references to fields in the product tableand the fact table itself must be checked. In the case of Figure 14.5, the check will be successful only if the references to the product table are restricted to the categorydescription, the department description, or both. In a successful match, the final SQL differs from the original SQL only by the substitution of Category for the table nameProduct and sales_fact_ agg_by_category for the table name sales_fact.
For example, if our original SQL is: select p.category, sum(f.dollar_sales), sum(f.dollar.cost) from sales_fact f, product p, time t, store s where f.product_key = p.product_key and f.time_key = t.time_key and f.store_key = s.store_key and p.category = 'Candy' and t.day_of_week = 'Saturday' and s.floor_plan_type = 'Super Market' group by p.category
we are asking for the total dollar sales and total dollar cost of all candy sold insupermarket stores on Saturdays. The aggregate navigator scans this SQL and firstlooks at the aggregate tables in Figure 14.6 because that aggregate is the smallest,having only 200 fact table rows. However, this aggregate fails because the constraints ontime (day_of_week) and store (floorplan_type) both violate this schema. Day_ of_week cannot be found in the Month aggregate dimension table, and floorplan_type cannot befound in the Region aggregate dimension table.
Figure 14.6 The three-way category-month-region aggregate schema.
Then the aggregate navigator tries the next larger schema, shown in Figure 14.5. This time it is successful. All of the fields in the SQL query match. In particular, the product references to Category are found in the shrunken product table named Category. Nowthe aggregate navigator replaces the table references and produces the following SQL.Only the items set in bold are different:
select p.category, sum(f.dollar_sales), sum(f.dollar.cost) from sales_fact_agg_by_category f, category p, time t, store s where f.product_key = p.product_key and f.time_key = t.time_key and f.store_key = s.store_key and p.category = 'Candy' and t.day_of_week = 'Saturday' and s.floor_plan_type = 'Super Market'group by p.category
The most straightforward implementation of the aggregate navigation algorithm woulddecompose the SQL query and look up each field name in Step 2 of the algorithm. Each such lookup would be a SQL call to the DBMS’s system tables. This is not a crazyapproach because such calls are quite efficient and should run in a few hundredmilliseconds each. However, in a large and complex data warehouse environment, a

14.13
practical consideration arises. Calls to the DBMS system tables may take severalseconds each, rather than several hundred milliseconds. If six or eight layers ofaggregate tables exist, the aggregate navigator may take 20 seconds to determine the correct choice. This is an example of snatching defeat from the jaws of victory.
A better approach is to cache the system tables in the aggregate navigator so that thelookup of prospective field names does not require a SQL call to the DBMS. This approach is wonderful from a performance point of view, but it makes the aggregatenavigator somewhat more difficult to design. First, the navigator must be able to read andstore complicated system table configurations including, in the worst case, those with potentially thousands of fields scattered across hundreds of tables. Of course, yourestrict your readout of the system tables to only those fields named in your aggregatenavigator metadata table. Second, the navigator must have some idea of when to return to the real DBMS system tables to refresh its representation.
The aggregate navigation algorithm has certain limitations. Note that we are assuming akind of data warehouse law that no star join query will ever mention more than one fact table in the from clause. The basis of this law is the presumption that any DBMS thatattempts to join multiple huge fact tables together in a single query will lose control ofperformance. Fortunately, few, if any, end-user query tools let users easily combine multiple fact tables. In the vast majority of cases, the query is a simple set of joinsbetween a single fact table and a suite of dimension tables. So this is not a seriousrestriction.
A second limitation is that each aggregation is “complete.” For example, our category aggregate table in Figure 14.5 contains summaries for every possible aggregate. Theaggregate tables are not restricted to a subset of values. Suppose the complete list ofcategories had 10 names. Our category table must always contain entries for all 10. Youcould not build a category table for just the categories Snacks and Candy. It would bedifficult to generalize the algorithm to handle a subset of values because there is noobvious representation of a subset of values that could be quickly stored and that it couldbe compared against. For example, with Snacks and Candy, do you store the text names of the categories, their underlying key values, or a more complex criterion such as in theConvenience department, but not including Hardware? And how would you handle verylong lists with hundreds or even thousands of entries?
Intersecting Planning Data
Our design approach has one major and unexpected benefit. As you ascend the variousdimension hierarchies, you are likely to intersect the natural levels at which corporateplanning and budgeting occur. For instance, in Figure 14.6, we show an aggregate fact table that could easily arise from the aggregate construction process. This table showssales at the category by region by month level. In Figure 14.6, all three of the dimensions are shrunken. Although this is a small table physically, it may be accessed frequently for high-level analyses. For completely coincidental reasons, it is likely that the corporateplanning (or budgeting) process is producing plans at the same level, namely categoryby region by month.
A goal of most data warehouses is to compare plans to actuals. This is very efficient if these comparisons are intrarecord computations. When you notice the serendipitouscorrespondence between your aggregate fact table at the category by region by monthlevel and the planning table at the same level, take the opportunity to combine these two tables. You should add the italicized fields in Figure 14.6. At a certain high level of the aggregate hierarchy, planning (or budgeting) data “snaps in” and resides in the sametable.
The addition of planning or budgeting data at high levels of aggregation requiresgeneralizing your algorithm somewhat. You now have fields that don’t exist at the base level. The search for tables that match all of the fields in the query becomes morecomplicated. The end user’s interfaces now must know about planning (or budgeting)fields. However, these fields can only be used successfully in the example at the category by region by month level and above. The aggregate navigator must now be ableto detect when its search for fields in successively lower-level fact tables fails. For instance, if a user tries to compare planned and actual results at the level of product flavor, the system will deny the request because planning is not performed at the flavorlevel.

14.14
Handling MIN, MAX, COUNT, and AVG
An optional extension of this design allows the SQL functions of MIN, MAX, COUNT, andAVG to be handled in addition to SUM. This extension of the design may be of somevalue, although these additional functions are used far less than SUM in mostapplications.
Once an aggregate fact table has been created, it is not possible to correctly determine these other functions unless they have been prestored at the time the aggregate tablewas derived from the base data. For example, the minimum value of an additive factcould be separately stored in the aggregate fact table. If the base fact name is dollars_sold, then the special value for the minimum function could be min_dollars_sold.The aggregate navigator would have to look for this special fact if a request of the formSELECT MIN(DOLLARS_SOLD) was made by the user. The maximum and countfunctions could be handled the same way. The average function does not need to bestored if the SUM and the COUNT are available.
Interestingly, these special facts can be updated incrementally along with the normalsummed values if the aggregate fact table is administered that way. Any incoming fact would be added to the SUM value, and tested against the MIN and MAX values. TheCOUNT total would be incremented by 1.
Finally note that constructions such as COUNT(DISTINCT fact) cannot be supported using this scheme.
Aggregates for Everyone
The aggregate architecture described in this chapter allows for a very flexibleadministration. Aggregates are always behind the scenes. Neither the users nor theapplication developers need ever be aware that specific aggregations have been built.Aggregates can be added or removed by the DBA, even on an hourly basis. A goodaggregate navigator should be accompanied by query usage statistics that guide theDBA in building new aggregates. If a group of queries is observed to be running slowly and all of them are requesting sales summaries by calendar quarter, the DBA should bealerted to this pattern and begin thinking about building quarterly aggregates. Note thatquarterly aggregates would almost never be needed if a “close by” aggregate, such asmonth aggregates, already exists. There would be little advantage in providing a newlevel of aggregate that only represents a rollup of a factor of three from an existingaggregate. A quarterly aggregate would make much more sense if the next lower timeaggregate was by week, in which case the quarterly aggregate would offer a 13-fold (52 weeks/4 quarters) advantage.
Tip
It is very important that the aggregate navigator capability is available to all clients of the data warehouse. It is not acceptable to have aggregate navigationbuilt into only a single client tool because then only some of the end userswould experience the benefits of navigation.
Because it is practically impossible to restrict a large corporate environment to using oneend-user tool, an embedded navigator approach would be an administrative headache.The worst scenario would involve two or more incompatible navigator schemes,potentially with different aggregate table structures and different metadata. The aggregate navigator must be a corporate network resource, and it must be a uniformDBMS front-end for all query clients.
This chapter describes a simple but powerful architecture for aggregate navigation. If DBAs would adhere to the design requirements we’ve outlined, and if one or moreDBMS or middleware vendors would market an aggregate navigator similar to the onewe describe, your database query performance would improve, your DBAs wouldspend their time on activities other than fighting with aggregates, and your metadatamaintenance responsibilities would drop drastically.
Summary
In this chapter we discussed the principles that guide the design of aggregate structuresand determine which aggregates to build. The process to create and maintain aggregateswas also presented. Overall, remember that aggregates are as important as indexes forproviding acceptable query response time.

15.1

15.2
Overview
This chapter outlines the steps required to turn a logical design into a physical database.Because the details of implementation vary widely by platform and project and because software, hardware, and tools are evolving rapidly, this chapter can at best offer only abroad introduction to the subject. Our goal is to provide the warehouse project managerwith a sufficient understanding of the topic to be able to make informed decisions about staff and resources and to develop a sound project plan. We also hope to provide a fewtechnical pointers that might not be obvious.
The details of the physical data model and database implementation are, of course, highly dependent on the individual factors of a project: the logical data model, thewarehouse RDBMS, data volumes, usage patterns, and access tools. Nonetheless,some overarching themes and guidelines appear:
• Make a plan, even during a prototype. Tie this physical implementation plan to theoverall project plan.
• Don’t succumb to the temptation to do something the easy (but wrong) way. It’s verylikely to stay that way.
• Develop standards and follow them. • Use tools where available.
Figure 15.1 shows a high-level model of the physical design process. The basicsequence of events is to start out with a little planning—develop naming and database standards, and a security strategy. Next, build the physical model, including a cut at the preliminary database size and growth rates. The aggregate plan is a key part of thephysical model for which you need to develop an initial plan. Once you know what all thetables are, you can take a cut at the preliminary index strategy. At this point, you can actually begin to get physical. You now have enough information about what is going intothe database and when, and you can design and build the database instance. Finally,plan out the physical details like partitioning, tablespaces, and disk layout.
Figure 15.1 The high-level physical design process.
15.3
Develop Standards
It is more important to have standards and follow them than they be perfect. Remember,it’s only a foolish consistency that’s the hobgoblin of little minds. A reasonableconsistency is a fine and desirable thing. If your company’s IS department has standards,you should use them. However, existing standards were probably developed for OLTPsystems, and they may need to be modified for your purposes. For data warehousing,there are two important sets of standards: those for database object names and those forphysical file names and locations.
Database Object Naming Standards
Essentially, there are three basic components of any database object name: primewords, class words, and qualifiers. Data element definitions, logical data element names,and physical data element names are all composed of these three basic components:
•
Prime words. A prime word describes the data element’s subject area—what is this object? Some examples of prime words include: customer, product, account, city, state, postal code, and region. Each prime word should have a clear, unambiguous definition that goes right into the information catalog.
• Class words. A class word describes the major classification of data associated with adata element—what type of object is this? Some examples of class words are: average, total, count, code, date, flag, ID, name, description, amount, and number.
• Qualifiers. Qualifiers are optional elements that can further define or describe theprime and class words. Some examples of qualifiers are: start, end, primary, and secondary.
Database object naming usually follows a prescribed syntax that goes something likePrime_Qualifier_Class, as in account_start_date. You may need a qualifier first to helpdescribe the column, like primary_customer_id. We’ve included an example taxonomy on the companion CD-ROM, but the highlights of our recommendations follow:
• Decide whether objects will have the same name for their physical representation—for internal programming use—and the more descriptive logical or business name.
Programmers often argue the other side, in their desire to minimize typing and to retainnames that are similar to those used in the source systems. Since our entiremethodology focuses on the business rather than the data, it should come as littlesurprise that we recommend that object names do the same. Programmers areincreasingly using productivity tools that reduce the typing they must do, furtherweakening the other argument.
• List all your prime words and work with the user community to define them.
•
To the extent that you need to abbreviate, develop a reasonable list of abbreviationsthat would be obvious to a new employee the first day on the job. For example, descrobviously means description, but spo is not an intuitive abbreviation for sponsored projects office.
• Use class words. List them and define them. We prefer to suffix all column names witha class word.
•
Most RDBMSs support a structure such as “database” or “schema” that permits at leastone level of object grouping. You should create a schema or database for developmentand/or test and one for production, naming objects identically within the schema.Similarly, you should create development and production stage schemas to hold thestaging tables associated with the development and production processes. You willalmost certainly end up moving the development schemas onto their own machine, butusually most or all of the staging tables are in the same instance or server as the end-user tables they support.
• Name staging tables in a way that ties them to the process or purpose they serve.Good examples are usage_facts_daily_stage or newly_encountered_page_keys.
• Find a good balance between being incredibly specific(my_company_billingDW_customer_id) and far too vague (description). Remember

15.4
that column names are often seen out of the table’s context and that they becomedefault report headers in many query and reporting tools. It can be helpful to include atable or subject reference as part of the column name for standard class names, sincethese will often appear in the same query. For example, if you had the productdescription and store description in the same query, it helps to have names likeproduct_descr and store_descr when someone comes along to decipher your query later on. On the other hand, everyone knows what company—and probably what subject area—the warehouse or data mart is for.
•
The data steward is responsible for resolving name disputes. This is a business-oriented task; don’t go off in the corner and come up with names that make sense toyou. Pull together a representative group of business folks and go through the processof gathering suggestions, making choices, and getting buy-in.
•
Use underscores rather than spaces or capital letters to delineate separate words in anobject’s name. Underscores work just about everywhere. (Except at one site where theIS team had written a utility to substitute spaces for underscores in their DNS load utility. They substituted a dash for an underscore in our server name, thinking that mustbe what we meant. It took a while to figure out why we couldn’t find our server on thenetwork.)
•
Be very careful with capitalization. Some databases have a case-sensitive mode, which leads to more legible scripts. However, it means every script, query, and so on musthave the correct case for all database objects (tables, columns, etc.). This case-sensitive (or binary) mode can also impact performance for better or worse, depending on the database. You may have to reinstall (i.e., unload the database, drop it, and re-create it) to change it.
• Document your naming standards, especially any choices provoking controversy withinthe team.
• Plan for the naming standards to be a living document. Follow the standards, but bewilling to modify them as real needs arise.
Tip
In general we recommend that logical and physical names be identical and asdescriptive as possible.
Tip
It may be best to assume case sensitivity from the start, even if you don’t turnthe feature on. That way, you don’t have to go back and redo everything if youmigrate to a database that is case sensitive.
Use Synonyms for All Tables That Users Access
As an exception to the rule that both business users and programmers use the samenames, we recommend that access to all tables be granted through synonyms, whichmost RDBMSs support. A synonym is simply another name for a table, analogous to an alias or shortcut to a file on your PC. This sounds like an arbitrary rule, but we havenever regretted following it and have always regretted not doing so. The reason this ruleis worth following is that the time will come when the data warehouse team needs to physically restructure a large table. It is much easier to change the synonym to point tothe new version than it is to change the maintenance and access applications, or retrainthe users. Trust us now; you’ll thank us someday.
An alternative or complementary approach is to provide access through views. A viewappears to users of the database like a table, but it can be a complex, multitable query.Through views, you can create a more user-friendly interface atop a physically normalized structure. For example, if the physical design calls for a snowflakeddimension—typically because of access tool requirements—we usually create a denormalized “collapsed” star dimension view for those few users who occasionally mustaccess the data more directly. We cautiously evaluate the performance consequences ofusing any view—even a single-table view—before incorporating it into the data warehouse. In theory, there should be no noticeable performance degradation for accessthrough a view, but experience tells us otherwise.
Tip
We recommend only limited—and carefully planned and justified—use of multitable views in the data warehouse.
Although it is tempting to think that you can create your warehouse by defining

15.5
simplifying views over a normalized data structure, it works only for the tiniest datastores. If your users have more than a very occasional need for data to be structureddimensionally you really should structure it dimensionally.
Physical File Locations
It is very important to develop and use standards for the locations of source code, scripts,binaries (if any), and database files. Even if there is only one or a few developers duringthe initial phase, a successful warehouse will require teamwork—in series if not in parallel.
•
Ideally, the data warehouse project should use a code maintenance system thatmanages code with capabilities like checkout, check-in, and merge. Realistically, a prototype warehouse is unlikely to receive approval for such a purchase if the tool is not already in-house, so you will probably need to develop internal procedures for codemanagement.
•
Whether using a tool or going it alone, the warehouse team needs to decide how tostructure the code libraries. There is always some code, even with the best tool. Oneapproach is to have the major branches of your code tree based on subject area ortable, like Billing, Customer, and Product. Figure 15.2 shows an example table-oriented data warehouse code tree. Another approach is to have the top branches based onsimilar functions, such as DDL, initial loads, and daily loads.
Figure 15.2 Example code tree directory structure.
Drive A4 GB RAID1 (fully mirrored)
RDBMS
Directory contains RDBMS executables
STAGE_TOOL
Directory contains data staging tool executables
LOG
Directory contains RDBMS log files
logfile1.dbf
RDBMS log file 1
logfile2.dbf
RDBMS log file 2
SCRIPT_PROD
Directory contains all production SQL scripts
metadata
Scripts for managing metadata store
customer
For dimension table customer
crt_customer.sql
DDL for creating customer table
crt_cust_stage.sql
DDL for creating the staging table for customer
crx_customer.sql
DDL for creating customer table indexes
drx_customer.sql
DDL for dropping customer table indexes
customer_stage.ctl
Control script for bulk-loading the customer staging table
upd_customer.sql
SQL script for updating customer fromcustomer_stage
readme
Describes everything in the directory
calendar
For dimension table calendar
crt_calendar.sql
DDL for creating period table, including indexes
calendar.ctl
Control script for bulk-loading the period table (dumped from Excel)

15.6
calendar.xls Excel spreadsheet in which period table wasdeveloped
period_calendar_upd.sql
Stored procedure script to update “current_day_ind”every night
readme
Describes everything in the directory
product
For dimension table product
sales_detail_fact
For fact table
store_market
For dimension table store
SCRIPT_DEV
Directory contains all SQL scripts in development
Directory structure should match script_prod
DRIVE B RAID5
DATABASE
Directory contains all database files
dims.dbf
dims_inx.dbf
fact1.dbf
fact1_inx.dbf
fact2.dbf
fact2_inx.dbf
DRIVE C NO RAID
DATASTAGE
Directory contains data (flat) files
customer_hist.dat
customer_upd.dat
period.dat
TEMPDATA
Directory contains database temp space
JOBLOGS
Directory contains all script/job output and logs
• Develop standards for where to locate application documents, such as data modelsand documents required by your chosen extract/transformation/load application.
• Place database files outside the directory structure of the RDBMS and the applicationcode tree.
Develop the Physical Data Model
The starting point for the physical data model is the logical model. The physical model should mirror the logical model as much as possible, although some changes in thestructure of tables and columns will be necessary to accommodate the idiosyncrasies ofyour chosen RDBMS and access tools. In addition, your physical model will include staging and other maintenance tables that are usually not included in the logical model.
The major difference between the physical and logical models, though, is the thoroughand detailed specification of the physical database characteristics, starting with the data

15.7
types and flowing through to table segmentation, table storage parameters, and diskstriping.
This book is not intended to be a reference guide for physical database design, nor is itintended to replace a skilled DBA on the project team. Rather, the following discussionwill focus on how database administration for a data warehouse is different than for anOLTP system, and where, in our experience, the greatest pitfalls lie.
The Beverage Store Sales Case Study
To assist our explanation of the physical design tasks, we have developed a set ofexamples around the case of a fictitious national chain of beverage stores, which hasrecently implemented a point-of-sale “RewardCard” program. Although the program is relatively new, with RewardCard sales accounting for less than 5 percent of overall salesnationwide, management is very interested in understanding customer-level sales and marketing, and in learning whether their RewardCard customers’ purchases differ from anonymous customers’ patterns. We have identified the logical model illustrated in Figure15.3 as meeting the broad spectrum of analytical requirements.
Figure 15.3 Beverage store chain sales logical model.
Use a Data Modeling Tool
As discussed in Chapter 7, you should use a data modeling tool, preferably one that stores your model’s structure in a relational database, to develop the physical datamodel. As the data staging tools mature, information will flow more naturally from thepopular data modeling tools, through the transformation engine, and into the metadata that users will access to learn about the data in the warehouse.
The advantages of using a data modeling tool include: • It integrates the data warehouse model with other corporate data models.
•
It helps assure consistency in naming and definition. A data modeling tool is not amagic bullet, but most tools have features that let the team create a pool of commonlyused column names, or permit one column to inherit the characteristics of another, andeven to change characteristics when the parent column’s definition changes. To takegreatest advantage of your data modeling tool, the team must develop and follow a setof standards for its use in your environment.
• It creates good documentation in a variety of useful formats. • It generates physical object DDL (data definition language) for most popular RDBMSs.
•
It provides a reasonably intuitive user interface for entering comments about objects(tables and columns). Many data modeling tools support at least two types of object comments. In a data warehouse, it works best to reserve one comment field fortechnical documentation, such as “From T58.CUSTNAME, converting to title case andchanging NULL to ‘N/A’,” and one for business users “Customer name as Last, First, e.g., ‘Smith, Joe’.”
15.8
Design the Physical Data Structure
Keep it as simple and as much like the logical model, as possible. Differences betweenthe physical and logical models are inevitable, however. They can be necessary to support the specific requirements of your access tool, to improve query performance, andeven to keep the maintenance cycle within an acceptable window.
• Start with the logical model. If you have not already done so, enter the logical model into your data modeling tool, ignoring physical characteristics. Save a copy of thelogical model at this point.
• Alter object names to conform to your naming standards.
•
Determine which columns will have data types that differ from their representation in the source systems. Much of this determination can be rules-based, and it may flow directly from the naming conventions. For example, the zip code may be stored as aninteger in the source system and as CHAR within the warehouse.
• Document, usually in the technical comments field in the data modeling tool, anoverview of the transformation rule. For example “Source ADDRESS ZIPCODE converted from integer to character.”
•
Determine the data types for your key columns. For good performance in querying, it’simportant that key columns be the most efficient data type for joining. Thischaracteristic varies among databases, but it’s usually an integer. At least one majordatabase stores all numbers, integer or float, in the same format, so for relatively low-cardinality keys, a fixed-length CHAR may be more efficient. Your DBAs need tounderstand the storage characteristics of your RDBMS.
•
Date keys should also be reduced to efficient surrogate keys, despite the temptation to leave them as dates. Almost all warehouse queries involve a condition on time, so it’sespecially important that the join to the period table be efficient. A surrogate key fordate also allows the existence of non-date entries, like “not applicable” rather than null, or 12/31/2099.
•
Determine and specify columns that permit nulls. To save space in the table’s storage,all not-null columns should be physically ordered before columns that permit nulls. Remember, you should be able to change the display order for your users in the front-end tool. If you can’t, you probably want to know before you’ve installed the tool on 25desktops.
Tip
We advise instituting a general rule against nullable columns because they pose difficulties for business users in ad hoc querying. Even if your databaseallows you to define a nullable column as part of the primary key, you shouldnever do so.
• Specify primary and foreign key relationships in the data model.
•
Decide whether to explicitly declare primary/foreign keys in the database. You maychoose to not enforce referential integrity within the database, if your loading process isclean and careful, as those constraints create additional burden on the database. On the other hand, some RDBMSs’ query optimizers develop better query plans if theprimary and foreign key relationships are declared.
• Be sure to model all permanent tables and views, including staging tables. Generally, staging and aggregate tables are placed on a separate “page,” or submodel, of thedata model document.
• Plan to represent all table indexes in the physical data model. Model the basic structureof the primary and foreign key indexes without worrying about storage parameters at this point.
•
If your main user access tool has already been chosen, modify the schema to addressits requirements. Some tools require that dimension tables be normalized into asnowflake, but others are more flexible. If the tool requires a snowflake yet hides thatcomplexity from the end user, it’s perfectly acceptable to deviate from the logicalmodel. Some tools require additional columns in the dimensions that are typically notpart of the logical model. An example of these additional columns is a level indicator for

15.9
hierarchies within dimen
•
sions. Another example is a current period indicator in the period table. Keep thedimensions in a denormalized star structure unless you have an excellent reason for snowflaking. The OLTP design guide that says “normalization=good” is not an excellentreason in this case.
•
If the main user access tool requires a snowflake design, consider keeping adenormalized star version of the data accessible for users of other tools. Sometimes it is acceptable to present a “star version” as a database view joining physical snowflakesor to present a snowflake as a view on a physical star. More often, though, the cost ofreplicating the data in the form most efficient for multiple tools is amply repaid by improved usability and performance. In the case of very large dimensions, though, youusually want to store only a single version, and you must decide where to compromise.
•
If your data warehouse faces maintenance problems—if you have trouble loading data within an acceptable window—think creatively about the transformation process, as discussed in more detail in Chapter 16. Very often, a difficult maintenance application problem is solved by breaking a complex step into multiple staging tables or bytimestamping or otherwise annotating data.
•
The physical specification for the user tables in our case study is illustrated in Figure15.4. Note that we have identified two potential aggregate tables and have modeledthem as well. This information is carried within a data modeling tool differently, and it islaid out here in tabular form for illustrative purposes.
Figure 15.4 Beverage chain case study physical model.
Table/column name
Data type
Permitnulls?
Prim.Key
Comment
calendar
Calendar or period dimension table
date_key
integer
n
1
Surrogate key
day_date
date
n
Date, can be used for date arithmetic
day_of_week_name
varchar(9)
n
Weekday, e.g., “Monday”
week_begin_date_key
integer
n
Key of this week’s Monday
week_begin_date
date
n
Date of this week’s Monday
calendar_week_num
smallint
n
Takes values 1..53. Week 1 begins first Mon in year
calendar_month_num
smallint
n
Takes values 1..12
calendar_month_name
varchar(9)
n
Month, e.g., “January”
calendar_quarter_num
smallint
n
Takes values 1..4.
calendar_year_num
integer
n
Calendar year carried as a number
year_month_num
integer
n
Year and month, carried as a number, e.g., 199801
fiscal_week_num
integer
n
Takes values 1..53.

15.10
Week 1 begins first Monday in fiscal year
fiscal_month_num
integer
n
Takes values 1..12
fiscal_quarter_num
integer
n
Takes values 1..4.
fiscal_year_num
integer
n
Fiscal year carried as a number
weekday_ind
char(8)
n
Takes values “weekday” or “weekend”
hour
Hour dimension
hour_key
integer
n
1
Integer, 0..23, corresponds to hour in which purchase occurred
hour_time
time
n
Corresponding time, can be used for time arithmetic
am_pm_ind
char(2)
n
Takes values am/pm
peak_period_ind
char(8)
n
Takes values peak/off-peak. “peak” when hour btwn 15-20 (3p-8p)
product
Product dimension
product_key
integer
n
1
Surrogate key
brand_key
integer
n
Surrogate key, may be used for building aggregates
manufacturer_key
integer
n
Surrogate key, may be used for building aggregates
sub_category_key
integer
n
Surrogate key, may be used for building aggregates
category_key
integer
n
Surrogate key, may be used for building aggregates
product_name
varchar(15)
n
Short product name, use as column headings
brand_name
varchar(15)
n
Brand name, aggregates to manufacturer and sub-category
manufacturer_name
varchar(20)
n
Manufacturer name
sub_category_name
varchar(25)
n
Sub-category, aggregates to category
category_name
varchar(25)
n
Product category name
product_descr
varchar(125)
n
Long product name
package_size_amt
number(11,2)
y
Package size as a

15.11
number pkg_size_unit_name
varchar(15)
y
Units of package size, e.g., “ounce” or “quart”
package_size_group
varchar(15)
y
Package group, e.g., “family”
flavor_name
varchar(25)
y
Flavor, e.g., “chocolate”
store_market
Store/market dimension
store_key
integer
n
1
Surrogate key
market_key
integer
n
Key for markets, may be used to build aggregate tables
region_key
integer
n
Key for regions, may be used to build aggregate tables
country_key
integer
n
Key for countries, may be used in aggregate tables
store_name
varchar(50)
n
Store name, aggregates to market
store_zip5_code
char(5)
n
5-digit zip code of store
market_name
varchar(50)
n
Market name, aggregates to region
region_name
varchar(50)
n
Region name, aggregates to country
country_name
varchar(50)
n
Currently takes one value: “Total U.S.”
customer
Customer dimension. Tracks our RewardCard customers and “all other”
customer key
integer
n
1
Surrogate key; Most transactions occur with customer_key=0 (no RewardCard)
customer_acctnum
char(20)
n
Customer RewardCard account number
customer_state_code
char(2)
n
U.S. state for customer’s billing address
customer_zip5_code
char(5)
n
5-digit zip code
customer_area_code
char(3)
n
Telephone area code
phone_prefix_code
char(3)
n
First 3 characters of phone number
subscribe_date
date
n
Date customer subscribed to RewardCard service

15.12
customer_ssn char(11) n
Social Security number, ‘000-00-0000’ if unknown; limited user access
customer_city_name
varchar(50)
n
City in customer’s billing address
income_group_num
integer
n
Takes value 0..9. Data are purchased, updated quarterly
profitability_score_num
integer
n
Takes value 0..9. Data come from offline customer scoring process, updated monthly.
customer_last_name
varchar(50)
n
Customer last name; limited user access
customer_first_name
varchar(50)
n
Customer first name; limited user access
customer_billing_address
varchar(250)
n
Street address (excluding City/State/Zip); limited user access
sales_detail_fact
Fact table, with sales by store, day, hour, customer (if known), and product
date_key
integer
n
1
Foreign key to period.date_key
customer_key
integer
n
2
Foreign key to customer.customer_key
product_key
integer
n
3
Foreign key to product.product_key
store_key
integer
n
4
Foreign key to market.store_key
hour_key
integer
n
5
Foreign key to hour.hour_key
dollar_sales_amt
number(11,2)
n
Dollar amount sold of item
unit_sales_amt
integer
n
Quantity sold
retail_price
number(11,2)
n
Price per item
transaction_dollar_ sales_amt
number(11,2)
n
Total transaction dollar value (all items in transaction)
coupon_cnt
integer
n
Takes value 1 if customer used a coupon on this item
row_batch_key
integer
n
Foreign key to meta_load_batch table (not modeled here)

15.13
Aggregate Tables
sales_week_prod_ store_fact
Aggregate table, sum over customer & hour, retaining product, store, aggregate day to week
week_begin_date_key
integer
n
1
Foreign key to period.date_key (We’ll probably need to instantiate a week_period table)
product_key
integer
n
2
Foreign key to product.product_key
store_key
integer
n
3
Foreign key to market.store_key
dollar_sales_amt
number(11,2)
n
Dollar amount sold of item (aggregated from detail)
unit_sales_amt
integer
n
Quantity sold (aggregated from detail)
avg_retail_price
number(11,2)
n
Average price per item (computed from detail)
transaction_cnt
integer
n
Count of transactions within date/store for this product (computed from detail)
transaction_avg_amt
number(11,2)
n
Average transaction size that included this item (computed from detail)
coupon_cnt
integer
n
Count of these transactions that used a coupon (computed from detail)
sales_day_prod_ mkt_fact
Aggregate table, sum over customer & hour, retaining day, product, aggregate store to market
date_key
integer
n
1
Foreign key to period.date_key
product_key
integer
n
2
Foreign key to product.product_key
market_key
integer
n
3
Foreign key to market.market_key
dollar_sales_amt
number(11,2)
n
Dollar amount sold of item
unit_sales_amt
integer
n
Quantity sold

15.14
retail_price number(11,2) n Price per item
transaction_dollar_ sales_amt
number(11,2)
n
Total transaction dollar value (all items in transaction)
coupon_cnt
integer
n
Takes value 1 if customer used a coupon on this item
Develop Initial Sizing Estimates
In the early stages of the physical design, the data warehouse team is often pressured toestimate the warehouse’s size. Whether you need to support platform decisions, orderdisks, or simply satisfy management’s curiosity, it’s useful at this point to develop a quickballpark estimate of storage requirements of the entire warehouse. Your team’s DBA willdevelop a much more accurate estimate of short- and long-term space requirements when designing the database’s physical storage.
Although in theory we would prefer to use the modeling tool to develop sizing estimates,those tools have not been convenient for this stage of the project. We usually use annotations on the data models’ printouts combined with a simple spreadsheet to storethe calculations as the rather inadequate “tools of choice” here. See what your datamodeling tool can do for you first.
Tasks to develop the preliminary sizing estimates include:
• Estimate row lengths, taking into account that VARCHAR and nullable columns aretypically much smaller than their maximum length. (We usually sample 1000 or so rowsfrom the source to get a reasonable estimate.)
• For each table, estimate the number of rows for the initial prototype, for the fullhistorical load (by year of history if the size of the historical load is still under debate),and for incremental rows per load when in production.
• For a standard RDBMS, count on indexes to take up as much room as the base data.You’ll do a more precise estimate later, after you develop the initial indexing plan.
•
For temp/sort space, you typically need about twice as much temp space as an index to build that index. You should also think about what kinds of sorting and groupingoperations you expect your users to execute or that you need to build aggregations. Ifsomeone will be doing a grouping operation on the entirety of your largest table, your temp space must be at least as large as your largest table. By using partitioned tables,as discussed shortly, you may be able to reduce the temp space requirements.
• Reserve 20 MB for metadata tables. That should be more than enough. Don’t wastetime on more precise computations.
•
Aggregate tables can take up considerable space, depending on the degree ofaggregates stored in the database, the sparsity of the data, and the depths of the hierarchies. There are more thorough discussions of aggregates in Chapters 9 and 14, but on average, aggregates and their indexes take up as much room as the base-level fact tables. This is a very general rule of thumb, and it should be smothered withcaveats if you need to use it.
• In sum, a very general rule of thumb is that the entire data warehouse typically takesup three or four times as much space as the data in your atomic star schema.
Figure 15.5 includes sample calculations for computing the database size for our case study. As is usually the case, the dimension tables’ size pales in comparison with the facttables. In fact, we didn’t even bother to compute the index sizes for the dimension tablesfor this initial sizing. If the RewardCard program is extremely successful, and we have 50 million identified customers in the customer dimension, the dimension table will, ofcourse, be large enough to appear on our radar screen.

15.15
Figure 15.5: Beverage chain initial database sizing.
Tip
In almost all data warehouses, the size of the dimension tables is insignificantcompared to the size of the fact tables. The second biggest thing in theenvironment is the size of the indexes on the fact tables.
For our case study schema, most of the fact table’s size is taken up by data outside ourarea of direct interest—the sales to “anonymous” customers. For a prototype, we wouldprobably choose to aggregate this data at least past the hourly level (reducing data volume ten-fold) or possibly eliminate the anonymous customer data from the prototype.
At this point we have not specified our indexes, but we do know what types of indexes wewill have, and we can consider their space requirements when ordering disk. In this situation, considering the expected growth of the data over the coming six months, wewould probably order 450 GB of disk. This estimate does not include space required fordevelopment, staging, test, and so on.
Develop the Initial Index Plan
Get into the habit of thinking of the index plan that you develop at this stage in the projectas the initial index plan. Plan to adjust indexes over the life of the warehouse, as youbetter understand usage patterns and as usage patterns change. Use an expert for the initial plan if one is available, but you absolutely must develop expertise in-house. Learn how to generate and read the query plans generated by your RDBMS.
When hiring or contracting with an expert for indexing, it is particularly important to verify expertise and experience with star schema warehouses. Do not pay a premium for a consultant—however skilled—whose experience is limited to OLTP and normalizeddatabases.
This section briefly examines the different types of indexes and query strategies that are used by the major RDBMSs, and then discusses in greater detail the indexing strategiesfor fact and dimension tables.
Overview of Indexes and Query Strategies
To develop a useful index plan, it’s important to understand how your RDBMS’s queryoptimizer and indexes work and how warehouse requirements differ from OLTPrequirements. Remember that most RDBMSs were developed first to support OLTPsystems, and only relatively recently have been modified to support the fundamentally different requirements of data warehousing. The following discussion is necessarilygeneral and incomplete, and it is not intended to substitute for expertise in your RDBMS.
The B-Tree Index
The first kind of index that RDBMSs developed is the classic B-tree, which is particularly valuable for high-cardinality columns like product_key or customer_key. The B-tree index builds a tree of possible values with a list of row IDs that have the leaf value. Finding the rows that contain a given value involves moving up the tree, comparing the value at eachbranch with the given value. If the given value is higher, you go up one branch, if it islower, you go down the other branch. If it is the same, you have found your match, and you return the list of row IDs associated with that node or leaf. B-tree indexes may be

15.16
built on multiple columns. Although some RDBMSs have developed alternative indexingtechniques that are useful to data warehousing, others use only B-trees. The B-tree is the default index type for most databases.
Most RDBMSs automatically build a unique B-tree index on the declared primary key of a table; it is through this index that the primary key constraint is enforced.
Traditionally, RDBMSs would use only one index during each step of a query. As of thiswriting, the latest version of most RDBMSs have query optimizers that use multipleindexes. As discussed in the next few sections, this change makes indexing much easierthan in the past.
The Bitmapped Index
Some RDBMSs support bitmapped indexes, which are the “opposite” of B-tree indexes in that they are more appropriate for columns of low cardinality. The classic examples areindexes on gender codes or yes/no indicators. The bitmapped index is essentially a string of bits for each possible value of the column. Each bit string has one bit for eachrow. Each bit is set to 1 if the row has the value the bit string represents, or 0 if it doesn’t.In the case of a 50,000 row customer table with a gender column, there might be threebit strings in the bitmapped index, one for the “M” values, one for the “F” values and onefor the “?” values. Each of these bit strings will be 50,000 bits long (or 6,250 bytes—about 6 KB). Therefore, the bitmapped index will be about 18 KB compared with about300 KB for a typical B-tree index on the same column. Computers are particularly goodat the vector manipulations involved in comparing these bit strings. It’s fairly easy tocombine bitmapped indexes.
Usually, bitmapped indexes can be built only on a single column, although the databaseoptimizer can use more than one bitmapped index in a query. Thus while a singlebitmapped index on gender provides little benefit, if a query’s condition includes limits on gender, age, and income and those three columns are bitmapped, a relatively smallsubset of rows can be targeted using the bitmapped indexes together. Bitmappedindexes are commonly used on the attributes and hierarchies of dimension tables and are used today by several RDBMSs for the fact tables.
Tip
Bitmapped indexes are a major advance in indexing that benefit datawarehouse applications. Bitmap indexes are used both with dimension tablesand with fact tables, where the constraint on the table results in a low cardinality match with the table.
The Hash Index
A few RDBMSs support hash indexes, which use a hashing algorithm to represent acomposite in a succinct (but unreadable by human eyes) form. A hashing algorithm is used to assign a set of characters to represent a text string such as a composite of keysor partial keys, and compresses the underlying data enormously. Consider, for example,that a 12-character hash key can represent the full range of possible URLs with infinitesimal chance of repetition.
A hash index, because it so tersely represents the underlying data, can very efficiently beused to locate data rows. The downside is that hash indexes take longer to build and aresupported by relatively few RDBMSs.
Other Index Types
Some RDBMSs use additional index structures or optimization strategies that are usuallyproprietary. Many of these are particularly useful to data warehouse applications, as wediscuss in greater detail later in this chapter. You should carefully evaluate the indextechnologies available within your chosen RDBMS. Indeed, the indexing and queryoptimization technologies available and their applicability to data warehousingapplications should be among the most important factors in your RDBMS decisionmaking process.
Columnar RDBMSs
A few RDBMSs designed for data warehousing store data in columns rather than rows.These databases store data as (R1C1, R2C1, R3C1 . . .) rather than the more familiar (R1C1, R1C2, R1C3 . . .) format. These databases and their optimizers apply a wide

15.17
range of index structures, depending on the column’s cardinality.
Columnar databases offer significant data compression, which is valuable in data warehousing. These databases differ in their implementation details, but typically youindex, as a single-column index, each column potentially used in a join or condition.Some databases force you to index all columns; some databases allow the DBA tospecify what type of the many index structures to apply to each column, while othersdetermine the appropriate structure automatically from the cardinality of the data.
Since you index most or all columns, and the optimizer will use multiple indexes in a query regardless of index type, indexing is generally much easier for columnar databasesthan for the standard RDBMSs.
Star Schema Optimization
Some relational databases attack the n-way join problem inherent in a star query by providing star schema optimization. We have seen performance improvement of up to 60 times from using star schema optimization rather than classic sequential joins onsystems that are otherwise configured identically.
You want standard queries against a dimensional star schema to start at the dimensiontables that have conditions on them, and then assemble a list of composite dimensionkey combinations that meet those conditions. Typically, this is a relatively small listcompared to the total number of keys in the fact table. Next, the optimizer should use thislist of partial or complete fact table keys to extract the appropriate rows from the facttable, using an index on the fact table keys.
The reason that many RDBMSs do not include star schema optimization is that the strategy effectively requires a Cartesian product between the unrelated dimension tables.In theory, a Cartesian product is a very bad thing, but in the case of star schema queries,it is far more efficient than joining the dimension tables through the fact table one by one.
Some RDBMSs that support star schema optimization require special indexes for thatoptimization to work. Other RDBMSs determine if a star strategy is appropriate from thestructure of the query.
Indexing Fact Tables
The first fact table index will be a B-tree on the primary key. When you declare a primary key constraint on a table, a unique index is built on those columns in the order they weredeclared. Some optimizers are strongly drawn to the primary key index, especially if the table’s data are sorted in the same order as the index. Thus, we strongly recommendthat the primary key, and hence its primary key index, be carefully constructed to be ofgreatest use in querying. Most data warehouse queries are constrained by date, and thedate_key should be in the first position in the primary key index. Having the date_key infirst position also speeds the warehouse maintenance process, in which incrementalloads are keyed by date.
The determination of other fact table indexes, outside of the primary key index, is verydependent on the index types and optimization strategies available within your RDBMS.As of this writing, the latest releases of the major RDBMSs permit more than one index on a table to be used at the same time in resolving the query. As discussed next, in theold days we had to define multiple composite indexes on the fact table keys to cover thelikely query paths. Now, it is much more common simply to create a single-column index on each fact table key and let the optimizer combine those indexes as appropriate toresolve the queries.
If your chosen RDBMS does not permit multiple indexes in a query, then almost certainlyyou did not choose that RDBMS but rather had the choice thrust upon you. You mustcreate multiple composite indexes on the fact table columns. Typically, we do not includeall of the key columns in all of the composite indexes, and we alternate the order ofcolumns in a useful way. As the complexity of the schema increases, so does thenumber of fact table key indexes. A four-dimension schema may have two- or three-key indexes, including the obligatory primary key index; an eight-dimension schema may have six or more.
The initial index plan often includes no fact table indexes other than the key indexes. Ifthe business requirements indicate that users will frequently be filtering on fact column

15.18
values, for example, looking for transactions greater than $1,000,000, the initial index plan will also include an index on those fact columns. Typically, non-key fact table indexes are single-column indexes, are relatively rare, and are usually less useful thankey indexes.
Indexing Dimension Tables
Dimension tables should have a single-column primary key and hence one unique index on that key. If bitmapped indexes are available in your RDBMS, add single-column bitmapped indexes to the nonselective dimension attributes that are most commonlyused for applying filters or for row headers.
Small dimension tables seldom benefit from additional indexing. Large dimension tables,such as a customer dimension, are often very useful for queries in their own right. Theyoften support useful questions like “How many customers meet a specific profile?” If your business requirements indicate that these queries will be executed frequently and thedimension table is large, then it will be valuable to develop a set of multicolumn indexeson the dimension attributes that are most frequently used together in filters.
As with the fact tables, columnar RDBMSs with a wide range of index types have simplerindex rules: index individually every column likely to be used as a join condition, filter, orgroup by.
Indexing for Loads
Most of the time, we think about indexes’ utility for users’ queries. However, mostsuccessful warehouses are under pressure to keep the system’s load and maintenanceperiod as brief as possible. Be sure to analyze any queries used in the maintenance process and build indexes to make those important and time-consuming steps as efficient as possible.
If a load adds more than 10 to 20 percent to the size of a table, it is often more time-effective to drop indexes before insertion, add the data, and then rebuild all the indexes.
Analyze Tables and Indexes after the Load
The multipurpose RDBMSs such as DB2, Informix, Sybase, and Oracle do notautomatically recompute statistics on tables and indexes after each load process, nor even after a complete index rebuild. This is a very important step to postpend to any loador index creation process, as the query optimizer must have accurate information on thesize of tables and indexes, to develop effective query plans.
Case Study Indexes
Figure 15.6 documents the initial index plan for our beverage chain case study schema.Notice that the justifications for indexes are driven most often by business userrequirements and occasionally for requirements of the maintenance application. As the warehouse evolves, it is very important to keep an up-to-date list of the indexes (existing, removed, and planned) and the reasons and results obtained from them.
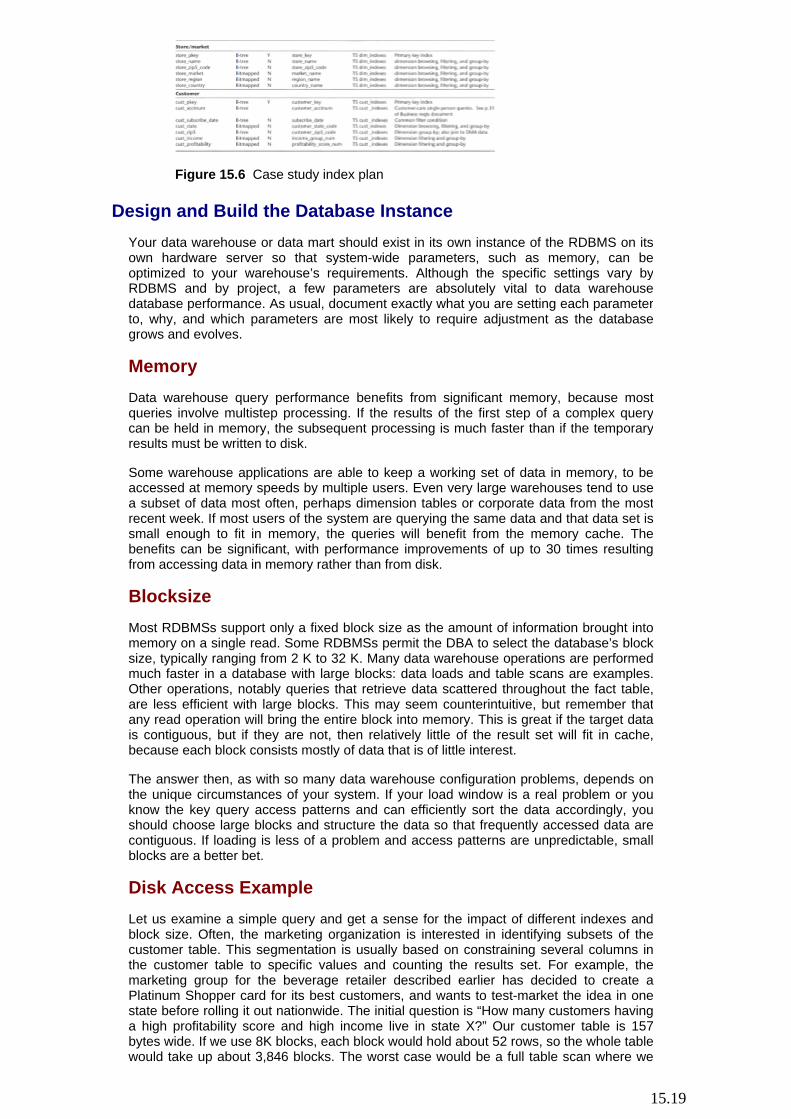
15.19
Figure 15.6 Case study index plan Design and Build the Database Instance
Your data warehouse or data mart should exist in its own instance of the RDBMS on itsown hardware server so that system-wide parameters, such as memory, can be optimized to your warehouse’s requirements. Although the specific settings vary byRDBMS and by project, a few parameters are absolutely vital to data warehousedatabase performance. As usual, document exactly what you are setting each parameterto, why, and which parameters are most likely to require adjustment as the databasegrows and evolves.
Memory
Data warehouse query performance benefits from significant memory, because mostqueries involve multistep processing. If the results of the first step of a complex query can be held in memory, the subsequent processing is much faster than if the temporaryresults must be written to disk.
Some warehouse applications are able to keep a working set of data in memory, to beaccessed at memory speeds by multiple users. Even very large warehouses tend to usea subset of data most often, perhaps dimension tables or corporate data from the mostrecent week. If most users of the system are querying the same data and that data set issmall enough to fit in memory, the queries will benefit from the memory cache. Thebenefits can be significant, with performance improvements of up to 30 times resultingfrom accessing data in memory rather than from disk.
Blocksize
Most RDBMSs support only a fixed block size as the amount of information brought intomemory on a single read. Some RDBMSs permit the DBA to select the database’s blocksize, typically ranging from 2 K to 32 K. Many data warehouse operations are performedmuch faster in a database with large blocks: data loads and table scans are examples.Other operations, notably queries that retrieve data scattered throughout the fact table,are less efficient with large blocks. This may seem counterintuitive, but remember thatany read operation will bring the entire block into memory. This is great if the target datais contiguous, but if they are not, then relatively little of the result set will fit in cache,because each block consists mostly of data that is of little interest.
The answer then, as with so many data warehouse configuration problems, depends onthe unique circumstances of your system. If your load window is a real problem or youknow the key query access patterns and can efficiently sort the data accordingly, youshould choose large blocks and structure the data so that frequently accessed data arecontiguous. If loading is less of a problem and access patterns are unpredictable, smallblocks are a better bet.
Disk Access Example
Let us examine a simple query and get a sense for the impact of different indexes andblock size. Often, the marketing organization is interested in identifying subsets of thecustomer table. This segmentation is usually based on constraining several columns inthe customer table to specific values and counting the results set. For example, themarketing group for the beverage retailer described earlier has decided to create aPlatinum Shopper card for its best customers, and wants to test-market the idea in one state before rolling it out nationwide. The initial question is “How many customers havinga high profitability score and high income live in state X?” Our customer table is 157bytes wide. If we use 8K blocks, each block would hold about 52 rows, so the whole tablewould take up about 3,846 blocks. The worst case would be a full table scan where we

15.20
have to retrieve all 3,846 blocks.
Let’s see how standard RDBMS B-tree indexes help speed this up. The B-tree index is based on a tree structure where the leaves contain row IDs (or lists of row IDs). The B-tree index on a single column usually takes less than 10 bytes per row. Most RDBMSscan only select from one B-tree index before they go to the underlying table. In our case,we chose the most selective index, use the resulting row ID list to get the matching rows, and then checked each row for the remaining constraints. The state constraint is themost selective if we assume the target state is average size:
Column
Selectivity
Income group
1/10
Profitablility score
1/10
State
1/50
This sounds like a significant advantage—we should only have to examine 1/50 of the customer records for their income and profitability values, or about 4,000 rows. We pay a small price in that we have to read in the index to find the row IDs for the target 4,000rows first, but that should be trivial, right? The B-tree index typically takes less than 10 bytes per row, or about 2 MB for the State index, which is about 244 8-K pages. Once we have the row IDs, we can go look them up in the table. Here is where the trouble starts. Ifthe rows are distributed relatively evenly, it could mean that every 50th row comes fromthe target state. Since there are 52 rows in a block, we end up bringing back every block anyway. Note that a larger block size almost guarantees that we bring back every block.The disk access kills the advantage we gained by using the index.
You can improve this significantly with multicolumn indexes, but the order of the columns in the index matters, and the indexes are bigger.
Bitmapped indexes help significantly in this case because they can be combined andcounted without having to go to the base table. Since all our constraints are set to equal a single value, we only need one bit-map vector for each constraint. Each vector is one bit wide by the number of rows in the table: 200,000 rows ¥ 1 bit = about 24 K, or three-disk blocks. We can get the answer using a bitmapped index by reading only 9 blocks, (one set for each of the three columns). The RDBMS can AND the results and count thesuccessful matches. This gives us a more than 400 times improvement over the full tablescan.
Of course, this is a simple example for a single table, but it shows how bitmapped indexes can be used on dimension tables in conjunction with other indexes on the factstable to dramatically speed query performance.
Save the Database Build Scripts and Parameter Files
Most RDBMSs permit the DBA to configure and build the database using a point-and-click GUI. Although such GUIs are convenient, they typically do not self-document well. We recommend the use of such an interface only if the DBA uses a process or tool tocapture the resulting information. At the minimum, you should have a script scheduled torun every night against the data dictionary tables to generate and archive the DDL fromthe actual schema.
Any team member who changes the layout of a physical table should model that change first in the data modeling tool and preferably generate the changes from the tool ratherthan by retyping (or pointing and clicking) at the database console. However, we havefound that data modeling tools do not always generate the complete DDL in the way it needs to be run, especially when the change is to an existing table. (You typically do notwant to drop and re-create a very large table in order to add a new column.) In this case,start with the data model, generate the DDL from the model, and edit and save the DDL according to your group’s code management standards.
Once again we want to emphasize the benefits of using a code management tool for thedata warehouse. We have seldom had the luxury of using such a tool, but when it has been available we have really appreciated the benefits. The best tools ease the coordinationproblems associated with large teams working on the same code base. You can generatereports (easily posted as Web pages) of the changed code, and permit reverting to earlier

15.21
code should you—unlikely as it sounds—mess things up. Develop the Physical Storage Structure
There is a level to the physical model that lies below the data structures we’ve alreadydiscussed: the storage structures of blocks, files, disks, partitions, and table spaces or databases. Your warehouse project will greatly benefit from the services of a physicalDBA who has extensive experience with your hardware and RDBMS platform and, justas important, is knowledgeable about the requirements of data warehouses. If such a resource is not available within your company, consider bringing in a consultant either todo the work outlined next or perhaps to conduct a review of the physical design.
Compute Table and Index Sizes
As discussed earlier in this chapter, we recommend that a rough estimate of diskrequirements be made at the beginning of the physical design process. The main goal ofthe preliminary sizing estimates was to support platform decision making.
Now that the logical design has been finalized, it’s time actually to put data to disk.Accurate computations are necessary: Use an expert for this process. If you really needto go it alone, thoroughly read and follow the documentation provided by your RDBMS vendor, and use vendor-supplied sizing tools where available.
Determine the timeframe for which you are planning your storage requirements, butdocument and understand the growth requirements beyond that timeframe. Typically, weplan for an initial data load of fixed size, plus at least six months of growth during ongoingloads. Plan for success, and understand how and when to add new drives should yourteam be pressured to move swiftly into production or to add more historical data.
Develop the Partitioning Plan
If your RDBMS supports partitioning tables, you should plan to take advantage of it ifpossible. The best way to partition tables is by date, with data segmented by month,quarter, or year into separate storage partitions. Typically, only fact tables and very large dimension tables and their indexes are partitioned. The partitioned table looks like asingle table, but it is managed in separate pieces.
The advantages of partitioning are two-fold: A query will access only the partitions necessary to resolve the query, and an entire partition can easily and quickly be added ordropped from the table. This can greatly reduce the maintenance burden for awarehouse that keeps only recent data directly active and accessible. It also helps if you need to restructure or restate data in a fact table.
To take full advantage of table partitioning, you typically have to declare the criteria thatuniquely determine into which partition a row will be placed and similarly partition your indexes. The second condition can certainly be eased, but at the cost of someperformance both during queries and maintenance.
Tip
Partitioning can significantly improve your warehouse’s performance andmaintainability, and implementing partitions from the outset adds no cost toyour project. If your RDBMS supports partitioning, use it.
Set up RAID
RAID stands for redundant array of inexpensive disks. We strongly recommend the useof RAID storage for your data warehouse. The minimum RAID configuration, RAID0, willstripe the data for you. By striping the data, we mean that it will spread the storage for a file across multiple physical drives. You should choose RAID technology that uses anexternal RAID controller rather than have the RDBMS CPU double as the RAIDmanager. Disk subsystems can cost significantly more than your hardware vendor’sstandard disk drives, but we have found them to be worth the price. A disk subsystemprovides its own controllers and cache. They are also relatively machine- and operating system-independent, and they can be moved from one machine to another fairly quickly.
Fault Tolerance If your budget is flexible, RAID5 is an extremely valuable configuration. RAID5, like

15.22
RAID0, spreads data across multiple disks, with the valuable additional feature ofredundancy across a set of disks. You typically lose 20 percent of storage capacity, so aRAID5 drive defined over 100 GB of physical disk will hold 80 GB of data. With RAID5, if a disk fails, your data warehouse will continue to function seamlessly (albeit a bit moreslowly). Recovery is automatic as well, upon insertion of a new disk, especially if yourRAID technology supports “hot swapping” of disks. This redundancy is important because the disk drives are the most likely point of failure across the hardware platform.
If money is no object, RAID1 is the ideal configuration: it offers 100 percent mirroring ofthe data and index disks. Full mirroring gives you full and instant recovery from a disk failure with no degradation in performance.
Remember, however, that no RAID configuration is a substitute for regular backups.Even with a fully mirrored configuration, someone could login under the system accountand delete a fact table or inadvertently corrupt data by running the wrong script.
Configuration of Volumes and Drives
The easiest configuration to manage, regardless of the level of fault tolerance, is one thatdefines a single array volume to hold all the database’s tables and indexes. The RAIDcontroller balances the application’s I/O by performing low-level data striping of files across all the disks in the volume, without further intervention required by the DBA. Thisconfiguration delivers very good query performance and is easy to manage. It isappropriate for small data warehouses.
If you are not using RAID technology, the DBA and system administrator need tounderstand access patterns well enough to predict which tables and indexes will be accessed simultaneously and segment the data so each drive receives approximately thesame number of data requests. This is particularly difficult to do in a data warehousingenvironment where usage patterns are constantly evolving.
When the amount of data and indexes exceeds the capacity of a single controller, youwill have a multiple-volume system. When your warehouse is managing a medium-to-large amount of data, requiring multiple volumes, the length of the load window is often a significant problem. A good way to segment data on a multiple volume system is to do itin such a way as to improve load performance. If you are loading from a flat file into thedatabase, you want the source data on one volume, the tables and indexes on a second and third, and the transaction log (if you have one) segmented on a fourth volume.
Be careful to avoid creating a bottleneck for querying. For best query performance, youshould segment storage so that data accessed together, such as the customer dimension and the fact table, are on different disks. Although large warehouses are moredifficult to manage, at least they use enough disk that you can usually segment data sothat it meets both the easier-to-load and the faster-to-query requirements.
Tip
Remember that the best way to avoid I/O bottlenecks is to have as many diskcontrollers as possible. You are better off with many smaller drives controlledby multiple controllers, than a few large drives and a few controllers. Clearly, the large-drives-and-few-controllers option is more cost-effective. You need to find the best balance between cost and performance for your system.
With a multiple volume system, you may choose to implement multiple levels of faulttolerance. Operating system files, database executables, database system tables, andtransaction logs coexist well on a volume with some fault tolerance (RAID1 or RAID5).Depending on the project’s budget and requirements for data availability, we oftenrecommend less fault tolerance (RAID5 or RAID0) for the data table and index volumes.
If an unprotected drive fails, the database instance will crash, and the database must berestored from backups. If a protected drive fails, by contrast, the database typically remains up and available for use while repairs are under way, although performancedoes slow down.
Temp Database
The exception to the RAID rule is the temp database. If your database can handle a crashin the temp space, then it does not need to be RAIDed. Temp space disk should be as fastas possible. Consider using silicon disk for your temp space if it fits within your budget.

15.23
Implement Usage Monitoring
As discussed in Chapter 10, you should build or implement a usage monitoring systemfor your data warehouse as early in the project as possible. Especially during the veryearly days of the project, you must be able to monitor the system’s response to loads and queries. You will want to capture and present information on what processes are running,what resources they’re using, who submitted them, and how long they took. Thisinformation is particularly vital during the development of the warehouse database and maintenance systems.
Activity monitoring captures information about the use of the data warehouse. There areseveral excellent reasons to include resources in your project plan to create an activity monitoring capability. These mainly center around four areas: performance, user support,marketing, and planning.
Performance
Collecting information about usage over time allows the DBA to tune the warehousemore effectively. The DBA can use the data to see what tables and columns are mostoften joined, selected, aggregated, and filtered. In many cases, this can lead to changesin the aggregate tables, the indexes, and the schema design.
We typically build a set of queries early on that point at the system tables so we can get a quick sense of what’s going on. These queries are especially helpful if they include theuser name and the actual SQL being processed. These queries actually become acritical part of the database management toolset for large data warehouses. Often, the way someone formulates a query can mean the difference between getting an answer inseconds and not getting an answer at all. The DBA can spot these runaway queries(through an investigation usually sparked by the fact that the warehouse has slowed to a crawl), and contact the user to help them understand how to reformulate the query andget them to kill the existing one.
User Support
We encourage our clients to watch for activity from users who recently went through training. People who use the warehouse right away often need help formulating effectivequeries, and people who wait too long will probably need help with the basics. Ifsomeone doesn’t log on at all within a few weeks, it’s worth a call to at least find out why. Often they either haven’t come across a real business need yet, or they tried to use thewarehouse and couldn’t connect to the database. Most people will solve a problem with apredictable approach rather than risk spending a significant amount of time and not get any results. If they aren’t successful the first time, they are unlikely to try again withoutsome encouragement.
The next step beyond monitoring current activity is to keep a history of query activity.Ideally, this should include the resources used (CPU seconds, cache hits, disk reads),elapsed time, completion status, query source, and possibly the query SQL. We haveoften developed a basic usage history system simply by snapshotting the appropriatesystem monitor tables at midnight, storing the day’s activity in a history table, andresetting the monitored values to zero. This information will allow the DBA to gain anunderstanding of how the warehouse is used over time: where it needs to be tuned,where aggregate tables should be added or dropped, and so on.
Marketing
Marketing is an extremely valuable side benefit of activity monitoring. Publishing simpleusage statistics over time will let management know that their investment is being used. A nice growth curve is a wonderful marketing tool. On the other hand, a flat or decreasingcurve might provide motivation for the warehouse team.
We’ve also seen this information create a significant rise in demand for the datawarehouse. A simple report that shows who is creating the most queries (along with theirdepartment), can really get peoples’ competitive juices flowing. In one case, a fewmonths after the initial rollout of a warehouse at a large finance institution, a manager’smeeting came to a halt when they all gathered around to see a user activity report thewarehouse manager happened to have in his briefcase and wasn’t even planning toshow.

15.24
Planning
Monitoring usage growth, average query time, concurrent user counts, database sizes, load times, and so on will provide data needed to help quantify capacity increases andtiming. This information also could support a mainframe-style chargeback system. We don’t encourage this return to the glass-house mentality, especially in the early days of the warehouse. If everyone is concerned about how much a query will cost, they won’t dothe experimentation they need to do to learn the tools and the data or the explorationthey need to find the real business value.
Tools
Like most of the services we’ve discussed, you can build a rudimentary version yourselfor buy a full-featured package. There are packages on the market specifically designedto monitor user activity. Many of the query management tools also offer query monitoring as a natural byproduct of managing the query process, as do some of the front-end application toolsets.
Most RDBMSs provide basic monitoring tools, which usually are turned off by default atRDBMS installation because they use significant system resources. The most expensivekind of usage to monitor is the capture of the SQL used in queries. You should develop aplan for how much, when, and how to monitor and store query text, and filter out system-issued queries such as those run in the maintenance application. As tempting as itsounds to save a copy of all the SQL issued in the database, without a tool to parse andmake sense of those queries you end up with far more data than information.
Few tools do more than capture the SQL and resource statistics while they aremonitoring the system. You may be faced with the task of monitoring a large andcomplex data warehouse, with little or no a priori knowledge of the database structure orusage patterns. With little information about how the database is used, you will have littlechoice but to capture all SQL for a week or two. To make sense of the resulting data, youcan write a custom application to parse the SQL text, looking particularly for tables thatare used together and columns that are used in join conditions, filters, and group-bys. Be sure to sort the results by user group (e.g., Marketing, Planning). This is an unpleasanttask, but the results are usually extremely valuable. In one instance we learned that 85 percent of all queries issued against a schema with 6,000 data elements were resolvedby a mere 200 data elements. This knowledge helped make a gargantuan task(redesigning a huge enterprise-wide schema) much more reasonable.
For a new data warehouse that is designed and built from user requirements, we expectthat the data warehouse team would remain close enough to the users that suchdraconian measures would not be necessary. The standard tools that monitor CPUusage, cache hits, and the count of queries executed per user usually suffice.
Key Roles Key roles for completing the physical design include: • The database administrator needs to be the primary driver for all of these tasks.
• The business systems analyst, data modeler, project manager, and businessproject lead need to support the database administrator to answer any questionsthat may arise.
Estimating Considerations
The physical design process effort can vary significantly. At one end of the spectrum, it could be a two-week effort in the case where a DBA is implementing awell-designed logical model for a single, relatively small data mart. At the other endof the spectrum, the physical design effort can take months.
Planning for physical design can be a time-consuming process if naming conventions aren’t already in place. An even greater degree of uncertainty stemsfrom a lack of clarity around the logical or business names for the data elements.

15.25
Vague, conflicting definitions at this point are a sure sign of trouble. Theseproblems have to be resolved at this point, or they will haunt the warehouse for avery long time.
The size of the database and the complexity of the warehouse technicalenvironment have a major impact on the effort. The process is multiplicative ratherthan additive as complexity increases. Multiple platforms and multiple instancesbring the added difficulty of interoperation.
The level of DBA skill and experience with the target platform can also extend the timeline significantly. An inexperienced DBA can more than double the length of thephysical design process, and in most cases, will produce an inferior implementation.
Summary
The details of physical implementation vary dramatically from project to project. The datavolumes of the project are one of the key drivers, as it is significantly harder to completethe physical design for a terabyte warehouse as it is for a 50 GB mart, although theirbusiness requirements and logical designs may be identical.
The hardware, software, and tools available to the team can make the implementationtasks much easier or much more difficult than they need to be. With the help of goodtools, the team can spend less time managing file layouts, partitions, and indexes, andmore time designing new implementations and meeting the users’ data accessrequirements in a successful data warehouse. Be sure to consult the project planspreadsheet at the end of this chapter for a summary of the tasks and responsibilities forcompleting the physical design (Figure 15.7).
Figure 15.7 Project plan tasks and responsibilities for completing the physicaldesign.

16.1

16.2
Overview
The data staging process is the iceberg of the data warehouse project. So manychallenges are buried in the data sources and the systems they run on that this part of the process invariably takes much more time than you expect. This chapter is structuredas a ten-step plan for creating the data staging application for a data mart. It lays out theten steps in detail, then reviews data quality and cleansing issues. Some additional administrative issues are covered at the end of the chapter. The concepts and approachdescribed in this chapter apply to both hand-coded staging systems and data staging tools. Most of the examples are code-based, since that represents a lowest-common-denominator approach.
This chapter should be read in detail by each member of the data staging team. The datamodelers and DBAs should also be familiar with the techniques described in this chapter.The project manager should use this chapter as the foundation for educating the rest of theorganization about why data staging development is so complex and time consuming. Therest of the project team can simply skim the chapter to become familiar with the basic steps.These other team members do not need to have in-depth knowledge of these concepts.
Data Staging Overview
How do you think we will advise you to begin the process of building the data stagingapplication? For once we will skip our primary mantra of focus on the business requirements and present our second-favorite aphorism: Make a plan. It’s rare to see a data staging process that is planned in a concrete and documented way. This isunderstandable, for so much of the work to this point has been planning and designing; now everyone is anxious to see some real data.
Nonetheless, you really need a plan. Like anything else, if you don’t have a plan, youcannot explain to others where you are going or how you expect to get there.
This chapter uses the following structure to describe the data staging planning andimplementation process.
• Plan: 1. Create a very high-level, one-page schematic of the source-to-target flow. 2. Test, choose, and implement a data staging tool.
3.
Drill down by target table, graphically sketching any complex data restructuringor transformations. Graphically illustrate the surrogate-key generation process. Develop preliminary job sequencing.
• Dimension loads:
4.
Build and test a static dimension table load. The primary goal of this step is towork out the infrastructure kinks, including connectivity, file transfer, andsecurity problems.
5. Build and test the slowly changing process for one dimension. 6. Build and test remaining dimension loads. • Fact tables and automation:

16.3
7.
Build and test the historical fact table loads (base tables only), includingsurrogate key lookup and substitution.
8. Build and test the incremental load process. 9. Build and test aggregate table loads and/or MOLAP loads. 10. Design, build, and test the staging application automation. Do the Preliminary Work
Before you begin the data staging application design for a set of fact tables, you shouldhave completed the logical design, drafted your high-level architecture plan, and completed (or nearly so) the source-to-target mapping for all data elements. The physical design and implementation work should be well under way.
The data staging system design process is critical. Gather all the relevant information,including the processing burden your extracts will be allowed to place on the transactionsystems. Test some of the key alternatives. Does it make sense to host the transformation process on the source system, the target system, or its own platform?What tools are available on each, and how effective are they? Set up the developmentenvironment, including directories, naming conventions (Development, Test, Production, etc.). If you end up writing code from scratch, take advantage of code managementsystems that might be available. Again, what you actually need to do depends on thescope of your project and the tools available to you.
Importance of Good System Development Practices
Data warehouse development may follow an iterative, interactive process, but thefundamentals of good systems development still apply. The data warehouse team shouldalways:
• Set up a header format and comment fields for your code. • Hold structured design reviews early enough to allow changes. • Write clean, well-commented code. • Stick to the naming standards. • Use the code library and management system. • Test everything—both unit testing and system testing. • Document everything—hopefully in the information catalog.
Plan Effectively
The planning phase starts out with the high-level plan, which is independent of the specific approach. However, it’s a good idea to decide on a data staging tool before youdo any detailed planning. This will save you some redesign and rework later in theprocess.
Step 1. High-Level Plan
Start the design process with a very simple schematic of the pieces of the plan that youknow: the sources and targets. Keep it very high-level, a one-pager that highlights where data are coming from, and annotate the major challenges that you already know about. Figure 16.1 illustrates what we mean. This schematic is for a fictitious utility company’sdata warehouse, which is primarily sourced from a 30-year-old COBOL system. (Note: Utility company schemas are usually far more complex than this.) In this example, additional attribute information comes from the customer and geography masters in anRDBMS, a departmental system in Microsoft Access, and an as-yet-unidentified source for the period table. Put in a placeholder box in your model to represent data element sources that are as yet unmapped, to highlight the lack. It will feel great when you finallydo get to fill in these empty boxes.

16.4
Figure 16.1 Basic high-level data staging plan schematic.
If most or all of the data come from a modern relational OLTP system, the boxes oftenrepresent a logical grouping of tables in the transaction system model (the billing group,the customer group, etc.).
This one-pager is a good way to communicate some of the project’s complexity to management. It’s probably as deep as they—indeed, most people—will want to delve into the staging application.
Data staging applications perform three major steps: they extract data from a source, transform it, and load it into the warehouse. You can see those three steps in the high-level schematic: getting data out of sources, transforming it and loading it into the targets.
There is quite a bit of overlap among the steps—only the end points are discrete. Although most of the standard transformations take place in the staging area,transformations can occur in any of the three steps, and in any of the three data stores.
Step 2. Data Staging Tools
The extracts are typically written in source system code (e.g., COBOL, PL/SQL, etc.) since this is what the source environment is set up to support. Historically, data stagingtools were source system code generators. These products are effectively CASE toolsthat have been customized to support data warehousing. Most of them have been upgraded to create code based on a graphical representation of the extract process. Thiscode is stored and managed in a repository that drives the product’s execution module.
The decision to use a data staging tool instead of hand-coding the extracts is becoming easier as data warehousing becomes a mainstream market. Although a few high-end mainframe-based vendors have been around for years, a second generation of toolsbegan to emerge in this area beginning around 1995. By the end of 1997, these second-generation vendors had reasonable customer bases and were quickly learning the fullrange of extract and transformation requirements. Their new releases are now showing asignificant increase in functionality and usability. Many of these new tools have a different architecture from the first generation. They are based around a transformation enginethat is designed to perform the kinds of transformations common to data warehousing.The transformation engine improves scalability because multiple engines can run in parallel with a central management facility.
The new tools are also improving the transformation process by creating reusabletransformation modules, or objects, that build in business rules. If the rules change, a single change to the base module will cause all the instances of it to also update. Thefirst-generation tools tended to generate standalone code for each extract process. Anychanges had to be recompiled into each piece of code.
New vendors are forcing prices to drop as well, especially as the capability and popularityof NT grows. This combination of improving functionality and lower prices is socompelling that we recommend selecting a data staging tool early on and using it rightfrom the start—for the prototype if possible. Do not expect to recoup the investment in astaging tool during your first prototype or data mart project: Because of the learningcurve, it seldom saves much time or money compared with developing the initial staging

16.5
by hand. Significant benefits from the staging tools come from turning the prototype intoa production system that can be updated nightly with minimal human intervention andfrom building the second and subsequent data marts.
Remember, though, this decision must be based on the nature of your systemsenvironment. If you have a complex, custom source system based on proprietarydatabases, the tool options are more limited and more costly. Also, if the first effort is aproof of concept that has not really been approved by management, and is not intendedto become production, the extra cost and time of including a data staging tool may not beworth it. In a production system, however, the long-term improvements in manageability, productivity, and training are significant.
If it is possible to defer the decision whether to purchase a staging tool (and which one)until this point in the design process, you will be able to make a well-informed decision. You can present alternative vendors with your high-level schematic and a 5- to 30-page detailed plan and expect clear responses to your well-educated and specific questions.
Throughout this chapter we will use the lowest common denominator of a code-based approach to describe the data staging process. If you are using a data staging tool, it willneed to provide the functionality described.
Whether you are hand-coding or choosing a tool, an important functionality across thedata staging process is pre- and post-step exits. Every step you define in the process should have a way to make an external function call as a part of the step, both beforeand after the step is run. This can be critical when you need to do something outside thecapabilities of the tool or utility. For example, it may make sense to run the data set through a sort routine before the load process. Or, it may be necessary to call aproprietary function that scores a record based on a predetermined formula.
Step 3. Detailed Plan
The next step, not surprisingly, is to drill down on each of the flows. Start planning whichtables to work on, in which order, and for sequencing the transformations within eachdata set. Graphically diagram the complex restructurings. Where the high-level plan fits a set of fact tables onto a single page (more or less), the detailed plan graphics can devotea page or more to each complex target table. Sometimes it makes more sense tostructure the diagrams around the source tables instead of the target tables. Theschematic is backed up with a few pages of pseudocode detailing complextransformations. Figure 16.2 illustrates the first pass on the detailed plan schematic forthe main utility fact table.
Figure 16.2 First draft of historical load schematic for the fact table.
All of the dimension tables must be processed before the key lookup steps for the facttable. The dimension tables are usually fairly independent from each other—that’s why they are dimensions, after all.
Organizing the Data Staging Area
The data staging area is the data warehouse workbench. It is the place where raw data isloaded, cleaned, combined, archived, and quickly exported to one or more presentationserver platforms. The overriding goal of the data staging area is to get the data ready to

16.6
be loaded into a presentation server (a relational DBMS or an OLAP engine). Weassume that the data staging area is not a query service. In other words, any databasethat is used for querying is assumed to be physically downstream from the data stagingarea.
If the raw data is naturally available in a relational database and the load window is largeenough, it may make sense to perform all the processing steps within the relationalframework, especially if the source relational database and the eventual target data martdatabase are from the same vendor. This makes even more sense when there is a high-speed link between the source and target databases.
However, there are many variations on this theme, and in many cases it may not makesense to load the source data into a relational database for transformation. In thedetailed descriptions of the processing steps, we will see that almost all the processing issorting, followed by a single sequential pass through one or two tables. This simpleprocessing paradigm does not need the power or overhead of a relational DBMS. Insome cases, it may be a serious mistake to load the data into a relational database whenwhat is needed is sequential flat file processing.
Tip
If the raw data is not in a normalized entity-relation format, it often does not pay to convert it. The most important data integrity steps involving the enforcementof one-to-one and one-to-many relationships can be performed with simple sorting and sequential processing.
If you build your application with a staging tool, that tool’s requirements will drive yourphysical infrastructure implementation. We describe the underlying processes here soyou can implement them directly or understand what your data staging tool is up to.
Dimension Table Staging
Start building the data staging application with the simplest dimension table. Usually, atleast one dimension table is static; that is, it is not a slowly changing dimension. The primary goal of this step is to work out the infrastructure kinks, including connectivity,security, and file transfer problems (which always seem to exist). If all of your dimensiontables are complex, we recommend that you do a static load of the simplest one, to get started. Later you can loop back and build the change logic.
Once you have successfully built your first dimension table, tackle the slowly changingdimension problem. Typically, the techniques or code that you develop for one slowly changing dimension are reusable for all. Your second and subsequent slowly changingdimensions will be much easier than your first, even if they are larger tables.
You also need to build those dimension tables that are largely or entirely “made up.” A common example is the period table, which we usually build from spreadsheets. ThePeriod table is so easy that we like to leave it as a treat for some day when we’re feelingdownhearted about the whole project.
Step 4. Populate a Simple Dimension Table
The primary reason to start with a static dimension table is that it is the simplest sort oftable to populate. We will take the opportunity in this section to present information aboutthe data staging process that is relevant to all types of target tables.
Static Dimension Extract
The extract process for a static dimension table is usually straightforward. The primarysource is often a lookup table or file that can be pulled in its entirety to the staging area. Work closely with the data owners and source system team so that you understand thecharacteristics of the source. Is the file you have been directed to the authoritative sourcefor the dimension information? How is it updated? Is there a time of day when you should not access it? When are transactions against it complete for the target load period? Isthere a reliable timestamp for changed records?
Sometimes the file, although logically simple, is stored in an inaccessible way. The source system owners can most efficiently convert the file into a useful structure. Moreoften than not, they will use their standard reporting tools to generate an extract “report.”A report, as long as it is correctly defined and can be scheduled, is a perfectly acceptable extract mechanism.

16.7
Creating and Moving the Result Set
There are two primary methods for getting data from a source system: as a file or as astream. If the source is an aging mainframe system, it is often much easier to extract into files and then move those files to the staging server.
If you are using a staging tool and your data are in a database (not necessarily anRDBMS), you may be able to set up the extract as a stream. Note that we’re not necessarily talking about an ongoing “trickle” stream, but rather that the extract can beconstructed so that data flow out of the source system, through the transformationengine, and into the staging database as a single process. An extract to file approach, by contrast, consists of three or four discrete steps: extract to file, move file to stagingserver, transform file contents, and load transformed data into the staging database.
Tip
Although the stream extract is more appealing, extracts to file do have some advantages. They are easy to restart at various points. As long as you save theextract file, you can rerun the load. You can easily encrypt and compress thedata before transferring across the network. Finally, it is easy to verify that all data has moved correctly by comparing file row counts before and after thetransfer. Generally, we use a data transfer utility such as FTP to move theextracted file.
Data compression is important if you need to transfer large amounts of data over a significant distance or through a public network. In this case, the communications link isoften the bottleneck. If too much time is spent transmitting the data, compression canreduce the transmission time by 30 to 50 percent or more, depending on the nature of the original data file.
Data encryption is important if you are transferring data through a public network, or eveninternally in some situations. If this is the case, it is best to send everything through anencrypted link and not worry about what needs to be secure and what doesn’t.Remember to compress before encrypting as described in Chapter 12.
Static Dimension Transformation
Even the simplest dimension table may require substantial data cleanup, and it willcertainly require surrogate key assignment. Data cleanup is a huge topic, tackled in a separate section at the end of this chapter.
Simple Data Transformations
The most common, and easiest, form of data transformation is data type conversion. Atthe most basic level, data that comes from a mainframe has to be converted from theEBCDIC character set to ASCII. In addition, your logical and physical models oftenspecify that values be stored in a different data type than the source: date, number, orcharacter. All databases and file-based toolsets have rich functions for data type conversion. This task can be tedious, but it is seldom onerous.
For dimension tables, another common and easy transformation is to “pretty up” the dimension labels. Make sure your tools offer a full set of functions, including stringmanipulation and conditional statements. User extensibility to these functions is veryvaluable. One tool we’ve used let us add a simple Nice_Name function that took a user-entered name field (first and last) and cleaned it up so it looked nice. Nice in this case means we capitalized the first and last name, and changed the all caps entries to titlecase. No big deal, but it made the reports much more readable and appealing to the usercommunity.
Surrogate Key Assignment
Once you are confident that you have a version of your dimension table with one row foreach true unique dimension value, you can assign the surrogate keys. Although otherstaging tables may be deleted after the dimension processing is complete, you need to maintain a table in the staging area matching production keys to surrogate keys. This keymap will be used later during fact table processing.
Surrogate keys are typically assigned as integers, increasing by one for each new key. If your staging area is in an RDBMS, surrogate key assignment is elegantly accomplishedby creating a sequence. Although syntax varies among the RDBMS, the process looks

16.8
like this: • One-time creation of the sequence:
create sequence dim1_seq cache=1000; — choose appropriate cache level
• Populate the key map table: insert into dim1_key_map (production_key_id, dim1_key) select production_key_id, dim1_seq.NEXT from dim1_extract_table;
If your staging area is file-based, your surrogate key assignment logic should be equallystraightforward. If you do not use a database sequence, you need to save the current (ornext) surrogate key to be assigned in the metadata to avoid performing a max(surrogate_key)+1 operation every time you need to assign a new key.
Combining from Separate Sources
Often dimensions are derived from several sources. Customer information may need tobe merged from several lines of business and from outside sources. There is seldom a universal key that makes this merge operation easy. The raw data and the existingdimension table data may need to be sorted at different times on different fields toattempt a match. Sometimes a match may be based on fuzzy criteria. Names and addresses may match except for minor spelling differences. In these cases, a sequentialprocessing paradigm is more natural than a relational equi-join. As we described in Chapter 9, there are tools and companies who can help with this process.
Once a pair of records is determined to be a match, place an entry in a mapping tablewith the warehouse surrogate key, and the matching keys from all the various sourcesystems.
A common merging task in data preparation is looking up text equivalents for productioncodes. In many cases, the text equivalents are sourced informally from a nonproductionsource. Again, the task of adding the text equivalents can be done in a single pass byfirst sorting the raw data and the text lookup table by the production code.
Validating One-to-One and One-to-Many Relationships
If two attributes in a dimension are supposed to have a one-to-one relationship, for example, key-to-label, this can be checked easily by sorting the dimension records onone of the attributes. A sequential scan of the data will show whether there are anyviolations. Each attribute value in the sorted column must have exactly one value in theother column. Reverse the check by sorting on the second column and repeating.
A many-to-one relationship, such as zip code-to-state, can similarly be verified by sorting on the “many” attribute and verifying that each value has a unique value on the “one”attribute.
Load
Once the data is properly prepared, the load process is fairly straightforward. This isparticularly true for the process we’ve described since the transformations have been performed in the staging area. All we have to do now is load the prepared data into thetarget tables. Even though the first dimension table is usually small, you should load itusing your database’s bulk loader program.
Tip
The bulk loader is a utility built to get data into the database as quickly aspossible, and every mainstream database has one. The bulk loader is the mostefficient way to load data, and you should take this opportunity to becomefamiliar with its capabilities.
Even if your staging area is in the same RDBMS and server as the target warehouse,you should plan to use the bulk loader. Although anyone can write the SQL to SELECTFROM the staging table and INSERT INTO the target table, this approach is inefficient, slow, and often fails because of insufficient log or rollback space. Remember, most of theRDBMSs will log transactions, and it’s not feasible to keep sufficient log space to supporta large table load. Equally important, INSERT INTO is extremely slow. The requirement

16.9
to use the bulk loader is nearly universal; we have worked with only one RDBMS thatdoes efficient discrete INSERTs.
Bulk Loader
The bulk load utilities tend to be script driven and come with a range of parameters and transformation capabilities. If you are using a data staging tool, make sure it worksdirectly with your database’s bulk loader and takes advantage of its features. Some ofthe primary suggestions for using these utilities are:
•
Turn off logging. Transaction-oriented databases keep track of all changes to the database in a log file. Logging allows the database to recover its current state if it runsinto a fatal error. It is vital for a transaction database. However, the log adds significant overhead and is not valuable when loading data warehouse tables. If something goeswrong, you still have the load file in the staging area.
• Pre-sort the file. Sorting the file in the order of the primary index speeds up theindexing process significantly. In some cases, this is a parameter in the bulk loader orin the index command.
•
Transform with caution. In some cases, the loader will let you do data conversions,calculations, string and date/time manipulation, and so on. Use these features carefully, and test performance. In some cases, these transformations cause the loaderto switch out of high-speed mode into a line-by-line evaluation of the load file. If you are doing transformations that involve lookups on other tables, (e.g., RI checking), make sure the lookup tables are indexed to support it.
• Aggregations. If your bulk loader supports the creation of aggregations as part of theloading process, definitely take advantage of it. In some cases, this can speed the load process significantly.
•
Use the bulk loader to perform “within-database” inserts. As discussed earlier, even if your staging area is simply a different schema within the target RDBMS, youshould use the bulk loader to move data from staging table to target. Write a query that extracts from the staging table (typically “select * from stage_table”), and stream theresults into the bulk loader. If you are writing this code by hand, this is a one-line shell script, where “QueryProgram” is the program (like isql, sqlplus, or risql) that executesSQL, and “LoaderProgram” is the bulk loader (bcp, sqlload, tmu):
QueryProgram &username &password <extract_query.sql | \LoaderProgram load_script.ctl &username &password
The loader control file (load_script.ctl) notifies the bulk loader that the data is coming inas a stream rather than from a file as is more common. This approach is elegant anddoes not require extra disk space to store the result set out in the file system.
Truncate Target Table before Full Refresh
Most RDBMSs have a “truncate table” command that is logically equivalent to a delete allrows command. Physically, a truncate table is much more efficient, because it does notlog the deletions and frees up all table space without needing to reorganize or restructurethe table. Be warned, however, that there is often no way to undo a truncate tablecommand.
Index Management
Recall from Chapter 15 on physical design, that indexes are costly during the loadprocess. Each record added to the table also has to be added to every index. Severalindexes on a table can cause the load time to balloon. Adding rows to an index can alsothrow the index structure out of balance and adversely affect queries. You basically havetwo choices during the load: drop and re-create the indexes or add rows with the indexes in place.
•
Drop and reindex. Take this approach if you are loading a significant portion of thetable each time. As a rule of thumb, if you are adding more than 10 to 15 percent of thetotal rows, you are probably better off dropping and rebuilding the indexes, especially if your RDBMS supports partitioned indexes.
• Keep indexes in place. With this approach, it is important to understand how data will

16.10
be added to the various indexes so you can create them with appropriate fill factorsand with room to grow. It’s also a good idea to rebuild the indexes every so often sothey don’t get too fragmented.
The right cutoff will vary depending on the database, the hardware configuration(especially memory), and how many indexes you have. Test these options out in your environment. It doesn’t take long to try it a few different ways and see what works best.
Maintaining Dimension Tables
The dimension tables in the warehouse almost always end up with additional attributesthat are important to business analysis, but not to the transaction systems. Many of thedata cleansing steps, like name and address processing, geo-coding, scoring, or householding, end up creating these attributes. Other attributes, like the entire Periodtable, are created manually. Wherever they come from, these attributes must be kept upto date. When a hierarchy changes, or new rows come into the dimension table, thecorresponding additional attribute values must be added. This can happen in two places:
Warehouse-Managed Maintenance
Most often, the warehouse ends up with stewardship responsibility for these new“master” dimension tables. The best-case scenario here is to have the appropriate user department agree to own the maintenance of these attributes. The warehouse team needs to provide a user interface for this maintenance. Typically this takes the form of asimple application built using the company’s standard visual programming tool. The datastaging process should add default attribute values for new rows, and the user-owner needs to update them. If these rows are loaded into the warehouse before they arechanged, they still appear in reports with whatever default description is supplied.
Tip
The warehouse staging process should create a unique default-dimension attribute description that shows that someone hasn’t done their datastewardship job yet. We favor a label that concatenates the phrase “Not yetassigned” with the surrogate key value: “Not yet assigned 157.” That way,multiple “Not yet assigned” values do not inadvertently get lumped together inreports and aggregate tables. This also helps identify the row when someonewants to correct it.
Source System-Managed Maintenance
The ideal situation, at least from the warehouse point of view, is to have the sourcesystem take on the ownership of these analytic attributes, just like the other attributes ofthe dimension. The source system owners are better equipped to create themaintenance applications, and the new attributes will then be available in the source system for operational reporting that matches the warehouse. The warehouse can thensimply extract the full dimension.
Step 5. Implement Dimension Change Logic
Recall that every data warehouse key should be a surrogate key because the datawarehouse DBA must have the flexibility to respond to changing descriptions andabnormal conditions in the raw data. If the physical join key between dimension and facttables is a direct derivation of a production key, the data warehouse DBA eventually willface an impossible situation. Production keys can be reused or reformatted, or thedimension value itself might be unknown. The most common need for a generalized keyis when the data warehouse wants to track a revised dimensional description, and the production key has not been changed.
Almost every warehouse project we have worked with has immediately or eventuallyrequired at least one slowly changing dimension. In this chapter, we focus on the Type 2 slowly changing dimension, wherein a new dimension row is created for a substantivechange in the dimension attributes. The Type 2 logic is the most complicated, but it alsoserves as the primary slowly changing dimension technique.
Dimension Table Extracts
In many cases, there is a customer master file or product master file that can serve asthe single source for a dimension. In other cases, the raw data is a mixture ofdimensional and fact data. For example, customer orders may include customer

16.11
information, product information, and numeric facts from the detailed line items of theorder.
Often, it’s easiest to pull the current snapshots of the dimension tables in their entiretyand let the transformation step deal with determining what has changed and how to handle it.
If the dimension tables are large, you must use the fact table technique, described later in this chapter, for identifying the changed record set. It can take a long time to look upeach entry in a large dimension table, even if it hasn’t changed from the existing entry.
Tip
There is often a paradox having to do with deleted items. Sometimes, an operational system will remove something from an active status by simplydeleting it. Unfortunately, if there is no record there, we cannot pull it out in theextract. We may want to know about this deletion in the warehouse, so we can handle it appropriately, typically by marking it as inactive. It’s rare to delete fromthe warehouse because we keep so much more history than operationalsystems do. Even if a product is not available today, we presumably sold somewhen it was available, and we need to be able to report that. Also,management will invariably want to know how many products have we deletedin the past five years. If they’re not there, how will we know?
If possible, construct the extract to pull only rows that have changed. This is particularly easy and valuable if the source system maintains an indicator of the type of change. Withsuch an indicator we can put new records in one file to be added to the dimension tablewithout lookups. Updated records are placed in a second file that will undergo the slowly changing dimension process. If we don’t know the change type, the entire results set ofchanged records goes through the slowly changing dimension process.
Processing Slowly Changing Dimensions
The data staging application must contain business rules to determine how to handle anattribute value that has changed from the value already stored in the data warehouse. Ifthe revised description is determined to be a legitimate and reliable update to previous information, then the techniques of slowly changing dimensions must be used.
The first step in preparing a dimension record is to decide if we already have that record.The raw data will usually have a production key value, which must be matched to the same field in the “current” dimension record. Remember, the production key in the datawarehouse dimension is an ordinary dimensional attribute and is not the dimension’ssurrogate key. If all the incoming dimensional information matches what we already have, then no further action is required. If the dimensional information has changed, weapply a Type 1, Type 2, or Type 3 change to the dimension. Recall the meaning of thetypes:
•
Type 1: Overwrite. We take the revised description in the raw data and overwrite the dimension table contents. For instance, we may receive a corrected customer address.In this case, overwriting is the right choice. Note that if the dimension table includesType 2 change tracking, we should overwrite all existing records for that particular customer.
•
Type 2: Create a new dimension record. We copy the previous version of the dimension record and create a new dimension record with a new surrogate key. If thereis not a previous version of the dimension record, we create a new one from scratch.We then update this record with the fields that have changed and add any other fieldsthat are needed. For instance, we may receive a record of a transaction that changes acustomer’s marital state. If we believe this is an actual change rather than a correction,we should use this method. This is the main workhorse technique for handlingoccasional changes in a dimension record.
•
Type 3: Push down the changed value into an “old” attribute field. In this case we have anticipated that an attribute may experience “soft” changes that require a user torefer either to the old value of the attribute or the new value. For example, if a salesteam is assigned to a newly named sales region, there may be a need to track the team both in the old region assignment as well as the new one.
Each dimension table will use one, two, or all three of these techniques to manage datachanges. The most useful and most difficult to manage is Type 2. This is because you

16.12
must create a new dimension row and a new surrogate key every time you encounter achanged dimension record. The only attributes in the new record that differ from theoriginal record are the surrogate key and whichever fields triggered the changed description.
The lookup and key assignment logic for handling a changed dimension record duringthe extract process is shown in Figures 16.3 and 16.4. In Figure 16.3, an upstreamprocess has identified the record as changed, so all we need to do is generate a new surrogate key from the key sequence and update the surrogate key lookup table.
Figure 16.3 The lookup and key assignment logic for handling a changeddimension record when we know that the input represents only changed records.
In Figure 16.4, we have today’s version of the entire dimension table, and must firstdetermine which records have changed. Once we have the changed records, the logicfor handling the surrogate key is the same as the first scenario.
Figure 16.4 The logic for determining if an input dimension record has beenchanged.
Slowly Changing Dimension Table Transformation and Load
Other than the slowly changing dimension processing, these dimensions are subject to the same transformations and loading techniques as other dimension tables. Very largedimensions share some characteristics with fact tables. You should examine the sectionon fact tables before finalizing the data staging design for a very large dimension.
Step 6. Populate Remaining Dimensions
At this point in the process, you should be able to populate the remaining dimensionswith relative ease, unless there are major data quality issues. Follow the logical stepsoutlined earlier for simple and slowly changing dimensions, as appropriate.

16.13
Implementing Your Own INSERT Statements
If your RDBMS does not support direct loading from an ODBC client, you cangenerate the “insert” statements directly in the spreadsheet. After you have set upall the dimension columns, construct a string using the worksheet string functions. The spreadsheet formula will look something like:
="insert into period (key, day_name, month_name) values ('"&A1&"', '"&B1&"', '"&C1&"');"
This ugly thing will resolve to an executable INSERT statement, and you can copy and paste the entire table into the database in a few moments. The multiple quotesseem overwhelming, but you get the hang of it very quickly.
The Period table, which appears in virtually all data warehouses, is usually created “by hand.” Because the Period table is so small—3,650 rows for a ten-year daily table—it is very easy to generate in a spreadsheet. An example Period table spreadsheet is includedon the book’s CD-ROM. Other dimensions that, like the Period table, are updated infrequently, may also be developed and maintained by hand, although a system asdescribed in Step 4 is greatly preferable.
Fact Table Loads and Warehouse Operations
Most warehouses grow too large to completely replace their central fact tables in a single load window, and even some of the dimension tables are too large to pull in all at once.
Tip
It is much more efficient to incrementally load only the records that have beenadded or updated since the previous load. This is especially true in a journal-style system where history is never changed and only adjustments in thecurrent period are allowed.
Some systems do not limit changes to the current period. Sales compensation systems,for example, can have significant changes to history (you may have seen some of those battles about who should get credit for which sale). You need to be able to identify thosechanged records and pull them out into the staging table.
Even with warehouses that start off with incremental loads, typically we begin with an initial population of some historical data.
Step 7. Historical Load of Atomic-Level Facts Historic Fact Table Extracts
As you are identifying records that fall within the basic parameters of your extract, you need to make sure these records are useful for the data warehouse. Many transactionsystems keep operational information in the source system that may not be interestingfrom a business point of view. These include entries to track intercompany transactions, accounting adjustments, amortized transactions, set up a new order, and so on. Thebusiness rules created during the design phase will help determine how each of theseevents is to be represented in the warehouse and which filters and sums should be applied during the extract as a result.
Determining and validating these rules can get unpleasant. Your extract has little chanceof being right the first time. Business rules that were overlooked or forgotten during dataanalysis surface during the extract process. Tracking down these subtle differencesrequires skillful detective work and endless patience.
It’s also a good idea to accumulate audit statistics during this step. As the extract createsthe results set, it is often possible to capture various subtotals, totals, and row counts.
Audit Statistics
If the statistics haven’t been captured yet, this step will make a pass through the data,resorting it if needed, and calculate the various numbers that were identified as useful for comparison. These numbers should tie backward to operational reports and forward tothe results of the load process in the warehouse. They should be stored in the metadata

16.14
catalog in a table or file created for this information.
The tie back to the operational system is important because it is what establishes thecredibility of the warehouse. Pick a report from the operational system that is agreed onas the official definition of what is right: the authoritative source. If the results set doesn’t tie back to the source, it’s likely that something has changed in the business rules thathas not been reflected in the extract. It is better to stop the process and check it out now.This is a good argument for including the extract as part of the source system’s responsibilities. If they make substantive changes in the source, they may forget to passthat information on. On the other hand, if they own the extract process, they are morelikely to roll any changes all the way through.
Tip
The issue of having the warehouse tie back to the source system iscontroversial. In many cases, the data warehouse extract includes manybusiness rules that have not been applied to the source systems. Also,differences in timing make it even more difficult to cross-foot the data. If it’s not possible to tie the data back exactly, you need to be able to explain thedifferences. As a general rule, you should not agree to make your datawarehouse automatically tie to the general ledger.
Fact Table Processing
Every data staging process must include a step for replacing the production IDs in theincoming fact table record with the data warehouse surrogate keys, for each dimension inthe fact table. Other processing, computation, and restructuring may also be necessary.
Fact Table Surrogate Key Lookup
In the warehouse, Referential integrity (RI) means that for each foreign key in the facttable, an entry exists in the corresponding dimension table. Recall from Chapter 9, if you have a sale in the fact table for product number 323442, you need to have a product inthe Product dimension table with the same number, or you won’t know what you’ve sold.You have a sale for what appears to be a nonexistent product. Even worse, without theproduct number in the dimension, a user can easily construct a query that will omit thissale, without even realizing it. The disciplined and consistent use of surrogate keysmeans that your extract logic always does two kinds of surrogate key lookups. First, youmust create a new surrogate key every time you encounter a changed dimension recordand you wish to use slowly changing dimension technique Type 2. Recall that this is themain workhorse technique for handling occasional changes in a dimension record. Youmust create a new dimension record for the changed item and assign it a brand newsurrogate key. The only attributes in this new record that are different from the originalrecord are the surrogate key and whichever field or fields that triggered the changeddescription.
The second kind of surrogate key lookup occurs when the fact table records are being processed. Remember that to preserve referential integrity, we always complete ourupdating of the dimension records first. In that way, the dimension tables are always thelegitimate source of primary keys. In this second kind of surrogate key lookup, we must replace the production keys in the fact table record with the proper current values of thesurrogate keys. This processing is depicted in Figure 16.5.
Figure 16.5 The processing of a fact table record showing how the production IDs are replaced with data warehouse surrogate keys.

16.15
In this case we could always use the actual dimension table as the source for the mostcurrent value of the surrogate key to use with each production key. Each time we needthe current surrogate key, we would look up all the records with the production key equalto the desired value and then take the maximum value of the all the surrogate keysfound. While this is logically correct, this approach is clearly inefficient. It is much faster to maintain a surrogate key lookup table that has exactly one record for each productionkey. These records contain the single current value of the surrogate key to use with theproduction key. If the fact records are sorted by the particular production key, then this lookup between the incoming fact record and the surrogate key lookup table can beaccomplished with a single pass sort merge operation.
When all the fact table production keys have been replaced with surrogate keys, the fact record is ready to load. The keys in the fact table record have been chosen to be properforeign keys to the respective dimension tables, and the fact table is guaranteed to havereferential integrity with respect to the dimension tables. It is worthwhile, however, to be paranoid in this situation. All of the fancy administration we have described in this sectionsets up referential integrity prior to actual database loading. It is still very possible todestroy referential integrity by failing to load one or more of the dimension tables or by making other administrative mistakes, like deleting dimensional records when there arestill fact records depending on the dimension key values.
An alternative approach, which works well when the staging application uses relational technology, is to maintain a current indicator in the dimension table and join between thefact staging table and the dimension table where the current indicator is “yes.” Abitmapped index on the current indicator column really helps out here.
Note that you will need a separate process to perform surrogate key lookups if you everneed to reload history because you don’t want to map the most current value to ahistorical event. In this case, you need to create logic to find the surrogate key that applied at the time the fact record was generated. This means finding the surrogate keywhere the fact transaction date is between the key’s effective start date and end date.
When the fact table production keys have been replaced with surrogate keys, the fact record is ready to load. The keys in the fact table record have been chosen to be properforeign keys, and the fact table is guaranteed to have referential integrity with respect tothe dimension tables. Strictly speaking, it is not necessary to declare referential integritybetween facts and dimensions, but we recommend doing so because every databaseotherwise develops integrity problems.
Null Fact Table Values
All major RDBMSs support a null value explicitly. In many source systems, however, the null value is represented by a special value of what should be a legitimate fact. Perhapsthe special value of -1 is understood to represent null. Null dates are often representedby some agreed-upon date like January 1, 1900. (We hope you haven’t been usingJanuary 1, 2000.)
Null values in data are tricky because philosophically there are at least two kinds of nulls.A null value in the data may mean that at the time of the measurement, the value literally did not exist and could not exist. In other words, any data value at all is wrong.Conversely, a null value in the data may mean that the measurement process failed todeliver the data, but the value certainly existed at some point. In this second case, you might argue that to use an estimate value would be better than to disqualify the factrecord from analysis. As discussed shortly, this distinction is particularly important in datamining applications.
If you have ignored our repeated advice about surrogate keys and have designed a fact table that uses dates as foreign keys to the date dimension table, null dates will present aparticular problem. There is not a good way to represent null dates in your fact tablerecord. You cannot use a null-valued foreign key in the fact table because null in SQL isnever equal to itself. In other words, you cannot use a null value in a join between a facttable and a dimension table. You should implement the join with an anonymous integerkey and then have a special record in the dimension table to represent the null date.
Improving Fact Table Content As we discussed in Chapter 5, all of the facts in the final fact table record must be

16.16
expressed in the same grain. This means that there must be no facts representing totalsfor the year in a daily fact table or totals for some geography larger than the fact tablegrain. If your extract includes an interleaving of facts at different grains, thetransformation process must eliminate these aggregations, or move them into theappropriate aggregate tables.
The fact record may contain derived facts, although in many cases it is more efficient to calculate derived facts in a view rather than in the physical table. For instance, a factrecord that contains revenues and costs may want a fact representing net profit. It is veryimportant that the net profit value be calculated correctly every time a user accesses it. If the data warehouse forces all users to access the data through a view, it would be fine tocalculate the net profit in that view. If users are allowed to see the physical table, or ifthey often filter on net profit and thus you’d want to index it, precomputing it and storing itphysically is preferable.
Similarly, if some facts need to be presented simultaneously with multiple units ofmeasure, the same logic applies. If users access the data through a view, then the various versions of the facts can efficiently be calculated at access time. As we remarkedin Chapter 6, this approach is nearly mandatory when we have several facts and several units of measure.
Data Restructuring
Improving the content of the data isn’t the only fact table transformation that takes placein the staging area. Sometimes the structure also needs work: either denormalizing or renormalizing the database. In some cases, we denormalize to make the database moreuseful from a business point of view. A common example is a financial schema that hasan amount type field in the source for the fact table, indicating whether the associated number is a budget, actual, or forecast amount. In the warehouse, it usually is better topivot those entries into separate columns, simplifying the calculation of variances.Although each database has a different syntax, the following SQL gives an example of how to accomplish this pivot on the RDBMS:
select account_num,
sum(case when amt_type='actual' then trxn_amt else 0) asactual_amt,
sum(case when amt_type='budget' then trxn_amt else 0) asbudget_amt
from source_trxn_table group by account_num;
Normalization is also common in the transformation process. In many legacy systems,the main data source is a large flat file that is used for report generation. These numbersare the “right” numbers, so this is the source to draw from. However, the file is usuallycompletely denormalized, and a long history is usually the biggest casualty. Data getdistributed across the row in buckets—there is one for each month the source system reports on. The transformation task here is to take that information and “unpivot” it from asingle row into a period column and the associated amounts, with a row for each period.
Data Mining Transformations
Data mining has its own set of requirements beyond the business requirements you’ve gathered from the user community. Many of these are driven by the technical, statisticalnature of the data mining process. For a full discussion of data mining, we encourageyou to consult Data Mining Techniques for Marketing, Sales, and Customer Support, a wonderful book by Michael Berry and Gordon Linoff (Wiley 1997). Most of the techniqueswe discuss next are useful for a general data warehouse and imperative for data miningapplications. If you know that data mining is in your future, even if it is not a Phase 1application, you should consider making the investment now to develop these flags.Usually, the flags are hidden from the business user applications.
•
Flag normal, abnormal, out of bounds, or impossible facts. Marking measured facts with special flags may be extremely helpful. Some measured facts may be correctbut highly unusual. Perhaps these facts are based on a small sample or a specialcircumstance. Other facts may be present in the data but must be regarded as impossible or inexplicable. For each of these circumstances, it is better to mark thedata with a status flag so that it can be constrained into or out of the analysis, ratherthan to delete the unusual value from the table. A good way to handle these cases is to create a special data status dimension for the fact record. You can use this dimension

16.17
as a constraint and to describe the status of each fact.
•
Recognize random or noise values from context and mask out. A special case of the preceding transformation is to recognize when the legacy system has supplied arandom number rather than a real fact. This can happen when no value is meant to bedelivered by the legacy system, but a number left over in a buffer has been passed down to the data warehouse. When this case can be recognized, the random numbershould be replaced with a null value. See the next transformation.
•
Apply a uniform treatment to null values. As discussed earlier, data mining toolsare sensitive to the distinction between “cannot exist” and “exists but is unknown.”Some data mining professionals assign a most probable or median value in the secondcase, so that the rest of the fact table record can participate in the analysis. This could be done either in the original data by overwriting the null value with the estimatedvalue, or it could be handled by a sophisticated data mining tool that knows how toprocess null data with various analysis options.
•
Flag fact records with changed status. A helpful data transformation is to add a special status indicator to a fact table record to show that the status of that account (orcustomer or product or location) has just changed or is about to change. The statusindicator is implemented as a status dimension in the star join design. This status canbe combined with the status dimension that we illustrated in Figure 5.13. Useful statuses include New Customer, Customer Defaulted, Customer About to Cancel, orChanged Order. The Customer About to Cancel status is especially valuable becausewithout this flag the only evidence that the customer canceled may be the absence ofaccount records beginning the next billing period. Finding such an absence by noticingthat records don’t exist is impractical in most database applications.
•
Classify an individual record by one of its aggregates. In some cases it may be desirable to identify the sale of a very specific product, such as a garment in aparticular color and size combination or by one of the garment’s aggregates, such asits brand. Using the detailed color or size description in this case might generate somuch output in the market basket report that the correlation of the clothing brand withsay, a shoe style, would be hard to see. One of the goals of using an aggregate label inthis way is to produce reporting buckets that are statistically significant.
Beyond these general transformations for data mining, many of the tools and approachesrequire additional transformation steps before they can do their thing.
•
Divide data into training, test, and evaluation sets. Almost all data mining applications require that the raw input data be separated into three groups. Forexample, the data could be separated randomly into three control groups, or it could beseparated by time. The first data group is used for training the data mining tool. Aclustering tool, a neural network tool, or a decision tree tool absorbs this first data setand establishes parameters from which future classifications and predictions can bemade. The second data set is then used to test these parameters to see how well themodel performs. Michael Berry and Gordon Linoff discuss an interesting problem intheir book Data Mining Techniques for Marketing, Sales, and Customer Support (Wiley 1997) that occurs when the data mining tool has been trained too intensively on thefirst set. In this case the data is said to be “over-fitted” because it predicts results from the first data set too well and does poorly on the test data set. This is the reason tohave a fresh second set of data for testing. When the data mining tool has beenproperly tuned on the first and second data sets, it is then applied to the thirdevaluation data set, where the clusters, classifications, and predictions coming from thetool are to be trusted and used.
•
Add computed fields as inputs or targets. A data mining exercise can be greatly leveraged by letting the data mining tool operate on computed values as well as onbase data. For instance, a computed field such as profit or customer satisfaction thatrepresents the value of a set of customer transactions may be required as a target for the data mining tool to pick out the best customers, or to pick out behavior that youwant to encourage. You may not have to modify your base schemas with thesecomputed values if you can present the data mining tool with a view that contains these computed values. In other cases where the added information is too complicated tocompute at query time in a view, you have to add the values to the base data itselfbefore you can perform data mining.
• Map continuous values into ranges. Some data mining tools, such as decision

16.18
trees, encourage you to “band” continuous values into discrete ranges. You may beable to do this by joining your fact table to a little band values dimension table, but thismay be an expensive join against millions or billions of unindexed numeric facts. Insuch a case, you may have to add a textual bucket fact or even a bucket dimension toyour fact table if the fact in question is important enough to be used as a frequent datamining target.
•
Normalize values between 0 and 1. Neural network data mining tools usually require that all numeric values be mapped into a range of zero to one. Berry and Linoff warnthat you should make your data range a little larger than the observed data for this normalization calculation so that you can accommodate new values that fall outside theactual data you have on hand in your training set.
•
Convert from textual to numeric or numeral category. Some data mining tools may only operate on numeric input. In these cases, discrete text values need to be assignedcodes. You should do this only when the data mining tool is smart enough to treat suchinformation categorically, and it does not infer an ordering or a magnitude to thesenumbers that is unwarranted. For instance, you can convert most locations in theUnited States into a zip code, but you cannot compute on the zip codes.
•
Emphasize the unusual case abnormally to drive recognition. Often a data mining tool is used to describe and recognize unusual cases. Perhaps you are looking forfraud in a series of sales transactions. The problem is that your training set data maynot contain enough instances of the target fraud behavior to extract meaningfulpredictive indicators. In this case you may have to artificially replicate, or seed, thetraining data with the desired target patterns to make the data mining tool create auseful set of parameters.
Step 8. Incremental Fact Table Staging
Many fact tables become so large they simply cannot be loaded all at once. One of themost common techniques for reducing the length of the staging process is to load onlydata that is new or has changed.
Incremental Fact Table Extracts
In the ongoing extract process, you generally want to pull the new transactions thatoccurred since the last extract run. Figuring out what has occurred can be difficult.Transactions are represented in many different ways, and many systems have no needto keep the history of a transaction. Your challenge will be figuring out how thetransaction process works and making sure you can get the information you need from it.The problem is, there are actually several types of transactions that occur, and each onehas different implications for the warehouse.
•
New transactions. When a new order for six devices comes in on Day 1, it is enteredinto the transaction file with an order date of Day 1. This record will show up when ourextract pulls all the records with an order date greater than 12:00 midnight from the night before and less than 12:00 midnight last night. What happens when the ordergets changed tomorrow?
•
Updated transactions. On Day 2, the customer calls back and increases the orderquantity from six to nine. Since our goal is to represent the business events as closelyas possible (without making the system unusable), we want to reflect the fact that thecustomer ordered six devices on Day 1 and three on Day 2. Many legacy systems areledger-driven and will generate a journal entry to reverse the original order of six andadd a new order for nine, but keep the original order date. Rows in this source file arenever updated; corrections or modifications are accomplished through reversal entries. Other systems generate a net change to the order of +3. In any case, we need to beable to define an extract that can pull what we want.
A ledger-driven system allows us to develop an extract based on simple row-selection techniques using the transaction table. We select every row from the source systemthat has been added during the prior day (using the timestamp present in each row),and then extract associated rows from additional tables based on keys present in thetransaction detail rows.
• Database logs. In some cases, fields in the source system like update_date ororder_date are not reliable or do not exist. In that case, you may need to turn to the

16.19
database log files to identify what records actually changed during the target time period. Tools that generate database extracts using “change data capture” or “logtraversal” techniques are sometimes necessary when no ledgered source system isavailable to support the business requirements. The log captures every change thatoccurs to a record. For example, during the span of an initial order entry, the orderrecord can change dozens of times, and all those changes are logged. The first stepafter the changed records are identified is to collapse the logs into the net change forthe day. In one case we know of, collapsing the log yields about a 15-to-1 reduction in the number of rows to be processed downstream. Most projects will collapse the logson the source system to reduce the network load as the rows are moved to the stagingarea.
It is possible to create a specialized log for the warehouse that records only changes ofinterest to the warehouse. This can be accomplished by adding a trigger to thetransaction table of interest. Of course, this adds overhead to the source system, which is generally frowned upon.
Extracts based on log techniques are more complex to develop and difficult tomaintain. Log-based extract products are also highly specific to the version of thesource DBMS. If the DBMS version is upgraded, there is no guarantee that the log-based extract tool will be available for the new version in time to meet the sourcesystem upgrade schedules. You definitely don’t want your extracts to be the reason theoperational systems can’t upgrade.
•
Replication. Replication has several meanings depending on the database vendor orproduct involved. In a warehouse context, it may be used to create a copy of a table orof changed rows in the staging database during the day. This copy is then available to support the data staging process overnight.
Replication is also very important when conformed dimensions that support multipledata marts have been created. When a new version of a conformed dimension hasbeen prepared, it should be replicated nearly simultaneously to all the affected data marts. Increasingly, data warehouses are taking advantage of end-user query and reporting tools that can open connections to multiple database servers in the course ofbuilding a complex result. If such a tool manages to request data from data mart A with one version of the customer dimension and then requests data from data mart B withan incompatible version of the customer dimension, the result is likely to be wrong.Tracing the problem would be very difficult. The best way to avoid this situation is to replicate the conformed dimensions to all affected data marts simultaneously.
Incremental Fact Table Load
The physical process of loading the incremental fact table rows is the same as we have previously discussed. However, the successful data warehouse will inevitably facepressure to complete more processing in a smaller window. For smaller warehouses, itmay take months or years to hit this wall, but for larger warehouses, it may happenbefore the first deployment.
Speeding Up the Load Cycle
Processing only changed increments is one way to speed up the data staging cycle. Thissection lists several additional techniques you may find valuable.
More Frequent Loading
Although it is a huge leap to move from a monthly or weekly process to a nightly one, it isan effective way to shorten the load window. Every nightly process involves 1/30 the datavolume of a monthly one. Most data warehouses that we’ve worked with recently are on a nightly refresh process.
Partitioned Files and Indexes
As discussed in Chapter 15, high-end relational databases support partitioned files and partitioned indexes. Useful file partitioning allows a logical and physical segment of thefile to be taken off-line and later restored. This should allow the DBA to split off an oldsegment of a fact table and place it on slower media, or even take it off-line for optional reloading if the data is requested.

16.20
Useful index partitioning is similar, and allows the DBA to drop an index on a portion of alarge fact table so that bulk loading can occur at a very high rate. When the loading is done, the dropped portion of the index can be recomputed. This is usually far moreefficient than dropping the index on the whole table or loading with the index intact.
Using partitions can greatly speed the data staging process, although it does require somewhat more intervention on the part of the DBA and a more complex data stagingapplication.
Parallel Processing
One way to shorten the load time is to parallelize the data staging process. This can happen in two ways: multiple steps running in parallel and a single step running inparallel.
Tip
There are good ways and bad ways to break processing into parallel steps.One very simple way to parallelize is to FTP all source files together, then load and transform the dimensions, and then check referential integrity between thefact table and all dimensions simultaneously. Unfortunately, such an approachis likely to be no faster—and possibly much slower—than the even simpler sequential approach, since each step launches parallel processes that competefor the same system resources such as network bandwidth, I/O, and memory.To structure parallel jobs well, then, you need to account not just for logicallysequential steps but for system resources.
•
Multiple load steps. Divide the data staging job stream into several independent jobssubmitted together. Think carefully about what goes into each job. The primary goal isto create jobs that are independent. If one load requires the results of another load before it can run successfully, the two loads should be sequential in the same job. Anobvious example is the referential integrity check from the fact table to the dimensions:Obviously, the dimension processing must complete first.
On the plus side, parallel processing can be very elegant and efficient. We know of asystem that, for a few months before a larger server was purchased, spent 28 hoursloading a day’s worth of data. The staging process could manage such a feat and still keep up to date only because of very clever parallelization.
•
Parallel execution. The database itself can also identify certain tasks it can execute inparallel. For example, creating an index can typically be parallelized across as many processors as are available on the machine. Each processor works on a chunk of thedata, and the results are merged together at the end. Parallel indexing is especiallyeasy if the table and index are partitioned. In this case, each index is independent of the others; no merging is required. This capability is a standard part of mostmainstream databases today. Make sure your database can parallelize activities andthat this feature is enabled. Monitor your jobs and see what happens.
Parallel Databases
Although it’s expensive, you can use RAID1 to set up a three-way mirror configuration on two servers to maintain a continuous load data warehouse, with one server managing theloads and the second handling the queries. The maintenance window is reduced to a few minutes daily to swap the disks attached to each server.
Duplicate Tables
If your warehouse is small and you must provide nearly 24-hour availability, you can use the parallel tables technique, in which you keep two versions of the database available: one for loading and one for querying. At the end of a load cycle, the switch is nearlyinstantaneous.
This technique doesn’t stretch the load window so much as make it less obvious that theload takes so long. It also has the benefit of buffering users from the load process so thewarehouse operations team has time to review and verify the load before it is released tothe public. The costs of this approach are retaining three copies of the tables at anygiven time and running loads and queries on the same server, potentially at the sametime. With some middleware to provide indirection between user access tools and thedatabase, it is not too difficult to modify the process described next and illustrated inFigure 16.6 so they run on two servers.
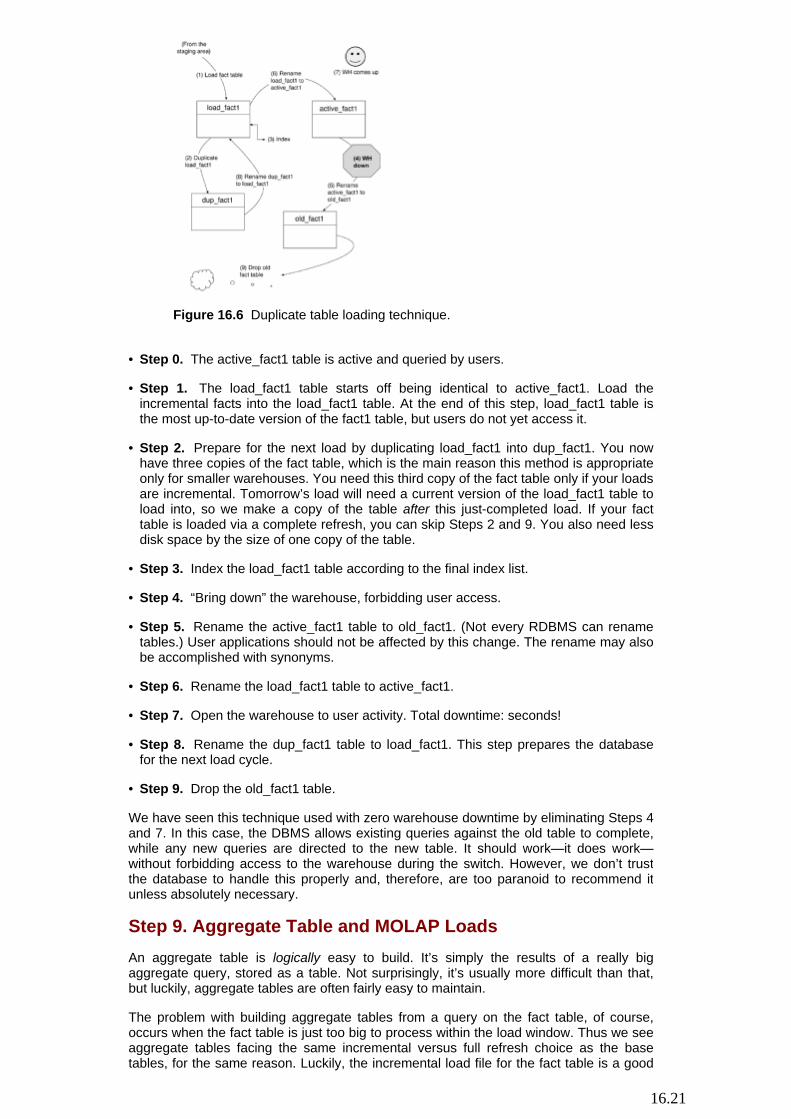
16.21
Figure 16.6 Duplicate table loading technique.
• Step 0. The active_fact1 table is active and queried by users.
• Step 1. The load_fact1 table starts off being identical to active_fact1. Load the incremental facts into the load_fact1 table. At the end of this step, load_fact1 table isthe most up-to-date version of the fact1 table, but users do not yet access it.
•
Step 2. Prepare for the next load by duplicating load_fact1 into dup_fact1. You nowhave three copies of the fact table, which is the main reason this method is appropriateonly for smaller warehouses. You need this third copy of the fact table only if your loadsare incremental. Tomorrow’s load will need a current version of the load_fact1 table toload into, so we make a copy of the table after this just-completed load. If your fact table is loaded via a complete refresh, you can skip Steps 2 and 9. You also need lessdisk space by the size of one copy of the table.
• Step 3. Index the load_fact1 table according to the final index list. • Step 4. “Bring down” the warehouse, forbidding user access.
• Step 5. Rename the active_fact1 table to old_fact1. (Not every RDBMS can rename tables.) User applications should not be affected by this change. The rename may alsobe accomplished with synonyms.
• Step 6. Rename the load_fact1 table to active_fact1. • Step 7. Open the warehouse to user activity. Total downtime: seconds!
• Step 8. Rename the dup_fact1 table to load_fact1. This step prepares the databasefor the next load cycle.
• Step 9. Drop the old_fact1 table.
We have seen this technique used with zero warehouse downtime by eliminating Steps 4 and 7. In this case, the DBMS allows existing queries against the old table to complete,while any new queries are directed to the new table. It should work—it does work—without forbidding access to the warehouse during the switch. However, we don’t trust the database to handle this properly and, therefore, are too paranoid to recommend itunless absolutely necessary.
Step 9. Aggregate Table and MOLAP Loads
An aggregate table is logically easy to build. It’s simply the results of a really big aggregate query, stored as a table. Not surprisingly, it’s usually more difficult than that,but luckily, aggregate tables are often fairly easy to maintain.
The problem with building aggregate tables from a query on the fact table, of course, occurs when the fact table is just too big to process within the load window. Thus we seeaggregate tables facing the same incremental versus full refresh choice as the basetables, for the same reason. Luckily, the incremental load file for the fact table is a good

16.22
source for the aggregate table incremental load. An aggregate table that still includesdaily data can easily be appended to, if the incremental fact load includes only the latestday’s data.
Often, the aggregation is made over time, to the weekly or monthly level. There are twogeneral cases:
• The aggregate table does not include the most recent month until the month hasfinished. In this case, define a monthly process that recomputes the latest month from the base fact table when the full month of data is in.
•
The aggregate table keeps the current month as “month-to-date.” In this case, define a nightly process that updates existing rows in the aggregate table for this month where they already exist and appends new rows where the key combination does not exist.Alternatively, you can delete the rows for the current month and recompute the month-to-date each night.
Matters start to get tricky when the incremental fact load includes reversals of earlier data. Sometimes these reversals come about because of a major change, such as salesregion restructuring. In this case, you are probably best off rebuilding the aggregatetable.
More troublesome are aggregate tables that see frequent, but smaller, reversals of data.These may result from the date key on the aggregate table being “out of synch” with thedata as they flow into the warehouse. Consider, for example, an aggregate table thatcomputes net sales as original sales minus returns, where returns can occur up to 90days after the original sale.
The first point is that maybe you should redesign the aggregate table so that you don’thave to solve this nasty problem. There may be a different aggregate table that delivers similar performance results but is much easier to maintain. If this aggregate table is afirm requirement, you will need to define an UPDATE/APPEND operation that backs outthe reversals from the historical aggregate data.
Computation and Loading Techniques
Although it is very tempting to use the database, as described, to perform the aggregatecomputations, that approach can lead to difficulties. Those problems are related to ournemesis, running out of log or rollback space, discussed earlier. If you use the databaseto compute the aggregates, use the bulk load technique already presented.
A file utility like Syncsort can aggregate data rapidly. Additionally, some databaseproducts provide an ability to create aggregates within the bulk loader.
You will run into operational difficulties with complex aggregate tables that requireUPDATEs or DELETEs unless your aggregate table is small. Yes, you will run out of logor rollback space. You should segment the table, isolating the current month in its ownsegment. Figure out a way to perform the appends and updates without logging. This willbe either in the file system or by creating a staging table within the database using a“create table as select unrecoverable” operation that does not log. Drop the old segment(no logging!), and bulk-load the new one in. Doesn’t that sound unpleasant? We can’tsugarcoat it; it really is pretty ghastly. If you are faced with such a problem, you shouldbe pressing staging tool vendors about their capabilities.
MOLAP Engines
We described the multidimensional OLAP (MOLAP) server and the multidimensionaldatabase systems in Chapter 10. These database engines are essentially aggregate processors that are based on dimensional design concepts. Individual vendors tend tochange the terminology somewhat, but the underlying principles are the same regardless of whether the physical implementation is relational or MOLAP. Recall that ourrecommendation is to load the atomic level data, the lowest level of detail, into the datawarehouse in a relational form. Any MOLAP-based data marts can be built from this atomic-level data warehouse. Drawing from this common source ensures consistentdefinitions and derivations.
The MOLAP cube design should match the atomic level warehouse data model. That is,the dimensions in the MOLAP cube should be built directly from the dimension tables in

16.23
the base-level warehouse. This will make the data mart extract development easier andfacilitate easier drill-through from the MOLAP data mart back to the atomic-level detail.
MOLAP engines typically compute their own aggregates. As a result, the loading processof the MOLAP cube can be time consuming. Many MOLAP engine providers are gettingsmarter about the aggregates they create, and they do not necessarily recompute theentire cube every night or create aggregates for every level in the hierarchy. If you plan to allow access to the atomic level only through a MOLAP drill-through link, it may not be necessary to keep aggregates in the base-level data warehouse. On the other hand, it may be possible to build the MOLAP cubes from the aggregate data, speeding theloading process significantly.
Step 10. Warehouse Operation and Automation
The ultimate warehouse operation would run the regular load processes in a lights-out manner, that is, completely unattended. While this is a difficult outcome to attain, it ispossible to get close. Of course, you identified the operational functions you need foryour warehouse in your architecture plans, didn’t you? As a reminder, we’ll list the typicaloperational functions again here, then offer a brief description of a few approaches toimplementing them.
A good data staging tool should be able to perform these ongoing functions in anautomated or semiautomated way.
Typical Operational Functions
The following list of operational functions comes from the technical architecture section inChapter 9:
• Job definition—flows and dependencies • Job scheduling—time and event based • Monitoring • Logging • Exception handling • Error handling • Notification
For the warehouse to truly be a production system, you need to provide these capabilities in some form. They can be rudimentary at first, but you should plan to retrofitwith more robust tools fairly soon. Nothing slows down warehouse progress faster than acreaky, failure-prone production process. The whole team can end up being diverted to monitor and patch the process, so new data sources are put on hold. Also, managementbegins to lose confidence because the problems are fairly public—they usually cause the data to be unavailable at the least opportune time.
Job Control Approaches
The options available to provide job control capabilities depends on the basicinfrastructure of the warehouse, the experience base of the team, the complexity of thedata staging process, and the funds available. Some sites we’ve worked with were builton mainframes by mainframe programmers, and rely on mainframe job scheduling tools.These are generally fairly cryptic to use, but they are robust and reliable. Other sites areUNIX oriented, and use UNIX-based tools ranging from CRONTAB to TP monitoringsystems. Most of the data staging tools include a reasonable level of schedulingcapability. Some even integrate with popular TP monitors so you can take advantage ofthe full range of capabilities. If you choose to patch together your own system, be sureyou understand what it will take to make it scale. Think through how difficult it will be tomaintain the system, make changes, and add new data sources. Make sure you have theresources to manage it.

16.24
Extract Metadata
Once the extract step has completed, the process needs to record several pieces ofmetadata. These items fall into the categories of managing or measuring the process.
Process Management
To keep the process moving, the extract step needs to notify the next process to start.The next step could be either the associated transformation process or another extractprocess that is dependent on the completion of the current process. We’ve seen a lot ofcreative ways to accomplish this, all involving some kind of monitoring process.
•
File existence. In this case, the extract process doesn’t need to do anything extra.Simply moving the file to the appropriate directory is enough to set the wheels in motion. A data staging monitor periodically checks the directory where the extractresults set is deposited. Once the file appears, the data staging monitor fires up thetransformation process, and off we go.
•
Flag set. In this case, the extract process sets a flag (or writes a record) in the metadata catalog that indicates completion of the extract. A data staging processperiodically checks the table for a record or checks the value of the flag. When it iscorrect, the data staging monitor fires up the transformation process, and off we go.
• Built in. If you are using a data staging tool, process management should be built in tothe product.
Process Measurement
The extract step should also write out metadata about the extract itself. A simple version will write out the job name, batch ID, userid, start time, stop time, elapsed time (inminutes—calculating it once now saves the trouble of figuring out the formula every timeyou query the table), row count, success indicator, and, if available, CPU seconds, disk reads, disk writes, and cache hits. This information can also be recorded in an auditdimension attached to the fact table.
Operations Metadata
Metadata should play an active role in the warehouse operations. Any tool you buy should be metadata based, and any process you create yourself will be more flexible ifyou use metadata from the metadata catalog rather than hard-coding the process.
Typical Job Schedule
The following outline is the high-level job flow for a nightly load process. Each of thesesteps represents a load for potentially several tables:
• Extract dimensions and write out metadata • Extract facts and write out metadata • Process dimensions – Surrogate key/slowly changing processing/key lookup, etc. – Data quality checks—write out metadata • Process facts – Surrogate key lookup—RI check—write out failed records – Process failed records – Data transformations • Process aggregates • Load dimensions before the fact table to enforce referential integrity • Load facts

16.25
• Load aggregates • Review load process—validate load against metadata • Change pointers or switch instance for high uptime (24 x 7) or parallel load warehouses • Extract, load and notify downstream data marts (and other systems) • Update metadata as needed • Write job metadata • Review job logs, verify successful load cycle Data Quality and Cleansing
Data quality depends on a chain of events, many of which are outside the control of thewarehouse team. To get quality data in the warehouse, the data gathering process must be well designed, and the resources—usually people—who enter that data must be committed to delivering quality information. These data gathering processes, however,are typically far removed from the warehouse team. As well, the warehouse project often begins with a load of historical data, which requires cleansing and quality control.
In an ongoing warehouse, clean data comes from two processes: entering clean dataand cleaning up problems once the data are entered. As we discuss next, once the value of the data warehouse is established, it is easier to apply leverage to the source systemsto modify their data entry processes to deliver better data.
It is unrealistic to expect any system to contain perfect data. Each implementation must define its own standards of acceptable data quality. In defining those standards, it’suseful to understand the characteristics of quality data:
• Accurate. The data in the warehouse matches with the system of record. Insofar as the numbers are different, and sometimes they must be, you have a documented audittrail that explains the differences.
•
Complete. The data in the warehouse represents the entire set of relevant data, andthe users are notified of the scope. For example, a data element called Total CorporateIncome should include the Medical division. If you don’t have that division’s data,rename the data element.
• Consistent. The data in the warehouse is free from contradiction. For example, aggregates are in synch with underlying detail.
• Unique. If two elements are the same, they should be called the same thing and giventhe same key value. For example, I.B.M. and IBM are the same company.
• Timely. Data must be updated on a schedule that is useful to the business users; thatschedule must be published and adhered to. Any deviations must be posted.
In sum, quality data is “the truth, the whole truth, and nothing but the truth.” Come asclose as you can with the resources available and commit to full disclosure ofuncertainties and deviations.
Data Improvement
The actual content of the data presents a substantial challenge to the warehouse. Thedata coming out of the operational systems is often surprisingly messy. Problems like thefollowing are common:
• Inconsistent or incorrect use of codes and special characters. The Gender field might contain values like “M,” “F,” “m,” “f,” “y,” “n,” “u,” and blank. It is common to find values that can’t be right when you begin to explore the data.
• A single field is used for unofficial or undocumented purposes. Comment fields and extra address lines often contain information gold, but it’s usually free-form entry and needs to be cleaned up.

16.26
•
Overloaded codes. Many systems, especially older ones built in the days whensaving bits was important, use a single code for multiple purposes. For example, “whenthe catalog is mailed to one of our existing customers, the code refers to their computed likelihood-to-purchase score; when the catalog is mailed to someone on apurchased list, the code refers to which vendor sold us the list.” We’re not making thisup.
• Evolving data. Systems that have evolved over time may have old data and new data that use the same fields for different purposes or where the meaning of the codes havechanged over time.
•
Missing, incorrect, or duplicate values. Names and addresses are the classic example of this problem. Transaction systems do not need to collect information that isuseful for business analysis to send out the invoices. In other words, the exact name ofa customer isn’t necessary, as long as the customer is not offended (it could be IBM orI.B.M., or Tom Jones or Thomas Jones). But they can end up looking like two differentcustomers in the warehouse.
The historical responsibilities and incentive structures around the operational systemsare at the root of this confusion. These systems were created to accomplish specific tasks, like take orders, ship products, and send out invoices. The name of the customerdoesn’t have to be exactly the same for them to successfully receive the product—the ABC company will still receive shipment with any of the spellings given previously. (This is not to say that correct spelling isn’t important. There is another rumor in our littleindustry about a well-known actress who closed her sizable investment account whenthey couldn’t spell her name right—Barbra with two as.) If the orders are shipped and the invoices are sent out on time, nothing else matters—until the data warehouse project comes along.
Adding the data validation checks in the entry system can add unacceptable overhead tothe transaction. In a job function where transactions per second is the sole measure ofsuccess, you have to be pretty persuasive to add to the transaction time. As we discussnext, fixing the source systems so they deliver accurate information is the right thing todo, but we advise you to choose your battles carefully and muster strong steeringcommittee support for these initiatives.
Processing Names and Addresses
The customer name and address problem described earlier is a specific case of tracking identity information. We find the same problems when tracking physician and patientinformation, business customers, and even descriptive information about retail locations.The customer name and address example is representative.
Incoming name and address fields often are packed into a small number of generic fieldslike Address1, Address2, and Address3. Often, these fields are free form entry. Theymay have different spellings for the same entity (like ABC, A.B.C. Applied Bus. Concepts,etc.), or they may be omitted altogether. They could have the full name on one line, ortwo names, or the name and the first line of the address. We’ve done hundreds ofqueries that count transactions by customer name that show 10 to 20 alternativespellings on average. One of the data cleaning companies claims there are more than120 different elements in the name and address area. In Chapter 5 we described a recommended verbose encoding of names and addresses. If you plan to use yourcustomer information to drive your business, incoming names and addresses must beparsed, broken down into the elements, corrected, and completed. This specializedprocessing logic is available from a number of data extract tool providers. We provide asample name and address parsing scheme in Chapter 5.
Once names and addresses have been cleaned and put into standardized formats,duplications are easier to eliminate. What appear to be two customers at first may turnout to be one. Perhaps one entry has a PO box address and the other has a streetaddress, but the rest of the data clearly indicates that it is the same customer. In thiscase, the two records should be combined under a single surrogate key. (The trick hereis to know which address to pick. That’s where the data experts come in.) Any factrecords that may exist with an invalidated key will have to be corrected to maintainreferential integrity. A database system where referential integrity is enforced will notallow a dimension key to be deleted without first addressing the fact records.
At this point, the data should be fed back into the source systems to ensure consistency

16.27
and reduce the company’s error rate in its customer communications.
A more powerful form of eliminating duplication is householding. In this case, aneconomic unit consisting of several customers is linked under a single householdidentifier. The most common case would be husband and wife who have various singleand joint accounts with various slight differences in name spellings and addresses. Thereare a number of vendors that specialize in householding tools.
Data cleaning may also check the spelling of an attribute or membership in a list. Onceagain, this is best accomplished by sorting the raw data and the permissible target valuesand processing them in a single comparison pass.
An Approach to Improving the Data The following steps will help you deal with data cleaning issues:
• Where there are alternatives, identify the highest quality source system: theorganization’s system of record.
• Examine the source to see how bad it is. Our favorite, and rather low-tech, approach is to perform a frequency count on each attribute:
select my_attribute, count(*) from source_table group by my_attribute order by 1;
•
Upon scanning this list, you will immediately find minor variations in spelling. Theattributes with low frequencies can be checked, by hand, if necessary, and corrected.Beyond that, tools exist to help comb through the data to derive the implicit business rules and identify problems.
•
Raise problems with the steering committee. Data quality is a business problem, butthe warehouse will suffer if the users believe the data is bad. They don’t understand thedifference between the warehouse and the source systems. All they know is the data inthe warehouse is wrong. Clarify the magnitude of the problem and its source, but takecare not to blindside the source systems folks in the process. Work with them toidentify the causes and potential solutions, and include them in the presentation to thesteering committee. They don’t want to provide bad data—it just hasn’t been their job to improve the data the business users are most interested in.
•
Fix problems at the source if at all possible. The ideal solution is to work with sourcesystem groups to correct the causes of data problems. Fixing the data downstreamdoes not solve the problem in the long run. You will create a complex set of rules thatneed to be watched and maintained to account for new oddities in the data. In fact,some problems should not be fixed in the warehouse. If the source system is assigningincorrect state codes, it needs to be fixed. Usually, the source systems group does nothave the resources available immediately, so we agree to fix the data in the datastaging process until the next release of the source system. Don’t count on supportfrom the source system folks. As we’ve said before, it’s just not their job to provide thiskind of information (yet).
•
Fix some problems during data staging. For the problems you agree to fix, work withyour business users to determine the appropriate business rules to clean these up inthe transformation process. Often, there is a single pass during the initial load to clean up and align history with current data. Codes, descriptions, and IDs change when thebusiness changes (or when the system runs out of new product numbers).
•
Don’t fix all the problems. Some problems will simply need to pass through the warehouse and out to the business users. This can help management understand thebreadth and severity of the issue when they see spurious entries appearing on theirreports. It can also shoot you in the foot. Make sure they understand the nature and source of these problems.
• Use data cleansing tools against the data, and use trusted sources for correct valueslike address.
• Work with the source system owners to help them institute regular examination andcleansing of the source systems.
• If it’s politically feasible, make the source system team responsible for a clean extract.

16.28
If they are on the hook for an extract of clean data, they may be more eager to revisethe transaction system to fix the data problems.
Data Quality Assurance
Now that we have the data prepared and ready to load, let’s stop and ask an interestingquestion. Is the data you are about to load correct? The basic data staging auditinformation tells us we have the right number of rows, and referential integrity checking tells us everything matches up. But how do we know if the contents are right?
Cross-Footing
To the extent that the data comes from a known source, it is possible to run severalqueries against the source system at different levels and compare the results withqueries against the load set. This process can even be automated to save a log of theresults of every run and set a “proceed” flag when the data matches or send an e-mail when the numbers are off by a certain amount.
If you are building a financial warehouse, make sure that assets = liabilities + equity andrevenue – expense = profit. Accounting users are really fussy about that.
Manual Examination
In some cases, the data cannot be traced back to a single source system. It may beconsolidated from several systems (or thousands in the case of a retail data warehouse).The only alternative here is to do some reasonableness checks. This involves looking fornumbers that fall outside of acceptable ranges. Share changes or sales changes greaterthan ± 5 percent are likely to be data errors. Work with your business users and thesource systems owners to create a solid set of data checks. In this case, the data may not be released to the users until the checks are complete.
Process Validation
The whole issue of how close is close enough is a slippery one. This is especiallyproblematic during the initial transition to the warehouse. People are still getting information from two sources, and they want to know why they are different. The old numbers areconsidered to be the right numbers, mainly because they were there first. For the Financegroup, the answer to the question of how close is clear—it usually has to be pretty close. For Marketing, exact figures usually aren’t critical. For Sales, the numbers can be off, butonly if they are high. In large companies, there are always exceptions and timing differencesthat cause the warehouse to be slightly different from the source systems at any given pointin time. It is worth the effort to work with the Finance group to validate the extract processand the data in the data warehouse.
Miscellaneous Issues
Several other items have big consequences for the reliability of the data staging process. This section describes a few we see on a regular basis.
Archiving in the Data Staging Area
An important function of the data staging area is to archive the data both in its mostgranular form as well as in all of its aggregated forms. This archived data serves anumber of purposes. The data may be more granular or more complete than any of thedownstream data marts. If this is true, then none of the data marts could logicallymaintain a complete archive. The end user groups may wish to return to the archive toaccess more data elements, or to process the final extract differently. Sometimes data istransformed for the purposes of data mining, and the data staging area may be the place to archive untransformed data.
The central data staging archive should also be able to help a data mart recover fromdata loss. This can relieve the data marts of much of its backup overhead.
Source System Rollback Segments
When extracting from a relational source, extracts that take a long time can beproblematic. If an extract asks for all records updated in the last 24 hours, the system

16.29
must locate the appropriate set of records. This means no other users can change theupdated_date field while your request is being processed. As transactions flow in duringyour query, they are queued up in a separate place called a rollback segment, to be applied once your request is finished. If your query takes too long, this queue gets toolarge and runs out of space. The system then kills your job and processes thetransactions that have been queued up. In general, the folks responsible for thetransaction system don’t like this kind of behavior.
Disk Space Management
One of the most common problems in the data staging process is running out of physicalstorage space in the middle of a staging cycle. This can happen at any time during thestaging process and for several major reasons, only one of which is the availability of raw disk space. Most databases manage their own use of disk space because a databasecan span several disks. When a table is created, it is usually assigned to a certain logicalspace, usually called a tablespace or segment. It is also assigned parameters that determine the size of each growth increment, and the total number of increments it isallowed to have. So, a table can run out of space in the table space or use up itsallotment of growth increments. It is important for the DBA to pay close attention to how much space is available, how much is used, what the typical increments are for the majortables, and so on. This should be a daily task. It is fairly straightforward to build reportsagainst the system tables that will highlight potential trouble spots.
It is also possible to automate this process through clever use of the metadata in thedatabase system tables. One of our customers has built an automated data stagingenvironment that is entirely metadata driven. It builds the extracts, checks for room on the target system (and creates it if necessary), and loads the data, all based on abouttwo dozen metadata tables. As a result, the size is always set up appropriately, and thereliability of the data staging process has improved significantly.
Key Roles Key roles for data staging development include the following:
•
The data staging team is on the front line for this entire part of the project. Thestaging team must communicate clearly and often to the rest of the team. This not only keeps them informed about progress but makes it easy to solicitassistance when appropriate.
•
The project manager must take a proactive role to partner closely with the datastaging team. Often, the data staging team gets overwhelmed and buried in the details. The project manager must keep an eye on the big picture and intercedeon their behalf.
• The quality assurance analysts and data stewards begin to take an active roleduring data staging development. The quality assurance processes need to bedesigned with their guidance. Also, as the data is loaded, it must be validated.
• The database administrator continues active involvement by setting upappropriate backup, recovery, and archival processes.
Estimating Considerations
Much of the estimating for designing the data staging area has already beenincluded in the physical design, which was the subject of the previous chapter. However, it is worth pointing out that the overall estimate of the effort of the datastaging area is the single largest source of uncertainty and risk in planning a datawarehouse. It is impossible to know how complex the data staging area needs tobe until the programmer faces the actual data sources in microscopic detail. If asingle data field is discovered that has been used for two purposes, the complexityof the data extract routines can double. An off-the-shelf tool may need to be augmented with custom hand-written code. Although many people tend to wince atthe following guideline, we have found over the years that allocating six months ofprogramming labor for each dimensional model turns out in the long run to be wise.

16.30
If the project is going to take nine months to finish, you are much better off estimatingtwelve months and beating the schedule by three months, than estimating six monthsand slipping by three months.
Summary
The data staging application is one of the most difficult pieces of the data warehouseproject. We have found that no matter how thorough our interviewing and analysis, thereis nothing like working with real data to uncover data quality problems—some of which may be bad enough to force a redesign of the schema.
The extract logic is a challenging step. You need to work closely with the source systemprogrammers to develop an extract process that generates quality data, does not place an unbearable burden on the transaction system, and can be incorporated into the flowof your automated data staging application.
Data transformation may sound mysterious, but hopefully at this point you realize that it’sreally fairly straightforward. We have tried to demystify the jargon around implementingdimensional designs, emphasizing the importance of using surrogate keys anddescribing in detail how to implement key assignment.
Data loading at its heart is quite simple: Always use the bulk loader. But, as with all aspects of data warehousing, there are many tricks and techniques that help minimizethe load window.
Finally, we hope that the many ideas presented in this chapter have sparked yourcreativity for designing your data staging application. More than anything else, we wantto leave you with the notion that there are very many ways to solve any problem. Themost difficult problems require patience and perseverance—a willingness to keep bashing your head against the wall—but an elegant and efficient solution is its own reward. Be sure to consult the project plan spreadsheet at the end of this chapter for asummary of the tasks and responsibilities for data staging development (Figure 16.7).
Figure 16.7 Project plan tasks and responsibilities for data staging development.

17.1

17.2
Overview
At this point in our explanation of the Lifecycle, we climb out of the detailed back roomissues of architecture and database design and development and move into the front room. The main front room development activity involves creating the starter set ofcanned reports we call end user application templates. This chapter is about the process of creating these application templates. It starts by defining the concept of the end user application and its role in providing access to business information. The bulk of thechapter provides a description of the process of creating these applications, divided intwo major phases: specification and development. This is a very exciting point in the process because we finally get to see the business impact of all the design anddevelopment efforts that have occurred thus far.
This chapter is a must-read for the entire team. Because technical details are specific to individual products, this chapter is not technical in nature. It does provide the basicsso that the whole team can communicate effectively. The task of relating the generalend user application approach to a specific technology is the responsibility of the end user application developer.
Role of the End User Application
End user applications fill a critical gap in meeting the organization’s range of data access needs. Figure 17.1 shows the range of reporting needs from operational to strategic.Strategic reporting and analysis occurs at the business opportunity level: longer term infocus and ad hoc in nature. Operational reporting occurs at the tactical level; it has short-term impact, and is usually predefined. As we described in the data access tools section in Chapter 10, a large percentage of the warehouse user base will fall in between thesetwo points.
Figure 17.1 The role of end user applications.
Tip
To most business professionals, ad hoc is simply the ability to change the parameters on a report to create their own personalized version of that report.This need shows itself through statements like “I want this report, but by monthrather than quarter,” or “Can we see this report at the district level instead ofregion?” For many users, this is as ad hoc as they ever want to get. The enduser applications provide the primary access tool for most of these businessusers.
Figure 17.1 also shows the value provided by end user applications. For power users,

17.3
these canned reports provide a set of reporting and analysis examples. They can usethese reports as a learning vehicle and take them apart to understand how to achievecertain results. Or, they can use the reports as a starting point and make incrementalmodifications rather than starting from scratch. These reports also serve as a quality-assured reference point for various measures of the business. If an ad hoc user can tiequery results back to results from the end user applications, they can be reasonablycertain that they are using the appropriate query logic. The value to the push-button user is a little different. To this group, the end user applications represent a low-cost (i.e., easy to use, short learning curve) means to get at the information in the data warehouse. The applications are typically more flexible and more current, in terms of how they view thebusiness, than other alternatives. The organization overall gets value from theapplications as well, because they provide an early delivery of information from the warehouse.
Another valuable aspect of end user applications is the role they play in helping to definean organization’s official standard reports. Once the data warehouse is in place, reportsusually begin as part of an ad hoc exploration process—business analysts use the warehouse to determine a new way of looking at the business. The most valuable,enlightening alternatives become end user applications, almost in a Darwinian fashion.Over time, this new way of looking at the world trickles down to the operational reporting systems so the business has a consistent way of measuring the business. The end userapplications are development and test area for which reports will be useful to thebusiness.
What Is an End User Application Template?
Now that we have told you why end user applications are so valuable, you are probablywondering just what these things are. An end user application template provides thelayout and structure of a report that is driven by a set of parameters. The user sets the parameters from pick lists, or by accepting the defaults when they run the template. Thisparameter-driven approach allows users to generate dozens or potentially hundreds ofsimilarly structured reports from a single template.
This may sound familiar to you. This is simply the new generation of the old 4GL-based menu-driven reporting systems that were built in the 1970s and 1980s. The differences:these modern reports are easier to build, the user interface is more graphical, and you do not have to deal with all the data management issues since the data warehouse is yourstarting point. Figure 17.2 shows a sample report template.
Figure 17.2 Sample template for topline report.
<Geography Name>Topline Performance Report
<Period> Compared to <Previous Period>
Product Line
Sales Units
YA SalesUnits
Sales Index
Market Share
% VarPrev Share
xxxxxxxxxx
xxx,xxx
xxx,xxx
xx.x
xx.xx
x.x
xxxxxxxxxx
xxx,xxx
xxx,xxx
xx.x
xx.xx
x.x
xxxxxxxxxx
xxx,xxx
xxx,xxx
xx.x
xx.xx
x.x
xxxxxxxxxx
xxx,xxx
xxx,xxx
xx.x
xx.xx
x.x
xxxxxxxxxx
xxx,xxx
xxx,xxx
xx.x
xx.xx
x.x
The user parameter for the geography dimension is a combination of constraints that will be used to select the desired geographic areas and then combine them for the purposesof this report. For example, this template could produce reports at the level of the Total

17.4
Company, Eastern Region, Southeast District, and Southern Florida Zone—from the top of the hierarchy all the way down to the lowest level of detail. These different reports canbe produced simply by changing the constraints on the geography dimension, with nochanges to the structure of the template. Likewise, this could be a daily, monthly, or quarterly report based upon the constraints on the period dimension. A user can alsoflexibly define the previous period, perhaps as year ago or yesterday. This templateproduces a report by product line. Some constraints may be applied to limit the product lines to be included.
Application Models: Planning, Budgeting, Forecasting, and What-If
There is a separate class of application that requires both read and write access.These applications include planning, budgeting, forecasting, and what-if modeling. The data to start these applications is often fed from the data warehouse. Thecurrent sales information is used to begin the forecasting process. Projections arethen developed to predict future sales. This can be as simple as taking prior sales increased by 3 percent, or it may involve intense statistical modeling. Once aforecast is developed, it needs to be stored somewhere. Often multiple versionsare desired. These forecast versions can be included in the data warehouse. Separate fact tables must be set up to contain forecast information. After theforecast is stored back in the warehouse, the versions can be compared. When afinal forecast is developed, that version is commonly compared with actualperformance.
By storing this information in the data warehouse, we introduce a new capability:The users now are writing to the warehouse. This introduces the need for manageddatabase updating of this process, including security and some kind of transaction monitoring. However, keep in mind that the volume of activity is generally muchlower than most production operational systems.
Due to the read-and-write nature of this type of application, multiple technologieswill be needed for development. Most data access tools provide only half of the functionality (read) and do not support write capabilities. Your data accessfunctionality needs to be closely tied to another application to provide writecapabilities. MOLAP tools excel in this area.
Through the use of drill-down capabilities, a user could produce reports on other productattributes. This action results in changing the actual template structure. Many dataaccess tools provide this functionality transparently. By leveraging this functionality, a single template can produce even more reports.
Lifecycle Timing
This chapter is a bit discontinuous because the end user application process actuallyoccurs in two places in the Lifecycle. The templates should be specified just after the requirements are completed. Even with a great requirements findings document, a lot ofinformation related to applications is stored only in the brains of the interviewparticipants. It is important to capture this information immediately so that it is not lost. If you wait until you are ready to develop end user applications, the people who wereinvolved in the requirements gathering process may be off on another project. Even if thesame team is in place, a several month time lag between the completion of the requirements and application specification will mean a significant rediscovery effort.
Once the specifications are captured, you do not need to return to the applicationdevelopment process until much later in the Lifecycle. It does not make sense, and in fact, it is not really even possible, to begin end user application development until afterthe data access tool is selected, the initial database design is in place, and some of theinitial data loads have been run.
Because of this difference in timing, we have split this chapter into specification anddevelopment sections.

17.5
Application Specification
There are four major steps in the specification process: determine the initial template set,develop the navigation strategy, determine template standards, and develop detailedtemplate specifications. You should at least get to the second step of determining thereport set within a week or two of finishing the requirements phase.
Of course, the mandatory Step 0 is getting user involvement. Creating end userapplications is a true software product development effort. You must get your customersinvolved in the specification process if you want to help solve their business problems. Ifyou go off in the corner and design it by yourself, well, that would be like a softwarevendor designing their products without talking to their customers. Perhaps that’s a badexample, but you know what we mean. Get users involved in reviewing the report list,setting priorities, and evaluating different navigation strategies. If people don’t get it, ifthey don’t think the reports are useful, or they can’t find the one they want, they will notuse it.
Determine the Initial Template Set
The first step in the specification process is to develop the target list of report templates.The goal is to end up with a small set (between 10 and 20) of high-value templates that provide a range of report types. The process to accomplish this involves three tasks: identifying report candidates, consolidating the candidate list, and setting priorities. Wewill examine each of these tasks in turn.
Identify Report Candidates
The requirement findings document and supporting notes, described in Chapter 4, are the ideal places to start. Each interview write up should have a list of potential reports todraw from. Approach this as a brainstorming process. Use a spreadsheet to make a list of individual report requests, one request per line. Include a name, the type of report, therow data elements, column data elements, and measures. A few additional attributesmight help in the consolidation process. For example, list the groups or departments thatwould be interested in the report. Once you have a first pass of this list, get some usersinvolved in a design session to review it. They should be able to add several more reportcandidates and help you clarify what you mean by some of the existing candidates.
Consolidate the Candidate List
Once the list is exhausted (or at least long enough), refocus the group on categorizingthe list. Categorize according to the items in the spreadsheet—which data elements does each report contain in each section? These categories are the first pass at templates.Sometimes, categories quickly become apparent because of the way the group or thebusiness views the world. It may be helpful to think about the types of analysis businesses typically perform. We have found the following analytical cycle concept to bea useful way to categorize reports.
Typical Analytical Cycle
While the specific issues that are to be addressed by a data warehouse vary widely from company to company, there is a common theme in how analyses are performed. Thispattern of analysis is also consistent across many industries:
•
How’s business? The first and primary need for all businesses is to understand current performance. This provides an overall view of key business indicators and theirvariance over time. Examples include market share, percentage of company sales,required inventory, and minimum assets. The level of detail required depends uponwho is asking the question. Senior executives are often interested in total corporateperformance, while individual sales managers are concerned with their own salesarea’s performance. In either case, a single snapshot of performance is often the placeto start.
•
What are the trends? Given a single-point-in-time view of performance, the next most common question is to determine whether it is an anomaly or a longer-term trend. Providing a look at those same key performance indicators over a period of time allows you to identify short- and long-term trends. The actual elapsed time needed to identify

17.6
trends varies between industries. For example, phone sales campaigns usually last 30to 60 days. In these instances, fluctuations that span several days may indicate a trend that requires action. On the other hand, it may take months to identify a trend in creditcard payments.
•
What’s unusual? Quick identification of exceptional situations is important.Identification of both good and bad situations is helpful. Rather than searching and drilling on lots of things to identify these interesting situations, a set of exception reportscan be defined. These exception templates can focus on the key performanceindicators that vary from the common or expected results. This is not data mining. However, data mining could be applied to the data to determine criteria that need to bemonitored on an ongoing basis.
•
What is driving those exceptions? While it is interesting to identify situations with exceptional performance, it is more interesting to understand what is driving theexception. For example, 15 insurance agents may have opened 150 percent moreclaims than the highest number of claims they opened during the past 8 months. This is clearly an exception that should be identified. It is also important to note that a severehail storm in their area caused a higher than normal influx of claims. However, withoutthe causal information, these agents could have been flagged for fraud investigation.
•
What if . . . ? Based upon the findings in the data, the next step is to explore a varietyof possible situations. What would happen if we increased the price per unit by $0.05?What would the sales dollars be? What is the gap between our products and our competitor’s products? If we were left with more products to mark down, how muchadditional inventory would we have to liquidate? What happens to the overall profit if Ican negotiate a 1/100 of a cent decrease in the cost of a major component? As you can see, a simple what-if question can generate many more questions.
•
Make a business decision. Now that you have studied the situation, a businessdecision can be made. Sometimes major decisions, such as restructuring the entire product pricing, are made. In many other cases, smaller decisions are made. A call canbe made to a sales representative to compliment their performance or to another salesrep to review poor performance and develop a plan to improve it.
•
Implement the decision. One more step is required to complete the cycle: You haveto implement the decision. What is required to put the decision into effect? For a pricingdecision that impacts 15,000 items, what is required to set these prices in the cash registers across the country? The best situation would be to take the results from thedecision support analysis and feed them directly into the operational systems. In thepricing scenario, the new prices could be fed into the current system that sends the prices down to the individual stores/cash registers. This then closes the loop.
This cycle never ends. Now that a decision has been implemented, the next thing is tosee the impact of that decision. So, how’s business?
Look for this type of pattern in your business as you decide what templates to provide toyour users. Do not expect to be able to define templates to support every step in thiscycle up front. While this is a common business pattern, in reality it can take months oryears to grow your end user application portfolio into a full closed-loop decision-making environment. Today, most organizations provide end user applications that only go up tothe point a business decision is made.
Prioritize the Template List
Once you have the list of templates, work with the users to assign a priority to each one.Remember, your goal is to identify a small number of templates that will serve as thestarting point. The underlying business goal is to identify a set of templates that will help address the issues that are keeping the executives awake at night. Keep in mind that theinitial templates are not intended to provide a total solution for your users. As thebusiness people begin to use the system, they will find that some of the templates they thought they needed are not as useful as expected. They will also begin to identify newtemplates that would be useful across the organization. Through use of the datawarehouse, the template requirements will change. In fact, if there have been no requests to change the initial templates, it is likely that no one is using the warehouse.
If you can’t actually rank them, at least try to split them up into three groups, the As, Bs,

17.7
and Cs. Limit the A list to 15 or less, keep the B list handy for next iteration, and throw the C list away. The A list is what you plan to implement.
Tip
Do not re-create the past. While it is useful to learn from existing reportsamples and reporting system structures, avoid the trap of re-creating existing reports if at all possible. This is usually a no-win situation for the warehouse. The new versions rarely match the old versions for reasons we describe later inthe chapter, so lots of time and energy is wasted trying to reconcile the two, and users lose confidence in the warehouse. Worse, once you finally get thetwo sides to reconcile, you have accomplished very little from a business pointof view: You have a set of reports that already existed. If you have to convertsome reports to get rid of redundant systems, be sure you set expectations thatthey won’t match. Also, do not think you can count this conversion as fulfillingyour end user application requirements. We want to see something new andinteresting out of the warehouse, not the same old, boring stuff.
Design the Template Navigation Approach
Although you are starting with only 15 or so templates, this will soon change. Over thenext 12 months, you will add data from additional business processes with templates to go along with the new data. Also, users will develop new templates that you will want tomake available to other users. If users create as many templates as the warehouseteam, you will end up with around 100 templates in a year or so. Even with meaningful naming standards, it would be difficult to navigate a list of 100 templates. We need todevise a method for grouping and organizing these objects and templates. Should theybe grouped by data content or by who uses them or by the business issue they address? There is no correct answer.
Tip
You must develop a strategy that will help your users find what they needquickly. Note that the template metadata can be extremely helpful in supportingthis navigation. Make sure you capture it now so you can put it to work in the development process.
At this stage, we are creating a preliminary design for the navigation. Regardless of thetool, this basic business view of the report templates and how they relate to each othershould not change. However, since so much of the navigation’s implementation dependson the tool set, detailed navigation design will take place during the development phase.Figure 17.3 shows how a simple navigation could be documented.
Figure 17.3 Template navigation diagram.
Determine Template Standards
It makes sense to create a few standards for your templates once you have identified theinitial set, but before you dive into the detailed specifications. We spend hours debating the name of each data element and setting up naming standards for the database, butmost organizations completely overlook the need to develop standards for the dataaccess environment. These standards cover areas like naming and formatting. They are particularly important in helping users quickly understand the nature of a report—its contents, sources, timing, and so on. Putting some thought into standards now will helpyou create a consistent set of specifications. These will then be easier to develop and roll out across many user groups. Of course, understand now that your standards willchange. The tool you choose may not be able to implement the standards you havedefined. (This isn’t necessarily bad—there may be a better way to accomplish the same thing.) Be prepared to modify your standards as needed when you get to thedevelopment phase.

17.8
Naming and Placement of Objects
Naming templates is perhaps the most obvious area for the need for standards. Whenyou name reports, consider including the type of report and type of data in the name. Forexample, the name Regional Claim Amount Paid Exceptions denotes that the templateidentifies exceptions based upon paid claim amounts by region. When possible, use yourtool’s metadata capabilities to provide users with a detailed description of the templatefrom within the tool itself. Depending upon the data access tool, you may need to namemultiple kinds of objects such as business measures, filters (constraints), and templates. Develop a consistent naming strategy for each object within the data accessenvironment.
While full names are great, they can become unmanageable within the confined space ofa computer screen or sheet of paper, so abbreviations can be helpful. Work with the business users to develop a glossary of acceptable abbreviations. Typical abbreviationsinclude YA for year ago and YTD for year to date.
Output Look and Feel
All output created from the data warehouse is more useful across the organization if it has a common format. Users will quickly learn that the date the report was created canbe found in a specific location. Determine now what should be in the report headers andfooters. Typical information contained in a header or footer includes:
• Name of the data warehouse/mart • Name of the template • Name of the group or division creating the report • Date and time the report was run • Page numbers
Additional guidelines should be created for the location and content of report titles. It isalso useful to include a list of the constraints that were used to create this report.
Detailed Template Specification
Now that you have determined the template grouping, navigation, and standards, you are ready to define the actual templates. Remember, do not define the 100 individual static reports that are to be generated for the users; the goal is to create between 10 and 20templates for a given user community.
Each organization requires a different level of detail for project documentation. Honestlydetermine if your project team will formally document the application templates. If theanswer is no, you still need to capture the thoughts and ideas generated during the requirements gathering process. Jot down your ideas and file them for future use. Do notcompletely skip this step even if you are not planning to get user sign-off.
Specification Format
There are two parts of an end user application specification: the definition and the layout.The definition provides basic information about the template, while the layout provides avisual representation of what a report would look like.
The template definition includes the name, description or purpose, frequency, parameters, user input, and default constraints. Unusual processing requirements shouldalso be noted here. Figure 17.4 shows a sample template definition. Only businessmeasures that have been defined as part of the dimensional modeling process should be included on any of the templates. If a new measure is identified for a template, simplyadd it to the fact table diagram as described in Chapter 7.
Figure 17.4 Sample end user application template definition.

17.9
Template Name: Product Performance Topline Description/Purpose:
This template summarizes 4-, 12-, and 52-week unit volume and market share by brand for a specific geography. Thisprovides a snapshot of the volume movement.
Frequency:
Weekly and as needed.
User Inputs:
—Geography: the user is required to select one or more geographies to be included in the report. If more than onegeography is selected, the data on the report will beaggregated based upon the rules defined for each businessmeasure. The default is the National total.
—Current Ending Date: The user is required to select the date that the report will be based on. The default is the mostrecent date in the data warehouse.
Default Constraints:
This reports defaults to product category for the sharecalculation.
Calculations:
See Business Measure Worksheet
Notes:
The end user application template layout is a sample of what the report would look likewith data. The parameters that are provided as input are enclosed in square brackets [ ]. Figure 17.5 shows a sample template layout.
Figure 17.5 Sample end user application template layout.
User Review
The template specifications should be compared to the final dimensional model prior to reviewing it with the users. Be sure you do not include elements in the applicationspecifications that are not to be included in the initial data mart. Now, the templatespecifications can be reviewed with the users for their approval. These specifications will change when you get to the application development phase of the project, so make sure your users know that these specs simply represent a target set of templates to the bestof your collective knowledge at this time.
When you review the specifications, be sure to remind the users that these represent astarter set of templates and that each one can generate many reports. They need to alsounderstand that this is not the final and complete list of templates that will be developed. Advanced users will build additional applications and the starter set will be modified andenhanced.
End User Application Development
Now you are ready to begin developing the templates. The steps required for this phaseof the Lifecycle are highly dependent upon each organization and the data access tool tobe used. This section simply provides ideas about what should be considered. Theapplication development process follows a standard software development flow. We startby selecting an implementation approach, then we do the actual development based on

17.10
the specs and test, document, and release the product.
Keep in mind that some time will have passed since the application specificationactivities described in the last section occurred. The first thing to do at this point is to review the specifications that were developed earlier in the project. Update them toreflect any changes in the data that is going to be available in the data warehouse.
Select an Implementation Approach
The specifications we created earlier in the project were not necessarily based on yourdata access tool of choice, since that choice may not have been known at the time. Thedata access tools that are available today provide a wide array of delivery mechanisms. As you develop your end-user applications, you need to revisit the original specificationsand the navigation structure. The primary issue at this point is to determine yourfundamental approach to implementing these templates. The main alternatives are:
•
Web-based. We believe this will be the primary delivery vehicle for end userapplications. Through their own Web browsers, users can link to these reports via anintranet or the Internet right off the data warehouse home page, among other places. Using the Web has the added benefit of integrating the metadata into the navigationprocess. If you have stored the report metadata in the metadata catalog, it is possibleto set up a few simple queries to allow users to search for reports by category, data element, report type, and so on. Once they find the report they want, the final link willinvoke that report. The whole navigation structure is built into the metadata. Reportscan easily belong to multiple categories, and changing the navigation structure is simply a matter of editing the metadata. Web-based development tools are taking over all aspects of user interface development. Many of the issues for the data warehouseare virtually the same as general Web site development.
•
Direct tool-based. Simply develop a set of templates and provide them to the usersdirectly using the standard data access tool interface. If your tool does not have a built-in, shared report repository capability, it is possible to create a simple file structure on the network to match the navigation path. This is not very flexible, but it is fast.
•
Tool-based executive interface. Provide structured access to the templates via a series of screens. Many data access tools provide some form of EIS-like push-button front-end development capability. This approach uses these extensions to the dataaccess tool to allow the user to easily navigate to their template of choice.
•
Custom-coded interface. Many data access tools provide an API to allow you to develop your own interface, which then invokes the core tool functionality. This is atypical programming development effort using one of the visual development tools.Again, the interface provides the structured navigation to the appropriate templates.
Application Development
At this point, you know what you want to build, you have a set of standards to follow, anda basic approach. Finally, we can get started with the actual development. It may seemthat we spend too much time on up-front planning, but our experience has shown that a little thought up front can save you days, or even weeks, of effort later.
Data Access Tool Metadata Definition
Before we can do anything, we have to get the data access tool set up properly. Most data access tools require that some metadata be defined prior to beginning templatedevelopment. The richness and complexity of defining the metadata is highly tooldependent. At the low end, definition may simply be selecting tables to be used right out of the DBMS system tables and setting up default joins. At the high end, full businessdefinitions, default drill paths, and common business measures must be predefined.
Once the data access tool metadata has been populated, the basic functions of the data access tool should be working. Test each attribute within each dimension to see ifeverything has been defined properly. If strange and unusual things happen, it may bebecause of the metadata definitions, but may also be the result of errors in the data.
Debugging metadata definitions requires a deep understanding of the tool metadata and

17.11
the ability to look directly at the data in the tables. The data access tools perform manyfunctions on your behalf based upon the metadata and the values in the tables.
Template and Navigation Development
Advances in technology over the past several years may make it possible to construct 10templates in a day or two. This does not mean that the entire application development effort will be completed in a week!
Some applications are truly complex. Trying to figure out how to build some templatescan take a lot of time. There may be additional product features that could accomplishwhat you need very quickly, but you could spend hours or days searching for them. Todevelop these advanced applications you may need assistance from the vendor or otherresource highly skilled with that technology. It may be well worth the investment to hire aconsultant who is highly experienced with this technology to work with you for severalweeks. When you hire a consultant, look for someone with expertise using your tool.Check their experience and references. If they check out, request them by name in thecontract. Such a consultant will be able to help you learn about real development usingyour tool that may not be captured in documentation or formal classroom education.
In addition to the templates, the end user navigation must also be developed. Again, this process is tied directly to the software that you are planning to use.
Tip
You must have some test data to adequately develop the templates. The dataaccess tools are driven by the data itself, and it is difficult, if not impossible, to determine if you are on the right track unless you are able to see data.
Prerun Report Selection
Another area that requires consideration is to determine which of the templates shouldbe prerun on a scheduled basis. Templates combined with runtime parameters constitute an end user report. Standard reports can be set up as templates with predefinedparameters. If there are five standard reports that all 150 end users look at first thingevery morning, it makes sense to run these reports once and allow all the users to view the same result set. These reports may be run at a regularly scheduled time, or they mayrun as the result of an event such as completion of the data load process. The reportsmay be stored centrally and retrieved as requested by the users or automatically distributed to specified users.
The specifics of report distribution and management is highly dependent upon thecapabilities of your data access tool. Many data access tools support report caching,where users simply retrieve the final report from a report repository. You need toconsider the criteria for reports to be included in the scheduler and who is allowed toschedule reports to be run.
This is another area that may not be crystal clear with the initial release of your applications. As the users learn more about what they want and need from a businessperspective, you can also learn about what they want and need from a systemsperspective.
Testing and Data Verification
As in any successful software development effort, testing is a required step in creatingapplication templates. First, check your logic. Create a simple query and copy the datafor a report out into a spreadsheet and recreate the calculations by hand. Verify that your percentages and variances are based on the correct numbers. Change the parameters,and run it again. Run it on another computer, in another building. Enter garbage numbersfor the parameters. Once you think it is perfect, have someone else test it.
Once you have confirmed that the tool is working correctly, it is time to take a look at thedata itself. It is surprising how quickly data issues can be identified using today’s dataaccess tools. Some of the most common issues you are likely to find include:
• Meaningless descriptions. Often the names and descriptions that are supplied byother systems were not designed for browsing and report labels. While it may seem likea good idea to use the existing names, once you see them in a pick list or as row and

17.12
column headers, you may change your mind.
•
Duplicate dimension information. The data staging process should include checks to make sure that there are no duplicate keys. However, two different keys can comefrom the source data to represent the same thing. This is not obvious in the datastaging process, but it will show up when you look at the data via the end user tool.
• Incorrect dimensional relationships. Check to make sure that the correct information is pulled when drilling. Sometimes, the attributes within a dimension are notproperly assigned. This causes unusual results when drilling.
•
Data not balancing. Another data issue that comes up during applicationdevelopment is the inability to balance the data to another existing system. There canbe several causes. One could be that the end user application is calculating a businessmeasure differently. Another is that the facts themselves may not represent the samething as in the legacy system. Finally, the facts should represent the same thing, butthe values do not match. While this is often perceived as a data warehouse problem, inmany cases we have found the data warehouse to be correct. It means that theexisting system is wrong or not as accurate. This can be unsettling to users. Be prepared to conduct detailed sessions to describe why the data warehouse is correct.
The end user application developer must work closely with the data staging team to workthrough these issues. It is common to continue to identify more issues once the first oneor two are corrected. This is simply because the deeper data issues cannot be seen untilthe initial ones are resolved. It can take several weeks to work through completely.
Document and Roll Out
Beyond the business-level documentation that should already be securely stored in themetadata catalog, it is vital to document the application template infrastructureinformation as well. This includes the naming standards, information about where the master templates are kept, and who the system owner is. The training materialsdescribed in Chapter 18 are also part of this documentation. The rest of the rollout process is described in Chapter 18.
Think Like a Software Development Manager
Throughout application development, testing, documenting, and rollout, it is very helpfulto pretend to be a professional software development manager. Actually, it’s notpretending. Real software development managers go through the same steps. The bestsoftware development managers have also learned some lessons:
•
The project is 25 percent done when your developer gives you the first demo of the working application. The first demo from a proud developer is an importantmilestone that you should look forward to, but seasoned software developmentmanagers know that the developer has only passed the first unit test. The second 25 percent is making the application pass the complete system test, where all the units are working. The third 25 percent is validating and debugging the completed system in asimulated production environment. The final 25 percent is documenting and delivering the system into production.
• Don’t believe developers who say their code is so beautiful that it is self-documenting. Every developer must stay on the project long enough to delivercomplete, readable, high-quality documentation.
•
Manage against a bug reporting database. A bug reporting database should be set up to capture every system crash, every incorrect result, and every suggestion. Amanager should scan this database every day, assigning priorities to the new reports. An application cannot be released to the user community if there are any outstandingpriority 1 bug reports that have not been fixed.
•
Be proactive if you collect bug reports from users and testers. Acknowledge receipt of every reported bug, allow the users and testers to see what priority you haveassigned to their reports and what the resolution status of their reports is, and then fixall the bugs.

17.13
• Place a very high professional premium on testing and bug reporting. Establish bug-finding awards. Have senior management praise these efforts. Make sure that theapplication developers are patient with end users and testers.
Application Template Maintenance
Over time, you will need to keep the templates up-to-date. This includes the following kinds of activities:
• Adding new templates (from both users and the warehouse team) • Updating templates to include new data sources or changes to existing sources • Monitoring template performance
• Removing unused templates (look for a way to capture usage by template name in thedatabase)
Key Roles Key roles for building end user applications include the following: • The end user application developer is the primary driver of these tasks.
• The business systems analyst works closely with the end user applicationdeveloper when developing the specifications and testing the applications.
• The data warehouse quality assurance analyst should also play a strong role inlooking at the data via the applications and verifing the data and applicationaccuracy.
Estimating Considerations
End user application template specification and navigation design can take several weeks. It should start immediately following the requirements and be completed atthe same time as the dimensional model.
End user application development may begin as soon as some test data isavailable in the database structures. In general, you should allow four to six weeksfor the development of the templates. This includes time to debug the data stagingprocess. There can be wide variations on the development time, depending uponthe end user data access tool itself.
Development of the structured navigation paths varies too widely for general guidelines.Work with people who have experience using the software you have selected to developa realistic timeline for development.

17.14
Summary
End user application templates play a pivotal role in determining the organization’s viewof the warehouse. They can help show value quickly, lower the barrier to entry for mostof the user community, and help advanced users by giving them examples of how to build more complex reports. It is important to capture the specifications for these reportssoon after the completion of the requirement findings document while the information isstill fresh in peoples’ minds. The development process is fairly standard, except that it is typically based on the data access tool of choice and therefore subject to itsidiosyncrasies. For a summary of the project plan tasks and reponsibilities for buildingend user applications, consult the spreadsheet at the end of the chapter (Figure 17.6).
Figure 17.6 Project plan tasks and responsibilities for building end userapplications.

18.1

18.2
Overview
Hopefully, you haven’t waited until the completion of your data warehouse developmenttasks to begin reading this chapter. Data warehouse deployment requires the coordination of numerous variables. You can’t wait until two weeks before your promiseddelivery date to begin getting the puzzle pieces in place. It takes extensive planning. Theproject team needs to start preparing for the big event months before actual deployment is scheduled to occur.
Deployment is the convergence of technology, data, and applications on the businessusers’ desks, along with the necessary education and user support structure. In thischapter, we’ll first discuss deployment issues and considerations, and then provide youwith a deployment release framework. Think of this chapter as a recipe for successfuldeployment, a list of deployment ingredients followed by procedural recommendations.
Project managers and deployment coordinators should read this chapter closely. Teammembers who will interact directly with the data warehouse users, including desktopadministrators, educators, and user support representatives, will also find the materialuseful. Finally, project sponsors and drivers should be familiar with the overall coordinationeffort, as well as the deployment readiness checklist.
Determine Desktop Installation Readiness
We discussed the overall technical architecture strategy in Chapter 8. Obviously, many components of your strategy will be implemented prior to deployment. Much of the backroom architecture and infrastructure, such as the hardware platform, database management system, metadata catalog, and so on will be established long beforedeployment as it is needed for development activities.
Tip
The technology that resides on the users’ desktops is the last piece that must be put in place prior to deployment. Unfortunately, organizations oftenunderestimate the effort and lead times required to implement the user-oriented components of their technical architecture.
The following checklist outlines the activities that should occur well before deployment to ensure that the appropriate desktop infrastructure is in place for your target business endusers:
• Determine client configuration requirements to support end user data access software,including hardware configurations, database connections, intranet and Internetconnectivity, and so on.
• Determine LAN addresses for the identified target users if you are not already usingdynamically assigned LAN addresses.
• Conduct a physical audit of the technology currently installed on these users’ desksand compare it to the stated client configuration requirements.
•
Complete the contract and procurement process to acquire any necessary clienthardware, software, and upgrades. Depending on the size of your organization, thisacquisition process may take an inordinate amount of time. Desktop technology istypically the fiscal responsibility of the user business area, rather than the datawarehouse team. Hopefully, the business area has budget funds available to cover any necessary purchases within the project timeframes. Be sure to allow adequate time forthe approval and acquisition process because it will probably occur outside yourimmediate organization and control. Also, be prepared for unanticipated lead times on client upgrade components.

18.3
•
Acquire user logons and security approval as necessary for network and databaseaccess. Again, depending on your organization, you may be surprised by how muchlead-time is required to obtain user logons and security authorizations. You will alsoneed to consider ancillary procedures to comply with your corporate security policies,such as changing your database or UNIX passwords on a regular basis.
• Test installation procedures on a variety of machines. These procedures can be refinedvia the alpha and beta release processes discussed later in this chapter.
• Schedule the installation with the users to align with their data warehouse education.
•
Install the desktop hardware and/or software and complete installation testing. It isimportant to fully test each installation to verify the user’s existing system has not beenadversely impacted and to ensure that the appropriate connectivities have beenestablished or retained.
Develop the End User Education Strategy
The education for business users differs significantly from the education described inChapter 3 for the technical project team. Business users will receive less education thantheir technical counterparts, but their education must be well orchestrated. A robusteducation strategy for business end users is a prerequisite for data warehouse success. You may have built a very sophisticated architecture and loaded a massive amount ofclean, legible data into your warehouse, but it may be for naught without the appropriateuser education to leverage your work of art.
Integrate and Tailor Education Content
Education for your business users must address three key aspects of the datawarehouse: data content, end user applications, and the data access tool. Business endusers don’t understand the boundaries between the tool, data, and applications in the warehouse, nor should they be expected to. To users, it’s all the data warehouse, not abunch of discrete components. Your education offering should reflect the sameperspective.
Tip
Data warehouse teams are too often guilty of interpreting user education to mean end user data access tool training, and forget about the data content andapplication topics. Tool training is useless unless users understand which datais available, what it means, how to use it, and what to use it for.
As you might expect, sending your business users to generic vendor-provided data access tool training is not very effective, although it’s the path of least resistance. Tooltraining in a classroom environment is definitely preferable to the read-the-manual approach, but it still leaves much room for improvement. Another alternative is tosupplement vendor educational offerings with a customized education session on yourdata and application templates. This is certainly a step in the right direction, but it’s still not the most efficient use of time for your business users. The optimal approach is todevelop customized education that provides integrated training on the tool, data, andapplications. While this is the most effective alternative, it may also be the most costly approach in the short term.
Even if it is tightly integrated, data warehouse education for your business users may beineffective if it is not correlated to their anticipated type of usage. As you know, users are not homogenous. Each one brings a spectrum of previous experience, skill sets, andinterest to bear on the data warehouse. You need to assess their general comfort levelswith data, analysis, and technology as these will impact their education needs. At either end of the range, users will have already perhaps stratified into a push-button or advanced ad hoc user profile. Within a user profile class, your education needs toaddress the average end user.
Tip
Ideally, your data warehouse curriculum should include an advanced techniques course aimed at your more analytical users about two to fourmonths after deployment.
Finally, remember that you will have future opportunities to further educate the businessusers. You don’t need to bombard them with everything they will ever need to know

18.4
about the data warehouse all at once. You should let them absorb the basics withoutoverwhelming them with advanced topics initially.
Data Education Content
Data education should provide an overview of the structures, hierarchies, business rules,and definitions. The dimensional modeling techniques, presented in Chapter 7, embody effective graphics for communicating much of this information. A session on the browserfor the business metadata in the metadata catalog would also be useful.
As you’re making data available to business users, they will naturally compare the data coming from the data warehouse with data on existing reports. There are inevitably goingto be situations where the information now available via the data warehouse does notmatch the information that was previously available to business users. Several factors may cause a discrepancy between data from the data warehouse and previouslyreported information:
• The data warehouse information is incorrect. • The data warehouse information has a different or new business definition or meaning. • The previously reported information was incorrect.
Obviously, the first scenario is to be avoided. Data errors must be corrected before yourbusiness users are given access to the warehouse. Data errors will immediately cause a loss of credibility for the data warehouse. The data quality and verification techniquesdescribed in Chapter 16 will help ensure that this doesn’t happen.
The other two scenarios are very likely to occur with your data warehouse. Beforedeployment, the data warehouse team needs to identify, document, and communicatethese data caveats and inconsistencies to the business users before they stumble across them on their own. Even though it requires some effort, it is much better to be proactivein these situations than to ignore them and hope no one notices.
End User Application Education Content
You will also want to review the prebuilt end user applications during your educationoffering. The business users should be introduced to the complete inventory of prebuiltend user applications. For each application, you should present the analytic usage orpurpose, location or navigation aids and procedures required to initiate the application.
Develop the End User Education
Responsibility for business end user education development needs to be clearly definedup front. Often this responsibility resides within the business community; as described in Chapter 3, sometimes it is shared with the IS team, where IS has responsibility for thetool training and a business representative is responsible for the data and applicationstraining. Figure 18.1 illustrates a sample end user class introductory outline.
Figure 18.1 Sample end user one-day introductory course outline. End User One-Day Intro Course Outline A. Introduction to Data Warehousing & Project Background B. Interacting with the Data Warehouse – How to Get Started – Hands on Exploration of the Data Warehouse Web Site C. Data Exploration and Navigation – About Your Dimensions

18.5
– Hands on Exploration of Dimensions – About Your Facts – Hand on Exploration of Facts D. End User Applications – About the Prebuilt Reports – How to Access the Report You Want – How to Use the Reports for Your Job E. More Tool Techniques – Printing – Exporting to Word Processors & Spreadsheets – Manipulating Reports—Drilling, Graphing, Surfing, etc. F. Open Forum – Apply What You’ve Learned to a Real Situation
The effort required to create an effective education program for the business users isoften underestimated. It’s also an activity that is frequently squeezed out of a project planif the team begins to fall behind schedule.
A rule of thumb is that it takes one day to develop one hour of educational material. Inother words, it’s reasonable to assume that it would take eight days to develop and prepare the materials for a one-day training session, and perhaps even more for the firstinitiative. Since your materials are going to cover the available data and applicationtemplates, the data and application development efforts must be complete and stable before you can begin to construct education materials. Assuming a one-day training session, your data and application templates should be ready for deployment at least twoweeks before the scheduled training date to allow time for course development and preparation. Obviously, the course developer must be knowledgeable about the data, thedata access tool, and the prebuilt end user applications prior to creating the class.
Tip
If you intend to educate a large user population, consider building a trainingdatabase with a subset of the production data warehouse. This approach offersnumerous advantages. First, query performance during the education courseswill be much more predictable. Likewise, the production environment is isolated from unintentional student errors. Finally, the education exercises will returnconsistent results, rather than reflecting the latest update to your productiondata warehouse.
Deliver the End User Education
End user education should occur once all aspects of the deployment are ready to go.Optimally, the business users will return from training with the tools loaded on theirdesktop ready to access the appropriate data and application templates.
Formal education sessions typically have 10 to 12 business user attendees. This numberis often driven by the number of computers available in a single training room. If possible,each student should have their own computer for training.
We suggest you recruit an administrator to handle the details and coordination.Reserving the training rooms, confirming user availability, ordering snacks, and so on is abig job. You will also need to allocate resources to preload the data access software andsample end-user applications and education materials on the training room desktops.
We have already discussed the need to allocate sufficient time to develop the materialsonce your data and applications are ready for deployment. You should also allocate time to prepare for the course. Teaching in a classroom environment is very much like public

18.6
speaking. Granted, the audience will probably be smaller, but the instructor is essentially“on stage” for the entire class. The people who are responsible for delivering education should be strong verbal communicators. They should have a solid understanding of allaspects of the data warehouse, including the tool, data, and applications. They shouldalso be enthusiastic. Education is a key marketing opportunity for the data warehouse. You want users to return to their work environments, motivated to delve into thewarehouse, without having unrealistic expectations. It can be challenging to find all theseskills and traits in one person. Organizations often use teaching teams, especially in the early stages of the data warehouse. This approach also ensures that students’ questionsare more quickly answered, given the higher teacher-to-student ratio.
Conduct Education Only If the Warehouse Is Ready
We have worked with some data warehouse teams that intend to install their end usertool early and get the users trained so they have time to play with it. Playing withtechnology may be viewed as a perk for IS professionals, but most users have littledesire to experiment with technology.
It is very important that the users receive their end user tool and education when theycan productively use the data warehouse; providing access under any othercircumstances is seldom successful and frequently detrimental. If the database still has serious flaws, the applications haven’t been built yet, or the technology is not in place sothat people can access the data warehouse from their desktops, then you are not readyto train the users yet—even if the training has been on their calendars for weeks. In general, it is better to postpone the training than to continue marching down the pathknowing that deployment issues are lurking, although it requires substantial courage tomake that tough call.
Establish “No Education—Then No Access” Policy
Inevitably, some users will be unable to attend your training session because of someunexpected business disaster or emergency. You should not let a business user access thedata warehouse or associated applications without adequate training. Users’ demands fordata warehouse support will skyrocket without adequate training. In addition, users’frustration with the data warehouse will also soar. Rather than educating users in a formalclass, you’ll end up educating the users individually over time with your support staff. Werecommend that you establish strict policies up front restricting access without appropriateeducation. You should solicit the support of your business sponsor to enforce these policies and to reinforce the importance of education throughout the management ranks.
Develop an End User Support Strategy
You will need to establish a strategy for supporting your business end users well inadvance of deployment. User support strategies seem to vary by organization and culture, based largely on the expectations of senior business management, coupled withthe realities of your data warehouse deliverables. Earlier in the project lifecycle, youconducted meetings with senior business management to better understand their expectations of users’ direct interaction with the data warehouse. This feedback servedas input for your data access tool and end user application template strategies. It comesinto play once again here. If business management expects users to get their hands dirty and muck around in the data, the demands on the data warehouse support staff arereduced. On the other hand, if business management does not expect or want users toperform ad hoc analyses, a larger support staff will be required.
It is critical that you are in sync with business management regarding these expectationsbecause they will drive decisions that impact both the development and deployment ofyour data warehouse. It is also important to know if there is consensus among your organization’s business management regarding these staff expectations. Some businessmanagers have a vision of direct user interaction, while others want data gophers toserve up information to their team. You should acknowledge these differences and plan accordingly.
Finally, it is important to get business management’s commitment to reinforce theirexpectations with their teams. At times, it can be difficult to change the underlying cultureregarding information analysis. We saw an organization where a new person at the topwanted to put information on users’ desktops, but neglected to inform the users of theseexpectations. When they said “no thank you” to the data warehouse team, the new

18.7
business manager backed down from his original course. This organization wasted work-months delivering to a target that moved once they got there. At the other end of thespectrum, we’ve worked with organizations that modified users’ performance evaluationmetrics in order to alter their attitude. As you can see, it is critical that the datawarehouse team clearly understands the expectations of business management.
Determine the Support Organization Structure
After you deploy the data warehouse, questions from users will run the gamut from tool mechanics to data usage and meaning to application calculations and interpretations.The typical personal computer help desk will not be able to handle the full spectrum ofpotential user support questions. Some user questions, such as LAN connectivity issues, will fall within the realm of the help desk, but most will be data warehouse-specific.
Typically, we see a tiered user support structure put into place. The first line of defensefor user support is a resource that typically resides within the business area. Thesehighly-accessible resources are often the business support analysts who have beeninvolved with the data warehouse from its inception. They already have a goodunderstanding of the data. We typically recommend that the business support analysts attend tool training early and participate in the development of the application templates.The initial data warehouse development efforts serve as further hands-on education for these user support teams. By the time their users attend data warehouse education, thebusiness support analysts are highly proficient in the tool, data, and applications.
Complementing this decentralized team of experts, we typically see a centralized team ofsupport resources. This central team handles the more global data warehousemaintenance responsibilities, as we’ll discuss in further detail in Chapter 19. In addition, the centralized team typically serves as a second line of defense and provides a pool ofadvanced application development resources. There’s an opportunity for careeradvancement and cross-pollination between the centralized and decentralized support teams.
A robust support team is essential for both the initial deployment and long-term viability of your data warehouse. The data warehouse user support resources require a uniqueset of skills as they must be business-, data-, and technology-savvy. In addition, they must be user-oriented, flexible, patient, and enjoy solving problems for others’ benefit.Finally, they have a big impact on user perception and acceptance as they are one of themost visible aspects of the data warehouse.
This extensive skill set requirement makes the support team a difficult resource to bothrecruit and replace. To further complicate matters, resources in the user support role areoften the “forgotten soldiers.” Senior management may need to be reminded that the user support team has a huge impact on the organization’s ability to use their datawarehouse competitively. Your user support teams should be rewarded for theircontribution. The organization should also invest in external education as appropriate for these individuals.
It is nearly impossible to provide general staffing guidelines for your centralized anddecentralized support organizations because there are just too many variables toconsider. It’s difficult to even reach agreement regarding the basis for headcount—per user, location, data size, and so on. Any guidelines we could provide would be plus orminus 100 percent, so it is probably best to avoid mentioning any ballpark numbers.
Anticipate Data Reconciliation Support
As we discussed in Chapter 16, data quality verification and reconciliation should occurprior to any user access. However, it is possible that some data errors might slip through the net. As you define your support strategy, it is wise to earmark resources for datareconciliation shortly after deployment.
Tip
Especially when previously reported information is found to be incorrect, it may require some digging to help the users fully comprehend the inaccuraciessurrounding information that they had been using for years to run theirbusiness.
For example, it’s quite possible that historical reporting was based on a series of flags tied to the customer, product, or account file. The logic behind the flag setting hasprobably become convoluted over time. We’ve worked on many projects where the

18.8
historical reporting was incorrect due to error-prone data entry or misinterpretation of the flags within a report-writer module. Over the years, bonuses have been paid, productstrategies implemented, and customer retention plans initiated on the basis of thiserroneously reported information. It may take some doing to convince your users that they’ve been using faulty information to support management decision making in thepast.
The resources assigned to data reconciliation require a broad set of skills. They will needaccess to both the data warehouse, as well as to the source systems or production reports. It is also helpful to have a solid understanding of the data transformationprocess.
Anticipate End User Application Support
The good news about modern data access tools is that end users can get the answers they need, but that does not mean that they generate the most efficient SQL possible toformulate their questions. In fact, users often create queries that are not efficient at all. Itmay be acceptable to have several inefficient queries developed and executed by individual users. It is unacceptable to allow those inefficient queries to be distributedacross the entire user population. Hence, you need to develop a procedure to collect,test, polish, and release end user applications to the general users. It need not be as formal as that required for operational system maintenance, but there should be someguidelines.
The most common application release procedure is for users to submit their personalqueries and templates to the support team. The end user application developer, who has been trained to understand the nuances of the technology, can then revise theapplication as needed to improve performance and ensure that standards, as describedin Chapter 17, are followed. Once the end user application developer has polished theapplication and made it bullet-proof, the application can be released for use by the rest ofthe business community.
Establish Support Communication and Feedback
It is important to maintain an ongoing dialogue with the data warehouse business users.Communication with your users should, at minimum, consist of general informational andstatus updates. In addition, success stories can help motivate the more timid or skepticalusers.
Inbound communication from your users regarding problems or enhancement requests iseven more critical. Processes must be put in place to capture and respond to this user feedback. You need to acknowledge the request and act upon it as soon as possible.The worst thing would be if users stop communicating because they feel like no one islistening. You should establish a formal tracking system, similar to the one designed for issue tracking that was described in Chapter 3, so that change requests and feedback flowing into multiple support people does not fall between the cracks. Alternatively, you can use the same system as the internal help desk for problem tracking.
Provide Support Documentation
Operational systems are often supported by reams of documentation. In the case of the data warehouse, we recommend that you document the warehouse, such as businessdefinitions and metric calculations, within the warehouse. A data warehouse will evolvequickly. Although the user education materials provide limited system documentation and usage examples, more elaborate and expensive formal documentation will probably beobsolete before it has been distributed. Documentation is nearly worthless if it is not keptcurrent.
At a minimum, we suggest leveraging the documentation capabilities of your end user data access tool by linking into the metadata catalog for detailed attribute descriptions.You should also develop and maintain a listing of your end user applications with a briefdescription and usage guidelines.

18.9
Create a Data Warehouse Web Site
Data warehouse support documentation is often made available via Web pages on yourorganization’s intranet. The Web is an excellent tool for enhanced user communicationand support. Figure 18.2 illustrates a sample data warehouse Web site map. This sample site provides both access to the data in the warehouse as well as information about thewarehouse. The sample site is organized as follows:
Figure 18.2 Sample data warehouse Web site.
• Standard Reports and Analysis. Documentation on the available standard reports and structured navigation to locate and access these reports is included here.
• Learn About the Warehouse. This is the central location for reference information about the warehouse. It should include:
–
Data Warehouse Overview. Brief overview of the data warehouse project’s who,what, when, why, and how.
–
About the Data. High-level introduction to the content of the data warehouse. Detailed information is provided through direct links to the metadata catalog.
–
Education and Class Schedule. Highlights the data warehouse’s education catalog and schedule. On-line registration may also be supported.
–
Data Warehouse Status. Pertinent details might include the date and status of themost recent data load and number of data feeds included (e.g., number of storesreporting). New dimension records added with the most recent load might beidentified. In this site, users can also view the status of any problem or enhancementrequests they’ve submitted.
•
Warehouse Community. These pages provide a listing of the data warehouse projectteam members and their roles so users know who to contact. There may be a similar listing of data warehouse users to encourage collaboration. This site also may includean on-line discussion group.
•
Fact of the Month. As success is realized through use of the warehouse, keyanalyses can be shared here. This page highlights a new, interesting application of the data warehouse each month. The highlighted analyses can then be shared andleveraged across the organization, spawning user creativity and cross-organizational synergy.
• What’s New. Quick reference for changes to the data warehouse Web pages. Develop the Deployment Release Framework
Now that we understand the pieces that must converge for a successful deployment, it ishelpful to think about deployment within an overall framework. The process used to deploy your data warehouse should be strikingly similar to the process used to deploy anew commercial software package. With a software program, releases are defined fordevelopment based on requirements (in theory, at least). The new software release goes

18.10
through an internal alpha test period, followed by a beta period with a limited number ofclients, and then it is finally made generally available.
You can use this same release framework to deploy your data warehouse. Releases are defined for the data warehouse. Every major change to the data warehouse, consistingof new data and/or application content or new groups of users, should be considered arelease. As with a new software release, data warehouse releases should go through the same rigors of alpha and beta testing prior to general availability and rollout. Although theinitial release of the data warehouse will be the most labor-intensive to deploy, each subsequent release needs to go through the same structured deployment planning process. Let’s further define these data warehouse release steps.
Alpha Release
The alpha period is the data warehouse team’s first opportunity to conduct an end-to-end system test. Unfortunately, data warehouse teams often interpret their target data warehouse delivery date to mean the first time they deliver data into their datawarehouse environment. However, rather than reaching the target goal line, they’re reallynot even ready be at the start of their alpha test period. At this point, the team has probably completed less than half of the work required to deploy this release of the datawarehouse.
The goal of the alpha test period is to internally test all the components of the datawarehouse developed thus far, including the technical infrastructure, extract and loadprocesses, data quality procedures, performance tuning, application templates, andeducation materials. Alpha testing is typically an iterative process. The alpha periodshould not conclude until the team is confident in the quality of the data warehouse,especially concerning the data and application templates. As you define your alpha testperiod, be sure to allow enough time to correct any problems encountered along the way.
The alpha team typically consists of core data warehouse team members. It may alsoinclude specific business representatives, such as business support analysts, if they aretasked with data quality assurance, end user application template development, oreducation development.
Beta Release
During the beta period, a limited number of business users are given access to the datawarehouse. The beta period is sometimes referred to as the pilot, but we avoid that terminology given the multitude of definitions. We believe that every major data warehouse release should go through the rigors of a beta period, not just the initialdeployment.
The goal of the beta test period is to conduct an end-to-end user test of the variables described earlier in this chapter and to work out any remaining glitches. The beta periodshould confirm the readiness of the data warehouse release for a more general releaseto your user population. Variables to be tested include:
• Desktop hardware and software installation • Data quality and completeness • End user application quality and business relevance • End user ad hoc query performance • Education materials and procedures • Support infrastructure and user communication and change request procedures
• Ability of the data warehouse to provide meaningful insights into the compellingbusiness requirements
You may need to impose an unnatural structure and discipline during the beta period to ensure that these variables are adequately tested. The data warehouse team should alsouse the beta period to verify the necessary back-room operational processes before the user population expands, including back-up and archiving procedures, disaster recovery, stress testing, and performance monitoring, as described in Chapter 16.
18.11
Beta Team
The beta team consists of key business user representatives who are committed to active participation in this test period with full knowledge of all that can (and probably will)go wrong. We typically limit the beta team to between 10 and 15 users. If you work withfewer beta users, the release may not be tested adequately. If you recruit too many betausers, you’ve essentially skipped the beta period and gone directly to full availability.
There are several characteristics that you should look for in a beta team candidate,including:
• Management support. The manager of beta team members needs to understand thatparticipating in the beta will consume significant energy. You need management’scommitment that the beta will receive a top priority from their perspective.
•
Availability. Unfortunately, the star performers are often asked to take on more thanshould be asked of any one person. Beta team candidates shouldn’t already bejuggling two jobs and several special task force assignments. Such candidates arealready too overloaded to seriously participate in a data warehouse beta test.
• Motivation. Beta users should be excited about the data warehouse initiative ingeneral. Optimally, they’re motivated to get their hands on the first cut to make the final deliverable even better.
• Flexibility. The beta team must be willing and able to deal with a less than perfectworld. They shouldn’t object to being guinea pigs.
•
Organizational respect. Beta users often become the early, informal ambassadors for the data warehouse. The beta team members should be well-respected by the user community. They’ll be the first to find valuable business insights in the data to supportmore effective decision making.
Production Release (a.k.a. Deployment)
The production release, or deployment, of your data warehouse is somewhat analogousto general availability for a software product. As with a software general availabilityrelease, your data warehouse must be bug-free and well-supported to be viable in the long term.
General availability is something of a misnomer when applied to the data warehouse. Ifyou hope to deliver a data warehouse content release to 200 people, you can’t provideaccess to all of them at once. We suggest that you identify groups of 10 to 12 users who will be deployed in a single iteration or wave. This is a very manageable number and itapproximates the number of people that can be trained at once.
We recommend that you allow several weeks between iterations of a release to various groups of product users. This time lag will allow adequate time for training and initialsupport for each group of users. It also allows time for the deployment team to learn fromthe early waves and make any minor course adjustments before the next deployment wave. For this reason, you should allow extra time between the first couple of waves.
Your production users for a given release may come from multiple business areas,locations, etc. In terms of sequencing the rollout to these users, geographic locationseems to be the most important variable, although politics runs a close second.Obviously, if your users are in disparate locations, you will want to deploy to all the usersin each location at once. You don’t want to make multiple trips to a remote office forsoftware installation and user education.
We suggest identifying a team within the data warehouse project team to focus ondeployment. These people will operate like a SWAT team that is focused on deployment-related issues. The team will probably consist of the user educationresources and several user support representatives. The team should also includesomeone with technical depth to deal with any desktop infrastructure issues, such as ODBC connection failures.
Assess Deployment Readiness An optimum deployment might be described as one where the user attends data

18.12
warehouse education and then returns to their desk the next day with access to accuratedata and application templates and readily accessible support if they run into anyproblems. This convergence of events will not happen by itself.
We encourage you to assess your deployment readiness critically using the followingchecklist. Deployment of your data warehouse release should be delayed if you are unable to emphatically respond positively to any items on the checklist. It is much wiserto postpone than to attempt deployment when you’re not ready. Deployment is somewhatanalogous to serving an elaborate holiday meal. Everything should come together as your family is sitting down for dinner—the table must be set, the entree and side dishes ready at the same time, and the dessert prepared and waiting in the kitchen. Your guestswould certainly prefer having dinner delayed by a half an hour to being seated onschedule and served food that’s only partially cooked.
Deployment Readiness Checklist Desktop installation: • Necessary technology in place for business end-user access to data warehouse. • User logons and security authorizations obtained. Data quality verification and reconciliation:
• Data quality assurance testing performed (per the guidelines established in Chapter 16).
• Inconsistencies with historically reported data investigated, resolved and documented.
• Beta team business representative signed off on data legibility, completeness, and quality.
End user applications: • End user applications developed and tested (as recommended in Chapter 17).
• Beta team business representative signed off on application template quality andbusiness relevance.
End user education:
• Introductory business user education materials developed on data content, application templates, and data access tool usage.
• Beta team business representatives signed off on introductory user education offering.
• Education delivery logistics (e.g., venue, projection capabilities, user PCs withnecessary data and application access, education materials duplication, etc.) handled.
• Production end users registered for education with appropriate approval from theirmanagers.
End user support: • Support organization in place and thoroughly trained.
• Support communication, bug report, and change request tracking procedures testedduring beta period.
Document Your Deployment Strategy
As you plan your deployment, you’re putting stakes in the ground regarding each of the variables we have discussed in this chapter. We recommend that you document yourstrategies as they are being developed within the team and reviewed with your businessand IS management and project sponsors. Like any good planning document, thedeployment strategy document should have an owner who will facilitate a regular reviewand update, rather than allowing it to stagnate on someone’s book shelf.

18.13
Key Roles Keys roles for planning the deployment include:
• The data warehouse educator responsibilities are front and center now with thedevelopment of end user education courses.
• The project manager and business project lead determine the structure andstaffing of the end user support organization, based on direction and feedback from management and the project sponsors.
• Special teams’ players play a pivotal role during deployment. Hardware andsoftware acquisition, installation, and testing must be accommodated.
Estimating Considerations
Planning for deployment should occur in a relatively short period of time. A coregroup needs to be convened for working sessions to establish the strategiesoutlined in this chapter. You should allow time for presentation of these preliminary strategies to the appropriate business and IS management and sponsors, andmodification as necessary.
Completing the tasks to then prepare for deployment will vary greatly depending onthe strategy you choose to pursue in each area of your deployment plan.
Appropriate lead times for desktop upgrades, installations, and associated securitymust be considered during deployment planning.
It typically takes one day to develop one hour of educational material. In otherwords, count on eight days to develop a one-day training session. Course development requires access to complete and stable data and end userapplications.
In general, approximately four to eight weeks should be allocated for the combinedalpha and beta periods to allow time for iterative testing and correction of anyproblems identified.
Summary
Successful deployment of the data warehouse requires thoughtful planning andcoordination prior to the completion of development efforts. Key areas to consider include desktop installation, integrated user education, and support. Most importantly, yourdeployment readiness should be critically assessed. Deployment must be delayed if yourproject is not absolutely ready for prime time. For a summary of the project plan tasks and responsibilities for planning the deployment, consult the speadsheet at the end ofthis chapter (Figure 18.3).
Figure 18.3 Project plan tasks and responsibilities for planning the deployment.

19.1

19.2
Overview
Congratulations, you’ve successfully deployed your first data warehouse deliverable.However, there’s no time for a two-week hiatus yet. Your efforts to date will be an exercise in futility if you don’t focus a similar effort on maintaining and growing your datawarehouse. The key difference is that business users are now accessing the datawarehouse. They’re inevitably demanding more from the data warehouse team, while at the same time motivating the team with stories of improved decision making.
We laid the groundwork for this stage of your data warehouse with many of therecommendations of Chapter 18. This chapter expands on those concepts. It is dividedinto two sections: maintaining your existing data warehouse environment and thenpreparing for its growth and evolution.
Project managers should read this chapter very closely. Business and IS management andsponsors should also read it to understand the effort required to fully reap the benefits ofyour data warehouse initiative. Finally, other team members involved in the ongoing support of the warehouse should also become familiar with the recommendations presented in thischapter.
Manage the Existing Data Warehouse Environment
As we enter the maintenance stage, once again the data warehouse requires anapproach that differs from traditional operational systems. In a traditional systemsdevelopment effort, deployment signals a hand-off from the development team to the maintenance organization. However, a data warehouse is never really finished. Ongoingcare and feeding of the warehouse simply can’t be turned over to a separatemaintenance organization while the data warehouse team moves on to tackle the nextimplementation.
This no-end-in-sight phenomena has a big impact on the investment required to maintain your data warehouse. You need to ensure that there will be adequate funding fordedicated data warehouse maintenance resources beyond the initial construction phase.The maintenance activities described in this chapter are nonnegotiable; they must be performed if you expect a return on your original investment. As a general rule, it takes50 percent of the development resources to provide ongoing maintenance for a steady-state warehouse, assuming no additional users or data sources. Typically, there is no decline in ongoing needs; therefore, management must be willing to commit to this levelof resources for the foreseeable future. This represents a drastic change fromoperational system development projects—don’t be surprised if you need to deliver this message to management several times before it sticks.
Diagnosing the Dysfunctional Data Warehouse
The reader should be aware that the recommendations presented in this chapterare based on the assumption that your data warehouse is heavily used and warrants the investment in additional resources to maintain it. But what if that’s notthe case? What do you do if your users aren’t jumping on the data warehousebandwagon? This symptom often points to more serious underlying problems. Take the following data warehouse self-check test. If you’re unable to respond affirmatively to these questions, you should refer to the appropriate project lifecyclechapter and perform resuscitative measures.
• Is the project sponsored by an influential business executive? Does thisexecutive feel strongly about using information to support decision making, or is

19.3
he or she just jumping on the latest bandwagon? Is this individual still with yourorganization in a relevant position, or has he or she departed since initially supporting the data warehouse project?
• Does the data warehouse team understand the business user requirements? Dothe business users believe the data warehouse team understands what they’retrying to accomplish?
•
Is the data organized to support business requirements, or is it organized tosupport operational concerns, like streamlining the extraction process orminimizing disk space requirements? Can business users understand thedimensional model, or are they forced to confront a large number of tables in theinitial data mart?
• Were users’ analytical requirements given consideration during the data accesstool selection process?
• Is the data accurate? Does it match current operational reporting? If not, does the data warehouse team thoroughly understand the data inconsistencies and havethey informed the end users?
• Is the data refreshed in a timely manner?
• Is the database properly tuned, or do users typically launch a query and hope it’s completed by the time they return from lunch?
• Has the data warehouse team constructed application templates to jump-start the users’ analysis?
• Have the business users received basic training on the data, application templates, and data access tools?
• Do the users know what the data means and where it comes from? Do they haveaccess to table and column definitions and what typical values should be?
• Do the business users know who to call if they’re having problems with the datawarehouse? Does anyone respond to their calls in a timely manner?
Focus on Business Users
It’s nearly impossible to achieve success with your data warehouse if business users aren’t using it. You need to focus attention on the business community first and foremost.
Continue to Support Business Users
The first couple of weeks following users’ initial education and deployment are pivotal.You need to maintain the excitement and momentum established during their initialexposure to the data warehouse. With customer service in general, it’s more important tomaintain an existing customer than it is to recruit a new one. The same could be said ofyour data warehouse customers. You simply can’t afford to have a business user who isdissatisfied with the data warehouse. They’ll tell a friend, and before you know it, the datawarehouse will have a terrible reputation within the business community.
To avoid this scenario, make sure the support resources described in Chapter 18 are available shortly after the initial training for one-on-one hand-holding. Don’t wait for the users to call you—you should go to them before they have a chance to run into a wall offrustration. Also, they will be more likely to admit that they didn’t understand somethingfrom the formal training sessions if you’re working with them independently. These one-on-one sessions can also serve as remedial education for some users.
As we’ve stressed the importance of the first couple of weeks following deployment, it’salso important that the support organization be accessible on an ongoing basis. Users should feel comfortable going to their decentralized expert or business support analyst,as described in Chapter 18, with questions about data, analysis, and tools. This supportstaff should champion the efforts of the key business drivers within the organization whoare likely to have an early breakthrough or business insight from the data warehouse.

19.4
One-on-one support sessions with business users, or house calls, should also continueto be provided indefinitely. If you’re unable to provide dedicated on-site resources to a team of business users, you might consider setting up a “Doctor Is In” program for user support. Office hours are established so that users know when they can drop in for“urgent care.”
The centralized user support organization should be focusing their attention on thedecentralized support resources. The decentralized experts or business support analysts are essentially the central data warehouse team’s eyes and ears on the street. They’llhave keen insight about what’s working, what’s not, and why. The centralized teamshould try to make the decentralized tier as productive as possible as this will reflect positively on the data warehouse in general.
Everything we’ve said so far assumes that your original support strategy continues tomake sense given your organizational culture, user skill sets, support resources, and so on. Are the users digging into the data on their own, or are they reluctant to get theirhands dirty and want a “data gopher” staff to do the digging for them? We encourage youto reassess your original support strategy about a month or two following deployment. Question whether the original assumptions still make sense or if there needs to be amidcourse adjustment. If the strategy isn’t working, design the appropriate changes, getmanagement buy-in, document it in your deployment strategy document, and implement accordingly.
Continue to Educate Business Users
We outlined a basic education strategy for deployment in Chapter 18. When considering longer-term user education, you should think of it as an overall data warehousecurriculum. The following ongoing education options are often neglected:
•
Advanced education. There should be an advanced class to satisfy user demands after they have mastered the basics. It should be conducted approximately six to eightweeks following the introductory offering. If you don’t offer an advanced class, you’llend up disseminating the advanced concepts to users one at a time through the support organization. A formal advanced class is probably much more efficient andeffective.
•
Refresher education. Some users may need a refresher course on the datawarehouse. They may have attended the introductory class but need a review of the material. The refresher course may offer content similar to the introductory class but atan accelerated pace.
• New hire education. There should be an on-going program to train new hires. Depending on the rate of new hiring, such a training program should be offered at least twice per year.
Tip
You’ll need to offer the introductory education program periodically to meet theneeds of new hires. We strongly encourage you to continue enforcing a strictaccess policy: No one is allowed access to the data warehouse unless theyhave completed introductory training.
•
Regularly scheduled education seminars. Some organizations establish a regular forum, perhaps an internal user group meeting and/or quarterly brown bag lunch series, to answer questions, demonstrate new capabilities, present tips and techniques,etc. For example, you could conduct a seminar on strategies for testing your complexad hoc queries.
These sessions are typically sponsored by the data warehouse user support or education resources, although you may be able to recruit business users or supportanalysts who are willing to share tips. Consultants with your end-user tool vendors may welcome the opportunity to present query and application development techniques, although this may not be a free service. The educational material from these sessionsshould be documented in a data warehouse tip sheet so that it’s not missed by thosewho couldn’t attend the session. In addition, the tip sheet provides reference documentation.
• Newsletter. The data warehouse support team often publishes a periodic newsletterthat contains project updates, tips and techniques, success stories, and so on.
• Web site. Finally, as we mentioned earlier, many projects have begun using a Web

19.5
site as a centralized repository for educational materials, tip sheets, frequently askedquestions (FAQs), data warehouse load status updates, and on-line tutorials.
Manage Data Warehouse Operations
Gone are the days when you could make multiple attempts to get the data loaded andindexed. In all likelihood, your data warehouse will quickly become a mission-critical application.
Your users will expect the most current information to be rapidly loaded into the data warehouse and accessible to them. Mission-critical status puts a greater burden on the data warehouse operations organization to maintain the technical infrastructure,database management system, and data and metadata management processes. This added burden will also stretch the existing experience and knowledge base of your datawarehouse operations team. It’s important that you continue to invest in your operationsteam by providing them with ongoing education and new tools to help them perform their jobs efficiently.
Manage the Technical Infrastructure
The maintenance of your technical infrastructure is one of the few areas where the datawarehouse is not that dissimilar from other systems you’re familiar with. You can use your tried-and-true techniques to monitor the technical infrastructure. At a minimum,you’ll need to monitor network bandwidth, database, and application server disk use anddatabase server fragmentation. Clearly, you should involve the appropriate IS resources to assist with data warehouse technical infrastructure maintenance. For example, yournetwork administration group should play an active role in these activities.
You’ll want to capture performance, growth, and usage measures or statistics over time. You can then analyze these trends proactively to identify problems before you’re facedwith a user revolt. We recommend establishing a core set of application templates thatare executed after each load or update to the data warehouse. Tracking the performance of these applications over time will help the data warehouse team monitor and react toperformance degradation rather than rely on user feedback to the support organization.
In general, you’ll want to go back and review the appropriate chapters of this book tomanage your techncial infrastructure. We have provided an abundance of solid advice,much of which will only make sense now that you’re ready to think about ongoingmaintenance.
Your technical infrastructure will inevitably change, driven by existing data warehousegrowth, in addition to vendor-initiated product changes. You will need to continuebalancing new and existing technology. We recommend using your organization’sstandard planning and testing procedures prior to implementing any upgrades tocomponents of your technical infrastructure. At a minimum, you will want to establishseparate development and production environments to support the testing of newreleases, and so on. This multi-environment strategy will become more important as more people come to rely on the data warehouse and expect it to be there for them.
Tune for Database Performance
The demands on your database platform are bound to change as you load additional information with every update of the data warehouse. These frequent changes warrantongoing performance monitoring and tuning. Performance tuning should be based onusage and growth characteristics—which databases are being accessed frequently, which aggregations are being requested, are the indexes effective, and so on? Thepredicted usage and growth patterns that you relied on during the initial physical designneed to be reevaluated. Also, don’t be surprised if you underestimated the growth indata, due in part to additional, dense aggregation tables. We recommend you employ theaggregation, indexing, and partitioning strategies discussed earlier in Chapters 14 and 15to modify your database tuning strategy as necessary.
Maintain Data and Metadata Management Processes
It’s hard for the data warehouse team to complain too loudly about these source systemchanges. Chances are that the modifications were initiated by the data warehouse teamor their users. The deployment of a data warehouse frequently leads to reengineering projects that address data integrity and attribute-sourcing issues in the operating

19.6
systems.
Tip
Unfortunately, the data extracts from your source systems into the datawarehouse will also change all too frequently. These feeder processes are vulnerable to change given the sheer number of source systems they touch.Maintenance resources will need to assess the impact and then react to anychanges in the source operational systems.
It is frequently more challenging to remain informed of source system changes than it is to remain informed of user-driven changes. IS management should be cognizant of theimplications of source system changes. In many organizations, the data administrationfunction is often aware of underlying system changes. Routine IS change control meetings might be another forum for learning of planned changes. We know of one clientwhere the onus of communicating changes to the data warehouse team was put on thesource system maintenance team.
If you elected to defer an investment in a packaged data staging tool, you probably nowhave a much greater appreciation for its potential value and payback. Of course, thebenefit is that you now know the exact capabilities needed. The longer you wait to selectand implement a data staging tool, the deeper the data staging maintenance hole you’llhave to climb out of.
Finally, the data warehouse often forces organizations to deal with the issues related todata ownership. In many cases, the data warehouse team dealt with data issues during the data warehouse development process because no one else understood theramifications. It is now time to transfer this ownership and associated responsibilities tothe business community working in conjunction with the data steward. Their responsibilities cover a range of data-related issues, from providing consistent high-level data definitions to championing source system changes for improved data capture andquality to ensuring the maintenance of conformed dimension attributes.
Measure and Market Your Data Warehouse Success
It’s important that you routinely measure the performance of your data warehouseagainst agreed-upon success and satisfaction criteria. If the data warehouse isperforming well against these criteria, we suggest you market the data warehouse withinyour organization, and perhaps externally as well. If it’s not performing well, we suggestyou figure out why.
Monitor Success and Service Metrics
About a month following deployment, we suggest you conduct a thorough post-deployment assessment. Although it would be easier to rely exclusively on input from thedata warehouse team, both the business users and team should participate in thisassessment. The primary objective is to measure performance against the predetermined success criteria, as well as to gauge the general level of satisfaction withthe data warehouse. In addition, you should solicit feedback concerning the businessuser-oriented education, deployment, and support processes. User input regarding what worked and what didn’t is critical for process improvement prior to the next round ofdevelopment and deployment.
In Chapter 4, we recommended establishing project success criteria following theanalysis of business requirements. Agreed-upon success criteria are important for ensuring that the business users and data warehouse team are in sync regarding project goals. It’s far too easy to fall into the “moving target” trap unless the criteria for gaugingsuccess are established early within the project.
Tip
It’s important that you track performance against success and service metrics on a regular basis, not just immediately following the deployment. It is alsouseful to capture this information over time to support success and serviceperformance trending. Don’t assume that no news is good news. No newsusually means that no one is using the data warehouse.
Data for many of the metrics can be captured routinely by system utilities, but lessoperationally-oriented metrics must be gathered directly from the business users. You’llneed to talk with your business users to continually assess their satisfaction level and to gauge the fit of the data warehouse with current business requirements. You can’t rely onwritten surveys to gather this type of feedback.

19.7
Capture the Decisions Made Using the Data Warehouse
Sometimes a data warehouse is very successful, but no scientific measurements areavailable to support it. After all, the true valuable output of a data warehouse is the set ofbusiness decisions that are made as a result of using the warehouse. The datawarehouse manager should be alert to decisions that various business users make andask their permission to “capture” those decisions as part of the justification for the datawarehouse. Once a business decision is marked as coming from the data warehouse,the financial impact of that decision can often be determined without a lot of arguments.The entire data warehouse team should be put on notice to solicit and listen for examplesof business improvements attributable to the data warehouse. The support team is a key source for these success stories.
If the impact of such decisions is compared against the cost of the warehouse, a returnon investment (ROI) can be computed. A good aspect of this approach is that often someof the big decisions made in a business have a financial impact that is greater than thecost of the warehouse itself. We recommend that in such a case, you take credit only forpart of the decision. This is a reasonable stance in any case, and it insulates you fromarguments that the data warehouse could not be solely responsible for a major decision.
We strongly advise you to keep a written log of all business impact success stories.You’ll want to note who, what, when, how, and how much was associated with eachexample so you can provide complete details when asked. You’ll be surprised by theusefulness of this log, especially if your business sponsor is promoted within (as seemsto happen on the majority of data warehouse projects) or leaves the organization and thenew person questions whether the ongoing investment is worthwhile.
Proactively Market the Data Warehouse
When you develop a new order-entry system, the system’s users don’t have much choiceabout whether they use it or not; if the new system doesn’t get used, orders don’t get processed. That’s typically not the case with the data warehouse; using the datawarehouse is often completely optional. Business users have been making decisionswithout access to information for years, and some will prefer to continue doing so.
Marketing of the data warehouse is important to support both funding for ongoingmaintenance as well as growth initiatives. Someone on the team should be assignedresponsibility for data warehouse public relations. This individual, often the organization’s overall data warehouse coordinator, becomes the internal spokesperson for the datawarehouse. A spokesperson is more important for a data warehouse project than fortypical systems development projects due to the potential impact it may have on every department within an organization. The data warehouse spokesperson should develop astandard data warehouse presentation—if one isn’t already available. This presentation would discuss the data warehouse’s mission, accomplishments to date (with examples and dollar impacts), available data, current users and usage trends, and future plans.
Your log of data warehouse business impact examples will be relevant material for yourmarketing plan. These successes should be broadcast throughout the organization, and the industry, if appropriate. You can employ a variety of media, including datawarehouse, IS or corporate newsletters, intranet Web pages, industry publications, andvendor success stories. If possible, you should solicit management’s help to broadcast the wins. Users will be motivated to use the data warehouse and perhaps be part of thenext success story, if management’s support is highly visible.
Communicate Constantly
We’ve stressed the importance of communication throughout the planning, design, anddevelopment stages of your data warehouse project.
Tip
Your maintenance game plan should include an extensive communicationstrategy as a cornerstone. It is critical to ensuring the continued health of your data warehouse.
The data warehouse team needs to establish a multitiered communication plan toaddress the information requirements of its many constituencies in both the business andIS communities. This communication plan complements the change request process instituted during the deployment of your data warehouse, as described in Chapter 18.

19.8
•
Business sponsors and drivers. You can’t forget about your business sponsors just because you’ve deployed the first data warehouse deliverable. You’ll need to maintainregular, predictable reporting to sustain their sponsorship. Communication will helpaddress ongoing funding and resource allocation requirements. As we encouragedearlier, you should communicate successes to your business sponsors, as well asissues and your plans for addressing them.
•
Business users. The users of the data warehouse need detailed tactical information about the data warehouse. Depending on your organization, you might establish amonthly data warehouse newsletter or maintain an intranet Web site. Some datawarehouse teams also communicate with their business users via internal user groups.
Again, open and honest communication is the key to managing expectations. Youshould enthusiastically inform the users of successes and of your plans for correctingproblems. You can’t keep users in the dark regarding data warehouse errors, such as inaccurate data or incorrect application template calculations, in the hope that you’ll getthem fixed before anyone notices. It’s inevitable that someone will notice!
•
General business community. You should broadcast general updates to the rest of the business community to keep them informed of current status and future plans.These may take the form of a quarterly one-page update or a column in your corporate newsletter.
•
IS management. IS management should also receive the general broadcast updates. In addition, you need to make them aware of more detailed plans for the datawarehouse to ensure that they’re considering implications on their areas ofresponsibility, such as network capacity planning or operational system application development.
•
Data warehouse team updates. It’s critical that you maintain communication within the data warehouse team. Unfortunately, status meetings are often dropped as theschedule tightens around deployment and then not resumed following deployment. We strongly encourage you to make team communications a priority. Communication iskey to making sure that everyone on the team is marching in the same direction, bothduring the deployment crunch and throughout the ongoing maintenance period.
Prepare for Data Warehouse Growth and Evolution
If you’ve taken our advice thus far, your warehouse is bound to evolve and grow. Ingeneral, this evolution should be viewed as a sign of success, not failure. It indicates your existing data warehouse business users are asking for more data and applicationtemplates. At the same time, they’re spreading the news about the data warehouse atthe grass roots level, so new users will be clamoring for access to data, and applications.
Operational systems developed 20 years ago still retain many of their originalcharacteristics. Changes to the data warehouse will be more dramatic. Everyoneinvolved with the data warehouse, from both the business and IS communities, should anticipate and appreciate the evolution of the data warehouse.
In addition, the factors that influenced the early design of your data warehouse—including business sponsorship, users and their requirements, technical architecture, andavailable source data—are evolving rapidly. Your data warehouse will probably changeat warp speed compared with more traditional system development efforts. We hope theemphasis we have placed in this Business Dimensional Lifecycle approach in making thedata warehouse respond gracefully to change serves you well.
As you’ve been maintaining the data warehouse, you’ve been setting the stage for itsgrowth and evolution. We have several additional recommendations to facilitate theongoing development of your data warehouse.
Establish a Data Warehouse Steering Committee
If your first data warehouse deliverable was successful, other business areas will beknocking down your door to be next in line. We suggest that you avoid the role of datawarehouse arbitrator, deciding who’s going to be served in what order and at what cost.It’s impossible for the data warehouse team to please everyone.

19.9
A much safer approach is to form a cross-functional steering committee to establish the overall direction and ground rules for growing the data warehouse. The project end-user steering committee described in Chapter 3 may serve as an initial committee, but you will probably need to expand or modify the roster to ensure broader, corporate-wide perspective. The responsibilities of the data warehouse steering committee typicallyinclude the following:
• Establish a process for prioritizing data warehouse initiatives.
• Establish the data warehouse funding procedures based on existing organizationalprocesses and requirements.
• Establish overall infrastructure funding levels. • Determine ongoing priorities for growth and evolution initiatives.
The data warehouse steering committee should be composed of representatives fromboth the business area and IS management. By participating in the data warehousesteering committee, the business community becomes part of the solution, rather than merely finding fault with the decisions made by the data warehouse team. The followingvariables should be considered prior to inviting representatives to participate in the datawarehouse steering committee:
•
Organizational level. Steering committee representatives are typically “drivers” withintheir respective organizations rather than senior executives, largely due to theiravailability and accessibility. However, it’s important that the drivers be empowered by their senior executive to represent the area and make decisions.
• Organizational influence. The steering committee members should have influenceover their own organizations in addition to commanding cross-organizational authority.
• Belief in information-based decision making. It’s helpful if the steering committee members have a genuine interest in promoting information-based decision making throughout the organization.
•
Ability to set direction on behalf of the overall organization. Your steering committee will be totally ineffective if its members are unwilling to look beyond theirproprietary worlds. Steering committee members need to be able to put their ownpersonal requirements aside to evaluate initiatives and establish priorities based on the potential benefit to the overall organization.
The data warehouse steering committee typically meets at least once every quarter.More frequent meetings are required during the early formation of the steering committee. In addition, data warehouse steering committees often establish a charterwhen they are formed. This charter or statement of vision documents their tenets andlong-term strategies to ensure that everyone is in sync. The steering committee charter might include bedrock statements such as those illustrated in Figure 19.1.
Figure 19.1 Sample steering committee charter. Data Warehouse Steering Committee Charter
•
All data warehouse initiatives will require a partnership between IS and the business area. Projects will be established as joint business/IS initiatives with joint business/ISproject management responsibility. Senior level business management sponsorship isa prerequisite.
• Data warehouse initiatives will be prioritized based on the following criteria: – Alignment with overall business objectives – Potential business impact/return – Cost versus time to implement – Strategic importance to overall IS plan (e.g., provides necessary analysis

19.10
capabilities to complement new ERP operational system) • Existing technical investments will be leveraged whenever possible.
• The business community will anticipate and embrace change in the data warehouse. Unlike traditional systems development, change will be viewed as a positive sign ofsuccess, not failure.
Prioritize Growth and Evolution Opportunities
One of the data warehouse steering committee’s responsibilities is to establish a process for prioritization of data warehouse growth and evolution opportunities. The effortrequired to add another attribute to an existing dimension table differs significantly fromthat required to add a new fact table to the data warehouse. Typically, we see two processes put into place to handle prioritization of growth and evolution opportunities,one for relatively minor projects and another for major data warehouse initiatives. Both ofthese processes are described shortly.
Data warehouse errors are typically handled outside the prioritization framework. Theerror correction may be needed to address inaccurate data transformation, incorrect datadefinition, or erroneous calculation in an application template. As we’ve mentioned throughout this book, data warehouse errors cannot be tolerated—they must be addressed as quickly as possible. For this reason, these issues are typically dealt withpromptly by the data warehouse maintenance team, rather than burdening the general prioritization processes.
Prioritize Minor Enhancements
A minor enhancement to the data warehouse might consist of additional data elements,additional end user applications based on existing data, changes to existing applications, and so on. The creation of an additional aggregation table would typically also beconsidered a minor enhancement. There is often a cost estimate limit for minorenhancements, although this cost ceiling varies by organization. Minor enhancements are typically characterized as requiring days or a small number of weeks to complete,rather than measuring the effort in work-months.
Your organization probably already has a process for change service requests in place.The prioritization of minor data warehouse enhancements is typically handled in a similarfashion. The data warehouse support team receives and reviews user feedback, possiblysubmitted via e-mail to a change request mailbox. The team researches and scopes theeffort required to implement the enhancement. The support team then presents apreliminary prioritization recommendation to the steering committee. The goal is to obtainsteering committee buy-in without bogging them down with unnecessary tactical details.Also, you don’t want the steering committee to become a bottleneck. Depending on theirmeeting frequency, you may want to deal with minor enhancements by working withgeneral guidelines from the steering committee. Finally, it is paramount that the user whosubmitted the request receive feedback on its established priority.
Tip
Don’t fall prey to the simplistic reasoning that because a requested change issmall, it is not worth doing. This argument can be extended to not doinganything at all. One of the reasons Japanese cars are such of high quality is the manufacturers’ attitude of “1000 little improvements is a strategicadvantage.”
Prioritize Major Initiatives
A major enhancement to the data warehouse might involve a new fact table derived from a business process that is not yet represented in the data warehouse. Majorenhancements typically represent a relatively large investment in incremental design,development, and maintenance resources measured in work-months rather than days of effort.
In these cases, the project’s business sponsor typically presents the opportunity to thesteering committee. Although a formal requirements analysis, as described in Chapter 4, has probably not yet been done, a feasibility analysis and business case should becompleted. Subsequent data warehouse projects should meet the same criteria we

19.11
described in Chapter 3. Each project should be meaningful to the business (asdetermined by your prioritization process), manageable (in terms of the number of users,amount of data, and so on), and doable in a reasonable time frame. The steeringcommittee employs their agreed-upon prioritization criteria to establish the sequencing ofmajor initiatives.
Manage Iterative Growth and Evolution Using the Lifecycle
At this point, you’re ready to tackle your next data warehouse project. We remind you toremember everything you’ve read so far in this book. Unfortunately, we’ve seenorganizations that use this business-oriented approach for their first warehouse project fall back into old habits as the next data warehouse project queues up.
As you embark on subsequent projects, you’ll be leveraging the foundation already put inplace, while preparing for new variables. You may be delivering existing information tonew users or new information to existing users. In either case, you should continue touse the Business Dimensional Lifecycle described throughout this book. The knowledgeand experience gained during your initial data warehouse project should be leveraged onsubsequent projects (without completely abandoning your initial user base).
As illustrated on the overall Business Dimensional Lifecycle diagram, you should nowloop back to the beginning of the lifecycle again. The following section reviews eachmajor step of the project lifecycle and highlights changes or extensions as it is applied tosubsequent phases.
•
Project planning. Each subsequent data warehouse initiative should be establishedas a defined project. Subsequent initiatives should be clearly scoped, with defined start and stop dates—don’t just start tackling a project without a scope document, projectworkplan, and management techniques as recommended in Chapter 3.
A project manager should be assigned to each initiative. A project team with roles as described in Chapter 3 needs to be established. Organizations sometimes get greedyas they move beyond their first data warehouse deliverable. They want to satisfy everyone else in the second release, moving from a manageable first project to the “bigbang” approach. The reasoning we used to discourage this approach up front stillapplies as you’re expanding your data warehouse. Depending on your resource levels, it is possible to stagger several concurrent initiatives with multiple separate projectteams. This approach allows for concurrent design and development, rather thanrelying on a serial timeline, but it also requires additional coordination and communication.
• Business requirements definition. Users’ business requirements should be the driver at all times. The activities described in Chapter 4 are still very applicable as you move forward with your next warehouse project.
• Technical architecture strategy and infrastructure. You’ll want to leverage the existing technical architecture, while making adjustments as required. You should besure to document any changes to the technical architecture strategy.
• Dimensional modeling. As discussed in Chapter 5, embracing the Data Warehouse Bus Architecture concept and conforming your business dimensions is the key tosupporting integration within your data warehouse over time.
• Data staging. The data staging processes described in Chapter 16 and constructed for your first data warehouse deliverable should be reused and further built upon.
• Application design and development. You should be able to leverage the application design and development infrastructure, including application developmentstandards, during subsequent warehouse development efforts.
•
Deployment planning, education, and support. Once again, you’ll want to leverage existing deployment, education, and support processes to the extent possible. Usereducation needs to accompany every release of new data content or applicationtemplates to a user population, not just the first deployment. Additional training is also warranted if there are major changes to the end user tool software.

19.12
Key Roles Keys roles for maintaining and growing the data warehouse include:
• Superior user support can be achieved only through the coordinated efforts of allteam members. Each core team member typically retains responsibility formaintaining their component of the data warehouse.
• The data warehouse steering committee provides direction and establishes priorities for subsequent data warehouse expansion. This group is frequentlycomprised of business and IS management representatives.
Estimating Considerations
Unlike most systems development projects, the data warehouse is never done. Consequently, there’s no end in sight regarding data warehouse maintenance andgrowth activities and associated timeframes.
As we mentioned earlier, it’s not uncommon for the maintenance of your datawarehouse to require up to 50 percent of the resources required to develop it.Subsequent projects to address data warehouse growth should be staffed,planned, and managed as described in Chapter 3.
Summary
Congratulations! Your hard work has paid off, and the warehouse is now in fullproduction. In this chapter, we highlighted recommendations to ensure your datawarehouse remains a vital and healthy data warehouse, and is poised for growth.Remember to always put the business users first, without sacrificing attention to the backroom and technical environment. You should measure, track, and communicate datawarehouse successes on an ongoing basis. Be sure to consult Figure 19.2 for asummary of the project plan tasks and responsibilities spreadsheet for maintaining andgrowing the data warehouse.
Figure 19.2 Project plan tasks and responsibilities for maintaining and growingthe data warehouse.
Last but not least, remember that success breeds success. Be prepared for the onslaught ofrequests for more data, reports, and users. You should continue to rely on the BusinessDimensional Lifecycle as your data warehouse grows and evolves.


