Embed Size (px)
Citation preview
The curing of epoxy resins as studied by various methods
M. Younes*, S. Wartewigt and D. Lellinger Fachbereich Physik, Martin- L uther- Universitat Halle- Wittenberg, 06108 Halle/ Saale, Germany
and B. Strehmel and V. Strehmel Fachbereich Chemie, Martin-L uther- Universitat Halle- Wittenberg, 06217 Merseburg, Germany (Received 26 April 1994)
The sol-gel-glass transformations were examined in the thermosets of diglycidyi ether of bisphenol A (DGEBA) and diglycidylaniline (DGA) cured with 4,4'-diaminodiphenylmethane (DDM) at 70°C by using time-resolved fluorescence, Fourier-transform (FT) Raman spectroscopy, an ultrasonic technique and torque measurements. The rotational correlation times of substituted styryl and cyanine dyes showing a twisted intramolecular charge-transfer increase as the isothermal cure reaction proceeds and are sensitive to gelation. The chromophores detect the local viscosity of the surroundings. In the case of DGEBA/DDM, the extent of the epoxide ring reaction, obtained from FT-Raman studies over the whole curing process, was used to determine the variation of the glass transition temperature and the reduced free volume during crosslinking. Thus, it was possible to relate quantitatively the increase of the rotational correlation time of the dyes to the decrease of the reduced free volume. The variation of the ultrasonic velocity and absorption in the course of curing indicates vitrification (dynamic glass transition), but shows no characteristics with respect to gelation. Differences in the curing behaviour of DGEBA/DDM and DGA/DDM were clearly evident.
(Keywordse epoxy resins; curing behaviour; sol-gel-glass transformations)
INTRODUCTION
Network formation due to crosslinking in polymers is a complex process and it is of specific interest in both basic and applied research. During the thermal curing of epoxides, the sample changes from a low-molecular- weight liquid mixture to a highly crosslinked network. The molecular mobility in the system decreases as the cure reaction proceeds. These irreversible transformations from sol to gel to glass can be followed by a variety of techniques, such as viscometry 1, calorimetry 2, dielectric 3 and mechanical 4'5 relaxations, dilatometry 5, electrical 6 and thermal 7 conductivity, ultrasonic measurements 8-1° and several spectroscopic methods, e.g. infra-red 11,12 and Raman 13-15 spectroscopy, nuclear magnetic resonance 16, electron paramagnetic resonance 17, fluorescence14, ~ 8-2 i, Brillouin scattering 1°'22 and photon correlation spec- troscopy ~°. It has been demonstrated that it is useful to combine different methods in order to obtain a deeper insight into the crosslinking behaviour. Of particular interest are in situ techniques for monitoring the changes in physical properties that occur during the whole period of curing.
In the present investigation, we have employed Fourier-transform (FT) Raman spectroscopy, time- resolved fluorescence, ultrasonic methods and viscometry in order to monitor the isothermal curing process of
* Present address: Department of Physics, A1-Baath University, Homs, Syria t To whom correspondence should be addressed
epoxy resins with 4,4'-diaminodiphenylmethane (DDM). In this comparative study we were especially interested to detect the gelation and the vitrification transition.
Raman spectroscopy offers the advantage of providing precise information on the composition variation at the molecular level, and, accordingly, on the degree of cure. Because of the simplicity of the sampling requirements and the Fourier-transform technique, this kind of vibrational spectroscopy is useful for in situ non- destructive studies over the complete curing time.
Fluorescence techniques are useful to monitor changes in local viscosity. The fluorescence technique can also be easily adapted to in situ monitoring over the whole reaction process. So far, variations of the fluorescence intensity have mainly been investigated during the curing reaction of epoxy resins by applying four techniques: (i) detection of new fluorescent products, (ii) enhancement of fluorescence of dyes dispersed in the matrix, (iii) intramolecular excimer formation, and (iv) fluorescence polarization is. However, few studies based on time-resolved fluorescence have been reported, although that technique is well developed.
For the time-resolved fluorescence experiments we have used substituted styryl and cyanine dyes, because these chromophores exhibit a strong viscosity-dependent fluorescence, which is connected with formation of twisted intramolecular charge-transfer (TICT) states. Such TICT states 23 are formed through rotation of molecular parts and charge separation within the excited state of the chromophore. It should be emphasized that only
0032-3861/94/24/5269-10 © 1994 Butterworth-Heinemann Ltd POLYMER Volume 35 Number 24 1994 5269
Curing of epoxy resins: M. Younes et al.
the rate constant for the TICT state is dependent on the macroscopic viscosity. The usefulness of TICT chromophores as fluorescence probes for sensing the microscopic dynamics in polymer systems has been shown by several authors 2*-~6.
In addition, ultrasonic measurements are well suited for determining the mechanical properties of the system at each stage of the reaction. From the time dependence of the ultrasonic parameters, it is possible to elucidate the vitrification and the final stage of curing.
EXPERIMENTAL
Substances and sample preparation The diglycidyl ether of bisphenol A (DGEBA) (I) was
obtained from Leuna-Werke AG. It was recrystallized from a mixture of acetone and methanol (m.p. 44°C) 27. The 4,4'-diaminodiphenylmethane (DDM) (II) from Merck was recrystallized twice from ethanol using activated carbon (m.p. 89°C) 2a.
diglycidyl ether of bisphenol A (DGEBA)
CH 3
CH3
diaminodiphenylmethane { DDM )
H2N - - ~ CH2 - ~ N H 2
DGEBA was cured with DDM at a curing temperature of 70°C. The molar ratio of DGEBA and DDM was 2:1. The starting materials were mechanically mixed for 3 min at 70°C. Then, the mixture was rapidly transferred into the reaction cell, which was preheated to the curing temperature chosen.
For the fluorescence experiment, trace amounts of the dye (< 10-s mol 1-1) were dissolved in the mixture before the curing reaction started. The following dyes were used: 4-(dimethylaminostyryl)-2-methylpyridinium iodide (DASPMI; Aldrich), 4-(dimethylaminostyryl)-2-ethyl- pyridinium iodide (DASPI; Lambda Physik), jolulydyl- styrylmethylpyridinium iodide (JSMPI), jolulydylstyryl- ethylpyridinium iodide (JSEPI) and quinaldine blue (QB; Aldrich). JSMPI and JSEPI were synthesized as described elsewhere 29.
\CHs C H 3 CzH5
DASPM I DASP I
3SMPI ]SEPI
C-zHs CzHs
CIB
Furthermore, the curing process of diglycidylaniline (DGA) (III) with DDM (molar ratio=2:l) was also investigated at 70°C. The procedure for mixing the components was the same as described above. DGA was synthesized from aniline and epichlorohydrin 3°.
diglycidylaniline (DGA)
CH2-CH- CH 2 __ N / ~0 /
N 0.2-0 .o#.2 Time-resolvedfluorescence
Fluorescence decays were determined with the time- correlated single-photon-counting technique using an experimental set-up described elsewhere 26. In this appar- atus, the light source was the argon-ion laser ILA 120-1 (Carl Zeiss Jena AG) equipped with an acousto-optical modulator, which generates laser light pulses with a pulse width of about 1.6 ns and a pulse separation of 8.117 ns. The time resolution of the equipment amounts to 50 ps. The samples DASPI and DASPMI were excited at 476nm, and QB, JSMPI and JSEPI at 514nm. The fluorescence light was detected at the wavelength of the emission maximum. Using a thermostatic sample cell holder, temperature regulation to _ 1 K was achieved for the range from 283 to 363 K. A cryostat was used for measurements between 80 and 283 K (stability + 1 K).
The experimental decay data were treated according to an iterative deconvolution method including Marquardt's non-linear least-squares fitting.
Fourier-transform Raman spectroscopy Raman spectra were recorded with a Bruker Fourier-
transform infra-red spectrometer IFS 66 equipped with the Raman model FRA 106 with excitation at 1.064 #m. Employing this technique, it was easy to obtain Raman spectra of the epoxy system at each step of the curing process because of the short accumulation time. The extent of epoxide ring reaction P(t) was derived from the Raman intensity ratio of the epoxide band I= to a reference band I r according to:
I=(t)l~(to) e(t) = 1 (1)
lr(t)l=(to) where I= and I r are integrated band intensities.
Ultrasonic measurements Using the ultrasonic pulse-transmission method, adopted
for in situ monitoring of the curing process 31, the sound velocity v and the relative sound absorption 0~ were determined at 1 MHz. The thermosetting liquid was contained in a 10 ml capacity bag made from 20 #m thick polyethylene foil. This bag was pressed between two acoustic delay lines of fused quartz and was coupled to
5270 POLYMER Volume 35 Number 24 1994
10
9
8
- - 7
6
.
2'.9 3'.0 3'.1 3'.2 3'.3 3'.4
1000FF (K -1)
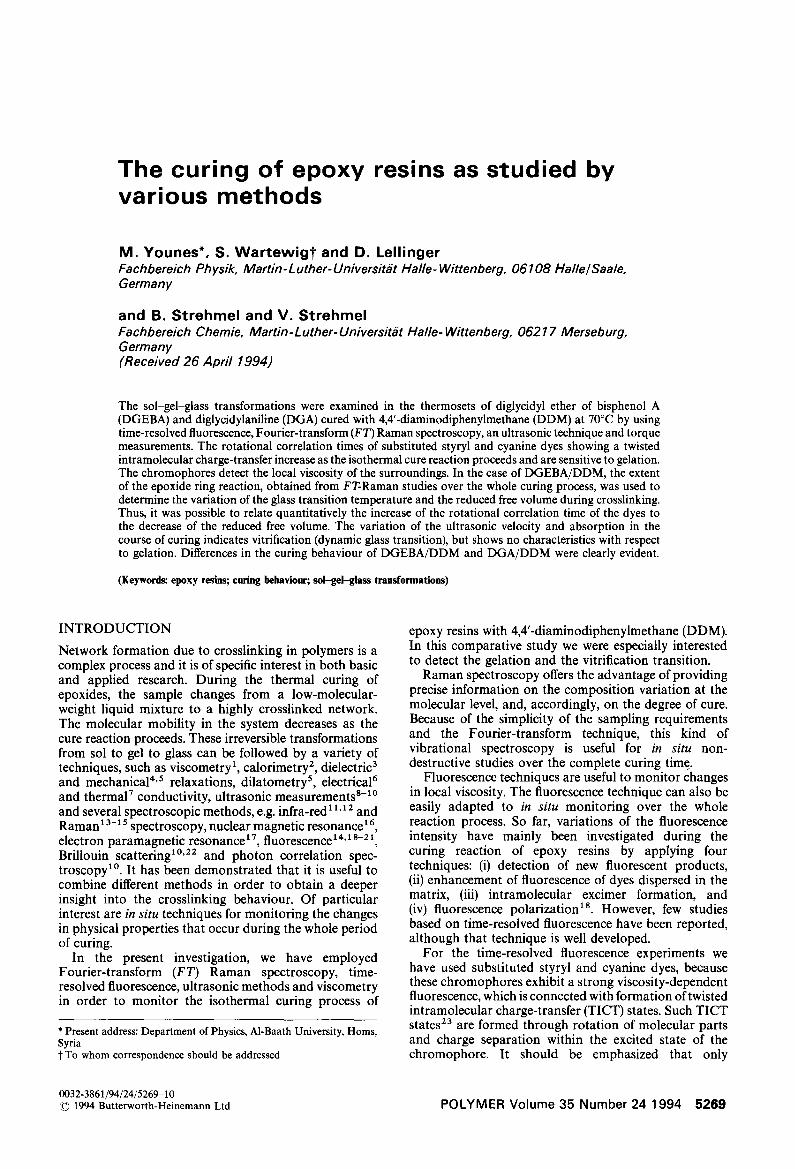
Figure 1 Arrhenius plot of the shear viscosity r/(mPas) for uncured DGEBA/DDM
them by a thin film of silicone oil. The temperature of the measuring cell (70°C) remained stable within ___ 0.3 K. The absolute error of the sound velocity is about 5%, whereas the relative error is about 0.1%. The accuracy of the relative absorption amounts to 10%.
Viscometry The temperature dependence of the viscosity of the
uncured system was investigated with a Couette- type viscometer (Rheotest 2, MLW Medingen) in the temperature range from 296 to 343 K. Glycerol was used as a standard because the temperature dependence of the viscosity of this substance is known.
Torque measurements at a frequency of 0.1 Hz were carried out with a cycloviscograph from Brabender in order to study the increase of the viscosity in the course of the curing reaction and to extrapolate the gel point.
RESULTS AND DISCUSSION
Properties of the uncured system DGEBA/DDM First, the temperature dependence of the macroscopic
shear viscosity r/ was compared with that of the microscopic viscosity indirectly detected by the correlation time Tro t of the chromophore.
The dependence of the shear viscosity r/on temperature in the range from 296 to 343 K is shown in Figure 1. This dependence can be described by the Vogel-Fulcher- Tamman-Hesse (VFTH) equation32:
q=r/o exP(T_--~oBTo ) (2)
where the parameters amount to B= 829_+ 50 K, To=225+5K and r/o=0.17_+0.04mPas. The corre- sponding Williams-Landel-Ferry (WLF) parameters with respect to Tg = 254 K 33 a re C1 = 12.4 and C 2 =29 K, which are typical for glass-forming substances 32. Alterna- tively, it is usual to express the viscosity by the reduced
Curing of epoxy resins: M. Younes et al.
free volume f r at the temperature T34:
with
(3)
fT =fg + %(T- Tg) (4)
wherefg is the reduced free volume at the glass transition temperature Tg and % is the cubic thermal expansion coefficient. A and b are fitting parameters. By taking from the literature 35 the characteristic values fg=0.025 and %=4.8 x 10⁻⁴K -1, we obtained from the plot of lnq versus (1--1/fT) the parameter b=0.615, which is in agreement with data of Sanford and McCullough 36.
For the various probes in uncured DGEBA/DDM, the temperature dependence of the fluorescence decay was studied in the range from 80 to 333 K. In all cases the measured fluorescence decays were fitted by an average fluorescence decay time zf:
I(t) ,,~ exp( - t/TO (5)
It is known 26 that the decay time zf can be expressed by the rate constants for the different deactivation processes:
1/Tf = k f + knr + kro t (6)
where kf is the rate constant for fluorescence, k,r is the rate constant of viscosity-independent non-radiative processes and krot is the rate constant describing the deactivation by TICT formation. Only the last process is strongly viscosity-dependent. Additionally, this reaction can also indicate variations in movements of the probe. Assuming the motions involved in the formation of TICT states are frozen in at liquid-nitrogen temperature, experiments at low temperature provide the value r°:
1/z°f=kf+k.r (7)
Thus, from the temperature dependence of the fluorescence decay we can deduce the rotational correlation time Z,ot:
1 1 1 - (8)
Tro t ~Tf 3 °
which characterizes the recombination via the TICT state of the probe molecule.
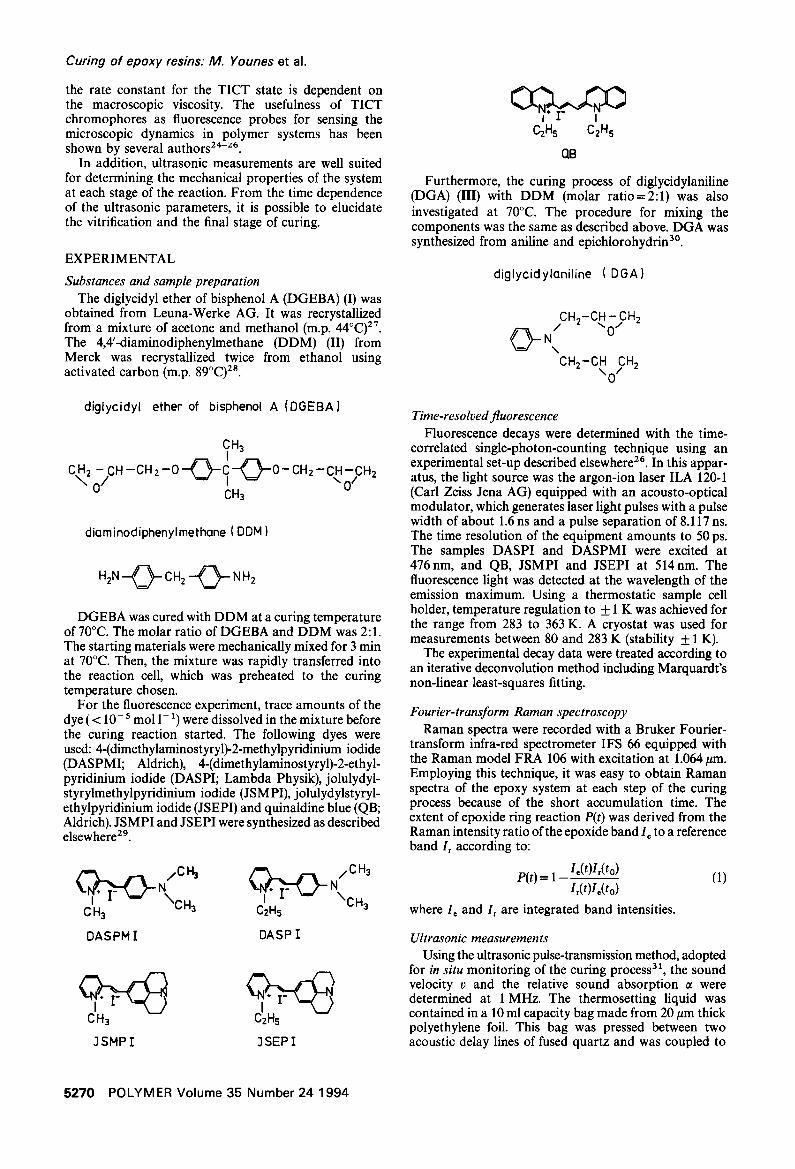
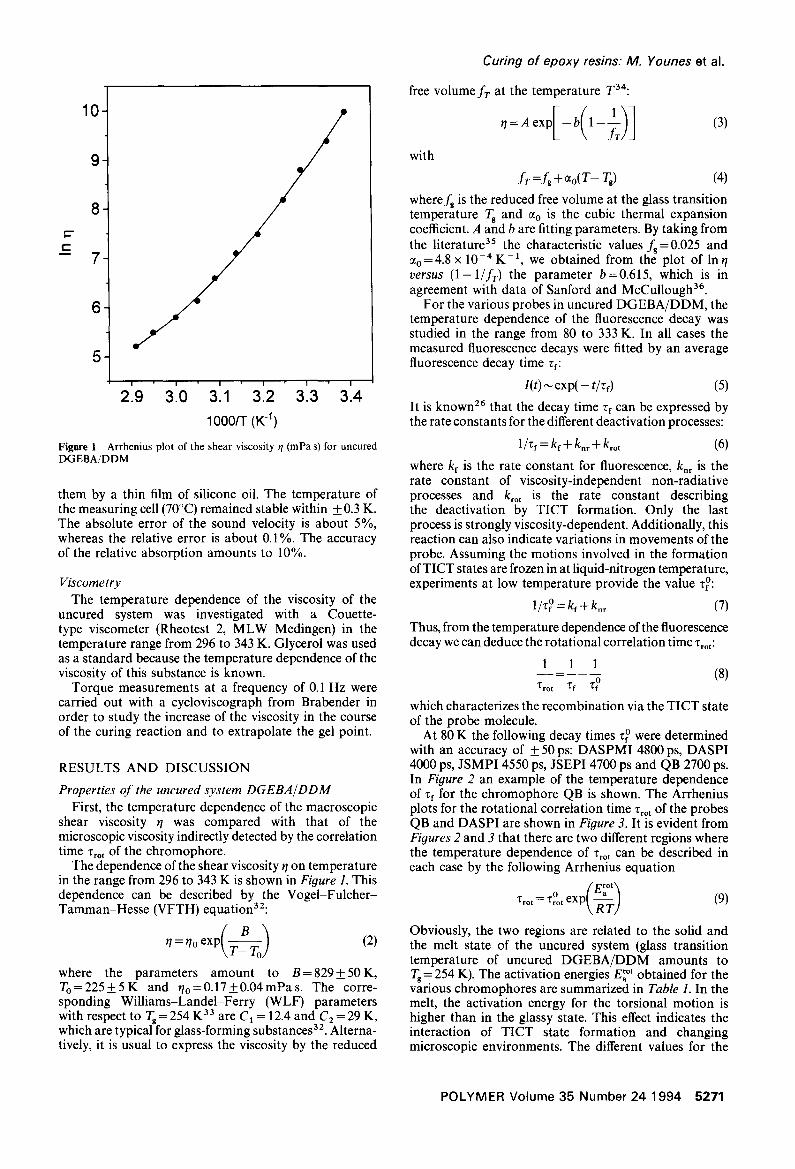
At 80 K the following decay times 3 ° were determined with an accuracy of + 50 ps: DASPMI 4800 ps, DASPI 4000 ps, JSMPI 4550 ps, JSEPI 4700 ps and QB 2700 ps. In Figure 2 an example of the temperature dependence of Tf for the chromophore QB is shown. The Arrhenius plots for the rotational correlation time Trot of the probes QB and DASPI are shown in Figure 3. It is evident from Figures 2 and 3 that there are two different regions where the temperature dependence of Zro t can be described in each case by the following Arrhenius equation
[ E r o t \ Trot=TrOt e x p ~ T ) (9)
Obviously, the two regions are related to the solid and the melt state of the uncured system (glass transition temperature of uncured DGEBA/DDM amounts to Tg = 254 K). The activation energies E~ °t obtained for the various chromophores are summarized in Table 1. In the melt, the activation energy for the torsional motion is higher than in the glassy state. This effect indicates the interaction of TICT state formation and changing microscopic environments. The different values for the
POLYMER Volume 35 Number 24 1994 5271
Curing of epoxy resins: M. Younes et al.
3000
O. v
¢-
2500
2000.
1500"
1000'
5 0 0
0 50 100'150 260 250'360 350
T (K)
Figure 2 Temperature dependence of the fluorescence decay time zf (ps) of QB in uncured DGEBA/DDM
11 • QB j • DASPI
,o
9
• ~/ Tg
~" 8 =
7' g
6
2.5 310 315 410 415 510 1000/T (K -1)
Figure 3 Arrhenius plots of the rotational correlation time "t'ro ' (ps) for the probes QB and DASPI in uncured DGEBA/DDM
activation energy hint that the molecular structure of the probes as well as their different interaction with the matrix (rate constant for TICT formation) are responsible for different Arrhenius behaviours.
It was observed for the DGEBA/DDM melt that the temperature dependence of the macroscopic viscosity follows the VFTH equation, while changes of the local viscosity around the chromophores can be described by the Arrhenius expression (9). This fact indicates that the TICT probes used are sensitive to detect changes of the
microscopic environment. Such a behaviour of TICT molecules is generally known from the literature 14,24-26.
Curing of DGEBA/DDM Torque studies. Implying the torque D is proportional
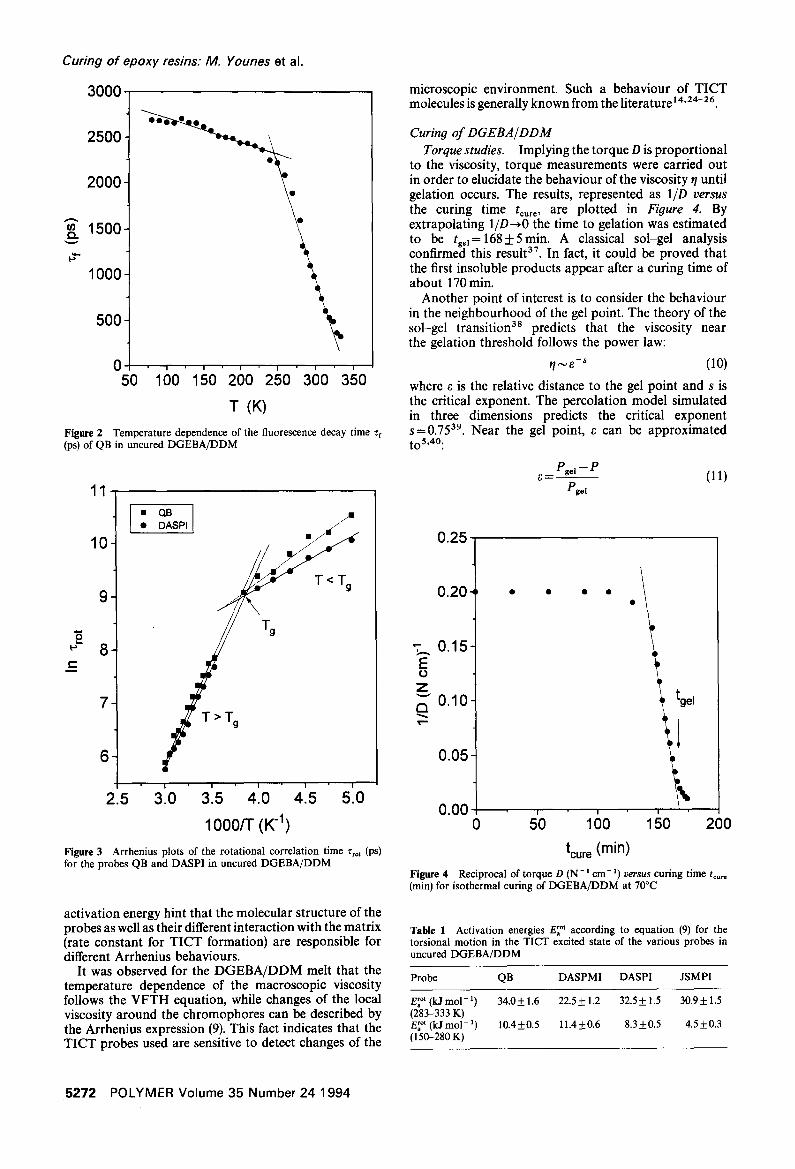
to the viscosity, torque measurements were carried out in order to elucidate the behaviour of the viscosity t/until gelation occurs. The results, represented as lID versus the curing time t ..... are plotted in Figure 4. By extrapolating 1/D--,O the time to gelation was estimated to be tsel=168+5min. A classical sol-gel analysis confirmed this result 37. In fact, it could be proved that the first insoluble products appear after a curing time of about 170 min.
Another point of interest is to consider the behaviour in the neighbourhood of the gel point. The theory of the sol-gel transition 3s predicts that the viscosity near the gelation threshold follows the power law:
r/~s-" (10)
where e is the relative distance to the gel point and s is the critical exponent. The percolation model simulated in three dimensions predicts the critical exponent S=0 .7539 . Near the gel point, e can be approximated toS,*O:
Pg=l - P ~ = - - (11) Pg¢l
0.25
0.20
"7_. 0.15 E 0 Z "-" 0.10 Q
0.05
0.00 0 200
I
5'0 100 150
tcure (min)
Figure 4 Reciprocal of torque D (N- 1 cm- 1) v e r s u s curing time t . . . .
(rain) for isothermal curing of DGEBA/DDM at 70°C
Table 1 Activation energies E r°' according to equation (9) for the torsional motion in the TICT excited state of the various probes in uncured DGEBA/DDM
Probe QB DASPMI DASPI JSMPI
Er°t (kJ tool -1 ) 34.0+1.6 22.5+1.2 32.5+1.5 30.9+1.5 (283-333 K) E~ °t (kJ mo1-1) 10.4+0.5 11.4+0.6 8.3+0.5 4.5+0.3 ( 15O-280 K)
5272 POLYMER Volume 35 Number 24 1994
2.0
1'8 t
0
1.6,
1.4'
1.2 ¸
1.0
0.8
0 . 6 ~ -1.8 -1.6
slope -0.89
-1.4 -1.2 -1.0 -0.8
Iog[(Pgei-P)/Pgel]
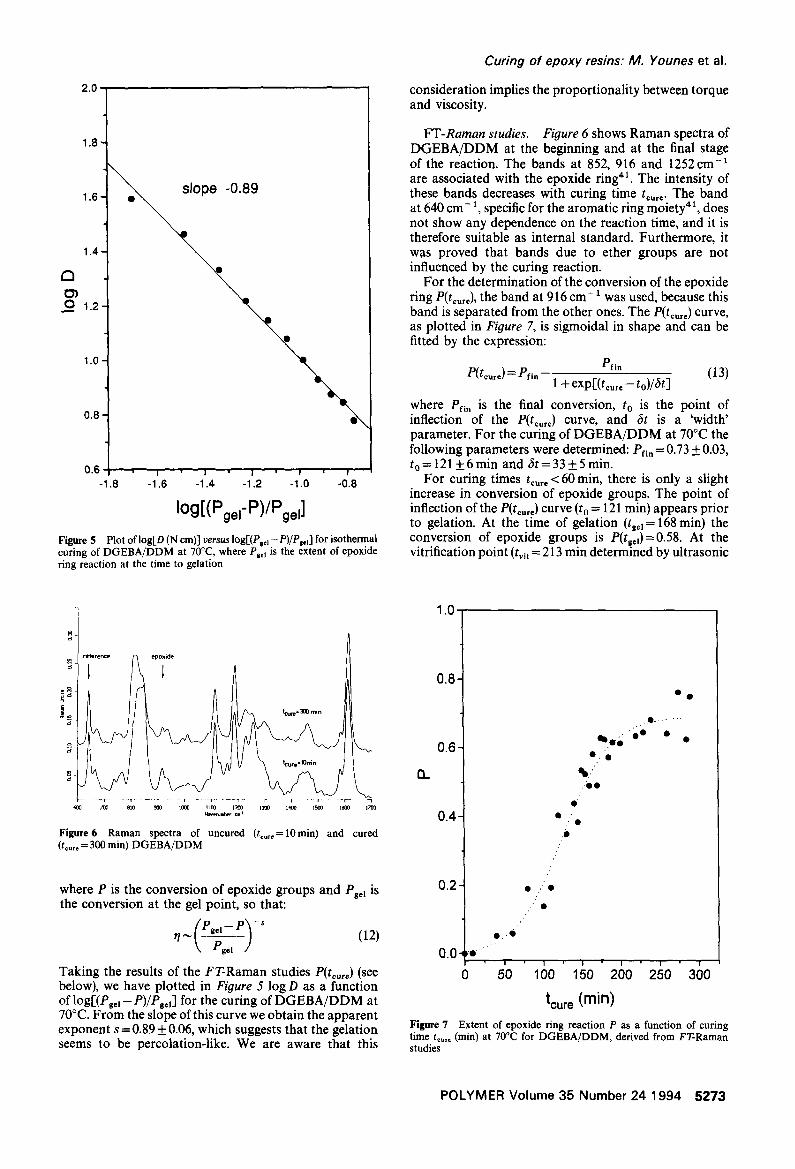
Figure 5 Plot oflog[D (N cm)] versus log[(P=c]-P)/P.]'l for isothermal curing of DGEBA/DDM at 70°C, where Pg,l is the extent of epoxide ring reaction at the time to gelation
Curing of epoxy resins." M. Younes et al.
consideration implies the proportionality between torque and viscosity.
FT-Raman studies. Figure 6 shows Raman spectra of DGEBA/DDM at the beginning and at the final stage of the reaction. The bands at 852, 916 and 1252 cm -1 are associated with the epoxide ring 4t. The intensity of these bands decreases with curing time t~,,=. The band at 640 cm - ~, specific for the aromatic ring moiety 41, does not show any dependence on the reaction time, and it is therefore suitable as internal standard. Furthermore, it was proved that bands due to ether groups are not influenced by the curing reaction.
For the determination of the conversion of the epoxide ring P(t~u,~), the band at 916 cm- ~ was used, because this band is separated from the other ones. The P(t¢u,= ) curve, as plotted in Figure 7, is sigmoidal in shape and can be fitted by the expression:
Pfin P(t~e)= Pfi, (13) 1 + exp[(t .... - to)/6t ]
where Pfin is the final conversion, to is the point of inflection of the P(t~u~ ) curve, and fit is a 'width' parameter. For the curing of DGEBA/DDM at 70°C the following parameters were determined: Pn. = 0.73 __+. 0.03, t o = 121 +_ 6 min and ~t = 33 +_ 5 rain.
For curing times t~u~= < 60 rain, there is only a slight increase in conversion of epoxide groups. The point of inflection of the P(t~e) curve (t o = 121 min) appears prior to gelation. At the time of gelation (tge~ = 168 min) the conversion of epoxide groups is P(t~©l)=0.58. At the vitrification point (t~ t -- 213 min determined by ultrasonic
A
- - T 1" -- I [ T- ] " r 1 I I - 7 6OO ~ ~ 90O 1 ~ It00 1200 13110 1t1~ 1500 t~00 1700
Uav tmu~at, r ~
Figure 6 Raman spectra of uncured (tcu,,=10min) and cured (t .... = 300 min) DGEBA/DDM
where P is the conversion of epoxide groups and P~e] is the conversion at the gel point, so that:
~1,~ ( P'=l- P)-= (12) ' , Peel /
Taking the results of the FT-Raman studies P(tou,e) (see below), we have plotted in Figure 5 log D as a function of logr(PBe ~ -- P)/PsJ for the curing of DGEBA/DDM at 70°C. From the slope of this curve we obtain the apparent exponent s =0 .89_ 0.06, which suggests that the gelation seems to be percolation-like. We are aware that this
1.0
0.6"
0.6-
n
0.4.
0.2.
O. •
0.0 -e o
~ . l l o " o O • •
O / 0
• • .O
• . ' 0 /
/ • /
2;0 3;0 tcure (min)
Figure 7 Extent of epoxide ring reaction P as a function of curing time t¢~,, (min) at 70°C for DGEBA/DDM, derived from FT-Raman studies
POLYMER Volume 35 Number 24 1994 5 2 7 3
Curing of epoxy resins." M. Younes et al.
400
380'
3 6 0
340,
- - - 320 v
I-'~ 3 0 0
280
260
240
a • m
• / 1
• • t gel
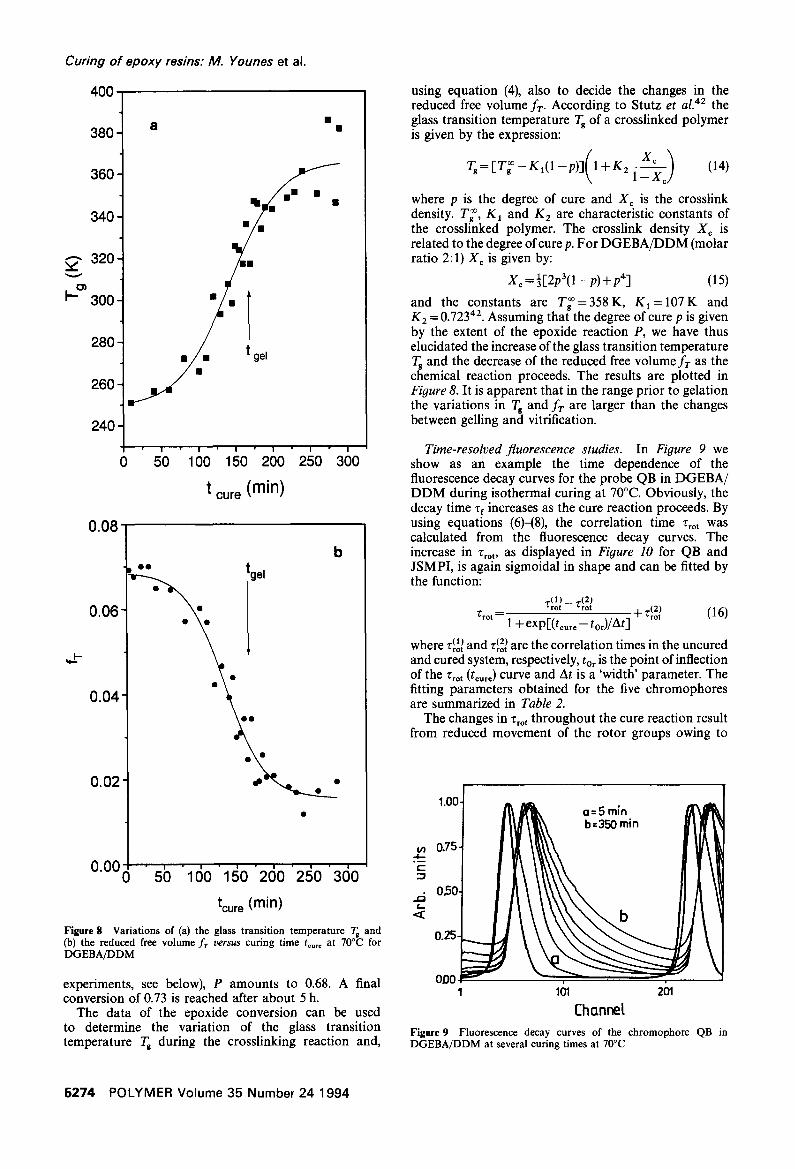
using equation (4), also to decide the changes in the reduced free volume Jr. According to Stutz et al. 42 the glass transition temperature Tg of a crosslinked polymer is given by the expression:
Tg=[T~-KI(1-p)](I + K21X_~X~ ) (14)
where p is the degree of cure and X c is the crosslink density. T~, K1 and K 2 are characteristic constants of the crosslinked polymer. The crosslink density Xc is related to the degree of cure p. For DGEBA/DDM (molar ratio 2:1) X c is given by:
X c = ½12p3(1 - p) + p43 (15)
and the constants are T~=358K, K I = 1 0 7 K and K 2 = 0.72342. Assuming that the degree of cure p is given by the extent of the epoxide reaction P, we have thus elucidated the increase of the glass transition temperature Tg and the decrease of the reduced free volume f r as the chemical reaction proceeds. The results are plotted in Figure 8. It is apparent that in the range prior to gelation the variations in Tg and fr are larger than the changes between gelling and vitrification.
" 260 " 250 " 360 Time-reso&ed fluorescence studies. In Figure 9 we 2_ 0 bU 1UO l bO show as an example the time dependence of the
t cure (rain) fluorescence decay curves for the probe QB in DGEBA/ DDM during isothermal curing at 70°C. Obviously, the decay time rf increases as the cure reaction proceeds. By
0 .08 = using equations (6)--(8), the correlation time Tro t was L I calculated from the fluorescence decay curves. The
b [ increase in "Crot, as displayed in Figure 10 for QB and JSMPI, is again sigmoidal in shape and can be fitted by
tgel I the function:
0 . 0 6 ~ ,o t ~ ,o t - r ~.~2) . ~ "Crot ~ ~ - - ~ r o t [ l U )
1 + expUt .... - toO/AtJ where Z~ol~ and z~o2~ are the correlation times in the uncured
"~ ] ~ ] and cured system' respectively' t°r is the p°int °f inflecti°n • of the "Cro t (t . . . . ) curve and At is a 'width parameter. The
fitting parameters obtained for the five chromophores 0 . 0 4 ] ~ , l aresummarizedin Table2"
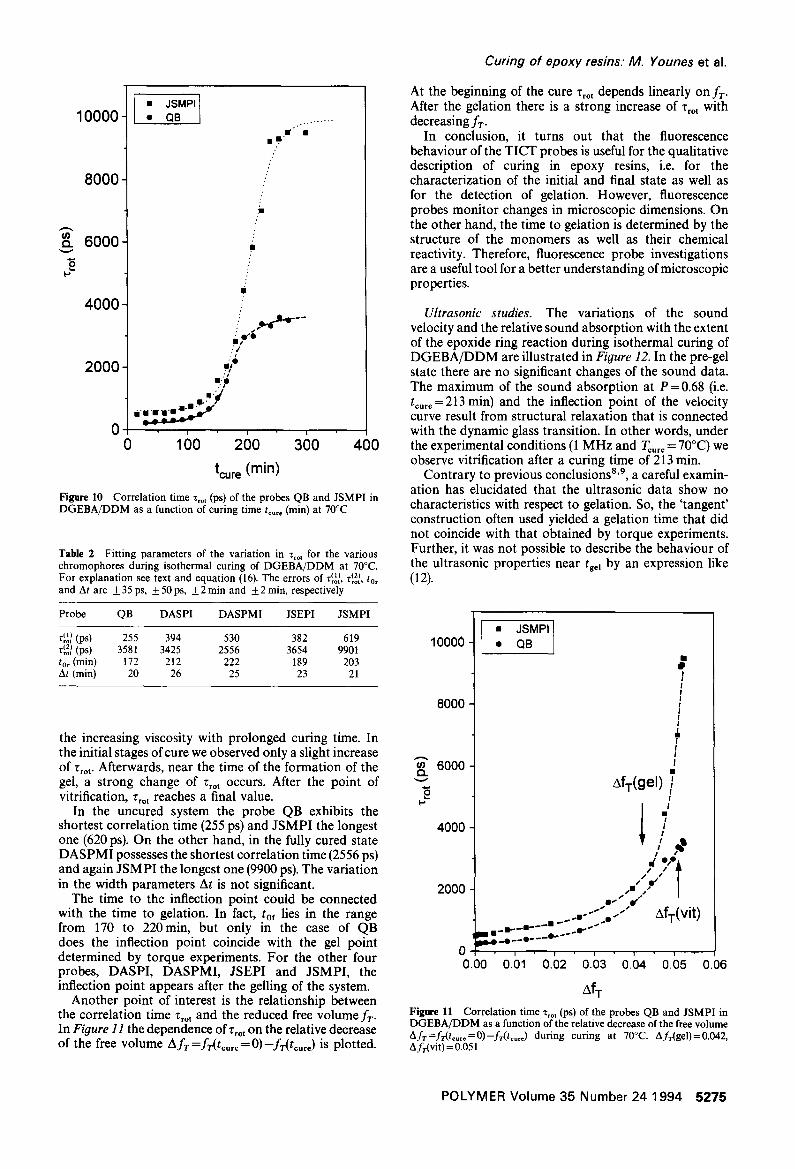
The changes in Zrot throughout the cure reaction result from reduced movement of the rotor groups owing to
'°°1 lrlr l " 0 "50 " 1 0 0 " 1 5 0 " 2 0 0 2 5 0 3 0 0 =
tcure (min) < ~ b
Figure 8 Variations of (a) the glass transition temperature Tg and (b) the reduced free volume f r v e r s u s curing time t . . . . at 70°C for 0.25 DGEBA/DDM
OOO I = ~ - - - Y experiments, see below), P amounts to 0.68. A final conversion of 0.73 is reached after about 5 h. 1 101 201
The data of the epoxide conversion can be used (htmnet to determine the variation of the glass transition Figure9 Fluorescence decay curves of the chromophore QB in temperature T~ during the crosslinking reaction and, DGEBA/DDM at several curing times at 70°C
5274 POLYMER Volume 35 Number 24 1994
10000.
8 0 0 0
¢x 6 0 0 0
4 0 0 0
2000
• JSMPI [ • QB . .... ......
/ •
m +"
I
I
..J i ,/.
..! l.p . '1
0 0 I00 2oo 3oo 400
tcure (min)
Figure 10 Correlation time Tro t (ps) of the probes QB and JSMPI in DGEBA/DDM as a function of curing time t . . . . (min) at 70°C
Table 2 Fitting parameters of the variation in Tro t for the various chromophores during isothermal curing of DGEBA/DDM at 70°C. For explanation see text and equation (16). The errors of T~ol~, Z~o2~, to, and At are +35 ps, _+50ps, _+2 rain and _+2 min, respectively
Probe QB DASPI DASPMI JSEPI JSMPI
r~o~ (ps) 255 394 530 382 619 r~o2~ (ps) 3581 3425 2556 3654 9901 t0r (min) 172 212 222 189 203 At (min) 20 26 25 23 21
the increasing viscosity with prolonged curing time. In the initial stages of cure we observed only a slight increase of Tro t . Afterwards, near the time of the formation of the gel, a strong change of Z,o t occurs. After the point of vitrification, Tro t reaches a final value.
In the uncured system the probe QB exhibits the shortest correlation time (255 ps) and JSMPI the longest one (620 ps). On the other hand, in the fully cured state DASPMI possesses the shortest correlation time (2556 ps) and again JSMPI the longest one (9900 ps). The variation in the width parameters At is not significant.
The time to the inflection point could be connected with the time to gelation. In fact, tof lies in the range from 170 to 220min, but only in the case of QB does the inflection point coincide with the gel point determined by torque experiments. For the other four probes, DASPI, DASPMI, JSEPI and JSMPI, the inflection point appears after the gelling of the system.
Another point of interest is the relationship between the correlation time Tro t and the reduced free volume fT. In Figure 11 the dependence of Z~o t on the relative decrease of the free volume AfT =fr(t . . . . = O)- fr( t .... ) is plotted.
Curing of epoxy resins: M. Younes et al.
At the beginning of the cure Z,o, depends linearly on fT. After the gelation there is a strong increase of r,ot with decreasing fT.
In conclusion, it turns out that the fluorescence behaviour of the TICT probes is useful for the qualitative description of curing in epoxy resins, i.e. for the characterization of the initial and final state as well as for the detection of gelation. However, fluorescence probes monitor changes in microscopic dimensions. On the other hand, the time to gelation is determined by the structure of the monomers as well as their chemical reactivity. Therefore, fluorescence probe investigations are a useful tool for a better understanding of microscopic properties.
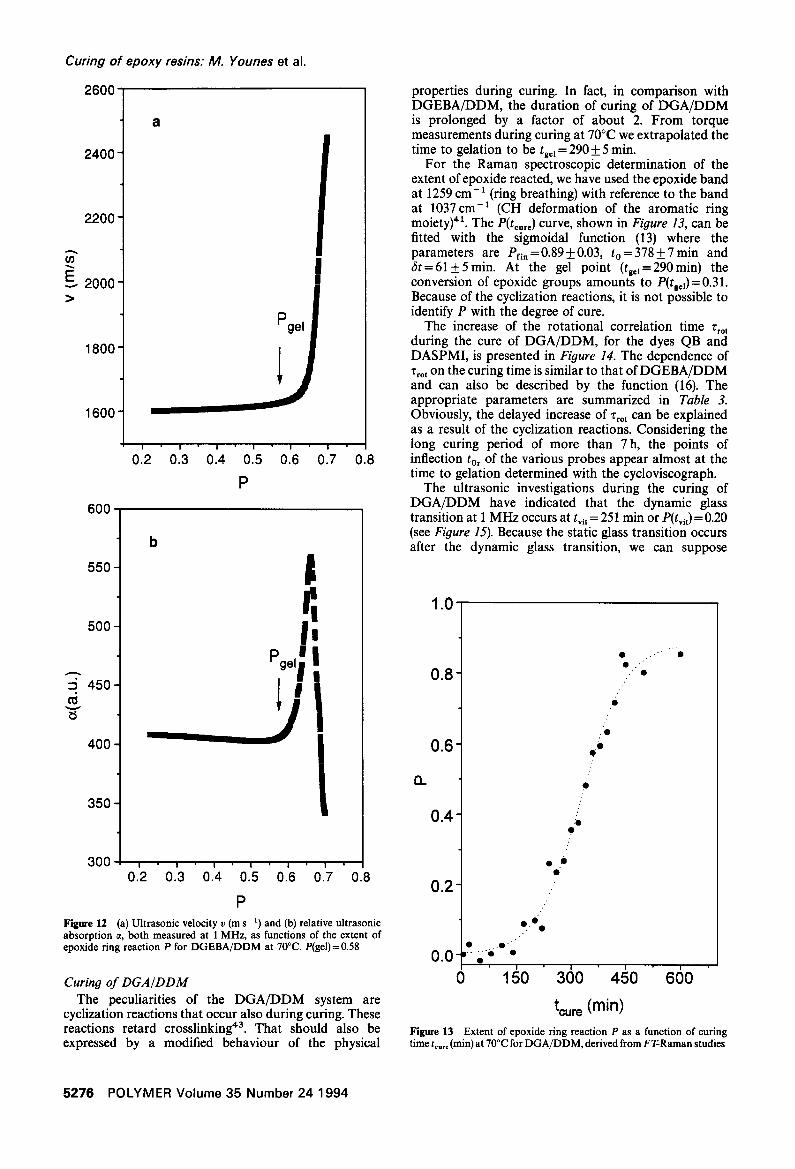
Ultrasonic studies. The variations of the sound velocity and the relative sound absorption with the extent of the epoxide ring reaction during isothermal curing of DGEBA/DDM are illustrated in Figure 12. In the pre-gel state there are no significant changes of the sound data. The maximum of the sound absorption at P =0.68 (i.e. t .... =213 min) and the inflection point of the velocity curve result from structural relaxation that is connected with the dynamic glass transition. In other words, under the experimental conditions (1 MHz and T,,,e = 70°C) we observe vitrification after a curing time of 213 rain.
Contrary to previous conclusions 8'9, a careful examin- ation has elucidated that the ultrasonic data show no characteristics with respect to gelation. So, the 'tangent' construction often used yielded a gelation time that did not coincide with that obtained by torque experiments. Further, it was not possible to describe the behaviour of the ultrasonic properties near tg=~ by an expression like (12).
10000
8000
6000
4000
2000
• JSMPI • QB
J. I ! ! !
MT(gel) / I /
g I I
d *,eA
/ ' • ' / T .,~,." 1
.."" / AfT(vit ) m_m--m- ~-
1 e.---"
0 o ooobl ob3o . 0.06
AfT Figure l l Correlation time Tro t (ps) of the probes QB and JSMPI in DGEBA/DDM as a function of the relative decrease of the free volume Afr=fr(t . . . . =0)-fr(tc=r=) during curing at 70°C. AfT(gel)=0.042, Afr(vit ) = 0.051
POLYMER Volume 35 Number 24 1994 5 2 7 5
Curing of epoxy resins: M. Younes et al.
2600
2400
2200
ffl
E 2000
18oo
1600
a
I
I
0.2 I I I I I
0.3 0.4 0.5 0.6 0.7
P 0.8
600
550
500'
4 5 0
400'
3 5 0
300
b
1
_____j i 0.'2 ' 0.'3 " 0.'4 '0. '5 ' 0.'6 " 0.'7 0.8
P Figure 12 (a) Ultrasonic velocity v (m s- t) and (b) relative ultrasonic absorption ct, both measured at 1 MHz, as functions of the extent of epoxide ring reaction P for DGEBA/DDM at 70°C. P(gel)=0.58
Curing of DGA/DDM The peculiarities of the DGA/DDM system are
cyclization reactions that occur also during curing. These reactions retard crosslinking 4a. That should also be expressed by a modified behaviour of the physical
properties during curing. In fact, in comparison with DGEBA/DDM, the duration of curing of DGA/DDM is prolonged by a factor of about 2. From torque measurements during curing at 70°C we extrapolated the time to gelation to be tgct = 290_ 5 min.
For the Raman spectroscopic determination of the extent of epoxide reacted, we have used the epoxide band at 1259 cm-1 (ring breathing) with reference to the band at 1037 cm-1 (CH deformation of the aromatic ring moiety) 4~. The P(t .... ) curve, shown in Figure 13, can be fitted with the sigmoidal function (13) where the parameters are Pfi, = 0.89___ 0.03, to = 378___ 7 min and &t=61+5min. At the gel point (t~=l=290min) the conversion of epoxide groups amounts to P(tg,l)=0.31. Because of the cyclization reactions, it is not possible to identify P with the degree of cure.
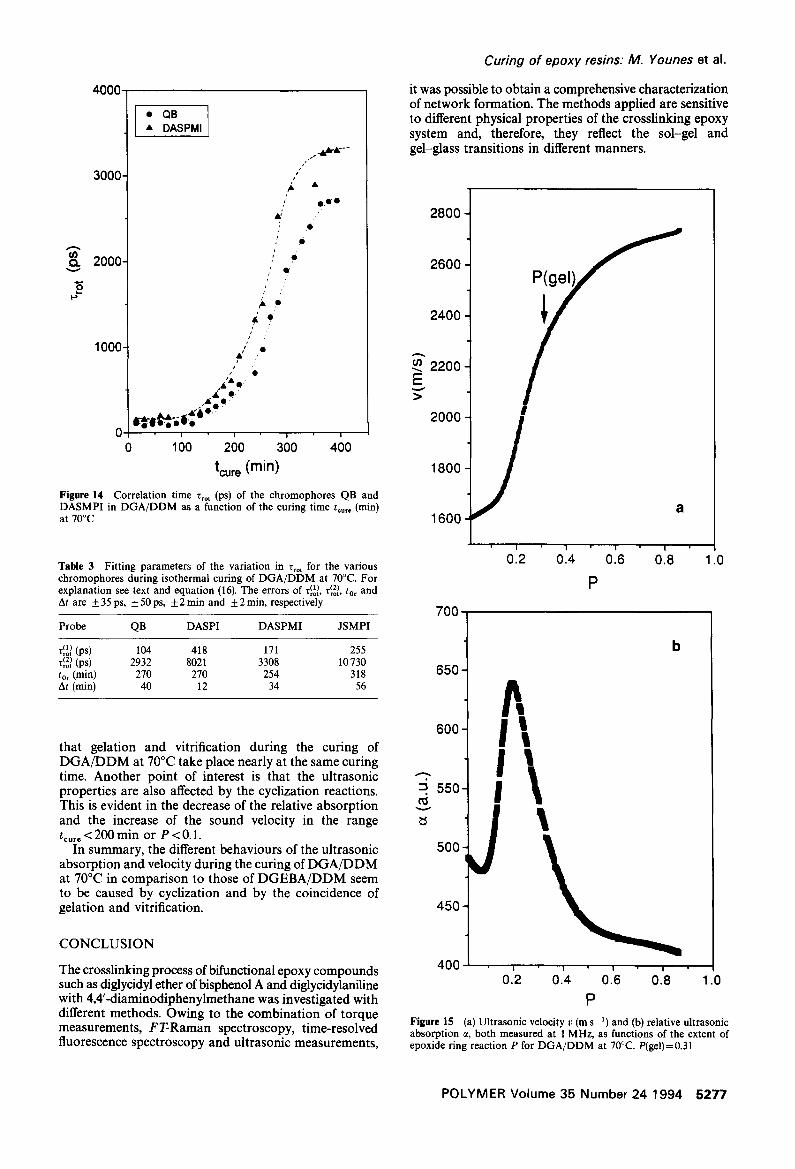
The increase of the rotational correlation time Zrot during the cure of DGA/DDM, for the dyes QB and DASPMI, is presented in Figure 14. The dependence of Zrot on the curing time is similar to that of DGEBA/DDM and can also be described by the function (16). The appropriate parameters are summarized in Table 3. Obviously, the delayed increase of Tro t can be explained as a result of the cyclization reactions. Considering the long curing period of more than 7 h, the points of inflection tor of the various probes appear almost at the time to gelation determined with the cycloviscograph.
The ultrasonic investigations during the curing of DGA/DDM have indicated that the dynamic glass transition at 1 MHz occurs at tvi t = 251 min or P(tvit)= 0.20 (see Figure 15). Because the static glass transition occurs after the dynamic glass transition, we can suppose
1.0
0 . 8
0 . 6
0 . 4
0.2
e /
• i
/
/
/
e ?'
• 0 0 0
...'"
e l • /
O
0 . 0 ' I '
0 360 450 660
tcure (min) Figure 13 Extent of epoxide ring reaction P as a function of curing time to.,= (rain) at 70°C for DGA/DDM, derived from FT-Raman studies
5276 POLYMER Volume 35 Number 24 1994
4000
3000
2000 v
1000
• QB • DASPMI
i t
j l
&,
; = / •
/ I '
i '
~ = i o
s' O t
/ / O .,~I~A Q. '
/
o OO
O
u I i
0 1 O0 200 300 400
tcure (min) Figure 14 Correlation time Z,o t (ps) of the chromophores QB and DASMPI in D G A / D D M as a function of the curing time t . . . . (min) at 70°C
Table 3 Fitting parameters of the variation in Trot for the various chromophores during isothermal curing of DGA/DDM at 70°C. For explanation see text and equation (16). The errors of ~o~, T~2o~, tot and At are + 35 ps, + 50 ps, + 2 rain and + 2 min, respectively
Probe QB DASPI DASPMI JSMPI
r~l~ (ps) 104 418 171 255 r~2d (ps) 2932 8021 3308 10730 tOr (min) 270 270 254 318 At (min) 40 12 34 56
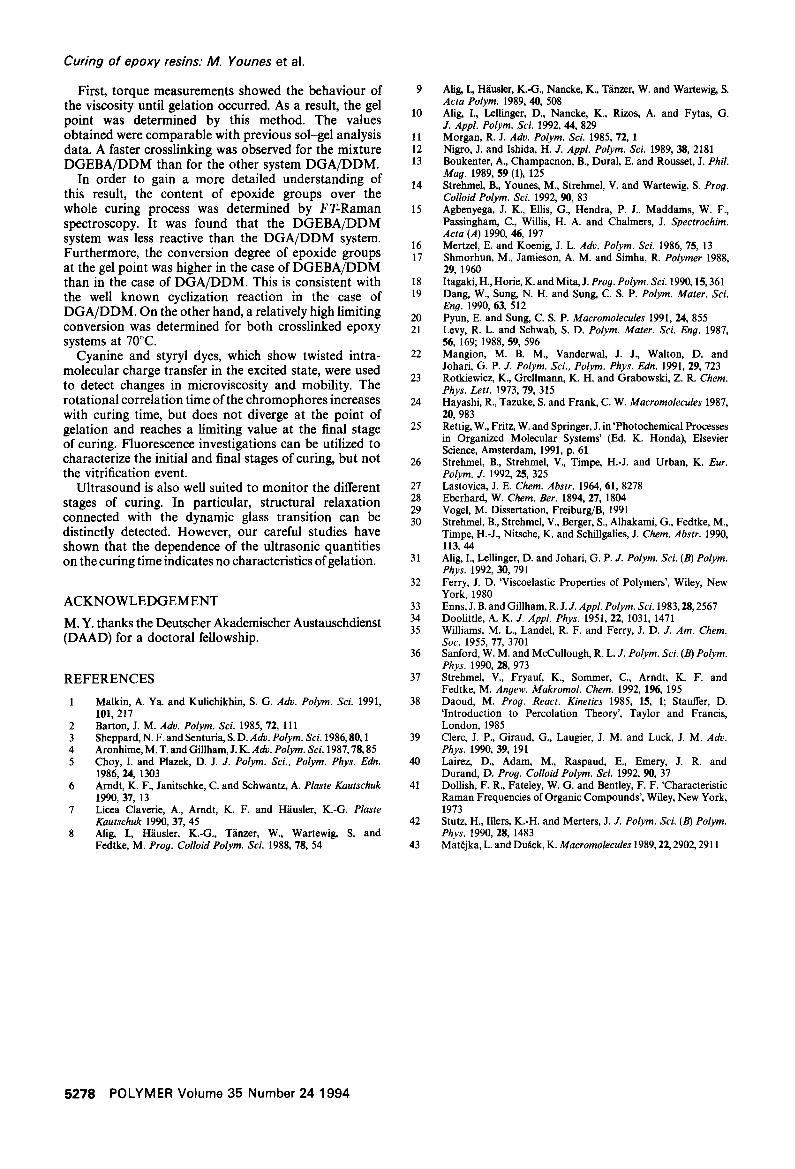
that gelation and vitrification during the curing of DGA/DDM at 70°C take place nearly at the same curing time. Another point of interest is that the ultrasonic properties are also affected by the cyclization reactions. This is evident in the decrease of the relative absorption and the increase of the sound velocity in the range t .... < 2130 min or P < 0.1.
In summary, the different behaviours of the ultrasonic absorption and velocity during the curing of DGA/DDM at 70°C in comparison to those of DGEBA/DDM seem to be caused by cyclization and by the coincidence of gelation and vitrification.
CONCLUSION
The crosslinking process of bifunctional epoxy compounds such as diglycidyl ether of bisphenol A and diglycidylaniline with 4,4'-diaminodiphenylmethane was investigated with different methods. Owing to the combination of torque measurements, FT-Raman spectroscopy, time-resolved fluorescence spectroscopy and ultrasonic measurements,
Curing of epoxy resins. M. Younes et al.
it was possible to obtain a comprehensive characterization of network formation. The methods applied are sensitive to different physical properties of the crosslinking epoxy system and, therefore, they reflect the sol-gel and gel-glass transitions in different manners.
2 8 0 0
2600
2400
(n 2 2 0 0 E
2000
1800
1600
.j P(!
a
o12 o14 o16 o18 1.o P
700
650,
6 0 0
~ " 550
500
450
400
Figure 15
b
A ix J
0.'2 0.'4 0.'6 0.'8 1.0 P
(a) Ultrasonic velocity v (m s-1) and (b) relative ultrasonic absorption ct, both m e a s u r e d at 1 MHz, as functions of the extent of epoxide ring reaction P for DGA/ DDM at 70°C. P(gel)=0.31
POLYMER Volume 35 Number 24 1994 5277
Curing of epoxy resins: 114. Younes et al.
First, torque measurements showed the behaviour of the viscosity until gelation occurred. As a result, the gel point was determined by this method. The values obtained were comparable with previous sol-gel analysis data. A faster crosslinking was observed for the mixture D G E B A / D D M than for the other system D G A / D D M .
In order to gain a more detailed unders tanding of this result, the content of epoxide groups over the whole curing process was determined by FT-Raman spectroscopy. It was found that the D G E B A / D D M system was less reactive than the D G A / D D M system. Furthermore, the conversion degree of epoxide groups at the gel point was higher in the case of D G E B A / D D M than in the case of D G A / D D M . This is consistent with the well known cyclization reaction in the case of D G A / D D M . On the other hand, a relatively high limiting conversion was determined for bo th crosslinked epoxy systems at 70°C.
Cyanine and styryl dyes, which show twisted intra- molecular charge transfer in the excited state, were used to detect changes in microviscosity and mobility. The rotat ional correlat ion time of the chromophores increases with curing time, but does not diverge at the point of gelation and reaches a limiting value at the final stage of curing. Fluorescence investigations can be utilized to characterize the initial and final stages of curing, but not the vitrification event.
Ul t rasound is also well suited to moni to r the different stages of curing. In particular, structural relaxation connected with the dynamic glass transit ion can be distinctly detected. However, our careful studies have shown that the dependence of the ultrasonic quantities on the curing time indicates no characteristics of gelation.
A C K N O W L E D G E M E N T
M. Y. thanks the Deutscher Akademischer Austauschdienst (DAAD) for a doctoral fellowship.
R E F E R E N C E S
1 Malkin, A. Ya. and Kulichikhin, S. G. Adv. Polym. Sci. 1991, 101, 217
2 Barton, J. M. Adv. Polym. Sci. 1985, 72, 111 3 Sheppard, N. F. and Senturia, S. D. Adv. Polym. Sci. 1986, $0,1 4 Aronhime, M. T. and Gillham, J. K. Adv. Polym. Sci. 1987, 78, 85 5 Choy, I. and Plazek, D. J. J. Polym. Sei., Polym. Phys. Edn.
1986, 24, 1303 6 Arndt, K. F., Janitschke, C. and Schwantz, A. Plaste Kautsehuk
1990, 37, 13 7 Licea Claverie, A., Arndt, K. F. and Hiiusler, K.-G. Plaste
Kautschuk 1990, 37, 45 8 Alig, I., Hiiusler, K.-G., Tiinzer, W., Wartewig, S. and
Fedtke, M. Prog. Colloid Polym. Sci. 1988, 78, 54
9 Alig, I., Hiiusler, K.-G., Nancke, K., T'dnzer, W. and Wartewig, S. Acta Polym. 1989, 40, 508
10 Alig, I., Lellinger, D., Nancke, K., Rizos, A. and Fytas, G. J. Appl. Polym. Sci. 1992, 44, 829
11 Morgan, R. J. Adv. Polym. Sci. 1985, 72, 1 12 Nigro, J. and Ishida, H. J. Appl. Polym. Sci. 1989, 38, 2181 13 Boukenter, A., Champacnon, B., Dural, E. and Rousset, J. Phil.
Mag. 1989, 59 (1), 125 14 Strehmd, B., Younes, M., Strehmel, V. and Wartewig, S. Prog.
Colloid Polym. Sci. 1992, 90, 83 15 Agbenyega, J. K., Ellis, G., Hendra, P. J., Maddams, W. F.,
Passingham, C., Willis, H. A. and Chalmers, J. Spectrochim. Acta (A) 1990, 46, 197
16 Mertzd, E. and Koenig, J. L. Adv. Polym. Sci. 1986, 75, 13 17 Shmorhun, M., Jamieson, A. M. and Simha, R. Polymer 1988,
29, 1960 18 Itagaki, H., Horie, K. and Mita, J. Prog. Polym. Sci. 1990,15, 361 19 Dang, W., Sung, N. H. and Sung, C. S. P. Polym. Mater. Sci.
Eng. 1990, 63, 512 20 Pyun, E. and Sung, C. S. P. Macromolecules 1991, 24, 855 21 Levy, R. L. and Schwab, S. D. Polym. Mater. Sci. Eng. 1987,
56, 169; 1988, 59, 596 22 Mangion, M. B. M., Vanderwal, J. J., Walton, D. and
Johari, G. P. J. Polym. Sci., Polym. Phys. Edn. 1991, 29, 723 23 Rotkiewicz, K., Grellmann, K. H. and Grabowski, Z. R. Chem.
Phys. Lett. 1973, 79, 315 24 Hayashi, R., Tazuke, S. and Frank, C. W. Macromolecules 1987,
20, 983 25 Rettig, W., Fritz, W. and Springer, J. in 'Photochemical Processes
in Organized Molecular Systems' (Ed. K. Honda), Elsevier Science, Amsterdam, 1991, p. 61
26 Strehmel, B., Strehmel, V., Timpe, H.-J. and Urban, K. Fur. Polym. J. 1992, 25, 325
27 Lastovica, J. E. Chem. Abstr. 1964, 61, 8278 28 Eberhard, W. Chem. Bet. 1894, 27, 1804 29 Vogel, M. Dissertation, Freiburg/B, 1991 30 Strehmd, B., Strehmel, V., Berger, S., Alhakami, G., Fedtke, M.,
Timpe, H.-J., Nitsche, K. and Schillgalies, J. Chem. Abstr. 1990, 113, 44
31 Alig, I., Ldlinger, D. and Johari, G. P. J. Polym. Sci. (B) Polym. Phys. 1992, 30, 791
32 Ferry, J. D. 'Viscoelastic Properties of Polymers', Wiley, New York, 1980
33 Enns, J.B.andGillham, R.J.J. Appl. Polym. Sci. 1983,28,2567 34 Doolittle, A. K. J. Appl. Phys. 1951, 22, 1031, 1471 35 Williams, M. L., Landel, R. F. and Ferry, J. D. J. Am. Chem.
Soc. 1955, 77, 3701 36 Sanford, W. M. and McCullough, R. L. J. Polym. Sci. (B) Polym.
Phys. 1990, 28, 973 37 Strehmel, V., Fryauf, K., Sommer, C., Arndt, K. F. and
Fedtke, M. Angew. Makromol. Chem. 1992, 196, 195 38 Daoud, M. Prog. React. Kinetics 1985, 15, 1; Stauffer, D.
'Introduction to Percolation Theory', Taylor and Francis, London, 1985
39 Clerc, J. P., Giraud, G., Laugier, J. M. and Luck, J. M. Adv. Phys. 1990, 39, 191
40 Lairez, D., Adam, M., Raspaud, E., Emery, J. R. and Durand, D. Prog. Colloid Polym. Sei. 1992, 90, 37
41 Dollish, F. R., Fateley, W. G. and Bentley, F. F. 'Characteristic Raman Frequencies of Organic Compounds', Wiley, New York, 1973
42 Stutz, H., Illers, K.-H. and Merters, J. J. Polym. Sci. (B) Polym. Phys. 1990, 28, 1483
43 Mat~jka, L. and Du~ek, K. Macromolecules 1989, 22, 2902, 2911
5278 POLYMER Volume 35 Number 24 1994


