Embed Size (px)
Citation preview
Hindawi Publishing CorporationThe Scientific World JournalVolume 2013 Article ID 653035 28 pageshttpdxdoiorg1011552013653035
Research ArticleThe Convergence Coefficient across Political Systems
Maria Gallego12 and Norman Schofield1
1 Center in Political Economy Washington University 1 Brookings Drive Saint Louis MO 63130 USA2Department of Economics Wilfrid Laurier University 75 University Avenue West Waterloo ON Canada N2L 3C5
Correspondence should be addressed to Norman Schofield schofieldnormangmailcom
Received 4 August 2013 Accepted 21 August 2013
Academic Editors M Kohl and J Pacheco
Copyright copy 2013 M Gallego and N SchofieldThis is an open access article distributed under the Creative Commons AttributionLicense which permits unrestricted use distribution and reproduction in any medium provided the original work is properlycited
Formal work on the electoral model often suggests that parties or candidates should locate themselves at the electoral mean Recentresearch has found no evidence of such convergence In order to explain nonconvergence the stochastic electoral model is extendedby including estimates of electoral valence We introduce the notion of a convergence coefficient 119888 It has been shown that highvalues of 119888 imply that there is a significant centrifugal tendency acting on partiesWe used electoral surveys to construct a stochasticvalence model of the the elections in various countries We find that the convergence coefficient varies across elections in a countryacross countries with similar regimes and across political regimes In some countries the centripetal tendency leads parties toconverge to the electoral mean In others the centrifugal tendency dominates and some parties locate far from the electoral meanIn particular for countries with proportional electoral systems namely Israel Turkey and Poland the centrifugal tendency is veryhigh In the majoritarian polities of the United States and Great Britain the centrifugal tendency is very low In anocracies theautocrat imposes limitations on how far from the origin the opposition parties can move
1 Introduction
Work on modeling elections has often assumed that the pol-icy space was restricted to one dimension or that there wereat most two parties [1 2] The extensive formal literature onelectoral competition has typically been based on the assump-tion that parties or candidates adopt positions in orderto win and has inferred that parties will converge to the elec-toral median under deterministic voting in one dimensionor to the electoral mean in stochastic models
In this paper we offer a formal stochastic model of ele-ctions that emphasizes the importance of the idea of valenceand use this notion to provide an explanation of why votemaximizing political leaders in some countries will not adoptconvergent policy positions at the mean of the electoral dis-tribution In the standard spatial model candidate positionsmatter to voters However as Stokes [3 4] has emphasizedthe nonpolicy evaluations or valences of candidates by theelectorate are just as important (See also Clarke et al [5 6]Scotto et al [7] and Clarke et al [8])
The main objective of this paper is to examine whetherparties locate close to or far from the electoral mean
(the electoral mean is the mean of voters ideal policiesdimension by dimension) of various countries We useSchofieldrsquos [9] stochastic electoral model as a unifying frame-work that allows us to compare parties positions acrossdifferent political systems In this model parties respondto their partisan constituencies after taking into accountthe anticipated electoral outcome and the positions of otherparties Voters decisions depend on partiesrsquo locations and onthe partyrsquos valence the votersrsquo overall common evaluation ofthe ability of a party leader to provide good governanceUsingthis model we examine whether parties converge to electoralmean in several elections in various countries under differentpolitical systems and use convergence or the lack thereof toclassify political systems
To examine whether parties converge to the electoralmean in each country in a particular election we test whetherany party has an incentive to stay or move away from theelectoral mean to increase its vote share In formal votingtheory it is usual to define a ldquoNash equilibriumrdquo as a vector ofparty positions with the property that no party may make aunilateral move so as to increase its vote share We use avariant of this concept that is a ldquolocal Nash equilibriumrdquo
2 The Scientific World Journal
(LNE) where we consider only marginal moves from theposition One of the standard results in formal theory is themean voter theorem where the ldquoNash equilibriumrdquo of a spatialvoting game under votemaximization is one where all partiesposition themselves at the electoral mean (For variants ofthe theorem see Enelow and Hinich [10ndash12]) We call such avector the electoral mean
To study each partyrsquos best response to the electoral situ-ation they face we use the results presented in Schofield [9]Schofield identifies a convergence coefficient denoted 119888 whosevalue determines whether vote maximizing parties convergeor not to the electoral mean This coefficient depends onvarious parameters of the model In particular it dependson the competence valences of the party leaders Using 119895 isin
119875 = 1 119901 to denote the parties the valence of party 119895 120582119895essentially measures the electoral perception of the ldquoqualityrdquoof 119895 the votersrsquo overall common evaluation of the ability of119895rsquos leader to provide good governance The valence terms120582 = (1205821 120582119901) are assumed to be independent of the partyrsquospositions and can be estimated as the intercept term in theappropriate stochastic model of the voter utility function AsSanders et al [13] comment valence theory is based on theassumption that ldquovoters maximize their utilities by choosingthe party that is best able to deliver policy successrdquo Thesevalence terms measure the bias in favor of one another of theparty leaders [14]
The convergence coefficient 119888 also depends on theweight that voters give to the policy differences they havewith the various parties 120573 Lastly 119888 depends on the vari-ancecovariance matrix of the electoral distribution 1205902 Byits construction 119888 equiv 119888(120582 120573 120590
2) is dimensionless and thus
independent of the units of measurement of the variousparameters We use the convergence coefficient to compareresults across elections and countries and to classify politicalsystems
The convergence coefficient is a summary measure thatprovides an estimate of the centrifugal or centripetal forcesacting on the parties The Valence Theorem presented inSection 2 (see Schofield [9] for the proof of this result) showsthat if the policy space is two-dimensional and if 119888(120582 120573 120590
2) lt
1 then the sufficient condition for convergence to the meanhas been met and the ldquolocal Nash Equilibriumrdquo (LNE) (theset of such local Nash Equilibria contains the set of NashEquilibria) is one where all parties locate at the electoralmean On the other hand if 119908 is the dimension of the policyspace and 119888(120582 120573 120590
2) ge 119908 then the LNE if it exists will be
one where at least one party will have an incentive to divergefrom the electoral mean in order to maximize its vote shareThus the necessary condition for convergence to the mean isthat 119888(120582 120573 120590
2) lt 119908
In essence a high empirical convergence coefficient of anelection is a convenient measure of the electoral incentive ofa small or low valence party tomove away from the electoralmean to its core constituency position We can interpreta high value of the convergence coefficient as a measureof the centrifugal tendency exerted on parties pulling themaway from the electoral mean The convergence coefficient istherefore a convenient simple and intuitive way to examine
whether parties will have an incentive to locate close to or farfrom the electoral mean We will show that there is a strongconnection between the values of the convergence coefficientand the nature of the political system under which partiesoperate
We used preelection polls to study elections in severalcountries operating under different political regimes Thefactor analysis done on preelection surveys showed that forall elections the policy space was two-dimensional exceptin Azerbaijan were it was one-dimensional The position ofvoters along this two-dimensional space were then estimatedand their voting intentions used to estimate party positionsWe then ran a multinomial logit (MNL) model for theelection using the estimated party and voter positions Theintercept of the MNL model gives the valences of eachpartyleader Following Schofieldrsquos [9] formal model we rankparties according to their valenceUsing theseMNL estimateswe calculate the convergence coefficient of the election andexamine whether the party with the lowest valence has anincentive to locate close to or far from the electoral origin
When comparing the convergence coefficients acrosscountries we observe that in countries with proportionalrepresentation the convergence coefficient is high and that incountries with plurality systems or in anocracies it is lowThus suggesting that we can use the valence theorem and itsassociated convergence result to classify electoral systems
The convergence coefficients for the 2005 and 2010elections in the UK were not significantly different from 1meeting the necessary condition for convergence to themeanFor the 2000 2004 and 2008 US presidential elections theconvergence coefficient is significantly below 1 in 2000 and2004 thusmeeting the sufficient and thus necessary conditionfor convergence and not significantly different from 1 in2008 only meeting the necessary condition for convergenceWe suggest that the centrifugal tendency in the majoritarianpolities like the United States and theUnited Kingdom is verylow
In contrast the convergence coefficient gives an indi-cation that the centrifugal tendency in Israel Poland andTurkey is very high In these proportional representationsystems with highly fragmented polities the convergencecoefficients are significantly greater than 2 failing to meet thenecessary condition for convergence to the electoral mean
In the anocracies of Georgia Russia and Azerbaijanwhere the Presidentautocrat dominates and controls whocan run in legislative elections the convergence coefficient isnot significantly different from the dimension of the policyspace (2 for Georgia and Russia and 1 for Azerbaijan) failingthe necessary condition for convergence While the analysisGeorgia and Azerbaijan show that not all parties convergeto the mean in Russia it is likely that they did Thus inRussia opposition parties found it difficult to diverge from themean Note that convergence in anocracies may not generatea stable equilibrium as any change in the valence of theautocrat and the oppositionmay cause parties to diverge fromthe mean and may even lead to popular uprising that bringabout changes in the governing parties such as in Georgia inprevious elections or in the Arab revolutions
The Scientific World Journal 3
We can also classify polities using the effective votenumber and the effective seat number (Fragmentation canbe identified with the effective number That is let 119867V (theHerfindahl index) be the sum of the squares of the relativevote shares and let 119890119899V = 119867
minus1V be the effective number of
party vote strength In the same way we can define ens asthe effective number of party seat strength using shares ofseats See Laakso and Taagepera [15]) We examine how thesetwo measures of fragmentation relate to the convergencecoefficient for the polities we consider The effective voteor seat numbers give an indication of the difficulty inher-ent in interparty negotiation over government These twomeasures do not however address the fundamental aspectof democracy namely the electoral preferences for policySince convergence involves both preferences in terms of theelectoral covariance matrix and the effect of the electoralsystemwe argue that theValenceTheorem and the associatedconvergence coefficient allow for a more comprehensive wayof classifying polities and political systems precisely becauseit is derived from the fundamental characteristics of theelectorateThat is while we can use the effective vote and seatnumber to identifywhich polities are fragmented theValenceTheorem and the convergence result can help us understandwhy parties locate close to or far from the electoral mean andhow under some circumstances these considerations lead topolitical fragmentation
The next section presents Schofieldrsquos [9] stochastic formalmodel of elections and implications it has for convergenceto the mean Section 31 applies the model to the electionsto two plurality polities The United States and the UnitedKingdom In Section 32 we apply the model to polities usingproportional electoral systems namely Israel Turkey andPoland Section 33 considers the convergence coefficients forthree ldquoanocraciesrdquo Azerbaijan Georgia and Russia Com-parisons between different fragmentation measures and theconvergence coefficient are examined in Section 4 Section 5concludes the paper In the appendix we estimate the con-fidence intervals for the convergence coefficient as well asdetermining whether the low valence party has an incentiveto deviate from the electoral mean
2 The Spatial Voting Model with Valence
Recent research on modelling elections has followed earlierwork by Stokes [3 4] and emphasized the notion of valence ofpolitical candidates As Sanders et al [13] comment valencetheory extends the spatial or Downsian model of elections byconsidering not just the policy positions of parties but also thepartiesrsquo rival attractions in terms of their perceived ability tohandle themost serious problems that face the countryThusvoters maximize their utilities by choosing the party that theythink is best able to deliver policy success
Schofield and Sened [16] have also argued that Valencerelates to votersrsquo judgments about positively or negativelyevaluated conditions which they associate with particularparties or candidates These judgements could refer to partyleadersrsquo competence integrity moral stance or ldquocharismardquoover issues such as the ability to deal with the economy andpolitics
Valence theory has led to a considerable theoretical liter-ature on voting based on the assumption that valence playsan important role in the relationship between party posi-tioning and the votes that parties receive (Ansolabare andSnyder [17] Groseclose [18] Aragones and Palfrey [19 20]Schofield [21] Schofield et al [22] Miller and Schofield [23]Schofield and Miller [24] Peress [25]) Empirical work basedon multinomial logit (MNL) methods has also shown theimportance of electoral judgements in analyses of electionsin the United States and the United Kingdom (Clarke et al[8 26ndash28] Schofield [29] Schofield et al [30 31] Scotto et al[7])These empiricalmodels of elections have a ldquoprobabilisticrdquocomponent That is they all assume that ldquovoter utilityrdquo ispartly ldquoDownsianrdquo in the sense that it is based on the distancebetween party positions and voter preferred positions andpartly due to valence The estimates of a partyrsquos valence isassumed to be subject to a ldquostochastic errorrdquo In this paper weuse the same methodology
The pure ldquoDownsianrdquo spatial model of voting tends topredict that parties will converge to the center of the electoraldistribution [10ndash12] However when valence is included theprediction is very different To see this suppose there are twoparties A and B and both choose the same position at theelectoral center but A has much higher valence than B Thishigher valence indicates that voters have a bias towards partyA and as a consequence more voters will choose A over BThe question for B is whether it can gain votes by movingaway from the center It should be obvious that the optimalposition of bothA andBwill depend on the various estimatedparameters of the model To answer this question we nowpresent the details of the spatial model
21 The Theoretical Model To find the optimal party posi-tions to the anticipated electoral outcome we use a Downsianvote model that has a valence component as presented inSchofield [9] Let the set of parties be denoted by119875 = 1 119901The positions of the 119901 parties (We will use candidate partyand agents interchangeably throughout the paper) in119883 sube R119908
where119908 is the dimension of the policy space it is given by thevector
z = (1199111 119911119895 119911119901) isin 119883119901 (1)
Denote voter 119894rsquos ideal policy be 119909119894 isin 119883 and her utility by119906119894(119909119894 119911) = (1199061198941(119909119894 1199111) 119906119894119901(119909119894 119911119901)) where
119906119894119895 (119909119894 119911119895) = 120582119895 minus 120573
10038171003817100381710038171003817119909119894 minus 119911119895
10038171003817100381710038171003817
2+ 120598119895 = 119906
lowast119894119895 (119909119894 119911119895) + 120598119895
(2)
Here 119906lowast119894119895(119909119894 119911119895) is the observable component of the utility
voter 119894 derived from party 119895 The competence valence ofcandidate 119895 is 120582119895 and the competence valence vector 120582 =
(1205821 1205822 120582119901) is such that 120582119901 ge 120582119901minus1 ge sdot sdot sdot ge 1205822 ge 1205821so that party 1 has the lowest valence Note that 120582119895 is the samefor all voters and provides an estimate of the ldquoqualityrdquo of party119895 or its ability to govern The term 119909119894 minus 119911119895 is simply theEuclidean distance between voter 119894rsquos position119909119894 and candidate119895rsquos position 119911119895 The coefficient 120573 is the weight given to thispolicy difference The error vector 120598 = (1205981 120598119895 120598119901) hasa Type I extreme value distribution where the variance of 120598119895
4 The Scientific World Journal
is fixed at 12058726 Note that 120573 has dimension 11198712 where 119871 is
whatever unit of measurement used in 119883Since voter behavior is modeled by a probability vector
the probability that voter 119894 chooses party 119895 when partiesposition themselves at z is
120588119894119895 (z) = Pr [119906119894119895 (119909119894 119911119895) gt 119906119894119897 (119909119894 119911119897) forall119897 = 119895]
= Pr [120598119897 minus 120598119895 lt 119906lowast119894119895 (119909119894 119911119895) minus 119906
lowast119894119897 (119909119894 119911119895) forall119897 = 119895]
(3)
Here Pr stands for the probability operator generated bythe distribution assumption on 120598 Thus the probability that119894 votes for 119895 is given by the probability that 119906119894119895(119909119894 119911119895) gt
119906119894119895(119909119894 119911119897) for all 119897 = 119895 isin 119875 that is that 119894 gets a higher utilityfrom 119895 than from any other party
Train [32] showed that when the error vector 120598 has aType I extreme value distribution the probability 120588119894119895(119911) has aMultinomial Logit (MNL) specification and can be estimatedThus for each voter 119894 and party 119895 the probability that voter 119894
chooses party 119895 at the vector z is given by
120588119894119895 (z) =
exp [119906lowast119894119895 (119909119894 119911119895)]
sum119901
119896=1exp 119906lowast119894119896(119909119894 119911119896)
(4)
Voters decisions are stochastic in this framework (Seefor example the models of McKelvey and Patty [14] Notethat there is a problem with the independence of irrelevantalternatives assumption (IIA) which can be avoided using aprobit model [33] However Quinn et al [34] have shownthat probit and logit models tend to give very similar resultsIndeed the results given here for the logit model carrythrough for probit though they are less elegant) Even thoughparties cannot perfectly anticipate how voters will vote theycan estimate the expected vote share of party 119895 as the averageof these probabilities as follows
119881119895 (z) =
1
119899
sum
119894isin119873
120588119894119895 (z) (5)
We assume a partyrsquos objective is to find the position thatmaximizes its expected vote share as desired by ldquoDownsianrdquoopportunists On the other hand the party may desire toadopt a position that is preferred by the base of the partysupporters namely the ldquoguardiansrdquo of the party as suggestedby Roemer [35]
We assume that parties can estimate how their vote shareswould change if they marginally move their policy positionThe Local Nash Equilibrium (LNE) is that vector z of partypositions such that no party may shift position by a smallamount to increase its vote share More formally a LNE isa vector z = (1199111 119911119895 119911119901) such that each vote share119881119895(z) is weakly locally maximized at the position 119911119895 To avoidproblems with zero eigenvalues we also define a SLNE to be avector that strictly locally maximizes 119881119895(z)
Using the estimated MNL coefficients we simulate thesemodels and then relate any vector of party positions z toa vector of vote share functions 119881(z) = (1198811(z) 119881119901(z))predicted by the particular model with 119901 parties Moreoverwe can examine whether in equilibrium parties position
themselves at the electoral mean (The electoral mean or ori-gin is the mean of all votersrsquo positions (1119899)sum119909119894 normalizedto zero so that (1119899)sum119909119894 = 0)We call this vector the electoralmean
Given the vector of policy position z and since theprobability that voter 119894 votes for party 119895 is given by (4) theimpact of amarginal change in 119895rsquos position on the probabilitythat 119894 votes for 119895 is then
119889120588119894119895 (z)119889119911119895
1003816100381610038161003816100381610038161003816100381610038161003816zminus119895
= 2120573120588119894119895 (1 minus 120588119894119895) (119909119894 minus 119911119895) (6)
where zminus119895 indicates that we are holding the positions of allparties but 119895 is fixedThe effect that 119895rsquos change in position hason the probability that 119894 votes for 119895 depends on the weightgiven to the policy differences with parties 120573 on how likelyis 119894 to vote for 119895 120588119894119895 and for any other party (1 minus 120588119894119895) and onhow far apart 119894rsquos ideal policy is from 119895rsquos (119909119894 minus 119911119895)
From (5) party 119895 adjusts its position to maximize itsexpected vote share that is 119895rsquos first order condition is
119889119881119895 (z)119889119911119895
1003816100381610038161003816100381610038161003816100381610038161003816119911minus119895
=
1
119899
sum
119894isin119873
119889120588119894119895
119889119911119895
=
1
119899
sum
119894isin119873
2120573120588119894119895 (1minus120588119894119895) (119909119894minus119911119895) = 0
(7)
where the third term follows after substituting in (6) TheFOC for party 119895 in (7) is satisfied when
sum
119894isin119873
120588119894119895 (1 minus 120588119894119895) (119909119894 minus 119911119895) = 0 (8)
so that the candidate for party 119895rsquos votemaximizing policy (SeeSchofield [36] for the proof) is
119911119862119895 = sum
119894isin119873
120572119894119895119909119894 where 120572119894119895 equiv
120588119894119895 (1 minus 120588119894119895)
sum119894isin119873 120588119894119895 (1 minus 120588119894119895)
(9)
where 120572119894119895 represents the weight that party 119895 gives to voter119894 when choosing its candidate vote maximizing policy Thisweight depends on how likely is 119894 to vote for 119895 120588119894119895 and for anyother party (1 minus 120588119894119895) relative to all voters (For example if allvoters are equally likely to vote for 119895 say with probability Vthen the weight party 119895 gives to voter 119894 in its vote maximizingpolicy is 1119899 that is the weight 119895 gives each voter is justthe inverse of the population size) Note that 120572119894119895 may benonmonotonic in 120588119894119895 To see this exclude voter 119894 from thedenominator of 120572119894119895 When sum119886isin119873minus119894 120588119886119895(1 minus 120588119886119895) lt 23 then120572119894119895 (120588119894119895 = 0) lt 120572119894119895 (120588119894119895 = 1) lt 120572119894119895 (120588119894119895 = 12) Thus if 119894 willfor sure vote for 119895 119894 receives a lower weight in 119895rsquos candidateposition than a voter who will only vote for 119895with probability12 (an ldquoundecidedrdquo voter) Party 119895 caters then to ldquoundecidedrdquovoters by giving them a higher weight in 119895rsquos policy weight andthus a higher weight on its positionThis is themost commoncase When sum119886isin119873minus119894 120588119886119895(1 minus 120588119886119895) gt 23 then 120572119894119895 increases in120588119894119895 If 119895 expects a large enough vote share (excluding voter119894) it gives a core supporter (a voter who votes for sure for119895) a higher weight in its policy position than it gives other
The Scientific World Journal 5
voters as there is no risk of doing so The weights 120572119894119895 areendogenously determined in the model
Note that since voter 119894rsquos utility depends on how far 119894 isfrom party 119895 the probability that 119894 votes for 119895 given in (4) andthe expected vote share of the party given in (5) are influencedby the voters and parties positions in the policy space Thatis in the empirical models estimated below the positionsof voters and parties in the policy space together with thevalence estimates influence voters electoral choices
Recall that we are interested in finding whether partiesconverge to or diverge from the electoral mean Suppose thatall parties locate at the same position 119911119896 = 119911 for all 119896 isin 119875Thus from (2) we see that
[119906lowast119894119896 (119909119894 119911) minus 119906
lowast119894119895 (119909119894 119911)] = (120582119896 minus 120582119895) (10)
so the probability that 119894 votes for 119895 in (4) is given by
120588119894119895 (z) =
1
sum119901
119896=1exp [119906
lowast119894119896(119909119894 119911119896) minus 119906
lowast119894119895 (119909119894 119911119895)]
= [
119901
sum
119896=1
exp (120582119896 minus 120582119895)]
minus1
(11)
Clearly in this case 120588119894119895(z) = 120588119895(z) is independent of voter 119894rsquosideal pointThus from (9) the weight given by 119895 to each voteris also independent of voter 119894rsquos position and given by
120572119895 equiv
120588119895 (1 minus 120588119895)
sum119894isin119873 120588119895 (1 minus 120588119895)
=
1
119899
(12)
so that 119895 gives each voter equal weight in its policy positionIn this case from (9) 119895rsquos candidate position is
119911119862119895 =
1
119899
sum
119894isin119873
119909119894 (13)
that is 119895rsquos candidate position is to locate at the electoralmean which we have placed at the electoral origin Let z0 =
(0 0) be the vector of party positions when all parties areat the electoral mean
Moreover as (11) indicateswhenparties locate at themeanz0 only valence differences between parties matter in votersrsquochoices The probability that a generic voter votes for party 1(the party with the lowest valence) is
1205881 equiv 1205881(z0) = [
119901
sum
119896=1
exp (120582119896 minus 1205821)]
minus1
(14)
Using this spatial model Schofield [9] proved a ValenceTheoremdeterminingwhether votemaximizing parties locateat the mean The theorem showed that the spatial model ischaracterized by a convergence coefficient given by
119888 equiv 119888 (120582 120573 1205902) = 2120573 [1 minus 21205881] 120590
2 (15)
The convergence coefficient depends on120573 theweight given topolicy differences on 1205881 the probability that a generic voter
votes for the lowest valence party at the vector z0 and on 1205902
the electoral variance given by
1205902equiv trace (nabla) (16)
where nabla is the symmetric 119908 times 119908 electoral covariance matrix(nabla is simply a description of the distribution of voter preferredpoints taken about the electoral mean)
The convergence coefficient increases in 120573 and 1205902 (and
on its product 1205731205902) and decreases in 1205881 As (14) indicates 1205881
decreases if the valence differences between party 1 and theother parties increases that is when the difference between1205821 and 1205822 120582119901 increases
The Valence Theorem allows us to characterize politiesaccording to the value of their convergence coefficientThe theorem states that when the sufficient condition forconvergence to the electoral mean is met that is when 119888 lt 1the LNE is onewhere all parties adopt the same position at themean of the electoral distribution A necessary condition forconvergence to the electoralmean is that 119888 lt 119908 where119908 is thedimension of the policy space If 119888 ge 119908 then theremay exist anonconvergent LNE Note that in this case there may indeedbe no LNE However there will exist a mixed strategy Nashequilibrium (MNE) In either of these two cases we expect atleast one party will diverge from the electoral mean
Note that 119888 is dimensionless because 1205731205902 has no dimen-
sion In a sense 1205731205902 is a measure of the polarization of the
preferences of the electorateMoreover 1205881 in (14) is a functionof the distribution of beliefs about the competence of partyleaders which is a function of the difference (120582119896 minus 1205821)
When some parties have a low valence so the probabilitythat a generic voter votes for party 1 (with the lowest valencewhen all parties locate at the origin) 1205881 in (14) will tend tobe small because the valence differences between party 1 andthe other parties is sufficiently large Thus vote maximizingparties will not all converge to the electoral mean In thiscase 119888 will be close to 2120573120590
2 If 21205731205902 is large because for
example the electoral variance is large then 119888 will be largesuggesting 119888 gt 119908 In this case the low valence party has anincentive to move away from the origin to increase its voteshare This implies the existence of a centrifugal force pullingsome parties away from the origin
Thus for 1205731205902 sufficiently large so that 119888 ge 119908 we expect
parties to diverge from the electoral center Indeed we expectthose parties that exhibit the lowest valence to move furtheraway from the electoral center implying that the centrifugalforce on parties will be significant Thus in fragmented poli-ties with a polarized electorate the nature of the equilibriumtends to maintain this centrifugal characteristic
On the contrary in a polity where there are no very smallor low valence parties 1205881 will tend to 12 and so 119888 willbe small In a polity with small 120573120590
2 and with low valencedifferences so that 119888 lt 1 we expect all parties to convergeto the center In this case we expect this centripetal tendencyto be maintained
The convergence coefficient is a way of characterizing theHessian (the 119908 by 119908 second derivatives of the vote sharefunction) of party 1 with the lowest valence The Hessian of
6 The Scientific World Journal
the vote share function of party 1 is given by the characteristicmatrix
1198621 = 2120573 (1 minus 21205881) nabla minus 119868 (17)
Here 119868 is a 119908 by 119908 identity matrix and the other terms areas before The eigenvalues of 1198621 determine whether the voteshare function of party 1 will be at a maximum minimum orat a saddlepoint at the electoral mean If 1198621 shows that party1 is at a minimum or at a saddlepoint at the mean then party 1has an incentive to locate away from the mean to increase itsvote share When all parties are at the mean and 119888 lt 1 thenall eigenvalues of the Hessian of the vote share function ofthe lowest valence party are negative indicating that the voteshare function is at a maximumThe LNEmust then be at theelectoral mean
For an arbitrary dimension 119908 if 119888(120582 120573 1205902) le 1 in
(15) then trace (1198621) lt 0 In the two-dimensional case if119888(120582 120573 120590
2) lt 1 then det (1198621) must be positive implying
that both eigenvalues of 1198621 are negative It then follows thatall 119862119895 have negative eigenvalues giving a SLNE and thusan LNE at the electoral mean (This result follows from theapplication of the triangle inequality to the determinant Aparallel result can be obtained inmore than two dimensions)
The Valence Theorem asserts that if 119888(120582 120573 1205902) gt 119908
then the party with the lowest valence has an incentive tomove away from the electoral mean to increase its vote shareWhen this is the case then other low valence parties mayalso find it advantageous to vacate the center The value ofthe convergence coefficient together with the analysis of theHessians of the low valence parties allows us to identifywhich parties have an incentive to move away from theelectoralmeanThe convergence coefficient then gives an easyand intuitive way to identify whether a low valence partyshould vacate the electoral mean
In the next section we estimate the convergence coeffi-cient of various elections in different countries
3 MNL Models of the Elections ofVarious Countries
We use the framework of the spatial model presented inSection 2 as a unifying methodology that allows us tostudy convergence across elections countries and politicalregimes The Valence Theorem leads to the convergencecoefficient of the election a summary statistic that determineswhether parties converge to or diverge from the electoralmean Using this formal multinomial (MNL) spatial modelwe now estimate the convergence coefficient for the electionsin various countries For each MNL estimation we choosea baseline party and normalize its coefficients to zero thenestimate the coefficients of all other parties relative to those ofthe base party Using these coefficients we estimate the con-vergence coefficient and the characteristic matrix of the lowvalence parties to determine whether these parties convergeto or diverge from the electoralmean in each election for eachcountry (These elections were studied in depth elsewhereIn this paper we present only the calculations leading to theconvergence coefficient and estimate the confidence intervals
for the convergence coefficients that were not provided inearlier work)
We study convergence under three political regimes(plurality proportional representation and anocracy) andgroup countries according to the similarities of their politicalregimes Under plurality rule we examine elections in twoAnglo-Saxon countries the US and the UK under propor-tional representation we study Israel Turkey and Polandand under anocracy Georgia Russia and Azerbaijan Sincewe use the same unifying methodology for all countrieswe present the methodology for the first elections in detailthen condense the analysis to its basic components for theremaining countries For each country we give a generaldescription of the analysis and direct the reader to the fullanalysis of each election in the detailed country paper Wesummarize the results across countries in various tables
31 Convergence in Plurality Systems We begin our analysisby examining the United States and the United KingdomElections in these countries are carried out under pluralityrule We show that the electoral system in these countriesproduces relatively low convergence coefficients (Relative tothe convergence coefficient of other countries included inthis study In Section 4 we discuss how the values of theconvergence coefficient are related to the political systemsunder which the countries operate)
311 The 2000 2004 and 2008 Elections in the United StatesWe construct stochastic models of the 2000 2004 and 2008US presidential elections using survey data taken from theAmerican National Election Surveys (ANES) The factoranalysis done on ten survey questions taken from the ANES(See Schofield et al [30 31] for the list of survey questions andthe factor loadings and the full analysis of the US elections)led us to conclude that voters preferences can be representedalong the economic (119864 = 119909-axis) and social (119878 = 119910-axis)dimensions for all three elections Voters located on the leftof the economic axis are pro-redistributionThe social axis isdetermined by attitudes to abortion and gays We interpretedgreater values along this axis to mean more support forcertain civil rights Using the factor loadings we estimatedeach voterrsquos position in these two dimensions Figures 1 2and 3 give a smoothing of the estimated voter distribution ofthe 2000 2004 and 2008 elections respectively
Votersrsquo ideal points in the 2000 US election are character-ized by the following electoral covariance matrix
nablaUS2000 = [
1205902119864 = 058 120590119864119878 = minus020
120590119864119878 = minus020 1205902119878 = 059
] (18)
The trace of electoral covariance matrix is 1205902US 2000 equiv
trace (nabla2000US ) = 1205902119864 + 1205902119878 = 117 Given the negative covariance
between these two dimensions 120590119864119878 = minus020 the correlationbetween these two factors is minus0344
Using the spatial model presented in Section 2 we esti-mated the MNL model of the 2000 election The coefficientsfor the US 2000 shown in Table 1 are
120582US2000rep = minus043 120582
US2000dem equiv 00 120573
US2000 = 082
(19)
The Scientific World Journal 7
minus2 minus1 0 1 2
minus2
minus1
0
1
2
Redistributive Policy
Soci
al p
olic
y
Democrats
Republicans
Bush
Gore
median
005
015
02
02
03025
01
119901(vo
te de
m)
=05
Figure 1 Distribution of voter ideal points and candidate positionsin the 2000 US election
minus2 minus1 0 1 2
minus2
minus1
0
1
2
Economic policy
Soci
al p
olic
y
Bush
Kerry
Median
Democrats
Republicans
005
02
025
01501
119901(vo
te de
m)
=05
Figure 2 Distribution of voter ideal points and candidate positionsin the 2004 US election
Bushrsquos competence valence 120582US2000rep = minus043 measures the
common perception that voters in the sample have on Bushrsquosability to govern and represents the nonpolicy componentin the voterrsquos utility function in (2) As seen in Table 1for the 2000 election Bush has a statistically significantlower valence thanGore the democratic (baseline) candidateBushrsquos negative valence is an indication that voters regardedhim as less able to govern than Gore once policy differencesare taken into account
To find the convergence coefficient for this election weassume that all parties locate at the electoral mean so thatparties differ only in their valence terms (see Section 2)We can use (14) and the coefficients in (19) to estimate theprobability that a typical US voter chooses to vote for thelow valence Republican candidate when both Bush and Gorelocate at origin z0 that is
120588US2000rep = [
2
sum
119896=1
exp(120582US2000119896 minus 120582
US2000rep )]
minus1
= [1 + exp(043)]minus1 = 040
(20)
minus2 minus1 0 1 2
0
2
1
3
minus2
minus1
Obama
McCain
Economic policy
Soci
al p
olic
y
Figure 3 Distribution of voter ideal points and candidate positionsin the 2008 US election
We found the estimate for 120588US2000rep using the MNL valence
estimates Note that since the central estimates of 120582 =
(1205821 120582119901) given by the MNL regressions depend on thesample of voters surveyed then so does 1205881 Thus to makeinferences from empirical models we need the 95 confi-dence bounds of 1205881 In the introduction of the appendix wederive the methodology used to find the confidence boundsof 1205881 The bounds of 1205881 are calculated in Appendix A1
The results indicate that in the 2000 election bothcandidates found it in their best interest to locate at theelectoral mean To see this we compute the convergencecoefficient using (15) and the electoral covariance matrix in(18) nabla2000US to determine whether the two parties converge toor diverge from the electoral mean
Using (19) and (20) we have that 2120573US2000(1 minus 2120588
US2000rep ) =
2 times 082 times 02 = 0328 and from (18) the trace is 1205902US2000 =
117 so that using (15) the convergence coefficient for 2000US election is
1198882000US equiv 2120573
US2000 (1 minus 2120588
US2000rep ) 120590
2US2000 = 0328 times 117 = 0384
(21)
Appendix A1 shows that 1198882000US is significantly less than 1
implying that 1198882000US meets the sufficient and thus necessary
condition for convergence to the electoral mean given inSection 2
To check whether Bush the low valence candidate hasan incentive to stay at the electoral origin z0 that is whetherBushrsquos vote share function is at a maximum at z0 we use theHessian or characteristic matrix (of second order conditions)of Bushrsquos vote share function using (17) at z0 as follows
119862US2000rep = [2120573
US2000 (1 minus 2120588
US2000rep )] nabla
US2000 minus 119868
= 0328 [
058 minus020
minus020 059] minus 119868
= [
minus081 minus006
minus006 minus081]
(22)
Because the characteristic matrix for Bush 119862US2000rep is esti-
mated using the MNL coefficients of the 2000 US sample
8 The Scientific World Journal
Table 1 MNL spatial model for countries with plurality systems
United Statesb United Kingdomc
Party 2000 2004 2008 Party 2005 2010
Var Esta|119905 minus value|
Esta|119905 minus value|
Esta|119905 minus value|
Esta|119905 minus value|
Esta|119905 minus value|
120573
082lowastlowastlowast(149)
095lowastlowastlowast(1421)
085lowastlowastlowast(1416)
015lowastlowastlowast(1256)
086lowastlowastlowast(3845)
Valence 120582repminus043lowastlowastlowast(505)
minus043lowastlowastlowast(505)
minus084lowastlowastlowast(764) 120582Lab
052lowastlowastlowast(684)
minus004(131)
120582Con027lowastlowastlowast(322)
017lowastlowastlowast(450)
Base party Demb Demb Repb Libc Libc
119899 1238 935 788 1149 6218119871119871 minus708 minus501 minus298 minus1136 minus5490alowastprob lt 005 lowastlowastprob lt 001 lowastlowastlowastprob lt 0001bUS Rep Republican Dem DemocratscUK Lab Labour Con Conservatives Lib Liberal Democrats
Table 2 The convergence coefficient in plurality systems
United States United Kingdom2000 2004 2008 2005 2010
Weight of policy differences (120573)Est 120573(conf Inta)
082(071 093)
095(082 108)
085(073 097)
015(013 017)
086(081 090)
Electoral variance (tracenabla = 1205902)
1205902 117 117 163 5607 1462
Probability of voting for lowest valence party (party 1 1205881 = [sum119901
119896=1exp(120582119896 minus 1205821)]
minus1)Demb Demb Repb LibDemc Labourc
Est 1205881(conf Inta)
120588Dem = 04(035 044)
120588Dem = 04(035 044)
120588rep = 03(026 035)
120588Lib = 025(018 032)
120588Lab = 032(029 032)
Convergence coefficient (119888 equiv 119888(120582 120573 1205902) = 2120573[1 minus 21205881]120590
2)Est 119888(conf Inta)
038(02 065)
045(023 076)
11(071 152)
084(051 125)
098(086 110)
aConf Int confidence intervalsbUS Dem Democrats Rep RepublicancUK LibDem Liberal Democrats
119862US2000rep depends on the sample of voters surveyed The
confidence bounds on 119862US2000rep in Appendix A1 suggest that
if Bush positions himself at the electoral origin then withprobability exceeding 95 his vote share function would beat amaximumWe infer that with probability exceeding 95the origin is an LNE for the spatial model for the 2000 USelection The valence differences between Bush and Gore arenot large enough to cause either of them to move from theorigin The unique local Nash equilibrium was one whereboth candidates converge to the electoral origin in order tomaximize their vote shares
All the components needed to derive the convergencecoefficient for 2000US election and its confidence bounds aresummarized in Table 2
Bush faced Kerry as the democratic candidate in the2004 US election The distribution of voters in 2004 gives
the following electoral covariance matrix along the economicand social dimensions
nablaUS2004 = [
1205902119864 = 058 120590119864119878 = minus0177
120590119864119878 = minus0177 1205902119878 = 059
] (23)
While the covariance between economic and social axesdiffers the trace 120590
2US2004 = trace (nabla2004US ) = 120590
2119864 + 120590
2119878 = 117
is similar to that in the 2000 US electionFrom Table 1 the MNL estimates of the spatial model for
the 2004 US election are
120582US2004rep = minus043 120582
US2004dem equiv 00 120573
US2004 = 095
(24)
Bush has a significantly lower valence (120582US2004rep = minus043) than
Kerry (120582US2004dem equiv 00) the baseline candidate
The Scientific World Journal 9
From (14) the probability that a US voter chooses Bushthe low valence candidate when both Bush and Kerry are atthe electoral origin z0 is
120588US2004rep = [
2
sum
119896=1
exp (120582US2004119896 minus 120582
US2004rep )]
minus1
= [1 + exp (043)]minus1
= 040
(25)
The confidence bounds for 120588US2004rep are given in Appendix A1
Since Bushrsquos valence relative to that of his opponent wassimilar in the two elections it is not surprising that theprobability of voting Republican is similar in the two elec-tions compare (20) and (25) From (15) 2120573US
2004(1minus2120588US2004rep ) =
2 times 095 times 02 = 038 and 1205902US2004 = 117 so that the
convergence coefficient of the 2004 election is
1198882004US = 2120573
US2004 [1 minus 2120588
US2004rep ] 120590
2US2004 = 038 times 119 = 045
(26)
Since 1198882004US = 045 is significantly less than 1 (see
Appendix A1) the sufficient condition for convergence givenin Section 2 is met Moreover from (17) Bushrsquos characteristicmatrix is
119862US2004rep = [2120573
US2004 (1 minus 2120588
US2004rep )] nabla
US2004 minus 119868
= 038 [
053 minus018
minus018 066] minus 119868
= [
minus080 minus006
minus006 minus075]
(27)
If Bush positions himself at the electoral origin then withprobability exceeding 95 (see Appendix A1) his vote sharefunction would be at a maximum Bush the low valencecandidate has then no incentive to move from the originz0 With probability exceeding 95 the mean is an LNE formodel of the 2004 US election
Our analysis suggests that Obamarsquos victory over McCainin the 2008 US election was the result of an overall shiftin the relative valences of the Democratic and Republicancandidates as compared to those of the candidates in the 2000and 2004 elections The electoral covariance matrix for thesample in 2008 along the economic and social dimensions is
nablaUS2008 = [
1205902119864 = 080 120590119864119878 = minus0127
120590119864119878 = minus0127 1205902119878 = 083
] (28)
Relative to the two previous elections the ldquovariancerdquo of theelectoral distribution 120590
2US2008 = trace (nablaUS
2008) = 1205902119864 +1205902119878 = 163
increased while the covariance between these dimensions120590119864119878 = minus0127 decreased
The MNL estimates of the spatial model given in Table 1for the 2008 US election are
120582US2008rep = minus084 120582
US2008dem equiv 00 120573
US2008 = 085
(29)
Obama the baseline candidate has a significantly highervalence than McCain
From (14) the probability that a voter chooses McCainwhen both candidates are at the origin z0 is
120588US2008rep = [
2
sum
119896=1
exp(120582US2008119896 minus 120582
US2008rep )]
minus1
= [1 + exp(084)]minus1 = 030
(30)
From (15) 21205732008US (1 minus 2120588US2008dem ) = 2 times 085 times 04 = 068 and
1205902US2008 = 163 so the convergence coefficient is
1198882008US = 2120573
US2008 [1 minus 2120588
US2008dem ] 120590
2US2008
= 068 times 163 = 111
(31)
Appendix A1 shows that 1198882008US = 111 is significantly greaterthan 1 and significantly less than 2 The Valence Theoremthen states that the necessary but not the sufficient conditionfor convergence has been met To check whether the lowvalence candidateMcCain has an incentive tomove from theelectoral mean we examine McCainrsquos characteristic matrixusing (17) to get
119862US2008rep = [2120573
US2008 (1 minus 2120588
US2008rep )] nabla
US2008 minus 119868
= 068 [
080 minus0127
minus0127 083] minus 119868
= [
minus046 minus0086
minus0086 minus044]
(32)
With probability exceeding 95 (see Appendix A1)McCainrsquosvote share function is at a maximum when he locates at theorigin and thus has no incentive to move Thus with pro-bability exceeding 95 the electoral origin is an LNE for thespatial model for the 2008 US election
In conclusion Table 2 illustrates that the convergencecoefficient varies across elections in the same country evenwhen there are only two parties This is to be expected asfrom (15) the convergence coefficient depends on the ldquovari-ancerdquo of the electoral distribution 120590
2= trace(nabla) on the
weight voters give to differences with partyrsquos policies 120573 andon the probability that a voter chooses the party with thelowest valence 1205881 The electoral distributions of the 2000and 2004 are quite similar as can be seen by comparing(18) and (23) Votersrsquo preferences had however substantiallychanged by 2008 see (28) The electoral variance along bothaxes increased relative to 2000 and 2004 While the 2000and 2004 convergence coefficients are indistinguishable fromeach other the 2008 coefficient is significantly different fromthat in 2000 and 2004 In spite of these differences candidatesin all three elections had no incentive to move from theorigin
312 The 2005 and 2010 Elections in Great Britain We studythe 2005 and 2010 elections in the UK using the British
10 The Scientific World Journal
minus4 minus2 0 2
0
2
4
minus4
minus2
4
Party positions
Economy
Nat
iona
lism
Lab
Con
Lib
Figure 4 Electoral distribution and estimated party positions inBritain in 2005
Election Study (BES) (The full analysis of the 2005 and 2010elections in Great Britain can be found in Schofield et al[37]) The factor analysis conducted on the questions of thetwo surveys led us to conclude that the same two dimensionsmattered in voter choices in the two elections The firstfactor deals with issues on ldquoEU membershiprdquo ldquoImmigrantsrdquoldquoAsylum seekersrdquo and ldquoTerrorismrdquo A voter who feels stronglyabout nationalism has a high value in the nationalism dimen-sion (Nat = 119909-axis) Items such as ldquotaxspendrdquo ldquofree marketrdquoldquointernational monetary transferrdquo ldquointernational companiesrdquoand ldquoworry about job loss overseasrdquo have strong influencein the economic (119864 = 119910-axis) dimension with higher valuesindicating a promarket attitude Figures 4 and 5 present thesmoothed electoral distribution obtained from these analysesfor the 2005 and 2010 elections
The electoral covariance matrix for the 2005 UK electionis
nablaUK2005 = [
1205902Nat = 1646 120590Nat119864 = 000
120590119864Nat = 0067 1205902119864 = 3961
] (33)
where 1205902UK2005 equiv trace(nablaUK
2005) = 1205902Nat + 120590
2119864 = 5607
From Table 1 the MNL estimates of the spatial model forthe 2005 UK are
120582UK2005Lab = 052 120582
UK2005Con = 027
120582UK2005Lib equiv 00 120573
UK2005 = 015
(34)
Both the Labour (Lab) and the Conservative (Con) partieshad a significantly higher valence than the Liberal Democrats(Lib) the baseline party
minus2 minus1 0 1 2
0
1
2
minus2
minus1
Voter distribution
Economy
Nat
iona
lism
Lab
Con
Lib
Figure 5 Voter and party positions in Britain in 2010
From (14) the probability that a voter chooses the LiberalDemocratic Party the lowest valence party when all partieslocate at the origin z0 is
120588UK2005Lib = [
3
sum
119896=1
exp (120582UK2005119896 minus 120582
UK2005Lib )]
minus1
= [1 + exp (052) + exp (027)]minus1
= 025
(35)
Given that 2120573UK2005(1 minus 2120588
UK2005Lib ) = 2 times 015 times 05 = 015
and since 1205902UK2005 = 5607 in (33) from (15) the convergence
coefficient in Table 2 is
1198882005UK = 2120573
UK2005 [1 minus 2120588
UK2005Lib ] 120590
2UK2005
= 015 times 5607 = 084
(36)
Appendix A1 shows that 1198882005UK is significantly less than 1 andthusmeets the sufficient and necessary conditions for conver-gence given in Section 2 From (17) the characteristic matrixof the Liberal Democratic Party is
1198622005UKLib = [2120573
UK2005 (1 minus 2120588
UK2005Lib )] nabla
UK2005 minus 119868
= 015 [
1646 00
0067 3961] minus 119868
= [
minus075 00
001 minus0406]
(37)
From the 95 confidence bounds in Appendix A1 we con-clude that if the LibDem locates at the origin it is maximizingits vote share and has no incentive to vacate the center Thuswith probability exceeding 95 the origin is an LNE for the2005 UK election
The Scientific World Journal 11
The electoral covariance matrix for the 2010 UK electionis
nablaUK2010 = [
1205902Nat = 0601 120590Nat119864 = 0067
120590119864Nat = 0067 1205902119864 = 0861
] (38)
where 1205902UK2010 equiv trace(nablaUK
2010) = 1462 lower than in 2005From Table 1 the MNL estimates of the spatial model of
the 2010 election are
120582UK2010Lab = minus004 120582
UK2010Con = 017
120582UK2010Lib equiv 00 120573
UK2010 = 086
(39)
Given the great popular discontent with Gordon Brownthe Labour leader heading into the 2010 election it isnot surprising to find that both Conservatives and LiberalDemocrats (the base party) had significantly higher valencesthan Labour
From (14) the probability that a voter chooses Labourwhen all parties locate at the origin z0 is
120588UK2010Lab = [
3
sum
119896=1
exp (120582UK2010119896 minus 120582
UK2010Lab )]
minus1
= [1 + exp (021) + exp (004)]minus1
= 0319
(40)
Since 2120573UK2010(1 minus 2120588
UK2010Lab ) = 2 times 086 times 0362 = 0622 and
1205902UK2010 = 1462 in (38) from (15) the convergence coefficient
in Table 2 is
1198882010UK = 2120573
UK2010 [1 minus 2120588
2010Lab ] 120590
2UK2010
= 0622 times 1462 = 091
(41)
The convergence coefficient 1198882010UK = 091 is significantly lessthan 1 (see Appendix A1) meeting the sufficient and thusnecessary condition for convergence From (17) Labourrsquoscharacteristic matrix is
119862UK2010Lab = [2120573
UK2010 (1 minus 2120588
UK2010Lab )] nabla
UK2010 minus 119868
= 0622 [
0601 0067
0067 0861] minus 119868
= [
minus063 0042
0042 minus046]
(42)
If Labour the low valence party locates at the origin thenwith probability exceeding 95 its vote share function is at amaximum (see Appendix A1) giving it no incentive to movefrom the mean Thus with probability exceeding 95 theelectoral origin is an LNE for the 2010 UK election
The major shift in votersrsquo preferences between the twoelections led to very different electoral outcomes as evidencedby the electoral covariance matrices in (33) and (38) Voterdissatisfaction with the governing Labour leader led to adramatic decrease in his competence valence and on theprobability of voting Labour Even though the electoral
variance fell in 2010 relative to 2005 the increase in theconvergence coefficient meant that this lower variance wasmore than compensated by the lower probability of votingLabour in 2010 The analysis for the UK elections showsthat the convergence coefficient reflects not only changes inthe electoral distribution but also changes in votersrsquo valencepreferences as the convergence coefficient of the 2005 electionis substantially lower than the one for the 2010 election
The analysis of these twoAnglo-Saxon countries illustratethat even under plurality rule the convergence coefficientvaries from election to election and from country to countryThe analysis for the 2010 UK election highlights that candi-datesrsquo valences matter and that parties understand how theirvalence affects their electoral prospects and may adjust theirpositions to increase their votes This section illustrates thatunder plurality the convergence coefficient has low valuesthat generally satisfy the necessary condition for convergenceto the mean and is thus below the dimension of the policyspace
32 Convergence in Proportional Systems We now estimatethe convergence coefficients for three parliamentary coun-tries using proportional representation Israel Turkey andPoland As is well known these countries are characterizedby multiparty elections in which generally no party wins alegislative majority leading then to coalitions governmentsThis section shows that these countries are characterized byvery high convergence coefficients
321 The 1996 Election in Israel In the 1996 as in previouselections Israel had approximately nineteen parties attainingseats in the Knesset (These include parties on the left onthe center on the right as well as religious parties Onthe left there is Labor Merets Democrat Communists andBalad those on the center include Olim Third Way CenterShinui those on the right Likud Gesher Tsomet and YisraelThe religious parties are Shas Yahadut NRP Moledet andTechiya) There were small parties with 2 seats to moderatelylarge parties such as Likud and Labor whose seat strengthslie in the range 19 to 44 out of a total of 120 Knesset seatsSince Likud and Labour compete for dominance of coalitiongovernment these large parties must maximize their seatstrengthMoreover Israel uses a highly proportional electoralsystem with close correspondence between seat and voteshares Thus one can consider vote shares as the maximandand for these parties
Schofield et al [30] performed a factor analysis of thesurveys conducted by Arian and Shamir [38] for the 1996Israeli election The two dimensions identified by the factoranalysis were Security (119878 = 119909-axis) and Religion (119877 = 119910-axis) ldquoSecurityrdquo refers to attitudes toward peace initiativesldquoreligionrdquo to the significance of religious considerations ingovernment policy A voter on the left of the security axis isinterpreted as supporting negotiations with the PLO whilehigher values on the religious axis indicates support for theimportance of the Jewish faith in Israel The distribution ofvoters is shown in Figure 6
12 The Scientific World Journal
Meretz
Labor Olim
Likud
Shas NRP
Moledet
lll Way
0
1
2
minus2
minus2 minus1 0 1Security
Relig
ion
2
minus1
Gesher
Yahadut
Tzomet
Dem-ArabCommunists
Figure 6 Party positions and voter distribution in Israel in the 1996election
Voter distribution along these two axes gives the follow-ing covariance matrix
nablaI996 = [
1205902119878 = 100 120590119878119877 = 0591
120590119877119878 = 0591 1205902119877 = 0732
] (43)
giving a ldquovariancerdquo of 1205902I1996 equiv trace(nablaI996) = 1732
Only the seven largest parties are included in the MNLestimationThese include Likud Labor NRP Moledat ThirdWay (TW) and Shas with Meretz being the base party FromTable 2 the MNL coefficients for the 1996 election in Israel(I) are
120582I1996Lik = 078 120582
I1996Lab = 0999
120582I1996NRP = minus0626 120582
I1996MO = minus1259
120582I1996TW equiv minus2291 120582
I1996Shas = minus2023
120582I1996Merezt equiv 00 120573
I1996 = 1207
(44)
The 120573-coefficient and the valence estimates for all partiesare significantly nonzero The two largest parties Likud andLabour have significantly higher valences than the othersmaller parties with Third Way (TW) having the smallestvalence
From (14) the probability that an Israeli votes for TWwhen all parties locate at the mean is
120588I1996TW = [
7
sum
119896=1
exp [120582I1996119895 minus 120582
I1996TW ]]
minus1
= [1 + 1198903071
+ 119890329
+ 1198901665
+ 1198901032
+ 1198900268
+ 1198902291
]
minus1≃ 0014
(45)
Given that 2120573I1996(1 minus 2120588
I1996TW ) = 2 times 1207 times 0972 = 2346
and since 1205902I1996 = 1732 from (43) then using (15) we com-
pute the convergence coefficient for Israel in Table 4 as
119888I1996 = 2120573
I1996 (1 minus 2120588
I1996TW ) 120590
2I1996
= 2346 times 1732 = 406
(46)
The 95 confidence intervals for 119888I1996 = 406 in
Appendix A2 confirm that the necessary condition is notsatisfied as 119888
I1996 = 406 is significantly higher than 2 the
dimension of the policy space Moreover at the electoralmean the vote share function of Third Way is not at amaximum since its Hessian from (17)
119862I1996TW = 2120573
I1996 (1 minus 2120588
I1996TW ) nabla
I996 minus 119868
= 2346 [
100 0591
0591 0732] minus 119868
= [
1346 1386
1386 0717]
(47)
shows that if TW locates at the mean its vote share functionis at a saddlepoint since 119862
I1996TW has one positive (2453) and
one negative (minus039) eigenvalue Appendix A2 confirms that119862I1996TW has one negative and one positive eigenvalue at both its
lower and upper boundsThus with a high degree of certaintyTW deviates from the mean to maximize its votes and theelectoral mean is not a LNE for the 1996 Israeli election
322 The 1999 and 2002 Elections in Turkey We used factoranalysis of electoral survey data of Veri Arastima for TUSESto study the 1999 and 2002 Turkish elections (See Schofieldet al [39] for details of the estimation)The analysis indicatesthat voters made decisions in a two-dimensional spaceduring the two elections Voters who support secularism orldquoKemalismrdquo are placed on the left of the Religious (119877 = 119909)axis and those supporting Turkish nationalism (119873 = 119910) tothe north Figures 7 and 8 give the distribution of voters alongthese two dimensions surveyed in these two elections
Minor differences between these two figures include thedisappearance of the Virtue Party (FP) which was bannedby the Constitutional Court in 2001 and the change of thename of the pro-Kurdish party fromHADEP toDEHAP (Forsimplicity the pro-Kurdish party is denoted HADEP in thevarious figures and tables Notice that theHADEP position inFigures 8 and 9 is interpreted as secular andnonnationalistic)The most important change is the emergence of the newJustice and Development Party (AKP) in 2002 essentiallysubstituting for the outlawed Virtue Party
The parties included in the analysis of the 1999 electionare the Democratic Left Party (DSP) the National Actionparty (MHP) the Vitue Party (VP) the Motherland Party(ANAP) the True Path Party (DYP) the Republican PeoplersquosParty (CHP) and the Peoplersquos Democratic Party (HADEP)A DSP minority government formed supported by ANAPand DYP This only lasted about 4 months and was replacedby a DSP-ANAP-MHP coalition indicating the difficulty
The Scientific World Journal 13
0 1 2 3
0
1
2
Religion
ANAP
CHPDSP DYP
FP
HADEP
MHP
minus2
minus1
Nat
iona
lism
minus3 minus2 minus1
Figure 7 Party positions and voter distribution in the 1999 Turkishelection
Religion
AKP
DYPCHP
HADEP
MHP
ANAPNat
iona
lism
2
1
0
minus1
minus22 310minus1minus2minus3
Figure 8 Party positions and voter distribution in Turkey in 2002
of negotiating a coalition compromise across the disparatepolicy positions of the coalition members
In the 1999 election the electoral covariance matrix alongthe Religious (119877) and Nationalism (119873) axes is
nablaT999 = [
1205902119877 = 120 120590119877119873 = 078
120590119873119877 = 078 1205902119873 = 114
] (48)
with 1205902T1999 equiv trace(nablaT
999) = 234
minus3 minus2 minus1
minus1
0 1 2 3
0
1
2
Economic
UPUW
AWS
SLD
PSL UPR
ROP
Soci
al
Figure 9 Voter distribution and party-positions in Poland in 1997
Using DYP as the base party from Table 3 the 1999MNLcoefficients are
120582T1999FP = minus016 120582
T1999MHP = 066
120582T1999DYP equiv 00 120582
T1999HADEP = minus0071
120582T1999ANAP = 034 120582
T1999CHP equiv 073
120582T1999DSP = 072 120573
T1999 = 038
(49)
The 120573-coefficient and the valence estimates of DSP andMHPand CHP are significantly nonzero The probability that aTurkish voter chooses FP with lowest valence in 1999 whenall parties locate at the mean 120588T1999
FP in (14) is
120588T1999FP = [
7
sum
119896=1
exp [120582T1999119895 minus 120582
T1999FP ]]
minus1
= [1 + 119890082
+ 119890016
+ 119890009
+ 11989005
+ 119890089
+ 119890088
]
minus1≃ 008
(50)
Given that 2120573T1999(1 minus 2120588
T1999FP ) = 2 times 038 times 084 = 064
and since 1205902T1999 = 234 in (48) then using (15) Turkeyrsquos
convergence coefficient in 1999 in Table 4 is
119888T1999 = 2120573
T1999 (1 minus 2120588
T1999FP ) 120590
2T1999
= 064 times 234 = 149
(51)
The convergence coefficient is significantly higher that 1 andsignificantly lower than 2 (see Appendix A2) From (17) FPrsquosHessian at the origin is
119862T1999FP = 2120573
T1999 (1 minus 2120588
T1999FP ) nabla
T999 minus 119868
= 064 [
120 078
078 114] minus 119868
= [
minus024 0448
0448 minus027]
(52)
14 The Scientific World Journal
Table 3 MNL spatial model for countries with proportional systems
Var Israelb Turkeyd Polandc
Party 1996 Party 1999 2002 Party 1997
Distance Esta|119905 minus value|
Esta|119905 minus value|
Esta|119905 minus value|
Esta|119905 minus value|
120573
1207lowastlowastlowast(1843)
0375lowastlowastlowast(426)
152lowastlowastlowast(1266)
1739lowastlowastlowast(1504)
Valence
120582Lik0777lowastlowastlowast(412) 120582DSP
0724lowastlowastlowast(473) 120582SLD
1419lowastlowastlowast(747)
120582Lab0999lowastlowastlowastlowast(606) 120582MHP
0666lowastlowastlowast(453)
minus012(066) 120582PSL
0073(033)
120582NRPminus0626lowastlowastlowast(253) 120582FP
minus0159(090) 120582AWS
1921lowastlowastlowast(1105)
120582MOminus1259lowastlowastlowast(438) 120582ANAP
0336lowastlowastlowast(219)
minus031(163) 120582UW
0731lowastlowastlowast(367)
120582TWminus2291lowastlowastlowast(830) 120582CHP
0734lowastlowastlowast(412)
133lowastlowastlowast(740) 120582UP
minus056lowastlowastlowast(213)
120582Shasminus2023lowastlowastlowast(645) 120582HADEP
minus0071(030)
043lowast(20) 120582UPR
minus2348lowastlowastlowast(469)
120582AKP078lowastlowastlowast(52)
Base party Meretz DYPd DYPd ROPc
119899 922 635 483 660119871119871 minus777 minus1183 minus737 minus855alowastprob lt 005 lowastlowastprob lt 001 lowastlowastlowastprob lt 0001bIsrael Lik Likud Lab Labor NRP Mafdal Mo Moledet TWThird WaycPoland SLD Democratic Left Alliance PSL Polish Peoplersquos Party UW Freedom Union AWS Solidarity ElectionAction UP Labor Party UPR Union of Political Realism ROP Movement for Reconstruction of Poland SO Self Defense PiS Law and Justice PO CivicPlatform LPR League of Polish Families DEM Democratic Party SDP Social Democracy of PolanddTurkey DSP Democratic Left Party MHP Nationalist Action Party FP Virtue Party ANAP Motherland Party CHP Republican Peoplersquos Party HADEPPeoplersquos Democracy Party DYP True Path Party
Table 4 The convergence coefficient in proportional systems
Israel Turkey Poland1996 1999 2002 1997
Weight of policy differences (120573)Central Esta of 120573(conf Intb)
1207(1076 1338)
0375(0203 0547)
1520(1285 1755)
1739(1512 1966)
Electoral variance (tracenabla = 1205902)
1205902 1732 234 233 200
Probability of voting for lowest valence party (party 1 1205881 = [sum119901
119896=1exp(120582119896 minus 1205821)]
minus1)TWc FPd ANAPd ROPe
Central Esta of 1205881(conf Intb)
120588ITW = 0014
(0006 0034)120588FP = 008
(0046 0145)120588TANAP = 008
(0038 0133)120588PROP = 0007
(0002 0022)Convergence coefficient (119888 equiv 119888(120582 120573 120590
2) = 2120573[1 minus 21205881]120590
2)Central Esta of 119888(conf Intb)
406(3474 4579)
149(0675 2234)
575(4388 7438)
599(5782 7833)
aCentral Est central estimatebConf Int confidence intervalscIsrael TWThird WaydTurkey DYP True Path PartyePoland ROP Movement for Reconstruction of Poland
The Scientific World Journal 15
When at the electoral origin FPrsquos characteristic functionshows that its vote share function is at a saddlepoint asthe eigenvalues of 119862
T1999FP are minus074 with minor eigenvector
(+1 minus 1116) and +023 with major eigenvector (+1 +0896)Moreover as seen in Appendix A2 the 95 confidencebounds show that at the lower bound of 119862
T1999FP FP has no
incentive to move but it does at the upper bound Since FPwants to move at the central estimate of 119862
T1999FP in (52) it
is probable that in general FP wants to move away fromthe mean to increase its vote share Moreover since theconvergence coefficient is significantly greater than 2 thenwith a high degree confidence the electoral mean cannot bea LNE for Turkey in 1999
The electoral covariance matrix of the 2002 Turkishelection is
nablaT2002 = [
1205902119877 = 118 120590119877119873 = 074
120590119873119877 = 074 1205902119873 = 115
] (53)
with 1205902T2002 = trace (nablaT
2002) = 233Note that the covariance matrix of 1999 in (48) and that
of 2002 in (53) suggest few changes in the distribution ofvoters between these two election Figures 8 and 9 suggest thatthere were few changes in party positions between these twoelections The basis of support for the AKP may be regardedas similar to that of the banned FP suggesting that the leaderof this party changed the partyrsquos position on the religion axisadopting amuch less radical positionOnewould think of thisas generating political stability in Turkey Yet between 1999and 2002 Turkey experienced two severe economic crises andin 2002 a 10 electoral cut-off rule was instituted The crisesand the cut-off rule changed the political landscape in TurkeyIn the 2002 election seven parties obtained less than 10 ofthe vote and won no seatsThe AKPwon 34 of the vote anddue to the cut-off rule obtained a majority of the seats (363out of 550)
Our analysis reflects this change in the political landscapeUsing DYP as the base party from Table 3 the 2002 MNLcoefficients are
120582T2002ANAP = minus031 120582
T2002MHP = minus012
120582T2002DYP equiv 00 120582
T2002HADEP = 043
120582T2002AKP = 078 120582
T2002CHP equiv 133 120573
T2002 = 152
(54)
The 120573-coefficient and the valences of AKP and CHP aresignificantly nonzero with ANAP having the lowest valenceThe probability of voting ANAP when parties locate at themean 120588T20029
ANAP in (14) is
120588T2002ANAP = [
6
sum
119896=1
exp [120582T2002119895 minus 120582
T2002ANAP]]
minus1
= [1 + 119890019
+ 119890031
+ 119890074
+ 119890109
+ 1198901164
]
minus1≃ 008
(55)
Given that 2120573T2002(1minus2120588
T2002ANAP) = 2times152times084 = 255 and
since 1205902T2002 = 233 from (53) then using (15) we find that the
2002 convergence coefficient for Turkey in Table 4 is
119888T2002 = 2120573
T2002 (1 minus 2120588
T20029ANAP ) 120590
2T2002 = 255 times 233 = 594
(56)
The political changes induced by the cut-off rule led toa higher convergence coefficient in 2002 relative to 1999(increasing from a low of 119888T1999 = 149 in (51) to a high 119888
T2002 =
594 in (56)) An indication that a more fractionalized polityemerged from this reformThe convergence coefficient of the2002 election is significantly above 2 the dimension of thepolicy space (see Appendix A2) giving ANAP an incentive tolocate far from the mean ANAPrsquos characteristic matrix using(17) is
119862T2002ANAP = 2120573
T2002 (1 minus 2120588
T2002ANAP) nabla
T2002 minus 119868
= 255 [
118 074
074 115] minus 119868
= [
201 188
188 193]
(57)
When at the origin 119862T2002ANAP indicates that ANAP is minimiz-
ing its vote share since its eigenvalues are both positive (0090and 3850) This together with the 95 confidence boundsin Appendix A2 implies that there is a high probability thatANAP will vacate the center and that the mean is not an LNEfor Turkey in 2002
323 The 1997 Polish Election In the election held in Polandin 1997 (In this election Poland used an open-list propor-tional representation electoral system with a threshold of 5nationwide vote for parties and 8 for electoral coalitionsVotes are translated into seats using the DrsquoHondt method)the following five parties won seats in the Sejm (lowerhouse)The left-wing excommunist Democratic Left Alliance(SLD) and the agrarian Polish Peoplesrsquo Party (PSL) bothof which have been the most frequent governing parties inthe postcommunist period The Freedom Union (UW) andthe Solidarity Election Action (AWS) had grown out of theSolidarity movement AWS combined various mostly rightwing and Christian groups under one label while UW wasformed based on the liberal wing of SolidarityThe remainingparty is the Movement for Reconstruction of Poland (ROP)
Applying factor analysis to questions from the PolishNational Election Survey an economic and a social valuedimensions were identified (see [40]) The economic dimen-sion is influenced by issues such as privatization versusstate ownership of enterprises fighting unemployment ver-sus keeping inflation and government expenditure undercontrol proportional versus flat income tax support versusopposition to state subsidies to agriculture and state versusindividual social responsibilityThe separation of church andstate versus the influence of church over politics completedecommunization versus equal rights for former nomencla-ture and abortion rights regardless of situation versus nosuch rights regardless of situation are the most influential
16 The Scientific World Journal
issues in this social values dimension The distribution ofvoters along these dimensions is seen in Figure 9 (SeeSchofield et al [40] for details of the estimation)
The covariance matrix for the 1997 Polish (P) election is
nablaP1997 = [
1205902119864 = 100 120590119864119878 = 00
120590119878119864 = 00 1205902119878 = 100
] (58)
with variance 1205902P1997 = trace(nablaP
1997) = 200From Table 3 the MNL coefficients for the 1997 election
are
120582P1997UPR = minus23 120582
P1997UP = minus056
120582P1997ROP equiv 00 120582
P1997PSL = 007
120582P1997UW equiv 073 120582
P1997SLD = 140
120582P1997AWS = 192 120573
P1997 = 174
(59)
The 120573-coefficient and valence estimates for all parties exceptUP and PSL are significantly nonzero The probability ofvoting UPR with lowest valence in 1997 when parties locateat the mean 120588P1997
TW in (14) is
120588P1997UPR = [
6
sum
119896=1
exp [120582P1997119895 minus 120582
P1997UPR ]]
minus1
= [1 + 1198900048
+ 119890308
+ 119890427
+ 119890377
+ 119890242
]
minus1≃ 001
(60)
Given that 2120573P1997(1minus2120588
P1997UPR ) = 2times174times098 = 341 and
since 1205902P1997 = 2 from (58) then using (15) the convergence
coefficient for Poland in Table 4 is
119888P1997 = 2120573
P1997 (1 minus 2120588
P1997UPR ) 120590
2P1997
= 341 times 2 = 682
(61)
Appendix A2 shows that 119888P1997 = 682 is significantly greaterthan 2 and thus fails the necessary condition for convergenceto the mean UPRrsquos Hessian from (17) is
119862P1997UPR = 2120573
P1997 (1 minus 2120588
P1997UPR ) nabla
P1997 minus 119868
= 341 [
10 00
00 10] minus 119868
= [
241 00
00 241]
(62)
The trace (= 382) the determinant (= 580) and the eigen-values of 119862I
UPR (241 141) are positive The 95 confidencebound of 119862
IUPR in Appendix A2 also shows positive eigen-
values at the lower and upper bounds of 119862IUPR Thus with a
high degree of certainty UPR locates far from the origin tomaximize its votes and the electoral mean is not a LNE for1997 Polish election
Summarizing in this section we examined three coun-tries that use proportional representationTheir convergencecoefficients are significantly higher than 2 the dimension ofthe policy space and are also much higher than that of theUS and the UK A high convergence coefficient signals then ahigh degree of political fractionalization in these multi-partyparliamentary democracies
33 Convergence in Anocracies We now study elections inGeorgia Russia and Azerbaijan In these partial democ-racies or anocracies (The term ldquopartial democracyrdquo hasbeen applied to new democracies lacking the full array ofdemocratic institutions present in western democracies (see[41])) the Presidentautocrat holds regular presidential andlegislative elections while exerting undue influence on theelections Anocracies lack important democratic institutionssuch as freedom of the press Autocrats hold regular electionsin an attempt to give their regime legitimacy The autocratldquobuysrdquo legitimacy by rewarding their supporters and oppo-sition members with well-paid legislative positions and givelegislators the ability to influence policies Opposition partiesparticipate in elections to become known political entitiesThis allows them to regularly communicate with votersTheirobjective is to oust the autocrat either in a future electionor through popular uprisings We assume that oppositionparties maximize their vote share even when understandingthat there is little chance of ousting the autocrat in theelection
331 The 2008 Georgian Election We use the postelectionsurvey conducted by GORBI-GALLUP International fromMarch 19 through April 3 2008 to built a formal model ofthe 2008 election in Georgia (see [42]) The factor analysisdone on the survey questions determined that there were twodimensions describing votersrsquo attitudes towards democracyand the west One dimension is strongly related with therespondentsrsquo attitude toward the US the EU and NATO withlarger values in the West (119882 = 119910-axis) dimension implying astronger anti-western attitude Along the democracy (119863 = 119909-axis) dimension larger values are associated with negativejudgements on the current state of democratic institutions inGeorgia coupled with a demand for more democracy Theelectoral distribution along these two dimensions is given inFigure 10 The points (S G P N) in Figure 10 represent theestimated positions of the four candidates Saakashvili (S)Gachechiladze (G) Patarkatsishvili (P) and Natelashvili (N)(See Schofield et al [39] for details of the estimation)
The 2008 electoral covariance matrix in the Democracy(119863) and West (119882) axes is
nablaG2008 = [
1205902119863 = 082 120590119863119882 = 003
120590119882119863 = 003 1205902119882 = 091
] (63)
with 1205902G2008 equiv trace (nablaG
2008) = 173From Table 5 the MNL estimates of the 2008 election
with Natelashvili as the base candidate are120582G2008S = 256 120582
G2008G = 150 120582
G2008P = 053
120582G2008N equiv 00 120573
G2008 = 078
(64)
The Scientific World Journal 17
minus2 minus1 0 1 2
0
1
2
minus2
minus1
Demand for more democracy
Wes
tern
izat
ion
SG
P N
Figure 10 Voter distribution and candidate positions in the 2008Georgian election
All coefficients are significantly nonzero showingNatelashvilias having the lowest valence
The probability that a Georgian votes for Natelashviliwhen all candidates locate at the mean is
120588G2008N = [
4
sum
119896=1
exp [120582G2008119895 minus 120582
G2008N ]]
minus1
= [1 + 119890256
+ 119890150
+ 119890053
]
minus1≃ 005
(65)
Given that 2120573G2008(1 minus 2120588
G2008N ) = 2 times 078 times 09 = 14 and
since 1205902G2008 = 173 from (63) then using (15) Georgiarsquos the
convergence coefficient in Table 6 is
119888G2008 = 2120573
G2008(1 minus 2120588
G2008N ) 120590
2G2008
= 14 times 173 = 242
(66)
As shown in Appendix A3 119888G2008 is not significantly
different from 2 and thus fails the necessary condition forconvergence to the mean Natelashvilirsquos Hessian or character-istic matrix from (17) is
119862G2008N = 2120573
G2008 (1 minus 2120588
G2008N ) nabla
G2008 minus 119868
= 14 [
082 003
003 091] minus 119868
= [
015 004
004 028]
(67)
Since the eigenvalues of 119862G2008N are both positive (+0139
+0291) Natelashvilirsquos vote share function is at a minimumwhen he is at the mean and has an incentive to move toincrease his vote share This together with the analysis of
the 95 confidence intervals of 119862G2008N in Appendix A3
shows that with a high degree of certainty Natelashvili willlocate far from the mean This is not surprising since Geor-gians managed to induce three major changes in governmentthroughmass protests prior to this electionThus with a highdegree of certainty Natelashvili locates far from the origin inthis election and the electoral mean cannot be an LNE for the2008 Georgian election
332 The 2007 Russian Election The analysis of the 2007Russian election concentrates on four parties the pro-Kremlin United Russia party (ER) Liberal Democratic Party(LDPR) Communist Party (CPRF) and Fair Russia (SR)Votersrsquo ideological preferences were measured according totwo questions taken from the survey conducted by VCIOM(Russian Public Opinion Research Center) in May 2007 (see[43]) The first dimension gives a measure of voters general(dis)satisfaction (119863 = 119909-axis) High values in this dimensioncorrespond to negative feelings toward ldquojusticerdquo ldquolaborrdquo andto a lesser extent ldquoorderrdquo ldquostaterdquo ldquostabilityrdquo and ldquoequalityrdquoAlso those with high values of the first axis tend to feelneutral toward order elite West and non-Russians Thesecond dimension measures the voterrsquos degree of economicliberalism (119864 = 119910-axis) High values correspond to positivefeelings to ldquofreedomrdquo ldquobusinessrdquo ldquocapitalismrdquo ldquowell-beingrdquoldquosuccessrdquo and ldquoprogressrdquo and to negative feelings towardldquocommunismrdquo ldquosocialismrdquo ldquoUSSRrdquo and related conceptsThedistribution of voter preferences along these two dimensionscan be seen in Figure 11 (See Schofield and Zakharov [43] fordetails of the estimation)
The 2007 electoral covariance matrix along the (dis)satisfaction (119863) and economic liberalism (119864) axes is
nablaR2007 = [
1205902119863 = 295 120590119863119864 = 013
120590119864119863 = 013 1205902119864 = 295
] (68)
with 1205902R2007 equiv trace(nablaR
2007) = 59From Table 5 the MNL estimates of the spatial model for
Russia are120582R2007SR = minus04 120582
R2007119864119877 equiv 0 120582
R2007LDPR = 0153
120582R2007CPRF = 1971 120573
R2007 = 0181
(69)
Distance and all valences except for that of the LDPR partyare significantly nonzero When parties locate at the meanthe probability that a Russian votes for Fair Russia (SR) withlowest valence from (14) is
120588R2007SR = [
4
sum
119896=1
exp[120582R2007119895 minus 120582
R2007SR ]]
minus1
= [1 + 11989004
+ 1198900553
+ 1198902371
]
minus1≃ 007
(70)
Given that 2120573R2007(1 minus 2120588
R2007SR ) = 2 times 0181 times 086 = 031
and since 1205902R2007 = 59 from (68) then using (15) Russiarsquos
convergence coefficient in Table 6 is
119888R2007 = 2120573
R2007 (1 minus 2120588
R2007SR ) 120590
2R2007
= 031 times 59 = 183
(71)
18 The Scientific World Journal
Table 5 MNL spatial model in anocracies
Georgiac Russiab Azerbaijand
Party 2008 Party 2007 Party 2010
Var Esta|119905 minus value|
Esta|119905 minus value|
Esta|119905 minus value|
120573
078lowastlowastlowast(1378)
0181lowastlowastlowast(1208)
134lowastlowastlowast(462)
Valance
120582S256lowastlowastlowast(1366) 120582CPRF
1971lowastlowastlowast(1779) 120582YAP
130lowast(214)
120582G150lowastlowastlowast(796) 120582LDRP
0153(109)
120582P053lowast(251) 120582SR
minus0404lowastlowastlowast(250)
Base party N ER AXCP-MP119899 676 1004 149119871119871 minus533 minus797 minus115alowastprob lt 005 lowastlowastprob lt 001 lowastlowastlowastprob lt 0001bGeorgia S Saakashvili G Gachechiladze P Patarkatsishvili and N NatelashvilicRusia ER United Russia CPRF Communist Party SR Fair Russia LDPR Liberal Democratic PartydAzerbaijan YAP Yeni Azerbaijan Party AXCP-MP Azerbaijan Popular Front Party (AXCP)-and Musavat (MP)
Table 6 The convergence coefficient in anocracies
Georgia Russia Azerbaijand
2008 2007 2010Weight of policy differences (120573)
Est 120573(conf Inta)
078(066 089)
0181(015 020)
134(077 191)
Electoral variance (tracenabla = 1205902)
1205902 173 590 093
Probability of voting for lowest valence party (party 1 1205881 = [sum119901
119896=1exp(120582119896 minus 1205821)]
minus1)Nc SRb AXCP-MPd
Est 1205881(conf Inta)
120588GN = 005
(003 007)120588RSR = 007
(004 012)120588AXCP-MP = 021
(008 047)Convergence coefficient (119888 equiv 119888(120582 120573 120590
2) = 2120573[1 minus 21205881]120590
2)Est 119888(conf Inta)
242(199 289)
183(135 228)
144(0085 2984)
aConf Int confidence intervalsbGeorgia N NatelashvilicRussia SR Fair RussiadAzerbaijan AXCP-MP Azerbaijan Popular Front Party (AXCP) and Musavat (MP)The estimates for Azerbaijan are less precise because the sample is small
Since 119888R2007 is not significantly different from 2 (see Appendix
A3) the necessary condition for convergence is notmetThecharacteristic matrix or Hessian of Fair Russia (SR) from (17)is
119862R2007SR = 2120573
R2007 (1 minus 2120588
R2007SR ) nabla
R2007 minus 119868
= 031 [
295 013
013 295] minus 119868
= [
minus0086 004
004 minus0086]
(72)
The eigenvalues are both negative (minus0126 minus0046) implyingthat at this central estimate Fair Russia is maximizing itsvote share and thus has no incentive to vacate the originThis conclusion holds at the lower 95 bound of 119862
R2007SR in
Appendix A3 However at the upper bound of 119862R2007SR Fair
Russia is minimizing its vote share It seems then that withthe Russian President and his party exerting much influenceover the election and Putin being so popular that Fair Russiais more likely to remain at the origin (This result howeverhighlights that unexpected political events could prompt FairRussia to move from the origin) It is then likely that theelectoral mean is a LNE for the 2007 Russian election
The Scientific World Journal 19
minus4 minus3 minus2 minus1 0 1 2 3 4 5
minus4
minus2
0
2
4
6
CPRFSR
ER
LDPR
Figure 11 Party positions and voters distribution in the 2007Russian election
333 The 2010 Election in Azerbaijan In the 2010 electionin Azerbaijan 2500 candidates filed application to run inthe election but only 690 were given permission by theelectoral commission The parties that competed in theelection were the Yeni Azerbaijan Party (the party of thePresident YAP) Civic Solidarity Party (VHP) MotherlandParty (AVP) Azerbaijan Popular Front Party (AXCP) andMusavat (MP) Various small parties formed political blocks
President Ilham Aliyevrsquos ruling Yeni Azerbaijan Partytook a majority of 72 out of 125 seats Nominally independentcandidates who were aligned with the government received38 seats and 10 small opposition or quasiopposition partiestook 10 seatsTheDemocratic Reforms party Great Creationthe Movement for National Rebirth Umid Civic WelfareAdalet (Justice) and the Popular Front of United Azerbaijanmost of which were represented in the previous parliamentwon one seat a piece Civic Solidarity retained its 3 seats andAnaVaten kept the 2 seats they had in the previous legislatureFor the first time not a single candidate from the oppositionAzerbaijan Popular Front (AXCP) or Musavat were elected
We organized a small preelection survey of 2010 electionin Azerbaijan allowing us to construct a model of the election(see [42]) For VHP and AVP the estimation of their partypositions was very sensitive to inclusion or exclusion of onerespondentThus we used only the small subset of 149 voterswho completed the factor analysis questions and intended tovote for YAP or the AXCP+MP coalition
The factor analysis showed that voters were only con-cerned with one dimension the ldquodemand for democracyrdquowith higher values being associated with voters who had anegative evaluation of the current democratic situation inAzerbaijan who did not think that free opinion is allowedhad a low degree of trust in key national political institutionsand expected that the 2010 parliamentary election would beundemocratic Figure 12 shows the distribution of voters andthe party positions at the mean of their supporters (See [42]
minus2 minus1 0 1 2
00
01
02
03
04
05
Demand for democracy
Den
sity
YAP AXCP-MP
YAP activist AXCP-MP activist
Figure 12 Voter distribution and activist positions in the 2010Azerbaijani election
for details of the estimation) In this one dimensional modelthe variance is
1205902A2010 equiv trace (nabla2010G ) = 093 (73)
The binomial logit estimates for the 2010 election withAXCP-MP as the base party in Table 5 are
120582A2010YAP = 130 120582
A2010AXCP-MP equiv 00 120573
A2010 = 134
(74)
All coefficients are significantly nonzero with AXCP-MPhaving the lowest valence If these two parties locate at themean the probability that an Azerbaijani votes AXCP-MPfrom (14) is
120588A2010AXCP-MP = [
2
sum
119896=1
exp [120582A2010119895 minus 120582
A2010AXCP-MP]]
minus1
= [1 + 11989013
]
minus1≃ 021
(75)
Given that 2120573A2010(1 minus 2120588
A2010AXCP-MP) = 2 times 134 times 058 =
1554 and since 1205902A2010 = 093 from (73) then using (15) the
convergence coefficient for Azerbaijan in Table 6 is
119888A2010 = 2120573
A2010 (1 minus 2120588
A2010AXCP-MP) 120590
2A2010
= 1554 times 093 = 1445
(76)
Given that 119888A2010 is not significantly different from 1 the
dimension of the policy space (see Appendix A3) and thenecessary condition for convergence is not met The onedimensional Hessian of AXCP-MP from (17) is
119862A2010AXCP-MP = 2120573
A2010 (1 minus 2120588
A2010AXCP-MP) 120590
2A2010 minus 119868
= 1554 times 093 minus 1 = 0445
(77)
20 The Scientific World Journal
Clearly 119862A2010AXCP-MP has a single positive eigenvalue indicating
the AXCP+MP is minimizing its vote share at the originThe 95 bounds of 119862
A2010AXCP-MP in Appendix A3 shows that
this matrix has positive eigenvalues at the lower and upperbounds of the confidence interval Thus with a high degreeof certainty AXCP+MP will deviate from the origin andthe electoral mean is not a LNE for the 2010 election inAzerbaijan
This section illustrates that for the three anocracies thatwe consider the convergence coefficient does not satisfy thenecessary condition for convergence to the mean That isthese convergence coefficients are not significantly differentfrom the dimension of the policy space As a consequenceparties are at a knife-edge equilibrium Under some con-ditions parties converge to the mean under others theydiverge Which equilibrium materializes depends on howpopular or unpopular the Presidentautocrat and his partyare and so depends on the valence of all parties and on howdispersed voters are in the policy space Thus any change invalence can substantially affect party positions
4 Convergence across Political Systems
In the previous sections we used the unifying framework ofSchofieldrsquos [9] stochastic electoralmodel outlined in Section 2to study whether parties locate near or far from the electoralmean for countries with plurality and proportional represen-tation systems and in anocracies Using this framework weestimated the convergence coefficient for various electionsin different countries We will now use this dimensionlesscoefficient to compare convergence to the electoral meanacross elections countries and political systems We canthen illustrate the use of the convergence coefficient toclassify political systems Table 7 presents a summary ofthe convergence coefficients across elections countries andpolitical systems that we now discuss
As Table 7 indicates the two countries using pluralitysystems (the US and the UK) studied in Section 31 meet theconditions for convergence to the mean Thus suggestingthat plurality rule imposes a strong centripetal tendency thatkeeps parties close to the mean Our analysis suggests that incountries with plurality systems the convergence coefficientwill be low at or below the dimension of the policy space
Of the anocratic countries that we studied in Section 33Georgia seems to have the highest convergence coefficient119888G2008 = 242 in (66) which is not different from 2 suggestingthat parties can diverge from the mean (Note that priorto 2008 Georgians had already brought about three majorpolitical changes throughmass popular revoltThis rebelliousldquotraditionrdquo may give opposition candidates the ability toposition themselves away from the mean) The convergencecoefficient of all three anocracies was not significantly dif-ferent than the dimension of the policy space [2 for Georgiaand Russia and 1 for Azerbaijan 119888G2008 = 242 given in (66)119888Ru2007 = 183 in (71) and 119888
A2010 = 144 in (76)] These results
suggest that convergence in anocracies is fragile and dependson the distribution of votersrsquo preferences as well as on thevalences of the autocrat and the opposition parties
The countries with proportional systems studied inSection 32 have convergence coefficients that are signifi-cantly above their two-dimensional policy space signallingthe lack of convergence of small valence parties to the elec-toral mean (fromTable 7 Israelrsquos 119888I1996 = 406 in (46) Turkeyrsquos119888T1999 = 149 in (51) in 1999 and 119888
T2002 = 594 in (56) in 2002 and
Polandrsquos 119888P1997 = 682 in (61)) Having no possibility of forminggovernment these small parties maximize their vote sharesby locating closer to their core supporters Elections lead tomultiparty legislatures producing a highly fragmented partysystem where coalition governments are the norm Note thatchanges to the electoral process in Turkey between 1999 and2002 forced parties to move from locating close to the meanin 1999 to diverging towards their partisan constituencies soas to increase their vote shares in 2002 These results suggestthat in countries with proportional systems with highlyfragmented political parties divergence from the mean is thenorm
We can explain the lack of convergence to the meanin proportional systems with multiparty (gt3) legislatures bynoting that the convergence coefficient 119888 equiv 119888(120582 120573 120590
2) =
2120573[1minus21205881]1205902 in (15) depends on fundamental characteristics
of the electorate These characteristics include the weightgiven by voters to the distance to the partiesrsquo positions 120573 theelectoral variance 1205902 in (16) and the probability that a voterchooses the lowest valence party 1205881 in (14)Thus in countrieswith many parties the smallest low valence parties have littlechance of receiving much support a low 1205881 If in additionvoters care a lot about policy differences (a high 120573) and if theelectorate is very dispersed (a high 120590
2) then small parties willhave an incentive to move towards their core supporters andaway from the mean That is in highly fragmented politieswhere voters and correspondingly parties are very dispersedwe observe high convergence coefficients
In essence Schofieldrsquos [9] Valence theorem gives a simplesummary statistic the convergence coefficient that measuresthe degree of fragmentation or lack thereof in each polityPoland is an extreme case of this fragmentation and cor-respondingly has a very high convergence coefficient (seeTable 7)
The are other measures of political fragmentation in theliterature The effective number of party vote strength (env)used by Laakso and Taagepera [15] serves to measure howmany dominant parties there are in a polity a given electionTo find the env let the Herfindahl index of the election begiven by
119867V =
119901
sum
119895=1
V2119895 (78)
where V119895 is the vote share of party 119895 for 119895 = 1 119901 ThisHerfindahl index 119867V gives a measure of the party size inan election and measures how competitive the election wasLaakso and Taageperarsquos effective number of party vote strengthis then the inverse of 119867V that is
119890119899V = 119867minus1V (79)
The Scientific World Journal 21
Table 7 Convergence and fragmentation
Plurality systemsVariable US BritainPolitical system Presidential ParliamentaryElection year 2000 2004 2008 2005 2010Conv Coefa(conf Intb) 038 (02 07) 045 (02 08) 111 (07 15) 084 (05 13) 095 (09 11)
Converge to mean Yes Yes Yes Yes YesNumber of partiesc 2 2 2 9 9
Presidentenvc 216 205 205
House ofRepresentatives House of Commons
envd 225 218 218 361 374ensd 202 200 200 247 258
Proportional RepresentationIsrael Turkey Poland
Political system Fragmented Fragmented Cut off FragmentedElection year 1996 1999 2002 1997Conv Coefa(conf Intb) 398 (35 46) 149 (07 22) 594 (44 74) 682 (58 78)
Converge to mean No Likely No NoNumber of partiesb 11 9 10 7
Prime Ministerse
envc 200Knesset Parliament Sejm
envc 584 691 562 499ensc 589 635 229 677
AnocraciesmdashpluralityGeorgia Russia Azerbaijan
Political system Presidential Presidential PresidentialElection year 2008 2007 2010Conv Coefa(conf Intb) 242 (20 29) 183 (14 23) 144 (01 30)
Converge to mean No Likely NoPresident President (2008) President (2008)
Number of partiesc 8 4 7
envd 276 188 131Parliamentary Duma (2007) National assembly (2010)
Number of partiesa 5 7 12
envd 256 222 474
ensd 155 194 227aThis is the central estimate of the convergence coefficientbConf Int confidence interval rounded to the nearest tenthcNumber of parties who won votes in the electiondBased on the number of parties who obtained seats in the electioneThis was the first time the Prime Minister was elected on a ballot separate from the Knesset
In the same way we can define the effective number of partyseat strength (119890119899119904) using seat shares instead of vote sharesgiving us a measure of the strength of parties in a legislature
We calculate the 119890119899V and 119890119899119904 for each electionwe consider(see Table 7) using all the parties that obtained votes in eachelection and exclude parties that ran in the election but that
22 The Scientific World Journal
got no votes We now compare the level of fragmentationgiven by the 119890119899V and 119890119899119904 with that given by the convergencecoefficient for each country and each election under the threepolitical systems that we studied
We first examine countries with plurality rule In Table 7we see that for the US the 119890119899V and the 119890119899119904 at the Presidentialand House levels are closely aligned There is little variationbetween the 119890119899V and 119890119899V indices in the three electionsAccording to these indices there is essentially no changein political fragmentation across these three elections Theconvergence coefficient however rises in 2008 relative to2000 and 2004 indicating that in 2008 the dispersion amongvoters was higher than in the previous two elections For theUS the convergence coefficient provides more informationthan do 119890119899V or 119890119899V For the UK the convergence coefficientshows that the electorate was more dispersed in 2010 thanin 2005 (see Tables 2 and 7) This dispersion led to the firstminority government since 1974 which resulted in highereffective number of parties as measured by the 119890119899V and 119890119899VAll three measures 119888 119890119899V and 119890119899119904 indicate that the UnitedKingdom became more fragmented in 2010 Thus in thecountries using plurality the convergence coefficient tends toprovide more information than the 119890119899V and 119890119899119904 numbers doas the convergence coefficient takes into account the degreeof dispersion among the electorate and the valence of parties
Polities with high convergence coefficients (Israel Turkeyin 2002 and Poland in Table 7) had a large number of partiescompeting in these elections The greater the number ofparties obtaining votes and thus effectively competing in theelection led to large 119890119899V values These elections producedhighly fragmented legislatures leading to very high 119890119899119904
values Having a large number of effective parties competingin the election and greater effective number of parties inthe legislature does not necessarily translate into a higherconvergence coefficient The convergence coefficient is lowerfor Israel with a larger number of effective parties (higher 119890119899Vand 119890119899119904) than for Poland with fewer parties Changes in theTurkish electoral system between 1999 and 2002 in which aminimum cut-off rule has instituted led to a high 119890119899V but alow 119890119899119904 Small parties were however able to gain enough votesleading to a high convergence coefficient an indication thatthese parties would disperse themselves in the policy spaceThe 119890119899V and 119890119899119904 values of the 2002 Turkish election show highparty fragmentation but no legislative fragmentation Thisshows that these three measures of fragmentation providedifferent information about a particular election
The convergence coefficient suggests that a way of inter-preting the arguments of Duverger [44] and Riker [45] onthe effects of proportional electoral methods on electoraloutcomes the strong centrifugal tendency pulling all partiesaway from the electoralmean towards their core constituencyThis tendency will be particularly strong for small or lowvalence parties In particular even small parties in such apolity can assign a nonnegligible probability to becoming amember of a coalition government and it is this phenomenonthat maintains the fragmentation of the party system Forexample in Poland no party can obtain a majority andparties and coalitions regularly form and dissolve In general
the convergence coefficients in Poland were of the order of60 in the elections in the 1990rsquos
For countries using proportional representation whilethe 119890119899V and 119890119899119904 give a measure of electoral and legislativedispersion the convergence coefficient provides a measurethat summarizes dispersion across voters and parties in thepolicy space
In the anocratic countries studied the convergence coef-ficient seems in line with the 119890119899V in presidential electionsbut going in the opposite direction in parliamentary elections(see Table 7) In these countries the convergence coefficientdoes not meet the necessary condition for convergence tothe mean These countries that we study show that partiescould either converge to or diverge from the mean underanocracy as the equilibrium is fragile Changes in valencesfor example of the autocrat or in votersrsquo preferences can leadsmall valence opposition parties to diverge from the meanand to mount popular uprisings as happened in previouselections in Georgia or in recent Arab uprisings
The convergence coefficient reflects information that the119890119899V and 119890119899119904 cannot capture as it reflects the preferences ofthe electorate through the policy weight 120573 the perceivedability of parties or candidates to govern as captured by theirvalences 120582 = (1205821 120582119901) and the dispersion of votersrsquopreferences in the policy space 120590
2 All of which are nottaken into account in the 119890119899V and 119890119899119904 Moreover 119890119899V and 119890119899119904
have nothing to say about the dispersion in partiesrsquo positionsrelative to the mean
The analysis carried out in this section suggests that thereis an inverse relationship between the degree of fractionaliza-tion in a polity and the convergence coefficient By our inter-pretation of the nature of the convergence coefficient the con-vergence effect in presidential elections in the United Statesis stronger than in parliamentary elections in Great BritainThat is our results suggest that democratic presidentialsystems have fewer parties and a low convergence coefficientParliamentary democracies operating under plurality ruletend to have more parties than presidential democracies anda somewhat higher convergence coefficient Parliamentarydemocracies operating under proportional representationtend to have multiparty legislatures and high convergencecoefficients Anocratic countries tend to havemultiple partiescompeting in the election but low convergence coefficients asopposition parties remain close to the electoral mean whenPresidentsautocrats have high valences and diverge whenthey do not
5 Conclusion
In this paper Schofieldrsquos [9] Valence Theorem together withmultinomial logit models of elections are used as a unifyingframework to compare the convergence properties of partiesacross elections countries and political systems We foundevidence to support the hypothesis that in countries withproportional representation parties located away from theelectoral mean
We relate the convergence coefficient to the effectivenumber of parties according to both vote (env) and seat (ens)
The Scientific World Journal 23
shares and showed how the characteristics of the electorateand the political regime under which parties operate Thencompare the convergence coefficient to the fractionalizationmeasures provided by the env and ens The advantage of theconvergence coefficient is that it is a summary statistic thatincorporates the preferences of voters the valence of partiesand the dispersion of voters and parties in the policy space
Appendix
A Confidence Intervals
Schofieldrsquos [9] Valence Theorem presented in Section 2perfectly predicts whether parties converge to or diverge fromthe electoral origin Convergence or divergence depends onthe value of the convergence coefficient 119888 equiv 2120573[1 minus 21205881]120590
2 in(15) and on the Characteristic matrix of party 1 with lowestvalence 1198621 = 2120573(1 minus 21205881)nabla minus 119868 in (17) Both 119888 and 1198621 dependon 120573 and on 1205881 = [sum
119901
119896=1exp(120582119896 minus 1205821)]
minus1 in (14)The central estimate of 120573 and of 120582 = (1205821 120582119901) given
by the MNL regressions depend on the sample of voterssurveyed as do 1205881 119888 and 1198621 Thus to make inferences fromempirical models we need the 95 confidence bounds ofthese estimates Using these bounds we assert with somedegree of certainty whether parties converge to or divergefrom the electoral mean or if there is a knife-edge unstableequilibrium
To build these bounds we could perform simulations ofthe election For each simulation we could generate the valueof 120573 120582 = (1205821 120582119901) 1205881 119888 and 1198621 Repeating the simulationmany times would generate their distribution from whichwe could derive their 95 confidence bounds Note that 119888
and 1198621 increase in 120573 and decrease in 1205881 So that given theelectoral covariance matrix nabla and variancetrace 120590
2 in (16) ofan election when in a simulation 120573 has a low value and 1205881
a high one the values of 119888 and 1198621 are low with the oppositebeing true when 120573 is high and 1205881 is low Since we have notperformed simulations for the elections in this study we usethese features of 119888 and 1198621 to generate our confidence bounds
Let 119871 identify the lower and 119880 the upper bounds ofthe 95 confidence intervals of any estimate The MNLestimation for an election gives the confidence bounds of 120573and 1205821 (120573
119871 120573119880) and [120582
1198711 1205821198801 ] To estimate the bounds on 1205881 in
(14) [1205881198711 1205881198801 ] we use the bounds on 1205821 and TaylorrsquosTheorem
which asserts that
1205881(1205821 plusmn ℎ) = 1205881 (1205821) plusmn ℎ
1198891205881
1198891205821
= 1205881 (1205821) plusmn ℎ1205881(1205821) [1 minus 1205881(1205821)]
= 1205881 (1205821) [1 plusmn ℎ (1 minus 1205881(1205821))] = [1205881198711 1205881198801 ]
(A1)
Using (15) and the bounds on 120573 and 1205881 we build theconfidence intervals for the convergence coefficient 119888 asfollows In (15) use 120573
119871 and 1205881198801 to get the lower bound of 119888
119888119871 and use 120573
119880 and 1205881198711 for the upper bound of 119888 119888119880 The 95
confidence interval of the convergence coefficient is then
[119888119871 119888119880] = [2120573
119871[1 minus 2120588
1198801 ] 1205902 2120573119880[1 minus 2120588
1198711 ] 1205902] (A2)
Following a similar procedure we estimate the bounds for1198621 using (17) and the corresponding bounds of120573 and 1205881 to getthe bounds for the Hessian of the lowest valence party
[1198621198711 1198621198801 ] = [2120573
119871[1 minus 2120588
1198801 ] nabla minus 119868 2120573
119880[1 minus 2120588
1198711 ] nabla minus 119868]
(A3)
Clearly the bounds for 119888 and 1198621 must be similar to thosegenerated by repeated simulations
Using these procedures we now derive the 95 confi-dence intervals for the central estimates of 1205881 119888 and 1198621 foreach of the elections studied (see summary in Tables 2 4 and6) We first derive the detail of the confidence bounds for the2000 US election then in less detail those of other electionsTable 7 gives the values needed to derive the confidenceintervals for the convergence coefficient of the election
A1 Convergence in Plurality Systems
A11 Confidence Bounds for the 2000 2004and 2008 US Elections
US 2000 Election From Table 1 the 95 confidence intervalfor 120573
US2000 = 082 are [120573
US1198712000 120573
US1198802000] = [082 plusmn 196 times 006] =
[071 093] Using (A1) the bounds for 120588US2000rep = 04 in (20)
are [120588US2000119871rep 120588
US2000119880rep ] = [035 044] Using these bounds
and (18) the bounds for the convergence coefficient for the2000 US election in (21) from (A2) are
[119888US1198712000 119888
US1198802000 ]
= [2 (071) (1 minus 2 times 044) (117)
2 (093) (1 minus 2 times 035) (117)]
= [020 065]
(A4)
With 95 confidence the convergence coefficient is below1 meeting the sufficient and thus necessary condition forconvergence to themeanThe bounds on Bushrsquos characteristicmatrix in (22) from (A3) are
[119862US2000119871rep 119862
US2000119880rep ]
= [2 (071) (1 minus 2 times 044) [
058 minus020
minus020 059] minus 119868
2 (093) (1 minus 2 times 035) [
058 minus020
minus020 059] minus 119868]
= [[
minus090 minus003
minus003 minus090] [
minus068 minus011
minus011 minus067]]
(A5)
Since the eigenvalues of the lower and upper bounds of119862US2000rep are negative [119862
US2000119871rep = (minus087 minus093) 119862
US2000119880Bush =
(minus079 minus057)] with 95 confidence Bushrsquos vote share is at amaximum when all parties locate at the mean Thus with ahigh degree of certainty the origin is a LNE for the 2000 USelection
US 2004 Election From Table 1 the 95 confidence boundsof 120573
US2004 = 095 is [120573
US1198712004 120573
US1198802004] = [095 plusmn 196 times 007] =
24 The Scientific World Journal
[082 108] Using (A1) the bounds of 120588US2004rep = 04 in (25)
are [120588US2004119871rep 120588
US2004119880rep ] = [035 044] The bounds for 119888US2004 =
038 in (21) from (A2) and for the characteristic matrix ofBush 119862
2004rep in (27) from (A3) are
[119888US1198712004 119888
US1198802004 ] = [2 (082) (1 minus 2 times 044) (117)
2 (108) (1 minus 2 times 035) (117)]
= [023 076]
[119862US2004119871rep 119862
US2004119880rep ]
= [2 (082) (1 minus 2 times 044) [
058 minus018
minus018 059] minus 119868
2 (108) (1 minus 2 times 035) [
058 minus018
minus018 059] minus 119868]
= [[
minus089 minus004
minus004 minus088] [
minus062 minus012
minus012 minus062]]
(A6)
The convergence coefficient is significantly below 1 Bushmaximizes his vote share when located at the origin since theeigenvalues of the lower and upper bounds of119862US2004
rep are neg-ative [119862
US2004119871rep = (minus087 minus093) 119862
US2004119880rep = (minus079 minus057)]
Thus with 95 confidence Bush does not want to move fromthe mean implying that with a great certainty the origin is aLNE for the 2004 US election
US 2008 Election FromTable 1 the bounds of 120573US2008 = 085 are
[120573US1198712008 120573
US1198802008] = [085plusmn196times006] = [073 097] Using (A1)
those of 120588US2008rep in (30) are [120588
US2008119871rep 120588
US2080119880rep ] = [026 035]
So that the bounds for cUS2008 = 11 in (31) from (A2) and forMcCainrsquos characteristic matrix CUS2008
rep in (32) from (A3) are
[119888US1198712008 119888
US1198802008 ] = [2 (073) (1 minus 2 times 035) (163)
2 (097) (1 minus 2 times 026) (163)]
= [071 152]
[119862US2008119871rep 119862
US2008119880rep ]
= [2 (073) (1 minus 2 times 035) [
080 minus013
minus013 083] minus 119868
2 (097) (1 minus 2 times 026) [
080 minus013
minus013 083] minus 119868]
= [[
minus065 minus006
minus006 minus064] [
minus026 minus012
minus012 minus023]]
(A7)
The convergence coefficient is not statistically different from 1and thus meets the necessary but not the sufficient conditionfor convergence Since the eigenvalues of the lower andupper bounds of 119862
US2008rep are negative [119862
US2008119871rep = (minus075
minus059) 119862US2008119880rep = (minus037 minus012)] then with 95 confi-
dence McCain stays at the origin With a high degree ofcertainty the mean is an LNE for the 2008 US election
A12 Confidence Bounds for the 2005 and 2010 UK Elections
UK 2005 Election From Table 1 the bounds of 120573UK2005 = 015
are [120573UK1198712005 120573
UK1198802005 ] = [015 plusmn 196 times 001] = [013 017] Using
(A1) those for 120588UK2005lib in (35) are [120588
UK2005119871lib 120588
UK2005119880lib ] =
[018 032] so that those for 119888UK2005 in (36) from (A2) and for
the Liberal Democratsrsquo characteristic matrix 119862UK2005lib in (37)
from (A3) are
[119888UK1198712005 119888
UK1198802005 ] = [2 (013) (1 minus 2 times 032) (561)
2 (017) (1 minus 2 times 018) (561)]
= [051 125]
[119862UK2005119871lib 119862
UK2005119880lib ]
= [2 (013) (1 minus 2 times 032) [
165 000
000 396] minus 119868
2 (017) (1 minus 2 times 018) [
165 000
000 396] minus 119868]
= [[
minus085 000
000 minus064] [
minus063 000
000 minus012]]
(A8)
With 119888UK2005 not significantly different from 1 the necessary
but not the sufficient condition for convergence to the meanhas been met The eigenvalues of the bounds on 119862
UK2005lib
are negative [119862UK2005119871lib = (minus085 minus064) 119862
UK2005119880lib =
(minus037 minus012)] With 95 confidence the LibDem locate atthe origin and the mean is an LNE of the 2005 UK election
UK 2010 Election From Table 1 the bounds of 120573UK2010 = 086
are [120573UK1198712010 120573
UK1198802010 ] = [086 plusmn 196 times 002] = [081 090] Using
(A1) those for 120588UK2010lab in (40) are [120588
UK2010119871lab 120588
UK2010119880lab ] =
[029 032] So that those for 1198882010UK in (41) from (A2) and for
Labourrsquos characteristic matrix 119862UK2010lab in (42) from (A3) are
[1198882010119871UK 119888
2010119880UK ] = [2 (081) (1 minus 2 times 032) (146)
2 (090) (1 minus 2 times 029) (146)]
= [086 110]
[119862UK2010119871lib 119862
UK2010119880lib ]
= [2 (081) (1 minus 2 times 032) [
060 007
007 086] minus 119868
2 (090) (1 minus 2 times 029) [
060 007
007 086] minus 119868]
= [[
minus065 004
004 minus049] [
minus055 005
005 minus035]]
(A9)
The convergence coefficient meets the necessary but not thesufficient condition for convergence to the mean as is notsignificantly different from 1The eigenvalues of the bounds of119862UK2010lib are negative [119862UK2010119871
lab = (minus066 minus048) 119862UK2015119880lab =
(minus056 minus034)] Thus with 95 confidence Labour does not
The Scientific World Journal 25
want to move from the origin and the origin is an LNE of themodel of the 2010 UK election
A2 Convergence in Proportional Systems
A21 Confidence Bounds for the 1996 Israeli Election FromTable 3 the bounds of 120573
I1996 = 1207 are [120573
I1198711996 120573
I1198801996] =
[1207 plusmn 196 times 0065] = [1076 1338] Using (A1) those for120588I1996TW in (45) are [120588
I1996119871TW 120588
I1996119880TW ] = [0006 0034] implying
that those of 119888I1996 in (46) from (A2) and for the TWrsquos
characteristic matrix 119862I1996TW in (47) from (A3) are
[119888I1198711996 119888
I1198801996] = [2 (1076) (1 minus 2 times 0034) (1732)
2 (1338) (1 minus 2 times 0006) (1732)]
= [3474 4579]
[119862I1996119871TW 119862
I1996119880TW ]
= [2 (1076) (1 minus 2 times 0034) [
100 0591
0591 0732] minus 119868
2 (1338) (1 minus 2 times 0006) [
100 0591
0591 0732] minus 119868]
= [[
1006 1185
1185 0468] [
1644 1563
1563 0935]]
(A10)
Since 119888I1996 is significantly greater than 2 the necessary
condition for convergence to the electoral mean is not metThe lower and upper bounds of 119862I1996
TW have one negative andone positive eigenvalue [119862I1996119871
119879119882 = (minus048 195) 119862I1996119880TW =
(minus0313 2892)] TW is at a saddle point at both boundsThus with 95 confidence TW locates away from the originand the origin fails to be a LNE for the 1996 Israeli election
A22 Confidence Bounds for the 1999 and2002 Turkish Elections
1999 Turkish Election From Table 3 the bounds of 120573T1999 =
0375 are [120573T1198711999 120573
T1198801999] = [0375 plusmn 196 times 0088] =
[0203 0547] Using (A1) those for 120588T1999FP in (50) are
[120588T1999119871FP 120588
T1999119880FP ] = [0046 0145] so that those of 119888
T1999 in
(51) from (A2) and for the FPrsquos characteristic matrix 119862T1999FP
in (52) from (A3) are
[119888T1198711999 119888
T1198801999] = [2 (0203) (1 minus 2 times 0145) (234)
2 (0547) (1 minus 2 times 0046) (234)]
= [0675 2234]
[119862T1999119871FP 119862
T1999119880FP ]
= [2 (0203) (1 minus 2 times 0145) [
120 078
078 114] minus 119868
2 (0547) (1 minus 2 times 0046) [
120 078
078 114] minus 119868]
= [[
minus0654 0225
0225 minus0671] [
0192 0775
0775 0132]]
(A11)
Since 119888T1999 is significantly greater than 2 the necessary
condition for convergence to the mean is not met 119862T1999119871FP
has two negative eigenvalues [119862T1999119871FP = (minus0888 minus0437)]
indicating that at the lower bound FP has no incentive tomove from the origin However119862T1999119880
FP has one negative andone positive eigenvalue 119862
T1999119880FP = (minus0614 0938) thus FP is
at a saddlepoint at the upper bound and wants to move fromthe mean At the central estimate of 119862T1999
FP given in (52) FPis also at a saddlepoint It is more probable that FP wants tomove and that the electoralmean is not a LNE of 1999 Turkishelection
2002 Turkish Election From Table 3 the bounds of 120573T2002 =
152 are [120573T1198712002 120573
T1198802002] = [152 plusmn 196 times 012] = [1285 1755]
Using (A1) those for 120588T2002ANAP in (55) are [120588
T2002119871ANAP 120588
T2002119880ANAP ] =
[0038 0133] implying that those of 119888T2002 in (56) from (A2)and for the ANAPrsquos characteristic matrix 119862
T2002ANAP in (57) from
(A3) are
[119888T1198712002 119888
T1198802002] = [2 (1285) (1 minus 2 times 0133) (233)
2 (1755) (1 minus 2 times 0038) (233)]
= [4338 7438]
[119862T2002119871ANAP 119862
T2002119880ANAP ]
= [2 (1285) (1 minus 2 times 0133) [
118 074
074 115] minus 119868
2 (1755) (1 minus 2 times 0038) [
118 074
074 115] minus 119868]
= [[
minus0660 0213
0213 minus0669] [
0172 0735
0735 0142]]
(A12)
Since 119888T2002 is significantly greater than 2 the necessary
condition for convergence to the mean has not been metTheeigenvalues of 119862
T2002119871ANAP are all negative 119862T2002119871
ANAP = (minus0878
minus0451) so that at the lower boundANAP remain at themeanHowever at 119862
T2002119880ANAP there is one negative and one posi-
tive eigenvalue 119862T2002119880ANAP = (minus0578 0892) ANAP is at a
saddlepoint and wants to move At the central estimate of119862T2002ANAP in (57) the eigenvalues are both positive and ANAP
is minimizing its vote share There is a high likelihood thatANAP wants to move from the origin and that the electoralmean is not a LNE of 2002 Turkish election
A23 Confidence Bounds for the 1997 Polish Election FromTable 3 the bounds of 120573
P1997 = 1739 are [120573
P1198711997 120573
P1198801997] =
[1739 plusmn 196 times 012] = [1512 1966] Using (A1) thosefor 120588
P1997UPR in (60) are [120588
P1198711997 120588
P1198801997] = [0002 0022] so that
those of 119888P1997 in (61) from (A2) and for the UPRrsquos character-istic matrix 119862
P1997UPR in (62) from (A3) are
[119888P1198711997 119888
P1198801997] = [2 (1512) (1 minus 2 times 0022) (2)
2 (1966) (1 minus 2 times 0002) (2)]
= [5782 7833]
26 The Scientific World Journal
[119862P1198711997 119862
P1198801997]
= [2 (1512) (1 minus 2 times 0022) [
1 0
0 1] minus 119868
2 (1966) (1 minus 2 times 0002) [
1 0
0 1] minus 119868]
= [[
1891 0000
0000 1891] [
2916 0000
0000 2916]]
(A13)
With 119888P1997 significantly greater than 2 the necessary con-
dition for convergence to the mean is not met The eigen-values of the bounds of 119862
P1997 are positive [119862
P1997119871UPR =
(1891 1891) 119862P1997119871UPR = (2916 2916)] as are those of the
central estimate of119862P1997 in (62)Thus with a high probability
UPR will not locate at the mean and the electoral mean is nota LNE of 1997 Polish election
A3 Convergence in Anocracies
A31 Confidence Bounds for the 2008 Georgian ElectionFrom Table 5 the bounds of 120573G
2008 = 078 are [120573G1198712008 120573
G1198802008] =
[078 plusmn 196 times 006] = [066 089] Using (A1) those for120588G2008N = 005 in (65) are [120588
G2001198718N 120588
G2008119880N ] = [003 007] So
that those of 119888G2008 in (66) from (A2) and for Natelashvilirsquos
characteristic matrix 119862G2008N in (67) from (A3) are
[119888G1198712008 119888
G1198802008] = [2 (066) (1 minus 2 times 007) (173)
2 (089) (1 minus 2 times 003) (173)]
= [199 289]
[119862G2008119871N 119862
G2008119880N ]
= [2 (066) (1 minus 2 times 007) [
082 003
003 091] minus 119868
2 (089) (1 minus 2 times 003) [
082 003
003 091] minus 119868]
= [[
minus006 003
003 005] [
037 005
005 052]]
(A14)
Since 119888G2008 is not statistically different from 2 the necessary
condition for convergence is not met The lower boundof 119862
G2008N has one negative and one positive eigenvalue
[119862G2008119871N = (minus0068 0058)] so that at the lower bound Nate-
lashvilirsquos vote share function is at a saddlepoint The upperbound has two positive eigenvalues [119862G200119880
N = (0355 0535)]
so that at the upper boundNatelashvili is minimizing his voteshare At the central estimate of 119862G2008
N in (67) Natelashvili isalso minimizing his vote share Thus with a high probabilityNatelashvili diverges from the mean and the mean cannot bea LNE of the 2008 Georgian election
A32 Confidence Bounds for the 2007 Russian ElectionFromTable 5 the bounds of 120573R
2007 = 0181 are [120573R1198712007 120573
R1198802007] =
[018 plusmn 196 times 001] = [015 020] Using (A1) those for120588R2007SR = 007 in (70) are [120588
R2007LSR 120588
R2007119880SR ] = [004 012] So
that those of 119888R2007 in (71) from (A2) and for SRrsquos characteristicmatrix 119862
R2007SR in (72) from (A3) are
[119888R1198712007 119888
R1198802007] = [2 (015) (1 minus 2 times 012) (59)
2 (015) (1 minus 2 times 004) (59)]
= [135 228]
[119862R2007119871SR 119862
R2007119880SR ]
= [2 (015) (1 minus 2 times 012) [
295 013
013 295] minus 119868
2 (02) (1 minus 2 times 004) [
295 013
013 295] minus 119868]
= [[
minus033 003
003 minus033] [
014 005
005 014]]
(A15)
With 119888R2007 not significantly different from 2 the necessary for
convergence is not met The lower bound of 119862R2007SR has two
negative eigenvalues [119862R2007119871SR = (minus030 minus036)] implying
that at lower bound SRrsquos vote share is at a maximum and SRstays at the origin However at the upper bound there aretwo positive eigenvalues [119862R2007119880
SR = (009 019)] Thus at theupper bound SRrsquos vote share is at minimum and SR wants tomove At the central estimate of119862R2007
SR in (72) SR also has twonegative eigenvalues suggesting that SRwants to remain at theorigin So it seems more likely that SR will stay at the originand that the mean is a LNE of the 2007 Russian election
A33 Confidence Bounds for the 2010 Azerbaijani ElectionFrom Table 5 the bounds for 120573A
2010 = 134 are [120573A1198712010 120573
A1198802010] =
[134 plusmn 196 times 029] = [077 191] Using (A1) thosefor 120588
A2010AXCP-MP = 021 in (75) are [120588
A2010119871AXCP-MP 120588
A2010119880AXCP-MP] =
[008 047] So that those of 119888A2010 in (76) from (A2) and forAXCP-MPrsquos characteristicmatrix119862
A2010AXCP-MP in (77) from (A3)
are
[119888A1198712010 119888
A1198802010] = [2 (077) (1 minus 2 times 047) (093)
2 (191) (1 minus 2 times 008) (093)]
= [0085 2984]
[119862A2010119871AXCP-MP 119862
A2010119880AXCP-MP]
= [2 (077) (1 minus 2 times 047) (0445) minus 1
2 (191) (1 minus 2 times 008) (0445) minus 1]
= [0037 1428]
(A16)
With 119888A2010 not significantly different from 1 the dimension of
the policy space the necessary and the sufficient (in this case
The Scientific World Journal 27
the same) conditions for convergence are not met This one-dimensional characteristic matrix has positive eigenvalues atthe lower and upper bounds as does the central estimate of119862A2010AXCP-MP = 0445 in (77) It is then very likely that AXCP-
MP locates far from the origin and that the electoral mean isnot an LNE for the 2010 election in Azerbaijan
Conflict of Interests
The authors declare that there is no conflict of interestsregarding the publication of this paper
Acknowledgment
Prepared for presentation at the Journees Louis-AndreGerard-Varet 24-28 June Marseille and for presentation atthe joint LSE-WashU workshop on Comparative politicaleconomy September 2013 This paper is based on worksupported by NSF grant 0715929 and a Weidenbaum Centergrant Earlier versions were completed while Gallego was avisitor at the Center and later while Schofield was the GlennCampbell and Rita Ricardo-Campbell National Fellow at theHoover Institution Stanford
References
[1] A DownsAn EconomicTheory of Democracy Harper and RowNew York NY USA 1957
[2] W H Riker and P C Ordeshook An Introduction to PositivePoliticalTheory Prentice-Hall EnglewoodCliffs NJ USA 1973
[3] D Stokes ldquoSpatial models and party competitionrdquo The Ameri-can Political Science Review vol 57 pp 368ndash377 1963
[4] D Stokes ldquoValence politicsrdquo in Electoral Politics D KavanaghEd pp 141ndash164 Clarendon Press Oxford UK 1992
[5] H Clarke D Sanders M Stewart and P Whiteley OxfordUniversity Press Oxford UK 2005
[6] H Clarke D Sanders M Stewart and PWhiteley PerformancePolitics and the British Voter Cambridge University PressCambridge UK 2009
[7] T J Scotto H D Clarke A Kornberg et al ldquoThe dynamicpolitical economyof support for BarackObamaduring the 2008presidential election campaignrdquo Electoral Studies vol 29 no 4pp 545ndash556 2010
[8] H D Clarke T J Scotto and A Kornberg ldquoValence politicsand economic crisis electoral choice in Canada 2008rdquo ElectoralStudies vol 30 no 3 pp 438ndash449 2011
[9] N Schofield ldquoThemean voter theorem necessary and sufficientconditions for convergent equilibriumrdquo Review of EconomicStudies vol 74 no 3 pp 965ndash980 2007
[10] J M Enelow andM J Hinich ldquoNonspatial candidate character-istics and electoral competitionrdquo Polish Journal of Ecology vol44 pp 115ndash131 1982
[11] J M Enelow and M J Hinich The Spatial Theory of VotingCambridge University Press Cambridge UK 1984
[12] J M Enelow and M J Hinich ldquoA general probabilistic spatialtheory of electionsrdquo Public Choice vol 61 no 2 pp 101ndash1131989
[13] D Sanders H D Clarke M C Stewart and P WhiteleyldquoDowns stokes and the dynamics of electoral choicerdquo BritishJournal of Political Science vol 41 no 2 pp 287ndash314 2011
[14] R D McKelvey and J W Patty ldquoA theory of voting in largeelectionsrdquoGames and Economic Behavior vol 57 no 1 pp 155ndash180 2006
[15] M Laakso and R Taagepera ldquoEffective number of parties ameasure with applications to West Europerdquo Competition andPolitical Science vol 12 pp 3ndash27 1979
[16] N Schofield and I SenedMultiparty Democracy Elections andLegislative Politics Cambridge University Press CambridgeUK 2006
[17] S Ansolabare and J M Snyder ldquoValence politics and equilib-rium in spatial election modelsrdquo Public Choice vol 103 no 3-4pp 327ndash336 2000
[18] T Groseclose ldquoA model of candidate location when onecandidate has a valence advantagerdquoAmerican Journal of PoliticalScience vol 45 no 4 pp 862ndash886 2001
[19] E Aragones and T R Palfrey ldquoMixed equilibrium in a Down-sian model with a favored candidaterdquo Journal of EconomicTheory vol 103 no 1 pp 131ndash161 2002
[20] E Aragones and T R Palfrey ldquoElectoral competition betweentwo candidates of different quality the effects of candidateideology and private informationrdquo Social Choice and StrategicDecisions Studies in Choice and Welfare pp 93ndash112 2005
[21] N Schofield ldquoValence competition in the spatial stochasticmodelrdquo Journal of Theoretical Politics vol 15 no 4 pp 371ndash3832003
[22] N Schofield G Miller and A Martin ldquoCritical elections andpolitical realignments in the USA 1860ndash2000rdquo Political Studiesvol 51 no 2 pp 217ndash442 2003
[23] G Miller and N Schofield ldquoActivists and partisan realignmentin the United Statesrdquo American Political Science Review vol 97no 2 pp 245ndash260 2003
[24] N Schofield and G Miller ldquoElections and activist coalitions inthe United Statesrdquo American Journal of Political Science vol 51no 3 pp 518ndash531 2007
[25] M Peress ldquoThe spatial model with non-policy factors a theoryof policy-motivated candidatesrdquo Social Choice and Welfare vol34 no 2 pp 265ndash294 2010
[26] HD Clarke A Kornberg JMacLeod andT Scotto ldquoToo closeto call political choice in Canada 2004rdquo Political Science andPolitics vol 38 no 2 pp 247ndash253 2005
[27] H D Clarke A Kornberg T Scotto and J Twyman ldquoFlawlesscampaign fragile victory voting in Canadarsquos 2006 federalelectionrdquo Political Science and Politics vol 39 no 4 pp 815ndash8192006
[28] H D Clarke A Kornberg and T Scotto Making PoliticalChoices Toronto University Press Toronto Canada 2009
[29] N Schofield ldquoA valence model of political competition inBritain 1992ndash1997rdquo Electoral Studies vol 24 no 3 pp 347ndash3702005
[30] N Schofield C Claassen U Ozdemir and A ZakharovldquoEstimating the effects of activists in two-party and multi-partysystems comparing the United States and Israelrdquo Social Choiceand Welfare vol 36 no 3 pp 483ndash518 2011
[31] N Schofield C Claassen M Gallego and U Ozdemir ldquoEmpir-ical and formal models of the US presidential elections in 2004and 2008rdquo in The Political Economy of Institutions Democracyand Voting N Schofield and G Caballero Eds pp 217ndash258Springer Berlin Germany 2011
[32] K Train Discrete Choice Methods for Simulation CambridgeUniversity Press Cambridge UK 2003
28 The Scientific World Journal
[33] J K Dow and JW Endersby ldquoMultinomial probit andmultino-mial logit a comparison of choice models for voting researchrdquoElectoral Studies vol 23 no 1 pp 107ndash122 2004
[34] K M Quinn A D Martin and A B Whitford ldquoVoter choicein multi-party democracies a test of competing theories andmodelsrdquo American Journal of Political Science vol 43 no 4 pp1231ndash1247 1999
[35] J E Roemer ldquoA theory of income taxation where politiciansfocus upon core and swing votersrdquo Social Choice and Welfarevol 36 no 3 pp 383ndash421 2011
[36] N Schofield ldquoEquilibria in the spatial stochastic model ofvoting with party activistsrdquo Review of Economic Design vol 10no 3 pp 183ndash203 2006
[37] N Schofield M Gallego and J Jeon ldquoLeaders voters andactivists in the elections in Great Britain 2005 and 2010rdquoElectoral Studies vol 30 no 3 pp 484ndash496 2011
[38] A Arian and M Shamir The Election in Israel 1996 SUNYPress Albany NY USA 1999
[39] N Schofield M Gallego U Ozdemir and A Zakharov ldquoCom-petition for popular support a valence model of elections inTurkeyrdquo Social Choice and Welfare vol 36 no 3 pp 451ndash4822011
[40] N Schofield J S Jeon M Muskhelishvili U Ozdemir andM Tavits ldquoModeling elections in post-communist regimesvoter perceptions political leaders and activistsrdquo inThePoliticalEconomy of InstitutionsDemocracy andVoting N Schofield andG Caballero Eds pp 259ndash301 Springer Berlin Germany 2011
[41] D L Epstein R Bates J Goldstone I Kristensen and SOrsquoHalloran ldquoDemocratic transitionsrdquo American Journal ofPolitical Science vol 50 no 3 pp 551ndash569 2006
[42] N Schofield M Gallego J Jeon and M MuskhelishvilildquoModelling elections in the Caucasusrdquo Journal of ElectionsPublic Opinion and Parties vol 22 no 2 pp 187ndash214 2012
[43] N Schofield and A Zakharov ldquoA stochastic model of the 2007Russian Duma electionrdquo Public Choice vol 142 no 1-2 pp 177ndash194 2010
[44] M Duverger Political Parties Their Organization and Activityin the Modern State John Wiley amp Sons New York NY USA1954
[45] W H Riker Democracy in the United States Macmillan NewYork NY USA 1953
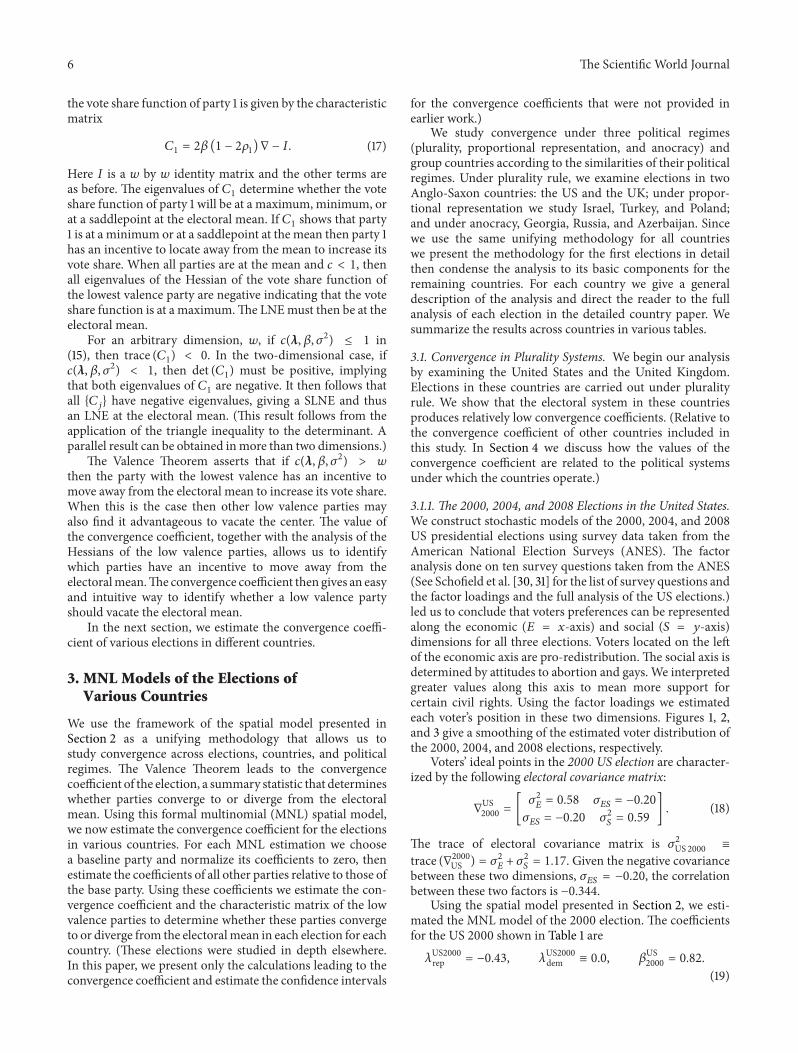
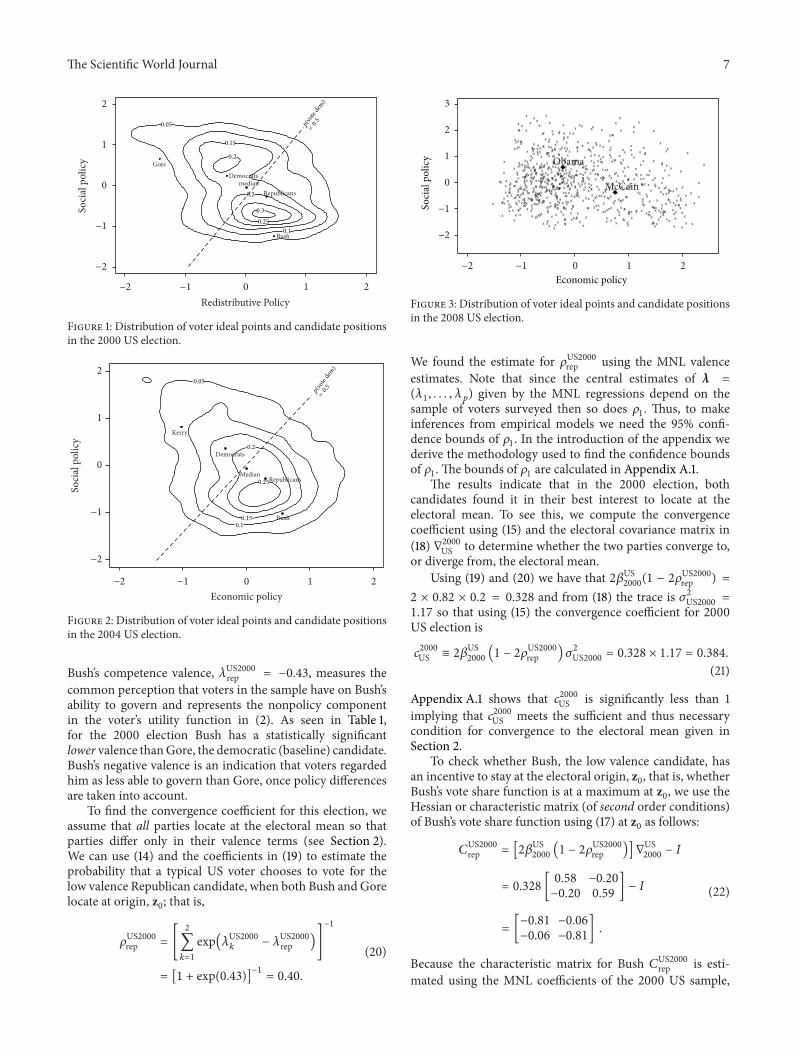
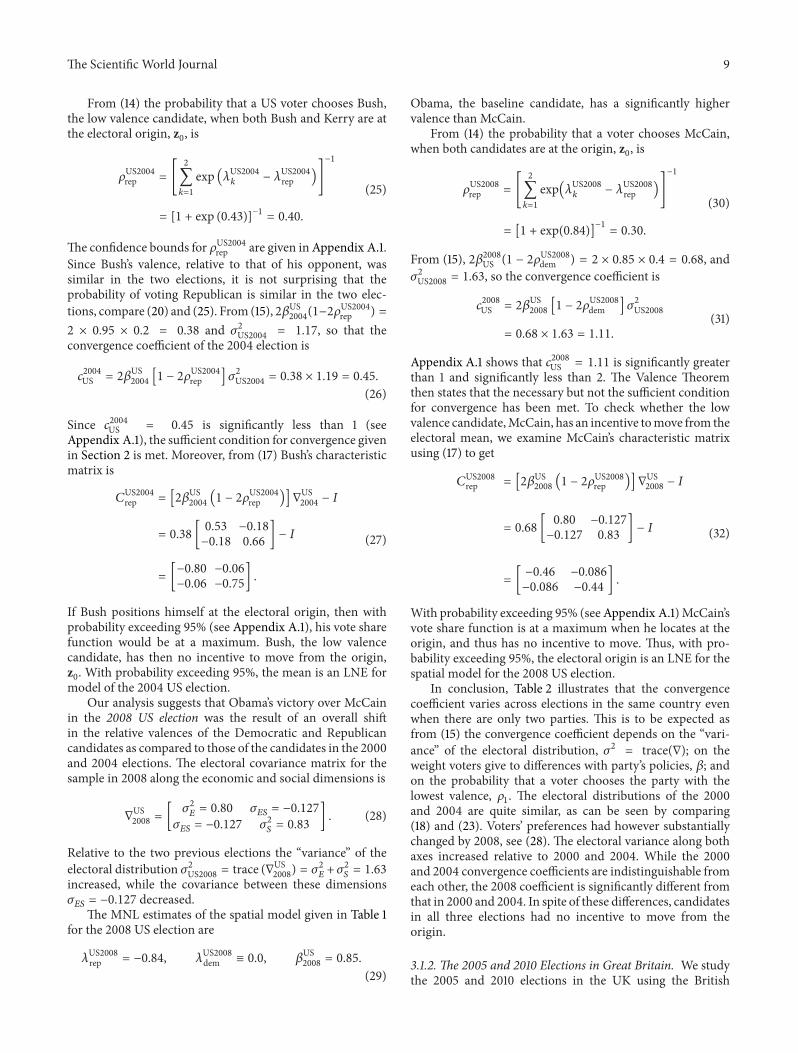
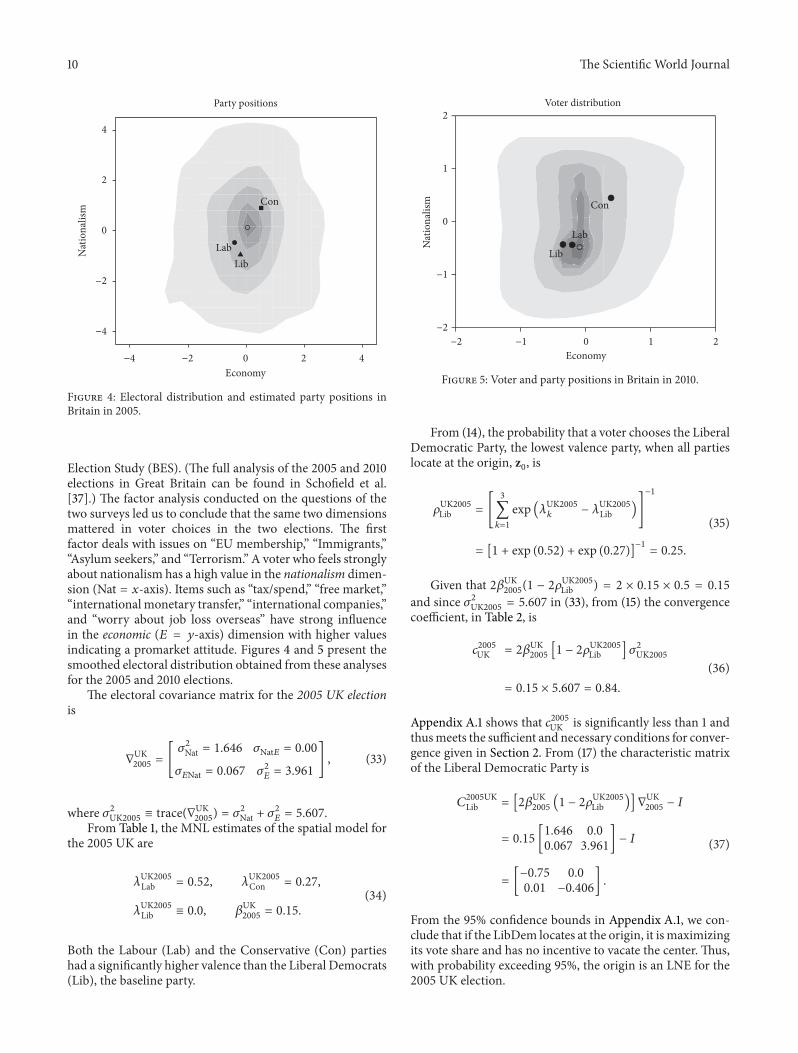
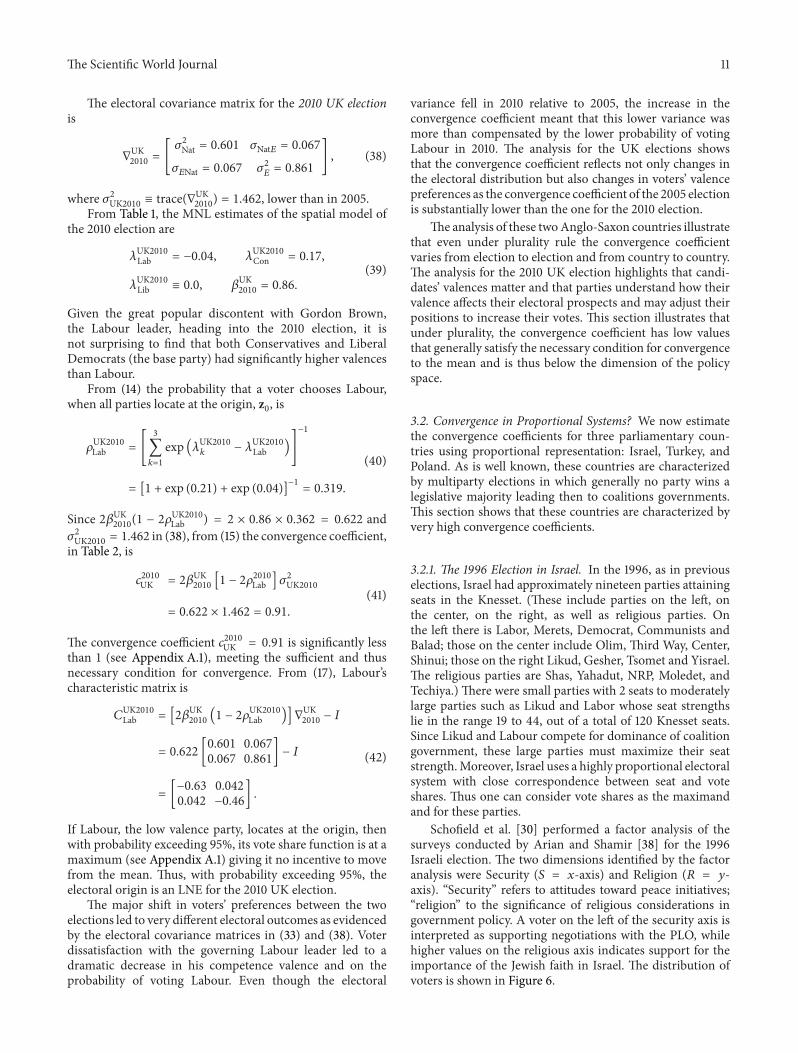
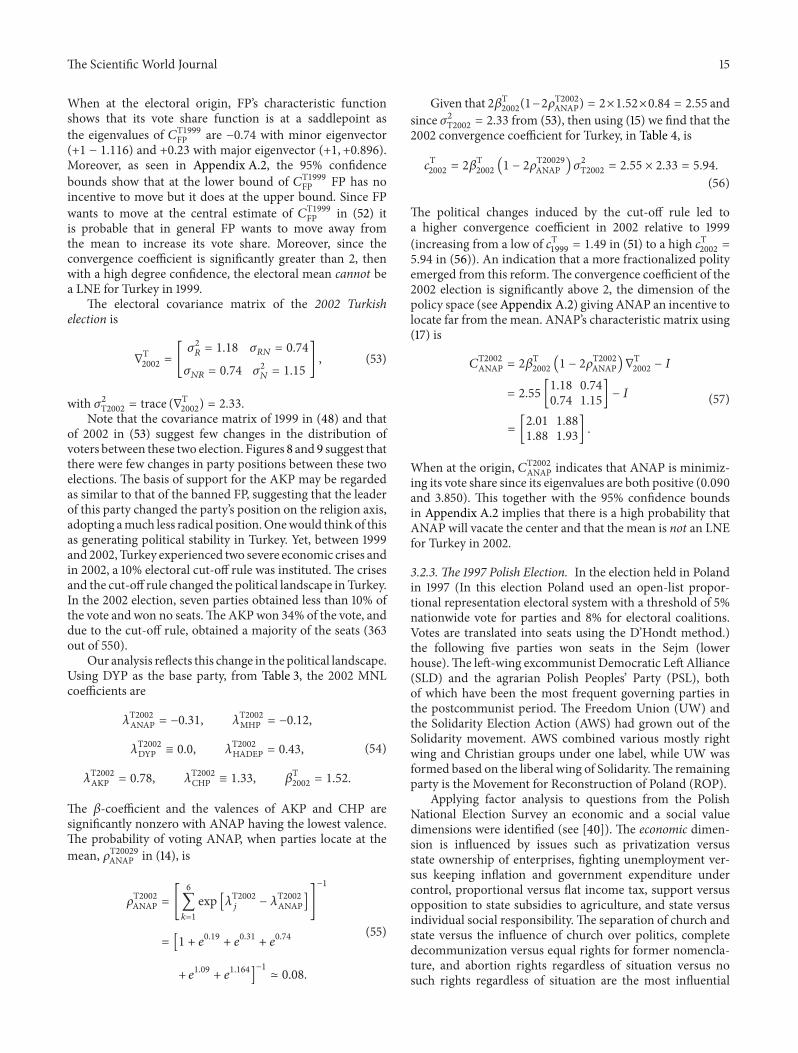
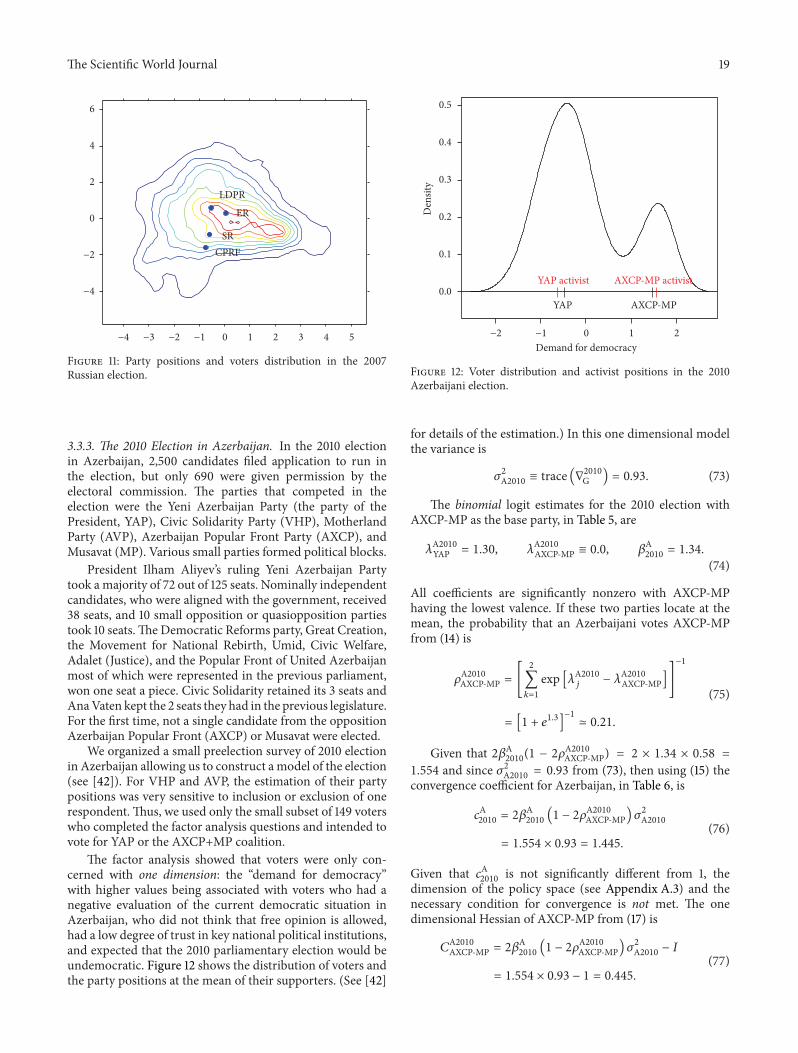
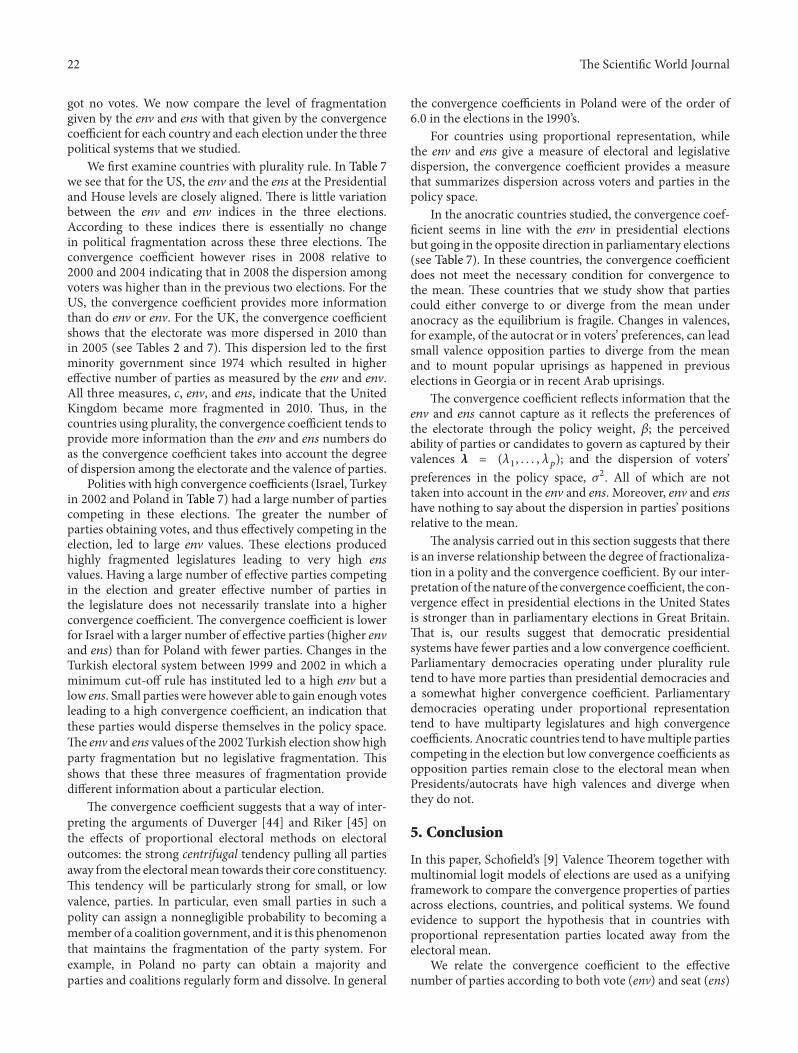


