Embed Size (px)
Citation preview
ORIGINAL RESEARCHINTERVENTIONAL
The Computational Fluid Dynamics Rupture Challenge 2013—Phase I: Prediction of Rupture Status in Intracranial Aneurysms
G. Janiga, P. Berg, S. Sugiyama, K. Kono, and D.A. Steinman
ABSTRACT
BACKGROUND AND PURPOSE: Rupture risk assessment for intracranial aneurysms remains challenging, and risk factors, including wallshear stress, are discussed controversially. The primary purpose of the presented challenge was to determine how consistently aneurysmrupture status and rupture site could be identified on the basis of computational fluid dynamics.
MATERIALS AND METHODS: Two geometrically similar MCA aneurysms were selected, 1 ruptured, 1 unruptured. Participating computa-tional fluid dynamics groups were blinded as to which case was ruptured. Participants were provided with digitally segmented lumengeometries and, for this phase of the challenge, were free to choose their own flow rates, blood rheologies, and so forth. Participants wereasked to report which case had ruptured and the likely site of rupture. In parallel, lumen geometries were provided to a group ofneurosurgeons for their predictions of rupture status and site.
RESULTS: Of 26 participating computational fluid dynamics groups, 21 (81%) correctly identified the ruptured case. Although the known rupturesite was associated with low and oscillatory wall shear stress, most groups identified other sites, some of which also experienced low andoscillatory shear. Of the 43 participating neurosurgeons, 39 (91%) identified the ruptured case. None correctly identified the rupture site.
CONCLUSIONS: Geometric or hemodynamic considerations favor identification of rupture status; however, retrospective identificationof the rupture site remains a challenge for both engineers and clinicians. A more precise understanding of the hemodynamic factorsinvolved in aneurysm wall pathology is likely required for computational fluid dynamics to add value to current clinical decision-makingregarding rupture risk.
ABBREVIATIONS: CFD � computational fluid dynamics; OSI � oscillatory shear index; Re � Reynolds; RRT � relative residence time; TAWSS � temporal-averagedwall shear stress; WSS � wall shear stress
In case of a weakened cerebral vasculature, dilations of the vessel
walls may form. It has been estimated that such intracranial
aneurysms are present in approximately 2%–5% of the Western
population.1,2 Slightly �1% of these aneurysms rupture annually,
but with mostly severe consequences.3 The mortality rate is up to
40%, and even if treatment were available within hours, irrevers-
ible disabilities may remain afterward.4,5
However, if aneurysms are detected incidentally, the attending
physician needs to suggest to the patient whether a treatment is
necessary or a repeated observation is the best choice. Especially in
complex case scenarios, the risk that treatment complications oc-
cur could be even higher than the potential risk of an aneurysm
rupture itself. Therefore, any reliable assistance that can support
the physician’s therapy planning can improve the outcome for the
patient.
During the past years, there has been success in using compu-
tational fluid dynamics (CFD) to predict intracranial aneurysm
rupture status on the basis of a nominal relationship between local
hemodynamics (notably wall shear stress, [WSS]) and aneurys-
mal wall remodeling and degradation.6-9 However, the retrospec-
tive prediction of rupture status (and, by extension, the prospec-
tive prediction of rupture risk) in intracranial aneurysms is
Received March 7, 2014; accepted after revision September 9.
From the Department of Fluid Dynamics and Technical Flows (G.J., P.B.), University ofMagdeburg, Magdeburg, Germany; Department of Neurosurgery (S.S.), Tohoku Univer-sity Graduate School of Medicine, Miyagi, Japan; Department of Neurosurgery (K.K.),Wakayama Rosai Hospital, Wakayama, Japan; and Department of Mechanical and In-dustrial Engineering (D.A.S.), University of Toronto, Toronto, Ontario, Canada.
This work was partly funded by the Federal Ministry of Education and Research in Ger-many within the Research Campus STIMULATE under grant number 03FO16102A.
P.B. was supported by the International Max Planck Research School Magdeburg.D.A.S. was supported by a MidCareer Investigator award from the Heart andStroke Foundation of Ontario.
Please address correspondence to Gabor Janiga, PhD, Laboratory of Fluid Dynam-ics and Technical Flows, University of Magdeburg “Otto von Guericke,” Germany,Universitatsplatz 2, D-39106 Magdeburg, Germany; e-mail: [email protected]
Indicates open access to non-subscribers at www.ajnr.org
Indicates article with supplemental on-line tables.
Indicates article with supplemental on-line photo.
http://dx.doi.org/10.3174/ajnr.A4157
AJNR Am J Neuroradiol ●:● ● 2015 www.ajnr.org 1
Published December 11, 2014 as 10.3174/ajnr.A4157
Copyright 2014 by American Society of Neuroradiology.
controversially discussed in the literature. Xiang et al10 found that
rupture status correlated with significantly lower WSS and a
higher oscillatory shear index (OSI). In contrast, Cebral et al11
found that high maximum WSS and concentrated impingement
regions might be responsible for an aneurysm rupture. In both
studies, �100 intracranial aneurysms were investigated, and the
authors tried to find correlations between hemodynamic or mor-
phologic parameters and the known rupture status. Both studies
agreed that ruptured aneurysms present complex flow structures
and concentrated inflow. Recently, Meng et al12 and Xiang et al13
published a 2-part review summarizing the various criteria for
rupture status predictions and introducing a hypothesis that both
high and low WSS might lead to aneurysm rupture.
In the present study, we wanted to produce a snapshot of
whether engineering groups are able to predict the event of an
aneurysm rupture. Two of the authors (G.J. and D.A.S.) decided
to propose a new computational challenge addressing 2 main ques-
tions: First, can an aneurysm rupture be predicted by using CFD?
Second, along the lines of the previous American Society of Mechan-
ical Engineering aneurysm CFD challenge,14 how broad is the vari-
ability of the different solution strategies used for the computations?
In Phase I, the participants were asked to predict which of the
2 provided aneurysms was ruptured and where the rupture site
was located. The study was completely blinded; none of the CFD
participants had information about the cases, and the source of
the data was not communicated. For the second phase, partici-
pants were provided with prescribed viscosity and patient-specific
mean velocity boundary conditions and were asked to repeat the
simulations to separate solution variations from boundary condi-
tion variations. In the current work, only Phase I of this challenge
and the corresponding results are presented. The variability of the
CFD solutions is discussed in a complementary article.15
MATERIALS AND METHODSCase DetailsOne of the major difficulties was to find unpublished appropriate
datasets in which the rupture site is known. One of the authors
(S.S.) was able to provide 2 cases: an unruptured aneurysm with
MRA examination every 6 months during 5 years and a ruptured
one with a documented site of rupture. They were chosen on the
basis of similar geometric characteristics of the MCA segments.
The 2 intracranial aneurysms that were part of this rupture chal-
lenge were both located at the left M1 segment. On-line Table 1
summarizes the characteristics of both cases, which were not pro-
vided to participating CFD groups.
Clinical Presentation of Case 1. A 77-year-old female patient un-
derwent a medical checkup of the brain, and MR angiography
revealed an unruptured aneurysm (approximately 10 mm) at the
bifurcation of the left middle cerebral artery. Thereafter, the pa-
tient was followed up by MR angiography at 6-month intervals.
Gradual growth of the aneurysm was observed during a 5-year
follow-up; its form changed from spheric to irregular shape. Coil
embolization was performed, considering the risk of rupture.
Clinical Presentation of Case 2. The chief symptom of the case 2
patient was sudden headache. CT examination determined the
diagnosis of an SAH (Hunt and Kosnik grade II/World Federation
of Neurosurgical Societies grade I). During the neck clipping sur-
gery, the aneurysm was completely exposed except for the rup-
tured site, which was covered with a thick fibrin cap. The fibrin
cap was removed gradually with much caution, but acciden-
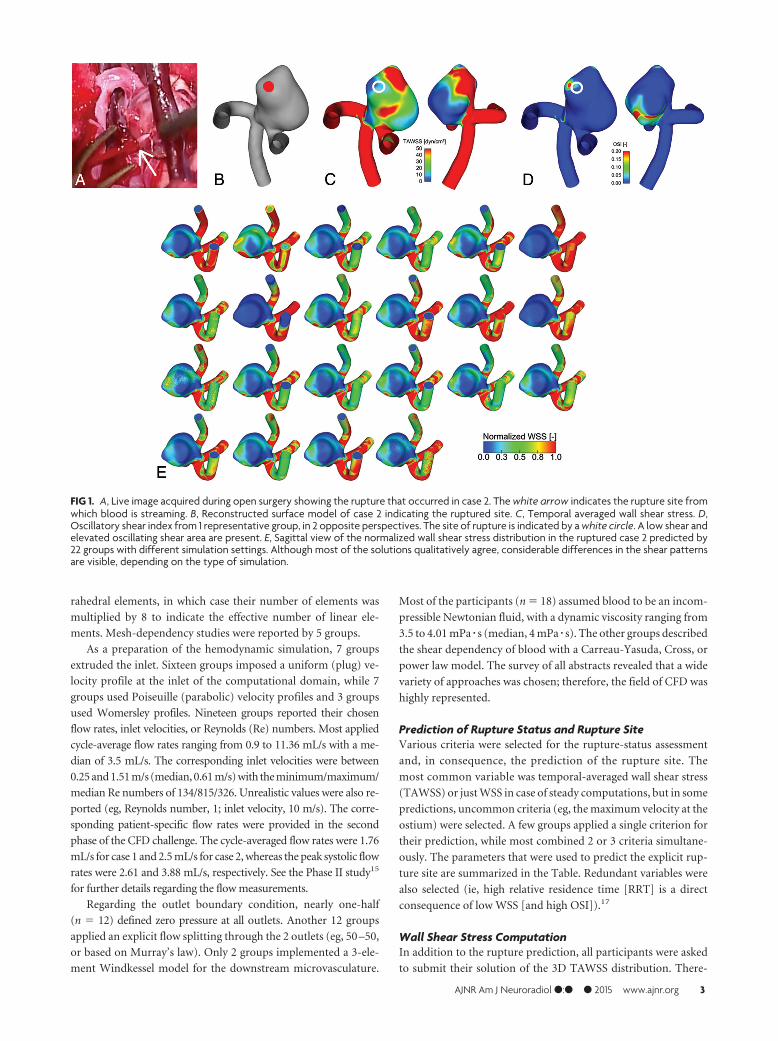
tally, intraoperative rupture occurred. Fig 1A shows an image
acquired during the intervention, with the rupture bleed
clearly visible. Fig 1B shows the reconstructed aneurysm model
in a lateral view to visualize the nominal rupture site.
Vascular ReconstructionThe image acquisition was performed by using 3D digital subtrac-
tion angiography. Digital segmentation was performed in Magde-
burg, Germany, to fix the computational geometry for all partic-
ipants.16 A neuroradiologist reviewed the virtual geometries
afterward to check the plausibility of the reconstructed shapes.
The obtained surface geometries were provided to the partici-
pants as surface triangulation mesh files. On-line Fig 1 shows the
2 investigated cases.
Participating GroupsThe first phase of the CFD Rupture Challenge 2013 started on July
1, and all groups that were willing to participate had the opportu-
nity to submit the requested data until August 23. The complete
announcement can be accessed on http://www.ovgu.de/isut/LSS/
CFD/CFD_Challenge.html. More than 30 groups from academia
and industry accepted the challenge and asked for the recon-
structed surface geometries. Ultimately, 26 submitted a short ab-
stract describing the details of their computations and their rup-
ture predictions. They were from 15 countries and 4 different
continents; therefore, the challenge indeed represented a world-
wide snapshot in computational hemodynamics of intracranial
aneurysms. The participating groups are listed in On-line Table 2.
CFD MethodsOften in CFD challenges, very strict conditions are provided (see,
eg, Steinman et al14) to test the variability of the solution in the
absence of other sources of measurement variability. However,
because a variety of rupture-status-predicting approaches exist
throughout the literature, we decided in advance to provide the
surface models of the intracranial aneurysms exclusively. There-
fore, each group had the freedom to choose any desired volume
mesh with arbitrary types of elements and resolution, flow/veloc-
ity boundary conditions, solver methodology, blood rheology,
and so forth. With this flexibility, the participants were asked
solely to report which of the 2 cases had ruptured and where the
site of rupture was located.
Most the simulations (16/26) were performed by using com-
mercial CFD solvers, but open-source and in-house codes were
also applied. Ten groups decided to use steady-state computa-
tions; 14 groups used unsteady simulations for their predictions,
while 2 groups performed both. The unsteady computations were
performed by using various time-steps in the range of �t � 1 �
10�5 seconds to 5 � 10�3 seconds (ie, 100,000 down to 200 time-
steps per cardiac cycle) with a median of 7.5 � 10�4 seconds
(�1300 steps per cardiac cycle). The reported mesh sizes were in
the range of 283,000 to 17.97 million linear elements (median, 2.1
million). These figures included 3 groups that used quadratic tet-
2 Janiga ● 2015 www.ajnr.org
rahedral elements, in which case their number of elements was
multiplied by 8 to indicate the effective number of linear ele-
ments. Mesh-dependency studies were reported by 5 groups.
As a preparation of the hemodynamic simulation, 7 groups
extruded the inlet. Sixteen groups imposed a uniform (plug) ve-
locity profile at the inlet of the computational domain, while 7
groups used Poiseuille (parabolic) velocity profiles and 3 groups
used Womersley profiles. Nineteen groups reported their chosen
flow rates, inlet velocities, or Reynolds (Re) numbers. Most applied
cycle-average flow rates ranging from 0.9 to 11.36 mL/s with a me-
dian of 3.5 mL/s. The corresponding inlet velocities were between
0.25 and 1.51 m/s (median, 0.61 m/s) with the minimum/maximum/
median Re numbers of 134/815/326. Unrealistic values were also re-
ported (eg, Reynolds number, 1; inlet velocity, 10 m/s). The corre-
sponding patient-specific flow rates were provided in the second
phase of the CFD challenge. The cycle-averaged flow rates were 1.76
mL/s for case 1 and 2.5 mL/s for case 2, whereas the peak systolic flow
rates were 2.61 and 3.88 mL/s, respectively. See the Phase II study15
for further details regarding the flow measurements.
Regarding the outlet boundary condition, nearly one-half
(n � 12) defined zero pressure at all outlets. Another 12 groups
applied an explicit flow splitting through the 2 outlets (eg, 50 –50,
or based on Murray’s law). Only 2 groups implemented a 3-ele-
ment Windkessel model for the downstream microvasculature.
Most of the participants (n � 18) assumed blood to be an incom-
pressible Newtonian fluid, with a dynamic viscosity ranging from
3.5 to 4.01 mPa � s (median, 4 mPa � s). The other groups described
the shear dependency of blood with a Carreau-Yasuda, Cross, or
power law model. The survey of all abstracts revealed that a wide
variety of approaches was chosen; therefore, the field of CFD was
highly represented.
Prediction of Rupture Status and Rupture SiteVarious criteria were selected for the rupture-status assessment
and, in consequence, the prediction of the rupture site. The
most common variable was temporal-averaged wall shear stress
(TAWSS) or just WSS in case of steady computations, but in some
predictions, uncommon criteria (eg, the maximum velocity at the
ostium) were selected. A few groups applied a single criterion for
their prediction, while most combined 2 or 3 criteria simultane-
ously. The parameters that were used to predict the explicit rup-
ture site are summarized in the Table. Redundant variables were
also selected (ie, high relative residence time [RRT] is a direct
consequence of low WSS [and high OSI]).17
Wall Shear Stress ComputationIn addition to the rupture prediction, all participants were asked
to submit their solution of the 3D TAWSS distribution. There-
FIG 1. A, Live image acquired during open surgery showing the rupture that occurred in case 2. The white arrow indicates the rupture site fromwhich blood is streaming. B, Reconstructed surface model of case 2 indicating the ruptured site. C, Temporal averaged wall shear stress. D,Oscillatory shear index from 1 representative group, in 2 opposite perspectives. The site of rupture is indicated by a white circle. A low shear andelevated oscillating shear area are present. E, Sagittal view of the normalized wall shear stress distribution in the ruptured case 2 predicted by22 groups with different simulation settings. Although most of the solutions qualitatively agree, considerable differences in the shear patternsare visible, depending on the type of simulation.
AJNR Am J Neuroradiol ●:● ● 2015 www.ajnr.org 3
fore, the variability of the WSS computation could be assessed
directly. Another purpose was to ensure that the participating
groups had actually performed the simulations that informed
their prediction of rupture status and site. The submitted WSS
distributions have shown very different maximum values, possi-
bly due to the different near-wall resolutions but more likely
because of the very different flow rates applied at the inlet.
Because the results could not be compared dimensionally, each
dataset was cropped at a chosen location of the parent artery
and the calculated WSS field was normalized by the maximum
value in the sac, to compare the relative qualitative distribu-
tions of WSS.
Neurosurgeon ChallengeOne of the authors (K.K.), who performs endovascular treat-
ments, open skull surgery, and CFD simulations on cerebral
aneurysms, thought that it would be interesting to know the
prediction of the ruptured aneurysm and the rupture site by neu-
rosurgeons versus computer simulations. A single-page question-
naire (On-line Fig 3) was created providing only 3D images of the
2 aneurysms in 4 different angles. The questionnaire included the
following: maximum size, neck size, height, diameters of the an-
eurysm in 3 axes, and size of the parent arteries. No other infor-
mation, including the patient data, risk factors, and treatments
presented in On-line Table 1, was available. As noted above, both
aneurysms had been carefully selected in advance to have compa-
rable dimensions. K.K. asked 43 neurosurgeons in Japan to pre-
dict the ruptured aneurysm and the rupture site using the ques-
tionnaire. Additionally, they were asked to report the years of
experience as a neurosurgeon and the reasons for the prediction
of the ruptured aneurysm and the rupture point. The question-
naire had been completed before the CFD simulations were per-
formed and the ruptured case identified. Thus, this questionnaire
was performed in a double-blinded fashion.
RESULTSPrediction of Rupture Status and Rupture SiteRegarding the challenge in Phase I, 4 groups predicted rupture for
case 1, 21 groups chose case 2, and 1 group was unsure and there-
fore did not contribute any predictions. The ruptured aneurysm
was case 2 as described above, so most, 21 of 26 groups (81%),
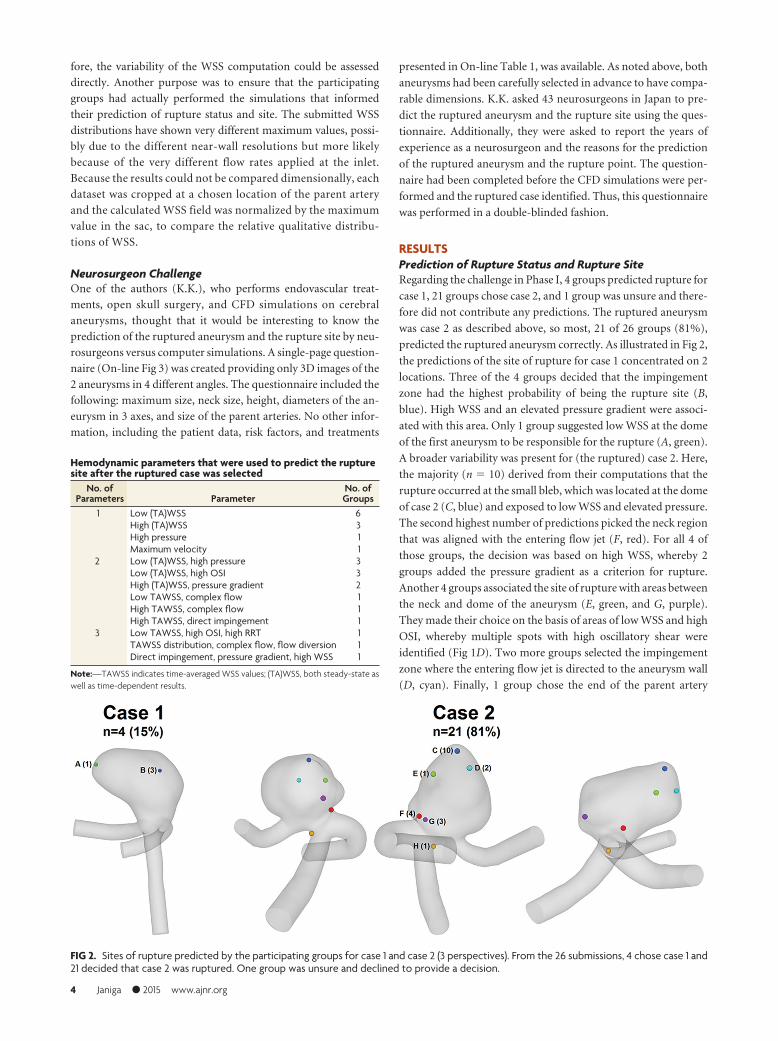
predicted the ruptured aneurysm correctly. As illustrated in Fig 2,
the predictions of the site of rupture for case 1 concentrated on 2
locations. Three of the 4 groups decided that the impingement
zone had the highest probability of being the rupture site (B,
blue). High WSS and an elevated pressure gradient were associ-
ated with this area. Only 1 group suggested low WSS at the dome
of the first aneurysm to be responsible for the rupture (A, green).
A broader variability was present for (the ruptured) case 2. Here,
the majority (n � 10) derived from their computations that the
rupture occurred at the small bleb, which was located at the dome
of case 2 (C, blue) and exposed to low WSS and elevated pressure.
The second highest number of predictions picked the neck region
that was aligned with the entering flow jet (F, red). For all 4 of
those groups, the decision was based on high WSS, whereby 2
groups added the pressure gradient as a criterion for rupture.
Another 4 groups associated the site of rupture with areas between
the neck and dome of the aneurysm (E, green, and G, purple).
They made their choice on the basis of areas of low WSS and high
OSI, whereby multiple spots with high oscillatory shear were
identified (Fig 1D). Two more groups selected the impingement
zone where the entering flow jet is directed to the aneurysm wall
(D, cyan). Finally, 1 group chose the end of the parent artery
FIG 2. Sites of rupture predicted by the participating groups for case 1 and case 2 (3 perspectives). From the 26 submissions, 4 chose case 1 and21 decided that case 2 was ruptured. One group was unsure and declined to provide a decision.
Hemodynamic parameters that were used to predict the rupturesite after the ruptured case was selected
No. ofParameters Parameter
No. ofGroups
1 Low (TA)WSS 6High (TA)WSS 3High pressure 1Maximum velocity 1
2 Low (TA)WSS, high pressure 3Low (TA)WSS, high OSI 3High (TA)WSS, pressure gradient 2Low TAWSS, complex flow 1High TAWSS, complex flow 1High TAWSS, direct impingement 1
3 Low TAWSS, high OSI, high RRT 1TAWSS distribution, complex flow, flow diversion 1Direct impingement, pressure gradient, high WSS 1
Note:—TAWSS indicates time-averaged WSS values; (TA)WSS, both steady-state aswell as time-dependent results.
4 Janiga ● 2015 www.ajnr.org
because the highest velocities were present due to the smallest
vessel diameter (H, orange). However, after we reviewed the sub-
mitted abstract of this particular group, the results can be classi-
fied as unrealistic (peak velocity as rupture criterion; peak-systolic
inflow velocity of 10 m/s for both cases).
Throughout the complete challenge period, both the partici-
pants and the organizers were blinded regarding the rupture so-
lution to ensure objective conditions. Afterward, author S.S. re-
vealed the ruptured case.
The known site of rupture can now be compared with hemo-
dynamic parameters that are typically used to characterize aneu-
rysmal flow. We focused on TAWSS and OSI as major represen-
tatives of the predictions (Table). The results of wall shear stress
and the oscillatory shear index were taken from a group that im-
plemented inflow conditions that have been close to patient-spe-
cific. As indicated in Fig 1C, the ruptured site is located in an area
that experiences rather low TAWSS compared with the parent
artery with values well above 50 dyn/cm2. In the indicated region,
TAWSS ranges between 0.1 and 19 dyn/cm2. Furthermore, ele-
vated OSI is visible within the region of interest (Fig 1D). How-
ever, very low WSS (�5 dyn/cm2) and high oscillatory shear with
values up to 0.42 are present beside this area.
WSS DistributionsWSS distributions contributed by the participants are shown in
Fig 1E (for the ruptured case 2). The WSS distributions for the
unruptured case 1 are presented in On-line Fig 4. The WSS pat-
terns on the aneurysm surface are obtained from 22 participants
that used different assumptions to calculate the hemodynamic
parameters. The normalized values demonstrate qualitative sim-
ilarities, but differences regarding, for example, the size of differ-
ent regions can also be observed. These differences show the vari-
ability of CFD and might explain the variability of rupture site
prediction.
The different WSS predictions revealed the importance of re-
alistic boundary conditions such as patient-specific measure-
ments. This information was provided to all participants in a
second phase along with further simulation conditions. The
corresponding results, which represent the inherent variability of
the CFD solutions among all groups, are not discussed in this
article but are extensively described in the complementary
work.15
Neurosurgeon PredictionsThe mean experience of neurosurgeons was 14.5 9.4 years.
Most of the neurosurgeons (39/43) correctly predicted that the
case 2 aneurysm was the ruptured one because of blebs (56%) or
irregular shape (44%). The predictions of the rupture site were
split (On-line Fig 2). The main reasons for prediction of the rup-
ture site in case 2 were impact zone (42%) or tip of the aneurysm
(58%) for point B (red) and the irregular and sharp bleb (75%) or
the flow stagnation area (15%) for point C (blue), respectively.
None predicted the rupture site correctly.
DISCUSSIONThe results of the challenge were first presented in a plenary talk at
the IntraCranial Stent Meeting, which was held as a joint meeting
with the World Federation of Interventional and Therapeutic
Neuroradiology Congress in November 2013 in Buenos Aires. At
the beginning of the talk, only the attending neurosurgeons and
neuroradiologists from the whole audience were polled to predict
the rupture status before seeing the results of the challenge. Five
selected case 1, while �20 chose case 2. The clinicians from the
audience were shown only the geometry of both cases and On-line
Table 1 (without the geometric information). That table was not
available for the participants during the challenge (engineers and
neurosurgeons). Case 1 is slightly larger, while for case 2, smoking
and hypertension should be mentioned. This information might
have influenced the ad hoc on-site poll. The ratio of the predic-
tions was very similar regarding both the engineering participants
from the CFD challenge and the clinicians at the conference and
from the independent neurosurgeon questionnaire.
One of the goals of CFD research is to make CFD simulations
clinically useful. However, CFD simulations still seem far from
clinical use. There are only a few reports in which CFD simula-
tions are used for designing treatment strategy.18 CFD simula-
tions would not become helpful if they predict a rupture in the
same aneurysms as clinicians already do. CFD simulations can be
useful only when they change neurosurgeons’ decisions or treat-
ment strategy or add helpful hemodynamic information that is
inaccessible to physicians. In the current CFD and neurosurgeon
challenge, which consists of 2 cases only, prediction by computers
and neurosurgeons was comparable. Prediction by CFD simula-
tions took hours, while prediction by neurosurgeons took �1
minute. Thus, in this particular situation at least, neurosurgeons
would not use CFD in the clinical field. One method to clarify
possible clinical applications of computer simulations is to exam-
ine in what situations computer simulations can exceed clini-
cians’ experience or decisions. In addition, clinicians should learn
possible clinical applications and limitations of computational
simulations, and engineers should provide this information.
Then, clinicians using CFD simulations may provide better treat-
ment to patients in selected situations.
Regarding the second task of the CFD challenge, the specific
predictions of the site of rupture were distributed throughout the
second aneurysm, with the groups defining 6 different locations.
One essential reason might be that only a few hemodynamic stud-
ies about rupture points are available.19,20 In general, ruptured-
versus-unruptured aneurysms are compared, but no information
regarding the real rupture site can be derived. In addition, hemo-
dynamic studies addressing thin walls and blebs do not necessarily
indicate actual rupture sites. Another reason can be seen in the
potential level of experience regarding hemodynamic simulations
in intracranial aneurysms. Although some groups were highly ex-
perienced in other fields of engineering, the survey of the abstracts
revealed that unrealistic inflow rates or velocities were applied.
For instance, one group defined an inflow velocity of 10 m/s,
whereas another group used a turbulence model that was devel-
oped for industrial flows and has not been well-tested on aneu-
rysm-type flows. Another concern is related to the spatial and
temporal resolution because some groups used coarse meshes
and/or large time-steps in their computations.21
Proponents of both the low and the high WSS theory were able
to predict the ruptured case. It was found for the group with
AJNR Am J Neuroradiol ●:● ● 2015 www.ajnr.org 5
boundary conditions close to the patient-specific that case 2 had
lower area-averaged WSS and higher maximum WSS than case 1
(averaged WSS1 � 32.1 dyn/cm2 versus averaged WSS2 � 27.8
dyn/cm2; maximumWSS1 � 203.2 dyn/cm2 versus maximum-
WSS2 � 244.4 dyn/cm2). Therefore, the different results (low-
versus-high WSS) may not contradict each other. Although at the
ruptured site, relatively low WSS and partly elevated OSI were
detected, the groups who used these parameters to predict the
location did not necessarily succeed in choosing the correct rup-
ture site. Because multiple areas throughout the aneurysm sac
fulfilled these conditions, other, even stronger, spots were picked
by the corresponding groups (Fig 1C, -D).
Most interesting, RRT is prolonged on the rupture site and the
flow stagnation area on the opposite side. Live images acquired
during the intervention revealed the presence of atherosclerosis in
this stagnation area, which supports recent findings.17 However,
no thickening of the aneurysm wall was observed at the rupture
site. In that study,17 the thick wall had prolonged RRT, but pro-
longed regions with RRT did not necessarily show a thick wall.
Because the results of the second phase15 demonstrate that almost
all groups are capable of generating nearly identical flow fields
under the prescribed boundary conditions, the importance of a
realistic numeric setup and model parameters is emphasized once
again. Hence, if CFD is integrated in clinical routines some day,
guidelines that have evolved from years of experience (eg, spatial
and temporal discretization, flow rates, and so forth) should be
provided. Such guidelines for hemodynamic simulations in intra-
cranial aneurysms need to address the choice of inflow boundary
condition (eg, idealized versus patient-specific22), flow splitting
through multiple outlet sections, wall treatment, blood modeling,
and the consideration of pulsatile flow (steady versus unsteady23),
and so forth.
Overall, the following knowledge can be derived from this
CFD challenge, which should be considered a snapshot of the
current state-of-the-art regarding hemodynamic simulations.
Twenty-one of the 26 participants could predict the correct aneu-
rysm and therefore demonstrated that the applied methods are
capable of differentiating between the provided cases. Because the
particular predictions of the rupture site were relatively diverse, it
is not possible to state that CFD can be used to detect the rupture
point with high probability currently. To reach this aim, investi-
gating the nature and magnitude of forces that give rise to aneu-
rysm wall remodeling and degradation is necessary. Additionally,
CFD should be considered as only 1 aspect besides, for example,
patient history or shape analyses within the treatment planning.
As a numerical method, it just provides help and not a decision for
the attending clinician.
Limitations of the StudyAlthough precise predictions of the site of rupture in intracranial
aneurysms were performed, this study does not claim that a reli-
able virtual rupture prediction is possible now. Still, the numeric
models underlie too many assumptions, and it is unclear how
strongly they affect the real hemodynamics. First, this study in-
volved only 2 aneurysms. Because this study is the first of its kind,
participants focused on 2 aneurysms with similar geometric prop-
erties and were aware that one had ruptured. This number of cases
and prior knowledge are not representative and need to be im-
proved in the future to decide how reliably computational models
can predict rupture status. Selected cases from private or open
data bases should be considered.
A second limitation is related to the implemented outlet
boundary conditions. Some groups applied flow splitting through
the different outflows or used Windkessel and resistance models
to improve on the assumption of a constant pressure at the out-
lets. However, the lack of knowledge regarding the real temporal
pressure/flow variation at the outlet cross-section certainly leads
to inaccuracies of the blood flow simulations.
As a third aspect, rigid vessel walls were assumed for all simu-
lations performed within this study. Although Oubel et al24 found
that the actual wall motion does not influence the hemodynamics
predicted by CFD and the lack of elastin of aneurysms, which is
the essential component to enable flexibility, generally strong dif-
ferences regarding the wall thickness were observed.25 In conse-
quence, the resistance against the imposed flow structures is not
equally distributed over the complete aneurysm sac. Therefore, a
better understanding of the interaction between the flow and the
wall response is required. Vessel wall information such as thick-
ness and strength should be included in future studies if reliable
measurements by using, for example, optical coherence tomogra-
phy or intraoperative microscopy26 are possible.
The actual rupture was observed intraoperatively and was
thought to be a rerupture of the spontaneous rupture that oc-
curred before the intervention.
Finally, a broad range of skill and experience was detected
among the CFD participants, representing a possible state-of-the-
art of the current status in the field of computational hemody-
namics for intracranial aneurysms. The neurosurgeons who com-
pleted the questionnaire have years of experience and can be
considered experts. This heterogeneity among the biomedical en-
gineers might have an influence on the comparison of both
communities.
CONCLUSIONSMany groups throughout the world apply numerical methods to
investigate cerebral hemodynamics. Challenging these groups by
asking them to predict the rupture status of an intracranial aneu-
rysm revealed that approximately 80% were able to choose the
correct aneurysm on the basis of their computations. In particu-
lar, low and oscillatory shear was associated with the site of rup-
ture correctly. However, the determination of the rupture site
remained challenging if CFD (or, indeed, geometry) was used
for the decision exclusively; the predictions were distributed
throughout the entire aneurysm sac. Reviewing the participating
groups and their submitted abstracts indicates that though great
experience concerning engineering problems exists, it might not
be sufficient for the investigation of aneurysmal hemodynamics.
Therefore, it is of enormous importance that groups have experi-
ence in simulating cerebrovascular flows before conclusions are
drawn from computational results.
Future challenges in the retrospective prediction of the rup-
ture status in intracranial aneurysms might include more biolog-
ical aspects. This step will be a necessary one toward the prospec-
tive rupture risk assessment. In particular, aneurysm wall
6 Janiga ● 2015 www.ajnr.org
information and the formation of blood clots or even thrombi
should be considered within the numerical modeling. However,
because reliable information is not available up to now, the rup-
ture-prediction challenge might be expanded to more cases to test
the consistency of the CFD groups.
ACKNOWLEDGMENTSThe authors express their gratitude to all participants of the CFD
Rupture Challenge 2013. The large number of contributions en-
abled us to reflect the current state-of-the-art in the field of virtual
aneurysm research. Additionally, we thank Pedro Lylyk (Inter-
ventional Neuroradiology, Clinical Institute ENERI, Buenos Ai-
res, Argentina) and Juan R. Cebral (George Mason University,
Fairfax, Virginia) for providing the opportunity to present the
results in a plenary session at the IntraCranial Stent Meeting 2013
in Buenos Aires. Furthermore, the authors warmly acknowledge
the fruitful discussions with Oliver Beuing (Department of Neu-
roradiology, University Hospital of Magdeburg, Germany). Spe-
cial thanks are addressed to Mathias Neugebauer (Department of
Simulation and Graphics, University Magdeburg, Magdeburg,
Germany) who performed the 3D reconstruction of the patient-
specific aneurysms. S.S. thanks Ayako Nadia Aoyagi (Tohoku
University Hospital, Japan) for her technical support on this
study.
REFERENCES1. Bonneville F, Sourour N, Biondi A. Intracranial aneurysms: an over-
view. Neuroimag Clin N Am 2006;16:371– 82, vii2. Curtis SL, Bradley M, Wilde P, et al. Results of screening for intra-
cranial aneurysms in patients with coarctation of the aorta. AJNRAm J Neuroradiol 2012;33:1182– 86
3. Morita A, Kirino T, Hashi K, et al. The natural course of unrupturedcerebral aneurysms in a Japanese cohort. N Engl J Med 2012;366:2474 – 82
4. Teunissen LL, Rinkel GJ, Algra A, et al. Risk factors for subarachnoidhemorrhage: a systematic review. Stroke 1996;27:544 – 49
5. Bederson JB, Connolly ES, Jr., Batjer HH, et al. Guidelines for themanagement of aneurysmal subarachnoid hemorrhage: a state-ment for healthcare professionals from a special writing group ofthe Stroke Council, American Heart Association. Stroke 2009;40:994 –1025
6. Qian Y, Takao H, Umezu M, et al. Risk analysis of unruptured an-eurysms using computational fluid dynamics technology: prelimi-nary results. AJNR Am J Neuroradiol 2011;32:1948 –55
7. Takao H, Murayama Y, Otsuka S, et al. Hemodynamic differencesbetween unruptured and ruptured intracranial aneurysms duringobservation. Stroke 2012;43:1436 –39
8. Goubergrits L, Schaller J, Kertzscher U, et al. Statistical wall shearstress maps of ruptured and unruptured middle cerebral artery an-eurysms. J R Soc Interface 2012;9:677– 88
9. Zhang Y, Mu S, Chen J, et al. Hemodynamic analysis of intracranialaneurysms with daughter blebs. Eur Neurol 2011;66:359 – 67
10. Xiang J, Natarajan SK, Tremmel M, et al. Hemodynamic-morpho-
logic discriminants for intracranial aneurysm rupture. Stroke2011;42:144 –52
11. Cebral JR, Mut F, Raschi M, et al. Aneurysm rupture following treat-ment with flow-diverting stents: computational hemodynamicsanalysis of treatment. AJNR Am J Neuroradiol 2011;32:27–33
12. Meng H, Tutino VM, Xiang J, et al. High WSS or low WSS? Complexinteractions of hemodynamics with intracranial aneurysm initia-tion, growth, and rupture: toward a unifying hypothesis. AJNR Am JNeuroradiol 2014;35:1254 – 62
13. Xiang J, Tutino VM, Snyder KV, et al. CFD: computational fluiddynamics or confounding factor dissemination? The role of hemo-dynamics in intracranial aneurysm rupture risk assessment. AJNRAm J Neuroradiol 2014;35:1849 –57
14. Steinman DA, Hoi Y, Fahy P, et al. Variability of computational fluiddynamics solutions for pressure and flow in a giant aneurysm: theASME 2012 Summer Bioengineering Conference CFD Challenge.J Biomech Eng 2013;135:021016
15. Berg P, Roloff C, Beuing O, et al. The Computational Fluid DynamicsRupture Challenge 2013—Phase II: variability of hemodynamic sim-ulations in two intracranial aneurysms. J Biomech Eng. In press
16. Neugebauer M, Lawonn K, Beuing O, et al. Automatic generation ofanatomic characteristics from cerebral aneurysm surface models.Int J Comput Assist Radiol Surg 2013;8:279 – 89
17. Sugiyama S, Niizuma K, Nakayama T, et al. Relative residence timeprolongation in intracranial aneurysms: a possible association withatherosclerosis. Neurosurgery 2013;73:767–76
18. Kono K, Shintani A, Fujimoto T, et al. Stent-assisted coil emboliza-tion and computational fluid dynamics simulations of bilateral ver-tebral artery dissecting aneurysms presenting with subarachnoidhemorrhage: case report. Neurosurgery 2012;71:E1192–200; discus-sion E1200 – 01
19. Kono K, Fujimoto T, Shintani A, et al. Hemodynamic characteristicsat the rupture site of cerebral aneurysms: a case study. Neurosurgery2012;71:E1202– 08; discussion 1209
20. Omodaka S, Sugiyama S, Inoue T, et al. Local hemodynamics at therupture point of cerebral aneurysms determined by computationalfluid dynamics analysis. Cerebrovasc Dis 2012;34:121–29
21. Valen-Sendstad K, Steinman DA. Mind the gap: impact of computa-tional fluid dynamics solution strategy on prediction of intracra-nial aneurysm hemodynamics and rupture status indicators. AJNRAm J Neuroradiol 2014;35:536 – 43
22. Jansen IG, Schneiders JJ, Potters WV, et al. Generalized versus pa-tient-specific inflow boundary conditions in computational fluiddynamics simulations of cerebral aneurysmal hemodynamics.AJNR Am J Neuroradiol 2014;35:1543– 48
23. Babiker MH, Gonzalez LF, Albuquerque F, et al. An in vitro study ofpulsatile fluid dynamics in intracranial aneurysm models treatedwith embolic coils and flow diverters. IEEE Trans Biomed Eng2013;60:1150 –59
24. Oubel E, DeCraene M, Putman CM, et al. Analysis of intracranialaneurysm wall motion and its effects on hemodynamic patterns.Proc SPIE 2007;6511:65112A
25. Frosen J, Tulamo R, Paetau A, et al. Saccular intracranial aneurysm:pathology and mechanisms. Acta Neuropathol 2012;123:773– 86
26. Kadasi LM, Dent WC, Malek AM. Cerebral aneurysm wall thicknessanalysis using intraoperative microscopy: effect of size and genderon thin translucent regions. J Neurointerv Surg 2013;5:201– 06
AJNR Am J Neuroradiol ●:● ● 2015 www.ajnr.org 7


