Embed Size (px)
Citation preview
Copyright
Copyright©2018byJudeaPearlandDanaMackenzie
HachetteBookGroupsupportstherighttofreeexpressionandthevalueofcopyright.Thepurposeofcopyrightistoencouragewritersandartiststoproducethecreativeworksthatenrichourculture.
Thescanning,uploading,anddistributionofthisbookwithoutpermissionisatheftoftheauthor’sintellectualproperty.Ifyouwouldlikepermissiontousematerialfromthebook(otherthanforreviewpurposes),pleasecontactpermissions@hbgusa.com.Thankyouforyoursupportoftheauthor’srights.
BasicBooks
HachetteBookGroup
1290AvenueoftheAmericas,NewYork,NY10104
www.basicbooks.com
FirstEdition:May2018
PublishedbyBasicBooks,animprintofPerseusBooks,LLC,asubsidiaryofHachetteBookGroup,Inc.TheBasicBooksnameandlogoisatrademarkoftheHachetteBookGroup.
TheHachetteSpeakersBureauprovidesawiderangeofauthorsforspeakingevents.Tofindoutmore,gotowww.hachettespeakersbureau.comorcall(866)376-6591.
Thepublisherisnotresponsibleforwebsites(ortheircontent)thatarenotownedbythepublisher.
LibraryofCongressCataloging-in-PublicationData
Names:Pearl,Judea,author.|Mackenzie,Dana,author.
Title:Thebookofwhy:thenewscienceofcauseandeffect/JudeaPearlandDanaMackenzie.
Description:NewYork:BasicBooks,[2018]|Includesbibliographical

referencesandindex.
Identifiers:LCCN2017056458(print)|LCCN2018005510(ebook)|ISBN9780465097616(ebook)|ISBN9780465097609(hardcover)|ISBN046509760X(hardcover)|ISBN0465097618(ebook)
Subjects:LCSH:Causation.|Inference.
Classification:LCCQ175.32.C38(ebook)|LCCQ175.32.C38P432018(print)|DDC501—dc23
LCrecordavailableathttps://lccn.loc.gov/2017056458
ISBNs:978-0-465-09760-9(hardcover);978-0-465-09761-6(ebook)
E3-20180417-JV-PC
CONTENTS
CoverTitlePageCopyrightDedicationPreface
INTRODUCTIONMindoverDataCHAPTER1TheLadderofCausationCHAPTER2FromBuccaneerstoGuineaPigs:TheGenesisofCausal
InferenceCHAPTER3FromEvidencetoCauses:ReverendBayesMeetsMr.HolmesCHAPTER4ConfoundingandDeconfounding:Or,SlayingtheLurking
VariableCHAPTER5TheSmoke-FilledDebate:ClearingtheAirCHAPTER6ParadoxesGalore!CHAPTER7BeyondAdjustment:TheConquestofMountInterventionCHAPTER8Counterfactuals:MiningWorldsThatCouldHaveBeenCHAPTER9Mediation:TheSearchforaMechanismCHAPTER10BigData,ArtificialIntelligence,andtheBigQuestions
AcknowledgmentsAbouttheAuthorsAlsobyJudeaPearlNotesBibliographyIndex

ToRuth
PREFACE
ALMOSTtwodecadesago,whenIwrotetheprefacetomybookCausality(2000),Imadearatherdaringremarkthatfriendsadvisedmetotonedown.“Causalityhasundergoneamajor transformation,”Iwrote,“fromaconceptshroudedinmysteryintoamathematicalobjectwithwell-definedsemanticsand well-founded logic. Paradoxes and controversies have been resolved,slippery concepts have been explicated, and practical problems relying oncausal information that long were regarded as either metaphysical orunmanageablecannowbesolvedusingelementarymathematics.Putsimply,causalityhasbeenmathematized.”
Reading this passage today, I feel Iwas somewhat shortsighted.What Idescribed as a “transformation” turned out to be a “revolution” that haschangedthethinkinginmanyofthesciences.Manynowcall it“theCausalRevolution,” and the excitement that it has generated in research circles isspillingovertoeducationandapplications.Ibelievethetimeisripetoshareitwithabroaderaudience.
Thisbookstrivestofulfillathree-prongedmission:first,tolaybeforeyouinnonmathematicallanguagetheintellectualcontentoftheCausalRevolutionandhowit isaffectingourlivesaswellasourfuture;second, tosharewithyou some of the heroic journeys, both successful and failed, that scientistshaveembarkedonwhenconfrontedbycriticalcause-effectquestions.
Finally, returning the Causal Revolution to its womb in artificialintelligence,Iaimtodescribetoyouhowrobotscanbeconstructedthatlearntocommunicateinourmothertongue—thelanguageofcauseandeffect.Thisnewgenerationofrobotsshouldexplaintouswhythingshappened,whytheyresponded the way they did, and why nature operates one way and notanother.Moreambitiously,theyshouldalsoteachusaboutourselves:whyourmindclicksthewayitdoesandwhatitmeanstothinkrationallyaboutcauseandeffect,creditandregret,intentandresponsibility.
WhenIwriteequations, Ihaveaveryclear ideaofwhomyreadersare.NotsowhenIwriteforthegeneralpublic—anentirelynewadventureforme.Strange, but this new experience has been one of the most rewardingeducational trips of my life. The need to shape ideas in your language, toguess your background, your questions, and your reactions, did more tosharpenmyunderstandingof causality thanall the equations Ihavewrittenpriortowritingthisbook.
ForthisIwillforeverbegratefultoyou.IhopeyouareasexcitedasIamtoseetheresults.
JudeaPearl
LosAngeles,October2017
INTRODUCTION:MINDOVERDATA
Everysciencethathasthrivenhasthrivenuponitsownsymbols.
—AUGUSTUSDEMORGAN(1864)
THIS book tells the story of a science that has changed the way wedistinguish facts from fiction and yet has remained under the radar of thegeneral public.The consequencesof thenew science are already impactingcrucial facets of our lives and have the potential to affect more, from thedevelopment of new drugs to the control of economic policies, fromeducation and robotics to gun control and global warming. Remarkably,despitethediversityandapparentincommensurabilityoftheseproblemareas,the new science embraces them all under a unified framework that waspracticallynonexistenttwodecadesago.
The new science does not have a fancy name: I call it simply “causalinference,”asdomanyofmycolleagues.Norisitparticularlyhigh-tech.Theideal technology that causal inference strives to emulate resideswithin ourownminds. Some tens of thousands of years ago, humans began to realizethatcertain thingscauseother thingsand that tinkeringwith the formercanchangethelatter.Nootherspeciesgraspsthis,certainlynottotheextentthatwedo.Fromthisdiscoverycameorganizedsocieties, then townsandcities,andeventuallythescience-andtechnology-basedcivilizationweenjoytoday.Allbecauseweaskedasimplequestion:Why?
Causal inference is all about taking this question seriously. It posits thatthehumanbrainisthemostadvancedtooleverdevisedformanagingcausesand effects. Our brains store an incredible amount of causal knowledgewhich,supplementedbydata,wecouldharnesstoanswersomeofthemostpressingquestionsofourtime.Moreambitiously,oncewereallyunderstandthe logicbehindcausal thinking,wecouldemulate itonmoderncomputersand create an “artificial scientist.” This smart robot would discover yetunknown phenomena, find explanations to pending scientific dilemmas,designnewexperiments,andcontinuallyextractmorecausalknowledgefromtheenvironment.
Butbeforewecanventuretospeculateonsuchfuturisticdevelopments,itis important tounderstandtheachievementsthatcausal inferencehastalliedthus far. We will explore the way that it has transformed the thinking ofscientists in almost every data-informed discipline and how it is about tochangeourlives.
Thenewscienceaddressesseeminglystraightforwardquestionslikethese:
•Howeffectiveisagiventreatmentinpreventingadisease?
• Did the new tax law cause our sales to go up, or was it ouradvertisingcampaign?
•Whatisthehealth-carecostattributabletoobesity?
•Canhiringrecordsproveanemployerisguiltyofapolicyofsexdiscrimination?
•I’mabouttoquitmyjob.ShouldI?
These questions have in common a concern with cause-and-effectrelationships, recognizable through words such as “preventing,” “cause,”“attributable to,” “policy,” and “should I.” Such words are common ineveryday language, and our society constantly demands answers to suchquestions. Yet, until very recently, science gave us no means even toarticulate,letaloneanswer,them.
Byfarthemostimportantcontributionofcausalinferencetomankindhasbeen to turn thisscientificneglect intoa thingof thepast.Thenewsciencehasspawnedasimplemathematicallanguagetoarticulatecausalrelationshipsthat we know as well as those we wish to find out about. The ability toexpress this information in mathematical form has unleashed a wealth ofpowerfulandprincipledmethodsforcombiningourknowledgewithdataandansweringcausalquestionslikethefiveabove.
I have been lucky to be part of this scientific development for the pastquartercentury. Ihavewatched itsprogress takeshape instudents’cubiclesand research laboratories, and I have heard its breakthroughs resonate insomberscientificconferences,farfromthelimelightofpublicattention.Now,as we enter the era of strong artificial intelligence (AI) andmany tout theendless possibilities of Big Data and deep learning, I find it timely andexcitingtopresenttothereadersomeofthemostadventurouspathsthatthenew science is taking, how it impacts data science, and themanyways inwhichitwillchangeourlivesinthetwenty-firstcentury.
Whenyouhearmedescribe theseachievementsasa“newscience,”youmaybeskeptical.Youmayevenask,Whywasn’tthisdonealongtimeago?Say when Virgil first proclaimed, “Lucky is he who has been able tounderstand the causes of things” (29BC).Orwhen the founders ofmodernstatistics, FrancisGalton andKarl Pearson, first discovered that populationdatacan shed lightonscientificquestions.There isa long talebehind theirunfortunatefailuretoembracecausationatthisjuncture,whichthehistoricalsections of this book will relate. But the most serious impediment, in myopinion,hasbeenthefundamentalgapbetweenthevocabularyinwhichwecastcausalquestionsandthetraditionalvocabularyinwhichwecommunicatescientifictheories.
Toappreciatethedepthofthisgap,imaginethedifficultiesthatascientistwouldfaceintryingtoexpresssomeobviouscausalrelationships—say,thatthe barometer readingB tracks the atmospheric pressureP. We can easilywritedownthisrelationshipinanequationsuchasB=kP,wherekissomeconstantofproportionality.Therulesofalgebranowpermitustorewritethissameequationinawildvarietyofforms,forexample,P=B/k,k=B/P,orB–kP= 0.They allmean the same thing—that ifwe know any twoof thethreequantities,thethirdisdetermined.Noneofthelettersk,B,orPisinanymathematicalwayprivilegedoveranyoftheothers.Howthencanweexpressour strong conviction that it is the pressure that causes the barometer tochange andnot theotherway around?And ifwe cannot express even this,how canwe hope to express themanyother causal convictions that do nothavemathematical formulas, suchas that the rooster’s crowdoesnot causethesuntorise?
Mycollegeprofessorscouldnotdo itandnevercomplained. Iwouldbewilling to bet that none of yours ever did either.We now understandwhy:never were they shown a mathematical language of causes; nor were theyshownitsbenefits.Itisinfactanindictmentofsciencethatithasneglectedtodevelop such a language for so many generations. Everyone knows thatflipping a switchwill cause a light to turn on or off and that a hot, sultrysummerafternoonwillcausesalestogoupatthelocalice-creamparlor.Whythenhavescientistsnotcapturedsuchobviousfactsinformulas,astheydidwith the basic laws of optics, mechanics, or geometry? Why have theyallowed these facts to languish in bare intuition, deprived of mathematicaltoolsthathaveenabledotherbranchesofsciencetoflourishandmature?
Partoftheansweristhatscientifictoolsaredevelopedtomeetscientificneeds.Preciselybecausewearesogoodathandlingquestionsaboutswitches,ice cream, and barometers, our need for specialmathematicalmachinery to
handle themwas not obvious. But as scientific curiosity increased and webegan posing causal questions in complex legal, business, medical, andpolicy-makingsituations,wefoundourselveslackingthetoolsandprinciplesthatmaturescienceshouldprovide.
Belated awakenings of this sort are not uncommon in science. Forexample,until about fourhundredyears ago,peoplewerequitehappywiththeirnaturalabilitytomanagetheuncertaintiesindailylife,fromcrossingastreet to risking a fistfight.Only after gamblers invented intricate gamesofchance,sometimescarefullydesignedtotrickusintomakingbadchoices,didmathematicians like Blaise Pascal (1654), Pierre de Fermat (1654), andChristiaanHuygens (1657) find it necessary to developwhatwe today callprobability theory. Likewise, only when insurance organizations demandedaccurate estimates of life annuity did mathematicians like Edmond Halley(1693) andAbrahamdeMoivre (1725) begin looking atmortality tables tocalculate life expectancies. Similarly, astronomers’ demands for accuratepredictionsofcelestialmotionledJacobBernoulli,Pierre-SimonLaplace,andCarlFriedrichGauss todevelopa theoryoferrors tohelpusextractsignalsfromnoise.Thesemethodswereallpredecessorsoftoday’sstatistics.
Ironically,theneedforatheoryofcausationbegantosurfaceatthesametimethatstatisticscameintobeing.Infact,modernstatisticshatchedfromthecausal questions that Galton and Pearson asked about heredity and theiringenious attempts to answer them using cross-generational data.Unfortunately,theyfailedinthisendeavor,andratherthanpausetoaskwhy,theydeclared thosequestionsoff limitsand turned todevelopinga thriving,causality-freeenterprisecalledstatistics.
Thiswasacriticalmoment in thehistoryof science.Theopportunity toequipcausalquestionswithalanguageoftheirowncameveryclosetobeingrealized but was squandered. In the following years, these questions weredeclared unscientific and went underground. Despite heroic efforts by thegeneticist Sewall Wright (1889–1988), causal vocabulary was virtuallyprohibitedformorethanhalfacentury.Andwhenyouprohibitspeech,youprohibitthoughtandstifleprinciples,methods,andtools.
Readers do not have to be scientists to witness this prohibition. InStatistics 101, every student learns to chant, “Correlation is not causation.”Withgood reason!The rooster’s crow ishighly correlatedwith the sunrise;yetitdoesnotcausethesunrise.
Unfortunately, statistics has fetishized this commonsense observation. Ittellsusthatcorrelationisnotcausation,butitdoesnottelluswhatcausation
is. Invainwillyou search the indexofa statistics textbook foranentryon“cause.”StudentsarenotallowedtosaythatXisthecauseofY—onlythatXandYare“related”or“associated.”
Because of this prohibition, mathematical tools to manage causalquestions were deemed unnecessary, and statistics focused exclusively onhowtosummarizedata,notonhowto interpret it.Ashiningexceptionwaspathanalysis,inventedbygeneticistSewallWrightinthe1920sandadirectancestorofthemethodswewillentertaininthisbook.However,pathanalysiswas badly underappreciated in statistics and its satellite communities andlanguished for decades in its embryonic status.What should have been thefirststeptowardcausalinferenceremainedtheonlystepuntilthe1980s.Therestofstatistics,includingthemanydisciplinesthatlookedtoitforguidance,remained in the Prohibition era, falsely believing that the answers to allscientific questions reside in the data, to be unveiled through clever data-miningtricks.
Muchof thisdata-centrichistory stillhauntsus today.We live inanerathat presumes Big Data to be the solution to all our problems. Courses in“data science” are proliferating in our universities, and jobs for “datascientists” are lucrative in the companies that participate in the “dataeconomy.”ButIhopewiththisbooktoconvinceyouthatdataareprofoundlydumb.Datacantellyouthatthepeoplewhotookamedicinerecoveredfasterthanthosewhodidnottakeit,buttheycan’ttellyouwhy.Maybethosewhotook the medicine did so because they could afford it and would haverecoveredjustasfastwithoutit.
Overandoveragain, inscienceandinbusiness,weseesituationswheremeredataaren’tenough.Mostbig-dataenthusiasts,whilesomewhatawareofthese limitations, continue the chase after data-centric intelligence, as ifwewerestillintheProhibitionera.
AsImentionedearlier,thingshavechangeddramaticallyinthepastthreedecades.Nowadays,thankstocarefullycraftedcausalmodels,contemporaryscientists can address problems that would have once been consideredunsolvableorevenbeyondthepaleofscientificinquiry.Forexample,onlyahundredyearsago,thequestionofwhethercigarettesmokingcausesahealthhazard would have been considered unscientific. The mere mention of thewords“cause”or“effect”wouldcreateastormofobjectionsinanyreputablestatisticaljournal.
Even two decades ago, asking a statistician a question like “Was it theaspirin that stopped my headache?” would have been like asking if he
believed in voodoo. To quote an esteemed colleague of mine, it would be“moreof a cocktail conversation topic than a scientific inquiry.”But today,epidemiologists, social scientists, computer scientists, and at least someenlightened economists and statisticians pose such questions routinely andanswerthemwithmathematicalprecision.Tome,thischangeisnothingshortof a revolution. I dare to call it theCausalRevolution, a scientific shakeupthat embraces rather than denies our innate cognitive gift of understandingcauseandeffect.
TheCausalRevolutiondidnothappeninavacuum;ithasamathematicalsecretbehinditwhichcanbebestdescribedasacalculusofcausation,whichanswers some of the hardest problems ever asked about cause-effectrelationships. I am thrilled to unveil this calculus not only because theturbulent history of its development is intriguing but even more because Iexpect that its full potential will be developed one day beyondwhat I canimagine…perhapsevenbyareaderofthisbook.
Thecalculusofcausationconsistsof two languages:causaldiagrams, toexpress what we know, and a symbolic language, resembling algebra, toexpress what we want to know. The causal diagrams are simply dot-and-arrow pictures that summarize our existing scientific knowledge. The dotsrepresent quantities of interest, called “variables,” and the arrows representknown or suspected causal relationships between those variables—namely,whichvariable“listens”towhichothers.Thesediagramsareextremelyeasytodraw,comprehend,anduse,andthereaderwillfinddozensoftheminthepagesofthisbook.Ifyoucannavigateusingamapofone-waystreets,thenyoucanunderstandcausaldiagrams,andyoucansolvethetypeofquestionsposedatthebeginningofthisintroduction.
Thoughcausaldiagramsaremytoolofchoiceinthisbook,asinthelastthirty-fiveyearsofmyresearch, theyarenot theonlykindofcausalmodelpossible. Some scientists (e.g., econometricians) like to work withmathematical equations; others (e.g., hard-core statisticians) prefer a list ofassumptions that ostensibly summarizes the structure of the diagram.Regardlessof language, themodel shoulddepict, howeverqualitatively, theprocess thatgenerates thedata—inotherwords, thecause-effect forces thatoperateintheenvironmentandshapethedatagenerated.
Side by side with this diagrammatic “language of knowledge,” we alsohave a symbolic “language of queries” to express the questions we wantanswers to.Forexample, ifweare interested in theeffectofadrug (D)onlifespan(L),thenourquerymightbewrittensymbolicallyas:P(L|do(D)).In
otherwords,whatistheprobability(P)thatatypicalpatientwouldsurviveLyearsifmadetotakethedrug?Thisquestiondescribeswhatepidemiologistswouldcallaninterventionoratreatmentandcorrespondstowhatwemeasureinaclinical trial. InmanycaseswemayalsowishtocompareP(L |do(D))with P(L | do(not-D)); the latter describes patients denied treatment, alsocalled the “control” patients. The do-operator signifies that we are dealingwithaninterventionratherthanapassiveobservation;classicalstatisticshasnothingremotelysimilartothisoperator.
Wemustinvokeaninterventionoperatordo(D)toensurethattheobservedchangeinLifespanLisduetothedrugitselfandisnotconfoundedwithotherfactorsthattendtoshortenorlengthenlife.If,insteadofintervening,weletthepatienthimselfdecidewhethertotakethedrug,thoseotherfactorsmightinfluencehisdecision,andlifespandifferencesbetweentakingandnottakingthe drugwould no longer be solely due to the drug. For example, supposeonlythosewhowereterminallyilltookthedrug.Suchpersonswouldsurelydiffer from thosewho did not take the drug, and a comparison of the twogroupswouldreflectdifferencesintheseverityoftheirdiseaseratherthantheeffectofthedrug.Bycontrast,forcingpatientstotakeorrefrainfromtakingthe drug, regardless of preconditions, would wash away preexistingdifferencesandprovideavalidcomparison.
Mathematically, we write the observed frequency of Lifespan L amongpatients who voluntarily take the drug as P(L |D), which is the standardconditional probability used in statistical textbooks. This expression standsfor the probability (P) of LifespanL conditional on seeing the patient takeDrugD.NotethatP(L |D)maybe totallydifferent fromP(L |do(D)).Thisdifferencebetweenseeinganddoingisfundamentalandexplainswhywedonotregardthefallingbarometertobeacauseofthecomingstorm.Seeingthebarometer fall increases theprobabilityof thestorm,while forcing it to falldoesnotaffectthisprobability.
This confusion between seeing and doing has resulted in a fountain ofparadoxes,someofwhichwewillentertaininthisbook.AworlddevoidofP(L|do(D))andgovernedsolelybyP(L|D)wouldbeastrangeoneindeed.For example, patients would avoid going to the doctor to reduce theprobability of being seriously ill; cities would dismiss their firefighters toreducetheincidenceoffires;doctorswouldrecommendadrugtomaleandfemalepatientsbutnot topatientswithundisclosedgender; andsoon. It ishardtobelievethatlessthanthreedecadesagosciencedidoperateinsuchaworld:thedo-operatordidnotexist.

Oneof thecrowningachievementsof theCausalRevolutionhasbeen toexplainhowtopredicttheeffectsofaninterventionwithoutactuallyenactingit.Itwouldneverhavebeenpossibleifwehadnot,firstofall,definedthedo-operatorsothatwecanasktherightquestionand,second,devisedawaytoemulateitbynoninvasivemeans.
Whenthescientificquestionofinterestinvolvesretrospectivethinking,wecall on another type of expression unique to causal reasoning called acounterfactual.Forexample,supposethatJoetookDrugDanddiedamonthlater;ourquestionofinterestiswhetherthedrugmighthavecausedhisdeath.To answer this question, we need to imagine a scenario in which Joe wasabouttotakethedrugbutchangedhismind.Wouldhehavelived?
Again, classical statistics only summarizes data, so it does not provideevenalanguageforaskingthatquestion.Causalinferenceprovidesanotationand, more importantly, offers a solution. As with predicting the effect ofinterventions (mentioned above), in many cases we can emulate humanretrospective thinkingwithanalgorithmthat takeswhatweknowabout theobservedworldandproducesanansweraboutthecounterfactualworld.This“algorithmizationofcounterfactuals”isanothergemuncoveredbytheCausalRevolution.
Counterfactual reasoning, which deals with what-ifs, might strike somereaders as unscientific. Indeed, empirical observation can never confirm orrefute theanswers to suchquestions.Yetourmindsmakevery reliable andreproduciblejudgmentsallthetimeaboutwhatmightbeormighthavebeen.Weallunderstand,forinstance,thathadtheroosterbeensilentthismorning,thesunwouldhaverisenjustaswell.Thisconsensusstemsfromthefactthatcounterfactuals arenot products ofwhimsybut reflect thevery structureofour world model. Two people who share the same causal model will alsoshareallcounterfactualjudgments.
Counterfactuals are the building blocks of moral behavior as well asscientific thought. The ability to reflect on one’s past actions and envisionalternative scenarios is the basis of free will and social responsibility. Thealgorithmizationofcounterfactualsinvitesthinkingmachinestobenefitfromthisabilityandparticipateinthis(untilnow)uniquelyhumanwayofthinkingabouttheworld.
Mymention of thinkingmachines in the last paragraph is intentional. Icame to this subjectasacomputer scientistworking in theareaofartificialintelligence, which entails two points of departure from most of mycolleaguesinthecausalinferencearena.First,intheworldofAI,youdonot
reallyunderstandatopicuntilyoucanteachittoamechanicalrobot.Thatiswhy you will find me emphasizing and reemphasizing notation, language,vocabulary,andgrammar.Forexample,Iobsessoverwhetherwecanexpressa certain claim in a given language and whether one claim follows fromothers. It is amazing how much one can learn from just following thegrammarofscientificutterances.Myemphasisonlanguagealsocomesfroma deep conviction that language shapes our thoughts.You cannot answer aquestionthatyoucannotask,andyoucannotaskaquestionthatyouhavenowordsfor.Asastudentofphilosophyandcomputerscience,myattractiontocausal inference has largely been triggered by the excitement of seeing anorphanedscientificlanguagemakingitfrombirthtomaturity.
Mybackground inmachine learninghas givenmeyet another incentivefor studying causation. In the late 1980s, I realized that machines’ lack ofunderstandingofcausalrelationswasperhapsthebiggestroadblocktogivingthemhuman-levelintelligence.Inthelastchapterofthisbook,Iwillreturntomy roots, and together we will explore the implications of the CausalRevolutionforartificialintelligence.IbelievethatstrongAIisanachievablegoal and one not to be feared precisely because causality is part of thesolution.Acausalreasoningmodulewillgivemachinestheabilitytoreflecton their mistakes, to pinpoint weaknesses in their software, to function asmoralentities,andtoconversenaturallywithhumansabouttheirownchoicesandintentions.
ABLUEPRINTOFREALITY
In our era, readers have no doubt heard terms like “knowledge,”“information,”“intelligence,”and“data,”andsomemayfeelconfusedaboutthe differences between themor how they interact.Now I amproposing tothrow another term, “causal model,” into the mix, and the reader mayjustifiablywonderifthiswillonlyaddtotheconfusion.
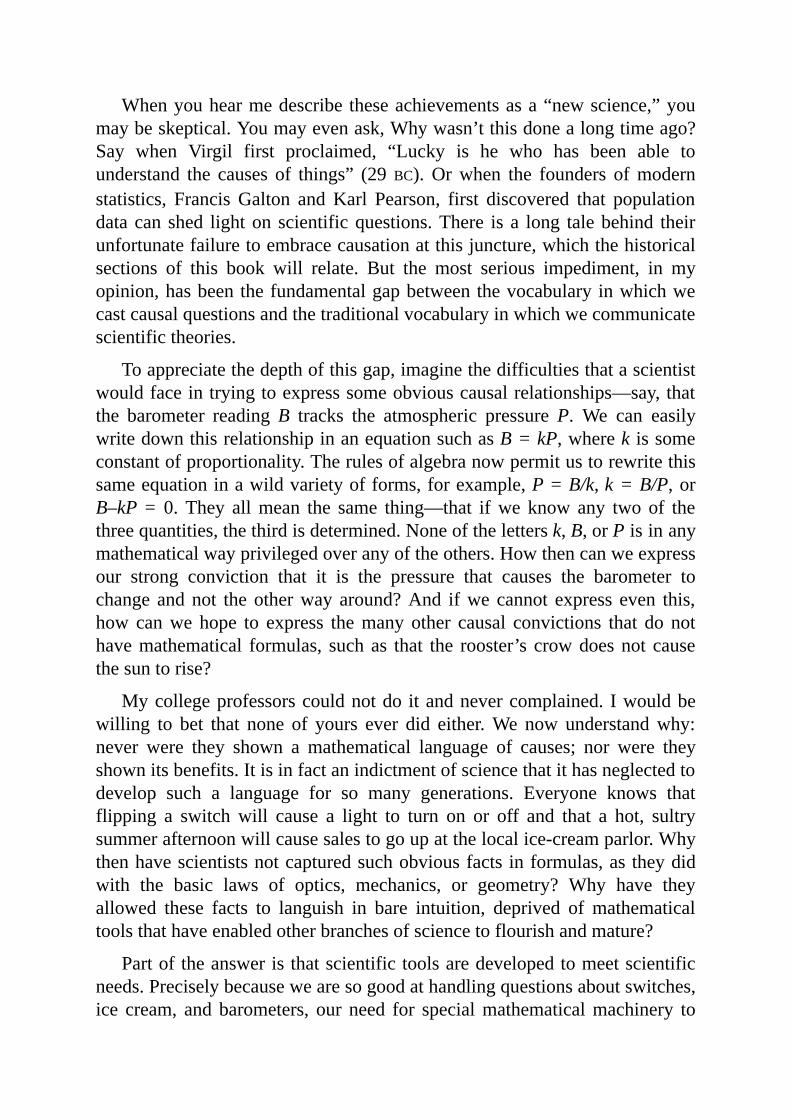
It will not! In fact, it will anchor the elusive notions of science,knowledge,anddatainaconcreteandmeaningfulsetting,andwillenableustoseehowthe threework together toproduceanswers todifficultscientificquestions. Figure I.1 shows a blueprint for a “causal inference engine” thatmighthandlecausalreasoningforafutureartificialintelligence.It’simportanttorealizethatthisisnotonlyablueprintforthefuturebutalsoaguidetohowcausalmodelsworkinscientificapplicationstodayandhowtheyinteractwithdata.
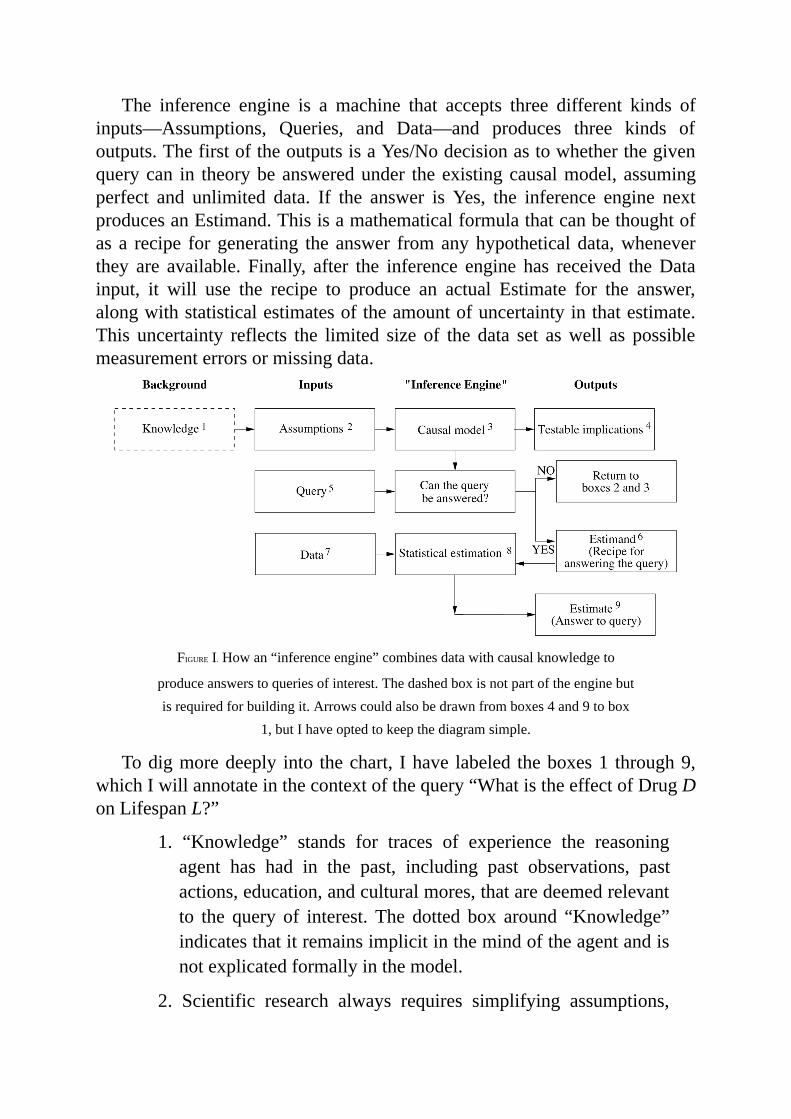
The inference engine is a machine that accepts three different kinds ofinputs—Assumptions, Queries, and Data—and produces three kinds ofoutputs.ThefirstoftheoutputsisaYes/Nodecisionastowhetherthegivenquerycan in theorybeansweredunder theexistingcausalmodel, assumingperfect and unlimited data. If the answer is Yes, the inference engine nextproducesanEstimand.Thisisamathematicalformulathatcanbethoughtofas a recipe forgenerating the answer fromanyhypotheticaldata,wheneverthey are available. Finally, after the inference engine has received theDatainput, it will use the recipe to produce an actual Estimate for the answer,alongwithstatisticalestimatesoftheamountofuncertaintyinthatestimate.This uncertainty reflects the limited size of the data set aswell as possiblemeasurementerrorsormissingdata.
FIGUREI.Howan“inferenceengine”combinesdatawithcausalknowledgeto
produceanswerstoqueriesofinterest.Thedashedboxisnotpartoftheenginebutisrequiredforbuildingit.Arrowscouldalsobedrawnfromboxes4and9tobox
1,butIhaveoptedtokeepthediagramsimple.
Todigmoredeeply into thechart, Ihave labeled theboxes1 through9,whichIwillannotateinthecontextofthequery“WhatistheeffectofDrugDonLifespanL?”
1. “Knowledge” stands for traces of experience the reasoningagent has had in the past, including past observations, pastactions,education,andculturalmores,thataredeemedrelevantto the query of interest. The dotted box around “Knowledge”indicatesthatitremainsimplicitinthemindoftheagentandisnotexplicatedformallyinthemodel.
2. Scientific research always requires simplifying assumptions,
that is, statements which the researcher deems worthy ofmakingexplicitonthebasisoftheavailableKnowledge.Whilemost of the researcher’s knowledge remains implicit in his orher brain, only Assumptions see the light of day and areencapsulated in themodel.They can in fact be read from themodel,whichhasledsomelogicianstoconcludethatamodelisnothingmorethanalistofassumptions.Computerscientiststake exception to this claim, noting that how assumptions arerepresentedcanmakeaprofounddifference inone’sability tospecify themcorrectly,drawconclusionsfromthem,andevenextendormodifytheminlightofcompellingevidence.
3. Various options exist for causal models: causal diagrams,structural equations, logical statements, and so forth. I amstrongly sold on causal diagrams for nearly all applications,primarilyduetotheir transparencybutalsoduetotheexplicitanswerstheyprovidetomanyofthequestionswewishtoask.For the purpose of constructing the diagram, the definitionof“causation”issimple,ifalittlemetaphorical:avariableXisacause of Y if Y “listens” to X and determines its value inresponse to what it hears. For example, if we suspect that apatient’s Lifespan L “listens” to whether DrugD was taken,thenwecallDacauseofLanddrawanarrowfromDtoLinacausaldiagram.Naturally,theanswertoourqueryaboutDandLislikelytodependonothervariablesaswell,whichmustalsobe represented in the diagram along with their causes andeffects.(Here,wewilldenotethemcollectivelybyZ.)
4. The listening pattern prescribed by the paths of the causalmodelusuallyresultsinobservablepatternsordependenciesinthe data. These patterns are called “testable implications”because they can be used for testing the model. These arestatements like“There isnopathconnectingDandL,”whichtranslatestoastatisticalstatement,“DandLareindependent,”thatis,findingDdoesnotchangethelikelihoodofL.Ifthedatacontradict this implication, thenweneed to reviseourmodel.Suchrevisionsrequireanotherengine,whichobtainsitsinputsfromboxes4and7andcomputesthe“degreeoffitness,”that
is, the degree to which the Data are compatible with themodel’sassumptions.Forsimplicity,IdidnotshowthissecondengineinFigureI.1.
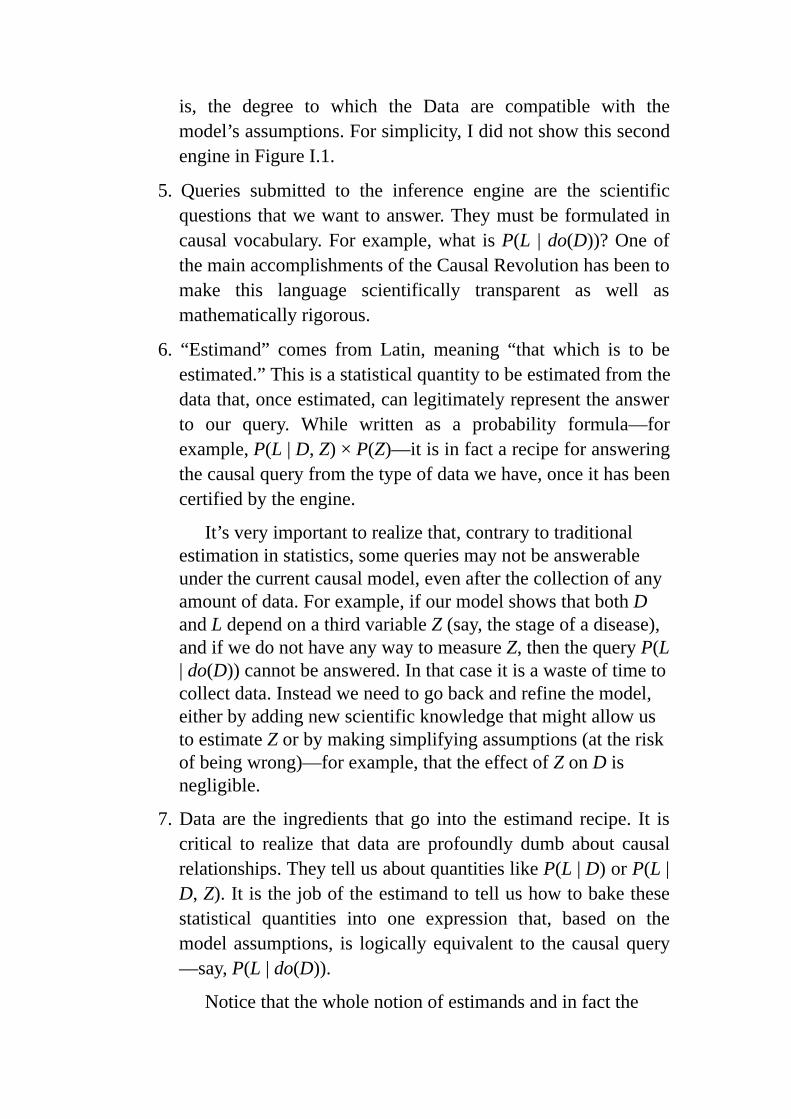
5. Queries submitted to the inference engine are the scientificquestionsthatwewanttoanswer.Theymustbeformulatedincausalvocabulary.Forexample,what isP(L |do(D))?OneofthemainaccomplishmentsoftheCausalRevolutionhasbeentomake this language scientifically transparent as well asmathematicallyrigorous.
6. “Estimand” comes from Latin, meaning “that which is to beestimated.”Thisisastatisticalquantitytobeestimatedfromthedatathat,onceestimated,canlegitimatelyrepresenttheanswerto our query. While written as a probability formula—forexample,P(L|D,Z)×P(Z)—itisinfactarecipeforansweringthecausalqueryfromthetypeofdatawehave,onceithasbeencertifiedbytheengine.
It’sveryimportanttorealizethat,contrarytotraditionalestimationinstatistics,somequeriesmaynotbeanswerableunderthecurrentcausalmodel,evenafterthecollectionofanyamountofdata.Forexample,ifourmodelshowsthatbothDandLdependonathirdvariableZ(say,thestageofadisease),andifwedonothaveanywaytomeasureZ,thenthequeryP(L|do(D))cannotbeanswered.Inthatcaseitisawasteoftimetocollectdata.Insteadweneedtogobackandrefinethemodel,eitherbyaddingnewscientificknowledgethatmightallowustoestimateZorbymakingsimplifyingassumptions(attheriskofbeingwrong)—forexample,thattheeffectofZonDisnegligible.
7.Dataare the ingredients thatgo into theestimand recipe. It iscritical to realize that data are profoundly dumb about causalrelationships.TheytellusaboutquantitieslikeP(L|D)orP(L|D,Z).Itisthejoboftheestimandtotellushowtobakethesestatistical quantities into one expression that, based on themodelassumptions, is logicallyequivalent to thecausalquery—say,P(L|do(D)).
Noticethatthewholenotionofestimandsandinfactthe
wholetoppartofFigureIdoesnotexistintraditionalmethodsofstatisticalanalysis.There,theestimandandthequerycoincide.Forexample,ifweareinterestedintheproportionofpeopleamongthosewithLifespanLwhotooktheDrugD,wesimplywritethisqueryasP(D|L).Thesamequantitywouldbeourestimand.Thisalreadyspecifieswhatproportionsinthedataneedtobeestimatedandrequiresnocausalknowledge.Forthisreason,somestatisticianstothisdayfinditextremelyhardtounderstandwhysomeknowledgeliesoutsidetheprovinceofstatisticsandwhydataalonecannotmakeupforlackofscientificknowledge.
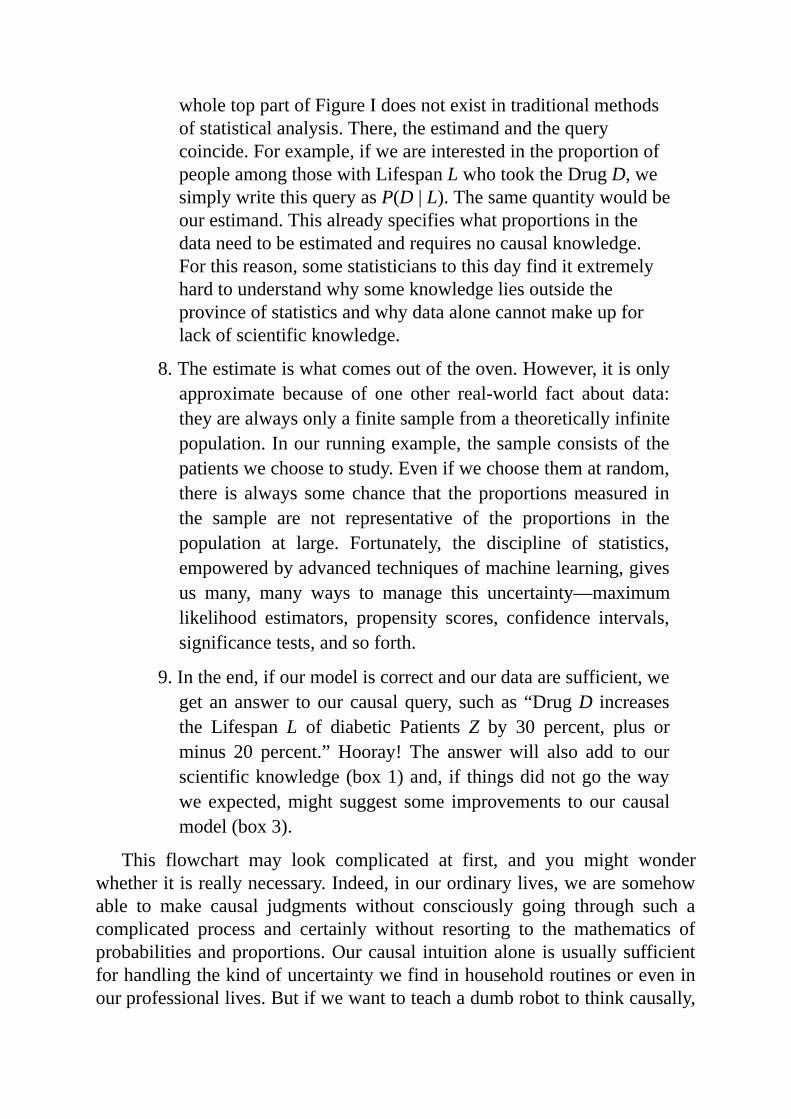
8.Theestimateiswhatcomesoutoftheoven.However,itisonlyapproximate because of one other real-world fact about data:theyarealwaysonlyafinitesamplefromatheoreticallyinfinitepopulation.Inourrunningexample,thesampleconsistsofthepatientswechoosetostudy.Evenifwechoosethematrandom,there is always somechance that theproportionsmeasured inthe sample are not representative of the proportions in thepopulation at large. Fortunately, the discipline of statistics,empoweredbyadvancedtechniquesofmachinelearning,givesus many, many ways to manage this uncertainty—maximumlikelihood estimators, propensity scores, confidence intervals,significancetests,andsoforth.
9.Intheend,ifourmodeliscorrectandourdataaresufficient,weget ananswer toour causalquery, suchas“DrugD increasesthe Lifespan L of diabetic Patients Z by 30 percent, plus orminus 20 percent.” Hooray! The answer will also add to ourscientificknowledge(box1)and,if thingsdidnotgothewayweexpected,might suggest some improvements toourcausalmodel(box3).
This flowchart may look complicated at first, and you might wonderwhetheritisreallynecessary.Indeed,inourordinarylives,wearesomehowable to make causal judgments without consciously going through such acomplicated process and certainly without resorting to the mathematics ofprobabilitiesandproportions.Ourcausal intuitionalone isusuallysufficientforhandlingthekindofuncertaintywefindinhouseholdroutinesoreveninourprofessionallives.Butifwewanttoteachadumbrobottothinkcausally,

or ifwearepushing the frontiersof scientificknowledge,wherewedonothave intuition to guide us, then a carefully structured procedure like this ismandatory.
Iespeciallywanttohighlighttheroleofdataintheaboveprocess.First,noticethatwecollectdataonlyafterwepositthecausalmodel,afterwestatethescientificquerywewishtoanswer,andafterwederivetheestimand.Thiscontrasts with the traditional statistical approach, mentioned above, whichdoesnotevenhaveacausalmodel.
But our present-day scientific world presents a new challenge to soundreasoningaboutcausesandeffects.Whileawarenessoftheneedforacausalmodelhasgrownbyleapsandboundsamongthesciences,manyresearchersin artificial intelligencewould like to skip the hard step of constructing oracquiringacausalmodelandrelysolelyondataforallcognitivetasks.Thehope—andat present, it is usually a silent one—is that thedata themselveswillguideustotherightanswerswhenevercausalquestionscomeup.
Iamanoutspokenskepticof this trendbecause Iknowhowprofoundlydumbdataareaboutcausesandeffects.Forexample, informationabout theeffectsofactionsorinterventionsissimplynotavailableinrawdata,unlessitiscollectedbycontrolledexperimentalmanipulation.Bycontrast,ifweareinpossession of a causal model, we can often predict the result of aninterventionfromhands-off,intervention-freedata.
Thecaseforcausalmodelsbecomesevenmorecompellingwhenweseektoanswercounterfactualqueriessuchas“Whatwouldhavehappenedhadweacted differently?” We will discuss counterfactuals in great detail becausetheyarethemostchallengingqueriesforanyartificialintelligence.Theyarealso at the core of the cognitive advances that made us human and theimaginative abilities that havemade science possible.Wewill also explainwhyanyqueryaboutthemechanismbywhichcausestransmittheireffects—themostprototypical“Why?”question—isactuallyacounterfactualquestionindisguise.Thus,ifweeverwantrobotstoanswer“Why?”questionsorevenunderstandwhat theymean,wemust equip themwith a causalmodel andteachthemhowtoanswercounterfactualqueries,asinFigureI.1.
Anotheradvantagecausalmodelshavethatdatamininganddeeplearninglackisadaptability.NotethatinFigureI.1,theestimandiscomputedonthebasisofthecausalmodelalone,priortoanexaminationofthespecificsofthedata. Thismakes the causal inference engine supremely adaptable, becausethe estimand computed is good for any data that are compatible with thequalitative model, regardless of the numerical relationships among the
variables.
To see why this adaptability is important, compare this engine with alearningagent—inthisinstanceahuman,butinothercasesperhapsadeep-learning algorithm or maybe a human using a deep-learning algorithm—trying to learn solely from the data. By observing the outcomeL ofmanypatientsgivenDrugD,sheisabletopredicttheprobabilitythatapatientwithcharacteristicsZ will surviveL years.Now she is transferred to a differenthospital,inadifferentpartoftown,wherethepopulationcharacteristics(diet,hygiene,workhabits)aredifferent.Evenif thesenewcharacteristicsmerelymodify the numerical relationships among the variables recorded, she willstillhavetoretrainherselfandlearnanewpredictionfunctionalloveragain.That’sallthatadeep-learningprogramcando:fitafunctiontodata.Ontheotherhand,ifshepossessedamodelofhowthedrugoperatedanditscausalstructureremainedintactinthenewlocation,thentheestimandsheobtainedintrainingwouldremainvalid.Itcouldbeappliedtothenewdatatogenerateanewpopulation-specificpredictionfunction.
Many scientific questions look different “through a causal lens,” and Ihavedelightedinplayingwiththislens,whichoverthelasttwenty-fiveyearshasbeenincreasinglyempoweredbynewinsightsandnewtools.Ihopeandbelievethatreadersofthisbookwillshareinmydelight.Therefore,I’dliketoclosethisintroductionwithapreviewofsomeofthecomingattractionsinthisbook.
Chapter 1 assembles the three steps of observation, intervention, andcounterfactuals into the Ladder of Causation, the central metaphor of thisbook.Itwillalsoexposeyoutothebasicsofreasoningwithcausaldiagrams,our main modeling tool, and set you well on your way to becoming aproficient causal reasoner—in fact, youwill be far ahead of generations ofdata scientists who attempted to interpret data through a model-blind lens,oblivioustothedistinctionsthattheLadderofCausationilluminates.
Chapter2tellsthebizarrestoryofhowthedisciplineofstatisticsinflictedcausal blindness on itself, with far-reaching effects for all sciences thatdependondata.Italsotellsthestoryofoneofthegreatheroesofthisbook,thegeneticistSewallWright,whointhe1920sdrewthefirstcausaldiagramsandformanyyearswasoneofthefewscientistswhodaredtotakecausalityseriously.
Chapter3relates theequallycuriousstoryofhowIbecameaconvert tocausality through my work in AI and particularly on Bayesian networks.These were the first tool that allowed computers to think in “shades of
gray”—andforatimeIbelievedtheyheldthekeytounlockingAI.Towardtheendofthe1980sIbecameconvincedthatIwaswrong,andthischaptertells of my journey from prophet to apostate. Nevertheless, Bayesiannetworks remainavery important tool forAIandstill encapsulatemuchofthe mathematical foundation of causal diagrams. In addition to a gentle,causality-minded introduction to Bayes’s rule and Bayesian methods ofreasoning, Chapter 3 will entertain the reader with examples of real-lifeapplicationsofBayesiannetworks.
Chapter 4 tells about the major contribution of statistics to causalinference:therandomizedcontrolledtrial(RCT).Fromacausalperspective,theRCTisaman-madetoolforuncoveringthequeryP(L|do(D)),whichisaproperty of nature. Its main purpose is to disassociate variables of interest(say,DandL)fromothervariables(Z)thatwouldotherwiseaffectthemboth.Disarming the distortions, or “confounding,” produced by such lurkingvariables has been a century-old problem. This chapter walks the readerthrough a surprisingly simple solution to the general confounding problem,whichyouwillgraspintenminutesofplayfullytracingpathsinadiagram.
Chapter 5 gives an account of a seminal moment in the history ofcausationandindeedthehistoryofscience,whenstatisticiansstruggledwiththe question of whether smoking causes lung cancer. Unable to use theirfavorite tool, the randomized controlled trial, they struggled to agree on ananswerorevenonhow tomakesenseof thequestion.Thesmokingdebatebrings the importance of causality into its sharpest focus.Millions of liveswerelostorshortenedbecausescientistsdidnothaveanadequatelanguageormethodologyforansweringcausalquestions.
Chapter 6 will, I hope, be a welcome diversion for the reader after theseriousmattersofChapter5.Thisisachapterofparadoxes:theMontyHallparadox, Simpson’s paradox, Berkson’s paradox, and others. Classicalparadoxes like thesecanbeenjoyedasbrainteasers,but theyhaveaserioussidetoo,especiallywhenviewedfromacausalperspective.Infact,almostallof them represent clashes with causal intuition and therefore reveal theanatomy of that intuition. Theywere canaries in the coalmine that shouldhavealertedscientiststothefactthathumanintuitionisgroundedincausal,notstatistical,logic.Ibelievethatthereaderwillenjoythisnewtwistonhisorherfavoriteoldparadoxes.
Chapters7to9finallytakereadersonathrillingascentoftheLadderofCausation. We start in Chapter 7 with questions about intervention andexplain how my students and I went through a twenty-year struggle to
automate the answers todo-type questions.We succeeded, and this chapterexplainsthegutsofthe“causalinferenceengine,”whichproducestheyes/noanswerandtheestimandinFigureI.1.Studyingthisenginewillempowerthereader to spot certain patterns in the causal diagram that deliver immediateanswerstothecausalquery.Thesepatternsarecalledback-dooradjustment,front-door adjustment, and instrumental variables, theworkhorses of causalinferenceinpractice.
Chapter8takesyoutothetopoftheladderbydiscussingcounterfactuals.Thesehavebeenseenasafundamentalpartofcausalityatleastsince1748,when Scottish philosopher David Hume proposed the following somewhatcontorted definition of causation: “Wemay define a cause to be an objectfollowed by another, and where all the objects, similar to the first, arefollowedbyobjects similar to the second.Or, inotherwords,where, if thefirst object had not been, the second never had existed.” David Lewis, aphilosopheratPrincetonUniversitywhodiedin2001,pointedoutthatHumereallygave twodefinitions,notone, the firstof regularity (i.e., thecause isregularlyfollowedbytheeffect)andthesecondofthecounterfactual(“ifthefirst object had not been…”).While philosophers and scientists hadmostlypaidattentiontotheregularitydefinition,Lewisarguedthatthecounterfactualdefinitionalignsmorecloselywithhumanintuition:“Wethinkofacauseassomething that makes a difference, and the difference it makes must be adifferencefromwhatwouldhavehappenedwithoutit.”
Readers will be excited to find out that we can now move past theacademic debates and compute an actual value (or probability) for anycounterfactual query, no matter how convoluted. Of special interest arequestionsconcerningnecessaryandsufficientcausesofobservedevents.Forexample,howlikelyisitthatthedefendant’sactionwasanecessarycauseofthe claimant’s injury? How likely is it that man-made climate change is asufficientcauseofaheatwave?
Finally, Chapter 9 discusses the topic of mediation. You may havewondered, when we talked about drawing arrows in a causal diagram,whether we should draw an arrow fromDrugD to Lifespan L if the drugaffectslifespanonlybywayofitseffectonbloodpressureZ(amediator).Inotherwords,istheeffectofDonLdirectorindirect?Andifboth,howdoweassess their relative importance? Such questions are not only of greatscientific interestbutalsohavepractical ramifications; ifweunderstand themechanism through which a drug acts, wemight be able to develop otherdrugswith the same effect that are cheaper or have fewer side effects.Thereader will be pleased to discover how this age-old quest for a mediation
mechanismhasbeenreducedtoanalgebraicexerciseandhowscientistsareusingthenewtoolsinthecausaltoolkittosolvesuchproblems.
Chapter10bringsthebooktoaclosebycomingbacktotheproblemthatinitially led me to causation: the problem of automating human-levelintelligence(sometimescalled“strongAI”).Ibelievethatcausalreasoningisessential formachines to communicatewith us in our own language aboutpolicies, experiments, explanations, theories, regret, responsibility, freewill,andobligations—and,eventually,tomaketheirownmoraldecisions.
IfIcouldsumupthemessageofthisbookinonepithyphrase,itwouldbethat you are smarter than your data. Data do not understand causes andeffects;humansdo.Ihopethatthenewscienceofcausalinferencewillenableus to better understand how we do it, because there is no better way tounderstandourselves thanby emulatingourselves. In the ageof computers,this new understanding also brings with it the prospect of amplifying ourinnateabilitiessothatwecanmakebettersenseofdata,beitbigorsmall.
1
THELADDEROFCAUSATION
INthebeginning…IwasprobablysixorsevenyearsoldwhenIfirstreadthestoryofAdam
andEveintheGardenofEden.MyclassmatesandIwerenotatallsurprisedby God’s capricious demands, forbidding them to eat from the Tree ofKnowledge. Deities have their reasons, we thought. What we were moreintrigued by was the idea that as soon as they ate from the Tree ofKnowledge,AdamandEvebecameconscious,likeus,oftheirnakedness.
Asteenagers,ourinterestshiftedslowlytothemorephilosophicalaspectsof thestory. (Israelistudents readGenesisseveral timesayear.)Ofprimaryconcerntouswasthenotionthattheemergenceofhumanknowledgewasnota joyfulprocessbut apainfulone, accompaniedbydisobedience,guilt, andpunishment.Was itworth giving up the carefree life ofEden? some asked.Were the agricultural and scientific revolutions that followed worth theeconomichardships,wars,andsocialinjusticesthatmodernlifeentails?
Don’t get me wrong: we were no creationists; even our teachers wereDarwinists at heart.Weknew, however, that the authorwho choreographedthe story of Genesis struggled to answer the most pressing philosophicalquestionsofhistime.WelikewisesuspectedthatthisstoryboretheculturalfootprintsoftheactualprocessbywhichHomosapiensgaineddominionoverour planet. What, then, was the sequence of steps in this speedy, super-evolutionaryprocess?
Myinterestinthesequestionswanedinmyearlycareerasaprofessorof
engineeringbutwasreignitedsuddenlyinthe1990s,when,whilewritingmybookCausality,IconfrontedtheLadderofCausation.
As I rereadGenesis for the hundredth time, I noticed a nuance that hadsomehow eluded my attention for all those years. When God finds Adamhidinginthegarden,heasks,“HaveyoueatenfromthetreewhichIforbadeyou?”AndAdamanswers,“Thewomanyougavemeforacompanion,shegaveme fruit from the tree and I ate.” “What is thisyouhavedone?”GodasksEve.Shereplies,“Theserpentdeceivedme,andIate.”
Asweknow, this blamegamedid notworkverywell on theAlmighty,who banished both of them from the garden. But here is the point I hadmissedbefore:Godasked“what,”andtheyanswered“why.”Godaskedforthefacts,andtheyrepliedwithexplanations.Moreover,bothwerethoroughlyconvinced that naming causes would somehow paint their actions in adifferentlight.Wheredidtheygetthisidea?
For me, these nuances carried three profound implications. First, veryearlyinourevolution,wehumansrealizedthattheworldisnotmadeuponlyof dry facts (what we might call data today); rather, these facts are gluedtogether by an intricate web of cause-effect relationships. Second, causalexplanations,notdryfacts,makeupthebulkofourknowledge,andshouldbethe cornerstone of machine intelligence. Finally, our transition fromprocessorsofdata tomakersof explanationswasnotgradual; itwasa leapthat required an external push from an uncommon fruit. This matchedperfectlywithwhatIhadobservedtheoreticallyin theLadderofCausation:Nomachinecanderiveexplanationsfromrawdata.Itneedsapush.
Ifweseekconfirmationofthesemessagesfromevolutionaryscience,wewon’t find the Tree of Knowledge, of course, but we still see a majorunexplainedtransition.Weunderstandnowthathumansevolvedfromapelikeancestorsoveraperiodof5millionto6millionyearsandthatsuchgradualevolutionaryprocessesarenotuncommontolifeonearth.Butinroughlythelast50,000years,somethinguniquehappened,whichsomecalltheCognitiveRevolution andothers (with a touchof irony) call theGreatLeapForward.Humans acquired the ability to modify their environment and their ownabilitiesatadramaticallyfasterrate.
Forexample,overmillionsofyears,eaglesandowlshaveevolved trulyamazing eyesight—yet they’ve never devised eyeglasses, microscopes,telescopes,ornight-visiongoggles.Humanshaveproducedthesemiraclesina matter of centuries. I call this phenomenon the “super-evolutionaryspeedup.”Some readersmight object tomy comparing apples andoranges,
evolutiontoengineering,butthatisexactlymypoint.Evolutionhasendoweduswiththeabilitytoengineerourlives,agiftshehasnotbestowedoneaglesandowls,andthequestion,again,is“Why?”Whatcomputationalfacilitydidhumanssuddenlyacquirethateaglesdidnot?
Many theorieshavebeenproposed,butone isespeciallypertinent to theideaofcausation.InhisbookSapiens,historianYuvalHararipositsthatourancestors’capacity to imaginenonexistent thingswas thekeytoeverything,for it allowed them to communicate better. Before this change, they couldonly trustpeople fromtheir immediate familyor tribe.Afterward their trustextended to larger communities, bound by common fantasies (for example,beliefininvisibleyetimaginabledeities,intheafterlife,andinthedivinityoftheleader)andexpectations.WhetherornotyouagreewithHarari’stheory,theconnectionbetweenimaginingandcausalrelationsisalmostself-evident.It is useless to ask for the causes of things unless you can imagine theirconsequences.Conversely,youcannotclaimthatEvecausedyoutoeatfromthetreeunlessyoucanimagineaworldinwhich,countertofacts,shedidnothandyoutheapple.
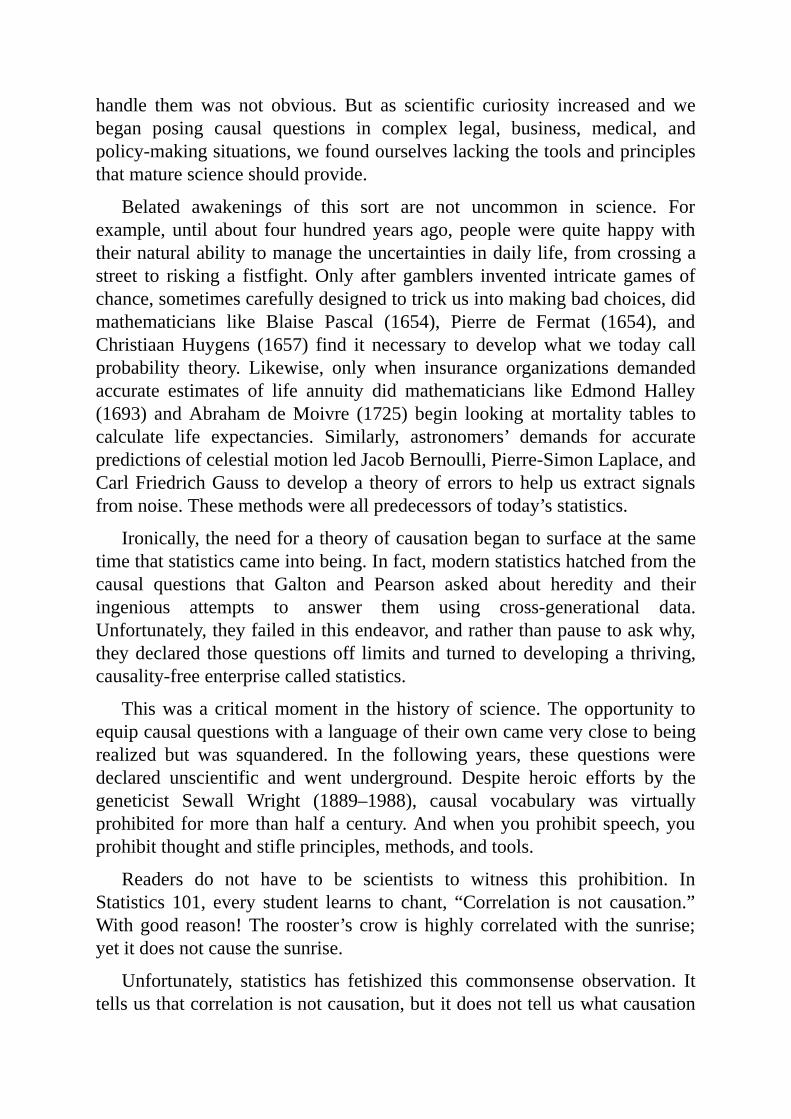
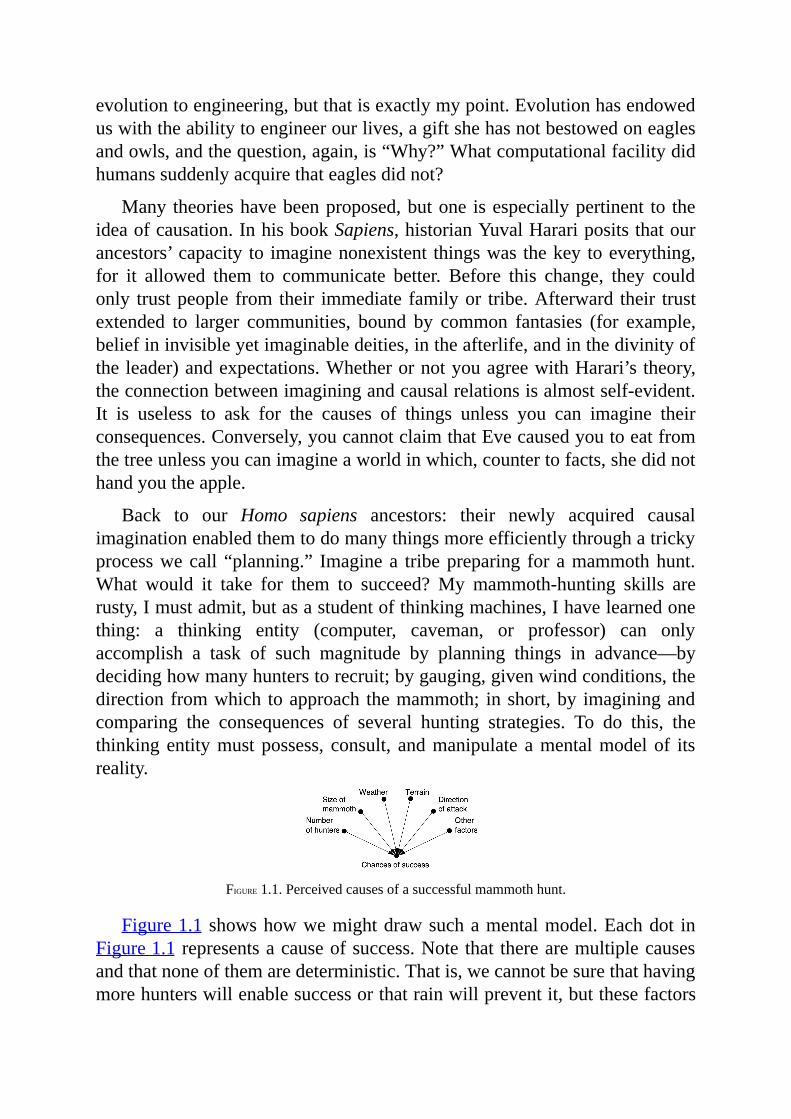
Back to our Homo sapiens ancestors: their newly acquired causalimaginationenabledthemtodomanythingsmoreefficientlythroughatrickyprocesswecall “planning.” Imaginea tribepreparing for amammothhunt.What would it take for them to succeed?My mammoth-hunting skills arerusty,Imustadmit,butasastudentofthinkingmachines,Ihavelearnedonething: a thinking entity (computer, caveman, or professor) can onlyaccomplish a task of such magnitude by planning things in advance—bydecidinghowmanyhunterstorecruit;bygauging,givenwindconditions,thedirectionfromwhich toapproach themammoth; inshort,by imaginingandcomparing the consequences of several hunting strategies. To do this, thethinkingentitymustpossess, consult, andmanipulate amentalmodelof itsreality.
FIGURE1.1.Perceivedcausesofasuccessfulmammothhunt.
Figure1.1showshowwemightdrawsuchamentalmodel.Eachdot inFigure1.1representsacauseofsuccess.Notethat therearemultiplecausesandthatnoneofthemaredeterministic.Thatis,wecannotbesurethathavingmorehunterswillenablesuccessorthatrainwillpreventit,butthesefactors
dochangetheprobabilityofsuccess.
Thementalmodelisthearenawhereimaginationtakesplace.Itenablesusto experiment with different scenarios by making local alterations to themodel. Somewhere in our hunters’ mental model was a subroutine thatevaluatedtheeffectofthenumberofhunters.Whentheyconsideredaddingmore,theydidn’thavetoevaluateeveryotherfactorfromscratch.Theycouldmakealocalchangetothemodel,replacing“Hunters=8”with“Hunters=9,”andreevaluatetheprobabilityofsuccess.Thismodularityisakeyfeatureofcausalmodels.
I don’t mean to imply, of course, that early humans actually drew apictorialmodellikethisone.Butwhenweseektoemulatehumanthoughtona computer, or indeedwhenwe try to solve unfamiliar scientific problems,drawinganexplicitdots-and-arrowspictureisextremelyuseful.Thesecausaldiagrams are the computational core of the “causal inference engine”describedintheIntroduction.
THETHREELEVELSOFCAUSATION
So far I may have given the impression that the ability to organize ourknowledgeoftheworldintocausesandeffectswasmonolithicandacquiredall at once. In fact,my research onmachine learning has taughtme that acausal learnermustmaster at least three distinct levels of cognitive ability:seeing,doing,andimagining.
The first, seeing or observing, entails detection of regularities in ourenvironmentand issharedbymanyanimalsaswellasearlyhumansbeforetheCognitiveRevolution.Thesecond,doing,entailspredicting theeffect(s)of deliberate alterations of the environment and choosing among thesealterations to produce a desired outcome. Only a small handful of specieshave demonstrated elements of this skill. Use of tools, provided it isintentionalandnotjustaccidentalorcopiedfromancestors,couldbetakenasa sign of reaching this second level.Yet even tool users do not necessarilypossessa“theory”of their tool that tells themwhyitworksandwhat todowhenitdoesn’t.Forthat,youneedtohaveachievedalevelofunderstandingthatpermits imagining. Itwasprimarily this third level thatpreparedus forfurtherrevolutionsinagricultureandscienceandledtoasuddenanddrasticchangeinourspecies’impactontheplanet.
I cannot prove this, but I canprovemathematically that the three levels
differ fundamentally, each unleashing capabilities that the ones below it donot.TheframeworkIusetoshowthisgoesbacktoAlanTuring,thepioneerofresearchinartificialintelligence(AI),whoproposedtoclassifyacognitivesystemin termsof thequeries itcananswer.Thisapproach isexceptionallyfruitful when we are talking about causality because it bypasses long andunproductivediscussionsofwhatexactlycausalityisandfocusesinsteadonthe concrete and answerable question “What can a causal reasoner do?”Ormoreprecisely,whatcananorganismpossessingacausalmodelcomputethatonelackingsuchamodelcannot?
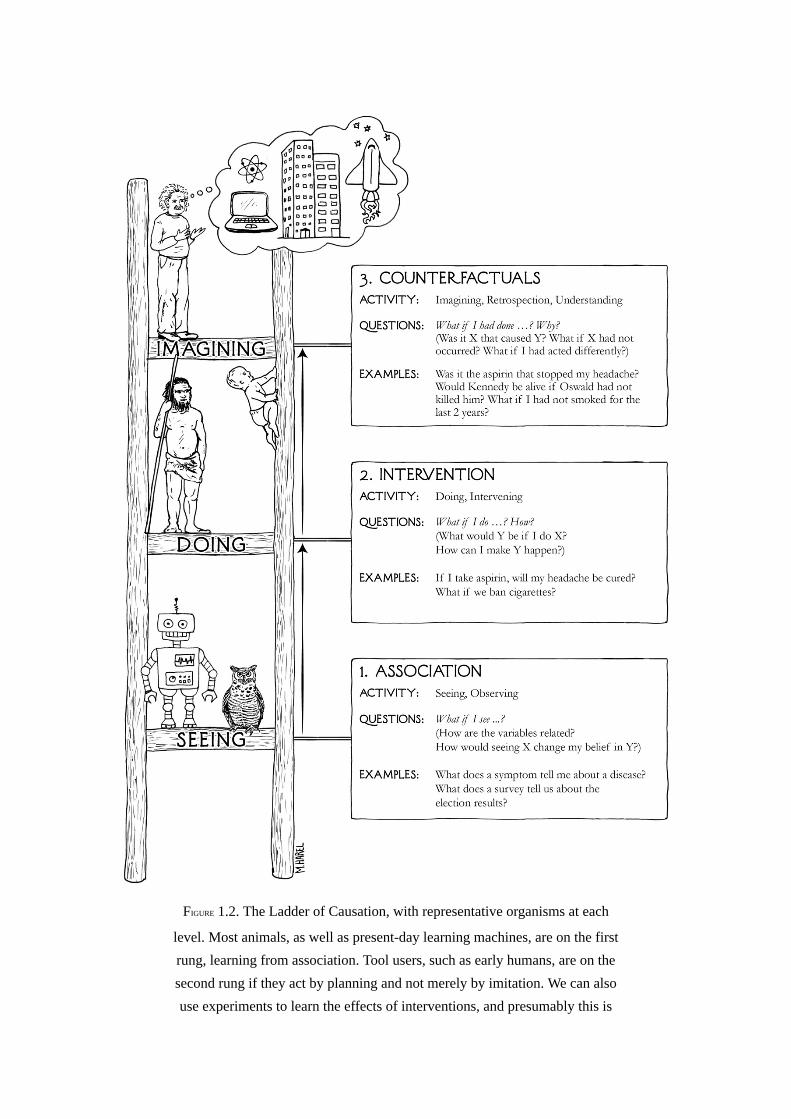
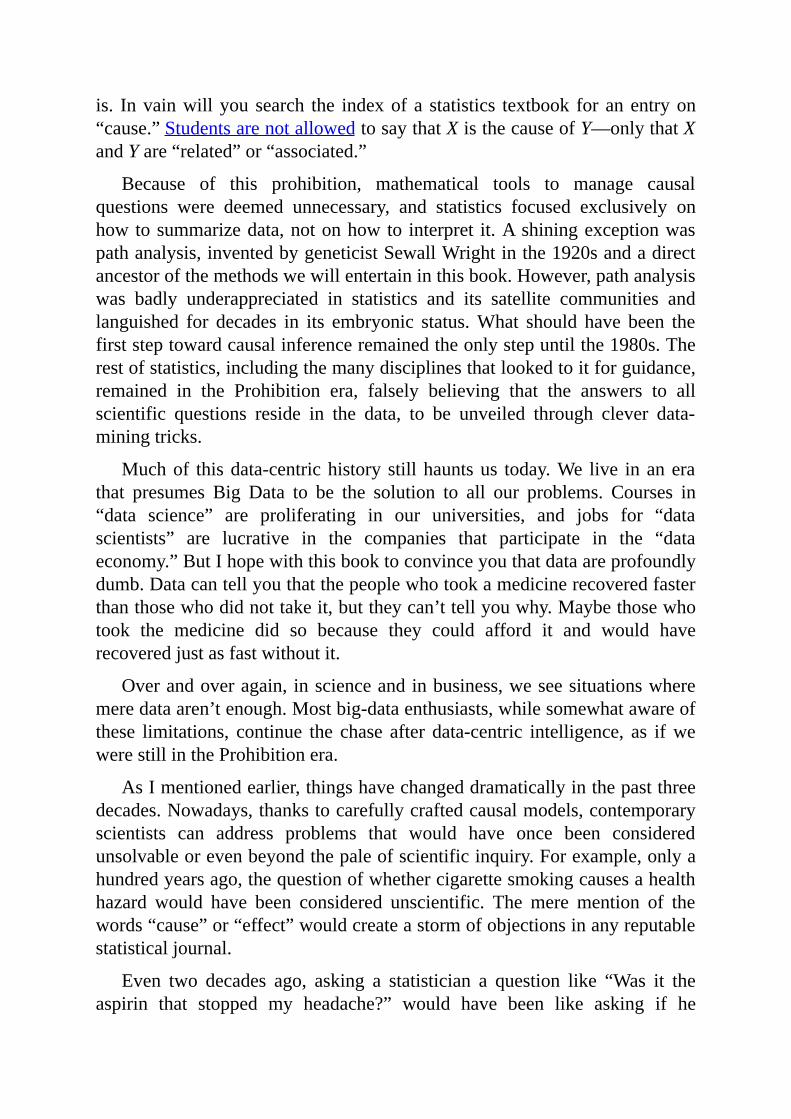
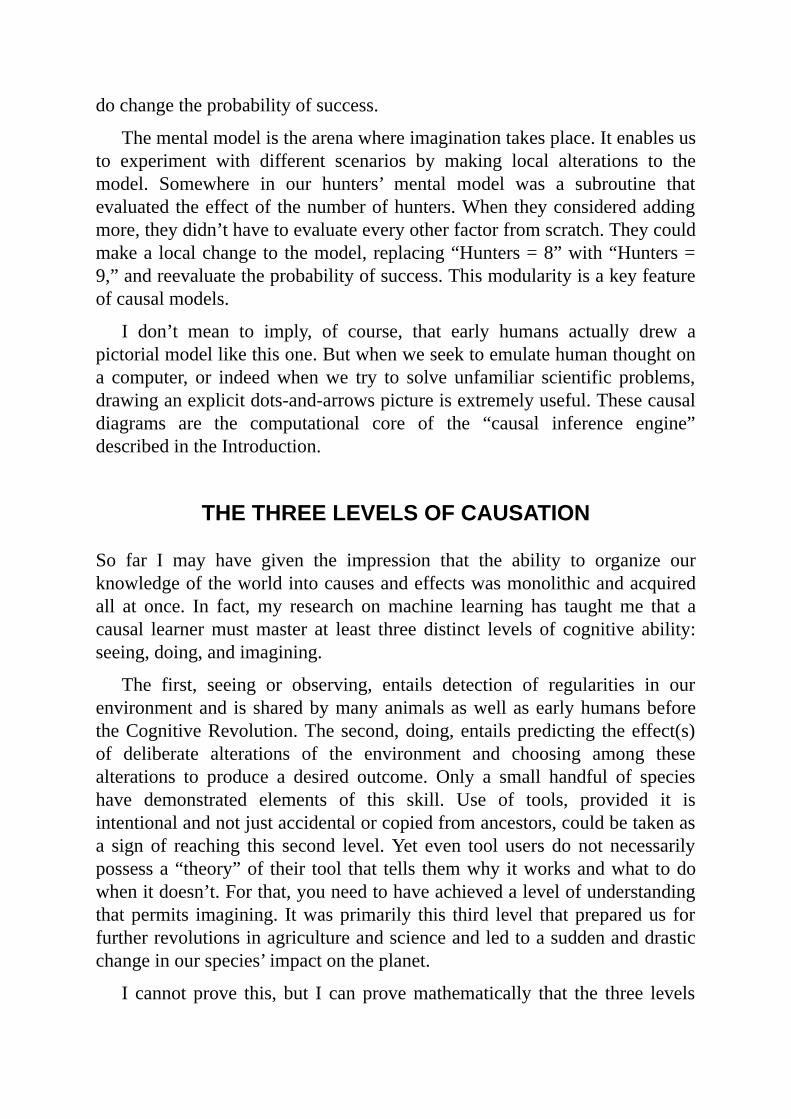
FIGURE1.2.TheLadderofCausation,withrepresentativeorganismsateach
level.Mostanimals,aswellaspresent-daylearningmachines,areonthefirstrung,learningfromassociation.Toolusers,suchasearlyhumans,areonthesecondrungiftheyactbyplanningandnotmerelybyimitation.Wecanalsouseexperimentstolearntheeffectsofinterventions,andpresumablythisis

howbabiesacquiremuchoftheircausalknowledge.Counterfactuallearners,
onthetoprung,canimagineworldsthatdonotexistandinferreasonsforobservedphenomena.(Source:DrawingbyMaayanHarel.)
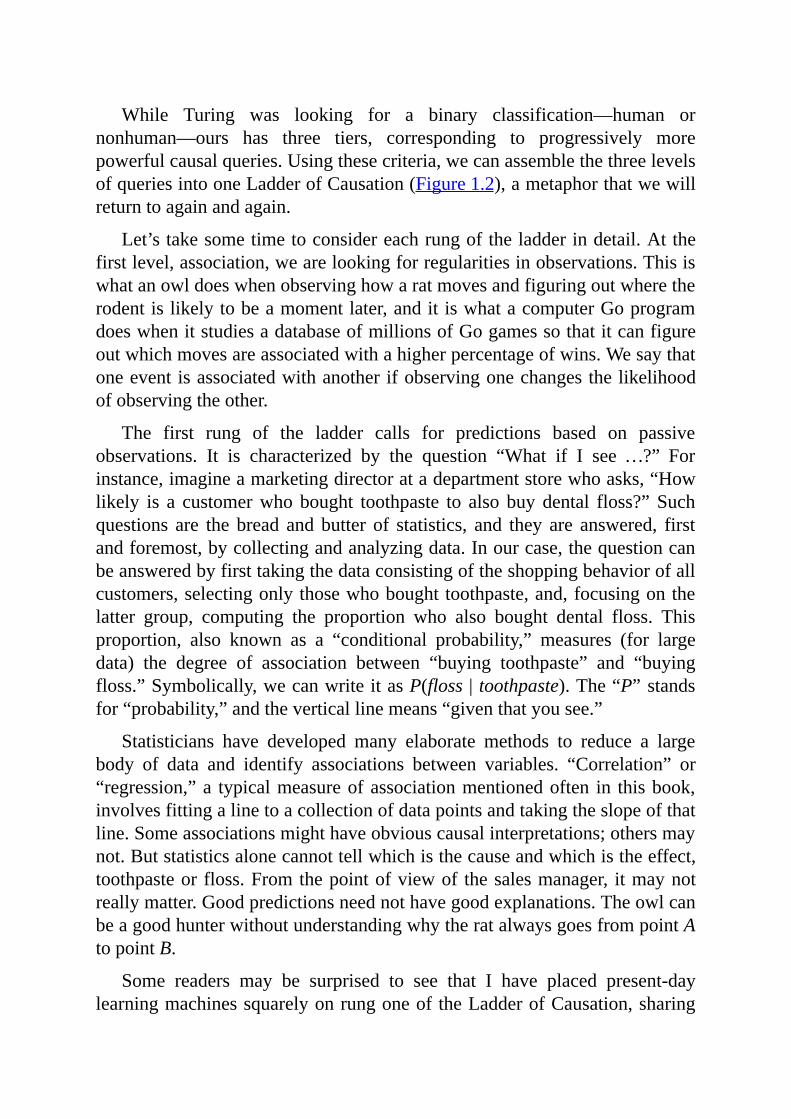
While Turing was looking for a binary classification—human ornonhuman—ours has three tiers, corresponding to progressively morepowerfulcausalqueries.Usingthesecriteria,wecanassemblethethreelevelsofqueriesintooneLadderofCausation(Figure1.2),ametaphorthatwewillreturntoagainandagain.
Let’stakesometimetoconsidereachrungoftheladderindetail.Atthefirstlevel,association,wearelookingforregularitiesinobservations.Thisiswhatanowldoeswhenobservinghowaratmovesandfiguringoutwheretherodentislikelytobeamomentlater,anditiswhatacomputerGoprogramdoeswhenitstudiesadatabaseofmillionsofGogamessothatitcanfigureoutwhichmovesareassociatedwithahigherpercentageofwins.Wesaythatoneeventisassociatedwithanotherifobservingonechangesthelikelihoodofobservingtheother.
The first rung of the ladder calls for predictions based on passiveobservations. It is characterized by the question “What if I see…?” Forinstance,imagineamarketingdirectoratadepartmentstorewhoasks,“Howlikely is a customerwhobought toothpaste to also buydental floss?”Suchquestions are the bread andbutter of statistics, and they are answered, firstandforemost,bycollectingandanalyzingdata.Inourcase,thequestioncanbeansweredbyfirsttakingthedataconsistingoftheshoppingbehaviorofallcustomers,selectingonlythosewhoboughttoothpaste,and,focusingonthelatter group, computing the proportion who also bought dental floss. Thisproportion, also known as a “conditional probability,” measures (for largedata) the degree of association between “buying toothpaste” and “buyingfloss.”Symbolically,wecanwriteitasP(floss |toothpaste).The“P”standsfor“probability,”andtheverticallinemeans“giventhatyousee.”
Statisticians have developed many elaborate methods to reduce a largebody of data and identify associations between variables. “Correlation” or“regression,”a typicalmeasureofassociationmentionedoften in thisbook,involvesfittingalinetoacollectionofdatapointsandtakingtheslopeofthatline.Someassociationsmighthaveobviouscausalinterpretations;othersmaynot.Butstatisticsalonecannottellwhichisthecauseandwhichistheeffect,toothpasteorfloss.Fromthepointofviewof thesalesmanager, itmaynotreallymatter.Goodpredictionsneednothavegoodexplanations.TheowlcanbeagoodhunterwithoutunderstandingwhytheratalwaysgoesfrompointAtopointB.
Some readers may be surprised to see that I have placed present-daylearningmachinessquarelyonrungoneoftheLadderofCausation,sharing
the wisdom of an owl. We hear almost every day, it seems, about rapidadvancesinmachinelearningsystems—self-drivingcars,speech-recognitionsystems, and, especially in recent years, deep-learning algorithms (or deepneuralnetworks).Howcouldtheystillbeonlyatlevelone?
The successes of deep learning have been truly remarkable and havecaught many of us by surprise. Nevertheless, deep learning has succeededprimarilybyshowingthatcertainquestionsortaskswethoughtweredifficultareinfactnot.Ithasnotaddressedthetrulydifficultquestionsthatcontinueto prevent us fromachieving humanlikeAI.As a result the public believesthat“strongAI,”machinesthatthinklikehumans,isjustaroundthecornerormaybeevenherealready.Inreality,nothingcouldbefartherfromthetruth.IfullyagreewithGaryMarcus,aneuroscientistatNewYorkUniversity,whorecentlywroteintheNewYorkTimesthatthefieldofartificialintelligenceis“bursting with microdiscoveries”—the sort of things that make good pressreleases—but machines are still disappointingly far from humanlikecognition.MycolleagueincomputerscienceattheUniversityofCalifornia,Los Angeles, Adnan Darwiche, has titled a position paper “Human-LevelIntelligenceorAnimal-LikeAbilities?”whichIthinkframesthequestioninjust the right way. The goal of strong AI is to produce machines withhumanlike intelligence, able to converse with and guide humans. Deeplearninghasinsteadgivenusmachineswithtrulyimpressiveabilitiesbutnointelligence.Thedifferenceisprofoundandliesintheabsenceofamodelofreality.
Just as they did thirty years ago,machine learning programs (includingthosewithdeepneuralnetworks)operatealmostentirely inanassociationalmode.Theyaredrivenbyastreamofobservationstowhichtheyattempttofitafunction,inmuchthesamewaythatastatisticiantriestofitalinetoacollectionofpoints.Deepneuralnetworkshaveaddedmanymore layers tothe complexity of the fitted function, but raw data still drives the fittingprocess. They continue to improve in accuracy asmore data are fitted, buttheydonot benefit from the “super-evolutionary speedup.” If, for example,the programmers of a driverless car want it to react differently to newsituations,theyhavetoaddthosenewreactionsexplicitly.Themachinewillnotfigureoutfor itself thatapedestrianwithabottleofwhiskeyinhandislikely to respond differently to a honking horn. This lack of flexibility andadaptability is inevitable in any system that works at the first level of theLadderofCausation.
Westepuptothenextlevelofcausalquerieswhenwebegintochangetheworld.Atypicalquestionforthislevelis“Whatwillhappentoourflosssales
ifwe double the price of toothpaste?”This already calls for a newkind ofknowledge,absentfromthedata,whichwefindatrungtwooftheLadderofCausation,intervention.
Intervention ranks higher than association because it involves not justseeing but changingwhat is. Seeing smoke tells us a totally different storyaboutthelikelihoodoffirethanmakingsmoke.Wecannotanswerquestionsaboutinterventionswithpassivelycollecteddata,nomatterhowbigthedataset or how deep the neural network. Many scientists have been quitetraumatized to learn that none of the methods they learned in statistics issufficient even to articulate, let alone answer, a simple question like “Whathappens ifwedouble theprice?” I know this becauseonmanyoccasions Ihavehelpedthemclimbtothenextrungoftheladder.
Whycan’tweanswerourflossquestionjustbyobservation?Whynotjustgo into our vast database of previous purchases and see what happenedpreviously when toothpaste cost twice as much? The reason is that on thepreviousoccasions,thepricemayhavebeenhigherfordifferentreasons.Forexample, the productmay have been in short supply, and every other storealso had to raise its price. But now you are considering a deliberateintervention that will set a new price regardless of market conditions. Theresultmightbequitedifferentfromwhenthecustomercouldn’tfindabetterdealelsewhere.Ifyouhaddataonthemarketconditions thatexistedonthepreviousoccasions, perhapsyoucouldmake abetter prediction…butwhatdatadoyouneed?Andthen,howwouldyoufigureitout?Thoseareexactlythequestionsthescienceofcausalinferenceallowsustoanswer.
Averydirectwaytopredicttheresultofaninterventionistoexperimentwith it under carefully controlled conditions. Big-data companies likeFacebookknowthisandconstantlyperformexperimentstoseewhathappensifitemsonthescreenarearrangeddifferentlyorthecustomergetsadifferentprompt(orevenadifferentprice).
Moreinterestingandlesswidelyknown—eveninSiliconValley—isthatsuccessfulpredictionsoftheeffectsofinterventionscansometimesbemadeevenwithoutanexperiment.Forexample,thesalesmanagercoulddevelopamodel of consumer behavior that includes market conditions. Even if shedoesn’t have data on every factor, she might have data on enough keysurrogates tomake the prediction.A sufficiently strong and accurate causalmodelcanallowustouserung-one(observational)datatoanswerrung-two(interventional)queries.Withoutthecausalmodel,wecouldnotgofromrungonetorungtwo.Thisiswhydeep-learningsystems(aslongastheyuseonly
rung-onedataanddonothaveacausalmodel)willneverbeabletoanswerquestions about interventions, which by definition break the rules of theenvironmentthemachinewastrainedin.
Astheseexamplesillustrate,thedefiningqueryofthesecondrungoftheLadderofCausationis“What ifwedo…?”Whatwillhappenifwechangetheenvironment?WecanwritethiskindofqueryasP(floss|do(toothpaste)),whichasksabouttheprobabilitythatwewillsellflossatacertainprice,giventhatwesetthepriceoftoothpasteatanotherprice.
Another popular question at the second level of causation is “How?,”whichisacousinof“Whatifwedo…?”Forinstance,themanagermaytellusthatwehavetoomuchtoothpasteinourwarehouse.“Howcanwesellit?”heasks.Thatis,whatpriceshouldwesetforit?Again,thequestionreferstoan intervention, which we want to perform mentally before we decidewhetherandhowtodoitinreallife.Thatrequiresacausalmodel.
Weperforminterventionsallthetimeinourdailylives,althoughwedon’tusuallyusesuchafancytermforthem.Forexample,whenwetakeaspirintocureaheadache,weareinterveningononevariable(thequantityofaspirininour body) in order to affect another one (our headache status). If we arecorrectinourcausalbeliefaboutaspirin,the“outcome”variablewillrespondbychangingfrom“headache”to“noheadache.”
While reasoning about interventions is an important step on the causalladder,itstilldoesnotanswerallquestionsofinterest.Wemightwonder,Myheadacheisgonenow,butwhy?WasittheaspirinItook?ThefoodIate?Thegoodnews I heard?Thesequeries takeus to the top rungof theLadderofCausation, the levelofcounterfactuals,because toanswer themwemustgoback in time,changehistory,andask,“Whatwouldhavehappened if Ihadnottakentheaspirin?”Noexperimentintheworldcandenytreatmenttoanalready treatedpersonandcompare the twooutcomes,sowemust importawholenewkindofknowledge.
Counterfactuals have a particularly problematic relationship with databecausedataare,bydefinition,facts.Theycannottelluswhatwillhappenina counterfactual or imaginaryworldwhere some observed facts are bluntlynegated. Yet the human mind makes such explanation-seeking inferencesreliablyandrepeatably.Evediditwhensheidentified“Theserpentdeceivedme”asthereasonforheraction.Thisabilitymostdistinguisheshumanfromanimalintelligence,aswellasfrommodel-blindversionsofAIandmachinelearning.
Youmay be skeptical that science canmake any useful statement about“wouldhaves,”worlds thatdonot exist and things thathavenothappened.But it does and always has. The laws of physics, for example, can beinterpreted as counterfactual assertions, such as “Had the weight on thisspringdoubled, its lengthwouldhavedoubledaswell” (Hooke’s law).Thisstatement is, of course, backed by a wealth of experimental (rung-two)evidence, derived from hundreds of springs, in dozens of laboratories, onthousands of different occasions. However, once anointed as a “law,”physicistsinterpretitasafunctionalrelationshipthatgovernsthisveryspring,at this verymoment, under hypothetical values of theweight. All of thesedifferentworlds,wheretheweightisxpoundsandthelengthofthespringisLx inches, are treated as objectively knowable and simultaneously active,eventhoughonlyoneofthemactuallyexists.
Going back to the toothpaste example, a top-rung question would be“What is the probability that a customerwho bought toothpastewould stillhaveboughtitifwehaddoubledtheprice?”Wearecomparingtherealworld(whereweknowthatthecustomerboughtthetoothpasteatthecurrentprice)toafictitiousworld(wherethepriceistwiceashigh).
The rewards of having a causal model that can answer counterfactualquestionsareimmense.Findingoutwhyablunderoccurredallowsustotakethe right corrective measures in the future. Finding out why a treatmentworkedonsomepeopleandnotonotherscanleadtoanewcureforadisease.Answering the question “What if things had been different?” allows us tolearn from history and the experience of others, something that no otherspeciesappearstodo.It isnotsurprisingthat theancientGreekphilosopherDemocritus(460–370BC)said,“IwouldratherdiscoveronecausethanbetheKingofPersia.”
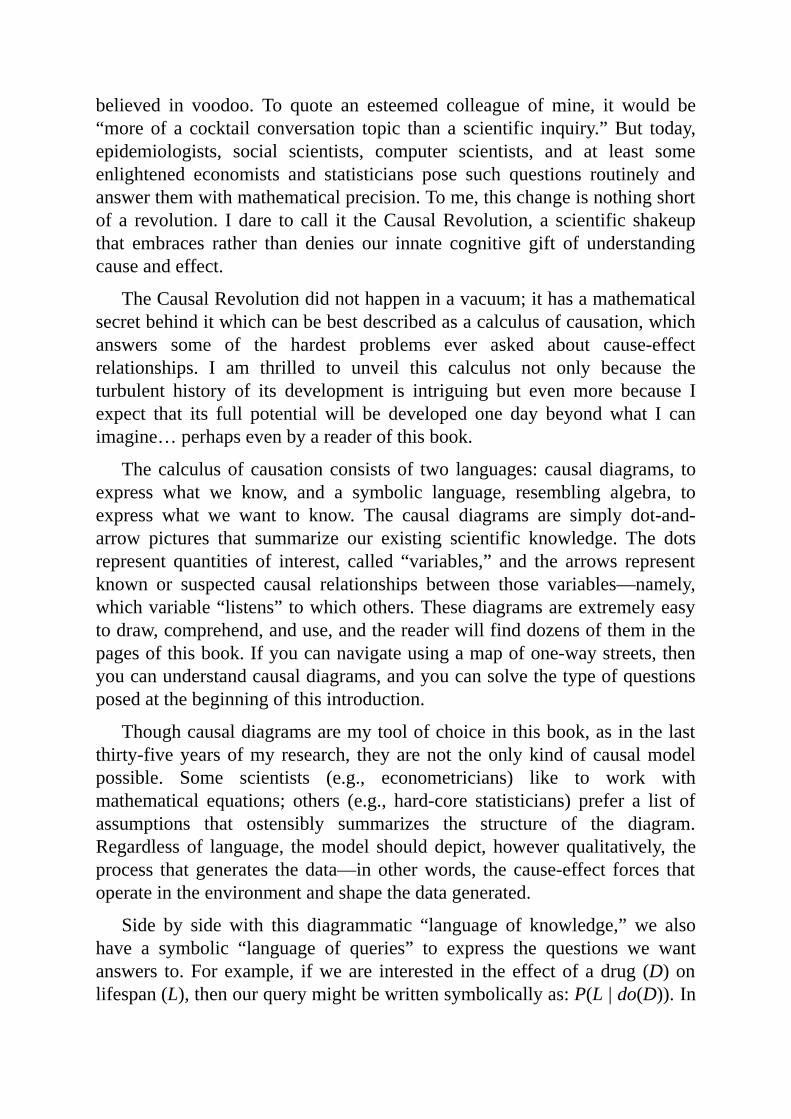
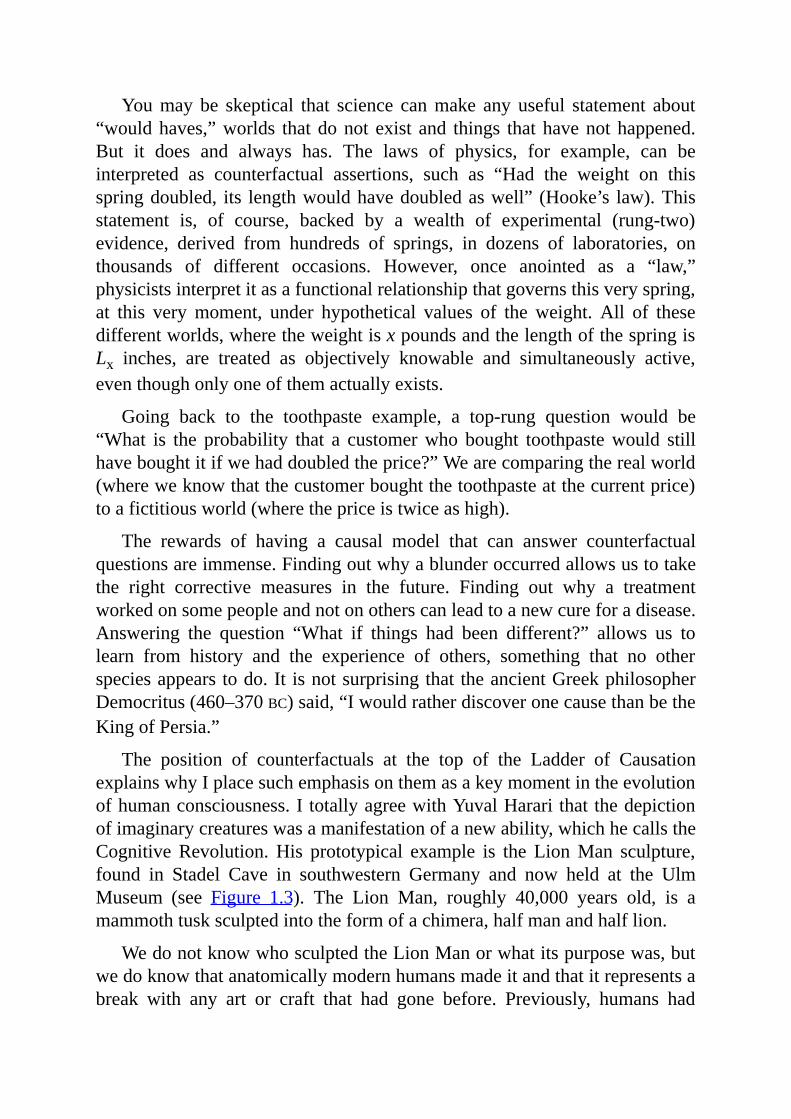
The position of counterfactuals at the top of the Ladder of CausationexplainswhyIplacesuchemphasisonthemasakeymomentintheevolutionofhumanconsciousness.I totallyagreewithYuvalHarari that thedepictionofimaginarycreatureswasamanifestationofanewability,whichhecallstheCognitiveRevolution.His prototypical example is the LionMan sculpture,found in Stadel Cave in southwestern Germany and now held at the UlmMuseum (see Figure 1.3). The Lion Man, roughly 40,000 years old, is amammothtusksculptedintotheformofachimera,halfmanandhalflion.
WedonotknowwhosculptedtheLionManorwhatitspurposewas,butwedoknowthatanatomicallymodernhumansmadeitandthatitrepresentsabreak with any art or craft that had gone before. Previously, humans had

fashionedtoolsandrepresentationalart,frombeadstoflutestospearpointstoelegant carvings of horses and other animals. TheLionMan is different: acreatureofpureimagination.
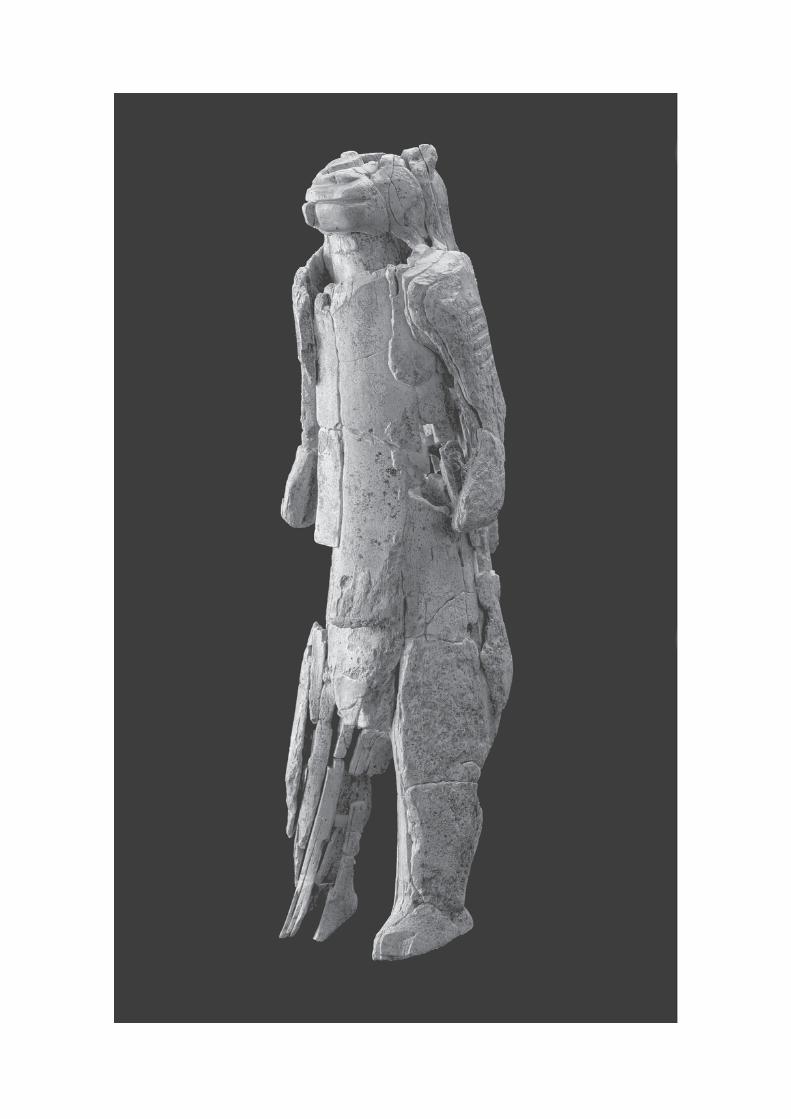


FIGURE1.3.TheLionManofStadelCave.Theearliestknownrepresentationof
animaginarycreature(halfmanandhalflion),itisemblematicofanewlydevelopedcognitiveability,thecapacitytoreasonaboutcounterfactuals.(Source:PhotobyYvonneMühleis,courtesyofStateOfficeforCultural
HeritageBaden-Württemberg/UlmerMuseum,Ulm,Germany.)
As amanifestation of our newfound ability to imagine things that havenever existed, theLionMan is the precursor of every philosophical theory,scientific discovery, and technological innovation, from microscopes toairplanes to computers. Every one of these had to take shape in someone’simaginationbeforeitwasrealizedinthephysicalworld.
This leap forward in cognitive abilitywas as profound and important toour species as any of the anatomical changes thatmade us human.Within10,000yearsaftertheLionMan’screation,allotherhominids(exceptforthevery geographically isolated Flores hominids) had become extinct. Andhumans have continued to change the natural world with incredible speed,using our imagination to survive, adapt, and ultimately take over. Theadvantagewegainedfromimaginingcounterfactualswasthesamethenasitis today: flexibility, the ability to reflect and improve on past actions, and,perhapsevenmoresignificant,ourwillingnesstotakeresponsibilityforpastandcurrentactions.
AsshowninFigure1.2,thecharacteristicqueriesforthethirdrungoftheLadderofCausationare“WhatifIhaddone…?”and“Why?”Bothinvolvecomparing theobservedworld toacounterfactualworld.Experimentsalonecannotanswersuchquestions.Whilerungonedealswiththeseenworld,andrungtwodealswithabravenewworldthatisseeable,rungthreedealswithaworldthatcannotbeseen(becauseitcontradictswhatisseen).Tobridgethegap,weneedamodelof theunderlyingcausalprocess, sometimescalleda“theory”oreven(incaseswhereweareextraordinarilyconfident)a“lawofnature.” In short,weneedunderstanding.This is, of course, aholygrail ofany branch of science—the development of a theory that will enable us topredictwhatwillhappeninsituationswehavenotevenenvisionedyet.Butitgoesevenfurther:havingsuchlawspermitsustoviolatethemselectivelysoas to create worlds that contradict ours. Our next section features suchviolationsinaction.
THEMINI-TURINGTEST
In1950,AlanTuringaskedwhatitwouldmeanforacomputertothinklikeahuman.Hesuggestedapractical test,whichhecalled“the imitationgame,”but every AI researcher since then has called it the “Turing test.” For allpractical purposes, a computer could be called a thinking machine if anordinaryhuman,communicatingwith thecomputerby typewriter,couldnottell whether he was talkingwith a human or a computer. Turing was veryconfidentthatthiswaswithintherealmoffeasibility.“Ibelievethatinaboutfiftyyears’timeitwillbepossibletoprogramcomputers,”hewrote,“tomakethem play the imitation game sowell that an average interrogator will nothavemore thana70percent chanceofmaking the right identificationafterfiveminutesofquestioning.”
Turing’s prediction was slightly off. Every year the Loebner Prizecompetitionidentifiesthemosthumanlike“chatbot”intheworld,withagoldmedaland$100,000offeredtoanyprogramthatsucceedsinfoolingallfourjudges into thinking it is human. As of 2015, in twenty-five years ofcompetition, not a single programhas fooled all the judges or even half ofthem.
Turing didn’t just suggest the “imitation game”; he also proposed astrategy to pass it. “Instead of trying to produce a program to simulate theadultmind,whynotrather try toproduceonewhichsimulates thechild’s?”heasked.Ifyoucoulddothat,thenyoucouldjustteachitthesamewayyouwouldteachachild,andpresto,twentyyearslater(orless,givenacomputer’sgreater speed), you would have an artificial intelligence. “Presumably thechildbrainissomethinglikeanotebookasonebuysitfromthestationer’s,”hewrote.“Ratherlittlemechanism,andlotsofblanksheets.”Hewaswrongaboutthat:thechild’sbrainisrichinmechanismsandprestoredtemplates.
Nonetheless, I think thatTuringwason to something.Weprobablywillnot succeed in creatinghumanlike intelligenceuntilwe can create childlikeintelligence, and a key component of this intelligence is the mastery ofcausation.
How can machines acquire causal knowledge? This is still a majorchallenge that will undoubtedly involve an intricate combination of inputsfrom active experimentation, passive observation, and (not least) theprogrammer—much the same inputs that a child receives, with evolution,parents,andpeerssubstitutedfortheprogrammer.
However, we can answer a slightly less ambitious question: How canmachines(andpeople)representcausalknowledgeinawaythatwouldenablethemtoaccessthenecessaryinformationswiftly,answerquestionscorrectly,
and do itwith ease, as a three-year-old child can? In fact, this is themainquestionweaddressinthisbook.
Icallthisthemini-Turingtest.Theideaistotakeasimplestory,encodeitonamachineinsomeway,andthentesttoseeifthemachinecancorrectlyanswercausalquestionsthatahumancananswer.Itis“mini”fortworeasons.First, it is confined to causal reasoning, excluding other aspects of humanintelligence such as vision and natural language. Second, we allow thecontestanttoencodethestoryinanyconvenientrepresentation,unburdeningthe machine of the task of acquiring the story from its own personalexperience.Passing thismini-testhasbeenmy life’swork—consciously forthelasttwenty-fiveyearsandsubconsciouslyevenbeforethat.
Obviously, as we prepare to take the mini-Turing test, the question ofrepresentation needs to precede the question of acquisition. Without arepresentation, we wouldn’t know how to store information for future use.Even ifwecould letour robotmanipulate itsenvironmentatwill,whateverinformationwe learned thiswaywould be forgotten, unless our robotwereendowedwith a template to encode the results of thosemanipulations.Onemajor contribution of AI to the study of cognition has been the paradigm“Representation first, acquisition second.” Often the quest for a goodrepresentation has led to insights into how the knowledge ought to beacquired,beitfromdataoraprogrammer.
WhenIdescribethemini-Turingtest,peoplecommonlyclaimthatitcaneasily be defeated by cheating. For example, take the list of all possiblequestions,store theircorrectanswers,and thenread themout frommemorywhenasked.Thereisnowaytodistinguish(sotheargumentgoes)betweenamachinethatstoresadumbquestion-answerlistandonethatanswersthewaythatyouand Ido—that is, byunderstanding thequestionandproducingananswer using a mental causal model. So what would the mini-Turing testprove,ifcheatingissoeasy?
ThephilosopherJohnSearleintroducedthischeatingpossibility,knownasthe“ChineseRoom”argument, in1980 tochallengeTuring’sclaimthat theabilitytofakeintelligenceamountstohavingintelligence.Searle’schallengehasonlyoneflaw:cheatingisnoteasy;infact,itisimpossible.Evenwithasmall number of variables, the number of possible questions growsastronomically. Say thatwe have ten causal variables, each ofwhich takesonlytwovalues(0or1).Wecouldaskroughly30millionpossiblequeries,such as “What is the probability that the outcome is 1, given that we seevariableXequals1andwemakevariableYequal0andvariableZequal1?”
Ifthereweremorevariables,ormorethantwostatesforeachone,thenumberofpossibilitieswouldgrowbeyondourability toevenimagine.Searle’s listwouldneedmoreentriesthanthenumberofatomsintheuniverse.So,clearlyadumblistofquestionsandanswerscanneversimulatetheintelligenceofachild,letaloneanadult.
Humans must have some compact representation of the informationneeded in their brains, as well as an effective procedure to interpret eachquestionproperlyandextracttherightanswerfromthestoredrepresentation.To pass themini-Turing test, therefore, we need to equipmachines with asimilarlyefficientrepresentationandanswer-extractionalgorithm.
Sucharepresentationnotonlyexistsbuthaschildlikesimplicity:acausaldiagram.Wehavealreadyseenoneexample, thediagramfor themammothhunt.Consideringtheextremeeasewithwhichpeoplecancommunicatetheirknowledgewithdot-and-arrowdiagrams,Ibelievethatourbrainsindeedusea representation like this. But more importantly for our purposes, thesemodels pass themini-Turing test; no othermodel is known to do so. Let’slookatsomeexamples.
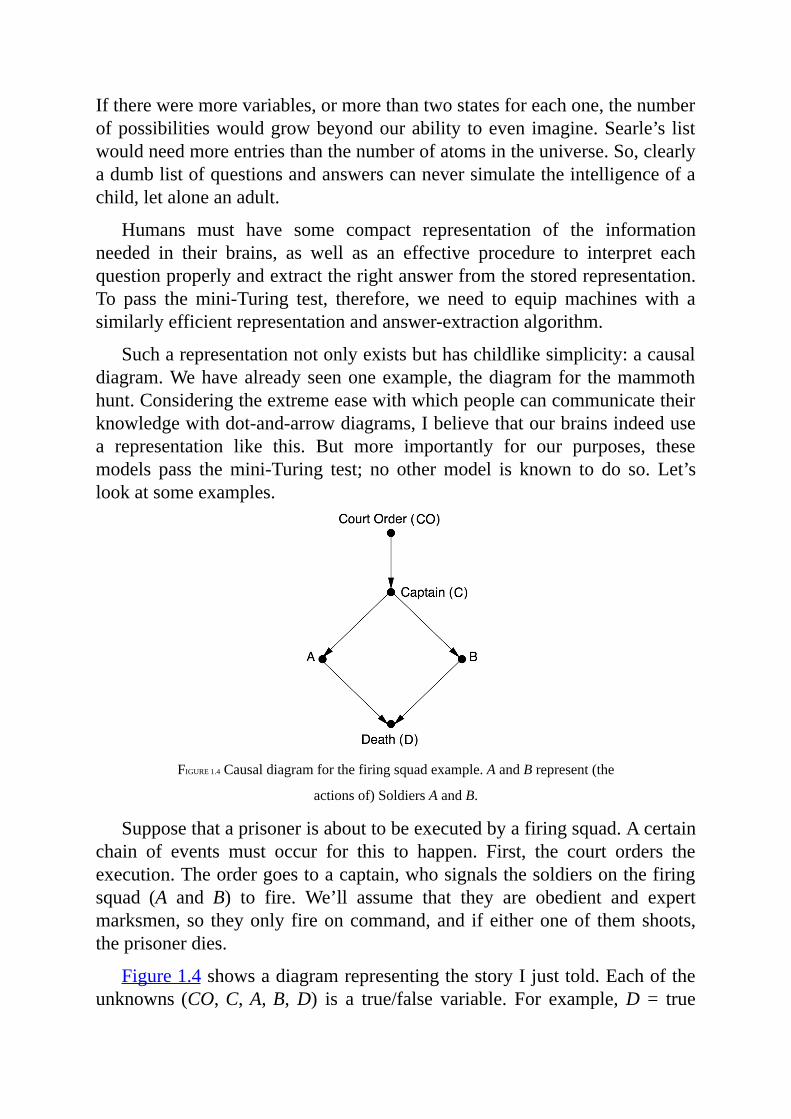
FIGURE1.4Causaldiagramforthefiringsquadexample.AandBrepresent(the
actionsof)SoldiersAandB.
Supposethataprisonerisabouttobeexecutedbyafiringsquad.Acertainchain of events must occur for this to happen. First, the court orders theexecution.Theordergoestoacaptain,whosignalsthesoldiersonthefiringsquad (A and B) to fire. We’ll assume that they are obedient and expertmarksmen,so theyonlyfireoncommand,and ifeitheroneof themshoots,theprisonerdies.
Figure1.4showsadiagramrepresentingthestoryIjusttold.Eachoftheunknowns(CO,C,A,B,D) is a true/false variable. For example,D = true
meanstheprisonerisdead;D=falsemeanstheprisonerisalive.CO=falsemeansthecourtorderwasnotissued;CO=truemeansitwas,andsoon.
Usingthisdiagram,wecanstartansweringcausalquestionsfromdifferentrungsof the ladder.First,wecananswerquestionsofassociation(i.e.,whatone fact tells us about another). If the prisoner is dead, does thatmean thecourtorderwasgiven?We (or a computer) can inspect thegraph, trace therulesbehindeachofthearrows,and,usingstandardlogic,concludethatthetwo soldierswouldn’t have firedwithout the captain’s command.Likewise,thecaptainwouldn’thavegiventhecommandifhedidn’thavetheorder inhis possession. Therefore the answer to our query is yes. Alternatively,supposewefindoutthatAfired.WhatdoesthattellusaboutB?Byfollowingthearrows,thecomputerconcludesthatBmusthavefiredtoo.(Awouldnothavefiredifthecaptainhadn’tsignaled,soBmusthavefiredaswell.)ThisistrueeventhoughAdoesnotcauseB(thereisnoarrowfromAtoB).
Going up the Ladder of Causation, we can ask questions aboutintervention.WhatifSoldierAdecidesonhisowninitiativetofire,withoutwaitingforthecaptain’scommand?Willtheprisonerbedeadoralive?Thisquestioninfactalreadyhasacontradictoryflavortoit.IjusttoldyouthatAonlyshootsifcommandedto,andyetnowweareaskingwhathappensifhefiredwithoutacommand.Ifyou’rejustusingtherulesoflogic,ascomputerstypicallydo,thequestionismeaningless.Astherobotinthe1960ssci-fiTVseriesLostinSpaceusedtosayinsuchsituations,“Thatdoesnotcompute.”
Ifwewantourcomputertounderstandcausation,wehavetoteachithowto break the rules. We have to teach it the difference between merelyobserving an event and making it happen. “Whenever you make an eventhappen,”wetellthecomputer,“removeallarrowsthatpointtothateventandcontinue the analysis by ordinary logic, as if the arrows had never beenthere.”Thus,weeraseallthearrowsleadingintotheintervenedvariable(A).Wealsosetthatvariablemanuallytoitsprescribedvalue(true).Therationaleforthispeculiar“surgery”issimple:makinganeventhappenmeansthatyouemancipate it from all other influences and subject it to one and only oneinfluence—thatwhichenforcesitshappening.
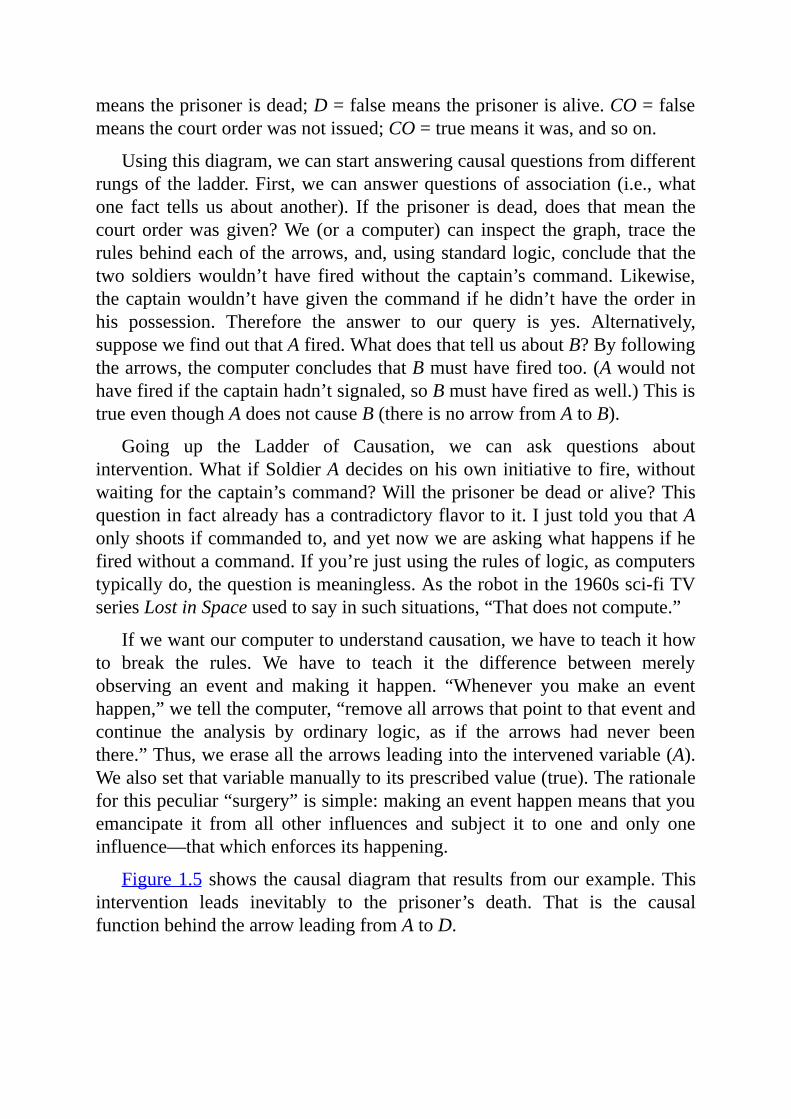
Figure1.5shows thecausaldiagramthat results fromourexample.Thisintervention leads inevitably to the prisoner’s death. That is the causalfunctionbehindthearrowleadingfromAtoD.
FIGURE1.5.Reasoningaboutinterventions.SoldierAdecidestofire;arrowfromC
toAisdeleted,andAisassignedthevaluetrue.
Note that this conclusion agrees with our intuitive judgment that A’sunauthorized firing will lead to the prisoner’s death, because the surgeryleavesthearrowfromAtoDintact.Also,ourjudgmentwouldbethatB (inall likelihood) did not shoot; nothing about A’s decision should affectvariablesinthemodelthatarenoteffectsofA’sshot.Thisbearsrepeating.IfweseeAshoot,thenweconcludethatBshottoo.ButifAdecidestoshoot,orifwemakeAshoot,thentheoppositeis true.This is thedifferencebetweenseeing anddoing. Only a computer capable of grasping this difference canpassthemini-Turingtest.
Note also that merely collecting Big Data would not have helped usascend the ladder and answer the above questions. Assume that you are areportercollectingrecordsofexecutionscenesdayafterday.Yourdatawillconsistoftwokindsofevents:eitherallfivevariablesaretrue,orallofthemare false. There is no way that this kind of data, in the absence of anunderstanding of who listens to whom, will enable you (or any machinelearning algorithm) to predict the results of persuadingmarksmanA not toshoot.
Finally,toillustratethethirdrungoftheLadderofCausation,let’sposeacounterfactual question. Suppose the prisoner is lying dead on the ground.Fromthiswecanconclude(usinglevelone)thatAshot,B shot, thecaptaingavethesignal,andthecourtgavetheorder.ButwhatifAhaddecidednottoshoot?Wouldtheprisonerbealive?ThisquestionrequiresustocomparetherealworldwithafictitiousandcontradictoryworldwhereAdidn’tshoot.Inthe fictitious world, the arrow leading into A is erased to liberate A fromlisteningtoC.InsteadAissettofalse,leavingitspasthistorythesameasitwasintherealworld.SothefictitiousworldlookslikeFigure1.6.
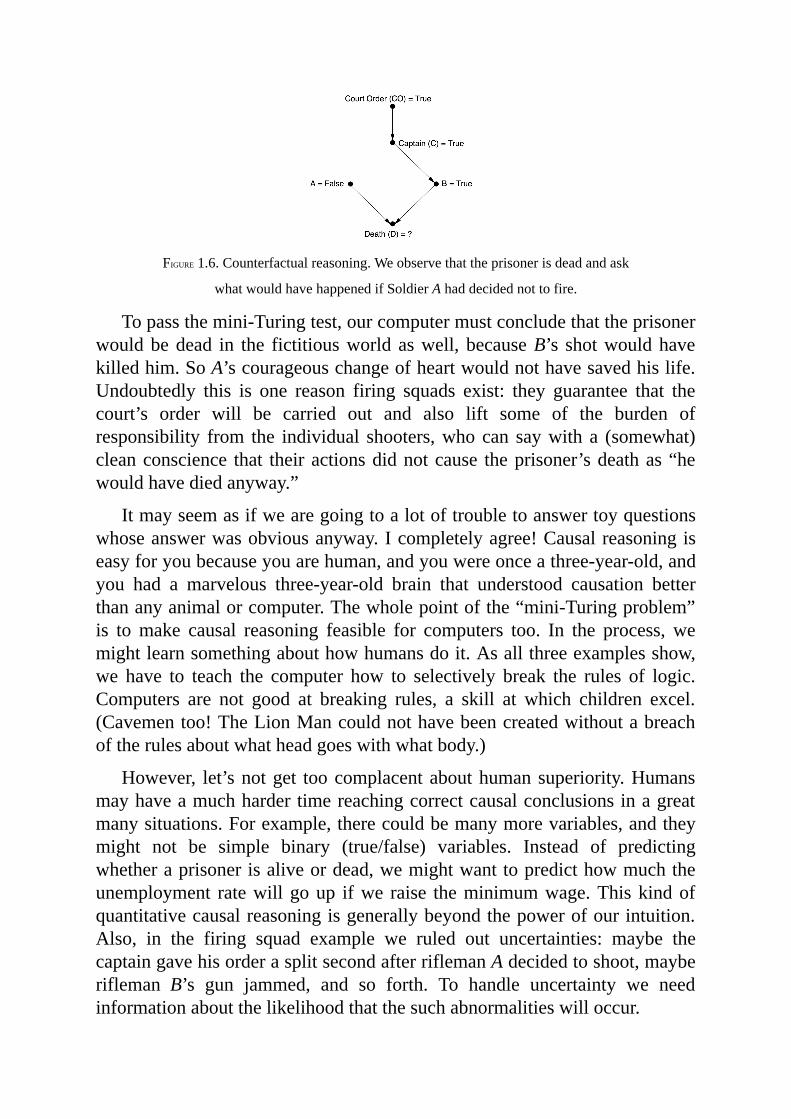
FIGURE1.6.Counterfactualreasoning.Weobservethattheprisonerisdeadandask
whatwouldhavehappenedifSoldierAhaddecidednottofire.
Topassthemini-Turingtest,ourcomputermustconcludethattheprisonerwouldbedead in the fictitiousworld aswell, becauseB’s shotwouldhavekilledhim.SoA’scourageouschangeofheartwouldnothavesavedhislife.Undoubtedly this is one reason firing squads exist: they guarantee that thecourt’s order will be carried out and also lift some of the burden ofresponsibility from the individual shooters,whocan saywith a (somewhat)cleanconscience that theiractionsdidnotcause theprisoner’sdeathas“hewouldhavediedanyway.”
Itmayseemasifwearegoingtoalotoftroubletoanswertoyquestionswhoseanswerwasobviousanyway.Icompletelyagree!Causalreasoningiseasyforyoubecauseyouarehuman,andyouwereonceathree-year-old,andyou had a marvelous three-year-old brain that understood causation betterthananyanimalorcomputer.Thewholepointofthe“mini-Turingproblem”is tomake causal reasoning feasible for computers too. In the process, wemightlearnsomethingabouthowhumansdoit.Asallthreeexamplesshow,we have to teach the computer how to selectively break the rules of logic.Computers are not good at breaking rules, a skill at which children excel.(Cavementoo!TheLionMancouldnothavebeencreatedwithoutabreachoftherulesaboutwhatheadgoeswithwhatbody.)
However, let’snotget toocomplacentabouthumansuperiority.Humansmayhaveamuchhardertimereachingcorrectcausalconclusionsinagreatmanysituations.Forexample,therecouldbemanymorevariables,andtheymight not be simple binary (true/false) variables. Instead of predictingwhetheraprisonerisaliveordead,wemightwanttopredicthowmuchtheunemployment ratewillgoup ifwe raise theminimumwage.Thiskindofquantitativecausalreasoningisgenerallybeyondthepowerofourintuition.Also, in the firing squad example we ruled out uncertainties: maybe thecaptaingavehisorderasplitsecondafterriflemanAdecidedtoshoot,mayberifleman B’s gun jammed, and so forth. To handle uncertainty we needinformationaboutthelikelihoodthatthesuchabnormalitieswilloccur.

Letmegiveyouanexampleinwhichprobabilitiesmakeallthedifference.ItechoesthepublicdebatethateruptedinEuropewhenthesmallpoxvaccinewasfirstintroduced.Unexpectedly,datashowedthatmorepeoplediedfromsmallpoxinoculationsthanfromsmallpoxitself.Naturally,somepeopleusedthis information to argue that inoculation shouldbebanned,when in fact itwassavinglivesbyeradicatingsmallpox.Let’slookatsomefictitiousdatatoillustratetheeffectandsettlethedispute.
Suppose that out of1million children, 99percent arevaccinated, and1percent are not. If a child is vaccinated, he or she has one chance in onehundred of developing a reaction, and the reaction has one chance in onehundred of being fatal. On the other hand, he or she has no chance ofdeveloping smallpox. Meanwhile, if a child is not vaccinated, he or sheobviouslyhaszerochanceofdevelopingareactiontothevaccine,butheorshehasonechanceinfiftyofdevelopingsmallpox.Finally,let’sassumethatsmallpoxisfatalinoneoutoffivecases.
Ithinkyouwouldagreethatvaccinationlookslikeagoodidea.Theoddsof having a reaction are lower than the odds of getting smallpox, and thereaction ismuch less dangerous than the disease.But now let’s look at thedata. Out of 1 million children, 990,000 get vaccinated, 9,900 have thereaction,and99diefromit.Meanwhile,10,000don’tgetvaccinated,200getsmallpox,and40die fromthedisease. Insummary,morechildrendie fromvaccination(99)thanfromthedisease(40).
I can empathize with the parents who might march to the healthdepartmentwith signs saying, “Vaccines kill!”And the data seem to be ontheirside;thevaccinationsindeedcausemoredeathsthansmallpoxitself.Butis logic on their side? Should we ban vaccination or take into account thedeathsprevented?Figure1.7showsthecausaldiagramforthisexample.
When we began, the vaccination rate was 99 percent.We now ask thecounterfactual question “What if we had set the vaccination rate to zero?”Using the probabilities I gave you above, we can conclude that out of 1millionchildren,20,000wouldhavegottensmallpox,and4,000wouldhavedied.Comparingthecounterfactualworldwiththerealworld,weseethatnotvaccinating would have cost the lives of 3,861 children (the differencebetween4,000and139).Weshouldthankthelanguageofcounterfactualsforhelpingustoavoidsuchcosts.
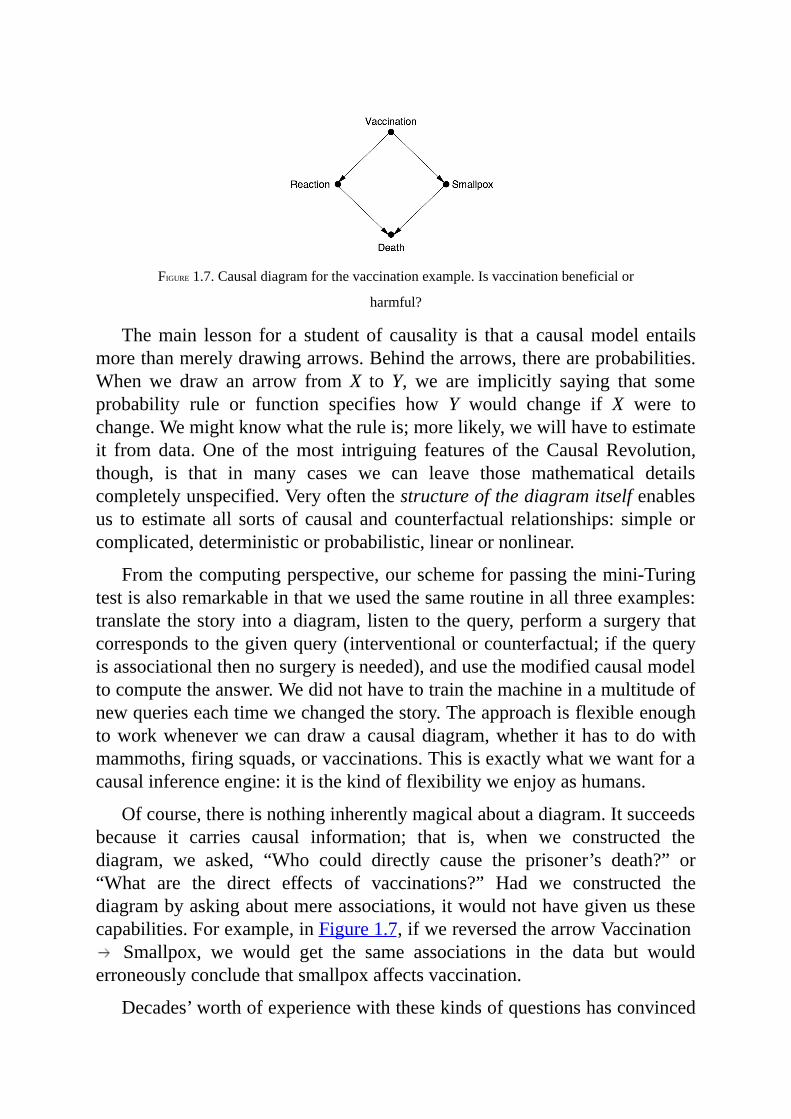
FIGURE1.7.Causaldiagramforthevaccinationexample.Isvaccinationbeneficialor
harmful?
Themain lesson for a student of causality is that a causalmodel entailsmorethanmerelydrawingarrows.Behindthearrows,thereareprobabilities.When we draw an arrow fromX toY, we are implicitly saying that someprobability rule or function specifies how Y would change if X were tochange.Wemightknowwhattheruleis;morelikely,wewillhavetoestimateit from data.One of themost intriguing features of theCausalRevolution,though, is that in many cases we can leave those mathematical detailscompletelyunspecified.Veryoftenthestructureofthediagramitselfenablesus to estimate all sortsof causal andcounterfactual relationships: simpleorcomplicated,deterministicorprobabilistic,linearornonlinear.
Fromthecomputingperspective,ourschemeforpassingthemini-Turingtestisalsoremarkableinthatweusedthesameroutineinallthreeexamples:translate thestoryintoadiagram,listento thequery,performasurgerythatcorrespondstothegivenquery(interventionalorcounterfactual;ifthequeryisassociationalthennosurgeryisneeded),andusethemodifiedcausalmodeltocomputetheanswer.Wedidnothavetotrainthemachineinamultitudeofnewquerieseachtimewechangedthestory.Theapproachisflexibleenoughtoworkwheneverwecandrawacausaldiagram,whether ithas todowithmammoths,firingsquads,orvaccinations.Thisisexactlywhatwewantforacausalinferenceengine:itisthekindofflexibilityweenjoyashumans.
Ofcourse,thereisnothinginherentlymagicalaboutadiagram.Itsucceedsbecause it carries causal information; that is, when we constructed thediagram, we asked, “Who could directly cause the prisoner’s death?” or“What are the direct effects of vaccinations?” Had we constructed thediagrambyaskingaboutmereassociations,itwouldnothavegivenusthesecapabilities.Forexample,inFigure1.7,ifwereversedthearrowVaccination Smallpox, we would get the same associations in the data but would
erroneouslyconcludethatsmallpoxaffectsvaccination.
Decades’worthofexperiencewiththesekindsofquestionshasconvinced
methat,inbothacognitiveandaphilosophicalsense,theideaofcausesandeffects is much more fundamental than the idea of probability. We beginlearning causes and effects before we understand language and before weknow any mathematics. (Research has shown that three-year-olds alreadyunderstand the entire Ladder of Causation.) Likewise, the knowledgeconveyedinacausaldiagramistypicallymuchmorerobustthanthatencodedin a probability distribution.For example, suppose that timeshave changedandamuchsaferandmoreeffectivevaccineisintroduced.Suppose,further,that due to improved hygiene and socioeconomic conditions, the danger ofcontractingsmallpoxhasdiminished.Thesechangeswilldrasticallyaffectalltheprobabilities involved;yet, remarkably, thestructureof thediagramwillremain invariant.This is thekeysecretofcausalmodeling.Moreover,oncewegothroughtheanalysisandfindhowtoestimatethebenefitofvaccinationfrom data, we do not have to repeat the entire analysis from scratch. Asdiscussed in the Introduction, the same estimand (i.e., recipe for answeringthequery)willremainvalidand,aslongasthediagramdoesnotchange,canbe applied to the newdata and produce a new estimate for our query. It isbecause of this robustness, I conjecture, that human intuition is organizedaroundcausal,notstatistical,relations.
ONPROBABILITIESANDCAUSATION
Therecognitionthatcausationisnotreducibletoprobabilitieshasbeenveryhard-won, both for me personally and for philosophers and scientists ingeneral.Understandingthemeaningof“cause”hasbeenthefocusofalongtraditionofphilosophers,fromDavidHumeandJohnStuartMillinthe1700sand 1800s, to Hans Reichenbach and Patrick Suppes in the mid-1900s, toNancy Cartwright, Wolfgang Spohn, and Christopher Hitchcock today. Inparticular, beginningwithReichenbachandSuppes,philosophershave triedto define causation in terms of probability, using the notion of “probabilityraising”:XcausesYifXraisestheprobabilityofY.
This concept is solidly ensconced in intuition. We say, for example,“Recklessdrivingcausesaccidents”or“Youwill fail thiscoursebecauseofyourlaziness,”knowingquitewellthattheantecedentsmerelytendtomakethe consequences more likely, not absolutely certain. One would expect,therefore,thatprobabilityraisingshouldbecomethebridgebetweenrungoneand rung two of the Ladder of Causation. Alas, this intuition has led todecadesoffailedattempts.
Whatprevented theattempts fromsucceedingwasnot the idea itselfbuttheway itwasarticulated formally.Almostwithoutexception,philosophersexpressed the sentence “X raises the probability of Y” using conditionalprobabilitiesandwroteP(Y |X)>P(Y).This interpretationiswrong,asyousurely noticed, because “raises” is a causal concept, connoting a causalinfluence ofX overY. The expressionP(Y |X) >P(Y), on the other hand,speaksonlyaboutobservationsandmeans:“IfweseeX,thentheprobabilityofYincreases.”Butthisincreasemaycomeaboutforotherreasons,includingY being a causeofX or someothervariable (Z)being thecauseofbothofthem.That’sthecatch!Itputsthephilosophersbackatsquareone,tryingtoeliminatethose“otherreasons.”
Probabilities,asgivenbyexpressionslikeP(Y|X),lieonthefirstrungoftheLadderofCausationandcannotever(by themselves)answerqueriesonthe second or third rung. Any attempt to “define” causation in terms ofseemingly simpler, first-rung concepts must fail. That is why I have notattempted to define causation anywhere in this book: definitions demandreduction, and reduction demands going to a lower rung. Instead, I havepursued the ultimately more constructive program of explaining how toanswercausalqueriesandwhatinformationisneededtoanswerthem.Ifthisseemsodd, consider thatmathematicians take exactly the sameapproach toEuclideangeometry.Nowhereinageometrybookwillyoufindadefinitionoftheterms“point”and“line.”Yetwecanansweranyandallqueriesaboutthem on the basis of Euclid’s axioms (or even better, the various modernversionsofEuclid’saxioms).
But let’s look at this probability-raising criterionmore carefully and seewhereitrunsaground.Theissueofacommoncause,orconfounder,ofXandYwas among themost vexing for philosophers. Ifwe take the probability-raising criterion at face value, wemust conclude that high ice-cream salescausecrimebecausetheprobabilityofcrimeishigherinmonthswhenmoreice cream is sold. In this particular case, we can explain the phenomenonbecause both ice-cream sales and crime are higher in summer, when theweather is warmer. Nevertheless, we are still left asking what generalphilosophical criterioncould tellus thatweather,not ice-creamsales, is thecause.
Philosophers tried hard to repair the definition by conditioning onwhattheycalled“backgroundfactors”(anotherwordforconfounders),yieldingthecriterionP(Y|X,K=k)>P(Y|K=k),whereKstandsforsomebackgroundvariables. In fact, thiscriterionworks forour ice-creamexample ifwe treattemperatureasabackgroundvariable.Forexample, ifwe lookonlyatdays

when the temperature is ninety degrees (K = 90), wewill find no residualassociation between ice-cream sales and crime. It’s onlywhenwe compareninety-degree days to thirty-degree days that we get the illusion of aprobabilityraising.
Still,nophilosopherhasbeenabletogiveaconvincinglygeneralanswertothequestion“WhichvariablesneedtobeincludedinthebackgroundsetKand conditioned on?” The reason is obvious: confounding too is a causalconcept and hence defies probabilistic formulation. In 1983, NancyCartwright broke this deadlock and enriched the description of thebackground contextwith a causal component.Sheproposed thatwe shouldconditiononanyfactorthatis“causallyrelevant”totheeffect.ByborrowingaconceptfromrungtwooftheLadderofCausation,sheessentiallygaveupontheideaofdefiningcausesbasedonprobabilityalone.Thiswasprogress,butitopenedthedoortothecriticismthatwearedefiningacauseintermsofitself.
Philosophical disputes over the appropriate content of K continued formorethantwodecadesandreachedanimpasse.Infact,wewillseeacorrectcriterioninChapter4,andIwillnotspoilthesurprisehere.Itsufficesforthemomenttosaythatthiscriterionispracticallyimpossibletoenunciatewithoutcausaldiagrams.
In summary,probabilistic causalityhas always founderedon the rockofconfounding.Everytimetheadherentsofprobabilisticcausationtrytopatchup the ship with a new hull, the boat runs into the same rock and springsanotherleak.Onceyoumisrepresent“probabilityraising”inthelanguageofconditionalprobabilities,noamountofprobabilisticpatchingwillgetyoutothe next rung of the ladder. As strange as it may sound, the notion ofprobabilityraisingcannotbeexpressedintermsofprobabilities.
The proper way to rescue the probability-raising idea is with the do-operator:wecansaythatXcausesYifP(Y|do(X))>P(Y).Sinceinterventionisarung-twoconcept,thisdefinitioncancapturethecausalinterpretationofprobability raising, and it can also be made operational through causaldiagrams.Inotherwords,ifwehaveacausaldiagramanddataonhandandaresearcher asks whether P(Y | do(X)) > P(Y), we can answer his questioncoherently and algorithmically and thus decide ifX is a cause of Y in theprobability-raisingsense.
I usually pay a great deal of attention towhat philosophers have to sayabout slippery concepts such as causation, induction, and the logic ofscientific inference.Philosophershave theadvantageofstandingapart from

thehurly-burlyofscientificdebateandthepracticalrealitiesofdealingwithdata.Theyhavebeenlesscontaminatedthanotherscientistsbytheanticausalbiasesofstatistics.TheycancalluponatraditionofthoughtaboutcausationthatgoesbackatleasttoAristotle,andtheycantalkaboutcausationwithoutblushingorhidingitbehindthelabelof“association.”
However,intheirefforttomathematizetheconceptofcausation—itselfalaudable idea—philosophers were too quick to commit to the onlyuncertainty-handling language they knew, the language of probability.Theyhavefor themostpartgottenover thisblunder in thepastdecadeorso,butunfortunately similar ideas are being pursued in econometrics even now,undernameslike“Grangercausality”and“vectorautocorrelation.”
Now I have a confession to make: I made the samemistake. I did notalwaysputcausalityfirstandprobabilitysecond.Quitetheopposite!WhenIstarted working in artificial intelligence, in the early 1980s, I thought thatuncertainty was the most important thing missing from AI. Moreover, Iinsistedthatuncertaintyberepresentedbyprobabilities.Thus,asIexplaininChapter 3, I developed an approach to reasoning under uncertainty, calledBayesiannetworks, thatmimicshowanidealized,decentralizedbrainmightincorporate probabilities into its decisions. Given that we see certain facts,Bayesiannetworkscanswiftlycomputethelikelihoodthatcertainotherfactsaretrueorfalse.Notsurprisingly,Bayesiannetworkscaughtonimmediatelyin theAI community and even today are considered a leading paradigm inartificialintelligenceforreasoningunderuncertainty.
Though I am delightedwith the ongoing success ofBayesian networks,they failed tobridge thegapbetween artificial andhuman intelligence. I’msureyoucanfigureoutthemissingingredient:causality.True,causalghostswereallovertheplace.Thearrowsinvariablypointedfromcausestoeffects,andpractitioners oftennoted that diagnostic systemsbecameunmanageablewhen the direction of the arrows was reversed. But for the most part wethoughtthatthiswasaculturalhabit,oranartifactofoldthoughtpatterns,notacentralaspectofintelligentbehavior.
At the time, I was so intoxicated with the power of probabilities that Iconsideredcausalityasubservientconcept,merelyaconvenienceoramentalshorthand for expressing probabilistic dependencies and distinguishingrelevant variables from irrelevant ones. In my 1988 book ProbabilisticReasoning in Intelligent Systems, I wrote, “Causation is a language withwhich one can talk efficiently about certain structures of relevancerelationships.” The words embarrass me today, because “relevance” is so
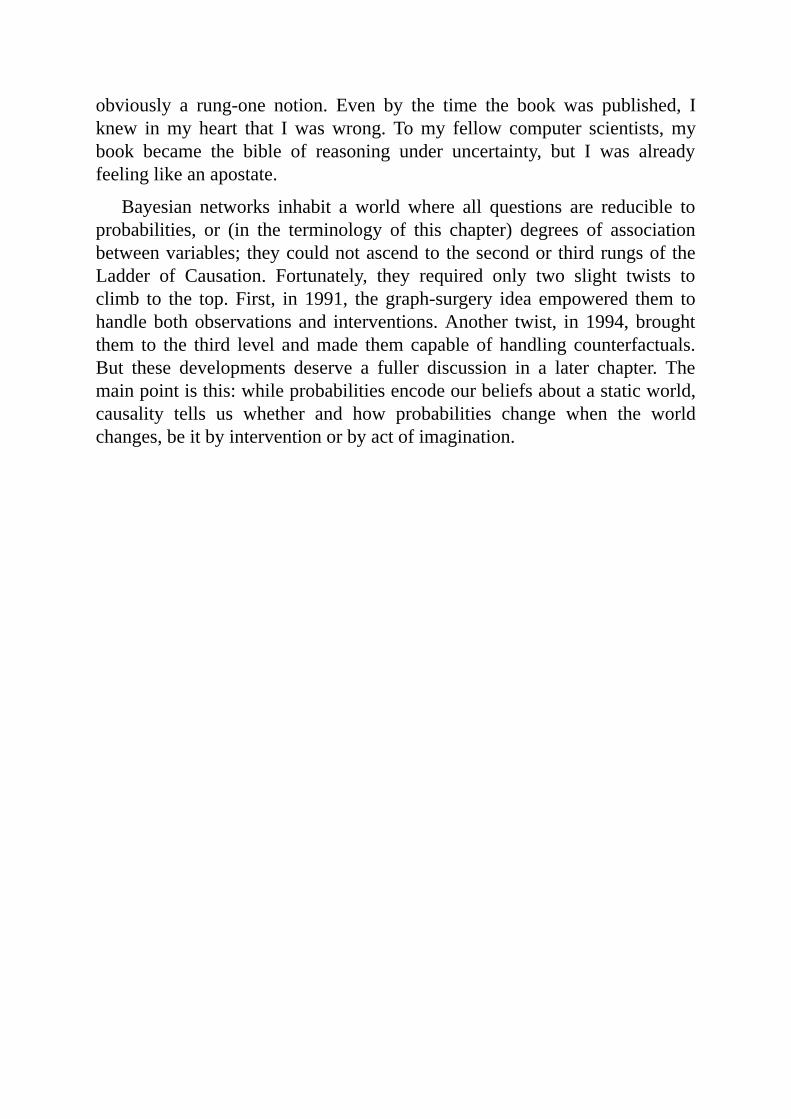
obviously a rung-one notion. Even by the time the book was published, Iknew inmy heart that Iwaswrong. Tomy fellow computer scientists,mybook became the bible of reasoning under uncertainty, but I was alreadyfeelinglikeanapostate.
Bayesian networks inhabit a world where all questions are reducible toprobabilities, or (in the terminology of this chapter) degrees of associationbetweenvariables; theycouldnotascendtothesecondorthirdrungsoftheLadder of Causation. Fortunately, they required only two slight twists toclimb to the top.First, in 1991, thegraph-surgery idea empowered them tohandlebothobservationsand interventions.Another twist, in1994,broughtthem to the third level andmade themcapable of handling counterfactuals.But these developments deserve a fuller discussion in a later chapter. Themainpointisthis:whileprobabilitiesencodeourbeliefsaboutastaticworld,causality tells us whether and how probabilities change when the worldchanges,beitbyinterventionorbyactofimagination.
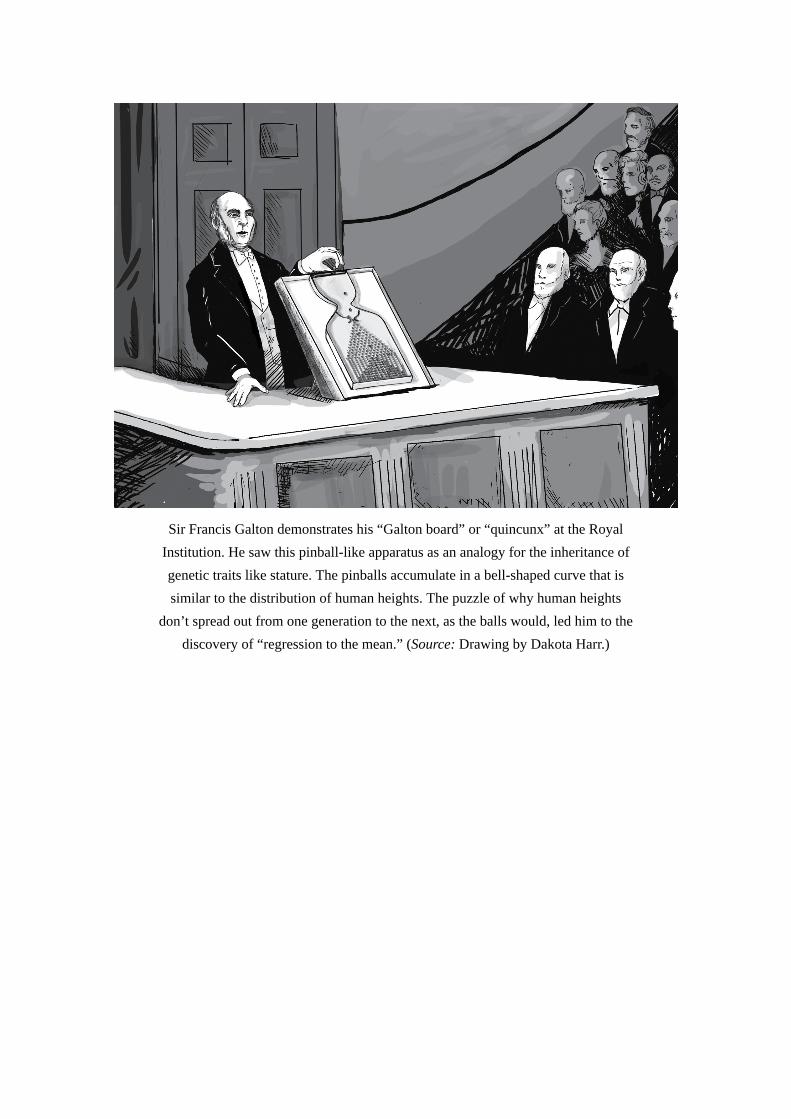
SirFrancisGaltondemonstrateshis“Galtonboard”or“quincunx”attheRoyalInstitution.Hesawthispinball-likeapparatusasananalogyfortheinheritanceofgenetictraitslikestature.Thepinballsaccumulateinabell-shapedcurvethatissimilartothedistributionofhumanheights.Thepuzzleofwhyhumanheights
don’tspreadoutfromonegenerationtothenext,astheballswould,ledhimtothediscoveryof“regressiontothemean.”(Source:DrawingbyDakotaHarr.)
2
FROMBUCCANEERSTOGUINEAPIGS:THEGENESISOFCAUSALINFERENCE
Andyetitmoves.
—ATTRIBUTEDTOGALILEOGALILEI(1564–1642)
FOR close to two centuries, one of the most enduring rituals in Britishscience has been the Friday Evening Discourse at the Royal Institution ofGreat Britain in London.Many discoveries of the nineteenth century werefirst announced to the public at this venue: Michael Faraday and theprinciplesofphotography in1839; J. J.Thomsonand the electron in1897;JamesDewarandtheliquefactionofhydrogenin1904.
Pageantrywasanimportantpartoftheoccasion;itwasliterallyscienceastheater, and the audience, the cream of British society, would dress to thenines(tuxedoswithblacktieformen).Attheappointedhour,achimewouldstrike, and the evening’s speaker would be ushered into the auditorium.Traditionallyhewouldbeginthelectureimmediately,withoutintroductionorpreamble.Experimentsandlivedemonstrationswerepartofthespectacle.
OnFebruary9,1877,theevening’sspeakerwasFrancisGalton,FRS,firstcousinofCharlesDarwin,notedAfricanexplorer,inventoroffingerprinting,and the very model of a Victorian gentleman scientist. Galton’s title was“TypicalLawsofHeredity.”Hisexperimentalapparatusfortheeveningwasacurious contraption that he called a quincunx, now often called a “Galtonboard.”Asimilargamehasoftenappearedon the televisedgameshowThe
PriceIsRight,where it isknownasPlinko.TheGaltonboardconsistsofatriangulararrayofpinsorpegs,intowhichsmallmetalballscanbeinsertedthroughanopeningatthetop.Theballsbouncedownwardfromonerowtothenext,pinballstyle,beforesettlingintooneofalineofslotsatthebottom(seefrontispiece).Foranyindividualball,thezigsandzagstotheleftorrightlookcompletelyrandom.However,ifyoupouralotofballsintotheGaltonboard,astartlingregularityemerges:theaccumulatedballsatthebottomwillalwaysformaroughapproximationtoabell-shapedcurve.Theslotsnearestthecenterwillbestackedhighwithballs,andthenumberoftheballsineachslotgraduallytapersdowntozeroattheedgesofthequincunx.
This patternhas amathematical explanation.Thepathof any individualballislikeasequenceofindependentcoinflips.Eachtimeaballhitsapin,itbounces either to the left or the right, and fromadistance its choice seemscompletelyrandom.Thesumoftheresults—say,theexcessoftherightsoverthelefts—determineswhichslottheballendsupin.Accordingtothecentrallimit theorem, proven in 1810 by Pierre-Simon Laplace, any such randomprocess—onethatamountstoasumofalargenumberofcoinflips—willleadto the same probability distribution, called the normal distribution (or bell-shaped curve). The Galton board is simply a visual demonstration ofLaplace’stheorem.
The central limit theorem is truly a miracle of nineteenth-centurymathematics.Think about it: even though thepathof any individual ball isunpredictable,thepathof1,000ballsisextremelypredictable—aconvenientfactfortheproducersofThePriceIsRight,whocanestimateaccuratelyhowmuchmoneythecontestantswillwinatPlinkooverthelongrun.Thisisthesame law that makes insurance companies so profitable, despite theuncertaintiesinhumanaffairs.
Thewell-dressedaudienceattheRoyalInstitutemusthavewonderedwhatall this had to dowith the laws of heredity, the promised lecture topic. Toillustratetheconnection,GaltonshowedthemsomedatacollectedinFranceon the heights ofmilitary recruits.These also follow a normal distribution:manymenareofaboutaverageheight,withagraduallydiminishingnumberwho are either extremely tall or extremely short. In fact, it does notmatterwhether you are talking about 1,000military recruits or 1,000 balls in theGalton board: the numbers in each slot (or height category) are almost thesame.
Thus, toGalton, thequincunxwasamodel for the inheritanceofstatureor,indeed,manyothergenetictraits.It isacausalmodel.Insimplestterms,
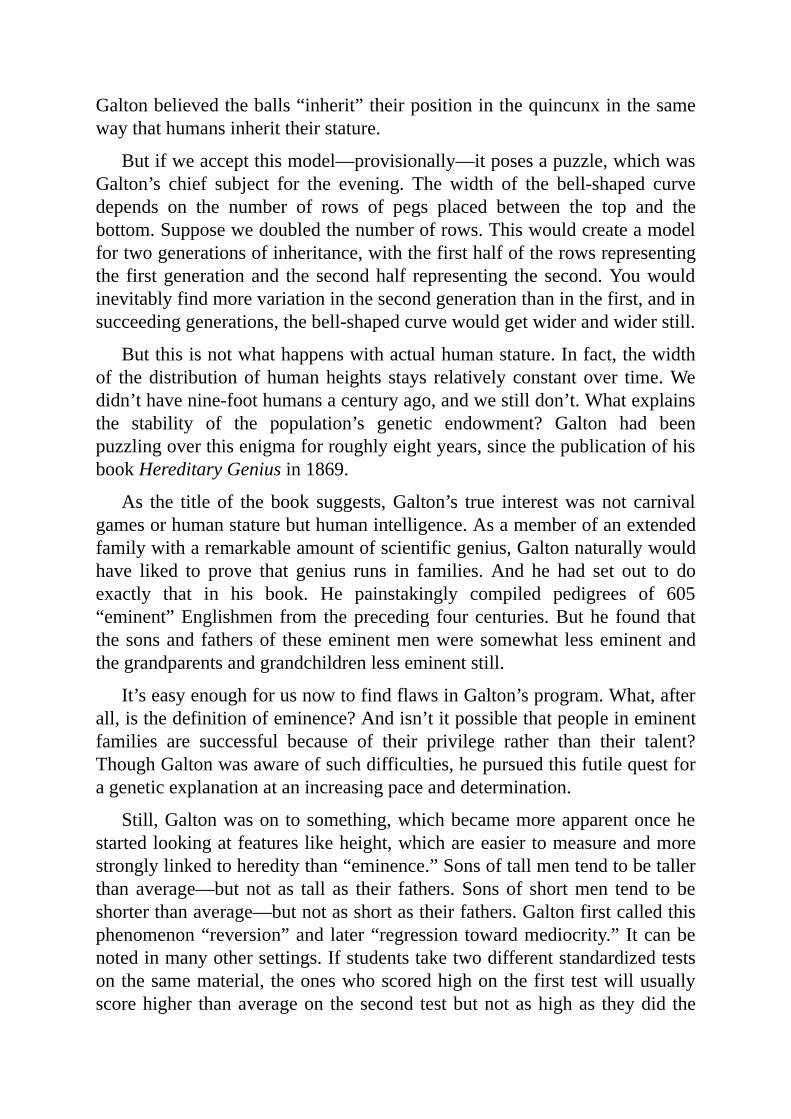
Galtonbelievedtheballs“inherit”theirpositioninthequincunxinthesamewaythathumansinherittheirstature.
Butifweacceptthismodel—provisionally—itposesapuzzle,whichwasGalton’s chief subject for the evening. The width of the bell-shaped curvedepends on the number of rows of pegs placed between the top and thebottom.Supposewedoubledthenumberofrows.Thiswouldcreateamodelfortwogenerationsofinheritance,withthefirsthalfoftherowsrepresentingthe firstgenerationand the secondhalf representing thesecond.Youwouldinevitablyfindmorevariationinthesecondgenerationthaninthefirst,andinsucceedinggenerations,thebell-shapedcurvewouldgetwiderandwiderstill.
Butthisisnotwhathappenswithactualhumanstature.Infact,thewidthof thedistributionofhumanheights stays relativelyconstantover time.Wedidn’thavenine-foothumansacenturyago,andwestilldon’t.Whatexplainsthe stability of the population’s genetic endowment? Galton had beenpuzzlingoverthisenigmaforroughlyeightyears,sincethepublicationofhisbookHereditaryGeniusin1869.
As the title of thebook suggests,Galton’s true interestwasnot carnivalgamesorhumanstaturebuthumanintelligence.Asamemberofanextendedfamilywitharemarkableamountofscientificgenius,Galtonnaturallywouldhave liked to prove that genius runs in families. And he had set out to doexactly that in his book. He painstakingly compiled pedigrees of 605“eminent”Englishmen from thepreceding fourcenturies.Buthe found thatthesonsandfathersof theseeminentmenweresomewhat lesseminentandthegrandparentsandgrandchildrenlesseminentstill.
It’seasyenoughforusnowtofindflawsinGalton’sprogram.What,afterall,isthedefinitionofeminence?Andisn’titpossiblethatpeopleineminentfamilies are successful because of their privilege rather than their talent?ThoughGaltonwasawareofsuchdifficulties,hepursuedthisfutilequestforageneticexplanationatanincreasingpaceanddetermination.
Still,Galtonwasontosomething,whichbecamemoreapparentoncehestartedlookingatfeatureslikeheight,whichareeasiertomeasureandmorestronglylinkedtohereditythan“eminence.”Sonsoftallmentendtobetallerthan average—butnot as tall as their fathers.Sonsof shortmen tend to beshorterthanaverage—butnotasshortastheirfathers.Galtonfirstcalledthisphenomenon“reversion”andlater“regressiontowardmediocrity.”Itcanbenotedinmanyothersettings.Ifstudentstaketwodifferentstandardizedtestsonthesamematerial, theoneswhoscoredhighonthefirst testwillusuallyscorehigher thanaverageon thesecond testbutnotashighas theydid the
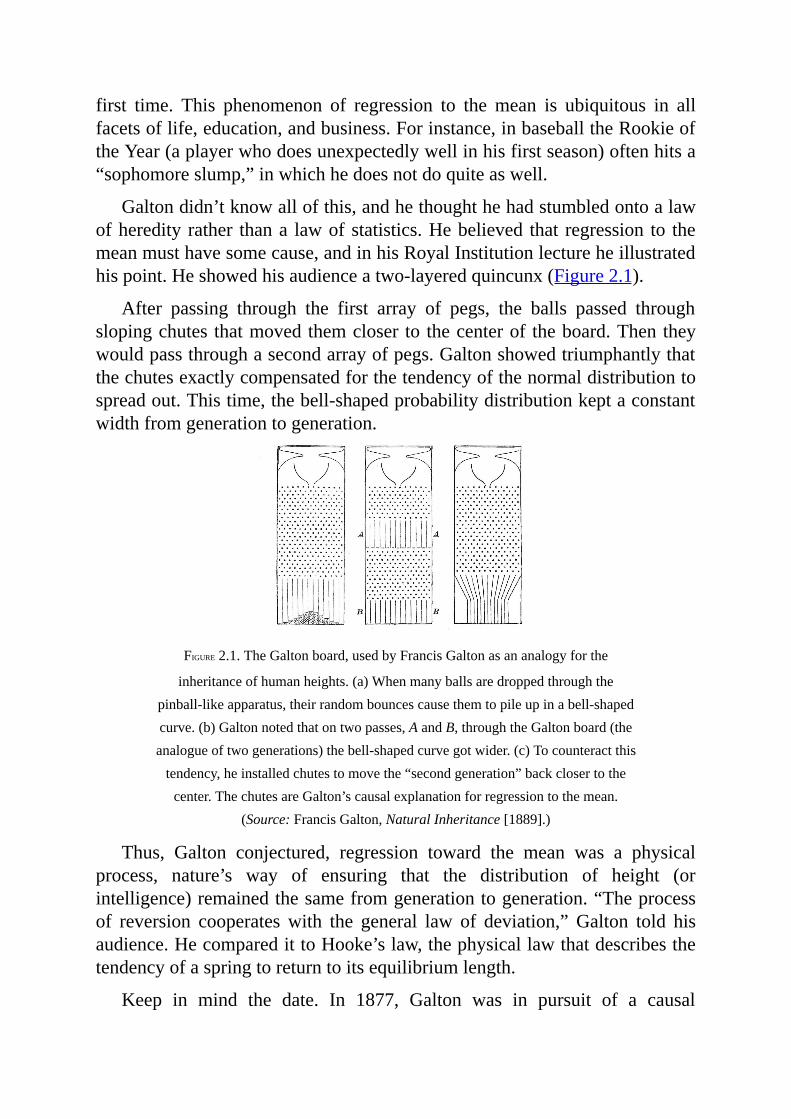
first time. This phenomenon of regression to themean is ubiquitous in allfacetsoflife,education,andbusiness.Forinstance,inbaseballtheRookieoftheYear(aplayerwhodoesunexpectedlywellinhisfirstseason)oftenhitsa“sophomoreslump,”inwhichhedoesnotdoquiteaswell.
Galtondidn’tknowallofthis,andhethoughthehadstumbledontoalawofheredity rather thana lawofstatistics.Hebelieved that regression to themeanmusthavesomecause,andinhisRoyalInstitutionlectureheillustratedhispoint.Heshowedhisaudienceatwo-layeredquincunx(Figure2.1).
After passing through the first array of pegs, the balls passed throughslopingchutes thatmovedthemcloser to thecenterof theboard.Thentheywouldpassthroughasecondarrayofpegs.Galtonshowedtriumphantlythatthechutesexactlycompensatedforthetendencyofthenormaldistributiontospreadout.Thistime,thebell-shapedprobabilitydistributionkeptaconstantwidthfromgenerationtogeneration.
FIGURE2.1.TheGaltonboard,usedbyFrancisGaltonasananalogyforthe
inheritanceofhumanheights.(a)Whenmanyballsaredroppedthroughthepinball-likeapparatus,theirrandombouncescausethemtopileupinabell-shapedcurve.(b)Galtonnotedthatontwopasses,AandB,throughtheGaltonboard(theanalogueoftwogenerations)thebell-shapedcurvegotwider.(c)Tocounteractthistendency,heinstalledchutestomovethe“secondgeneration”backclosertothecenter.ThechutesareGalton’scausalexplanationforregressiontothemean.
(Source:FrancisGalton,NaturalInheritance[1889].)
Thus, Galton conjectured, regression toward the mean was a physicalprocess, nature’s way of ensuring that the distribution of height (orintelligence)remainedthesamefromgenerationtogeneration.“Theprocessof reversion cooperateswith the general law of deviation,”Galton told hisaudience.HecomparedittoHooke’slaw,thephysicallawthatdescribesthetendencyofaspringtoreturntoitsequilibriumlength.
Keep in mind the date. In 1877, Galton was in pursuit of a causal
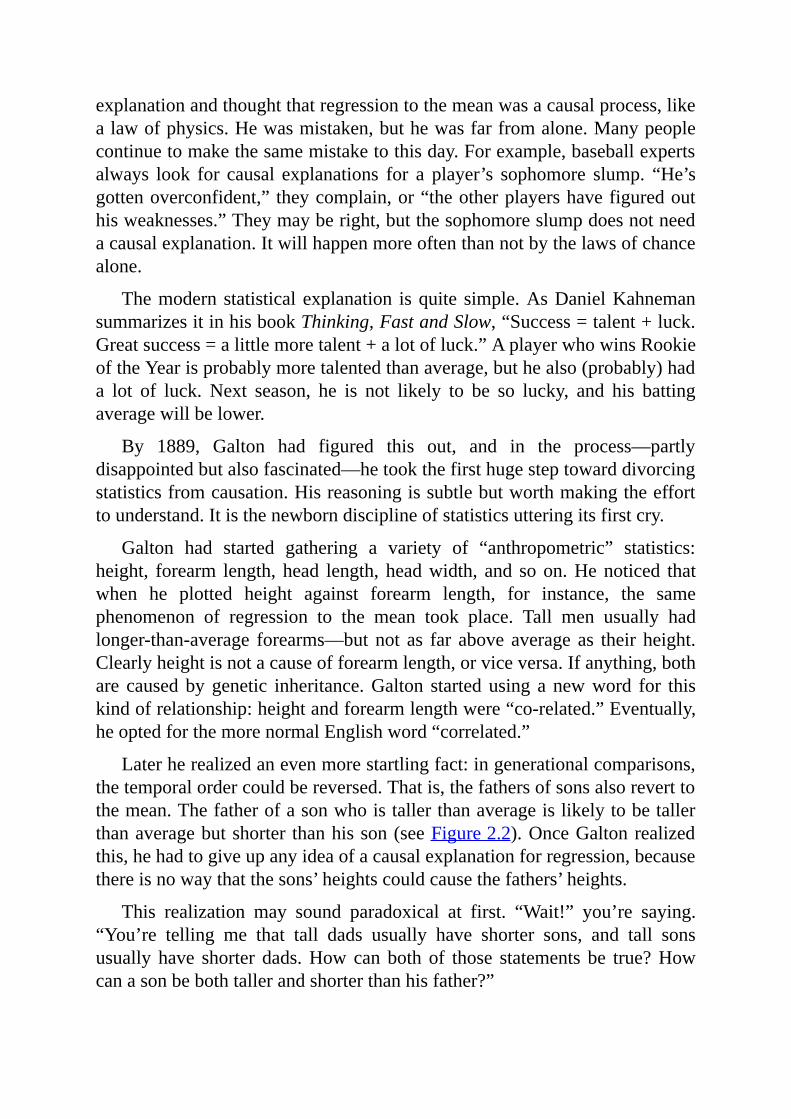
explanationandthoughtthatregressiontothemeanwasacausalprocess,likealawofphysics.Hewasmistaken,buthewasfarfromalone.Manypeoplecontinuetomakethesamemistaketothisday.Forexample,baseballexpertsalways look for causal explanations for a player’s sophomore slump. “He’sgottenoverconfident,” theycomplain,or“theotherplayershavefiguredouthisweaknesses.”Theymayberight,butthesophomoreslumpdoesnotneedacausalexplanation.Itwillhappenmoreoftenthannotbythelawsofchancealone.
Themodernstatisticalexplanation isquite simple.AsDanielKahnemansummarizesitinhisbookThinking,FastandSlow,“Success=talent+luck.Greatsuccess=alittlemoretalent+alotofluck.”AplayerwhowinsRookieoftheYearisprobablymoretalentedthanaverage,buthealso(probably)hada lot of luck. Next season, he is not likely to be so lucky, and his battingaveragewillbelower.
By 1889, Galton had figured this out, and in the process—partlydisappointedbutalsofascinated—hetookthefirsthugesteptowarddivorcingstatisticsfromcausation.Hisreasoningissubtlebutworthmakingtheefforttounderstand.Itisthenewborndisciplineofstatisticsutteringitsfirstcry.
Galton had started gathering a variety of “anthropometric” statistics:height, forearm length, head length, headwidth, and soon.Henoticed thatwhen he plotted height against forearm length, for instance, the samephenomenon of regression to the mean took place. Tall men usually hadlonger-than-average forearms—butnot as far above average as their height.Clearlyheightisnotacauseofforearmlength,orviceversa.Ifanything,bothare causedbygenetic inheritance.Galton startedusing a newword for thiskindofrelationship:heightandforearmlengthwere“co-related.”Eventually,heoptedforthemorenormalEnglishword“correlated.”
Laterherealizedanevenmorestartlingfact:ingenerationalcomparisons,thetemporalordercouldbereversed.Thatis,thefathersofsonsalsoreverttothemean.Thefatherofasonwhoistallerthanaverageislikelytobetallerthanaveragebutshorter thanhisson(seeFigure2.2).OnceGaltonrealizedthis,hehadtogiveupanyideaofacausalexplanationforregression,becausethereisnowaythatthesons’heightscouldcausethefathers’heights.
This realization may sound paradoxical at first. “Wait!” you’re saying.“You’re telling me that tall dads usually have shorter sons, and tall sonsusually have shorter dads.Howcan both of those statements be true?Howcanasonbebothtallerandshorterthanhisfather?”
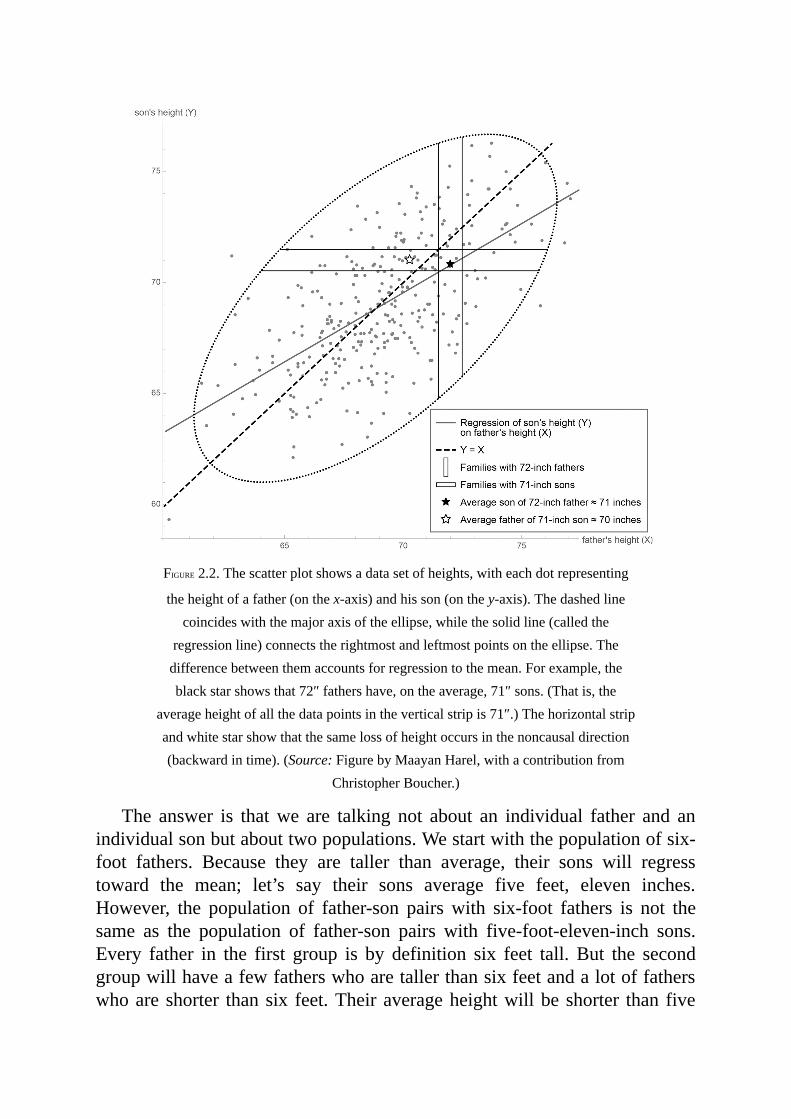
FIGURE2.2.Thescatterplotshowsadatasetofheights,witheachdotrepresenting
theheightofafather(onthex-axis)andhisson(onthey-axis).Thedashedlinecoincideswiththemajoraxisoftheellipse,whilethesolidline(calledthe
regressionline)connectstherightmostandleftmostpointsontheellipse.Thedifferencebetweenthemaccountsforregressiontothemean.Forexample,theblackstarshowsthat72″fathershave,ontheaverage,71″sons.(Thatis,the
averageheightofallthedatapointsintheverticalstripis71″.)Thehorizontalstripandwhitestarshowthatthesamelossofheightoccursinthenoncausaldirection(backwardintime).(Source:FigurebyMaayanHarel,withacontributionfrom
ChristopherBoucher.)
The answer is thatwe are talking not about an individual father and anindividualsonbutabouttwopopulations.Westartwiththepopulationofsix-foot fathers. Because they are taller than average, their sons will regresstoward the mean; let’s say their sons average five feet, eleven inches.However, the population of father-son pairswith six-foot fathers is not thesame as the population of father-son pairs with five-foot-eleven-inch sons.Every father in the first group is by definition six feet tall. But the secondgroupwillhaveafewfatherswhoaretallerthansixfeetandalotoffatherswhoare shorter thansix feet.Theiraverageheightwillbeshorter than five
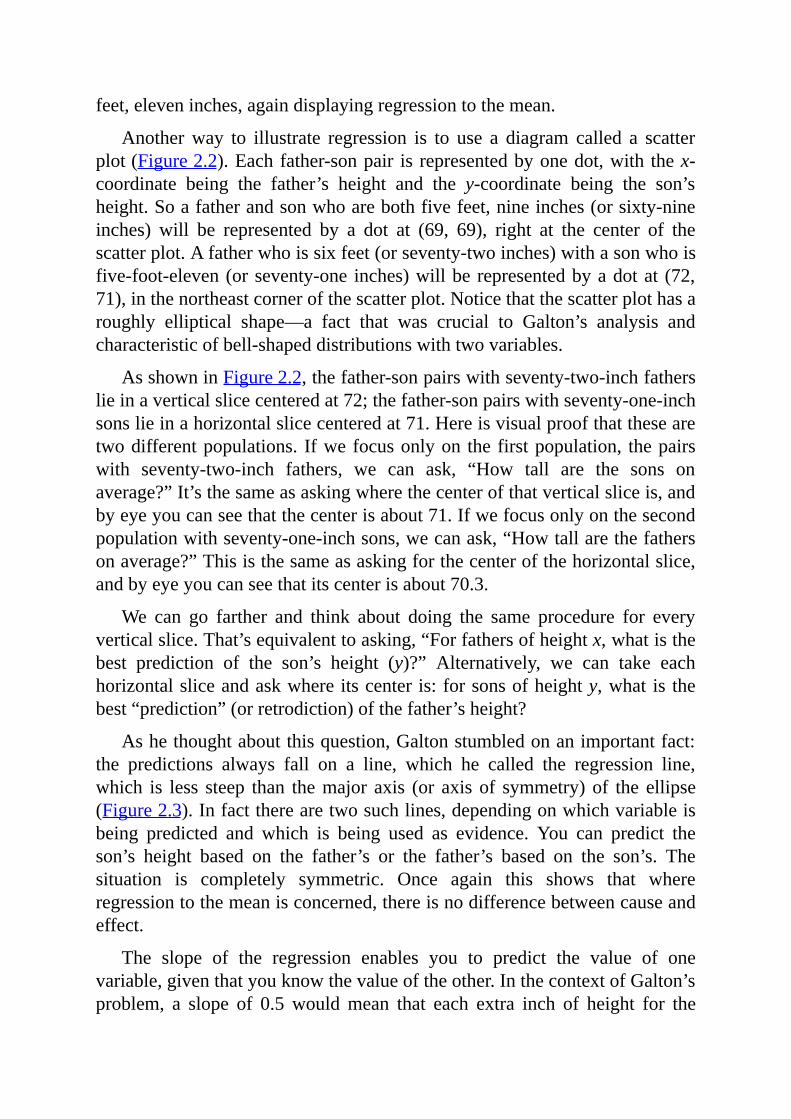
feet,eleveninches,againdisplayingregressiontothemean.
Anotherway to illustrate regression is to use a diagram called a scatterplot(Figure2.2).Eachfather-sonpair is representedbyonedot,with thex-coordinate being the father’s height and the y-coordinate being the son’sheight.Soafatherandsonwhoarebothfivefeet,nineinches(orsixty-nineinches) will be represented by a dot at (69, 69), right at the center of thescatterplot.Afatherwhoissixfeet(orseventy-twoinches)withasonwhoisfive-foot-eleven(orseventy-one inches)willbe representedbyadotat (72,71),inthenortheastcornerofthescatterplot.Noticethatthescatterplothasaroughly elliptical shape—a fact that was crucial to Galton’s analysis andcharacteristicofbell-shapeddistributionswithtwovariables.
AsshowninFigure2.2,thefather-sonpairswithseventy-two-inchfatherslieinaverticalslicecenteredat72;thefather-sonpairswithseventy-one-inchsonslieinahorizontalslicecenteredat71.Hereisvisualproofthatthesearetwodifferentpopulations. Ifwefocusonlyon thefirstpopulation, thepairswith seventy-two-inch fathers, we can ask, “How tall are the sons onaverage?”It’sthesameasaskingwherethecenterofthatverticalsliceis,andbyeyeyoucanseethatthecenterisabout71.Ifwefocusonlyonthesecondpopulationwithseventy-one-inchsons,wecanask,“Howtallarethefathersonaverage?”Thisisthesameasaskingforthecenterofthehorizontalslice,andbyeyeyoucanseethatitscenterisabout70.3.
We can go farther and think about doing the same procedure for everyverticalslice.That’sequivalenttoasking,“Forfathersofheightx,whatisthebest prediction of the son’s height (y)?” Alternatively, we can take eachhorizontalsliceandaskwhereitscenteris:forsonsofheighty,what is thebest“prediction”(orretrodiction)ofthefather’sheight?
Ashethoughtaboutthisquestion,Galtonstumbledonanimportantfact:the predictions always fall on a line, which he called the regression line,which is less steep than themajor axis (or axis of symmetry)of the ellipse(Figure2.3).Infacttherearetwosuchlines,dependingonwhichvariableisbeing predicted and which is being used as evidence. You can predict theson’s height based on the father’s or the father’s based on the son’s. Thesituation is completely symmetric. Once again this shows that whereregressiontothemeanisconcerned,thereisnodifferencebetweencauseandeffect.
The slope of the regression enables you to predict the value of onevariable,giventhatyouknowthevalueoftheother.InthecontextofGalton’sproblem, a slope of 0.5wouldmean that each extra inch of height for the
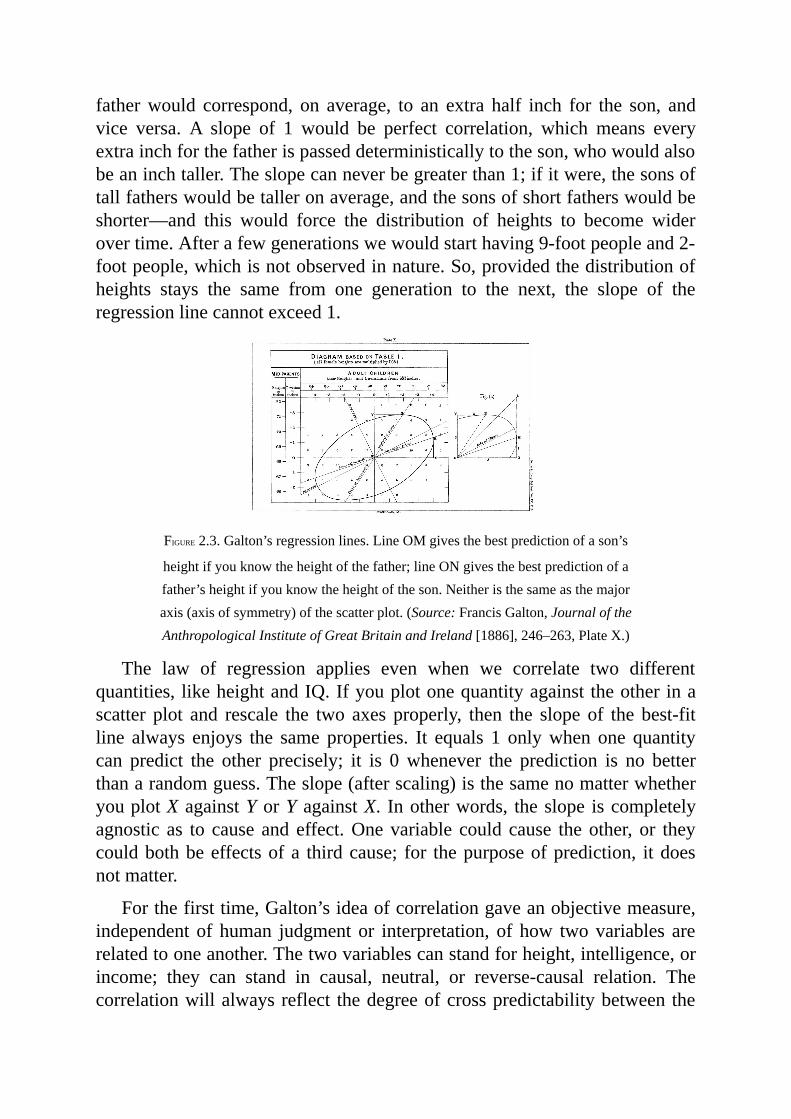
fatherwould correspond, on average, to an extra half inch for the son, andvice versa. A slope of 1 would be perfect correlation, which means everyextrainchforthefatherispasseddeterministicallytotheson,whowouldalsobeaninchtaller.Theslopecanneverbegreaterthan1;ifitwere,thesonsoftallfatherswouldbetalleronaverage,andthesonsofshortfatherswouldbeshorter—and this would force the distribution of heights to become widerovertime.Afterafewgenerationswewouldstarthaving9-footpeopleand2-footpeople,whichisnotobservedinnature.So,providedthedistributionofheights stays the same from one generation to the next, the slope of theregressionlinecannotexceed1.
FIGURE2.3.Galton’sregressionlines.LineOMgivesthebestpredictionofason’s
heightifyouknowtheheightofthefather;lineONgivesthebestpredictionofafather’sheightifyouknowtheheightoftheson.Neitheristhesameasthemajoraxis(axisofsymmetry)ofthescatterplot.(Source:FrancisGalton,JournaloftheAnthropologicalInstituteofGreatBritainandIreland[1886],246–263,PlateX.)
The law of regression applies even when we correlate two differentquantities, likeheightandIQ.Ifyouplotonequantityagainsttheotherinascatter plot and rescale the two axes properly, then the slope of the best-fitline always enjoys the same properties. It equals 1 onlywhen one quantitycan predict the other precisely; it is 0whenever the prediction is no betterthanarandomguess.Theslope(afterscaling)isthesamenomatterwhetheryouplotXagainstYorYagainstX. Inotherwords, theslope iscompletelyagnostic as to cause and effect.Onevariable could cause theother, or theycouldbothbeeffectsofa thirdcause; for thepurposeofprediction, itdoesnotmatter.
Forthefirsttime,Galton’sideaofcorrelationgaveanobjectivemeasure,independent of human judgment or interpretation, of how twovariables arerelatedtooneanother.Thetwovariablescanstandforheight,intelligence,orincome; they can stand in causal, neutral, or reverse-causal relation. Thecorrelationwillalwaysreflect thedegreeofcrosspredictabilitybetweenthe
twovariables.Galton’sdiscipleKarlPearsonlaterderivedaformulafor theslope of the (properly rescaled) regression line and called it the correlationcoefficient.This is still the first number that statisticians all over theworldcomputewhen theywant toknowhowstrongly twodifferentvariables inadatasetarerelated.GaltonandPearsonmusthavebeenthrilledtofindsuchauniversalwayofdescribingtherelationshipsbetweenrandomvariables.ForPearson, especially, the slippery old concepts of cause and effect seemedoutdatedandunscientific,compared to themathematicallyclearandpreciseconceptofacorrelationcoefficient.
GALTONANDTHEABANDONEDQUEST
It is an irony of history that Galton started out in search of causation andendedupdiscoveringcorrelation,arelationshipthatisobliviousofcausation.Even so, hints of causal thinking remained inhiswriting. “It is easy to seethatcorrelation[betweenthesizesoftwoorgans]mustbetheconsequenceofthe variations of the two organs being partly due to common causes,” hewrotein1889.
The first sacrifice on the altar of correlation was Galton’s elaboratemachinerytoexplainthestabilityofthepopulation’sgeneticendowment.Thequincunxsimulatedthecreationofvariationsinheightandtheirtransmissionfromonegenerationtothenext.ButGaltonhadtoinventtheinclinedchutesin the quincunx specifically to rein in the ever-growing diversity in thepopulation. Having failed to find a satisfactory biological mechanism toaccountforthisrestoringforce,Galtonsimplyabandonedtheeffortaftereightyears and turned his attention to the siren song of correlation. HistorianStephen Stigler, who has written extensively about Galton, noticed thissuddenshiftinGalton’saimsandaspirations:“WhatwassilentlymissingwasDarwin, thechutes, andall the ‘survivalof the fittest.’…In supreme irony,what had started out as an attempt to mathematize the framework of theOriginofSpeciesendedwiththeessenceofthatgreatworkbeingdiscardedasunnecessary!”
But to us, in the modern era of causal inference, the original problemremains.Howdoweexplainthestabilityofthepopulation,despiteDarwinianvariationsthatonegenerationbestowsonthenext?
LookingbackonGalton’smachineinthelightofcausaldiagrams,thefirstthingInoticeisthatthemachinewaswronglyconstructed.Theever-growingdispersion,whichbeggedGaltonforacounterforce,shouldneverhavebeen
thereinthefirstplace.Indeed,ifwetraceaballdroppingfromoneleveltothe next in the quincunx, we see that the displacement at the next levelinheritsthesumtotalofvariationsbestoweduponitbyallthepegsalongtheway.ThisstandsinblatantcontradictiontoKahneman’sequations:
Success=talent+luck
Greatsuccess=Alittlemoretalent+alotofluck.
Accordingtotheseequations,successingeneration2doesnotinherittheluckofgeneration1.Luck,byitsverydefinition,isatransitoryoccurrence;henceit has no impact on future generations. But such transitory behavior isincompatiblewithGalton’smachine.
To compare these two conceptions side by side, let us draw theirassociatedcausaldiagrams.InFigure2.4(a)(Galton’sconception),successistransmitted across generations, and luck variations accumulate indefinitely.This is perhaps natural if “success” is equated to wealth or eminence.However,fortheinheritanceofphysicalcharacteristicslikestature,wemustreplace Galton’s model with that in Figure 2.4(b). Here only the geneticcomponent,shownhereastalent,ispasseddownfromonegenerationtothenext. Luck affects each generation independently, in such a way that thechancefactors inonegenerationhavenowayofaffecting latergenerations,eitherdirectlyorindirectly.
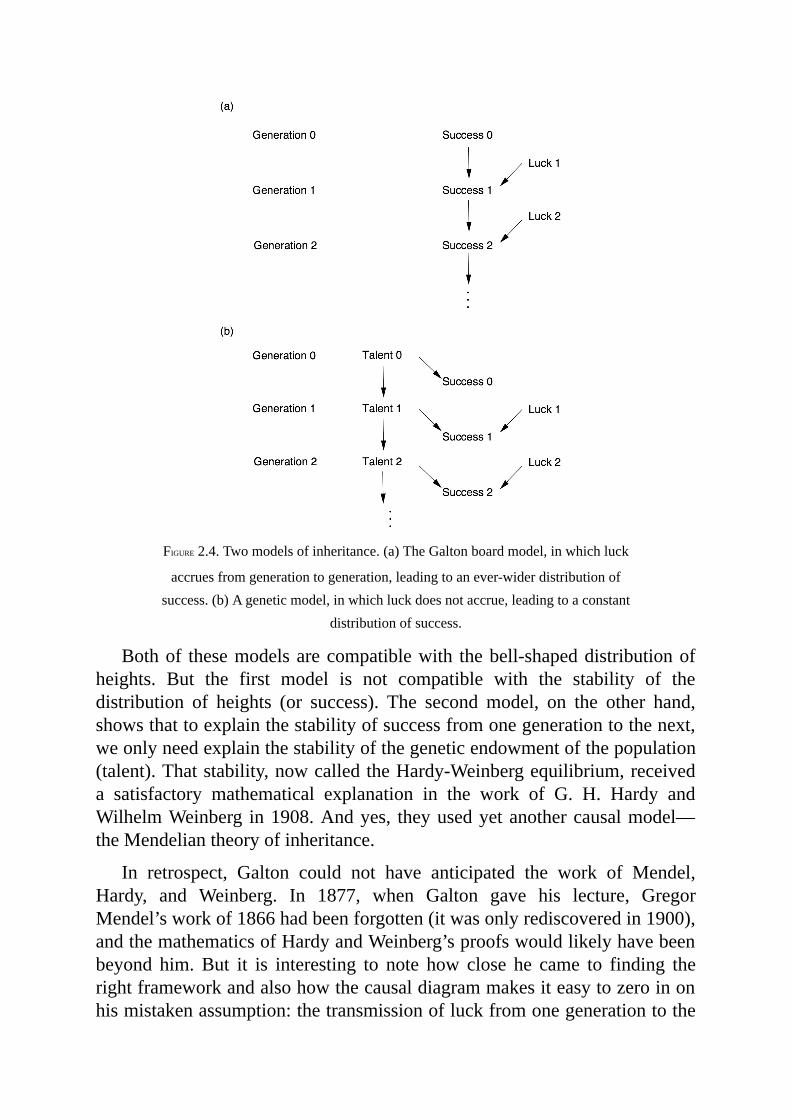
FIGURE2.4.Twomodelsofinheritance.(a)TheGaltonboardmodel,inwhichluck
accruesfromgenerationtogeneration,leadingtoanever-widerdistributionofsuccess.(b)Ageneticmodel,inwhichluckdoesnotaccrue,leadingtoaconstant
distributionofsuccess.
Bothof thesemodelsarecompatiblewith thebell-shapeddistributionofheights. But the first model is not compatible with the stability of thedistribution of heights (or success). The second model, on the other hand,showsthattoexplainthestabilityofsuccessfromonegenerationtothenext,weonlyneedexplainthestabilityofthegeneticendowmentofthepopulation(talent).Thatstability,nowcalledtheHardy-Weinbergequilibrium,receiveda satisfactory mathematical explanation in the work of G. H. Hardy andWilhelmWeinberg in1908.Andyes, theyusedyetanothercausalmodel—theMendeliantheoryofinheritance.
In retrospect, Galton could not have anticipated the work of Mendel,Hardy, and Weinberg. In 1877, when Galton gave his lecture, GregorMendel’sworkof1866hadbeenforgotten(itwasonlyrediscoveredin1900),andthemathematicsofHardyandWeinberg’sproofswouldlikelyhavebeenbeyond him.But it is interesting to note how close he came to finding therightframeworkandalsohowthecausaldiagrammakesiteasytozeroinonhismistakenassumption:thetransmissionofluckfromonegenerationtothe
next. Unfortunately, he was led astray by his beautiful but flawed causalmodel, and later, having discovered the beauty of correlation, he came tobelievethatcausalitywasnolongerneeded.
AsafinalpersonalcommentonGalton’sstory,Iconfesstocommittingacardinalsinofhistorywriting,oneofmanysinsIwillcommitinthisbook.Inthe 1960s, it became unfashionable to write history from the viewpoint ofmodern-day science, as I have done above. “Whig history”was the epithetused to mock the hindsighted style of history writing, which focused onsuccessful theories and experiments and gave little credit to failed theoriesanddeadends.Themodernstyleofhistorywritingbecamemoredemocratic,treating chemists and alchemists with equal respect and insisting onunderstandingalltheoriesinthesocialcontextoftheirowntime.
When it comes to explaining the expulsion of causality from statistics,however,IacceptthemantleofWhighistorianwithpride.Theresimplyisnootherwaytounderstandhowstatisticsbecameamodel-blinddata-reductionenterprise,exceptbyputtingonourcausallensesandretellingthestoriesofGaltonandPearsoninthelightofthenewscienceofcauseandeffect.Infact,bysodoing,Irectifythedistortionsintroducedbymainstreamhistorianswho,lackingcausalvocabulary,marvel at the inventionof correlationand fail tonoteitscasualty—thedeathofcausation.
PEARSON:THEWRATHOFTHEZEALOT
It remained to Galton’s disciple, Karl Pearson, to complete the task ofexpungingcausationfromstatistics.Yetevenhewasnotentirelysuccessful.
ReadingGalton’sNaturalInheritancewasoneofthedefiningmomentsofPearson’s life:“I felt likeabuccaneerofDrake’sdays—oneof theorderofmen ‘not quite pirates, but with decidedly piratical tendencies,’ as thedictionary has it!” he wrote in 1934. “I interpreted…Galton to mean thatthere was a category broader than causation, namely correlation, of whichcausation was only the limit, and that this new conception of correlationbroughtpsychology,anthropology,medicineandsociologyinlargepart intothefieldofmathematicaltreatment.ItwasGaltonwhofirstfreedmefromtheprejudicethatsoundmathematicscouldonlybeappliedtonaturalphenomenaunderthecategoryofcausation.”
In Pearson’s eyes, Galton had enlarged the vocabulary of science.Causation was reduced to nothing more than a special case of correlation
(namely, the case where the correlation coefficient is 1 or –1 and therelationship between x and y is deterministic). He expresses his view ofcausation with great clarity in The Grammar of Science (1892): “That acertain sequence has occurred and reoccurred in the past is a matter ofexperiencetowhichwegiveexpressionintheconceptcausation.…Scienceinno case candemonstrate any inherentnecessity in a sequence, norprovewithabsolutecertaintythatitmustberepeated.”Tosummarize,causationforPearson is only a matter of repetition and, in the deterministic sense, canneverbeproven.As for causality in anondeterministicworld,Pearsonwasevenmoredismissive:“theultimatescientificstatementofdescriptionoftherelationbetweentwothingscanalwaysbethrownbackupon…acontingencytable.”Inotherwords,dataisallthereistoscience.Fullstop.Inthisview,thenotions of intervention and counterfactuals discussed in Chapter 1 do notexist,andthelowestrungoftheLadderofCausationisallthatisneededfordoingscience.
ThementalleapfromGaltontoPearsonisbreathtakingandindeedworthyofabuccaneer.Galtonhadprovedonlythatonephenomenon—regressiontothemean—didnotrequireacausalexplanation.NowPearsonwascompletelyremovingcausationfromscience.Whatmadehimtakethisleap?
Historian Ted Porter, in his biography Karl Pearson, describes howPearson’sskepticismaboutcausationpredatedhis readingofGalton’sbook.Pearsonhadbeenwrestlingwiththephilosophicalfoundationofphysicsandwrote (for example), “Force as a cause of motion is exactly on the samefootingasatree-godasacauseofgrowth.”Moregenerally,Pearsonbelongedtoaphilosophicalschoolcalledpositivism,whichholdsthattheuniverseisaproduct of human thought and that science is only a description of thosethoughts.Thus causation, construed as anobjectiveprocess that happens intheworld outside the human brain, could not have any scientificmeaning.Meaningfulthoughtscanonlyreflectpatternsofobservations,andthesecanbecompletelydescribedbycorrelations.Havingdecidedthatcorrelationwasamore universal descriptor of human thought than causation, Pearsonwaspreparedtodiscardcausationcompletely.
Porter paints a vivid picture of Pearson throughout his life as a self-describedSchwärmer,aGermanwordthattranslatesas“enthusiast”butcanalso be interpreted more strongly as “zealot.” After graduating fromCambridgein1879,PearsonspentayearabroadinGermanyandfellsomuchinlovewithitsculturethathepromptlychangedhisnamefromCarltoKarl.Hewasasocialistlongbeforeitbecamepopular,andhewrotetoKarlMarxin1881,offeringtotranslateDasKapitalintoEnglish.Pearson,arguablyone
ofEngland’sfirstfeminists,startedtheMen’sandWomen’sClubinLondonfordiscussionsof“thewomanquestion.”Hewasconcernedaboutwomen’ssubordinate position in society and advocated for them to be paid for theirwork.Hewasextremelypassionateabout ideaswhileat thesametimeverycerebral about his passions. It took him nearly half a year to persuade hisfuturewife,MariaSharpe,tomarryhim,andtheirletterssuggestthatshewasfranklyterrifiedofnotlivinguptohishighintellectualideals.
WhenPearsonfoundGaltonandhiscorrelations,heatlastfoundafocusforhispassions:anideathathebelievedcouldtransformtheworldofscienceandbringmathematical rigor to fields likebiologyandpsychology.Andhemoved with a buccaneer’s sense of purpose toward accomplishing thismission.His firstpaperonstatisticswaspublished in1893, fouryearsafterGalton’s discovery of correlation. By 1901 he had founded a journal,Biometrika, which remains one of the most influential statistical journals(and,somewhatheretically,publishedmyfirstfullpaperoncausaldiagramsin 1995). By 1903, Pearson had secured a grant from the WorshipfulCompanyofDraperstostartaBiometricsLabatUniversityCollegeLondon.In1911itofficiallybecameadepartmentwhenGaltonpassedawayandleftanendowmentforaprofessorship(withthestipulationthatPearsonbeitsfirstholder). For at least two decades, Pearson’s Biometrics Labwas theworldcenterofstatistics.
OncePearsonheld a positionof power, his zealotry cameoutmore andmore clearly. As Porter writes in his biography, “Pearson’s statisticalmovement had aspects of a schismatic sect. He demanded the loyalty andcommitment of his associates and drove dissenters from the churchbiometric.”Oneofhisearliestassistants,GeorgeUdnyYule,wasalsooneofthefirstpeopletofeelPearson’swrath.Yule’sobituaryofPearson,writtenforthe Royal Society in 1936, conveys well the sting of those days, thoughcouchedinpolitelanguage.
The infection of his enthusiasm, it is true, was invaluable; but hisdominance,evenhisveryeagernesstohelp,couldbeadisadvantage.…Thisdesire fordomination, for everything tobe just ashewanted it,comesoutinotherways,notablytheeditingofBiometrika—surelythemostpersonallyedited journal thatwaseverpublished.…Thosewholeft him and began to think for themselves were apt, as happenedpainfullyinmoreinstancesthanone,tofindthatafteradivergenceofopinion the maintenance of friendly relations became difficult, afterexpresscriticismimpossible.
Evenso, therewerecracks inPearson’sedificeofcausality-freescience,perhapsevenmoresoamongthefoundersthanamongthelaterdisciples.Forinstance, Pearson himself surprisinglywrote several papers about “spuriouscorrelation,” a concept impossible to make sense of without making somereferencetocausation.
Pearson noticed that it’s relatively easy to find correlations that are justplainsilly.Forinstance,forafunexamplepostdatingPearson’stime,thereisastrongcorrelationbetweenanation’spercapitachocolateconsumptionanditsnumberofNobelPrizewinners.This correlation seemssillybecausewecannotenvisionanywayinwhicheatingchocolatecouldcauseNobelPrizes.Amorelikelyexplanationis thatmorepeopleinwealthy,Westerncountrieseat chocolate, and the Nobel Prize winners have also been chosenpreferentially from those countries.But this is a causal explanation,which,forPearson,isnotnecessaryforscientificthinking.Tohim,causationisjusta“fetish amidst the inscrutable arcana of modern science.” Correlation issupposed to be the goal of scientific understanding. This puts him in anawkwardpositionwhenhehastoexplainwhyonecorrelationismeaningfulandanotheris“spurious.”Heexplainsthatagenuinecorrelationindicatesan“organic relationship” between the variables, while a spurious correlationdoesnot.Butwhatisan“organicrelationship”?Isitnotcausalitybyanothername?
Together, Pearson and Yule compiled several examples of spuriouscorrelations.Onetypicalcaseisnowcalledconfounding,andthechocolate-Nobelstoryisanexample.(Wealthandlocationareconfounders,orcommoncausesofbothchocolateconsumptionandNobelfrequency.)Anothertypeof“nonsensecorrelation”oftenemerges in timeseriesdata.Forexample,Yulefoundanincrediblyhighcorrelation(0.95)betweenEngland’smortalityratein a given year and the percentage ofmarriages conducted that year in theChurchofEngland.WasGodpunishingmarriage-happyAnglicans?No!Twoseparate historical trends were simply occurring at the same time: thecountry’s mortality rate was decreasing and membership in the Church ofEnglandwasdeclining.Sincebothweregoingdownatthesametime,therewasapositivecorrelationbetweenthem,butnocausalconnection.
Pearson discovered possibly the most interesting kind of “spuriouscorrelation”as earlyas1899. It ariseswhen twoheterogeneouspopulationsareaggregatedintoone.Pearson,who,likeGalton,wasafanaticalcollectorof data on thehumanbody, hadobtainedmeasurements of 806male skullsand340femaleskulls fromtheParisCatacombs(Figure2.5).Hecomputedthecorrelationbetweenskulllengthandskullbreadth.Whenthecomputation
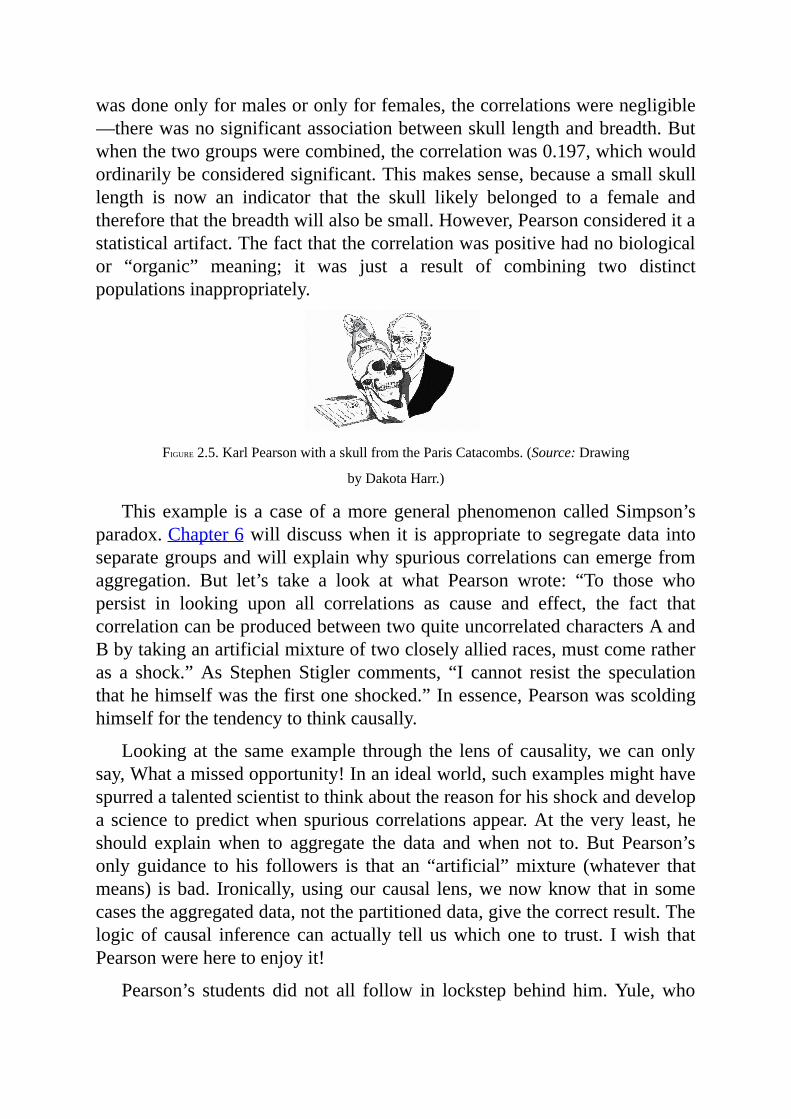
wasdoneonlyformalesoronlyforfemales,thecorrelationswerenegligible—therewasnosignificantassociationbetweenskulllengthandbreadth.Butwhenthetwogroupswerecombined,thecorrelationwas0.197,whichwouldordinarilybeconsideredsignificant.Thismakessense,becauseasmallskulllength is now an indicator that the skull likely belonged to a female andthereforethatthebreadthwillalsobesmall.However,Pearsonconsidereditastatisticalartifact.Thefactthatthecorrelationwaspositivehadnobiologicalor “organic” meaning; it was just a result of combining two distinctpopulationsinappropriately.
FIGURE2.5.KarlPearsonwithaskullfromtheParisCatacombs.(Source:Drawing
byDakotaHarr.)
Thisexample is a caseofamoregeneralphenomenoncalledSimpson’sparadox.Chapter6willdiscusswhenit isappropriate tosegregatedata intoseparategroupsandwillexplainwhyspuriouscorrelationscanemergefromaggregation. But let’s take a look at what Pearson wrote: “To those whopersist in looking upon all correlations as cause and effect, the fact thatcorrelationcanbeproducedbetweentwoquiteuncorrelatedcharactersAandBbytakinganartificialmixtureoftwocloselyalliedraces,mustcomeratheras a shock.”As Stephen Stigler comments, “I cannot resist the speculationthathehimselfwasthefirstoneshocked.”Inessence,Pearsonwasscoldinghimselfforthetendencytothinkcausally.
Lookingat the sameexample through the lensofcausality,wecanonlysay,Whatamissedopportunity!Inanidealworld,suchexamplesmighthavespurredatalentedscientisttothinkaboutthereasonforhisshockanddevelopascience topredictwhenspuriouscorrelationsappear.At thevery least,heshould explainwhen to aggregate the data andwhen not to. But Pearson’sonly guidance to his followers is that an “artificial”mixture (whatever thatmeans) isbad. Ironically,usingourcausal lens,wenowknow that in somecasestheaggregateddata,notthepartitioneddata,givethecorrectresult.Thelogicof causal inferencecanactually tell uswhichone to trust. Iwish thatPearsonwereheretoenjoyit!
Pearson’s students did not all follow in lockstep behind him.Yule,who

brokewithPearsonforotherreasons,brokewithhimover this too.Initiallyhe was in the hard-line camp holding that correlations say everything wecouldeverwishtounderstandaboutscience.However,hechangedhismindtosomeextentwhenheneededtoexplainpovertyconditions inLondon.In1899, he studied the question of whether “out-relief” (that is, welfaredelivered to a pauper’s home versus a poorhouse) increased the rate ofpoverty. The data showed that districts with more out-relief had a higherpoverty rate, but Yule realized that the correlation was possibly spurious:these districtsmight also havemore elderly people,who tend to be poorer.However, he then showed that even in comparisons of districts with equalproportionsofelderlypeople,thecorrelationremained.Thisemboldenedhimtosaythattheincreasedpovertyratewasduetoout-relief.Butaftersteppingout of line tomake this assertion, he fell back into line again,writing in afootnote,“Strictlyspeaking,for‘dueto’read‘associatedwith.’”Thissetthepatternforgenerationsofscientistsafterhim.Theywouldthink“dueto”andsay“associatedwith.”
WithPearsonandhisfollowersactivelyhostiletowardcausation,andwithhalfhearted dissidents such asYule fearful of antagonizing their leader, thestage was set for another scientist from across the ocean to issue the firstdirectchallengetothecausality-avoidingculture.
SEWALLWRIGHT,GUINEAPIGS,ANDPATHDIAGRAMS
When Sewall Wright arrived at Harvard University in 1912, his academicbackground scarcely suggested the kind of lasting effect hewould have onscience. He had attended a small (and now defunct) college in Illinois,LombardCollege, graduating in a class of only seven students.One of histeachers had been his own father, Philip Wright, an academic jack-of-all-trades who even ran the college’s printing press. Sewall and his brotherQuincyhelpedoutwiththepress,andamongotherthingstheypublishedthefirstpoetrybyanot-yet-famousLombardstudent,CarlSandburg.
Sewall Wright’s ties with his father remained very close long after hegraduated from college. Papa Philip moved toMassachusetts when Sewalldid.Later,whenSewallworkedinWashington,DC,Philipdidlikewise,firstat the US Tariff Commission and then at the Brookings Institution as aneconomist. Although their academic interests diverged, they neverthelessfoundwaystocollaborate,andPhilipwasthefirsteconomisttomakeuseofhisson’sinventionofpathdiagrams.
Wrightcame toHarvard to studygenetics,at the timeoneof thehottesttopicsinsciencebecauseGregorMendel’stheoryofdominantandrecessivegenes had just been rediscovered. Wright’s advisor, William Castle, hadidentifiedeightdifferenthereditaryfactors(orgenes,aswewouldcallthemtoday)thataffectedfurcolorinrabbits.CastleassignedWrighttodothesamethingforguineapigs.Afterearninghisdoctoratein1915,Wrightgotanofferfor which he was uniquely qualified: taking care of guinea pigs at the USDepartmentofAgriculture(USDA).
OnewondersiftheUSDAknewwhatitwasgettingwhenithiredWright.Perhaps itexpectedadiligentanimalcaretakerwhocouldstraightenout thechaosof twentyyearsofpoorlykept records.Wrightdidall thatandmuch,muchmore.Wright’s guinea pigswere the springboard to hiswhole careerand hiswhole theory of evolution,much like the finches on theGalapagosislandsthathadinspiredCharlesDarwin.Wrightwasanearlyadvocateoftheviewthatevolutionisnotgradual,asDarwinhadposited,buttakesplaceinrelativelysuddenbursts.
In 1925, Wright moved on to a faculty position at the University ofChicago that was probably better suited to someonewith his wide-rangingtheoreticalinterests.Evenso,heremainedverydevotedtohisguineapigs.Anoftentoldanecdotesaysthathewasonceholdinganunrulyguineapigunderhis arm while lecturing, and absentmindedly began using it to erase theblackboard (see Figure 2.6). While his biographers agree that this story islikelyapocryphal,suchstoriesoftencontainmoretruththandrybiographiesdo.
Wright’searlyworkat theUSDAinterestsusmosthere.TheinheritanceofcoatcoloringuineapigsstubbornlyrefusedtoplaybyMendelianrules.Itproved virtually impossible to breed an all-white or all-colored guinea pig,andeventhemostinbredfamilies(aftermultiplegenerationsofbrother-sistermating)stillhadpronouncedvariation,frommostlywhitetomostlycolored.Thiscontradicted thepredictionofMendeliangenetics thataparticular traitshouldbecome“fixed”bymultiplegenerationsofinbreeding.
Wrightbegantodoubt thatgeneticsalonegovernedtheamountofwhiteandpostulatedthat“developmentalfactors”inthewombwerecausingsomeofthevariations.Withhindsight,weknowthathewascorrect.Differentcolorgenesareexpressedindifferentplacesonthebody,andthepatternsofcolordepend not only on what genes the animal has inherited but where and inwhatcombinationstheyhappentobeexpressedorsuppressed.
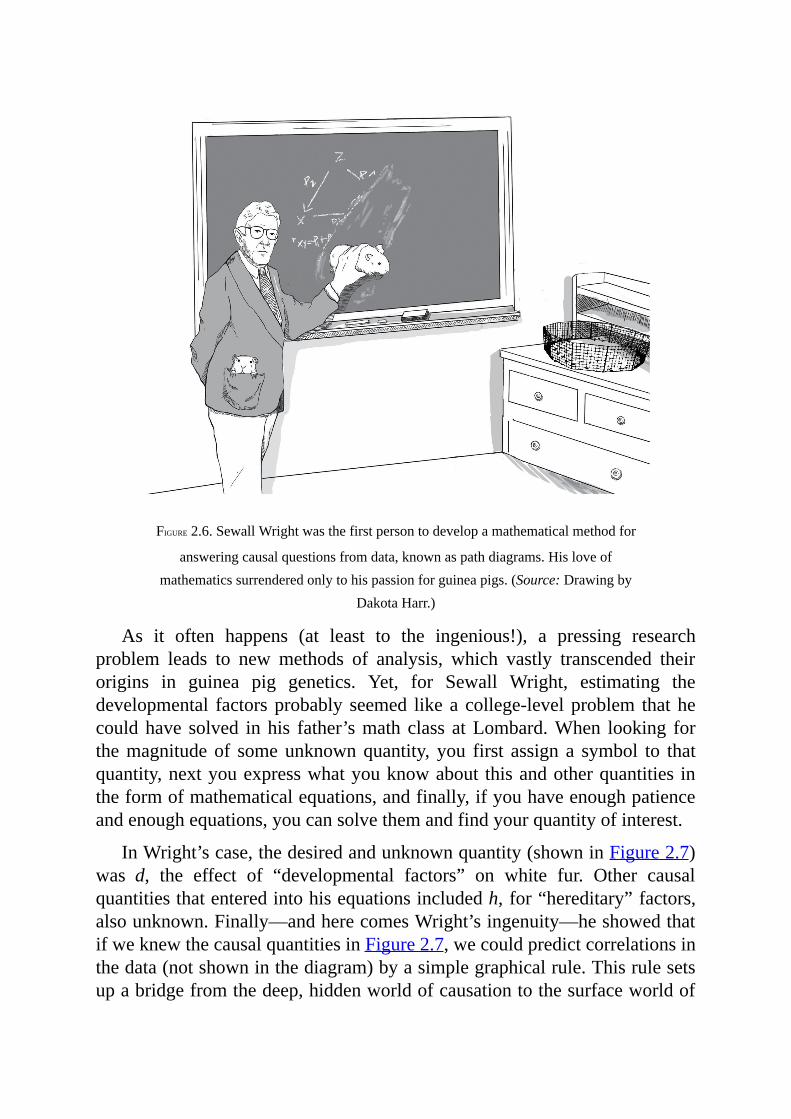
FIGURE2.6.SewallWrightwasthefirstpersontodevelopamathematicalmethodfor
answeringcausalquestionsfromdata,knownaspathdiagrams.Hisloveofmathematicssurrenderedonlytohispassionforguineapigs.(Source:Drawingby
DakotaHarr.)
As it often happens (at least to the ingenious!), a pressing researchproblem leads to new methods of analysis, which vastly transcended theirorigins in guinea pig genetics. Yet, for Sewall Wright, estimating thedevelopmental factorsprobably seemed likea college-levelproblem thathecouldhave solved inhis father’smath class atLombard.When looking forthemagnitudeof someunknownquantity, you first assign a symbol to thatquantity,nextyouexpresswhatyouknowabout thisandotherquantities intheformofmathematicalequations,andfinally,ifyouhaveenoughpatienceandenoughequations,youcansolvethemandfindyourquantityofinterest.
InWright’scase,thedesiredandunknownquantity(showninFigure2.7)was d, the effect of “developmental factors” on white fur. Other causalquantitiesthatenteredintohisequationsincludedh,for“hereditary”factors,alsounknown.Finally—andherecomesWright’singenuity—heshowedthatifweknewthecausalquantitiesinFigure2.7,wecouldpredictcorrelationsinthedata(notshowninthediagram)byasimplegraphicalrule.Thisrulesetsupabridgefromthedeep,hiddenworldofcausationtothesurfaceworldof
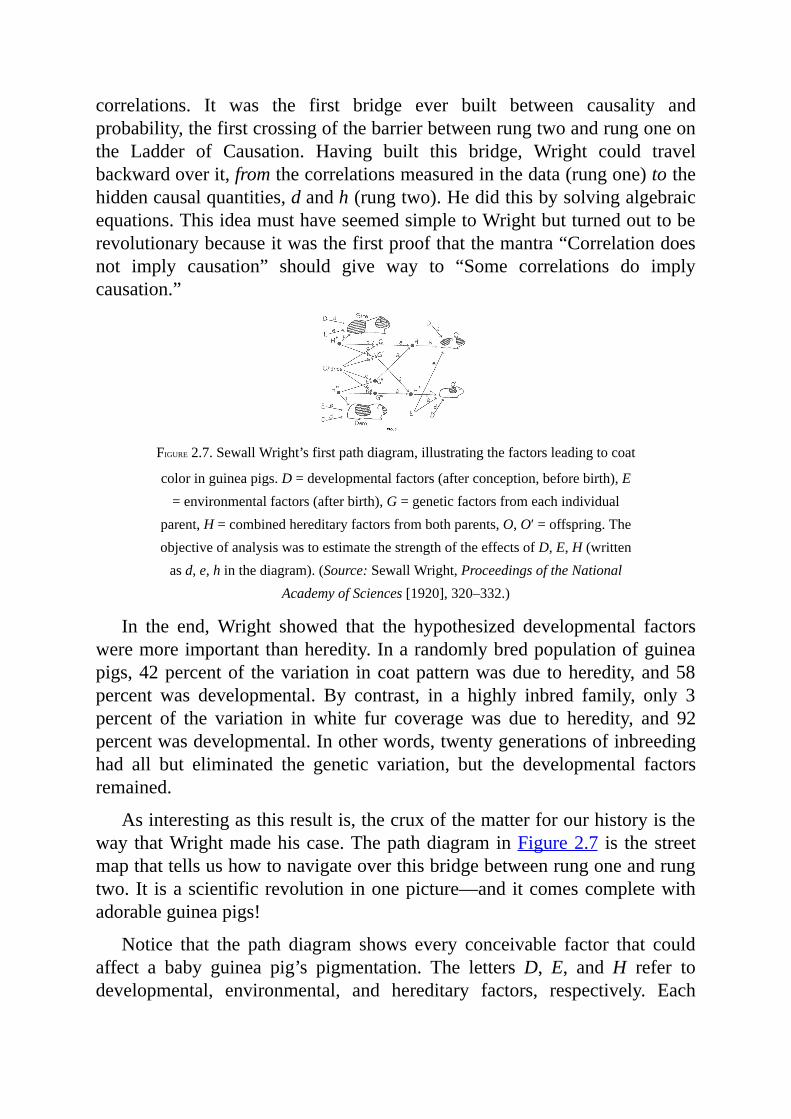
correlations. It was the first bridge ever built between causality andprobability,thefirstcrossingofthebarrierbetweenrungtwoandrungoneonthe Ladder of Causation. Having built this bridge, Wright could travelbackwardoverit,fromthecorrelationsmeasuredinthedata(rungone)tothehiddencausalquantities,dandh(rungtwo).Hedidthisbysolvingalgebraicequations.ThisideamusthaveseemedsimpletoWrightbutturnedouttoberevolutionarybecauseitwasthefirstproofthatthemantra“Correlationdoesnot imply causation” should give way to “Some correlations do implycausation.”
FIGURE2.7.SewallWright’sfirstpathdiagram,illustratingthefactorsleadingtocoat
coloringuineapigs.D=developmentalfactors(afterconception,beforebirth),E=environmentalfactors(afterbirth),G=geneticfactorsfromeachindividual
parent,H=combinedhereditaryfactorsfrombothparents,O,O′=offspring.TheobjectiveofanalysiswastoestimatethestrengthoftheeffectsofD,E,H(writtenasd,e,hinthediagram).(Source:SewallWright,ProceedingsoftheNational
AcademyofSciences[1920],320–332.)
In the end,Wright showed that the hypothesized developmental factorsweremoreimportantthanheredity.Inarandomlybredpopulationofguineapigs,42percentof thevariation incoatpatternwasdue toheredity,and58percent was developmental. By contrast, in a highly inbred family, only 3percent of the variation in white fur coverage was due to heredity, and 92percentwasdevelopmental.Inotherwords,twentygenerationsofinbreedinghad all but eliminated the genetic variation, but the developmental factorsremained.
Asinterestingasthisresultis,thecruxofthematterforourhistoryisthewaythatWrightmadehiscase.ThepathdiagraminFigure2.7 is thestreetmapthattellsushowtonavigateoverthisbridgebetweenrungoneandrungtwo.It isascientificrevolutioninonepicture—anditcomescompletewithadorableguineapigs!
Notice that the path diagram shows every conceivable factor that couldaffect a baby guinea pig’s pigmentation. The lettersD, E, andH refer todevelopmental, environmental, and hereditary factors, respectively. Each
parent(thesireandthedam)andeachchild(offspringOandO′)hasitsownsetofD,E,andHfactors.Thetwooffspringshareenvironmentalfactorsbuthave different developmental histories. The diagram incorporates the thennovelinsightsofMendeliangenetics:achild’sheredity(H)isdeterminedbyitsparents’spermandeggcells(GandG″),andtheseinturnaredeterminedfromtheparents’heredity(H″andH‴)viaamixingprocessthatwasnotyetunderstood (because DNA had not been discovered). It was understood,though,thatthemixingprocessincludedanelementofrandomness(labeled“Chance”inthediagram).
Onethingthediagramdoesnotshowexplicitlyisthedifferencebetweenan inbredfamilyandanormal family. Inan inbredfamily therewouldbeastrongcorrelationbetweentheheredityofthesireandthedam,whichWrightindicated with a two-headed arrow between H″ andH‴. Aside from that,everyarrow in thediagram isone-wayand leads fromacause toaneffect.Forexample,thearrowfromGtoHindicatesthatthesire’sspermcellmayhave a direct causal effect on the offspring’s heredity. The absence of anarrowfromGtoH′indicatesthatthespermcellthatgaverisetooffspringOhasnocausaleffectontheheredityofoffspringO′.
Whenyoutakeapartthediagramarrowbyarrowinthisway,Ithinkyouwill find that every one of themmakes perfect sense. Note also that eacharrowisaccompaniedbyasmallletter(a,b,c,etc.).Theseletters,calledpathcoefficients,representthestrengthofthecausaleffectsthatWrightwantedtosolve for. Roughly speaking, a path coefficient represents the amount ofvariabilityinthetargetvariablethatisaccountedforbythesourcevariable.For instance, it is fairly evident that 50 percent of each child’s hereditarymakeupshouldcomefromeachparent,sothatashouldbe1/2.(Fortechnicalreasons,Wrightpreferred to take the square root, so thata = 1/ anda2 =1/2.)
Thisinterpretationofpathcoefficients,intermsoftheamountofvariationexplained by a variable, was reasonable at the time. The modern causalinterpretation is different: the path coefficients represent the results of ahypothetical intervention on the source variable.However, the notion of aninterventionwouldhave towaituntil the1940s,andWrightcouldnothaveanticipated it when he wrote his paper in 1920. Fortunately, in the simplemodelsheanalyzedthen,thetwointerpretationsyieldthesameresult.
Iwanttoemphasizethatthepathdiagramisnotjustaprettypicture;itisapowerful computational device because the rule for computing correlations(thebridgefromrungtwotorungone)involvestracingthepathsthatconnect
twovariablestoeachotherandmultiplyingthecoefficientsencounteredalongtheway.Also,noticethattheomittedarrowsactuallyconveymoresignificantassumptionsthanthosethatarepresent.Anomittedarrowrestrictsthecausaleffect to zero, while a present arrow remains totally agnostic about themagnitude of the effect (unlesswe a priori impose some value on the pathcoefficient).
Wright’spaperwasa tourdeforceanddeserves tobeconsideredoneofthe landmarkresultsof twentieth-centurybiology.Certainly it isa landmarkfor the history of causality. Figure 2.7 is the first causal diagram everpublished,thefirststepoftwentieth-centuryscienceontothesecondrungoftheLadderofCausation.Andnotatentativestepbutaboldanddecisiveone!The following year Wright published a much more general paper called“CorrelationandCausation”thatexplainedhowpathanalysisworkedinothersettingsthanguineapigbreeding.
Idon’tknowwhatkindofreaction the thirty-year-oldscientistexpected,butthereactionhegotsurelymusthavestunnedhim.Itcameintheformofarebuttal published in 1921 by one Henry Niles, a student of AmericanstatisticianRaymondPearl (no relation),who in turnwas a student ofKarlPearson,thegodfatherofstatistics.
Academia is full of genteel savagery, which I have had the honor toweather at times in my own otherwise placid career, but even so I haveseldomseenacriticismassavageasNiles’s.Hebeginswithalongseriesofquotes from his heroes, Karl Pearson and Francis Galton, attesting to theredundancyorevenmeaninglessnessoftheword“cause.”Heconcludes,“Tocontrast ‘causation’ and ‘correlation’ is unwarranted because causation issimply perfect correlation.” In this sentence he is directly echoing whatPearsonwroteinGrammarofScience.
Niles further disparages Wright’s entire methodology. He writes, “Thebasicfallacyofthemethodappearstobetheassumptionthatitispossibletoset up a priori a comparatively simple graphic system which will trulyrepresentthelinesofactionofseveralvariablesuponeachother,anduponacommonresult.”Finally,Nilesworks throughsomeexamplesand,bunglingthecomputationsbecausehehasnottakenthetroubletounderstandWright’srules, he arrives at opposite conclusions. In summary, he declares, “Wetherefore conclude that philosophically the basis of the method of pathcoefficientsisfaulty,whilepracticallytheresultsofapplyingitwhereitcanbecheckedproveittobewhollyunreliable.”
FromthescientificpointofviewadetaileddiscussionofNiles’scriticism
is perhaps not worth the time, but his paper is very important to us ashistoriansofcausation.First,itfaithfullyreflectstheattitudeofhisgenerationtowardcausationandthetotalgripthathismentor,KarlPearson,hadonthescientificthinkingofhistime.Second,wecontinuetohearNiles’sobjectionstoday.
Ofcourse,attimesscientistsdonotknowtheentirewebofrelationshipsbetweentheirvariables.Inthatcase,Wrightargued,wecanusethediagraminexploratorymode;wecanpostulatecertaincausalrelationshipsandworkoutthepredictedcorrelationsbetweenvariables.If thesecontradictthedata,thenwehaveevidencethattherelationshipsweassumedwerefalse.Thiswayof using path diagrams, rediscovered in 1953 by Herbert Simon (a 1978Nobellaureateineconomics),inspiredmuchworkinthesocialsciences.
Although we don’t need to know every causal relation between thevariablesof interest andmightbeable todrawsomeconclusionswithonlypartialinformation,Wrightmakesonepointwithabsoluteclarity:youcannotdrawcausal conclusionswithout somecausalhypotheses.This echoeswhatweconcludedinChapter1:youcannotansweraquestiononrungtwooftheLadderofCausationusingonlydatacollectedfromrungone.
Sometimespeopleaskme,“Doesn’tthatmakecausalreasoningcircular?Aren’t you just assumingwhat youwant to prove?” The answer is no. Bycombiningverymild,qualitative,andobviousassumptions(e.g.,coatcolorofthesondoesnotinfluencethatoftheparents)withhistwentyyearsofguineapigdata,heobtainedaquantitativeandbynomeansobviousresult: that42percent of the variation in coat color is due to heredity. Extracting thenonobvious from the obvious is not circular—it is a scientific triumph anddeservestobehailedassuch.
Wright’s contribution is unique because the information leading to theconclusion (of 42 percent heritability) resided in two distinct, almostincompatiblemathematical languages: thelanguageofdiagramsononesideand that of data on the other. This heretical idea of marrying qualitative“arrow-information” to quantitative “data-information” (two foreignlanguages!) was one of the miracles that first attracted me, as a computerscientist,tothisenterprise.
ManypeoplestillmakeNiles’smistakeofthinkingthatthegoalofcausalanalysisistoprovethatXisacauseofYorelsetofindthecauseofYfromscratch. That is the problem of causal discovery, which wasmy ambitiousdreamwhen I first plunged into graphical modeling and is still an area ofvigorousresearch.Incontrast,thefocusofWright’sresearch,aswellasthis
book, is representing plausible causal knowledge in some mathematicallanguage,combiningitwithempiricaldata,andansweringcausalqueriesthatareofpracticalvalue.Wrightunderstoodfromtheverybeginningthatcausaldiscoverywasmuchmoredifficultandperhapsimpossible.InhisresponsetoNiles, he writes, “The writer [i.e., Wright himself] has never made thepreposterous claim that the theory of path coefficients provides a generalformula for the deduction of causal relations.Hewishes to submit that thecombinationofknowledgeofcorrelationswithknowledgeofcausalrelationsto obtain certain results, is a different thing from the deduction of causalrelationsfromcorrelationsimpliedbyNiles’statement.”
EPURSIMUOVE(ANDYETITMOVES)
If I were a professional historian, I would probably stop here. But as the“Whig historian” that I promised to be, I cannot contain myself fromexpressingmy sheer admiration for the precision ofWright’s words in thequote ending the previous section,which have not gone stale in the ninetyyears since he first articulated them andwhich essentially defined the newparadigmofmoderncausalanalysis.
MyadmirationforWright’sprecisionissecondonlytomyadmirationforhis courage and determination. Imagine the situation in 1921.A self-taughtmathematician faces the hegemony of the statistical establishment alone.Theytellhim,“Yourmethodisbasedonacompletemisapprehensionofthenature of causality in the scientific sense.” And he retorts, “Not so! Mymethodgeneratessomethingthatisimportantandgoesbeyondanythingthatyoucangenerate.”Theysay,“Ourguruslookedintotheseproblemsalready,twodecades ago, andconcluded thatwhatyouhavedone is nonsense.Youhave only combined correlations with correlations and gotten correlations.When you grow up, you will understand.” And he continues, “I am notdismissingyourgurus, but a spade is a spade.Mypath coefficients arenotcorrelations.Theyaresomethingtotallydifferent:causaleffects.”
Imagine that you are in kindergarten, and your friends mock you forbelievingthat3+4=7,wheneverybodyknowsthat3+4=8.Thenimaginegoingtoyourteacherforhelpandhearinghersay,too,that3+4=8.Wouldyounotgohomeandaskyourselfifperhapstherewassomethingwrongwiththewayyouwerethinking?Eventhestrongestmanwouldstart towaverinhisconvictions.Ihavebeeninthatkindergarten,andIknow.
ButWright did not blink. And this was not just amatter of arithmetic,
wheretherecanbesomesortofindependentverification.Onlyphilosophershaddaredtoexpressanopiniononthenatureofcausation.WheredidWrightget this inner conviction that hewas on the right track and the rest of thekindergartenclasswas justplainwrong?MaybehisMidwesternupbringingand the tinycollegehewent toencouragedhis self-relianceand taughthimthatthesurestkindofknowledgeiswhatyouconstructyourself.
One of the earliest science books I read in school told of how theInquisition forcedGalileo to recant his teaching that Earth revolves aroundthesunandhowhewhisperedunderhisbreath,“Andyetitmoves”(Epursimuove). I don’t think that there is a child in the world who has read thislegend and not been inspired by Galileo’s courage in defending hisconvictions. Yet asmuch as we admire him for his stand, I can’t help butthinkthatheatleasthadhisastronomicalobservationstofallbackon.Wrighthad only untested conclusions—say, that developmental factors account for58 percent, not 3 percent, of variation.With nothing to lean on except hisinternalconvictionthatpathcoefficientstellyouwhatcorrelationsdonot,hestilldeclared,“Andyetitmoves!”
Colleagues tell me that when Bayesian networks fought against theartificialintelligenceestablishment(seeChapter3),Iactedstubbornly,single-mindedly,anduncompromisingly.Indeed,Irecallbeingtotallyconvincedofmyapproach,withnotan iotaofhesitation.ButIhadprobability theoryonmy side. Wright didn’t have even one theorem to lean on. Scientists hadabandoned causation, so Wright could not fall back on any theoreticalframework.Norcouldherelyonauthorities,asNilesdid,becausetherewasnooneforhimtoquote;thegurushadalreadypronouncedtheirverdictsthreedecadesearlier.
ButonesolacetoWright,andonesignthathewasontherightpath,musthave been his understanding that he could answer questions that cannot beanswered in any otherway.Determining the relative importance of severalfactorswasonesuchquestion.Anotherbeautifulexampleofthiscanbefoundinhis“CorrelationandCausation”paper,from1921,whichaskshowmuchaguinea pig’s birthweightwill be affected if it spends onemore day in thewomb.Iwouldlike toexamineWright’sanswer insomedetail toenjoythebeautyof hismethod and to satisfy readerswhowould like to seehow themathematicsofpathanalysisworks.
NoticethatwecannotanswerWright’squestiondirectly,becausewecan’tweigh a guinea pig in thewomb.Whatwe can do, though, is compare thebirth weights of guinea pigs that spend (say) sixty-six days gestating with
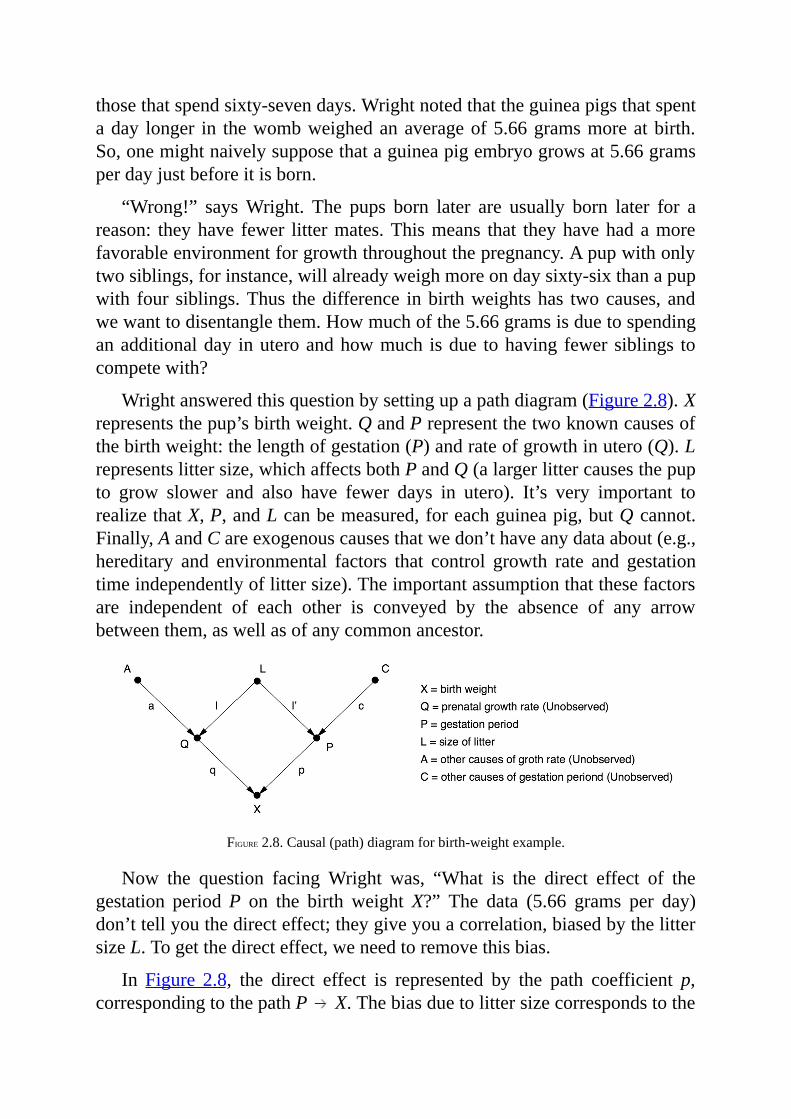
thosethatspendsixty-sevendays.Wrightnotedthattheguineapigsthatspentaday longer in thewombweighedanaverageof5.66gramsmoreatbirth.So,onemightnaivelysupposethataguineapigembryogrowsat5.66gramsperdayjustbeforeitisborn.
“Wrong!” saysWright. The pups born later are usually born later for areason: theyhave fewer littermates.Thismeans that theyhavehadamorefavorableenvironmentforgrowththroughoutthepregnancy.Apupwithonlytwosiblings,forinstance,willalreadyweighmoreondaysixty-sixthanapupwith four siblings.Thus thedifference inbirthweightshas twocauses, andwewanttodisentanglethem.Howmuchofthe5.66gramsisduetospendinganadditionalday inuteroandhowmuch isdue tohavingfewersiblings tocompetewith?
Wrightansweredthisquestionbysettingupapathdiagram(Figure2.8).Xrepresentsthepup’sbirthweight.QandPrepresentthetwoknowncausesofthebirthweight:thelengthofgestation(P)andrateofgrowthinutero(Q).Lrepresentslittersize,whichaffectsbothPandQ(alargerlittercausesthepupto grow slower and also have fewer days in utero). It’s very important torealizethatX,P,andLcanbemeasured,foreachguineapig,butQcannot.Finally,AandCareexogenouscausesthatwedon’thaveanydataabout(e.g.,hereditary and environmental factors that control growth rate and gestationtimeindependentlyoflittersize).Theimportantassumptionthatthesefactorsare independent of each other is conveyed by the absence of any arrowbetweenthem,aswellasofanycommonancestor.
FIGURE2.8.Causal(path)diagramforbirth-weightexample.
Now the question facingWright was, “What is the direct effect of thegestation periodP on the birth weightX?” The data (5.66 grams per day)don’ttellyouthedirecteffect;theygiveyouacorrelation,biasedbythelittersizeL.Togetthedirecteffect,weneedtoremovethisbias.
In Figure 2.8, the direct effect is represented by the path coefficient p,correspondingtothepathP X.Thebiasduetolittersizecorrespondstothe
pathP L Q X.Andnowthealgebraicmagic: theamountofbias isequaltotheproductofthepathcoefficientsalongthatpath(inotherwords,ltimes l′ times q). The total correlation, then, is just the sum of the pathcoefficientsalongthetwopaths:algebraically,p+(l×l′×q)=5.66gramsperday.
Ifweknewthepathcoefficients l,l′,andq, thenwecould justworkoutthesecondtermandsubtractitfrom5.66togetthedesiredquantityp.Butwedon’tknowthem,becauseQ(forexample)isnotmeasured.Buthere’swheretheingenuityofpathcoefficientsreallyshines.Wright’smethodstellushowtoexpresseachofthemeasuredcorrelationsintermsofthepathcoefficients.Afterdoingthisforeachofthemeasuredpairs(P,X),(L,X),and(L,P),weobtainthreeequationsthatcanbesolvedalgebraicallyfortheunknownpathcoefficients,p,l′,andl×q.Thenwearedone,becausethedesiredquantityphasbeenobtained.
Todaywecanskipthemathematicsaltogetherandcalculatepbycursoryinspection of the diagram. But in 1920, this was the first time thatmathematics was summoned to connect causation and correlation. And itworked!Wrightcalculatedptobe3.34gramsperday.Inotherwords,hadallthe other variables (A, L,C,Q) been held constant and only the time ofgestation increasedby aday, the average increase inbirthweightwouldbe3.34gramsperday.Notethatthisresultisbiologicallymeaningful.Ittellsushow rapidly the pups are growing per day before birth. By contrast, thenumber 5.66 grams per day has no biological significance, because itconflatestwoseparateprocesses,oneofwhichisnotcausalbutanticausal(ordiagnostic)inthelinkP L.Lessononefromthisexample:causalanalysisallowsustoquantifyprocessesintherealworld,notjustpatternsinthedata.Thepupsaregrowingat3.34gramsperday,not5.66gramsperday.Lessontwo,whetheryoufollowedthemathematicsornot:inpathanalysisyoudrawconclusions about individual causal relationships by examining thediagramas awhole. The entire structure of the diagrammay be needed to estimateeachindividualparameter.
Inaworldwherescienceprogresseslogically,Wright’sresponsetoNilesshould have produced a scientific excitement followed by an enthusiasticadoptionof hismethodsbyother scientists and statisticians.But that is notwhathappened.“Oneofthemysteriesofthehistoryofsciencefrom1920to1960isthevirtualabsenceofanyappreciableuseofpathanalysis,exceptbyWrighthimself andby studentsof animalbreeding,”wroteoneofWright’sgeneticist colleagues, James Crow. “AlthoughWright had illustrated manydiverse problems to which themethodwas applicable, none of these leads

wasfollowed.”
Crowdidn’tknowit,butthemysteryextendedtosocialsciencesaswell.In1972,economistArthurGoldbergerlamentedthe“scandalousneglect”ofWright’sworkduringthatperiodandnoted,withtheenthusiasmofaconvert,that“[Wright’s]approach…sparkedtherecentupsurgeofcausalmodelinginsociology.”
IfonlywecouldgobackandaskWright’scontemporaries,“Whydidn’tyou pay attention?” Crow suggests one reason: path analysis “doesn’t lenditself to ‘canned’ programs. The user has to have a hypothesis and mustdevise an appropriate diagramofmultiple causal sequences.” Indeed,Crowputhisfingeronanessentialpoint:pathanalysisrequiresscientificthinking,asdoeseveryexerciseincausalinference.Statistics,asfrequentlypracticed,discourages it and encourages “canned” procedures instead. Scientists willalways prefer routine calculations on data to methods that challenge theirscientificknowledge.
R.A.Fisher,theundisputedhighpriestofstatisticsinthegenerationafterGaltonandPearson,described thisdifference succinctly. In1925,hewrote,“Statistics may be regarded as… the study of methods of the reduction ofdata.”Payattentiontothewords“methods,”“reduction,”and“data.”Wrightabhorred the idea of statistics as merely a collection of methods; Fisherembraced it. Causal analysis is emphatically not just about data; in causalanalysiswemustincorporatesomeunderstandingoftheprocessthatproducesthedata,andthenwegetsomethingthatwasnotinthedatatobeginwith.ButFisherwasrightaboutonepoint:onceyouremovecausationfromstatistics,reductionofdataistheonlythingleft.
AlthoughCrowdidnotmention it,Wright’sbiographerWilliamProvinepointsoutanotherfactorthatmayhaveaffectedthelackofsupportforpathanalysis.Fromthemid-1930sonward,FisherconsideredWrighthisenemy.IpreviouslyquotedYuleonhowrelationswithPearsonbecamestrainedifyoudisagreedwith him and impossible if you criticized him. Exactly the samething could be said about Fisher. The latter carried out nasty feuds withanyone he disagreed with, including Pearson, Pearson’s son Egon, JerzyNeyman(morewillbesaidonthesetwoinChapter8),andofcourseWright.
The real focus of the Fisher-Wright rivalry was not path analysis butevolutionarybiology.FisherdisagreedwithWright’s theory (called“geneticdrift”) that a species can evolve rapidly when it undergoes a populationbottleneck.Thedetailsofthedisputearebeyondthescopeofthisbook,andthe interested reader shouldconsultProvine.Relevanthere is this: from the
1920stothe1950s,thescientificworldforthemostpartturnedtoFisherasitsoracleforstatisticalknowledge.AndyoucanbecertainthatFisherneversaidonekindwordtoanyoneaboutpathanalysis.
In the 1960s, things began to change. A group of social scientists,includingOtisDuncan,HubertBlalock,andtheeconomistArthurGoldberger(mentionedearlier),rediscoveredpathanalysisasamethodofpredictingtheeffect of social and educational policies. In yet another irony of history,Wright had actually been asked to speak to an influential group ofeconometricianscalledtheCowlesCommissionin1947,butheutterlyfailedto communicate to them what path diagrams were about. Only wheneconomists arrivedat similar ideas themselveswasa short-livedconnectionforged.
Thefatesofpathanalysis ineconomicsandsociologyfolloweddifferenttrajectories,eachleadingtoabetrayalofWright’sideas.Sociologistsrenamedpathanalysisasstructuralequationmodeling(SEM),embraceddiagrams,andusedthemextensivelyuntil1970,whenacomputerpackagecalledLISRELautomatedthecalculationofpathcoefficients(insomecases).Wrightwouldhave predictedwhat followed: path analysis turned into a rotemethod, andresearchers became software userswith little interest inwhatwas going onunder the hood. In the late 1980s, a public challenge (by statisticianDavidFreedman) to explain the assumptions behind SEM went unanswered, andsome leading SEM experts even disavowed that SEMs had anything to dowithcausality.
In economics, the algebraic part of path analysis became known assimultaneous equation models (no acronym). Economists essentially neverusedpathdiagramsandcontinuenottousethemtothisday,relyinginsteadonnumericalequationsandmatrixalgebra.Adireconsequenceofthisisthat,becausealgebraicequationsarenondirectional(thatis,x=yisthesameasy= x), economists had no notational means to distinguish causal fromregressionequationsandthuswereunabletoanswerpolicy-relatedquestions,evenaftersolvingtheequations.Aslateas1995,mosteconomistsrefrainedfromexplicitlyattributingcausalorcounterfactualmeaningtotheirequations.Even those who used structural equations for policy decisions remainedincurably suspicious of diagrams, which could have saved them pages andpages of computation.Not surprisingly, some economists continue to claimthat“it’sallinthedata”tothisveryday.
Forallthesereasons,thepromiseofpathdiagramsremainedonlypartiallyrealized,atbest,untilthe1990s.In1983,Wrighthimselfwascalledbackinto
theringonemoretimetodefendthem,thistimeintheAmericanJournalofHumanGenetics. At the time hewrote this article,Wrightwas past ninetyyearsold.Itisbothwonderfulandtragictoreadhisessay,writtenin1983,onthe very same topic he hadwritten about in 1923.Howmany times in thehistoryofsciencehavewehadtheprivilegeofhearingfromatheory’screatorsixtyyearsafterhefirstsetitdownonpaper?ItwouldbelikeCharlesDarwincomingback from thegrave to testifyat theScopesMonkeyTrial in1925.Butit isalsotragic,becauseintheinterveningsixtyyearshistheoryshouldhavedeveloped,grown,andflourished;insteadithadadvancedlittlesincethe1920s.
The motivation for Wright’s paper was a critique of path analysis,published in the same journal,bySamuelKarlin (aStanfordmathematicianandrecipientofthe1989NationalMedalofScience,whomadefundamentalcontributions to economics and population genetics) and two coauthors.OfinteresttousaretwoofKarlin’sarguments.
First,KarlinobjectstopathanalysisforareasonthatNilesdidnotraise:itassumes that all the relationships between any two variables in the pathdiagram are linear. This assumption allows Wright to describe the causalrelationshipswithasinglenumber,thepathcoefficient.Iftheequationswerenotlinear,thentheeffectonYofaone-unitchangeinXmightdependonthecurrentvalueofX.NeitherKarlinnorWrightrealizedthatageneralnonlineartheorywasjustaroundthecorner.(Itwouldbedevelopedthreeyearslaterbyastarstudentinmylab,ThomasVerma.)
ButKarlin’smostinterestingcriticismwasalsotheonethatheconsideredthemost important:“Finally,andwethinkmostfruitfully,onecanadoptanessentiallymodel-freeapproach,seekingtounderstandthedatainteractivelyby using a battery of displays, indices, and contrasts. This approachemphasizes the concept of robustness in interpreting results.” In this onesentenceKarlinarticulateshow littlehadchangedfromthedaysofPearsonandhowmuch influencePearson’s ideology still had in 1983.He is sayingthatthedatathemselvesalreadycontainallscientificwisdom;theyneedonlybe cajoled and massaged (by “displays, indices, and contrasts”) intodispensingthosepearlsofwisdom.Thereisnoneedforouranalysistotakeintoaccounttheprocessthatgeneratedthedata.Wewoulddojustaswell,ifnotbetter,witha“model-freeapproach.”IfPearsonwerealivetoday, livingin theeraofBigData,hewouldsayexactly this: theanswersareall in thedata.
Ofcourse,Karlin’sstatementviolateseverythingwelearnedinChapter1.
To speak of causality, we must have a mental model of the real world. A“model-free approach” may take us to the first rung of the Ladder ofCausation,butnofarther.
Wright, tohisgreatcredit,understood theenormousstakesandstated inno uncertain terms, “In treating the model-free approach (3) as preferredalternative…Karlinetal.areurgingnotmerelyachange inmethod,butanabandonment of the purpose of path analysis and evaluation of the relativeimportanceofvaryingcauses.Therecanbenosuchanalysiswithoutamodel.Theiradvicetoanyonewithanurgetomakesuchanevaluationistorepressitanddosomethingelse.”
Wrightunderstoodthathewasdefendingtheveryessenceofthescientificmethodandtheinterpretationofdata.Iwouldgivethesameadvicetodaytobig-data, model-free enthusiasts. Of course, it is okay to tease out all theinformationthatthedatacanprovide,butlet’saskhowfarthiswillgetus.ItwillnevergetusbeyondthefirstrungoftheLadderofCausation,anditwillneveranswerevenassimpleaquestionas“Whatistherelativeimportanceofvariouscauses?”Epursimuove!
FROMOBJECTIVITYTOSUBJECTIVITY—THEBAYESIANCONNECTION
One other theme in Wright’s rebuttal may hint at another reason for theresistance of statisticians to causality. He repeatedly states that he did notwant path analysis to become “stereotyped.” According to Wright, “Theunstereotyped approach of path analysis differs profoundly from thestereotyped modes of description designed to avoid any departures fromcompleteobjectivity.”
Whatdoeshemean?First,hemeansthatpathanalysisshouldbebasedontheuser’spersonalunderstandingofcausalprocesses,reflectedinthecausaldiagram.Itcannotbereducedtomechanicalroutines,suchasthoselaidoutinstatistics manuals. For Wright, drawing a path diagram is not a statisticalexercise;itisanexerciseingenetics,economics,psychology,orwhateverthescientist’sownfieldofexpertiseis.
Second, Wright traces the allure of “model-free” methods to theirobjectivity.Thishasindeedbeenaholygrailforstatisticianssincedayone—orsinceMarch15,1834,whentheStatisticalSocietyofLondonwasfounded.Its founding charter said that datawere to receive priority in all cases over
opinionsandinterpretations.Dataareobjective;opinionsaresubjective.Thisparadigm long predates Pearson. The struggle for objectivity—the idea ofreasoning exclusively fromdata and experiment—has been part of thewaythatsciencehasdefineditselfeversinceGalileo.
Unlike correlation and most of the other tools of mainstream statistics,causalanalysisrequirestheusertomakeasubjectivecommitment.Shemustdrawacausaldiagramthat reflectsherqualitativebelief—or,betteryet, theconsensusbeliefofresearchersinherfieldofexpertise—aboutthetopologyofthecausalprocessesatwork.Shemustabandonthecenturies-olddogmaofobjectivity for objectivity’s sake.Where causation is concerned, a grain ofwise subjectivity tells us more about the real world than any amount ofobjectivity.
In theaboveparagraph,Isaid that“mostof” the toolsofstatisticsstriveforcompleteobjectivity.Thereisoneimportantexceptiontothisrule,though.A branch of statistics called Bayesian statistics has achieved growingpopularityoverthelastfiftyyearsorso.Onceconsideredalmostanathema,ithasnowgonecompletelymainstream,andyoucanattendanentirestatisticsconferencewithouthearinganyofthegreatdebatesbetween“Bayesians”and“frequentists”thatusedtothunderinthe1960sand1970s.
The prototype of Bayesian analysis goes like this: Prior Belief + NewEvidence RevisedBelief.Forinstance,supposeyoutossacointentimesandfindthatinnineofthosetossesthecoincameupheads.Yourbeliefthatthecoin is fair isprobablyshaken,buthowmuch?Anorthodoxstatisticianwould say, “In theabsenceofanyadditionalevidence, Iwouldbelieve thatthis coin is loaded, so I would bet nine to one that the next toss turns upheads.”
ABayesianstatistician,ontheotherhand,wouldsay,“Waitaminute.Wealso need to take into account our prior knowledge about the coin.”Did itcome from the neighborhood grocery or a shady gambler? If it’s just anordinaryquarter,mostofuswouldnotletthecoincidenceofnineheadsswayourbeliefsodramatically.Ontheotherhand,ifwealreadysuspectedthecoinwas weighted, we would conclude more willingly that the nine headsprovidedseriousevidenceofbias.
Bayesian statistics give us an objectiveway of combining the observedevidencewithourpriorknowledge (orsubjectivebelief) toobtaina revisedbeliefandhencearevisedpredictionof theoutcomeof thecoin’snext toss.Still, what frequentists could not abide was that Bayesians were allowingopinion, in the form of subjective probabilities, to intrude into the pristine
kingdom of statistics. Mainstream statisticians were won over onlygrudgingly, whenBayesian analysis proved a superior tool for a variety ofapplications, such asweatherprediction and tracking enemy submarines. Inaddition, inmany cases it can be proven that the influence of prior beliefsvanishes as the size of the data increases, leaving a single objectiveconclusionintheend.
Unfortunately, the acceptance of Bayesian subjectivity in mainstreamstatistics did nothing to help the acceptance of causal subjectivity, the kindneeded to specify a path diagram. Why? The answer rests on a grandlinguisticbarrier.Toarticulatesubjectiveassumptions,Bayesianstatisticiansstill use the language of probability, the native language of Galton andPearson. The assumptions entering causal inference, on the other hand,require a richer language (e.g., diagrams) that is foreign to Bayesians andfrequentists alike. The reconciliation between Bayesians and frequentistsshowsthatphilosophicalbarrierscanbebridgedwithgoodwillandacommonlanguage.Linguisticbarriersarenotsurmountedsoeasily.
Moreover, the subjective component in causal information does notnecessarily diminish over time, even as the amount of data increases. Twopeople who believe in two different causal diagrams can analyze the samedataandmaynevercometothesameconclusion,regardlessofhow“big”thedata are.This is a terrifyingprospect for advocates of scientific objectivity,whichexplainstheirrefusaltoaccepttheinevitabilityofrelyingonsubjectivecausalinformation.
On the positive side, causal inference is objective in one criticallyimportant sense: once two people agree on their assumptions, it provides a100 percent objective way of interpreting any new evidence (or data). Itshares this property with Bayesian inference. So the savvy reader willprobablynotbesurprisedtofindoutthatIarrivedatthetheoryofcausalitythroughacircuitousroutethatstartedwithBayesianprobabilityandthentooka huge detour through Bayesian networks. I will tell that story in the nextchapter.
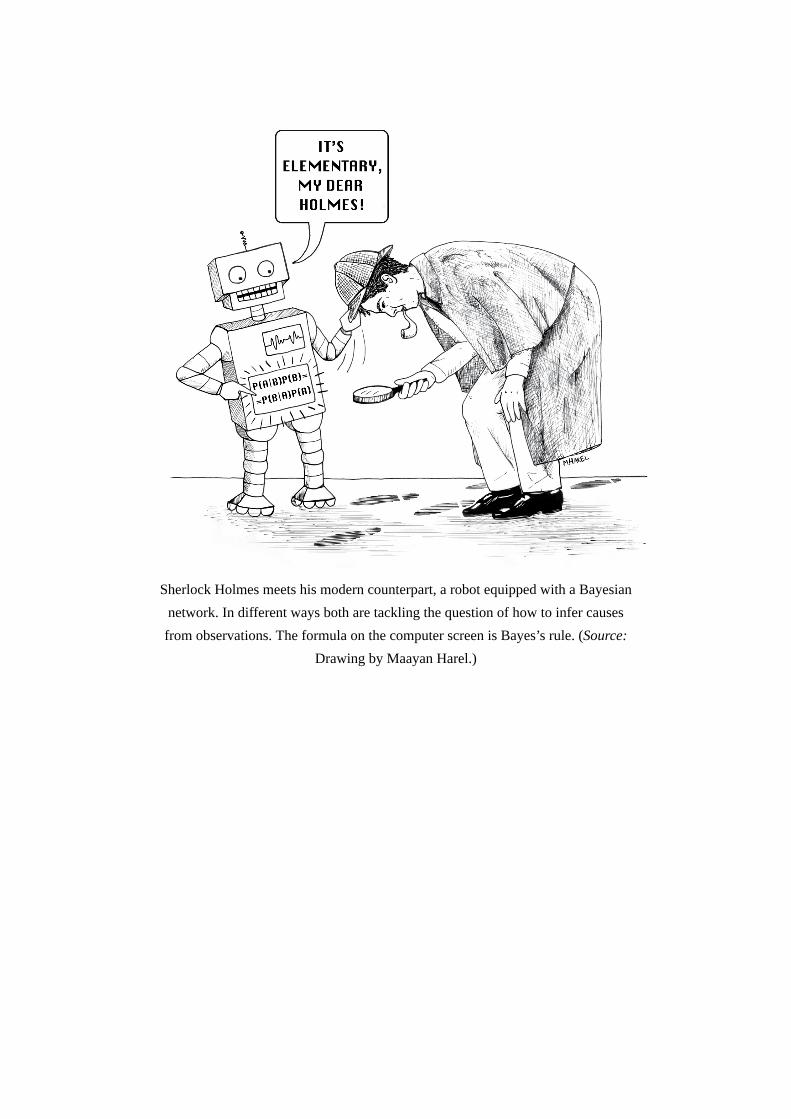
SherlockHolmesmeetshismoderncounterpart,arobotequippedwithaBayesiannetwork.Indifferentwaysbotharetacklingthequestionofhowtoinfercausesfromobservations.TheformulaonthecomputerscreenisBayes’srule.(Source:
DrawingbyMaayanHarel.)
3
FROMEVIDENCETOCAUSES:REVERENDBAYESMEETSMR.
HOLMES
Dotwomentraveltogetherunlesstheyhaveagreed?
Doesthelionroarintheforestifhehasnoprey?
—AMOS3:3
“IT’Selementary,mydearWatson.”
SospokeSherlockHolmes(atleastinthemovies)justbeforedazzlinghisfaithfulassistantwithoneofhisfamouslynonelementarydeductions.Butinfact,Holmesperformednotjustdeduction,whichworksfromahypothesistoa conclusion. His great skill was induction, which works in the oppositedirection,fromevidencetohypothesis.
Another of his famous quotes suggests hismodus operandi: “Whenyouhaveeliminatedtheimpossible,whateverremains,howeverimprobable,mustbe the truth.”Having induced several hypotheses,Holmes eliminated themone by one in order to deduce (by elimination) the correct one. Althoughinduction and deduction go hand in hand, the former is by far the moremysterious.ThisfactkeptdetectiveslikeSherlockHolmesinbusiness.
However,inrecentyearsexpertsinartificialintelligence(AI)havemadeconsiderable progress toward automating the process of reasoning fromevidence to hypothesis and likewise from effect to cause. I was fortunate
enoughtoparticipateintheveryearlieststagesofthisprogressbydevelopingoneof itsbasic tools,calledBayesiannetworks.Thischapterexplainswhatthese are, looks at someof their current-dayapplications, anddiscusses thecircuitousroutebywhichtheyledmetostudycausation.
BONAPARTE,THECOMPUTERDETECTIVE
On July 17, 2014,MalaysiaAirlines Flight 17 took off fromAmsterdam’sSchipholAirport,boundforKualaLumpur.Alas,theairplaneneverreachedits destination. Three hours into the flight, as the jet flew over easternUkraine,itwasshotdownbyaRussian-madesurface-to-airmissile.All298peopleonboard,283passengersand15crewmembers,werekilled.
July23,thedaythefirstbodiesarrivedintheNetherlands,wasdeclaredanational dayofmourning.But for investigators at theNetherlandsForensicInstitute (NFI) in The Hague, July 23 was the day when the clock startedticking.Their jobwas to identify the remainsof thedeceasedasquicklyaspossible and return them to their loved ones for burial. Time was of theessence, because every dayof uncertaintywould bring fresh anguish to thegrievingfamilies.
The investigators faced many obstacles. The bodies had been badlyburned, andmanywere stored in formaldehyde,which breaks downDNA.Also, because eastern Ukraine was a war zone, forensics experts had onlysporadicaccesstothecrashsite.Newlyrecoveredremainscontinuedtoarrivefortenmoremonths.Finally,theinvestigatorsdidnothavepreviousrecordsof the victims’ DNA, for the simple reason that the victims were notcriminals. They would have to rely instead on partial matches with familymembers.
Fortunately, the scientists at NFI had a powerful tool working in theirfavor, a state-of-the-art disaster victim identification program calledBonaparte. This software, developed in the mid-2000s by a team fromRadboudUniversity inNijmegen,usesBayesiannetworks tocombineDNAinformationtakenfromseveraldifferentfamilymembersofthevictims.
Thanks in part to Bonaparte’s accuracy and speed, theNFImanaged toidentifyremainsfrom294ofthe298victimsbyDecember2014.Asof2016,onlytwovictimsofthecrash(bothDutchcitizens)havevanishedwithoutatrace.
Bayesian networks, the machine-reasoning tool that underlies the
Bonaparte software, affectour lives inmanyways thatmostpeople arenotaware of. They are used in speech-recognition software, in spam filters, inweatherforecasting, intheevaluationofpotentialoilwells,andintheFoodandDrugAdministration’sapprovalprocessformedicaldevices.Ifyouplayvideo games on aMicrosoftXbox, aBayesian network ranks your skill. Ifyouownacellphone,thecodesthatyourphoneusestopickyourcalloutofthousandsofothersaredecodedbybeliefpropagation,analgorithmdevisedfor Bayesian networks. Vint Cerf, the chief Internet evangelist at anothercompany youmight have heard of, Google, puts it this way: “We’re hugeconsumersofBayesianmethods.”
InthischapterIwilltellthestoryofBayesiannetworksfromtheirrootsintheeighteenthcenturytotheirdevelopmentinthe1980s,andIwillgivesomemore examples of how they are used today. They are related to causaldiagramsinasimpleway:acausaldiagramisaBayesiannetworkinwhicheveryarrowsignifiesadirectcausalrelation,oratleastthepossibilityofone,in the directionof that arrow.Not allBayesiannetworks are causal, and inmanyapplicationsitdoesnotmatter.However,ifyoueverwanttoaskarung-twoorrung-threequeryaboutyourBayesiannetwork,youmustdrawitwithscrupulousattentiontocausality.
REVERENDBAYESANDTHEPROBLEMOFINVERSEPROBABILITY
ThomasBayes,afterwhomInamedthenetworksin1985,neverdreamedthataformulahederivedinthe1750swouldonedaybeusedtoidentifydisastervictims.Hewasconcernedonlywiththeprobabilitiesoftwoevents,one(thehypothesis)occurringbeforetheother(theevidence).Nevertheless,causalitywasverymuchonhismind.Infact,causalaspirationswerethedrivingforcebehindhisanalysisof“inverseprobability.”
A Presbyterian minister who lived from 1702 to 1761, the ReverendThomasBayesappearstohavebeenamathematicsgeek.AsadissenterfromtheChurchofEngland,hecouldnotstudyatOxfordorCambridgeandwaseducated instead at the University of Scotland, where he likely picked upquiteabitofmath.HecontinuedtodabbleinitandorganizemathdiscussioncirclesafterhereturnedtoEngland.
In an article published after his death (see Figure 3.1), Bayes tackled aproblemthatwastheperfectmatchforhim,pittingmathagainsttheology.Tosetthecontext,in1748,theScottishphilosopherDavidHumehadwrittenan

essay titled “On Miracles,” in which he argued that eyewitness testimonycould never prove that amiracle had happened. Themiracle Hume had inmindwas,ofcourse,theresurrectionofChrist,althoughhewassmartenoughnottosayso.(Twentyyearsearlier,theologianThomasWoolstonhadgonetoprison for blasphemy forwriting such things.)Hume’smain pointwas thatinherently fallible evidence cannot overrule a propositionwith the force ofnaturallaw,suchas“Deadpeoplestaydead.”
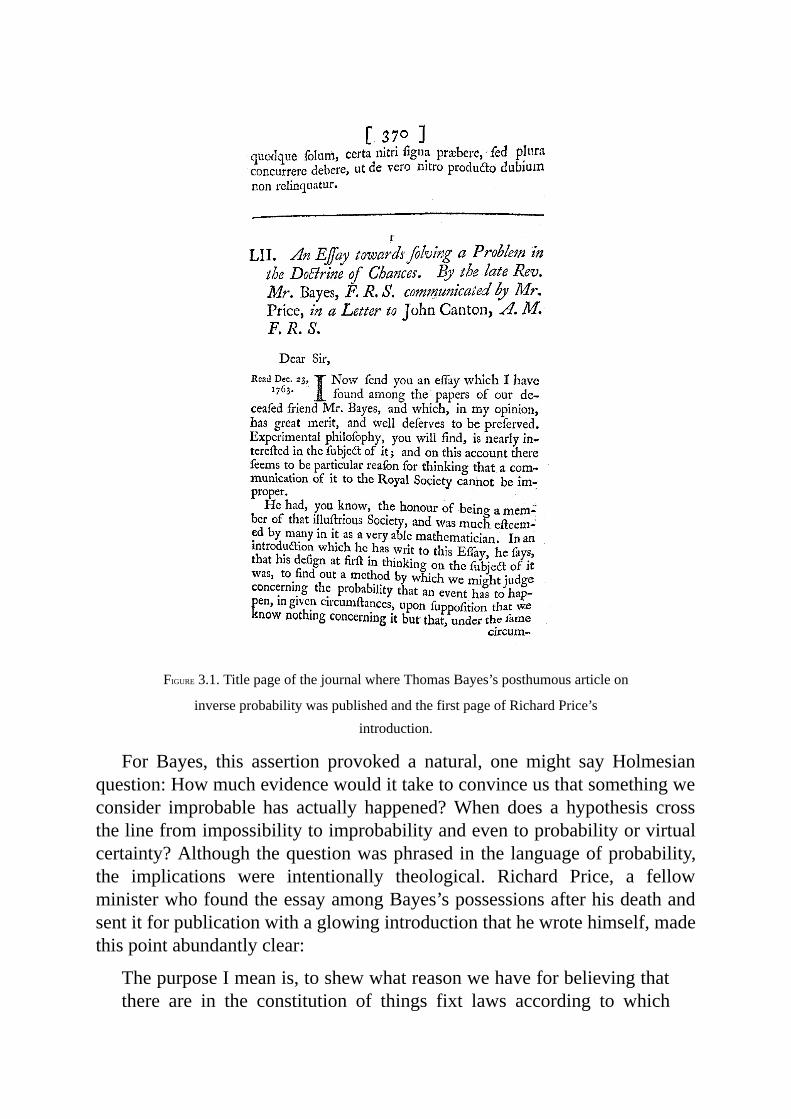
FIGURE3.1.TitlepageofthejournalwhereThomasBayes’sposthumousarticleon
inverseprobabilitywaspublishedandthefirstpageofRichardPrice’sintroduction.
For Bayes, this assertion provoked a natural, one might say Holmesianquestion:Howmuchevidencewouldittaketoconvinceusthatsomethingweconsider improbable has actually happened?When does a hypothesis crossthelinefromimpossibilitytoimprobabilityandeventoprobabilityorvirtualcertainty?Althoughthequestionwasphrasedinthelanguageofprobability,the implications were intentionally theological. Richard Price, a fellowministerwhofoundtheessayamongBayes’spossessionsafterhisdeathandsentitforpublicationwithaglowingintroductionthathewrotehimself,madethispointabundantlyclear:
ThepurposeImeanis,toshewwhatreasonwehaveforbelievingthatthere are in the constitution of things fixt laws according to which
thingshappen,andthat,therefore,theframeoftheworldmustbetheeffect of the wisdom and power of an intelligent cause; and thus toconfirmtheargument takenfromfinalcausesfor theexistenceof theDeity. Itwill be easy to see that the converseproblem solved in thisessayismoredirectlyapplicabletothispurpose;foritshewsus,withdistinctness and precision, in every case of any particular order orrecurrencyofevents,whatreasonthereistothinkthatsuchrecurrencyororderisderivedfromstablecausesorregulationsinnature,andnotfromanyirregularitiesofchance.
Bayeshimselfdidnotdiscussanyof this inhispaper;Pricehighlightedthese theological implications, perhaps to make the impact of his friend’spapermorefar-reaching.ButitturnedoutthatBayesdidn’tneedthehelp.Hispaperisrememberedandarguedabout250yearslater,notforitstheologybutbecause it shows that you can deduce the probability of a cause from aneffect.Ifweknowthecause,itiseasytoestimatetheprobabilityoftheeffect,whichisaforwardprobability.Goingtheotherdirection—aproblemknownin Bayes’s time as “inverse probability”—is harder. Bayes did not explainwhy it is harder; he took that as self-evident, proved that it is doable, andshowedushow.
To appreciate the nature of the problem, let’s look at the example hesuggestedhimselfinhisposthumouspaperof1763.Imaginethatweshootabilliard ball on a table,making sure that it bouncesmany times so thatwehave no ideawhere itwill end up.What is the probability that itwill stopwithinx feetof the left-handendof the table?Ifweknowthe lengthof thetableandit isperfectlysmoothandflat, this isaveryeasyquestion(Figure3.2,top).Forexample,onatwelve-footsnookertable,theprobabilityoftheballstoppingwithinafootoftheendwouldbe1/12.Onaneight-footbilliardtable,theprobabilitywouldbe1/8.
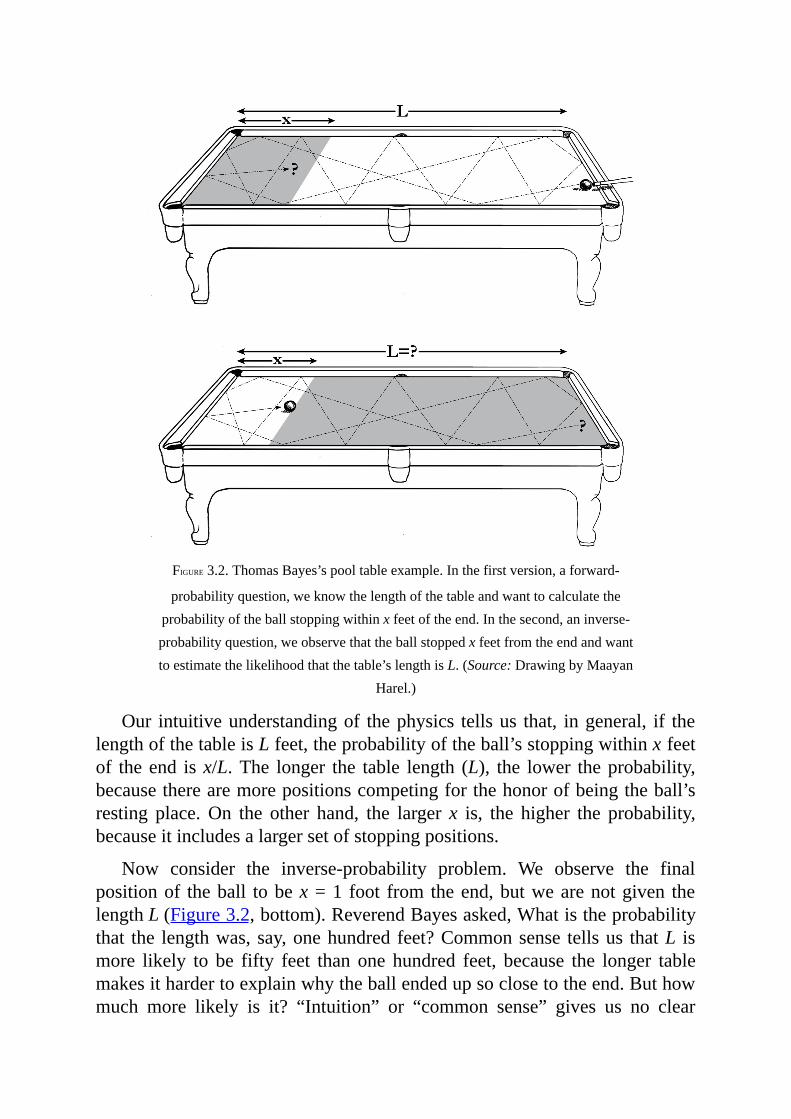
FIGURE3.2.ThomasBayes’spooltableexample.Inthefirstversion,aforward-
probabilityquestion,weknowthelengthofthetableandwanttocalculatetheprobabilityoftheballstoppingwithinxfeetoftheend.Inthesecond,aninverse-probabilityquestion,weobservethattheballstoppedxfeetfromtheendandwanttoestimatethelikelihoodthatthetable’slengthisL.(Source:DrawingbyMaayan
Harel.)
Our intuitiveunderstandingof thephysics tellsus that, ingeneral, if thelengthofthetableisLfeet,theprobabilityoftheball’sstoppingwithinxfeetof theend isx/L.The longer the table length (L), the lower theprobability,becausetherearemorepositionscompetingforthehonorofbeingtheball’sresting place.On the other hand, the larger x is, the higher the probability,becauseitincludesalargersetofstoppingpositions.
Now consider the inverse-probability problem. We observe the finalpositionof theball tobex=1 foot from theend,butwearenotgiven thelengthL(Figure3.2,bottom).ReverendBayesasked,Whatistheprobabilitythat the lengthwas, say,onehundred feet?Commonsense tellsus thatL ismore likely to be fifty feet than one hundred feet, because the longer tablemakesithardertoexplainwhytheballendedupsoclosetotheend.Buthowmuch more likely is it? “Intuition” or “common sense” gives us no clear
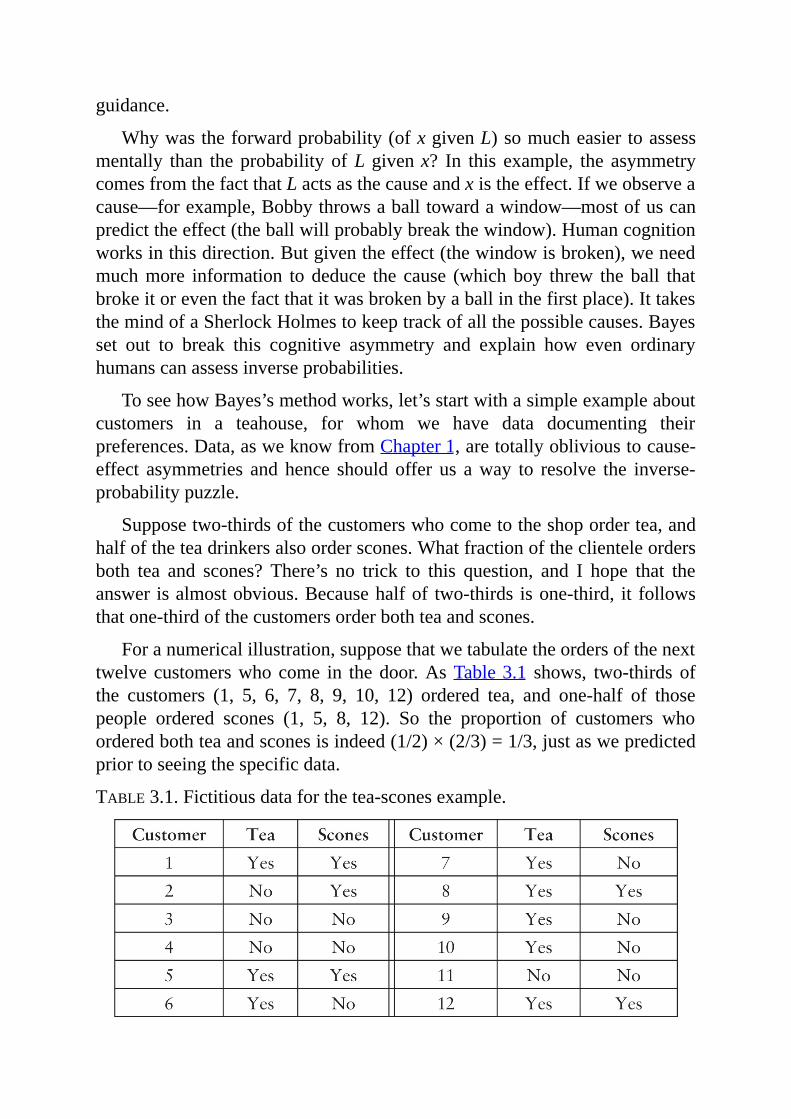
guidance.
Whywastheforwardprobability(ofxgivenL)somucheasier toassessmentally than theprobabilityofLgivenx? In this example, the asymmetrycomesfromthefactthatLactsasthecauseandxistheeffect.Ifweobserveacause—forexample,Bobbythrowsaballtowardawindow—mostofuscanpredicttheeffect(theballwillprobablybreakthewindow).Humancognitionworksinthisdirection.Butgiventheeffect(thewindowisbroken),weneedmuchmore information to deduce the cause (whichboy threw theball thatbrokeitoreventhefactthatitwasbrokenbyaballinthefirstplace).IttakesthemindofaSherlockHolmestokeeptrackofallthepossiblecauses.Bayesset out to break this cognitive asymmetry and explain how even ordinaryhumanscanassessinverseprobabilities.
ToseehowBayes’smethodworks,let’sstartwithasimpleexampleaboutcustomers in a teahouse, for whom we have data documenting theirpreferences.Data,asweknowfromChapter1,aretotallyoblivioustocause-effect asymmetries andhence should offer us away to resolve the inverse-probabilitypuzzle.
Supposetwo-thirdsofthecustomerswhocometotheshopordertea,andhalfoftheteadrinkersalsoorderscones.Whatfractionoftheclienteleordersboth tea and scones? There’s no trick to this question, and I hope that theanswerisalmostobvious.Becausehalfof two-thirds isone-third, it followsthatone-thirdofthecustomersorderbothteaandscones.
Foranumericalillustration,supposethatwetabulatetheordersofthenexttwelve customerswhocome in thedoor.AsTable3.1 shows, two-thirds ofthe customers (1, 5, 6, 7, 8, 9, 10, 12) ordered tea, and one-half of thosepeople ordered scones (1, 5, 8, 12). So the proportion of customers whoorderedbothteaandsconesisindeed(1/2)×(2/3)=1/3,justaswepredictedpriortoseeingthespecificdata.
TABLE3.1.Fictitiousdataforthetea-sconesexample.
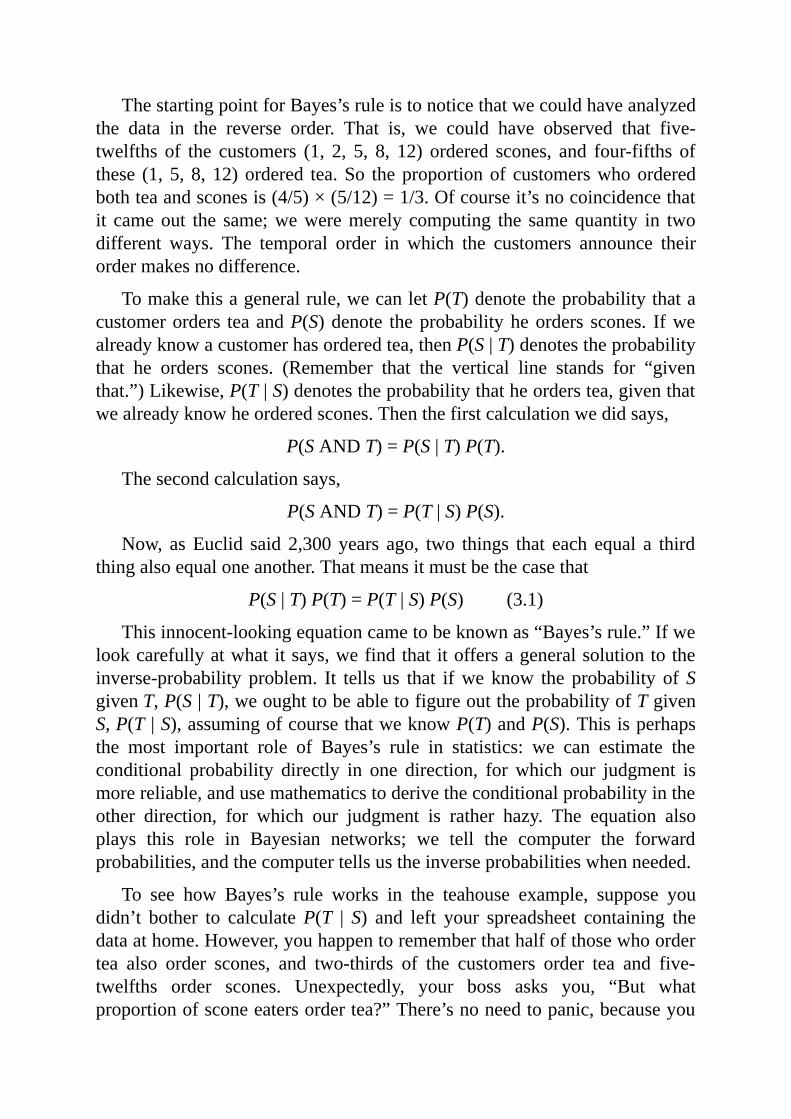
ThestartingpointforBayes’sruleistonoticethatwecouldhaveanalyzedthe data in the reverse order. That is, we could have observed that five-twelfths of the customers (1, 2, 5, 8, 12) ordered scones, and four-fifths ofthese (1,5,8,12)ordered tea.So theproportionof customerswhoorderedbothteaandsconesis(4/5)×(5/12)=1/3.Ofcourseit’snocoincidencethatit cameout the same;weweremerely computing the samequantity in twodifferent ways. The temporal order in which the customers announce theirordermakesnodifference.
Tomakethisageneralrule,wecanletP(T)denotetheprobabilitythatacustomerorders teaandP(S)denote theprobabilityheorders scones. Ifwealreadyknowacustomerhasorderedtea,thenP(S|T)denotestheprobabilitythat he orders scones. (Remember that the vertical line stands for “giventhat.”)Likewise,P(T|S)denotestheprobabilitythatheorderstea,giventhatwealreadyknowheorderedscones.Thenthefirstcalculationwedidsays,
P(SANDT)=P(S|T)P(T).
Thesecondcalculationsays,
P(SANDT)=P(T|S)P(S).
Now, asEuclid said 2,300 years ago, two things that each equal a thirdthingalsoequaloneanother.Thatmeansitmustbethecasethat
P(S|T)P(T)=P(T|S)P(S)(3.1)
Thisinnocent-lookingequationcametobeknownas“Bayes’srule.”Ifwelookcarefullyatwhatitsays,wefindthatitoffersageneralsolutiontotheinverse-probability problem. It tells us that ifweknow the probability ofSgivenT,P(S|T),weoughttobeabletofigureouttheprobabilityofTgivenS,P(T |S),assumingofcoursethatweknowP(T)andP(S).Thisisperhapsthe most important role of Bayes’s rule in statistics: we can estimate theconditional probability directly in one direction, forwhich our judgment ismorereliable,andusemathematicstoderivetheconditionalprobabilityintheother direction, for which our judgment is rather hazy. The equation alsoplays this role in Bayesian networks; we tell the computer the forwardprobabilities,andthecomputertellsustheinverseprobabilitieswhenneeded.
To see how Bayes’s rule works in the teahouse example, suppose youdidn’t bother to calculateP(T |S) and left your spreadsheet containing thedataathome.However,youhappentorememberthathalfofthosewhoordertea also order scones, and two-thirds of the customers order tea and five-twelfths order scones. Unexpectedly, your boss asks you, “But whatproportionofsconeeatersordertea?”There’snoneedtopanic,becauseyou
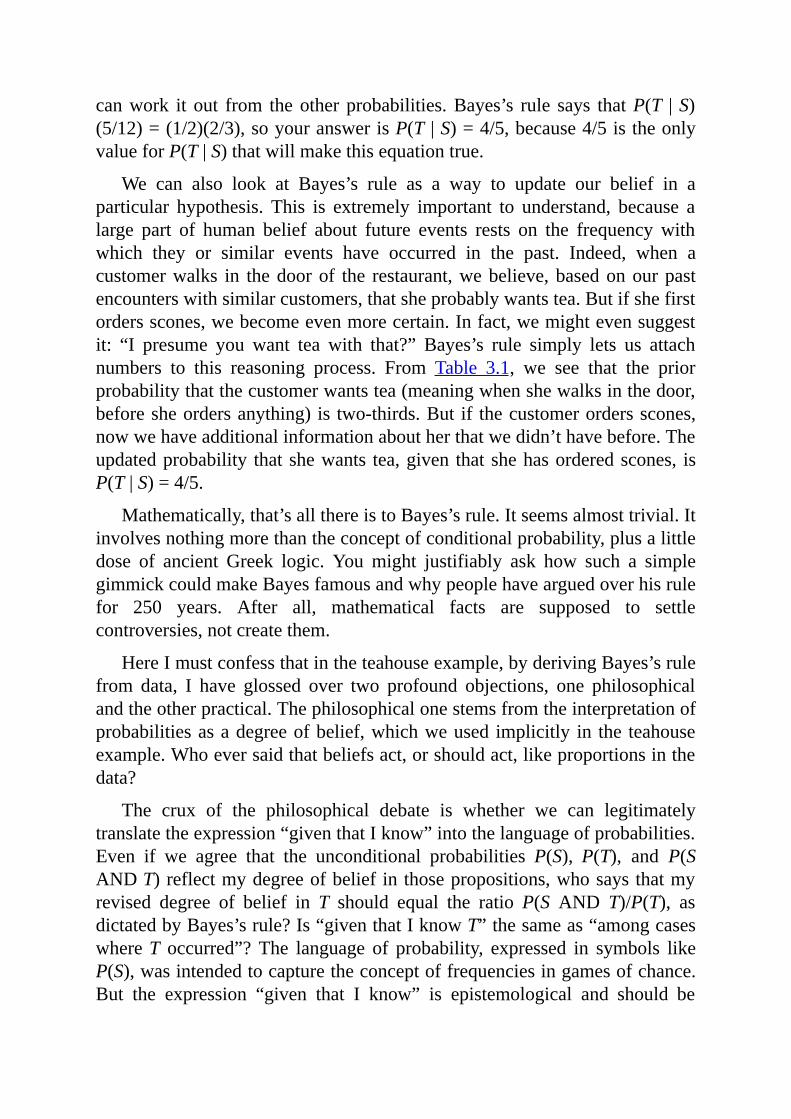
canwork it out from theotherprobabilities.Bayes’s rule says thatP(T |S)(5/12)=(1/2)(2/3),soyouranswerisP(T |S)=4/5,because4/5istheonlyvalueforP(T|S)thatwillmakethisequationtrue.
We can also look at Bayes’s rule as a way to update our belief in aparticular hypothesis. This is extremely important to understand, because alarge part of human belief about future events rests on the frequencywithwhich they or similar events have occurred in the past. Indeed, when acustomerwalks in thedoorof the restaurant,webelieve,basedonourpastencounterswithsimilarcustomers,thatsheprobablywantstea.Butifshefirstordersscones,webecomeevenmorecertain.Infact,wemightevensuggestit: “I presume you want tea with that?” Bayes’s rule simply lets us attachnumbers to this reasoning process. From Table 3.1, we see that the priorprobabilitythatthecustomerwantstea(meaningwhenshewalksinthedoor,beforesheordersanything) is two-thirds.But if thecustomerordersscones,nowwehaveadditionalinformationaboutherthatwedidn’thavebefore.Theupdatedprobability thatshewants tea,given thatshehasorderedscones, isP(T|S)=4/5.
Mathematically,that’sallthereistoBayes’srule.Itseemsalmosttrivial.Itinvolvesnothingmorethantheconceptofconditionalprobability,plusalittledose of ancient Greek logic. You might justifiably ask how such a simplegimmickcouldmakeBayesfamousandwhypeoplehavearguedoverhisrulefor 250 years. After all, mathematical facts are supposed to settlecontroversies,notcreatethem.
HereImustconfessthatintheteahouseexample,byderivingBayes’srulefrom data, I have glossed over two profound objections, one philosophicalandtheotherpractical.Thephilosophicalonestemsfromtheinterpretationofprobabilitiesasadegreeofbelief,whichweused implicitly in the teahouseexample.Whoeversaidthatbeliefsact,orshouldact,likeproportionsinthedata?
The crux of the philosophical debate is whether we can legitimatelytranslatetheexpression“giventhatIknow”intothelanguageofprobabilities.Even if we agree that the unconditional probabilities P(S), P(T), and P(SANDT)reflectmydegreeofbelief inthosepropositions,whosaysthatmyrevised degree of belief in T should equal the ratio P(S AND T)/P(T), asdictatedbyBayes’srule?Is“giventhatIknowT”thesameas“amongcaseswhereT occurred”?The language of probability, expressed in symbols likeP(S),wasintendedtocapturetheconceptoffrequenciesingamesofchance.But the expression “given that I know” is epistemological and should be
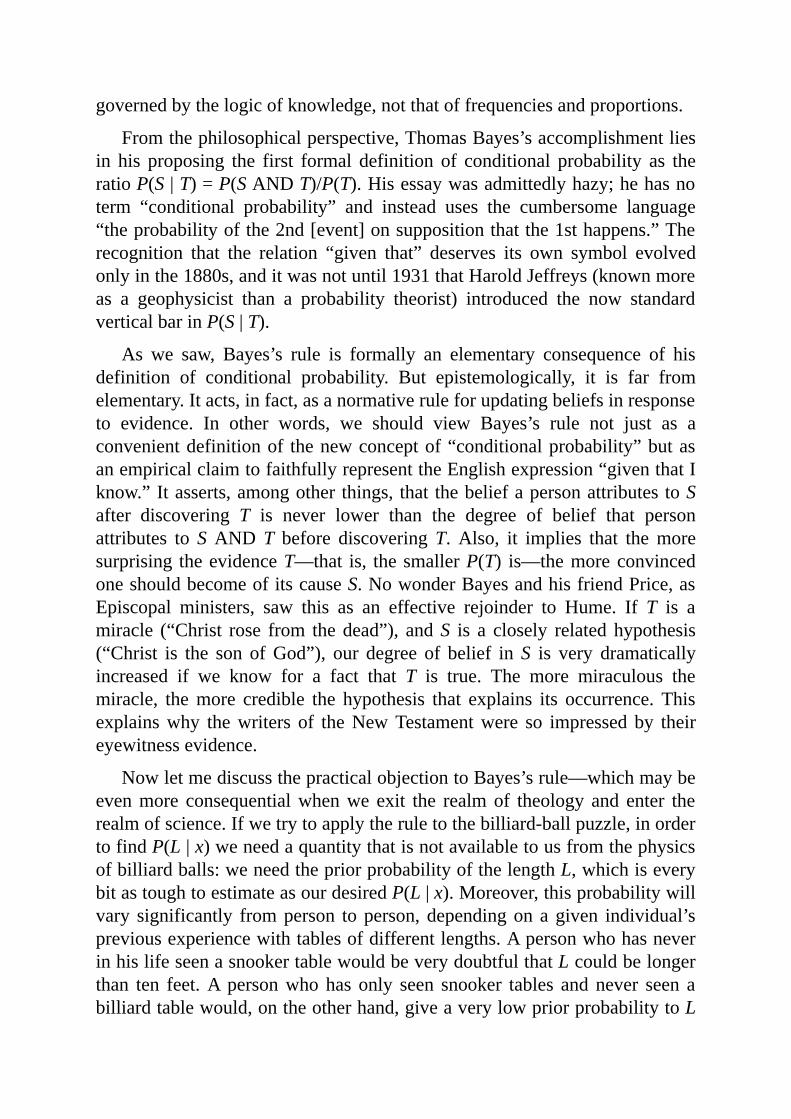
governedbythelogicofknowledge,notthatoffrequenciesandproportions.
Fromthephilosophicalperspective,ThomasBayes’saccomplishmentliesin his proposing the first formal definition of conditional probability as theratioP(S|T)=P(SANDT)/P(T).Hisessaywasadmittedlyhazy;hehasnoterm “conditional probability” and instead uses the cumbersome language“theprobabilityofthe2nd[event]onsuppositionthatthe1sthappens.”Therecognition that the relation “given that” deserves its own symbol evolvedonlyinthe1880s,anditwasnotuntil1931thatHaroldJeffreys(knownmoreas a geophysicist than a probability theorist) introduced the now standardverticalbarinP(S|T).
As we saw, Bayes’s rule is formally an elementary consequence of hisdefinition of conditional probability. But epistemologically, it is far fromelementary.Itacts,infact,asanormativeruleforupdatingbeliefsinresponseto evidence. In other words, we should view Bayes’s rule not just as aconvenientdefinitionof thenewconceptof“conditionalprobability”butasanempiricalclaimtofaithfullyrepresenttheEnglishexpression“giventhatIknow.”Itasserts,amongotherthings, that thebeliefapersonattributestoSafter discovering T is never lower than the degree of belief that personattributes toS ANDT before discoveringT. Also, it implies that themoresurprising theevidenceT—that is, thesmallerP(T) is—themoreconvincedoneshouldbecomeofitscauseS.NowonderBayesandhisfriendPrice,asEpiscopal ministers, saw this as an effective rejoinder to Hume. If T is amiracle (“Christ rose from thedead”), andS is a closely related hypothesis(“Christ is the son ofGod”), our degree of belief inS is very dramaticallyincreased if we know for a fact that T is true. The more miraculous themiracle, themore credible the hypothesis that explains its occurrence. Thisexplainswhy thewriters of theNewTestamentwere so impressed by theireyewitnessevidence.
NowletmediscussthepracticalobjectiontoBayes’srule—whichmaybeevenmore consequentialwhenwe exit the realmof theology and enter therealmofscience.Ifwetrytoapplytheruletothebilliard-ballpuzzle,inordertofindP(L|x)weneedaquantitythatisnotavailabletousfromthephysicsofbilliardballs:weneedthepriorprobabilityofthelengthL,whichiseverybitastoughtoestimateasourdesiredP(L|x).Moreover,thisprobabilitywillvary significantly fromperson toperson,dependingonagiven individual’spreviousexperiencewithtablesofdifferentlengths.ApersonwhohasneverinhislifeseenasnookertablewouldbeverydoubtfulthatLcouldbelongerthan ten feet.Apersonwhohas only seen snooker tables andnever seen abilliardtablewould,ontheotherhand,giveaverylowpriorprobabilitytoL
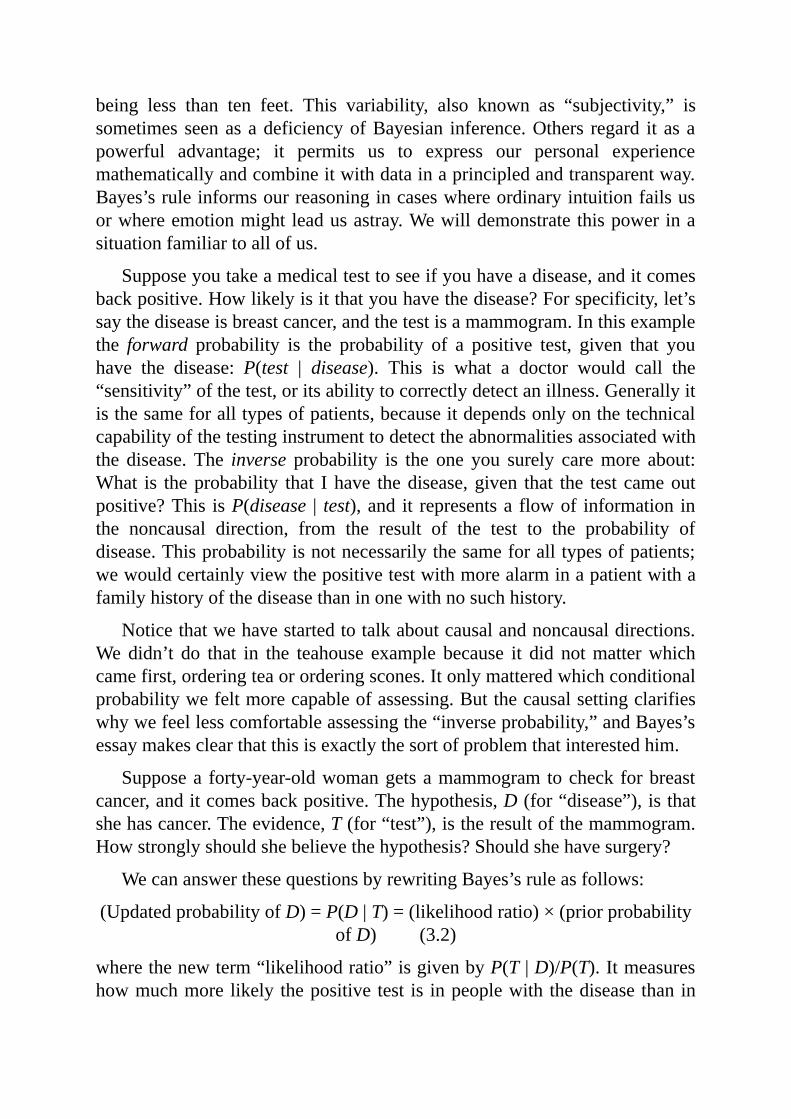
being less than ten feet. This variability, also known as “subjectivity,” issometimesseenasadeficiencyofBayesian inference.Others regard it asapowerful advantage; it permits us to express our personal experiencemathematicallyandcombineitwithdatainaprincipledandtransparentway.Bayes’sruleinformsourreasoningincaseswhereordinaryintuitionfailsusorwhereemotionmightleadusastray.Wewilldemonstratethispowerinasituationfamiliartoallofus.
Supposeyoutakeamedicaltesttoseeifyouhaveadisease,anditcomesbackpositive.Howlikelyisitthatyouhavethedisease?Forspecificity,let’ssaythediseaseisbreastcancer,andthetestisamammogram.Inthisexamplethe forward probability is the probability of a positive test, given that youhave the disease: P(test | disease). This is what a doctor would call the“sensitivity”ofthetest,oritsabilitytocorrectlydetectanillness.Generallyitisthesameforalltypesofpatients,becauseitdependsonlyonthetechnicalcapabilityofthetestinginstrumenttodetecttheabnormalitiesassociatedwiththe disease.The inverse probability is the one you surely caremore about:What is theprobability that Ihave thedisease,given that the test cameoutpositive?This isP(disease | test),and it representsa flowof information inthe noncausal direction, from the result of the test to the probability ofdisease.Thisprobabilityisnotnecessarilythesameforalltypesofpatients;wewouldcertainlyviewthepositivetestwithmorealarminapatientwithafamilyhistoryofthediseasethaninonewithnosuchhistory.
Noticethatwehavestartedtotalkaboutcausalandnoncausaldirections.We didn’t do that in the teahouse example because it did notmatterwhichcamefirst,orderingteaororderingscones.Itonlymatteredwhichconditionalprobabilitywefeltmorecapableofassessing.Butthecausalsettingclarifieswhywefeellesscomfortableassessingthe“inverseprobability,”andBayes’sessaymakesclearthatthisisexactlythesortofproblemthatinterestedhim.
Supposea forty-year-oldwomangetsamammogramtocheck forbreastcancer,anditcomesbackpositive.Thehypothesis,D(for“disease”),isthatshehascancer.Theevidence,T(for“test”),istheresultofthemammogram.Howstronglyshouldshebelievethehypothesis?Shouldshehavesurgery?
WecananswerthesequestionsbyrewritingBayes’sruleasfollows:
(UpdatedprobabilityofD)=P(D|T)=(likelihoodratio)×(priorprobabilityofD)(3.2)
wherethenewterm“likelihoodratio”isgivenbyP(T|D)/P(T).Itmeasureshowmuchmorelikely thepositive test is inpeoplewith thedisease thanin
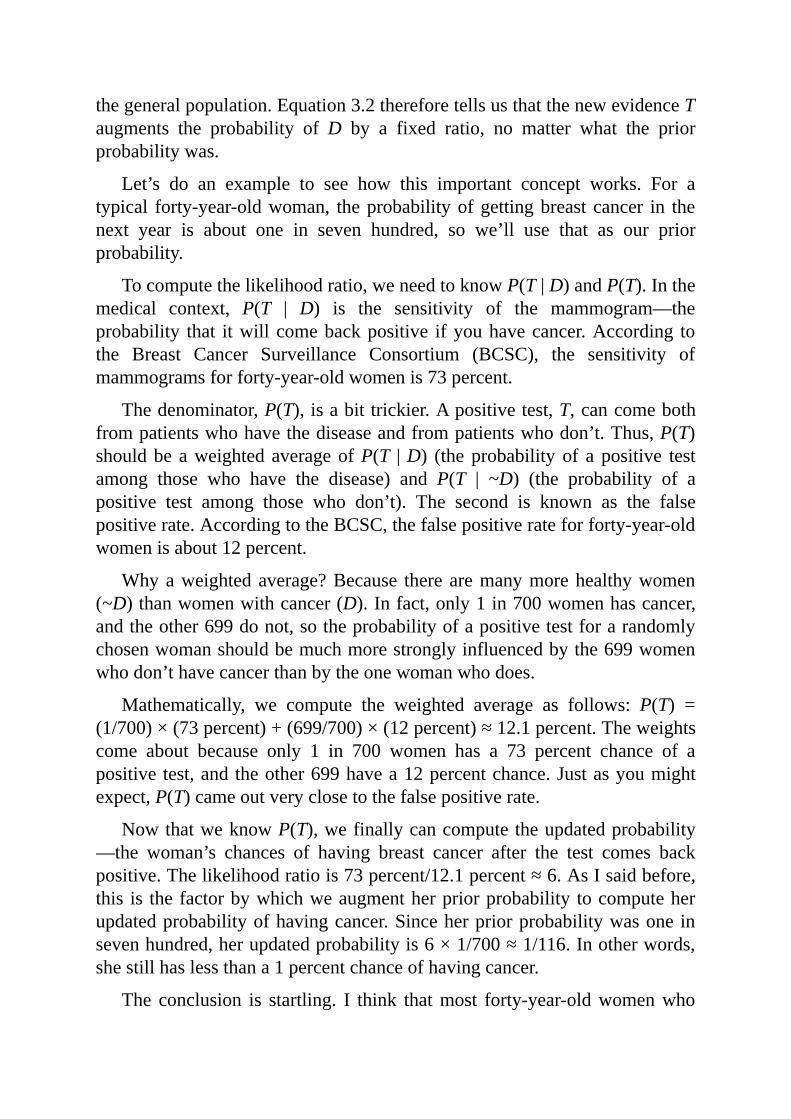
thegeneralpopulation.Equation3.2thereforetellsusthatthenewevidenceTaugments the probability ofD by a fixed ratio, no matter what the priorprobabilitywas.
Let’s do an example to see how this important concept works. For atypical forty-year-oldwoman, theprobabilityofgettingbreastcancer in thenext year is about one in seven hundred, so we’ll use that as our priorprobability.
Tocomputethelikelihoodratio,weneedtoknowP(T|D)andP(T).Inthemedical context, P(T | D) is the sensitivity of the mammogram—theprobability that itwillcomebackpositive ifyouhavecancer.According tothe Breast Cancer Surveillance Consortium (BCSC), the sensitivity ofmammogramsforforty-year-oldwomenis73percent.
Thedenominator,P(T),isabittrickier.Apositivetest,T,cancomebothfrompatientswhohavethediseaseandfrompatientswhodon’t.Thus,P(T)shouldbeaweightedaverageofP(T |D) (theprobability of a positive testamong those who have the disease) and P(T | ~D) (the probability of apositive test among those who don’t). The second is known as the falsepositiverate.AccordingtotheBCSC,thefalsepositiverateforforty-year-oldwomenisabout12percent.
Whyaweightedaverage?Because therearemanymorehealthywomen(~D)thanwomenwithcancer(D).Infact,only1in700womenhascancer,andtheother699donot,sotheprobabilityofapositivetestforarandomlychosenwomanshouldbemuchmorestronglyinfluencedbythe699womenwhodon’thavecancerthanbytheonewomanwhodoes.
Mathematically, we compute the weighted average as follows: P(T) =(1/700)×(73percent)+(699/700)×(12percent)≈12.1percent.Theweightscome about because only 1 in 700 women has a 73 percent chance of apositive test,andtheother699havea12percentchance.Justasyoumightexpect,P(T)cameoutveryclosetothefalsepositiverate.
NowthatweknowP(T),wefinallycancomputetheupdatedprobability—the woman’s chances of having breast cancer after the test comes backpositive.Thelikelihoodratiois73percent/12.1percent≈6.AsIsaidbefore,this is thefactorbywhichweaugmentherpriorprobability tocomputeherupdatedprobabilityofhavingcancer.Sinceherpriorprobabilitywasone insevenhundred,herupdatedprobabilityis6×1/700≈1/116.Inotherwords,shestillhaslessthana1percentchanceofhavingcancer.
The conclusion is startling. I think thatmost forty-year-oldwomenwho
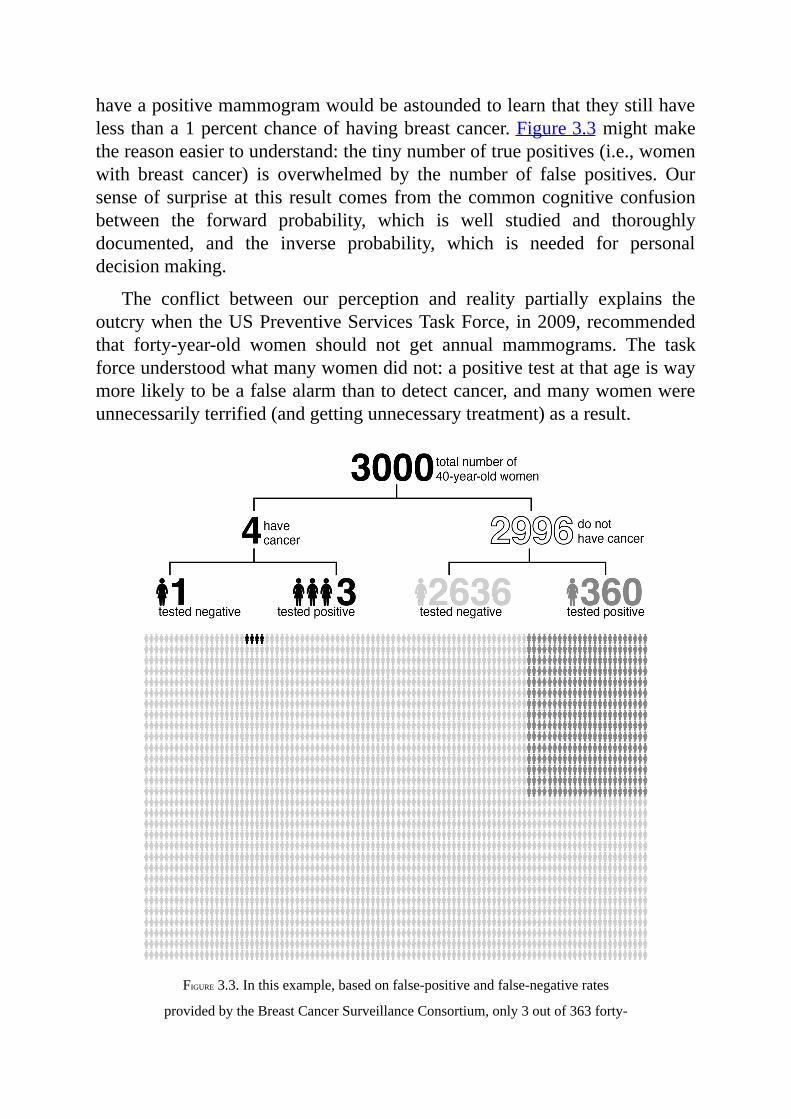
haveapositivemammogramwouldbeastoundedtolearnthattheystillhavelessthana1percentchanceofhavingbreastcancer.Figure3.3mightmakethereasoneasiertounderstand:thetinynumberoftruepositives(i.e.,womenwith breast cancer) is overwhelmed by the number of false positives. Oursenseofsurpriseat this resultcomes fromthecommoncognitiveconfusionbetween the forward probability, which is well studied and thoroughlydocumented, and the inverse probability, which is needed for personaldecisionmaking.
The conflict between our perception and reality partially explains theoutcrywhentheUSPreventiveServicesTaskForce,in2009,recommendedthat forty-year-old women should not get annual mammograms. The taskforceunderstoodwhatmanywomendidnot:apositivetestatthatageiswaymorelikelytobeafalsealarmthantodetectcancer,andmanywomenwereunnecessarilyterrified(andgettingunnecessarytreatment)asaresult.
FIGURE3.3.Inthisexample,basedonfalse-positiveandfalse-negativerates
providedbytheBreastCancerSurveillanceConsortium,only3outof363forty-
year-oldwomenwhotestpositiveforbreastcanceractuallyhavethedisease.(Proportionsdonotexactlymatchthetextbecauseofrounding.)(Source:
InfographicbyMaayanHarel.)
However,thestorywouldbeverydifferentifourpatienthadagenethatputherathighriskforbreastcancer—say,aone-in-twentychancewithinthenextyear.Thenapositivetestwouldincreasetheprobabilitytoalmostoneinthree. For a woman in this situation, the chances that the test provideslifesavinginformationaremuchhigher.Thatiswhythetaskforcecontinuedtorecommendannualmammogramsforhigh-riskwomen.
ThisexampleshowsthatP(disease|test)isnotthesameforeveryone;itiscontextdependent.Ifyouknowthatyouareathighriskforadiseasetobeginwith,Bayes’s rule allowsyou to factor that information in.Or if youknowthat you are immune, you need not even bother with the test! In contrast,P(test|disease)doesnotdependonwhetheryouareathighriskornot.Itis“robust” to such variations,which explains to some degreewhy physiciansorganize their knowledge and communicatewith forward probabilities. Theformer are properties of the disease itself, its stage of progression, or thesensitivityofthedetectinginstruments;hencetheyremainrelativelyinvarianttothereasonsforthedisease(epidemic,diet,hygiene,socioeconomicstatus,familyhistory).Theinverseprobability,P(disease|test),issensitivetotheseconditions.
The history-minded reader will surely wonder how Bayes handled thesubjectivityofP(L),whereListhelengthofabilliardtable.Theanswerhastwoparts.First,Bayeswasinterestednotinthelengthofthetablepersebutinitsfutureconsequences(i.e.,theprobabilitythatthenextballwouldendupat some specified location on the table). Second, Bayes assumed that L isdeterminedmechanicallybyshootingabilliardball fromagreaterdistance,sayL*. In thisway he bestowed objectivity ontoP(L) and transformed theproblemintoonewherepriorprobabilitiesareestimablefromdata,asweseeintheteahouseandcancertestexamples.
Inmanyways,Bayes’sruleisadistillationofthescientificmethod.Thetextbook description of the scientific method goes something like this: (1)formulateahypothesis,(2)deduceatestableconsequenceofthehypothesis,(3)performanexperimentandcollectevidence,and(4)updateyourbeliefinthe hypothesis. Usually the textbooks deal with simple yes-or-no tests andupdates; theevidenceeitherconfirmsor refutes thehypothesis.But lifeandscience are never so simple! All evidence comeswith a certain amount ofuncertainty.Bayes’sruletellsushowtoperformstep(4)intherealworld.
FROMBAYES’SRULETOBAYESIANNETWORKS
Intheearly1980s,thefieldofartificialintelligencehadworkeditselfintoacul-de-sac. Ever since Alan Turing first laid out the challenge in his 1950paper “ComputingMachineryand Intelligence,” the leadingapproach toAIhad been so-called rule-based systems or expert systems, which organizehuman knowledge as a collection of specific and general facts, along withinference rules to connect them. For example: Socrates is a man (specificfact).Allmenaremortals(generalfact).Fromthisknowledgebasewe(oranintelligentmachine) can derive the fact that Socrates is amortal, using theuniversalruleofinference:ifallA’sareB’s,andxisanA,thenxisaB.
Theapproachwasfineintheory,buthard-and-fastrulescanrarelycapturereal-lifeknowledge.Perhapswithoutrealizingit,wedealwithexceptionstorules and uncertainties in evidence all the time. By 1980, it was clear thatexpert systems struggled with making correct inferences from uncertainknowledge. The computer could not replicate the inferential process of ahumanexpertbecausetheexpertsthemselveswerenotabletoarticulatetheirthinkingprocesswithinthelanguageprovidedbythesystem.
Thelate1970s,then,wereatimeoffermentintheAIcommunityoverthequestion of how to deal with uncertainty. There was no shortage of ideas.LotfiZadehofBerkeleyoffered“fuzzylogic,”inwhichstatementsareneithertruenorfalsebutinsteadtakearangeofpossibletruthvalues.GlenShaferofthe University of Kansas proposed “belief functions,” which assign twoprobabilitiestoeachfact,oneindicatinghowlikelyitistobe“possible,”theother, how likely it is to be “provable.” Edward Feigenbaum and hiscolleagues at Stanford University tried “certainty factors,” which insertednumericalmeasuresofuncertaintyintotheirdeterministicrulesforinference.
Unfortunately, although ingenious, these approaches suffered a commonflaw:theymodeledtheexpert,nottheworld,andthereforetendedtoproduceunintendedresults.Forexample,theycouldnotoperateinbothdiagnosticandpredictivemodes, theuncontestedspecialtyofBayes’s rule. In thecertaintyfactor approach, the rule “If fire, then smoke (with certaintyc1)” could notcombine coherently with “If smoke, then fire (with certainty c2)” withouttriggeringarunawaybuildupofbelief.
Probabilitywas also considered at the time but immediately fell into illrepute, since the demands on storage space and processing time becameformidable. I entered the arena rather late, in 1982, with an obvious yetradicalproposal:insteadofreinventinganewuncertaintytheoryfromscratch,
let’s keep probability as a guardian of common sense andmerely repair itscomputational deficiencies. More specifically, instead of representingprobability in huge tables, aswas previously done, let’s represent itwith anetwork of loosely coupled variables. If we only allow each variable tointeract with a few neighboring variables, then we might overcome thecomputationalhurdlesthathadcausedotherprobabiliststostumble.
Theideadidnotcometomeinadream;itcamefromanarticlebyDavidRumelhart,acognitivescientistatUniversityofCalifornia,SanDiego,andapioneerofneuralnetworks.Hisarticleaboutchildren’sreading,publishedin1976,madeclearthatreadingisacomplexprocessinwhichneuronsonmanydifferent levels are active at the same time (see Figure 3.4). Some of theneurons are simply recognizing individual features—circles or lines.Abovethem, another layer of neurons is combining these shapes and formingconjectures about what the letter might be. In Figure 3.4, the network isstrugglingwithagreatdealofambiguityaboutthesecondword.Attheletterlevel,itcouldbe“FHP,”butthatdoesn’tmakemuchsenseatthewordlevel.At thewordlevel itcouldbe“FAR”or“CAR”or“FAT.”Theneuronspassthis informationup to the syntactic level,whichdecides that after theword“THE,”it’sexpectinganoun.Finallythisinformationgetspassedallthewayuptothesemanticlevel,whichrealizesthattheprevioussentencementioneda Volkswagen, so the phrase is likely to be “THE CAR,” referring to thatsame Volkswagen. The key point is that all the neurons are passinginformationbackandforth, fromthe topdownandfromthebottomupandfromsidetoside.It’sahighlyparallelsystem,andonethatisquitedifferentfrom our self-perception of the brain as a monolithic, centrally controlledsystem.
ReadingRumelhart’spaper,Ifeltconvincedthatanyartificialintelligencewouldhavetomodelitselfonwhatweknowabouthumanneuralinformationprocessing and thatmachine reasoning under uncertaintywould have to beconstructed with a similar message-passing architecture. But what are themessages?This tookmequitea fewmonths to figureout. I finally realizedthat the messages were conditional probabilities in one direction andlikelihoodratiosintheother.
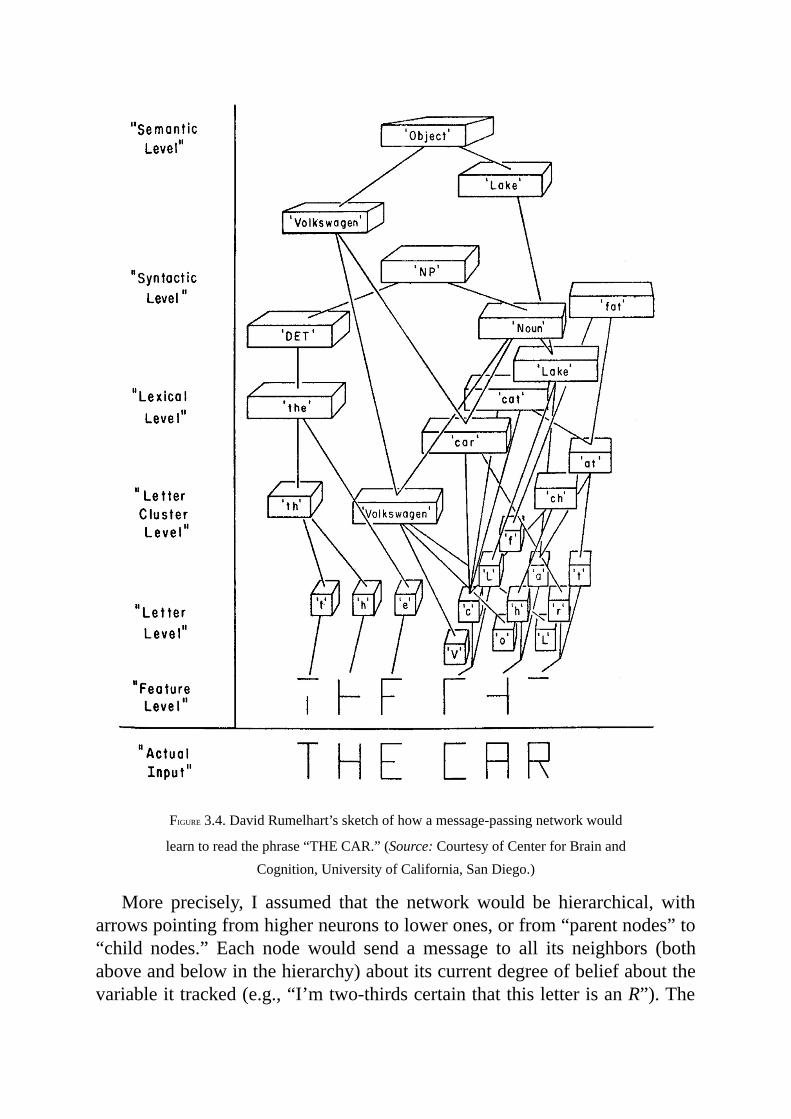
FIGURE3.4.DavidRumelhart’ssketchofhowamessage-passingnetworkwould
learntoreadthephrase“THECAR.”(Source:CourtesyofCenterforBrainandCognition,UniversityofCalifornia,SanDiego.)
More precisely, I assumed that the networkwould be hierarchical, witharrowspointingfromhigherneuronstolowerones,orfrom“parentnodes”to“child nodes.” Each node would send a message to all its neighbors (bothaboveandbelowinthehierarchy)aboutitscurrentdegreeofbeliefaboutthevariableittracked(e.g.,“I’mtwo-thirdscertainthatthisletterisanR”).The
recipientwouldprocessthemessageintwodifferentways,dependingonitsdirection.Ifthemessagewentfromparenttochild,thechildwouldupdateitsbeliefsusingconditionalprobabilities, like theoneswesaw in the teahouseexample.If themessagewentfromchildtoparent, theparentwouldupdateitsbeliefsbymultiplying thembya likelihood ratio,as in themammogramexample.
Applyingthesetworulesrepeatedlytoeverynodeinthenetworkiscalledbeliefpropagation. In retrospect there isnothingarbitraryor inventedabouttheserules;theyareinstrictcompliancewithBayes’srule.Therealchallengewastoensurethatnomatterinwhatorderthesemessagesaresentout,thingswill settle eventually into a comfortable equilibrium; moreover, the finalequilibrium will represent the correct state of belief in the variables. By“correct” I mean, as if we had conducted the computation by textbookmethodsratherthanbymessagepassing.
This challenge would occupy my students and me, as well as mycolleagues,forseveralyears.Butbytheendofthe1980s,wehadresolvedthedifficulties to the point that Bayesian networks had become a practicalscheme formachine learning. The next decade saw a continual increase inreal-world applications, such as spam filtering and voice recognition.However, by then I was already trying to climb the Ladder of Causation,while entrusting the probabilistic side of Bayesian networks to thesafekeepingofothers.
BAYESIANNETWORKS:WHATCAUSESSAYABOUTDATA
AlthoughBayesdidn’tknowit,hisruleforinverseprobabilityrepresentsthesimplestBayesiannetwork.Wehaveseenthisnetworkinseveralguisesnow:Tea Scones,Disease Test,or,moregenerally,Hypothesis Evidence.Unlikethecausaldiagramswewilldealwiththroughoutthebook,aBayesiannetwork carries no assumption that the arrowhas any causalmeaning.Thearrowmerelysignifiesthatweknowthe“forward”probability,P(scones|tea)or P(test | disease). Bayes’s rule tells us how to reverse the procedure,specificallybymultiplyingthepriorprobabilitybyalikelihoodratio.
Belief propagation formallyworks in exactly the samewaywhether thearrows are noncausal or causal. Nevertheless, you may have the intuitivefeelingthatwehavedonesomethingmoremeaningfulinthelattercasethanintheformer.Thatisbecauseourbrainsareendowedwithspecialmachinery
for comprehending cause-effect relationships (such as cancer andmammograms).Notsoformereassociations(suchasteaandscones).
Thenextstepafteratwo-nodenetworkwithonelinkis,ofcourse,athree-node networkwith two links,which Iwill call a “junction.” These are thebuildingblocksofallBayesiannetworks(andcausalnetworksaswell).Therearethreebasictypesofjunctions,withthehelpofwhichwecancharacterizeanypatternofarrowsinthenetwork.
1.A B C.Thisjunctionisthesimplestexampleofa“chain,”or of mediation. In science, one often thinks of B as themechanism,or“mediator,”thattransmitstheeffectofAtoC.AfamiliarexampleisFire Smoke Alarm.Althoughwecallthem“fire alarms,” they are really smoke alarms.The fire byitselfdoesnotsetoffanalarm,sothereisnodirectarrowfromFire toAlarm.Nordoes thefiresetoff thealarmthroughanyothervariable,suchasheat. Itworksonlybyreleasingsmokemolecules in the air. If we disable that link in the chain, forinstancebysuckingallthesmokemoleculesawaywithafumehood,thentherewillbenoalarm.
Thisobservationleadstoanimportantconceptualpointaboutchains:themediatorB“screensoff”informationaboutAfromC,andviceversa.(ThiswasfirstpointedoutbyHansReichenbach,aGerman-Americanphilosopherofscience.)Forexample,onceweknowthevalueofSmoke,learningaboutFiredoesnotgiveusanyreasontoraiseorlowerourbeliefinAlarm.Thisstabilityofbeliefisarung-oneconcept;henceitshouldalsobeseeninthedata,whenitisavailable.Supposewehadadatabaseofalltheinstanceswhentherewasfire,whentherewassmoke,orwhenthealarmwentoff.IfwelookedatonlytherowswhereSmoke=1,wewouldexpectAlarm=1everytime,regardlessofwhetherFire=0orFire=1.Thisscreening-offpatternstillholdsiftheeffectisnotdeterministic.Forexample,imagineafaultyalarmsystemthatfailstorespondcorrectly5percentofthetime.IfwelookonlyattherowswhereSmoke=1,wewillfindthattheprobabilityofAlarm=1isthesame(95percent),regardlessofwhetherFire=0orFire=1.
Theprocessoflookingonlyatrowsinthetablewhere
Smoke=1iscalledconditioningonavariable.Likewise,wesaythatFireandAlarmareconditionallyindependent,giventhevalueofSmoke.Thisisimportanttoknowifyouareprogrammingamachinetoupdateitsbeliefs;conditionalindependencegivesthemachinealicensetofocusontherelevantinformationanddisregardtherest.Weallneedthiskindoflicenseinoureverydaythinking,orelsewewillspendallourtimechasingfalsesignals.Buthowdowedecidewhichinformationtodisregard,wheneverynewpieceofinformationchangestheboundarybetweentherelevantandtheirrelevant?Forhumans,thisunderstandingcomesnaturally.Eventhree-year-oldtoddlersunderstandthescreening-offeffect,thoughtheydon’thaveanameforit.Theirinstinctmusthavecomefromsomementalrepresentation,possiblyresemblingacausaldiagram.Butmachinesdonothavethisinstinct,whichisonereasonthatweequipthemwithcausaldiagrams.
2.A B C.Thiskindof junction iscalleda“fork,”andB isoften called a common cause or confounder of A and C. Aconfounder will make A and C statistically correlated eventhough there is no direct causal link between them. A goodexample(duetoDavidFreedman)isShoeSize AgeofChildReadingAbility.Childrenwithlargershoestendtoreadata
higherlevel.Buttherelationshipisnotoneofcauseandeffect.Giving a child larger shoes won’t make him read better!Instead, both variables are explained by a third, which is thechild’sage.Olderchildrenhavelargershoes,andtheyalsoaremoreadvancedreaders.
Wecaneliminatethisspuriouscorrelation,asKarlPearsonandGeorgeUdnyYulecalledit,byconditioningonthechild’sage.Forinstance,ifwelookonlyatseven-year-olds,weexpecttoseenorelationshipbetweenshoesizeandreadingability.Asinthecaseofchainjunctions,AandCareconditionallyindependent,givenB.
Beforewegoontoourthirdjunction,weneedtoaddawordofclarification.TheconditionalindependencesIhavejustmentionedareexhibitedwheneverwelookatthesejunctionsinisolation.Ifadditionalcausalpathssurroundthem,thesepathsneedalsobetakenintoaccount.ThemiracleofBayesian
networksliesinthefactthatthethreekindsofjunctionswearenowdescribinginisolationaresufficientforreadingoffalltheindependenciesimpliedbyaBayesiannetwork,regardlessofhowcomplicated.
3.A B C. This is the most fascinating junction, called a“collider.”FelixElwertandChrisWinshiphaveillustratedthisjunction using three features of Hollywood actors: TalentCelebrity Beauty.Hereweareasserting thatboth talentandbeauty contribute to an actor’s success, but beauty and talentare completely unrelated to one another in the generalpopulation.
Wewillnowseethatthiscolliderpatternworksinexactlytheoppositewayfromchainsorforkswhenweconditiononthevariableinthemiddle.IfAandCareindependenttobeginwith,conditioningonBwillmakethemdependent.Forexample,ifwelookonlyatfamousactors(inotherwords,weobservethevariableCelebrity=1),wewillseeanegativecorrelationbetweentalentandbeauty:findingoutthatacelebrityisunattractiveincreasesourbeliefthatheorsheistalented.
Thisnegativecorrelationissometimescalledcolliderbiasorthe“explain-away”effect.Forsimplicity,supposethatyoudon’tneedbothtalentandbeautytobeacelebrity;oneissufficient.ThenifCelebrityAisaparticularlygoodactor,that“explainsaway”hissuccess,andhedoesn’tneedtobeanymorebeautifulthantheaverageperson.Ontheotherhand,ifCelebrityBisareallybadactor,thentheonlywaytoexplainhissuccessishisgoodlooks.So,giventheoutcomeCelebrity=1,talentandbeautyareinverselyrelated—eventhoughtheyarenotrelatedinthepopulationasawhole.Eveninamorerealisticsituation,wheresuccessisacomplicatedfunctionofbeautyandtalent,theexplain-awayeffectwillstillbepresent.Thisexampleisadmittedlysomewhatapocryphal,becausebeautyandtalentarehardtomeasureobjectively;nevertheless,colliderbiasisquitereal,andwewillseelotsofexamplesinthisbook.
These three junctions—chains, forks, and colliders—are like keyholesthrough the door that separates the first and second levels of theLadder of
Causation. If we peek through them, we can see the secrets of the causalprocessthatgeneratedthedataweobserve;eachstandsforadistinctpatternofcausalflowandleavesitsmarkintheformofconditionaldependencesandindependencesinthedata.InmypubliclecturesIoftencallthem“giftsfromthegods”becausetheyenableustotestacausalmodel,discovernewmodels,evaluateeffectsofinterventions,andmuchmore.Still,standinginisolation,theygiveusonlyaglimpse.Weneedakeythatwillcompletelyopenthedoorandletusstepoutontothesecondrung.Thatkey,whichwewilllearnaboutin Chapter 7, involves all three junctions, and is called d-separation. Thisconcepttellsus,foranygivenpatternofpathsinthemodel,whatpatternsofdependencies we should expect in the data. This fundamental connectionbetween causes and probabilities constitutes the main contribution ofBayesiannetworkstothescienceofcausalinference.
WHEREISMYBAG?FROMAACHENTOZANZIBAR
SofarIhaveemphasizedonlyoneaspectofBayesiannetworks—namely,thediagramanditsarrowsthatpreferablypointfromcausetoeffect.Indeed,thediagram is like the engine of theBayesian network.But like any engine, aBayesian network runs on fuel. The fuel is called a conditional probabilitytable.
Anotherway toput this is that thediagramdescribes the relationof thevariablesinaqualitativeway,butifyouwantquantitativeanswers,youalsoneed quantitative inputs. In a Bayesian network, we have to specify theconditionalprobabilityofeachnodegivenits“parents.”(Rememberthattheparentsof anode are all thenodes that feed into it.)These are the forwardprobabilities,P(evidence|hypotheses).
InthecasewhereAisarootnode,withnoarrowspointingintoit,weneedonlyspecifythepriorprobabilityforeachstateofA.Inoursecondnetwork,Disease Test, Disease is a root node. Therefore we specified the priorprobabilitythatapersonhasthedisease(1/700inourexample)andthatshedoesnothavethedisease(699/700inourexample).
BydepictingAasarootnode,wedonotreallymeanthatAhasnopriorcauses.Hardlyanyvariable isentitled tosuchastatus.Wereallymean thatanypriorcausesofAcanbeadequatelysummarizedinthepriorprobabilityP(A) that A is true. For example, in the Disease Test example, familyhistory might be a cause of Disease. But as long as we are sure that thisfamilyhistorywill not affect thevariableTest (onceweknow the statusof
Disease),weneednotrepresentitasanodeinthegraph.However,ifthereisa cause of Disease that also directly affects Test, then that cause must berepresentedexplicitlyinthediagram.
InthecasewherethenodeAhasaparent,Ahas to“listen”to itsparentbeforedecidingonitsownstate.Inourmammogramexample,theparentofTestwasDisease.Wecanshowthis“listening”processwitha2×2table(seeTable3.2).Forexample,ifTest“hears”thatD=0,then88percentofthetimeitwilltakethevalueT=0,and12percentofthetimeitwilltakethevalueT=1.Noticethatthesecondcolumnofthistablecontainsthesameinformationwe saw earlier from the Breast Cancer Surveillance Consortium: the falsepositiverate(upperrightcorner)is12percent,andthesensitivity(lowerrightcorner) is 73 percent.The remaining two entries are filled in tomake eachrowsumto100percent.
TABLE3.2.Asimpleconditionalprobabilitytable.
As wemove to more complicated networks, the conditional probabilitytable likewisegetsmorecomplicated.For example, ifwehaveanodewithtwoparents,theconditionalprobabilitytablehastotakeintoaccountthefourpossiblestatesofbothparents.Let’slookataconcreteexample,suggestedbyStefanConradyandLionelJouffeofBayesiaLab,Inc.It’sascenariofamiliartoalltravelers:wecancallit“WhereIsMyBag?”
Supposeyou’vejustlandedinZanzibaraftermakingatightconnectioninAachen,andyou’rewaitingforyoursuitcasetoappearonthecarousel.Otherpassengers have started to get their bags, but you keep waiting… andwaiting… and waiting. What are the chances that your suitcase did notactuallymaketheconnectionfromAachentoZanzibar?Theanswerdepends,ofcourse,onhowlongyouhavebeenwaiting.Ifthebagshavejuststartedtoshowupon thecarousel,perhapsyoushouldbepatientandwaita littlebitlonger. Ifyou’vebeenwaitinga long time, then thingsare lookingbad.Wecanquantifytheseanxietiesbysettingupacausaldiagram(Figure3.5).
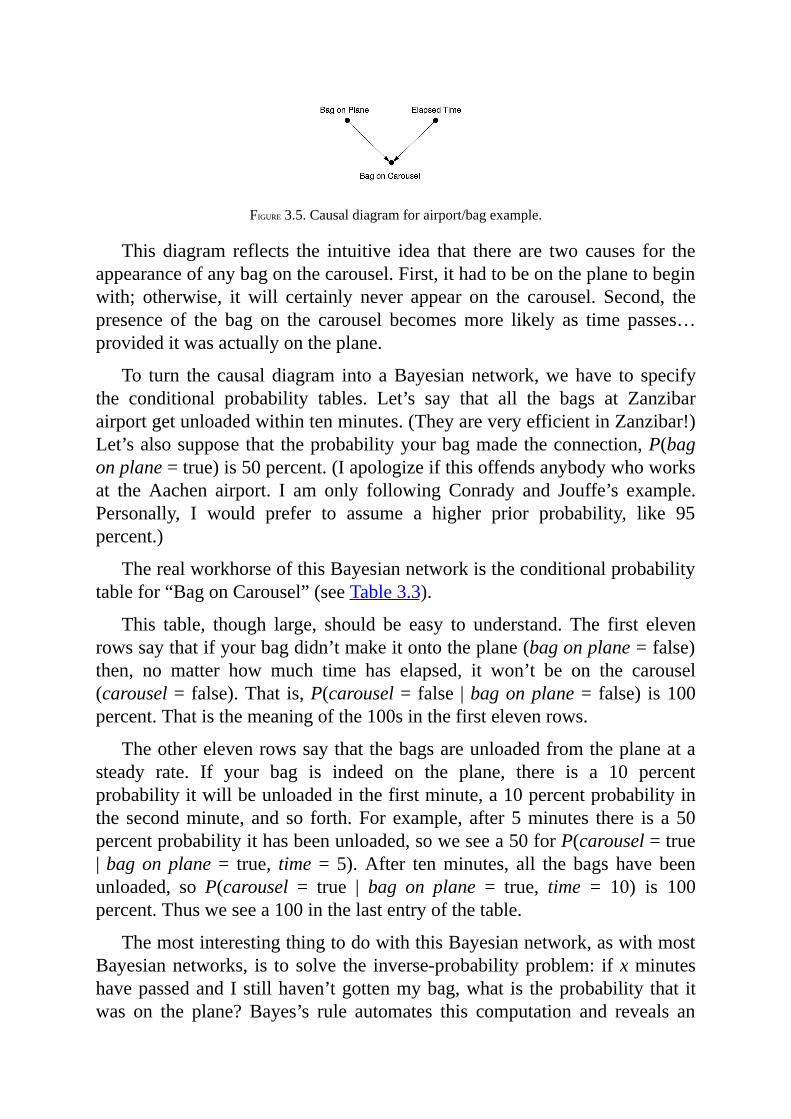
FIGURE3.5.Causaldiagramforairport/bagexample.
This diagram reflects the intuitive idea that there are two causes for theappearanceofanybagonthecarousel.First,ithadtobeontheplanetobeginwith; otherwise, it will certainly never appear on the carousel. Second, thepresence of the bag on the carousel becomesmore likely as time passes…provideditwasactuallyontheplane.
To turn the causaldiagram into aBayesiannetwork,wehave to specifythe conditional probability tables. Let’s say that all the bags at Zanzibarairportgetunloadedwithintenminutes.(TheyareveryefficientinZanzibar!)Let’salsosupposethattheprobabilityyourbagmadetheconnection,P(bagonplane=true)is50percent.(Iapologizeifthisoffendsanybodywhoworksat the Aachen airport. I am only following Conrady and Jouffe’s example.Personally, I would prefer to assume a higher prior probability, like 95percent.)
TherealworkhorseofthisBayesiannetworkistheconditionalprobabilitytablefor“BagonCarousel”(seeTable3.3).
This table, though large, should be easy to understand. The first elevenrowssaythatifyourbagdidn’tmakeitontotheplane(bagonplane=false)then, no matter how much time has elapsed, it won’t be on the carousel(carousel=false).That is,P(carousel=false |bagonplane= false) is100percent.Thatisthemeaningofthe100sinthefirstelevenrows.
Theotherelevenrowssaythatthebagsareunloadedfromtheplaneatasteady rate. If your bag is indeed on the plane, there is a 10 percentprobabilityitwillbeunloadedinthefirstminute,a10percentprobabilityinthe secondminute, and so forth.For example, after5minutes there is a50percentprobabilityithasbeenunloaded,soweseea50forP(carousel=true|bagonplane = true, time = 5).After tenminutes, all the bags have beenunloaded, so P(carousel = true | bag on plane = true, time = 10) is 100percent.Thusweseea100inthelastentryofthetable.
ThemostinterestingthingtodowiththisBayesiannetwork,aswithmostBayesiannetworks, is tosolve the inverse-probabilityproblem: ifxminuteshavepassedandIstillhaven’tgottenmybag,what is theprobability that itwas on the plane? Bayes’s rule automates this computation and reveals an
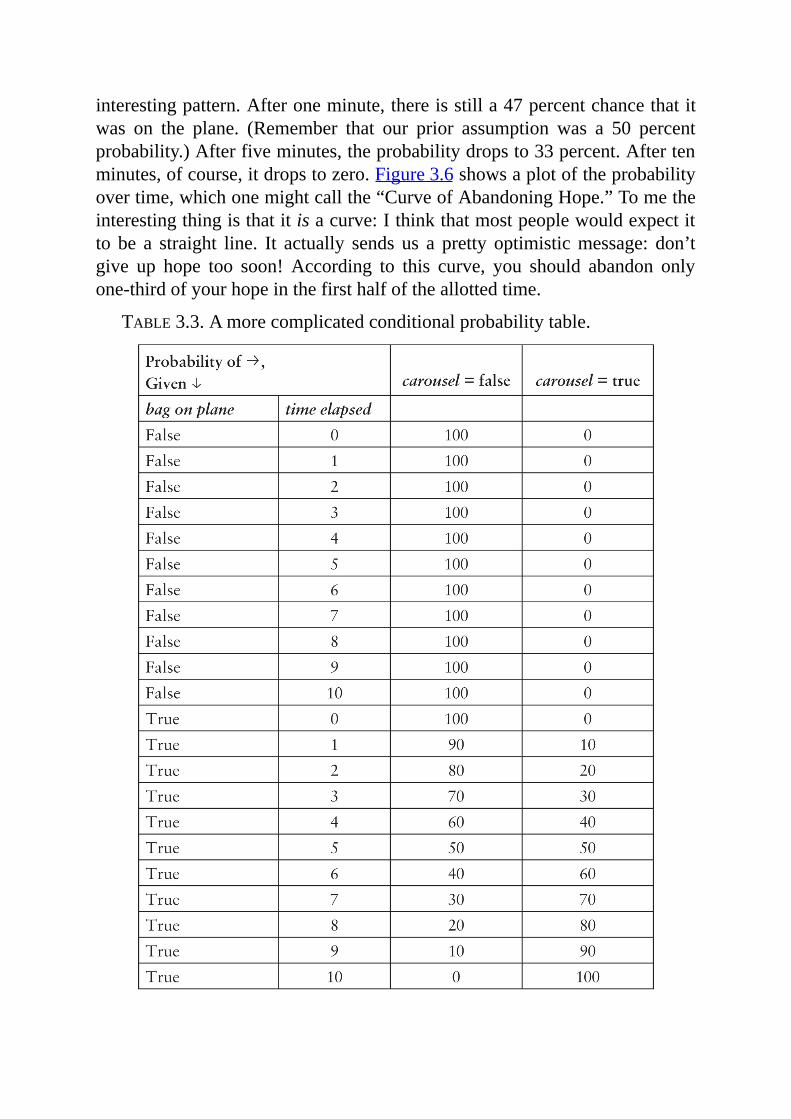
interestingpattern.Afteroneminute,thereisstilla47percentchancethatitwas on the plane. (Remember that our prior assumption was a 50 percentprobability.)Afterfiveminutes,theprobabilitydropsto33percent.Aftertenminutes,ofcourse,itdropstozero.Figure3.6showsaplotoftheprobabilityovertime,whichonemightcallthe“CurveofAbandoningHope.”Tometheinterestingthingisthatitisacurve:Ithinkthatmostpeoplewouldexpectitto be a straight line. It actually sends us a pretty optimisticmessage: don’tgive up hope too soon! According to this curve, you should abandon onlyone-thirdofyourhopeinthefirsthalfoftheallottedtime.
TABLE3.3.Amorecomplicatedconditionalprobabilitytable.
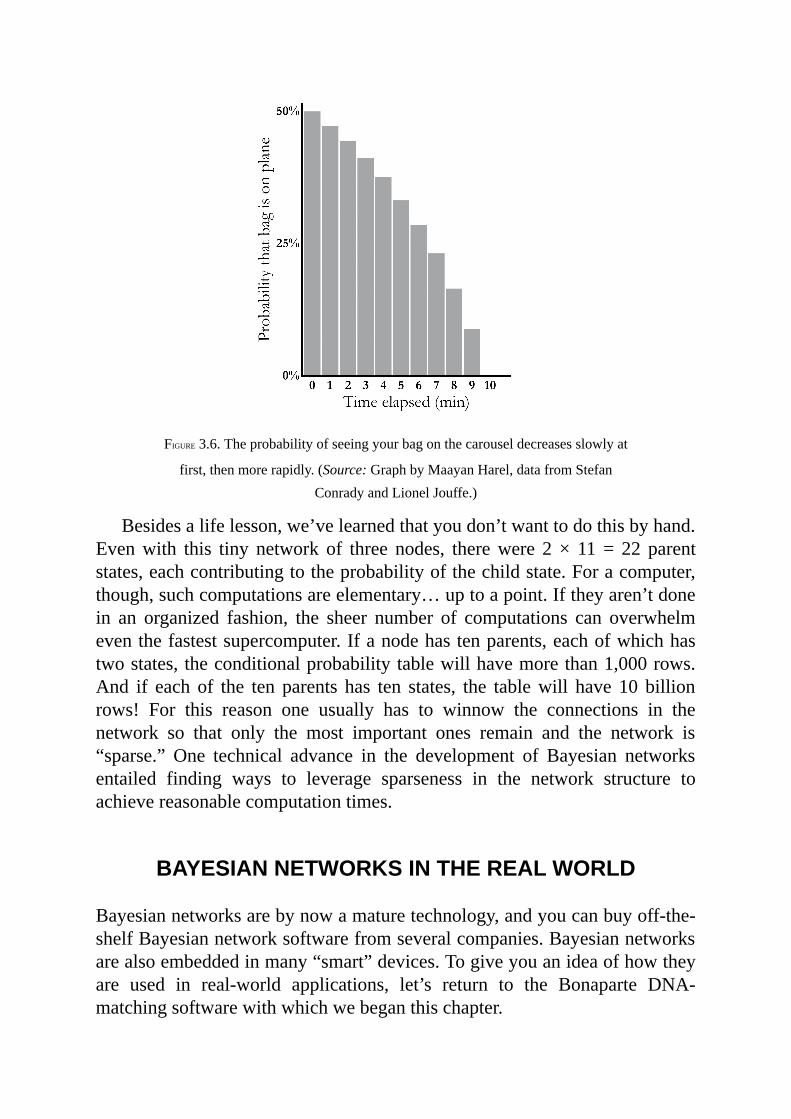
FIGURE3.6.Theprobabilityofseeingyourbagonthecarouseldecreasesslowlyat
first,thenmorerapidly.(Source:GraphbyMaayanHarel,datafromStefanConradyandLionelJouffe.)
Besidesalifelesson,we’velearnedthatyoudon’twanttodothisbyhand.Evenwith this tiny network of three nodes, therewere 2 × 11= 22 parentstates,eachcontributingtotheprobabilityofthechildstate.Foracomputer,though,suchcomputationsareelementary…uptoapoint.Iftheyaren’tdonein an organized fashion, the sheer number of computations can overwhelmeventhefastestsupercomputer.Ifanodehastenparents,eachofwhichhastwostates,theconditionalprobabilitytablewillhavemorethan1,000rows.And if each of the ten parents has ten states, the tablewill have 10 billionrows! For this reason one usually has to winnow the connections in thenetwork so that only the most important ones remain and the network is“sparse.” One technical advance in the development of Bayesian networksentailed finding ways to leverage sparseness in the network structure toachievereasonablecomputationtimes.
BAYESIANNETWORKSINTHEREALWORLD
Bayesiannetworksarebynowamaturetechnology,andyoucanbuyoff-the-shelfBayesiannetworksoftwarefromseveralcompanies.Bayesiannetworksarealsoembeddedinmany“smart”devices.Togiveyouanideaofhowtheyare used in real-world applications, let’s return to the Bonaparte DNA-matchingsoftwarewithwhichwebeganthischapter.
TheNetherlandsForensic InstituteusesBonaparte everyday,mostly formissing-persons cases, criminal investigations, and immigration cases.(ApplicantsforasylummustprovethattheyhavefifteenfamilymembersintheNetherlands.)However, theBayesian network does itsmost impressiveworkafter amassivedisaster, suchas thecrashofMalaysiaAirlinesFlight17.
Few, if any, of the victims of the plane crash could be identified bycomparingDNAfromthewreckage toDNAinacentraldatabase.ThenextbestthingtodowastoaskfamilymemberstoprovideDNAswabsandlookforpartialmatches to theDNAof thevictims.Conventional(non-Bayesian)methodscandothisandhavebeeninstrumentalinsolvinganumberofcoldcases in theNetherlands, theUnited States, and elsewhere. For example, asimple formula called the “Paternity Index” or the “Sibling Index” canestimate the likelihood that the unidentifiedDNAcomes from the father orthebrotherofthepersonwhoseDNAwastested.
However,theseindicesareinherentlylimitedbecausetheyworkforonlyonespecifiedrelationandonlyforcloserelations.TheideabehindBonaparteistomakeitpossibletouseDNAinformationfrommoredistantrelativesorfrommultiplerelatives.Bonapartedoesthisbyconvertingthepedigreeofthefamily(seeFigure3.7)intoaBayesiannetwork.
In Figure 3.8, we see how Bonaparte converts one small piece of apedigree to a (causal) Bayesian network. The central problem is that thegenotype of an individual, detected in a DNA test, contains a contributionfromboththefatherandthemother,butwecannottellwhichpartiswhich.Thus these twocontributions (called“alleles”)have tobe treatedashidden,unmeasurablevariablesintheBayesiannetwork.PartofBonaparte’sjobistoinfertheprobabilityofthecause(thevictim’sgeneforblueeyescamefromhisfather)fromtheevidence(e.g.,hehasablue-eyedgeneandablack-eyedgene;hiscousinson thefather’ssidehaveblueeyes,buthiscousinson themother’ssidehaveblackeyes).Thisisaninverse-probabilityproblem—justwhatBayes’srulewasinventedfor.
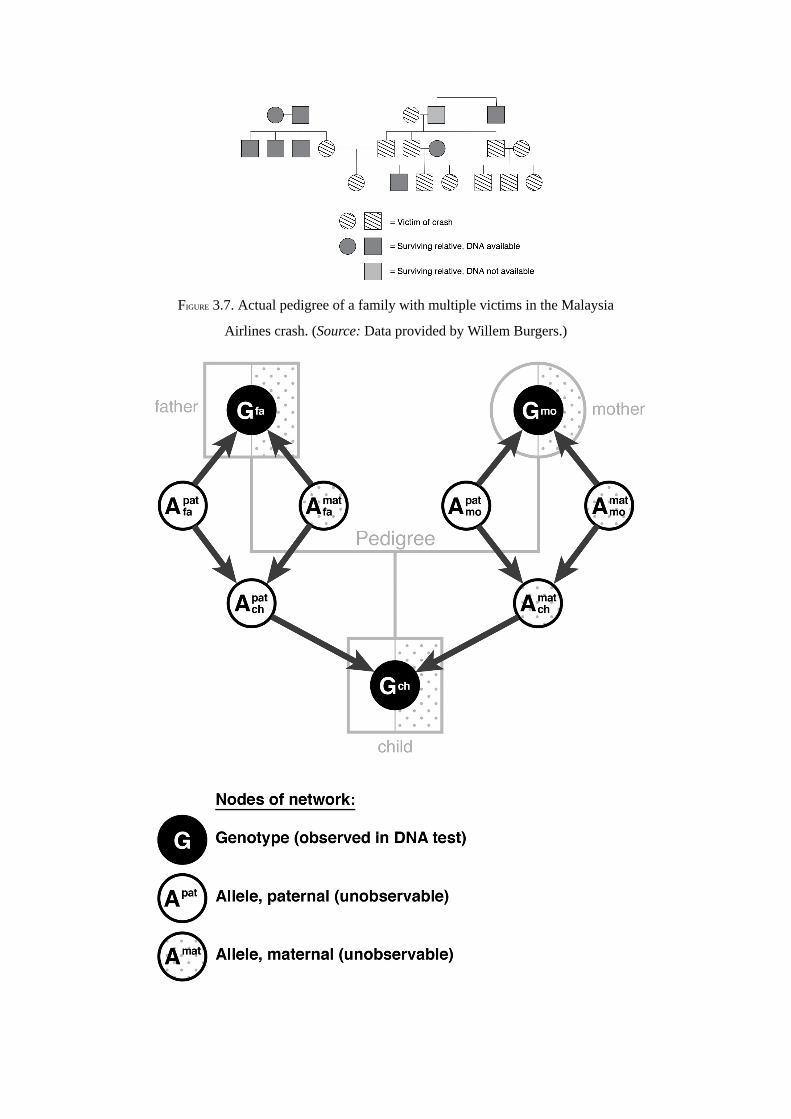
FIGURE3.7.ActualpedigreeofafamilywithmultiplevictimsintheMalaysia
Airlinescrash.(Source:DataprovidedbyWillemBurgers.)
FIGURE3.8.FromDNAteststoBayesiannetworks.InBayesiannetwork,unshaded
nodesrepresentalleles,andshadednodesrepresentgenotypes.Dataareonlyavailableonshadednodesbecausegenotypescannotindicatewhichallelecamefromthefatherandwhichfromthemother.TheBayesiannetworkenables
inferenceontheunobservednodesandalsoallowsustoestimatethelikelihoodthatagivenDNAsamplecamefromthechild.(Source:InfographicbyMaayan
Harel.)
OncetheBayesiannetworkissetup,thefinalstepistoinputthevictim’sDNAandcomputethelikelihoodthatitfitsintoaspecificslotinthepedigree.ThisisdonebybeliefpropagationwithBayes’srule.Thenetworkbeginswithaparticulardegreeofbeliefineachpossiblestatementaboutthenodesinthenetwork,suchas“thisperson’spaternalalleleforeyecolorisblue.”Asnewevidence is entered into the network—at any place in the network—thedegreesofbeliefateverynode,upanddown thenetwork,willchange inacascadingfashion.Thus,forexample,oncewefindoutthatagivensampleisa likely match for one person in the pedigree, we can propagate thatinformationupanddownthenetwork.Inthisway,Bonapartenotonlylearnsfromthelivingfamilymembers’DNAbutalsofromtheidentificationsithasalreadymade.
This example vividly illustrates a number of advantages of Bayesiannetworks. Once the network is set up, the investigator does not need tointervenetotellithowtoevaluateanewpieceofdata.Theupdatingcanbedoneveryquickly.(Bayesiannetworksareespeciallygoodforprogrammingon a distributed computer.) The network is integrative,whichmeans that itreactsasawholetoanynewinformation.That’swhyevenDNAfromanauntorasecondcousincanhelpidentifythevictim.Bayesiannetworksarealmostlikealivingorganictissue,whichisnoaccidentbecausethisispreciselythepicture I had inmindwhen Iwas struggling tomake themwork. IwantedBayesiannetworks tooperate like theneuronsofahumanbrain;you touchoneneuron,andtheentirenetworkrespondsbypropagatingtheinformationtoeveryotherneuroninthesystem.
The transparency of Bayesian networks distinguishes them from mostother approaches to machine learning, which tend to produce inscrutable“black boxes.” In a Bayesian network you can follow every step andunderstand how and why each piece of evidence changed the network’sbeliefs.
AselegantasBonaparteis,it’sworthnotingonefeatureitdoesnot(yet)incorporate:humanintuition.Onceithasfinishedtheanalysis,itprovidesthe
NFI’sexpertswitharankingofthemostlikelyidentificationsforeachDNAsample and a likelihood ratio for each. The investigators are then free tocombinetheDNAevidencewithotherphysicalevidencerecoveredfromthecrash site, as well as their intuition, tomake their final determinations. Atpresent,noidentificationsaremadebythecomputeractingalone.Onegoalofcausal inference is to create a smoother human-machine interface, whichmightallowtheinvestigators’intuitiontojointhebeliefpropagationdance.
This example of DNA identification with Bonaparte only scratches thesurface of the applications of Bayesian networks to genomics. However, Iwouldliketomoveontoasecondapplicationthathasbecomeubiquitousintoday’ssociety.Infact,thereisaverygoodchancethatyouhaveaBayesiannetworkinyourpocketrightnow.It’scalledacellphone,everyoneofwhichuseserror-correctionalgorithmsbasedonbeliefpropagation.
Tobegin at the beginning,whenyou talk into a phone, it converts yourbeautifulvoiceintoastringofonesandzeros(calledbits)andtransmitstheseusing a radio signal.Unfortunately, no radio signal is receivedwith perfectfidelity.Asthesignalmakesitswaytothecelltowerandthentoyourfriend’sphone,somerandombitswillflipfromzerotooneorviceversa.
Tocorrecttheseerrors,wecanaddredundantinformation.Anultrasimplescheme for error correction is simply to repeat each information bit threetimes:encodeaoneas“111”andazeroas“000.”Thevalidstrings“111”and“000” are called codewords. If the receiver hears an invalid string, such as“101,”itwillsearchforthemostlikelyvalidcodewordtoexplainit.Thezeroismorelikely tobewrongthanbothones,so thedecoderwill interpret thismessageas“111”andthereforeconcludethattheinformationbitwasaone.
Alas, this code is highly inefficient, because it makes all our messagesthree times longer. However, communication engineers have worked forseventyyearsonfindingbetterandbettererror-correctingcodes.
The problem of decoding is identical to the other inverse-probabilityproblems we have discussed, because we once again want to infer theprobability of a hypothesis (the message sent was “Hello world!”) fromevidence (the message received was “Hxllo wovld!”). The situation seemsripeforanapplicationofbeliefpropagation.
In 1993, an engineer for FranceTelecomnamedClaudeBerrou stunnedthe coding world with an error-correcting code that achieved near-optimalperformance.(Inotherwords,theamountofredundantinformationrequiredisclosetothetheoreticalminimum.)Hisidea,calleda“turbocode,”canbe
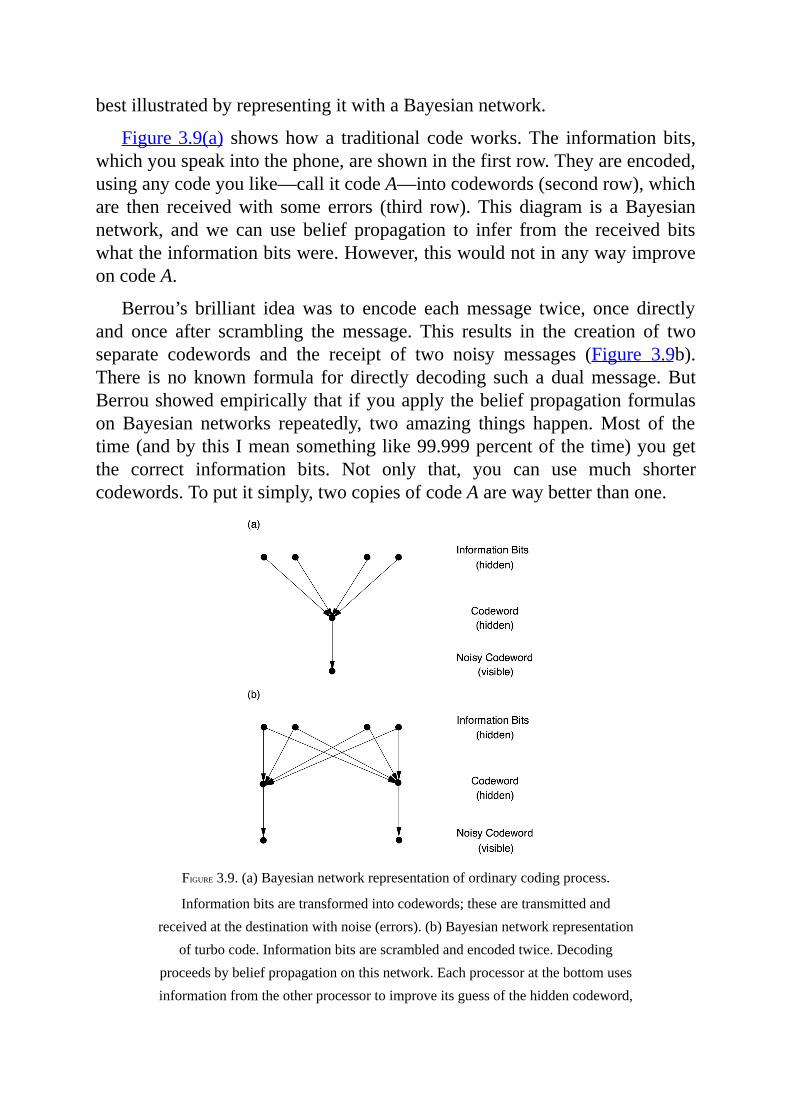
bestillustratedbyrepresentingitwithaBayesiannetwork.
Figure3.9(a) showshowa traditional codeworks.The informationbits,whichyouspeakintothephone,areshowninthefirstrow.Theyareencoded,usinganycodeyoulike—callitcodeA—intocodewords(secondrow),whichare then receivedwith some errors (third row).This diagram is aBayesiannetwork, andwe can use belief propagation to infer from the received bitswhattheinformationbitswere.However,thiswouldnotinanywayimproveoncodeA.
Berrou’s brilliant ideawas to encode eachmessage twice, once directlyand once after scrambling themessage. This results in the creation of twoseparate codewords and the receipt of two noisy messages (Figure 3.9b).There is noknown formula for directly decoding such a dualmessage.ButBerroushowedempiricallythatifyouapplythebeliefpropagationformulason Bayesian networks repeatedly, two amazing things happen.Most of thetime(andbythisImeansomethinglike99.999percentofthetime)yougetthe correct information bits. Not only that, you can use much shortercodewords.Toputitsimply,twocopiesofcodeAarewaybetterthanone.
FIGURE3.9.(a)Bayesiannetworkrepresentationofordinarycodingprocess.
Informationbitsaretransformedintocodewords;thesearetransmittedandreceivedatthedestinationwithnoise(errors).(b)Bayesiannetworkrepresentation
ofturbocode.Informationbitsarescrambledandencodedtwice.Decodingproceedsbybeliefpropagationonthisnetwork.Eachprocessoratthebottomusesinformationfromtheotherprocessortoimproveitsguessofthehiddencodeword,
inaniterativeprocess.
Thiscapsulehistoryiscorrectexceptforonething:BerroudidnotknowthathewasworkingwithBayesiannetworks!Hehadsimplydiscoveredthebelief propagation algorithm himself. It wasn’t until five years later thatDavidMacKayofCambridgerealizedthatitwasthesamealgorithmthathehadbeen enjoying in the late 1980swhileplayingwithBayesiannetworks.ThisplacedBerrou’salgorithminafamiliar theoreticalcontextandallowedinformationtheoriststosharpentheirunderstandingofitsperformance.
Infact,anotherengineer,RobertGallageroftheMassachusettsInstituteofTechnology,haddiscoveredacode thatusedbeliefpropagation (thoughnotcalledby thatname)wayback in1960,so longago thatMacKaydescribeshiscodeas“almostclairvoyant.”Inanyevent,itwastoofaraheadofitstime.Gallager needed thousands of processors on a chip, passingmessages backandforthabout theirdegreeofbelief thataparticular informationbitwasaone or a zero. In 1960 this was impossible, and his code was virtuallyforgotten until MacKay rediscovered it in 1998. Today, it is in every cellphone.
Byanymeasure, turbocodeshavebeenastaggeringsuccess.Before theturborevolution,2Gcellphonesused“softdecoding”(i.e.,probabilities)butnot belief propagation. 3G cell phones used Berrou’s turbo codes, and 4GphonesusedGallager’sturbo-likecodes.Fromtheconsumer’sviewpoint,thismeans that your cell phone uses less energy and the battery lasts longer,because coding and decoding are your cell phone’s most energy-intensiveprocesses.Also,bettercodesmean thatyoudonothave tobeasclose toacelltowertogethigh-qualitytransmission.Inotherwords,Bayesiannetworksenabledphonemanufacturerstodeliverontheirpromise:morebarsinmoreplaces.
FROMBAYESIANNETWORKSTOCAUSALDIAGRAMS
After a chapterdevoted toBayesiannetworks,youmightwonderhow theyrelatetotherestofthisbookandinparticulartocausaldiagrams,thekindwemet in Chapter 1. Of course, I have discussed them in such detail in partbecause they were my personal route into causality. But more importantlyfrombotha theoreticalandpracticalpointofview,Bayesiannetworksholdthe key that enables causal diagrams to interface with data. All theprobabilistic properties of Bayesian networks (including the junctions wediscussed earlier in this chapter) and the belief propagation algorithms that
were developed for them remain valid in causal diagrams.They are in factindispensableforunderstandingcausalinference.
ThemaindifferencesbetweenBayesiannetworksandcausaldiagramslieinhowtheyareconstructedand theuses towhich theyareput.ABayesiannetwork is literally nothing more than a compact representation of a hugeprobabilitytable.Thearrowsmeanonlythattheprobabilitiesofchildnodesarerelatedtothevaluesofparentnodesbyacertainformula(theconditionalprobability tables) and that this relation is sufficient. That is, knowingadditional ancestors of the child will not change the formula. Likewise, amissingarrowbetweenanytwonodesmeansthattheyareindependent,oncewe know the values of their parents. We saw a simple version of thisstatement earlier, whenwe discussed the screening-off effect in chains andlinks.InachainA B C,themissingarrowbetweenAandCmeansthatAandCareindependentonceweknowthevaluesoftheirparents.BecauseAhas no parents, and the only parent ofC isB, it follows thatA andC areindependentonceweknowthevalueofB,whichagreeswithwhatwesaidbefore.
If,however, thesamediagramhasbeenconstructedasacausaldiagram,thenboththethinkingthatgoesintotheconstructionandtheinterpretationofthefinaldiagramchange.Intheconstructionphase,weneedtoexamineeachvariable,sayC,andaskourselveswhichothervariablesit“listens”tobeforechoosingitsvalue.ThechainstructureA B CmeansthatBlistenstoAonly,ClistenstoBonly,andA listenstonoone;thatis, it isdeterminedbyexternalforcesthatarenotpartofourmodel.
This listeningmetaphor encapsulates the entire knowledge that a causalnetworkconveys;therestcanbederived,sometimesbyleveragingdata.Notethatifwereversetheorderofarrowsinthechain,thusobtainingA B C,the causal reading of the structure will change drastically, but theindependenceconditionswillremainthesame.ThemissingarrowbetweenAandCwillstillmeanthatAandCareindependentonceweknowthevalueofB,asintheoriginalchain.Thishastwoenormouslyimportantimplications.First,ittellsusthatcausalassumptionscannotbeinventedatourwhim;theyare subject to the scrutiny of data and can be falsified. For instance, if theobserveddatadonotshowAandCtobeindependent,conditionalonB,thenwecansafelyconcludethatthechainmodelisincompatiblewiththedataandneeds to be discarded (or repaired). Second, the graphical properties of thediagramdictatewhichcausalmodelscanbedistinguishedbydataandwhichwill forever remain indistinguishable, no matter how large the data. Forexample,wecannotdistinguishtheforkA B CfromthechainA B
C by data alone, because the two diagrams imply the same independenceconditions.
Anotherconvenientwayofthinkingaboutthecausalmodelisintermsofhypotheticalexperiments.Eacharrowcanbethoughtofasastatementabouttheoutcomeofahypotheticalexperiment.AnarrowfromAtoCmeansthatifwe could wiggle only A, then we would expect to see a change in theprobability of C. A missing arrow from A to C means that in the sameexperiment wewould not see any change inC, oncewe held constant theparents of C (in other words, B in the example above). Note that theprobabilisticexpression“onceweknowthevalueofB”hasgivenwaytothecausal expression “once we hold B constant,” which implies that we arephysicallypreventingBfromvaryinganddisablingthearrowfromAtoB.
Thecausalthinkingthatgoesintotheconstructionofthecausalnetworkwill pay off, of course, in the type of questions the network can answer.WhereasaBayesiannetworkcanonlytellushowlikelyoneeventis,giventhatweobservedanother(rung-oneinformation),causaldiagramscananswerinterventionalandcounterfactualquestions.Forexample,thecausalforkAB CtellsusinnouncertaintermsthatwigglingAwouldhavenoeffectonC,nomatterhowintensethewiggle.Ontheotherhand,aBayesiannetworkisnotequippedtohandlea“wiggle,”ortotellthedifferencebetweenseeinganddoing,orindeedtodistinguishaforkfromachain.Inotherwords,bothachainandaforkwouldpredictthatobservedchangesinAareassociatedwithchangesinC,makingnopredictionabouttheeffectof“wiggling”A.
Now we come to the second, and perhaps more important, impact ofBayesian networks on causal inference. The relationships that werediscoveredbetweenthegraphicalstructureofthediagramandthedatathatitrepresents now permit us to emulatewigglingwithout physically doing so.Specifically,applyingasmartsequenceofconditioningoperationsenablesustopredicttheeffectofactionsorinterventionswithoutactuallyconductinganexperiment.To demonstrate, consider again the causal forkA B C, inwhichweproclaimedthecorrelationbetweenAandCtobespurious.Wecanverify this by an experiment inwhichwewiggleA and find no correlationbetweenAandC.Butwecandobetter.Wecanask thediagramtoemulatethe experiment and tell us if any conditioning operation can reproduce thecorrelationthatwouldprevailintheexperiment.Theanswerwouldcomeoutaffirmative:“ThecorrelationbetweenAandC thatwouldbemeasuredafterconditioningonBwouldequal thecorrelationseenintheexperiment.”Thiscorrelationcanbeestimatedfromthedata,andinourcaseitwouldbezero,faithfullyconfirmingourintuitionthatwigglingAwouldhavenoeffectonC.
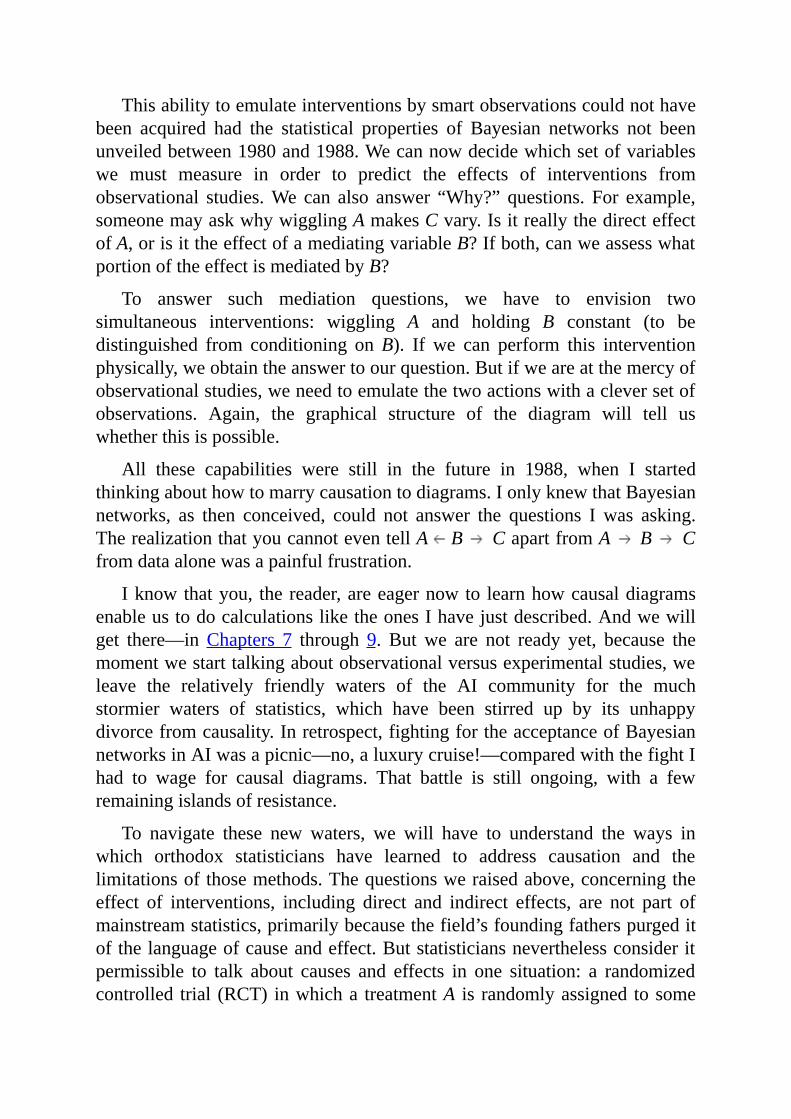
Thisabilitytoemulateinterventionsbysmartobservationscouldnothavebeen acquired had the statistical properties of Bayesian networks not beenunveiledbetween1980and1988.Wecannowdecidewhichsetofvariableswe must measure in order to predict the effects of interventions fromobservational studies.We can also answer “Why?” questions. For example,someonemayaskwhywigglingAmakesCvary.IsitreallythedirecteffectofA,orisittheeffectofamediatingvariableB?Ifboth,canweassesswhatportionoftheeffectismediatedbyB?
To answer such mediation questions, we have to envision twosimultaneous interventions: wiggling A and holding B constant (to bedistinguished from conditioning onB). If we can perform this interventionphysically,weobtaintheanswertoourquestion.Butifweareatthemercyofobservationalstudies,weneedtoemulatethetwoactionswithacleversetofobservations. Again, the graphical structure of the diagram will tell uswhetherthisispossible.
All these capabilities were still in the future in 1988, when I startedthinkingabouthowtomarrycausationtodiagrams.IonlyknewthatBayesiannetworks, as then conceived, could not answer the questions I was asking.TherealizationthatyoucannoteventellA B CapartfromA B Cfromdataalonewasapainfulfrustration.
Iknowthatyou, thereader,areeagernowto learnhowcausaldiagramsenableustodocalculationsliketheonesIhavejustdescribed.Andwewillget there—inChapters 7 through 9. But we are not ready yet, because themomentwestarttalkingaboutobservationalversusexperimentalstudies,weleave the relatively friendly waters of the AI community for the muchstormier waters of statistics, which have been stirred up by its unhappydivorcefromcausality.Inretrospect,fightingfortheacceptanceofBayesiannetworksinAIwasapicnic—no,aluxurycruise!—comparedwiththefightIhad to wage for causal diagrams. That battle is still ongoing, with a fewremainingislandsofresistance.
To navigate these new waters, we will have to understand the ways inwhich orthodox statisticians have learned to address causation and thelimitationsofthosemethods.Thequestionsweraisedabove,concerningtheeffect of interventions, including direct and indirect effects, are not part ofmainstreamstatistics,primarilybecausethefield’sfoundingfatherspurgeditofthelanguageofcauseandeffect.Butstatisticiansneverthelessconsideritpermissible to talk about causes and effects in one situation: a randomizedcontrolled trial (RCT) inwhicha treatmentA is randomlyassigned tosome
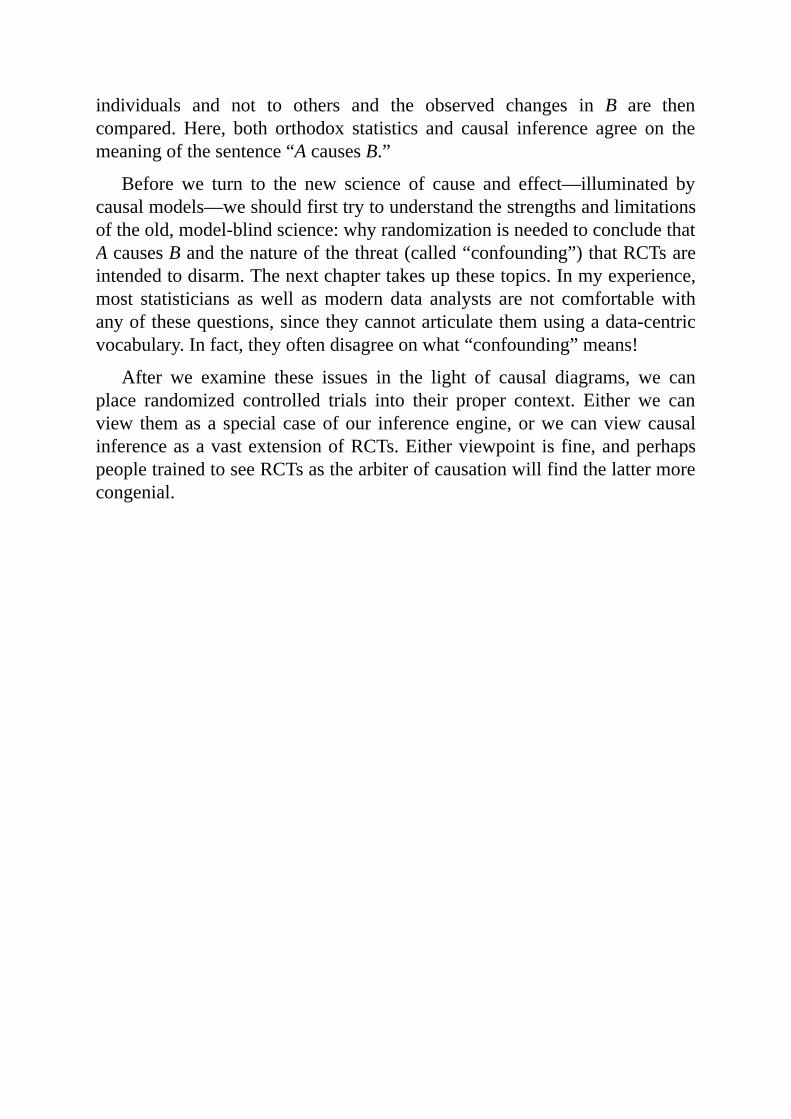
individuals and not to others and the observed changes in B are thencompared. Here, both orthodox statistics and causal inference agree on themeaningofthesentence“AcausesB.”
Before we turn to the new science of cause and effect—illuminated bycausalmodels—weshouldfirsttrytounderstandthestrengthsandlimitationsoftheold,model-blindscience:whyrandomizationisneededtoconcludethatAcausesBandthenatureofthethreat(called“confounding”)thatRCTsareintendedtodisarm.Thenextchaptertakesupthesetopics.Inmyexperience,most statisticians aswell asmodern data analysts are not comfortablewithanyofthesequestions,sincetheycannotarticulatethemusingadata-centricvocabulary.Infact,theyoftendisagreeonwhat“confounding”means!
After we examine these issues in the light of causal diagrams, we canplace randomized controlled trials into their proper context. Either we canview themasa specialcaseofour inferenceengine,orwecanviewcausalinferenceasavastextensionofRCTs.Eitherviewpoint isfine,andperhapspeopletrainedtoseeRCTsasthearbiterofcausationwillfindthelattermorecongenial.

ThebiblicalstoryofDaniel,oftencitedasthefirstcontrolledexperiment.Daniel(thirdfromleft?)realizedthatapropercomparisonoftwodietscouldonlybemadewhentheyweregiventotwogroupsofsimilarindividuals,chosenin
advance.KingNebuchadnezzar(rear)wasimpressedwiththeresults.(Source:DrawingbyDakotaHarr.)

4
CONFOUNDINGANDDECONFOUNDING:OR,SLAYINGTHE
LURKINGVARIABLE
Ifourconceptionofcausaleffectshadanythingtodowithrandomizedexperiments, the latter would have been invented 500 years beforeFisher.
—THEAUTHOR(2016)
ASHPENAZ, the overseer of King Nebuchadnezzar’s court, had a majorproblem. In597BC, the king ofBabylon had sacked the kingdomof Judahand brought back thousands of captives, many of them the nobility ofJerusalem.Aswascustomaryinhiskingdom,Nebuchadnezzarwantedsomeof them to serve in his court, so he commanded Ashpenaz to seek out“children in whom was no blemish, but well favoured, and skilful in allwisdom,andcunninginknowledge,andunderstandingscience.”TheseluckychildrenweretobeeducatedinthelanguageandcultureofBabylonsothattheycouldserveintheadministrationoftheempire,whichstretchedfromthePersianGulftotheMediterraneanSea.Aspartoftheireducation,theywouldgettoeatroyalmeatanddrinkroyalwine.
And therein lay theproblem.Oneof his favorites, a boynamedDaniel,refused to touch the food. For religious reasons, he could not eatmeat notprepared according to Jewish laws, andhe asked that he andhis friendsbegivenadietofvegetablesinstead.Ashpenazwouldhavelikedtocomplywith
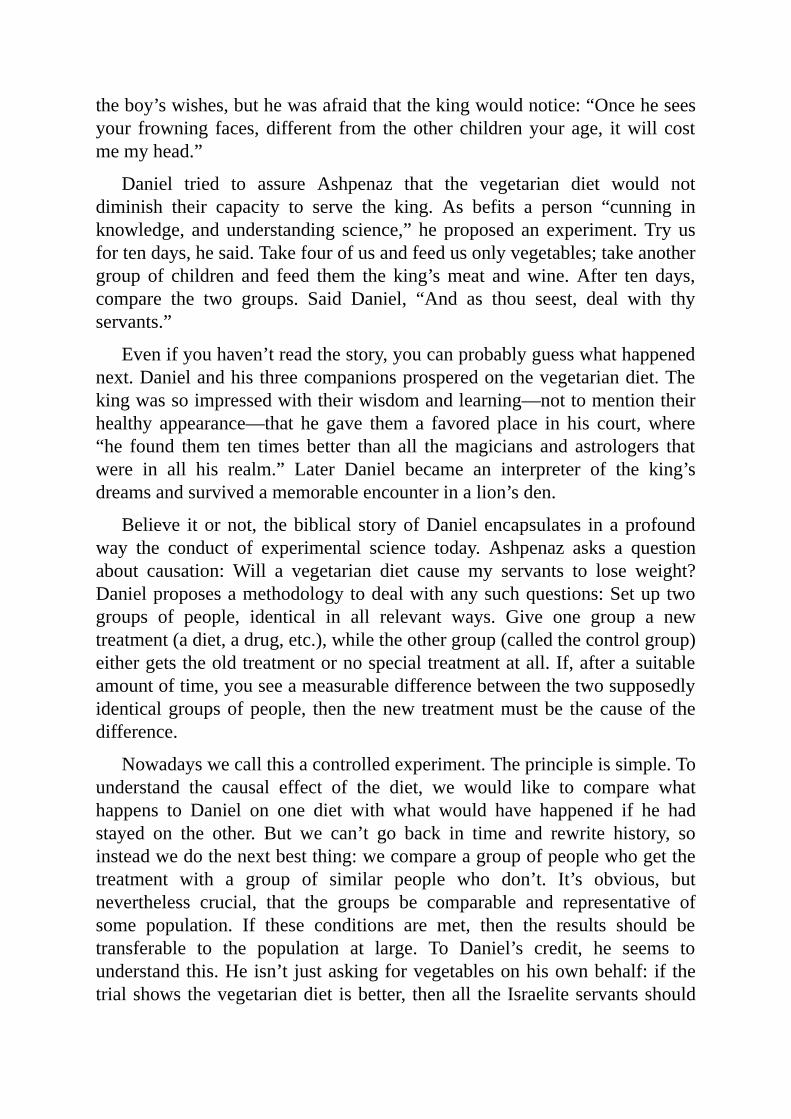
theboy’swishes,buthewasafraidthatthekingwouldnotice:“Onceheseesyour frowning faces,different from theother childrenyour age, itwill costmemyhead.”
Daniel tried to assure Ashpenaz that the vegetarian diet would notdiminish their capacity to serve the king. As befits a person “cunning inknowledge, andunderstanding science,”heproposed an experiment.Tryusfortendays,hesaid.Takefourofusandfeedusonlyvegetables;takeanothergroup of children and feed them the king’smeat andwine.After ten days,compare the two groups. Said Daniel, “And as thou seest, deal with thyservants.”
Evenifyouhaven’treadthestory,youcanprobablyguesswhathappenednext.Danielandhisthreecompanionsprosperedonthevegetariandiet.Thekingwassoimpressedwiththeirwisdomandlearning—nottomentiontheirhealthy appearance—that he gave them a favored place in his court,where“he found them ten times better than all themagicians and astrologers thatwere in all his realm.” Later Daniel became an interpreter of the king’sdreamsandsurvivedamemorableencounterinalion’sden.
Believe itornot, thebiblical storyofDaniel encapsulates inaprofoundway the conduct of experimental science today. Ashpenaz asks a questionabout causation: Will a vegetarian diet cause my servants to lose weight?Danielproposesamethodologytodealwithanysuchquestions:Setuptwogroups of people, identical in all relevant ways. Give one group a newtreatment(adiet,adrug,etc.),whiletheothergroup(calledthecontrolgroup)eithergetstheoldtreatmentornospecialtreatmentatall.If,afterasuitableamountoftime,youseeameasurabledifferencebetweenthetwosupposedlyidenticalgroupsofpeople, then thenew treatmentmustbe thecauseof thedifference.
Nowadayswecallthisacontrolledexperiment.Theprincipleissimple.Tounderstand the causal effect of the diet, we would like to compare whathappens to Daniel on one diet with what would have happened if he hadstayed on the other. But we can’t go back in time and rewrite history, soinsteadwedothenextbestthing:wecompareagroupofpeoplewhogetthetreatment with a group of similar people who don’t. It’s obvious, butnevertheless crucial, that the groups be comparable and representative ofsome population. If these conditions are met, then the results should betransferable to the population at large. To Daniel’s credit, he seems tounderstandthis.Heisn’t justaskingforvegetablesonhisownbehalf: if thetrialshowsthevegetariandiet isbetter, thenall theIsraeliteservantsshould
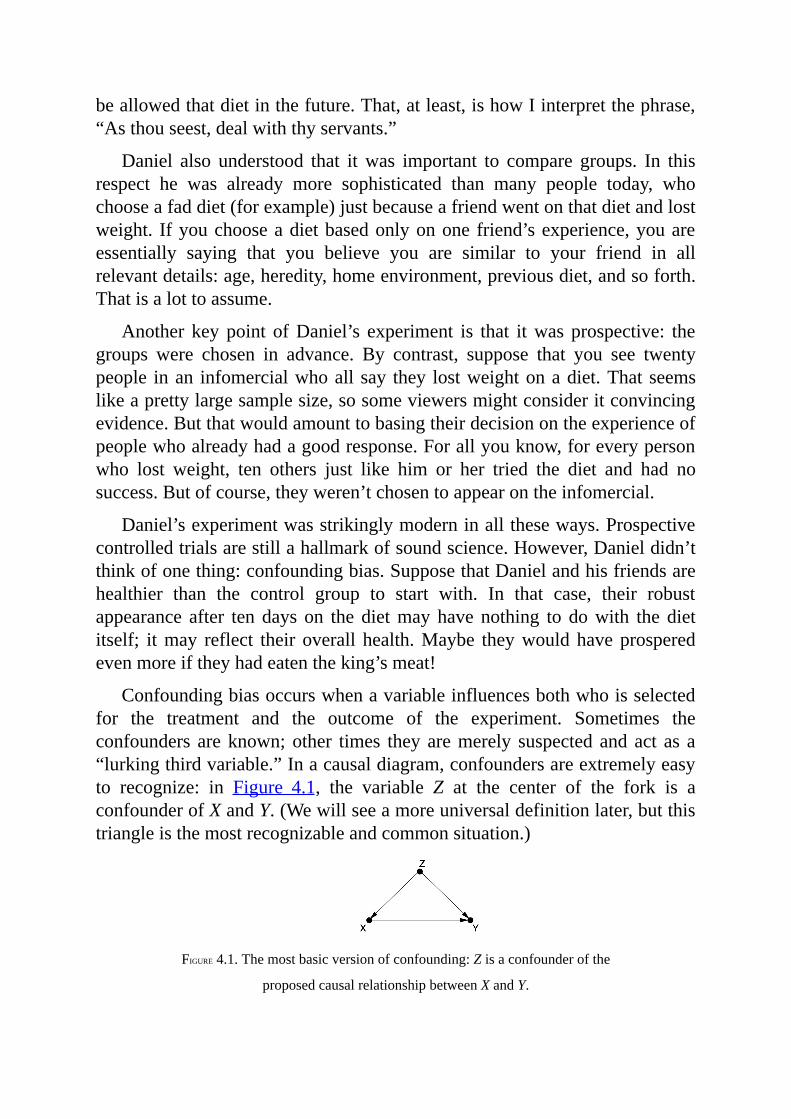
beallowedthatdietinthefuture.That,atleast,ishowIinterpretthephrase,“Asthouseest,dealwiththyservants.”
Daniel also understood that itwas important to compare groups. In thisrespect he was already more sophisticated than many people today, whochooseafaddiet(forexample)justbecauseafriendwentonthatdietandlostweight. Ifyouchooseadietbasedonlyonone friend’sexperience,youareessentially saying that you believe you are similar to your friend in allrelevantdetails:age,heredity,homeenvironment,previousdiet,andsoforth.Thatisalottoassume.
Another keypoint ofDaniel’s experiment is that itwas prospective: thegroups were chosen in advance. By contrast, suppose that you see twentypeople inan infomercialwhoall say they lostweightonadiet.Thatseemslikeaprettylargesamplesize,sosomeviewersmightconsideritconvincingevidence.Butthatwouldamounttobasingtheirdecisionontheexperienceofpeoplewhoalreadyhadagoodresponse.Forallyouknow,foreverypersonwho lost weight, ten others just like him or her tried the diet and had nosuccess.Butofcourse,theyweren’tchosentoappearontheinfomercial.
Daniel’sexperimentwasstrikinglymoderninalltheseways.Prospectivecontrolledtrialsarestillahallmarkofsoundscience.However,Danieldidn’tthinkofonething:confoundingbias.SupposethatDanielandhisfriendsarehealthier than the control group to start with. In that case, their robustappearance after ten days on the dietmayhave nothing to dowith the dietitself; itmay reflect their overall health.Maybe theywouldhaveprosperedevenmoreiftheyhadeatentheking’smeat!
Confoundingbiasoccurswhenavariableinfluencesbothwhoisselectedfor the treatment and the outcome of the experiment. Sometimes theconfounders areknown;other times they aremerely suspected andact as a“lurkingthirdvariable.”Inacausaldiagram,confoundersareextremelyeasyto recognize: in Figure 4.1, the variable Z at the center of the fork is aconfounderofXandY.(Wewillseeamoreuniversaldefinitionlater,butthistriangleisthemostrecognizableandcommonsituation.)
FIGURE4.1.Themostbasicversionofconfounding:Zisaconfounderofthe
proposedcausalrelationshipbetweenXandY.
Theterm“confounding”originallymeant“mixing”inEnglish,andwecanunderstand from the diagram why this name was chosen. The true causaleffect X Y is “mixed” with the spurious correlation between X and YinducedbytheforkX Z Y.Forexample,ifwearetestingadrugandgiveittopatientswhoareyoungeronaveragethanthepeopleinthecontrolgroup,then age becomes a confounder—a lurking third variable. Ifwe don’t haveanydataontheages,wewillnotbeabletodisentanglethetrueeffectfromthespuriouseffect.
However, the converse is also true. Ifwe do havemeasurements of thethirdvariable,thenitisveryeasytodeconfoundthetrueandspuriouseffects.Forinstance,iftheconfoundingvariableZisage,wecomparethetreatmentandcontrolgroupsineveryagegroupseparately.Wecanthentakeanaverageof the effects, weighting each age group according to its percentage in thetargetpopulation.Thismethodofcompensationisfamiliartoallstatisticians;itiscalled“adjustingforZ”or“controllingforZ.”
Oddly, statisticiansbothover- andunderrate the importanceof adjustingforpossibleconfounders.Theyoverrateitinthesensethattheyoftencontrolformanymorevariables than theyneed to and even for variables that theyshouldnotcontrolfor.IrecentlycameacrossaquotefromapoliticalbloggernamedEzraKleinwhoexpressesthisphenomenonof“overcontrolling”veryclearly:“Youseeitallthetimeinstudies.‘Wecontrolledfor…’Andthenthelist starts.The longer thebetter. Income.Age.Race.Religion.Height.Haircolor.Sexualpreference.Crossfitattendance.Loveofparents.CokeorPepsi.Themorethingsyoucancontrolfor,thestrongeryourstudyis—or,atleast,the stronger your study seems. Controls give the feeling of specificity, ofprecision.…But sometimes, you can control for toomuch. Sometimes youendupcontrollingforthethingyou’retryingtomeasure.”Kleinraisesavalidconcern. Statisticians have been immensely confused about what variablesshould and shouldnot be controlled for, so thedefault practicehasbeen tocontrol for everything one can measure. The vast majority of studiesconducted in this day and age subscribe to this practice. It is a convenient,simpleproceduretofollow,butit isbothwastefulandriddenwitherrors.Akey achievement of theCausalRevolutionhas been to bring an end to thisconfusion.
At the same time, statisticians greatly underrate controlling in the sensethat they are loath to talk about causality at all, even if the controlling hasbeendonecorrectly.Thistoostandscontrarytothemessageofthischapter:ifyou have identified a sufficient set of deconfounders in your diagram,gathereddataonthem,andproperlyadjustedforthem,thenyouhaveevery
right to say that you have computed the causal effectX Y (provided, ofcourse,thatyoucandefendyourcausaldiagramonscientificgrounds).
The textbook approach of statisticians to confounding is quite differentand rests on an idea most effectively advocated by R. A. Fisher: therandomized controlled trial (RCT). Fisher was exactly right, but not forexactly the right reasons. The randomized controlled trial is indeed awonderful invention—but until recently the generations of statisticianswhofollowedFishercouldnotprovethatwhattheygotfromtheRCTwasindeedwhattheysoughttoobtain.Theydidnothavealanguagetowritedownwhattheywerelookingfor—namely,thecausaleffectofXonY.Oneofmygoalsin this chapter is to explain, from the point of view of causal diagrams,precisely why RCTs allow us to estimate the causal effectX Y withoutfallingprey toconfounderbias.OncewehaveunderstoodwhyRCTswork,thereisnoneedtoputthemonapedestalandtreatthemasthegoldstandardof causal analysis, which all other methods should emulate. Quite theopposite: we will see that the so-called gold standard in fact derives itslegitimacyfrommorebasicprinciples.
Thischapterwillalsoshowthatcausaldiagramsmakepossibleashiftofemphasisfromconfounderstodeconfounders.Theformercausetheproblem;thelattercureit.Thetwosetsmayoverlap,buttheydon’thaveto.Ifwehavedataonasufficientsetofdeconfounders,itdoesnotmatterifweignoresomeorevenalloftheconfounders.
This shift of emphasis is a main way in which the Causal Revolutionallowsus togobeyondFisherian experiments and infer causal effects fromnonexperimentalstudies.Itenablesustodeterminewhichvariablesshouldbecontrolled for to serve as deconfounders. This question has bedeviled boththeoreticalandpracticalstatisticians;ithasbeenanAchilles’heelofthefieldfor decades. That is because it has nothing to do with data or statistics.Confounding is a causal concept—it belongs on rung two of theLadder ofCausation.
Graphicalmethods,beginninginthe1990s,havetotallydeconfoundedtheconfounding problem. In particular,wewill soonmeet amethod called theback-door criterion, which unambiguously identifies which variables in acausaldiagramaredeconfounders.Iftheresearchercangatherdataonthosevariables, she can adjust for them and thereby make predictions about theresultofaninterventionevenwithoutperformingit.
In fact, the Causal Revolution has gone even farther than this. In somecaseswecancontrol for confoundingevenwhenwedonothavedataona
sufficientsetofdeconfounders.Inthesecaseswecanusedifferentadjustmentformulas—not theconventionalone,which is only appropriate for usewiththe back-door criterion—and still eradicate all confounding. We will savetheseexcitingdevelopmentsforChapter7.
Although confounding has a long history in all areas of science, therecognitionthat theproblemrequirescausal,notstatistical,solutionsisveryrecent.Even as recently as 2001, reviewers rebuked a paper ofminewhileinsisting,“Confoundingissolidlyfoundedinstandardstatistics.”Fortunately,the number of such reviewers has shrunk dramatically in the past decade.Thereisnowanalmostuniversalconsensus,atleastamongepidemiologists,philosophers, and social scientists, that (1) confounding needs and has acausal solution, and (2) causal diagramsprovide a complete and systematicway of finding that solution. The age of confusion over confounding hascometoanend!
THECHILLINGFEAROFCONFOUNDING
In 1998, a study in the New England Journal of Medicine revealed anassociation between regularwalking and reduced death rates among retiredmen.TheresearchersuseddatafromtheHonoluluHeartProgram,whichhasfollowedthehealthof8,000menofJapaneseancestrysince1965.
Theresearchers,ledbyRobertAbbott,abiostatisticianattheUniversityofVirginia,wantedtoknowwhetherthemenwhoexercisedmorelivedlonger.Theychoseasampleof707menfromthelargergroupof8,000,allofwhomwerephysicallyhealthyenoughtowalk.Abbott’s teamfoundthat thedeathrateoveratwelve-yearperiodwastwotimeshigheramongmenwhowalkedlessthanamileaday(I’llcallthem“casualwalkers”)thanamongmenwhowalked more than two miles a day (“intense walkers”). To be precise, 43percentofthecasualwalkershaddied,whileonly21.5percentoftheintensewalkershaddied.
However, because the experimenters did not prescribe who would be acasual walker and who would be an intense walker, we have to take intoconsideration the possibility of confounding bias. An obvious confoundermightbeage:youngermenmightbemorewillingtodoavigorousworkoutandalsowouldbelesslikelytodie.SowewouldhaveacausaldiagramlikethatinFigure4.2.
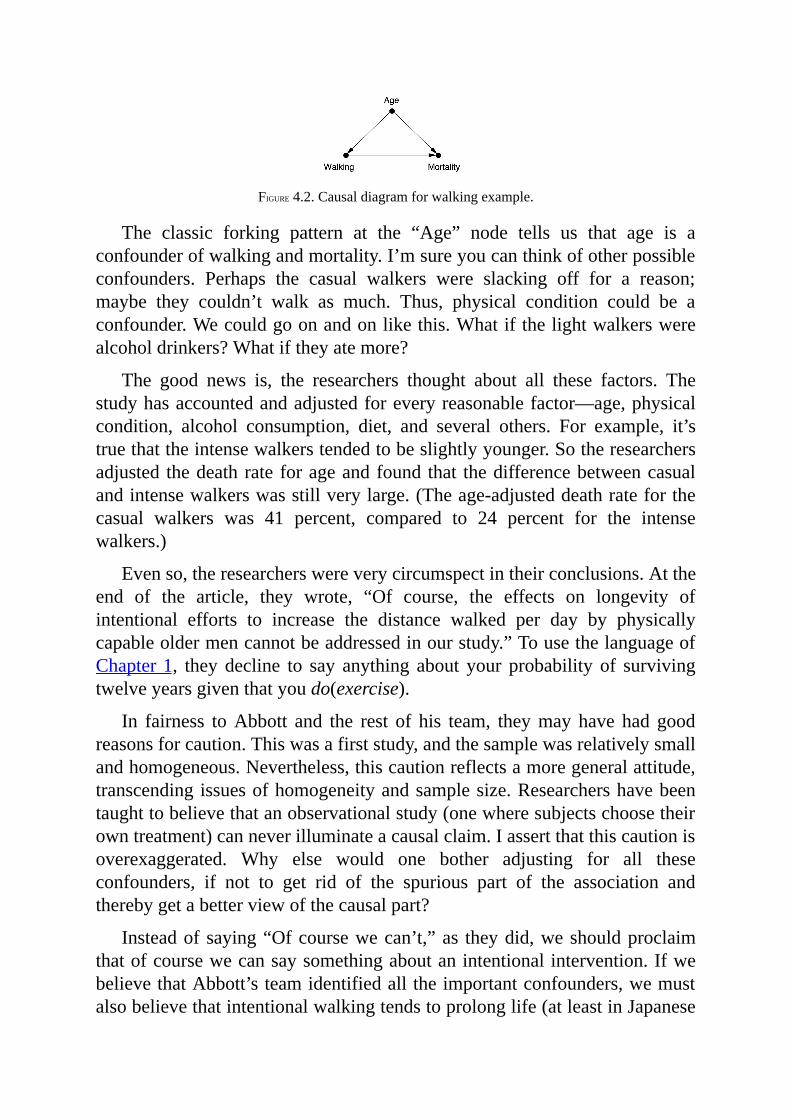
FIGURE4.2.Causaldiagramforwalkingexample.
The classic forking pattern at the “Age” node tells us that age is aconfounderofwalkingandmortality.I’msureyoucanthinkofotherpossibleconfounders. Perhaps the casual walkers were slacking off for a reason;maybe they couldn’t walk as much. Thus, physical condition could be aconfounder.Wecouldgoonandonlikethis.Whatifthelightwalkerswerealcoholdrinkers?Whatiftheyatemore?
The good news is, the researchers thought about all these factors. Thestudyhasaccountedandadjustedforeveryreasonablefactor—age,physicalcondition, alcohol consumption, diet, and several others. For example, it’struethattheintensewalkerstendedtobeslightlyyounger.Sotheresearchersadjusted thedeathrate forageandfound that thedifferencebetweencasualandintensewalkerswasstillverylarge.(Theage-adjusteddeathrateforthecasual walkers was 41 percent, compared to 24 percent for the intensewalkers.)
Evenso,theresearcherswereverycircumspectintheirconclusions.Attheend of the article, they wrote, “Of course, the effects on longevity ofintentional efforts to increase the distance walked per day by physicallycapableoldermencannotbeaddressedinourstudy.”TousethelanguageofChapter1, they decline to say anything about your probability of survivingtwelveyearsgiventhatyoudo(exercise).
In fairness toAbbott and the rest of his team, theymay have had goodreasonsforcaution.Thiswasafirststudy,andthesamplewasrelativelysmallandhomogeneous.Nevertheless,thiscautionreflectsamoregeneralattitude,transcendingissuesofhomogeneityandsamplesize.Researchershavebeentaughttobelievethatanobservationalstudy(onewheresubjectschoosetheirowntreatment)canneverilluminateacausalclaim.Iassertthatthiscautionisoverexaggerated. Why else would one bother adjusting for all theseconfounders, if not to get rid of the spurious part of the association andtherebygetabetterviewofthecausalpart?
Insteadofsaying“Ofcoursewecan’t,”as theydid,weshouldproclaimthatofcoursewecansaysomethingaboutanintentionalintervention.IfwebelievethatAbbott’steamidentifiedalltheimportantconfounders,wemustalsobelievethatintentionalwalkingtendstoprolonglife(atleastinJapanese
males).
This provisional conclusion, predicated on the assumption that no otherconfounders could play a major role in the relationships found, is anextremelyvaluablepieceof information. It tellsapotentialwalkerpreciselywhatkindofuncertaintyremainsintakingtheclaimatfacevalue.Ittellshimthattheremaininguncertaintyisnothigherthanthepossibilitythatadditionalconfounders exist thatwere not taken into account. It is also valuable as aguide to future studies, which should focus on those other factors (if theyexist),nottheonesneutralizedinthecurrentstudy.Inshort,knowingthesetofassumptionsthatstandbehindagivenconclusionisnotlessvaluablethanattemptingtocircumventthoseassumptionswithanRCT,which,asweshallsee,hascomplicationsofitsown.
THESKILLFULINTERROGATIONOFNATURE:WHYRCTSWORK
AsIhavementionedalready,theonecircumstanceunderwhichscientistswillabandon some of their reticence to talk about causality is when they haveconductedarandomizedcontrolledtrial.YoucanreaditonWikipediaorinathousandotherplaces:“TheRCTisoftenconsidered thegoldstandardofaclinicaltrial.”Wehaveonepersontothankforthis,R.A.Fisher,soitisveryinterestingtoreadwhatapersonveryclose tohimwroteabouthis reasons.Thepassageislengthy,butworthquotinginfull:
Thewholeartandpracticeofscientificexperimentation iscomprisedin the skillful interrogation of Nature. Observation has provided thescientist with a picture of Nature in some aspect, which has all theimperfections of a voluntary statement. He wishes to check hisinterpretation of this statement by asking specific questions aimed atestablishing causal relationships. His questions, in the form ofexperimentaloperations,arenecessarilyparticular,andhemustrelyonthe consistency of Nature in making general deductions from herresponse in a particular instance or in predicting the outcome to beanticipated from similar operations on other occasions.His aim is todraw valid conclusions of determinate precision and generality fromtheevidenceheelicits.
Far from behaving consistently, however, Nature appearsvacillating, coy, and ambiguous in her answers. She responds to theformofthequestionasit issetoutinthefieldandnotnecessarilyto
thequestionintheexperimenter’smind;shedoesnotinterpretforhim;shegivesnogratuitousinformation;andsheisasticklerforaccuracy.Inconsequence,theexperimenterwhowantstocomparetwomanurialtreatmentswasteshislaborif,dividinghisfieldintotwoequalparts,hedresseseachhalfwithoneofhismanures,growsacrop,andcomparestheyieldsfromthetwohalves.Theformofhisquestionwas:whatisthedifferencebetweentheyieldofplotAunderthefirsttreatmentandthat of plot B under the second? He has not asked whether plot AwouldyieldthesameasplotBunderuniformtreatment,andhecannotdistinguishploteffectsfromtreatmenteffects,forNaturehasrecorded,as requested, not only the contributionof themanurial differences totheplotyieldsbutalsothecontributionsofdifferencesinsoilfertility,texture,drainage,aspect,microflora,andinnumerableothervariables.
The author of this passage is Joan Fisher Box, the daughter of RonaldAylmer Fisher, and it is taken from her biography of her illustrious father.Though not a statistician herself, she has clearly absorbed very deeply thecentralchallengestatisticians face.Shestates in nouncertain terms that thequestionstheyaskare“aimedatestablishingcausalrelationships.”Andwhatgetsintheirwayisconfounding,althoughshedoesnotusethatword.Theywanttoknowtheeffectofafertilizer(or“manurialtreatment,”asfertilizerswere called in that era)—that is, the expected yield under one fertilizercompared with the yield under an alternative. Nature, however, tells themabouttheeffectofthefertilizermixed(remember,thisistheoriginalmeaningof“confounded”)withavarietyofothercauses.
IliketheimagethatFisherBoxprovidesintheabovepassage:Natureislikeageniethatanswersexactlythequestionwepose,notnecessarilytheoneweintendtoask.Butwehavetobelieve,asFisherBoxclearlydoes,thattheanswertothequestionwewishtoaskdoesexistinnature.Ourexperimentsareasloppymeansofuncoveringtheanswer,buttheydonotbyanymeansdefinetheanswer.Ifwefollowheranalogyexactly,thendo(X=x)mustcomefirst, because it is a property of nature that represents the answerwe seek:What is the effect of using the first fertilizer on the whole field?Randomizationcomessecond,becauseitisonlyaman-mademeanstoelicitthe answer to that question. One might compare it to the gauge on athermometer, which is a means to elicit the temperature but is not thetemperatureitself.
InhisearlyyearsatRothamstedExperimentalStation,Fisherusuallytookaveryelaborate,systematicapproachtodisentanglingtheeffectsoffertilizerfromothervariables.Hewoulddividehis fields intoagridof subplotsand
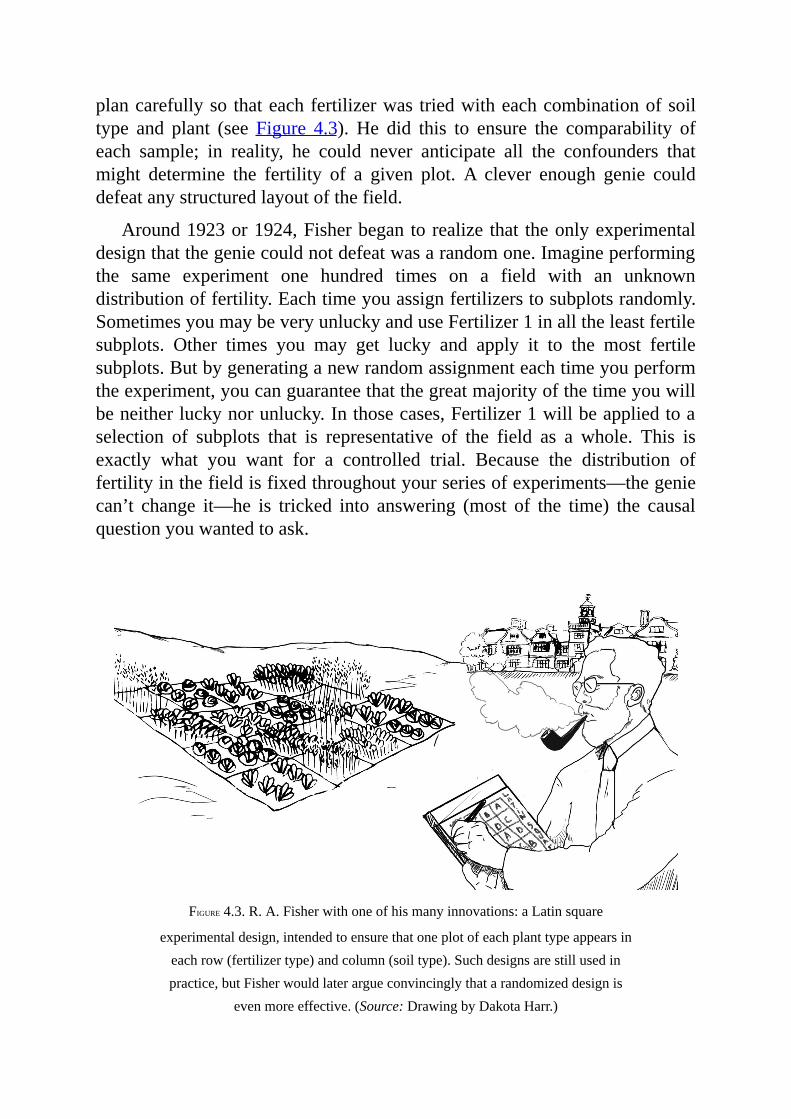
plancarefullyso thateachfertilizerwas triedwitheachcombinationofsoiltype and plant (see Figure 4.3). He did this to ensure the comparability ofeach sample; in reality, he could never anticipate all the confounders thatmight determine the fertility of a given plot. A clever enough genie coulddefeatanystructuredlayoutofthefield.
Around1923or1924,Fisherbegantorealize that theonlyexperimentaldesignthatthegeniecouldnotdefeatwasarandomone.Imagineperformingthe same experiment one hundred times on a field with an unknowndistributionoffertility.Eachtimeyouassignfertilizerstosubplotsrandomly.SometimesyoumaybeveryunluckyanduseFertilizer1inalltheleastfertilesubplots. Other times you may get lucky and apply it to the most fertilesubplots.Butbygeneratinganewrandomassignmenteachtimeyouperformtheexperiment,youcanguaranteethatthegreatmajorityofthetimeyouwillbeneitherluckynorunlucky.Inthosecases,Fertilizer1willbeappliedtoaselection of subplots that is representative of the field as a whole. This isexactly what you want for a controlled trial. Because the distribution offertilityinthefieldisfixedthroughoutyourseriesofexperiments—thegeniecan’t change it—he is tricked into answering (most of the time) the causalquestionyouwantedtoask.
FIGURE4.3.R.A.Fisherwithoneofhismanyinnovations:aLatinsquare
experimentaldesign,intendedtoensurethatoneplotofeachplanttypeappearsineachrow(fertilizertype)andcolumn(soiltype).Suchdesignsarestillusedinpractice,butFisherwouldlaterargueconvincinglythatarandomizeddesignis
evenmoreeffective.(Source:DrawingbyDakotaHarr.)
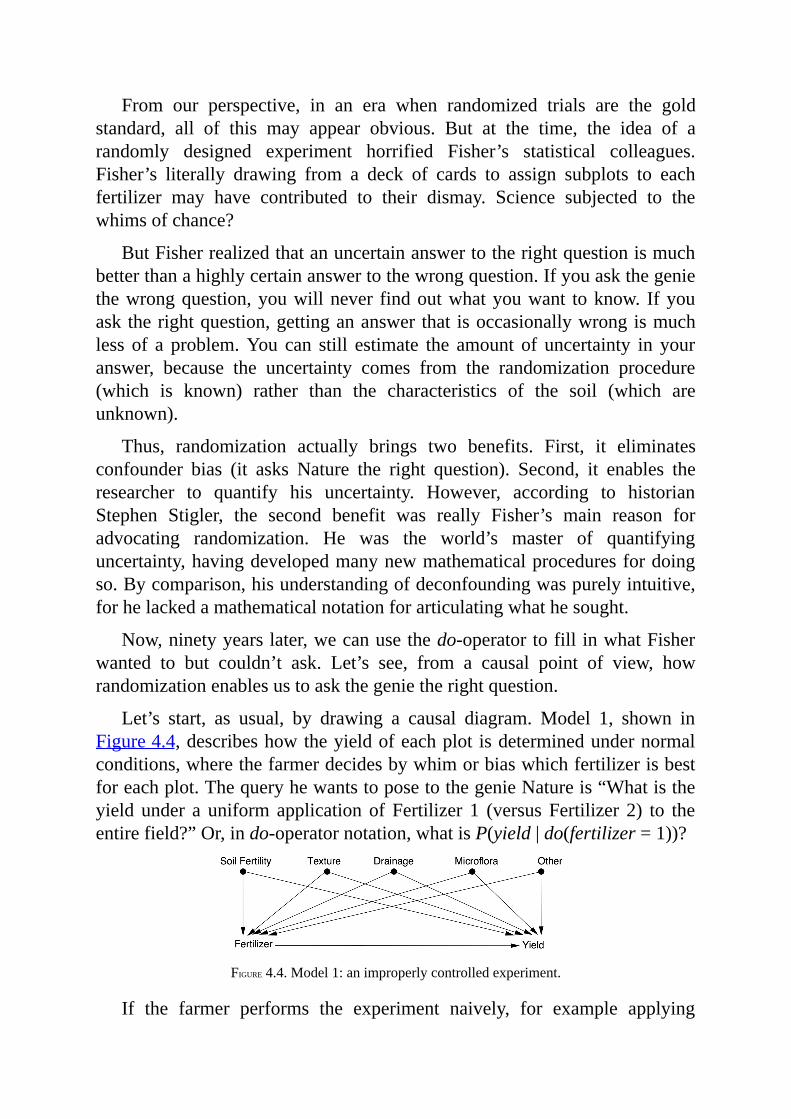
From our perspective, in an era when randomized trials are the goldstandard, all of this may appear obvious. But at the time, the idea of arandomly designed experiment horrified Fisher’s statistical colleagues.Fisher’s literally drawing from a deck of cards to assign subplots to eachfertilizer may have contributed to their dismay. Science subjected to thewhimsofchance?
ButFisherrealizedthatanuncertainanswertotherightquestionismuchbetterthanahighlycertainanswertothewrongquestion.Ifyouaskthegeniethewrongquestion,youwillnever findoutwhatyouwant toknow. Ifyouasktherightquestion,gettingananswerthat isoccasionallywrongismuchless of a problem.You can still estimate the amount of uncertainty in youranswer, because the uncertainty comes from the randomization procedure(which is known) rather than the characteristics of the soil (which areunknown).
Thus, randomization actually brings two benefits. First, it eliminatesconfounder bias (it asks Nature the right question). Second, it enables theresearcher to quantify his uncertainty. However, according to historianStephen Stigler, the second benefit was really Fisher’s main reason foradvocating randomization. He was the world’s master of quantifyinguncertainty,havingdevelopedmanynewmathematicalproceduresfordoingso.Bycomparison,hisunderstandingofdeconfoundingwaspurelyintuitive,forhelackedamathematicalnotationforarticulatingwhathesought.
Now,ninetyyearslater,wecanusethedo-operatortofillinwhatFisherwanted to but couldn’t ask. Let’s see, from a causal point of view, howrandomizationenablesustoaskthegenietherightquestion.
Let’s start, as usual, by drawing a causal diagram. Model 1, shown inFigure4.4,describeshowtheyieldofeachplot isdeterminedundernormalconditions,wherethefarmerdecidesbywhimorbiaswhichfertilizerisbestforeachplot.ThequeryhewantstoposetothegenieNatureis“Whatistheyield under a uniform application ofFertilizer 1 (versusFertilizer 2) to theentirefield?”Or,indo-operatornotation,whatisP(yield|do(fertilizer=1))?
FIGURE4.4.Model1:animproperlycontrolledexperiment.
If the farmer performs the experiment naively, for example applying
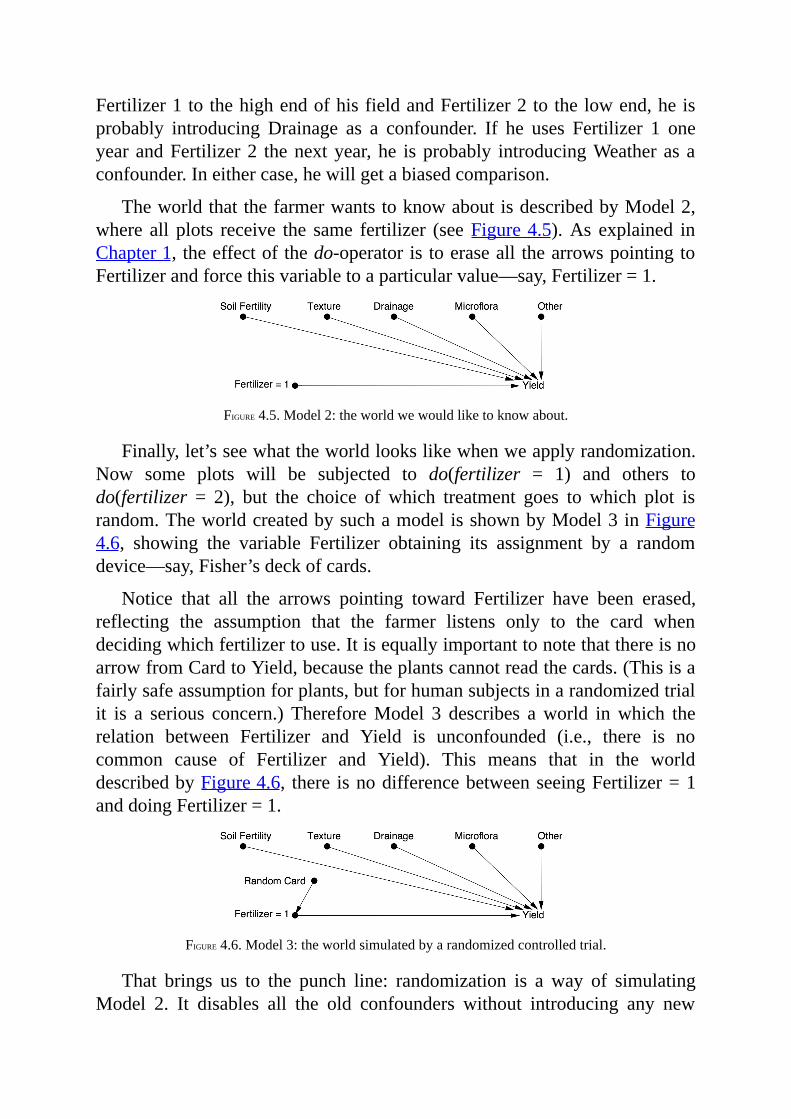
Fertilizer1tothehighendofhisfieldandFertilizer2tothelowend,heisprobably introducing Drainage as a confounder. If he uses Fertilizer 1 oneyear andFertilizer2 thenextyear,he isprobably introducingWeather as aconfounder.Ineithercase,hewillgetabiasedcomparison.
TheworldthatthefarmerwantstoknowaboutisdescribedbyModel2,where all plots receive the same fertilizer (seeFigure4.5).As explained inChapter1,theeffectofthedo-operatoris toeraseall thearrowspointingtoFertilizerandforcethisvariabletoaparticularvalue—say,Fertilizer=1.
FIGURE4.5.Model2:theworldwewouldliketoknowabout.
Finally,let’sseewhattheworldlookslikewhenweapplyrandomization.Now some plots will be subjected to do(fertilizer = 1) and others todo(fertilizer = 2), but the choice of which treatment goes to which plot israndom.TheworldcreatedbysuchamodelisshownbyModel3inFigure4.6, showing the variable Fertilizer obtaining its assignment by a randomdevice—say,Fisher’sdeckofcards.
Notice that all the arrows pointing toward Fertilizer have been erased,reflecting the assumption that the farmer listens only to the card whendecidingwhichfertilizertouse.ItisequallyimportanttonotethatthereisnoarrowfromCardtoYield,becausetheplantscannotreadthecards.(Thisisafairlysafeassumptionforplants,butforhumansubjectsinarandomizedtrialit is a serious concern.) ThereforeModel 3 describes aworld inwhich therelation between Fertilizer and Yield is unconfounded (i.e., there is nocommon cause of Fertilizer and Yield). This means that in the worlddescribedbyFigure4.6, there isnodifferencebetweenseeingFertilizer=1anddoingFertilizer=1.
FIGURE4.6.Model3:theworldsimulatedbyarandomizedcontrolledtrial.
That brings us to the punch line: randomization is a way of simulatingModel 2. It disables all the old confounders without introducing any new
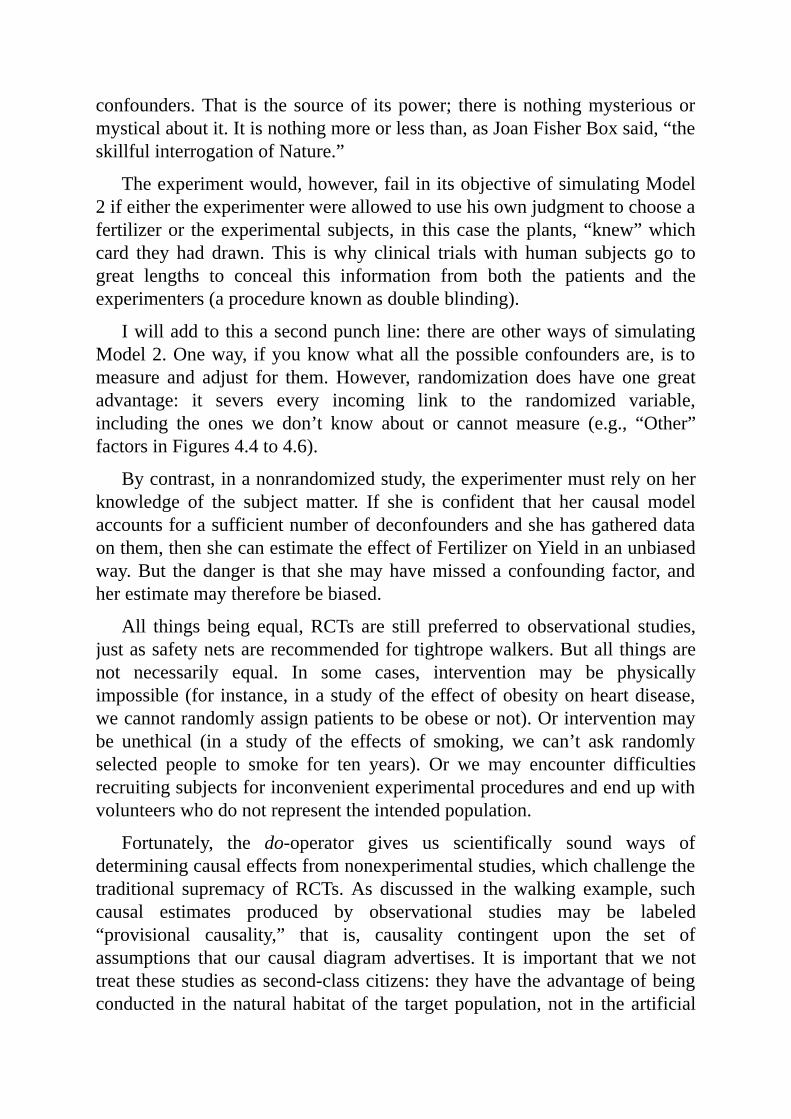
confounders.That is thesourceof itspower; there isnothingmysteriousormysticalaboutit.Itisnothingmoreorlessthan,asJoanFisherBoxsaid,“theskillfulinterrogationofNature.”
Theexperimentwould,however,failinitsobjectiveofsimulatingModel2ifeithertheexperimenterwereallowedtousehisownjudgmenttochooseafertilizeror theexperimentalsubjects, in thiscase theplants,“knew”whichcard they had drawn. This iswhy clinical trialswith human subjects go togreat lengths to conceal this information from both the patients and theexperimenters(aprocedureknownasdoubleblinding).
Iwilladdtothisasecondpunchline:thereareotherwaysofsimulatingModel2.Oneway, ifyouknowwhatall thepossibleconfoundersare, is tomeasure and adjust for them.However, randomization does have one greatadvantage: it severs every incoming link to the randomized variable,including the ones we don’t know about or cannot measure (e.g., “Other”factorsinFigures4.4to4.6).
Bycontrast,inanonrandomizedstudy,theexperimentermustrelyonherknowledge of the subject matter. If she is confident that her causal modelaccountsforasufficientnumberofdeconfoundersandshehasgathereddataonthem,thenshecanestimatetheeffectofFertilizeronYieldinanunbiasedway.But thedanger is that shemayhavemissedaconfounding factor, andherestimatemaythereforebebiased.
All things being equal,RCTs are still preferred to observational studies,justassafetynetsarerecommendedfortightropewalkers.Butallthingsarenot necessarily equal. In some cases, intervention may be physicallyimpossible(forinstance, inastudyoftheeffectofobesityonheartdisease,wecannotrandomlyassignpatientstobeobeseornot).Orinterventionmaybe unethical (in a study of the effects of smoking, we can’t ask randomlyselected people to smoke for ten years). Or we may encounter difficultiesrecruitingsubjectsforinconvenientexperimentalproceduresandendupwithvolunteerswhodonotrepresenttheintendedpopulation.
Fortunately, the do-operator gives us scientifically sound ways ofdeterminingcausaleffectsfromnonexperimentalstudies,whichchallengethetraditional supremacy ofRCTs.As discussed in thewalking example, suchcausal estimates produced by observational studies may be labeled“provisional causality,” that is, causality contingent upon the set ofassumptions that our causal diagram advertises. It is important that we nottreatthesestudiesassecond-classcitizens:theyhavetheadvantageofbeingconducted in thenaturalhabitatof the targetpopulation,not in theartificial
setting of a laboratory, and they can be “pure” in the sense of not beingcontaminatedbyissuesofethicsorfeasibility.
Now that we understand that the principal objective of an RCT is toeliminate confounding, let’s look at the other methods that the CausalRevolutionhasgivenus.Thestorybeginswitha1986paperby twoofmylongtime colleagues, which started a reevaluation of what confoundingmeans.
THENEWPARADIGMOFCONFOUNDING
“While confounding iswidely recognizedasoneof the centralproblems inepidemiological research, a review of the literature will reveal littleconsistencyamong thedefinitionsofconfoundingorconfounder.”With thisonesentence,SanderGreenlandoftheUniversityofCalifornia,LosAngeles,andJamieRobinsofHarvardUniversityputtheirfingeronthecentralreasonwhy the control of confounding had not advanced one bit since Fisher.Lackingaprincipledunderstandingofconfounding, scientistscouldnot sayanything meaningful in observational studies where physical control overtreatmentsisinfeasible.
Howwasconfoundingdefinedthen,andhowshoulditbedefined?Armedwithwhatwenowknowaboutthelogicofcausality,theanswertothesecondquestion is easier.Thequantityweobserve is the conditionalprobabilityofthe outcomegiven the treatment,P(Y |X).The questionwewant to ask ofNature has to do with the causal relationship between X and Y, which iscaptured by the interventional probabilityP(Y |do(X)). Confounding, then,shouldsimplybedefinedasanythingthatleadstoadiscrepancybetweenthetwo:P(Y|X)≠P(Y|do(X)).Whyallthefuss?
Unfortunately,thingswerenotaseasyasthatbeforethe1990sbecausethedo-operatorhadyettobeformalized.Eventoday,ifyoustopastatisticianinthe street and ask, “What does ‘confounding’ mean to you?” you willprobablygetoneof themost convolutedandconfoundedanswersyoueverheard fromascientist.One recentbook,coauthoredby leadingstatisticians,spendsliterallytwopagestryingtoexplainit,andIhaveyettofindareaderwhounderstoodtheexplanation.
Thereasonforthedifficultyisthatconfoundingisnotastatisticalnotion.It stands for the discrepancy between what we want to assess (the causaleffect)andwhatweactuallydoassessusingstatisticalmethods.Ifyoucan’t
articulatemathematicallywhatyouwanttoassess,youcan’texpecttodefinewhatconstitutesadiscrepancy.
Historically,theconceptof“confounding”hasevolvedaroundtworelatedconceptions: incomparability and a lurking third variable. Both of theseconceptshaveresistedformalization.Whenwetalkedaboutcomparability,inthe context of Daniel’s experiment, we said that the treatment and controlgroupsshouldbeidenticalinallrelevantways.Butthisbegsustodistinguishrelevantfromirrelevantattributes.HowdoweknowthatageisrelevantintheHonoluluwalking study?Howdoweknow that the alphabetical orderof aparticipant’s name is not relevant? Youmight say it’s obvious or commonsense,butgenerationsofscientistshavestruggled toarticulate thatcommonsenseformally,andarobotcannotrelyonourcommonsensewhenaskedtoactproperly.
The same ambiguity plagues the third-variable definition. Should aconfounder be a common cause of bothX andY ormerely correlatedwitheach?Todaywecananswersuchquestionsbyreferringtothecausaldiagramand checkingwhich variables produce a discrepancy betweenP(X |Y) andP(X | do(Y)). Lacking a diagram or a do-operator, five generations ofstatisticians and health scientists had to struggle with surrogates, none ofwhichweresatisfactory.Consideringthatthedrugsinyourmedicinecabinetmay have been developed on the basis of a dubious definition of“confounders,”youshouldbesomewhatconcerned.
Let’s take a look at some of the surrogate definitions of confounding.Thesefallintotwomaincategories,declarativeandprocedural.Atypical(andwrong)declarativedefinitionwouldbe“Aconfounderisanyvariablethatiscorrelated with both X and Y.” On the other hand, a procedural definitionwouldattempttocharacterizeaconfounderintermsofastatisticaltest.Thisappeals tostatisticians,wholoveany test thatcanbeperformedon thedatadirectlywithoutappealingtoamodel.
Here is a procedural definition that goes by the scary name of“noncollapsibility.” It comes from a 1996 paper by the NorwegianepidemiologistSvenHernberg:“Formallyonecancomparethecruderelativerisk and the relative risk resulting after adjustment for the potentialconfounder.Adifference indicatesconfounding,andin thatcaseoneshoulduse the adjusted risk estimate. If there is no or a negligible difference,confoundingisnotanissueandthecrudeestimateistobepreferred.”Inotherwords, ifyoususpectaconfounder, tryadjustingfor itandtrynotadjustingfor it. If there is a difference, it is a confounder, and you should trust the
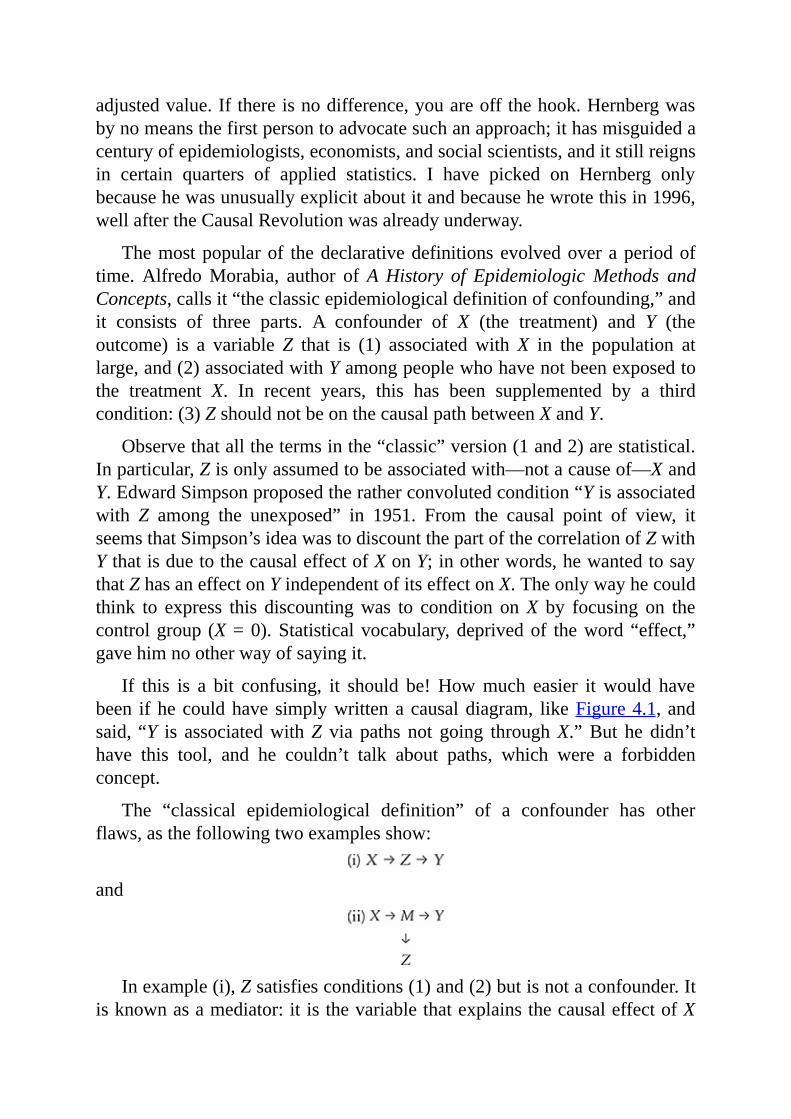
adjustedvalue.Ifthereisnodifference,youareoffthehook.Hernbergwasbynomeansthefirstpersontoadvocatesuchanapproach;ithasmisguidedacenturyofepidemiologists,economists,andsocialscientists,anditstillreignsin certain quarters of applied statistics. I have picked on Hernberg onlybecausehewasunusuallyexplicitaboutitandbecausehewrotethisin1996,wellaftertheCausalRevolutionwasalreadyunderway.
Themostpopularof thedeclarativedefinitionsevolvedoveraperiodoftime.AlfredoMorabia, author ofAHistory of Epidemiologic Methods andConcepts,callsit“theclassicepidemiologicaldefinitionofconfounding,”andit consists of three parts. A confounder of X (the treatment) and Y (theoutcome) is a variableZ that is (1) associated withX in the population atlarge,and(2)associatedwithYamongpeoplewhohavenotbeenexposedtothe treatment X. In recent years, this has been supplemented by a thirdcondition:(3)ZshouldnotbeonthecausalpathbetweenXandY.
Observethatallthetermsinthe“classic”version(1and2)arestatistical.Inparticular,Zisonlyassumedtobeassociatedwith—notacauseof—XandY.EdwardSimpsonproposedtheratherconvolutedcondition“Yisassociatedwith Z among the unexposed” in 1951. From the causal point of view, itseemsthatSimpson’sideawastodiscountthepartofthecorrelationofZwithYthatisduetothecausaleffectofXonY;inotherwords,hewantedtosaythatZhasaneffectonYindependentofitseffectonX.Theonlywayhecouldthink to express this discountingwas to condition onX by focusing on thecontrolgroup(X=0).Statisticalvocabulary,deprivedof theword“effect,”gavehimnootherwayofsayingit.
If this is a bit confusing, it should be!Howmuch easier itwould havebeen ifhecouldhave simplywrittenacausaldiagram, likeFigure4.1,andsaid,“Y is associatedwithZ via paths not going throughX.”But he didn’thave this tool, and he couldn’t talk about paths, which were a forbiddenconcept.
The “classical epidemiological definition” of a confounder has otherflaws,asthefollowingtwoexamplesshow:
and
Inexample(i),Zsatisfiesconditions(1)and(2)butisnotaconfounder.Itisknownasamediator:itisthevariablethatexplainsthecausaleffectofX
onY.ItisadisastertocontrolforZifyouaretryingtofindthecausaleffectofXonY. Ifyoulookonlyat thoseindividuals in thetreatmentandcontrolgroups forwhomZ =0, thenyouhave completelyblocked the effect ofX,becauseitworksbychangingZ.SoyouwillconcludethatXhasnoeffectonY.ThisisexactlywhatEzraKleinmeantwhenhesaid,“Sometimesyouendupcontrollingforthethingyou’retryingtomeasure.”
Inexample(ii),Z isaproxy for themediatorM.Statisticiansveryoftencontrol for proxies when the actual causal variable can’t be measured; forinstance, party affiliation might be used as a proxy for political beliefs.BecauseZisn’taperfectmeasureofM,someoftheinfluenceofXonYmight“leak through” ifyoucontrol forZ.Nevertheless, controlling forZ isstillamistake.WhilethebiasmightbelessthanifyoucontrolledforM, it isstillthere.
For thisreasonlaterstatisticians,notablyDavidCoxinhis textbookTheDesignofExperiments (1958),warned thatyoushouldonlycontrol forZ ifyouhavea“strongpriorreason”tobelievethatit isnotaffectedbyX.This“strong prior reason” is nothingmore or less than a causal assumption.Headds, “Such hypotheses may be perfectly in order, but the scientist shouldalwaysbeawarewhentheyarebeingappealedto.”Rememberthatit’s1958,inthemidstofthegreatprohibitiononcausality.Coxissayingthatyoucango ahead and take a swig of causal moonshine when adjusting forconfounders,butdon’t tell thepreacher.Adaringsuggestion!Ineverfail tocommendhimforhisbravery.
By 1980, Simpson’s and Cox’s conditions had been combined into thethree-part test for confounding that I mentioned above. It is about astrustworthy as a canoe with only three leaks. Even though it does make ahalfheartedappeal tocausality inpart (3),eachof thefirst twopartscanbeshowntobebothunnecessaryandinsufficient.
GreenlandandRobinsdrewthatconclusionintheirlandmark1986paper.Thetwotookacompletelynewapproachtoconfounding,whichtheycalled“exchangeability.”Theywentbacktotheoriginalideathatthecontrolgroup(X=0)shouldbecomparabletothetreatmentgroup(X=1).Buttheyaddedacounterfactual twist. (Remember fromChapter 1 that counterfactuals are atrungthreeoftheLadderofCausationandthereforepowerfulenoughtodetectconfounding.) Exchangeability requires the researcher to consider thetreatmentgroup,imaginewhatwouldhavehappenedtoitsconstituentsiftheyhadnotgotten treatment,and then judgewhether theoutcomewouldbe thesameasforthosewho(inreality)didnotreceivetreatment.Onlythencanwe
saythatnoconfoundingexistsinthestudy.
In 1986, talking counterfactuals to an audience of epidemiologists tooksome courage, because they were still very much under the influence ofclassical statistics,which holds that all the answers are in the data—not inwhatmighthavebeen,whichwillremainforeverunobserved.However, thestatisticalcommunitywassomewhatpreparedtolistentosuchheresy,thanksto the pioneering work of another Harvard statistician, Donald Rubin. InRubin’s “potential outcomes” framework, proposed in 1974, counterfactualvariables like “Blood Pressure of Person X had he received DrugD” and“Blood Pressure of Person X had he not received Drug D” are just aslegitimateasatraditionalvariablelikeBloodPressure—despitethefactthatoneofthosetwovariableswillremainforeverunobserved.
RobinsandGreenlandsetouttoexpresstheirconceptionofconfoundingin terms of potential outcomes. They partitioned the population into fourtypes of individuals: doomed, causative, preventive, and immune. Thelanguage issuggestive,so let’s thinkof the treatmentXasa fluvaccinationandtheoutcomeYascomingdownwithflu.Thedoomedpeoplearethoseforwhomthevaccinedoesn’twork;theywillgetfluwhethertheygetthevaccineor not. The causative group (whichmay be nonexistent) includes those forwhomthevaccineactuallycausesthedisease.Thepreventivegroupconsistsofpeopleforwhomthevaccinepreventsthedisease:theywillgetfluiftheyarenotvaccinated,andtheywillnotgetfluiftheyarevaccinated.Finally,theimmunegroupconsistsofpeoplewhowillnotgetfluineithercase.Table4.1sumsuptheseconsiderations.
Ideally, each person would have a sticker on his forehead identifyingwhich group he belonged to. Exchangeability simply means that thepercentageofpeoplewitheachkindofsticker(dpercent,cpercent,ppercent,and i percent, respectively) should be the same in both the treatment andcontrolgroups.Equalityamongtheseproportionsguaranteesthattheoutcomewouldbejustthesameifweswitchedthetreatmentsandcontrols.Otherwise,thetreatmentandcontrolgroupsarenotalike,andourestimateoftheeffectofthevaccinewillbeconfounded.Notethatthetwogroupsmaybedifferentinmanyways.Theycandifferinage,sex,healthconditions,andavarietyofothercharacteristics.Onlyequalityamongd,c,p,and idetermineswhethertheyareexchangeableornot.Soexchangeabilityamountstoequalitybetweentwo sets of four proportions, a vast reduction in complexity from thealternativeofassessingtheinnumerablefactorsbywhichthetwogroupsmaydiffer.
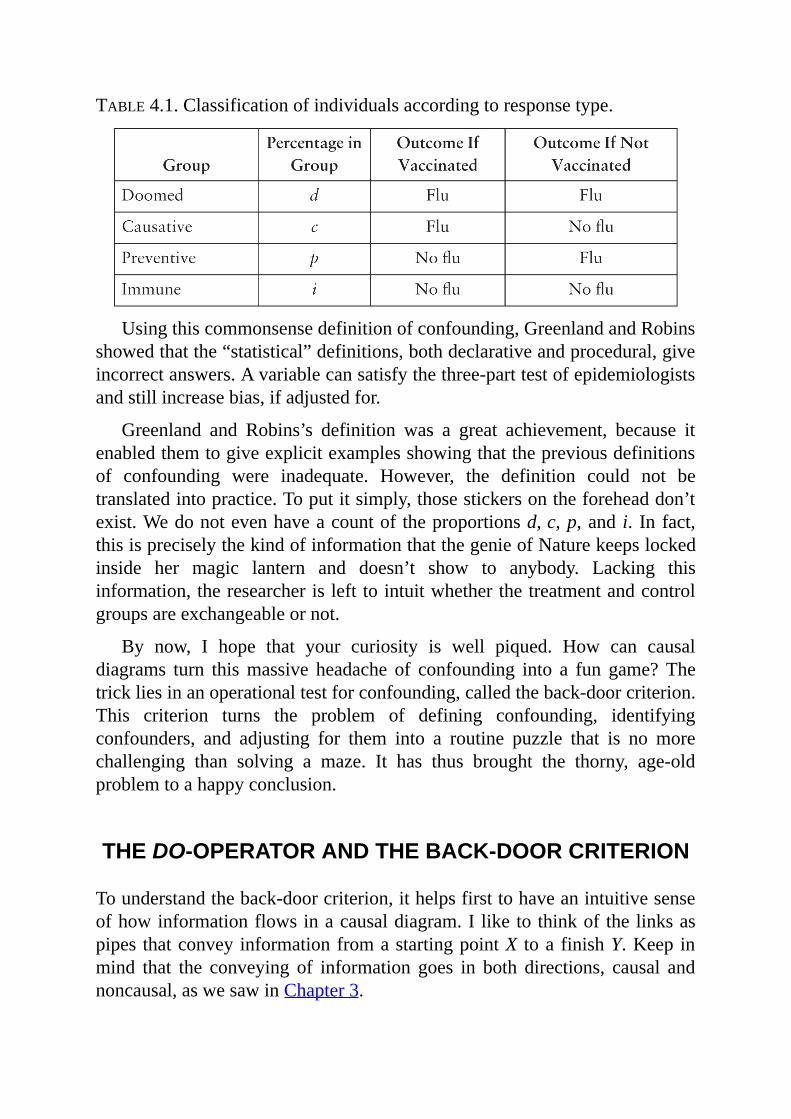
TABLE4.1.Classificationofindividualsaccordingtoresponsetype.
Usingthiscommonsensedefinitionofconfounding,GreenlandandRobinsshowedthatthe“statistical”definitions,bothdeclarativeandprocedural,giveincorrectanswers.Avariablecansatisfythethree-parttestofepidemiologistsandstillincreasebias,ifadjustedfor.
Greenland and Robins’s definition was a great achievement, because itenabledthemtogiveexplicitexamplesshowingthatthepreviousdefinitionsof confounding were inadequate. However, the definition could not betranslatedintopractice.Toputitsimply,thosestickersontheforeheaddon’texist.Wedonotevenhaveacountoftheproportionsd,c,p,and i. In fact,thisispreciselythekindofinformationthatthegenieofNaturekeepslockedinside her magic lantern and doesn’t show to anybody. Lacking thisinformation,theresearcherislefttointuitwhetherthetreatmentandcontrolgroupsareexchangeableornot.
By now, I hope that your curiosity is well piqued. How can causaldiagrams turn thismassive headache of confounding into a fun game?Thetrickliesinanoperationaltestforconfounding,calledtheback-doorcriterion.This criterion turns the problem of defining confounding, identifyingconfounders, and adjusting for them into a routine puzzle that is no morechallenging than solving a maze. It has thus brought the thorny, age-oldproblemtoahappyconclusion.
THEDO-OPERATORANDTHEBACK-DOORCRITERION
Tounderstandtheback-doorcriterion,ithelpsfirsttohaveanintuitivesenseofhowinformationflowsinacausaldiagram.I liketothinkof thelinksaspipes thatconveyinformationfromastartingpointX toa finishY.Keep inmind that the conveying of information goes in both directions, causal andnoncausal,aswesawinChapter3.
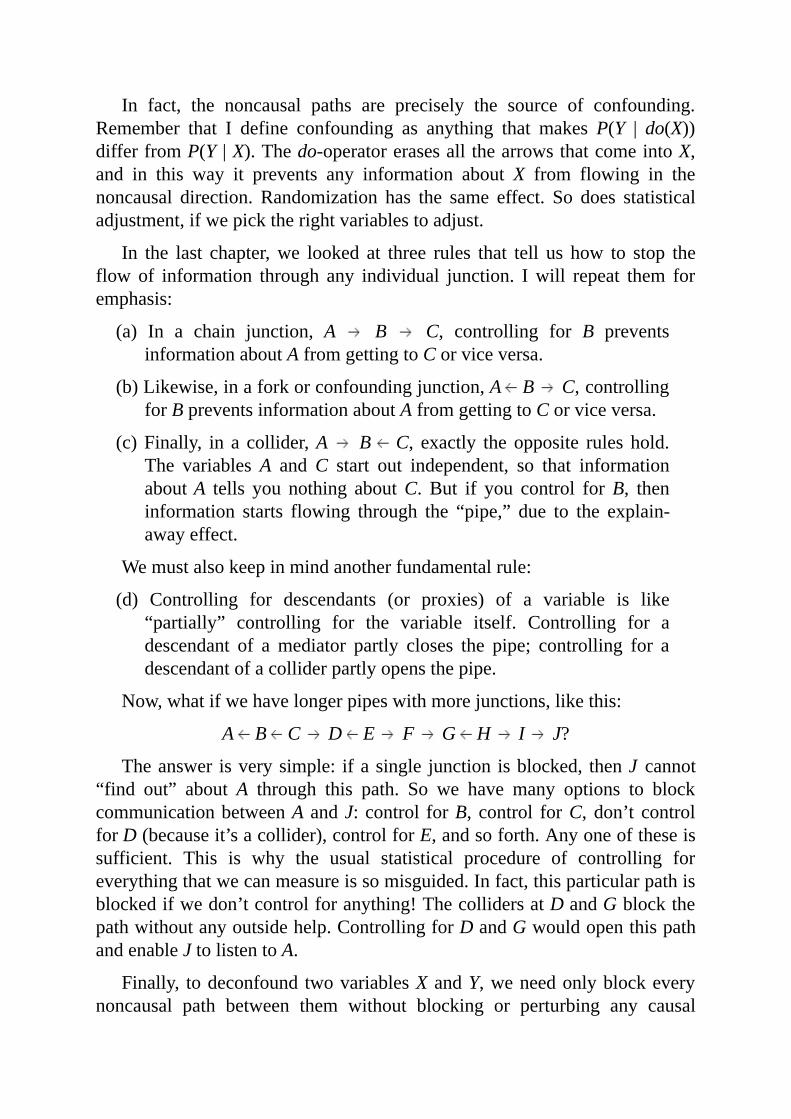
In fact, the noncausal paths are precisely the source of confounding.Remember that I define confounding as anything that makes P(Y | do(X))differfromP(Y |X).Thedo-operatorerasesallthearrowsthatcomeintoX,and in this way it prevents any information about X from flowing in thenoncausal direction. Randomization has the same effect. So does statisticaladjustment,ifwepicktherightvariablestoadjust.
In the last chapter,we looked at three rules that tell us how to stop theflow of information through any individual junction. Iwill repeat them foremphasis:
(a) In a chain junction, A B C, controlling for B preventsinformationaboutAfromgettingtoCorviceversa.
(b)Likewise,inaforkorconfoundingjunction,A B C,controllingforBpreventsinformationaboutAfromgettingtoCorviceversa.
(c)Finally, in a collider,A B C, exactly the opposite rules hold.The variablesA andC start out independent, so that informationaboutA tells you nothing aboutC. But if you control forB, theninformation starts flowing through the “pipe,” due to the explain-awayeffect.
Wemustalsokeepinmindanotherfundamentalrule:
(d) Controlling for descendants (or proxies) of a variable is like“partially” controlling for the variable itself. Controlling for adescendant of a mediator partly closes the pipe; controlling for adescendantofacolliderpartlyopensthepipe.
Now,whatifwehavelongerpipeswithmorejunctions,likethis:
A B C D E F G H I J?
Theanswer isverysimple: ifasingle junction isblocked, thenJ cannot“find out” about A through this path. So we have many options to blockcommunicationbetweenAandJ:control forB, control forC, don’t controlforD(becauseit’sacollider),controlforE,andsoforth.Anyoneoftheseissufficient. This is why the usual statistical procedure of controlling foreverythingthatwecanmeasureissomisguided.Infact,thisparticularpathisblockedifwedon’tcontrolforanything!ThecollidersatDandGblockthepathwithoutanyoutsidehelp.ControllingforDandGwouldopenthispathandenableJtolistentoA.
Finally, todeconfound twovariablesXandY,weneedonlyblockeverynoncausal path between them without blocking or perturbing any causal
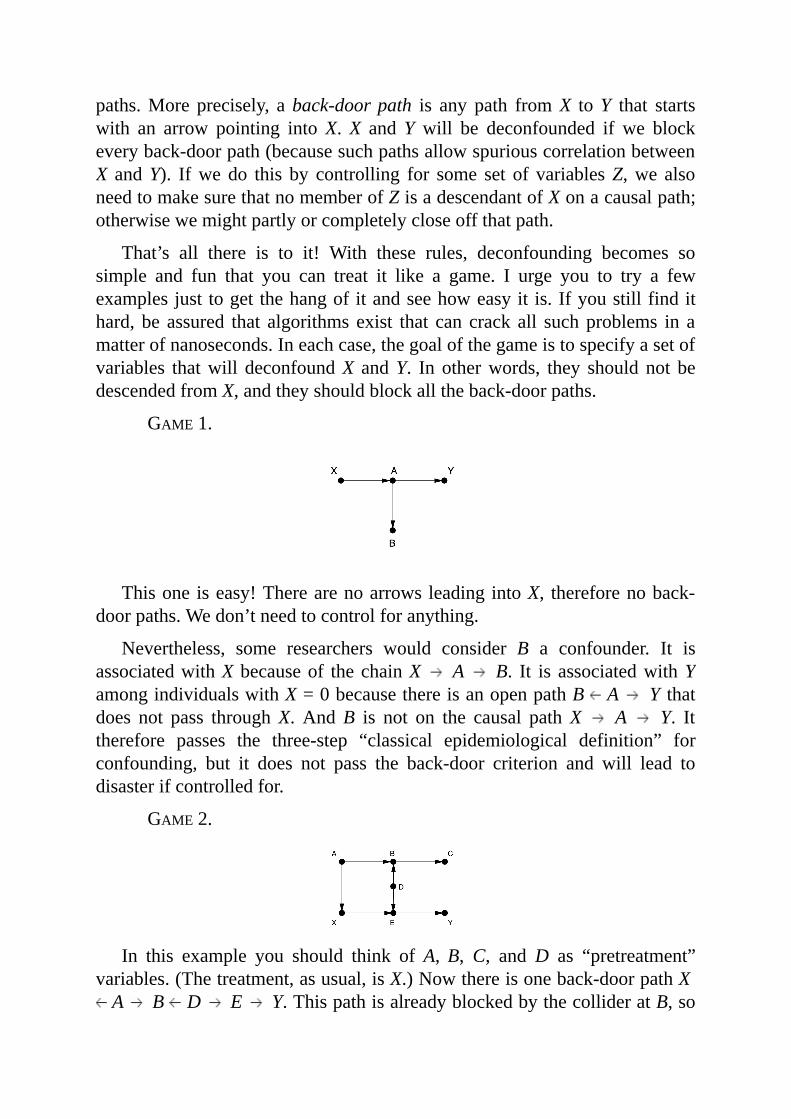
paths.Moreprecisely, aback-doorpath is any path fromX toY that startswith an arrow pointing intoX.X andY will be deconfounded if we blockeveryback-doorpath(becausesuchpathsallowspuriouscorrelationbetweenX andY). Ifwe do this by controlling for some set of variablesZ,we alsoneedtomakesurethatnomemberofZisadescendantofXonacausalpath;otherwisewemightpartlyorcompletelycloseoffthatpath.
That’s all there is to it! With these rules, deconfounding becomes sosimple and fun that you can treat it like a game. I urge you to try a fewexamplesjust togetthehangofitandseehoweasyit is.Ifyoustillfindithard, be assured that algorithms exist that can crack all suchproblems in amatterofnanoseconds.Ineachcase,thegoalofthegameistospecifyasetofvariables thatwill deconfoundX andY. In otherwords, they should not bedescendedfromX,andtheyshouldblockalltheback-doorpaths.
GAME1.
Thisone iseasy!TherearenoarrowsleadingintoX, thereforenoback-doorpaths.Wedon’tneedtocontrolforanything.
Nevertheless, some researchers would consider B a confounder. It isassociatedwithXbecauseof thechainX A B. It is associatedwithYamongindividualswithX=0becausethereisanopenpathB A Y thatdoes not pass throughX. AndB is not on the causal pathX A Y. Ittherefore passes the three-step “classical epidemiological definition” forconfounding, but it does not pass the back-door criterion and will lead todisasterifcontrolledfor.
GAME2.
In this example you should think of A,B,C, andD as “pretreatment”variables.(Thetreatment,asusual,isX.)Nowthereisoneback-doorpathXA B D E Y.ThispathisalreadyblockedbythecollideratB,so
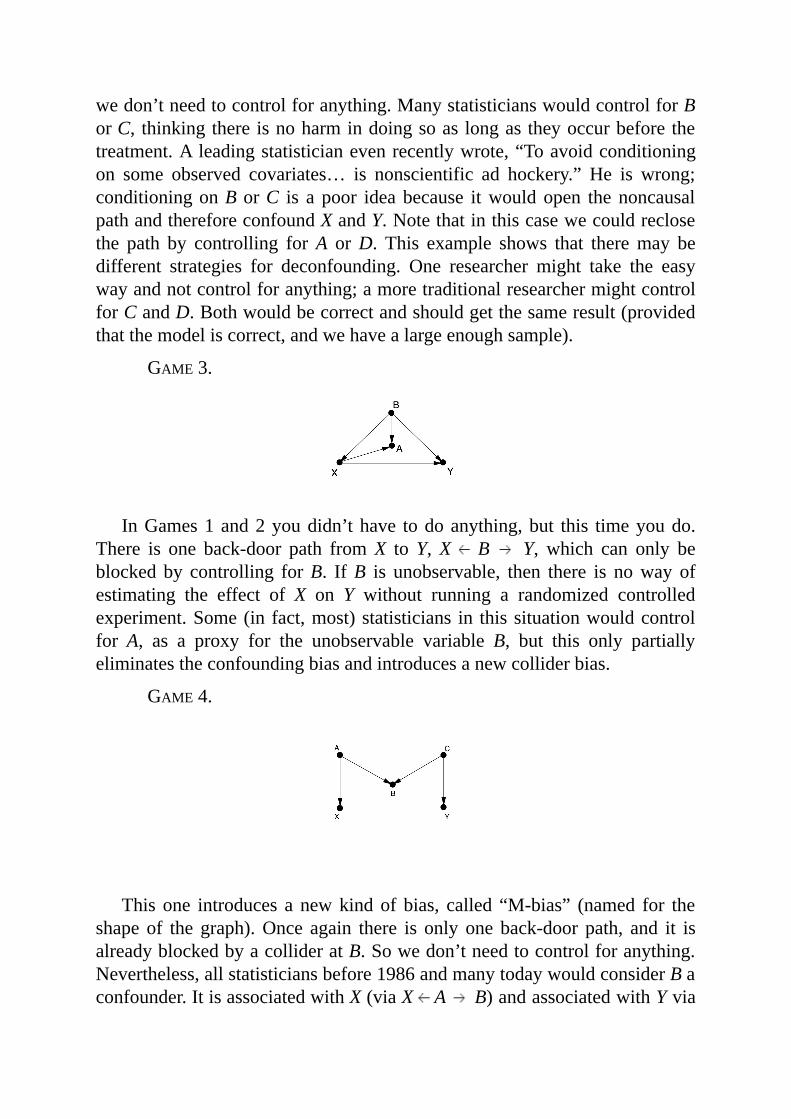
wedon’tneedtocontrolforanything.ManystatisticianswouldcontrolforBorC, thinkingthereisnoharmindoingsoas longastheyoccurbeforethetreatment.Aleadingstatisticianevenrecentlywrote,“Toavoidconditioningon some observed covariates… is nonscientific ad hockery.” He is wrong;conditioningonBorC is a poor ideabecause itwouldopen thenoncausalpathandthereforeconfoundXandY.Notethatinthiscasewecouldreclosethe path by controlling forA orD. This example shows that theremay bedifferent strategies for deconfounding. One researcher might take the easywayandnotcontrolforanything;amoretraditionalresearchermightcontrolforCandD.Bothwouldbecorrectandshouldgetthesameresult(providedthatthemodeliscorrect,andwehavealargeenoughsample).
GAME3.
InGames1and2youdidn’thave todoanything,but this timeyoudo.There is one back-door path fromX toY,X B Y, which can only beblockedby controlling forB. IfB is unobservable, then there is noway ofestimating the effect of X on Y without running a randomized controlledexperiment.Some(in fact,most)statisticians in thissituationwouldcontrolfor A, as a proxy for the unobservable variable B, but this only partiallyeliminatestheconfoundingbiasandintroducesanewcolliderbias.
GAME4.
This one introduces a newkindof bias, called “M-bias” (named for theshapeof the graph).Once again there is only one back-door path, and it isalreadyblockedbyacollideratB.Sowedon’tneedtocontrolforanything.Nevertheless,allstatisticiansbefore1986andmanytodaywouldconsiderBaconfounder.ItisassociatedwithX(viaX A B)andassociatedwithYvia
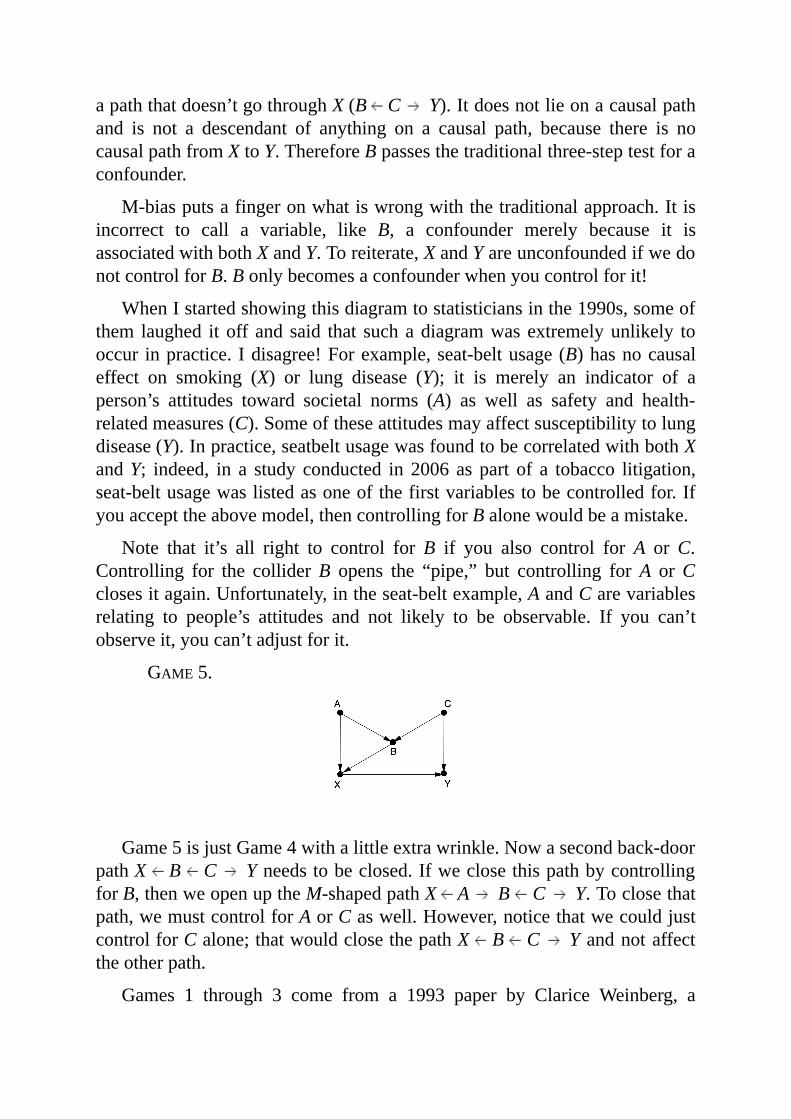
apaththatdoesn’tgothroughX(B C Y).Itdoesnotlieonacausalpathand is not a descendant of anything on a causal path, because there is nocausalpathfromXtoY.ThereforeBpassesthetraditionalthree-steptestforaconfounder.
M-biasputsafingeronwhatiswrongwiththetraditionalapproach.Itisincorrect to call a variable, like B, a confounder merely because it isassociatedwithbothXandY.Toreiterate,XandYareunconfoundedifwedonotcontrolforB.Bonlybecomesaconfounderwhenyoucontrolforit!
WhenIstartedshowingthisdiagramtostatisticiansinthe1990s,someofthem laughed itoff and said that suchadiagramwasextremelyunlikely tooccur inpractice. Idisagree!Forexample,seat-beltusage(B)hasnocausaleffect on smoking (X) or lung disease (Y); it is merely an indicator of aperson’s attitudes toward societal norms (A) as well as safety and health-relatedmeasures(C).Someoftheseattitudesmayaffectsusceptibilitytolungdisease(Y).Inpractice,seatbeltusagewasfoundtobecorrelatedwithbothXandY; indeed, in a study conducted in 2006 as part of a tobacco litigation,seat-beltusagewaslistedasoneofthefirstvariablestobecontrolledfor.Ifyouaccepttheabovemodel,thencontrollingforBalonewouldbeamistake.
Note that it’s all right to control forB if you also control for A orC.Controlling for the colliderB opens the “pipe,” but controlling forA orCclosesitagain.Unfortunately,intheseat-beltexample,AandCarevariablesrelating to people’s attitudes and not likely to be observable. If you can’tobserveit,youcan’tadjustforit.
GAME5.
Game5isjustGame4withalittleextrawrinkle.Nowasecondback-doorpathX B C Yneedstobeclosed.IfweclosethispathbycontrollingforB,thenweopenuptheM-shapedpathX A B C Y.Toclosethatpath,wemustcontrolforAorCaswell.However,noticethatwecouldjustcontrolforCalone;thatwouldclosethepathX B C Yandnotaffecttheotherpath.
Games 1 through 3 come from a 1993 paper by Clarice Weinberg, a
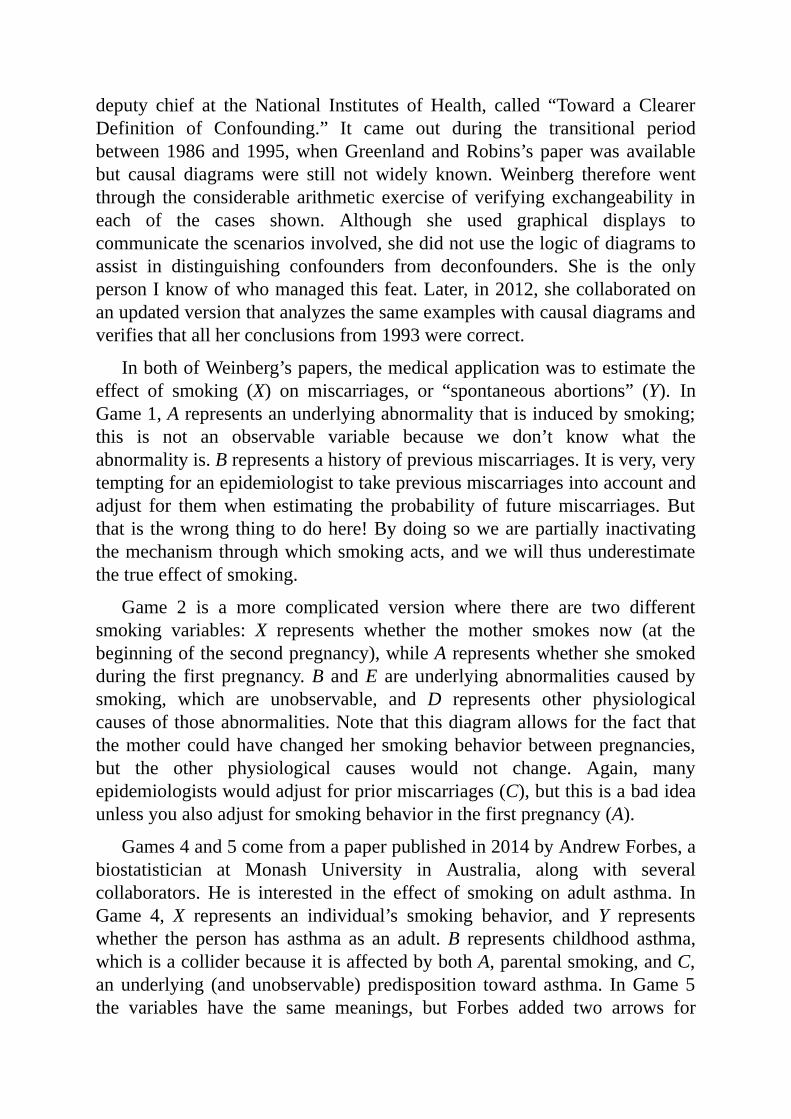
deputy chief at the National Institutes of Health, called “Toward a ClearerDefinition of Confounding.” It came out during the transitional periodbetween1986and1995,whenGreenlandandRobins’spaperwasavailablebut causal diagramswere still not widely known.Weinberg therefore wentthrough the considerable arithmetic exercise of verifying exchangeability ineach of the cases shown. Although she used graphical displays tocommunicatethescenariosinvolved,shedidnotusethelogicofdiagramstoassist in distinguishing confounders from deconfounders. She is the onlypersonIknowofwhomanagedthisfeat.Later,in2012,shecollaboratedonanupdatedversionthatanalyzesthesameexampleswithcausaldiagramsandverifiesthatallherconclusionsfrom1993werecorrect.
InbothofWeinberg’spapers,themedicalapplicationwastoestimatetheeffect of smoking (X) on miscarriages, or “spontaneous abortions” (Y). InGame1,Arepresentsanunderlyingabnormalitythatisinducedbysmoking;this is not an observable variable because we don’t know what theabnormalityis.Brepresentsahistoryofpreviousmiscarriages.Itisvery,verytemptingforanepidemiologisttotakepreviousmiscarriagesintoaccountandadjust for themwhen estimating the probability of futuremiscarriages.Butthat is thewrongthingtodohere!Bydoingsowearepartiallyinactivatingthemechanismthroughwhichsmokingacts,andwewillthusunderestimatethetrueeffectofsmoking.
Game 2 is a more complicated version where there are two differentsmoking variables: X represents whether the mother smokes now (at thebeginningofthesecondpregnancy),whileArepresentswhethershesmokedduring the first pregnancy.B andE are underlying abnormalities caused bysmoking, which are unobservable, and D represents other physiologicalcausesofthoseabnormalities.Notethatthisdiagramallowsforthefactthatthemothercouldhavechangedher smokingbehaviorbetweenpregnancies,but the other physiological causes would not change. Again, manyepidemiologistswouldadjustforpriormiscarriages(C),butthisisabadideaunlessyoualsoadjustforsmokingbehaviorinthefirstpregnancy(A).
Games4and5comefromapaperpublishedin2014byAndrewForbes,abiostatistician at Monash University in Australia, along with severalcollaborators.He is interested in the effect of smoking on adult asthma. InGame 4, X represents an individual’s smoking behavior, and Y representswhether the person has asthma as an adult.B represents childhood asthma,whichisacolliderbecauseitisaffectedbybothA,parentalsmoking,andC,anunderlying (andunobservable) predisposition toward asthma. InGame5the variables have the same meanings, but Forbes added two arrows for
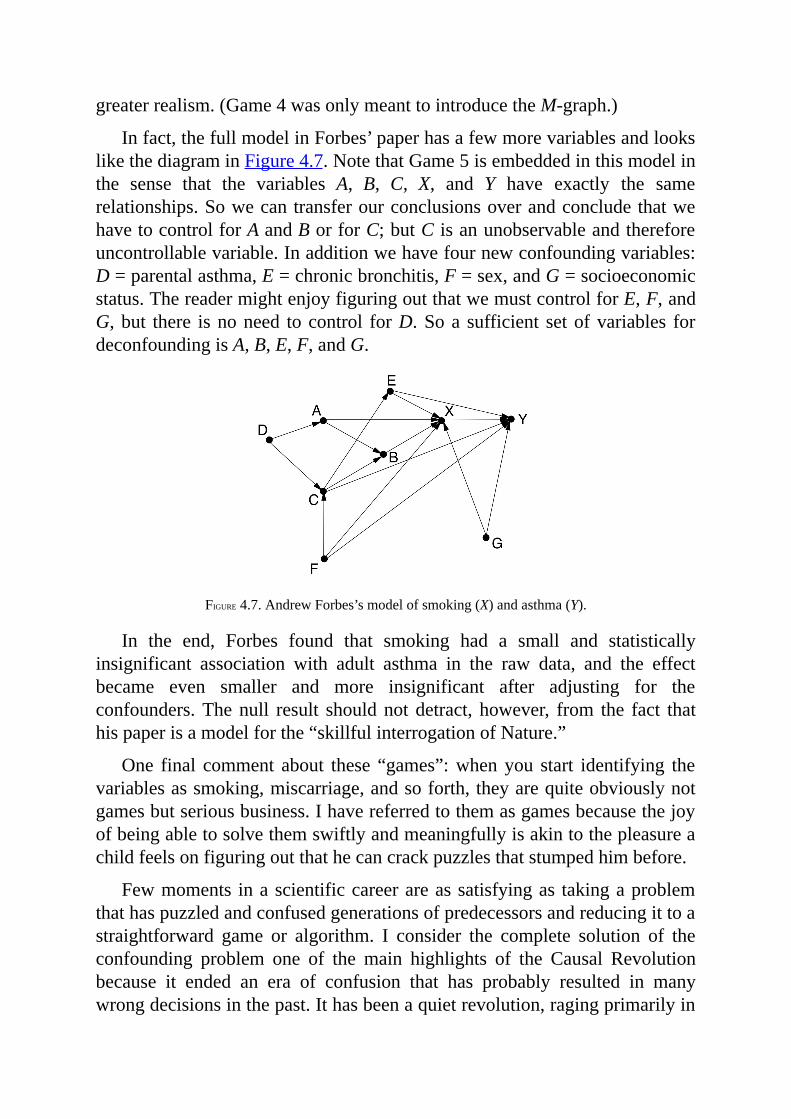
greaterrealism.(Game4wasonlymeanttointroducetheM-graph.)
Infact,thefullmodelinForbes’paperhasafewmorevariablesandlookslikethediagraminFigure4.7.NotethatGame5isembeddedinthismodelinthe sense that the variables A, B, C, X, and Y have exactly the samerelationships.SowecantransferourconclusionsoverandconcludethatwehavetocontrolforAandBorforC;butC isanunobservableandthereforeuncontrollablevariable.Inadditionwehavefournewconfoundingvariables:D=parentalasthma,E=chronicbronchitis,F=sex,andG=socioeconomicstatus.ThereadermightenjoyfiguringoutthatwemustcontrolforE,F,andG,but there isnoneed tocontrol forD.Soa sufficient setofvariables fordeconfoundingisA,B,E,F,andG.
FIGURE4.7.AndrewForbes’smodelofsmoking(X)andasthma(Y).
In the end, Forbes found that smoking had a small and statisticallyinsignificant association with adult asthma in the raw data, and the effectbecame even smaller and more insignificant after adjusting for theconfounders.Thenull result shouldnot detract, however, from the fact thathispaperisamodelforthe“skillfulinterrogationofNature.”
One final comment about these “games”:whenyou start identifying thevariablesassmoking,miscarriage,andsoforth,theyarequiteobviouslynotgamesbutseriousbusiness.Ihavereferredtothemasgamesbecausethejoyofbeingabletosolvethemswiftlyandmeaningfullyisakintothepleasureachildfeelsonfiguringoutthathecancrackpuzzlesthatstumpedhimbefore.
Fewmoments inascientificcareerareassatisfyingas takingaproblemthathaspuzzledandconfusedgenerationsofpredecessorsandreducingittoastraightforward game or algorithm. I consider the complete solution of theconfounding problem one of the main highlights of the Causal Revolutionbecause it ended an era of confusion that has probably resulted in manywrongdecisionsinthepast.Ithasbeenaquietrevolution,ragingprimarilyin

researchlaboratoriesandscientificmeetings.Yet,armedwiththesenewtoolsandinsights,thescientificcommunityisnowtacklingharderproblems,boththeoreticalandpractical,assubsequentchapterswillshow.
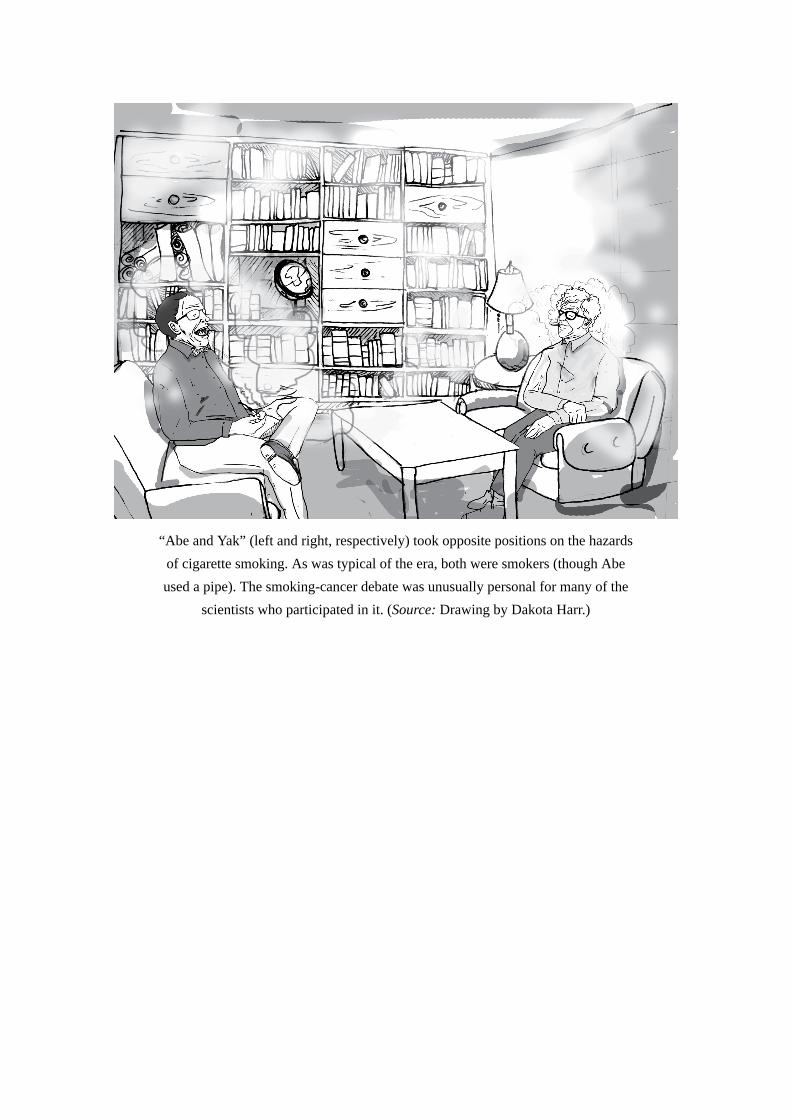
“AbeandYak”(leftandright,respectively)tookoppositepositionsonthehazardsofcigarettesmoking.Aswastypicaloftheera,bothweresmokers(thoughAbeusedapipe).Thesmoking-cancerdebatewasunusuallypersonalformanyofthe
scientistswhoparticipatedinit.(Source:DrawingbyDakotaHarr.)
5
THESMOKE-FILLEDDEBATE:CLEARINGTHEAIR
Atlastthesailorssaidtoeachother,Comeandletuscastlotstofindoutwhoistoblameforthisordeal.
—JONAH1:7
INthelate1950sandearly1960s,statisticiansanddoctorsclashedoveroneofthehighest-profilemedicalquestionsof thecentury:Doessmokingcauselungcancer?Halfacenturyafterthisdebate,wetaketheanswerforgranted.But at that time, the issue was by no means clear. Scientists, and evenfamilies,weredivided.
JacobYerushalmy’swasonesuchdividedfamily.Abiostatisticianat theUniversityofCalifornia,Berkeley,Yerushalmy(1904–1973)wasoneof thelastofthepro-tobaccoholdoutsinacademia.“Yerushalmyopposedthenotionthatcigarettesmokingcausedcanceruntilhisdyingday,”wrotehisnephewDavidLilienfeldmanyyearslater.Ontheotherhand,Lilienfeld’sfather,AbeLilienfeld,wasanepidemiologistatJohnsHopkinsUniversityandoneofthemostoutspokenproponentsofthetheorythatsmokingdidcausecancer.TheyoungerLilienfeldrecalledhowUncle“Yak”(shortforJacob)andhisfatherwouldsitaroundanddebatetheeffectsofsmoking,wreathedallthewhileina “haze of smoke from Yak’s cigarette and Abe’s pipe” (see chapterfrontispiece).
IfonlyAbeandYakhadbeenable tosummontheCausalRevolution to
clear the air! As this chapter shows, one of the most important scientificargumentsagainst thesmoking-cancerhypothesiswasthepossibleexistenceofunmeasured factors that causeboth craving fornicotine and lungcancer.We have just discussed such confounding patterns and noted that today’scausaldiagramshavedriventhemenaceofconfoundingoutofexistence.Butwe are now in the 1950s and 1960s, two decades before SanderGreenlandand Jamie Robins and three decades before anyone had heard of the do-operator.Itisinterestingtoexamine,therefore,howscientistsofthateradealtwith the issue and showed that the confounding argument is all smoke andmirrors.
NodoubtthesubjectofmanyofAbeandYak’ssmoke-filleddebateswasneithertobacconorcancer.Itwasthatinnocuousword“caused.”Itwasn’tthefirsttimethatphysiciansconfrontedperplexingcausalquestions:someofthegreatestmilestonesinmedicalhistorydealtwithidentifyingcausativeagents.Inthemid-1700s,JamesLindhaddiscoveredthatcitrusfruitscouldpreventscurvy, and in the mid-1800s, John Snow had figured out that watercontaminatedwith fecalmatter caused cholera. (Later research identified amorespecificcausativeagent ineachcase:vitaminCdeficiencyforscurvy,thecholerabacillusforcholera.)Thesebrilliantpiecesofdetectiveworkhadin common a fortunate one-to-one relation between cause and effect. Thecholerabacillusis theonlycauseofcholera;oraswewouldsaytoday,it isbothnecessaryandsufficient. Ifyouaren’texposed to it,youwon’tget thedisease.Likewise,avitaminCdeficiencyisnecessarytoproducescurvy,andgivenenoughtime,itisalsosufficient.
The smoking-cancer debate challenged this monolithic concept ofcausation.Manypeople smoke theirwhole lives andneverget lungcancer.Conversely,somepeoplegetlungcancerwithouteverlightingupacigarette.Somepeoplemaygetitbecauseofahereditarydisposition,othersbecauseofexposuretocarcinogens,andsomeforbothreasons.
Of course, statisticians already knew of one excellent way to establishcausationinamoregeneralsense:therandomizedcontrolledtrial(RCT).Butsuch a studywould be neither feasible nor ethical in the case of smoking.How could you assign people chosen at random to smoke for decades,possibly ruining theirhealth, just to see if theywouldget lungcancer afterthirty years? It’s impossible to imagine anyone outside North Korea“volunteering”forsuchastudy.
Without a randomized controlled trial, there was no way to convinceskeptics likeYerushalmyandR.A.Fisher,whowerecommitted to the idea
thattheobservedassociationbetweensmokingandlungcancerwasspurious.To them, some lurking third factor could be producing the observedassociation.Forexample,therecouldbeasmokinggenethatcausedpeopletocravecigarettesandalso,atthesametime,madethemmorelikelytodeveloplung cancer (perhaps because of other lifestyle choices). The confoundersthey suggested were implausible at best. Still, the onus was on theantismoking contingent to prove there was no confounder—to prove anegative,whichFisherandYerushalmywellknewisalmostimpossible.
Thefinalbreachofthisstalemateisataleatonceofagreattriumphandagreat opportunity missed. It was a triumph for public health because theepidemiologistsdidgetitrightintheend.TheUSsurgeongeneral’sreport,in1964,statedinnouncertainterms,“Cigarettesmoking iscausally related tolung cancer inmen.” This blunt statement forever shut down the argumentthat smokingwas“notproven” tocausecancer.The rateof smoking in theUnitedStates amongmenbegan to decrease the followingyear and is nowlessthanhalfwhatitwasin1964.Nodoubtmillionsofliveshavebeensavedandlifespanslengthened.
Ontheotherhand,thetriumphisincomplete.Theperiodittooktoreachtheaboveconclusion,roughlyfrom1950to1964,mighthavebeenshorterifscientists hadbeen able to call upon amoreprincipled theoryof causation.Andmostsignificantlyfromthepointofviewofthisbook, thescientistsofthe1960sdidnotreallyput togethersucha theory.Tojustify theclaimthatsmokingcausedcancer,thesurgeongeneral’scommitteereliedonaninformalseries of guidelines, called Hill’s criteria, named for University of LondonstatisticianAustinBradfordHill.Everyoneofthesecriteriahasdemonstrableexceptions,althoughcollectivelytheyhaveacompellingcommonsensevalueandevenwisdom.FromtheoverlymethodologicalworldofFisher, theHillguidelinestakeustotheoppositerealm,toamethodology-freeworldwherecausality is decided on the basis of qualitative patterns of statistical trends.The Causal Revolution builds a bridge between these two extremes,empoweringourintuitivesenseofcausalitywithmathematicalrigor.Butthisjobwouldbelefttothenextgeneration.
TOBACCO:AMANMADEEPIDEMIC
In 1902, cigarettes comprised only 2 percent of the US tobacco market;spittoons rather than ashtrays were themost ubiquitous symbol of tobaccoconsumption.ButtwopowerfulforcesworkedtogethertochangeAmericans’
habits: automation and advertising. Machine-made cigarettes easilyoutcompeted handcrafted cigars and pipes on the basis of availability andcost.Meanwhile,thetobaccoindustryinventedandperfectedmanytricksofthetradeofadvertising(seeFigure5.1).PeoplewhowatchedTVinthe1960scaneasilyrememberanynumberofcatchycigarettejingles,from“YougetalottolikeinaMarlboro”to“You’vecomealongway,baby.”
By1952,cigarettes’shareofthetobaccomarkethadrocketedfrom2to81percent,andthemarketitselfhadgrowndramatically.Thisseachangeinthehabits of a country hadunexpected ramifications for public health.Even inthe early years of the twentieth century, there had been suspicions thatsmoking was unhealthy, that it “irritated” the throat and caused coughing.Around mid-century, the evidence started to become a good deal moreominous.Beforecigarettes,lungcancerhadbeensorarethatadoctormightencounteritonlyonceinalifetimeofpractice.Butbetween1900and1950,the formerly rare disease quadrupled in frequency, and by 1960 it wouldbecomethemostcommonformofcanceramongmen.Suchahugechangeintheincidenceofalethaldiseasebeggedforanexplanation.
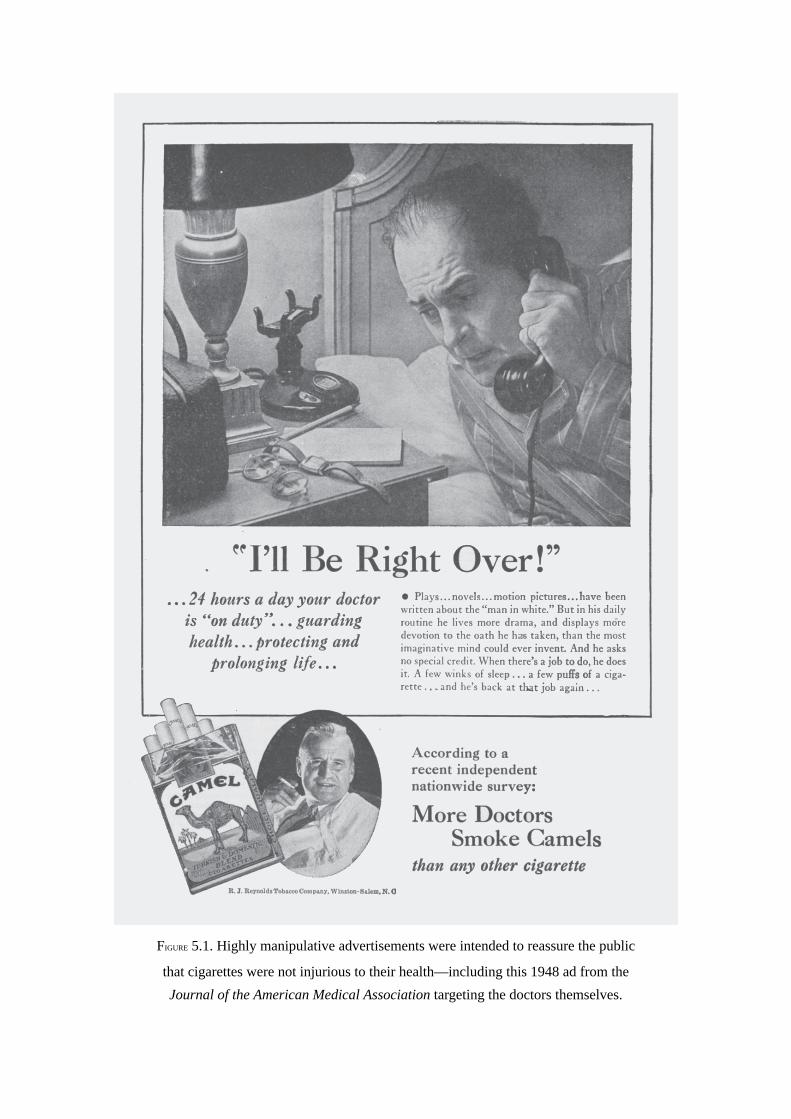
FIGURE5.1.Highlymanipulativeadvertisementswereintendedtoreassurethepublic
thatcigaretteswerenotinjurioustotheirhealth—includingthis1948adfromtheJournaloftheAmericanMedicalAssociationtargetingthedoctorsthemselves.
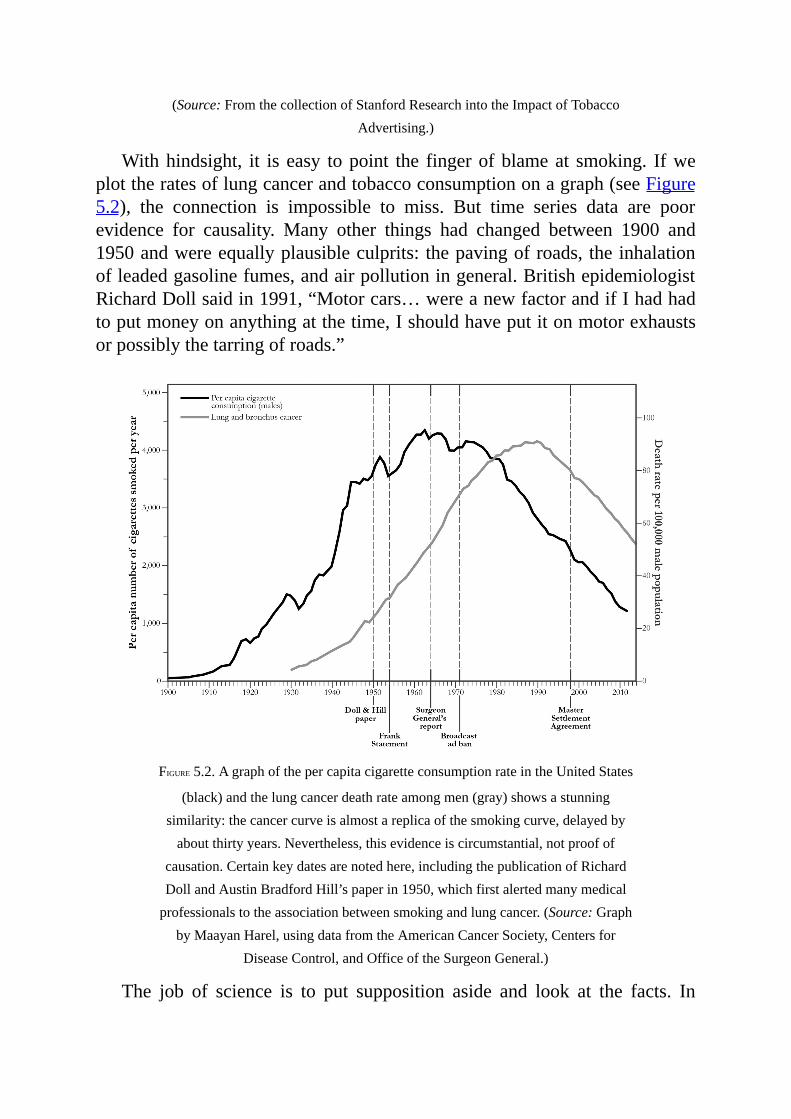
(Source:FromthecollectionofStanfordResearchintotheImpactofTobaccoAdvertising.)
Withhindsight, it is easy topoint the fingerofblameat smoking. Ifweplottheratesoflungcancerandtobaccoconsumptiononagraph(seeFigure5.2), the connection is impossible to miss. But time series data are poorevidence for causality. Many other things had changed between 1900 and1950andwereequallyplausibleculprits: thepavingofroads, theinhalationofleadedgasolinefumes,andairpollutioningeneral.BritishepidemiologistRichardDollsaidin1991,“Motorcars…wereanewfactorandifIhadhadtoputmoneyonanythingatthetime,Ishouldhaveputitonmotorexhaustsorpossiblythetarringofroads.”
FIGURE5.2.AgraphofthepercapitacigaretteconsumptionrateintheUnitedStates
(black)andthelungcancerdeathrateamongmen(gray)showsastunningsimilarity:thecancercurveisalmostareplicaofthesmokingcurve,delayedbyaboutthirtyyears.Nevertheless,thisevidenceiscircumstantial,notproofof
causation.Certainkeydatesarenotedhere,includingthepublicationofRichardDollandAustinBradfordHill’spaperin1950,whichfirstalertedmanymedicalprofessionalstotheassociationbetweensmokingandlungcancer.(Source:Graph
byMaayanHarel,usingdatafromtheAmericanCancerSociety,CentersforDiseaseControl,andOfficeoftheSurgeonGeneral.)
The job of science is to put supposition aside and look at the facts. In
1948, Doll and Austin Bradford Hill teamed up to see if they could learnanything about the causes of the cancer epidemic. Hill had been the chiefstatistician on a highly successful randomized controlled trial, publishedearlier that year, which had proved that streptomycin—one of the firstantibiotics—was effective against tuberculosis. The study, a landmark inmedical history, not only introduced doctors to “wonder drugs” but alsocementedthereputationofrandomizedcontrolledtrials,whichsoonbecamethestandardforclinicalresearchinepidemiology.
OfcourseHillknewthatanRCTwasimpossibleinthiscase,buthehadlearnedtheadvantagesofcomparingatreatmentgrouptoacontrolgroup.Soheproposedtocomparepatientswhohadalreadybeendiagnosedwithcancerto a control group of healthy volunteers. Each group’s members wereinterviewedontheirpastbehaviorsandmedicalhistories.Toavoidbias, theinterviewerswerenottoldwhohadcancerandwhowasacontrol.
The results of the studywere shocking: out of 649 lung cancer patientsinterviewed, all but two had been smokers. This was a statisticalimprobability so extreme thatDoll andHill couldn’t resistworking out theexactoddsagainstit:1.5millionto1.Also,thelungcancerpatientshadbeenheaviersmokersonaveragethanthecontrols,but(inaninconsistencythatR.A.Fisherwouldlaterpounceon)asmallerpercentagereportedinhalingtheirsmoke.
The type of studyDoll andHill conducted is now called a case-controlstudy because it compares “cases” (peoplewith a disease) to controls. It isclearlyanimprovementovertimeseriesdata,becauseresearcherscancontrolfor confounders like age, sex, and exposure to environmental pollutants.Nevertheless, the case-control design has some obvious drawbacks. It isretrospective; that means we study people known to have cancer and lookbackward to discoverwhy.Theprobability logic is backward too.Thedatatell us the probability that a cancer patient is a smoker instead of theprobabilitythatasmokerwillgetcancer.Itisthelatterprobabilitythatreallymatterstoapersonwhowantstoknowwhetherheshouldsmokeornot.
In addition, case-control studies admit several possible sources of bias.One of them is called recall bias: although Doll and Hill ensured that theinterviewersdidn’tknowthediagnoses, thepatientscertainlyknewwhethertheyhadcancerornot.Thiscouldhaveaffectedtheirrecollections.Anotherproblem is selection bias. Hospitalized cancer patients were in no way arepresentativesampleofthepopulation,orevenofthesmokingpopulation.
Inshort,DollandHill’sresultswereextremelysuggestivebutcouldnotbe
takenasproofthatsmokingcausescancer.Thetworesearcherswerecarefulat first to call the correlation an “association.” After dismissing severalconfounders,theyventuredastrongerassertionthat“smokingisafactor,andanimportantfactor,intheproductionofcarcinomaofthelung.”
Over the next few years, nineteen case-control studies conducted indifferentcountriesallarrivedatbasically thesameconclusion.ButasR.A.Fisher was only too happy to point out, repeating a biased study nineteentimesdoesn’tproveanything.It’sstillbiased.Fisherwrotein1957thatthesestudies “were mere repetitions of evidence of the same kind, and it isnecessary to try toexaminewhether thatkind issufficient foranyscientificconclusion.”
DollandHillrealizedthatiftherewerehiddenbiasesinthecase-controlstudies,merereplicationwouldnotovercomethem.Thus,in1951theybeganaprospectivestudy,forwhichtheysentoutquestionnairesto60,000Britishphysicians about their smoking habits and followed them forward in time.(TheAmericanCancerSocietylaunchedasimilarandlargerstudyaroundthesame time.) Even in just five years, some dramatic differences emerged.Heavysmokershadadeath rate from lungcancer twenty-four times thatofnonsmokers. In the American Cancer Society study, the results were evengrimmer:smokersdiedfromlungcancer twenty-nine timesmoreoften thannonsmokers,andheavysmokersdiedninety timesmoreoften.On theotherhand,peoplewhohadsmokedandthenstoppedreducedtheirriskbyafactoroftwo.Theconsistencyofalltheseresults—moresmokingleadstoahigherrisk of cancer, stopping leads to a lower risk—was another strong piece ofevidenceforcausality.Doctorscallita“dose-responseeffect”:ifsubstanceAcausesabiologicaleffectB,thenusually(thoughnotalways)alargerdoseofAcausesastrongerresponseB.
Nevertheless, skeptics like Fisher and Yerushalmy would not beconvinced. The prospective studies still failed to compare smokers tootherwiseidenticalnonsmokers.Infact,itisnotclearthatsuchacomparisoncan be made. Smokers are self-selecting. They may be genetically or“constitutionally”differentfromnonsmokersinanumberofways—morerisktaking,likeliertodrinkheavily.Someofthesebehaviorsmightcauseadversehealth effects that might otherwise be attributed to smoking. This was anespecially convenient argument for a skeptic to make because theconstitutionalhypothesiswasalmostuntestable.Onlyafterthesequencingofthehumangenomein2000diditbecomepossibletolookforgeneslinkedtolungcancer.(Ironically,Fisherwasprovenright,albeitinaverylimitedway:suchgenesdoexist.)However, in1959JeromeCornfield,writingwithAbe
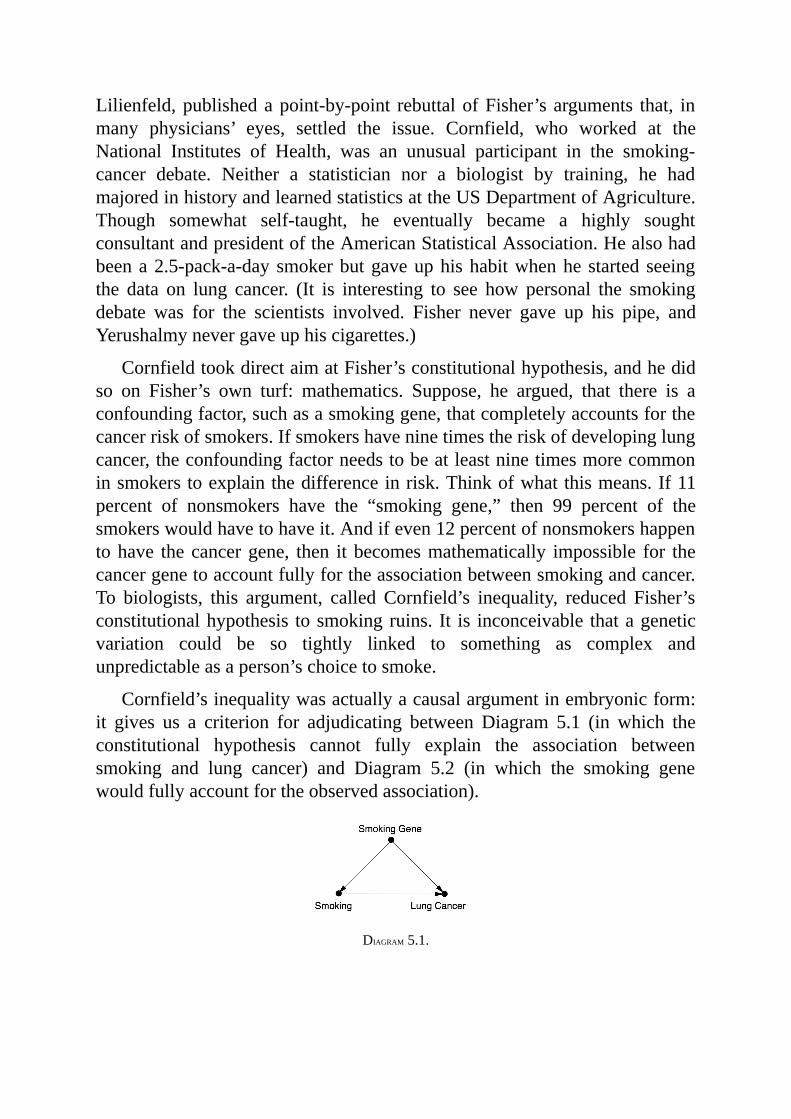
Lilienfeld,publishedapoint-by-point rebuttalofFisher’sarguments that, inmany physicians’ eyes, settled the issue. Cornfield, who worked at theNational Institutes of Health, was an unusual participant in the smoking-cancer debate. Neither a statistician nor a biologist by training, he hadmajoredinhistoryandlearnedstatisticsattheUSDepartmentofAgriculture.Though somewhat self-taught, he eventually became a highly soughtconsultantandpresidentoftheAmericanStatisticalAssociation.Healsohadbeena2.5-pack-a-day smokerbutgaveuphishabitwhenhe started seeingthe data on lung cancer. (It is interesting to see how personal the smokingdebate was for the scientists involved. Fisher never gave up his pipe, andYerushalmynevergaveuphiscigarettes.)
CornfieldtookdirectaimatFisher’sconstitutionalhypothesis,andhedidso on Fisher’s own turf: mathematics. Suppose, he argued, that there is aconfoundingfactor,suchasasmokinggene,thatcompletelyaccountsforthecancerriskofsmokers.Ifsmokershaveninetimestheriskofdevelopinglungcancer,theconfoundingfactorneedstobeatleastninetimesmorecommoninsmokerstoexplainthedifferenceinrisk.Thinkofwhatthismeans.If11percent of nonsmokers have the “smoking gene,” then 99 percent of thesmokerswouldhavetohaveit.Andifeven12percentofnonsmokershappentohave the cancergene, then it becomesmathematically impossible for thecancergenetoaccountfullyfortheassociationbetweensmokingandcancer.To biologists, this argument, called Cornfield’s inequality, reduced Fisher’sconstitutionalhypothesis tosmokingruins. It is inconceivable thatageneticvariation could be so tightly linked to something as complex andunpredictableasaperson’schoicetosmoke.
Cornfield’sinequalitywasactuallyacausalargumentinembryonicform:it gives us a criterion for adjudicating between Diagram 5.1 (in which theconstitutional hypothesis cannot fully explain the association betweensmoking and lung cancer) and Diagram 5.2 (in which the smoking genewouldfullyaccountfortheobservedassociation).
DIAGRAM5.1.
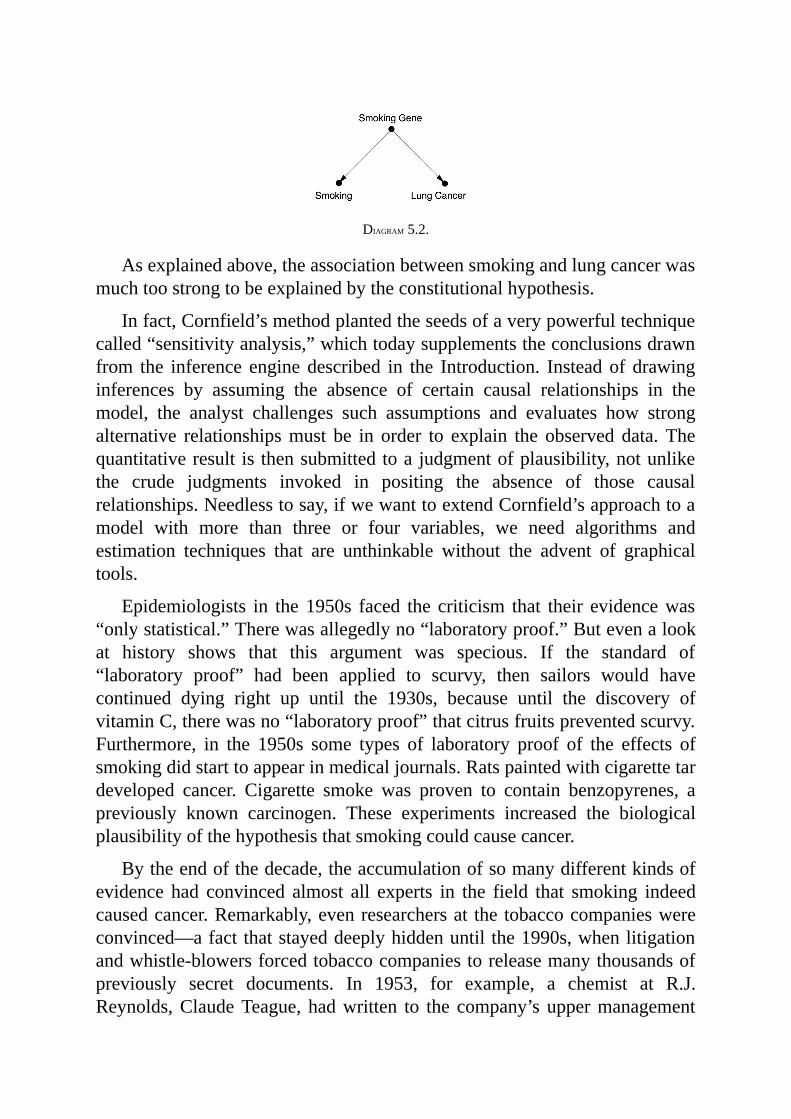
DIAGRAM5.2.
Asexplainedabove,theassociationbetweensmokingandlungcancerwasmuchtoostrongtobeexplainedbytheconstitutionalhypothesis.
Infact,Cornfield’smethodplantedtheseedsofaverypowerfultechniquecalled“sensitivityanalysis,”whichtodaysupplementstheconclusionsdrawnfrom the inference enginedescribed in the Introduction. Insteadof drawinginferences by assuming the absence of certain causal relationships in themodel, the analyst challenges such assumptions and evaluates how strongalternative relationshipsmust be in order to explain the observed data.Thequantitativeresult is thensubmittedtoa judgmentofplausibility,notunlikethe crude judgments invoked in positing the absence of those causalrelationships.Needlesstosay,ifwewanttoextendCornfield’sapproachtoamodel with more than three or four variables, we need algorithms andestimation techniques that are unthinkable without the advent of graphicaltools.
Epidemiologists in the1950s faced the criticism that their evidencewas“onlystatistical.”Therewasallegedlyno“laboratoryproof.”Butevenalookat history shows that this argument was specious. If the standard of“laboratory proof” had been applied to scurvy, then sailors would havecontinued dying right up until the 1930s, because until the discovery ofvitaminC,therewasno“laboratoryproof”thatcitrusfruitspreventedscurvy.Furthermore, in the 1950s some types of laboratory proof of the effects ofsmokingdidstarttoappearinmedicaljournals.Ratspaintedwithcigarettetardeveloped cancer. Cigarette smoke was proven to contain benzopyrenes, apreviously known carcinogen. These experiments increased the biologicalplausibilityofthehypothesisthatsmokingcouldcausecancer.
Bytheendofthedecade,theaccumulationofsomanydifferentkindsofevidence had convinced almost all experts in the field that smoking indeedcausedcancer.Remarkably,evenresearchersat the tobaccocompanieswereconvinced—afactthatstayeddeeplyhiddenuntil the1990s,whenlitigationandwhistle-blowersforcedtobaccocompaniestoreleasemanythousandsofpreviously secret documents. In 1953, for example, a chemist at R.J.Reynolds,ClaudeTeague, hadwritten to the company’suppermanagement
that tobaccowas “an important etiologic factor in the induction of primarycancer of the lung,” nearly a word-for-word repetition of Hill and Doll’sconclusion.
Inpublic,thecigarettecompaniessangadifferenttune.InJanuary1954,the leading tobaccocompanies (includingReynolds)publishedanationwidenewspaper advertisement, “A Frank Statement to Cigarette Smokers,” thatsaid,“Webelievetheproductswemakearenotinjurioustohealth.Wealwayshave and always will cooperate closely with those whose task it is tosafeguard the public health.” In a speech given in March 1954, GeorgeWeissman,vicepresidentofPhilipMorrisandCompany,said,“Ifwehadanythoughtorknowledgethat inanywayweweresellingaproductharmful toconsumers,wewouldstopbusinesstomorrow.”Sixtyyearslater,wearestillwaitingforPhilipMorristokeepthatpromise.
This brings us to the saddest episode in the whole smoking-cancercontroversy: the deliberate efforts of the tobacco companies to deceive thepublicaboutthehealthrisks.IfNatureislikeageniethatanswersaquestiontruthfullybutonlyexactlyasitisasked,imaginehowmuchmoredifficultitisforscientiststofaceanadversarythatintendstodeceiveus.Thecigarettewarswerescience’sfirstconfrontationwithorganizeddenialism,andnoonewas prepared. The tobacco companies magnified any shred of scientificcontroversy they could. They set up their own Tobacco Industry ResearchCommittee,afrontorganizationthatgavemoneytoscientiststostudyissuesrelated to cancer or tobacco—but somehownever got around to the centralquestion. When they could find legitimate skeptics of the smoking-cancerconnection—such as R. A. Fisher and Jacob Yerushalmy—the tobaccocompaniespaidthemconsultingfees.
ThecaseofFisherisparticularlysad.Ofcourse,skepticismhasitsplace.Statisticiansarepaid tobeskeptics; theyare theconscienceof science.Butthereisadifferencebetweenreasonableandunreasonableskepticism.Fishercrossed that line and then some.Alwaysunable to admithisownmistakes,and surely influenced by his lifetime pipe-smoking habit, he could notacknowledgethatthetideofevidencehadturnedagainsthim.Hisargumentsbecamedesperate.HeseizedononecounterintuitiveresultinDollandHill’sfirst paper—the finding (which barely reached the level of statisticalsignificance) that lung cancer patients described themselves as inhalers lessoften than the controls—and would not let it go. None of the subsequentstudiesfoundanysucheffect.AlthoughFisherknewaswellasanybodythat“statisticallysignificant”resultssometimesfailtobereplicated,heresortedtomockery.Hearguedthattheirstudyhadshowedthatinhalingcigarettesmoke
might be beneficial and called for further research on this “extremelyimportantpoint.”Perhaps theonlypositive thingwecan sayaboutFisher’sroleinthedebateisthatitisveryunlikelythattobaccomoneycorruptedhiminanyway.Hisownobstinacywassufficient.
For all these reasons, the link between smoking and cancer remainedcontroversial in the public mind long after it had ended amongepidemiologists. Even doctors, who should have been more attuned to thescience, remained unconvinced: a poll conducted by the American CancerSocietyin1960showedthatonlyathirdofAmericandoctorsagreedwiththestatementthatsmokingwas“amajorcauseoflungcancer,”and43percentofdoctorswerethemselvessmokers.
While we may justly blame Fisher for his obduracy and the tobaccocompaniesfortheirdeliberatedeception,wemustalsoacknowledgethatthescientificcommunitywaslaboringinanideologicalstraightjacket.Fisherhadbeenrighttopromoterandomizedcontrolledtrialsasahighlyeffectivewaytoassessacausaleffect.However,heandhisfollowersfailedtorealizethatthereismuchwecanlearnfromobservationalstudies.Thatisthebenefitofacausalmodel: it leverages the experimenter’s scientific knowledge. Fisher’smethodsassumethattheexperimenterbeginswithnopriorknowledgeoforopinions about the hypothesis to be tested. They impose ignorance on thescientist,asituationthatthedenialistseagerlytookadvantageof.
Because scientistshadnostraightforwarddefinitionof theword“cause”andnowaytoascertainacausaleffectwithoutarandomizedcontrolledtrial,theywereillpreparedforadebateoverwhethersmokingcausedcancer.Theywereforced to fumble theirway towardadefinition inaprocess that lastedthroughoutthe1950sandreachedadramaticconclusionin1964.
THESURGEONGENERAL’SCOMMISSIONANDHILL’SCRITERIA
The paper by Cornfield and Lilienfeld had paved the way for a definitivestatement by health authorities about the effects of smoking. The RoyalCollegeofPhysiciansintheUnitedKingdomtookthelead,issuingareportin1962concludingthatcigarettesmokingwasacausativeagentinlungcancer.Shortly thereafter,USSurgeonGeneral Luther Terry (quite possibly on theurging of President John F.Kennedy) announced his intention to appoint aspecialadvisorycommitteetostudythematter(seeFigure5.3).
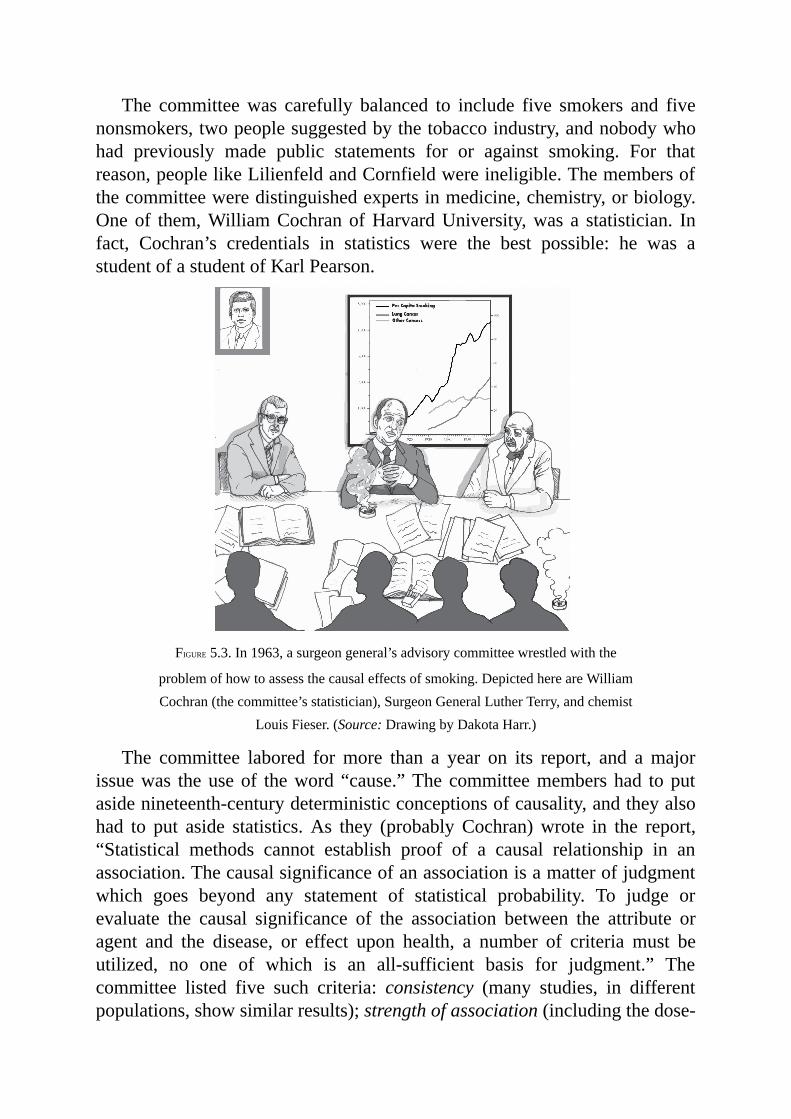
The committeewas carefully balanced to include five smokers and fivenonsmokers,twopeoplesuggestedbythetobaccoindustry,andnobodywhohad previously made public statements for or against smoking. For thatreason,peoplelikeLilienfeldandCornfieldwereineligible.Themembersofthecommitteeweredistinguishedexpertsinmedicine,chemistry,orbiology.Oneof them,WilliamCochranofHarvardUniversity,was a statistician. Infact, Cochran’s credentials in statistics were the best possible: he was astudentofastudentofKarlPearson.
FIGURE5.3.In1963,asurgeongeneral’sadvisorycommitteewrestledwiththe
problemofhowtoassessthecausaleffectsofsmoking.DepictedhereareWilliamCochran(thecommittee’sstatistician),SurgeonGeneralLutherTerry,andchemist
LouisFieser.(Source:DrawingbyDakotaHarr.)
The committee labored formore than a year on its report, and amajorissuewas theuseof theword“cause.”Thecommitteemembershad toputasidenineteenth-centurydeterministicconceptionsofcausality,andtheyalsohad to put aside statistics.As they (probablyCochran)wrote in the report,“Statistical methods cannot establish proof of a causal relationship in anassociation.Thecausalsignificanceofanassociationisamatterofjudgmentwhich goes beyond any statement of statistical probability. To judge orevaluate the causal significance of the association between the attribute oragent and the disease, or effect upon health, a number of criteria must beutilized, no one of which is an all-sufficient basis for judgment.” Thecommittee listed five such criteria: consistency (many studies, in differentpopulations,showsimilarresults);strengthofassociation(includingthedose-
responseeffect:moresmokingisassociatedwithahigherrisk);specificityoftheassociation (a particular agent should have a particular effect and not along litany of effects); temporal relationship (the effect should follow thecause); and coherence (biological plausibility and consistency with othertypesofevidencesuchaslaboratoryexperimentsandtimeseries).
In1965,AustinBradfordHill,whowasnotonthecommittee,attemptedto summarize the arguments in away that could be applied to other publichealthproblemsandaddedfourmorecriteriatothelist;asaresult,thewholelist of nine criteria have become known as “Hill’s criteria.” Actually Hillcalledthem“viewpoints,”notrequirements,andemphasizedthatanyofthemmight be lacking in any particular case. “None ofmy nine viewpoints canbring indisputable evidence for or against the cause-and-effect hypothesis,andnonecanberequiredasasinequanon,”hewrote.
Indeed, it is quite easy to find arguments against each of the criteria oneitherHill’slistortheadvisorycommittee’sshorterlist.Consistencybyitselfproves nothing; if thirty studies each ignore the same confounder, all caneasilybebiased.Strengthofassociationisvulnerableforthesamereason;aspointedoutearlier,children’sshoesizesarestronglyassociatedwithbutnotcausally related to their reading aptitude. Specificity has always been aparticularlycontroversialcriterion.Itmakessenseinthecontextofinfectiousdisease, where one agent typically produces one illness, but less so in thecontextof environmental exposure.Smoking leads toan increased riskof avariety of other diseases, such as emphysema and cardiovascular disease.Doesthisreallyweakentheevidencethatitcausescancer?Temporalrelationhassomeexceptions,asmentionedbefore—forexample,aroostercrowdoesnot cause the sun to rise, even though it always precedes the sun. Finally,coherence with established theory or facts is certainly desirable, but thehistoryofscience is filledwithoverturned theoriesandmistaken laboratoryfindings.
Hill’s “viewpoints” are still useful as a description of how a disciplinecomes to accept a causal hypothesis, using a variety of evidence, but theycame with no methodology to implement them. For example, biologicalplausibility and consistency with experiments are supposedly good things.Buthow,precisely,arewesupposedtoweighthesekindsofevidence?Howdowebringpreexistingknowledgeintothepicture?Apparentlyeachscientistjust has to decide for him- or herself. But gut decisions can be wrong,especiallyiftherearepoliticalpressuresormonetaryconsiderationsorifthescientistisaddictedtothesubstancebeingstudied.

None of these comments is intended to denigrate the work of thecommittee. Its members did the best they could in an environment thatprovidedthemwithnomechanismfordiscussingcausality.Theirrecognitionthatnonstatisticalcriteriawerenecessarywasagreat step forward.And thedifficultpersonaldecisionsthatthesmokersonthecommitteemadeattesttothe seriousnessof their conclusions.LutherTerry,whohadbeenacigarettesmoker, switched to a pipe. Leonard Schuman announced that he wasquitting. William Cochran acknowledged that he could reduce his risk ofcancerbyquittingbutfelt thatthe“comfortofmycigarettes”wassufficientcompensation for the risk. Most painfully, Louis Fieser, a four-pack-a-daysmoker,wasdiagnosedwithlungcancerlessthanayearafterthereport.Hewrotetothecommittee,“Youmayrecallthatalthoughfullyconvincedbytheevidence, I continued heavy smoking throughout the deliberations of ourcommitteeand invokedall theusualexcuses.…Mycaseseemstomemoreconvincingthananystatistics.”Minusonelung,hefinallystoppedsmoking.
Viewed from theperspectiveof publichealth, the report of the advisorycommittee was a landmark. Within two years, Congress had requiredmanufacturers to place health warnings on all cigarette packs. In 1971,cigarette advertisements were banned from radio and television. ThepercentageofUSadultswhosmokedeclined fromitsall-timemaximumof45percent in1965 to19.3percent in2010.Theantismokingcampaignhasbeen one of the largest and most successful, though painfully slow andincomplete,publichealthinterventionsinhistory.Thecommittee’sworkalsoprovidedavaluabletemplateforachievingscientificconsensusandservedasa model for future surgeon general’s reports on smoking and many othertopics in the years to come (including secondhand smoke,which became amajorissueinthe1980s).
Viewedfromtheperspectiveofcausality,thereportwasatbestamodestsuccess. It clearly established the gravity of causal questions and that dataalone could not answer them. But as a roadmap for future discovery, itsguidelines were uncertain and flimsy. Hill’s criteria are best read as ahistoricaldocument,summarizingthetypesofevidencethathademergedinthe1950s,andultimatelyconvincedthemedicalcommunity.Butasaguidetofutureresearch,theyareinadequate.Forallbutthebroadestcausalquestions,we need a more precise instrument. In retrospect, Cornfield’s inequality,whichplantedtheseedsofsensitivityanalysis,wasastepinthatdirection.
SMOKINGFORNEWBORNS
Even after the smoking and cancer debate died down, one major paradoxlingered. In the mid-1960s, Jacob Yerushalmy pointed out that a mother’ssmokingduringpregnancyseemedtobenefitthehealthofhernewbornbaby,if thebabyhappened tobebornunderweight.Thispuzzle, called thebirth-weight paradox, flew in the face of the emergingmedical consensus aboutsmoking and was not satisfactorily explained until 2006—more than fortyyearsafterYerushalmy’soriginalpaper.Iamabsolutelyconvincedittooksolongbecausethelanguageofcausalitywasnotavailablefrom1960to1990.
In 1959,Yerushalmy had launched a long-term public health study thatcollected pre- and postnatal data on more than 15,000 children in the SanFrancisco Bay Area. The data included information on mothers’ smokinghabits,aswellas thebirthweightsandmortalityratesof theirbabies in thefirstmonthoflife.
Several studies had already shown that the babies of smoking mothersweighed less atbirthonaverage than thebabiesofnonsmokers, and itwasnatural to suppose that this would translate to poorer survival. Indeed, anationwide study of low-birth-weight infants (defined as those who weighlessthan5.5poundsatbirth)hadshownthattheirdeathratewasmorethantwenty times higher than that of normal-birth-weight infants. Thus,epidemiologistspositedachainofcausesandeffects:Smoking LowBirthWeight Mortality.
WhatYerushalmyfound in thedatawasunexpectedeven tohim. Itwastrue that the babies of smokers were lighter on average than the babies ofnonsmokers (by seven ounces). However, the low-birth-weight babies ofsmokingmothershadabettersurvivalratethanthoseofnonsmokers.Itwasasifthemother’ssmokingactuallyhadaprotectiveeffect.
If Fisher had discovered something like this, he probably would haveloudly proclaimed it as one of the benefits of smoking.Yerushalmy, to hiscredit,didnot.Hewrote,muchmorecautiously,“Theseparadoxicalfindingsraisedoubtsandargueagainst thepropositionthatcigarettesmokingactsasan exogenous factor which interferes with intrauterine development of thefetus.”Inshort,thereisnocausalpathfromSmokingtoMortality.
ModernepidemiologistsbelievethatYerushalmywaswrong.Mostbelievethat smoking does increase neonatal mortality—for example, because itinterfereswithoxygentransferacrosstheplacenta.Buthowcanwereconcilethishypothesiswiththedata?
Statisticians and epidemiologists insisted on analyzing the paradox in
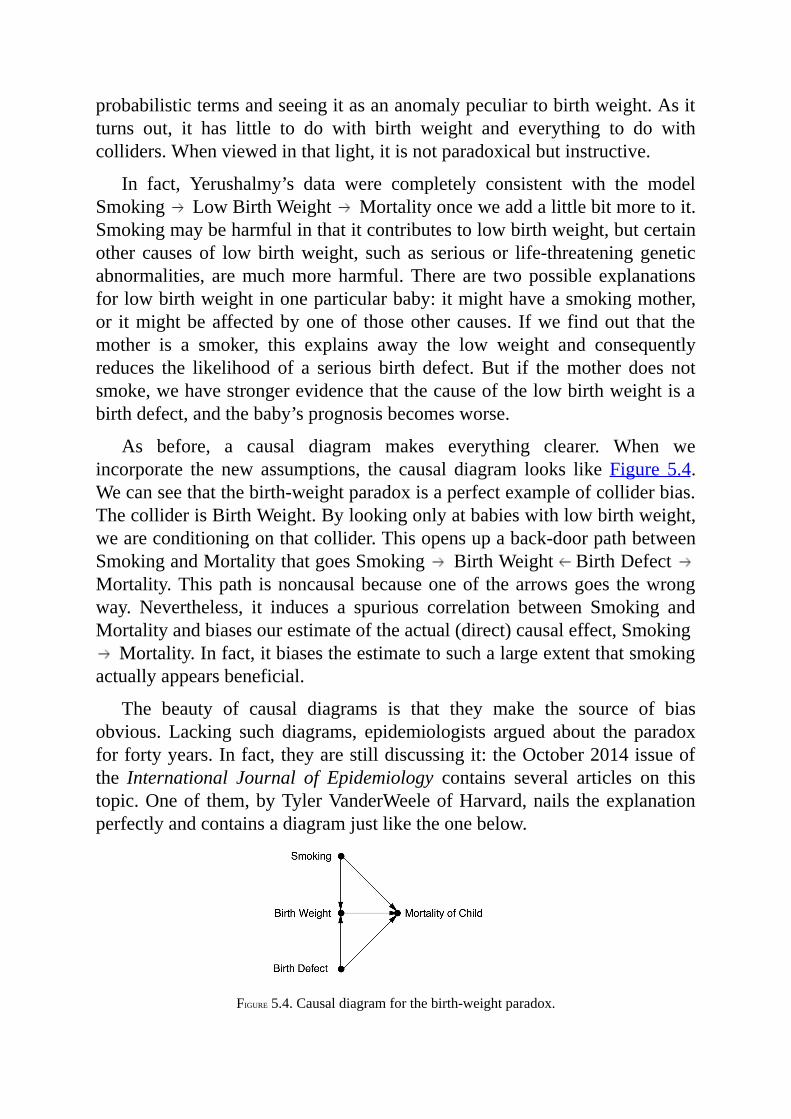
probabilistictermsandseeingitasananomalypeculiartobirthweight.Asitturns out, it has little to do with birth weight and everything to do withcolliders.Whenviewedinthatlight,itisnotparadoxicalbutinstructive.
In fact, Yerushalmy’s data were completely consistent with the modelSmoking LowBirthWeight Mortalityonceweaddalittlebitmoretoit.Smokingmaybeharmfulinthatitcontributestolowbirthweight,butcertainother causesof lowbirthweight, such as seriousor life-threateninggeneticabnormalities, aremuchmoreharmful.There are twopossible explanationsforlowbirthweightinoneparticularbaby:itmighthaveasmokingmother,or itmightbeaffectedbyoneof thoseothercauses. Ifwe findout that themother is a smoker, this explains away the low weight and consequentlyreduces the likelihood of a serious birth defect. But if themother does notsmoke,wehavestrongerevidencethatthecauseofthelowbirthweightisabirthdefect,andthebaby’sprognosisbecomesworse.
As before, a causal diagram makes everything clearer. When weincorporate the new assumptions, the causal diagram looks like Figure 5.4.Wecanseethatthebirth-weightparadoxisaperfectexampleofcolliderbias.ThecolliderisBirthWeight.Bylookingonlyatbabieswithlowbirthweight,weareconditioningonthatcollider.Thisopensupaback-doorpathbetweenSmokingandMortalitythatgoesSmoking BirthWeight BirthDefectMortality.Thispath isnoncausalbecauseoneof thearrowsgoes thewrongway. Nevertheless, it induces a spurious correlation between Smoking andMortalityandbiasesourestimateoftheactual(direct)causaleffect,SmokingMortality.Infact,itbiasestheestimatetosuchalargeextentthatsmoking
actuallyappearsbeneficial.
The beauty of causal diagrams is that they make the source of biasobvious. Lacking such diagrams, epidemiologists argued about the paradoxforfortyyears.Infact,theyarestilldiscussingit:theOctober2014issueofthe International Journal of Epidemiology contains several articles on thistopic.Oneof them,byTylerVanderWeeleofHarvard,nails theexplanationperfectlyandcontainsadiagramjustliketheonebelow.
FIGURE5.4.Causaldiagramforthebirth-weightparadox.

Ofcourse,thisdiagramislikelytoosimpletocapturethefullstorybehindsmoking,birthweight,andinfantmortality.However,theprincipleofcolliderbias is robust. In this case the bias was detected because the apparentphenomenon was too implausible, but just imagine how many cases ofcolliderbiasgoundetectedbecausethebiasdoesnotconflictwiththeory.
PASSIONATEDEBATES:SCIENCEVS.CULTURE
After Ibeganworkon thischapter, Ihadoccasion tocontactAllenWilcox,theepidemiologistprobablymostidentifiedwiththisparadox.HehasaskedaveryinconvenientquestionaboutthediagraminFigure5.4:Howdoweknowthat low birth weight is actually a direct cause of mortality? In fact, hebelievesthatdoctorshavemisinterpretedlowbirthweightallalong.Becauseitisstronglyassociatedwithinfantmortality,doctorshaveinterpreteditasacause. In fact, that association could be due entirely to confounders(represented by “Birth Defect” in Figure 5.4, though Wilcox is not sospecific).
TwopointsareworthmakingaboutWilcox’sargument.First,evenifwedelete the arrow BirthWeight Mortality, the collider remains. Thus thecausal diagram continues to account for the birth-weight paradoxsuccessfully.Second,thecausalvariablethatWilcoxhasstudiedthemostisnotsmokingbutrace.Andracestillincitespassionatedebateinoursociety.
In fact, the same birth-weight paradox is observed in children of blackmothers as in childrenof smokers.Blackwomengive birth to underweightbabies more often than white women do, and their babies have a highermortality rate. Yet their low-birth-weight babies have a better survival ratethan the low-birth-weight babies of white women. Now what conclusionsshouldwedraw?Wecantellapregnantsmokerthatshewouldhelpherbabybystoppingsmoking.Butwecan’ttellapregnantblackwomantostopbeingblack.
Instead,we should address the societal issues that cause the children ofblack mothers to have a higher mortality rate. This is surely not acontroversialstatement.Butwhatcausesshouldweaddress,andhowshouldwemeasureourprogress?Forbetterorforworse,manyadvocatesforracialjusticehaveassumedbirthweightasanintermediatestepinthechainRaceBirthWeight Mortality.Notonly that, theyhave takenbirthweight as aproxy for infant mortality, assuming that improvements in the one willautomaticallyleadtoimprovementsintheother.It’seasytounderstandwhy
theydid this.Measurementsofaveragebirthweightsareeasier tocomebythanmeasurementsofinfantmortality.
NowimaginewhathappenswhensomeonelikeWilcoxcomesalongandasserts that lowbirthweightby itself isnotamedicalconditionandhasnocausal relation to infantmortality. Itupsets theentireapplecart.Wilcoxwasaccusedofracismwhenhefirstsuggestedthisideabackinthe1970s,andhedidn’t dare to publish it until 2001. Even then, two commentariesaccompaniedhisarticle,andoneof thembroughtup the race issue:“In thecontext of a society whose dominant elements justify their positions byarguingthegeneticinferiorityofthosetheydominate,itishardtobeneutral,”wroteRichardDavidofCookCountyHospitalinChicago.“Inthepursuitof‘purescience’awell-meaninginvestigatormaybeperceivedas—andmaybe—aidingandabettingasocialorderheabhors.”
This harsh accusation, conceived out of the noblest of motivations, issurely not the first instance in which a scientist has been reprimanded forelucidatingtruthsthatmighthaveadversesocialconsequences.TheVatican’sobjections to Galileo’s ideas surely arose out of genuine concerns for thesocial order of the time. The same can be said about Charles Darwin’sevolution and Francis Galton’s eugenics. However, the cultural shocks thatemanate from new scientific findings are eventually settled by culturalrealignments that accommodate those findings—not by concealment. Aprerequisite for this realignment is that we sort out the science from theculturebeforeopinionsbecomeinflamed.Fortunately,thelanguageofcausaldiagramsnowgivesusawaytobedispassionateaboutcausesandeffectsnotonlywhenitiseasybutalsowhenitishard.
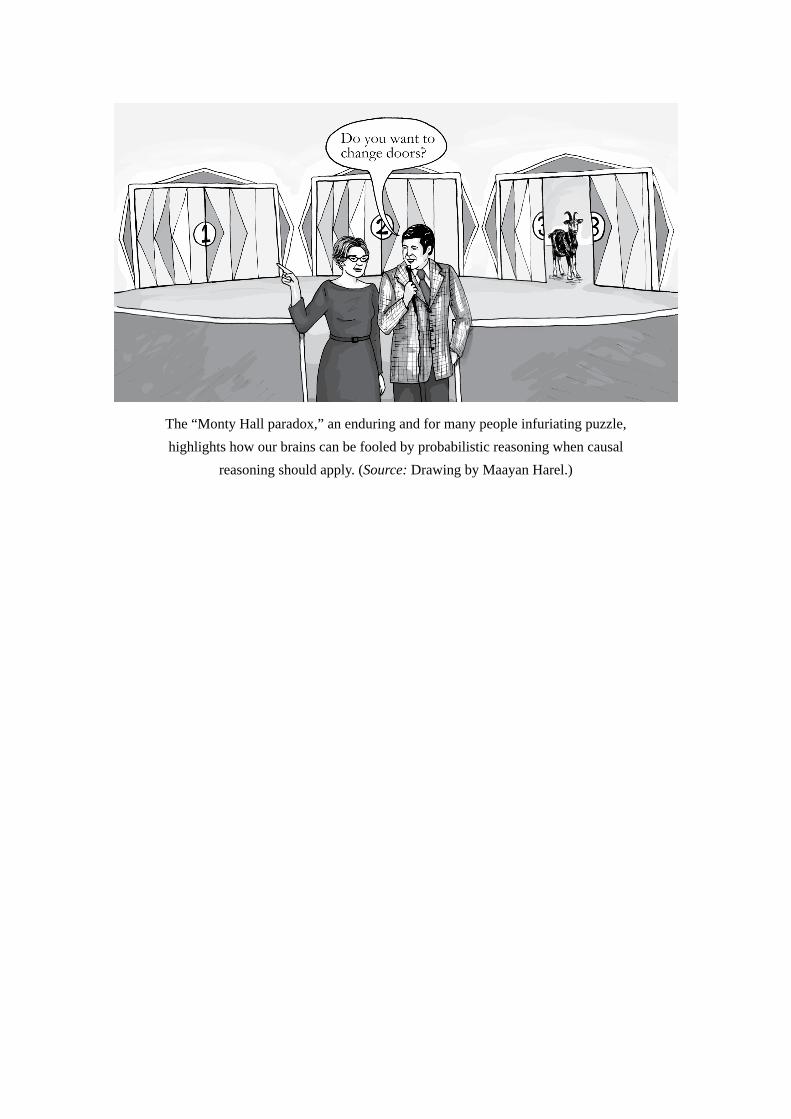
The“MontyHallparadox,”anenduringandformanypeopleinfuriatingpuzzle,highlightshowourbrainscanbefooledbyprobabilisticreasoningwhencausal
reasoningshouldapply.(Source:DrawingbyMaayanHarel.)
6
PARADOXESGALORE!
Hewhoconfrontstheparadoxicalexposeshimselftoreality.
—FRIEDRICHDÜRRENMATT(1962)
THE birth-weight paradox, with which we ended Chapter 5, isrepresentative of a surprisingly large class of paradoxes that reflect thetensionsbetween causation and association.The tension starts because theystandontwodifferentrungsoftheLadderofCausationandisaggravatedbythefactthathumanintuitionoperatesunderthelogicofcausation,whiledataconform to the logicofprobabilities andproportions.Paradoxesarisewhenwemisapplytheruleswehavelearnedinonerealmtotheother.
Wearegoingtodevoteachapter tosomeof themostbafflingandwell-knownparadoxesinprobabilityandstatisticsbecause,firstofall,they’refun.If you haven’t seen theMontyHall andSimpson’s paradoxes before, I canpromisethattheywillgiveyourbrainaworkout.Andevenifyouthinkyouknowall about them, I think that youwill enjoyviewing them through thelensofcausality,whichmakeseverythinglookquiteabitdifferent.
However,we study paradoxes not just because they are fun and games.Likeopticalillusions,theyalsorevealthewaythebrainworks,theshortcutsittakes,andthethingsitfindsconflicting.Causalparadoxesshineaspotlightonto patterns of intuitive causal reasoning that clash with the logic ofprobabilityandstatistics.To theextent that statisticianshavestruggledwiththem—andwe’llseethattheywhiffedratherbadly—it’sawarningsignthatsomethingmightbeamisswithviewingtheworldwithoutacausallens.
THEPERPLEXINGMONTYHALLPROBLEM
Inthelate1980s,awriternamedMarilynvosSavantstartedaregularcolumninParademagazine,aweeklysupplementtotheSundaynewspaperinmanyUScities.Hercolumn,“AskMarilyn,”continuestothisdayandfeaturesheranswerstovariouspuzzles,brainteasers,andscientificquestionssubmittedbyreaders. The magazine billed her as “the world’s smartest woman,” whichundoubtedlymotivatedreaderstocomeupwithaquestionthatwouldstumpher.
Ofall thequestionssheeveranswered,nonecreatedagreaterfuror thanthisone,whichappearedinacolumninSeptember1990:“Supposeyou’reonagameshow,andyou’regiventhechoiceofthreedoors.Behindonedoorisacar, behind the others, goats. You pick a door, say #1, and the host, whoknowswhat’sbehindthedoors,opensanotherdoor,say#3,whichhasagoat.He says to you, ‘Do youwant to pick door #2?’ Is it to your advantage toswitchyourchoiceofdoors?”
For American readers, the question was obviously based on a populartelevisedgameshowcalledLet’sMakeaDeal,whosehost,MontyHall,usedtoplaypreciselythissortofmindgamewiththecontestants.Inheranswer,vos Savant argued that contestants should switch doors. By not switching,they would have only a one-in-three probability of winning; by switching,theywoulddoubletheirchancestotwointhree.
Eventhesmartestwomanintheworldcouldneverhaveanticipatedwhathappened next. Over the next fewmonths, she received more than 10,000letters from readers,most of themdisagreeingwith her, andmany of themfrompeoplewhoclaimedtohavePhDsinmathematicsorstatistics.Asmallsampleofthecommentsfromacademicsincludes“Youblewit,andyoublewit big!” (Scott Smith, PhD); “May I suggest that you obtain and refer to astandard textbookonprobabilitybeforeyoutry toansweraquestionof thistypeagain?”(CharlesReid,PhD);“Youblewit!” (RobertSachs,PhD);and“You are utterly incorrect” (RayBobo, PhD). In general, the critics arguedthatitshouldn’tmatterwhetheryouswitchdoorsornot—thereareonlytwodoorsleftinthegame,andyouhavechosenyourdoorcompletelyatrandom,sotheprobabilitythatthecarisbehindyourdoormustbeone-halfeitherway.
Whowasright?Whowaswrong?Andwhydoestheproblemincitesuchpassion?Allthreequestionsdeservecloserexamination.
Let’stakealookfirstathowvosSavantsolvedthepuzzle.Hersolutionisactually astounding in its simplicity and more compelling than any I have

seen in many textbooks. She made a list (Table 6.1) of the three possiblearrangements of doors and goats, along with the corresponding outcomesunder the“Switch” strategyand the“Stay” strategy.All threecasesassumethat you picked Door 1. Because all three possibilities listed are (initially)equally likely, the probability ofwinning if you switch doors is two-thirds,and the probability of winning if you stay with Door 1 is only one-third.NoticethatvosSavant’stabledoesnotexplicitlystatewhichdoorwasopenedbythehost.Thatinformationisimplicitlyembeddedincolumns4and5.Forexample,inthesecondrow,wekeptinmindthatthehostmustopenDoor3;thereforeswitchingwilllandyouonDoor2,awin.Similarly,inthefirstrow,the door opened could be either Door 2 or Door 3, but column 4 statescorrectlythatyouloseineithercaseifyouswitch.
Eventoday,manypeopleseeingthepuzzleforthefirsttimefindtheresulthard to believe.Why?What intuitive nerve is jangled? There are probably10,000differentreasons,oneforeachreader,butIthinkthemostcompellingargumentisthis:vosSavant’ssolutionseemstoforceustobelieveinmentaltelepathy. If I should switchnomatterwhat door I originally chose, then itmeans that the producers somehow read my mind. How else could theyposition the car so that it is more likely to be behind the door I did notchoose?
TABLE6.1.ThethreepossiblearrangementsofdoorsandgoatsinLet’sMakeaDeal,showingthatswitchingdoorsistwiceasattractiveasnot.
The key element in resolving this paradox is that we need to take intoaccountnotonlythedata(i.e.,thefactthatthehostopenedaparticulardoor)butalso thedata-generatingprocess—inotherwords, therulesof thegame.Theytellussomethingaboutthedatathatcouldhavebeenbuthasnotbeenobserved. No wonder statisticians in particular found this puzzle hard tocomprehend. They are accustomed to, as R. A. Fisher (1922) put it, “thereductionofdata”andignoringthedata-generatingprocess.
Forstarters,let’strychangingtherulesofthegameabitandseehowthataffectsourconclusion.Imagineanalternativegameshow,calledLet’sFakeaDeal,whereMontyHallopensoneof the twodoorsyoudidn’tchoose,but
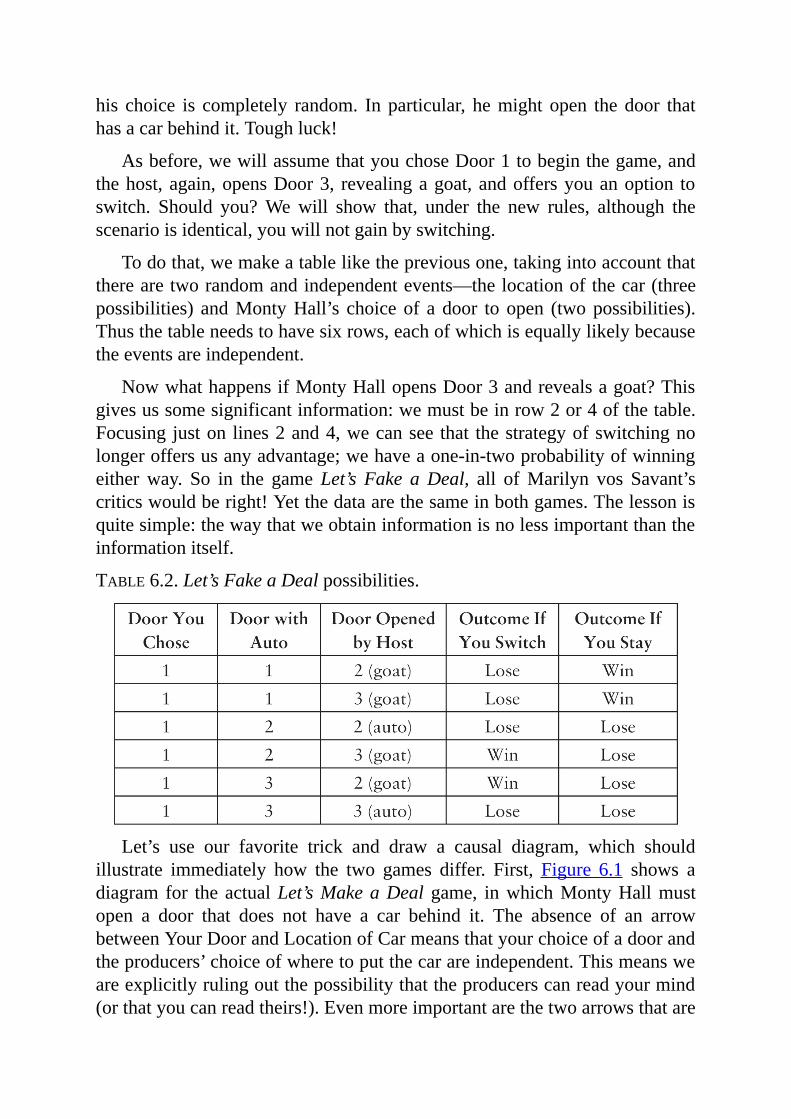
his choice is completely random. Inparticular, hemight open thedoor thathasacarbehindit.Toughluck!
Asbefore,wewillassumethatyouchoseDoor1tobeginthegame,andthehost,again,opensDoor3, revealingagoat,andoffersyouanoption toswitch. Should you?Wewill show that, under the new rules, although thescenarioisidentical,youwillnotgainbyswitching.
Todothat,wemakeatablelikethepreviousone,takingintoaccountthattherearetworandomandindependentevents—thelocationofthecar(threepossibilities) andMontyHall’s choiceof a door toopen (twopossibilities).Thusthetableneedstohavesixrows,eachofwhichisequallylikelybecausetheeventsareindependent.
NowwhathappensifMontyHallopensDoor3andrevealsagoat?Thisgivesussomesignificantinformation:wemustbeinrow2or4ofthetable.Focusing juston lines2and4,wecansee that thestrategyofswitchingnolongeroffersusanyadvantage;wehaveaone-in-twoprobabilityofwinningeitherway. So in the gameLet’s Fake aDeal, all ofMarilyn vos Savant’scriticswouldberight!Yetthedataarethesameinbothgames.Thelessonisquitesimple:thewaythatweobtaininformationisnolessimportantthantheinformationitself.
TABLE6.2.Let’sFakeaDealpossibilities.
Let’s use our favorite trick and draw a causal diagram, which shouldillustrate immediately how the two games differ. First, Figure 6.1 shows adiagramfor theactualLet’sMakeaDeal game, inwhichMontyHallmustopen a door that does not have a car behind it. The absence of an arrowbetweenYourDoorandLocationofCarmeansthatyourchoiceofadoorandtheproducers’choiceofwheretoputthecarareindependent.Thismeansweareexplicitlyrulingoutthepossibilitythattheproducerscanreadyourmind(orthatyoucanreadtheirs!).Evenmoreimportantarethetwoarrowsthatare
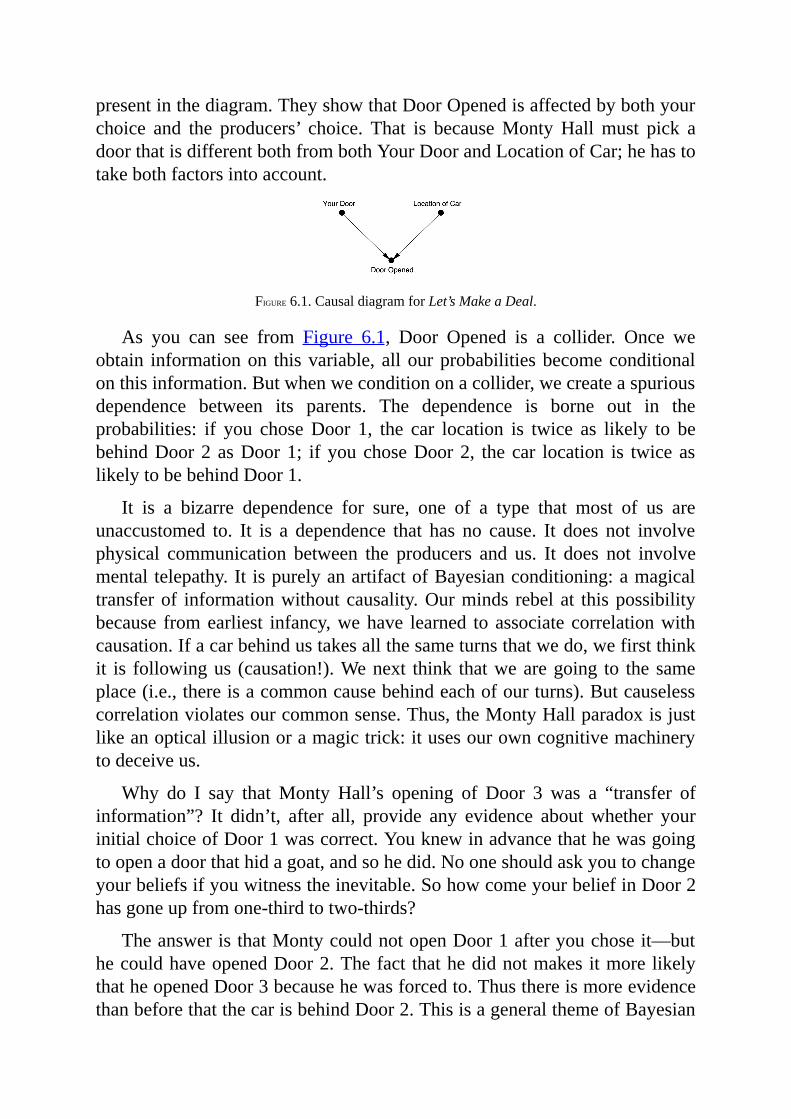
presentinthediagram.TheyshowthatDoorOpenedisaffectedbybothyourchoice and the producers’ choice. That is becauseMontyHallmust pick adoorthatisdifferentbothfrombothYourDoorandLocationofCar;hehastotakebothfactorsintoaccount.
FIGURE6.1.CausaldiagramforLet’sMakeaDeal.
As you can see from Figure 6.1, Door Opened is a collider. Once weobtain informationon thisvariable, allourprobabilitiesbecomeconditionalonthisinformation.Butwhenweconditiononacollider,wecreateaspuriousdependence between its parents. The dependence is borne out in theprobabilities: if you choseDoor 1, the car location is twice as likely to bebehindDoor2asDoor1; ifyouchoseDoor2, thecar location is twiceaslikelytobebehindDoor1.
It is a bizarre dependence for sure, one of a type that most of us areunaccustomed to. It is a dependence that has no cause. It does not involvephysical communication between the producers and us. It does not involvementaltelepathy.It ispurelyanartifactofBayesianconditioning:amagicaltransferof informationwithoutcausality.Ourminds rebelat thispossibilitybecause fromearliest infancy,wehave learned toassociate correlationwithcausation.Ifacarbehindustakesallthesameturnsthatwedo,wefirstthinkit is followingus (causation!).Wenext think thatwearegoing to thesameplace(i.e.,thereisacommoncausebehindeachofourturns).Butcauselesscorrelationviolatesourcommonsense.Thus,theMontyHallparadoxisjustlikeanopticalillusionoramagictrick:itusesourowncognitivemachinerytodeceiveus.
Why do I say thatMonty Hall’s opening of Door 3 was a “transfer ofinformation”? It didn’t, after all, provide any evidence about whether yourinitialchoiceofDoor1wascorrect.Youknewinadvancethathewasgoingtoopenadoorthathidagoat,andsohedid.Nooneshouldaskyoutochangeyourbeliefsifyouwitnesstheinevitable.SohowcomeyourbeliefinDoor2hasgoneupfromone-thirdtotwo-thirds?
TheansweristhatMontycouldnotopenDoor1afteryouchoseit—buthecouldhaveopenedDoor2.Thefact thathedidnotmakesitmorelikelythatheopenedDoor3becausehewasforcedto.ThusthereismoreevidencethanbeforethatthecarisbehindDoor2.ThisisageneralthemeofBayesian

analysis:anyhypothesisthathassurvivedsometestthatthreatensitsvaliditybecomesmorelikely.Thegreaterthethreat,themorelikelyitbecomesaftersurviving.Door2wasvulnerabletorefutation(i.e.,Montycouldhaveopenedit), butDoor1wasnot.Therefore,Door2becomesamore likely location,whileDoor1doesnot.TheprobabilitythatthecarisbehindDoor1remainsoneinthree.
Now,forcomparison,Figure6.2showsthecausaldiagramforLet’sFakeaDeal, thegameinwhichMontyHallchoosesadoorthatisdifferentfromyours but otherwise chosen at random. This diagram still has an arrowpointingfromYourDoor toDoorOpenedbecausehehas tomakesure thathisdoorisdifferentfromyours.However,thearrowfromLocationofCartoDoorOpenedwouldbedeletedbecausehenolongercareswherethecaris.Inthis diagram, conditioning on Door Opened has absolutely no effect: YourDoor andLocation ofCarwere independent to startwith, and they remainindependent afterwe see the contents ofMonty’s door. So inLet’s Fake aDeal, the car is just as likely to be behind your door as the other door, asobservedinTable6.2.
FIGURE6.2.CausaldiagramforLet’sFakeaDeal.
FromtheBayesianpointofview,thedifferencebetweenthetwogamesisthatinLet’sFakeaDeal,Door1isvulnerabletorefutation.MontyHallcouldhaveopenedDoor3andrevealedthecar,whichwouldhaveproventhatyourdoor choice was wrong. Because your door and Door 2 were equallyvulnerabletorefutation,theystillhaveequalprobability.
Although purely qualitative, this analysis could bemade quantitative byusing Bayes’s rule or by thinking of the diagrams as a simple Bayesiannetwork.Doingsoplaces thisprobleminaunifyingframeworkthatweusefor thinking about other problems. We don’t have to invent a method forsolvingthepuzzle;thebeliefpropagationschemedescribedinChapter3willdeliverthecorrectanswer:thatis,P(Door2)=2/3forLet’sMakeaDeal,andP(Door2)=1/2forLet’sFakeaDeal.
Notice that I have really given two explanations of the Monty Hallparadox. The first one uses causal reasoning to explain why we observe aspurious dependence between Your Door and Location of Car; the secondusesBayesianreasoningtoexplainwhytheprobabilityofDoor2goesupin
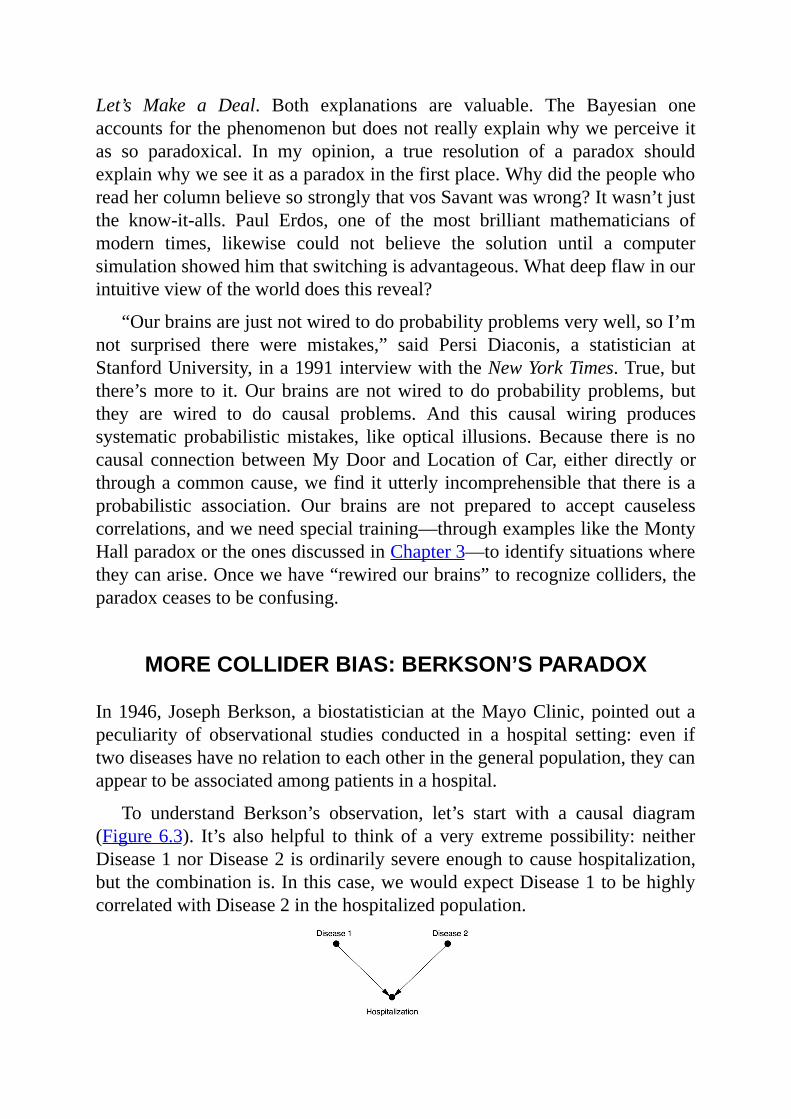
Let’s Make a Deal. Both explanations are valuable. The Bayesian oneaccountsforthephenomenonbutdoesnotreallyexplainwhyweperceiveitas so paradoxical. In my opinion, a true resolution of a paradox shouldexplainwhyweseeitasaparadoxinthefirstplace.WhydidthepeoplewhoreadhercolumnbelievesostronglythatvosSavantwaswrong?Itwasn’tjustthe know-it-alls. Paul Erdos, one of the most brilliant mathematicians ofmodern times, likewise could not believe the solution until a computersimulationshowedhimthatswitchingisadvantageous.Whatdeepflawinourintuitiveviewoftheworlddoesthisreveal?
“Ourbrainsarejustnotwiredtodoprobabilityproblemsverywell,soI’mnot surprised there were mistakes,” said Persi Diaconis, a statistician atStanfordUniversity,ina1991interviewwiththeNewYorkTimes.True,butthere’smore to it.Ourbrains arenotwired todoprobability problems, butthey are wired to do causal problems. And this causal wiring producessystematic probabilisticmistakes, like optical illusions.Because there is nocausal connectionbetweenMyDoor andLocationofCar, eitherdirectlyorthroughacommoncause,wefind itutterly incomprehensible that there isaprobabilistic association. Our brains are not prepared to accept causelesscorrelations,andweneedspecialtraining—throughexamplesliketheMontyHallparadoxortheonesdiscussedinChapter3—toidentifysituationswheretheycanarise.Oncewehave“rewiredourbrains”torecognizecolliders,theparadoxceasestobeconfusing.
MORECOLLIDERBIAS:BERKSON’SPARADOX
In1946,JosephBerkson,abiostatisticianat theMayoClinic,pointedoutapeculiarity of observational studies conducted in a hospital setting: even iftwodiseaseshavenorelationtoeachotherinthegeneralpopulation,theycanappeartobeassociatedamongpatientsinahospital.
To understand Berkson’s observation, let’s start with a causal diagram(Figure6.3). It’s also helpful to thinkof a very extremepossibility: neitherDisease1norDisease2isordinarilysevereenoughtocausehospitalization,butthecombinationis.Inthiscase,wewouldexpectDisease1tobehighlycorrelatedwithDisease2inthehospitalizedpopulation.
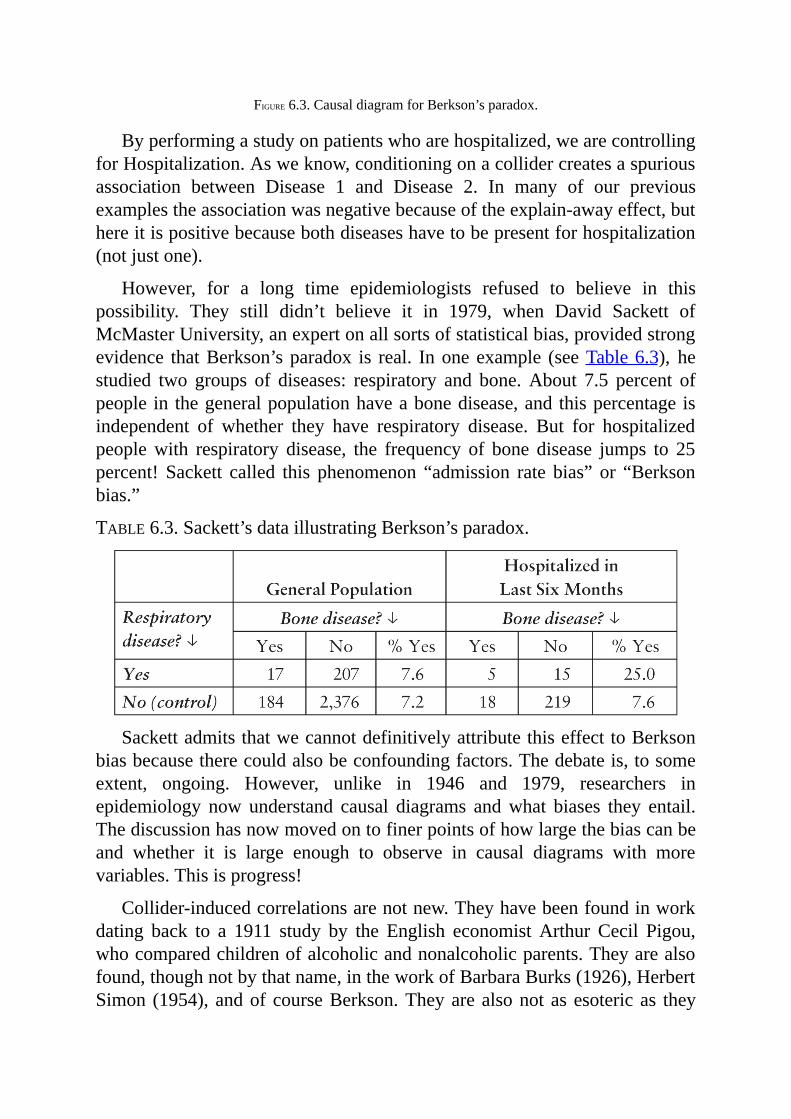
FIGURE6.3.CausaldiagramforBerkson’sparadox.
Byperformingastudyonpatientswhoarehospitalized,wearecontrollingforHospitalization.Asweknow,conditioningonacollidercreatesaspuriousassociation between Disease 1 and Disease 2. In many of our previousexamplestheassociationwasnegativebecauseoftheexplain-awayeffect,buthereitispositivebecausebothdiseaseshavetobepresentforhospitalization(notjustone).
However, for a long time epidemiologists refused to believe in thispossibility. They still didn’t believe it in 1979, when David Sackett ofMcMasterUniversity,anexpertonallsortsofstatisticalbias,providedstrongevidence thatBerkson’sparadox is real. Inoneexample (seeTable6.3), hestudied two groups of diseases: respiratory and bone.About 7.5 percent ofpeople in thegeneralpopulationhaveabonedisease,and thispercentage isindependent of whether they have respiratory disease. But for hospitalizedpeoplewith respiratory disease, the frequency of bone disease jumps to 25percent! Sackett called this phenomenon “admission rate bias” or “Berksonbias.”
TABLE6.3.Sackett’sdataillustratingBerkson’sparadox.
SackettadmitsthatwecannotdefinitivelyattributethiseffecttoBerksonbiasbecausetherecouldalsobeconfoundingfactors.Thedebateis,tosomeextent, ongoing. However, unlike in 1946 and 1979, researchers inepidemiology now understand causal diagrams andwhat biases they entail.Thediscussionhasnowmovedontofinerpointsofhowlargethebiascanbeand whether it is large enough to observe in causal diagrams with morevariables.Thisisprogress!
Collider-inducedcorrelationsarenotnew.Theyhavebeenfoundinworkdating back to a 1911 study by the English economist Arthur Cecil Pigou,whocomparedchildrenofalcoholicandnonalcoholicparents.Theyarealsofound,thoughnotbythatname,intheworkofBarbaraBurks(1926),HerbertSimon (1954), andofcourseBerkson.Theyarealsonotasesotericas they
may seem from my examples. Try this experiment: Flip two coinssimultaneously onehundred times andwrite down the results onlywhen atleastoneofthemcomesupheads.Lookingatyourtable,whichwillprobablycontainroughlyseventy-fiveentries,youwillseethattheoutcomesofthetwosimultaneouscoinflipsarenot independent.EverytimeCoin1landedtails,Coin 2 landed heads. How is this possible? Did the coins somehowcommunicate with each other at light speed? Of course not. In reality youconditionedonacolliderbycensoringallthetails-tailsoutcomes.
InTheDirection of Time, published posthumously in 1956, philosopherHans Reichenbach made a daring conjecture called the “common causeprinciple.” Rebutting the adage “Correlation does not imply causation,”Reichenbach posited a much stronger idea: “No correlation withoutcausation.” He meant that a correlation between two variables, X and Y,cannotcomeaboutbyaccident.Eitheroneofthevariablescausestheother,orathirdvariable,sayZ,precedesandcausesthemboth.
Oursimplecoin-flipexperimentprovesthatReichenbach’sdictumwastoostrong,because itneglects toaccountfor theprocessbywhichobservationsareselected.Therewasnocommoncauseof theoutcomeof the twocoins,and neither coin communicated its result to the other. Nevertheless, theoutcomesonour listwerecorrelated.Reichenbach’serrorwashis failure toconsider collider structures—the structure behind the data selection. Themistakewas particularly illuminating because it pinpoints the exact flaw inthewiringofourbrains.Weliveourlivesasifthecommoncauseprinciplewere true.Wheneverwe see patterns,we look for a causal explanation. Infact, we hunger for an explanation, in terms of stable mechanisms that lieoutsidethedata.Themostsatisfyingkindofexplanationisdirectcausation:XcausesY.When that fails, findinga commoncauseofXandYwill usuallysatisfy us. By comparison, colliders are too ethereal to satisfy our causalappetites.Westillwanttoknowthemechanismthroughwhichthetwocoinscoordinatetheirbehavior.Theanswerisacrushingdisappointment.Theydonotcommunicateatall.Thecorrelationweobserveis,inthepurestandmostliteral sense, an illusion.Orperhapsevenadelusion: that is, an illusionwebroughtuponourselvesbychoosingwhichevents to include inourdatasetand which to ignore. It is important to realize that we are not alwaysconsciousofmakingthischoice,andthisisonereasonthatcolliderbiascanso easily trap the unwary. In the two-coin experiment, the choice wasconscious:Itoldyounottorecordthetrialswithtwotails.Butonplentyofoccasionswearen’tawareofmakingthechoice,orthechoiceismadeforus.In the Monty Hall paradox, the host opens the door for us. In Berkson’s
paradox,anunwaryresearchermightchoosetostudyhospitalizedpatientsforreasonsofconvenience,withoutrealizingthatheisbiasinghisstudy.
Thedistortingprismofcolliders is justasprevalent ineveryday life.AsJordanEllenbergasksinHowNottoBeWrong,haveyouevernoticed that,among the people you date, the attractive ones tend to be jerks? Instead ofconstructingelaboratepsychosocial theories,considerasimplerexplanation.Your choice of people to date depends on two factors: attractiveness andpersonality.You’lltakeachanceondatingameanattractivepersonoraniceunattractive person, and certainly a nice attractive person, but not a meanunattractive person. It’s the same as the two-coin example, when youcensored tails-tails outcomes. This creates a spurious negative correlationbetween attractiveness and personality. The sad truth is that unattractivepeople are just as mean as attractive people—but you’ll never realize it,becauseyou’llneverdatesomebodywhoisbothmeanandunattractive.
SIMPSON’SPARADOX
Now that we have shown that TV producers don’t really have telepathicabilities andcoins cannot communicatewithone another,whatothermythscanweexplode?Let’sstartwiththemythofthebad/bad/good,orBBG,drug.
Imagine a doctor—Dr. Simpson, we’ll call him—reading in his officeaboutapromisingnewdrug(DrugD)thatseemstoreducetheriskofaheartattack. Excitedly, he looks up the researchers’ data online. His excitementcoolsalittlewhenhelooksatthedataonmalepatientsandnoticesthattheirriskofaheartattackisactuallyhigheriftheytakeDrugD.“Ohwell,hesays,“DrugDmustbeveryeffectiveforwomen.”
But then he turns to the next table, and his disappointment turns tobafflement.“Whatisthis?”Dr.Simpsonexclaims.“ItsaysherethatwomenwhotookDrugDwerealsoathigherriskofaheartattack.Imustbelosingmymarbles!Thisdrugseemstobebadforwomen,badformen,butgoodforpeople.”
Areyouperplexedtoo?Ifso,youareingoodcompany.Thisparadox,firstdiscovered by a real-life statistician named Edward Simpson in 1951, hasbeenbotheringstatisticiansformorethansixtyyears—anditremainsvexingtothisveryday.Evenin2016,asIwaswritingthisbook,fournewarticles(including a PhD dissertation) came out, attempting to explain Simpson’sparadoxfromfourdifferentpointsofview.
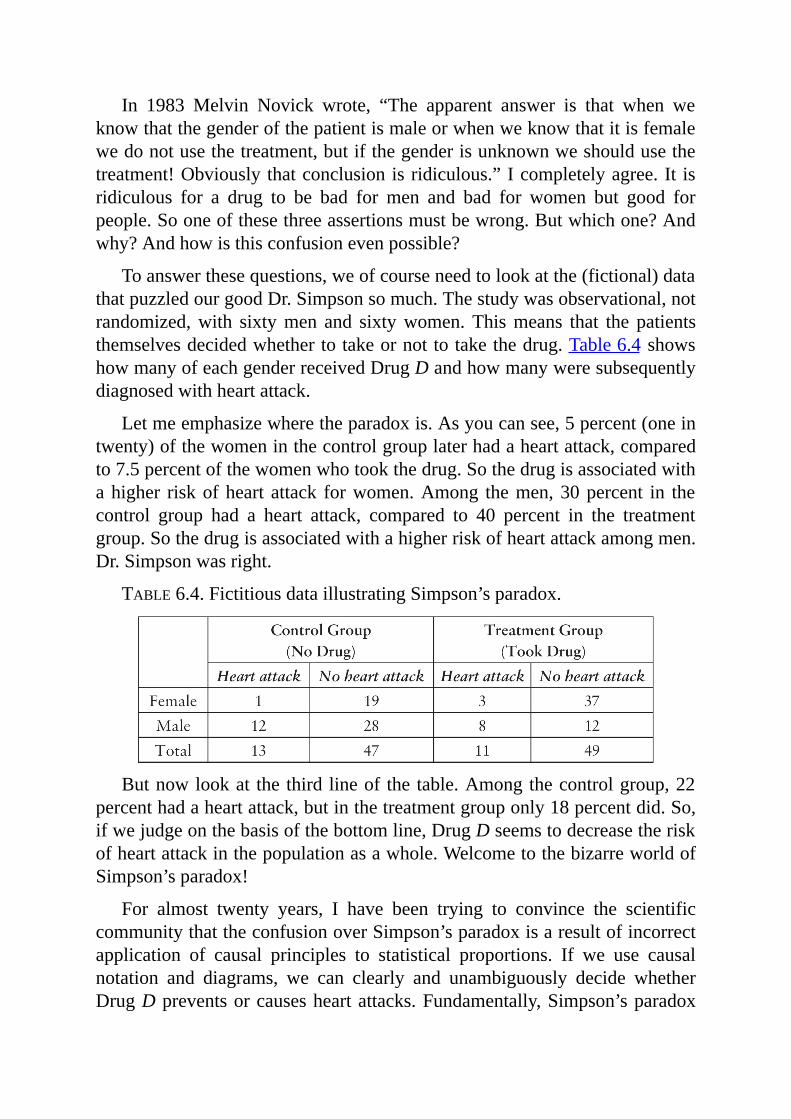
In 1983 Melvin Novick wrote, “The apparent answer is that when weknowthatthegenderofthepatientismaleorwhenweknowthatitisfemalewedonotusethetreatment,butifthegenderisunknownweshouldusethetreatment!Obviouslythatconclusionisridiculous.”Icompletelyagree.It isridiculous for a drug to be bad for men and bad for women but good forpeople.Sooneofthesethreeassertionsmustbewrong.Butwhichone?Andwhy?Andhowisthisconfusionevenpossible?
Toanswerthesequestions,weofcourseneedtolookatthe(fictional)datathatpuzzledourgoodDr.Simpsonsomuch.Thestudywasobservational,notrandomized,with sixtymen and sixtywomen.Thismeans that the patientsthemselvesdecidedwhethertotakeornottotakethedrug.Table6.4showshowmanyofeachgenderreceivedDrugDandhowmanyweresubsequentlydiagnosedwithheartattack.
Letmeemphasizewheretheparadoxis.Asyoucansee,5percent(oneintwenty)ofthewomeninthecontrolgrouplaterhadaheartattack,comparedto7.5percentofthewomenwhotookthedrug.Sothedrugisassociatedwithahigher riskofheart attack forwomen.Among themen,30percent in thecontrol group had a heart attack, compared to 40 percent in the treatmentgroup.Sothedrugisassociatedwithahigherriskofheartattackamongmen.Dr.Simpsonwasright.
TABLE6.4.FictitiousdataillustratingSimpson’sparadox.
Butnowlookat the third lineof the table.Amongthecontrolgroup,22percenthadaheartattack,butinthetreatmentgrouponly18percentdid.So,ifwejudgeonthebasisofthebottomline,DrugDseemstodecreasetheriskofheartattackinthepopulationasawhole.WelcometothebizarreworldofSimpson’sparadox!
For almost twenty years, I have been trying to convince the scientificcommunitythattheconfusionoverSimpson’sparadoxisaresultofincorrectapplication of causal principles to statistical proportions. If we use causalnotation and diagrams, we can clearly and unambiguously decide whetherDrugDpreventsorcausesheartattacks.Fundamentally,Simpson’sparadox
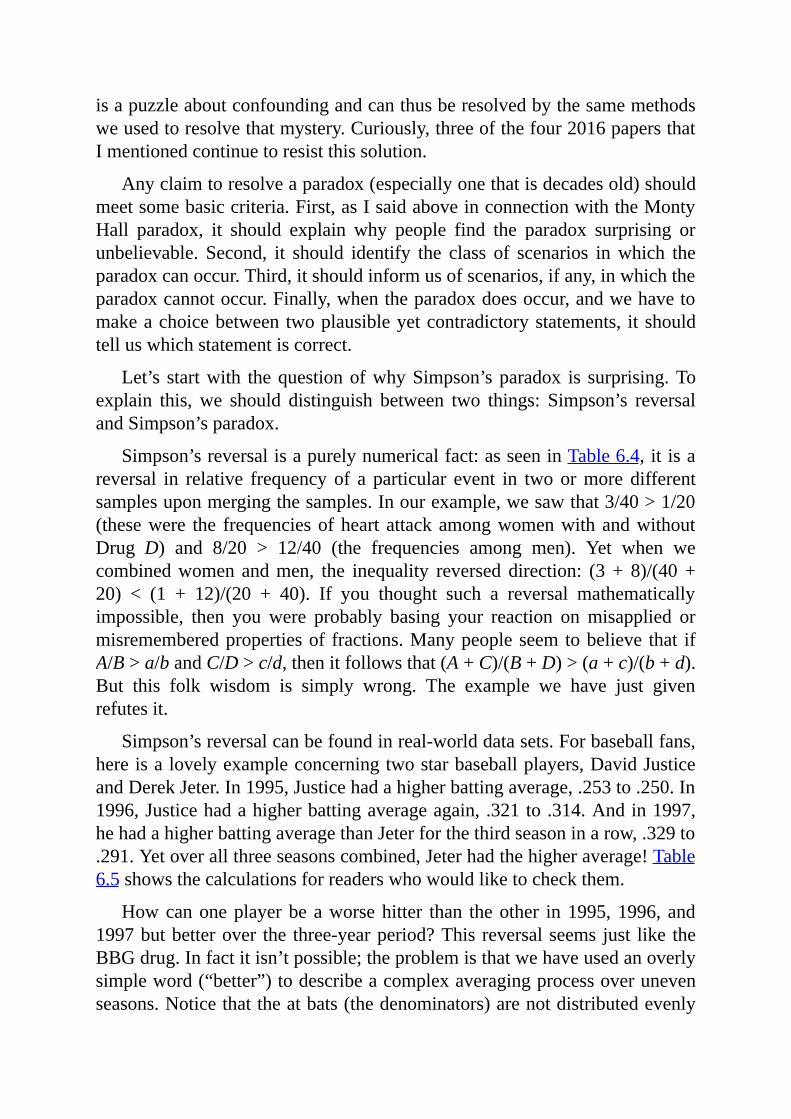
isapuzzleaboutconfoundingandcanthusberesolvedbythesamemethodsweusedtoresolvethatmystery.Curiously,threeofthefour2016papersthatImentionedcontinuetoresistthissolution.
Anyclaimtoresolveaparadox(especiallyonethatisdecadesold)shouldmeetsomebasiccriteria.First,asIsaidaboveinconnectionwiththeMontyHall paradox, it should explain why people find the paradox surprising orunbelievable. Second, it should identify the class of scenarios inwhich theparadoxcanoccur.Third,itshouldinformusofscenarios,ifany,inwhichtheparadoxcannotoccur.Finally,whentheparadoxdoesoccur,andwehavetomakeachoicebetweentwoplausibleyetcontradictorystatements, itshouldtelluswhichstatementiscorrect.
Let’s startwith thequestionofwhySimpson’sparadox is surprising.Toexplain this,we should distinguish between two things: Simpson’s reversalandSimpson’sparadox.
Simpson’sreversalisapurelynumericalfact:asseeninTable6.4,it isareversal in relative frequencyof a particular event in twoormore differentsamplesuponmergingthesamples.Inourexample,wesawthat3/40>1/20(thesewere the frequenciesofheart attackamongwomenwithandwithoutDrug D) and 8/20 > 12/40 (the frequencies among men). Yet when wecombinedwomenandmen, the inequality reversed direction: (3 + 8)/(40+20) < (1 + 12)/(20 + 40). If you thought such a reversal mathematicallyimpossible, then you were probably basing your reaction onmisapplied ormisrememberedpropertiesof fractions.Manypeopleseemtobelieve that ifA/B>a/bandC/D>c/d,thenitfollowsthat(A+C)/(B+D)>(a+c)/(b+d).But this folk wisdom is simply wrong. The example we have just givenrefutesit.
Simpson’sreversalcanbefoundinreal-worlddatasets.Forbaseballfans,hereisalovelyexampleconcerningtwostarbaseballplayers,DavidJusticeandDerekJeter.In1995,Justicehadahigherbattingaverage,.253to.250.In1996,Justicehadahigherbattingaverageagain, .321to.314.Andin1997,hehadahigherbattingaveragethanJeterforthethirdseasoninarow,.329to.291.Yetoverallthreeseasonscombined,Jeterhadthehigheraverage!Table6.5showsthecalculationsforreaderswhowouldliketocheckthem.
Howcanoneplayerbeaworsehitter than theother in1995,1996, and1997butbetterover the three-yearperiod?This reversalseems just like theBBGdrug.Infactitisn’tpossible;theproblemisthatwehaveusedanoverlysimpleword(“better”)todescribeacomplexaveragingprocessoverunevenseasons.Noticethattheatbats(thedenominators)arenotdistributedevenly
year to year. Jeter had very few at bats in 1995, so his rather low battingaverage thatyearhad littleeffectonhisoverallaverage.Ontheotherhand,Justice hadmanymore at bats in his least productive year, 1995, and thatbroughthisoverallbattingaveragedown.Onceyourealizethat“betterhitter”is defined not by an actual head-to-head competition but by a weightedaverage that takes into account how often each player played, I think thesurprisestartstowane.
TABLE6.5.Data(notfictitious)illustratingSimpson’sreversal.
ThereisnoquestionthatSimpson’sreversalissurprisingtosomepeople,evenbaseballfans.EveryyearIhavesomestudentswhocannotbelieveitatfirst.But then they go home,work out some examples like the two I haveshownhere,andcometo termswith it. Itsimplybecomespartof theirnewandslightlydeeperunderstandingofhownumbers(andespeciallyaggregatesofpopulations)work.IdonotcallSimpson’sreversalaparadoxbecauseitis,atmost,simplyamatterofcorrectingamistakenbeliefaboutthebehaviorofaverages.Aparadoxismorethanthat:itshouldentailaconflictbetweentwodeeplyheldconvictions.
Forprofessional statisticianswhoworkwithnumbers everydayof theirlives, there is even less reason to considerSimpson’s reversal aparadox.Asimplearithmetic inequalitycouldnotpossiblypuzzleandfascinatethemtosuch an extent that theywould still be writing articles about it sixty yearslater.
Nowlet’sgobacktoourmainexample,theparadoxoftheBBGdrug.I’veexplained why the three statements “bad for men,” “bad for women,” and“goodforpeople,”wheninterpretedasanincreaseordecreaseinproportions,arenotmathematicallycontradictory.Yetitmaystillseemtoyouthattheyarephysicallyimpossible.Adrugcan’tsimultaneouslycausemeandyoutohaveaheartattackandatthesametimepreventusbothfromhavingheartattacks.This intuition is universal; we develop it as two-year-olds, long before westartlearningaboutnumbersandfractions.SoIthinkyouwillberelievedtofindoutthatyoudonothavetoabandonyourintuition.ABBGdrugindeeddoesnotexistandwillneverbeinvented,andwecanproveitmathematically.
Thefirstpersontobringattentiontothisintuitivelyobviousprinciplewas
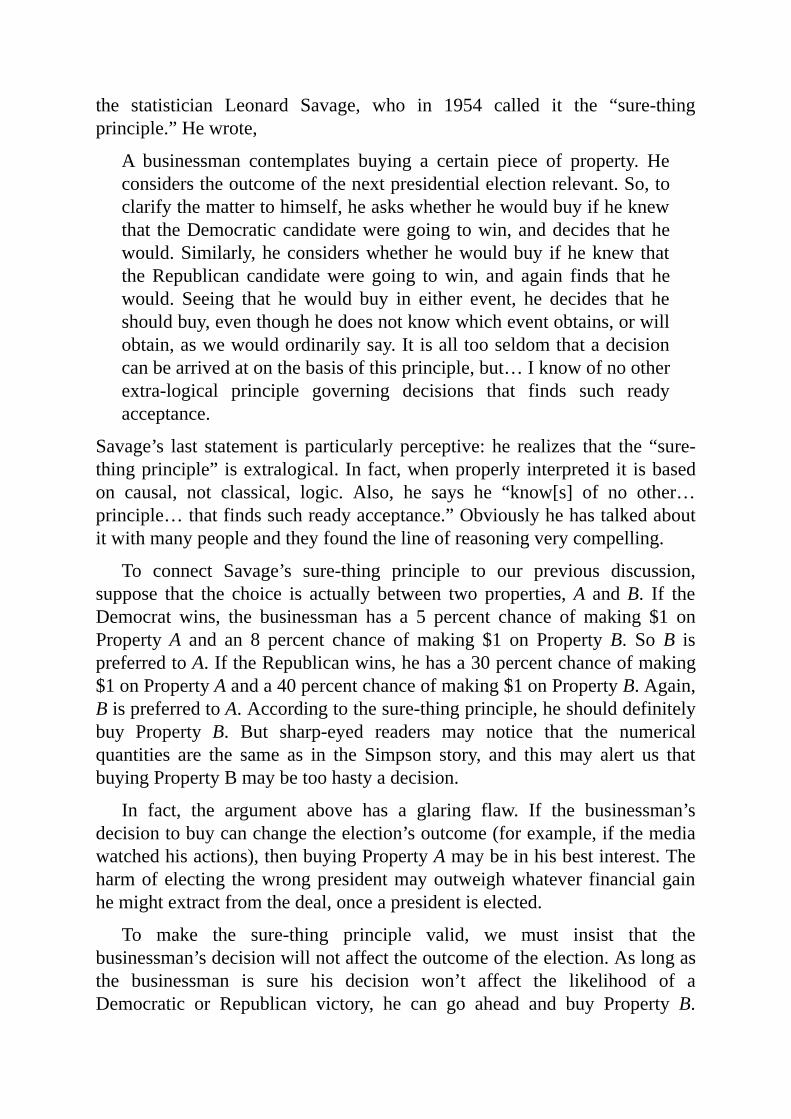
the statistician Leonard Savage, who in 1954 called it the “sure-thingprinciple.”Hewrote,
A businessman contemplates buying a certain piece of property. Heconsiderstheoutcomeofthenextpresidentialelectionrelevant.So,toclarifythemattertohimself,heaskswhetherhewouldbuyifheknewthat theDemocraticcandidateweregoing towin,anddecides thathewould.Similarly,heconsiderswhetherhewouldbuy ifheknewthattheRepublican candidatewere going towin, and again finds that hewould. Seeing that hewould buy in either event, he decides that heshouldbuy,eventhoughhedoesnotknowwhicheventobtains,orwillobtain,aswewouldordinarilysay.Itisalltooseldomthatadecisioncanbearrivedatonthebasisofthisprinciple,but…Iknowofnootherextra-logical principle governing decisions that finds such readyacceptance.
Savage’s last statement is particularlyperceptive: he realizes that the “sure-thingprinciple”isextralogical.Infact,whenproperlyinterpretedit isbasedon causal, not classical, logic. Also, he says he “know[s] of no other…principle…thatfindssuchreadyacceptance.”Obviouslyhehastalkedaboutitwithmanypeopleandtheyfoundthelineofreasoningverycompelling.
To connect Savage’s sure-thing principle to our previous discussion,suppose that the choice is actually between two properties,A andB. If theDemocrat wins, the businessman has a 5 percent chance of making $1 onPropertyA and an 8 percent chance of making $1 on PropertyB. SoB ispreferredtoA.IftheRepublicanwins,hehasa30percentchanceofmaking$1onPropertyAanda40percentchanceofmaking$1onPropertyB.Again,BispreferredtoA.Accordingtothesure-thingprinciple,heshoulddefinitelybuy Property B. But sharp-eyed readers may notice that the numericalquantities are the same as in the Simpson story, and thismay alert us thatbuyingPropertyBmaybetoohastyadecision.
In fact, the argument above has a glaring flaw. If the businessman’sdecisiontobuycanchangetheelection’soutcome(forexample,ifthemediawatchedhisactions),thenbuyingPropertyAmaybeinhisbestinterest.Theharmofelecting thewrongpresidentmayoutweighwhatever financialgainhemightextractfromthedeal,onceapresidentiselected.
To make the sure-thing principle valid, we must insist that thebusinessman’sdecisionwillnotaffecttheoutcomeoftheelection.Aslongasthe businessman is sure his decision won’t affect the likelihood of aDemocratic or Republican victory, he can go ahead and buy Property B.
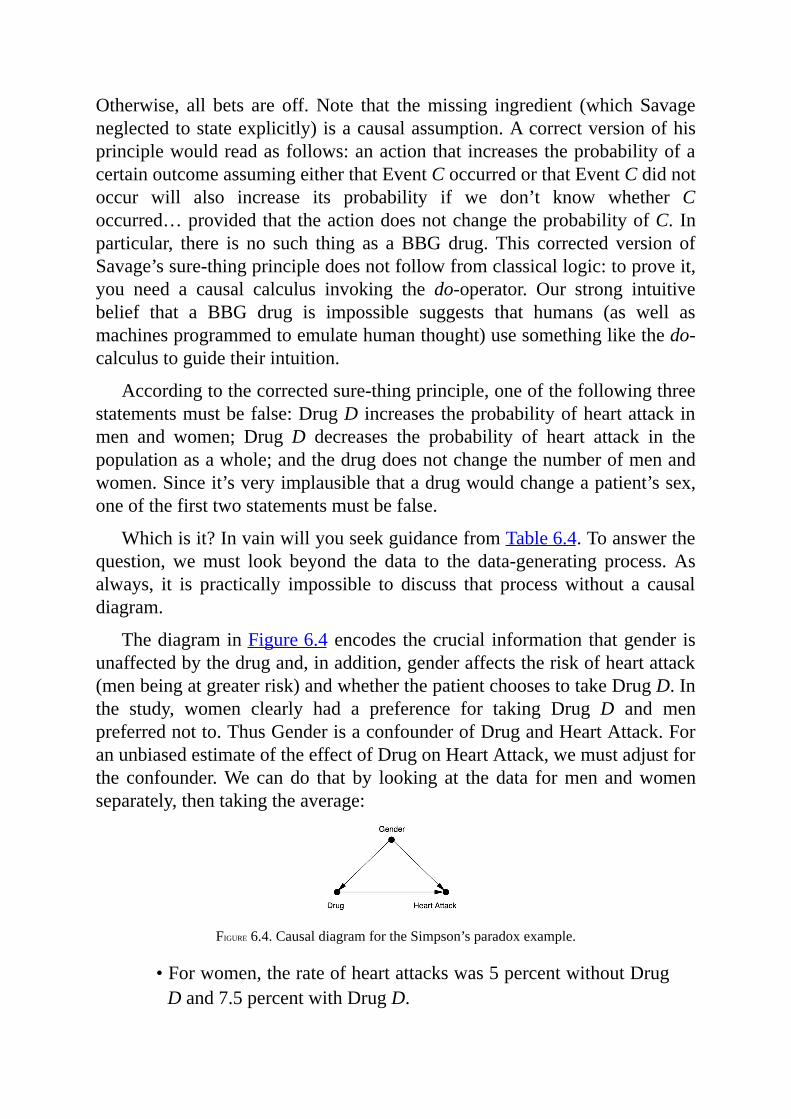
Otherwise, all bets are off.Note that themissing ingredient (which Savageneglectedtostateexplicitly)isacausalassumption.Acorrectversionofhisprinciplewouldreadasfollows:anactionthatincreasestheprobabilityofacertainoutcomeassumingeitherthatEventCoccurredorthatEventCdidnotoccur will also increase its probability if we don’t know whether Coccurred…providedthattheactiondoesnotchangetheprobabilityofC. Inparticular, there is no such thing as aBBGdrug. This corrected version ofSavage’ssure-thingprincipledoesnotfollowfromclassicallogic:toproveit,you need a causal calculus invoking the do-operator. Our strong intuitivebelief that a BBG drug is impossible suggests that humans (as well asmachinesprogrammedtoemulatehumanthought)usesomethinglikethedo-calculustoguidetheirintuition.
Accordingtothecorrectedsure-thingprinciple,oneofthefollowingthreestatementsmustbefalse:DrugD increasestheprobabilityofheartattackinmen and women; DrugD decreases the probability of heart attack in thepopulationasawhole;andthedrugdoesnotchangethenumberofmenandwomen.Sinceit’sveryimplausiblethatadrugwouldchangeapatient’ssex,oneofthefirsttwostatementsmustbefalse.
Whichisit?InvainwillyouseekguidancefromTable6.4.Toanswerthequestion,wemust look beyond the data to the data-generating process.Asalways, it is practically impossible to discuss that processwithout a causaldiagram.
ThediagraminFigure6.4encodes thecrucial information thatgender isunaffectedbythedrugand,inaddition,genderaffectstheriskofheartattack(menbeingatgreaterrisk)andwhetherthepatientchoosestotakeDrugD.Inthe study, women clearly had a preference for taking Drug D and menpreferrednotto.ThusGenderisaconfounderofDrugandHeartAttack.ForanunbiasedestimateoftheeffectofDrugonHeartAttack,wemustadjustforthe confounder.Wecando that by looking at thedata formen andwomenseparately,thentakingtheaverage:
FIGURE6.4.CausaldiagramfortheSimpson’sparadoxexample.
•Forwomen,therateofheartattackswas5percentwithoutDrugDand7.5percentwithDrugD.
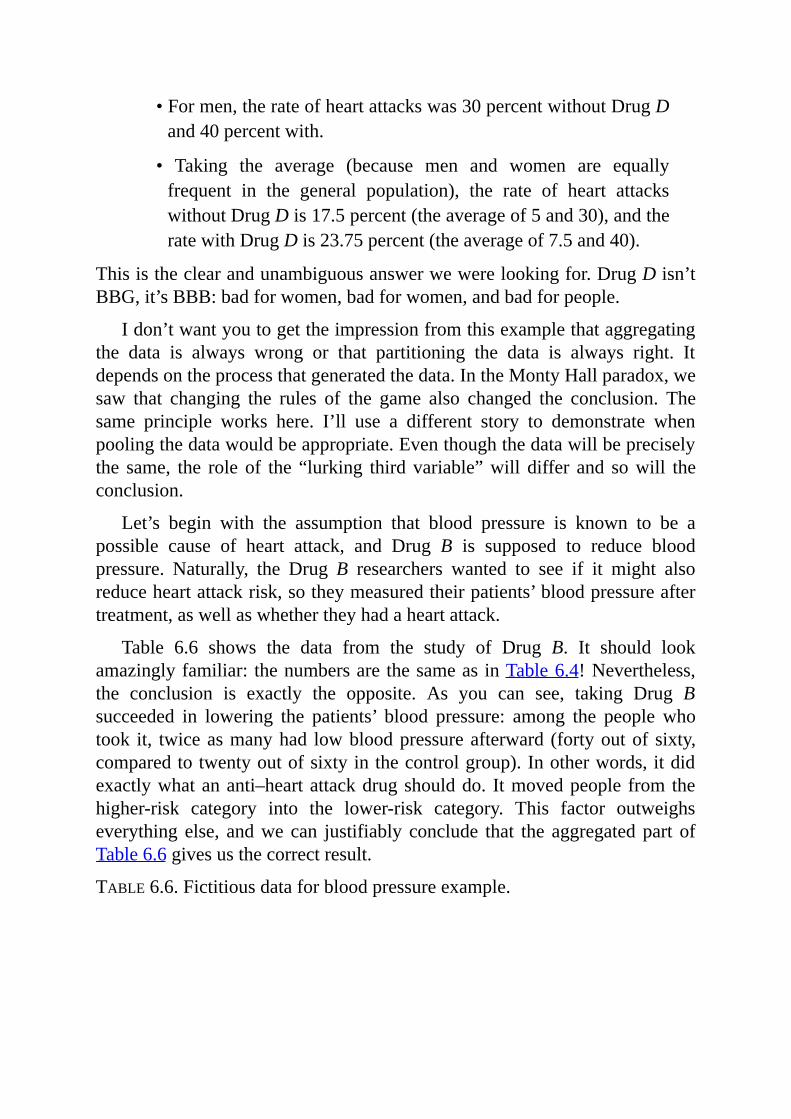
•Formen,therateofheartattackswas30percentwithoutDrugDand40percentwith.
• Taking the average (because men and women are equallyfrequent in the general population), the rate of heart attackswithoutDrugDis17.5percent(theaverageof5and30),andtheratewithDrugDis23.75percent(theaverageof7.5and40).
Thisistheclearandunambiguousanswerwewerelookingfor.DrugDisn’tBBG,it’sBBB:badforwomen,badforwomen,andbadforpeople.
Idon’twantyoutogettheimpressionfromthisexamplethataggregatingthe data is always wrong or that partitioning the data is always right. Itdependsontheprocessthatgeneratedthedata.IntheMontyHallparadox,wesaw that changing the rules of the game also changed the conclusion. Thesame principle works here. I’ll use a different story to demonstrate whenpoolingthedatawouldbeappropriate.Eventhoughthedatawillbepreciselythe same, the role of the “lurking thirdvariable”will differ and sowill theconclusion.
Let’s begin with the assumption that blood pressure is known to be apossible cause of heart attack, and Drug B is supposed to reduce bloodpressure. Naturally, the Drug B researchers wanted to see if it might alsoreduceheartattackrisk,sotheymeasuredtheirpatients’bloodpressureaftertreatment,aswellaswhethertheyhadaheartattack.
Table 6.6 shows the data from the study of Drug B. It should lookamazinglyfamiliar: thenumbersarethesameasinTable6.4!Nevertheless,the conclusion is exactly the opposite. As you can see, taking Drug Bsucceeded in lowering the patients’ blood pressure: among the people whotook it, twiceasmanyhad lowbloodpressureafterward (fortyoutof sixty,comparedtotwentyoutofsixtyinthecontrolgroup).Inotherwords,itdidexactlywhatananti–heartattackdrugshoulddo. Itmovedpeople fromthehigher-risk category into the lower-risk category. This factor outweighseverything else, andwe can justifiably conclude that the aggregatedpart ofTable6.6givesusthecorrectresult.
TABLE6.6.Fictitiousdataforbloodpressureexample.
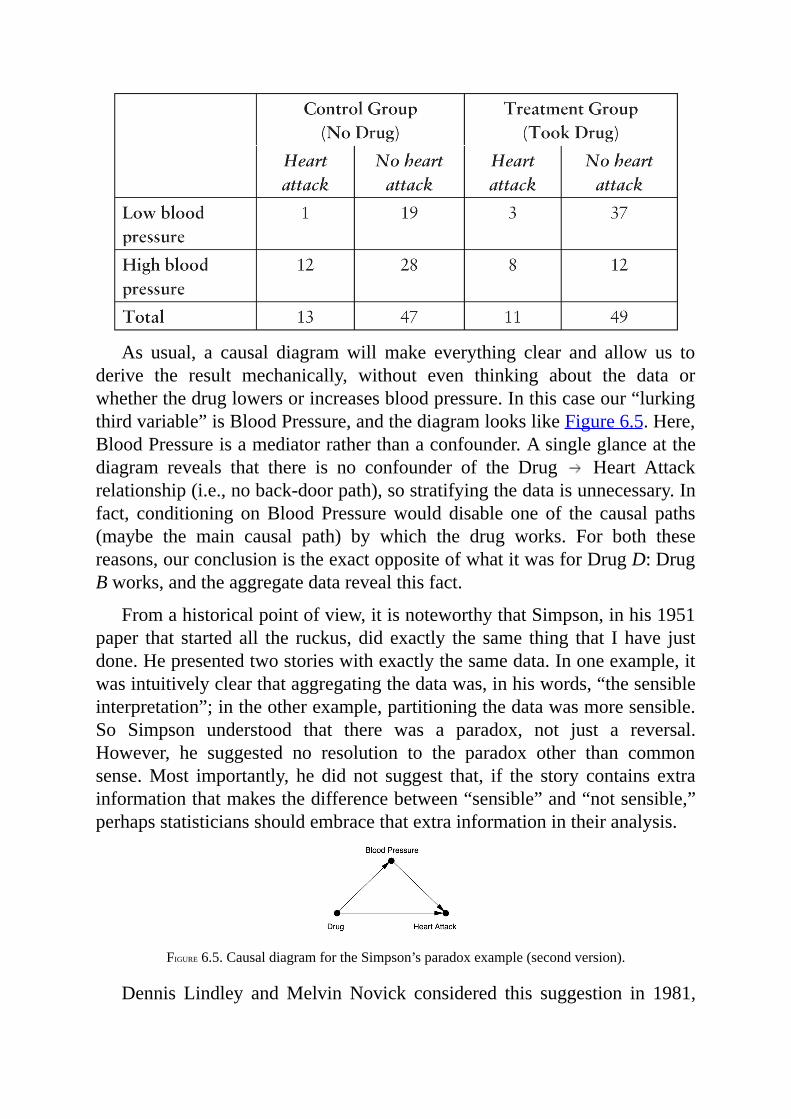
As usual, a causal diagramwill make everything clear and allow us toderive the result mechanically, without even thinking about the data orwhetherthedruglowersorincreasesbloodpressure.Inthiscaseour“lurkingthirdvariable”isBloodPressure,andthediagramlookslikeFigure6.5.Here,BloodPressureisamediatorratherthanaconfounder.Asingleglanceatthediagram reveals that there is no confounder of the Drug Heart Attackrelationship(i.e.,noback-doorpath),sostratifyingthedataisunnecessary.Infact, conditioning onBloodPressurewould disable one of the causal paths(maybe the main causal path) by which the drug works. For both thesereasons,ourconclusionistheexactoppositeofwhatitwasforDrugD:DrugBworks,andtheaggregatedatarevealthisfact.
Fromahistoricalpointofview,itisnoteworthythatSimpson,inhis1951paper that startedall the ruckus,did exactly the same thing that I have justdone.Hepresentedtwostorieswithexactlythesamedata.Inoneexample,itwasintuitivelyclearthataggregatingthedatawas,inhiswords,“thesensibleinterpretation”;intheotherexample,partitioningthedatawasmoresensible.So Simpson understood that there was a paradox, not just a reversal.However, he suggested no resolution to the paradox other than commonsense.Most importantly, he did not suggest that, if the story contains extrainformationthatmakesthedifferencebetween“sensible”and“notsensible,”perhapsstatisticiansshouldembracethatextrainformationintheiranalysis.
FIGURE6.5.CausaldiagramfortheSimpson’sparadoxexample(secondversion).
Dennis Lindley andMelvin Novick considered this suggestion in 1981,
but theycouldnot reconcile themselves to the idea that thecorrectdecisiondependsonthecausalstory,notonthedata.Theyconfessed,“Onepossibilitywouldbetousethelanguageofcausation.…Wehavenotchosentodothis;nortodiscusscausation,becausetheconcept,althoughwidelyused,doesnotseemtobewell-defined.”Withthesewords,theysummarizedthefrustrationof five generations of statisticians, recognizing that causal information isbadlyneededbutthelanguageforexpressingitishopelesslylacking.In2009,four years before his death at age ninety, Lindley confided in me that hewouldnothavewrittenthosewordsifmybookhadbeenavailablein1981.
Some readers of my books and articles have suggested that the rulegoverning data aggregation and separation rests simply on the temporalprecedenceofthetreatmentandthe“lurkingthirdvariable.”Theyarguethatweshouldaggregatethedatainthecaseofbloodpressurebecausethebloodpressuremeasurementcomesafter thepatient takes thedrug,butweshouldstratify the data in the case of gender because it is determined before thepatient takes thedrug.While this rulewillwork inagreatmanycases, it isnotfoolproof.AsimplecaseisthatofM-bias(Game4inChapter4).HereBcan precedeA; yet we should still not condition onB, because thatwouldviolatetheback-doorcriterion.Weshouldconsultthecausalstructureofthestory,notthetemporalinformation.
Finally,youmightwonderifSimpson’sparadoxoccursintherealworld.The answer is yes. It is certainly not common enough for statisticians toencounteronadailybasis,butnorisitcompletelyunknown,anditprobablyhappens more often than journal articles report. Here are two documentedcases:
• In an observational study published in 1996, open surgery toremovekidneystoneshadabettersuccess rate thanendoscopicsurgeryforsmallkidneystones.Italsohadabettersuccessratefor large kidney stones. However, it had a lower success rateoverall. Just as in our first example, thiswas a casewhere thechoice of treatment was related to the severity of the patients’case:largerstonesweremorelikelytoleadtoopensurgeryandalsohadaworseprognosis.
• Ina studyof thyroiddiseasepublished in1995, smokershadahigher survival rate (76 percent) over twenty years thannonsmokers(69percent).However,thenonsmokershadabettersurvival rate in sixout of seven agegroups, and thedifference
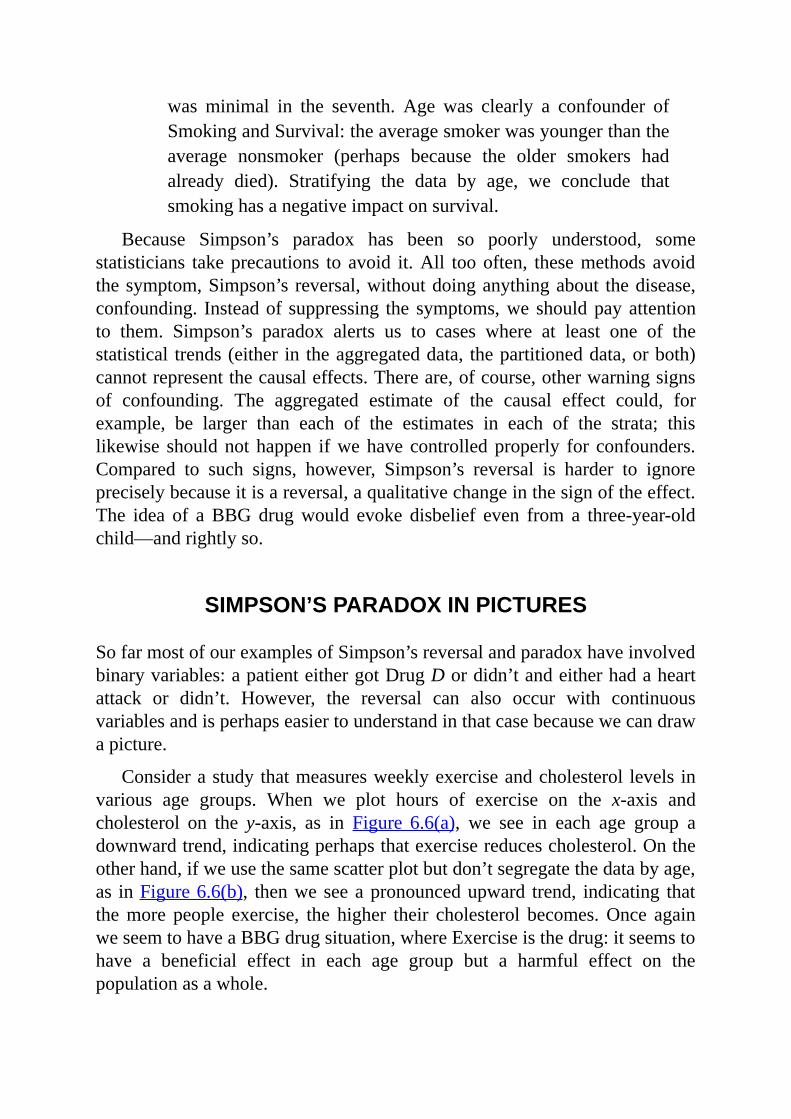
was minimal in the seventh. Age was clearly a confounder ofSmokingandSurvival:theaveragesmokerwasyoungerthantheaverage nonsmoker (perhaps because the older smokers hadalready died). Stratifying the data by age, we conclude thatsmokinghasanegativeimpactonsurvival.
Because Simpson’s paradox has been so poorly understood, somestatisticians takeprecautions to avoid it.All toooften, thesemethods avoidthesymptom,Simpson’s reversal,withoutdoinganythingabout thedisease,confounding. Insteadofsuppressing the symptoms,we shouldpayattentionto them. Simpson’s paradox alerts us to cases where at least one of thestatistical trends(either in theaggregateddata, thepartitioneddata,orboth)cannotrepresentthecausaleffects.Thereare,ofcourse,otherwarningsignsof confounding. The aggregated estimate of the causal effect could, forexample, be larger than each of the estimates in each of the strata; thislikewise shouldnothappen ifwehave controlledproperly for confounders.Compared to such signs, however, Simpson’s reversal is harder to ignorepreciselybecauseitisareversal,aqualitativechangeinthesignoftheeffect.The idea of aBBGdrugwould evoke disbelief even from a three-year-oldchild—andrightlyso.
SIMPSON’SPARADOXINPICTURES
SofarmostofourexamplesofSimpson’sreversalandparadoxhaveinvolvedbinaryvariables:apatienteithergotDrugDordidn’tandeitherhadaheartattack or didn’t. However, the reversal can also occur with continuousvariablesandisperhapseasiertounderstandinthatcasebecausewecandrawapicture.
Considerastudythatmeasuresweeklyexerciseandcholesterol levels invarious age groups. When we plot hours of exercise on the x-axis andcholesterol on the y-axis, as in Figure 6.6(a), we see in each age group adownwardtrend,indicatingperhapsthatexercisereducescholesterol.Ontheotherhand,ifweusethesamescatterplotbutdon’tsegregatethedatabyage,as inFigure6.6(b), thenweseeapronouncedupward trend, indicating thatthemore people exercise, the higher their cholesterol becomes.Once againweseemtohaveaBBGdrugsituation,whereExerciseisthedrug:itseemstohave a beneficial effect in each age group but a harmful effect on thepopulationasawhole.
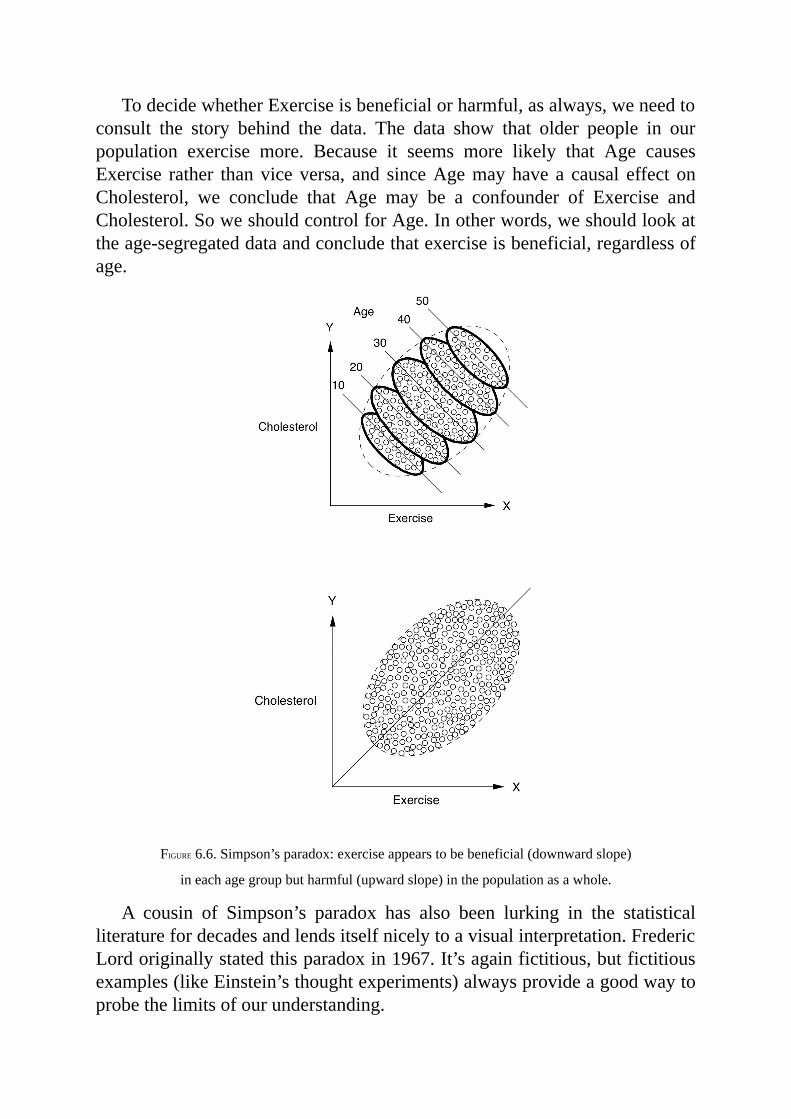
TodecidewhetherExerciseisbeneficialorharmful,asalways,weneedtoconsult the story behind the data. The data show that older people in ourpopulation exercise more. Because it seems more likely that Age causesExercise rather thanviceversa, and sinceAgemayhave a causal effect onCholesterol, we conclude that Age may be a confounder of Exercise andCholesterol.SoweshouldcontrolforAge.Inotherwords,weshouldlookattheage-segregateddataandconcludethatexerciseisbeneficial,regardlessofage.
FIGURE6.6.Simpson’sparadox:exerciseappearstobebeneficial(downwardslope)
ineachagegroupbutharmful(upwardslope)inthepopulationasawhole.
A cousin of Simpson’s paradox has also been lurking in the statisticalliteraturefordecadesandlendsitselfnicelytoavisualinterpretation.FredericLordoriginallystatedthisparadoxin1967.It’sagainfictitious,butfictitiousexamples(likeEinstein’sthoughtexperiments)alwaysprovideagoodwaytoprobethelimitsofourunderstanding.
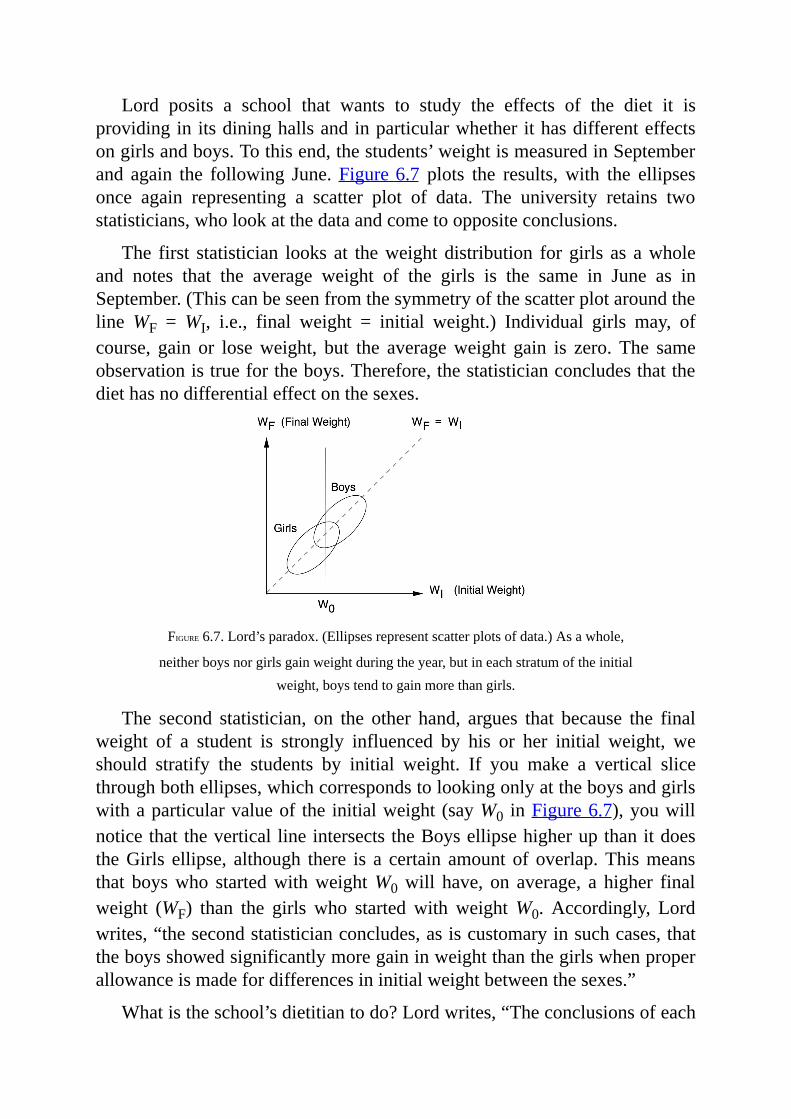
Lord posits a school that wants to study the effects of the diet it isprovidinginitsdininghallsandinparticularwhetherithasdifferenteffectsongirlsandboys.Tothisend,thestudents’weightismeasuredinSeptemberand again the following June. Figure6.7 plots the results, with the ellipsesonce again representing a scatter plot of data. The university retains twostatisticians,wholookatthedataandcometooppositeconclusions.
The first statistician looks at theweightdistribution forgirls as awholeand notes that the average weight of the girls is the same in June as inSeptember.(ThiscanbeseenfromthesymmetryofthescatterplotaroundthelineWF =WI, i.e., final weight = initial weight.) Individual girls may, ofcourse, gain or loseweight, but the averageweight gain is zero. The sameobservationistruefortheboys.Therefore,thestatisticianconcludesthatthediethasnodifferentialeffectonthesexes.
FIGURE6.7.Lord’sparadox.(Ellipsesrepresentscatterplotsofdata.)Asawhole,
neitherboysnorgirlsgainweightduringtheyear,butineachstratumoftheinitialweight,boystendtogainmorethangirls.
The second statistician, on the other hand, argues that because the finalweight of a student is strongly influenced by his or her initial weight, weshould stratify the students by initial weight. If you make a vertical slicethroughbothellipses,whichcorrespondstolookingonlyattheboysandgirlswithaparticularvalueof the initialweight(sayW0 inFigure6.7),youwillnoticethattheverticallineintersectstheBoysellipsehigherupthanitdoestheGirls ellipse, although there is a certain amount of overlap.Thismeansthat boyswho startedwithweightW0will have, on average, a higher finalweight (WF) than the girls who started with weightW0. Accordingly, Lordwrites,“thesecondstatisticianconcludes,asiscustomaryinsuchcases,thattheboysshowedsignificantlymoregaininweightthanthegirlswhenproperallowanceismadefordifferencesininitialweightbetweenthesexes.”
Whatistheschool’sdietitiantodo?Lordwrites,“Theconclusionsofeach
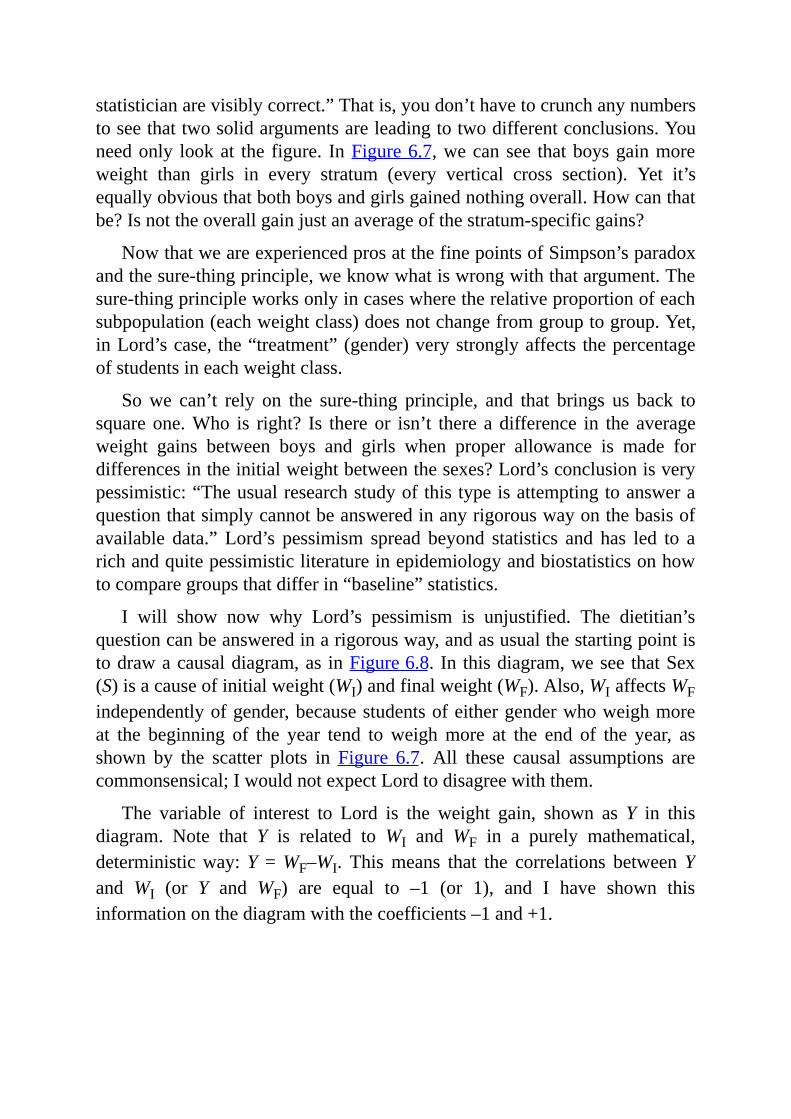
statisticianarevisiblycorrect.”Thatis,youdon’thavetocrunchanynumberstoseethattwosolidargumentsareleadingtotwodifferentconclusions.Youneedonly lookat the figure. InFigure6.7,wecansee thatboysgainmoreweight than girls in every stratum (every vertical cross section). Yet it’sequallyobviousthatbothboysandgirlsgainednothingoverall.Howcanthatbe?Isnottheoverallgainjustanaverageofthestratum-specificgains?
NowthatweareexperiencedprosatthefinepointsofSimpson’sparadoxandthesure-thingprinciple,weknowwhatiswrongwiththatargument.Thesure-thingprincipleworksonlyincaseswheretherelativeproportionofeachsubpopulation(eachweightclass)doesnotchangefromgrouptogroup.Yet,inLord’scase, the“treatment”(gender)verystronglyaffects thepercentageofstudentsineachweightclass.
Sowe can’t rely on the sure-thing principle, and that brings us back tosquareone.Who is right? Is thereor isn’t there adifference in the averageweight gains between boys and girls when proper allowance is made fordifferencesintheinitialweightbetweenthesexes?Lord’sconclusionisverypessimistic:“Theusualresearchstudyofthistypeisattemptingtoansweraquestionthatsimplycannotbeansweredinanyrigorouswayonthebasisofavailable data.” Lord’s pessimism spread beyond statistics and has led to arichandquitepessimisticliteratureinepidemiologyandbiostatisticsonhowtocomparegroupsthatdifferin“baseline”statistics.
I will show now why Lord’s pessimism is unjustified. The dietitian’squestioncanbeansweredinarigorousway,andasusualthestartingpointistodrawacausaldiagram,as inFigure6.8.In thisdiagram,wesee thatSex(S)isacauseofinitialweight(WI)andfinalweight(WF).Also,WIaffectsWFindependentlyofgender,becausestudentsofeithergenderwhoweighmoreat the beginning of the year tend toweighmore at the end of the year, asshown by the scatter plots in Figure 6.7. All these causal assumptions arecommonsensical;IwouldnotexpectLordtodisagreewiththem.
The variable of interest to Lord is the weight gain, shown as Y in thisdiagram. Note that Y is related to WI andWF in a purely mathematical,deterministicway:Y =WF–WI. Thismeans that the correlations betweenYand WI (or Y and WF) are equal to –1 (or 1), and I have shown thisinformationonthediagramwiththecoefficients–1and+1.
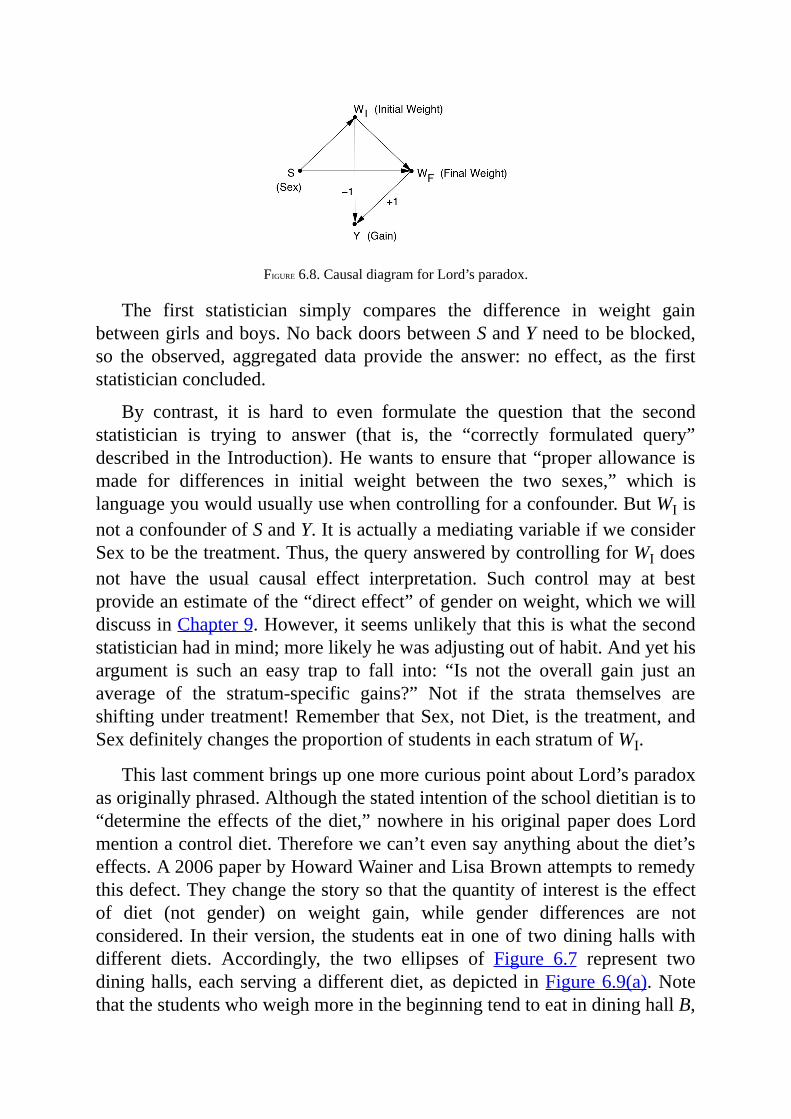
FIGURE6.8.CausaldiagramforLord’sparadox.
The first statistician simply compares the difference in weight gainbetweengirlsandboys.NobackdoorsbetweenSandYneedtobeblocked,so the observed, aggregated data provide the answer: no effect, as the firststatisticianconcluded.
By contrast, it is hard to even formulate the question that the secondstatistician is trying to answer (that is, the “correctly formulated query”described in theIntroduction).Hewants toensure that“properallowance ismade for differences in initial weight between the two sexes,” which islanguageyouwouldusuallyusewhencontrollingforaconfounder.ButWIisnotaconfounderofSandY.ItisactuallyamediatingvariableifweconsiderSextobethetreatment.Thus,thequeryansweredbycontrollingforWIdoesnot have the usual causal effect interpretation. Such control may at bestprovideanestimateofthe“directeffect”ofgenderonweight,whichwewilldiscussinChapter9.However,itseemsunlikelythatthisiswhatthesecondstatisticianhadinmind;morelikelyhewasadjustingoutofhabit.Andyethisargument is such an easy trap to fall into: “Is not the overall gain just anaverage of the stratum-specific gains?” Not if the strata themselves areshiftingundertreatment!RememberthatSex,notDiet,isthetreatment,andSexdefinitelychangestheproportionofstudentsineachstratumofWI.
ThislastcommentbringsuponemorecuriouspointaboutLord’sparadoxasoriginallyphrased.Althoughthestatedintentionoftheschooldietitianisto“determine theeffectsof thediet,”nowhere inhisoriginalpaperdoesLordmentionacontroldiet.Thereforewecan’tevensayanythingaboutthediet’seffects.A2006paperbyHowardWainerandLisaBrownattemptstoremedythisdefect.Theychangethestorysothatthequantityofinterestistheeffectof diet (not gender) on weight gain, while gender differences are notconsidered.In theirversion, thestudentseat inoneof twodininghallswithdifferent diets. Accordingly, the two ellipses of Figure 6.7 represent twodininghalls,eachservingadifferentdiet,asdepictedinFigure6.9(a).NotethatthestudentswhoweighmoreinthebeginningtendtoeatindininghallB,
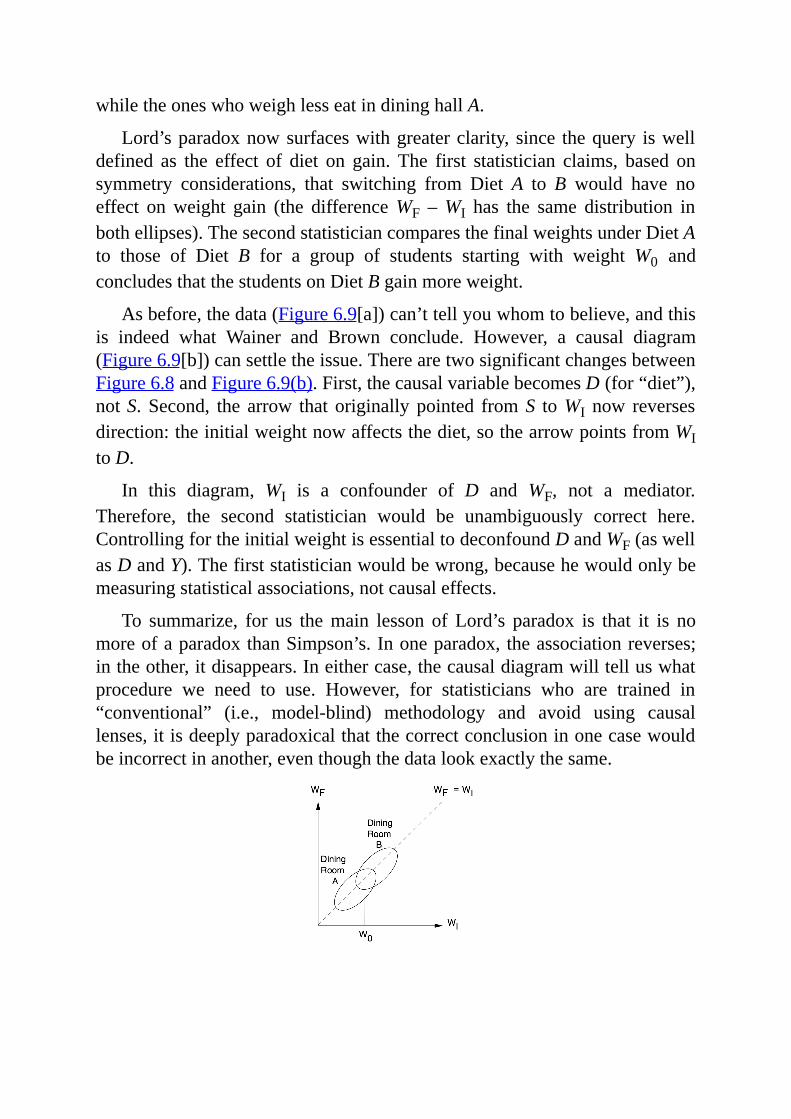
whiletheoneswhoweighlesseatindininghallA.
Lord’sparadoxnowsurfaceswithgreaterclarity, since thequery iswelldefined as the effect of diet on gain. The first statistician claims, based onsymmetry considerations, that switching from Diet A toB would have noeffect onweight gain (the differenceWF –WI has the same distribution inbothellipses).ThesecondstatisticiancomparesthefinalweightsunderDietAto those of Diet B for a group of students starting with weight W0 andconcludesthatthestudentsonDietBgainmoreweight.
Asbefore,thedata(Figure6.9[a])can’ttellyouwhomtobelieve,andthisis indeed what Wainer and Brown conclude. However, a causal diagram(Figure6.9[b])cansettletheissue.TherearetwosignificantchangesbetweenFigure6.8andFigure6.9(b).First,thecausalvariablebecomesD(for“diet”),notS. Second, the arrow that originally pointed fromS toWI now reversesdirection:theinitialweightnowaffectsthediet,sothearrowpointsfromWItoD.
In this diagram, WI is a confounder of D and WF, not a mediator.Therefore, the second statistician would be unambiguously correct here.ControllingfortheinitialweightisessentialtodeconfoundDandWF(aswellasDandY).Thefirststatisticianwouldbewrong,becausehewouldonlybemeasuringstatisticalassociations,notcausaleffects.
To summarize, for us themain lesson of Lord’s paradox is that it is nomoreofaparadoxthanSimpson’s.Inoneparadox,theassociationreverses;intheother,itdisappears.Ineithercase,thecausaldiagramwilltelluswhatprocedure we need to use. However, for statisticians who are trained in“conventional” (i.e., model-blind) methodology and avoid using causallenses,itisdeeplyparadoxicalthatthecorrectconclusioninonecasewouldbeincorrectinanother,eventhoughthedatalookexactlythesame.

FIGURE6.9.WainerandBrown’srevisedversionofLord’sparadoxandthe
correspondingcausaldiagram.
Nowthatwehaveathoroughgroundingincolliders,confounders,andtheperilsthatbothpose,weareatlastpreparedtoreapthefruitsofourlabor.InthenextchapterwebeginourascentuptheLadderofCausation,beginningwithrungtwo:intervention.

Scaling“MountIntervention.”Themostfamiliarmethodstoestimatetheeffectofanintervention,inthepresenceofconfounders,aretheback-dooradjustmentandinstrumentalvariables.Themethodoffront-dooradjustmentwasunknownbeforetheintroductionofcausaldiagrams.Thedo-calculus,whichmystudentshavefullyautomated,makesitpossibletotailortheadjustmentmethodtoanyparticular
causaldiagram.(Source:DrawingbyDakotaHarr.)

7
BEYONDADJUSTMENT:THECONQUESTOFMOUNTINTERVENTION
Hewhoseactionsexceedhistheory,histheoryshallendure.
—RABBIHANINABENDOSA(FIRSTCENTURYAD)
INthischapterwefinallymakeourboldascentontothesecondleveloftheLadder of Causation, the level of intervention—the holy grail of causalthinking from antiquity to the present day. This level is involved in thestruggle topredict theeffectsofactionsandpolicies thathaven’tbeen triedyet, ranging from medical treatments to social programs, from economicpolicies to personal choices. Confounding was the primary obstacle thatcausedus toconfuseseeingwithdoing.Having removed this obstaclewiththetoolsof“pathblocking”andtheback-doorcriterion,wecannowmaptheroutes up Mount Intervention with systematic precision. For the noviceclimber, thesafest routesup themountainare theback-dooradjustmentanditsvarious cousins, somegoingunder the rubricof “front-door adjustment”andsomeunder“instrumentalvariables.”
Buttheseroutesmaynotbeavailableinallcases,sofortheexperiencedclimber this chapter describes a “universal mapping tool” called the do-calculus,whichallows the researcher toexploreandplotallpossible routesupMountIntervention,nomatterhowtwisty.Oncearoutehasbeenmapped,and the ropes and carabiners and pitons are in place, our assault on themountainwillassuredlyresultinasuccessfulconquest!
THESIMPLESTROUTE:THEBACK-DOORADJUSTMENTFORMULA
Formanyresearchers,themost(perhapsonly)familiarmethodofpredictingthe effect of an intervention is to “control” for confounders using theadjustment formula.This is themethod touse ifyouareconfident thatyouhavedataonasufficientsetofvariables(calleddeconfounders) toblockalltheback-doorpathsbetweentheinterventionandtheoutcome.Todothis,wemeasure the average causal effect of an intervention by first estimating itseffect at each “level,” or stratum, of the deconfounder.We then compute aweightedaverageofthosestrata,whereeachstratumisweightedaccordingtoitsprevalenceinthepopulation.If,forexample,thedeconfounderisgender,wefirstestimatethecausaleffectformalesandfemales.Thenweaveragethetwo, if the population is (as usual) half male and half female. If theproportionsaredifferent—say,two-thirdsmaleandone-thirdfemale—thentoestimatetheaveragecausaleffectwewouldtakeacorrespondinglyweightedaverage.
Therolethattheback-doorcriterionplaysinthisprocedureistoguaranteethatthecausaleffectineachstratumofthedeconfounderisnoneotherthanthe observed trend in this stratum. So the causal effect can be estimatedstratumbystratumfromthedata.Absenttheback-doorcriterion,researchershavenoguaranteethatanyadjustmentislegitimate.
The fictitious drug example in Chapter 6 was the simplest situationpossible:one treatmentvariable (DrugD),oneoutcome(HeartAttack),oneconfounder(Gender),andall threevariablesarebinary.Theexampleshowshow we take a weighted average of the conditional probabilities P(heartattack|drug)ineachgenderstratum.Buttheproceduredescribedabovecanbeadaptedeasily to handlemore complicated situations, includingmultiple(de)confoundersandmultiplestrata.
However,inmanycases,thevariablesX,Y,orZtakenumericalvalues—for example, income or height or birth weight. We saw this in our visualexampleofSimpson’sparadox.Becausethevariablecouldtake(atleast,forallpracticalpurposes)infinitepossiblevalues,wecannotmakeatablelistingallthepossibilities,aswedidinChapter6.
Anobvious remedy is to separate the numerical values into a finite andmanageablenumberof categories.There isnothing inprinciplewrongwiththisoption,but thechoiceofcategories isabitarbitrary.Worse, ifwehavemore thanahandfulofadjustedvariables,wegetanexponentialblowup in
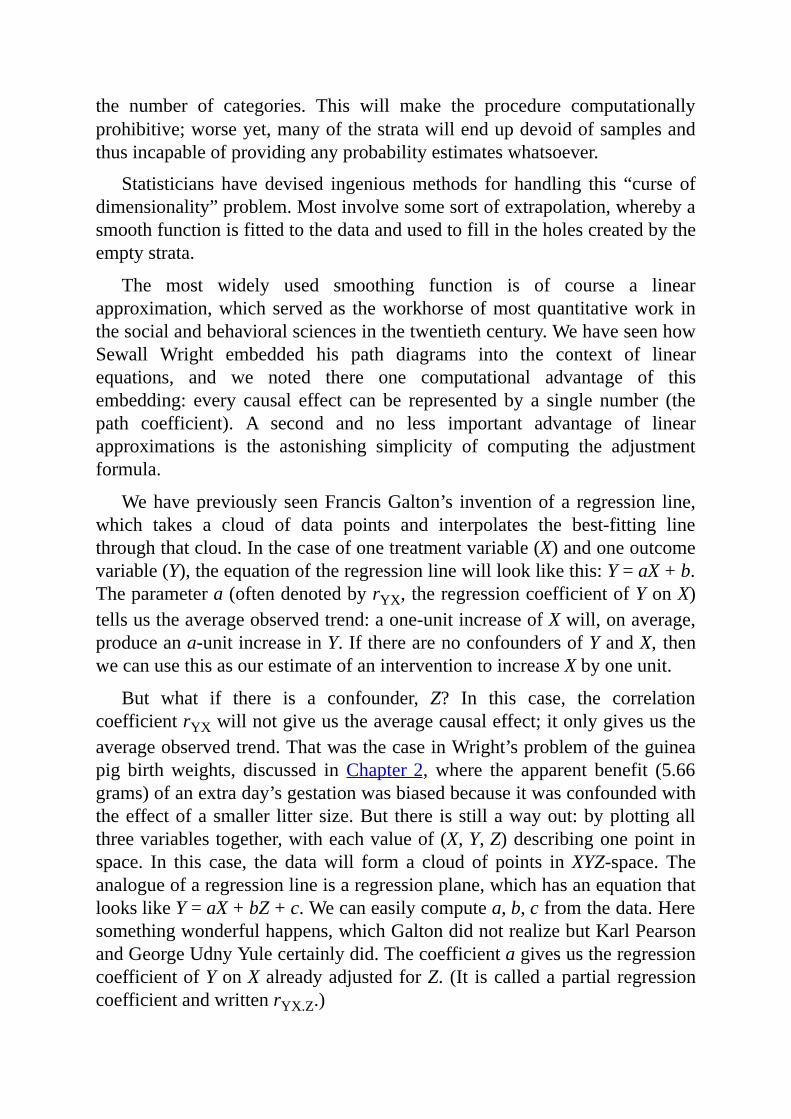
the number of categories. This will make the procedure computationallyprohibitive;worseyet,manyofthestratawillendupdevoidofsamplesandthusincapableofprovidinganyprobabilityestimateswhatsoever.
Statisticians have devised ingeniousmethods for handling this “curse ofdimensionality”problem.Mostinvolvesomesortofextrapolation,wherebyasmoothfunctionisfittedtothedataandusedtofillintheholescreatedbytheemptystrata.
The most widely used smoothing function is of course a linearapproximation,whichservedas theworkhorseofmostquantitativework inthesocialandbehavioralsciencesinthetwentiethcentury.WehaveseenhowSewall Wright embedded his path diagrams into the context of linearequations, and we noted there one computational advantage of thisembedding: every causal effect can be represented by a single number (thepath coefficient). A second and no less important advantage of linearapproximations is the astonishing simplicity of computing the adjustmentformula.
WehavepreviouslyseenFrancisGalton’s inventionofa regression line,which takes a cloud of data points and interpolates the best-fitting linethroughthatcloud.Inthecaseofonetreatmentvariable(X)andoneoutcomevariable(Y),theequationoftheregressionlinewilllooklikethis:Y=aX+b.Theparametera(oftendenotedbyrYX,theregressioncoefficientofYonX)tellsustheaverageobservedtrend:aone-unitincreaseofXwill,onaverage,produceana-unitincreaseinY.IftherearenoconfoundersofYandX, thenwecanusethisasourestimateofaninterventiontoincreaseXbyoneunit.
But what if there is a confounder, Z? In this case, the correlationcoefficientrYXwillnotgiveustheaveragecausaleffect;itonlygivesustheaverageobservedtrend.ThatwasthecaseinWright’sproblemoftheguineapig birthweights, discussed inChapter2,where the apparent benefit (5.66grams)ofanextraday’sgestationwasbiasedbecauseitwasconfoundedwiththeeffectofasmaller littersize.But there isstillawayout:byplottingallthreevariablestogether,witheachvalueof(X,Y,Z)describingonepoint inspace. In this case, the datawill form a cloud of points inXYZ-space. Theanalogueofaregressionlineisaregressionplane,whichhasanequationthatlookslikeY=aX+bZ+c.Wecaneasilycomputea,b,cfromthedata.Heresomethingwonderfulhappens,whichGaltondidnotrealizebutKarlPearsonandGeorgeUdnyYulecertainlydid.ThecoefficientagivesustheregressioncoefficientofYonXalreadyadjustedforZ. (It iscalledapartial regressioncoefficientandwrittenrYX.Z.)
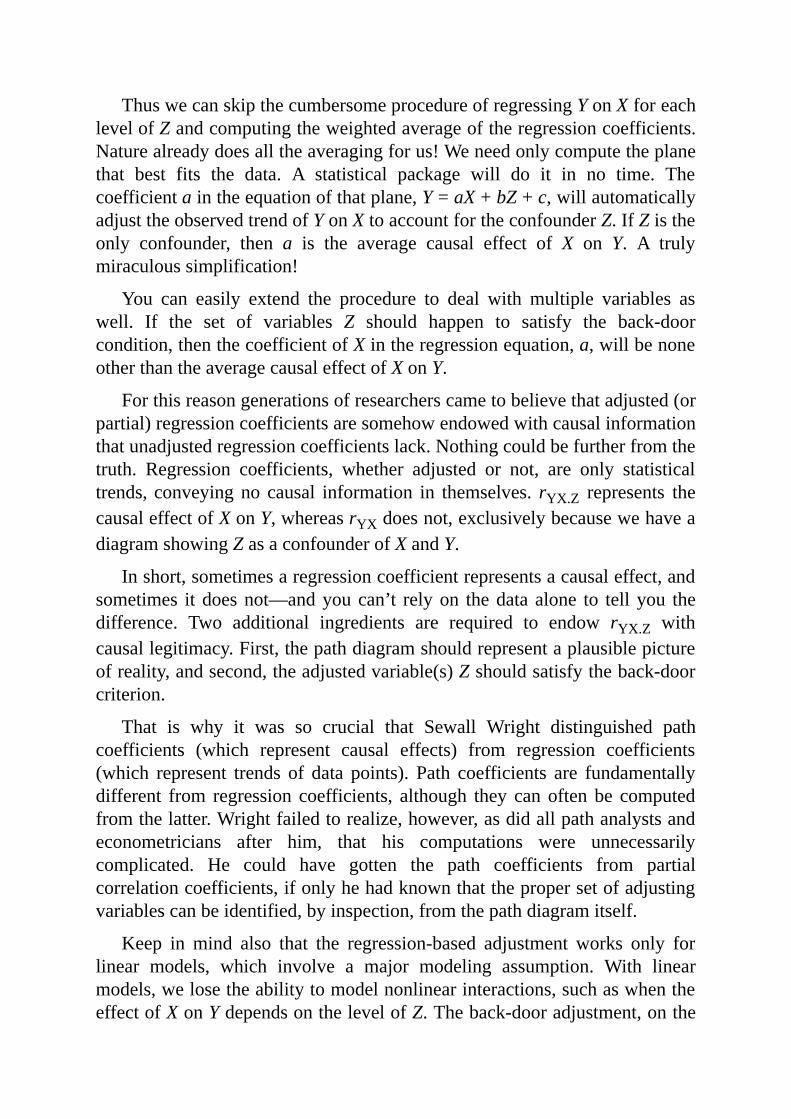
ThuswecanskipthecumbersomeprocedureofregressingYonXforeachlevelofZandcomputingtheweightedaverageoftheregressioncoefficients.Naturealreadydoesalltheaveragingforus!Weneedonlycomputetheplanethat best fits the data. A statistical package will do it in no time. Thecoefficientaintheequationofthatplane,Y=aX+bZ+c,willautomaticallyadjusttheobservedtrendofYonXtoaccountfortheconfounderZ.IfZistheonly confounder, then a is the average causal effect of X on Y. A trulymiraculoussimplification!
You can easily extend the procedure to deal with multiple variables aswell. If the set of variables Z should happen to satisfy the back-doorcondition,thenthecoefficientofXintheregressionequation,a,willbenoneotherthantheaveragecausaleffectofXonY.
Forthisreasongenerationsofresearcherscametobelievethatadjusted(orpartial)regressioncoefficientsaresomehowendowedwithcausalinformationthatunadjustedregressioncoefficientslack.Nothingcouldbefurtherfromthetruth. Regression coefficients, whether adjusted or not, are only statisticaltrends,conveyingno causal information in themselves. rYX.Z represents thecausaleffectofXonY,whereasrYXdoesnot,exclusivelybecausewehaveadiagramshowingZasaconfounderofXandY.
Inshort,sometimesaregressioncoefficientrepresentsacausaleffect,andsometimes itdoesnot—andyoucan’t relyon thedataalone to tellyou thedifference. Two additional ingredients are required to endow rYX.Z withcausallegitimacy.First,thepathdiagramshouldrepresentaplausiblepictureofreality,andsecond,theadjustedvariable(s)Zshouldsatisfytheback-doorcriterion.
That is why it was so crucial that Sewall Wright distinguished pathcoefficients (which represent causal effects) from regression coefficients(which represent trends of data points). Path coefficients are fundamentallydifferent from regression coefficients, although they canoften be computedfromthelatter.Wrightfailedtorealize,however,asdidallpathanalystsandeconometricians after him, that his computations were unnecessarilycomplicated. He could have gotten the path coefficients from partialcorrelationcoefficients,ifonlyhehadknownthatthepropersetofadjustingvariablescanbeidentified,byinspection,fromthepathdiagramitself.
Keep in mind also that the regression-based adjustment works only forlinear models, which involve a major modeling assumption. With linearmodels,welosetheabilitytomodelnonlinearinteractions,suchaswhentheeffectofXonYdependsonthelevelofZ.Theback-dooradjustment,onthe
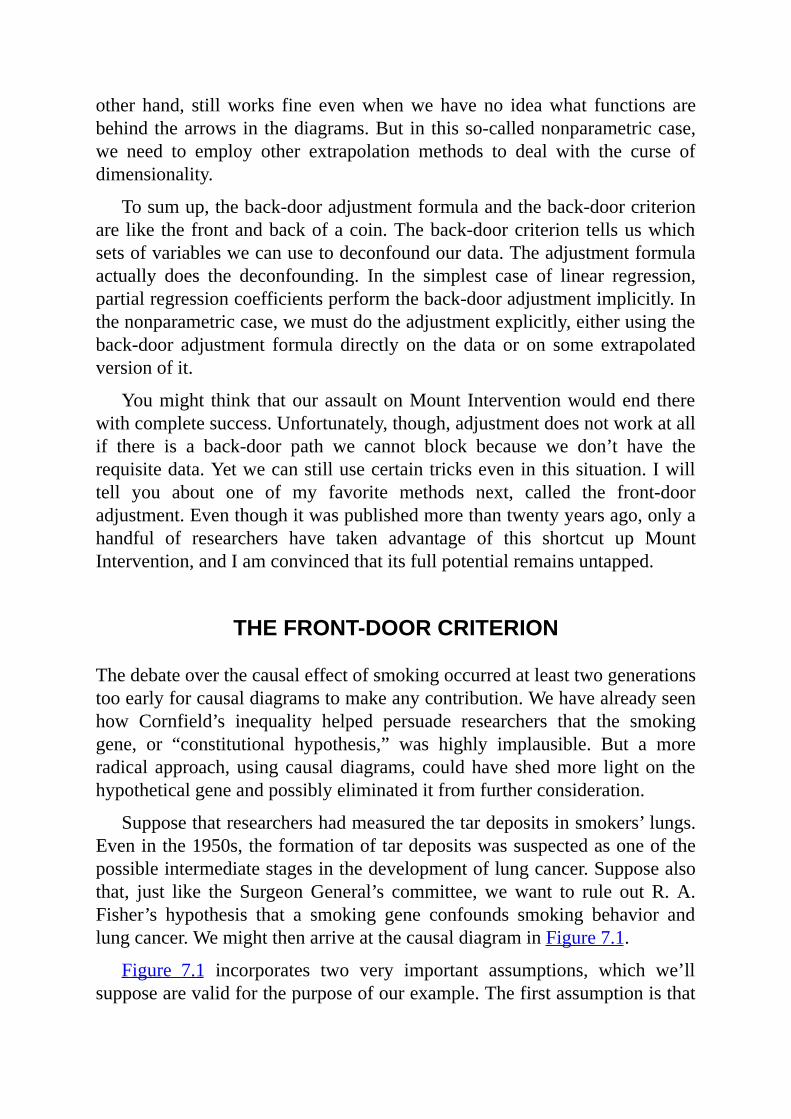
other hand, stillworks fine evenwhenwe have no ideawhat functions arebehindthearrowsinthediagrams.But in thisso-callednonparametriccase,we need to employ other extrapolation methods to deal with the curse ofdimensionality.
Tosumup,theback-dooradjustmentformulaandtheback-doorcriterionare like thefrontandbackofacoin.Theback-doorcriterion tellsuswhichsetsofvariableswecanusetodeconfoundourdata.Theadjustmentformulaactually does the deconfounding. In the simplest case of linear regression,partialregressioncoefficientsperformtheback-dooradjustmentimplicitly.Inthenonparametriccase,wemustdotheadjustmentexplicitly,eitherusingtheback-door adjustment formula directly on the data or on some extrapolatedversionofit.
Youmight think thatourassaultonMount Interventionwouldend therewithcompletesuccess.Unfortunately,though,adjustmentdoesnotworkatallif there is a back-door path we cannot block because we don’t have therequisitedata.Yetwecanstillusecertaintrickseveninthissituation.Iwilltell you about one of my favorite methods next, called the front-dooradjustment.Eventhoughitwaspublishedmorethantwentyyearsago,onlyahandful of researchers have taken advantage of this shortcut up MountIntervention,andIamconvincedthatitsfullpotentialremainsuntapped.
THEFRONT-DOORCRITERION
Thedebateoverthecausaleffectofsmokingoccurredatleasttwogenerationstooearlyforcausaldiagramstomakeanycontribution.Wehavealreadyseenhow Cornfield’s inequality helped persuade researchers that the smokinggene, or “constitutional hypothesis,” was highly implausible. But a moreradical approach,usingcausaldiagrams, couldhave shedmore lighton thehypotheticalgeneandpossiblyeliminateditfromfurtherconsideration.
Supposethatresearchershadmeasuredthetardepositsinsmokers’lungs.Eveninthe1950s,theformationoftardepositswassuspectedasoneofthepossibleintermediatestagesinthedevelopmentoflungcancer.Supposealsothat, just like the SurgeonGeneral’s committee,wewant to rule out R.A.Fisher’s hypothesis that a smoking gene confounds smoking behavior andlungcancer.WemightthenarriveatthecausaldiagraminFigure7.1.
Figure 7.1 incorporates two very important assumptions, which we’llsupposearevalidforthepurposeofourexample.Thefirstassumptionisthat
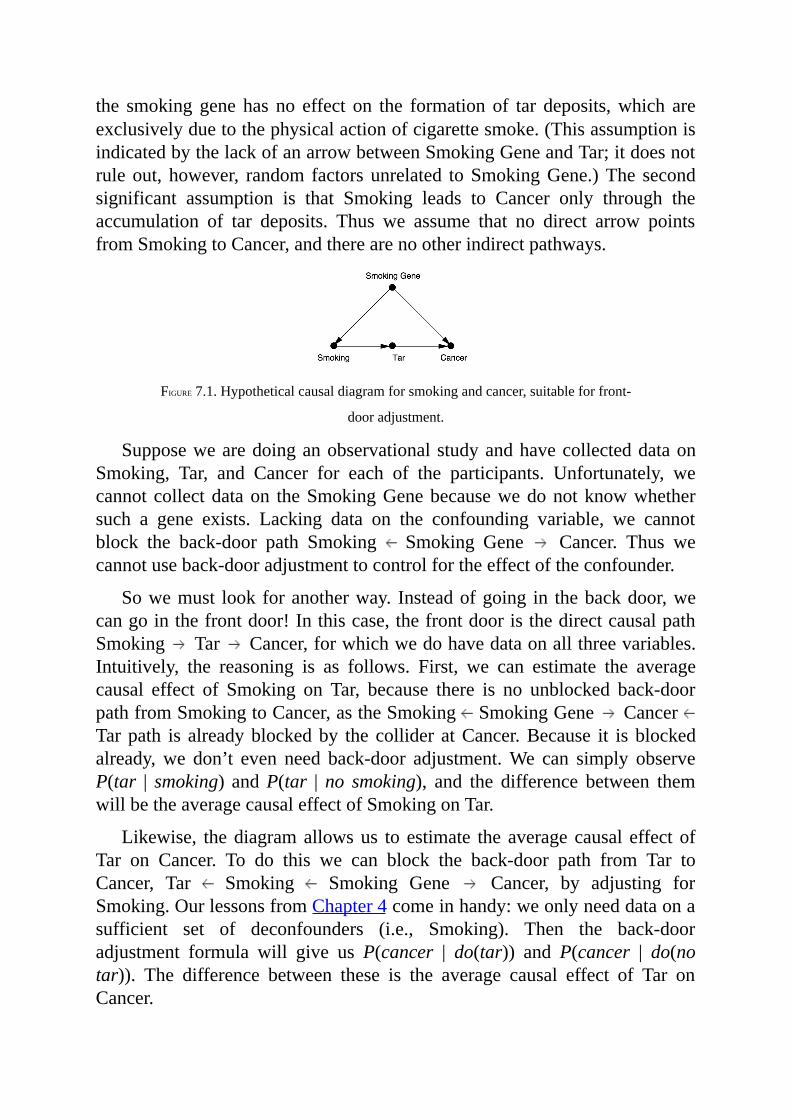
the smoking gene has no effect on the formation of tar deposits,which areexclusivelyduetothephysicalactionofcigarettesmoke.(ThisassumptionisindicatedbythelackofanarrowbetweenSmokingGeneandTar;itdoesnotruleout, however, random factorsunrelated toSmokingGene.)The secondsignificant assumption is that Smoking leads to Cancer only through theaccumulation of tar deposits. Thus we assume that no direct arrow pointsfromSmokingtoCancer,andtherearenootherindirectpathways.
FIGURE7.1.Hypotheticalcausaldiagramforsmokingandcancer,suitableforfront-
dooradjustment.
SupposewearedoinganobservationalstudyandhavecollecteddataonSmoking, Tar, and Cancer for each of the participants. Unfortunately, wecannotcollectdataon theSmokingGenebecausewedonotknowwhethersuch a gene exists. Lacking data on the confounding variable, we cannotblock the back-door path Smoking Smoking Gene Cancer. Thus wecannotuseback-dooradjustmenttocontrolfortheeffectoftheconfounder.
Sowemust lookforanotherway. Insteadofgoing in thebackdoor,wecangointhefrontdoor!Inthiscase,thefrontdooristhedirectcausalpathSmoking Tar Cancer,forwhichwedohavedataonallthreevariables.Intuitively, the reasoning is as follows. First, we can estimate the averagecausal effect of Smoking on Tar, because there is no unblocked back-doorpathfromSmokingtoCancer,astheSmoking SmokingGene CancerTarpath is alreadyblockedby the collider atCancer.Because it is blockedalready,we don’t even need back-door adjustment.We can simply observeP(tar | smoking) andP(tar |no smoking), and the difference between themwillbetheaveragecausaleffectofSmokingonTar.
Likewise, thediagramallowsus to estimate the averagecausal effectofTar on Cancer. To do this we can block the back-door path from Tar toCancer, Tar Smoking Smoking Gene Cancer, by adjusting forSmoking.OurlessonsfromChapter4comeinhandy:weonlyneeddataonasufficient set of deconfounders (i.e., Smoking). Then the back-dooradjustment formula will give us P(cancer | do(tar)) and P(cancer | do(notar)). The difference between these is the average causal effect of Tar onCancer.
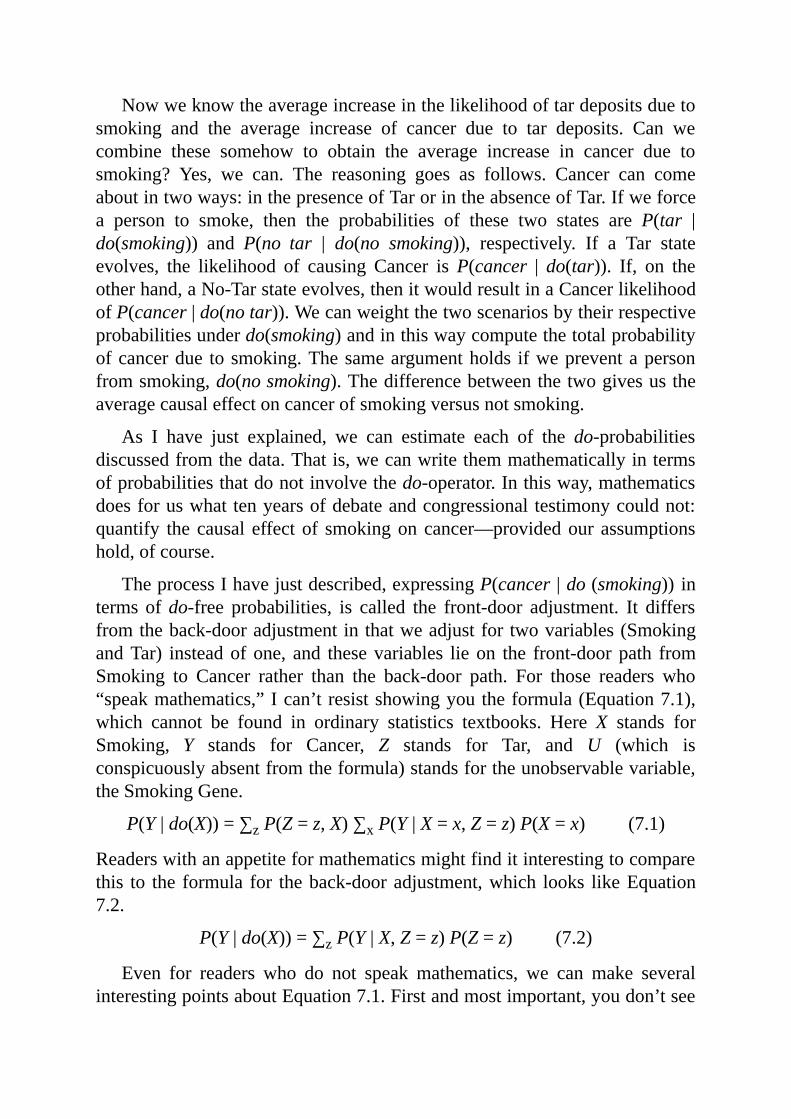
Nowweknowtheaverageincreaseinthelikelihoodoftardepositsduetosmoking and the average increase of cancer due to tar deposits. Can wecombine these somehow to obtain the average increase in cancer due tosmoking? Yes, we can. The reasoning goes as follows. Cancer can comeaboutintwoways:inthepresenceofTarorintheabsenceofTar.Ifweforcea person to smoke, then the probabilities of these two states are P(tar |do(smoking)) and P(no tar | do(no smoking)), respectively. If a Tar stateevolves, the likelihood of causing Cancer isP(cancer |do(tar)). If, on theotherhand,aNo-Tarstateevolves,thenitwouldresultinaCancerlikelihoodofP(cancer|do(notar)).Wecanweightthetwoscenariosbytheirrespectiveprobabilitiesunderdo(smoking)andinthiswaycomputethetotalprobabilityofcancerdue tosmoking.Thesameargumentholds ifwepreventapersonfromsmoking,do(nosmoking).Thedifferencebetweenthetwogivesustheaveragecausaleffectoncancerofsmokingversusnotsmoking.
As I have just explained, we can estimate each of the do-probabilitiesdiscussedfromthedata.Thatis,wecanwritethemmathematicallyintermsofprobabilitiesthatdonotinvolvethedo-operator.Inthisway,mathematicsdoesforuswhattenyearsofdebateandcongressionaltestimonycouldnot:quantify thecausal effectof smokingoncancer—providedour assumptionshold,ofcourse.
TheprocessIhavejustdescribed,expressingP(cancer |do(smoking)) intermsofdo-free probabilities, is called the front-door adjustment. It differsfromtheback-dooradjustmentinthatweadjustfortwovariables(SmokingandTar) insteadofone, and thesevariables lieon the front-doorpath fromSmoking to Cancer rather than the back-door path. For those readers who“speakmathematics,”Ican’tresistshowingyoutheformula(Equation7.1),which cannot be found in ordinary statistics textbooks. Here X stands forSmoking, Y stands for Cancer, Z stands for Tar, and U (which isconspicuouslyabsentfromtheformula)standsfortheunobservablevariable,theSmokingGene.
P(Y|do(X))=∑zP(Z=z,X)∑xP(Y|X=x,Z=z)P(X=x)(7.1)
Readerswithanappetiteformathematicsmightfinditinterestingtocomparethis to the formula for theback-dooradjustment,which looks likeEquation7.2.
P(Y|do(X))=∑zP(Y|X,Z=z)P(Z=z)(7.2)
Even for readers who do not speak mathematics, we can make severalinterestingpointsaboutEquation7.1.Firstandmostimportant,youdon’tsee
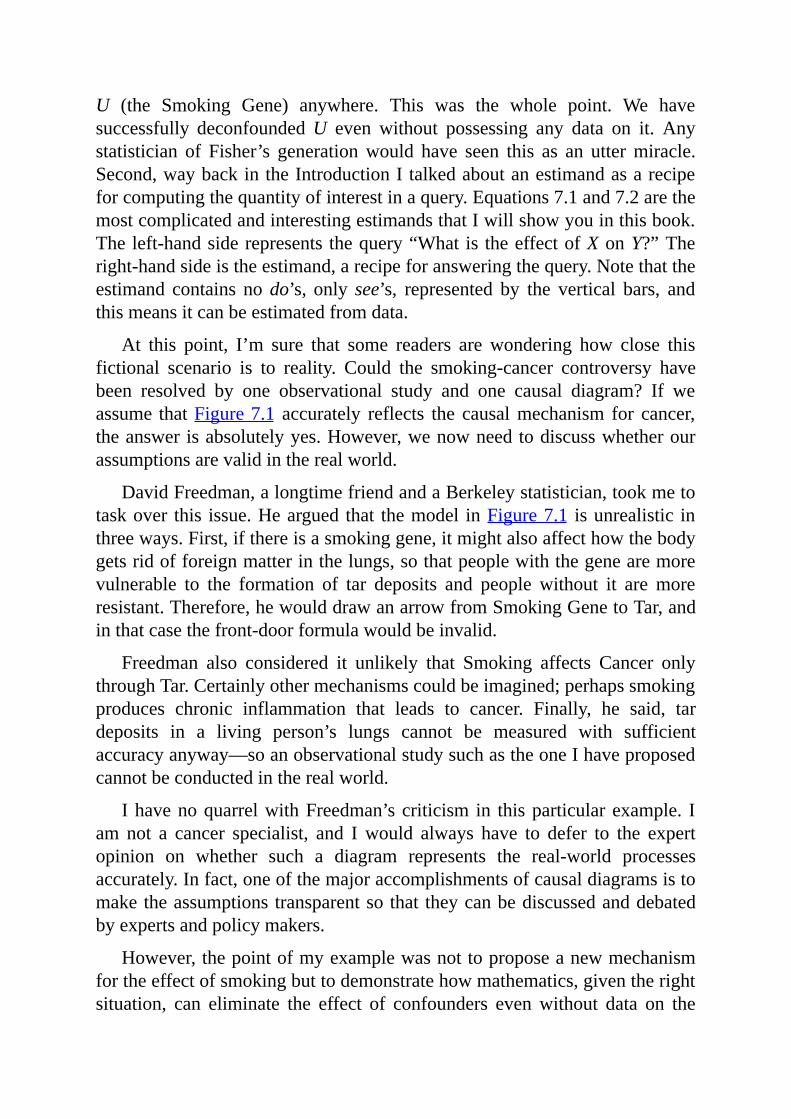
U (the Smoking Gene) anywhere. This was the whole point. We havesuccessfully deconfoundedU even without possessing any data on it. Anystatistician of Fisher’s generationwould have seen this as an uttermiracle.Second,waybackintheIntroductionItalkedaboutanestimandasarecipeforcomputingthequantityofinterestinaquery.Equations7.1and7.2arethemostcomplicatedandinterestingestimandsthatIwillshowyouinthisbook.Theleft-handsiderepresents thequery“What is theeffectofXonY?”Theright-handsideistheestimand,arecipeforansweringthequery.Notethattheestimand contains nodo’s, only see’s, represented by the vertical bars, andthismeansitcanbeestimatedfromdata.
At this point, I’m sure that some readers are wondering how close thisfictional scenario is to reality. Could the smoking-cancer controversy havebeen resolved by one observational study and one causal diagram? If weassumethatFigure7.1 accurately reflects the causalmechanism for cancer,theanswerisabsolutelyyes.However,wenowneedtodiscusswhetherourassumptionsarevalidintherealworld.
DavidFreedman,alongtimefriendandaBerkeleystatistician,tookmetotaskover this issue.Heargued that themodel inFigure7.1 isunrealistic inthreeways.First,ifthereisasmokinggene,itmightalsoaffecthowthebodygetsridofforeignmatterinthelungs,sothatpeoplewiththegenearemorevulnerable to the formation of tar deposits and people without it are moreresistant.Therefore,hewoulddrawanarrowfromSmokingGenetoTar,andinthatcasethefront-doorformulawouldbeinvalid.
Freedman also considered it unlikely that Smoking affects Cancer onlythroughTar.Certainlyothermechanismscouldbeimagined;perhapssmokingproduces chronic inflammation that leads to cancer. Finally, he said, tardeposits in a living person’s lungs cannot be measured with sufficientaccuracyanyway—soanobservationalstudysuchastheoneIhaveproposedcannotbeconductedintherealworld.
IhavenoquarrelwithFreedman’scriticism in thisparticularexample. Iam not a cancer specialist, and Iwould always have to defer to the expertopinion on whether such a diagram represents the real-world processesaccurately.Infact,oneofthemajoraccomplishmentsofcausaldiagramsistomaketheassumptionstransparentsothat theycanbediscussedanddebatedbyexpertsandpolicymakers.
However,thepointofmyexamplewasnottoproposeanewmechanismfortheeffectofsmokingbuttodemonstratehowmathematics,giventherightsituation, can eliminate the effect of confounders evenwithout data on the
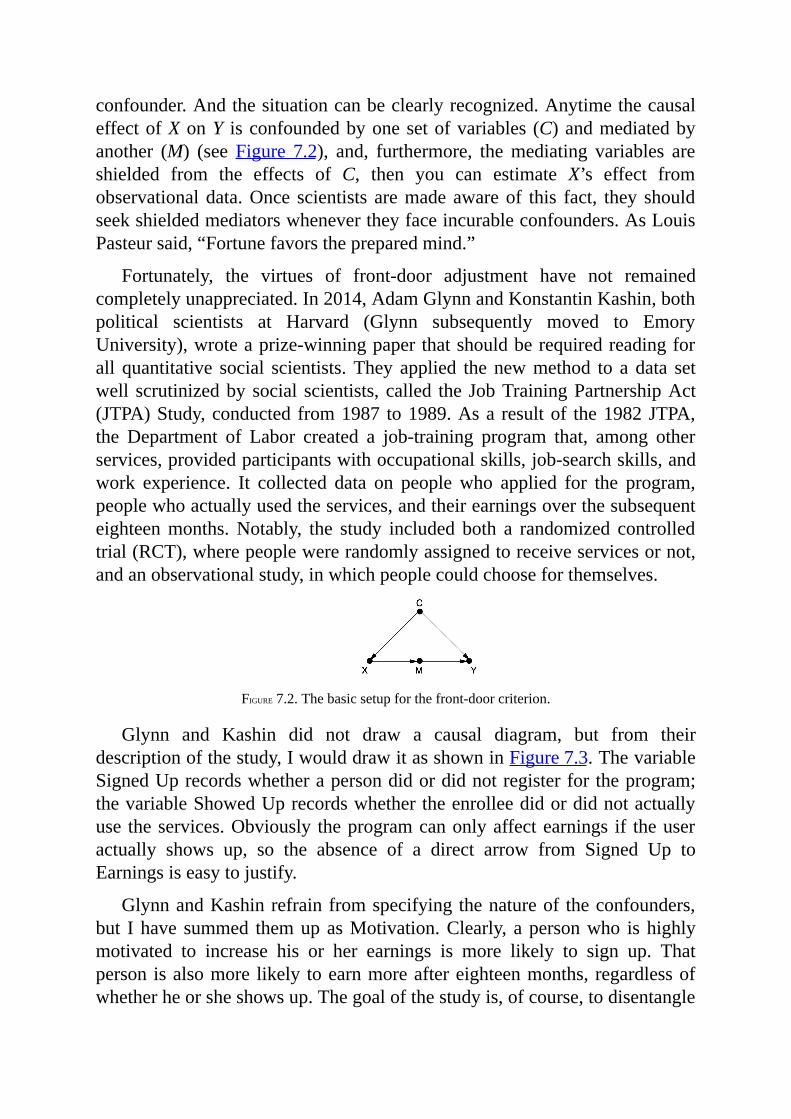
confounder.Andthesituationcanbeclearlyrecognized.AnytimethecausaleffectofXonY isconfoundedbyonesetofvariables (C)andmediatedbyanother (M) (see Figure 7.2), and, furthermore, themediating variables areshielded from the effects of C, then you can estimate X’s effect fromobservationaldata.Once scientists aremadeawareof this fact, they shouldseekshieldedmediatorswhenevertheyfaceincurableconfounders.AsLouisPasteursaid,“Fortunefavorsthepreparedmind.”
Fortunately, the virtues of front-door adjustment have not remainedcompletelyunappreciated.In2014,AdamGlynnandKonstantinKashin,bothpolitical scientists at Harvard (Glynn subsequently moved to EmoryUniversity),wroteaprize-winningpaperthatshouldberequiredreadingforall quantitative social scientists.They applied thenewmethod to a data setwell scrutinizedbysocial scientists, called the JobTrainingPartnershipAct(JTPA)Study,conducted from1987 to1989.Asa resultof the1982JTPA,the Department of Labor created a job-training program that, among otherservices,providedparticipantswithoccupationalskills,job-searchskills,andwork experience. It collected data on peoplewho applied for the program,peoplewhoactuallyusedtheservices,andtheirearningsoverthesubsequenteighteenmonths.Notably, the study included both a randomized controlledtrial(RCT),wherepeoplewererandomlyassignedtoreceiveservicesornot,andanobservationalstudy,inwhichpeoplecouldchooseforthemselves.
FIGURE7.2.Thebasicsetupforthefront-doorcriterion.
Glynn and Kashin did not draw a causal diagram, but from theirdescriptionofthestudy,IwoulddrawitasshowninFigure7.3.ThevariableSignedUprecordswhetherapersondidordidnotregisterfortheprogram;thevariableShowedUprecordswhethertheenrolleedidordidnotactuallyuse theservices.Obviously theprogramcanonlyaffectearnings if theuseractually shows up, so the absence of a direct arrow from Signed Up toEarningsiseasytojustify.
GlynnandKashinrefrainfromspecifyingthenatureof theconfounders,but Ihave summed themupasMotivation.Clearly, apersonwho ishighlymotivated to increase his or her earnings is more likely to sign up. Thatperson isalsomore likely toearnmoreaftereighteenmonths, regardlessofwhetherheorsheshowsup.Thegoalofthestudyis,ofcourse,todisentangle
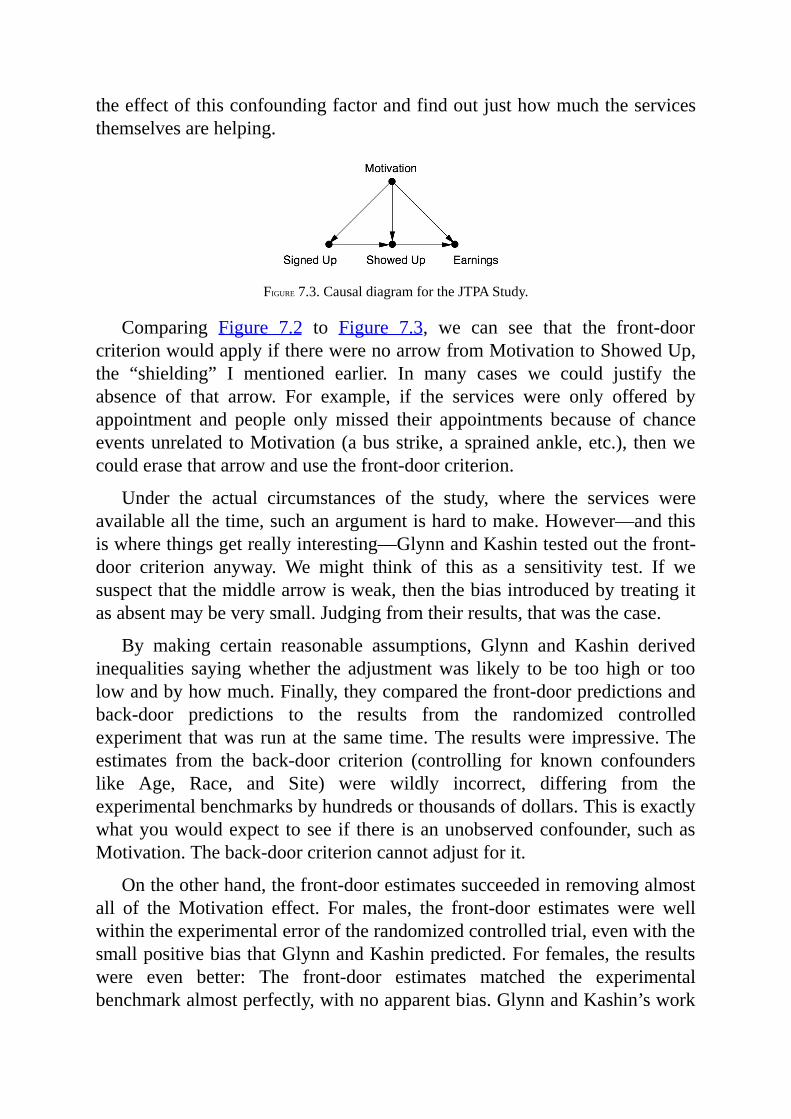
theeffectofthisconfoundingfactorandfindoutjusthowmuchtheservicesthemselvesarehelping.
FIGURE7.3.CausaldiagramfortheJTPAStudy.
Comparing Figure 7.2 to Figure 7.3, we can see that the front-doorcriterionwouldapplyiftherewerenoarrowfromMotivationtoShowedUp,the “shielding” I mentioned earlier. In many cases we could justify theabsence of that arrow. For example, if the services were only offered byappointment and people onlymissed their appointments because of chanceeventsunrelatedtoMotivation(abusstrike,asprainedankle,etc.), thenwecoulderasethatarrowandusethefront-doorcriterion.
Under the actual circumstances of the study, where the services wereavailableallthetime,suchanargumentishardtomake.However—andthisiswherethingsgetreallyinteresting—GlynnandKashintestedoutthefront-door criterion anyway. We might think of this as a sensitivity test. If wesuspectthatthemiddlearrowisweak,thenthebiasintroducedbytreatingitasabsentmaybeverysmall.Judgingfromtheirresults,thatwasthecase.
By making certain reasonable assumptions, Glynn and Kashin derivedinequalities sayingwhether the adjustmentwas likely to be too high or toolowandbyhowmuch.Finally,theycomparedthefront-doorpredictionsandback-door predictions to the results from the randomized controlledexperiment thatwasrunat thesame time.Theresultswere impressive.Theestimates from the back-door criterion (controlling for known confounderslike Age, Race, and Site) were wildly incorrect, differing from theexperimentalbenchmarksbyhundredsorthousandsofdollars.Thisisexactlywhatyouwouldexpect tosee if there isanunobservedconfounder,suchasMotivation.Theback-doorcriterioncannotadjustforit.
Ontheotherhand,thefront-doorestimatessucceededinremovingalmostall of theMotivation effect. For males, the front-door estimates were wellwithintheexperimentalerroroftherandomizedcontrolledtrial,evenwiththesmallpositivebiasthatGlynnandKashinpredicted.Forfemales,theresultswere even better: The front-door estimates matched the experimentalbenchmarkalmostperfectly,withnoapparentbias.GlynnandKashin’swork
givesbothempiricalandmethodologicalproofthataslongastheeffectofConM (in Figure 7.2) isweak, front-door adjustment can give a reasonablygoodestimateoftheeffectofXonY.ItismuchbetterthannotcontrollingforC.
GlynnandKashin’sresultsshowwhythefront-dooradjustmentissuchapowerfultool:itallowsustocontrolforconfoundersthatwecannotobserve(like Motivation), including those that we can’t even name. RCTs areconsidered the “gold standard” of causal effect estimation for exactly thesame reason. Because front-door estimates do the same thing, with theadditionalvirtueofobservingpeople’sbehavior in theirownnaturalhabitatinstead of a laboratory, I would not be surprised if this method eventuallybecomesaseriouscompetitortorandomizedcontrolledtrials.
THEDO-CALCULUS,ORMINDOVERMATTER
Inboththefront-andback-dooradjustmentformulas,theultimategoalistocalculatetheeffectofanintervention,P(Y |do(X)), in termsofdatasuchasP(Y |X,A,B,Z,…) thatdonot involveado-operator. Ifwearecompletelysuccessful at eliminating the do’s, then we can use observational data toestimate thecausaleffect,allowingus to leapfromrungonetorungtwooftheLadderofCausation.
Thefactthatweweresuccessfulinthesetwocases(front-andback-door)immediately raises the question of whether there are other doors throughwhichwe can eliminate all the do’s. Thinkingmore generally, we can askwhetherthereissomewaytodecideinadvanceifagivencausalmodellendsitselftosuchaneliminationprocedure.Ifso,wecanapplytheprocedureandfindourselvesinpossessionofthecausaleffect,withouthavingtoliftafingerto intervene. Otherwise, we would at least know that the assumptionsimbedded in themodel are not sufficient to uncover the causal effect fromobservationaldata,andnomatterhowcleverweare,thereisnoescapefromrunninganinterventionalexperimentofsomekind.
The prospect of making these determinations by purely mathematicalmeans should dazzle anybody who understands the cost and difficulty ofrunningrandomizedcontrolledtrials,evenwhentheyarephysicallyfeasibleandlegallypermissible.Theideadazzledme,too,intheearly1990s,notasanexperimenterbutasacomputerscientistandpart-timephilosopher.Surelyoneofthemostexhilaratingexperiencesyoucanhaveasascientististositatyour desk and realize that you can finally figure out what is possible or
impossibleintherealworld—especiallyiftheproblemisimportanttosocietyandhasbaffledthosewhohavetriedtosolveitbeforeyou.IimaginethisishowHipparchus ofNicaea feltwhenhe discovered he could figure out theheightofapyramidfromitsshadowontheground,withoutactuallyclimbingthepyramid.Itwasaclearvictoryofmindovermatter.
Indeed,theapproachItookwasverymuchinspiredbytheancientGreeks(including Hipparchus) and their invention of a formal logical system forgeometry.AtthecenteroftheGreeks’logic,wefindasetofaxiomsorself-evidenttruths,suchas“Betweenanytwopointsonecandrawoneandonlyoneline.”Withthehelpofthoseaxioms,theGreekscouldconstructcomplexstatements, called theorems, whose truth is far from evident. Take, forinstance,thestatementthatthesumoftheanglesinatriangleis180degrees(or two right angles), regardless of its size or shape. The truth of thisstatementisnotself-evidentbyanymeans;yetthePythagoreanphilosophersofthefifthcenturyBCwereabletoproveitsuniversaltruthusingthoseself-evidentaxiomsasbuildingblocks.
Ifyourememberyourhighschoolgeometry,evenjust thegistof it,youwill recall that proofs of theorems invariably consist of auxiliaryconstructions: for example, drawing a lineparallel to an edgeof a triangle,markingcertainanglesasequal,drawingacirclewithagivensegmentasitsradius,andsoon.Theseauxiliaryconstructionscanberegardedastemporarymathematical sentences thatmake assertions (or claims) aboutproperties ofthefiguredrawn.Eachnewconstructionislicensedbythepreviousones,aswell as by the axioms of geometry and perhaps some already derivedtheorems. For example, drawing a line parallel to one edge of a triangle islicensedbyEuclid’sfifthaxiom,thatitispossibletodrawoneandonlyoneparalleltoagivenlinefromapointoutsidethatline.Theactofdrawinganyof these auxiliary constructions is just amechanical “symbolmanipulation”operation; it takes the sentence previously written (or picture previouslydrawn)andrewritesitinanewformat,whenevertherewritingislicensedbytheaxioms.Euclid’sgreatnesswastoidentifyashort listoffiveelementaryaxioms,fromwhichallothertruegeometricstatementscanbederived.
Nowletusreturntoourcentralquestionofwhenamodelcanreplaceanexperiment, or when a “do” quantity can be reduced to a “see” quantity.Inspiredby theancientGreekgeometers,wewant to reduce theproblemtosymbolmanipulation and in thiswaywrest causality fromMountOlympusandmakeitavailabletotheaverageresearcher.
First, let us rephrase the task of finding the effect ofX onY using the
language of proofs, axioms, and auxiliary constructions, the language ofEuclid andPythagoras.We startwithour target sentence,P(Y |do(X)). Ourtaskwillbecompleteifwecansucceedineliminatingthedo-operatorfromit,leavingonlyclassicalprobabilityexpressions,likeP(Y|X)orP(Y|X,Z,W).Wecannot,ofcourse,manipulateourtargetexpressionatwill;theoperationsmustconformtowhatdo(X)meansasaphysicalintervention.Thus,wemustpass the expression through a sequence of legitimate manipulations, eachlicensedbytheaxiomsandtheassumptionsofourmodel.Themanipulationsshould preserve themeaning of themanipulated expression, only changingthe format it is written in. An example of a “meaning preserving”transformationisthealgebraictransformationthatturnsy=ax+bintoax=y–b.Therelationshipbetweenxandyremainsintact;onlytheformatchanges.
We are already familiar with some “legitimate” transformations on do-expressions.Forexample,Rule1sayswhenweobserveavariableWthatisirrelevanttoY(possiblyconditionalonothervariablesZ),thentheprobabilitydistributionofYwillnotchange.Forexample,inChapter3wesawthat thevariableFire is irrelevant toAlarmonceweknow the stateof themediator(Smoke). This assertion of irrelevance translates into a symbolicmanipulation:
P(Y|do(X),Z,W)=P(Y|do(X),Z)
ThestatedequationholdsprovidedthatthevariablesetZblocksallthepathsfromW to Y after we have deleted all the arrows leading into X. In theexample of Fire Smoke Alarm,we haveW = Fire,Z = Smoke, Y =Alarm,andZblocksallthepathsfromWtoY.(InthiscasewedonothaveavariableX.)
Another legitimate transformation is familiar to us from our back-doordiscussion.Weknow that if a setZ of variables blocks all back-door pathsfromX toY, then conditional onZ,do(X) is equivalent to see(X).We can,therefore,write
P(Y|do(X),Z)=P(Y|X,Z)
ifZsatisfiestheback-doorcriterion.WeadoptthisasRule2ofouraxiomaticsystem.While this is perhaps less self-evident thanRule 1, in the simplestcasesitisHansReichenbach’scommon-causeprinciple,amendedsothatwewon’tmistakecolliders for confounders. Inotherwords,weare saying thatafter we have controlled for a sufficient deconfounding set, any remainingcorrelationisagenuinecausaleffect.
Rule3isquitesimple:itessentiallysaysthatwecanremovedo(X)from
P(Y|do(X))inanycasewheretherearenocausalpathsfromXtoY.Thatis,
P(Y|do(X))=P(Y)
if there is no path fromX toY with only forward-directed arrows.We canparaphrasethisruleisfollows:ifwedosomethingthatdoesnotaffectY,thentheprobabilitydistributionofYwillnotchange.Asidefrombeingjustasself-evidentasEuclid’saxioms,Rules1 to3canalsobeprovenmathematicallyusing our arrow-deleting definition of the do-operator and basic laws ofprobability.
Note that Rules 1 and 2 include conditional probabilities involvingauxiliaryvariablesZotherthanXandY.Thesevariablescanbethoughtofasacontextinwhichtheprobabilityisbeingcomputed.Sometimesthepresenceof this context itself licenses the transformation. Rule 3 may also haveauxiliaryvariables,butIomittedthemforsimplicity.
Note that each rule has a simple syntactic interpretation.Rule 1 permitstheadditionordeletionofobservations.Rule2permitsthereplacementofaninterventionwithanobservation,orviceversa.Rule3permitsthedeletionoraddition of interventions. All of these permits are issued under appropriateconditions,whichhave tobeverified inanyparticularcase from thecausaldiagram.
WearereadynowtodemonstratehowRules1to3allowustotransformoneformulaintoanotheruntil,ifwearesmart,weobtainanexpressiontoourliking. Although it’s a bit elaborate, I think that nothing can substitute foractually showing you how the front-door formula is derived using asuccessive application of the rules of do-calculus (Figure 7.4). You do notneedtofollowallthesteps,butIamshowingyouthederivationtogiveyoutheflavorofdo-calculus.WebeginthejourneywithatargetexpressionP(Y|do(X)).We introduceauxiliaryvariablesand transformthe targetexpressioninto a do-free expression that coincides, of course, with the front-dooradjustmentformula.EachstepoftheargumentgetsitslicensefromthecausaldiagramthatrelatesX,Y,andtheauxiliaryvariablesor,inseveralcases,fromsubdiagramsthathavehadarrowserasedtoaccountforinterventions.Theselicensesaredisplayedontheright-handside.
I feel a special attachment to the do-calculus. With these three humblerules Iwas able to derive the front-door formula. Thiswas the first causaleffect estimatedbymeansother thancontrol for confounders. Ibelievednoonecoulddothiswithoutthedo-calculus,soIpresenteditasachallengeinastatisticsseminaratBerkeleyin1993andevenoffereda$100prizetoanyone
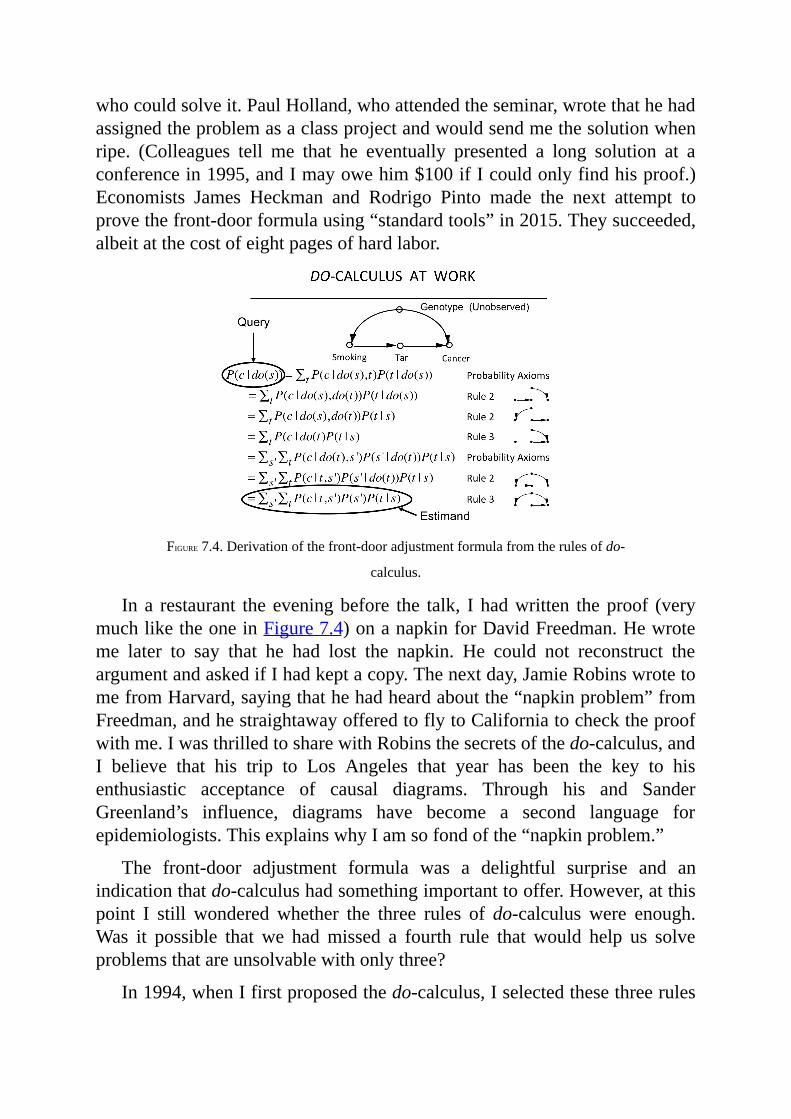
whocouldsolveit.PaulHolland,whoattendedtheseminar,wrotethathehadassignedtheproblemasaclassprojectandwouldsendmethesolutionwhenripe. (Colleagues tell me that he eventually presented a long solution at aconferencein1995,andImayowehim$100ifIcouldonlyfindhisproof.)Economists James Heckman and Rodrigo Pinto made the next attempt toprovethefront-doorformulausing“standardtools”in2015.Theysucceeded,albeitatthecostofeightpagesofhardlabor.
FIGURE7.4.Derivationofthefront-dooradjustmentformulafromtherulesofdo-
calculus.
Ina restaurant theeveningbefore the talk, Ihadwritten theproof (verymuchliketheoneinFigure7.4)onanapkinforDavidFreedman.Hewroteme later to say that he had lost the napkin. He could not reconstruct theargumentandaskedifIhadkeptacopy.Thenextday,JamieRobinswrotetomefromHarvard,sayingthathehadheardaboutthe“napkinproblem”fromFreedman,andhestraightawayofferedtoflytoCaliforniatochecktheproofwithme.IwasthrilledtosharewithRobinsthesecretsofthedo-calculus,andI believe that his trip to Los Angeles that year has been the key to hisenthusiastic acceptance of causal diagrams. Through his and SanderGreenland’s influence, diagrams have become a second language forepidemiologists.ThisexplainswhyIamsofondofthe“napkinproblem.”
The front-door adjustment formula was a delightful surprise and anindicationthatdo-calculushadsomethingimportanttooffer.However,atthispoint I still wonderedwhether the three rules of do-calculus were enough.Was it possible that we hadmissed a fourth rule that would help us solveproblemsthatareunsolvablewithonlythree?
In1994,whenIfirstproposedthedo-calculus,Iselectedthesethreerules
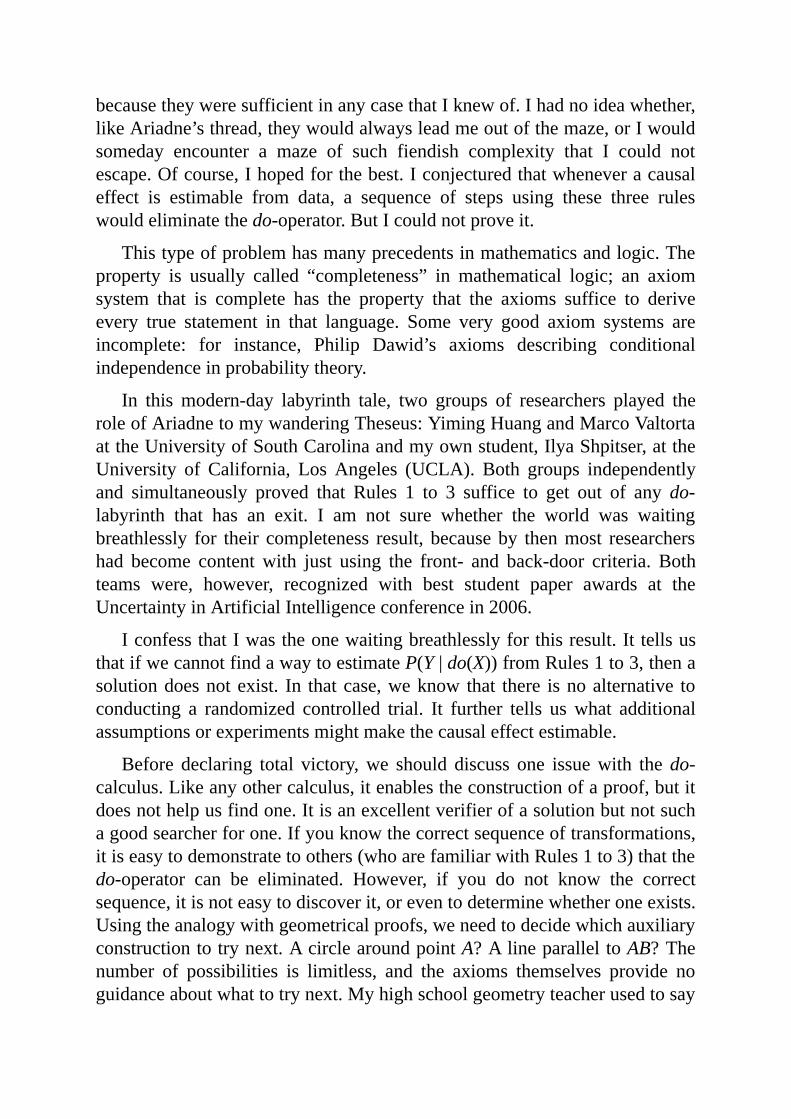
becausetheyweresufficientinanycasethatIknewof.Ihadnoideawhether,likeAriadne’sthread,theywouldalwaysleadmeoutofthemaze,orIwouldsomeday encounter a maze of such fiendish complexity that I could notescape.Ofcourse,Ihopedforthebest.Iconjecturedthatwheneveracausaleffect is estimable from data, a sequence of steps using these three ruleswouldeliminatethedo-operator.ButIcouldnotproveit.
Thistypeofproblemhasmanyprecedentsinmathematicsandlogic.Theproperty is usually called “completeness” in mathematical logic; an axiomsystem that is complete has the property that the axioms suffice to deriveevery true statement in that language. Some very good axiom systems areincomplete: for instance, Philip Dawid’s axioms describing conditionalindependenceinprobabilitytheory.
In this modern-day labyrinth tale, two groups of researchers played theroleofAriadnetomywanderingTheseus:YimingHuangandMarcoValtortaattheUniversityofSouthCarolinaandmyownstudent,IlyaShpitser,attheUniversity of California, LosAngeles (UCLA). Both groups independentlyand simultaneously proved that Rules 1 to 3 suffice to get out of any do-labyrinth that has an exit. I am not sure whether the world was waitingbreathlessly for their completeness result, becauseby thenmost researchershad become content with just using the front- and back-door criteria. Bothteams were, however, recognized with best student paper awards at theUncertaintyinArtificialIntelligenceconferencein2006.
IconfessthatIwastheonewaitingbreathlesslyforthisresult.IttellsusthatifwecannotfindawaytoestimateP(Y|do(X))fromRules1to3,thenasolutiondoesnotexist. In thatcase,weknow that there isnoalternative toconducting a randomized controlled trial. It further tells uswhat additionalassumptionsorexperimentsmightmakethecausaleffectestimable.
Before declaring total victory,we should discuss one issuewith thedo-calculus.Likeanyothercalculus,itenablestheconstructionofaproof,butitdoesnothelpusfindone.Itisanexcellentverifierofasolutionbutnotsuchagoodsearcherforone.Ifyouknowthecorrectsequenceoftransformations,itiseasytodemonstratetoothers(whoarefamiliarwithRules1to3)thatthedo-operator can be eliminated. However, if you do not know the correctsequence,itisnoteasytodiscoverit,oreventodeterminewhetheroneexists.Usingtheanalogywithgeometricalproofs,weneedtodecidewhichauxiliaryconstructiontotrynext.AcirclearoundpointA?AlineparalleltoAB?Thenumber of possibilities is limitless, and the axioms themselves provide noguidanceaboutwhattotrynext.Myhighschoolgeometryteacherusedtosay
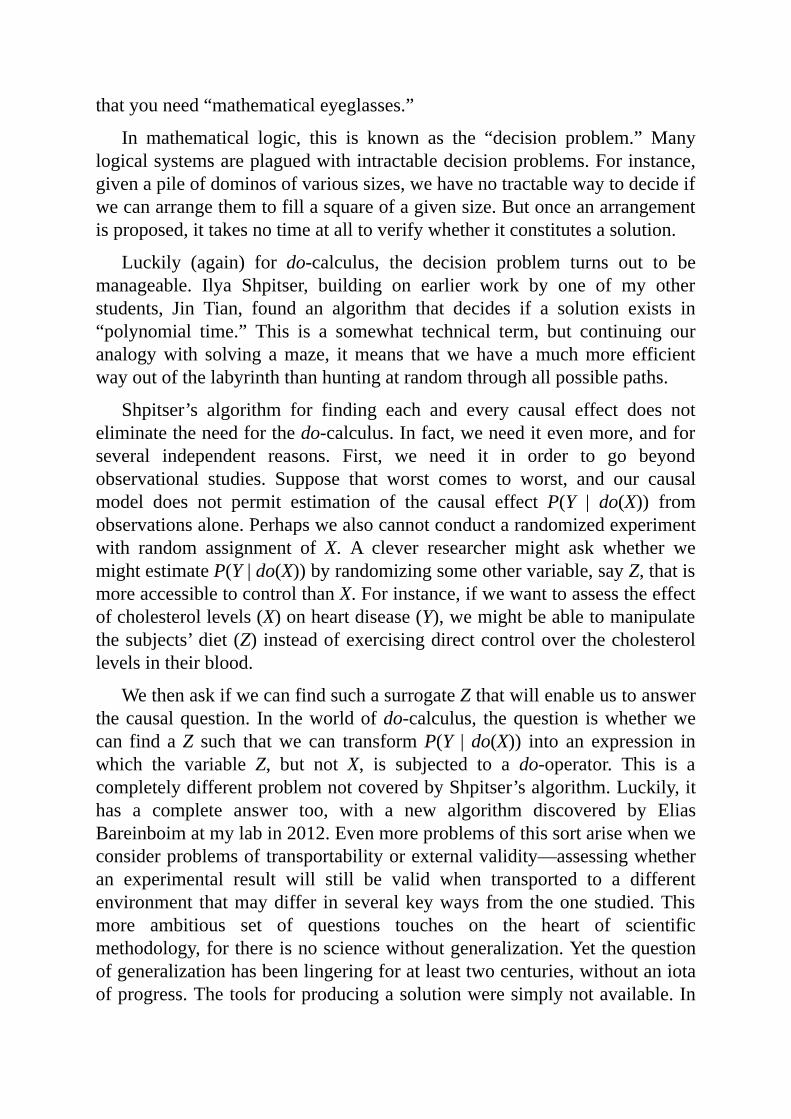
thatyouneed“mathematicaleyeglasses.”
In mathematical logic, this is known as the “decision problem.” Manylogicalsystemsareplaguedwithintractabledecisionproblems.Forinstance,givenapileofdominosofvarioussizes,wehavenotractablewaytodecideifwecanarrangethemtofillasquareofagivensize.Butonceanarrangementisproposed,ittakesnotimeatalltoverifywhetheritconstitutesasolution.
Luckily (again) for do-calculus, the decision problem turns out to bemanageable. Ilya Shpitser, building on earlier work by one of my otherstudents, Jin Tian, found an algorithm that decides if a solution exists in“polynomial time.” This is a somewhat technical term, but continuing ouranalogywith solving amaze, itmeans thatwe have amuchmore efficientwayoutofthelabyrinththanhuntingatrandomthroughallpossiblepaths.
Shpitser’s algorithm for finding each and every causal effect does noteliminatetheneedforthedo-calculus.Infact,weneeditevenmore,andforseveral independent reasons. First, we need it in order to go beyondobservational studies. Suppose that worst comes to worst, and our causalmodel does not permit estimation of the causal effect P(Y | do(X)) fromobservationsalone.Perhapswealsocannotconductarandomizedexperimentwith random assignment of X. A clever researcher might ask whether wemightestimateP(Y|do(X))byrandomizingsomeothervariable,sayZ,thatismoreaccessibletocontrolthanX.Forinstance,ifwewanttoassesstheeffectofcholesterollevels(X)onheartdisease(Y),wemightbeabletomanipulatethesubjects’diet(Z)insteadofexercisingdirectcontroloverthecholesterollevelsintheirblood.
WethenaskifwecanfindsuchasurrogateZthatwillenableustoanswerthecausalquestion. In theworldofdo-calculus, thequestion iswhetherwecan findaZ such thatwe can transformP(Y |do(X)) into an expression inwhich the variable Z, but not X, is subjected to a do-operator. This is acompletelydifferentproblemnotcoveredbyShpitser’salgorithm.Luckily,ithas a complete answer too, with a new algorithm discovered by EliasBareinboimatmylabin2012.Evenmoreproblemsofthissortarisewhenweconsiderproblemsoftransportabilityorexternalvalidity—assessingwhetheran experimental result will still be valid when transported to a differentenvironment thatmaydiffer inseveralkeywaysfromtheonestudied.Thismore ambitious set of questions touches on the heart of scientificmethodology,forthereisnosciencewithoutgeneralization.Yetthequestionofgeneralizationhasbeenlingeringforatleasttwocenturies,withoutaniotaofprogress.Thetoolsforproducingasolutionweresimplynotavailable.In
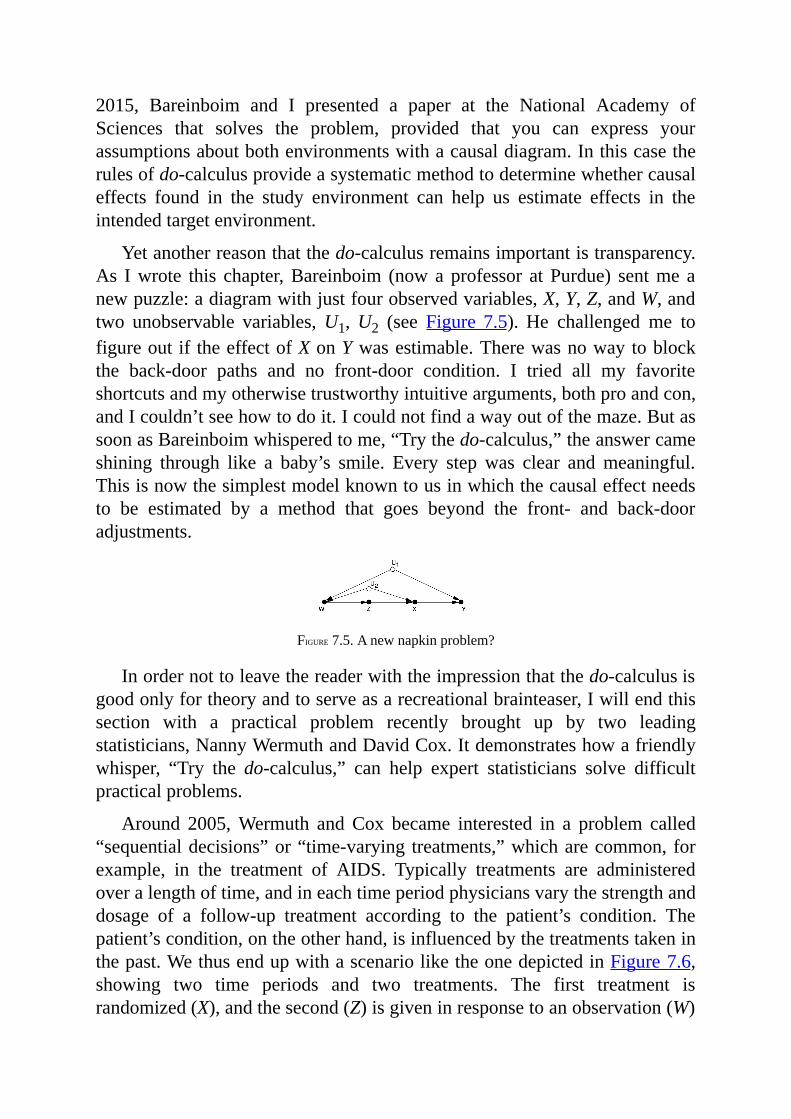
2015, Bareinboim and I presented a paper at the National Academy ofSciences that solves the problem, provided that you can express yourassumptionsaboutbothenvironmentswithacausaldiagram.Inthiscasetherulesofdo-calculusprovideasystematicmethodtodeterminewhethercausaleffects found in the study environment can help us estimate effects in theintendedtargetenvironment.
Yetanotherreasonthatthedo-calculusremainsimportantistransparency.As Iwrote this chapter,Bareinboim (nowa professor atPurdue) sentme anewpuzzle:adiagramwithjustfourobservedvariables,X,Y,Z,andW,andtwo unobservable variables,U1,U2 (see Figure 7.5).He challenged me tofigureoutiftheeffectofXonYwasestimable.Therewasnowaytoblockthe back-door paths and no front-door condition. I tried all my favoriteshortcutsandmyotherwisetrustworthyintuitivearguments,bothproandcon,andIcouldn’tseehowtodoit.Icouldnotfindawayoutofthemaze.ButassoonasBareinboimwhisperedtome,“Trythedo-calculus,”theanswercameshining through like a baby’s smile. Every step was clear andmeaningful.Thisisnowthesimplestmodelknowntousinwhichthecausaleffectneedsto be estimated by a method that goes beyond the front- and back-dooradjustments.
FIGURE7.5.Anewnapkinproblem?
Inordernottoleavethereaderwiththeimpressionthatthedo-calculusisgoodonlyfortheoryandtoserveasarecreationalbrainteaser,Iwillendthissection with a practical problem recently brought up by two leadingstatisticians,NannyWermuthandDavidCox.Itdemonstrateshowafriendlywhisper, “Try the do-calculus,” can help expert statisticians solve difficultpracticalproblems.
Around 2005,Wermuth andCox became interested in a problem called“sequentialdecisions”or“time-varying treatments,”whicharecommon, forexample, in the treatment of AIDS. Typically treatments are administeredoveralengthoftime,andineachtimeperiodphysiciansvarythestrengthanddosage of a follow-up treatment according to the patient’s condition. Thepatient’scondition,ontheotherhand,isinfluencedbythetreatmentstakeninthepast.WethusendupwithascenarioliketheonedepictedinFigure7.6,showing two time periods and two treatments. The first treatment israndomized(X),andthesecond(Z)isgiveninresponsetoanobservation(W)
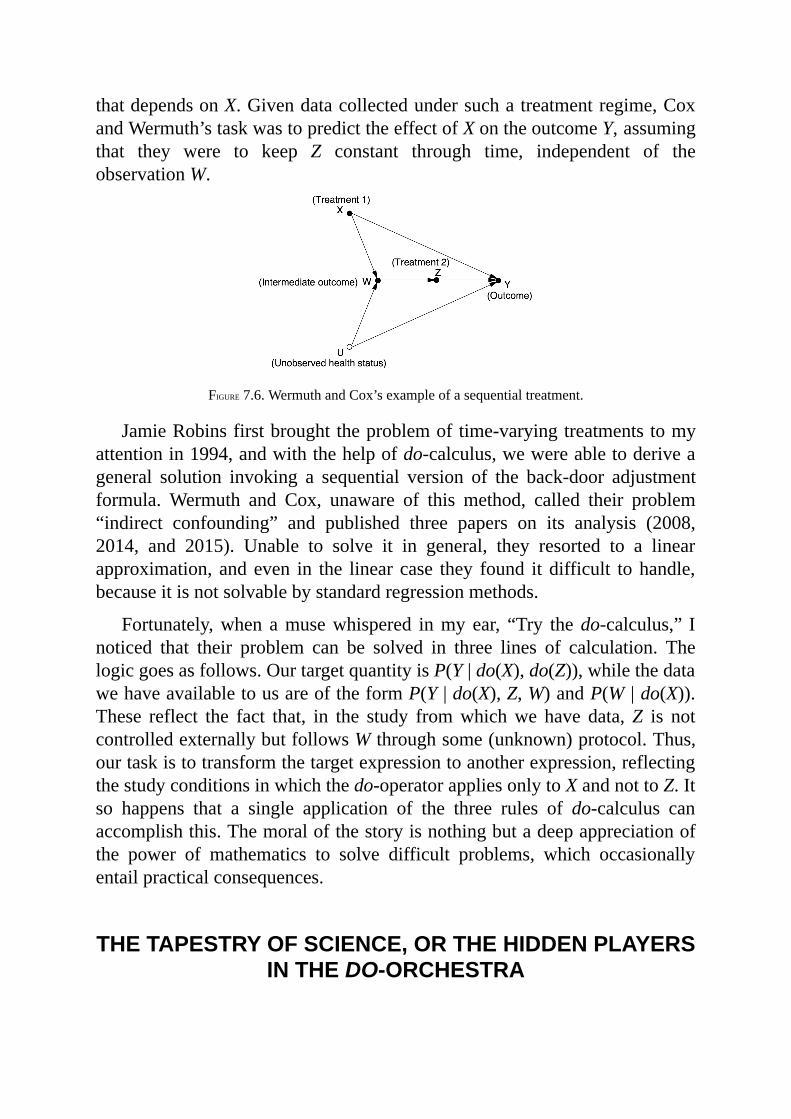
thatdependsonX.Givendatacollectedundersuchatreatmentregime,CoxandWermuth’staskwastopredicttheeffectofXontheoutcomeY,assumingthat they were to keep Z constant through time, independent of theobservationW.
FIGURE7.6.WermuthandCox’sexampleofasequentialtreatment.
JamieRobinsfirstbroughttheproblemoftime-varyingtreatmentstomyattentionin1994,andwiththehelpofdo-calculus,wewereabletoderiveageneral solution invoking a sequential version of the back-door adjustmentformula. Wermuth and Cox, unaware of this method, called their problem“indirect confounding” and published three papers on its analysis (2008,2014, and 2015). Unable to solve it in general, they resorted to a linearapproximation, andeven in the linear case they found it difficult tohandle,becauseitisnotsolvablebystandardregressionmethods.
Fortunately,when amusewhispered inmy ear, “Try thedo-calculus,” Inoticed that their problem can be solved in three lines of calculation. Thelogicgoesasfollows.OurtargetquantityisP(Y|do(X),do(Z)),whilethedatawehaveavailabletousareoftheformP(Y|do(X),Z,W)andP(W |do(X)).These reflect the fact that, in the study fromwhichwe have data,Z is notcontrolledexternallybutfollowsWthroughsome(unknown)protocol.Thus,ourtaskistotransformthetargetexpressiontoanotherexpression,reflectingthestudyconditionsinwhichthedo-operatorappliesonlytoXandnottoZ.Itso happens that a single application of the three rules of do-calculus canaccomplishthis.Themoralofthestoryisnothingbutadeepappreciationofthe power of mathematics to solve difficult problems, which occasionallyentailpracticalconsequences.
THETAPESTRYOFSCIENCE,ORTHEHIDDENPLAYERSINTHEDO-ORCHESTRA
I’ve already mentioned the role of some of my students in weaving thisbeautiful do-calculus tapestry. Like any tapestry, it gives a sense ofcompletenessthatmayconcealhowpainstakingmakingitwasandhowmanyhandscontributedtotheprocess.Inthiscase,ittookmorethantwentyyearsandcontributionsfromseveralstudentsandcolleagues.
ThefirstwasThomasVerma,whomImetwhenhewasasixteen-year-oldboy.Hisfatherbroughthimtomyofficeonedayandsaid,essentially,“Givehimsomething todo.”Hewas too talented foranyofhishighschoolmathteachers tokeephiminterested.Whatheeventuallyaccomplishedwas trulyamazing. Verma finally proved what became known as the d-separationproperty(i.e.,thefactthatyoucanusetherulesofpathblockingtodeterminewhichindependenciesshouldholdinthedata).Astonishingly,hetoldmethatheprovedthed-separationpropertythinkingitwasahomeworkproblem,notanunsolvedconjecture!Sometimes itpays tobeyoungandnaive.Youcanstillseehis legacyinRule1of thedo-calculusandinanyimprint thatpathblockingleavesonrungoneoftheLadderofCausation.
The power of Verma’s proof would have remained only partiallyappreciated without a complementary result to show that it cannot beimproved.That is,noother independenciesare impliedbyacausaldiagramexcept those revealed through path blocking. This step was completed byanother student, Dan Geiger. He had switched to my research lab fromanothergroupatUCLA,afterIpromisedtogivehiman“instantPhD”ifhecouldprove two theorems.Hedid, and Idid!He isnowDeanofcomputerscienceattheTechnioninIsrael,myalmamater.
ButDanwasnottheonlystudentIraidedfromanotherdepartment.Onedayin1997,asIwasgettingdressedinthelockerroomoftheUCLApool,Istruck up a conversationwith aChinese fellow next tome.Hewas a PhDstudentinphysics,and,aswasmyusualhabitatthetime,Itriedtoconvincehimtoswitchovertoartificialintelligence,wheretheactionwas.Hewasnotcompletelyconvinced,buttheverynextdayIreceivedanemailfromafriendofhis,JinTian,sayingthathewouldliketoswitchfromphysicstocomputerscienceanddidIhaveachallengingsummerprojectforhim?Twodayslater,hewasworkinginmylab.
Four years later, in April 2001, he stunned the world with a simplegraphicalcriterionthatgeneralizesthefrontdoor,thebackdoor,andalldoorswecouldthinkofatthetime.IrecallpresentingTian’scriterionataSantaFeconference. One by one, leaders in the research community stared at myposterandshooktheirheadsindisbelief.Howcouldsuchasimplecriterion
workforalldiagrams?
Tian (now a professor at IowaStateUniversity) came to our labwith astyleofthinkingthatwasforeigntousthen,inthe1990s.Ourconversationswere always loaded with wild metaphors and half-baked conjectures. ButTianwouldneverutterawordunlessitwasrigorous,proven,andbakedfivetimes over. Themixture of the two styles proved itsmerit. Tian’smethod,called c-decomposition, enabled Ilya Shpitser to develop his completealgorithmforthedo-calculus.Themoral:neverunderestimatethepowerofalocker-roomconversation!
Ilya Shpitser came in at the end of the ten-year battle to understandinterventions.He arrived during a very difficult period,when I had to taketimeofftosetupafoundationinhonorofmyson,Daniel,avictimofanti-Westernterrorism.Ihavealwaysexpectedmystudentstobeself-reliant,butformystudentsatthattime,thisexpectationwaspushedtotheextreme.Theygavemethebestofallpossiblegiftsbyputtingthefinalbutcrucialtouchesonthetapestryofdo-calculus,whichIcouldnothavedonemyself.Infact,ItriedtodiscourageIlyafromtryingtoprovethecompletenessofdo-calculus.Completeness proofs are notoriously difficult and are best avoided by anystudentwhoaims to finishhisPhDon time.Luckily, Ilyadid it behindmyback.
Colleagues, too, exert a profound effect on your thinking at crucialmoments. Peter Spirtes, a professor of philosophy at Carnegie-Mellon,preceded me in the network approach to causality, and his influence waspivotal.AtalectureofhisinUppsala,Sweden,Ifirstlearnedthatperforminginterventionscouldbe thoughtofasdeletingarrowsfromacausaldiagram.Until then I had been laboring under the same burden as generations ofstatisticians, trying to think of causality in terms of only one diagramrepresentingonestaticprobabilitydistribution.
TheideaofarrowdeletionwasnotentirelySpirtes’s,either.In1960,twoSwedish economists, Robert Strotz andHermanWold, proposed essentiallythe same idea. In theworldof economics at the time, diagramswereneverused; instead, economists relied on structural equation models, which areSewallWright’s equations without the diagrams. Arrow deletion in a pathdiagramcorrespondstodeletinganequationfromastructuralequationmodel.So,inaroughsense,StrotzandWoldhadtheideafirst,unlesswewanttogoeven further back in history: they were preceded by Trygve Haavelmo (aNorwegianeconomistandNobel laureate),who in1943advocatedequationmodificationtorepresentinterventions.
Nevertheless, Spirtes’s translation of equation deletion into theworld ofcausaldiagramsunleashedanavalancheofnewinsightsandnewresults.Theback-doorcriterionwasoneofthefirstbeneficiariesofthetranslation,whilethe do-calculus came second. The avalanche, however, is not yet over.Advancesinsuchareasascounterfactuals,generalizability,missingdata,andmachinelearningarestillcomingup.
If I were less modest, I would close here with Isaac Newton’s famoussayingabout“standingontheshouldersofgiants.”ButgivenwhoIam,Iamtempted to quote from the Mishnah instead: “Harbe lamadeti mirabotaium’haverai yoter mehem, umitalmidai yoter mikulam”—that is, “I havelearnedmuchfrommyteachers,andmoresofrommycolleagues,andmostofallfrommystudents”(Taanit7a).Thedo-operatoranddo-calculuswouldnotexistas theydo todaywithout thecontributionsofVerma,Geiger,Tian,andShpitser,amongothers.
THECURIOUSCASE(S)OFDR.SNOW
In1853and1854,Englandwasinthegripsofacholeraepidemic.Inthatera,cholera was as terrifying as Ebola is today; a healthy person who drinkscholera-taintedwatercandiewithin twenty-fourhours.Weknowtoday thatcholeraiscausedbyabacteriumthatattackstheintestines.Itspreadsthroughthe“ricewater”diarrheaofitsvictims,whoexcretethisdiarrheaincopiousamountsbeforedying.
But in 1853, disease-causing germs had never yet been seen under amicroscopeforanyillness,letalonecholera.Theprevailingwisdomheldthata“miasma”ofunhealthyaircausedcholera,atheoryseeminglysupportedbythefactthattheepidemichitharderinthepoorersectionsofLondon,wheresanitationwasworse.
Dr. John Snow, a physician who had taken care of cholera victims formore than twenty years, was always skeptical of the miasma theory. Heargued, sensibly, that since the symptoms manifested themselves in theintestinaltract,thebodymustfirstcomeintocontactwiththepathogenthere.Butbecausehecouldn’tseetheculprit,hehadnowaytoprovethis—untiltheepidemicof1854.
TheJohnSnowstoryhas twochapters,onemuchmore famous than theother.Inwhatwecouldcallthe“Hollywood”version,hepainstakinglygoesfromhousetohouse,recordingwherevictimsofcholeradied,andnoticesa
clusterofdozensofvictimsnearapumpinBroadStreet.Talkingwithpeoplewholiveinthearea,hediscoversthatalmostallthevictimshaddrawntheirwaterfromthatparticularpump.Heevenlearnsofafatalcasethatoccurredfaraway,inHampstead,toawomanwholikedthetasteofthewaterfromtheBroadStreetpump.SheandherniecedrankthewaterfromBroadStreetanddied,while no one else in her area even got sick. Putting all this evidencetogether,Snowasksthelocalauthoritiestoremovethepumphandle,andonSeptember8theyagree.AsSnow’sbiographerwrote,“Thepump-handlewasremoved,andtheplaguewasstayed.”
Allofthismakesawonderfulstory.NowadaysaJohnSnowSocietyevenreenactstheremovalofthefamouspumphandleeveryyear.Yet,intruth,theremoval of the pump handle hardly made a dent in the citywide choleraepidemic,whichwentontoclaimnearly3,000lives.
Inthenon-Hollywoodchapterofthestory,weagainseeDr.Snowwalkingthe streets of London, but this time his real object is to find out whereLondonersgettheirwater.Thereweretwomainwatercompaniesatthetime:theSouthwarkandVauxhallCompanyand theLambethCompany.Thekeydifferencebetweenthetwo,asSnowknew,wasthattheformerdrewitswaterfromtheareaof theLondonBridge,whichwasdownstreamfromLondon’ssewers.The latterhadmoved itswater intakeseveralyearsearlierso that itwould be upstreamof the sewers.Thus, Southwark customerswere gettingwatertaintedbytheexcrementofcholeravictims.Lambethcustomers,ontheotherhand,weregettinguncontaminatedwater.(NoneofthishasanythingtodowiththecontaminatedBroadStreetwater,whichcamefromawell.)
ThedeathstatisticsboreoutSnow’sgrimhypothesis.Districtssuppliedbythe Southwark and Vauxhall Company were especially hard-hit by choleraand had a death rate eight times higher. Even so, the evidencewasmerelycircumstantial.Aproponentofthemiasmatheorycouldarguethatthemiasmawasstrongestinthosedistricts,andtherewouldbenowaytodisproveit.Intermsofacausaldiagram,wehave thesituationdiagrammedinFigure7.7.We have noway to observe the confounderMiasma (or other confounderslikePoverty),sowecan’tcontrolforitusingback-dooradjustment.
HereSnowhadhismostbrilliant idea.Henoticed that in thosedistrictsserved by both companies, the death rate was still much higher in thehouseholdsthatreceivedSouthwarkwater.Yetthesehouseholdsdidnotdifferin terms of miasma or poverty. “The mixing of the supply is of the mostintimate kind,” Snowwrote. “The pipes of eachCompany go down all thestreets, and into nearly all the courts and alleys.…Each company supplies
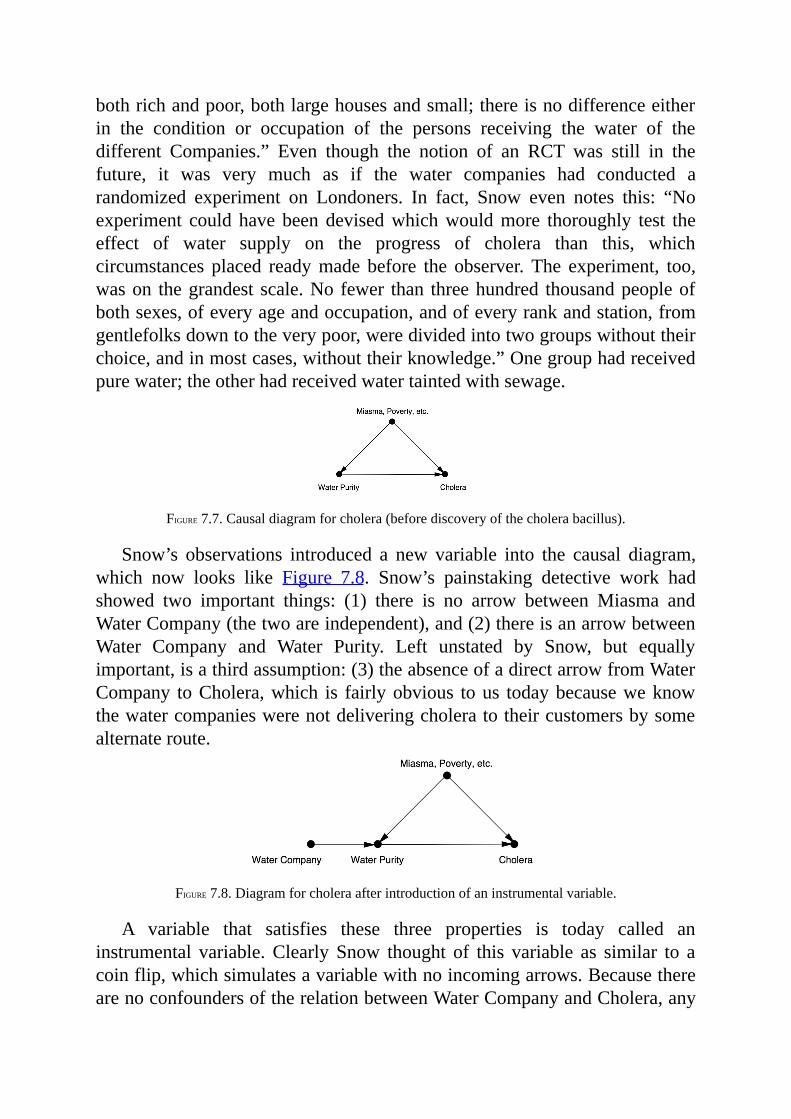
bothrichandpoor,bothlargehousesandsmall;thereisnodifferenceeitherin the condition or occupation of the persons receiving the water of thedifferent Companies.” Even though the notion of an RCT was still in thefuture, it was very much as if the water companies had conducted arandomized experiment on Londoners. In fact, Snow even notes this: “Noexperiment could have been devisedwhichwouldmore thoroughly test theeffect of water supply on the progress of cholera than this, whichcircumstances placed readymade before the observer.The experiment, too,wason thegrandest scale.No fewer than threehundred thousandpeopleofbothsexes,ofeveryageandoccupation,andofeveryrankandstation,fromgentlefolksdowntotheverypoor,weredividedintotwogroupswithouttheirchoice,andinmostcases,withouttheirknowledge.”Onegrouphadreceivedpurewater;theotherhadreceivedwatertaintedwithsewage.
FIGURE7.7.Causaldiagramforcholera(beforediscoveryofthecholerabacillus).
Snow’s observations introduced a new variable into the causal diagram,which now looks like Figure 7.8. Snow’s painstaking detective work hadshowed two important things: (1) there is no arrow between Miasma andWaterCompany(thetwoareindependent),and(2)thereisanarrowbetweenWater Company and Water Purity. Left unstated by Snow, but equallyimportant,isathirdassumption:(3)theabsenceofadirectarrowfromWaterCompany toCholera,which is fairlyobvious tous todaybecauseweknowthewatercompanieswerenotdeliveringcholeratotheircustomersbysomealternateroute.
FIGURE7.8.Diagramforcholeraafterintroductionofaninstrumentalvariable.
A variable that satisfies these three properties is today called aninstrumental variable.Clearly Snow thought of this variable as similar to acoinflip,whichsimulatesavariablewithnoincomingarrows.BecausetherearenoconfoundersoftherelationbetweenWaterCompanyandCholera,any
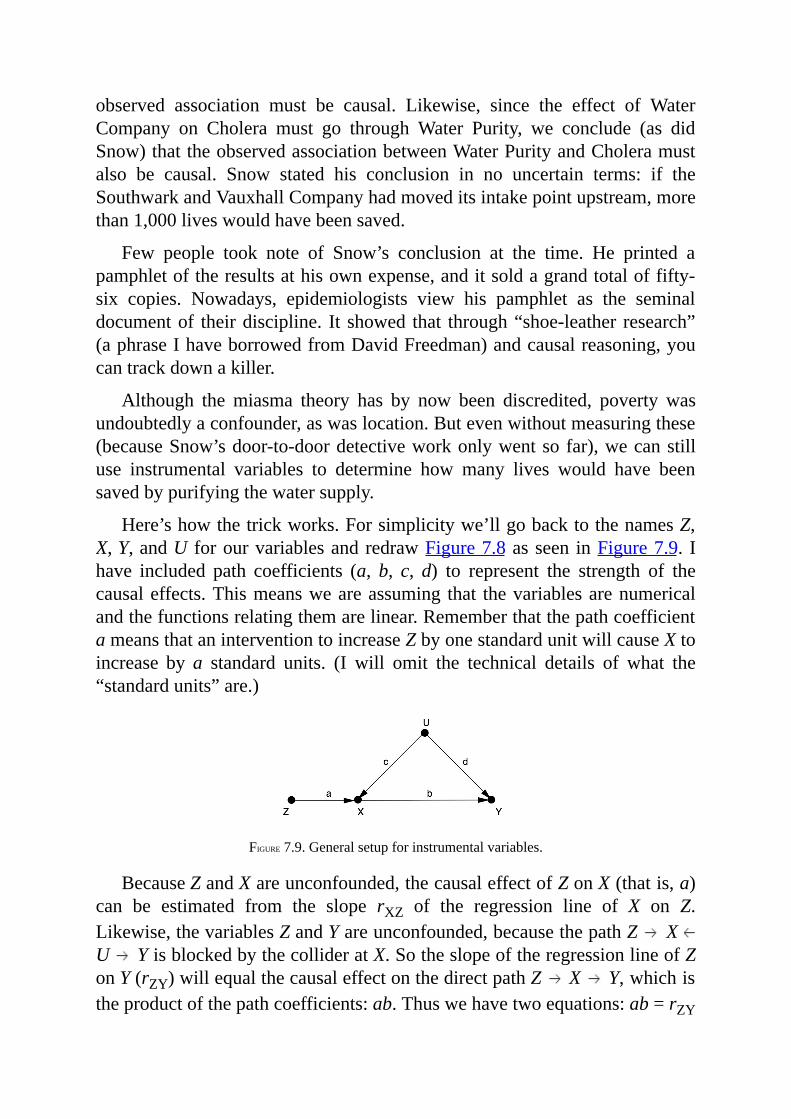
observed association must be causal. Likewise, since the effect of WaterCompany on Cholera must go through Water Purity, we conclude (as didSnow)thattheobservedassociationbetweenWaterPurityandCholeramustalso be causal. Snow stated his conclusion in no uncertain terms: if theSouthwarkandVauxhallCompanyhadmoveditsintakepointupstream,morethan1,000liveswouldhavebeensaved.
Few people took note of Snow’s conclusion at the time. He printed apamphletoftheresultsathisownexpense,anditsoldagrandtotaloffifty-six copies. Nowadays, epidemiologists view his pamphlet as the seminaldocumentof theirdiscipline. It showed that through“shoe-leather research”(aphraseIhaveborrowedfromDavidFreedman)andcausalreasoning,youcantrackdownakiller.
Although themiasma theory has by now been discredited, poverty wasundoubtedlyaconfounder,aswaslocation.Butevenwithoutmeasuringthese(becauseSnow’sdoor-to-doordetectiveworkonlywentsofar),wecanstilluse instrumental variables to determine how many lives would have beensavedbypurifyingthewatersupply.
Here’showthetrickworks.Forsimplicitywe’llgobacktothenamesZ,X,Y,andU forourvariablesandredrawFigure7.8asseen inFigure7.9. Ihave included path coefficients (a,b, c,d) to represent the strength of thecausaleffects.Thismeansweareassuming that thevariablesarenumericalandthefunctionsrelatingthemarelinear.RememberthatthepathcoefficientameansthataninterventiontoincreaseZbyonestandardunitwillcauseXtoincrease bya standard units. (I will omit the technical details of what the“standardunits”are.)
FIGURE7.9.Generalsetupforinstrumentalvariables.
BecauseZandXareunconfounded,thecausaleffectofZonX(thatis,a)can be estimated from the slope rXZ of the regression line of X on Z.Likewise,thevariablesZandYareunconfounded,becausethepathZ XU YisblockedbythecollideratX.SotheslopeoftheregressionlineofZonY(rZY)willequalthecausaleffectonthedirectpathZ X Y,whichistheproductofthepathcoefficients:ab.Thuswehavetwoequations:ab=rZY
anda=rZX.Ifwedividethefirstequationbythesecond,wegetthecausaleffectofXonY:b=rZY/rZX.
In thisway, instrumentalvariablesallowus toperform thesamekindofmagictrickthatwedidwithfront-dooradjustment:wehavefoundtheeffectof X on Y even without being able to control for, or collect data on, theconfounder,U.Wecan thereforeprovidedecisionmakerswithaconclusiveargument that they shouldmove theirwater supply—even if those decisionmakers still believe in themiasma theory. Also notice that we have gotteninformation on the second rung of the Ladder of Causation (b) frominformationaboutthefirstrung(thecorrelations,rZYandrZX).Wewereabletodothisbecausetheassumptionsembodiedinthepathdiagramarecausalinnature,especiallythecrucialassumptionthatthereisnoarrowbetweenUandZ.Ifthecausaldiagramweredifferent—forexample,ifZwereaconfounderofXandY—theformulab=rZY/rZXwouldnotcorrectlyestimatethecausaleffect of X on Y. In fact, these two models cannot be told apart by anystatisticalmethod,regardlessofhowbigthedata.
Instrumental variables were known before the Causal Revolution, butcausal diagrams have brought new clarity to how theywork. Indeed, Snowwas using an instrumental variable implicitly, although he did not have aquantitative formula. Sewall Wright certainly understood this use of pathdiagrams;theformulab=rZY/rZXcanbederiveddirectlyfromhismethodofpathcoefficients.AnditseemsthatthefirstpersonotherthanSewallWrightto use instrumental variables in a deliberate way was… Sewall Wright’sfather,Philip!
Recall that Philip Wright was an economist who worked at what laterbecame the Brookings Institution. He was interested in predicting how theoutputofacommoditywouldchangeifatariffwereimposed,whichwouldraise the price and therefore, in theory, encourage production. In economicterms,hewantedtoknowtheelasticityofsupply.
In 1928 Wright wrote a long monograph dedicated to computing theelasticityofsupplyforflaxseedoil.Inaremarkableappendix,heanalyzedtheproblemusingapathdiagram.Thiswasabravethingtodo:rememberthatnoeconomisthadeverseenorheardofsuchathingbefore.(Infact,hehedgedhisbetsandverifiedhiscalculationsusingmoretraditionalmethods.)
Figure 7.10 shows a somewhat simplified version ofWright’s diagram.Unlike most diagrams in this book, this one has “two-way” arrows, but Iwould ask the reader not to lose too much sleep over it. With some
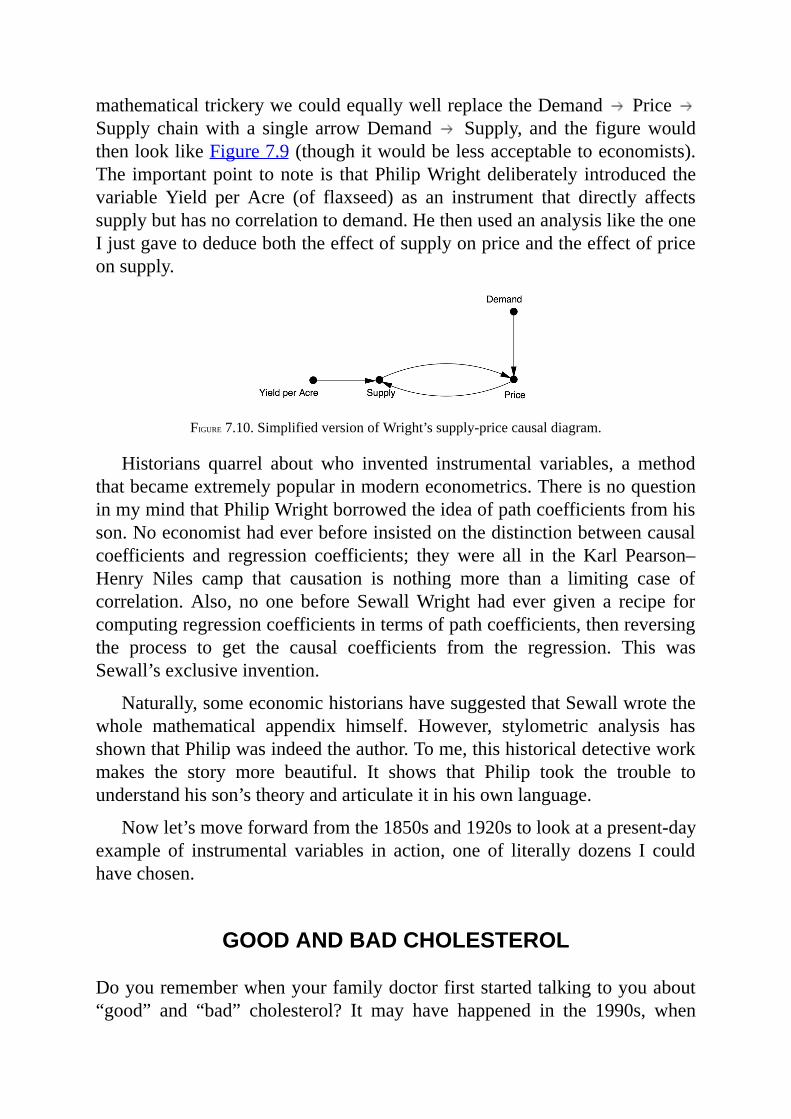
mathematicaltrickerywecouldequallywellreplacetheDemand PriceSupply chainwith a single arrowDemand Supply, and the figurewouldthenlooklikeFigure7.9(thoughitwouldbelessacceptabletoeconomists).The importantpoint tonote is thatPhilipWrightdeliberately introducedthevariable Yield per Acre (of flaxseed) as an instrument that directly affectssupplybuthasnocorrelationtodemand.HethenusedananalysisliketheoneIjustgavetodeduceboththeeffectofsupplyonpriceandtheeffectofpriceonsupply.
FIGURE7.10.SimplifiedversionofWright’ssupply-pricecausaldiagram.
Historians quarrel about who invented instrumental variables, a methodthatbecameextremelypopularinmoderneconometrics.ThereisnoquestioninmymindthatPhilipWrightborrowedtheideaofpathcoefficientsfromhisson.Noeconomisthadeverbeforeinsistedonthedistinctionbetweencausalcoefficients and regression coefficients; theywere all in the Karl Pearson–Henry Niles camp that causation is nothing more than a limiting case ofcorrelation.Also, no one before SewallWright had ever given a recipe forcomputingregressioncoefficientsintermsofpathcoefficients,thenreversingthe process to get the causal coefficients from the regression. This wasSewall’sexclusiveinvention.
Naturally,someeconomichistorianshavesuggestedthatSewallwrotethewhole mathematical appendix himself. However, stylometric analysis hasshownthatPhilipwasindeedtheauthor.Tome,thishistoricaldetectiveworkmakes the story more beautiful. It shows that Philip took the trouble tounderstandhisson’stheoryandarticulateitinhisownlanguage.
Nowlet’smoveforwardfromthe1850sand1920stolookatapresent-dayexample of instrumental variables in action, one of literally dozens I couldhavechosen.
GOODANDBADCHOLESTEROL
Doyourememberwhenyourfamilydoctorfirststartedtalkingtoyouabout“good” and “bad” cholesterol? It may have happened in the 1990s, when
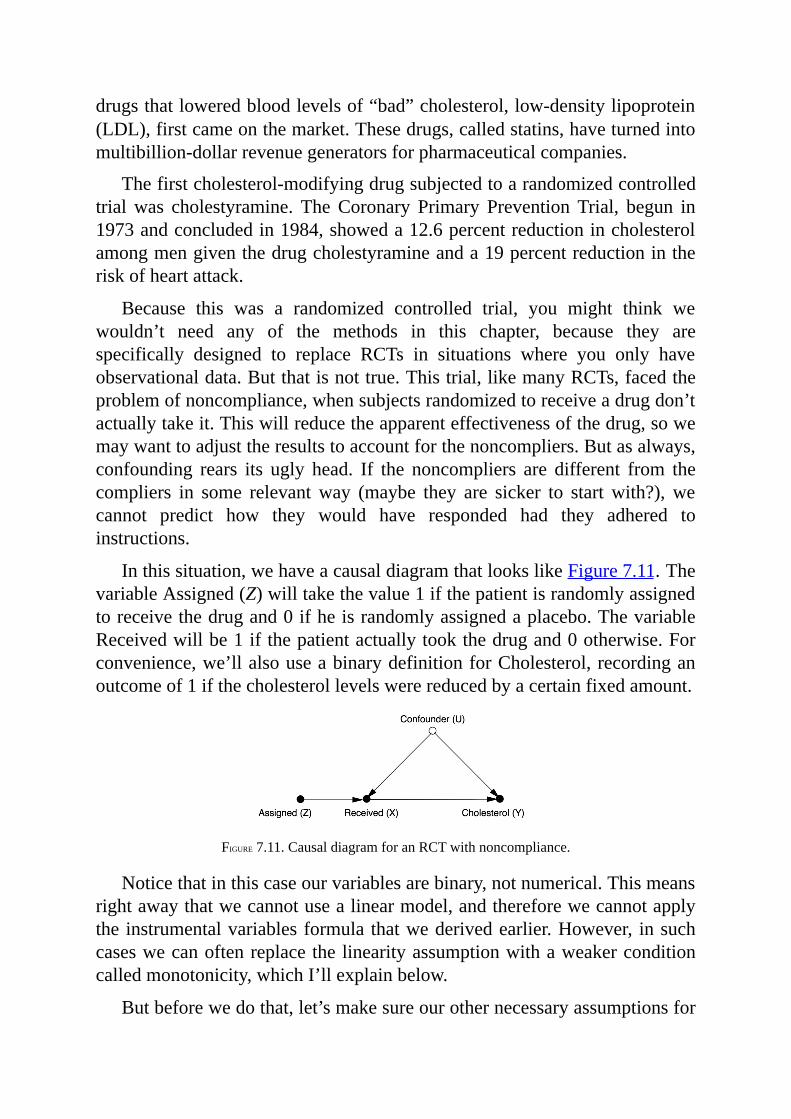
drugsthatloweredbloodlevelsof“bad”cholesterol,low-densitylipoprotein(LDL),firstcameonthemarket.Thesedrugs,calledstatins,haveturnedintomultibillion-dollarrevenuegeneratorsforpharmaceuticalcompanies.
Thefirstcholesterol-modifyingdrugsubjectedtoarandomizedcontrolledtrialwas cholestyramine. TheCoronary Primary PreventionTrial, begun in1973andconcludedin1984,showeda12.6percentreductionincholesterolamongmengiventhedrugcholestyramineanda19percentreductionintheriskofheartattack.
Because this was a randomized controlled trial, you might think wewouldn’t need any of the methods in this chapter, because they arespecifically designed to replace RCTs in situations where you only haveobservationaldata.Butthatisnottrue.Thistrial,likemanyRCTs,facedtheproblemofnoncompliance,whensubjectsrandomizedtoreceiveadrugdon’tactuallytakeit.Thiswillreducetheapparenteffectivenessofthedrug,sowemaywanttoadjusttheresultstoaccountforthenoncompliers.Butasalways,confounding rears its ugly head. If the noncompliers are different from thecompliers in some relevantway (maybe they are sicker to startwith?),wecannot predict how they would have responded had they adhered toinstructions.
Inthissituation,wehaveacausaldiagramthatlookslikeFigure7.11.ThevariableAssigned(Z)willtakethevalue1ifthepatientisrandomlyassignedtoreceivethedrugand0ifheisrandomlyassignedaplacebo.ThevariableReceivedwillbe1ifthepatientactuallytookthedrugand0otherwise.Forconvenience,we’llalsouseabinarydefinitionforCholesterol,recordinganoutcomeof1ifthecholesterollevelswerereducedbyacertainfixedamount.
FIGURE7.11.CausaldiagramforanRCTwithnoncompliance.
Noticethatinthiscaseourvariablesarebinary,notnumerical.Thismeansrightawaythatwecannotusealinearmodel,andthereforewecannotapplythe instrumentalvariablesformula thatwederivedearlier.However, insuchcaseswecanoftenreplacethelinearityassumptionwithaweakerconditioncalledmonotonicity,whichI’llexplainbelow.
Butbeforewedothat,let’smakesureourothernecessaryassumptionsfor
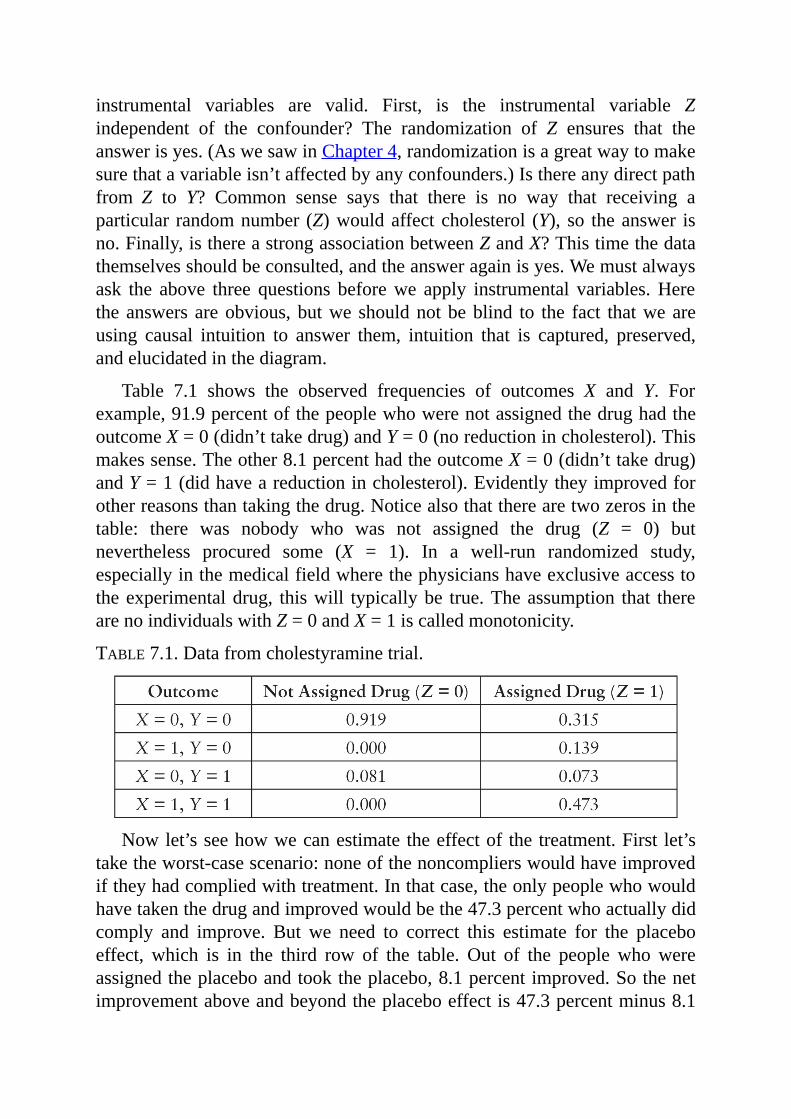
instrumental variables are valid. First, is the instrumental variable Zindependent of the confounder? The randomization of Z ensures that theanswerisyes.(AswesawinChapter4,randomizationisagreatwaytomakesurethatavariableisn’taffectedbyanyconfounders.)Isthereanydirectpathfrom Z to Y? Common sense says that there is no way that receiving aparticular randomnumber(Z)wouldaffect cholesterol (Y), so theanswer isno.Finally,isthereastrongassociationbetweenZandX?Thistimethedatathemselvesshouldbeconsulted,andtheansweragainisyes.Wemustalwaysask the above three questions beforewe apply instrumental variables.Heretheanswers areobvious,butwe shouldnotbeblind to the fact thatweareusing causal intuition to answer them, intuition that is captured, preserved,andelucidatedinthediagram.
Table 7.1 shows the observed frequencies of outcomes X and Y. Forexample,91.9percentofthepeoplewhowerenotassignedthedrughadtheoutcomeX=0(didn’ttakedrug)andY=0(noreductionincholesterol).Thismakessense.Theother8.1percenthadtheoutcomeX=0(didn’ttakedrug)andY=1(didhaveareductionincholesterol).Evidentlytheyimprovedforotherreasonsthantakingthedrug.Noticealsothattherearetwozerosinthetable: there was nobody who was not assigned the drug (Z = 0) butnevertheless procured some (X = 1). In a well-run randomized study,especiallyinthemedicalfieldwherethephysicianshaveexclusiveaccesstotheexperimentaldrug, thiswill typicallybe true.Theassumption that therearenoindividualswithZ=0andX=1iscalledmonotonicity.
TABLE7.1.Datafromcholestyraminetrial.
Nowlet’sseehowwecanestimate theeffectof the treatment.First let’staketheworst-casescenario:noneofthenoncomplierswouldhaveimprovediftheyhadcompliedwithtreatment.Inthatcase,theonlypeoplewhowouldhavetakenthedrugandimprovedwouldbethe47.3percentwhoactuallydidcomply and improve. But we need to correct this estimate for the placeboeffect, which is in the third row of the table. Out of the people whowereassignedtheplaceboandtooktheplacebo,8.1percentimproved.Sothenetimprovementaboveandbeyondtheplaceboeffectis47.3percentminus8.1
percent,or39.2percent.
What about thebest-case scenario, inwhich all the noncomplierswouldhaveimprovedif theyhadcomplied?Inthiscaseweaddthenoncompliers’31.5percentplus7.3percenttothe39.2percentbaselinewejustcomputed,foratotalof78.0percent.
Thus, even in the worst-case scenario, where the confounding goescompletely against the drug, we can still say that the drug improvescholesterolfor39percentofthepopulation.Inthebest-casescenario,wherethe confounding works completely in favor of the drug, 78 percent of thepopulationwouldseeanimprovement.Eventhoughtheboundsarequitefarapart, due to the large number of noncompliers, the researcher cancategoricallystatethatthedrugiseffectiveforitsintendedpurpose.
Thisstrategyoftakingtheworstcaseandthenthebestcasewillusuallygive us a range of estimates. Obviously it would be nice to have a pointestimate,aswedidinthelinearcase.Therearewaystonarrowtherangeifnecessary, and in some cases it is even possible to get point estimates. Forexample, if you are interested only in the complying subpopulation (thosepeople who will take X if and only if assigned), you can derive a pointestimateknownastheLocalAverageTreatmentEffect(LATE).Inanyevent,I hope this example shows that our hands are not tied when we leave theworldoflinearmodels.
Instrumentalvariablemethodshavecontinuedtodevelopsince1984,andone particular version has become extremely popular: Mendelianrandomization. Here’s an example. Although the effect of LDL, or “bad,”cholesterol isnowsettled, there is still considerableuncertaintyabouthigh-density lipoprotein (HDL), or “good,” cholesterol. Early observationalstudies,suchastheFraminghamHeartStudyinthelate1970s,suggestedthatHDLhadaprotectiveeffectagainstheartattacks.ButhighHDLoftengoeshandinhandwithlowLDL,sohowcanwetellwhichlipidisthetruecausalfactor?
Toanswerthisquestion,supposeweknewofagenethatcausedpeopletohavehigherHDL levels,with no effect onLDL.Thenwe could set up thecausal diagram in Figure 7.12, where I have used Lifestyle as a possibleconfounder.Rememberthatitisalwaysadvantageous,asinSnow’sexample,to use an instrumental variable that is randomized. If it’s randomized, nocausalarrowspointtowardit.Forthisreason,ageneisaperfectinstrumentalvariable.Ourgenesarerandomizedatthetimeofconception,soit’sjustasifGregorMendel himself had reached down from heaven and assigned some
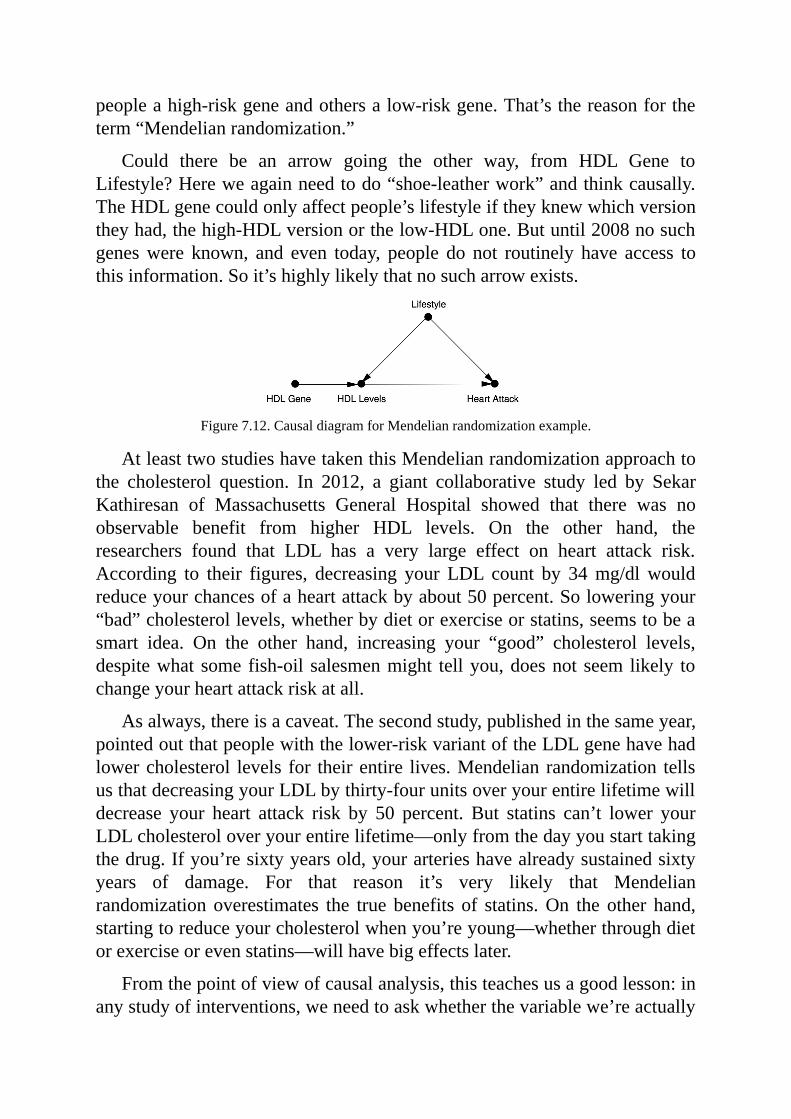
peopleahigh-riskgeneandothersalow-riskgene.That’sthereasonfortheterm“Mendelianrandomization.”
Could there be an arrow going the other way, from HDL Gene toLifestyle?Hereweagainneedtodo“shoe-leatherwork”andthinkcausally.TheHDLgenecouldonlyaffectpeople’slifestyleiftheyknewwhichversiontheyhad,thehigh-HDLversionorthelow-HDLone.Butuntil2008nosuchgeneswere known, and even today, people do not routinely have access tothisinformation.Soit’shighlylikelythatnosucharrowexists.
Figure7.12.CausaldiagramforMendelianrandomizationexample.
AtleasttwostudieshavetakenthisMendelianrandomizationapproachtothe cholesterol question. In 2012, a giant collaborative study led by SekarKathiresan of Massachusetts General Hospital showed that there was noobservable benefit from higher HDL levels. On the other hand, theresearchers found that LDL has a very large effect on heart attack risk.According to their figures, decreasing your LDL count by 34mg/dlwouldreduceyourchancesofaheartattackbyabout50percent.Soloweringyour“bad”cholesterollevels,whetherbydietorexerciseorstatins,seemstobeasmart idea. On the other hand, increasing your “good” cholesterol levels,despitewhat some fish-oil salesmenmight tellyou,doesnot seem likely tochangeyourheartattackriskatall.
Asalways,thereisacaveat.Thesecondstudy,publishedinthesameyear,pointedoutthatpeoplewiththelower-riskvariantoftheLDLgenehavehadlowercholesterol levels for theirentire lives.Mendelian randomization tellsusthatdecreasingyourLDLbythirty-fourunitsoveryourentirelifetimewilldecrease your heart attack risk by 50 percent. But statins can’t lower yourLDLcholesteroloveryourentirelifetime—onlyfromthedayyoustarttakingthedrug.Ifyou’resixtyyearsold,yourarterieshavealreadysustainedsixtyyears of damage. For that reason it’s very likely that Mendelianrandomization overestimates the true benefits of statins.On the other hand,startingtoreduceyourcholesterolwhenyou’reyoung—whetherthroughdietorexerciseorevenstatins—willhavebigeffectslater.
Fromthepointofviewofcausalanalysis,thisteachesusagoodlesson:inanystudyofinterventions,weneedtoaskwhetherthevariablewe’reactually
manipulating (lifetimeLDL levels) is the sameas thevariablewe thinkweare manipulating (current LDL levels). This is part of the “skillfulinterrogationofnature.”
Tosumup, instrumentalvariablesareanimportant tool in that theyhelpus uncover causal information that goes beyond the do-calculus. The latterinsistsonpointestimatesratherthaninequalitiesandwouldgiveuponcaseslikeFigure7.12,inwhichallwecangetareinequalities.Ontheotherhand,it’salsoimportanttorealizethatthedo-calculusisvastlymoreflexiblethaninstrumental variables. Indo-calculuswemake no assumptionswhatsoeverregardingthenatureofthefunctionsinthecausalmodel.Butifwecanjustifyan assumption like monotonicity or linearity on scientific grounds, then amorespecial-purposetoollikeinstrumentalvariablesisworthconsidering.
Instrumental variable methods can be extended beyond simple four-variablemodelslikeFigure7.9(or7.11or7.12),butit isnotpossibletogoveryfarwithoutguidancefromcausaldiagrams.Forexample,insomecasesanimperfectinstrument(e.g.,onethatisnotindependentoftheconfounder)canbeusedafterconditioningonacleverlychosensetofauxiliaryvariables,whichblockthepathsbetweentheinstrumentandtheconfounder.Myformerstudent Carlos Brito, now a professor at the Federal University of Ceara,Brazil, fully developed this idea of turning noninstrumental variables intoinstrumentalvariables.
Inaddition,Britostudiedmanycaseswhereasetofvariablescanbeusedsuccessfullyasaninstrument.Althoughtheidentificationofinstrumentalsetsgoes beyond do-calculus, it still uses the tools of causal diagrams. Forresearcherswhounderstand this language, thepossible researchdesigns arerichandvaried; theyneednot feelconstrained touseonly the four-variablemodelshowninFigures7.9,7.11,and7.12.Thepossibilitiesarelimitedonlybyourimaginations.
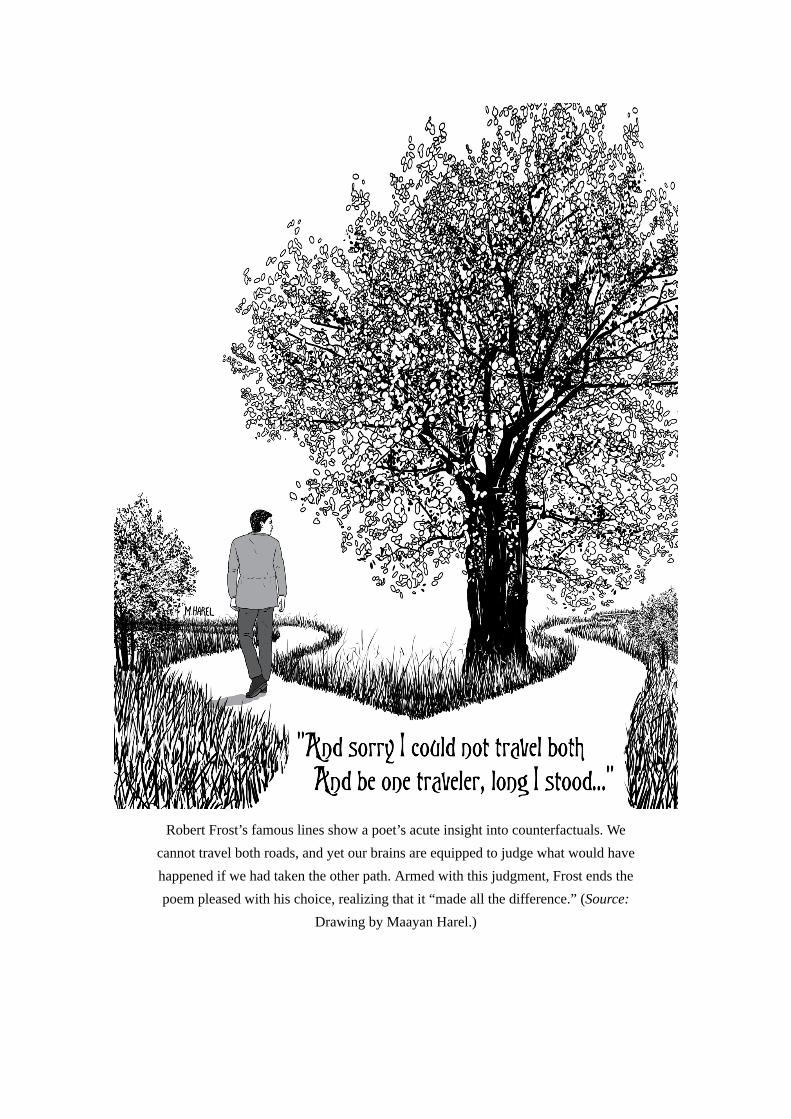
RobertFrost’sfamouslinesshowapoet’sacuteinsightintocounterfactuals.Wecannottravelbothroads,andyetourbrainsareequippedtojudgewhatwouldhavehappenedifwehadtakentheotherpath.Armedwiththisjudgment,Frostendsthepoempleasedwithhischoice,realizingthatit“madeallthedifference.”(Source:
DrawingbyMaayanHarel.)
8
COUNTERFACTUALS:MININGWORLDSTHATCOULDHAVEBEEN
HadCleopatra’snosebeenshorter,thewholefaceoftheworldwouldhavechanged.
—BLAISEPASCAL(1669)
ASwepreparetomoveuptothetoprungoftheLadderofCausation,let’srecapitulate what we have learned from the second rung. We have seenseveralwaystoascertaintheeffectofaninterventioninvarioussettingsandunder a variety of conditions. In Chapter 4, we discussed randomizedcontrolledtrials,thewidelycited“goldstandard”formedicaltrials.Wehavealso seen methods that are suitable for observational studies, in which thetreatmentandcontrolgroupsarenotassignedatrandom.Ifwecanmeasurevariables that block all the back-door paths, we can use the back-dooradjustment formula to obtain the needed effect. Ifwe can find a front-doorpaththatis“shielded”fromconfounders,wecanusefront-dooradjustment.Ifwe arewilling to livewith the assumption of linearity ormonotonicity,wecanuseinstrumentalvariables(assumingthatanappropriatevariablecanbefound in the diagram or created by an experiment). And truly adventurousresearcherscanplotother routes to the topofMount Interventionusing thedo-calculusoritsalgorithmicversion.
In all these endeavors, we have dealt with effects on a population or atypicalindividualselectedfromastudypopulation(theaveragecausaleffect).Butsofarwearemissing theability to talkaboutpersonalizedcausationat
the levelofparticulareventsor individuals. It’sone thing to say,“Smokingcausescancer,”butanother tosay thatmyuncleJoe,whosmokedapackadayforthirtyyears,wouldhavebeenalivehadhenotsmoked.Thedifferenceis both obvious and profound: none of the people who, like Uncle Joe,smokedforthirtyyearsanddiedcaneverbeobservedinthealternateworldwheretheydidnotsmokeforthirtyyears.
Responsibility and blame, regret and credit: these concepts are thecurrencyofacausalmind.Tomakeanysenseof them,wemustbeable tocompare what did happen with what would have happened under somealternative hypothesis. As argued in Chapter 1, our ability to conceive ofalternative, nonexistentworlds separated us fromour protohuman ancestorsandindeedfromanyothercreatureontheplanet.Everyothercreaturecanseewhat is.Ourgift,whichmaysometimesbeacurse, is thatwecanseewhatmighthavebeen.
This chapter shows how to use observational and experimental data toextract information about counterfactual scenarios. It explains how torepresent individual-level causes in the context of a causal diagram, a taskthatwill forceus toexplainsomenutsandboltsofcausaldiagramsthatwehave not talked about yet. I also discuss a highly related concept called“potentialoutcomes,”ortheNeyman-Rubincausalmodel,initiallyproposedin the 1920s by Jerzy Neyman, a Polish statistician who later became aprofessor at Berkeley. But only after Donald Rubin began writing aboutpotential outcomes in the mid-1970s did this approach to causal analysisreallybegintoflourish.
I will show how counterfactuals emerge naturally in the frameworkdevelopedoverthelastseveralchapters—SewallWright’spathdiagramsandtheir extension to structural causalmodels (SCMs).Wegot a good taste ofthis inChapter1, in theexampleof the firingsquad,whichshowedhowtoanswer counterfactual questions such as “Would the prisoner be alive ifriflemanAhadnotshot?”IwillcomparehowcounterfactualsaredefinedintheNeyman-Rubinparadigmand inSCMs,where theyenjoy thebenefitofcausal diagrams. Rubin has steadfastly maintained over the years thatdiagrams servenouseful purpose.Sowewill examinehow students of theRubin causal model must navigate causal problems blindfolded, lacking afacilitytorepresentcausalknowledgeortoderiveitstestableimplications.
Finally,wewilllookattwoapplicationswherecounterfactualreasoningisessential. For decades or even centuries, lawyers have used a relativelystraightforwardtestofadefendant’sculpabilitycalled“but-forcausation”:the
injurywould not have occurredbut for the defendant’s action.Wewill seehowthelanguageofcounterfactualscancapturethiselusivenotionandhowtoestimatetheprobabilitythatadefendantisculpable.
Next, Iwilldiscuss theapplicationofcounterfactuals toclimatechange.Untilrecently,climatescientistshavefounditverydifficultandawkwardtoanswer questions like “Did global warming cause this storm [or this heatwave, or this drought]?” The conventional answer has been that individualweathereventscannotbeattributedtoglobalclimatechange.Yetthisanswerseems rather evasive andmay even contribute to public indifference aboutclimatechange.
Counterfactual analysis allows climate scientists to make much moreprecise and definite statements than before. It requires, however, a slightaddition to our everyday vocabulary. It will be helpful to distinguish threedifferent kinds of causation: necessary causation, sufficient causation, andnecessary-and-sufficient causation. (Necessary causation is the sameasbut-forcausation.)Usingthesewords,aclimatescientistcansay,“Thereisa90percentprobability thatman-madeclimatechangewasanecessarycauseofthis heatwave,” or “There is an 80 percent probability that climate changewill be sufficient to produce a heatwave this strong at least once every50years.”Thefirstsentencehastodowithattribution:Whowasresponsiblefortheunusualheat?Thesecondhastodowithpolicy.Itsaysthatwehadbetterprepareforsuchheatwavesbecausetheyarelikelytooccursoonerorlater.Eitherof thesestatements ismore informative thanshruggingourshouldersandsayingnothingaboutthecausesofindividualweatherevents.
FROMTHUCYDIDESANDABRAHAMTOHUMEANDLEWIS
Giventhatcounterfactualreasoningispartofthementalapparatusthatmakesushuman,itisnotsurprisingthatwecanfindcounterfactualstatementsasfarback as we want to go in human history. For example, in Thucydides’sHistory of the Peloponnesian War, the ancient Greek historian, oftendescribed as the pioneer of a “scientific” approach to history, describes atsunamithatoccurredin426BC:
Aboutthesametimethattheseearthquakesweresocommon,theseaatOrobiae, inEuboea,retiringfromthethenlineofcoast, returnedinahugewaveandinvadedagreatpartofthetown,andretreatedleavingsome of it still underwater; so thatwhatwas once land is now sea;
such of the inhabitants perishing as could not run up to the highergroundintime.…Thecause,inmyopinion,ofthisphenomenonmustbesoughtintheearthquake.Atthepointwhereitsshockhasbeenthemost violent the sea is driven back, and suddenly recoiling withredoubledforce,causestheinundation.WithoutanearthquakeIdonotseehowsuchanaccidentcouldhappen.
Thisisatrulyremarkablepassagewhenyouconsidertheerainwhichitwaswritten.First,theprecisionofThucydides’sobservationswoulddocredittoanymodernscientist,andallthemoresobecausehewasworkinginanerawhentherewerenosatellites,novideocameras,no24/7newsorganizationsbroadcastingimagesofthedisasterasitunfolded.Second,hewaswritingatatimeinhumanhistorywhennaturaldisasterswereordinarilyascribedtothewill of the gods. His predecessor Homer or his contemporary Herodotuswould undoubtedly have attributed this event to the wrath of Poseidon orsome other deity. Yet Thucydides proposes a causal model without anysupernaturalprocesses:theearthquakedrivesbackthesea,whichrecoilsandinundates the land. The last sentence of the quote is especially interestingbecauseitexpressesthenotionofnecessaryorbut-forcausation:butfortheearthquake, the tsunami could not have occurred. This counterfactualjudgmentpromotestheearthquakefromamereantecedentofthetsunamitoanactualcause.
Another fascinating and revealing instance of counterfactual reasoningoccurs in the book of Genesis in the Bible. Abraham is talking with Godabout the latter’s intention todestroy the citiesofSodomandGomorrah asretributionfortheirevilways.
And Abraham drew near, and said, Wilt thou really destroy therighteouswiththewicked?
Suppose there be fifty righteous within the city: wilt thou alsodestroyandnotsparetheplaceforthesakeofthefiftyrighteousthataretherein?…
AndtheLordsaid,IfIfindinSodomfiftyrighteouswithinthecity,thenIwillsparealltheplacefortheirsakes.
But the story does not end there.Abraham is not satisfied and asks theLord,whatifthereareonlyforty-fiverighteousmen?Orforty?Orthirty?Ortwenty?Oreventen?Eachtimehereceivesanaffirmativeanswer,andGodultimately assures him that he will spare Sodom even for the sake of tenrighteousmen,ifhecanfindthatmany.
WhatisAbrahamtryingtoaccomplishwiththishagglingandbargaining?Surely he does not doubt God’s ability to count. And of course, AbrahamknowsthatGodknowshowmanyrighteousmenliveinSodom.Heis,afterall,omniscient.
KnowingAbraham’sobedienceanddevotion,itishardtobelievethatthequestionsaremeant to convince theLord to changehismind. Instead, theyare meant for Abraham’s own comprehension. He is reasoning just as amodernscientistwould, trying tounderstand the laws thatgoverncollectivepunishment.What level of wickedness is sufficient to warrant destruction?Would thirty righteousmen be enough to save a city? Twenty?We do nothaveacompletecausalmodelwithoutsuch information.Amodernscientistmightcallitadose-responsecurveorathresholdeffect.
While Thucydides and Abraham probed counterfactuals throughindividual cases, theGreek philosopherAristotle investigatedmore genericaspectsofcausation.Inhistypicallysystematicstyle,Aristotlesetupawholetaxonomy of causation, including “material causes,” “formal causes,”“efficientcauses,”and“finalcauses.”Forexample,thematerialcauseoftheshape of a statue is the bronze fromwhich it is cast and its properties;wecould not make the same statue out of Silly Putty. However, Aristotlenowhere makes a statement about causation as a counterfactual, so hisingenious classification lacks the simple clarity of Thucydides’s account ofthecauseofthetsunami.
Tofindaphilosopherwhoplacedcounterfactualsattheheartofcausality,we have to move ahead to David Hume, the Scottish philosopher andcontemporary of Thomas Bayes. Hume rejected Aristotle’s classificationscheme and insisted on a single definition of causation. But he found thisdefinitionquiteelusiveandwasinfacttornbetweentwodifferentdefinitions.Later these would turn into two incompatible ideologies, which ironicallycouldbothciteHumeastheirsource!
InhisTreatiseofHumanNature (Figure8.1),Humedenies thatany twoobjectshaveinnatequalitiesor“powers”thatmakeoneacauseandtheotheraneffect.Inhisview,thecause-effectrelationshipisentirelyaproductofourownmemoryandexperience.“Thusweremembertohaveseenthatspeciesof object we call flame, and to have felt that species of sensation we callheat,”hewrites.“We likewisecall tomind theirconstantconjunction inallpast instances.Withoutanyfurtherceremony,wecall theonecauseandtheothereffect, and infer theexistenceof theone from theother.”This isnowknownasthe“regularity”definitionofcausation.
Thepassageisbreathtakinginitschutzpah.Humeiscuttingoffthesecondand third rungs of the Ladder of Causation and saying that the first rung,observation, isall thatweneed.Onceweobserveflameandheat togetherasufficientnumberoftimes(andnotethatflamehastemporalprecedence),weagreetocallflamethecauseofheat.Likemosttwentieth-centurystatisticians,Hume in 1739 seems happy to consider causation as merely a species ofcorrelation.
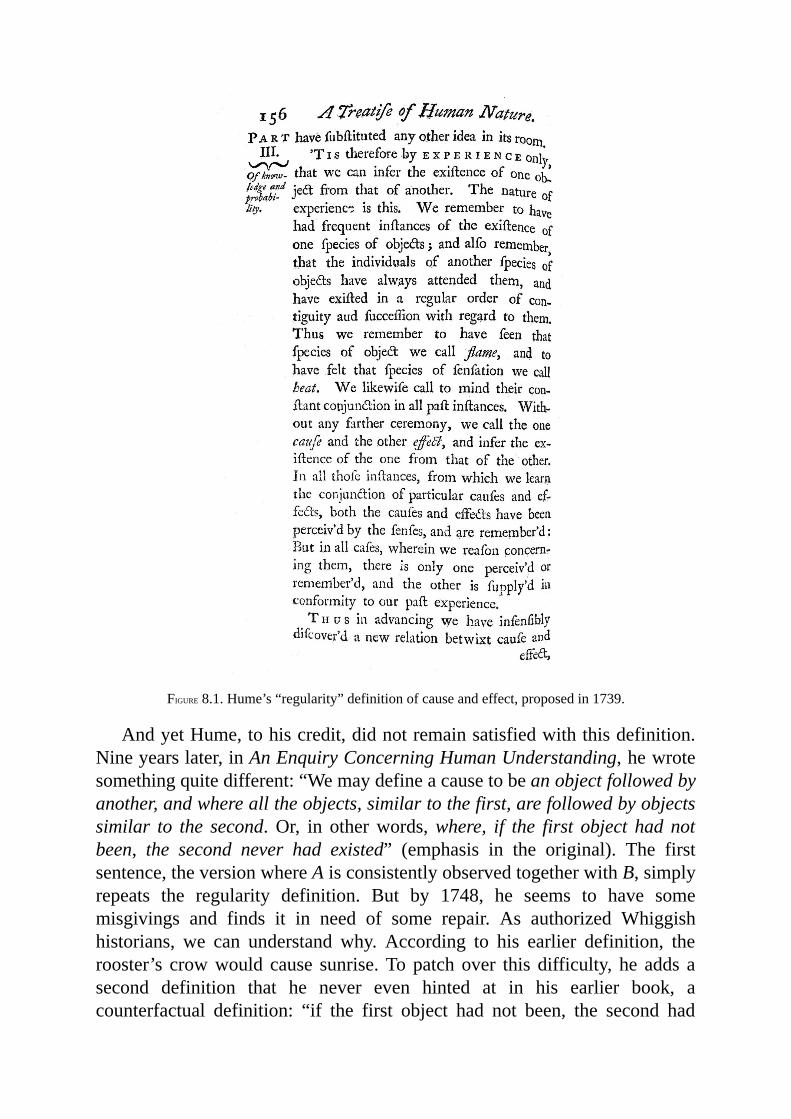
FIGURE8.1.Hume’s“regularity”definitionofcauseandeffect,proposedin1739.
AndyetHume,tohiscredit,didnotremainsatisfiedwiththisdefinition.Nineyearslater,inAnEnquiryConcerningHumanUnderstanding,hewrotesomethingquitedifferent:“Wemaydefineacausetobeanobjectfollowedbyanother,andwherealltheobjects,similartothefirst,arefollowedbyobjectssimilar to the second.Or, in otherwords,where, if the first object had notbeen, the second never had existed” (emphasis in the original). The firstsentence,theversionwhereAisconsistentlyobservedtogetherwithB,simplyrepeats the regularity definition. But by 1748, he seems to have somemisgivings and finds it in need of some repair. As authorized Whiggishhistorians, we can understand why. According to his earlier definition, therooster’s crowwould cause sunrise.Topatchover this difficulty, he adds asecond definition that he never even hinted at in his earlier book, acounterfactual definition: “if the first object had not been, the second had
neverexisted.”
Note that the second definition is exactly the one that Thucydides usedwhenhediscussedthetsunamiatOrobiae.Thecounterfactualdefinitionalsoexplainswhywedonot consider the rooster’s crowa causeof sunrise.Weknowthatiftheroosterwassickoneday,orcapriciouslyrefusedtocrow,thesunwouldriseanyway.
AlthoughHumetriestopassthesetwodefinitionsoffasone,bymeansofhis innocent interjection “inotherwords,” the secondversion is completelydifferentfromthefirst.Itexplicitlyinvokesacounterfactual,soitliesonthethirdrungoftheLadderofCausation.Whereasregularitiescanbeobserved,counterfactualscanonlybeimagined.
It is worth thinking for a moment about why Hume chooses to definecauses in terms of counterfactuals, rather than the other way around.Definitionsare intended to reduceamorecomplicatedconcept toa simplerone.Humesurmisesthathisreaderswillunderstandthestatement“ifthefirstobjecthadnotbeen, thesecondhadneverexisted”withlessambiguitythanthey will understand “the first object caused the second.” He is absolutelyright. The latter statement invites all sorts of fruitless metaphysicalspeculation about what quality or power inherent in the first object bringsabout the second one. The former statement merely asks us to perform asimplementaltest:imagineaworldwithouttheearthquakeandaskwhetheritalsocontainsa tsunami.Wehavebeenmakingjudgments likethissincewewere children, and the human species has been making them sinceThucydides(andprobablylongbefore).
Nevertheless,philosophersignoredHume’sseconddefinitionformostofthenineteenthandtwentiethcenturies.Counterfactualstatements,the“wouldhaves,”havealwaysappearedtoosquishyanduncertaintosatisfyacademics.Instead, philosophers tried to rescue Hume’s first definition through thetheoryofprobabilisticcausation,asdiscussedinChapter1.
Onephilosopherwhodefiedconvention,DavidLewis,calledinhis1973bookCounterfactualsforabandoningtheregularityaccountaltogetherandforinterpreting“A has causedB”as“Bwouldnothaveoccurred if not forA.”Lewisasked,“Whynottakecounterfactualsatfacevalue:asstatementsaboutpossiblealternativestotheactualsituation?”
LikeHume,Lewiswasevidentlyimpressedbythefactthathumansmakecounterfactual judgments without much ado, swiftly, comfortably, andconsistently.Wecanassign them truthvaluesandprobabilitieswithno less
confidence than we do for factual statements. In his view, we do this byenvisioning“possibleworlds”inwhichthecounterfactualstatementsaretrue.
When we say, “Joe’s headache would have gone away if he had takenaspirin,” we are saying (according to Lewis) that there are other possibleworlds inwhichJoedidtakeanaspirinandhisheadachewentaway.Lewisargued thatwe evaluate counterfactuals by comparing ourworld,where hedidnottakeaspirin,tothemostsimilarworldinwhichhedidtakeanaspirin.Upon finding no headache in that world, we declare the counterfactualstatement to be true. “Most similar” is key. There may be some “possibleworlds” in which his headache did not go away—for example, a world inwhichhe took theaspirinand thenbumpedhisheadon thebathroomdoor.But that world contains an extra, adventitious circumstance. Among allpossibleworldsinwhichJoetookaspirin,theonemostsimilartoourswouldbeonenotwherehebumpedhisheadbutwherehisheadacheisgone.
ManyofLewis’scriticspouncedontheextravaganceofhisclaimsfortheliteralexistenceofmanyotherpossibleworlds.“Mr.Lewiswasoncedubbeda ‘mad-dogmodal realist’ forhis idea thatany logicallypossibleworldyoucanthinkofactuallyexists,”saidhisNewYorkTimesobituaryin2001.“Hebelieved,forinstance,thattherewasaworldwithtalkingdonkeys.”
But I think that his critics (andperhapsLewishimself)missed themostimportantpoint.Wedonotneedtoargueaboutwhethersuchworldsexistasphysicalorevenmetaphysicalentities.Ifweaimtoexplainwhatpeoplemeanby saying “A causesB,”we need only postulate that people are capable ofgeneratingalternativeworldsintheirheads,judgingwhichworldis“closer”tooursand,mostimportantly,doingitcoherentlysoastoformaconsensus.Surely we could not communicate about counterfactuals if one person’s“closer”was another person’s “farther.” In this view,Lewis’s appeal “Whynot take counterfactuals at face value?” called not for metaphysics but forattentiontotheamazinguniformityofthearchitectureofthehumanmind.
Asa licensedWhiggishphilosopher, Icanexplain thisconsistencyquitewell:itstemsfromthefactthatweexperiencethesameworldandsharethesamementalmodelof its causal structure.We talkedabout this all thewayback in Chapter 1. Our shared mental models bind us together intocommunities. We can therefore judge closeness not by some metaphysicalnotionof“similarity”butbyhowmuchwemust takeapartandperturboursharedmodelbeforeitsatisfiesagivenhypotheticalconditionthatiscontrarytofact(Joenottakingaspirin).
In structuralmodelswe do a very similar thing, albeit embellishedwith

moremathematicaldetail.Weevaluateexpressionslike“hadXbeenx”inthesameway thatwehandled interventionsdo(X =x), bydeleting arrows in acausal diagram or equations in a structuralmodel.We can describe this asmaking theminimal alteration to a causal diagram needed to ensure thatXequals x. In this respect, structural counterfactuals are compatible withLewis’sideaofthemostsimilarpossibleworld.
Structural models also offer a resolution of a puzzle Lewis kept silentabout: How do humans represent “possible worlds” in their minds andcompute theclosestone,when thenumberofpossibilities is farbeyond thecapacityofthehumanbrain?Computerscientistscallthisthe“representationproblem.”Wemust have some extremely economical code to manage thatmanyworlds.Couldstructuralmodels, insomeshapeorform,betheactualshortcutthatweuse?Ithinkitisverylikely,fortworeasons.First,structuralcausal models are a shortcut that works, and there aren’t any competitorsaround with that miraculous property. Second, they were modeled onBayesian networks, which in turn were modeled on David Rumelhart’sdescriptionofmessagepassinginthebrain.Itisnottoomuchofastretchtothinkthat40,000yearsago,humansco-optedthemachineryintheirbrainthatalready existed for pattern recognition and started to use it for causalreasoning.
Philosophers tend to leave it to psychologists tomake statements abouthowtheminddoesthings,whichexplainswhythequestionsabovewerenotaddresseduntilquiterecently.However,artificialintelligence(AI)researcherscould not wait. They aimed to build robots that could communicate withhumansaboutalternatescenarios,creditandblame,responsibilityandregret.These are all counterfactual notions that AI researchers had to mechanizebeforetheyhadtheslightestchanceofachievingwhattheycall“strongAI”—humanlikeintelligence.
WiththesemotivationsIenteredcounterfactualanalysisin1994(withmystudentAlexBalke).Notsurprisingly,thealgorithmizationofcounterfactualsmade a bigger splash in artificial intelligence and cognitive science than inphilosophy.Philosophers tended toviewstructuralmodelsasmerelyoneofmany possible implementations of Lewis’s possible-worlds logic. I dare tosuggest that they aremuchmore than that. Logic void of representation ismetaphysics. Causal diagrams, with their simple rules of following anderasing arrows, must be close to the way that our brains representcounterfactuals.
Thisassertionmustremainunprovenforthetimebeing,buttheupshotof
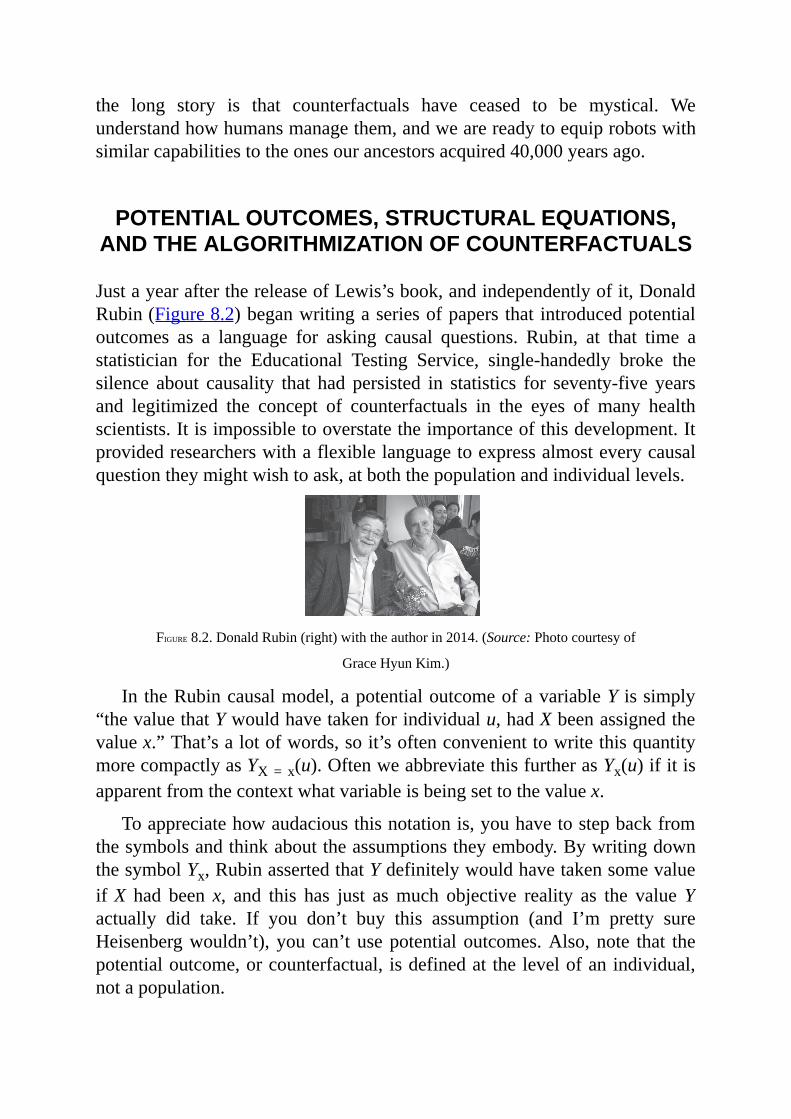
the long story is that counterfactuals have ceased to be mystical. Weunderstandhowhumansmanagethem,andwearereadytoequiprobotswithsimilarcapabilitiestotheonesourancestorsacquired40,000yearsago.
POTENTIALOUTCOMES,STRUCTURALEQUATIONS,ANDTHEALGORITHMIZATIONOFCOUNTERFACTUALS
JustayearafterthereleaseofLewis’sbook,andindependentlyofit,DonaldRubin(Figure8.2)beganwritingaseriesofpapersthat introducedpotentialoutcomes as a language for asking causal questions. Rubin, at that time astatistician for the Educational Testing Service, single-handedly broke thesilence about causality that had persisted in statistics for seventy-five yearsand legitimized the concept of counterfactuals in the eyes of many healthscientists.Itisimpossibletooverstatetheimportanceofthisdevelopment.Itprovidedresearcherswithaflexiblelanguagetoexpressalmosteverycausalquestiontheymightwishtoask,atboththepopulationandindividuallevels.
FIGURE8.2.DonaldRubin(right)withtheauthorin2014.(Source:Photocourtesyof
GraceHyunKim.)
IntheRubincausalmodel,apotentialoutcomeofavariableYissimply“thevaluethatYwouldhavetakenforindividualu,hadXbeenassignedthevaluex.”That’salotofwords,soit’softenconvenienttowritethisquantitymorecompactlyasYX=x(u).OftenweabbreviatethisfurtherasYx(u)ifitisapparentfromthecontextwhatvariableisbeingsettothevaluex.
Toappreciatehowaudaciousthisnotationis,youhavetostepbackfromthesymbolsandthinkabouttheassumptionstheyembody.BywritingdownthesymbolYx,RubinassertedthatYdefinitelywouldhavetakensomevalueifX had been x, and this has just asmuch objective reality as the valueYactually did take. If you don’t buy this assumption (and I’m pretty sureHeisenbergwouldn’t),youcan’tusepotentialoutcomes.Also,note that thepotentialoutcome,orcounterfactual, isdefinedat thelevelofanindividual,notapopulation.
The very first scientific appearance of a potential outcome came in themaster’s thesisof JerzyNeyman,written in1923.Neyman,adescendantofPolish nobility, had grownup in exile inRussia and did not set foot in hisnativelanduntil1921,whenhewastwenty-sevenyearsold.Hehadreceiveda very strong mathematical education in Russia and would have liked tocontinue research in pure mathematics, but it was easier for him to findemploymentasastatistician.Much likeR.A.Fisher inEngland,hedidhisfirst statistical research at an agricultural institute, a job for which he washugelyoverqualified.Notonlywashetheonlystatisticianintheinstitute,buthe was really the only person in the country thinking about statistics as adiscipline.
Neyman’s firstmentionofpotentialoutcomescame in the contextof anagriculturalexperiment,wherethesubscriptnotationrepresentsthe“unknownpotentialyieldofthei-thvariety[ofagivenseed]ontherespectiveplot.”ThethesisremainedunknownanduntranslatedintoEnglishuntil1990.However,Neyman himself did not remain unknown. He arranged to spend a year atKarlPearson’sstatistical laboratoryatUniversityCollegeLondon,wherehemade friendswith Pearson’s son Egon. The two kept in touch for the nextseven years, and their collaboration paid great dividends: the Neyman-Pearsonapproachtostatisticalhypothesis testingwasamilestonethateverybeginningstatisticsstudentlearnsabout.
In1933,KarlPearson’slongautocraticleadershipfinallycametoanendwithhisretirement,andEgonwashislogicalsuccessor—orwouldhavebeen,if not for the singular problem of R. A. Fisher, by then the most famousstatisticianinEngland.Theuniversitycameupwithauniqueanddisastroussolution,dividingPearson’spositionintoachairofstatistics(EgonPearson)andachairofeugenics(Fisher).EgonwastednotimehiringhisPolishfriend.Neymanarrivedin1934andalmostimmediatelylockedhornswithFisher.
Fisher was already spoiling for a fight. He knew he was the world’sleadingstatisticianandhadpracticallyinventedlargepartsofthesubject,yetwas forbidden from teaching in the statistics department. Relations wereextraordinarily tense. “The Common Room was carefully shared,” writesConstanceReidinherbiographyofNeyman.“Pearson’sgrouphadteaat4;and at 4:30, when they were safely out of the way, Fisher and his grouptroopedin.”
In 1935, Neyman gave a lecture at the Royal Statistical Society titled“Statistical Problems in Agricultural Experimentation,” in which he calledintoquestionsomeofFisher’sownmethodsandalso,incidentally,discussed
theideaofpotentialoutcomes.AfterNeymanwasdone,Fisherstoodupandtold the society that“hehadhoped thatDr.Neyman’spaperwouldbeonasubjectwithwhichtheauthorwasfullyacquainted.”
“[Neymanhad]assertedthatFisherwaswrong,”wroteOscarKempthorneyearslaterabouttheincident.“Thiswasanunforgivableoffense—Fisherwasneverwrongandindeedthesuggestionthathemightbewastreatedbyhimasa deadly assault. Anyone who did not accept Fisher’s writing as the God-giventruthwasatbeststupidandatworstevil.”NeymanandPearsonsawtheextentofFisher’sfuryafewdayslater,whentheywenttothedepartmentinthe evening and found Neyman’s wooden models, with which he hadillustrated his lecture, strewn all over the floor. They concluded that onlyFishercouldhavebeenresponsibleforthewreckage.
WhileFisher’s fit of ragemay seemamusingnow,his attitudedidhaveserious consequences. Of course he could not swallow his pride and useNeyman’spotentialoutcomenotation,eventhoughitwouldhavehelpedhimlaterwithproblemsofmediation.The lackofpotentialoutcomevocabularyledhimandmanyother people into the so-calledMediationFallacy,whichwewilldiscussinChapter9.
At thispointsomereadersmightstill findtheconceptofcounterfactualssomewhatmystical,soI’dliketoshowhowsomeofRubin’sfollowerswouldinfer potential outcomes and contrast this model-free approach with thestructuralcausalmodelapproach.
Supposethatwearelookingatacertainfirmtoseewhethereducationoryearsofexperienceisamoreimportantfactorindetermininganemployee’ssalary. We have collected some data on the existing salaries at this firm,reproducedinTable8.1.We’relettingEX representyearsofexperience,EDrepresent education, and S represent salary. We’re also assuming, forsimplicity,justthreelevelsofeducation:0=highschooldegree,1=collegedegree,2=graduatedegree.ThusSED=0(u),orS0(u),representsthesalaryofindividualuifuwereahighschoolgraduatebutnotacollegegraduate,andS1(u) represents u’s salary if u were a college graduate. A typicalcounterfactualquestionwemightwanttoaskis,“WhatwouldAlice’ssalarybeifshehadacollegedegree?”Inotherwords,whatisS1(Alice)?
ThefirstthingtonoticeaboutTable8.1isall themissingdata, indicatedbyquestionmarks.Wecanneverobservemorethanonepotentialoutcomeinthe same individual. Although obvious, nevertheless this statement isimportant.StatisticianPaulHollandoncecalleditthe“fundamentalproblemof causal inference,” a name that has stuck. If we could only fill in the
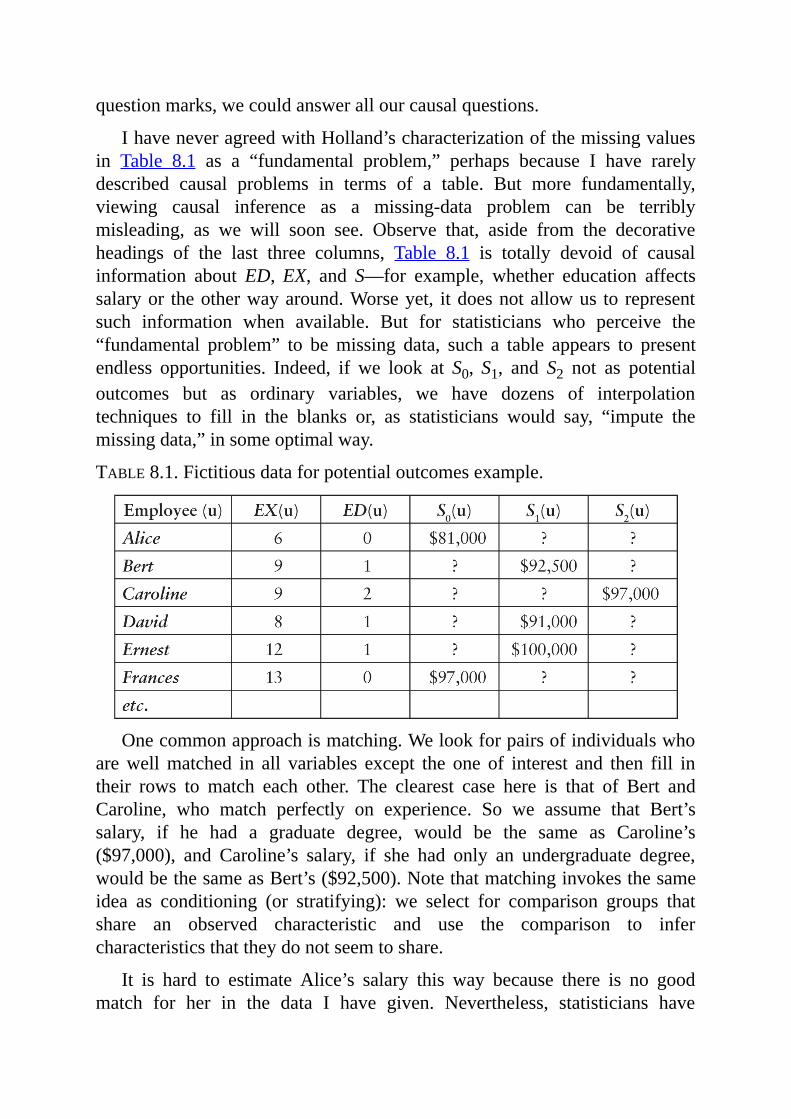
questionmarks,wecouldanswerallourcausalquestions.
IhaveneveragreedwithHolland’scharacterizationofthemissingvaluesin Table 8.1 as a “fundamental problem,” perhaps because I have rarelydescribed causal problems in terms of a table. But more fundamentally,viewing causal inference as a missing-data problem can be terriblymisleading, as we will soon see. Observe that, aside from the decorativeheadings of the last three columns, Table 8.1 is totally devoid of causalinformation aboutED,EX, and S—for example, whether education affectssalaryor theotherwayaround.Worseyet, itdoesnotallowus to representsuch information when available. But for statisticians who perceive the“fundamental problem” to bemissing data, such a table appears to presentendless opportunities. Indeed, if we look at S0,S1, and S2 not as potentialoutcomes but as ordinary variables, we have dozens of interpolationtechniques to fill in the blanks or, as statisticians would say, “impute themissingdata,”insomeoptimalway.
TABLE8.1.Fictitiousdataforpotentialoutcomesexample.
Onecommonapproachismatching.Welookforpairsofindividualswhoarewellmatched in all variables except the one of interest and then fill intheir rows to match each other. The clearest case here is that of Bert andCaroline, who match perfectly on experience. So we assume that Bert’ssalary, if he had a graduate degree, would be the same as Caroline’s($97,000), and Caroline’s salary, if she had only an undergraduate degree,wouldbethesameasBert’s($92,500).Notethatmatchinginvokesthesameidea as conditioning (or stratifying): we select for comparison groups thatshare an observed characteristic and use the comparison to infercharacteristicsthattheydonotseemtoshare.
It is hard to estimate Alice’s salary this way because there is no goodmatch for her in the data I have given. Nevertheless, statisticians have
developed techniques of considerable subtlety to imputemissing data fromapproximate matches, and Rubin has been a pioneer of this approach.Unfortunately,eventhemostgiftedmatchmakerintheworldcannotturndataintopotentialoutcomes,notevenapproximately. Iwill showbelow that thecorrectanswerdependscriticallyonwhethereducationaffectsexperienceortheotherwayaround,informationnowheretobefoundinthetable.
A second possiblemethod is linear regression (not to be conflatedwithstructural equations). In this approach we pretend that the data came fromsomeunknownrandomsourceandusestandardstatisticalmethodstofindtheline (or, in this case, plane) that best fits the data. The output of such anapproachmightbeanequationthatlookslikethis:
S=$65,000+2,500×EX+5,000×ED(8.1)
Equation8.1tellsusthat(onaverage)thebasesalaryofanemployeewithnoexperienceandonlyahigh schooldiploma is$65,000.For eachyearofexperience, the salary increases by $2,500, and for each additionaleducationaldegree(uptotwo),thesalaryincreasesby$5,000.Accordingly,aregression analystwould claim, our estimate ofAlice’s salary, if she had acollegedegree,is$65,000+$2,500×6+$5,000×1=$85,000.
The ease and familiarity of such imputation techniques explain whyRubin’sconceptionofcausalinferenceasamissing-dataproblemhasenjoyedbroad popularity.Alas, as innocuous as these interpolationmethods appear,theyare fundamentally flawed.Theyaredatadriven,notmodeldriven.Allthemissingdataare filled inbyexaminingothervalues in the table.Aswehave learned from theLadder ofCausation, any suchmethod is doomed tostart with; no methods based only on data (rung one) can answercounterfactualquestions(rungthree).
Before contrasting these methods with the structural causal modelapproach, let us examine intuitively what goes wrong with model-blindimputation. In particular, let us explainwhyBert andCaroline,whomatchperfectlyinexperience,mayinfactbequiteincomparablewhenitcomestocomparing their potential outcomes. More surprising, a reasonable causalstory (fitting Table 8.1) would show that the best match for Caroline forSalarywouldbesomeonewhodoesnotmatchheronExperience.
The first key point to realize is that Experience is likely to depend onEducation. After all, those employeeswho got an extra educational degreetookfouryearsoftheirlivestodoso.Thus,ifCarolinehadonlyonedegreeofeducation (likeBert), shewouldhavebeenable touse thatextra time to
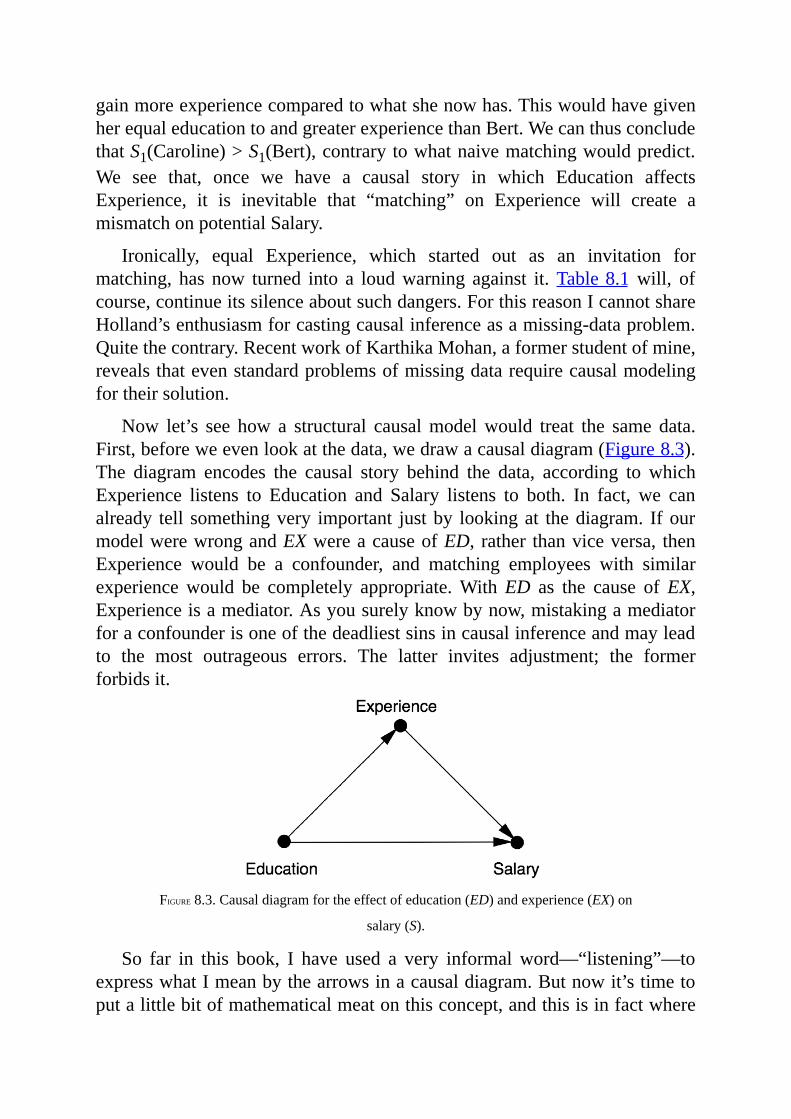
gainmoreexperiencecomparedtowhatshenowhas.ThiswouldhavegivenherequaleducationtoandgreaterexperiencethanBert.WecanthusconcludethatS1(Caroline)>S1(Bert),contrarytowhatnaivematchingwouldpredict.We see that, once we have a causal story in which Education affectsExperience, it is inevitable that “matching” on Experience will create amismatchonpotentialSalary.
Ironically, equal Experience, which started out as an invitation formatching, has now turned into a loudwarning against it. Table8.1will, ofcourse,continueitssilenceaboutsuchdangers.ForthisreasonIcannotshareHolland’senthusiasmforcastingcausalinferenceasamissing-dataproblem.Quitethecontrary.RecentworkofKarthikaMohan,aformerstudentofmine,revealsthatevenstandardproblemsofmissingdatarequirecausalmodelingfortheirsolution.
Now let’s see how a structural causalmodelwould treat the same data.First,beforeweevenlookatthedata,wedrawacausaldiagram(Figure8.3).The diagram encodes the causal story behind the data, according to whichExperience listens to Education and Salary listens to both. In fact, we canalready tell somethingvery important justby lookingat thediagram. IfourmodelwerewrongandEXwereacauseofED, rather thanviceversa, thenExperience would be a confounder, and matching employees with similarexperiencewould be completely appropriate.WithED as the cause ofEX,Experienceisamediator.Asyousurelyknowbynow,mistakingamediatorforaconfounderisoneofthedeadliestsinsincausalinferenceandmayleadto the most outrageous errors. The latter invites adjustment; the formerforbidsit.
FIGURE8.3.Causaldiagramfortheeffectofeducation(ED)andexperience(EX)on
salary(S).
So far in this book, I have used a very informalword—“listening”—toexpresswhatImeanbythearrowsinacausaldiagram.Butnowit’stimetoputalittlebitofmathematicalmeatonthisconcept,andthisisinfactwhere
structuralcausalmodelsdifferfromBayesiannetworksorregressionmodels.WhenIsaythatSalarylistenstoEducationandExperience,Imeanthatitisamathematical function of those variables: S = fS(EX,ED). But we need toallowforindividualvariations,soweextendthisfunctiontoreadS=fS(EX,ED,US),whereUS stands for “unobservedvariables that affect salary.”Weknowthesevariablesexist(e.g.,Aliceisafriendofthecompany’spresident),but theyare toodiverseand toonumerous to incorporateexplicitly intoourmodel.
Let’s see how this would play out in our education/experience/salaryexample, assuming linear functions throughout. We can use the samestatisticalmethodsasbeforetofindthebest-fittinglinearequation.TheresultwouldlookjustlikeEquation8.1withonesmalldifference:
S=$65,000+2,500×EX+5,000×ED+US(8.2)
However, the formal similarity between Equations 8.1 and 8.2 isprofoundlydeceptive;theirinterpretationsdifferlikenightandday.ThefactthatwechosetoregressSonEDandEXinEquation8.1innowayimpliesthatS listens toEDandEX in the realworld.That choicewaspurelyours,andnothinginthedatawouldpreventusfromregressingEXonEDandSorfollowinganyotherorder.(RememberFrancisGalton’sdiscoveryinChapter2thatregressionsarecauseblind.)Welosethisfreedomonceweproclaimanequation tobe“structural.” Inotherwords, theauthorofEquation8.2mustcommittowritingequationsthatmirrorhisbeliefaboutwholistenstowhomintheworld.Inourcase,hebelievesthatStrulylistenstoEXandED.Moreimportantly,theabsenceofanequationED=fED(EX,S,UED)fromthemodelmeans that ED is believed to be oblivious to changes in EX or S. Thisdifference in commitment gives structural equations the power to supportcounterfactuals,apowerdeniedtoregressionequations.
IncompliancewithFigure8.3,wemustalsohaveastructuralequationforEX,butnowwewillforcethecoefficientofStozero,toreflecttheabsenceofanarrowfromStoEX.Onceweestimatethecoefficientsfromthedata,theequationmightlooksomethinglikethis:
EX=10–4×ED+UEX(8.3)
Thisequationsays that theaverageexperienceforpeoplewithnoadvanceddegreesis tenyears,andeachdegreeofeducation(uptotwo)decreasesEXby fouryearsonaverage.Again,note thekeydifferencebetween structuralandregressionequations:variableSdoesnotenterintoEquation8.3,despitethe fact that S andEX are likely to be highly correlated. This reflects the
analyst’sbelief that the experienceEX acquired by any individual is totallyunaffectedbyhiscurrentsalary.
Now let’s demonstrate how to derive counterfactuals from a structuralmodel.ToestimateAlice’ssalaryifshehadacollegeeducation,weperformthreesteps:
1. (Abduction) Use the data about Alice and about the otheremployees to estimateAlice’s idiosyncratic factors,US(Alice)andUEX(Alice).
2.(Action)Usethedo-operatortochangethemodeltoreflectthecounterfactualassumptionbeingmade,inthiscasethatshehasacollegedegree:ED(Alice)=1.
3. (Prediction) Calculate Alice’s new salary using the modifiedmodel and the updated information about the exogenousvariablesUS(Alice),UEX(Alice), and ED(Alice). This newlycalculatedsalaryisequaltoSED=1(Alice).
Forstep1,weobservefromthedatathatEX(Alice)=6andED(Alice)=0.WesubstitutethesevaluesintoEquations8.2and8.3.Theequationsthentellus Alice’s idiosyncratic factors:US(Alice) = $1,000 andUEX(Alice) = –4.Thisrepresentseverythingthatisunique,special,andwonderfulaboutAlice.Whateverthatis,itadds$1,000toherpredictedsalary.
Step2 tellsus touse thedo-operator toerase thearrowspointing to thevariablethatisbeingsettoacounterfactualvalue(Education)andsetAlice’sEducation to a college degree (Education = 1). In this example, Step 2 istrivial, because there are no arrows pointing to Education and hence noarrowstoerase.Inmorecomplicatedmodels,though,thisstepoferasingthearrows cannot be left out, because it affects the computation in Step 3.Variables that might have affected the outcome through the intervenedvariablewillnolongerbeallowedtodoso.
Finally,Step3saystoupdatethemodeltoreflectthenewinformationthatUS=$1,000,UEX=–4,andED=1.FirstweuseEquation8.3torecomputewhatAlice’sExperiencewouldbeifshehadgonetocollege:EXED=1(Alice)=10–4–4=2years.ThenweuseEquation8.2torecomputeherpotentialSalary:
SED=1(Alice)=$65,000+2,500×2+5,000×1+1,000=$76,000.
Our result,S1(Alice) = $76,000, is a valid estimate ofAlice’swould-besalary; that is, the two will coincide if the model assumptions are valid.Because this example entails a very simple causal model and very simple(linear) functions, the differences between it and the data-driven regressionmethod may seem rather minor. But the minor differences on the surfacereflect vast differences underneath. Whatever counterfactual (potential)outcome we obtain from the structural method follows logically from theassumptionsdisplayed in themodel,while theanswerobtainedby thedata-driven method is as whimsical as spurious correlations because it leavesimportantmodelingassumptionsunaccountedfor.
Thisexamplehasforcedustogofurtherintothe“nutsandbolts”ofcausalmodels thanwe have previously done in this book.But letme step back alittle to celebrate and appreciate the miracle that came into being throughAlice’s example.Using a combination of data andmodel,wewere able topredict the behavior of an individual (Alice) under totally hypotheticalconditions.Of course, there is no such thing as a free lunch:we got thesestrong resultsbecausewemadestrongassumptions. Inaddition toassertingthecausalrelationshipsbetweentheobservedvariables,wealsoassumedthatthe functional relationships were linear. But the linearity matters less herethanknowingwhatthosespecificfunctionsare.ThatenabledustocomputeAlice’sidiosyncrasiesfromherobservedcharacteristicsandupdatethemodelasrequiredinthethree-stepprocedure.
Attheriskofaddingasobernotetoourcelebration,Ihavetotellyouthatthis functional informationwillnotalwaysbeavailable tous inpractice. Ingeneral,we call amodel “completely specified” if the functions behind thearrows are known and “partially specified” otherwise. For instance, as inBayesian networks, we may only know probabilistic relationships betweenparentsandchildreninthegraph.Ifthemodelispartiallyspecified,wemaynotbeabletoestimateAlice’ssalaryexactly;insteadwemayhavetomakeaprobability-interval statement, such as “There is a 10 to 20 percent chancethat her salarywould be $76,000.”But even such probabilistic answers aregood enough for many applications. Moreover, it is truly remarkable howmuchinformationwecanextractfromthecausaldiagramevenwhenwehavenoinformationonthespecificfunctionslyingbehindthearrowsoronlyverygeneral information,suchasthe“monotonicity”assumptionweencounteredinthelastchapter.
Steps1to3abovecanbesummedupinwhatIcallthe“firstlawofcausalinference”:Yx(u)=YMx(u).This is the same rule thatweused in the firing
squadexampleinChapter1,exceptthatthefunctionsaredifferent.Thefirstlaw says that the potential outcome Yx(u) can be imputed by going to themodelMx(witharrowsintoXdeleted)andcomputingtheoutcomeY(u)there.All estimablequantitieson rungs twoand threeof theLadderofCausationfollowfromthere. Inshort, the reductionofcounterfactuals toanalgorithmallowsus toconquerasmuch territory fromrung threeasmathematicswillpermit—but,ofcourse,notabitmore.
THEVIRTUEOFSEEINGYOURASSUMPTIONS
TheSCMmethodIhaveshownforcomputingcounterfactualsisnotthesamemethodthatRubinwoulduse.Amajorpointofdifferencebetweenusistheuse of causal diagrams. They allow researchers to represent causalassumptions in terms that they can understand and then treat allcounterfactualsasderivedpropertiesoftheirworldmodel.TheRubincausalmodel treats counterfactuals as abstract mathematical objects that aremanagedbyalgebraicmachinerybutnotderivedfromamodel.
Deprived of a graphical facility, the user of the Rubin causal model isusually asked to accept three assumptions. The first one, called the “stableunit treatment value assumption,” or SUTVA, is reasonably transparent. Itsays that each individual (or “unit,” the preferred term of causalmodelers)willhavethesameeffectoftreatmentregardlessofwhattreatmenttheotherindividuals (or“units”) receive. Inmanycases,barringepidemicsandothercollective interactions, this makes perfectly good sense. For example,assumingheadacheisnotcontagious,myresponsetoaspirinwillnotdependonwhetherJoereceivesaspirin.
The second assumption in Rubin’s model, also benign, is called“consistency.” It says that a person who took aspirin and recovered wouldalso recover if given aspirin by experimental design. This reasonableassumption,whichisatheoremintheSCMframework,saysineffectthattheexperimentisfreeofplaceboeffectsandotherimperfections.
But the major assumption that potential outcome practitioners areinvariablyrequiredtomakeiscalled“ignorability.”It ismoretechnical,butit’s the crucial part of the transaction, for it is in essence the same thing asJamieRobinsandSanderGreenland’sconditionofexchangeabilitydiscussedinChapter 4. Ignorability expresses this same requirement in terms of thepotential outcome variable Yx. It requires that Yx be independent of the
treatment actually received, namelyX, given the values of a certain set of(de)confounding variablesZ. Before exploring its interpretation, we shouldacknowledge that any assumption expressed as conditional independenceinherits a large body of familiar mathematical machinery developed bystatisticians for ordinary (noncounterfactual) variables. For example,statisticians routinely use rules for deciding when one conditionalindependence follows from another. To Rubin’s credit, he recognized theadvantagesof translating thecausalnotionof“nonconfoundedness” into thesyntax of probability theory, albeit on counterfactual variables. Theignorability assumption makes the Rubin causal model actually a model;Table8.1initselfisnotamodelbecauseitcontainsnoassumptionsabouttheworld.
Unfortunately, I have yet to find a single personwho can explainwhatignorability means in a language spoken by those who need to make thisassumptionorassessitsplausibilityinagivenproblem.Hereismybesttry.Theassignmentofpatientstoeithertreatmentorcontrolisignorableif,withinany stratum of the confounder Z, patients who would have one potentialoutcome,Yx=y,arejustaslikelytobeinthetreatmentorcontrolgroupasthe patients who would have a different potential outcome, Yx = y′. Thisdefinition is perfectly legitimate for someone in possession of a probabilityfunctionovercounterfactuals.Buthowisabiologistoreconomistwithonlyscientificknowledgeforguidancesupposed toassesswhether this is trueornot?Moreconcretely,howisascientist toassesswhetherignorabilityholdsinanyoftheexamplesdiscussedinthisbook?
Tounderstandthedifficulty,letusattempttoapplythisexplanationtoourexample. To determine if ED is ignorable (conditional on EX), we aresupposed to judgewhetheremployeeswhowouldhaveonepotentialsalary,sayS1=s,arejustaslikelytohaveonelevelofeducationastheemployeeswhowouldhaveadifferentpotentialsalary,sayS1=s′.Ifyouthinkthatthissounds circular, I can only agree with you!We want to determine Alice’spotential salary, and evenbeforewe start—evenbeforeweget ahint abouttheanswer—wearesupposedtospeculateonwhethertheresultisdependentor independent of ED, in every stratum of EX. It is quite a cognitivenightmare.
As it turns out, ED in our example is not ignorable with respect to S,conditionalonEX, and this iswhy thematchingapproach (settingBertandCarolineequal)wouldyieldthewronganswerfortheirpotentialsalaries.Infact, their estimates should differ by an amount S1(Bert)–S1(Caroline) =
$5,000.(ThereadershouldbeabletoshowthisfromthenumbersinTable8.1andthethree-stepprocedure.)Iwillnowshowthatwiththehelpofacausaldiagram,astudentcouldseeimmediatelythatEDisnotignorableandwouldnotattemptmatchinghere.Lackingadiagram,astudentwouldbetemptedtoassumethatignorabilityholdsbydefaultandwouldfallintothistrap.(Thisisnot a speculation. I borrowed the idea for this example from an article inHarvardLawReviewwhere the storywas essentially the sameas inFigure8.3andtheauthordidusematching.)
Here is how we can use a causal diagram to test for (conditional)ignorability.TodetermineifXisignorablerelativetooutcomeY,conditionalonasetZofmatchingvariables,weneedonlytesttoseeifZblocksalltheback-doorpathsbetweenXandYandnomemberofZisadescendantofX.Itis as simple as that! In our example, the proposed matching variable(Experience)blocksalltheback-doorpaths(becausetherearen’tany),butitfails the test because it is a descendant of Education. ThereforeED is notignorable, and EX cannot be used for matching. No elaborate mentalgymnastics are needed, just a look at a diagram. Never is a researcherrequired to mentally assess how likely a potential outcome is given onetreatmentoranother.
Unfortunately, Rubin does not consider causal diagrams to “aid thedrawingofcausal inferences.”Therefore, researcherswhofollowhisadvicewillbedeprivedof this test for ignorabilityandwill eitherhave toperformformidable mental gymnastics to convince themselves that the assumptionholds or else simply accept the assumption as a “black box.” Indeed, aprominent potential outcome researcher,Marshall Joffe, wrote in 2010 thatignorability assumptions are usually made because they justify the use ofavailablestatisticalmethods,notbecausetheyaretrulybelieved.
Closelyrelatedtotransparencyisthenotionoftestability,whichhascomeupseveraltimesinthisbook.Amodelcastasacausaldiagramcaneasilybetested for compatibility with the data, whereas a model cast in potentialoutcome language lacks this feature. The test goes like this: whenever allpathsbetweenXandYinthediagramareblockedbyasetofnodesZ,theninthe data X and Y should be independent, conditional on Z. This is the d-separationpropertymentionedinChapter7,whichallowsustorejectamodelwhenever the independence fails to show up in the data. In contrast, if thesame model is expressed in the language of potential outcomes (i.e., as acollectionofignorabilitystatements),welackthemathematicalmachinerytounveiltheindependenciesthatthemodelentails,andresearchersareunabletosubject themodel to a test. It is hard to understand howpotential outcome
researchersmanaged to livewith thisdeficiencywithout rebelling.Myonlyexplanationisthattheywerekeptawayfromgraphicaltoolsforsolongthattheyforgotthatcausalmodelscanandshouldbetestable.
NowImustapplythesamestandardsoftransparencytomyselfandsayalittlebitmoreabouttheassumptionsembodiedinastructuralcausalmodel.
Remember the story of Abraham that I related earlier? Abraham’s firstresponsetothenewsofSodom’simminentdestructionwastolookforadose-response relationship,ora response function, relating thewickednessof thecitytoitspunishment.Itwasasoundscientificinstinct,butIsuspectfewofuswouldhavebeencalmenoughtoreactthatway.
TheresponsefunctionisthekeyingredientthatgivesSCMsthepowertohandle counterfactuals. It is implicit inRubin’spotentialoutcomeparadigmbut a major point of difference between SCMs and Bayesian networks,includingcausalBayesiannetworks.InaprobabilisticBayesiannetwork,thearrows intoYmean that theprobabilityofY is governedby the conditionalprobabilitytablesforY,givenobservationsofitsparentvariables.Thesameis true for causalBayesiannetworks, except that theconditionalprobabilitytablesspecifytheprobabilityofYgiveninterventionsontheparentvariables.Both models specify probabilities for Y, not a specific value of Y. In astructural causal model, there are no conditional probability tables. ThearrowssimplymeanY isa functionof itsparents,aswellas theexogenousvariableUY:
Y=fY(X,A,B,C,…,UY)(8.4)
Thus,Abraham’s instinctwassound.To turnanoncausalBayesiannetworkinto a causal model—or, more precisely, to make it capable of answeringcounterfactualqueries—weneedadose-responserelationshipateachnode.
This realization did not come to me easily. Even before delving intocounterfactuals,Itriedforaverylongtimetoformulatecausalmodelsusingconditionalprobabilitytables.OneobstacleIfacedwascyclicmodels,whichwere totally resistant to conditional probability formulations. Anotherobstacle was that of coming upwith a notation to distinguish probabilisticBayesiannetworksfromcausalones.In1991,itsuddenlyhitmethatallthedifficultieswouldvanishifwemadeYafunctionofitsparentvariablesandlet theUY term handle all the uncertainties concerning Y. At the time, itseemedlikeaheresyagainstmyownteaching.Afterdevotingseveralyearstothe cause of probabilities in artificial intelligence, I was now proposing totakeastepbackwardanduseanonprobabilistic,quasi-deterministicmodel.I
can still remember my student at the time, Danny Geiger, askingincredulously, “Deterministic equations? Truly deterministic?” It was as ifSteveJobshadjusttoldhimtobuyaPCinsteadofaMac.(Thiswas1990!)
On the surface, there was nothing revolutionary about these equations.Economistsandsociologistshadbeenusingsuchmodelssincethe1950sand1960s and calling them structural equation models (SEMs). But this namesignaled controversy and confusion over the causal interpretation of theequations. Over time, economists lost sight of the fact that the pioneers ofthese models, Trygve Haavelmo in economics and Otis Dudley Duncan insociology,hadintendedthemtorepresentcausalrelationships.Theybegantoconfusestructuralequationswithregressionlines,thusstrippingthesubstancefrom the form. For example, in 1988, when David Freedman challengedelevenSEMresearcherstoexplainhowtoapplyinterventionstoastructuralequationmodel,notoneofthemcould.Theycouldtellyouhowtoestimatethe coefficients from data, but they could not tell you why anyone shouldbother. If the response-function interpretation Ipresentedbetween1990and1994 did anything new, itwas simply to restore and formalizeHaavelmo’sand Duncan’s original intentions and lay before their disciples the boldconclusionsthatfollowfromthoseintentionsifyoutakethemseriously.
Some of these conclusions would be considered astounding, even byHaavelmoandDuncan.TakeforexampletheideathatfromeverySEM,nomatter how simple, we can compute all the counterfactuals that one canimagine among the variables in the model. Our ability to compute Alice’spotentialsalary,hadshehadcollegeeducation,followedfromthisidea.Eventodaymodern-dayeconomistshavenotinternalizedthisidea.
One other important difference between SEMs and SCMs, besides themiddleletter,isthattherelationshipbetweencausesandeffectsinanSCMisnot necessarily linear. The techniques that emerge from SCM analysis arevalidfornonlinearaswellaslinearfunctions,discreteaswellascontinuousvariables.
Linear structural equation models have many advantages and manydisadvantages. From the viewpoint of methodology, they are seductivelysimple.Theycanbeestimated fromobservationaldataby linear regression,andyoucanchoosebetweendozensofstatisticalsoftwarepackagestodothisforyou.
On the other hand, linearmodels cannot represent dose-response curvesthatarenotstraight lines.Theycannotrepresent thresholdeffects,suchasadrug that has increasing effects up to a certain dosage and then no further
effect. They also cannot represent interactions between variables. Forinstance, a linear model cannot describe a situation in which one variableenhancesor inhibits theeffectof anothervariable. (Forexample,EducationmightenhancetheeffectofExperiencebyputtingtheindividualinafaster-trackjobthatgetsbiggerannualraises.)
Whiledebatesabout theappropriateassumptions tomakeare inevitable,ourmainmessage isquite simple:Rejoice!Witha fully specifiedstructuralcausalmodel,entailingacausaldiagramandall the functionsbehind it,wecan answer any counterfactual query. Even with a partial SCM, in whichsomevariablesarehiddenorthedose-responserelationshipsareunknown,wecan still inmany cases answer our query.Thenext two sections give someexamples.
COUNTERFACTUALSANDTHELAW
Inprinciple,counterfactualsshouldfindeasyapplicationinthecourtroom.Isay“inprinciple”becausethelegalprofessionisveryconservativeandtakesalongtimetoacceptnewmathematicalmethods.Butusingcounterfactualsasamodeofargumentisactuallyveryoldandknowninthelegalprofessionas“but-forcausation.”
TheModelPenalCodeexpressesthe“but-for”testasfollows:“Conductisthecauseofaresultwhen:(a)itisanantecedentbutforwhichtheresultinquestionwouldnothaveoccurred.”Ifthedefendantfiredagunandthebulletstruckandkilled thevictim, the firingof thegun is abut-for, ornecessary,causeofthedeath,sincethevictimwouldbealiveifnotforthefiring.But-forcausescanalsobeindirect.IfJoeblocksabuilding’sfireexitwithfurniture,andJudydies inafireaftershecouldnot reach theexit, thenJoe is legallyresponsibleforherdeatheventhoughhedidnotlightthefire.
How can we express necessary or but-for causes in terms of potentialoutcomes?IfwelettheoutcomeYbe“Judy’sdeath”(withY=0ifJudylivesandY=1ifJudydies)andthetreatmentXbe“Joe’sblockingthefireescape”(with X = 0 if he does not block it and X = 1 if he does), then we areinstructedtoaskthefollowingquestion:
Giventhatweknowthefireescapewasblocked(X=1)andJudydied(Y=1),whatistheprobabilitythatJudywouldhavelived(Y=0)ifXhadbeen0?
Symbolically,theprobabilitywewanttoevaluateisP(YX=0=0|X=1,Y=
1).Becausethisexpressionisrathercumbersome,Iwilllaterabbreviateitas“PN,” the probability of necessity (i.e., the probability that X = 1 is anecessaryorbut-forcauseofY=1).
Note that the probability of necessity involves a contrast between twodifferentworlds: theactualworldwhereX=1and thecounterfactualworldwhereX=0(expressedbythesubscriptX=0). Infact,hindsight(knowingwhat happened in the actual world) is a critical distinction betweencounterfactuals (rung three of the Ladder of Causation) and interventions(rung two).Withouthindsight, there isnodifferencebetweenP(YX = 0 = 0)andP(Y = 0 | do(X = 0)). Both express the probability that, under normalconditions,Judywillbealiveifweensurethattheexitisnotblocked;theydonot mention the fire, Judy’s death, or the blocked exit. But hindsight maychangeourestimateoftheprobabilities.SupposeweobservethatX=1andY=1(hindsight).ThenP(YX=0=0|X=1,Y=1)isnotthesameasP(YX=0=0 | X = 1). Knowing that Judy died (Y = 1) gives us information on thecircumstances that we would not get just by knowing that the door wasblocked(X=1).Foronething,itisevidenceofthestrengthofthefire.
Infact,itcanbeshownthatthereisnowaytocaptureP(YX=0=0|X=1,Y=1)inado-expression.Whilethismayseemlikearatherarcanepoint,itdoes give mathematical proof that counterfactuals (rung three) lie aboveinterventions(rungtwo)ontheLadderofCausation.
In the last few paragraphs, we have almost surreptitiously introducedprobabilities into our discussion. Lawyers have long understood thatmathematicalcertaintyis toohighastandardofproof.ForcriminalcasesintheUnitedStates,theSupremeCourtin1880establishedthatguilthastobeproven“totheexclusionofallreasonabledoubt.”Thecourtsaidnot“beyondalldoubt”or“beyondashadowofadoubt”butbeyondreasonabledoubt.TheSupreme Court has never given a precise definition of that term, but onemight conjecture that there is some threshold, perhaps 99 percent or 99.9percentprobabilityofguilt,abovewhichdoubtbecomesunreasonableanditis insociety’s interest to lock thedefendantup. Incivil rather thancriminalproceedings, the standard of proof is somewhat clearer. The law requires a“preponderance of evidence” that the defendant caused the injury, and itseemsreasonabletointerpretthistomeanthattheprobabilityisgreaterthan50percent.
Althoughbut-forcausationisgenerallyaccepted,lawyershaverecognizedthat in some cases it might lead to a miscarriage of justice. One classicexampleisthe“fallingpiano”scenario,wherethedefendantfiresashotatthe
victimandmisses,andintheprocessoffleeingthescene,thevictimhappensto run under a falling piano and is killed.By the but-for test the defendantwouldbeguiltyofmurder,becausethevictimwouldnothavebeenanywherenearthefallingpianoifhehadn’tbeenrunningaway.Butourintuitionsaysthat the defendant is not guilty of murder (though he may be guilty ofattemptedmurder),becausetherewasnowaythathecouldhaveanticipatedthefallingpiano.Alawyerwouldsaythat thepiano,not thegunshot, is theproximatecauseofdeath.
Thedoctrineofproximatecauseismuchmoreobscurethanbut-forcause.TheModelPenalCode says that theoutcomeshouldnotbe“too remoteoraccidentalinitsoccurrencetohavea[just]bearingontheactor’sliabilityorthegravityofhisoffense.”Atpresentthisdeterminationislefttotheintuitionof the judge. Iwould suggest that it is a form of sufficientcause.Was thedefendant’sactionsufficienttobringabout,withhighenoughprobability,theeventthatactuallycausedthedeath?
While the meaning of proximate cause is very vague, the meaning ofsufficientcauseisquiteprecise.Usingcounterfactualnotation,wecandefinetheprobabilityofsufficiency,orPS,tobeP(YX=1=1|X=0,Y=0).ThistellsustoimagineasituationwhereX=0andY=0:theshooterdidnotfireat the victim, and the victim did not run under a piano. Thenwe ask howlikely it is that in such a situation, firing the shot (X = 1) would result inoutcome Y = 1 (running under a piano)? This calls for counterfactualjudgment,butIthinkthatmostofuswouldagreethatthelikelihoodofsuchan outcomewould be extremely small.Both intuition and theModel PenalCodesuggestthatifPS istoosmall,weshouldnotconvictthedefendantofcausingY=1.
Because the distinction between necessary and sufficient causes is soimportant, I think it may help to anchor these two concepts in simpleexamples. Sufficient cause is the more common of the two, and we havealready encountered this concept in the firing squad example ofChapter 1.There, the firing of either SoldierA or SoldierB is sufficient to cause theprisoner’sdeath,andneither(initself)isnecessary.SoPS=1andPN=0.
Thingsgetabitmoreinterestingwhenuncertaintystrikes—forexample,ifeachsoldierhassomeprobabilityofdisobeyingordersormissingthetarget.Forexample,ifSoldierAhasaprobabilitypAofmissingthetarget,thenhisPS would be 1–pA, since this is his probability of hitting the target andcausingdeath.HisPN,however,woulddependonhowlikelySoldierBistorefrain from shooting or tomiss the target.Only under such circumstances
wouldtheshootingofSoldierAbenecessary; that is, theprisonerwouldbealivehadSoldierAnotshot.
Aclassic exampledemonstratingnecessary causation tells the storyof afire thatbrokeoutafter someonestruckamatch,and thequestion is“Whatcaused the fire, striking thematchor thepresenceofoxygen in the room?”Note that both factors are equally necessary, since the firewould not haveoccurredabsentoneofthem.So,fromapurelylogicalpointofview,thetwofactorsareequallyresponsibleforthefire.Why,then,doweconsiderlightingthe match a more reasonable explanation of the fire than the presence ofoxygen?
Toanswerthis,considerthetwosentences:
1. The house would still be standing if only thematch had notbeenstruck.
2.Thehousewould still be standing if only theoxygenhadnotbeenpresent.
Bothsentencesaretrue.Yettheoverwhelmingmajorityofreaders,I’msure,would come upwith the first scenario if asked to explainwhat caused thehouse to burn down, the match or the oxygen. So, what accounts for thedifference?
Theanswerclearlyhassomethingtodowithnormality:havingoxygeninthehouseisquitenormal,butwecanhardlysaythataboutstrikingamatch.Thedifferencedoesnotshowupinthelogic,butitdoesshowupinthetwomeasureswediscussedabove,PSandPN.
Ifwe take into account that the probability of striking amatch ismuchlowerthanthatofhavingoxygen,wefindquantitativelythatforMatch,bothPNandPSarehigh,whileforOxygen,PNishighbutPSislow.Isthiswhy,intuitively, we blame thematch and not the oxygen?Quite possibly, but itmaybeonlypartoftheanswer.
In1982,psychologistsDanielKahnemanandAmosTverskyinvestigatedhowpeoplechoosean“ifonly”culpritto“undo”anundesiredoutcomeandfoundconsistentpatternsintheirchoices.Onewasthatpeoplearemorelikelytoimagineundoingarareeventthanacommonone.Forexample,ifweareundoingamissedappointment,wearemore likely to say,“Ifonly the trainhadleftonschedule,”than“Ifonlythetrainhadleftearly.”Anotherpatternwas people’s tendency to blame their own actions (e.g., striking a match)ratherthaneventsnotundertheircontrol.OurabilitytoestimatePNandPS
from our model of the world suggests a systematic way of accounting forthese considerations and eventually teaching robots to produce meaningfulexplanationsofpeculiarevents.
WehaveseenthatPNcapturestherationalebehindthe“but-for”criterioninalegalsetting.ButshouldPSenterlegalconsiderationsincriminalandtortlaw?Ibelievethatitshould,becauseattentiontosufficiencyimpliesattentionto theconsequencesofone’saction.Thepersonwho lit thematchought tohave anticipated the presence of oxygen, whereas nobody is generallyexpectedtopumpalltheoxygenoutofthehouseinanticipationofamatch-strikingceremony.
Whatweight,then,shouldthelawassigntothenecessaryversussufficientcomponents of causation?Philosophers of lawhave not discussed the legalstatusof thisquestion,perhapsbecause thenotionsofPS andPNwerenotformalizedwithsuchprecision.However,fromanAIperspective,clearlyPNand PS should take part in generating explanations. A robot instructed toexplainwhyafirebrokeouthasnochoicebuttoconsiderboth.FocusingonPN only would yield the untenable conclusion that striking a match andhaving oxygen are equally adequate explanations for the fire. A robot thatissuesthissortofexplanationwillquicklyloseitsowner’strust.
NECESSARYCAUSES,SUFFICIENTCAUSES,ANDCLIMATECHANGE
InAugust2003, themost intenseheatwaveinfivecenturiesstruckwesternEurope, concentrating its most severe effects on France. The Frenchgovernment blamed the heatwave for nearly 15,000 deaths,many of themamong elderly people who lived by themselves and did not have air-conditioning.Weretheyvictimsofglobalwarmingorofbadluck—oflivinginthewrongplaceatthewrongtime?
Before2003,climatescientistshadavoidedspeculatingonsuchquestions.Theconventionalwisdomwassomethinglikethis:“Althoughthisisthekindof phenomenon that global warming might make more frequent, it isimpossible to attribute this particular event to past emissionsof greenhousegases.”
Myles Allen, a physicist at the University of Oxford and author of theabove quote, suggested a way to do better: use a metric called fraction ofattributable risk (FAR) to quantify the effect of climate change. The FAR
requiresustoknowtwonumbers:p0,theprobabilityofaheatwavelikethe2003 heat wave before climate change (e.g., before 1800), and p1, theprobabilityafterclimatechange.Forexample,iftheprobabilitydoubles,thenwecansaythathalfoftheriskisduetoclimatechange.Ifittriples,thentwo-thirdsoftheriskisduetoclimatechange.
BecausetheFARisdefinedpurelyfromdata,itdoesnotnecessarilyhaveany causal meaning. It turns out, however, that under two mild causalassumptions, it is identical to theprobability of necessity.First,weneed toassume that the treatment (greenhousegases)andoutcome(heatwaves)arenotconfounded:thereisnocommoncauseofeach.Thisisveryreasonable,becauseasfarasweknow,theonlycauseoftheincreaseingreenhousegasesis ourselves. Second, we need to assume monotonicity. We discussed thisassumption briefly in the last chapter; in this context, it means that thetreatment never has the opposite effect from what we expect: that is,greenhousegasescanneverprotectusfromaheatwave.
Provided theassumptionsofnoconfoundingandnoprotectionhold, therung-onemetricofFARispromotedtorungthree,whereitbecomesPN.ButAllendidnotknowthecausal interpretationof theFAR—it isprobablynotcommon knowledge amongmeteorologists—and this forced him to presenthisresultsusingsomewhattortuouslanguage.
ButwhatdatacanweusetoestimatetheFAR(orPN)?Wehaveobservedonlyonesuchheatwave.Wecan’tdoacontrolledexperiment,becausethatwouldrequireustocontrolthelevelofcarbondioxideasifwewereflickinga switch. Fortunately, climate scientists have a secret weapon: they canconductaninsilicoexperiment—acomputersimulation.
AllenandPeterStottoftheMetOffice(theBritishweatherservice)tookup the challenge, and in 2004 they became the first climate scientists tocommit themselves toacausalstatementaboutan individualweatherevent.Ordidthey?Judgeforyourself.Thisiswhattheywrote:“Itisverylikelythatover half the risk of European summer temperature anomalies exceeding athresholdof1.6°C.isattributabletohumaninfluence.”
Although I commend Allen and Stott’s bravery, it is a pity that theirimportantfindingwasburiedinsuchathicketofimpenetrablelanguage.Letmeunpackthisstatementandthentrytoexplainwhytheyhadtoexpressitinsuchaconvolutedway.First,“temperatureanomalyexceedingathresholdof1.6°C.”was theirway of defining the outcome. They chose this thresholdbecausetheaveragetemperatureinEuropethatsummerwasmorethan1.6°Cabove normal, which had never previously happened in recorded history.
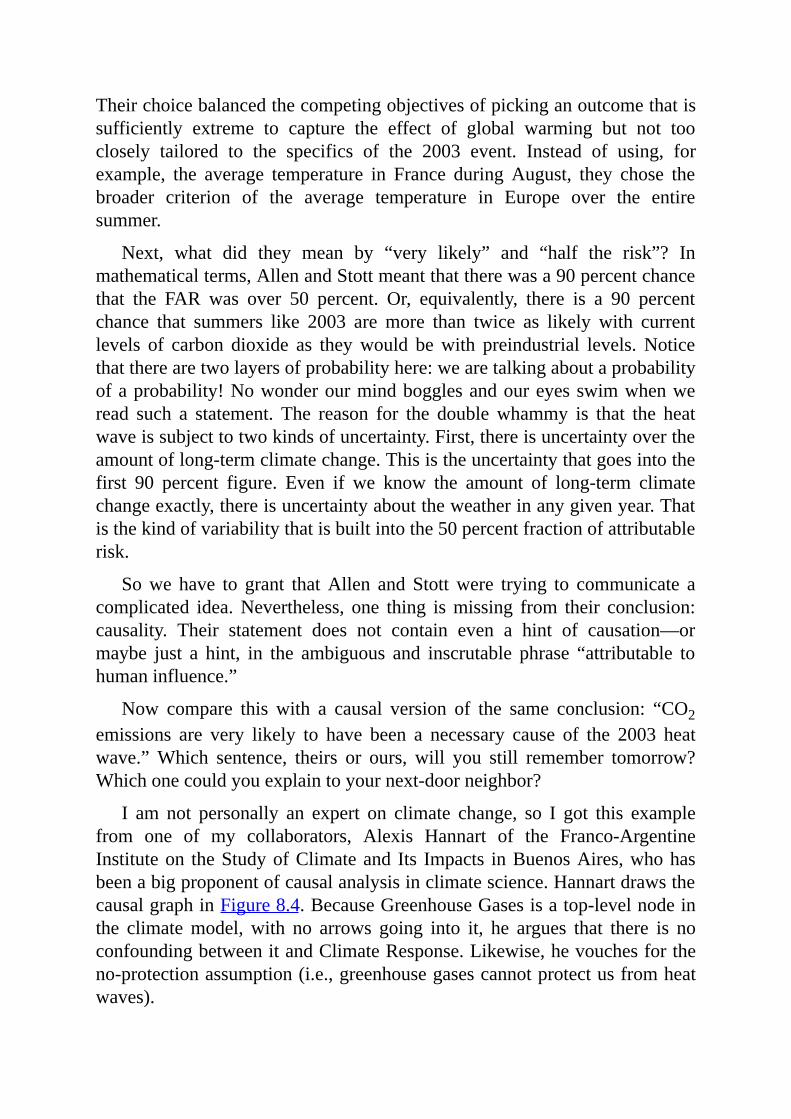
Theirchoicebalancedthecompetingobjectivesofpickinganoutcomethatissufficiently extreme to capture the effect of global warming but not tooclosely tailored to the specifics of the 2003 event. Instead of using, forexample, the average temperature in France duringAugust, they chose thebroader criterion of the average temperature in Europe over the entiresummer.
Next, what did they mean by “very likely” and “half the risk”? Inmathematicalterms,AllenandStottmeantthattherewasa90percentchancethat the FAR was over 50 percent. Or, equivalently, there is a 90 percentchance that summers like 2003 are more than twice as likely with currentlevels of carbon dioxide as theywould bewith preindustrial levels.Noticethattherearetwolayersofprobabilityhere:wearetalkingaboutaprobabilityofaprobability!Nowonderourmindbogglesandoureyesswimwhenweread such a statement. The reason for the doublewhammy is that the heatwaveissubjecttotwokindsofuncertainty.First,thereisuncertaintyovertheamountoflong-termclimatechange.Thisistheuncertaintythatgoesintothefirst 90 percent figure. Even if we know the amount of long-term climatechangeexactly,thereisuncertaintyabouttheweatherinanygivenyear.Thatisthekindofvariabilitythatisbuiltintothe50percentfractionofattributablerisk.
Sowe have to grant thatAllen and Stottwere trying to communicate acomplicated idea.Nevertheless, one thing ismissing from their conclusion:causality. Their statement does not contain even a hint of causation—ormaybe just a hint, in the ambiguous and inscrutable phrase “attributable tohumaninfluence.”
Now compare this with a causal version of the same conclusion: “CO2emissions are very likely to have been a necessary cause of the 2003 heatwave.”Which sentence, theirs or ours, will you still remember tomorrow?Whichonecouldyouexplaintoyournext-doorneighbor?
I am not personally an expert on climate change, so I got this examplefrom one of my collaborators, Alexis Hannart of the Franco-ArgentineInstituteon theStudyofClimateand Its Impacts inBuenosAires,whohasbeenabigproponentofcausalanalysisinclimatescience.HannartdrawsthecausalgraphinFigure8.4.BecauseGreenhouseGasesisatop-levelnodeinthe climatemodel,with no arrows going into it, he argues that there is noconfoundingbetweenitandClimateResponse.Likewise,hevouchesfortheno-protectionassumption(i.e.,greenhousegasescannotprotectusfromheatwaves).
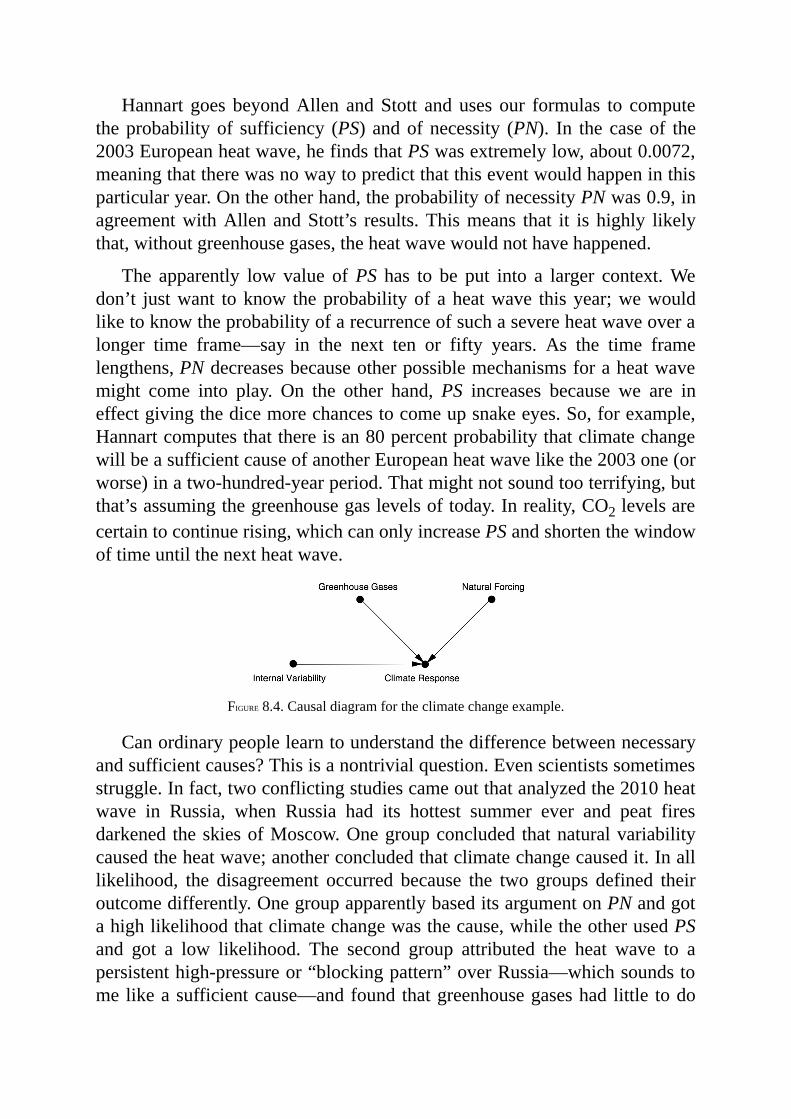
Hannart goes beyondAllen andStott anduses our formulas to computetheprobabilityof sufficiency (PS) andofnecessity (PN). In the caseof the2003Europeanheatwave,hefindsthatPSwasextremelylow,about0.0072,meaningthattherewasnowaytopredictthatthiseventwouldhappeninthisparticularyear.Ontheotherhand,theprobabilityofnecessityPNwas0.9,inagreementwithAllen andStott’s results.Thismeans that it is highly likelythat,withoutgreenhousegases,theheatwavewouldnothavehappened.
The apparently low value ofPS has to be put into a larger context.Wedon’t justwant toknow theprobabilityof aheatwave thisyear;wewouldliketoknowtheprobabilityofarecurrenceofsuchasevereheatwaveoveralonger time frame—say in the next ten or fifty years. As the time framelengthens,PNdecreasesbecauseotherpossiblemechanismsforaheatwavemight come into play. On the other hand,PS increases because we are ineffectgivingthedicemorechancestocomeupsnakeeyes.So,forexample,Hannartcomputesthatthereisan80percentprobabilitythatclimatechangewillbeasufficientcauseofanotherEuropeanheatwavelikethe2003one(orworse)inatwo-hundred-yearperiod.Thatmightnotsoundtooterrifying,butthat’sassumingthegreenhousegaslevelsoftoday.Inreality,CO2levelsarecertaintocontinuerising,whichcanonlyincreasePSandshortenthewindowoftimeuntilthenextheatwave.
FIGURE8.4.Causaldiagramfortheclimatechangeexample.
Canordinarypeoplelearntounderstandthedifferencebetweennecessaryandsufficientcauses?Thisisanontrivialquestion.Evenscientistssometimesstruggle.Infact,twoconflictingstudiescameoutthatanalyzedthe2010heatwave in Russia, when Russia had its hottest summer ever and peat firesdarkened theskiesofMoscow.Onegroupconcluded thatnaturalvariabilitycausedtheheatwave;anotherconcludedthatclimatechangecausedit.Inalllikelihood, the disagreement occurred because the two groups defined theiroutcomedifferently.OnegroupapparentlybaseditsargumentonPNandgotahighlikelihoodthatclimatechangewasthecause,whiletheotherusedPSand got a low likelihood. The second group attributed the heat wave to apersistenthigh-pressureor“blockingpattern”overRussia—whichsoundstomelikeasufficientcause—andfoundthatgreenhousegaseshad little todo

with thisphenomenon.Butanystudy thatusesPS asametric,overa shortperiod,issettingahighbarforprovingcausation.
Before leaving this example, I would like to comment again on thecomputer models. Most other scientists have to work very hard to getcounterfactual information, for example by painfully combining data fromobservational and experimental studies. Climate scientists can getcounterfactualsveryeasily from their computermodels: just enter in anewnumber for the carbon dioxide concentration and let the program run.“Easily” is, of course, relative.Behind the simple causal diagramofFigure8.4liesafabulouslycomplexresponsefunction,givenbythemillionsoflinesofcomputercodethatgointoaclimatesimulation.
Thisbringsupanaturalquestion:Howmuchcanwe trust thecomputersimulations?The question has political ramifications, especially here in theUnited States. However, I will try to give an apolitical answer. I wouldconsider theresponsefunction in thisexamplemuchmorecredible than thelinear models that one sees so often in natural and social sciences. Linearmodels are often chosen for no good reason other than convenience. Bycomparison, the climate models reflect more than a century of study byphysicists, meteorologists, and climate scientists. They represent the besteffortsofacommunityofscientists tounderstand theprocesses thatgovernour weather and climate. By any normal scientific standards, the climatemodelsarestrongandcompellingevidence,butwithonecaveat.Thoughtheyare excellent at forecasting theweather a few days ahead, they have neverbeenverifiedinaprospectivetrialovercentury-longtimescales,sotheycouldstillcontainsystematicerrorsthatwedon’tknowabout.
AWORLDOFCOUNTERFACTUALS
Ihope thatbynowit isobvious thatcounterfactualsareanessentialpartofhowhumans learnabout theworldandhowouractionsaffect it.Whilewecanneverwalkdownboththepathsthatdivergeinawood,inagreatmanycaseswecanknow,withsomedegreeofconfidence,whatliesdowneach.
Beyonddoubt,thevarietyandrichnessofcausalqueriesthatwecanposeto our “inference engine” are greatly enhanced when we can includecounterfactualsinthemix.Anotherverypopularkindofquery,whichIhavenotdiscussedhere,calledtheeffectoftreatmentonthetreated(ETT),isusedto evaluate whether people who gain access to a treatment are those whowould benefitmost from it. Thismeasure is inmany cases superior to the
conventionalmeasureofatreatment’seffectiveness,theaveragecausaleffect(ACE). The ACE, which you can get from a randomized controlled trial,averagestreatmentefficacyovertheentirepopulation.Butwhatif, inactualimplementation, those recruited for a treatment program are the ones leastlikely tobenefit fromit?Toassess theoveralleffectivenessof theprogram,ETTmeasureshowadverselytreatedpatientswouldbeaffectedhadtheynotbeen treated—a counterfactual measure of critical significance in practicaldecisionmaking.MyformerstudentIlyaShpitser(nowatJohnsHopkins)hasnowdoneforETTwhat thedo-calculusdidforACE—providedacompleteunderstandingofwhenitisestimablefromdata,givenacausaldiagram.
Undoubtedly the most popular application of counterfactuals in sciencetodayiscalledmediationanalysis.Forthatreason,Idevoteaseparatechaptertoit(Chapter9).Oddly,manypeople,especiallyifusingclassicalmediationanalysis techniques, may not realize that they are talking about acounterfactualeffect.
In a scientific context, a mediator, or mediating variable, is one thattransmits the effect of the treatment to the outcome. We have seen manymediationexamplesinthisbook,suchasSmoking Tar Cancer (whereTar is themediator).Themainquestionof interest in suchcases iswhetherthemediatingvariableaccountsfortheentireeffectofthetreatmentvariableor somepart of the effect does not require amediator.Wewould representsuchaneffectbyaseparatearrowleadingdirectlyfromthetreatmenttotheoutcome,suchasSmoking Cancer.
Mediation analysis aims to disentangle the direct effect (which does notpass through the mediator) from the indirect effect (the part that passesthroughthemediator).Theimportanceiseasytosee.Ifsmokingcauseslungcanceronlythroughtheformationoftardeposits,thenwecouldeliminatetheexcesscancerriskbygivingsmokerstar-freecigarettes,suchase-cigarettes.On theother hand, if smoking causes cancer directly or through a differentmediator, then e-cigarettes might not solve the problem. At present thismedicalquestionisunresolved.
At this point it is probably not obvious to you that direct and indirecteffectsinvolvecounterfactualstatements.Itwasdefinitelynotobvioustome!Infact,itwasoneofthebiggestsurprisesofmycareer.Thenextchaptertellsthisstoryandgivesmanyreal-lifeapplicationsofmediationanalysis.
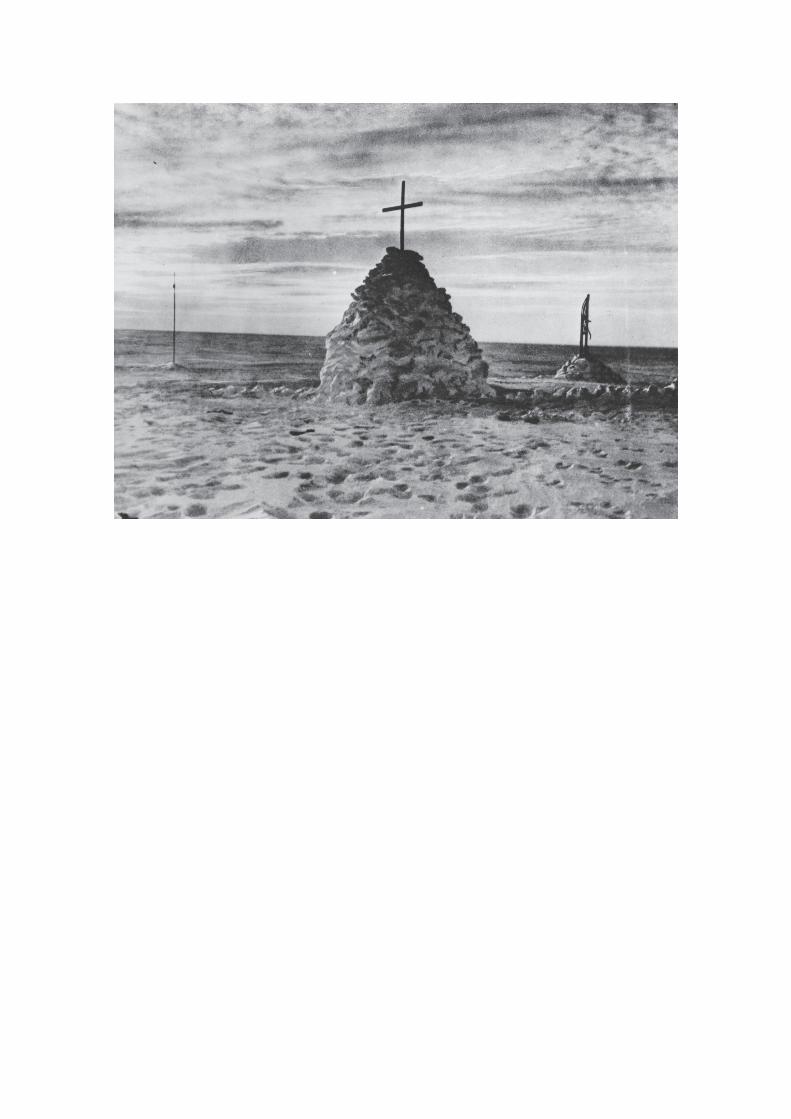
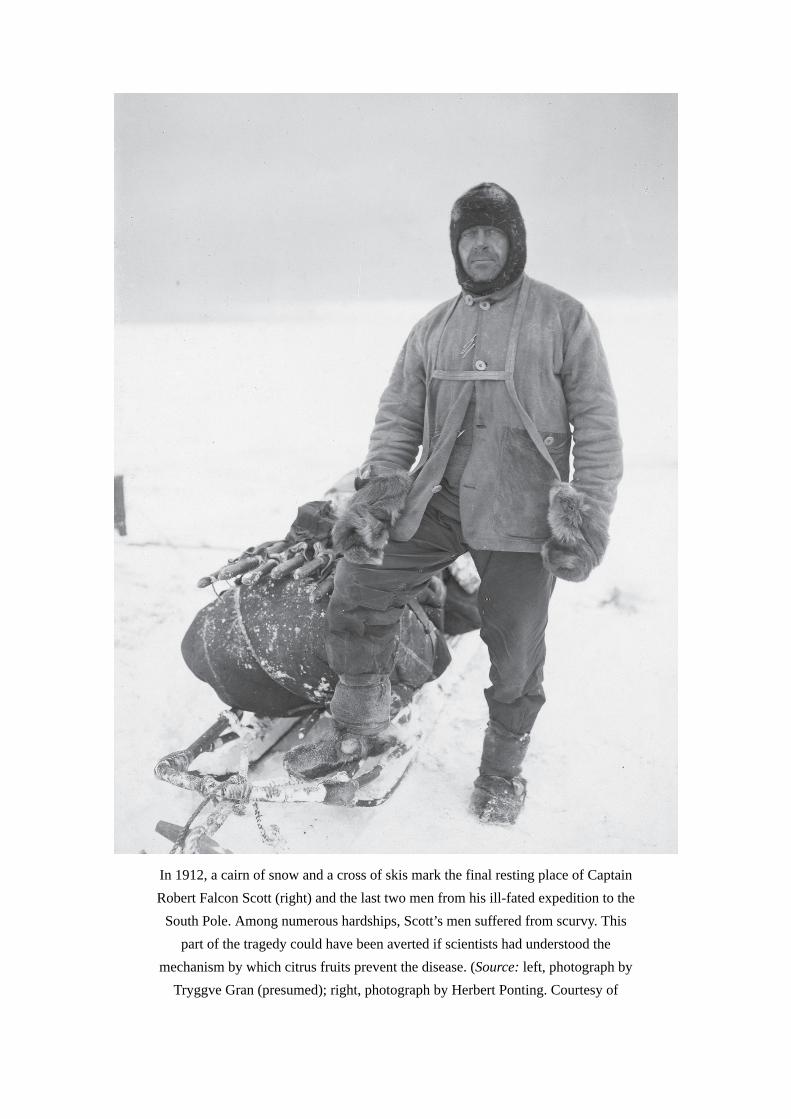
In1912,acairnofsnowandacrossofskismarkthefinalrestingplaceofCaptainRobertFalconScott(right)andthelasttwomenfromhisill-fatedexpeditiontotheSouthPole.Amongnumeroushardships,Scott’smensufferedfromscurvy.Thispartofthetragedycouldhavebeenavertedifscientistshadunderstoodthe
mechanismbywhichcitrusfruitspreventthedisease.(Source:left,photographbyTryggveGran(presumed);right,photographbyHerbertPonting.Courtesyof

CanterburyMuseum,NewZealand.)
9
MEDIATION:THESEARCHFORAMECHANISM
Forwantofanailtheshoewaslost.
Forwantofashoethehorsewaslost.…
Forwantofabattlethekingdomwaslost.
Andallforthewantofanail.
—ANONYMOUS
IN ordinary language, the question “Why?” has at least two versions. Thefirst is straightforward:you see aneffect, andyouwant toknow the cause.Yourgrandfatherislyinginthehospital,andyouask,“Why?Howcouldhehavehadaheartattackwhenheseemedsohealthy?”
Butthereisasecondversionofthe“Why?”question,whichweaskwhenwewant to better understand the connection between a known cause and aknowneffect.Forinstance,weobservethatDrugBpreventsheartattacks.Or,like James Lind, we observe that citrus fruits prevent scurvy. The humanmindisrestlessandalwayswantstoknowmore.Beforelongwestartaskingthesecondversionofthequestion:“Why?Whatisthemechanismbywhichcitrusfruitspreventscurvy?”Thischapterfocusesonthissecondversionof“why.”
The search formechanisms is critical to science, aswell as to everydaylife, because different mechanisms call for different actions when
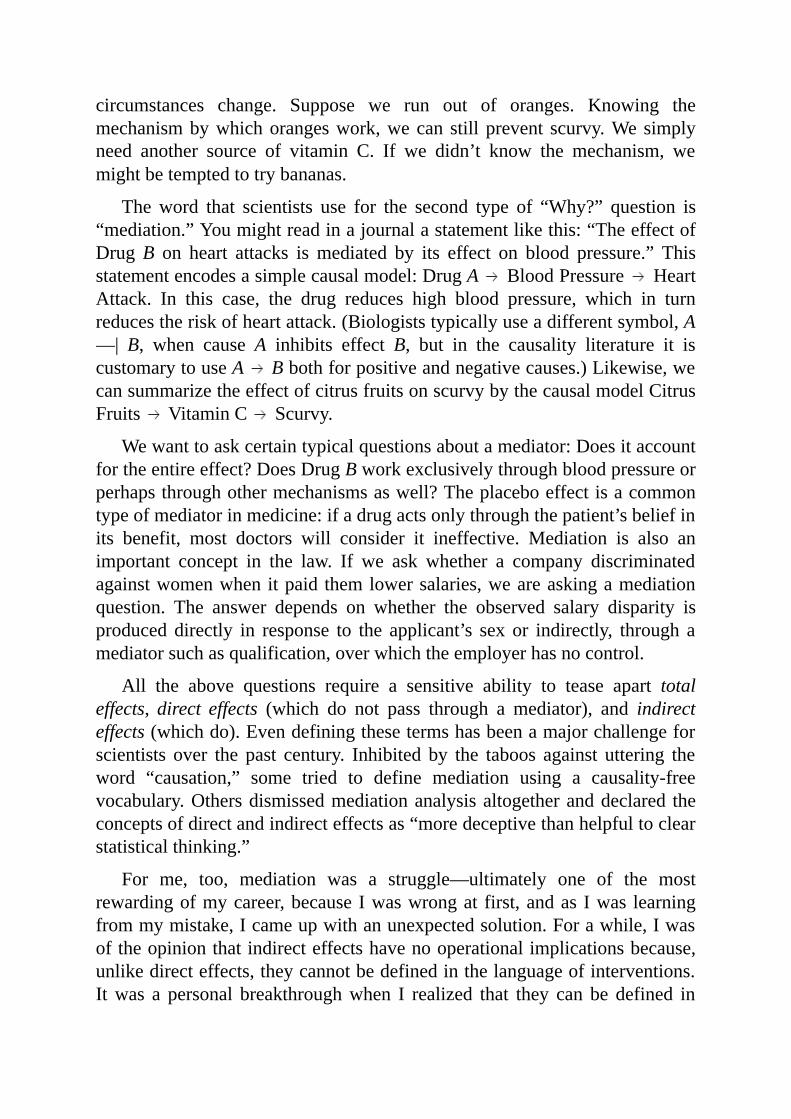
circumstances change. Suppose we run out of oranges. Knowing themechanismbywhichorangeswork,wecan stillprevent scurvy.Wesimplyneed another source of vitamin C. If we didn’t know the mechanism, wemightbetemptedtotrybananas.
Theword that scientists use for the second type of “Why?” question is“mediation.”Youmightreadinajournalastatementlikethis:“TheeffectofDrugB on heart attacks ismediated by its effect on blood pressure.” Thisstatementencodesasimplecausalmodel:DrugA BloodPressure HeartAttack. In this case, the drug reduces high blood pressure, which in turnreducestheriskofheartattack.(Biologiststypicallyuseadifferentsymbol,A—| B, when cause A inhibits effect B, but in the causality literature it iscustomarytouseA Bbothforpositiveandnegativecauses.)Likewise,wecansummarizetheeffectofcitrusfruitsonscurvybythecausalmodelCitrusFruits VitaminC Scurvy.
Wewanttoaskcertaintypicalquestionsaboutamediator:Doesitaccountfortheentireeffect?DoesDrugBworkexclusivelythroughbloodpressureorperhapsthroughothermechanismsaswell?Theplaceboeffectisacommontypeofmediatorinmedicine:ifadrugactsonlythroughthepatient’sbeliefinits benefit, most doctors will consider it ineffective. Mediation is also animportant concept in the law. If we ask whether a company discriminatedagainstwomenwhenitpaid themlowersalaries,weareaskingamediationquestion. The answer depends on whether the observed salary disparity isproduced directly in response to the applicant’s sex or indirectly, through amediatorsuchasqualification,overwhichtheemployerhasnocontrol.
All the above questions require a sensitive ability to tease apart totaleffects,direct effects (which do not pass through a mediator), and indirecteffects(whichdo).Evendefiningthesetermshasbeenamajorchallengeforscientists over the past century. Inhibited by the taboos against uttering theword “causation,” some tried to define mediation using a causality-freevocabulary.Othersdismissedmediationanalysisaltogetheranddeclared theconceptsofdirectandindirecteffectsas“moredeceptivethanhelpfultoclearstatisticalthinking.”
For me, too, mediation was a struggle—ultimately one of the mostrewardingofmycareer,becauseIwaswrongat first,andas Iwas learningfrommymistake,Icameupwithanunexpectedsolution.Forawhile,Iwasoftheopinionthatindirecteffectshavenooperationalimplicationsbecause,unlikedirecteffects,theycannotbedefinedinthelanguageofinterventions.Itwas a personal breakthroughwhen I realized that they can be defined in
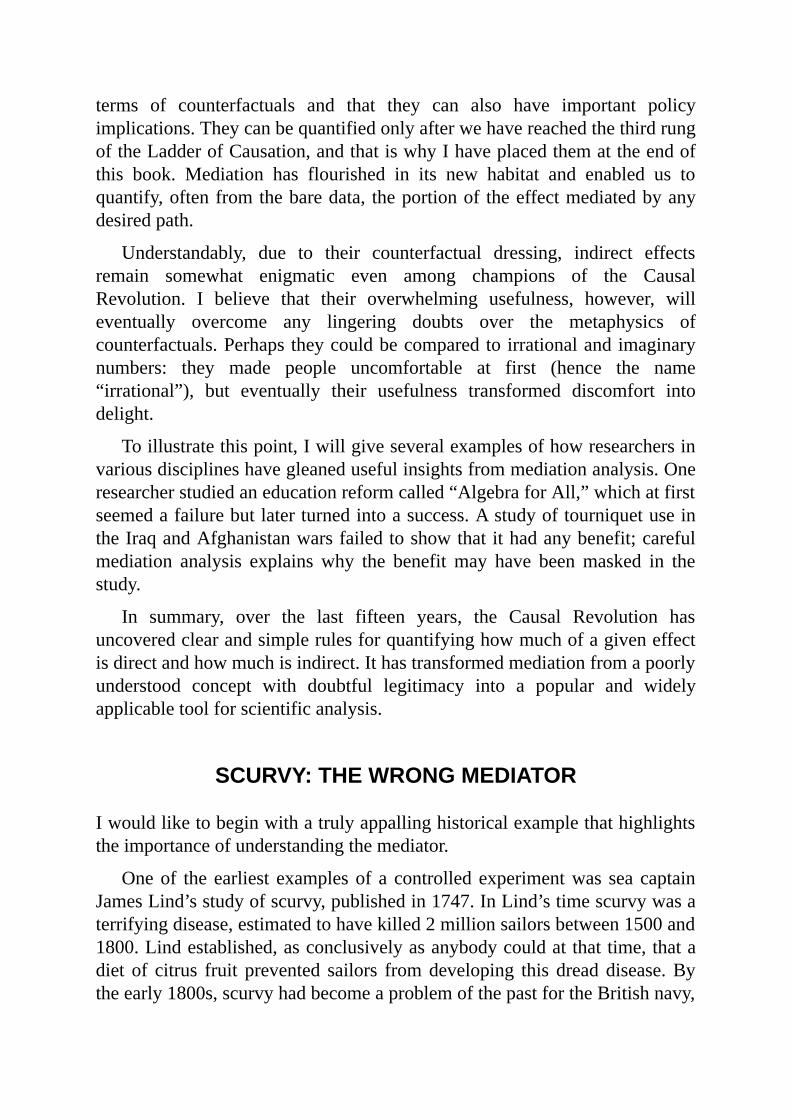
terms of counterfactuals and that they can also have important policyimplications.TheycanbequantifiedonlyafterwehavereachedthethirdrungoftheLadderofCausation,andthatiswhyIhaveplacedthemattheendofthis book. Mediation has flourished in its new habitat and enabled us toquantify,oftenfromthebaredata, theportionof theeffectmediatedbyanydesiredpath.
Understandably, due to their counterfactual dressing, indirect effectsremain somewhat enigmatic even among champions of the CausalRevolution. I believe that their overwhelming usefulness, however, willeventually overcome any lingering doubts over the metaphysics ofcounterfactuals.Perhapstheycouldbecomparedtoirrationalandimaginarynumbers: they made people uncomfortable at first (hence the name“irrational”), but eventually their usefulness transformed discomfort intodelight.
Toillustratethispoint,Iwillgiveseveralexamplesofhowresearchersinvariousdisciplineshavegleanedusefulinsightsfrommediationanalysis.Oneresearcherstudiedaneducationreformcalled“AlgebraforAll,”whichatfirstseemedafailurebutlaterturnedintoasuccess.AstudyoftourniquetuseintheIraqandAfghanistanwarsfailedtoshowthatithadanybenefit;carefulmediation analysis explains why the benefit may have beenmasked in thestudy.
In summary, over the last fifteen years, the Causal Revolution hasuncoveredclearandsimplerulesforquantifyinghowmuchofagiveneffectisdirectandhowmuchisindirect.Ithastransformedmediationfromapoorlyunderstood concept with doubtful legitimacy into a popular and widelyapplicabletoolforscientificanalysis.
SCURVY:THEWRONGMEDIATOR
Iwouldliketobeginwithatrulyappallinghistoricalexamplethathighlightstheimportanceofunderstandingthemediator.
Oneof the earliest examplesof a controlled experimentwas sea captainJamesLind’sstudyofscurvy,publishedin1747.InLind’stimescurvywasaterrifyingdisease,estimatedtohavekilled2millionsailorsbetween1500and1800.Lindestablished,asconclusivelyasanybodycouldatthattime,thatadiet of citrus fruit prevented sailors fromdeveloping this dreaddisease.Bytheearly1800s,scurvyhadbecomeaproblemofthepastfortheBritishnavy,
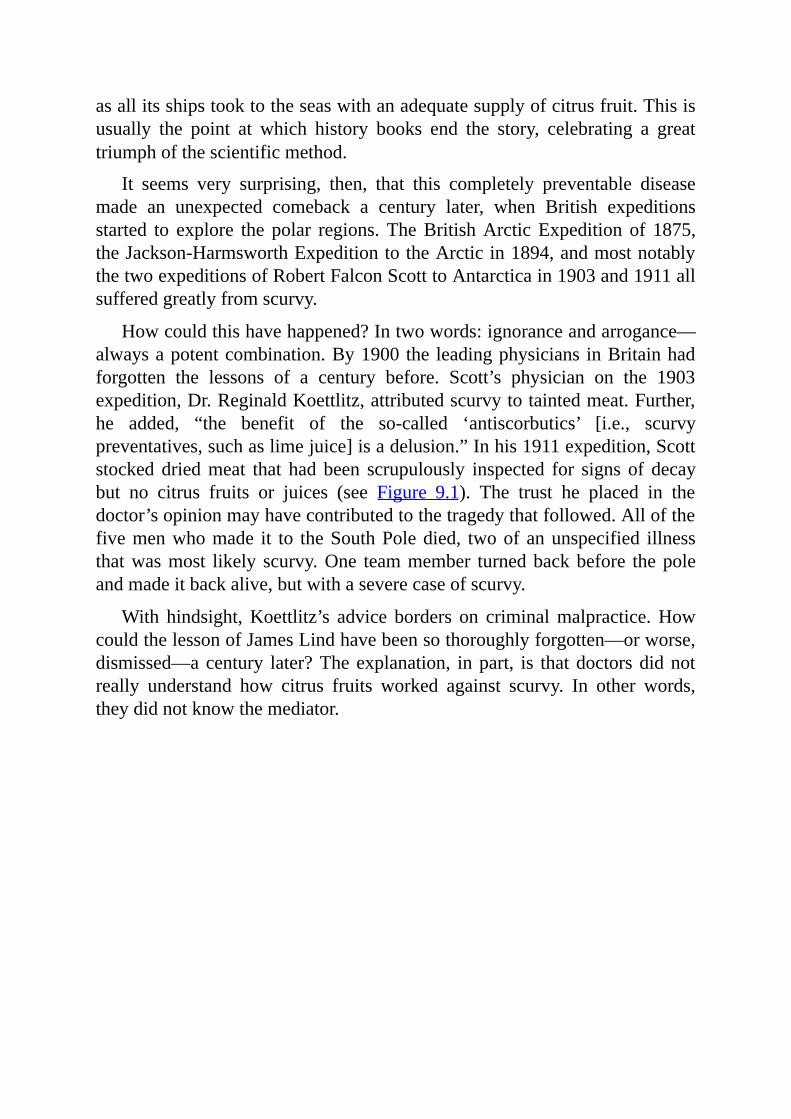
asallitsshipstooktotheseaswithanadequatesupplyofcitrusfruit.Thisisusually the point at which history books end the story, celebrating a greattriumphofthescientificmethod.
It seems very surprising, then, that this completely preventable diseasemade an unexpected comeback a century later, when British expeditionsstarted to explore the polar regions.TheBritishArcticExpedition of 1875,theJackson-HarmsworthExpeditiontotheArcticin1894,andmostnotablythetwoexpeditionsofRobertFalconScotttoAntarcticain1903and1911allsufferedgreatlyfromscurvy.
Howcouldthishavehappened?Intwowords:ignoranceandarrogance—alwaysapotentcombination.By1900the leadingphysicians inBritainhadforgotten the lessons of a century before. Scott’s physician on the 1903expedition,Dr.ReginaldKoettlitz,attributedscurvytotaintedmeat.Further,he added, “the benefit of the so-called ‘antiscorbutics’ [i.e., scurvypreventatives,suchaslimejuice]isadelusion.”Inhis1911expedition,Scottstocked driedmeat that had been scrupulously inspected for signs of decaybut no citrus fruits or juices (see Figure 9.1). The trust he placed in thedoctor’sopinionmayhavecontributedtothetragedythatfollowed.Allofthefivemenwhomade it to theSouthPoledied, twoofanunspecified illnessthatwasmost likely scurvy.One teammember turnedbackbefore thepoleandmadeitbackalive,butwithaseverecaseofscurvy.
With hindsight,Koettlitz’s advice borders on criminalmalpractice.HowcouldthelessonofJamesLindhavebeensothoroughlyforgotten—orworse,dismissed—acentury later?Theexplanation, inpart, is thatdoctorsdidnotreally understand how citrus fruits worked against scurvy. In other words,theydidnotknowthemediator.
FIGURE9.1.DailyrationsforthemenonScott’strektothepole:chocolate,
pemmican(apreservedmeatdish),sugar,biscuits,butter,tea.Conspicuouslyabsent:anyfruitcontainingvitaminC.(Source:PhotographbyHerbertPonting,
courtesyofCanterburyMuseum,NewZealand.)
FromLind’sdayonward,ithadalwaysbeenbelieved(butneverproved)thatcitrusfruitspreventedscurvyasaresultoftheiracidity.Inotherwords,doctors understood the process to be governed by the following causaldiagram:
CitrusFruits Acidity Scurvy
From this point of view, any acid would do. Even Coca-Cola would work(althoughithadnotyetbeeninvented).AtfirstsailorsusedSpanishlemons;then,foreconomicreasons,theysubstitutedWestIndianlimes,whichwereasacidicastheSpanishlemonsbutcontainedonlyaquarterofthevitaminC.Tomake things worse, they started “purifying” the lime juice by cooking it,whichmayhavebrokendownwhatevervitaminCitstillcontained.Inotherwords,theyweredisablingthemediator.
Whenthesailorsonthe1875Arcticexpeditionfellillwithscurvydespitetaking lime juice, themedical communitywas thrown into utter confusion.Those sailors who had eaten freshly killed meat did not get scurvy, whilethosewhohadeatentinnedmeatdid.Koettlitzandothersblamedimproperlypreserved meat as the culprit. Sir AlmrothWright concocted a theory that
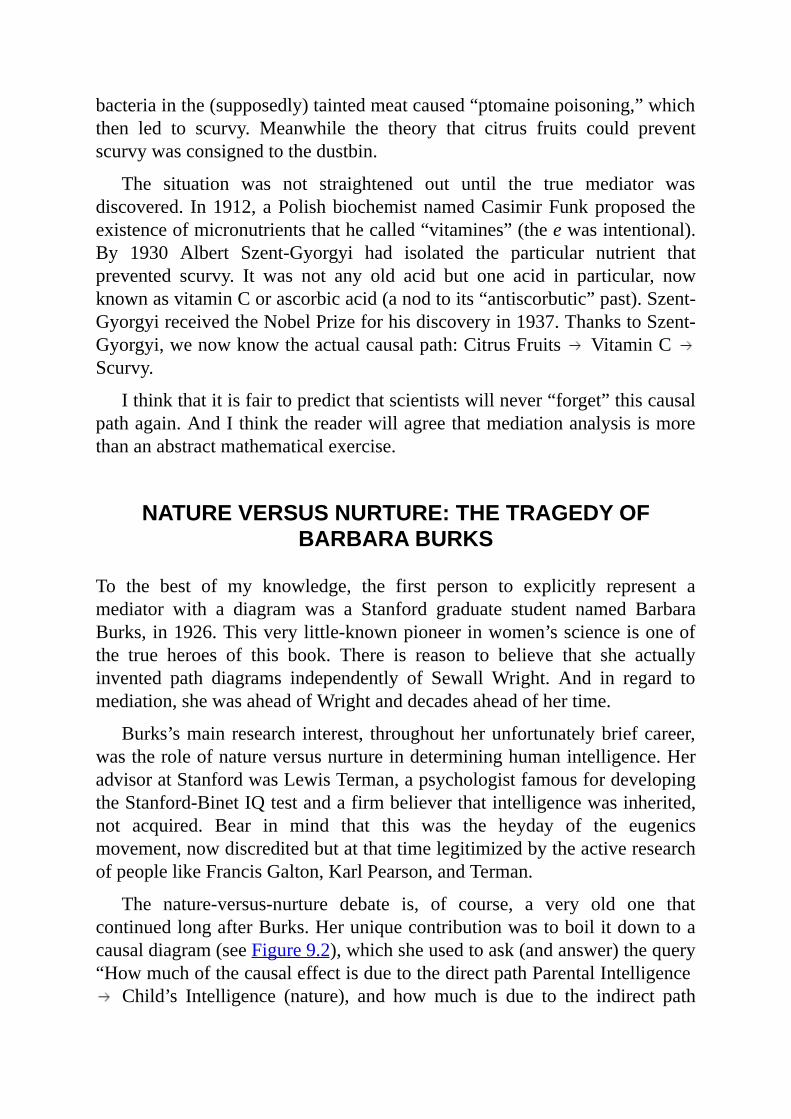
bacteriainthe(supposedly)taintedmeatcaused“ptomainepoisoning,”whichthen led to scurvy. Meanwhile the theory that citrus fruits could preventscurvywasconsignedtothedustbin.
The situation was not straightened out until the true mediator wasdiscovered. In1912,aPolishbiochemistnamedCasimirFunkproposed theexistenceofmicronutrientsthathecalled“vitamines”(theewasintentional).By 1930 Albert Szent-Gyorgyi had isolated the particular nutrient thatprevented scurvy. It was not any old acid but one acid in particular, nowknownasvitaminCorascorbicacid(anodtoits“antiscorbutic”past).Szent-GyorgyireceivedtheNobelPrizeforhisdiscoveryin1937.ThankstoSzent-Gyorgyi,wenowknowtheactualcausalpath:CitrusFruits VitaminCScurvy.
Ithinkthatitisfairtopredictthatscientistswillnever“forget”thiscausalpathagain.AndIthinkthereaderwillagreethatmediationanalysisismorethananabstractmathematicalexercise.
NATUREVERSUSNURTURE:THETRAGEDYOFBARBARABURKS
To the best of my knowledge, the first person to explicitly represent amediator with a diagram was a Stanford graduate student named BarbaraBurks,in1926.Thisverylittle-knownpioneerinwomen’sscienceisoneofthe true heroes of this book. There is reason to believe that she actuallyinvented path diagrams independently of Sewall Wright. And in regard tomediation,shewasaheadofWrightanddecadesaheadofhertime.
Burks’smainresearch interest, throughoutherunfortunatelybriefcareer,wastheroleofnatureversusnurtureindetermininghumanintelligence.HeradvisoratStanfordwasLewisTerman,apsychologistfamousfordevelopingtheStanford-BinetIQtestandafirmbelieverthatintelligencewasinherited,not acquired. Bear in mind that this was the heyday of the eugenicsmovement,nowdiscreditedbutatthattimelegitimizedbytheactiveresearchofpeoplelikeFrancisGalton,KarlPearson,andTerman.
The nature-versus-nurture debate is, of course, a very old one thatcontinuedlongafterBurks.Heruniquecontributionwastoboilitdowntoacausaldiagram(seeFigure9.2),whichsheusedtoask(andanswer)thequery“HowmuchofthecausaleffectisduetothedirectpathParentalIntelligence Child’s Intelligence (nature), and howmuch is due to the indirect path
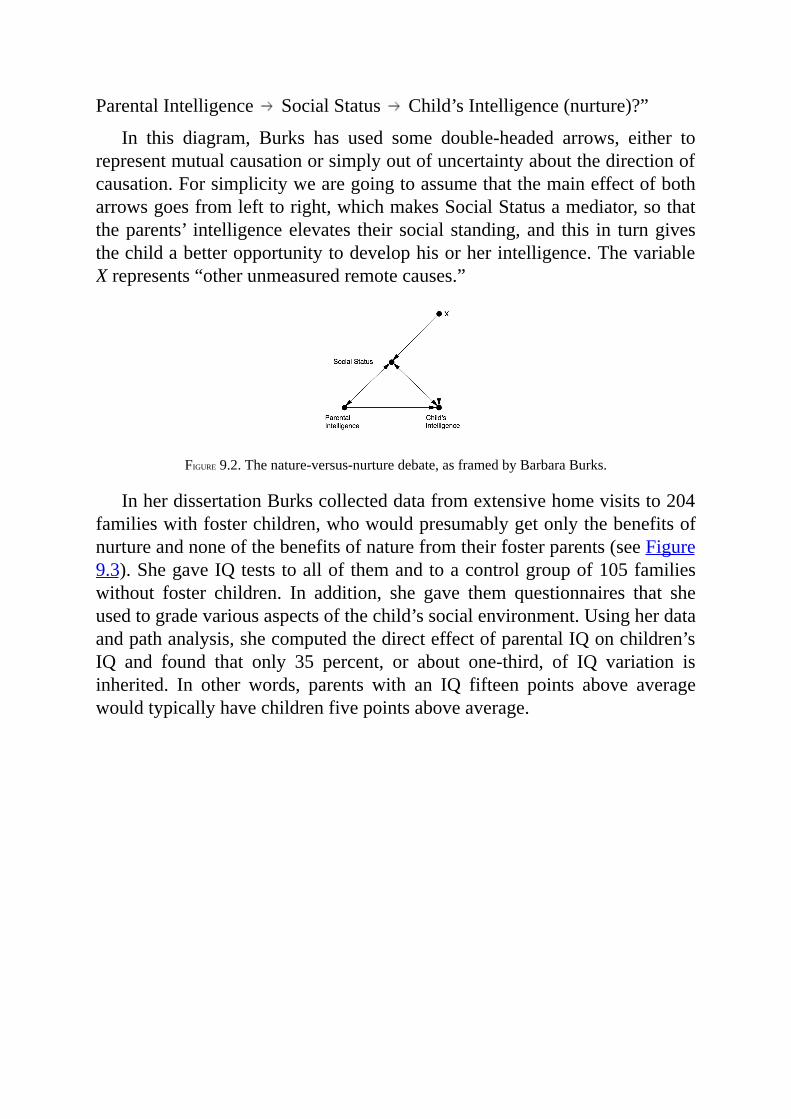
ParentalIntelligence SocialStatus Child’sIntelligence(nurture)?”
In this diagram, Burks has used some double-headed arrows, either torepresentmutualcausationorsimplyoutofuncertaintyaboutthedirectionofcausation.Forsimplicitywearegoingtoassumethatthemaineffectofbotharrowsgoesfromlefttoright,whichmakesSocialStatusamediator,sothattheparents’ intelligenceelevates their social standing,and this in turngivesthechildabetteropportunitytodevelophisorherintelligence.ThevariableXrepresents“otherunmeasuredremotecauses.”
FIGURE9.2.Thenature-versus-nurturedebate,asframedbyBarbaraBurks.
InherdissertationBurkscollecteddatafromextensivehomevisitsto204familieswithfosterchildren,whowouldpresumablygetonlythebenefitsofnurtureandnoneofthebenefitsofnaturefromtheirfosterparents(seeFigure9.3).ShegaveIQteststoallofthemandtoacontrolgroupof105familieswithout foster children. In addition, she gave them questionnaires that sheusedtogradevariousaspectsofthechild’ssocialenvironment.Usingherdataandpathanalysis,shecomputedthedirecteffectofparentalIQonchildren’sIQ and found that only 35 percent, or about one-third, of IQ variation isinherited. In other words, parents with an IQ fifteen points above averagewouldtypicallyhavechildrenfivepointsaboveaverage.
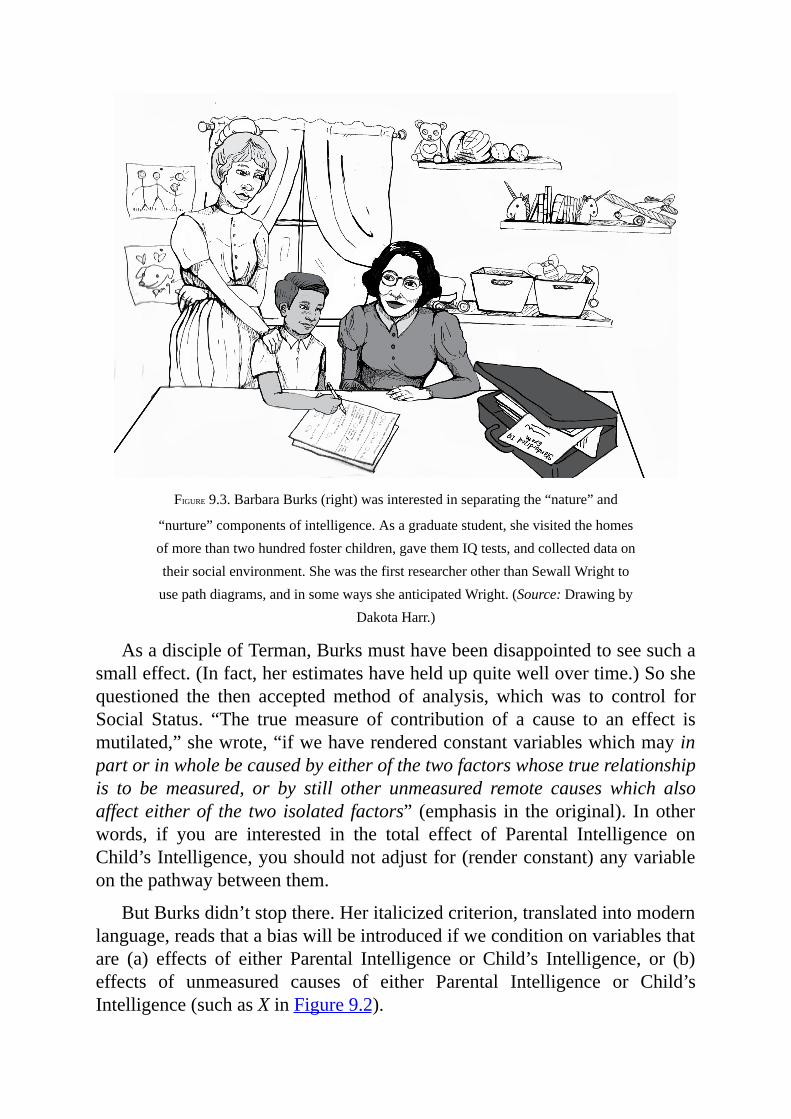
FIGURE9.3.BarbaraBurks(right)wasinterestedinseparatingthe“nature”and
“nurture”componentsofintelligence.Asagraduatestudent,shevisitedthehomesofmorethantwohundredfosterchildren,gavethemIQtests,andcollecteddataontheirsocialenvironment.ShewasthefirstresearcherotherthanSewallWrighttousepathdiagrams,andinsomewayssheanticipatedWright.(Source:Drawingby
DakotaHarr.)
AsadiscipleofTerman,Burksmusthavebeendisappointedtoseesuchasmalleffect.(Infact,herestimateshaveheldupquitewellovertime.)Soshequestioned the then acceptedmethod of analysis, whichwas to control forSocial Status. “The truemeasure of contribution of a cause to an effect ismutilated,”shewrote,“ifwehaverenderedconstantvariableswhichmayinpartorinwholebecausedbyeitherofthetwofactorswhosetruerelationshipis to be measured, or by still other unmeasured remote causes which alsoaffecteitherof the two isolated factors” (emphasis in theoriginal). Inotherwords, if you are interested in the total effect of Parental Intelligence onChild’sIntelligence,youshouldnotadjustfor(renderconstant)anyvariableonthepathwaybetweenthem.
ButBurksdidn’tstopthere.Heritalicizedcriterion,translatedintomodernlanguage,readsthatabiaswillbeintroducedifweconditiononvariablesthatare (a) effects of either Parental Intelligence or Child’s Intelligence, or (b)effects of unmeasured causes of either Parental Intelligence or Child’sIntelligence(suchasXinFigure9.2).
ThesecriteriawerefaraheadoftheirtimeandunlikeanythingthatSewallWrighthadwritten.Infact,criterion(b)isoneoftheearliestexampleseverofcolliderbias.IfwelookatFigure9.2,weseethatSocialStatusisacollider(ParentalIntelligence SocialStatus X).Therefore,controllingforSocialStatusopenstheback-doorpathParentalIntelligence SocialStatus XChild’sIntelligence.Anyresultingestimateof the indirectanddirecteffectswillbebiased.Becausestatisticiansbefore(andafter)Burksdidnotthinkintermsofarrowsanddiagrams, theywere totally immersed in themyth that,whilesimplecorrelationhasnocausalimplications,controlledcorrelation(orpartialregressioncoefficients,seep.222)isastepinthedirectionofcausalexplanation.
Burkswasnotthefirstpersontodiscoverthecollidereffect,butonecanarguethatshewasthefirsttocharacterizeitgenerallyingraphicalterms.Hercriterion(b)appliesperfectlytotheexamplesofM-biasinChapter4.Hersisthe firstwarning ever against conditioningon a pretreatment factor, a habitdeemed safeby all twentieth-century statisticians andoddly still consideredsafebysome.
NowputyourselfinBarbaraBurks’sshoes.You’vejustdiscoveredthatallyourcolleagueshavebeencontrollingforthewrongvariables.Youhavetwostrikesagainstyou:you’reonlyastudent,andyou’reawoman.Whatdoyoudo?Doyouputyourheaddown,pretendtoaccepttheconventionalwisdom,andcommunicatewithyourcolleaguesintheirinadequatevocabulary?
Not Barbara Burks! She titled her first published paper “On theInadequacyofthePartialandMultipleCorrelationTechnique”andstarteditout by saying, “Logical considerations lead to the conclusion that thetechniques of partial andmultiple correlation are fraughtwith dangers thatseriously restrict their applicability.” Fighting words from someone whodoesn’t have a PhD yet! As Terman wrote, “Her ability was somewhattemperedbyhertendencytorubpeoplethewrongway.Ithinkthetroublelaypartly in the fact that shewasmore aggressive in standing up for her ownideasthanmanyteachersandmalegraduatestudentsliked.”EvidentlyBurkswasaheadofhertimeinmorewaysthanone.
BurksmayactuallyhaveinventedpathdiagramsindependentlyofSewallWright, who preceded her by only six years.We can say for sure that shedidn’t learn them in any class. Figure 9.2 is the first appearance of a pathdiagram outside Sewall Wright’s work and the first ever in the social orbehavioral sciences. True, she credits Wright at the very end of her 1926paper, but she does so in amanner that looks like a last-minute addition. I
haveahunchthatshefoundoutaboutWright’sdiagramsonlyaftershehaddrawn her own, possibly after being tipped off by Terman or an astutereviewer.
It is fascinating towonderwhatBurksmight have become, had she notbeenavictimofhertimes.Afterobtainingherdoctorateshenevermanagedto get a job as a professor at a university, for which she was certainlyqualified.Shehadtomakedowithlesssecureresearchpositions,forexampleat theCarnegie Institution. In1942shegotengaged,whichonemighthaveexpected to mark an upturn in her fortunes; instead, she went into a deepdepression. “I am convinced that, whether right or not, shewas sure somesinister change was going on in her brain, from which she could neverrecover,”hermother,FrancesBurks,wrotetoTerman.“Sointenderestlovetousall shechose tospareus thegriefofsharingwithher thespectacleofsuchatragicdecline.”OnMay25,1943,atageforty,shejumpedtoherdeathfromtheGeorgeWashingtonBridgeinNewYork.
But ideas have a way of surviving tragedies.When sociologists HubertBlalock and Otis Duncan resuscitated path analysis in the 1960s, Burks’spaperservedasthesourceoftheirinspiration.Duncanexplainedthatoneofhis mentors, William Fielding Ogburn, had briefly mentioned pathcoefficients inhis1946lectureonpartialcorrelations.“Ogburnhadareportof a brief paper byWright, the one that dealt with Burks’ material, and Iacquiredthisreprint,”Duncansaid.
So there we have it! Burks’s 1926 paper got Wright interested in theinappropriateuseofpartialcorrelations.Wright’sresponsefounditswayintoOgburn’slecturetwentyyearslaterandimplanteditselfintoDuncan’smind.Twentyyearsafterthat,whenDuncanreadBlalock’sworkonpathdiagrams,it called back this half-forgotten memory from his student years. It’s trulyamazingtoseehowthisfragilebutterflyofanideaflutteredalmostunnoticedthroughtwogenerationsbeforereemergingtriumphantlyintothelight.
INSEARCHOFALANGUAGE(THEBERKELEYADMISSIONSPARADOX)
DespiteBurks’searlywork,halfacentury laterstatisticianswerestrugglingeven toexpress the ideaof, letaloneestimate,directand indirecteffects.Acaseinpointisawell-knownparadox,relatedtoSimpson’sparadoxbutwithatwist.
In1973EugeneHammel,anassociatedeanattheUniversityofCalifornia,noticed a worrisome trend in the university’s admission rates for men andwomen.Hisdatashowedthat44percentofthemenwhoappliedtograduateschool at Berkeley had been accepted, compared to only 35 percent of thewomen. Gender discrimination was coming to wide public attention, andHammeldidn’twant towait for someone else to start askingquestions.Hedecidedtoinvestigatethereasonsforthedisparity.
Graduate admissions decisions, at Berkeley as at other universities, aremadebyindividualdepartmentsratherthanbytheuniversityasawhole.Soitmadesensetolookattheadmissionsdatadepartmentbydepartmenttoisolatethe culprit. But when he did so, Hammel discovered an amazing fact.Department after department, the admissions decisions were consistentlymorefavorabletowomenthantomen.Howcouldthisbe?
AtthispointHammeldidsomethingsmart:hecalledastatistician.PeterBickel, when asked to look at the data, immediately recognized a form ofSimpson’sparadox.Aswesaw inChapter6,Simpson’sparadox refers toatrendthatseemstogoonedirectionineachlayerofapopulation(womenareacceptedatahigherrateineachdepartment)butintheoppositedirectionforthewholepopulation(menareacceptedatahigherrateintheuniversityasawhole).WealsosawinChapter6 that thecorrect resolutionof theparadoxdepends very much on the question you want to answer. In this case thequestion is clear: Is the university (or someone within the university)discriminatingagainstwomen?
When I first told my wife about this example, her reaction was, “It’simpossible. If each department discriminates one way, the school cannotdiscriminate the other way.” And she’s right! The paradox offends ourunderstanding of discrimination, which is a causal concept, involvingpreferentialresponsetoanapplicant’sreportedsex.Ifallactorspreferonesexover theother, thegroupasawholemustshowthatsamepreference. If thedataseemtosayotherwise,itmustmeanthatwearenotprocessingthedataproperly,inaccordancewiththelogicofcausation.Onlywithsuchlogic,andwithaclearcausalstory,canwedeterminetheuniversity’sinnocenceorguilt.
Infact,BickelandHammelfoundacausalstorythatcompletelysatisfiedthem. They wrote an article, published in Science magazine in 1975,proposing a simple explanation: women were rejected in greater numbersbecausetheyappliedtoharderdepartmentstogetinto.
To be specific, a higher proportion of females than males applied todepartmentsinthehumanitiesandsocialsciences.Theretheyfacedadouble
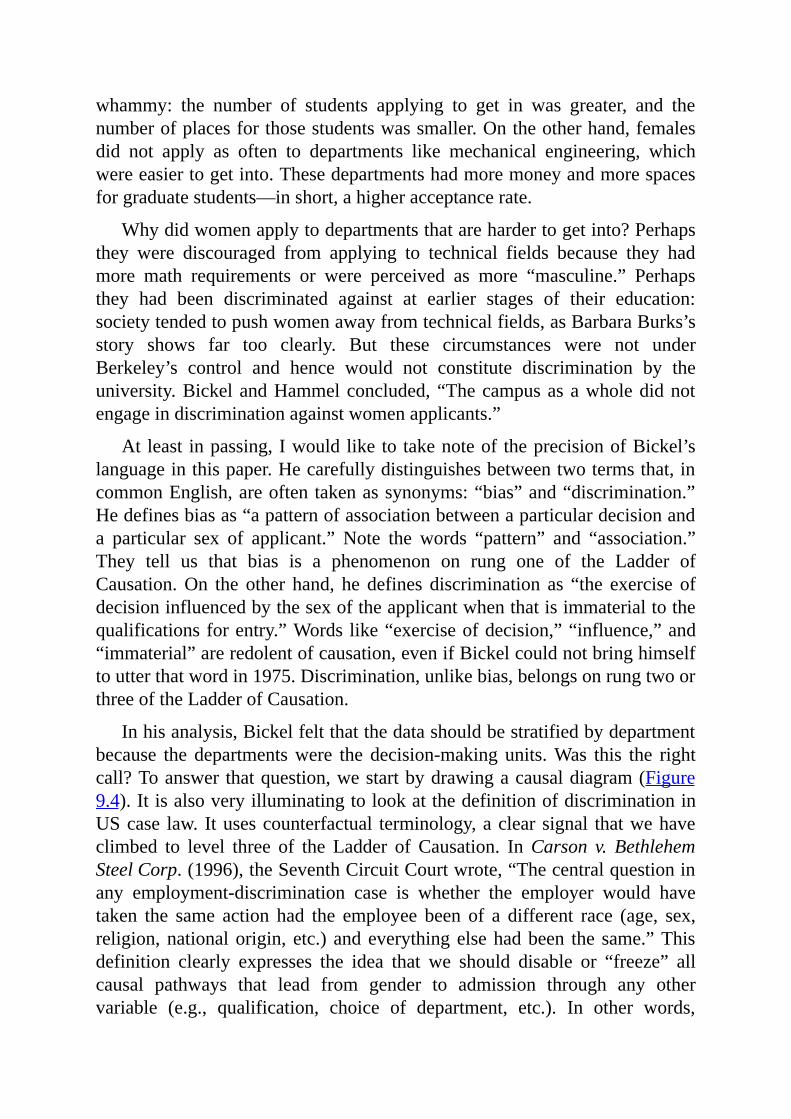
whammy: the number of students applying to get in was greater, and thenumberofplacesforthosestudentswassmaller.Ontheotherhand,femalesdid not apply as often to departments like mechanical engineering, whichwereeasiertogetinto.Thesedepartmentshadmoremoneyandmorespacesforgraduatestudents—inshort,ahigheracceptancerate.
Whydidwomenapplytodepartmentsthatarehardertogetinto?Perhapsthey were discouraged from applying to technical fields because they hadmore math requirements or were perceived as more “masculine.” Perhapsthey had been discriminated against at earlier stages of their education:societytendedtopushwomenawayfromtechnicalfields,asBarbaraBurks’sstory shows far too clearly. But these circumstances were not underBerkeley’s control and hence would not constitute discrimination by theuniversity.BickelandHammelconcluded,“Thecampusasawholedidnotengageindiscriminationagainstwomenapplicants.”
At least inpassing,Iwouldlike to takenoteof theprecisionofBickel’slanguageinthispaper.Hecarefullydistinguishesbetweentwotermsthat,incommonEnglish,areoftentakenassynonyms:“bias”and“discrimination.”Hedefinesbiasas“apatternofassociationbetweenaparticulardecisionanda particular sex of applicant.” Note the words “pattern” and “association.”They tell us that bias is a phenomenon on rung one of the Ladder ofCausation.On the other hand, he defines discrimination as “the exercise ofdecisioninfluencedbythesexoftheapplicantwhenthatisimmaterialtothequalificationsforentry.”Words like“exerciseofdecision,”“influence,”and“immaterial”areredolentofcausation,evenifBickelcouldnotbringhimselftoutterthatwordin1975.Discrimination,unlikebias,belongsonrungtwoorthreeoftheLadderofCausation.
Inhisanalysis,Bickelfeltthatthedatashouldbestratifiedbydepartmentbecause the departmentswere the decision-making units.Was this the rightcall?Toanswerthatquestion,westartbydrawingacausaldiagram(Figure9.4).ItisalsoveryilluminatingtolookatthedefinitionofdiscriminationinUScase law. Itusescounterfactual terminology,aclearsignal thatwehaveclimbed to level three of the Ladder of Causation. InCarson v. BethlehemSteelCorp.(1996),theSeventhCircuitCourtwrote,“Thecentralquestioninany employment-discrimination case is whether the employer would havetaken the same action had the employee been of a different race (age, sex,religion,nationalorigin, etc.) andeverythingelsehadbeen the same.”Thisdefinition clearly expresses the idea that we should disable or “freeze” allcausal pathways that lead from gender to admission through any othervariable (e.g., qualification, choice of department, etc.). In other words,
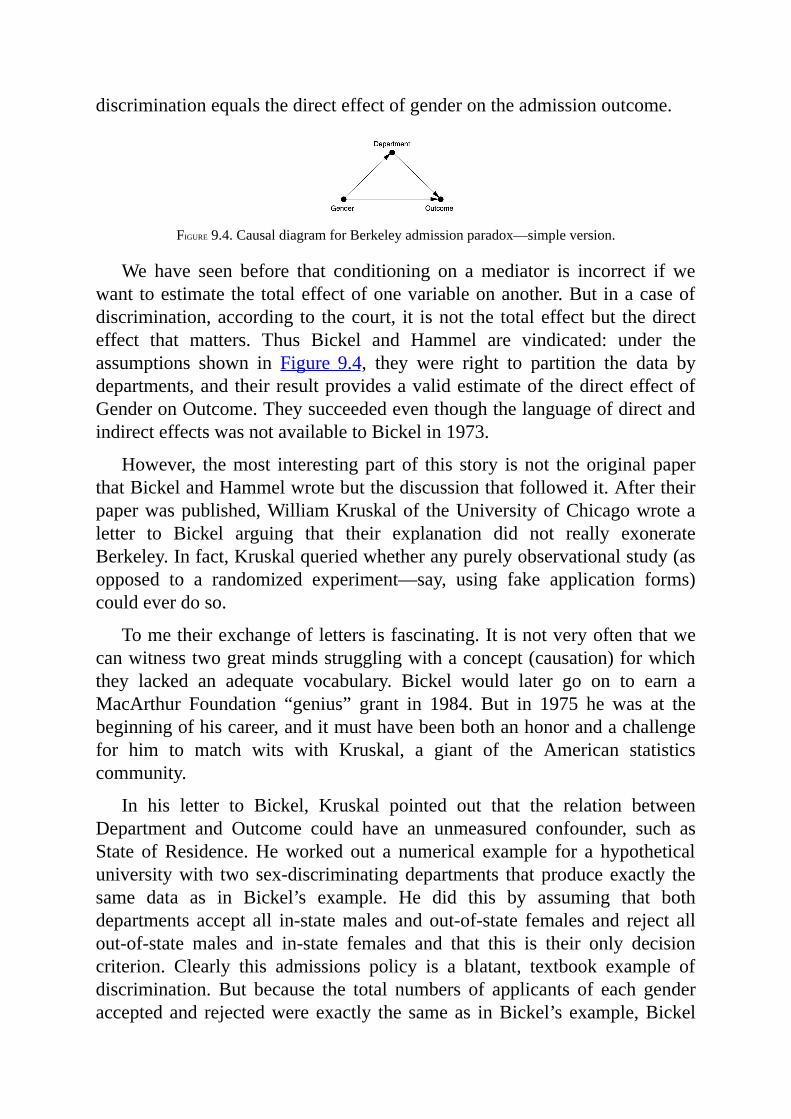
discriminationequalsthedirecteffectofgenderontheadmissionoutcome.
FIGURE9.4.CausaldiagramforBerkeleyadmissionparadox—simpleversion.
We have seen before that conditioning on amediator is incorrect if wewanttoestimatethetotaleffectofonevariableonanother.But inacaseofdiscrimination,according to thecourt, it isnot the totaleffectbut thedirecteffect that matters. Thus Bickel and Hammel are vindicated: under theassumptions shown in Figure 9.4, they were right to partition the data bydepartments,andtheirresultprovidesavalidestimateofthedirecteffectofGenderonOutcome.TheysucceededeventhoughthelanguageofdirectandindirecteffectswasnotavailabletoBickelin1973.
However, themost interestingpartof this story isnot theoriginalpaperthatBickelandHammelwrotebutthediscussionthatfollowedit.Aftertheirpaperwaspublished,WilliamKruskalof theUniversityofChicagowrotealetter to Bickel arguing that their explanation did not really exonerateBerkeley.Infact,Kruskalqueriedwhetheranypurelyobservationalstudy(asopposed to a randomized experiment—say, using fake application forms)couldeverdoso.
Tometheirexchangeoflettersisfascinating.Itisnotveryoftenthatwecanwitnesstwogreatmindsstrugglingwithaconcept(causation)forwhichthey lacked an adequate vocabulary. Bickel would later go on to earn aMacArthur Foundation “genius” grant in 1984. But in 1975 he was at thebeginningofhiscareer,anditmusthavebeenbothanhonorandachallengefor him to match wits with Kruskal, a giant of the American statisticscommunity.
In his letter to Bickel, Kruskal pointed out that the relation betweenDepartment and Outcome could have an unmeasured confounder, such asState ofResidence.Heworked out a numerical example for a hypotheticaluniversitywith twosex-discriminatingdepartments thatproduceexactly thesame data as in Bickel’s example. He did this by assuming that bothdepartments accept all in-statemales and out-of-state females and reject allout-of-state males and in-state females and that this is their only decisioncriterion. Clearly this admissions policy is a blatant, textbook example ofdiscrimination. But because the total numbers of applicants of each genderacceptedand rejectedwereexactly the sameas inBickel’s example,Bickel
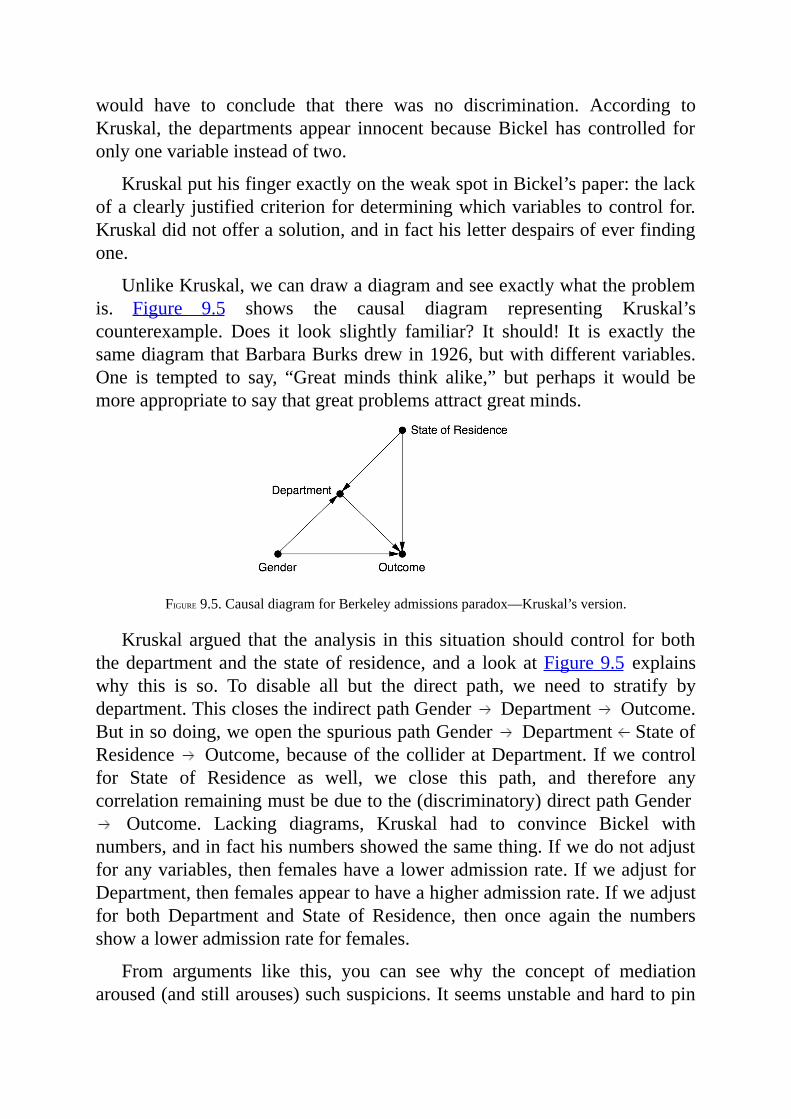
would have to conclude that there was no discrimination. According toKruskal, thedepartments appear innocent becauseBickel has controlled foronlyonevariableinsteadoftwo.
KruskalputhisfingerexactlyontheweakspotinBickel’spaper:thelackofaclearlyjustifiedcriterionfordeterminingwhichvariablestocontrolfor.Kruskaldidnotofferasolution,andinfacthisletterdespairsofeverfindingone.
UnlikeKruskal,wecandrawadiagramandseeexactlywhattheproblemis. Figure 9.5 shows the causal diagram representing Kruskal’scounterexample. Does it look slightly familiar? It should! It is exactly thesamediagramthatBarbaraBurksdrewin1926,butwithdifferentvariables.One is tempted to say, “Greatminds think alike,” but perhaps it would bemoreappropriatetosaythatgreatproblemsattractgreatminds.
FIGURE9.5.CausaldiagramforBerkeleyadmissionsparadox—Kruskal’sversion.
Kruskal argued that the analysis in this situation shouldcontrol forboththedepartmentand the stateof residence,anda lookatFigure9.5 explainswhy this is so. To disable all but the direct path, we need to stratify bydepartment.ThisclosestheindirectpathGender Department Outcome.Butinsodoing,weopenthespuriouspathGender Department StateofResidence Outcome,becauseof thecollideratDepartment. Ifwecontrolfor State of Residence as well, we close this path, and therefore anycorrelationremainingmustbeduetothe(discriminatory)directpathGender Outcome. Lacking diagrams, Kruskal had to convince Bickel with
numbers,andinfacthisnumbersshowedthesamething.Ifwedonotadjustforanyvariables,thenfemaleshavealoweradmissionrate.IfweadjustforDepartment,thenfemalesappeartohaveahigheradmissionrate.Ifweadjustfor both Department and State of Residence, then once again the numbersshowaloweradmissionrateforfemales.
From arguments like this, you can see why the concept of mediationaroused(andstillarouses)suchsuspicions.Itseemsunstableandhardtopin
down.Firsttheadmissionratesarebiasedagainstwomen,thenagainstmen,thenagainstwomen.InhisreplytoKruskal,Bickelcontinuedtomaintainthatconditioning on a decision-making unit (Department) is somehow differentfromconditioningonacriterion foradecision (StateofResidence).Buthedid not sound at all confident about it. He asks plaintively, “I see anonstatisticalquestionhere:Whatdowemeanbybias?”Whydoesthebiassignchangedependingonthewaywemeasureit?Infacthehadtherightideawhen he distinguished between bias and discrimination. Bias is a slipperystatisticalnotion,whichmaydisappear ifyouslice thedataadifferentway.Discrimination,asacausalconcept,reflectsrealityandmustremainstable.
The missing phrase in both their vocabularies was “hold constant.” TodisabletheindirectpathfromGendertoOutcome,wemustholdconstantthevariableDepartmentandthentweakthevariableGender.Whenweholdthedepartment constant,weprevent (figuratively speaking) the applicants fromchoosingwhichdepartment to apply to.Because statisticians donot have awordforthisconcept,theydosomethingsuperficiallysimilar:theyconditiononDepartment.ThatwasexactlywhatBickelhaddone:helookedatthedatadepartment-by-department and concluded that there was no evidence ofdiscriminationagainstwomen.ThatprocedureisvalidwhenDepartmentandOutcome are unconfounded; in that case, seeing is the same as doing. ButKruskalcorrectlyasked,“Whatifthereisaconfounder,StateofResidence?”He probably didn’t realize that hewas following in the footsteps ofBurks,whohaddrawnessentiallythesamediagram.
Icannotstressenoughhowoftenthisblunderhasbeenrepeatedovertheyears—conditioningonthemediatorinsteadofholdingthemediatorconstant.For that reason I call it the Mediation Fallacy. Admittedly, the blunder isharmless if there is no confounding of the mediator and the outcome.However, if there is confounding, it can completely reverse the analysis, asKruskal’snumericalexampleshowed.Itcanleadtheinvestigatortoconcludethereisnodiscriminationwheninfactthereis.
BurksandKruskalwereunusualinrecognizingtheMediationFallacyasablunder,althoughtheydidn’texactlyofferasolution.R.A.Fisherfellvictimto the same blunder in 1936, and eighty years later statisticians are stillstrugglingwith theproblem.Fortunately therehasbeenhugeprogresssincethe timeofFisher.Epidemiologists, forexample,knownowthatonehas towatch out for confounders between mediator and outcome. Yet those whoeschew the language of diagrams (some economists still do) complain andconfessthatitisatorturetoexplainwhatthiswarningmeans.
Thankfully,theproblemthatKruskaloncecalled“perhapsinsoluble”wassolvedtwodecadesago.IhavethisstrangefeelingthatKruskalwouldhaveenjoyedthesolution,andinmyfantasyIimagineshowinghimthepowerofthedo-calculusandthealgorithmizationofcounterfactuals.Unfortunately,heretiredin1990,justwhentherulesofdo-calculuswerebeingshaped,andhediedin2005.
I’msure that some readersarewondering:What finallyhappened in theBerkeleycase?Theansweris,nothing.HammelandBickelwereconvincedthatBerkeleyhadnothingtoworryabout,andindeednolawsuitsorfederalinvestigations ever materialized. The data hinted at reverse discriminationagainstmales,andinfacttherewasexplicitevidenceofthis:“Inmostofthecases involving favored status for women it appears that the admissionscommitteeswere seeking toovercome long-established shortagesofwomenintheirfields,”Bickelwrote.Justthreeyearslater,alawsuitoveraffirmativeactiononanothercampusoftheUniversityofCaliforniawentallthewaytotheSupremeCourt.Had theSupremeCourt struckdownaffirmativeaction,such “favored status forwomen”might have become illegal. However, theSupreme Court upheld affirmative action, and the Berkeley case became ahistoricalfootnote.
AwisemanleavesthefinalwordnotwiththeSupremeCourtbutwithhiswife.Whydidminehavesuchastrong intuitiveconviction that it isutterlyimpossible for a school to discriminate while each of its departments actsfairly? It is a theoremof causal calculus similar to the sure-thingprinciple.The sure-thing principle, as Jimmie Savage originally stated it, pertains tototaleffects,whilethistheoremholdsfordirecteffects.Theverydefinitionofa direct effect on a global level relies on aggregating direct effects in thesubpopulations.
Toputitsuccinctly,localfairnesseverywhereimpliesglobalfairness.Mywifewasright.
DAISY,THEKITTENSANDINDIRECTEFFECTS
Sofarwehavediscussedtheconceptsofdirectandindirecteffectsinavagueandintuitiveway,butIhavenotgiventhemaprecisescientificmeaning.Itislongpasttimeforustorectifythisomission.
Let’sstartwiththedirecteffect,becauseitisundoubtedlyeasier,andwecandefineaversionofitusingthedo-calculus(i.e.,atrungtwooftheLadder
of Causation). We’ll consider first the simplest case, which includes threevariables:atreatmentX,anoutcomeY,andamediatorM.WegetthedirecteffectofXonYwhenwe“wiggle”XwithoutallowingM tochange. In thecontextoftheBerkeleyadmissionsparadoxexample,weforceeverybodytoapplytothehistorydepartment—thatis,wedo(M=0).Werandomlyassignsomepeopletoreporttheirsex(ontheapplication)asmale(do(X=1))andsome to report it as female (do(X = 0)), regardless of their actual genders.Thenweobservethedifferenceinadmissionratesbetweenthetworeportinggroups. The result is called the controlled direct effect, or CDE(0). Insymbols,
CDE(0)=P(Y=1|do(X=1),do(M=0))–P(Y=1|do(X=0),do(M=0))(9.1)
The“0”inCDE(0)indicatesthatweforcedthemediatortotakeonthevaluezero.Wecouldalsodo thesameexperiment, forcingeverybody toapply toengineering:do(M=1).WewoulddenotetheresultingcontrolleddirecteffectasCDE(1).
Alreadyweseeonedifferencebetweendirecteffectsandtotaleffects:wehave two different versions of the controlled direct effect, CDE(0) andCDE(1).Which one is right?One option is simply to report both versions.Indeed, it is not unthinkable that one department will discriminate againstfemalesand theother againstmales, and itwouldbe interesting to findoutwhodoeswhat.Thatwas,afterall,Hammel’soriginalintention.
However, I would not recommend running this experiment, and here iswhy. Imagine an applicant named Joe whose lifetime dream is to studyengineering and who happened to be (randomly) assigned to apply to thehistory department. Having sat on a few admissions committees, I cancategorically vow that Joe’s application would look awfully strange to thecommittee.HisA+inelectromagneticwavesandB–inEuropeannationalismwould totally distort the committee’s decision, regardless of whether hemarked“male”or“female”onhisapplication.Theproportionofmalesandfemalesadmittedunderthesedistortionswouldhardlyreflecttheadmissionspolicycomparedtoapplicantswhonormallyapplytothehistorydepartment.
Luckily, an alternative avoids the pitfalls of this overcontrolledexperiment.We instruct theapplicants to reporta randomizedgenderbut toapply to thedepartment theywouldhavepreferred.Wecall this thenaturaldirecteffect(NDE),becauseeveryapplicantendsupinadepartmentofhisorherchoice.The“wouldhave”phrasingisacluethatNDE’sformaldefinitionrequires counterfactuals. For readers who enjoy mathematics, here is the
definitionexpressedasaformula:
NDE=P(YM=M0=1|do(X=1))–P(YM=M0=1|do(X=0))(9.2)
Theinterestingtermisthefirst,whichstandsfortheprobabilitythatafemalestudentselectingadepartmentofherchoice(M=M0)wouldbeadmitted ifshefakedhersextoread“male”(do(X=1)).Herethechoiceofdepartmentisgovernedbytheactualsexwhileadmissionisdecidedbythereported(fake)sex. Since the former cannot bemandated,we cannot translate this term tooneinvolvingdo-operators;weneedtoinvokethecounterfactualsubscript.
Nowyouknowhowwedefinethecontrolleddirecteffectandthenaturaldirect effect, but how do we compute them? The task is simple for thecontrolled direct effect; because it can be expressed as ado-expression,weneed only use the laws ofdo-calculus to reduce the do-expressions to see-expressions (i.e., conditional probabilities, which can be estimated fromobservationaldata).
The natural direct effect poses a greater challenge, though, because itcannot be defined in a do-expression. It requires the language ofcounterfactuals,andhenceitcannotbeestimatedusingthedo-calculus.ItwasoneofthegreatestthrillsinmylifewhenImanagedtostriptheformulaforthe NDE from all of its counterfactual subscripts. The result, called theMediation Formula, makes the NDE a truly practical tool because we canestimateitfromobservationaldata.
Indirecteffects,unlikedirecteffects,haveno“controlled”versionbecausethereisnowaytodisablethedirectpathbyholdingsomevariableconstant.Buttheydohavea“natural”version,thenaturalindirecteffect(NIE),whichisdefined(likeNDE)usingcounterfactuals.Tomotivatethedefinition,Iwillconsiderasomewhatplayfulexamplethatmycoauthorsuggested.
My coauthor and his wife adopted a dog namedDaisy, a rambunctiouspoodle-and-Chihuahuamixwithamindofherown.Daisywasnotaseasytohouse-trainastheirpreviousdog,andafterseveralweeksshewasstillhavingoccasional “accidents” inside the house. But then something very oddhappened. Dana and his wife brought home three foster kittens from theanimalshelter,andthe“accidents”stopped.Thefosterkittensremainedwiththem for three weeks, and Daisy did not break her training a single timeduringthatperiod.
Was it just coincidence, or had the kittens somehow inspired Daisy tocivilizedbehavior?Dana’swife suggested that thekittensmighthavegivenDaisyasenseofbelongingtoa“pack,”andshewouldnotwanttomessup
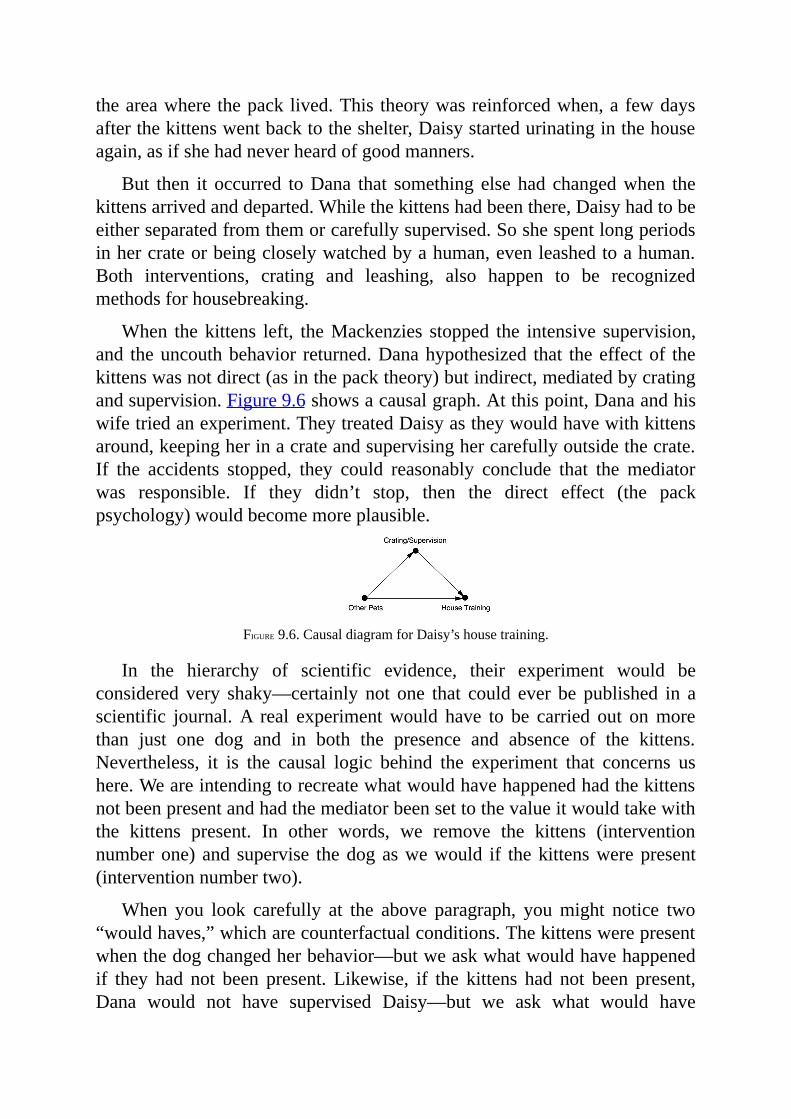
theareawherethepacklived.This theorywasreinforcedwhen,afewdaysafterthekittenswentbacktotheshelter,Daisystartedurinatinginthehouseagain,asifshehadneverheardofgoodmanners.
But then it occurred toDana that something else had changedwhen thekittensarrivedanddeparted.Whilethekittenshadbeenthere,Daisyhadtobeeitherseparatedfromthemorcarefullysupervised.Soshespentlongperiodsinhercrateorbeingcloselywatchedbyahuman,evenleashedtoahuman.Both interventions, crating and leashing, also happen to be recognizedmethodsforhousebreaking.
When thekittens left, theMackenzies stopped the intensive supervision,and theuncouthbehavior returned.Danahypothesized that theeffectof thekittenswasnotdirect(asinthepacktheory)butindirect,mediatedbycratingandsupervision.Figure9.6showsacausalgraph.Atthispoint,Danaandhiswifetriedanexperiment.TheytreatedDaisyastheywouldhavewithkittensaround,keepingherinacrateandsupervisinghercarefullyoutsidethecrate.If the accidents stopped, they could reasonably conclude that the mediatorwas responsible. If they didn’t stop, then the direct effect (the packpsychology)wouldbecomemoreplausible.
FIGURE9.6.CausaldiagramforDaisy’shousetraining.
In the hierarchy of scientific evidence, their experiment would beconsidered very shaky—certainly not one that could ever be published in ascientific journal.A real experimentwould have to be carried out onmorethan just one dog and in both the presence and absence of the kittens.Nevertheless, it is the causal logic behind the experiment that concerns ushere.Weareintendingtorecreatewhatwouldhavehappenedhadthekittensnotbeenpresentandhadthemediatorbeensettothevalueitwouldtakewiththe kittens present. In other words, we remove the kittens (interventionnumberone) and supervise thedogaswewould if thekittenswerepresent(interventionnumbertwo).
When you look carefully at the above paragraph, youmight notice two“wouldhaves,”whicharecounterfactualconditions.Thekittenswerepresentwhenthedogchangedherbehavior—butweaskwhatwouldhavehappenedif they had not been present. Likewise, if the kittens had not been present,Dana would not have supervised Daisy—but we ask what would have

happenedifhehad.
You can see why statisticians struggled for so long to define indirecteffects. If even a single counterfactual was outlandish, then double-nestedcounterfactualswerecompletelybeyondthepale.Nevertheless,thisdefinitionconformscloselywithournatural intuitionaboutcausation.Our intuition issocompelling thatDana’swife,withnospecial training, readilyunderstoodthelogicoftheproposedexperiment.
Forreaderswhoarecomfortablewithformulas,hereishowtodefinetheNIEthatwehavejustdescribedinwords:
NIE=P(YM=M1=1|do(X=0))–P(YM=M0=1|do(X=0))(9.3)
ThefirstPtermistheoutcomeoftheDaisyexperiment:theprobabilityofsuccessfulhousetraining(Y=1),giventhatwedonotintroduceotherpets(X=0)butsetthemediatortothevalueitwouldhaveifwehadintroducedthem(M=M1).Wecontrast thiswith theprobabilityofsuccessfulhouse trainingunder“normal”conditions,withnootherpets.Note that thecounterfactual,M1, has to be computed for each animal on a case-by-case basis: differentdogs might have different needs for Crating/Supervision. This puts theindirect effect out of reach of the do-calculus. It may also render theexperimentunfeasible,because theexperimentermaynotknowM1(u) foraparticulardogu.Nevertheless,assumingthereisnoconfoundingbetweenMand Y, the natural indirect effect can still be computed. It is possible toremove all the counterfactuals from the NIE and arrive at a MediationFormula for it, like the one for the NDE. This quantity, which requiresinformationfromthethirdrungoftheLadderofCausation,canneverthelessbereducedtoanexpressionthatcanbecomputedwithrung-onedata.Suchareduction is only possible because we have made an assumption of noconfounding,which,owing to thedeterministicnatureof theequations inastructuralcausalmodel,isonrungthree.
TofinishDaisy’sstory,theexperimentwasinconclusive.It’squestionablewhetherDanaandhiswifemonitoredDaisyascarefullyastheywouldhaveiftheyhadbeenkeepingher away fromkittens. (So it’snot clear thatMwastruly set toM1.) With patience and time—it took several months—Daisyeventuallylearnedto“doherbusiness”outside.Evenso,Daisy’sstoryholdssomeusefullessons.Simplybybeingattunedtothepossibilityofamediator,Danawasabletoconjectureanothercausalmechanism.Thatmechanismhadanimportantpracticalconsequence:heandhiswifedidnothavetokeepthehousefilledwithafosterkitten“pack”fortherestofDaisy’slife.
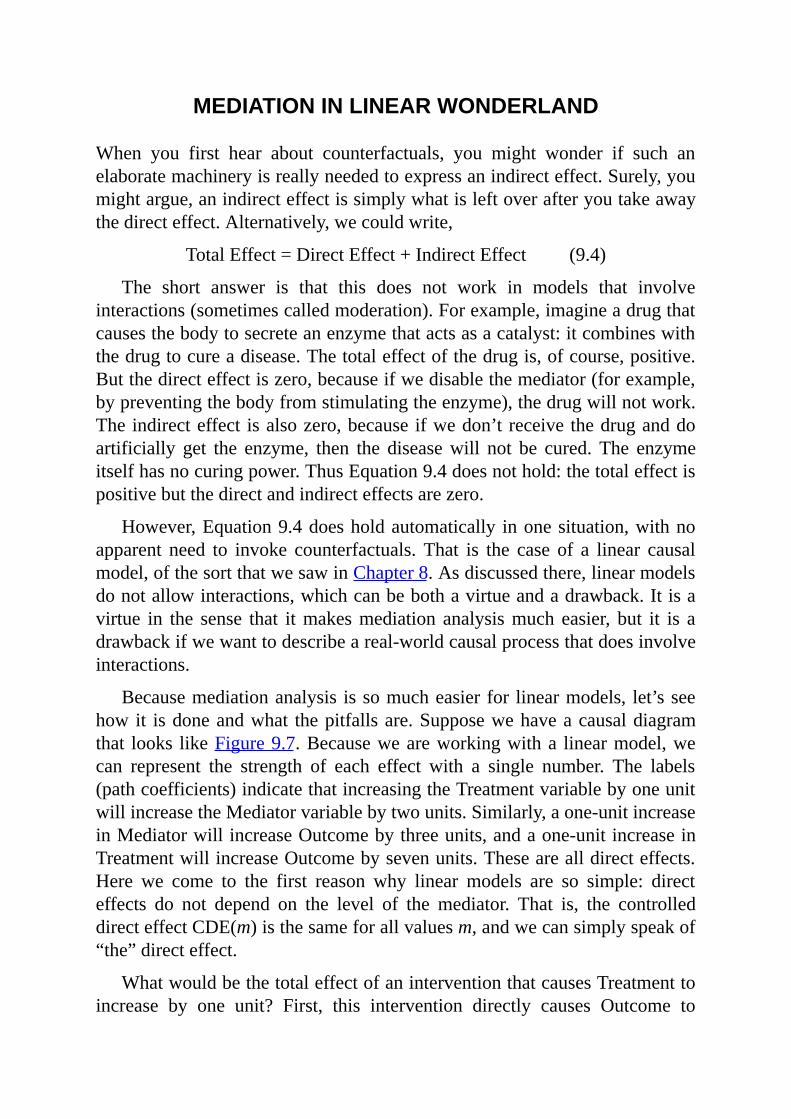
MEDIATIONINLINEARWONDERLAND
When you first hear about counterfactuals, you might wonder if such anelaboratemachineryisreallyneededtoexpressanindirecteffect.Surely,youmightargue,anindirecteffectissimplywhatisleftoverafteryoutakeawaythedirecteffect.Alternatively,wecouldwrite,
TotalEffect=DirectEffect+IndirectEffect(9.4)
The short answer is that this does not work in models that involveinteractions(sometimescalledmoderation).Forexample,imagineadrugthatcausesthebodytosecreteanenzymethatactsasacatalyst:itcombineswiththedrugtocureadisease.Thetotaleffectofthedrugis,ofcourse,positive.Butthedirecteffectiszero,becauseifwedisablethemediator(forexample,bypreventingthebodyfromstimulatingtheenzyme),thedrugwillnotwork.Theindirecteffect isalsozero,becauseifwedon’treceivethedruganddoartificially get the enzyme, then the diseasewill not be cured. The enzymeitselfhasnocuringpower.ThusEquation9.4doesnothold:thetotaleffectispositivebutthedirectandindirecteffectsarezero.
However,Equation9.4doesholdautomatically inonesituation,withnoapparent need to invoke counterfactuals. That is the case of a linear causalmodel,ofthesortthatwesawinChapter8.Asdiscussedthere,linearmodelsdonotallowinteractions,whichcanbebothavirtueandadrawback.Itisavirtue in the sense that itmakesmediation analysismuch easier, but it is adrawbackifwewanttodescribeareal-worldcausalprocessthatdoesinvolveinteractions.
Becausemediationanalysis issomucheasierfor linearmodels, let’sseehowit isdoneandwhat thepitfallsare.Supposewehaveacausaldiagramthat looks likeFigure9.7.Becauseweareworkingwitha linearmodel,wecan represent the strength of each effect with a single number. The labels(pathcoefficients)indicatethatincreasingtheTreatmentvariablebyoneunitwillincreasetheMediatorvariablebytwounits.Similarly,aone-unitincreaseinMediatorwillincreaseOutcomebythreeunits,andaone-unitincreaseinTreatmentwillincreaseOutcomebysevenunits.Thesearealldirecteffects.Here we come to the first reason why linear models are so simple: directeffects do not depend on the level of the mediator. That is, the controlleddirecteffectCDE(m)isthesameforallvaluesm,andwecansimplyspeakof“the”directeffect.
WhatwouldbethetotaleffectofaninterventionthatcausesTreatmenttoincrease by one unit? First, this intervention directly causes Outcome to

increase by seven units (if we hold Mediator constant). It also causesMediatortoincreasebytwounits.Finally,becauseeachone-unitincreaseinMediatordirectlycausesathree-unitincreaseinOutcome,atwo-unitincreaseinMediatorwillleadtoanadditionalsix-unitincreaseinOutcome.Sothenetincrease inOutcome,frombothcausalpathways,willbe thirteenunits.Thefirst sevenunits correspond to thedirect effect, and the remaining sixunitscorrespondtotheindirecteffect.Easyaspie!
FIGURE9.7.Exampleofalinearmodel(pathdiagram)withmediation.
In general, if there ismore than one indirect pathway fromX toY, weevaluate the indirect effect alongeachpathwayby taking theproductof allthepathcoefficientsalongthatpathway.Thenwegetthetotalindirecteffectbyaddingupalltheindirectcausalpathways.Finally,thetotaleffectofXonYisthesumofthedirectandindirecteffects.This“sumofproducts”rulehasbeen used since Sewall Wright invented path analysis, and, formallyspeaking,itindeedfollowsfromthedo-operatordefinitionoftotaleffect.
In1986,ReubenBaronandDavidKennyarticulatedasetofprinciplesfordetecting and evaluatingmediation in a system of equations. The essentialprinciplesare,first,thatthevariablesareallrelatedbylinearequations,whichareestimatedby fitting them to thedata.Second,directand indirecteffectsare computed by fitting two equations to the data: one with the mediatorincluded and one with the mediator excluded. Significant change in thecoefficients when the mediator is introduced is taken as evidence ofmediation.
ThesimplicityandplausibilityoftheBaron-Kennymethodtookthesocialsciences by storm.As of 2014, their article ranks thirty-third on the list ofmostfrequentlycitedscientificpapersofalltime.Asof2017,GoogleScholarreportsthat73,000scholarlyarticleshavecitedBaronandKenny.Justthinkabout that! They’ve been citedmore times thanAlbert Einstein,more thanSigmundFreud,more thanalmost anyother famous scientist youcan thinkof.Theirarticlerankssecondamongallpapersinpsychologyandpsychiatry,andyetit’snotaboutpsychologyatall.It’saboutnoncausalmediation.
TheunprecedentedpopularityoftheBaron-Kennyapproachundoubtedlystems from two factors. First, mediation is in high demand. Our desire to
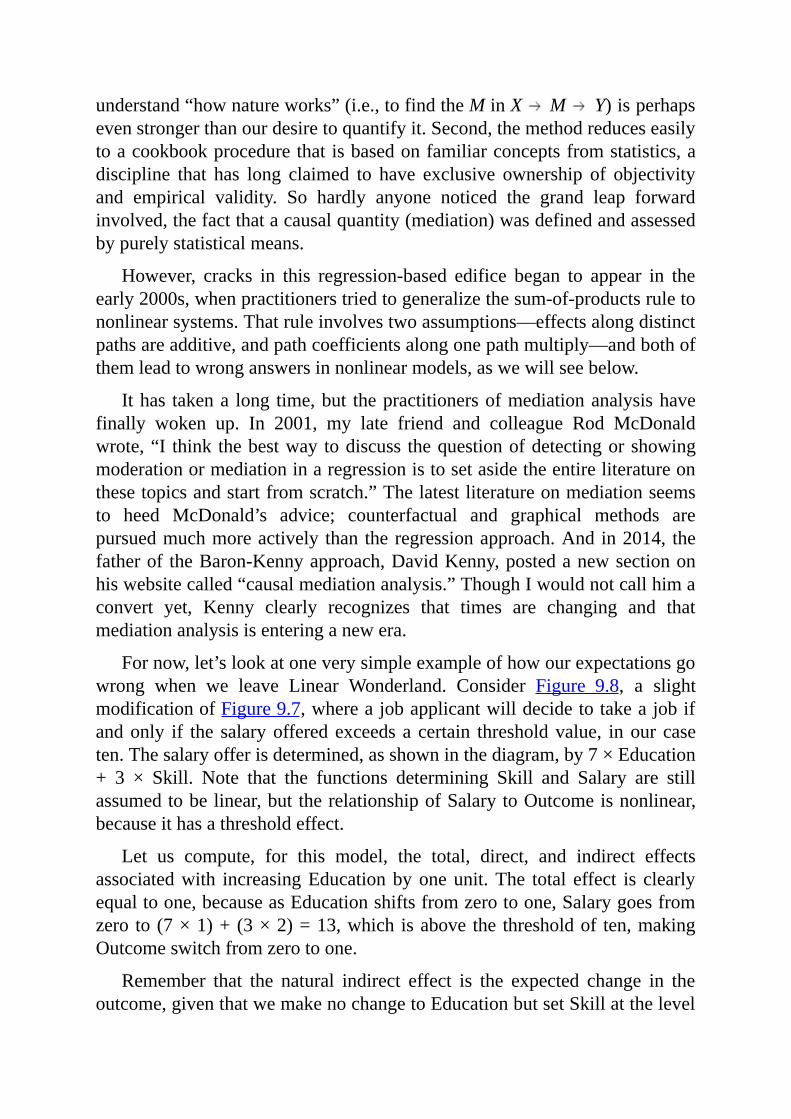
understand“hownatureworks”(i.e.,tofindtheMinX M Y)isperhapsevenstrongerthanourdesiretoquantifyit.Second,themethodreduceseasilytoacookbookprocedurethatisbasedonfamiliarconceptsfromstatistics,adiscipline that has long claimed to have exclusive ownership of objectivityand empirical validity. So hardly anyone noticed the grand leap forwardinvolved,thefactthatacausalquantity(mediation)wasdefinedandassessedbypurelystatisticalmeans.
However, cracks in this regression-based edifice began to appear in theearly2000s,whenpractitionerstriedtogeneralizethesum-of-productsruletononlinearsystems.Thatruleinvolvestwoassumptions—effectsalongdistinctpathsareadditive,andpathcoefficientsalongonepathmultiply—andbothofthemleadtowronganswersinnonlinearmodels,aswewillseebelow.
Ithas takena long time,but thepractitionersofmediationanalysishavefinally woken up. In 2001, my late friend and colleague Rod McDonaldwrote,“I think thebestwaytodiscuss thequestionofdetectingorshowingmoderationormediationinaregressionistosetasidetheentireliteratureonthesetopicsandstartfromscratch.”Thelatestliteratureonmediationseemsto heed McDonald’s advice; counterfactual and graphical methods arepursuedmuchmoreactively than theregressionapproach.Andin2014, thefatherof theBaron-Kennyapproach,DavidKenny,postedanewsectiononhiswebsitecalled“causalmediationanalysis.”ThoughIwouldnotcallhimaconvert yet, Kenny clearly recognizes that times are changing and thatmediationanalysisisenteringanewera.
Fornow,let’slookatoneverysimpleexampleofhowourexpectationsgowrong when we leave Linear Wonderland. Consider Figure 9.8, a slightmodificationofFigure9.7,whereajobapplicantwilldecidetotakeajobifandonly if the salaryofferedexceedsa certain thresholdvalue, inourcaseten.Thesalaryofferisdetermined,asshowninthediagram,by7×Education+ 3 × Skill. Note that the functions determining Skill and Salary are stillassumedtobelinear,buttherelationshipofSalarytoOutcomeisnonlinear,becauseithasathresholdeffect.
Let us compute, for this model, the total, direct, and indirect effectsassociatedwith increasingEducationbyoneunit.The total effect is clearlyequaltoone,becauseasEducationshiftsfromzerotoone,Salarygoesfromzero to(7×1)+(3×2)=13,which isabove the thresholdof ten,makingOutcomeswitchfromzerotoone.
Remember that the natural indirect effect is the expected change in theoutcome,giventhatwemakenochangetoEducationbutsetSkillatthelevel
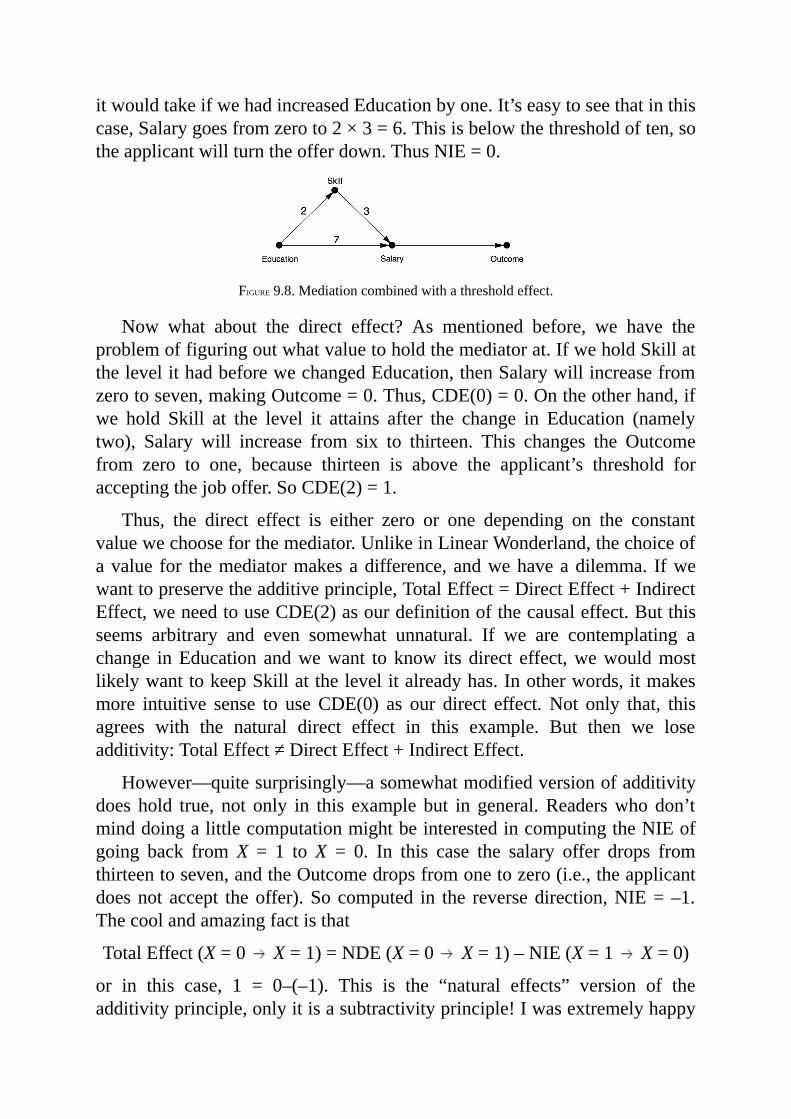
itwouldtakeifwehadincreasedEducationbyone.It’seasytoseethatinthiscase,Salarygoesfromzeroto2×3=6.Thisisbelowthethresholdoften,sotheapplicantwillturntheofferdown.ThusNIE=0.
FIGURE9.8.Mediationcombinedwithathresholdeffect.
Now what about the direct effect? As mentioned before, we have theproblemoffiguringoutwhatvaluetoholdthemediatorat.IfweholdSkillatthelevelithadbeforewechangedEducation,thenSalarywillincreasefromzerotoseven,makingOutcome=0.Thus,CDE(0)=0.Ontheotherhand,ifwe hold Skill at the level it attains after the change in Education (namelytwo), Salary will increase from six to thirteen. This changes the Outcomefrom zero to one, because thirteen is above the applicant’s threshold foracceptingthejoboffer.SoCDE(2)=1.
Thus, the direct effect is either zero or one depending on the constantvaluewechooseforthemediator.UnlikeinLinearWonderland,thechoiceofavalue for themediatormakesadifference,andwehaveadilemma. Ifwewanttopreservetheadditiveprinciple,TotalEffect=DirectEffect+IndirectEffect,weneedtouseCDE(2)asourdefinitionofthecausaleffect.Butthisseems arbitrary and even somewhat unnatural. If we are contemplating achange inEducationandwewant toknow itsdirect effect,wewouldmostlikelywanttokeepSkillatthelevelitalreadyhas.Inotherwords,itmakesmore intuitive sense to useCDE(0) as our direct effect.Not only that, thisagrees with the natural direct effect in this example. But then we loseadditivity:TotalEffect≠DirectEffect+IndirectEffect.
However—quitesurprisingly—asomewhatmodifiedversionofadditivitydoes hold true, not only in this example but in general.Readerswhodon’tminddoingalittlecomputationmightbeinterestedincomputingtheNIEofgoing back fromX = 1 toX = 0. In this case the salary offer drops fromthirteentoseven,andtheOutcomedropsfromonetozero(i.e.,theapplicantdoesnot accept theoffer).Socomputed in the reversedirection,NIE=–1.Thecoolandamazingfactisthat
TotalEffect(X=0 X=1)=NDE(X=0 X=1)–NIE(X=1 X=0)
or in this case, 1 = 0–(–1). This is the “natural effects” version of theadditivityprinciple,onlyitisasubtractivityprinciple!Iwasextremelyhappy
to see this version of additivity emerging from the analysis, despite thenonlinearityoftheequations.
A staggering amount of ink has been spilled on the “right” way togeneralize direct and indirect effects from linear to nonlinear models.Unfortunately,most of the articles go at the problem backward. Instead ofrethinkingfromscratchwhatwemeanbydirectandindirecteffects,theystartfromthesuppositionthatweonlyhavetotweakthelineardefinitionsalittlebit. For example, in Linear Wonderland we saw that the indirect effect isgiven by a product of two path coefficients. So some researchers tried todefine the indirect effect in the form of a product of two quantities, onemeasuringtheeffectofXonM,theothertheeffectofMonY.Thiscametobeknownas the “product of coefficients”method.Butwe also saw that inLinearWonderlandtheindirecteffectisgivenbythedifferencebetweenthetotal effect and the direct effect. So another, equally dedicated group ofresearchersdefined the indirect effect as a differenceof twoquantities, onemeasuringthetotaleffect,theotherthedirecteffect.Thiscametobeknownasthe“differenceincoefficients”method.
Whichoftheseisright?Neither!Bothgroupsofresearchersconfusedtheprocedurewith themeaning.Theprocedure ismathematical; themeaningiscausal.Infact,theproblemgoesevendeeper:theindirecteffectneverhadameaning for regression analysts outside the bubble of linear models. Theindirecteffect’sonlymeaningwasastheoutcomeofanalgebraicprocedure(“multiplythepathcoefficients”).Oncethatprocedurewastakenawayfromthem,theywerecastadrift,likeaboatwithoutananchor.
OnereaderofmybookCausalitydescribedthislostfeelingbeautifullyina letter tome.MelanieWall, now at ColumbiaUniversity, used to teach amodeling course to biostatistics and public health students. One time, sheexplained to her students as usual how to compute the indirect effect bytaking the product of direct path coefficients.A student askedherwhat theindirecteffectmeant.“IgavetheanswerthatIalwaysgive,thattheindirecteffectistheeffectthatachangeinXhasonYthroughitsrelationshipwiththemediator,Z,”Walltoldme.
But the student was persistent. He remembered how the teacher hadexplainedthedirecteffectastheeffectremainingafterholdingthemediatorfixed,andheasked,“Thenwhatisbeingheldconstantwhenweinterpretanindirecteffect?”
Wall didn’t knowwhat to say. “I’m not sure I have a good answer foryou,”shesaid.“HowaboutIgetbacktoyou?”
ThiswasinOctober2001,justfourmonthsafterIhadpresentedapaperoncausalmediationattheUncertaintyinArtificialIntelligenceconferenceinSeattle. Needless to say, I was eager to impress Melanie with my newlyacquired solution to her puzzle, and Iwrote to her the same answer I havegivenyouhere:“TheindirecteffectofXonYistheincreasewewouldseeinY while holding X constant and increasingM to whatever valueM wouldattainunderaunitincreaseinX.”
I am not sure if Melanie was impressed with my answer, but herinquisitive student got me thinking, quite seriously, about how scienceprogressesinourtimes.Hereweare,Ithought,fortyyearsafterBlalockandDuncan introducedpathanalysis tosocial science.Dozensof textbooksandhundredsof researchpapers arepublishedeveryyearondirect and indirecteffects, some with oxymoronic titles like “Regression-Based Approach toMediation.” Each generation passes along to the next the receivedwisdomthattheindirecteffectisjusttheproductoftwoothereffects,orthedifferencebetweenthetotalanddirecteffects.Nobodydarestoaskthesimplequestion“Butwhatdoestheindirecteffectmeaninthefirstplace?”JustliketheboyinHansChristianAndersen’s fable “TheEmperor’sNewClothes,”weneededan innocent student with unabashed chutzpah to shatter our faith in theoracularroleofscientificconsensus.
EMBRACETHE“WOULD-HAVES”
AtthispointIshouldtellmyownconversionstory,becauseforquiteawhileIwasstymiedbythesamequestionthatpuzzledMelanieWall’sstudent.
I wrote in Chapter 4 about Jamie Robins (Figure 9.9), a pioneeringstatistician and epidemiologist at Harvard University who, together withSander Greenland at the University of California, Los Angeles, is largelyresponsibleforthewidespreadadoptionofgraphicalmodelsinepidemiologytoday.Wecollaboratedforacoupleofyears,from1993to1995,andhegotme thinking about the problem of sequential intervention plans,whichwasoneofhisprincipalresearchinterests.
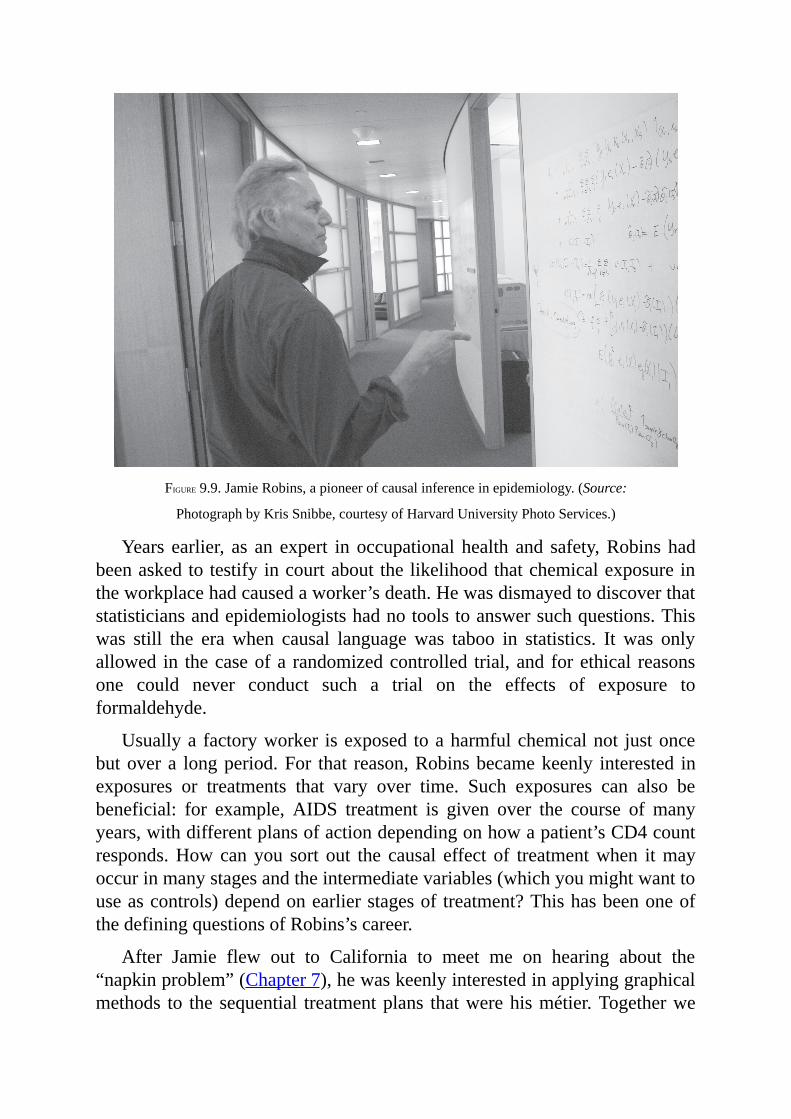
FIGURE9.9.JamieRobins,apioneerofcausalinferenceinepidemiology.(Source:
PhotographbyKrisSnibbe,courtesyofHarvardUniversityPhotoServices.)
Years earlier, as an expert inoccupational health and safety,Robinshadbeenaskedtotestifyincourtaboutthelikelihoodthatchemicalexposureintheworkplacehadcausedaworker’sdeath.Hewasdismayedtodiscoverthatstatisticiansandepidemiologistshadnotoolstoanswersuchquestions.Thiswas still the era when causal languagewas taboo in statistics. It was onlyallowed in thecaseofa randomizedcontrolled trial,and forethical reasonsone could never conduct such a trial on the effects of exposure toformaldehyde.
Usuallya factoryworker isexposed toaharmfulchemicalnot justoncebutovera longperiod.For that reason,Robinsbecamekeenly interested inexposures or treatments that vary over time. Such exposures can also bebeneficial: for example, AIDS treatment is given over the course of manyyears,withdifferentplansofactiondependingonhowapatient’sCD4countresponds.Howcanyou sort out the causal effect of treatmentwhen itmayoccurinmanystagesandtheintermediatevariables(whichyoumightwanttouseascontrols)dependonearlierstagesoftreatment?ThishasbeenoneofthedefiningquestionsofRobins’scareer.
After Jamie flew out to California to meet me on hearing about the“napkinproblem”(Chapter7),hewaskeenlyinterestedinapplyinggraphicalmethods to thesequential treatmentplans thatwerehismétier.Togetherwe
cameupwithasequentialback-doorcriterionforestimatingthecausaleffectof such a treatment stream. I learned some important lessons from thiscollaboration. In particular, he showed me that two actions are sometimeseasiertoanalyzethanonebecauseanactioncorrespondstoerasingarrowsonagraph,whichmakesitsparser.
Our back-door criterion dealt with a long-term treatment consisting ofsomearbitrarilylargenumberofdo-operations.Buteventwooperationswillproducesomeinterestingmathematics—includingthecontrolleddirecteffect,whichconsistsofoneactionthat“wiggles”thevalueofthetreatment,whileanotheractionfixesthevalueofthemediator.Moreimportantly,theideaofdefining direct effects in terms of do-operations liberated them from theconfinesoflinearmodelsandgroundedthemincausalcalculus.
ButIdidn’treallygetinterestedinmediationuntillater,whenIsawthatpeoplewerestillmakingelementarymistakes,suchastheMediationFallacymentionedearlier.Iwasalsofrustratedthattheaction-baseddefinitionofthedirecteffectdidnotextend to the indirecteffect.AsMelanieWall’sstudentsaid,we have no variable or set of variables to intervene on to disable thedirect path and let the indirect path stay active. For this reason the indirecteffectseemedtomelikeafigmentoftheimagination,devoidofindependentmeaningexcept to remindus that the totaleffectmaydiffer from thedirecteffect. I evensaid so in the first edition (2000)ofmybookCausality. Thiswasoneofthethreegreatestblundersofmycareer.
Inretrospect,Iwasblindedbythesuccessofthedo-calculus,whichhadledme to believe that the onlyway to disable a causal pathwas to take avariable and set it tooneparticularvalue.This isnot so; if Ihavea causalmodel,Icanmanipulateitinmanycreativeways,bydictatingwholistenstowhom,when, and how. In particular, I can fix the primary variable for thepurposeofsuppressingitsdirecteffectand,hypotheticallyyetsimultaneously,energizetheprimaryvariableforthepurposeoftransmittingitseffectthroughthemediator. That allowsme to set the treatment variable (e.g., kittens) atzeroandtosetthemediatoratthevalueitwouldhavehadifIhadsetkittensto one. My model of the data-generating process then tells me how tocomputetheeffectofthesplitintervention.
Iamindebtedtoonereaderofthefirstedition,JacquesHagenaars(authorof Categorical Longitudinal Data), for urging me not to give up on theindirecteffect.“Manyexpertsinsocialscienceagreeontheinputandoutput,butdifferexactlywithrespecttothemechanism,”hewrotetome.ButIwasstuckforalmost twoyearsonthedilemmaIwroteabout inthelastsection:
HowcanIdisablethedirecteffect?
All these struggles came to sudden resolution, almost like a divinerevelation, when I read the legal definition of discrimination that I quotedearlier in this chapter: “had the employee been of a different race… andeverythingelsehadbeenthesame.”Herewehaveit—thecruxoftheissue!It’s amake-believe game.We dealwith each individual on his or her ownmerits,andwekeepallcharacteristicsoftheindividualconstantatwhateverleveltheyhadpriortothechangeinthetreatmentvariable.
Howdoes thissolveourdilemma?Itmeans, firstofall, thatwehave toredefineboththedirecteffectandtheindirecteffect.Forthedirecteffect,weletthemediatorchoosethevalueitwouldhave—foreachindividual—intheabsenceof treatment,andwefix it there.Nowwewiggle the treatmentandregister the difference. This is different from the controlled direct effect Idiscussed earlier, where the mediator is fixed at one value for everyone.Becauseweletthemediatorchooseits“natural”value,Icalleditthenaturaldirecteffect.Similarly,forthenaturalindirecteffectIfirstdenytreatmenttoeveryone,andthenIletthemediatorchoosethevalueitwouldhave,foreachindividual,inthepresenceoftreatment.FinallyIrecordthedifference.
Idon’tknowif thelegalwordsin thedefinitionofdiscriminationwouldhave moved you, or anyone else, in the same way. But by 2000 I couldalreadyspeakcounterfactualslikeanative.Havinglearnedhowtoreadthemincausalmodels,Irealizedthattheywerenothingbutquantitiescomputedbyinnocentoperationsonequationsordiagrams.Assuch,theystoodreadytobeencapsulated in a mathematical formula. All I had to do was embrace the“would-haves.”
In a second, I realized that every direct and indirect effect could betranslatedintoacounterfactualexpression.OnceIsawhowtodothat,itwasasnaptoderiveaformulathattellsyouhowtoestimatethenaturaldirectandindirecteffectsfromdataandwhenitispermissible.Importantly,theformulamakesnoassumptionsabout thespecific functional formof therelationshipbetweenX,M,andY.WehaveescapedfromLinearWonderland.
IcalledthenewruletheMediationFormula,thoughthereareactuallytwoformulas, one for the natural direct effect and one for the natural indirecteffect.Subjecttotransparentassumptions,explicitlydisplayedinthegraph,ittellsyouhowtheycanbeestimatedfromdata.Forexample,inasituationlikeFigure9.4,wherethereisnoconfoundingbetweenanyofthevariables,andMisthemediatorbetweentreatmentXandoutcomeY:
NIE=Σm[P(M=m|X=1)–P(M=m|X=0)]××P(Y=1|X=0,M=m)(9.5)
Theinterpretationofthisformulaisilluminating.Theexpressioninbracketsstandsfor theeffectofXonM, and the followingexpressionstands for theeffect ofM onY (whenX = 0). So it reveals the origin of the product-of-coefficients idea, cast as a product of two nonlinear effects. Note also thatunlikeEquation9.3,Equation9.5hasnosubscriptsandnodo-operators,soitcanbeestimatedfromrung-onedata.
Whetheryouareascientistinalaboratoryorachildridingabicycle,itisalways a thrill to find you can do something today that you could not doyesterday.AndthatishowIfeltwhentheMediationFormulafirstappearedonpaper.Icouldseeataglanceeverythingaboutdirectandindirecteffects:whatisneededtomakethemlargeorsmall,whenwecanestimatethemfromobservational or interventional data, and when we can deem a mediator“responsible”fortransmittingobservedchangestotheoutcomevariable.Therelationshipbetweencauseandeffectcanbelinearornonlinear,numericalorlogical.Previouslyeachofthesecaseshadtobehandledinadifferentway,iftheywerediscussedatall.Nowasingleformulawouldapplytoallofthem.Giventherightdataandtherightmodel,wecoulddetermineifanemployerwasguiltyofdiscriminationorwhatkindsofconfounderswouldpreventusfrom making that determination. From Barbara Burks’s data, we couldestimatehowmuchofthechild’sIQcomesfromnatureandhowmuchfromnurture.Wecouldevencalculatethepercentageofthetotaleffectexplainedby mediation and the percentage owed to mediation—two complementaryconceptsthatcollapsetooneinlinearmodels.
AfterIwrotedownthecounterfactualdefinitionofthedirectandindirecteffects, I learned that I was not the first to hit on the idea. Robins andGreenland got there before me, all the way back in 1992. But their paperdescribestheconceptofthenaturaleffectinwords,withoutcommittingittoamathematicalformula.
Moreseriously,theytookapessimisticviewofthewholeideaofnaturaleffects and stated that such effects cannot be estimated from experimentalstudiesandcertainlynotfromobservationalstudies.Thisstatementpreventedotherresearchersfromseeingthepotentialofnaturaleffects.ItishardtotellifRobinsandGreenlandwouldhaveswitchedtoamoreoptimisticviewhadthey taken the extra step of expressing the natural effect as a formula incounterfactuallanguage.Forme,thisextrastepwascrucial.
Thereispossiblyanotherreasonfortheirpessimisticview,whichIdonot

agree with but will try to explain. They examined the counterfactualdefinitionofthenaturaleffectandsawthatitcombinesinformationfromtwodifferentworlds, one inwhich you hold the treatment constant at zero andanotherinwhichyouchangethemediatortowhatitwouldhavebeenifyouhadsetthetreatmenttoone.Becauseyoucannotreplicatethis“cross-worlds”conditioninanyexperiment,theybelieveditwasoutofbounds.
This is a philosophical difference between their school andmine. Theybelievethatthelegitimacyofcausalinferenceliesinreplicatingarandomizedexperimentascloselyaspossible,ontheassumptionthatthisistheonlyrouteto thescientific truth.Ibelievethat theremaybeotherroutes,whichderivetheir legitimacy from a combination of data and established (or assumed)scientificknowledge.Tothatend,theremaybemethodsmorepowerfulthana randomized experiment, based on rung-three assumptions, and I do nothesitatetousethem.Wheretheygaveresearchersaredlight,Igavethemagreenlight,whichwas theMediationFormula: ifyoufeelcomfortablewiththese assumptions, here is what you can do! Unfortunately, Robins andGreenland’s red lightkept the fieldofmediationat a standstill fornine fullyears.
Manypeoplefindformulasdaunting,seeingthemasawayofconcealingratherthanrevealinginformation.Buttoamathematician,ortoapersonwhoisadequatelytrainedinthemathematicalwayofthinking,exactlythereverseistrue.Aformularevealseverything:itleavesnothingtodoubtorambiguity.Whenreadingascientificarticle,Ioftencatchmyselfjumpingfromformulatoformula,skippingthewordsaltogether.Tome,aformulaisabakedidea.Wordsareideasintheoven.
A formula serves two purposes, one practical and one social. From thepractical point of view, students or colleagues can read it as they would arecipe. The recipemay be simple or complex, but at the end of the day itpromises that if you follow the steps, youwill know the natural direct andindirect effects—provided, of course, your causalmodel accurately reflectstherealworld.
Thesecondpurposeissubtler.IhadafriendinIsraelwhowasafamousartist. I visited his studio to acquire one of his paintings, and his canvaseswereallovertheplace—ahundredunderthebed,dozensinthekitchen.Theywerepricedatbetween$300and$500each,andIhadahardtimedeciding.Finally,Ipointedtooneonthewallandsaid,“Ilikethisone.”“Thisoneis$5,000,”hesaid.“Howcome?”Iasked,partlysurprisedandpartlyprotesting.Heanswered,“Thisone is framed.”It tookmeafewminutes tofigureout,
but then I understood what he meant. It wasn’t valuable because it wasframed; it was framed because it was valuable. Out of all the hundreds ofpaintingsinhisapartment,thatonewashispersonalchoice.Itbestexpressedwhathehadlaboredtoexpressintheothers,anditwasthusanointedwithasealofcompleteness—aframe.
That is the secondpurposeofa formula. It isa socialcontract. Itputsaframearoundanideaandsays,“ThisissomethingIbelieveisimportant.Thisissomethingthatdeservessharing.”
ThatiswhyIhavechosentoputaframearoundtheMediationFormula.Itdeservessharingbecause,tomeandmanylikeme,itrepresentstheendtoanage-old dilemma.And it is important, because it offers a practical tool foridentifying mechanisms and assessing their importance. This is the socialpromisethattheMediationFormulaexpresses.
Since then, once the realization took hold that nonlinear mediationanalysisispossible,researchinthefieldhastakenoff.Ifyougotoadatabaseofacademicarticlesandsearchfortitleswiththewords“mediationanalysis,”youwill find almost nothing before 2004. Then therewere seven papers ayear,thenten,thentwenty;nowtherearemorethanahundredpapersayear.I’dliketoendthischapterwith threeexamples,whichIhopewill illustratethevarietyofpossibilitiesofmediationanalysis.
CASESTUDIESOFMEDIATION
“AlgebraforAll”:AProgramandItsSideEffects
Likemanybig-citypublic school systems, theChicagoPublicSchools faceproblems that sometimes seem intractable: high poverty rates, lowbudgets,andbigachievementgapsbetweenblack,Latino,white,andAsianstudents.In 1988, then US secretary of educationWilliam Bennett called Chicago’spublicschoolstheworstinthenation.
But in the 1990s, under new leadership, the Chicago Public Schoolsundertook a number of reforms and moved from “worst in the nation” to“innovatorforthenation.”Someofthesuperintendentsresponsibleforthesechangesgainednationwideprominence, suchasArneDuncan,whobecamesecretaryofeducationunderPresidentBarackObama.
One innovation that actually predated Duncan was a policy, adopted in1997, eliminating remedial courses in high school and requiring all ninth
graders to takecollege-prepcourses likeEnglish IandAlgebra I.Themathpartofthispolicywascalled“AlgebraforAll.”
Was “Algebra for All” a success? That question, it turned out, wassurprisinglydifficulttoanswer.Therewasbothgoodnewsandbadnews.Thegoodnewswas that testscoresdid improve.Mathscoresroseby7.8pointsover threeyears,astatisticallysignificantchange that isequivalent toabout75percentofstudentsscoringabovethemeanthatexistedbeforethepolicychange.
Butbeforewecantalkaboutcausality,wehavetoruleoutconfounders,and in this case there is an important one. By 1997, the qualifications ofincoming ninth-grade students were already improving thanks to earlierchanges in theK–8 curriculum.Sowe are not comparing apples to apples.Becausethesechildrenbeganninthgradewithbettermathskillsthanstudentshad in 1994, the higher scores could be due to the already instituted K–8changes,notto“AlgebraforAll.”
GuangleiHong, a professor of human development at theUniversity ofChicago,studiedthedataandfoundnosignificantimprovementintestscoresoncethisconfounderwastakenintoaccount.Atthispointitwouldhavebeeneasy for Hong to jump to the conclusion that “Algebra for All” was not asuccess. But she didn’t, because there was another factor—this time amediator,notaconfounder—totakeintoaccount.
Asanygood teacherknows,students’successdependsnotonlyonwhatyou teach them but on how you teach them.When the “Algebra for All”policy was introduced, more than the curriculum changed. The lower-achieving students found themselves in classrooms with higher-achievingstudentsandcouldnotkeepup.Thisledtoallsortsofnegativeconsequences:discouragement, class cutting, and, of course, lower test scores. Also, in amixed-ability classroom, the low-achieving studentsmayhave received lessattentionfromtheirteachersthantheywouldhaveinaremedialclass.Finally,theteachersthemselvesmayhavestruggledwiththenewdemandsplacedonthem. The teachers experienced in teaching Algebra I probably were notexperienced in teaching low-ability students, and the teachers experiencedwithlow-abilitystudentsmaynothavebeenasqualifiedtoteachalgebra.Allof these were unanticipated side effects of “Algebra for All.” Mediationanalysisisideallysuitedforevaluatingtheinfluenceofsideeffects.
Hong hypothesized, therefore, that classroom environment had changedandhadstronglyaffectedtheoutcomeoftheintervention.Inotherwords,shepostulated the causal diagram shown in Figure 9.10. Environment (which
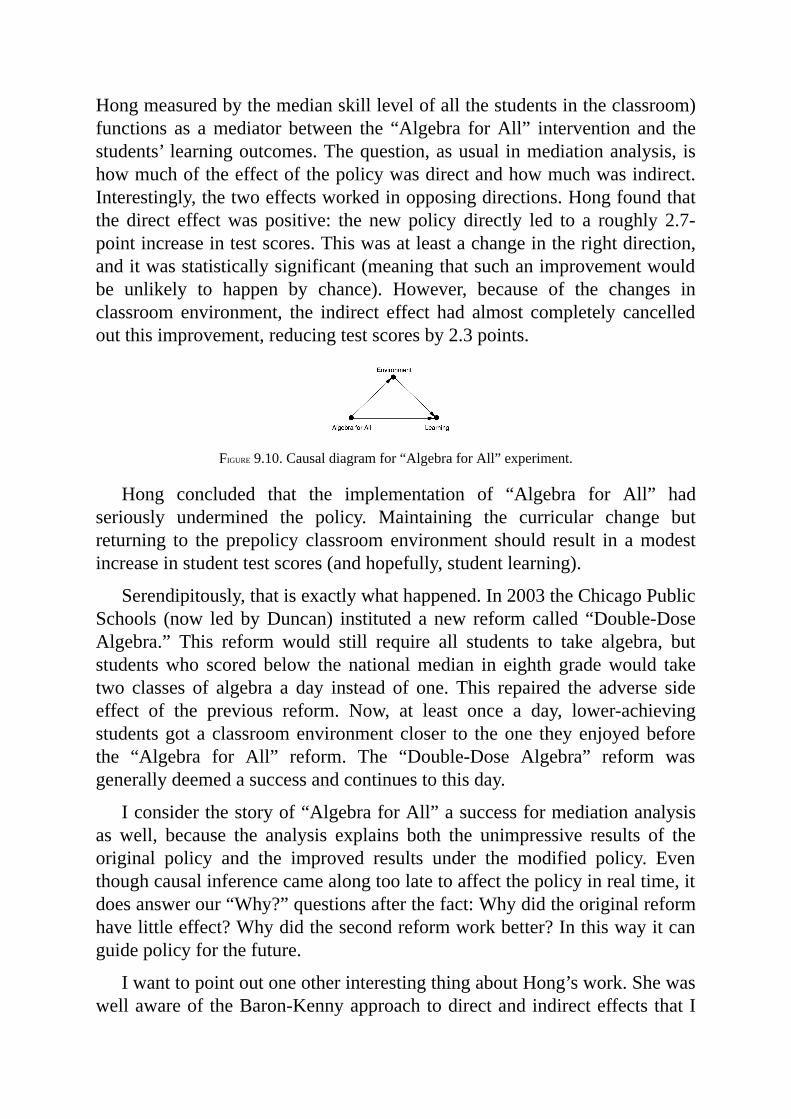
Hongmeasuredbythemedianskilllevelofallthestudentsintheclassroom)functions as amediator between the “Algebra forAll” intervention and thestudents’ learningoutcomes.Thequestion,asusual inmediationanalysis, ishowmuchoftheeffectofthepolicywasdirectandhowmuchwasindirect.Interestingly,thetwoeffectsworkedinopposingdirections.Hongfoundthatthe direct effectwas positive: the newpolicy directly led to a roughly 2.7-pointincreaseintestscores.Thiswasatleastachangeintherightdirection,anditwasstatisticallysignificant(meaningthatsuchanimprovementwouldbe unlikely to happen by chance). However, because of the changes inclassroom environment, the indirect effect had almost completely cancelledoutthisimprovement,reducingtestscoresby2.3points.
FIGURE9.10.Causaldiagramfor“AlgebraforAll”experiment.
Hong concluded that the implementation of “Algebra for All” hadseriously undermined the policy. Maintaining the curricular change butreturning to the prepolicy classroomenvironment should result in amodestincreaseinstudenttestscores(andhopefully,studentlearning).
Serendipitously,thatisexactlywhathappened.In2003theChicagoPublicSchools (now ledbyDuncan) instituted a new reformcalled “Double-DoseAlgebra.” This reform would still require all students to take algebra, butstudentswho scored below the nationalmedian in eighth gradewould taketwo classes of algebra a day instead of one. This repaired the adverse sideeffect of the previous reform. Now, at least once a day, lower-achievingstudentsgotaclassroomenvironmentcloser to theone theyenjoyedbeforethe “Algebra for All” reform. The “Double-Dose Algebra” reform wasgenerallydeemedasuccessandcontinuestothisday.
Iconsiderthestoryof“AlgebraforAll”asuccessformediationanalysisas well, because the analysis explains both the unimpressive results of theoriginal policy and the improved results under the modified policy. Eventhoughcausalinferencecamealongtoolatetoaffectthepolicyinrealtime,itdoesanswerour“Why?”questionsafterthefact:Whydidtheoriginalreformhavelittleeffect?Whydidthesecondreformworkbetter?Inthiswayitcanguidepolicyforthefuture.
IwanttopointoutoneotherinterestingthingaboutHong’swork.ShewaswellawareoftheBaron-KennyapproachtodirectandindirecteffectsthatI
havecalled theLinearWonderland. Inherpapersheactuallyperformed thesame analysis twice: once using a variation of theMediation Formula, theother using the “conventional procedures” (her term) of Baron andKenny.TheBaron-Kennymethod failed to detect the indirect effect. The reason ismost likely just what I discussed before: linear methods cannot spotinteractionsbetweenthetreatmentandthemediator.Perhapsthecombinationofmoredifficultmaterialandalesssupportiveclassroomenvironmentcausedthe low-achievingstudents tobecomediscouraged. Is thisplausible? I thinkso.Algebra isahardsubject.Perhaps itsdifficultymade theextraattentionfromtheteachersunderthedouble-dosepolicythatmuchmorevaluable.
TheSmokingGene:MediationandInteraction
InChapter5Iwroteaboutthescientificandpoliticalwaroversmokinginthe1950s and 1960s. The skeptics of that era, who included R. A. Fisher andJacobYerushalmy,arguedthattheapparentlinkbetweensmokingandcancermight be a statistical artifact due to a confounding variable. Yerushalmythought in terms of a smoking personality type,while Fisher suggested thepossibilityofagenethatwouldpredisposepeoplebothtowardsmokingandtowarddevelopinglungcancer.
Ironically,genomicsresearchersdiscoveredin2008thatFisherwasright:thereisa“smokinggene”thatoperatesexactlyinthewayhesuggested.Thisdiscovery came about through a new genomic analysis technique called agenome-wideassociationstudy(GWASforshort,pronounced“gee-wahss.”)This is a prototypical “big-data” method that allows researchers to combthroughthewholegenomestatistically,lookingforgenesthathappentoshowup more often in people with a certain disease, such as diabetes orschizophreniaorlungcancer.
It is important tonotice theword“association” in the termGWAS.Thismethod does not prove causality; it only identifies genes associatedwith acertaindiseaseinthegivensample.Itisadata-drivenratherthanhypothesis-drivenmethod,andthispresentsproblemsforcausalinference.
Althoughprevious hypothesis-drivengene studies had failed to find anyclearevidenceofgenesrelatedtosmokingortolungcancer,thingschangedovernight in 2008. In that year researchers identified a gene located in aregionof thefifteenthchromosomethatcodesfornicotinereceptors in lungcells. It has an official name, rs16969968, but that is a mouthful even forgenomics experts. So they started calling it “the Big One” or “Mr. Big”becauseofitsextremelystrongassociationwithlungcancer.“Inthesmoking
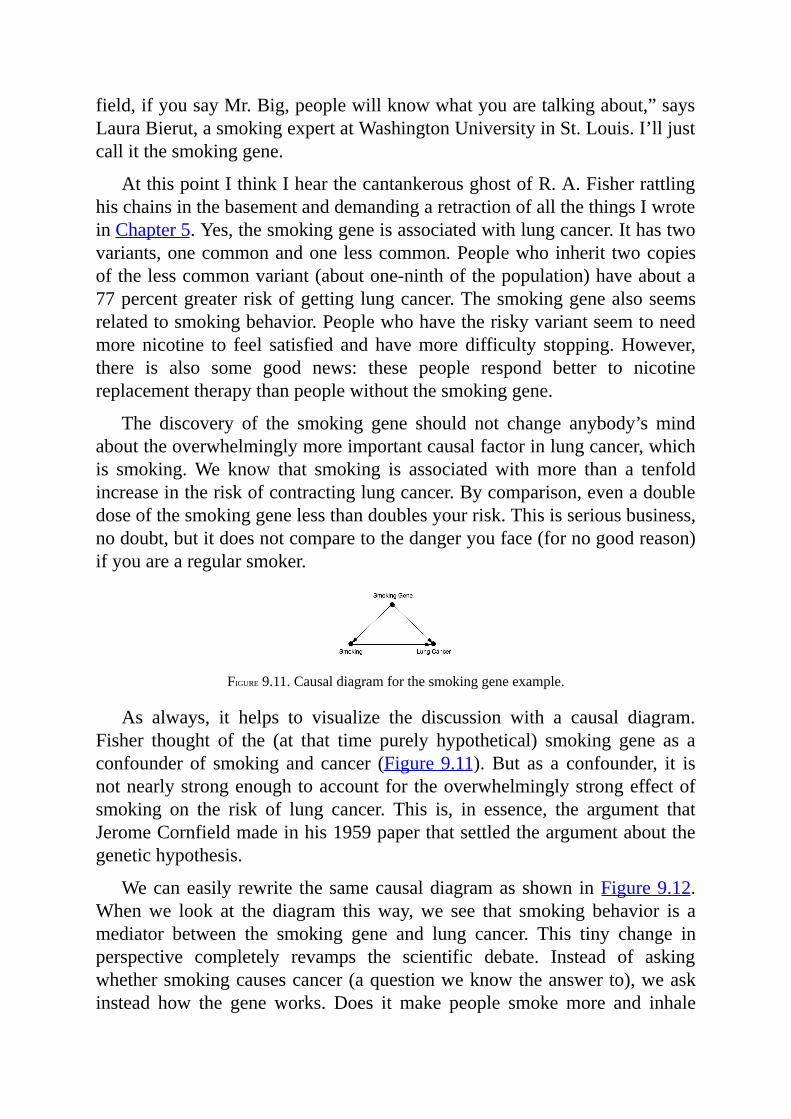
field,ifyousayMr.Big,peoplewillknowwhatyouaretalkingabout,”saysLauraBierut,asmokingexpertatWashingtonUniversityinSt.Louis.I’lljustcallitthesmokinggene.
AtthispointIthinkIhearthecantankerousghostofR.A.FisherrattlinghischainsinthebasementanddemandingaretractionofallthethingsIwroteinChapter5.Yes,thesmokinggeneisassociatedwithlungcancer.Ithastwovariants,onecommonandonelesscommon.Peoplewhoinherit twocopiesofthelesscommonvariant(aboutone-ninthofthepopulation)haveabouta77percentgreaterriskofgettinglungcancer.Thesmokinggenealsoseemsrelatedtosmokingbehavior.Peoplewhohavetheriskyvariantseemtoneedmore nicotine to feel satisfied and havemore difficulty stopping.However,there is also some good news: these people respond better to nicotinereplacementtherapythanpeoplewithoutthesmokinggene.
The discovery of the smoking gene should not change anybody’s mindabouttheoverwhelminglymoreimportantcausalfactorinlungcancer,whichis smoking.We know that smoking is associatedwithmore than a tenfoldincreaseintheriskofcontractinglungcancer.Bycomparison,evenadoubledoseofthesmokinggenelessthandoublesyourrisk.Thisisseriousbusiness,nodoubt,butitdoesnotcomparetothedangeryouface(fornogoodreason)ifyouarearegularsmoker.
FIGURE9.11.Causaldiagramforthesmokinggeneexample.
As always, it helps to visualize the discussion with a causal diagram.Fisher thought of the (at that time purely hypothetical) smoking gene as aconfounderof smokingandcancer (Figure9.11).But as a confounder, it isnotnearlystrongenoughtoaccountfortheoverwhelminglystrongeffectofsmoking on the risk of lung cancer. This is, in essence, the argument thatJeromeCornfieldmadeinhis1959paperthatsettledtheargumentaboutthegenetichypothesis.
Wecaneasily rewrite thesamecausaldiagramasshown inFigure9.12.Whenwe look at the diagram thisway,we see that smoking behavior is amediator between the smoking gene and lung cancer. This tiny change inperspective completely revamps the scientific debate. Instead of askingwhethersmokingcausescancer(aquestionweknowtheanswerto),weaskinstead how the gene works. Does it make people smokemore and inhale
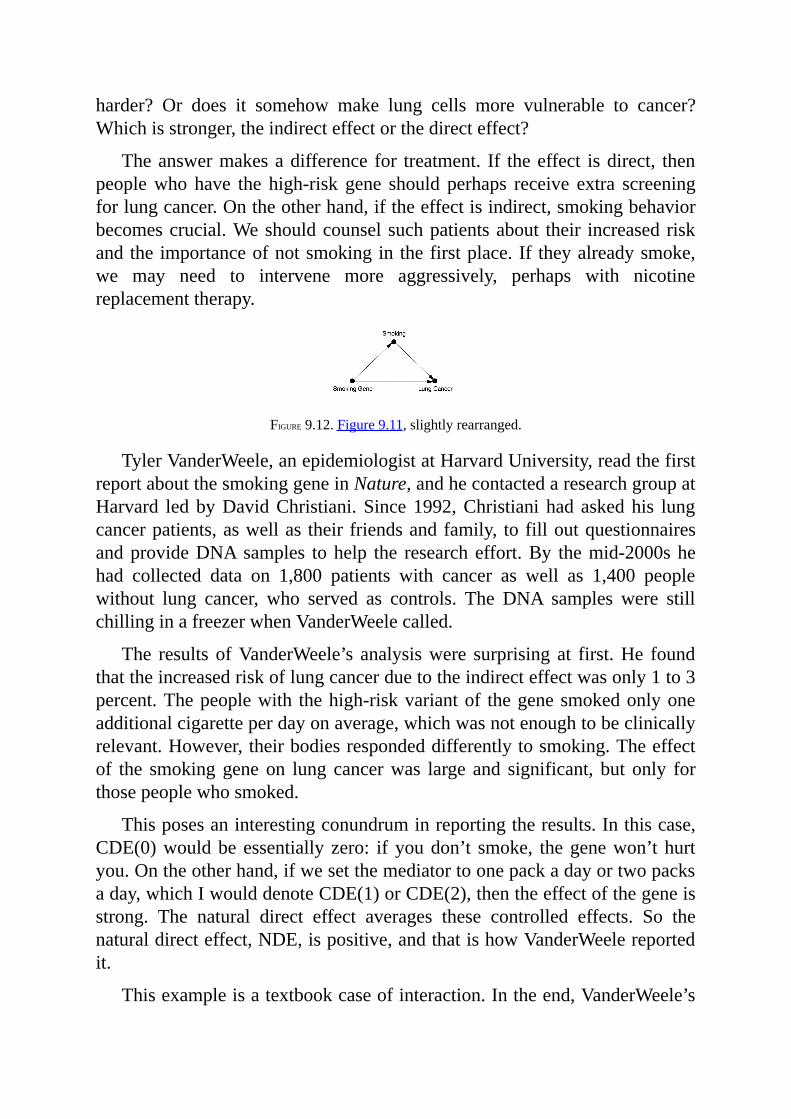
harder? Or does it somehow make lung cells more vulnerable to cancer?Whichisstronger,theindirecteffectorthedirecteffect?
Theanswermakesadifference for treatment. If theeffect isdirect, thenpeoplewho have the high-risk gene should perhaps receive extra screeningforlungcancer.Ontheotherhand,iftheeffectisindirect,smokingbehaviorbecomescrucial.Weshouldcounsel suchpatientsabout their increased riskandtheimportanceofnotsmokingin thefirstplace.If theyalreadysmoke,we may need to intervene more aggressively, perhaps with nicotinereplacementtherapy.
FIGURE9.12.Figure9.11,slightlyrearranged.
TylerVanderWeele,anepidemiologistatHarvardUniversity,readthefirstreportaboutthesmokinggeneinNature,andhecontactedaresearchgroupatHarvard ledbyDavidChristiani.Since1992,Christiani had askedhis lungcancerpatients,aswellas their friendsandfamily, tofilloutquestionnairesandprovideDNAsamples tohelp the researcheffort.By themid-2000shehad collected data on 1,800 patients with cancer as well as 1,400 peoplewithout lung cancer, who served as controls. The DNA samples were stillchillinginafreezerwhenVanderWeelecalled.
The results ofVanderWeele’s analysiswere surprising at first.He foundthattheincreasedriskoflungcancerduetotheindirecteffectwasonly1to3percent.Thepeoplewith thehigh-riskvariantof thegenesmokedonlyoneadditionalcigaretteperdayonaverage,whichwasnotenoughtobeclinicallyrelevant.However,theirbodiesrespondeddifferentlytosmoking.Theeffectof the smokinggeneon lung cancerwas large and significant, but only forthosepeoplewhosmoked.
Thisposesaninterestingconundruminreportingtheresults.Inthiscase,CDE(0)wouldbeessentially zero: if youdon’t smoke, thegenewon’thurtyou.Ontheotherhand,ifwesetthemediatortoonepackadayortwopacksaday,whichIwoulddenoteCDE(1)orCDE(2),thentheeffectofthegeneisstrong. The natural direct effect averages these controlled effects. So thenaturaldirecteffect,NDE,ispositive,andthatishowVanderWeelereportedit.
Thisexampleisatextbookcaseofinteraction.Intheend,VanderWeele’s
analysisprovesthreeimportantthingsaboutthesmokinggene.First,itdoesnot significantly increase cigarette consumption. Second, it does not causelungcancerthroughasmoking-independentpath.Third,forthosepeoplewhodo smoke, it significantly increases the risk of lung cancer. The interactionbetweenthegeneandthesubject’sbehavioriseverything.
As is the case with any new result, of coursemore research is needed.Bierut points out one problemwith VanderWeele and Christiani’s analysis:they had only onemeasure of smoking behavior—the number of cigarettesperday.Thegenecouldpossiblycausepeopletoinhalemoredeeplytogetalargerdoseofnicotineperpuff.TheHarvardstudysimplydidn’thavedatatotestthistheory.
Even if some uncertainty remains, the research on the smoking geneprovides a glimpse into the future of personalizedmedicine. It seems quiteclear that in this case the important thing is how the gene and behaviorinteract.Westilldon’tknowforsurewhetherthegenechangesbehavior(asBierutsuggests)ormerelyinteractswithbehaviorthatwouldhavehappenedanyway(asVanderWeele’sanalysissuggests).Nevertheless,wemaybeableto use genetic status to give people better information about the risks theyface. In the future, causalmodels capable of detecting interactions betweengenesandbehaviororgenesandenvironmentaresuretobeanimportanttoolintheepidemiologist’skit.
Tourniquets:AHiddenFallacy
When John Kragh, an army surgeon, arrived for his first day of duty in aBaghdadhospital in2006, he received an immediate awakening to thenewrealitiesofwartimemedicine.Seeingaclipboardwiththecurrentday’scases,he remarked to the nurse on duty, “Hey, that’s interesting—you’ve had anemergencytourniquetusedduringyourshift.”
Thenursereplied,“That’snotinteresting.Wehaveoneeveryshift.”
Inhisfirstfiveminutesonthejob,KraghhadstumbleduponaseachangeintraumacarethattookplaceduringtheIraqandAfghanistanwars.Thoughused for centuries, both on the battlefield and in the operating room,tourniquets have always been somewhat controversial. A tourniquet left ontoo long will lead to loss of a limb. Also, tourniquets have often beenimprovised under duress, from straps or other handy materials, so theireffectiveness is unsurprisingly a hit-or-miss affair.AfterWorldWar II theywere considered a treatment of last resort, and their use was officiallydiscouraged.
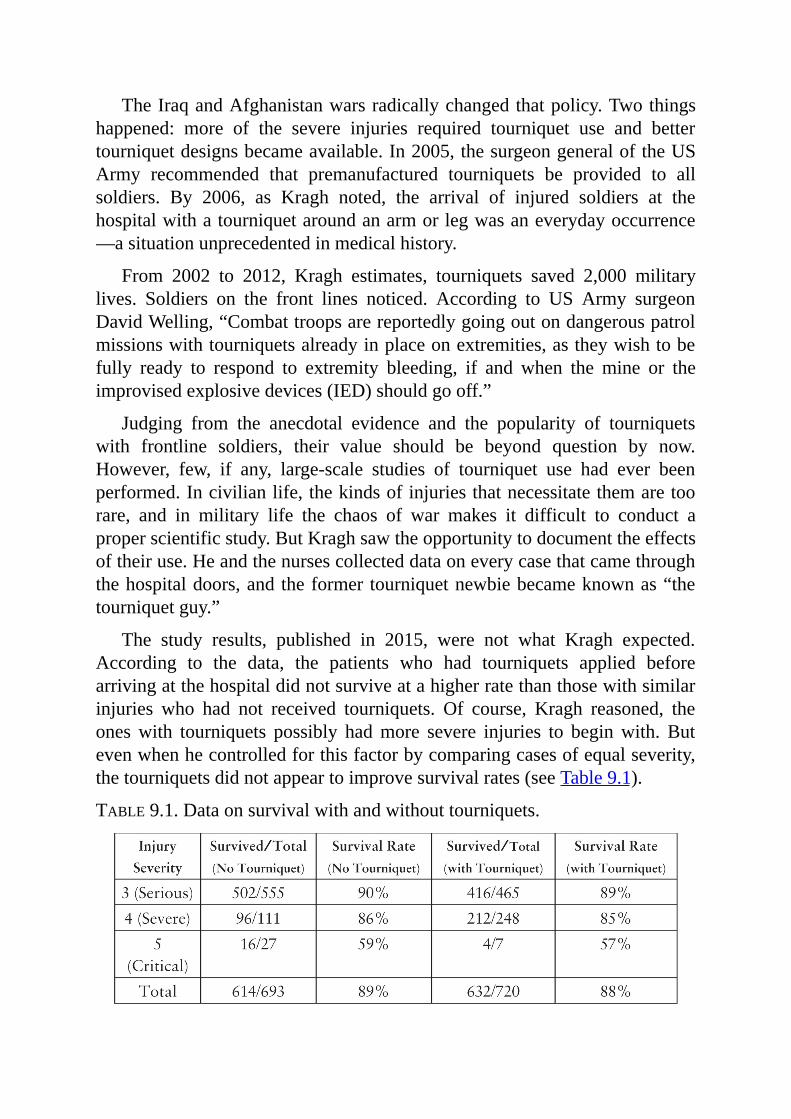
TheIraqandAfghanistanwarsradicallychangedthatpolicy.Twothingshappened: more of the severe injuries required tourniquet use and bettertourniquetdesignsbecameavailable.In2005,thesurgeongeneraloftheUSArmy recommended that premanufactured tourniquets be provided to allsoldiers. By 2006, as Kragh noted, the arrival of injured soldiers at thehospitalwithatourniquetaroundanarmorlegwasaneverydayoccurrence—asituationunprecedentedinmedicalhistory.
From 2002 to 2012, Kragh estimates, tourniquets saved 2,000 militarylives. Soldiers on the front lines noticed. According to US Army surgeonDavidWelling,“Combattroopsarereportedlygoingoutondangerouspatrolmissionswithtourniquetsalreadyinplaceonextremities,astheywishtobefully ready to respond to extremity bleeding, if and when the mine or theimprovisedexplosivedevices(IED)shouldgooff.”
Judging from the anecdotal evidence and the popularity of tourniquetswith frontline soldiers, their value should be beyond question by now.However, few, if any, large-scale studies of tourniquet use had ever beenperformed.Incivilianlife,thekindsofinjuriesthatnecessitatethemaretoorare, and in military life the chaos of war makes it difficult to conduct aproperscientificstudy.ButKraghsawtheopportunitytodocumenttheeffectsoftheiruse.Heandthenursescollecteddataoneverycasethatcamethroughthehospitaldoors,andtheformer tourniquetnewbiebecameknownas“thetourniquetguy.”
The study results, published in 2015, were not what Kragh expected.According to the data, the patients who had tourniquets applied beforearrivingatthehospitaldidnotsurviveatahigherratethanthosewithsimilarinjuries who had not received tourniquets. Of course, Kragh reasoned, theoneswith tourniquets possibly hadmore severe injuries to beginwith. Butevenwhenhecontrolledforthisfactorbycomparingcasesofequalseverity,thetourniquetsdidnotappeartoimprovesurvivalrates(seeTable9.1).
TABLE9.1.Dataonsurvivalwithandwithouttourniquets.
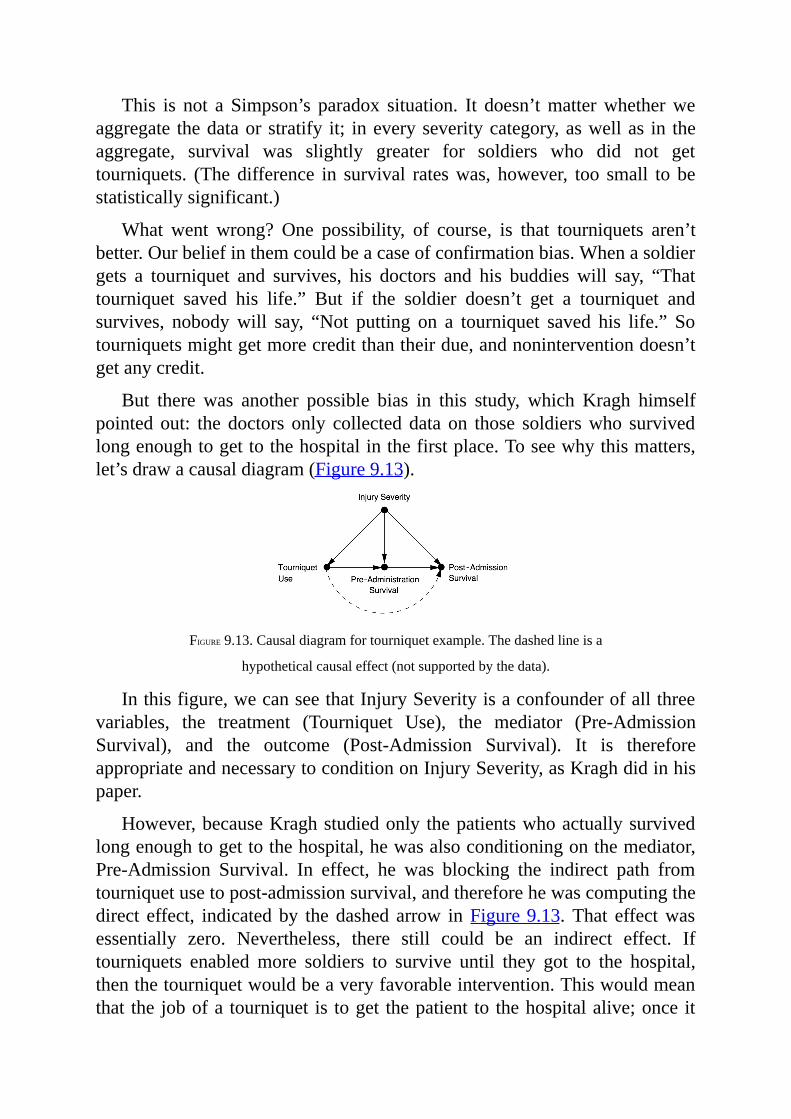
This is not a Simpson’s paradox situation. It doesn’tmatterwhetherweaggregate thedataorstratify it; ineveryseveritycategory,aswellas in theaggregate, survival was slightly greater for soldiers who did not gettourniquets. (Thedifference in survival rateswas, however, too small to bestatisticallysignificant.)
What went wrong? One possibility, of course, is that tourniquets aren’tbetter.Ourbeliefinthemcouldbeacaseofconfirmationbias.Whenasoldiergets a tourniquet and survives, his doctors and his buddies will say, “Thattourniquet saved his life.” But if the soldier doesn’t get a tourniquet andsurvives, nobodywill say, “Not putting on a tourniquet saved his life.” Sotourniquetsmightgetmorecreditthantheirdue,andnoninterventiondoesn’tgetanycredit.
But there was another possible bias in this study, which Kragh himselfpointedout: the doctors only collected data on those soldierswho survivedlongenoughtogettothehospitalinthefirstplace.Toseewhythismatters,let’sdrawacausaldiagram(Figure9.13).
FIGURE9.13.Causaldiagramfortourniquetexample.Thedashedlineisa
hypotheticalcausaleffect(notsupportedbythedata).
Inthisfigure,wecanseethatInjurySeverityisaconfounderofallthreevariables, the treatment (Tourniquet Use), the mediator (Pre-AdmissionSurvival), and the outcome (Post-Admission Survival). It is thereforeappropriateandnecessarytoconditiononInjurySeverity,asKraghdidinhispaper.
However,becauseKraghstudiedonly thepatientswhoactuallysurvivedlongenoughtogettothehospital,hewasalsoconditioningonthemediator,Pre-Admission Survival. In effect, he was blocking the indirect path fromtourniquetusetopost-admissionsurvival,andthereforehewascomputingthedirect effect, indicatedby thedashed arrow inFigure9.13.That effectwasessentially zero. Nevertheless, there still could be an indirect effect. Iftourniquets enabledmore soldiers to survive until they got to the hospital,thenthetourniquetwouldbeaveryfavorableintervention.Thiswouldmeanthat the jobofa tourniquet is toget thepatient to thehospitalalive;onceit
hasdonethat,ithasnofurthervalue.Unfortunately,nothinginthedata(Table9.1)caneitherconfirmorrefutethishypothesis.
WilliamKruskaloncelamentedthat thereisnoHomertosingthepraiseofstatisticians.IwouldliketosingthepraiseofKragh,whounderthemostadverse conditions imaginablehad thepresenceofmind to collectdata andsubject the standard treatment to a scientific test.His example is a shininglight for anyone who wants to practice evidence-based medicine. It’s aparticularlybitter irony that his study couldnot succeedbecausehehadnoway to collect data on soldierswhodidn’t survive to the hospital.Wemaywish thathecouldhaveprovedonceand forall that tourniquets save lives.Kragh himself wrote in an email, “I have no doubt that tourniquets are adesirable intervention.” But in the end he had to report a “null result,” thekind that doesn’t make headlines. Even so, he deserves credit for soundscientificinstincts.
10
BIGDATA,ARTIFICIALINTELLIGENCE,ANDTHEBIGQUESTIONS
Allispre-determined,yetpermissionisalwaysgranted.
—MAIMONIDES(MOSHEBENMAIMON)(1138–1204)
WHENIbeganmyjourneyintocausation,Iwasfollowingthetracksofananomaly.WithBayesiannetworks,wehadtaughtmachinestothinkinshadesofgray, and thiswas an important step towardhumanlike thinking.Butwestill couldn’t teachmachines to understand causes and effects.We couldn’texplaintoacomputerwhyturningthedialofabarometerwon’tcauserain.Nor couldwe teach itwhat to expectwhenone of the riflemenon a firingsquad changes his mind and decides not to shoot. Without the ability toenvision alternate realities and contrast them with the currently existingreality,amachinecannotpassthemini-Turingtest;itcannotanswerthemostbasic question that makes us human: “Why?” I took this as an anomalybecause I did not anticipate such natural and intuitive questions to residebeyondthereachofthemostadvancedreasoningsystemsofthetime.
OnlylaterdidIrealizethatthesameanomalywasafflictingmorethanjustthefieldofartificial intelligence(AI).Theverypeoplewhoshouldcare themost about “Why?” questions—namely, scientists—were laboring under astatisticalculturethatdeniedthemtherighttoaskthosequestions.Ofcoursethey asked them anyway, informally, but they had to cast them asassociational questions whenever they wanted to subject them tomathematicalanalysis.
The pursuit of this anomaly brought me into contact with people in avariety of fields, like Clark Glymour and his team (Richard Scheines andPeterSpirtes)fromphilosophy,JosephHalpernfromcomputerscience,JamieRobins and Sander Greenland from epidemiology, Chris Winship fromsociology, and Don Rubin and Philip Dawid from statistics, who werethinking about the same problem. Together we lit the spark of a CausalRevolution,whichhasspreadlikeachainoffirecrackersfromonedisciplineto the next: epidemiology, psychology, genetics, ecology, geology, climatescience, and so on. With every passing year I see a greater and greaterwillingnessamongscientiststospeakandwriteaboutcausesandeffects,notwithapologiesanddowncast eyesbutwithconfidenceandassertiveness.Anewparadigmhasevolvedaccordingtowhichitisokaytobaseyourclaimsonassumptionsaslongasyoumakeyourassumptionstransparentsothatyouandotherscanjudgehowplausibletheyareandhowsensitiveyourclaimsaretotheirviolation.TheCausalRevolutionhasperhapsnotledtoanyparticulargadget that has changed our lives, but it has led to a transformation inattitudesthatwillinevitablyleadtohealthierscience.
Ioftenthinkofthistransformationas“thesecondgiftofAItohumanity,”and ithasbeenourmain focus in thisbook.Butaswebring the story toaconclusion,itistimeforustogobackandinquireaboutthefirstgift,whichhastakenanunexpectedlylongtimetomaterialize.Areweinfactgettinganycloser to the day when computers or robots can understand causalconversations?Canwemakeartificialintelligenceswithasmuchimaginationas a three-year-old human? I share some thoughts, but give no definitiveconclusions,inthisfinalchapter.
CAUSALMODELSAND“BIGDATA”
Throughout science, business, government, and even sports, the amount ofrawdatawehave about ourworld has grown at a staggering rate in recentyears.ThechangeisperhapsmostvisibletothoseofuswhousetheInternetandsocialmedia. In2014, the lastyear forwhich I’veseendata,Facebookreportedlywaswarehousing300petabytesof data about its 2billion activeusers,or150megabytesofdataperuser.Thegamespeopleplay,theproductsthey like to buy, the names of all their Facebook friends, and of course alltheir cat videos—all of them are out there in a glorious ocean of ones andzeros.
Less obvious to the public, but just as important, is the rise of huge
databases inscience.Forexample, the1000GenomesProjectcollected twohundredterabytesofinformationinwhatitcalls“thelargestpubliccatalogueofhumanvariationandgenotypedata.”NASA’sMikulskiArchiveforSpaceTelescopes has collected 2.5 petabytes of data from several deep-spacesurveys. But BigData hasn’t only affected high-profile sciences; it’smadeinroads intoeveryscience.Agenerationago,amarinebiologistmighthavespentmonths doing a census of his or her favorite species. Now the samebiologisthasimmediateaccessonlinetomillionsofdatapointsonfish,eggs,stomach contents, or anything else he or shewants. Instead of just doing acensus,thebiologistcantellastory.
Most relevant for us is the question of what comes next. How do weextractmeaning from all these numbers, bits, and pixels?The datamay beimmense,butthequestionsweaskaresimple.Isthereagenethatcauseslungcancer?Whatkindsofsolarsystemsare likely toharborEarth-likeplanets?Whatfactorsarecausingthepopulationofourfavoritefishtodecrease,andwhatcanwedoaboutit?
In certain circles there is an almost religious faith that we can find theanswerstothesequestionsinthedataitself,ifonlywearesufficientlycleverat data mining. However, readers of this book will know that this hype islikely to bemisguided. The questions I have just asked are all causal, andcausalquestionscanneverbeansweredfromdataalone.Theyrequireus toformulate a model of the process that generates the data, or at least someaspectsofthatprocess.Anytimeyouseeapaperorastudythatanalyzesthedatainamodel-freeway,youcanbecertainthattheoutputofthestudywillmerelysummarize,andperhapstransform,butnotinterpretthedata.
This isnot tosaythatdataminingisuseless. Itmaybeanessential firststep to search for interesting patterns of association and posemore preciseinterpretivequestions.Insteadofasking,“Arethereanylung-cancer-causinggenes?” we can now start scanning the genome for genes with a highcorrelation with lung cancer (such as the “Mr. Big” gene mentioned inChapter 9). Then we can ask, “Does this gene cause lung cancer? (Andhow?)”Wenevercouldhaveaskedabout the“Mr.Big”gene ifwedidnothave datamining. To get any farther, though,we need to develop a causalmodelspecifying(forexample)whatvariableswethinkthegeneaffects,whatconfoundersmightexist,andwhatothercausalpathwaysmightbringabouttheresult.Datainterpretationmeanshypothesizingonhowthingsoperateintherealworld.
AnotherroleofBigDataincausalinferenceproblemsliesinthelaststage
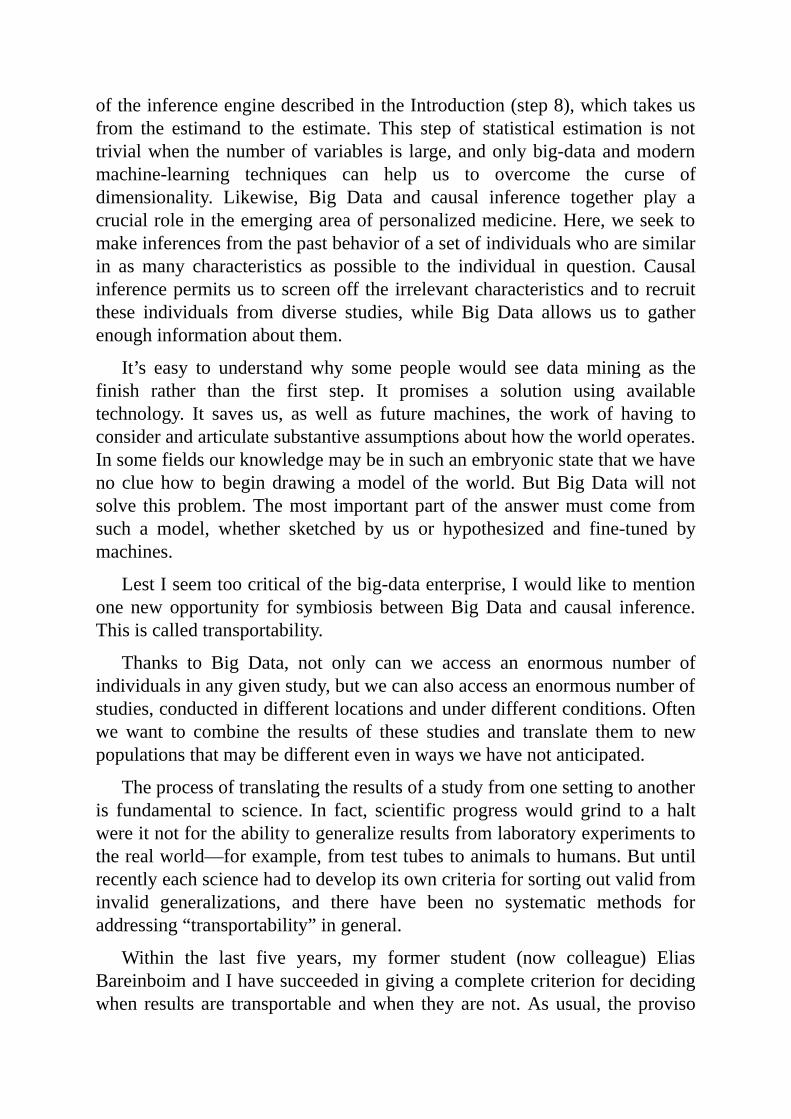
oftheinferenceenginedescribedintheIntroduction(step8),whichtakesusfrom the estimand to the estimate. This step of statistical estimation is nottrivialwhenthenumberofvariables is large,andonlybig-dataandmodernmachine-learning techniques can help us to overcome the curse ofdimensionality. Likewise, Big Data and causal inference together play acrucialroleintheemergingareaofpersonalizedmedicine.Here,weseektomakeinferencesfromthepastbehaviorofasetofindividualswhoaresimilarin asmany characteristics as possible to the individual in question. Causalinferencepermitsustoscreenofftheirrelevantcharacteristicsandtorecruitthese individuals from diverse studies, while Big Data allows us to gatherenoughinformationaboutthem.
It’s easy to understand why some people would see datamining as thefinish rather than the first step. It promises a solution using availabletechnology. It saves us, as well as futuremachines, the work of having toconsiderandarticulatesubstantiveassumptionsabouthowtheworldoperates.Insomefieldsourknowledgemaybeinsuchanembryonicstatethatwehavenocluehow tobegindrawingamodelof theworld.ButBigDatawill notsolve thisproblem.Themost importantpartof theanswermustcome fromsuch a model, whether sketched by us or hypothesized and fine-tuned bymachines.
LestIseemtoocriticalofthebig-dataenterprise,Iwouldliketomentionone newopportunity for symbiosis betweenBigData and causal inference.Thisiscalledtransportability.
Thanks to Big Data, not only can we access an enormous number ofindividualsinanygivenstudy,butwecanalsoaccessanenormousnumberofstudies,conductedindifferentlocationsandunderdifferentconditions.Oftenwewant to combine the results of these studies and translate them to newpopulationsthatmaybedifferenteveninwayswehavenotanticipated.
Theprocessoftranslatingtheresultsofastudyfromonesettingtoanotheris fundamental to science. In fact, scientific progresswould grind to a haltwereitnotfortheabilitytogeneralizeresultsfromlaboratoryexperimentstotherealworld—forexample,fromtesttubestoanimalstohumans.Butuntilrecentlyeachsciencehadtodevelopitsowncriteriaforsortingoutvalidfrominvalid generalizations, and there have been no systematic methods foraddressing“transportability”ingeneral.
Within the last five years, my former student (now colleague) EliasBareinboimandIhavesucceededingivingacompletecriterionfordecidingwhen results are transportableandwhen theyarenot.Asusual, theproviso
forusing this criterion is thatyou represent the salient featuresof thedata-generatingprocesswithacausaldiagram,markedwithlocationsofpotentialdisparities.“Transporting”aresultdoesnotnecessarilymeantakingitatfacevalue and applying it to the new environment. The researchermay have torecalibrateittoallowfordisparitiesbetweenthetwoenvironments.
Supposewewanttoknowtheeffectofanonlineadvertisement(X)onthelikelihood that a consumerwill purchase the product (Y)—say, a surfboard.Wehavedatafromstudiesinfivedifferentplaces:LosAngeles,Boston,SanFrancisco,Toronto,andHonolulu.Nowwewanttoestimatehoweffectivetheadvertisementwillbe inArkansas.Unfortunately, eachpopulationandeachstudy differs slightly. For example, the Los Angeles population is youngerthanourtargetpopulation,andtheSanFranciscopopulationdiffersinclick-throughrate.Figure10.1showstheuniquecharacteristicsofeachpopulationand each study.Canwe combine the data from these remote and disparatestudies toestimatethead’seffectiveness inArkansas?CanwedoitwithouttakinganydatainArkansas?Orperhapsbymeasuringmerelyasmallsetofvariablesorconductingapilotobservationalstudy?
FIGURE10.1.Thetransportabilityproblem.
Figure10.2translatesthesedifferencesintographicalform.ThevariableZrepresentsage,which isaconfounder;youngpeoplemaybemore likely tosee theadandmore likely tobuytheproducteven if theydon’tsee thead.ThevariableWrepresentsclickingonalinktogetmoreinformation.Thisisamediator, a step that must take place in order to convert “seeing theadvertisement” into “buying theproduct.”The letterS, in each case, standsfor a “difference-producing” variable, a hypothetical variable that points tothe characteristic bywhich the two populations differ. For example, inLosAngeles (b), the indicatorS points toZ, age. In each of the other cities theindicatorpoints to thedistinguishing featureof thepopulationmentioned inFigure10.1.
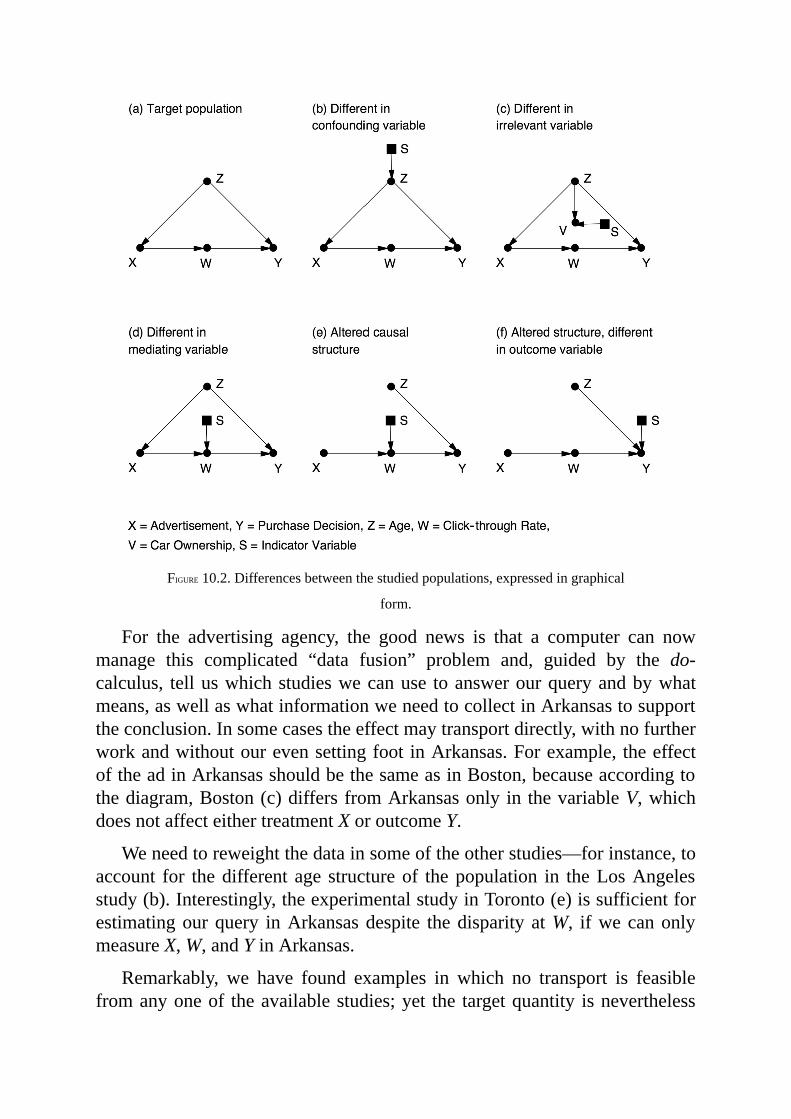
FIGURE10.2.Differencesbetweenthestudiedpopulations,expressedingraphical
form.
For the advertising agency, the good news is that a computer can nowmanage this complicated “data fusion” problem and, guided by the do-calculus, telluswhichstudieswecanuse toanswerourqueryandbywhatmeans,aswellaswhatinformationweneedtocollectinArkansastosupporttheconclusion.Insomecasestheeffectmaytransportdirectly,withnofurtherworkandwithoutourevensettingfootinArkansas.Forexample, theeffectoftheadinArkansasshouldbethesameasinBoston,becauseaccordingtothediagram,Boston(c)differsfromArkansasonlyin thevariableV,whichdoesnotaffecteithertreatmentXoroutcomeY.
Weneedtoreweightthedatainsomeoftheotherstudies—forinstance,toaccount for thedifferent age structureof thepopulation in theLosAngelesstudy(b).Interestingly,theexperimentalstudyinToronto(e)issufficientforestimatingourquery inArkansasdespite thedisparity atW, ifwecanonlymeasureX,W,andYinArkansas.
Remarkably, we have found examples in which no transport is feasiblefromanyoneof theavailablestudies;yet the targetquantity isnevertheless
estimable from their combination. Also, even studies that are nottransportable are not entirely useless. Take, for example, the Honolulu (f)studyinFigure10.2,whichisnottransportableduetothearrowS Y.ThearrowX W,on theotherhand, isnotcontaminatedbyS,andso thedataavailablefromHonolulucanbeusedtoestimateP(W|X).BycombiningthiswithestimatesofP(W|X)fromotherstudies,wecanincreasetheprecisionofthissubexpression.Bycarefullycombiningsuchsubexpressions,wemaybeabletosynthesizeanaccurateoverallestimateofthetargetquantity.
Althoughinsimplecasestheseresultsareintuitivelyreasonable,whenthediagramsgetmore complicated,weneed thehelpof a formalmethod.Thedo-calculus provides a general criterion for determining transportability insuchcases.Theruleisquitesimple: ifyoucanperformavalidsequenceofdo-operations (using the rules from Chapter 7) that transforms the targetquantityintoanotherexpressioninwhichanyfactorinvolvingSisfreeofdo-operators, then the estimate is transportable. The logic is simple; any suchfactor can be estimated from the available data, uncontaminated by thedisparityfactorS.
EliasBareinboim hasmanaged to do the same thing for the problemoftransportabilitythatIlyaShpitserdidfortheproblemofinterventions.Hehasdevelopedanalgorithmthatcanautomaticallydetermineforyouwhethertheeffectyouareseekingistransportable,usinggraphicalcriteriaalone.Inotherwords, it can tell you whether the required separation of S from the do-operatorscanbeaccomplishedornot.
Bareinboim’sresultsareexcitingbecausetheychangewhatwasformerlyseenasathreattovalidityintoanopportunitytoleveragethemanystudiesinwhich participation cannot be mandated and where we therefore cannotguarantee that the studypopulationwouldbe the sameas thepopulationofinterest.Insteadofseeingthedifferencebetweenpopulationsasathreattothe“external validity”of a study,wenowhave amethodology for establishingvalidityinsituationsthatwouldhaveappearedhopelessbefore.ItispreciselybecauseweliveintheeraofBigDatathatwehaveaccesstoinformationonmanystudiesandonmanyoftheauxiliaryvariables(likeZandW)thatwillallowustotransportresultsfromonepopulationtoanother.
I will mention in passing that Bareinboim has also proved analogousresults for another problem that has long bedeviled statisticians: selectionbias.This kind of bias occurswhen the sample group being studied differsfrom the target population in some relevantway.This sounds a lot like thetransportability problem—and it is, except for one very important
modification:insteadofdrawinganarrowfromtheindicatorvariableStotheaffectedvariable,wedrawthearrowtowardS.WecanthinkofSasstandingfor “selection” (into the study). For example, if our study observes onlyhospitalized patients, as in the Berkson bias example, we would draw anarrowfromHospitalization toS, indicating thathospitalization isacauseofselectionforourstudy.InChapter6wesawthissituationonlyasathreattothevalidityofourstudy.Butnow,wecanlookatitasanopportunity.Ifweunderstandthemechanismbywhichwerecruitsubjectsforthestudy,wecanrecover from bias by collecting data on the right set of deconfounders andusinganappropriate reweightingoradjustment formula.Bareinboim’sworkallowsustoexploitcausallogicandBigDatatoperformmiraclesthatwerepreviouslyinconceivable.
Wordslike“miracles”and“inconceivable”arerareinscientificdiscourse,and the readermaywonder if I ambeinga little tooenthusiastic.But Iusethem for a good reason. The concept of external validity as a threat toexperimental sciencehas been around for at least half a century, ever sinceDonaldCampbellandJulianStanleyrecognizedanddefinedthetermin1963.I have talked todozensof experts andprominent authorswhohavewrittenaboutthistopic.Tomyamazement,notoneofthemwasabletotackleanyofthetoyproblemspresentedinFigure10.2.Icallthem“toyproblems”becausetheyareeasytodescribe,easytosolve,andeasytoverifyifagivensolutioniscorrect.
At present, the culture of “external validity” is totally preoccupiedwithlistingandcategorizingthethreatstovalidityratherthanfightingthem.It isinfactsoparalyzedbythreatsthatitlookswithsuspicionanddisbeliefonthevery idea that threats can be disarmed. The experts, who are novices tographicalmodels,finditeasiertoconfigureadditionalthreatsthantoattempttoremedyanyoneofthem.Languagelike“miracles,”soIhope,shouldjoltmycolleaguesintolookingatsuchproblemsasintellectualchallengesratherthanreasonsfordespair.
I wish that I could present the reader with successful case studies of acomplex transportability task and recovery from selection bias, but thetechniquesarestilltoonewtohavepenetratedintogeneralusage.Iamveryconfident, though, that researcherswill discover thepowerofBareinboim’salgorithmsbeforelong,andthenexternalvalidity,likeconfoundingbeforeit,willceasetohaveitsmysticalandterrifyingpower.
STRONGAIANDFREEWILL
The ink was scarcely dry on Alan Turing’s great paper, “ComputingMachinery and Intelligence,”when science fictionwriters and futurologistsbegan toying with the prospect of machines that think. Sometimes theyenvisioned thesemachines asbenignor evennoble figures, like thewhirry,chirpy R2D2 and the oddly British android C3PO from Star Wars. Othertimes the machines are much more sinister, plotting the destruction of thehumanspecies,asintheTerminatormovies,orenslavinghumansinavirtualreality,asinTheMatrix.
Inallthesecases,theAIssaymoreabouttheanxietiesofthewritersorthecapabilities of the movie’s special effects department than they do aboutactualartificial intelligenceresearch.Artificial intelligencehasturnedouttobe a more elusive goal than Turing ever suspected, even though the sheercomputational power of our computers has no doubt exceeded hisexpectations.
InChapter3Iwroteaboutsomeofthereasonsforthisslowprogress.Inthe1970sandearly1980s,artificialintelligenceresearchwashamperedbyitsfocus on rule-based systems. But rule-based systems proved to be on thewrong track. They were very brittle. Any slight change to their workingassumptions required that theybe rewritten.They couldnot copewellwithuncertainty or with contradictory data. Finally, they were not scientificallytransparent;youcouldnotprovemathematicallythattheywouldbehaveinacertainway,andyoucouldnotpinpointexactlywhatneededrepairwhentheydidn’t.NotallAIresearchersobjectedtothelackoftransparency.Thefieldatthe time was divided into “neats” (who wanted transparent systems withguarantees of behavior) and “scruffies” (who just wanted something thatworked).Iwasalwaysa“neat.”
Iwas luckytocomealongata timewhenthefieldwasreadyforanewapproach.Bayesiannetworkswereprobabilistic;theycouldcopewithaworldfull of conflicting and uncertain data. Unlike the rule-based systems, theyweremodular and easily implementedon adistributed computingplatform,whichmade them fast.Finally, aswas important tome (andother “neats”),Bayesian networks dealt with probabilities in amathematically soundway.Thisguaranteedthatifanythingwentwrong,thebugwasintheprogram,notinourthinking.
Even with all these advantages, Bayesian networks still could notunderstandcausesandeffects.Bydesign,inaBayesiannetwork,informationflowsinbothdirections,causalanddiagnostic:smokeincreasesthelikelihoodoffire,andfireincreasesthelikelihoodofsmoke.Infact,aBayesiannetwork
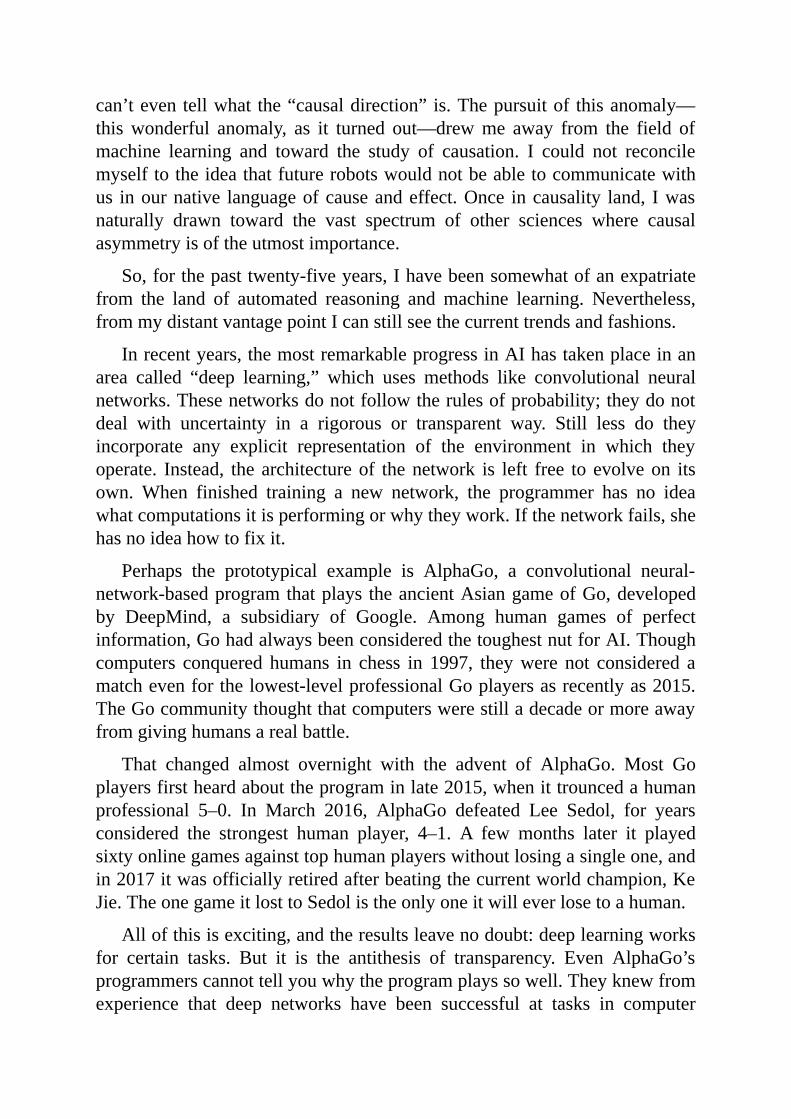
can’teventellwhat the“causaldirection”is.Thepursuitof thisanomaly—thiswonderful anomaly, as it turned out—drewme away from the field ofmachine learning and toward the study of causation. I could not reconcilemyselftotheideathatfuturerobotswouldnotbeabletocommunicatewithus inournative languageofcauseandeffect.Once incausality land, Iwasnaturally drawn toward the vast spectrum of other sciences where causalasymmetryisoftheutmostimportance.
So,forthepasttwenty-fiveyears,Ihavebeensomewhatofanexpatriatefrom the land of automated reasoning and machine learning. Nevertheless,frommydistantvantagepointIcanstillseethecurrenttrendsandfashions.
Inrecentyears,themostremarkableprogressinAIhastakenplaceinanarea called “deep learning,” which uses methods like convolutional neuralnetworks.Thesenetworksdonotfollowtherulesofprobability;theydonotdeal with uncertainty in a rigorous or transparent way. Still less do theyincorporate any explicit representation of the environment in which theyoperate. Instead, the architectureof thenetwork is left free to evolveon itsown. When finished training a new network, the programmer has no ideawhatcomputationsitisperformingorwhytheywork.Ifthenetworkfails,shehasnoideahowtofixit.
Perhaps the prototypical example is AlphaGo, a convolutional neural-network-basedprogramthatplays theancientAsiangameofGo,developedby DeepMind, a subsidiary of Google. Among human games of perfectinformation,GohadalwaysbeenconsideredthetoughestnutforAI.Thoughcomputers conquered humans in chess in 1997, theywere not considered amatchevenforthelowest-levelprofessionalGoplayersasrecentlyas2015.TheGocommunitythoughtthatcomputerswerestilladecadeormoreawayfromgivinghumansarealbattle.
That changed almost overnight with the advent of AlphaGo. Most Goplayersfirstheardabouttheprograminlate2015,whenittrouncedahumanprofessional 5–0. In March 2016, AlphaGo defeated Lee Sedol, for yearsconsidered the strongest human player, 4–1. A few months later it playedsixtyonlinegamesagainsttophumanplayerswithoutlosingasingleone,andin2017itwasofficiallyretiredafterbeatingthecurrentworldchampion,KeJie.TheonegameitlosttoSedolistheonlyoneitwilleverlosetoahuman.
Allofthisisexciting,andtheresultsleavenodoubt:deeplearningworksfor certain tasks. But it is the antithesis of transparency. Even AlphaGo’sprogrammerscannottellyouwhytheprogramplayssowell.Theyknewfromexperience that deep networks have been successful at tasks in computer
vision and speech recognition. Nevertheless, our understanding of deeplearningiscompletelyempiricalandcomeswithnoguarantees.TheAlphaGoteamcouldnothavepredictedat theoutset that theprogramwouldbeat thebesthumaninayear,ortwo,orfive.Theysimplyexperimented,anditdid.
Somepeoplewillarguethattransparencyisnotreallyneeded.Wedonotunderstandindetailhowthehumanbrainworks,andyetitrunswell,andweforgive our meager understanding. So, they argue, why not unleash deep-learningsystemsandcreateanewkindofintelligencewithoutunderstandinghowitworks?Icannotsaytheyarewrong.The“scruffies,”atthismomentintime,havetakenthelead.Nevertheless,IcansaythatIpersonallydon’tlikeopaquesystems,andthatiswhyIdonotchoosetodoresearchonthem.
Mypersonaltasteaside,thereisanotherfactortoaddtothisanalogywiththe humanbrain.Yes,we forgive ourmeager understandingof howhumanbrains work, but we can still communicate with other humans, learn fromthem,instructthem,andmotivatetheminourownnativelanguageofcauseand effect.We can do that because our brains work the same way. If ourrobots will all be as opaque as AlphaGo, we will not be able to hold ameaningfulconversationwiththem,andthatwouldbequiteunfortunate.
WhenmyhouserobotturnsonthevacuumcleanerwhileIamstillasleep(Figure10.3) and I tell it, “You shouldn’t havewokenmeup,” Iwant it tounderstandthatthevacuumingwasatfault,butIdon’twantittointerpretthecomplaint as an instruction never to vacuum the upstairs again. It shouldunderstandwhatyouandIperfectlyunderstand:vacuumcleanersmakenoise,noisewakespeopleup,andthatmakessomepeopleunhappy.Inotherwords,our robot will have to understand cause-and-effect relations—in fact,counterfactualrelations,suchasthoseencodedinthephrase“Youshouldn’thave.”
Indeed,observetherichcontentofthisshortsentenceofinstructions.Weshould not need to tell the robot that the same applies to vacuum cleaningdownstairsoranywhereelseinthehouse,butnotwhenIamawakeornotathome,whenthevacuumcleanerisequippedwithasilencer,andsoforth.Canadeep-learningprogramunderstand the richnessof this instruction?That iswhy I am not satisfied with the apparently superb performance of opaquesystems.Transparencyenableseffectivecommunication.
FIGURE10.3.Asmartrobotcontemplatingthecausalramificationsofhis/heractions.
(Source:DrawingbyMaayanHarel.)
Oneaspectofdeeplearningdoesinterestme:thetheoreticallimitationsofthese systems, primarily limitations that stem from their inability to gobeyondrungoneoftheLadderofCausation.Thislimitationdoesnothinderthe performance of AlphaGo in the narrow world of go games, since theboarddescriptiontogetherwiththerulesofthegameconstitutesanadequatecausalmodelofthego-world.Yetithinderslearningsystemsthatoperateinenvironments governed by richwebs of causal forces, while having accessmerely to surface manifestations of those forces. Medicine, economics,education, climatology, and social affairs are typical examples of suchenvironments. Like the prisoners in Plato’s famous cave, deep-learningsystemsexploretheshadowsonthecavewallandlearntoaccuratelypredicttheirmovements.Theylacktheunderstandingthattheobservedshadowsaremereprojectionsofthree-dimensionalobjectsmovinginathree-dimensionalspace.StrongAIrequiresthisunderstanding.
Deep-learningresearchersarenotunawareof thesebasiclimitations.Forexample,economistsusingmachinelearninghavenotedthattheirmethodsdonotanswerkeyquestionsofinterest,suchasestimatingtheimpactofuntried
policiesandactions.Typicalexamplesareintroducingnewpricestructuresorsubsidies or changing the minimum wage. In technical terms, machine-learningmethodstodayprovideuswithanefficientwayofgoingfromfinitesample estimates to probability distributions, andwe still need to get fromdistributionstocause-effectrelations.
WhenwestarttalkingaboutstrongAI,causalmodelsmovefromaluxurytoanecessity.Tome,astrongAIshouldbeamachinethatcanreflectonitsactions and learn from past mistakes. It should be able to understand thestatement “I shouldhaveacteddifferently,”whether it is toldasmuchbyahumanorarrivesatthatconclusionitself.Thecounterfactualinterpretationofthisstatementreads,“IhavedoneX=x,andtheoutcomewasY=y.ButifIhadacteddifferently, sayX =x′, then the outcomewould have beenbetter,perhapsY = y′.”Aswe have seen, the estimation of such probabilities hasbeen completely automated, given enough data and an adequately specifiedcausalmodel.
In fact, I think that a very important target for machine learning is thesimpler probabilityP(YX = x1 =y′ |X = x), where themachine observes aneventX=xbutnot theoutcomeY,and thenasksfor theoutcomeunderanalternativeeventX=x′.Ifitcancomputethisquantity,themachinecantreatitsintendedactionasanobservedevent(X=x)andask,“WhatifIchangemymindanddoX=x′ instead?”Thisexpressionismathematicallythesameastheeffectoftreatmentonthetreated(mentionedinChapter8),andwehavelotsofresultsindicatinghowtoestimateit.
Intent is a very important part of personal decisionmaking. If a formersmokerfeelshimselftemptedtolightupacigarette,heshouldthinkveryhardabout the reasons behind that intention and ask whether a contrary actionmightinfact leadtoabetteroutcome.Theabilitytoconceiveofone’sownintentandthenuseitasapieceofevidenceincausalreasoningisalevelofself-awareness(ifnotconsciousness)thatnomachineIknowofhasachieved.I would like to be able to lead amachine into temptation and have it say,“No.”
Anydiscussionof intent leads toanothermajor issue forstrongAI: freewill.IfweareaskingamachinetohavetheintenttodoX=x,becomeawareof it, andchoose todoX=x′ instead,weseem tobeasking it tohave freewill.Buthowcanarobothavefreewillifitjustfollowsinstructionsstoredinitsprogram?
Berkeley philosopher John Searle has labeled the free will problem “ascandalinphilosophy,”partlyduetothezeroprogressmadeontheproblem
sinceantiquityandpartlybecausewecannotbrushitoffasanopticalillusion.Our entire conception of “self” presupposes that we have such a thing aschoices. For example, there seems to be no way to reconcile my vivid,unmistakablesensationofhavinganoption(say,totouchornottotouchmynose)withmyunderstandingofrealitythatpresupposescausaldeterminism:all our actions are triggeredbyelectricalneural signals emanating from thebrain.
While many philosophical problems have disappeared over time in thelightofscientificprogress,freewillremainsstubbornlyenigmatic,asfreshasit appeared toAristotle andMaimonides.Moreover,while human freewillhas sometimes been justified on spiritual or theological grounds, theseexplanationswouldnotapplytoaprogrammedmachine.Soanyappearanceof robotic free will must be a gimmick—at least this is the conventionaldogma.
Notallphilosophersareconvincedthattherereallyisaclashbetweenfreewillanddeterminism.Agroupcalled“compatibilists,”amongwhomIcountmyself,consideritonlyanapparentclashbetweentwolevelsofdescription:the neural level at which processes appear deterministic (barring quantumindeterminism)andthecognitivelevelatwhichwehaveavividsensationofoptions.Suchapparentclashesarenotinfrequentinscience.Forexample,theequations of physics are time reversible on amicroscopic level, yet appearirreversible on themacroscopic level of description; the smokenever flowsback into the chimney.But that opens up new questions:Granted that freewillis(ormaybe)anillusion,whyisitsoimportanttousashumanstohavethis illusion? Why did evolution labor to endow us with this conception?Gimmick or no gimmick, should we program the next generation ofcomputerstohavethisillusion?Whatfor?Whatcomputationalbenefitsdoesitentail?
Ithinkthatunderstandingthebenefitsoftheillusionoffreewillisthekeytothestubbornlyenigmaticproblemofreconcilingitwithdeterminism.Theproblemwilldissolvebeforeoureyesonceweendowadeterministicmachinewiththesamebenefits.
Togetherwith this functional issue,wemustalsocopewithquestionsofsimulation. If neural signals from the brain trigger all our actions, then ourbrainsmustbefairlybusydecoratingsomeactionswiththetitle“willed”or“intentional”andotherswith“unintentional.”Whatpreciselyisthislabelingprocess?Whatneuralpathwouldearnagivensignalthelabel“willed”?
Inmanycases,voluntaryactionsare recognizedbya trace they leave in
short-term memory, with the trace reflecting a purpose or motivation. Forexample, “Whydid youdo it?” “Because Iwanted to impress you.”Or, asEveinnocentlyanswered,“Theserpentdeceivedme,andIate.”Butinmanyothercasesanintentionalactionistaken,andyetnoreasonormotivescometo mind. Rationalization of actions may be a reconstructive, post-actionprocess.Forexample,asoccerplayermayexplainwhyhedecidedtopasstheball to Joe instead of Charlie, but it is rarely the case that those reasonsconsciouslytriggeredtheaction.Intheheatofthegame,thousandsofinputsignals compete for the player’s attention. The crucial decision is whichsignalstoprioritize,andthereasonscanhardlyberecalledandarticulated.
AI researchers are therefore trying to answer two questions—aboutfunction and simulation—with the first driving the second. Once weunderstandwhatcomputationalfunctionfreewillservesinourlives,thenwecan attend to equipping machines with such functions. It becomes anengineeringproblem,albeitahardone.
Tome, certain aspects of the functional question stand out clearly. Theillusion of free will gives us the ability to speak about our intents and tosubject them to rational thinking,possiblyusingcounterfactual logic.Whenthecoachpullsusoutofasoccergameandsays,“YoushouldhavepassedtheballtoCharlie,”considerallthecomplexmeaningsembeddedintheseeightwords.
First,thepurposeofsucha“shouldhave”instructionistoswiftlytransmitvaluableinformationfromthecoachtotheplayer:inthefuture,whenfacedwithasimilarsituation,chooseactionBratherthanactionA.Butthe“similarsituations” are far too numerous to list and are hardly known even to thecoachhimself.Insteadoflistingthefeaturesofthese“similarsituations,”thecoach points to the player’s action, which is representative of his intent atdecisiontime.Byproclaimingtheactioninadequate, thecoachisaskingtheplayertoidentifythesoftwarepackagesthatledtohisdecisionandthenresetpriorities among those packages so that “pass to Charlie” becomes thepreferredaction.Thereisprofoundwisdominthisinstructionbecausewho,ifnottheplayerhimself,wouldknowtheidentitiesofthosepackages?Theyarenamelessneuralpathsthatcannotbereferencedbythecoachoranyexternalobserver. Asking the player to take an action different from the one takenamountstoencouraginganintent-specificanalysis,liketheonewementionedabove.Thinkingintermsofintents,therefore,offersusashorthandtoconvertcomplicatedcausalinstructionsintosimpleones.
Iwouldconjecture,then,thatateamofrobotswouldplaybettersoccerif
theywere programmed to communicate as if they had freewill.Nomatterhow technically proficient the individual robots are at soccer, their team’sperformancewillimprovewhentheycanspeaktoeachotherasiftheyarenotpreprogrammedrobotsbutautonomousagentsbelievingtheyhaveoptions.
Althoughitremainstobeseenwhethertheillusionoffreewillenhancesrobot-to-robotcommunication,thereismuchlessuncertaintyaboutrobot-to-human communication. In order to communicate naturally with humans,strongAIswill certainly need to understand the vocabulary of options andintents, and thus they will need to emulate the illusion of free will. As Iexplainedabove,theymayalsofinditadvantageousto“believe”intheirownfreewillthemselves,totheextentofbeingabletoobservetheirintentandactdifferently.
Theabilitytoreasonaboutone’sownbeliefs,intents,anddesireshasbeena major challenge to AI researchers and defines the notion of “agency.”Philosophers, on the other hand, have studied these abilities as part of theclassical question of consciousness.Questions such as “Canmachines haveconsciousness?”or“Whatmakesasoftwareagentdifferentfromanordinaryprogram?”haveengagedthebestmindsofmanygenerations,andIwouldnotpretend to answer them in full. I believe, nevertheless, that thealgorithmizationofcounterfactualsisamajorsteptowardunderstandingthesequestionsandmakingconsciousnessandagencyacomputationalreality.Themethodsdescribedforequippingamachinewithasymbolicrepresentationofitsenvironmentandthecapacitytoimagineahypotheticalperturbationofthatenvironment can be extended to include the machine itself as part of theenvironment.Nomachinecanprocessacompletecopyof itsownsoftware,butitcanhaveablueprintsummaryofitsmajorsoftwarecomponents.Othercomponents can then reason about that blueprint andmimic a state of self-awareness.
To create the perception of agency, we must also equip this softwarepackagewithamemorytorecordpastactivations,towhichitcanreferwhenasked, “Why did you do that?” Actions that pass certain patterns of pathactivation will receive reasoned explanations, such as “Because thealternative proved less attractive.” Others will end up with evasive anduselessanswers,suchas“IwishIknewwhy”or“Becausethat’sthewayyouprogrammedme.”
Insummary, Ibelieve that thesoftwarepackage thatcangivea thinkingmachinethebenefitsofagencywouldconsistofatleastthreeparts:acausalmodeloftheworld;acausalmodelofitsownsoftware,howeversuperficial;
andamemorythatrecordshowintentsinitsmindcorrespondtoeventsintheoutsideworld.
Thismay even be how our own causal education as infants begins.Wemayhavesomethinglikean“intentiongenerator”inourminds,whichtellsusthatwearesupposedtotakeactionX=x.Butchildrenlovetoexperiment—todefy theirparents’, their teachers’, even theirown initial intentions—and tosomethingdifferent,justforfun.FullyawarethatwearesupposedtodoX=x,weplayfullydoX=x′instead.Wewatchwhathappens,repeattheprocess,andkeeparecordofhowgoodour intentiongenerator is.Finally,whenwestart to adjust our own software, that is when we begin to take moralresponsibility for our actions. This responsibilitymay be an illusion at thelevelofneuralactivationbutnotatthelevelofself-awarenesssoftware.
Encouraged by these possibilities, I believe that strong AI with causalunderstandingandagencycapabilitiesisarealizablepromise,andthisraisesthe question that science fiction writers have been asking since the 1950s:Shouldwebeworried?IsstrongAIaPandora’sboxthatweshouldnotopen?
RecentlypublicfigureslikeElonMuskandStephenHawkinghavegoneonrecordsayingthatweshouldbeworried.OnTwitter,MusksaidthatAIswere “potentially more dangerous than nukes.” In 2015, John Brockman’swebsiteEdge.orgposedasitsannualquestion,thatyearasking,“Whatdoyouthink about machines that think?” It drew 186 thoughtful and provocativeanswers (since collected into a book titledWhat to Think AboutMachinesThatThink).
Brockman’s intentionally vague question can be subdivided into at leastfiverelatedones:
1.Havewealreadymademachinesthatthink?
2.Canwemakemachinesthatthink?
3.Willwemakemachinesthatthink?
4.Shouldwemakemachinesthatthink?
Andfinally,theunstatedquestionthatliesattheheartofouranxieties:
5.Canwemakemachinesthatarecapableofdistinguishinggoodfromevil?
Theanswertothefirstquestionisno,butIbelievethattheanswertoalloftheothersisyes.Wecertainlyhavenotyetmademachinesthatthinkinanyhumanlike interpretation of the word. So far we can only simulate human
thinkinginnarrowlydefineddomainsthathaveonlythemostprimitivecausalstructures.Therewecanactuallymakemachinesthatoutperformhumans,butthis shouldbeno surprise because thesedomains reward theone thing thatcomputersdowell:compute.
The answer to the second question is almost certainly yes, ifwe definethinkingasbeingabletopasstheTuringtest.Isaythatonthebasisofwhatwehavelearnedfromthemini-Turingtest.Theabilitytoanswerqueriesatallthree levels of the Ladder of Causation provides the seeds of “agency”softwaresothatthemachinecanthinkaboutitsownintentionsandreflectonits own mistakes. The algorithms for answering causal and counterfactualqueriesalreadyexist(thanksinlargeparttomystudents),andtheyareonlywaitingforindustriousAIresearcherstoimplementthem.
Thethirdquestiondepends,ofcourse,onhumanevents thataredifficultto predict. But historically, humans have seldom refrained frommaking ordoingthingsthattheyaretechnologicallycapableof.Partlythisisbecausewedonotknowwearetechnologicallycapableofsomethinguntilweactuallydoit, whether it’s cloning animals or sending astronauts to the moon. Thedetonationof the atomicbomb,however,was a turningpoint:manypeoplethinkthistechnologyshouldnothavebeendeveloped.
SinceWorldWar II, a good exampleof scientists pullingback from thefeasible was the 1975Asilomar conference onDNA recombination, a newtechnologyseenbythemediainsomewhatapocalypticterms.Thescientistsworking in the fieldmanaged to come to a consensusongood-sense safetypractices, and the agreement they reached then has held up well over theensuing four decades. Recombinant DNA is now a common, maturetechnology.
In 2017, the Future of Life Institute convened a similar Asilomarconference on artificial intelligence and agreed on a set of twenty-threeprinciplesforfutureresearchin“beneficialAI.”Whilemostoftheguidelinesarenotrelevanttothetopicsdiscussedinthisbook,therecommendationsonethics and values are definitely worthy of attention. For example,recommendations6,“AIsystemsshouldbesafeandsecurethroughouttheiroperationallifetime,andverifiablyso,”and7,“IfanAIsystemcausesharm,it should be possible to ascertain why,” clearly speak to the importance oftransparency.Recommendation 10, “Highly autonomousAI systems shouldbe designed so that their goals and behaviors can be assured to alignwithhumanvaluesthroughouttheiroperation,”israthervagueasstatedbutcouldbe given operationalmeaning if these systemswere required to be able to
declare their own intents and communicate with humans about causes andeffects.
Myanswertothefourthquestionisalsoyes,basedontheanswertothefifth. I believe that wewill be able tomakemachines that can distinguishgoodfromevil,atleastasreliablyashumansandhopefullymoreso.Thefirstrequirement of amoralmachine is the ability to reflect on its own actions,which fallsundercounterfactual analysis.Onceweprogramself-awareness,however limited, empathy and fairness follow, for it is based on the samecomputationalprinciples,withanotheragentaddedtotheequation.
Thereisabigdifferenceinspiritbetweenthecausalapproachtobuildingthemoralrobotandanapproachthathasbeenstudiedandrehashedoverandover in science fiction since the 1950s: Asimov’s laws of robotics. IsaacAsimovproposedthreeabsolutelaws,startingwith“Arobotmaynotinjureahumanbeingor,throughinaction,allowahumanbeingtocometoharm.”Butassciencefictionhasshownoverandoveragain,Asimov’slawsalwaysleadto contradictions. To AI scientists, this comes as no surprise: rule-basedsystemsneverturnoutwell.Butitdoesnotfollowthatbuildingamoralrobotis impossible. It means that the approach cannot be prescriptive and rulebased. It means that we should equip thinking machines with the samecognitiveabilitiesthatwehave,whichincludeempathy,long-termprediction,andself-restraint,andthenallowthemtomaketheirowndecisions.
Oncewehavebuiltamoralrobot,manyapocalypticvisionsstarttorecedeintoirrelevance.Thereisnoreasontorefrainfrombuildingmachinesthatarebetter able to distinguish good from evil than we are, better able to resisttemptation,betterabletoassignguiltandcredit.Atthispoint,likechessandGoplayers,wemayevenstarttolearnfromourowncreation.Wewillbeableto depend on our machines for a clear-eyed and causally sound sense ofjustice.Wewillbeable to learnhowourownfreewill softwareworksandhowitmanagestohideitssecretsfromus.SuchathinkingmachinewouldbeawonderfulcompanionforourspeciesandwouldtrulyqualifyasAI’sfirstandbestgifttohumanity.

ACKNOWLEDGMENTS
Toenumeratetheentirecastofstudents,friends,colleagues,andteacherswhohave contributed ideas to this bookwould amount towriting another book.Still, a fewplayersdeserve specialmention, frommypersonalpersective. IwouldliketothankPhilDawid,forgivingmemyfirstauditiononthepagesofBiometrika;JamieRobinsandSanderGreenland,forturningepidemiologyintoagraph-speakingcommunity;thelateDennisLindley,forgivingmetheassurance that even seasoned statisticians can recognize flaws in their fieldandrallyforitsreform;ChrisWinship,StevenMorgan,andFelixElwertforushering social science into theageof causation; and, finally,PeterSpirtes,ClarkGlymour,andRichardScheines,fortheirhelpinpushingmeoverthecliffofprobabilitiesintothestormywatersofcausation.
Diggingdeeperintomyancienthistory,ImustthankJosephHermony,Dr.Shimshon Lange, Professor Franz Ollendorff, and other dedicated scienceteachers who inspired me from grade school to college. They instilled inmany of us first-generation Israelis a sense of mission and historicalresponsibility topursue scientificexplorationsasmankind’smostnobleandfunchallenge.
Thisbookwouldhaveremainedarelicofwishfulthinkingifitwerenotformyco-author,DanaMackenzie,whotookmywishful thinkingseriouslyandmadeitareality.Henotonlycorrectedmyforeignaccentbutalsotookme to distant lands, from the Navy ships of Captain James Lind to theAntarctic expedition of Captain Robert Scott, adding knowledge, stories,structure,andclaritytoamessofmathematicalequationsthatwereawaitinganorganizingnarrative.
I owe a great debt tomembers of the Cognitive Systems Laboratory atUCLAwhoseworkandideasover thepast threeandahalfdecadesformedthe scientificbasisof thisbook:AlexBalke,EliasBareinboim,Blai Bonet,CarloBrito,AvinChen,BryantChen,DavidChickering,AdnanDarwiche,
Rina Dechter, Andrew Forney, David Galles, Hector Geffner, Dan Geiger,Moises Goldszmidt, David Heckerman, Mark Hopkins, Jin Kim, ManabuKuroki, Trent Kyono, Karthika Mohan, Azaria Paz, George Rebane, IlyaShpitser,JinTian,andThomasVerma.
Fundingagenciesreceiveritualizedthanksinscholarlypublicationsbutfartoo little real credit, considering their crucial role in recognizing seeds ofideas before they become fashionable. I must acknowledge the steady andunfailingsupportoftheNationalScienceFoundationandtheOfficeofNavalResearch,throughtheMachineLearningandIntelligenceprogramheadedbyBehzadKamgar-Parsi.
DanaandIwould like to thankouragent,JohnBrockman,whogaveustimelyencouragementandthebenefitofhisprofessionalexpertise.OureditoratBasicBooks,TJKelleher,askedusjusttherightquestionsandpersuadedBasicBooks thatastory thisambitiouscouldnotbe told in200pages.Ourillustrators, Maayan Harel and Dakota Harr, managed to cope with oursometimesconflicting instructions andbrought abstract subjects to lifewithhumor and beauty. Kaoru Mulvihill at UCLA deserves much credit forproofing several versions of the manuscript and illustrating the hordes ofgraphsanddiagrams.
Danawill be forever grateful to JohnWilkes,who founded the ScienceCommunicationProgramatUCSantaCruz,whichisstillgoingstrongandisthebestpossiblerouteintoacareerasasciencewriter.Danawouldalsoliketothankhiswife,Kay,whoencouragedhimtopursuehischildhooddreamofbeingawriter,evenwhenitmeantpullingupstakes,crossingthecountry,andstartingover.
Finally, my deepest debt is owed to my family, for their patience,understanding,andsupport.Especiallytomywife,Ruth,mymoralcompass,forherendlessloveandwisdom.Tomylateson,Danny,forshowingmethesilentaudacityoftruth.TomydaughtersTamaraandMichellefortrustingmyperennial promise that the book will eventually be done. And to mygrandchildren,Leora,Tori,Adam,AriandEvan,forgivingapurposetomylongjourneysandforalwaysdissolvingmy“why”questionsaway.
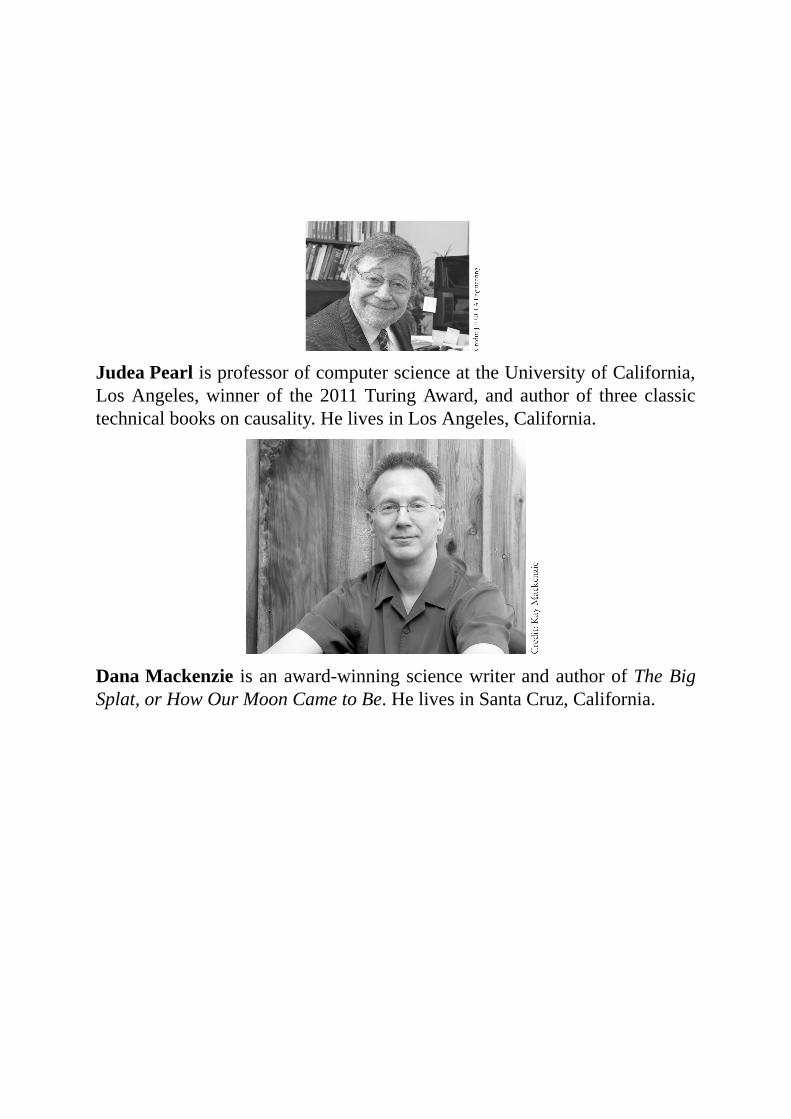
JudeaPearlisprofessorofcomputerscienceattheUniversityofCalifornia,LosAngeles,winnerof the2011TuringAward, and authorof three classictechnicalbooksoncausality.HelivesinLosAngeles,California.
DanaMackenzie isanaward-winningsciencewriterandauthorofTheBigSplat,orHowOurMoonCametoBe.HelivesinSantaCruz,California.
ALSOBYJUDEAPEARL:
CausalInferenceinStatistics:APrimer(withMadelynGlymourandNicholasJewell)
AnIntroductiontoCausalInference
IAmJewish:PersonalReflectionsInspiredbytheLastWordsofDanielPearl(coeditedwithRuthPearl)
Causality:Models,ReasoningandInference
ProbabilisticReasoninginIntelligentSystems:NetworksofPlausibleInference
Heuristics:IntelligentSearchStrategiesforComputerProblemSolving
ALSOBYDANAMACKENZIE:
TheUniverseinZeroWords:TheStoryofMathematicsasToldThroughEquations
What’sHappeningintheMathematicalSciences(volumes6–10)
TheBigSplat,orHowOurMoonCametoBe
NOTES
NOTESTOINTRODUCTION
Students are never allowed: With possibly one exception: if we haveperformedarandomizedcontrolledtrial,asdiscussedinChapter4.
NOTESTOCHAPTERONEthentheoppositeistrue:Inotherwords,whenevaluatinganinterventionina causal model, we make the minimum changes possible to enforce itsimmediateeffect.Sowe“break”themodelwhereitcomestoAbutnotB.
We should thank the language: I should also mention here thatcounterfactuals allowus to talk about causality in individual cases:Whatwouldhavehappened toMr.Smith,whowasnotvaccinated anddiedofsmallpox, if he had been vaccinated? Such questions, the backbone ofpersonalizedmedicine,cannotbeansweredfromrung-twoinformation.
Yetwecananswer:Tobemoreprecise, ingeometry,undefined terms like“point”and“line”areprimitives.Theprimitive incausal inference is therelationof“listeningto,”indicatedbyanarrow.
NOTESTOCHAPTERTWO
And now the algebraicmagic: For anyone who takes the trouble to readWright’s paper, let me warn you that he does not compute his pathcoefficients ingramsperday.He computes them in “standardunits” andthenconvertstogramsperdayattheend.
NOTESTOCHAPTERFIVE“Cigarettesmokingiscausallyrelated”:Theevidenceforwomenwaslessclear at that time, primarily becausewomen had smokedmuch less thanmenintheearlydecadesofthecentury.
NOTESTOCHAPTEREIGHTAndAbrahamdrewnear:Asbefore,IhaveusedtheKingJamestranslationbutmadesmallchangestoalignitmorecloselywiththeHebrew.
The ease and familiarity of such: The 2013 Joint Statistical Meetingsdedicatedawholesessiontothetopic“CausalInferenceasaMissingDataProblem”—Rubin’s traditional mantra. One provocative paper at thatsessionwastitled“WhatIsNotaMissingDataProblem?”Thistitlesumsupmythoughtsprecisely.
Thisdifferenceincommitment:Readerswhoareseeingthisdistinctionforthefirsttimeshouldnotfeelalone;therearewellover100,000regressionanalystsintheUnitedStateswhoareconfusedbythisveryissue,togetherwithmost authors of statistical textbooks.Thingswill only changewhenreadersofthisbooktakethoseauthorstotask.
Unfortunately, Rubin does not consider: “Pearl’s work is clearlyinteresting,andmanyresearchersfindhisargumentsthatpathdiagramsarea natural and convenient way to express assumptions about causalstructuresappealing. Inourownwork,perhaps influencedby the typeofexamples arising in social andmedical sciences, we have not found thisapproachtoaidthedrawingofcausalinferences”(ImbensandRubin2013,p.25).
OneobstacleIfacedwascyclicmodels:Thesearemodelswitharrowsthatformaloop.Ihaveavoideddiscussingtheminthisbook,butsuchmodelsarequiteimportantineconomics,forexample.
Eventodaymodern-dayeconomists:Between1995and1998, IpresentedthefollowingtoypuzzletohundredsofeconometricsstudentsandfacultyacrosstheUnitedStates:
Consider the classical supply-and-demand equations that every economicsstudentsolvesinEconomics101.
1. What is the expected value of the demandQ if the price isreportedtobeP=p0?
2.WhatistheexpectedvalueofthedemandQifthepriceissettoP=p0?
3.GiventhatthecurrentpriceisP=p0,whatwouldtheexpectedvalueofthedemandQbeifweweretosetthepriceatP=p1?
Thereadershouldrecognizethesequeriesascomingfromthethreelevelsof the Ladder of Causation: predictions, actions, and counterfactuals. As Iexpected, respondents had no trouble answering question 1, one person (adistinguishedprofessor)wasabletosolvequestion2,andnobodymanagedtoanswerquestion3.
TheModelPenalCodeexpresses:ThisisasetofstandardlegalprinciplesproposedbytheAmericanLawInstitutein1962tobringuniformitytothevariousstatelegalcodes.Itdoesnothavefulllegalforceinanystate,butaccordingtoWikipedia,asof2016,morethantwo-thirdsofthestateshaveenactedpartsoftheModelPenalCode.
NOTESTOCHAPTERNINE
Thosesailorswhohadeaten:ThereasonisthatpolarbearliversdocontainvitaminC.
“OntheInadequacyofthePartial”:Thetitlereferstopartialcorrelation,astandard method of controlling for a confounder that we discussed inChapter7.
here is how to define the NIE: In the original delivery room, NIE wasexpressedusingnestedsubscripts,asinY(0,M1).Ihopethereaderwillfindthe mixture of counterfactual subscripts and do-operators above moretransparent.
In that year researchers identified:To be technically correct it should becalleda“singlenucleotidepolymorphism,”orSNP. It isasingle letter inthegeneticcode,whileageneismorelikeawordorasentence.However,inordernottoburdenthereaderwithunfamiliarterminology,Iwillsimplyrefertoitasagene.
BIBLIOGRAPHY
INTRODUCTION:MINDOVERDATA
AnnotatedBibliographyThe history of probability and statistics from antiquity to modern days iscovered in depth by Hacking (1990); Stigler (1986, 1999, 2016). A lesstechnicalaccountisgiveninSalsburg(2002).Comprehensiveaccountsofthehistory of causal thought are unfortunately lacking, though interestingmaterial can be found in Hoover (2008); Kleinberg (2015); Losee (2012);Mumford andAnjum (2014).Theprohibitionon causal talk canbe seen inalmost every standard statistical text, for example, Freedman, Pisani, andPurves(2007)orEfronandHastie(2016).Forananalysisofthisprohibitionas a linguistic impediment, see Pearl (2009, Chapters 5 and 11), and as aculturalbarrier,seePearl(2000b).
Recent accounts of the achievements and limitations of Big Data andmachinelearningareDarwiche(2017);Pearl(2017);Mayer-SchönbergerandCukier (2013); Domingos (2015);Marcus (July 30, 2017). Toulmin (1961)provideshistoricalcontexttothisdebate.
Readersinterestedin“modeldiscovery”andmoretechnicaltreatmentsofthe do-operator can consult Pearl (1994, 2000a, Chapters 2–3); Spirtes,Glymour, and Scheines (2000). For a gentler introduction, see Pearl,Glymour, and Jewell (2016). This last source is recommended for readerswith college-level mathematical skills but no background in statistics orcomputer science. It also provides basic introduction to conditionalprobabilities,Bayes’srule,regression,andgraphs.
EarlierversionsoftheinferenceengineshowninFigure1.1canbefoundinPearl(2012);PearlandBareinboim(2014).
References
Darwiche,A.(2017).Human-levelintelligenceoranimal-likeabilities?Tech.rep.,DepartmentofComputerScience,UniversityofCalifornia,LosAngeles,CA.SubmittedtoCommunicationsoftheACM.Accessedonlineathttps://arXiv:1707.04327.
Domingos,P.(2015).TheMasterAlgorithm:HowtheQuestfortheUltimateLearningMachineWillRemakeOurWorld.BasicBooks,NewYork,NY.
Efron,B.,andHastie,T.(2016).ComputerAgeStatisticalInference.CambridgeUniversityPress,NewYork,NY.
Freedman,D.,Pisani,R.,andPurves,R.(2007).Statistics.4thed.W.W.Norton&Company,NewYork,NY.
Hacking,I.(1990).TheTamingofChance(IdeasinContext).CambridgeUniversityPress,Cambridge,UK.
Hoover,K.(2008).Causalityineconomicsandeconometrics.InTheNewPalgraveDictionaryofEconomics(S.DurlaufandL.Blume,eds.),2nded.PalgraveMacmillan,NewYork,NY.
Kleinberg,S.(2015).Why:AGuidetoFindingandUsingCauses.O’ReillyMedia,Sebastopol,CA.
Losee,J.(2012).TheoriesofCausality:FromAntiquitytothePresent.Routledge,NewYork,NY.
Marcus,G.(July30,2017).Artificialintelligenceisstuck.Here’showtomoveitforward.NewYorkTimes,SR6.
Mayer-Schönberger,V.,andCukier,K.(2013).BigData:ARevolutionThatWillTransformHowWeLive,Work,andThink.HoughtonMifflinHarcourtPublishing,NewYork,NY.
Morgan,S.,andWinship,C.(2015).CounterfactualsandCausalInference:MethodsandPrinciplesforSocialResearch(AnalyticalMethodsforSocialResearch).2nded.CambridgeUniversityPress,NewYork,NY.
Mumford,S.,andAnjum,R.L.(2014).Causation:AVeryShortIntroduction(VeryShortIntroductions).OxfordUniversityPress,NewYork,NY.
Pearl,J.(1988).ProbabilisticReasoninginIntelligentSystems.MorganKaufmann,SanMateo,CA.
Pearl,J.(1994).Aprobabilisticcalculusofactions.InUncertaintyinArtificialIntelligence10(R.L.deMantarasandD.Poole,eds.).MorganKaufmann,SanMateo,CA,454–462.
Pearl,J.(1995).Causaldiagramsforempiricalresearch.Biometrika82:669–710.
Pearl,J.(2000a).Causality:Models,Reasoning,andInference.CambridgeUniversityPress,NewYork,NY.
Pearl,J.(2000b).CommentonA.P.Dawid’sCausalinferencewithoutcounterfactuals.JournaloftheAmericanStatisticalAssociation95:428–431.
Pearl,J.(2009).Causality:Models,Reasoning,andInference.2nded.CambridgeUniversityPress,NewYork,NY.
Pearl,J.(2012).Thecausalfoundationsofstructuralequationmodeling.InHandbookofStructuralEquationModeling(R.Hoyle,ed.).GuilfordPress,NewYork,NY,68–91.
Pearl,J.(2017).Advancesindeepneuralnetworks,atACMTuring50Celebration.Availableat:https://www.youtube.com/watch?v=mFYM9j8bGtg(June23,2017).
Pearl,J.,andBareinboim,E.(2014).Externalvalidity:Fromdo-calculustotransportabilityacrosspopulations.StatisticalScience29:579–595.
Pearl,J.,Glymour,M.,andJewell,N.(2016).CausalInferenceinStatistics:APrimer.Wiley,NewYork,NY.
Provine,W.B.(1986).SewallWrightandEvolutionaryBiology.UniversityofChicagoPress,Chicago,IL.
Salsburg,D.(2002).TheLadyTastingTea:HowStatisticsRevolutionizedScienceintheTwentiethCentury.HenryHoltandCompany,LLC,NewYork,NY.
Spirtes,P.,Glymour,C.,andScheines,R.(2000).Causation,Prediction,andSearch.2nded.MITPress,Cambridge,MA.
Stigler,S.M.(1986).TheHistoryofStatistics:TheMeasurementofUncertaintyBefore1900.BelknapPressofHarvardUniversityPress,Cambridge,MA.
Stigler,S.M.(1999).StatisticsontheTable:TheHistoryofStatisticalConceptsandMethods.HarvardUniversityPress,Cambridge,MA.
Stigler,S.M.(2016).TheSevenPillarsofStatisticalWisdom.HarvardUniversityPress,Cambridge,MA.
Toulmin,S.(1961).ForesightandUnderstanding:AnEnquiryintotheAims
ofScience.UniversityofIndianaPress,Bloomington,IN.
Virgil.(29BC).Georgics.Verse490,Book2.
CHAPTER1.THELADDEROFCAUSATION
AnnotatedBibliographyAtechnicalaccountofthedistinctionsbetweenthethreelevelsoftheLadderofCausationcanbefoundinChapter1ofPearl(2000).
Ourcomparisonsbetween theLadderofCausationandhumancognitivedevelopmentwere inspired byHarari (2015) and by the recent findings byKindetal.(2014).Kind’sarticlecontainsdetailsabouttheLionManandthesite where it was found. Related research on the development of causalunderstandinginbabiescanbefoundinWeisbergandGopnik(2013).
TheTuringtestwasfirstproposedasanimitationgamein1950(Turing,1950).Searle’s“ChineseRoom”argumentappearedinSearle(1980)andhasbeen widely discussed in the years since. See Russell and Norvig (2003);PrestonandBishop(2002);Pinker(1997).
Theuseofmodelmodificationtorepresentinterventionhasitsconceptualroots with the economist Trygve Haavelmo (1943); see Pearl (2015) for adetailed account.Spirtes,Glymour, andScheines (1993)gave it agraphicalrepresentation in terms of arrow deletion. Balke and Pearl (1994a, 1994b)extendedittosimulatecounterfactualreasoning,asdemonstratedinthefiringsquadexample.
AcomprehensivesummaryofprobabilisticcausalityisgiveninHitchcock(2016). Key ideas can be found in Reichenbach (1956); Suppes (1970);Cartwright(1983);Spohn(2012).MyanalysesofprobabilisticcausalityandprobabilityraisingarepresentedinPearl(2000;2009,Section7.5;2011).
ReferencesBalke,A.,andPearl,J.(1994a).Counterfactualprobabilities:Computationalmethods,bounds,andapplications.InUncertaintyinArtificialIntelligence10(R.L.deMantarasandD.Poole,eds.).MorganKaufmann,SanMateo,CA,46–54.
Balke,A.,andPearl,J.(1994b).Probabilisticevaluationofcounterfactualqueries.InProceedingsoftheTwelfthNationalConferenceonArtificialIntelligence,vol.1.MITPress,MenloPark,CA,230–237.
Cartwright,N.(1983).HowtheLawsofPhysicsLie.ClarendonPress,
Oxford,UK.
Haavelmo,T.(1943).Thestatisticalimplicationsofasystemofsimultaneousequations.Econometrica11:1–12.ReprintedinD.F.HendryandM.S.Morgan(Eds.),TheFoundationsofEconometricAnalysis,CambridgeUniversityPress,Cambridge,UK,477–490,1995.
Harari,Y.N.(2015).Sapiens:ABriefHistoryofHumankind.HarperCollinsPublishers,NewYork,NY.
Hitchcock,C.(2016).Probabilisticcausation.InStanfordEncyclopediaofPhilosophy(Winter2016)(E.N.Zalta,ed.).MetaphysicsResearchLab,Stanford,CA.Availableat:https://stanford.library.sydney.edu.au/archives/win2016/entries/causation-probabilistic.
Kind,C.-J.,Ebinger-Rist,N.,Wolf,S.,Beutelspacher,T.,andWehrberger,K.(2014).ThesmileoftheLionMan.RecentexcavationsinStadelcave(Baden-Württemberg,south-westernGermany)andtherestorationofthefamousupperpalaeolithicfigurine.Quartär61:129–145.
Pearl,J.(2000).Causality:Models,Reasoning,andInference.CambridgeUniversityPress,NewYork,NY.
Pearl,J.(2009).Causality:Models,Reasoning,andInference.2nded.CambridgeUniversityPress,NewYork,NY.
Pearl,J.(2011).Thestructuraltheoryofcausation.InCausalityintheSciences(P.M.Illari,F.Russo,andJ.Williamson,eds.),chap.33.ClarendonPress,Oxford,UK,697–727.
Pearl,J.(2015).TrygveHaavelmoandtheemergenceofcausalcalculus.EconometricTheory31:152–179.SpecialissueonHaavelmocentennial.
Pinker,S.(1997).HowtheMindWorks.W.W.NortonandCompany,NewYork,NY.
Preston,J.,andBishop,M.(2002).ViewsintotheChineseRoom:NewEssaysonSearleandArtificialIntelligence.OxfordUniversityPress,NewYork,NY.
Reichenbach,H.(1956).TheDirectionofTime.UniversityofCaliforniaPress,Berkeley,CA.
Russell,S.J.,andNorvig,P.(2003).ArtificialIntelligence:AModernApproach.2nded.PrenticeHall,UpperSaddleRiver,NJ.
Searle,J.(1980).Minds,brains,andprograms.BehavioralandBrainSciences3:417–457.

Spirtes,P.,Glymour,C.,andScheines,R.(1993).Causation,Prediction,andSearch.Springer-Verlag,NewYork,NY.
Spohn,W.(2012).TheLawsofBelief:RankingTheoryandItsPhilosophicalApplications.OxfordUniversityPress,Oxford,UK.
Suppes,P.(1970).AProbabilisticTheoryofCausality.North-HollandPublishingCo.,Amsterdam,Netherlands.
Turing,A.(1950).Computingmachineryandintelligence.Mind59:433–460.
Weisberg,D.S.,andGopnik,A.(2013).Pretense,counterfactuals,andBayesiancausalmodels:Whywhatisnotrealreallymatters.CognitiveScience37:1368–1381.
CHAPTER2.FROMBUCCANEERSTOGUINEAPIGS:THEGENESISOFCAUSALINFERENCE
AnnotatedBibliographyGalton’s explorationsof heredity and correlation are described in his books(Galton,1869,1883,1889)andarealsodocumentedinStigler(2012,2016).
ForabasicintroductiontotheHardy-Weinbergequilibrium,seeWikipedia(2016a).For theoriginofGalileo’squote “Epur simuove,” seeWikipedia(2016b).ThestoryofthePariscatacombsandPearson’sshockatcorrelationsinducedby“artificialmixtures”canbefoundinStigler(2012,p.9).
BecauseWrightlivedsuchalonglife,hehadtherareprivilegeofseeingabiography (Provine, 1986) come out while he was still alive. Provine’sbiography is still the best place to learn about Wright’s career, and weparticularlyrecommendChapter5onpathanalysis.Crow’stwobiographicalsketches (Crow, 1982, 1990) also provide a very useful biographicalperspective. Wright (1920) is the seminal paper on path diagrams; Wright(1921) is a fuller exposition and the source for the guinea pig birth-weightexample. Wright (1983) is Wright’s response to Karlin’s critique, writtenwhenhewasoverninetyyearsold.
The fate of path analysis in economics and social science is narrated inChapter 5 of Pearl (2000) and in Bollen and Pearl (2013). Blalock (1964),Duncan (1966), and Goldberger (1972) introducedWright’s ideas to socialsciencewith great enthusiasm, but their theoretical underpinningswere notwell articulated. A decade later, when Freedman (1987) challenged pathanalysts to explain how interventions are modelled, the enthusiasmdisappeared,andleadingresearchersretreatedtoviewingSEMasanexercise
in statistical analysis. This revealing discussion among twelve scholars isdocumented in the same issue of the Journal of Educational Statistics asFreedman’sarticle.
Thereluctanceofeconomiststoembracediagramsandstructuralnotationis described in Pearl (2015). The painful consequences for economiceducationaredocumentedinChenandPearl(2013).
ApopularexpositionoftheBayesian-versus-frequentistdebateisgiveninMcGrayne(2011).
More technical discussions can be found in Efron (2013) and Lindley(1987).
ReferencesBlalock,H.,Jr.(1964).CausalInferencesinNonexperimentalResearch.UniversityofNorthCarolinaPress,ChapelHill,NC.
Bollen,K.,andPearl,J.(2013).Eightmythsaboutcausalityandstructuralequationmodels.InHandbookofCausalAnalysisforSocialResearch(S.Morgan,ed.).Springer,Dordrecht,Netherlands,301–328.
Chen,B.,andPearl,J.(2013).Regressionandcausation:Acriticalexaminationofeconometricstextbooks.Real-WorldEconomicsReview65:2–20.
Crow,J.F.(1982).SewallWright,thescientistandtheman.PerspectivesinBiologyandMedicine25:279–294.
Crow,J.F.(1990).SewallWright’splaceintwentieth-centurybiology.JournaloftheHistoryofBiology23:57–89.
Duncan,O.D.(1966).Pathanalysis.AmericanJournalofSociology72:1–16.
Efron,B.(2013).Bayes’theoreminthe21stcentury.Science340:1177–1178.
Freedman,D.(1987).Asothersseeus:Acasestudyinpathanalysis(withdiscussion).JournalofEducationalStatistics12:101–223.
Galton,F.(1869).HereditaryGenius.Macmillan,London,UK.
Galton,F.(1883).InquiriesintoHumanFacultyandItsDevelopment.Macmillan,London,UK.
Galton,F.(1889).NaturalInheritance.Macmillan,London,UK.
Goldberger,A.(1972).Structuralequationmodelsinthesocialsciences.Econometrica:JournaloftheEconometricSociety40:979–1001.
Lindley,D.(1987).BayesianStatistics:AReview.CBMS-NSFRegionalConferenceSeriesinAppliedMathematics(Book2).SocietyforIndustrialandAppliedMathematics,Philadelphia,PA.
McGrayne,S.B.(2011).TheTheoryThatWouldNotDie.YaleUniversityPress,NewHaven,CT.
Pearl,J.(2000).Causality:Models,Reasoning,andInference.CambridgeUniversityPress,NewYork,NY.
Pearl,J.(2015).TrygveHaavelmoandtheemergenceofcausalcalculus.EconometricTheory31:152–179.SpecialissueonHaavelmocentennial.
Provine,W.B.(1986).SewallWrightandEvolutionaryBiology.UniversityofChicagoPress,Chicago,IL.
Stigler,S.M.(2012).Studiesinthehistoryofprobabilityandstatistics,L:KarlPearsonandtheruleofthree.Biometrika99:1–14.
Stigler,S.M.(2016).TheSevenPillarsofStatisticalWisdom.HarvardUniversityPress,Cambridge,MA.
Wikipedia.(2016a).Hardy-Weinbergprinciple.Availableat:https://en.wikipedia.org/wiki/Hardy-Weinberg-principle(lastedited:October2,2016).
Wikipedia.(2016b).GalileoGalilei.Availableat:https://en.wikipedia.org/wiki/Galileo_Galilei(lastedited:October6,2017).
Wright,S.(1920).Therelativeimportanceofheredityandenvironmentindeterminingthepiebaldpatternofguinea-pigs.ProceedingsoftheNationalAcademyofSciencesoftheUnitedStatesofAmerica6:320–332.
Wright,S.(1921).Correlationandcausation.JournalofAgriculturalResearch20:557–585.
Wright,S.(1983).On“Pathanalysisingeneticepidemiology:Acritique.”AmericanJournalofHumanGenetics35:757–768.
CHAPTER3.FROMEVIDENCETOCAUSES:REVERENDBAYESMEETSMR.HOLMES
AnnotatedBibliographyElementaryintroductionstoBayes’sruleandBayesianthinkingcanbefound
in Lindley (2014) and Pearl, Glymour, and Jewell (2016). Debates withcompeting representations of uncertainty are presented in Pearl (1988); seealsotheextensivelistofreferencesgiventhere.
OurmammogramdataarebasedprimarilyoninformationfromtheBreastCancerSurveillanceConsortium (BCSC,2009) andUSPreventiveServicesTaskForce(USPSTF,2016)andarepresentedforinstructionalpurposesonly.
“Bayesiannetworks”receivedtheirnamein1985(Pearl,1985)andwerefirst presented as amodel of self-activatedmemory.Applications to expertsystems followed the development of belief updating algorithms for loopynetworks(Pearl,1986;LauritzenandSpiegelhalter,1988).
Theconceptofd-separation,whichconnectspathblockinginadiagramtodependencies in thedata,has its roots in the theoryofgraphoids (PearlandPaz,1985).The theoryunveils thecommonpropertiesofgraphs (hence thename) and probabilities and explains why these two seemingly alienmathematical objects can support one another in so many ways. See also“Graphoid,”Wikipedia.
The amusing example of the bag on the airline flight can be found inConradyandJouffe(2015,Chapter4).
TheMalaysiaAirlinesFlight17disasterwaswellcovered in themedia;seeClarkandKramer(October14,2015)foranupdateontheinvestigationayear after the incident.Wiegerinck, Burgers, and Kappen (2013) describeshow Bonaparte works. Further details on the identification of Flight 17victims, including the pedigree shown in Figure 3.7, came from personalcorrespondence fromW. Burgers to D. Mackenzie (August 24, 2016) andfrom a phone interviewwithW. Burgers andB.Kappen byD.Mackenzie(August23,2016).
Thecomplexandfascinatingstoryof turboandlow-densityparity-checkcodes has not been told in a truly layman-friendly form, but good startingpoints are Costello and Forney (2007) and Hardesty (2010a, 2010b). ThecrucialrealizationthatturbocodesworkbythebeliefpropagationalgorithmstemsfromMcEliece,David,andCheng(1998).
Efficientcodescontinuetobeabattlegroundforwirelesscommunications;Carlton (2016) takes a lookat thecurrent contenders for “5G”phones (dueoutinthe2020s).
ReferencesBreastCancerSurveillanceConsortium(BCSC).(2009).Performance
measuresfor1,838,372screeningmammographyexaminationsfrom2004to2008byage.Availableat:http://www.bcsc-research.org/statistics/performance/screening/2009/perf_age.html(accessedOctober12,2016).
Carlton,A.(2016).Surprise!Polarcodesarecominginfromthecold.Computerworld.Availableat:https://www.computerworld.com/article/3151866/mobile-wireless/surprise-polar-codes-are-coming-in-from-the-cold.html(postedDecember22,2016).
Clark,N.,andKramer,A.(October14,2015).MalaysiaAirlinesFlight17mostlikelyhitbyRussian-mademissile,inquirysays.NewYorkTimes.
Conrady,S.,andJouffe,L.(2015).BayesianNetworksandBayesiaLab:APracticalIntroductionforResearchers.BayesiaUSA,Franklin,TN.
Costello,D.J.,andForney,G.D.,Jr.(2007).Channelcoding:Theroadtochannelcapacity.ProceedingsofIEEE95:1150–1177.
Hardesty,L.(2010a).Explained:Gallagercodes.MITNews.Availableat:http://news.mit.edu/2010/gallager-codes-0121(posted:January21,2010).
Hardesty,L.(2010b).Explained:TheShannonlimit.MITNews.Availableat:http://news.mit.edu/2010/explained-shannon-0115(postedJanuary19,2010).
Lauritzen,S.,andSpiegelhalter,D.(1988).Localcomputationswithprobabilitiesongraphicalstructuresandtheirapplicationtoexpertsystems(withdiscussion).JournaloftheRoyalStatisticalSociety,SeriesB50:157–224.
Lindley,D.V.(2014).UnderstandingUncertainty.Rev.ed.JohnWileyandSons,Hoboken,NJ.
McEliece,R.J.,David,J.M.,andCheng,J.(1998).TurbodecodingasaninstanceofPearl’s“beliefpropagation”algorithm.IEEEJournalonSelectedAreasinCommunications16:140–152.
Pearl,J.(1985).Bayesiannetworks:Amodelofself-activatedmemoryforevidentialreasoning.InProceedings,CognitiveScienceSociety(CSS-7).UCLAComputerScienceDepartment,Irvine,CA.
Pearl,J.(1986).Fusion,propagation,andstructuringinbeliefnetworks.ArtificialIntelligence29:241–288.
Pearl,J.(1988).ProbabilisticReasoninginIntelligentSystems.Morgan
Kaufmann,SanMateo,CA.
Pearl,J.,Glymour,M.,andJewell,N.(2016).CausalInferenceinStatistics:APrimer.Wiley,NewYork,NY.
Pearl,J.,andPaz,A.(1985).GRAPHOIDS:Agraph-basedlogicforreasoningaboutrelevancerelations.Tech.Rep.850038(R-53-L).ComputerScienceDepartment,UniversityofCalifornia,LosAngeles.ShortversioninB.DuBoulay,D.Hogg,andL.Steels(Eds.)AdvancesinArtificialIntelligence—II,Amsterdam,NorthHolland,357–363,1987.
USPreventiveServicesTaskForce(USPSTF)(2016).Finalrecommendationstatement:Breastcancer:Screening.Availableat:https://www.uspreventiveservicestaskforce.org/Page/Document/RecommendationStatementFinal/breast-cancer-screening1(updated:January2016).
Wikipedia.(2018).Graphoid.Availableat:https://en.wikipedia.org/wiki/Graphoid(lastedited:January8,2018).
Wiegerinck,W.,Burgers,W.,andKappen,B.(2013).Bayesiannetworks,introductionandpracticalapplications.InHandbookonNeuralInformationProcessing(M.Bianchini,M.Maggini,andL.C.Jain,eds.).IntelligentSystemsReferenceLibrary(Book49).Springer,Berlin,Germany,401–431.
CHAPTER4.CONFOUNDINGANDDECONFOUNDING:OR,SLAYINGTHELURKINGVARIABLE
AnnotatedBibliographyThestoryofDanielhasfrequentlybeencitedasthefirstcontrolledtrial;see,forexample,Lilienfeld(1982)orStigler(2016).TheresultsoftheHonoluluwalkingstudywerereportedinHakim(1998).
Fisher Box’s lengthy quote about “the skillful interrogation of Nature”comes from her excellent biography of her father (Box, 1978, Chapter 6).Fisher, too,wrote about experiments as a dialoguewithNature; see Stigler(2016).ThusIbelievewecanthinkofherquoteasnearlycomingfromthepatriarchhimself,onlymorebeautifullyexpressed.
It is fascinating to read Weinberg’s papers on confounding (Weinberg,1993;Howardsetal.,2012)back-to-back.Theyareliketwosnapshotsofthehistory of confounding, one taken just before causal diagrams becamewidespread and the second taken twenty years later, revisiting the sameexamplesusingcausaldiagrams.Forbes’scomplicateddiagramofthecausal
networkforasthmaandsmokingcanbefoundinWilliamsonetal.(2014).
Morabia’s “classic epidemiological definition of confounding” can befoundinMorabia(2011).ThequotesfromDavidCoxcomefromCox(1992,pp.66–67).OthergoodsourcesonthehistoryofconfoundingareGreenlandandRobins(2009)andWikipedia(2016).
Theback-doorcriterionforeliminatingconfoundingbias,togetherwithitsadjustment formula, were introduced in Pearl (1993). Its impact onepidemiology can be seen through Greenland, Pearl, and Robins (1999).Extensions to sequential interventions and other nuances are developed inPearl(2000,2009)andmoregentlydescribedinPearl,Glymour,andJewell(2016).Softwareforcomputingcausaleffectsusingdo-calculus isavailableinTikkaandKarvanen(2017).
ThepaperbyGreenlandandRobins(1986)wasrevisitedbytheauthorsaquartercentury later, in lightof theextensivedevelopments since that time,includingtheadventofcausaldiagrams(GreenlandandRobins,2009).
ReferencesBox,J.F.(1978).R.A.Fisher:TheLifeofaScientist.JohnWileyandSons,NewYork,NY.
Cox,D.(1992).PlanningofExperiments.Wiley-Interscience,NewYork,NY.
Greenland,S.,Pearl,J.,andRobins,J.(1999).Causaldiagramsforepidemiologicresearch.Epidemiology10:37–48.
Greenland,S.,andRobins,J.(1986).Identifiability,exchangeability,andepidemiologicalconfounding.InternationalJournalofEpidemiology15:413–419.
Greenland,S.,andRobins,J.(2009).Identifiability,exchangeability,andconfoundingrevisited.EpidemiologicPerspectives&Innovations6.doi:10.1186/1742-5573-6-4.
Hakim,A.(1998).Effectsofwalkingonmortalityamongnonsmokingretiredmen.NewEnglandJournalofMedicine338:94–99.
Hernberg,S.(1996).Significancetestingofpotentialconfoundersandotherpropertiesofstudygroups—Misuseofstatistics.ScandinavianJournalofWork,EnvironmentandHealth22:315–316.
Howards,P.P.,Schisterman,E.F.,Poole,C.,Kaufman,J.S.,andWeinberg,C.R.(2012).“Towardaclearerdefinitionofconfounding”revisitedwithdirectedacyclicgraphs.AmericanJournalofEpidemiology176:506–511.
Lilienfeld,A.(1982).Ceterisparibus:Theevolutionoftheclinicaltrial.BulletinoftheHistoryofMedicine56:1–18.
Morabia,A.(2011).Historyofthemodernepidemiologicalconceptofconfounding.JournalofEpidemiologyandCommunityHealth65:297–300.
Pearl,J.(1993).Comment:Graphicalmodels,causality,andintervention.StatisticalScience8:266–269.
Pearl,J.(2000).Causality:Models,Reasoning,andInference.CambridgeUniversityPress,NewYork,NY.
Pearl,J.(2009).Causality:Models,Reasoning,andInference.2nded.CambridgeUniversityPress,NewYork,NY.
Pearl,J.,Glymour,M.,andJewell,N.(2016).CausalInferenceinStatistics:APrimer.Wiley,NewYork,NY.
Stigler,S.M.(2016).TheSevenPillarsofStatisticalWisdom.HarvardUniversityPress,Cambridge,MA.
Tikka,J.,andKarvanen,J.(2017).IdentifyingcausaleffectswiththeRPackagecausaleffect.JournalofStatisticalSoftware76,no.12.doi:10.18637/jss.r076.i12.
Weinberg,C.(1993).Towardaclearerdefinitionofconfounding.AmericanJournalofEpidemiology137:1–8.
Wikipedia.(2016).Confounding.Availableat:https://en.wikipedia.org/wiki/Confounding(accessed:September16,2016).
Williamson,E.,Aitken,Z.,Lawrie,J.,Dharmage,S.,Burgess,H.,andForbes,A.(2014).Introductiontocausaldiagramsforconfounderselection.Respirology19:303–311.
CHAPTER5.THESMOKE-FILLEDDEBATE:CLEARINGTHEAIR
AnnotatedBibliographyTwobook-lengthstudies,Brandt(2007)andProctor(2012a),containall theinformationanyreadercouldaskforaboutthesmoking–lungcancerdebate,shortofreadingtheactualtobaccocompanydocuments(whichareavailableonline). Shorter surveys of the smoking-cancer debate in the 1950s areSalsburg (2002, Chapter 18), Parascandola (2004), and Proctor (2012b).Stolley(1991)takesalookattheuniqueroleofR.A.Fisher,andGreenhouse
(2009)commentsonJeromeCornfield’s importance.TheshotheardaroundtheworldwasDollandHill (1950),which first implicatedsmoking in lungcancer;thoughtechnical,itisascientificclassic.
Forthestoryofthesurgeongeneral’scommitteeandtheemergenceoftheHillguidelinesforcausation,seeBlackburnandLabarthe(2012)andMorabia(2013).Hill’sowndescriptionofhiscriteriacanbefoundinHill(1965).
Lilienfeld(2007)isthesourceofthe“AbeandYak”storywithwhichwebeganthechapter.
VanderWeele (2014) and Hernández-Díaz, Schisterman, and Hernán(2006)resolvethebirth-weightparadoxusingcausaldiagrams.Aninteresting“before-and-after”pairofarticlesisWilcox(2001,2006),writtenbeforeandafter the author learned about causal diagrams; his excitement in the latterarticleispalpable.
Readers interested in the latest statistics and historical trends in cancermortality and smoking may consult US Department of Health and HumanServices (USDHHS, 2014), American Cancer Society (2017), and Wingo(2003).
ReferencesAmericanCancerSociety.(2017).Cancerfactsandfigures.Availableat:https://www.cancer.org/research/cancer-facts-statistics.html(posted:February19,2015).
Blackburn,H.,andLabarthe,D.(2012).Storiesfromtheevolutionofguidelinesforcausalinferenceinepidemiologicassociations:1953–1965.AmericanJournalofEpidemiology176:1071–1077.
Brandt,A.(2007).TheCigaretteCentury.BasicBooks,NewYork,NY.
Doll,R.,andHill,A.B.(1950).Smokingandcarcinomaofthelung.BritishMedicalJournal2:739–748.
Greenhouse,J.(2009).Commentary:Cornfield,epidemiology,andcausality.InternationalJournalofEpidemiology38:1199–1201.
Hernández-Díaz,S.,Schisterman,E.,andHernán,M.(2006).Thebirthweight“paradox”uncovered?AmericanJournalofEpidemiology164:1115–1120.
Hill,A.B.(1965).Theenvironmentanddisease:Associationorcausation?JournaloftheRoyalSocietyofMedicine58:295–300.
Lilienfeld,A.(2007).AbeandYak:TheinteractionsofAbrahamM.LilienfeldandJacobYerushalmyinthedevelopmentofmodernepidemiology(1945–1973).Epidemiology18:507–514.
Morabia,A.(2013).Hume,Mill,Hill,andthesuigenerisepidemiologicapproachtocausalinference.AmericanJournalofEpidemiology178:1526–1532.
Parascandola,M.(2004).Twoapproachestoetiology:Thedebateoversmokingandlungcancerinthe1950s.Endeavour28:81–86.
Proctor,R.(2012a).GoldenHolocaust:OriginsoftheCigaretteCatastropheandtheCaseforAbolition.UniversityofCaliforniaPress,Berkeley,CA.
Proctor,R.(2012b).Thehistoryofthediscoveryofthecigarette–lungcancerlink:Evidentiarytraditions,corporatedenial,andglobaltoll.TobaccoControl21:87–91.
Salsburg,D.(2002).TheLadyTastingTea:HowStatisticsRevolutionizedScienceintheTwentiethCentury.HenryHoltandCompany,NewYork,NY.
Stolley,P.(1991).Whengeniuserrs:R.A.Fisherandthelungcancercontroversy.AmericanJournalofEpidemiology133:416–425.
USDepartmentofHealthandHumanServices(USDHHS).(2014).Thehealthconsequencesofsmoking—50yearsofprogress:Areportofthesurgeongeneral.USDHHSandCentersforDiseaseControlandPrevention,Atlanta,GA.
VanderWeele,T.(2014).Commentary:Resolutionsofthebirthweightparadox:Competingexplanationsandanalyticalinsights.InternationalJournalofEpidemiology43:1368–1373.
Wilcox,A.(2001).Ontheimportance—andtheunimportance—ofbirthweight.InternationalJournalofEpidemiology30:1233–1241.
Wilcox,A.(2006).Theperilsofbirthweight—Alessonfromdirectedacyclicgraphs.AmericanJournalofEpidemiology164:1121–1123.
Wingo,P.(2003).Long-termtrendsincancermortalityintheUnitedStates,1930–1998.Cancer97:3133–3275.
CHAPTER6.PARADOXESGALORE!
AnnotatedBibliographyTheMontyHallparadoxappears inmanyintroductorybooksonprobability
theory (e.g.,GrinsteadandSnell, 1998,p.136;Lindley,2014,p.201).Theequivalent“threeprisonersdilemma”wasusedtodemonstratetheinadequacyofnon-BayesianapproachesinPearl(1988,pp.58–62).
Tierney(July21,1991)andCrockett(2015)telltheamazingstoryofvosSavant’s column on the Monty Hall paradox; Crockett gives several otherentertaining and embarrassing comments that vos Savant received from so-calledexperts.Tierney’sarticletellswhatMontyHallhimselfthoughtofthefuss—aninterestinghuman-interestangle!
AnextensiveaccountofthehistoryofSimpson’sparadoxisgiveninPearl(2009, pp. 174–182), including many attempts by statisticians andphilosopherstoresolveitwithoutinvokingcausation.Amorerecentaccount,gearedforeducators,isgiveninPearl(2014).
Savage (2009), Julious and Mullee (1994), and Appleton, French, andVanderpump(1996)givethethreereal-worldexamplesofSimpson’sparadoxmentioned in the text (relating to baseball, kidney stones, and smoking,respectively).
Savage’s sure-thingprinciple (Savage, 1954) is treated inPearl (2016b),anditscorrectedcausalversionisderivedinPearl(2009,pp.181–182).
VersionsofLord’sparadox(Lord,1967)aredescribedinGlymour(2006);Hernández-Díaz, Schisterman, and Hernán (2006); Senn (2006); Wainer(1991).AcomprehensiveanalysiscanbefoundinPearl(2016a).
Paradoxesinvokingcounterfactualsarenotincludedinthischapterbutarenolessintriguing.Forasample,seePearl(2013).
ReferencesAppleton,D.,French,J.,andVanderpump,M.(1996).Ignoringacovariate:AnexampleofSimpson’sparadox.AmericanStatistician50:340–341.
Crockett,Z.(2015).Thetimeeveryone“corrected”theworld’ssmartestwoman.Priceonomics.Availableat:http://priceonomics.com/the-time-everyone-corrected-the-worlds-smartest(posted:February19,2015).
Glymour,M.M.(2006).Usingcausaldiagramstounderstandcommonproblemsinsocialepidemiology.InMethodsinSocialEpidemiology.JohnWileyandSons,SanFrancisco,CA,393–428.
Grinstead,C.M.,andSnell,J.L.(1998).IntroductiontoProbability.2ndrev.ed.AmericanMathematicalSociety,Providence,RI.
Hernández-Díaz,S.,Schisterman,E.,andHernán,M.(2006).Thebirth
weight“paradox”uncovered?AmericanJournalofEpidemiology164:1115–1120.
Julious,S.,andMullee,M.(1994).ConfoundingandSimpson’sparadox.BritishMedicalJournal309:1480–1481.
Lindley,D.V.(2014).UnderstandingUncertainty.Rev.ed.JohnWileyandSons,Hoboken,NJ.
Lord,F.M.(1967).Aparadoxintheinterpretationofgroupcomparisons.PsychologicalBulletin68:304–305.
Pearl,J.(1988).ProbabilisticReasoninginIntelligentSystems.MorganKaufmann,SanMateo,CA.
Pearl,J.(2009).Causality:Models,Reasoning,andInference.2nded.CambridgeUniversityPress,NewYork,NY.
Pearl,J.(2013).Thecurseoffree-willandparadoxofinevitableregret.JournalofCausalInference1:255–257.
Pearl,J.(2014).UnderstandingSimpson’sparadox.AmericanStatistician88:8–13.
Pearl,J.(2016a).Lord’sparadoxrevisited—(OhLord!Kumbaya!).JournalofCausalInference4.doi:10.1515/jci-2016-0021.
Pearl,J.(2016b).Thesure-thingprinciple.JournalofCausalInference4:81–86.
Savage,L.(1954).TheFoundationsofStatistics.JohnWileyandSons,NewYork,NY.
Savage,S.(2009).TheFlawofAverages:WhyWeUnderestimateRiskintheFaceofUncertainty.JohnWileyandSons,Hoboken,NJ.
Senn,S.(2006).Changefrombaselineandanalysisofcovariancerevisited.StatisticsinMedicine25:4334–4344.
Simon,H.(1954).Spuriouscorrelation:Acausalinterpretation.JournaloftheAmericanStatisticalAssociation49:467–479.
Tierney,J.(July21,1991).BehindMontyHall’sdoors:Puzzle,debateandanswer?NewYorkTimes.
Wainer,H.(1991).Adjustingfordifferentialbaserates:Lord’sparadoxagain.PsychologicalBulletin109:147–151.
CHAPTER7.BEYONDADJUSTMENT:THECONQUEST
OFMOUNTINTERVENTION
AnnotatedBibliographyExtensionsoftheback-doorandfront-dooradjustmentswerefirstreportedinTianandPearl(2002)basedonTian’sc-componentfactorization.Thesewerefollowed by Shpitser’s algorithmization of the do-calculus (Shpitser andPearl,2006a)andthenthecompletenessresultsofShpitserandPearl(2006b)andHuangandValtorta(2006).
Theeconomistsamongourreadersshouldnotethattheculturalresistanceofsomeeconomiststographicaltoolsofanalysis(HeckmanandPinto,2015;ImbensandRubin,2015)isnotsharedbyalleconomists.WhiteandChalak(2009), for example, have generalized and applied the do-calculus toeconomic systems involving equilibrium and learning. Recent textbooks inthe social and behavioral sciences,Morgan andWinship (2007) and Kline(2016), further signal to young researchers that cultural orthodoxy, like thefear of telescopes in the seventeenth century, is not long lasting in thesciences.
JohnSnow’sinvestigationofcholerawasverylittleappreciatedduringhislifetime, and his one-paragraph obituary inLancet did not evenmention it.Remarkably,thepremierBritishmedicaljournal“corrected”itsobituary155yearslater(Hempel,2013).FormorebiographicalmaterialonSnow,seeHill(1955)andCameronandJones(1983).GlynnandKashin(2018)isoneofthefirstpaperstodemonstrateempiricallythatfront-dooradjustmentissuperiortoback-dooradjustmentwhenthereareunobservedconfounders.Freedman’scritiqueofthesmoking–tar–lungcancerexamplecanbefoundinachapterofFreedman(2010)titled“OnSpecifyingGraphicalModelsforCausation.”
IntroductionstoinstrumentalvariablescanbefoundinGreenland(2000)andinmanytextbooksofeconometrics(e.g.,BowdenandTurkington,1984;Wooldridge,2013).
Generalized instrumental variables, extending the classical definitiongiveninourtext,wereintroducedinBritoandPearl(2002).
The program DAGitty (available online athttp://www.dagitty.net/dags.html) permits users to search the diagram forgeneralizedinstrumentalvariablesandreportstheresultingestimands(Textor,Hardt, and Knüppel, 2011). Another diagram-based software package fordecisionmakingisBayesiaLab(www.bayesia.com).
BoundsoninstrumentalvariableestimatesarestudiedatlengthinChapter
8 of Pearl (2009) and are applied to the problem of noncompliance. TheLATEapproximationisadvocatedanddebatedinImbens(2010).
ReferencesBareinboim,E.,andPearl,J.(2012).Causalinferencebysurrogateexperiments:z-identifiability.InProceedingsoftheTwenty-EighthConferenceonUncertaintyinArtificialIntelligence(N.deFreitasandK.Murphy,eds.).AUAIPress,Corvallis,OR.
Bowden,R.,andTurkington,D.(1984).InstrumentalVariables.CambridgeUniversityPress,Cambridge,UK.
Brito,C.,andPearl,J.(2002).Generalizedinstrumentalvariables.InUncertaintyinArtificialIntelligence,ProceedingsoftheEighteenthConference(A.DarwicheandN.Friedman,eds.).MorganKaufmann,SanFrancisco,CA,85–93.
Cameron,D.,andJones,I.(1983).JohnSnow,theBroadStreetpump,andmodernepidemiology.InternationalJournalofEpidemiology12:393–396.
Cox,D.,andWermuth,N.(2015).Designandinterpretationofstudies:Relevantconceptsfromthepastandsomeextensions.ObservationalStudies1.Availableat:https://arxiv.org/pdf/1505.02452.pdf.
Freedman,D.(2010).StatisticalModelsandCausalInference:ADialoguewiththeSocialSciences.CambridgeUniversityPress,NewYork,NY.
Glynn,A.,andKashin,K.(2018).Front-doorversusback-dooradjustmentwithunmeasuredconfounding:Biasformulasforfront-doorandhybridadjustments.JournaloftheAmericanStatisticalAssociation.Toappear.
Greenland,S.(2000).Anintroductiontoinstrumentalvariablesforepidemiologists.InternationalJournalofEpidemiology29:722–729.
Heckman,J.J.,andPinto,R.(2015).CausalanalysisafterHaavelmo.EconometricTheory31:115–151.
Hempel,S.(2013).Obituary:JohnSnow.Lancet381:1269–1270.
Hill,A.B.(1955).Snow—Anappreciation.JournalofEconomicPerspectives48:1008–1012.
Huang,Y.,andValtorta,M.(2006).Pearl’scalculusofinterventioniscomplete.InProceedingsoftheTwenty-SecondConferenceonUncertaintyinArtificialIntelligence(R.DechterandT.Richardson,eds.).AUAIPress,Corvallis,OR,217–224.
Imbens,G.W.(2010).BetterLATEthannothing:SomecommentsonDeaton(2009)andHeckmanandUrzua(2009).JournalofEconomicLiterature48:399–423.
Imbens,G.W.,andRubin,D.B.(2015).CausalInferenceforStatistics,Social,andBiomedicalSciences:AnIntroduction.CambridgeUniversityPress,Cambridge,MA.
Kline,R.B.(2016).PrinciplesandPracticeofStructuralEquationModeling.3rded.Guilford,NewYork,NY.
Morgan,S.,andWinship,C.(2007).CounterfactualsandCausalInference:MethodsandPrinciplesforSocialResearch(AnalyticalMethodsforSocialResearch).CambridgeUniversityPress,NewYork,NY.
Pearl,J.(2009).Causality:Models,Reasoning,andInference.2nded.CambridgeUniversityPress,NewYork,NY.
Pearl,J.(2013).ReflectionsonHeckmanandPinto’s“CausalanalysisafterHaavelmo.”Tech.Rep.R-420.DepartmentofComputerScience,UniversityofCalifornia,LosAngeles,CA.Workingpaper.
Pearl,J.(2015).Indirectconfoundingandcausalcalculus(onthreepapersbyCoxandWermuth).Tech.Rep.R-457.DepartmentofComputerScience,UniversityofCalifornia,LosAngeles,CA.
Shpitser,I.,andPearl,J.(2006a).Identificationofconditionalinterventionaldistributions.InProceedingsoftheTwenty-SecondConferenceonUncertaintyinArtificialIntelligence(R.DechterandT.Richardson,eds.).AUAIPress,Corvallis,OR,437–444.
Shpitser,I.,andPearl,J.(2006b).Identificationofjointinterventionaldistributionsinrecursivesemi-Markoviancausalmodels.InProceedingsoftheTwenty-FirstNationalConferenceonArtificialIntelligence.AAAIPress,MenloPark,CA,1219–1226.
Stock,J.,andTrebbi,F.(2003).Whoinventedinstrumentalvariableregression?JournalofEconomicPerspectives17:177–194.
Textor,J.,Hardt,J.,andKnüppel,S.(2011).DAGitty:Agraphicaltoolforanalyzingcausaldiagrams.Epidemiology22:745.
Tian,J.,andPearl,J.(2002).Ageneralidentificationconditionforcausaleffects.InProceedingsoftheEighteenthNationalConferenceonArtificialIntelligence.AAAIPress/MITPress,MenloPark,CA,567–573.
Wermuth,N.,andCox,D.(2008).Distortionofeffectscausedbyindirect
confounding.Biometrika95:17–33.(SeePearl[2009,Chapter4]forageneralsolution.)
Wermuth,N.,andCox,D.(2014).GraphicalMarkovmodels:Overview.ArXiv:1407.7783.
White,H.,andChalak,K.(2009).Settablesystems:AnextensionofPearl’scausalmodelwithoptimization,equilibriumandlearning.JournalofMachineLearningResearch10:1759–1799.
Wooldridge,J.(2013).IntroductoryEconometrics:AModernApproach.5thed.South-Western,Mason,OH.
CHAPTER8.COUNTERFACTUALS:MININGWORLDSTHATCOULDHAVEBEEN
AnnotatedBibliographyThe definition of counterfactuals as derivatives of structural equations wasintroduced by Balke and Pearl (1994a, 1994b) and was used to estimateprobabilities of causation in legal settings. The relationships between thisframeworkandthosedevelopedbyRubinandLewisarediscussedat lengthinPearl(2000,Chapter7),wheretheyareshowntobelogicallyequivalent;aproblemsolvedinoneframeworkwouldyieldthesamesolutioninanother.
Recentbooks in social science (e.g.,MorganandWinship,2015)and inhealth science (e.g., VanderWeele, 2015) are taking the hybrid, graph-counterfactualapproachpursuedinourbook.
The section on linear counterfactuals is based on Pearl (2009, pp. 389–391),whichalsoprovidesthesolutiontotheproblemposedinnote12.OurdiscussionofETTisbasedonShpitserandPearl(2009).
Legal questions of attribution, as well as probabilities of causation, arediscussed at length in Greenland (1999), who pioneered the counterfactualapproach to suchquestions.Our treatmentofPN,PS, andPNS isbasedonTian and Pearl (2000) and Pearl (2009, Chapter 9). A gentle approach tocounterfactualattribution,includingatoolkitforestimation,isgiveninPearl,Glymour, and Jewell (2016). An advanced formal treatment of actualcausationcanbefoundinHalpern(2016).
Matching techniques for estimating causal effects are used routinely bypotentialoutcomeresearchers(Sekhon,2007),thoughtheyusuallyignorethepitfalls shown in our education-experience-salary example. My realizationthat missing-data problems should be viewed in the context of causal
modelingwasformedthroughtheanalysisofMohanandPearl(2014).
Cowles (2016) and Reid (1998) tell the story of Neyman’s tumultuousyearsinLondon,includingtheanecdoteaboutFisherandthewoodenmodels.Greiner(2008)isalongandsubstantiveintroductionto“but-for”causationinthelaw.Allen(2003),Stottetal.(2013),Trenberth(2012),andHannartetal.(2016)addresstheproblemofattributionofweathereventstoclimatechange,and Hannart in particular invokes the ideas of necessary and sufficientprobability,whichbringmoreclaritytothesubject.
ReferencesAllen,M.(2003).Liabilityforclimatechange.Nature421:891–892.
Balke,A.,andPearl,J.(1994a).Counterfactualprobabilities:Computationalmethods,bounds,andapplications.InUncertaintyinArtificialIntelligence10(R.L.deMantarasandD.Poole,eds.).MorganKaufmann,SanMateo,CA,46–54.
Balke,A.,andPearl,J.(1994b).Probabilisticevaluationofcounterfactualqueries.InProceedingsoftheTwelfthNationalConferenceonArtificialIntelligence,vol.1.MITPress,MenloPark,CA,230–237.
Cowles,M.(2016).StatisticsinPsychology:AnHistoricalPerspective.2nded.Routledge,NewYork,NY.
Duncan,O.(1975).IntroductiontoStructuralEquationModels.AcademicPress,NewYork,NY.
Freedman,D.(1987).Asothersseeus:Acasestudyinpathanalysis(withdiscussion).JournalofEducationalStatistics12:101–223.
Greenland,S.(1999).Relationofprobabilityofcausation,relativerisk,anddoublingdose:Amethodologicerrorthathasbecomeasocialproblem.AmericanJournalofPublicHealth89:1166–1169.
Greiner,D.J.(2008).Causalinferenceincivilrightslitigation.HarvardLawReview81:533–598.
Haavelmo,T.(1943).Thestatisticalimplicationsofasystemofsimultaneousequations.Econometrica11:1–12.ReprintedinD.F.HendryandM.S.Morgan(Eds.),TheFoundationsofEconometricAnalysis,CambridgeUniversityPress,Cambridge,UK,477–490,1995.
Halpern,J.(2016).ActualCausality.MITPress,Cambridge,MA.
Hannart,A.,Pearl,J.,Otto,F.,Naveu,P.,andGhil,M.(2016).Causal
counterfactualtheoryfortheattributionofweatherandclimate-relatedevents.BulletinoftheAmericanMeteorologicalSociety(BAMS)97:99–110.
Holland,P.(1986).Statisticsandcausalinference.JournaloftheAmericanStatisticalAssociation81:945–960.
Hume,D.(1739).ATreatiseofHumanNature.OxfordUniversityPress,Oxford,UK.Reprinted1888.
Hume,D.(1748).AnEnquiryConcerningHumanUnderstanding.ReprintedOpenCourtPress,LaSalle,IL,1958.
Joffe,M.M.,Yang,W.P.,andFeldman,H.I.(2010).Selectiveignorabilityassumptionsincausalinference.InternationalJournalofBiostatistics6.doi:10.2202/1557-4679.1199.
Lewis,D.(1973a).Causation.JournalofPhilosophy70:556–567.ReprintedwithpostscriptinD.Lewis,PhilosophicalPapers,vol.2,OxfordUniversityPress,NewYork,NY,1986.
Lewis,D.(1973b).Counterfactuals.HarvardUniversityPress,Cambridge,MA.
Lewis,M.(2016).TheUndoingProject:AFriendshipThatChangedOurMinds.W.W.NortonandCompany,NewYork,NY.
Mohan,K.,andPearl,J.(2014).Graphicalmodelsforrecoveringprobabilisticandcausalqueriesfrommissingdata.ProceedingsofNeuralInformationProcessing27:1520–1528.
Morgan,S.,andWinship,C.(2015).CounterfactualsandCausalInference:MethodsandPrinciplesforSocialResearch(AnalyticalMethodsforSocialResearch).2nded.CambridgeUniversityPress,NewYork,NY.
Neyman,J.(1923).Ontheapplicationofprobabilitytheorytoagriculturalexperiments.Essayonprinciples.Section9.StatisticalScience5:465–480.
Pearl,J.(2000).Causality:Models,Reasoning,andInference.CambridgeUniversityPress,NewYork,NY.
Pearl,J.(2009).Causality:Models,Reasoning,andInference.2nded.CambridgeUniversityPress,NewYork,NY.
Pearl,J.,Glymour,M.,andJewell,N.(2016).CausalInferenceinStatistics:APrimer.Wiley,NewYork,NY.
Reid,C.(1998).Neyman.Springer-Verlag,NewYork,NY.
Rubin,D.(1974).Estimatingcausaleffectsoftreatmentsinrandomizedandnonrandomizedstudies.JournalofEducationalPsychology66:688–701.
Sekhon,J.(2007).TheNeyman-Rubinmodelofcausalinferenceandestimationviamatchingmethods.InTheOxfordHandbookofPoliticalMethodology(J.M.Box-Steffensmeier,H.E.Brady,andD.Collier,eds.).OxfordUniversityPress,Oxford,UK.
Shpitser,I.,andPearl,J.(2009).Effectsoftreatmentonthetreated:Identificationandgeneralization.InProceedingsoftheTwenty-FifthConferenceonUncertaintyinArtificialIntelligence.AUAIPress,Montreal,Quebec,514–521.
Stott,P.A.,Allen,M.,Christidis,N.,Dole,R.M.,Hoerling,M.,Huntingford,C.,PardeepPall,J.P.,andStone,D.(2013).Attributionofweatherandclimate-relatedevents.InClimateScienceforServingSociety:Research,Modeling,andPredictionPriorities(G.R.AsrarandJ.W.Hurrell,eds.).Springer,Dordrecht,Netherlands,449–484.
Tian,J.,andPearl,J.(2000).Probabilitiesofcausation:Boundsandidentification.AnnalsofMathematicsandArtificialIntelligence28:287–313.
Trenberth,K.(2012).Framingthewaytorelateclimateextremestoclimatechange.ClimaticChange115:283–290.
VanderWeele,T.(2015).ExplanationinCausalInference:MethodsforMediationandInteraction.OxfordUniversityPress,NewYork,NY.
CHAPTER9.MEDIATION:THESEARCHFORAMECHANISM
AnnotatedBibliographyThereareseveralbooksdedicatedtothetopicofmediation.Themostup-to-datereferenceisVanderWeele(2015);MacKinnon(2008)alsocontainsmanyexamples.ThedramatictransitionfromthestatisticalapproachofBaronandKenny (1986) to the counterfactual-based approach of causal mediation isdescribed in Pearl (2014) and Kline (2015).McDonald’s quote (to discussmediation,“startfromscratch”)istakenfromMcDonald(2001).
Natural direct and indirect effects were conceptualized in Robins andGreenland (1992) anddeemedproblematic.Theywere later formalized andlegitimizedinPearl(2001),leadingtotheMediationFormula.
InadditiontothecomprehensivetextofVanderWeele(2015),newresults
and applications of mediation analysis can be found in De Stavola et al.(2015); Imai, Keele, and Yamamoto (2010); and Muthén and Asparouhov(2015). Shpitser (2013) provides a general criterion for estimating arbitrarypath-specificeffectsingraphs.
TheMediationFallacyandthefallacyof“conditioning”onamediatoraredemonstratedinPearl(1998)andColeandHernán(2002).Fisher’sfallingforthis fallacy is told inRubin(2005),whereasRubin’sdismissalofmediationanalysisas“deceptive”isexpressedinRubin(2004).
Thestartlingstoryofhowthecureforscurvywas“lost”istoldinLewis(1972) and Ceglowski (2010). Barbara Burks’s story is told in King,Montañez Ramírez, and Wertheimer (1996); the quotes from Terman andBurks’smotheraredrawnfromtheletters(L.TermantoR.Tolman,1943).
ThesourcepaperfortheBerkeleyadmissionsparadoxisBickel,Hammel,and O’Connell (1975), and the ensuing correspondence between him andKruskalisfoundinFairleyandMosteller(1977).
VanderWeele (2014) is the source for the “smoking gene” example, andBierutandCesarini(2015)tellsthestoryofhowthegenewasdiscovered.
Thesurprisinghistoryof tourniquets,beforeandduring theGulfWar, istold in Welling et al. (2012) and Kragh et al. (2013). The latter article iswritteninapersonalandentertainingstylethatisquiteunusualforascholarlypublication. Kragh et al. (2015) describes the research that unfortunatelyfailedtoprovethattourniquetsimprovethechancesforsurvival.
ReferencesBaron,R.,andKenny,D.(1986).Themoderator-mediatorvariabledistinctioninsocialpsychologicalresearch:Conceptual,strategic,andstatisticalconsiderations.JournalofPersonalityandSocialPsychology51:1173–1182.
Bickel,P.J.,Hammel,E.A.,andO’Connell,J.W.(1975).Sexbiasingraduateadmissions:DatafromBerkeley.Science187:398–404.
Bierut,L.,andCesarini,D.(2015).Howgeneticandotherbiologicalfactorsinteractwithsmokingdecisions.BigData3:198–202.
Burks,B.S.(1926).Ontheinadequacyofthepartialandmultiplecorrelationtechnique(partsI–II).JournalofExperimentalPsychology17:532–540,625–630.
Burks,F.,toMrs.Terman.(June16,1943).Correspondence.LewisM.
TermanArchives,StanfordUniversity.
Ceglowski,M.(2010).Scottandscurvy.IdleWords(blog).Availableat:http://www.idlewords.com/2010/03/scott_and_scurvy.htm(posted:March6,2010).
Cole,S.,andHernán,M.(2002).Fallibilityinestimatingdirecteffects.InternationalJournalofEpidemiology31:163–165.
DeStavola,B.L.,Daniel,R.M.,Ploubidis,G.B.,andMicali,N.(2015).Mediationanalysiswithintermediateconfounding.AmericanJournalofEpidemiology181:64–80.
Fairley,W.B.,andMosteller,F.(1977).StatisticsandPublicPolicy.Addison-Wesley,Reading,MA.
Imai,K.,Keele,L.,andYamamoto,T.(2010).Identification,inference,andsensitivityanalysisforcausalmediationeffects.StatisticalScience25:51–71.
King,D.B.,MontañezRamírez,L.,andWertheimer,M.(1996).BarbaraStoddardBurks:Pioneerbehavioralgeneticistandhumanitarian.InPortraitsofPioneersinPsychology(C.W.G.A.KimbleandM.Wertheimer,eds.),vol.2.ErlbaumAssociates,Hillsdale,NJ,212–225.
Kline,R.B.(2015).Themediationmyth.Chance14:202–213.
Kragh,J.F.,Jr.,Nam,J.J.,Berry,K.A.,Mase,V.J.,Jr.,Aden,J.K.,III,Walters,T.J.,Dubick,M.A.,Baer,D.G.,Wade,C.E.,andBlackbourne,L.H.(2015).TransfusionforshockinU.S.militarywarcasualtieswithandwithouttourniquetuse.AnnalsofEmergencyMedicine65:290–296.
Kragh,J.F.,Jr.,Walters,T.J.,Westmoreland,T.,Miller,R.M.,Mabry,R.L.,Kotwal,R.S.,Ritter,B.A.,Hodge,D.C.,Greydanus,D.J.,Cain,J.S.,Parsons,D.S.,Edgar,E.P.,Harcke,T.,Baer,D.G.,Dubick,M.A.,Blackbourne,L.H.,Montgomery,H.R.,Holcomb,J.B.,andButler,F.K.(2013).Tragedyintodrama:AnAmericanhistoryoftourniquetuseinthecurrentwar.JournalofSpecialOperationsMedicine13:5–25.
Lewis,H.(1972).Medicalaspectsofpolarexploration:SixtiethanniversaryofScott’slastexpedition.JournaloftheRoyalSocietyofMedicine65:39–42.
MacKinnon,D.(2008).IntroductiontoStatisticalMediationAnalysis.LawrenceErlbaumAssociates,NewYork,NY.
McDonald,R.(2001).Structuralequationsmodeling.JournalofConsumer
Psychology10:92–93.
Muthén,B.,andAsparouhov,T.(2015).Causaleffectsinmediationmodeling.StructuralEquationModeling22:12–23.
Pearl,J.(1998).Graphs,causality,andstructuralequationmodels.SociologicalMethodsandResearch27:226–284.
Pearl,J.(2001).Directandindirecteffects.InProceedingsoftheSeventeenthConferenceonUncertaintyinArtificialIntelligence.MorganKaufmann,SanFrancisco,CA,411–420.
Pearl,J.(2014).Interpretationandidentificationofcausalmediation.PsychologicalMethods19:459–481.
Robins,J.,andGreenland,S.(1992).Identifiabilityandexchangeabilityfordirectandindirecteffects.Epidemiology3:143–155.
Rubin,D.(2004).Directandindirectcausaleffectsviapotentialoutcomes.ScandinavianJournalofStatistics31:161–170.
Rubin,D.(2005).Causalinferenceusingpotentialoutcomes:Design,modeling,decisions.JournaloftheAmericanStatisticalAssociation100:322–331.
Shpitser,I.(2013).Counterfactualgraphicalmodelsforlongitudinalmediationanalysiswithunobservedconfounding.CognitiveScience37:1011–1035.
Terman,L.,toTolman,R.(August6,1943).Correspondence.LewisM.TermanArchives,StanfordUniversity.
VanderWeele,T.(2014).Aunificationofmediationandinteraction:Afour-waydecomposition.Epidemiology25:749–761.
VanderWeele,T.(2015).ExplanationinCausalInference:MethodsforMediationandInteraction.OxfordUniversityPress,NewYork,NY.
Welling,D.,MacKay,P.,Rasmussen,T.,andRich,N.(2012).Abriefhistoryofthetourniquet.JournalofVascularSurgery55:286–290.
CHAPTER10.BIGDATA,ARTIFICIALINTELLIGENCE,ANDTHEBIGQUESTIONS
AnnotatedBibliographyAnaccessiblesourcefortheperpetualfreewilldebateisHarris(2012).Thecompatibilist school of philosophers is represented in the writings of
MumfordandAnjum(2014)andDennett(2003).
Artificial intelligence conceptualizations of agency can be found inRussell andNorvig (2003) andWooldridge (2009). Philosophical views onagencyarecompiled inBratman (2007).An intent-based learningsystem isdescribedinForneyetal.(2017).
The twenty-three principles for “beneficial AI” agreed to at the 2017AsilomarmeetingcanbefoundatFutureofLifeInstitute(2017).
ReferencesBratman,M.E.(2007).StructuresofAgency:Essays.OxfordUniversityPress,NewYork,NY.
Brockman,J.(2015).WhattoThinkAboutMachinesThatThink.HarperCollins,NewYork,NY.
Dennett,D.C.(2003).FreedomEvolves.VikingBooks,NewYork,NY.
Forney,A.,Pearl,J.,andBareinboim,E.(2017).Counterfactualdata-fusionforonlinereinforcementlearners.Proceedingsofthe34thInternationalConferenceonMachineLearning.ProceedingsofMachineLearningResearch70:1156–1164.
FutureofLifeInstitute.(2017).AsilomarAIprinciples.Availableat:https://futureoflife.org/ai-principles(accessedDecember2,2017).
Harris,S.(2012).FreeWill.FreePress,NewYork,NY.
Mumford,S.,andAnjum,R.L.(2014).Causation:AVeryShortIntroduction(VeryShortIntroductions).OxfordUniversityPress,NewYork,NY.
Russell,S.J.,andNorvig,P.(2003).ArtificialIntelligence:AModernApproach.2nded.PrenticeHall,UpperSaddleRiver,NJ.
Wooldridge,J.(2009).IntroductiontoMulti-agentSystems.2nded.JohnWileyandSons,NewYork,NY.
INDEX
Abbott,Robert,141,143
abduction,278,280
ACE.Seeaveragecausaleffect
acquisition,representationand,38
action,incounterfactuals,278,280
agency,367
AI.Seeartificialintelligence
Allen,Myles,291–294
AmericanCancerSociety,174,178–179
anthropometricstatistics,58
Aristotle,50,264
artificialintelligence(AI),ix–x,10
Bayesiannetworksin,18,93–94,108–109,112,132
message-passingnetworkof,110–111,111(fig.)
ofrobots,291
Turingon,27,108–109
uncertaintyin,109
weak,362
“why?”questionin,349
SeealsostrongAI
Asimov,Isaac,370
association,50,340
causationand,181,189
inLadderofCausation,28(fig.),29–30,51
patternof,311
specificity,strengthof,181
Seealsocorrelation,genome-wideassociationstudy
assumptions,12–13,12(fig.)
astronomy,5
attribution,261,291,293,393-394
averagecausaleffect(ACE),296–297
backdooradjustmentformula,220–224
backdoorcriterion
andcausaleffects,220,225–226
confoundingand,157,219
indo-calculus,234
do-operatorand,157–165,330
backdoorpath,158–159
backgroundfactors,48
Bareinboim,Elias,239,353,356–358
Baron,Reuben,324–325,339
Bayes,Thomas,95–96,96(fig.),264
ondata,100,102
oninverseprobability,97–99,98(fig.),101,104–105,112–113
methodof,99–100
onmiracles,103
onprobability,97–98,102
andsubjectivity,90,104,108
Bayesiananalysis,194–195
Bayesianconditioning,194
Bayesiannetworks,50–51,81,92(photo)
inAI,18,93–94,108–109,112,132
inBonapartesoftware,95
causaldiagramsand,128–133
codewords,turbocodesin,126,127(fig.)128
conditionalprobabilitytablein,117,119,120(table)
DNAtestsand,122,123(fig.),124
inverse-probabilityproblemin,112–113,119–120
junctionsin,113–116
inmachinelearning,125
parentnodesin,117
probabilityin,358–359
probabilitytablesin,128–129
SCMsversus,284
Bayesianstatistics,89–91
Bayes’srule,101–104,196
BCSC.SeeBreastCancerSurveillanceConsortium
belief,101–102
beliefpropagation,112–113,128
Berkeleyadmissionparadox,197–198
Berkson,Joseph,197–200,197(fig.),198(table)
Bernoulli,Jacob,5
Berrou,Claude,126–127
Bickel,Peter,310–312,315–316
BigData,3,350–358,354(fig.)
birthweight,82–83,82(fig.)
birth-weightparadox,185–186,185(fig.),189
blackboxanalysis,125,283
Blalock,Hubert,309,326
Bonaparte,94–95,122,123(fig.),124–125
brain
managingcauses,effects,2
representation,ofinformationin,39
Seealsohumanmind
BreastCancerSurveillanceConsortium(BCSC),105–106,107(fig.),118
Brito,Carlos,257
Brockman,John,367–368
Brown,Lisa,216,217(fig.)
Burks,Barbara,198,304,311,333
onnature-versus-nurturedebate,305–306,305(fig.),306(fig.)
pathdiagramof,308–309
onsocialstatus,307
but-forcausation,261–263,286–288
cannedprocedures,84–85
Cartwright,Nancy,49
casestudies.Seeexamples
case-controlstudies,173
Castle,William,72–73
causalanalysis
datain,85
subjectivityand,89
causaldiagram,7,39–40,39(fig.),41–42,41(fig.),118(fig.),142(fig.)
for“AlgebraforAll,”337,338(fig.)
Bayesiannetworkand,128–133
forBerkeleyadmissionparadox,311–312,312(fig.),314(fig.)
forBerkson’sparadox,197(fig.)
forbirth-weightparadox,185,185(fig.)
forcholera,247–248,247(fig.),248(fig.)
forclimatechange,294,294(fig.)
confounderin,138,138(fig.),140
ofcounterfactual,42–43,42(fig.)
directeffectin,320–321
do-operatorin,148(fig.)
front-dooradjustmentin,225(fig.)
ofGaltonboard,64–65,64(fig.)
ofgeneticmodel,64–65,64(fig.)
graphicalstructureof,131
forimproperlycontrolledexperiment,147–148,147(fig.)
instrumentalvariablesand,250
ofJTPAStudy,229–231,230(fig.)
forLord’sparadox,214,215(fig.)
forMendelianrandomization,255–256,256(fig.)
forMontyHallparadox,193–194,193(fig.),195(fig.)
ofnapkinproblem,239–240,240(fig.)
ofnature-versus-nurturedebate,305,305(fig.)
noncausalpathin,157,160
forRCT,withnoncompliance,252–253,253(fig.)
RCTin,140,148–149,149(fig.)
ofSimpson’sparadox,206–207,206(fig.),209(fig.)
forsmokinggeneexample,341,341(fig.),342(fig.)
supply-side,250–251,251(fig.)
fortourniquetexample,346,346(fig.)
ofvaccination,44–46,45(fig.)
Seealsopathdiagram
causaleffect
backdoorcriterionfor,220,225–226
throughpathcoefficients,77
throughregressioncoefficients,222–223
causalinference
cause,effectin,2–3
humanmindand,1–2,43
mathematicallanguageof,3–8
objectivityof,91
byrobots,2,350,361,361(fig.)
instatistics,18
technologyof,1–2
causalinferenceengine,11–15,12(fig.),26–27,46
causalknowledge,ofmachines,37
causalmodel,12(fig.),13,16–17,45–46
BigDataand,350–358,354(fig.)
ashypotheticalexperiments,130
doingin,27
imaginingin,27
mediationin,300–301
seeingvs.doing,27
ofRubin,261,280–281
testingof,116
Seealsolinearcausalmodel;structuralcausalmodel
causalparadoxes,189–190
causalquestions,languageof,5
causalreasoning,20–21,43
theCausalRevolution,ix–x,7,9,11,45,140,301,350
causalsubjectivity,90
causalvocabulary,5
causality,ix
provisional,150
queriesof,27,183
statisticsand,66,190
Causality(Pearl),ix,24,328,331
causation
associationand,181,189
computersunderstanding,40–41
correlationand,5–6,82–84
intuitionabout,321
necessary,289–290
Pearson,K.,and,71–72
probabilityand,47–51
RCTfor,169
repetitionand,66–67
smoking-cancerdebatein,168
instatistics,18
threelevelsof,27–36
Wright,S.,on,79–81
SeealsoLadderofCausation
cause
defining,47–48,179–180
proximate,288–289
sufficientandnecessary,288–291,295
Seealsocommoncauseprinciple
causes,effectsand,2–3
incausaldiagrams,187
probabilityversus,46
c-decomposition,243
Cerf,Vint,95
childnodes,111–112,129
ChineseRoomargument,38–39
cholera,168
Seealsoexamples
climatechange
causaldiagramof,294,294(fig.)
computersimulationof,292–296
counterfactualsand,261–262,295
FARand,291–292
Seealsoexamples
Cochran,William,180,182
codewords,126,127(fig.),128
coefficients
differencein,327
path,77,223,251
productof,327
regression,222–223
CognitiveRevolution,24–25,34–35
coherence,181–182
colliderbias,185–186,197–200
commoncauseprinciple,199
compatibilists,364
completeness,237,243–244
computersimulation,inclimatescience,292–296
computers
causationand,40–41
counterfactualsand,43
“ComputingMachineryandIntelligence”(Turing),358
conditionalprobability,101,103
conditionalprobabilitytable,117(table),119,120(table)
confounders,137,138(fig.),140
ofmediator,outcome,315–316
mediatorsand,276
provisionalconclusionsand,143
RCTand,149–150
insmokingrisk,175
instatistics,138–139,141–142
Seealsodeconfounders
confounding
backdoorcriterionfor,157,219
classicalepidemiologicaldefinitionof,153–154,159
defining,150–151,156,162
inepidemiology,152–154
incomparabilityin,151
indirect,241
inLadderofCausation,140
statisticsand,141,151,156
surrogatesin,152
third-variabledefinition,151–152
confoundingbias,137–138,147
Conrady,Stefan,118–119
consistency,181,281
controlledexperiment,136–137,147(fig.)
Seealsoexperimentaldesign;randomizedcontrolledtrial
Cornfield,Jerome,175,179–180,183,224,341
Cornfield’sinequality,175
CoronaryPrimaryPreventionTrial,252
correlation,29
causationand,5–6,82–84
Galtonon,62–63
spurious,69–72
Seealsoassociation,colliderbias
“CorrelationandCausation”(Wright,S.),82
counterfactualanalysis,261–262
counterfactuals,9–10
causaldiagramfor,42–43,42(fig.)
climatechangeand,261–262,295
computersand,43
dataand,33
do-expressionof,287–288
exchangeabilityand,154–155
Frostand,258(photo)
inhumanmind,33
Humeand,19–20,265–267
indirecteffectsand,322
ininferenceengine,296
inLadderofCausation,266
lawand,286–291
Lewison,266–269
mediationanalysisfor,297
andpossibleworlds,266–269
queriesas,20,28(fig.),36,260–261,284
reasoning,10
SCMsfor,276–280,283–284
forstrongAI,269
Cox,David,154,240–241,241(fig.)
Crow,James,84–85
culpability,261
curseofdimensionality,221
CurveofAbandoningHope,120–121
d-separation,116,242,283,381
Darwiche,Adnan,30
Darwin,Charles,63,73,87
data,11,12(fig.),14–16
Bayeson,100,102
incausalanalysis,85
counterfactualsand,33
economistsand,86
fusion,355
interpretation,352
inmachinelearning,30–31
methodsand,84–85
mining,351–352
objectivityof,89
Pearson,K.,on,87–88
reductionof,85
inscience,6,84–85
SeealsoBigData
David,Richard,187
Dawid,Phillip,237,350
deFermat,Pierre,4–5
deMoivre,Abraham,5
death,proximatecauseof,288
decisionproblem,238–239
decoding,125–126,127(fig.),128
deconfounders,139–140
back-doorpathsfor,158–159
inintervention,220
deconfoundinggames,159–165
deduction,inductionand,93
deeplearning,3,30,359,362
Democritus,34
TheDesignofExperiments(Cox),154
developmentalfactors,ofguineapigs,74–76,75(fig.)
Dewar,James,53
Diaconis,Persi,196
difference,incoefficients,327
directeffect,297,300–301,317–318
incausaldiagram,320–321
ofintervention,323–324
inmediationformula,333
mediatorsand,326,332
Seealsoindirecteffects;naturaldirecteffect
TheDirectionofTime(Reichenbach),199
discrimination,311–312,315–316

DNAtest,94–95,122,123(fig.),124,342
do-calculus,241–242
backdoorcriterionin,234
completenessof,243–244
decisionproblemin,238–239
eliminationprocedurein,231–232
front-dooradjustmentin,235–237,236(fig.)
instrumentalvariablesin,257
transformationsin,233–234,238
transparencyin,239–240
asuniversalmappingtool,219–220
do-expression,8,32,49,287–288
Doll,Richard,171–174,172(fig.)
do-operator,8–9,49,147–148,148(fig.),151
backdoorcriterionand,157–165,330
eliminationprocedurefor,237
forintervention,231
innoncausalpaths,157
do-probabilities,226
Duncan,Arne,336
Duncan,Otis,285,309,326
economics,pathanalysisin,79,84,86,236,244,250,285,362,376
effectsoftreatmentonthetreated(ETT),296–297
eliminationprocedure,231–232,237
Ellenberg,Jordan,200
Elwert,Felix,115
AnEnquiryConcerningHumanUnderstanding(Hume),265–266
epidemiology,169
admissionratebiasin,197–198
confoundingin,152–154
mediationfallacyin,315–316
RCTin,172–173
Robinsin,329(fig.)
equationdeletion,244
Erdos,Paul,196
error-correctingcode,126
estimand,12(fig.),14–15,17
estimate,12(fig.),15
ETT.Seeeffectsoftreatmentonthetreated
Euclideangeometry,48,101,233
evolution,human,23–26
examples
Abrahamandfiftyrighteousmen,263–264,283–284
“AlgebraforAll,”301,336–339,338(fig.)
AlphaGo,359–362
aspirinandheadache,33,267
attractivemenarejerks,200
bagonplane,118–121,118(fig.)
Bayes’sbilliardball,98–99,98(fig.),104,108
Berkeleyadmissionsanddiscrimination,309–316,312(fig.),314(fig.),317–318
Berkson’sparadox,197–200,197(fig.),198(table)
birthweightinguineapigs,82–83,82(fig.)
blockedfireescape,286–291
chocolateandNobelPrizewinners,69
cholera,245–249,247(fig.),248(fig.)
coatcoloringuineapigs,72–76,74(fig.),75(fig.)
coinflipexperiment,199–200
Daisyandkittens,319–322,320(fig.)
Danielandvegetariandiet,134(photo),135–137
education,skillandsalary,325–326
fallingpiano,288–289
fertilizerandcropyield,145–149
fire,smoke,andalarm,113–114
firingsquad,39–43,39(fig.)
flaxseed,elasticityofsupply,250–251,251(fig.)
fluvaccine,155–156,156(table)
Galtonboard,52(photo),54–55,56–57,57(fig.),63–65,64(fig.)
GardenofEden,23–25
HDLcholesterolandheartattack,254–257
icecreamandcrimerates,48
inheritanceofstature,55–60,59(fig.)
intelligence,natureversusnurture,304–309
jobtrainingandearnings,228–231
LDLcholesterol,252–257,254(table)
Let’sFakeaDeal,192–196,195(fig.)
Lord’sparadox:dietandweightgain,215–217,215(fig.),217(fig.)
Lord’sparadox:genderandweightgain,212–215,213(fig.)
mammogramandcancerrisk,104–108
mammothhunt,25–26,26(fig.)
matchesoroxygenascauseoffire,289–290
MontyHallparadox,188(photo),189–197,191(table),193(fig.),193(table),195(fig.),200
mortalityrateandAnglicanweddings,70
onlineadvertising,354–355
robotsoccer,365–366
salary,education,andexperience,272–283,273(table),276(fig.)
scurvyandScottexpedition,298(photo),299–300,302–304,303(fig.)
shoesize,age,andreadingability,114–115
Simpson’sparadox:BBGdrug,189,200–204,201(table),206–210,206(fig.),208(table),209(fig.),221
Simpson’sparadox:exerciseandcholesterol,211–212,212(fig.)
Simpson’sparadox:kidneystones,210
Simpson’sparadox:smokingandthyroiddisease,210
Simpson’sreversal:battingaverages,203–204,203(table),211
skulllengthandbreadth,70–71,70(fig.)
smoking,birthweight,andinfantmortality,183–187,185(fig.)
smoking,tar,andcancer,224–228,297
smokingandadultasthma,164,164(fig.)
smokingandlungcancer,18–19,167–179,172(fig.),176(fig.)
smokingandmiscarriages,162–163
smokinggene,339–343,341(fig.),342(fig.)
sure-thingprinciple,204–206,316
talent,success,andbeauty,115–116
teaandscones,99–102,100(table),104–105,112–113
toothpasteanddentalfloss,29–30,32,34
tourniquets,343–347,345(table),346(fig.)
tsunamiatOrobiae,262–263,266
turbocodes,125–126,127(fig.),128
2003heatwaveandclimatechange,292–296,294(fig.)
vaccinationandsmallpox,43–44,45(fig.)
victimDNAidentification,94–95
walkinganddeathrate,141–143,142(fig.)
exchangeability,154–156,162,181
experimentaldesign,145–146,146(fig.)
externalvalidity,357
Facebook,32,351
falsepositives,106–107,107(fig.)
falsenegatives,107(fig.)
FAR.Seefractionofattributablerisk
Faraday,Michael,53
Feigenbaum,Edward,109
feminism,67–68
Fieser,Louis,182
Fisher,R.A.,169,224,271–272
experimentaldesignof,145–146,146(fig.)
Neyman,J.,and,271–272
onRCT,139–140,143–144
onsmokinggene,174–175
insmoking-cancerdebate,178–179
onstatistics,85
Wright,S.,and,85
FisherBox,Joan,144–145,149
Forbes,Andrew,163–164,164(fig.)
formulas,334–335
forwardprobability,104,112–113
fractionofattributablerisk(FAR),291–292
freewill,358–370
Freedman,David,227–228,236,285
front-dooradjustment,225(fig.),235–237,236(fig.)
front-doorcriterion,224–231,225(fig.),229(fig.)
Frost,Robert,258(photo)
Galileo,81,187
Gallagher,Robert,128
Galton,Francis,3,5,52(photo),53,78
anthropometricstatisticsof,58
oncorrelation,62–63
oneminence,56
HereditaryGeniusby,55–56
NaturalInheritanceby,66
Pearson,K.,and,66–68
onregressiontothemean,57–58,67
onregressionline,60–62,61(fig.),221–222
“TypicalLawsofHeredity”by,54
Seealsoexamples
games,deconfounding,159–165
Gauss,CarlFriedrich,5
Geiger,Dan,242–243,245,285
Genesis,23–25,263
geneticmodeling,64–65,64(fig.)
genetics.SeeDNAtest;examples;Mendeliangenetics
genome-wideassociationstudy(GWAS),339–340
geometry,232–233
Glymour,Clark,350
Glynn,Adam,228–230
God,23–24
Goldberger,Arthur,84–85
graphoids,381
Greeklogic,232
Greenland,Sander,150,154–156,168,237,333–334
SeealsoRobins,Jamie
guilt,probabilityof,288
guineapigs.Seeexamples
GWAS.Seegenome-wideassociationstudy
Haavelmo,Trygve,285
Hagenaars,Jacques,331
Halley,Edmond,5
Halpern,Joseph,350
Hammel,Eugene,309–311
Hannart,Alexis,294–295
Harari,Yuval,25,34
Hardy,G.H.,65
HDL.Seehigh-densitylipoproteincholesterol
Heckman,James,236
HereditaryGenius(Galton),55–56
Hernberg,Sven,152
high-densitylipoprotein(HDL)cholesterol,254–257
Hill,AustinBradford,169–170,172–174,172(fig.),181
Hill’scriteria,181–183
Hipparchus,232
AHistoryofEpidemiologicMethodsandConcepts(Morabia),152–153
HistoryofthePeloponnesianWar(Thucydides),262
Hitchcock,Christopher,350
Holland,Paul,236,273,275
Hooke’sLaw,33
Hong,Guanglei,337–338
HowNottoBeWrong(Ellenberg),200
human
cognition,99
communicating,withrobot,366
evolution,23–26
humanmind
causalinferenceof,1–2,43
counterfactualsin,33
humanlikeintelligence,30,269
Hume,David,103
oncounterfactuals,19–20,265–267
AnEnquiryConcerningHumanUnderstandingby,265–266
“OnMiracles”by,96–97
TreatiseofHumanNatureby,264–265,265(fig.)
Huygens,Christiaan,4–5
hypotheticalexperiments,130
ignorability,281–282
imagination
incausation,27
theLionManas,34–35
inmentalmodel,26,26(fig.)
imitationgame,36–37
incomparability,151
indirectconfounding,241
indirecteffects
counterfactualsand,322
inmediationanalysis,297,300–301
asproduct,328–329
Seealsonaturalindirecteffect
induction,deductionand,93
inferenceengine,296,352
Seealsocausalinferenceengine
information
flowof,157–158
representing,inbrain,97
transferof,194
instrumentalvariables,249–250,249(fig.),257
intention,367
intervention,9,131,150
deconfoundersin,220
directeffectof,323–324
do-operatorfor,149–150,231
inLadderofCausation,28(fig.),31–33,40,219,231
predictionand,32
variablesin,257
SeealsoMountIntervention
intuition,47,99,125,189,321
inverseprobability
Bayeson,97–99,98(fig.),101,104–105
inBayesiannetwork,112–113,119–120
likelihoodratioand,105,113
Jeffreys,Harold,103
Jeter,Derek,203,203(table)
JobTrainingPartnershipAct(JTPA)Study,228–231,229(fig.),230(fig.)
Joffe,Marshall,283
Jouffe,Lionel,118–119
JTPA.SeeJobTrainingPartnershipActStudy
junctions
inBayesiannetworks,113–116
inflow,ofinformation,157–158
Justice,David,203,203(table)
Kahneman,Daniel,58,63–64,290
KarlPearson(Porter),67
Karlin,Samuel,87
Kashin,Konstantin,228–230
Kathiresan,Sekar,256
KeJie,360
Kempthorne,Oscar,272
Kenny,David,324–325,339
Klein,Ezra,139,154
knowledge,8,11–12,12(fig.)
Koettlitz,Reginald,302–304
Kragh,John,343–347
Kruskal,William,312–316,346
LadderofCausation,17–19,24,116
associationin,28(fig.),29–30,51
biasin,311
confoundingin,140
counterfactualsin,266
interventionin,28(fig.),31–33,40,219,231
model-freeapproachto,88
observationin,264
probabilitiesand,47–49,75
queriesin,28(fig.),29,32
language
ofknowledge,8
mathematical,3–8
ofprobability,102–103
ofqueries,8,10
Laplace,Pierre-Simon,5
Latinsquare,145,146(fig.)
law,counterfactualsand,286–291
LDL.Seelow-densitylipoproteincholesterol
Let’sMakeaDeal.Seeexamples
Lewis,David,20,266–269
likelihoodratio,105–106,113
Lilienfeld,Abe,175,179–180
Lind,James,168,299,302–303
Lindley,Dennis,209
linearcausalmodel,322–323,327
linearmodels,295–296
linearregression,285–286
linearSCMs,285–286
theLionMan,34–36,35(fig.)
LISREL,86
logic,232,238
Lord’sparadox.Seeexamples
low-densitylipoprotein(LDL)cholesterol,252–257,254(table)
lungcancer,smokingin,18–19,167–168
machinelearning,10–11,30–31,125,363
Seealsoartificialintelligence(AI)
machines
causalknowledgeof,37
thinking,367–368
Seealsorobots
MacKay,David,127–128
MalaysiaAirlinescrash,122,123(fig.)
Marcus,Gary,30
matching,274
mathematicalcertainty,288
mathematicallanguage,3–8
mathematics,scienceand,4–5,84–85
Seealsogeometry
M-bias,161
McDonald,Rod,325
mediation,20
“AlgebraforAll”as,336–339,338(fig.)
analysis,297,300–301,322–323
incausation,300–301
fallacy,272,315–316
formula,319,332–333,335
questions,131
smokinggeneexampleas,339–343,341(fig.),342(fig.)
thresholdeffectand,325,326(fig.)
mediators,153–154,228,297
confoundersand,276
directeffectand,326,332
outcomesand,315–316
Mendel,Gregor,65
Mendeliangenetics,73
Mendelianrandomization,255–256,256(fig.)
mentalmodel,26,26(fig.)
message-passingnetwork,110–111,111(fig.)
methods,dataand,84–85
mini-Turingtest,36–46
miracles,103,357
modeldiscovery,373
model-blind,33,66,132,217,275
ModelPenalCode,286,288
model-freeapproach,87–89,272,351
Seealsomodel-blind
Morabia,Alfredo,152–153
MountIntervention,218(photo),219–220,224,259–260
Musk,Elon,367
napkinproblem,239–240,240(fig.),330
naturaldirecteffect(NDE),318–319,332–333
naturaleffects,327
naturalindirecteffect(NIE),319,321,325–326,332–333
NaturalInheritance(Galton),66
nature,144–145,147,149,156,257
nature-versus-nurturedebate,304–309,305(fig.),306(fig.)
NDE.Seenaturaldirecteffect
necessarycausation,289–290,295
necessity,probabilityof,294
NetherlandsForensicInstitute(NFI),94,122,125
Neyman,Jerzy,85,261,270–272
NFI.SeeNetherlandsForensicInstitute
NIE.Seenaturalindirecteffect
Niles,Henry,78–81,84
noncausalpath,incausaldiagram,157,160
noncollapsibility,152
noncompliance,RCTwith,252–253,253(fig.)
nonconfoundedness,281
nonlinearanalysis,335
nonrandomizedstudies,149
Novick,Melvin,201,209
objectivity
inBayesianinference,89
ofcausalinference,91
observationalstudies,150–151,229
Ogburn,WilliamFielding,309
“OnMiracles”(Hume),96–97
“OntheInadequacyofthePartialandMultipleCorrelationTechnique”(Burks),308
OriginofSpecies(Darwin),63
paradox,9,19,189–190
birth-weight,185–186,185(fig.),189
asopticalillusion,189–190
Seealsoexamples
parentnodes,111–112,117–118,129
Pascal,Blaise,4–5
Pasteur,Louis,228
pathanalysis
ineconomics,86
insocialsciences,85–86
Wright,S.,on,86–89,324
pathcoefficients,77,223,251
pathdiagram
forbirth-weightexample,82–83,82(fig.)
ofBurks,308–309
ofWright,S.,74–77,75(fig.),85–86,221,260–261
Paz,Azaria,381
Pearl,Judea,ix,24,51,328,331
Pearson,Egon,271–272
Pearson,Karl,5,62,78,85,180,222
causationand,71–72
ondata,87–88
Galtonand,66–68
onskullsize,70(fig.)
onspuriouscorrelation,69
aszealot,67–68
philosophers,oncausation,47–51,81
physics,33–34,67,99
Pigou,ArthurCecil,198
Pinto,Rodrigo,236
placeboeffect,300
polynomialtime,238
Porter,Ted,67
potentialoutcomes,155,260
potentialoutcomesframework,155
prediction,278,280
interventionand,32
inscience,36
preponderanceofevidence,288
pretreatmentvariables,160
Price,Richard,97
priorknowledge,90,104
probabilisticcausality,47–51
ProbabilisticReasoninginIntelligentSystems(Pearl),51
probability,43–44,46,90,110
Bayeson,97–98,102
Bayesiannetworksand,358–359
inbut-forcausation,287
causationand,47–51
ofguilt,288
LadderofCausationand,47–49,75
languageof,102–103
ornecessity,294
overtime,120–121,121(fig.)
raising,49
ofsufficiency,294
Seealsoconditionalprobability;inverseprobability
probabilitytable,117(table),128–129
probabilitytheory,4–5
product
ofcoefficients,327
indirecteffectas,328–329
Provine,William,85
provisionalcausality,150
proximatecause,288–289
Pythagoras,233
quantitativecausalreasoning,43
queries,8,10,12(fig.),14–15
causal,27,183
counterfactual,20,28(fig.),36,260–261,284
inLadderofCausation,28(fig.),29,32
mediation,131
Seealso“Why?”question
randomizedcontrolledtrial(RCT),18,132–133,143–147
incausaldiagram,140,148–149,149(fig.)
confoundersand,149–150
inepidemiology,172–173
Fisheron,139–140,143–144
as“goldstandard,”231
withnoncompliance,causaldiagramfor,252–253,253(fig.)
observationalstudiesversus,150,229
recombinantDNA,369
reduction,ofdata,85
regression,29,325
Seealsolinearregression
regressioncoefficient,222–223
regressionline,60–62,61(fig.),221–222
regressiontothemean,57–58,67
Reichenbach,Hans,199,234
Reid,Constance,271–272
representation
acquisitionand,38
ofinformation,inbrain,39
representationproblem,268
reversion,56–57
Robins,Jamie,168,329–330,329(fig.),333–334
onconfounding,150
do-calculusand,236–237,241
onexchangeability,154–156
robots,ix–x
AI,291
causalinferenceby,2,350,361,361(fig.)
communicating,withhumans,366
asmoral,370
soccer,365–366
rootnode,117
Rubin,Donald,269–270,270(photo),275,283
causalmodelof,261,280–281
onpotentialoutcomes,155
Rumelhart,David,110,111(fig.),268
Sackett,David,197–198,198(table)
Sapiens(Harari),25
Savage,Jimmie,316
Savage,Leonard,204–206
scatterplot,59(fig.),60,62
Scheines,Richard,350
Schuman,Leonard,182
science
datain,6,84–85
historyof,4–5
mathematicsand,4–5,84–85
predictionin,36
Seealsocausalinference;socialsciences
scientificmethod,108,302
SCMs.Seestructuralcausalmodels
Scott,RobertFalcon,298(photo),302,303(fig.)
Searle,John,38,363
seatbeltusage,161–162
Sedol,Lee,360
Seeingvs.doing,8–9,27,130,149,233
self-awareness,363,367
SEM.Seestructuralequationmodel
sensitivityanalysis,176
sequentialtreatment,241(fig.)
Shafer,Glen,109
Sharpe,Maria,68
SherlockHolmes,92(photo),93
Shpitser,Ilya,24,238–239,243,245,296–297
SiliconValley,32
Simon,Herbert,79,198
Simpson,Edward,153–154,208–209
Simpson’sparadox.Seeexamples
smoking.Seeexamples;surgeongeneral’sadvisorycommittee;tobaccoindustry
smokinggene,174–175,224–227,339–343,341(fig.),342(fig.)
smoking-cancerdebate,166(photo),167–179
Snow,John,168,245–249
socialsciences,84–86
socialstatus,307
sophomoreslump,56–58
Spirtes,Peter,244
Spohn,Wolfgang,350
spuriouscorrelation,69–72
spuriouseffects,138
stableunittreatmentvalueassumption(SUTVA),280–281
Stanford-BinetIQtest,305–306
statisticalestimation,12(fig.),15
statistics,5–6,9
anthropometricand,58
cannedproceduresin,84–85
causalinferencein,18
causalityand,18,66,190
confoundersin,138–139,141–142
methodsof,31,180–181
objectivityand,89
skepticismin,178
SeealsoBayesianstatistics
Stigler,Stephen,63,71,147
Stott,Peter,292–294
strongAI,3,11
causalreasoningof,20–21
counterfactualsfor,269
freewilland,358–370
ashumanlikeintelligence,30,269
Strotz,Robert,244
structuralcausalmodels(SCMs),260–261,276–280,276(fig.),283–286
structuralequationmodel(SEM),86,285
subjectivity
Bayeson,90,104,108
causal,90
causalanalysisand,89
sufficiency,probabilityof,294
sufficientcause,288–291,295
sumofproductsrule,324
SupremeCourt,U.S.,288,316
sure-thingprinciple,204–206,316
surgeongeneral’sadvisorycommittee,179–183,180(fig.)
surrogates,152
SUTVA.Seestableunittreatmentvalueassumption
Szent-Gyorgyi,Albert,304
Teague,Claude,177
temporalrelationship,181
Terman,Lewis,305,307
Terry,Luther,179,182
testability,116,242,283,381
testableimplications,12(fig.),13,283
theology,97
Thinking,FastandSlow(Kahneman),58
thinkingmachines,10
Thomson,J.J.,53
thresholdeffect,mediationand,325,326(fig.)
Thucydides,262
Tian,Jin,238,243
time-varyingtreatments,241
tobaccoindustry,170,171(fig.),177–179
totaleffects,300,317
tourniquet.Seeexamples
“TowardaClearerDefinitionofConfounding”(Weinberg,C.),162
transfer,ofinformation,194
transformations,indo-calculus,233–234,238
transparency,indo-calculus,239–240
transportability,353,354(fig.),356
TreatiseofHumanNature(Hume),264–265,265(fig.)
Turing,Alan,27,29,36–37,108–109,358
Tversky,Amos,290
“TypicalLawsofHeredity”(Galton),54
uncertainty,4,109,143
UnitedStatesDepartmentofAgriculture(USDA),73
universalmappingtool,219–220
VanderWeele,Tyler,185,342–343
Variables
causallyrelevant,48–49
instrumental,249–250,249(fig.),257
inintervention,257
pretreatment,160
inprobability,48–49
Verma,Thomas,87,242,245
Virgil,3
vosSavant,Marilyn,190–193,191(table),196
Wainer,Howard,216,217(fig.)
Wall,Melanie,328,331
weakAI,362
weightedaverage,106
Weinberg,Clarice,162–163
Weinberg,Wilhelm,65
Weissman,George,177
Welling,David,344
Wermuth,Nanny,240–241,241(fig.)
Whighistory,65–66,80
“Why?”question,299–300,349–350
Wilcox,Allen,186–187
Winship,Christopher,115,350
Wold,Herman,244
would-haves,329–336
Wright,Philip,72,250–252,251(fig.)
Wright,Sewall,5–6,18,244,309
oncausation,79–81
“CorrelationandCausation”by,82
ondevelopmentalfactors,74–76,75(fig.)
Fisherand,85
guineapigsof,72–74,74(fig.),222
onmodel-freeapproach,88–89
Nileson,78–81,84
onpathanalysis,86–89,324
onpathcoefficients,223,251
pathdiagramof,74–77,75(fig.),85–86,221,260–261
Yerushalmy,Jacob,167–169,174,183–184
Yule,GeorgeUdny,68–72,222
Zadeh,Lotfi,109


