Embed Size (px)
Citation preview

1
The Bending and Failure of Sandwich Structures with
Auxetic Gradient Cellular Cores
Y. Hou1,2, Y. P. Tai3, C. Lira2,4, F. Scarpa2*, J. R. Yates5, B. Gu1* 1 College of Textiles, Key Laboratory of high-performance fibers & products, Ministry of
Education, Donghua University, Shanghai, China, 201620
2 Advanced Composites Centre for Innovation and Science, University of Bristol, BS8 1TR
Bristol, UK
3 Department of Mechanical Engineering, University of Sheffield, Sheffield S1 3JD, UK
4 National Composites Centre, Feynman Way Central, Bristol & Bath Science Park, Bristol
BS16 7FS
5 MACE, University of Manchester, Manchester M60 1QD, UK
* Corresponding Authors
Abstract
We describe the bending and failure behaviour of polymorphic honeycomb topologies
consisting of gradient variations of the horizontal rib length and cell internal across the
surface of the cellular structures. The novel cores were used to manufacture sandwich
beams subjected to 3-point bending tests. Full-scale nonlinear Finite Element models
were also developed to simulate the flexural and failure behaviour of the sandwich
structures. Good agreement was observed between the experimental and FE model
results. And the validated numerical model was then used to perform a parametric
analysis on the influence of the gradient core geometry over the mechanical
performance of the structures. It was found that the aspect ratio and the extent of

2
gradient (i.e. the horizontal rib length growth rate or the internal angle increment) have
a significant influence on the flexural properties of the sandwich panels with angle
gradient cores.
Keywords
A. Sandwich; B. Auxetics; C. Finite Element Modelling (FEM); D. gradient honeycomb.
Nomenclature
A reduced area bds2/c l Core oblique rib length
b Sandwich width L Specimen total length
c Core thickness Pmax Maximum force prior to failure
d Sandwich thickness S Support span length
ds specimen depth between the two
neutral lines of the skins t Cell wall thickness
D Sandwich bending stiffness tf Skin thickness
D* Specific sandwich bending stiffness W Total weight of sandwich panel
E Sandwich bending modulus α Aspect ratio, h/l
E* Specific sandwich bending modulus α0 Aspect ratio of the first row
Fult Core shear ultimate strength β Aspect ratio of the oblique rib
thickness, t/l
Fult* Specific core shear ultimate strength θ Cell internal angle
Gyz Core shear modulus in yz plain △θ Increment of cell internal angle
Gyz* Specific core shear modulus in yz plain δ deflection at maximum load
Gs Shear modulus of the solid material the
core was made of σ Skin stress
h Core horizontal rib length ρc Core density
hg Growth rate of horizontal rib length ρs Density of the core solid
3
material
1 Introduction
Lightweight cellular honeycombs or foams have been widely used in automotive,
marine and aerospace applications due to superior indentation resistance, acoustic
attenuation, thermal insulation and energy absorption ability (Aktay et al., 2008; Gibson
and Ashby, 1999; Hanssen et al., 2006; Mills et al., 2003; Papka and Kyriakides, 1998;
Sun et al., 2010). The great diversity in terms of topology and material composition in
cellular solids provides the material and structural designer with a large range of
possible multifunctional properties, as well as unusual deformation characteristics. A
typical example of cellular materials with extreme material characteristics is represented
by auxetic (negative Poisson’s ratio) honeycombs and porous solids, manufactured for
the first time by Lakes (Lakes, 1987) in the form of thermoplastic open cell foam. Since
Lake’s seminal paper, negative Poisson’s ratio structures have been extensively
investigated due to their stiffening geometric effects (Evans and Alderson, 2000; Grima
et al., 2012a; Grima et al., 2012b; Grima et al., 2011; Yang et al., 2004), enhanced
in-plane indentation resistance (Evans and Alderson, 2000; Grima et al., 2012a; Scarpa
et al., 2007), shear modulus (Ju and Summers, 2011; Prawoto, 2012), impact absorption
(Ju and Summers, 2011; Scarpa et al., 2003a) and damage tolerance (Liu and Hu, 2010).
Functionally graded cellular structures are characterized by a gradual variation of cell

4
size, shape and wall thickness over a prescribed volume. The gradient topology leads to
a continuous distribution of curvatures, stiffness and energy absorption capability. In
nature, gradient topologies in plant stems are widely present to provide resistance to
high bending loading. Some typical examples are the honeycomb-like vascular bundles
of Cocus nucifera, and the radial density of the cells distribution in Iriartea gigantea
providing higher bending stiffness compared to a uniform density section (Gibson et al.,
2010)Error! Reference source not found.. Ajdari et al (Ajdari et al., 2011) introduced
a density gradient cellular structure by a gradual change of the cell wall thickness, and
investigated its deformation mechanism under low and high crushing velocities. The
decrease of the honeycomb relative density along the crushing direction significantly
enhanced the energy absorption at early stage. Cui et al (Cui et al., 2009) have explored
in detail the energy absorption capability of functionally graded foam with different
density parameters. Lee et al (Lee et al., 2007) have used a finite element method
approach to understand the fracture behavior in functionally graded foams. Kirugulige
et al (Kirugulige et al., 2005) showed that the introduction of gradients in the core
would considerably reduce the stress intensification of the equivalent sandwich
structure under dynamic loading. While references (Ajdari et al., 2011; Cui et al., 2009;
Kirugulige et al., 2005; Lee et al., 2007) concern foam configurations, Lim (Lim, 2002)
proposed for the first time a gradient cellular structure made of centresymmetric regular
cells by varying the internal cell angle row by row. The gradient cellular core provided
the design of a functionally graded beam with Poisson-curving characteristics. Lira et al

5
(Lira and Scarpa, 2010) provided a feasible solution to optimize the transverse shear
stiffness of the honeycomb through changing the horizontal rib thickness across the
whole panel. The use of a step-wise honeycomb core was introduced by Lira et al (Lira
et al., 2011) as a filler for aeroengine fan blades, showing a significant decrease in terms
of mass and mass modal displacement compared to existing baseline fan blade
configurations. More recently, Alderson et al (Alderson et al., 2012) have produced
gradient open-cell PU foams with complex geometry moulds to achieve gradient elastic
properties along the length of whole specimen. These gradient cellular solids are also
called polymorphic (Alderson et al., 2012), because they can assume varying shape
changes and Poisson’s ratio values along the principal manufacturing direction. The
gradual Poisson’s ratio change and variation of curvature is indeed one of the main
characteristics of the gradient cellular cores. The topologies shown in Fig. 1 (which will
be the subject of this work) are all characterized by a re-entrant (butterfly) shape. The
configuration with gradually changing aspect ratio will be called topology #1, while the
cellular layout with varying internal cell angle is denominated as topology #2. When
cellular panels made with these configurations are subjected to a distributed bending
moment along their edges, the resulting curvatures assume a complex shape. A FE
model has been developed to simulate this particular loading case. The curvature of
each surface segment along the horizontal rib direction is calculated from the
displacement of the nodes belonging to the horizontal ribs (aligned along the X-axis).
The distribution of the X-curves is displayed in Fig. 2. Bent plates made with positive

6
Poisson’s ratio materials assume a single anticlastic curvature, while negative Poisson’s
ratio provides a synclastic shape. Topology #1 features cells having re-entrant unit cell,
therefore showing an auxetic effect under uniaxial loading. The curvatures are all
synclastic, but with different magnitudes because of the varying unit cell shape (Fig. 2a).
On the contrary, the panel made with topology #2 (Fig. 2b) has a continuous
distribution of curvatures, ranging from synclastic (where the cells have a re-entrant
shape) to anticlastic corresponding to convex hexagonal units. The honeycomb with
topology #1 is composed by cells all having a re-entrant shape, however the magnitude
of the synclastic curvature is different along the surface of the cellular panel (Fig. 2a).
Multiple curvature cores could be very useful for developing sandwich structures with
complex shape geometry, ranging from radar radome to acoustic liners and ducts. At the
same time, little is understood about the distribution (and variation) of the mechanical
properties due to gradient configurations, in particular when failure within the core is
considered.
The work described in this paper concerns two different angle gradient honeycomb
configurations based on the topology of auxetic unit cell, with a variation in horizontal
rib length and cell internal angle separately. Specimens of the two gradient structures
were produced using rapid prototyping (RP) technique. Sandwich panels were made by
bonding two layers of thin and stiff skin to the gradient core and subjected to three point
bending tests according to ASTM standard. The experimental results were used to
validate the Finite Element model (FEM), and subsequently used to perform a

7
parametric analysis on the bending properties (linear and nonlinear) of the angle
gradient honeycombs for various cell wall aspect ratios, horizontal rib length growth
rate and increment of the cell internal angle. To the best of the Author’s knowledge, this
is the first time a comprehensive analysis on the bending and failure of man-made
gradient cellular structures has been performed.
2 Manufacturing and Experiments
2.1 Angle gradient configurations
As mentioned in the introduction, the fundamental topology of re-entrant unit cell is
characterized by the cell internal angle θ, the cell wall aspect ratio α=h/l and relative
thickness of the oblique rib β=t/l (Fig. 1(a)). The two gradient honeycomb
configurations (#1 and #2) have been designed by varying the horizon rib length h and
internal cell angle θ row by row along the y direction (Fig. 1 (b)). Both configurations
are made by changing the position of the point connecting the three ribs. The position of
the node can only change along the y direction. For the configuration #1, the horizontal
rib length of the (i+1)th row increases by 5% compared to the one belonging to the ith
row (i.e. hg = (hi+1-hi)/hi = 0.05). In this configuration the connecting nodes move along
the same direction, with the angle change provided by the progressing shortening of the
horizontal ribs. For configuration #2, it is the internal cell angle at each row which
increases (by 5°, in our case), progressing along the y axis (i.e. Δθ = (θi+1-θi)/θi = 0.05).

8
The first row from the bottom of the two configurations (Figure 1b) has different
starting angle (-10º for #1, -25º for #2). In this way, configuration #2 maintains an
integer number of row with the same gradient, with both the lower and upper rows
terminating aligned to the horizontal rib.
The geometric parameters of the first row (labeled by subscript 0) of the two cell
gradient structures are detailed in Table 1.
Fig. 1 Topology of re-entrant unit cell and geometric configurations of angle gradient honeycombs
Table 1 Initial parameters belonging to the first row and size of the specimens.
Specimen Re-entrant Unit cell in the first row Specimen size (mm)
0θ 0l 0α t L b c ft S
#1 -10° 12 1 0.6 154 79 22 1.2 108 #2 -25° 12 1 0.6 138 69 22 1.2 88
Gradient honeycomb samples were manufactured using a Fused Deposition Molding
Rapid Prototyping technique (FDM RP, Stratasys® Dimension® Elite). The FDM

9
machine is able to deposit minimum thickness of 0.178mm of ABSplus (Stratasys®)
material, including also the support material. The samples of the gradient honeycombs
have been cut into dimensions according to the ASTM C393/C393M-06 standard
(393M-06) (Table 1).
Fig. 2 Gradient curvature displayed by angle gradient honeycombs
2.2 Three-‐point bending tests
Two composite face skins have been bonded to the gradient cores using epoxy super
glue (Hexcel Redux® 810) cold cured for 72 hours (Fig. 3 (a)) at room temperature.
The composite skins (stacking sequence of [±25°]2s) have been obtained from IM7/8552

10
carbon/epoxy unidirectional prepreg (Hexcel Corporation) with a sheet thickness of
0.15mm. The particular stacking sequence used provides a through-the-thickness
negative Poisson’s ratio effect, which shows strong localization of the damage after
low-kinetic energy impacts typical of damage tolerance problems (Alderson and Coenen,
2008; Hadi Harkati et al., 2007). However, the effect of the stacking sequences over the
global mechanical behavior of the composite sandwich beams is not evaluated within
the context of this work. The three point bending tests were performed using a servo
hydraulic machine Instron 8501 with a calibrated load cell of 50kN (Fig. 3(b)). Three
rigid rollers having 12 mm of diameter have been used as loading and supporting
devices. Rubber pressure pads of 12mm width were placed between the bars and
specimen to prevent local damage to the face skins (Fig. 3 (c)). The tests have been
carried out under displacement-control mode at a constant velocity of 0.1mm/s, with
data acquisition sampled at 3Hz. The deflection of the specimen has been calculated
from the displacements of the skin under the top roller, which were tracked using a 2D
digital image correlation system (Davis 7). All the tests have been conducted at ambient
room temperature and humidity around 50 %. The load-displacement curves of the two
gradient cellular core sandwich panels are shown in Fig. 4, while the corresponding
damage morphologies are represented in Fig. 5. It is possible to observe the presence of
shear cracks in the gradient cellular core, and distinct delamination occurring between
the core and skin. The core shear strength, skin stress is calculated from the
load-displacement curve based on the ASTM C393/C393M-06 standard (Eq. 1 & Eq. 2).

11
The pure bending stiffness, bending modulus of the sandwich panel and the shear
modulus of the core can also be obtained using simple bending theory (Eq. 3 ~ Eq. 5)
(Fan, 2006). To consider the effect of the mass, the mechanical properties of Eq. 2 ~ Eq.
5 have been normalised with the total weight W of the sandwich configurations. The
normalized (specific) parameters are represented with the superscript *. The comparison
between the specific mechanical properties of the two gradient cellular sandwich beams
is illustrated in Table 2. The angle gradient configuration #1 has a lower relative density
than the one exhibited by topology #2. However, the #2 layout (i.e., the angle-gradient
centre-symmetric configuration) shows the highest specific flexural properties. When
compared against the aspect ratio gradient configuration (#1), samples #2 show higher
average value of core shear strength (38.4%), shear modulus (44%), bending stiffness
(19.7%), flexural modulus (19.7%), and skin strength (26%). The cellular configuration
#2 is characterised by cells with a higher degree of topology change – the unit cells vary
continuously between re-entrant, rectangular and convex hexagonal shapes, while
configuration #1 has a single topology, but with different aspect ratio. The lower
equivalent density of the configuration #1 provides also a smaller contact surface
between the face skins and the core itself, therefore decreasing the amount of transfer
load during the bending deformation of the sandwich beams.
bcdPFult )(max
+=
(1)
bcdtSP
f )(2max
+=σ
(2)

12
bSPDδ48
3max=
(3)
3
3max
3 412
bdSP
dDE
δ==
(4)
DAS
SPA
G 1241
2
max−=
δ
(5)
Table 2 Flexural properties of the gradient core sandwich panels.
Parameters 1-1 1-2 2-1 2-2
sc ρρ 0.092 0.092 0.119 0.119
∗ultF ( gMPa / ) 2.04×10⁻² 2.17×10⁻² 3.43×10⁻² 3.39×10⁻²
∗yzG ( gGPa / ) 0.59 0.65 1.11 1.08
∗D ( gmN /⋅ ) 13.05 14.19 17.16 16.73
∗E ( gMPa / ) 10.78 11.72 14.18 13.82
∗σ ( gMPa / ) 0.88 0.94 1.24 1.23

13
Fig. 3 (a) Sandwich panels with the gradient cores produced; (b) experimental setup for the
3-point bending tests; (c) typical sandwich beam configuration for the ASTM C393/C393M-06 standard.
Fig. 4 Load displacement curves for sandwich panels with gradient cellular core under the
3-point bending tests.

14
Fig.5 Damage morphologies of the gradient cellular sandwich panels under 3-point bending
loading. (a) Specimen #1; (b) Specimen #2.
3 Full scale three-‐point bending model
The Finite Element model representing the sandwich beams with the gradient cellular
core has been developed using the commercial software ANSYS 11.0. The full-scale

15
geometric model of the sandwich panel is shown in Fig.6 (a). For simplicity, no
interface regions between the skin and the core elements have been modeled, therefore
the model is representative only of the maximum static load, flexural behavior and core
failure, while skin-core debonding observed in the experimental results cannot be
simulated. The composite skin is represented using triangular linear layered structure
shell elements (SHELL99) with eight nodes and six degree freedoms. The triangular
meshing allowed following the complexity of skin-core geometry through a mapped
mesh approach. The core material was represented via quadrilateral eight-node
structural shells (SHELL93). The cell wall thickness (0.6mm) and the parameters of the
carbon/epoxy prepreg (0.15mm×8 layers, [±25°]2s) were specified in the real constants
of the element type. A convergence analysis (mesh size equal to l/2, l/3 and l/4) was
performed to obtain an acceptable compromise between accuracy and CPU time. An
average mesh size equal to l/2 was adopted for both the SHELL99 and SHELL93
elements. The skin material (IM7/8552 carbon/epoxy unidirectional prepreg) was
defined as a transversely isotropic but in-plane special orthotropic material, with
Ex=171.42 GPa, Ey=9.08 GPa, Gxy=5.29 GPa, vxy=0.32, and density ρ=1430 kg/m3. The
core material (FDM ABSplus) properties were determined by performing tensile tests
(ASTM D638-08) on dog-bone shaped specimens. The FDM ABSplus material
presented a transversely isotropic mechanical behaviour, with Ex=2.016 GPa, Ez=1.53
GPa, Gxz=0.626 GPa, vxy=0.43, ρ=1040 kg/m3. The mechanical properties of the core
plastic material are consistent with data used for other types of FDM-produced cellular

16
configurations. In the full-scale three point bending model, boundary conditions were
applied on three nodal regions (A, B, C) of 12mm width to simulate the experimental
setup. All the nodal degree freedoms of the A and B regions at the bottom surface have
been constrained, whereas the nodes in A region have been subjected to a displacement
along the negative Z direction (Fig. 6(b)). The constant loading velocity used during the
test has been represented using a total time approach. Tsai-Wu failure (Tsai and Wu,
1971) and maximum stress failure criterion have been also used to predict the failure of
the composite skin and core respectively and the strength values are listed in Table 3.
Element birth and death technology was introduced to kill elements meeting the defined
failure criteria during the loading process. The force-displacement results obtained from
the FE model is shown in Fig.7, revealing a general good agreement between the FE
model and experimental data, in particular when considering the initial stage of the
loading and the maximum load sustained by the whole sandwich panel. The
load-displacement relations obtained from the FE model imply an earlier and larger
material softening ascribed to the constitutive relationship of the stress and strain of
FDM ABSplus represented by multilinear isotropic hardening (miso option in ANSYS
11.0). However, multilinear isotropic hardening does not allow negative slope between
the stress and strain, meaning that the FE model could only simulate the softening stage
of the core material and not its failure stage (which is represented through element death
using failure criteria). An example of the numerical failure simulation process is given
in Fig. 8, in which the specimen #2 is considered. The angle gradient core fails due to

17
shear crack under the bending loading (Fig. 8(c)), and no elements belonging to the
composite skin are eliminated, although the stress levels are significantly higher than
within the ones present in the core.
The FE model validated by the experimental results represents a toll showing a robust
fidelity for what concerns the prediction of the elastic flexural properties, transverse
shear core and onset of failure. From this point onwards it will be used to perform a
parametric analysis and predict the dependence of the mechanical properties of
sandwich beams with auxetic gradient core versus the geometry of gradient topology.
Fig. 6 (a) Geometric model in FE analysis; (b) mesh scheme and boundary conditions.
Table 3 Failure criteria of the skin and core material (unit: MPa) Composite skin (Tsai-Wu) Core
XT YT ZT XC YC ZC XYS Coupling Von Mises
Maximum Stress 2326.2 62.3 62.3 1200.1 199.8 199.8 92.3 -1 35.5

18
Fig. 7 Comparison in load displacement curves between experimental and FE results.

19
Fig. 8 Nodal contour plots of Von Mises Stress of angle gradient sandwich panels: (a) overall;
(b) angle gradient core; (c) angle gradient core after elements killing (sideview).
A direct comparison between Fig.5 (a, b) and Fig. 8 (c) shows that the FEM model
can also approximate the damage morphology observed during the experiments. For
configuration #1, the crack first propagates vertically and then horizontally, a
behaviour which is also observed in the FEM model (Fig. 8 (c)). In configuration #2,
the crack propagates simultaneously both vertically and horizontally, as predicted also
by the FEM representation.
4 Parametric analysis
Full-scale FE models representing the sandwich beams have been parameterized
against the unit cell initial aspect ratio α0, horizontal rib length growth rate hg and cell

20
internal angle increment Δθ. The gradient auxetic cores have been produced using
rapid prototyping techniques, hence also the use of thermoplastics as core material.
However, for practical manufacturing applications, gradient cellular cores could be
produced using more composite production-oriented techniques, like Kirigami
(Origami plus ply-cut patterns) adopted to build complex cellular shapes using
thermoset fabrics and thermoplastic films (Saito et al., 2011). Hence the core material
within the parametric FE has been replaced by standard Kevlar 49/914 epoxy prepreg
(Hexcel Composites Ltd, UK), according to (Saito et al., 2011). Kevlar 49 plain
woven fabric/914 epoxy prepreg has excellent thermal stability as well as high
specific stiffness and strength, with E=29 GPa, v=0.05, ρ=1380 kg/m3. The skin of the
sandwich panel in the FE models is the same IM7/8552 carbon/epoxy prepreg. The
geometry nondimensional groups used for the parametric analysis range from 0.8 to 2
for the cell wall aspect ratio, from 0 to 0.05 for the horizontal rib length growth rate in
topology #1, and cell internal angle increment varying between 0º and 5° for #2
configuration. The dimensions of the specimens are all based on the ASTM
C393/C393M-06 standard and are detailed in Tables 4 and 5. For specimen of the #1
type, the average length is 156.9 mm (standard deviation of 3.13 mm), and the width
average is 70.4 mm (standard deviation of 7.4 mm). For specimen #2, the average
dimensions are 153.8 mm×71.4 mm (standard deviations being 8.4 mm and 4.1 mm
respectively). The height for all specimens is 25 mm. The images contained in Tables
4 and 5 include also the locations of the failure onset in the cores. The core failure
behaviour will be the subject of a detailed analysis in Paragraph 4.3.

21
Table 4 Topologies of #1 under different geometric parameters and the according specimen size.
#1 l0=12, t=0.6, θ0= -10° α0=0.8 α0=1.0 α0=1.2 α0=1.6
hg=0
153.9×60.1×25
153.9×79.3×25
159.9×73.9×25
159.9×68.4×25
hg=0.02
153.9×60.1×25
153.9×79.3×25
159.9×73.9×25
159.9×68.4×25
hg=0.05
153.9×60.1×25
153.9×79.3×25
159.9×73.9×25
159.9×68.4×25

22
Table 5 Topologies of #2 under different geometric parameters and the according specimen size.
#2 l0=12, t=0.6, θ0= -25° α0=1.0 α0=1.2 α0=1.8 α0=2
Δθ=0°
152×69.3×25
152×74.6×25
152×66.1×25
152×75.7×25
Δθ=3°
140×69.3×25
164×74.6×25
164×66.1×25
164×75.7×25
Δθ=5°
138×69.3×25
156×74.6×25
156×66.1×25
156×75.7×25
4.1 Relative density
The relative density is defined as ρc/ρs, where ρc is the density of the cellular structure
and ρs is that of the solid core material. The relative density plays a crucial role in the
mechanical, thermal and dielectric properties of cellular solids (Gibson and Ashby,

23
1999). The variation of ρc/ρs versus the gradient core cell aspect ratio and different
parameters (hg for configurations #1, Δθ for topologies #2) is shown in Fig. 9. A
common feature of the two gradient configurations is the decrease of the relative
density for increasing cell wall aspect ratio values. Configuration #1 has also a
general lower relative density than the angle gradient #2. Topology #1 does show
almost no sensitivity versus the hg parameter, with the relative density diminishing by
50 % when α0 changes from 0.8 to 2. On the contrary, angle-gradient configurations
#2 have significantly higher relative densities. The denser honeycombs correspond to
Δθ=0° (i.e., no gradient and fully auxetic configuration), and decrease on average by
15 % for Δθ=3°and Δθ=5°. A direct comparison between the configuration #1 (l=12,
α0=1.0, t=0.6, θ0=-10°, hg=0) and the #2 (l=12, α0=1.0, t=0.6, θ0=-10°, Δθ=0°) leads to
conclusion that relative density of auxetic structures with the same wall thickness
decreases with the increase of the cell internal angle (-90°~0°) when the aspect ratio
equals 1.

24
Fig.9 Relative density versus the aspect ratio and geometry parameters for the two auxetic gradient core configurations.
4.2 Specific mechanical properties The flexural mechanical properties (Fult
*, Gyz*, D*, E*, σ*) versus the base (first row)
cell wall aspect ratio α0 have been normalised using the total weight of each gradient
core configuration (Figs. 10 and 11). The gradient topology #1 shows a common trend
of decrease versus the base cell wall aspect ratio for all the mechanical properties
considered. The specific critical load decreases by 61 % when α0 varies from 0.8 to
1.6, similarly to the specific transverse shear modulus (53%), and skin stress (56 %).
The sensitivity to the hg parameter is small, and only observable at higher values of
base cell wall aspect ratio for the specific critical load and skin stress. The angle
gradient configuration #2 shows however a more significant dependence over the
angle increment Δθ, maintaining however an overall decreasing trend for increasing

25
α0 values (Fig. 11). For base cell wall configurations those α0 > 1.2, the specific
critical loads are on average 10 % higher for the non gradient configuration (Δθ = 0º),
while positive angle variation do only provide a negligible contribution (Fig. 11(a)).
The specific transverse shear modulus receives a positive contribution from non-zero
angle increments only for α0 < 1.2, otherwise no effect is observed for the Δθ values
considered in this work (Fig. 11 (b)). More sensitive to the angle increment is the
specific flexural stiffness of the sandwich beams (Fig. 11 (c)). For α0 = 1.2, Δθ = 1º
provides a 14 % increase in flexural stiffness compared to the non gradient
configuration. Increasing Δθ to 3º leads to a 28 % enhancement, this is approximately
maintained also for higher values of base cell wall aspect ratio. The specific skin
stress is only mildly affected by the internal cell angle increments, and for α0 >1.2 the
presence of non-zero angle increments alleviates on average by 9 % the skin stress
compared to the non-gradient configuration.
The gradient configuration #2 shows general improved specific flexural properties
compared to the #1 topology for the same aspect ratio values. At α0 = 1.2, the specific
critical load is on average 45 % higher in the #2 layout. The same behaviour is
observed for the specific shear modulus (40 %), flexural stiffness (31 %) and skin
stress (38 %). At higher aspect ratios (α0 > 1.8), the enhancement is significantly
decreased, and the two configurations do offer similar global mechanical properties.

26
Fig.10 Specific flexural properties of gradient core sandwich panels (#1) under different
honeycomb geometry. (a) critical load; (b) core shear modulus in yz plane; (c) bending
stiffness; (d) skin stress.

27
Fig.11 Specific flexural properties of gradient core sandwich panels (#2) for various
honeycomb geometry. (a) critical load; (b) core shear modulus in yz plane; (c) bending
stiffness; (d) skin stress.
Three-point bending allows identifying the transverse shear modulus of the
honeycomb core along the plane loading. In centersymmetric honeycomb
configurations the transverse shear modulus Gyz (i.e., in the plane of the transverse
bending loading) is expressed in closed form as a function of the geometry and core
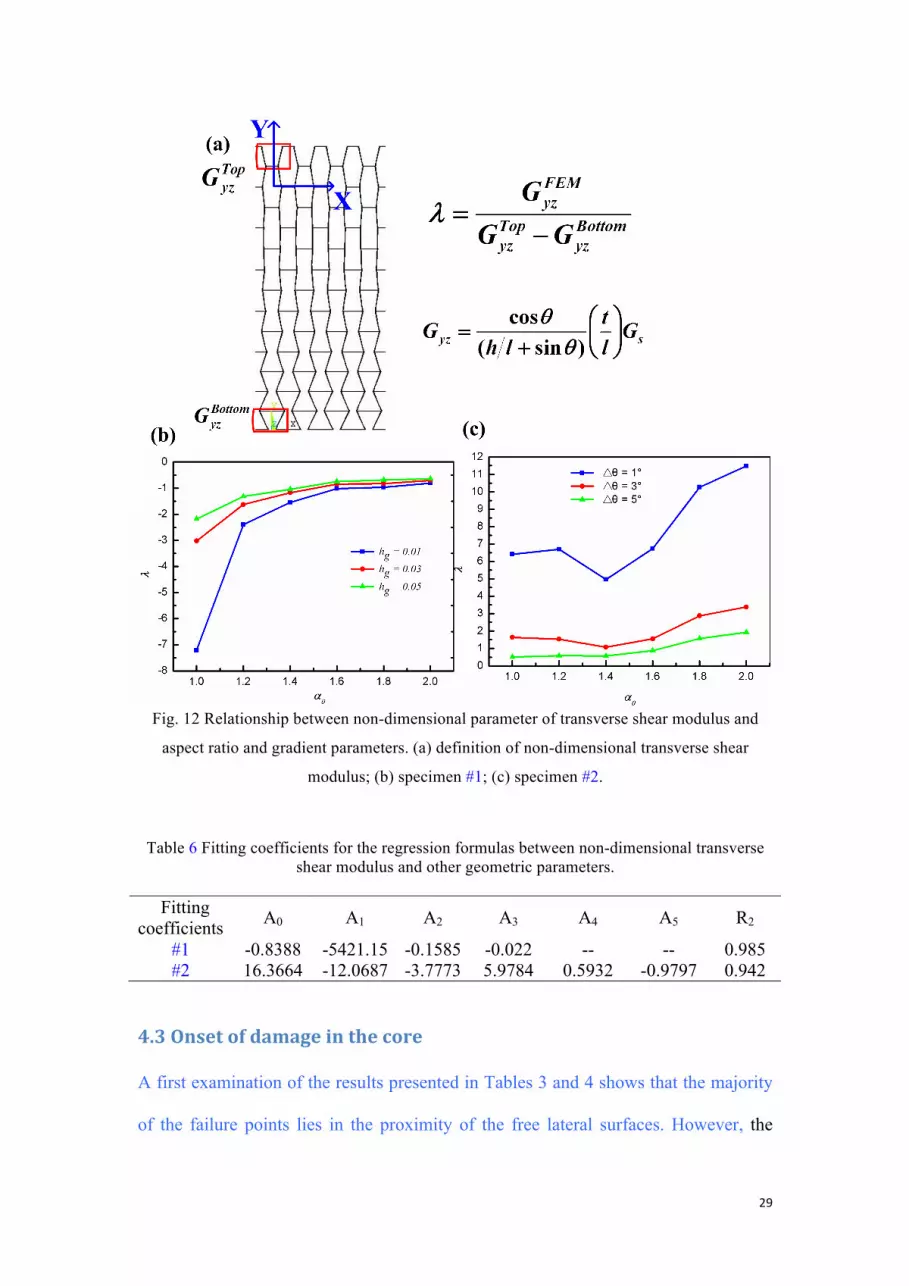
material shear modulus Gs (see Fig. 12 (a)) (Gibson and Ashby, 1999). A convenient
way to describe the shear modulus for gradient configurations is to express the
relation between the FE-generated results and equivalent shear moduli TopyzG and
BottomyzG related to the unit cell shapes at the top and bottom configuration of the
gradient honeycomb panel as ( )Bottomyz
Topyz
FEMyz GGG −= λ . The dependence of the
non-dimensional transverse shear modulus on the various geometric parameters (α0,

28
hg, Δθ) can be expressed by nonlinear regression analysis. For the configuration #1, a
suitable expression for the λ parameter is:
)exp(32
010 A
hA
AA g−−⋅+=α
λ (6)
The sensitivity of λ versus the parameter hg is stronger for small base cell wall aspect
ratios, while for higher values of α0, l tends to unity, with negligible effect from the
horizontal rib gradient (Fig. 12(b)). The configuration #2 has otherwise another
expression for the λ parameter:
θαθαθαλ Δ⋅⋅+Δ⋅+⋅+Δ⋅+⋅+= 052
42032010 AAAAAA (7)
The sensitivity of λ versus the cell wall aspect ratio is stronger for small angle
gradient increments above α0 = 1.4. For the various Δθ values, λ increases by a factor
of 3 passing from low to high aspect ratios. The smaller angle gradient configuration
(Δθ = 1º) provides the highest λ values (and therefore the highest shear modulus).
With a small angle gradient value, the configuration #2 is composed by a complete set
of re-entrant cells (i.e., fully auxetic). The fully auxetic configuration provides the
highest values for shear modulus Gyz at constant cell wall aspect ratio (Scarpa et al.,
2003b). The fitting coefficients for each expression are listed in Table 6.
29
Fig. 12 Relationship between non-dimensional parameter of transverse shear modulus and
aspect ratio and gradient parameters. (a) definition of non-dimensional transverse shear
modulus; (b) specimen #1; (c) specimen #2.
Table 6 Fitting coefficients for the regression formulas between non-dimensional transverse shear modulus and other geometric parameters.
Fitting
coefficients A0 A1 A2 A3 A4 A5 R2
#1 -0.8388 -5421.15 -0.1585 -0.022 -- -- 0.985 #2 16.3664 -12.0687 -3.7773 5.9784 0.5932 -0.9797 0.942
4.3 Onset of damage in the core
A first examination of the results presented in Tables 3 and 4 shows that the majority
of the failure points lies in the proximity of the free lateral surfaces. However, the

30
gradient core topology provides also an influence on the initiation of the core failure
within the sandwich beams. The crack initiation position for each configuration,
where the first elements were de-activated due to the maximum stress failure criterion,
is shown with a ‘×’ mark for topologies featured in Tables 4 and 5. We use the
nondimensional variable ξ = x / (L/2) to locate the failure onset along the x-direction
of the sandwich panel (Fig.13 (a)). The variation of ξ versus the characteristics
parameters hg and Δθ are visualised in the maps shown in Fig. 13(b, c).
Fig. 13 Initial crack positions for each gradient configuration. (a) definition of nondimensional parameter ξ. (b) specimen #1. (c) specimen #2.
Note: NPR stands for Negative Poisson’s ratio, ZPR for Zero Poisson’s ratio, PPR for Positive Poisson’s ratio.

31
The gradient topology #1 has only the 32.3 % of the failure locations occurring under
the centrally loaded area of the sandwich beams (Figure 13(b)). The majority of the
failed sections of the core (64.7 %) are concentrated on the top supporting area
(ξ→1). It is worth noticing that aside from the non-gradient configuration (i.e. hg =
0.0), failure does not occur above the lower support end (ξ = -1). Crack initiation on
the core therefore happens in the areas with the cells having the largest dimensions,
and in the oblique ribs. The increase of the gradient parameter hg leads to a
concentration of the failure in the ξ = 1 region, again due to the relative increase with
the gradient of the core cell sizes in that area.
The topology #2 has a different type of behaviour. The majority of the failure occurs
under the centrally loaded area (70.8 %). The support at ξ = 1 features a 16.7 %
localisation of the crack initiation, while 12.5 % of the cracks are concentrated on the
area with ξ = -1 (Figure 13(c)). It is apparent that the central portion of the core tends
to concentrate the overall deformation of the sandwich panel. The core under the
loaded area assumes unit cell shapes with small positive and negative internal cell
angles in rapid succession. Small values of internal cell angles tend to provide large
negative or positive equivalent Poisson’s ratios values νxy (between ~-8 and +7 for α0
= 1) (Smith et al., 2002). At the same time, the Poisson’s ratio νyx tends to be zero, in
the view of the quasi-rectangular local shape of the cell units (Hayes et al., 2004). The
presence of a small concentrated are with equivalent large negative Poisson’s ratio
behaviour gives a strong concentration of the overall deformation of the sandwich,
similarly to what has been observed in composite laminates with
through-the-thickness negative Poisson’s ratio subjected to low kinetic energy impact
(Alderson and Coenen, 2008). A higher portion of failure onset is however observed

32
in the cells with local equivalent positive Poisson’s ratio (PPR). In general, re-entrant
honeycomb configurations do show a higher out-of-plane shear buckling stress
(Zhang and Ashby, 1992), making therefore the areas with convex hexagonal shape
more prone to fail due to core shear. When no gradient angle is present (i.e., Δθ = 0º),
failure occurs close the loaded and supported areas of the sandwich beam. Higher
values of gradient angle Δθ appear to concentrate further the location of the failure
onset under the centrally loaded region, leaving the area with the highest equivalent
negative Poisson’s ratio effect undamaged.
Conclusions
Gradient honeycomb cored with variable cell-wall aspect ratios and internal cell
angles have been manufactured and used as fillers for sandwich beams. The gradient
cores show a multiple curvature (polymorphic) behaviour, and different specific
mechanical properties depending on the gradient topology are considered.
Angle-gradient configurations with constant cell-wall aspect ratio provide the highest
specific critical load, shear modulus and bending stiffness of composite sandwich
panels with gradient filler. Gradient core topologies with varying cell horizontal rib
length (and therefore cell wall aspect ratio) are sensitive to the relative size of the cells
versus the overall dimension of the honeycomb panel, in particular with regards of the
location of the failure onset in the core. Angle-gradient configurations tend to localise
strongly the damage around the loaded area, the more the higher the angle increment
used to build the gradient topology. The two gradient configurations show that it is
possible to tune and control the global and local mechanical response of polymorphic
cores based on geometry and selection of the core material.

33
Acknowledgements
The manufacturing of the sandwich samples and their mechanical testing has been
performed under the auspices of the UK TSB 16093 REACTICS project. YH would
also like to thank the Chinese Scholarship Council for the provision of a bursary to
support her research. Further support for the FE simulations has been provided by the
logistics of the European Project FP7-NMP-2009-LARGE-3M-RECT. The Authors
would like also to thank the anonymous Referees for their useful and insightful
suggestions.

34
References 393M-‐06, A.C.C., Standard test method for core shear properties of sandwich construction by beam flexure. Ajdari, A., Nayeb-‐Hashemi, H., Vaziri, A., 2011. Dynamic crushing and energy absorption of regular, irregular and functionally graded cellular structures. International Journal of Solids and Structures 48, 506-‐516. Aktay, L., Johnson, A.F., Kröplin, B.H., 2008. Numerical modelling of honeycomb core crush behaviour. Engineering Fracture Mechanics 75, 2616-‐2630. Alderson, A., Alderson, K.L., McDonald, S.A., Mottershead, B., Nazare, S., Withers, P.J., Yao, Y.T., 2012. Piezomorphic Materials. Macromolecular Materials and Engineering. Alderson, K., Coenen, V., 2008. The low velocity impact response of auxetic carbon fibre laminates. physica status solidi (b) 245, 489-‐496. Cui, L., Kiernan, S., Gilchrist, M.D., 2009. Designing the energy absorption capacity of functionally graded foam materials. Materials Science and Engineering: A 507, 215-‐225. Evans, K.E., Alderson, A., 2000. Auxetic materials: Functional materials and structures from lateral thinking! Advanced materials 12, 617-‐628. Fan, X., 2006. Investigation on processing and mechanical properties of the continuously produced thermoplastic honeycomb. Doctoraatsproefschrift D/2006/7515/14. Gibson, L.J., Ashby, M.F., 1999. Cellular solids: structure and properties. Cambridge university press. Gibson, L.J., Ashby, M.F., Harley, B.A., 2010. Cellular materials in nature and medicine. Cambridge University Press. Grima, J.N., Caruana-‐Gauci, R., Attard, D., Gatt, R., 2012a. Three-‐dimensional cellular structures with negative Poisson's ratio and negative compressibility properties. Proceedings of the Royal Society A: Mathematical, Physical and Engineering Science 468, 3121-‐3138. Grima, J.N., Chetcuti, E., Manicaro, E., Attard, D., Camilleri, M., Gatt, R., Evans, K.E., 2012b. On the auxetic properties of generic rotating rigid triangles. Proceedings of the Royal Society A: Mathematical, Physical and Engineering Science 468, 810-‐830. Grima, J.N., Manicaro, E., Attard, D., 2011. Auxetic behaviour from connected different-‐sized squares and rectangles. Proceedings of the Royal Society A: Mathematical, Physical and Engineering Science 467, 439-‐458. Hadi Harkati, E., Bezazi, A., Scarpa, F., Alderson, K., Alderson, A., 2007. Modelling the influence of the orientation and fibre reinforcement on the Negative Poisson's ratio in composite laminates. physica status solidi (b) 244, 883-‐892. Hanssen, A., Girard, Y., Olovsson, L., Berstad, T., Langseth, M., 2006. A numerical model for bird strike of aluminium foam-‐based sandwich panels. International Journal of Impact Engineering 32, 1127-‐1144. Hayes, A.M., Wang, A., Dempsey, B.M., McDowell, D.L., 2004. Mechanics of linear cellular alloys. Mechanics of materials 36, 691-‐713. Ju, J., Summers, J.D., 2011. Compliant hexagonal periodic lattice structures having both high shear strength and high shear strain. Materials & Design 32, 512-‐524. Kirugulige, M., Kitey, R., Tippur, H., 2005. Dynamic fracture behavior of model sandwich structures with functionally graded core: a feasibility study. Composites science and technology 65, 1052-‐1068. Lakes, R., 1987. Foam structures with a negative Poisson's ratio. Science 235, 1038-‐1040. Lee, S.J., Wang, J., Sankar, B.V., 2007. A micromechanical model for predicting the fracture toughness of functionally graded foams. International Journal of Solids and Structures 44, 4053-‐4067. Lim, T.C., 2002. Functionally graded beam for attaining Poisson-‐curving. Journal of materials science letters 21, 1899-‐1901. Lira, C., Scarpa, F., 2010. Transverse shear stiffness of thickness gradient honeycombs. Composites science and technology 70, 930-‐936. Lira, C., Scarpa, F., Rajasekaran, R., 2011. A Gradient Cellular Core for Aeroengine Fan Blades Based on Auxetic Configurations. Journal of Intelligent Material Systems and Structures 22, 907-‐917. Liu, Y., Hu, H., 2010. A review on auxetic structures and polymeric materials. Sci. Res. Essays 5, 1052-‐1063.

35
Mills, N., Fitzgerald, C., Gilchrist, A., Verdejo, R., 2003. Polymer foams for personal protection: cushions, shoes and helmets. Composites science and technology 63, 2389-‐2400. Papka, S.D., Kyriakides, S., 1998. Experiments and full-‐scale numerical simulations of in-‐plane crushing of a honeycomb. Acta Materialia 46, 2765-‐2776. Prawoto, Y., 2012. Seeing auxetic materials from the mechanics point of view: A structural review on the negative Poisson’s ratio. Computational Materials Science 58, 140-‐153. Saito, K., Agnese, F., Scarpa, F., 2011. A Cellular Kirigami Morphing Wingbox Concept. Journal of Intelligent Material Systems and Structures 22, 935-‐944. Scarpa, F., Blain, S., Lew, T., Perrott, D., Ruzzene, M., Yates, J., 2007. Elastic buckling of hexagonal chiral cell honeycombs. Composites Part A: Applied Science and Manufacturing 38, 280-‐289. Scarpa, F., Ciffo, L., Yates, J., 2003a. Dynamic properties of high structural integrity auxetic open cell foam. Smart Materials and Structures 13, 49. Scarpa, F., Smith, F., Chambers, B., Burriesci, G., 2003b. Mechanical and electromagnetic behaviour of auxetic honeycomb structures. Aeronautical Journal 107, 175-‐183. Smith, F.C., Scarpa, F., Burriesci, G., 2002. Simultaneous optimization of the electromagnetic and mechanical properties of honeycomb materials, Proceedings of SPIE, p. 582. Sun, G., Li, G., Hou, S., Zhou, S., Li, W., Li, Q., 2010. Crashworthiness design for functionally graded foam-‐filled thin-‐walled structures. Materials Science and Engineering: A 527, 1911-‐1919. Tsai, S.W., Wu, E.M., 1971. A general theory of strength for anisotropic materials. Journal of composite materials 5, 58-‐80. Yang, W., Li, Z.M., Shi, W., Xie, B.H., Yang, M.B., 2004. Review on auxetic materials. Journal of materials science 39, 3269-‐3279. Zhang, J., Ashby, M., 1992. The out-‐of-‐plane properties of honeycombs. International Journal of Mechanical Sciences 34, 475-‐489.


![No free lunch with the sandwich [sandwich estimator]](https://img.dokumen.tips/doc/110x75/6348f90b7442d262850f4be4/no-free-lunch-with-the-sandwich-sandwich-estimator.jpg)

