Embed Size (px)
Citation preview
1
Danielle A. Macdonald (2014). The application of focus variation microscopy for lithic use-wear quantification.
Journal of Archaeological Science. 48:26-33. http://dx.doi.org/10.1016/j.jas.2013.10.003
The Application of Focus Variation Microscopy for Lithic Use-Wear Quantification
Danielle A. Macdonald
CEPAM, CNRS, Université Nice Sophia Antipolis, 24 avenue des Diables Bleus, Nice 06357,
France. [email protected]
Abstract
As the field of use-wear analysis has developed, the number of different methodologies that address tool
function has increased. Multiple new methods have been published in recent years, both in qualitative and
quantitative approaches. This paper focuses on a recent development in quantitative microscopy,
specifically focus variation microscopy. This microscope characterizes surface features and has the ability
to generate measurements of surface roughness, particularly useful for lithic use-wear studies. This paper
presents the results of some preliminary measurements taken on experimental tools, highlighting the
strengths and weaknesses of this new method and how it can contribute to the growing field of use-wear
quantification. Finally, it presents some of the new challenges facing archaeologists interested in the
quantification of use-wear and future directions of research.
Keywords
Lithic use-wear analysis; use-wear quantification; focus variation microscopy
1. Introduction
Understanding lithic tool function is integral to
interpreting behaviours and actions of past
peoples. Lithic use-wear analysis allows
researchers insight into tool function through the
study of fractures, polish, and striations found on
tool surfaces (Grace, 1989, 1996; Hayden, 1979;
Keeley, 1980; Semenov, 1964; Tringham et al.,
1974; Vaughan, 1985). This analytical technique
has traditionally relied on the qualitative
observations of specialists who identify wear
patterns microscopically. These observations are
made with low- and high-powered microscopy,
and the combination of these approaches
provides a more holistic picture of tool function
than the use of a single method alone (e.g.,
Lemorini et al., 2006; Richter, 2007; Rots, 2008;
van Gijn, 2010). The ability to recognize visual
differences between types of wear is a highly
specialized field, requiring the use of
experimental reference collections to interpret
archaeological assemblages.
However, the qualitative nature of use-
wear analysis leaves open the possibility for
error and conflict of interpretation between
individuals. Blind tests have been conducted by
numerous researchers, with variable degrees of
reliability and reproducibility (e.g., Bamforth,
1988; Moss, 1987; Newcomer et al., 1986, 1988;
Odell and Odell-Vereecken, 1980; Rots et al.,
2006). Some of these tests have reported
positive results, while others have shown a high
degree of variability between different use-wear
analysts’ interpretations of wear features (see
Evans, this volume). As a result, the subjective
interpretations of different researchers can
greatly influence and impact research outcomes.
This causes difficulties when attempting to
compare results from assemblages analyzed by
2
Danielle A. Macdonald (2014). The application of focus variation microscopy for lithic use-wear quantification.
Journal of Archaeological Science. 48:26-33. http://dx.doi.org/10.1016/j.jas.2013.10.003
different researchers. The identification of
contact material is more problematic than the
identification of tool motion; an average of 43%
of contact materials were correctly identified in
aggregated scores from published blind test
results (Evans and Macdonald, 2011). Thus, the
current qualitative method of contact material
identification needs refinement to increase the
success rate of material identification. It is this
aspect of use-wear analysis where quantification
can contribute to the development of use-wear
methodology.
To address issues inherent in qualitative
methods, recent studies have been taking a
quantitative approach to lithic use-wear analysis,
using new technologies that generate
measurements of surface topography, polish
texture, and profile paths across surface features
(e.g., Anderson et al., 2006; Evans and Donahue,
2008; González-Urquijo and Ibáñez-Estévez,
2003; Kimball et al., 1995; Stemp and Stemp,
2001; Stevens et al., 2010). Early papers on use-
wear quantification focused on image analysis,
evaluating grey scale levels to understand polish
brightness produced by different contact
materials (e.g., González-Urquijo and Ibáñez-
Estévez, 2003; Grace, 1989; Grace et al., 1985;
Knutsson, 1988a, 1988b; Rees et al., 1991; Vila
and Gallart, 1993). Recent image analysis
research has built upon these early studies to
understand how polish can be characterized
between different lithic raw material types
(Lerner, 2009; Lerner et al., 2007). In addition to
image analysis, several early studies attempted
to quantify use-wear by measuring the surface
texture of tools using a variety of
instrumentation including optical interferometres
(Dumont, 1982) and rugosimeters (Anderson et
al., 1998; Beyries et al., 1988).
Recent research into lithic use-wear has
turned to the field of surface metrology to
measure surfaces, using microscopes
manufactured for machining and industrial
purposes. Attempts to characterize worn surface
texture include laser-scanning confocal
microscopy (Evans and Donahue, 2008; Evans
and Macdonald, 2011; Giusca et al., 2012;
Stemp and Chung, 2011; Stevens et al., 2010),
laser profilometry (Stemp et al., 2009; Stemp
and Stemp, 2001, 2003), interferometry
(Anderson et al., 2006), and atomic force
microscopy (Faulks et al., 2011; Kimball et al.,
1998; Kimball et al., 1995). These microscopy
technologies measure surface texture, providing
the user with quantitative information about
surface features.
In many of these studies, the authors
focus specifically on the analysis of worn
surfaces, operating under the hypothesis that the
worn surfaces produced from contact with
different materials (e.g., hide, wood, antler) have
surface textures that are distinguishable from
each other on a microscopic scale. These worn
surfaces are visible under high powered
magnifications, ranging from 100x - 500x
(Keeley, 1980; Vaughan, 1985). When these
contact materials interact with the tool they
impact the lithic’s surface causing characteristic
wear. This wear will have different textures
based on the contact material, as each material
has a different surface texture and material
hardness. Use-wear quantification allows the
researcher to measure the surface of the stone
tool directly, quantifying the surface texture of
worn areas to identify the type of contact
material that produced the wear.
This paper presents the application of
focus variation microscopy to lithic use-wear
analysis. Focus variation microscopy is
specifically designed for surface metrology and
can be used to characterize surface texture.
These microscopes have the ability to generate
measurements of surface roughness, which have
been shown useful for lithic use-wear studies in
previous research (e.g., Evans and Donahue,
2008; Faulks et al., 2011; Kimball et al., 1995).
Currently only a small pilot study has been
published using this instrumentation for lithic
use-wear analysis (Evans and Macdonald, 2011),
however there have been a number of studies
conducted using the microscope for the analysis
of faunal and human remains that have shown
very promising results (Bello et al., 2009; Bello
and Soligo, 2008; Bello, 2011; Bello et al.,
2011a; Bello et al., 2011b; Bocaege et al., 2010;
Hillson et al., 2010). In this paper, the
application of focus variation microscopy to the
quantification of lithic use-wear is explored
through the analysis of an experimental
3
Danielle A. Macdonald (2014). The application of focus variation microscopy for lithic use-wear quantification.
Journal of Archaeological Science. 48:26-33. http://dx.doi.org/10.1016/j.jas.2013.10.003
collection of lithic tools used on known
materials. The results suggest that focus
variation microscopy is a promising technology
that can contribute to the further development of
use-wear methods. The development of
quantitative analysis has the potential to allow
for greater comparability between tools,
assemblages, and between the results of different
researchers. In combination with qualitative
research, quantitative analysis can provide a
robust understanding of lithic tool function.
2. Focus Variation Microscopy and Surface
Metrology
Many of the new microscopy technologies
employed by archaeologists for use-wear
quantification, including focus variation
microscopy, were designed for applications in
the field of surface metrology. Surface
metrology is the study of surface texture, or
deviations, (Whitehouse, 2011), characterizing
this texture in a quantifiable way. Traditionally
this field has focused on the study of machined
and engineered surfaces, evaluating deviations
produced through manufacturing processes and
wear; however it has recently branched into
more interdisciplinary fields such as
anthropology, archaeology, forensic science,
food science, and art conservation (e.g. Evans
and Macdonald, 2011; Gambino et al., 2011;
Moreno et al., 2010; Schulz et al., 2010; Stemp
et al., 2012)
Early surface metrology studies focused
on measuring surface texture on a two-
dimensional plane by measuring the surface
profile. However, these profile measurements
are highly sensitive to the placement of the
measured line. As the field developed,
techniques were developed to measure areal
surface texture, or texture of an area, providing a
more realistic representation of the surface
(Leach, 2010). The field of surface metrology is
currently undergoing changes and
standardization in areal definitions (three-
dimensional parameters), including the
development of a new ISO standard (ISO25178-
2, 2011). This standard defines the parameters of
three-dimensional surfaces, including
parameters useful for characterization of lithic
use-wear (Table 1). Microscopes currently being
used for archaeological applications, such as
laser-scanning confocal microscopy and focus
variation microscopy, adhere to these ISO
standards of surface characterization. In
addition, new developments in the field of
nanometrology are greatly contributing to the
traceability and calibration of these
instrumentation types (Leach 2010). The
integration of knowledge from both surface
metrology and nanometrology, in conjunction
with the practice of qualitative use-wear
analysis, will help propel the study of use-wear
analysis forward.
As mentioned previously, focus
variation microscopy has the ability to take both
profile and areal measurements useful for a
variety of surface metrology applications.
Included in the areal measurements is average
roughness, or Sa, defined as the mean height of a
selected area, and Sq, the root mean square of
the mean height (ISO25178-2, 2011). The
measurement of mean height (Sa) is based on
the calculations of Ra, which is the average
roughness on a two-dimensional plane and is
used in profilometry measurements. Average
roughness (Ra) represents the arithmetic mean
of the surface texture, with the valleys inverted
to obtain a positive value (Figure 1). In contrast
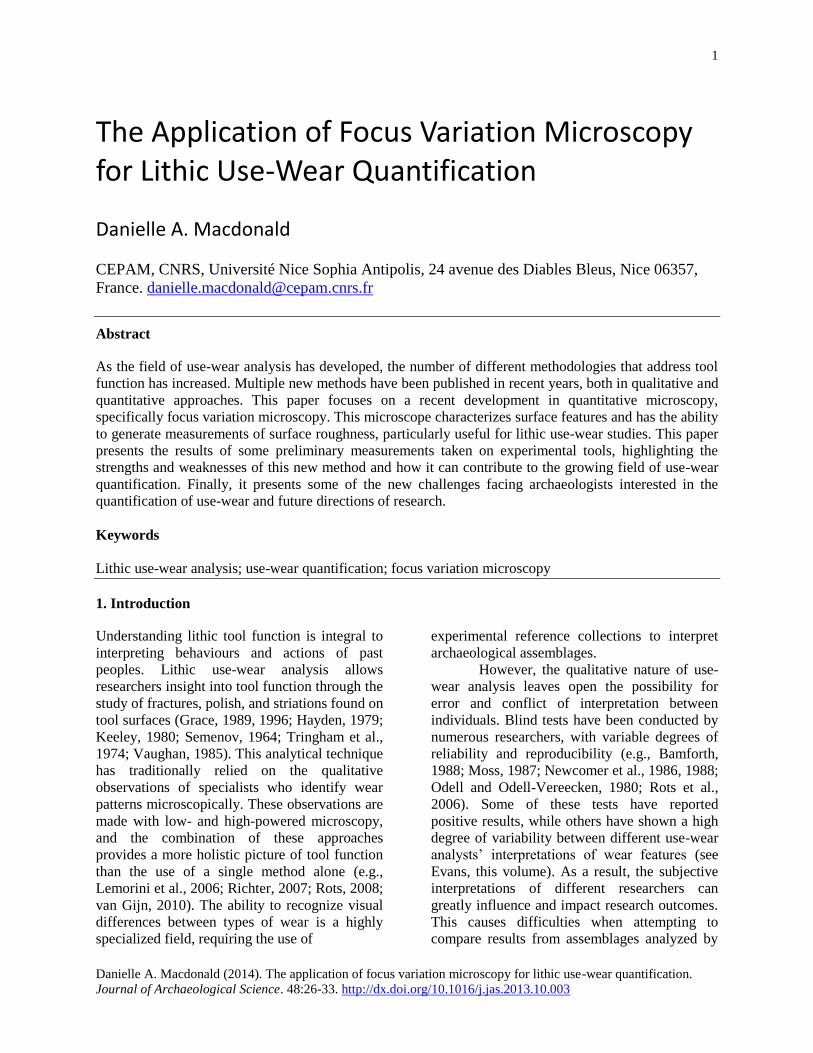
Table 1: Areal surface parameters (ISO25178-2,
2011).
Parameter Description
Sa Arithmetical mean height
Sq Root mean square of mean height
Sv Maximum pit depth
Sz Maximum height of the scale
limited surface
Sdq Root mean square gradient of the
scale limited surface
Sdr Developed interfacial area ratio of
the scale limited surface
Smr(c) Area material ratio of the scale
limited surface
Sdc (mr) Inverse areal material ratio of the
scale limited surface
Sxp Peak extreme height
Vv (mr) Void volume
Vvc Core void volume of the scale
limited surface
Vmc Core material volume of the scale
limited surface
4
Danielle A. Macdonald (2014). The application of focus variation microscopy for lithic use-wear quantification.
Journal of Archaeological Science. 48:26-33. http://dx.doi.org/10.1016/j.jas.2013.10.003
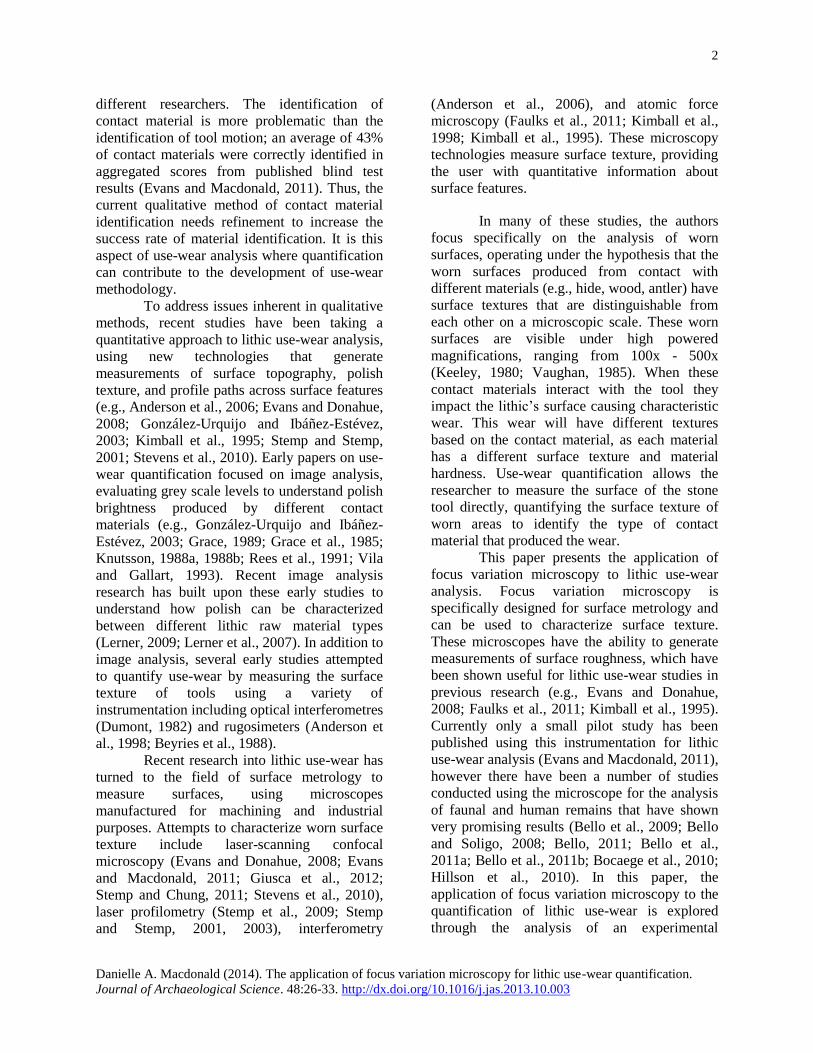
Figure 1: Schematic of Ra (mean roughness) calculation across a surface profile path (surface length). Average
roughness is calculated by finding the average deviation of the peaks and valleys, indicated in the shaded areas. The
valleys are then inverted to obtain a positive value. The horizontal mid-line represents the average roughness, Ra, of
this surface.
to this measurement, Sa calculates average
roughness in three-dimensions. This areal
measurement is useful for the quantification of
wear features, as it is less sensitive to small
variations in surface texture. The parameter Sq is
the root-mean-square of average roughness in
three-dimensions and is better for describing
data that can be both positive and negative,
making it a more robust calculation for surface
texture.
Previous studies using different
microscopy technologies such as laser-scanning
confocal microscopy have been successful in
distinguishing different contact materials from
the Sa and Sq parameters (Evans and Donahue,
2008; Evans and Macdonald, 2011; Giusca et
al., 2012). These studies showed that the Sq
parameter is sensitive to worn surfaces from
different contact materials. For this study, the
differences in Sq between contact materials will
be evaluated due to the previous success of this
parameter in lithic use-wear quantification
studies, making this current research comparable
with the published literature. The goal of this
analysis is to identify whether polish created by
different contact materials produce different Sq
measurement values.
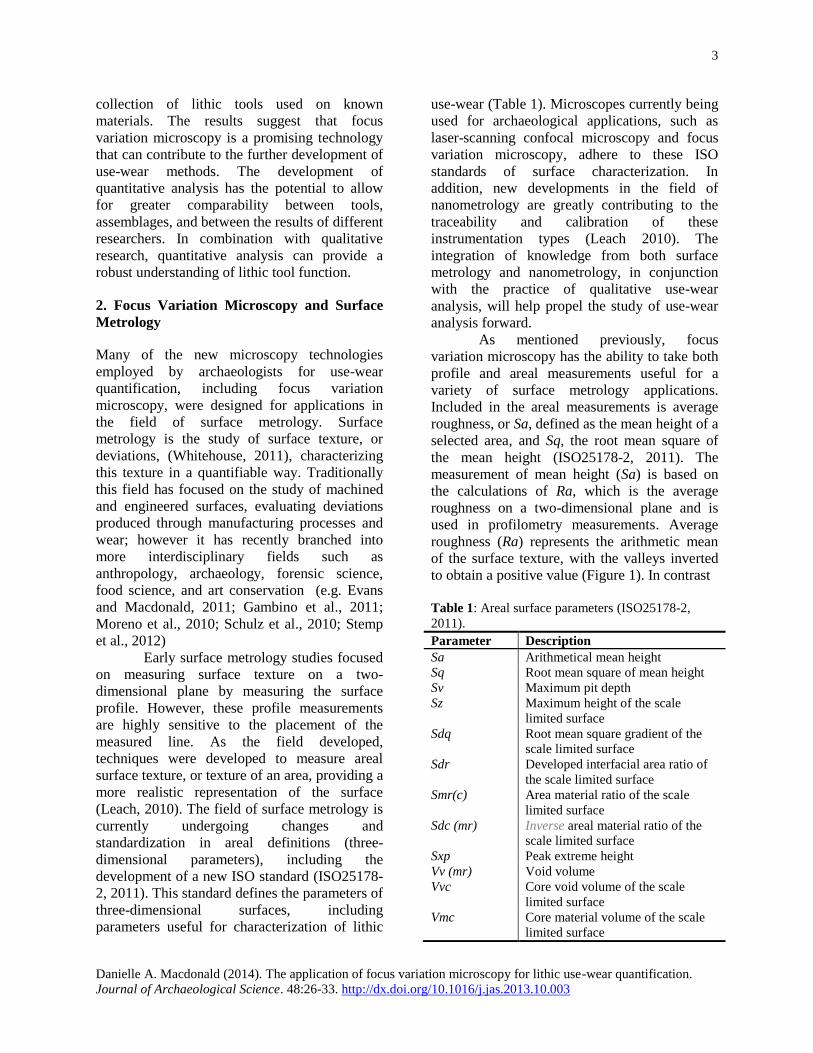
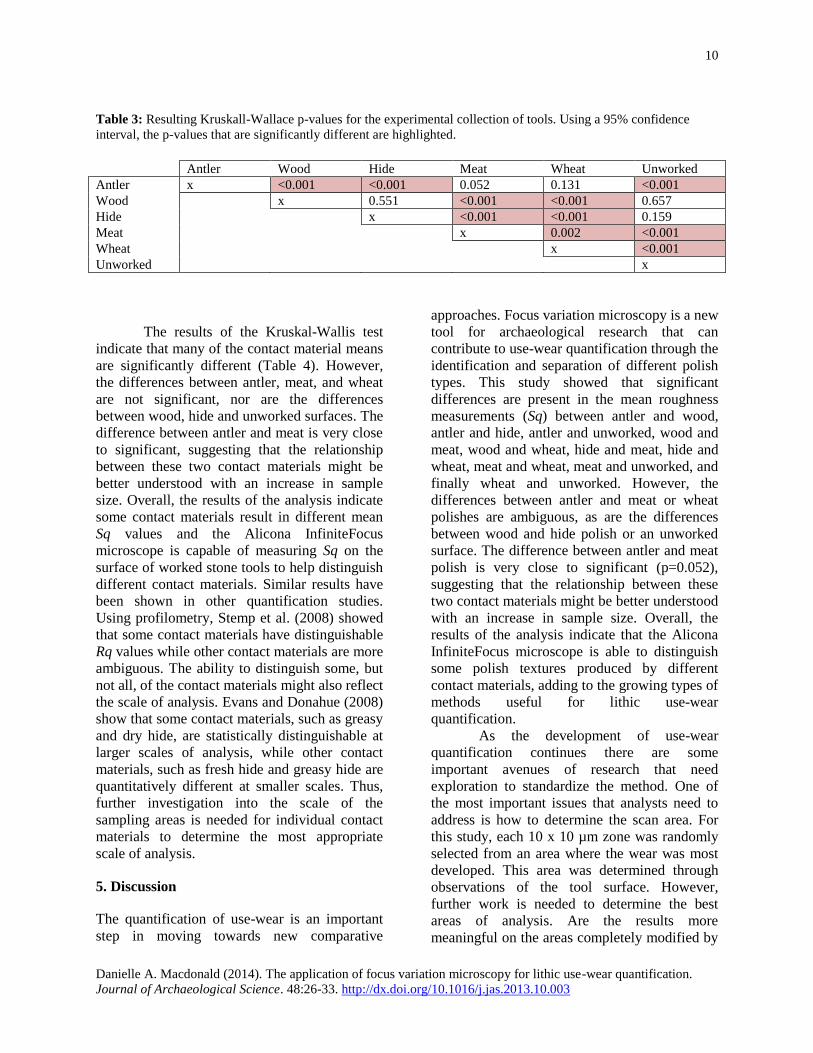
The Alicona InfiniteFocus microscope
was used for this study (Figure 2), which is
Figure 2: The Alicona InfiniteFocus microscope
(focus variation microscope) with lithic sample on
the stage.
5
Danielle A. Macdonald (2014). The application of focus variation microscopy for lithic use-wear quantification.
Journal of Archaeological Science. 48:26-33. http://dx.doi.org/10.1016/j.jas.2013.10.003
based on the principle of focus variation (Danzl
et al., 2009; Helmli, 2011). To create a three-
dimensional image, the microscope searches for
the best focus related to a known distance from
the sample. The image is acquired by moving
the microscope objectives vertically in relation
to the object, bringing the object in and out of
focus. The sensor within the microscope
identifies and measures where the object was
best in focus, a process that is repeated at
sequential lateral positions to build an image.
The sensor then evaluates the region around
each pixel to calculate the standard deviation of
the grey levels of the local region, thereby
measuring the focus. If the focus is very low or
very high, the grey values are almost identical
with a low standard deviation. Thus, the surface
topography is calculated through the in-focus
depth of each plane and a composite image is
generated from the in-focus slices (Helmli,
2011). Currently, the Alicona is one of the few
commercial focus variation microscopes on the
market that is calibrated to ISO standards for the
acquisition of surface texture data.
An Alicona microscope has a motorized
stage that moves in the xy direction, while the
microscope objectives move in the z direction. It
has a vertical range of 100 mm making it
excellent for highly variable surfaces. The
microscope is non-contact and any surface can
be studied with no sample preparation. This is
particularity useful for archaeological materials,
as the technique is non-destructive. The
available objectives range from 2.5x - 100x
magnification and have a vertical resolution of
up to 10 nm at 100x magnification, however
increasing the vertical resolution also increases
the scan time. Lower magnifications offer less
vertical resolution, so it is important to choose
the correct magnification necessary to obtain
enough resolution to measure the surface
texture. Scan time can be variable and
experience has shown that a scan can take
between a few seconds and 30 minutes,
depending on the resolution and the vertical scan
distance. In addition to coaxial illumination used
by techniques such as image confocal
microscopy, focus variation can use different
light sources to collect information. Light
sources available for this system include ring
light, dark field illumination, diffuse
illumination, point light source, and coaxial
illumination. These different illumination types
allow for different sample types to be imaged.
Although focus variation microscopy
has a lot of strengths, the technology also has
limitations in comparison to other techniques.
Translucent materials cause significant problems
when acquiring a focus variation measurement.
This has been noted for bone and teeth samples,
where the translucent and highly reflective
surfaces do not allow the microscope to properly
capture the an image (Bello et al., 2011b).
Although replicas or coatings can be used to
counteract this problem (Bello et al., 2011b), it
is not always possible to replicate or modify the
object. As well, because the differences in
surface texture can be at the nanoscale, the
resolution of the casting material must be
sufficient to capture this variability. Because the
microscope measures a range of focuses, there
needs to be sufficient contrast on the sample’s
surface to obtain a measurement. Thus, the
microscope has difficulties obtaining
measurements from highly polished or very
smooth surfaces. The surface must have a level
of surface roughness >15 nm to obtain a
measurement (Helmli, 2011).
3. Methods
Experimental tools used on five different contact
materials were analyzed, totaling eight
experimental pieces (Table 2). The number of
strokes was recorded, rather than duration of
use, to mitigate user fatigue and maintain a
consistent amount of contact between the tool
and the worked material. The tools were
manufactured on high-quality chert collected
from the Negev, Israel, and were knapped by
Dodi Ben Ami. The lithics were modeled on
Middle Epipalaeolithic trapeze-rectangle
geometric microliths; each tool is approximately
2.5 x 1.5 x 0.5 cm in size, with straight, abrupt
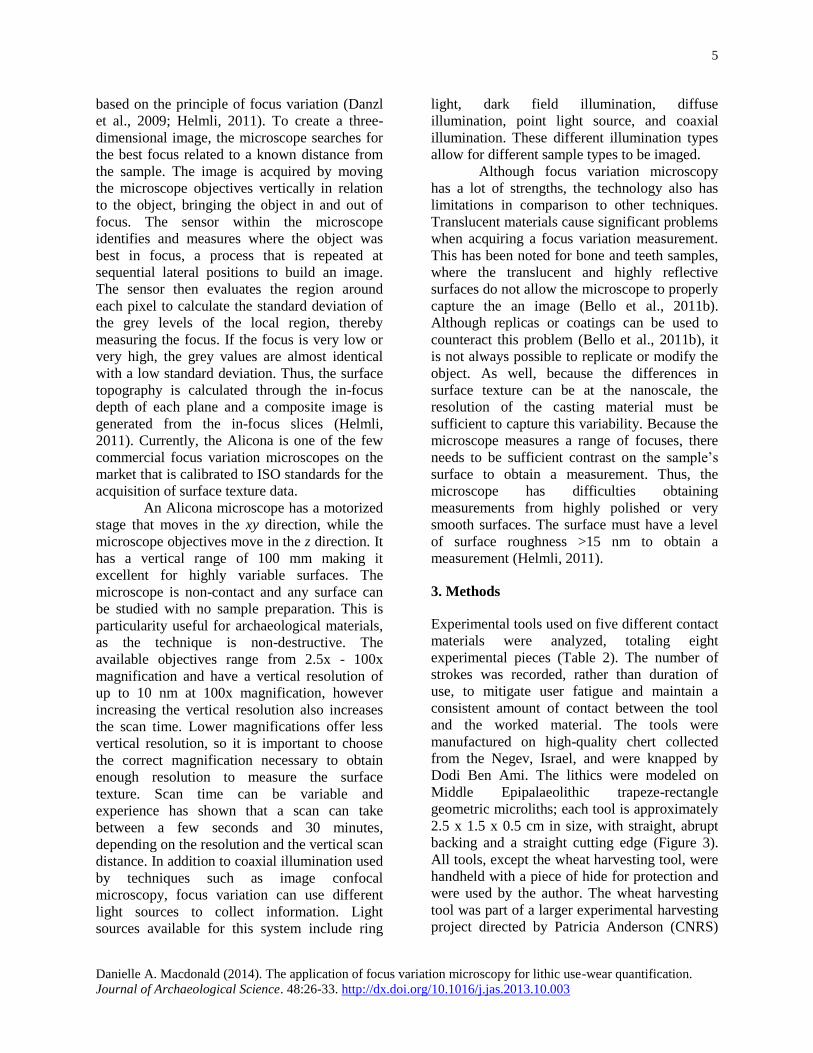
backing and a straight cutting edge (Figure 3).
All tools, except the wheat harvesting tool, were
handheld with a piece of hide for protection and
were used by the author. The wheat harvesting
tool was part of a larger experimental harvesting
project directed by Patricia Anderson (CNRS)
6
Danielle A. Macdonald (2014). The application of focus variation microscopy for lithic use-wear quantification.
Journal of Archaeological Science. 48:26-33. http://dx.doi.org/10.1016/j.jas.2013.10.003
Table 1: Details of experimental chert microliths used in analysis.
Experiment # Contact Material Angle Direction of Motion # of Strokes Additional Comments
EX-4a meat 45-90 longitudinal 1000 pig meat
EX-4b meat 45-90 longitudinal 1000 pig meat
EX-6 hardwood (dry) 90 longitudinal 1000 dry hardwood
EX-9 antler (dry) 45-90 transverse 1000 ventral surface towards the antler
EX-13 antler (dry) 45-90 transverse 1000 ventral surface towards the antler
EX-10 hide (dry) 90 longitudinal 1000 tanned leather
EX-11 hide (dry) 90 longitudinal 1000 tanned leather
EX-14 einkorn wheat 45-90 longitudinal 12 150 part of larger harvesting
experiments
Figure 3: A. set of experimental microliths, un-hafted, used in the experiments. B. replicated Middle Epipalaeolithic
haft used for harvesting experiments with six inset microliths.
and was hafted in a wooden handle replicated by
Dan Rahimi (Royal Ontario Museum) with five
additional microliths. These microliths are from
the same replicated set used in the other
experiments. The harvesting experiment was
designed to test microliths as cereal cutting tools
and the tool was used continuously for three
days to test their effectiveness. As a result, the
inset microliths in the harvesting tool were used
more intensely than the other analyzed
microliths. It is important to note that the
resulting measurements for the wheat cutting
tool could be impacted by the use-duration as
well as the contact material. Further work is
needed to identify the effects of use duration on
surface roughness measurements, although
preliminary studies suggest that surface texture
produced by certain contact materials plateaus
after minimal use (Giusca et al., 2012).
The contact materials used in the
experiments were antler, wood, dry hide, meat,
and wheat. Unworked surface measurements
were also included in the analysis to create a
control sample. Two different experimental tools
for antler, hide, and meat were included in the
analysis. Tools were either used in a longitudinal
motion (cutting) or a transverse motion
(scraping). Unfortunately due to limitations in
accessing the microscope, only one experimental
tool was included for wood and wheat.
Prior to analysis with the Alicona, each
tool was thoroughly cleaned using methods
adapted from Keeley (1980). First, each piece
was cleaned with warm water and a mild
detergent while being lightly brushed with a
soft-bristled tooth brush. Next each piece was
soaked in a bath of 10% sodium hydroxide
(NaOH) for 10 minutes to remove organic
deposits. Following this cleaning, the artifacts
were soaked in a 10 minute bath of 10%
7
Danielle A. Macdonald (2014). The application of focus variation microscopy for lithic use-wear quantification.
Journal of Archaeological Science. 48:26-33. http://dx.doi.org/10.1016/j.jas.2013.10.003
hydrochloric acid (HCl) to remove any mineral
deposits. The NaOH and the HCl were changed
between each tool to maintain the chemical
effectiveness. Finally, the experimental tools
were bathed in water for 10 minutes to remove
any remaining chemical traces. Although
chemical cleaning is not accepted by all use-
wear analysts, it was undertaken in this study so
that surfaces roughness measurements did not
unintentionally include adhering materials.
Artifacts were mounted directly onto a
piece of plasticine modeling clay for analysis
under the microscope. Unlike other modeling
clays, plasticine has low elastic properties and
does not oscillate once the object has been
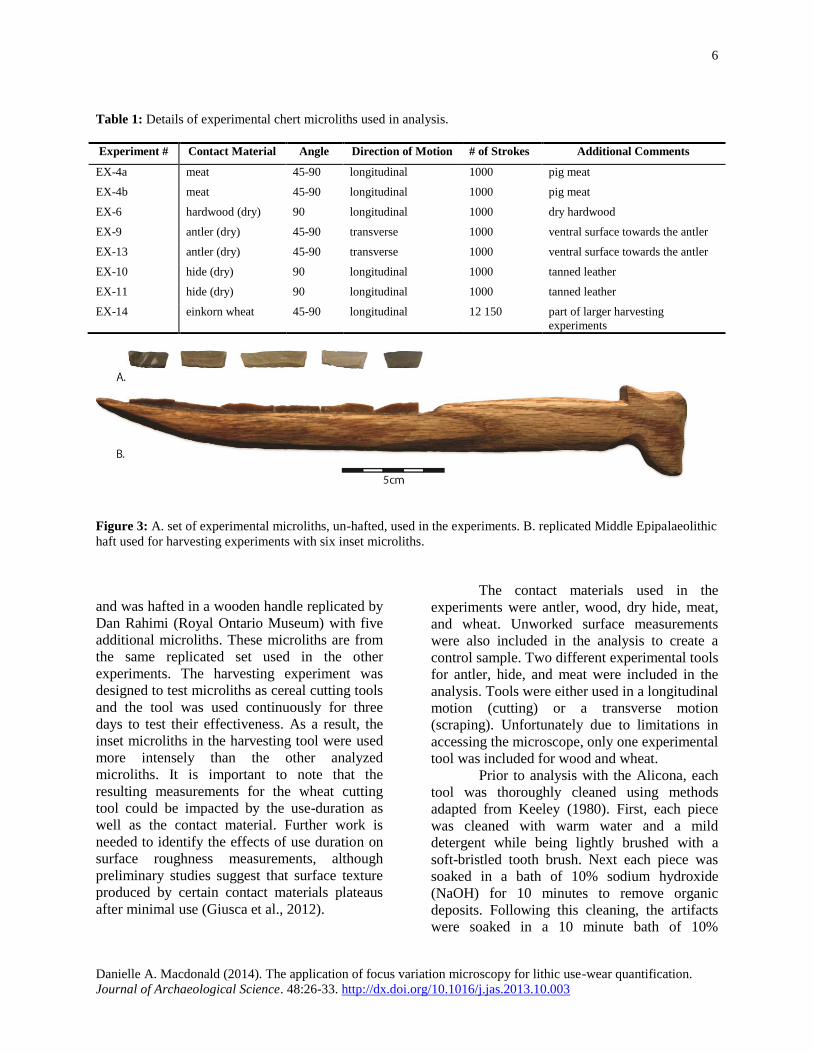
mounted. Each piece was scanned under the
focus variation microscope using the 20x
objective to identify areas heavily affected by
wear. Coaxial illumination was used for this
study. Once an area was selected, the
magnification was increased to 50x. Scans of
286 x 218 µm were acquired at this
magnification level (Figure 4). For each tool, a
Figure 4: Examples of the images produced by the focus variation microscope for each contact material. The edge
of the tool is to the upper right side of the image (black spikes are scans off of the tool’s edge).
8
Danielle A. Macdonald (2014). The application of focus variation microscopy for lithic use-wear quantification.
Journal of Archaeological Science. 48:26-33. http://dx.doi.org/10.1016/j.jas.2013.10.003
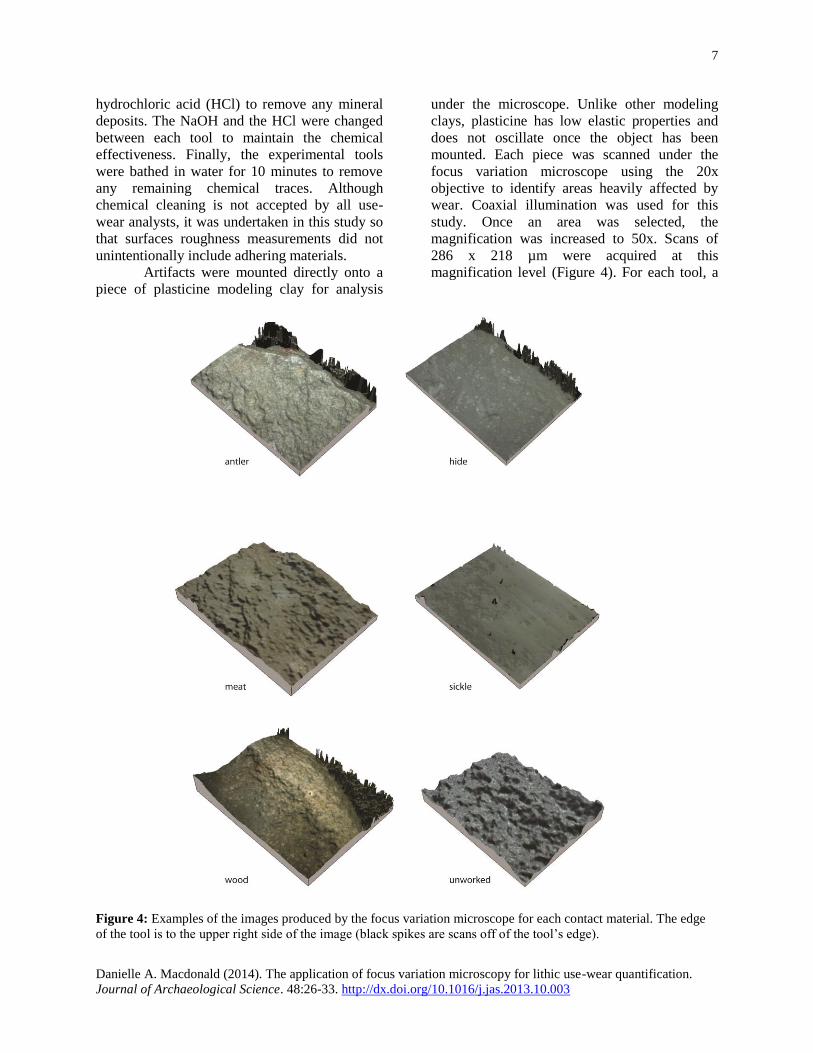
total of five areas were selected along the worn
edge at 50x magnification, targeting areas that
had the most visible modification from use.
Polish does not develop evenly along the edge of
the worked tool, therefore an element of
subjectivity was introduced by visually choosing
the sample areas to ensure worn areas of the
tool’s surface were measured.
Once the scans were acquired, the files
were imported into Mountains Map 6.2 for
analysis. This software is designed for surface
metrology applications and measures areal
parameters based on ISO 25178. For this study I
employed the sampling methodology developed
by Evans and Donahue (2008) for the
quantification of lithic use-wear using a laser-
scanning confocal microscope. On each 286 x
218 µm image, ten areas of 10 x 10µm were
selected for roughness analysis (Sq) (Figure 5).
These areas were randomly selected from the
areas visibly worn on the larger surface. For
each tool, fifty 10 x 10µm scans were collected
from the worn areas. Additionally, five areas of
the same size were measured from the unused
chert surface just below the areas that had
evidence of wear. These were also selected
randomly from the unworn surface and were
used as a control for the contact material
roughness, providing a base roughness for the
original raw material.
Figure 5: Example of sampling method of 10x10 µm
squares from the lithic surface (antler working tool).
Red squares are sampled from the polished area and
yellow squares are sampled from the unpolished area.
A series of areal surface parameters,
including Sa and Sq, were collected from each
10 x 10µm scan. Additional parameters were
also measured for future research but are not
included in this analysis. For this study Sq (root-
mean-square of height) was chosen as the
parameter for comparison among the contact
materials because it is a standard in the field of
surface metrology. As mentioned previously,
this parameter has also shown potential in recent
publications for the quantification of wear (e.g.,
Evans and Macdonald, 2011; Giusca et al.,
2012).
4. Results
Prior to analysis of the full assemblage, t-tests
were run on the tools in each contact material
group to test whether Sq between the tools used
on the same contact material were significantly
different. This was important to test for prior to
analyzing the full assemblage to confirm that
each contact material produces comparable
roughness measurements. For the antler working
tools, a t-test for unequal variance was run
between the two tools. The results of the test
indicate that the means between the two tools
are not significantly different (unequal variance
t-test, t= 0.671, p=0.507). The meat cutting tools
also show that the means are not significantly
different between the two tools (unequal
variance t-test, t= -1.4025, p=0.166). It is
encouraging that the same contact materials on
different tools produce average roughness
measurements (Sq) that are not significantly
different. However, the result between the hide
working tools is not as optimistic. The t-test
shows that the means between the two hide
working tools are significantly different
(t=4.037, p=<0.001). This suggests that there is
more variability in the measurements for hide
working tools. The polish from the hide tools is
less developed than the harder materials and the
variability in measurements may be the result of
the less developed polish. It may also be the
result of sampling error, where the unworked
surface was also sampled due to difficulties in
distinguishing polished from un-polished areas
(see Stemp, this volume for other examples).
9
Danielle A. Macdonald (2014). The application of focus variation microscopy for lithic use-wear quantification.
Journal of Archaeological Science. 48:26-33. http://dx.doi.org/10.1016/j.jas.2013.10.003
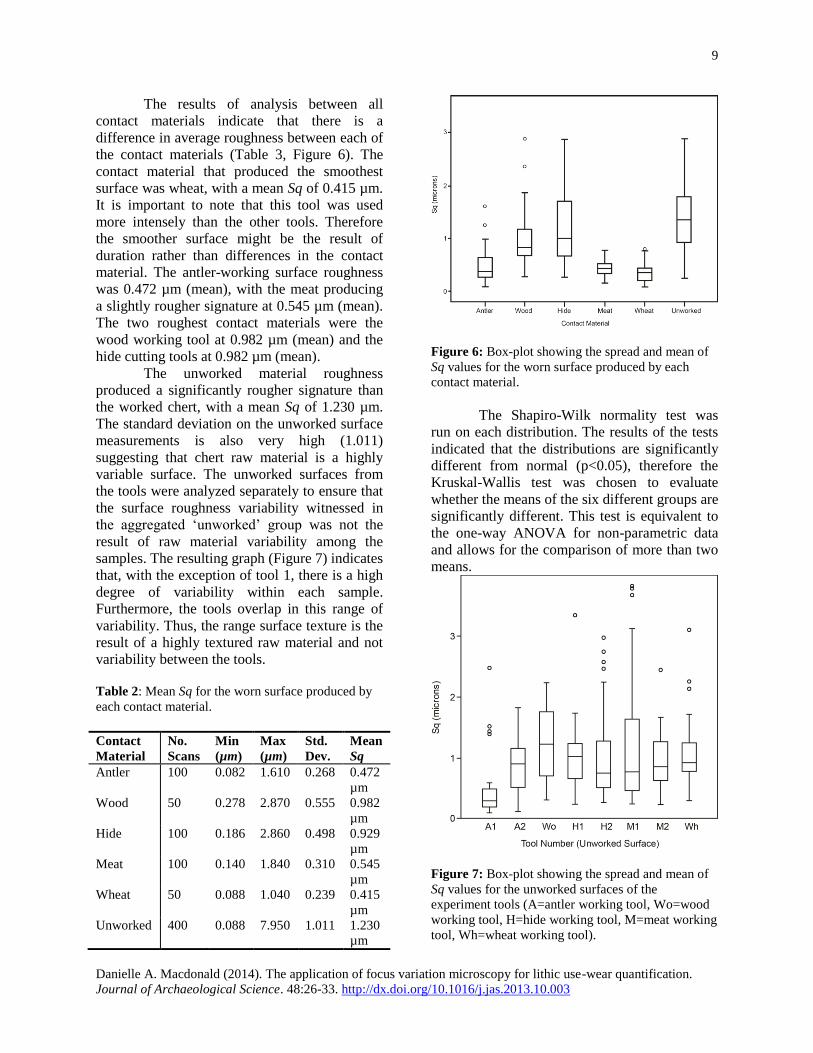
The results of analysis between all
contact materials indicate that there is a
difference in average roughness between each of
the contact materials (Table 3, Figure 6). The
contact material that produced the smoothest
surface was wheat, with a mean Sq of 0.415 µm.
It is important to note that this tool was used
more intensely than the other tools. Therefore
the smoother surface might be the result of
duration rather than differences in the contact
material. The antler-working surface roughness
was 0.472 µm (mean), with the meat producing
a slightly rougher signature at 0.545 µm (mean).
The two roughest contact materials were the
wood working tool at 0.982 µm (mean) and the
hide cutting tools at 0.982 µm (mean).
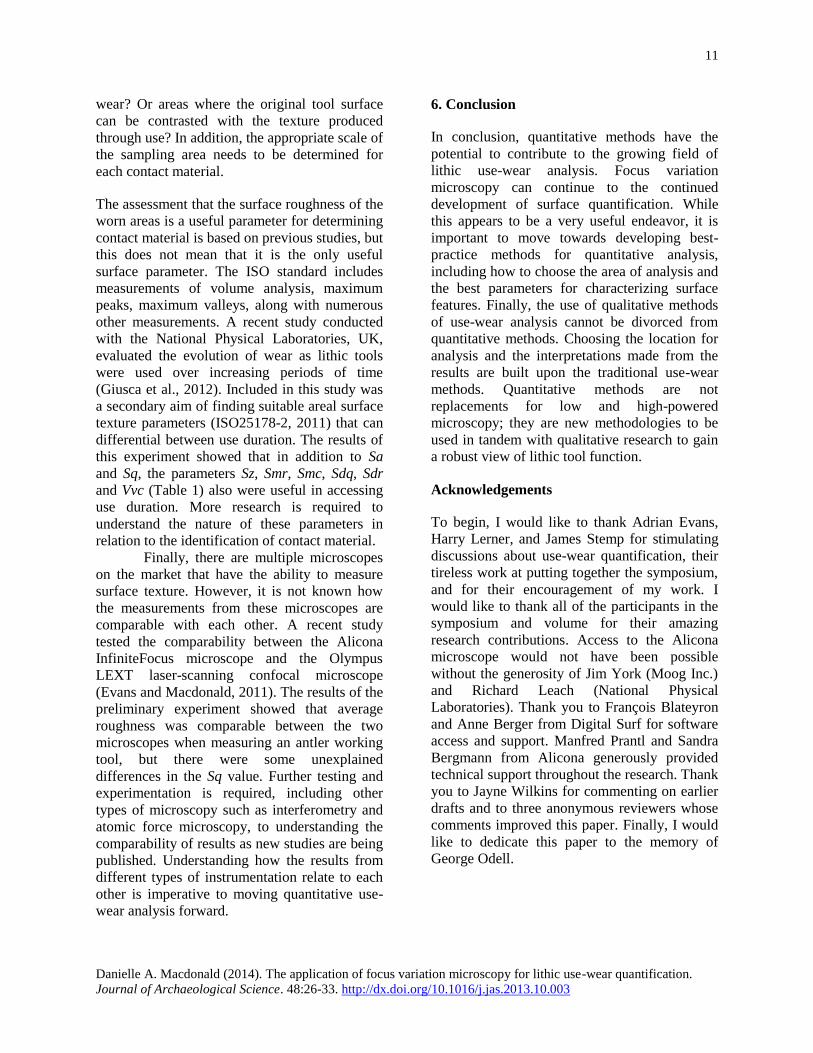
The unworked material roughness
produced a significantly rougher signature than
the worked chert, with a mean Sq of 1.230 µm.
The standard deviation on the unworked surface
measurements is also very high (1.011)
suggesting that chert raw material is a highly
variable surface. The unworked surfaces from
the tools were analyzed separately to ensure that
the surface roughness variability witnessed in
the aggregated ‘unworked’ group was not the
result of raw material variability among the
samples. The resulting graph (Figure 7) indicates
that, with the exception of tool 1, there is a high
degree of variability within each sample.
Furthermore, the tools overlap in this range of
variability. Thus, the range surface texture is the
result of a highly textured raw material and not
variability between the tools.
Table 2: Mean Sq for the worn surface produced by
each contact material.
Contact
Material
No.
Scans
Min
(µm)
Max
(µm)
Std.
Dev.
Mean
Sq
Antler 100 0.082 1.610 0.268 0.472
µm
Wood 50 0.278 2.870 0.555 0.982
µm
Hide 100 0.186 2.860 0.498 0.929
µm
Meat 100 0.140 1.840 0.310 0.545
µm
Wheat 50 0.088 1.040 0.239 0.415
µm
Unworked 400 0.088 7.950 1.011 1.230
µm
Figure 6: Box-plot showing the spread and mean of
Sq values for the worn surface produced by each
contact material.
The Shapiro-Wilk normality test was
run on each distribution. The results of the tests
indicated that the distributions are significantly
different from normal (p<0.05), therefore the
Kruskal-Wallis test was chosen to evaluate
whether the means of the six different groups are
significantly different. This test is equivalent to
the one-way ANOVA for non-parametric data
and allows for the comparison of more than two
means.
Figure 7: Box-plot showing the spread and mean of
Sq values for the unworked surfaces of the
experiment tools (A=antler working tool, Wo=wood
working tool, H=hide working tool, M=meat working
tool, Wh=wheat working tool).
10
Danielle A. Macdonald (2014). The application of focus variation microscopy for lithic use-wear quantification.
Journal of Archaeological Science. 48:26-33. http://dx.doi.org/10.1016/j.jas.2013.10.003
Table 3: Resulting Kruskall-Wallace p-values for the experimental collection of tools. Using a 95% confidence
interval, the p-values that are significantly different are highlighted.
Antler Wood Hide Meat Wheat Unworked
Antler x <0.001 <0.001 0.052 0.131 <0.001
Wood x 0.551 <0.001 <0.001 0.657
Hide x <0.001 <0.001 0.159
Meat x 0.002 <0.001
Wheat x <0.001
Unworked x
The results of the Kruskal-Wallis test
indicate that many of the contact material means
are significantly different (Table 4). However,
the differences between antler, meat, and wheat
are not significant, nor are the differences
between wood, hide and unworked surfaces. The
difference between antler and meat is very close
to significant, suggesting that the relationship
between these two contact materials might be
better understood with an increase in sample
size. Overall, the results of the analysis indicate
some contact materials result in different mean
Sq values and the Alicona InfiniteFocus
microscope is capable of measuring Sq on the
surface of worked stone tools to help distinguish
different contact materials. Similar results have
been shown in other quantification studies.
Using profilometry, Stemp et al. (2008) showed
that some contact materials have distinguishable
Rq values while other contact materials are more
ambiguous. The ability to distinguish some, but
not all, of the contact materials might also reflect
the scale of analysis. Evans and Donahue (2008)
show that some contact materials, such as greasy
and dry hide, are statistically distinguishable at
larger scales of analysis, while other contact
materials, such as fresh hide and greasy hide are
quantitatively different at smaller scales. Thus,
further investigation into the scale of the
sampling areas is needed for individual contact
materials to determine the most appropriate
scale of analysis.
5. Discussion
The quantification of use-wear is an important
step in moving towards new comparative
approaches. Focus variation microscopy is a new
tool for archaeological research that can
contribute to use-wear quantification through the
identification and separation of different polish
types. This study showed that significant
differences are present in the mean roughness
measurements (Sq) between antler and wood,
antler and hide, antler and unworked, wood and
meat, wood and wheat, hide and meat, hide and
wheat, meat and wheat, meat and unworked, and
finally wheat and unworked. However, the
differences between antler and meat or wheat
polishes are ambiguous, as are the differences
between wood and hide polish or an unworked
surface. The difference between antler and meat
polish is very close to significant (p=0.052),
suggesting that the relationship between these
two contact materials might be better understood
with an increase in sample size. Overall, the
results of the analysis indicate that the Alicona
InfiniteFocus microscope is able to distinguish
some polish textures produced by different
contact materials, adding to the growing types of
methods useful for lithic use-wear
quantification.
As the development of use-wear
quantification continues there are some
important avenues of research that need
exploration to standardize the method. One of
the most important issues that analysts need to
address is how to determine the scan area. For
this study, each 10 x 10 µm zone was randomly
selected from an area where the wear was most
developed. This area was determined through
observations of the tool surface. However,
further work is needed to determine the best
areas of analysis. Are the results more
meaningful on the areas completely modified by
11
Danielle A. Macdonald (2014). The application of focus variation microscopy for lithic use-wear quantification.
Journal of Archaeological Science. 48:26-33. http://dx.doi.org/10.1016/j.jas.2013.10.003
wear? Or areas where the original tool surface
can be contrasted with the texture produced
through use? In addition, the appropriate scale of
the sampling area needs to be determined for
each contact material.
The assessment that the surface roughness of the
worn areas is a useful parameter for determining
contact material is based on previous studies, but
this does not mean that it is the only useful
surface parameter. The ISO standard includes
measurements of volume analysis, maximum
peaks, maximum valleys, along with numerous
other measurements. A recent study conducted
with the National Physical Laboratories, UK,
evaluated the evolution of wear as lithic tools
were used over increasing periods of time
(Giusca et al., 2012). Included in this study was
a secondary aim of finding suitable areal surface
texture parameters (ISO25178-2, 2011) that can
differential between use duration. The results of
this experiment showed that in addition to Sa
and Sq, the parameters Sz, Smr, Smc, Sdq, Sdr
and Vvc (Table 1) also were useful in accessing
use duration. More research is required to
understand the nature of these parameters in
relation to the identification of contact material.
Finally, there are multiple microscopes
on the market that have the ability to measure
surface texture. However, it is not known how
the measurements from these microscopes are
comparable with each other. A recent study
tested the comparability between the Alicona
InfiniteFocus microscope and the Olympus
LEXT laser-scanning confocal microscope
(Evans and Macdonald, 2011). The results of the
preliminary experiment showed that average
roughness was comparable between the two
microscopes when measuring an antler working
tool, but there were some unexplained
differences in the Sq value. Further testing and
experimentation is required, including other
types of microscopy such as interferometry and
atomic force microscopy, to understanding the
comparability of results as new studies are being
published. Understanding how the results from
different types of instrumentation relate to each
other is imperative to moving quantitative use-
wear analysis forward.
6. Conclusion
In conclusion, quantitative methods have the
potential to contribute to the growing field of
lithic use-wear analysis. Focus variation
microscopy can continue to the continued
development of surface quantification. While
this appears to be a very useful endeavor, it is
important to move towards developing best-
practice methods for quantitative analysis,
including how to choose the area of analysis and
the best parameters for characterizing surface
features. Finally, the use of qualitative methods
of use-wear analysis cannot be divorced from
quantitative methods. Choosing the location for
analysis and the interpretations made from the
results are built upon the traditional use-wear
methods. Quantitative methods are not
replacements for low and high-powered
microscopy; they are new methodologies to be
used in tandem with qualitative research to gain
a robust view of lithic tool function.
Acknowledgements
To begin, I would like to thank Adrian Evans,
Harry Lerner, and James Stemp for stimulating
discussions about use-wear quantification, their
tireless work at putting together the symposium,
and for their encouragement of my work. I
would like to thank all of the participants in the
symposium and volume for their amazing
research contributions. Access to the Alicona
microscope would not have been possible
without the generosity of Jim York (Moog Inc.)
and Richard Leach (National Physical
Laboratories). Thank you to François Blateyron
and Anne Berger from Digital Surf for software
access and support. Manfred Prantl and Sandra
Bergmann from Alicona generously provided
technical support throughout the research. Thank
you to Jayne Wilkins for commenting on earlier
drafts and to three anonymous reviewers whose
comments improved this paper. Finally, I would
like to dedicate this paper to the memory of
George Odell.
12
Danielle A. Macdonald (2014). The application of focus variation microscopy for lithic use-wear quantification.
Journal of Archaeological Science. 48:26-33. http://dx.doi.org/10.1016/j.jas.2013.10.003
References
Anderson, P., Astruc, L., Vargiolu, R., Zahouani, H.,
1998. Contribution of quantitative analysis of surface
states to a multi-method approach for characterising
plant-processing traces on flint tools with gloss,
Functional Analysis of Lithic Artefacts: Current State
of the Research, XIII International Congress of
Prehistoric and Protohistoric Sciences, Workshops,
Tome II, ABACO Edizioni, Forli, pp. 1151–1160.
Anderson, P., Georges, J.-M., Vargiolu, R.,
Zahouani, H., 2006. Insights from a tribological
analysis of the tribulum, J Archaeol Sci 33, 1559-
1568.
Bamforth, D., 1988. Investigating Microwear
Polishes with Blind Tests: The Institute Results in
Context, J Archaeol Sci 15, 11-23.
Bello, S., Parfitt, S., Stringer, C., 2009. Quantitative
micromorphological analyses of cut marks produced
by ancient and modern handaxes, J Archaeol Sci 36,
1869-1880.
Bello, S., Soligo, C., 2008. A new method for the
quantitative analysis of cutmark micromorphology, J
Archaeol Sci 35, 1542-1552.
Bello, S.M., 2011. New results from the examination
of cut-marks using 3-dimenstional imaging, in:
Ashton, N.M., Lewis, S.G., Stringer, C.B. (Eds.), The
Ancient Human Occupation of Britain, Elsevier,
Amsterdam, pp. 249-262.
Bello, S.M., Parfitt, S.A., Stringer, C.B., 2011a.
Earliest Directly-Dated Human Skull-Cups, PloS One
6, e17026.
Bello, S.M., Verveniotou, E., Cornish, L., Parfitt,
S.A., 2011b. 3-Dimensional microscope analysis of
bone and tooth surface modifications: comparisons of
fossil specimens and replicas, Scanning 33, 316-324.
Beyries, S., Delamare, F., Quantin, J.-C., 1988.
Traceologie et Rugosimetrie Tridimensionnelle, in:
Beyries, S. (Ed.), Traceology et Technologie:
Aspects Methodologiques, BAR International
Oxford, pp. 115-132.
Bocaege, E., Humphrey, L., Hillson, S., 2010.
Technical Note: A New Three-Dimensional
Technique for High Resolution Quantitative
Recording of Perikymata, Am. J. Phys. Anthropol.
141, 498-503.
Danzl, R., Helmli, F., Scherer, S., 2009. Focus
variation - a new technology for high resolution
optical 3D surface metrology, The 10th International
Conference of the Slovenian Society for Non-
Destructive Testing: Application of Contemporary
Non-Destructive Testing in Engineering, Ljubljana,
Slovenia.
Dumont, J., 1982. The Quantification of Microwear
Traces: A New Use for Interferometry, Wld Archaeol
14, 206-217.
Evans, A.A., Donahue, R.E., 2008. Laser scanning
confocal microscopy: a potential technique for the
study of lithic microwear, J Archaeol Sci 35, 2223-
2230.
Evans, A.A., Macdonald, D., 2011. Using metrology
in early prehistoric stone tool research: further work
and a brief instrument comparison, Scanning 33, 294-
303.
Faulks, N., Kimball, L.R., Hidjrati, N., Coffey, T.,
2011. Atomic Force Microscopy of Microwear
Traces on Mousterian Tools from Myshtylagty Lagat
(Weasel Cave), Russia, Scanning 33, 304-315.
Gambino, C., McLaughlin, P., Kuo, L., Kammerman,
F., Shenkin, P., Diaczuk, P., Petraco, N., Hamby, J.,
Petraco, N.D.K., 2011. Forensic surface metrology:
tool mark evidence, Scanning 33, 272-278.
Giusca, C., Evans, A.A., Macdonald, D.A., Leach,
R.K., 2012. The Effect of Use Duration on Surface
Roughness Measurements of Stone Tools NPL
Report ENG, National Physical Laboratories,
Teddington, UK.
González-Urquijo, J.E., Ibáñez-Estévez, J.J., 2003.
The Quantification of Use-Wear Polish Using Image
Analysis. First Results, J Archaeol Sci 30, 481-489.
Grace, R., 1989. Interpreting the Function of Stone
Tools: The Quantification and Computerization of
Microwear Analysis, BAR, Oxford.
Grace, R., 1996. Use-wear Analysis: The State of the
Art, Archaeometry 38, 209-229.
Grace, R., Graham, D.G., Newcomer, M.H., 1985.
The Quantification of Microwear Polishes, Wld
Archaeol 17, 112-120.
Hayden, B., 1979. Lithic Use-Wear Analysis,
Academic Press, London.
13
Danielle A. Macdonald (2014). The application of focus variation microscopy for lithic use-wear quantification.
Journal of Archaeological Science. 48:26-33. http://dx.doi.org/10.1016/j.jas.2013.10.003
Helmli, F., 2011. Focus Variation Instruments, in:
Leach, R. (Ed.), Optical Measurement of Surface
Topography, Springer, Berlin, pp. 131-166.
Hillson, S.W., Parfitt, S., Bello, S., Roberts, M.B.,
Stringer, C., 2010. Two hominin incisor teeth from
the Middle Pleistocene site of Boxgrove, Sussex,
England, J. Hum. Evol. 59, 493-503.
ISO25178-2, 2011. Geometrical production
specifications (GPS) Surface texture: Areal, Part 2:
Terms, definitions, and surface texture parameters
International Organization for Standardization.
Keeley, L., 1980. Experimental Determination of
Stone Tool Uses: A Microwear Analysis, The
University of Chicago Press, Chicago.
Kimball, L.R., Allen, P.E., Kimball, J.F., Schlichting,
B., Pham, K., 1998. The Analysis of Microwear
Polishes with the Atomic Force Microscope XIII
Congress of the International Union of Prehistoric
and Protohistoric Sciences, ABACO, Forli, Italy, pp.
1121-1132.
Kimball, L.R., Kimball, J.F., Allen, P.E., 1995.
Microwear polishes as viewed through the atomic
force microscope: New frontiers, Lithic Technology
20, 6-28.
Knutsson, K., 1988a. Making and Using Stone Tools:
The Analysis of the Lithic Assemblages from Middle
Neolithic Sites with Flint in Vasterbotten, Northern
Sweden, Societas Archaeologica Upsaliensis,
Uppsala.
Knutsson, K., 1988b. Patterns of Tool Use: Scanning
Electron Microscopy of Experimental Quartz Tools,
Societas Archaeologica Upsaliensis, Uppsala.
Leach, R.K., 2010. Fundamental Principles of
Engineering Nanometrology, Elsevier, Oxford.
Lemorini, C., Stiner, M., Gopher, A., Shimelmitz, R.,
Barkai, R., 2006. Use-wear Analysis of an Amudian
Laminar Assemblage from the Acheuleo-Yabrudian
of Qesem Cave, Israel, J Archaeol Sci 33, 921-934.
Lerner, H., 2009. Non-Flint Raw Material Use in
Prehistory, in: Sternke, F., Eigeland, L., Costa, L.-J.
(Eds.).
Lerner, H., Du, X., Costopoulos, A., Ostoja-
Starzewski, M., 2007. Lithic raw material physical
properties and use-wear accrual, J Archaeol Sci 34,
711-722.
Moreno, M.C., Bouchon, P., Brown, C.A., 2010.
Evaluating the ability of different characterization
parameters to describe the surface of fried foods,
Scanning 32, 212-218.
Moss, E., 1987. A review of “Investigating
microwear polishes with blind tests”, J Archaeol Sci
14.
Newcomer, M., Grace, R., Unger-Hamilton, R.,
1986. Investigating microwear polishes with blind
tests, J Archaeol Sci 13, 203-217.
Newcomer, M., Grace, R., Unger-Hamilton, R.,
1988. Microwear methodology: a reply to Moss,
Hurcombe and Bamforth, J Archaeol Sci 15, 25-33.
Odell, G., Odell-Vereecken, F., 1980. Verifying the
Reliability of Lithic Use-Wear Assessments by 'Blind
Tests': The Low-Power Approach, J Field Archaeol
70, 87-120.
Rees, D., Wilkinson, G.G., Grace, R., Orton, C.R.,
1991. An Investigation of the Fractal Properties of
Flint Microwear Images, J Archaeol Sci 18, 629-640.
Richter, T., 2007. A Comparative Use-Wear Analysis
of Late Epipalaeolithic (Natufian) Chipped Stone
Artefacts from the Southern Levant, Levant 39, 97-
122.
Rots, V., 2008. Hafting Traces on Flint Tools, in:
Longo, L., Skakun, N. (Eds.), 'Prehistoric
Technology' 40 Years Later: Functional Studies and
the Russian Legacy Archaeopress, Oxford, pp. 75-84.
Rots, V., Pirnay, L., Pirson, P., Baudoux, O., 2006.
Blind tests shed light on possibilities and limitations
for identifying stone tool prehension and hafting, J
Archaeol Sci 33, 935-952.
Schulz, E., Calandra, I., Kaiser, T.M., 2010.
Applying tribology to teeth of hoofed mammals,
Scanning 32, 162-182.
Semenov, S.A., 1964. Prehistoric Technology: An
Experimental Study of the Oldest Tools and Artifacts
from Traces of Manufacture and Wear, Barnes and
Noble, New Jersey.
Stemp, W.J., Childs, B.E., Vionnet, S., Brown, C.A.,
2008. The quantification of microwear on chipped
14
Danielle A. Macdonald (2014). The application of focus variation microscopy for lithic use-wear quantification.
Journal of Archaeological Science. 48:26-33. http://dx.doi.org/10.1016/j.jas.2013.10.003
stone tools: assessing the effectiveness of root mean
square roughness (Rq), Lithic Technology 33, 173-
189.
Stemp, W.J., Childs, B.E., Vionnet, S., Brown, C.A.,
2009. Quantification and Discrimination of Lithic
Use-Wear: Surface Profile Measurements and
Length-Scale Fractal Analysis, Archaeometry 3.
Stemp, W.J., Chung, S., 2011. Discrimination of
surface wear on obsidian tools using LSCM and
RelA: pilot study results (area-scale analysis of
obsidian tool surfaces), Scanning 33, 279-293.
Stemp, W.J., Lerner, H.J., Kristant, E.H., 2012.
Quantifying Microwear on Experimental Mistassini
Quartzite Scrapers: Preliminary Results of
Exploratory Research Using LSCM and Scale-
Sensitive Fractal Analysis, Scanning 00, 1-12.
Stemp, W.J., Stemp, M., 2001. UBM Laser
Profilometry and Lithic Use-Wear Analysis: A
Variable Length Scale Investigation of Surface
Topography, J Archaeol Sci 28, 81-88.
Stemp, W.J., Stemp, M., 2003. Documenting Stages
of Polish Development on Experimental Stone Tools:
Surface Characterization by Fractal Geometry Using
UBM Laser Profilometry, J Archaeol Sci 30, 287-
296.
Stevens, N.E., Harro, D., Hicklin, A., 2010. Practical
quantitative lithic use-wear analysis using multiple
classifiers, J Archaeol Sci 37, 2671-2678.
Tringham, R., Cooper, G., Odell, G., Voytek, B.,
Whitman, A., 1974. Experimentation in the
Formation of Edge Damage: A New Approach to
Lithic Analysis, J Field Archaeol 1, 171-196.
van Gijn, A., 2010. Flint in Focus: Lithic Biographies
in the Neolithic and Bronze Age, Sidestone Press,
Leiden.
Vaughan, P., 1985. Use-wear Analysis of Flaked
Stone Tools, The University of Arizona Press,
Tucson.
Vila, A., Gallart, F., 1993. Caracterizacion de los
Micropulidos de Uso: Ejemplo de Aplicacion del
Analisis de Imagenes Digitalizadas, in: Anderson, P.,
Beyries, S., Otte, M., Plisson, H. (Eds.), Traces et
Fonction: Les Gestes Retrouvés, University de Liege,
Liege.
Whitehouse, D.J., 2011. Handbook of Surface and
Nanometrology, Second ed., CrC Press, Boca Raton.


