Embed Size (px)
Citation preview

AMT Data Management & Dissemination, DSRII AMT special Issue 1
The AMT data management experience 1 2
Claudia Castellani*, Gwenaëlle Moncoiffé and Juan Brown 3 4
British Oceanographic Data Centre, Joseph Proudman Building, 6 Brownlow Street, L3 5 5DA, Liverpool, Merseyside, U.K. 6
7 8 9
Abstract 10 11 As the UK’s National marine data centre, a key responsibility of the British Oceanographic 12
Data Centre (BODC) is to provide data management support for the scientific activities of 13
complex multidisciplinary long term research programmes. Since the initial cruise in 1995, the 14
NERC funded Atlantic Meridional Transect (AMT) project has undertaken 18 north-south 15
transects of the Atlantic Ocean. As the project has evolved there has been a steady growth in 16
the number of participants, the data volume, complexity and the demand for data. BODC 17
became involved in AMT in 2002 at the beginning of phase II of this programme and since 18
then has provided continuous support to both the AMT and wider scientific community 19
through rescue, quality control, processing and access to the data. The data management 20
comprises a team of specialist data managers using a sophisticated infrastructure of software 21
and hardware to manage, integrate and serve the physical, biological and chemical data. Here, 22
we discuss the approach adopted, techniques applied and some guiding principles for 23
management of large multi-disciplinary programmes. 24
25 *Corresponding author: [email protected] 26 27 28 Keywords: Atlantic Meridional Transect, data processing, Inventories, Information centres, 29 Instrument platforms, quality control. 30 31 32 Acknowledgement: Funding was provided by the UK Natural Environmental Research 33 Council. We thank all the AMT participants for submitting their data to BODC and for 34 improving the quality of data management through their feed-back. Particular thanks go to 35 Carol Robinson for her continuous support and help with the acquisition of the data and to 36 Dawn Ashby for her superb assistance. The ship personnel team is also gratefully 37 acknowledged for their technical support and for supplying the CTD and underway data to 38 BODC. 39 40

AMT Data Management & Dissemination, DSRII AMT special Issue 2
1. Introduction 41 42
In the enthusiasm that surrounds exciting and novel science it is easy to forget that a 43
unified approach to data management aimed to ensure consistency in data quality, ease of 44
dissemination between collaborators, secure archiving and future utilisation of the data is 45
critical to the success of projects (Lowry et al., 2005). This is particularly true of major multi-46
disciplinary and multi-partner programmes. Collection of marine data involves expensive 47
platform operations, such as running research vessels and training of qualified personnel. In 48
addition, because of the inherent difficulties in their collection marine measurements are 49
irreplaceable assets that are both expensive to collect and uniquely document the changing 50
earth system. 51
Over the past two decades the scientific community has become increasingly aware of 52
the importance of time series measurements as baselines for the quantification of changes in 53
the marine environment (Beaugrand, 2002). It is essential that future generations of scientists 54
and research users are able to access environmental data that has been properly managed and 55
preserved, to known standards and formats, together with basic background information on 56
how the data were collected and analysed (metadata). Scientists and funding bodies have also a 57
legal and moral responsibility to make the data and results from publicly funded activities 58
widely available. Moreover, insurance is required against accidental loss and technological 59
redundancy through changes in storage media. Delivering all this requires a dedicated 60
infrastructure of complex relational databases and staff that understand the data and their use as 61
well as information technology. 62
The scarcity and high value of oceanographic data has led increasingly to the 63
development of a culture where long-term data curation and data sharing, through specialised 64
national data centres, has become the norm rather than the exception (Glover et al 2006, Seys 65
et al 2006). Since its creation in 1979 the British Oceanographic Data Centre (BODC) has 66
provided support to the UK marine science through its data management activities, by 67
delivering fully integrated and quality controlled data for future utilisation by research 68
scientists, the government, industry as well as the wider public. BODC deals with biological, 69
chemical, physical, and geophysical data and its databases contain measurements of nearly 70
15,000 different variables. Its staff includes data scientists from a wide range of scientific 71
disciplines who have direct experience of marine data collection and analysis working 72
alongside information technology specialists developing and maintaining the databases and 73

AMT Data Management & Dissemination, DSRII AMT special Issue 3
software infrastructure required to support data management and data distribution systems. One 74
of the key responsibilities of National data centres such as BODC is to provide data 75
management support for the scientific activities of complex multidisciplinary long term 76
research programmes. In the present paper we discuss our experience in managing the data 77
arising from the Atlantic Meridional Transect (AMT) project and provide some guiding 78
principles for the data management of large multi-disciplinary programmes. 79
80
2. Overview of the AMT data set 81 82
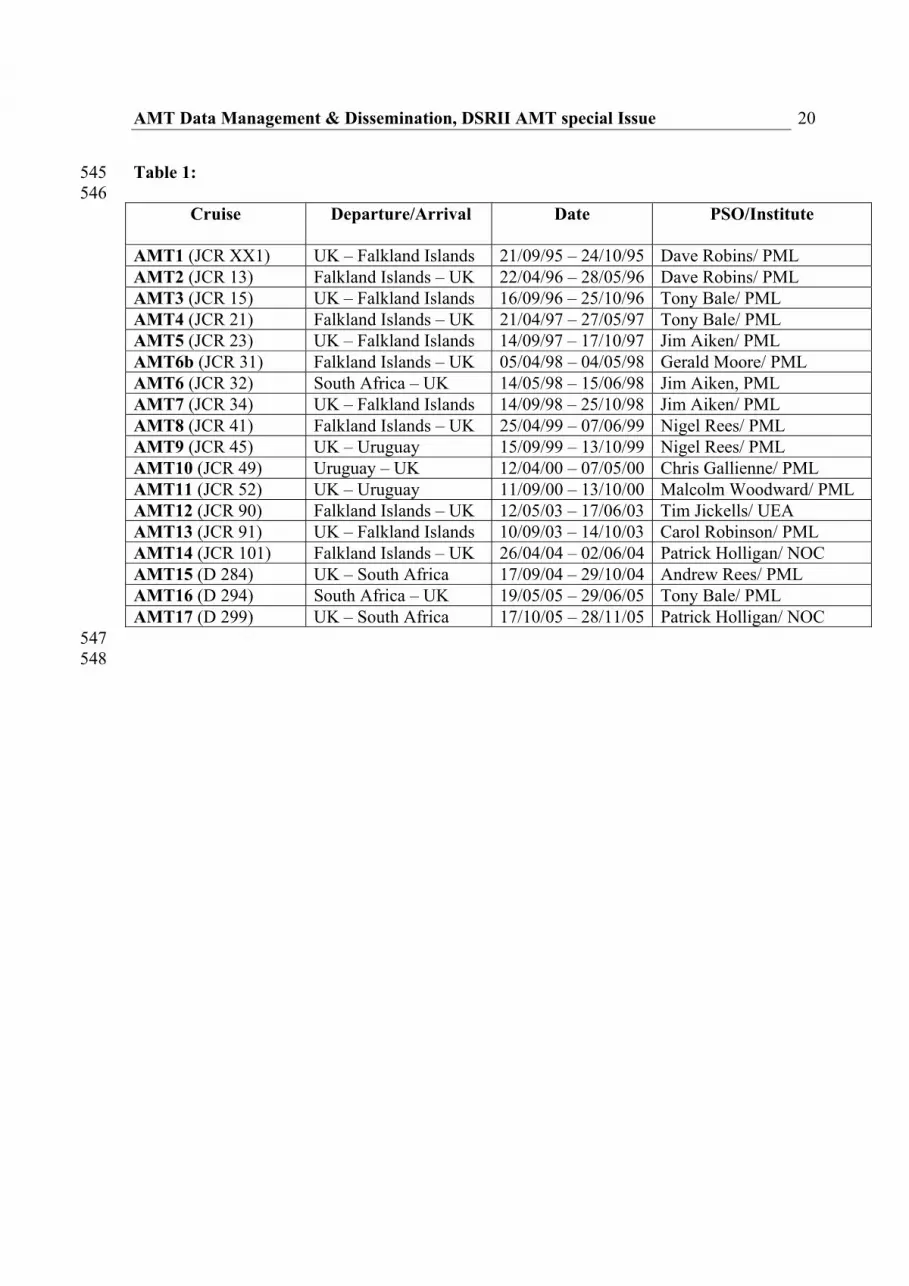
Between 1995 and 2005 AMT has undertaken 18 cruises essentially twice yearly 83
between the UK and the southern Atlantic Ocean which involved 46 international research 84
groups (Table 1; Robinson, et al., 2006). The programme was divided into two phases (i.e. 85
phase I and phase II), separated by two years during which there was no fieldwork. 86
The scientific aims of phase I were to assess mesoscale to basin scale phytoplankton 87
processes, the functional interpretation of bio-optical signatures and the seasonal, regional and 88
latitudinal variations in mesozooplankton dynamics. During phase II, the program was 89
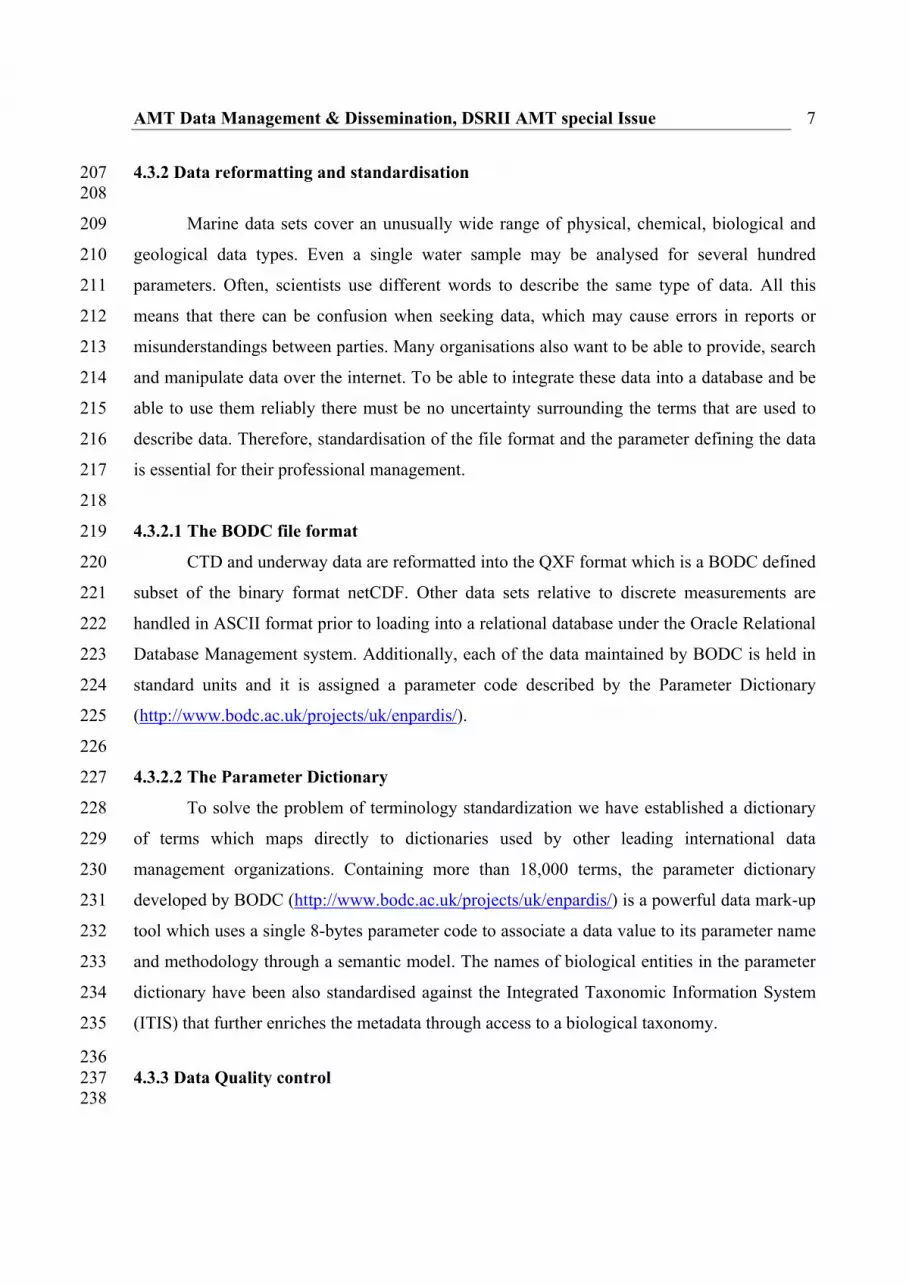
broadened (Figure 1 and Robinson et al., 2006) to address a suite of cross-disciplinary 90
questions concerning ocean plankton ecology and biogeochemistry and their links to 91
atmospheric processes. Broadly, the measurements comprised hydrographic and bio-optical 92
properties, biogeochemistry, aerosol and rainwater composition, plankton community structure 93
and plankton physiology, as summarised in Robinson et al. (2006) and Figure 1. 94
The objectives included the determination of how 1) the structure, functional properties 95
and trophic status of the major planktonic ecosystems vary in space and time; 2) physical 96
processes control the rates of nutrient supply, including dissolved organic matter, to the 97
planktonic ecosystem and 3) atmosphere-ocean exchange and photodegradation influence the 98
formation and fate of organic matter. Determinands include temperature, salinity, inorganic 99
nutrients, carbon dioxide, oxygen, nitrous oxide, methane, dimethylsulphide, dissolved and 100
particulate carbon, nitrogen and phosphorus, chlorophyll, phytoplankton pigments and 101
taxonomy, photosynthesis, respiration, new production, nitrogen fixation, calcification, 102
bacterial and microzooplankton abundance and activity, microbial molecular diversity, viral 103
activity, mesozooplankton community structure and physiology (i.e. respiration, copepod egg 104
production rates), atmospheric dust deposition and characterisation, bio-optical properties, and 105
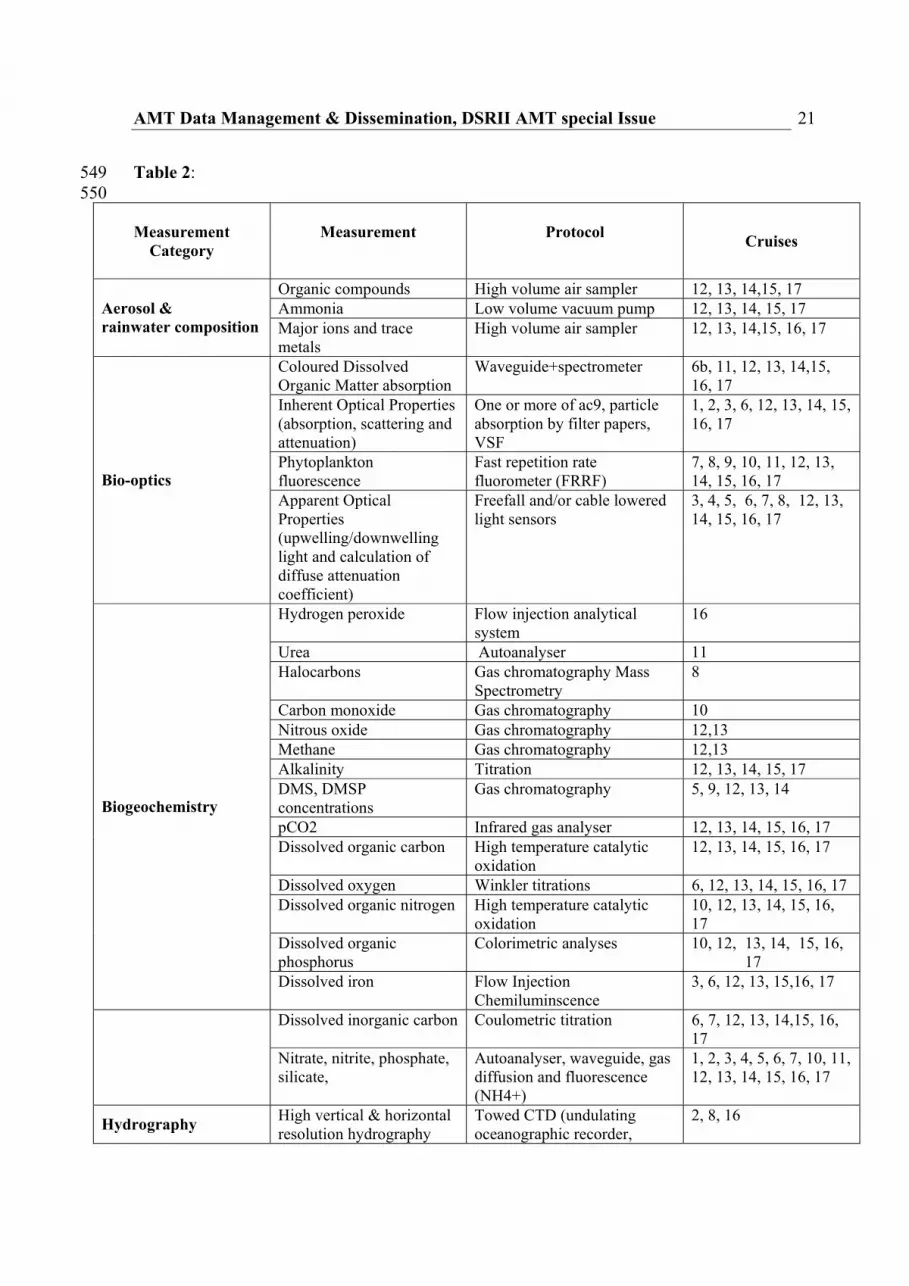
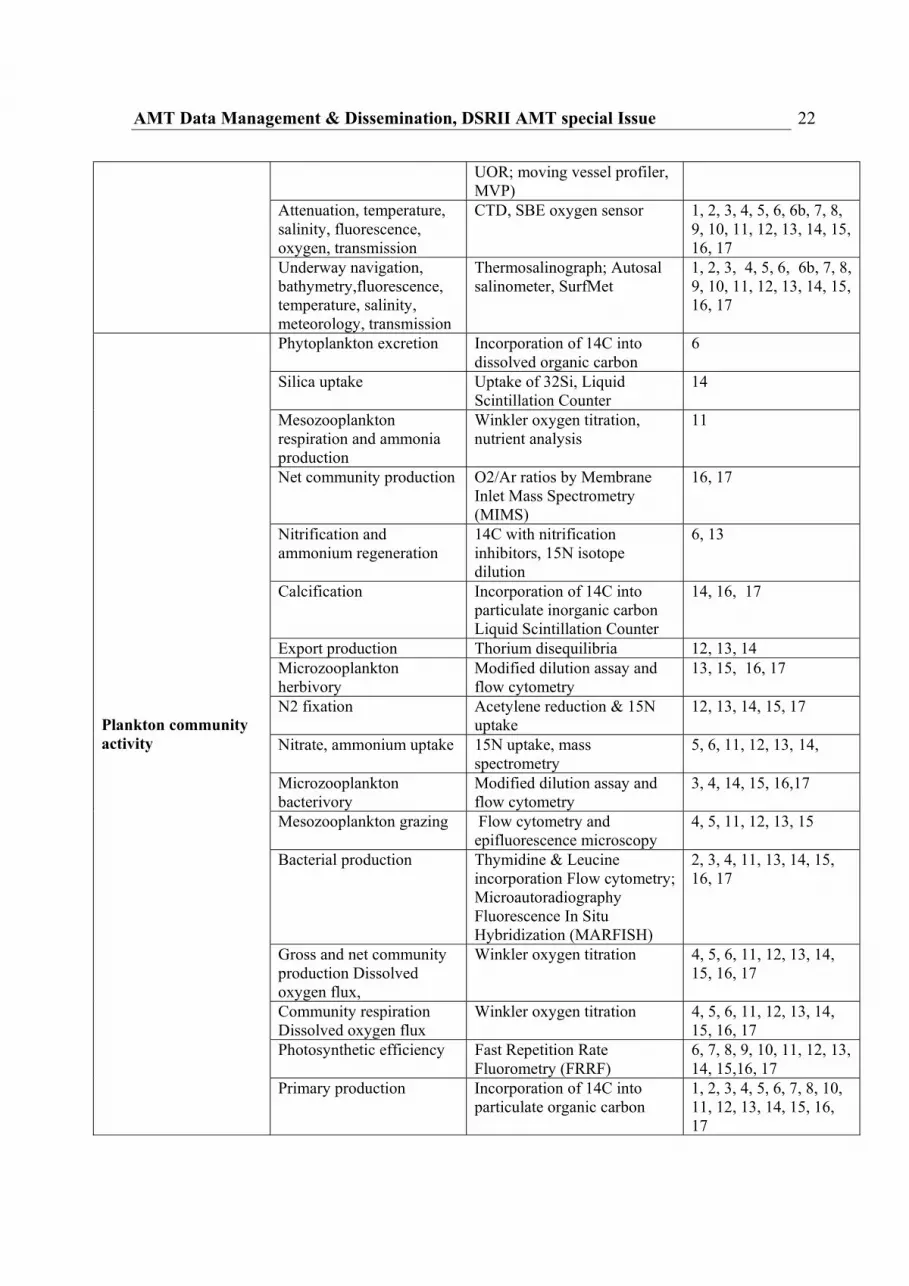
coloured dissolved organic matter (Table 2). An “individual dataset” or “AMT dataset” in the 106

AMT Data Management & Dissemination, DSRII AMT special Issue 4
context of this paper is a single or multiple sets of related measurements originating from a 107
single or a team of data originators during a given AMT cruise. 108
109 3. Challenges posed by the AMT dataset management: phase I and phase II 110 111
The two phases of the AMT project presented BODC with very different challenges. 112
When the formal data management began at the beginning of phase II in 2002 our database 113
system was already designed to deal with the complexity of biological and biogeochemical 114
measurements. However, the number of individual sources of data, the size of the AMT 115
community, each successive cruise often having new scientists and students and the available 116
funding all presented significant challenges for the successful management of the data. The 117
relative importance of these factors varied for each phase. 118
119
3.1 Phase I 120
As no provision had been made for data management during phase I, BODC and the 121
AMT community were essentially involved in a data rescue effort. First additional funding was 122
secured. As a large number of individuals (including temporary staff & PhD students) had been 123
involved in collection, the data were in a varied state of repair. Consequently, the data had been 124
kept in assorted formats on a range of media, there were no authoritative protocols for 125
collection and often there was no definitive version of data sets. Thus, there was considerable 126
potential for: data loss; confusion during analysis and subsequent interpretation; and wasted 127
effort tracking down and re-processing data. The process of acquiring these data was helped 128
considerably as the benefits of a central data management effort were realised during phase II 129
and by the realisation of AMT participants that data from phase I were not readily available. 130
131
3.2 Phase II 132
Phase II presented the opportunity to undertake a more formal and structured approach 133
to the data management. Initially, many scientists were unaccustomed to a culture of integrated 134
data management. Whilst BODC had pioneered such an approach during the NERC North Sea 135
programme in the early 1980’s (Lowry et al., 2005) and later during other NERC and European 136
projects, a period of organisational upheaval in UK marine science during the late 1990’s 137
meant that a number of the guiding principles had to be re-learned. Previously, it had often 138
been the practice that BODC data scientists would accompany cruises to provide direct support 139

AMT Data Management & Dissemination, DSRII AMT special Issue 5
on fundamental on-board data management activities (e.g. CTD and underway data 140
processing). Regrettably, space constraints precluded BODC personnel participation during 141
AMT cruises. This situation led to the development and implementation of a more formalised 142
strategy for cruise preparation. This included the writing up of guideline documents of what 143
was expected at the end of a cruise with regards to data and ancillary information associated 144
with CTD and underway continuous measurements and also individual scientist data. 145
Additionally, there was insufficient continuity in shipboard personnel to ensure consistent 146
calibration and quality of the CTD and underway data. Consequently, it proved most efficient 147
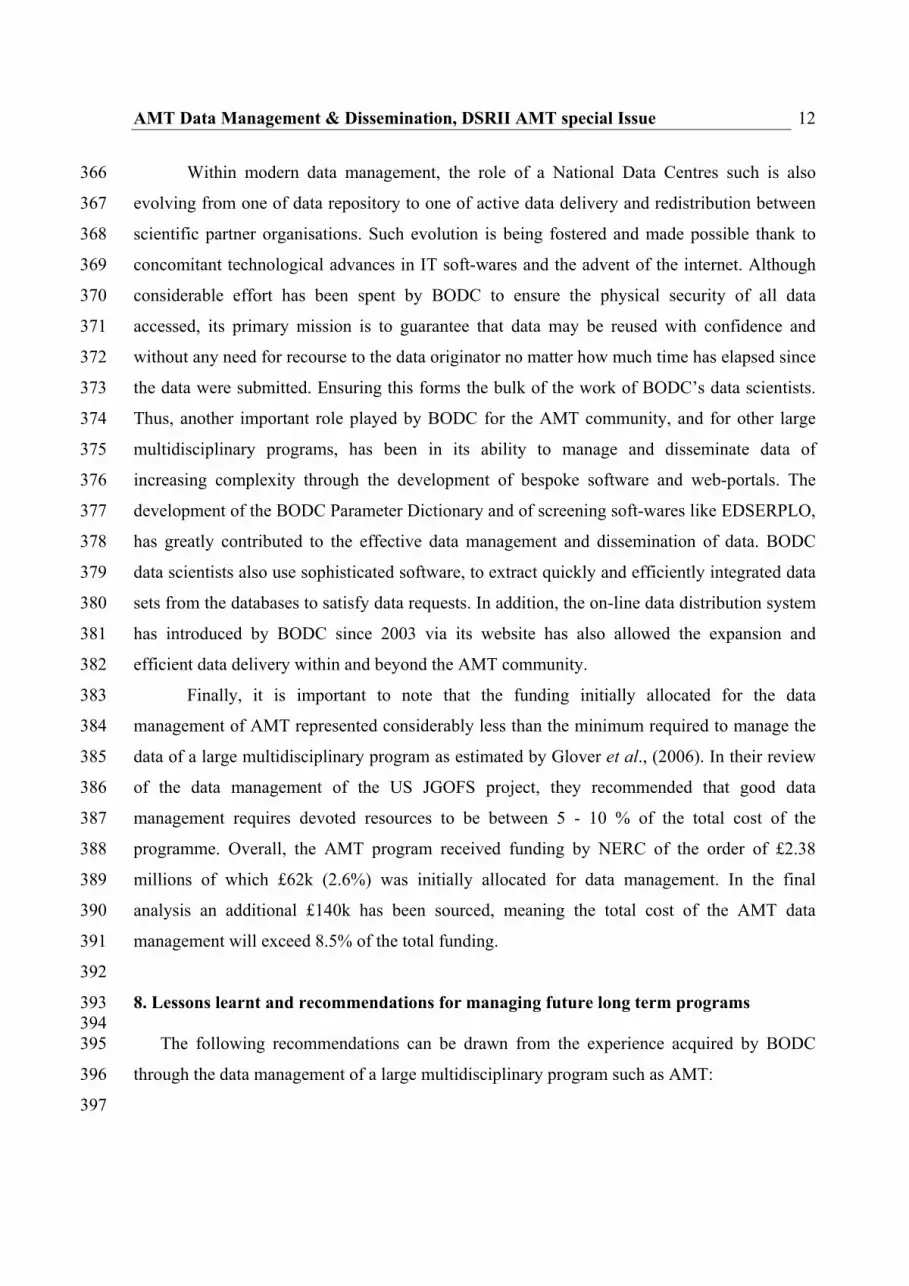
for BODC to undertake these tasks for which further resource had to be found. Figure 2 148
illustrates the disparity between the initial estimate of effort required for the data management 149
and that actually expended. 150
151
4. How are the data managed by BODC? 152 153 4.1 BODC communication and networking culture 154 155
BODC’s philosophy is that communication lays the foundations to good data 156
management. Data management begins with the exchange of information between the different 157
parties involved in the project (i.e. BODC staff/AMT data manager, scientists and ship 158
personnel) at the planning stage and throughout the fieldwork. Whilst space constraints 159
prevented data scientists from participating on AMT cruises, BODC participated in the AMT 160
planning and science meetings, preparation of newsletter and contributed to reports. As 161
mentioned previously, a number of what should have been standard working practices had to 162
be re-learned to attain the processes described below. 163
164 4.2 Initial acquisition of cruise data in liaison with the ship technical personnel & the PI 165 166
Before the starts of each cruise BODC liaise closely with the ship’s technical personnel 167
based at the National Marine Facility and the Principal Investigator (PI). This enables data 168
scientists to understand the scope of data collection activities and the nature of equipment 169
deployed, but also enables BODC to provide a set of guidelines to assist in good data 170
management practices and the recording of the metadata necessary for the accurate future 171
description of the data. Following the cruise, the PI is required to compile a comprehensive list 172
of the data collected during the cruise into the Cruise Summary Report (CSR, formerly the 173

AMT Data Management & Dissemination, DSRII AMT special Issue 6
“ROSCOP”) conceived by the Intergovernmental Oceanographic Commission (IOC) in the 174
late 1960s to provide a low level inventory for tracking oceanographic data collected on 175
Research Vessels. It is expected that the PI submits the CSR, within a week of the cruise and a 176
full “Cruise Report” collating the cruise narrative and a description of the methodology of the 177
data sets collected by the scientists on board, within 6 month from the end of a cruise. These 178
documents provide the key information outlining the nature of the data collected and the 179
techniques employed. Alongside this, an electronic version of the CTD and underway 180
navigation data is submitted with the appropriate documentation relating to the calibration and 181
configuration of the scientific instrumentation employed. 182
183
4.3 Data tracking and banking 184 185
The initial source of information collated by the PI at the end of the AMT cruise is 186
recorded by BODC into a series of inventory tables, one for each data set collected, together 187
with the details of the scientist responsible for the data. The inventory tables are interfaced with 188
the Oracle database to display the AMT data holdings dynamically on the BODC website 189
(http://www.bodc.ac.uk/projects/uk/amt/data_inventories/). The records contained in the 190
inventory tables are continuously updated following dialogue with data originators and used to 191
keep the AMT participants informed about the availability and the processing status of the 192
data. 193
194
4.3.1 Physical security 195
Clearly, physical security of data is one of BODC’s primary concerns and the 196
organisation’s approach to this has two components: an ‘accession system’ and an ‘archive 197
system’ for long-term preservation of the data. When the data arrive at BODC they are 198
recorded on an electronic accession table and the data copied into the inventory via the Unix 199
operating system. The physical integrity of the data is secured by preservation of the original 200
media together with a copy placed in the BODC data archive and wherever possible, an 201
additional version of the data supplied is saved into ASCII format. The archive system is 202
supported by an accession system containing the metadata record which provide the data 203
submission with a unique identifier and describe its contents and provenance. 204
205 206
AMT Data Management & Dissemination, DSRII AMT special Issue 7
4.3.2 Data reformatting and standardisation 207 208
Marine data sets cover an unusually wide range of physical, chemical, biological and 209
geological data types. Even a single water sample may be analysed for several hundred 210
parameters. Often, scientists use different words to describe the same type of data. All this 211
means that there can be confusion when seeking data, which may cause errors in reports or 212
misunderstandings between parties. Many organisations also want to be able to provide, search 213
and manipulate data over the internet. To be able to integrate these data into a database and be 214
able to use them reliably there must be no uncertainty surrounding the terms that are used to 215
describe data. Therefore, standardisation of the file format and the parameter defining the data 216
is essential for their professional management. 217
218
4.3.2.1 The BODC file format 219
CTD and underway data are reformatted into the QXF format which is a BODC defined 220
subset of the binary format netCDF. Other data sets relative to discrete measurements are 221
handled in ASCII format prior to loading into a relational database under the Oracle Relational 222
Database Management system. Additionally, each of the data maintained by BODC is held in 223
standard units and it is assigned a parameter code described by the Parameter Dictionary 224
(http://www.bodc.ac.uk/projects/uk/enpardis/). 225
226
4.3.2.2 The Parameter Dictionary 227
To solve the problem of terminology standardization we have established a dictionary 228
of terms which maps directly to dictionaries used by other leading international data 229
management organizations. Containing more than 18,000 terms, the parameter dictionary 230
developed by BODC (http://www.bodc.ac.uk/projects/uk/enpardis/) is a powerful data mark-up 231
tool which uses a single 8-bytes parameter code to associate a data value to its parameter name 232
and methodology through a semantic model. The names of biological entities in the parameter 233
dictionary have been also standardised against the Integrated Taxonomic Information System 234
(ITIS) that further enriches the metadata through access to a biological taxonomy. 235
236 4.3.3 Data Quality control 237
238

AMT Data Management & Dissemination, DSRII AMT special Issue 8
After reformatting and attributing parameter codes, the quality control of many 239
oceanographic data sets is operated through data visualisation. The two main approaches to 240
data quality control are either via screening using bespoke soft-wares or simply via direct 241
visualisation of the data by experienced data scientists: 242
243
4.3.3.1 EDSERPLO: the BODC way forward to CTD profile and time series data 244
screening 245
Edserplo (Editing and SERies PLOtting) is the soft-ware developed by BODC for 246
screening 1- and 2-dimensions continuous data series including continuous underway and CTD 247
profile data. This software can be used to visualise multiple parameters and series and it has a 248
quick editing tool which allows the quality control of data through the flagging spikes and 249
suspect data points (Fig 3). Since 2006 EDSERPLO runs on PC computers compared to a 250
previous version, operating on Silicon Graphic stations, allowing a more efficient and faster 251
processing of the data. 252
253
4.3.3.2 Quality control of non continuous profiles or time series data 254
Discrete data measurements measured, for instance, from CTD cast bottles, net hauls or 255
during experiments are also quality controlled through direct visualisation of data points on 256
spreadsheets and graphical plots of the data. After the data are screened, quality controlled and 257
reformatted they become integrated in the databases. 258
259 4.4 Integration of AMT data in the databases 260 261
Once reformatted and quality controlled, all the data collected during AMT cruises 262
which originates from discrete water column sampling, continuous profilers, tows or benthic 263
sampling, are managed within the BODC databases where they are fully integrated with 264
concomitant oceanographic measurements and associated metadata. The data are stored into 265
the BODC databases into a series of tables linked to each other to various degree of complexity 266
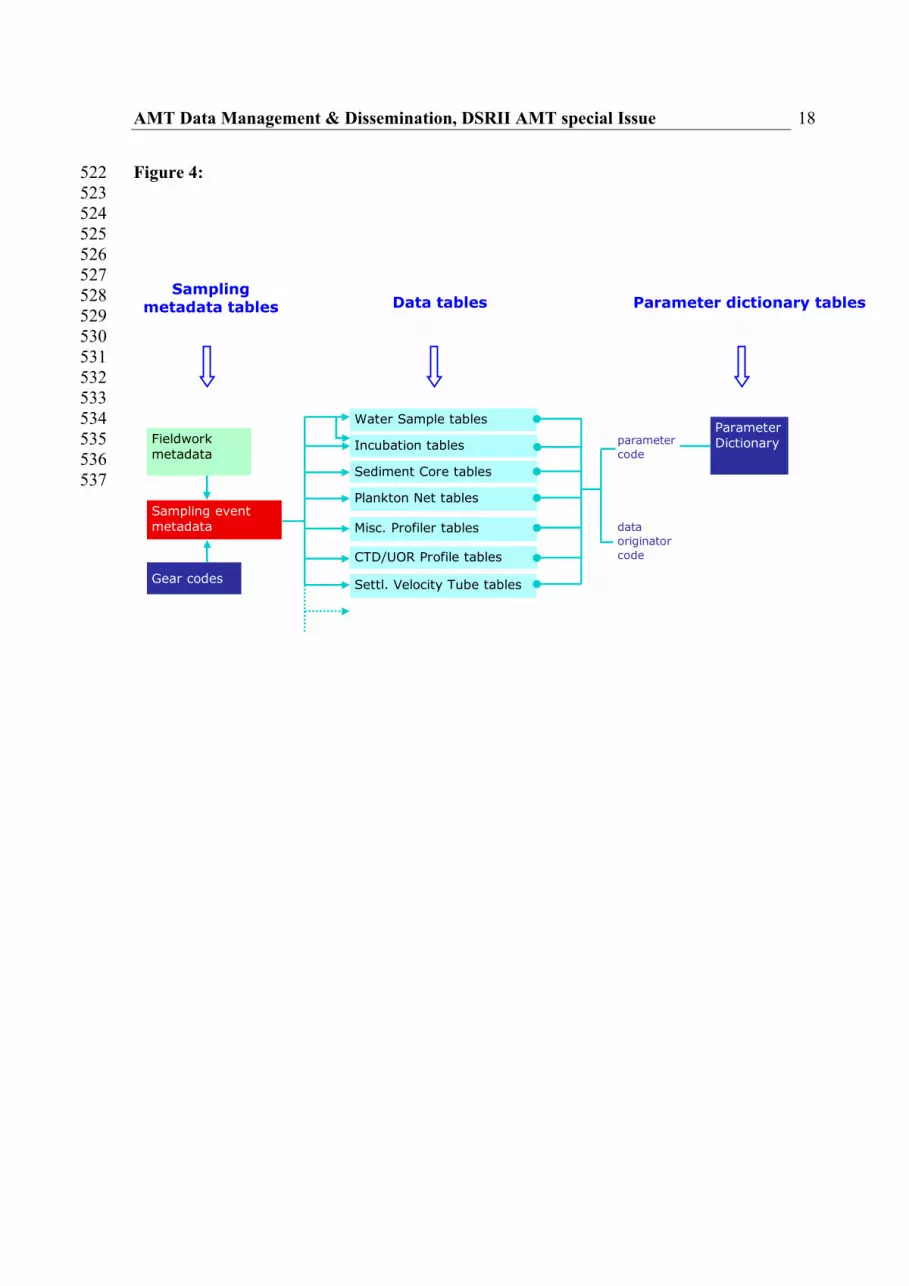
to minimise duplication of information. Figure 4 shows a simplified representation of the 267
BODC databases within the 3 main groups of tables; 268
269

AMT Data Management & Dissemination, DSRII AMT special Issue 9
• The sampling metadata tables consisting of the sampling activity or event 270
description table with links to the fieldwork description table and to the sampling 271
gear code table. 272
273
• The data tables consisting of a series of linkage and data storage tables for each 274
main type of sampling or data collection techniques. 275
276
• The parameter dictionary tables defining the 8-byte parameter codes 277
278 All data storage tables have the same field structure consisting of a unique key linking 279
each record to the linkage tables, a data parameter code, a data value, a data quality control 280
flag, a data originator code and a loading date. The data linkage tables invariably control the 281
one-to-many relationship between the events and the data. Their structure has been adapted 282
differently for each main type of sampling or data collection technique in order to incorporate 283
specific metadata information such as for example bottle depth and bottle type for water 284
collection events, plankton net depth range, mesh size, mouth area for plankton net hauls. The 285
structure of the database is such that it may be easily expanded to include new sampling gear, 286
new methodologies and instrumentation, and new parameters. 287
288 5. AMT data policy and data dissemination 289 290
The distribution of the AMT data is regulated by the data policy 291
(http://www.bodc.ac.uk/projects/uk/amt/data_policy/) drawn up by the AMT Scientific 292
Steering Committee (SSC). The policy was developed to ensure an appropriate balance 293
between the protection of data originators' intellectual property rights and the potential benefits 294
that may arise via data use by the programme, the wider research community and other 295
interested parties. According to this policy, when AMT data are transferred to BODC they 296
become available to other investigators within the AMT programme on the condition that the 297
originator is kept informed about how the data are being used and he/she is acknowledged in 298
any exploitation of that data. The AMT data can also be made available to the wider scientific 299
community, immediately upon permission being granted by the data originator and the 300
signature of a licence or after 6 months from the end of the program in April 2006. 301

AMT Data Management & Dissemination, DSRII AMT special Issue 10
BODC supplies the AMT data to both internal and external users either directly via 302
email, the ftp system or in the case of the CTD and underway data, via automatic download 303
through the BODC website (http://www.bodc.ac.uk/data/online_delivery/amt/). Before any of 304
the AMT data can be downloaded, however, users are required to be registered as BODC web 305
users. The data are supplied in a fixed ASCII (CSV) format and they are associated with 306
documentation providing information about sensors, quality control, calibrations and 307
processing status. Each time modifications to data are made by BODC, these files are updated 308
and changes are noted in the documentation. 309
310 6. AMT data requests 311 312
Requests for AMT data can be made directly to the BODC staff for all data or via the 313
BODC website for CTD and underway data. Data requests and queries made directly to BODC 314
are handled by either the AMT data manager or the BODC requests officer. Data requests and 315
the processing of data sets required by PhD students are given priority over all other requests. 316
When data are lodged at BODC, it is the aim that requests be serviced within 1 to 3 working 317
days. Currently only the CTD and underway cruise data can be downloaded from the BODC 318
website whereas discrete data sets can only be obtained contacting the BODC staff. However, 319
BODC is developing a system for online delivery of its data holding and AMT data will 320
become available alongside all other publicly available data held in its databases. 321
Statistical information on AMT data request is only available from 2002. Since then 322
570 requests for AMT data have been handled (Fig. 5). Figure 5 also shows that data requests 323
have steadily increased from 16 in 2002 to190 in 2005. This increase in data requests reflects 324
both the expansion of the scientific community to approximately 180 scientists from 11 325
countries and the provision of an on-line system for the automatic download of the CTD 326
profiles and the underway data. On the other hand, the slight decrease in 2006 is probably the 327
results of the conclusion of the phase II of the program and the graduation of many of the 328
“AMT PhD students” (who accounted for a significant proportion of the data requests). Since 329
2003 (i.e. after the introduction of the BODC web data delivery system) the proportion of data 330
requests from the web has represented between 47% and 50% of total requests. Interestingly, 331
however, although the number of AMT requests received from external users has also 332
increased, their proportion has remained overall stable over time at around 20 % of the total 333

AMT Data Management & Dissemination, DSRII AMT special Issue 11
AMT requests (Fig 5). The largest data request was received from USA scientists followed by 334
that of the UK and French scientific community (Figure 6). 335
336 7. Discussion and conclusions 337 338
The planning and implementation of research and the efficient management of the 339
resulting data often appear to be two widely separate worlds. This is because, whereas data 340
managers consider data collection, management and dissemination as essential for the effective 341
use of research funds, many researchers consider data management as technical and secondary 342
to publications. As a consequence data management is often insufficiently planned or not 343
planned at all (Seys et al 2006). Perhaps, the realisation by the scientific community, in the 344
1990s, of the importance of long term time series to predict the impact of future changes in the 345
earth system on human activities together with the need to handle increasingly large and 346
complex data sets, has resulted in a change in attitude towards the role of marine data 347
management. 348
A long-term multi-disciplinary international programs such as AMT provide numerous 349
challenges for the managements of the data they produce in terms of their large volume, 350
diversity of measurements, changes in sampling instrumentation and increased sophistication 351
of analytical methods. Increase in diversity and number of variables measured also means 352
increasing demand and needs from the end users for their rational integration. Measurements 353
also need to be supported by a rich metadata if they are to have value for the future. Clearly, 354
when it comes to satisfying the requirements of modern science on the delivery of fully 355
integrated and quality controlled complex data sets, such challenge cannot longer simply be 356
met by individuals or single scientific organisations without large investment of time and 357
resources. BODC through its support to multidisciplinary programs has specialised in handling 358
data sets which are small in volume, but extremely high in complexity covering a wide range 359
of physical, chemical, biological, atmospheric and geological parameters. Progresses in the 360
acquisition and management of AMT data were facilitated by a culture of communication and 361
collaboration between the data scientists and IT specialists with the AMT scientists and ship 362
technical staff. Thanks to this collaboration, BODC has rescued > 90 % of the data collected 363
during the phase I of the project by scientists who have moved on in their careers often loosing 364
contact with the AMT community. 365
AMT Data Management & Dissemination, DSRII AMT special Issue 12
Within modern data management, the role of a National Data Centres such is also 366
evolving from one of data repository to one of active data delivery and redistribution between 367
scientific partner organisations. Such evolution is being fostered and made possible thank to 368
concomitant technological advances in IT soft-wares and the advent of the internet. Although 369
considerable effort has been spent by BODC to ensure the physical security of all data 370
accessed, its primary mission is to guarantee that data may be reused with confidence and 371
without any need for recourse to the data originator no matter how much time has elapsed since 372
the data were submitted. Ensuring this forms the bulk of the work of BODC’s data scientists. 373
Thus, another important role played by BODC for the AMT community, and for other large 374
multidisciplinary programs, has been in its ability to manage and disseminate data of 375
increasing complexity through the development of bespoke software and web-portals. The 376
development of the BODC Parameter Dictionary and of screening soft-wares like EDSERPLO, 377
has greatly contributed to the effective data management and dissemination of data. BODC 378
data scientists also use sophisticated software, to extract quickly and efficiently integrated data 379
sets from the databases to satisfy data requests. In addition, the on-line data distribution system 380
has introduced by BODC since 2003 via its website has also allowed the expansion and 381
efficient data delivery within and beyond the AMT community. 382
Finally, it is important to note that the funding initially allocated for the data 383
management of AMT represented considerably less than the minimum required to manage the 384
data of a large multidisciplinary program as estimated by Glover et al., (2006). In their review 385
of the data management of the US JGOFS project, they recommended that good data 386
management requires devoted resources to be between 5 - 10 % of the total cost of the 387
programme. Overall, the AMT program received funding by NERC of the order of £2.38 388
millions of which £62k (2.6%) was initially allocated for data management. In the final 389
analysis an additional £140k has been sourced, meaning the total cost of the AMT data 390
management will exceed 8.5% of the total funding. 391
392
8. Lessons learnt and recommendations for managing future long term programs 393 394
The following recommendations can be drawn from the experience acquired by BODC 395
through the data management of a large multidisciplinary program such as AMT: 396
397
AMT Data Management & Dissemination, DSRII AMT special Issue 13
• At the beginning: The data center should be involved at the planning stage of any 398
scientific program to ensure that data management can be properly planned and 399
resourced. 400
401
• A sound data policy: A comprehensive data policy must be drawn at the start to enable 402
the steady and harmonious integration of the data into the database and their subsequent 403
dissemination in relation the protection of the intellectual property rights of the data 404
originator. 405
406
• Early contact with PIs: An early data management liaison with the project PIs 407
improves data quality and the identification and logging of the information in a data 408
inventory. 409
410
• A good cruise report: The preparation of a detailed and comprehensive cruise report 411
by the cruise Principal Scientist in collaboration with the technical ship personnel is key 412
to the subsequent management of the data collected during the cruise 413
414
• Proactive sea-going support: The activity undertaken by the ship technical personnel 415
in monitoring the functioning of the underway ship sensors and during CTD operation 416
also represents a crucial step towards gathering high quality data and support for 417
successful data management. 418
419
• Early data acquisition: To prevent/minimise the risk of their loss, data and metadata 420
should be acquired by the data centre as early as possible, from the time of their 421
collection. This is particularly important when data processing and delivery is handled 422
by staff on short term contract and students. 423
424
• Data management culture: Close collaboration with project participants including 425
attendance at planning and science meetings, and where possible data scientists 426
participating on cruises helps foster a culture of rigorous Data management. 427
428

AMT Data Management & Dissemination, DSRII AMT special Issue 14
• Data centralization: Centralisation of the data sets collected during the scientific 429
program through their submission to the data centre also prevents confusion that may 430
arise through the dissemination of multiple versions of the same data sets by different 431
parties. 432
433 434 References 435 436 Atlantic Meridional Transect, NERC Consortium programme (2005) 2004/05 Review of the NERC Funded 437
Marine Sector Consortium Programmes. NERC, Swindon, 14 April 2005, 90 pp. 438 439 Beaugrand G, PC Reid, F Ibanez, JA Lindley, M Edwards (2002) Reorganization of North Atlantic Marine 440
Copepod Biodiversity and Climate, Science, 296: 1692- 1694 441 442 Glover DM, Chandler CL, Doney SC, Buesseler KO, Heimerdinger G, Bishop JKB, Flierl GR (2006) The US 443
JGOFS data management experience. Deep-Sea Research II, 53:793-802 444 445 Lowry R, Rickards L and Brown J (2005) Adding Value to Oceanographic Data at the British Oceanographic 446
Data Centre. Proceedings of the Ensuring Long-term Preservation and Adding Value to Scientific and 447 Technical data (PV 2005) Conference, Edinburgh, November 2005. 448
449 Robinson Carol, Alex J. Poulton, Patrick M. Holligan, Alex R. Baker, Grant Forster, Niki Gist, Tim D. Jickells, 450
Gill Malin, Rob Upstill-Goddard, Richard G. Williams, E. Malcolm S. Woodward, Mikhail V. Zubkov (2006) 451 The Atlantic Meridional Transect (AMT) Programme: A contextual view 1995–2005. Deep-Sea Research II 452 53:1485–1515 453
454 Seys J, Mees J, Vanden Berghe W and Pissierssens P (2006) Marine Data management: we can do more, but can 455
we do better? (www.iode.org) 456 457

AMT Data Management & Dissemination, DSRII AMT special Issue 15
List of Figures 458 459 Figure 1: Histogram showing the total data sets collected from 1995 and 2005 during AMT1 to 460 AMT17. 461 462 Figure 2: Bar chart comparing the Data Management Effort (DME, Staffs year-1) initially funded 463 and that expended by BODC between April 2002 and December 2006. 464 465 Figure 3: EDSERPLO, the BODC visualisation software showing a temperature profile from 466 CTD measured during the AMT 16 cruises. Note the quality control flags applied on the profile 467 468 Figure 4: The BODC database structure detailing the 3 main groups of tables. Sampling 469 metadata tables containing information on sampling activity or event description table with links 470 to the fieldwork description table and to the sampling gear code table. Data tables consisting of a 471 series of data storage tables for each main type of sampling or data collection techniques. 472 Parameter dictionary tables containing the 8-byte parameter codes used in the data tables. 473 474 Figure 5: Bar chart showing the total AMT data requests handled by BODC between 2002 and 475 2006. Requests for CTD and underway data down-loaded by users from the website (Web) are 476 shown in blue whereas requests handled directly (Direct) by the personnel are shown in red. The 477 solid triangle indicates the relative proportion of requests by non AMT participants. 478 479 Figure 6: Break-down of external requests for AMT data according to countries. 480 481 482 List of Tables 483 484 Table 1: Summary of the Atlantic Meridional Transect (AMT) cruises undertaken between 2002 485 and 2005. PSO = Principal scientific officer, PML = Plymouth Marine Laboratory, UEA = 486 University of East Anglia, NOC = National Oceanography Centre. Note the change of the 487 research ships from James Clark Ross (JCR) to Discovery (D) from AMT15. 488 489 490 Table 2: Summary of the measurements undertaken during the AMT cruises and protocols 491 (Table redrawn from Robinson et al 2006). 492
AMT Data Management & Dissemination, DSRII AMT special Issue 16
Figure 1: 493 494 495
0
5
10
15
20
25
30
35
40
45
AMT1AMT2
AMT3AMT4
AMT5AMT6
AMT6b
AMT7AMT8
AMT9AMT10
AMT11
AMT12
AMT13
AMT14
AMT15
AMT16
AMT17
Cruise
Num
ber o
f dat
a se
ts
Aerosol & rainwater compositionBio-opticsPlankton physiologyChemistryPlankton community structureHydrography
Phase IIPhase I
496 497 498 Figure 2: 499 500 501
0.00
0.50
1.00
1.50
2.00
2.50
2002_03 2003_04 2004_05 2005_06 2006_07
Financial Year
Dat
a M
anag
emen
t Effo
rt (S
taff
year
-1) Allocated by BODC
Funded to AMT
502

AMT Data Management & Dissemination, DSRII AMT special Issue 17
Figure 3: 503 504 505
506 507 508 509 510 511 512 513 514 515 516 517 518 519 520 521
AMT Data Management & Dissemination, DSRII AMT special Issue 18
Figure 4: 522 523 524 525 526 527 528 529 530 531 532 533 534 535 536 537
CTD/UOR Profile tables
Settl. Velocity Tube tables
Incubation tablesFieldworkmetadata
Sampling eventmetadata
Gear codes
Water Sample tables
Sediment Core tables
Plankton Net tables
Misc. Profiler tables
Parameter Dictionary parameter
code
data originator code
Sampling metadata tables Data tables Parameter dictionary tables

AMT Data Management & Dissemination, DSRII AMT special Issue 19
Figure 5: 538 539
0
50
100
150
200
250
2002 2003 2004 2005 2006Year
Num
ber o
f dat
a re
ques
ts
0
5
10
15
20
25
Exte
rnal
dat
a re
ques
ts (%
)
Web Direct External
540 541 Figure 6: 542 543
External Data Requests
Brasil5%
UK31% USA
35%
France23%
Germany3%
Spain3%
544
AMT Data Management & Dissemination, DSRII AMT special Issue 20
Table 1: 545 546
Cruise
Departure/Arrival Date PSO/Institute
AMT1 (JCR XX1) UK – Falkland Islands 21/09/95 – 24/10/95 Dave Robins/ PML AMT2 (JCR 13) Falkland Islands – UK 22/04/96 – 28/05/96 Dave Robins/ PML AMT3 (JCR 15) UK – Falkland Islands 16/09/96 – 25/10/96 Tony Bale/ PML AMT4 (JCR 21) Falkland Islands – UK 21/04/97 – 27/05/97 Tony Bale/ PML AMT5 (JCR 23) UK – Falkland Islands 14/09/97 – 17/10/97 Jim Aiken/ PML AMT6b (JCR 31) Falkland Islands – UK 05/04/98 – 04/05/98 Gerald Moore/ PML AMT6 (JCR 32) South Africa – UK 14/05/98 – 15/06/98 Jim Aiken, PML AMT7 (JCR 34) UK – Falkland Islands 14/09/98 – 25/10/98 Jim Aiken/ PML AMT8 (JCR 41) Falkland Islands – UK 25/04/99 – 07/06/99 Nigel Rees/ PML AMT9 (JCR 45) UK – Uruguay 15/09/99 – 13/10/99 Nigel Rees/ PML AMT10 (JCR 49) Uruguay – UK 12/04/00 – 07/05/00 Chris Gallienne/ PML AMT11 (JCR 52) UK – Uruguay 11/09/00 – 13/10/00 Malcolm Woodward/ PML AMT12 (JCR 90) Falkland Islands – UK 12/05/03 – 17/06/03 Tim Jickells/ UEA AMT13 (JCR 91) UK – Falkland Islands 10/09/03 – 14/10/03 Carol Robinson/ PML AMT14 (JCR 101) Falkland Islands – UK 26/04/04 – 02/06/04 Patrick Holligan/ NOC AMT15 (D 284) UK – South Africa 17/09/04 – 29/10/04 Andrew Rees/ PML AMT16 (D 294) South Africa – UK 19/05/05 – 29/06/05 Tony Bale/ PML AMT17 (D 299) UK – South Africa 17/10/05 – 28/11/05 Patrick Holligan/ NOC 547 548
AMT Data Management & Dissemination, DSRII AMT special Issue 21
Table 2: 549 550
Measurement
Category
Measurement
Protocol Cruises
Organic compounds High volume air sampler 12, 13, 14,15, 17 Ammonia Low volume vacuum pump 12, 13, 14, 15, 17 Aerosol &
rainwater composition Major ions and trace metals
High volume air sampler 12, 13, 14,15, 16, 17
Coloured Dissolved Organic Matter absorption
Waveguide+spectrometer 6b, 11, 12, 13, 14,15, 16, 17
Inherent Optical Properties (absorption, scattering and attenuation)
One or more of ac9, particle absorption by filter papers, VSF
1, 2, 3, 6, 12, 13, 14, 15, 16, 17
Phytoplankton fluorescence
Fast repetition rate fluorometer (FRRF)
7, 8, 9, 10, 11, 12, 13, 14, 15, 16, 17 Bio-optics
Apparent Optical Properties (upwelling/downwelling light and calculation of diffuse attenuation coefficient)
Freefall and/or cable lowered light sensors
3, 4, 5, 6, 7, 8, 12, 13, 14, 15, 16, 17
Hydrogen peroxide Flow injection analytical system
16
Urea Autoanalyser 11 Halocarbons Gas chromatography Mass
Spectrometry 8
Carbon monoxide Gas chromatography 10 Nitrous oxide Gas chromatography 12,13 Methane Gas chromatography 12,13 Alkalinity Titration 12, 13, 14, 15, 17 DMS, DMSP concentrations
Gas chromatography 5, 9, 12, 13, 14
pCO2 Infrared gas analyser 12, 13, 14, 15, 16, 17 Dissolved organic carbon High temperature catalytic
oxidation 12, 13, 14, 15, 16, 17
Dissolved oxygen Winkler titrations 6, 12, 13, 14, 15, 16, 17 Dissolved organic nitrogen High temperature catalytic
oxidation 10, 12, 13, 14, 15, 16, 17
Dissolved organic phosphorus
Colorimetric analyses 10, 12, 13, 14, 15, 16, 17
Biogeochemistry
Dissolved iron Flow Injection Chemiluminscence
3, 6, 12, 13, 15,16, 17
Dissolved inorganic carbon Coulometric titration 6, 7, 12, 13, 14,15, 16, 17
Nitrate, nitrite, phosphate, silicate,
Autoanalyser, waveguide, gas diffusion and fluorescence (NH4+)
1, 2, 3, 4, 5, 6, 7, 10, 11, 12, 13, 14, 15, 16, 17
Hydrography High vertical & horizontal resolution hydrography
Towed CTD (undulating oceanographic recorder,
2, 8, 16
AMT Data Management & Dissemination, DSRII AMT special Issue 22
UOR; moving vessel profiler, MVP)
Attenuation, temperature, salinity, fluorescence, oxygen, transmission
CTD, SBE oxygen sensor 1, 2, 3, 4, 5, 6, 6b, 7, 8, 9, 10, 11, 12, 13, 14, 15, 16, 17
Underway navigation, bathymetry,fluorescence, temperature, salinity, meteorology, transmission
Thermosalinograph; Autosal salinometer, SurfMet
1, 2, 3, 4, 5, 6, 6b, 7, 8, 9, 10, 11, 12, 13, 14, 15, 16, 17
Phytoplankton excretion Incorporation of 14C into dissolved organic carbon
6
Silica uptake Uptake of 32Si, Liquid Scintillation Counter
14
Mesozooplankton respiration and ammonia production
Winkler oxygen titration, nutrient analysis
11
Net community production O2/Ar ratios by Membrane Inlet Mass Spectrometry (MIMS)
16, 17
Nitrification and ammonium regeneration
14C with nitrification inhibitors, 15N isotope dilution
6, 13
Calcification Incorporation of 14C into particulate inorganic carbon Liquid Scintillation Counter
14, 16, 17
Export production Thorium disequilibria 12, 13, 14 Microzooplankton herbivory
Modified dilution assay and flow cytometry
13, 15, 16, 17
N2 fixation Acetylene reduction & 15N uptake
12, 13, 14, 15, 17
Nitrate, ammonium uptake 15N uptake, mass spectrometry
5, 6, 11, 12, 13, 14,
Microzooplankton bacterivory
Modified dilution assay and flow cytometry
3, 4, 14, 15, 16,17
Mesozooplankton grazing Flow cytometry and epifluorescence microscopy
4, 5, 11, 12, 13, 15
Bacterial production Thymidine & Leucine incorporation Flow cytometry; Microautoradiography Fluorescence In Situ Hybridization (MARFISH)
2, 3, 4, 11, 13, 14, 15, 16, 17
Gross and net community production Dissolved oxygen flux,
Winkler oxygen titration 4, 5, 6, 11, 12, 13, 14, 15, 16, 17
Community respiration Dissolved oxygen flux
Winkler oxygen titration 4, 5, 6, 11, 12, 13, 14, 15, 16, 17
Photosynthetic efficiency Fast Repetition Rate Fluorometry (FRRF)
6, 7, 8, 9, 10, 11, 12, 13, 14, 15,16, 17
Plankton community activity
Primary production Incorporation of 14C into particulate organic carbon
1, 2, 3, 4, 5, 6, 7, 8, 10, 11, 12, 13, 14, 15, 16, 17

AMT Data Management & Dissemination, DSRII AMT special Issue 23
Aerobic anoxygenic phototroph production
Kinetic Infra-Red Fluorometry
16
Viral abundance Filtration then Polymerase Chain Reaction (PCR)
2, 15, 16
Particulate inorganic carbon & nitrogen
Inductively Coupled Plasma Argon Emission Spectrometry (ICPAES)
14, 15, 16, 17
Biogenic silica Spectrophotometer 14, 15, 16, 17 Particle size Coulter counter 2, 3, 4, 6b Mesozooplankton distribution
Optical plankton counter 1, 2, 3, 4, 5, 6, 10
Heterotrophic nanoplankton
Microscopy, enzymatic assay, flow cytometry
3, 4, 12, 13, 14,15, 16, 17
Cyanobacterial abundance Flow cytometry; Fluorescence In situ Hybridisation (FISH)
2, 4, 6, 12, 13, 14, 15, 16, 17
Mesozooplankton size-fractionated particulate organic carbon & nitrogen
CHN analysis 1, 2, 3, 4, 5, 6, 10, 12, 13, 14
Heterotrophic bacterial abundance
Flow cytometry; Fluorescence In situ Hybridisation (FISH)
2, 3, 4, 6, 11, 12, 13, 14, 15, 16, 17
Particulate organic carbon & nitrogen
CHN analyser 1, 2, 3, 4, 5, 6, 12, 13, 14, 15, 16, 17
Plankton community structure
Mesozooplankton taxonomy and abundance
Microscopy 1, 2, 3, 4, 5, 6, 9, 10, 12, 13, 14, 15
Coccolithophore composition and abundance
Scanning Electron Microscopy; optical microscopy; Calcareous Optical Detection, Fluorescent In Situ Hybridisation (CODFISH)
1, 2, 3, 4, 5, 6, 7, 8, 10,11, 12, 14, 15
Phytoplankton composition and abundance
Microscopy, flow cytometry 1, 2, 3, 4, 5, 6, 7, 8, 10, 11, 12,13, 14, 15, 16,17
Microzooplankton composition and abundance
Microscopy, FlowCam 1, 2, 3, 4, 5, 6, 7, 8, 10, 11, 12,13, 14, 15, 16, 17
Chlorophyll pigments Fluorometry & high performance liquid chromatography
1, 2, 3, 4, 5, 6, 6b, 7, 8,9, 10, 11, 12, 13, 14, 15, 16, 17
551


