Embed Size (px)
Citation preview

THE ALKALINE DENATURATION OF DNA
M. AGENO, E. DORE, and C. FRONTALI
From the Physics Laboratory, Istituto Superiore di Sanita, Rome, Italy
ABSTRACT A kinetic study of the alkaline transition of DNA, in clearly definedphysico-chemical conditions, is presented, which allows us to identify, within thealkaline transition region, different pH ranges, corresponding to different rate-limiting factors. This analysis brings into consideration three distinct intervals oftime which characterize the whole process, namely the time necessary for fullhyperchromicity to be reached, the time required for strand separation in the caseof a single DNA molecule, and the time for complete denaturation to be reachedin the case of a DNA solution. l;The results obtained from ultracentrifugal, and spectrophotometric measure-
ments, involving rapid mixing experiments, seem to indicate the following con-clusions: whereas, in the lower pH ranges considered within the transition region,the denaturation process is limited by the first time constant, this same constantbecomes extremely short at higher pH. On the other hand the fact that, in thehigher pH range, the second and third time constants do not coincide (the timeto unwind a single T2 DNA molecule being at least one order of magnitude shorterthan the time required for bulk denaturation to be reached) suggests that in thispH range the overall denaturation rate is limited by a statistical process governingthe initiation of unwinding.
These observations are discussed in terms of a model in which the unwindingenergy is given by the electrostatic repulsions which originate in the deprotonatedDNA molecule. The model itself suggests some experiment which seem to confirmit.
INTRODUCTION
Although the physico-chemical properties of DNA molecules have been extensivelyinvestigated in recent years, much work has still to be done in order to understandits behaviour from the point of view of its functions in the cell.
In a sense, we might say that in a chemical chain reaction there is always somemolecule that duplicates itself. However, no other molecule is yet known which isable to duplicate such a complex pattern carrying chemical information, i.e. whichis at the same time the starting point of a very long and complex series of chemicalreactions.Not much is yet known about the duplication process and about the mechanism
through which chemical information is copied at the right moment by a moleculeof messenger RNA. What is known seems to indicate that both processes involvepartial separation of the two complementary strands (1-5).
1281

Denaturation studies in vitro are generally carried out either by a suitable varia-tion of the concentration of hydrogen ions, or by raising the temperature of themedium in which the DNA molecule is immersed. Thermal denaturation of DNAhas been extensively investigated in recent years (6-9). Less attention has been givento the pH-denaturation process (10-12), in spite of the fact that it is hard to con-ceive of a physico-chemical condition in the cell in which thermal denaturationoccurs, while the other process is likely to give a hint of what happens in the cell.With this point in mind, we have undertaken a careful investigation of the alkali
denaturation process of DNA. Our main purpose was to collect information on theproperties of this very important molecule and to work out, if possible, a reasonablemodel of the partial denaturation process that might control duplication of themolecule and synthesis of messenger-RNA.The two conditions in which the DNA molecule is found at equilibrium during
thermal or alkaline denaturation can be shown to be different, for instance by meansof spectrophotometric absorption measurements on the same DNA either at hightemperature or at high pH.
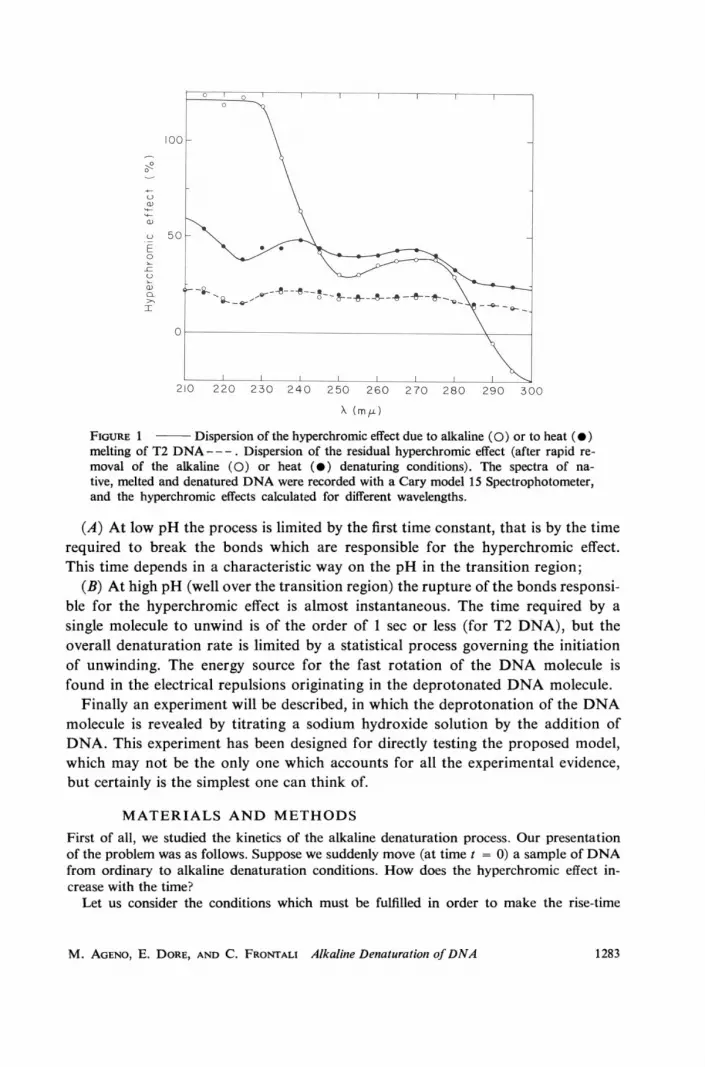
In Fig. 1 the hyperchromic effects measured for T2 DNA when the solution isbrought either to 88°C, or to pH 12.5 are plotted as functions of the wavelength.(The measurements were performed with a Cary model 15 spectrophotometer(Cary Instruments, Monrovia, Calif.) flushed with dry nitrogen.) The difference isremarkable especially in the short wavelength region.
In both cases the molecules certainly have an extended conformation and nohydrogen bond can survive. But clearly heat-melted DNA is in a different statefrom that of the same DNA at pH 12.5 as revealed by the strong difference in ab-sorption below 250 min. Such an effect, on the other hand, could be anticipated,given the spectral differences observed in nucleotides at neutral and high pH (13).The dispersion of the hyperchromic effect of heat-melted DNA agrees with data ofFelsenfeld and Hirschman (14). The absorption spectra of heat-denatured andalkali-denatured DNA at room temperature and at pH 7 are indistinguishable.(See dashed curve in Fig. 1.)
It is the purpose of this work to discuss the physical aspects of alkaline denatura-tion. To this end we will first describe some kinetic experiments which allow us todiscuss the nature of the rate limiting factors for the denaturation process, at differ-ent pH values, over a range covering the alkaline transition. As a consequence ofthis discussion we will consider three distinct intervals of time which characterizethe whole process, namely the time necessary for full hyperchromicity to be reached,the time required for strand separation in the case of a single DNA molecule, andthe time for complete denaturation to be reached in the case of a DNA solution.A series of data obtained by spectrophotometric and ultracentrifugal techniques,
and involving rapid mixing experiments will then be presented, this suggesting as apossible interpretation, which explains all of the obtained results, a new dynamicmodel of the process, whose main features are the following:
BIOPHYSICAL JOURNAL VOLUME 9 19691282
0
500
210 220 230 240 250 260 270 280 290 300X (m z)
FIGURE 1 Dispersion of the hyperchromic effect due to alkaline (0) or to heat (0)melting of T2 DNA - - -. Dispersion of the residual hyperchromic effect (after rapid re-moval of the alkaline (0) or heat (e) denaturing conditions). The spectra of na-tive, melted and denatured DNA were recorded with a Cary model 15 Spectrophotometer,and the hyperchromic effects calculated for different wavelengths.
(A) At low pH the process is limited by the first time constant, that is by the timerequired to break the bonds which are responsible for the hyperchromic effect.This time depends in a characteristic way on the pH in the transition region;
(B) At high pH (well over the transition region) the rupture of the bonds responsi-ble for the hyperchromic effect is almost instantaneous. The time required by asingle molecule to unwind is of the order of 1 sec or less (for T2 DNA), but theoverall denaturation rate is limited by a statistical process governing the initiationof unwinding. The energy source for the fast rotation of the DNA molecule isfound in the electrical repulsions originating in the deprotonated DNA molecule.
Finally an experiment will be described, in which the deprotonation of the DNAmolecule is revealed by titrating a sodium hydroxide solution by the addition ofDNA. This experiment has been designed for directly testing the proposed model,which may not be the only one which accounts for all the experimental evidence,but certainly is the simplest one can think of.
MATERIALS AND METHODSFirst of all, we studied the kinetics of the alkaline denaturation process. Our presentationof the problem was as follows. Suppose we suddenly move (at time t = 0) a sample of DNAfrom ordinary to alkaline denaturation conditions. How does the hyperchromic effect in-crease with the time?
Let us consider the conditions which must be fulfilled in order to make the rise-time
M. AGENO, E. DORE, AND C. FRONTALI Alkaline Denaturation ofDNA 1283
measurements meaningful. Some of them concern the measuring technique, others the sampleof DNA used, the physico-chemical state of the environment and of the test solution.As far as the measuring technique is concerned, it is necessary to change the pH of the
sample in a time interval as short as possible. The change in pH can be obtained by mixingtwo solutions (rapid mixing is required). However a compromise must be made betweenrapid mixing and careful handling of DNA samples in order not to damage the DNA mole-cules. Two different methods were adopted.
Hand-mixing
1.6 ml of DNA solution at a concentration of about 20 ,g/ml were put in a beaker and 0.7ml of NaOH solution 0.2 M were added with a graduated pipette. Air bubbles formed byblowing gently down the pipette were sufficient to cause complete mixing in about onesecond.
In another set of measurements, we took care to avoid that not even a small fraction ofthe DNA was exposed to a pH appreciably higher than the final one. Thus, the procedureadopted was the following: 4.5 ml of NaOH solution 0.05 M were put in a beaker and 0.5ml of DNA at a concentration of 300 ,g/ml were added, using Marburg micropipettes(Eppendorf Geratebau, Hamburg, Germany) with disposable tips, which were cut to a di-ameter of 2 mm to avoid damaging the DNA molecules. Magnetic stirring was used and inless than one second sufficient mixing occurred. Using dyes as indicators we verified that in afew tenths of a second all the DNA solution reached the pH of denaturation. TemporarypH-overshoot was less than 0.1 units at pH 12.5.
Hand-mixing, however, can be used only when the hyperchromic effect increases veryslowly, which happens only in the neighbourhood of the transition pH-value.
Automatic Mixing and Spectrophotometric Recording Unit
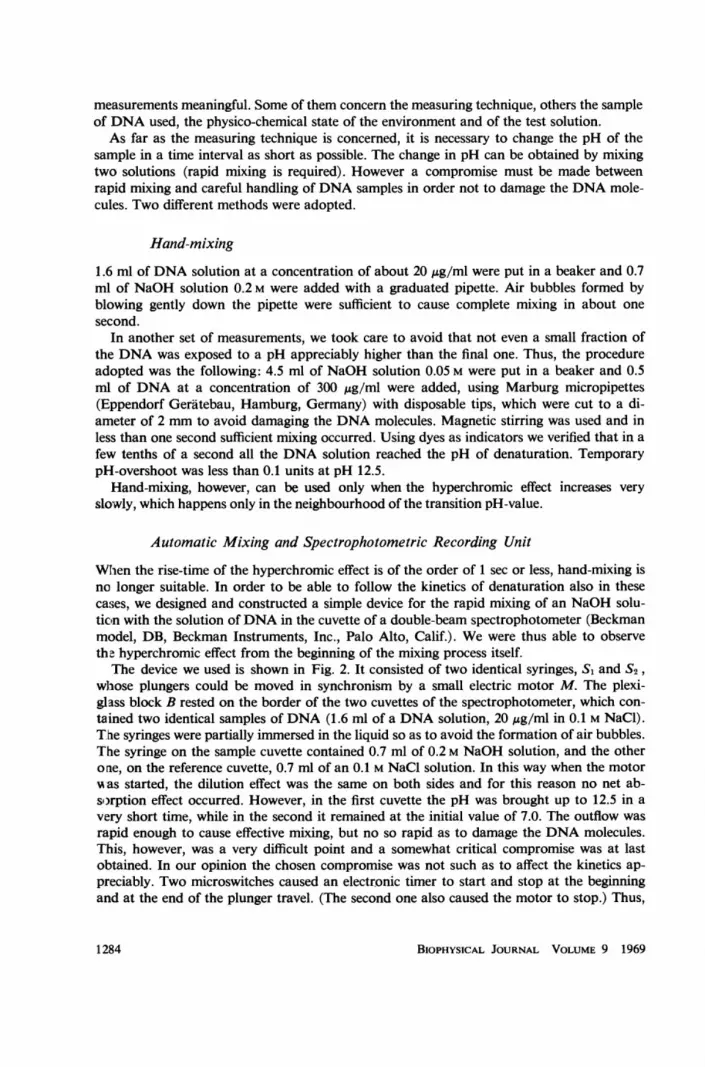
When the rise-time of the hyperchromic effect is of the order of 1 sec or less, hand-mixing isno longer suitable. In order to be able to follow the kinetics of denaturation also in thesecases, we designed and constructed a simple device for the rapid mixing of an NaOH solu-tion with the solution ofDNA in the cuvette of a double-beam spectrophotometer (Beckmanmodel, DB, Beckman Instruments, Inc., Palo Alto, Calif.). We were thus able to observethe hyperchromic effect from the beginning of the mixing process itself.The device we used is shown in Fig. 2. It consisted of two identical syringes, Si and S2,
whiose plungers could be moved in synchronism by a small electric motor M. The plexi-glass block B rested on the border of the two cuvettes of the spectrophotometer, which con-tained two identical samples of DNA (1.6 ml of a DNA solution, 20 ,ug/ml in 0.1 M NaCl).The syringes were partially immersed in the liquid so as to avoid the formation of air bubbles.The syringe on the sample cuvette contained 0.7 ml of 0.2 M NaOH solution, and the otherone, on the reference cuvette, 0.7 ml of an 0.1 M NaCl solution. In this way when the motormas started, the dilution effect was the same on both sides and for this reason no net ab-s)rption effect occurred. However, in the first cuvette the pH was brought up to 12.5 in avery short time, while in the second it remained at the initial value of 7.0. The outflow wasrapid enough to cause effective mixing, but no so rapid as to damage the DNA molecules.This, however, was a very difficult point and a somewhat critical compromise was at lastobtained. In our opinion the chosen compromise was not such as to affect the kinetics ap-preciably. Two microswitches caused an electronic timer to start and stop at the beginningand at the end of the plunger travel. (The second one also caused the motor to stop.) Thus,
BIOPHYSICAL JOURNAL VOLUME 9 19691284
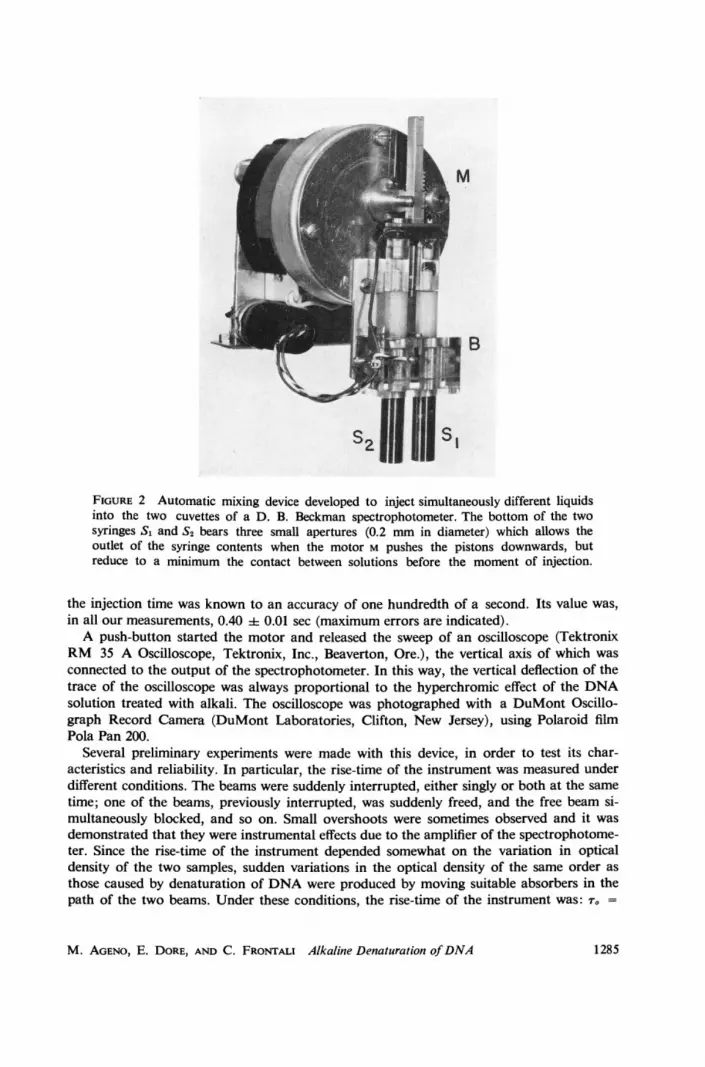
FIGURE 2 Automatic mixing device developed to inject simultaneously different liquidsinto the two cuvettes of a D. B. Beckman spectrophotometer. The bottom of the twosyringes S1 and S2 bears three small apertures (0.2 mm in diameter) which allows theoutlet of the syringe contents when the motor M pushes the pistons downwards, butreduce to a minimum the contact between solutions before the moment of injection.
the injection time was known to an accuracy of one hundredth of a second. Its value was,in all our measurements, 0.40 0.01 sec (maximum errors are indicated).A push-button started the motor and released the sweep of an oscilloscope (Tektronix
RM 35 A Oscilloscope, Tektronix, Inc., Beaverton, Ore.), the vertical axis of which wasconnected to the output of the spectrophotometer. In this way, the vertical deflection of thetrace of the oscilloscope was always proportional to the hyperchromic effect of the DNAsolution treated with alkali. The oscilloscope was photographed with a DuMont Oscillo-graph Record Camera (DuMont Laboratories, Clifton, New Jersey), using Polaroid filmPola Pan 200.
Several preliminary experiments were made with this device, in order to test its char-acteristics and reliability. In particular, the rise-time of the instrument was measured underdifferent conditions. The beams were suddenly interrupted, either singly or both at the sametime; one of the beams, previously interrupted, was suddenly freed, and the free beam si-multaneously blocked, and so on. Small overshoots were sometimes observed and it wasdemonstrated that they were instrumental effects due to the amplifier of the spectrophotome-ter. Since the rise-time of the instrument depended somewhat on the variation in opticaldensity of the two samples, sudden variations in the optical density of the same order asthose caused by denaturation of DNA were produced by moving suitable absorbers in thepath of the two beams. Under these conditions, the rise-time of the instrument was: rT =
M. AGENO, E. DORE, AND C. FRONTALI Alkaline Denaturation ofDNA 1285
FIGURE 3 Modified mixing device, developed to inject simultaneously into the cuvettes of aD. B. spectrophotometer first two different solutions (syringes S1 and S2 , driven by the motorM) and, after a predetermined interval of time, again two different solutions (syringes S'and S2', motor M').
0.28 sec, and this value was used in following calculations. Fig. 5 a shows one of the photo-grams obtained.
Later on, this device was improved in order to be able to neutralize the solution in thecuvettes of the spectrophotometer, at a given time after denaturation. Two other syringeswere added, S1 and S', whose plungers were moved in synchronism by a second smallelectric motor M'. The needle tips touched the liquid surface. The sequence of operationswas as follows. (a) The push-button started the motor M and released the sweep of theoscillograph. The syringes S1 and S2 injected an 0.2 M NaOH solution into the first cuvetteand an 0.1 M NaCl solution into the second. The first DNA sample was thus denaturedand the second diluted. Two microswitches started and stopped an electronic timer whichmeasured the injection time. (b) The endrun microswitch stopped the motor M and startedan electronic timer, which after r seconds started the motor M' (r could be varied at will).The syringes S' and S2 injected a suitable HC1 solution into the first cuvette and an NaCIsolution into the second one in order to balance the dilution effect. In this way the pH ofthe first sample was again brought to 7.0. The second injection time could also be measured,if necessary, by another electronic timer. The second pair of syringes was equipped withmultiple needles, in order to aid mixing. In Fig. 3 the two pairs of syringes with their motorsare shown.The DNA used in our experiments was either a bacterial DNA (extracted from Escherichia
BIOPHYSICAL JOURNAL VOLUME 9 19691286
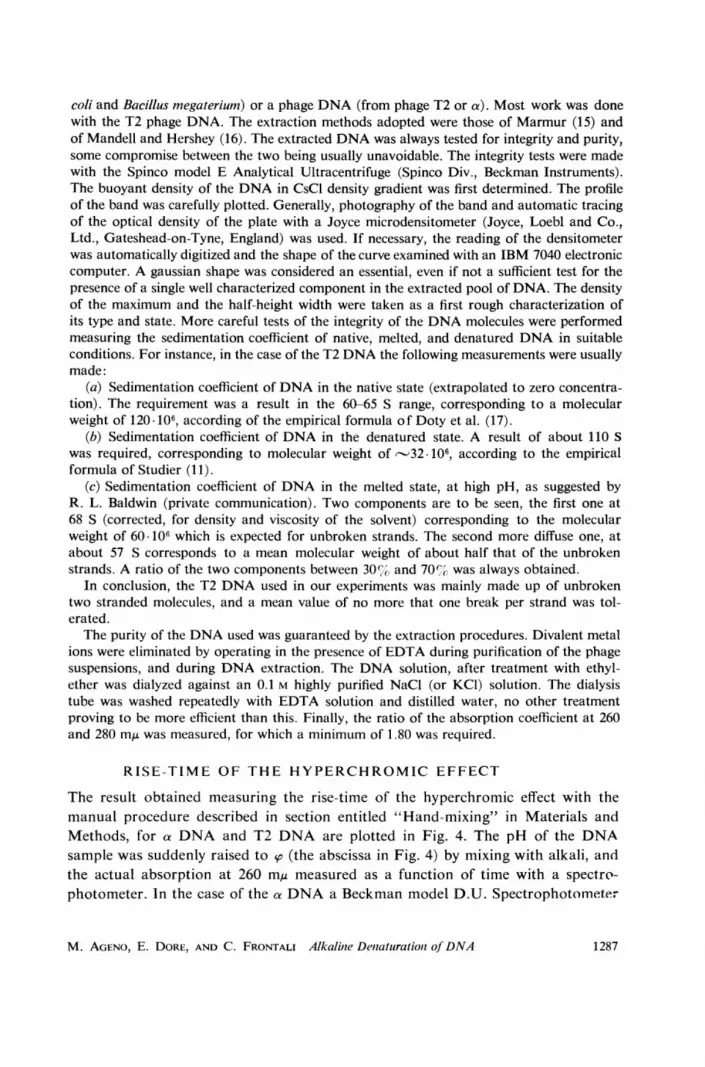
coli and Bacillus megaterium) or a phage DNA (from phage T2 or a)). Most work was donewith the T2 phage DNA. The extraction methods adopted were those of Marmur (15) andof Mandell and Hershey (16). The extracted DNA was always tested for integrity and purity,some compromise between the two being usually unavoidable. The integrity tests were madewith the Spinco model E Analytical Ultracentrifuge (Spinco Div., Beckman Instruments).The buoyant density of the DNA in CsCl density gradient was first determined. The profileof the band was carefully plotted. Generally, photography of the band and automatic tracingof the optical density of the plate with a Joyce microdensitometer (Joyce, Loebl and Co.,Ltd., Gateshead-on-Tyne, England) was used. If necessary, the reading of the densitometerwas automatically digitized and the shape of the curve examined with an IBM 7040 electroniccomputer. A gaussian shape was considered an essential, even if not a sufficient test for thepresence of a single well characterized component in the extracted pool of DNA. The densityof the maximum and the half-height width were taken as a first rough characterization ofits type and state. More careful tests of the integrity of the DNA molecules were performedmeasuring the sedimentation coefficient of native, melted, and denatured DNA in suitableconditions. For instance, in the case of the T2 DNA the following measurements were usuallymade:
(a) Sedimentation coefficient of DNA in the native state (extrapolated to zero concentra-tion). The requirement was a result in the 60-65 S range, corresponding to a molecularweight of 120. 106, according of the empirical formula of Doty et al. (17).
(b) Sedimentation coefficient of DNA in the denatured state. A result of about 110 Swas required, corresponding to molecular weight of -32 106, according to the empiricalformula of Studier (11).
(c) Sedimentation coefficient of DNA in the melted state, at high pH, as suggested byR. L. Baldwin (private communication). Two components are to be seen, the first one at68 S (corrected, for density and viscosity of the solvent) corresponding to the molecularweight of 60. 106 which is expected for unbroken strands. The second more diffuse one, atabout 57 S corresponds to a mean molecular weight of about half that of the unbrokenstrands. A ratio of the two components between 30%xO and 70%;rO was always obtained.
In conclusion, the T2 DNA used in our experiments was mainly made up of unbrokentwo stranded molecules, and a mean value of no more that one break per strand was tol-erated.The purity of the DNA used was guaranteed by the extraction procedures. Divalent metal
ions were eliminated by operating in the presence of EDTA during purification of the phagesuspensions, and during DNA extraction. The DNA solution, after treatment with ethyl-ether was dialyzed against an 0.1 M highly purified NaCl (or KCl) solution. The dialysistube was washed repeatedly with EDTA solution and distilled water, no other treatmentproving to be more efficient than this. Finally, the ratio of the absorption coefficient at 260and 280 mr, was measured, for which a minimum of 1.80 was required.
RISE-TIME OF THE HYPERCHROMIC EFFECT
The result obtained measuring the rise-time of the hyperchromic effect with themanual procedure described in section entitled "Hand-mixing" in Materials andMethods, for a DNA and T2 DNA are plotted in Fig. 4. The pH of the DNAsample was suddenly raised to so (the abscissa in Fig. 4) by mixing with alkali, andthe actual absorption at 260 my measured as a function of time with a spectre-photometer. In the case of the a DNA a Beckman model D.U. Spectrophotometer
M. AGENO, E. DORE, AND C. FRONTALI Alkalinie Deniaturatio,z ofDNA 1287
30
20 / E20
a) o +E
010
,Lli 1fi,l o
40 _
a30 -430
20 / 20
10 10
0 + 0
~~~II_11
11.4 11.6 11.8 12.0 12.2 12.4 12.6pH
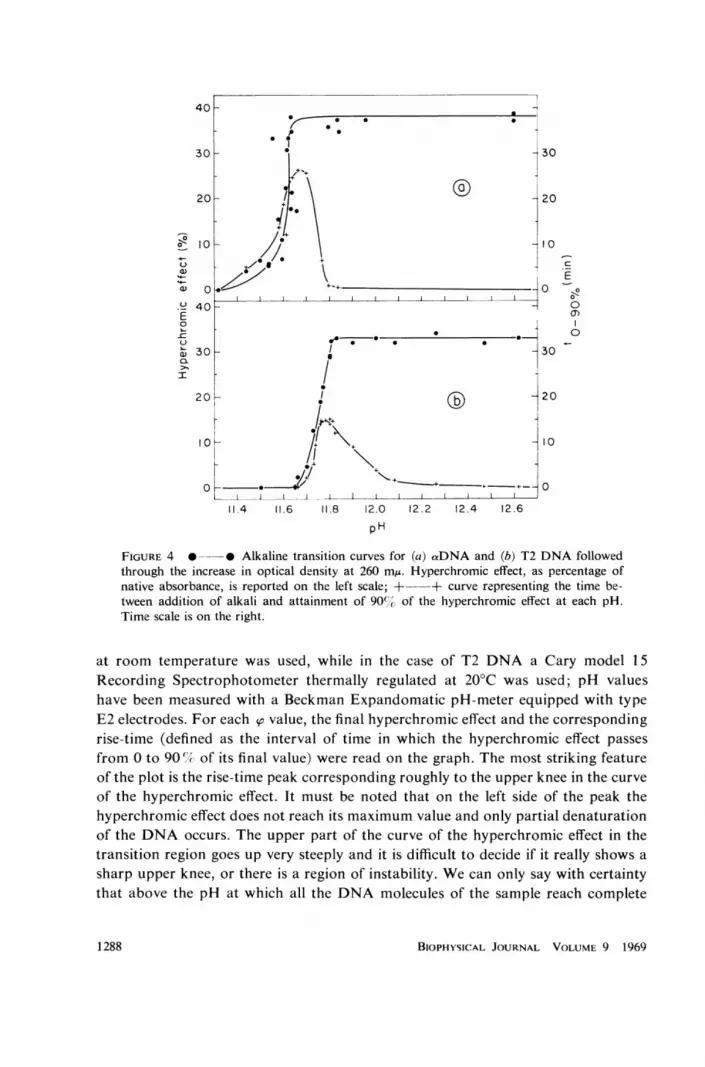
FIGURE 4 0 0 Alkaline transition curves for (a) aDNA and (b) T2 DNA followedthrough the increase in optical density at 260 m,u. Hyperchromic effect, as percentage ofnative absorbance, is reported on the left scale; +--+ curve representing the time be-tween addition of alkali and attainment of 90e,, of the hyperchromic effect at each pH.Time scale is on the right.
at room temperature was used, while in the case of T2 DNA a Cary model 15Recording Spectrophotometer thermally regulated at 20°C was used; pH valueshave been measured with a Beckman Expandomatic pH-meter equipped with typeE2 electrodes. For each so value, the final hyperchromic effect and the correspondingrise-time (defined as the interval of time in which the hyperchromic effect passesfrom 0 to 90 (/ of its final value) were read on the graph. The most striking featureof the plot is the rise-time peak corresponding roughly to the upper knee in the curveof the hyperchromic effect. It must be noted that on the left side of the peak thehyperchromic effect does not reach its maximum value and only partial denaturationof the DNA occurs. The upper part of the curve of the hyperchromic effect in thetransition region goes up very steeply and it is difficult to decide if it really shows asharp upper knee, or there is a region of instability. We can only say with certaintythat above the pH at which all the DNA molecules of the sample reach complete
BIOPHYSICAL JOURNAL VOLUME 9 19691288

TABLE I
RISE-TIME OF THE HYPERCHROMIC EFFECT
DNA Observed rise-time T
secT2 0.49a 0.50E. coli 0.49B. megatherium 0.49
denaturation, the rise-time decreases very rapidly with increasing pH, and verysoon the manual procedure of mixing is no longer suitable.
In order to see how the denaturation process behaves at a higher pH, we havealso made some sets of measurements at pH 12.5 with the automatic device pre-viously described. Four different DNAs were tested, two of them from T2 and a
phages and two bacterial DNAs from E. coli and B. megatherium. The results aregiven in Table I.They must be compared with the rise-time of the instrument of 0.28 sec and with
the time of mixing which, as already stated, was always 0.40 0.01 sec. These twointervals of time and the actual rise-time To combine quadratically to give the ob-served rise time T. Thus we have:
V/(0.28)2 + (0.40)2 + T2 = 0.49
from which we must conclude that, at pH 12.5, To is always less then 0.1 sec.In Fig. 5, some photographs obtained with our automatic device are shown. The
top value of the hyperchromic effect is always a little lower than 40% and, in all ourexperiments, is equal to the hyperchromic effect measured in the usual way on asample of the same DNA after complete denaturation. Thus the observed hyper-chromic effects are those corresponding to complete denaturation. However, ourresults must not be interpreted as meaning that in less than one tenth of a secondthe denaturation is complete. We can only say that, when the proper physico-chemical environmental conditions are reached suddenly, in a very short time (ofthe order of a tenth of a second at most, and perhaps much shorter) the orderedarrangement of the bases in the two-stranded configuration of a DNA molecule iscompletely lost, which implies that the major part of the hydrogen-bonds betweencomplementary bases must have been broken. The two strands can still be twistedtogether, however, or bound by a small number of remaining bonds.
In conclusion, our measurements of the rise-time of the hyperchromic effect ofDNA seem to indicate that the investigated pH range must be divided into fourintervals in which the DNA shows different behaviours. For clarity, we refer inparticular to the case of T2 DNA as shown in Fig. 4 b.
M. AGENO, E. DORE, AND C. FRONTALi Alkaline Denaturation ofDNA 1289

©
FIGURE 5 Oscillographic traces obtained with the automatic mixing device shown in Fig. 2.Time scale is in every case 0.5 sec/division. (a) Instrumental rise-time, due to the amplifierbuilt into the spectrophotometer, measured by effecting a rapid OD variation of the sameorder as those of the following images. The small overshoot is also of instrumental origin;(b) rise-time of the hyperchromic effect for T2 DNA; (c) for a DNA; (d) for E. coli and (e)for B. megatherium DNA.
(a) Below pH 11.65, no hyperchromic effect can be measured and the DNAremains, at least seemingly, in the native state.
(b) Between pH 11.65 and pH 11.8, the hyperchromic effect does not reach itsmaximum value. Its value increases with increasing pH, as well as its rise-time.
(c) Above 11.8, the hyperchromic effect reaches the total denaturation value.The rise-time decreases steeply with increasing pH and above 12.1 it can no longerbe measured with our techniques. The interval 11.8 . 12.1 seems to be consideredan intermediate region.
(d) In the pH range above 12.1, the hyperchromic effect goes up almost in-stantaneously, as soon as the denaturation conditions are established. However,the unwinding of the two strands of the molecule is likely to be much slower thanthe breakage of the bonds responsible for the reduced UV-absorption of the bases.
Other experiments are necessary, in order to understand how denaturation pro-ceeds in the different pH ranges here considered.
IRREVERSIBILITY OF THE HYPERCHROMIC EFFECT
The main question we want to investigate is the connection between the kinetics ofthe hyperchromic effect and the unwinding process of the two strands of the DNA
BIOPHYSICAL JOURNAL VOLUME 9 19691290

() i _20 '=0) ~~~~~~~~~~~~~~~~~E20 0
00~~~~~~~~~~~~~~~~~~~~~~~~~~~~~~~~~~~~~~~~~~~~
0
dI11.5 11.6 11.7 11.8 11.9 120 12.1 12.2 12.3 12.4 12.5 12.6
FIGURE 6 Phenomenology of the alkaline transition region for T2 DNA as described bythe curves of full (*) and residual (0) hyperchromic effects (scale at left) and by the curveof time required to reach 90% of the full hyperchromic effect (dashed curve, scale at right).Four different regions are identified and indicated with a, b, c, and d. The upper scalereports for comparison the number of hydroxylions present in solution per hydrogen bridgein the native DNA molecule.
molecule. First of all we can ask if the hyperchromic effect is always accompaniedby irreversible process of denaturation or if it is partially or totally reversible.To this aim, the pH of a solution of native DNA of phage T2 was suddenly in-
creased to a value so. After a time r, the solution was brought back to pH 7 and theresidual hyperchromic effect was determined. The experiment was repeated fordifferent values of (p and r in the various range of pH, previously considered.The results obtained in the pH region, in which the hyperchromic effect does not
reach its maximum value (11.65 . 11.8) and in the transition region (11.8 - 12.1)are plotted in Fig. 6. In this case sp was made variable and T was equal to severalminutes, that is long enough to allow the hyperchromic effect to reach its finalvalue for every so. The absorption of the sample at 260 m, was recorded as a func-tion of time with a Cary model 15 spectrophotometer and the absorption of thesample after neutralization was measured with the same instrument. For comparisonthe direct hyperchromic effect and its rise-time are also plotted in Fig. 6.As is apparent, in the b region, the hyperchromic effect is completely reversible,
its residual value after neutralization being zero. This result is easily interpreted ifwe assume that in this region an equilibrium is established between the alkaline
M. AGENO, E. DORE, AND C. FRONTALI Alkaline Denaturation ofDNA 1291
solution and the DNA molecules in which a number of secondary weak bonds be-tween the bases are broken, but this number is not sufficient to cause strand separa-tion. Careful examination of the spectrophotometric graphs showed that, when thepH was suddenly raised to a given value, a very rapid initial increase of the absorb-ing power of the sample (lasting no more than few seconds) was followed by a muchslower variation. It may be that the initial increase was due to random breaks ofbonds between neighbouring bases and that the following slower increase was dueto an internal rearrangement of each molecule. In fact, the breaks are likely to formclusters, when equilibrium is reached, owing to the free energy of stacking storedbetween neighbouring bases (18).
In the c region (pH 11.8 : 12.1) on the contrary, a residual irreversible hyper-chromic effect builds up, and increases with increasing pH. At pH 11.95, the topvalue, corresponding to complete denaturation of the DNA, is reached, and athigher pH the hyperchromic effect is completely irreversible (d region). However,in this region, the adopted procedure gives no information on the denaturationprocess, owing to the very high value of r.A new set of measurements was thus obtained in which, at fixed pH (12.5), r was
varied between zero and 30 sec or more. In Fig. 7, typical results obtained for T2DNA are shown. Owing to the manual mixing procedure adopted, the pointscorresponding to the first two seconds are not very reliable. Moreover, r is the timebetween the end of mixing with alkali and the injection of the neutralizing solution.This is why at T = 0 the residual hyperchromic effect is not zero. The most strikingaspect of the curve of Fig. 7 is the rise-time of the residual (irreversible) hyper-chromic effect, about two orders of magnitude longer than the rise-time of the totalhyperchromicity previously considered. In fact in the case of T2 DNA this rise-timeis about twenty seconds and in the case of a DNA it is nearly four seconds. Ourvalues agree with those obtained by Davison (12).These results can be easily interpreted if we take into account the double stranded
structure of the DNA molecules. When the denaturation conditions at high pH areestablished suddenly, a first stage of the denaturation process follows in which mostof the secondary bonds between the bases have been broken, but the two strands ofthe molecules are still in their place, so that for some time the process is completelyreversible. As time goes on, the two strands separate and the process gradually be-comes irreversible.At high pH, the rupture of the bonds and the strand separation are thus two fairly
distinct processes, while in the intermediate (c) region, most probably they are largelycontemporary. It is likely that near the transition point, the rupture of the bondsdetermines the overall rate of the denaturation process while at extreme pH theunwinding time predominates.However, it is not clear whether or not the rise-time of the irreversible hyper-
chromic effect is to be interpreted as the unwinding time of a single DNA-molecule.The previous results are in fact liable to two different interpretations. We can sup-
BIOPHYSICAL JOURNAL VOLUME 9 19691292

20 __
E Y0
() 10
r 0 10 20 30 40 50 60
r= (sec)
FIGURE 7 Residual hyperchromic effect for T2 DNA as a function of the time of exposureto pH 12.5.
pose that each DNA molecule is gradually unwinding, so that its residual absorptionof light is gradually increasing with the time of exposure to the high pH. But wecan also suppose that each molecule takes a short time to become denatured whenthe process of separation of the strands has begun, and that the number of denaturedmolecules is gradually increasing with the rise-time of the irreversible hyperchromiceffect. These two different hypotheses correspond to different shapes of the curveof Fig. 7, but the accuracy of our measurements is not sufficient to differentiatebetween them and it seems necessary to make use of different techniques to singleout the right interpretation. At this point we can only say that the following threecharacteristic intervals of time have to be considered as regards the process of alka-line denaturation of DNA.
1. The rise-time t1 of the total hyperchromic effect, which gives a measure of themelting rate of the intramolecular bonds in the actual physicochemical condition ofthe DNA solution. At high pH its value is less than 0.1 sec, while near the transitionpoint it determines the much slower overall rate of the denaturation process.
2. The interval of time, t2, required for strand separation in the case of a singleDNA-molecule.
3. The rise-time, t3 , of the residual (irreversible) hyperchromic effect of the DNA,solution, which, at high pH, is at least two orders of magnitude greater than t1 .Our problem was now to determine if t2 and t3 do coincide or not.
STRAND SEPARATION OF THE DNA MOLECULES IN SOLU-TION AT HIGH PH
Results
The technique employed to study the process of strand separation in a DNA solu-tion was the CsCl density gradient method with the analytical ultracentrifuge. Theexperiments were carried out as follows. A DNA solution was brought suddenly to
M. AGENO, E. DORE, AND C. FRONTALI Alkaline Dentaturationt ofDNA 1293
-
- -
6.2 6.4 6.6 6.25 6.45 6.65x(cm) x(cm)
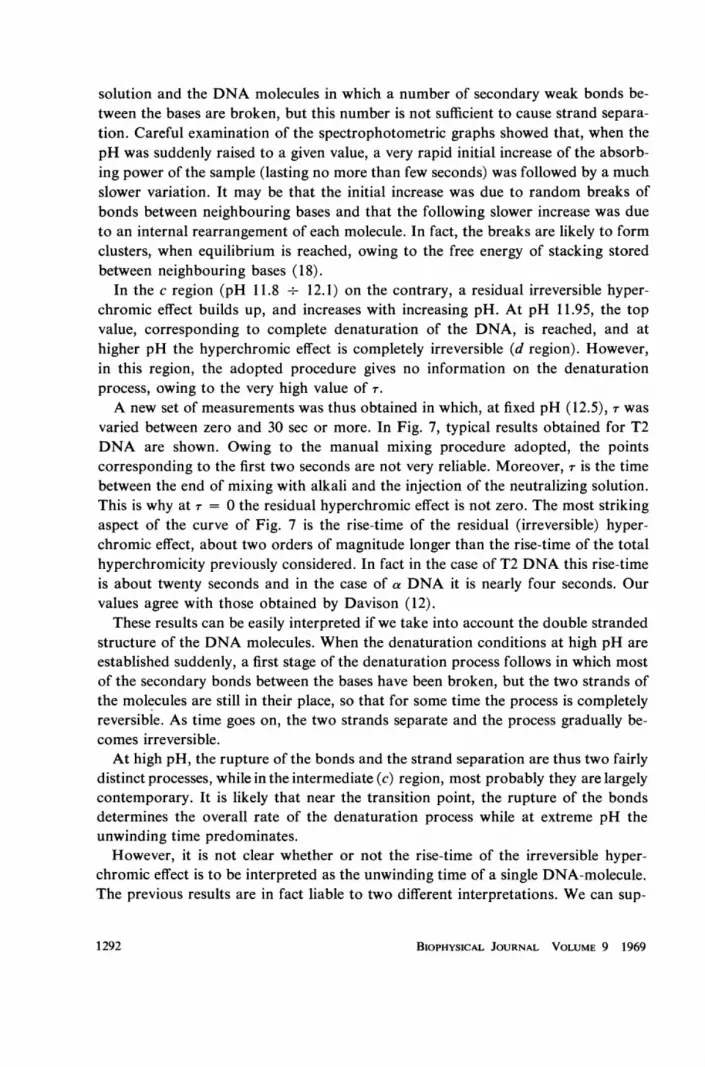
FIGURE 8 CsCl density gradient profile observed for partially denatured DNA (a) fromphage a(T = 1 sec); (b) from phage T2 (T = 10 sec), together with the results of the analysisin gaussian components. In the case of T2 DNA, a small amount of material of intermedi-ate density is present.
a predetermined pH in the denaturation region at which it was kept for -r (a few)seconds, and then suddenly neutralized. After that, the buoyant density spectrumof the DNA was examined in a CsCl density gradient, making use of a Spincomodel E Analytical Ultracentrifuge (Spinco Div., Beckman Instruments). As iswellknown, the native and the denatured DNA form two distinct bands in a CsCdensity gradient, the single strands having a buoyant density considerably higherthan that of the double molecules. A partially denatured molecule must thereforehave an intermediate density between that of the native and that of the completelvdenatured DNA and we can easily foresee what kind of patterns are to be observedin the two different hypotheses previously considered. If t2 and t3 do coincide, thatis if the unwinding time of a DNA molecule is also the rise time of the residual(irreversible) hyperchromic effect, in the CsCl density gradient a single band ofDNA has to be observed, and its density must vary from that of the native to thatof the denatured DNA, while the denaturing interval of time r is varied from zeroto t3 (,-- 20 sec in the case of T2 DNA). If, on the other hand, t2 is much shorterthan t3 , that is if the molecules are denatured at random in the interval of time t3and for each of them the transition from the native to the denatured state is almostinstantaneous, two bands at a time should be observed in the CsCl density gradient.The first one must have the density of the native DNA and its intensity must de-crease as r increases between 0 and t3. The second one, at the density of the de-
BIOPHYSICAL JOURNAL VOLUME 9 19691294
10
c0
0
~0.0
0-2 0 2 4 6 8
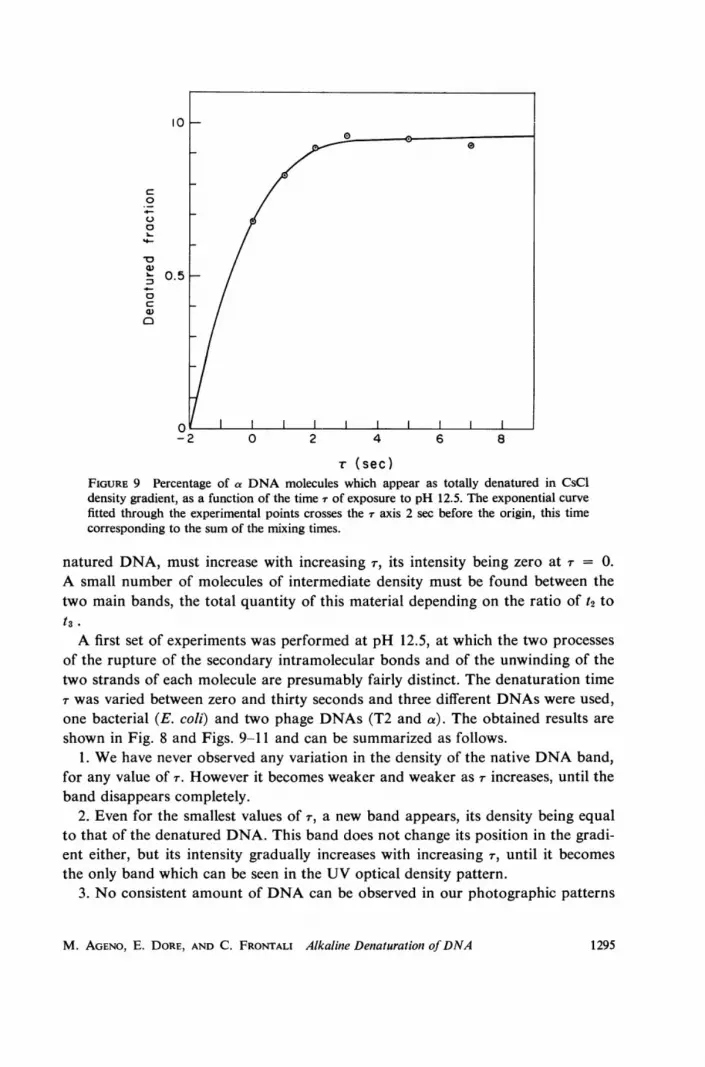
-r (sec)FIGURE 9 Percentage of a DNA molecules which appear as totally denatured in CsCldensity gradient, as a function of the time r of exposure to pH 12.5. The exponential curvefitted through the experimental points crosses the r axis 2 sec before the origin, this timecorresponding to the sum of the mixing times.
natured DNA, must increase with increasing T, its intensity being zero at Tr = 0.A small number of molecules of intermediate density must be found between thetwo main bands, the total quantity of this material depending on the ratio of t2 tot3 .
A first set of experiments was performed at pH 12.5, at which the two processesof the rupture of the secondary intramolecular bonds and of the unwinding of thetwo strands of each molecule are presumably fairly distinct. The denaturation timer was varied between zero and thirty seconds and three different DNAs were used,one bacterial (E. coli) and two phage DNAs (T2 and a). The obtained results areshown in Fig. 8 and Figs. 9-11 and can be summarized as follows.
1. We have never observed any variation in the density of the native DNA band,for any value of r. However it becomes weaker and weaker as T increases, until theband disappears completely.
2. Even for the smallest values of r, a new band appears, its density being equalto that of the denatured DNA. This band does not change its position in the gradi-ent either, but its intensity gradually increases with increasing T, until it becomesthe only band which can be seen in the UV optical density pattern.
3. No consistent amount of DNA can be observed in our photographic patterns
M. AGENO, E. DORE, AND C. FRONTALI Alkaline Denaturation ofDNA 1295
C
V 0.5 -
o4,
0.
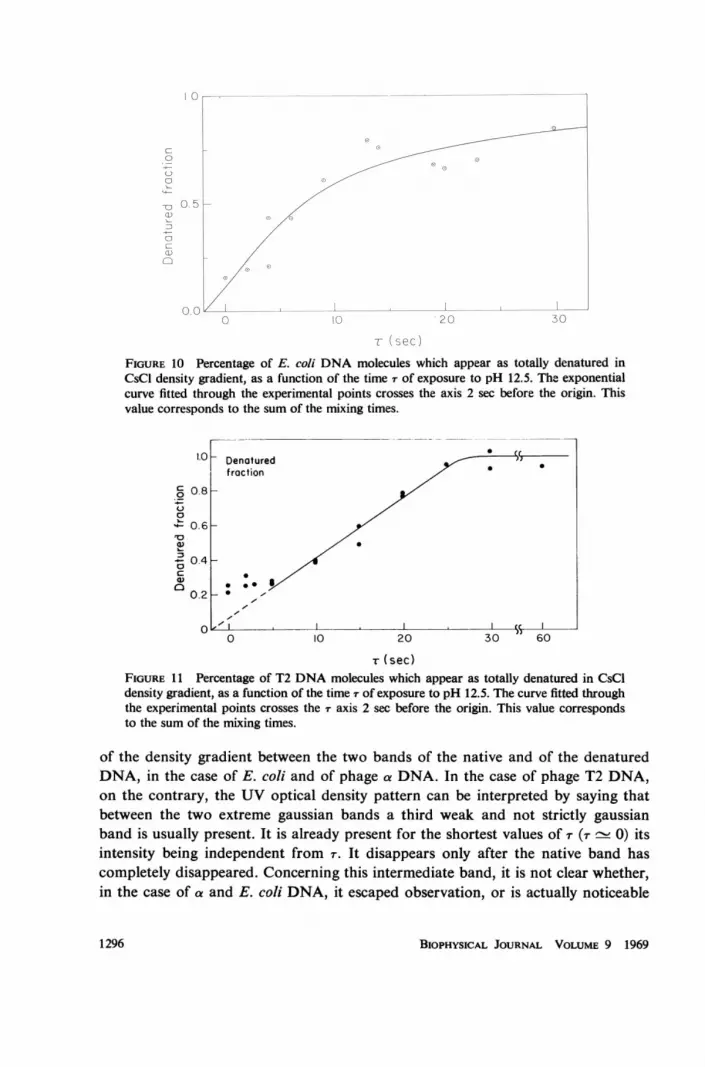
r (sec)FIGURE 10 Percentage of E. coli DNA molecules which appear as totally denatured inCsCl density gradient, as a function of the time T of exposure to pH 12.5. The exponentialcurve fitted through the experimental points crosses the axis 2 sec before the origin. Thisvalue corresponds to the sum of the mixing times.
1.0_1.0 Denotured
fraction /
E.0C]
C-)
90
Ta)
a)0
0.8[
0.61
0.4
0.2
0
0~~
* -
-,, I I, ,,
0 10 30 " 60L
-r (sec)FIGURE 11 Percentage of T2 DNA molecules which appear as totally denatured in CsCldensity gradient, as a function of the time T of exposure to pH 12.5. The curve fitted throughthe experimental points crosses the T axis 2 sec before the origin. This value correspondsto the sum of the mixing times.
of the density gradient between the two bands of the native and of the denaturedDNA, in the case of E. coli and of phage a DNA. In the case of phage T2 DNA,on the contrary, the UV optical density pattern can be interpreted by saying thatbetween the two extreme gaussian bands a third weak and not strictly gaussianband is usually present. It is already present for the shortest values of r (T - 0) itsintensity being independent from r. It disappears only after the native band hascompletely disappeared. Concerning this intermediate band, it is not clear whether,in the case of a and E. coli DNA, it escaped observation, or is actually noticeable
BIOPHYSICAL JOURNAL VOLUME 9 19691296

only for a longer DNA. Control mixtures of native and denatured T2 DNA showedno material of intermediate density, so that an artifact due to aggregation of asingle and a double stranded molecule should be ruled out.
In Fig. 8 two typical density gradient patterns of two partially denatured DNAsamples are shown. The values of r were so selected as to have comparable amountsof DNA in the native and in the denatured states. Fig. 8 a refers to the a DNA,with r = 1 sec, Fig. 8 b to the T2 DNA with r = 10 sec. It must be noted that thefirst photograph demonstrates the complete separation of the two strands of themolecules that have undergone denaturation during the interval of time r. In fact,the two strands of a DNA have different bouyant density (19) and two distinctbands are observable in addition to that of the native a DNA.
In Fig. 8 the corresponding densitometric plots are also shown, together with theresults of the electronic computer analysis in gaussian components, a continuousbackground and an intermediate semidenatured distribution. A modified Orangoprogram (a Montecarlo method followed by an iterative analytical procedure ofapproximation) was used (20). Finally, for each value of r, the areas of the gaussianbands were measured, and taking into account the difference in absorbance betweennative and denatured DNA the denatured fraction of molecules was calculated,and the graphs of Figs. 9-11 obtained. Obviously, this measurement is a rather in-direct one and the resulting points are somewhat scattered. However, there is nodoubt that the rise-time of the number of the totally denatured molecules is of thesame order as the rise-time of the residual (irreversible) hyperchromicity and atleast two orders of magnitude longer than t1 .
In conclusion, the experimental results seem to demonstrate that t2 (the time ofunwinding of a single molecule) is much shorter than t3 (the rise-time of the irreversi-ble hyperchromicity) and that strand separation is a very short random process inthe solution, provided the transition pH is exceeded.
DISCUSSION
This conclusion cannot be accepted without a very careful criticism of the experi-mental conditions and procedures previously described and a series of alternativeexplanations of the obtained results must be considered.
First of all, we must ask if the neutralization of the solution actually stops anydenaturation or renaturation process of the DNA molecules. Although it is generallyassumed that half denatured molecules rewind themselves completely when neutralpH is re-established, no direct demonstration of this phenomenon exists. It seemsherefore legitimate to wonder whether under our conditions the effect of a veryrapid neutralization is not more likely to be the formation of, imperfectly paired,short sequences. Such an effect would hinder rather than favour ordered rewinding.One might suspect that after neutralization some half-denatured molecules com-
plete their unwinding and the remaining ones rewind themselves completely. In this
M. AGENO, E. DORE, AND C. FRONTALI Alkaline Denaturaiion ofDNA 1297

O~EMOT =2sec IEEEEEE
EEEUEEEuXEU FIGURE 12 Oscillographic traces ob-(IEEE1NEEEEEE tained for T2 DNA with the automaticI******** mixing device shown in Fig. 3. The first
T 4 sec Iuuuuuuuuuul increase corresponds to the injection of..3EEEE. NaOH. The interval of time r after
which an equivalent amount of HCI is*EEEEEEEEE added to neutralize, is indicated. Time*&)Ili** luu..uuu scales are 2 sec/div. in (a) and (b); 5
EEE|1i1iiiE5;Eiiii- sec/div. in (c). The decrease time ofT=
12 secIEEE
the hyperchromic effect is in every case
EEEEEEEEEE as fast as the initial increase.
case, we cannot find any half-denatured molecule in the CsCl density gradient andthe all or none aspect of the strand separation process would be an artifact, withno relation at all to the denaturation process.
This interpretation of the experimental results seems, however, quite artificial.One cannot see why some molecules must unwind and others must rewind them-selves, whatever r may be, if during the denaturation time they are all graduallyand regularly unwinding themselves. If for instance, for a certain value of r, afterneutralization some molecules rewind and the other unwind completely, a smallchange in T must eliminate this all-or-none effect. In particular for very small valueof r no denatured molecules at all should be found. We might suspect, however, thatwe are dealing with broken DNA molecules of every length and that the all-or-noneeffect may be due to the fact that the shorter the molecules are, the faster they reachthe point at which after neutralization the unwinding process continues till strandseparation. In this case the half-width of the bands in the CsCl density gradientwould change in a characteristic way with increasing -r, but, as we will see later, thisis not the case. Moreover, there are other arguments against this interpretation ofthe experiments. Making use of our four syringe automatic mixing device, we havecarefully examined how the absorption of the DNA solution at 260 mu4 does changefrom neutralization onwards. In Fig. 12, some photographic records of the trace ofthe oscillograph are shown in which the absorption of the sample is plotted againstthe time. The two almost vertical edges of the square wave correspond to the injec-tion of alkali and to the neutralization of the DNA solution. Its width is propor-tional to the denaturation time and its height to the total hyperchromic effect. Thefact that the absorption falls in a time comparable with the rise-time whatever Tmay be, seems to demonstrate that the neutralization actually stops the unwindingor rewinding of the DNA molecules and that only the bonds between still neigh-bouring bases are restored almost immediately. From neutralization onwards the
BIOPHYSICAL JOURNAL VOLUME 9 19691298
trace is horizontal, apart from some occasional undulation due to imperfect mixing.In the first tens of seconds no variation in the absorption of the solution is detecta-ble.
Actually, observing of the falling edge of the absorption wave is quite difficult.The injection rate of the neutralizing solution is critical and a sharp compromisemust be made between imperfect mixing and shear degradation of the DNA mole-cules. However, even if the residual hyperchromic effect evaluated in this way is notcompletely reliable, (actually the residual hyperchromic effects measured in this wayare higher than those reported in Fig. 7) the steepness of the fall is in any case verymeaningful and no spurious effect seems to be able to increase it.
It was also verified experimentally that, when care is taken to work in rigorouslycontrolled conditions, and particularly at constant temperature, the absorption ofthe DNA sample does not undergo any slow variation during an interval of time ofseveral minutes after neutralization, and this for very different values of r. Thus, itseems difficult to avoid the conclusion that neutralization stops any process ofdenaturation or renaturation within a few tenths of a second.At first glance these results seem to contradict what is generally accepted con-
cerning the reversibility of denaturation, on the basis of the experiments carried outby E. P. Geiduschek (21, 22) on DNA thermally denatured. In effect, if the un-winding of the two strands is gradual, and the renaturation of partially denaturedmolecules easy and fast, we should be able to observe a decrease in the optical den-sity over a period of time at least as long as r. Furthermore, in the CsCl densitygradient only native molecules would be present for each value of r shorter than aspecific critical value. The same would be true of the residual hyperchromic effect,so that the curves in Figs. 7 and 11 should have a characteristic step shape.
This contrast, however, is only an apparent one, since the experimental conditionshere are quite different from those used by Geiduschek (21, 22). In particular,denaturing conditions are removed in a much shorter time than that required forthe procedure of ice-quenching (6) as demonstrated in Fig. 12.A second possible interpretation of our experimental results is that the density
spectrum of the DNA sample is an artifact due to its staying in the CsCl solution forat least 24 hr, i.e., the time necessary for the formation of the density gradient in theultracentrifuge.To test this interpretation, a search for a very slow variation in the absorbance of
a semidenatured DNA sample was made and the effect of the 8 M CsCl solution in-vestigated. To this aim the optical density of partially denatured T2 DNA sampleswas recorded with a Cary model 15 spectrophotometer during more than 20 hr.CsCl was added to a final concentration 8 M at different times after neutralization,and the optical density further recorded. No variation with time of the hyperchromiceffect was observed. The lowering of the hyperchromic effect caused by the additionof CsCl (calculated taking into account the volume variation of the sample) wasfound to be independent of DNA concentration and of time of addition and is to
M. AGENO, E. DORE, AND C. FRONTALI Alkaline Denaturation ofDNA 1299

be attributed to the more compact shape single stranded molecules assume in highionic strength (11).The behaviour of DNA in the CsCl density gradient was also tested directly in
the analytical ultracentrifuge. It has already been mentioned that in the case of T2DNA, a small quantity of material of intermediate density is present between thetwo bands of native and denatured DNA. A sample of half-denatured T2 DNA(r = 15 sec) was examined in a CsCl density gradient and two photographic UV-records of the density spectrum were taken after 23 and after 50 hr of permanenceof the sample in the ultracentrifuge. The densitometric readings of the two photo-graphs could be brought to coincide exactly, the quantity of material of intermediatedensity not being appreciably changed during 27 hr. On the other hand, we haveproved that the material of intermediate density can renaturate very easily, in theproper physico-chemical conditions. As an example, in Fig. 13 two density spectra ofpartially denatured T2 DNA are shown. Imperfect mixing caused an unusually largequantity of intermediate material, as is shown in (a). A sample of the partially de-natured solution was then incubated for 7 min at 45°C. As it is shown in (b), thistreatment was sufficient to cause complete disappearence of the partially denaturedmaterial. This experiment also shows that the material of intermediate density can-not be interpreted as due to partly double, partly single-stranded molecules resultingfrom single-strand breakages and partial denaturation. Such molecules would, ineffect, renature more slowly than fully denatured ones, instead of being more effici-ently renatured, as shown here.
Moreover, it is possible to show that artificially prepared half-denatured moleculescan remain for more than 24 hr as such, in the CsCl density gradient. Results ob-tained by us with partially renatured DNA (23) as well as those reported by Subirana(24) demonstrate that half-renatured molecules (annealed either by thermal treat-ment, or by exposure to a suitable pH value) do remain as such in the CsCl densitygradient. The rate of renaturation measured at room temperature, even in thepresence of 8 M CsCl, is too slow to cause noticeable reannealing of this material.
This line of evidence is not really conclusive, since half-renatured material maypossess a structure different from that of the half-denatured material yielded in thecourse of alkaline denaturation. This latter material may be more ordered than theformer (although it is likely that on neutralizing so fast wrong complementarysequences-either inter or intrastrand-are formed by chance), and renaturationmay then proceed at a much faster rate. The experiment illustrated in Figure 13,however, shows that even in this latter case renaturation is not instantaneous, butrequires several minutes under the proper annealing conditions, and that 24 hr inCsCl are by no means sufficient to cause renaturation.
In conclusion, also the CsCl artifact hypothesis seems untenable.A third possible interpretation of our all-or-none effect starts from the considera-
tion that a single DNA strand is much weaker than a double-stranded molecule.
BIOPHYSICAL JOURNAL VOLUME 9 19691300

6.3 6.4 6.5 6.6
x (cm)FIGURE 13 (a) Partially denatured T2 DNA. (b) The same after a very mild renaturationtreatment. (7 min at 45°C, at 5,ug/ml). The intermediate material has completely disap-peared.
When the DNA solution, after partial denaturation, is neutralized, segments ofsingle-stranded DNA can be wrenched out of partially unwound molecules. Forinstance, if we assume that the unwinding precedes regularly from the free ends ofa molecule, it may be that the branching points are subject to particularly intensestresses and in these points the DNA will most probably break. In this case we shouldobserve in the CsCl density gradient a band in the position of denatured DNA,even if no molecule has effectively reached strand separation. If, moreover, theremaining unwound double-stranded segments would renature quickly, we shouldobserve only another band in the position of the native DNA, and the all-or-noneeffect would be explained.At first sight, this interpretation seems most plausible. However, it can be easily
tested experimentally. In fact, the mean molecular weight of the native fractionwould decrease with increasing r and that of the denatured fraction would increase.Both the halfwidth of the gaussian band in CsCl density gradient, and the sedimenta-tion coefficient depend on the molecular weight.
M. AGENO, E. DORE, AND C. FRONTALI Alkaline Denaturation ofDNA 1301

00 20 30 "' 60
-r ( sec)FIGURE 14 - standard deviations of the gaussian components obtained by the electroniccomputer analysis for partially denatured T2 DNA as a function ofT (time of exposure topH 12.5). The width of the native band (a) is relative to the width of undenatured DNA,the width of the denatured band (b) is relative to the width of totally denatured DNA. Thecontinuous curves ( ) give the variation of the bandwidths which would be expectedunder the hypothesis of simultaneous unwinding of the molecules at a constant rate, ac-companied by breakage at the bifurcation point, assuming that the molecular weight isinversely proportional to a2.
The half widths of the gaussian bands were measured on the relevant densito-metric records, and the results plotted in Fig. 14. All the experimental points arecompatible with a horizontal straight line, and no indication of the foreseen varia-tion with r was obtained. To give an idea of the disagreement, in each figure a curvecalculated for a DNA in which the unwinding proceeds with constant speed andgoes to an end in 30 sec was reported. Obviously, this is not a very realistic hypothe-sis, but it is presented only for comparison.
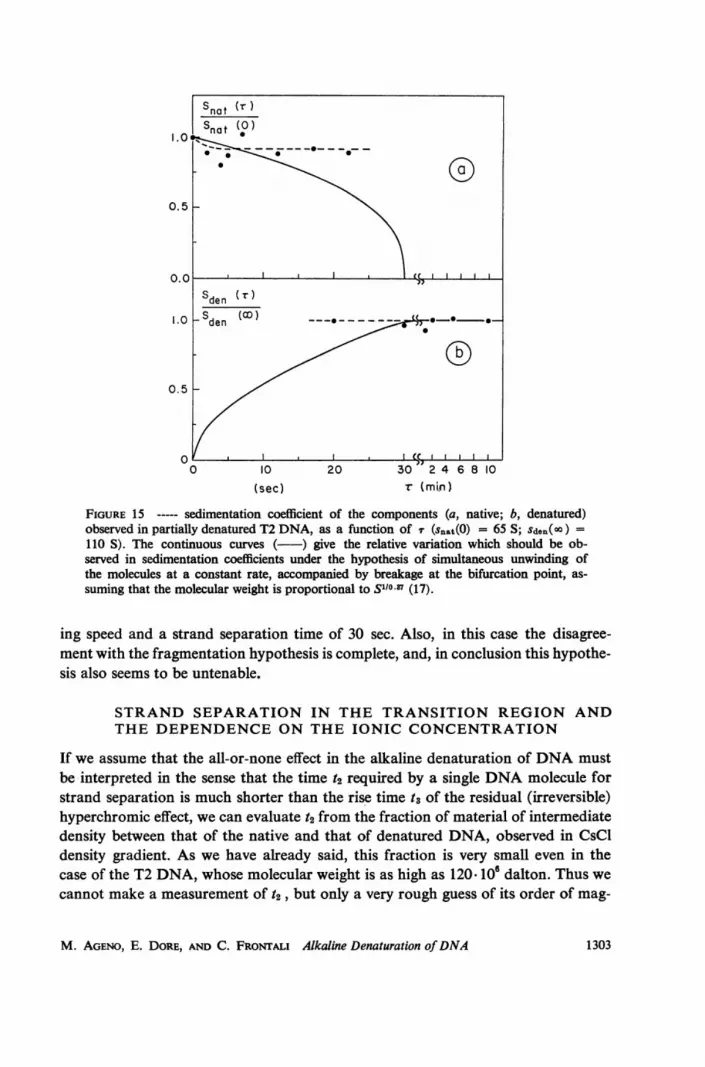
Since CsCl bandwidths are not very reliable with regard to the molecular weight,the sedimentation coefficient of the native and denatured fractions were also meas-ured as functions of r and the results are plotted in Figure 15. Here also the con-tinuous curves are calculated only for comparison, in the case of a constant unwind-
BIOPHYSICAL JOURNAL VOLUME 9 1969
0
1 302
0 10 20 30 2 4 6 8 10
(sec) r (min )
FIGURE 15- sedimentation coefficient of the components (a, native; b, denatured)observed in partially denatured T2 DNA, as a function of X (snat(0) = 65 S; sden(oo) =110 S). The continuous curves ( ) give the relative variation which should be ob-served in sedimentation coefficients under the hypothesis of simultaneous unwinding ofthe molecules at a constant rate, accompanied by breakage at the bifurcation point, as-suming that the molecular weight is proportional to S1i0 87 (17).
ing speed and a strand separation time of 30 sec. Also, in this case the disagree-ment with the fragmentation hypothesis is complete, and, in conclusion this hypothe-sis also seems to be untenable.
STRAND SEPARATION IN THE TRANSITION REGION ANDTHE DEPENDENCE ON THE IONIC CONCENTRATION
If we assume that the all-or-none effect in the alkaline denaturation of DNA mustbe interpreted in the sense that the time t2 required by a single DNA molecule forstrand separation is much shorter than the rise time t3 of the residual (irreversible)hyperchromic effect, we can evaluate t2 from the fraction of material of intermediatedensity between that of the native and that of denatured DNA, observed in CsCldensity gradient. As we have already said, this fraction is very small even in thecase of the T2 DNA, whose molecular weight is as high as 120. 106 dalton. Thus wecannot make a measurement of t2, but only a very rough guess of its order of mag-
M. AGENO, E. DORE, AND C. FRONTALI Alkaline Denaturation ofDNA 1303

0Io Iu-0~~~~~~~~~~~~~~~~~
E 20 0020
--0 ) ,- -
i
o o o115* 1. 1. 1181.0 201. 2. 231. 251.
F 1 O
IO ¼ 0.5
0. I~~~~~~~~
0 0
11.5 11.6 11.7 11.8 11.9 12.0 12.1 12.2 12.3 12.4 12.5 12.6
pHFIGURE 16 On the same graph of Fig. 6 are reported here as black dots (0) the percent-ages of T2 DNA molecules which appear totally denatured in CsCl density gradient. (Scaleat right.)
nitude. In the case of T2, the result is t2 1-' 1 sec, at pH 12.5, and, as it is obvious,it depends on the correctness of our general interpretation.
Furthermore, the occurrence of single strand breakages, which is almost unavoid-able (an average of one break per strand is already initially present, see Materialsand Methods) may effect the absolute values of t2 and t8, which are therefore givenas rough estimates. Still, we believe that such an effect cannot change the generalpicture of the process.
Let us now consider what happens in the transition region. Referring to Fig. 6,we have seen that the phonomenology in the transition region of pH is complex.We meet first a region (b region) in which the hyperchromic effect and its rise-timeare both gradually increasing with increasing pH, the process being totally reversible.In the following region (c region), the rise-time of the hyperchromic effect falls andthe process becomes gradually irreversible. What about strand separation in thesetwo regions?The same samples of DNA with which the points in Fig. 6 were obtained, were
also examined at the ultracentrifuge in the CsCl density gradient. As expected, nostrand separation at all was found in the b region, where the process is completelyreversible. In the c region, on the contrary, the all-or-none effect already studied inthe d region, is present and the relative amount of totally denatured DNA increasesin practically the same way as the irreversible hyperchromic effect. The black pointsin Fig. 16 represent the denatured fractions deduced in the usual way from the UV-photographic records of the CsCl density gradient.At this point, we are able to present the following tentative description of the
BIOPHYsICAL JOURNAL VOLUME 9 19691 304
0~~~~~~0~
0~~~~
%- C- 15 _ +
*E10 _ /
0~~~~~~~~
<, 5 _- /
04~~~~~~
0 +~~~~~~~~~Q~~~~ +
o -,~0 * +___=3 K~~~~~~~~~~~~~~~~~~~~
0 10 0 20 30K
t5
IOCsS-** '(
0 10 20 30 40 60
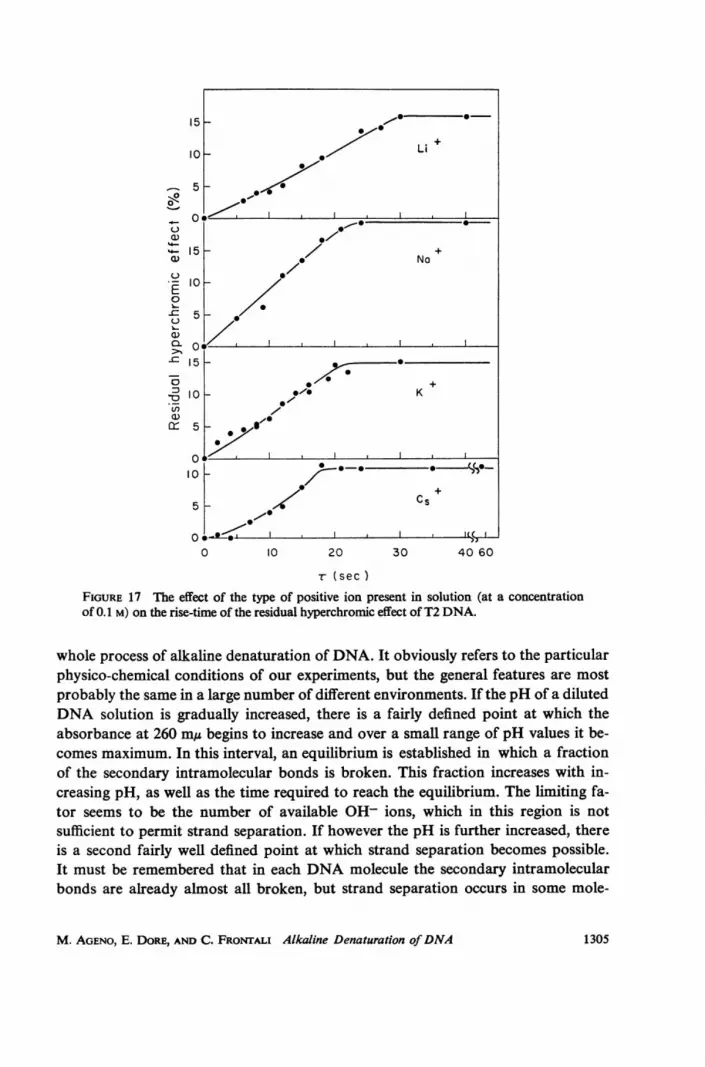
r (secFIGURE 17 The effect of the type of positive ion present in solution (at a concentrationof 0.1 M) on the rise-time of the residual hyperchromic effect of T2 DNA.
whole process of alkaline denaturation of DNA. It obviously refers to the particularphysico-chemical conditions of our experiments, but the general features are mostprobably the same in a large number of different environments. If the pH of a dilutedDNA solution is gradually increased, there is a fairly defined point at which theabsorbance at 260 m,u begins to increase and over a small range of pH values it be-comes maximum. In this interval, an equilibrium is established in which a fractionof the secondary intramolecular bonds is broken. This fraction increases with in-creasing pH, as well as the time required to reach the equilibrium. The limiting fa-tor seems to be the number of available OH- ions, which in this region is notsufficient to permit strand separation. If however the pH is further increased, thereis a second fairly well defined point at which strand separation becomes possible.It must be remembered that in each DNA molecule the secondary intramolecularbonds are already almost all broken, but strand separation occurs in some mole-
M. AGENO, E. DORE, AND C. FRONTALI Alkaline Denaturation ofDNA 1305
0
>' 101
-
a 1 [Na'] 0.2 M ~/ [K +]=0.2 M
o
0 10 20 30 0 10 20 30
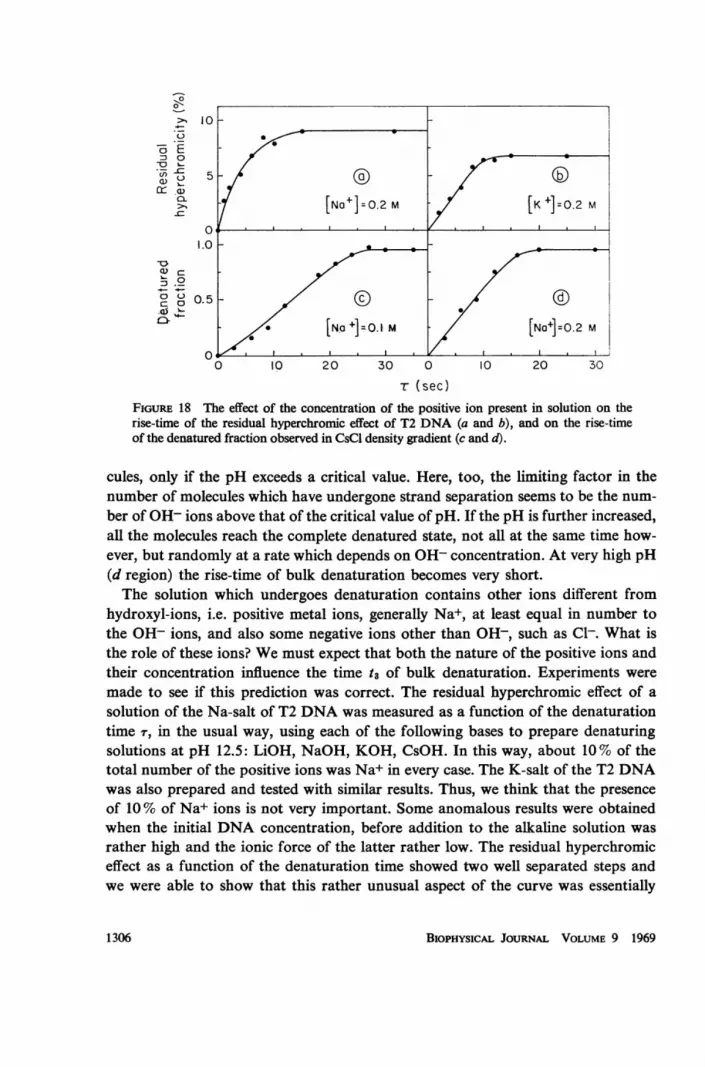
T (sec)FIGURE 18 The effect of the concentration of the positive ion present in solution on therise-time of the residual hyperchromic effect of T2 DNA (a and b), and on the rise-timeof the denatured fraction observed in CsCl density gradient (c and d).
cules, only if the pH exceeds a critical value. Here, too, the limiting factor in thenumber of molecules which have undergone strand separation seems to be the num-ber of OH- ions above that of the critical value of pH. If the pH is further increased,all the molecules reach the complete denatured state, not all at the same time how-ever, but randomly at a rate which depends on OH- concentration. At very high pH(d region) the rise-time of bulk denaturation becomes very short.The solution which undergoes denaturation contains other ions different from
hydroxyl-ions, i.e. positive metal ions, generally Na+, at least equal in number tothe OH- ions, and also some negative ions other than OH-, such as C1-. What isthe role of these ions? We must expect that both the nature of the positive ions andtheir concentration influence the time t8 of bulk denaturation. Experiments weremade to see if this prediction was correct. The residual hyperchromic effect of asolution of the Na-salt of T2 DNA was measured as a function of the denaturationtime T, in the usual way, using each of the following bases to prepare denaturingsolutions at pH 12.5: LiOH, NaOH, KOH, CsOH. In this way, about 10% of thetotal number of the positive ions was Na+ in every case. The K-salt of the T2 DNAwas also prepared and tested with similar results. Thus, we think that the presenceof 10% of Na+ ions is not very important. Some anomalous results were obtainedwhen the initial DNA concentration, before addition to the alkaline solution wasrather high and the ionic force of the latter rather low. The residual hyperchromiceffect as a function of the denaturation time showed two well separated steps andwe were able to show that this rather unusual aspect of the curve was essentially
BIOPHYSICAL JOURNAL VOLUME 9 19691306

due to aggregates of DNA molecules. This phenomenon will be discussed at lengthelsewhere. In Fig. 17 the results obtained with an initial DNA concentration of 150jig/ml (to be diluted 10 times in the denaturing solution) are shown, for LiOH,NaOH, KOH and CsOH. The final concentration of positive ions was in the fourcases 0.1 M. It is evident that the bigger the positive ion, the steeper the bulk de-naturation process. Similar curves with a final concentrations of Na+ and K+ 0.2 Mare shown in Fig. 18 a and b. As the ionic force increases the rise-time of the irreversi-ble hyperchromic effect becomes shorter. In Fig. 18 c and d, similar results wereobtained, measuring in a CsCl density gradient the fraction of denatured moleculesas a function of 7 for Na+ concentrations equal to 0.1 and 0.2 M. It must be saidthat in many cases we have measured a rise-time of the fraction of denatured mole-cules a little longer than that of the irreversible hyperchromic effect of the same DNAsolution. This point however was not sufficiently investigated and we cannot say ifthe effect is real.
In conclusion, an effect of the positive ions on the bulk denaturation time of aDNA solution was put in evidence, this time becoming shorter as the positive ionconcentration was increased and as the ion radius increased.
ENERGY CONSIDERATIONS. THE DEPROTONATION MODEL
All the previous results must now be interpreted in the framework of the molecularmodel of Crick and Watson. At first sight, no difficulty arises from the qualitativepoint of view, but it does not seem to be easy to understand the mechanics of thedenaturation process.Even Watson and Crick in one of their classical papers on the structure of the
DNA molecule, have pointed out the necessity of a very careful examination of themechanical aspects of strand separation and duplication of the molecule (25). Thequestion is that the unwinding movement in a viscous medium wastes energy, andthe total energy dissipation depends on the rate of unwinding. Several years ago,Levinthal and Crane (26) evaluated the total energy requirement, making use ofthe data then available on the molecular weight of DNA and on the time requiredfor strand separation. The result was not out of keeping with the energy set free bythe triphosphates of the bases, during the process of DNA duplication, and thequestion appeared to be settled.
However, the results discussed in this paper, obtained withDNA ofknown molec-ular weight, much higher than that considered by Levinthal and Crane, open thequestion again. We have found that at pH 12.5 the total unwinding of a T2 DNAmolecule requires about one second. If we use the formula of Levinthal and Craneto give a very rough estimation of the energy required by a DNA molecule of 120-106 dalton to unwind in 1 sec, the result is about 1.2- 1019 cal/rev, that is one thousandtimes higher than the previously considered value.Now the question arises, "what is the energy source that makes strand separation
M. AGENO, E. DORE, AND C. FRONTALI Alkaline Denaturation ofDNA 1307

energetically possible in the alkaline medium?" Obviously, no energy rich moleculeis available in the solution, which contains only water, OH-, Na+ (and some un-predictable impurities). Thus, we have no alternative. Only the recombination ofhydroxylions with the hydrogen atoms of the H-bridges between bases to formwater, can be considered as a likely energy source. And, in fact, it is so, since theenergy set free (13.5 kcal mole-') is sufficiently higher than the mean binding energyof one proton of the H-bridges. Assuming that the difference between the two is ofthe order of 10 kcal/mole, and considering that there is an average of 24 H-bridgesper turn of the helix in T2 DNA, we can estimate to about 4. l0-1 cal/rev the energyavailable for the rotation of the molecule. This value compares favourably with theenergy requirement (1.2. 10-1' cal/rev).These energy considerations allow us to discuss one more alternative hypothesis
which can be put forward to explain our results. According to this hypothesis theinitial rapid melting, occurring in a time t,, proceeds by unwinding the double helix.Unwinding therefore starts rapidly in all molecules, but there is one final step, slowand variable, which is responsible for the time tl required for irreversible denatura-tion. The molecules which still possess a nucleus for rewinding, rewind rapidly onre-neutralization.
In order to be compatible with all our results, such a hypothesis requires that bothunwinding and rewinding take place in less than 0.1 sec (a figure which was givenas an upper limit for ti). The energy requirement then increases by more than a fac-tor of ten, and it becomes very difficult to think of a possible energy source.
This conclusion agrees fairly well with the description of the alkaline denaturationprocess we have given in the previous paragraph. It seems possible that the hyper-chromic effect is in part a consequence of deprotonation as suggested by the spectraldifference shown in Fig. 1. The high charge density in the interior of the helix willprobably prohibit stacking of the bases. The following considerations explain howone can envisage a hyperchromic state in which DNA is not unwound.When a proton of a H-bridge is extracted from the DNA molecule and a water
molecule is formed with a hydroxyl-ion of the solution, a fairly high part of theenergy set free remains stored in the DNA molecule, as repulsive electrostatic energy,between the electrons of the shoulders of the destroyed bridge. As the deprotonationproceeds further, the molecule even more resembles a charged spring. However,one must not forget the presence in the solution of the positive ions, in number atleast equal to that of the hydroxyl-ions. They tend to shield one deprotonated sitefrom the neighbouring ones, so that the work of extraction of a proton from themolecule does not increase as the deprotonation proceeds. Although they cannotsubstitute the protons, they lower the electrostatic repulsion between the two halvesof the molecule, so that their presence tends to stabilize the DNA. This is a well-known effect, depending on which the melting point increases with increasing ionicstrength.A deprotonated molecule, in which each deprotonated site is surrounded by a
BIOPHYSICAL JOURNAL VOLUME 9 19691308

cloud of positive ions, is probably a case of unstable equilibrium. Occasionally, inone place, the two mutually repelling shoulders of the destroyed bridge can be pushedback, and a positive ion can take the place of the dismissed proton. In this case,two consequences follow. The first is that the two relevant bases no longer interactstrongly, because the positive ion cannot substitute the proton in the bridge. Thesecond is that, if the ion is much bigger than the proton, the molecule will be highlydeformed in the surrounding area. Consequently in the neighbouring deprotonatedsites, the two repelling shoulders are pushed back, and a second cation can take theplace of the next dismissed proton, and so on. Thus strand separation begins and ismore likely to go quickly to completion if the positive ions are heavier. This modelseems to be able to explain not only the all-or-none effect we have observed, butalso the fact that if the positive ion concentration increases, the rise-time of theirreversible hyperchromic effect is lowered, because the probability that one of themcan take the place of a dismissed proton increases, (although different hypothesesare possible, for example an effect of the positive ion on the viscosity of the DNAsolution, or on the transition pH).To further test our model, the deprotonation process was demonstrated directly,
by measuring the drop in pH of an NaOH solution due to the addition of a givenamount of DNA. In fact, the proton capture must be accompanied by the dis-appearance of an equal number of hydroxyl-ions, with the formation of watermolecule.
In order to measure the drop in pH below the value of the corresponding blank,it is advisable to raise the DNA concentration as much as possible. However, it isnecessary to use relatively large volumes of solution ('-.' 30 ml) of not too high aviscosity, in order to facilitate mixing, and this, in practice, limits the concentrationto about 100,ug/ml.Under these conditions the drop in pH turned out to be rather small, of the order
of a few hundredths of one pH unit in the transition region (between pH 11.8 and12.0). The measurements were performed at 20.00C with a Beckman Research pH-meter, accurate to 0.001 pH units, and equipped with a glass electrode suited to highpH values. The precision limit depends on the manual operations of dilution andmixing, which could be reproduced only within 0.01 pH units.
In order to work at a constant Na+ concentration, the denaturing solution forevery pH value was prepared by mixing solutions of NaCl 0.1 M and NaOH 0.1 Min suitable proportions. To 26 ml of this solution, 4 ml of a concentrated DNA solu-tion were added, and mixed for 60 sec. Readings were taken at intervals of 3-5 minover a period of about 40 min, and extrapolated back to zero time, in order to com-pensate for the drift in pH due to the C02 present in the air. The difference in pHbetween blank and sample can be easily converted into the number of hydroxyl-ionswhich disappeared during the deprotonation process. The final concentration ofDNA was deduced from the optical density of the solution at 260 m,us.
In Fig. 19 the results obtained as a function of pH are given and compared (upper
M. AGENO, E. DORE, AND C. FRONTALI Alkaline Denaturation ofDNA 1309

pH
FiGuRE 19 (a) Number of OH- ions lost per hydrogen bridge of added DNA, as a func-tion of the pH of the solution, measured before addition. The abrupt increase in OH- trap-ping corresponds to the alkaline transition, shown in (b), where the hyperchromic effectis plotted vs. the same abscissa.
part of the figure) with the hyperchromic effect of the same solution of DNA at thecorresponding pH. Between pH 8.4 and 11.6 there is a slow almost linear increasein the number of hydroxyl-ions lost per H-bridge of the DNA. This regular increasecan be thought of as due to the titration of the phosphate groups, and perhapspartially to impurities of the solution. The most interesting feature of the curvehowever is the abrupt increase in the number of trapped OH- ions, just in the regionof the alkaline transition. There is little doubt that this increase corresponds to thecapture of the protons bridging complementary strands. The results confirm thewell known titration curve of Gulland, Jordan and Taylor (27) obtained with DNAsamples and under experimental conditions quite different from those we can obtaintoday. The total size of thejump (1.6 OH-/H-bridge) appears to be larger than ex-pected. However the statistical errors are quite large and, furthermore, it is con-ceivable that, as a result of the opening of the double stranded structure, otherhydrogen atoms in the molecule become suddenly accessible and may be capturedby the same mechanism.
In conclusion, it seems to us that the deprotonation model here proposed isdirectly confirmed by experiment and that all our results have a place in the frame-work of the well known Crick and Watson model of the DNA molecule.Even if the alkaline denaturation process seems to have no more bearing than
thermal denaturation, on what happens in the cell when DNA is duplicated or itsinformation copied, it does seem possible that partial unwinding of the doublestranded structure is produced by some proton acceptor molecule present in the cellin the right place, at the right moment. This process would be much more similar
BIOPHYSICAL JOURNAL VOLUME 9 19691310

to the alkaline denaturation here studied than to the thermal denaturation process,even if neither high temperature nor extreme value of pH can exist in the cell.Thanks are due to Franca Podo, who contributed to some experiments, and also to the whole tech-nical staff of the Laboratory of Physics, Istituto Superiore di Sanita. All discussion and criticism isgratefully acknowledged. In particular we should like to thank Drs. R. L. Baldwin, P. F. Davison,E. P. Geiduschek, A. M. Michelson, J. Marmur, H. Nassie, and L. Paoloni, for their important andhelpful comments. We are also indebted to Professor E. Segre for the interest shown in this work.This work is a part of the research program in progress at the Physics Laboratory of the IstitutoSuperiore di Sanita with the support of the Consiglio Nazionale delle Ricerche.
Received for publication 29 April 1969.
REFERENCES
1. CAIRNS, J. 1963. J. Mol. Biol. 6:208.2. PETTUOHN, D. E., and P. C. HANAWALT. 1964. J. Mol. Biol. 8:170.3. KIDSON, C. 1966. J. Mol. Biol. 17:1.4. HAYASKI, M. 1965. Proc. Nat. Acad. Sci. U.S.A. 54:1738.5. HAYASKI, M. N., and M. HAYASKI. 1966. Proc. Nat. Acad. Sci. U.S.A. 55:635.6. MARMUR, J., RowND, R. and C. L. SCHILDKRAUT. 1963. Progress in Nucleic Acid Research.
J. N. Davidson and W. E. Cohn, editors. Academic Press, Inc., New York. 1:232.7. EIGNER, J., and P. DoTY. 1965. J. Mol. Biol. 12:549.8. CRoTHERS, D. M., N. R. KALLENBACH, and B. H. ZIMM. 1965. J. Mol. Biol. 11:802.9. SCHILDKRAUT, C., and S. LIFSON. 1965. Biopolymers. 3:195.
10. CROTHERS, D. M. 1964. J. Mol. Biol. 9:712.11. STUDIER, F. W. 1965. J. Mol. Biol. 11:373.12. DAVISON, P. F. 1966. J. Mol. Biol. 22:97.13. BEAVEN, G. M., E. R. HOLIDAY, and E. A. JOHNSON. 1955. Nucleic Acids. E. Chargaff and J. N.
Davidson, editors. Academic Press, Inc., New York. 1:493.14. FELsENFELD, G., and S. Z. HIRSCHMAN. 1965. J. Mol. Biol. 13:407.15. MARMUR, J. 1961. J. Mol. Biol. 3:208.16. MANDELL, J. D., and A. D. HERSHEY. 1960. Anal. Biochem. 1:66.17. DoTy, P., B. B. McGILL, and S. A. RICE. 1958. Proc. Nat. Acad. Sci. U.S.A. 44:43318. CROTHERS, D. M., and B. H. ZNM. 1964. J. Mol. Biol. 9:1.19. AURISICCHIO, S., C. FRoNTALI, F. GRAzIOsI, and G. TosCHI. 1962. Nuovo Cimento, Serie X.
25 (Suppl.): 41.20. FARCHI, G., and D. GIUccI. 1966. Ann. Ist. Super. Sanit:. 2:722.21. GEIDUSCHEK, E. P. 1961. Proc. Nat. Acad. Sci. U.S.A. 47:950.22. GEIDUSCHEK, E. P. 1962. J. Mol. Biol. 4:467.23. AGENO, M., E. DORE, and C. FRONTALI. 1966. Atti Accad. Naz. Lincei Rend. Cl. Sci. Fis. Mat.
Natur. 41:234.24. SUBIRANA, J. A. 1966. Biopolymers. 4:189.25. WATSON, J. D., and F. H. C. CRICK. 1963. Cold Spring Harbor Symp. Quant. Biol. 18:123.26. LEVINTHAL, C., and H. R. CRANE. 1956. Proc. Nat. Acad. Sci. U.S.A. 42:436.27. GULLAND, J. M., D. 0. JORDAN, and H. F. W. TAYLOR. 1947. J. Chem. Soc. 1947:1131.
M. AGENO, E. DORE, AND C. FRONTALI Alkaline Denaturation of DNA 1311


